UNITED STATES
SECURITIES AND EXCHANGE COMMISSION
Washington, D.C. 20549
FORM N-CSR
CERTIFIED SHAREHOLDER REPORT OF REGISTERED
MANAGEMENT INVESTMENT COMPANIES
Investment Company Act file number 811-21714
|
MML Series Investment Fund II |
(Exact name of registrant as specified in charter) |
|
100 Bright Meadow Blvd., Enfield, CT 06082 |
(Address of principal executive offices) (Zip code) |
Tina Wilson
|
100 Bright Meadow Blvd., Enfield, CT 06082 |
| (Name and address of agent for service) |
Registrant’s telephone number, including area code: (860) 562-1000
Date of fiscal year end: 12/31/2017
Date of reporting period: 12/31/2017
Item 1. Reports to Stockholders.
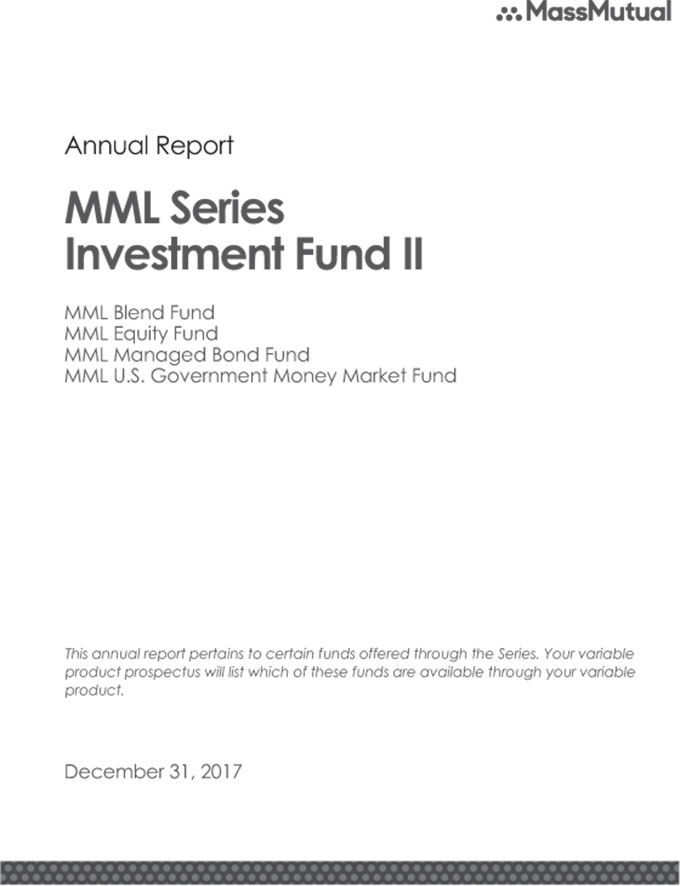
Table of Contents
This material must be preceded or accompanied by a current prospectus (or summary prospectus, if available) for the MML Series Investment Fund II. Investors should consider a Fund’s investment objective, risks, and charges and expenses carefully before investing. This and other information about the investment company is available in the prospectus (or summary prospectus, if available). Read it carefully before investing.
MML Series Investment Fund II – President’s Letter to Shareholders (Unaudited)
To Our Shareholders

Tina Wilson
“MassMutual believes that ever-changing market conditions have the potential to benefit people who maintain a long-term perspective on investing.”
December 31, 2017
Continued strength in U.S. markets benefits equity investors; global markets stabilize
I am pleased to present you with the MML Series Investment Fund II Annual Report, covering the year ended December 31, 2017 (the “fiscal year”). Domestic stocks enjoyed strong performance during the fiscal year, as investor sentiment was buoyed by campaign promises focused on tax reforms, infrastructure spending, health care reform, and the creation of American jobs. One campaign promise fulfilled was the passage of tax reform, as President Trump signed sweeping tax legislation (i.e., the Tax Cuts and Jobs Act) into law on December 22, 2017.
Foreign stocks also performed well for investors, as European markets stabilized significantly with Brexit concerns shifting to the actual details of executing Great Britain’s separation from the European Union. Asian markets also stabilized, even though geopolitical tensions in the region escalated due to China’s disputed expansion in the South China Sea, North Korea’s increased nuclear and missile arsenal, and lingering suspicions regarding Russia’s covert involvement in the American political process and its participation in Middle Eastern conflicts. Japan’s economic policies also appeared to be helping that country overcome its long-term economic challenges.
While equity markets added to an impressive string of consecutive quarters with positive results, investment-grade bond investors found it more difficult to generate satisfying returns during the period.
In MassMutual’s view, the ongoing uncertainties associated with investing in today’s markets validate the importance of taking a long-term perspective and not reacting to current events or short-term market changes. We also believe investors preparing for retirement who follow certain investment guidelines, such as the ones below, may increase their chances of reaching their long-term income retirement goals.
Suggestions for retirement investors under any market conditions
Save as much as you can
There is no way to predict how the markets will perform. But you can control how often and how much you contribute to your retirement accounts. Contributing as much as you can and increasing your contribution level as often as possible may be one way to help you realize your retirement income goals.*
Invest in all market conditions
Many seasoned investors believe that retirement savers who can tolerate a market downturn have the potential to be rewarded by accumulating larger positions at more favorable prices (compared to those who do not invest during a down market). That’s why financial professionals often advise their clients to stay in the market, regardless of short-term results.
Retirement investors have time on their side
For most, saving and investing for retirement occurs over many decades. While most retirement investors may be familiar with market volatility, savvy investors know that adopting a long-term view of the markets can help them withstand all market conditions.
| | * | Systematic investing and asset allocation do not ensure a profit or protect against loss in a declining market. Systematic investing involves continuous investment in securities regardless of fluctuating price levels. Investors should consider their ability to continue investing through periods of low price levels. |
(Continued)
1
MML Series Investment Fund II – President’s Letter to Shareholders (Unaudited) (Continued)
Monitor your asset allocation regularly – and diversify
Stocks, bonds, and short-term/money market investments typically (although not always) behave differently, depending on the economic and market environment. Each of these asset classes contains an even greater array of sub-categories, such as small-cap stocks, international stocks, and high-yield bonds. Many financial professionals believe that investors can take advantage of different opportunities in the market and reduce the risk of over-exposure to one or two poorly performing investment types by maintaining retirement accounts that contain a mix of investment types and sub-categories.
Make informed choices and seek professional guidance
Many financial advisors suggest that retirement investors select an appropriate combination of investments that aligns with their retirement income goals. Doing so can help you withstand the inevitable ups and downs of the markets.
If you work with a financial professional, this may be an excellent time to contact him or her for assistance in assessing whether or not you:
| | • | | may be saving enough for adequate retirement income based on your long-term needs; |
| | • | | are invested properly for all market conditions, based on your retirement income goals and objectives and where you are in your retirement planning journey; and |
| | • | | feel you are taking the right steps to help reduce your longevity risk, which is related to the possibility that you could “outlive” your retirement savings. |
We’re people protecting people
MassMutual believes that nothing matters more than people. Our commitment has always been to help you care for the people you care about. We’ve helped people secure their future and protect the ones they love since 1851. And that’s why we consistently encourage retirement investors to maintain a long-term view toward retirement investing, and avoid reacting to short-term market movements. We believe that ever-changing market conditions have the potential to benefit people who maintain a long-term perspective on investing. Thank you for your continued confidence in MassMutual.
Sincerely,

Tina Wilson
President
The information provided is the opinion of MML Investment Advisers, LLC as of 1/1/18 and is subject to change without notice. It is not to be construed as tax, legal, or investment advice. Of course, past performance does not guarantee future results.
2
MML Series Investment Fund II – Economic and Market Overview (Unaudited)
December 31, 2017
Market Highlights
| | • | | U.S. stock investors enjoyed strong performance during the fiscal year, bolstered by a rally which started after the November 2016 U.S. presidential election. |
| | • | | Data throughout the period pointed to sustained improvements in the global economic environment. |
| | • | | Foreign markets rebounded over the past 12 months, even though geopolitical turbulence increased in some regions. |
| | • | | The Federal Reserve Board (the “Fed”) raised short-term interest rates three times during the reporting period and introduced a plan to shrink its balance sheet, beginning in 2017. |
| | • | | Investment-grade bond investors saw the smallest returns during this annual reporting cycle. |
Market Environment
U.S. stock investors enjoyed strong performance during the fiscal year ended December 31, 2017, bolstered by a rally which started after the November 2016 U.S. presidential election. All major domestic stock indexes registered positive returns during the period, though returns varied widely across asset classes and investment types.
Following the surprising election of Donald J. Trump as the 45th President of the United States, investor sentiment was buoyed by campaign promises focused on tax reforms, infrastructure spending, health care reform, and the creation of American jobs. While the Trump administration and the Republican-led Congress struggled, for a good bit of the year, to turn campaign promises into policy realities, investor sentiment remained high through the end of the reporting period. One campaign promise that the President was able to fulfill, however, was the passage of tax reform (i.e., the Tax Cuts and Jobs Act), which he signed into law on December 22, 2017.
Consecutive improved quarterly earnings reports fueled strong investor sentiment. For each quarterly reporting cycle of this fiscal year, the majority of American corporations reported earnings and sales that beat forecasts. (This, despite the fact that many companies cited the impact of hurricanes and high foreign exchange rates as negatively impacting earnings or revenue in the third quarter.) While the market generally acknowledges that stock valuations are high by historical standards, strong earnings and sales results appear to justify ongoing investor participation in equity markets.
Continued improving domestic economic data also supported investor confidence over the past 12 months. In 2017, the scope of improved economic data expanded to include developed international markets. European markets stabilized significantly as Brexit concerns shifted to the actual details of executing Great Britain’s separation from the European Union (EU). Prime Minister Teresa May triggered Article 50 of the Lisbon Treaty (which outlines the process for EU members to withdraw from the EU) on March 29, 2017 – setting the time frame for Britain to officially leave the EU as no later than April 2019. Continued German economic strength, bolstered by Angela Merkel’s re-election in September 2017, added stability to EU and global markets. Emmanuel Macron’s resounding victory in France’s May 2017 presidential election seemed to stem the populist political tide that had added turbulence to EU markets.
Asian markets also stabilized, even though geopolitical tensions in the region escalated due to China’s disputed expansion in the South China Sea, North Korea’s increased nuclear and missile arsenal, and lingering suspicions regarding Russia’s covert involvement in the American political process and its participation in Middle Eastern conflicts. China’s central bank managed to successfully navigate concerns about production declines, real estate, currency pricing, and the growing Chinese middle class. Japan’s economic policies also appeared to be helping that country overcome its long-term economic challenges.
The Fed continued to influence domestic and global markets during this annual reporting cycle, but generally improving economic conditions muted that influence. The Fed raised short-term interest rates three times during the fiscal year – in March, June and December of 2017. After starting the reporting period at 0.75%, the short-term interest rate ended the year at 1.50%. In September, the Fed introduced plans to begin selling down its balance sheet, ending the era of Quantitative Easing (i.e., the Fed’s program of encouraging economic growth by purchasing government bonds). In other Fed news, President Trump announced his
3
MML Series Investment Fund II – Economic and Market Overview (Unaudited) (Continued)
selection of Jerome Powell as the next Fed chair following current chair Janet Yellen’s term. The selection, which was largely anticipated, is expected to be supportive of markets. As noted earlier, the Fed’s impact on the markets in 2017 was relatively muted compared to recent years, when the mere threat of a rate hike added turbulence to markets. During this reporting period, Fed actions did not negatively disrupt markets.
During the one-year period ended December 31, 2017, the technology-focused NASDAQ Composite® Index rose 29.64%, the S&P 500® Index (S&P 500) of large-capitalization U.S. stocks gained 21.83%, the Dow Jones Industrial AverageSM grew 28.11%, and the Russell 2000® Index of small-capitalization stocks added 14.65%. Notably, this marks the second consecutive year these indexes logged double-digit returns. Domestic large-cap growth stocks outperformed other domestic indexes for the reporting period, as the Russell 1000® Growth Index reported a remarkable 30.21% return.
In foreign markets, the MSCI EAFE® Index, a barometer for foreign stocks in developed markets, returned an impressive 25.03% for the fiscal year. Developing market companies also delivered strong performance for the period, as the MSCI Emerging Markets Index, a measure of the performance of emerging stock markets throughout the world, rose an astounding 37.28%.*
Investment-grade bond investors were once again left largely on the sidelines, as the Bloomberg Barclays U.S. Aggregate Bond Index, a broad measure of the U.S. investment-grade bond markets, advanced only 3.54% for the period. Market yields generally accelerated following last November’s U.S. presidential election. Since bond prices typically fall during periods of rising interest rates, this was a particularly challenging time for the bond market.
Yield on the 2-year U.S. Treasury bond rose to end the reporting period at 1.88%. Yield on the 10-year Treasury bond dropped a modest 0.03%, ending the period at 2.41%. With equity markets returning double-digit growth for the second consecutive year, high-yield corporate bonds outperformed other fixed-income investments, as the Bloomberg Barclays U.S. Corporate High-Yield Index, which measures the performance of fixed-rate, below-investment-grade debt securities from corporate sectors, delivered a return of 7.50%.*
With nine consecutive quarters of positive returns for the S&P 500 now in the history books, thoughtful investors are asking themselves how long this upward climb can continue. We remain convinced that a broadly diversified portfolio aligned to a long-term strategy is, for those investors seeking retirement income, the wisest course. When one side of the market enjoys outsized growth for a long period of time, portfolios may become overweight in one asset class. Consequently, as we close out this fiscal year, you may find that this is the right time to evaluate your portfolio to ensure that it matches your overall risk tolerance, investment strategy and objectives.
The information provided is the opinion of MML Investment Advisers, LLC as of 1/1/18 and is subject to change without notice. It is not to be construed as tax, legal, or investment advice. Of course, past performance does not guarantee future results.
| * | Indexes are unmanaged, do not incur fees or expenses, and cannot be purchased directly for investment. |
4
MML Blend Fund – Portfolio Manager Report (Unaudited)
What is the investment approach of MML Blend Fund, and who is the Fund’s subadviser?
The Fund seeks to achieve as high a level of total rate of return over an extended period of time as is considered consistent with prudent investment risk and the preservation of capital. The Fund invests across different asset classes (equity securities, fixed income securities, including bank loans and Rule 144A securities, and money market instruments), each represented by a different segment of the Fund’s portfolio. The subadviser typically adjusts the allocation among the three segments, based on its judgment about each segment’s potential for returns in comparison with those of other segments and corresponding risk. The Fund’s subadviser is Barings LLC (Barings).
How did the Fund perform during the 12 months ended December 31, 2017?
The Fund’s Initial Class shares returned 15.25%, significantly underperforming the 21.83% return of the S&P 500® Index (the “stock component’s benchmark”), which measures the performance of 500 widely held stocks in the U.S. equity market. The Fund outperformed, by a wide margin, the 3.54% return of the Bloomberg Barclays U.S. Aggregate Bond Index (the “bond component’s benchmark”), which measures the performance of the investment grade, U.S. dollar-denominated, fixed-rate taxable bond market, including Treasuries, government-related and corporate securities, mortgage-backed securities (MBS) (agency fixed-rate and hybrid ARM pass-throughs), asset-backed securities (ABS), and commercial mortgage-backed securities. The Fund outperformed the 14.10% return of the Lipper Balanced Fund Index, an unmanaged, equally weighted index of the 30 largest mutual funds within the Lipper Balanced Category. Finally, the Fund outperformed the 14.26% return of the Custom Balanced Index (the “blend benchmark”), which comprises the stock component’s benchmark and the bond component’s benchmark. The weightings of each index are 60% and 40%, respectively.
For a discussion on the economic and market environment during the 12-month period ended December 31, 2017, please see the Economic and Market Overview, beginning on page 3.
Subadviser discussion of factors that contributed to the Fund’s performance
For the year ended December 31, 2017, the Fund had a substantial portion of its portfolio invested in equities, which rose over 21% in 2017. Within the equity investments in the Fund, a lower-than-benchmark allocation to strong-performing large-cap growth stocks, such as Amazon, detracted from the Fund’s relative performance during the year, since growth stocks outperformed their value counterparts by 16.5% in 2017. The companies that have been growing their earnings and revenues the most had the highest return in 2017. Often investors will favor value-oriented companies when the economy is accelerating, as they generally benefit from cyclical growth; in 2017, however, that was not the case. Instead, investors clamored to own companies that were growing rapidly, and many of these companies were beneficiaries of the use of data and artificial intelligence. Generally, these companies underperformed in 2016, so some of the 2017 gains were catch-up, but certainly not all. We believe the rest has been a realization by investors that these companies are extremely profitable, earning high margins – and may be able to maintain those growth levels for longer than many had previously believed. For example, Alphabet, the parent company of well-known web search company Google, collects massive amounts of data each day and makes the bulk of their money by selling that data. Alphabet rose over 32% in 2017, and their earnings are estimated to have risen over 16% in 2017. (The company’s share price rose only 1.8% in 2016, even as their earnings grew 22%.) On the opposite end of the spectrum, companies that pay high dividends generally underperformed the rest of the market, as investors have begun to question how much should be paid for these slow-growing companies.
In the Fund’s fixed-income investments, the Fund was more invested in corporate bonds than was the bond component’s benchmark, and this helped performance. (Corporate bonds often have performance that more similarly resembles equity performance, rather than bond performance.) The Fund was also able to successfully navigate between 30- and 15-year mortgages over the period, based on relative value pricing, proving that positive performance contributions can be found even in challenging periods.
The Fund is permitted to use derivative instruments. Derivatives are securities that derive their value from the performance of one or more other investments and take the form of a contract between two or more parties. The equity portion of the Fund did not use derivatives during the year. The fixed-income component uses derivative instruments for yield curve, duration, downside hedging and to gain exposures. They may also be used as a substitute as a direct investment. In aggregate, these positions detracted from performance for the year.
5
MML Blend Fund – Portfolio Manager Report (Unaudited) (Continued)
Subadviser outlook
Looking to 2018, we continue to favor equities, as the fundamental reason for their higher than normal margins has not changed. Companies have had lower growth in wage cost due to the globalization of labor markets and the move to automation. These trends are in place, and we don’t see them changing dramatically in 2018. As for the high-growth companies, we remember a similar run by the internet companies in the late 1990s. We believe there are fundamental differences now because the current crop of big growers is making a tremendous amount of money. Valuation does ultimately matter, though, so our view is that these companies will need to continue to grow rapidly to support their high valuations. Some will not be able to, but the Fund is invested in some that Fund management believes will.
| | | | |
MML Blend Fund
Portfolio Characteristics
(% of Net Assets) on 12/31/17 | |
| | |
Common Stock | | | 70.2 | % |
Corporate Debt | | | 10.2 | % |
Non-U.S. Government Agency Obligations | | | 8.5 | % |
U.S. Government Agency Obligations and Instrumentalities | | | 7.4 | % |
U.S. Treasury Obligations | | | 2.8 | % |
Sovereign Debt Obligations | | | 0.2 | % |
Municipal Obligations | | | 0.2 | % |
Purchased Options | | | 0.1 | % |
Preferred Stock | | | 0.1 | % |
Rights | | | 0.0 | % |
| | | | | |
Total Long-Term Investments | | | 99.7 | % |
Short-Term Investments and Other Assets and Liabilities | | | 0.3 | % |
| | | | | |
Net Assets | | | 100.0 | % |
| | | | | |
6
MML Blend Fund – Portfolio Manager Report (Unaudited) (Continued)
Growth of a $10,000 Investment
Hypothetical Investments in MML Blend Fund Initial Class, the S&P 500 Index, the Bloomberg Barclays U.S. Aggregate Bond Index, the Lipper Balanced Fund Index, and the Custom Balanced Index.
| | | | | | | | | | | | |
| | | | |
| TOTAL RETURN | | One Year
1/1/17 -
12/31/17 | | | Five Year
Average
Annual
1/1/13 -
12/31/17 | | | Ten Year
Average
Annual
1/1/08 -
12/31/17 | |
| Initial Class | | | 15.25% | | | | 11.00% | | | | 7.62% | |
| S&P 500 Index* | | | 21.83% | | | | 15.79% | | | | 8.50% | |
Bloomberg Barclays U.S. Aggregate Bond Index | | | 3.54% | | | | 2.10% | | | | 4.01% | |
| Lipper Balanced Fund Index | | | 14.10% | | | | 8.73% | | | | 5.73% | |
| Custom Balanced Index | | | 14.26% | | | | 10.25% | | | | 7.09% | |
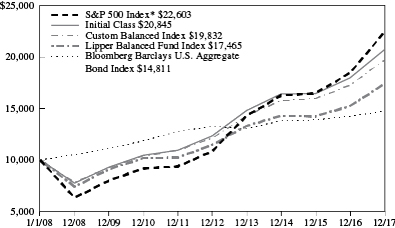
Hypothetical Investments in MML Blend Fund Service Class, the S&P 500 Index, the Bloomberg Barclays U.S. Aggregate Bond Index, the Lipper Balanced Fund Index, and the Custom Balanced Index.
| | | | | | | | | | | | |
| | | | |
| TOTAL RETURN | | One Year
1/1/17 -
12/31/17 | | | Five Year
Average
Annual
1/1/13 -
12/31/17 | | | Since
Inception
Average
Annual
8/15/08 -
12/31/17 | |
| Service Class | | | 14.97% | | | | 10.73% | | | | 8.63% | |
| S&P 500 Index* | | | 21.83% | | | | 15.79% | | | | 10.42% | |
Bloomberg Barclays U.S. Aggregate Bond Index | | | 3.54% | | | | 2.10% | | | | 4.15% | |
| Lipper Balanced Fund Index | | | 14.10% | | | | 8.73% | | | | 7.00% | |
| Custom Balanced Index | | | 14.26% | | | | 10.25% | | | | 8.29% | |
GROWTH OF $10,000 INVESTMENT FOR THE PAST 10 YEARS
GROWTH OF $10,000 INVESTMENT SINCE INCEPTION
Generally accepted accounting principles require adjustments to be made to the net assets of the Fund at period end for financial reporting purposes only, and as such, the total return based on the unadjusted net asset value per share may differ from the total return reported in the financial highlights.
* Benchmark
Performance data quoted represents past performance; past performance is not predictive of future results. The investment return and principal value of shares of the Fund will fluctuate with market conditions so that shares of the Fund, when redeemed, may be worth more or less than their original cost. Current performance of the Fund may be lower or higher than the performance quoted. Performance data current to the most recent month end may be obtained by accessing the website at www.massmutual.com.
Investors should note that the Fund is a professionally managed mutual fund, while the S&P 500 Index, the Bloomberg Barclays U.S. Aggregate Bond Index, the Lipper Balanced Fund Index, and the Custom Balanced Index are unmanaged, do not incur expenses, and cannot be purchased directly by investors. Investors should read the Fund’s prospectus with regard to the Fund’s investment objective, risks, and charges and expenses in conjunction with these financial statements. The Fund’s return reflects changes in the net asset value per share without the deduction of any product charges (e.g., cost of insurance, mortality and expense risk charges, administrative fees, and CDSL). The inclusion of these charges would have reduced the performance shown here.
7
MML Equity Fund – Portfolio Manager Report (Unaudited)
What is the investment approach of MML Equity Fund, and who are the Fund’s subadvisers?
The Fund’s primary objective is to achieve a superior total rate of return over an extended period of time from both capital appreciation and current income. Its secondary objective is the preservation of capital when business and economic conditions indicate that investing for defensive purposes is appropriate. The Fund invests primarily in common stocks of companies that the subadvisers believe are undervalued in the marketplace, with a focus on securities of larger size companies. Under normal circumstances, the Fund invests at least 80% of its net assets (plus the amount of any borrowings for investment purposes) in common stocks, preferred stocks, securities convertible into common or preferred stocks, and other securities, such as warrants and stock rights, whose value is based on stock prices. The Fund typically invests most of its assets in securities of U.S. companies, but may invest up to 25% of its total assets in foreign securities and American Depositary Receipts (“ADRs”), including developed and emerging market securities. The Fund may invest up to 10% of its net assets in debt securities. The Fund’s two subadvisers are OppenheimerFunds, Inc. (OFI), which managed approximately 59% of the Fund’s portfolio; and Brandywine Global Investment Management, LLC (Brandywine Global), which was responsible for approximately 41% of the Fund’s portfolio, as of December 31, 2017. Effective December 4, 2017, Brandywine Global replaced Loomis, Sayles & Company, L.P. (Loomis Sayles) as a co-subadviser of the MML Equity Fund.
How did the Fund perform during the 12 months ended December 31, 2017?
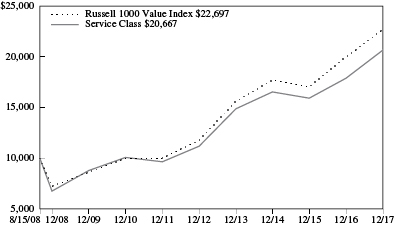
The Fund’s Initial Class shares returned 15.79%, outperforming the 13.66% return of the Russell 1000® Value Index (the “benchmark”), which measures the performance of the large-cap value segment of U.S. equity securities. It includes the Russell 1000 Index companies with lower price-to-book ratios and lower expected growth values. It is market-capitalization weighted.
For a discussion on the economic and market environment during the 12-month period ended December 31, 2017, please see the Economic and Market Overview, beginning on page 3.
Subadviser discussion of factors that contributed to the Fund’s performance
For the time that Loomis Sayles served as co-subadviser for the Fund (January 1 – December 3, 2017), the Fund component holdings that contributed most to performance were Bank of America and JPMorgan Chase. Solid earnings results plus various positive developments on the deregulation front served as positive catalysts for stocks within the financials sector, as did the beneficial outlook for these shares due to the prospects of tax reform passage. Two Fund component holdings detracted the most from full-year returns: Advance Auto Parts and Anadarko Petroleum. Shares of Advance Auto Parts came under severe pressure throughout the year, due to the combination of elevated expectations and industry deceleration. Anadarko underperformed in the wake of the Colorado home explosion that originated from a gas leak in a nearby well. While it is unclear who will ultimately be deemed responsible for the explosion, Anadarko, as the owner of the well at the time of the tragedy, saw its share price decline.
For the time that Brandywine Global served as co-subadviser for the Fund (December 4 – December 31, 2017), many of this Fund component’s lowest-momentum energy holdings performed extraordinarily well, as the price of crude oil moved markedly higher. This Fund component’s underweight allocation, relative to the benchmark, to the utilities sector (the worst-performing sector in December by a wide margin) benefited performance. Fund component holdings in the energy and technology sectors hindered performance.
With respect to the OFI portion of the Fund, the top-performing Fund component holdings were in the financials sector, including Bank of America and JPMorgan Chase. The financials sector in general performed well in 2017, as investors became more optimistic about tax reform, which they viewed could positively impact banks. Bank of America and JPMorgan were both beneficiaries of the rally in financial stocks. Another top contributor was XPO Logistics, Inc. Shares of this Fund component holding, a vertically integrated logistics company providing both freight brokerage and trucking services, advanced strongly – due to solid margin improvement after integrating the 2015 acquisition of trucking company Con-Way. Top detractors from performance included energy Fund component holdings Hess Corporation (an American global energy company engaged in the exploration and production of crude oil and natural gas) and Weatherford International plc, one of the largest multinational oilfield service companies. Financial stock Synchrony Financial was another Fund component holding that detracted from results. Synchrony Financial, which provides private label credit cards to merchants, declined after reporting financial results that fell short of expectations. OFI eliminated the position from its portfolio.
8
MML Equity Fund – Portfolio Manager Report (Unaudited) (Continued)
Subadviser outlook
In the view of Brandywine Global, the economy remains quite strong as we head into 2018. Our bottom-up sector weighting remains more pro-cyclical and positively exposed to higher interest rates. At year end, our Fund component held overweight positions in consumer discretionary, technology, and banks and insurance companies within the finance sector, as well as large underweights in higher-yielding utilities and real estate companies. In our view, changes in tax policy have the potential to continue to benefit our Fund component holdings in the industrials, consumer discretionary and financial sectors, particularly if tax reform ultimately contributes to higher economic growth than expected.
OFI observes that 2017 was characterized by improving global economic activity. As bottom-up value investors, we believe there are attractively valued stocks that can benefit from these positive trends. While many investors focus on a short-term view when considering potential investments, we use in-depth fundamental research to identify companies that could be poised for an unanticipated acceleration in return on invested capital over a multi-year time horizon.
| | | | |
MML Equity Fund
Largest Holdings
(% of Net Assets) on 12/31/17 | |
| | |
JP Morgan Chase & Co. | | | 4.7 | % |
Bank of America Corp. | | | 3.3 | % |
Chevron Corp. | | | 2.8 | % |
Citigroup, Inc. | | | 2.5 | % |
Wal-Mart Stores, Inc. | | | 2.4 | % |
Pfizer, Inc. | | | 2.2 | % |
Apple, Inc. | | | 2.0 | % |
UnitedHealth Group, Inc. | | | 1.8 | % |
Suncor Energy, Inc. | | | 1.7 | % |
Johnson & Johnson | | | 1.7 | % |
| | | | | |
| | | | 25.1 | % |
| | | | | |
| | | | |
MML Equity Fund
Sector Table
(% of Net Assets) on 12/31/17 | |
| | |
Financial | | | 30.8 | % |
Consumer, Non-cyclical | | | 16.1 | % |
Industrial | | | 10.7 | % |
Consumer, Cyclical | | | 10.2 | % |
Technology | | | 9.7 | % |
Energy | | | 9.5 | % |
Communications | | | 6.5 | % |
Mutual Funds | | | 2.9 | % |
Utilities | | | 2.8 | % |
Basic Materials | | | 1.9 | % |
| | | | | |
Total Long-Term Investments | | | 101.1 | % |
Short-Term Investments and Other Assets and Liabilities | | | (1.1 | )% |
| | | | | |
Net Assets | | | 100.0 | % |
| | | | | |
9
MML Equity Fund – Portfolio Manager Report (Unaudited) (Continued)
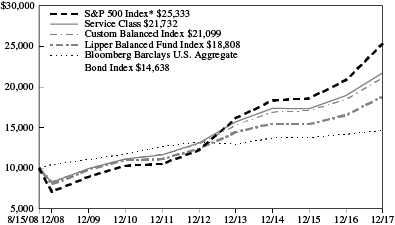
Growth of a $10,000 Investment
Hypothetical Investments in MML Equity Fund Initial Class and the Russell 1000 Value Index.
| | | | | | | | | | | | |
| | | | |
| TOTAL RETURN | | One Year
1/1/17 -
12/31/17 | | | Five Year
Average
Annual
1/1/13 -
12/31/17 | | | Ten Year
Average
Annual
1/1/08 -
12/31/17 | |
| Initial Class | | | 15.79% | | | | 13.36% | | | | 6.24% | |
| Russell 1000 Value Index | | | 13.66% | | | | 14.04% | | | | 7.10% | |
Hypothetical Investments in MML Equity Fund Service Class and the Russell 1000 Value Index.
| | | | | | | | | | | | |
| | | | |
| TOTAL RETURN | | One Year
1/1/17 -
12/31/17 | | | Five Year
Average
Annual
1/1/13 -
12/31/17 | | | Since
Inception
Average
Annual
8/15/08 -
12/31/17 | |
| Service Class | | | 15.50% | | | | 13.08% | | | | 8.05% | |
| Russell 1000 Value Index | | | 13.66% | | | | 14.04% | | | | 9.13% | |
GROWTH OF $10,000 INVESTMENT FOR THE PAST 10 YEARS
GROWTH OF $10,000 INVESTMENT SINCE INCEPTION
Generally accepted accounting principles require adjustments to be made to the net assets of the Fund at period end for financial reporting purposes only, and as such, the total return based on the unadjusted net asset value per share may differ from the total return reported in the financial highlights.
Performance data quoted represents past performance; past performance is not predictive of future results. The investment return and principal value of shares of the Fund will fluctuate with market conditions so that shares of the Fund, when redeemed, may be worth more or less than their original cost. Current performance of the Fund may be lower or higher than the performance quoted. Performance data current to the most recent month end may be obtained by accessing the website at www.massmutual.com.
Investors should note that the Fund is a professionally managed mutual fund, while the Russell 1000 Value Index is unmanaged, does not incur expenses, and cannot be purchased directly by investors. Investors should read the Fund’s prospectus with regard to the Fund’s investment objective, risks, and charges and expenses in conjunction with these financial statements. The Fund’s return reflects changes in the net asset value per share without the deduction of any product charges (e.g., cost of insurance, mortality and expense risk charges, administrative fees, and CDSL). The inclusion of these charges would have reduced the performance shown here.
10
MML Managed Bond Fund – Portfolio Manager Report (Unaudited)
What is the investment approach of MML Managed Bond Fund, and who is the Fund’s subadviser?
The Fund’s investment objective is to achieve as high a total rate of return on an annual basis as is considered consistent with the preservation of capital. Under normal circumstances, the Fund invests at least 80% of its net assets (plus the amount of any borrowings for investment purposes) in investment grade fixed income securities (rated Baa3 or higher by Moody’s, BBB- or higher by Standard & Poor’s or the equivalent by any NRSRO, or, if unrated, determined to be of comparable quality by the subadviser). The Fund’s subadviser is Barings LLC (Barings).
How did the Fund perform during the 12 months ended December 31, 2017?
The Fund’s Initial Class shares returned 4.69%, outperforming the 3.54% return of the Bloomberg Barclays U.S. Aggregate Bond Index (the “benchmark”), which measures the performance of the investment grade, U.S. dollar-denominated, fixed-rate taxable bond market, including Treasuries, government-related and corporate securities, MBS (agency fixed-rate and hybrid ARM pass-throughs), ABS, and CMBS.
For a discussion on the economic and market environment during the 12-month period ended December 31, 2017, please see the Economic and Market Overview, beginning on page 3.
Subadviser discussion of factors that contributed to the Fund’s performance
For the year ended December 31, 2017, the Fund’s overweight allocation, relative to the benchmark, to investment-grade corporate bonds was a positive contributor to performance. Security selection within the banking sector benefited full-year returns, despite the Fund being slightly underweight in this sector. The Fund’s exposure to the insurance sector also contributed positively to performance, as insurers continued to improve their earnings and capital positions.
An overweight to asset-backed securities (ABS) sector was the primary positive contributor within the securitized sector, with holdings concentrated in government-guaranteed FFELP (Federal Family Education Loan Program) student loans. Once rating review and action was taken by the Nationally Recognized Statistical Rating Organizations early in 2017, prices on these securities recovered.
Agency mortgage-backed securities (MBS) also contributed to performance. (“Agency” refers to government-sponsored entities that issue bonds backed by mortgage loans, including Ginnie Mae, Fannie Mae, Freddie Mac, and the Federal Home Loan Banks.) The Fund held an underweight stake in this sector, on average, as it has provided relatively low returns. Tactical positioning in lower-coupon securities during the beginning of the period and rotating into higher coupons later helped performance. The Fund was also able to successfully navigate between 30- and 15-year mortgages over the period, based on relative value pricing, proving that positive performance contributions can be found even in challenging periods.
Fund holdings within the integrated oil sector detracted from performance. Within energy, the Fund was positioned in the pipeline and drilling sub-sectors, as those companies are diversified and less sensitive to the spot price of oil. Taxable municipal bonds also hampered performance. The Fund managed to avoid headline names in the municipal market, but overall sector performance lagged relative to the benchmark, as late in the year many of those troubled headline names rallied amid strong economic conditions.
The Fund uses derivative instruments – securities that derive their value from the performance of one or more other investments and take the form of a contract between two or more parties – for yield curve, duration, downside hedging and to gain exposures. They may also be used as a substitute for a direct investment. In aggregate, these positions detracted from performance over the year.
Subadviser outlook
Our view is that global growth prospects remain relatively sound. This has pushed short-maturity government bond yields higher, as market participants have begun to reappraise future monetary policy expectations. Longer-dated maturity yields have fallen – reflecting the current benign inflation environment. Risk assets have performed well, suggesting that investors are increasingly taking note of a period of stronger, synchronized global growth.
11
MML Managed Bond Fund – Portfolio Manager Report (Unaudited) (Continued)
As we move into 2018, the Fund is focusing on yield opportunities away from Treasury and government bonds. In our view, ABS is attractive, relative to other shorter-duration fixed-income asset classes. The natural liquidity profile from monthly principal paydowns provides a frequent source of income. We believe that corporate fundamentals, though still stretched, are improving, and could continue with a tailwind from a weaker U.S. dollar and tax reform-fueled stronger earnings. For now, economic and market volatility remains subdued, but we believe it could tick upward as global central banks become more hawkish, suggesting that “credit picking” could continue to trump sector rotation strategies.
| | | | |
MML Managed Bond Fund
Portfolio Characteristics
(% of Net Assets) on 12/31/17 | |
| | |
Corporate Debt | | | 35.2 | % |
Non-U.S. Government Agency Obligations | | | 28.7 | % |
U.S. Government Agency Obligations and Instrumentalities | | | 25.2 | % |
U.S. Treasury Obligations | | | 7.2 | % |
Municipal Obligations | | | 0.8 | % |
Sovereign Debt Obligations | | | 0.7 | % |
Purchased Options | | | 0.4 | % |
Preferred Stock | | | 0.2 | % |
| | | | | |
Total Long-Term Investments | | | 98.4 | % |
Short-Term Investments and Other Assets and Liabilities | | | 1.6 | % |
| | | | | |
Net Assets | | | 100.0 | % |
| | | | | |
12
MML Managed Bond Fund – Portfolio Manager Report (Unaudited) (Continued)
Growth of a $10,000 Investment
Hypothetical Investments in MML Managed Bond Fund Initial Class and the Bloomberg Barclays U.S. Aggregate Bond Index.
| | | | | | | | | | | | |
| | | | |
| TOTAL RETURN | | One Year
1/1/17 -
12/31/17 | | | Five Year
Average
Annual
1/1/13 -
12/31/17 | | | Ten Year
Average
Annual
1/1/08 -
12/31/17 | |
| Initial Class | | | 4.69% | | | | 2.26% | | | | 4.35% | |
Bloomberg Barclays U.S. Aggregate Bond Index | | | 3.54% | | | | 2.10% | | | | 4.01% | |
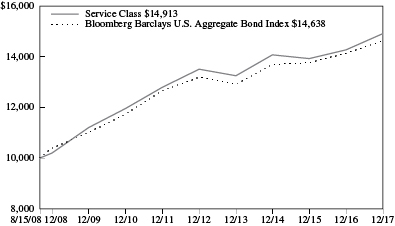
Hypothetical Investments in MML Managed Bond Fund Service Class and the Bloomberg Barclays U.S. Aggregate Bond Index.
| | | | | | | | | | | | |
| | | | |
| TOTAL RETURN | | One Year
1/1/17 -
12/31/17 | | | Five Year
Average
Annual
1/1/13 -
12/31/17 | | | Since
Inception
Average
Annual
8/15/08 -
12/31/17 | |
| Service Class | | | 4.43% | | | | 2.00% | | | | 4.35% | |
Bloomberg Barclays U.S. Aggregate Bond Index | | | 3.54% | | | | 2.10% | | | | 4.15% | |
GROWTH OF $10,000 INVESTMENT FOR THE PAST 10 YEARS
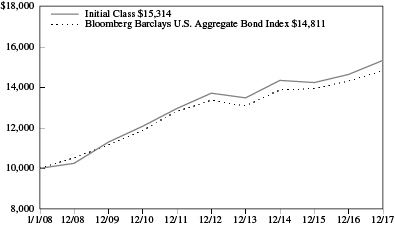
GROWTH OF $10,000 INVESTMENT SINCE INCEPTION
Generally accepted accounting principles require adjustments to be made to the net assets of the Fund at period end for financial reporting purposes only, and as such, the total return based on the unadjusted net asset value per share may differ from the total return reported in the financial highlights.
Performance data quoted represents past performance; past performance is not predictive of future results. The investment return and principal value of shares of the Fund will fluctuate with market conditions so that shares of the Fund, when redeemed, may be worth more or less than their original cost. Current performance of the Fund may be lower or higher than the performance quoted. Performance data current to the most recent month end may be obtained by accessing the website at www.massmutual.com.
Investors should note that the Fund is a professionally managed mutual fund, while the Bloomberg Barclays U.S. Aggregate Bond Index is unmanaged, does not incur expenses, and cannot be purchased directly by investors. Investors should read the Fund’s prospectus with regard to the Fund’s investment objective, risks, and charges and expenses in conjunction with these financial statements. The Fund’s return reflects changes in the net asset value per share without the deduction of any product charges (e.g., cost of insurance, mortality and expense risk charges, administrative fees, and CDSL). The inclusion of these charges would have reduced the performance shown here.
13
MML U.S. Government Money Market Fund – Portfolio Manager Report (Unaudited)
What is the investment approach of MML U.S. Government Money Market Fund, and who is the Fund’s subadviser?
The Fund’s investment objective is to achieve current income consistent with preservation of capital and liquidity. The Fund normally invests at least 99.5% of its total assets in cash, U.S. Government securities, and/or repurchase agreements fully collateralized by cash or U.S. Government securities. It is important to note that this Fund seeks to maintain, but does not guarantee, a stable $1.00 share price. Under normal circumstances, the Fund invests at least 80% of its net assets in U.S. Government securities and repurchase agreements that are fully collateralized by U.S. Government securities. You could lose money by investing in the Fund. Although the Fund seeks to preserve the value of your investment at $1.00 per share, it cannot guarantee it will do so. An investment in the Fund is not insured or guaranteed by the Federal Deposit Insurance Corporation or any other government agency. The Fund’s sponsor has no legal obligation to provide financial support to the Fund, and you should not expect that the sponsor will provide financial support to the Fund at any time. The Fund’s subadviser is Barings LLC (Barings).
How did the Fund perform during the 12 months ended December 31, 2017?
The Fund’s Initial Class shares returned 0.36%, underperforming the 0.84% return of the Citigroup 3-Month Treasury Bill Index (the “benchmark”), which measures the performance of the last three three-month Treasury bill month-end rates.
For a discussion on the economic and market environment during the 12-month period ended December 31, 2017, please see the Economic and Market Overview, beginning on page 3.
Subadviser discussion of factors that contributed to the Fund’s performance
Short-term interest rates have started to move off their historical lows, as monetary policy ever so slowly starts to tighten. LIBOR (London Interbank Offered Rate) rates increased over the last year, due to Federal Reserve (the “Fed”) rate hikes in March, June and December of 2017. One-month LIBOR has increased 0.73% to 1.50% over the year and three-month LIBOR increased 0.63% to 1.63% over the 12-month period.
In 2016, the Fund converted to a government-only fund from a prime fund. The Fund consists of United States government securities or those issued by one of the U.S. government agencies. The Fund bought a large amount of adjustable rate agency paper in order to maximize yield while keeping the Weighted Average Maturity (WAM) at a manageable level. These adjustable rate issues continued to provide an attractive yield advantage for the Fund, as the Fed raised rates three times in 2017, sending LIBOR higher. The Fund does have some exposure to longer-dated fixed-maturity agency paper. (“Agency” refers to debt issued by U.S. federal government agencies or government-sponsored entities for financing purposes.) Almost all of that paper matures in the first quarter of 2018. These instruments trade slightly cheaper than U.S. Treasury bills.
The Fund underperformed its benchmark due to shortening of WAM during the period. The WAM of the Fund dropped quite a bit in 2017, but the Weighted Average Life (WAL), which takes into account a bond’s final maturity date, has not dropped nearly as much. Much of the drop in WAM can be attributed to many more one-month agency adjustable rate issues (instead of three-month issues) being purchased in 2017, as the Fund tried to capitalize on the flattening between the one-month and three-month LIBOR curve. The other component of the drop in WAM has been the Fund’s desire to keep fixed rate purchases short of, or right around, any Fed meeting that might be in play. In the last 12 months, we have seen the Fed hike rates three times. The decrease in WAM has allowed the Fund to react quickly to changing market conditions and to maintain its commitment to the objectives of stability and liquidity. In addition to WAM shortening, fund expenses also contributed to under performance compared to the benchmark.
Subadviser outlook
In our view, global growth prospects remain relatively sound. This has pushed short government bond yields and LIBOR higher, as market participants have begun to reappraise future monetary policy expectations across both domestic and international markets. Risk assets have performed well, suggesting that investors are looking at better global growth prospects.
The Fund is buying adjustable rate issues when it makes sense and keeping most fixed rate purchases short. In a rising rate environment, such as the one we are in, the WAM of the Fund should not rise meaningfully, and may even drop, as two to three
14
MML U.S. Government Money Market Fund – Portfolio Manager Report (Unaudited) (Continued)
more interest rate hikes could materialize in 2018. As a way to protect against these future hikes, the Fund will continue to purchase adjustable rate paper and short fixed rate paper.
| | | | |
MML U.S. Government Money
Market Fund
Portfolio Characteristics
(% of Net Assets) on 12/31/17 | |
| | |
Discount Notes | | | 86.8 | % |
Repurchase Agreement | | | 13.4 | % |
Time Deposits | | | 0.1 | % |
| | | | | |
Total Short-Term Investments | | | 100.3 | % |
Other Assets and Liabilities | | | (0.3 | )% |
| | | | | |
Net Assets | | | 100.0 | % |
| | | | | |
15
MML U.S. Government Money Market Fund – Portfolio Manager Report (Unaudited) (Continued)
Growth of a $10,000 Investment
Hypothetical Investments in MML U.S. Government Money Market Fund Initial Class and the Citigroup 3-Month Treasury Bill Index.
| | | | | | | | | | | | |
| | | | |
| TOTAL RETURN | | One Year
1/1/17 -
12/31/17 | | | Five Year
Average
Annual
1/1/13 -
12/31/17 | | | Ten Year
Average
Annual
1/1/08 -
12/31/17 | |
| Initial Class | | | 0.36% | | | | 0.09% | | | | 0.26% | |
| Citigroup 3-Month Treasury Bill Index | | | 0.84% | | | | 0.24% | | | | 0.34% | |
GROWTH OF $10,000 INVESTMENT FOR THE PAST 10 YEARS
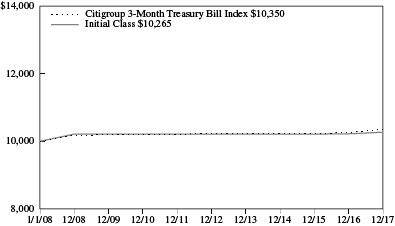
Generally accepted accounting principles require adjustments to be made to the net assets of the Fund at period end for financial reporting purposes only, and as such, the total return based on the unadjusted net asset value per share may differ from the total return reported in the financial highlights.
Performance data quoted represents past performance; past performance is not predictive of future results. The investment return and principal value of shares of the Fund will fluctuate with market conditions so that shares of the Fund, when redeemed, may be worth more or less than their original cost. Current performance of the Fund may be lower or higher than the performance quoted. Performance data current to the most recent month end may be obtained by accessing the website at www.massmutual.com.
Investors should note that the Fund is a professionally managed mutual fund, while the Citigroup 3-Month Treasury Bill Index is unmanaged, does not incur expenses, and cannot be purchased directly by investors. Investors should read the Fund’s prospectus with regard to the Fund’s investment objective, risks, and charges and expenses in conjunction with these financial statements. The Fund’s return reflects changes in the net asset value per share without the deduction of any product charges (e.g., cost of insurance, mortality and expense risk charges, administrative fees, and CDSL). The inclusion of these charges would have reduced the performance shown here. An investment in the MML U.S. Government Money Market Fund is not insured or guaranteed by the Federal Deposit Insurance Corporation or any other government agency. Although the Fund seeks to maintain a stable net asset value per share, it is possible to lose money by investing in the Fund.
16
MML Blend Fund – Portfolio of Investments
December 31, 2017
| | | | | | | | |
| | | Number of
Shares | | | Value | |
| EQUITIES — 70.3% | |
|
| COMMON STOCK — 70.2% | |
| Basic Materials — 1.4% | | | | | | | | |
| Chemicals — 1.1% | | | | | | | | |
Air Products & Chemicals, Inc. | | | 7,795 | | | $ | 1,279,004 | |
Albemarle Corp. | | | 5,110 | | | | 653,518 | |
CF Industries Holdings, Inc. | | | 37,990 | | | | 1,616,095 | |
DowDuPont, Inc. | | | 2,820 | | | | 200,840 | |
Eastman Chemical Co. | | | 6,070 | | | | 562,325 | |
LyondellBasell Industries NV Class A | | | 10,230 | | | | 1,128,574 | |
Monsanto Co. | | | 6,694 | | | | 781,725 | |
PPG Industries, Inc. | | | 8 | | | | 934 | |
Praxair, Inc. | | | 6,736 | | | | 1,041,924 | |
The Sherwin-Williams Co. | | | 3 | | | | 1,230 | |
| | | | | | | | |
| | | | | | | 7,266,169 | |
| | | | | | | | |
| Forest Products & Paper — 0.0% | | | | | | | | |
International Paper Co. | | | 3,587 | | | | 207,831 | |
| | | | | | | | |
| Iron & Steel — 0.0% | | | | | | | | |
Nucor Corp. | | | 56 | | | | 3,561 | |
| | | | | | | | |
| Mining — 0.3% | | | | | | | | |
Freeport-McMoRan, Inc. (a) | | | 70,864 | | | | 1,343,582 | |
Newmont Mining Corp. | | | 23,670 | | | | 888,098 | |
| | | | | | | | |
| | | | | | | 2,231,680 | |
| | | | | | | | |
| | | | | | | 9,709,241 | |
| | | | | | | | |
| Communications — 9.2% | | | | | | | | |
| Advertising — 0.1% | | | | | | | | |
The Interpublic Group of Cos., Inc. | | | 6,922 | | | | 139,548 | |
Omnicom Group, Inc. | | | 3,747 | | | | 272,894 | |
| | | | | | | | |
| | | | | | | 412,442 | |
| | | | | | | | |
| Internet — 5.6% | | | | | | | | |
Alphabet, Inc. Class A (a) | | | 11,020 | | | | 11,608,468 | |
Alphabet, Inc. Class C (a) | | | 6,591 | | | | 6,896,823 | |
Amazon.com, Inc. (a) | | | 3,550 | | | | 4,151,619 | |
eBay, Inc. (a) | | | 20,777 | | | | 784,124 | |
Expedia, Inc. | | | 5,157 | | | | 617,654 | |
F5 Networks, Inc. (a) | | | 6,200 | | | | 813,564 | |
Facebook, Inc. Class A (a) | | | 60,670 | | | | 10,705,828 | |
Netflix, Inc. (a) | | | 1,593 | | | | 305,792 | |
The Priceline Group, Inc. (a) | | | 891 | | | | 1,548,326 | |
Symantec Corp. | | | 55 | | | | 1,543 | |
TripAdvisor, Inc. (a) | | | 37 | | | | 1,275 | |
VeriSign, Inc. (a) | | | 16,091 | | | | 1,841,454 | |
| | | | | | | | |
| | | | | | | 39,276,470 | |
| | | | | | | | |
| Media — 1.7% | | | | | | | | |
CBS Corp. Class B | | | 57 | | | | 3,363 | |
Charter Communications, Inc. Class A (a) | | | 401 | | | | 134,720 | |
| | | | | | | | |
| | | Number of
Shares | | | Value | |
Comcast Corp. Class A | | | 128,424 | | | $ | 5,143,381 | |
Discovery Communications, Inc. Class A (a) | | | 27,900 | | | | 624,402 | |
Discovery Communications, Inc. Class C (a) | | | 6,900 | | | | 146,073 | |
DISH Network Corp. Class A (a) | | | 12,200 | | | | 582,550 | |
News Corp. Class A | | | 81,166 | | | | 1,315,701 | |
Scripps Networks Interactive, Inc. Class A | | | 8,072 | | | | 689,187 | |
Time Warner, Inc. | | | 18,005 | | | | 1,646,917 | |
Twenty-First Century Fox, Inc. Class A | | | 19,567 | | | | 675,649 | |
Twenty-First Century Fox, Inc. Class B | | | 8,100 | | | | 276,372 | |
Viacom, Inc. Class B | | | 12,810 | | | | 394,676 | |
The Walt Disney Co. | | | 2 | | | | 215 | |
| | | | | | | | |
| | | | | | | 11,633,206 | |
| | | | | | | | |
| Telecommunications — 1.8% | | | | | | | | |
AT&T, Inc. | | | 184,253 | | | | 7,163,757 | |
CenturyLink, Inc. | | | 28 | | | | 467 | |
Cisco Systems, Inc. | | | 103,042 | | | | 3,946,509 | |
Juniper Networks, Inc. | | | 25,489 | | | | 726,436 | |
Motorola Solutions, Inc. | | | 3,137 | | | | 283,396 | |
Verizon Communications, Inc. | | | 7,155 | | | | 378,714 | |
| | | | | | | | |
| | | | | | | 12,499,279 | |
| | | | | | | | |
| | | | | | | 63,821,397 | |
| | | | | | | | |
| Consumer, Cyclical — 6.8% | | | | | | | | |
| Airlines — 0.9% | | | | | | | | |
Alaska Air Group, Inc. | | | 21,700 | | | | 1,595,167 | |
American Airlines Group, Inc. | | | 28,200 | | | | 1,467,246 | |
Delta Air Lines, Inc. | | | 23,200 | | | | 1,299,200 | |
Southwest Airlines Co. | | | 10,383 | | | | 679,567 | |
United Continental Holdings, Inc. (a) | | | 22,100 | | | | 1,489,540 | |
| | | | | | | | |
| | | | | | | 6,530,720 | |
| | | | | | | | |
| Apparel — 0.5% | | | | | | | | |
Hanesbrands, Inc. | | | 6,900 | | | | 144,279 | |
Michael Kors Holdings Ltd. (a) | | | 6,900 | | | | 434,355 | |
NIKE, Inc. Class B | | | 84 | | | | 5,254 | |
Ralph Lauren Corp. | | | 13,350 | | | | 1,384,262 | |
VF Corp. | | | 14,900 | | | | 1,102,600 | |
| | | | | | | | |
| | | | | | | 3,070,750 | |
| | | | | | | | |
| Auto Manufacturers — 0.7% | | | | | | | | |
Ford Motor Co. | | | 128,513 | | | | 1,605,127 | |
General Motors Co. | | | 45,200 | | | | 1,852,748 | |
PACCAR, Inc. | | | 14,022 | | | | 996,684 | |
| | | | | | | | |
| | | | | | | 4,454,559 | |
| | | | | | | | |
| Auto Parts & Equipment — 0.4% | | | | | | | | |
Aptiv PLC | | | 9,300 | | | | 788,919 | |
BorgWarner, Inc. | | | 33,300 | | | | 1,701,297 | |
The accompanying notes are an integral part of the financial statements.
17
MML Blend Fund – Portfolio of Investments (Continued)
| | | | | | | | |
| | | Number of
Shares | | | Value | |
Delphi Technologies PLC (a) | | | 3,100 | | | $ | 162,657 | |
The Goodyear Tire & Rubber Co. | | | 4,351 | | | | 140,581 | |
| | | | | | | | |
| | | | | | | 2,793,454 | |
| | | | | | | | |
| Distribution & Wholesale — 0.1% | | | | | | | | |
Fastenal Co. | | | 82 | | | | 4,485 | |
W.W. Grainger, Inc. | | | 3,402 | | | | 803,722 | |
| | | | | | | | |
| | | | | | | 808,207 | |
| | | | | | | | |
| Home Builders — 0.2% | | | | | | | | |
D.R. Horton, Inc. | | | 21,747 | | | | 1,110,620 | |
PulteGroup, Inc. | | | 16,873 | | | | 561,027 | |
| | | | | | | | |
| | | | | | | 1,671,647 | |
| | | | | | | | |
| Home Furnishing — 0.0% | | | | | | | | |
Leggett & Platt, Inc. | | | 86 | | | | 4,105 | |
Whirlpool Corp. | | | 1,243 | | | | 209,619 | |
| | | | | | | | |
| | | | | | | 213,724 | |
| | | | | | | | |
| Leisure Time — 0.3% | | | | | | | | |
Harley-Davidson, Inc. | | | 34,902 | | | | 1,775,814 | |
Royal Caribbean Cruises Ltd. | | | 3,720 | | | | 443,721 | |
| | | | | | | | |
| | | | | | | 2,219,535 | |
| | | | | | | | |
| Lodging — 0.6% | | | | | | | | |
Hilton Worldwide Holdings, Inc. | | | 12,700 | | | | 1,014,222 | |
Marriott International, Inc. Class A | | | 14,171 | | | | 1,923,430 | |
Wyndham Worldwide Corp. | | | 5,709 | | | | 661,502 | |
Wynn Resorts Ltd. | | | 3,038 | | | | 512,176 | |
| | | | | | | | |
| | | | | | | 4,111,330 | |
| | | | | | | | |
| Retail — 3.1% | | | | | | | | |
AutoZone, Inc. (a) | | | 494 | | | | 351,417 | |
Best Buy Co., Inc. | | | 11,892 | | | | 814,245 | |
Costco Wholesale Corp. | | | 7,370 | | | | 1,371,704 | |
CVS Health Corp. | | | 21,694 | | | | 1,572,815 | |
Darden Restaurants, Inc. | | | 2,654 | | | | 254,837 | |
Dollar Tree, Inc. (a) | | | 48 | | | | 5,151 | |
Foot Locker, Inc. | | | 42,300 | | | | 1,983,024 | |
The Gap, Inc. | | | 10,990 | | | | 374,319 | |
Genuine Parts Co. | | | 34 | | | | 3,230 | |
The Home Depot, Inc. | | | 11,887 | | | | 2,252,943 | |
Kohl’s Corp. | | | 6,330 | | | | 343,276 | |
L Brands, Inc. | | | 2,200 | | | | 132,484 | |
Lowe’s Cos., Inc. | | | 95 | | | | 8,829 | |
Macy’s, Inc. | | | 76,551 | | | | 1,928,320 | |
McDonald’s Corp. | | | 7,350 | | | | 1,265,082 | |
Nordstrom, Inc. | | | 2,308 | | | | 109,353 | |
O’Reilly Automotive, Inc. (a) | | | 333 | | | | 80,100 | |
PVH Corp. | | | 1,620 | | | | 222,280 | |
Ross Stores, Inc. | | | 2,644 | | | | 212,181 | |
Signet Jewelers Ltd. | | | 34,900 | | | | 1,973,595 | |
Starbucks Corp. | | | 54 | | | | 3,101 | |
Tapestry, Inc. | | | 6,220 | | | | 275,111 | |
Target Corp. | | | 17,286 | | | | 1,127,912 | |
Tiffany & Co. | | | 802 | | | | 83,368 | |
| | | | | | | | |
| | | Number of
Shares | | | Value | |
The TJX Cos., Inc. | | | 3,106 | | | $ | 237,485 | |
Wal-Mart Stores, Inc. | | | 30,922 | | | | 3,053,548 | |
Walgreens Boots Alliance, Inc. | | | 16,557 | | | | 1,202,369 | |
Yum! Brands, Inc. | | | 35 | | | | 2,856 | |
| | | | | | | | |
| | | | | | | 21,244,935 | |
| | | | | | | | |
| Toys, Games & Hobbies — 0.0% | | | | | | | | |
Hasbro, Inc. | | | 461 | | | | 41,901 | |
Mattel, Inc. | | | 90 | | | | 1,384 | |
| | | | | | | | |
| | | | | | | 43,285 | |
| | | | | | | | |
| | | | | | | 47,162,146 | |
| | | | | | | | |
| | |
| Consumer, Non-cyclical — 15.4% | | | | | | | | |
| Agriculture — 0.5% | | | | | | | | |
Altria Group, Inc. | | | 27,959 | | | | 1,996,552 | |
Archer-Daniels-Midland Co. | | | 92 | | | | 3,687 | |
Philip Morris International, Inc. | | | 16,486 | | | | 1,741,746 | |
| | | | | | | | |
| | | | | | | 3,741,985 | |
| | | | | | | | |
| Beverages — 0.9% | | | | | | | | |
Brown-Forman Corp. Class B | | | 12 | | | | 824 | |
The Coca-Cola Co. | | | 24,930 | | | | 1,143,788 | |
Constellation Brands, Inc. Class A | | | 542 | | | | 123,885 | |
Dr. Pepper Snapple Group, Inc. | | | 4,404 | | | | 427,452 | |
PepsiCo, Inc. | | | 36,270 | | | | 4,349,499 | |
| | | | | | | | |
| | | | | | | 6,045,448 | |
| | | | | | | | |
| Biotechnology — 1.7% | | | | | | | | |
Amgen, Inc. | | | 27,781 | | | | 4,831,116 | |
Biogen, Inc. (a) | | | 3,662 | | | | 1,166,603 | |
Celgene Corp. (a) | | | 16,176 | | | | 1,688,127 | |
Gilead Sciences, Inc. | | | 54,610 | | | | 3,912,261 | |
| | | | | | | | |
| | | | | | | 11,598,107 | |
| | | | | | | | |
| Commercial Services — 1.4% | | | | | | | | |
Automatic Data Processing, Inc. | | | 4,809 | | | | 563,567 | |
Cintas Corp. | | | 1,878 | | | | 292,649 | |
Ecolab, Inc. | | | 2 | | | | 268 | |
Equifax, Inc. | | | 132 | | | | 15,565 | |
H&R Block, Inc. | | | 29,063 | | | | 762,032 | |
Moody’s Corp. | | | 3,330 | | | | 491,541 | |
PayPal Holdings, Inc. (a) | | | 30,877 | | | | 2,273,165 | |
Quanta Services, Inc. (a) | | | 13 | | | | 508 | |
Robert Half International, Inc. | | | 26 | | | | 1,444 | |
S&P Global, Inc. | | | 5,508 | | | | 933,055 | |
Total System Services, Inc. | | | 26,107 | | | | 2,064,803 | |
United Rentals, Inc. (a) | | | 7,110 | | | | 1,222,280 | |
The Western Union Co. | | | 71,888 | | | | 1,366,591 | |
| | | | | | | | |
| | | | | | | 9,987,468 | |
| | | | | | | | |
| Cosmetics & Personal Care — 1.1% | | | | | | | | |
Colgate-Palmolive Co. | | | 5,906 | | | | 445,608 | |
The Estee Lauder Cos., Inc. Class A | | | 7,910 | | | | 1,006,468 | |
The Procter & Gamble Co. | | | 68,829 | | | | 6,324,009 | |
| | | | | | | | |
| | | | | | | 7,776,085 | |
| | | | | | | | |
The accompanying notes are an integral part of the financial statements.
18
MML Blend Fund – Portfolio of Investments (Continued)
| | | | | | | | |
| | | Number of
Shares | | | Value | |
| Foods — 0.8% | | | | | | | | |
Campbell Soup Co. | | | 1,624 | | | $ | 78,131 | |
Conagra Brands, Inc. | | | 45,174 | | | | 1,701,705 | |
General Mills, Inc. | | | 1,962 | | | | 116,327 | |
The Hershey Co. | | | 1,647 | | | | 186,951 | |
Hormel Foods Corp. | | | 15,732 | | | | 572,487 | |
The J.M. Smucker Co. | | | 845 | | | | 104,983 | |
Kellogg Co. | | | 8,428 | | | | 572,935 | |
The Kraft Heinz Co. | | | 4,958 | | | | 385,534 | |
The Kroger Co. | | | 34,958 | | | | 959,597 | |
McCormick & Co., Inc. | | | 161 | | | | 16,407 | |
Mondelez International, Inc. Class A | | | 75 | | | | 3,210 | |
Sysco Corp. | | | 5,334 | | | | 323,934 | |
Tyson Foods, Inc. Class A | | | 4,301 | | | | 348,682 | |
| | | | | | | | |
| | | | | | | 5,370,883 | |
| | | | | | | | |
| Health Care – Products — 1.9% | | | | | | | | |
Abbott Laboratories | | | 31,601 | | | | 1,803,469 | |
Align Technology, Inc. (a) | | | 2,440 | | | | 542,144 | |
Baxter International, Inc. | | | 37,161 | | | | 2,402,087 | |
Becton, Dickinson & Co. | | | 5,653 | | | | 1,209,986 | |
Boston Scientific Corp. (a) | | | 46,600 | | | | 1,155,214 | |
The Cooper Cos., Inc. | | | 1,240 | | | | 270,171 | |
Danaher Corp. | | | 11,256 | | | | 1,044,782 | |
DENTSPLY SIRONA, Inc. | | | 56 | | | | 3,686 | |
Edwards Lifesciences Corp. (a) | | | 30 | | | | 3,381 | |
Hologic, Inc. (a) | | | 1,400 | | | | 59,850 | |
Intuitive Surgical, Inc. (a) | | | 288 | | | | 105,103 | |
Medtronic PLC | | | 36,300 | | | | 2,931,225 | |
Patterson Cos., Inc. | | | 86 | | | | 3,107 | |
Stryker Corp. | | | 4,630 | | | | 716,909 | |
Thermo Fisher Scientific, Inc. | | | 3,971 | | | | 754,014 | |
Varian Medical Systems, Inc. (a) | | | 2,097 | | | | 233,082 | |
Zimmer Biomet Holdings, Inc. | | | 2,455 | | | | 296,245 | |
| | | | | | | | |
| | | | | | | 13,534,455 | |
| | | | | | | | |
| Health Care – Services — 1.8% | | | | | | | | |
Aetna, Inc. | | | 6,227 | | | | 1,123,289 | |
Anthem, Inc. | | | 5,796 | | | | 1,304,158 | |
Centene Corp. (a) | | | 17,600 | | | | 1,775,488 | |
Cigna Corp. | | | 6,512 | | | | 1,322,522 | |
DaVita, Inc. (a) | | | 3,030 | | | | 218,917 | |
HCA Healthcare, Inc. (a) | | | 2,600 | | | | 228,384 | |
Humana, Inc. | | | 1,084 | | | | 268,908 | |
Laboratory Corp. of America Holdings (a) | | | 2 | | | | 319 | |
Quest Diagnostics, Inc. | | | 3,309 | | | | 325,903 | |
UnitedHealth Group, Inc. | | | 26,944 | | | | 5,940,074 | |
Universal Health Services, Inc. Class B | | | 50 | | | | 5,668 | |
| | | | | | | | |
| | | | | | | 12,513,630 | |
| | | | | | | | |
| Household Products & Wares — 0.2% | |
Avery Dennison Corp. | | | 1,915 | | | | 219,957 | |
| | | | | | | | |
| | | Number of
Shares | | | Value | |
The Clorox Co. | | | 723 | | | $ | 107,539 | |
Kimberly-Clark Corp. | | | 7,345 | | | | 886,248 | |
| | | | | | | | |
| | | | | | | 1,213,744 | |
| | | | | | | | |
| Pharmaceuticals — 5.1% | | | | | | | | |
AbbVie, Inc. | | | 49,322 | | | | 4,769,931 | |
Allergan PLC | | | 9,790 | | | | 1,601,448 | |
AmerisourceBergen Corp. | | | 1,507 | | | | 138,373 | |
Bristol-Myers Squibb Co. | | | 20,767 | | | | 1,272,602 | |
Cardinal Health, Inc. | | | 15,778 | | | | 966,718 | |
Eli Lilly & Co. | | | 16,614 | | | | 1,403,218 | |
Express Scripts Holding Co. (a) | | | 23,301 | | | | 1,739,187 | |
Johnson & Johnson | | | 57,122 | | | | 7,981,086 | |
McKesson Corp. | | | 7,525 | | | | 1,173,524 | |
Merck & Co., Inc. | | | 51,583 | | | | 2,902,575 | |
Mylan NV (a) | | | 32,247 | | | | 1,364,370 | |
Perrigo Co. PLC | | | 20,600 | | | | 1,795,496 | |
Pfizer, Inc. | | | 207,241 | | | | 7,506,269 | |
Zoetis, Inc. | | | 11,400 | | | | 821,256 | |
| | | | | | | | |
| | | | | | | 35,436,053 | |
| | | | | | | | |
| | | | | | | 107,217,858 | |
| | | | | | | | |
| Diversified — 0.0% | | | | | | | | |
| Holding Company – Diversified — 0.0% | |
Leucadia National Corp. | | | 37 | | | | 980 | |
| | | | | | | | |
| Energy — 3.1% | | | | | | | | |
| Oil & Gas — 2.9% | | | | | | | | |
Anadarko Petroleum Corp. | | | 48 | | | | 2,575 | |
Andeavor | | | 2,517 | | | | 287,794 | |
Apache Corp. | | | 21 | | | | 886 | |
Cabot Oil & Gas Corp. | | | 48 | | | | 1,373 | |
Chesapeake Energy Corp. (a) | | | 90 | | | | 356 | |
Chevron Corp. | | | 17,788 | | | | 2,226,880 | |
ConocoPhillips | | | 39 | | | | 2,141 | |
Devon Energy Corp. | | | 43,647 | | | | 1,806,986 | |
EOG Resources, Inc. | | | 6,478 | | | | 699,041 | |
EQT Corp. | | | 97 | | | | 5,521 | |
Exxon Mobil Corp. | | | 63,897 | | | | 5,344,345 | |
Helmerich & Payne, Inc. | | | 60 | | | | 3,878 | |
Hess Corp. | | | 32 | | | | 1,519 | |
Marathon Oil Corp. | | | 106,627 | | | | 1,805,195 | |
Marathon Petroleum Corp. | | | 37,706 | | | | 2,487,842 | |
Newfield Exploration Co. (a) | | | 36,100 | | | | 1,138,233 | |
Noble Energy, Inc. | | | 56 | | | | 1,632 | |
Occidental Petroleum Corp. | | | 13,315 | | | | 980,783 | |
Phillips 66 | | | 2,869 | | | | 290,199 | |
Pioneer Natural Resources Co. | | | 1 | | | | 173 | |
Range Resources Corp. | | | 99 | | | | 1,689 | |
Valero Energy Corp. | | | 33,500 | | | | 3,078,985 | |
| | | | | | | | |
| | | | | | | 20,168,026 | |
| | | | | | | | |
| Oil & Gas Services — 0.2% | | | | | | | | |
Baker Hughes a GE Co. | | | 31 | | | | 981 | |
Halliburton Co. | | | 17,867 | | | | 873,160 | |
The accompanying notes are an integral part of the financial statements.
19
MML Blend Fund – Portfolio of Investments (Continued)
| | | | | | | | |
| | | Number of
Shares | | | Value | |
National Oilwell Varco, Inc. | | | 5,594 | | | $ | 201,496 | |
Schlumberger Ltd. | | | 4,531 | | | | 305,344 | |
TechnipFMC PLC | | | 8,340 | | | | 261,126 | |
| | | | | | | | |
| | | | | | | 1,642,107 | |
| | | | | | | | |
| Pipelines — 0.0% | | | | | | | | |
Kinder Morgan, Inc. | | | 38 | | | | 687 | |
The Williams Cos., Inc. | | | 48 | | | | 1,463 | |
| | | | | | | | |
| | | | | | | 2,150 | |
| | | | | | | | |
| | | | | | | 21,812,283 | |
| | | | | | | | |
| Financial — 14.1% | | | | | | | | |
| Banks — 7.1% | | | | | | | | |
Bank of America Corp. | | | 278,498 | | | | 8,221,261 | |
The Bank of New York Mellon Corp. | | | 29,707 | | | | 1,600,019 | |
BB&T Corp. | | | 3,166 | | | | 157,414 | |
Capital One Financial Corp. | | | 9,142 | | | | 910,360 | |
Citigroup, Inc. | | | 95,251 | | | | 7,087,627 | |
Citizens Financial Group, Inc. | | | 57,900 | | | | 2,430,642 | |
Comerica, Inc. | | | 8,721 | | | | 757,070 | |
Fifth Third Bancorp | | | 67,621 | | | | 2,051,621 | |
The Goldman Sachs Group, Inc. | | | 12,980 | | | | 3,306,785 | |
Huntington Bancshares, Inc. | | | 6,800 | | | | 99,008 | |
JP Morgan Chase & Co. | | | 109,722 | | | | 11,733,671 | |
KeyCorp | | | 32,764 | | | | 660,850 | |
M&T Bank Corp. | | | 1,355 | | | | 231,691 | |
Morgan Stanley | | | 61,597 | | | | 3,231,995 | |
Northern Trust Corp. | | | 5,059 | | | | 505,343 | |
The PNC Financial Services Group, Inc. | | | 12,918 | | | | 1,863,938 | |
Regions Financial Corp. | | | 26,415 | | | | 456,451 | |
State Street Corp. | | | 17,476 | | | | 1,705,832 | |
SunTrust Banks, Inc. | | | 12,100 | | | | 781,539 | |
US Bancorp | | | 7,602 | | | | 407,315 | |
Wells Fargo & Co. | | | 17,416 | | | | 1,056,629 | |
Zions Bancorp | | | 4,241 | | | | 215,570 | |
| | | | | | | | |
| | | | | | | 49,472,631 | |
| | | | | | | | |
| Diversified Financial Services — 2.5% | |
Alliance Data Systems Corp. | | | 880 | | | | 223,062 | |
American Express Co. | | | 23,549 | | | | 2,338,651 | |
Ameriprise Financial, Inc. | | | 11,356 | | | | 1,924,501 | |
BlackRock, Inc. | | | 3,180 | | | | 1,633,598 | |
The Charles Schwab Corp. | | | 4,612 | | | | 236,919 | |
Discover Financial Services | | | 1,783 | | | | 137,148 | |
E*TRADE Financial Corp. (a) | | | 12,761 | | | | 632,563 | |
Franklin Resources, Inc. | | | 6,387 | | | | 276,749 | |
Intercontinental Exchange, Inc. | | | 15 | | | | 1,058 | |
Invesco Ltd. | | | 37,212 | | | | 1,359,727 | |
Mastercard, Inc. Class A | | | 17,840 | | | | 2,700,262 | |
Nasdaq, Inc. | | | 45 | | | | 3,457 | |
Navient Corp. | | | 142,991 | | | | 1,904,640 | |
Raymond James Financial, Inc. | | | 4,900 | | | | 437,570 | |
Synchrony Financial | | | 20,100 | | | | 776,061 | |
| | | | | | | | |
| | | Number of
Shares | | | Value | |
T. Rowe Price Group, Inc. | | | 15,606 | | | $ | 1,637,538 | |
Visa, Inc. Class A | | | 11,872 | | | | 1,353,646 | |
| | | | | | | | |
| | | | | | | 17,577,150 | |
| | | | | | | | |
| Insurance — 2.9% | | | | | | | | |
Aflac, Inc. | | | 14,472 | | | | 1,270,352 | |
The Allstate Corp. | | | 12,035 | | | | 1,260,185 | |
American International Group, Inc. | | | 46 | | | | 2,741 | |
Aon PLC | | | 3,445 | | | | 461,630 | |
Assurant, Inc. | | | 5,216 | | | | 525,981 | |
Berkshire Hathaway, Inc. Class B (a) | | | 13,486 | | | | 2,673,195 | |
Brighthouse Financial, Inc. (a) | | | 26 | | | | 1,525 | |
Chubb Ltd. | | | 7,568 | | | | 1,105,912 | |
Cincinnati Financial Corp. | | | 4,419 | | | | 331,292 | |
Everest Re Group Ltd. | | | 3,000 | | | | 663,780 | |
The Hartford Financial Services Group, Inc. | | | 5,952 | | | | 334,979 | |
Lincoln National Corp. | | | 30,851 | | | | 2,371,516 | |
Loews Corp. | | | 20,783 | | | | 1,039,774 | |
Marsh & McLennan Cos., Inc. | | | 5,813 | | | | 473,120 | |
MetLife, Inc. | | | 32,190 | | | | 1,627,526 | |
Principal Financial Group, Inc. | | | 8,129 | | | | 573,582 | |
The Progressive Corp. | | | 18,114 | | | | 1,020,180 | |
Prudential Financial, Inc. | | | 15,737 | | | | 1,809,440 | |
Torchmark Corp. | | | 3,282 | | | | 297,710 | |
The Travelers Cos., Inc. | | | 2,287 | | | | 310,209 | |
Unum Group | | | 36,931 | | | | 2,027,143 | |
XL Group Ltd. | | | 3,788 | | | | 133,186 | |
| | | | | | | | |
| | | | | | | 20,314,958 | |
| | | | | | | | |
| Real Estate — 0.2% | | | | | | | | |
CBRE Group, Inc. Class A (a) | | | 24,287 | | | | 1,051,870 | |
| | | | | | | | |
| Real Estate Investment Trusts (REITS) — 1.3% | |
American Tower Corp. | | | 119 | | | | 16,978 | |
Apartment Investment & Management Co. Class A | | | 685 | | | | 29,941 | |
AvalonBay Communities, Inc. | | | 2,081 | | | | 371,271 | |
Boston Properties, Inc. | | | 3 | | | | 390 | |
Digital Realty Trust, Inc. | | | 280 | | | | 31,892 | |
Duke Realty Corp. | | | 68,100 | | | | 1,853,001 | |
Equinix, Inc. | | | 120 | | | | 54,387 | |
Equity Residential | | | 56 | | | | 3,571 | |
Essex Property Trust, Inc. | | | 1,500 | | | | 362,055 | |
Extra Space Storage, Inc. | | | 7,000 | | | | 612,150 | |
GGP, Inc. | | | 19,700 | | | | 460,783 | |
HCP, Inc. | | | 35 | | | | 913 | |
Host Hotels & Resorts, Inc. | | | 27,837 | | | | 552,565 | |
Iron Mountain, Inc. | | | 48 | | | | 1,811 | |
Kimco Realty Corp. | | | 2,767 | | | | 50,221 | |
Mid-America Apartment Communities, Inc. | | | 60 | | | | 6,034 | |
Prologis, Inc. | | | 27,038 | | | | 1,744,221 | |
Public Storage | | | 203 | | | | 42,427 | |
Simon Property Group, Inc. | | | 645 | | | | 110,772 | |
The accompanying notes are an integral part of the financial statements.
20
MML Blend Fund – Portfolio of Investments (Continued)
| | | | | | | | |
| | | Number of
Shares | | | Value | |
Ventas, Inc. | | | 28,825 | | | $ | 1,729,788 | |
Vornado Realty Trust | | | 1,373 | | | | 107,341 | |
Welltower, Inc. | | | 2,100 | | | | 133,917 | |
Weyerhaeuser Co. | | | 20,626 | | | | 727,273 | |
| | | | | | | | |
| | | | | | | 9,003,702 | |
| | | | | | | | |
| Savings & Loans — 0.1% | | | | | | | | |
People’s United Financial, Inc. | | | 25,351 | | | | 474,064 | |
| | | | | | | | |
| | | | | | | 97,894,375 | |
| | | | | | | | |
| Industrial — 6.1% | | | | | | | | |
| Aerospace & Defense — 1.1% | | | | | | | | |
Arconic, Inc. | | | 8 | | | | 218 | |
The Boeing Co. | | | 18,292 | | | | 5,394,494 | |
General Dynamics Corp. | | | 602 | | | | 122,477 | |
Harris Corp. | | | 770 | | | | 109,070 | |
L3 Technologies, Inc. | | | 970 | | | | 191,914 | |
Lockheed Martin Corp. | | | 1,530 | | | | 491,206 | |
Northrop Grumman Corp. | | | 3,968 | | | | 1,217,819 | |
Raytheon Co. | | | 889 | | | | 166,999 | |
Rockwell Collins, Inc. | | | 8 | | | | 1,085 | |
United Technologies Corp. | | | 1,410 | | | | 179,874 | |
| | | | | | | | |
| | | | | | | 7,875,156 | |
| | | | | | | | |
| Building Materials — 0.0% | | | | | | | | |
Johnson Controls International PLC | | | 65 | | | | 2,477 | |
Masco Corp. | | | 25 | | | | 1,098 | |
Vulcan Materials Co. | | | 5 | | | | 642 | |
| | | | | | | | |
| | | | | | | 4,217 | |
| | | | | | | | �� |
| Electrical Components & Equipment — 0.3% | |
AMETEK, Inc. | | | 25,500 | | | | 1,847,985 | |
Emerson Electric Co. | | | 4,869 | | | | 339,321 | |
| | | | | | | | |
| | | | | | | 2,187,306 | |
| | | | | | | | |
| Electronics — 0.9% | | | | | | | | |
Agilent Technologies, Inc. | | | 15,163 | | | | 1,015,466 | |
Allegion PLC | | | 1,633 | | | | 129,922 | |
Amphenol Corp. Class A | | | 4,264 | | | | 374,379 | |
Corning, Inc. | | | 6,667 | | | | 213,277 | |
FLIR Systems, Inc. | | | 2,852 | | | | 132,960 | |
Fortive Corp. | | | 5,878 | | | | 425,273 | |
Garmin Ltd. | | | 2,100 | | | | 125,097 | |
Honeywell International, Inc. | | | 14,922 | | | | 2,288,438 | |
PerkinElmer, Inc. | | | 2,720 | | | | 198,887 | |
TE Connectivity Ltd. | | | 14,300 | | | | 1,359,072 | |
Waters Corp. (a) | | | 1,540 | | | | 297,513 | |
| | | | | | | | |
| | | | | | | 6,560,284 | |
| | | | | | | | |
| Engineering & Construction — 0.4% | |
Fluor Corp. | | | 16,809 | | | | 868,185 | |
Jacobs Engineering Group, Inc. | | | 27,320 | | | | 1,802,027 | |
| | | | | | | | |
| | | | | | | 2,670,212 | |
| | | | | | | | |
| | | | | | | | |
| | | Number of
Shares | | | Value | |
| Environmental Controls — 0.0% | | | | | | | | |
Republic Services, Inc. | | | 337 | | | $ | 22,784 | |
Stericycle, Inc. (a) | | | 97 | | | | 6,595 | |
Waste Management, Inc. | | | 1,973 | | | | 170,270 | |
| | | | | | | | |
| | | | | | | 199,649 | |
| | | | | | | | |
| Hand & Machine Tools — 0.0% | | | | | | | | |
Snap-on, Inc. | | | 1 | | | | 175 | |
Stanley Black & Decker, Inc. | | | 9 | | | | 1,527 | |
| | | | | | | | |
| | | | | | | 1,702 | |
| | | | | | | | |
| Machinery – Construction & Mining — 0.5% | |
Caterpillar, Inc. | | | 20,655 | | | | 3,254,815 | |
| | | | | | | | |
| Machinery – Diversified — 0.5% | | | | | | | | |
Cummins, Inc. | | | 11,795 | | | | 2,083,469 | |
Deere & Co. | | | 5,870 | | | | 918,714 | |
Flowserve Corp. | | | 70 | | | | 2,949 | |
Rockwell Automation, Inc. | | | 493 | | | | 96,800 | |
Roper Technologies, Inc. | | | 663 | | | | 171,717 | |
Xylem, Inc. | | | 3,355 | | | | 228,811 | |
| | | | | | | | |
| | | | | | | 3,502,460 | |
| | | | | | | | |
| Miscellaneous – Manufacturing — 1.7% | |
3M Co. | | | 11,212 | | | | 2,638,968 | |
Dover Corp. | | | 5,173 | | | | 522,421 | |
Eaton Corp. PLC | | | 13,566 | | | | 1,071,850 | |
General Electric Co. | | | 86 | | | | 1,501 | |
Illinois Tool Works, Inc. | | | 14,905 | | | | 2,486,899 | |
Ingersoll-Rand PLC | | | 9,600 | | | | 856,224 | |
Parker-Hannifin Corp. | | | 12,218 | | | | 2,438,468 | |
Pentair PLC | | | 18,023 | | | | 1,272,784 | |
Textron, Inc. | | | 4,672 | | | | 264,389 | |
| | | | | | | | |
| | | | | | | 11,553,504 | |
| | | | | | | | |
| Packaging & Containers — 0.1% | | | | | | | | |
Ball Corp. | | | 4 | | | | 151 | |
Packaging Corp. of America | | | 750 | | | | 90,413 | |
Sealed Air Corp. | | | 53 | | | | 2,613 | |
WestRock Co. | | | 9,167 | | | | 579,446 | |
| | | | | | | | |
| | | | | | | 672,623 | |
| | | | | | | | |
| Transportation — 0.6% | | | | | | | | |
C.H. Robinson Worldwide, Inc. | | | 120 | | | | 10,691 | |
CSX Corp. | | | 3,507 | | | | 192,920 | |
Expeditors International of Washington, Inc. | | | 126 | | | | 8,151 | |
Norfolk Southern Corp. | | | 7,813 | | | | 1,132,104 | |
Union Pacific Corp. | | | 16,712 | | | | 2,241,079 | |
United Parcel Service, Inc. Class B | | | 4,880 | | | | 581,452 | |
| | | | | | | | |
| | | | | | | 4,166,397 | |
| | | | | | | | |
| | | | | | | 42,648,325 | |
| | | | | | | | |
| Technology — 12.4% | | | | | | | | |
| Computers — 4.7% | | | | | | | | |
Accenture PLC Class A | | | 8,860 | | | | 1,356,377 | |
Apple, Inc. | | | 119,897 | | | | 20,290,169 | |
The accompanying notes are an integral part of the financial statements.
21
MML Blend Fund – Portfolio of Investments (Continued)
| | | | | | | | |
| | | Number of
Shares | | | Value | |
Cognizant Technology Solutions Corp. Class A | | | 10,256 | | | $ | 728,381 | |
CSRA, Inc. | | | 3,126 | | | | 93,530 | |
DXC Technology Co. | | | 16,979 | | | | 1,611,307 | |
Hewlett Packard Enterprise Co. | | | 67,274 | | | | 966,055 | |
HP, Inc. | | | 21,274 | | | | 446,967 | |
International Business Machines Corp. | | | 15,040 | | | | 2,307,437 | |
NetApp, Inc. | | | 35,798 | | | | 1,980,345 | |
Seagate Technology PLC | | | 17,400 | | | | 728,016 | |
Western Digital Corp. | | | 25,647 | | | | 2,039,706 | |
| | | | | | | | |
| | | | | | | 32,548,290 | |
| | | | | | | | |
| Office & Business Equipment — 0.2% | |
Xerox Corp. | | | 55,436 | | | | 1,615,959 | |
| | | | | | | | |
| Semiconductors — 3.3% | | | | | | | | |
Analog Devices, Inc. | | | 1,072 | | | | 95,440 | |
Applied Materials, Inc. | | | 41,339 | | | | 2,113,250 | |
Broadcom Ltd. | | | 219 | | | | 56,261 | |
Intel Corp. | | | 165,423 | | | | 7,635,926 | |
KLA-Tencor Corp. | | | 19,689 | | | | 2,068,723 | |
Lam Research Corp. | | | 10,423 | | | | 1,918,562 | |
Microchip Technology, Inc. | | | 12,421 | | | | 1,091,557 | |
Micron Technology, Inc. (a) | | | 29,817 | | | | 1,226,075 | |
NVIDIA Corp. | | | 7,486 | | | | 1,448,541 | |
QUALCOMM, Inc. | | | 35,100 | | | | 2,247,102 | |
Skyworks Solutions, Inc. | | | 6,010 | | | | 570,649 | |
Texas Instruments, Inc. | | | 22,274 | | | | 2,326,297 | |
Xilinx, Inc. | | | 3,756 | | | | 253,230 | |
| | | | | | | | |
| | | | | | | 23,051,613 | |
| | | | | | | | |
| Software — 4.2% | | | | | | | | |
Activision Blizzard, Inc. | | | 23,800 | | | | 1,507,016 | |
Adobe Systems, Inc. (a) | | | 12,600 | | | | 2,208,024 | |
Akamai Technologies, Inc. (a) | | | 26 | | | | 1,691 | |
ANSYS, Inc. (a) | | | 2,350 | | | | 346,837 | |
Autodesk, Inc. (a) | | | 37 | | | | 3,879 | |
CA, Inc. | | | 15,073 | | | | 501,629 | |
Cadence Design Systems, Inc. (a) | | | 32,500 | | | | 1,359,150 | |
Citrix Systems, Inc. (a) | | | 77 | | | | 6,776 | |
Electronic Arts, Inc. (a) | | | 867 | | | | 91,087 | |
Fidelity National Information Services, Inc. | | | 5,500 | | | | 517,495 | |
Fiserv, Inc. (a) | | | 1,676 | | | | 219,774 | |
Intuit, Inc. | | | 9,710 | | | | 1,532,044 | |
Microsoft Corp. | | | 167,695 | | | | 14,344,630 | |
Oracle Corp. | | | 87,557 | | | | 4,139,695 | |
Paychex, Inc. | | | 64 | | | | 4,357 | |
Red Hat, Inc. (a) | | | 15,181 | | | | 1,823,238 | |
salesforce.com, Inc. (a) | | | 7,004 | | | | 716,019 | |
Synopsys, Inc. (a) | | | 600 | | | | 51,144 | |
| | | | | | | | |
| | | | | | | 29,374,485 | |
| | | | | | | | |
| | | | | | | 86,590,347 | |
| | | | | | | | |
| | | | | | | | |
| | | Number of
Shares | | | Value | |
| Utilities — 1.7% | | | | | | | | |
| Electric — 1.6% | | | | | | | | |
AES Corp. | | | 55,887 | | | $ | 605,256 | |
Ameren Corp. | | | 660 | | | | 38,933 | |
American Electric Power Co., Inc. | | | 8,385 | | | | 616,885 | |
CenterPoint Energy, Inc. | | | 23,731 | | | | 673,011 | |
CMS Energy Corp. | | | 7,903 | | | | 373,812 | |
Consolidated Edison, Inc. | | | 2,182 | | | | 185,361 | |
Dominion Energy, Inc. | | | 1,716 | | | | 139,099 | |
DTE Energy Co. | | | 3,020 | | | | 330,569 | |
Duke Energy Corp. | | | 5,790 | | | | 486,997 | |
Edison International | | | 17,526 | | | | 1,108,344 | |
Entergy Corp. | | | 21,498 | | | | 1,749,722 | |
Eversource Energy | | | 812 | | | | 51,302 | |
Exelon Corp. | | | 22,140 | | | | 872,538 | |
FirstEnergy Corp. | | | 44,980 | | | | 1,377,288 | |
NextEra Energy, Inc. | | | 3,040 | | | | 474,818 | |
NRG Energy, Inc. | | | 1,200 | | | | 34,176 | |
PG&E Corp. | | | 13,916 | | | | 623,854 | |
Pinnacle West Capital Corp. | | | 1,396 | | | | 118,911 | |
PPL Corp. | | | 11,618 | | | | 359,577 | |
Public Service Enterprise Group, Inc. | | | 1,424 | | | | 73,336 | |
SCANA Corp. | | | 2,947 | | | | 117,232 | |
The Southern Co. | | | 7,922 | | | | 380,969 | |
WEC Energy Group, Inc. | | | 4,542 | | | | 301,725 | |
Xcel Energy, Inc. | | | 5,472 | | | | 263,258 | |
| | | | | | | | |
| | | | | | | 11,356,973 | |
| | | | | | | | |
| Gas — 0.1% | | | | | | | | |
NiSource, Inc. | | | 713 | | | | 18,303 | |
Sempra Energy | | | 2,231 | | | | 238,538 | |
| | | | | | | | |
| | | | | | | 256,841 | |
| | | | | | | | |
| | | | | | | 11,613,814 | |
| | | | | | | | |
| | |
TOTAL COMMON STOCK
(Cost $337,553,089) | | | | | | | 488,470,766 | |
| | | | | | | | |
|
| PREFERRED STOCK — 0.1% | |
| Financial — 0.1% | | | | | | | | |
| Insurance — 0.1% | | | | | | | | |
The Allstate Corp.
5.100%, 3 mo. USD LIBOR + 3.165%, VRN | | | 20,000 | | | | 524,800 | |
| | | | | | | | |
| | |
TOTAL PREFERRED STOCK
(Cost $500,000) | | | | | | | 524,800 | |
| | | | | | | | |
| | |
TOTAL EQUITIES
(Cost $338,053,089) | | | | | | | 488,995,566 | |
| | | | | | | | |
The accompanying notes are an integral part of the financial statements.
22
MML Blend Fund – Portfolio of Investments (Continued)
| | | | | | | | |
| | | Principal
Amount | | | Value | |
| BONDS & NOTES — 29.3% | |
|
| CORPORATE DEBT — 10.2% | |
| Advertising — 0.0% | | | | | | | | |
WPP Finance 2010
5.625% 11/15/43 | | $ | 204,000 | | | $ | 233,979 | |
| | | | | | | | |
| Aerospace & Defense — 0.0% | | | | | | | | |
United Technologies Corp.
6.125% 7/15/38 | | | 80,000 | | | | 106,057 | |
| | | | | | | | |
| Agriculture — 0.1% | | | | | | | | |
Bunge Ltd. Finance Corp.
3.250% 8/15/26 | | | 165,000 | | | | 157,686 | |
Bunge Ltd. Finance Corp.
3.500% 11/24/20 | | | 160,000 | | | | 163,338 | |
Reynolds American, Inc.
5.850% 8/15/45 | | | 120,000 | | | | 149,852 | |
| | | | | | | | |
| | | | | | | 470,876 | |
| | | | | | | | |
| Airlines — 0.2% | | | | | | | | |
American Airlines Group, Inc. (b)
5.500% 10/01/19 | | | 879,000 | | | | 903,172 | |
American Airlines Pass-Through Trust, Series 2014-1, Class B
4.375% 4/01/24 | | | 33,202 | | | | 33,912 | |
Spirit Airlines Pass-Through Trust, Series 2015-1, Class A
4.100% 10/01/29 | | | 304,927 | | | | 316,483 | |
WestJet Airlines Ltd. (b)
3.500% 6/16/21 | | | 117,000 | | | | 118,091 | |
| | | | | | | | |
| | | | | | | 1,371,658 | |
| | | | | | | | |
| Auto Manufacturers — 0.2% | | | | | | | | |
Ford Motor Co.
5.291% 12/08/46 | | | 80,000 | | | | 87,057 | |
Ford Motor Credit Co. LLC
4.375% 8/06/23 | | | 200,000 | | | | 210,601 | |
General Motors Co.
4.200% 10/01/27 | | | 215,000 | | | | 222,785 | |
General Motors Co.
5.150% 4/01/38 | | | 130,000 | | | | 138,600 | |
General Motors Financial Co., Inc.
3.500% 11/07/24 | | | 315,000 | | | | 314,356 | |
Hyundai Capital America (b)
2.550% 2/06/19 | | | 170,000 | | | | 169,701 | |
Hyundai Capital America (b)
2.875% 8/09/18 | | | 135,000 | | | | 135,281 | |
| | | | | | | | |
| | | | | | | 1,278,381 | |
| | | | | | | | |
| Auto Parts & Equipment — 0.0% | | | | | | | | |
Lear Corp.
5.375% 3/15/24 | | | 85,000 | | | | 89,909 | |
| | | | | | | | |
| Banks — 1.3% | | | | | | | | |
Associated Banc-Corp.
2.750% 11/15/19 | | | 460,000 | | | | 461,563 | |
| | | | | | | | |
| | | Principal
Amount | | | Value | |
Associated Banc-Corp.
4.250% 1/15/25 | | $ | 494,000 | | | $ | 508,647 | |
Banco Santander SA
3.125% 2/23/23 | | | 400,000 | | | | 397,964 | |
Banco Santander SA
4.250% 4/11/27 | | | 200,000 | | | | 207,338 | |
Bank of America Corp.
4.183% 11/25/27 | | | 465,000 | | | | 485,584 | |
Bank of America Corp. 3 mo. USD LIBOR + 1.814%, VRN
4.244% 4/24/38 | | | 240,000 | | | | 260,287 | |
Bank of America Corp.
6.110% 1/29/37 | | | 100,000 | | | | 127,846 | |
Bank of America Corp.
7.750% 5/14/38 | | | 95,000 | | | | 142,347 | |
Bank of Montreal VRN (c)
3.803% 12/15/32 | | | 245,000 | | | | 242,214 | |
The Bank of Nova Scotia
4.500% 12/16/25 | | | 200,000 | | | | 210,391 | |
The Bank of Nova Scotia VRN (c)
4.650% 12/31/99 | | | 190,000 | | | | 188,870 | |
Barclays PLC
4.337% 1/10/28 | | | 260,000 | | | | 269,091 | |
BPCE SA (b)
3.500% 10/23/27 | | | 420,000 | | | | 413,276 | |
Citigroup, Inc.
3.875% 3/26/25 | | | 562,000 | | | | 575,291 | |
Citigroup, Inc.
8.125% 7/15/39 | | | 90,000 | | | | 143,903 | |
Credit Suisse Group AG (b)
4.282% 1/09/28 | | | 250,000 | | | | 260,650 | |
First Horizon National Corp.
3.500% 12/15/20 | | | 625,000 | | | | 638,238 | |
First Republic Bank
4.375% 8/01/46 | | | 685,000 | | | | 700,292 | |
Fulton Financial Corp.
3.600% 3/16/22 | | | 230,000 | | | | 230,915 | |
The Goldman Sachs Group, Inc.
5.950% 1/15/27 | | | 212,000 | | | | 247,653 | |
The Goldman Sachs Group, Inc.
6.250% 2/01/41 | | | 60,000 | | | | 80,856 | |
The Goldman Sachs Group, Inc.
6.750% 10/01/37 | | | 75,000 | | | | 100,398 | |
ICICI Bank Ltd. (b)
4.700% 2/21/18 | | | 395,000 | | | | 396,010 | |
JP Morgan Chase & Co.
3.375% 5/01/23 | | | 140,000 | | | | 142,305 | |
JP Morgan Chase & Co.
3.625% 12/01/27 | | | 205,000 | | | | 207,209 | |
JP Morgan Chase & Co.
5.600% 7/15/41 | | | 195,000 | | | | 250,828 | |
Regions Bank
7.500% 5/15/18 | | | 130,000 | | | | 132,603 | |
The accompanying notes are an integral part of the financial statements.
23
MML Blend Fund – Portfolio of Investments (Continued)
| | | | | | | | |
| | | Principal
Amount | | | Value | |
SVB Financial Group
3.500% 1/29/25 | | $ | 460,000 | | | $ | 461,100 | |
SVB Financial Group
5.375% 9/15/20 | | | 75,000 | | | | 80,158 | |
Turkiye Garanti Bankasi AS (b)
4.750% 10/17/19 | | | 445,000 | | | | 451,684 | |
Valley National Bancorp
5.125% 9/27/23 | | | 245,000 | | | | 262,267 | |
| | | | | | | | |
| | | | | | | 9,277,778 | |
| | | | | | | | |
| Beverages — 0.1% | | | | | | | | |
Anheuser-Busch InBev Finance, Inc.
4.900% 2/01/46 | | | 575,000 | | | | 666,419 | |
Molson Coors Brewing Co.
4.200% 7/15/46 | | | 90,000 | | | | 91,712 | |
| | | | | | | | |
| | | | | | | 758,131 | |
| | | | | | | | |
| Biotechnology — 0.1% | | | | | | | | |
Amgen, Inc.
5.150% 11/15/41 | | | 115,000 | | | | 138,012 | |
Baxalta, Inc.
5.250% 6/23/45 | | | 140,000 | | | | 163,160 | |
Celgene Corp.
3.450% 11/15/27 | | | 380,000 | | | | 379,717 | |
Celgene Corp.
4.350% 11/15/47 | | | 305,000 | | | | 316,813 | |
| | | | | | | | |
| | | | | | | 997,702 | |
| | | | | | | | |
| Building Materials — 0.1% | | | | | | | | |
Standard Industries, Inc. (b)
5.000% 2/15/27 | | | 471,000 | | | | 481,597 | |
Standard Industries, Inc. (b)
5.375% 11/15/24 | | | 246,000 | | | | 257,144 | |
Standard Industries, Inc. (b)
5.500% 2/15/23 | | | 178,000 | | | | 185,565 | |
| | | | | | | | |
| | | | | | | 924,306 | |
| | | | | | | | |
| Chemicals — 0.2% | | | | | | | | |
Incitec Pivot Finance LLC (b)
6.000% 12/10/19 | | | 185,000 | | | | 195,970 | |
LYB International Finance BV
5.250% 7/15/43 | | | 175,000 | | | | 203,529 | |
Monsanto Co.
4.400% 7/15/44 | | | 100,000 | | | | 106,555 | |
The Mosaic Co.
3.250% 11/15/22 | | | 185,000 | | | | 183,382 | |
The Mosaic Co.
4.050% 11/15/27 | | | 190,000 | | | | 190,498 | |
RPM International, Inc.
3.750% 3/15/27 | | | 110,000 | | | | 111,307 | |
The Sherwin-Williams Co.
4.500% 6/01/47 | | | 105,000 | | | | 114,801 | |
The Sherwin-Williams Co. (b)
7.250% 6/15/19 | | | 125,000 | | | | 133,636 | |
| | | | | | | | |
| | | | | | | 1,239,678 | |
| | | | | | | | |
| | | | | | | | |
| | | Principal
Amount | | | Value | |
| Commercial Services — 0.1% | | | | | | | | |
The ADT Corp.
6.250% 10/15/21 | | $ | 440,000 | | | $ | 481,800 | |
ERAC USA Finance LLC (b)
6.700% 6/01/34 | | | 78,000 | | | | 98,452 | |
| | | | | | | | |
| | | | | | | 580,252 | |
| | | | | | | | |
| Computers — 0.3% | | | | | | | | |
Dell International LLC/EMC Corp. (b)
3.480% 6/01/19 | | | 450,000 | | | | 455,637 | |
Dell International LLC/EMC Corp. (b)
6.020% 6/15/26 | | | 76,000 | | | | 83,799 | |
DXC Technology Co.
2.875% 3/27/20 | | | 90,000 | | | | 90,438 | |
DXC Technology Co.
4.750% 4/15/27 | | | 275,000 | | | | 292,438 | |
Leidos Holdings, Inc.
4.450% 12/01/20 | | | 835,000 | | | | 866,313 | |
| | | | | | | | |
| | | | | | | 1,788,625 | |
| | | | | | | | |
| Diversified Financial Services — 0.7% | | | | | | | | |
AerCap Ireland Capital DAC/AerCap Global Aviation Trust
4.500% 5/15/21 | | | 290,000 | | | | 304,563 | |
Affiliated Managers Group, Inc.
3.500% 8/01/25 | | | 290,000 | | | | 293,247 | |
Aircastle Ltd.
5.000% 4/01/23 | | | 275,000 | | | | 289,781 | |
Ally Financial, Inc.
3.250% 11/05/18 | | | 485,000 | | | | 486,213 | |
Ally Financial, Inc.
4.750% 9/10/18 | | | 360,000 | | | | 364,500 | |
Ares Finance Co. LLC (b)
4.000% 10/08/24 | | | 355,000 | | | | 341,492 | |
Brookfield Finance LLC
4.000% 4/01/24 | | | 455,000 | | | | 471,028 | |
Discover Financial Services
4.100% 2/09/27 | | | 265,000 | | | | 271,448 | |
Genpact Luxembourg Sarl (b)
3.700% 4/01/22 | | | 360,000 | | | | 357,799 | |
International Lease Finance Corp.
3.875% 4/15/18 | | | 270,000 | | | | 271,236 | |
International Lease Finance Corp.
6.250% 5/15/19 | | | 15,000 | | | | 15,719 | |
Lazard Group LLC
3.625% 3/01/27 | | | 184,000 | | | | 183,620 | |
Lazard Group LLC
4.250% 11/14/20 | | | 600,000 | | | | 624,948 | |
Legg Mason, Inc.
5.625% 1/15/44 | | | 175,000 | | | | 195,103 | |
Neuberger Berman Group LLC/Neuberger Berman Finance Corp. (b)
4.500% 3/15/27 | | | 170,000 | | | | 178,806 | |
| | | | | | | | |
| | | | | | | 4,649,503 | |
| | | | | | | | |
The accompanying notes are an integral part of the financial statements.
24
MML Blend Fund – Portfolio of Investments (Continued)
| | | | | | | | |
| | | Principal
Amount | | | Value | |
| Electric — 0.6% | | | | | | | | |
The Cleveland Electric Illuminating Co. (b)
3.500% 4/01/28 | | $ | 155,000 | | | $ | 155,169 | |
Duke Energy Corp.
3.750% 9/01/46 | | | 195,000 | | | | 192,838 | |
EDP Finance BV (b)
3.625% 7/15/24 | | | 420,000 | | | | 422,992 | |
Entergy Louisiana LLC
4.950% 1/15/45 | | | 165,000 | | | | 173,376 | |
Florida Power & Light Co.
4.950% 6/01/35 | | | 125,000 | | | | 148,116 | |
IPALCO Enterprises, Inc.
3.450% 7/15/20 | | | 615,000 | | | | 621,150 | |
IPALCO Enterprises, Inc. (b)
3.700% 9/01/24 | | | 170,000 | | | | 169,846 | |
Israel Electric Corp. Ltd. (b)
7.250% 1/15/19 | | | 200,000 | | | | 208,376 | |
Majapahit Holding BV (b)
7.750% 1/20/20 | | | 195,000 | | | | 213,291 | |
Nevada Power Co., Series N
6.650% 4/01/36 | | | 135,000 | | | | 187,618 | |
Oncor Electric Delivery Co.
7.500% 9/01/38 | | | 40,000 | | | | 60,508 | |
Pacific Gas & Electric Co.
5.800% 3/01/37 | | | 120,000 | | | | 149,750 | |
Pennsylvania Electric Co. (b)
4.150% 4/15/25 | | | 295,000 | | | | 308,855 | |
Progress Energy, Inc.
7.000% 10/30/31 | | | 25,000 | | | | 33,407 | |
Puget Energy, Inc.
3.650% 5/15/25 | | | 350,000 | | | | 358,810 | |
Puget Energy, Inc.
6.500% 12/15/20 | | | 271,000 | | | | 299,999 | |
Transelec SA (b)
4.625% 7/26/23 | | | 175,000 | | | | 186,154 | |
Tri-State Pass-Through Trust, Series 2003, Class A (b)
6.040% 1/31/18 | | | 16,620 | | | | 16,666 | |
| | | | | | | | |
| | | | | | | 3,906,921 | |
| | | | | | | | |
| Electronics — 0.2% | | | | | | | | |
Arrow Electronics, Inc.
3.250% 9/08/24 | | | 155,000 | | | | 151,882 | |
Arrow Electronics, Inc.
3.500% 4/01/22 | | | 255,000 | | | | 258,416 | |
Arrow Electronics, Inc.
3.875% 1/12/28 | | | 145,000 | | | | 144,565 | |
Arrow Electronics, Inc.
4.500% 3/01/23 | | | 80,000 | | | | 84,147 | |
Avnet, Inc.
3.750% 12/01/21 | | | 30,000 | | | | 30,431 | |
Avnet, Inc.
4.875% 12/01/22 | | | 123,000 | | | | 130,759 | |
| | | | | | | | |
| | | Principal
Amount | | | Value | |
FLIR Systems, Inc.
3.125% 6/15/21 | | $ | 195,000 | | | $ | 196,443 | |
Ingram Micro, Inc. STEP
5.450% 12/15/24 | | | 203,000 | | | | 201,617 | |
Tech Data Corp.
3.700% 2/15/22 | | | 130,000 | | | | 130,403 | |
| | | | | | | | |
| | | | | | | 1,328,663 | |
| | | | | | | | |
| Engineering & Construction — 0.1% | | | | | | | | |
SBA Tower Trust (b)
2.877% 7/10/46 | | | 200,000 | | | | 198,500 | |
SBA Tower Trust (b)
3.156% 10/10/45 | | | 210,000 | | | | 211,575 | |
SBA Tower Trust (b)
3.168% 4/09/47 | | | 260,000 | | | | 258,815 | |
| | | | | | | | |
| | | | | | | 668,890 | |
| | | | | | | | |
| Foods — 0.0% | | | | | | | | |
Kraft Heinz Foods Co.
3.000% 6/01/26 | | | 315,000 | | | | 303,118 | |
| | | | | | | | |
| Gas — 0.1% | | | | | | | | |
NiSource Finance Corp.
5.800% 2/01/42 | | | 175,000 | | | | 216,829 | |
Spire, Inc.
4.700% 8/15/44 | | | 290,000 | | | | 321,943 | |
| | | | | | | | |
| | | | | | | 538,772 | |
| | | | | | | | |
| Hand & Machine Tools — 0.0% | | | | | | | | |
Kennametal, Inc.
2.650% 11/01/19 | | | 150,000 | | | | 150,119 | |
| | | | | | | | |
| Health Care – Products — 0.2% | | | | | | | | |
Abbott Laboratories
3.750% 11/30/26 | | | 125,000 | | | | 128,358 | |
Abbott Laboratories
4.900% 11/30/46 | | | 115,000 | | | | 131,847 | |
Becton Dickinson & Co.
3.363% 6/06/24 | | | 240,000 | | | | 240,670 | |
Becton Dickinson & Co.
3.700% 6/06/27 | | | 295,000 | | | | 297,275 | |
Becton Dickinson & Co.
4.685% 12/15/44 | | | 225,000 | | | | 246,037 | |
| | | | | | | | |
| | | | | | | 1,044,187 | |
| | | | | | | | |
| Health Care – Services — 0.1% | | | | | | | | |
Humana, Inc.
3.950% 3/15/27 | | | 250,000 | | | | 258,846 | |
Humana, Inc.
4.800% 3/15/47 | | | 125,000 | | | | 140,942 | |
UnitedHealth Group, Inc.
3.950% 10/15/42 | | | 55,000 | | | | 57,169 | |
UnitedHealth Group, Inc.
6.875% 2/15/38 | | | 110,000 | | | | 159,547 | |
| | | | | | | | |
| | | | | | | 616,504 | |
| | | | | | | | |
The accompanying notes are an integral part of the financial statements.
25
MML Blend Fund – Portfolio of Investments (Continued)
| | | | | | | | |
| | | Principal
Amount | | | Value | |
| Home Builders — 0.1% | | | | | | | | |
Lennar Corp.
4.500% 11/15/19 | | $ | 516,000 | | | $ | 529,545 | |
| | | | | | | | |
| Household Products & Wares — 0.0% | | | | | | | | |
Church & Dwight Co., Inc.
3.150% 8/01/27 | | | 85,000 | | | | 83,745 | |
| | | | | | | | |
| Insurance — 0.8% | | | | | | | | |
The Allstate Corp. 3 mo. USD LIBOR +
2.938%, VRN
5.750% 8/15/53 | | | 345,000 | | | | 376,395 | |
American International Group, Inc.
4.500% 7/16/44 | | | 200,000 | | | | 215,420 | |
AmTrust Financial Services, Inc.
6.125% 8/15/23 | | | 495,000 | | | | 475,448 | |
Arch Capital Group US, Inc.
5.144% 11/01/43 | | | 170,000 | | | | 198,291 | |
Athene Global Funding (b)
3.000% 7/01/22 | | | 365,000 | | | | 361,267 | |
AXIS Specialty Finance PLC
2.650% 4/01/19 | | | 95,000 | | | | 94,683 | |
AXIS Specialty Finance PLC
4.000% 12/06/27 | | | 265,000 | | | | 266,195 | |
Brown & Brown, Inc.
4.200% 9/15/24 | | | 69,000 | | | | 72,330 | |
The Chubb Corp. 3 mo. USD LIBOR +
2.250%, VRN
3.609% 3/29/67 | | | 50,000 | | | | 49,625 | |
CNA Financial Corp.
3.450% 8/15/27 | | | 185,000 | | | | 182,310 | |
CNO Financial Group, Inc.
5.250% 5/30/25 | | | 465,000 | | | | 490,575 | |
Enstar Group Ltd.
4.500% 3/10/22 | | | 140,000 | | | | 142,585 | |
Five Corners Funding Trust (b)
4.419% 11/15/23 | | | 215,000 | | | | 230,400 | |
Reinsurance Group of America, Inc.
3.950% 9/15/26 | | | 360,000 | | | | 367,924 | |
Trinity Acquisition PLC
3.500% 9/15/21 | | | 270,000 | | | | 275,265 | |
Trinity Acquisition PLC
4.400% 3/15/26 | | | 70,000 | | | | 74,031 | |
USF&G Capital I (b)
8.500% 12/15/45 | | | 150,000 | | | | 220,115 | |
Willis North America, Inc.
7.000% 9/29/19 | | | 97,000 | | | | 104,029 | |
Willis Towers Watson PLC
5.750% 3/15/21 | | | 230,000 | | | | 250,277 | |
XLIT Ltd.
4.450% 3/31/25 | | | 395,000 | | | | 404,007 | |
XLIT Ltd.
5.500% 3/31/45 | | | 100,000 | | | | 106,250 | |
XLIT Ltd.
5.750% 10/01/21 | | | 115,000 | | | | 126,217 | |
| | | | | | | | |
| | | Principal
Amount | | | Value | |
XLIT Ltd.
6.375% 11/15/24 | | $ | 325,000 | | | $ | 378,596 | |
| | | | | | | | |
| | | | | | | 5,462,235 | |
| | | | | | | | |
| Internet — 0.1% | | | | | | | | |
Amazon.com, Inc. (b)
4.050% 8/22/47 | | | 300,000 | | | | 323,315 | |
Expedia, Inc.
7.456% 8/15/18 | | | 425,000 | | | | 438,333 | |
| | | | | | | | |
| | | | | | | 761,648 | |
| | | | | | | | |
| Investment Companies — 0.2% | | | | | | | | |
Ares Capital Corp.
3.500% 2/10/23 | | | 510,000 | | | | 502,438 | |
Ares Capital Corp.
3.875% 1/15/20 | | | 255,000 | | | | 259,505 | |
FS Investment Corp.
4.000% 7/15/19 | | | 390,000 | | | | 394,623 | |
TCP Capital Corp.
4.125% 8/11/22 | | | 470,000 | | | | 462,599 | |
| | | | | | | | |
| | | | | | | 1,619,165 | |
| | | | | | | | |
| Iron & Steel — 0.2% | | | | | | | | |
ArcelorMittal
5.125% 6/01/20 | | | 320,000 | | | | 334,400 | |
ArcelorMittal STEP
5.750% 8/05/20 | | | 618,000 | | | | 651,990 | |
Reliance Steel & Aluminum Co.
4.500% 4/15/23 | | | 37,000 | | | | 39,001 | |
Vale Overseas Ltd.
5.875% 6/10/21 | | | 475,000 | | | | 517,275 | |
Vale Overseas Ltd.
6.875% 11/21/36 | | | 95,000 | | | | 116,375 | |
| | | | | | | | |
| | | | | | | 1,659,041 | |
| | | | | | | | |
| Machinery – Diversified — 0.1% | | | | | | | | |
CNH Industrial Capital LLC
3.375% 7/15/19 | | | 230,000 | | | | 231,725 | |
CNH Industrial Capital LLC
3.625% 4/15/18 | | | 116,000 | | | | 116,601 | |
CNH Industrial Capital LLC
3.875% 10/15/21 | | | 500,000 | | | | 508,770 | |
| | | | | | | | |
| | | | | | | 857,096 | |
| | | | | | | | |
| Media — 0.2% | | | | | | | | |
Charter Communications Operating LLC/Charter Communications Operating Capital
3.579% 7/23/20 | | | 270,000 | | | | 275,033 | |
Charter Communications Operating LLC/Charter Communications Operating Capital
4.464% 7/23/22 | | | 244,000 | | | | 254,577 | |
Charter Communications Operating LLC/Charter Communications Operating Capital
6.484% 10/23/45 | | | 225,000 | | | | 262,334 | |
The accompanying notes are an integral part of the financial statements.
26
MML Blend Fund – Portfolio of Investments (Continued)
| | | | | | | | |
| | | Principal
Amount | | | Value | |
Comcast Corp.
3.400% 7/15/46 | | $ | 220,000 | | | $ | 208,154 | |
Discovery Communications LLC
5.000% 9/20/37 | | | 160,000 | | | | 165,775 | |
Time Warner Cable, Inc.
6.750% 6/15/39 | | | 110,000 | | | | 131,987 | |
Time Warner Cable, Inc.
8.250% 4/01/19 | | | 45,000 | | | | 48,095 | |
Time Warner Cable, Inc.
8.750% 2/14/19 | | | 65,000 | | | | 69,305 | |
Time Warner, Inc.
6.250% 3/29/41 | | | 25,000 | | | | 30,875 | |
Viacom, Inc.
4.250% 9/01/23 | | | 123,000 | | | | 125,581 | |
| | | | | | | | |
| | | | | | | 1,571,716 | |
| | | | | | | | |
| Mining — 0.2% | | | | | | | | |
Glencore Funding LLC (b)
3.000% 10/27/22 | | | 140,000 | | | | 138,635 | |
Glencore Funding LLC (b)
3.875% 10/27/27 | | | 160,000 | | | | 157,882 | |
Glencore Funding LLC (b)
4.625% 4/29/24 | | | 355,000 | | | | 374,809 | |
Kinross Gold Corp. (b)
4.500% 7/15/27 | | | 166,000 | | | | 167,038 | |
Kinross Gold Corp.
5.125% 9/01/21 | | | 375,000 | | | | 390,937 | |
| | | | | | | | |
| | | | | | | 1,229,301 | |
| | | | | | | | |
| Miscellaneous – Manufacturing — 0.0% | | | | | | | | |
General Electric Co.
4.125% 10/09/42 | | | 270,000 | | | | 282,852 | |
| | | | | | | | |
| Office Equipment/Supplies — 0.1% | | | | | | | | |
Pitney Bowes, Inc.
3.625% 9/15/20 | | | 135,000 | | | | 133,650 | |
Pitney Bowes, Inc. STEP
3.625% 10/01/21 | | | 485,000 | | | | 451,050 | |
| | | | | | | | |
| | | | | | | 584,700 | |
| | | | | | | | |
| Office Furnishings — 0.0% | | | | | | | | |
Steelcase, Inc.
6.375% 2/15/21 | | | 100,000 | | | | 109,440 | |
| | | | | | | | |
| Oil & Gas — 0.7% | | | | | | | | |
Anadarko Petroleum Corp.
6.450% 9/15/36 | | | 250,000 | | | | 306,203 | |
Andeavor
3.800% 4/01/28 | | | 135,000 | | | | 135,323 | |
Andeavor
4.500% 4/01/48 | | | 85,000 | | | | 85,963 | |
Antero Resources Corp.
5.375% 11/01/21 | | | 475,000 | | | | 486,875 | |
Cenovus Energy, Inc.
3.000% 8/15/22 | | | 200,000 | | | | 198,753 | |
Cenovus Energy, Inc.
4.250% 4/15/27 | | | 300,000 | | | | 299,277 | |
| | | | | | | | |
| | | Principal
Amount | | | Value | |
Continental Resources, Inc. (b)
4.375% 1/15/28 | | $ | 260,000 | | | $ | 256,672 | |
Encana Corp.
6.500% 5/15/19 | | | 125,000 | | | | 131,343 | |
Encana Corp.
6.500% 2/01/38 | | | 80,000 | | | | 100,956 | |
EQT Corp.
3.900% 10/01/27 | | | 515,000 | | | | 511,978 | |
Helmerich & Payne International Drilling Co.
4.650% 3/15/25 | | | 190,000 | | | | 200,003 | |
Marathon Petroleum Corp.
4.750% 9/15/44 | | | 100,000 | | | | 104,483 | |
Marathon Petroleum Corp.
6.500% 3/01/41 | | | 170,000 | | | | 213,069 | |
Nabors Industries, Inc.
5.500% 1/15/23 | | | 215,000 | | | | 208,550 | |
Newfield Exploration Co.
5.750% 1/30/22 | | | 200,000 | | | | 213,500 | |
PBF Holding Co. LLC/PBF Finance Corp.
7.000% 11/15/23 | | | 175,000 | | | | 182,000 | |
Petroleos Mexicanos
3.125% 1/23/19 | | | 50,000 | | | | 50,250 | |
Petroleos Mexicanos
3.500% 1/30/23 | | | 100,000 | | | | 97,900 | |
Petroleos Mexicanos
4.625% 9/21/23 | | | 100,000 | | | | 102,875 | |
Petroleos Mexicanos
5.500% 1/21/21 | | | 285,000 | | | | 302,385 | |
Petroleos Mexicanos
6.375% 1/23/45 | | | 80,000 | | | | 80,428 | |
Petroleos Mexicanos (b)
6.500% 3/13/27 | | | 60,000 | | | | 65,580 | |
Petroleos Mexicanos
6.625% 6/15/38 | | | 37,000 | | | | 38,480 | |
QEP Resources, Inc.
6.875% 3/01/21 | | | 260,000 | | | | 280,800 | |
| | | | | | | | |
| | | | | | | 4,653,646 | |
| | | | | | | | |
| Oil & Gas Services — 0.0% | | | | | | | | |
National Oilwell Varco, Inc.
3.950% 12/01/42 | | | 216,000 | | | | 190,513 | |
Weatherford International Ltd.
6.000% 3/15/18 | | | 75,000 | | | | 75,090 | |
| | | | | | | | |
| | | | | | | 265,603 | |
| | | | | | | | |
| Packaging & Containers — 0.1% | | | | | | | | |
Amcor Finance USA, Inc. (b)
3.625% 4/28/26 | | | 490,000 | | | | 482,837 | |
Brambles USA, Inc. (b)
4.125% 10/23/25 | | | 134,000 | | | | 138,968 | |
Brambles USA, Inc. (b)
5.350% 4/01/20 | | | 90,000 | | | | 94,701 | |
| | | | | | | | |
| | | | | | | 716,506 | |
| | | | | | | | |
The accompanying notes are an integral part of the financial statements.
27
MML Blend Fund – Portfolio of Investments (Continued)
| | | | | | | | |
| | | Principal
Amount | | | Value | |
| Pharmaceuticals — 0.3% | | | | | | | | |
AbbVie, Inc.
4.700% 5/14/45 | | $ | 165,000 | | | $ | 185,010 | |
Allergan Funding SCS
4.550% 3/15/35 | | | 100,000 | | | | 105,817 | |
Allergan Funding SCS
4.750% 3/15/45 | | | 190,000 | | | | 202,266 | |
Express Scripts Holding Co.
4.500% 2/25/26 | | | 180,000 | | | | 191,017 | |
Express Scripts Holding Co.
4.800% 7/15/46 | | | 195,000 | | | | 207,439 | |
Johnson & Johnson
5.850% 7/15/38 | | | 40,000 | | | | 54,194 | |
McKesson Corp.
4.883% 3/15/44 | | | 60,000 | | | | 65,294 | |
McKesson Corp.
6.000% 3/01/41 | | | 125,000 | | | | 152,693 | |
Shire Acquisitions Investments Ireland DAC
2.875% 9/23/23 | | | 95,000 | | | | 93,392 | |
Teva Pharmaceutical Finance Netherlands III BV
1.700% 7/19/19 | | | 100,000 | | | | 97,160 | |
Teva Pharmaceutical Finance Netherlands III BV
2.200% 7/21/21 | | | 445,000 | | | | 406,494 | |
Teva Pharmaceutical Finance Netherlands III BV
4.100% 10/01/46 | | | 75,000 | | | | 57,113 | |
| | | | | | | | |
| | | | | | | 1,817,889 | |
| | | | | | | | |
| Pipelines — 0.8% | | | | | | | | |
Andeavor Logistics LP VRN (c)
6.875% 12/31/99 | | | 250,000 | | | | 253,800 | |
Andeavor Logistics LP/Tesoro Logistics Finance Corp.
3.500% 12/01/22 | | | 75,000 | | | | 74,858 | |
Energy Transfer LP
4.200% 4/15/27 | | | 165,000 | | | | 164,142 | |
Energy Transfer LP
6.125% 12/15/45 | | | 75,000 | | | | 81,444 | |
Energy Transfer LP
6.500% 2/01/42 | | | 100,000 | | | | 113,231 | |
Energy Transfer Partners LP VRN (c)
6.250% 12/31/99 | | | 385,000 | | | | 373,931 | |
EnLink Midstream Partners LP
4.150% 6/01/25 | | | 125,000 | | | | 126,304 | |
EnLink Midstream Partners LP
4.850% 7/15/26 | | | 149,000 | | | | 156,132 | |
Enterprise Products Operating LLC
5.700% 2/15/42 | | | 5,000 | | | | 6,047 | |
Enterprise Products Operating LLC
5.950% 2/01/41 | | | 150,000 | | | | 185,138 | |
| | | | | | | | |
| | | Principal
Amount | | | Value | |
Enterprise Products Operating LLC
6.125% 10/15/39 | | $ | 4,000 | | | $ | 5,032 | |
Kinder Morgan Energy Partners LP
5.300% 9/15/20 | | | 475,000 | | | | 506,271 | |
Kinder Morgan Energy Partners LP
6.375% 3/01/41 | | | 65,000 | | | | 75,554 | |
Kinder Morgan Energy Partners LP
6.500% 2/01/37 | | | 120,000 | | | | 140,433 | |
Kinder Morgan Energy Partners LP
6.550% 9/15/40 | | | 90,000 | | | | 105,222 | |
Kinder Morgan Energy Partners LP
6.950% 1/15/38 | | | 10,000 | | | | 12,433 | |
Kinder Morgan Finance Co. LLC (b)
6.000% 1/15/18 | | | 150,000 | | | | 150,264 | |
Magellan Midstream Partners LP
5.150% 10/15/43 | | | 170,000 | | | | 192,296 | |
MPLX LP
4.875% 6/01/25 | | | 372,000 | | | | 398,680 | |
MPLX LP
5.200% 3/01/47 | | | 35,000 | | | | 38,410 | |
MPLX LP
5.500% 2/15/23 | | | 136,000 | | | | 139,955 | |
Phillips 66 Partners LP
3.750% 3/01/28 | | | 135,000 | | | | 135,062 | |
Phillips 66 Partners LP
4.680% 2/15/45 | | | 28,000 | | | | 28,760 | |
Plains All American Pipeline LP VRN (c)
6.125% 12/31/99 | | | 385,000 | | | | 384,422 | |
Plains All American Pipeline LP/PAA Finance Corp.
3.650% 6/01/22 | | | 191,000 | | | | 192,113 | |
Plains All American Pipeline LP/PAA Finance Corp.
4.500% 12/15/26 | | | 210,000 | | | | 212,877 | |
Plains All American Pipeline LP/PAA Finance Corp.
4.700% 6/15/44 | | | 100,000 | | | | 93,485 | |
Sabine Pass Liquefaction LLC (b)
4.200% 3/15/28 | | | 240,000 | | | | 242,827 | |
Sunoco Logistics Partners Operations LP
4.000% 10/01/27 | | | 230,000 | | | | 225,527 | |
Sunoco Logistics Partners Operations LP
5.300% 4/01/44 | | | 75,000 | | | | 74,017 | |
Tesoro Logistics LP/Tesoro Logistics Finance Corp.
6.250% 10/15/22 | | | 97,000 | | | | 102,914 | |
Western Gas Partners LP
4.000% 7/01/22 | | | 481,000 | | | | 490,705 | |
| | | | | | | | |
| | | | | | | 5,482,286 | |
| | | | | | | | |
| Private Equity — 0.1% | | | | | | | | |
Hercules Capital, Inc.
4.625% 10/23/22 | | | 470,000 | | | | 476,551 | |
| | | | | | | | |
The accompanying notes are an integral part of the financial statements.
28
MML Blend Fund – Portfolio of Investments (Continued)
| | | | | | | | |
| | | Principal
Amount | | | Value | |
| Real Estate Investment Trusts (REITS) — 0.3% | |
American Tower Corp.
4.400% 2/15/26 | | $ | 140,000 | | | $ | 147,222 | |
Crown Castle International Corp.
3.200% 9/01/24 | | | 265,000 | | | | 262,252 | |
Crown Castle International Corp.
4.000% 3/01/27 | | | 120,000 | | | | 122,691 | |
Healthcare Trust of America Holdings LP
3.500% 8/01/26 | | | 200,000 | | | | 196,916 | |
Highwoods Realty LP
7.500% 4/15/18 | | | 265,000 | | | | 269,010 | |
Host Hotels & Resorts LP
3.875% 4/01/24 | | | 245,000 | | | | 249,265 | |
Kimco Realty Corp.
3.300% 2/01/25 | | | 160,000 | | | | 158,753 | |
Mid-America Apartments LP
3.600% 6/01/27 | | | 155,000 | | | | 155,264 | |
UDR, Inc.
3.500% 7/01/27 | | | 220,000 | | | | 219,949 | |
Weingarten Realty Investors
3.250% 8/15/26 | | | 85,000 | | | | 81,582 | |
| | | | | | | | |
| | | | | | | 1,862,904 | |
| | | | | | | | |
| Retail — 0.3% | | | | | | | | |
CVS Health Corp.
6.125% 9/15/39 | | | 175,000 | | | | 219,935 | |
CVS Pass-Through Trust (b)
5.926% 1/10/34 | | | 274,008 | | | | 312,354 | |
Dollar Tree, Inc.
5.750% 3/01/23 | | | 470,000 | | | | 492,325 | |
El Puerto de Liverpool SAB de CV (b)
3.950% 10/02/24 | | | 445,000 | | | | 447,225 | |
The Home Depot, Inc.
5.950% 4/01/41 | | | 150,000 | | | | 203,134 | |
QVC, Inc.
3.125% 4/01/19 | | | 155,000 | | | | 155,579 | |
QVC, Inc.
4.375% 3/15/23 | | | 150,000 | | | | 153,816 | |
QVC, Inc.
4.450% 2/15/25 | | | 245,000 | | | | 249,917 | |
QVC, Inc.
5.125% 7/02/22 | | | 30,000 | | | | 31,729 | |
Tiffany & Co.
4.900% 10/01/44 | | | 165,000 | | | | 166,551 | |
| | | | | | | | |
| | | | | | | 2,432,565 | |
| | | | | | | | |
| Semiconductors — 0.0% | | | | | | | | |
QUALCOMM, Inc.
4.300% 5/20/47 | | | 205,000 | | | | 206,518 | |
| | | | | | | | |
| Software — 0.1% | | | | | | | | |
Microsoft Corp.
4.450% 11/03/45 | | | 330,000 | | | | 386,792 | |
| | | | | | | | |
| | | Principal
Amount | | | Value | |
Oracle Corp.
4.000% 7/15/46 | | $ | 270,000 | | | $ | 287,283 | |
| | | | | | | | |
| | | | | | | 674,075 | |
| | | | | | | | |
| Telecommunications — 0.6% | | | | | | | | |
AT&T, Inc.
3.400% 8/14/24 | | | 330,000 | | | | 331,694 | |
AT&T, Inc.
3.800% 3/01/24 | | | 255,000 | | | | 261,148 | |
AT&T, Inc.
3.900% 8/14/27 | | | 305,000 | | | | 307,038 | |
AT&T, Inc.
4.750% 5/15/46 | | | 260,000 | | | | 254,292 | |
AT&T, Inc.
4.900% 8/14/37 | | | 200,000 | | | | 202,519 | |
AT&T, Inc.
5.250% 3/01/37 | | | 190,000 | | | | 200,949 | |
CenturyLink, Inc.
6.150% 9/15/19 | | | 140,000 | | | | 144,900 | |
Cisco Systems, Inc.
5.500% 1/15/40 | | | 55,000 | | | | 72,776 | |
Crown Castle Towers LLC (b)
6.113% 1/15/40 | | | 170,000 | | | | 179,204 | |
Hughes Satellite Systems Corp.
6.500% 6/15/19 | | | 175,000 | | | | 182,875 | |
Sprint Communications, Inc.
9.250% 4/15/22 | | | 410,000 | | | | 488,925 | |
Ericsson LM
4.125% 5/15/22 | | | 500,000 | | | | 503,510 | |
Verizon Communications, Inc.
4.125% 3/16/27 | | | 175,000 | | | | 182,475 | |
Verizon Communications, Inc.
4.862% 8/21/46 | | | 372,000 | | | | 387,484 | |
Verizon Communications, Inc.
6.550% 9/15/43 | | | 149,000 | | | | 194,508 | |
| | | | | | | | |
| | | | | | | 3,894,297 | |
| | | | | | | | |
| Toys, Games & Hobbies — 0.0% | | | | | | | | |
Mattel, Inc.
1.700% 3/15/18 | | | 290,000 | | | | 288,913 | |
| | | | | | | | |
| Transportation — 0.1% | | | | | | | | |
Asciano Finance Ltd. (b)
4.625% 9/23/20 | | | 105,000 | | | | 108,530 | |
Asciano Finance Ltd. (b)
5.000% 4/07/18 | | | 250,000 | | | | 251,590 | |
Autoridad del Canal de Panama (b)
4.950% 7/29/35 | | | 210,000 | | | | 234,150 | |
| | | | | | | | |
| | | | | | | 594,270 | |
| | | | | | | | |
| Trucking & Leasing — 0.1% | | | | | | | | |
DAE Funding LLC (b)
4.000% 8/01/20 | | | 173,000 | | | | 174,730 | |
Park Aerospace Holdings Ltd. (b)
4.500% 3/15/23 | | | 250,000 | | | | 238,750 | |
The accompanying notes are an integral part of the financial statements.
29
MML Blend Fund – Portfolio of Investments (Continued)
| | | | | | | | |
| | | Principal
Amount | | | Value | |
Park Aerospace Holdings Ltd. (b)
5.250% 8/15/22 | | $ | 350,000 | | | $ | 347,813 | |
| | | | | | | | |
| | | | | | | 761,293 | |
| | | | | | | | |
| | |
TOTAL CORPORATE DEBT
(Cost $69,301,658) | | | | | | | 71,201,809 | |
| | | | | | | | |
|
| MUNICIPAL OBLIGATIONS — 0.2% | |
JobsOhio Beverage System Series B
4.532% 1/01/35 | | | 325,000 | | | | 363,785 | |
Orange County Local Transportation Authority BAB
6.908% 2/15/41 | | | 230,000 | | | | 324,282 | |
Panhandle-Plains Student Finance Corp., Series 2001-A2, FRN (c)
3.052% 12/01/31 | | | 300,000 | | | | 294,813 | |
State of California BAB
7.550% 4/01/39 | | | 120,000 | | | | 188,833 | |
State of California BAB
7.600% 11/01/40 | | | 105,000 | | | | 167,678 | |
| | | | | | | | |
| | | | | | | 1,339,391 | |
| | | | | | | | |
| | |
TOTAL MUNICIPAL OBLIGATIONS
(Cost $1,241,286) | | | | | | | 1,339,391 | |
| | | | | | | | |
|
| NON-U.S. GOVERNMENT AGENCY OBLIGATIONS — 8.5% | |
| Automobile ABS — 0.3% | | | | | | | | |
CPS Auto Trust, Series 2016-C, Class A (b)
1.620% 1/15/20 | | | 44,462 | | | | 44,398 | |
Drive Auto Receivables Trust, Series 2016-BA, Class B (b)
2.560% 6/15/20 | | | 73,067 | | | | 73,136 | |
First Investors Auto Owner Trust, Series 2016-2A, Class B (b)
2.210% 7/15/22 | | | 450,000 | | | | 444,669 | |
GLS Auto Receivables Trust, Series 2015-1A, Class A (b)
2.250% 12/15/20 | | | 11,348 | | | | 11,342 | |
Oscar US Funding Trust II, Series 2015-1A, Class A4 (b)
2.440% 6/15/22 | | | 350,000 | | | | 348,921 | |
Oscar US Funding Trust IV, Series 2016-1A, Class A2B, 1 mo. USD LIBOR + 1.700%, FRN (b)
2.950% 7/15/20 | | | 82,020 | | | | 82,444 | |
Oscar US Funding Trust V, Series 2016-2A, Class A4 (b)
2.990% 12/15/23 | | | 690,000 | | | | 687,141 | |
Oscar US Funding Trust VI, Series 2017-1A, Class A4 (b)
3.300% 5/10/24 | | | 150,000 | | | | 150,497 | |
| | | | | | | | |
| | | Principal
Amount | | | Value | |
Santander Drive Auto Receivables Trust, Series 2015-4, Class C
2.970% 3/15/21 | | $ | 250,000 | | | $ | 251,698 | |
| | | | | | | | |
| | | | | | | 2,094,246 | |
| | | | | | | | |
| Commercial MBS — 0.4% | | | | | | | | |
Banc of America Commercial Mortgage, Inc., Series 2008-1, Class AM, VRN (c)
6.184% 2/10/51 | | | 99,582 | | | | 99,541 | |
Commercial Mortgage Pass-Through Certificates, Series 2012-CR4, Class B (b)
3.703% 10/15/45 | | | 195,000 | | | | 195,255 | |
Commercial Mortgage Pass-Through Certificates, Series 2014-UBS2, Class A5
3.961% 3/10/47 | | | 319,000 | | | | 335,211 | |
Commercial Mortgage Pass-Through Certificates, Series 2015-CR23, Class C, VRN (c)
4.254% 5/10/48 | | | 140,000 | | | | 137,926 | |
DBCCRE Mortgage Trust, Series 2014-ARCP, Class A (b)
4.238% 1/10/34 | | | 165,000 | | | | 169,771 | |
DBUBS Mortgage Trust, Series 2011-LC1A, Class B, VRN (b) (c)
5.471% 11/10/46 | | | 110,000 | | | | 118,116 | |
GCCFC Commercial Mortgage Trust, Series 2006-GG7, Class AM, VRN (c)
5.767% 7/10/38 | | | 183,840 | | | | 185,673 | |
GS Mortgage Securities Corp. II, Series 2012-GC6, Class AS (b)
4.948% 1/10/45 | | | 100,000 | | | | 106,863 | |
JP Morgan Chase Commercial Mortgage Securities Corp., Series 2007-CB18, Class AM, VRN (c)
5.466% 6/12/47 | | | 81,858 | | | | 81,725 | |
Morgan Stanley Capital I Trust, Series 2011-C2, Class B, VRN (b) (c)
5.200% 6/15/44 | | | 250,000 | | | | 263,560 | |
TIAA Seasoned Commercial Mortgage Trust, Series 2007-C4, Class AJ, VRN (c)
5.476% 8/15/39 | | | 25,863 | | | | 25,805 | |
VNO Mortgage Trust, Series 2013-PENN, Class A (b)
3.808% 12/13/29 | | | 240,000 | | | | 247,380 | |
Wachovia Bank Commercial Mortgage Trust, Series 2007-C33, Class AM, VRN (c)
6.011% 2/15/51 | | | 122,654 | | | | 123,016 | |
Wells Fargo Commercial Mortgage Trust, Series 2010-C1, Class A1 (b)
3.349% 11/15/43 | | | 21,753 | | | | 22,020 | |
The accompanying notes are an integral part of the financial statements.
30
MML Blend Fund – Portfolio of Investments (Continued)
| | | | | | | | |
| | | Principal
Amount | | | Value | |
WF-RBS Commercial Mortgage Trust, Series 2012-C8, Class B
4.311% 8/15/45 | | $ | 190,000 | | | $ | 196,897 | |
| | | | | | | | |
| | | | | | | 2,308,759 | |
| | | | | | | | |
| Home Equity ABS — 0.0% | | | | | | | | |
Mastr Asset-Backed Securities Trust, Series 2005-WMC1, Class M3, 1 mo. USD LIBOR + .720%, FRN
2.272% 3/25/35 | | | 92,686 | | | | 92,873 | |
| | | | | | | | |
| Other ABS — 4.5% | | | | | | | | |
321 Henderson Receivables I LLC, Series 2015-1A, Class A (b)
3.260% 9/15/72 | | | 51,131 | | | | 50,491 | |
321 Henderson Receivables LLC, Series 2005-1A, Class A1, 1 mo. USD LIBOR + .230%, FRN (b)
1.707% 11/15/40 | | | 77,423 | | | | 73,678 | |
Aames Mortgage Investment Trust, Series 2005-1, Class M4, 1 mo. USD LIBOR + 1.125%, FRN
2.453% 6/25/35 | | | 45,606 | | | | 45,479 | |
Aames Mortgage Investment Trust, Series 2004-1, Class M5, 1 mo. USD LIBOR + 1.725%, FRN
3.053% 1/25/35 | | | 110,812 | | | | 110,400 | |
AIMCO CLO, Series 2014-AA, Class AR, 3 mo. USD LIBOR + 1.100%, FRN (b)
2.463% 7/20/26 | | | 250,000 | | | | 250,417 | |
ALM VII Ltd., Series 2012-7A, Class A1R, 3 mo. USD LIBOR +
1.480%, FRN (b)
2.839% 10/15/28 | | | 410,000 | | | | 413,422 | |
Alterna Funding II LLC, Series 2015-1A, Class A (b)
2.500% 2/15/24 | | | 88,679 | | | | 88,513 | |
Apidos CLO XXV, Series 2016-25A, Class A1, 3 mo. USD LIBOR + 1.460%, FRN (b)
2.823% 10/20/28 | | | 250,000 | | | | 250,770 | |
Arbys Funding LLC, Series 2015-1A, Class A2 (b)
4.969% 10/30/45 | | | 313,600 | | | | 320,289 | |
ARL Second LLC, Series 2014-1A, Class A1 (b)
2.920% 6/15/44 | | | 574,284 | | | | 566,172 | |
Avery Point III CLO Ltd., Series 2013-3A, Class AR, 3 mo. USD LIBOR +
1.120%, FRN (b)
2.474% 1/18/25 | | | 250,000 | | | | 250,647 | |
Avery Point VI CLO Ltd., Series 2015-6A, Class A, 3 mo. USD LIBOR +
1.450%, FRN (b)
2.841% 8/05/27 | | | 570,000 | | | | 571,714 | |
| | | | | | | | |
| | | Principal
Amount | | | Value | |
Bain Capital Credit CLO, Series 2017-1A, Class A1, 3 mo. USD LIBOR +
1.250%, FRN (b)
2.564% 7/20/30 | | $ | 400,000 | | | $ | 401,226 | |
Birchwood Park CLO Ltd., Series 2014-1A, Class AR, 3 mo. USD LIBOR +
1.180%, FRN (b)
2.539% 7/15/26 | | | 345,000 | | | | 346,150 | |
BlueMountain CLO Ltd., Series 2015-2A, Class A1, 3 mo. USD LIBOR +
1.430%, FRN (b)
2.784% 7/18/27 | | | 380,000 | | | | 381,790 | |
BlueVirgo Trust, Series 2015-1A, Class NOTE (b)
3.000% 12/15/22 | | | 213,895 | | | | 214,369 | |
BRE Grand Islander Timeshare Issuer LLC, Series 2017-1A, Class A (b)
2.940% 5/25/29 | | | 175,741 | | | | 173,853 | |
Capital Automotive REIT, Series 2014-1A, Class A (b)
3.660% 10/15/44 | | | 160,000 | | | | 160,072 | |
Capital Automotive REIT, Series 2017-1A, Class A2 (b)
4.180% 4/15/47 | | | 139,067 | | | | 141,289 | |
Carlyle Global Market Strategies CLO Ltd., Series 2014-4A, Class A1R, 3 mo. USD LIBOR + 1.200%, FRN (b)
2.559% 10/15/26 | | | 250,000 | | | | 250,485 | |
Carlyle Global Market Strategies CLO Ltd., Series 2013-1A, Class A1R, 3 mo. USD LIBOR + 1.220%, FRN (b)
2.633% 8/14/30 | | | 750,000 | | | | 753,035 | |
Cazenovia Creek Funding I LLC, Series 2015-1A, Class A (b)
2.000% 12/10/23 | | | 37,469 | | | | 37,329 | |
CIFC Funding V Ltd., Series 2017-5A, Class A1, FRN (b) (c)
2.543% 11/16/30 | | | 340,000 | | | | 340,112 | |
CKE Restaurant Holdings, Inc., Series 2013-1A, Class A2 (b)
4.474% 3/20/43 | | | 155,092 | | | | 155,599 | |
Clear Creek CLO Ltd., Series 2015-1A, Class AR, FRN (b) (c)
2.563% 10/20/30 | | | 480,000 | | | | 483,253 | |
Countrywide Asset-Backed Certificates, Series 2004-5, Class 3A, 1 mo. USD LIBOR + .460%, FRN
2.012% 9/25/34 | | | 36,692 | | | | 36,559 | |
Cronos Containers Program I Ltd., Series 2014-2A, Class A (b)
3.270% 11/18/29 | | | 197,222 | | | | 195,913 | |
Diamond Resorts Owner Trust, Series 2013-2, Class A (b)
2.270% 5/20/26 | | | 307,886 | | | | 307,043 | |
The accompanying notes are an integral part of the financial statements.
31
MML Blend Fund – Portfolio of Investments (Continued)
| | | | | | | | |
| | | Principal
Amount | | | Value | |
Diamond Resorts Owner Trust, Series 2014-1, Class A (b)
2.540% 5/20/27 | | $ | 46,901 | | | $ | 46,857 | |
Diamond Resorts Owner Trust, Series 2016-1, Class A (b)
3.080% 11/20/28 | | | 441,276 | | | | 434,420 | |
Domino’s Pizza Master Issuer LLC, Series 2015-1A, Class A2I (b)
3.484% 10/25/45 | | | 502,350 | | | | 504,940 | |
Domino’s Pizza Master Issuer LLC, Series 2017-1A, Class A23 (b)
4.118% 7/25/47 | | | 109,725 | | | | 112,072 | |
Domino’s Pizza Master Issuer LLC, Series 2015-1A, Class A2II (b)
4.474% 10/25/45 | | | 531,900 | | | | 542,775 | |
Drug Royalty Corp., Inc., Series 2012-1, Class A2 (b)
5.800% 7/15/24 | | | 13,462 | | | | 13,489 | |
Element Rail Leasing II LLC, Series 2015-1A, Class A1 (b)
2.707% 2/19/45 | | | 65,141 | | | | 63,597 | |
Element Rail Leasing II LLC, Series 2016-1A, Class A1 (b)
3.968% 3/19/46 | | | 181,963 | | | | 184,793 | |
Entegry New Orleans Storm Recovery Funding I LLC, Series 2015-1, Class A
2.670% 6/01/27 | | | 89,348 | | | | 89,147 | |
Fairway Outdoor Funding LLC, Series 2012-1A, Class A2 (b)
4.212% 10/15/42 | | | 379,590 | | | | 387,082 | |
First Franklin Mortgage Loan Trust, Series 2004-FFH4, Class M6, 1 mo. USD LIBOR + 1.725%, FRN
3.277% 1/25/35 | | | 420,000 | | | | 429,424 | |
Galaxy XX CLO Ltd., Series 2015-20A, Class A, 3 mo. USD LIBOR +
1.450%, FRN (b)
2.813% 7/20/27 | | | 425,000 | | | | 425,442 | |
Global SC Finance II SRL, Series 2014-1A, Class A1 (b)
3.190% 7/17/29 | | | 164,583 | | | | 163,389 | |
Global SC Finance II SRL, Series 2013-2A, Class A (b)
3.670% 11/17/28 | | | 154,495 | | | | 151,960 | |
GoldenTree Loan Opportunities VII Ltd., Series 2013-7A, Class A, 3 mo. USD LIBOR + 1.150%, FRN (b)
2.517% 4/25/25 | | | 490,052 | | | | 490,154 | |
Goodgreen Trust, Series 2016-1A, Class A (b)
3.230% 10/15/52 | | | 419,902 | | | | 418,802 | |
Goodgreen Trust, Series 2017-2A, Class A (b)
3.260% 10/15/53 | | | 477,115 | | | | 473,452 | |
| | | | | | | | |
| | | Principal
Amount | | | Value | |
Goodgreen Trust, Series 2017-1A, Class A (b)
3.740% 10/15/52 | | $ | 191,903 | | | $ | 190,555 | |
GSAMP Trust, Series 2005-AHL, Class M1, 1 mo. USD LIBOR +
.645%, FRN
2.197% 4/25/35 | | | 23,650 | | | | 23,760 | |
Helios Issuer LLC, Series 2017-1A, Class A (b)
4.940% 9/20/49 | | | 244,469 | | | | 250,508 | |
Hero Funding, Series 2017-3A, Class A1 (b)
3.190% 9/20/48 | | | 258,552 | | | | 257,846 | |
HERO Funding Trust, Series 2016-3A, Class A1 (b)
3.080% 9/20/42 | | | 251,982 | | | | 248,684 | |
HERO Funding Trust, Series 2016-4A, Class A1 (b)
3.570% 9/20/47 | | | 257,135 | | | | 261,319 | |
Hilton Grand Vacations Trust, Series 2013-A, Class A (b)
2.280% 1/25/26 | | | 43,583 | | | | 43,283 | |
J.G. Wentworth XXXV LLC, Series 2015-2A, Class A (b)
3.870% 3/15/58 | | | 94,620 | | | | 98,049 | |
KDAC Aircraft Finance Ltd., Series 2017-1A, Class A (b) (d) (e)
4.212% 12/15/42 | | | 440,000 | | | | 439,985 | |
Lendmark Funding Trust, Series 2017-1A, Class A (b)
2.830% 12/22/25 | | | 200,000 | | | | 199,477 | |
Long Beach Mortgage Loan Trust, Series 2005-1, Class M2, 1 mo. USD LIBOR + .795%, FRN
2.347% 2/25/35 | | | 48,880 | | | | 49,013 | |
Long Beach Mortgage Loan Trust, Series 2005-WL1, Class M2, 1 mo. USD LIBOR + .825%, FRN
2.377% 6/25/35 | | | 94,801 | | | | 94,877 | |
Marble Point CLO XI Ltd., Series 2017-2A, Class A, FRN (b) (c)
2.793% 12/18/30 | | | 1,000,000 | | | | 1,000,396 | |
Mariner Finance Issuance Trust, Series 2017-BA, Class A (b)
2.920% 12/20/29 | | | 750,000 | | | | 748,530 | |
Marlette Funding Trust, Series 2016-1A, Class A (b)
3.060% 1/17/23 | | | 100,873 | | | | 101,051 | |
Marlette Funding Trust, Series 2017-2A, Class B (b)
3.190% 7/15/24 | | | 140,000 | | | | 140,279 | |
Miramax LLC, Series 2014-1A, Class A2 (b)
3.340% 7/20/26 | | | 139,328 | | | | 139,442 | |
The accompanying notes are an integral part of the financial statements.
32
MML Blend Fund – Portfolio of Investments (Continued)
| | | | | | | | |
| | | Principal
Amount | | | Value | |
Mosaic Solar Loans LLC, Series 2017-2A, Class A (b)
3.820% 9/20/42 | | $ | 173,075 | | | $ | 173,734 | |
Mosaic Solar Loans LLC, Series 2017-1A, Class A (b)
4.450% 6/20/42 | | | 80,618 | | | | 82,256 | |
MP CLO III Ltd., Series 2013-1A, Class AR, FRN (b) (c)
2.613% 10/20/30 | | | 300,000 | | | | 302,247 | |
Nations Equipment Finance Funding II LLC, Series 2014-1A, Class A (b)
1.558% 7/20/18 | | | 2,422 | | | | 2,421 | |
New Residential Advance Receivables Trust, Series 2016-T4, Class AT4 (b)
3.107% 12/15/50 | | | 450,000 | | | | 447,996 | |
NP SPE II LLC, Series 2017-1A, Class A2 (b)
4.219% 10/21/47 | | | 380,000 | | | | 386,501 | |
NRZ Advance Receivables Trust, Series 2016-T3, Class AT3 (b)
2.833% 10/16/51 | | | 1,650,000 | | | | 1,620,638 | |
OHA Credit Partners VIII Ltd., Series 2013-8A, Class A, 3 mo. USD LIBOR + 1.120%, FRN (b)
2.483% 4/20/25 | | | 312,239 | | | | 312,696 | |
OnDeck Asset Securitization Trust II LLC, Series 2016-1A, Class A (b)
4.210% 5/17/20 | | | 130,000 | | | | 130,481 | |
Oportun Funding VI LLC, Series 2017-A, Class A (b)
3.230% 6/08/23 | | | 280,000 | | | | 278,600 | |
Orange Lake Timeshare Trust, Series 2014-AA, Class A (b)
2.290% 7/09/29 | | | 37,899 | | | | 37,371 | |
Orange Lake Timeshare Trust, Series 2016-A, Class B (b)
2.910% 3/08/29 | | | 171,101 | | | | 168,252 | |
Oxford Finance Funding Trust, Series 2016-1A, Class A (b)
3.968% 6/17/24 | | | 220,000 | | | | 220,835 | |
Race Point VIII CLO Ltd., Series 2013-8A, Class AR, 3 mo. USD LIBOR + 1.340%, FRN (b)
2.776% 2/20/30 | | | 250,000 | | | | 251,893 | |
Sierra Receivables Funding Co. LLC, Series 2015-3A, Class B (b)
3.080% 9/20/32 | | | 33,686 | | | | 33,502 | |
SoFi Consumer Loan Program LLC, Series 2016-3, Class A (b)
3.050% 12/26/25 | | | 225,136 | | | | 226,216 | |
SoFi Consumer Loan Program LLC, Series 2016-5, Class A (b)
3.060% 9/25/28 | | | 1,078,273 | | | | 1,080,958 | |
| | | | | | | | |
| | | Principal
Amount | | | Value | |
SoFi Consumer Loan Program LLC, Series 2016-2A, Class A (b)
3.090% 10/27/25 | | $ | 348,663 | | | $ | 350,393 | |
SoFi Consumer Loan Program LLC, Series 2016-1A, Class A (b)
3.260% 8/25/25 | | | 513,110 | | | | 516,104 | |
SoFi Consumer Loan Program LLC, Series 2017-2, Class A (b)
3.280% 2/25/26 | | | 402,400 | | | | 404,973 | |
Spirit Master Funding LLC, Series 2014-4A, Class A1 (b)
3.501% 1/20/45 | | | 160,000 | | | | 160,449 | |
SpringCastle America Funding LLC, Series 2016-AA, Class A (b)
3.050% 4/25/29 | | | 195,728 | | | | 196,941 | |
SPS Servicer Advance Receivables Trust, Series 2016-T2, Class AT2 (b)
2.750% 11/15/49 | | | 670,000 | | | | 669,163 | |
Structured Receivables Finance LLC, Series 2010-B, Class A (b)
3.730% 8/15/36 | | | 90,830 | | | | 90,086 | |
SuttonPark Structured Settlements LLC, Series 2017-1A, Class A (b)
4.190% 1/15/71 | | | 347,562 | | | | 346,788 | |
Symphony CLO XV Ltd., Series 2014-15A, Class AR, 3 mo. USD LIBOR +
1.180%, FRN (b)
2.533% 10/17/26 | | | 430,000 | | | | 431,271 | |
Taco Bell Funding LLC, Series 2016-1A, Class A2I (b)
3.832% 5/25/46 | | | 385,125 | | | | 390,523 | |
TAL Advantage VI LLC, Series 2017-1A, Class A
4.500% 4/20/42 | | | 384,317 | | | | 394,125 | |
TCI-Symphony CLO Ltd., Series 2016-1A, Class A, 3 mo. USD LIBOR +
1.480%, FRN (b)
2.839% 10/13/29 | | | 340,000 | | | | 345,864 | |
Textainer Marine Containers Ltd., Series 2017-2A, Class A (b)
3.520% 6/20/42 | | | 240,271 | | | | 238,727 | |
Treman Park CLO Ltd., Series 2015-1A, Class AR, 3 mo. USD LIBOR +
1.370%, FRN (b)
2.733% 4/20/27 | | | 490,000 | | | | 490,814 | |
Trip Rail Master Funding LLC, Series 2017-1A, Class A2 (b)
3.736% 8/15/47 | | | 140,000 | | | | 138,697 | |
Triton Container Finance IV LLC, Series 2017-2A, Class A (b)
3.620% 8/20/42 | | | 834,357 | | | | 835,246 | |
Triton Container Finance VI LLC, Series 2017-1A, Class A (b)
3.520% 6/20/42 | | | 161,896 | | | | 159,557 | |
The accompanying notes are an integral part of the financial statements.
33
MML Blend Fund – Portfolio of Investments (Continued)
| | | | | | | | |
| | | Principal
Amount | | | Value | |
Velocity Commercial Capital Loan Trust, Series 2016-2, Class AFX, VRN (c)
2.997% 10/25/46 | | $ | 257,942 | | | $ | 257,918 | |
VSE VOI Mortgage LLC, Series 2016-A, Class A (b)
2.540% 7/20/33 | | | 286,137 | | | | 283,702 | |
WAVE Trust, Series 2017-1A, Class A (b)
3.844% 11/15/42 | | | 695,520 | | | | 696,981 | |
Welk Resorts LLC, Series 2015-AA, Class A (b)
2.790% 6/16/31 | | | 117,816 | | | | 115,652 | |
Welk Resorts LLC, Series 2017-AA, Class B (b)
3.410% 6/15/33 | | | 269,125 | | | | 266,475 | |
Wendys Funding LLC, Series 2015-1A, Class A2I (b)
3.371% 6/15/45 | | | 464,313 | | | | 465,016 | |
Wendys Funding LLC, Series 2015-1A, Class A2II (b)
4.080% 6/15/45 | | | 303,025 | | | | 310,201 | |
Wendys Funding LLC, Series 2015-1A, Class A23 (b)
4.497% 6/15/45 | | | 415,438 | | | | 423,173 | |
| | | | | | | | |
| | | | | | | 31,324,354 | |
| | | | | | | | |
| Student Loans ABS — 3.2% | | | | | | | | |
Academic Loan Funding Trust, Series 2012-1A, Class A2, 1 mo. USD LIBOR + 1.100%, FRN (b)
2.428% 12/27/44 | | | 495,000 | | | | 494,412 | |
AccessLex Institute, Series 2004-A, Class A3, 28 day ARS, FRN
1.699% 7/01/39 | | | 400,000 | | | | 394,609 | |
AccessLex Institute, Series 2003-A, Class A3, 3 mo. Treasury +
1.200%, FRN
2.550% 7/01/38 | | | 133,318 | | | | 125,689 | |
CIT Education Loan Trust, Series 2005-1, Class B, 3 mo. USD LIBOR + .210%, FRN
1.799% 6/15/43 | | | 507,608 | | | | 469,209 | |
College Loan Corp. Trust I, Series 2007-1, Class B2, 28 day ARS, FRN
1.182% 1/25/47 | | | 130,000 | | | | 105,478 | |
DRB Prime Student Loan Trust, Series 2016-B, Class A2 (b)
2.890% 6/25/40 | | | 252,221 | | | | 252,748 | |
DRB Prime Student Loan Trust, Series 2016-R, Class A2 (b)
3.070% 10/25/44 | | | 712,581 | | | | 719,707 | |
| | | | | | | | |
| | | Principal
Amount | | | Value | |
DRB Prime Student Loan Trust, Series 2015-B, Class A2 (b)
3.170% 7/25/31 | | $ | 160,035 | | | $ | 160,768 | |
DRB Prime Student Loan Trust, Series 2015-B, Class A1, 1 mo. USD LIBOR + 1.900%, FRN (b)
3.238% 10/27/31 | | | 45,822 | | | | 46,800 | |
DRB Prime Student Loan Trust, Series 2016-R, Class A1, 1 mo. USD LIBOR + 1.900%, FRN (b)
3.464% 10/25/44 | | | 712,581 | | | | 719,707 | |
Earnest Student Loan Program LLC, Series 2016-D, Class A2 (b)
2.720% 1/25/41 | | | 267,958 | | | | 265,115 | |
Earnest Student Loan Program LLC, Series 2016-B, Class A2 (b)
3.020% 5/25/34 | | | 190,497 | | | | 189,536 | |
Earnest Student Loan Program LLC, Series 2016-C, Class A1, 1 mo. USD LIBOR + 1.850%, FRN (b) 3.402% 10/27/36 | | | 415,257 | | | | 421,637 | |
ECMC Group Student Loan Trust, Series 2017-1A, Class A, 1 mo. USD LIBOR + 1.200%, FRN (b)
2.752% 12/27/66 | | | 405,653 | | | | 410,328 | |
ECMC Group Student Loan Trust, Series 2016-1A, Class A, 1 mo. USD LIBOR + 1.350%, FRN (b) 2.902% 7/26/66 | | | 548,216 | | | | 553,281 | |
Edlinc Student Loan Funding, Series 2017-A, Class A (Acquired 12/22/17, Cost $595,828), FRN (b) (c) (d) (e) (f)
3.350% 12/01/47 | | | 600,000 | | | | 595,828 | |
EdLinc Student Loan Funding Trust, Series 2012-1, Class B, 1 mo. USD LIBOR + 4.240%, FRN (b) 5.792% 11/26/40 | | | 270,000 | | | | 312,641 | |
Goal Capital Funding Trust, Series 2006-1, Class B, 3 mo. USD LIBOR + .450%, FRN
1.912% 8/25/42 | | | 160,748 | | | | 149,446 | |
Goal Structured Solutions Trust, Series 2016-B, Class A2, Prime — 1.250%, FRN (b)
3.250% 8/25/51 | | | 500,000 | | | | 504,146 | |
KnowledgeWorks Foundation, Series 2010-1, Class A, 3 mo. USD LIBOR + .950%, FRN
2.412% 2/25/42 | | | 168,726 | | | | 169,629 | |
Laurel Road Prime Student Loan Trust, Series 2017-B, Class BFX (b)
3.020% 8/25/42 | | | 190,000 | | | | 187,154 | |
The accompanying notes are an integral part of the financial statements.
34
MML Blend Fund – Portfolio of Investments (Continued)
| | | | | | | | |
| | | Principal
Amount | | | Value | |
Navient Student Loan Trust, Series 2016-1A, Class A, 1 mo. USD LIBOR + .700%, FRN (b)
2.252% 2/25/70 | | $ | 472,316 | | | $ | 473,769 | |
Navient Student Loan Trust, Series 2017-5A, Class A, FRN (b) (c)
2.352% 7/26/66 | | | 504,936 | | | | 506,676 | |
Navient Student Loan Trust, Series 2017-4A, Class A3, 1 mo. USD LIBOR + 1.000%, FRN (b) 2.552% 9/27/66 | | | 700,000 | | | | 706,677 | |
Navient Student Loan Trust, Series 2017-3A, Class A3, 1 mo. USD LIBOR + 1.050%, FRN (b) 2.602% 7/26/66 | | | 300,000 | | | | 307,840 | |
Navient Student Loan Trust, Series 2017-1A, Class A3, 1 mo. USD LIBOR + 1.150%, FRN (b) 2.702% 7/26/66 | | | 750,000 | | | | 767,846 | |
Navient Student Loan Trust, Series 2016-5A, Class A, 1 mo. USD LIBOR + 1.250%, FRN (b) 2.802% 6/25/65 | | | 452,042 | | | | 462,883 | |
Navient Student Loan Trust, Series 2014-1, Class B, 1 mo. USD LIBOR + 1.500%, FRN 2.828% 6/25/48 | | | 220,000 | | | | 193,091 | |
Navient Student Loan Trust, Series 2016-6A, Class A3, 1 mo. USD LIBOR + 1.300%, FRN (b) 2.852% 3/25/66 | | | 2,150,000 | | | | 2,210,715 | |
Navient Student Loan Trust, Series 2014-8, Class B, 1 mo. USD LIBOR + 1.500%, FRN
3.052% 7/26/49 | | | 155,000 | | | | 152,344 | |
Navient Student Loan Trust, Series 2015-3, Class B, 1 mo. USD LIBOR + 1.500%, FRN 3.052% 10/25/58 | | | 150,000 | | | | 150,000 | |
Nelnet Private Education Loan Trust, Series 2016-A, Class A1B (b)
3.600% 12/26/40 | | | 185,833 | | | | 183,429 | |
Nelnet Student Loan Trust, Series 2005-2, Class A5, 3 mo. USD LIBOR + .100%, FRN 1.758% 3/23/37 | | | 301,926 | | | | 298,702 | |
Nelnet Student Loan Trust, Series 2006-3, Class B, 3 mo. USD LIBOR + .250%, FRN 1.925% 6/25/41 | | | 116,553 | | | | 100,229 | |
Nelnet Student Loan Trust, Series 2013-5A, Class A, 1 mo. USD LIBOR + .630%, FRN (b) 2.182% 1/25/37 | | | 182,843 | | | | 181,937 | |
| | | | | | | | |
| | | Principal
Amount | | | Value | |
Nelnet Student Loan Trust, Series 2005-4, Class A4R2, 28 day ARS, FRN
2.347% 3/22/32 | | $ | 200,000 | | | $ | 187,803 | |
Nelnet Student Loan Trust, Series 2015-3A, Class B, 1 mo. USD LIBOR + 1.500%, FRN (b)
2.828% 6/25/54 | | | 150,000 | | | | 135,763 | |
North Carolina State Education Assistance Authority, Series 2011-2, Class A3, 3 mo. USD LIBOR + .800%, FRN
2.167% 7/25/36 | | | 250,000 | | | | 246,954 | |
PHEAA Student Loan Trust, Series 2016-2A, Class A, 1 mo. USD LIBOR + .950%, FRN (b) 2.502% 11/25/65 | | | 497,061 | | | | 497,950 | |
SLC Private Student Loan Trust, Series 2006-A, Class A5, 3 mo. USD LIBOR + .170%, FRN
1.529% 7/15/36 | | | 10,859 | | | | 10,859 | |
SLC Private Student Loan Trust, Series 2006-A, Class C, 3 mo. USD LIBOR + .450%, FRN
1.809% 7/15/36 | | | 230,000 | | | | 219,006 | |
SLC Student Loan Trust, Series 2006-A, Class B, 3 mo. USD LIBOR + .300%, FRN
1.659% 7/15/36 | | | 125,000 | | | | 123,722 | |
SLM Student Loan Trust, Series 2002-7, Class A10, 28 day ARS, FRN
0.500% 3/15/28 | | | 136,000 | | | | 136,000 | |
SLM Student Loan Trust, Series 2002-7, Class A11, 28 day ARS, FRN
0.500% 3/15/28 | | | 160,000 | | | | 160,000 | |
SLM Student Loan Trust, Series 2003-5, Class A7, 28 day ARS, FRN
0.500% 6/17/30 | | | 50,000 | | | | 50,000 | |
SLM Student Loan Trust, Series 2003-5, Class A9, 28 day ARS, FRN
0.500% 6/17/30 | | | 350,000 | | | | 350,000 | |
SLM Student Loan Trust, Series 2005-5, Class A4, 3 mo. USD LIBOR + .140%, FRN
1.507% 10/25/28 | | | 330,000 | | | | 328,742 | |
SLM Student Loan Trust, Series 2005-3, Class B, 3 mo. USD LIBOR + .150%, FRN
1.517% 4/25/40 | | | 180,067 | | | | 164,984 | |
SLM Student Loan Trust, Series 2006-5, Class B, 3 mo. USD LIBOR + .210%, FRN
1.577% 10/25/40 | | | 409,864 | | | | 386,445 | |
SLM Student Loan Trust, Series 2004-3A, Class A6A, 3 mo. USD LIBOR +
.550%, FRN (b)
1.917% 10/25/64 | | | 750,000 | | | | 741,829 | |
The accompanying notes are an integral part of the financial statements.
35
MML Blend Fund – Portfolio of Investments (Continued)
| | | | | | | | |
| | | Principal
Amount | | | Value | |
SLM Student Loan Trust, Series 2005-5, Class A5, 3 mo. USD LIBOR + .750%, FRN
2.117% 10/25/40 | | $ | 300,000 | | | $ | 298,081 | |
SLM Student Loan Trust, Series 2002-7, Class B, 28 day ARS, FRN
4.892% 12/15/39 | | | 550,000 | | | | 549,622 | |
SMB Private Education Loan Trust, Series 2016-B, Class A2A (b)
2.430% 2/17/32 | | | 245,000 | | | | 240,721 | |
SMB Private Education Loan Trust, Series 2015-B, Class A2B, 1 mo. USD LIBOR + 1.200%, FRN (b)
2.677% 7/15/27 | | | 192,124 | | | | 193,518 | |
SMB Private Education Loan Trust, Series 2016-A, Class A2A (b)
2.700% 5/15/31 | | | 450,000 | | | | 447,453 | |
SMB Private Education Loan Trust, Series 2017-A, Class B (b)
3.500% 6/17/41 | | | 300,000 | | | | 289,667 | |
SMB Private Education Loan Trust, Series 2017-B, Class B (b)
3.500% 12/16/41 | | | 150,000 | | | | 149,084 | |
SoFi Professional Loan Program LLC, Series 2015-A, Class RC, (Acquired 4/19/17, Cost $281,375) (b) (d) (f) 0.000% 3/25/33 | | | 100 | | | | 200,000 | |
SoFi Professional Loan Program LLC, Series 2017-D, Class R1 (Acquired 7/19/17, Cost $565,900) (b) (d) (f)
0.000% 9/25/40 | | | 1,000,000 | | | | 565,900 | |
SoFi Professional Loan Program LLC, Series 2016-D, Class A1, 1 mo. USD LIBOR + .950%, FRN (b)
2.502% 1/25/39 | | | 107,156 | | | | 108,242 | |
SoFi Professional Loan Program LLC, Series 2016-B, Class A2B (b)
2.740% 10/25/32 | | | 300,000 | | | | 296,656 | |
SoFi Professional Loan Program LLC, Series 2016-B, Class A1, 1 mo. USD LIBOR + 1.200%, FRN (b)
2.752% 6/25/33 | | | 273,110 | | | | 277,553 | |
SoFi Professional Loan Program LLC, Series 2017-A, Class B, VRN (b) (c)
3.440% 3/26/40 | | | 180,000 | | | | 176,807 | |
SoFi Professional Loan Program LLC, Series 2017-D, Class BFX (b)
3.610% 9/25/40 | | | 500,000 | | | | 485,721 | |
South Carolina Student Loan Corp., Series 2014-1, Class A2, 1 mo. USD LIBOR + 1.000%, FRN 2.361% 1/03/33 | | | 290,000 | | | | 287,082 | |
| | | | | | | | |
| | | Principal
Amount | | | Value | |
South Carolina Student Loan Corp., Series 2010-1, Class A3, 3 mo. USD LIBOR + 1.050%, FRN
2.417% 10/27/36 | | $ | 170,000 | | | $ | 171,941 | |
| | | | | | | | |
| | | | | | | 22,422,111 | |
| | | | | | | | |
| WL Collateral CMO — 0.1% | | | | | | | | |
Countrywide Home Loans, Inc., Series 2004-2, Class 1A1, VRN (c)
3.445% 2/25/34 | | | 19,777 | | | | 20,298 | |
Countrywide Home Loans, Inc., Series 2003-42, Class 1A1, VRN (c)
3.887% 9/25/33 | | | 7,502 | | | | 6,987 | |
GSR Mortgage Loan Trust, Series 2004-9, Class 2A1, VRN (c)
3.596% 8/25/34 | | | 7,725 | | | | 7,780 | |
IndyMac Index Mortgage Loan Trust, Series 2004-AR4, Class 1A, VRN (c)
3.190% 8/25/34 | | | 49,390 | | | | 48,142 | |
JP Morgan Mortgage Trust, Series 2017-1, Class A11, VRN (b) (c)
3.500% 1/25/47 | | | 509,993 | | | | 513,034 | |
Merrill Lynch Mortgage Investors, Inc., Series 2004-A1, Class IA, VRN (c)
3.525% 2/25/34 | | | 5,418 | | | | 5,277 | |
Merrill Lynch Mortgage Investors, Inc., Series 2003-A4, Class IA, VRN (c)
3.588% 7/25/33 | | | 3,544 | | | | 3,649 | |
Morgan Stanley Mortgage Loan Trust, Series 2004-2AR, Class 1A, VRN (c)
3.500% 2/25/34 | | | 237 | | | | 252 | |
Structured Adjustable Rate Mortgage Loan Trust, Series 2004-2, Class 2A, VRN (c)
3.494% 3/25/34 | | | 30,484 | | | | 31,433 | |
Washington Mutual Mortgage Pass-Through Certificates, Series 2004-AR2, Class A, 12 mo. MTA + 1.400%, FRN
2.463% 4/25/44 | | | 75,650 | | | | 76,208 | |
| | | | | | | | |
| | | | | | | 713,060 | |
| | | | | | | | |
| | |
TOTAL NON-U.S. GOVERNMENT AGENCY OBLIGATIONS
(Cost $58,617,297) | | | | | | | 58,955,403 | |
| | | | | | | | |
|
| SOVEREIGN DEBT OBLIGATIONS — 0.2% | |
Colombia Government International Bond
6.125% 1/18/41 | | | 620,000 | | | | 748,650 | |
Mexico Government International Bond
4.750% 3/08/44 | | | 724,000 | | | | 731,964 | |
The accompanying notes are an integral part of the financial statements.
36
MML Blend Fund – Portfolio of Investments (Continued)
| | | | | | | | |
| | | Principal
Amount | | | Value | |
Mexico Government International Bond
6.750% 9/27/34 | | $ | 160,000 | | | $ | 208,000 | |
| | | | | | | | |
| | | | | | | 1,688,614 | |
| | | | | | | | |
| | |
TOTAL SOVEREIGN DEBT OBLIGATIONS
(Cost $1,559,023) | | | | | | | 1,688,614 | |
| | | | | | | | |
|
| U.S. GOVERNMENT AGENCY OBLIGATIONS AND INSTRUMENTALITIES — 7.4% | |
| Collateralized Mortgage Obligations — 0.4% | |
Federal Home Loan Mortgage Corp.
Series 4303, Class AP
3.000% 8/15/43 | | | 415,961 | | | | 421,538 | |
Series 4290, Class CA
3.500% 12/15/38 | | | 287,557 | | | | 294,897 | |
Series 2617, Class Z
5.500% 5/15/33 | | | 226,536 | | | | 249,788 | |
Series 2693, Class Z
5.500% 10/15/33 | | | 404,026 | | | | 435,379 | |
Series 3423, Class PB
5.500% 3/15/38 | | | 82,590 | | | | 89,568 | |
Federal National Mortgage Association Series 2014-7, Class VA
3.500% 5/25/25 | | | 211,571 | | | | 218,671 | |
Series 2014-48, Class AB
4.000% 10/25/40 | | | 385,409 | | | | 399,865 | |
Series 2007-32, Class Z
5.500% 4/25/37 | | | 129,745 | | | | 140,897 | |
Series 2010-60, Class HJ
5.500% 5/25/40 | | | 88,669 | | | | 94,750 | |
Federal National Mortgage Association REMIC Series 2007-B2, Class ZA
5.500% 6/25/37 | | | 109,093 | | | | 117,690 | |
| | | | | | | | |
| | | | | | | 2,463,043 | |
| | | | | | | | |
| Pass-Through Securities — 7.0% | | | | | | | | |
Federal Home Loan Mortgage Corp. | | | | | | | | |
Pool #Q41916 3.500%
7/01/46 | | | 294,840 | | | | 305,344 | |
Pool #Q42045 3.500%
7/01/46 | | | 116,916 | | | | 121,081 | |
Pool #Q44275 3.500%
11/01/46 | | | 236,086 | | | | 244,497 | |
Pool #Q44277 3.500%
11/01/46 | | | 106,577 | | | | 110,091 | |
Pool #Q52216 3.500%
11/01/47 | | | 647,226 | | | | 665,227 | |
Pool #V83655 3.500%
12/01/47 | | | 1,921,558 | | | | 1,975,002 | |
Pool #V83763 3.500%
12/01/47 | | | 2,322,494 | | | | 2,387,089 | |
| | | | | | | | |
| | | Principal
Amount | | | Value | |
Pool #Q52868 3.500%
12/01/47 | | $ | 975,000 | | | $ | 1,002,117 | |
Pool #Q47742 4.000%
4/01/47 | | | 193,747 | | | | 204,940 | |
Pool #Q47730 4.000%
4/01/47 | | | 238,916 | | | | 252,718 | |
Pool #V83764 4.000%
12/01/47 | | | 1,973,134 | | | | 2,071,405 | |
Pool #V83796 4.000%
12/01/47 | | | 2,900,000 | | | | 3,038,996 | |
Pool #Q52834 4.000%
12/01/47 | | | 250,000 | | | | 261,982 | |
Pool #C03537 4.500%
8/01/40 | | | 231,458 | | | | 248,817 | |
Pool #G06057 4.500%
10/01/40 | | | 167,493 | | | | 179,689 | |
Pool #G60485 4.500%
10/01/41 | | | 212,546 | | | | 227,955 | |
Pool #G60172 4.500%
9/01/43 | | | 215,513 | | | | 231,778 | |
Pool #Q48208 4.500%
5/01/47 | | | 119,468 | | | | 127,476 | |
Pool #Q48869 4.500%
6/01/47 | | | 903,767 | | | | 961,947 | |
Pool #C55867 7.500%
2/01/30 | | | 49,739 | | | | 56,174 | |
Pool #C01079 7.500%
10/01/30 | | | 7,124 | | | | 8,316 | |
Pool #C01135 7.500%
2/01/31 | | | 20,639 | | | | 24,039 | |
Pool #C00470 8.000%
8/01/26 | | | 14,995 | | | | 17,249 | |
Pool #G00924 8.000%
3/01/28 | | | 15,267 | | | | 17,577 | |
Federal Home Loan Mortgage Corp. TBA (g)
Pool #648 3.500%
1/01/45 | | | 1,150,000 | | | | 1,181,266 | |
Federal National Mortgage Association Pool #725692 1 year CMT + 2.140%, FRN 3.229%
10/01/33 | | | 49,793 | | | | 51,470 | |
Pool #888586 1 year CMT + 2.210%, FRN 3.282%
10/01/34 | | | 84,247 | | | | 88,675 | |
Pool #AS1304 3.500%
12/01/28 | | | 279,762 | | | | 289,947 | |
Pool #AV1897 3.500%
12/01/28 | | | 44,804 | | | | 46,435 | |
Pool #AV2325 3.500%
12/01/28 | | | 153,760 | | | | 159,358 | |
Pool #BH5155 3.500%
9/01/47 | | | 2,680,763 | | | | 2,754,693 | |
The accompanying notes are an integral part of the financial statements.
37
MML Blend Fund – Portfolio of Investments (Continued)
| | | | | | | | |
| | | Principal
Amount | | | Value | |
Pool #CA0770 3.500%
11/01/47 | | $ | 2,195,491 | | | $ | 2,256,382 | |
Pool #MA3210 3.500%
12/01/47 | | | 323,966 | | | | 332,951 | |
Pool #BH9008 4.000%
8/01/47 | | | 49,742 | | | | 52,064 | |
Pool #CA0181 4.000%
8/01/47 | | | 2,425,855 | | | | 2,539,093 | |
Pool #BH9011 4.000%
9/01/47 | | | 49,791 | | | | 52,115 | |
Pool #CA0620 4.000%
10/01/47 | | | 2,267,711 | | | | 2,374,276 | |
Pool #BF0094 4.000%
5/01/56 | | | 1,058,981 | | | | 1,114,371 | |
Pool #BF0105 4.000%
6/01/56 | | | 268,252 | | | | 282,283 | |
Pool #AH6787 4.500%
3/01/41 | | | 181,647 | | | | 195,321 | |
Pool #CA0185 4.500%
8/01/47 | | | 491,781 | | | | 524,881 | |
Pool #AD6437 5.000%
6/01/40 | | | 97,807 | | | | 106,755 | |
Pool #AD6996 5.000%
7/01/40 | | | 655,744 | | | | 709,075 | |
Pool #AL8173 5.000%
2/01/44 | | | 259,219 | | | | 279,977 | |
Pool #564594 7.000%
1/01/31 | | | 10,437 | | | | 11,952 | |
Pool #572844 7.000%
4/01/31 | | | 23,373 | | | | 27,163 | |
Pool #253795 7.000%
5/01/31 | | | 58,051 | | | | 66,900 | |
Pool #499386 7.500%
9/01/29 | | | 1,369 | | | | 1,591 | |
Pool #521006 7.500%
12/01/29 | | | 639 | | | | 742 | |
Pool #522769 7.500%
12/01/29 | | | 65 | | | | 76 | |
Pool #252981 7.500%
1/01/30 | | | 8,068 | | | | 9,368 | |
Pool #531196 7.500%
2/01/30 | | | 963 | | | | 1,121 | |
Pool #524317 7.500%
3/01/30 | | | 1,066 | | | | 1,247 | |
Pool #530520 7.500%
3/01/30 | | | 11,277 | | | | 13,025 | |
Pool #530299 7.500%
3/01/30 | | | 260 | | | | 294 | |
Pool #253183 7.500%
4/01/30 | | | 3,324 | | | | 3,860 | |
Pool #253265 7.500%
5/01/30 | | | 1,964 | | | | 2,257 | |
| | | | | | | | |
| | | Principal
Amount | | | Value | |
Pool #536949 8.000%
5/01/30 | | $ | 1,459 | | | $ | 1,743 | |
Pool #526380 8.000%
5/01/30 | | | 5,847 | | | | 6,952 | |
Pool #535351 8.000%
6/01/30 | | | 2,794 | | | | 3,306 | |
Pool #253481 8.000%
10/01/30 | | | 2,306 | | | | 2,729 | |
Pool #602008 8.000%
8/01/31 | | | 2,572 | | | | 3,032 | |
Pool #596656 8.000%
8/01/31 | | | 718 | | | | 758 | |
Pool #190317 8.000%
8/01/31 | | | 897 | | | | 1,057 | |
Federal National Mortgage Association TBA | | | | | | | | |
Pool #1963 3.500%
10/01/44 (g) | | | 5,875,000 | | | | 6,034,268 | |
Pool #9174 4.000%
3/01/44 (g) | | | 1,500,000 | | | | 1,568,906 | |
Government National Mortgage Association
Pool #783896 3.500%
5/15/44 | | | 795,015 | | | | 826,101 | |
Pool #BF1053 3.500%
12/15/47 | | | 300,000 | | | | 310,840 | |
Pool #359587 7.000%
6/15/23 | | | 31 | | | | 31 | |
Pool #337539 7.000%
7/15/23 | | | 492 | | | | 537 | |
Pool #363066 7.000%
8/15/23 | | | 3,996 | | | | 4,385 | |
Pool #354674 7.000%
10/15/23 | | | 4,046 | | | | 4,413 | |
Pool #368814 7.000%
10/15/23 | | | 470 | | | | 481 | |
Pool #362651 7.000%
10/15/23 | | | 4,121 | | | | 4,328 | |
Pool #352021 7.000%
11/15/23 | | | 2,273 | | | | 2,485 | |
Government National Mortgage Association II
Pool #82462 1 year CMT + 1.500%, FRN 2.375%
1/20/40 | | | 78,314 | | | | 80,695 | |
Pool #82488 1 year CMT + 1.500%, FRN 2.375%
3/20/40 | | | 104,191 | | | | 107,264 | |
Pool #784026 3.500%
12/20/44 | | | 220,456 | | | | 228,353 | |
Pool #BC4641 3.500%
9/20/47 | | | 447,940 | | | | 463,740 | |
The accompanying notes are an integral part of the financial statements.
38
MML Blend Fund – Portfolio of Investments (Continued)
| | | | | | | | |
| | | Principal
Amount | | | Value | |
Pool #MA4778 3.500%
10/20/47 | | $ | 2,189,358 | | | $ | 2,267,269 | |
Pool #BC4885 3.500%
11/20/47 | | | 673,922 | | | | 698,799 | |
Pool #BD6940 3.500%
12/20/47 | | | 425,000 | | | | 440,058 | |
Pool #AC2985 4.000%
10/20/47 | | | 124,658 | | | | 130,624 | |
Government National Mortgage Association II TBA
Pool #207 3.500%
5/01/45 (g) | | | 3,125,000 | | | | 3,231,934 | |
Pool #232 4.000%
12/01/44 (g) | | | 1,800,000 | | | | 1,876,781 | |
| | | | | | | | |
| | | | | | | 48,574,359 | |
| | | | | | | | |
| Whole Loans — 0.0% | | | | | | | | |
Federal Home Loan Mortgage Corp. Structured Agency Credit Risk Debt Notes Series 2016-DNA1, Class M1, 1 mo. USD LIBOR +
1.450%, FRN
3.002% 7/25/28 | | | 32,664 | | | | 32,709 | |
| | | | | | | | |
| | |
| TOTAL U.S. GOVERNMENT AGENCY OBLIGATIONS AND INSTRUMENTALITIES (Cost $51,286,741) | | | | | | | 51,070,111 | |
| | | | | | | | |
|
| U.S. TREASURY OBLIGATIONS — 2.8% | |
| U.S. Treasury Bonds & Notes — 2.8% | |
U.S. Treasury Bond
2.500% 5/15/46 | | | 5,870,000 | | | | 5,585,213 | |
U.S. Treasury Bond (h)
3.500% 2/15/39 | | | 2,580,000 | | | | 2,946,038 | |
U.S. Treasury Note
1.625% 11/30/20 | | | 750,000 | | | | 742,500 | |
U.S. Treasury Note
1.625% 8/31/22 | | | 5,650,000 | | | | 5,510,737 | |
U.S. Treasury Note
2.000% 11/15/26 | | | 2,260,000 | | | | 2,187,521 | |
U.S. Treasury Note
2.250% 8/15/27 | | | 2,440,000 | | | | 2,405,878 | |
| | | | | | | | |
| | | | | | | 19,377,887 | |
| | | | | | | | |
| | |
TOTAL U.S. TREASURY OBLIGATIONS
(Cost $19,255,876) | | | | | | | 19,377,887 | |
| | | | | | | | |
| | |
TOTAL BONDS & NOTES
(Cost $201,261,881) | | | | | | | 203,633,215 | |
| | | | | | | | |
| | |
TOTAL PURCHASED OPTIONS (#) — 0.1%
(Cost $804,384) | | | | | | | 767,579 | |
| | | | | | | | |
| | | | | | | | |
| | | Number of
Shares | | | Value | |
| RIGHTS — 0.0% | |
| Consumer, Cyclical — 0.0% | | | | | | | | |
| Retail — 0.0% | | | | | | | | |
Safeway Casa Ley (CVR) (a) (d) (e) | | | 18,800 | | | $ | 18,988 | |
Safeway PDC, LLC. (CVR) (a) (d) (e) | | | 18,800 | | | | 940 | |
| | | | | | | | |
| | | | | | | 19,928 | |
| | | | | | | | |
| | |
TOTAL RIGHTS
(Cost $19,608) | | | | | | | 19,928 | |
| | | | | | | | |
| | |
TOTAL LONG-TERM INVESTMENTS
(Cost $540,138,962) | | | | | | | 693,416,288 | |
| | | | | | | | |
| | |
| | | Principal
Amount | | | | |
| SHORT-TERM INVESTMENTS — 3.7% | |
| Commercial Paper — 3.6% | | | | | | | | |
Ameren Corp.
1.775% 1/04/18 | | $ | 2,000,000 | | | | 1,999,442 | |
Bell Canada (b)
1.936% 3/19/18 | | | 2,000,000 | | | | 1,991,911 | |
Carnival Corp. (b)
1.915% 3/14/18 | | | 2,000,000 | | | | 1,992,542 | |
Dominion Resources, Inc. (b)
1.535% 1/02/18 | | | 2,000,000 | | | | 1,999,629 | |
Fortive Corp. (b)
1.608% 1/16/18 | | | 1,500,000 | | | | 1,498,712 | |
Glencore Funding LLC (b)
1.629% 1/10/18 | | | 2,000,000 | | | | 1,998,810 | |
HP, Inc. (b)
1.566% 1/08/18 | | | 2,000,000 | | | | 1,999,203 | |
Marriott International, Inc. (b)
1.596% 1/16/18 | | | 1,000,000 | | | | 999,141 | |
Molex Electronic Technologies (b)
2.038% 3/13/18 | | | 2,000,000 | | | | 1,991,728 | |
Nasdaq, Inc. (b)
1.650% 1/24/18 | | | 400,000 | | | | 399,503 | |
Nasdaq, Inc. (b)
1.682% 2/20/18 | | | 1,600,000 | | | | 1,595,890 | |
Public Service Enterprise Group, Inc. (b)
2.137% 2/20/18 | | | 2,000,000 | | | | 1,994,803 | |
Spectra Energy Partners (b)
1.849% 1/25/18 | | | 2,000,000 | | | | 1,997,387 | |
Telus Corp. (b)
2.089% 3/28/18 | | | 1,500,000 | | | | 1,493,292 | |
Thomson Reuters Corp. (b)
1.649% 2/13/18 | | | 1,250,000 | | | | 1,247,139 | |
| | | | | | | | |
| | | | | | | 25,199,132 | |
| | | | | | | | |
The accompanying notes are an integral part of the financial statements.
39
MML Blend Fund – Portfolio of Investments (Continued)
| | | | | | | | |
| | | Principal
Amount | | | Value | |
| Repurchase Agreement — 0.1% | | | | | | | | |
Fixed Income Clearing Corp. Repurchase Agreement, dated 12/29/17, 0.540%, due 1/02/18 (i) | | $ | 400,810 | | | $ | 400,810 | |
| | | | | | | | |
| Time Deposit — 0.0% | | | | | | | | |
Euro Time Deposit
0.120% 1/02/18 | | | 36,208 | | | | 36,208 | |
| | | | | | | | |
| | |
TOTAL SHORT-TERM INVESTMENTS
(Cost $25,637,960) | | | | | | | 25,636,150 | |
| | | | | | | | |
| | |
| TOTAL INVESTMENTS — 103.4% (Cost $565,776,922) (j) | | | | | | | 719,052,438 | |
| | |
| Other Assets/(Liabilities) — (3.4)% | | | | | | | (23,564,729 | ) |
| | | | | | | | |
| | |
| NET ASSETS — 100.0% | | | | | | $ | 695,487,709 | |
| | | | | | | | �� |
Abbreviation Legend
| CLO | Collateralized Loan Obligation |
| CMO | Collateralized Mortgage Obligation |
| CMT | Constant Maturity Treasury Index |
| CVR | Contingent Value Rights |
| MBS | Mortgage-Backed Security |
| MTA | Monthly Treasury Average Index |
Notes to Portfolio of Investments
Percentages are stated as a percent of net assets.
| (a) | Non-income producing security. |
| (b) | Securities exempt from registration under rule 144A of the Securities Act of 1933. These securities may be resold in transactions exempt from registration, normally to qualified institutional buyers. At December 31, 2017, these securities amounted to a value of $86,581,990 or 12.45% of net assets. |
| (c) | Certain variable rate securities are not based on a published reference rate and spread but are determined by the issuer or agent and are based on current market conditions. These securities do not indicate a reference rate and spread in their description above. The rates shown are the current interest rates at December 31, 2017. |
| (d) | Investment was valued using significant unobservable inputs. |
| (e) | This security is fair valued in good faith in accordance with procedures approved by the Board of Trustees. At December 31, 2017, these securities amounted to a value of $1,055,741 or 0.15% of net assets. |
| (f) | Restricted security. Certain securities are restricted as to resale. At December 31, 2017, these securities amounted to a value of $1,361,728 or 0.20% of net assets. The Fund generally bears the costs, if any, associated with the disposition of restricted securities. |
| (g) | A portion of this security is purchased on a when-issued, delayed-delivery or forward commitment basis. (Note 2). |
| (h) | A portion of this security is pledged/held as collateral for open futures contracts. (Note 2). |
| (i) | Maturity value of $400,834. Collateralized by U.S. Government Agency obligations with a rate of 2.750%, maturity date of 2/15/24, and an aggregate market value, including accrued interest, of $413,955. |
| (j) | See Note 6 for aggregate cost for federal tax purposes. |
(#) The Fund had the following open Purchased Swaptions contracts at December 31, 2017:
Purchased Swaptions
| | | | | | | | | | | | | | | | | | | | | | | | | | | | | | |
| OTC Counterparty* | | Units | | | Notional
Amount | | | Expiration
Date | | | Pay/
Receive
Exercise
Rate | | | Description | | Premiums
Purchased | | | Value | | | Unrealized
Appreciation/
(Depreciation) | |
| Call | | | | | | | | | | | | | | | | | | | | | | | |
Barclays Bank PLC | | | 5,300,000 | | | USD | 5,300,000 | | | | 12/13/32 | | | | Receive | | | 3-Month USD LIBOR BBA 10 Year Swaption, Underlying swap terminates 12/15/42, Strike 2.44 | | $ | 264,960 | | | $ | 257,630 | | | $ | (7,330 | ) |
| Put | | | | | | | | | | | | | | | | | | | | | | | |
Barclays Bank PLC | | | 10,790,000 | | | USD | 10,790,000 | | | | 12/13/32 | | | | Pay | | | 3-Month USD LIBOR BBA 10 Year Swaption, Underlying swap terminates 12/15/42, Strike 2.94 | | $ | 539,424 | | | $ | 509,949 | | | $ | (29,475 | ) |
| | | | | | | | | | | | | | | | | | | | | | | | | | | | | | |
| | | | | | | | | | | | | | | | | | | | $ | 804,384 | | | $ | 767,579 | | | $ | (36,805 | ) |
| | | | | | | | | | | | | | | | | | | | | | | | | | | | | | |
| * | Contracts are subject to a Master Netting Agreement. |
The accompanying notes are an integral part of the financial statements.
40
MML Blend Fund – Portfolio of Investments (Continued)
The Fund had the following open Futures contracts at December 31, 2017:
Futures
| | | | | | | | | | | | | | | | |
| | | Expiration
Date | | | Number of
Contracts | | | Notional
Amount | | | Value/Net
Unrealized
Appreciation/
(Depreciation) | |
| Futures Contracts — Long | | | | | | | | | | | | |
| U.S. Treasury Ultra Long Bond | | | 3/20/18 | | | | 18 | | | $ | 2,990,310 | | | $ | 27,503 | |
| U.S. Treasury Note 2 Year | | | 3/29/18 | | | | 59 | | | | 12,659,913 | | | | (27,460 | ) |
| U.S. Treasury Note 5 Year | | | 3/29/18 | | | | 150 | | | | 17,499,504 | | | | (74,895 | ) |
| | | | | | | | | | | | | | | | |
| | | | | | | | | | | | | | $ | (74,852 | ) |
| | | | | | | | | | | | | | | | |
The Fund had the following open Swap agreements at December 31, 2017:
Swaps
| | | | | | | | | | | | | | | | | | | | | | | | | | | | | | | | | | |
| Counterparty | | Currency | | | Notional
Amount | | | Expiration
Date | | Payment
Frequency | | | Receive (Pay)
Fixed Rate | | | Deliverable on Default | | Unrealized
Appreciation
(Depreciation) | | | Premium
(Received)
Paid | | | Value | |
Credit Default Swaps — Sell Protection†† | |
OTC Swaps* | |
| Goldman Sachs International | | | USD | | | | 500,000 | | | 5/11/63 | | | Monthly | | | | 3.000% | | | CMBX.NA.BBB-.6† (Rating: BBB-) | | $ | (73,468 | ) | | $ | 308 | | | $ | (73,160 | ) |
| Goldman Sachs International | | | USD | | | | 430,000 | | | 5/11/63 | | | Monthly | | | | 3.000% | | | CMBX.NA.BBB-.6† (Rating: BBB-) | | | (25,679 | ) | | | (37,238 | ) | | | (62,917 | ) |
| Goldman Sachs International | | | USD | | | | 160,000 | | | 5/11/63 | | | Monthly | | | | 3.000% | | | CMBX.NA.BBB-.6† (Rating: BBB-) | | | (10,592 | ) | | | (12,819 | ) | | | (23,411 | ) |
| | | | | | | | | | | | | | | | | | | | | | | | | | | | | | | | | | |
| | | | | | | | | | | | | | | | | | | | | | | | $ | (109,739 | ) | | $ | (49,749 | ) | | $ | (159,488 | ) |
| | | | | | | | | | | | | | | | | | | | | | | | | | | | | | | | | | |
| * | Contracts are subject to a Master Netting Agreement. |
| † | Payment is based on a percentage of the index. Reference entities are a number of individual issuers comprising the index. |
| †† | For each credit derivative with sold protection, the credit ratings of the entities referenced, as rated by any rating organization, are included in the equivalent S&P Global Ratings. The reference entity rating represents the likelihood of a potential payment by the Fund if the referenced entity experiences a credit event as of period end. Notional amounts represent the maximum potential amount of future payments (undiscounted) the Fund could be required to make under the credit derivatives with sold protection. |
Currency Legend
The accompanying notes are an integral part of the financial statements.
41
MML Equity Fund – Portfolio of Investments
December 31, 2017
| | | | | | | | |
| | | Number of
Shares | | | Value | |
| EQUITIES — 98.2% | |
|
| COMMON STOCK — 98.2% | |
| Basic Materials — 1.9% | |
| Chemicals — 1.6% | |
Ashland Global Holdings, Inc. | | | 1,700 | | | $ | 121,040 | |
Celanese Corp. Series A | | | 5,400 | | | | 578,232 | |
Eastman Chemical Co. | | | 96,380 | | | | 8,928,643 | |
Huntsman Corp. | | | 8,800 | | | | 292,952 | |
LyondellBasell Industries NV Class A | | | 18,800 | | | | 2,074,016 | |
PPG Industries, Inc. | | | 9,300 | | | | 1,086,426 | |
RPM International, Inc. | | | 4,600 | | | | 241,132 | |
Westlake Chemical Corp. | | | 4,900 | | | | 521,997 | |
| | | | | | | | |
| | | | | | | 13,844,438 | |
| | | | | | | | |
| Forest Products & Paper — 0.1% | |
International Paper Co. | | | 16,200 | | | | 938,628 | |
| | | | | | | | |
| Iron & Steel — 0.1% | |
Nucor Corp. | | | 12,300 | | | | 782,034 | |
Reliance Steel & Aluminum Co. | | | 2,200 | | | | 188,738 | |
Steel Dynamics, Inc. | | | 9,500 | | | | 409,735 | |
| | | | | | | | |
| | | | | | | 1,380,507 | |
| | | | | | | | |
| Mining — 0.1% | |
Newmont Mining Corp. | | | 13,500 | | | | 506,520 | |
| | | | | | | | |
| | | | | | | 16,670,093 | |
| | | | | | | | |
| Communications — 6.5% | |
| Internet — 0.5% | |
Alphabet, Inc. Class A (a) | | | 3,390 | | | | 3,571,026 | |
CDW Corp. | | | 6,100 | | | | 423,889 | |
| | | | | | | | |
| | | | | | | 3,994,915 | |
| | | | | | | | |
| Media — 3.0% | |
Comcast Corp. Class A | | | 167,200 | | | | 6,696,360 | |
DISH Network Corp. Class A (a) | | | 63,940 | | | | 3,053,135 | |
News Corp. Class A | | | 14,600 | | | | 236,666 | |
Time Warner, Inc. | | | 47,200 | | | | 4,317,384 | |
Twenty-First Century Fox, Inc. Class A | | | 39,900 | | | | 1,377,747 | |
The Walt Disney Co. | | | 96,740 | | | | 10,400,517 | |
| | | | | | | | |
| | | | | | | 26,081,809 | |
| | | | | | | | |
| Telecommunications — 3.0% | |
ARRIS International PLC (a) | | | 7,000 | | | | 179,830 | |
AT&T, Inc. | | | 251,350 | | | | 9,772,488 | |
Cisco Systems, Inc. | | | 189,000 | | | | 7,238,700 | |
Juniper Networks, Inc. | | | 14,300 | | | | 407,550 | |
Motorola Solutions, Inc. | | | 6,600 | | | | 596,244 | |
Verizon Communications, Inc. | | | 148,700 | | | | 7,870,691 | |
| | | | | | | | |
| | | | | | | 26,065,503 | |
| | | | | | | | |
| | | | | | | 56,142,227 | |
| | | | | | | | |
| | | | | | | | |
| | | Number of
Shares | | | Value | |
| Consumer, Cyclical — 10.2% | |
| Airlines — 1.0% | |
American Airlines Group, Inc. | | | 19,700 | | | $ | 1,024,991 | |
Delta Air Lines, Inc. | | | 28,800 | | | | 1,612,800 | |
JetBlue Airways Corp. (a) | | | 11,900 | | | | 265,846 | |
Southwest Airlines Co. | | | 92,470 | | | | 6,052,161 | |
| | | | | | | | |
| | | | | | | 8,955,798 | |
| | | | | | | | |
| Apparel — 0.7% | |
Carter’s, Inc. | | | 1,700 | | | | 199,733 | |
Hanesbrands, Inc. (b) | | | 245,140 | | | | 5,125,877 | |
Michael Kors Holdings Ltd. (a) | | | 4,400 | | | | 276,980 | |
Ralph Lauren Corp. (b) | | | 1,900 | | | | 197,011 | |
| | | | | | | | |
| | | | | | | 5,799,601 | |
| | | | | | | | |
| Auto Manufacturers — 0.9% | |
Ford Motor Co. | | | 142,600 | | | | 1,781,074 | |
General Motors Co. | | | 58,400 | | | | 2,393,816 | |
PACCAR, Inc. | | | 49,810 | | | | 3,540,495 | |
| | | | | | | | |
| | | | | | | 7,715,385 | |
| | | | | | | | |
| Auto Parts & Equipment — 0.3% | |
Adient PLC | | | 2,600 | | | | 204,620 | |
Allison Transmission Holdings, Inc. | | | 5,200 | | | | 223,964 | |
Aptiv PLC | | | 10,600 | | | | 899,198 | |
BorgWarner, Inc. | | | 8,200 | | | | 418,938 | |
The Goodyear Tire & Rubber Co. | | | 9,900 | | | | 319,869 | |
Lear Corp. | | | 2,600 | | | | 459,316 | |
| | | | | | | | |
| | | | | | | 2,525,905 | |
| | | | | | | | |
| Entertainment — 0.0% | |
The Madison Square Garden Co. Class A (a) | | | 900 | | | | 189,765 | |
| | | | | | | | |
| Home Builders — 0.2% | |
NVR, Inc. (a) | | | 100 | | | | 350,822 | |
PulteGroup, Inc. | | | 12,100 | | | | 402,325 | |
Thor Industries, Inc. | | | 2,000 | | | | 301,440 | |
Toll Brothers, Inc. | | | 6,800 | | | | 326,536 | |
| | | | | | | | |
| | | | | | | 1,381,123 | |
| | | | | | | | |
| Home Furnishing — 0.5% | |
Leggett & Platt, Inc. | | | 5,000 | | | | 238,650 | |
Whirlpool Corp. | | | 23,580 | | | | 3,976,531 | |
| | | | | | | | |
| | | | | | | 4,215,181 | |
| | | | | | | | |
| Leisure Time — 0.8% | |
Brunswick Corp. | | | 3,300 | | | | 182,226 | |
Carnival Corp. | | | 78,500 | | | | 5,210,045 | |
Norwegian Cruise Line Holdings Ltd. (a) | | | 8,900 | | | | 473,925 | |
Royal Caribbean Cruises Ltd. | | | 8,500 | | | | 1,013,880 | |
| | | | | | | | |
| | | | | | | 6,880,076 | |
| | | | | | | | |
| Lodging — 0.6% | |
Hyatt Hotels Corp. Class A (a) | | | 1,500 | | | | 110,310 | |
The accompanying notes are an integral part of the financial statements.
42
MML Equity Fund – Portfolio of Investments (Continued)
| | | | | | | | |
| | | Number of
Shares | | | Value | |
Wyndham Worldwide Corp. | | | 47,580 | | | $ | 5,513,095 | |
| | | | | | | | |
| | | | | | | 5,623,405 | |
| | | | | | | | |
| Retail — 5.0% | |
AutoNation, Inc. (a) (b) | | | 2,600 | | | | 133,458 | |
Best Buy Co., Inc. | | | 10,800 | | | | 739,476 | |
CarMax, Inc. (a) | | | 7,400 | | | | 474,562 | |
CVS Health Corp. | | | 26,700 | | | | 1,935,750 | |
Dollar General Corp. | | | 10,100 | | | | 939,401 | |
The Gap, Inc. | | | 11,000 | | | | 374,660 | |
Genuine Parts Co. | | | 4,100 | | | | 389,541 | |
Kohl’s Corp. | | | 6,300 | | | | 341,649 | |
L Brands, Inc. | | | 10,500 | | | | 632,310 | |
Lowe’s Cos., Inc. | | | 30,200 | | | | 2,806,788 | |
Nordstrom, Inc. (b) | | | 4,700 | | | | 222,686 | |
PVH Corp. | | | 3,000 | | | | 411,630 | |
Tapestry, Inc. | | | 89,420 | | | | 3,955,047 | |
Target Corp. | | | 115,450 | | | | 7,533,113 | |
Tractor Supply Co. | | | 3,500 | | | | 261,625 | |
Wal-Mart Stores, Inc. | | | 211,610 | | | | 20,896,487 | |
Walgreens Boots Alliance, Inc. | | | 21,350 | | | | 1,550,437 | |
Williams-Sonoma, Inc. (b) | | | 3,400 | | | | 175,780 | |
| | | | | | | | |
| | | | | | | 43,774,400 | |
| | | | | | | | |
| Textiles — 0.1% | |
Mohawk Industries, Inc. (a) | | | 3,000 | | | | 827,700 | |
| | | | | | | | |
| Toys, Games & Hobbies — 0.1% | |
Hasbro, Inc. | | | 4,600 | | | | 418,094 | |
| | | | | | | | |
| | | | | | | 88,306,433 | |
| | | | | | | | |
| Consumer, Non-cyclical — 16.1% | |
| Agriculture — 0.6% | |
Philip Morris International, Inc. | | | 53,180 | | | | 5,618,467 | |
| | | | | | | | |
| Beverages — 1.1% | |
The Coca-Cola Co. | | | 104,400 | | | | 4,789,872 | |
Coca-Cola European Partners PLC | | | 117,150 | | | | 4,668,427 | |
Dr. Pepper Snapple Group, Inc. | | | 4,800 | | | | 465,888 | |
| | | | | | | | |
| | | | | | | 9,924,187 | |
| | | | | | | | |
| Biotechnology — 2.0% | |
Amgen, Inc. | | | 55,570 | | | | 9,663,623 | |
Biogen, Inc. (a) | | | 8,400 | | | | 2,675,988 | |
Gilead Sciences, Inc. | | | 72,540 | | | | 5,196,766 | |
| | | | | | | | |
| | | | | | | 17,536,377 | |
| | | | | | | | |
| Commercial Services — 0.3% | |
AMERCO | | | 600 | | | | 226,746 | |
Booz Allen Hamilton Holding Corp. | | | 5,400 | | | | 205,902 | |
H&R Block, Inc. | | | 8,000 | | | | 209,760 | |
ManpowerGroup, Inc. | | | 2,600 | | | | 327,886 | |
Robert Half International, Inc. | | | 5,100 | | | | 283,254 | |
United Rentals, Inc. (a) | | | 3,500 | | | | 601,685 | |
The Western Union Co. | | | 17,400 | | | | 330,774 | |
| | | | | | | | |
| | | | | | | 2,186,007 | |
| | | | | | | | |
| | | | | | | | |
| | | Number of
Shares | | | Value | |
| Cosmetics & Personal Care — 0.7% | |
The Procter & Gamble Co. | | | 67,560 | | | $ | 6,207,413 | |
| | | | | | | | |
| Foods — 0.2% | |
Ingredion, Inc. | | | 2,600 | | | | 363,480 | |
Pilgrim’s Pride Corp. (a) (b) | | | 9,500 | | | | 295,070 | |
Tyson Foods, Inc. Class A | | | 8,000 | | | | 648,560 | |
| | | | | | | | |
| | | | | | | 1,307,110 | |
| | | | | | | | |
| Health Care – Products — 2.3% | |
Boston Scientific Corp. (a) | | | 102,010 | | | | 2,528,828 | |
Danaher Corp. | | | 61,938 | | | | 5,749,085 | |
Thermo Fisher Scientific, Inc. | | | 22,660 | | | | 4,302,681 | |
Zimmer Biomet Holdings, Inc. | | | 57,910 | | | | 6,988,000 | |
| | | | | | | | |
| | | | | | | 19,568,594 | |
| | | | | | | | |
| Health Care – Services — 2.9% | |
Aetna, Inc. | | | 12,600 | | | | 2,272,914 | |
Anthem, Inc. | | | 9,700 | | | | 2,182,597 | |
Cigna Corp. | | | 10,000 | | | | 2,030,900 | |
DaVita, Inc. (a) | | | 7,800 | | | | 563,550 | |
HCA Healthcare, Inc. (a) | | | 14,300 | | | | 1,256,112 | |
Laboratory Corp. of America Holdings (a) | | | 4,200 | | | | 669,942 | |
Quest Diagnostics, Inc. | | | 5,200 | | | | 512,148 | |
UnitedHealth Group, Inc. | | | 70,840 | | | | 15,617,386 | |
| | | | | | | | |
| | | | | | | 25,105,549 | |
| | | | | | | | |
| Household Products & Wares — 0.1% | |
Kimberly-Clark Corp. | | | 9,100 | | | | 1,098,006 | |
| | | | | | | | |
| Pharmaceuticals — 5.9% | |
AbbVie, Inc. | | | 61,900 | | | | 5,986,349 | |
AmerisourceBergen Corp. | | | 6,100 | | | | 560,102 | |
Bristol-Myers Squibb Co. | | | 147,360 | | | | 9,030,221 | |
Herbalife Ltd. (a) (b) | | | 3,700 | | | | 250,564 | |
Johnson & Johnson | | | 102,700 | | | | 14,349,244 | |
McKesson Corp. | | | 7,900 | | | | 1,232,005 | |
Perrigo Co. PLC | | | 5,200 | | | | 453,232 | |
Pfizer, Inc. | | | 530,950 | | | | 19,231,009 | |
| | | | | | | | |
| | | | | | | 51,092,726 | |
| | | | | | | | |
| | | | | | | 139,644,436 | |
| | | | | | | | |
| Energy — 9.5% | |
| Oil & Gas — 7.3% | |
Chevron Corp. | | | 191,742 | | | | 24,004,181 | |
Concho Resources, Inc. (a) | | | 33,920 | | | | 5,095,462 | |
ConocoPhillips | | | 164,201 | | | | 9,012,993 | |
Energen Corp. (a) | | | 3,600 | | | | 207,252 | |
HollyFrontier Corp. | | | 6,700 | | | | 343,174 | |
Marathon Oil Corp. | | | 23,800 | | | | 402,934 | |
Marathon Petroleum Corp. | | | 20,400 | | | | 1,345,992 | |
Phillips 66 | | | 66,129 | | | | 6,688,948 | |
Suncor Energy, Inc. | | | 398,290 | | | | 14,625,209 | |
Valero Energy Corp. | | | 17,500 | | | | 1,608,425 | |
| | | | | | | | |
| | | | | | | 63,334,570 | |
| | | | | | | | |
The accompanying notes are an integral part of the financial statements.
43
MML Equity Fund – Portfolio of Investments (Continued)
| | | | | | | | |
| | | Number of
Shares | | | Value | |
| Oil & Gas Services — 1.5% | |
Halliburton Co. | | | 119,117 | | | $ | 5,821,248 | |
Weatherford International PLC (a) (b) | | | 1,719,890 | | | | 7,171,941 | |
| | | | | | | | |
| | | | | | | 12,993,189 | |
| | | | | | | | |
| Pipelines — 0.7% | |
Enbridge, Inc. (b) | | | 164,477 | | | | 6,432,696 | |
| | | | | | | | |
| | | | | | | 82,760,455 | |
| | | | | | | | |
| Financial — 30.8% | |
| Banks — 18.8% | |
Bank of America Corp. | | | 960,960 | | | | 28,367,539 | |
The Bank of New York Mellon Corp. | | | 40,000 | | | | 2,154,400 | |
BB&T Corp. | | | 28,900 | | | | 1,436,908 | |
BOK Financial Corp. | | | 2,400 | | | | 221,568 | |
Capital One Financial Corp. | | | 18,600 | | | | 1,852,188 | |
CIT Group, Inc. | | | 4,800 | | | | 236,304 | |
Citigroup, Inc. | | | 287,620 | | | | 21,401,804 | |
Citizens Financial Group, Inc. | | | 19,600 | | | | 822,808 | |
Comerica, Inc. | | | 5,800 | | | | 503,498 | |
Commerce Bancshares, Inc. | | | 4,100 | | | | 228,944 | |
Cullen/Frost Bankers, Inc. | | | 2,400 | | | | 227,160 | |
East West Bancorp, Inc. | | | 5,400 | | | | 328,482 | |
Fifth Third Bancorp | | | 28,800 | | | | 873,792 | |
The Goldman Sachs Group, Inc. | | | 51,120 | | | | 13,023,331 | |
Huntington Bancshares, Inc. | | | 30,100 | | | | 438,256 | |
JP Morgan Chase & Co. | | | 378,980 | | | | 40,528,122 | |
KeyCorp | | | 396,730 | | | | 8,002,044 | |
M&T Bank Corp. | | | 6,000 | | | | 1,025,940 | |
Morgan Stanley | | | 181,480 | | | | 9,522,256 | |
Northern Trust Corp. | | | 8,000 | | | | 799,120 | |
The PNC Financial Services Group, Inc. | | | 18,700 | | | | 2,698,223 | |
Prosperity Bancshares, Inc. | | | 2,600 | | | | 182,182 | |
Regions Financial Corp. | | | 46,000 | | | | 794,880 | |
State Street Corp. | | | 14,400 | | | | 1,405,584 | |
SunTrust Banks, Inc. | | | 18,600 | | | | 1,201,374 | |
Synovus Financial Corp. | | | 4,800 | | | | 230,112 | |
US Bancorp | | | 65,200 | | | | 3,493,416 | |
Wells Fargo & Co. | | | 191,200 | | | | 11,600,104 | |
Western Alliance Bancorp (a) | | | 3,000 | | | | 169,860 | |
Zions Bancorp | | | 177,140 | | | | 9,004,026 | |
| | | | | | | | |
| | | | | | | 162,774,225 | |
| | | | | | | | |
| Diversified Financial Services — 3.9% | |
Alliance Data Systems Corp. | | | 1,600 | | | | 405,568 | |
Ally Financial, Inc. | | | 17,600 | | | | 513,216 | |
American Express Co. | | | 34,400 | | | | 3,416,264 | |
Ameriprise Financial, Inc. | | | 40,280 | | | | 6,826,252 | |
BlackRock, Inc. | | | 13,570 | | | | 6,971,045 | |
Credit Acceptance Corp. (a) (b) | | | 600 | | | | 194,088 | |
Discover Financial Services | | | 15,600 | | | | 1,199,952 | |
| | | | | | | | |
| | | Number of
Shares | | | Value | |
E*TRADE Financial Corp. (a) | | | 10,300 | | | $ | 510,571 | |
FNF Group | | | 9,200 | | | | 361,008 | |
Franklin Resources, Inc. | | | 21,700 | | | | 940,261 | |
Invesco Ltd. | | | 15,700 | | | | 573,678 | |
Lazard Ltd. Class A | | | 4,800 | | | | 252,000 | |
Nasdaq, Inc. | | | 118,110 | | | | 9,074,391 | |
Raymond James Financial, Inc. | | | 5,200 | | | | 464,360 | |
Santander Consumer USA Holdings, Inc. | | | 13,200 | | | | 245,784 | |
Synchrony Financial | | | 31,000 | | | | 1,196,910 | |
T. Rowe Price Group, Inc. | | | 9,400 | | | | 986,342 | |
| | | | | | | | |
| | | | | | | 34,131,690 | |
| | | | | | | | |
| Insurance — 5.8% | |
Aflac, Inc. | | | 15,500 | | | | 1,360,590 | |
Alleghany Corp. (a) | | | 700 | | | | 417,263 | |
The Allstate Corp. | | | 15,000 | | | | 1,570,650 | |
American Financial Group, Inc. | | | 6,700 | | | | 727,218 | |
American International Group, Inc. | | | 48,000 | | | | 2,859,840 | |
Aon PLC | | | 43,030 | | | | 5,766,020 | |
Assurant, Inc. | | | 2,200 | | | | 221,848 | |
Chubb Ltd. | | | 17,000 | | | | 2,484,210 | |
Cincinnati Financial Corp. | | | 6,100 | | | | 457,317 | |
Everest Re Group Ltd. | | | 1,500 | | | | 331,890 | |
The Hartford Financial Services Group, Inc. | | | 142,900 | | | | 8,042,412 | |
Lincoln National Corp. | | | 8,300 | | | | 638,021 | |
Loews Corp. | | | 12,800 | | | | 640,384 | |
Markel Corp. (a) | | | 600 | | | | 683,478 | |
MetLife, Inc. | | | 170,820 | | | | 8,636,659 | |
Old Republic International Corp. | | | 10,300 | | | | 220,214 | |
Principal Financial Group, Inc. | | | 11,200 | | | | 790,272 | |
Prudential Financial, Inc. | | | 16,600 | | | | 1,908,668 | |
Reinsurance Group of America, Inc. | | | 2,600 | | | | 405,418 | |
Torchmark Corp. | | | 11,400 | | | | 1,034,094 | |
The Travelers Cos., Inc. | | | 25,400 | | | | 3,445,256 | |
Unum Group | | | 9,000 | | | | 494,010 | |
Voya Financial, Inc. | | | 7,500 | | | | 371,025 | |
W.R. Berkley Corp. | | | 4,700 | | | | 336,755 | |
Willis Towers Watson PLC | | | 4,900 | | | | 738,381 | |
XL Group Ltd. | | | 170,850 | | | | 6,007,086 | |
| | | | | | | | |
| | | | | | | 50,588,979 | |
| | | | | | | | |
| Real Estate — 0.0% | |
Jones Lang LaSalle, Inc. | | | 1,700 | | | | 253,181 | |
| | | | | | | | |
| Real Estate Investment Trusts (REITS) — 2.3% | |
Crown Castle International Corp. | | | 68,700 | | | | 7,626,387 | |
Digital Realty Trust, Inc. | | | 28,150 | | | | 3,206,285 | |
Invitation Homes, Inc. | | | 100,160 | | | | 2,360,771 | |
Prologis, Inc. | | | 102,220 | | | | 6,594,212 | |
| | | | | | | | |
| | | | | | | 19,787,655 | |
| | | | | | | | |
| Savings & Loans — 0.0% | |
Investors Bancorp, Inc. | | | 11,400 | | | | 158,232 | |
| | | | | | | | |
| | | | | | | 267,693,962 | |
| | | | | | | | |
The accompanying notes are an integral part of the financial statements.
44
MML Equity Fund – Portfolio of Investments (Continued)
| | | | | | | | |
| | | Number of
Shares | | | Value | |
| Industrial — 10.7% | |
| Aerospace & Defense — 2.0% | |
General Dynamics Corp. | | | 12,500 | | | $ | 2,543,125 | |
L3 Technologies, Inc. | | | 3,100 | | | | 613,335 | |
Lockheed Martin Corp. | | | 31,791 | | | | 10,206,501 | |
Spirit AeroSystems Holdings, Inc. Class A | | | 4,800 | | | | 418,800 | |
United Technologies Corp. | | | 30,900 | | | | 3,941,913 | |
| | | | | | | | |
| | | | | | | 17,723,674 | |
| | | | | | | | |
| Building Materials — 0.1% | |
Owens Corning | | | 4,600 | | | | 422,924 | |
USG Corp. (a) | | | 5,400 | | | | 208,224 | |
| | | | | | | | |
| | | | | | | 631,148 | |
| | | | | | | | |
| Electrical Components & Equipment — 0.0% | |
Hubbell, Inc. | | | 1,500 | | | | 203,010 | |
| | | | | | | | |
| Electronics — 1.3% | |
Arrow Electronics, Inc. (a) | | | 3,300 | | | | 265,353 | |
Corning, Inc. | | | 47,900 | | | | 1,532,321 | |
Garmin Ltd. | | | 7,700 | | | | 458,689 | |
Gentex Corp. | | | 11,100 | | | | 232,545 | |
Honeywell International, Inc. | | | 29,500 | | | | 4,524,120 | |
Jabil, Inc. | | | 6,600 | | | | 173,250 | |
SYNNEX Corp. | | | 1,100 | | | | 149,545 | |
TE Connectivity Ltd. | | | 40,410 | | | | 3,840,566 | |
| | | | | | | | |
| | | | | | | 11,176,389 | |
| | | | | | | | |
| Engineering & Construction — 0.5% | |
Fluor Corp. | | | 75,070 | | | | 3,877,365 | |
Jacobs Engineering Group, Inc. | | | 4,600 | | | | 303,416 | |
| | | | | | | | |
| | | | | | | 4,180,781 | |
| | | | | | | | |
| Environmental Controls — 0.7% | |
Waste Management, Inc. | | | 65,780 | | | | 5,676,814 | |
| | | | | | | | |
| Hand & Machine Tools — 0.0% | |
Snap-on, Inc. | | | 2,200 | | | | 383,460 | |
| | | | | | | | |
| Machinery – Construction & Mining — 1.1% | |
Caterpillar, Inc. | | | 61,470 | | | | 9,686,443 | |
| | | | | | | | |
| Machinery – Diversified — 0.4% | |
AGCO Corp. | | | 3,000 | | | | 214,290 | |
Cummins, Inc. | | | 6,800 | | | | 1,201,152 | |
Zebra Technologies Corp. Class A (a) | | | 23,380 | | | | 2,426,844 | |
| | | | | | | | |
| | | | | | | 3,842,286 | |
| | | | | | | | |
| Manufacturing — 0.4% | |
Siemens AG Sponsored ADR | | | 46,280 | | | | 3,205,816 | |
| | | | | | | | |
| Miscellaneous – Manufacturing — 1.3% | |
Carlisle Cos., Inc. | | | 2,400 | | | | 272,760 | |
Eaton Corp. PLC | | | 17,200 | | | | 1,358,972 | |
Ingersoll-Rand PLC | | | 9,400 | | | | 838,386 | |
Parker-Hannifin Corp. | | | 37,093 | | | | 7,403,021 | |
Pentair PLC | | | 5,900 | | | | 416,658 | |
Textron, Inc. | | | 10,700 | | | | 605,513 | |
| | | | | | | | |
| | | Number of
Shares | | | Value | |
Trinity Industries, Inc. | | | 5,700 | | | $ | 213,522 | |
| | | | | | | | |
| | | | | | | 11,108,832 | |
| | | | | | | | |
| Packaging & Containers — 0.7% | |
Crown Holdings, Inc. (a) | | | 5,200 | | | | 292,500 | |
Packaging Corp. of America | | | 3,500 | | | | 421,925 | |
Sonoco Products Co. | | | 3,900 | | | | 207,246 | |
WestRock Co. | | | 86,770 | | | | 5,484,732 | |
| | | | | | | | |
| | | | | | | 6,406,403 | |
| | | | | | | | |
| Shipbuilding — 0.1% | |
Huntington Ingalls Industries, Inc. | | | 1,800 | | | | 424,260 | |
| | | | | | | | |
| Transportation — 2.1% | |
FedEx Corp. | | | 14,490 | | | | 3,615,835 | |
Kansas City Southern | | | 30,010 | | | | 3,157,652 | |
Norfolk Southern Corp. | | | 7,600 | | | | 1,101,240 | |
United Parcel Service, Inc. Class B | | | 25,400 | | | | 3,026,410 | |
XPO Logistics, Inc. (a) (b) | | | 84,640 | | | | 7,752,177 | |
| | | | | | | | |
| | | | | | | 18,653,314 | |
| | | | | | | | |
| | | | | | | 93,302,630 | |
| | | | | | | | |
| Technology — 9.7% | |
| Computers — 3.5% | |
Apple, Inc. | | | 100,200 | | | | 16,956,846 | |
Check Point Software Technologies Ltd. (a) | | | 18,080 | | | | 1,873,450 | |
CSRA, Inc. | | | 4,600 | | | | 137,632 | |
HP, Inc. | | | 277,060 | | | | 5,821,030 | |
International Business Machines Corp. | | | 34,000 | | | | 5,216,280 | |
NetApp, Inc. | | | 7,600 | | | | 420,432 | |
| | | | | | | | |
| | | | | | | 30,425,670 | |
| | | | | | | | |
| Office & Business Equipment — 0.0% | |
Xerox Corp. | | | 9,900 | | | | 288,585 | |
| | | | | | | | |
| Semiconductors — 3.1% | |
Applied Materials, Inc. | | | 37,800 | | | | 1,932,336 | |
Broadcom Ltd. | | | 12,032 | | | | 3,091,021 | |
Intel Corp. | | | 180,400 | | | | 8,327,264 | |
KLA-Tencor Corp. | | | 5,700 | | | | 598,899 | |
Marvell Technology Group Ltd. | | | 324,490 | | | | 6,966,800 | |
Qorvo, Inc. (a) | | | 5,100 | | | | 339,660 | |
Skyworks Solutions, Inc. | | | 7,100 | | | | 674,145 | |
Teradyne, Inc. | | | 5,700 | | | | 238,659 | |
Texas Instruments, Inc. | | | 46,610 | | | | 4,867,948 | |
| | | | | | | | |
| | | | | | | 27,036,732 | |
| | | | | | | | |
| Software — 3.1% | |
CA, Inc. | | | 15,400 | | | | 512,512 | |
First Data Corp. Class A (a) | | | 332,060 | | | | 5,548,723 | |
Microsoft Corp. | | | 86,980 | | | | 7,440,269 | |
Oracle Corp. | | | 155,100 | | | | 7,333,128 | |
Synopsys, Inc. (a) | | | 68,100 | | | | 5,804,844 | |
| | | | | | | | |
| | | | | | | 26,639,476 | |
| | | | | | | | |
| | | | | | | 84,390,463 | |
| | | | | | | | |
The accompanying notes are an integral part of the financial statements.
45
MML Equity Fund – Portfolio of Investments (Continued)
| | | | | | | | |
| | | Number of
Shares | | | Value | |
| Utilities — 2.8% | |
| Electric — 2.7% | |
AES Corp. | | | 8,900 | | | $ | 96,387 | |
Ameren Corp. | | | 9,500 | | | | 560,405 | |
American Electric Power Co., Inc. | | | 19,300 | | | | 1,419,901 | |
DTE Energy Co. | | | 7,400 | | | | 810,004 | |
Duke Energy Corp. | | | 22,500 | | | | 1,892,475 | |
Edison International | | | 119,790 | | | | 7,575,520 | |
Entergy Corp. | | | 68,660 | | | | 5,588,237 | |
Eversource Energy | | | 12,100 | | | | 764,478 | |
NextEra Energy, Inc. | | | 15,325 | | | | 2,393,612 | |
OGE Energy Corp. | | | 8,000 | | | | 263,280 | |
Pinnacle West Capital Corp. | | | 4,600 | | | | 391,828 | |
Public Service Enterprise Group, Inc. | | | 19,600 | | | | 1,009,400 | |
Westar Energy, Inc. | | | 5,200 | | | | 274,560 | |
Xcel Energy, Inc. | | | 17,700 | | | | 851,547 | |
| | | | | | | | |
| | | | | | | 23,891,634 | |
| | | | | | | | |
| Gas — 0.1% | |
National Fuel Gas Co. (b) | | | 3,200 | | | | 175,712 | |
UGI Corp. | | | 6,500 | | | | 305,175 | |
| | | | | | | | |
| | | | | | | 480,887 | |
| | | | | | | | |
| | | | | | | 24,372,521 | |
| | | | | | | | |
| | |
TOTAL COMMON STOCK
(Cost $678,973,133) | | | | | | | 853,283,220 | |
| | | | | | | | |
| | |
TOTAL EQUITIES
(Cost $678,973,133) | | | | | | | 853,283,220 | |
| | | | | | | | |
| | |
| MUTUAL FUNDS — 2.9% | | | | | | | | |
| Diversified Financial Services — 2.9% | |
iShares Russell 1000 Value Index Fund | | | 42,900 | | | | 5,334,186 | |
State Street Navigator Securities Lending Prime Portfolio (c) | | | 20,307,925 | | | | 20,307,925 | |
| | | | | | | | |
| | | | | | | 25,642,111 | |
| | | | | | | | |
| | |
TOTAL MUTUAL FUNDS
(Cost $25,639,652) | | | | | | | 25,642,111 | |
| | | | | | | | |
| | |
TOTAL LONG-TERM INVESTMENTS
(Cost $704,612,785) | | | | | | | 878,925,331 | |
| | | | | | | | |
| | | | | | | | |
| | | Principal
Amount | | | Value | |
| SHORT-TERM INVESTMENTS — 1.2% | |
| Repurchase Agreement — 1.2% | |
Fixed Income Clearing Corp., Repurchase Agreement, dated 12/29/17, 0.540%, due 1/02/18 (d) | | $ | 10,361,349 | | | $ | 10,361,349 | |
| | | | | | | | |
| | |
TOTAL SHORT-TERM INVESTMENTS
(Cost $10,361,349) | | | | | | | 10,361,349 | |
| | | | | | | | |
| | |
TOTAL INVESTMENTS — 102.3%
(Cost $714,974,134) (e) | | | | | | | 889,286,680 | |
| | |
| Other Assets/(Liabilities) — (2.3)% | | | | | | | (20,193,987 | ) |
| | | | | | | | |
| | |
| NET ASSETS — 100.0% | | | | | | $ | 869,092,693 | |
| | | | | | | | |
Abbreviation Legend
| ADR | American Depositary Receipt |
Notes to Portfolio of Investments
Percentages are stated as a percent of net assets.
| (a) | Non-income producing security. |
| (b) | Denotes all or a portion of security on loan. The total value of securities on loan as of December 31, 2017, was $19,709,581 or 2.27% of net assets. Total securities on loan may not correspond with the amounts identified in the Portfolio of Investments because pending sales may be in the process of recall from the brokers. (Note 2). |
| (c) | Represents investment of security lending collateral. (Note 2). |
| (d) | Maturity value of $10,361,970. Collateralized by U.S. Government Agency obligations with rates ranging from 2.000% – 2.750%, maturity dates ranging from 2/15/24 – 4/30/24, and an aggregate market value, including accrued interest, of $10,571,498. |
| (e) | See Note 6 for aggregate cost for federal tax purposes. |
The accompanying notes are an integral part of the financial statements.
46
MML Managed Bond Fund – Portfolio of Investments
December 31, 2017
| | | | | | | | |
| | | Number of
Shares | | | Value | |
| EQUITIES — 0.2% | |
|
| PREFERRED STOCK — 0.2% | |
| Financial — 0.2% | | | | | | | | |
| Insurance — 0.2% | | | | | | | | |
The Allstate Corp., 3 mo. USD LIBOR +
3.165%, VRN
5.100% | | | 95,000 | | | $ | 2,492,800 | |
| | | | | | | | |
| | |
TOTAL PREFERRED STOCK
(Cost $2,375,000) | | | | | | | 2,492,800 | |
| | | | | | | | |
| | |
TOTAL EQUITIES
(Cost $2,375,000) | | | | | | | 2,492,800 | |
| | | | | | | | |
| | |
| | | Principal
Amount | | | | |
| BONDS & NOTES — 97.8% | |
|
| CORPORATE DEBT — 35.2% | |
| Advertising — 0.1% | | | | | | | | |
WPP Finance 2010
5.625% 11/15/43 | | $ | 1,205,000 | | | | 1,382,084 | |
| | | | | | | | |
| Aerospace & Defense — 0.0% | | | | | | | | |
United Technologies Corp.
6.125% 7/15/38 | | | 350,000 | | | | 463,999 | |
| | | | | | | | |
| Agriculture — 0.2% | | | | | | | | |
Bunge Ltd. Finance Corp.
3.250% 8/15/26 | | | 1,050,000 | | | | 1,003,452 | |
Bunge Ltd. Finance Corp.
3.500% 11/24/20 | | | 955,000 | | | | 974,923 | |
Reynolds American, Inc.
5.850% 8/15/45 | | | 760,000 | | | | 949,065 | |
| | | | | | | | |
| | | | | | | 2,927,440 | |
| | | | | | | | |
| Airlines — 0.7% | | | | | | | | |
American Airlines Group, Inc. (a)
5.500% 10/01/19 | | | 5,926,000 | | | | 6,088,965 | |
American Airlines Pass-Through Trust, Series 2014-1, Class B
4.375% 4/01/24 | | | 202,902 | | | | 207,238 | |
Spirit Airlines Pass-Through Trust, Series 2015-1, Class A
4.100% 10/01/29 | | | 1,753,329 | | | | 1,819,780 | |
WestJet Airlines Ltd. (a)
3.500% 6/16/21 | | | 735,000 | | | | 741,852 | |
| | | | | | | | |
| | | | | | | 8,857,835 | |
| | | | | | | | |
| Auto Manufacturers — 0.7% | | | | | | | | |
Ford Motor Co.
5.291% 12/08/46 | | | 530,000 | | | | 576,751 | |
Ford Motor Credit Co. LLC
2.681% 1/09/20 | | | 1,340,000 | | | | 1,343,233 | |
Ford Motor Credit Co. LLC
4.375% 8/06/23 | | | 340,000 | | | | 358,021 | |
| | | | | | | | |
| | | Principal
Amount | | | Value | |
General Motors Co.
4.200% 10/01/27 | | $ | 1,315,000 | | | $ | 1,362,616 | |
General Motors Co.
5.150% 4/01/38 | | | 800,000 | | | | 852,923 | |
General Motors Financial Co., Inc.
3.500% 11/07/24 | | | 1,925,000 | | | | 1,921,066 | |
Hyundai Capital America (a)
2.550% 2/06/19 | | | 1,045,000 | | | | 1,043,162 | |
Hyundai Capital America (a)
2.875% 8/09/18 | | | 800,000 | | | | 801,666 | |
| | | | | | | | |
| | | | | | | 8,259,438 | |
| | | | | | | | |
| Auto Parts & Equipment — 0.0% | | | | | | | | |
Lear Corp.
5.375% 3/15/24 | | | 535,000 | | | | 565,895 | |
| | | | | | | | |
| Banks — 4.4% | | | | | | | | |
Associated Banc-Corp.
2.750% 11/15/19 | | | 2,805,000 | | | | 2,814,530 | |
Associated Banc-Corp.
4.250% 1/15/25 | | | 2,991,000 | | | | 3,079,685 | |
Banco Santander SA
3.125% 2/23/23 | | | 1,800,000 | | | | 1,790,840 | |
Banco Santander SA
4.250% 4/11/27 | | | 1,800,000 | | | | 1,866,041 | |
Bank of America Corp.
4.183% 11/25/27 | | | 3,015,000 | | | | 3,148,463 | |
Bank of America Corp. 3 mo. USD LIBOR + 1.814%, VRN
4.244% 4/24/38 | | | 1,625,000 | | | | 1,762,362 | |
Bank of America Corp.
5.875% 2/07/42 | | | 470,000 | | | | 622,355 | |
Bank of America Corp.
7.750% 5/14/38 | | | 400,000 | | | | 599,354 | |
Bank of Montreal VRN (b)
3.803% 12/15/32 | | | 1,505,000 | | | | 1,487,888 | |
The Bank of Nova Scotia
4.500% 12/16/25 | | | 1,295,000 | | | | 1,362,284 | |
The Bank of Nova Scotia VRN (b)
4.650% 12/31/99 | | | 1,175,000 | | | | 1,168,009 | |
Barclays PLC
4.337% 1/10/28 | | | 1,720,000 | | | | 1,780,140 | |
BPCE SA (a)
3.500% 10/23/27 | | | 2,570,000 | | | | 2,528,857 | |
Citigroup, Inc.
4.125% 7/25/28 | | | 2,975,000 | | | | 3,066,199 | |
Credit Suisse Group AG (a)
4.282% 1/09/28 | | | 1,325,000 | | | | 1,381,445 | |
First Horizon National Corp.
3.500% 12/15/20 | | | 3,580,000 | | | | 3,655,828 | |
First Republic Bank
4.375% 8/01/46 | | | 4,360,000 | | | | 4,457,331 | |
The accompanying notes are an integral part of the financial statements.
47
MML Managed Bond Fund – Portfolio of Investments (Continued)
| | | | | | | | |
| | | Principal
Amount | | | Value | |
Fulton Financial Corp.
3.600% 3/16/22 | | $ | 1,565,000 | | | $ | 1,571,227 | |
The Goldman Sachs Group, Inc.
5.750% 1/24/22 | | | 950,000 | | | | 1,053,389 | |
The Goldman Sachs Group, Inc.
5.950% 1/15/27 | | | 1,410,000 | | | | 1,647,124 | |
The Goldman Sachs Group, Inc.
6.125% 2/15/33 | | | 335,000 | | | | 426,977 | |
The Goldman Sachs Group, Inc.
6.750% 10/01/37 | | | 345,000 | | | | 461,832 | |
ICICI Bank Ltd. (a)
4.700% 2/21/18 | | | 1,250,000 | | | | 1,253,198 | |
JP Morgan Chase & Co.
3.625% 12/01/27 | | | 1,235,000 | | | | 1,248,308 | |
JP Morgan Chase & Co.
5.600% 7/15/41 | | | 1,125,000 | | | | 1,447,085 | |
SVB Financial Group
3.500% 1/29/25 | | | 2,960,000 | | | | 2,967,078 | |
SVB Financial Group
5.375% 9/15/20 | | | 475,000 | | | | 507,667 | |
Turkiye Garanti Bankasi AS (a)
4.750% 10/17/19 | | | 3,010,000 | | | | 3,055,210 | |
Valley National Bancorp
5.125% 9/27/23 | | | 1,530,000 | | | | 1,637,831 | |
| | | | | | | | |
| | | | | | | 53,848,537 | |
| | | | | | | | |
| Beverages — 0.4% | | | | | | | | |
Anheuser-Busch InBev Finance, Inc.
4.900% 2/01/46 | | | 3,825,000 | | | | 4,433,133 | |
Molson Coors Brewing Co.
4.200% 7/15/46 | | | 620,000 | | | | 631,794 | |
| | | | | | | | |
| | | | | | | 5,064,927 | |
| | | | | | | | |
| Biotechnology — 0.5% | | | | | | | | |
Amgen, Inc.
5.150% 11/15/41 | | | 475,000 | | | | 570,050 | |
Baxalta, Inc.
5.250% 6/23/45 | | | 885,000 | | | | 1,031,406 | |
Celgene Corp.
3.450% 11/15/27 | | | 2,330,000 | | | | 2,328,264 | |
Celgene Corp.
4.350% 11/15/47 | | | 1,890,000 | | | | 1,963,198 | |
| | | | | | | | |
| | | | | | | 5,892,918 | |
| | | | | | | | |
| Building Materials — 0.5% | | | | | | | | |
Standard Industries, Inc. (a)
5.000% 2/15/27 | | | 3,037,000 | | | | 3,105,332 | |
Standard Industries, Inc. (a)
5.375% 11/15/24 | | | 1,636,000 | | | | 1,710,111 | |
Standard Industries, Inc. (a)
5.500% 2/15/23 | | | 1,238,000 | | | | 1,290,615 | |
| | | | | | | | |
| | | | | | | 6,106,058 | |
| | | | | | | | |
| | | | | | | | |
| | | Principal
Amount | | | Value | |
| Chemicals — 0.5% | | | | | | | | |
Ashland, Inc.
6.875% 5/15/43 | | $ | 302,000 | | | $ | 335,220 | |
Incitec Pivot Finance LLC (a)
6.000% 12/10/19 | | | 1,160,000 | | | | 1,228,783 | |
Monsanto Co.
4.400% 7/15/44 | | | 650,000 | | | | 692,606 | |
The Mosaic Co.
3.250% 11/15/22 | | | 1,150,000 | | | | 1,139,940 | |
The Mosaic Co.
4.050% 11/15/27 | | | 1,170,000 | | | | 1,173,067 | |
RPM International, Inc.
3.750% 3/15/27 | | | 725,000 | | | | 733,617 | |
The Sherwin-Williams Co.
4.500% 6/01/47 | | | 700,000 | | | | 765,341 | |
The Sherwin-Williams Co. (a)
7.250% 6/15/19 | | | 315,000 | | | | 336,762 | |
| | | | | | | | |
| | | | | | | 6,405,336 | |
| | | | | | | | |
| Commercial Services — 0.3% | | | | | | | | |
The ADT Corp.
6.250% 10/15/21 | | | 2,875,000 | | | | 3,148,125 | |
ERAC USA Finance LLC (a)
6.700% 6/01/34 | | | 125,000 | | | | 157,776 | |
| | | | | | | | |
| | | | | | | 3,305,901 | |
| | | | | | | | |
| Computers — 1.0% | | | | | | | | |
Dell International LLC/EMC Corp. (a)
3.480% 6/01/19 | | | 2,975,000 | | | | 3,012,269 | |
Dell International LLC/EMC Corp. (a)
6.020% 6/15/26 | | | 487,000 | | | | 536,975 | |
DXC Technology Co.
2.875% 3/27/20 | | | 610,000 | | | | 612,967 | |
DXC Technology Co.
4.750% 4/15/27 | | | 1,845,000 | | | | 1,961,995 | |
Enterprise Services LLC
7.450% 10/15/29 | | | 300,000 | | | | 372,858 | |
Leidos Holdings, Inc.
4.450% 12/01/20 | | | 5,665,000 | | | | 5,877,438 | |
| | | | | | | | |
| | | | | | | 12,374,502 | |
| | | | | | | | |
| Diversified Financial Services — 2.3% | |
AerCap Ireland Capital DAC/AerCap Global Aviation Trust
4.500% 5/15/21 | | | 1,810,000 | | | | 1,900,896 | |
Affiliated Managers Group, Inc.
3.500% 8/01/25 | | | 2,080,000 | | | | 2,103,292 | |
Aircastle Ltd.
5.000% 4/01/23 | | | 1,750,000 | | | | 1,844,063 | |
Ally Financial, Inc.
3.250% 11/05/18 | | | 3,060,000 | | | | 3,067,650 | |
Ally Financial, Inc.
4.750% 9/10/18 | | | 2,165,000 | | | | 2,192,062 | |
The accompanying notes are an integral part of the financial statements.
48
MML Managed Bond Fund – Portfolio of Investments (Continued)
| | | | | | | | |
| | | Principal
Amount | | | Value | |
Ares Finance Co. LLC (a)
4.000% 10/08/24 | | $ | 2,080,000 | | | $ | 2,000,856 | |
Brookfield Finance LLC
4.000% 4/01/24 | | | 3,030,000 | | | | 3,136,737 | |
Discover Financial Services
4.100% 2/09/27 | | | 1,750,000 | | | | 1,792,580 | |
Genpact Luxembourg Sarl (a)
3.700% 4/01/22 | | | 2,400,000 | | | | 2,385,327 | |
Lazard Group LLC
3.625% 3/01/27 | | | 1,253,000 | | | | 1,250,410 | |
Lazard Group LLC
4.250% 11/14/20 | | | 3,710,000 | | | | 3,864,259 | |
Legg Mason, Inc.
5.625% 1/15/44 | | | 1,195,000 | | | | 1,332,277 | |
Neuberger Berman Group LLC/Neuberger Berman Finance Corp. (a)
4.500% 3/15/27 | | | 1,150,000 | | | | 1,209,570 | |
| | | | | | | | |
| | | | | | | 28,079,979 | |
| | | | | | | | |
| Electric — 2.1% | | | | | | | | |
The Cleveland Electric Illuminating Co. (a)
3.500% 4/01/28 | | | 945,000 | | | | 946,032 | |
Duke Energy Corp.
3.750% 9/01/46 | | | 1,235,000 | | | | 1,221,305 | |
EDP Finance BV (a)
3.625% 7/15/24 | | | 2,665,000 | | | | 2,683,985 | |
Entergy Louisiana LLC
4.950% 1/15/45 | | | 1,005,000 | | | | 1,056,016 | |
Florida Power & Light Co.
4.950% 6/01/35 | | | 630,000 | | | | 746,507 | |
Infraestructura Energetica Nova SAB de CV (a)
3.750% 1/14/28 | | | 820,000 | | | | 808,930 | |
IPALCO Enterprises, Inc.
3.450% 7/15/20 | | | 4,160,000 | | | | 4,201,600 | |
IPALCO Enterprises, Inc. (a)
3.700% 9/01/24 | | | 1,060,000 | | | | 1,059,037 | |
Israel Electric Corp. Ltd. (a)
7.250% 1/15/19 | | | 1,250,000 | | | | 1,302,350 | |
Majapahit Holding BV (a)
7.750% 1/20/20 | | | 1,220,000 | | | | 1,334,436 | |
Nevada Power Co., Series N
6.650% 4/01/36 | | | 550,000 | | | | 764,369 | |
Oncor Electric Delivery Co.
7.500% 9/01/38 | | | 495,000 | | | | 748,786 | |
Pacific Gas & Electric Co.
5.800% 3/01/37 | | | 543,000 | | | | 677,617 | |
Pennsylvania Electric Co. (a)
4.150% 4/15/25 | | | 1,860,000 | | | | 1,947,360 | |
Progress Energy, Inc.
7.000% 10/30/31 | | | 485,000 | | | | 648,099 | |
Puget Energy, Inc.
3.650% 5/15/25 | | | 2,345,000 | | | | 2,404,029 | |
| | | | | | | | |
| | | Principal
Amount | | | Value | |
Puget Energy, Inc.
6.500% 12/15/20 | | $ | 1,580,000 | | | $ | 1,749,071 | |
Tri-State Pass-Through Trust, Series 2003, Class A (a)
6.040% 1/31/18 | | | 20,291 | | | | 20,348 | |
Tri-State Pass-Through Trust, Series 2003, Class B (a)
7.144% 7/31/33 | | | 480,000 | | | | 593,328 | |
Virginia Electric and Power Co.
6.350% 11/30/37 | | | 640,000 | | | | 882,260 | |
| | | | | | | | |
| | | | | | | 25,795,465 | |
| | | | | | | | |
| Electronics — 0.6% | | | | | | | | |
Arrow Electronics, Inc.
3.250% 9/08/24 | | | 965,000 | | | | 945,589 | |
Arrow Electronics, Inc.
3.500% 4/01/22 | | | 1,680,000 | | | | 1,702,503 | |
Arrow Electronics, Inc.
3.875% 1/12/28 | | | 985,000 | | | | 982,047 | |
Avnet, Inc.
3.750% 12/01/21 | | | 405,000 | | | | 410,826 | |
FLIR Systems, Inc.
3.125% 6/15/21 | | | 1,235,000 | | | | 1,244,137 | |
Ingram Micro, Inc. STEP
5.450% 12/15/24 | | | 1,288,000 | | | | 1,279,222 | |
Tech Data Corp.
3.700% 2/15/22 | | | 855,000 | | | | 857,651 | |
Tyco Electronics Group SA
7.125% 10/01/37 | | | 335,000 | | | | 485,034 | |
| | | | | | | | |
| | | | | | | 7,907,009 | |
| | | | | | | | |
| Engineering & Construction — 0.4% | | | | | | | | |
SBA Tower Trust (a)
3.156% 10/10/45 | | | 1,200,000 | | | | 1,209,000 | |
SBA Tower Trust (a)
2.877% 7/10/46 | | | 1,200,000 | | | | 1,191,000 | |
SBA Tower Trust (a)
3.168% 4/09/47 | | | 1,930,000 | | | | 1,921,202 | |
| | | | | | | | |
| | | | | | | 4,321,202 | |
| | | | | | | | |
| Foods — 0.2% | | | | | | | | |
Kraft Heinz Foods Co.
3.000% 6/01/26 | | | 1,915,000 | | | | 1,842,767 | |
| | | | | | | | |
| Gas — 0.3% | | | | | | | | |
NiSource Finance Corp.
5.800% 2/01/42 | | | 950,000 | | | | 1,177,070 | |
Spire, Inc.
4.700% 8/15/44 | | | 1,840,000 | | | | 2,042,673 | |
| | | | | | | | |
| | | | | | | 3,219,743 | |
| | | | | | | | |
| Hand & Machine Tools — 0.1% | | | | | | | | |
Kennametal, Inc.
2.650% 11/01/19 | | | 800,000 | | | | 800,633 | |
| | | | | | | | |
The accompanying notes are an integral part of the financial statements.
49
MML Managed Bond Fund – Portfolio of Investments (Continued)
| | | | | | | | |
| | | Principal
Amount | | | Value | |
| Health Care – Products — 0.5% | | | | | | | | |
Abbott Laboratories
3.750% 11/30/26 | | $ | 810,000 | | | $ | 831,762 | |
Abbott Laboratories
4.900% 11/30/46 | | | 755,000 | | | | 865,605 | |
Becton Dickinson & Co.
3.363% 6/06/24 | | | 1,625,000 | | | | 1,629,540 | |
Becton Dickinson & Co.
3.700% 6/06/27 | | | 1,705,000 | | | | 1,718,146 | |
Becton Dickinson & Co.
4.685% 12/15/44 | | | 825,000 | | | | 902,134 | |
| | | | | | | | |
| | | | | | | 5,947,187 | |
| | | | | | | | |
| Health Care – Services — 0.3% | | | | | | | | |
Humana, Inc.
3.950% 3/15/27 | | | 1,660,000 | | | | 1,718,738 | |
Humana, Inc.
4.800% 3/15/47 | | | 830,000 | | | | 935,859 | |
UnitedHealth Group, Inc.
3.950% 10/15/42 | | | 350,000 | | | | 363,801 | |
UnitedHealth Group, Inc.
6.875% 2/15/38 | | | 580,000 | | | | 841,247 | |
| | | | | | | | |
| | | | | | | 3,859,645 | |
| | | | | | | | |
| Home Builders — 0.3% | | | | | | | | |
Lennar Corp.
4.500% 11/15/19 | | | 3,390,000 | | | | 3,478,987 | |
Lennar Corp.
6.950% 6/01/18 | | | 45,000 | | | | 45,844 | |
| | | | | | | | |
| | | | | | | 3,524,831 | |
| | | | | | | | |
| Household Products & Wares — 0.0% | | | | | | | | |
Church & Dwight Co., Inc.
3.150% 8/01/27 | | | 520,000 | | | | 512,319 | |
| | | | | | | | |
| Insurance — 2.8% | | | | | | | | |
The Allstate Corp. 3 mo. USD LIBOR + 2.938%, VRN
5.750% 8/15/53 | | | 2,260,000 | | | | 2,465,660 | |
American International Group, Inc.
4.500% 7/16/44 | | | 1,175,000 | | | | 1,265,594 | |
AmTrust Financial Services, Inc.
6.125% 8/15/23 | | | 3,030,000 | | | | 2,910,315 | |
Arch Capital Group US, Inc.
5.144% 11/01/43 | | | 1,040,000 | | | | 1,213,074 | |
Athene Global Funding (a)
3.000% 7/01/22 | | | 2,280,000 | | | | 2,256,683 | |
AXIS Specialty Finance PLC
2.650% 4/01/19 | | | 590,000 | | | | 588,029 | |
AXIS Specialty Finance PLC
4.000% 12/06/27 | | | 1,625,000 | | | | 1,632,328 | |
Brown & Brown, Inc.
4.200% 9/15/24 | | | 456,000 | | | | 478,009 | |
The Chubb Corp. 3 mo. USD LIBOR + 2.250%, VRN
3.609% 3/29/67 | | | 374,000 | | | | 371,195 | |
| | | | | | | | |
| | | Principal
Amount | | | Value | |
CNA Financial Corp.
3.450% 8/15/27 | | $ | 1,115,000 | | | $ | 1,098,785 | |
CNO Financial Group, Inc.
4.500% 5/30/20 | | | 1,602,000 | | | | 1,650,060 | |
CNO Financial Group, Inc.
5.250% 5/30/25 | | | 2,321,000 | | | | 2,448,655 | |
Enstar Group Ltd.
4.500% 3/10/22 | | | 920,000 | | | | 936,984 | |
Five Corners Funding Trust (a)
4.419% 11/15/23 | | | 1,315,000 | | | | 1,409,192 | |
Reinsurance Group of America, Inc.
3.950% 9/15/26 | | | 2,260,000 | | | | 2,309,747 | |
Trinity Acquisition PLC
3.500% 9/15/21 | | | 1,540,000 | | | | 1,570,031 | |
Trinity Acquisition PLC
4.400% 3/15/26 | | | 445,000 | | | | 470,627 | |
USF&G Capital I (a)
8.500% 12/15/45 | | | 885,000 | | | | 1,298,680 | |
Willis North America, Inc.
7.000% 9/29/19 | | | 566,000 | | | | 607,014 | |
Willis Towers Watson PLC
5.750% 3/15/21 | | | 1,690,000 | | | | 1,838,994 | |
XLIT Ltd.
4.450% 3/31/25 | | | 1,200,000 | | | | 1,227,363 | |
XLIT Ltd.
5.750% 10/01/21 | | | 1,260,000 | | | | 1,382,900 | |
XLIT Ltd.
6.375% 11/15/24 | | | 2,590,000 | | | | 3,017,121 | |
| | | | | | | | |
| | | | | | | 34,447,040 | |
| | | | | | | | |
| Internet — 0.4% | | | | | | | | |
Amazon.com, Inc. (a)
4.050% 8/22/47 | | | 1,840,000 | | | | 1,982,999 | |
Expedia, Inc.
7.456% 8/15/18 | | | 2,550,000 | | | | 2,629,997 | |
| | | | | | | | |
| | | | | | | 4,612,996 | |
| | | | | | | | |
| Investment Companies — 0.8% | | | | | | | | |
Ares Capital Corp.
3.500% 2/10/23 | | | 3,100,000 | | | | 3,054,034 | |
Ares Capital Corp.
3.875% 1/15/20 | | | 1,850,000 | | | | 1,882,684 | |
FS Investment Corp.
4.000% 7/15/19 | | | 2,450,000 | | | | 2,479,044 | |
TCP Capital Corp.
4.125% 8/11/22 | | | 2,870,000 | | | | 2,824,805 | |
| | | | | | | | |
| | | | | | | 10,240,567 | |
| | | | | | | | |
| Iron & Steel — 0.8% | | | | | | | | |
ArcelorMittal
5.125% 6/01/20 | | | 2,165,000 | | | | 2,262,425 | |
ArcelorMittal STEP
5.750% 8/05/20 | | | 2,034,000 | | | | 2,145,870 | |
ArcelorMittal STEP
6.750% 2/25/22 | | | 1,201,000 | | | | 1,336,113 | |
The accompanying notes are an integral part of the financial statements.
50
MML Managed Bond Fund – Portfolio of Investments (Continued)
| | | | | | | | |
| | | Principal
Amount | | | Value | |
Vale Overseas Ltd.
5.875% 6/10/21 | | $ | 2,825,000 | | | $ | 3,076,425 | |
Vale Overseas Ltd.
6.875% 11/21/36 | | | 630,000 | | | | 771,750 | |
| | | | | | | | |
| | | | | | | 9,592,583 | |
| | | | | | | | |
| Machinery – Diversified — 0.5% | | | | | | | | |
CNH Industrial Capital LLC
3.375% 7/15/19 | | | 1,530,000 | | | | 1,541,475 | |
CNH Industrial Capital LLC
3.625% 4/15/18 | | | 655,000 | | | | 658,393 | |
CNH Industrial Capital LLC
3.875% 10/15/21 | | | 3,280,000 | | | | 3,337,531 | |
| | | | | | | | |
| | | | | | | 5,537,399 | |
| | | | | | | | |
| Media — 0.8% | | | | | | | | |
Charter Communications Operating LLC/Charter Communications Operating Capital
3.579% 7/23/20 | | | 1,560,000 | | | | 1,589,080 | |
Charter Communications Operating LLC/Charter Communications Operating Capital
4.464% 7/23/22 | | | 1,580,000 | | | | 1,648,492 | |
Charter Communications Operating LLC/Charter Communications Operating Capital
6.484% 10/23/45 | | | 1,285,000 | | | | 1,498,220 | |
Comcast Corp.
3.400% 7/15/46 | | | 645,000 | | | | 610,271 | |
Comcast Corp.
6.950% 8/15/37 | | | 515,000 | | | | 735,502 | |
Discovery Communications LLC
5.000% 9/20/37 | | | 995,000 | | | | 1,030,913 | |
Time Warner Cable, Inc.
6.750% 6/15/39 | | | 985,000 | | | | 1,181,878 | |
Time Warner Cable, Inc.
8.250% 4/01/19 | | | 75,000 | | | | 80,159 | |
Time Warner Cable, Inc.
8.750% 2/14/19 | | | 325,000 | | | | 346,524 | |
Time Warner, Inc.
6.250% 3/29/41 | | | 210,000 | | | | 259,346 | |
Viacom, Inc.
4.250% 9/01/23 | | | 753,000 | | | | 768,802 | |
| | | | | | | | |
| | | | | | | 9,749,187 | |
| | | | | | | | |
| Mining — 0.7% | | | | | | | | |
Anglo American Capital PLC (a)
3.625% 9/11/24 | | | 665,000 | | | | 661,815 | |
Glencore Funding LLC (a)
3.000% 10/27/22 | | | 850,000 | | | | 841,713 | |
Glencore Funding LLC (a)
3.875% 10/27/27 | | | 975,000 | | | | 962,091 | |
Glencore Funding LLC (a)
4.625% 4/29/24 | | | 2,365,000 | | | | 2,496,967 | |
| | | | | | | | |
| | | Principal
Amount | | | Value | |
Kinross Gold Corp. (a)
4.500% 7/15/27 | | $ | 1,020,000 | | | $ | 1,026,375 | |
Kinross Gold Corp.
5.125% 9/01/21 | | | 2,225,000 | | | | 2,319,562 | |
| | | | | | | | |
| | | | | | | 8,308,523 | |
| | | | | | | | |
| Miscellaneous – Manufacturing — 0.2% | |
General Electric Co.
4.125% 10/09/42 | | | 1,430,000 | | | | 1,498,069 | |
General Electric Corp.
6.875% 1/10/39 | | | 298,000 | | | | 429,415 | |
| | | | | | | | |
| | | | | | | 1,927,484 | |
| | | | | | | | |
| Office Equipment/Supplies — 0.3% | | | | | | | | |
Pitney Bowes, Inc.
3.625% 9/15/20 | | | 845,000 | | | | 836,550 | |
Pitney Bowes, Inc. STEP
3.625% 10/01/21 | | | 3,005,000 | | | | 2,794,650 | |
| | | | | | | | |
| | | | | | | 3,631,200 | |
| | | | | | | | |
| Office Furnishings — 0.0% | | | | | | | | |
Steelcase, Inc.
6.375% 2/15/21 | | | 100,000 | | | | 109,440 | |
| | | | | | | | |
| Oil & Gas — 2.1% | | | | | | | | |
Andeavor
3.800% 4/01/28 | | | 805,000 | | | | 806,924 | |
Andeavor
4.500% 4/01/48 | | | 510,000 | | | | 515,780 | |
Antero Resources Corp.
5.375% 11/01/21 | | | 3,050,000 | | | | 3,126,250 | |
Cenovus Energy, Inc.
3.000% 8/15/22 | | | 1,275,000 | | | | 1,267,047 | |
Cenovus Energy, Inc.
4.250% 4/15/27 | | | 1,875,000 | | | | 1,870,484 | |
Continental Resources, Inc. (a)
4.375% 1/15/28 | | | 1,573,000 | | | | 1,552,866 | |
Encana Corp.
6.500% 5/15/19 | | | 805,000 | | | | 845,849 | |
Encana Corp.
6.500% 2/01/38 | | | 545,000 | | | | 687,760 | |
EQT Corp.
3.900% 10/01/27 | | | 3,085,000 | | | | 3,066,898 | |
Helmerich & Payne International Drilling Co.
4.650% 3/15/25 | | | 935,000 | | | | 984,227 | |
Marathon Petroleum Corp.
6.500% 3/01/41 | | | 1,120,000 | | | | 1,403,748 | |
Nabors Industries, Inc.
5.500% 1/15/23 | | �� | 1,415,000 | | | | 1,372,550 | |
Newfield Exploration Co.
5.750% 1/30/22 | | | 1,200,000 | | | | 1,281,000 | |
PBF Holding Co. LLC/PBF Finance Corp.
7.000% 11/15/23 | | | 1,175,000 | | | | 1,222,000 | |
The accompanying notes are an integral part of the financial statements.
51
MML Managed Bond Fund – Portfolio of Investments (Continued)
| | | | | | | | |
| | | Principal
Amount | | | Value | |
Petroleos Mexicanos
3.125% 1/23/19 | | $ | 325,000 | | | $ | 326,625 | |
Petroleos Mexicanos
3.500% 1/30/23 | | | 675,000 | | | | 660,825 | |
Petroleos Mexicanos
4.625% 9/21/23 | | | 575,000 | | | | 591,531 | |
Petroleos Mexicanos
5.500% 1/21/21 | | | 1,190,000 | | | | 1,262,590 | |
Petroleos Mexicanos
6.375% 1/23/45 | | | 595,000 | | | | 598,183 | |
Petroleos Mexicanos (a)
6.500% 3/13/27 | | | 585,000 | | | | 639,405 | |
Petroleos Mexicanos
6.625% 6/15/35 | | | 140,000 | | | | 149,568 | |
QEP Resources, Inc.
6.875% 3/01/21 | | | 1,750,000 | | | | 1,890,000 | |
| | | | | | | | |
| | | | | | | 26,122,110 | |
| | | | | | | | |
| Oil & Gas Services — 0.1% | | | | | | | | |
National Oilwell Varco, Inc.
3.950% 12/01/42 | | | 1,451,000 | | | | 1,279,791 | |
Weatherford International Ltd.
6.000% 3/15/18 | | | 525,000 | | | | 525,630 | |
| | | | | | | | |
| | | | | | | 1,805,421 | |
| | | | | | | | |
| Packaging & Containers — 0.5% | | | | | | | | |
Amcor Finance USA, Inc. (a)
3.625% 4/28/26 | | | 3,105,000 | | | | 3,059,613 | |
Brambles USA, Inc. (a)
4.125% 10/23/25 | | | 772,000 | | | | 800,619 | |
Brambles USA, Inc. (a)
5.350% 4/01/20 | | | 490,000 | | | | 515,595 | |
The WestRock MWV LLC
7.550% 3/01/47 | | | 1,000,000 | | | | 1,418,216 | |
| | | | | | | | |
| | | | | | | 5,794,043 | |
| | | | | | | | |
| Pharmaceuticals — 0.9% | | | | | | | | |
AbbVie, Inc.
4.700% 5/14/45 | | | 1,060,000 | | | | 1,188,551 | |
Allergan Funding SCS
4.750% 3/15/45 | | | 1,270,000 | | | | 1,351,987 | |
Express Scripts Holding Co.
4.500% 2/25/26 | | | 1,180,000 | | | | 1,252,224 | |
Express Scripts Holding Co.
4.800% 7/15/46 | | | 1,180,000 | | | | 1,255,270 | |
Johnson & Johnson
5.850% 7/15/38 | | | 175,000 | | | | 237,097 | |
McKesson Corp.
4.883% 3/15/44 | | | 625,000 | | | | 680,148 | |
McKesson Corp.
6.000% 3/01/41 | | | 550,000 | | | | 671,851 | |
Pfizer, Inc.
7.200% 3/15/39 | | | 395,000 | | | | 605,748 | |
| | | | | | | | |
| | | Principal
Amount | | | Value | |
Shire Acquisitions Investments Ireland DAC
2.875% 9/23/23 | | $ | 1,085,000 | | | $ | 1,066,636 | |
Teva Pharmaceutical Finance Netherlands III BV
1.700% 7/19/19 | | | 625,000 | | | | 607,248 | |
Teva Pharmaceutical Finance Netherlands III BV
2.200% 7/21/21 | | | 2,568,000 | | | | 2,345,792 | |
Teva Pharmaceutical Finance Netherlands III BV
4.100% 10/01/46 | | | 460,000 | | | | 350,292 | |
| | | | | | | | |
| | | | | | | 11,612,844 | |
| | | | | | | | |
| Pipelines — 2.5% | | | | | | | | |
Andeavor Logistics LP VRN (b)
6.875% 12/31/99 | | | 1,545,000 | | | | 1,568,484 | |
Andeavor Logistics LP/Tesoro Logistics Finance Corp.
3.500% 12/01/22 | | | 450,000 | | | | 449,146 | |
Energy Transfer LP
4.200% 4/15/27 | | | 1,085,000 | | | | 1,079,360 | |
Energy Transfer LP
6.125% 12/15/45 | | | 800,000 | | | | 868,734 | |
Energy Transfer Partners LP VRN (b)
6.250% 12/31/99 | | | 2,370,000 | | | | 2,301,863 | |
EnLink Midstream Partners LP
4.150% 6/01/25 | | | 700,000 | | | | 707,302 | |
EnLink Midstream Partners LP
4.850% 7/15/26 | | | 951,000 | | | | 996,523 | |
Enterprise Products Operating LLC
5.700% 2/15/42 | | | 336,000 | | | | 406,336 | |
Enterprise Products Operating LLC
5.950% 2/01/41 | | | 455,000 | | | | 561,585 | |
Enterprise Products Operating LLC
6.125% 10/15/39 | | | 249,000 | | | | 313,236 | |
Kinder Morgan Energy Partners LP
6.375% 3/01/41 | | | 376,000 | | | | 437,049 | |
Kinder Morgan Energy Partners LP
6.500% 2/01/37 | | | 150,000 | | | | 175,541 | |
Kinder Morgan Energy Partners LP
6.550% 9/15/40 | | | 500,000 | | | | 584,566 | |
Kinder Morgan Energy Partners LP
6.950% 1/15/38 | | | 175,000 | | | | 217,586 | |
Kinder Morgan Finance Co. LLC (a)
6.000% 1/15/18 | | | 2,700,000 | | | | 2,704,747 | |
Magellan Midstream Partners LP
5.150% 10/15/43 | | | 1,115,000 | | | | 1,261,237 | |
MPLX LP
4.875% 6/01/25 | | | 2,418,000 | | | | 2,591,418 | |
MPLX LP
5.200% 3/01/47 | | | 245,000 | | | | 268,869 | |
MPLX LP
5.500% 2/15/23 | | | 912,000 | | | | 938,521 | |
The accompanying notes are an integral part of the financial statements.
52
MML Managed Bond Fund – Portfolio of Investments (Continued)
| | | | | | | | |
| | | Principal
Amount | | | Value | |
Phillips 66 Partners LP
3.750% 3/01/28 | | $ | 830,000 | | | $ | 830,379 | |
Phillips 66 Partners LP
4.680% 2/15/45 | | | 178,000 | | | | 182,829 | |
Plains All American Pipeline LP VRN (b)
6.125% 12/31/99 | | | 2,345,000 | | | | 2,341,482 | |
Plains All American Pipeline LP/PAA Finance Corp.
3.650% 6/01/22 | | | 1,195,000 | | | | 1,201,963 | |
Plains All American Pipeline LP/PAA Finance Corp.
4.500% 12/15/26 | | | 1,360,000 | | | | 1,378,632 | |
Plains All American Pipeline LP/PAA Finance Corp.
4.700% 6/15/44 | | | 675,000 | | | | 631,025 | |
Sabine Pass Liquefaction LLC (a)
4.200% 3/15/28 | | | 1,585,000 | | | | 1,603,671 | |
Sunoco Logistics Partners Operations LP
4.000% 10/01/27 | | | 1,375,000 | | | | 1,348,257 | |
Sunoco Logistics Partners Operations LP
5.300% 4/01/44 | | | 525,000 | | | | 518,122 | |
Tesoro Logistics LP/Tesoro Logistics Finance Corp.
6.250% 10/15/22 | | | 652,000 | | | | 691,752 | |
Western Gas Partners LP
4.000% 7/01/22 | | | 2,044,000 | | | | 2,085,241 | |
| | | | | | | | |
| | | | | | | 31,245,456 | |
| | | | | | | | |
| Private Equity — 0.2% | | | | | | | | |
Hercules Capital, Inc.
4.625% 10/23/22 | | | 2,910,000 | | | | 2,950,560 | |
| | | | | | | | |
| Real Estate Investment Trusts (REITS) — 0.8% | |
American Tower Corp.
4.400% 2/15/26 | | | 860,000 | | | | 904,363 | |
Crown Castle International Corp.
3.200% 9/01/24 | | | 1,605,000 | | | | 1,588,358 | |
Crown Castle International Corp.
4.000% 3/01/27 | | | 790,000 | | | | 807,717 | |
Healthcare Trust of America Holdings LP
3.500% 8/01/26 | | | 1,265,000 | | | | 1,245,490 | |
Highwoods Realty LP
7.500% 4/15/18 | | | 195,000 | | | | 197,951 | |
Host Hotels & Resorts LP
3.875% 4/01/24 | | | 1,675,000 | | | | 1,704,160 | |
Kimco Realty Corp.
3.300% 2/01/25 | | | 960,000 | | | | 952,516 | |
Mid-America Apartments LP
3.600% 6/01/27 | | | 1,115,000 | | | | 1,116,902 | |
UDR, Inc.
3.500% 7/01/27 | | | 1,435,000 | | | | 1,434,668 | |
| | | | | | | | |
| | | Principal
Amount | | | Value | |
Weingarten Realty Investors
3.250% 8/15/26 | | $ | 535,000 | | | $ | 513,486 | |
| | | | | | | | |
| | | | | | | 10,465,611 | |
| | | | | | | | |
| Retail — 1.1% | | | | | | | | |
CVS Health Corp.
6.125% 9/15/39 | | | 560,000 | | | | 703,793 | |
CVS Pass-Through Trust (a)
5.926% 1/10/34 | | | 1,180,340 | | | | 1,345,526 | |
CVS Pass-Through Trust (a)
7.507% 1/10/32 | | | 1,040,779 | | | | 1,275,571 | |
Dollar Tree, Inc.
5.750% 3/01/23 | | | 2,945,000 | | | | 3,084,887 | |
El Puerto de Liverpool SAB de CV (a)
3.950% 10/02/24 | | | 2,620,000 | | | | 2,633,100 | |
The Home Depot, Inc.
5.950% 4/01/41 | | | 600,000 | | | | 812,537 | |
QVC, Inc.
3.125% 4/01/19 | | | 960,000 | | | | 963,583 | |
QVC, Inc.
4.450% 2/15/25 | | | 1,380,000 | | | | 1,407,696 | |
QVC, Inc.
5.125% 7/02/22 | | | 545,000 | | | | 576,404 | |
Tiffany & Co.
4.900% 10/01/44 | | | 990,000 | | | | 999,307 | |
| | | | | | | | |
| | | | | | | 13,802,404 | |
| | | | | | | | |
| Semiconductors — 0.1% | | | | | | | | |
QUALCOMM, Inc.
4.300% 5/20/47 | | | 1,400,000 | | | | 1,410,368 | |
| | | | | | | | |
| Software — 0.4% | | | | | | | | |
Microsoft Corp.
4.450% 11/03/45 | | | 2,064,000 | | | | 2,419,207 | |
Oracle Corp.
4.000% 7/15/46 | | | 1,820,000 | | | | 1,936,500 | |
| | | | | | | | |
| | | | | | | 4,355,707 | |
| | | | | | | | |
| Telecommunications — 2.0% | |
AT&T, Inc.
3.400% 8/14/24 | | | 2,005,000 | | | | 2,015,294 | |
AT&T, Inc.
3.800% 3/01/24 | | | 1,680,000 | | | | 1,720,505 | |
AT&T, Inc.
3.900% 8/14/27 | | | 1,835,000 | | | | 1,847,261 | |
AT&T, Inc.
4.750% 5/15/46 | | | 1,775,000 | | | | 1,736,033 | |
AT&T, Inc.
4.900% 8/14/37 | | | 850,000 | | | | 860,706 | |
AT&T, Inc.
5.250% 3/01/37 | | | 1,295,000 | | | | 1,369,623 | |
CenturyLink, Inc.
6.150% 9/15/19 | | | 560,000 | | | | 579,600 | |
Cisco Systems, Inc.
5.500% 1/15/40 | | | 345,000 | | | | 456,505 | |
The accompanying notes are an integral part of the financial statements.
53
MML Managed Bond Fund – Portfolio of Investments (Continued)
| | | | | | | | |
| | | Principal
Amount | | | Value | |
Crown Castle Towers LLC (a)
3.222% 5/15/42 | | $ | 1,700,000 | | | $ | 1,717,051 | |
Embarq Corp.
7.995% 6/01/36 | | | 145,000 | | | | 141,013 | |
Hughes Satellite Systems Corp.
6.500% 6/15/19 | | | 1,125,000 | | | | 1,175,625 | |
Sprint Communications, Inc.
9.250% 4/15/22 | | | 2,550,000 | | | | 3,040,875 | |
Ericsson LM
4.125% 5/15/22 | | | 3,075,000 | | | | 3,096,588 | |
Turk Telekomunikasyon AS (a)
3.750% 6/19/19 | | | 240,000 | | | | 241,382 | |
Verizon Communications, Inc.
4.125% 3/16/27 | | | 1,205,000 | | | | 1,256,469 | |
Verizon Communications, Inc.
4.862% 8/21/46 | | | 2,228,000 | | | | 2,320,736 | |
Verizon Communications, Inc.
6.550% 9/15/43 | | | 885,000 | | | | 1,155,297 | |
| | | | | | | | |
| | | | | | | 24,730,563 | |
| | | | | | | | |
| Toys, Games & Hobbies — 0.1% | |
Mattel, Inc.
1.700% 3/15/18 | | | 1,805,000 | | | | 1,798,231 | |
| | | | | | | | |
| Transportation — 0.3% | |
Asciano Finance Ltd. (a)
4.625% 9/23/20 | | | 610,000 | | | | 630,507 | |
Asciano Finance Ltd. (a)
5.000% 4/07/18 | | | 1,150,000 | | | | 1,157,315 | |
Autoridad del Canal de Panama (a)
4.950% 7/29/35 | | | 1,050,000 | | | | 1,170,750 | |
Burlington Northern Santa Fe LLC
6.150% 5/01/37 | | | 720,000 | | | | 965,138 | |
| | | | | | | | |
| | | | | | | 3,923,710 | |
| | | | | | | | |
| Trucking & Leasing — 0.4% | |
DAE Funding LLC (a)
4.000% 8/01/20 | | | 1,049,000 | | | | 1,059,490 | |
Park Aerospace Holdings Ltd. (a)
4.500% 3/15/23 | | | 1,550,000 | | | | 1,480,250 | |
Park Aerospace Holdings Ltd. (a)
5.250% 8/15/22 | | | 2,125,000 | | | | 2,111,719 | |
| | | | | | | | |
| | | | | | | 4,651,459 | |
| | | | | | | | |
| | |
TOTAL CORPORATE DEBT
(Cost $421,696,625) | | | | | | | 434,090,556 | |
| | | | | | | | |
|
| MUNICIPAL OBLIGATIONS — 0.8% | |
JobsOhio Beverage System Series B
4.532% 1/01/35 | | | 3,950,000 | | | | 4,421,393 | |
New York City Water & Sewer System
5.882% 6/15/44 | | | 105,000 | | | | 145,258 | |
| | | | | | | | |
| | | Principal
Amount | | | Value | |
Orange County Local Transportation Authority BAB
6.908% 2/15/41 | | $ | 1,350,000 | | | $ | 1,903,392 | |
Panhandle-Plains Student Finance Corp., Series 2001-A2, FRN (b)
3.052% 12/01/31 | | | 800,000 | | | | 786,168 | |
State of California BAB
7.550% 4/01/39 | | | 120,000 | | | | 188,833 | |
State of California BAB
7.600% 11/01/40 | | | 1,115,000 | | | | 1,780,577 | |
| | | | | | | | |
| | | | | | | 9,225,621 | |
| | | | | | | | |
| | |
TOTAL MUNICIPAL OBLIGATIONS
(Cost $8,475,308) | | | | | | | 9,225,621 | |
| | | | | | | | |
|
NON-U.S. GOVERNMENT AGENCY
OBLIGATIONS — 28.7% | |
| Automobile ABS — 0.9% | | | | | | | | |
CFC LLC, Series 2014-2A, Class A (a) 1.440% 11/16/20 | | | 84,342 | | | | 84,278 | |
CPS Auto Trust, Series 2016-C, Class A (a)
1.620% 1/15/20 | | | 266,773 | | | | 266,387 | |
Drive Auto Receivables Trust, Series 2016-BA, Class B (a)
2.560% 6/15/20 | | | 488,638 | | | | 489,098 | |
First Investors Auto Owner Trust, Series 2016-2A, Class B (a)
2.210% 7/15/22 | | | 2,990,000 | | | | 2,954,576 | |
Oscar US Funding Trust II, Series 2015-1A, Class A4 (a)
2.440% 6/15/22 | | | 2,250,000 | | | | 2,243,063 | |
Oscar US Funding Trust IV, Series 2016-1A, Class A2B, 1 mo. USD LIBOR + 1.700%, FRN (a)
2.950% 7/15/20 | | | 515,557 | | | | 518,218 | |
Oscar US Funding Trust V, Series 2016-2A, Class A4 (a)
2.990% 12/15/23 | | | 4,000,000 | | | | 3,983,428 | |
Oscar US Funding Trust VI, Series 2017-1A, Class A4 (a)
3.300% 5/10/24 | | | 950,000 | | | | 953,148 | |
| | | | | | | | |
| | | | | | | 11,492,196 | |
| | | | | | | | |
| Commercial MBS — 1.0% | |
Banc of America Commercial Mortgage, Inc., Series 2008-1, Class AM, VRN (b)
6.184% 2/10/51 | | | 606,753 | | | | 606,503 | |
Bear Stearns Commercial Mortgage Securities, Series 2007-T26, Class AM, VRN (b)
5.513% 1/12/45 | | | 750,208 | | | | 748,909 | |
The accompanying notes are an integral part of the financial statements.
54
MML Managed Bond Fund – Portfolio of Investments (Continued)
| | | | | | | | |
| | | Principal
Amount | | | Value | |
Commercial Mortgage Pass-Through Certificates, Series 2012-CR4, Class B (a)
3.703% 10/15/45 | | $ | 1,060,000 | | | $ | 1,061,388 | |
Commercial Mortgage Pass-Through Certificates, Series 2014-UBS2, Class AM
4.199% 3/10/47 | | | 1,375,000 | | | | 1,440,224 | |
Commercial Mortgage Pass-Through Certificates, Series 2014-CR14, Class A4, VRN (b)
4.236% 2/10/47 | | | 1,410,000 | | | | 1,508,012 | |
Commercial Mortgage Pass-Through Certificates, Series 2015-CR23, Class C, VRN (b)
4.254% 5/10/48 | | | 1,000,000 | | | | 985,188 | |
DBCCRE Mortgage Trust, Series 2014-ARCP, Class A (a)
4.238% 1/10/34 | | | 995,000 | | | | 1,023,772 | |
GCCFC Commercial Mortgage Trust, Series 2006-GG7, Class AM, VRN (b)
5.767% 7/10/38 | | | 1,280,685 | | | | 1,293,450 | |
GS Mortgage Securities Corp. II, Series 2012-GC6, Class AS (a)
4.948% 1/10/45 | | | 488,000 | | | | 521,491 | |
JP Morgan Chase Commercial Mortgage Securities Corp., Series 2007-CB18, Class AM, VRN (b)
5.466% 6/12/47 | | | 500,416 | | | | 499,599 | |
Morgan Stanley Capital I Trust, Series 2011-C2, Class B, VRN (a) (b)
5.200% 6/15/44 | | | 1,325,000 | | | | 1,396,869 | |
TIAA Seasoned Commercial Mortgage Trust, Series 2007-C4, Class AJ, VRN (b)
5.476% 8/15/39 | | | 126,083 | | | | 125,798 | |
Wachovia Bank Commercial Mortgage Trust, Series 2006-C26, Class AM, VRN (b)
5.997% 6/15/45 | | | 364,135 | | | | 366,075 | |
Wachovia Bank Commercial Mortgage Trust, Series 2007-C33, Class AM, VRN (b)
6.011% 2/15/51 | | | 795,948 | | | | 798,297 | |
Wells Fargo Commercial Mortgage Trust, Series 2010-C1, Class A1 (a)
3.349% 11/15/43 | | | 97,887 | | | | 99,088 | |
| | | | | | | | |
| | | | | | | 12,474,663 | |
| | | | | | | | |
| | | | | | | | |
| | | Principal
Amount | | | Value | |
| Home Equity ABS — 0.1% | |
ACE Securities Corp., Series 2005-HE7, Class A2D, 1 mo. USD LIBOR +
.660%, FRN
2.212% 11/25/35 | | $ | 117,558 | | | $ | 117,499 | |
Bayview Financial Mortgage Pass-Through Trust, Series 2005-C, Class M1, 1 mo. USD LIBOR +
.500%, FRN
2.064% 6/28/44 | | | 148,548 | | | | 148,766 | |
Countrywide Partnership Trust, Series 2004-EC1, Class M1, 1 mo. USD LIBOR + .900%, FRN
2.452% 2/25/35 | | | 541,680 | | | | 511,261 | |
Mastr Asset-Backed Securities Trust, Series 2005-WMC1, Class M3, 1 mo. USD LIBOR + .720%, FRN
2.272% 3/25/35 | | | 560,827 | | | | 561,961 | |
| | | | | | | | |
| | | | | | | 1,339,487 | |
| | | | | | | | |
| Other ABS — 15.7% | |
321 Henderson Receivables I LLC, Series 2007-1A, Class A1, 1 mo. USD LIBOR + .200%, FRN (a)
1.677% 3/15/42 | | | 590,191 | | | | 565,267 | |
321 Henderson Receivables I LLC, Series 2015-1A, Class A (a)
3.260% 9/15/72 | | | 1,227,142 | | | | 1,211,773 | |
Aames Mortgage Investment Trust, Series 2004-1, Class M5, 1 mo. USD LIBOR + 1.725%, FRN
3.053% 1/25/35 | | | 383,580 | | | | 382,154 | |
ALM VII Ltd., Series 2012-7A, Class A1R, 3 mo. USD LIBOR + 1.480%, FRN (a)
2.839% 10/15/28 | | | 2,620,000 | | | | 2,641,869 | |
ALM XIV Ltd., Series 2014-14A, Class A1R, 3 mo. USD LIBOR +
1.150%, FRN (a)
2.528% 7/28/26 | | | 2,450,000 | | | | 2,455,003 | |
Alterna Funding II LLC, Series 2015-1A, Class A (a)
2.500% 2/15/24 | | | 550,424 | | | | 549,392 | |
Apidos CLO XXV, Series 2016-25A, Class A1, 3 mo. USD LIBOR +
1.460%, FRN (a)
2.823% 10/20/28 | | | 770,000 | | | | 772,371 | |
Arbys Funding LLC, Series 2015-1A, Class A2 (a)
4.969% 10/30/45 | | | 1,862,000 | | | | 1,901,718 | |
ARL First LLC, Series 2012-1A, Class A1, 1 mo. USD LIBOR +
1.750%, FRN (a)
3.227% 12/15/42 | | | 1,012,617 | | | | 1,020,193 | |
The accompanying notes are an integral part of the financial statements.
55
MML Managed Bond Fund – Portfolio of Investments (Continued)
| | | | | | | | |
| | | Principal
Amount | | | Value | |
Avery Point III CLO Ltd., Series 2013-3A, Class AR, 3 mo. USD LIBOR + 1.120%, FRN (a)
2.474% 1/18/25 | | $ | 1,250,000 | | | $ | 1,253,235 | |
Avery Point VI CLO Ltd., Series 2015-6A, Class A, 3 mo. USD LIBOR + 1.450%, FRN (a)
2.841% 8/05/27 | | | 3,825,000 | | | | 3,836,502 | |
Bain Capital Credit CLO, Series 2017-1A, Class A1, 3 mo. USD LIBOR + 1.250%, FRN (a)
2.564% 7/20/30 | | | 1,990,000 | | | | 1,996,101 | |
Birchwood Park CLO Ltd., Series 2014-1A, Class AR, 3 mo. USD LIBOR + 1.180%, FRN (a)
2.539% 7/15/26 | | | 2,180,000 | | | | 2,187,268 | |
Blackbird Capital Aircraft Lease Securitization Ltd., Series 2016-1A, Class AA, STEP (a)
2.487% 12/16/41 | | | 1,664,583 | | | | 1,649,139 | |
BlueMountain CLO Ltd., Series 2015-2A, Class A1, 3 mo. USD LIBOR + 1.430%, FRN (a)
2.784% 7/18/27 | | | 2,595,000 | | | | 2,607,222 | |
BlueVirgo Trust, Series 2015-1A, Class NOTE (a)
3.000% 12/15/22 | | | 1,262,328 | | | | 1,265,131 | |
BRE Grand Islander Timeshare Issuer LLC, Series 2017-1A, Class A (a)
2.940% 5/25/29 | | | 1,146,498 | | | | 1,134,185 | |
Capital Automotive REIT, Series 2014-1A, Class A (a)
3.660% 10/15/44 | | | 900,000 | | | | 900,404 | |
Capital Automotive REIT, Series 2017-1A, Class A2 (a)
4.180% 4/15/47 | | | 993,333 | | | | 1,009,210 | |
Carlyle Global Market Strategies CLO Ltd., Series 2013-1A, Class A1R, 3 mo. USD LIBOR + 1.220%, FRN (a)
2.633% 8/14/30 | | | 4,000,000 | | | | 4,016,188 | |
CBAM Ltd., Series 2017-3A, Class A, FRN (a) (b)
2.599% 10/17/29 | | | 3,510,000 | | | | 3,513,538 | |
CIFC Funding V Ltd., Series 2017-5A, Class A1, FRN (a) (b)
2.543% 11/16/30 | | | 2,330,000 | | | | 2,330,767 | |
CKE Restaurant Holdings, Inc., Series 2013-1A, Class A2 (a)
4.474% 3/20/43 | | | 1,107,802 | | | | 1,111,418 | |
Clear Creek CLO Ltd., Series 2015-1A, Class AR, FRN (a) (b)
2.563% 10/20/30 | | | 2,040,000 | | | | 2,053,823 | |
| | | | | | | | |
| | | Principal
Amount | | | Value | |
Consumer Installment Loan Trust, Series 2016-LD1, Class A (a)
3.960% 7/15/22 | | $ | 463,404 | | | $ | 464,512 | |
Countrywide Asset-Backed Certificates, Series 2004-5, Class 3A, 1 mo. USD LIBOR + .460%, FRN
2.012% 9/25/34 | | | 156,238 | | | | 155,671 | |
Cronos Containers Program I Ltd., Series 2014-2A, Class A (a)
3.270% 11/18/29 | | | 394,444 | | | | 391,826 | |
Diamond Resorts Owner Trust, Series 2014-1, Class A (a)
2.540% 5/20/27 | | | 281,406 | | | | 281,143 | |
Diamond Resorts Owner Trust, Series 2015-1, Class A (a)
2.730% 7/20/27 | | | 604,895 | | | | 600,941 | |
Diamond Resorts Owner Trust, Series 2015-2, Class A (a)
2.990% 5/22/28 | | | 634,583 | | | | 628,539 | |
Diamond Resorts Owner Trust, Series 2016-1, Class A (a)
3.080% 11/20/28 | | | 2,949,580 | | | | 2,903,753 | |
Domino’s Pizza Master Issuer LLC, Series 2015-1A, Class A2I (a)
3.484% 10/25/45 | | | 2,856,500 | | | | 2,871,226 | |
Domino’s Pizza Master Issuer LLC, Series 2017-1A, Class A23 (a)
4.118% 7/25/47 | | | 778,050 | | | | 794,694 | |
Domino’s Pizza Master Issuer LLC, Series 2015-1A, Class A2II (a)
4.474% 10/25/45 | | | 3,053,500 | | | | 3,115,933 | |
Dong Fang Container Finance II SPV Ltd., Series 2014-1A, Class A1 (a)
1.950% 11/25/39 | | | 458,333 | | | | 455,499 | |
Drug Royalty Corp., Inc., Series 2014-1, Class A2 (a)
3.484% 7/15/23 | | | 308,777 | | | | 305,479 | |
Drug Royalty Corp., Inc., Series 2012-1, Class A2 (a)
5.800% 7/15/24 | | | 53,846 | | | | 53,958 | |
Elara HGV Timeshare Issuer LLC, Series 2016-A, Class A (a)
2.730% 4/25/28 | | | 1,725,359 | | | | 1,715,118 | |
Element Rail Leasing II LLC, Series 2015-1A, Class A1 (a)
2.707% 2/19/45 | | | 444,146 | | | | 433,614 | |
Element Rail Leasing II LLC, Series 2016-1A, Class A1 (a)
3.968% 3/19/46 | | | 1,213,090 | | | | 1,231,951 | |
Entegry New Orleans Storm Recovery Funding I LLC, Series 2015-1, Class A 2.670% 6/01/27 | | | 524,434 | | | | 523,253 | |
The accompanying notes are an integral part of the financial statements.
56
MML Managed Bond Fund – Portfolio of Investments (Continued)
| | | | | | | | |
| | | Principal
Amount | | | Value | |
Fairway Outdoor Funding LLC, Series 2012-1A, Class A2 (a)
4.212% 10/15/42 | | $ | 1,961,928 | | | $ | 2,000,650 | |
Galaxy XX CLO Ltd., Series 2015-20A, Class A, 3 mo. USD LIBOR + 1.450%, FRN (a)
2.813% 7/20/27 | | | 2,875,000 | | | | 2,877,993 | |
Global SC Finance II SRL, Series 2014-1A, Class A1 (a)
3.190% 7/17/29 | | | 329,167 | | | | 326,777 | |
Global SC Finance II SRL, Series 2013-2A, Class A (a)
3.670% 11/17/28 | | | 947,375 | | | | 931,830 | |
Global SC Finance IV Ltd., Series 2017-1A, Class A (a)
3.850% 4/15/37 | | | 1,741,347 | | | | 1,768,965 | |
Goldentree Loan Management US CLO Ltd., Series 2017-2A, Class A, FRN (a) (b)
2.724% 11/28/30 | | | 1,950,000 | | | | 1,955,875 | |
GoldenTree Loan Opportunities VII Ltd., Series 2013-7A, Class A, 3 mo. USD LIBOR + 1.150%, FRN (a)
2.517% 4/25/25 | | | 3,122,455 | | | | 3,123,104 | |
Goodgreen Trust, Series 2016-1A, Class A (a)
3.230% 10/15/52 | | | 2,778,499 | | | | 2,771,220 | |
Goodgreen Trust, Series 2017-1A, Class A (a)
3.740% 10/15/52 | | | 1,276,156 | | | | 1,267,188 | |
GSAMP Trust, Series 2005-AHL, Class M1, 1 mo. USD LIBOR + ..645%, FRN
2.197% 4/25/35 | | | 94,599 | | | | 95,042 | |
Helios Issuer LLC, Series 2017-1A, Class A (a)
4.940% 9/20/49 | | | 1,711,284 | | | | 1,753,555 | |
Hercules Capital Funding Trust, Series 2014-1A, Class A (a)
3.524% 4/16/21 | | | 380,143 | | | | 380,499 | |
Hero Funding, Series 2017-3A, Class A1 (a)
3.190% 9/20/48 | | | 1,571,201 | | | | 1,566,913 | |
HERO Funding Trust, Series 2016-3A, Class A1 (a)
3.080% 9/20/42 | | | 1,637,884 | | | | 1,616,447 | |
HERO Funding Trust, Series 2017-2A, Class A1 (a)
3.280% 9/20/48 | | | 487,153 | | | | 485,218 | |
HERO Funding Trust, Series 2016-4A, Class A1 (a)
3.570% 9/20/47 | | | 1,799,946 | | | | 1,829,232 | |
| | | | | | | | |
| | | Principal
Amount | | | Value | |
HERO Funding Trust, Series 2017-2A, Class A2 (a)
4.070% 9/20/48 | | $ | 391,659 | | | $ | 399,416 | |
Hilton Grand Vacations Trust, Series 2013-A, Class A (a)
2.280% 1/25/26 | | | 572,031 | | | | 568,086 | |
Labrador Aviation Finance Ltd., Series 2016-1A, Class A1 (a)
4.300% 1/15/42 | | | 2,658,438 | | | | 2,702,245 | |
LCM XIV LP, Series 14A, Class A, 3 mo. USD LIBOR + 1.150%, FRN (a)
2.509% 7/15/25 | | | 971,249 | | | | 972,593 | |
LCM XXIII Ltd., Series 23A, Class A1, 3 mo. USD LIBOR + 1.400%, FRN (a)
2.763% 10/20/29 | | | 3,030,000 | | | | 3,068,451 | |
Lendmark Funding Trust, Series 2017-1A, Class A (a)
2.830% 12/22/25 | | | 1,270,000 | | | | 1,266,680 | |
Long Beach Mortgage Loan Trust, Series 2005-1, Class M2, 1 mo. USD LIBOR + .795%, FRN
2.347% 2/25/35 | | | 202,263 | | | | 202,810 | |
Long Beach Mortgage Loan Trust, Series 2005-WL1, Class M2, 1 mo. USD LIBOR + .825%, FRN
2.377% 6/25/35 | | | 573,708 | | | | 574,167 | |
Marble Point CLO XI Ltd., Series 2017-2A, Class A, FRN (a) (b)
2.793% 12/18/30 | | | 1,200,000 | | | | 1,200,475 | |
Marlette Funding Trust, Series 2016-1A, Class A (a)
3.060% 1/17/23 | | | 617,846 | | | | 618,940 | |
Marlette Funding Trust, Series 2017-2A, Class B (a)
3.190% 7/15/24 | | | 1,000,000 | | | | 1,001,993 | |
Marriott Vacation Club Owner Trust, Series 2012-1A, Class A (a)
2.510% 5/20/30 | | | 197,007 | | | | 196,764 | |
Miramax LLC, Series 2014-1A, Class A2 (a)
3.340% 7/20/26 | | | 970,320 | | | | 971,113 | |
Mosaic Solar Loans LLC, Series 2017-2A, Class A (a)
3.820% 9/20/42 | | | 1,124,989 | | | | 1,129,268 | |
Mosaic Solar Loans LLC, Series 2017-1A, Class A (a)
4.450% 6/20/42 | | | 556,998 | | | | 568,311 | |
MP CLO III Ltd., Series 2013-1A, Class AR, FRN (a) (b)
2.613% 10/20/30 | | | 1,750,000 | | | | 1,763,106 | |
MVW Owner Trust, Series 2017-1A, Class A (a)
2.420% 12/20/34 | | | 480,647 | | | | 476,255 | |
The accompanying notes are an integral part of the financial statements.
57
MML Managed Bond Fund – Portfolio of Investments (Continued)
| | | | | | | | |
| | | Principal
Amount | | | Value | |
MVW Owner Trust, Series 2015-1A, Class A (a)
2.520% 12/20/32 | | $ | 686,082 | | | $ | 682,335 | |
Nations Equipment Finance Funding II LLC, Series 2014-1A, Class A (a)
1.558% 7/20/18 | | | 13,727 | | | | 13,720 | |
NP SPE II LLC, Series 2017-1A, Class A2 (a)
4.219% 10/21/47 | | | 2,260,000 | | | | 2,298,666 | |
NRZ Advance Receivables Trust, Series 2016-T4, Class AT4 (a)
3.107% 12/15/50 | | | 3,000,000 | | | | 2,986,641 | |
NRZ Advance Receivables Trust, Series 2016-T3, Class AT3 (a)
2.833% 10/16/51 | | | 10,600,000 | | | | 10,411,374 | |
OHA Credit Partners VIII Ltd., Series 2013-8A, Class A, 3 mo. USD LIBOR + 1.120%, FRN (a)
2.483% 4/20/25 | | | 1,847,050 | | | | 1,849,751 | |
OnDeck Asset Securitization Trust II LLC, Series 2016-1A, Class A (a)
4.210% 5/17/20 | | | 870,000 | | | | 873,217 | |
Oportun Funding VI LLC, Series 2017-A, Class A (a)
3.230% 6/08/23 | | | 1,880,000 | | | | 1,870,602 | |
Orange Lake Timeshare Trust, Series 2014-AA, Class A (a)
2.290% 7/09/29 | | | 236,866 | | | | 233,568 | |
Orange Lake Timeshare Trust, Series 2016-A, Class A (a)
2.610% 3/08/29 | | | 1,335,913 | | | | 1,322,380 | |
Orange Lake Timeshare Trust, Series 2016-A, Class B (a)
2.910% 3/08/29 | | | 1,118,740 | | | | 1,100,110 | |
Oxford Finance Funding Trust, Series 2016-1A, Class A (a)
3.968% 6/17/24 | | | 1,400,000 | | | | 1,405,315 | |
Oxford Finance Funding Trust, Series 2014-1A, Class A (a)
3.475% 12/15/22 | | | 384,448 | | | | 382,320 | |
Race Point VIII CLO Ltd., Series 2013-8A, Class AR, 3 mo. USD LIBOR + 1.340%, FRN (a)
2.776% 2/20/30 | | | 700,000 | | | | 705,300 | |
Residential Asset Mortgage Products, Inc., Series 2005-EFC5, Class M1, 1 mo. USD LIBOR + ..400%, FRN
1.952% 10/25/35 | | | 3,602 | | | | 3,602 | |
Sierra Receivables Funding Co. LLC, Series 2013-2A, Class A, VRN (a) (b)
2.280% 11/20/25 | | | 685,611 | | | | 685,343 | |
| | | | | | | | |
| | | Principal
Amount | | | Value | |
Sierra Receivables Funding Co. LLC, Series 2015-3A, Class B (a)
3.080% 9/20/32 | | $ | 214,367 | | | $ | 213,197 | |
SoFi Consumer Loan Program LLC, Series 2016-3, Class A (a)
3.050% 12/26/25 | | | 1,446,501 | | | | 1,453,437 | |
SoFi Consumer Loan Program LLC, Series 2016-5, Class A (a)
3.060% 9/25/28 | | | 7,068,678 | | | | 7,086,278 | |
SoFi Consumer Loan Program LLC, Series 2016-2A, Class A (a)
3.090% 10/27/25 | | | 2,211,518 | | | | 2,222,491 | |
SoFi Consumer Loan Program LLC, Series 2016-1A, Class A (a)
3.260% 8/25/25 | | | 3,249,696 | | | | 3,268,658 | |
SoFi Consumer Loan Program LLC, Series 2017-2, Class A (a)
3.280% 2/25/26 | | | 2,682,667 | | | | 2,699,821 | |
Spirit Master Funding LLC, Series 2014-4A, Class A1 (a)
3.501% 1/20/45 | | | 1,000,000 | | | | 1,002,807 | |
SpringCastle America Funding LLC, Series 2016-AA, Class A (a)
3.050% 4/25/29 | | | 1,262,105 | | | | 1,269,932 | |
SPS Servicer Advance Receivables Trust, Series 2016-T2, Class AT2 (a)
2.750% 11/15/49 | | | 4,490,000 | | | | 4,484,389 | |
Steele Creek CLO Ltd., Series 2017-1A, Class A, FRN (a) (b)
2.884% 1/15/30 | | | 660,000 | | | | 660,251 | |
Structured Receivables Finance LLC, Series 2010-B, Class A (a)
3.730% 8/15/36 | | | 254,325 | | | | 252,241 | |
SuttonPark Structured Settlements LLC, Series 2017-1A, Class A (a)
4.190% 1/15/71 | | | 2,025,793 | | | | 2,021,279 | |
Symphony CLO XV Ltd., Series 2014-15A, Class AR, 3 mo. USD LIBOR + 1.180%, FRN (a)
2.533% 10/17/26 | | | 2,900,000 | | | | 2,908,570 | |
Taco Bell Funding LLC, Series 2016-1A, Class A2I (a)
3.832% 5/25/46 | | | 2,468,750 | | | | 2,503,354 | |
TAL Advantage VI LLC, Series 2017-1A, Class A
4.500% 4/20/42 | | | 2,540,244 | | | | 2,605,073 | |
TCI-Symphony CLO Ltd., Series 2016-1A, Class A, 3 mo. USD LIBOR + 1.480%, FRN (a)
2.839% 10/13/29 | | | 2,150,000 | | | | 2,187,083 | |
Treman Park CLO Ltd., Series 2015-1A, Class AR, 3 mo. USD LIBOR + 1.370%, FRN (a)
2.733% 4/20/27 | | | 1,750,000 | | | | 1,752,907 | |
The accompanying notes are an integral part of the financial statements.
58
MML Managed Bond Fund – Portfolio of Investments (Continued)
| | | | | | | | |
| | | Principal
Amount | | | Value | |
Trip Rail Master Funding LLC, Series 2017-1A, Class A1 (a)
2.709% 8/15/47 | | $ | 595,509 | | | $ | 593,181 | |
Trip Rail Master Funding LLC, Series 2017-1A, Class A2 (a)
3.736% 8/15/47 | | | 810,000 | | | | 802,460 | |
Triton Container Finance IV LLC, Series 2017-2A, Class A (a)
3.620% 8/20/42 | | | 3,327,725 | | | | 3,331,273 | |
Triton Container Finance VI LLC, Series 2017-1A, Class A (a)
3.520% 6/20/42 | | | 914,234 | | | | 901,030 | |
Velocity Commercial Capital Loan Trust, Series 2016-2, Class AFX, VRN (b)
2.997% 10/25/46 | | | 1,782,146 | | | | 1,781,977 | |
VSE VOI Mortgage LLC, Series 2016-A, Class A (a)
2.540% 7/20/33 | | | 1,879,397 | | | | 1,863,403 | |
WAVE Trust, Series 2017-1A, Class A (a)
3.844% 11/15/42 | | | 4,034,016 | | | | 4,042,487 | |
WAVE Trust, Series 2017-1A, Class C (a)
6.656% 11/15/42 | | | 2,727,156 | | | | 2,727,074 | |
Wendys Funding LLC, Series 2015-1A, Class A2I (a)
3.371% 6/15/45 | | | 3,885,563 | | | | 3,891,448 | |
Wendys Funding LLC, Series 2015-1A, Class A2II (a)
4.080% 6/15/45 | | | 1,788,825 | | | | 1,831,186 | |
Wendys Funding LLC, Series 2015-1A, Class A23 (a)
4.497% 6/15/45 | | | 2,150,500 | | | | 2,190,541 | |
Westgate Resorts LLC, Series 2015-1A, Class A (a)
2.750% 5/20/27 | | | 770,088 | | | | 769,788 | |
Westgate Resorts LLC, Series 2017-1A, Class A (a)
3.050% 12/20/30 | | | 1,463,739 | | | | 1,460,991 | |
| | | | | | | | |
| | | | | | | 193,325,013 | |
| | | | | | | | |
| Student Loans ABS — 10.7% | | | | | | | | |
AccessLex Institute, Series 2004-A, Class A3, 28 day ARS, FRN
1.699% 7/01/39 | | | 2,950,000 | | | | 2,910,243 | |
AccessLex Institute, Series 2003-A, Class A3, 3 mo. Treasury + 1.200%, FRN
2.550% 7/01/38 | | | 439,951 | | | | 414,775 | |
College Loan Corp. Trust I, Series 2007-1, Class B2, 28 day ARS, FRN
1.182% 1/25/47 | | | 900,000 | | | | 730,232 | |
| | | | | | | | |
| | | Principal
Amount | | | Value | |
Collegiate Funding Services Education Loan Trust, Series 2005-B, Class A4, 3 mo. USD LIBOR + .160%, FRN
1.846% 3/28/35 | | $ | 1,463,758 | | | $ | 1,439,691 | |
DRB Prime Student Loan Trust, Series 2016-B, Class A2 (a)
2.890% 6/25/40 | | | 1,681,476 | | | | 1,684,984 | |
DRB Prime Student Loan Trust, Series 2015-D, Class A2 (a)
3.200% 1/25/40 | | | 900,550 | | | | 899,793 | |
DRB Prime Student Loan Trust, Series 2015-B, Class A1, 1 mo. USD LIBOR + 1.900%, FRN (a)
3.238% 10/27/31 | | | 229,109 | | | | 234,001 | |
DRB Prime Student Loan Trust, Series 2016-R, Class A1, 1 mo. USD LIBOR + 1.900%, FRN (a)
3.464% 10/25/44 | | | 4,592,189 | | | | 4,638,111 | |
DRB Prime Student Loan Trust, Series 2016-A, Class A1, 1 mo. USD LIBOR + 2.000%, FRN (a)
3.552% 4/25/40 | | | 712,956 | | | | 711,103 | |
Earnest Student Loan Program LLC, Series 2016-D, Class A2 (a)
2.720% 1/25/41 | | | 1,758,902 | | | | 1,740,245 | |
Earnest Student Loan Program LLC, Series 2016-B, Class A2 (a)
3.020% 5/25/34 | | | 1,241,118 | | | | 1,234,857 | |
Earnest Student Loan Program LLC, Series 2016-C, Class A1, 1 mo. USD LIBOR + 1.850%, FRN (a)
3.402% 10/27/36 | | | 2,759,276 | | | | 2,801,669 | |
ECMC Group Student Loan Trust, Series 2017-1A, Class A, 1 mo. USD LIBOR + 1.200%, FRN (a)
2.752% 12/27/66 | | | 3,064,931 | | | | 3,100,253 | |
ECMC Group Student Loan Trust, Series 2016-1A, Class A, 1 mo. USD LIBOR + 1.350%, FRN (a)
2.902% 7/26/66 | | | 3,567,156 | | | | 3,600,116 | |
Edlinc Student Loan Funding, Series 2017-A, Class A (Acquired 12/22/17, Cost $ 3,773,575), FRN (a) (b) (c) (d) (e)
3.350% 12/01/47 | | | 3,800,000 | | | | 3,773,575 | |
Education Services of America, Series 2014-4, Class B, 1 mo. USD LIBOR + 1.500%, FRN (a)
3.052% 6/25/48 | | | 1,200,000 | | | | 1,041,539 | |
Education Services of America, Series 2015-1, Class B, 1 mo. USD LIBOR + 1.500%, FRN (a)
3.052% 10/25/56 | | | 1,100,000 | | | | 963,229 | |
The accompanying notes are an integral part of the financial statements.
59
MML Managed Bond Fund – Portfolio of Investments (Continued)
| | | | | | | | |
| | | Principal
Amount | | | Value | |
Educational Funding of the South, Inc., Series 2011-1, Class B, 3 mo. USD LIBOR + 3.700%, FRN
5.067% 4/25/46 | | $ | 625,000 | | | $ | 678,183 | |
Higher Education Funding I, Series 2004-1, Class B1, 28 day ARS, FRN (a)
1.120% 1/01/44 | | | 450,000 | | | | 394,126 | |
Higher Education Funding I, Series 2004-1, Class B2, 28 day ARS, FRN (a)
1.288% 1/01/44 | | | 450,000 | | | | 384,440 | |
KeyCorp Student Loan Trust, Series 2006-A, Class 2A4, 3 mo. USD LIBOR + .310%, FRN
1.985% 9/27/35 | | | 550,309 | | | | 548,207 | |
Laurel Road Prime Student Loan Trust, Series 2017-B, Class BFX (a)
3.020% 8/25/42 | | | 1,210,000 | | | | 1,191,876 | |
Navient Student Loan Trust, Series 2014-1, Class A4, 1 mo. USD LIBOR + .750%, FRN
2.078% 2/25/39 | | | 3,000,000 | | | | 2,919,108 | |
Navient Student Loan Trust, Series 2016-1A, Class A, 1 mo. USD LIBOR + .700%, FRN (a)
2.252% 2/25/70 | | | 2,833,898 | | | | 2,842,612 | |
Navient Student Loan Trust, Series 2017-5A, Class A, FRN (a) (b)
2.352% 7/26/66 | | | 2,068,297 | | | | 2,075,425 | |
Navient Student Loan Trust, Series 2017-4A, Class A3, 1 mo. USD LIBOR + 1.000%, FRN (a)
2.552% 9/27/66 | | | 2,600,000 | | | | 2,624,802 | |
Navient Student Loan Trust, Series 2017-3A, Class A3, 1 mo. USD LIBOR + 1.050%, FRN (a)
2.602% 7/26/66 | | | 2,500,000 | | | | 2,565,334 | |
Navient Student Loan Trust, Series 2017-1A, Class A3, 1 mo. USD LIBOR + 1.150%, FRN (a)
2.702% 7/26/66 | | | 6,000,000 | | | | 6,142,771 | |
Navient Student Loan Trust, Series 2016-5A, Class A, 1 mo. USD LIBOR + 1.250%, FRN (a)
2.802% 6/25/65 | | | 2,829,448 | | | | 2,897,304 | |
Navient Student Loan Trust, Series 2016-6A, Class A3, 1 mo. USD LIBOR + 1.300%, FRN (a)
2.852% 3/25/66 | | | 13,750,000 | | | | 14,138,292 | |
| | | | | | | | |
| | | Principal
Amount | | | Value | |
Navient Student Loan Trust, Series 2015-3, Class B, 1 mo. USD LIBOR + 1.500%, FRN
3.052% 10/25/58 | | $ | 940,000 | | | $ | 939,999 | |
Navient Student Loan Trust, Series 2016-2, Class A3, 1 mo. USD LIBOR + 1.500%, FRN (a)
3.052% 6/25/65 | | | 2,370,000 | | | | 2,436,943 | |
Nelnet Private Education Loan Trust, Series 2016-A, Class A1B (a)
3.600% 12/26/40 | | | 1,207,917 | | | | 1,192,291 | |
Nelnet Student Loan Trust, Series 2006-2, Class A6, 3 mo. USD LIBOR + .120%, FRN
1.487% 4/25/31 | | | 1,220,000 | | | | 1,222,021 | |
Nelnet Student Loan Trust, Series 2005-2, Class A5, 3 mo. USD LIBOR + .100%, FRN
1.758% 3/23/37 | | | 1,121,439 | | | | 1,109,463 | |
Nelnet Student Loan Trust, Series 2006-3, Class B, 3 mo. USD LIBOR + .250%, FRN
1.925% 6/25/41 | | | 845,007 | | | | 726,658 | |
Nelnet Student Loan Trust, Series 2013-5A, Class A, 1 mo. USD LIBOR + .630%, FRN (a)
2.182% 1/25/37 | | | 2,011,269 | | | | 2,001,311 | |
Nelnet Student Loan Trust, Series 2005-4, Class A4A, 7 day ARS, FRN
2.379% 3/22/32 | | | 325,000 | | | | 303,494 | |
North Carolina State Education Assistance Authority, Series 2011-2, Class A3, 3 mo. USD LIBOR + .800%, FRN
2.167% 7/25/36 | | | 1,600,000 | | | | 1,580,505 | |
PHEAA Student Loan Trust, Series 2016-2A, Class A, 1 mo. USD LIBOR + .950%, FRN (a)
2.502% 11/25/65 | | | 3,199,827 | | | | 3,205,552 | |
SLC Student Loan Trust, Series 2006-A, Class B, 3 mo. USD LIBOR + .300%, FRN
1.659% 7/15/36 | | | 378,000 | | | | 374,136 | |
SLM Student Loan Trust, Series 2002-7, Class A10, 28 day ARS, FRN
0.500% 3/15/28 | | | 247,000 | | | | 247,000 | |
SLM Student Loan Trust, Series 2002-7, Class A11, 28 day ARS, FRN
0.500% 3/15/28 | | | 718,000 | | | | 718,000 | |
SLM Student Loan Trust, Series 2003-2, Class A7, 28 day ARS, FRN
0.500% 9/15/28 | | | 650,000 | | | | 650,000 | |
The accompanying notes are an integral part of the financial statements.
60
MML Managed Bond Fund – Portfolio of Investments (Continued)
| | | | | | | | |
| | | Principal
Amount | | | Value | |
SLM Student Loan Trust, Series 2003-5, Class A7, 28 day ARS, FRN
0.500% 6/17/30 | | $ | 250,000 | | | $ | 250,000 | |
SLM Student Loan Trust, Series 2007-3, Class B, 3 mo. USD LIBOR + .150%, FRN
1.517% 1/25/28 | | | 2,400,000 | | | | 2,140,649 | |
SLM Student Loan Trust, Series 2005-3, Class B, 3 mo. USD LIBOR + .150%, FRN
1.517% 4/25/40 | | | 1,012,875 | | | | 928,032 | |
SLM Student Loan Trust, Series 2006-5, Class B, 3 mo. USD LIBOR + .210%, FRN
1.577% 10/25/40 | | | 2,526,478 | | | | 2,382,118 | |
SLM Student Loan Trust, Series 2004-3A, Class A6A, 3 mo. USD LIBOR + .550%, FRN (a)
1.917% 10/25/64 | | | 5,100,000 | | | | 5,044,437 | |
SLM Student Loan Trust, Series 2005-5, Class A5, 3 mo. USD LIBOR + .750%, FRN
2.117% 10/25/40 | | | 1,056,000 | | | | 1,049,244 | |
SLM Student Loan Trust, Series 2013-2, Class B, 1 mo. USD LIBOR + 1.500%, FRN
2.828% 6/25/43 | | | 1,420,000 | | | | 1,392,642 | |
SLM Student Loan Trust, Series 2002-7, Class B, 28 day ARS, FRN
4.892% 12/15/39 | | | 3,950,000 | | | | 3,947,288 | |
SMB Private Education Loan Trust, Series 2016-B, Class A2A (a)
2.430% 2/17/32 | | | 1,575,000 | | | | 1,547,495 | |
SMB Private Education Loan Trust, Series 2016-A, Class A2A (a)
2.700% 5/15/31 | | | 3,000,000 | | | | 2,983,021 | |
SoFi Professional Loan Program LLC, Series 2015-A, Class RC (Acquired 4/19/17, Cost $3,376,500) (a) (c) (d) 0.000% 3/25/33 | | | 1,200 | | | | 2,400,000 | |
SoFi Professional Loan Program LLC, Series 2017-D, Class R1 (Acquired 7/19/17, Cost $2,653,222) (a) (c) (d)
0.000% 9/25/40 | | | 4,688,500 | | | | 2,653,222 | |
SoFi Professional Loan Program LLC, Series 2016-D, Class A2B (a)
2.340% 4/25/33 | | | 1,300,000 | | | | 1,277,955 | |
SoFi Professional Loan Program LLC, Series 2016-C, Class A2B (a)
2.360% 12/27/32 | | | 570,000 | | | | 562,768 | |
SoFi Professional Loan Program LLC, Series 2016-E, Class A2B (a)
2.490% 1/25/36 | | | 1,610,000 | | | | 1,600,452 | |
| | | | | | | | |
| | | Principal
Amount | | | Value | |
SoFi Professional Loan Program LLC, Series 2016-B, Class A2B (a)
2.740% 10/25/32 | | $ | 2,300,000 | | | $ | 2,274,360 | |
SoFi Professional Loan Program LLC, Series 2016-B, Class A1, 1 mo. USD LIBOR + 1.200%, FRN (a)
2.752% 6/25/33 | | | 1,760,041 | | | | 1,788,673 | |
SoFi Professional Loan Program LLC, Series 2016-A, Class A1, 1 mo. USD LIBOR + 1.750%, FRN (a)
3.302% 8/25/36 | | | 858,507 | | | | 879,399 | |
SoFi Professional Loan Program LLC, Series 2017-A, Class B, VRN (a) (b)
3.440% 3/26/40 | | | 1,220,000 | | | | 1,198,357 | |
SoFi Professional Loan Program LLC, Series 2017-C, Class C, VRN (a) (b)
4.210% 7/25/40 | | | 990,000 | | | | 953,381 | |
South Carolina Student Loan Corp., Series 2014-1, Class A2, 1 mo. USD LIBOR + 1.000%, FRN
2.361% 1/03/33 | | | 1,800,000 | | | | 1,781,887 | |
South Carolina Student Loan Corp., Series 2014-1, Class B, 1 mo. USD LIBOR + 1.500%, FRN
2.861% 8/01/35 | | | 3,050,000 | | | | 2,969,695 | |
South Texas Higher Education Authority, Inc., Series 2012-1, Class A3, 3 mo. USD LIBOR + .850%, FRN
2.185% 10/01/46 | | | 1,700,000 | | | | 1,694,801 | |
| | | | | | | | |
| | | | | | | 131,728,145 | |
| | | | | | | | |
| WL Collateral CMO — 0.3% | |
Bank of America Mortgage Securities, Series 2004-G, Class 2A7, VRN (b)
3.810% 8/25/34 | | | 43,704 | | | | 43,991 | |
Countrywide Home Loans, Inc., Series 2004-2, Class 1A1, VRN (b)
3.445% 2/25/34 | | | 18,646 | | | | 19,138 | |
Countrywide Home Loans, Inc., Series 2003-42, Class 1A1, VRN (b)
3.887% 9/25/33 | | | 7,389 | | | | 6,882 | |
GSR Mortgage Loan Trust, Series 2004-9, Class 2A1, VRN (b)
3.596% 8/25/34 | | | 7,585 | | | | 7,639 | |
IndyMac Index Mortgage Loan Trust, Series 2004-AR4, Class 1A, VRN (b)
3.190% 8/25/34 | | | 48,204 | | | | 46,986 | |
JP Morgan Mortgage Trust, Series 2017-1, Class A11, VRN (a) (b)
3.500% 1/25/47 | | | 3,338,137 | | | | 3,358,045 | |
The accompanying notes are an integral part of the financial statements.
61
MML Managed Bond Fund – Portfolio of Investments (Continued)
| | | | | | | | |
| | | Principal
Amount | | | Value | |
Merrill Lynch Mortgage Investors, Inc., Series 2004-A1, Class IA, VRN (b)
3.525% 2/25/34 | | $ | 5,212 | | | $ | 5,076 | |
Merrill Lynch Mortgage Investors, Inc., Series 2003-A4, Class IA, VRN (b)
3.588% 7/25/33 | | | 3,340 | | | | 3,439 | |
Morgan Stanley Mortgage Loan Trust, Series 2004-2AR, Class 1A, VRN (b)
3.500% 2/25/34 | | | 226 | | | | 241 | |
Structured Adjustable Rate Mortgage Loan Trust, Series 2004-2, Class 2A, VRN (b)
3.494% 3/25/34 | | | 29,814 | | | | 30,742 | |
Washington Mutual Mortgage Pass-Through Certificates, Series 2004-AR2, Class A, 12 mo. MTA + 1.400%, FRN
2.463% 4/25/44 | | | 76,255 | | | | 76,817 | |
| | | | | | | | |
| | | | | | | 3,598,996 | |
| | | | | | | | |
| | |
TOTAL NON-U.S. GOVERNMENT AGENCY OBLIGATIONS
(Cost $352,417,530) | | | | | | | 353,958,500 | |
| | | | | | | | |
|
| SOVEREIGN DEBT OBLIGATIONS — 0.7% | |
Colombia Government International Bond
6.125% 1/18/41 | | | 2,580,000 | | | | 3,115,350 | |
Mexico Government International Bond
6.750% 9/27/34 | | | 685,000 | | | | 890,500 | |
Mexico Government International Bond
4.750% 3/08/44 | | | 4,727,000 | | | | 4,778,997 | |
| | | | | | | | |
| | | | | | | 8,784,847 | |
| | | | | | | | |
| | |
TOTAL SOVEREIGN DEBT OBLIGATIONS
(Cost $8,257,423) | | | | | | | 8,784,847 | |
| | | | | | | | |
|
| U.S. GOVERNMENT AGENCY OBLIGATIONS AND INSTRUMENTALITIES — 25.2% | |
| Collateralized Mortgage Obligations — 1.3% | |
Federal Home Loan Mortgage Corp. | |
Series 4303, Class AP
3.000% 8/15/43 | | | 2,619,540 | | | | 2,654,661 | |
Series 4290, Class CA
3.500% 12/15/38 | | | 1,766,814 | | | | 1,811,918 | |
Series 2617, Class Z
5.500% 5/15/33 | | | 1,433,354 | | | | 1,580,477 | |
| | | | | | | | |
| | | Principal
Amount | | | Value | |
Series 2693, Class Z
5.500% 10/15/33 | | $ | 2,529,046 | | | $ | 2,725,304 | |
Series 3423, Class PB
5.500% 3/15/38 | | | 528,576 | | | | 573,234 | |
Series 2178, Class PB
7.000% 8/15/29 | | | 58,942 | | | | 65,489 | |
Federal National Mortgage Association | | | | | | | | |
Series 2014-7, Class VA
3.500% 5/25/25 | | | 1,331,858 | | | | 1,376,553 | |
Series 2014-48, Class AB
4.000% 10/25/40 | | | 2,422,568 | | | | 2,513,440 | |
Series 2007-32, Class Z
5.500% 4/25/37 | | | 803,018 | | | | 872,035 | |
Series 2010-60, Class HJ
5.500% 5/25/40 | | | 554,179 | | | | 592,185 | |
Federal National Mortgage Association REMIC Series 2007-B2, Class ZA
5.500% 6/25/37 | | | 692,179 | | | | 746,723 | |
| | | | | | | | |
| | | | | | | 15,512,019 | |
| | | | | | | | |
| Pass-Through Securities — 23.2% | | | | | | | | |
Federal Home Loan Mortgage Corp. | | | | | | | | |
Pool #G11630 3.500%
6/01/19 | | | 25,186 | | | | 26,038 | |
Pool #J13972 3.500%
1/01/26 | | | 59,964 | | | | 62,011 | |
Pool #C91344 3.500%
11/01/30 | | | 162,015 | | | | 168,483 | |
Pool #C91424 3.500%
1/01/32 | | | 107,895 | | | | 112,202 | |
Pool #Q42045 3.500%
7/01/46 | | | 793,357 | | | | 821,620 | |
Pool #Q41916 3.500%
7/01/46 | | | 1,907,790 | | | | 1,975,755 | |
Pool #Q44277 3.500%
11/01/46 | | | 444,071 | | | | 458,712 | |
Pool #Q44275 3.500%
11/01/46 | | | 1,543,641 | | | | 1,598,633 | |
Pool #Q52216 3.500%
11/01/47 | | | 3,758,888 | | | | 3,863,432 | |
Pool #Q52868 3.500%
12/01/47 | | | 5,825,000 | | | | 5,987,008 | |
Pool #V83763 3.500%
12/01/47 | | | 13,560,370 | | | | 13,937,518 | |
Pool #V83655 3.500%
12/01/47 | | | 11,454,485 | | | | 11,773,062 | |
Pool #Q47730 4.000%
4/01/47 | | | 1,672,409 | | | | 1,769,029 | |
Pool #Q47742 4.000%
4/01/47 | | | 1,404,664 | | | | 1,485,817 | |
Pool #Q52834 4.000%
12/01/47 | | | 1,570,000 | | | | 1,645,250 | |
The accompanying notes are an integral part of the financial statements.
62
MML Managed Bond Fund – Portfolio of Investments (Continued)
| | | | | | | | |
| | | Principal
Amount | | | Value | |
Pool #V83796 4.000%
12/01/47 | | $ | 17,225,000 | | | $ | 18,050,589 | |
Pool #V83764 4.000%
12/01/47 | | | 10,565,007 | | | | 11,091,193 | |
Pool #C91239 4.500%
3/01/29 | | | 8,367 | | | | 8,904 | |
Pool #C91251 4.500%
6/01/29 | | | 52,735 | | | | 56,120 | |
Pool #C03537 4.500%
8/01/40 | | | 1,166,934 | | | | 1,254,454 | |
Pool #G06057 4.500%
10/01/40 | | | 1,116,620 | | | | 1,197,924 | |
Pool #G60485 4.500%
10/01/41 | | | 1,394,831 | | | | 1,495,956 | |
Pool #G60172 4.500%
9/01/43 | | | 1,442,741 | | | | 1,551,623 | |
Pool #Q48208 4.500%
5/01/47 | | | 1,146,891 | | | | 1,223,769 | |
Pool #Q48869 4.500%
6/01/47 | | | 10,226,840 | | | | 10,885,192 | |
Pool #G05253 5.000%
2/01/39 | | | 255,237 | | | | 277,401 | |
Pool #C90939 5.500%
12/01/25 | | | 32,774 | | | | 35,927 | |
Pool #D97258 5.500%
4/01/27 | | | 37,064 | | | | 40,630 | |
Pool #C91026 5.500%
4/01/27 | | | 54,398 | | | | 59,631 | |
Pool #C91074 5.500%
8/01/27 | | | 5,361 | | | | 5,877 | |
Pool #D97417 5.500%
10/01/27 | | | 12,195 | | | | 13,368 | |
Pool #C91128 5.500%
12/01/27 | | | 2,869 | | | | 3,145 | |
Pool #C91148 5.500%
1/01/28 | | | 110,442 | | | | 121,068 | |
Pool #C91176 5.500%
5/01/28 | | | 40,337 | | | | 44,218 | |
Pool #C91217 5.500%
11/01/28 | | | 14,534 | | | | 15,933 | |
Pool #C01079 7.500%
10/01/30 | | | 1,994 | | | | 2,327 | |
Pool #C01135 7.500%
2/01/31 | | | 5,790 | | | | 6,743 | |
Federal Home Loan Mortgage Corp. TBA
Pool #648 3.500%
1/01/45 (f) | | | 6,750,000 | | | | 6,933,516 | |
Federal National Mortgage Association | |
Pool #AO8180 3.000%
9/01/42 | | | 41,430 | | | | 41,718 | |
Pool #AR1975 3.000%
12/01/42 | | | 51,315 | | | | 51,608 | |
| | | | | | | | |
| | | Principal
Amount | | | Value | |
Pool #AP8668 3.000%
12/01/42 | | $ | 224,614 | | | $ | 225,895 | |
Pool #AB7401 3.000%
12/01/42 | | | 178,406 | | | | 179,647 | |
Pool #AB7397 3.000%
12/01/42 | | | 191,626 | | | | 192,958 | |
Pool #AR5391 3.000%
1/01/43 | | | 122,066 | | | | 122,762 | |
Pool #AR0306 3.000%
1/01/43 | | | 15,940 | | | | 16,031 | |
Pool #AL3215 3.000%
2/01/43 | | | 168,720 | | | | 169,683 | |
Pool #AR4109 3.000%
2/01/43 | | | 151,898 | | | | 152,764 | |
Pool #AB8809 3.000%
3/01/43 | | | 93,518 | | | | 94,051 | |
Pool #MA1368 3.000%
3/01/43 | | | 307,772 | | | | 309,527 | |
Pool #AT0169 3.000%
3/01/43 | | | 289,827 | | | | 291,480 | |
Pool #AR4432 3.000%
3/01/43 | | | 64,724 | | | | 65,093 | |
Pool #AR2174 3.000%
4/01/43 | | | 322,930 | | | | 324,772 | |
Pool #725692 3.229%
10/01/33 1 year CMT + 2.140%, FRN | | | 134,233 | | | | 138,755 | |
Pool #888586 3.282%
10/01/34 1 year CMT + 2.210%, FRN | | | 136,047 | | | | 143,196 | |
Pool #775539 3.475%
5/01/34 12 mo. USD LIBOR + 1.645%, FRN | | | 47,590 | | | | 49,662 | |
Pool #AS1304 3.500%
12/01/28 | | | 1,795,142 | | | | 1,860,497 | |
Pool #AV1897 3.500%
12/01/28 | | | 313,627 | | | | 325,045 | |
Pool #AV2325 3.500%
12/01/28 | | | 946,218 | | | | 980,666 | |
Pool #BH5155 3.500%
9/01/47 | | | 15,513,675 | | | | 15,941,512 | |
Pool #CA0770 3.500%
11/01/47 | | | 14,844,513 | | | | 15,256,217 | |
Pool #MA3210 3.500%
12/01/47 | | | 2,068,398 | | | | 2,125,764 | |
Pool #CA0181 4.000%
8/01/47 | | | 10,438,526 | | | | 10,925,794 | |
Pool #BH9008 4.000%
8/01/47 | | | 348,196 | | | | 364,450 | |
Pool #BH9011 4.000%
9/01/47 | | | 348,535 | | | | 364,804 | |
Pool #CA0620 4.000%
10/01/47 | | | 14,528,305 | | | | 15,211,022 | |
The accompanying notes are an integral part of the financial statements.
63
MML Managed Bond Fund – Portfolio of Investments (Continued)
| | | | | | | | |
| | | Principal
Amount | | | Value | |
Pool #BF0094 4.000%
5/01/56 | | $ | 7,059,875 | | | $ | 7,429,140 | |
Pool #BF0105 4.000%
6/01/56 | | | 2,235,432 | | | | 2,352,355 | |
Pool #AA3980 4.500%
4/01/28 | | | 78,379 | | | | 85,613 | |
Pool #AH6787 4.500%
3/01/41 | | | 1,089,884 | | | | 1,171,924 | |
Pool #CA0185 4.500%
8/01/47 | | | 5,704,665 | | | | 6,088,616 | |
Pool #AD6437 5.000%
6/01/40 | | | 622,409 | | | | 679,350 | |
Pool #AD6996 5.000%
7/01/40 | | | 4,118,893 | | | | 4,453,875 | |
Pool #AL8173 5.000%
2/01/44 | | | 1,684,926 | | | | 1,819,852 | |
Pool #AD0836 5.500%
11/01/28 | | | 98,510 | | | | 107,987 | |
Pool #575667 7.000%
3/01/31 | | | 12,698 | | | | 14,797 | |
Pool #529453 7.500%
1/01/30 | | | 2,744 | | | | 3,209 | |
Pool #531196 7.500%
2/01/30 | | | 344 | | | | 401 | |
Pool #530299 7.500%
3/01/30 | | | 382 | | | | 433 | |
Pool #536386 7.500%
4/01/30 | | | 483 | | | | 563 | |
Pool #535996 7.500%
6/01/31 | | | 7,446 | | | | 8,689 | |
Pool #523499 8.000%
11/01/29 | | | 280 | | | | 328 | |
Pool #252926 8.000%
12/01/29 | | | 242 | | | | 285 | |
Pool #532819 8.000%
3/01/30 | | | 136 | | | | 161 | |
Pool #534703 8.000%
5/01/30 | | | 2,868 | | | | 3,395 | |
Pool #253437 8.000%
9/01/30 | | | 177 | | | | 208 | |
Pool #253481 8.000%
10/01/30 | | | 106 | | | | 126 | |
Pool #190317 8.000%
8/01/31 | | | 3,844 | | | | 4,532 | |
Pool #596656 8.000%
8/01/31 | | | 1,492 | | | | 1,575 | |
Pool #602008 8.000%
8/01/31 | | | 4,447 | | | | 5,242 | |
Pool #597220 8.000%
9/01/31 | | | 3,309 | | | | 3,931 | |
Federal National Mortgage Association TBA | | | | | | | | |
Pool #1963 3.500%
10/01/44 (f) | | | 21,450,000 | | | | 22,031,497 | |
| | | | | | | | |
| | | Principal
Amount | | | Value | |
Pool #9174 4.000%
3/01/44 (f) | | $ | 5,080,000 | | | $ | 5,313,362 | |
Government National Mortgage Association | | | | | | | | |
Pool #783896 3.500%
5/15/44 | | | 4,982,619 | | | | 5,177,447 | |
Pool #BF1053 3.500%
12/15/47 | | | 1,775,000 | | | | 1,839,136 | |
Pool #371146 7.000%
9/15/23 | | | 446 | | | | 486 | |
Pool #352022 7.000%
11/15/23 | | | 6,839 | | | | 7,514 | |
Pool #374440 7.000%
11/15/23 | | | 467 | | | | 507 | |
Pool #491089 7.000%
12/15/28 | | | 9,541 | | | | 10,701 | |
Pool #480539 7.000%
4/15/29 | | | 447 | | | | 515 | |
Pool #488634 7.000%
5/15/29 | | | 2,406 | | | | 2,780 | |
Pool #478658 7.000%
5/15/29 | | | 2,279 | | | | 2,651 | |
Pool #500928 7.000%
5/15/29 | | | 4,496 | | | | 5,214 | |
Pool #499410 7.000%
7/15/29 | | | 1,323 | | | | 1,542 | |
Pool #510083 7.000%
7/15/29 | | | 1,238 | | | | 1,429 | |
Pool #516706 7.000%
8/15/29 | | | 91 | | | | 96 | |
Pool #493723 7.000%
8/15/29 | | | 2,687 | | | | 3,134 | |
Pool #581417 7.000%
7/15/32 | | | 12,872 | | | | 14,974 | |
Government National Mortgage Association II | | | | | | | | |
Pool #008746 2.250%
11/20/25 1 year CMT + 1.500%, FRN | | | 5,158 | | | | 5,251 | |
Pool #080136 2.250%
11/20/27 1 year CMT + 1.500%, FRN | | | 995 | | | | 1,017 | |
Pool #82462 2.375%
1/20/40 1 year CMT + 1.500%, FRN | | | 574,304 | | | | 591,762 | |
Pool #82488 2.375%
3/20/40 1 year CMT + 1.500%, FRN | | | 531,587 | | | | 547,265 | |
Pool #784026 3.500%
12/20/44 | | | 1,735,433 | | | | 1,797,596 | |
Pool #BC4641 3.500%
9/20/47 | | | 2,787,183 | | | | 2,885,497 | |
Pool #MA4778 3.500%
10/20/47 | | | 14,827,927 | | | | 15,355,592 | |
The accompanying notes are an integral part of the financial statements.
64
MML Managed Bond Fund – Portfolio of Investments (Continued)
| | | | | | | | |
| | | Principal
Amount | | | Value | |
Pool #BC4885 3.500%
11/20/47 | | $ | 4,193,290 | | | $ | 4,348,081 | |
Pool #BD6940 3.500%
12/20/47 | | | 2,650,000 | | | | 2,743,889 | |
Pool #AC2985 4.000%
10/20/47 | | | 847,678 | | | | 888,240 | |
Government National Mortgage Association II TBA | | | | | | | | |
Pool #207 3.500%
5/01/45 (f) | | | 17,800,000 | | | | 18,409,095 | |
Pool #232 4.000%
12/01/44 (f) | | | 13,750,000 | | | | 14,336,523 | |
| | | | | | | | |
| | | | | | | 286,544,831 | |
| | | | | | | | |
| Whole Loans — 0.7% | | | | | | | | |
Federal Home Loan Mortgage Corp. Structured Agency Credit Risk Debt Notes | | | | | | | | |
Series 2016-HQA3,
2.352% 3/25/29 Class M1 1 mo. USD LIBOR + .800%, FRN | | | 509,538 | | | | 510,222 | |
Series 2016-HQA3,
2.902% 3/25/29 Class M2 1 mo. USD LIBOR + 1.350%, FRN | | | 790,000 | | | | 797,457 | |
Series 2016-DNA1,
3.002% 7/25/28 Class M1, 1 mo. USD LIBOR + 1.450%, FRN | | | 169,854 | | | | 170,085 | |
Federal National Mortgage Association Connecticut Avenue Securities | | | | | | | | |
Series 2016-C06, 2.852% 4/25/29 Class 1M1 1 mo. USD LIBOR + 1.300%, FRN | | | 2,320,712 | | | | 2,343,622 | |
Series 2016-C05, 2.902% 1/25/29 Class 2M1 1 mo. USD LIBOR + 1.350%, FRN | | | 2,878,255 | | | | 2,893,956 | |
Series 2016-C04, 3.002% 1/25/29 Class 1M1 1 mo. USD LIBOR + 1.450%, FRN | | | 1,866,458 | | | | 1,883,097 | |
| | | | | | | | |
| | | | | | | 8,598,439 | |
| | | | | | | | |
| | |
TOTAL U.S. GOVERNMENT AGENCY OBLIGATIONS AND INSTRUMENTALITIES
(Cost $312,310,172) | | | | | | | 310,655,289 | |
| | | | | | | | |
|
| U.S. TREASURY OBLIGATIONS — 7.2% | |
| U.S. Treasury Bonds & Notes — 7.2% | |
U.S. Treasury Bond
2.500% 5/15/46 | | | 34,950,000 | | | | 33,254,380 | |
U.S. Treasury Bond (g)
3.500% 2/15/39 | | | 16,600,000 | | | | 18,955,125 | |
U.S. Treasury Note
1.625% 8/31/22 | | | 13,200,000 | | | | 12,874,641 | |
| | | | | | | | |
| | | Principal
Amount | | | Value | |
U.S. Treasury Note
2.000% 11/15/26 | | $ | 21,700,000 | | | $ | 21,004,075 | |
U.S. Treasury Note
2.250% 8/15/27 | | | 2,400,000 | | | | 2,366,437 | |
| | | | | | | | |
| | | | | | | 88,454,658 | |
| | | | | | | | |
| | |
TOTAL U.S. TREASURY OBLIGATIONS
(Cost $87,995,148) | | | | | | | 88,454,658 | |
| | | | | | | | |
| | |
TOTAL BONDS & NOTES
(Cost $1,191,152,206) | | | | | | | 1,205,169,471 | |
| | | | | | | | |
| | |
TOTAL PURCHASED OPTIONS (#) — 0.4%
(Cost $4,965,783) | | | | | | | 4,738,571 | |
| | | | | | | | |
| | |
TOTAL LONG-TERM INVESTMENTS
(Cost $1,198,492,989) | | | | | | | 1,212,400,842 | |
| | | | | | | | |
|
| SHORT-TERM INVESTMENTS — 11.4% | |
| Commercial Paper — 11.4% | | | | | | | | |
Ameren Corp.
1.775% 1/04/18 | | | 8,200,000 | | | | 8,197,709 | |
American Electric Power Co., Inc. (a)
1.979% 1/11/18 | | | 2,000,000 | | | | 1,998,770 | |
Bell Canada (a)
1.700% 3/01/18 | | | 6,600,000 | | | | 6,579,517 | |
Carnival Corp. (a)
1.915% 3/14/18 | | | 12,000,000 | | | | 11,955,250 | |
CenterPoint Energy, Inc. (a)
1.731% 3/05/18 | | | 3,900,000 | | | | 3,887,287 | |
Dominion Resources, Inc. (a)
1.535% 1/02/18 | | | 8,000,000 | | | | 7,998,516 | |
Dominion Resources, Inc. (a)
1.738% 4/09/18 | | | 3,000,000 | | | | 2,984,640 | |
Enbridge (US), Inc. (a)
1.987% 3/22/18 | | | 3,000,000 | | | | 2,987,543 | |
Entergy Corp. (a)
1.968% 1/11/18 | | | 2,000,000 | | | | 1,998,615 | |
Enterprise Products Operating LLC (a)
1.576% 1/18/18 | | | 2,000,000 | | | | 1,998,086 | |
Florida Power & Light Co.
1.527% 1/23/18 | | | 4,700,000 | | | | 4,694,233 | |
Fortive Corp. (a)
1.608% 1/16/18 | | | 10,000,000 | | | | 9,991,410 | |
Glencore Funding LLC (a)
1.629% 1/10/18 | | | 5,200,000 | | | | 5,196,906 | |
Glencore Funding LLC (a)
1.731% 1/23/18 | | | 6,750,000 | | | | 6,741,375 | |
The accompanying notes are an integral part of the financial statements.
65
MML Managed Bond Fund – Portfolio of Investments (Continued)
| | | | | | | | |
| | | Principal
Amount | | | Value | |
Hyundai Capital America (a)
1.506% 1/04/18 | | $ | 2,000,000 | | | $ | 1,999,441 | |
Hyundai Capital America (a)
1.596% 1/17/18 | | | 9,000,000 | | | | 8,991,825 | |
Marriott International (a)
1.596% 1/16/18 | | | 5,000,000 | | | | 4,995,705 | |
Marriott International (a)
1.596% 1/16/18 | | | 2,400,000 | | | | 2,397,938 | |
Molex Electronic Technologies (a)
1.656% 1/02/18 | | | 6,800,000 | | | | 6,798,588 | |
Nasdaq, Inc. (a)
1.608% 1/18/18 | | | 6,300,000 | | | | 6,294,040 | |
Nasdaq, Inc. (a)
1.650% 1/24/18 | | | 2,000,000 | | | | 1,997,517 | |
Nasdaq, Inc. (a)
1.682% 2/20/18 | | | 3,700,000 | | | | 3,690,495 | |
Public Service Enterprise Group, Inc. (a)
2.137% 2/20/18 | | | 2,000,000 | | | | 1,994,803 | |
Spectra Energy Partners (a)
1.849% 1/25/18 | | | 3,500,000 | | | | 3,495,427 | |
Telus Corp. (a)
2.089% 3/26/18 | | | 1,000,000 | | | | 995,636 | |
Thomson Reuters Corp. (a)
1.629% 2/13/18 | | | 7,000,000 | | | | 6,983,981 | |
Thomson Reuters Corp. (a)
1.649% 2/13/18 | | | 4,000,000 | | | | 3,990,846 | |
Transcanada Pipelines Ltd. (a)
1.576% 1/09/18 | | | 4,000,000 | | | | 3,997,928 | |
WPP CP Finance PLC (a)
1.736% 2/09/18 | | | 5,000,000 | | | | 4,989,745 | |
| | | | | | | | |
| | | | | | | 140,823,772 | |
| | | | | | | | |
| Time Deposit — 0.0% | | | | | | | | |
Euro Time Deposit
0.120% 1/02/18 | | | 177,529 | | | | 177,529 | |
| | | | | | | | |
| | |
TOTAL SHORT-TERM INVESTMENTS
(Cost $141,027,226) | | | | | | | 141,001,301 | |
| | | | | | | | |
| | |
TOTAL INVESTMENTS — 109.8%
(Cost $1,339,520,215) (h) | | | | | | | 1,353,402,143 | |
| | |
| Other Assets/(Liabilities) — (9.8)% | | | | | | | (120,728,436 | ) |
| | | | | | | | |
| | |
| NET ASSETS — 100.0% | | | | | | $ | 1,232,673,707 | |
| | | | | | | | |
Abbreviation Legend
| CLO | Collateralized Loan Obligation |
| CMO | Collateralized Mortgage Obligation |
| CMT | Constant Maturity Treasury Index |
| MBS | Mortgage-Backed Security |
| MTA | Monthly Treasury Average Index |
Notes to Portfolio of Investments
Percentages are stated as a percent of net assets.
| (a) | Securities exempt from registration under rule 144A of the Securities Act of 1933. These securities may be resold in transactions exempt from registration, normally to qualified institutional buyers. At December 31, 2017, these securities amounted to a value of $517,087,448 or 41.95% of net assets. |
| (b) | Certain variable rate securities are not based on a published reference rate and spread but are determined by the issuer or agent and are based on current market conditions. These securities do not indicate a reference rate and spread in their description above. The rates shown are the current interest rates at December 31, 2017. |
| (c) | Investment was valued using significant unobservable inputs. |
| (d) | Restricted security. Certain securities are restricted as to resale. At December 31, 2017, these securities amounted to a value of $8,826,797 or 0.72% of net assets. The Fund generally bears the costs, if any, associated with the disposition of restricted securities. |
| (e) | This security is fair valued in good faith in accordance with procedures approved by the Board of Trustees. At December 31, 2017, these securities amounted to a value of $3,773,575 or 0.31% of net assets. |
| (f) | A portion of this security is purchased on a when-issued, delayed-delivery or forward commitment basis. (Note 2). |
| (g) | A portion of this security is pledged/held as collateral for open futures contracts and open swap agreements. (Note 2). |
| (h) | See Note 6 for aggregate cost for federal tax purposes. |
The accompanying notes are an integral part of the financial statements.
66
MML Managed Bond Fund – Portfolio of Investments (Continued)
(#) The Fund had the following open Purchased Swaptions contracts at December 31, 2017:
Purchased Swaptions
| | | | | | | | | | | | | | | | | | | | | | | | | | | | | | | | |
| OTC Counterparty* | | Units | | | Notional
Amount | | | Expiration
Date | | | Pay/
Receive
Exercise
Rate | | Description | | Premiums
Purchased | | | Value | | | Unrealized
Appreciation/
(Depreciation) | |
| Call | | | | | | | | | | | | | | | | | | | | | | | | | |
Barclays Bank PLC | | | 32,720,000 | | | | USD | | | | 32,720,000 | | | | 12/13/32 | | | Receive | | 3-Month USD LIBOR BBA 10 Year Swaption, Underlying swap terminates 12/15/42, Strike 2.44 | | $ | 1,635,748 | | | $ | 1,590,497 | | | $ | (45,251 | ) |
| Put | | | | | | | | | | | | | | | | | | | | | | | | | |
Barclays Bank PLC | | | 66,610,000 | | | | USD | | | | 66,610,000 | | | | 12/13/32 | | | Pay | | 3-Month USD LIBOR BBA 10 Year Swaption, Underlying swap terminates 12/15/42, Strike 2.94 | | $ | 3,330,035 | | | $ | 3,148,074 | | | $ | (181,961 | ) |
| | | | | | | | | | | | | | | | | | | | | | | | | | | | | | | | |
| | | | | | | | | | | | | | | | | | | | $ | 4,965,783 | | | $ | 4,738,571 | | | $ | (227,212 | ) |
| | | | | | | | | | | | | | | | | | | | | | | | | | | | | | | | |
| * | Contracts are subject to a Master Netting Agreement. |
The Fund had the following open Futures contracts at December 31, 2017:
Futures
| | | | | | | | | | | | | | | | |
| | | Expiration
Date | | | Number of
Contracts | | | Notional
Amount | | | Value/Net
Unrealized
Appreciation/
(Depreciation) | |
| Futures Contracts — Long | |
| U.S. Treasury Ultra Long Bond | | | 3/20/18 | | | | 100 | | | $ | 16,614,989 | | | $ | 150,636 | |
| U.S. Treasury Note 2 Year | | | 3/29/18 | | | | 318 | | | | 68,239,605 | | | | (152,824 | ) |
| U.S. Treasury Note 5 Year | | | 3/29/18 | | | | 1,119 | | | | 130,575,688 | | | | (588,101 | ) |
| | | | | | | | | | | | | | | | |
| | | | | | | | | | | | | | $ | (590,289 | ) |
| | | | | | | | | | | | | | | | |
The Fund had the following open Swap agreements at December 31, 2017:
Swaps
| | | | | | | | | | | | | | | | | | | | | | | | | | | | |
| Counterparty | | Currency | | Notional
Amount | | | Expiration
Date | | | Payment
Frequency | | Receive (Pay)
Fixed Rate | | Deliverable on
Default | | Unrealized
Appreciation
(Depreciation) | | | Premium
(Received)
Paid | | | Value | |
Credit Default Swaps — Sell Protection†† | |
OTC Swaps* | |
| Goldman Sachs International | | USD | | | 3,200,000 | | | | 5/11/63 | | | Monthly | | 3.000% | | CMBX.NA.BBB-.6† (Rating: BBB-) | | $ | (470,192 | ) | | $ | 1,972 | | | $ | (468,220 | ) |
| Goldman Sachs International | | USD | | | 920,000 | | | | 5/11/63 | | | Monthly | | 3.000% | | CMBX.NA.BBB-.6† (Rating: BBB-) | | | (60,903 | ) | | | (73,711 | ) | | | (134,614 | ) |
| Goldman Sachs International | | USD | | | 2,540,000 | | | | 5/11/63 | | | Monthly | | 3.000% | | CMBX.NA.BBB-.6† (Rating: BBB-) | | | (151,686 | ) | | | (219,964 | ) | | | (371,650 | ) |
| | | | | | | | | | | | | | | | | | | | | | | | | | | | |
| | | | | | | | | | | | | | | | | | $ | (682,781 | ) | | $ | (291,703 | ) | | $ | (974,484 | ) |
| | | | | | | | | | | | | | | | | | | | | | | | | | | | |
| * | Contracts are subject to a Master Netting Agreement. |
The accompanying notes are an integral part of the financial statements.
67
MML Managed Bond Fund – Portfolio of Investments (Continued)
Collateral for swap agreements held by Goldman Sachs International amounted to $970,120 in securities at December 31, 2017.
| † | Payment is based on a percentage of the index. Reference entities are a number of individual issuers comprising the index. |
| †† | For each credit derivative with sold protection, the credit ratings of the entities referenced, as rated by any rating organization, are included in the equivalent S&P Global Ratings. The reference entity rating represents the likelihood of a potential payment by the Fund if the referenced entity experiences a credit event as of period end. Notional amounts represent the maximum potential amount of future payments (undiscounted) the Fund could be required to make under the credit derivatives with sold protection. |
Currency Legend
Country weightings, as a percentage of net assets, is as follows:
| | | | |
United States | | | 86.0 | % |
Cayman Islands | | | 5.3 | % |
Canada | | | 1.3 | % |
Mexico | | | 1.1 | % |
Luxembourg | | | 0.8 | % |
United Kingdom | | | 0.7 | % |
Netherlands | | | 0.6 | % |
Ireland | | | 0.4 | % |
Bermuda | | | 0.3 | % |
Spain | | | 0.3 | % |
Turkey | | | 0.3 | % |
Colombia | | | 0.3 | % |
Sweden | | | 0.3 | % |
France | | | 0.2 | % |
Australia | | | 0.1 | % |
Switzerland | | | 0.1 | % |
Barbados | | | 0.1 | % |
India | | | 0.1 | % |
Panama | | | 0.1 | % |
United States Virgin Islands | | | 0.0 | % |
| | | | |
Total Long-Term Investments | | | 98.4 | % |
Short-Term Investments and Other Assets and Liabilities | | | 1.6 | % |
| | | | |
Net Assets | | | 100.0 | % |
| | | | |
The accompanying notes are an integral part of the financial statements.
68
MML U.S. Government Money Market Fund – Portfolio of Investments
December 31, 2017
| | | | | | | | |
| | | Principal
Amount | | | Value | |
| SHORT-TERM INVESTMENTS — 100.3% | |
| Discount Notes — 86.8% | |
Federal Farm Credit Bank
1.170% , 3/29/18, 3/29/18 (a) | | $ | 450,000 | | | $ | 448,728 | |
Federal Farm Credit Bank
1.541% , 4/16/18, 4/16/18 (a) | | | 3,000,000 | | | | 3,001,549 | |
Federal Home Loan Bank
1.023% , 2/09/18, 2/09/18 (a) | | | 4,000,000 | | | | 3,999,334 | |
Federal Home Loan Bank
1.120% , 2/14/18, 2/14/18 (a) | | | 900,000 | | | | 898,768 | |
Federal Home Loan Bank
1.262% , 8/08/18, 8/08/18 (a) | | | 8,000,000 | | | | 8,000,008 | |
Federal Home Loan Bank
1.278% , 1/02/18, 1/02/18 (a) | | | 2,000,000 | | | | 1,999,930 | |
Federal Home Loan Bank
1.278% , 1/03/18, 1/03/18 (a) | | | 2,430,000 | | | | 2,429,830 | |
Federal Home Loan Bank
1.300% , 2/01/18, 2/01/18 (a) | | | 3,000,000 | | | | 2,996,693 | |
Federal Home Loan Bank
1.302% , 2/26/18, 2/26/18 (a) | | | 12,000,000 | | | | 12,001,629 | |
Federal Home Loan Bank
1.322% , 10/11/18, 10/11/18 (a) | | | 2,000,000 | | | | 2,000,000 | |
Federal Home Loan Bank
1.338% , 3/06/18, 3/06/18 (a) | | | 5,000,000 | | | | 5,000,851 | |
Federal Home Loan Bank
1.343% , 3/14/18, 3/14/18 (a) | | | 10,000,000 | | | | 9,973,600 | |
Federal Home Loan Bank
1.371% , 7/20/18, 7/20/18 (a) | | | 8,000,000 | | | | 8,000,000 | |
Federal Home Loan Bank
1.371% , 8/20/18, 8/20/18 (a) | | | 5,000,000 | | | | 4,999,724 | |
Federal Home Loan Bank
1.387% , 1/23/18, 1/23/18 (a) | | | 5,000,000 | | | | 4,999,988 | |
Federal Home Loan Bank
1.387% , 1/25/18, 1/25/18 (a) | | | 14,000,000 | | | | 13,999,936 | |
Federal Home Loan Bank
1.420% , 3/16/18, 3/16/18 (a) | | | 16,400,000 | | | | 16,402,826 | |
Federal Home Loan Bank
1.452% , 12/27/18, 12/27/18 (a) | | | 5,000,000 | | | | 5,000,336 | |
Federal Home Loan Bank Discount Notes
1.080% , 1/12/18, 1/12/18 (a) | | | 170,000 | | | | 169,944 | |
Federal Home Loan Bank Discount Notes
1.087% , 1/02/18, 1/02/18 (a) | | | 700,000 | | | | 699,979 | |
Federal Home Loan Bank Discount Notes
1.099% , 1/05/18, 1/05/18 (a) | | | 1,550,000 | | | | 1,549,814 | |
Federal Home Loan Bank Discount Notes
1.115% , 1/10/18, 1/10/18 (a) | | | 1,800,000 | | | | 1,799,498 | |
Federal Home Loan Bank Discount Notes
1.283% , 1/12/18, 1/12/18 (a) | | | 200,000 | | | | 199,923 | |
| | | | | | | | |
| | | Principal
Amount | | | Value | |
Federal Home Loan Bank Discount Notes
1.289% , 1/16/18, 1/16/18 (a) | | $ | 3,000,000 | | | $ | 2,998,412 | |
Federal Home Loan Bank Discount Notes
1.289% , 1/19/18, 1/19/18 (a) | | | 2,500,000 | | | | 2,498,412 | |
Federal Home Loan Bank Discount Notes
1.294% , 1/31/18, 1/31/18 (a) | | | 4,000,000 | | | | 3,995,750 | |
Federal Home Loan Bank Discount Notes
1.321% , 2/22/18, 2/22/18 (a) | | | 800,000 | | | | 798,498 | |
Federal Home Loan Bank Discount Notes
1.326% , 2/21/18, 2/21/18 (a) | | | 5,000,000 | | | | 4,990,756 | |
Federal Home Loan Bank Discount Notes
1.332% , 2/26/18, 2/26/18 (a) | | | 1,000,000 | | | | 997,962 | |
Federal Home Loan Bank Discount Notes
1.353% , 3/19/18, 3/19/18 (a) | | | 1,620,000 | | | | 1,615,392 | |
Federal Home Loan Mortgage Corp.
1.543% , 3/08/18, 3/08/18 (a) | | | 1,100,000 | | | | 1,100,498 | |
| | | | | | | | |
| | | | | | | 129,568,568 | |
| | | | | | | | |
|
| Repurchase Agreement — 13.4% | |
HSBC Securities (USA) Inc. Tri-Party Repurchase Agreement, dated 12/29/17, 1.350%, due 1/02/18 (b) | | | 20,000,000 | | | | 20,000,000 | |
| | | | | | | | |
|
| Time Deposit — 0.1% | |
Euro Time Deposit
0.120% 1/02/18 | | | 87,794 | | | | 87,794 | |
| | | | | | | | |
| | |
TOTAL SHORT-TERM INVESTMENTS
(Cost $149,656,362) | | | | | | | 149,656,362 | |
| | | | | | | | |
| | |
TOTAL INVESTMENTS — 100.3%
(Cost $149,656,362) (c) | | | | | | | 149,656,362 | |
| | |
| Other Assets/(Liabilities) — (0.3)% | | | | | | | (385,528 | ) |
| | | | | | | | |
| | |
| NET ASSETS — 100.0% | | | | | | $ | 149,270,834 | |
| | | | | | | | |
Notes to Portfolio of Investments
Percentages are stated as a percent of net assets.
| (a) | The stated maturity dates reflect demand date and stated maturity date, respectively. |
| (b) | Maturity value of $20,003,000. Collateralized by U.S. Government Agency obligations with rates ranging from 1.875% – 2.875%, maturity dates ranging from 2/28/22 – 5/15/43, and an aggregate market value, including accrued interest, of $20,401,569. |
| (c) | See Note 6 for aggregate cost for federal tax purposes. |
The accompanying notes are an integral part of the financial statements.
69
MML Series Investment Fund II – Financial Statements
Statements of Assets and Liabilities
December 31, 2017
| | | | | | | | | | | | | | | | |
| | | MML
Blend Fund | | | MML
Equity Fund | | | MML
Managed
Bond Fund | | | MML
U.S. Government
Money Market
Fund | |
| Assets: | |
Investments, at value (Note 2) (a) | | $ | 693,416,288 | | | $ | 878,925,331 | | | $ | 1,212,400,842 | | | $ | - | |
Repurchase agreements, at value (Note 2) (b) | | | 400,810 | | | | 10,361,349 | | | | - | | | | 20,000,000 | |
Other short-term investments, at value (Note 2) (c) | | | 25,235,340 | | | | - | | | | 141,001,301 | | | | 129,656,362 | |
| | | | | | | | | | | | | | | | |
Total investments (d) | | | 719,052,438 | | | | 889,286,680 | | | | 1,353,402,143 | | | | 149,656,362 | |
| | | | | | | | | | | | | | | | |
Receivables from: | |
Investments sold | | | 903,554 | | | | 1,167,381 | | | | 1,978,755 | | | | - | |
Investments sold on a when-issued basis (Note 2) | | | 18,139,840 | | | | - | | | | 105,553,057 | | | | - | |
Fund shares sold | | | 174,814 | | | | 18,897 | | | | 201,623 | | | | 2,392 | |
Variation margin on open derivative instruments (Note 2) | | | 25,477 | | | | - | | | | 161,454 | | | | - | |
Interest and dividends | | | 1,660,230 | | | | 897,646 | | | | 7,200,569 | | | | 62,188 | |
Interest tax reclaim receivable | | | 113 | | | | - | | | | - | | | | - | |
Foreign taxes withheld | | | - | | | | 42,804 | | | | - | | | | - | |
| | | | | | | | | | | | | | | | |
Total assets | | | 739,956,466 | | | | 891,413,408 | | | | 1,468,497,601 | | | | 149,720,942 | |
| | | | | | | | | | | | | | | | |
| Liabilities: | |
Payables for: | |
Investments purchased | | | 10,545,904 | | | | 1,106,047 | | | | 55,844,533 | | | | - | |
Collateral held for open purchased options (Note 2) | | | 790,000 | | | | - | | | | 4,825,000 | | | | - | |
Investments purchased on a when-issued basis (Note 2) | | | 32,050,375 | | | | - | | | | 172,675,156 | | �� | | - | |
Fund shares repurchased | | | 221,094 | | | | 218,788 | | | | 579,136 | | | | 301,828 | |
Securities on loan (Note 2) | | | - | | | | 20,307,925 | | | | - | | | | - | |
Open swap agreements, at value (Note 2) | | | 159,488 | | | | - | | | | 974,484 | | | | - | |
Trustees’ fees and expenses (Note 3) | | | 210,347 | | �� | | 264,840 | | | | 246,800 | | | | 54,559 | |
Affiliates (Note 3): | |
Investment advisory fees | | | 245,060 | | | | 295,824 | | | | 404,536 | | | | 61,557 | |
Service fees | | | 53,033 | | | | 58,345 | | | | 178,253 | | | | - | |
Due to custodian | | | 121,156 | | | | - | | | | - | | | | - | |
Commitment and Contingent Liabilities (Note 9) | | | - | | | | - | | | | - | | | | - | |
Accrued expense and other liabilities | | | 72,300 | | | | 68,946 | | | | 95,996 | | | | 32,164 | |
| | | | | | | | | | | | | | | | |
Total liabilities | | | 44,468,757 | | | | 22,320,715 | | | | 235,823,894 | | | | 450,108 | |
| | | | | | | | | | | | | | | | |
Net assets | | $ | 695,487,709 | | | $ | 869,092,693 | | | $ | 1,232,673,707 | | | $ | 149,270,834 | |
| | | | | | | | | | | | | | | | |
| Net assets consist of: | |
Paid-in capital | | $ | 498,813,164 | | | $ | 566,017,701 | | | $ | 1,236,606,233 | | | $ | 149,319,990 | |
Undistributed (accumulated) net investment income (loss) | | | - | | | | 14,674,449 | | | | 1,192,188 | | | | - | |
Distributions in excess of net investment income | | | (97,146 | ) | | | - | | | | - | | | | (49,379 | ) |
Accumulated net realized gain (loss) on investments and foreign currency transactions | | | 43,680,766 | | | | 114,087,997 | | | | (17,733,572 | ) | | | 223 | |
Net unrealized appreciation (depreciation) on investments and foreign currency translations | | | 153,090,925 | | | | 174,312,546 | | | | 12,608,858 | | | | - | |
| | | | | | | | | | | | | | | | |
Net assets | | $ | 695,487,709 | | | $ | 869,092,693 | | | $ | 1,232,673,707 | | | $ | 149,270,834 | |
| | | | | | | | | | | | | | | | |
| | | | | | | | | | | | | | | | |
(a) Cost of investments: | | $ | 540,138,962 | | | $ | 704,612,785 | | | $ | 1,198,492,989 | | | $ | - | |
(b) Cost of repurchase agreements: | | $ | 400,810 | | | $ | 10,361,349 | | | $ | - | | | $ | 20,000,000 | |
(c) Cost of other short-term investments: | | $ | 25,237,150 | | | $ | - | | | $ | 141,027,226 | | | $ | 129,656,362 | |
(d) Securities on loan with market value of: | | $ | - | | | $ | 19,709,581 | | | $ | - | | | $ | - | |
The accompanying notes are an integral part of the financial statements.
70
MML Series Investment Fund II – Financial Statements (Continued)
Statements of Assets and Liabilities
December 31, 2017
| | | | | | | | | | | | | | | | |
| | | MML
Blend Fund | | | MML
Equity Fund | | | MML
Managed
Bond Fund | | | MML
U.S. Government
Money Market
Fund | |
| Initial Class shares: | |
Net assets | | $ | 607,368,496 | | | $ | 774,277,651 | | | $ | 953,592,143 | | | $ | 149,270,834 | |
| | | | | | | | | | | | | | | | |
Shares outstanding (a) | | | 26,035,856 | | | | 24,436,467 | | | | 76,811,115 | | | | 149,273,449 | |
| | | | | | | | | | | | | | | | |
Net asset value, offering price and redemption price per share | | $ | 23.33 | | | $ | 31.69 | | | $ | 12.41 | | | $ | 1.00 | |
| | | | | | | | | | | | | | | | |
| Service Class shares: | |
Net assets | | $ | 88,119,213 | | | $ | 94,815,042 | | | $ | 279,081,564 | | | $ | - | |
| | | | | | | | | | | | | | | | |
Shares outstanding (a) | | | 3,786,117 | | | | 3,027,975 | | | | 22,524,029 | | | | - | |
| | | | | | | | | | | | | | | | |
Net asset value, offering price and redemption price per share | | $ | 23.27 | | | $ | 31.31 | | | $ | 12.39 | | | $ | - | |
| | | | | | | | | | | | | | | | |
| (a) | Authorized unlimited number of shares with no par value. |
The accompanying notes are an integral part of the financial statements.
71
MML Series Investment Fund II – Financial Statements (Continued)
Statements of Operations
For the Year Ended December 31, 2017
| | | | | | | | | | | | | | | | |
| | | MML
Blend Fund | | | MML
Equity Fund | | | MML
Managed
Bond Fund | | | MML
U.S. Government
Money Market
Fund | |
| Investment income (Note 2): | |
Dividends (a) | | $ | 9,664,442 | | | $ | 17,970,097 | | | $ | 121,125 | | | $ | - | |
Interest | | | 6,064,653 | | | | 23,282 | | | | 38,974,687 | | | | 1,381,230 | |
Securities lending net income | | | - | | | | 37,329 | | | | - | | | | - | |
| | | | | | | | | | | | | | | | |
Total investment income | | | 15,729,095 | | | | 18,030,708 | | | | 39,095,812 | | | | 1,381,230 | |
| | | | | | | | | | | | | | | | |
| Expenses (Note 3): | |
Investment advisory fees | | | 2,781,076 | | | | 3,364,883 | | | | 4,750,435 | | | | 751,785 | |
Custody fees | | | 87,330 | | | | 63,119 | | | | 33,808 | * | | | 18,817 | |
Audit fees | | | 36,655 | | | | 35,929 | | | | 37,714 | | | | 31,248 | |
Legal fees | | | 4,741 | | | | 6,685 | | | | 2,323 | * | | | 6,785 | |
Proxy fees | | | 976 | | | | 976 | | | | - | * | | | 976 | |
Shareholder reporting fees | | | 58,924 | | | | 70,296 | | | | 43,415 | * | | | 17,745 | |
Trustees’ fees | | | 42,174 | | | | 52,844 | | | | 71,853 | | | | 10,046 | |
| | | | | | | | | | | | | | | | |
| | | 3,011,876 | | | | 3,594,732 | | | | 4,939,548 | | | | 837,402 | |
Service fees: | | | | | | | | | | | | | | | | |
Service Class | | | 181,322 | | | | 216,923 | | | | 690,880 | | | | - | |
| | | | | | | | | | | | | | | | |
Total expenses | | | 3,193,198 | | | | 3,811,655 | | | | 5,630,428 | | | | 837,402 | |
| | | | | | | | | | | | | | | | |
Net investment income (loss) | | | 12,535,897 | | | | 14,219,053 | | | | 33,465,384 | | | | 543,828 | |
| | | | | | | | | | | | | | | | |
| Realized and unrealized gain (loss): | |
Net realized gain (loss) on: | | | | | | | | | | | | | | | | |
Investment transactions | | | 49,947,580 | | | | 117,560,614 | | | | 7,412,592 | | | | 223 | |
Futures contracts | | | (1,261,555 | ) | | | - | | | | 1,560,429 | | | | - | |
Swap agreements | | | (17,383 | ) | | | - | | | | (114,954 | ) | | | - | |
Foreign currency transactions | | | - | | | | 11,681 | | | | - | | | | - | |
| | | | | | | | | | | | | | | | |
Net realized gain (loss) | | | 48,668,642 | | | | 117,572,295 | | | | 8,858,067 | | | | 223 | |
| | | | | | | | | | | | | | | | |
Net change in unrealized appreciation (depreciation) on: | | | | | | | | | | | | | | | | |
Investment transactions | | | 33,430,366 | | | | (9,508,654 | ) | | | 13,889,014 | | | | - | |
Futures contracts | | | 45,638 | | | | - | | | | 49,535 | | | | - | |
Swap agreements | | | (94,810 | ) | | | - | | | | (578,832 | ) | | | - | |
| | | | | | | | | | | | | | | | |
Net change in unrealized appreciation (depreciation) | | | 33,381,194 | | | | (9,508,654 | ) | | | 13,359,717 | | | | - | |
| | | | | | | | | | | | | | | | |
Net realized gain (loss) and change in unrealized appreciation (depreciation) | | | 82,049,836 | | | | 108,063,641 | | | | 22,217,784 | | | | 223 | |
| | | | | | | | | | | | | | | | |
Net increase (decrease) in net assets resulting from operations | | $ | 94,585,733 | | | $ | 122,282,694 | | | $ | 55,683,168 | | | $ | 544,051 | |
| | | | | | | | | | | | | | | | |
(a) Net of foreign withholding tax of: | | $ | - | | | $ | 136,183 | | | $ | - | | | $ | - | |
| * | Paid by MassMutual from 1/1/17-9/30/17, pursuant to investment advisory agreement dated 12/15/11 for a period of at least three years. The agreement was terminated after that period upon approval of a majority of the Independent Trustees, and effective 10/1/17, the Fund has paid these expenses. |
The accompanying notes are an integral part of the financial statements.
72
THIS PAGE INTENTIONALLY LEFT BLANK
73
MML Series Investment Fund II – Financial Statements (Continued)
Statements of Changes in Net Assets
| | | | | | | | |
| | | MML
Blend Fund | |
| | | Year
Ended
December 31, 2017 | | | Year
Ended
December 31, 2016 | |
| Increase (Decrease) in Net Assets: | | | | | | | | |
| Operations: | | | | | | | | |
Net investment income (loss) | | $ | 12,535,897 | | | $ | 12,544,719 | |
Net realized gain (loss) | | | 48,668,642 | | | | 28,039,281 | |
Net change in unrealized appreciation (depreciation) | | | 33,381,194 | | | | 15,605,210 | |
| | | | | | | | |
Net increase (decrease) in net assets resulting from operations | | | 94,585,733 | | | | 56,189,210 | |
| | | | | | | | |
| Distributions to shareholders (Note 2): | |
From net investment income: | |
Initial Class | | | (12,531,025 | ) | | | (12,269,213 | ) |
Service Class | | | (1,429,608 | ) | | | (1,001,145 | ) |
| | | | | | | | |
Total distributions from net investment income | | | (13,960,633 | ) | | | (13,270,358 | ) |
| | | | | | | | |
From net realized gains: | |
Initial Class | | | (23,720,611 | ) | | | (54,825,750 | ) |
Service Class | | | (2,665,274 | ) | | | (4,650,473 | ) |
| | | | | | | | |
Total distributions from net realized gains | | | (26,385,885 | ) | | | (59,476,223 | ) |
| | | | | | | | |
| Net fund share transactions (Note 5): | |
Initial Class | | | (22,711,107 | ) | | | 11,426,537 | |
Service Class | | | 21,969,778 | | | | 13,484,118 | |
| | | | | | | | |
Increase (decrease) in net assets from fund share transactions | | | (741,329 | ) | | | 24,910,655 | |
| | | | | | | | |
Capital Contribution | | | - | | | | - | |
| | | | | | | | |
Total increase (decrease) in net assets | | | 53,497,886 | | | | 8,353,284 | |
| Net assets | |
Beginning of year | | | 641,989,823 | | | | 633,636,539 | |
| | | | | | | | |
End of year | | $ | 695,487,709 | | | $ | 641,989,823 | |
| | | | | | | | |
Undistributed (accumulated) net investment income (loss) included in net assets at end of year | | $ | - | | | $ | 129,711 | |
| | | | | | | | |
Distributions in excess of net investment income included in net assets at end of year | | $ | (97,146 | ) | | $ | - | |
| | | | | | | | |
The accompanying notes are an integral part of the financial statements.
74
| | | | | | | | | | | | | | | | | | | | | | |
MML
Equity Fund | | | MML
Managed Bond Fund | | | MML U.S. Government
Money Market Fund | |
Year
Ended
December 31, 2017
| | | Year
Ended
December 31, 2016
| | | Year
Ended
December 31, 2017
| | | Year
Ended
December 31, 2016
| | | Year
Ended
December 31, 2017
| | | Year
Ended
December 31, 2016
| |
| | | | | | |
| | | | | | |
| $ | 14,219,053 | | | $ | 16,139,713 | | | $ | 33,465,384 | | | $ | 31,556,238 | | | $ | 543,828 | | | $ | 221 | |
| | 117,572,295 | | | | 6,307,274 | | | | 8,858,067 | | | | (14,492,350 | ) | | | 223 | | | | 3,790 | |
| | (9,508,654 | ) | | | 68,646,016 | | | | 13,359,717 | | | | 16,355,296 | | | | - | | | | - | |
| | | | | | | | | | | | | | | | | | | | | | |
| | 122,282,694 | | | | 91,093,003 | | | | 55,683,168 | | | | 33,419,184 | | | | 544,051 | | | | 4,011 | |
| | | | | | | | | | | | | | | | | | | | | | |
| | | | | | | | | | | | | | | | | | | | | | |
| | | | | | | | | | | | | | | | | | | | | | |
| | (13,519,486 | ) | | | (11,993,394 | ) | | | (30,212,037 | ) | | | (27,667,303 | ) | | | (546,360 | ) | | | (222 | ) |
| | (1,449,726 | ) | | | (1,123,086 | ) | | | (8,142,837 | ) | | | (6,650,943 | ) | | | - | | | | - | |
| | | | | | | | | | | | | | | | | | | | | | |
| | (14,969,212 | ) | | | (13,116,480 | ) | | | (38,354,874 | ) | | | (34,318,246 | ) | | | (546,360 | ) | | | (222 | ) |
| | | | | | | | | | | | | | | | | | | | | | |
| | | | | | | | | | | | | | | | | | | | | | |
| | (5,088,008 | ) | | | (43,851,037 | ) | | | - | | | | (4,333,772 | ) | | | (1,678 | ) | | | - | |
| | (613,145 | ) | | | (4,678,832 | ) | | | - | | | | (1,095,099 | ) | | | - | | | | - | |
| | | | | | | | | | | | | | | | | | | | | | |
| | (5,701,153 | ) | | | (48,529,869 | ) | | | - | | | | (5,428,871 | ) | | | (1,678 | ) | | | - | |
| | | | | | | | | | | | | | | | | | | | | | |
| | | | | | | | | | | | | | | | | | | | | | |
| | (44,354,184 | ) | | | (8,210,073 | ) | | | (1,563,502 | ) | | | (30,773,399 | ) | | | (16,861,181 | ) | | | (1,944,234 | ) |
| | 2,249,122 | | | | 9,935,719 | | | | 14,553,437 | | | | 17,106,810 | | | | - | | | | - | |
| | | | | | | | | | | | | | | | | | | | | | |
| | (42,105,062 | ) | | | 1,725,646 | | | | 12,989,935 | | | | (13,666,589 | ) | | | (16,861,181 | ) | | | (1,944,234 | ) |
| | | | | | | | | | | | | | | | | | | | | | |
| | - | | | | - | | | | - | | | | - | | | | - | | | | 176,276 | |
| | | | | | | | | | | | | | | | | | | | | | |
| | 59,507,267 | | | | 31,172,300 | | | | 30,318,229 | | | | (19,994,522 | ) | | | (16,865,168 | ) | | | (1,764,169 | ) |
| | | | | | | | | | | | | | | | | | | | | | |
| | 809,585,426 | | | | 778,413,126 | | | | 1,202,355,478 | | | | 1,222,350,000 | | | | 166,136,002 | | | | 167,900,171 | |
| | | | | | | | | | | | | | | | | | | | | | |
| $ | 869,092,693 | | | $ | 809,585,426 | | | $ | 1,232,673,707 | | | $ | 1,202,355,478 | | | $ | 149,270,834 | | | $ | 166,136,002 | |
| | | | | | | | | | | | | | | | | | | | | | |
$ | 14,674,449 | | | $ | 15,593,338 | | | $ | 1,192,188 | | | $ | 2,417,099 | | | $ | - | | | $ | - | |
| | | | | | | | | | | | | | | | | | | | | | |
| $ | - | | | $ | - | | | $ | - | | | $ | - | | | $ | (49,379 | ) | | $ | (46,335 | ) |
| | | | | | | | | | | | | | | | | | | | | | |
75
MML Series Investment Fund II – Financial Statements (Continued)
Financial Highlights (For a share outstanding throughout each period)
MML Blend Fund
| | | | | | | | | | | | | | | | | | | | | | | | | | | | | | | | | | | | | | | | | | | | | | | | |
| | | | | | Income (loss) from investment
operations | | | Less distributions to shareholders | | | | | | | | | Ratios / Supplemental Data | |
| | | Net asset
value,
beginning
of the
period | | | Net
investment
income
(loss)c | | | Net
realized
and
unrealized
gain (loss)
on
investments | | | Total
income
(loss) from
investment
operations | | | From net
investment
income | | | From net
realized
gains | | | Total
distributions | | | Net
asset
value,
end of
the
period | | | Total
returnm | | | Net
assets,
end of
the
period
(000’s) | | | Ratio of
expenses
to average
daily net
assets | | | Net
investment
income
(loss) to
average
daily net
assets | |
| Initial Class | | | | | | | | | | | | | | | | | | | | | | | | | | | | | | | | | |
| 12/31/17 | | $ | 21.54 | | | $ | 0.42 | | | $ | 2.74 | | | $ | 3.16 | | | $ | (0.47 | ) | | $ | (0.90 | ) | | $ | (1.37 | ) | | $ | 23.33 | | | | 15.25% | | | $ | 607,368 | | | | 0.45% | | | | 1.91% | |
| 12/31/16 | | | 22.22 | | | | 0.43 | | | | 1.48 | | | | 1.91 | | | | (0.46 | ) | | | (2.13 | ) | | | (2.59 | ) | | | 21.54 | | | | 9.42% | | | | 581,972 | | | | 0.46% | | | | 2.03% | |
| 12/31/15 | | | 24.51 | | | | 0.48 | | | | (0.45 | ) | | | 0.03 | | | | (0.50 | ) | | | (1.82 | ) | | | (2.32 | ) | | | 22.22 | | | | 0.08% | | | | 586,082 | | | | 0.45% | | | | 2.07% | |
| 12/31/14 | | | 22.78 | | | | 0.45 | | | | 2.01 | | | | 2.46 | | | | (0.49 | ) | | | (0.24 | ) | | | (0.73 | ) | | | 24.51 | | | | 10.99% | | | | 644,881 | | | | 0.45% | | | | 1.92% | |
| 12/31/13 | | | 19.33 | | | | 0.41 | | | | 3.48 | | | | 3.89 | | | | (0.44 | ) | | | - | | | | (0.44 | ) | | | 22.78 | | | | 20.31% | | | | 639,537 | | | | 0.46% | | | | 1.94% | |
| Service Class | | | | | | | | | | | | | | | | | | | | | | | | | | | | | | | | | |
| 12/31/17 | | $ | 21.50 | | | $ | 0.37 | | | $ | 2.72 | | | $ | 3.09 | | | $ | (0.42 | ) | | $ | (0.90 | ) | | $ | (1.32 | ) | | $ | 23.27 | | | | 14.97% | | | $ | 88,119 | | | | 0.70% | | | | 1.66% | |
| 12/31/16 | | | 22.18 | | | | 0.37 | | | | 1.48 | | | | 1.85 | | | | (0.40 | ) | | | (2.13 | ) | | | (2.53 | ) | | | 21.50 | | | | 9.15% | | | | 60,018 | | | | 0.71% | | | | 1.78% | |
| 12/31/15 | | | 24.48 | | | | 0.42 | | | | (0.46 | ) | | | (0.04 | ) | | | (0.44 | ) | | | (1.82 | ) | | | (2.26 | ) | | | 22.18 | | | | (0.17% | ) | | | 47,555 | | | | 0.70% | | | | 1.83% | |
| 12/31/14 | | | 22.75 | | | | 0.39 | | | | 2.01 | | | | 2.40 | | | | (0.43 | ) | | | (0.24 | ) | | | (0.67 | ) | | | 24.48 | | | | 10.71% | | | | 40,333 | | | | 0.70% | | | | 1.68% | |
| 12/31/13 | | | 19.30 | | | | 0.36 | | | | 3.47 | | | | 3.83 | | | | (0.38 | ) | | | - | | | | (0.38 | ) | | | 22.75 | | | | 20.01% | | | | 30,932 | | | | 0.71% | | | | 1.70% | |
| | | | | | | | | | | | | | | | | | | | |
| | | Year ended December 31 | |
| | | 2017 | | | 2016 | | | 2015 | | | 2014 | | | 2013 | |
Portfolio turnover rate | | | 134 | % | | | 175 | % | | | 209 | % | | | 183 | % | | | 235 | % |
| c | Per share amount calculated on the average shares method. |
| m | Total return does not reflect expenses that apply at the separate account level or to related insurance products. Inclusion of these charges would reduce the total return figures for all periods shown. |
The accompanying notes are an integral part of the financial statements.
76
MML Series Investment Fund II – Financial Statements (Continued)
Financial Highlights (For a share outstanding throughout each period)
MML Equity Fund
| | | | | | | | | | | | | | | | | | | | | | | | | | | | | | | | | | | | | | | | | | | | | | | | |
| | | | | | Income (loss) from investment
operations | | | Less distributions to shareholders | | | | | | | | | Ratios / Supplemental Data: | |
| | | Net asset
value,
beginning
of the
period | | | Net
investment
income
(loss)c | | | Net
realized
and
unrealized
gain (loss)
on
investments | | | Total
income
(loss) from
investment
operations | | | From net
investment
income | | | From net
realized gains | | | Total
distributions | | | Net
asset
value,
end of
the
period | | | Total
returnm | | | Net
assets,
end of
the
period
(000’s) | | | Ratio of
expenses
to average
daily net
assets | | | Net
investment
income
(loss) to
average
daily net
assets | |
Initial Class | | | | | | | | | | | | | | | | | | | | | | | | | | | | | | | | | | | | | | | | | |
12/31/17 | | $ | 28.08 | | | $ | 0.52 | | | $ | 3.85 | | | $ | 4.37 | | | $ | (0.55 | ) | | $ | (0.21 | ) | | $ | (0.76 | ) | | $ | 31.69 | | | | 15.79% | | | $ | 774,278 | | | | 0.43% | | | | 1.73% | |
| 12/31/16 | | | 27.08 | | | | 0.58 | | | | 2.69 | | | | 3.27 | | | | (0.49 | ) | | | (1.78 | ) | | | (2.27 | ) | | | 28.08 | | | | 12.59% | | | | 727,540 | | | | 0.44% | | | | 2.15% | |
| 12/31/15 | | | 30.28 | | | | 0.50 | | | | (1.67 | ) | | | (1.17 | ) | | | (0.64 | ) | | | (1.39 | ) | | | (2.03 | ) | | | 27.08 | | | | (3.43% | ) | | | 709,315 | | | | 0.43% | | | | 1.69% | |
| 12/31/14 | | | 27.55 | | | | 0.61 | | | | 2.57 | | | | 3.18 | | | | (0.45 | ) | | | - | | | | (0.45 | ) | | | 30.28 | | | | 11.57% | | | | 799,222 | | | | 0.43% | | | | 2.12% | |
| 12/31/13 | | | 21.07 | | | | 0.41 | | | | 6.54 | | | | 6.95 | | | | (0.47 | ) | | | - | | | | (0.47 | ) | | | 27.55 | | | | 33.27% | | | | 787,449 | | | | 0.44% | | | | 1.69% | |
Service Class | | | | | | | | | | | | | | | | | | | | | | | | | | | | | | | | | | | | | | | | | |
12/31/17 | | $ | 27.77 | | | $ | 0.44 | | | $ | 3.80 | | | $ | 4.24 | | | $ | (0.49 | ) | | $ | (0.21 | ) | | $ | (0.70 | ) | | $ | 31.31 | | | | 15.50% | | | $ | 94,815 | | | | 0.68% | | | | 1.49% | |
| 12/31/16 | | | 26.81 | | | | 0.50 | | | | 2.67 | | | | 3.17 | | | | (0.43 | ) | | | (1.78 | ) | | | (2.21 | ) | | | 27.77 | | | | 12.31% | | | | 82,045 | | | | 0.69% | | | | 1.90% | |
| 12/31/15 | | | 30.01 | | | | 0.42 | | | | (1.65 | ) | | | (1.23 | ) | | | (0.58 | ) | | | (1.39 | ) | | | (1.97 | ) | | | 26.81 | | | | (3.67% | ) | | | 69,098 | | | | 0.68% | | | | 1.45% | |
| 12/31/14 | | | 27.34 | | | | 0.52 | | | | 2.56 | | | | 3.08 | | | | (0.41 | ) | | | - | | | | (0.41 | ) | | | 30.01 | | | | 11.29% | | | | 56,685 | | | | 0.68% | | | | 1.82% | |
| 12/31/13 | | | 20.93 | | | | 0.35 | | | | 6.49 | | | | 6.84 | | | | (0.43 | ) | | | - | | | | (0.43 | ) | | | 27.34 | | | | 32.94% | | | | 41,591 | | | | 0.69% | | | | 1.44% | |
| | | | | | | | | | | | | | | | | | | | |
| | | Year ended December 31 | |
| | | 2017 | | | 2016 | | | 2015 | | | 2014 | | | 2013 | |
Portfolio turnover rate | | | 70 | % | | | 47 | % | | | 39 | % | | | 38 | % | | | 100 | % |
| c | Per share amount calculated on the average shares method. |
| m | Total return does not reflect expenses that apply at the separate account level or to related insurance products. Inclusion of these charges would reduce the total return figures for all periods shown. |
The accompanying notes are an integral part of the financial statements.
77
MML Series Investment Fund II – Financial Statements (Continued)
Financial Highlights (For a share outstanding throughout each period)
MML Managed Bond Fund
| | | | | | | | | | | | | | | | | | | | | | | | | | | | | | | | | | | | | | | | | | | | | | | | |
| | | | | | Income (loss) from investment
operations | | | Less distributions to shareholders | | | | | | | | | Ratios / Supplemental Data | |
| | | Net asset
value,
beginning
of the
period | | | Net
investment
income
(loss)c | | | Net
realized
and
unrealized
gain (loss)
on
investments | | | Total
income
(loss) from
investment
operations | | | From net
investment
income | | | From
net
realized
gains | | | Total
distributions | | | Net
asset
value,
end of
the
period | | | Total
returnm | | | Net
assets,
end of
the
period
(000’s) | | | Ratio of
expenses
to average
daily net
assets | | | Net
investment
income
(loss) to
average
daily net
assets | |
Initial Class | | | | | | | | | | | | | | | | | | | | | | | | | | | | | | | | | | | | | | | | | |
| 12/31/17 | | $ | 12.24 | | | $ | 0.35 | | | $ | 0.22 | | | $ | 0.57 | | | $ | (0.40 | ) | | $ | - | | | $ | (0.40 | ) | | $ | 12.41 | | | | 4.69% | | | $ | 953,592 | | | | 0.40% | | | | 2.78% | |
| 12/31/16 | | | 12.31 | | | | 0.33 | | | | 0.02 | | | | 0.35 | | | | (0.36 | ) | | | (0.06 | ) | | | (0.42 | ) | | | 12.24 | | | | 2.75% | | | | 941,621 | | | | 0.39% | | | | 2.61% | |
| 12/31/15 | | | 12.82 | | | | 0.33 | | | | (0.43 | ) | | | (0.10 | ) | | | (0.36 | ) | | | (0.05 | ) | | | (0.41 | ) | | | 12.31 | | | | (0.75% | ) | | | 976,932 | | | | 0.39% | | | | 2.59% | |
| 12/31/14 | | | 12.44 | | | | 0.32 | | | | 0.47 | | | | 0.79 | | | | (0.41 | ) | | | - | | | | (0.41 | ) | | | 12.82 | | | | 6.46% | | | | 1,218,504 | | | | 0.39% | | | | 2.47% | |
| 12/31/13 | | | 13.20 | | | | 0.31 | | | | (0.52 | ) | | | (0.21 | ) | | | (0.40 | ) | | | (0.15 | ) | | | (0.55 | ) | | | 12.44 | | | | (1.64% | ) | | | 1,123,545 | | | | 0.39% | | | | 2.46% | |
Service Class | | | | | | | | | | | | | | | | | | | | | | | | | | | | | | | | | | | | | | | | | |
| 12/31/17 | | $ | 12.22 | | | $ | 0.31 | | | $ | 0.23 | | | $ | 0.54 | | | $ | (0.37 | ) | | $ | - | | | $ | (0.37 | ) | | $ | 12.39 | | | | 4.43% | | | $ | 279,082 | | | | 0.65% | | | | 2.53% | |
| 12/31/16 | | | 12.29 | | | | 0.29 | | | | 0.03 | | | | 0.32 | | | | (0.33 | ) | | | (0.06 | ) | | | (0.39 | ) | | | 12.22 | | | | 2.49% | | | | 260,735 | | | | 0.64% | | | | 2.36% | |
| 12/31/15 | | | 12.80 | | | | 0.30 | | | | (0.43 | ) | | | (0.13 | ) | | | (0.33 | ) | | | (0.05 | ) | | | (0.38 | ) | | | 12.29 | | | | (1.00% | ) | | | 245,418 | | | | 0.64% | | | | 2.36% | |
| 12/31/14 | | | 12.42 | | | | 0.28 | | | | 0.48 | | | | 0.76 | | | | (0.38 | ) | | | - | | | | (0.38 | ) | | | 12.80 | | | | 6.19% | | | | 217,495 | | | | 0.64% | | | | 2.22% | |
| 12/31/13 | | | 13.18 | | | | 0.28 | | | | (0.52 | ) | | | (0.24 | ) | | | (0.37 | ) | | | (0.15 | ) | | | (0.52 | ) | | | 12.42 | | | | (1.88% | ) | | | 178,346 | | | | 0.64% | | | | 2.21% | |
| | | | | | | | | | | | | | | | | | | | |
| | | Year ended December 31 | |
| | | 2017 | | | 2016 | | | 2015 | | | 2014 | | | 2013 | |
Portfolio turnover rate | | | 237 | % | | | 314 | % | | | 358 | % | | | 368 | % | | | 313 | % |
| c | Per share amount calculated on the average shares method. |
| m | Total return does not reflect expenses that apply at the separate account level or to related insurance products. Inclusion of these charges would reduce the total return figures for all periods shown. |
The accompanying notes are an integral part of the financial statements.
78
MML Series Investment Fund II – Financial Statements (Continued)
Financial Highlights (For a share outstanding throughout each period)
MML U. S. Government Money Market Fund
| | | | | | | | | | | | | | | | | | | | | | | | | | | | | | | | | | | | | | | | | | | | | | | | | | | | |
| | | | | | Income (loss) from investment
operations | | | Less distributions to shareholders | | | | | | | | | Ratios / Supplemental Data | |
| | | Net asset
value,
beginning
of the
period | | | Net
investment
income
(loss)c,j | | | Net
realized
and
unrealized
gain (loss)
on
investments | | | Total
income
(loss) from
investment
operations | | | From net
investment
income | | | From
net
realized
gains | | | Total
distributions | | | Net
asset
value,
end of
the
period | | | Total
returnm | | | Net
assets,
end of
the
period
(000’s) | | | Ratio of
expenses
to average
daily net
assets
before
expense
waivers | | | Ratio of
expenses
to average
daily net
assets
after
expense
waiversj | | | Net
investment
income
(loss) to
average
daily net
assets | |
Initial Class | | | | | | | | | | | | | | | | | | | | | | | | | | | | | | | | | | | | | | | | | | | | | |
| 12/31/17 | | $ | 1.00 | | | $ | 0.00 | d | | $ | 0.00 | d | | $ | 0.00 | d | | $ | (0.00 | )d | | $ | (0.00 | )d | | $ | (0.00 | )d | | $ | 1.00 | | | | 0.36% | | | $ | 149,271 | | | | 0.54% | | | | 0.54% | n | | | 0.35 | % |
| 12/31/16 | | | 1.00 | | | | 0.00 | d | | | 0.00 | d | | | 0.00 | d | | | (0.00 | )d | | | - | | | | (0.00 | )d | | | 1.00 | | | | 0.11% | | | | 166,136 | | | | 0.54% | | | | 0.40% | | | | 0.00 | %e |
| 12/31/15 | | | 1.00 | | | | - | | | | 0.00 | d | | | 0.00 | d | | | (0.00 | )d | | | (0.00 | )d | | | (0.00 | )d | | | 1.00 | | | | 0.00% | e | | | 167,900 | | | | 0.52% | | | | 0.15% | | | | - | |
| 12/31/14 | | | 1.00 | | | | - | | | | 0.00 | d | | | 0.00 | d | | | (0.00 | )d | | | (0.00 | )d | | | (0.00 | )d | | | 1.00 | | | | 0.00% | e | | | 252,701 | | | | 0.51% | | | | 0.11% | | | | - | |
| 12/31/13 | | | 1.00 | | | | - | | | | 0.00 | d | | | 0.00 | d | | | (0.00 | )d | | | - | | | | (0.00 | )d | | | 1.00 | | | | 0.00% | e | | | 272,401 | | | | 0.51% | | | | 0.14% | | | | - | |
| c | Per share amount calculated on the average shares method. |
| d | Amount is less than $0.005 per share. |
| e | Amount is less than 0.005%. |
| j | Computed after giving effect to an agreement by MML Advisers and/or MassMutual to waive certain fees and expenses of the Fund. |
| m | Total return does not reflect expenses that apply at the separate account level or to related insurance products. Inclusion of these charges would reduce the total return figures for all periods shown. |
| n | Expenses incurred during the period fell under the expense cap. |
The accompanying notes are an integral part of the financial statements.
79
Notes to Financial Statements
MML Series Investment Fund II (the “Trust”) is registered under the Investment Company Act of 1940, as amended (the “1940 Act”), as a no-load, open-end, management investment company. The Trust is organized under the laws of the Commonwealth of Massachusetts as a Massachusetts business trust pursuant to an Agreement and Declaration of Trust dated February 8, 2005, which was amended and restated as of February 28, 2005 and December 15, 2011, as it may be further amended from time to time. The following are four series of the Trust (each individually referred to as a “Fund” or collectively as the “Funds”):
MML Blend Fund (“Blend Fund”)
MML Equity Fund (“Equity Fund”)
MML Managed Bond Fund (“Managed Bond Fund”)
MML U.S. Government Money Market Fund (“U.S. Government Money Market Fund”)
The Trust makes shares of the Funds available for the investment of assets of various separate investment accounts established by Massachusetts Mutual Life Insurance Company (“MassMutual”) and by life insurance companies which are subsidiaries of MassMutual. Shares of the Trust are not offered to the general public. MassMutual, MML Bay State Life Insurance Company, C.M. Life Insurance Company, and the MML Allocation Funds, which are “funds of funds” series of MML Series Investment Fund, another open-end management investment company sponsored by MassMutual, are the record owners of all of the outstanding shares of the Funds.
Each share class of a Fund represents an interest in the same portfolio of assets. The principal difference among the classes is the level of shareholder and distribution service expenses borne by the classes. Because each class will have different fees and expenses, performance and share prices will vary between the classes. The classes of shares are offered to different types of investors, as outlined in the Funds’ Prospectus.
| 2. | | Significant Accounting Policies |
The following is a summary of significant accounting policies followed consistently by each Fund in the preparation of the financial statements in conformity with accounting principles generally accepted in the United States of America (“generally accepted accounting principles”). The preparation of the financial statements in accordance with generally accepted accounting principles requires management to make estimates and assumptions that affect the reported amounts and disclosures in the financial statements. Actual results could differ from those estimates.
Investment Valuation
The net asset value of each Fund’s shares is determined once daily as of the close of regular trading on the New York Stock Exchange (“NYSE”), on each day the NYSE is open for trading (a “business day”). The NYSE normally closes at 4:00 p.m. Eastern Time, but may close earlier on some days. If the NYSE is scheduled to close early, the business day will be considered to end as of the time of the NYSE’s scheduled close. A Fund will not treat an intraday disruption in NYSE trading or other event that causes an unscheduled closing of the NYSE as a close of business of the NYSE for these purposes and will instead fair value securities in accordance with procedures approved annually by the Trustees, and under the general oversight of the Trustees. On holidays and other days when the NYSE is closed, each Fund’s net asset value generally is not calculated and the Funds do not anticipate accepting buy or sell orders. However, the value of each Fund’s assets may still be affected on such days to the extent that a Fund holds foreign securities that trade on days that foreign securities markets are open.
Equity securities and derivative contracts that are actively traded on a national securities exchange or contract market are valued on the basis of information furnished by a pricing service, which provides the last reported sale price, or, in the case of futures contracts, the settlement price, for securities or derivatives listed on the exchange or contract market or the official closing price on the NASDAQ National Market System (“NASDAQ System”), or in the case of over-the-counter (“OTC”) securities for which an official closing price is unavailable or not reported on the NASDAQ System, the last reported bid price. Portfolio securities traded on more than one national securities exchange are valued at the last price at the close of the exchange representing the principal market for such securities. Debt securities (with the exception of debt securities held by the U.S. Government Money Market Fund) are valued on the basis of valuations furnished by a pricing service, which generally determines valuations taking into account
80
Notes to Financial Statements (Continued)
factors such as institutional-size trading in similar securities, yield, quality, coupon rate, maturity, type of issue, trading characteristics, and other market data. Shares of other open-end mutual funds are valued at their closing net asset values as reported on each business day. The U.S. Government Money Market Fund’s debt securities are typically valued at amortized cost, but may be valued using a vendor quote if the Fund’s investment adviser determines it more closely approximates current market value, in accordance with Rule 2a-7 under the 1940 Act pursuant to which the U.S. Government Money Market Fund must adhere to certain conditions. It is the intention of the U.S. Government Money Market Fund to maintain a stable net asset value per share of $1.00, although this cannot be assured.
Investments for which market quotations are readily available are marked to market daily based on those quotations. Market quotations may be provided by third-party vendors or market makers, and may be determined on the basis of a variety of factors, such as broker quotations, financial modeling, and other market data, such as market indexes and yield curves, counterparty information, and foreign exchange rates. U.S. Government and agency securities may be valued on the basis of market quotations or using a model that may incorporate market observable data such as reported sales of similar securities, broker quotes, yields, bids, offers, quoted market prices, and reference data. The fair values of OTC derivative contracts, including forward, swap, and option contracts related to interest rates, foreign currencies, credit standing of reference entities, equity prices, or commodity prices, may be based on market quotations or may be modeled using a series of techniques, including simulation models, depending on the contract and the terms of the transaction. The fair values of asset-backed securities and mortgage-backed securities are estimated based on models that consider the estimated cash flows of each debt tranche of the issuer, established benchmark yield, and estimated tranche-specific spread to the benchmark yield based on the unique attributes of the tranche, including, but not limited to, prepayment speed assumptions and attributes of the collateral. Restricted securities are generally valued at a discount to similar publicly traded securities.
Investments for which market quotations are not available or for which a pricing service or vendor does not provide a value, or for which such market quotations or values are considered by the investment adviser or subadviser to be unreliable (including, for example, certain foreign securities, thinly-traded securities, certain restricted securities, certain initial public offerings, or securities whose values may have been affected by a significant event) are stated at fair valuations determined in good faith by the Funds’ Valuation Committee1 in accordance with procedures approved annually by the Board of Trustees (“Trustees”), and under the general oversight of the Trustees. The Funds’ Valuation Committee employs various methods to determine fair valuations including a regular review of significant inputs and assumptions and review of any related market activity. The Funds’ Valuation Committee reports to the Trustees at its regularly scheduled meetings. It is possible that fair value prices will be used by the Funds to a significant extent. The value determined for an investment using the Funds’ fair value procedures may differ from recent market prices for the investment and may be significantly different from the value realized upon the sale of such investment.
The Funds may invest in securities that are traded principally in foreign markets and that trade on weekends and other days when the Funds do not price their shares. As a result, the values of the Funds’ portfolio securities may change on days when the prices of the Funds’ shares are not calculated. The prices of the Funds’ shares will reflect any such changes when the prices of the Funds’ shares are next calculated, which is the next business day. The Funds may use fair value pricing more frequently for securities primarily traded in foreign markets because, among other things, most foreign markets close well before the Funds value their securities. The earlier close of these foreign markets gives rise to the possibility that significant events, including broad market moves, may have occurred in the interim. The Funds’ investments may be priced based on fair values provided by a third-party vendor, based on certain factors and methodologies applied by such vendor, in the event that there is movement in the U.S. market, between the close of the foreign market and the time the Funds calculate their net asset values. All assets and liabilities expressed in foreign currencies are converted into U.S. dollars at the mean between the buying and selling rates of such currencies against the U.S. dollar at the end of each business day.
For investments in equity or debt issued by privately held companies or funds (“Private Company” or collectively, the “Private Companies”) and any other investments fair valued using significant unobservable inputs, as described below, the fair valuation approaches used by third party service providers and/or the Funds’ subadvisers utilize one or a combination of, but not limited to, the following inputs.
| 1 | The Valuation Committee consists of the President, Treasurer, Assistant Treasurers, Vice Presidents (except for the CCO), Secretary, and Assistant Secretaries of the Trust, as well as such alternate members as the Trustees may from time to time designate. The Valuation Committee reviews and determines the fair valuation of portfolio securities and the Funds’ pricing procedures in general. |
81
Notes to Financial Statements (Continued)
Market approach: (i) recent market transactions, including subsequent rounds of financing, in the underlying investment or comparable issuers; (ii) recapitalizations and other transactions across the capital structure; and (iii) market multiples of comparable issuers.
Income approach: (i) future cash flows discounted to present value and adjusted as appropriate for liquidity, credit, and/or market risks; (ii) quoted prices for similar investments or assets in active markets; and (iii) other risk factors, such as interest rates, yield curves, volatilities, prepayment speeds, loss severities, credit risks, recovery rates, liquidation amounts, and/or default rates.
Cost approach: (i) audited or unaudited financial statements, investor communications, and financial or operational metrics issued by the Private Company; (ii) changes in the valuation of relevant indices or publicly traded companies comparable to the Private Company; (iii) relevant news and other public sources; and (iv) known secondary market transactions in the Private Company’s interests and merger or acquisition activity in companies comparable to the Private Company.
Investments in series of preferred stock issued by Private Companies are typically valued utilizing Market approach in determining the enterprise value of the company. Such investments often contain rights and preferences that differ from other series of preferred and common stock of the same issuer. Valuation techniques such as the current value method (“CVM”), an option pricing model (“OPM”), a probability weighted expected return model (“PWERM”), or a hybrid of those techniques are used in allocating enterprise value of the company, as deemed appropriate under the circumstances. The CVM allocates value among the various parts of a company’s capital structure assuming that the value of convertible preferred stock is represented by the most favorable claim the preferred stockholders have on the enterprise value as of the valuation date. The use of OPM and PWERM techniques involve a determination of the exit scenarios of the investment in order to appropriately allocate the enterprise value of the company among the various parts of its capital structure.
The Private Companies are not subject to the public company disclosure, timing, and reporting standards as other investments held by a Fund. Typically, the most recently available information for a Private Company is as of a date that is earlier than the date a Fund is calculating its net asset value. This factor may result in a difference between the value of the investment and the price a Fund could receive upon the sale of the investment.
Fair value is defined as the price that would be received to sell an asset or paid to transfer a liability in an orderly transaction between market participants at the measurement date. A three-tier hierarchy is utilized to maximize the use of observable market data inputs and minimize the use of unobservable inputs and to establish classification of fair value measurements for disclosure purposes. Inputs refer broadly to the assumptions that market participants would use in pricing the asset or liability, including assumptions about risk, for example, the risk inherent in a particular valuation technique used to measure fair value (such as a pricing model) and/or the risk inherent in the inputs to the valuation technique. Inputs may be observable or unobservable. Observable inputs are inputs that reflect the assumptions market participants would use in pricing the asset or liability and are developed based on market data obtained from sources independent of the reporting entity. Unobservable inputs are inputs that reflect the reporting entity’s own assumptions about the assumptions market participants would use in pricing the asset or liability and are developed based on the best information available in the circumstances. The three-tier hierarchy of inputs is summarized in the three broad Levels listed below. The inputs or methodology used for valuing investments are not necessarily an indication of the risk associated with investing in those investments and the determination of the significance of a particular input to the fair value measurement in its entirety requires judgment and consideration of factors specific to each security.
Level 1 – quoted prices (unadjusted) in active markets for identical investments that the Funds can access at the measurement date
The types of assets and liabilities categorized in Level 1 generally include actively traded domestic and certain foreign equity securities, derivatives actively traded on a national securities exchange (such as some warrants, rights, futures, and options), and shares of open-end mutual funds.
Level 2 – other significant observable inputs (including quoted prices for similar investments, interest rates, prepayment speeds, credit risk, etc.)
The types of assets and liabilities categorized in Level 2 generally include debt securities such as U.S. Government and agency securities, mortgage-backed securities, asset-backed securities, municipal obligations, sovereign debt obligations, bank loans, corporate bonds, and those securities valued at amortized cost; OTC derivatives such as swaps, options, swaptions, and forward
82
Notes to Financial Statements (Continued)
foreign currency exchange contracts; certain restricted securities; and non-exchange traded equity securities and certain foreign equity securities traded on particular foreign exchanges that close before the Funds determine their net asset values.
Level 3 – significant unobservable inputs (including the Funds’ own assumptions in determining the fair value of investments)
The types of assets and liabilities categorized in Level 3 generally include securities for which prices, spreads, or any of the other aforementioned significant inputs are unobservable. Generally, securities whose trading has been suspended or that have been de-listed from their current primary trading exchange; securities in default or bankruptcy proceedings for which there is no current market quotation; securities and certain derivatives valued by broker quotes which may include brokers’ assumptions; and any illiquid Rule 144A securities or restricted securities issued by non-public entities are categorized in Level 3.
The availability of observable inputs can vary from security to security and is affected by a wide variety of factors, including, for example, the type of security, whether the security is new and not yet established in the marketplace, the liquidity of markets, and other characteristics particular to the security. To the extent that valuation is based on models or inputs that are less observable or unobservable in the market, the determination of fair value requires more judgment. Accordingly, the degree of judgment exercised in determining fair value is greatest for instruments categorized in Level 3.
Changes in valuation techniques may result in transfers in or out of an investment’s assigned Level within the hierarchy. In addition, in periods of market dislocation, the observability of prices and inputs may be reduced for many instruments. This condition, as well as changes related to liquidity of investments, could cause a security to be reclassified between Level 1, Level 2, or Level 3.
In certain cases, the inputs used to measure fair value may fall into different levels of the fair value hierarchy. In such cases, for disclosure purposes the level in the fair value hierarchy within which the fair value measurement falls is determined based on the lowest level input that is significant to the overall fair value measurement.
The U.S. Government Money Market Fund characterized all investments at Level 2, as of December 31, 2017. The Equity Fund characterized all long-term investments at Level 1, and all short-term investments at Level 2, as of December 31, 2017. For each Fund noted in the preceding sentences, the level classification by major category of investments is the same as the category presentation in the Portfolio of Investments.
The following is the aggregate value by input level, as of December 31, 2017, for the remaining Funds’ investments:
| | | | | | | | | | | | | | | | |
| | | Level 1 | | | Level 2 | | | Level 3 | | | Total | |
Blend Fund | | | | | | | | | | | | | | | | |
Asset Investments | | | | | | | | | | | | | | | | |
Common Stock | | $ | 488,470,766 | | | $ | - | | | $ | - | | | $ | 488,470,766 | |
Preferred Stock | | | 524,800 | | | | - | | | | - | | | | 524,800 | |
Corporate Debt | | | - | | | | 71,201,809 | | | | - | | | | 71,201,809 | |
Municipal Obligations | | | - | | | | 1,339,391 | | | | - | | | | 1,339,391 | |
Non-U.S. Government Agency Obligations | | | - | | | | 57,153,690 | | | | 1,801,713 | * | | | 58,955,403 | |
Sovereign Debt Obligations | | | - | | | | 1,688,614 | | | | - | | | | 1,688,614 | |
U.S. Government Agency Obligations and Instrumentalities | | | - | | | | 51,070,111 | | | | - | | | | 51,070,111 | |
U.S. Treasury Obligations | | | - | | | | 19,377,887 | | | | - | | | | 19,377,887 | |
Purchased Options | | | - | | | | 767,579 | | | | - | | | | 767,579 | |
Rights | | | - | | | | - | | | | 19,928 | * | | | 19,928 | |
Short-Term Investments | | | - | | | | 25,636,150 | | | | - | | | | 25,636,150 | |
| | | | | | | | | | | | | | | | |
| Total Investments | | $ | 488,995,566 | | | $ | 228,235,231 | | | $ | 1,821,641 | | | $ | 719,052,438 | |
| | | | | | | | | | | | | | | | |
Asset Derivatives | | | | | | | | | | | | | | | | |
Futures Contracts | | $ | 27,503 | | | $ | - | | | $ | - | | | $ | 27,503 | |
| | | | | | | | | | | | | | | | |
83
Notes to Financial Statements (Continued)
| | | | | | | | | | | | | | | | |
| | | Level 1 | | | Level 2 | | | Level 3 | | | Total | |
Blend Fund (Continued) | | | | | | | | | | | | | | | | |
Liability Derivatives | | | | | | | | | | | | | | | | |
Futures Contracts | | $ | (102,355 | ) | | $ | - | | | $ | - | | | $ | (102,355 | ) |
Swap Agreements | | | - | | | | (159,488 | ) | | | - | | | | (159,488 | ) |
| | | | | | | | | | | | | | | | |
| Total | | $ | (102,355 | ) | | $ | (159,488 | ) | | $ | - | | | $ | (261,843 | ) |
| | | | | | | | | | | | | | | | |
| | | | |
Managed Bond Fund | | | | | | | | | | | | | | | | |
Asset Investments | | | | | | | | | | | | | | | | |
Preferred Stock | | $ | 2,492,800 | | | $ | - | | | $ | - | | | $ | 2,492,800 | |
Corporate Debt | | | - | | | | 434,090,556 | | | | - | | | | 434,090,556 | |
Municipal Obligations | | | - | | | | 9,225,621 | | | | - | | | | 9,225,621 | |
Non-U.S. Government Agency Obligations | | | - | | | | 345,131,703 | | | | 8,826,797 | * | | | 353,958,500 | |
Sovereign Debt Obligations | | | - | | | | 8,784,847 | | | | - | | | | 8,784,847 | |
U.S. Government Agency Obligations and Instrumentalities | | | - | | | | 310,655,289 | | | | - | | | | 310,655,289 | |
U.S. Treasury Obligations | | | - | | | | 88,454,658 | | | | - | | | | 88,454,658 | |
Purchased Options | | | - | | | | 4,738,571 | | | | - | | | | 4,738,571 | |
Short-Term Investments | | | - | | | | 141,001,301 | | | | - | | | | 141,001,301 | |
| | | | | | | | | | | | | | | | |
| Total Investments | | $ | 2,492,800 | | | $ | 1,342,082,546 | | | $ | 8,826,797 | | | $ | 1,353,402,143 | |
| | | | | | | | | | | | | | | | |
Asset Derivatives | | | | | | | | | | | | | | | | |
Futures Contracts | | $ | 150,636 | | | $ | - | | | $ | - | | | $ | 150,636 | |
| | | | | | | | | | | | | | | | |
Liability Derivatives | | | | | | | | | | | | | | | | |
Futures Contracts | | $ | (740,925 | ) | | $ | - | | | $ | - | | | $ | (740,925 | ) |
Swap Agreements | | | - | | | | (974,484 | ) | | | - | | | | (974,484 | ) |
| | | | | | | | | | | | | | | | |
| Total | | $ | (740,925 | ) | | $ | (974,484 | ) | | $ | - | | | $ | (1,715,409 | ) |
| | | | | | | | | | | | | | | | |
| * | None of the unobservable inputs for Level 3 assets, individually or collectively, had a material impact on the Fund(s). Level 3 investments at the beginning and/or end of the period in relation to net assets were not significant and accordingly, a reconciliation of Level 3 assets for the year ended December 31, 2017 is not presented. |
The following table shows Fund(s) with certain assets and liabilities, which approximate fair value and would be categorized at Level 2 as of December 31, 2017.
| | | | | | |
Statements of Assets and Liabilities location: | | Blend
Fund | | Equity
Fund | | Managed
Bond
Fund |
Receivables from: | | | | | | |
Investments sold on a when-issued basis | | X | | | | X |
| | | | |
Payables for: | | | | | | |
Investments purchased on a when-issued basis | | X | | | | X |
Securities on loan | | | | X | | |
Due to custodian | | X | | | | |
Collateral held for open purchased options | | X | | | | X |
The Funds had no transfers between Level 1, Level 2, and Level 3 of the fair value hierarchy during the year ended December 31, 2017. The Funds recognize transfers between the Levels as of the beginning of the year.
84
Notes to Financial Statements (Continued)
Derivative Instruments
Derivatives are financial instruments whose values are based on the values of one or more indicators, such as a security, asset, currency, interest rate, or index. Derivative transactions can create investment leverage and may be highly volatile. Gains or losses from derivatives can be substantially greater than their original cost and can sometimes be unlimited. A Fund may not be able to close out a derivative transaction at a favorable time or price. For those Funds that held derivatives during the year ended December 31, 2017, the following table shows how the Fund used these types of derivatives during the period (marked with an “A”), as well as additional uses, if any, it may have for them in the future (marked with an “M”).
| | | | |
Type of Derivative and Objective for Use | | Blend
Fund | | Managed
Bond
Fund |
Futures Contracts* | | | | |
Hedging/Risk Management | | A | | A |
Duration/Credit Quality Management | | A | | A |
Substitution for Direct Investment | | A | | A |
Intention to Create Investment Leverage in Portfolio | | M | | M |
| | | |
Credit Default Swaps (Protection Buyer) | | | | |
Hedging/Risk Management | | A | | A |
Duration/Credit Quality Management | | A | | A |
Income | | A | | A |
Substitution for Direct Investment | | A | | A |
Intention to Create Investment Leverage in Portfolio | | M | | M |
| | | |
Credit Default Swaps (Protection Seller) | | | | |
Hedging/Risk Management | | A | | A |
Duration/Credit Quality Management | | A | | A |
Income | | A | | A |
Substitution for Direct Investment | | A | | A |
Intention to Create Investment Leverage in Portfolio | | M | | M |
| | | |
Options (Purchased) | | | | |
Hedging/Risk Management | | A | | A |
Duration/Credit Quality Management | | A | | A |
Substitution for Direct Investment | | A | | A |
Directional Investment | | A | | A |
Intention to Create Investment Leverage in Portfolio | | M | | M |
| * | Includes any options purchased or written on futures contracts, if applicable. |
At December 31, 2017, and during the year then ended, the Fund(s) had the following derivatives and transactions in derivatives, grouped into the indicated risk categories:
| | | | | | | | | | | | | | | | |
| | | Credit
Risk | | | Equity
Risk | | | Interest
Rate
Risk | | | Total | |
| Blend Fund | | | | | | | | | | | | |
| Asset Derivatives | | | | | | | | | | | | |
Purchased Options* | | $ | - | | | $ | - | | | $ | 767,579 | | | $ | 767,579 | |
Futures Contracts^^ | | | - | | | | - | | | | 27,503 | | | | 27,503 | |
| | | | | | | | | | | | | | | | |
Total Value | | $ | - | | | $ | - | | | $ | 795,082 | | | $ | 795,082 | |
| | | | | | | | | | | | | | | | |
85
Notes to Financial Statements (Continued)
| | | | | | | | | | | | | | | | |
| | | Credit
Risk | | | Equity
Risk | | | Interest
Rate
Risk | | | Total | |
| Blend Fund (Continued) | | | | | | | | | | | | |
| Liability Derivatives | | | | | | | | | | | | |
Futures Contracts^^ | | $ | - | | | $ | - | | | $ | (102,355 | ) | | $ | (102,355 | ) |
Swap Agreements^ | | | (159,488 | ) | | | - | | | | - | | | | (159,488 | ) |
| | | | | | | | | | | | | | | | |
Total Value | | $ | (159,488 | ) | | $ | - | | | $ | (102,355 | ) | | $ | (261,843 | ) |
| | | | | | | | | | | | | | | | |
| Realized Gain (Loss)# | |
Purchased Options | | $ | - | | | $ | - | | | $ | (64,225 | ) | | $ | (64,225 | ) |
Futures Contracts | | | - | | | | (1,469,980 | ) | | | 208,425 | | | | (1,261,555 | ) |
Swap Agreements | | | (17,383 | ) | | | - | | | | - | | | | (17,383 | ) |
| | | | | | | | | | | | | | | | |
Total Realized Gain (Loss) | | $ | (17,383 | ) | | $ | (1,469,980 | ) | | $ | 144,200 | | | $ | (1,343,163 | ) |
| | | | | | | | | | | | | | | | |
| Change in Appreciation (Depreciation)## | |
Purchased Options | | $ | - | | | $ | - | | | $ | (36,805 | ) | | $ | (36,805 | ) |
Futures Contracts | | | - | | | | - | | | | 45,638 | | | | 45,638 | |
Swap Agreements | | | (94,810 | ) | | | - | | | | - | | | | (94,810 | ) |
| | | | | | | | | | | | | | | | |
Total Change in Appreciation (Depreciation) | | $ | (94,810 | ) | | $ | - | | | $ | 8,833 | | | $ | (85,977 | ) |
| | | | | | | | | | | | | | | | |
| Managed Bond Fund | |
| Asset Derivatives | |
Purchased Options* | | $ | - | | | $ | - | | | $ | 4,738,571 | | | $ | 4,738,571 | |
Futures Contracts^^ | | | - | | | | - | | | | 150,636 | | | | 150,636 | |
| | | | | | | | | | | | | | | | |
Total Value | | $ | - | | | $ | - | | | $ | 4,889,207 | | | $ | 4,889,207 | |
| | | | | | | | | | | | | | | | |
| Liability Derivatives | |
Futures Contracts^^ | | $ | - | | | $ | - | | | $ | (740,925 | ) | | $ | (740,925 | ) |
Swap Agreements^ | | | (974,484 | ) | | | - | | | | - | | | | (974,484 | ) |
| | | | | | | | | | | | | | | | |
Total Value | | $ | (974,484 | ) | | $ | - | | | $ | (740,925 | ) | | $ | (1,715,409 | ) |
| | | | | | | | | | | | | | | | |
| Realized Gain (Loss)# | |
Purchased Options | | $ | - | | | $ | - | | | $ | (404,003 | ) | | $ | (404,003 | ) |
Futures Contracts | | | - | | | | - | | | | 1,560,429 | | | | 1,560,429 | |
Swap Agreements | | | (114,954 | ) | | | - | | | | - | | | | (114,954 | ) |
| | | | | | | | | | | | | | | | |
Total Realized Gain (Loss) | | $ | (114,954 | ) | | $ | - | | | $ | 1,156,426 | | | $ | 1,041,472 | |
| | | | | | | | | | | | | | | | |
| Change in Appreciation (Depreciation)## | |
Purchased Options | | $ | - | | | $ | - | | | $ | (227,212 | ) | | $ | (227,212 | ) |
Futures Contracts | | | - | | | | - | | | | 49,535 | | | | 49,535 | |
Swap Agreements | | | (578,832 | ) | | | - | | | | - | | | | (578,832 | ) |
| | | | | | | | | | | | | | | | |
Total Change in Appreciation (Depreciation) | | $ | (578,832 | ) | | $ | - | | | $ | (177,677 | ) | | $ | (756,509 | ) |
| | | | | | | | | | | | | | | | |
| * | Statements of Assets and Liabilities location: Investments, at value. |
| ^ | Statements of Assets and Liabilities location: Payables for: open swap agreements, at value. |
| ^^ | Cumulative appreciation (depreciation) on futures contracts is reported in each applicable Fund’s Portfolio of Investments. Only current day’s variation margin, if any, is reported within the Statements of Assets and Liabilities. |
| # | Statements of Operations location: Amounts are included in net realized gain (loss) on: investment transactions, futures contracts, or swap agreements, as applicable. |
| ## | Statements of Operations location: Amounts are included in net change in unrealized appreciation (depreciation) on: investment transactions, futures contracts, or swap agreements, as applicable. |
86
Notes to Financial Statements (Continued)
For the year ended December 31, 2017, the number of contracts, notional amounts, or shares/units for each derivative type was as follows:
| | | | | | | | | | | | |
| | | Number of Contracts, Notional Amounts,
or Shares/Units† | |
| | | Futures
Contracts | | | Swap
Agreements | | | Purchased
Swaptions | |
Blend Fund | | | 273 | | | $ | 3,491,667 | | | $ | 5,133,833 | |
Managed Bond Fund | | | 1,491 | | | | 21,748,333 | | | | 31,967,333 | |
| † | Amount(s) disclosed represent average number of contracts for futures contracts, notional amounts for swap agreements and purchased swaptions, based on absolute values, which is indicative of volume of this derivative type, for the months that the Fund held such derivatives during the year ended December 31, 2017. |
The following table presents derivative assets by counterparty net of amounts available for offset under a master netting agreement (“MNA”), or similar agreement, and net of the related collateral received by the Fund(s) as of December 31, 2017.
Asset Valuation Inputs
| | | | | | | | | | | | | | | | |
Counterparty | | Derivative Assets
Subject to an
MNA by
Counterparty† | | | Financial
Instruments
Available for Offset | | | Collateral
Received*** | | | Net Amount* | |
| Blend Fund | | | | | | | | | | | | |
Barclays Bank PLC | | $ | 767,579 | | | $ | - | | | $ | (767,579 | ) | | $ | - | |
| | | | | | | | | | | | | | | | |
| Managed Bond Fund | | | | | | | | | | | | |
Barclays Bank PLC | | $ | 4,738,571 | | | $ | - | | | $ | (4,738,571 | ) | | $ | - | |
| | | | | | | | | | | | | | | | |
The following table presents derivative liabilities by counterparty net of amounts available for offset under an MNA, or similar agreement, and net of the related collateral pledged by the Fund(s) as of December 31, 2017.
Liability Valuation Inputs
| | | | | | | | | | | | | | | | |
Counterparty | | Derivative Liabilities
Subject to an
MNA by
Counterparty† | | | Financial
Instruments
Available for Offset | | | Collateral
Pledged*** | | | Net Amount** | |
| Blend Fund | | | | | | | | | | | | |
Goldman Sachs International | | $ | (159,488 | ) | | $ | - | | | $ | - | | | $ | (159,488 | ) |
| | | | | | | | | | | | | | | | |
| Managed Bond Fund | | | | | | | | | | | | |
Goldman Sachs International | | $ | (974,484 | ) | | $ | - | | | $ | 970,120 | | | $ | (4,364 | ) |
| | | | | | | | | | | | | | | | |
| * | Represents the net amount receivable from the counterparty in the event of default. |
| ** | Represents the net amount payable to the counterparty in the event of default. |
| *** | The amount presented here may be less than the total amount of collateral received/pledged as the net amount of derivative assets and liabilities for a counterparty cannot be less than $0. |
| † | The amount presented here may be less than the total amount shown in the Statements of Assets and Liabilities as some derivatives held by the counterparty are not covered within the master netting agreements. |
Such agreements typically permit a single net payment in the event of default, including the bankruptcy or insolvency of the counterparty. Typically, the Fund(s) and counterparties are not permitted to sell, re-pledge, or use the collateral they receive.
87
Notes to Financial Statements (Continued)
Further details regarding the derivatives and other investments held by the Fund(s) during the year ended December 31, 2017, are discussed below.
Futures Contracts
A Fund may seek to manage a variety of different risks, such as interest rate risk, equity price risk, and currency risk, through the use of futures contracts. A Fund may use interest rate futures contracts to adjust the interest rate sensitivity (duration) of its portfolio or the credit exposure of the portfolio. Interest rate futures contracts obligate the long or short holder to take or make delivery of a specified quantity of a financial instrument, such as a specific fixed-income security, during a specified future period at a specified price. A Fund may use index futures to hedge against broad market risks to its portfolio or to gain broad market exposure when it holds uninvested cash or as an inexpensive substitute for cash investments directly in securities or other assets. Securities index futures contracts are contracts to buy or sell units of a securities index at a specified future date at a price agreed upon when the contract is made and are settled in cash. Positions in futures may be closed out only on an exchange or board of trade which provides a secondary market for such futures. Because futures contracts are exchange-traded, they typically have minimal exposure to counterparty risk.
Parties to a futures contract are not required to post the entire notional amount of the contract, but rather a small percentage of that amount (by way of margin), both at the time they enter into futures transactions, and then on a daily basis if their positions decline in value; as a result, futures contracts are highly leveraged. Such payments are known as variation margin and are recorded by the Funds as unrealized gains or losses. Because futures markets are highly leveraged, they can be extremely volatile, and there can be no assurance that the pricing of a futures contract will correlate precisely with the pricing of the asset or index underlying it or the asset or liability of the Fund that is the subject of the hedge. It may not always be possible for a Fund to enter into a closing transaction with respect to a futures contract it has entered into, at a favorable time or price. When a Fund enters into a futures transaction, it is subject to the risk that the value of the futures contract will move in a direction unfavorable to it. When a Fund uses futures contracts for hedging purposes, it is likely that the Fund will have an asset or liability that will offset any loss (or gain) on the transactions, at least in part.
When a futures contract is closed, the Fund records a realized gain or loss equal to the difference between the value of the contract at the time it was opened and the value at the time it was closed. Futures contracts are valued at the settlement price established each day by the board of trade or exchange on which they are traded.
Futures contracts outstanding at the end of the year, if any, are listed in each applicable Fund’s Portfolio of Investments.
Swap Agreements
Swap agreements are typically two-party contracts entered into primarily by institutional investors. In a standard “swap” transaction, two parties agree to exchange the returns (or differentials in rates of return) earned or realized on particular predetermined investments or instruments, which may be adjusted for an interest factor. The gross returns to be exchanged or “swapped” between the parties are generally calculated with respect to a “notional amount,” (i.e., the return on or increase in value of a particular dollar amount invested at a particular interest rate or in a “basket” of securities representing a particular index).
Credit Default Swaps. A Fund may enter into credit default swap transactions, as a “buyer” or “seller” of credit protection. In a credit default swap, one party provides what is in effect insurance against a default or other adverse credit event affecting an issuer of debt securities (typically referred to as a “reference entity”). In general, the buyer of credit protection is obligated to pay the protection seller an upfront amount or a periodic stream of payments over the term of the swap. If a “credit event” occurs, the buyer has the right to deliver to the seller bonds or other obligations of the reference entity (with a value up to the full notional value of the swap), and to receive a payment equal to the par value of the bonds or other obligations. Credit events that would trigger a request that the seller make payment are specific to each credit default swap agreement, but generally include bankruptcy, failure to pay, restructuring, acceleration, default, or repudiation/moratorium. When a Fund buys protection, it may or may not own securities of the reference entity. If it does own securities of the reference entity, the swap serves as a hedge against a decline in the value of the securities due to the occurrence of a credit event involving the issuer of the securities. If the Fund does not own securities of the reference entity, the credit default swap may be seen to create a short position in the reference entity. If a Fund is a
88
Notes to Financial Statements (Continued)
buyer and no credit event occurs, the Fund will typically recover nothing under the swap, but will have had to pay the required upfront payment or stream of continuing payments under the swap. When a Fund sells protection under a credit default swap, the position may have the effect of creating leverage in the Fund’s portfolio through the Fund’s indirect long exposure to the issuer or securities on which the swap is written. When a Fund sells protection, it may do so either to earn additional income or to create a “synthetic” long position.
Whenever a Fund enters into a swap agreement, it takes on counterparty risk — the risk that its counterparty will be unable or unwilling to meet its obligations under the swap agreement. The Fund also takes the risk that the market will move against its position in the swap agreement. In the case of a credit default swap, the swap will become more or less valuable depending on the credit of the issuer of the underlying security, and, if a credit event occurs under a swap where the Fund is the seller of credit protection, the Fund could be required to purchase the security at par value, resulting in a significant loss to the Fund. When the Fund enters into any type of swap for hedging purposes, it is likely that the Fund will have an asset or liability that will offset any loss (or gain) on the swap, at least in part. Swap agreements may be non-transferable or otherwise highly illiquid, and a Fund may not be able to terminate or transfer a swap agreement at any particular time or at an acceptable price.
Swaptions. A Fund may also enter into options on swap agreements (“swaptions”). A swaption is a contract that gives a counterparty the right (but not the obligation) to enter into a new swap agreement or to shorten, extend, cancel, or otherwise modify an existing swap agreement, at some designated future time on specified terms. A Fund may write (sell) and purchase put and call swaptions. Depending on the terms of the particular option agreement, a Fund will generally incur a greater degree of risk when it writes a swaption than it will incur when it purchases a swaption. When a Fund purchases a swaption, it risks losing only the amount of the premium it has paid should it decide to let the option expire unexercised. However, when a Fund writes a swaption, upon exercise of the option the Fund will become obligated according to the terms of the underlying agreement. A Fund may enter into swaptions for the same purposes as swaps. For information regarding the accounting treatment of options, see “Options, Rights, and Warrants” below.
Centrally Cleared Swaps. Certain clearinghouses currently offer clearing for limited types of derivatives transactions, principally certain interest rate swaps, certain index swaps, and credit derivatives. In a cleared derivative transaction, a Fund typically enters into the transaction with a financial institution counterparty, and performance of the transaction is effectively guaranteed by a central clearinghouse, thereby reducing or eliminating the Fund’s exposure to the credit risk of its original counterparty. The Fund will be required to post amounts (“initial margin”) with the clearinghouse or at the instruction of the clearinghouse. The initial margin required by a clearinghouse may be greater than the initial margin the Fund would be required to post in an uncleared transaction. If cash is deposited as the initial margin, it is shown as collateral on a Fund’s Statement of Assets and Liabilities. Swap agreements are marked-to-market daily and subsequent payments (“variation margin”) are made or received by a Fund depending on whether unrealized gains or losses are incurred. These amounts are reflected as receivables or payables on a Fund’s Statement of Assets and Liabilities (“Variation margin on open derivative instruments”) and as a component of net change in unrealized appreciation (depreciation) on a Fund’s Statement of Operations. Only a limited number of transaction types are currently eligible for clearing.
During the term of a swap transaction, changes in the value of the swap are recognized as unrealized gains or losses by marking to market to reflect the market value of the swap. When the swap is terminated, a Fund will record a realized gain or loss equal to the difference, if any, between the proceeds from (or cost of) the closing transaction and a Fund’s basis in the agreement. Upfront swap premium payments paid or received by a Fund, if any, are recorded within the value of the open swap agreement on the Fund’s Statement of Assets and Liabilities and represent payments paid or received upon entering into the swap agreement to compensate for differences between stated terms of the swap agreement and prevailing market conditions (credit spreads, currency exchange rates, and other relevant factors). These upfront payments are recorded as realized gain or loss on the Fund’s Statement of Operations upon termination or maturity of the swap agreement.
During the term of a swap transaction, the periodic net payments can be made for a set period of time or may be triggered by a predetermined credit event. The net periodic payments may be based on a fixed or variable interest rate, the change in market value of a specified security, basket of securities or index, or the return generated by a security. These periodic payments received or made by the Funds are recorded in the accompanying Statements of Operations as realized gains and losses, respectively.
Swap agreements outstanding at the end of the year, if any, are listed in each applicable Fund’s Portfolio of Investments. A Fund’s current exposure to a counterparty is the fair value of the transaction.
89
Notes to Financial Statements (Continued)
Options, Rights, and Warrants
A Fund may purchase and sell put and call options on securities or an index of securities to enhance investment performance or to protect against changes in market prices. A Fund that invests in debt securities may also purchase and sell put and call options to adjust the interest rate sensitivity of its portfolio or the credit exposure of the portfolio.
Call Options. A call option gives the holder the right to purchase, and obligates the writer to sell, a security at the strike price at any time before the expiration date.
Put Options. A put option gives the holder the right to sell, and obligates the writer to buy, a security at the exercise price at any time before the expiration date.
Writing put and call options. A Fund may write call options on a security it owns, in a “directional” strategy hoping to realize a greater current return through the receipt of premiums. In return for the option premium, the Fund takes the risk that it will have to forego any increase in the value of the security over the strike price. When a Fund has written a call option on a security it does not own, its exposure on such an option is theoretically unlimited. A Fund may enter into closing purchase transactions in order to realize a profit or limit a loss on a previously written call option or, in the case of a call option on a security it owns, to free itself to sell the underlying security or to write another call on the security, or protect a security from being called in an unexpected market rise. Any profits from a closing purchase transaction in the case of a call option on a security a Fund owns may be offset by a decline in the value of the underlying security. Conversely, because increases in the market price of a call option will generally reflect increases in the market price of the underlying security, any loss resulting from a closing purchase transaction relating to a call option on a security a Fund owns is likely to be offset in whole or in part by unrealized appreciation of the underlying security owned by the Fund. A Fund may not be able to close out a call option that it has previously written. A Fund may write put options in order to enhance its current return by taking a long directional position as to a security or index of securities. By writing a put option, the Fund assumes the risk that it may be required to purchase the underlying security for an exercise price higher than its then current market value, resulting in a potential capital loss unless the security later appreciates in value. A Fund may terminate a put option that it has written before it expires by entering into a closing purchase transaction. Any loss from this transaction may be partially or entirely offset by the premium received on the terminated option. A Fund may not be able to close out a put option that it has previously written.
When a Fund writes a call or put option, an amount equal to the premium received is recorded as a liability. Premiums received from writing options which expire are treated as realized gains. Premiums received from writing options which are exercised or closed are added to the proceeds or offset against the amount paid on the underlying investment to determine the realized gain or loss.
Purchasing put and call options. A Fund may purchase put options to protect portfolio holdings against a decline in market value of a security or securities held by it. A Fund may also purchase a put option hoping to profit from an anticipated decline in the value of the underlying security. If the Fund holds the security underlying the option, the option premium and any transaction costs will reduce any profit the Fund might have realized had it sold the underlying security instead of buying the put option. A Fund may purchase call options to hedge against an increase in the price of securities that the Fund wants ultimately to buy. A Fund may also purchase a call option as a long directional investment hoping to profit from an anticipated increase in the value of the underlying security. In order for a call option to be profitable, the market price of the underlying security must rise sufficiently above the exercise price to cover the premium and transaction costs. These costs will reduce any profit the Fund might have realized had it bought the underlying security at the time it purchased the call option.
When a Fund purchases an option, it runs the risk that it will lose its entire investment in the option in a relatively short period of time, unless the Fund exercises the option or enters into a closing sale transaction before the option’s expiration. If the price of the underlying security does not rise (in the case of a call) or fall (in the case of a put) to an extent sufficient to cover the option premium and transaction costs, the Fund will lose part or all of its investment in the option. This contrasts with an investment by a Fund in the underlying security, since the Fund will not realize a loss if the security’s price does not change. Premiums paid for purchasing options that expire are treated as realized losses.
OTC Options. OTC options purchased or sold by a Fund are not traded on securities or options exchanges or backed by clearinghouses. Rather, they are entered into directly between a Fund and the counterparty to the option. In the case of an OTC
90
Notes to Financial Statements (Continued)
option purchased by the Fund, the value of the option to the Fund will depend on the willingness and ability of the option writer to perform its obligations to the Fund. In addition, OTC options may not be transferable and there may be little or no secondary market for them, so they may be considered illiquid. It may not be possible to enter into closing transactions with respect to OTC options or otherwise to terminate such options, and as a result a Fund may be required to remain obligated on an unfavorable OTC option until its expiration. OTC options are valued using prices supplied by a primary pricing source, selected pursuant to procedures approved by the Trustees.
Rights and Warrants. A Fund may purchase or hold warrants or rights in order to gain exposure to the underlying security without owning the security, including, for example, cases where the Fund hopes to lock in the price today of a security it may wish to purchase in the future. Warrants generally give the holder the right, but not the obligation, to buy a security at a stated price. In order for a warrant to be profitable, the market price of the underlying security must rise sufficiently above the exercise price to cover any premium and transaction costs. Rights may similarly confer on the holder the right to purchase or acquire securities, including through participation in a so-called rights offering. Bonds may be issued with warrants or other rights attached to purchase or acquire equity or other debt securities, typically of the bond issuer. The market prices of bonds with warrants or rights attached to purchase equity securities or bonds may, to some degree, reflect changes in the values of the underlying securities.
When a Fund purchases or otherwise acquires warrants or other rights, it runs the risk that it will lose its entire investment in the warrants or rights, unless the Fund exercises the warrant or right, acquires the underlying securities, or enters into a closing transaction before expiration. If the price of the underlying security does not rise to an extent sufficient to cover any premium and transaction costs, the Fund will lose part or all of its investment. Any premiums or purchase price paid for warrants or other rights that expire are treated as realized losses. Warrants and similar rights differ from options in that they are typically written by the issuer of the security underlying the warrant or right. Although some warrants and rights may be non-transferable, others may be traded over-the-counter or on an exchange.
Inflation-Indexed Bonds
The Funds may invest in inflation-indexed bonds, which are fixed income securities whose principal value or coupon is periodically adjusted according to the rate of inflation, as measured by the Consumer Price Index for All Urban Consumers (“CPI-U”) (for U.S. Treasury inflation-indexed bonds) or, generally, by a comparable inflation index calculated by the foreign government issuing the inflation-indexed bonds.
If the periodic adjustment rate measuring inflation falls, the principal value of inflation-indexed bonds will be adjusted downward, and consequently the interest payable on these securities (calculated with respect to a smaller principal amount) will be reduced. Repayment of the original bond principal upon maturity (as adjusted for inflation) is guaranteed in the case of U.S. Treasury inflation-indexed bonds, even during a period of deflation. However, the current market value of the bonds is not guaranteed, and will fluctuate. The Funds may also invest in other inflation related bonds which may or may not provide a similar guarantee. If a guarantee of principal is not provided, the adjusted principal value of the bond repaid at maturity may be less than the original principal. Any adjustments to the principal amount of an inflation-indexed bond due to inflation will be reflected as increases or decreases to interest income. Such adjustments may have a significant impact on the Fund’s distributions.
The value of inflation-indexed bonds is generally based on changes in real interest rates, which in turn are tied to the relationship between nominal interest rates and the rate of inflation. Therefore, if nominal interest rates increased at a faster rate than inflation, real interest rates might rise, leading to a decrease in value of inflation-indexed bonds. While the values of these securities are expected to be protected from long-term inflationary trends, short-term increases in inflation may lead to a decline in value. There can be no assurance that the CPI-U or any foreign inflation index will accurately measure the real rate of inflation, or that the rate of inflation in a foreign country will correlate to the rate of inflation in the United States. Additionally, if interest rates rise due to reasons other than inflation, investors in these securities may not be protected to the extent that the increase is not reflected in the bond’s inflation measure.
Repurchase Agreements
Each Fund may enter into repurchase agreements with certain banks and broker-dealers whereby a Fund acquires a security for cash and obtains a simultaneous commitment from the seller to repurchase the security at an agreed upon price and date. A Fund,
91
Notes to Financial Statements (Continued)
through its custodian, takes possession of the securities collateralizing the repurchase agreement in a segregated account. Repurchase agreements must be fully collateralized at all times, but involve some risk to a Fund if the other party should default on its obligation and the Fund is delayed or prevented from recovering the collateral, or if the Fund is required to return collateral to a borrower at a time when it may realize a loss on the investment of that collateral. Collateral for certain tri-party repurchase agreements is held at the Fund’s custodian or sub-custodian in a segregated account for the benefit of the Fund and the counterparty.
When-Issued, Delayed-Delivery, Forward Commitment, and To-Be-Announced Transactions
A Fund may enter into when-issued, delayed-delivery, forward commitment, or to-be-announced (“TBA”) transactions (collectively, the “Forward Transactions”) in order to lock in the purchase price of the underlying security, or in order to adjust the interest rate exposure of the Fund’s existing portfolio. In Forward Transactions, a Fund commits to purchase or sell particular securities, with payment and delivery to take place at a future date. In the case of TBA purchase commitments, the unit price and the estimated principal amount are established when the Fund enters into a commitment, with the actual principal amount being within a specified range of the estimate. Although a Fund does not typically pay for the securities in these types of transactions until they are delivered, it immediately assumes the risks of ownership, including the risk of price fluctuation. As a result, each of these types of transactions may create investment leverage in a Fund’s portfolio and increase the volatility of the Fund. If a Fund’s counterparty fails to deliver a security purchased in a Forward Transaction, there may be a loss, and the Fund may have missed an opportunity to make an alternative investment.
These securities are valued on the basis of valuations furnished by a pricing service, selected pursuant to procedures approved by the Trustees, which determines valuations taking into account appropriate factors such as institutional-size trading in similar groups of securities, yield, quality, coupon rate, maturity, type of issue, trading characteristics, and other market data. Securities for which no market quotation is available are valued at fair value in accordance with procedures approved by the Trustees. The Funds record on a daily basis the unrealized appreciation (depreciation) based upon changes in the values of these securities. When a Forward Transaction is closed, the Funds record a realized gain or loss equal to the difference between the value of the transaction at the time it was opened and the value of the transaction at the time it was closed.
Dollar Roll Transactions
A Fund may enter into dollar roll transactions, in which the Fund sells mortgage-backed securities for delivery in the current month and simultaneously contracts to purchase substantially similar securities on a specified future date from the same party. A Fund may invest in dollar rolls in order to benefit from anticipated changes in pricing for the mortgage-backed securities during the term of the transaction, or for the purpose of creating investment leverage. In a dollar roll, the securities that are to be purchased will be of the same type as the securities sold, but will be supported by different pools of mortgages.
Dollar rolls involve the risk that the Fund’s counterparty will be unable to deliver the mortgage-backed securities underlying the dollar roll at the fixed time. If the counterparty files for bankruptcy or becomes insolvent, a Fund’s use of the transaction proceeds may be restricted pending a determination by the counterparty or its representative, whether to enforce the Fund’s obligation to repurchase the securities. A Fund can incur a loss on a dollar roll transaction (either because its counterparty fails to perform or because the value of the mortgages subject to the transaction declines) and on the investments made by the Fund with the proceeds of the dollar roll transaction.
A Fund accounts for a dollar roll transaction as a purchase and sale whereby the difference in the sales price and purchase price of the security sold is recorded as a realized gain (loss). If certain criteria are met, these dollar roll transactions may be considered financing transactions, whereby the difference in the sales price and the future purchase price is recorded as an adjustment to interest income. Dollar roll transactions generally have the effect of creating leverage in a Fund’s portfolio.
Securities Lending
The Blend Fund, Equity Fund, and Managed Bond Fund may lend their securities; however, lending cannot exceed 10% of the total assets of the Managed Bond Fund taken at current value, and 33% of the total assets of the Blend Fund and Equity Fund,
92
Notes to Financial Statements (Continued)
respectively, taken at current value. The Funds’ securities lending activities are governed by a Securities Lending Agency Agreement (“Lending Agreement”) between each Fund and the lending Agent (“Agent”). The Lending Agreement authorizes the Agent to lend qualifying U.S. and foreign securities held by a Fund to approved borrowers (each, a “Borrower”).
Each Fund expects that in connection with any securities on loan, the loan will be secured continuously by collateral consisting of cash or securities adjusted daily to have market value at least equal to the current market value of the securities loaned. The market value of the loaned securities is determined at the close of business of a Fund and any additional collateral is delivered to the Fund the next business day. The Funds bear the risk of loss with respect to the investment of cash collateral. As with other extensions of credit, the Funds may bear the risk of delay in recovery of the loaned securities or even loss of rights in the collateral should the Borrower of the securities fail financially. Pursuant to the Lending Agreement, the Agent has provided indemnification to the Funds in the event of default by a Borrower with respect to a loan. The Funds receive compensation for lending their securities in the form of a securities loan fee paid by the Borrower, as well as a share of the income earned on investment of the cash collateral received for the loaned securities. At December 31, 2017, the Funds’ collateral was equal to or greater than 100% of the market value of securities on loan.
Security loans can be terminated at the discretion of either the Agent or the Fund and the related securities must be returned within the earlier of the standard trade settlement period for such securities or within three business days. For all Funds, all securities on loan are classified as common stock in the Fund’s Portfolio of Investments at December 31, 2017.
The Funds employ the Agent to implement their securities lending program and the Agent receives a fee from the Funds for its services. In addition, the Funds may be required to pay a rebate to the Borrower. Accordingly, a Fund’s compensation for lending its securities is reduced by any such fees or rebate paid to the Agent or Borrower, respectively. For the year ended December 31, 2017, the Fund(s) earned securities lending net income as follows:
| | | | | | | | | | | | |
| | | Securities Lending
Gross Income | | | Securities Lending
Fees and Expenses | | | Securities Lending
Net Income | |
Equity Fund | | $ | 46,468 | | | $ | 9,139 | | | $ | 37,329 | |
Accounting for Investment Transactions
Investment transactions are accounted for on the trade date. Realized gains and losses on sales of investments and unrealized appreciation and depreciation of investments are computed by the specific identification cost method. Proceeds received from litigation, if any, are included in realized gains on investment transactions for any investments that are no longer held in the portfolio and as a reduction in cost for investments that continue to be held in the portfolio. Interest income, adjusted for amortization of discounts and premiums on debt securities, is earned from the settlement date and is recorded on the accrual basis. Dividend income and realized capital gain distributions are recorded on the ex-dividend date. Withholding taxes on foreign interest, dividends, and capital gains have been provided for in accordance with the applicable country’s tax rules and rates. Foreign dividend income is recorded on the ex-dividend date or as soon as practicable after the Fund determines the existence of a dividend declaration after exercising reasonable due diligence. Distributions received on securities that represent a return of capital or capital gain are recorded as a reduction of cost of investments and/or as a realized gain. The Funds determine the classification of distributions received as return of capital distributions or capital gain distributions.
Foreign Currency Translation
The books and records of the Funds are maintained in U.S. dollars. The market values of foreign currencies, foreign securities, and other assets and liabilities denominated in foreign currencies are translated into U.S. dollars at the mean of the buying and selling rates of such currencies against the U.S. dollar at the end of each business day. Purchases and sales of foreign securities and income and expense items are translated at the rates of exchange prevailing on the respective dates of such transactions. The Funds do not isolate that portion of the results of operations arising from changes in the exchange rates from that portion arising from changes in the market prices of securities. Net realized foreign currency gains and losses resulting from changes in exchange rates include foreign currency gains and losses between trade date and settlement date on investment securities transactions, foreign currency transactions, and the difference between the amounts of dividends or interest recorded on the books of the Funds and the amount actually received.
93
Notes to Financial Statements (Continued)
Allocation of Operating Activity
In maintaining the records for the Funds, the income and expense accounts are allocated daily to each class of shares. Investment income and loss, and unrealized and realized gains or losses are prorated among the classes of shares based on the relative net assets of each. Expenses are allocated to each class of shares depending on the nature of the expenditures. Expenses of a Fund not directly attributable to the operations of any specific class of shares of the Fund are prorated among classes to which the expense relates based on relative net assets.
Foreign Securities
The Funds may invest in foreign securities. Foreign securities, including American Depositary Receipts, are subject to additional risks compared to securities of U.S. issuers, including international trade, currency, political, regulatory, and diplomatic risks. In addition, fluctuations in currency exchange rates may adversely affect the values of foreign securities and the price of a Fund’s shares. Emerging markets securities are subject to greater risks than securities issued in developed foreign markets, including less liquidity, greater price volatility, higher relative rates of inflation, greater political, economic, and social instability, greater custody and operational risks, and greater volatility in currency exchange rates.
Federal Income Tax
It is each Fund’s intent to continue to comply with the provisions of subchapter M of the Internal Revenue Code of 1986, as amended, applicable to a regulated investment company. Under such provisions, the Funds would not be subject to federal income taxes on their ordinary income and net realized capital gains to the extent they are distributed or deemed to have been distributed to their shareholders. Therefore, the Funds have not made any provision for federal income tax.
Dividends and Distributions to Shareholders
Dividends from net investment income are declared and paid quarterly for the Blend Fund and Managed Bond Fund and annually for the Equity Fund and at other times as may be required to satisfy tax or regulatory requirements. Dividends from net investment income are declared daily and paid monthly for the U.S. Government Money Market Fund. Distributions of any net realized capital gains of each Fund are declared and paid annually and at other times as may be required to satisfy tax or regulatory requirements.
Distributions to shareholders are recorded on the ex-dividend date. Income and capital gain distributions are determined in accordance with income tax regulations, which may differ from generally accepted accounting principles. As a result, net investment income and net realized capital gains on investment transactions for a reporting period may differ significantly from distributions during such period.
| 3. | | Advisory Fees and Other Transactions |
Investment Advisory Fees and Investment Subadvisers
MML Investment Advisers, LLC (“MML Advisers”), a wholly-owned subsidiary of MassMutual, serves as investment adviser to each Fund. Under investment advisory agreements between MML Advisers and the Trust on behalf of each Fund, MML Advisers is responsible for providing investment management services for each Fund. In return for these services, MML Advisers receives advisory fees, based upon each Fund’s average daily net assets, computed and accrued daily and payable monthly, at the following annual rates:
|
0.50% on the first $100 million; |
0.45% on the next $200 million; |
0.40% on the next $200 million; and |
0.35% on any excess over $500 million |
94
Notes to Financial Statements (Continued)
MML Advisers has entered into investment subadvisory agreements with Barings LLC (“Barings”), a wholly-owned subsidiary of MM Asset Management Holding LLC, itself a wholly-owned subsidiary of MassMutual Holding LLC, a controlled subsidiary of MassMutual, on behalf of certain Funds. These agreements provide that Barings manage the investment and reinvestment of assets of these Funds. Barings receives a subadvisory fee from MML Advisers, based upon each Fund’s average daily net assets at the following annual rates:
| | |
Blend Fund | | 0.13% (Equity Segment) 0.09% (Money Market and Bond Segments) |
Managed Bond Fund | | 0.10% |
U.S. Government Money Market Fund | | 0.05% |
MML Advisers has entered into an investment subadvisory agreement with OppenheimerFunds, Inc. (“OFI”), a wholly-owned subsidiary of Oppenheimer Acquisition Corp., itself an indirect majority-owned subsidiary of MassMutual Holding LLC, pursuant to which OFI serves as one of the subadvisers to the Equity Fund. This agreement provides that OFI manage the investment and reinvestment of a portion of the assets of the Fund. OFI receives a subadvisory fee from MML Advisers, based upon the average daily net assets of the portion of the Fund that OFI manages, at the following annual rate:
Through December 3, 2017, MML Advisers had entered into an investment subadvisory agreement with the unaffiliated investment subadviser, Loomis, Sayles & Company, L.P. (“Loomis Sayles”), pursuant to which Loomis Sayles served as one of the subadvisers to the Equity Fund. This agreement provided that Loomis Sayles manage the investment and reinvestment of a portion of the assets of the Fund. Loomis Sayles received a subadvisory fee from MassMutual based upon the average daily net assets of the portion of the Fund that Loomis Sayles managed.
Effective December 4, 2017, Brandywine Global Investment, LLC (“Brandywine Global”) replaced Loomis Sayles as co-subadviser to the Fund. MML Advisers has entered into an investment subadvisory agreement with the unaffiliated subadviser, Brandywine Global, pursuant to which Brandywine Global serves as one of the subadvisers to the Equity Fund. This agreement provides that Brandywine Global manage the investment and reinvestment of a portion of the assets of the Fund. Brandywine Global receives a subadvisory fee from MassMutual based upon the average daily net assets of the portion of the Fund that Brandywine Global manages.
The Funds’ subadvisory fees are paid monthly by MML Advisers out of the advisory fees previously disclosed above.
Distribution and Service Fees
MML Distributors, LLC (the “Distributor”) acts as distributor to the Funds. Pursuant to a Distribution and Services Plan adopted by the Funds pursuant to Rule 12b-1 under the 1940 Act, Service Class shares of the Funds pay an annual fee of 0.25% of the average daily net asset value of Service Class shares. This fee, or a portion thereof, is paid to: (i) the Distributor for services provided and expenses incurred by it in connection with the distribution of Service Class shares, if available, of each Fund; and/or (ii) MassMutual for services provided and expenses incurred by it for purposes of maintaining or providing personal services to Service Class shareholders. The Distributor is a wholly-owned subsidiary of MassMutual.
Expense Caps and Waivers
For the U.S. Government Money Market Fund, MML Advisers has agreed to voluntarily waive some or all of its advisory fees and, if necessary, reimburse some or all of the Fund’s other expenses, in an attempt to allow the Initial Class shares of the Fund to maintain a 1-day yield of at least approximately 0.00%. MML Advisers may amend or discontinue this waiver at any time without advance notice.
95
Notes to Financial Statements (Continued)
Deferred Compensation
Trustees of the Funds who are not officers or employees of MassMutual may elect to defer receipt of their annual fees in accordance with terms of a Non-Qualified Deferred Compensation Plan. Amounts deferred shall accrue interest or earnings and shall be recorded on the Funds’ books as other liabilities. Deferred compensation is included within Trustees’ fees and expenses in the Statements of Assets and Liabilities.
Other
Certain officers and trustees of the Funds may also be employees of MassMutual. The compensation of a trustee who is not an employee of MassMutual is borne by the Funds.
Elaine A. Sarsynski resigned as a Trustee of the Trust effective as of February 1, 2017. Teresa Hassara became a Trustee of the Trust effective as of June 6, 2017.
| 4. | | Purchases and Sales of Investments |
Cost of purchases and proceeds from sales of investment securities (excluding short-term investments) for the year ended December 31, 2017, were as follows:
| | | | | | | | | | | | | | | | |
| | | Purchases | | | Sales | |
| | | Long-Term U.S.
Government
Securities | | | Other
Long-Term
Securities | | | Long-Term U.S.
Government
Securities | | | Other
Long-Term
Securities | |
Blend Fund | | $ | 414,218,060 | | | $ | 471,967,773 | | | $ | 396,143,199 | | | $ | 518,876,011 | |
Equity Fund | | | - | | | | 567,130,478 | | | | - | | | | 606,679,733 | |
Managed Bond Fund | | | 2,459,535,519 | | | | 419,195,689 | | | | 2,416,229,046 | | | | 452,215,938 | |
The Funds may purchase from, or sell securities to, other affiliated Funds under procedures adopted by the Trustees. These policies have been designed to ensure that cross-trades conducted by the Funds comply with Rule 17a-7 under the 1940 Act. These trades are included within the respective purchases and sales amounts shown in the table above, as applicable.
| 5. | | Capital Share Transactions |
Changes in shares outstanding for each Fund were as follows:
| | | | | | | | | | | | | | | | |
| | | Year Ended December 31, 2017 | | | Year Ended December 31, 2016 | |
| | | Shares | | | Amount | | | Shares | | | Amount | |
| | | | | | | | | | | | | | | | |
Blend Fund Initial Class | | | | | | | | | | | | | | | | |
Sold | | | 589,688 | | | $ | 13,074,798 | | | | 678,616 | | | $ | 14,246,804 | |
Issued as reinvestment of dividends | | | 1,674,930 | | | | 36,251,636 | | | | 3,286,450 | | | | 67,094,963 | |
Redeemed | | | (3,243,006 | ) | | | (72,037,541 | ) | | | (3,323,286 | ) | | | (69,915,230 | ) |
| | | | | | | | | | | | | | | | |
Net increase (decrease) | | | (978,388 | ) | | $ | (22,711,107 | ) | | | 641,780 | | | $ | 11,426,537 | |
| | | | | | | | | | | | | | | | |
Blend Fund Service Class | | | | | | | | | | | | | | | | |
Sold | | | 1,146,791 | | | $ | 25,446,915 | | | | 570,292 | | | $ | 12,018,067 | |
Issued as reinvestment of dividends | | | 189,349 | | | | 4,094,882 | | | | 277,336 | | | | 5,651,618 | |
Redeemed | | | (341,691 | ) | | | (7,572,019 | ) | | | (199,529 | ) | | | (4,185,567 | ) |
| | | | | | | | | | | | | | | | |
Net increase (decrease) | | | 994,449 | | | $ | 21,969,778 | | | | 648,099 | | | $ | 13,484,118 | |
| | | | | | | | | | | | | | | | |
96
Notes to Financial Statements (Continued)
| | | | | | | | | | | | | | | | |
| | | Year Ended December 31, 2017 | | | Year Ended December 31, 2016 | |
| | | Shares | | | Amount | | | Shares | | | Amount | |
| | | | | | | | | | | | | | | | |
Equity Fund Initial Class | | | | | | | | | | | | | | | | |
Sold | | | 516,163 | | | $ | 15,345,298 | | | | 679,955 | | | $ | 18,346,000 | |
Issued as reinvestment of dividends | | | 639,529 | | | | 18,607,494 | | | | 2,111,189 | | | | 55,844,431 | |
Redeemed | | | (2,630,242 | ) | | | (78,306,976 | ) | | | (3,072,954 | ) | | | (82,400,504 | ) |
| | | | | | | | | | | | | | | | |
Net increase (decrease) | | | (1,474,550 | ) | | $ | (44,354,184 | ) | | | (281,810 | ) | | $ | (8,210,073 | ) |
| | | | | | | | | | | | | | | | |
Equity Fund Service Class | | | | | | | | | | | | | | | | |
Sold | | | 436,476 | | | $ | 12,912,046 | | | | 374,309 | | | $ | 9,937,363 | |
Issued as reinvestment of dividends | | | 71,682 | | | | 2,062,870 | | | | 221,602 | | | | 5,801,918 | |
Redeemed | | | (434,797 | ) | | | (12,725,794 | ) | | | (218,237 | ) | | | (5,803,562 | ) |
| | | | | | | | | | | | | | | | |
Net increase (decrease) | | | 73,361 | | | $ | 2,249,122 | | | | 377,674 | | | $ | 9,935,719 | |
| | | | | | | | | | | | | | | | |
Managed Bond Fund Initial Class | | | | | | | | | | | | | | | | |
Sold | | | 11,771,449 | | | $ | 146,212,529 | | | | 9,441,992 | | | $ | 118,221,404 | |
Issued as reinvestment of dividends | | | 2,440,386 | | | | 30,212,037 | | | | 2,566,362 | | | | 32,001,075 | |
Redeemed | | | (14,315,792 | ) | | | (177,988,068 | ) | | | (14,434,430 | ) | | | (180,995,878 | ) |
| | | | | | | | | | | | | | | | |
Net increase (decrease) | | | (103,957 | ) | | $ | (1,563,502 | ) | | | (2,426,076 | ) | | $ | (30,773,399 | ) |
| | | | | | | | | | | | | | | | |
Managed Bond Fund Service Class | | | | | | | | | | | | | | | | |
Sold | | | 2,870,161 | | | $ | 35,490,830 | | | | 2,445,350 | | | $ | 30,561,975 | |
Issued as reinvestment of dividends | | | 659,027 | | | | 8,142,837 | | | | 622,475 | | | | 7,746,042 | |
Redeemed | | | (2,343,314 | ) | | | (29,080,230 | ) | | | (1,697,341 | ) | | | (21,201,207 | ) |
| | | | | | | | | | | | | | | | |
Net increase (decrease) | | | 1,185,874 | | | $ | 14,553,437 | | | | 1,370,484 | | | $ | 17,106,810 | |
| | | | | | | | | | | | | | | | |
U.S. Government Money Market Fund Initial Class | | | | | | | | | | | | | | | | |
Sold | | | 52,121,545 | | | $ | 52,121,863 | | | | 76,950,748 | | | $ | 76,922,227 | |
Issued as reinvestment of dividends | | | 548,038 | | | | 548,038 | | | | 222 | | | | 222 | |
Redeemed | | | (69,530,642 | ) | | | (69,531,082 | ) | | | (78,896,714 | ) | | | (78,866,683 | ) |
| | | | | | | | | | | | | | | | |
Net increase (decrease) | | | (16,861,059 | ) | | $ | (16,861,181 | ) | | | (1,945,744 | ) | | $ | (1,944,234 | ) |
| | | | | | | | | | | | | | | | |
| 6. | | Federal Income Tax Information |
At December 31, 2017, the aggregate cost of investments and the unrealized appreciation (depreciation) in the value of all investments owned by the Fund(s), as computed on a federal income tax basis, were as follows:
| | | | | | | | | | | | | | | | |
| | | Federal Income
Tax Cost | | | Tax Basis
Unrealized
Appreciation | | | Tax Basis
Unrealized
(Depreciation) | | | Net Unrealized
Appreciation
(Depreciation) | |
Blend Fund | | $ | 568,626,378 | | | $ | 154,601,806 | | | $ | (4,360,337 | ) | | $ | 150,241,469 | |
Equity Fund | | | 717,792,041 | | | | 177,925,660 | | | | (6,431,021 | ) | | | 171,494,639 | |
Managed Bond Fund | | | 1,342,214,783 | | | | 17,750,401 | | | | (7,836,111 | ) | | | 9,914,290 | |
Note: The aggregate cost for investments for the U.S. Government Money Market Fund at December 31, 2017, is the same for financial reporting and federal income tax purposes.
Net capital loss carryforwards may be applied against any net realized taxable gains in succeeding years, subject to the carryforward period limitations, where applicable. On December 22, 2010, the Regulated Investment Company Modernization Act of 2010 (the “Modernization Act”) was signed by the President. The Modernization Act changed the capital loss carryforward rules as they relate to regulated investment companies. Capital losses generated in tax years beginning after the date of enactment may now be carried forward indefinitely, and retain the character of the original loss. Under pre-enactment law, capital losses could be
97
Notes to Financial Statements (Continued)
carried forward for up to eight tax years as short-term capital losses. The provisions affecting the utilization of capital loss carryforwards under the Modernization Act also require the utilization of post-enactment losses prior to the utilization of pre-enactment losses.
At December 31, 2017, for federal income tax purposes, there were no unused capital losses.
At December 31, 2017, the following Fund(s) had post-enactment accumulated capital loss carryforwards:
| | | | | | | | |
| | | Short Term
Capital Loss
Carryforward | | | Long Term
Capital Loss
Carryforward | |
Managed Bond Fund | | $ | 2,149,132 | | | $ | 12,212,583 | |
Net capital loss carryforwards for the Fund(s) shown in the above table are from post-enactment years and are, therefore, not subject to the eight-year carryforward period and possible expiration.
Generally accepted accounting principles in the United States of America require that only distributions in excess of tax basis earnings and profits be reported in the financial statements as a return of capital.
The tax character of distributions (including capital gain dividends, if any, designated pursuant to Section 852 of the Code) paid during the year ended December 31, 2017, was as follows:
| | | | | | | | | | | | |
| | | Ordinary
Income | | | Long Term
Capital Gain | | | Return of
Capital | |
Blend Fund | | $ | 18,645,802 | | | $ | 21,700,716 | | | $ | - | |
Equity Fund | | | 14,969,212 | | | | 5,701,153 | | | | - | |
Managed Bond Fund | | | 38,354,874 | | | | - | | | | - | |
U.S. Government Money Market Fund | | | 548,038 | | | | - | | | | - | |
The tax character of distributions (including capital gain dividends, if any, designated pursuant to Section 852 of the Code) paid during the year ended December 31, 2016, was as follows:
| | | | | | | | | | | | |
| | | Ordinary
Income | | | Long Term
Capital Gain | | | Return of
Capital | |
Blend Fund | | $ | 13,270,358 | | | $ | 59,476,223 | | | $ | - | |
Equity Fund | | | 13,116,480 | | | | 48,529,869 | | | | - | |
Managed Bond Fund | | | 36,359,150 | | | | 3,387,967 | | | | - | |
U.S. Government Money Market Fund | | | 222 | | | | - | | | | - | |
Capital accounts within the financial statements are periodically adjusted for permanent differences between book and tax accounting. These adjustments have no impact on net assets or the results of operations. Temporary book and tax accounting differences will reverse in subsequent periods. At December 31, 2017, temporary book and tax accounting differences were primarily attributable to investments in futures contracts, swap agreements, premium amortization accruals, corporate action basis adjustments, non-taxable dividends basis adjustments, the deferral of wash sale losses, and deferred Trustee compensation.
98
Notes to Financial Statements (Continued)
At December 31, 2017, the components of distributable earnings on a tax basis were as follows:
| | | | | | | | | | | | | | | | |
| | | Undistributed
Ordinary
Income | | | Undistributed
Long Term
Capital Gain
(Capital Loss
Carryover) | | | Other
Temporary
Differences | | | Unrealized
Appreciation
(Depreciation) | |
Blend Fund | | $ | 11,011,641 | | | $ | 35,628,320 | | | $ | (206,885 | ) | | $ | 150,241,469 | |
Equity Fund | | | 14,933,609 | | | | 116,905,904 | | | | (259,160 | ) | | | 171,494,639 | |
Managed Bond Fund | | | 753,329 | | | | (14,361,715 | ) | | | (238,430 | ) | | | 9,914,290 | |
U.S. Government Money Market Fund | | | 4,361 | | | | - | | | | (53,517 | ) | | | - | |
During the year ended December 31, 2017, the following amounts were reclassified due to permanent differences between book and tax accounting:
| | | | | | | | | | | | |
| | | Paid-in
Capital | | | Accumulated
Net Realized
Gain (Loss) on
Investments | | | Undistributed
Net Investment
Income (Loss) | |
Blend Fund | | $ | (571,973 | ) | | $ | (625,906 | ) | | $ | 1,197,879 | |
Equity Fund | | | (1,002,339 | ) | | | 1,171,069 | | | | (168,730 | ) |
Managed Bond Fund | | | 884 | | | | (3,665,463 | ) | | | 3,664,579 | |
U.S. Government Money Market Fund | | | 4,277 | | | | (3,765 | ) | | | (512 | ) |
The Funds did not have any unrecognized tax benefits at December 31, 2017, nor were there any increases or decreases in unrecognized tax benefits for the year then ended. The Funds recognize interest and penalties, if any, related to unrecognized tax benefits as an income tax expense in the Statements of Operations. During the year ended December 31, 2017, the Funds did not incur any such interest or penalties. The Funds are subject to examination by U.S. federal and state tax authorities for returns filed for the prior three fiscal years. Foreign taxes are provided for based on the Funds’ understanding of the tax rules and rates that exist in the foreign markets in which they invest.
Under the Funds’ organizational documents, current and former Trustees and Officers are provided with specified rights to indemnification against liabilities arising in connection with the performance of their duties to the Funds, and shareholders are indemnified against personal liability for obligations of the Funds. In the normal course of business, the Funds may also enter into contracts that provide general indemnifications. The Funds’ maximum exposure under these arrangements is unknown as this would be dependent on future claims that may be made against the Funds. The risk of material loss from such claims is considered remote.
| 8. | | New Accounting Pronouncements |
In October 2016, the Securities and Exchange Commission (“SEC”) released its Final Rule on Investment Company Reporting Modernization (the “Rule”). The Rule, which introduces two new regulatory reporting forms for investment companies — Form N-PORT and Form N-CEN — also contains amendments to Regulation S-X which impact financial statement presentation, particularly the presentation of derivative investments, for all reporting periods ending after August 1, 2017. Management is still evaluating the impact of the Rule; however, the Funds have adopted the Rule’s Regulation S-X amendments and the Funds’ financial statements are in compliance with those amendments.
In March 2017, FASB issued Accounting Standards Update 2017-08, Receivables — Nonrefundable Fees and Other Costs (Subtopic 310-20): Premium Amortization on Purchased Callable Debt Securities (“ASU 2017-08”). For entities that hold callable debt securities at a premium, ASU 2017-08 requires that the premium be amortized to the earliest call date. ASU 2017-08 would
99
Notes to Financial Statements (Continued)
first be effective for fiscal years beginning after December 15, 2018, and interim periods within those fiscal years. Management is currently evaluating the implication, if any, of these changes and its impact on the Funds’ financial statments.
On December 7, 2010, the Trust was named as a defendant and putative member of the proposed defendant class of shareholders named in an adversary proceeding brought by The Official Committee of Unsecured Creditors of Tribune Company (the “Official Committee”) in the U.S. Bankruptcy Court for the District of Delaware, in connection with Tribune Company’s Chapter 11 bankruptcy proceeding (In re Tribune Company). The proceeding relates to a leveraged buyout (“LBO”) transaction by which Tribune Company converted to a privately-held company in 2007, and the putative defendant class is comprised of beneficial owners of shares of Tribune Company who received proceeds (the “Proceeds”) of the LBO. The Official Committee seeks to recover payments of those Proceeds.
The potential amount sought to be recovered from the Blend Fund plus interest and the Official Committee’s court costs, is approximately $207,400.
In addition, on June 2, 2011, the Blend Fund was named as a defendant in a closely related, parallel adversary proceeding brought in connection with the Tribune Company’s LBO by Deutsche Bank Trust Company Americas, in its capacity as successor indenture trustee for a certain series of Senior Notes, Law Debenture Trust Company of New York, in its capacity as successor indenture trustee for a certain series of Senior Notes, and Wilmington Trust Company, in its capacity as successor indenture trustee for the PHONES Notes (together, the “Plaintiffs”), in the United States District Court for the District of Massachusetts. The Plaintiffs also seek to recover payments of the Proceeds.
The Fund cannot predict the outcome of these proceedings. Accordingly, the Fund has not accrued any amounts related to these proceedings. If the proceedings were to be decided in a manner adverse to the Fund, or if the Fund was to enter into a settlement agreement with the Official Committee or the Plaintiffs, as applicable, the payment of such judgment or settlement could potentially have a material adverse effect on the Fund’s net asset value depending on the net assets of the Fund at the time of such judgment or settlement.
100
Report of Independent Registered Public Accounting Firm
To the Board of Trustees of MML Series Investment Fund II and Shareholders of MML Blend Fund, MML Equity Fund, MML Managed Bond Fund, and MML U.S. Government Money Market Fund (collectively, the “Funds”):
Opinion on the Financial Statements and Financial Highlights
We have audited the accompanying statements of assets and liabilities of the Funds, including the portfolios of investments, as of December 31, 2017, and the related statements of operations for the year then ended, the statements of changes in net assets for each of the two years in the period then ended, the financial highlights for each of the periods presented, and the related notes. In our opinion, the financial statements and financial highlights present fairly, in all material respects, the financial position of each of the Funds constituting the MML Series Investment Fund II as of December 31, 2017, and the results of their operations for the year then ended, the changes in their net assets for each of the two years in the period then ended, and the financial highlights for each of the periods presented, in conformity with accounting principles generally accepted in the United States of America.
Basis for Opinion
These financial statements and financial highlights are the responsibility of the Funds’ management. Our responsibility is to express an opinion on the Funds’ financial statements and financial highlights based on our audits. We are a public accounting firm registered with the Public Company Accounting Oversight Board (United States) (PCAOB) and are required to be independent with respect to the Funds in accordance with the U.S. federal securities laws and the applicable rules and regulations of the Securities and Exchange Commission and the PCAOB.
We conducted our audits in accordance with the standards of the PCAOB. Those standards require that we plan and perform the audit to obtain reasonable assurance about whether the financial statements and financial highlights are free of material misstatement, whether due to error or fraud. The Funds are not required to have, nor were we engaged to perform, an audit of their internal control over financial reporting. As part of our audits we are required to obtain an understanding of internal control over financial reporting but not for the purpose of expressing an opinion on the effectiveness of the Funds’ internal control over financial reporting. Accordingly, we express no such opinion.
Our audits included performing procedures to assess the risks of material misstatement of the financial statements and financial highlights, whether due to error or fraud, and performing procedures that respond to those risks. Such procedures included examining, on a test basis, evidence regarding the amounts and disclosures in the financial statements and financial highlights. Our audits also included evaluating the accounting principles used and significant estimates made by management, as well as evaluating the overall presentation of the financial statements and financial highlights. Our procedures included confirmation of securities owned as of December 31, 2017, by correspondence with the custodian and brokers; when replies were not received from brokers, we performed other auditing procedures. We believe that our audits provide a reasonable basis for our opinion.
Deloitte & Touche LLP
Boston, Massachusetts
February 21, 2018
We have served as the auditor of one or more of the MassMutual investment companies since 1995.
101
Trustees and Officers (Unaudited)
The following table lists the Trust’s Trustees and Officers; their address and age; their position with the Trust; the length of time holding that position with the Trust; their principal occupation(s) during the past five years; the number of portfolios in the fund complex they oversee; and other directorships they hold in companies subject to registration or reporting requirements of the Securities Exchange Act of 1934 (generally called “public companies”) or in registered investment companies. The Trust’s Statement of Additional Information includes additional information about the Trust’s Trustees and is available, without charge, upon request by calling 1-888-309-3539 or by writing MML Series Investment Fund II, c/o Massachusetts Mutual Life Insurance Company, 100 Bright Meadow Blvd., Enfield, Connecticut 06082-1981, Attention: MassMutual U.S. Product and Marketing.
Disinterested Trustees
| | | | | | | | | | |
Name, Address*, and Age | | Position(s)
Held with
Trust | | Term of
Office** and
Length of
Time Served | | Principal Occupation(s)
During Past 5 Years | | Number of
Portfolios in
Fund Complex
Overseen by Trustee | | Other Directorships Held by Trustee |
Allan W. Blair
Age: 69 | | Trustee | | Since 2012 | | Retired; President and Chief Executive Officer (1996-2014), Economic Development Council of Western Massachusetts (non-profit development company); President and Chief Executive Officer (1984-2014), Westover Metropolitan Development Corporation (quasi-public development company). | | 93 | | Trustee (since 2003), MassMutual Select Funds (open-end investment company); Trustee (since 2003), MML Series Investment Fund (open-end investment company); Trustee (since 2012), MassMutual Premier Funds (open-end investment company). |
| | | | | |
Nabil N. El-Hage
Age: 59 | | Trustee Chairman | | Since 2005 2006-2012 | | Founder and sole member of PR Academy of Executive Education, LLC (since 2016); Chairman (2011-2016), Academy of Executive Education, LLC (predecessor to PR Academy of Executive Education, LLC). | | 93 | | Director (2011-2015), Argo Group International Holdings, Ltd. (underwriter of specialty insurance and reinsurance products); Trustee (since 2012), MassMutual Select Funds (open-end investment company); Trustee (since 2012), MML Series Investment Fund (open-end investment company); Trustee (since 2003), Chairman (2006-2012), MassMutual Premier Funds (open-end investment company). |
| | | | | |
Maria D. Furman
Age: 63 | | Trustee | | Since 2005 | | Retired. | | 93 | | Trustee (since 2011), GMO Series Trust (open-end investment company); Trustee (since 2012), MassMutual Select Funds (open-end investment company); Trustee (since 2012), MML Series Investment Fund (open-end investment company); Trustee (since 2004), MassMutual Premier Funds (open-end investment company). |
| | | | | |
R. Alan Hunter, Jr.
Age: 71 | | Chairperson Trustee | | Since 2016 Since 2012 | | Retired. | | 93 | | Director (since 2007), Actuant Corporation (diversified industrial company); Chairperson (since 2016), Trustee (since 2003), MassMutual Select Funds (open-end investment company); Chairperson (since 2016), Trustee (since 2003), MML Series Investment Fund (open-end investment company); Chairperson (since 2016), Trustee (since 2012), MassMutual Premier Funds (open-end investment company). |
102
Trustees and Officers (Unaudited) (Continued)
| | | | | | | | | | |
Name, Address*, and Age | | Position(s)
Held with
Trust | | Term of
Office** and
Length of
Time Served | | Principal Occupation(s)
During Past 5 Years | | Number of
Portfolios in
Fund Complex
Overseen by Trustee | | Other Directorships Held by Trustee |
C. Ann Merrifield
Age: 66 | | Trustee | | Since 2005 | | Retired; President and Chief Executive Officer (2012-2014), PathoGenetix (genomics company). | | 93 | | Director (since 2015), Juniper Pharmaceuticals Inc. (specialty pharmaceutical company); Director (since 2014), Flexion Therapeutics (specialty pharmaceutical company); Chairperson (since 2017) and Director (since 2014), InVivo Therapeutics (research and clinical-stage biomaterials and biotechnology company); Trustee (since 2012), MassMutual Select Funds (open-end investment company); Trustee (since 2012), MML Series Investment Fund (open-end investment company); Trustee (since 2004), MassMutual Premier Funds (open-end investment company). |
| | | | | |
Susan B. Sweeney
Age: 65 | | Trustee | | Since 2012 | | Retired; Senior Vice President and Chief Investment Officer (2010-2014), Selective Insurance Group (property and casualty company. | | 95^ | | Trustee (since 2012), Barings Corporate Investors (closed-end investment company); Trustee (since 2012), Barings Participation Investors (closed-end investment company); Trustee (since 2009), MassMutual Select Funds (open-end investment company); Trustee (since 2009), MML Series Investment Fund (open-end investment company); Trustee (since 2012), MassMutual Premier Funds (open-end investment company). |
Interested Trustees
| | | | | | | | | | |
Name, Address*, and Age | | Position(s)
Held with
Trust | | Term of
Office** and
Length of
Time Served | | Principal Occupation(s)
During Past 5 Years | | Number of
Portfolios in
Fund Complex
Overseen by Trustee | | Other Directorships Held by Trustee |
Teresa Hassara^^
Age: 55 | | Trustee | | Since 2017 | | Head of Workplace Solutions (since 2017), MassMutual; President of Institutional Retirement (2009-2016), TIAA-CREF. | | 93 | | Director (since 2017), MML Advisers; Trustee (since 2017), MassMutual Select Funds (open-end investment company); Trustee (since 2017), MML Series Investment Fund (open-end investment company); Trustee (since 2017), MassMutual Premier Funds (open-end investment company). |
| | | | | |
Robert E. Joyal^^^
Age: 72 | | Trustee | | Since 2012 | | Retired. | | 95^ | | Director (since 2013), Leucadia National Corporation (holding company); Director (2012-2017), Ormat Technologies, Inc. (provider of alternative and renewable energy technology); Director (2006-2014), Jefferies Group LLC (investment bank); Trustee (since 2003), Barings Corporate Investors (closed-end investment company); Trustee (since 2003), Barings Participation Investors (closed-end investment company); Trustee (since 2003), MassMutual Select Funds (open-end investment company); Trustee (since 2003), MML Series Investment Fund (open-end investment company); Trustee (since 2012), MassMutual Premier Funds (open-end investment company). |
103
Trustees and Officers (Unaudited) (Continued)
Principal Officers who are Not Trustees
| | | | | | | | |
Name, Address*, and Age | | Position(s)
Held with Trust | | Term of
Office# and
Length of
Time Served | | Principal Occupation(s) During Past 5 Years | | Number of
Portfolios in
Fund Complex
Overseen by Officer |
Joseph Fallon
Age: 42 | | Vice President Assistant Vice President | | Since
2017 2015-
2017 | | Investment Director (since 2014), MML Advisers; Head of Investment Consulting & Strategy (since 2017), Investment Director (2006-2017), MassMutual; Vice President (since 2017), Assistant Vice President (2015-2017), MassMutual Select Funds (open-end investment company); Vice President (since 2017), Assistant Vice President (2015-2017), MML Series Investment Fund (open-end investment company); Vice President (since 2017), Assistant Vice President (2015-2017), MassMutual Premier Funds (open-end investment company). | | 93 |
| | | | |
Andrew M. Goldberg
Age: 51 | | Vice President, Secretary (formerly known as “Clerk”), and Chief Legal Officer Assistant Clerk | | Since
2008 2005-
2008 | | Assistant Vice President and Counsel (since 2004), MassMutual; Secretary (since 2015), Assistant Secretary (2013-2015), MML Advisers; Vice President, Secretary, and Chief Legal Officer (since 2008), Assistant Secretary (2001-2008), MassMutual Select Funds (open-end investment company); Vice President, Secretary, and Chief Legal Officer (since 2008), Assistant Secretary (2001-2008), MML Series Investment Fund (open-end investment company); Vice President, Secretary, (formerly known as “Clerk”), and Chief Legal Officer (since 2008), Assistant Clerk (2004-2008), MassMutual Premier Funds (open-end investment company). | | 93 |
| | | | |
Renee Hitchcock
Age: 47 | | Chief Financial Officer and Treasurer Assistant Treasurer | | Since
2016 2007-
2016 | | Assistant Vice President (since 2015), Director (2007-2015), MassMutual; Chief Financial Officer and Treasurer (since 2016), Assistant Treasurer (2007-2016), MassMutual Select Funds (open-end investment company); Chief Financial Officer and Treasurer (since 2016), Assistant Treasurer (2007-2016), MML Series Investment Fund (open-end investment company); Chief Financial Officer and Treasurer (since 2016), Assistant Treasurer (2007-2016), MassMutual Premier Funds (open-end investment company). | | 93 |
| | | | |
Jill Nareau Robert
Age: 45 | | Vice President and Assistant Secretary Assistant Secretary (formerly known as “Assistant Clerk”) | | Since
2017 2008-
2017 | | Assistant Vice President and Counsel (since 2009), MassMutual; Assistant Secretary (since 2015), MML Advisers; Vice President and Assistant Secretary (since 2017), Assistant Secretary (2008-2017), MassMutual Select Funds (open-end investment company); Vice President and Assistant Secretary (since 2017), Assistant Secretary (2008-2017), MML Series Investment Fund (open-end investment company); Vice President and Assistant Secretary (since 2017), Assistant Secretary (formerly known as “Assistant Clerk”) (2008-2017), MassMutual Premier Funds (open-end investment company). | | 93 |
| | | | |
Douglas Steele
Age: 42 | | Vice President | | Since
2016 | | Vice President and Head of Investment Management (since 2017), Head of Investment Due Diligence (2016-2017), MML Advisers; Head of Investment Management (since 2017), Assistant Vice President (2013-2017), Investment Director (2005-2013), MassMutual; Vice President (since 2016), MassMutual Select Funds (open-end investment company); Vice President (since 2016), MML Series Investment Fund (open-end investment company); Vice President (since 2016), MassMutual Premier Funds (open-end investment company). | | 93 |
| | | | |
Philip S. Wellman
Age: 53 | | Vice President and Chief Compliance Officer | | Since
2007 | | Vice President and Chief Compliance Officer (since 2013), MML Advisers; Vice President, Associate General Counsel, and Chief Compliance Officer (Mutual Funds) (since 2014), Vice President, Associate General Counsel, and Chief Compliance Officer (Mutual Funds and Investment Advisory) (2008-2014), MassMutual; Vice President and Chief Compliance Officer (since 2007), MassMutual Select Funds (open-end investment company); Vice President and Chief Compliance Officer (since 2007), MML Series Investment Fund (open-end investment company); Vice President and Chief Compliance Officer (since 2007), MassMutual Premier Funds (open-end investment company). | | 93 |
104
Trustees and Officers (Unaudited) (Continued)
| | | | | | | | |
Name, Address*, and Age | | Position(s)
Held with Trust | | Term of
Office# and
Length of
Time Served | | Principal Occupation(s) During Past 5 Years | | Number of
Portfolios in
Fund Complex
Overseen by Officer |
Eric H. Wietsma
Age: 51 | | Vice President | | Since
2006
| | Director and President (since 2013), MML Advisers; Senior Vice President (since 2010), MassMutual; President (since 2008), Vice President (2006-2008), MassMutual Select Funds (open-end investment company); Vice President (since 2006), MML Series Investment Fund (open-end investment company); President (since 2008), Vice President (2006-2008), MassMutual Premier Funds (open-end investment company). | | 93 |
| | | | |
Tina Wilson
Age: 47 | | Vice President | | Since
2016 | | Vice President and Head of Investments (since 2016), MML Advisers; Senior Vice President (since 2014), Vice President (2009-2014), MassMutual; Vice President (since 2016), MassMutual Select Funds (open-end investment company); President (since 2017), Vice President (2016-2017), MML Series Investment Fund (open-end investment company); Vice President (since 2016), MassMutual Premier Funds (open-end investment company). | | 93 |
| * | The address of each Trustee and Principal Officer is the same as that for the Trust; 100 Bright Meadow Blvd., Enfield, CT 06082-1981. |
| ** | Each Trustee of the Trust serves until the next meeting of shareholders called for the purpose of electing Trustees and until the election and qualification of his or her successor or until he or she dies, resigns, or is removed. Notwithstanding the foregoing, unless the Trustees determine that it is desirable and in the best interest of the Trust that an exception to the retirement policy of the Trust be made, a Trustee shall retire and cease to serve as a Trustee upon the conclusion of the calendar year in which such Trustee attains the age of seventy-five years, however, with the exception of Mr. Robert E. Joyal, an interested Trustee of the Trust shall no longer serve as a Trustee if or when they are no longer an employee of MassMutual or an affiliate. |
| | The Chairperson is elected to hold such office for a term of three years or until their successor is elected and qualified to carry out the duties and responsibilities of their office, or until he or she retires, dies, resigns, is removed, or becomes disqualified. The Chairperson shall hold office at the pleasure of the Trustees. |
| ^ | Barings Participation Investors and Barings Corporate Investors are deemed to be a part of the Fund Complex, because they are managed by Barings LLC, an affiliate of MML Advisers. |
| ^^ | Ms. Hassara is an “Interested Person,” as that term is defined in the 1940 Act, as an employee of MassMutual. |
| ^^^ | Mr. Joyal is an “Interested Person,” as that term is defined in the 1940 Act, through his position as a director of Leucadia National Corporation, which controls Jefferies Group LLC, a broker-dealer that may execute portfolio transactions and/or engage in principal transactions with the Funds, other investment companies advised by MML Advisers or holding themselves out to investors as related companies for purposes of investment or investor services, or any other advisory accounts over which MML Advisers has brokerage placement discretion. |
| # | The President, Treasurer, and Secretary and such other officers as the Trustees may in their discretion from time to time elect are elected to hold such office until their successor is elected and qualified to carry out the duties and responsibilities of their office, or until he or she dies, resigns, is removed, or becomes disqualified. Each officer shall hold office at the pleasure of the Trustees. |
105
Federal Tax Information (Unaudited)
For corporate shareholders, a portion of the ordinary dividends paid during the Fund(s)’ year ended December 31, 2017, qualified for the dividends received deduction, as follows:
| | | | |
| |
| | | Dividends Received
Deductions | |
Blend Fund | | | 40.64% | |
Equity Fund | | | 88.07% | |
Managed Bond Fund | | | 0.34% | |
106
Other Information (Unaudited)
Proxy Voting
A description of the policies and procedures that each Fund’s investment adviser and subadvisers use to vote proxies relating to the Fund’s portfolio securities is available, without charge, upon request, by calling 1-888-309-3539, and on the SEC’s EDGAR database on its website at http://www.sec.gov.
Information regarding how the Funds voted proxies relating to portfolio securities during the most recent 12-month period ended June 30 is available, without charge, upon request, on the MassMutual website at http://www.massmutual.com/funds and on the SEC’s EDGAR database on its website at http://www.sec.gov.
Quarterly Reporting
The Funds file their complete schedule of portfolio holdings with the SEC for the first and third quarters of each fiscal year on Form N-Q. The Funds’ Forms N-Q are available on the SEC’s EDGAR database on its website at http://www.sec.gov and may be reviewed and copied at the SEC’s Public Reference Room in Washington D.C. Information on the operation of the SEC’s Public Reference Room may be obtained by calling 1-800-SEC-0330.
Trustees’ Approval of Investment Advisory Contracts
At their meeting in September 2017, the Trustees, including the Trustees who are not “interested persons” (as such term is defined in the 1940 Act) of the Trust, MML Advisers, or the subadvisers (the “Independent Trustees”), approved a new subadvisory agreement with Brandywine Global Investment Management, LLC (“Brandywine Global”) for the Equity Fund (the “Fund” and the “New Subadvisory Agreement”). In preparation for the meeting, the Trustees requested, and MML Advisers provided in advance, certain materials relevant to the consideration of the New Subadvisory Agreement. In all of their deliberations, the Trustees were advised by independent counsel.
In reviewing the New Subadvisory Agreement, the Independent Trustees discussed with MML Advisers and considered a wide range of information about, among other things: (i) Brandywine Global and its personnel with responsibilities for providing services to the Fund; (ii) the terms of the New Subadvisory Agreement; (iii) the scope and quality of services that Brandywine Global will provide under the New Subadvisory Agreement; (iv) the historical investment performance track record of Brandywine Global; and (v) the fees payable to Brandywine Global by MML Advisers for the Fund and the effect of such fees on the profitability to MML Advisers.
Based on the foregoing, the Trustees concluded that: (i) overall, they were satisfied with the nature, extent, and quality of services expected to be provided under the New Subadvisory Agreement; (ii) MML Advisers’ projected levels of profitability due to the New Subadvisory Agreement were not excessive and the subadvisory fee amount under the New Subadvisory Agreement is fair and reasonable; (iii) the investment processes, research capabilities, and philosophy of Brandywine Global appear well suited to the Fund, given its investment objective and policies; and (iv) the terms of the New Subadvisory Agreement are fair and reasonable with respect to the Fund and are in the best interests of the Fund’s shareholders. After carefully considering the information summarized above, the Trustees, including the Independent Trustees voting separately, unanimously voted to approve the New Subadvisory Agreement.
Prior to the votes being taken to approve the New Subadvisory Agreement, the Independent Trustees met separately in executive session to discuss the appropriateness of the contract. The Independent Trustees weighed the foregoing matters in light of the advice given to them by their independent legal counsel as to the law applicable to the review of investment advisory contracts. In arriving at a decision, the Trustees, including the Independent Trustees, did not identify any single matter as all-important or controlling. The foregoing summary does not detail all of the matters considered.
The New Subadvisory Agreement became effective on December 4, 2017.
107
Other Information (Unaudited)
Fund Expenses December 31, 2017
Expense Examples:
The following information is in regards to expenses for the six months ended December 31, 2017:
As a shareholder of the Funds, you incur ongoing costs, including advisory fees, distribution and/or service (12b-1) fees, and other Fund expenses. These examples are intended to help you understand your ongoing costs (in dollars) of investing in the Funds and to compare these costs with the ongoing costs of investing in other mutual funds. These examples are based on an investment of $1,000 invested for the six months ended December 31, 2017.
Actual Expenses:
The first four columns of the table below provide information about actual account values and actual expenses. You may use this information, together with the amount you invested, to estimate the expenses that you paid over the period. Simply divide your account value by $1,000 (for example, an $8,600 account value divided by $1,000 = 8.6), then multiply the result by the number under the heading entitled “Operating Expenses Incurred” to estimate the expenses you paid on your account during this period.
Hypothetical Example for Comparison Purposes:
The last two columns of the table below provide information about hypothetical account values and hypothetical expenses based on the Fund’s actual expense ratio and an assumed rate of return of 5% per year before expenses, which is not the Fund’s actual return. The hypothetical account values and expenses may not be used to estimate the actual ending account balance or expenses you paid for the period. You may use this information to compare the ongoing costs of investing in the Fund and other funds. To do so, compare this 5% hypothetical example with the 5% hypothetical examples that appear in the shareholder reports of the other funds.
Please note that the expenses shown in the table are meant to highlight your ongoing costs only and do not reflect any transactional costs. Therefore, the last two columns of the table are useful in comparing ongoing costs only, and will not help you determine the relative total costs of owning different funds. In addition, if these transactional costs were included, your costs would have been higher.
| | | | | | | | | | | | | | | | | | | | | | | | |
| | | Beginning
Value | | | Annualized
Expense
Ratio | | | Ending
Value (Based
on Actual
Returns and
Expenses) | | | Operating
Expenses
Incurred* | | | Ending
Value (Based
on
Hypothetical
Returns and
Expenses) | | | Operating
Expenses
Incurred* | |
| Blend Fund | | | | | | | | | | | | | | | | | | | | | | | | |
Initial Class | | $ | 1,000 | | | | 0.45 | % | | $ | 1,085.30 | | | $ | 2.37 | | | $ | 1,022.90 | | | $ | 2.29 | |
Service Class | | | 1,000 | | | | 0.70 | % | | | 1,083.90 | | | | 3.68 | | | | 1,021.70 | | | | 3.57 | |
| Equity Fund | | | | | | | | | | | | | | | | | | | | | | | | |
Initial Class | | | 1,000 | | | | 0.43 | % | | | 1,084.00 | | | | 2.26 | | | | 1,023.00 | | | | 2.19 | |
Service Class | | | 1,000 | | | | 0.68 | % | | | 1,082.70 | | | | 3.57 | | | | 1,021.80 | | | | 3.47 | |
| Managed Bond Fund | | | | | | | | | | | | | | | | | | | | | | | | |
Initial Class | | | 1,000 | | | | 0.41 | % | | | 1,016.50 | | | | 2.08 | | | | 1,023.10 | | | | 2.09 | |
Service Class | | | 1,000 | | | | 0.66 | % | | | 1,015.20 | | | | 3.35 | | | | 1,021.90 | | | | 3.36 | |
| U.S. Government Money Market Fund | | | | | | | | | | | | | | | | | | | | | | | | |
Initial Class | | | 1,000 | | | | 0.54 | % | | | 1,002.70 | | | | 2.73 | | | | 1,022.50 | | | | 2.75 | |
| * | Expenses are calculated using the annualized expense ratio for the six months ended December 31, 2017, multiplied by the average account value over the period, multiplied by 184 days in the period, divided by 365 days in the year, unless stated otherwise. The annualized expense ratio does not reflect expenses deducted under the variable life insurance or variable annuity contract through which the Funds are invested in. Inclusion of these expenses would increase the annualized expense ratios shown. |
108
| | |
Underwriter: MML Distributors, LLC 100 Bright Meadow Blvd. Enfield, CT 06082-1981 | | |

| | |
© 2018 Massachusetts Mutual Life Insurance Company (MassMutual), Springfield, MA 01111-0001. All rights reserved. www.massmutual.com. Investment Adviser: MML Investment Advisers, LLC | | RS-44297-00 |
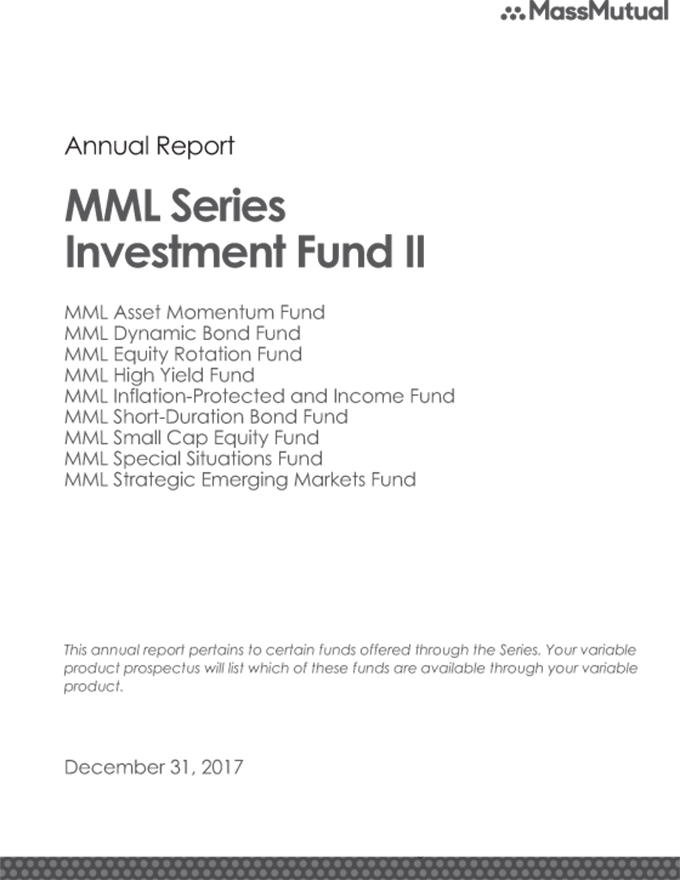
Table of Contents
This material must be preceded or accompanied by a current prospectus (or summary prospectus, if available) for the MML Series Investment Fund II. Investors should consider a Fund’s investment objective, risks, and charges and expenses carefully before investing. This and other information about the investment company is available in the prospectus (or summary prospectus, if available). Read it carefully before investing.
MML Series Investment Fund II – President’s Letter to Shareholders (Unaudited)
To Our Shareholders

Tina Wilson
“MassMutual believes that ever-changing market conditions have the potential to benefit people who maintain a long-term perspective on investing.”
December 31, 2017
Continued strength in U.S. markets benefits equity investors; global markets stabilize
I am pleased to present you with the MML Series Investment Fund II Annual Report, covering the year ended December 31, 2017 (the “fiscal year”). Domestic stocks enjoyed strong performance during the fiscal year, as investor sentiment was buoyed by campaign promises focused on tax reforms, infrastructure spending, health care reform, and the creation of American jobs. One campaign promise fulfilled was the passage of tax reform, as President Trump signed sweeping tax legislation (i.e., the Tax Cuts and Jobs Act) into law on December 22, 2017.
Foreign stocks also performed well for investors, as European markets stabilized significantly with Brexit concerns shifting to the actual details of executing Great Britain’s separation from the European Union. Asian markets also stabilized, even though geopolitical tensions in the region escalated due to China’s disputed expansion in the South China Sea, North Korea’s increased nuclear and missile arsenal, and lingering suspicions regarding Russia’s covert involvement in the American political process and its participation in Middle Eastern conflicts. Japan’s economic policies also appeared to be helping that country overcome its long-term economic challenges.
While equity markets added to an impressive string of consecutive quarters with positive results, investment-grade bond investors found it more difficult to generate satisfying returns during the period.
In MassMutual’s view, the ongoing uncertainties associated with investing in today’s markets validate the importance of taking a long-term perspective and not reacting to current events or short-term market changes. We also believe investors preparing for retirement who follow certain investment guidelines, such as the ones below, may increase their chances of reaching their long-term retirement income goals.
Suggestions for retirement investors under any market conditions
Save as much as you can
There is no way to predict how the markets will perform. But you can control how often and how much you contribute to your retirement accounts. Contributing as much as you can and increasing your contribution level as often as possible may be one way to help you realize your retirement income goals.*
Invest in all market conditions
Many seasoned investors believe that retirement savers who can tolerate a market downturn have the potential to be rewarded by accumulating larger positions at more favorable prices (compared to those who do not invest during a down market). That’s why financial professionals often advise their clients to stay in the market, regardless of short-term results.
| | * | Systematic investing and asset allocation do not ensure a profit or protect against loss in a declining market. Systematic investing involves continuous investment in securities regardless of fluctuating price levels. Investors should consider their ability to continue investing through periods of low price levels. |
(Continued)
1
MML Series Investment Fund II – President’s Letter to Shareholders (Unaudited) (Continued)
Retirement investors have time on their side
For most, saving and investing for retirement occurs over many decades. While most retirement investors may be familiar with market volatility, savvy investors know that adopting a long-term view of the markets can help them withstand all market conditions.
Monitor your asset allocation regularly – and diversify
Stocks, bonds, and short-term/money market investments typically (although not always) behave differently, depending on the economic and market environment. Each of these asset classes contains an even greater array of sub-categories, such as small-cap stocks, international stocks, and high-yield bonds. Many financial professionals believe that investors can take advantage of different opportunities in the market and reduce the risk of over-exposure to one or two poorly performing investment types by maintaining retirement accounts that contain a mix of investment types and sub-categories.
Make informed choices and seek professional guidance
Many financial advisors suggest that retirement investors select an appropriate combination of investments that aligns with their retirement income goals. Doing so can help you withstand the inevitable ups and downs of the markets.
If you work with a financial professional, this may be an excellent time to contact him or her for assistance in assessing whether or not you:
| | • | | may be saving enough for adequate retirement income based on your long-term needs; |
| | • | | are invested properly for all market conditions, based on your retirement income goals and objectives and where you are in your retirement planning journey; and |
| | • | | feel you are taking the right steps to help reduce your longevity risk, which is related to the possibility that you could “outlive” your retirement savings. |
We’re people protecting people
MassMutual believes that nothing matters more than people. Our commitment has always been to help you care for the people you care about. We’ve helped people secure their future and protect the ones they love since 1851. And that’s why we consistently encourage retirement investors to maintain a long-term view toward retirement investing, and avoid reacting to short-term market movements. We believe that ever-changing market conditions have the potential to benefit people who maintain a long-term perspective on investing. Thank you for your continued confidence in MassMutual.
Sincerely,

Tina Wilson
President
The information provided is the opinion of MML Investment Advisers, LLC as of 1/1/18 and is subject to change without notice. It is not to be construed as tax, legal, or investment advice. Of course, past performance does not guarantee future results.
2
MML Series Investment Fund II – Economic and Market Overview (Unaudited)
December 31, 2017
Market Highlights
| | • | | U.S. stock investors enjoyed strong performance during the fiscal year, bolstered by a rally which started after the November 2016 U.S. presidential election. |
| | • | | Data throughout the period pointed to sustained improvements in the global economic environment. |
| | • | | Foreign markets rebounded over the past 12 months, even though geopolitical turbulence increased in some regions. |
| | • | | The Federal Reserve Board (the “Fed”) raised short-term interest rates three times during the reporting period and introduced a plan to shrink its balance sheet, beginning in 2017. |
| | • | | Investment-grade bond investors saw the smallest returns during this annual reporting cycle. |
Market Environment
U.S. stock investors enjoyed strong performance during the fiscal year ended December 31, 2017, bolstered by a rally which started after the November 2016 U.S. presidential election. All major domestic stock indexes registered positive returns during the period, though returns varied widely across asset classes and investment types.
Following the surprising election of Donald J. Trump as the 45th President of the United States, investor sentiment was buoyed by campaign promises focused on tax reforms, infrastructure spending, health care reform, and the creation of American jobs. While the Trump administration and the Republican-led Congress struggled, for a good bit of the year, to turn campaign promises into policy realities, investor sentiment remained high through the end of the reporting period. One campaign promise that the President was able to fulfill, however, was the passage of tax reform (i.e., the Tax Cuts and Jobs Act), which he signed into law on December 22, 2017.
Consecutive improved quarterly earnings reports fueled strong investor sentiment. For each quarterly reporting cycle of this fiscal year, the majority of American corporations reported earnings and sales that beat forecasts. (This, despite the fact that many companies cited the impact of hurricanes and high foreign exchange rates as negatively impacting earnings or revenue in the third quarter.) While the market generally acknowledges that stock valuations are high by historical standards, strong earnings and sales results appear to justify ongoing investor participation in equity markets.
Continued improving domestic economic data also supported investor confidence over the past 12 months. In 2017, the scope of improved economic data expanded to include developed international markets. European markets stabilized significantly as Brexit concerns shifted to the actual details of executing Great Britain’s separation from the European Union (EU). Prime Minister Teresa May triggered Article 50 of the Lisbon Treaty (which outlines the process for EU members to withdraw from the EU) on March 29, 2017 – setting the time frame for Britain to officially leave the EU as no later than April 2019. Continued German economic strength, bolstered by Angela Merkel’s re-election in September 2017, added stability to EU and global markets. Emmanuel Macron’s resounding victory in France’s May 2017 presidential election seemed to stem the populist political tide that had added turbulence to EU markets.
Asian markets also stabilized, even though geopolitical tensions in the region escalated due to China’s disputed expansion in the South China Sea, North Korea’s increased nuclear and missile arsenal, and lingering suspicions regarding Russia’s covert involvement in the American political process and its participation in Middle Eastern conflicts. China’s central bank managed to successfully navigate concerns about production declines, real estate, currency pricing, and the growing Chinese middle class. Japan’s economic policies also appeared to be helping that country overcome its long-term economic challenges.
The Fed continued to influence domestic and global markets during this annual reporting cycle, but generally improving economic conditions muted that influence. The Fed raised short-term interest rates three times during the fiscal year – in March, June and December of 2017. After starting the reporting period at 0.75%, the short-term interest rate ended the year at 1.50%. In September, the Fed introduced plans to begin selling down its balance sheet, ending the era of Quantitative Easing (i.e., the Fed’s program of encouraging economic growth by purchasing government bonds). In other Fed news, President Trump announced his
3
MML Series Investment Fund II – Economic and Market Overview (Unaudited) (Continued)
selection of Jerome Powell as the next Fed chair following current chair Janet Yellen’s term. The selection, which was largely anticipated, is expected to be supportive of markets. As noted earlier, the Fed’s impact on the markets in 2017 was relatively muted compared to recent years, when the mere threat of a rate hike added turbulence to markets. During this reporting period, Fed actions did not negatively disrupt markets.
During the one-year period ended December 31, 2017, the technology-focused NASDAQ Composite® Index rose 29.64%, the S&P 500® Index (S&P 500) of large-capitalization U.S. stocks gained 21.83%, the Dow Jones Industrial AverageSM grew 28.11%, and the Russell 2000® Index of small-capitalization stocks added 14.65%. Notably, this marks the second consecutive year these indexes logged double-digit returns. Domestic large-cap growth stocks outperformed other domestic indexes for the reporting period, as the Russell 1000® Growth Index reported a remarkable 30.21% return.
In foreign markets, the MSCI EAFE® Index, a barometer for foreign stocks in developed markets, returned an impressive 25.03% for the fiscal year. Developing market companies also delivered strong performance for the period, as the MSCI Emerging Markets Index, a measure of the performance of emerging stock markets throughout the world, rose an astounding 37.28%.*
Investment-grade bond investors were once again left largely on the sidelines, as the Bloomberg Barclays U.S. Aggregate Bond Index, a broad measure of the U.S. investment-grade bond markets, advanced only 3.54% for the period. Market yields generally accelerated following last November’s U.S. presidential election. Since bond prices typically fall during periods of rising interest rates, this was a particularly challenging time for the bond market.
Yield on the 2-year U.S. Treasury bond rose to end the reporting period at 1.88%. Yield on the 10-year Treasury bond dropped a modest 0.03%, ending the period at 2.41%. With equity markets returning double-digit growth for the second consecutive year, high-yield corporate bonds outperformed other fixed-income investments, as the Bloomberg Barclays U.S. Corporate High-Yield Index, which measures the performance of fixed-rate, below-investment-grade debt securities from corporate sectors, delivered a return of 7.50%.*
With nine consecutive quarters of positive returns for the S&P 500 now in the history books, thoughtful investors are asking themselves how long this upward climb can continue. We remain convinced that a broadly diversified portfolio aligned to a long-term strategy is, for those investors seeking retirement income, the wisest course. When one side of the market enjoys outsized growth for a long period of time, portfolios may become overweight in one asset class. Consequently, as we close out this fiscal year, you may find that this is the right time to evaluate your portfolio to ensure that it matches your overall risk tolerance, investment strategy and objectives.
The information provided is the opinion of MML Investment Advisers, LLC as of 1/1/18 and is subject to change without notice. It is not to be construed as tax, legal, or investment advice. Of course, past performance does not guarantee future results.
| * | Indexes are unmanaged, do not incur fees or expenses, and cannot be purchased directly for investment. |
4
MML Asset Momentum Fund – Portfolio Manager Report (Unaudited)
What is the investment approach of MML Asset Momentum Fund, and who is the Fund’s subadviser?
The Fund seeks growth of capital over the long-term by investing in asset classes the Fund’s subadviser considers to exhibit “bull market” characteristics. These “bull market” characteristics may include, for example, upward trending prices and relatively low volatility. The Fund expects that it will allocate its investment among the following asset classes: equity investments, debt investments, property investments, alternative investments, currency, and cash on deposit, excluding short term instruments. The Fund may invest in securities of issuers anywhere in the world, including emerging market countries. The Fund’s subadviser is Barings LLC (Barings).
How did the Fund perform during the 12 months ended December 31, 2017?
The Fund’s Class II shares returned 33.92%, outperforming, by a wide margin, the 21.83% return of the S&P 500® Index (the “benchmark”), which measures the performance of 500 widely held stocks in the U.S. equity market.
For a discussion on the economic and market environment during the 12-month period ended December 31, 2017, please see the Economic and Market Overview, beginning on page 3.
Subadviser discussion of factors that contributed to the Fund’s performance
For the year ended December 31, 2017, the Fund benefited the most from its investments in U.S. stocks. Fund positions in home builders and industrials were strong drivers of the Fund’s full-year performance. Home builder NVR Inc., a large holding of the Fund, advanced 110%, due to strong housing demand and the pending corporate tax cut. The Fund held numerous defense stocks, including Northrop Grumman, Raytheon, Lockheed Martin, and General Dynamics. These Fund holdings performed well because of increasing spending on national defense by governments around the world. International stocks also helped to drive the Fund’s performance. Fund holdings in Brazil and India did particularly well. In the second quarter, the Fund made a large purchase of a Brazilian exchange-traded fund to take advantage of a sell-off due to the allegation that the Brazilian president had accepted bribes. The sell-off was short-lived, and the Fund made a good profit during its holding period.
On the downside, the Fund lost money on a Russia exchange-traded fund. Increasing volatility of oil prices caused the Fund to liquidate this Russian position in the second quarter, and the Fund incurred a loss.
The dollar weakened during the year, and the Fund’s emerging market currency holdings appreciated in value. The weak dollar also helped increase the value of the Fund’s international equity holdings.
The performance contribution from bonds was almost flat in 2017, as the Fund’s bond holdings were concentrated in the U.S. government and government agency obligations with maturities of two years or less.
The Fund uses derivative instruments – securities that derive their value from the performance of one or more other investments and take the form of a contract between two or more parties – to gain exposure to global assets and to hedge downside risk of securities. In 2017, forward contracts were used to gain exposures to currencies, and futures contracts were used to gain exposures to global equities. There was not much usage of options. In aggregate, these positions contributed to performance over the year.
Subadviser outlook
The Fund is bullish on global equities. Our view is that a majority of countries could register economic growth in 2018. In the U.S., corporate profits have been strengthening, and the tax cut may further boost companies’ earnings. In the Eurozone and Japan, economies have been looking better all year, and climbing earnings have driven stock appreciation. Many emerging market economies are early in the cycle. The upside potential could be more than most believe. The global stock market is supported by an upswing in global growth and strong corporate earnings. A combination of earnings growth and rising multiples has, in our view, the potential to lead to another year of above-average returns.
5
MML Asset Momentum Fund – Portfolio Manager Report (Unaudited) (Continued)
| | | | |
MML Asset Momentum Fund
Portfolio Characteristics
(% of Net Assets) on 12/31/17 | |
| | |
Mutual Funds | | | 37.9 | % |
Common Stock | | | 35.5 | % |
U.S. Treasury Obligations | | | 13.7 | % |
| | | | | |
Total Long-Term Investments | | | 87.1 | % |
Short-Term Investments and Other Assets and Liabilities | | | 12.9 | % |
| | | | | |
Net Assets | | | 100.0 | % |
| | | | | |
6
MML Asset Momentum Fund – Portfolio Manager Report (Unaudited) (Continued)
Growth of a $10,000 Investment
Hypothetical Investments in MML Asset Momentum Fund Class II, Service Class I, and the S&P 500 Index.
| | | | | | | | |
| | | |
| TOTAL RETURN | | One Year
1/1/17 -
12/31/17 | | | Since
Inception
5/15/15 -
12/31/17 | |
Class II | | | 33.92% | | | | 13.41% | |
Service Class I | | | 33.77% | | | | 13.14% | |
S&P 500 Index | | | 21.83% | | | | 11.51% | |
GROWTH OF $10,000 INVESTMENT SINCE INCEPTION
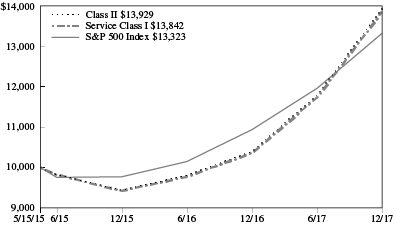
Generally accepted accounting principles require adjustments to be made to the net assets of the Fund at period end for financial reporting purposes only, and as such, the total return based on the unadjusted net asset value per share may differ from the total return reported in the financial highlights.
Performance data quoted represents past performance; past performance is not predictive of future results. The investment return and principal value of shares of the Fund will fluctuate with market conditions so that shares of the Fund, when redeemed, may be worth more or less than their original cost. Current performance of the Fund may be lower or higher than the performance quoted. Performance data current to the most recent month end may be obtained by accessing the website at www.massmutual.com.
Investors should note that the Fund is a professionally managed mutual fund, while the S&P 500 Index is unmanaged, does not incur expenses, and cannot be purchased directly by investors. Investors should read the Fund’s prospectus with regard to the Fund’s investment objective, risks, and charges and expenses in conjunction with these financial statements. The Fund’s return reflects changes in the net asset value per share without the deduction of any product charges (e.g., cost of insurance, mortality and expense risk charges, administrative fees, and CDSL). The inclusion of these charges would have reduced the performance shown here.
7
MML Dynamic Bond Fund – Portfolio Manager Report (Unaudited)
What is the investment approach of MML Dynamic Bond Fund, and who is the Fund’s subadviser?
The Fund seeks to maximize current income and total return by investing, under normal circumstances, at least 80% of its net assets (plus the amount of any borrowings for investment purposes) in bonds, which may include securities issued or guaranteed by the U.S. Government, its agencies, instrumentalities, or sponsored corporations; corporate obligations (including foreign hybrid securities); mortgage-backed securities; asset-backed securities; foreign securities (corporate and government); emerging market securities (corporate and government); bank loans and assignments; and other securities bearing fixed or variable interest rates of any maturity. The Fund may invest a portion of its net assets in inverse floaters and interest-only and principal-only securities, which may experience high volatility in response to changes in interest rates. The Fund may invest in other investment companies, including other open-end or closed-end investment companies, exchange-traded funds (ETFs), and domestic or foreign private investment vehicles, including investment companies sponsored or managed by the Fund’s subadviser and its affiliates. The Fund’s subadviser is DoubleLine Capital LP (DoubleLine).
How did the Fund perform during the 12 months ended December 31, 2017?
The Fund’s Class II shares returned 4.45%, outperforming the 3.54% return of the Bloomberg Barclays U.S. Aggregate Bond Index (the “benchmark”), which measures the performance of the investment grade, U.S. dollar-denominated, fixed-rate taxable bond market, including Treasuries, government-related and corporate securities, MBS (agency fixed-rate and hybrid ARM pass-throughs), ABS, and CMBS.
For a discussion on the economic and market environment during the 12-month period ended December 31, 2017, please see the Economic and Market Overview, beginning on page 3.
Subadviser discussion of factors that contributed to the Fund’s performance
Overall, 2017 was positive for risk assets – and allocations to emerging markets and Collateralized Loan Obligations (CLOs) posted the strongest returns. At the end of both January and August, we trimmed the Fund’s allocation to U.S. Treasuries and allocated the proceeds to credit sectors. For the year ended December 31, 2017, all sectors within the Fund posted positive returns – and a majority of the credit sectors outperformed the benchmark. (There were no negative-returning sectors over the one-year period.)
Emerging market debt (EM) was the best-performing sector for the year, benefiting from a rally in rates through September. In the third quarter, the EM portfolio began taking a more defensive position, helping to secure gains as interest rates began to climb. Global demand from investors for EM assets drove prices up and spreads tighter to levels not seen since 2007. Investment-grade (IG) and high-yield (HY) corporate bonds contributed positively to the Fund’s performance in 2017. Within IG and HY, the reach for yield continued, with lower-rated bonds continuing to outperform their higher-rated counterparts. The industrial sector continued to be a strong performer, specifically on the metals and mining front, as commodity prices rebounded significantly from the lows seen in 2016.
Within residential mortgage-backed securities (RMBS), both agency and non-agency RMBS contributed positively over the year. (“Agency” refers to government-sponsored entities that issue bonds backed by mortgage loans, including Ginnie Mae, Fannie Mae, Freddie Mac, and the Federal Home Loan Banks.) Within agency RMBS, contributions to performance were split evenly between pass-through and collateralized mortgage obligation (CMO) bonds. Non-agency performance provided a majority of the RMBS contribution, as it was bolstered by rising home prices. CLOs and bank loans were both positive contributors in 2017 as both benefited from a continued tightening in credit spreads and stable fundamentals. Demand for both sectors continued to benefit from a market digesting the idea of higher rates. Commercial mortgage-backed securities (CMBS) were also a positive contributor on the back of the theme of spreads tightening in credit-sensitive sectors. In particular, the CMBS team was able to find outperforming bonds rated A and interest-only securities that tightened significantly relative to the sector as a whole.
Subadviser outlook
At the current state of the cycle, there are not any sectors in the market that stand out as obviously cheap. We believe that the credit cycle is getting long in the tooth – and because of this, we prefer to keep the Fund’s portfolio higher in quality.
8
MML Dynamic Bond Fund – Portfolio Manager Report (Unaudited) (Continued)
Additionally, the Federal Reserve has signaled a desire to raise rates three times in 2018, while the market is currently projecting two hikes. We believe that a combination of higher rates and limited upside to spread products at current levels merits slightly defensive positioning. The result is staying shorter in duration and higher in credit quality relative to other points in the cycle. (Duration is a measure of a bond fund’s sensitivity to interest rates. The longer the duration, the greater the price impact on the bond or portfolio when interest rates rise or fall.)
| | | | |
MML Dynamic Bond Fund
Portfolio Characteristics
(% of Net Assets) on 12/31/17 | |
| | |
Non-U.S. Government Agency Obligations | | | 28.1 | % |
Corporate Debt | | | 25.0 | % |
U.S. Treasury Obligations | | | 24.2 | % |
U.S. Government Agency Obligations and Instrumentalities | | | 13.4 | % |
Mutual Funds | | | 2.6 | % |
Sovereign Debt Obligations | | | 2.3 | % |
Municipal Obligations | | | 0.1 | % |
Common Stock | | | 0.0 | % |
| | | | | |
Total Long-Term Investments | | | 95.7 | % |
Short-Term Investments and Other Assets and Liabilities | | | 4.3 | % |
| | | | | |
Net Assets | | | 100.0 | % |
| | | | | |
9
MML Dynamic Bond Fund – Portfolio Manager Report (Unaudited) (Continued)
Growth of a $10,000 Investment
Hypothetical Investments in MML Dynamic Bond Fund Class II, Service Class I, and the Bloomberg Barclays U.S. Aggregate Bond Index.
| | | | | | | | |
| | | |
| TOTAL RETURN | | One Year
1/1/17 -
12/31/17 | | | Since
Inception
5/15/15 -
12/31/17 | |
Class II | | | 4.45% | | | | 3.01% | |
Service Class I | | | 4.11% | | | | 2.74% | |
Bloomberg Barclays U.S. Aggregate Bond Index | | | 3.54% | | | | 2.39% | |
GROWTH OF $10,000 INVESTMENT SINCE INCEPTION
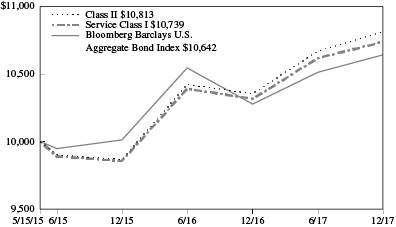
Generally accepted accounting principles require adjustments to be made to the net assets of the Fund at period end for financial reporting purposes only, and as such, the total return based on the unadjusted net asset value per share may differ from the total return reported in the financial highlights.
Performance data quoted represents past performance; past performance is not predictive of future results. The investment return and principal value of shares of the Fund will fluctuate with market conditions so that shares of the Fund, when redeemed, may be worth more or less than their original cost. Current performance of the Fund may be lower or higher than the performance quoted. Performance data current to the most recent month end may be obtained by accessing the website at www.massmutual.com.
Investors should note that the Fund is a professionally managed mutual fund, while the Bloomberg Barclays U.S. Aggregate Bond Index is unmanaged, does not incur expenses, and cannot be purchased directly by investors. Investors should read the Fund’s prospectus with regard to the Fund’s investment objective, risks, and charges and expenses in conjunction with these financial statements. The Fund’s return reflects changes in the net asset value per share without the deduction of any product charges (e.g., cost of insurance, mortality and expense risk charges, administrative fees, and CDSL). The inclusion of these charges would have reduced the performance shown here.
10
MML Equity Rotation Fund – Portfolio Manager Report (Unaudited)
What is the investment approach of MML Equity Rotation Fund, and who is the Fund’s subadviser?
The Fund seeks growth of capital over the long-term by investing primarily in common stocks of large- and medium-capitalization U.S. companies. The Fund’s subadviser does not typically invest in companies with market capitalizations, at the time of purchase, of less than $1 billion. Under normal circumstances, the Fund invests at least 80% of its net assets (plus the amount of any borrowings for investment purposes) in equity securities. The Fund’s subadviser is Barings LLC (Barings).
How did the Fund perform during the 12 months ended December 31, 2017?
The Fund’s Class II shares returned 30.09%, substantially outperforming the 21.83% return of the S&P 500® Index (the “benchmark”), which measures the performance of 500 widely held stocks in the U.S. equity market.
For a discussion on the economic and market environment during the 12-month period ended December 31, 2017, please see the Economic and Market Overview, beginning on page 3.
Subadviser discussion of factors that contributed to the Fund’s performance
The Fund tries to outperform passive instruments in two ways: The first is through stock selection, and the second is by weighting factor portfolios (sometimes referred to as “smart-beta”), based on where we are in the economic or market cycle. In 2017, we did very well on the first component and marginally well on the second.
For the first months of 2017, the Fund was invested in growth stocks more than value issues because of the improvement in the fundamentals of that group. However, as the year progressed, and the valuations of those companies rose, the Fund started investing in more stocks that Fund management felt were inexpensive (i.e., value stocks). The Fund would have performed better had it not moved towards value.
On the first portion – stock selection – the Fund did much better. Fund management thought there was value in semiconductors and had a substantial investment in companies like Micron Technologies, the maker of memory chips. These companies benefited from strong earnings growth and a re-rating by the market as prices rose due to capacity constraints. This is a common story with memory chips.
The other value sector the Fund favored was banks. The Fund invested in companies such as Bank of America because their earnings, net interest margins, and revenues were rising – yet the market had been pricing them only as a proxy for rates. That is, when bond yields fell, bank stocks fell and when bond yields rose, bank stocks rose. Bank profits are correlated to interest rates – particularly with respect to the difference between short-term interest rates and long-term interest rates. But that is not the only factor affecting earnings. Banks also make money on fees, investment banking, and trading. They were not getting any credit for the improvements in their businesses, and Fund management believed that this presented a value opportunity. In general, bank stocks helped the Fund, but the returns of banks were almost triple the volatility as the rest of the market, so there is still plenty of controversy in this investment choice.
Subadviser outlook
Although we are in the eighth year of the current cycle, we feel there are some sectors of the market that are still undervalued. We continue to be enamored with certain growth stocks, particularly those that have been able to use “free” resources (data) to build new products. These are self-financing, cash flow-generating companies that are somewhat different from most growth stocks due to their low need for outside capital to grow. Investment flows are rapidly moving in and out of sectors and factor-based portfolios. We feel that a key to outperformance in 2018 will be to invest in companies, not to chase trends.
11
MML Equity Rotation Fund – Portfolio Manager Report (Unaudited) (Continued)
| | | | |
MML Equity Rotation Fund
Largest Holdings
(% of Net Assets) on 12/31/17 | |
| | |
The PNC Financial Services Group, Inc. | | | 4.7 | % |
Citigroup, Inc. | | | 4.2 | % |
Chevron Corp. | | | 3.1 | % |
Amazon.com, Inc. | | | 3.0 | % |
Huntsman Corp. | | | 2.7 | % |
Celanese Corp. Series A | | | 2.6 | % |
Deere & Co. | | | 2.5 | % |
JP Morgan Chase & Co. | | | 2.5 | % |
Comerica, Inc. | | | 2.3 | % |
Lockheed Martin Corp. | | | 1.9 | % |
| | | | | |
| | | | 29.5 | % |
| | | | | |
| | | | |
MML Equity Rotation Fund
Sector Table
(% of Net Assets) on 12/31/17 | |
| | |
Financial | | | 22.4 | % |
Industrial | | | 14.4 | % |
Communications | | | 12.8 | % |
Consumer, Non-cyclical | | | 12.2 | % |
Basic Materials | | | 9.9 | % |
Technology | | | 8.9 | % |
Consumer, Cyclical | | | 8.3 | % |
Energy | | | 8.1 | % |
| | | | | |
Total Long-Term Investments | | | 97.0 | % |
Short-Term Investments and Other Assets and Liabilities | | | 3.0 | % |
| | | | | |
Net Assets | | | 100.0 | % |
| | | | | |
12
MML Equity Rotation Fund – Portfolio Manager Report (Unaudited) (Continued)
Growth of a $10,000 Investment
Hypothetical Investments in MML Equity Rotation Fund Class II, Service Class I, and the S&P 500 Index.
| | | | | | | | |
| | | |
| TOTAL RETURN | | One Year
1/1/17 -
12/31/17 | | | Since
Inception
5/15/15 -
12/31/17 | |
Class II | | | 30.09% | | | | 16.50% | |
Service Class I | | | 29.68% | | | | 16.20% | |
S&P 500 Index | | | 21.83% | | | | 11.51% | |
GROWTH OF $10,000 INVESTMENT SINCE INCEPTION
Generally accepted accounting principles require adjustments to be made to the net assets of the Fund at period end for financial reporting purposes only, and as such, the total return based on the unadjusted net asset value per share may differ from the total return reported in the financial highlights.
Performance data quoted represents past performance; past performance is not predictive of future results. The investment return and principal value of shares of the Fund will fluctuate with market conditions so that shares of the Fund, when redeemed, may be worth more or less than their original cost. Current performance of the Fund may be lower or higher than the performance quoted. Performance data current to the most recent month end may be obtained by accessing the website at www.massmutual.com.
Investors should note that the Fund is a professionally managed mutual fund, while the S&P 500 Index is unmanaged, does not incur expenses, and cannot be purchased directly by investors. Investors should read the Fund’s prospectus with regard to the Fund’s investment objective, risks, and charges and expenses in conjunction with these financial statements. The Fund’s return reflects changes in the net asset value per share without the deduction of any product charges (e.g., cost of insurance, mortality and expense risk charges, administrative fees, and CDSL). The inclusion of these charges would have reduced the performance shown here.
13
MML High Yield Fund – Portfolio Manager Report (Unaudited)
What is the investment approach of MML High Yield Fund, and who is the Fund’s subadviser?
The Fund seeks to achieve a high level of total return, with an emphasis on current income, by investing primarily in high yield debt and related securities. The Fund invests primarily in lower rated U.S. debt securities (“junk” or “high yield” bonds), including securities in default. Under normal circumstances, the Fund invests at least 80% of its net assets (plus the amount of any borrowings for investment purposes) in lower rated fixed income securities (rated below Baa3 by Moody’s, below BBB- by Standard & Poor’s or the equivalent by any NRSRO (using the lower rating) or, if unrated, determined to be of below investment grade quality by the Fund’s subadviser. The Fund’s subadviser is Barings LLC (Barings).
How did the Fund perform during the 12 months ended December 31, 2017?
The Fund’s Class II shares returned 8.22%, outperforming the 7.50% return of the Bloomberg Barclays U.S. Corporate High-Yield Bond Index (the “benchmark”), which measures the performance of U.S. dollar-denominated, non-investment grade, fixed-rate, taxable corporate bonds, including corporate bonds, fixed-rate bullet, putable, and callable bonds, SEC Rule 144A securities, original issue zeros, pay-in-kind bonds, fixed-rate and fixed-to-floating capital securities.
For a discussion on the economic and market environment during the 12-month period ended December 31, 2017, please see the Economic and Market Overview, beginning on page 3.
Subadviser discussion of factors that contributed to the Fund’s performance
Strength in the global economy was a key theme in 2017. Corporate fundamentals were stable to improving and defaults remained below historical averages. The global high-yield markets experienced large new issuance volumes, but since a large percentage of transactions were refinancing related, net new issuance was much more modest. During most of the year, demand outstripped supply.
From an industry perspective, the Fund outperformed relative to the benchmark, most notably in the capital goods and communications sectors. This outperformance was due to prudent credit selection within each sector. And while communications represented the largest sector by average weight, its underweight allocation, relative to the benchmark, was also a strong positive, since the Fund avoided positions in wireline providers. Transportation posted positive returns and was a contributor to the Fund’s relative outperformance due to an overweight position. Fund holdings within the transportation sector included Direct ChassisLink (a leader in the chassis leasing business), car rental company Hertz, and Kenan Advantage Group, North America’s largest tank truck transporter. Alternatively, the Fund was negatively impacted by a select few industry groups, most notably within the energy sector. While energy posted positive returns overall during the year, specific credit events, particularly related to Fund holdings EP Energy and Fieldwood Energy, contributed to the Fund’s underperformance relative to the Index. Both of these Fund holdings are oil and natural gas exploration and production companies.
Bonds rated BB were the main driver of the Fund’s outperformance relative to the benchmark, although the Fund held an underweight allocation to this category. Conversely, bonds rated CCC lagged the benchmark, while still posting strong positive returns for the Fund overall.
The Fund’s top three performing holdings during the year were Pinnacle Operating, one of the largest agricultural input supply and distribution businesses in the mid-South; Caelus Energy, a privately held exploration and production company with operations focused in the North Slope of Alaska; and Valeant Pharmaceuticals, a specialty pharmaceutical and over-the-counter drug manufacturer focused in the areas of neurology, dermatology, and the central nervous system.
The top three detractors from Fund performance were Appvion Inc., which makes coated paper products, including carbonless, thermal and security papers; Jupiter Resources, a Western Canadian natural gas producer; and Community Health Systems, the largest owner and operator of non-urban hospitals in the U.S.
Subadviser outlook
Overall, high yield in both the U.S. and Europe performed well, showing little signs of stress, with most companies generating top- and bottom-line growth as well as reasonable balance sheet leverage. Global growth, which appears to be synchronized
14
MML High Yield Fund – Portfolio Manager Report (Unaudited) (Continued)
across North America and Europe, remains supportive. There are certain sectors that are experiencing secular and/or competitive pressures, including wirelines and the wireless and cable sectors. Looking into 2018, we believe the fundamental picture remains sound, as corporate balance sheets continue to improve, and default rates continue to stay below historical averages. We are expecting a robust calendar for new issuance during the first quarter of 2018, which we believe has the potential to create attractive opportunities in both the new issue and secondary markets.
| | | | |
MML High Yield Fund
Portfolio Characteristics
(% of Net Assets) on 12/31/17 | |
| | |
Corporate Debt | | | 89.8 | % |
Bank Loans | | | 6.1 | % |
Preferred Stock | | | 0.8 | % |
| | | | | |
Total Long-Term Investments | | | 96.7 | % |
Short-Term Investments and Other Assets and Liabilities | | | 3.3 | % |
| | | | | |
Net Assets | | | 100.0 | % |
| | | | | |
15
MML High Yield Fund – Portfolio Manager Report (Unaudited) (Continued)
Growth of a $10,000 Investment
Hypothetical Investments in MML High Yield Fund Class II, Service Class I, and the Bloomberg Barclays U.S. Corporate High-Yield Bond Index.
| | | | | | | | | | | | |
| | | | |
| TOTAL RETURN | | One Year
1/1/17 -
12/31/17 | | | Five Year
Average
Annual
1/1/13 -
12/31/17 | | | Since
Inception
Average
Annual
5/3/10 -
12/31/17 | |
Class II | | | 8.22% | | | | 6.90% | | | | 8.33% | |
Service Class I | | | 7.88% | | | | 6.62% | | | | 8.05% | |
Bloomberg Barclays U.S. Corporate High-Yield Bond Index | | | 7.50% | | | | 5.78% | | | | 7.42% | |
GROWTH OF $10,000 INVESTMENT SINCE INCEPTION
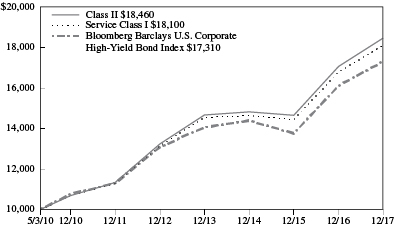
Generally accepted accounting principles require adjustments to be made to the net assets of the Fund at period end for financial reporting purposes only, and as such, the total return based on the unadjusted net asset value per share may differ from the total return reported in the financial highlights.
Performance data quoted represents past performance; past performance is not predictive of future results. The investment return and principal value of shares of the Fund will fluctuate with market conditions so that shares of the Fund, when redeemed, may be worth more or less than their original cost. Current performance of the Fund may be lower or higher than the performance quoted. Performance data current to the most recent month end may be obtained by accessing the website at www.massmutual.com.
Investors should note that the Fund is a professionally managed mutual fund, while the Bloomberg Barclays U.S. Corporate High-Yield Bond Index is unmanaged, does not incur expenses, and cannot be purchased directly by investors. Investors should read the Fund’s prospectus with regard to the Fund’s investment objective, risks, and charges and expenses in conjunction with these financial statements. The Fund’s return reflects changes in the net asset value per share without the deduction of any product charges (e.g., cost of insurance, mortality and expense risk charges, administrative fees, and CDSL). The inclusion of these charges would have reduced the performance shown here.
16
MML Inflation-Protected and Income Fund – Portfolio Manager Report (Unaudited)
What is the investment approach of MML Inflation-Protected and Income Fund, and who is the Fund’s subadviser?
The Fund seeks to achieve as high a total rate of real return on an annual basis as is considered consistent with prudent investment risk and the preservation of capital. Under normal circumstances, the Fund invests at least 80% of its net assets (plus the amount of any borrowings for investment purposes) in inflation-indexed bonds and other income-producing securities. The Fund’s subadviser is Barings LLC (Barings).
How did the Fund perform during the 12 months ended December 31, 2017?
The Fund’s Initial Class shares returned 3.21%, outperforming the 3.01% return of the Bloomberg Barclays U.S. Treasury Inflation Protected Securities (TIPS) Index (Series-L) (the “benchmark”), which measures the performance of rules-based, market value-weighted inflation-protected securities issued by the U.S. Treasury. It is a subset of the Global Inflation-Linked Index (Series-L).
How do inflation-indexed bonds protect against inflation?
Like many other fixed-income securities, inflation-indexed bonds pay income twice a year, based on a stated coupon rate. However, both the principal and the interest payment are adjusted for the level of inflation. The inflation rate – as measured by the Consumer Price Index for All Urban Consumers (“CPI-U”) – results in an adjustment to the principal amount of an inflation-protected security. The coupon rate is then applied to the adjusted principal amount to determine the interest payment. For example, assuming an inflation rate of 3%, a security with a par value of $1,000 and an annual coupon rate of 1.75%, the adjusted principal amount after one year would be $1,030 ($1,000 increased by 3%). The semi-annual interest payment would be calculated by multiplying $1,030 by 1.75% and dividing by 2 instead of using the original $1,000 par value to calculate the amount of interest.
For a discussion on the economic and market environment during the 12-month period ended December 31, 2017, please see the Economic and Market Overview, beginning on page 3.
Subadviser discussion of factors that contributed to the Fund’s performance
For the year ended December 31, 2017, TIPS outperformed across various maturities. Breakeven inflation rates – the rates of inflation that need to prevail for TIPS to break even to nominal Treasuries – have seen mixed moves during the year, given concerns about future rate hikes as well as Federal Reserve (the “Fed”) balance sheet unwind. “Balance sheet unwind” refers to the Fed’s announcement that it would begin selling down its balance sheet, thus ending the era of Quantitative Easing (i.e., the Fed’s program of encouraging economic growth by purchasing government bonds).
Consumer prices, as measured by the U.S. Bureau of Labor Statistics, were up year over year, as unadjusted Headline CPI came in at 2.2%, up from 1.7%. While shelter costs continue to be a major driver of core inflation, the headline year-over-year increase was driven, in large part, by rising energy prices. Core CPI (excluding energy and food prices) decreased to 1.7%, down from 2.1%.
In the December Federal Open Market Committee statement, the Committee indicated that the labor market has continued to strengthen, and economic activity has been rising at a solid rate. Consequently, the Committee raised the target range for the federal funds rate to 1 1⁄4–1 1⁄2%. (The federal funds rate is the interest rate that banks and financial institutions charge each other for borrowing funds overnight.)
TIPS positioning in aggregate contributed to the Fund’s full-year performance. Underweight positioning in shorter-maturity inflation securities was positive. The Fund’s exposure to commercial mortgage-backed securities (CMBS), 2012, BBB vintages, detracted from performance. In addition to TIPS, the Fund also invested in high-quality income-producing securities, including asset-backed securities (ABS) and money market securities. The income earned by these asset classes contributed positively to the Fund’s performance. ABS were the main drivers of performance. Fund holdings in auto loans and student loans within the ABS sector were the primary contributors. An allocation to high-quality commercial paper also helped performance. (Commercial paper is the commonly used name for short-term unsecured promissory notes sold by banks and corporations to meet short-term debt obligations.)
17
MML Inflation-Protected and Income Fund – Portfolio Manager Report (Unaudited) (Continued)
The Fund may use derivative instruments for yield curve and duration management, as well as for replicating cash bonds and gaining market exposure in order to implement manager views. Derivatives are securities that derive their value from the performance of one or more other investments and take the form of a contract between two or more parties. During the period, Fund management used repurchase agreements, treasury futures, CPI swaps, credit default swaps to hedge whole business ABS exposure, CMBX as a proxy for commercial mortgage-backed securities, and interest rate swaps to manage the Fund. In aggregate, derivative use contributed to Fund performance during 2017.
Subadviser outlook
With fundamentals demonstrated by growing payrolls and improving gross domestic product (GDP), the market has shifted its attention from monitoring deflationary risks to becoming more vigilant for signs of increased inflationary pressures. While inflation as measured by CPI remains relatively benign, broad price stability in services, housing and transportation provides a solid foundation for inflationary pressures in 2018. We continue to monitor wage pressure as the primary catalyst for higher inflation – which has yet to materialize, despite tighter labor markets – as well as Fed policy response. In our view, potential catalysts in 2018 may include infrastructure spending, renegotiated trade policy and immigration reform. We are constructive on the TIPS market, given improved economic fundamentals, the accommodative policies of the Trump administration, and the recently passed overhaul to the U.S. tax code. We enter 2018 with tactical overweight positions in 2-, 5-, and 10-year TIPS and remain opportunistic, given relative value opportunities.
| | | | |
MML Inflation-Protected and
Income Fund
Portfolio Characteristics
(% of Net Assets) on 12/31/17 | |
| | |
U.S. Treasury Obligations | | | 90.8 | % |
Non-U.S. Government Agency Obligations | | | 39.1 | % |
Corporate Debt | | | 2.1 | % |
U.S. Government Agency Obligations and Instrumentalities | | | 1.5 | % |
Purchased Options | | | 0.4 | % |
Municipal Obligations | | | 0.0 | % |
| | | | | |
Total Long-Term Investments | | | 133.9 | % |
Short-Term Investments and Other Assets and Liabilities | | | (33.9 | )% |
| | | | | |
Net Assets | | | 100.0 | % |
| | | | | |
18
MML Inflation-Protected and Income Fund – Portfolio Manager Report (Unaudited) (Continued)
Growth of a $10,000 Investment
Hypothetical Investments in MML Inflation-Protected and Income Fund Initial Class and the Bloomberg Barclays U.S. Treasury Inflation Protected Securities (TIPS) Index (Series-L).
| | | | | | | | | | | | |
| | | | |
| TOTAL RETURN | | One Year
1/1/17 -
12/31/17 | | | Five Year
Average
Annual
1/1/13 -
12/31/17 | | | Ten Year
Average
Annual
1/1/08 -
12/31/17 | |
Initial Class | | | 3.21% | | | | 0.20% | | | | 3.34% | |
Bloomberg Barclays U.S. Treasury Inflation Protected Securities (TIPS) Index (Series-L) | | | 3.01% | | | | 0.13% | | | | 3.53% | |
Hypothetical Investments in MML Inflation-Protected and Income Fund Service Class and the Bloomberg Barclays U.S. Treasury Inflation Protected Securities (TIPS) Index (Series-L).
| | | | | | | | | | | | |
| | | | |
| TOTAL RETURN | | One Year
1/1/17 -
12/31/17 | | | Five Year
Average
Annual
1/1/13 -
12/31/17 | | | Since
Inception
Average
Annual
8/15/08 -
12/31/17 | |
Service Class | | | 2.96% | | | | -0.04% | | | | 2.90% | |
Bloomberg Barclays U.S. Treasury Inflation Protected Securities (TIPS) Index (Series-L) | | | 3.01% | | | | 0.13% | | | | 3.25% | |
GROWTH OF $10,000 INVESTMENT FOR THE PAST 10 YEARS
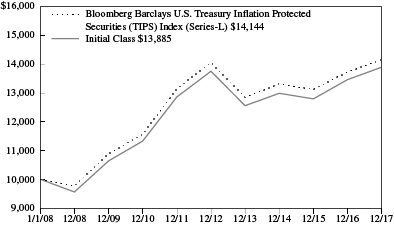
GROWTH OF $10,000 INVESTMENT SINCE INCEPTION
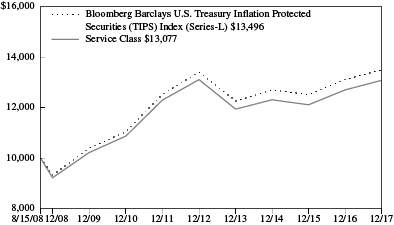
Generally accepted accounting principles require adjustments to be made to the net assets of the Fund at period end for financial reporting purposes only, and as such, the total return based on the unadjusted net asset value per share may differ from the total return reported in the financial highlights.
Performance data quoted represents past performance; past performance is not predictive of future results. The investment return and principal value of shares of the Fund will fluctuate with market conditions so that shares of the Fund, when redeemed, may be worth more or less than their original cost. Current performance of the Fund may be lower or higher than the performance quoted. Performance data current to the most recent month end may be obtained by accessing the website at www.massmutual.com.
Investors should note that the Fund is a professionally managed mutual fund, while the Bloomberg Barclays U.S. Treasury Inflation Protected Securities (TIPS) Index (Series-L) is unmanaged, does not incur expenses, and cannot be purchased directly by investors. Investors should read the Fund’s prospectus with regard to the Fund’s investment objective, risks, and charges and expenses in conjunction with these financial statements. The Fund’s return reflects changes in the net asset value per share without the deduction of any product charges (e.g., cost of insurance, mortality and expense risk charges, administrative fees, and CDSL). The inclusion of these charges would have reduced the performance shown here.
19
MML Short-Duration Bond Fund – Portfolio Manager Report (Unaudited)
What is the investment approach of MML Short-Duration Bond Fund, and who is the Fund’s subadviser?
The Fund seeks to achieve a high total rate of return primarily from current income while minimizing fluctuations in capital values by investing primarily in a diversified portfolio of short-term investment grade fixed income securities. Under normal circumstances, the Fund invests at least 80% of its net assets (plus the amount of any borrowings for investment purposes) in investment grade fixed income securities (rated Baa3 or higher by Moody’s, BBB- or higher by Standard & Poor’s or the equivalent by any NRSRO, or, if unrated, determined to be of comparable quality by the subadviser). The Fund’s subadviser is Barings LLC (Barings).
How did the Fund perform during the 12 months ended December 31, 2017?
The Fund’s Class II shares returned 2.55%, outperforming the 0.45% return of the Bloomberg Barclays U.S. 1-3 Year Government Bond Index (the “benchmark”), which measures the performance of the U.S. Treasury and U.S. Agency Indexes with maturities of 1-3 years, including Treasuries and U.S. agency debentures. It is a component of the U.S. Government/Credit Index and the U.S. Aggregate Index.
For a discussion on the economic and market environment during the 12-month period ended December 31, 2017, please see the Economic and Market Overview, beginning on page 3.
Subadviser discussion of factors that contributed to the Fund’s performance
The U.S. Treasury curve between 3 months and 3 years began the year steep, with the prospect for further Federal Reserve (the “Fed”) interest rate hikes, increasing inflation expectations, and the potential for healthy fiscal stimulus. (The yield curve is a graph showing the term structure of interest rates by plotting the yields of all bonds of comparable quality with maturities ranging from the shortest – typically one month – to the longest – typically 30 years – available. The resulting curve shows whether short-term interest rates are higher or lower than long-term rates.) As the year progressed, growth and inflation premiums priced into the market receded. In spite of this, the Fed still increased rates at its March, June and December Federal Open Market Committee meetings. As a result of these hikes, the short end of the yield curve between 3 months and 3 years flattened, while expectations for higher growth and inflation dissipated.
Bond duration and maturity positioning benefited the portfolio over the year, as the Fund shifted duration in accordance with its duration management process. (Duration is a measure of a bond fund’s sensitivity to interest rates. The longer the duration, the greater the price impact on the bond or portfolio when interest rates rise or fall.) At year end, duration of the Fund stood at 1.0 year.
An allocation to the corporate bond sector was the primary positive contributor to Fund performance for the year. Investment-grade and high-yield bonds rated BB contributed. Banking and life insurance companies were the best-performing sub-sectors, as U.S. money centers and regional banks represented attractive income opportunities with improving fundamentals. Asset-backed securities (ABS) were the primary contributors to performance within the securitized sector. Allocations to government-guaranteed Federal Family Education Loan Program (FFELP) student loans and automobile receivable ABS collateral were the largest contributing sub-sectors.
On the downside, the Fund’s underweight, relative to the benchmark, to U.S. Agency debentures detracted from Fund performance over the year. (“Agency” refers to government-sponsored entities that issue bonds backed by mortgage loans, including Ginnie Mae, Fannie Mae, Freddie Mac, and the Federal Home Loan Banks.)
The Fund is permitted to use derivative instruments. Derivatives are securities that derive their value from the performance of one or more other investments and take the form of a contract between two or more parties. The Fund uses derivative instruments for yield curve, duration, downside risk management and to gain exposures. Performance from derivatives detracted from relative performance in 2017.
20
MML Short-Duration Bond Fund – Portfolio Manager Report (Unaudited) (Continued)
Subadviser outlook
As we head into 2018, our view is that global growth prospects remain relatively sound. This has pushed short-maturity government bond yields higher, as market participants have begun to reappraise future monetary policy expectations. Longer-dated maturity yields have fallen – reflecting the current benign inflation environment. Risk assets have performed well, suggesting that investors are increasingly taking note of a period of stronger, synchronized global growth.
The Fund is focusing on yield opportunities away from Treasury and government bonds. ABS is attractive relative to other shorter-duration fixed-income asset classes. The natural liquidity profile from monthly principal paydowns provides a frequent source of income. Corporate fundamentals, though still stretched, are improving – and in our view, could continue with a tailwind from a weaker U.S. dollar and tax reform-fueled (stronger) earnings. At year end, economic and market volatility remained subdued – but could, we believe, tick up as global central banks become more hawkish, suggesting that “credit picking” could continue to trump sector rotation strategies.
| | | | |
MML Short-Duration Bond Fund
Portfolio Characteristics
(% of Net Assets) on 12/31/17 | |
| | |
Corporate Debt | | | 43.5 | % |
Non-U.S. Government Agency Obligations | | | 33.0 | % |
U.S. Treasury Obligations | | | 2.4 | % |
U.S. Government Agency Obligations and Instrumentalities | | | 1.0 | % |
Purchased Options | | | 0.4 | % |
Municipal Obligations | | | 0.0 | % |
| | | | | |
Total Long-Term Investments | | | 80.3 | % |
Short-Term Investments and Other Assets and Liabilities | | | 19.7 | % |
| | | | | |
Net Assets | | | 100.0 | % |
| | | | | |
21
MML Short-Duration Bond Fund – Portfolio Manager Report (Unaudited) (Continued)
Growth of a $10,000 Investment
Hypothetical Investments in MML Short-Duration Bond Fund Class II, Service Class I, and the Bloomberg Barclays U.S. 1-3 Year Government Bond Index.
| | | | | | | | | | | | |
| | | | |
| TOTAL RETURN | | One Year
1/1/17 -
12/31/17 | | | Five Year
Average
Annual
1/1/13 -
12/31/17 | | | Since
Inception
Average
Annual
5/3/10 -
12/31/17 | |
Class II | | | 2.55% | | | | 1.72% | | | | 2.36% | |
Service Class I | | | 2.29% | | | | 1.47% | | | | 2.11% | |
Bloomberg Barclays U.S. 1-3 Year Government Bond Index | | | 0.45% | | | | 0.58% | | | | 0.83% | |
GROWTH OF $10,000 INVESTMENT SINCE INCEPTION
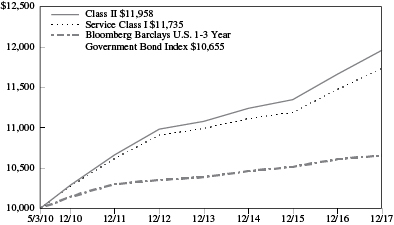
Generally accepted accounting principles require adjustments to be made to the net assets of the Fund at period end for financial reporting purposes only, and as such, the total return based on the unadjusted net asset value per share may differ from the total return reported in the financial highlights.
Performance data quoted represents past performance; past performance is not predictive of future results. The investment return and principal value of shares of the Fund will fluctuate with market conditions so that shares of the Fund, when redeemed, may be worth more or less than their original cost. Current performance of the Fund may be lower or higher than the performance quoted. Performance data current to the most recent month end may be obtained by accessing the website at www.massmutual.com.
Investors should note that the Fund is a professionally managed mutual fund, while the Bloomberg Barclays U.S. 1-3 Year Government Bond Index is unmanaged, does not incur expenses, and cannot be purchased directly by investors. Investors should read the Fund’s prospectus with regard to the Fund’s investment objective, risks, and charges and expenses in conjunction with these financial statements. The Fund’s return reflects changes in the net asset value per share without the deduction of any product charges (e.g., cost of insurance, mortality and expense risk charges, administrative fees, and CDSL). The inclusion of these charges would have reduced the performance shown here.
22
MML Small Cap Equity Fund – Portfolio Manager Report (Unaudited)
What is the investment approach of MML Small Cap Equity Fund, and who is the Fund’s subadviser?
The Fund seeks capital appreciation by investing primarily in common stocks of small-capitalization U.S. companies that the Fund’s subadviser believes have favorable business trends or prospects based on fundamental analysis. Under normal circumstances, the Fund invests at least 80% of its net assets (plus the amount of any borrowings for investment purposes) in securities of companies whose market capitalizations at the time of purchase are within the market capitalization range of companies included in the Russell 2000® Index. The Fund’s subadviser is OppenheimerFunds, Inc. (OFI).
How did the Fund perform during the 12 months ended December 31, 2017?
The Fund’s Initial Class shares returned 14.37%, underperforming the 14.65% return of the Russell 2000 Index (the “benchmark”), which measures the performance of the small-cap segment of the U.S. equity universe. It is a subset of the Russell 3000 Index and includes approximately 2000 of the smallest securities based on a combination of their market cap and current index membership.
For a discussion on the economic and market environment during the 12-month period ended December 31, 2017, please see the Economic and Market Overview, beginning on page 3.
Subadviser discussion of factors that contributed to the Fund’s performance
For the year ended December 31, 2017, the Fund underperformed the benchmark within the health care, consumer discretionary and financials sectors as a result of weaker relative stock selection – and outperformed the benchmark, primarily within the information technology, real estate and materials sectors, due to stronger relative stock selection.
Fund holdings that were top detractors from relative performance during the year included Prestige Brands Holdings, Inc. (in the health care sector); Wesco Aircraft Holdings; and Matthews International (both in industrials). Prestige Brands is engaged in the marketing, sales and distribution of over-the-counter health care and household cleaning products. Organic revenue growth has been sluggish, but the company continues to execute well on acquiring and integrating products and brands. Wesco materially underperformed in 2017, given its market share loss, disappointing execution, senior management turnover, and concerns regarding slower aerospace industry after-market growth. Matthews International is a provider of graphic and imaging solutions, memorialization products and industrial technologies. It experienced declines due partly to a slowdown in demand for graphics services, as regulatory changes in food labeling on packages have been delayed.
Holdings that contributed to the Fund’s relative full-year performance included Canada Goose Holdings, Inc. (consumer discretionary); SiteOne Landscape Supply; and Korn/Ferry International commercial services. Canada Goose Holdings is a Canadian-based designer, manufacturer, distributor and retailer of outerwear for men, women and children. Shares of Canada Goose rallied strongly late in the year, following excellent fiscal second-quarter results. The company posted strong order growth for its increasingly popular down parkas. Bitterly cold weather at the end of December kept sell-through to consumers brisk as well. SiteOne Landscape Supply is a national wholesale distributor of landscape supplies in the United States. During the year, the company executed solidly on both internal operations and its aggressive acquisition strategy, and was rewarded with a premium valuation. The Fund exited the stock in December, as its share price had moved above the Fund’s fair value estimate. Korn/Ferry, an executive recruiting and talent management company, has benefited from the overall strong global economic environment, as evidenced by strong earnings results and guidance reported during the period. The company experienced revenue acceleration in all key business units, including its Hay Group organizational consulting practice (acquired in 2015).
Subadviser outlook
The U.S. economy continued its “slow and steady” growth during the reporting period. This has been driven by favorable employment as well as wage and inflation data, while home prices and innovation also continued to help drive the economy higher. However, while innovation is alive and well and continuing to help generate economic growth, fundamental disruptions across market segments have been elevated. We continue to be focused on potential disruption risk to our companies.
Volatility in the markets was unusually low in 2017. We expect heightened uncertainty to eventually return to the equity markets. Traditionally, during periods of economic uncertainty and heightened market volatility, investors favor stocks of higher-quality
23
MML Small Cap Equity Fund – Portfolio Manager Report (Unaudited) (Continued)
companies – with greater consistency and stability of revenue and earnings – leading to relatively better stock performance of those companies. We think focusing on issuers with strong competitive positions, sound financials and skilled management teams could position the Fund well, should this environment come to pass. During times of economic volatility, such companies frequently widen their lead over their weaker competitors. The Fund seeks to invest in companies characterized by these qualities, at compelling valuations – and we believe this disciplined approach is essential to generating superior long-term performance.
| | | | |
MML Small Cap Equity Fund
Largest Holdings
(% of Net Assets) on 12/31/17 | |
| | |
Prestige Brands Holdings, Inc. | | | 2.0 | % |
Korn/Ferry International | | | 2.0 | % |
Visteon Corp. | | | 1.9 | % |
On Assignment, Inc. | | | 1.9 | % |
CACI International, Inc. Class A | | | 1.9 | % |
Hostess Brands, Inc. | | | 1.8 | % |
Group 1 Automotive, Inc. | | | 1.8 | % |
Brandywine Realty Trust | | | 1.7 | % |
Zynga, Inc. Class A | | | 1.7 | % |
Four Corners Property Trust, Inc. | | | 1.7 | % |
| | | | | |
| | | | 18.4 | % |
| | | | | |
| | | | |
MML Small Cap Equity Fund
Sector Table
(% of Net Assets) on 12/31/17 | |
| | |
Financial | | | 23.9 | % |
Consumer, Non-cyclical | | | 20.5 | % |
Technology | | | 13.4 | % |
Consumer, Cyclical | | | 13.2 | % |
Industrial | | | 11.5 | % |
Mutual Funds | | | 7.9 | % |
Communications | | | 5.6 | % |
Basic Materials | | | 3.8 | % |
Energy | | | 3.0 | % |
Utilities | | | 2.9 | % |
| | | | | |
Total Long-Term Investments | | | 105.7 | % |
Short-Term Investments and Other Assets and Liabilities | | | (5.7 | )% |
| | | | | |
Net Assets | | | 100.0 | % |
| | | | | |
24
MML Small Cap Equity Fund – Portfolio Manager Report (Unaudited) (Continued)
Growth of a $10,000 Investment
Hypothetical Investments in MML Small Cap Equity Fund Initial Class and the Russell 2000 Index.
| | | | | | | | | | | | |
| | | | |
| TOTAL RETURN | | One Year
1/1/17 -
12/31/17 | | | Five Year
Average
Annual
1/1/13 -
12/31/17 | | | Ten Year
Average
Annual
1/1/08 -
12/31/17 | |
Initial Class | | | 14.37% | | | | 15.08% | | | | 9.29% | |
Russell 2000 Index | | | 14.65% | | | | 14.12% | | | | 8.71% | |
Hypothetical Investments in MML Small Cap Equity Fund Service Class and the Russell 2000 Index.
| | | | | | | | | | | | |
| | | | |
| TOTAL RETURN | | One Year
1/1/17 -
12/31/17 | | | Five Year
Average
Annual
1/1/13 -
12/31/17 | | | Since
Inception
Average
Annual
8/15/08 -
12/31/17 | |
Service Class | | | 14.08% | | | | 14.79% | | | | 10.15% | |
Russell 2000 Index | | | 14.65% | | | | 14.12% | | | | 9.40% | |
GROWTH OF $10,000 INVESTMENT FOR THE PAST 10 YEARS
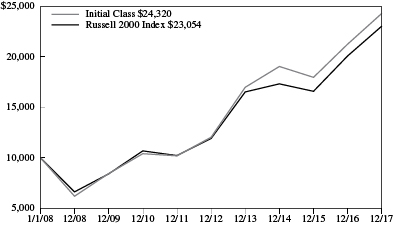
GROWTH OF $10,000 INVESTMENT SINCE INCEPTION
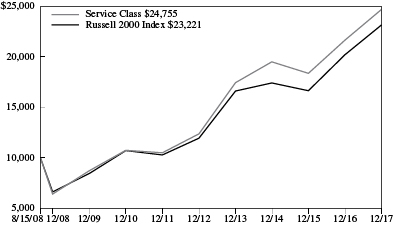
Generally accepted accounting principles require adjustments to be made to the net assets of the Fund at period end for financial reporting purposes only, and as such, the total return based on the unadjusted net asset value per share may differ from the total return reported in the financial highlights.
Performance data quoted represents past performance; past performance is not predictive of future results. The investment return and principal value of shares of the Fund will fluctuate with market conditions so that shares of the Fund, when redeemed, may be worth more or less than their original cost. Current performance of the Fund may be lower or higher than the performance quoted. Performance data current to the most recent month end may be obtained by accessing the website at www.massmutual.com.
Investors should note that the Fund is a professionally managed mutual fund, while the Russell 2000 Index is unmanaged, does not incur expenses, and cannot be purchased directly by investors. Investors should read the Fund’s prospectus with regard to the Fund’s investment objective, risks, and charges and expenses in conjunction with these financial statements. The Fund’s return reflects changes in the net asset value per share without the deduction of any product charges (e.g., cost of insurance, mortality and expense risk charges, administrative fees, and CDSL). The inclusion of these charges would have reduced the performance shown here.
25
MML Special Situations Fund – Portfolio Manager Report (Unaudited)
What is the investment approach of MML Special Situations Fund, and who is the Fund’s subadviser?
The Fund seeks growth of capital over the long-term by investing primarily in common stocks of U.S. companies that are involved in “special situations.” A special situation might include, for example, a recently announced spin-off or divestiture, a change in dividend policy, involvement in a merger or acquisition transaction, a change in management, a significant change in ownership, or changes due to bankruptcy or insolvency process. The Fund’s subadviser expects that the Fund’s portfolio will initially emphasize “large capitalization” issuers, which are considered to be companies with market capitalizations at the time of purchase within the market capitalization range of companies included within the Russell 1000® Index, although the Fund’s holdings of securities of different market capitalizations will vary over time, depending on market conditions generally and on the companies involved at the time (or that the subadviser expects to be involved) in special situations. The Fund will typically invest primarily in common stocks; however, when the subadviser determines that there are an insufficient number of companies involved (or likely to be involved) in special situations, it may invest in any equity securities it considers to be consistent with the Fund’s objective of growth of capital over the long term. It may also invest in exchange-traded funds (ETFs) providing broad equity exposures or in derivatives, including swaps, futures contracts, and options, to gain broad exposures to equity markets. The Fund’s subadviser is Barings LLC (Barings).
How did the Fund perform during the 12 months ended December 31, 2017?
The Fund’s Class II shares returned 18.82%, underperforming the 21.83% return of the S&P 500® Index (the “benchmark”), which measures the performance of 500 widely held stocks in the U.S. equity market.
For a discussion on the economic and market environment during the 12-month period ended December 31, 2017, please see the Economic and Market Overview, beginning on page 3.
Subadviser discussion of factors that contributed to the Fund’s performance
Given the nature of special situations, they tend to be in the small- to mid-capitalization range. In 2017, small- and medium-capitalization stocks significantly underperformed the benchmark, so there were headwinds for some of the Fund’s special situations.
The pace of corporations spinning off divisions as stand-alone companies slowed dramatically in 2017. The good news was that the companies that were spun off in 2016 had an exceptional year, rising over 30% on average. It is not unusual for special situations to have high returns on average. However, these averages are often deceiving, as the median return of special situations has been close to the market over the past few decades. What this means is that oftentimes, there are big winners, but there are big losers as well. That was evident in 2017, when the average return of a spin-off was 16%, while the median return was 12%.
The Fund was invested in over 40 special situations throughout most of 2017. One example was the spin-off of Hilton Grand Vacations, the timeshare company from Hilton Worldwide, the hotel company. The spin-off had 7% sales growth, relative to 3% for the parent company, which is about 10 times larger. The spin-off trades at 21 times this year’s earnings and the parent trades at 42 times. Our view is that that the spin-off may be able use its special relationship with Hilton Worldwide to grow their timeshare business at a rate in excess of 7%. They recently announced a deal that may be the template going forward, where they will own a timeshare resort in a mixed-use property with Hilton Worldwide.
The Fund recently invested in Delphi Automotive, the vehicle parts maker. On December 5, 2017 Delphi Automotive renamed itself Aptiv and spun off its powertrain and aftermarket related businesses to a stand-alone company. Aptiv retained the company’s display and dashboard segment. We believe there are substantial growth opportunities in the display segment, particularly with automated cars and electric vehicles. This business is growing revenue at a 10% rate and generating a substantial amount of operating cash flow.
Subadviser outlook
Although we are in the eighth year of the current cycle, we feel there are some areas of the market that are undervalued. In 2018, we believe that many special situations could be brought to the market at favorable valuations. Contrary to 2017’s spin-off slowdown, the number of special situation deals often accelerates late in the business cycle, but the opportunities are more fully valued when presented. Our view is that special situations have the potential to do well as the economy accelerates, as many of them are cyclicals.
26
MML Special Situations Fund – Portfolio Manager Report (Unaudited) (Continued)
| | | | |
MML Special Situations Fund
Largest Holdings
(% of Net Assets) on 12/31/17 | |
| | |
PayPal Holdings, Inc. | | | 6.2 | % |
Zoetis, Inc. | | | 6.0 | % |
Bioverativ, Inc. | | | 6.0 | % |
Fortive Corp. | | | 5.6 | % |
Adient PLC | | | 5.6 | % |
Synchrony Financial | | | 5.2 | % |
Ingevity Corp. | | | 3.7 | % |
Oshkosh Corp. | | | 3.6 | % |
Allegion PLC | | | 2.9 | % |
Lamb Weston Holdings, Inc. | | | 2.8 | % |
| | | | | |
| | | | 47.6 | % |
| | | | | |
| | | | |
MML Special Situations Fund
Sector Table
(% of Net Assets) on 12/31/17 | |
| | |
Consumer, Non-cyclical | | | 29.8 | % |
Industrial | | | 22.9 | % |
Consumer, Cyclical | | | 12.1 | % |
Basic Materials | | | 12.0 | % |
Financial | | | 8.9 | % |
Communications | | | 7.8 | % |
Technology | | | 3.9 | % |
Utilities | | | 2.3 | % |
Energy | | | 1.7 | % |
| | | | | |
Total Long-Term Investments | | | 101.4 | % |
Short-Term Investments and Other Assets and Liabilities | | | (1.4 | )% |
| | | | | |
Net Assets | | | 100.0 | % |
| | | | | |
27
MML Special Situations Fund – Portfolio Manager Report (Unaudited) (Continued)
Growth of a $10,000 Investment
Hypothetical Investments in MML Special Situations Fund Class II, Service Class I, and the S&P 500 Index.
| | | | | | | | |
| | | |
| TOTAL RETURN | | One Year
1/1/17 -
12/31/17 | | | Since
Inception
5/15/15 -
12/31/17 | |
Class II | | | 18.82% | | | | 5.82% | |
Service Class I | | | 18.58% | | | | 5.57% | |
S&P 500 Index | | | 21.83% | | | | 11.51% | |
GROWTH OF $10,000 INVESTMENT SINCE INCEPTION
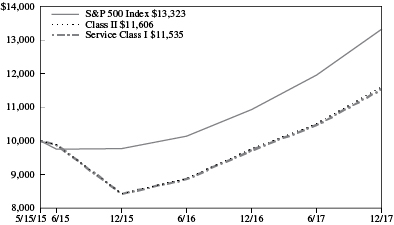
Generally accepted accounting principles require adjustments to be made to the net assets of the Fund at period end for financial reporting purposes only, and as such, the total return based on the unadjusted net asset value per share may differ from the total return reported in the financial highlights.
Performance data quoted represents past performance; past performance is not predictive of future results. The investment return and principal value of shares of the Fund will fluctuate with market conditions so that shares of the Fund, when redeemed, may be worth more or less than their original cost. Current performance of the Fund may be lower or higher than the performance quoted. Performance data current to the most recent month end may be obtained by accessing the website at www.massmutual.com.
Investors should note that the Fund is a professionally managed mutual fund, while the S&P 500 Index is unmanaged, does not incur expenses, and cannot be purchased directly by investors. Investors should read the Fund’s prospectus with regard to the Fund’s investment objective, risks, and charges and expenses in conjunction with these financial statements. The Fund’s return reflects changes in the net asset value per share without the deduction of any product charges (e.g., cost of insurance, mortality and expense risk charges, administrative fees, and CDSL). The inclusion of these charges would have reduced the performance shown here.
28
MML Strategic Emerging Markets Fund – Portfolio Manager Report (Unaudited)
What is the investment approach of MML Strategic Emerging Markets Fund, and who is the Fund’s subadviser?
The Fund seeks long-term capital growth by investing mainly in common stocks of issuers in developing and emerging markets throughout the world and at times, up to 100% of its total assets in foreign securities. Under normal market conditions, the Fund will invest at least 80% of its net assets (plus the amount of any borrowings for investment purposes) in equity securities of issuers whose principal activities are in a developing (or emerging) market, i.e., are in a developing market or are economically tied to a developing market country. The Fund will invest in at least three developing markets. The Fund focuses on companies with above-average earnings growth. In general, countries may be considered developing or emerging markets if they are included in any one of the Morgan Stanley Capital Index (MSCI) emerging markets indices, classified as a developing or emerging market, or classified under a similar or corresponding classification, by organizations such as the World Bank and the International Monetary Fund, or have economies, industries, and stock markets with similar characteristics. The Fund’s subadviser is OppenheimerFunds, Inc. (OFI).
How did the Fund perform during the 12 months ended December 31, 2017?
The Fund’s Class II Shares returned 34.02%, underperforming the 37.28% return of the MSCI Emerging Markets (EM) Index (the “benchmark”), which measures the performance of the large and mid cap segments of emerging market equity securities.
For a discussion on the economic and market environment during the 12-month period ended December 31, 2017, please see the Economic and Market Overview, beginning on page 3.
Subadviser discussion of factors that contributed to the Fund’s performance
For the year ended December 31, 2017, the Fund underperformed the benchmark, primarily due to stock selection in the consumer staples and real estate sectors. Outperformers included stock selection in financials and industrials, and an underweight position in telecommunication services. In terms of countries, an overweight position and stock selection in Russia detracted from performance, as did stock selection in India and South Africa. Stock selection in China and Taiwan contributed positively to performance. An overweight position in France also benefited the Fund on a relative basis.
Fund holdings that were top detractors from performance included Steinhoff International Holdings (consumer discretionary; South Africa), Magnit (consumer staples; Russia), and Novatek PAO (energy; Russia). During the year, Steinhoff International Holdings, the world’s second-largest household products and furniture retailer, faced concerns around unresolved legal and tax disputes, accounting irregularities that resulted in the resignation of the CEO and the Chairman of the Board, and a delay in reporting its fiscal year 2017 results. These events resulted in a significant correction in the company’s share price. Magnit, a leading Russian food retailer, has been impacted by a relatively weak Russian economy that has resulted in lower disposable income levels for Magnit’s core consumer base. Novatek experienced volatility in the first quarter as the overall global outlook for energy prices remained uncertain and talk of expanded U.S. sanctions put further pressure on Russian stocks.
Fund holdings that were top performers included Tencent Holdings and Alibaba Group Holding (both information technology; China), and Housing Development Finance Corporation (financials; India). Tencent Holdings is a dominant player in the Chinese consumer market – including gaming, messaging, payments and content. These businesses are seeing strong momentum and improving monetization. The Fund trimmed its position, given the stock’s 113% rise in 2017. Alibaba, the Chinese e-commerce company, exceeded analyst expectations when it reported a 54% rise in revenue in the third quarter. The company also raised its 2017 full-year guidance for revenue growth. The company continues to monetize capabilities in e-commerce, along with expanding and fine-tuning its ecosystem of mobile payments and cloud computing. Housing Development Finance Corporation (HDFC) is the largest mortgage lender in India. The Indian housing market is deeply under-penetrated, as is the use of mortgages, which prompted the Indian government to launch the Housing for All initiative in June 2015, with a target of constructing 20 million urban homes and 30 million rural houses by 2022. HDFC has benefited, and we believe will continue to benefit, from government-expanded subsidies on housing loans, bringing down the effective interest cost and leading to the improved affordability of home loans.
Subadviser outlook
Emerging markets ended 2017 up a cumulative 71% off their lows in 2016 and significantly outperforming their developed-market counterparts. While we do not expect such a generous emerging market equities backdrop in 2018, we do believe that
29
MML Strategic Emerging Markets Fund – Portfolio Manager Report (Unaudited) (Continued)
emerging market equities have the potential to further outperform U.S. equities as business cycles are less advanced in much of the developing world. We continue to believe that emerging markets should be an increasingly core allocation for global investors. The emerging markets now represent a meaningful portion of global gross domestic product (GDP) and are the largest contributors to global growth. Most investors are still under-allocated to the asset class and, especially for those who invest through passive vehicles, to the areas of emerging markets that exhibit the most attractive growth characteristics.
| | | | |
MML Strategic Emerging Markets Fund
Largest Holdings
(% of Net Assets) on 12/31/17 | |
| | |
Taiwan Semiconductor Manufacturing Co. Ltd. | | | 5.8 | % |
Alibaba Group Holding Ltd. Sponsored ADR | | | 5.7 | % |
Tencent Holdings Ltd. | | | 5.5 | % |
Housing Development Finance Corp. Ltd. | | | 4.1 | % |
AIA Group Ltd. | | | 3.0 | % |
Glencore PLC | | | 3.0 | % |
Novatek PJSC Sponsored GDR Registered | | | 2.7 | % |
Kering | | | 2.5 | % |
NAVER Corp. | | | 2.4 | % |
Jiangsu Hengrui Medicine Co. Ltd. Class A | | | 2.0 | % |
| | | | | |
| | | | 36.7 | % |
| | | | | |
| | | | |
MML Strategic Emerging Markets Fund
Sector Table
(% of Net Assets) on 12/31/17 | |
| | |
Financial | | | 23.1 | % |
Consumer, Non-cyclical | | | 22.9 | % |
Communications | | | 18.3 | % |
Consumer, Cyclical | | | 13.1 | % |
Technology | | | 7.7 | % |
Basic Materials | | | 5.7 | % |
Energy | | | 2.7 | % |
Industrial | | | 2.3 | % |
Mutual Funds | | | 2.1 | % |
Diversified | | | 1.4 | % |
| | | | | |
Total Long-Term Investments | | | 99.3 | % |
Short-Term Investments and Other Assets and Liabilities | | | 0.7 | % |
| | | | | |
Net Assets | | | 100.0 | % |
| | | | | |
30
MML Strategic Emerging Markets Fund – Portfolio Manager Report (Unaudited) (Continued)
Growth of a $10,000 Investment
Hypothetical Investments in MML Strategic Emerging Markets Fund Service Class I and the MSCI EM Index.
| | | | | | | | | | | | |
| | | | |
| TOTAL RETURN | | One Year
1/1/17 -
12/31/17 | | | Five Year
Average
Annual
1/1/13 -
12/31/17 | | | Since
Inception
Average
Annual
8/27/08 -
12/31/17 | |
Service Class I | | | 33.83% | | | | 1.37% | | | | 3.11% | |
MSCI EM Index | | | 37.28% | | | | 4.35% | | | | 4.74% | |
Hypothetical Investments in MML Strategic Emerging Markets Fund Class II and the MSCI EM Index.
| | | | | | | | | | | | |
| | | | |
| TOTAL RETURN | | One Year
1/1/17 -
12/31/17 | | | Five Year
Average
Annual
1/1/13 -
12/31/17 | | | Since
Inception
Average
Annual
5/1/09 -
12/31/17 | |
Class II | | | 34.02% | | | | 1.62% | | | | 6.77% | |
MSCI EM Index | | | 37.28% | | | | 4.35% | | | | 9.23% | |
GROWTH OF $10,000 INVESTMENT SINCE INCEPTION
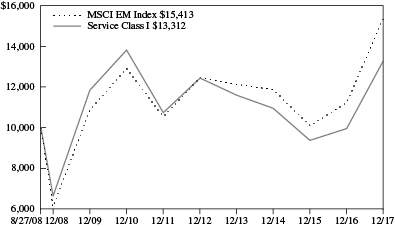
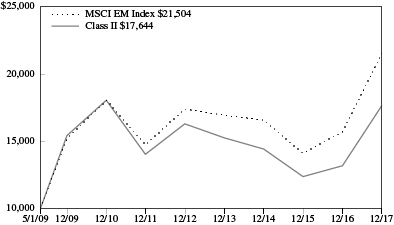
Generally accepted accounting principles require adjustments to be made to the net assets of the Fund at period end for financial reporting purposes only, and as such, the total return based on the unadjusted net asset value per share may differ from the total return reported in the financial highlights.
Performance data quoted represents past performance; past performance is not predictive of future results. The investment return and principal value of shares of the Fund will fluctuate with market conditions so that shares of the Fund, when redeemed, may be worth more or less than their original cost. Current performance of the Fund may be lower or higher than the performance quoted. Performance data current to the most recent month end may be obtained by accessing the website at www.massmutual.com.
Investors should note that the Fund is a professionally managed mutual fund, while the MSCI EM Index is unmanaged, does not incur expenses, and cannot be purchased directly by investors. Investors should read the Fund’s prospectus with regard to the Fund’s investment objective, risks, and charges and expenses in conjunction with these financial statements. The Fund’s return reflects changes in the net asset value per share without the deduction of any product charges (e.g., cost of insurance, mortality and expense risk charges, administrative fees, and CDSL). The inclusion of these charges would have reduced the performance shown here.
31
MML Asset Momentum Fund – Portfolio of Investments
December 31, 2017
| | | | | | | | |
| | | Number of
Shares | | | Value | |
| EQUITIES — 35.5% | | | | | | | | |
| COMMON STOCK — 35.5% | | | | | | | | |
| Communications — 1.5% | | | | | | | | |
| Telecommunications — 1.5% | | | | | | | | |
Drillisch AG | | | 3,800 | | | $ | 313,666 | |
NTT DOCOMO, Inc. | | | 5,600 | | | | 132,282 | |
| | | | | | | | |
| | | | | | | 445,948 | |
| | | | | | | | |
| Consumer, Cyclical — 11.6% | | | | | | | | |
| Distribution & Wholesale — 2.3% | | | | | | | | |
Pool Corp. | | | 5,100 | | | | 661,215 | |
| | | | | | | | |
| Home Builders — 7.2% | | | | | | | | |
NVR, Inc. (a) | | | 600 | | | | 2,104,932 | |
| | | | | | | | |
| Retail — 0.4% | | | | | | | | |
Fielmann AG | | | 1,400 | | | | 123,212 | |
| | | | | | | | |
| Textiles — 1.7% | | | | | | | | |
Mohawk Industries, Inc. (a) | | | 1,800 | | | | 496,620 | |
| | | | | | | | |
| | | | | | | 3,385,979 | |
| | | | | | | | |
| Consumer, Non-cyclical — 7.3% | | | | | | | | |
| Agriculture — 0.4% | | | | | | | | |
British American Tobacco PLC Sponsored ADR | | | 1,578 | | | | 105,710 | |
| | | | | | | | |
| Biotechnology — 1.1% | | | | | | | | |
CSL Ltd. | | | 2,800 | | | | 308,172 | |
| | | | | | | | |
| Commercial Services — 0.9% | | | | | | | | |
Equifax, Inc. | | | 2,300 | | | | 271,216 | |
| | | | | | | | |
| Foods — 0.9% | | | | | | | | |
Nestle SA Registered | | | 1,300 | | | | 111,712 | |
Saputo, Inc. | | | 4,500 | | | | 161,742 | |
| | | | | | | | |
| | | | | | | 273,454 | |
| | | | | | | | |
| Health Care – Products — 0.8% | | | | | | | | |
Advanced Medical Solutions Group PLC | | | 54,300 | | | | 233,855 | |
| | | | | | | | |
| Health Care – Services — 2.1% | | | | | | | | |
Fresenius SE & Co. KGaA | | | 5,900 | | | | 459,375 | |
Ramsay Health Care Ltd. | | | 3,000 | | | | 163,865 | |
| | | | | | | | |
| | | | | | | 623,240 | |
| | | | | | | | |
| Household Products — 0.3% | | | | | | | | |
Portmeirion Group PLC | | | 5,600 | | | | 69,938 | |
| | | | | | | | |
| Household Products & Wares — 0.8% | |
Henkel AG & Co. KGaA | | | 2,000 | | | | 240,100 | |
| | | | | | | | |
| | | | | | | 2,125,685 | |
| | | | | | | | |
| Financial — 2.4% | | | | | | | | |
| Diversified Financial Services — 2.0% | |
Mastercard, Inc. Class A | | | 3,800 | | | | 575,168 | |
| | | | | | | | |
| | | | | | | | |
| | | Number of
Shares | | | Value | |
| Private Equity — 0.4% | | | | | | | | |
Onex Corp. | | | 1,700 | | | $ | 124,680 | |
| | | | | | | | |
| | | | | | | 699,848 | |
| | | | | | | | |
| Industrial — 10.1% | | | | | | | | |
| Aerospace & Defense — 3.6% | | | | | | | | |
General Dynamics Corp. | | | 1,200 | | | | 244,140 | |
Lockheed Martin Corp. | | | 800 | | | | 256,840 | |
Northrop Grumman Corp. | | | 900 | | | | 276,219 | |
Raytheon Co. | | | 1,400 | | | | 262,990 | |
| | | | | | | | |
| | | | | | | 1,040,189 | |
| | | | | | | | |
| Building Materials — 0.3% | | | | | | | | |
Breedon Group PLC (a) | | | 88,100 | | | | 102,566 | |
| | | | | | | | |
| Electronics — 1.0% | | | | | | | | |
Halma PLC | | | 17,600 | | | | 298,684 | |
| | | | | | | | |
| Hand & Machine Tools — 0.5% | | | | | | | | |
Schindler Holding AG | | | 700 | | | | 161,095 | |
| | | | | | | | |
| Machinery – Diversified — 1.9% | | | | | | | | |
Cummins, Inc. | | | 1,500 | | | | 264,960 | |
Roper Technologies, Inc. | | | 1,100 | | | | 284,900 | |
| | | | | | | | |
| | | | | | | 549,860 | |
| | | | | | | | |
| Miscellaneous – Manufacturing — 2.8% | |
A.O. Smith Corp. | | | 4,200 | | | | 257,376 | |
General Electric Co. | | | 16,000 | | | | 279,200 | |
Illinois Tool Works, Inc. | | | 1,700 | | | | 283,645 | |
| | | | | | | | |
| | | | | | | 820,221 | |
| | | | | | | | |
| | | | | | | 2,972,615 | |
| | | | | | | | |
| Technology — 2.6% | | | | | | | | |
| Computers — 1.2% | | | | | | | | |
Amdocs Ltd. | | | 5,200 | | | | 340,496 | |
| | | | | | | | |
| Software — 1.4% | | | | | | | | |
EMIS Group PLC | | | 11,800 | | | | 161,122 | |
Nexus AG | | | 3,400 | | | | 106,152 | |
Open Text Corp. | | | 4,200 | | | | 149,389 | |
| | | | | | | | |
| | | | | | | 416,663 | |
| | | | | | | | |
| | | | | | | 757,159 | |
| | | | | | | | |
| | |
TOTAL COMMON STOCK
(Cost $7,740,106) | | | | | | | 10,387,234 | |
| | | | | | | | |
| | |
TOTAL EQUITIES
(Cost $7,740,106) | | | | | | | 10,387,234 | |
| | | | | | | | |
| | |
| | | Principal
Amount | | | | |
| BONDS & NOTES — 13.7% | | | | | | | | |
| U.S. TREASURY OBLIGATIONS — 13.7% | |
| U.S. Treasury Bonds & Notes — 13.7% | | | | | |
U.S. Treasury Note (b) | | $ | 1,000,000 | | | | 997,832 | |
The accompanying notes are an integral part of the financial statements.
32
MML Asset Momentum Fund – Portfolio of Investments (Continued)
| | | | | | | | |
| | | Principal
Amount | | | Value | |
U.S. Treasury Note | | $ | 3,000,000 | | | $ | 2,992,500 | |
| | | | | | | | |
| | | | | | | 3,990,332 | |
| | | | | | | | |
| | |
TOTAL U.S. TREASURY OBLIGATIONS
(Cost $3,990,039) | | | | | | | 3,990,332 | |
| | | | | | | | |
| | |
TOTAL BONDS & NOTES
(Cost $3,990,039) | | | | | | | 3,990,332 | |
| | | | | | | | |
| | |
| | | Number of
Shares | | | | |
| MUTUAL FUNDS — 37.9% | | | | | | | | |
| Diversified Financial Services — 37.9% | | | | | |
iShares MSCI Brazil Capped Index Fund | | | 36,000 | | | | 1,456,200 | |
iShares MSCI India ETF | | | 6,600 | | | | 238,062 | |
Vanguard Total Stock Market ETF | | | 68,500 | | | | 9,401,626 | |
| | | | | | | | |
| | | | | | | 11,095,888 | |
| | | | | | | | |
| | |
TOTAL MUTUAL FUNDS
(Cost $9,331,194) | | | | | | | 11,095,888 | |
| | | | | | | | |
| | |
TOTAL LONG-TERM INVESTMENTS
(Cost $21,061,339) | | | | | | | 25,473,454 | |
| | | | | | | | |
| | | | | | | | |
| | | Principal
Amount | | | Value | |
| SHORT-TERM INVESTMENTS — 12.8% | |
| Repurchase Agreement — 12.8% | | | | | | | | |
Fixed Income Clearing Corp., Repurchase Agreement, dated 12/29/17, 0.540%, due 1/02/18 (c) | | $ | 3,747,691 | | | $ | 3,747,691 | |
| | | | | | | | |
| | |
TOTAL SHORT-TERM INVESTMENTS
(Cost $3,747,691) | | | | | | | 3,747,691 | |
| | | | | | | | |
| | |
| TOTAL INVESTMENTS — 99.9% (Cost $24,809,030) (d) | | | | | | | 29,221,145 | |
| | |
| Other Assets/(Liabilities) — 0.1% | | | | | | | 25,200 | |
| | | | | | | | |
| | |
| NET ASSETS — 100.0% | | | | | | $ | 29,246,345 | |
| | | | | | | | |
Abbreviation Legend
| ADR | American Depositary Receipt |
Notes to Portfolio of Investments
Percentages are stated as a percent of net assets.
| (a) | Non-income producing security. |
| (b) | A portion of this security is pledged/held as collateral for open futures contracts. (Note 2). |
| (c) | Maturity value of $3,747,916. Collateralized by U.S. Government Agency obligations with a rate of 2.750%, maturity date of 2/15/24, and an aggregate market value, including accrued interest, of $3,823,911. |
| (d) | See Note 6 for aggregate cost for federal tax purposes. |
The Fund had the following open Forward contracts at December 31, 2017:
Forward Contracts
| | | | | | | | | | | | | | | | |
| | | | Counterparty | | Settlement Date | | In Exchange for | | | Unrealized
Appreciation/
(Depreciation) | |
| Contracts to Buy | |
| BRL | | | 2,851,680 | | | HSBC Bank USA* | | 2/15/18 | | $ | 831,879 | | | $ | 23,728 | |
| RUB | | | 74,889,600 | | | HSBC Bank USA* | | 2/15/18 | | | 1,200,000 | | | | 93,839 | |
| THB | | | 42,808,350 | | | HSBC Bank USA* | | 11/13/18 | | | 1,300,000 | | | | 21,671 | |
| | | | | | | | | | | | | | | | |
| | $ | 3,331,879 | | | $ | 139,238 | |
| | | | | | | | | | | | | | | | |
Cross Currency Forwards | |
| BRL | | | 4,110,000 | | | Barclays Bank PLC* | | 2/15/18 | | | CHF 1,200,000 | | | $ | (1,946 | ) |
| RUB | | | 62,460,000 | | | JP Morgan Chase Bank N.A.* | | 2/15/18 | | | SEK 8,977,163 | | | | (18,047 | ) |
| | | | | | | | | | | | | | | | |
| | | | | | $ | (19,993 | ) |
| | | | | | | | | | | | | | | | |
| * | Contracts are subject to a Master Netting Agreement. |
The accompanying notes are an integral part of the financial statements.
33
MML Asset Momentum Fund – Portfolio of Investments (Continued)
The Fund had the following open Futures contracts at December 31, 2017:
Futures
| | | | | | | | | | | | | | | | |
| | | Expiration
Date | | | Number of
Contracts | | Notional
Amount | | | | | Value/ Net
Unrealized
Appreciation/
(Depreciation) | |
| Future Contract — Long | |
| S&P 500 E Mini Index | | | 3/16/18 | | | 154 | | $20,266,140 | | | | | | $ | 339,060 | |
| | | | | | | | | | | | | | | | |
Currency Legend
The accompanying notes are an integral part of the financial statements.
34
MML Dynamic Bond Fund – Portfolio of Investments
December 31, 2017
| | | | | | | | |
| | | Number of
Shares | | | Value | |
| EQUITIES — 0.0% | |
|
| COMMON STOCK — 0.0% | |
| Energy — 0.0% | | | | | | | | |
| Oil & Gas — 0.0% | | | | | | | | |
SandRidge Energy, Inc. (a) | | | 648 | | | $ | 13,654 | |
| | | | | | | | |
| | |
TOTAL COMMON STOCK
(Cost $18,804) | | | | | | | 13,654 | |
| | | | | | | | |
| | |
TOTAL EQUITIES
(Cost $18,804) | | | | | | | 13,654 | |
| | | | | | | | |
| | |
| | | Principal
Amount | | | | |
| BONDS & NOTES — 93.1% | |
|
| CORPORATE DEBT — 25.0% | |
| Advertising — 0.1% | | | | | | | | |
Omnicom Group, Inc.
3.600% 4/15/26 | | $ | 570,000 | | | | 576,657 | |
| | | | | | | | |
| Aerospace & Defense — 0.3% | | | | | | | | |
The Boeing Co.
6.875% 3/15/39 | | | 405,000 | | | | 595,618 | |
Lockheed Martin Corp.
4.700% 5/15/46 | | | 440,000 | | | | 513,353 | |
TransDigm, Inc.
6.375% 6/15/26 | | | 305,000 | | | | 308,050 | |
| | | | | | | | |
| | | | | | | 1,417,021 | |
| | | | | | | | |
| Agriculture — 0.1% | | | | | | | | |
BAT Capital Corp. FRN (b) (c)
2.296% 8/15/22 | | | 105,000 | | | | 106,254 | |
Reynolds American, Inc.
4.000% 6/12/22 | | | 545,000 | | | | 569,432 | |
| | | | | | | | |
| | | | | | | 675,686 | |
| | | | | | | | |
| Airlines — 0.2% | | | | | | | | |
Delta Air Lines, Inc.
3.625% 3/15/22 | | | 285,000 | | | | 289,924 | |
Guanay Finance Ltd. (d)
6.000% 12/15/20 | | | 476,487 | | | | 489,376 | |
| | | | | | | | |
| | | | | | | 779,300 | |
| | | | | | | | |
| Auto Manufacturers — 0.4% | | | | | | | | |
Ford Motor Co.
7.450% 7/16/31 | | | 440,000 | | | | 575,174 | |
General Motors Co. 3 mo. USD LIBOR + .800%, FRN
2.192% 8/07/20 | | | 210,000 | | | | 211,257 | |
General Motors Financial Co., Inc.
3.950% 4/13/24 | | | 845,000 | | | | 869,919 | |
| | | | | | | | |
| | | | | | | 1,656,350 | |
| | | | | | | | |
| | | | | | | | |
| | | Principal
Amount | | | Value | |
| Auto Parts & Equipment — 0.1% | | | | | | | | |
Dana Financing Luxembourg Sarl (c)
5.750% 4/15/25 | | $ | 295,000 | | | $ | 310,856 | |
Delphi Technologies PLC (c)
5.000% 10/01/25 | | | 315,000 | | | | 318,938 | |
| | | | | | | | |
| | | | | | | 629,794 | |
| | | | | | | | |
| Banks — 4.4% | | | | | | | | |
Australia & New Zealand Banking Group Ltd. (c)
4.875% 1/12/21 | | | 540,000 | | | | 575,983 | |
Banco de Costa Rica (d)
5.250% 8/12/18 | | | 200,000 | | | | 200,250 | |
Banco De Credito del Per (d)
5.375% 9/16/20 | | | 200,000 | | | | 213,000 | |
Banco de Credito del Peru (d)
2.250% 10/25/19 | | | 500,000 | | | | 500,000 | |
Banco de Credito e Inversiones (d)
4.000% 2/11/23 | | | 200,000 | | | | 208,277 | |
Banco de Reservas de la Republica Dominicana (c)
7.000% 2/01/23 | | | 200,000 | | | | 210,843 | |
Banco Del Estado Chile (d)
4.125% 10/07/20 | | | 200,000 | | | | 208,557 | |
Banco del Estado de Chile (d)
3.875% 2/08/22 | | | 150,000 | | | | 156,278 | |
Banco Internacional del Peru SAA (d)
5.750% 10/07/20 | | | 700,000 | | | | 752,500 | |
Banco Latinoamericano de Comercio Exterior SA (d)
3.250% 5/07/20 | | | 150,000 | | | | 151,688 | |
Banco Santander Chile (d)
3.875% 9/20/22 | | | 150,000 | | | | 155,894 | |
Banco Santander Mexico SA Institucion de Banca Multiple Grupo Financiero Santand 5 year CMT + 4.580%, VRN (d)
5.950% 1/30/24 | | | 400,000 | | | | 416,000 | |
Banco Santander SA FRN (b)
2.552% 2/23/23 | | | 600,000 | | | | 603,677 | |
Bancolombia SA
6.125% 7/26/20 | | | 100,000 | | | | 106,750 | |
Banistmo SA (c)
3.650% 9/19/22 | | | 200,000 | | | | 197,500 | |
Bank of America Corp.
2.503% 10/21/22 | | | 425,000 | | | | 420,479 | |
Bank of America Corp. 3 mo. USD LIBOR + 1.021%, VRN
2.881% 4/24/23 | | | 425,000 | | | | 425,625 | |
Bank of Montreal VRN (b)
3.803% 12/15/32 | | | 450,000 | | | | 444,883 | |
BDO Unibank, Inc. (d)
2.625% 10/24/21 | | | 450,000 | | | | 445,530 | |
The accompanying notes are an integral part of the financial statements.
35
MML Dynamic Bond Fund – Portfolio of Investments (Continued)
| | | | | | | | |
| | | Principal
Amount | | | Value | |
BDO Unibank, Inc. (d)
2.950% 3/06/23 | | $ | 300,000 | | | $ | 294,138 | |
Citigroup, Inc. 3 mo. USD LIBOR +
1.100%, FRN
2.522% 5/17/24 | | | 865,000 | | | | 878,306 | |
Commonwealth Bank of Australia (c)
2.750% 3/10/22 | | | 835,000 | | | | 837,399 | |
Credit Suisse Group AG FRN (b) (c)
2.774% 12/14/23 | | | 595,000 | | | | 600,638 | |
DBS Group Holdings Ltd. 3 mo. USD LIBOR + .620%, FRN (c) 1.987% 7/25/22 | | | 700,000 | | | | 703,749 | |
DBS Group Holdings Ltd. 3 mo. USD LIBOR + .620%, FRN (d) 1.987% 7/25/22 | | | 200,000 | | | | 201,071 | |
Global Bank Corp. (d)
5.125% 10/30/19 | | | 700,000 | | | | 723,590 | |
The Goldman Sachs Group, Inc. FRN (b)
2.160% 10/31/22 | | | 740,000 | | | | 740,961 | |
Industrial Senior Trust (d)
5.500% 11/01/22 | | | 500,000 | | | | 510,000 | |
Itau CorpBanca (d)
3.875% 9/22/19 | | | 600,000 | | | | 611,766 | |
Lloyds Banking Group PLC VRN (b)
3.574% 11/07/28 | | | 600,000 | | | | 594,356 | |
Macquarie Group Ltd. VRN (b) (c)
3.189% 11/28/23 | | | 580,000 | | | | 575,963 | |
Malayan Banking Bhd 5 year USD Swap + 2.542%, VRN (d)
3.905% 10/29/26 | | | 600,000 | | | | 612,638 | |
Mizuho Financial Group, Inc. FRN (b)
2.416% 9/11/22 | | | 400,000 | | | | 402,704 | |
Morgan Stanley
2.750% 5/19/22 | | | 570,000 | | | | 567,908 | |
Morgan Stanley 3 mo. USD LIBOR + 1.340%, VRN
3.591% 7/22/28 | | | 585,000 | | | | 590,384 | |
MUFG Americas Holdings Corp.
1.625% 2/09/18 | | | 285,000 | | | | 284,943 | |
Oversea-Chinese Banking Corp. Ltd. 5 year USD Swap + 2.203%, VRN (d)
4.000% 10/15/24 | | | 600,000 | | | | 610,496 | |
Royal Bank of Scotland Group PLC 3 mo. USD LIBOR + 1.480%, VRN
3.498% 5/15/23 | | | 860,000 | | | | 861,875 | |
Sumitomo Mitsui Financial Group, Inc.
2.058% 7/14/21 | | | 420,000 | | | | 411,606 | |
Sumitomo Mitsui Financial Group, Inc.
2.934% 3/09/21 | | | 445,000 | | | | 449,213 | |
United Overseas Bank Ltd. 5 year USD Swap + 2.236%, VRN (d)
3.500% 9/16/26 | | | 200,000 | | | | 201,306 | |
| | | | | | | | |
| | | Principal
Amount | | | Value | |
United Overseas Bank Ltd. 5 year USD Swap + 1.995%, VRN (d)
3.750% 9/19/24 | | $ | 700,000 | | | $ | 708,263 | |
Wells Fargo & Co.
3.069% 1/24/23 | | | 555,000 | | | | 559,165 | |
| | | | | | | | |
| | | | | | | 19,926,152 | |
| | | | | | | | |
| Beverages — 0.2% | | | | | | | | |
Anheuser-Busch InBev Finance, Inc.
4.900% 2/01/46 | | | 250,000 | | | | 289,747 | |
Embotelladora Andina SA (d)
5.000% 10/01/23 | | | 600,000 | | | | 660,235 | |
Fomento Economico Mexicano SAB de CV
2.875% 5/10/23 | | | 200,000 | | | | 197,892 | |
| | | | | | | | |
| | | | | | | 1,147,874 | |
| | | | | | | | |
| Biotechnology — 0.1% | | | | | | | | |
Celgene Corp.
4.350% 11/15/47 | | | 595,000 | | | | 618,044 | |
| | | | | | | | |
| Chemicals — 0.4% | | | | | | | | |
Ashland LLC
4.750% 8/15/22 | | | 300,000 | | | | 312,000 | |
Grupo Idesa SA de CV (d)
7.875% 12/18/20 | | | 400,000 | | | | 376,000 | |
Hexion, Inc. (c)
10.375% 2/01/22 | | | 320,000 | | | | 297,800 | |
The Mosaic Co.
4.050% 11/15/27 | | | 580,000 | | | | 581,521 | |
Platform Specialty Products Corp. (c)
5.875% 12/01/25 | | | 160,000 | | | | 158,800 | |
| | | | | | | | |
| | | | | | | 1,726,121 | |
| | | | | | | | |
| Coal — 0.1% | | | | | | | | |
Peabody Energy Corp. (c)
6.000% 3/31/22 | | | 305,000 | | | | 316,437 | |
| | | | | | | | |
| Commercial Services — 0.2% | | | | | | | | |
Adani Ports & Special Economic Zone Ltd. (d)
3.950% 1/19/22 | | | 375,000 | | | | 382,421 | |
ENA Norte Trust (d)
4.950% 4/25/28 | | | 148,142 | | | | 154,068 | |
Prime Security Services Borrower LLC/Prime Finance, Inc. (c)
9.250% 5/15/23 | | | 275,000 | | | | 305,250 | |
S&P Global, Inc.
4.400% 2/15/26 | | | 285,000 | | | | 308,799 | |
| | | | | | | | |
| | | | | | | 1,150,538 | |
| | | | | | | | |
| Computers — 0.0% | | | | | | | | |
Riverbed Technology, Inc. (c)
8.875% 3/01/23 | | | 165,000 | | | | 155,719 | |
| | | | | | | | |
The accompanying notes are an integral part of the financial statements.
36
MML Dynamic Bond Fund – Portfolio of Investments (Continued)
| | | | | | | | |
| | | Principal
Amount | | | Value | |
| Diversified Financial Services — 1.6% | | | | | | | | |
AerCap Ireland Capital DAC / AerCap Global Aviation Trust
3.500% 1/15/25 | | $ | 600,000 | | | $ | 594,746 | |
Air Lease Corp.
3.750% 2/01/22 | | | 585,000 | | | | 604,440 | |
Ally Financial, Inc.
4.125% 3/30/20 | | | 555,000 | | | | 566,100 | |
Ally Financial, Inc.
4.250% 4/15/21 | | | 30,000 | | | | 30,750 | |
American Express Co.
2.500% 8/01/22 | | | 1,175,000 | | | | 1,160,817 | |
Discover Financial Services
4.100% 2/09/27 | | | 720,000 | | | | 737,519 | |
Interoceanica IV Finance Ltd. (d)
0.010% 11/30/25 | | | 1,022,889 | | | | 879,685 | |
National Rural Utilities Cooperative Finance Corp.
2.000% 1/27/20 | | | 360,000 | | | | 358,776 | |
NFP Corp. (c)
6.875% 7/15/25 | | | 310,000 | | | | 312,325 | |
SPARC EM SPC Panama Metro Line 2 SP (c)
0.010% 12/05/22 | | | 700,000 | | | | 642,250 | |
SPARC EM SPC Panama Metro Line 2 SP (d)
0.010% 12/05/22 | | | 600,000 | | | | 550,500 | |
Synchrony Financial
3.000% 8/15/19 | | | 555,000 | | | | 558,859 | |
Synchrony Financial
3.950% 12/01/27 | | | 25,000 | | | | 24,895 | |
| | | | | | | | |
| | | | | | | 7,021,662 | |
| | | | | | | | |
| Electric — 2.1% | | | | | | | | |
AES Andres BV / Dominican Power Partners/Empresa Generadora de Electricidad It (c)
7.950% 5/11/26 | | | 500,000 | | | | 541,250 | |
American Electric Power Co., Inc.
2.950% 12/15/22 | | | 313,000 | | | | 317,455 | |
American Electric Power Co., Inc.
3.200% 11/13/27 | | | 95,000 | | | | 94,325 | |
DTE Energy Co.
3.800% 3/15/27 | | | 500,000 | | | | 515,657 | |
Duke Energy Corp.
3.750% 9/01/46 | | | 215,000 | | | | 212,616 | |
Duke Energy Corp.
3.950% 8/15/47 | | | 240,000 | | | | 246,634 | |
Duke Energy Florida LLC
3.200% 1/15/27 | | | 1,000,000 | | | | 1,012,397 | |
Duke Energy Progress, Inc.
4.150% 12/01/44 | | | 470,000 | | | | 512,650 | |
| | | | | | | | |
| | | Principal
Amount | | | Value | |
Engie Energia Chile SA (d)
5.625% 1/15/21 | | $ | 100,000 | | | $ | 108,051 | |
Eversource Energy
2.750% 3/15/22 | | | 1,000,000 | | | | 1,001,810 | |
Exelon Corp.
3.400% 4/15/26 | | | 750,000 | | | | 750,249 | |
Fortis, Inc.
2.100% 10/04/21 | | | 580,000 | | | | 566,151 | |
NextEra Energy Capital Holdings, Inc.
3.550% 5/01/27 | | | 280,000 | | | | 285,220 | |
NextEra Energy Operating Partners LP (c)
4.500% 9/15/27 | | | 310,000 | | | | 308,450 | |
Sierra Pacific Power Co.
2.600% 5/01/26 | | | 1,000,000 | | | | 966,294 | |
The Southern Co.
1.850% 7/01/19 | | | 15,000 | | | | 14,909 | |
The Southern Co.
2.450% 9/01/18 | | | 820,000 | | | | 822,384 | |
Xcel Energy, Inc.
3.300% 6/01/25 | | | 1,000,000 | | | | 1,013,582 | |
| | | | | | | | |
| | | | | | | 9,290,084 | |
| | | | | | | | |
| Electronics — 0.2% | | | | | | | | |
Arrow Electronics, Inc.
3.875% 1/12/28 | | | 290,000 | | | | 289,131 | |
Corning, Inc.
4.375% 11/15/57 | | | 595,000 | | | | 590,658 | |
| | | | | | | | |
| | | | | | | 879,789 | |
| | | | | | | | |
| Engineering & Construction — 0.5% | | | | | | | | |
Aeropuerto Internacional de Tocumen SA
5.750% 10/09/23 | | | 776,615 | | | | 832,920 | |
Brand Industrial Services, Inc. (c)
8.500% 7/15/25 | | | 210,000 | | | | 220,500 | |
Mexico City Airport Trust (c)
4.250% 10/31/26 | | | 700,000 | | | | 715,750 | |
Sydney Airport Finance Co. Pty Ltd. (c)
3.375% 4/30/25 | | | 300,000 | | | | 298,905 | |
Sydney Airport Finance Co. Pty Ltd. (c)
3.625% 4/28/26 | | | 300,000 | | | | 303,008 | |
| | | | | | | | |
| | | | | | | 2,371,083 | |
| | | | | | | | |
| Entertainment — 0.3% | | | | | | | | |
Eldorado Resorts, Inc.
6.000% 4/01/25 | | | 315,000 | | | | 329,175 | |
GLP Capital LP/GLP Financing II, Inc.
5.375% 4/15/26 | | | 285,000 | | | | 305,662 | |
Pinnacle Entertainment, Inc.
5.625% 5/01/24 | | | 375,000 | | | | 401,250 | |
Six Flags Entertainment Corp. (c)
4.875% 7/31/24 | | | 310,000 | | | | 314,650 | |
| | | | | | | | |
| | | | | | | 1,350,737 | |
| | | | | | | | |
The accompanying notes are an integral part of the financial statements.
37
MML Dynamic Bond Fund – Portfolio of Investments (Continued)
| | | | | | | | |
| | | Principal
Amount | | | Value | |
| Environmental Controls — 0.1% | | | | | | | | |
Republic Services, Inc.
3.375% 11/15/27 | | $ | 585,000 | | | $ | 589,374 | |
| | | | | | | | |
| Foods — 1.0% | | | | | | | | |
B&G Foods, Inc.
5.250% 4/01/25 | | | 305,000 | | | | 310,231 | |
Cosan Overseas Ltd. (d)
8.250% 11/29/49 | | | 500,000 | | | | 511,825 | |
JBS USA LUX SA / JBS USA Finance, Inc. (c)
7.250% 6/01/21 | | | 255,000 | | | | 259,144 | |
JBS USA LUX SA / JBS USA Finance, Inc. (c)
7.250% 6/01/21 | | | 50,000 | | | | 50,812 | |
Kraft Heinz Foods Co.
2.000% 7/02/18 | | | 235,000 | | | | 234,993 | |
Kraft Heinz Foods Co.
2.800% 7/02/20 | | | 345,000 | | | | 346,989 | |
The Kroger Co.
3.400% 4/15/22 | | | 670,000 | | | | 685,814 | |
Marfrig Holdings Europe BV (c)
8.000% 6/08/23 | | | 200,000 | | | | 208,500 | |
Pilgrim’s Pride Corp. (c)
5.750% 3/15/25 | | | 300,000 | | | | 310,125 | |
Post Holdings, Inc. (c)
5.500% 3/01/25 | | | 305,000 | | | | 315,675 | |
Smithfield Foods, Inc. (c)
4.250% 2/01/27 | | | 550,000 | | | | 564,407 | |
Sysco Corp.
3.250% 7/15/27 | | | 580,000 | | | | 578,048 | |
| | | | | | | | |
| | | | | | | 4,376,563 | |
| | | | | | | | |
| Forest Products & Paper — 0.3% | | | | | | | | |
Celulosa Arauco y Constitucion SA
4.750% 1/11/22 | | | 200,000 | | | | 211,599 | |
Georgia-Pacific LLC (c)
3.600% 3/01/25 | | | 1,125,000 | | | | 1,156,189 | |
Inversiones CMPC SA/Cayman Islands Branch (d)
4.500% 4/25/22 | | | 200,000 | | | | 209,366 | |
| | | | | | | | |
| | | | | | | 1,577,154 | |
| | | | | | | | |
| Gas — 0.2% | | | | | | | | |
NGL Energy Partners LP / NGL Energy Finance Corp.
7.500% 11/01/23 | | | 220,000 | | | | 227,150 | |
Transportadora de Gas del Peru SA (d)
4.250% 4/30/28 | | | 600,000 | | | | 620,400 | |
| | | | | | | | |
| | | | | | | 847,550 | |
| | | | | | | | |
| Health Care – Products — 0.5% | | | | | | | | |
Avantor, Inc. (c)
6.000% 10/01/24 | | | 155,000 | | | | 154,419 | |
| | | | | | | | |
| | | Principal
Amount | | | Value | |
Avantor, Inc. (c)
9.000% 10/01/25 | | $ | 155,000 | | | $ | 152,675 | |
Becton Dickinson and Co.
2.894% 6/06/22 | | | 860,000 | | | | 854,620 | |
Universal Hospital Services, Inc.
7.625% 8/15/20 | | | 310,000 | | | | 310,000 | |
Zimmer Biomet Holdings, Inc.
2.700% 4/01/20 | | | 570,000 | | | | 570,277 | |
| | | | | | | | |
| | | | | | | 2,041,991 | |
| | | | | | | | |
| Health Care – Services — 0.3% | | | | | | | | |
Anthem, Inc.
2.300% 7/15/18 | | | 425,000 | | | | 425,928 | |
Anthem, Inc.
2.950% 12/01/22 | | | 160,000 | | | | 160,067 | |
Centene Corp.
4.750% 1/15/25 | | | 305,000 | | | | 310,337 | |
Polaris Intermediate Corp. (c)
8.500% 12/01/22 | | | 75,000 | | | | 77,813 | |
Tenet Healthcare Corp.
8.125% 4/01/22 | | | 210,000 | | | | 213,675 | |
| | | | | | | | |
| | | | | | | 1,187,820 | |
| | | | | | | | |
| Holding Companies-Diversified — 0.2% | | | | | | | | |
CK Hutchison International 17 II Ltd. (c)
2.250% 9/29/20 | | | 200,000 | | | | 198,054 | |
CK Hutchison International 17 Ltd. (d)
2.875% 4/05/22 | | | 200,000 | | | | 199,263 | |
CK Hutchison International Ltd. (c)
3.500% 4/05/27 | | | 200,000 | | | | 199,857 | |
Hutchison Whampoa Ltd. (d)
3.250% 11/08/22 | | | 300,000 | | | | 303,248 | |
| | | | | | | | |
| | | | | | | 900,422 | |
| | | | | | | | |
| Household Products & Wares — 0.1% | | | | | | | | |
Kronos Acquisition Holdings, Inc. (c)
9.000% 8/15/23 | | | 320,000 | | | | 299,200 | |
| | | | | | | | |
| Insurance — 0.8% | | | | | | | | |
Alliant Holdings Intermediate LLC / Alliant Holdings Co-Issuer (c)
8.250% 8/01/23 | | | 295,000 | | | | 309,750 | |
Athene Global Funding (c)
3.000% 7/01/22 | | | 580,000 | | | | 574,069 | |
Brighthouse Financial, Inc. (c)
3.700% 6/22/27 | | | 575,000 | | | | 565,494 | |
Liberty Mutual Group, Inc. (c)
6.500% 5/01/42 | | | 730,000 | | | | 974,104 | |
New York Life Global Funding (c)
2.300% 6/10/22 | | | 540,000 | | | | 532,437 | |
Nuveen Finance LLC (c)
2.950% 11/01/19 | | | 540,000 | | | | 545,163 | |
| | | | | | | | |
| | | | | | | 3,501,017 | |
| | | | | | | | |
The accompanying notes are an integral part of the financial statements.
38
MML Dynamic Bond Fund – Portfolio of Investments (Continued)
| | | | | | | | |
| | | Principal
Amount | | | Value | |
| Internet — 0.5% | | | | | | | | |
Alibaba Group Holding Ltd.
2.800% 6/06/23 | | $ | 200,000 | | | $ | 199,431 | |
Amazon.com, Inc. (c)
4.050% 8/22/47 | | | 585,000 | | | | 630,464 | |
eBay, Inc.
2.750% 1/30/23 | | | 575,000 | | | | 569,398 | |
Expedia, Inc. Co.
3.800% 2/15/28 | | | 595,000 | | | | 574,952 | |
Netflix, Inc. (c)
4.875% 4/15/28 | | | 130,000 | | | | 127,400 | |
| | | | | | | | |
| | | | | | | 2,101,645 | |
| | | | | | | | |
| Investment Companies — 0.2% | | | | | | | | |
Temasek Financial I Ltd. (d)
2.375% 1/23/23 | | | 750,000 | | | | 740,476 | |
| | | | | | | | |
| Iron & Steel — 0.1% | | | | | | | | |
Vale Overseas Ltd.
5.875% 6/10/21 | | | 380,000 | | | | 413,820 | |
| | | | | | | | |
| Leisure Time — 0.2% | | | | | | | | |
Constellation Merger Sub, Inc. (c)
8.500% 9/15/25 | | | 160,000 | | | | 156,000 | |
Royal Caribbean Cruises Ltd.
3.700% 3/15/28 | | | 295,000 | | | | 292,322 | |
Viking Cruises Ltd. (c)
5.875% 9/15/27 | | | 300,000 | | | | 305,250 | |
| | | | | | | | |
| | | | | | | 753,572 | |
| | | | | | | | |
| Lodging — 0.3% | | | | | | | | |
CRC Escrow Issuer LLC / CRC Finco, Inc. (c)
5.250% 10/15/25 | | | 320,000 | | | | 322,400 | |
Gohl Capital Ltd. (d)
4.250% 1/24/27 | | | 600,000 | | | | 615,316 | |
Hilton Domestic Operating Co., Inc.
4.250% 9/01/24 | | | 310,000 | | | | 313,100 | |
| | | | | | | | |
| | | | | | | 1,250,816 | |
| | | | | | | | |
| Machinery – Construction & Mining — 0.1% | | | | | |
BlueLine Rental Finance Corp./BlueLine Rental LLC (c)
9.250% 3/15/24 | | | 295,000 | | | | 314,912 | |
| | | | | | | | |
| Media — 0.4% | | | | | |
CBS Corp. (c)
3.700% 6/01/28 | | | 80,000 | | | | 78,894 | |
CCO Holdings LLC/CCO Holdings Capital Corp. (c)
5.000% 2/01/28 | | | 185,000 | | | | 179,913 | |
Cengage Learning, Inc. (c)
9.500% 6/15/24 | | | 265,000 | | | | 239,825 | |
Charter Communications Operating LLC/Charter Communications Operating Capital
4.908% 7/23/25 | | | 520,000 | | | | 552,856 | |
| | | | | | | | |
| | | Principal
Amount | | | Value | |
Comcast Corp.
4.400% 8/15/35 | | $ | 525,000 | | | $ | 573,980 | |
| | | | | | | | |
| | | | | | | 1,625,468 | |
| | | | | | | | |
| Oil & Gas — 2.1% | | | | | |
Bharat Petroleum Corp. Ltd. (d)
4.625% 10/25/22 | | | 200,000 | | | | 211,080 | |
BPRL International Singapore Pte Ltd. (d)
4.375% 1/18/27 | | | 500,000 | | | | 515,602 | |
Canadian Natural Resources Ltd.
2.950% 1/15/23 | | | 860,000 | | | | 856,149 | |
CNOOC Finance Ltd. (d)
4.250% 1/26/21 | | | 200,000 | | | | 207,871 | |
CNOOC Finance USA LLC
3.500% 5/05/25 | | | 600,000 | | | | 604,744 | |
CNPC HK Overseas Capital Ltd. (d)
4.500% 4/28/21 | | | 700,000 | | | | 735,320 | |
EQT Corp.
3.900% 10/01/27 | | | 575,000 | | | | 571,626 | |
Indian Oil Corp. Ltd. (d)
5.750% 8/01/23 | | | 600,000 | | | | 668,365 | |
MEG Energy Corp. (c)
7.000% 3/31/24 | | | 135,000 | | | | 113,906 | |
ONGC Videsh Vankorneft Pte Ltd. (d)
3.750% 7/27/26 | | | 850,000 | | | | 845,758 | |
Petrobras Global Finance BV
7.250% 3/17/44 | | | 100,000 | | | | 104,000 | |
Petroleos Mexicanos
6.750% 9/21/47 | | | 290,000 | | | | 302,717 | |
Petronas Capital Ltd. (d)
3.500% 3/18/25 | | | 800,000 | | | | 820,414 | |
Phillips 66
5.875% 5/01/42 | | | 235,000 | | | | 299,085 | |
QEP Resources, Inc.
5.250% 5/01/23 | | | 160,000 | | | | 161,898 | |
QEP Resources, Inc.
5.625% 3/01/26 | | | 160,000 | | | | 162,200 | |
Reliance Holding USA, Inc. (d)
5.400% 2/14/22 | | | 600,000 | | | | 651,671 | |
Sanchez Energy Corp.
6.125% 1/15/23 | | | 385,000 | | | | 325,325 | |
Sinopec Group Overseas Development Ltd. (d)
2.750% 9/29/26 | | | 900,000 | | | | 854,062 | |
Valero Energy Corp
6.625% 6/15/37 | | | 235,000 | | | | 309,710 | |
Vine Oil & Gas LP / Vine Oil & Gas Finance Corp. (c)
8.750% 4/15/23 | | | 140,000 | | | | 135,800 | |
Whiting Petroleum Corp. (c)
6.625% 1/15/26 | | | 155,000 | | | | 158,100 | |
| | | | | | | | |
| | | | | | | 9,615,403 | |
| | | | | | | | |
The accompanying notes are an integral part of the financial statements.
39
MML Dynamic Bond Fund – Portfolio of Investments (Continued)
| | | | | | | | |
| | | Principal
Amount | | | Value | |
| Oil & Gas Services — 0.1% | | | | | |
Baker Hughes a GE Co. LLC / Baker Hughes Co-Obligor, Inc. (c)
4.080% 12/15/47 | | $ | 300,000 | | | $ | 305,120 | |
Schlumberger Holdings Corp. (c)
2.350% 12/21/18 | | | 270,000 | | | | 270,606 | |
| | | | | | | | |
| | | | | | | 575,726 | |
| | | | | | | | |
| Packaging & Containers — 0.1% | | | | | |
Packaging Corp. of America
3.400% 12/15/27 | | | 290,000 | | | | 290,722 | |
Plastipak Holdings, Inc. (c)
6.250% 10/15/25 | | | 155,000 | | | | 158,488 | |
| | | | | | | | |
| | | | | | | 449,210 | |
| | | | | | | | |
| Pharmaceuticals — 0.7% | | | | | |
AbbVie, Inc.
4.700% 5/14/45 | | | 550,000 | | | | 616,701 | |
Allergan Funding SCS
2.350% 3/12/18 | | | 551,000 | | | | 551,436 | |
AstraZeneca PLC
2.375% 11/16/20 | | | 275,000 | | | | 274,584 | |
AstraZeneca PLC
2.375% 6/12/22 | | | 290,000 | | | | 286,561 | |
Shire Acquisitions Investments Ireland DAC
2.875% 9/23/23 | | | 580,000 | | | | 570,183 | |
Teva Pharmaceutical Finance Netherlands III BV
2.800% 7/21/23 | | | 780,000 | | | | 679,232 | |
Valeant Pharmaceuticals International, Inc. (c)
5.500% 11/01/25 | | | 320,000 | | | | 325,600 | |
| | | | | | | | |
| | | | | | | 3,304,297 | |
| | | | | | | | |
| Pipelines — 0.9% | | | | | |
Cheniere Energy Partners LP (c)
5.250% 10/01/25 | | | 310,000 | | | | 315,425 | |
Enable Midstream Partners LP
4.400% 3/15/27 | | | 565,000 | | | | 574,529 | |
Energy Transfer LP
4.200% 4/15/27 | | | 145,000 | | | | 144,246 | |
Energy Transfer LP
4.750% 1/15/26 | | | 470,000 | | | | 487,617 | |
Fermaca Enterprises S de RL de CV (c)
6.375% 3/30/38 | | | 232,000 | | | | 249,516 | |
Kinder Morgan Energy Partners LP
6.950% 1/15/38 | | | 470,000 | | | | 584,373 | |
Sabine Pass Liquefaction LLC
5.000% 3/15/27 | | | 660,000 | | | | 708,230 | |
Sunoco Logistics Partners Operations LP
3.900% 7/15/26 | | | 750,000 | | | | 733,926 | |
| | | | | | | | |
| | | Principal
Amount | | | Value | |
Williams Partners LP
3.750% 6/15/27 | | $ | 290,000 | | | $ | 290,603 | |
| | | | | | | | |
| | | | | | | 4,088,465 | |
| | | | | | | | |
| Real Estate Investment Trusts (REITS) — 1.0% | | | | | |
American Tower Corp.
3.550% 7/15/27 | | | 575,000 | | | | 570,797 | |
American Tower Corp.
4.400% 2/15/26 | | | 950,000 | | | | 999,005 | |
Boston Properties LP
4.125% 5/15/21 | | | 520,000 | | | | 543,481 | |
Crown Castle International Corp
3.700% 6/15/26 | | | 700,000 | | | | 699,523 | |
Crown Castle International Corp.
3.650% 9/01/27 | | | 575,000 | | | | 573,592 | |
Crown Castle International Corp.
4.000% 3/01/27 | | | 225,000 | | | | 230,046 | |
Digital Realty Trust LP
3.700% 8/15/27 | | | 250,000 | | | | 251,819 | |
ESH Hospitality, Inc. (c)
5.250% 5/01/25 | | | 300,000 | | | | 303,000 | |
Simon Property Group LP
3.375% 12/01/27 | | | 300,000 | | | | 301,390 | |
| | | | | | | | |
| | | | | | | 4,472,653 | |
| | | | | | | | |
| Retail — 0.2% | | | | | |
1011778 BC ULC/New Red Finance, Inc. (c)
4.250% 5/15/24 | | | 310,000 | | | | 309,225 | |
Beacon Escrow Corp. (c)
4.875% 11/01/25 | | | 310,000 | | | | 311,162 | |
PetSmart, Inc. (c)
5.875% 6/01/25 | | | 115,000 | | | | 88,263 | |
PetSmart, Inc. (c)
7.125% 3/15/23 | | | 200,000 | | | | 118,500 | |
| | | | | | | | |
| | | | | | | 827,150 | |
| | | | | | | | |
| Semiconductors — 0.1% | | | | | |
Applied Materials, Inc.
4.350% 4/01/47 | | | 280,000 | | | | 314,101 | |
| | | | | | | | |
| Software — 0.7% | | | | | |
Fidelity National Information Services, Inc.
3.625% 10/15/20 | | | 415,000 | | | | 426,402 | |
Genesys Telecommunications Laboratories, Inc./Greeneden Lux 3 Sarl/Greeneden US Ho (c)
10.000% 11/30/24 | | | 270,000 | | | | 294,975 | |
Microsoft Corp.
4.450% 11/03/45 | | | 520,000 | | | | 609,490 | |
Oracle Corp.
4.125% 5/15/45 | | | 540,000 | | | | 582,409 | |
The accompanying notes are an integral part of the financial statements.
40
MML Dynamic Bond Fund – Portfolio of Investments (Continued)
| | | | | | | | |
| | | Principal
Amount | | | Value | |
Solera LLC/ Solera Finance, Inc. (c)
10.500% 3/01/24 | | $ | 135,000 | | | $ | 151,872 | |
Sophia LP/Sophia Finance, Inc. (c)
9.000% 9/30/23 | | | 210,000 | | | | 222,075 | |
VMware, Inc.
2.950% 8/21/22 | | | 700,000 | | | | 698,044 | |
| | | | | | | | |
| | | | | | | 2,985,267 | |
| | | | | | | | |
| Telecommunications — 1.5% | | | | | |
America Movil SAB de CV
5.000% 3/30/20 | | | 100,000 | | | | 105,394 | |
AT&T, Inc.
5.250% 3/01/37 | | | 495,000 | | | | 523,524 | |
Axiata SPV2 Bhd (d)
3.466% 11/19/20 | | | 900,000 | | | | 911,099 | |
Bharti Airtel International Netherlands BV (d)
5.125% 3/11/23 | | | 400,000 | | | | 423,916 | |
Bharti Airtel Ltd. (d)
4.375% 6/10/25 | | | 500,000 | | | | 508,758 | |
British Telecommunications PLC
5.950% 1/15/18 | | | 1,025,000 | | | | 1,026,371 | |
CB Escrow Corp. (c)
8.000% 10/15/25 | | | 80,000 | | | | 81,200 | |
Cincinnati Bell, Inc. (c)
7.000% 7/15/24 | | | 235,000 | | | | 233,238 | |
Digicel Group Ltd. (d)
7.125% 4/01/22 | | | 500,000 | | | | 463,005 | |
Frontier Communications Corp.
8.500% 4/15/20 | | | 220,000 | | | | 182,600 | |
GTT Communications, Inc. (c)
7.875% 12/31/24 | | | 220,000 | | | | 232,100 | |
Intelsat Jackson Holdings SA
7.250% 10/15/20 | | | 230,000 | | | | 216,200 | |
Level 3 Financing, Inc.
5.375% 1/15/24 | | | 310,000 | | | | 309,612 | |
Orange SA
2.750% 2/06/19 | | | 564,000 | | | | 567,117 | |
SingTel Group Treasury Pte Ltd. (d)
4.500% 9/08/21 | | | 200,000 | | | | 212,440 | |
Telesat Canada/Telesat LLC (c)
8.875% 11/15/24 | | | 285,000 | | | | 319,200 | |
Verizon Communications, Inc.
4.400% 11/01/34 | | | 565,000 | | | | 575,757 | |
| | | | | | | | |
| | | | | | | 6,891,531 | |
| | | | | | | | |
| Toys, Games & Hobbies — 0.0% | | | | | |
Hasbro, Inc.
3.500% 9/15/27 | | | 170,000 | | | | 166,140 | |
| | | | | | | | |
| Transportation — 0.8% | | | | | |
Burlington Northern Santa Fe LLC
4.550% 9/01/44 | | | 505,000 | | | | 578,199 | |
CSX Corp.
3.800% 11/01/46 | | | 600,000 | | | | 596,572 | |
| | | | | | | | |
| | | Principal
Amount | | | Value | |
Empresa de Transporte de Pasajeros Metro SA (c)
5.000% 1/25/47 | | $ | 750,000 | | | $ | 821,640 | |
FedEx Corp.
4.750% 11/15/45 | | | 525,000 | | | | 587,884 | |
Lima Metro Line 2 Finance Ltd. (d)
5.875% 7/05/34 | | | 750,000 | | | | 810,375 | |
Union Pacific Corp.
3.000% 4/15/27 | | | 250,000 | | | | 251,243 | |
| | | | | | | | |
| | | | | | | 3,645,913 | |
| | | | | | | | |
| Trucking & Leasing — 0.1% | | | | | |
DAE Funding LLC (c)
5.000% 8/01/24 | | | 310,000 | | | | 306,125 | |
Penske Truck Leasing Co. LP/PTL Finance Corp. (c)
4.200% 4/01/27 | | | 275,000 | | | | 285,851 | |
| | | | | | | | |
| | | | | | | 591,976 | |
| | | | | | | | |
| Water — 0.1% | | | | | |
American Water Capital Corp.
3.400% 3/01/25 | | | 500,000 | | | | 515,251 | |
| | | | | | | | |
| | |
TOTAL CORPORATE DEBT
(Cost $111,590,199) | | | | | | | 112,653,931 | |
| | | | | | | | |
|
| MUNICIPAL OBLIGATIONS — 0.1% | |
North Texas Municipal Water District Water System Revenue
5.000% 9/01/35 | | | 220,000 | | | | 260,144 | |
| | | | | | | | |
| | |
TOTAL MUNICIPAL OBLIGATIONS
(Cost $250,892) | | | | | | | 260,144 | |
| | | | | | | | |
|
| NON-U.S. GOVERNMENT AGENCY OBLIGATIONS — 28.1% | |
| Commercial MBS — 8.1% | | | | | |
BBCMS Mortgage Trust, Series 2017-C1, Class XA, VRN (b)
1.524% 2/15/50 | | | 4,583,885 | | | | 476,356 | |
BX Trust, Series 2017-SLCT, Class D, 1 mo. LIBOR + 2.050%, FRN (c)
3.527% 7/15/34 | | | 216,000 | | | | 216,208 | |
BX Trust, Series 2017-SLCT, Class E, 1 mo. LIBOR + 3.150%, FRN (c)
4.627% 7/15/34 | | | 355,000 | | | | 356,553 | |
CD Mortgage Trust, Series 2017-CD4, Class XA, VRN (b)
1.327% 5/10/50 | | | 5,809,272 | | | | 523,380 | |
CFCRE Commercial Mortgage Trust, Series 2016-C3, Class XA, VRN (b)
1.073% 1/10/48 | | | 5,786,737 | | | | 395,532 | |
The accompanying notes are an integral part of the financial statements.
41
MML Dynamic Bond Fund – Portfolio of Investments (Continued)
| | | | | | | | |
| | | Principal
Amount | | | Value | |
CFCRE Commercial Mortgage Trust, Series 2016-C3, Class D, VRN (b) (c)
3.052% 1/10/48 | | $ | 563,000 | | | $ | 412,180 | |
CFCRE Commercial Mortgage Trust, Series 2016-C7, Class A3
3.839% 12/10/54 | | | 545,000 | | | | 567,771 | |
CHT Mortgage Trust, Series 2017-CSMO, Class E, FRN (b) (c)
4.380% 11/15/36 | | | 378,000 | | | | 379,059 | |
CHT Mortgage Trust, Series 2017-CSMO, Class F, FRN (b) (c)
5.121% 11/15/36 | | | 202,000 | | | | 202,311 | |
Citigroup Commercial Mortgage Trust, Series 2015-GC35, Class XA, VRN (b)
0.889% 11/10/48 | | | 5,310,235 | | | | 249,371 | |
Citigroup Commercial Mortgage Trust, Series 2016-P4, Class XA, VRN (b)
2.007% 7/10/49 | | | 3,748,526 | | | | 460,163 | |
Citigroup Commercial Mortgage Trust, Series 2016-GC36, Class D (c)
2.850% 2/10/49 | | | 583,000 | | | | 437,723 | |
Citigroup Commercial Mortgage Trust, Series 2016-P4, Class A4
2.902% 7/10/49 | | | 547,000 | | | | 539,209 | |
Citigroup Commercial Mortgage Trust, Series 2015-GC27, Class A5
3.137% 2/10/48 | | | 276,000 | | | | 277,964 | |
Citigroup Commercial Mortgage Trust, Series 2016-SMPL, Class D (c)
3.520% 9/10/31 | | | 534,000 | | | | 526,638 | |
Citigroup Commercial Mortgage Trust, Series 2016-P6, Class A5, VRN (b)
3.720% 12/10/49 | | | 435,000 | | | | 454,949 | |
Citigroup Commercial Mortgage Trust, Series 2015-GC31, Class C, VRN (b)
4.063% 6/10/48 | | | 700,000 | | | | 659,061 | |
Citigroup Commercial Mortgage Trust, Series 2015-GC35, Class C, VRN (b)
4.500% 11/10/48 | | | 413,000 | | | | 412,506 | |
CLNS Trust, Series 2017-IKPR, Class D, 1 mo. LIBOR + 2.050%, FRN (c)
3.482% 6/11/32 | | | 190,000 | | | | 190,179 | |
CLNS Trust, Series 2017-IKPR, Class E, 1 mo. LIBOR + 3.500%, FRN (c)
4.932% 6/11/32 | | | 190,000 | | | | 190,415 | |
CLNS Trust, Series 2017-IKPR, Class F, 1 mo. LIBOR + 4.500%, FRN (c)
5.932% 6/11/32 | | | 190,000 | | | | 190,653 | |
COMM Mortgage Trust, Series 2016-DC2, Class XA, VRN (b)
1.062% 2/10/49 | | | 986,085 | | | | 62,513 | |
COMM Mortgage Trust, Series 2016-GCT, Class E, VRN (b) (c)
3.461% 8/10/29 | | | 210,000 | | | | 205,969 | |
| | | | | | | | |
| | | Principal
Amount | | | Value | |
COMM Mortgage Trust, Series 2015-CR22, Class D, VRN (b) (c)
4.123% 3/10/48 | | $ | 650,000 | | | $ | 550,588 | |
COMM Mortgage Trust, Series 2012-CR4, Class D, VRN (b) (c)
4.575% 10/15/45 | | | 738,000 | | | | 614,861 | |
COMM Mortgage Trust, Series 2015-LC23, Class C, VRN (b)
4.646% 10/10/48 | | | 470,000 | | | | 489,586 | |
Commercial Mortgage Trust, Series 2016-CR28, Class C, VRN (b)
4.647% 2/10/49 | | | 517,000 | | | | 514,066 | |
Credit Suisse Mortgage Trust, Series 2008-C1, Class AM, VRN (b) (c)
6.330% 2/15/41 | | | 616,858 | | | | 616,479 | |
CSAIL Commercial Mortgage Trust, Series 2015-C1, Class XA, VRN (b)
0.940% 4/15/50 | | | 9,197,682 | | | | 443,575 | |
CSAIL Commercial Mortgage Trust, Series 2017-C8, Class XA, VRN (b)
1.257% 6/15/50 | | | 6,693,157 | | | | 533,560 | |
CSAIL Commercial Mortgage Trust, Series 2015-C4, Class C, VRN (b)
4.584% 11/15/48 | | | 427,000 | | | | 428,451 | |
CSMC Trust, Series 2017-LSTK, Class C (c)
3.229% 4/05/33 | | | 257,000 | | | | 256,698 | |
CSMC Trust, Series 2017-LSTK, Class D, VRN (b) (c)
3.331% 4/05/33 | | | 306,000 | | | | 301,509 | |
CSMC Trust, Series 2017-CHOP, Class D, 1 mo. LIBOR + 1.900%, FRN (c)
3.377% 7/15/32 | | | 285,000 | | | | 285,178 | |
CSMC Trust, Series 2017-CHOP, Class E, 1 mo. LIBOR + 3.300%, FRN (c)
4.777% 7/15/32 | | | 285,000 | | | | 285,717 | |
Great Wolf Trust, Series 2017-WOLF, Class D, FRN (b) (c)
3.727% 9/15/34 | | | 286,000 | | | | 286,091 | |
Great Wolf Trust, Series 2017-WOLF, Class E, FRN (b) (c)
4.727% 9/15/34 | | | 443,000 | | | | 443,152 | |
Great Wolf Trust, Series 2017-WOLF, Class F, FRN (b) (c)
5.697% 9/15/34 | | | 236,000 | | | | 236,077 | |
GS Mortgage Securities Corp. II, Series 2013-GC10, Class XA, VRN (b)
1.557% 2/10/46 | | | 5,353,195 | | | | 327,603 | |
GS Mortgage Securities Trust, Series 2015-GS1, Class XA, VRN (b) 0.824% 11/10/48 | | | 8,137,950 | | | | 412,780 | |
The accompanying notes are an integral part of the financial statements.
42
MML Dynamic Bond Fund – Portfolio of Investments (Continued)
| | | | | | | | |
| | | Principal
Amount | | | Value | |
GS Mortgage Securities Trust, Series 2014-GC20, Class XA, VRN (b)
1.005% 4/10/47 | | $ | 6,841,065 | | | $ | 334,726 | |
GS Mortgage Securities Trust, Series 2017-GS7, Class XA, VRN (b) 1.142% 8/10/50 | | | 6,713,071 | | | | 564,939 | |
GS Mortgage Securities Trust, Series 2014-GC26, Class D, VRN (b) (c)
4.510% 11/10/47 | | | 1,450,000 | | | | 1,251,505 | |
JP Morgan Chase Commercial Mortgage Securities Trust, Series 2015-JP1, Class XA, VRN (b)
1.138% 1/15/49 | | | 5,366,695 | | | | 286,759 | |
JP Morgan Chase Commercial Mortgage Securities Trust, Series 2016-JP2, Class XA, VRN (b)
1.857% 8/15/49 | | | 3,210,950 | | | | 388,822 | |
JP Morgan Chase Commercial Mortgage Securities Trust, Series 2017-MAUI, Class C, 1 mo. LIBOR + 1.250%, FRN (c)
2.727% 7/15/34 | | | 145,000 | | | | 145,014 | |
JP Morgan Chase Commercial Mortgage Securities Trust, Series 2017-MAUI, Class D, 1 mo. LIBOR +
1.950%, FRN (c)
3.427% 7/15/34 | | | 136,000 | | | | 136,083 | |
JP Morgan Chase Commercial Mortgage Securities Trust, Series 2016-JP2, Class B
3.460% 8/15/49 | | | 174,000 | | | | 170,370 | |
JP Morgan Chase Commercial Mortgage Securities Trust, Series 2016-JP2, Class C, VRN (b)
3.794% 8/15/49 | | | 134,000 | | | | 130,445 | |
JP Morgan Chase Commercial Mortgage Securities Trust, Series 2017-MAUI, Class E, 1 mo. LIBOR +
2.950%, FRN (c)
4.427% 7/15/34 | | | 121,000 | | | | 121,081 | |
JP Morgan Chase Commercial Mortgage Securities Trust, Series 2017-MAUI, Class F, 1 mo. LIBOR +
3.750%, FRN (c)
5.227% 7/15/34 | | | 170,000 | | | | 170,164 | |
JP Morgan Chase Commercial Mortgage Securities Trust, Series 2007-LDPX, Class AM, VRN (b)
5.464% 1/15/49 | | | 337,087 | | | | 337,919 | |
| | | | | | | | |
| | | Principal
Amount | | | Value | |
JPMBB Commercial Mortgage Securities Trust, Series 2015-C30, Class XA, VRN (b)
0.685% 7/15/48 | | $ | 11,007,961 | | | $ | 349,457 | |
JPMBB Commercial Mortgage Securities Trust, Series 2015-C29, Class XA, VRN (b)
0.927% 5/15/48 | | | 12,189,270 | | | | 424,479 | |
JPMBB Commercial Mortgage Securities Trust, Series 2014-C25, Class XA, VRN (b)
0.968% 11/15/47 | | | 5,114,351 | | | | 236,484 | |
JPMBB Commercial Mortgage Securities Trust, Series 2015-C28, Class XA, VRN (b)
1.181% 10/15/48 | | | 8,844,119 | | | | 454,987 | |
JPMBB Commercial Mortgage Securities Trust, Series 2015-C27, Class D, VRN (b) (c)
3.844% 2/15/48 | | | 704,000 | | | | 580,967 | |
JPMBB Commercial Mortgage Securities Trust, Series 2015-C30, Class B, VRN (b)
4.309% 7/15/48 | | | 610,000 | | | | 621,948 | |
JPMBB Commercial Mortgage Securities Trust, Series 2015-C33, Class C, VRN (b)
4.618% 12/15/48 | | | 527,000 | | | | 544,178 | |
JPMBB Commercial Mortgage Securities Trust, Series 2015-C32, Class C, VRN (b)
4.668% 11/15/48 | | | 100,000 | | | | 99,561 | |
JPMBB Commercial Mortgage Securities Trust, Series 2016-C1, Class C, VRN (b)
4.747% 3/15/49 | | | 466,000 | | | | 484,018 | |
Morgan Stanley Bank of America Merrill Lynch Trust, Series 2015-C26, Class D (c)
3.060% 10/15/48 | | | 650,000 | | | | 535,245 | |
Morgan Stanley Bank of America Merrill Lynch Trust, Series 2015-C27, Class D, VRN (b) (c)
3.237% 12/15/47 | | | 504,000 | | | | 373,322 | |
Morgan Stanley Bank of America Merrill Lynch Trust, Series 2015-C20, Class A4
3.249% 2/15/48 | | | 175,000 | | | | 177,384 | |
Morgan Stanley Bank of America Merrill Lynch Trust, Series 2016-C32, Class A4
3.720% 12/15/49 | | | 454,000 | | | | 474,606 | |
The accompanying notes are an integral part of the financial statements.
43
MML Dynamic Bond Fund – Portfolio of Investments (Continued)
| | | | | | | | |
| | | Principal
Amount | | | Value | |
Morgan Stanley Bank of America Merrill Lynch Trust, Series 2014-C19, Class C
4.000% 12/15/47 | | $ | 650,000 | | | $ | 622,127 | |
Morgan Stanley Bank of America Merrill Lynch Trust, Series 2015-C23, Class C, VRN (b)
4.134% 7/15/50 | | | 650,000 | | | | 633,795 | |
Morgan Stanley Bank of America Merrill Lynch Trust, Series 2015-C27, Class C, VRN (b)
4.534% 12/15/47 | | | 351,000 | | | | 337,360 | |
Morgan Stanley Bank of America Merrill Lynch Trust, Series 2016-C29, Class C, VRN (b)
4.752% 5/15/49 | | | 475,000 | | | | 496,449 | |
Morgan Stanley Capital I, Series 2007-HQ11, Class AJ, VRN (b)
5.508% 2/12/44 | | | 173,380 | | | | 173,313 | |
Morgan Stanley Capital I Trust, Series 2015-UBS8, Class XA, VRN (b)
0.958% 12/15/48 | | | 6,581,817 | | | | 380,847 | |
Morgan Stanley Capital I Trust, Series 2016-UB11, Class XA, VRN (b)
1.664% 8/15/49 | | | 1,585,697 | | | | 153,411 | |
Morgan Stanley Capital I Trust, Series 2015-XLF2, Class AFSC, 1 mo. LIBOR + 3.000%, FRN (c)
4.477% 8/15/26 | | | 478,000 | | | | 475,620 | |
Morgan Stanley Capital I Trust, Series 2017-PRME, Class D, 1 mo. LIBOR + 3.400%, FRN (c)
4.877% 2/15/34 | | | 425,000 | | | | 424,337 | |
MSCG Trust, Series 2016-SNR, Class C (c)
5.205% 11/15/34 | | | 539,000 | | | | 547,301 | |
PFP Ltd., Series 2017-3, Class A, 1 mo. LIBOR + 1.050%, FRN (c)
2.482% 1/14/35 | | | 185,252 | | | | 185,315 | |
PFP Ltd., Series 2017-3, Class AS, 1 mo. LIBOR + 1.300%, FRN (c)
2.732% 1/14/35 | | | 164,000 | | | | 163,813 | |
PFP Ltd., Series 2017-3, Class B, 1 mo. LIBOR + 1.750%, FRN (c)
3.182% 1/14/35 | | | 94,000 | | | | 94,051 | |
PFP Ltd., Series 2017-3, Class C, 1 mo. LIBOR + 2.500%, FRN (c)
3.932% 1/14/35 | | | 99,000 | | | | 97,219 | |
RAIT Trust, Series 2017-FL7, Class A, 1 mo. LIBOR + ..950%, FRN (c)
2.193% 6/15/37 | | | 504,929 | | | | 504,942 | |
| | | | | | | | |
| | | Principal
Amount | | | Value | |
RAIT Trust, Series 2017-FL7, Class AS, 1 mo. LIBOR + 1.300%, FRN (c)
2.539% 6/15/37 | | $ | 141,000 | | | $ | 141,054 | |
SG Commercial Mortgage Securities Trust, Series 2016-C5, Class XA, VRN (b)
2.018% 10/10/48 | | | 3,950,150 | | | | 463,616 | |
Sutherland Commercial Mortgage Loans LLC, Series 2015-SBC4, Class A (c)
4.000% 6/25/39 | | | 139,327 | | | | 140,167 | |
UBS Commercial Mortgage Trust, Series 2017-C6, Class C, VRN (b)
4.454% 12/15/50 | | | 580,000 | | | | 582,959 | |
Wachovia Bank Commercial Mortgage Trust Series, Series 2007-C30, Class AJ, VRN (b)
5.413% 12/15/43 | | | 295,068 | | | | 300,244 | |
Wachovia Bank Commercial Mortgage Trust Series, Series 2006-C28, Class AJ, VRN (b)
5.632% 10/15/48 | | | 541,221 | | | | 544,611 | |
Wells Fargo Commercial Mortgage Trust, Series 2015-NXS2, Class XA, VRN (b) 0.774% 7/15/58 | | | 12,759,416 | | | | 486,168 | |
Wells Fargo Commercial Mortgage Trust, Series 2015-P2, Class XA, VRN (b)
1.021% 12/15/48 | | | 5,470,925 | | | | 310,898 | |
Wells Fargo Commercial Mortgage Trust, Series 2015-C31, Class XA, VRN (b)
1.095% 11/15/48 | | | 6,681,798 | | | | 423,999 | |
Wells Fargo Commercial Mortgage Trust, Series 2016-NXS6, Class XA, VRN (b) 1.654% 11/15/49 | | | 2,389,689 | | | | 229,546 | |
Wells Fargo Commercial Mortgage Trust, Series 2015-P2, Class A4
3.809% 12/15/48 | | | 392,000 | | | | 412,011 | |
Wells Fargo Commercial Mortgage Trust, Series 2014-LC16, Class D (c)
3.938% 8/15/50 | | | 560,000 | | | | 463,843 | |
Wells Fargo Commercial Mortgage Trust, Series 2015-LC22, Class C, VRN (b)
4.541% 9/15/58 | | | 390,000 | | | | 392,896 | |
Wells Fargo Commercial Mortgage Trust, Series 2015-NXS4, Class C, VRN (b)
4.600% 12/15/48 | | | 421,000 | | | | 434,086 | |
Wells Fargo Commercial Mortgage Trust, Series 2015-C31, Class C, VRN (b)
4.611% 11/15/48 | | | 468,000 | | | | 487,368 | |
The accompanying notes are an integral part of the financial statements.
44
MML Dynamic Bond Fund – Portfolio of Investments (Continued)
| | | | | | | | |
| | | Principal
Amount | | | Value | |
WFRBS Commercial Mortgage Trust, Series 2014-C21, Class XA, VRN (b)
1.128% 8/15/47 | | $ | 12,615,510 | | | $ | 647,424 | |
| | | | | | | | |
| | | | | | | 36,557,887 | |
| | | | | | | | |
| Home Equity ABS — 0.8% | | | | | | | | |
GSAA Home Equity Trust, Series 2007-10, Class A2A
6.500% 11/25/37 | | | 5,047,876 | | | | 3,800,556 | |
| | | | | | | | |
| Other ABS — 9.7% | | | | | | | | |
ALM VII R Ltd., Series 2013-7RA, Class CR, 3 mo. USD LIBOR + 4.040%, FRN (c) 5.399% 10/15/28 | | | 1,000,000 | | | | 1,033,969 | |
ALM XIX LLC, Series 2016-19A, Class B, 3 mo. USD LIBOR + 3.000%, FRN (c)
4.359% 7/15/28 | | | 500,000 | | | | 506,736 | |
ALM XIX LLC, Series 2016-19A, Class C, 3 mo. USD LIBOR + 4.350%, FRN (c)
5.709% 7/15/28 | | | 500,000 | | | | 511,846 | |
Anchorage Capital CLO Ltd., Series 2014-5RA, Class A, 3 mo. USD LIBOR + 0.990%, FRN (c) (e)
2.712% 1/15/30 | | | 1,000,000 | | | | 999,999 | |
Anchorage Capital CLO Ltd., Series 2014-5A, Class AR, 3 mo. USD LIBOR + 1.150%, FRN (c) 2.509% 10/15/26 | | | 1,000,000 | | | | 1,002,856 | |
Blackbird Capital Aircraft Lease Securitization Ltd., Series 2016-1A, Class B, STEP (c)
5.682% 12/16/41 | | | 942,708 | | | | 944,362 | |
BlueMountain CLO Ltd., Series 2015-2A, Class C, 3 mo. USD LIBOR + 2.700%, FRN (c)
4.054% 7/18/27 | | | 1,000,000 | | | | 1,007,991 | |
BlueMountain CLO Ltd., Series 2015-3A, Class B, 3 mo. USD LIBOR + 3.100%, FRN (c)
4.463% 10/20/27 | | | 1,000,000 | | | | 1,005,830 | |
BlueMountain CLO Ltd., Series 2015-2A, Class D, 3 mo. USD LIBOR + 3.550%, FRN (c)
4.904% 7/18/27 | | | 1,000,000 | | | | 1,007,127 | |
BlueMountain CLO Ltd., Series 2015-3A, Class C, 3 mo. USD LIBOR + 3.550%, FRN (c)
4.913% 10/20/27 | | | 1,000,000 | | | | 1,003,517 | |
| | | | | | | | |
| | | Principal
Amount | | | Value | |
BlueMountain CLO Ltd., Series 2013-1A, Class CR, 3 mo. USD LIBOR + 4.150%, FRN (c)
5.513% 1/20/29 | | $ | 1,000,000 | | | $ | 1,015,481 | |
Carlyle Global Market Strategies CLO Ltd., Series 2016-2A, Class D2, 3 mo. USD LIBOR + 6.450%, FRN (c) 7.809% 7/15/27 | | | 500,000 | | | | 509,897 | |
Castle Aircraft SecuritizationTrust, Series 2015-1A, Class A (c)
4.703% 12/15/40 | | | 1,246,467 | | | | 1,252,708 | |
CLI Funding V LLC, Series 2014-2A, Class A (c)
3.380% 10/18/29 | | | 470,272 | | | | 469,356 | |
Gilbert Park Clo Ltd., Series 2017-1A, Class D, FRN (b) (c)
4.315% 10/15/30 | | | 500,000 | | | | 503,869 | |
Gilbert Park CLO Ltd., Series 2017-1A, Class E, FRN (b) (c)
7.765% 10/15/30 | | | 1,000,000 | | | | 1,014,494 | |
Global SC Finance II SRL, Series 2014-1A, Class A1 (c)
3.190% 7/17/29 | | | 467,417 | | | | 464,023 | |
Goldentree Loan Opportunities X Ltd., Series 2015-10A, Class D, 3 mo. USD LIBOR + 3.350%, FRN (c)
4.713% 7/20/27 | | | 1,000,000 | | | | 1,013,375 | |
Helios Issuer LLC, Series 2017-1A, Class A (c)
4.940% 9/20/49 | | | 244,469 | | | | 250,508 | |
HERO Funding Trust, Series 2016-4A, Class A2 (c)
4.290% 9/20/47 | | | 428,559 | | | | 451,145 | |
LCM XVIII LP, Series 19A, Class D, 3 mo. USD LIBOR + 3.450%, FRN (c) 4.809% 7/15/27 | | | 1,000,000 | | | | 1,007,942 | |
Madison Park Funding XV Ltd., Series 2014-15A, Class DR, 3 mo. USD LIBOR + 5.440%, FRN (c)
6.815% 1/27/26 | | | 1,000,000 | | | | 1,004,635 | |
Merrill Lynch Mortgage Investors Trust, Series 2006-OPT1, Class A2C, 1 mo. USD LIBOR + .150%, FRN
1.702% 8/25/37 | | | 2,905,873 | | | | 2,754,351 | |
Mosaic Solar Loans LLC, Series 2017-1A, Class A (c)
4.450% 6/20/42 | | | 732,892 | | | | 747,778 | |
Octagon Investment Partners Ltd., Series 2017-1A, Class C, 3 mo. USD LIBOR + 3.500%, FRN (c)
4.863% 3/17/30 | | | 1,000,000 | | | | 1,013,660 | |
The accompanying notes are an integral part of the financial statements.
45
MML Dynamic Bond Fund – Portfolio of Investments (Continued)
| | | | | | | | |
| | | Principal
Amount | | | Value | |
Octagon Investment Partners Ltd., Series 2017-1A, Class D, 3 mo. USD LIBOR + 6.200%, FRN (c)
7.563% 3/17/30 | | $ | 500,000 | | | $ | 508,497 | |
Octagon Investment Partners XIV Ltd., Series 2012-1A, Class CR, 3 mo. USD LIBOR + 4.000%, FRN (c)
5.359% 7/15/29 | | | 1,000,000 | | | | 1,030,538 | |
Octagon Investment Partners XXII Ltd., Series 2014-1A, Class ERR, 3 mo. USD LIBOR + 5.450%, FRN (c) (e)
7.195% 1/22/30 | | | 1,000,000 | | | | 989,600 | |
Octagon Investment Partners XXII Ltd., Series 2014-1A, Class E1, 3 mo. USD LIBOR + 5.250%, FRN (c)
6.613% 11/25/25 | | | 1,000,000 | | | | 994,840 | |
OneMain Financial Issuance Trust, Series 2015-2A, Class A (c)
2.570% 7/18/25 | | | 89,092 | | | | 89,024 | |
OneMain Financial Issuance Trust, Series 2015-1A, Class A (c)
3.190% 3/18/26 | | | 3,000,000 | | | | 3,015,240 | |
Springleaf Funding Trust, Series 2015-AA, Class A (c)
3.160% 11/15/24 | | | 3,000,000 | | | | 3,012,215 | |
Sprite Cayman, Series 2017-1, Class A (c)
4.250% 12/15/37 | | | 500,000 | | | | 497,855 | |
TAL Advantage V LLC, Series 2013-1A, Class A (c)
2.830% 2/22/38 | | | 258,333 | | | | 254,563 | |
TAL Advantage V LLC, Series 2014-1A, Class A (c)
3.510% 2/22/39 | | | 424,267 | | | | 422,118 | |
TCI-Cent CLO Income Note Issuer Ltd., Series 2017-1A, Class C, 3 mo. USD LIBOR + 3.650%, FRN (c)
5.017% 7/25/30 | | | 500,000 | | | | 508,976 | |
TCI-Cent CLO Ltd., Series 2016-1A, Class C, 3 mo. USD LIBOR + 4.000%, FRN (c)
5.375% 12/21/29 | | | 1,000,000 | | | | 1,018,352 | |
Thacher Park CLO Ltd., Series 2014-1A, Class D1R, 3 mo. USD LIBOR + 3.400%, FRN (c)
4.763% 10/20/26 | | | 1,000,000 | | | | 1,002,360 | |
THL Credit Wind River CLO Ltd., Series 2016-1A, Class C, 3 mo. USD LIBOR + 3.200%, FRN (c)
4.559% 7/15/28 | | | 500,000 | | | | 504,496 | |
THL Credit Wind River CLO Ltd., Series 2017-1A, Class D, 3 mo. USD LIBOR + 3.750%, FRN (c)
5.104% 4/18/29 | | | 1,000,000 | | | | 1,017,897 | |
| | | | | | | | |
| | | Principal
Amount | | | Value | |
THL Credit Wind River CLO Ltd., Series 2012-1A, Class DR, 3 mo. USD LIBOR + 4.100%, FRN (c) 5.459% 1/15/26 | | $ | 1,000,000 | | | $ | 1,023,530 | |
Towd Point Mortgage Trust, Series 2015-2, Class 1A13, VRN (b) (c)
2.500% 11/25/60 | | | 3,552,360 | | | | 3,528,673 | |
Trip Rail Master Funding LLC, Series 2017-1A, Class A1 (c)
2.709% 8/15/47 | | | 472,627 | | | | 470,779 | |
Venture XVII CLO Ltd., Series 2014-17A, Class B2R, 3 mo. USD LIBOR + 1.600%, FRN (c)
2.959% 7/15/26 | | | 1,000,000 | | | | 1,001,904 | |
Westcott Park Clo Ltd., Series 2016-1A, Class D, 3 mo. USD LIBOR + 4.350%, FRN (c)
5.713% 7/20/28 | | | 500,000 | | | | 514,503 | |
| | | | | | | | |
| | | | | | | 43,903,415 | |
| | | | | | | | |
| Student Loans ABS — 0.1% | | | | | | | | |
SoFi Professional Loan Program LLC, Series 2017-D, Class BFX (c)
3.610% 9/25/40 | | | 350,000 | | | | 340,005 | |
| | | | | | | | |
| WL Collateral CMO — 8.9% | | | | | | | | |
CIM Trust, Series 2017-6, Class A1, VRN (b) (c)
3.015% 6/25/57 | | | 2,834,779 | | | | 2,799,349 | |
Citigroup Mortgage Loan Trust, Series 2007-AR5, Class 1A2A, VRN (b)
3.495% 4/25/37 | | | 3,025,576 | | | | 2,904,588 | |
CitiMortgage Alternative Loan Trust, Series 2006-A1, Class 1A5
5.500% 4/25/36 | | | 3,519,788 | | | | 3,414,108 | |
Countrywide Alternative Loan Trust, Series 2006-13T1, Class A11
6.000% 5/25/36 | | | 2,767,809 | | | | 2,260,172 | |
Countrywide Alternative Loan Trust, Series 2006-36T2, Class 2A1
6.250% 12/25/36 | | | 4,624,919 | | | | 3,360,600 | |
Countrywide Home Loans Mortgage Pass-Through Trust, Series 2007-HYB2, Class 3A1, VRN (b)
3.391% 2/25/47 | | | 2,130,452 | | | | 1,923,474 | |
Countrywide Home Loans Mortgage Pass-Through Trust, Series 2007-14, Class A6
6.000% 9/25/37 | | | 2,201,817 | | | | 1,970,017 | |
CSMC Trust, Series 2015-RPL3, Class A1, STEP (c)
3.750% 12/25/56 | | | 4,760,788 | | | | 4,769,890 | |
The accompanying notes are an integral part of the financial statements.
46
MML Dynamic Bond Fund – Portfolio of Investments (Continued)
| | | | | | | | |
| | | Principal
Amount | | | Value | |
HarborView Mortgage Loan Trust, Series 2006-11, Class A1A, 1 mo. USD LIBOR + .170%, FRN
1.665% 12/19/36 | | $ | 1,761,021 | | | $ | 1,519,093 | |
IndyMac INDX Mortgage Loan Trust, Series 2007-AR5, Class 2A1, VRN (b)
3.502% 5/25/37 | | | 3,562,115 | | | | 3,291,431 | |
Lehman XS Trust, Series 2007-12N, Class 1A3A, 1 mo. LIBOR +
.200%, FRN
1.528% 7/25/47 | | | 4,255,854 | | | | 3,154,770 | |
Morgan Stanley Mortgage Loan Trust, Series 2005-3AR, Class 2A1, VRN (b)
3.223% 7/25/35 | | | 809,213 | | | | 733,376 | |
Nomura Asset Acceptance Corp. Alternative Loan Trust, Series 2006-AR1, Class 2A1, VRN (b)
3.641% 2/25/36 | | | 3,550,015 | | | | 2,998,086 | |
RBSSP Resecuritization Trust, Series 2009-5, Class 2A3, VRN (b) (c)
6.500% 10/26/37 | | | 1,383,029 | | | | 1,179,508 | |
RFMSI Trust, Series 2007-S4, Class A5, 1 mo. USD LIBOR +
.600%, FRN
6.000% 4/25/37 | | | 638,643 | | | | 599,391 | |
Structured Adjustable Rate Mortgage Loan Trust, Series 2008-1, Class A2, VRN (b)
3.463% 10/25/37 | | | 1,943,445 | | | | 1,850,053 | |
Washington Mutual Mortgage Pass-Through Certificates Trust, Series 2006-4, Class 3A5, STEP
6.350% 5/25/36 | | | 1,541,427 | | | | 1,207,626 | |
| | | | | | | | |
| | | | | | | 39,935,532 | |
| | | | | | | | |
| WL Collateral PAC — 0.5% | | | | | | | | |
Countrywide Alternative Loan Trust, Series 2006-19CB, Class A15
6.000% 8/25/36 | | | 2,671,960 | | | | 2,374,713 | |
| | | | | | | | |
| | |
TOTAL NON-U.S. GOVERNMENT AGENCY OBLIGATIONS
(Cost $128,581,654) | | | | | | | 126,912,108 | |
| | | | | | | | |
|
| SOVEREIGN DEBT OBLIGATIONS — 2.3% | |
Chile Government International Bond
2.250% 10/30/22 | | | 150,000 | | | | 147,975 | |
Chile Government International Bond
3.125% 3/27/25 | | | 600,000 | | | | 610,200 | |
Chile Government International Bond
3.125% 1/21/26 | | | 600,000 | | | | 608,250 | |
| | | | | | | | |
| | | Principal
Amount | | | Value | |
Export-Import Bank of India, FRN (b) (d)
2.441% 8/21/22 | | $ | 200,000 | | | $ | 200,836 | |
Export-Import Bank of India (d)
3.125% 7/20/21 | | | 400,000 | | | | 401,735 | |
Export-Import Bank of India (d)
4.000% 1/14/23 | | | 200,000 | | | | 207,104 | |
Fondo MIVIVIENDA SA (c)
3.500% 1/31/23 | | | 150,000 | | | | 150,585 | |
Fondo MIVIVIENDA SA (d)
3.500% 1/31/23 | | | 200,000 | | | | 200,780 | |
Indonesia Government International Bond (d)
4.875% 5/05/21 | | | 700,000 | | | | 746,553 | |
Israel Government International Bond
2.875% 3/16/26 | | | 600,000 | | | | 598,447 | |
Israel Government International Bond
4.000% 6/30/22 | | | 400,000 | | | | 423,722 | |
Malaysia Sovereign Sukuk Bhd (d)
3.043% 4/22/25 | | | 500,000 | | | | 501,500 | |
Malaysia Sukuk Global Bhd (d)
3.179% 4/27/26 | | | 250,000 | | | | 251,850 | |
Mexico Government International Bond
4.000% 10/02/23 | | | 100,000 | | | | 104,650 | |
Mexico Government International Bond
4.125% 1/21/26 | | | 200,000 | | | | 208,500 | |
Mexico Government International Bond
4.150% 3/28/27 | | | 2,048,000 | | | | 2,123,776 | |
Panama Government International Bond
3.875% 3/17/28 | | | 500,000 | | | | 522,500 | |
Panama Government International Bond
4.000% 9/22/24 | | | 200,000 | | | | 212,700 | |
Perusahaan Penerbit SBSN Indonesia III (c)
4.150% 3/29/27 | | | 400,000 | | | | 413,040 | |
Perusahaan Penerbit SBSN Indonesia III (d)
4.150% 3/29/27 | | | 200,000 | | | | 206,520 | |
Philippine Government International Bond
3.700% 2/02/42 | | | 600,000 | | | | 595,905 | |
Philippine Government International Bond
4.200% 1/21/24 | | | 900,000 | | | | 977,503 | |
| | | | | | | | |
| | | | | | | 10,414,631 | |
| | | | | | | | |
| | |
TOTAL SOVEREIGN DEBT OBLIGATIONS
(Cost $10,356,157) | | | | | | | 10,414,631 | |
| | | | | | | | |
The accompanying notes are an integral part of the financial statements.
47
MML Dynamic Bond Fund – Portfolio of Investments (Continued)
| | | | | | | | |
| | | Principal
Amount | | | Value | |
| U.S. GOVERNMENT AGENCY OBLIGATIONS AND INSTRUMENTALITIES — 13.4% | |
| Collateralized Mortgage Obligations — 7.9% | | | | | |
Federal Home Loan Mortgage Corp. | | | | | | | | |
Series 4481, Class B
3.000% 12/15/42 | | $ | 7,419,241 | | | $ | 7,437,192 | |
Series 4483, Class CA
3.000% 6/15/44 | | | 6,907,076 | | | | 6,921,234 | |
Series 4750, Class PA
3.000% 7/15/46 | | | 3,000,000 | | | | 3,009,141 | |
Series 355, Class 300
3.000% 8/15/47 | | | 3,834,903 | | | | 3,824,808 | |
Series 358, Class 300
3.000% 10/15/47 | | | 3,419,612 | | | | 3,398,772 | |
Federal Home Loan Mortgage Corp. Multifamily Structured Pass Through Certificates | | | | | | | | |
Series K722, Class X1 VRN
1.311% 3/25/23 (b) | | | 6,701,851 | | | | 365,611 | |
Series K053, Class A2
2.995% 12/25/25 | | | 463,000 | | | | 469,402 | |
Series K050, Class A2 VRN
3.334% 8/25/25 (b) | | | 350,000 | | | | 363,289 | |
Federal National Mortgage Association | | | | | | | | |
Series 2016-M3, Class A2
2.702% 2/25/26 | | | 465,000 | | | | 458,682 | |
Series 2015-9, Class HA
3.000% 1/25/45 | | | 1,075,790 | | | | 1,085,888 | |
Government National Mortgage Association | | | | | | | | |
Series 2015-74, Class LZ
3.500% 5/20/45 | | | 3,134,873 | | | | 3,113,854 | |
Series 2015-92, Class CZ
3.500% 6/20/45 | | | 4,988,058 | | | | 4,966,517 | |
| | | | | | | | |
| | | | | | | 35,414,390 | |
| | | | | | | | |
| Pass-Through Securities — 5.5% | | | | | | | | |
Federal Home Loan Mortgage Corp. Pool #G08658 3.000%
8/01/45 | | | 4,023,682 | | | | 4,032,955 | |
Pool #G08632 3.500%
3/01/45 | | | 3,184,233 | | | | 3,278,765 | |
Federal National Mortgage Association Pool #AL9238 3.000%
10/01/41 | | | 4,443,833 | | | | 4,462,233 | |
Pool #MA2248 3.000%
4/01/45 | | | 2,773,727 | | | | 2,756,608 | |
Pool #AS7661 3.000%
8/01/46 | | | 1,760,426 | | | | 1,749,561 | |
Pool #MA2711 3.000%
8/01/46 | | | 6,198,908 | | | | 6,160,649 | |
Pool #AX2501 4.000%
10/01/44 | | | 2,472,139 | | | | 2,585,993 | |
| | | | | | | | |
| | | | | | | 25,026,764 | |
| | | | | | | | |
| | | | | | | | |
| | | Principal
Amount | | | Value | |
TOTAL U.S. GOVERNMENT AGENCY OBLIGATIONS AND INSTRUMENTALITIES
(Cost $60,418,736) | | | | | | $ | 60,441,154 | |
| | | | | | | | |
|
| U.S. TREASURY OBLIGATIONS — 24.2% | |
| U.S. Treasury Bonds & Notes — 24.2% | |
U.S. Treasury Bond
2.750% 11/15/42 | | $ | 5,875,000 | | | | 5,912,178 | |
U.S. Treasury Bond
2.875% 8/15/45 | | | 10,010,000 | | | | 10,267,288 | |
U.S. Treasury Inflation Index
0.125% 4/15/22 | | | 8,033,098 | | | | 7,976,528 | |
U.S. Treasury Note
0.750% 8/31/18 | | | 1,565,000 | | | | 1,555,402 | |
U.S. Treasury Note
0.750% 10/31/18 | | | 9,960,000 | | | | 9,877,519 | |
U.S. Treasury Note
1.125% 1/15/19 | | | 3,390,000 | | | | 3,365,237 | |
U.S. Treasury Note
1.125% 9/30/21 | | | 2,380,000 | | | | 2,296,514 | |
U.S. Treasury Note
1.250% 11/30/18 | | | 6,770,000 | | | | 6,736,547 | |
U.S. Treasury Note
1.250% 10/31/21 | | | 6,575,000 | | | | 6,370,045 | |
U.S. Treasury Note
1.750% 11/30/21 | | | 5,650,000 | | | | 5,571,430 | |
U.S. Treasury Note
1.750% 3/31/22 | | | 6,820,000 | | | | 6,708,110 | |
U.S. Treasury Note
1.875% 1/31/22 | | | 5,650,000 | | | | 5,591,734 | |
U.S. Treasury Note
1.875% 8/31/24 | | | 5,790,000 | | | | 5,634,620 | |
U.S. Treasury Note
2.000% 12/31/21 | | | 5,590,000 | | | | 5,562,487 | |
U.S. Treasury Note
2.125% 7/31/24 | | | 4,000,000 | | | | 3,952,656 | |
U.S. Treasury Note
2.125% 9/30/24 | | | 5,690,000 | | | | 5,618,208 | |
U.S. Treasury Note
2.250% 10/31/24 | | | 3,005,000 | | | | 2,991,031 | |
U.S. Treasury Note
2.250% 8/15/27 | | | 6,030,000 | | | | 5,945,674 | |
U.S. Treasury Note
2.375% 5/15/27 | | | 2,570,000 | | | | 2,562,772 | |
U.S. Treasury Note
3.625% 8/15/43 | | | 3,900,000 | | | | 4,551,727 | |
| | | | | | | | |
| | | | | | | 109,047,707 | |
| | | | | | | | |
| | |
TOTAL U.S. TREASURY OBLIGATIONS
(Cost $109,098,427) | | | | | | | 109,047,707 | |
| | | | | | | | |
| | |
TOTAL BONDS & NOTES
(Cost $420,296,065) | | | | | | | 419,729,675 | |
| | | | | | | | |
The accompanying notes are an integral part of the financial statements.
48
MML Dynamic Bond Fund – Portfolio of Investments (Continued)
| | | | | | | | |
| | | Number
of Shares | | | Value | |
| MUTUAL FUNDS — 2.6% | |
| Diversified Financial Services — 2.6% | |
DoubleLine Floating Rate Fund | | | 1,202,268 | | | $ | 11,926,498 | |
| | | | | | | | |
| | |
TOTAL MUTUAL FUNDS
(Cost $12,154,937) | | | | | | | 11,926,498 | |
| | | | | | | | |
| | |
TOTAL LONG-TERM INVESTMENTS
(Cost $432,469,806) | | | | | | | 431,669,827 | |
| | | | | | | | |
| | |
| | | Principal
Amount | | | | |
| SHORT-TERM INVESTMENTS — 4.2% | |
| Repurchase Agreement — 1.8% | | | | | | | | |
Fixed Income Clearing Corp., Repurchase Agreement, dated 12/29/17,
0.540%, due 1/02/18 (f) | | $ | 8,205,799 | | | | 8,205,799 | |
| | | | | | | | |
| Time Deposit — 0.2% | | | | | | | | |
Euro Time Deposit
0.120% 1/02/18 | | | 994,738 | | | | 994,738 | |
| | | | | | | | |
| U.S. Treasury Bill — 2.2% | | | | | | | | |
U.S. Treasury Bill
0.000% 3/08/18 | | | 6,750,000 | | | | 6,734,233 | |
U.S. Treasury Bill
0.000% 6/07/18 | | | 3,430,000 | | | | 3,408,188 | |
| | | | | | | | |
| | | | | | | 10,142,421 | |
| | | | | | | | |
| | |
TOTAL SHORT-TERM INVESTMENTS
(Cost $19,345,177) | | | | | | | 19,342,958 | |
| | | | | | | | |
| | |
| TOTAL INVESTMENTS — 99.9% (Cost $451,814,983) (g) | | | | | | | 451,012,785 | |
| | |
| Other Assets/(Liabilities) — 0.1% | | | | | | | 544,823 | |
| | | | | | | | |
| | |
| NET ASSETS — 100.0% | | | | | | $ | 451,557,608 | |
| | | | | | | | |
Abbreviation Legend
| CLO | Collateralized Loan Obligation |
| CMO | Collateralized Mortgage Obligation |
| CMT | Constant Maturity Treasury Index |
| MBS | Mortgage-Backed Security |
| PAC | Planned Amortization Class |
Notes to Portfolio of Investments
Percentages are stated as a percent of net assets.
| (a) | Non-income producing security. |
| (b) | Certain variable rate securities are not based on a published reference rate and spread but are determined by the issuer or agent and are based on current market conditions. These securities do not indicate a reference rate and spread in their description above. The rates shown are the current interest rates at December 31, 2017. |
| (c) | Securities exempt from registration under rule 144A of the Securities Act of 1933. These securities may be resold in transactions exempt from registration, normally to qualified institutional buyers. At December 31, 2017, these securities amounted to a value of $89,779,871 or 19.88% of net assets. |
| (d) | Security exempt from registration under Regulation S of the Securities Act of 1933, which exempts from registration securities offered and sold outside the United States. Security may not be offered or sold in the United States except pursuant to an exemption from, or in a transaction not subject to, the registration requirements of the Securities Act of 1933. At December 31, 2017, these securities amounted to a value of $26,238,086 or 5.81% of net assets. |
| (e) | A portion of this security is purchased on a when-issued, delayed-delivery or forward commitment basis. (Note 2). |
| (f) | Maturity value of $8,206,292. Collateralized by U.S. Government Agency obligations with a rate of 2.750%, maturity date of 2/15/24, and an aggregate market value, including accrued interest, of $8,372,244. |
| (g) | See Note 6 for aggregate cost for federal tax purposes. |
Country weightings, as a percentage of net assets, is as follows:
| | | | |
United States | | | 77.6 | % |
Cayman Islands | | | 7.0 | % |
Mexico | | | 1.2 | % |
Singapore | | | 1.1 | % |
Chile | | | 1.1 | % |
Malaysia | | | 0.8 | % |
United Kingdom | | | 0.7 | % |
Canada | | | 0.6 | % |
Panama | | | 0.6 | % |
Australia | | | 0.6 | % |
India | | | 0.6 | % |
Peru | | | 0.5 | % |
Philippines | | | 0.5 | % |
Netherlands | | | 0.4 | % |
British Virgin Islands | | | 0.4 | % |
Indonesia | | | 0.3 | % |
Japan | | | 0.3 | % |
Ireland | | | 0.3 | % |
Luxembourg | | | 0.2 | % |
Israel | | | 0.2 | % |
Bermuda | | | 0.2 | % |
Spain | | | 0.1 | % |
Switzerland | | | 0.1 | % |
France | | | 0.1 | % |
Barbados | | | 0.1 | % |
Liberia | | | 0.1 | % |
The accompanying notes are an integral part of the financial statements.
49
MML Dynamic Bond Fund – Portfolio of Investments (Continued)
Notes to Portfolio of Investments (Continued)
| | | | |
Dominican Republic | | | 0.0 | % |
Costa Rica | | | 0.0 | % |
Colombia | | | 0.0 | % |
| | | | |
Total Long-Term Investments | | | 95.7 | % |
Short-Term Investments and Other Assets and Liabilities | | | 4.3 | % |
| | | | |
Net Assets | | | 100.0 | % |
| | | | |
The accompanying notes are an integral part of the financial statements.
50
MML Equity Rotation Fund – Portfolio of Investments
December 31, 2017
| | | | | | | | |
| | | Number of
Shares | | | Value | |
| EQUITIES — 97.0% | |
|
| COMMON STOCK — 97.0% | |
| Basic Materials — 9.9% | | | | | | | | |
| Chemicals — 5.5% | | | | | | | | |
Celanese Corp. Series A | | | 7,700 | | | $ | 824,515 | |
Eastman Chemical Co. | | | 300 | | | | 27,792 | |
Huntsman Corp. | | | 25,200 | | | | 838,908 | |
Praxair, Inc. | | | 200 | | | | 30,936 | |
| | | | | | | | |
| | | | | | | 1,722,151 | |
| | | | | | | | |
| Iron & Steel — 3.2% | | | | | | | | |
ArcelorMittal (a) | | | 15,633 | | | | 505,103 | |
Nucor Corp. | | | 4,800 | | | | 305,184 | |
Reliance Steel & Aluminum Co. | | | 2,100 | | | | 180,159 | |
| | | | | | | | |
| | | | | | | 990,446 | |
| | | | | | | | |
| Mining — 1.2% | | | | | | | | |
Kaiser Aluminum Corp. | | | 1,600 | | | | 170,960 | |
Teck Resources Ltd. Class B | | | 8,200 | | | | 214,594 | |
| | | | | | | | |
| | | | | | | 385,554 | |
| | | | | | | | |
| | | | | | | 3,098,151 | |
| | | | | | | | |
| Communications — 12.8% | | | | | | | | |
| Advertising — 1.4% | | | | | | | | |
Omnicom Group, Inc. | | | 6,100 | | | | 444,263 | |
| | | | | | | | |
| Internet — 7.4% | | | | | | | | |
Alibaba Group Holding Ltd. Sponsored ADR (a) | | | 1,500 | | | | 258,645 | |
Alphabet, Inc. Class A (a) | | | 280 | | | | 294,952 | |
Alphabet, Inc. Class C (a) | | | 50 | | | | 52,320 | |
Amazon.com, Inc. (a) | | | 790 | | | | 923,881 | |
Facebook, Inc. Class A (a) | | | 3,110 | | | | 548,791 | |
VeriSign, Inc. (a) | | | 1,900 | | | | 217,436 | |
| | | | | | | | |
| | | | | | | 2,296,025 | |
| | | | | | | | |
| Media — 2.8% | | | | | | | | |
Discovery Communications, Inc. Class A (a) | | | 10,700 | | | | 239,466 | |
News Corp. Class A | | | 2,400 | | | | 38,904 | |
Scripps Networks Interactive, Inc. Class A | | | 2,600 | | | | 221,988 | |
TEGNA, Inc. | | | 10,000 | | | | 140,800 | |
Viacom, Inc. Class B | | | 8,000 | | | | 246,480 | |
| | | | | | | | |
| | | | | | | 887,638 | |
| | | | | | | | |
| Telecommunications — 1.2% | | | | | | | | |
Cisco Systems, Inc. | | | 6,000 | | | | 229,800 | |
Zayo Group Holdings, Inc. (a) | | | 3,900 | | | | 143,520 | |
| | | | | | | | |
| | | | | | | 373,320 | |
| | | | | | | | |
| | | | | | | 4,001,246 | |
| | | | | | | | |
| | | | | | | | |
| | | Number of
Shares | | | Value | |
| Consumer, Cyclical — 8.3% | | | | | | | | |
| Airlines — 0.7% | | | | | | | | |
Delta Air Lines, Inc. | | | 3,700 | | | $ | 207,200 | |
| | | | | | | | |
| Auto Manufacturers — 0.9% | | | | | | | | |
General Motors Co. | | | 6,800 | | | | 278,732 | |
| | | | | | | | |
| Auto Parts & Equipment — 3.1% | | | | | | | | |
Dana, Inc. | | | 8,000 | | | | 256,080 | |
The Goodyear Tire & Rubber Co. | | | 4,800 | | | | 155,088 | |
Lear Corp. | | | 1,490 | | | | 263,223 | |
Magna International, Inc. | | | 5,300 | | | | 300,351 | |
| | | | | | | | |
| | | | | | | 974,742 | |
| | | | | | | | |
| Home Builders — 2.1% | | | | | | | | |
PulteGroup, Inc. | | | 10,300 | | | | 342,475 | |
Toll Brothers, Inc. | | | 6,400 | | | | 307,328 | |
| | | | | | | | |
| | | | | | | 649,803 | |
| | | | | | | | |
| Home Furnishing — 0.5% | | | | | | | | |
Sony Corp. Sponsored ADR | | | 3,600 | | | | 161,820 | |
| | | | | | | | |
| Housewares — 0.5% | | | | | | | | |
The Toro Co. | | | 2,400 | | | | 156,552 | |
| | | | | | | | |
| Retail — 0.5% | | | | | | | | |
Domino’s Pizza, Inc. | | | 880 | | | | 166,285 | |
| | | | | | | | |
| | | | | | | 2,595,134 | |
| | | | | | | | |
| Consumer, Non-cyclical — 12.2% | | | | | | | | |
| Agriculture — 1.4% | | | | | | | | |
Archer-Daniels-Midland Co. | | | 11,100 | | | | 444,888 | |
| | | | | | | | |
| Biotechnology — 2.4% | | | | | | | | |
Amgen, Inc. | | | 2,090 | | | | 363,451 | |
Biogen, Inc. (a) | | | 680 | | | | 216,628 | |
Celgene Corp. (a) | | | 1,540 | | | | 160,714 | |
| | | | | | | | |
| | | | | | | 740,793 | |
| | | | | | | | |
| Commercial Services — 4.2% | | | | | | | | |
AerCap Holdings NV (a) | | | 2,000 | | | | 105,220 | |
ManpowerGroup, Inc. | | | 2,300 | | | | 290,053 | |
Quanta Services, Inc. (a) | | | 5,400 | | | | 211,194 | |
Vantiv, Inc. Class A (a) | | | 7,100 | | | | 522,205 | |
The Western Union Co. | | | 8,500 | | | | 161,585 | |
| | | | | | | | |
| | | | | | | 1,290,257 | |
| | | | | | | | |
| Health Care – Services — 1.0% | | | | | | | | |
Aetna, Inc. | | | 1,730 | | | | 312,075 | |
| | | | | | | | |
| Pharmaceuticals — 3.2% | | | | | | | | |
AbbVie, Inc. | | | 1,600 | | | | 154,736 | |
Express Scripts Holding Co. (a) | | | 4,400 | | | | 328,416 | |
Johnson & Johnson | | | 300 | | | | 41,916 | |
McKesson Corp. | | | 1,110 | | | | 173,104 | |
Merck & Co., Inc. | | | 4,900 | | | | 275,723 | |
Pfizer, Inc. | | | 800 | | | | 28,976 | |
| | | | | | | | |
| | | | | | | 1,002,871 | |
| | | | | | | | |
| | | | | | | 3,790,884 | |
| | | | | | | | |
The accompanying notes are an integral part of the financial statements.
51
MML Equity Rotation Fund – Portfolio of Investments (Continued)
| | | | | | | | |
| | | Number of
Shares | | | Value | |
| Energy — 8.1% | | | | | | | | |
| Oil & Gas — 8.1% | | | | | | | | |
Andeavor | | | 2,900 | | | $ | 331,586 | |
Apache Corp. | | | 400 | | | | 16,888 | |
Chevron Corp. | | | 7,820 | | | | 978,986 | |
Concho Resources, Inc. (a) | | | 1,000 | | | | 150,220 | |
Devon Energy Corp. | | | 6,000 | | | | 248,400 | |
Exxon Mobil Corp. | | | 3,900 | | | | 326,196 | |
Marathon Petroleum Corp. | | | 2,600 | | | | 171,548 | |
Occidental Petroleum Corp. | | | 2,700 | | | | 198,882 | |
Rowan Cos. PLC Class A (a) | | | 7,000 | | | | 109,620 | |
| | | | | | | | |
| | | | | | | 2,532,326 | |
| | | | | | | | |
| Financial — 22.4% | | | | | | | | |
| Banks — 19.3% | | | | | | | | |
Bank of America Corp. | | | 15,800 | | | | 466,416 | |
Citigroup, Inc. | | | 17,400 | | | | 1,294,734 | |
Citizens Financial Group, Inc. | | | 3,300 | | | | 138,534 | |
Comerica, Inc. | | | 8,400 | | | | 729,204 | |
The Goldman Sachs Group, Inc. | | | 1,910 | | | | 486,592 | |
JP Morgan Chase & Co. | | | 7,200 | | | | 769,968 | |
The PNC Financial Services Group, Inc. | | | 10,080 | | | | 1,454,443 | |
S&T Bancorp, Inc. | | | 4,514 | | | | 179,702 | |
State Street Corp. | | | 3,100 | | | | 302,591 | |
Wells Fargo & Co. | | | 500 | | | | 30,335 | |
Zions Bancorp | | | 3,200 | | | | 162,656 | |
| | | | | | | | |
| | | | | | | 6,015,175 | |
| | | | | | | | |
| Diversified Financial Services — 0.6% | | | | | | | | |
Legg Mason, Inc. | | | 2,900 | | | | 121,742 | |
Visa, Inc. Class A | | | 600 | | | | 68,412 | |
| | | | | | | | |
| | | | | | | 190,154 | |
| | | | | | | | |
| Insurance — 1.0% | | | | | | | | |
Aflac, Inc. | | | 1,800 | | | | 158,004 | |
Berkshire Hathaway, Inc. Class B (a) | | | 300 | | | | 59,466 | |
Torchmark Corp. | | | 700 | | | | 63,497 | |
The Travelers Cos., Inc. | | | 200 | | | | 27,128 | |
| | | | | | | | |
| | | | | | | 308,095 | |
| | | | | | | | |
| Savings & Loans — 1.5% | | | | | | | | |
BofI Holding, Inc. (a) | | | 5,200 | | | | 155,480 | |
Brookline Bancorp, Inc. | | | 19,000 | | | | 298,300 | |
| | | | | | | | |
| | | | | | | 453,780 | |
| | | | | | | | |
| | | | | | | 6,967,204 | |
| | | | | | | | |
| Industrial — 14.4% | | | | | | | | |
| Aerospace & Defense — 2.6% | | | | | | | | |
Lockheed Martin Corp. | | | 1,830 | | | | 587,522 | |
Spirit AeroSystems Holdings, Inc. Class A | | | 2,500 | | | | 218,125 | |
| | | | | | | | |
| | | | | | | 805,647 | |
| | | | | | | | |
| | | | | | | | |
| | | Number of
Shares | | | Value | |
| Building Materials — 1.7% | | | | | | | | |
Owens Corning | | | 5,900 | | | $ | 542,446 | |
| | | | | | | | |
| Electronics — 3.2% | | | | | | | | |
Corning, Inc. | | | 13,600 | | | | 435,064 | |
TE Connectivity Ltd. | | | 5,900 | | | | 560,736 | |
| | | | | | | | |
| | | | | | | 995,800 | |
| | | | | | | | |
| Hand & Machine Tools — 1.3% | | | | | | | | |
Regal Beloit Corp. | | | 5,100 | | | | 390,660 | |
| | | | | | | | |
| Machinery – Construction & Mining — 0.5% | |
BWX Technologies, Inc. | | | 2,800 | | | | 169,372 | |
| | | | | | | | |
| Machinery – Diversified — 2.5% | | | | | | | | |
Deere & Co. | | | 5,000 | | | | 782,550 | |
| | | | | | | | |
| Miscellaneous – Manufacturing — 2.5% | |
3M Co. | | | 400 | | | | 94,148 | |
A.O. Smith Corp. | | | 1,800 | | | | 110,304 | |
Eaton Corp. PLC | | | 7,100 | | | | 560,971 | |
| | | | | | | | |
| | | | | | | 765,423 | |
| | | | | | | | |
| Transportation — 0.1% | | | | | | | | |
Union Pacific Corp. | | | 200 | | | | 26,820 | |
| | | | | | | | |
| | | | | | | 4,478,718 | |
| | | | | | | | |
| Technology — 8.9% | | | | | | | | |
| Computers — 4.1% | | | | | | | | |
Apple, Inc. | | | 1,210 | | | | 204,768 | |
Check Point Software Technologies Ltd. (a) | | | 1,400 | | | | 145,068 | |
Leidos Holdings, Inc. | | | 2,100 | | | | 135,597 | |
NetApp, Inc. | | | 10,300 | | | | 569,796 | |
Seagate Technology PLC | | | 5,100 | | | | 213,384 | |
| | | | | | | | |
| | | | | | | 1,268,613 | |
| | | | | | | | |
| Semiconductors — 2.1% | | | | | | | | |
ASML Holding NV | | | 810 | | | | 140,794 | |
Broadcom Ltd. | | | 500 | | | | 128,450 | |
Micron Technology, Inc. (a) | | | 2,900 | | | | 119,248 | |
NXP Semiconductor NV (a) | | | 590 | | | | 69,083 | |
Skyworks Solutions, Inc. | | | 2,000 | | | | 189,900 | |
| | | | | | | | |
| | | | | | | 647,475 | |
| | | | | | | | |
| Software — 2.7% | | | | | | | | |
Cadence Design Systems, Inc. (a) | | | 11,300 | | | | 472,566 | |
Fidelity National Information Services, Inc. | | | 1,000 | | | | 94,090 | |
Intuit, Inc. | | | 1,360 | | | | 214,581 | |
The accompanying notes are an integral part of the financial statements.
52
MML Equity Rotation Fund – Portfolio of Investments (Continued)
| | | | | | | | |
| | | Number of
Shares | | | Value | |
Microsoft Corp. | | | 900 | | | $ | 76,986 | |
| | | | | | | | |
| | | | | | | 858,223 | |
| | | | | | | | |
| | | | | | | 2,774,311 | |
| | | | | | | | |
| | |
TOTAL COMMON STOCK
(Cost $23,956,734) | | | | | | | 30,237,974 | |
| | | | | | | | |
| | |
TOTAL EQUITIES
(Cost $23,956,734) | | | | | | | 30,237,974 | |
| | | | | | | | |
| | |
TOTAL LONG-TERM INVESTMENTS
(Cost $23,956,734) | | | | | | | 30,237,974 | |
| | | | | | | | |
| | |
| | | Principal
Amount | | | | |
| SHORT-TERM INVESTMENTS — 3.0% | |
| Repurchase Agreement — 3.0% | | | | | | | | |
Fixed Income Clearing Corp., Repurchase Agreement, dated 12/29/17, 0.540%, due 1/02/18 (b) | | $ | 945,117 | | | | 945,117 | |
| | | | | | | | |
| Time Deposit — 0.0% | | | | | | | | |
Euro Time Deposit 0.120% 1/02/18 | | | 2,498 | | | | 2,498 | |
| | | | | | | | |
| | |
TOTAL SHORT-TERM INVESTMENTS
(Cost $947,615) | | | | | | | 947,615 | |
| | | | | | | | |
| | |
TOTAL INVESTMENTS — 100.0%
(Cost $24,904,349) (c) | | | | | | | 31,185,589 | |
| | |
| Other Assets/(Liabilities) — (0.0)% | | | | | | | (5,418 | ) |
| | | | | | | | |
| | |
| NET ASSETS — 100.0% | | | | | | $ | 31,180,171 | |
| | | | | | | | |
Abbreviation Legend
| ADR | American Depositary Receipt |
Notes to Portfolio of Investments
Percentages are stated as a percent of net assets.
| (a) | Non-income producing security. |
| (b) | Maturity value of $945,174. Collateralized by U.S. Government Agency obligations with a rate of 2.750%, maturity date of 2/15/24, and an aggregate market value, including accrued interest, of $967,620. |
| (c) | See Note 6 for aggregate cost for federal tax purposes. |
The accompanying notes are an integral part of the financial statements.
53
MML High Yield Fund – Portfolio of Investments
December 31, 2017
| | | | | | | | |
| | | Number
of Shares | | | Value | |
| EQUITIES — 0.8% | |
|
| PREFERRED STOCK — 0.8% | |
| Consumer, Non-cyclical — 0.8% | | | | | | | | |
| Agriculture — 0.8% | | | | | | | | |
Pinnacle Agriculture Holdings LLC (a) | | | 1,144,535 | | | $ | 1,041,527 | |
| | | | | | | | |
| | |
TOTAL PREFERRED STOCK
(Cost $733,962) | | | | | | | 1,041,527 | |
| | | | | | | | |
| | |
TOTAL EQUITIES
(Cost $733,962) | | | | | | | 1,041,527 | |
| | | | | | | | |
| | |
| | | Principal
Amount | | | | |
| BONDS & NOTES — 95.9% | |
|
| BANK LOANS — 6.1% | |
| Coal — 0.5% | | | | | | | | |
Murray Energy Corp., Term Loan B2 3 mo. LIBOR + 7.250% VRN
8.943% 4/16/20 | | $ | 744,032 | | | | 652,888 | |
| | | | | | | | |
| Foods — 0.2% | | | | | | | | |
Del Monte Foods, Inc., 1st Lien Term Loan 3 mo. LIBOR + 3.250% VRN
5.723% 2/18/21 | | | 276,338 | | | | 219,492 | |
| | | | | | | | |
| Health Care – Services — 1.1% | | | | | | | | |
Centene Corp., Bridge Term Loan VRN (b) (c) (d) (h)
0.000% 9/13/18 | | | 1,500,000 | | | | 1,496,250 | |
| | | | | | | | |
| Oil & Gas — 3.3% | | | | | | | | |
Caelus Energy Alaska O3 LLC, 2nd Lien Term Loan 3 mo. LIBOR + 7.500% VRN
9.100% 4/15/20 | | | 3,139,220 | | | | 2,778,209 | |
Fieldwood Energy LLC, New 1st Lien Term Loan 3 mo. LIBOR + 7.000% VRN
8.693% 8/31/20 | | | 674,554 | | | | 607,099 | |
Fieldwood Energy LLC, 1st Lien Last Out Term Loan 3 mo. LIBOR + 7.125% VRN
8.818% 9/30/20 | | | 387,384 | | | | 266,005 | |
Fieldwood Energy LLC, 2nd Lien Term Loan 3 mo. LIBOR + 7.125% VRN
8.818% 9/30/20 | | | 863,087 | | | | 276,904 | |
Gulf Finance LLC, Term Loan B 3 mo. LIBOR + 5.250% VRN
6.950% 8/25/23 | | | 520,764 | | | | 466,303 | |
| | | | | | | | |
| | | | | | | 4,394,520 | |
| | | | | | | | |
| | | | | | | | |
| | | Principal
Amount | | | Value | |
| Software — 1.0% | | | | | | | | |
Almonde, Inc., USD 2nd Lien Term Loan 3 mo. LIBOR +
7.250% VRN
8.729% 6/13/25 | | $ | 1,411,101 | | | $ | 1,411,454 | |
| | | | | | | | |
| | |
TOTAL BANK LOANS
(Cost $8,945,574) | | | | | | | 8,174,604 | |
| | | | | | | | |
|
| CORPORATE DEBT — 89.8% | |
| Aerospace & Defense — 1.7% | | | | | | | | |
TransDigm, Inc.
6.375% 6/15/26 | | | 1,219,000 | | | | 1,231,190 | |
Triumph Group, Inc.
4.875% 4/01/21 | | | 422,000 | | | | 414,615 | |
Triumph Group, Inc.
5.250% 6/01/22 | | | 94,000 | | | | 92,120 | |
Triumph Group, Inc. (e)
7.750% 8/15/25 | | | 471,000 | | | | 499,849 | |
| | | | | | | | |
| | | | | | | 2,237,774 | |
| | | | | | | | |
| Agriculture — 1.2% | | | | | | | | |
Pinnacle Operating Corp. (e)
9.000% 5/15/23 | | | 1,667,522 | | | | 1,550,795 | |
| | | | | | | | |
| Airlines — 1.1% | | | | | | | | |
American Airlines Group, Inc. (e)
5.500% 10/01/19 | | | 1,391,000 | | | | 1,429,253 | |
| | | | | | | | |
| Apparel — 0.5% | | | | | | | | |
Perry Ellis International, Inc.
7.875% 4/01/19 | | | 730,000 | | | | 730,000 | |
| | | | | | | | |
| Auto Manufacturers — 3.5% | | | | | | | | |
Deck Chassis Acquisition, Inc. (e)
10.000% 6/15/23 | | | 2,013,000 | | | | 2,239,462 | |
JB Poindexter & Co., Inc. (e)
9.000% 4/01/22 | | | 2,398,000 | | | | 2,487,925 | |
| | | | | | | | |
| | | | | | | 4,727,387 | |
| | | | | | | | |
| Auto Parts & Equipment — 1.4% | | | | | | | | |
Allison Transmission, Inc. (e)
5.000% 10/01/24 | | | 294,000 | | | | 303,188 | |
International Automotive Components Group SA (e)
9.125% 6/01/18 | | | 1,654,000 | | | | 1,637,460 | |
| | | | | | | | |
| | | | | | | 1,940,648 | |
| | | | | | | | |
| Building Materials — 1.6% | | | | | | | | |
James Hardie International Finance DAC (e)
5.000% 1/15/28 | | | 685,000 | | | | 690,137 | |
Jeld-Wen, Inc. (e)
4.875% 12/15/27 | | | 182,000 | | | | 183,820 | |
Standard Industries, Inc. (e)
4.750% 1/15/28 | | | 1,345,000 | | | | 1,348,107 | |
| | | | | | | | |
| | | | | | | 2,222,064 | |
| | | | | | | | |
The accompanying notes are an integral part of the financial statements.
54
MML High Yield Fund – Portfolio of Investments (Continued)
| | | | | | | | |
| | | Principal
Amount | | | Value | |
| Chemicals — 4.0% | | | | | | | | |
A Schulman, Inc. STEP
6.875% 6/01/23 | | $ | 1,112,000 | | | $ | 1,156,480 | |
The Chemours Co.
5.375% 5/15/27 | | | 222,000 | | | | 229,770 | |
The Chemours Co.
7.000% 5/15/25 | | | 409,000 | | | | 443,765 | |
Consolidated Energy Finance SA (e)
6.750% 10/15/19 | | | 761,000 | | | | 774,318 | |
Consolidated Energy Finance SA (e)
6.875% 6/15/25 | | | 655,000 | | | | 694,300 | |
Kissner Holdings LP/Kissner Milling Co. Ltd./BSC Holding, Inc./Kissner USA (e)
8.375% 12/01/22 | | | 1,225,000 | | | | 1,237,250 | |
Platform Specialty Products Corp. (e)
5.875% 12/01/25 | | | 414,000 | | | | 410,895 | |
Platform Specialty Products Corp. (e)
6.500% 2/01/22 | | | 423,000 | | | | 437,276 | |
| | | | | | | | |
| | | | | | | 5,384,054 | |
| | | | | | | | |
| Coal — 1.6% | | | | | | | | |
Alliance Resource Operating Partners LP/Alliance Resource Finance Corp. (e)
7.500% 5/01/25 | | | 669,000 | | | | 710,812 | |
SunCoke Energy Partners LP/SunCoke Energy Partners Finance Corp. (e)
7.500% 6/15/25 | | | 1,013,000 | | | | 1,058,585 | |
Warrior Met Coal, Inc. (e)
8.000% 11/01/24 | | | 339,000 | | | | 350,018 | |
| | | | | | | | |
| | | | | | | 2,119,415 | |
| | | | | | | | |
| Commercial Services — 4.5% | | | | | | | | |
Booz Allen Hamilton, Inc. (e)
5.125% 5/01/25 | | | 404,000 | | | | 405,010 | |
Cardtronics, Inc./Cardtronics USA, Inc. (e)
5.500% 5/01/25 | | | 578,000 | | | | 521,645 | |
CSVC Acquisition Corp. (e)
7.750% 6/15/25 | | | 1,043,000 | | | | 996,065 | |
The Hertz Corp. (e)
7.625% 6/01/22 | | | 1,500,000 | | | | 1,571,250 | |
Prime Security Services Borrower LLC/Prime Finance, Inc. (e)
9.250% 5/15/23 | | | 1,121,000 | | | | 1,244,310 | |
StoneMor Partners LP/Cornerstone Family Services of West Virginia Subsidiary
7.875% 6/01/21 | | | 785,000 | | | | 769,300 | |
United Rentals North America, Inc.
4.625% 10/15/25 | | | 249,000 | | | | 250,867 | |
| | | | | | | | |
| | | Principal
Amount | | | Value | |
United Rentals North America, Inc.
4.875% 1/15/28 | | $ | 365,000 | | | $ | 366,825 | |
| | | | | | | | |
| | | | | | | 6,125,272 | |
| | | | | | | | |
| Computers — 0.4% | | | | | | | | |
Dell, Inc.
6.500% 4/15/38 | | | 529,000 | | | | 538,258 | |
| | | | | | | | |
| Diversified Financial Services — 4.4% | | | | | | | | |
Aircastle Ltd.
4.125% 5/01/24 | | | 857,000 | | | | 869,855 | |
Aircastle Ltd.
5.000% 4/01/23 | | | 113,000 | | | | 119,074 | |
Aircastle Ltd.
5.500% 2/15/22 | | | 113,000 | | | | 121,051 | |
Ally Financial, Inc.
8.000% 11/01/31 | | | 1,030,000 | | | | 1,339,000 | |
LPL Holdings, Inc. (e)
5.750% 9/15/25 | | | 1,364,000 | | | | 1,387,870 | |
Tempo Acquisition LLC/Tempo Acquisition Finance Corp. (e)
6.750% 6/01/25 | | | 704,000 | | | | 711,040 | |
VFH Parent LLC/Orchestra Co-Issuer, Inc. (e)
6.750% 6/15/22 | | | 1,269,000 | | | | 1,335,622 | |
| | | | | | | | |
| | | | | | | 5,883,512 | |
| | | | | | | | |
| Electric — 1.3% | | | | | | | | |
NextEra Energy Operating Partners LP (e)
4.250% 9/15/24 | | | 198,000 | | | | 201,465 | |
NRG Energy, Inc. (e)
5.750% 1/15/28 | | | 765,000 | | | | 772,650 | |
NRG Energy, Inc.
6.625% 1/15/27 | | | 702,000 | | | | 742,365 | |
| | | | | | | | |
| | | | | | | 1,716,480 | |
| | | | | | | | |
| Engineering & Construction — 0.8% | | | | | | | | |
Zachry Holdings, Inc. (e)
7.500% 2/01/20 | | | 1,090,000 | | | | 1,106,350 | |
| | | | | | | | |
| Entertainment — 0.8% | | | | | | | | |
AMC Entertainment Holdings, Inc. (e)
6.125% 5/15/27 | | | 109,000 | | | | 108,183 | |
WMG Acquisition Corp. (e)
5.000% 8/01/23 | | | 262,000 | | | | 271,170 | |
WMG Acquisition Corp. (e)
6.750% 4/15/22 | | | 700,000 | | | | 731,500 | |
| | | | | | | | |
| | | | | | | 1,110,853 | |
| | | | | | | | |
| Environmental Controls — 0.0% | | | | | | | | |
Core & Main LP (e)
6.125% 8/15/25 | | | 29,000 | | | | 29,435 | |
| | | | | | | | |
| Foods — 3.6% | | | | | | | | |
C&S Group Enterprises LLC (e)
5.375% 7/15/22 | | | 1,030,000 | | | | 970,775 | |
The accompanying notes are an integral part of the financial statements.
55
MML High Yield Fund – Portfolio of Investments (Continued)
| | | | | | | | |
| | | Principal
Amount | | | Value | |
JBS USA LUX SA/JBS USA Finance, Inc. (e)
5.875% 7/15/24 | | $ | 646,000 | | | $ | 624,198 | |
JBS USA LUX SA/JBS USA Finance, Inc. (e)
8.250% 2/01/20 | | | 962,000 | | | | 964,886 | |
KeHE Distributors LLC/KeHE Finance Corp. (e)
7.625% 8/15/21 | | | 650,000 | | | | 651,625 | |
Pilgrim’s Pride Corp. (e)
5.875% 9/30/27 | | | 420,000 | | | | 432,600 | |
Post Holdings, Inc. (e)
5.500% 3/01/25 | | | 309,000 | | | | 319,815 | |
Post Holdings, Inc. (e)
5.625% 1/15/28 | | | 468,000 | | | | 470,480 | |
Post Holdings, Inc. (e)
5.750% 3/01/27 | | | 382,000 | | | | 388,685 | |
| | | | | | | | |
| | | | | | | 4,823,064 | |
| | | | | | | | |
| Forest Products & Paper — 0.2% | | | | | | | | |
Appvion, Inc. (e) (f)
9.000% 6/01/20 | | | 2,157,000 | | | | 323,550 | |
| | | | | | | | |
| Gas — 0.9% | | | | | | | | |
LBC Tank Terminals Holding Netherlands BV (e)
6.875% 5/15/23 | | | 1,111,000 | | | | 1,156,829 | |
| | | | | | | | |
| Hand & Machine Tools — 0.4% | | | | | | | | |
Apex Tool Group LLC (e)
7.000% 2/01/21 | | | 561,000 | | | | 539,963 | |
| | | | | | | | |
| Health Care – Products — 3.5% | | | | | | | | |
Avantor, Inc. (e)
6.000% 10/01/24 | | | 652,000 | | | | 649,555 | |
Avantor, Inc. (e)
9.000% 10/01/25 | | | 1,397,000 | | | | 1,376,045 | |
Halyard Health, Inc.
6.250% 10/15/22 | | | 1,300,000 | | | | 1,345,500 | |
Ortho-Clinical Diagnostics, Inc./Ortho-Clinical Diagnostics SA (e)
6.625% 5/15/22 | | | 1,147,000 | | | | 1,152,735 | |
Teleflex, Inc.
4.625% 11/15/27 | | | 182,000 | | | | 183,556 | |
| | | | | | | | |
| | | | | | | 4,707,391 | |
| | | | | | | | |
| Health Care – Services — 2.3% | | | | | | | | |
CHS/Community Health Systems, Inc.
6.250% 3/31/23 | | | 567,000 | | | | 510,300 | |
HCA, Inc.
5.875% 2/15/26 | | | 1,138,000 | | | | 1,203,435 | |
RegionalCare Hospital Partners Holdings, Inc. (e)
8.250% 5/01/23 | | | 176,000 | | | | 185,680 | |
| | | | | | | | |
| | | Principal
Amount | | | Value | |
Tenet Healthcare Corp. (e)
4.625% 7/15/24 | | $ | 400,000 | | | $ | 390,000 | |
Tenet Healthcare Corp.
8.125% 4/01/22 | | | 340,000 | | | | 345,950 | |
West Street Merger Sub, Inc. (e)
6.375% 9/01/25 | | | 489,000 | | | | 490,222 | |
| | | | | | | | |
| | | | | | | 3,125,587 | |
| | | | | | | | |
| Home Builders — 0.4% | | | | | | | | |
Brookfield Residential Properties, Inc. (e)
6.375% 5/15/25 | | | 491,000 | | | | 520,460 | |
| | | | | | | | |
| Insurance — 1.7% | | | | | | | | |
Acrisure LLC/Acrisure Finance, Inc. (e)
7.000% 11/15/25 | | | 536,000 | | | | 516,575 | |
AssuredPartners, Inc. (e)
7.000% 8/15/25 | | | 514,000 | | | | 511,430 | |
USIS Merger Sub, Inc. (e)
6.875% 5/01/25 | | | 309,000 | | | | 312,090 | |
York Risk Services Holding Corp. (e)
8.500% 10/01/22 | | | 992,000 | | | | 967,200 | |
| | | | | | | | |
| | | | | | | 2,307,295 | |
| | | | | | | | |
| Internet — 1.5% | | | | | | | | |
TIBCO Software, Inc. (e)
11.375% 12/01/21 | | | 1,879,000 | | | | 2,046,945 | |
| | | | | | | | |
| Iron & Steel — 2.1% | | | | | | | | |
Allegheny Technologies, Inc.
5.950% 1/15/21 | | | 1,192,000 | | | | 1,215,840 | |
ArcelorMittal STEP
7.250% 3/01/41 | | | 767,000 | | | | 970,255 | |
Big River Steel LLC/BRS Finance Corp. (e)
7.250% 9/01/25 | | | 565,000 | | | | 597,487 | |
| | | | | | | | |
| | | | | | | 2,783,582 | |
| | | | | | | | |
| Leisure Time — 3.1% | | | | | | | | |
Brunswick Corp.
7.375% 9/01/23 | | | 285,000 | | | | 329,729 | |
Brunswick Corp.
7.125% 8/01/27 | | | 2,245,000 | | | | 2,687,486 | |
Carlson Travel, Inc. (e)
6.750% 12/15/23 | | | 496,000 | | | | 448,880 | |
Carlson Travel, Inc. (e)
9.500% 12/15/24 | | | 862,000 | | | | 693,910 | |
| | | | | | | | |
| | | | | | | 4,160,005 | |
| | | | | | | | |
| Lodging — 0.4% | | | | | | | | |
Wynn Las Vegas LLC/Wynn Las Vegas Capital Corp. (e)
5.250% 5/15/27 | | | 492,000 | | | | 498,765 | |
| | | | | | | | |
| Media — 6.7% | | | | | | | | |
Altice Financing SA (e)
6.625% 2/15/23 | | | 600,000 | | | | 628,260 | |
The accompanying notes are an integral part of the financial statements.
56
MML High Yield Fund – Portfolio of Investments (Continued)
| | | | | | | | |
| | | Principal
Amount | | | Value | |
Altice Finco SA (e)
8.125% 1/15/24 | | $ | 615,000 | | | $ | 642,675 | |
Altice Luxembourg SA (e)
7.625% 2/15/25 | | | 1,000,000 | | | | 957,500 | |
CCO Holdings LLC/CCO Holdings Capital Corp. (e)
5.000% 2/01/28 | | | 1,086,000 | | | | 1,056,135 | |
CCO Holdings LLC/CCO Holdings Capital Corp. (e)
5.875% 4/01/24 | | | 1,500,000 | | | | 1,563,750 | |
Clear Channel Worldwide Holdings, Inc.
7.625% 3/15/20 | | | 1,608,000 | | | | 1,575,840 | |
DISH DBS Corp.
7.750% 7/01/26 | | | 987,000 | | | | 1,037,584 | |
Midcontinent Communications/Midcontinent Finance Corp. (e)
6.875% 8/15/23 | | | 864,000 | | | | 916,920 | |
SFR Group SA (e)
6.000% 5/15/22 | | | 203,000 | | | | 205,537 | |
SFR Group SA (e)
6.250% 5/15/24 | | | 260,000 | | | | 260,650 | |
Sirius XM Radio, Inc. (e)
5.375% 7/15/26 | | | 167,000 | | | | 173,054 | |
| | | | | | | | |
| | | | | | | 9,017,905 | |
| | | | | | | | |
| Mining — 3.4% | | | | | | | | |
First Quantum Minerals Ltd. (e)
7.250% 4/01/23 | | | 659,000 | | | | 710,072 | |
First Quantum Minerals Ltd. (e)
7.500% 4/01/25 | | | 652,000 | | | | 707,420 | |
Hecla Mining Co.
6.875% 5/01/21 | | | 1,271,000 | | | | 1,302,775 | |
Kinross Gold Corp. (e)
4.500% 7/15/27 | | | 640,000 | | | | 644,000 | |
Kinross Gold Corp.
5.950% 3/15/24 | | | 441,000 | | | | 483,446 | |
Kinross Gold Corp.
6.875% 9/01/41 | | | 476,000 | | | | 538,475 | |
Northwest Acquisitions ULC/Dominion Finco, Inc. (e)
7.125% 11/01/22 | | | 139,000 | | | | 143,518 | |
| | | | | | | | |
| | | | | | | 4,529,706 | |
| | | | | | | | |
| Miscellaneous – Manufacturing — 1.0% | | | | | |
EnPro Industries, Inc.
5.875% 9/15/22 | | | 1,271,000 | | | | 1,323,429 | |
| | | | | | | | |
| Oil & Gas — 8.6% | | | | | | | | |
Chesapeake Energy Corp. (e)
8.000% 1/15/25 | | | 898,000 | | | | 906,980 | |
Chesapeake Energy Corp. (e)
8.000% 6/15/27 | | | 300,000 | | | | 288,000 | |
Citgo Holding, Inc. (e)
10.750% 2/15/20 | | | 1,677,000 | | | | 1,798,582 | |
| | | | | | | | |
| | | Principal
Amount | | | Value | |
EP Energy LLC/Everest Acquisition Finance, Inc. (e)
8.000% 2/15/25 | | $ | 1,081,000 | | | $ | 789,130 | |
EP Energy LLC/Everest Acquisition Finance, Inc.
9.375% 5/01/20 | | | 356,000 | | | | 300,820 | |
Hess Infrastructure Partners LP/Hess Infrastructure Partners Finance Corp. (e)
5.625% 2/15/26 | | | 375,000 | | | | 387,188 | |
Jupiter Resources, Inc. (e)
8.500% 10/01/22 | | | 2,310,000 | | | | 1,432,200 | |
Kosmos Energy Ltd. (e)
7.875% 8/01/21 | | | 1,823,000 | | | | 1,864,017 | |
PBF Holding Co. LLC/PBF Finance Corp.
7.000% 11/15/23 | | | 47,000 | | | | 48,880 | |
PBF Holding Co. LLC/PBF Finance Corp.
7.250% 6/15/25 | | | 925,000 | | | | 971,250 | |
Rowan Cos., Inc.
7.375% 6/15/25 | | | 244,000 | | | | 248,270 | |
Sunoco LP/Sunoco Finance Corp.
6.250% 4/15/21 | | | 1,200,000 | | | | 1,247,400 | |
Transocean, Inc.
6.800% 3/15/38 | | | 198,000 | | | | 158,895 | |
Transocean, Inc. STEP
9.350% 12/15/41 | | | 150,000 | | | | 145,125 | |
Tullow Oil PLC (e)
6.250% 4/15/22 | | | 1,045,000 | | | | 1,048,971 | |
| | | | | | | | |
| | | | | | | 11,635,708 | |
| | | | | | | | |
| Oil & Gas Services — 1.5% | | | | | | | | |
Jonah Energy LLC/Jonah Energy Finance Corp. (e)
7.250% 10/15/25 | | | 985,000 | | | | 992,388 | |
Welltec A/S (e)
9.500% 12/01/22 | | | 1,000,000 | | | | 1,005,000 | |
| | | | | | | | |
| | | | | | | 1,997,388 | |
| | | | | | | | |
| Packaging & Containers — 1.9% | | | | | | | | |
Coveris Holdings SA (e)
7.875% 11/01/19 | | | 2,641,000 | | | | 2,621,192 | |
| | | | | | | | |
| Pharmaceuticals — 2.5% | | | | | | | | |
Endo Dac/Endo Finance LLC/Endo Finco, Inc. STEP (e)
6.000% 2/01/25 | | | 681,000 | | | | 527,775 | |
Valeant Pharmaceuticals International, Inc. (e)
5.500% 3/01/23 | | | 452,000 | | | | 413,580 | |
Valeant Pharmaceuticals International, Inc. (e)
5.500% 11/01/25 | | | 277,000 | | | | 281,847 | |
The accompanying notes are an integral part of the financial statements.
57
MML High Yield Fund – Portfolio of Investments (Continued)
| | | | | | | | |
| | | Principal
Amount | | | Value | |
Valeant Pharmaceuticals International, Inc. (e)
5.875% 5/15/23 | | $ | 193,000 | | | $ | 179,008 | |
Valeant Pharmaceuticals International, Inc. (e)
6.125% 4/15/25 | | | 1,643,000 | | | | 1,503,345 | |
Valeant Pharmaceuticals International, Inc. (e)
6.500% 3/15/22 | | | 171,000 | | | | 179,550 | |
Valeant Pharmaceuticals International, Inc. (e)
7.000% 3/15/24 | | | 290,000 | | | | 310,300 | |
| | | | | | | | |
| | | | | | | 3,395,405 | |
| | | | | | | | |
| Pipelines — 2.1% | | | | | | | | |
Energy Transfer Equity LP
4.250% 3/15/23 | | | 1,364,000 | | | | 1,353,770 | |
Genesis Energy LP/Genesis Energy Finance Corp.
6.000% 5/15/23 | | | 1,171,000 | | | | 1,185,637 | |
Genesis Energy LP/Genesis Energy Finance Corp.
6.750% 8/01/22 | | | 270,000 | | | | 280,125 | |
| | | | | | | | |
| | | | | | | 2,819,532 | |
| | | | | | | | |
| Real Estate Investment Trusts (REITS) — 1.1% | | | | | |
MPT Operating Partnership LP / MPT Finance Corp.
5.000% 10/15/27 | | | 656,000 | | | | 668,300 | |
RHP Hotel Properties LP/RHP Finance Corp.
5.000% 4/15/23 | | | 789,000 | | | | 806,753 | |
| | | | | | | | |
| | | | | | | 1,475,053 | |
| | | | | | | | |
| Retail — 2.3% | | | | | | | | |
Beacon Escrow Corp. (e)
4.875% 11/01/25 | | | 623,000 | | | | 625,336 | |
Ferrellgas LP/Ferrellgas Finance Corp.
6.750% 1/15/22 | | | 500,000 | | | | 462,500 | |
Ferrellgas Partners LP/Ferrellgas Partners Finance Corp.
8.625% 6/15/20 | | | 742,000 | | | | 632,555 | |
Ferrellgas Partners LP/Ferrellgas Partners Finance Corp.
8.625% 6/15/20 | | | 449,000 | | | | 382,773 | |
Penske Automotive Group, Inc.
5.500% 5/15/26 | | | 1,000,000 | | | | 1,014,700 | |
| | | | | | | | |
| | | | | | | 3,117,864 | |
| | | | | | | | |
| Software — 0.8% | | | | | | | | |
j2 Cloud Services LLC/j2 Global Co-Obligor, Inc. (e)
6.000% 7/15/25 | | | 462,000 | | | | 486,255 | |
| | | | | | | | |
| | | Principal
Amount | | | Value | |
RP Crown Parent LLC (e)
7.375% 10/15/24 | | $ | 191,000 | | | $ | 200,073 | |
Veritas US, Inc./Veritas Bermuda Ltd. (e)
10.500% 2/01/24 | | | 430,000 | | | | 447,200 | |
| | | | | | | | |
| | | | | | | 1,133,528 | |
| | | | | | | | |
| Telecommunications — 6.2% | | | | | | | | |
Digicel Group Ltd. (e)
8.250% 9/30/20 | | | 300,000 | | | | 295,137 | |
Digicel Ltd. (e)
6.000% 4/15/21 | | | 1,025,000 | | | | 1,008,866 | |
GCI, Inc.
6.875% 4/15/25 | | | 1,550,000 | | | | 1,650,750 | |
Hughes Satellite Systems Corp.
5.250% 8/01/26 | | | 805,000 | | | | 821,100 | |
Hughes Satellite Systems Corp.
6.625% 8/01/26 | | | 272,000 | | | | 284,920 | |
Sprint Corp.
7.250% 9/15/21 | | | 745,000 | | | | 788,769 | |
Sprint Corp.
7.875% 9/15/23 | | | 1,578,000 | | | | 1,680,570 | |
T-Mobile USA, Inc.
6.000% 4/15/24 | | | 453,000 | | | | 480,180 | |
T-Mobile USA, Inc.
6.500% 1/15/26 | | | 679,000 | | | | 740,959 | |
Telecom Italia SpA (e)
5.303% 5/30/24 | | | 512,000 | | | | 546,560 | |
| | | | | | | | |
| | | | | | | 8,297,811 | |
| | | | | | | | |
| Toys, Games & Hobbies — 0.3% | | | | | | | | |
Mattel, Inc. 6.750% 12/31/25 (e)
6.750% 12/31/25 | | | 340,000 | | | | 344,573 | |
| | | | | | | | |
| Transportation — 2.5% | | | | | | | | |
The Kenan Advantage Group, Inc. (e)
7.875% 7/31/23 | | | 3,200,000 | | | | 3,312,000 | |
Watco Cos. LLC/Watco Finance Corp. (e)
6.375% 4/01/23 | | | 8,000 | | | | 8,280 | |
| | | | | | | | |
| | | | | | | 3,320,280 | |
| | | | | | | | |
| | |
| TOTAL CORPORATE DEBT (Cost $120,878,071) | | | | | | | 120,874,360 | |
| | | | | | | | |
| | |
TOTAL BONDS & NOTES
(Cost $129,823,645) | | | | | | | 129,048,964 | |
| | | | | | | | |
| | |
TOTAL LONG-TERM INVESTMENTS
(Cost $130,557,607) | | | | | | | 130,090,491 | |
| | | | | | | | |
The accompanying notes are an integral part of the financial statements.
58
MML High Yield Fund – Portfolio of Investments (Continued)
| | | | | | | | |
| | | Principal
Amount | | | Value | |
| SHORT-TERM INVESTMENTS — 3.9% | |
| Commercial Paper — 2.8% | | | | | | | | |
Mondelez International, Inc. (e)
1.876% 1/02/18 | | $ | 1,300,000 | | | $ | 1,299,759 | |
Tyco International Holding Sarl (e)
1.825% 1/02/18 | | | 2,500,000 | | | | 2,499,537 | |
| | | | | | | | |
| | | | | | | 3,799,296 | |
| | | | | | | | |
| Time Deposit — 1.1% | | | | | | | | |
Euro Time Deposit
0.120% 1/02/18 | | | 1,494,186 | | | | 1,494,186 | |
| | | | | | | | |
| | |
TOTAL SHORT-TERM INVESTMENTS
(Cost $5,293,994) | | | | | | | 5,293,482 | |
| | | | | | | | |
| | |
TOTAL INVESTMENTS — 100.6%
(Cost $135,851,601) (g) | | | | | | | 135,383,973 | |
| | |
| Less Unfunded Loan Commitments — (1.1)% | | | | | | $ | (1,500,000 | ) |
| | |
NET INVESTMENTS — 99.5%
(Cost $134,351,601) | | | | | | | 133,883,973 | |
| | |
| Other Assets/(Liabilities) — 0.5% | | | | | | | 682,257 | |
| | | | | | | | |
| | |
| NET ASSETS — 100.0% | | | | | | $ | 134,566,230 | |
| | | | | | | | |
Abbreviation Legend
Notes to Portfolio of Investments
Percentages are stated as a percent of net assets.
| (a) | Non-income producing security. |
| (b) | Certain variable rate securities are not based on a published reference rate and spread but are determined by the issuer or agent and are based on current market conditions. These securities do not indicate a reference rate and spread in their description above. The rates shown are the current interest rates at 12/31/17. |
| (c) | Investment was valued using significant unobservable inputs. |
| (d) | This security is fair valued in good faith in accordance with procedures approved by the Board of Trustees. At December 31, 2017, these securities amounted to a value of $1,496,250 or 1.11% of net assets. |
| (e) | Securities exempt from registration under rule 144A of the Securities Act of 1933. These securities may be resold in transactions exempt from registration, normally to qualified institutional buyers. At December 31, 2017, these securities amounted to a value of $83,850,520 or 62.31% of net assets. |
| (f) | Security is currently in default due to bankruptcy or failure to make payment of principal or interest of the issuer. Income is not being accrued. At December 31, 2017, these securities amounted to a value of $323,550 or 0.00% of net assets. |
| (g) | See Note 6 for aggregate cost for federal tax purposes. |
| (h) | Unfunded or partially unfunded loan commitments. |
Country weightings, as a percentage of net assets, is as follows:
| | | | |
United States | | | 76.2 | % |
Canada | | | 6.9 | % |
Luxembourg | | | 6.6 | % |
Bermuda | | | 3.2 | % |
Netherlands | | | 0.9 | % |
United Kingdom | | | 0.8 | % |
Denmark | | | 0.7 | % |
Ireland | | | 0.5 | % |
Italy | | | 0.4 | % |
France | | | 0.3 | % |
Cayman Islands | | | 0.2 | % |
| | | | |
Total Long-Term Investments | | | 96.7 | % |
Short-Term Investments and Other Assets and Liabilities | | | 3.3 | % |
| | | | |
Net Assets | | | 100.0 | % |
| | | | |
The accompanying notes are an integral part of the financial statements.
59
MML Inflation-Protected and Income Fund – Portfolio of Investments
December 31, 2017
| | | | | | | | |
| | | Principal
Amount | | | Value | |
| BONDS & NOTES — 133.5% | |
|
| CORPORATE DEBT — 2.1% | |
| Auto Manufacturers — 0.4% | | | | | | | | |
General Motors Financial Co., Inc. 3 mo. USD LIBOR + 2.060%, FRN
3.419% 1/15/19 | | $ | 1,720,000 | | | $ | 1,749,273 | |
| | | | | | | | |
| Banks — 0.2% | | | | | | | | |
MUFG Americas Holdings Corp. 3 mo. USD LIBOR + .570%, FRN
1.973% 2/09/18 | | | 1,130,000 | | | | 1,130,179 | |
| | | | | | | | |
| Computers — 0.7% | | | | | | | | |
Dell International LLC/EMC Corp. (a)
3.480% 6/01/19 | | | 1,100,000 | | | | 1,113,780 | |
Hewlett Packard Enterprise Co. 3 mo. USD LIBOR + 1.930%, FRN
3.273% 10/05/18 | | | 1,700,000 | | | | 1,721,699 | |
| | | | | | | | |
| | | | | | | 2,835,479 | |
| | | | | | | | |
| Diversified Financial Services — 0.4% | | | | | | | | |
Ally Financial, Inc.
3.600% 5/21/18 | | | 1,705,000 | | | | 1,710,115 | |
| | | | | | | | |
| Pharmaceuticals — 0.4% | | | | | | | | |
Allergan Funding SCS 3 mo. USD LIBOR + 1.080%, FRN
2.629% 3/12/18 | | | 1,750,000 | | | | 1,752,556 | |
| | | | | | | | |
| | |
TOTAL CORPORATE DEBT
(Cost $4,612,344) | | | | | | | 9,177,602 | |
| | | | | | | | |
|
| MUNICIPAL OBLIGATIONS — 0.0% | |
Louisiana State Public Facilities Authority, Series 2011-A, Class A2, 3 mo. USD LIBOR + 0.900%, FRN
2.267% 4/26/27 | | | 155,094 | | | | 155,662 | |
| | | | | | | | |
| | |
TOTAL MUNICIPAL OBLIGATIONS
(Cost $155,094) | | | | | | | 155,662 | |
| | | | | | | | |
|
| NON-U.S. GOVERNMENT AGENCY OBLIGATIONS — 39.1% | |
| Auto Floor Plan ABS — 0.5% | | | | | | | | |
Ally Master Owner Trust, Series 2015-2, Class A1, 1 mo. LIBOR + .570%, FRN
2.047% 1/15/21 | | | 1,200,000 | | | | 1,202,075 | |
Navistar Financial Dealer Note Master Owner Trust II, Series 2016-1, Class A, 1 mo. LIBOR + 1.350%, FRN (a)
2.902% 9/27/21 | | | 780,000 | | | | 784,507 | |
| | | | | | | | |
| | | | | | | 1,986,582 | |
| | | | | | | | |
| | | | | | | | |
| | | Principal
Amount | | | Value | |
| Automobile ABS — 12.5% | | | | | | | | |
Ally Auto Receivables Trust, Series 2017-5, Class A1
1.400% 12/17/18 | | $ | 1,364,169 | | | $ | 1,363,722 | |
American Credit Acceptance Receivables Trust, Series 2017-4, Class A (a)
2.000% 7/10/20 | | | 1,430,000 | | | | 1,429,421 | |
American Credit Acceptance Receivables Trust, Series 2016-2, Class A (a)
2.220% 7/13/20 | | | 31,254 | | | | 31,245 | |
American Credit Acceptance Receivables Trust, Series 2017-1, Class B (a)
2.390% 2/16/21 | | | 950,000 | | | | 949,957 | |
American Credit Acceptance Receivables Trust, Series 2017-4, Class C (a)
2.940% 1/10/24 | | | 1,450,000 | | | | 1,449,240 | |
AmeriCredit Automobile Receivables Trust, Series 2017-3, Class A1
1.400% 8/20/18 | | | 1,329,442 | | | | 1,329,208 | |
AmeriCredit Automobile Receivables Trust, Series 2017-4, Class A1
1.450% 11/19/18 | | | 2,435,204 | | | | 2,434,576 | |
Bank of The West Auto Trust, Series 2014-1, Class A4 (a)
1.650% 3/16/20 | | | 442,747 | | | | 442,527 | |
CFC LLC, Series 2015-1A, Class A (a)
1.750% 6/15/21 | | | 112,458 | | | | 112,269 | |
CFC LLC, Series 2014-2A, Class A (a)
1.440% 11/16/20 | | | 21,929 | | | | 21,912 | |
Chesapeake Funding II LLC, Series 2016-2A, Class A2, 1 mo. USD LIBOR + 1.000%, FRN (a)
2.477% 6/15/28 | | | 1,451,653 | | | | 1,459,658 | |
CPS Auto Trust, Series 2015-A, Class A (a) 1.530% 7/15/19 | | | 22,751 | | | | 22,746 | |
CPS Auto Trust, Series 2016-C, Class A (a) 1.620% 1/15/20 | | | 111,155 | | | | 110,994 | |
CPS Auto Trust, Series 2015-B, Class A (a) 1.650% 11/15/19 | | | 130,146 | | | | 130,070 | |
CPS Auto Trust, Series 2013-B, Class A (a) 1.820% 9/15/20 | | | 146,956 | | | | 146,889 | |
CPS Auto Trust, Series 2016-A, Class A (a) 2.250% 10/15/19 | | | 1,182,998 | | | | 1,183,538 | |
CPS Auto Trust, Series 2015-C, Class B (a)
2.550% 2/18/20 | | | 598,117 | | | | 598,069 | |
CPS Auto Trust, Series 2017-D, Class A (a) 1.870% 3/15/21 | | | 1,643,225 | | | | 1,639,654 | |
CPS Auto Trust, Series 2016-B, Class A (a) 2.070% 11/15/19 | | | 57,785 | | | | 57,771 | |
CPS Auto Trust, Series 2017-A, Class B (a) 2.680% 5/17/21 | | | 2,000,000 | | | | 2,001,327 | |
The accompanying notes are an integral part of the financial statements.
60
MML Inflation-Protected and Income Fund – Portfolio of Investments (Continued)
| | | | | | | | |
| | | Principal
Amount | | | Value | |
Drive Auto Receivables Trust, Series 2017-3, Class A1
1.450% 11/15/18 | | $ | 1,192,629 | | | $ | 1,192,539 | |
Drive Auto Receivables Trust, Series 2016-BA, Class B (a)
2.560% 6/15/20 | | | 164,401 | | | | 164,556 | |
Drive Auto Receivables Trust, Series 2017-1, Class C
2.840% 4/15/22 | | | 650,000 | | | | 652,746 | |
DT Auto Owner Trust, Series 2017-4A, Class A (a)
1.850% 8/17/20 | | | 1,780,157 | | | | 1,778,575 | |
DT Auto Owner Trust, Series 2017-3A, Class B (a)
2.400% 5/17/21 | | | 810,000 | | | | 806,105 | |
DT Auto Owner Trust, Series 2016-1A, Class B (a)
2.790% 5/15/20 | | | 59,029 | | | | 59,037 | |
Enterprise Fleet Financing LLC, Series 2017-3, Class A1 (a)
1.500% 10/22/18 | | | 2,266,890 | | | | 2,265,694 | |
Enterprise Fleet Financing LLC, Series 2016-1, Class A2 (a)
1.830% 9/20/21 | | | 491,576 | | | | 491,304 | |
Exeter Automobile Receivables Trust, Series 2016-3A, Class B (a)
2.840% 8/16/21 | | | 420,000 | | | | 417,174 | |
Exeter Automobile Receivables Trust, Series 2017-1A, Class B (a)
3.000% 12/15/21 | | | 700,000 | | | | 697,461 | |
First Investors Auto Owner Trust, Series 2016-1A, Class A1 (a)
1.920% 5/15/20 | | | 148,968 | | | | 148,954 | |
First Investors Auto Owner Trust, Series 2017-3A, Class A1 (a)
2.000% 3/15/22 | | | 2,071,110 | | | | 2,066,855 | |
First Investors Auto Owner Trust, Series 2017-3A, Class B (a)
2.720% 4/17/23 | | | 600,000 | | | | 597,119 | |
Flagship Credit Auto Trust, Series 2016-3, Class A1 (a)
1.610% 12/15/19 | | | 242,491 | | | | 242,186 | |
Flagship Credit Auto Trust, Series 2015-1, Class A (a)
1.630% 6/15/20 | | | 71,089 | | | | 70,969 | |
Flagship Credit Auto Trust, Series 2015-2, Class A (a)
1.980% 10/15/20 | | | 291,607 | | | | 291,633 | |
Flagship Credit Auto Trust, Series 2017-4, Class A (a)
2.070% 4/15/22 | | | 1,710,000 | | | | 1,705,923 | |
| | | | | | | | |
| | | Principal
Amount | | | Value | |
Flagship Credit Auto Trust, Series 2015-3, Class A (a)
2.380% 10/15/20 | | $ | 2,011,223 | | | $ | 2,014,797 | |
Flagship Credit Auto Trust, Series 2017-4, Class B (a)
2.660% 10/17/22 | | | 2,190,000 | | | | 2,180,401 | |
Flagship Credit Auto Trust, Series 2016-4, Class C (a)
2.710% 11/15/22 | | | 680,000 | | | | 667,901 | |
Flagship Credit Auto Trust, Series 2016-1, Class A (a)
2.770% 12/15/20 | | | 357,696 | | | | 358,910 | |
Flagship Credit Auto Trust, Series 2017-1, Class B (a)
2.830% 3/15/23 | | | 1,320,000 | | | | 1,322,816 | |
GLS Auto Receivables Trust, Series 2015-1A, Class A (a)
2.250% 12/15/20 | | | 73,761 | | | | 73,727 | |
Hertz Fleet Lease Funding LP, Series 2016-1, Class A1, 1 mo. USD LIBOR + 1.100%, FRN (a)
2.532% 4/10/30 | | | 1,131,677 | | | | 1,134,727 | |
NextGear Floorplan Master Owner Trust, Series 2016-1A, Class A1, 1 mo. LIBOR + 1.700%, FRN (a)
3.177% 4/15/21 | | | 960,000 | | | | 974,731 | |
OneMain Direct Auto Receivables Trust, Series 2017-2A, Class A (a)
2.310% 12/14/21 | | | 940,000 | | | | 939,175 | |
Oscar US Funding Trust II, Series 2015-1A, Class A4 (a)
2.440% 6/15/22 | | | 750,000 | | | | 747,688 | |
Oscar US Funding Trust IV, Series 2016-1A, Class A2B, 1 mo. USD LIBOR + 1.700%, FRN (a)
2.950% 7/15/20 | | | 181,617 | | | | 182,554 | |
Oscar US Funding Trust VI, Series 2017-1A, Class A3 (a)
2.820% 6/10/21 | | | 500,000 | | | | 499,768 | |
Oscar US Funding Trust VI, Series 2017-1A, Class A4 (a)
3.300% 5/10/24 | | | 420,000 | | | | 421,392 | |
Oscar US Funding Trust VII LLC, Series 2017-2A, Class A1 (a)
1.450% 10/10/18 | | | 940,589 | | | | 939,729 | |
Prestige Auto Receivables Trust, Series 2015-1, Class B (a)
2.040% 4/15/21 | | | 700,000 | | | | 699,639 | |
Santander Drive Auto Receivables Trust, Series 2017-3, Class A1
1.400% 10/15/18 | | | 1,312,853 | | | | 1,312,717 | |
The accompanying notes are an integral part of the financial statements.
61
MML Inflation-Protected and Income Fund – Portfolio of Investments (Continued)
| | | | | | | | |
| | | Principal
Amount | | | Value | |
Santander Drive Auto Receivables Trust, Series 2014-2, Class C
2.330% 11/15/19 | | $ | 963,850 | | | $ | 964,868 | |
Santander Drive Auto Receivables Trust, Series 2014-1, Class C
2.360% 4/15/20 | | | 63,568 | | | | 63,596 | |
Santander Drive Auto Receivables Trust, Series 2015-2, Class C
2.440% 4/15/21 | | | 1,200,000 | | | | 1,202,464 | |
Santander Retail Auto Lease Trust, Series 2017-A, Class A1 (a)
1.500% 11/20/18 | | | 5,502,493 | | | | 5,500,407 | |
Westlake Automobile Receivables Trust, Series 2016-2A, Class A2 (a)
1.570% 6/17/19 | | | 162,546 | | | | 162,477 | |
| | | | | | | | |
| | | | | | | 52,928,107 | |
| | | | | | | | |
| Commercial MBS — 0.1% | | | | | | | | |
GCCFC Commercial Mortgage Trust, Series 2006-GG7, Class AM, VRN (b)
5.767% 7/10/38 | | | 413,124 | | | | 417,242 | |
| | | | | | | | |
| Home Equity ABS — 0.0% | | | | | | | | |
ACE Securities Corp., Series 2005-HE5, Class M2, 1 mo. USD LIBOR + .735%, FRN
2.287% 8/25/35 | | | 109,256 | | | | 110,084 | |
| | | | | | | | |
| Other ABS — 13.3% | | | | | | | | |
321 Henderson Receivables I LLC, Series 2006-1A, Class A1, 1 mo. USD LIBOR + .200%, FRN (a)
1.677% 3/15/41 | | | 688,543 | | | | 673,627 | |
321 Henderson Receivables I LLC, Series 2006-2A, Class A1, 1 mo. USD LIBOR + .200%, FRN (a)
1.677% 6/15/41 | | | 1,878,529 | | | | 1,834,844 | |
321 Henderson Receivables I LLC, Series 2006-4A, Class A1, 1 mo. USD LIBOR + .200%, FRN (a)
1.677% 12/15/41 | | | 390,713 | | | | 381,571 | |
321 Henderson Receivables I LLC, Series 2007-1A, Class A1, 1 mo. USD LIBOR + .200%, FRN (a)
1.677% 3/15/42 | | | 758,817 | | | | 726,772 | |
321 Henderson Receivables II LLC, Series 2006-3A, Class A1, 1 mo. USD LIBOR + .200%, FRN (a)
1.450% 9/15/41 | | | 182,406 | | | | 172,483 | |
AIMCO CLO, Series 2015-AA, Class AR, 3 mo. USD LIBOR + 0.850%, FRN (a) (c)
2.572% 1/15/28 | | | 2,450,000 | | | | 2,450,000 | |
| | | | | | | | |
| | | Principal
Amount | | | Value | |
ARL First LLC, Series 2012-1A, Class A1, 1 mo. USD LIBOR + 1.750%, FRN (a)
3.227% 12/15/42 | | $ | 780,244 | | | $ | 786,082 | |
Avant Loans Funding Trust, Series 2017-B, Class A (a)
2.290% 6/15/20 | | | 1,650,809 | | | | 1,650,386 | |
Avery Point IV CLO Ltd., Series 2014-1A, Class AR, 3 mo. USD LIBOR + 1.100%, FRN (a)
2.467% 4/25/26 | | | 2,450,000 | | | | 2,452,906 | |
BCC Funding X LLC, Series 2015-1, Class A2 (a)
2.224% 10/20/20 | | | 148,048 | | | | 147,820 | |
Blackbird Capital Aircraft Lease Securitization Ltd., Series 2016-1A, Class AA, STEP (a)
2.487% 12/16/41 | | | 363,021 | | | | 359,653 | |
BlueVirgo Trust, Series 2015-1A, Class NOTE (a)
3.000% 12/15/22 | | | 771,423 | | | | 773,135 | |
Cazenovia Creek Funding I LLC, Series 2015-1A, Class A (a)
2.000% 12/10/23 | | | 381,631 | | | | 380,200 | |
CIFC Funding II Ltd., Series 2015-2A, Class AR, 3 mo. USD LIBOR + 0.780%, FRN (a)
2.420% 4/15/27 | | | 2,450,000 | | | | 2,447,540 | |
Citigroup Mortgage Loan Trust Asset Backed Pass-Through Certificates, Series 2005-OPT3, Class M2, 1 mo. USD LIBOR + .675%, FRN
2.227% 5/25/35 | | | 219,084 | | | | 219,502 | |
Consumer Installment Loan Trust, Series 2016-LD1, Class A (a)
3.960% 7/15/22 | | | 158,881 | | | | 159,261 | |
Countrywide Asset-Backed Certificates, Series 2004-5, Class 3A, 1 mo. USD LIBOR + .460%, FRN
2.012% 9/25/34 | | | 72,497 | | | | 72,234 | |
Diamond Resorts Owner Trust, Series 2013-1, Class A (a)
1.950% 1/20/25 | | | 355,327 | | | | 354,438 | |
Diamond Resorts Owner Trust, Series 2013-2, Class A (a)
2.270% 5/20/26 | | | 574,166 | | | | 572,594 | |
Diamond Resorts Owner Trust, Series 2015-1, Class A (a)
2.730% 7/20/27 | | | 87,807 | | | | 87,233 | |
Diamond Resorts Owner Trust, Series 2015-2, Class B (a)
3.540% 5/22/28 | | | 160,761 | | | | 159,602 | |
The accompanying notes are an integral part of the financial statements.
62
MML Inflation-Protected and Income Fund – Portfolio of Investments (Continued)
| | | | | | | | |
| | | Principal
Amount | | | Value | |
Dong Fang Container Finance II SPV Ltd., Series 2014-1A, Class A1 (a)
1.950% 11/25/39 | | $ | 183,333 | | | $ | 182,200 | |
Drug Royalty Corp., Inc., Series 2014-1, Class A1, 3 mo. USD LIBOR +
2.850%, FRN (a)
4.154% 7/15/23 | | | 316,496 | | | | 319,215 | |
Elara HGV Timeshare Issuer LLC, Series 2014-A, Class B, VRN (a) (b)
3.020% 2/25/27 | | | 244,981 | | | | 239,817 | |
Element Rail Leasing II LLC, Series 2016-1A, Class A1 (a)
3.968% 3/19/46 | | | 409,418 | | | | 415,783 | |
FNA Trust, Series 2015-1, Class A (a)
3.240% 12/10/23 | | | 204,038 | | | | 202,872 | |
Hilton Grand Vacations Trust, Series 2014-AA, Class A (a)
1.770% 11/25/26 | | | 149,849 | | | | 147,336 | |
LCM XIV LP, Series 14A, Class A, 3 mo. USD LIBOR + 1.150%, FRN (a)
2.509% 7/15/25 | | | 1,324,431 | | | | 1,326,264 | |
LCM XXIII Ltd., Series 23A, Class X, 3 mo. USD LIBOR + 1.200%, FRN (a)
2.563% 10/20/29 | | | 580,000 | | | | 580,541 | |
Long Beach Mortgage Loan Trust, Series 2005-WL1, Class M2, 1 mo. USD LIBOR + .825%, FRN
2.377% 6/25/35 | | | 176,526 | | | | 176,667 | |
Mariner Finance Issuance Trust, Series 2017-BA, Class A (a)
2.920% 12/20/29 | | | 1,600,000 | | | | 1,596,865 | |
Mariner Finance Issuance Trust, Series 2017-AA, Class A (a)
3.620% 2/20/29 | | | 770,000 | | | | 772,643 | |
Marlette Funding Trust, Series 2017-3A, Class A (a)
2.360% 12/15/24 | | | 608,209 | | | | 607,963 | |
Marlette Funding Trust, Series 2017-2A, Class A (a)
2.390% 7/15/24 | | | 788,691 | | | | 788,600 | |
Marlette Funding Trust, Series 2017-1A, Class A (a)
2.827% 3/15/24 | | | 1,456,922 | | | | 1,461,200 | |
Marlette Funding Trust, Series 2016-1A, Class A (a)
3.060% 1/17/23 | | | 304,720 | | | | 305,260 | |
Miramax LLC, Series 2014-1A, Class A2 (a)
3.340% 7/20/26 | | | 594,632 | | | | 595,118 | |
Morgan Stanley ABS Capital I, Inc. Trust, Series 2005-WMC4, Class M4, 1 mo. USD LIBOR + .945%, FRN
2.497% 4/25/35 | | | 58,071 | | | | 58,961 | |
| | | | | | | | |
| | | Principal
Amount | | | Value | |
MP CLO VII Ltd., Series 2015-1A, Class A1R, FRN (a) (b)
2.370% 4/18/27 | | $ | 1,900,000 | | | $ | 1,898,630 | |
MVW Owner Trust, Series 2017-1A, Class A (a)
2.420% 12/20/34 | | | 211,485 | | | | 209,552 | |
Nations Equipment Finance Funding II LLC, Series 2014-1A, Class A (a)
1.558% 7/20/18 | | | 4,037 | | | | 4,035 | |
Nations Equipment Finance Funding III LLC, Series 2016-1A, Class A (a)
3.610% 2/20/21 | | | 276,489 | | | | 276,806 | |
Navitas Equipment Receivables LLC, Series 2015-1, Class A2 (a)
2.120% 11/15/18 | | | 61,061 | | | | 61,026 | |
Neuberger Berman CLO XX Ltd., Series 2015-20A, Class AR, 3 mo. USD LIBOR + 0.800%, FRN (a)
2.162% 1/15/28 | | | 2,450,000 | | | | 2,450,140 | |
New Residential Advance Receivables Trust, Series 2016-T1, Class AT1 (a)
2.751% 6/15/49 | | | 250,000 | | | | 248,500 | |
New Residential Advance Receivables Trust, Series 2016-T2, Class AT2 (a)
2.575% 10/15/49 | | | 3,800,000 | | | | 3,763,710 | |
NYCTL Trust, Series 2016-A, Class A (a)
1.470% 11/10/29 | | | 1,039,037 | | | | 1,033,167 | |
OCP CLO Ltd., Series 2015-10A, Class A1R, FRN (a) (b)
2.191% 10/26/27 | | | 2,450,000 | | | | 2,453,856 | |
OHA Credit Partners XIII Ltd., Series 2016-13A, Class X, 3 mo. USD LIBOR + 1.250%, FRN (a)
2.613% 1/21/30 | | | 390,000 | | | | 390,140 | |
Orange Lake Timeshare Trust, Series 2016-A, Class A (a)
2.610% 3/08/29 | | | 467,241 | | | | 462,507 | |
Oxford Finance Funding Trust, Series 2014-1A, Class A (a)
3.475% 12/15/22 | | | 123,023 | | | | 122,343 | |
Oxford Finance Funding Trust, Series 2016-1A, Class A (a)
3.968% 6/17/24 | | | 500,000 | | | | 501,898 | |
RAAC, Series 2006-RP2, Class A, 1 mo. USD LIBOR + .250%, FRN (a)
1.802% 2/25/37 | | | 86,391 | | | | 86,204 | |
Sierra Receivables Funding Co. LLC, Series 2014-2A, Class A, VRN (a) (b)
2.050% 6/20/31 | | | 267,550 | | | | 266,497 | |
Sierra Receivables Funding Co. LLC, Series 2013-2A, Class A, VRN (a) (b)
2.280% 11/20/25 | | | 236,123 | | | | 236,031 | |
The accompanying notes are an integral part of the financial statements.
63
MML Inflation-Protected and Income Fund – Portfolio of Investments (Continued)
| | | | | | | | |
| | | Principal
Amount | | | Value | |
Sierra Receivables Funding Co. LLC, Series 2014-3A, Class A (a)
2.300% 10/20/31 | | $ | 285,813 | | | $ | 283,977 | |
Sierra Receivables Funding Co. LLC, Series 2015-3A, Class B (a)
3.080% 9/20/32 | | | 61,248 | | | | 60,913 | |
Sierra Timeshare Receivables Funding LLC, Series 2013-1A, Class A (a)
1.590% 11/20/29 | | | 81,858 | | | | 81,817 | |
Sierra Timeshare Receivables Funding LLC, Series 2015-2A, Class B (a)
3.020% 6/20/32 | | | 117,243 | | | | 114,723 | |
SoFi Consumer Loan Program LLC, Series 2016-3, Class A (a)
3.050% 12/26/25 | | | 506,557 | | | | 508,986 | |
SoFi Consumer Loan Program LLC, Series 2016-5, Class A (a)
3.060% 9/25/28 | | | 2,515,970 | | | | 2,522,234 | |
SoFi Consumer Loan Program LLC, Series 2016-2A, Class A (a)
3.090% 10/27/25 | | | 757,096 | | | | 760,853 | |
SoFi Consumer Loan Program LLC, Series 2016-1A, Class A (a)
3.260% 8/25/25 | | | 1,157,348 | | | | 1,164,101 | |
SoFi Consumer Loan Program LLC, Series 2017-2, Class A (a)
3.280% 2/25/26 | | | 1,006,000 | | | | 1,012,433 | |
SpringCastle America Funding LLC, Series 2016-AA, Class A (a)
3.050% 4/25/29 | | | 1,079,876 | | | | 1,086,573 | |
Springleaf Funding Trust, Series 2016-AA, Class A (a)
2.900% 11/15/29 | | | 1,830,000 | | | | 1,832,697 | |
SVO VOI Mortgage LLC, Series 2012-AA, Class A (a)
2.000% 9/20/29 | | | 584,398 | | | | 578,842 | |
Taco Bell Funding LLC, Series 2016-1A, Class A2I (a)
3.832% 5/25/46 | | | 839,375 | | | | 851,140 | |
TAL Advantage LLC, Series 2014-2A, Class A1 (a)
1.700% 5/20/39 | | | 108,351 | | | | 108,164 | |
Trafigura Securitisation Finance PLC, Series 2017-1A, Class A1, 1 mo. USD LIBOR + .850%, FRN (a)
2.327% 12/15/20 | | | 1,000,000 | | | | 1,003,860 | |
Trafigura Securitisation Finance PLC, Series 2017-1A, Class B, 1 mo. USD LIBOR + 1.700%, FRN (a)
3.177% 12/15/20 | | | 1,330,000 | | | | 1,336,191 | |
Trip Rail Master Funding LLC, Series 2017-1A, Class A1 (a)
2.709% 8/15/47 | | | 302,481 | | | | 301,298 | |
| | | | | | | | |
| | | Principal
Amount | | | Value | |
Westgate Resorts LLC, Series 2014-1A, Class A (a)
2.150% 12/20/26 | | $ | 207,758 | | | $ | 205,480 | |
Westgate Resorts LLC, Series 2015-1A, Class A (a)
2.750% 5/20/27 | | | 241,869 | | | | 241,774 | |
Westgate Resorts LLC, Series 2017-1A, Class A (a)
3.050% 12/20/30 | | | 731,869 | | | | 730,496 | |
Westgate Resorts LLC, Series 2015-2A, Class A (a)
3.200% 7/20/28 | | | 461,618 | | | | 460,813 | |
| | | | | | | | |
| | | | | | | 56,351,595 | |
| | | | | | | | |
| Student Loans ABS — 12.4% | | | | | | | | |
Academic Loan Funding Trust, Series 2013-1A, Class A, 1 mo. USD LIBOR + .800%, FRN (a)
2.352% 12/26/44 | | | 2,298,859 | | | | 2,287,551 | |
Access Group, Inc., Series 2005-2, Class A3, 3 mo. USD LIBOR + .180%, FRN
1.495% 11/22/24 | | | 148,507 | | | | 148,507 | |
AccessLex Institute, Series 2004-A, Class A2, 3 mo. USD LIBOR + .260%, FRN
1.627% 4/25/29 | | | 182 | | | | 182 | |
AccessLex Institute, Series 2003-A, Class A3, 3 mo. Treasury + 1.200%, FRN
2.550% 7/01/38 | | | 133,318 | | | | 125,689 | |
Brazos Higher Education Authority, Inc., Series 2006-2, Class A10, 3 mo. USD LIBOR + .120%, FRN
1.795% 6/25/26 | | | 450,000 | | | | 436,316 | |
CIT Education Loan Trust, Series 2005-1, Class A3, 3 mo. USD LIBOR + .120%, FRN
1.709% 3/15/26 | | | 417,602 | | | | 415,248 | |
College Loan Corp. Trust I, Series 2005-2, Class B, 3 mo. USD LIBOR + .490%, FRN
1.849% 1/15/37 | | | 604,236 | | | | 551,418 | |
Commonbond Student Loan Trust, Series 2017-AGS, Class A2, 1 mo. USD LIBOR + .850%, FRN (a)
2.402% 5/25/41 | | | 766,696 | | | | 771,544 | |
DRB Prime Student Loan Trust, Series 2015-A, Class A3
2.320% 4/25/30 | | | 98,605 | | | | 97,912 | |
DRB Prime Student Loan Trust, Series 2015-B, Class A3 (a)
2.540% 4/27/26 | | | 186,872 | | | | 184,473 | |
The accompanying notes are an integral part of the financial statements.
64
MML Inflation-Protected and Income Fund – Portfolio of Investments (Continued)
| | | | | | | | |
| | | Principal
Amount | | | Value | |
DRB Prime Student Loan Trust, Series 2016-B, Class A2 (a)
2.890% 6/25/40 | | $ | 665,584 | | | $ | 666,973 | |
DRB Prime Student Loan Trust, Series 2015-D, Class A1, 1 mo. USD LIBOR + 1.700%, FRN (a)
3.252% 1/25/40 | | | 835,733 | | | | 851,787 | |
DRB Prime Student Loan Trust, Series 2016-R, Class A1, 1 mo. USD LIBOR + 1.900%, FRN (a)
3.464% 10/25/44 | | | 1,583,514 | | | | 1,599,349 | |
DRB Prime Student Loan Trust, Series 2016-A, Class A1, 1 mo. USD LIBOR + 2.000%, FRN (a)
3.552% 4/25/40 | | | 246,792 | | | | 246,151 | |
Earnest Student Loan Program LLC, Series 2016-C, Class A1, 1 mo. USD LIBOR + 1.850%, FRN (a)
3.402% 10/27/36 | | | 939,793 | | | | 954,232 | |
Earnest Student Loan Program LLC, Series 2016-B, Class A1, 1 mo. USD LIBOR + 2.050%, FRN (a)
3.602% 2/26/35 | | | 680,516 | | | | 682,834 | |
ECMC Group Student Loan Trust, Series 2017-1A, Class A, 1 mo. USD LIBOR + 1.200%, FRN (a)
2.752% 12/27/66 | | | 1,893,045 | | | | 1,914,862 | |
ECMC Group Student Loan Trust, Series 2016-1A, Class A, 1 mo. USD LIBOR + 1.350%, FRN (a)
2.902% 7/26/66 | | | 1,216,588 | | | | 1,227,829 | |
Edlinc Student Loan Funding, Series 2017-A, Class A (Acquired 12/22/17, Cost $1,290,960), FRN (a) (b) (d) (e) (f)
3.350% 12/01/47 | | | 1,300,000 | | | | 1,290,960 | |
Edsouth Indenture No. 9 LLC, Series 2015-1, Class A, 1 mo. USD LIBOR + .800%, FRN (a)
2.352% 10/25/56 | | | 591,285 | | | | 591,653 | |
Educational Services of America, Series 2015-2, Class B, 1 mo. USD LIBOR + 1.500%, FRN (a)
3.052% 12/25/58 | | | 1,000,000 | | | | 941,768 | |
Goal Capital Funding Trust, Series 2010-1, Class A, 3 mo. USD LIBOR + .700%, FRN (a)
2.162% 8/25/48 | | | 440,371 | | | | 436,997 | |
JP Morgan Student Loan Trust, Series 2007-A, Class B, 3 mo. USD LIBOR + .350%, FRN (a)
1.664% 6/28/39 | | | 667,634 | | | | 636,823 | |
| | | | | | | | |
| | | Principal
Amount | | | Value | |
Kentucky Higher Education Student Loan Corp., Series 2015-1, Class A1, 1 mo. USD LIBOR + .750%, FRN
2.111% 12/01/31 | | $ | 450,648 | | | $ | 449,643 | |
KeyCorp Student Loan Trust, Series 2000-A, Class A2, 3 mo. USD LIBOR + .320%, FRN
1.782% 5/25/29 | | | 476,758 | | | | 470,460 | |
KeyCorp Student Loan Trust, Series 2006-A, Class 2A4, 3 mo. USD LIBOR + .310%, FRN
1.985% 9/27/35 | | | 691,414 | | | | 688,774 | |
Laurel Road Prime Student Loan Trust, Series 2017-C, Class A2A (a)
1.870% 11/25/42 | | | 980,000 | | | | 976,949 | |
Navient Private Education Loan Trust, Series 2016-3A, Class A2, 1 mo. USD LIBOR + .850%, FRN (a)
2.402% 6/25/65 | | | 750,000 | | | | 757,757 | |
Navient Private Education Loan Trust, Series 2015-AA, Class A2B, 1 mo. USD LIBOR + 1.200%, FRN (a)
2.677% 12/15/28 | | | 796,507 | | | | 812,123 | |
Navient Student Loan Trust, Series 2017-4A, Class A3, 1 mo. USD LIBOR + 1.000%, FRN (a)
2.552% 9/27/66 | | | 1,450,000 | | | | 1,463,832 | |
Navient Student Loan Trust, Series 2016-5A, Class A, 1 mo. USD LIBOR + 1.250%, FRN (a)
2.802% 6/25/65 | | | 2,636,912 | | | | 2,700,150 | |
Navient Student Loan Trust, Series 2016-6A, Class A3, 1 mo. USD LIBOR + 1.300%, FRN (a)
2.852% 3/25/66 | | | 2,200,000 | | | | 2,262,127 | |
Nelnet Private Education Loan Trust, Series 2016-A, Class A1A, 1 mo. USD LIBOR + 1.750%, FRN (a)
3.078% 12/26/40 | | | 836,217 | | | | 837,861 | |
Nelnet Student Loan Trust, Series 2006-2, Class A6, 3 mo. USD LIBOR + .120%, FRN
1.487% 4/25/31 | | | 650,000 | | | | 651,077 | |
Nelnet Student Loan Trust, Series 2006-2, Class B, 3 mo. USD LIBOR + .200%, FRN 1.567% 1/25/38 | | | 941,383 | | | | 884,454 | |
Nelnet Student Loan Trust, Series 2004-3, Class B, 3 mo. USD LIBOR + .350%, FRN 1.717% 10/25/40 | | | 1,550,897 | | | | 1,476,059 | |
Nelnet Student Loan Trust, Series 2005-2, Class B, 3 mo. USD LIBOR + .170%, FRN
1.828% 3/23/37 | | | 1,133,474 | | | | 1,048,314 | |
The accompanying notes are an integral part of the financial statements.
65
MML Inflation-Protected and Income Fund – Portfolio of Investments (Continued)
| | | | | | | | |
| | | Principal
Amount | | | Value | |
Nelnet Student Loan Trust, Series 2006-3, Class B, 3 mo. USD LIBOR + .250%, FRN
1.925% 6/25/41 | | $ | 454,555 | | | $ | 390,892 | |
Nelnet Student Loan Trust, Series 2010-4A, Class A, 1 mo. USD LIBOR + .800%, FRN (a)
2.128% 4/25/46 | | | 100,121 | | | | 101,131 | |
Nelnet Student Loan Trust, Series 2014-2A, Class B, 1 mo. USD LIBOR + 1.500%, FRN (a)
2.828% 6/25/41 | | | 375,000 | | | | 340,694 | |
SLC Private Student Loan Trust, Series 2006-A, Class A5, 3 mo. USD LIBOR + .170%, FRN
1.529% 7/15/36 | | | 565,202 | | | | 565,201 | |
SLC Student Loan Trust, Series 2006-2, Class B, 3 mo. USD LIBOR + .230%, FRN
1.819% 12/15/39 | | | 1,599,829 | | | | 1,482,581 | |
SLC Student Loan Trust, Series 2005-2, Class B, 3 mo. USD LIBOR + .280%, FRN
1.869% 3/15/40 | | | 2,313,260 | | | | 2,158,244 | |
SLM Private Education Loan Trust, Series 2011-A, Class A3, 1 mo. USD LIBOR + 2.500%, FRN (a)
3.977% 1/15/43 | | | 440,000 | | | | 456,752 | |
SLM Student Loan Trust, Series 2002-7, Class A11, 28 day ARS, FRN
0.500% 3/15/28 | | | 240,000 | | | | 240,000 | |
SLM Student Loan Trust, Series 2003-2, Class A7, 28 day ARS, FRN
0.500% 9/15/28 | | | 750,000 | | | | 750,000 | |
SLM Student Loan Trust, Series 2003-5, Class A9, 28 day ARS, FRN
0.500% 6/17/30 | | | 700,000 | | | | 700,000 | |
SLM Student Loan Trust, Series 2003-5, Class A7, 28 day ARS, FRN
0.500% 6/17/30 | | | 550,000 | | | | 550,000 | |
SLM Student Loan Trust, Series 2007-5, Class A6, 3 mo. USD LIBOR + .110%, FRN
1.477% 1/26/43 | | | 600,000 | | | | 573,473 | |
SLM Student Loan Trust, Series 2005-5, Class A4, 3 mo. USD LIBOR + .140%, FRN
1.507% 10/25/28 | | | 700,000 | | | | 697,331 | |
SLM Student Loan Trust, Series 2006-4, Class B, 3 mo. USD LIBOR + .200%, FRN
1.567% 1/25/70 | | | 449,753 | | | | 421,650 | |
| | | | | | | | |
| | | Principal
Amount | | | Value | |
SLM Student Loan Trust, Series 2006-5, Class B, 3 mo. USD LIBOR + .210%, FRN
1.577% 10/25/40 | | $ | 489,390 | | | $ | 461,427 | |
SLM Student Loan Trust, Series 2006-2, Class B, 3 mo. USD LIBOR +
.220%, FRN
1.587% 1/25/41 | | | 493,946 | | | | 458,066 | |
SLM Student Loan Trust, Series 2003-14, Class A6, 3 mo. USD LIBOR + .300%, FRN
1.667% 7/25/25 | | | 400,000 | | | | 398,868 | |
SLM Student Loan Trust, Series 2005-8, Class B, 3 mo. USD LIBOR + .310%, FRN
1.677% 1/25/55 | | | 492,765 | | | | 446,755 | |
SLM Student Loan Trust, Series 2004-3, Class B, 3 mo. USD LIBOR + .470%, FRN
1.837% 10/25/64 | | | 373,504 | | | | 327,088 | |
SLM Student Loan Trust, Series 2003-12, Class A5, 3 mo. USD LIBOR + .280%, FRN (a)
1.869% 9/15/22 | | | 39,610 | | | | 39,625 | |
SLM Student Loan Trust, Series 2004-3A, Class A6A, 3 mo. USD LIBOR + .550%, FRN (a)
1.917% 10/25/64 | | | 1,850,000 | | | | 1,829,845 | |
SLM Student Loan Trust, Series 2003-11, Class B, 3 mo. USD LIBOR + .650%, FRN
2.239% 12/15/38 | | | 550,270 | | | | 522,191 | |
SLM Student Loan Trust, Series 2005-6, Class A5B, 3 mo. USD LIBOR + 1.200%, FRN
2.567% 7/27/26 | | | 158,501 | | | | 159,268 | |
SMB Private Education Loan Trust, Series 2016-A, Class A1, 1 mo. USD LIBOR + .700%, FRN (a)
2.177% 5/15/23 | | | 203,132 | | | | 203,209 | |
SMB Private Education Loan Trust, Series 2016-C, Class A2B, 1 mo. USD LIBOR + 1.100%, FRN (a)
2.577% 9/15/34 | | | 380,000 | | | | 386,343 | |
SMB Private Education Loan Trust, Series 2014-A, Class A2A (a) 3.050% 5/15/26 | | | 727,805 | | | | 734,627 | |
SoFi Professional Loan Program LLC, Series 2016-C, Class A2A (a)
1.480% 5/26/31 | | | 635,825 | | | | 633,401 | |
SoFi Professional Loan Program LLC, Series 2016-B, Class A2A (a)
1.680% 3/25/31 | | | 645,788 | | | | 644,848 | |
The accompanying notes are an integral part of the financial statements.
66
MML Inflation-Protected and Income Fund – Portfolio of Investments (Continued)
| | | | | | | | |
| | | Principal
Amount | | | Value | |
SoFi Professional Loan Program LLC, Series 2017-F, Class A1FX (a)
2.050% 1/25/41 | | $ | 1,200,000 | | | $ | 1,196,987 | |
SoFi Professional Loan Program LLC, Series 2017-A, Class A1, 1 mo. USD LIBOR + .700%, FRN (a)
2.252% 3/26/40 | | | 1,233,521 | | | | 1,239,932 | |
SoFi Professional Loan Program LLC, Series 2015-A, Class A1, 1 mo. USD LIBOR + 1.200%, FRN (a)
2.529% 3/25/33 | | | 228,088 | | | | 231,426 | |
SoFi Professional Loan Program LLC, Series 2016-A, Class A1, 1 mo. USD LIBOR + 1.750%, FRN (a)
3.302% 8/25/36 | | | 729,451 | | | | 747,202 | |
| | | | | | | | |
| | | | | | | 52,629,695 | |
| | | | | | | | |
| WL Collateral CMO — 0.3% | | | | | | | | |
Credit Suisse First Boston Mortgage Securities Corp., Series 2005-CF1, Class M1, 1 mo. USD LIBOR +
.700%, FRN (a)
2.252% 3/25/45 | | | 179,379 | | | | 178,318 | |
JP Morgan Mortgage Trust, Series 2017-6, Class A5, VRN (a) (b)
3.500% 12/25/48 | | | 1,130,000 | | | | 1,145,528 | |
| | | | | | | | |
| | | | | | | 1,323,846 | |
| | | | | | | | |
| | |
TOTAL NON-U.S. GOVERNMENT AGENCY OBLIGATIONS
(Cost $164,994,340) | | | | | | | 165,747,151 | |
| | | | | | | | |
|
| U.S. GOVERNMENT AGENCY OBLIGATIONS AND INSTRUMENTALITIES — 1.5% | |
| Collateralized Mortgage Obligations — 0.8% | | | | | |
Federal Home Loan Mortgage Corp. Series 4491, Class B
3.000% 8/15/40 | | | 916,666 | | | | 923,595 | |
Series 4720, Class A
3.000% 3/15/41 | | | 766,456 | | | | 772,366 | |
Federal National Mortgage Association | | | | | | | | |
Series 2015-80, Class CA
3.000% 4/25/40 | | | 1,173,558 | | | | 1,178,774 | |
Series 2015-63, Class KA
3.000% 1/25/41 | | | 606,025 | | | | 609,884 | |
| | | | | | | | |
| | | | | | | 3,484,619 | |
| | | | | | | | |
| Pass-Through Securities — 0.2% | | | | | | | | |
Federal Home Loan Mortgage Corp.
Pool #1Q0239 1 year CMT + 2.245%, FRN
3.237% 3/01/37 | | | 609,932 | | | | 645,446 | |
Government National Mortgage Association II
Pool #82462 1 year CMT + 1.500%, FRN
2.375% 1/20/40 | | | 165,330 | | | | 170,356 | |
| | | | | | | | |
| | | | | | | 815,802 | |
| | | | | | | | |
| | | | | | | | |
| | | Principal
Amount | | | Value | |
| Whole Loans — 0.5% | | | | | | | | |
Federal Home Loan Mortgage Corp. Structured Agency Credit Risk Debt Notes Series 2015-DNA1, Class M1 1 mo. USD LIBOR + .900%, FRN
2.452% 10/25/27 | | $ | 77,547 | | | $ | 77,611 | |
Federal National Mortgage Association Connecticut Avenue Securities | | | | | | | | |
Series 2016-C06, Class 1M1 1 mo. USD LIBOR + 1.300%, FRN
2.852% 4/25/29 | | | 838,812 | | | | 847,092 | |
Series 2016-C05, Class 2M1 1 mo. USD LIBOR + 1.350%, FRN
2.902% 1/25/29 | | | 462,684 | | | | 465,208 | |
Series 2016-C04, Class 1M1 1 mo. USD LIBOR + 1.450%, FRN
3.002% 1/25/29 | | | 639,298 | | | | 644,998 | |
| | | | | | | | |
| | | | | | | 2,034,909 | |
| | | | | | | | |
| | |
TOTAL U.S. GOVERNMENT AGENCY OBLIGATIONS AND INSTRUMENTALITIES
(Cost $6,323,847) | | | | | | | 6,335,330 | |
| | | | | | | | |
|
| U.S. TREASURY OBLIGATIONS — 90.8% | |
| U.S. Treasury Bonds & Notes — 90.8% | | | | | |
U.S. Treasury Inflation Index (g)
0.125% 4/15/20 | | | 11,586,520 | | | | 11,562,759 | |
U.S. Treasury Inflation Index (g)
0.125% 4/15/21 | | | 17,973,925 | | | | 17,899,853 | |
U.S. Treasury Inflation Index (g)
0.125% 1/15/22 | | | 16,195,022 | | | | 16,129,786 | |
U.S. Treasury Inflation Index (g)
0.125% 4/15/22 | | | 18,561,324 | | | | 18,430,614 | |
U.S. Treasury Inflation Index (g)
0.125% 7/15/22 | | | 16,320,218 | | | | 16,298,319 | |
U.S. Treasury Inflation Index (g)
0.125% 1/15/23 | | | 16,873,984 | | | | 16,742,936 | |
U.S. Treasury Inflation Index (g)
0.125% 7/15/24 | | | 15,915,029 | | | | 15,728,027 | |
U.S. Treasury Inflation Index (g)
0.125% 7/15/26 | | | 13,995,216 | | | | 13,674,599 | |
U.S. Treasury Inflation Index (g)
0.250% 1/15/25 | | | 15,944,293 | | | | 15,803,156 | |
U.S. Treasury Inflation Index (g)
0.375% 7/15/23 | | | 16,280,678 | | | | 16,403,021 | |
U.S. Treasury Inflation Index (g)
0.375% 7/15/25 | | | 15,966,456 | | | | 15,990,857 | |
U.S. Treasury Inflation Index (g)
0.375% 1/15/27 | | | 12,253,831 | | | | 12,165,534 | |
U.S. Treasury Inflation Index (g)
0.375% 7/15/27 | | | 15,529,052 | | | | 15,446,370 | |
U.S. Treasury Inflation Index (g)
0.625% 7/15/21 | | | 11,491,620 | | | | 11,712,666 | |
The accompanying notes are an integral part of the financial statements.
67
MML Inflation-Protected and Income Fund – Portfolio of Investments (Continued)
| | | | | | | | |
| | | Principal
Amount | | | Value | |
U.S. Treasury Inflation Index (g)
0.625% 1/15/24 | | $ | 15,857,407 | | | $ | 16,135,059 | |
U.S. Treasury Inflation Index (g)
0.625% 1/15/26 | | | 14,014,624 | | | | 14,238,943 | |
U.S. Treasury Inflation Index (g)
0.625% 2/15/43 | | | 5,793,552 | | | | 5,668,918 | |
U.S. Treasury Inflation Index (g)
0.750% 2/15/42 | | | 7,646,938 | | | | 7,721,363 | |
U.S. Treasury Inflation Index (g)
0.750% 2/15/45 | | | 8,662,825 | | | | 8,706,263 | |
U.S. Treasury Inflation Index
0.875% 2/15/47 | | | 6,642,025 | | | | 6,902,034 | |
U.S. Treasury Inflation Index (g)
1.000% 2/15/46 | | | 6,371,165 | | | | 6,806,085 | |
U.S. Treasury Inflation Index (g) (h)
1.125% 1/15/21 | | | 14,907,004 | | | | 15,351,886 | |
U.S. Treasury Inflation Index (g)
1.250% 7/15/20 | | | 7,917,420 | | | | 8,175,230 | |
U.S. Treasury Inflation Index (g)
1.375% 2/15/44 | | | 7,937,925 | | | | 9,163,892 | |
U.S. Treasury Inflation Index (g)
1.750% 1/15/28 | | | 6,475,865 | | | | 7,278,470 | |
U.S. Treasury Inflation Index (g)
2.000% 1/15/26 | | | 8,326,760 | | | | 9,366,055 | |
U.S. Treasury Inflation Index (g)
2.125% 2/15/40 | | | 2,567,790 | | | | 3,341,285 | |
U.S. Treasury Inflation Index (g)
2.125% 2/15/41 | | | 4,516,784 | | | | 5,918,086 | |
U.S. Treasury Inflation Index (g)
2.375% 1/15/25 | | | 10,213,701 | | | | 11,639,098 | |
U.S. Treasury Inflation Index (g)
2.375% 1/15/27 | | | 6,360,432 | | | | 7,441,523 | |
U.S. Treasury Inflation Index (g)
2.500% 1/15/29 | | | 6,686,598 | | | | 8,111,092 | |
U.S. Treasury Inflation Index (g)
3.375% 4/15/32 | | | 2,779,360 | | | | 3,844,814 | |
U.S. Treasury Inflation Index (g)
3.625% 4/15/28 | | | 4,575,270 | | | | 6,002,980 | |
U.S. Treasury Inflation Index (g)
3.875% 4/15/29 | | | 6,722,106 | | | | 9,164,223 | |
| | | | | | | | |
| | | | | | | 384,965,796 | |
| | | | | | | | |
| | |
TOTAL U.S. TREASURY OBLIGATIONS
(Cost $383,260,715) | | | | | | | 384,965,796 | |
| | | | | | | | |
| | |
TOTAL BONDS & NOTES
(Cost $559,346,340) | | | | | | | 566,381,541 | |
| | | | | | | | |
| | |
TOTAL PURCHASED OPTIONS (#) — 0.4%
(Cost $1,705,754) | | | | | | | 1,627,707 | |
| | | | | | | | |
| | |
TOTAL LONG-TERM INVESTMENTS
(Cost $561,052,094) | | | | | | | 568,009,248 | |
| | | | | | | | |
| | | | | | | | |
| | | Principal
Amount | | | Value | |
| SHORT-TERM INVESTMENTS — 46.6% | |
| Commercial Paper — 46.5% | | | | | | | | |
Bell Canada (a)
1.936% 3/19/18 | | $ | 6,000,000 | | | $ | 5,975,733 | |
Carnival Corp. (a)
1.780% 2/12/18 | | | 6,000,000 | | | | 5,986,800 | |
CenterPoint Energy, Inc. (a)
1.578% 1/04/18 | | | 6,000,000 | | | | 5,998,324 | |
Deutsche Telekom AG (a)
1.615% 1/26/18 | | | 6,000,000 | | | | 5,991,250 | |
Dominion Resources, Inc. (a)
1.738% 4/09/18 | | | 6,000,000 | | | | 5,969,279 | |
Enbridge (US), Inc. (a)
1.987% 3/22/18 | | | 6,000,000 | | | | 5,975,086 | |
Entergy Corp. (a)
1.524% 1/02/18 | | | 5,000,000 | | | | 4,998,941 | |
Enterprise Products Operating LLC (a)
1.576% 1/18/18 | | | 6,000,000 | | | | 5,994,257 | |
Equifax, Inc. (a)
1.571% 1/22/18 | | | 6,000,000 | | | | 5,993,064 | |
FedEx Corp. (a)
1.525% 1/08/18 | | | 6,000,000 | | | | 5,997,182 | |
Florida Power & Light Co.
1.527% 1/23/18 | | | 6,000,000 | | | | 5,992,638 | |
FMC Technologies, Inc. (a)
1.575% 1/04/18 | | | 6,000,000 | | | | 5,998,324 | |
Fortive Corp. (a)
1.608% 1/16/18 | | | 6,000,000 | | | | 5,994,846 | |
Glencore Funding LLC (a)
1.629% 1/10/18 | | | 6,000,000 | | | | 5,996,430 | |
HP, Inc. (a)
1.566% 1/08/18 | | | 6,000,000 | | | | 5,997,610 | |
Hyundai Capital America (a)
1.506% 1/04/18 | | | 6,000,000 | | | | 5,998,324 | |
Marriott International (a)
1.596% 1/18/18 | | | 6,000,000 | | | | 5,994,257 | |
Marriott International (a)
1.596% 1/16/18 | | | 500,000 | | | | 499,571 | |
Molex Electronic Technologies (a)
1.656% 1/02/18 | | | 6,000,000 | | | | 5,998,754 | |
Molex Electronic Technologies (a)
2.038% 3/13/18 | | | 3,750,000 | | | | 3,734,491 | |
Nasdaq, Inc. (a)
1.650% 1/24/18 | | | 6,000,000 | | | | 5,992,551 | |
Public Sevice Enterprise Group, Inc. (a)
1.576% 1/22/18 | | | 6,000,000 | | | | 5,993,064 | |
Rogers Communications (a)
1.525% 1/11/18 | | | 6,000,000 | | | | 5,996,310 | |
Schlumberger Holdings (a)
1.608% 2/20/18 | | | 6,000,000 | | | | 5,984,144 | |
Sempra Energy Holdings (a)
1.960% 1/19/18 | | | 6,000,000 | | | | 5,993,959 | |
The accompanying notes are an integral part of the financial statements.
68
MML Inflation-Protected and Income Fund – Portfolio of Investments (Continued)
| | | | | | | | |
| | | Principal
Amount | | | Value | |
Spectra Energy Partners (a)
1.594% 1/05/18 | | $ | 6,000,000 | | | $ | 5,998,040 | |
Suncor Energy, Inc. (a)
1.547% 1/12/18 | | | 6,000,000 | | | | 5,996,019 | |
TELUS Corp. (a)
1.682% 1/22/18 | | | 6,000,000 | | | | 5,993,064 | |
Thomson Reuters Corp. (a)
1.629% 2/12/18 | | | 6,000,000 | | | | 5,986,575 | |
Time Warner, Inc. (a)
1.778% 1/29/18 | | | 6,000,000 | | | | 5,990,953 | |
Transcanada Pipelines Ltd. (a)
1.576% 1/09/18 | | | 6,000,000 | | | | 5,996,892 | |
Walgreens Boots Alliance, Inc.
1.619% 2/20/18 | | | 6,000,000 | | | | 5,984,409 | |
Westar Energy, Inc. (a)
2.114% 1/31/18 | | | 3,200,000 | | | | 3,194,861 | |
WPP CP Finance PLC (a)
1.726% 1/08/18 | | | 2,000,000 | | | | 1,999,061 | |
WPP CP Finance PLC (a)
1.827% 1/05/18 | | | 3,000,000 | | | | 2,999,020 | |
Xcel Energy, Inc. (a)
1.717% 4/23/18 | | | 6,000,000 | | | | 5,960,670 | |
| | | | | | | | |
| | | | | | | 197,144,753 | |
| | | | | | | | |
| Repurchase Agreement — 0.1% | | | | | | | | |
Fixed Income Clearing Corp. Repurchase Agreement, dated 12/29/17,
0.540%, due 1/02/18 (i) | | | 370,643 | | | | 370,643 | |
| | | | | | | | |
| Time Deposit — 0.0% | | | | | | | | |
Euro Time Deposit
0.120% 1/02/18 | | | 68,868 | | | | 68,868 | |
| | | | | | | | |
| | |
TOTAL SHORT-TERM INVESTMENTS
(Cost $197,629,461) | | | | | | | 197,584,264 | |
| | | | | | | | |
| | |
TOTAL INVESTMENTS — 180.5%
(Cost $758,681,555) (j) | | | | | | | 765,593,512 | |
| | |
| Other Assets/(Liabilities) — (80.5)% | | | | | | | (341,505,388 | ) |
| | | | | | | | |
| | |
| NET ASSETS — 100.0% | | | | | | $ | 424,088,124 | |
| | | | | | | | |
Abbreviation Legend
| CLO | Collateralized Loan Obligation |
| CMO | Collateralized Mortgage Obligation |
| CMT | Constant Maturity Treasury Index |
| MBS | Mortgage-Backed Security |
Notes to Portfolio of Investments
Percentages are stated as a percent of net assets.
| (a) | Securities exempt from registration under rule 144A of the Securities Act of 1933. These securities may be resold in transactions exempt from registration, normally to qualified institutional buyers. At December 31, 2017, these securities amounted to a value of $320,508,348 or 75.58% of net assets. |
| (b) | Certain variable rate securities are not based on a published reference rate and spread but are determined by the issuer or agent and are based on current market conditions. These securities do not indicate a reference rate and spread in their description above. The rates shown are the current interest rates at December 31, 2017. |
| (c) | A portion of this security is purchased on a when-issued, delayed-delivery or forward commitment basis. (Note 2). |
| (d) | Investment was valued using significant unobservable inputs. |
| (e) | This security is fair valued in good faith in accordance with procedures approved by the Board of Trustees. At December 31, 2017, these securities amounted to a value of $1,290,960 or 0.30% of net assets. |
| (f) | Restricted security. Certain securities are restricted as to resale. At December 31, 2017, these securities amounted to a value of $1,290,960 or 0.30% of net assets. The Fund generally bears the costs, if any, associated with the disposition of restricted securities. |
| (g) | All or a portion of this security is pledged as collateral for open reverse repurchase agreements. (Note 2). |
| (h) | A portion of this security is pledged/held as collateral for open futures contracts and open swap agreements. (Note 2). |
| (i) | Maturity value of $370,665. Collateralized by U.S. Government Agency obligations with a rate of 2.750%, maturity date of 2/15/24, and an aggregate market value, including accrued interest, of $382,909. |
| (j) | See Note 6 for aggregate cost for federal tax purposes. |
The accompanying notes are an integral part of the financial statements.
69
MML Inflation-Protected and Income Fund – Portfolio of Investments (Continued)
(#) The Fund had the following open Purchased Swaptions contracts at December 31, 2017:
Purchased Swaptions
| | | | | | | | | | | | | | | | | | | | | | | | | | | | |
| OTC Counterparty* | | Units | | | Notional
Amount | | | Expiration
Date | | Pay/
Receive
Exercise
Rate | | | Description | | Premiums
Purchased | | | Value | | | Unrealized
Appreciation/
(Depreciation) | |
| Call | |
| | | | | | | | |
| Barclays Bank PLC | | | 11,240,000 | | | | USD 11,240,000 | | | 12/13/32 | | | Receive | | | 3-Month USD LIBOR BBA 10 Year Swaption, Underlying swap terminates 12/15/42, Strike 2.44 | | $ | 561,913 | | | $ | 546,369 | | | $ | (15,544 | ) |
| Put | |
| | | | | | | | |
| Barclays Bank PLC | | | 22,880,000 | | | | USD 22,880,000 | | | 12/13/32 | | | Pay | | | 3-Month USD LIBOR BBA 10 Year Swaption, Underlying swap terminates 12/15/42, Strike 2.94 | | $ | 1,143,841 | | | $ | 1,081,338 | | | $ | (62,503 | ) |
| | | | | | | | | | | | | | | | | | | | | | | | | | | | |
| | | | | | | | | | | | | | | | | | $ | 1,705,754 | | | $ | 1,627,707 | | | $ | (78,047 | ) |
| | | | | | | | | | | | | | | | | | | | | | | | | | | | |
| * | Contracts are subject to a Master Netting Agreement. |
The Fund had the following open Futures contracts at December 31, 2017:
Futures
| | | | | | | | | | | | | | | | |
| | | Expiration
Date | | | Number of
Contracts | | | Notional
Amount | | | Value/ Net
Unrealized
Appreciation/
(Depreciation) | |
| Futures Contracts — Short | |
U.S. Treasury Long Bond | | | 3/20/18 | | | | 1 | | | $ | (152,536 | ) | | $ | (464 | ) |
U.S. Treasury Note 10 Year | | | 3/20/18 | | | | 51 | | | | (6,339,681 | ) | | | 13,290 | |
U.S. Treasury Ultra Long Bond | | | 3/20/18 | | | | 5 | | | | (837,016 | ) | | | (1,265 | ) |
U.S. Treasury Note 5 Year | | | 3/29/18 | | | | 29 | | | | (3,361,865 | ) | | | (6,893 | ) |
| | | | | | | | | | | | | | | | |
| | | $ | 4,668 | |
| | | | | | | | | | | | | | | | |
The Fund had the following open Swap agreements at December 31, 2017:
Swaps
| | | | | | | | | | | | | | | | | | | | | | | | | | | | |
| Counterparty | | Currency | | Notional
Amount | | | Expiration
Date | | | Payment
Frequency | | Receive (Pay)
Fixed Rate | | Deliverable on Default | | Unrealized
Appreciation
(Depreciation) | | | Premium
(Received)
Paid | | | Value | |
Credit Default Swaps — Sell Protection†† | |
OTC Swaps* | |
| Goldman Sachs International | | USD | | | 1,600,000 | | | | 5/11/63 | | | Monthly | | 3.000% | | CMBX.NA.BBB-.6†
(Rating: BBB-) | | $ | (235,096 | ) | | $ | 986 | | | $ | (234,110 | ) |
| Goldman Sachs International | | USD | | | 330,000 | | | | 5/11/63 | | | Monthly | | 3.000% | | CMBX.NA.BBB-.6†
(Rating: BBB-) | | | (21,846 | ) | | | (26,439 | ) | | | (48,285 | ) |
| Goldman Sachs International | | USD | | | 890,000 | | | | 5/11/63 | | | Monthly | | 3.000% | | CMBX.NA.BBB-.6†
(Rating: BBB-) | | | (53,150 | ) | | | (77,074 | ) | | | (130,224 | ) |
| JP Morgan Chase Bank N.A. | | USD | | | 690,000 | | | | 5/11/63 | | | Monthly | | 3.000% | | CMBX.NA.BBB-.6†
(Rating: BBB-) | | | (101,810 | ) | | | 849 | | | | (100,961 | ) |
| | | | | | | | | | | | | | | | | | | | | | | | | | | | |
| | $ | (411,902 | ) | | $ | (101,678 | ) | | $ | (513,580 | ) |
| | | | | | | | | | | | | | | | | | | | | | | | | | | | |
The accompanying notes are an integral part of the financial statements.
70
MML Inflation-Protected and Income Fund – Portfolio of Investments (Continued)
| | | | | | | | | | | | | | | | | | | | | | | | | | | | | | |
| | | | | | | | | |
| Counterparty | | Currency | | Notional
Amount | | | Expiration
Date | | | Payment
Frequency | | Payments Made
by Fund | | Payments
Received
by Fund | | | Unrealized
Appreciation
(Depreciation) | | | Premium
Received
(Paid) | | | Value | |
Interest Rate Swaps | |
OTC Swaps* | |
| Goldman Sachs International | | USD | | | 8,300,000 | | | | 1/13/18 | | | Pay at maturity | | 1.295% | | | USA-CPI-U | | | $ | 97,761 | | | $ | - | | | $ | 97,761 | |
| JP Morgan Chase Bank N.A. | | USD | | | 8,500,000 | | | | 2/17/18 | | | Pay at maturity | | 1.033% | | | USA-CPI-U | | | | 169,591 | | | | - | | | | 169,591 | |
| Bank of America N.A. | | USD | | | 8,600,000 | | | | 2/16/19 | | | Pay at maturity | | 2.195% | | | USA-CPI-U | | | | (40,404 | ) | | | - | | | | (40,404 | ) |
| Bank of America N.A. | | USD | | | 8,700,000 | | | | 10/31/19 | | | Pay at maturity | | 2.090% | | | USA-CPI-U | | | | 14,587 | | | | - | | | | 14,587 | |
| Bank of America N.A. | | USD | | | 8,500,000 | | | | 11/20/19 | | | Pay at maturity | | 2.012% | | | USA-CPI-U | | | | 6,121 | | | | - | | | | 6,121 | |
| JPMorgan Chase Bank N.A. | | USD | | | 17,000,000 | | | | 12/20/19 | | | Pay at maturity | | 1.910% | | | USA-CPI-U | | | | 29,297 | | | | - | | | | 29,297 | |
| | | | | | | | | | | | | | | | | | | | | | | | | | | | | | |
| | | $ | 276,953 | | | $ | - | | | $ | 276,953 | |
| | | | | | | | | | | | | | | | | | | | | | | | | | | | | | |
Collateral for swap agreements held by Goldman Sachs International amounted to $260,232 in securities, at December 31, 2017.
| * | Contracts are subject to a Master Netting Agreement. |
| † | Payment is based on a percentage of the index. Reference entities are a number of individual issuers comprising the index. |
| †† | For each credit derivative with sold protection, the credit ratings of the entities referenced, as rated by any rating organization, are included in the equivalent S&P Global Ratings. The reference entity rating represents the likelihood of a potential payment by the Fund if the referenced entity experiences a credit event as of period end. Notional amounts represent the maximum potential amount of future payments (undiscounted) the Fund could be required to make under the credit derivatives with sold protection. |
The Fund had the following open Reverse Repurchase agreements at December 31, 2017:
| | | | | | | | |
Description | | Value | | | Value
Including
Accrued
Interest | |
Agreement with BNP Paribas SA, dated 11/03/17, 1.430%, to be repurchased on demand until 2/02/18 at value plus accrued interest. | | $ | 74,574,500 | | | $ | 74,749,273 | |
Agreement with Daiwa Securities, dated 11/06/17, 1.430%, to be repurchased on demand until 2/06/18 at value plus accrued interest. | | | 58,105,000 | | | | 58,234,251 | |
Agreement with Goldman Sachs & Co., dated 11/03/17, 1.450%, to be repurchased on demand until 1/31/18 at value plus accrued interest. | | | 64,633,711 | | | | 64,784,653 | |
Agreement with HSBC Bank USA Inc., dated 12/05/17, 1.520%, to be repurchased on demand until 3/06/18 at value plus accrued interest. | | | 94,453,250 | | | | 94,560,927 | |
Agreement with Morgan Stanley & Co. LLC, dated 10/04/17, 1.360%, to be repurchased on demand until 1/03/18 at value plus accrued interest. | | | 44,526,425 | | | | 44,676,133 | |
| | | | | | | | |
| | $ | 336,292,886 | | | $ | 337,005,237 | |
| | | | | | | | |
Currency Legend
USD U.S. Dollar
The accompanying notes are an integral part of the financial statements.
71
MML Short-Duration Bond Fund – Portfolio of Investments
December 31, 2017
| | | | | | | | |
| | | Principal
Amount | | | Value | |
| BONDS & NOTES — 79.9% | |
| | |
| CORPORATE DEBT — 43.5% | | | | | | | | |
| Aerospace & Defense — 0.8% | |
Harris Corp.
2.700% 4/27/20 | | $ | 1,154,000 | | | $ | 1,158,639 | |
L3 Technologies, Inc.
5.200% 10/15/19 | | | 885,000 | | | | 926,963 | |
| | | | | | | | |
| | | | | | | 2,085,602 | |
| | | | | | | | |
| Agriculture — 0.9% | |
Bunge Ltd. Finance Corp.
3.500% 11/24/20 | | | 1,180,000 | | | | 1,204,616 | |
Imperial Brands Finance PLC (a)
2.950% 7/21/20 | | | 1,087,000 | | | | 1,097,493 | |
| | | | | | | | |
| | | | | | | 2,302,109 | |
| | | | | | | | |
| Airlines — 0.3% | |
American Airlines Pass-Through Trust, Series 2014-1, Class B
4.375% 4/01/24 | | | 29,513 | | | | 30,144 | |
Delta Air Lines, Inc.
3.625% 3/15/22 | | | 775,000 | | | | 788,390 | |
| | | | | | | | |
| | | | | | | 818,534 | |
| | | | | | | | |
| Auto Manufacturers — 1.0% | |
General Motors Co.
3.500% 10/02/18 | | | 205,000 | | | | 207,132 | |
General Motors Financial Co., Inc.
2.400% 5/09/19 | | | 110,000 | | | | 110,027 | |
General Motors Financial Co., Inc.
3.100% 1/15/19 | | | 520,000 | | | | 522,783 | |
General Motors Financial Co., Inc.
3.200% 7/13/20 | | | 185,000 | | | | 187,511 | |
Hyundai Capital America (a)
2.000% 7/01/19 | | | 65,000 | | | | 64,222 | |
Hyundai Capital America (a)
2.550% 2/06/19 | | | 140,000 | | | | 139,754 | |
Hyundai Capital America (a)
3.000% 10/30/20 | | | 800,000 | | | | 798,712 | |
Nissan Motor Acceptance Corp. (a)
1.900% 9/14/21 | | | 480,000 | | | | 466,969 | |
| | | | | | | | |
| | | | | | | 2,497,110 | |
| | | | | | | | |
| Auto Parts & Equipment — 0.5% | |
Lear Corp.
5.375% 3/15/24 | | | 1,120,000 | | | | 1,184,677 | |
| | | | | | | | |
| Banks — 6.5% | | | | | | | | |
ANZ New Zealand Int’l Ltd. (a)
2.250% 2/01/19 | | | 1,290,000 | | | | 1,289,822 | |
Banco Santander SA
3.500% 4/11/22 | | | 1,200,000 | | | | 1,223,577 | |
Bancolombia SA
5.950% 6/03/21 | | | 345,000 | | | | 373,118 | |
| | | | | | | | |
| | | Principal
Amount | | | Value | |
Bank of America Corp.
2.151% 11/09/20 | | $ | 2,070,000 | | | $ | 2,060,520 | |
Capital One Financial Corp.
2.500% 5/12/20 | | | 365,000 | | | | 364,543 | |
Citigroup, Inc.
2.350% 8/02/21 | | | 1,155,000 | | | | 1,142,409 | |
Citigroup, Inc.
2.450% 1/10/20 | | | 35,000 | | | | 35,016 | |
First Horizon National Corp.
3.500% 12/15/20 | | | 1,430,000 | | | | 1,460,289 | |
The Goldman Sachs Group, Inc.
2.875% 2/25/21 | | | 2,360,000 | | | | 2,377,449 | |
Itau Unibanco Holding SA (a)
2.850% 5/26/18 | | | 270,000 | | | | 270,270 | |
JP Morgan Chase & Co.
4.500% 1/24/22 | | | 1,090,000 | | | | 1,166,357 | |
Macquarie Bank Ltd. (a)
2.850% 1/15/21 | | | 130,000 | | | | 130,680 | |
Mitsubishi UFJ Trust & Banking Corp. (a)
2.650% 10/19/20 | | | 1,110,000 | | | | 1,111,641 | |
Morgan Stanley
3.750% 2/25/23 | | | 550,000 | | | | 569,999 | |
Regions Bank
7.500% 5/15/18 | | | 130,000 | | | | 132,603 | |
Regions Financial Corp.
3.200% 2/08/21 | | | 1,095,000 | | | | 1,114,119 | |
Sumitomo Mitsui Financial Group, Inc.
2.058% 7/14/21 | | | 585,000 | | | | 573,308 | |
Sumitomo Mitsui Financial Group, Inc.
2.846% 1/11/22 | | | 150,000 | | | | 150,298 | |
SVB Financial Group
5.375% 9/15/20 | | | 75,000 | | | | 80,158 | |
Turkiye Garanti Bankasi AS (a)
4.750% 10/17/19 | | | 370,000 | | | | 375,557 | |
| | | | | | | | |
| | | | | | | 16,001,733 | |
| | | | | | | | |
| Beverages — 0.6% | | | | | | | | |
Anheuser-Busch InBev Finance, Inc.
2.650% 2/01/21 | | | 710,000 | | | | 713,563 | |
Coca-Cola Femsa SAB de CV
2.375% 11/26/18 | | | 492,000 | | | | 493,190 | |
Molson Coors Brewing Co.
2.100% 7/15/21 | | | 330,000 | | | | 323,443 | |
| | | | | | | | |
| | | | | | | 1,530,196 | |
| | | | | | | | |
| Biotechnology — 0.7% | | | | | | | | |
Baxalta, Inc.
2.000% 6/22/18 | | | 485,000 | | | | 484,888 | |
Celgene Corp.
2.875% 8/15/20 | | | 1,170,000 | | | | 1,180,904 | |
| | | | | | | | |
| | | | | | | 1,665,792 | |
| | | | | | | | |
The accompanying notes are an integral part of the financial statements.
72
MML Short-Duration Bond Fund – Portfolio of Investments (Continued)
| | | | | | | | |
| | | Principal
Amount | | | Value | |
| Building Materials — 1.2% | | | | | | | | |
Holcim US Finance Sarl & Cie SCS (a)
6.000% 12/30/19 | | $ | 1,160,000 | | | $ | 1,230,639 | |
Martin Marietta Materials, Inc. 3 mo. USD LIBOR + .650%, FRN
2.096% 5/22/20 | | | 395,000 | | | | 397,102 | |
Martin Marietta Materials, Inc. FRN (b)
2.126% 12/20/19 | | | 185,000 | | | | 185,301 | |
Masco Corp.
3.500% 4/01/21 | | | 370,000 | | | | 375,791 | |
Masco Corp.
7.125% 3/15/20 | | | 65,000 | | | | 70,878 | |
Standard Industries, Inc. (a)
5.500% 2/15/23 | | | 560,000 | | | | 583,800 | |
| | | | | | | | |
| | | | | | | 2,843,511 | |
| | | | | | | | |
| Chemicals — 1.7% | | | | | | | | |
Air Liquide Finance SA (a)
1.750% 9/27/21 | | | 200,000 | | | | 193,955 | |
The Dow Chemical Co.
8.550% 5/15/19 | | | 125,000 | | | | 135,398 | |
Incitec Pivot Finance LLC (a)
6.000% 12/10/19 | | | 902,000 | | | | 955,485 | |
LyondellBasell Industries NV
5.000% 4/15/19 | | | 565,000 | | | | 580,101 | |
LyondellBasell Industries NV
6.000% 11/15/21 | | | 500,000 | | | | 555,401 | |
RPM International, Inc.
3.450% 11/15/22 | | | 8,000 | | | | 8,198 | |
RPM International, Inc.
6.125% 10/15/19 | | | 1,078,000 | | | | 1,147,783 | |
The Sherwin-Williams Co.
2.750% 6/01/22 | | | 685,000 | | | | 682,341 | |
| | | | | | | | |
| | | | | | | 4,258,662 | |
| | | | | | | | |
| Commercial Services — 0.3% | | | | | | | | |
S&P Global, Inc.
3.300% 8/14/20 | | | 635,000 | | | | 646,812 | |
| | | | | | | | |
| Computers — 0.9% | | | | | | | | |
Dell International LLC/EMC Corp. (a)
3.480% 6/01/19 | | | 430,000 | | | | 435,387 | |
Dell International LLC/EMC Corp. (a)
4.420% 6/15/21 | | | 475,000 | | | | 494,959 | |
DXC Technology Co.
2.875% 3/27/20 | | | 230,000 | | | | 231,119 | |
Leidos Holdings, Inc.
4.450% 12/01/20 | | | 895,000 | | | | 928,562 | |
| | | | | | | | |
| | | | | | | 2,090,027 | |
| | | | | | | | |
| Diversified Financial Services — 2.3% | | | | | | | | |
AerCap Ireland Capital DAC/AerCap Global Aviation Trust
4.500% 5/15/21 | | | 1,010,000 | | | | 1,060,721 | |
| | | | | | | | |
| | | Principal
Amount | | | Value | |
Aircastle Ltd.
5.000% 4/01/23 | | $ | 1,310,000 | | | $ | 1,380,413 | |
Ally Financial, Inc.
3.600% 5/21/18 | | | 440,000 | | | | 441,320 | |
Ally Financial, Inc.
4.750% 9/10/18 | | | 920,000 | | | | 931,500 | |
Genpact Luxembourg Sarl (a)
3.700% 4/01/22 | | | 1,035,000 | | | | 1,028,672 | |
International Lease Finance Corp.
3.875% 4/15/18 | | | 100,000 | | | | 100,458 | |
Lazard Group LLC
4.250% 11/14/20 | | | 665,000 | | | | 692,650 | |
| | | | | | | | |
| | | | | | | 5,635,734 | |
| | | | | | | | |
| Electric — 2.1% | | | | | | | | |
Ameren Corp.
2.700% 11/15/20 | | | 555,000 | | | | 556,831 | |
Duke Energy Corp.
1.800% 9/01/21 | | | 480,000 | | | | 466,874 | |
EDP Finance BV (a)
4.125% 1/15/20 | | | 652,000 | | | | 671,895 | |
Enel Finance International NV (a)
2.875% 5/25/22 | | | 785,000 | | | | 782,866 | |
Entergy Texas, Inc.
2.550% 6/01/21 | | | 95,000 | | | | 94,301 | |
Entergy Texas, Inc.
7.125% 2/01/19 | | | 798,000 | | | | 838,336 | |
Israel Electric Corp. Ltd. (a)
7.250% 1/15/19 | | | 350,000 | | | | 364,658 | |
Majapahit Holding BV (a)
7.750% 1/20/20 | | | 330,000 | | | | 360,954 | |
Puget Energy, Inc.
6.000% 9/01/21 | | | 260,000 | | | | 287,649 | |
Puget Energy, Inc.
6.500% 12/15/20 | | | 255,000 | | | | 282,287 | |
The Southern Co.
2.350% 7/01/21 | | | 460,000 | | | | 457,271 | |
| | | | | | | | |
| | | | | | | 5,163,922 | |
| | | | | | | | |
| Electronics — 0.3% | | | | | | | | |
FLIR Systems, Inc.
3.125% 6/15/21 | | | 380,000 | | | | 382,812 | |
Tech Data Corp.
3.700% 2/15/22 | | | 240,000 | | | | 240,744 | |
| | | | | | | | |
| | | | | | | 623,556 | |
| | | | | | | | |
| Engineering & Construction — 0.1% | | | | | | | | |
SBA Tower Trust (a)
3.168% 4/09/47 | | | 350,000 | | | | 348,405 | |
| | | | | | | | |
| Foods — 0.9% | | | | | | | | |
Danone SA (a)
2.077% 11/02/21 | | | 1,340,000 | | | | 1,310,789 | |
JBS Investments GmbH (a)
7.750% 10/28/20 | | | 200,000 | | | | 204,000 | |
The accompanying notes are an integral part of the financial statements.
73
MML Short-Duration Bond Fund – Portfolio of Investments (Continued)
| | | | | | | | |
| | | Principal
Amount | | | Value | |
Mondelez International Holdings Netherlands BV (a)
2.000% 10/28/21 | | $ | 595,000 | | | $ | 578,855 | |
Tyson Foods, Inc.
2.650% 8/15/19 | | | 60,000 | | | | 60,289 | |
| | | | | | | | |
| | | | | | | 2,153,933 | |
| | | | | | | | |
| Hand & Machine Tools — 0.4% | | | | | | | | |
Stanley Black & Decker, Inc.
1.622% 11/17/18 | | | 345,000 | | | | 343,735 | |
Stanley Black & Decker, Inc.
2.451% 11/17/18 | | | 610,000 | | | | 611,842 | |
| | | | | | | | |
| | | | | | | 955,577 | |
| | | | | | | | |
| Health Care – Products — 0.8% | | | | | | | | |
Abbott Laboratories
2.350% 11/22/19 | | | 480,000 | | | | 480,522 | |
Abbott Laboratories
2.900% 11/30/21 | | | 675,000 | | | | 682,814 | |
Boston Scientific Corp.
2.850% 5/15/20 | | | 255,000 | | | | 257,022 | |
Zimmer Biomet Holdings, Inc.
2.000% 4/01/18 | | | 528,000 | | | | 528,192 | |
| | | | | | | | |
| | | | | | | 1,948,550 | |
| | | | | | | | |
| Health Care – Services — 1.1% | | | | | | | | |
Cigna Corp.
4.000% 2/15/22 | | | 316,000 | | | | 330,018 | |
Cigna Corp.
4.500% 3/15/21 | | | 790,000 | | | | 830,336 | |
HCA, Inc.
3.750% 3/15/19 | | | 1,130,000 | | | | 1,139,888 | |
Laboratory Corp. of America Holdings
2.625% 2/01/20 | | | 470,000 | | | | 471,237 | |
| | | | | | | | |
| | | | | | | 2,771,479 | |
| | | | | | | | |
| Home Builders — 0.5% | | | | | | | | |
Lennar Corp.
4.500% 11/15/19 | | | 1,128,000 | | | | 1,157,610 | |
| | | | | | | | |
| Housewares — 0.1% | | | | | | | | |
Newell Brands, Inc.
2.600% 3/29/19 | | | 171,000 | | | | 171,584 | |
| | | | | | | | |
| Insurance — 3.3% | | | | | | | | |
American International Group, Inc.
3.300% 3/01/21 | | | 550,000 | | | | 560,684 | |
AmTrust Financial Services, Inc.
6.125% 8/15/23 | | | 585,000 | | | | 561,892 | |
Athene Global Funding (a)
4.000% 1/25/22 | | | 1,240,000 | | | | 1,279,559 | |
CNA Financial Corp.
5.750% 8/15/21 | | | 93,000 | | | | 101,829 | |
Enstar Group Ltd.
4.500% 3/10/22 | | | 575,000 | | | | 585,615 | |
| | | | | | | | |
| | | Principal
Amount | | | Value | |
Jackson National Life Global Funding (a) 2.500% 6/27/22 | | $ | 1,165,000 | | | $ | 1,152,038 | |
Lincoln National Corp.
6.250% 2/15/20 | | | 500,000 | | | | 538,418 | |
Nuveen Finance LLC (a)
2.950% 11/01/19 | | | 1,155,000 | | | | 1,166,042 | |
Reinsurance Group of America, Inc.
5.000% 6/01/21 | | | 640,000 | | | | 684,353 | |
Trinity Acquisition PLC
3.500% 9/15/21 | | | 470,000 | | | | 479,165 | |
Unum Group
3.000% 5/15/21 | | | 135,000 | | | | 135,943 | |
Willis Towers Watson PLC
5.750% 3/15/21 | | | 370,000 | | | | 402,620 | |
XLIT Ltd.
5.750% 10/01/21 | | | 465,000 | | | | 510,356 | |
| | | | | | | | |
| | | | | | | 8,158,514 | |
| | | | | | | | |
| Internet — 0.5% | | | | | | | | |
Expedia, Inc.
7.456% 8/15/18 | | | 1,148,000 | | | | 1,184,014 | |
| | | | | | | | |
| Investment Companies — 0.7% | | | | | | | | |
Ares Capital Corp.
3.625% 1/19/22 | | | 30,000 | | | | 30,124 | |
Ares Capital Corp.
3.875% 1/15/20 | | | 548,000 | | | | 557,682 | |
FS Investment Corp.
4.000% 7/15/19 | | | 365,000 | | | | 369,327 | |
TCP Capital Corp.
4.125% 8/11/22 | | | 675,000 | | | | 664,370 | |
| | | | | | | | |
| | | | | | | 1,621,503 | |
| | | | | | | | |
| Leisure Time — 0.6% | | | | | | | | |
Brunswick Corp. (a)
4.625% 5/15/21 | | | 1,388,000 | | | | 1,410,855 | |
| | | | | | | | |
| Lodging — 0.4% | | | | | | | | |
Marriott International, Inc.
2.300% 1/15/22 | | | 30,000 | | | | 29,453 | |
Marriott International, Inc.
2.875% 3/01/21 | | | 875,000 | | | | 880,624 | |
| | | | | | | | |
| | | | | | | 910,077 | |
| | | | | | | | |
| Machinery – Diversified — 0.5% | | | | | | | | |
CNH Industrial Capital LLC
3.375% 7/15/19 | | | 353,000 | | | | 355,647 | |
CNH Industrial Capital LLC
3.625% 4/15/18 | | | 100,000 | | | | 100,518 | |
CNH Industrial Capital LLC
3.875% 10/15/21 | | | 635,000 | | | | 646,138 | |
CNH Industrial Capital LLC
4.875% 4/01/21 | | | 115,000 | | | | 120,750 | |
| | | | | | | | |
| | | | | | | 1,223,053 | |
| | | | | | | | |
The accompanying notes are an integral part of the financial statements.
74
MML Short-Duration Bond Fund – Portfolio of Investments (Continued)
| | | | | | | | |
| | | Principal
Amount | | | Value | |
| Media — 0.9% | | | | | | | | |
Charter Communications Operating LLC/Charter Communications Operating Capital
3.579% 7/23/20 | | $ | 605,000 | | | $ | 616,278 | |
Discovery Communications LLC
2.950% 3/20/23 | | | 355,000 | | | | 351,335 | |
Sirius XM Radio, Inc. (a)
3.875% 8/01/22 | | | 1,347,000 | | | | 1,350,368 | |
| | | | | | | | |
| | | | | | | 2,317,981 | |
| | | | | | | | |
| Mining — 0.9% | | | | | | | | |
Anglo American Capital PLC (a)
3.750% 4/10/22 | | | 500,000 | | | | 508,080 | |
Glencore Finance Canada Ltd. STEP (a)
4.250% 10/25/22 | | | 254,000 | | | | 266,141 | |
Glencore Funding LLC (a)
3.000% 10/27/22 | | | 260,000 | | | | 257,465 | |
Kinross Gold Corp.
5.125% 9/01/21 | | | 570,000 | | | | 594,225 | |
Newcrest Finance Pty Ltd. (a)
4.200% 10/01/22 | | | 565,000 | | | | 588,453 | |
| | | | | | | | |
| | | | | | | 2,214,364 | |
| | | | | | | | |
| Office Equipment/Supplies — 0.6% | | | | | | | | |
Pitney Bowes, Inc. STEP
3.625% 10/01/21 | | | 1,490,000 | | | | 1,385,700 | |
| | | | | | | | |
| Oil & Gas — 0.2% | | | | | | | | |
EQT Corp.
3.000% 10/01/22 | | | 565,000 | | | | 558,979 | |
| | | | | | | | |
| Packaging & Containers — 0.5% | | | | | | | | |
Graphic Packaging International, Inc.
4.750% 4/15/21 | | | 1,094,000 | | | | 1,143,230 | |
| | | | | | | | |
| Pharmaceuticals — 1.7% | | | | | | | | |
AbbVie, Inc.
1.800% 5/14/18 | | | 945,000 | | | | 944,538 | |
Allergan Funding SCS
2.350% 3/12/18 | | | 590,000 | | | | 590,467 | |
Express Scripts Holding Co.
3.300% 2/25/21 | | | 1,195,000 | | | | 1,213,755 | |
Shire Acquisitions Investments Ireland DAC
2.400% 9/23/21 | | | 235,000 | | | | 231,301 | |
Teva Pharmaceutical Finance Netherlands III BV
2.200% 7/21/21 | | | 1,325,000 | | | | 1,210,349 | |
| | | | | | | | |
| | | | | | | 4,190,410 | |
| | | | | | | | |
| Pipelines — 0.1% | | | | | | | | |
Andeavor Logistics LP/Tesoro Logistics Finance Corp.
3.500% 12/01/22 | | | 170,000 | | | | 169,677 | |
| | | | | | | | |
| | | | | | | | |
| | | Principal
Amount | | | Value | |
| Private Equity — 0.5% | | | | | | | | |
Hercules Capital, Inc.
4.625% 10/23/22 | | $ | 1,110,000 | | | $ | 1,125,471 | |
| | | | | | | | |
| Real Estate Investment Trusts (REITS) — 1.5% | |
American Tower Corp.
2.250% 1/15/22 | | | 415,000 | | | | 404,194 | |
American Tower Corp.
3.000% 6/15/23 | | | 350,000 | | | | 349,083 | |
American Tower Corp.
3.300% 2/15/21 | | | 175,000 | | | | 178,209 | |
Crown Castle International Corp.
3.400% 2/15/21 | | | 714,000 | | | | 729,165 | |
DDR Corp.
3.500% 1/15/21 | | | 210,000 | | | | 213,177 | |
DDR Corp.
7.500% 7/15/18 | | | 345,000 | | | | 354,415 | |
Digital Realty Trust LP
3.400% 10/01/20 | | | 320,000 | | | | 326,320 | |
Healthcare Trust of America Holdings LP
2.950% 7/01/22 | | | 275,000 | | | | 274,276 | |
Highwoods Realty LP
7.500% 4/15/18 | | | 25,000 | | | | 25,378 | |
Simon Property Group LP
2.350% 1/30/22 | | | 700,000 | | | | 693,358 | |
Weyerhaeuser Co.
7.375% 10/01/19 | | | 135,000 | | | | 146,300 | |
| | | | | | | | |
| | | | | | | 3,693,875 | |
| | | | | | | | |
| Retail — 1.5% | | | | | | | | |
AutoNation, Inc.
3.350% 1/15/21 | | | 825,000 | | | | 837,014 | |
CVS Health Corp.
2.125% 6/01/21 | | | 960,000 | | | | 936,873 | |
Dollar Tree, Inc.
5.750% 3/01/23 | | | 1,190,000 | | | | 1,246,525 | |
QVC, Inc.
3.125% 4/01/19 | | | 577,000 | | | | 579,153 | |
| | | | | | | | |
| | | | | | | 3,599,565 | |
| | | | | | | | |
| Semiconductors — 0.9% | | | | | | | | |
Analog Devices, Inc.
2.500% 12/05/21 | | | 245,000 | | | | 242,587 | |
Broadcom Corp./Broadcom Cayman Finance Ltd. (a)
3.000% 1/15/22 | | | 950,000 | | | | 941,953 | |
KLA-Tencor Corp.
3.375% 11/01/19 | | | 140,000 | | | | 142,308 | |
NXP BV/NXP Funding LLC (a)
4.125% 6/01/21 | | | 770,000 | | | | 785,400 | |
| | | | | | | | |
| | | | | | | 2,112,248 | |
| | | | | | | | |
The accompanying notes are an integral part of the financial statements.
75
MML Short-Duration Bond Fund – Portfolio of Investments (Continued)
| | | | | | | | |
| | | Principal
Amount | | | Value | |
| Telecommunications — 1.4% | | | | | | | | |
Hughes Satellite Systems Corp.
6.500% 6/15/19 | | $ | 1,083,000 | | | $ | 1,131,735 | |
Sprint Communications, Inc.
9.250% 4/15/22 | | | 490,000 | | | | 584,325 | |
Telefonaktiebolaget LM Ericsson
4.125% 5/15/22 | | | 1,200,000 | | | | 1,208,424 | |
Verizon Communications, Inc.
2.946% 3/15/22 | | | 480,000 | | | | 482,924 | |
| | | | | | | | |
| | | | | | | 3,407,408 | |
| | | | | | | | |
| Toys, Games & Hobbies — 0.1% | | | | | | | | |
Mattel, Inc.
1.700% 3/15/18 | | | 350,000 | | | | 348,688 | |
| | | | | | | | |
| Transportation — 0.9% | | | | | | | | |
Asciano Finance Ltd. (a)
5.000% 4/07/18 | | | 717,000 | | | | 721,561 | |
Ryder System, Inc.
2.250% 9/01/21 | | | 425,000 | | | | 418,421 | |
Ryder System, Inc.
2.500% 3/01/18 | | | 475,000 | | | | 475,089 | |
Ryder System, Inc.
2.875% 9/01/20 | | | 340,000 | | | | 342,346 | |
TTX Co. (a)
2.250% 2/01/19 | | | 300,000 | | | | 299,263 | |
| | | | | | | | |
| | | | | | | 2,256,680 | |
| | | | | | | | |
| Trucking & Leasing — 1.8% | | | | | | | | |
Aviation Capital Group Corp. (a)
2.875% 9/17/18 | | | 1,260,000 | | | | 1,264,228 | |
DAE Funding LLC (a)
4.000% 8/01/20 | | | 205,000 | | | | 207,050 | |
GATX Corp.
2.600% 3/30/20 | | | 575,000 | | | | 574,854 | |
Park Aerospace Holdings Ltd. (a)
5.250% 8/15/22 | | | 1,205,000 | | | | 1,197,469 | |
Penske Truck Leasing Co. LP/PTL Finance Corp. (a)
2.500% 6/15/19 | | | 370,000 | | | | 370,715 | |
Penske Truck Leasing Co. LP/PTL Finance Corp. (a)
3.050% 1/09/20 | | | 615,000 | | | | 622,376 | |
Penske Truck Leasing Co. LP/PTL Finance Corp. (a)
3.300% 4/01/21 | | | 150,000 | | | | 152,776 | |
Penske Truck Leasing Co. LP/PTL Finance Corp. (a)
3.375% 2/01/22 | | | 20,000 | | | | 20,374 | |
| | | | | | | | |
| | | | | | | 4,409,842 | |
| | | | | | | | |
| |
| TOTAL CORPORATE DEBT (Cost $106,491,037) | | | | 106,297,249 | |
| | | | | | | | |
| | | | | | | | |
| | | Principal
Amount | | | Value | |
| MUNICIPAL OBLIGATIONS — 0.0% | |
Louisiana State Public Facilities Authority, Series 2011-A, Class A2, 3 mo. USD LIBOR + 0.900%, FRN
2.267% 4/26/27 | | $ | 65,484 | | | $ | 65,724 | |
| | | | | | | | |
| | |
TOTAL MUNICIPAL OBLIGATIONS
(Cost $65,484) | | | | | | | 65,724 | |
| | | | | | | | |
|
| NON-U.S. GOVERNMENT AGENCY OBLIGATIONS — 33.0% | |
| Auto Floor Plan ABS — 0.4% | | | | | | | | |
Navistar Financial Dealer Note Master Owner Trust II, Series 2016-1, Class A, 1 mo. LIBOR + 1.350%, FRN (a)
2.902% 9/27/21 | | | 520,000 | | | | 523,005 | |
NextGear Floorplan Master Owner Trust, Series 2016-2A, Class A2 (a)
2.190% 9/15/21 | | | 480,000 | | | | 478,049 | |
| | | | | | | | |
| | | | | | | 1,001,054 | |
| | | | | | | | |
| Automobile ABS — 5.4% | | | | | | | | |
American Credit Acceptance Receivables Trust, Series 2016-2, Class A (a)
2.220% 7/13/20 | | | 26,879 | | | | 26,871 | |
American Credit Acceptance Receivables Trust, Series 2017-1, Class B (a)
2.390% 2/16/21 | | | 520,000 | | | | 519,976 | |
American Credit Acceptance Receivables Trust, Series 2017-4, Class C (a)
2.940% 1/10/24 | | | 770,000 | | | | 769,596 | |
AmeriCredit Automobile Receivables Trust, Series 2014-1, Class D
2.540% 6/08/20 | | | 210,000 | | | | 210,510 | |
Avis Budget Rental Car Funding AESOP LLC, Series 2012-3A, Class A (a)
2.100% 3/20/19 | | | 100,000 | | | | 99,989 | |
CFC LLC, Series 2015-1A, Class A (a)
1.750% 6/15/21 | | | 39,229 | | | | 39,164 | |
CPS Auto Trust, Series 2013-B, Class A (a)
1.820% 9/15/20 | | | 75,818 | | | | 75,783 | |
CPS Auto Trust, Series 2015-C, Class B (a)
2.550% 2/18/20 | | | 237,348 | | | | 237,329 | |
CPS Auto Trust, Series 2016-C, Class B (a)
2.480% 9/15/20 | | | 190,000 | | | | 189,579 | |
CPS Auto Trust, Series 2017-A, Class B (a)
2.680% 5/17/21 | | | 1,150,000 | | | | 1,150,763 | |
The accompanying notes are an integral part of the financial statements.
76
MML Short-Duration Bond Fund – Portfolio of Investments (Continued)
| | | | | | | | |
| | | Principal
Amount | | | Value | |
Drive Auto Receivables Trust, Series 2016-BA, Class B (a)
2.560% 6/15/20 | | $ | 63,934 | | | $ | 63,994 | |
Drive Auto Receivables Trust, Series 2017-2, Class C
2.750% 9/15/23 | | | 140,000 | | | | 140,161 | |
Drive Auto Receivables Trust, Series 2017-1, Class C
2.840% 4/15/22 | | | 270,000 | | | | 271,141 | |
DT Auto Owner Trust, Series 2016-1A, Class B (a)
2.790% 5/15/20 | | | 12,355 | | | | 12,357 | |
DT Auto Owner Trust, Series 2016-2A, Class B (a)
2.920% 5/15/20 | | | 63,582 | | | | 63,606 | |
Enterprise Fleet Financing LLC, Series 2016-1, Class A2 (a)
1.830% 9/20/21 | | | 216,872 | | | | 216,752 | |
Enterprise Fleet Financing LLC, Series 2017-1, Class A3 (a)
2.600% 7/20/22 | | | 210,000 | | | | 211,024 | |
Exeter Automobile Receivables Trust, Series 2016-3A, Class B (a)
2.840% 8/16/21 | | | 260,000 | | | | 258,250 | |
Exeter Automobile Receivables Trust, Series 2017-1A, Class B (a)
3.000% 12/15/21 | | | 260,000 | | | | 259,057 | |
Exeter Automobile Receivables Trust, Series 2015-2A, Class C (a)
3.900% 3/15/21 | | | 650,000 | | | | 657,638 | |
First Investors Auto Owner Trust, Series 2016-1A, Class A1 (a)
1.920% 5/15/20 | | | 38,822 | | | | 38,818 | |
First Investors Auto Owner Trust, Series 2016-2A, Class B (a)
2.210% 7/15/22 | | | 540,000 | | | | 533,602 | |
First Investors Auto Owner Trust, Series 2017-3A, Class B (a)
2.720% 4/17/23 | | | 340,000 | | | | 338,367 | |
Flagship Credit Auto Trust, Series 2015-2, Class A (a)
1.980% 10/15/20 | | | 49,209 | | | | 49,213 | |
Flagship Credit Auto Trust, Series 2015-3, Class A (a)
2.380% 10/15/20 | | | 64,388 | | | | 64,502 | |
Flagship Credit Auto Trust, Series 2016-4, Class B (a)
2.410% 10/15/21 | | | 910,000 | | | | 906,599 | |
Flagship Credit Auto Trust, Series 2016-4, Class C (a)
2.710% 11/15/22 | | | 410,000 | | | | 402,705 | |
| | | | | | | | |
| | | Principal
Amount | | | Value | |
Flagship Credit Auto Trust, Series 2016-1, Class A (a)
2.770% 12/15/20 | | $ | 162,589 | | | $ | 163,141 | |
Flagship Credit Auto Trust, Series 2017-1, Class B (a)
2.830% 3/15/23 | | | 615,000 | | | | 616,312 | |
Flagship Credit Auto Trust, Series 2017-4, Class C (a)
2.920% 11/15/23 | | | 650,000 | | | | 647,606 | |
GLS Auto Receivables Trust, Series 2015-1A, Class A (a)
2.250% 12/15/20 | | | 10,213 | | | | 10,208 | |
NextGear Floorplan Master Owner Trust, Series 2015-2A, Class A (a)
2.380% 10/15/20 | | | 250,000 | | | | 250,252 | |
NextGear Floorplan Master Owner Trust, Series 2016-1A, Class A1, 1 mo. LIBOR + 1.700%, FRN (a)
3.177% 4/15/21 | | | 370,000 | | | | 375,678 | |
OneMain Direct Auto Receivables Trust, Series 2017-2A, Class A (a)
2.310% 12/14/21 | | | 450,000 | | | | 449,605 | |
Oscar US Funding Trust II, Series 2015-1A, Class A3 (a)
1.860% 10/15/19 | | | 264,547 | | | | 264,097 | |
Oscar US Funding Trust II, Series 2015-1A, Class A4 (a)
2.440% 6/15/22 | | | 300,000 | | | | 299,075 | |
Oscar US Funding Trust IV, Series 2016-1A, Class A2B, 1 mo. USD LIBOR + 1.700%, FRN (a)
2.950% 7/15/20 | | | 73,233 | | | | 73,611 | |
Oscar US Funding Trust V, Series 2016-2A, Class A2A (a)
2.310% 11/15/19 | | | 212,533 | | | | 212,317 | |
Oscar US Funding Trust VI, Series 2017-1A, Class A3 (a)
2.820% 6/10/21 | | | 240,000 | | | | 239,889 | |
Oscar US Funding Trust VI, Series 2017-1A, Class A4 (a)
3.300% 5/10/24 | | | 160,000 | | | | 160,530 | |
Santander Drive Auto Receivables Trust, Series 2016-1, Class A3
1.620% 3/16/20 | | | 43,885 | | | | 43,877 | |
Santander Drive Auto Receivables Trust, Series 2015-2, Class C
2.440% 4/15/21 | | | 470,000 | | | | 470,965 | |
Santander Drive Auto Receivables Trust, Series 2016-1, Class B
2.470% 12/15/20 | | | 340,000 | | | | 340,431 | |
Santander Drive Auto Receivables Trust, Series 2014-4, Class D
3.100% 11/16/20 | | | 200,000 | | | | 201,859 | |
The accompanying notes are an integral part of the financial statements.
77
MML Short-Duration Bond Fund – Portfolio of Investments (Continued)
| | | | | | | | |
| | | Principal
Amount | | | Value | |
Santander Drive Auto Receivables Trust, Series 2016-1, Class D
4.020% 4/15/22 | | $ | 500,000 | | | $ | 512,565 | |
| | | | | | | | |
| | | | | | | 13,139,364 | |
| | | | | | | | |
| Commercial MBS — 0.3% | | | | | | | | |
Commercial Mortgage Pass-Through Certificates, Series 2014-CR14, Class A2
3.147% 2/10/47 | | | 290,000 | | | | 291,785 | |
GCCFC Commercial Mortgage Trust, Series 2006-GG7, Class AM, VRN (b)
5.767% 7/10/38 | | | 165,250 | | | | 166,897 | |
TIAA Seasoned Commercial Mortgage Trust, Series 2007-C4, Class AJ, VRN (b)
5.476% 8/15/39 | | | 25,863 | | | | 25,805 | |
Wachovia Bank Commercial Mortgage Trust, Series 2007-C33, Class AM, VRN (b)
6.011% 2/15/51 | | | 229,650 | | | | 230,328 | |
| | | | | | | | |
| | | | | | | 714,815 | |
| | | | | | | | |
| Home Equity ABS — 0.2% | | | | | | | | |
ACE Securities Corp., Series 2005-HE7, Class A2D, 1 mo. USD LIBOR +
.660%, FRN
2.212% 11/25/35 | | | 19,804 | | | | 19,794 | |
ACE Securities Corp., Series 2005-HE5, Class M2, 1 mo. USD LIBOR +
.735%, FRN 2.287% 8/25/35 | | | 52,866 | | | | 53,266 | |
Bear Stearns Asset-Backed Securities I Trust, Series 2005-HE12, Class M1, 1 mo. USD LIBOR + ..480%, FRN 2.032% 12/25/35 | | | 114,446 | | | | 114,734 | |
Countrywide Partnership Trust, Series 2004-EC1, Class M1, 1 mo. USD LIBOR + .900%, FRN
2.452% 2/25/35 | | | 102,644 | | | | 96,880 | |
Credit Suisse Seasoned Loan Trust, Series 2006-1, Class A, 1 mo. USD LIBOR + .240%, FRN (a)
1.792% 10/25/34 | | | 124,536 | | | | 124,299 | |
JP Morgan Mortgage Acquisition Corp., Series 2005-FRE1, Class A2V2, 1 mo. USD LIBOR + .220%, FRN
1.772% 10/25/35 | | | 16,100 | | | | 16,103 | |
Option One Mortgage Loan Trust, Series 2005-5, Class A3, 1 mo. USD LIBOR + .210%, FRN
1.762% 12/25/35 | | | 39,220 | | | | 39,237 | |
| | | | | | | | |
| | | | | | | 464,313 | |
| | | | | | | | |
| | | | | | | | |
| | | Principal
Amount | | | Value | |
| Other ABS — 16.7% | | | | | | | | |
321 Henderson Receivables I LLC, Series 2006-1A, Class A1, 1 mo. USD LIBOR + .200%, FRN (a)
1.677% 3/15/41 | | $ | 84,744 | | | $ | 82,908 | |
321 Henderson Receivables I LLC, Series 2010-3A, Class A (a)
3.820% 12/15/48 | | | 264,305 | | | | 269,844 | |
ALM VII Ltd., Series 2012-7A, Class A1R, 3 mo. USD LIBOR + 1.480%, FRN (a)
2.839% 10/15/28 | | | 370,000 | | | | 373,088 | |
Apidos CLO XXV, Series 2016-25A, Class A1, 3 mo. USD LIBOR +
1.460%, FRN (a)
2.823% 10/20/28 | | | 520,000 | | | | 521,601 | |
Arbys Funding LLC, Series 2015-1A, Class A2 (a)
4.969% 10/30/45 | | | 294,000 | | | | 300,271 | |
ARL First LLC, Series 2012-1A, Class A1, 1 mo. USD LIBOR + 1.750%, FRN (a)
3.227% 12/15/42 | | | 207,813 | | | | 209,368 | |
Avant Loans Funding Trust, Series 2017-B, Class A (a)
2.290% 6/15/20 | | | 595,374 | | | | 595,221 | |
Avery Point III CLO Ltd., Series 2013-3A, Class AR, 3 mo. USD LIBOR +
1.120%, FRN (a)
2.474% 1/18/25 | | | 580,000 | | | | 581,501 | |
BCC Funding X LLC, Series 2015-1, Class A2 (a)
2.224% 10/20/20 | | | 59,789 | | | | 59,697 | |
Birchwood Park CLO Ltd., Series 2014-1A, Class AR, 3 mo. USD LIBOR +
1.180%, FRN (a)
2.539% 7/15/26 | | | 340,000 | | | | 341,134 | |
BlueMountain CLO Ltd., Series 2015-2A, Class A1, 3 mo. USD LIBOR +
1.430%, FRN (a)
2.784% 7/18/27 | | | 475,000 | | | | 477,237 | |
BlueVirgo Trust, Series 2015-1A, Class NOTE (a)
3.000% 12/15/22 | | | 322,595 | | | | 323,311 | |
BRE Grand Islander Timeshare Issuer LLC, Series 2017-1A, Class A (a)
2.940% 5/25/29 | | | 225,952 | | | | 223,525 | |
Capital Automotive LLC, Series 2012-1A, Class A1 (a)
3.870% 4/15/47 | | | 258,267 | | | | 261,953 | |
Cazenovia Creek Funding I LLC, Series 2015-1A, Class A (a)
2.000% 12/10/23 | | | 83,265 | | | | 82,953 | |
CKE Restaurant Holdings, Inc., Series 2013-1A, Class A2 (a)
4.474% 3/20/43 | | | 451,983 | | | | 453,459 | |
The accompanying notes are an integral part of the financial statements.
78
MML Short-Duration Bond Fund – Portfolio of Investments (Continued)
| | | | | | | | |
| | | Principal
Amount | | | Value | |
CLI Funding VI LLC, Series 2017-1A, Class A (a)
3.620% 5/18/42 | | $ | 374,785 | | | $ | 375,042 | |
Countrywide Asset-Backed Certificates, Series 2004-5, Class 3A, 1 mo. USD LIBOR + .460%, FRN
2.012% 9/25/34 | | | 29,886 | | | | 29,778 | |
Crestline Denali CLO Ltd., Series 2013-1A, Class A1, FRN (a) (b)
2.421% 10/26/27 | | | 350,000 | | | | 351,194 | |
Diamond Resorts Owner Trust, Series 2013-2, Class A (a)
2.270% 5/20/26 | | | 91,534 | | | | 91,283 | |
Diamond Resorts Owner Trust, Series 2014-1, Class A (a)
2.540% 5/20/27 | | | 39,866 | | | | 39,829 | |
Diamond Resorts Owner Trust, Series 2015-1, Class A (a)
2.730% 7/20/27 | | | 87,807 | | | | 87,233 | |
Diamond Resorts Owner Trust, Series 2015-2, Class A (a)
2.990% 5/22/28 | | | 104,354 | | | | 103,360 | |
Diamond Resorts Owner Trust, Series 2016-1, Class A (a)
3.080% 11/20/28 | | | 627,076 | | | | 617,333 | |
Diamond Resorts Owner Trust, Series 2015-2, Class B (a)
3.540% 5/22/28 | | | 70,509 | | | | 70,001 | |
Domino’s Pizza Master Issuer LLC, Series 2015-1A, Class A2I (a)
3.484% 10/25/45 | | | 423,550 | | | | 425,734 | |
Dong Fang Container Finance II SPV Ltd., Series 2014-1A, Class A1 (a)
1.950% 11/25/39 | | | 68,750 | | | | 68,325 | |
Drug Royalty Corp., Inc., Series 2014-1, Class A1, 3 mo. USD LIBOR +
2.850%, FRN (a)
4.154% 7/15/23 | | | 108,072 | | | | 109,000 | |
Drug Royalty Corp., Inc., Series 2012-1, Class A1, 3 mo. USD LIBOR +
5.250%, FRN (a)
6.130% 7/15/24 | | | 35,000 | | | | 35,338 | |
Elara HGV Timeshare Issuer, Series 2017-A, Class A (a)
2.690% 3/25/30 | | | 260,334 | | | | 258,375 | |
Elara HGV Timeshare Issuer LLC, Series 2016-A, Class A (a)
2.730% 4/25/28 | | | 223,658 | | | | 222,330 | |
Elara HGV Timeshare Issuer LLC, Series 2014-A, Class B, VRN (a) (b)
3.020% 2/25/27 | | | 99,159 | | | | 97,069 | |
| | | | | | | | |
| | | Principal
Amount | | | Value | |
Element Rail Leasing I LLC, Series 2014-1A, Class A1 (a)
2.299% 4/19/44 | | $ | 120,693 | | | $ | 120,414 | |
Element Rail Leasing II LLC, Series 2015-1A, Class A1 (a)
2.707% 2/19/45 | | | 59,219 | | | | 57,815 | |
Element Rail Leasing II LLC, Series 2016-1A, Class A1 (a)
3.968% 3/19/46 | | | 159,218 | | | | 161,694 | |
Entegry New Orleans Storm Recovery Funding I LLC, Series 2015-1, Class A
2.670% 6/01/27 | | | 77,694 | | | | 77,519 | |
FNA Trust, Series 2015-1, Class A (a)
3.240% 12/10/23 | | | 48,969 | | | | 48,689 | |
FRS I LLC, Series 2013-1A, Class A1 (a)
1.800% 4/15/43 | | | 35,340 | | | | 35,117 | |
Galaxy XX CLO Ltd., Series 2015-20A, Class A, 3 mo. USD LIBOR +
1.450%, FRN (a)
2.813% 7/20/27 | | | 475,000 | | | | 475,495 | |
Global SC Finance II SRL, Series 2013-1A, Class A (a)
2.980% 4/17/28 | | | 157,333 | | | | 155,698 | |
Global SC Finance IV Ltd., Series 2017-1A, Class A (a)
3.850% 4/15/37 | | | 310,619 | | | | 315,545 | |
GoldenTree Loan Opportunities VII Ltd., Series 2013-7A, Class A, 3 mo. USD LIBOR + 1.150%, FRN (a)
2.517% 4/25/25 | | | 464,031 | | | | 464,128 | |
Goodgreen Trust, Series 2016-1A, Class A (a)
3.230% 10/15/52 | | | 509,243 | | | | 507,908 | |
GSAMP Trust, Series 2005-AHL, Class M1, 1 mo. USD LIBOR + .645%, FRN 2.197% 4/25/35 | | | 23,650 | | | | 23,760 | |
Hercules Capital Funding Trust, Series 2014-1A, Class A (a) 3.524% 4/16/21 | | | 95,036 | | | | 95,125 | |
Hero Funding, Series 2017-3A, Class A1 (a) 3.190% 9/20/48 | | | 308,274 | | | | 307,432 | |
HERO Funding Trust, Series 2016-4A, Class A1 (a)
3.570% 9/20/47 | | | 355,704 | | | | 361,491 | |
HERO Funding Trust, Series 2015-1A, Class A (a)
3.840% 9/21/40 | | | 805,876 | | | | 819,978 | |
Hilton Grand Vacations Trust, Series 2014-AA, Class A (a) 1.770% 11/25/26 | | | 127,531 | | | | 125,392 | |
Hilton Grand Vacations Trust, Series 2013-A, Class A (a) 2.280% 1/25/26 | | | 104,600 | | | | 103,879 | |
The accompanying notes are an integral part of the financial statements.
79
MML Short-Duration Bond Fund – Portfolio of Investments (Continued)
| | | | | | | | |
| | | Principal
Amount | | | Value | |
Hilton Grand Vacations Trust, Series 2017-AA, Class B, VRN (a) (b) 2.960% 12/26/28 | | $ | 309,872 | | | $ | 306,004 | |
LCM XIV LP, Series 14A, Class A, 3 mo. USD LIBOR + 1.150%, FRN (a) 2.509% 7/15/25 | | | 618,068 | | | | 618,923 | |
LCM XXIII Ltd., Series 23A, Class A1, 3 mo. USD LIBOR + 1.400%, FRN (a) 2.763% 10/20/29 | | | 590,000 | | | | 597,487 | |
Lendmark Funding Trust, Series 2017-1A, Class A (a)
2.830% 12/22/25 | | | 240,000 | | | | 239,373 | |
Long Beach Mortgage Loan Trust, Series 2005-WL1, Class M2, 1 mo. USD LIBOR + .825%, FRN
2.377% 6/25/35 | | | 89,897 | | | | 89,969 | |
Madison Park Funding Ltd., Series 2016-22A, Class A, 3 mo. USD LIBOR + 1.480%, FRN (a)
2.847% 10/25/29 | | | 420,000 | | | | 427,380 | |
Madison Park Funding XIV Ltd., Series 2014-14A, Class A1R, 3 mo. USD LIBOR + 1.120%, FRN (a) 2.483% 7/20/26 | | | 280,000 | | | | 281,251 | |
Magnetite XI Ltd., Series 2014-11A, Class A1R, 3 mo. USD LIBOR + 1.120%, FRN (a)
2.474% 1/18/27 | | | 700,000 | | | | 702,351 | |
Mariner Finance Issuance Trust, Series 2017-BA, Class A (a) 2.920% 12/20/29 | | | 900,000 | | | | 898,237 | |
Mariner Finance Issuance Trust, Series 2017-AA, Class A (a) 3.620% 2/20/29 | | | 400,000 | | | | 401,373 | |
Marlette Funding Trust, Series 2017-3A, Class A (a)
2.360% 12/15/24 | | | 261,998 | | | | 261,892 | |
Marlette Funding Trust, Series 2017-2A, Class A (a)
2.390% 7/15/24 | | | 297,489 | | | | 297,454 | |
Marlette Funding Trust, Series 2017-1A, Class A (a)
2.827% 3/15/24 | | | 482,030 | | | | 483,446 | |
Marlette Funding Trust, Series 2016-1A, Class A (a)
3.060% 1/17/23 | | | 241,675 | | | | 242,103 | |
Miramax LLC, Series 2014-1A, Class A2 (a) 3.340% 7/20/26 | | | 109,472 | | | | 109,561 | |
Morgan Stanley ABS Capital I, Inc. Trust, Series 2005-WMC4, Class M4, 1 mo. USD LIBOR + ..945%, FRN 2.497% 4/25/35 | | | 32,381 | | | | 32,878 | |
| | | | | | | | |
| | | Principal
Amount | | | Value | |
Mosaic Solar Loans LLC, Series 2017-1A, Class A (a)
4.450% 6/20/42 | | $ | 109,934 | | | $ | 112,167 | |
MVW Owner Trust, Series 2013-1A, Class A (a)
2.150% 4/22/30 | | | 95,982 | | | | 94,758 | |
MVW Owner Trust, Series 2014-2, Class A (a)
2.250% 9/22/31 | | | 155,812 | | | | 153,209 | |
MVW Owner Trust, Series 2016-1A, Class A (a)
2.250% 12/20/33 | | | 68,537 | | | | 67,805 | |
Nations Equipment Finance Funding II LLC, Series 2014-1A, Class A (a)
1.558% 7/20/18 | | | 2,019 | | | | 2,018 | |
Nations Equipment Finance Funding III LLC, Series 2016-1A, Class A (a)
3.610% 2/20/21 | | | 110,596 | | | | 110,722 | |
Navitas Equipment Receivables LLC, Series 2015-1, Class A2 (a) 2.120% 11/15/18 | | | 25,051 | | | | 25,036 | |
Neuberger Berman CLO XX Ltd., Series 2015-20A, Class BR,
FRN (a) (b)
6.623% 1/15/28 | | | 250,000 | | | | 250,036 | |
New Residential Advance Receivables Trust, Series 2016-T2, Class AT2 (a) 2.575% 10/15/49 | | | 1,950,000 | | | | 1,931,378 | |
NP SPE II LLC, Series 2017-1A, Class A1 (a)
3.372% 10/21/47 | | | 188,313 | | | | 187,138 | |
NRZ Advance Receivables Trust, Series 2016-T4, Class AT4 (a) 3.107% 12/15/50 | | | 700,000 | | | | 696,883 | |
OCP CLO Ltd., Series 2015-8A, Class A2AR, FRN (a) (b) 2.803% 4/17/27 | | | 650,000 | | | | 651,666 | |
OHA Loan Funding Ltd., Series 2015-1A, Class AR, 3 mo. USD LIBOR + 1.410%, FRN (a)
2.826% 8/15/29 | | | 590,000 | | | | 600,001 | |
OnDeck Asset Securitization Trust II LLC, Series 2016-1A, Class A (a) 4.210% 5/17/20 | | | 120,000 | | | | 120,444 | |
Oportun Funding VI LLC, Series 2017-A, Class A (a)
3.230% 6/08/23 | | | 350,000 | | | | 348,250 | |
Orange Lake Timeshare Trust, Series 2014-AA, Class A (a) 2.290% 7/09/29 | | | 37,899 | | | | 37,371 | |
Orange Lake Timeshare Trust, Series 2016-A, Class A (a) 2.610% 3/08/29 | | | 223,749 | | | | 221,482 | |
The accompanying notes are an integral part of the financial statements.
80
MML Short-Duration Bond Fund – Portfolio of Investments (Continued)
| | | | | | | | |
| | | Principal
Amount | | | Value | |
Oxford Finance Funding Trust, Series 2016-1A, Class A (a) 3.968% 6/17/24 | | $ | 200,000 | | | $ | 200,759 | |
Oxford Finance Funding Trust, Series 2014-1A, Class A (a) 3.475% 12/15/22 | | | 51,260 | | | | 50,976 | |
RAAC, Series 2006-RP2, Class A, 1 mo. USD LIBOR + ..250%, FRN (a) 1.802% 2/25/37 | | | 50,107 | | | | 49,998 | |
Race Point VIII CLO Ltd., Series 2013-8A, Class AR, 3 mo. USD LIBOR + 1.340%, FRN (a)
2.776% 2/20/30 | | | 700,000 | | | | 705,300 | |
Sierra Receivables Funding Co. LLC, Series 2014-2A, Class A, VRN (a) (b) 2.050% 6/20/31 | | | 124,332 | | | | 123,843 | |
Sierra Receivables Funding Co. LLC, Series 2013-2A, Class A, VRN (a) (b) 2.280% 11/20/25 | | | 25,604 | | | | 25,594 | |
Sierra Receivables Funding Co. LLC, Series 2014-3A, Class A (a) 2.300% 10/20/31 | | | 185,285 | | | | 184,095 | |
Sierra Receivables Funding Co. LLC, Series 2015-1A, Class A (a) 2.400% 3/22/32 | | | 218,290 | | | | 216,438 | |
Sierra Receivables Funding Co. LLC, Series 2015-3A, Class B (a)
3.080% 9/20/32 | | | 30,624 | | | | 30,457 | |
Sierra Timeshare Receivables Funding LLC, Series 2015-3A, Class A (a)
2.580% 9/20/32 | | | 79,622 | | | | 79,441 | |
Sierra Timeshare Receivables Funding LLC, Series 2017-1A, Class A (a)
2.910% 3/20/34 | | | 544,900 | | | | 545,701 | |
SoFi Consumer Loan Program LLC, Series 2016-3, Class A (a)
3.050% 12/26/25 | | | 247,650 | | | | 248,838 | |
SoFi Consumer Loan Program LLC, Series 2016-5, Class A (a)
3.060% 9/25/28 | | | 1,377,793 | | | | 1,381,224 | |
SoFi Consumer Loan Program LLC, Series 2016-2A, Class A (a)
3.090% 10/27/25 | | | 293,873 | | | | 295,331 | |
SoFi Consumer Loan Program LLC, Series 2016-1A, Class A (a)
3.260% 8/25/25 | | | 684,147 | | | | 688,139 | |
SoFi Consumer Loan Program LLC, Series 2015-2, Class A (a)
3.280% 9/15/23 | | | 548,491 | | | | 550,025 | |
SoFi Consumer Loan Program LLC, Series 2017-2, Class A (a)
3.280% 2/25/26 | | | 536,533 | | | | 539,964 | |
| | | | | | | | |
| | | Principal
Amount | | | Value | |
SpringCastle America Funding LLC, Series 2016-AA, Class A (a)
3.050% 4/25/29 | | $ | 492,693 | | | $ | 495,749 | |
Springleaf Funding Trust, Series 2016-AA, Class A (a)
2.900% 11/15/29 | | | 1,460,000 | | | | 1,462,151 | |
SPS Servicer Advance Receivables Trust, Series 2016-T1, Class AT1 (a)
2.530% 11/16/48 | | | 1,040,000 | | | | 1,030,872 | |
Symphony CLO XV Ltd., Series 2014-15A, Class AR, 3 mo. USD LIBOR + 1.180%, FRN (a)
2.533% 10/17/26 | | | 800,000 | | | | 802,364 | |
Taco Bell Funding LLC, Series 2016-1A, Class A2I (a)
3.832% 5/25/46 | | | 375,250 | | | | 380,510 | |
TAL Advantage LLC, Series 2014-2A, Class A1 (a)
1.700% 5/20/39 | | | 29,884 | | | | 29,832 | |
TAL Advantage VI LLC, Series 2017-1A, Class A
4.500% 4/20/42 | | | 468,680 | | | | 480,641 | |
TCI-Symphony CLO Ltd., Series 2016-1A, Class A, 3 mo. USD LIBOR + 1.480%, FRN (a)
2.839% 10/13/29 | | | 300,000 | | | | 305,174 | |
Trafigura Securitisation Finance PLC, Series 2017-1A, Class B, 1 mo. USD LIBOR + 1.700%, FRN (a)
3.177% 12/15/20 | | | 260,000 | | | | 261,210 | |
Treman Park CLO Ltd., Series 2015-1A, Class AR, 3 mo. USD LIBOR + 1.370%, FRN (a)
2.733% 4/20/27 | | | 950,000 | | | | 951,578 | |
Trip Rail Master Funding LLC, Series 2017-1A, Class A1 (a)
2.709% 8/15/47 | | | 170,146 | | | | 169,480 | |
Trip Rail Master Funding LLC, Series 2011-1A, Class A2 (a)
6.024% 7/15/41 | | | 670,000 | | | | 727,092 | |
Triton Container Finance IV LLC, Series 2017-2A, Class A (a)
3.620% 8/20/42 | | | 1,008,990 | | | | 1,010,065 | |
Velocity Commercial Capital Loan Trust, Series 2016-2, Class AFX, VRN (b)
2.997% 10/25/46 | | | 367,372 | | | | 367,337 | |
VSE VOI Mortgage LLC, Series 2016-A, Class A (a)
2.540% 7/20/33 | | | 572,273 | | | | 567,403 | |
Welk Resorts LLC, Series 2015-AA, Class A (a)
2.790% 6/16/31 | | | 102,449 | | | | 100,567 | |
The accompanying notes are an integral part of the financial statements.
81
MML Short-Duration Bond Fund – Portfolio of Investments (Continued)
| | | | | | | | |
| | | Principal
Amount | | | Value | |
Welk Resorts LLC, Series 2017-AA, Class B (a)
3.410% 6/15/33 | | $ | 269,125 | | | $ | 266,475 | |
Wendys Funding LLC, Series 2015-1A, Class A2I (a)
3.371% 6/15/45 | | | 904,188 | | | | 905,557 | |
Westgate Resorts LLC, Series 2014-1A, Class A (a)
2.150% 12/20/26 | | | 99,610 | | | | 98,518 | |
Westgate Resorts LLC, Series 2017-1A, Class A (a)
3.050% 12/20/30 | | | 274,451 | | | | 273,936 | |
Westgate Resorts LLC, Series 2015-2A, Class A (a)
3.200% 7/20/28 | | | 202,233 | | | | 201,880 | |
| | | | | | | | |
| | | | | | | 40,799,934 | |
| | | | | | | | |
| Student Loans ABS — 9.2% | | | | | | | | |
Access Group, Inc., Series 2015-1, Class A, 1 mo. USD LIBOR + .700%, FRN (a)
2.252% 7/25/56 | | | 271,603 | | | | 271,929 | |
Access Group, Inc., Series 2015-1, Class B, 1 mo. USD LIBOR + 1.500%, FRN (a)
3.052% 7/25/58 | | | 140,000 | | | | 120,880 | |
AccessLex Institute, Series 2004-A, Class A2, 3 mo. USD LIBOR + .260%, FRN
1.627% 4/25/29 | | | 99 | | | | 99 | |
AccessLex Institute, Series 2004-A, Class A3, 28 day ARS, FRN
1.699% 7/01/39 | | | 1,250,000 | | | | 1,233,154 | |
AccessLex Institute, Series 2003-A, Class A3, 3 mo. Treasury + 1.200%, FRN
2.550% 7/01/38 | | | 66,659 | | | | 62,845 | |
Brazos Student Finance Corp., Series 2003-A, Class A3, 28 day ARS, FRN
1.729% 7/01/38 | | | 200,000 | | | | 196,430 | |
College Loan Corp. Trust I, Series 2005-2, Class B, 3 mo. USD LIBOR + .490%, FRN
1.849% 1/15/37 | | | 241,694 | | | | 220,567 | |
Commonbond Student Loan Trust, Series 2017-AGS, Class C (a)
5.280% 5/25/41 | | | 520,000 | | | | 528,194 | |
Credit Suisse ABS Repackaging Trust, Series 2013-A, Class B (a)
2.500% 1/25/30 | | | 121,880 | | | | 115,044 | |
DRB Prime Student Loan Trust, Series 2015-A, Class A3
2.320% 4/25/30 | | | 78,884 | | | | 78,329 | |
| | | | | | | | |
| | | Principal
Amount | | | Value | |
DRB Prime Student Loan Trust, Series 2015-B, Class A3 (a)
2.540% 4/27/26 | | $ | 75,917 | | | $ | 74,942 | |
DRB Prime Student Loan Trust, Series 2016-B, Class A2 (a)
2.890% 6/25/40 | | | 224,197 | | | | 224,665 | |
DRB Prime Student Loan Trust, Series 2015-A, Class A2 (a)
3.060% 7/25/31 | | | 115,032 | | | | 115,029 | |
DRB Prime Student Loan Trust, Series 2015-B, Class A2 (a)
3.170% 7/25/31 | | | 103,552 | | | | 104,026 | |
DRB Prime Student Loan Trust, Series 2015-D, Class A2 (a)
3.200% 1/25/40 | | | 762,966 | | | | 762,324 | |
DRB Prime Student Loan Trust, Series 2015-D, Class A1, 1 mo. USD LIBOR + 1.700%, FRN (a)
3.252% 1/25/40 | | | 239,541 | | | | 244,143 | |
DRB Prime Student Loan Trust, Series 2016-R, Class A1, 1 mo. USD LIBOR + 1.900%, FRN (a)
3.464% 10/25/44 | | | 870,932 | | | | 879,642 | |
DRB Prime Student Loan Trust, Series 2016-A, Class A1, 1 mo. USD LIBOR + 2.000%, FRN (a)
3.552% 4/25/40 | | | 224,855 | | | | 224,271 | |
Earnest Student Loan Program LLC, Series 2016-C, Class A2 (a)
2.680% 7/25/35 | | | 397,165 | | | | 389,843 | |
Earnest Student Loan Program LLC, Series 2016-D, Class A2 (a)
2.720% 1/25/41 | | | 371,018 | | | | 367,083 | |
Earnest Student Loan Program LLC, Series 2016-B, Class A1, 1 mo. USD LIBOR + 2.050%, FRN (a)
3.602% 2/26/35 | | | 277,247 | | | | 278,192 | |
ECMC Group Student Loan Trust, Series 2017-1A, Class A, 1 mo. USD LIBOR + 1.200%, FRN (a)
2.752% 12/27/66 | | | 1,036,668 | | | | 1,048,615 | |
ECMC Group Student Loan Trust, Series 2016-1A, Class A, 1 mo. USD LIBOR + 1.350%, FRN (a)
2.902% 7/26/66 | | | 503,157 | | | | 507,806 | |
Edlinc Student Loan Funding, Series 2017-A, Class A, (Acquired 12/22/17, Cost $695,132), FRN (a) (b) (c) (d) (e)
3.350% 12/01/47 | | | 700,000 | | | | 695,132 | |
Education Loan Asset-Backed Trust I, Series 2013-1, Class A1, 1 mo. USD LIBOR + .800%, FRN (a)
2.352% 6/25/26 | | | 503,179 | | | | 503,500 | |
The accompanying notes are an integral part of the financial statements.
82
MML Short-Duration Bond Fund – Portfolio of Investments (Continued)
| | | | | | | | |
| | | Principal
Amount | | | Value | |
Higher Education Funding I, Series 2004-1, Class B1, 28 day ARS, FRN (a)
1.120% 1/01/44 | | $ | 950,000 | | | $ | 832,043 | |
KeyCorp Student Loan Trust, Series 2006-A, Class 2A4, 3 mo. USD LIBOR + .310%, FRN
1.985% 9/27/35 | | | 91,718 | | | | 91,368 | |
Laurel Road Prime Student Loan Trust, Series 2017-B, Class CFX (a)
3.610% 8/25/42 | | | 380,000 | | | | 373,820 | |
Navient Private Education Loan Trust, Series 2014-AA, Class A2A (a)
2.740% 2/15/29 | | | 261,347 | | | | 260,557 | |
Navient Student Loan Trust, Series 2017-5A, Class A, FRN (a) (b)
2.352% 7/26/66 | | | 427,254 | | | | 428,726 | |
Navient Student Loan Trust, Series 2017-4A, Class A3, 1 mo. USD LIBOR + 1.000%, FRN (a)
2.552% 9/27/66 | | | 500,000 | | | | 504,770 | |
Navient Student Loan Trust, Series 2017-1A, Class A3, 1 mo. USD LIBOR + 1.150%, FRN (a)
2.702% 7/26/66 | | | 950,000 | | | | 972,605 | |
Navient Student Loan Trust, Series 2016-5A, Class A, 1 mo. USD LIBOR + 1.250%, FRN (a)
2.802% 6/25/65 | | | 753,403 | | | | 771,471 | |
Navient Student Loan Trust, Series 2016-6A, Class A3, 1 mo. USD LIBOR + 1.300%, FRN (a)
2.852% 3/25/66 | | | 1,060,000 | | | | 1,089,934 | |
Nelnet Private Education Loan Trust, Series 2016-A, Class A1A, 1 mo. USD LIBOR + 1.750%, FRN (a)
3.078% 12/26/40 | | | 331,832 | | | | 332,484 | |
Nelnet Private Education Loan Trust, Series 2016-A, Class A1B (a)
3.600% 12/26/40 | | | 238,929 | | | | 235,838 | |
Nelnet Student Loan Trust, Series 2014-6A, Class A, 1 mo. USD LIBOR + .650%, FRN (a)
2.202% 11/25/52 | | | 358,343 | | | | 355,248 | |
Nelnet Student Loan Trust, Series 2015-3A, Class B, 1 mo. USD LIBOR + 1.500%, FRN (a)
2.828% 6/25/54 | | | 130,000 | | | | 117,661 | |
Nelnet Student Loan Trust, Series 2014-1A, Class B, 1 mo. USD LIBOR + 1.500%, FRN (a)
2.829% 10/25/47 | | | 170,000 | | | | 156,250 | |
| | | | | | | | |
| | | Principal
Amount | | | Value | |
North Carolina State Education Assistance Authority, Series 2011-1, Class A2, 3 mo. USD LIBOR + .900%, FRN
2.267% 1/26/26 | | $ | 22,129 | | | $ | 22,170 | |
Northstar Education Finance, Inc., Series 2005-1, Class A5, 3 mo. USD LIBOR + .750%, FRN
2.128% 10/30/45 | | | 198,587 | | | | 185,785 | |
PHEAA Student Loan Trust, Series 2016-2A, Class A, 1 mo. USD LIBOR + .950%, FRN (a)
2.502% 11/25/65 | | | 629,092 | | | | 630,218 | |
SLC Private Student Loan Trust, Series 2006-A, Class A5, 3 mo. USD LIBOR + .170%, FRN
1.529% 7/15/36 | | | 14,659 | | | | 14,659 | |
SLC Student Loan Trust, Series 2005-1, Class B, 3 mo. USD LIBOR + .200%, FRN
1.616% 2/15/45 | | | 408,657 | | | | 376,495 | |
SLM Student Loan Trust, Series 2003-5, Class A7, 28 day ARS, FRN
0.500% 6/17/30 | | | 50,000 | | | | 50,000 | |
SLM Student Loan Trust, Series 2007-5, Class A6, 3 mo. USD LIBOR + .110%, FRN
1.477% 1/26/43 | | | 120,000 | | | | 114,694 | |
SLM Student Loan Trust, Series 2005-5, Class A4, 3 mo. USD LIBOR + .140%, FRN
1.507% 10/25/28 | | | 280,000 | | | | 278,932 | |
SLM Student Loan Trust, Series 2006-5, Class B, 3 mo. USD LIBOR + .210%, FRN
1.577% 10/25/40 | | | 489,390 | | | | 461,427 | |
SLM Student Loan Trust, Series 2006-10, Class B, 3 mo. USD LIBOR + .220%, FRN
1.587% 3/25/44 | | | 134,631 | | | | 126,440 | |
SLM Student Loan Trust, Series 2003-14, Class A6, 3 mo. USD LIBOR + .300%, FRN
1.667% 7/25/25 | | | 150,000 | | | | 149,576 | |
SLM Student Loan Trust, Series 2005-8, Class B, 3 mo. USD LIBOR + .310%, FRN
1.677% 1/25/55 | | | 198,239 | | | | 179,729 | |
SLM Student Loan Trust, Series 2004-3A, Class A6A, 3 mo. USD LIBOR + .550%, FRN (a)
1.917% 10/25/64 | | | 850,000 | | | | 840,740 | |
The accompanying notes are an integral part of the financial statements.
83
MML Short-Duration Bond Fund – Portfolio of Investments (Continued)
| | | | | | | | |
| | | Principal
Amount | | | Value | |
SLM Student Loan Trust, Series 2013-4, Class B, 1 mo. USD LIBOR + 1.500%, FRN
2.828% 12/28/70 | | $ | 120,000 | | | $ | 117,408 | |
SMB Private Education Loan Trust, Series 2016-A, Class A1, 1 mo. USD LIBOR + .700%, FRN (a)
2.177% 5/15/23 | | | 79,983 | | | | 80,014 | |
SMB Private Education Loan Trust, Series 2016-C, Class A2B, 1 mo. USD LIBOR + 1.100%, FRN (a)
2.577% 9/15/34 | | | 290,000 | | | | 294,841 | |
SMB Private Education Loan Trust, Series 2014-A, Class A2B, 1 mo. USD LIBOR + 1.150%, FRN (a)
2.627% 5/15/26 | | | 648,539 | | | | 656,997 | |
SMB Private Education Loan Trust, Series 2016-B, Class A2B, 1 mo. USD LIBOR + 1.450%, FRN (a)
2.927% 2/17/32 | | | 144,000 | | | | 147,668 | |
SoFi Professional Loan Program LLC, Series 2015-A, Class RC, (Acquired 4/19/17, Cost $562,750) (a) (c) (e) 0.000% 3/25/33 | | | 200 | | | | 400,000 | |
SoFi Professional Loan Program LLC, Series 2017-D, Class R1, (Acquired 7/19/17, Cost $565,900) (a) (c) (e) 0.000% 9/25/40 | | | 1,000,000 | | | | 565,900 | |
SoFi Professional Loan Program LLC, Series 2016-B, Class A2A (a)
1.680% 3/25/31 | | | 90,889 | | | | 90,756 | |
SoFi Professional Loan Program LLC, Series 2016-E, Class A2B (a)
2.490% 1/25/36 | | | 330,000 | | | | 328,043 | |
SoFi Professional Loan Program LLC, Series 2016-D, Class A1, 1 mo. USD LIBOR + .950%, FRN (a)
2.502% 1/25/39 | | | 138,673 | | | | 140,077 | |
SoFi Professional Loan Program LLC, Series 2016-B, Class A1, 1 mo. USD LIBOR + 1.200%, FRN (a)
2.752% 6/25/33 | | | 242,764 | | | | 246,713 | |
SoFi Professional Loan Program LLC, Series 2016-A, Class A1, 1 mo. USD LIBOR + 1.750%, FRN (a)
3.302% 8/25/36 | | | 235,669 | | | | 241,404 | |
| | | | | | | | |
| | | | | | | 22,510,145 | |
| | | | | | | | |
| WL Collateral CMO — 0.8% | | | | | | | | |
Bank of America Mortgage Securities, Series 2004-G, Class 2A7, VRN (b)
3.810% 8/25/34 | | | 8,325 | | | | 8,379 | |
| | | | | | | | |
| | | Principal
Amount | | | Value | |
Countrywide Home Loans, Inc., Series 2004-2, Class 1A1, VRN (b)
3.445% 2/25/34 | | $ | 3,552 | | | $ | 3,645 | |
Countrywide Home Loans, Inc., Series 2003-42, Class 1A1, VRN (b)
3.887% 9/25/33 | | | 1,387 | | | | 1,292 | |
GSR Mortgage Loan Trust, Series 2004-9, Class 2A1, VRN (b)
3.596% 8/25/34 | | | 1,447 | | | | 1,457 | |
IndyMac Index Mortgage Loan Trust, Series 2004-AR4, Class 1A, VRN (b) 3.190% 8/25/34 | | | 9,088 | | | | 8,858 | |
JP Morgan Mortgage Trust, Series 2017-6, Class A5, VRN (a) (b) 3.500% 12/25/48 | | | 630,000 | | | | 638,657 | |
Merrill Lynch Mortgage Investors, Inc., Series 2004-A1, Class IA, VRN (b)
3.525% 2/25/34 | | | 980 | | | | 955 | |
Merrill Lynch Mortgage Investors, Inc., Series 2003-A4, Class IA, VRN (b)
3.588% 7/25/33 | | | 634 | | | | 653 | |
Morgan Stanley Mortgage Loan Trust, Series 2004-2AR, Class 1A, VRN (b)
3.500% 2/25/34 | | | 44 | | | | 47 | |
New Residential Mortgage Loan Trust, Series 2016-4A, Class A1, VRN (a) (b) 3.750% 11/25/56 | | | 388,050 | | | | 397,268 | |
Shellpoint Co-Originator Trust, Series 2016-1, Class 2A3, VRN (a) (b)
3.000% 10/25/31 | | | 912,369 | | | | 905,731 | |
Structured Adjustable Rate Mortgage Loan Trust, Series 2004-2, Class 2A, VRN (b)
3.494% 3/25/34 | | | 5,695 | | | | 5,872 | |
Washington Mutual Mortgage Pass-Through Certificates, Series 2004-AR2, Class A, 12 mo. MTA + 1.400%, FRN
2.463% 4/25/44 | | | 14,525 | | | | 14,632 | |
| | | | | | | | |
| | | | | | | 1,987,446 | |
| | | | | | | | |
| | |
TOTAL NON-U.S. GOVERNMENT AGENCY OBLIGATIONS
(Cost $80,431,363) | | | | | | | 80,617,071 | |
| | | | | | | | |
|
| U.S. GOVERNMENT AGENCY OBLIGATIONS AND INSTRUMENTALITIES — 1.0% | |
| Collateralized Mortgage Obligations — 0.9% | |
Federal Home Loan Mortgage Corp. | | | | | | | | |
Series 4491, Class B
3.000% 8/15/40 | | | 511,217 | | | | 515,082 | |
Series 4720, Class A
3.000% 3/15/41 | | | 431,131 | | | | 434,456 | |
The accompanying notes are an integral part of the financial statements.
84
MML Short-Duration Bond Fund – Portfolio of Investments (Continued)
| | | | | | | | |
| | | Principal
Amount | | | Value | |
Federal National Mortgage Association | | | | | | | | |
Series 2015-80, Class CA
3.000% 4/25/40 | | $ | 690,328 | | | $ | 693,397 | |
Series 2015-63, Class KA
3.000% 1/25/41 | | | 339,965 | | | | 342,130 | |
Government National Mortgage Association (b)
Series 2014-131, Class BW VRN
2.829% 5/20/41 | | | 154,006 | | | | 157,351 | |
| | | | | | | | |
| | | | | | | 2,142,416 | |
| | | | | | | | |
| Pass-Through Securities — 0.1% | | | | | | | | |
Federal Home Loan Mortgage Corp. | | | | | | | | |
Pool #C01079 7.500%
10/01/30 | | | 381 | | | | 445 | |
Pool #C01135 7.500%
2/01/31 | | | 1,092 | | | | 1,271 | |
Federal National Mortgage Association | | | | | | | | |
Pool #725692 1 year CMT + 2.140%, FRN 3.229%
10/01/33 | | | 25,519 | | | | 26,378 | |
Pool #888586 1 year CMT + 2.210%, FRN 3.282%
10/01/34 | | | 25,737 | | | | 27,089 | |
Pool #775539 12 mo. USD LIBOR + 1.645%, FRN 3.475%
5/01/34 | | | 9,065 | | | | 9,459 | |
Pool #575667 7.000%
3/01/31 | | | 2,419 | | | | 2,818 | |
Pool #529453 7.500%
1/01/30 | | | 523 | | | | 612 | |
Pool #531196 7.500%
2/01/30 | | | 68 | | | | 79 | |
Pool #530299 7.500%
3/01/30 | | | 72 | | | | 81 | |
Pool #536386 7.500%
4/01/30 | | | 87 | | | | 102 | |
Pool #535996 7.500%
6/01/31 | | | 1,415 | | | | 1,651 | |
Pool #523499 8.000%
11/01/29 | | | 56 | | | | 66 | |
Pool #252926 8.000%
12/01/29 | | | 37 | | | | 44 | |
Pool #532819 8.000%
3/01/30 | | | 32 | | | | 38 | |
Pool #534703 8.000%
5/01/30 | | | 534 | | | | 632 | |
Pool #253437 8.000%
9/01/30 | | | 36 | | | | 42 | |
Pool #253481 8.000%
10/01/30 | | | 16 | | | | 19 | |
Pool #602008 8.000%
8/01/31 | | | 846 | | | | 997 | |
| | | | | | | | |
| | | Principal
Amount | | | Value | |
Pool #596656 8.000%
8/01/31 | | $ | 289 | | | $ | 305 | |
Pool #190317 8.000%
8/01/31 | | | 718 | | | | 846 | |
Pool #597220 8.000%
9/01/31 | | | 644 | | | | 765 | |
Government National Mortgage Association | | | | | | | | |
Pool #371146 7.000%
9/15/23 | | | 274 | | | | 299 | |
Pool #352022 7.000%
11/15/23 | | | 1,377 | | | | 1,513 | |
Pool #491089 7.000%
12/15/28 | | | 1,839 | | | | 2,063 | |
Pool #478658 7.000%
5/15/29 | | | 434 | | | | 505 | |
Pool #500928 7.000%
5/15/29 | | | 833 | | | | 966 | |
Pool #499410 7.000%
7/15/29 | | | 252 | | | | 294 | |
Pool #510083 7.000%
7/15/29 | | | 236 | | | | 272 | |
Pool #493723 7.000%
8/15/29 | | | 505 | | | | 588 | |
Pool #581417 7.000%
7/15/32 | | | 2,452 | | | | 2,852 | |
Government National Mortgage Association II | | | | | | | | |
Pool #008746 1 year CMT + 1.500%, FRN 2.250%
11/20/25 | | | 986 | | | | 1,004 | |
Pool #080136 1 year CMT + 1.500%, FRN 2.250%
11/20/27 | | | 183 | | | | 187 | |
Pool #82462 1 year CMT + 1.500%, FRN 2.375%
1/20/40 | | | 69,613 | | | | 71,729 | |
Pool #82488 1 year CMT + 1.500%, FRN 2.375%
3/20/40 | | | 83,991 | | | | 86,468 | |
| | | | | | | | |
| | | | | | | 242,479 | |
| | | | | | | | |
| | |
TOTAL U.S. GOVERNMENT AGENCY OBLIGATIONS AND INSTRUMENTALITIES
(Cost $2,406,458) | | | | | | | 2,384,895 | |
| | | | | | | | |
|
| U.S. TREASURY OBLIGATIONS — 2.4% | |
| U.S. Treasury Bonds & Notes — 2.4% | |
U.S. Treasury Note (f)
0.750% 10/31/18 | | | 4,150,000 | | | | 4,115,633 | |
The accompanying notes are an integral part of the financial statements.
85
MML Short-Duration Bond Fund – Portfolio of Investments (Continued)
| | | | | | | | |
| | | Principal
Amount | | | Value | |
U.S. Treasury Note
0.875% 7/31/19 | | $ | 1,800,000 | | | $ | 1,772,719 | |
| | | | | | | | |
| | | | | | | 5,888,352 | |
| | | | | | | | |
| | |
TOTAL U.S. TREASURY OBLIGATIONS
(Cost $5,917,908) | | | | | | | 5,888,352 | |
| | | | | | | | |
| | |
TOTAL BONDS & NOTES
(Cost $195,312,250) | | | | | | | 195,253,291 | |
| | | | | | | | |
| | |
TOTAL PURCHASED OPTIONS (#) — 0.4%
(Cost $962,361) | | | | | | | 918,326 | |
| | | | | | | | |
| | |
TOTAL LONG-TERM INVESTMENTS
(Cost $196,274,611) | | | | | | | 196,171,617 | |
| | | | | | | | |
| SHORT-TERM INVESTMENTS — 19.8% | |
| Commercial Paper — 19.6% | | | | | | | | |
Anheuser-Busch InBev Worldwide, Inc. (a)
1.475% 1/10/18 | | | 2,000,000 | | | | 1,998,923 | |
Bell Canada (a)
1.608% 2/12/18 | | | 1,750,000 | | | | 1,746,084 | |
Carnival Corp. (a)
1.646% 1/23/18 | | | 1,400,000 | | | | 1,398,311 | |
CenterPoint Energy, Inc. (a)
1.578% 1/02/18 | | | 1,000,000 | | | | 999,815 | |
Cox Enterprises, Inc. (a)
1.896% 1/02/18 | | | 2,250,000 | | | | 2,249,532 | |
Entergy Corp. (a)
1.628% 2/14/18 | | | 2,000,000 | | | | 1,994,853 | |
FedEx Corp. (a)
1.515% 1/08/18 | | | 2,250,000 | | | | 2,248,943 | |
FMC Technologies, Inc. (a)
1.828% 1/17/18 | | | 1,500,000 | | | | 1,498,638 | |
Ford Motor Credit Co. (a)
1.882% 3/01/18 | | | 1,250,000 | | | | 1,246,215 | |
HP, Inc. (a)
1.535% 1/05/18 | | | 2,000,000 | | | | 1,999,444 | |
Hyundai Capital America (a)
1.555% 1/22/18 | | | 2,175,000 | | | | 2,172,486 | |
Marriott International, Inc. (a)
1.596% 1/16/18 | | | 2,000,000 | | | | 1,998,282 | |
Molex Electronic Technologies (a)
1.634% 1/04/18 | | | 2,000,000 | | | | 1,999,375 | |
Potash Corp. of Saskatchewan, Inc. (a) 1.626% 1/26/18 | | | 2,000,000 | | | | 1,997,286 | |
Public Service Enterprise Group, Inc. (a)
2.084% 2/01/18 | | | 2,000,000 | | | | 1,996,689 | |
| | | | | | | | |
| | | Principal
Amount | | | Value | |
Reckitt Benckiser Treasury Services PLC (a)
1.527% 1/16/18 | | $ | 1,500,000 | | | $ | 1,498,876 | |
Relx, Inc. (a)
1.846% 1/02/18 | | | 2,250,000 | | | | 2,249,583 | |
Sempra Energy Holdings (a)
1.545% 1/08/18 | | | 2,250,000 | | | | 2,248,943 | |
Southern California Edison Co. (a)
1.673% 1/05/18 | | | 2,250,000 | | | | 2,249,278 | |
Spectra Energy Partners (a)
1.949% 1/08/18 | | | 2,250,000 | | | | 2,248,943 | |
Suncor Energy, Inc. (a)
1.803% 3/14/18 | | | 1,500,000 | | | | 1,494,406 | |
Telus Corp. (a)
1.981% 1/29/18 | | | 2,250,000 | | | | 2,246,607 | |
The Southern Co. (a)
1.876% 1/02/18 | | | 2,250,000 | | | | 2,249,583 | |
Thomson Reuters Corp. (a)
1.649% 2/13/18 | | | 2,000,000 | | | | 1,995,423 | |
Volvo Group Treasury National (a)
1.979% 1/17/18 | | | 2,000,000 | | | | 1,998,183 | |
| | | | | | | | |
| | | | | | | 48,024,701 | |
| | | | | | | | |
| Time Deposit — 0.2% | | | | | | | | |
Euro Time Deposit
0.120% 1/02/18 | | | 527,091 | | | | 527,091 | |
| | | | | | | | |
| | |
TOTAL SHORT-TERM INVESTMENTS
(Cost $48,560,025) | | | | | | | 48,551,792 | |
| | | | | | | | |
| | |
TOTAL INVESTMENTS — 100.1%
(Cost $244,834,636) (g) | | | | | | | 244,723,409 | |
| | |
| Other Assets/(Liabilities) — (0.1)% | | | | | | | (170,393 | ) |
| | | | | | | | |
| | |
| NET ASSETS — 100.0% | | | | | | $ | 244,553,016 | |
| | | | | | | | |
Abbreviation Legend
| CLO | Collateralized Loan Obligation |
| CMO | Collateralized Mortgage Obligation |
| CMT | Constant Maturity Treasury Index |
| MBS | Mortgage-Backed Security |
| MTA | Monthly Treasury Average Index |
The accompanying notes are an integral part of the financial statements.
86
MML Short-Duration Bond Fund – Portfolio of Investments (Continued)
Notes to Portfolio of Investments
Percentages are stated as a percent of net assets.
| (a) | Securities exempt from registration under rule 144A of the Securities Act of 1933. These securities may be resold in transactions exempt from registration, normally to qualified institutional buyers. At December 31, 2017, these securities amounted to a value of $150,140,260 or 61.39% of net assets. |
| (b) | Certain variable rate securities are not based on a published reference rate and spread but are determined by the issuer or agent and are based on current market conditions. These securities do not indicate a reference rate and spread in their description above. The rates shown are the current interest rates at December 31, 2017. |
| (c) | Investment was valued using significant unobservable inputs. |
| (d) | This security is fair valued in good faith in accordance with procedures approved by the Board of Trustees. At December 31, 2017, these securities amounted to a value of $695,132 or 0.28% of net assets. |
| (e) | Restricted security. Certain securities are restricted as to resale. At December 31, 2017, these securities amounted to a value of $1,661,032 or 0.68% of net assets. The Fund generally bears the costs, if any, associated with the disposition of restricted securities. |
| (f) | A portion of this security is pledged/held as collateral for open futures contracts. (Note 2). |
| (g) | See Note 6 for aggregate cost for federal tax purposes. |
(#) The Fund had the following open Purchased Swaptions contracts at December 31, 2017:
Purchased Swaptions
| | | | | | | | | | | | | | | | | | | | | | | | | | | | |
| OTC Counterparty* | | Units | | | Notional
Amount | | | Expiration
Date | | | Pay/
Receive
Exercise
Rate | | Description | | Premiums
Purchased | | | Value | | | Unrealized
Appreciation/
(Depreciation) | |
| Call | |
Barclays Bank PLC | | | 6,340,000 | | | USD | 6,340,000 | | | | 12/13/32 | | | Receive | | 3-Month USD LIBOR BBA 10 Year Swaption, Underlying Swap terminates 12/15/42, Strike 2.44 | | $ | 316,951 | | | $ | 308,183 | | | $ | (8,768 | ) |
| Put | |
| | | | | | | | |
Barclays Bank PLC | | | 12,910,000 | | | USD | 12,910,000 | | | | 12/13/32 | | | Pay | | 3-Month USD LIBOR BBA 10 Year Swaption, Underlying Swap terminates 12/15/42, Strike 2.94 | | $ | 645,410 | | | $ | 610,143 | | | $ | (35,267 | ) |
| | | | | | | | | | | | | | | | | | | | | | | | | | | | |
| | | | | | | | | | | | | | | | | | $ | 962,361 | | | $ | 918,326 | | | $ | (44,035 | ) |
| | | | | | | | | | | | | | | | | | | | | | | | | | | | |
| * | Contracts are subject to a Master Netting Agreement. |
The Fund had the following open Futures contracts at December 31, 2017:
Futures
| | | | | | | | | | | | |
| | | Expiration
Date | | | Number of
Contracts | | Notional
Amount | | Value/ Net
Unrealized
Appreciation/
(Depreciation) | |
| Futures Contracts — Long | |
| U.S. Treasury Note 10 Year | | | 3/20/18 | | | 232 | | $28,867,458 | | $ | (88,583 | ) |
| U.S. Treasury Note 2 Year | | | 3/29/18 | | | 135 | | 28,959,199 | | | (54,433 | ) |
| | | | | | | | | | | | |
| | $ | (143,016 | ) |
| | | | | | | | | | | | |
| Futures Contracts — Short | |
| U.S. Treasury Ultra 10 Year | | | 3/20/18 | | | 84 | | $(11,232,765) | | $ | 13,515 | |
| U.S. Treasury Note 5 Year | | | 3/29/18 | | | 584 | | (68,180,184) | | | 340,371 | |
| | | | | | | | | | | | |
| | $ | 353,886 | |
| | | | | | | | | | | | |
The accompanying notes are an integral part of the financial statements.
87
MML Short-Duration Bond Fund – Portfolio of Investments (Continued)
The Fund had the following open Swap agreements at December 31, 2017:
Swaps
| | | | | | | | | | | | | | | | | | | | | | | | | | | | |
| Counterparty | | Currency | | Notional
Amount | | | Expiration
Date | | | Payment
Frequency | | Receive (Pay)
Fixed Rate | | Deliverable on
Default | | Unrealized
Appreciation
(Depreciation) | | | Premium
(Received)
Paid | | | Value | |
Credit Default Swaps — Sell Protection†† | |
OTC Swaps* | |
| Goldman Sachs International | | USD | | | 410,000 | | | | 5/11/63 | | | Monthly | | 3.000% | | CMBX.NA.BBB-.6†
(Rating: BBB-) | | $ | (60,243 | ) | | $ | 253 | | | $ | (59,990 | ) |
| Goldman Sachs International | | USD | | | 410,000 | | | | 5/11/63 | | | Monthly | | 3.000% | | CMBX.NA.BBB-.6† (Rating: BBB-) | | | (24,485 | ) | | | (35,506 | ) | | | (59,991 | ) |
| Goldman Sachs International | | USD | | | 150,000 | | | | 5/11/63 | | | Monthly | | 3.000% | | CMBX.NA.BBB-.6† (Rating: BBB-) | | | (9,930 | ) | | | (12,018 | ) | | | (21,948 | ) |
| | | | | | | | | | | | | | | | | | | | | | | | | | | | |
| | $ | (94,658 | ) | | $ | (47,271 | ) | | $ | (141,929 | ) |
| | | | | | | | | | | | | | | | | | | | | | | | | | | | |
| * | Contracts are subject to a Master Netting Agreement. |
| † | Payment is based on a percentage of the index. Reference entities are a number of individual issuers comprising the index. |
| †† | For each credit derivative with sold protection, the credit ratings of the entities referenced, as rated by any rating organization, are included in the equivalent S&P Global Ratings. The reference entity rating represents the likelihood of a potential payment by the Fund if the referenced entity experiences a credit event as of period end. Notional amounts represent the maximum potential amount of future payments (undiscounted) the Fund could be required to make under the credit derivatives with sold protection. |
Currency Legend
USD U.S. Dollar
Country weightings, as a percentage of net assets, is as follows:
| | | | |
United States | | | 64.5 | % |
Cayman Islands | | | 5.0 | % |
Netherlands | | | 2.3 | % |
Luxembourg | | | 1.2 | % |
United Kingdom | | | 0.9 | % |
Bermuda | | | 0.8 | % |
Ireland | | | 0.8 | % |
Japan | | | 0.8 | % |
France | | | 0.6 | % |
Australia | | | 0.6 | % |
New Zealand | | | 0.5 | % |
Spain | | | 0.5 | % |
Sweden | | | 0.5 | % |
Canada | | | 0.4 | % |
Mexico | | | 0.2 | % |
Turkey | | | 0.2 | % |
Colombia | | | 0.2 | % |
Brazil | | | 0.1 | % |
Austria | | | 0.1 | % |
Barbados | | | 0.1 | % |
United States Virgin Islands | | | 0.0 | % |
| | | | |
Total Long-Term Investments | | | 80.3 | % |
Short-Term Investments and Other Assets and Liabilities | | | 19.7 | % |
| | | | |
Net Assets | | | 100.0 | % |
| | | | |
The accompanying notes are an integral part of the financial statements.
88
MML Small Cap Equity Fund – Portfolio of Investments
December 31, 2017
| | | | | | | | |
| | | Number of
Shares | | | Value | |
| EQUITIES — 97.8% | |
|
| COMMON STOCK — 97.8% | |
| Basic Materials — 3.8% | |
| Forest Products & Paper — 0.6% | |
P.H. Glatfelter Co. | | | 36,920 | | | $ | 791,566 | |
| | | | | | | | |
| Iron & Steel — 0.8% | |
Allegheny Technologies, Inc. (a) (b) | | | 39,985 | | | | 965,238 | |
| | | | | | | | |
| Mining — 2.4% | |
Compass Minerals International, Inc. (b) | | | 17,710 | | | | 1,279,547 | |
Kaiser Aluminum Corp. | | | 14,775 | | | | 1,578,709 | |
| | | | | | | | |
| | | | | | | 2,858,256 | |
| | | | | | | | |
| | | | | | | 4,615,060 | |
| | | | | | | | |
| Communications — 5.6% | |
| Internet — 3.9% | |
Etsy, Inc. (a) | | | 48,320 | | | | 988,144 | |
Proofpoint, Inc. (a) | | | 14,910 | | | | 1,324,157 | |
Q2 Holdings, Inc. (a) | | | 22,190 | | | | 817,702 | |
Yelp, Inc. (a) | | | 36,620 | | | | 1,536,575 | |
| | | | | | | | |
| | | | | | | 4,666,578 | |
| | | | | | | | |
| Media — 1.5% | |
Houghton Mifflin Harcourt Co. (a) | | | 113,260 | | | | 1,053,318 | |
WideOpenWest, Inc. (a) (b) | | | 66,112 | | | | 698,804 | |
| | | | | | | | |
| | | | | | | 1,752,122 | |
| | | | | | | | |
| Telecommunications — 0.2% | |
RigNet, Inc. (a) | | | 17,633 | | | | 263,613 | |
| | | | | | | | |
| | | | | | | 6,682,313 | |
| | | | | | | | |
| Consumer, Cyclical — 13.2% | |
| Airlines — 1.5% | |
Spirit Airlines, Inc. (a) (b) | | | 39,580 | | | | 1,775,163 | |
| | | | | | | | |
| Apparel — 1.1% | |
Canada Goose Holdings, Inc. (a) | | | 41,575 | | | | 1,312,107 | |
| | | | | | | | |
| Auto Manufacturers — 0.9% | |
Navistar International Corp. (a) | | | 23,980 | | | | 1,028,262 | |
| | | | | | | | |
| Auto Parts & Equipment — 1.9% | |
Visteon Corp. (a) | | | 18,370 | | | | 2,298,822 | |
| | | | | | | | |
| Retail — 7.2% | |
DSW, Inc. Class A | | | 60,990 | | | | 1,305,796 | |
Fred’s, Inc. Class A (b) | | | 81,280 | | | | 329,184 | |
Group 1 Automotive, Inc. | | | 29,780 | | | | 2,113,486 | |
Papa John’s International, Inc. (b) | | | 17,290 | | | | 970,142 | |
Sonic Corp. (b) | | | 53,320 | | | | 1,465,234 | |
Suburban Propane Partners LP (c) | | | 66,400 | | | | 1,608,208 | |
Texas Roadhouse, Inc. | | | 15,750 | | | | 829,710 | |
| | | | | | | | |
| | | | | | | 8,621,760 | |
| | | | | | | | |
| | | | | | | | |
| | | Number of
Shares | | | Value | |
| Storage & Warehousing — 0.6% | |
Wesco Aircraft Holdings, Inc. (a) | | | 97,260 | | | $ | 719,724 | |
| | | | | | | | |
| | | | | | | 15,755,838 | |
| | | | | | | | |
| Consumer, Non-cyclical — 20.5% | |
| Agriculture — 0.8% | |
Universal Corp. | | | 18,160 | | | | 953,400 | |
| | | | | | | | |
| Biotechnology — 2.5% | |
Emergent BioSolutions, Inc. (a) | | | 18,850 | | | | 875,960 | |
Exact Sciences Corp. (a) | | | 13,370 | | | | 702,460 | |
Ligand Pharmaceuticals, Inc. (a) (b) | | | 4,680 | | | | 640,832 | |
Sage Therapeutics, Inc. (a) | | | 4,826 | | | | 794,890 | |
| | | | | | | | |
| | | | | | | 3,014,142 | |
| | | | | | | | |
| Commercial Services — 5.5% | |
Korn/Ferry International | | | 56,691 | | | | 2,345,873 | |
Matthews International Corp. Class A | | | 21,690 | | | | 1,145,232 | |
On Assignment, Inc. (a) | | | 35,400 | | | | 2,275,158 | |
Paylocity Holding Corp. (a) | | | 17,510 | | | | 825,772 | |
| | | | | | | | |
| | | | | | | 6,592,035 | |
| | | | | | | | |
| Cosmetics & Personal Care — 0.8% | |
elf Beauty, Inc. (a) (b) | | | 42,740 | | | | 953,529 | |
| | | | | | | | |
| Foods — 1.8% | |
Hostess Brands, Inc. (a) | | | 145,130 | | | | 2,149,375 | |
| | | | | | | | |
| Health Care – Products — 3.0% | |
NuVasive, Inc. (a) | | | 23,650 | | | | 1,383,288 | |
NxStage Medical, Inc. (a) | | | 22,830 | | | | 553,171 | |
Quidel Corp. (a) | | | 19,950 | | | | 864,833 | |
Wright Medical Group NV (a) | | | 37,370 | | | | 829,614 | |
| | | | | | | | |
| | | | | | | 3,630,906 | |
| | | | | | | | |
| Health Care – Services — 1.5% | |
Addus HomeCare Corp. (a) | | | 12,542 | | | | 436,462 | |
Amedisys, Inc. (a) | | | 25,150 | | | | 1,325,656 | |
| | | | | | | | |
| | | | | | | 1,762,118 | |
| | | | | | | | |
| Household Products & Wares — 1.3% | |
Acco Brands Corp. (a) | | | 129,540 | | | | 1,580,388 | |
| | | | | | | | |
| Pharmaceuticals — 3.3% | |
Clovis Oncology, Inc. (a) | | | 6,860 | | | | 466,480 | |
Galapagos NV (a) | | | 4,783 | | | | 453,108 | |
Prestige Brands Holdings, Inc. (a) | | | 54,771 | | | | 2,432,380 | |
TherapeuticsMD, Inc. (a) (b) | | | 96,070 | | | | 580,263 | |
| | | | | | | | |
| | | | | | | 3,932,231 | |
| | | | | | | | |
| | | | | | | 24,568,124 | |
| | | | | | | | |
| Energy — 3.0% | |
| Energy – Alternate Sources — 0.8% | |
Renewable Energy Group, Inc. (a) (b) | | | 79,579 | | | | 939,032 | |
| | | | | | | | |
| Oil & Gas — 0.8% | |
Matador Resources Co. (a) | | | 29,465 | | | | 917,246 | |
| | | | | | | | |
The accompanying notes are an integral part of the financial statements.
89
MML Small Cap Equity Fund – Portfolio of Investments (Continued)
| | | | | | | | |
| | | Number of
Shares | | | Value | |
| Pipelines — 1.4% | |
CNX Midstream Partners LP (c) | | | 41,895 | | | $ | 702,579 | |
Noble Midstream Partners LP (c) | | | 19,725 | | | | 986,250 | |
| | | | | | | | |
| | | | | | | 1,688,829 | |
| | | | | | | | |
| | | | | | | 3,545,107 | |
| | | | | | | | |
| Financial — 23.9% | |
| Banks — 8.5% | |
The Bank of NT Butterfield & Son Ltd. | | | 25,229 | | | | 915,560 | |
BankUnited, Inc. | | | 43,929 | | | | 1,788,789 | |
Chemical Financial Corp. | | | 22,572 | | | | 1,206,925 | |
Customers Bancorp, Inc. (a) | | | 24,750 | | | | 643,253 | |
FCB Financial Holdings, Inc. Class A (a) | | | 23,083 | | | | 1,172,616 | |
IBERIABANK Corp. | | | 15,470 | | | | 1,198,925 | |
MB Financial, Inc. | | | 32,670 | | | | 1,454,468 | |
Webster Financial Corp. | | | 31,480 | | | | 1,767,917 | |
| | | | | | | | |
| | | | | | | 10,148,453 | |
| | | | | | | | |
| Diversified Financial Services — 1.2% | |
Stifel Financial Corp. | | | 24,380 | | | | 1,452,073 | |
| | | | | | | | |
| Insurance — 0.9% | |
James River Group Holdings Ltd. | | | 26,285 | | | | 1,051,663 | |
| | | | | | | | |
| Real Estate — 1.0% | |
Realogy Holdings Corp. | | | 43,960 | | | | 1,164,940 | |
| | | | | | | | |
| Real Estate Investment Trusts (REITS) — 7.7% | |
Brandywine Realty Trust | | | 113,590 | | | | 2,066,202 | |
CYS Investments, Inc. | | | 210,760 | | | | 1,692,403 | |
DiamondRock Hospitality Co. | | | 152,970 | | | | 1,727,031 | |
Four Corners Property Trust, Inc. | | | 77,290 | | | | 1,986,353 | |
National Storage Affiliates Trust | | | 66,860 | | | | 1,822,604 | |
| | | | | | | | |
| | | | | | | 9,294,593 | |
| | | | | | | | |
| Savings & Loans — 4.6% | |
Beneficial Bancorp, Inc. | | | 47,370 | | | | 779,236 | |
Berkshire Hills Bancorp, Inc. | | | 25,260 | | | | 924,516 | |
OceanFirst Financial Corp. | | | 46,450 | | | | 1,219,312 | |
Oritani Financial Corp. | | | 41,150 | | | | 674,860 | |
Sterling Bancorp | | | 54,860 | | | | 1,349,556 | |
WSFS Financial Corp. | | | 11,790 | | | | 564,152 | |
| | | | | | | | |
| | | | | | | 5,511,632 | |
| | | | | | | | |
| | | | | | | 28,623,354 | |
| | | | | | | | |
| Industrial — 11.5% | |
| Building Materials — 2.4% | |
Masonite International Corp. (a) | | | 15,143 | | | | 1,122,854 | |
Summit Materials, Inc. Class A (a) | | | 53,609 | | | | 1,685,467 | |
| | | | | | | | |
| | | | | | | 2,808,321 | |
| | | | | | | | |
| Electrical Components & Equipment — 1.6% | |
Generac Holdings, Inc. (a) | | | 37,350 | | | | 1,849,572 | |
| | | | | | | | |
| Engineering & Construction — 2.2% | |
Dycom Industries, Inc. (a) | | | 11,770 | | | | 1,311,531 | |
| | | | | | | | |
| | | Number of
Shares | | | Value | |
KBR, Inc. | | | 65,216 | | | $ | 1,293,233 | |
| | | | | | | | |
| | | | | | | 2,604,764 | |
| | | | | | | | |
| Environmental Controls — 0.9% | |
Advanced Disposal Services, Inc. (a) | | | 43,968 | | | | 1,052,594 | |
| | | | | | | | |
| Machinery – Diversified — 0.8% | |
The Manitowoc Co., Inc. (a) | | | 25,417 | | | | 999,905 | |
| | | | | | | | |
| Metal Fabricate & Hardware — 1.0% | |
Rexnord Corp. (a) | | | 47,850 | | | | 1,245,057 | |
| | | | | | | | |
| Transportation — 1.5% | |
CryoPort, Inc. (a) | | | 23,290 | | | | 200,061 | |
Genesee & Wyoming, Inc. Class A (a) | | | 20,230 | | | | 1,592,708 | |
| | | | | | | | |
| | | | | | | 1,792,769 | |
| | | | | | | | |
| Trucking & Leasing — 1.1% | |
The Greenbrier Cos., Inc. (b) | | | 25,570 | | | | 1,362,881 | |
| | | | | | | | |
| | | | | | | 13,715,863 | |
| | | | | | | | |
| Technology — 13.4% | |
| Computers — 3.0% | |
CACI International, Inc. Class A (a) | | | 17,181 | | | | 2,273,905 | |
Teradata Corp. (a) | | | 32,590 | | | | 1,253,412 | |
| | | | | | | | |
| | | | | | | 3,527,317 | |
| | | | | | | | |
| Semiconductors — 4.6% | |
Brooks Automation, Inc. | | | 49,210 | | | | 1,173,658 | |
MaxLinear, Inc. (a) | | | 43,730 | | | | 1,155,347 | |
MKS Instruments, Inc. | | | 16,510 | | | | 1,560,195 | |
Semtech Corp. (a) | | | 48,180 | | | | 1,647,756 | |
| | | | | | | | |
| | | | | | | 5,536,956 | |
| | | | | | | | |
| Software — 5.8% | |
CommVault Systems, Inc. (a) | | | 16,310 | | | | 856,275 | |
Envestnet, Inc. (a) | | | 18,330 | | | | 913,750 | |
j2 Global, Inc. | | | 23,301 | | | | 1,748,274 | |
Pegasystems, Inc. | | | 31,086 | | | | 1,465,705 | |
Zynga, Inc. Class A (a) | | | 499,360 | | | | 1,997,440 | |
| | | | | | | | |
| | | | | | | 6,981,444 | |
| | | | | | | | |
| | | | | | | 16,045,717 | |
| | | | | | | | |
| Utilities — 2.9% | |
| Electric — 2.9% | |
Black Hills Corp. (b) | | | 30,480 | | | | 1,832,153 | |
NorthWestern Corp. | | | 28,450 | | | | 1,698,465 | |
| | | | | | | | |
| | | | | | | 3,530,618 | |
| | | | | | | | |
| | |
TOTAL COMMON STOCK
(Cost $94,420,635) | | | | | | | 117,081,994 | |
| | | | | | | | |
| | |
TOTAL EQUITIES
(Cost $94,420,635) | | | | | | | 117,081,994 | |
| | | | | | | | |
The accompanying notes are an integral part of the financial statements.
90
MML Small Cap Equity Fund – Portfolio of Investments (Continued)
| | | | | | | | |
| | | Number of
Shares | | | Value | |
| MUTUAL FUNDS — 7.9% | |
| Diversified Financial Services — 7.9% | |
State Street Navigator Securities Lending Prime Portfolio (d) | | | 9,444,321 | | | $ | 9,444,321 | |
| | | | | | | | |
| | |
TOTAL MUTUAL FUNDS
(Cost $9,444,321) | | | | | | | 9,444,321 | |
| | | | | | | | |
| | |
TOTAL LONG-TERM INVESTMENTS
(Cost $103,864,956) | | | | | | | 126,526,315 | |
| | | | | | | | |
| | |
| | | Principal
Amount | | | | |
| SHORT-TERM INVESTMENTS — 2.3% | |
| Repurchase Agreement — 2.3% | |
Fixed Income Clearing Corp., Repurchase Agreement, dated 12/29/17, 0.540%, due 1/02/18 (e) | | $ | 2,783,591 | | | | 2,783,591 | |
| | | | | | | | |
| | |
TOTAL SHORT-TERM INVESTMENTS
(Cost $2,783,591) | | | | | | | 2,783,591 | |
| | | | | | | | |
| | |
| TOTAL INVESTMENTS — 108.0% (Cost $106,648,547) (f) | | | | | | | 129,309,906 | |
| | |
| Other Assets/(Liabilities) — (8.0)% | | | | | | | (9,632,784 | ) |
| | | | | | | | |
| | |
| NET ASSETS — 100.0% | | | | | | $ | 119,677,122 | |
| | | | | | | | |
| | | | | | | | |
Notes to Portfolio of Investments
Percentages are stated as a percent of net assets.
| (a) | Non-income producing security. |
| (b) | Denotes all or a portion of security on loan. The total value of securities on loan as of December 31, 2017, was $9,192,182 or 7.68% of net assets. Total securities on loan may not correspond with the amounts identified in the Portfolio of Investments because pending sales may be in the process of recall from the brokers. (Note 2). |
| (c) | Security is a Master Limited Partnership. |
| (d) | Represents investment of security lending collateral. (Note 2). |
| (e) | Maturity value of $2,783,758. Collateralized by U.S. Government Agency obligations with a rate of 2.000%, maturity date of 4/30/24, and an aggregate market value, including accrued interest, of $2,842,754. |
| (f) | See Note 6 for aggregate cost for federal tax purposes. |
The accompanying notes are an integral part of the financial statements.
91
MML Special Situations Fund – Portfolio of Investments
December 31, 2017
| | | | | | | | |
| | | Number of
Shares | | | Value | |
| EQUITIES — 101.4% | |
|
| COMMON STOCK — 101.4% | |
| Basic Materials — 12.0% | | | | | | | | |
| Chemicals — 10.1% | | | | | | | | |
AdvanSix, Inc. (a) | | | 9,600 | | | $ | 403,872 | |
The Chemours Co. | | | 10,379 | | | | 519,573 | |
Ingevity Corp. (a) | | | 12,600 | | | | 887,922 | |
Rayonier Advanced Materials, Inc. | | | 4,600 | | | | 94,070 | |
Venator Materials PLC (a) | | | 10,800 | | | | 238,896 | |
Versum Materials, Inc. | | | 6,800 | | | | 257,380 | |
| | | | | | | | |
| | | | | | | 2,401,713 | |
| | | | | | | | |
| Mining — 1.9% | | | | | | | | |
Alcoa Corp. (a) | | | 8,100 | | | | 436,347 | |
| | | | | | | | |
| | | | | | | 2,838,060 | |
| | | | | | | | |
| Communications — 7.8% | | | | | | | | |
| Internet — 0.7% | | | | | | | | |
Liberty Expedia Holdings, Inc. Class A (a) | | | 1,360 | | | | 60,289 | |
Liberty Ventures Series A (a) | | | 2,040 | | | | 110,649 | |
| | | | | | | | |
| | | | | | | 170,938 | |
| | | | | | | | |
| Media — 7.1% | | | | | | | | |
Cable One, Inc. | | | 500 | | | | 351,675 | |
Liberty Broadband Corp. Class A (a) | | | 3,500 | | | | 297,675 | |
Liberty Broadband Corp. Class C (a) | | | 3,600 | | | | 306,576 | |
Liberty Media Corp-Liberty Formula One Class C (a) | | | 5,300 | | | | 181,048 | |
Liberty Media Corp-Liberty SiriusXM Class A (a) | | | 5,600 | | | | 222,096 | |
Liberty Media Corp-Liberty SiriusXM Class C (a) | | | 5,600 | | | | 222,096 | |
News Corp. Class A | | | 5,800 | | | | 94,018 | |
| | | | | | | | |
| | | | | | | 1,675,184 | |
| | | | | | | | |
| | | | | | | 1,846,122 | |
| | | | | | | | |
| Consumer, Cyclical — 12.1% | | | | | | | | |
| Auto Parts & Equipment — 7.2% | | | | | | | | |
Adient PLC | | | 16,800 | | | | 1,322,160 | |
Aptiv PLC | | | 4,679 | | | | 396,920 | |
| | | | | | | | |
| | | | | | | 1,719,080 | |
| | | | | | | | |
| Entertainment — 2.7% | | | | | | | | |
The Madison Square Garden Co. Class A (a) | | | 3,010 | | | | 634,658 | |
| | | | | | | | |
| Lodging — 2.2% | | | | | | | | |
Hilton Grand Vacations, Inc. (a) | | | 12,500 | | | | 524,375 | |
| | | | | | | | |
| | | | | | | 2,878,113 | |
| | | | | | | | |
| Consumer, Non-cyclical — 29.8% | | | | | | | | |
| Biotechnology — 6.0% | | | | | | | | |
Bioverativ, Inc. (a) | | | 26,300 | | | | 1,418,096 | |
| | | | | | | | |
| | | | | | | | |
| | | Number of
Shares | | | Value | |
| Commercial Services — 6.2% | | | | | | | | |
PayPal Holdings, Inc. (a) | | | 19,900 | | | $ | 1,465,038 | |
| | | | | | | | |
| Foods — 2.8% | | | | | | | | |
Lamb Weston Holdings, Inc. | | | 11,733 | | | | 662,328 | |
| | | | | | | | |
| Health Care – Products — 5.1% | | | | | | | | |
Danaher Corp. | | | 3,500 | | | | 324,870 | |
Halyard Health, Inc. (a) | | | 6,100 | | | | 281,698 | |
Varex Imaging Corp. (a) | | | 7,500 | | | | 301,275 | |
West Pharmaceutical Services, Inc. | | | 3,100 | | | | 305,877 | |
| | | | | | | | |
| | | | | | | 1,213,720 | |
| | | | | | | | |
| Household Products & Wares — 1.2% | | | | | | | | |
Avery Dennison Corp. | | | 2,400 | | | | 275,664 | |
| | | | | | | | |
| Pharmaceuticals — 8.5% | | | | | | | | |
AbbVie, Inc. | | | 6,300 | | | | 609,273 | |
Zoetis, Inc. | | | 19,700 | | | | 1,419,188 | |
| | | | | | | | |
| | | | | | | 2,028,461 | |
| | | | | | | | |
| | | | | | | 7,063,307 | |
| | | | | | | | |
| Energy — 1.7% | | | | | | | | |
| Oil & Gas — 1.7% | | | | | | | | |
Murphy USA, Inc. (a) | | | 5,000 | | | | 401,800 | |
| | | | | | | | |
| Financial — 8.9% | | | | | | | | |
| Diversified Financial Services — 5.2% | | | | | | | | |
Synchrony Financial | | | 31,800 | | | | 1,227,798 | |
| | | | | | | | |
| Real Estate Investment Trusts (REITS) — 3.3% | |
Four Corners Property Trust, Inc. | | | 10,300 | | | | 264,710 | |
Gaming and Leisure Properties, Inc. | | | 13,900 | | | | 514,300 | |
| | | | | | | | |
| | | | | | | 779,010 | |
| | | | | | | | |
| Savings & Loans — 0.4% | | | | | | | | |
Poage Bankshares, Inc. | | | 5,400 | | | | 112,050 | |
| | | | | | | | |
| | | | | | | 2,118,858 | |
| | | | | | | | |
| Industrial — 22.9% | | | | | | | | |
| Aerospace & Defense — 2.6% | | | | | | | | |
KLX, Inc. (a) | | | 9,000 | | | | 614,250 | |
| | | | | | | | |
| Electronics — 11.8% | | | | | | | | |
Allegion PLC | | | 8,500 | | | | 676,260 | |
Fortive Corp. | | | 18,500 | | | | 1,338,475 | |
Keysight Technologies, Inc. (a) | | | 7,770 | | | | 323,232 | |
Kimball Electronics, Inc. (a) | | | 24,514 | | | | 447,380 | |
| | | | | | | | |
| | | | | | | 2,785,347 | |
| | | | | | | | |
| Engineering & Construction — 1.2% | | | | | | | | |
TopBuild Corp. (a) | | | 3,800 | | | | 287,812 | |
| | | | | | | | |
| Machinery – Construction & Mining — 3.6% | |
Oshkosh Corp. | | | 9,500 | | | | 863,455 | |
| | | | | | | | |
| Metal Fabricate & Hardware — 0.5% | |
TimkenSteel Corp. (a) | | | 7,100 | | | | 107,849 | |
| | | | | | | | |
The accompanying notes are an integral part of the financial statements.
92
MML Special Situations Fund – Portfolio of Investments (Continued)
| | | | | | | | |
| | | Number of
Shares | | | Value | |
| Miscellaneous – Manufacturing — 3.2% | |
Pentair PLC | | | 2,340 | | | $ | 165,251 | |
Trinseo SA | | | 8,300 | | | | 602,580 | |
| | | | | | | | |
| | | | | | | 767,831 | |
| | | | | | | | |
| | | | | | | 5,426,544 | |
| | | | | | | | |
| Technology — 3.9% | | | | | | | | |
| Computers — 3.9% | | | | | | | | |
DXC Technology Co. | | | 3,874 | | | | 367,643 | |
Hewlett Packard Enterprise Co. | | | 22,600 | | | | 324,536 | |
Lumentum Holdings, Inc. (a) | | | 4,500 | | | | 220,050 | |
| | | | | | | | |
| | | | | | | 912,229 | |
| | | | | | | | |
| Utilities — 2.3% | | | | | | | | |
| Gas — 2.3% | | | | | | | | |
ONE Gas, Inc. | | | 7,300 | | | | 534,798 | |
| | | | | | | | |
| | |
TOTAL COMMON STOCK
(Cost $19,312,037) | | | | | | | 24,019,831 | |
| | | | | | | | |
| | |
TOTAL EQUITIES
(Cost $19,312,037) | | | | | | | 24,019,831 | |
| | | | | | | | |
| | |
TOTAL LONG-TERM INVESTMENTS
(Cost $19,312,037) | | | | | | | 24,019,831 | |
| | | | | | | | |
| | |
TOTAL INVESTMENTS — 101.4%
(Cost $19,312,037) (b) | | | | | | | 24,019,831 | |
| | |
| Other Assets/(Liabilities) — (1.4)% | | | | | | | (325,921 | ) |
| | | | | | | | |
| | |
| NET ASSETS — 100.0% | | | | | | $ | 23,693,910 | |
| | | | | | | | |
Notes to Portfolio of Investments
Percentages are stated as a percent of net assets.
| (a) | Non-income producing security. |
| (b) | See Note 6 for aggregate cost for federal tax purposes. |
Country weightings, as a percentage of net assets, is as follows:
| | | | |
United States | | | 87.1 | % |
Ireland | | | 9.1 | % |
United Kingdom | | | 2.7 | % |
Luxembourg | | | 2.5 | % |
| | | | |
Total Long-Term Investments | | | 101.4 | % |
Other Assets and Liabilities | | | (1.4 | )% |
| | | | |
Net Assets | | | 100.0 | % |
| | | | |
The accompanying notes are an integral part of the financial statements.
93
MML Strategic Emerging Markets Fund – Portfolio of Investments
December 31, 2017
| | | | | | | | |
| | | Number of
Shares | | | Value | |
| EQUITIES — 96.7% | |
|
| COMMON STOCK — 95.4% | |
| Bermuda — 2.2% | | | | | | | | |
Credicorp Ltd. | | | 4,610 | | | $ | 956,252 | |
Jardine Strategic Holdings Ltd. | | | 37,662 | | | | 1,490,771 | |
| | | | | | | | |
| | | | | | | 2,447,023 | |
| | | | | | | | |
| Brazil — 4.1% | | | | | | | | |
Atacadao Distribuicao Comercio e Industria Ltda (a) | | | 172,900 | | | | 792,321 | |
B3 SA - Brasil Bolsa Balcao | | | 279,700 | | | | 1,917,319 | |
Estacio Participacoes SA | | | 59,500 | | | | 585,952 | |
Itau Unibanco Holding SA Sponsored ADR | | | 12,830 | | | | 166,790 | |
Natura Cosmeticos SA | | | 8,900 | | | | 88,487 | |
Sul America SA | | | 92,034 | | | | 516,902 | |
Vale SA Sponsored ADR (b) | | | 35,610 | | | | 435,510 | |
| | | | | | | | |
| | | | | | | 4,503,281 | |
| | | | | | | | |
| Cayman Islands — 17.1% | | | | | | | | |
3SBio, Inc. (a) (c) | | | 197,500 | | | | 387,156 | |
Alibaba Group Holding Ltd. Sponsored ADR (a) | | | 36,200 | | | | 6,241,966 | |
China Lodging Group Ltd. Sponsored ADR | | | 14,189 | | | | 2,049,317 | |
Ctrip.com International Ltd. ADR (a) | | | 43,560 | | | | 1,920,996 | |
Hutchison China MediTech Ltd. ADR (a) (b) | | | 3,980 | | | | 156,892 | |
New Oriental Education & Technology Group, Inc. Sponsored ADR | | | 9,940 | | | | 934,360 | |
Tencent Holdings Ltd. | | | 116,459 | | | | 6,020,346 | |
Want Want China Holdings Ltd. | | | 606,000 | | | | 507,022 | |
Wuxi Biologics Cayman, Inc. (a) (c) | | | 23,000 | | | | 128,817 | |
ZTO Express Cayman, Inc. (a) | | | 31,320 | | | | 496,422 | |
| | | | | | | | |
| | | | | | | 18,843,294 | |
| | | | | | | | |
| Chile — 0.3% | | | | | | | | |
Banco de Chile | | | 1,161,162 | | | | 186,420 | |
SACI Falabella | | | 9,266 | | | | 92,524 | |
| | | | | | | | |
| | | | | | | 278,944 | |
| | | | | | | | |
| China — 5.6% | | | | | | | | |
China International Capital Corp. Ltd. Class H (c) | | | 187,600 | | | | 390,312 | |
Jiangsu Hengrui Medicine Co. Ltd. Class A | | | 209,000 | | | | 2,211,333 | |
Kweichow Moutai Co. Ltd. Class A | | | 13,542 | | | | 1,448,050 | |
Sinopharm Group Co. Ltd. Class H | | | 495,600 | | | | 2,134,632 | |
| | | | | | | | |
| | | | | | | 6,184,327 | |
| | | | | | | | |
| Colombia — 1.1% | | | | | | | | |
Grupo Aval Acciones y Valores SA (b) | | | 77,600 | | | | 659,600 | |
| | | | | | | | |
| | | Number of
Shares | | | Value | |
Grupo de Inversiones Suramericana SA | | | 38,192 | | | $ | 515,755 | |
| | | | | | | | |
| | | | | | | 1,175,355 | |
| | | | | | | | |
| Egypt — 0.4% | | | | | | | | |
Commercial International Bank Egypt SAE | | | 105,056 | | | | 459,103 | |
| | | | | | | | |
| France — 4.1% | | | | | | | | |
Kering | | | 5,805 | | | | 2,736,621 | |
LVMH Moet Hennessy Louis Vuitton SE | | | 6,166 | | | | 1,811,262 | |
| | | | | | | | |
| | | | | | | 4,547,883 | |
| | | | | | | | |
| Hong Kong — 4.7% | | | | | | | | |
AIA Group Ltd. | | | 382,600 | | | | 3,262,935 | |
China Mobile Ltd. | | | 111,500 | | | | 1,128,630 | |
Hang Lung Group Ltd. | | | 60,000 | | | | 220,729 | |
Hong Kong Exchanges & Clearing Ltd. | | | 18,624 | | | | 568,853 | |
| | | | | | | | |
| | | | | | | 5,181,147 | |
| | | | | | | | |
| India — 11.5% | | | | | | | | |
Apollo Hospitals Enterprise Ltd. | | | 33,839 | | | | 638,704 | |
Biocon Ltd. | | | 66,377 | | | | 561,485 | |
Cholamandalam Investment & Finance Co. Ltd. | | | 13,949 | | | | 283,144 | |
Dr. Reddy’s Laboratories Ltd. | | | 15,137 | | | | 571,486 | |
Housing Development Finance Corp. Ltd. | | | 168,955 | | | | 4,522,085 | |
Infosys Ltd. | | | 62,977 | | | | 1,026,063 | |
Kotak Mahindra Bank Ltd. | | | 97,123 | | | | 1,534,866 | |
Tata Consultancy Services Ltd. | | | 22,896 | | | | 968,434 | |
UltraTech Cement Ltd. | | | 13,106 | | | | 886,156 | |
Zee Entertainment Enterprises Ltd. | | | 186,986 | | | | 1,702,804 | |
| | | | | | | | |
| | | | | | | 12,695,227 | |
| | | | | | | | |
| Indonesia — 2.5% | | | | | | | | |
Astra International Tbk PT | | | 1,232,000 | | | | 753,092 | |
Bank Mandiri Persero Tbk PT | | | 1,388,100 | | | | 817,534 | |
Bank Rakyat Indonesia Persero Tbk PT | | | 2,198,900 | | | | 588,703 | |
Indocement Tunggal Prakarsa Tbk PT | | | 359,000 | | | | 581,603 | |
| | | | | | | | |
| | | | | | | 2,740,932 | |
| | | | | | | | |
| Italy — 1.2% | | | | | | | | |
PRADA SpA | | | 346,800 | | | | 1,256,364 | |
| | | | | | | | |
| Malaysia — 1.2% | | | | | | | | |
Genting Bhd | | | 425,300 | | | | 965,821 | |
Genting Malaysia Bhd | | | 252,100 | | | | 350,617 | |
| | | | | | | | |
| | | | | | | 1,316,438 | |
| | | | | | | | |
| Mexico — 4.7% | | | | | | | | |
Fomento Economico Mexicano SAB de CV | | | 151,053 | | | | 1,420,686 | |
94
MML Strategic Emerging Markets Fund – Portfolio of Investments (Continued)
| | | | | | | | |
| | | Number of
Shares | | | Value | |
Fomento Economico Mexicano SAB de CV Sponsored ADR | | | 6,360 | | | $ | 597,204 | |
Grupo Aeroportuario del Sureste SAB de CV Class B | | | 31,022 | | | | 565,866 | |
Grupo Financiero Inbursa SAB de CV Class O | | | 561,876 | | | | 919,862 | |
Grupo Mexico SAB de CV Series B | | | 409,323 | | | | 1,351,677 | |
Kimberly-Clark de Mexico SAB de CV Class A | | | 184,760 | | | | 325,309 | |
| | | | | | | | |
| | | | | | | 5,180,604 | |
| | | | | | | | |
| Netherlands — 0.5% | | | | | | | | |
Steinhoff International Holdings NV (b) | | | 331,652 | | | | 124,562 | |
Yandex NV Class A (a) | | | 12,040 | | | | 394,310 | |
| | | | | | | | |
| | | | | | | 518,872 | |
| | | | | | | | |
| Nigeria — 0.3% | | | | | | | | |
Nigerian Breweries PLC | | | 301,283 | | | | 112,892 | |
Zenith Bank PLC | | | 2,862,659 | | | | 204,610 | |
| | | | | | | | |
| | | | | | | 317,502 | |
| | | | | | | | |
| Philippines — 3.9% | | | | | | | | |
Ayala Corp. | | | 17,960 | | | | 365,199 | |
Ayala Land, Inc. | | | 903,800 | | | | 805,619 | |
Jollibee Foods Corp. | | | 122,900 | | | | 622,697 | |
SM Investments Corp. | | | 75,835 | | | | 1,501,951 | |
SM Prime Holdings, Inc. | | | 1,375,500 | | | | 1,033,213 | |
| | | | | | | | |
| | | | | | | 4,328,679 | |
| | | | | | | | |
| Portugal — 0.2% | | | | | | | | |
Jeronimo Martins SGPS SA | | | 10,909 | | | | 211,855 | |
| | | | | | | | |
| Republic of Korea — 6.5% | | | | | | | | |
Amorepacific Corp. | | | 2,412 | | | | 685,054 | |
AMOREPACIFIC Group | | | 1,672 | | | | 220,263 | |
Celltrion Healthcare Co. Ltd. (a) | | | 5,571 | | | | 562,601 | |
Celltrion, Inc. (a) | | | 2,140 | | | | 439,789 | |
LG Household & Health Care Ltd. | | | 1,650 | | | | 1,829,246 | |
NAVER Corp. | | | 3,250 | | | | 2,638,773 | |
Samsung Biologics Co. Ltd. (a) (c) | | | 2,366 | | | | 819,076 | |
| | | | | | | | |
| | | | | | | 7,194,802 | |
| | | | | | | | |
| Russia — 6.4% | | | | | | | | |
Alrosa PJSC (a) | | | 347,847 | | | | 452,269 | |
Magnit PJSC (a) | | | 15,439 | | | | 1,696,881 | |
Novatek PJSC Sponsored GDR Registered | | | 24,984 | | | | 3,002,125 | |
Polyus PJSC GDR (c) (d) | | | 7,000 | | | | 268,380 | |
Sberbank of Russia PJSC (a) | | | 174,972 | | | | 681,814 | |
Sberbank of Russia PJSC Sponsored ADR | | | 54,870 | | | | 928,725 | |
| | | | | | | | |
| | | | | | | 7,030,194 | |
| | | | | | | | |
| South Africa — 2.6% | | | | | | | | |
FirstRand Ltd. | | | 352,480 | | | | 1,915,609 | |
| | | | | | | | |
| | | Number of
Shares | | | Value | |
Shoprite Holdings Ltd. | | | 51,258 | | | $ | 916,326 | |
| | | | | | | | |
| | | | | | | 2,831,935 | |
| | | | | | | | |
| Spain — 0.3% | | | | | | | | |
Prosegur Cash SA (c) | | | 99,942 | | | | 320,634 | |
| | | | | | | | |
| Taiwan — 5.8% | | | | | | | | |
Taiwan Semiconductor Manufacturing Co. Ltd. | | | 837,000 | | | | 6,431,562 | |
| | | | | | | | |
| Turkey — 1.1% | | | | | | | | |
Anadolu Efes Biracilik Ve Malt Sanayii AS | | | 81,278 | | | | 519,375 | |
BIM Birlesik Magazalar AS | | | 32,592 | | | | 671,481 | |
| | | | | | | | |
| | | | | | | 1,190,856 | |
| | | | | | | | |
| United Arab Emirates — 1.8% | | | | | | | | |
DP World Ltd. | | | 62,778 | | | | 1,570,579 | |
Emaar Properties PJSC | | | 241,133 | | | | 455,155 | |
| | | | | | | | |
| | | | | | | 2,025,734 | |
| | | | | | | | |
| United Kingdom — 5.2% | | | | | | | | |
Anglo American PLC (b) | | | 27,270 | | | | 569,946 | |
Glencore PLC | | | 618,071 | | | | 3,251,851 | |
Mediclinic International PLC (b) | | | 58,690 | | | | 512,404 | |
Unilever PLC | | | 25,790 | | | | 1,428,755 | |
| | | | | | | | |
| | | | | | | 5,762,956 | |
| | | | | | | | |
| United States — 0.1% | | | | | | | | |
MercadoLibre, Inc. | | | 200 | | | | 62,932 | |
| | | | | | | | |
| | |
TOTAL COMMON STOCK
(Cost $80,814,718) | | | | | | | 105,038,435 | |
| | | | | | | | |
|
| PREFERRED STOCK — 1.3% | |
| Brazil — 1.2% | | | | | | | | |
Lojas Americanas SA
0.130% | | | 268,100 | | | | 1,373,949 | |
| | | | | | | | |
| India — 0.1% | | | | | | | | |
Zee Entertainment Enterprises Ltd.
6.000% | | | 503,840 | | | | 78,938 | |
| | | | | | | | |
| | |
TOTAL PREFERRED STOCK
(Cost $1,319,202) | | | | | | | 1,452,887 | |
| | | | | | | | |
| | |
TOTAL EQUITIES
(Cost $82,133,920) | | | | | | | 106,491,322 | |
| | | | | | | | |
| MUTUAL FUNDS — 2.1% | |
| United States — 2.1% | | | | | | | | |
State Street Navigator Securities Lending Prime Portfolio (e) | | | 2,356,190 | | | | 2,356,190 | |
| | | | | | | | |
| | |
TOTAL MUTUAL FUNDS
(Cost $2,356,190) | | | | | | | 2,356,190 | |
| | | | | | | | |
The accompanying notes are an integral part of the financial statements.
95
MML Strategic Emerging Markets Fund – Portfolio of Investments (Continued)
| | | | | | | | |
| | | Number of
Shares | | | Value | |
| RIGHTS — 0.5% | |
| Russia — 0.5% | | | | | | | | |
Moscow Exchange OAO (a) | | | 280,913 | | | $ | 529,222 | |
| | | | | | | | |
| | |
TOTAL RIGHTS
(Cost $531,576) | | | | | | | 529,222 | |
| | | | | | | | |
| | |
TOTAL LONG-TERM INVESTMENTS
(Cost $85,021,686) | | | | | | | 109,376,734 | |
| | | | | | | | |
| | |
| | | Principal
Amount | | | | |
| SHORT-TERM INVESTMENTS — 2.1% | |
| Repurchase Agreement — 2.1% | | | | | | | | |
Fixed Income Clearing Corp., Repurchase Agreement, dated 12/29/17, 0.540%, due 1/02/18 (f) | | $ | 2,266,896 | | | | 2,266,896 | |
| | | | | | | | |
| | |
TOTAL SHORT-TERM INVESTMENTS
(Cost $2,266,896) | | | | | | | 2,266,896 | |
| | | | | | | | |
| | |
TOTAL INVESTMENTS — 101.4%
(Cost $87,288,582) (g) | | | | | | | 111,643,630 | |
| | |
| Other Assets/(Liabilities) — (1.4)% | | | | | | | (1,511,534 | ) |
| | | | | | | | |
| | |
| NET ASSETS — 100.0% | | | | | | $ | 110,132,096 | |
| | | | | | | | |
Abbreviation Legend
| ADR | American Depositary Receipt |
| GDR | Global Depositary Receipt |
| PJSC | Public Joint Stock Company |
Notes to Portfolio of Investments
Percentages are stated as a percent of net assets.
| (a) | Non-income producing security. |
| (b) | Denotes all or a portion of security on loan. The total value of securities on loan as of December 31, 2017, was $2,267,499 or 2.06% of net assets. Total securities on loan may not correspond with the amounts identified in the Portfolio of Investments because pending sales may be in the process of recall from the brokers. (Note 2). |
| (c) | Securities exempt from registration under rule 144A of the Securities Act of 1933. These securities may be resold in transactions exempt from registration, normally to qualified institutional buyers. At December 31, 2017, these securities amounted to a value of $2,314,375 or 2.10% of net assets. |
| (d) | This security is fair valued in good faith in accordance with procedures approved by the Board of Trustees. At December 31, 2017, these securities amounted to a value of $268,380 or 0.24% of net assets. |
| (e) | Represents investment of security lending collateral. (Note 2). |
| (f) | Maturity value of $2,267,032. Collateralized by U.S. Government Agency obligations with rates ranging from 2.000% – 2.750%, maturity dates ranging from 2/15/24 – 4/30/24, and an aggregate market value, including accrued interest, of $2,314,199. |
| (g) | See Note 6 for aggregate cost for federal tax purposes. |
Sector weightings, as a percentage of net assets, is as follows:
| | | | |
Financial | | | 23.1 | % |
Consumer, Non-cyclical | | | 22.9 | % |
Communications | | | 18.3 | % |
Consumer, Cyclical | | | 13.1 | % |
Technology | | | 7.7 | % |
Basic Materials | | | 5.7 | % |
Energy | | | 2.7 | % |
Industrial | | | 2.3 | % |
Mutual Funds | | | 2.1 | % |
Diversified | | | 1.4 | % |
| | | | |
Total Long-Term Investments | | | 99.3 | % |
Short-Term Investments and Other Assets and Liabilities | | | 0.7 | % |
| | | | |
Net Assets | | | 100.0 | % |
| | | | |
The accompanying notes are an integral part of the financial statements.
96
[THIS PAGE INTENTIONALLY LEFT BLANK]
MML Series Investment Fund II — Financial Statements
Statements of Assets and Liabilities
December 31, 2017
| | | | | | | | |
| | | MML
Asset
Momentum
Fund | | | MML
Dynamic
Bond Fund | |
| Assets: | |
Investments, at value (Note 2) (a) | | $ | 25,473,454 | | | $ | 431,669,827 | |
Repurchase agreements, at value (Note 2) (b) | | | 3,747,691 | | | | 8,205,799 | |
Other short-term investments, at value (Note 2) (c) | | | - | | | | 11,137,159 | |
| | | | | | | | |
Total investments (d) | | | 29,221,145 | | | | 451,012,785 | |
| | | | | | | | |
Cash | | | - | | | | - | |
Foreign currency, at value (e) | | | - | | | | - | |
Receivables from: | |
Investments sold | | | - | | | | 19,692 | |
Open forward contracts (Note 2) | | | 139,238 | | | | - | |
Investment adviser (Note 3) | | | 3,818 | | | | - | |
Fund shares sold | | | - | | | | - | |
Interest and dividends | | | 14,571 | | | | 2,812,236 | |
Interest tax reclaim receivable | | | - | | | | 289 | |
Foreign taxes withheld | | | 5,927 | | | | - | |
Open swap agreements, at value (Note 2) | | | - | | | | - | |
| | | | | | | | |
Total assets | | | 29,384,699 | | | | 453,845,002 | |
| | | | | | | | |
| Liabilities: | |
Payables for: | |
Investments purchased | | | - | | | | - | |
Collateral held for reverse repurchase agreements (Note 2) | | | - | | | | - | |
Collateral held for open purchased options (Note 2) | | | - | | | | - | |
Reverse repurchase agreements (Note 2) | | | - | | | | - | |
Open forward contracts (Note 2) | | | 19,993 | | | | - | |
Investments purchased on a when-issued basis (Note 2) | | | - | | | | 1,989,600 | |
Fund shares repurchased | | | 5,650 | | | | 139 | |
Securities on loan (Note 2) | | | - | | | | - | |
Open swap agreements, at value (Note 2) | | | - | | | | - | |
Trustees’ fees and expenses (Note 3) | | | 1,439 | | | | 27,620 | |
Variation margin on open derivative instruments (Note 2) | | | 72,373 | | | | - | |
Affiliates (Note 3): | |
Investment advisory fees | | | 14,710 | | | | 152,671 | |
Administration fees | | | 3,677 | | | | 57,252 | |
Service fees | | | 909 | | | | 2,701 | |
Due to custodian | | | - | | | | - | |
Commitment and Contingent Liabilities (Note 9) | | | - | | | | - | |
Accrued expense and other liabilities | | | 19,603 | | | | 57,411 | |
| | | | | | | | |
Total liabilities | | | 138,354 | | | | 2,287,394 | |
| | | | | | | | |
Net assets | | $ | 29,246,345 | | | $ | 451,557,608 | |
| | | | | | | | |
| Net assets consist of: | |
Paid-in capital | | $ | 24,025,715 | | | $ | 453,730,427 | |
Undistributed (accumulated) net investment income (loss) | | | - | | | | 164,570 | |
Distributions in excess of net investment income | | | (71,250 | ) | | | - | |
Accumulated net realized gain (loss) on investments and foreign currency transactions | | | 421,130 | | | | (1,535,191 | ) |
Net unrealized appreciation (depreciation) on investments and foreign currency translations | | | 4,870,750 | | | | (802,198 | ) |
| | | | | | | | |
Net assets | | $ | 29,246,345 | | | $ | 451,557,608 | |
| | | | | | | | |
| | | | | | | | |
(a) Cost of investments: | | $ | 21,061,339 | | | $ | 432,469,806 | |
(b) Cost of repurchase agreements: | | $ | 3,747,691 | | | $ | 8,205,799 | |
(c) Cost of other short-term investments: | | $ | - | | | $ | 11,139,378 | |
(d) Securities on loan with market value of: | | $ | - | | | $ | - | |
(e) Cost of foreign currency: | | $ | - | | | $ | - | |
The accompanying notes are an integral part of the financial statements.
98
| | | | | | | | | | | | | | | | | | | | | | | | | | |
MML
Equity
Rotation Fund | | | MML
High
Yield Fund | | | MML
Inflation-
Protected and
Income Fund | | | MML
Short-
Duration
Bond Fund | | | MML
Small Cap
Equity Fund | | | MML
Special
Situations Fund | | | MML
Strategic
Emerging
Markets Fund | |
| | | | | | | | | | | | | | | | | | | | | | | | | | |
| $ | 30,237,974 | | | $ | 128,590,491 | | | $ | 568,009,248 | | | $ | 196,171,617 | | | $ | 126,526,315 | | | $ | 24,019,831 | | | $ | 109,376,734 | |
| | 945,117 | | | | - | | | | 370,643 | | | | - | | | | 2,783,591 | | | | - | | | | 2,266,896 | |
| | 2,498 | | | | 5,293,482 | | | | 197,213,621 | | | | 48,551,792 | | | | - | | | | - | | | | - | |
| | | | | | | | | | | | | | | | | | | | | | | | | | |
| | 31,185,589 | | | | 133,883,973 | | | | 765,593,512 | | | | 244,723,409 | | | | 129,309,906 | | | | 24,019,831 | | | | 111,643,630 | |
| | | | | | | | | | | | | | | | | | | | | | | | | | |
| | - | | | | - | | | | - | | | | - | | | | - | | | | - | | | | 370 | |
| | - | | | | - | | | | - | | | | - | | | | - | | | | - | | | | 1,003,493 | |
| | | | | | | | | | | | | | | | | | | | | | | | | | |
| | - | | | | 1,993 | | | | 2,156,725 | | | | 11,835 | | | | - | | | | - | | | | 70,551 | |
| | - | | | | - | | | | - | | | | - | | | | - | | | | - | | | | - | |
| | 3,063 | | | | 11,425 | | | | - | | | | 2,100 | | | | - | | | | 3,243 | | | | 17,364 | |
| | - | | | | 28 | | | | 17,912 | | | | 1,293 | | | | 8,750 | | | | - | | | | 17,974 | |
| | 27,576 | | | | 2,154,443 | | | | 1,393,002 | | | | 1,221,772 | | | | 75,640 | | | | 5,715 | | | | 31,024 | |
| | - | | | | 608 | | | | 131 | | | | - | | | | - | | | | - | | | | - | |
| | - | | | | - | | | | - | | | | - | | | | - | | | | - | | | | 18,583 | |
| | - | | | | - | | | | 317,357 | | | | - | | | | - | | | | - | | | | - | |
| | | | | | | | | | | | | | | | | | | | | | | | | | |
| | 31,216,228 | | | | 136,052,470 | | | | 769,478,639 | | | | 245,960,409 | | | | 129,394,296 | | | | 24,028,789 | | | | 112,802,989 | |
| | | | | | | | | | | | | | | | | | | | | | | | | | |
| | | | | | | | | | | | | | | | | | | | | | | | | | |
| | | | | | | | | | | | | | | | | | | | | | | | | | |
| | - | | | | 1,299,733 | | | | - | | | | - | | | | 38,907 | | | | - | | | | 42,068 | |
| | - | | | | - | | | | 3,168,048 | | | | - | | | | - | | | | - | | | | - | |
| | - | | | | - | | | | 1,660,000 | | | | 940,000 | | | | - | | | | - | | | | - | |
| | - | | | | - | | | | 337,005,237 | | | | - | | | | - | | | | - | | | | - | |
| | - | | | | - | | | | - | | | | - | | | | - | | | | - | | | | - | |
| | - | | | | - | | | | 2,450,000 | | | | - | | | | - | | | | - | | | | - | |
| | 37 | | | | 11,428 | | | | 160,862 | | | | 104,273 | | | | 97,254 | | | | 14 | | | | 12,703 | |
| | - | | | | - | | | | - | | | | - | | | | 9,444,321 | | | | - | | | | 2,356,190 | |
| | - | | | | - | | | | 553,984 | | | | 141,929 | | | | - | | | | - | | | | - | |
| | 1,502 | | | | 20,209 | | | | 87,564 | | | | 33,875 | | | | 32,774 | | | | 1,293 | | | | 12,370 | |
| | - | | | | - | | | | 14,712 | | | | 22,806 | | | | - | | | | - | | | | - | |
| | | | | | | | | | | | | | | | | | | | | | | | | | |
| | 11,812 | | | | 68,551 | | | | 196,866 | | | | 71,009 | | | | 65,233 | | | | 12,053 | | | | 96,438 | |
| | 3,937 | | | | 17,138 | | | | - | | | | 30,432 | | | | - | | | | 3,013 | | | | 13,777 | |
| | 836 | | | | 24,582 | | | | 29,760 | | | | 19,949 | | | | 10,787 | | | | 379 | | | | 9,067 | |
| | - | | | | - | | | | - | | | | 96 | | | | - | | | | 300,478 | | | | - | |
| | - | | | | - | | | | - | | | | - | | | | - | | | | - | | | | - | |
| | 17,933 | | | | 44,599 | | | | 63,482 | | | | 43,024 | | | | 27,898 | | | | 17,649 | | | | 128,280 | |
| | | | | | | | | | | | | | | | | | | | | | | | | | |
| | 36,057 | | | | 1,486,240 | | | | 345,390,515 | | | | 1,407,393 | | | | 9,717,174 | | | | 334,879 | | | | 2,670,893 | |
| | | | | | | | | | | | | | | | | | | | | | | | | | |
| $ | 31,180,171 | | | $ | 134,566,230 | | | $ | 424,088,124 | | | $ | 244,553,016 | | | $ | 119,677,122 | | | $ | 23,693,910 | | | $ | 110,132,096 | |
| | | | | | | | | | | | | | | | | | | | | | | | | | |
| | | | | | | | | | | | | | | | | | | | | | | | | | |
| $ | 23,055,637 | | | $ | 137,182,659 | | | $ | 427,041,067 | | | $ | 249,453,392 | | | $ | 81,114,987 | | | $ | 20,495,888 | | | $ | 94,046,236 | |
| | 8,036 | | | | - | | | | 323,767 | | | | 61,372 | | | | 999,566 | | | | - | | | | - | |
| | - | | | | (19,309 | ) | | | - | | | | - | | | | - | | | | (1,142 | ) | | | (216,374 | ) |
| | 1,835,258 | | | | (2,129,492 | ) | | | (10,058,386 | ) | | | (4,966,733 | ) | | | 14,901,210 | | | | (1,508,630 | ) | | | (8,030,510 | ) |
| | 6,281,240 | | | | (467,628 | ) | | | 6,781,676 | | | | 4,985 | | | | 22,661,359 | | | | 4,707,794 | | | | 24,332,744 | |
| | | | | | | | | | | | | | | | | | | | | | | | | | |
| $ | 31,180,171 | | | $ | 134,566,230 | | | $ | 424,088,124 | | | $ | 244,553,016 | | | $ | 119,677,122 | | | $ | 23,693,910 | | | $ | 110,132,096 | |
| | | | | | | | | | | | | | | | | | | | | | | | | | |
| | | | | | | | | | | | | | | | | | | | | | | | | | |
| $ | 23,956,734 | | | $ | 129,057,607 | | | $ | 561,052,094 | | | $ | 196,274,611 | | | $ | 103,864,956 | | | $ | 19,312,037 | | | $ | 85,021,686 | |
| $ | 945,117 | | | $ | - | | | $ | 370,643 | | | $ | - | | | $ | 2,783,591 | | | $ | - | | | $ | 2,266,896 | |
| $ | 2,498 | | | $ | 5,293,994 | | | $ | 197,258,818 | | | $ | 48,560,025 | | | $ | - | | | $ | - | | | $ | - | |
| $ | - | | | $ | - | | | $ | - | | | $ | - | | | $ | 9,192,182 | | | $ | - | | | $ | 2,267,499 | |
| $ | - | | | $ | - | | | $ | - | | | $ | - | | | $ | - | | | $ | - | | | $ | 1,003,787 | |
99
MML Series Investment Fund II — Financial Statements (Continued)
Statements of Assets and Liabilities
December 31, 2017
| | | | | | | | |
| | | MML
Asset
Momentum
Fund | | | MML
Dynamic
Bond Fund | |
| Initial Class shares: | |
Net assets | | $ | - | | | $ | - | |
| | | | | | | | |
Shares outstanding (a) | | | - | | | | - | |
| | | | | | | | |
Net asset value, offering price and redemption price per share | | $ | - | | | $ | - | |
| | | | | | | | |
| Class II shares: | |
Net assets | | $ | 27,727,788 | | | $ | 447,145,559 | |
| | | | | | | | |
Shares outstanding (a) | | | 2,228,117 | | | | 44,940,922 | |
| | | | | | | | |
Net asset value, offering price and redemption price per share | | $ | 12.44 | | | $ | 9.95 | |
| | | | | | | | |
| Service Class shares: | |
Net assets | | $ | - | | | $ | - | |
| | | | | | | | |
Shares outstanding (a) | | | - | | | | - | |
| | | | | | | | |
Net asset value, offering price and redemption price per share | | $ | - | | | $ | - | |
| | | | | | | | |
| Service Class I shares: | |
Net assets | | $ | 1,518,557 | | | $ | 4,412,049 | |
| | | | | | | | |
Shares outstanding (a) | | | 122,386 | | | | 444,217 | |
| | | | | | | | |
Net asset value, offering price and redemption price per share | | $ | 12.41 | | | $ | 9.93 | |
| | | | | | | | |
| (a) | Authorized unlimited number of shares with no par value. |
The accompanying notes are an integral part of the financial statements.
100
| | | | | | | | | | | | | | | | | | | | | | | | | | |
MML
Equity
Rotation Fund | | | MML
High
Yield Fund | | | MML
Inflation-
Protected and
Income Fund | | | MML
Short-
Duration
Bond Fund | | | MML
Small Cap
Equity Fund | | | MML
Special
Situations Fund | | | MML
Strategic
Emerging
Markets Fund | |
| | | | | | | | | | | | | | | | | | | | | | | | | | |
| $ | - | | | $ | - | | | $ | 377,984,389 | | | $ | - | | | $ | 102,032,816 | | | $ | - | | | $ | - | |
| | | | | | | | | | | | | | | | | | | | | | | | | | |
| | - | | | | - | | | | 37,210,061 | | | | - | | | | 9,910,507 | | | | - | | | | - | |
| | | | | | | | | | | | | | | | | | | | | | | | | | |
| $ | - | | | $ | - | | | $ | 10.16 | | | $ | - | | | $ | 10.30 | | | $ | - | | | $ | - | |
| | | | | | | | | | | | | | | | | | | | | | | | | | |
| | | | | | | | | | | | | | | | | | | | | | | | | | |
| $ | 29,744,950 | | | $ | 95,599,208 | | | $ | - | | | $ | 213,601,532 | | | $ | - | | | $ | 23,092,965 | | | $ | 95,374,492 | |
| | | | | | | | | | | | | | | | | | | | | | | | | | |
| | 2,141,758 | | | | 9,553,208 | | | | - | | | | 21,951,316 | | | | - | | | | 2,004,853 | | | | 8,241,508 | |
| | | | | | | | | | | | | | | | | | | | | | | | | | |
| $ | 13.89 | | | $ | 10.01 | | | $ | - | | | $ | 9.73 | | | $ | - | | | $ | 11.52 | | | $ | 11.57 | |
| | | | | | | | | | | | | | | | | | | | | | | | | | |
| | | | | | | | | | | | | | | | | | | | | | | | | | |
| $ | - | | | $ | - | | | $ | 46,103,735 | | | $ | - | | | $ | 17,644,306 | | | $ | - | | | $ | - | |
| | | | | | | | | | | | | | | | | | | | | | | | | | |
| | - | | | | - | | | | 4,557,573 | | | | - | | | | 1,742,137 | | | | - | | | | - | |
| | | | | | | | | | | | | | | | | | | | | | | | | | |
| $ | - | | | $ | - | | | $ | 10.12 | | | $ | - | | | $ | 10.13 | | | $ | - | | | $ | - | |
| | | | | | | | | | | | | | | | | | | | | | | | | | |
| | | | | | | | | | | | | | | | | | | | | | | | | | |
| $ | 1,435,221 | | | $ | 38,967,022 | | | $ | - | | | $ | 30,951,484 | | | $ | - | | | $ | 600,945 | | | $ | 14,757,604 | |
| | | | | | | | | | | | | | | | | | | | | | | | | | |
| | 103,629 | | | | 3,907,219 | | | | - | | | | 3,183,913 | | | | - | | | | 52,316 | | | | 1,273,680 | |
| | | | | | | | | | | | | | | | | | | | | | | | | | |
| $ | 13.85 | | | $ | 9.97 | | | $ | - | | | $ | 9.72 | | | $ | - | | | $ | 11.49 | | | $ | 11.59 | |
| | | | | | | | | | | | | | | | | | | | | | | | | | |
101
MML Series Investment Fund II — Financial Statements (Continued)
Statements of Operations
For the Year Ended December 31, 2017
| | | | | | | | |
| | | MML
Asset
Momentum
Fund | | | MML
Dynamic
Bond Fund | |
| Investment income (Note 2): | |
Dividends (a) | | $ | 283,078 | | | $ | 417,426 | |
Interest (b) | | | 31,439 | | | | 15,392,531 | |
Securities lending net income | | | - | | | | - | |
| | | | | | | | |
Total investment income | | | 314,517 | | | | 15,809,957 | |
| | | | | | | | |
| Expenses (Note 3): | | | | | | | | |
Investment advisory fees | | | 151,496 | | | | 1,761,124 | |
Custody fees | | | 5,427 | | | | 47,430 | |
Interest expense | | | - | | | | - | |
Audit fees | | | 30,947 | | | | 53,485 | |
Legal fees | | | 196 | | | | 3,191 | |
Proxy fees | | | 976 | | | | 976 | |
Shareholder reporting fees | | | 6,597 | | | | 38,261 | |
Trustees’ fees | | | 1,565 | | | | 28,004 | |
| | | | | | | | |
| | | 197,204 | | | | 1,932,471 | |
Administration fees: | | | | | | | | |
Class II | | | 36,026 | | | | 654,914 | |
Service Class I | | | 1,848 | | | | 5,507 | |
Service fees: | | | | | | | | |
Service Class | | | - | | | | - | |
Service Class I | | | 3,080 | | | | 9,180 | |
| | | | | | | | |
Total expenses | | | 238,158 | | | | 2,602,072 | |
Expenses waived: | | | | | | | | |
Class II fees reimbursed by adviser | | | (31,462 | ) | | | - | |
Service Class I fees reimbursed by adviser | | | (1,620 | ) | | | - | |
Class II advisory fees waived | | | - | | | | - | |
Service Class I advisory fees waived | | | - | | | | - | |
| | | | | | | | |
Net expenses | | | 205,076 | | | | 2,602,072 | |
| | | | | | | | |
Net investment income (loss) | | | 109,441 | | | | 13,207,885 | |
| | | | | | | | |
| Realized and unrealized gain (loss): | |
Net realized gain (loss) on: | | | | | | | | |
Investment transactions | | | (324,200 | ) | | | (65,571 | ) |
Futures contracts | | | 2,733,775 | | | | - | |
Swap agreements | | | - | | | | - | |
Foreign currency transactions | | | (130 | ) | | | - | |
Forward contracts | | | 231,919 | | | | - | |
| | | | | | | | |
Net realized gain (loss) | | | 2,641,364 | | | | (65,571 | ) |
| | | | | | | | |
Net change in unrealized appreciation (depreciation) on: | | | | | | | | |
Investment transactions | | | 4,232,610 | | | | 5,649,537 | |
Futures contracts | | | 371,241 | | | | - | |
Swap agreements | | | - | | | | - | |
Translation of assets and liabilities in foreign currencies | | | 469 | | | | - | |
Forward contracts | | | 41,345 | | | | - | |
| | | | | | | | |
Net change in unrealized appreciation (depreciation) | | | 4,645,665 | | | | 5,649,537 | |
| | | | | | | | |
Net realized gain (loss) and change in unrealized appreciation (depreciation) | | | 7,287,029 | | | | 5,583,966 | |
| | | | | | | | |
Net increase (decrease) in net assets resulting from operations | | $ | 7,396,470 | | | $ | 18,791,851 | |
| | | | | | | | |
| | | | | | | | |
(a) Net of foreign withholding tax of: | | $ | 4,926 | | | $ | - | |
(b) Net of foreign withholding tax of: | | $ | - | | | $ | 260 | |
* Net increase (decrease) in accrued foreign capital gains tax of: | | $ | - | | | $ | - | |
The accompanying notes are an integral part of the financial statements.
102
| | | | | | | | | | | | | | | | | | | | | | | | | | |
MML
Equity
Rotation Fund | | | MML
High
Yield Fund | | | MML
Inflation-
Protected and
Income Fund | | | MML
Short-Duration
Bond Fund | | | MML
Small Cap
Equity Fund | | | MML
Special
Situations
Fund | | | MML
Strategic
Emerging
Markets Fund | |
| | | | | | | | | | | | | | | | | | | | | | | | | | |
| $ | 388,036 | | | $ | - | | | $ | - | | | $ | - | | | $ | 1,428,513 | | | $ | 201,029 | | | $ | 1,709,760 | |
| | 963 | | | | 9,810,241 | | | | 16,359,471 | | | | 6,264,253 | | | | 2,434 | | | | 939 | | | | 8,685 | |
| | - | | | | - | | | | - | | | | - | | | | 120,489 | | | | - | | | | 7,255 | |
| | | | | | | | | | | | | | | | | | | | | | | | | | |
| | 388,999 | | | | 9,810,241 | | | | 16,359,471 | | | | 6,264,253 | | | | 1,551,436 | | | | 201,968 | | | | 1,725,700 | |
| | | | | | | | | | | | | | | | | | | | | | | | | | |
| | | | | | | | | | | | | | | | | | | | | | | | | | |
| | 121,595 | | | | 789,992 | | | | 2,334,452 | | | | 833,463 | | | | 738,333 | | | | 130,888 | | | | 1,131,253 | |
| | 3,251 | | | | 59,211 | | | | 84,712 | | | | 53,077 | | | | 20,140 | | | | 2,692 | | | | 246,154 | |
| | - | | | | - | | | | 3,878,963 | | | | - | | | | - | | | | - | | | | - | |
| | 30,948 | | | | 37,010 | | | | 38,599 | | | | 37,634 | | | | 36,253 | | | | 30,943 | | | | 58,249 | |
| | 208 | | | | 928 | | | | 3,038 | | | | 1,827 | | | | 833 | | | | 170 | | | | 782 | |
| | 976 | | | | 976 | | | | 976 | | | | 976 | | | | 976 | | | | 976 | | | | 976 | |
| | 6,567 | | | | 16,025 | | | | 41,762 | | | | 21,986 | | | | 12,193 | | | | 6,219 | | | | 11,907 | |
| | 1,676 | | | | 8,331 | | | | 27,221 | | | | 15,326 | | | | 7,266 | | | | 1,366 | | | | 6,810 | |
| | | | | | | | | | | | | | | | | | | | | | | | | | |
| | 165,221 | | | | 912,473 | | | | 6,409,723 | | | | 964,289 | | | | 815,994 | | | | 173,254 | | | | 1,456,131 | |
| | | | | | | | | | | | | | | | | | | | | | | | | | |
| | 39,154 | | | | 143,808 | | | | - | | | | 310,428 | | | | - | | | | 31,969 | | | | 142,702 | |
| | 1,377 | | | | 53,691 | | | | - | | | | 46,771 | | | | - | | | | 753 | | | | 18,906 | |
| | | | | | | | | | | | | | | | | | | | | | | | | | |
| | - | | | | - | | | | 118,243 | | | | - | | | | 37,830 | | | | - | | | | - | |
| | 2,296 | | | | 89,484 | | | | - | | | | 77,951 | | | | - | | | | 1,256 | | | | 31,509 | |
| | | | | | | | | | | | | | | | | | | | | | | | | | |
| | 208,048 | | | | 1,199,456 | | | | 6,527,966 | | | | 1,399,439 | | | | 853,824 | | | | 207,232 | | | | 1,649,248 | |
| | | | | | | | | | | | | | | | | | | | | | | | | | |
| | (29,077 | ) | | | - | | | | - | | | | (10,249 | ) | | | - | | | | (30,730 | ) | | | (82,937 | ) |
| | (1,036 | ) | | | - | | | | - | | | | (1,506 | ) | | | - | | | | (726 | ) | | | (11,470 | ) |
| | - | | | | (95,847 | ) | | | - | | | | - | | | | - | | | | - | | | | (38,049 | ) |
| | - | | | | (35,819 | ) | | | - | | | | - | | | | - | | | | - | | | | (5,046 | ) |
| | | | | | | | | | | | | | | | | | | | | | | | | | |
| | 177,935 | | | | 1,067,790 | | | | 6,527,966 | | | | 1,387,684 | | | | 853,824 | | | | 175,776 | | | | 1,511,746 | |
| | | | | | | | | | | | | | | | | | | | | | | | | | |
| | 211,064 | | | | 8,742,451 | | | | 9,831,505 | | | | 4,876,569 | | | | 697,612 | | | | 26,192 | | | | 213,954 | |
| | | | | | | | | | | | | | | | | | | | | | | | | | |
| | | | | | | | | | | | | | | | | | | | | | | | | | |
| | | | | | | | | | | | | | | | | | | | | | | | | | |
| | 4,309,177 | | | | 3,040,160 | | | | 578,320 | | | | (252,619 | ) | | | 14,831,301 | | | | 1,093,035 | | | | 6,576,229 | |
| | - | | | | - | | | | (96,476 | ) | | | 509,535 | | | | - | | | | - | | | | - | |
| | - | | | | - | | | | 196,285 | | | | (8,495 | ) | | | - | | | | - | | | | - | |
| | 44 | | | | - | | | | - | | | | - | | | | (401 | ) | | | (20 | ) | | | (70,757 | ) |
| | - | | | | - | | | | - | | | | - | | | | - | | | | - | | | | - | |
| | | | | | | | | | | | | | | | | | | | | | | | | | |
| | 4,309,221 | | | | 3,040,160 | | | | 678,129 | | | | 248,421 | | | | 14,830,900 | | | | 1,093,015 | | | | 6,505,472 | |
| | | | | | | | | | | | | | | | | | | | | | | | | | |
| | | | | | | | | | | | | | | | | | | | | | | | | | |
| | 2,588,946 | | | | (1,659,266 | ) | | | 3,376,774 | | | | 732,605 | | | | (153,349 | ) | | | 2,617,462 | | | | 24,401,016 | * |
| | - | | | | - | | | | (14,128 | ) | | | 174,412 | | | | - | | | | - | | | | - | |
| | - | | | | - | | | | (510,697 | ) | | | (84,744 | ) | | | - | | | | - | | | | - | |
| | - | | | | - | | | | - | | | | - | | | | - | | | | - | | | | (191 | ) |
| | - | | | | - | | | | - | | | | - | | | | - | | | | - | | | | - | |
| | | | | | | | | | | | | | | | | | | | | | | | | | |
| | 2,588,946 | | | | (1,659,266 | ) | | | 2,851,949 | | | | 822,273 | | | | (153,349 | ) | | | 2,617,462 | | | | 24,400,825 | |
| | | | | | | | | | | | | | | | | | | | | | | | | | |
| | 6,898,167 | | | | 1,380,894 | | | | 3,530,078 | | | | 1,070,694 | | | | 14,677,551 | | | | 3,710,477 | | | | 30,906,297 | |
| | | | | | | | | | | | | | | | | | | | | | | | | | |
| $ | 7,109,231 | | | $ | 10,123,345 | | | $ | 13,361,583 | | | $ | 5,947,263 | | | $ | 15,375,163 | | | $ | 3,736,669 | | | $ | 31,120,251 | |
| | | | | | | | | | | | | | | | | | | | | | | | | | |
| | | | | | | | | | | | | | | | | | | | | | | | | | |
| $ | 1,570 | | | $ | - | | | $ | - | | | $ | - | | | $ | - | | | $ | 139 | | | $ | 187,686 | |
| $ | - | | | $ | - | | | $ | 246 | | | $ | 35 | | | $ | - | | | $ | - | | | $ | - | |
| $ | - | | | $ | - | | | $ | - | | | $ | - | | | $ | - | | | $ | - | | | $ | 13,389 | |
103
MML Series Investment Fund II — Financial Statements (Continued)
Statements of Changes in Net Assets
| | | | | | | | |
| | | MML Asset Momentum Fund | |
| | | Year
Ended
December 31, 2017 | | | Year
Ended
December 31, 2016 | |
| Increase (Decrease) in Net Assets: | | | | | | | | |
| Operations: | | | | | | | | |
Net investment income (loss) | | $ | 109,441 | | | $ | 48,522 | |
Net realized gain (loss) | | | 2,641,364 | | | | 1,914,926 | |
Net change in unrealized appreciation (depreciation) | | | 4,645,665 | | | | 18,084 | |
| | | | | | | | |
Net increase (decrease) in net assets resulting from operations | | | 7,396,470 | | | | 1,981,532 | |
| | | | | | | | |
| Distributions to shareholders (Note 2): | | | | | | | | |
From net investment income: | | | | | | | | |
Class II | | | (372,224 | ) | | | (143,267 | ) |
Service Class I | | | (17,150 | ) | | | (4,891 | ) |
| | | | | | | | |
Total distributions from net investment income | | | (389,374 | ) | | | (148,158 | ) |
| | | | | | | | |
From net realized gains: | | | | | | | | |
Class II | | | (2,357,530 | ) | | | - | |
Service Class I | | | (127,396 | ) | | | - | |
| | | | | | | | |
Total distributions from net realized gains | | | (2,484,926 | ) | | | - | |
| | | | | | | | |
| Net fund share transactions (Note 5): | | | | | | | | |
Class II | | | 2,729,754 | | | | 143,267 | |
Service Class I | | | 378,001 | | | | 635,192 | |
| | | | | | | | |
Increase (decrease) in net assets from fund share transactions | | | 3,107,755 | | | | 778,459 | |
| | | | | | | | |
Total increase (decrease) in net assets | | | 7,629,925 | | | | 2,611,833 | |
| Net assets | | | | | | | | |
Beginning of year | | | 21,616,420 | | | | 19,004,587 | |
| | | | | | | | |
End of year | | $ | 29,246,345 | | | $ | 21,616,420 | |
| | | | | | | | |
Undistributed (accumulated) net investment income (loss) included in net assets at end of year | | $ | - | | | $ | - | |
| | | | | | | | |
Distributions in excess of net investment income included in net assets at end of year | | $ | (71,250 | ) | | $ | (23,661 | ) |
| | | | | | | | |
The accompanying notes are an integral part of the financial statements.
104
| | | | | | | | | | | | | | |
| MML Dynamic Bond Fund | | | MML Equity Rotation Fund | |
Year
Ended
December 31, 2017 | | | Year
Ended
December 31, 2016 | | | Year
Ended
December 31, 2017 | | | Year
Ended
December 31, 2016 | |
| | | | | | | | | | | | | | |
| | | | | | | | | | | | | | |
| $ | 13,207,885 | | | $ | 13,637,337 | | | $ | 211,064 | | | $ | 261,658 | |
| | (65,571 | ) | | | 2,556,483 | | | | 4,309,221 | | | | (824,002 | ) |
| | 5,649,537 | | | | 3,883,530 | | | | 2,588,946 | | | | 4,034,860 | |
| | | | | | | | | | | | | | |
| | 18,791,851 | | | | 20,077,350 | | | | 7,109,231 | | | | 3,472,516 | |
| | | | | | | | | | | | | | |
| | | | | | | | | | | | | | |
| | | | | | | | | | | | | | |
| | (14,681,150 | ) | | | (12,384,957 | ) | | | (194,875 | ) | | | (257,157 | ) |
| | (120,184 | ) | | | (61,280 | ) | | | (7,436 | ) | | | (4,270 | ) |
| | | | | | | | | | | | | | |
| | (14,801,334 | ) | | | (12,446,237 | ) | | | (202,311 | ) | | | (261,427 | ) |
| | | | | | | | | | | | | | |
| | | | | | | | | | | | | | |
| | (1,628,041 | ) | | | - | | | | (1,392,748 | ) | | | - | |
| | (12,410 | ) | | | - | | | | (66,083 | ) | | | - | |
| | | | | | | | | | | | | | |
| | (1,640,451 | ) | | | - | | | | (1,458,831 | ) | | | - | |
| | | | | | | | | | | | | | |
| | | | | | | | | | | | | | |
| | 23,178,616 | | | | 13,596,663 | | | | 1,587,623 | | | | 257,157 | |
| | 1,497,883 | | | | 2,536,553 | | | | 834,850 | | | | 252,558 | |
| | | | | | | | | | | | | | |
| | 24,676,499 | | | | 16,133,216 | | | | 2,422,473 | | | | 509,715 | |
| | | | | | | | | | | | | | |
| | 27,026,565 | | | | 23,764,329 | | | | 7,870,562 | | | | 3,720,804 | |
| | | | | | | | | | | | | | |
| | 424,531,043 | | | | 400,766,714 | | | | 23,309,609 | | | | 19,588,805 | |
| | | | | | | | | | | | | | |
| $ | 451,557,608 | | | $ | 424,531,043 | | | $ | 31,180,171 | | | $ | 23,309,609 | |
| | | | | | | | | | | | | | |
$ |
164,570 |
| | $ | 1,060,255 | | | $ | 8,036 | | | $ | 32 | |
| | | | | | | | | | | | | | |
| $ | - | | | $ | - | | | $ | - | | | $ | - | |
| | | | | | | | | | | | | | |
105
MML Series Investment Fund II — Financial Statements (Continued)
Statements of Changes in Net Assets
| | | | | | | | |
| | | MML High Yield Fund | |
| | | Year
Ended
December 31, 2017
| | | Year
Ended
December 31, 2016
| |
| Increase (Decrease) in Net Assets: | | | | | | | | |
| Operations: | | | | | | | | |
Net investment income (loss) | | $ | 8,742,451 | | | $ | 10,569,874 | |
Net realized gain (loss) | | | 3,040,160 | | | | (1,015,880 | ) |
Net change in unrealized appreciation (depreciation) | | | (1,659,266 | ) | | | 12,493,725 | |
| | | | | | | | |
Net increase (decrease) in net assets resulting from operations | | | 10,123,345 | | | | 22,047,719 | |
| | | | | | | | |
| Distributions to shareholders (Note 2): | | | | | | | | |
From net investment income: | | | | | | | | |
Initial Class | | | - | | | | - | |
Class II | | | (6,309,725 | ) | | | (8,197,683 | ) |
Service Class | | | - | | | | - | |
Service Class I | | | (2,363,997 | ) | | | (1,979,564 | ) |
| | | | | | | | |
Total distributions from net investment income | | | (8,673,722 | ) | | | (10,177,247 | ) |
| | | | | | | | |
Tax return of capital: | | | | | | | | |
Initial Class | | | - | | | | - | |
Class II | | | (423,400 | ) | | | - | |
Service Class | | | - | | | | - | |
Service Class I | | | (158,631 | ) | | | - | |
| | | | | | | | |
Total tax return of capital | | | (582,031 | ) | | | - | |
| | | | | | | | |
| Net fund share transactions (Note 5): | | | | | | | | |
Initial Class | | | - | | | | - | |
Class II | | | (372,155 | ) | | | (28,408,601 | ) |
Service Class | | | - | | | | - | |
Service Class I | | | 7,944,985 | | | | 2,367,805 | |
| | | | | | | | |
Increase (decrease) in net assets from fund share transactions | | | 7,572,830 | | | | (26,040,796 | ) |
| | | | | | | | |
Total increase (decrease) in net assets | | | 8,440,422 | | | | (14,170,324 | ) |
| Net assets | | | | | | | | |
Beginning of year | | | 126,125,808 | | | | 140,296,132 | |
| | | | | | | | |
End of year | | $ | 134,566,230 | | | $ | 126,125,808 | |
| | | | | | | | |
Undistributed (accumulated) net investment income (loss) included in net assets at end of year | | $ | - | | | $ | 69,663 | |
| | | | | | | | |
Distributions in excess of net investment income included in net assets at end of year | | $ | (19,309 | ) | | $ | - | |
| | | | | | | | |
The accompanying notes are an integral part of the financial statements.
106
| | | | | | | | | | | | | | |
| MML Inflation-Protected and Income Fund | | | MML Short-Duration Bond Fund | |
Year
Ended
December 31, 2017 | | | Year
Ended
December 31, 2016 | | | Year
Ended
December 31, 2017 | | | Year
Ended
December 31, 2016 | |
| | | | | | | | | | | | | | |
| | | | | | | | | | | | | | |
| $ | 9,831,505 | | | $ | 8,476,980 | | | $ | 4,876,569 | | | $ | 3,403,510 | |
| | 678,129 | | | | 2,087,381 | | | | 248,421 | | | | (22,334 | ) |
| | 2,851,949 | | | | 11,082,174 | | | | 822,273 | | | | 1,376,377 | |
| | | | | | | | | | | | | | |
| | 13,361,583 | | | | 21,646,535 | | | | 5,947,263 | | | | 4,757,553 | |
| | | | | | | | | | | | | | |
| | | | | | | | | | | | | | |
| | | | | | | | | | | | | | |
| | (10,186,007 | ) | | | (9,077,612 | ) | | | - | | | | - | |
| | - | | | | - | | | | (5,513,771 | ) | | | (3,741,339 | ) |
| | (1,173,425 | ) | | | (1,014,617 | ) | | | - | | | | - | |
| | - | | | | - | | | | (759,787 | ) | | | (560,359 | ) |
| | | | | | | | | | | | | | |
| | (11,359,432 | ) | | | (10,092,229 | ) | | | (6,273,558 | ) | | | (4,301,698 | ) |
| | | | | | | | | | | | | | |
| | | | | | | | | | | | | | |
| | (2,405,566 | ) | | | - | | | | - | | | | - | |
| | - | | | | - | | | | (62,704 | ) | | | - | |
| | (277,120 | ) | | | - | | | | - | | | | - | |
| | - | | | | - | | | | (8,640 | ) | | | - | |
| | | | | | | | | | | | | | |
| | (2,682,686 | ) | | | - | | | | (71,344 | ) | | | - | |
| | | | | | | | | | | | | | |
| | | | | | | | | | | | | | |
| | 3,444,088 | | | | (15,322,801 | ) | | | - | | | | - | |
| | - | | | | - | | | | 10,647,155 | | | | 47,725,913 | |
| | (834,974 | ) | | | (2,110,692 | ) | | | - | | | | - | |
| | - | | | | - | | | | (776,783 | ) | | | 7,587,141 | |
| | | | | | | | | | | | | | |
| | 2,609,114 | | | | (17,433,493 | ) | | | 9,870,372 | | | | 55,313,054 | |
| | | | | | | | | | | | | | |
| | 1,928,579 | | | | (5,879,187 | ) | | | 9,472,733 | | | | 55,768,909 | |
| | | | | | | | | | | | | | |
| | 422,159,545 | | | | 428,038,732 | | | | 235,080,283 | | | | 179,311,374 | |
| | | | | | | | | | | | | | |
| $ | 424,088,124 | | | $ | 422,159,545 | | | $ | 244,553,016 | | | $ | 235,080,283 | |
| | | | | | | | | | | | | | |
$ | 323,767 | | | $ | 600,143 | | | $ | 61,372 | | | $ | 426,410 | |
| | | | | | | | | | | | | | |
| $ | - | | | $ | - | | | $ | - | | | $ | - | |
| | | | | | | | | | | | | | |
107
MML Series Investment Fund II — Financial Statements (Continued)
Statements of Changes in Net Assets
| | | | | | | | |
| | | MML Small Cap Equity Fund | |
| | | Year
Ended
December 31, 2017
| | | Year
Ended
December 31, 2016
| |
| Increase (Decrease) in Net Assets: | | | | | | | | |
| Operations: | | | | | | | | |
Net investment income (loss) | | $ | 697,612 | | | $ | 1,189,742 | |
Net realized gain (loss) | | | 14,830,900 | | | | 6,363,213 | |
Net change in unrealized appreciation (depreciation) | | | (153,349 | ) | | | 9,716,409 | |
| | | | | | | | |
Net increase (decrease) in net assets resulting from operations | | | 15,375,163 | | | | 17,269,364 | |
| | | | | | | | |
| Distributions to shareholders (Note 2): | | | | | | | | |
From net investment income: | | | | | | | | |
Initial Class | | | (831,020 | ) | | | (946,569 | ) |
Class II | | | - | | | | - | |
Service Class | | | (104,656 | ) | | | (97,330 | ) |
Service Class I | | | - | | | | - | |
| | | | | | | | |
Total distributions from net investment income | | | (935,676 | ) | | | (1,043,899 | ) |
| | | | | | | | |
From net realized gains: | | | | | | | | |
Initial Class | | | (3,750,937 | ) | | | (2,038,912 | ) |
Service Class | | | (601,488 | ) | | | (268,264 | ) |
| | | | | | | | |
Total distributions from net realized gains | | | (4,352,425 | ) | | | (2,307,176 | ) |
| | | | | | | | |
Tax return of capital: | | | | | | | | |
Class II | | | - | | | | - | |
Service Class I | | | - | | | | - | |
| | | | | | | | |
Total tax return of capital | | | - | | | | - | |
| | | | | | | | |
| Net fund share transactions (Note 5): | | | | | | | | |
Initial Class | | | (4,513,036 | ) | | | (4,113,501 | ) |
Class II | | | - | | | | - | |
Service Class | | | 3,077,402 | | | | 509,259 | |
Service Class I | | | - | | | | - | |
| | | | | | | | |
Increase (decrease) in net assets from fund share transactions | | | (1,435,634 | ) | | | (3,604,242 | ) |
| | | | | | | | |
Total increase (decrease) in net assets | | | 8,651,428 | | | | 10,314,047 | |
| Net assets | | | | | | | | |
Beginning of year | | | 111,025,694 | | | | 100,711,647 | |
| | | | | | | | |
End of year | | $ | 119,677,122 | | | $ | 111,025,694 | |
| | | | | | | | |
Undistributed (accumulated) net investment income (loss) included in net assets at end of year | | $ | 999,566 | | | $ | 1,327,553 | |
| | | | | | | | |
Distributions in excess of net investment income included in net assets at end of year | | $ | - | | | $ | - | |
| | | | | | | | |
The accompanying notes are an integral part of the financial statements.
108
| | | | | | | | | | | | | | |
| MML Special Situations Fund | | | MML Strategic Emerging Markets Fund | |
Year
Ended
December 31, 2017
| | | Year
Ended
December 31, 2016
| | | Year
Ended
December 31, 2017
| | | Year
Ended
December 31, 2016
| |
| | | | | | | | | | | | | | |
| | | | | | | | | | | | | | |
| $ | 26,192 | | | $ | 75,523 | | | $ | 213,954 | | | $ | 247,842 | |
| | 1,093,015 | | | | (833,481 | ) | | | 6,505,472 | | | | (3,887,465 | ) |
| | 2,617,462 | | | | 3,466,670 | | | | 24,400,825 | | | | 10,037,410 | |
| | | | | | | | | | | | | | |
| | 3,736,669 | | | | 2,708,712 | | | | 31,120,251 | | | | 6,397,787 | |
| | | | | | | | | | | | | | |
| | | | | | | | | | | | | | |
| | | | | | | | | | | | | | |
| | - | | | | - | | | | - | | | | - | |
| | (34,572 | ) | | | (75,321 | ) | | | (81,649 | ) | | | (401,484 | ) |
| | - | | | | - | | | | - | | | | - | |
| | - | | | | (957 | ) | | | - | | | | (22,753 | ) |
| | | | | | | | | | | | | | |
| | (34,572 | ) | | | (76,278 | ) | | | (81,649 | ) | | | (424,237 | ) |
| | | | | | | | | | | | | | |
| | | | | | | | | | | | | | |
| | - | | | | - | | | | - | | | | - | |
| | - | | | | - | | | | - | | | | - | |
| | | | | | | | | | | | | | |
| | - | | | | - | | | | - | | | | - | |
| | | | | | | | | | | | | | |
| | | | | | | | | | | | | | |
| | - | | | | (35,171 | ) | | | - | | | | - | |
| | - | | | | (447 | ) | | | - | | | | - | |
| | | | | | | | | | | | | | |
| | - | | | | (35,618 | ) | | | - | | | | - | |
| | | | | | | | | | | | | | |
| | | | | | | | | | | | | | |
| | - | | | | - | | | | - | | | | - | |
| | 34,572 | | | | 110,492 | | | | (18,421,567 | ) | | | (3,478,523 | ) |
| | - | | | | - | | | | - | | | | - | |
| | 157,510 | | | | 133,267 | | | | 1,312,964 | | | | 942,536 | |
| | | | | | | | | | | | | | |
| | 192,082 | | | | 243,759 | | | | (17,108,603 | ) | | | (2,535,987 | ) |
| | | | | | | | | | | | | | |
| | 3,894,179 | | | | 2,840,575 | | | | 13,929,999 | | | | 3,437,563 | |
| | | | | | | | | | | | | | |
| | 19,799,731 | | | | 16,959,156 | | | | 96,202,097 | | | | 92,764,534 | |
| | | | | | | | | | | | | | |
| $ | 23,693,910 | | | $ | 19,799,731 | | | $ | 110,132,096 | | | $ | 96,202,097 | |
| | | | | | | | | | | | | | |
$ |
- |
| | $ | - | | | $ | - | | | $ | - | |
| | | | | | | | | | | | | | |
| $ | (1,142 | ) | | $ | (661 | ) | | $ | (216,374 | ) | | $ | (659,710 | ) |
| | | | | | | | | | | | | | |
109
MML Series Investment Fund II – Financial Statements (Continued)
Statement of Cash Flows
For the Year Ended December 31, 2017
| | | | |
| | | MML Inflation-
Protected and
Income Fund | |
| Cash flows from operating activities: | | | | |
Net increase (decrease) in net assets resulting from operations | | $ | 13,361,583 | |
Adjustments to reconcile net increase in net assets resulting from operations to net cash provided by (used in) operating activities: | | | | |
Investments purchased | | | (186,743,830 | ) |
Investments sold | | | 221,685,652 | |
(Increase ) Decrease to the principal amount of inflation-indexed bonds | | | (7,584,806 | ) |
(Purchase) Sale of short-term investments, net | | | (46,039,637 | ) |
Amortization (accretion) of discount and premium, net | | | 1,153,654 | |
(Increase) Decrease in receivable from interest and dividends | | | 170,714 | |
(Increase) Decrease in receivable for open swap agreements, at value | | | 156,994 | |
Increase (Decrease) in payable for Trustees’ fees and expenses | | | 7,968 | |
Increase (Decrease) in payable for investment advisory fees | | | 2,934 | |
Increase (Decrease) in payable for service fees | | | (416 | ) |
Increase (Decrease) in payable for open swap agreements, at value | | | 354,393 | |
Increase (Decrease) in collateral held for purchased options | | | 1,660,000 | |
Increase (Decrease) in variation margin payable on open derivative instruments | | | (12,952 | ) |
Increase (Decrease) in payable for accrued expenses and other liabilities | | | (310 | ) |
Net change in unrealized (appreciation) depreciation on investments | | | (3,376,774 | ) |
Net realized (gain) loss from investments | | | (578,320 | ) |
| | | | |
Net cash from (used in) operating activities | | | (5,783,153 | ) |
| | | | |
| Cash flows from (used in) financing activities: | | | | |
Increase (Decrease) in due to custodian | | | (1,957,137 | ) |
Proceeds from shares sold | | | 49,971,603 | |
Payment on shares redeemed | | | (61,321,983 | ) |
Net Increase (Decrease) in reverse repurchase agreements | | | 7,836,542 | |
Increase (Decrease) in collateral held for reverse repurchase agreements | | | 11,254,128 | |
| | | | |
Net cash from (used in) financing activities | | | 5,783,153 | |
| | | | |
| |
Net increase (decrease) in cash | | | - | |
Cash at beginning of period | | | - | |
| | | | |
Cash at end of period | | $ | - | |
| | | | |
| |
Non cash financing activities not included herein consist of: | | | | |
Reinvestment of all distributions | | $ | 14,042,118 | |
Cash paid out for interest on reverse repurchase agreements | | $ | 3,610,969 | |
The accompanying notes are an integral part of the financial statements.
110
MML Series Investment Fund II – Financial Statements
Financial Highlights (For a share outstanding throughout each period)
MML Asset Momentum Fund
| | | | | | | | | | | | | | | | | | | | | | | | | | | | | | | | | | | | | | | | | | | | | | | | | | | | | | | | |
| | | | | | Income (loss) from investment
operations | | | Less distributions to shareholders | | | | | | | | | Ratios / Supplemental Data | |
| | | Net
asset
value,
beginning
of the
period | | | Net
investment
income
(loss)c,j | | | Net
realized
and
unrealized
gain (loss)
on
investments | | | Total
income
(loss) from
investment
operations | | | From net
investment
income | | | From net
realized
gains | | | Tax
return
of
capital | | | Total
distributions | | | Net
asset
value,
end of
the
period | | | Total
returnm | | | Net
assets,
end of
the
period
(000’s) | | | Ratio of
expenses
to average
daily net
assets
before
expense
waivers | | | Ratio of
expenses
to average
daily net
assets
after
expense
waiversj | | | Net
investment
income
(loss) to
average
daily net
assets | |
Class II | | | | | | | | | | | | | | | | | | | | | | | | | | | | | | | | | | | | | | | | | | | | | | | | | |
| 12/31/17 | | $ | 10.32 | | | $ | 0.05 | | | $ | 3.40 | | | $ | 3.45 | | | $ | (0.18 | ) | | $ | (1.15 | ) | | $ | - | | | $ | (1.33 | ) | | $ | 12.44 | | | | 33.92% | | | $ | 27,728 | | | | 0.93% | | | | 0.80% | | | | 0.45% | |
12/31/16 | | | 9.43 | | | | 0.02 | | | | 0.94 | | | | 0.96 | | | | (0.07 | ) | | | - | | | | - | | | | (0.07 | ) | | | 10.32 | | | | 10.20% | | | | 20,688 | | | | 0.97% | | | | 0.80% | | | | 0.25% | |
| 12/31/15g | | | 10.00 | | | | 0.00 | d | | | (0.56 | ) | | | (0.56 | ) | | | (0.00 | )d | | | - | | | | (0.01 | ) | | | (0.01 | ) | | | 9.43 | | | | (5.62% | )b | | | 18,773 | | | | 1.25% | a | | | 0.80% | a | | | 0.01% | a |
Service Class I | | | | | | | | | | | | | | | | | | | | | | | | | | | | | | | | | | | | | | | | | | | | | | | | | |
| 12/31/17 | | $ | 10.29 | | | $ | 0.02 | | | $ | 3.41 | | | $ | 3.43 | | | $ | (0.16 | ) | | $ | (1.15 | ) | | $ | - | | | $ | (1.31 | ) | | $ | 12.41 | | | | 33.77% | | | $ | 1,519 | | | | 1.18% | | | | 1.05% | | | | 0.21% | |
12/31/16 | | | 9.42 | | | | 0.01 | | | | 0.92 | | | | 0.93 | | | | (0.06 | ) | | | - | | | | - | | | | (0.06 | ) | | | 10.29 | | | | 9.85% | | | | 929 | | | | 1.22% | | | | 1.05% | | | | 0.13% | |
| 12/31/15g | | | 10.00 | | | | (0.02 | ) | | | (0.56 | ) | | | (0.58 | ) | | | - | | | | - | | | | - | | | | - | | | | 9.42 | | | | (5.80% | )b | | | 232 | | | | 1.50% | a | | | 1.05% | a | | | (0.25% | )a |
| | | | | | | | | | | | |
| | | Year ended December 31 | | | Period ended
December 31, 2015b | |
| | | 2017 | | | 2016 | | |
Portfolio turnover rate | | | 19 | % | | | 82 | % | | | 141 | % |
| b | Percentage represents the results for the period and is not annualized. |
| c | Per share amount calculated on the average shares method. |
| d | Amount is less than $0.005 per share. |
| g | For the period May 15, 2015 (commencement of operations) through December 31, 2015. |
| j | Computed after giving effect to an agreement by MML Advisers to waive certain fees and expenses of the Fund. |
| m | Total return does not reflect expenses that apply at the separate account level or to related insurance products. Inclusion of these charges would reduce the total return figures for all periods shown. |
The accompanying notes are an integral part of the financial statements.
111
MML Series Investment Fund II – Financial Statements (Continued)
Financial Highlights (For a share outstanding throughout each period)
MML Dynamic Bond Fund
| | | | | | | | | | | | | | | | | | | | | | | | | | | | | | | | | | | | | | | | | | | | | | | | | | | | |
| | | | | | Income (loss) from investment
operations | | | Less distributions to shareholders | | | | | | | | | Ratios / Supplemental Data | |
| | | Net
asset
value,
beginning
of the
period | | | Net
investment
income
(loss)c,j | | | Net
realized
and
unrealized
gain (loss)
on
investments | | | Total
income
(loss) from
investment
operations | | | From net
investment
income | | | From net
realized
gains | | | Total
distributions | | | Net
asset
value,
end of
the
period | | | Total
returnm | | | Net
assets,
end of
the
period
(000’s) | | | Ratio of
expenses
to average
daily net
assets
before
expense
waivers | | | Ratio of
expenses
to average
daily net
assets
after
expense
waiversj | | | Net
investment
income
(loss) to
average
daily net
assets | |
Class II | | | | | | | | | | | | | | | | | | | | | | | | | | | | | | | | | | | | | | | | | | | | | |
| 12/31/17 | | $ | 9.89 | | | $ | 0.30 | | | $ | 0.14 | | | $ | 0.44 | | | $ | (0.34 | ) | | $ | (0.04 | ) | | $ | (0.38 | ) | | $ | 9.95 | | | | 4.45% | | | $ | 447,146 | | | | 0.59% | | | | 0.59% | l | | | 3.00% | |
12/31/16 | | | 9.71 | | | | 0.33 | | | | 0.15 | | | | 0.48 | | | | (0.30 | ) | | | - | | | | (0.30 | ) | | | 9.89 | | | | 4.94% | | | | 421,624 | | | | 0.59% | | | | 0.59% | l | | | 3.27% | |
| 12/31/15g | | | 10.00 | | | | 0.17 | | | | (0.30 | ) | | | (0.13 | ) | | | (0.16 | ) | | | - | | | | (0.16 | ) | | | 9.71 | | | | (1.34% | )b | | | 400,385 | | | | 0.61% | a | | | 0.60% | a | | | 2.78% | a |
Service Class I | | | | | | | | | | | | | | | | | | | | | | | | | | | | | | | | | | | | | | | | | | | | | |
| 12/31/17 | | $ | 9.88 | | | $ | 0.28 | | | $ | 0.12 | | | $ | 0.40 | | | $ | (0.31 | ) | | $ | (0.04 | ) | | $ | (0.35 | ) | | $ | 9.93 | | | | 4.11% | | | $ | 4,412 | | | | 0.84% | | | | 0.84% | l | | | 2.77% | |
12/31/16 | | | 9.71 | | | | 0.31 | | | | 0.14 | | | | 0.45 | | | | (0.28 | ) | | | - | | | | (0.28 | ) | | | 9.88 | | | | 4.67% | | | | 2,907 | | | | 0.84% | | | | 0.84% | l | | | 3.14% | |
| 12/31/15g | | | 10.00 | | | | 0.15 | | | | (0.29 | ) | | | (0.14 | ) | | | (0.15 | ) | | | - | | | | (0.15 | ) | | | 9.71 | | | | (1.45% | )b | | | 382 | | | | 0.86% | a | | | 0.85% | a | | | 2.39% | a |
| | | | | | | | | | | | |
| | | Year ended December 31 | | | Period ended
December 31, 2015b | |
| | | 2017 | | | 2016 | | |
Portfolio turnover rate | | | 100 | % | | | 79 | % | | | 106 | % |
| b | Percentage represents the results for the period and is not annualized. |
| c | Per share amount calculated on the average shares method. |
| g | For the period May 15, 2015 (commencement of operations) through December 31, 2015. |
| j | Computed after giving effect to an agreement by MML Advisers to waive certain fees and expenses of the Fund. |
| l | Expenses incurred during the period fell under the expense cap. |
| m | Total return does not reflect expenses that apply at the separate account level or to related insurance products. Inclusion of these charges would reduce the total return figures for all periods shown. |
The accompanying notes are an integral part of the financial statements.
112
MML Series Investment Fund II – Financial Statements (Continued)
Financial Highlights (For a share outstanding throughout each period)
MML Equity Rotation Fund
| | | | | | | | | | | | | | | | | | | | | | | | | | | | | | | | | | | | | | | | | | | | | | | | | | | | | | | | |
| | | | | | Income (loss) from investment
operations | | | Less distributions to shareholders | | | | | | | | | Ratios / Supplemental Data | |
| | | Net
asset
value,
beginning
of the
period | | | Net
investment
income
(loss)c,j | | | Net
realized
and
unrealized
gain (loss)
on
investments | | | Total
income
(loss) from
investment
operations | | | From net
investment
income | | | From net
realized
gains | | | Tax
return
of
capital | | | Total
distributions | | | Net
asset
value,
end of
the
period | | | Total
returnm | | | Net
assets,
end of
the
period
(000’s) | | | Ratio of
expenses
to average
daily net
assets
before
expense
waivers | | | Ratio of
expenses
to average
daily net
assets
after
expense
waiversj | | | Net
investment
income
(loss) to
average
daily net
assets | |
Class II | |
| 12/31/17 | | $ | 11.28 | | | $ | 0.10 | | | $ | 3.30 | | | $ | 3.40 | | | $ | (0.10 | ) | | $ | (0.69 | ) | | $ | - | | | $ | (0.79 | ) | | $ | 13.89 | | | | 30.09% | | | $ | 29,745 | | | | 0.76% | | | | 0.65% | | | | 0.79% | |
12/31/16 | | | 9.71 | | | | 0.13 | | | | 1.57 | | | | 1.70 | | | | (0.13 | ) | | | - | | | | - | | | | (0.13 | ) | | | 11.28 | | | | 17.48% | | | | 22,878 | | | | 0.76% | | | | 0.65% | | | | 1.28% | |
| 12/31/15g | | | 10.00 | | | | 0.07 | | | | (0.29 | ) | | | (0.22 | ) | | | (0.06 | ) | | | - | | | | (0.01 | ) | | | (0.07 | ) | | | 9.71 | | | | (2.18% | )b | | | 19,462 | | | | 0.96% | a | | | 0.65% | a | | | 1.06% | a |
Service Class I | |
| 12/31/17 | | $ | 11.27 | | | $ | 0.07 | | | $ | 3.28 | | | $ | 3.35 | | | $ | (0.08 | ) | | $ | (0.69 | ) | | $ | - | | | $ | (0.77 | ) | | $ | 13.85 | | | | 29.68% | | | $ | 1,435 | | | | 1.01% | | | | 0.90% | | | | 0.57% | |
12/31/16 | | | 9.71 | | | | 0.09 | | | | 1.58 | | | | 1.67 | | | | (0.11 | ) | | | - | | | | - | | | | (0.11 | ) | | | 11.27 | | | | 17.22% | | | | 431 | | | | 1.01% | | | | 0.90% | | | | 0.92% | |
| 12/31/15g | | | 10.00 | | | | 0.05 | | | | (0.28 | ) | | | (0.23 | ) | | | (0.06 | ) | | | - | | | | (0.00 | )d | | | (0.06 | ) | | | 9.71 | | | | (2.32% | )b | | | 127 | | | | 1.21% | a | | | 0.90% | a | | | 0.80% | a |
| | | | | | | | | | | | |
| | | Year ended December 31 | | | Period ended
December 31, 2015b | |
| | | 2017 | | | 2016 | | |
Portfolio turnover rate | | | 63 | % | | | 90 | % | | | 39 | % |
| b | Percentage represents the results for the period and is not annualized. |
| c | Per share amount calculated on the average shares method. |
| d | Amount is less than $0.005 per share. |
| g | For the period May 15, 2015 (commencement of operations) through December 31, 2015. |
| j | Computed after giving effect to an agreement by MML Advisers to waive certain fees and expenses of the Fund. |
| m | Total return does not reflect expenses that apply at the separate account level or to related insurance products. Inclusion of these charges would reduce the total return figures for all periods shown. |
The accompanying notes are an integral part of the financial statements.
113
MML Series Investment Fund II – Financial Statements (Continued)
Financial Highlights (For a share outstanding throughout each period)
MML High Yield Fund
| | | | | | | | | | | | | | | | | | | | | | | | | | | | | | | | | | | | | | | | | | | | | | | | | | | | | | | | |
| | | | | | Income (loss) from investment
operations | | | Less distributions to shareholders | | | | | | | | | Ratios / Supplemental Data | |
| | | Net
asset
value,
beginning
of the
period | | | Net
investment
income
(loss)c,j | | | Net
realized
and
unrealized
gain (loss)
on
investments | | | Total
income
(loss) from
investment
operations | | | From net
investment
income | | | From net
realized
gains | | | Tax
return
of
capital | | | Total
distributions | | | Net
asset
value,
end of
the
period | | | Total
returnm | | | Net
assets,
end of
the
period
(000’s) | | | Ratio of
expenses
to average
daily net
assets
before
expense
waivers | | | Ratio of
expenses
to average
daily net
assets
after
expense
waiversj | | | Net
investment
income
(loss) to
average
daily net
assets | |
Class II | | | | | | | | | | | | | | | | | | | | | | | | | | | | | | | | | | | | | | | | | | | | | | | | | |
| 12/31/17 | | $ | 9.93 | | | $ | 0.69 | | | $ | 0.11 | | | $ | 0.80 | | | $ | (0.67 | ) | | $ | - | | | $ | (0.05 | ) | | $ | (0.72 | ) | | $ | 10.01 | | | | 8.22% | | | $ | 95,599 | | | | 0.84% | | | | 0.74% | | | | 6.71% | |
12/31/16 | | | 9.17 | | | | 0.71 | | | | 0.76 | | | | 1.47 | | | | (0.71 | ) | | | - | | | | - | | | | (0.71 | ) | | | 9.93 | | | | 16.48% | | | | 95,180 | | | | 0.84% | | | | 0.74% | | | | 7.42% | |
| 12/31/15 | | | 9.98 | | | | 0.65 | | | | (0.74 | ) | | | (0.09 | ) | | | (0.66 | ) | | | (0.06 | ) | | | (0.00 | )d | | | (0.72 | ) | | | 9.17 | | | | (1.13% | ) | | | 113,880 | | | | 0.83% | | | | 0.71% | | | | 6.56% | |
| 12/31/14 | | | 11.03 | | | | 0.72 | | | | (0.57 | ) | | | 0.15 | | | | (0.74 | ) | | | (0.46 | ) | | | - | | | | (1.20 | ) | | | 9.98 | | | | 1.05% | | | | 116,277 | | | | 0.83% | | | | 0.69% | | | | 6.62% | |
| 12/31/13 | | | 10.93 | | | | 0.76 | | | | 0.38 | | | | 1.14 | | | | (0.74 | ) | | | (0.30 | ) | | | - | | | | (1.04 | ) | | | 11.03 | | | | 10.84% | | | | 129,251 | | | | 0.84% | | | | 0.69% | | | | 6.88% | |
Service Class I | | | | | | | | | | | | | | | | | | | | | | | | | | | | | | | | | | | | | | | | | | | | | | | | | |
| 12/31/17 | | $ | 9.90 | | | $ | 0.66 | | | $ | 0.11 | | | $ | 0.77 | | | $ | (0.66 | ) | | $ | - | | | $ | (0.04 | ) | | $ | (0.70 | ) | | $ | 9.97 | | | | 7.88% | | | $ | 38,967 | | | | 1.09% | | | | 0.99% | | | | 6.45% | |
12/31/16 | | | 9.14 | | | | 0.69 | | | | 0.75 | | | | 1.44 | | | | (0.68 | ) | | | - | | | | - | | | | (0.68 | ) | | | 9.90 | | | | 16.25% | | | | 30,946 | | | | 1.09% | | | | 0.99% | | | | 7.19% | |
| 12/31/15 | | | 9.95 | | | | 0.62 | | | | (0.73 | ) | | | (0.11 | ) | | | (0.64 | ) | | | (0.06 | ) | | | (0.00 | )d | | | (0.70 | ) | | | 9.14 | | | | (1.39% | ) | | | 26,416 | | | | 1.08% | | | | 0.97% | | | | 6.31% | |
| 12/31/14 | | | 11.01 | | | | 0.69 | | | | (0.58 | ) | | | 0.11 | | | | (0.71 | ) | | | (0.46 | ) | | | - | | | | (1.17 | ) | | | 9.95 | | | | 0.71% | | | | 25,255 | | | | 1.08% | | | | 0.94% | | | | 6.38% | |
| 12/31/13 | | | 10.91 | | | | 0.73 | | | | 0.38 | | | | 1.11 | | | | (0.71 | ) | | | (0.30 | ) | | | - | | | | (1.01 | ) | | | 11.01 | | | | 10.59% | | | | 22,141 | | | | 1.09% | | | | 0.94% | | | | 6.63% | |
| | | | | | | | | | | | | | | | | | | | |
| | | Year ended December 31 | |
| | | 2017 | | | 2016 | | | 2015 | | | 2014 | | | 2013 | |
Portfolio turnover rate | | | 63 | % | | | 59 | % | | | 70 | % | | | 79 | % | | | 113 | % |
| c | Per share amount calculated on the average shares method. |
| d | Amount is less than $0.005 per share. |
| j | Computed after giving effect to an agreement by MML Advisers and/or MassMutual to waive certain fees and expenses of the Fund. |
| m | Total return does not reflect expenses that apply at the separate account level or to related insurance products. Inclusion of these charges would reduce the total return figures for all periods shown. |
The accompanying notes are an integral part of the financial statements.
114
MML Series Investment Fund II – Financial Statements (Continued)
Financial Highlights (For a share outstanding throughout each period)
MML Inflation-Protected and Income Fund
| | | | | | | | | | | | | | | | | | | | | | | | | | | | | | | | | | | | | | | | | | | | | | | | | | | | | | | | |
| | | | | | Income (loss) from investment
operations | | | Less distributions to shareholders | | | | | | | | | Ratios / Supplemental Data | |
| | | Net
asset
value,
beginning
of the
period | | | Net
investment
income
(loss)c | | | Net
realized
and
unrealized
gain (loss)
on
investments | | | Total
income
(loss) from
investment
operations | | | From net
investment
income | | | From net
realized
gains | | | Tax
return
of
capital | | | Total
distributions | | | Net
asset
value,
end of
the
period | | | Total
returnm | | | Net
assets,
end of
the
period
(000’s) | | | Ratio of
expenses
to average
daily net
assets
(including
Interest
Expense)p | | | Ratio of
expenses
to average
daily net
assets
(excluding
Interest
Expense) | | | Net
investment
income
(loss) to
average
daily net
assets
(including
Interest
Expense) | |
Initial Class | | | | | | | | | | | | | | | | | | | | | | | | | | | | | | | | | | | | | | | | | | | | | | | | | |
| 12/31/17 | | $ | 10.18 | | | $ | 0.24 | | | $ | 0.08 | | | $ | 0.32 | | | $ | (0.28 | ) | | $ | - | | | $ | (0.06 | ) | | $ | (0.34 | ) | | $ | 10.16 | | | | 3.21% | | | $ | 377,984 | | | | 1.50% | | | | 0.59% | | | | 2.33% | |
| 12/31/16 | | | 9.92 | | | | 0.21 | | | | 0.30 | | | | 0.51 | | | | (0.25 | ) | | | - | | | | - | | | | (0.25 | ) | | | 10.18 | | | | 5.10% | | | | 375,135 | | | | 1.13% | | | | 0.60% | | | | 2.00% | |
| 12/31/15 | | | 10.18 | | | | 0.06 | | | | (0.20 | ) | | | (0.14 | ) | | | (0.12 | ) | | | - | | | | - | | | | (0.12 | ) | | | 9.92 | | | | (1.41% | ) | | | 380,221 | | | | 0.84% | | | | 0.59% | | | | 0.58% | |
| 12/31/14 | | | 10.35 | | | | 0.19 | | | | 0.16 | | | | 0.35 | | | | (0.29 | ) | | | (0.23 | ) | | | - | | | | (0.52 | ) | | | 10.18 | | | | 3.45% | | | | 412,861 | | | | 0.73% | | | | 0.60% | | | | 1.85% | |
| 12/31/13 | | | 11.86 | | | | 0.16 | | | | (1.16 | ) | | | (1.00 | ) | | | (0.21 | ) | | | (0.30 | ) | | | - | | | | (0.51 | ) | | | 10.35 | | | | (8.68% | ) | | | 326,380 | | | | 0.77% | | | | 0.60% | | | | 1.45% | |
Service Class | | | | | | | | | | | | | | | | | | | | | | | | | | | | | | | | | | | | | | | | | | | | | | | | | |
| 12/31/17 | | $ | 10.14 | | | $ | 0.21 | | | $ | 0.09 | | | $ | 0.30 | | | $ | (0.26 | ) | | $ | - | | | $ | (0.06 | ) | | $ | (0.32 | ) | | $ | 10.12 | | | | 2.96% | | | $ | 46,104 | | | | 1.75% | | | | 0.84% | | | | 2.08% | |
| 12/31/16 | | | 9.87 | | | | 0.18 | | | | 0.31 | | | | 0.49 | | | | (0.22 | ) | | | - | | | | - | | | | (0.22 | ) | | | 10.14 | | | | 4.90% | | | | 47,025 | | | | 1.38% | | | | 0.85% | | | | 1.77% | |
| 12/31/15 | | | 10.14 | | | | 0.03 | | | | (0.20 | ) | | | (0.17 | ) | | | (0.10 | ) | | | - | | | | - | | | | (0.10 | ) | | | 9.87 | | | | (1.65% | ) | | | 47,818 | | | | 1.09% | | | | 0.84% | | | | 0.33% | |
| 12/31/14 | | | 10.32 | | | | 0.18 | | | | 0.14 | | | | 0.32 | | | | (0.27 | ) | | | (0.23 | ) | | | - | | | | (0.50 | ) | | | 10.14 | | | | 3.16% | | | | 52,008 | | | | 0.98% | | | | 0.85% | | | | 1.75% | |
| 12/31/13 | | | 11.83 | | | | 0.13 | | | | (1.16 | ) | | | (1.03 | ) | | | (0.18 | ) | | | (0.30 | ) | | | - | | | | (0.48 | ) | | | 10.32 | | | | (8.95% | ) | | | 53,902 | | | | 1.02% | | | | 0.85% | | | | 1.20% | |
| | | | | | | | | | | | | | | | | | | | |
| | | Year ended December 31 | |
| | | 2017 | | | 2016 | | | 2015 | | | 2014 | | | 2013 | |
Portfolio turnover rate | | | 34 | % | | | 41 | % | | | 50 | % | | | 67 | % | | | 57 | % |
| c | Per share amount calculated on the average shares method. |
| m | Total return does not reflect expenses that apply at the separate account level or to related insurance products. Inclusion of these charges would reduce the total return figures for all periods shown. |
| p | Interest expense incurred as a result of entering into reverse repurchase agreements is included in the Fund’s net expenses in the Statements of Operations. Income earned on investing proceeds from reverse repurchase agreements is included in interest income in the Statements of Operations. |
The accompanying notes are an integral part of the financial statements.
115
MML Series Investment Fund II – Financial Statements (Continued)
Financial Highlights (For a share outstanding throughout each period)
MML Short-Duration Bond Fund
| | | | | | | | | | | | | | | | | | | | | | | | | | | | | | | | | | | | | | | | | | | | | | | | | | | | | | | | |
| | | | | | Income (loss) from investment
operations | | | Less distributions to shareholders | | | | | | | | | Ratios / Supplemental Data | |
| | | Net
asset
value,
beginning
of the
period | | | Net
investment
income
(loss)c,j | | | Net
realized
and
unrealized
gain (loss)
on
investments | | | Total
income
(loss) from
investment
operations | | | From net
investment
income | | | From net
realized
gains | | | Tax
return
of
capital | | | Total
distributions | | | Net
asset
value,
end of
the
period | | | Total
returnm | | | Net
assets,
end of
the
period
(000’s) | | | Ratio of
expenses
to average
daily net
assets
before
expense
waivers | | | Ratio of
expenses
to average
daily net
assets
after
expense
waiversj | | | Net
investment
income
(loss) to
average
daily net
assets | |
Class II | | | | | | | | | | | | | | | | | | | | | | | | | | | | | | | | | | | | | | | | | | | | | | | | | |
| 12/31/17 | | $ | 9.75 | | | $ | 0.20 | | | $ | 0.05 | | | $ | 0.25 | | | $ | (0.27 | ) | | $ | - | | | $
| (0.00
| )d
| | $ | (0.27 | ) | | $ | 9.73 | | | | 2.55% | | | $ | 213,602 | | | | 0.55% | | | | 0.55% | k | | | 2.08% | |
12/31/16 | | | 9.70 | | | | 0.18 | | | | 0.09 | | | | 0.27 | | | | (0.22 | ) | | | - | | | | - | | | | (0.22 | ) | | | 9.75 | | | | 2.80% | | | | 203,294 | | | | 0.56% | | | | 0.55% | | | | 1.84% | |
| 12/31/15 | | | 9.84 | | | | 0.17 | | | | (0.08 | ) | | | 0.09 | | | | (0.23 | ) | | | - | | | | - | | | | (0.23 | ) | | | 9.70 | | | | 0.93% | | | | 155,210 | | | | 0.55% | | | | 0.55% | k | | | 1.73% | |
| 12/31/14 | | | 9.94 | | | | 0.15 | | | | (0.01 | ) | | | 0.14 | | | | (0.24 | ) | | | (0.00 | )d | | | - | | | | (0.24 | ) | | | 9.84 | | | | 1.46% | | | | 166,438 | | | | 0.55% | | | | 0.55% | k | | | 1.50% | |
| 12/31/13 | | | 10.10 | | | | 0.14 | | | | (0.05 | ) | | | 0.09 | | | | (0.20 | ) | | | (0.05 | ) | | | - | | | | (0.25 | ) | | | 9.94 | | | | 0.89% | | | | 195,279 | | | | 0.55% | | | | 0.55% | k | | | 1.38% | |
Service Class I | | | | | | | | | | | | | | | | | | | | | | | | | | | | | | | | | | | | | | | | | | | | | | | | | |
| 12/31/17 | | $ | 9.74 | | | $ | 0.18 | | | $ | 0.04 | | | $ | 0.22 | | | $ | (0.24 | ) | | $ | - | | | $ | (0.00 | )d | | $ | (0.24 | ) | | $ | 9.72 | | | | 2.29% | | | $ | 30,951 | | | | 0.80% | | | | 0.80% | k | | | 1.83% | |
12/31/16 | | | 9.69 | | | | 0.16 | | | | 0.09 | | | | 0.25 | | | | (0.20 | ) | | | - | | | | - | | | | (0.20 | ) | | | 9.74 | | | | 2.55% | | | | 31,787 | | | | 0.81% | | | | 0.80% | | | | 1.60% | |
| 12/31/15 | | | 9.83 | | | | 0.15 | | | | (0.08 | ) | | | 0.07 | | | | (0.21 | ) | | | - | | | | - | | | | (0.21 | ) | | | 9.69 | | | | 0.68% | | | | 24,101 | | | | 0.80% | | | | 0.80% | k | | | 1.48% | |
| 12/31/14 | | | 9.94 | | | | 0.12 | | | | (0.01 | ) | | | 0.11 | | | | (0.22 | ) | | | (0.00 | )d | | | - | | | | (0.22 | ) | | | 9.83 | | | | 1.11% | | | | 24,288 | | | | 0.80% | | | | 0.80% | k | | | 1.26% | |
| 12/31/13 | | | 10.09 | | | | 0.11 | | | | (0.03 | ) | | | 0.08 | | | | (0.18 | ) | | | (0.05 | ) | | | - | | | | (0.23 | ) | | | 9.94 | | | | 0.74% | | | | 21,697 | | | | 0.80% | | | | 0.80% | k | | | 1.13% | |
| | | | | | | | | | | | | | | | | | | | |
| | | Year ended December 31 | |
| | | 2017 | | | 2016 | | | 2015 | | | 2014 | | | 2013 | |
Portfolio turnover rate | | | 51 | % | | | 96 | % | | | 51 | % | | | 86 | % | | | 114 | % |
| c | Per share amount calculated on the average shares method. |
| d | Amount is less than $0.005 per share. |
| j | Computed after giving effect to an agreement by MML Advisers and/or MassMutual to waive certain fees and expenses of the Fund. |
| k | Amount waived had no impact on the ratio of expenses to average daily net assets. |
| m | Total return does not reflect expenses that apply at the separate account level or to related insurance products. Inclusion of these charges would reduce the total return figures for all periods shown. |
The accompanying notes are an integral part of the financial statements.
116
MML Series Investment Fund II – Financial Statements (Continued)
Financial Highlights (For a share outstanding throughout each period)
MML Small Cap Equity Fund
| | | | | | | | | | | | | | | | | | | | | | | | | | | | | | | | | | | | | | | | | | | | | | | | |
| | | | | | Income (loss) from investment
operations | | | Less distributions to shareholders | | | | | | | | | Ratios / Supplemental Data | |
| | | Net
asset
value,
beginning
of the
period | | | Net
investment
income
(loss)c | | | Net
realized
and
unrealized
gain (loss)
on
investments | | | Total
income
(loss) from
investment
operations | | | From net
investment
income | | | From net
realized
gains | | | Total
distributions | | | Net
asset
value,
end of
the
period | | | Total
returnm | | | Net
assets,
end of
the
period
(000’s) | | | Ratio of
expenses
to average
daily net
assets | | | Net
investment
income
(loss) to
average
daily net
assets | |
Initial Class | |
| 12/31/17 | | $ | 9.45 | | | $ | 0.06 | | | $ | 1.27 | | | $ | 1.33 | | | $ | (0.09 | ) | | $ | (0.39 | ) | | $ | (0.48 | ) | | $ | 10.30 | | | | 14.37 | % | | $ | 102,033 | | | | 0.71 | % | | | 0.64 | % |
12/31/16 | | | 8.27 | | | | 0.10 | | | | 1.37 | | | | 1.47 | | | | (0.09 | ) | | | (0.20 | ) | | | (0.29 | ) | | | 9.45 | | | | 18.21 | % | | | 97,747 | | | | 0.72 | % | | | 1.21 | % |
| 12/31/15 | | | 10.64 | | | | 0.09 | | | | (0.73 | ) | | | (0.64 | ) | | | (0.09 | ) | | | (1.64 | ) | | | (1.73 | ) | | | 8.27 | | | | (5.63 | %) | | | 89,557 | | | | 0.71 | % | | | 0.89 | % |
| 12/31/14 | | | 10.97 | | | | 0.13 | | | | 1.11 | | | | 1.24 | | | | (0.11 | ) | | | (1.46 | ) | | | (1.57 | ) | | | 10.64 | | | | 12.16 | % | | | 104,745 | | | | 0.70 | % | | | 1.19 | % |
| 12/31/13 | | | 8.82 | | | | 0.09 | | | | 3.39 | | | | 3.48 | | | | (0.11 | ) | | | (1.22 | ) | | | (1.33 | ) | | | 10.97 | | | | 41.02 | % | | | 104,147 | | | | 0.72 | % | | | 0.86 | % |
Service Class | |
| 12/31/17 | | $ | 9.31 | | | $ | 0.04 | | | $ | 1.24 | | | $ | 1.28 | | | $ | (0.07 | ) | | $ | (0.39 | ) | | $ | (0.46 | ) | | $ | 10.13 | | | | 14.08 | % | | $ | 17,644 | | | | 0.96 | % | | | 0.40 | % |
12/31/16 | | | 8.15 | | | | 0.08 | | | | 1.35 | | | | 1.43 | | | | (0.07 | ) | | | (0.20 | ) | | | (0.27 | ) | | | 9.31 | | | | 17.92 | % | | | 13,279 | | | | 0.97 | % | | | 0.96 | % |
| 12/31/15 | | | 10.52 | | | | 0.06 | | | | (0.72 | ) | | | (0.66 | ) | | | (0.07 | ) | | | (1.64 | ) | | | (1.71 | ) | | | 8.15 | | | | (5.87 | %) | | | 11,155 | | | | 0.96 | % | | | 0.67 | % |
| 12/31/14 | | | 10.87 | | | | 0.10 | | | | 1.10 | | | | 1.20 | | | | (0.09 | ) | | | (1.46 | ) | | | (1.55 | ) | | | 10.52 | | | | 11.88 | % | | | 9,916 | | | | 0.95 | % | | | 0.94 | % |
| 12/31/13 | | | 8.76 | | | | 0.06 | | | | 3.36 | | | | 3.42 | | | | (0.09 | ) | | | (1.22 | ) | | | (1.31 | ) | | | 10.87 | | | | 40.67 | % | | | 7,674 | | | | 0.97 | % | | | 0.63 | % |
| | | | | | | | | | | | | | | | | | | | |
| | | Year ended December 31 | |
| | | 2017 | | | 2016 | | | 2015 | | | 2014 | | | 2013 | |
Portfolio turnover rate | | | 47 | % | | | 63 | % | | | 40 | % | | | 65 | % | | | 65 | % |
| c | Per share amount calculated on the average shares method. |
| m | Total return does not reflect expenses that apply at the separate account level or to related insurance products. Inclusion of these charges would reduce the total return figures for all periods shown. |
The accompanying notes are an integral part of the financial statements.
117
MML Series Investment Fund II – Financial Statements (Continued)
Financial Highlights (For a share outstanding throughout each period)
MML Special Situations Fund
| | | | | | | | | | | | | | | | | | | | | | | | | | | | | | | | | | | | | | | | | | | | | | | | | | | | |
| | | | | | Income (loss) from investment
operations | | | Less distributions to shareholders | | | | | | | | | Ratios / Supplemental Data | |
| | | Net
asset
value,
beginning
of the
period | | | Net
investment
income
(loss)c,j | | | Net
realized
and
unrealized
gain (loss)
on
investments | | | Total
income
(loss) from
investment
operations | | | From net
investment
income | | | Tax return
of capital | | | Total
distributions | | | Net
asset
value,
end of
the
period | | | Total
returnm | | | Net
assets,
end of
the
period
(000’s) | | | Ratio of
expenses
to average
daily net
assets
before
expense
waivers | | | Ratio of
expenses
to average
daily net
assets
after
expense
waiversj | | | Net
investment
income
(loss) to
average
daily net
assets | |
Class II | | | | | | | | | | | | | | | | | | | | | | | | | | | | | | | | | | | | | | | | | | | | | |
| 12/31/17 | | $ | 9.71 | | | $ | 0.01 | | | $ | 1.82 | | | $ | 1.83 | | | $ | (0.02 | ) | | $ | - | | | $ | (0.02 | ) | | $ | 11.52 | | | | 18.82% | | | $ | 23,093 | | | | 0.94% | | | | 0.80% | | | | 0.13% | |
12/31/16 | | | 8.43 | | | | 0.04 | | | | 1.30 | | | | 1.34 | | | | (0.04 | ) | | | (0.02 | ) | | | (0.06 | ) | | | 9.71 | | | | 15.84% | | | | 19,441 | | | | 0.93% | | | | 0.80% | | | | 0.43% | |
| 12/31/15g | | | 10.00 | | | | (0.00 | )d | | | (1.57 | ) | | | (1.57 | ) | | | - | | | | (0.00 | )d | | | (0.00 | )d | | | 8.43 | | | | (15.67% | )b | | | 16,776 | | | | 1.13% | a | | | 0.80% | a | | | (0.07% | )a |
Service Class I | | | | | | | | | | | | | | | | | | | | | | | | | | | | | | | | | | | | | | | | | | | | | |
| 12/31/17 | | $ | 9.69 | | | $ | (0.01 | ) | | $ | 1.81 | | | $ | 1.80 | | | $ | - | | | $ | - | | | $ | - | | | $ | 11.49 | | | | 18.58% | | | $ | 601 | | | | 1.19% | | | | 1.05% | | | | (0.13% | ) |
12/31/16 | | | 8.42 | | | | 0.02 | | | | 1.29 | | | | 1.31 | | | | (0.03 | ) | | | (0.01 | ) | | | (0.04 | ) | | | 9.69 | | | | 15.54% | | | | 359 | | | | 1.18% | | | | 1.05% | | | | 0.18% | |
| 12/31/15g | | | 10.00 | | | | (0.02 | ) | | | (1.56 | ) | | | (1.58 | ) | | | - | | | | - | | | | - | | | | 8.42 | | | | (15.80% | )b | | | 183 | | | | 1.38% | a | | | 1.05% | a | | | (0.30% | )a |
| | | | | | | | | | | | |
| | | Year ended December 31 | | | Period ended
December 31, 2015b | |
| | | 2017 | | | 2016 | | |
Portfolio turnover rate | | | 48 | % | | | 74 | % | | | 87 | % |
| b | Percentage represents the results for the period and is not annualized. |
| c | Per share amount calculated on the average shares method. |
| d | Amount is less than $0.005 per share. |
| g | For the period May 15, 2015 (commencement of operations) through December 31, 2015. |
| j | Computed after giving effect to an agreement by MML Advisers to waive certain fees and expenses of the Fund. |
| m | Total return does not reflect expenses that apply at the separate account level or to related insurance products. Inclusion of these charges would reduce the total return figures for all periods shown. |
The accompanying notes are an integral part of the financial statements.
118
MML Series Investment Fund II – Financial Statements (Continued)
Financial Highlights (For a share outstanding throughout each period)
MML Strategic Emerging Markets Fund
| | | | | | | | | | | | | | | | | | | | | | | | | | | | | | | | | | | | | | | | | | | | | | | | |
| | | | | | Income (loss) from investment
operations | | | Less distributions to
shareholders | | | | | | | | | Ratios / Supplemental Data | |
| | | Net
asset
value,
beginning
of the
period | | | Net
investment
income
(loss)c,j | | | Net
realized
and
unrealized
gain (loss)
on
investments | | | Total
income
(loss) from
investment
operations | | | From net
investment
income | | | Total
distributions | | | Net
asset
value,
end of
the
period | | | Total
returnm | | | Net
assets,
end of
the
period
(000’s) | | | Ratio of
expenses
to average
daily net
assets
before
expense
waivers | | | Ratio of
expenses
to average
daily net
assets
after
expense
waiversj | | | Net
investment
income
(loss) to
average
daily net
assets | |
Class II | | | | | | | | | | | | | | | | | | | | | | | | | | | | | | | | | | | | | | | | | |
| 12/31/17 | | $ | 8.64 | | | $ | 0.02 | | | $ | 2.92 | | | $ | 2.94 | | | $ | (0.01 | ) | | $ | (0.01 | ) | | $ | 11.57 | | | | 34.02% | | | $ | 95,374 | | | | 1.50% | | | | 1.37% | | | | 0.23% | |
12/31/16 | | | 8.15 | | | | 0.02 | | | | 0.51 | | | | 0.53 | | | | (0.04 | ) | | | (0.04 | ) | | | 8.64 | | | | 6.49% | | | | 86,289 | | | | 1.50% | | | | 1.40% | | | | 0.29% | |
| 12/31/15 | | | 9.63 | | | | 0.03 | | | | (1.41 | ) | | | (1.38 | ) | | | (0.10 | ) | | | (0.10 | ) | | | 8.15 | | | | (14.23% | ) | | | 84,356 | | | | 1.60% | | | | 1.40% | | | | 0.34% | |
| 12/31/14 | | | 10.21 | | | | 0.04 | | | | (0.59 | ) | | | (0.55 | ) | | | (0.03 | ) | | | (0.03 | ) | | | 9.63 | | | | (5.41% | ) | | | 85,833 | | | | 1.70% | | | | 1.40% | | | | 0.42% | |
| 12/31/13 | | | 10.91 | | | | 0.08 | | | | (0.78 | ) | | | (0.70 | ) | | | - | | | | - | | | | 10.21 | | | | (6.42% | ) | | | 91,651 | | | | 1.56% | | | | 1.40% | | | | 0.82% | |
Service Class I | | | | | | | | | | | | | | | | | | | | | | | | | | | | | | | | | | | | | | | | | |
| 12/31/17 | | $ | 8.66 | | | $ | (0.00 | )d | | $ | 2.93 | | | $ | 2.93 | | | $ | - | | | $ | - | | | $ | 11.59 | | | | 33.83% | | | $ | 14,758 | | | | 1.75% | | | | 1.62% | | | | (0.04% | ) |
12/31/16 | | | 8.17 | | | | 0.00 | d | | | 0.51 | | | | 0.51 | | | | (0.02 | ) | | | (0.02 | ) | | | 8.66 | | | | 6.24% | | | | 9,913 | | | | 1.75% | | | | 1.65% | | | | 0.03% | |
| 12/31/15 | | | 9.65 | | | | 0.01 | | | | (1.41 | ) | | | (1.40 | ) | | | (0.08 | ) | | | (0.08 | ) | | | 8.17 | | | | (14.46% | ) | | | 8,409 | | | | 1.85% | | | | 1.65% | | | | 0.09% | |
| 12/31/14 | | | 10.23 | | | | 0.01 | | | | (0.59 | ) | | | (0.58 | ) | | | (0.00 | )d | | | (0.00 | )d | | | 9.65 | | | | (5.63% | ) | | | 9,120 | | | | 1.95% | | | | 1.65% | | | | 0.14% | |
| 12/31/13 | | | 10.97 | | | | 0.08 | | | | (0.82 | ) | | | (0.74 | ) | | | - | | | | - | | | | 10.23 | | | | (6.75% | ) | | | 9,122 | | | | 1.81% | | | | 1.65% | | | | 0.76% | |
| | | | | | | | | | | | | | | | | | | | |
| | | Year ended December 31 | |
| | | 2017 | | | 2016 | | | 2015 | | | 2014 | | | 2013 | |
Portfolio turnover rate | | | 36 | % | | | 32 | % | | | 39 | % | | | 44 | % | | | 145 | % |
| c | Per share amount calculated on the average shares method. |
| d | Amount is less than $0.005 per share. |
| j | Computed after giving effect to an agreement by MML Advisers and/or MassMutual to waive certain fees and expenses of the Fund. |
| m | Total return does not reflect expenses that apply at the separate account level or to related insurance products. Inclusion of these charges would reduce the total return figures for all periods shown. |
The accompanying notes are an integral part of the financial statements.
119
Notes to Financial Statements
MML Series Investment Fund II (the “Trust”) is registered under the Investment Company Act of 1940, as amended (the “1940 Act”), as a no-load, open-end, management investment company. The Trust is organized under the laws of the Commonwealth of Massachusetts as a Massachusetts business trust pursuant to an Agreement and Declaration of Trust dated February 8, 2005, which was amended and restated as of February 28, 2005 and December 15, 2011, as it may be further amended from time to time. The following are nine series of the Trust (each individually referred to as a “Fund” or collectively as the “Funds”):
MML Asset Momentum Fund (“Asset Momentum Fund”)
MML Dynamic Bond Fund (“Dynamic Bond Fund”)
MML Equity Rotation Fund (“Equity Rotation Fund”)
MML High Yield Fund (“High Yield Fund”)
MML Inflation-Protected and Income Fund (“Inflation-Protected and Income Fund”)
MML Short-Duration Bond Fund (“Short-Duration Bond Fund”)
MML Small Cap Equity Fund (“Small Cap Equity Fund”)
MML Special Situations Fund (“Special Situations Fund”)
MML Strategic Emerging Markets Fund (“Strategic Emerging Markets Fund”)
The Trust makes shares of the Funds available for the investment of assets of various separate investment accounts established by Massachusetts Mutual Life Insurance Company (“MassMutual”) and by life insurance companies which are subsidiaries of MassMutual. Shares of the Trust are not offered to the general public. MassMutual, MML Bay State Life Insurance Company, C.M. Life Insurance Company, and the MML Allocation Funds, which are “funds of funds” series of MML Series Investment Fund, another open-end management investment company sponsored by MassMutual, are the record owners of all of the outstanding shares of the Funds.
Each share class of a Fund represents an interest in the same portfolio of assets. The principal difference among the classes is the level of service and administration fees, and shareholder and distribution service expenses borne by the classes. Because each class will have different fees and expenses, performance and share prices will vary between the classes. The classes of shares are offered to different types of investors, as outlined in the Funds’ Prospectus.
| 2. | | Significant Accounting Policies |
The following is a summary of significant accounting policies followed consistently by each Fund in the preparation of the financial statements in conformity with accounting principles generally accepted in the United States of America (“generally accepted accounting principles”). The preparation of the financial statements in accordance with generally accepted accounting principles requires management to make estimates and assumptions that affect the reported amounts and disclosures in the financial statements. Actual results could differ from those estimates.
Investment Valuation
The net asset value of each Fund’s shares is determined once daily as of the close of regular trading on the New York Stock Exchange (“NYSE”), on each day the NYSE is open for trading (a “business day”). The NYSE normally closes at 4:00 p.m. Eastern Time, but may close earlier on some days. If the NYSE is scheduled to close early, the business day will be considered to end as of the time of the NYSE’s scheduled close. A Fund will not treat an intraday disruption in NYSE trading or other event that causes an unscheduled closing of the NYSE as a close of business of the NYSE for these purposes and will instead fair value securities in accordance with procedures approved annually by the Trustees, and under the general oversight of the Trustees. On holidays and other days when the NYSE is closed, each Fund’s net asset value generally is not calculated and the Funds do not anticipate accepting buy or sell orders. However, the value of each Fund’s assets may still be affected on such days to the extent that a Fund holds foreign securities that trade on days that foreign securities markets are open.
Equity securities and derivative contracts that are actively traded on a national securities exchange or contract market are valued on the basis of information furnished by a pricing service, which provides the last reported sale price, or, in the case of futures contracts, the settlement price, for securities or derivatives listed on the exchange or contract market or the official closing price on
120
Notes to Financial Statements (Continued)
the NASDAQ National Market System (“NASDAQ System”), or in the case of over-the-counter (“OTC”) securities for which an official closing price is unavailable or not reported on the NASDAQ System, the last reported bid price. Portfolio securities traded on more than one national securities exchange are valued at the last price at the close of the exchange representing the principal market for such securities. Debt securities are valued on the basis of valuations furnished by a pricing service, which generally determines valuations taking into account factors such as institutional-size trading in similar securities, yield, quality, coupon rate, maturity, type of issue, trading characteristics, and other market data. Shares of other open-end mutual funds are valued at their closing net asset values as reported on each business day.
Investments for which market quotations are readily available are marked to market daily based on those quotations. Market quotations may be provided by third-party vendors or market makers, and may be determined on the basis of a variety of factors, such as broker quotations, financial modeling, and other market data, such as market indexes and yield curves, counterparty information, and foreign exchange rates. U.S. Government and agency securities may be valued on the basis of market quotations or using a model that may incorporate market observable data such as reported sales of similar securities, broker quotes, yields, bids, offers, quoted market prices, and reference data. The fair values of OTC derivative contracts, including forward, swap, and option contracts related to interest rates, foreign currencies, credit standing of reference entities, equity prices, or commodity prices, may be based on market quotations or may be modeled using a series of techniques, including simulation models, depending on the contract and the terms of the transaction. The fair values of asset-backed securities and mortgage-backed securities are estimated based on models that consider the estimated cash flows of each debt tranche of the issuer, established benchmark yield, and estimated tranche-specific spread to the benchmark yield based on the unique attributes of the tranche, including, but not limited to, prepayment speed assumptions and attributes of the collateral. Restricted securities are generally valued at a discount to similar publicly traded securities.
Investments for which market quotations are not available or for which a pricing service or vendor does not provide a value, or for which such market quotations or values are considered by the investment adviser or subadviser to be unreliable (including, for example, certain foreign securities, thinly-traded securities, certain restricted securities, certain initial public offerings, or securities whose values may have been affected by a significant event) are stated at fair valuations determined in good faith by the Funds’ Valuation Committee1 in accordance with procedures approved annually by the Board of Trustees (“Trustees”), and under the general oversight of the Trustees. The Funds’ Valuation Committee employs various methods to determine fair valuations including a regular review of significant inputs and assumptions and review of any related market activity. The Funds’ Valuation Committee reports to the Trustees at its regularly scheduled meetings. It is possible that fair value prices will be used by the Funds to a significant extent. The value determined for an investment using the Funds’ fair value procedures may differ from recent market prices for the investment and may be significantly different from the value realized upon the sale of such investment.
The Funds may invest in securities that are traded principally in foreign markets and that trade on weekends and other days when the Funds do not price their shares. As a result, the values of the Funds’ portfolio securities may change on days when the prices of the Funds’ shares are not calculated. The prices of the Funds’ shares will reflect any such changes when the prices of the Funds’ shares are next calculated, which is the next business day. The Funds may use fair value pricing more frequently for securities primarily traded in foreign markets because, among other things, most foreign markets close well before the Funds value their securities. The earlier close of these foreign markets gives rise to the possibility that significant events, including broad market moves, may have occurred in the interim. The Funds’ investments may be priced based on fair values provided by a third-party vendor, based on certain factors and methodologies applied by such vendor, in the event that there is movement in the U.S. market, between the close of the foreign market and the time the Funds calculate their net asset values. All assets and liabilities expressed in foreign currencies are converted into U.S. dollars at the mean between the buying and selling rates of such currencies against the U.S. dollar at the end of each business day.
| 1 | The Valuation Committee consists of the President, Treasurer, Assistant Treasurers, Vice Presidents (except for the CCO), Secretary, and Assistant Secretaries of the Trust, as well as such alternate members as the Trustees may from time to time designate. The Valuation Committee reviews and determines the fair valuation of portfolio securities and the Funds’ pricing procedures in general. |
121
Notes to Financial Statements (Continued)
For investments in equity or debt issued by privately held companies or funds (“Private Company” or collectively, the “Private Companies”) and any other investments fair valued using significant unobservable inputs, as described below, the fair valuation approaches used by third party service providers and/or the Funds’ subadvisers utilize one or a combination of, but not limited to, the following inputs.
Market approach: (i) recent market transactions, including subsequent rounds of financing, in the underlying investment or comparable issuers; (ii) recapitalizations and other transactions across the capital structure; and (iii) market multiples of comparable issuers.
Income approach: (i) future cash flows discounted to present value and adjusted as appropriate for liquidity, credit, and/or market risks; (ii) quoted prices for similar investments or assets in active markets; and (iii) other risk factors, such as interest rates, yield curves, volatilities, prepayment speeds, loss severities, credit risks, recovery rates, liquidation amounts, and/or default rates.
Cost approach: (i) audited or unaudited financial statements, investor communications, and financial or operational metrics issued by the Private Company; (ii) changes in the valuation of relevant indices or publicly traded companies comparable to the Private Company; (iii) relevant news and other public sources; and (iv) known secondary market transactions in the Private Company’s interests and merger or acquisition activity in companies comparable to the Private Company.
Investments in series of preferred stock issued by Private Companies are typically valued utilizing Market approach in determining the enterprise value of the company. Such investments often contain rights and preferences that differ from other series of preferred and common stock of the same issuer. Valuation techniques such as the current value method (“CVM”), an option pricing model (“OPM”), a probability weighted expected return model (“PWERM”), or a hybrid of those techniques are used in allocating enterprise value of the company, as deemed appropriate under the circumstances. The CVM allocates value among the various parts of a company’s capital structure assuming that the value of convertible preferred stock is represented by the most favorable claim the preferred stockholders have on the enterprise value as of the valuation date. The use of OPM and PWERM techniques involve a determination of the exit scenarios of the investment in order to appropriately allocate the enterprise value of the company among the various parts of its capital structure.
The Private Companies are not subject to the public company disclosure, timing, and reporting standards as other investments held by a Fund. Typically, the most recently available information for a Private Company is as of a date that is earlier than the date a Fund is calculating its net asset value. This factor may result in a difference between the value of the investment and the price a Fund could receive upon the sale of the investment.
Fair value is defined as the price that would be received to sell an asset or paid to transfer a liability in an orderly transaction between market participants at the measurement date. A three-tier hierarchy is utilized to maximize the use of observable market data inputs and minimize the use of unobservable inputs and to establish classification of fair value measurements for disclosure purposes. Inputs refer broadly to the assumptions that market participants would use in pricing the asset or liability, including assumptions about risk, for example, the risk inherent in a particular valuation technique used to measure fair value (such as a pricing model) and/or the risk inherent in the inputs to the valuation technique. Inputs may be observable or unobservable. Observable inputs are inputs that reflect the assumptions market participants would use in pricing the asset or liability and are developed based on market data obtained from sources independent of the reporting entity. Unobservable inputs are inputs that reflect the reporting entity’s own assumptions about the assumptions market participants would use in pricing the asset or liability and are developed based on the best information available in the circumstances. The three-tier hierarchy of inputs is summarized in the three broad Levels listed below. The inputs or methodology used for valuing investments are not necessarily an indication of the risk associated with investing in those investments and the determination of the significance of a particular input to the fair value measurement in its entirety requires judgment and consideration of factors specific to each security.
Level 1 – quoted prices (unadjusted) in active markets for identical investments that the Funds can access at the measurement date
The types of assets and liabilities categorized in Level 1 generally include actively traded domestic and certain foreign equity securities, derivatives actively traded on a national securities exchange (such as some warrants, rights, futures, and options), and shares of open-end mutual funds.
Level 2 – other significant observable inputs (including quoted prices for similar investments, interest rates, prepayment speeds, credit risk, etc.)
122
Notes to Financial Statements (Continued)
The types of assets and liabilities categorized in Level 2 generally include debt securities such as U.S. Government and agency securities, mortgage-backed securities, asset-backed securities, municipal obligations, sovereign debt obligations, bank loans, corporate bonds, and those securities valued at amortized cost; OTC derivatives such as swaps, options, swaptions, and forward foreign currency exchange contracts; certain restricted securities; and non-exchange traded equity securities and certain foreign equity securities traded on particular foreign exchanges that close before the Funds determine their net asset values.
Level 3 – significant unobservable inputs (including the Funds’ own assumptions in determining the fair value of investments)
The types of assets and liabilities categorized in Level 3 generally include securities for which prices, spreads, or any of the other aforementioned significant inputs are unobservable. Generally, securities whose trading has been suspended or that have been de-listed from their current primary trading exchange; securities in default or bankruptcy proceedings for which there is no current market quotation; securities and certain derivatives valued by broker quotes which may include brokers’ assumptions; and any illiquid Rule 144A securities or restricted securities issued by non-public entities are categorized in Level 3.
The availability of observable inputs can vary from security to security and is affected by a wide variety of factors, including, for example, the type of security, whether the security is new and not yet established in the marketplace, the liquidity of markets, and other characteristics particular to the security. To the extent that valuation is based on models or inputs that are less observable or unobservable in the market, the determination of fair value requires more judgment. Accordingly, the degree of judgment exercised in determining fair value is greatest for instruments categorized in Level 3.
Changes in valuation techniques may result in transfers in or out of an investment’s assigned Level within the hierarchy. In addition, in periods of market dislocation, the observability of prices and inputs may be reduced for many instruments. This condition, as well as changes related to liquidity of investments, could cause a security to be reclassified between Level 1, Level 2, or Level 3.
In certain cases, the inputs used to measure fair value may fall into different levels of the fair value hierarchy. In such cases, for disclosure purposes the level in the fair value hierarchy within which the fair value measurement falls is determined based on the lowest level input that is significant to the overall fair value measurement.
The Equity Rotation Fund and Special Situations Fund characterized all long-term investments at Level 1, and all short-term investments at Level 2, as of December 31, 2017. For each Fund noted in the preceding sentence, the level classification by major category of investments is the same as the category presentation in the Portfolio of Investments.
The following is the aggregate value by input level, as of December 31, 2017, for the remaining Funds’ investments:
| | | | | | | | | | | | | | | | |
| | | Level 1 | | | Level 2 | | | Level 3 | | | Total | |
Asset Momentum Fund | | | | | | | | | | | | | | | | |
Asset Investments | | | | | | | | | | | | | | | | |
Common Stock | | $ | 7,401,438 | | | $ | 2,985,796 | * | | $ | - | | | $ | 10,387,234 | |
U.S. Treasury Obligations | | | - | | | | 3,990,332 | | | | - | | | | 3,990,332 | |
Mutual Funds | | | 11,095,888 | | | | - | | | | - | | | | 11,095,888 | |
Short-Term Investments | | | - | | | | 3,747,691 | | | | - | | | | 3,747,691 | |
| | | | | | | | | | | | | | | | |
| Total Investments | | $ | 18,497,326 | | | $ | 10,723,819 | | | $ | - | | | $ | 29,221,145 | |
| | | | | | | | | | | | | | | | |
Asset Derivatives | | | | | | | | | | | | | | | | |
Forward Contracts | | $ | - | | | $ | 139,238 | | | $ | - | | | $ | 139,238 | |
Futures Contracts | | | 339,060 | | | | - | | | | - | | | | 339,060 | |
| | | | | | | | | | | | | | | | |
| Total | | $ | 339,060 | | | $ | 139,238 | | | $ | - | | | $ | 478,298 | |
| | | | | | | | | | | | | | | | |
Liability Derivatives | | | | | | | | | | | | | | | | |
Forward Contracts | | $ | - | | | $ | (19,993 | ) | | $ | - | | | $ | (19,993 | ) |
| | | | | | | | | | | | | | | | |
123
Notes to Financial Statements (Continued)
| | | | | | | | | | | | | | | | |
| | | Level 1 | | | Level 2 | | | Level 3 | | | Total | |
Dynamic Bond Fund | | | | | | | | | | | | | | | | |
Asset Investments | | | | | | | | | | | | | | | | |
Common Stock | | $ | 13,654 | | | $ | - | | | $ | - | | | $ | 13,654 | |
Corporate Debt | | | - | | | | 112,653,931 | | | | - | | | | 112,653,931 | |
Municipal Obligations | | | - | | | | 260,144 | | | | - | | | | 260,144 | |
Non-U.S. Government Agency Obligations | | | - | | | | 126,912,108 | | | | - | | | | 126,912,108 | |
Sovereign Debt Obligations | | | - | | | | 10,414,631 | | | | - | | | | 10,414,631 | |
U.S. Government Agency Obligations and Instrumentalities | | | - | | | | 60,441,154 | | | | - | | | | 60,441,154 | |
U.S. Treasury Obligations | | | - | | | | 109,047,707 | | | | - | | | | 109,047,707 | |
Mutual Funds | | | 11,926,498 | | | | - | | | | - | | | | 11,926,498 | |
Short-Term Investments | | | - | | | | 19,342,958 | | | | - | | | | 19,342,958 | |
| | | | | | | | | | | | | | | | |
| Total Investments | | $ | 11,940,152 | | | $ | 439,072,633 | | | $ | - | | | $ | 451,012,785 | |
| | | | | | | | | | | | | | | | |
| | | | |
High Yield Fund | | | | | | | | | | | | | | | | |
Asset Investments | | | | | | | | | | | | | | | | |
Preferred Stock | | $ | - | | | $ | 1,041,527 | | | $ | - | | | $ | 1,041,527 | |
Bank Loans (Less Unfunded Loan Commitments) | | | - | | | | 6,678,354 | | | | - | | | | 6,678,354 | |
Corporate Debt | | | - | | | | 120,874,360 | | | | - | | | | 120,874,360 | |
Short-Term Investments | | | - | | | | 5,293,482 | | | | - | | | | 5,293,482 | |
Unfunded Loan Commitments*** | | | - | | | | - | | | | (3,750 | )** | | | (3,750 | ) |
| | | | | | | | | | | | | | | | |
| Total Investments | | $ | - | | | $ | 133,887,723 | | | $ | (3,750 | ) | | $ | 133,883,973 | |
| | | | | | | | | | | | | | | | |
| | | | |
Inflation-Protected and Income Fund | | | | | | | | | | | | | | | | |
Asset Investments | | | | | | | | | | | | | | | | |
Corporate Debt | | $ | - | | | $ | 9,177,602 | | | $ | - | | | $ | 9,177,602 | |
Municipal Obligations | | | - | | | | 155,662 | | | | - | | | | 155,662 | |
Non-U.S. Government Agency Obligations | | | - | | | | 164,456,191 | | | | 1,290,960 | ** | | | 165,747,151 | |
U.S. Government Agency Obligations and Instrumentalities | | | - | | | | 6,335,330 | | | | - | | | | 6,335,330 | |
U.S. Treasury Obligations | | | - | | | | 384,965,796 | | | | - | | | | 384,965,796 | |
Purchased Options | | | - | | | | 1,627,707 | | | | - | | | | 1,627,707 | |
Short-Term Investments | | | - | | | | 197,584,264 | | | | - | | | | 197,584,264 | |
| | | | | | | | | | | | | | | | |
| Total Investments | | $ | - | | | $ | 764,302,552 | | | $ | 1,290,960 | | | $ | 765,593,512 | |
| | | | | | | | | | | | | | | | |
Asset Derivatives | | | | | | | | | | | | | | | | |
Futures Contracts | | $ | 13,290 | | | $ | - | | | $ | - | | | $ | 13,290 | |
Swap Agreements | | | - | | | | 317,357 | | | | - | | | | 317,357 | |
| | | | | | | | | | | | | | | | |
| Total | | $ | 13,290 | | | $ | 317,357 | | | $ | - | | | $ | 330,647 | |
| | | | | | | | | | | | | | | | |
Liability Derivatives | | | | | | | | | | | | | | | | |
Futures Contracts | | $ | (8,622 | ) | | $ | - | | | $ | - | | | $ | (8,622 | ) |
Swap Agreements | | | - | | | | (553,984 | ) | | | - | | | | (553,984 | ) |
| | | | | | | | | | | | | | | | |
| Total | | $ | (8,622 | ) | | $ | (553,984 | ) | | $ | - | | | $ | (562,606 | ) |
| | | | | | | | | | | | | | | | |
| | | | |
Short-Duration Bond Fund | | | | | | | | | | | | | | | | |
Asset Investments | | | | | | | | | | | | | | | | |
Corporate Debt | | $ | - | | | $ | 106,297,249 | | | $ | - | | | $ | 106,297,249 | |
Municipal Obligations | | | - | | | | 65,724 | | | | - | | | | 65,724 | |
Non-U.S. Government Agency Obligations | | | - | | | | 78,956,039 | | | | 1,661,032 | ** | | | 80,617,071 | |
U.S. Government Agency Obligations and Instrumentalities | | | - | | | | 2,384,895 | | | | - | | | | 2,384,895 | |
U.S. Treasury Obligations | | | - | | | | 5,888,352 | | | | - | | | | 5,888,352 | |
124
Notes to Financial Statements (Continued)
| | | | | | | | | | | | | | | | |
| | | Level 1 | | | Level 2 | | | Level 3 | | | Total | |
Short-Duration Bond Fund (Continued) | | | | | | | | | | | | | | | | |
Asset Investments (Continued) | | | | | | | | | | | | | | | | |
Purchased Options | | $ | - | | | $ | 918,326 | | | $ | - | | | $ | 918,326 | |
Short-Term Investments | | | - | | | | 48,551,792 | | | | - | | | | 48,551,792 | |
| | | | | | | | | | | | | | | | |
| Total Investments | | $ | - | | | $ | 243,062,377 | | | $ | 1,661,032 | | | $ | 244,723,409 | |
| | | | | | | | | | | | | | | | |
Asset Derivatives | | | | | | | | | | | | | | | | |
Futures Contracts | | $ | 353,886 | | | $ | - | | | $ | - | | | $ | 353,886 | |
| | | | | | | | | | | | | | | | |
Liability Derivatives | | | | | | | | | | | | | | | | |
Futures Contracts | | $ | (143,016 | ) | | $ | - | | | $ | - | | | $ | (143,016 | ) |
Swap Agreements | | | - | | | | (141,929 | ) | | | - | | | | (141,929 | ) |
| | | | | | | | | | | | | | | | |
| Total | | $ | (143,016 | ) | | $ | (141,929 | ) | | $ | - | | | $ | (284,945 | ) |
| | | | | | | | | | | | | | | | |
| | | | |
Small Cap Equity Fund | | | | | | | | | | | | | | | | |
Asset Investments | | | | | | | | | | | | | | | | |
Common Stock | | $ | 116,628,886 | | | $ | 453,108 | * | | $ | - | | | $ | 117,081,994 | |
Mutual Funds | | | 9,444,321 | | | | - | | | | - | | | | 9,444,321 | |
Short-Term Investments | | | - | | | | 2,783,591 | | | | - | | | | 2,783,591 | |
| | | | | | | | | | | | | | | | |
| Total Investments | | $ | 126,073,207 | | | $ | 3,236,699 | | | $ | - | | | $ | 129,309,906 | |
| | | | | | | | | | | | | | | | |
| | | | |
Strategic Emerging Markets Fund | | | | | | | | | | | | | | | | |
Asset Investments | | | | | | | | | | | | | | | | |
Common Stock* | | | | | | | | | | | | | | | | |
Bermuda | | $ | 956,252 | | | $ | 1,490,771 | | | $ | - | | | $ | 2,447,023 | |
Brazil | | | 602,300 | | | | 3,900,981 | | | | - | | | | 4,503,281 | |
Cayman Islands | | | 11,799,953 | | | | 7,043,341 | | | | - | | | | 18,843,294 | |
Chile | | | 278,944 | | | | - | | | | - | | | | 278,944 | |
China | | | - | | | | 6,184,327 | | | | - | | | | 6,184,327 | |
Colombia | | | 659,600 | | | | 515,755 | | | | - | | | | 1,175,355 | |
Egypt | | | - | | | | 459,103 | | | | - | | | | 459,103 | |
France | | | - | | | | 4,547,883 | | | | - | | | | 4,547,883 | |
Hong Kong | | | - | | | | 5,181,147 | | | | - | | | | 5,181,147 | |
India | | | - | | | | 12,695,227 | | | | - | | | | 12,695,227 | |
Indonesia | | | - | | | | 2,740,932 | | | | - | | | | 2,740,932 | |
Italy | | | - | | | | 1,256,364 | | | | - | | | | 1,256,364 | |
Malaysia | | | - | | | | 1,316,438 | | | | - | | | | 1,316,438 | |
Mexico | | | 5,180,604 | | | | - | | | | - | | | | 5,180,604 | |
Netherlands | | | 394,310 | | | | 124,562 | | | | - | | | | 518,872 | |
Nigeria | | | - | | | | 317,502 | | | | - | | | | 317,502 | |
Philippines | | | - | | | | 4,328,679 | | | | - | | | | 4,328,679 | |
Portugal | | | - | | | | 211,855 | | | | - | | | | 211,855 | |
Republic of Korea | | | - | | | | 7,194,802 | | | | - | | | | 7,194,802 | |
Russia | | | - | | | | 7,030,194 | | | | - | | | | 7,030,194 | |
South Africa | | | - | | | | 2,831,935 | | | | - | | | | 2,831,935 | |
Spain | | | - | | | | 320,634 | | | | - | | | | 320,634 | |
Taiwan | | | - | | | | 6,431,562 | | | | - | | | | 6,431,562 | |
Turkey | | | - | | | | 1,190,856 | | | | - | | | | 1,190,856 | |
United Arab Emirates | | | - | | | | 2,025,734 | | | | - | | | | 2,025,734 | |
United Kingdom | | | - | | | | 5,762,956 | | | | - | | | | 5,762,956 | |
United States | | | 62,932 | | | | - | | | | - | | | | 62,932 | |
125
Notes to Financial Statements (Continued)
| | | | | | | | | | | | | | | | |
| | | Level 1 | | | Level 2 | | | Level 3 | | | Total | |
Strategic Emerging Markets Fund (Continued) | | | | | | | | | | | | | | | | |
Asset Investments (Continued) | | | | | | | | | | | | | | | | |
Preferred Stock | | | | | | | | | | | | | | | | |
Brazil | | $ | - | | | $ | 1,373,949 | * | | $ | - | | | $ | 1,373,949 | |
India | | | 78,938 | | | | - | | | | - | | | | 78,938 | |
Mutual Funds | | | 2,356,190 | | | | - | | | | - | | | | 2,356,190 | |
Rights | | | - | | | | 529,222 | | | | - | | | | 529,222 | |
Short-Term Investments | | | - | | | | 2,266,896 | | | | - | | | | 2,266,896 | |
| | | | | | | | | | | | | | | | |
| Total Investments | | $ | 22,370,023 | | | $ | 89,273,607 | | | $ | - | | | $ | 111,643,630 | |
| | | | | | | | | | | | | | | | |
| * | Includes foreign equity securities whose values were adjusted to reflect market trading of comparable securities or other correlated instruments after the close of trading in their applicable foreign markets, as applicable. |
| ** | None of the unobservable inputs for Level 3 assets, individually or collectively, had a material impact on the Fund(s). Level 3 investments at the beginning and/or end of the period in relation to net assets were not significant and accordingly, a reconciliation of Level 3 assets for the year ended December 31, 2017 is not presented. |
| *** | Unfunded loan commitments are valued at the unrealized appreciation (depreciation) on the commitment. |
The following table shows Fund(s) with certain assets and liabilities, which approximate fair value and would be categorized at Level 2 as of December 31, 2017.
| | | | | | | | | | | | |
Statement of Assets and Liabilities location: | | Dynamic
Bond
Fund | | Inflation-
Protected
and Income
Fund | | Short-
Duration
Bond
Fund | | Small Cap
Equity
Fund | | Special
Situations
Fund | | Strategic
Emerging
Markets
Fund |
Receivables for: | | | | | | | | | | | | |
Investments sold on a when-issued basis | | | | | | X | | | | | | |
| | | | | | | |
Payables for: | | | | | | | | | | | | |
Investments purchased on a when-issued basis | | X | | X | | | | | | | | |
Collateral held for reverse repurchase agreements | | | | X | | | | | | | | |
Collateral held for open purchased options | | | | X | | X | | | | | | |
Reverse repurchase agreements | | | | X | | | | | | | | |
Securities on loan | | | | | | | | X | | | | X |
Due to custodian | | | | | | X | | | | X | | |
The Funds had no transfers between Levels of the fair value hierarchy during the year ended December 31, 2017. The Funds recognize transfers between the Levels as of the beginning of the year.
126
Notes to Financial Statements (Continued)
Derivative Instruments
Derivatives are financial instruments whose values are based on the values of one or more indicators, such as a security, asset, currency, interest rate, or index. Derivative transactions can create investment leverage and may be highly volatile. Gains or losses from derivatives can be substantially greater than their original cost and can sometimes be unlimited. A Fund may not be able to close out a derivative transaction at a favorable time or price. For those Funds that held derivatives during the year ended December 31, 2017, the following table shows how the Fund used these types of derivatives during the period (marked with an “A”), as well as additional uses, if any, it may have for them in the future (marked with an “M”).
| | | | | | |
Type of Derivative and Objective for Use | | Asset Momentum Fund | | Inflation-
Protected
and
Income
Fund | | Short- Duration
Bond
Fund |
Foreign Currency Exchange Transactions* | | | | | | |
Hedging/Risk Management | | M | | | | |
Directional Exposures to Currencies | | A | | | | |
Intention to Create Investment Leverage in Portfolio | | M | | | | |
| | | | |
Futures Contracts** | | | | | | |
Hedging/Risk Management | | A | | A | | A |
Duration/Credit Quality Management | | M | | A | | A |
Substitution for Direct Investment | | A | | A | | A |
Intention to Create Investment Leverage in Portfolio | | M | | M | | M |
| | | | |
Interest Rate Swaps*** | | | | | | |
Hedging/Risk Management | | | | A | | |
Duration Management | | | | A | | |
Asset/Liability Management | | | | M | | |
Substitution for Direct Investment | | | | M | | |
Intention to Create Investment Leverage in Portfolio | | | | M | | |
| | | | |
Credit Default Swaps (Protection Buyer) | | | | | | |
Hedging/Risk Management | | | | A | | A |
Duration/Credit Quality Management | | | | A | | A |
Income | | | | A | | A |
Substitution for Direct Investment | | | | A | | M |
Intention to Create Investment Leverage in Portfolio | | | | M | | M |
| | | | |
Credit Default Swaps (Protection Seller) | | | | | | |
Hedging/Risk Management | | | | A | | A |
Duration/Credit Quality Management | | | | A | | A |
Income | | | | A | | A |
Substitution for Direct Investment | | | | A | | A |
Intention to Create Investment Leverage in Portfolio | | | | M | | M |
127
Notes to Financial Statements (Continued)
| | | | | | |
Type of Derivative and Objective for Use | | Asset Momentum Fund | | Inflation-
Protected
and
Income
Fund | | Short- Duration
Bond
Fund |
Options (Purchased) | | | | | | |
Hedging/Risk Management | | | | A | | A |
Duration/Credit Quality Management | | | | A | | A |
Substitution for Direct Investment | | | | A | | A |
Directional Investment | | | | A | | A |
Intention to Create Investment Leverage in Portfolio | | | | M | | M |
| * | Includes any options purchased or written, futures contracts, forward contracts, and swap agreements, if applicable. |
| ** | Includes any options purchased or written on futures contracts, if applicable. |
| *** | Includes any caps, floors, and collars, and related purchased or written options, if applicable. |
At December 31, 2017, and during the year then ended, the Fund(s) had the following derivatives and transactions in derivatives, grouped into the indicated risk categories:
| | | | | | | | | | | | | | | | | | | | |
| | | Credit
Risk | | | Equity
Risk | | | Foreign
Exchange
Risk | | | Interest
Rate Risk | | | Total | |
| Asset Momentum Fund | |
| Asset Derivatives | |
Forward Contracts* | | $ | - | | | $ | - | | | $ | 139,238 | | | $ | - | | | $ | 139,238 | |
Futures Contracts^^ | | | - | | | | 339,060 | | | | - | | | | - | | | | 339,060 | |
| | | | | | | | | | | | | | | | | | | | |
Total Value | | $ | - | | | $ | 339,060 | | | $ | 139,238 | | | $ | - | | | $ | 478,298 | |
| | | | | | | | | | | | | | | | | | | | |
| Liability Derivatives | |
Forward Contracts^ | | $ | - | | | $ | - | | | $ | (19,993 | ) | | $ | - | | | $ | (19,993 | ) |
| | | | | | | | | | | | | | | | | | | | |
| Realized Gain (Loss)# | |
Forward Contracts | | $ | - | | | $ | - | | | $ | 231,919 | | | $ | - | | | $ | 231,919 | |
Futures Contracts | | | - | | | | 2,733,775 | | | | - | | | | - | | | | 2,733,775 | |
| | | | | | | | | | | | | | | | | | | | |
Total Realized Gain (Loss) | | $ | - | | | $ | 2,733,775 | | | $ | 231,919 | | | $ | - | | | $ | 2,965,694 | |
| | | | | | | | | | | | | | | | | | | | |
| Change in Appreciation (Depreciation)## | |
Forward Contracts | | $ | - | | | $ | - | | | $ | 41,345 | | | $ | - | | | $ | 41,345 | |
Futures Contracts | | | - | | | | 371,241 | | | | - | | | | - | | | | 371,241 | |
| | | | | | | | | | | | | | | | | | | | |
Total Change in Appreciation (Depreciation) | | $ | - | | | $ | 371,241 | | | $ | 41,345 | | | $ | - | | | $ | 412,586 | |
| | | | | | | | | | | | | | | | | | | | |
|
| Inflation-Protected and Income Fund | |
| Asset Derivatives | |
Purchased Options* | | $ | - | | | $ | - | | | $ | - | | | $ | 1,627,707 | | | $ | 1,627,707 | |
Futures Contracts^^ | | | - | | | | - | | | | - | | | | 13,290 | | | | 13,290 | |
Swap Agreements* | | | - | | | | - | | | | - | | | | 317,357 | | | | 317,357 | |
| | | | | | | | | | | | | | | | | | | | |
Total Value | | $ | - | | | $ | - | | | $ | - | | | $ | 1,958,354 | | | $ | 1,958,354 | |
| | | | | | | | | | | | | | | | | | | | |
| Liability Derivatives | |
Futures Contracts^^ | | $ | - | | | $ | - | | | $ | - | | | $ | (8,622 | ) | | $ | (8,622 | ) |
Swap Agreements^ | | | (513,580 | ) | | | - | | | | - | | | | (40,404 | ) | | | (553,984 | ) |
| | | | | | | | | | | | | | | | | | | | |
Total Value | | $ | (513,580 | ) | | $ | - | | | $ | - | | | $ | (49,026 | ) | | $ | (562,606 | ) |
| | | | | | | | | | | | | | | | | | | | |
128
Notes to Financial Statements (Continued)
| | | | | | | | | | | | | | | | | | | | |
| | | Credit
Risk | | | Equity
Risk | | | Foreign
Exchange
Risk | | | Interest
Rate Risk | | | Total | |
| Inflation-Protected and Income Fund (Continued) | |
| Realized Gain (Loss)# | |
Purchased Options | | $ | - | | | $ | - | | | $ | - | | | $ | (141,314 | ) | | $ | (141,314 | ) |
Futures Contracts | | | - | | | | - | | | | - | | | | (96,476 | ) | | | (96,476 | ) |
Swap Agreements | | | 93,881 | | | | - | | | | - | | | | 102,404 | | | | 196,285 | |
| | | | | | | | | | | | | | | | | | | | |
Total Realized Gain (Loss) | | $ | 93,881 | | | $ | - | | | $ | - | | | $ | (135,386 | ) | | $ | (41,505 | ) |
| | | | | | | | | | | | | | | | | | | | |
| Change in Appreciation (Depreciation)## | |
Purchased Options | | $ | - | | | $ | - | | | $ | - | | | $ | (78,047 | ) | | $ | (78,047 | ) |
Futures Contracts | | | - | | | | - | | | | - | | | | (14,128 | ) | | | (14,128 | ) |
Swap Agreements | | | (313,299 | ) | | | - | | | | - | | | | (197,398 | ) | | | (510,697 | ) |
| | | | | | | | | | | | | | | | | | | | |
Total Change in Appreciation (Depreciation) | | $ | (313,299 | ) | | $ | - | | | $ | - | | | $ | (289,573 | ) | | $ | (602,872 | ) |
| | | | | | | | | | | | | | | | | | | | |
|
| Short-Duration Bond Fund | |
| Asset Derivatives | |
Purchased Options* | | $ | - | | | $ | - | | | $ | - | | | $ | 918,326 | | | $ | 918,326 | |
Futures Contracts^^ | | | - | | | | - | | | | - | | | | 353,886 | | | | 353,886 | |
| | | | | | | | | | | | | | | | | | | | |
Total Value | | $ | - | | | $ | - | | | $ | - | | | $ | 1,272,212 | | | $ | 1,272,212 | |
| | | | | | | | | | | | | | | | | | | | |
| Liability Derivatives | |
Futures Contracts^^ | | $ | - | | | $ | - | | | $ | - | | | $ | (143,016 | ) | | $ | (143,016 | ) |
Swap Agreements^ | | | (141,929 | ) | | | - | | | | - | | | | - | | | | (141,929 | ) |
| | | | | | | | | | | | | | | | | | | | |
Total Value | | $ | (141,929 | ) | | $ | - | | | $ | - | | | $ | (143,016 | ) | | $ | (284,945 | ) |
| | | | | | | | | | | | | | | | | | | | |
| Realized Gain (Loss)# | |
Purchased Options | | $ | - | | | $ | - | | | $ | - | | | $ | (78,884 | ) | | $ | (78,884 | ) |
Futures Contracts | | | - | | | | - | | | | - | | | | 509,535 | | | | 509,535 | |
Swap Agreements | | | (8,495 | ) | | | - | | | | - | | | | - | | | | (8,495 | ) |
| | | | | | | | | | | | | | | | | | | | |
Total Realized Gain (Loss) | | $ | (8,495 | ) | | $ | - | | | $ | - | | | $ | 430,651 | | | $ | 422,156 | |
| | | | | | | | | | | | | | | | | | | | |
| Change in Appreciation (Depreciation)## | |
Purchased Options | | $ | - | | | $ | - | | | $ | - | | | $ | (44,035 | ) | | $ | (44,035 | ) |
Futures Contracts | | | - | | | | - | | | | - | | | | 174,412 | | | | 174,412 | |
Swap Agreements | | | (84,744 | ) | | | - | | | | - | | | | - | | | | (84,744 | ) |
| | | | | | | | | | | | | | | | | | | | |
Total Change in Appreciation (Depreciation) | | $ | (84,744 | ) | | $ | - | | | $ | - | | | $ | 130,377 | | | $ | 45,633 | |
| | | | | | | | | | | | | | | | | | | | |
| * | Statements of Assets and Liabilities location: Investments, at value, Receivables from: open forward contracts or open swap agreements, at value, as applicable. |
| ^ | Statements of Assets and Liabilities location: Payables for: open forward contracts, or open swap agreements, at value, as applicable. |
| ^^ | Cumulative appreciation (depreciation) on futures contracts is reported in each Fund’s Portfolio of Investments. Only current day’s variation margin, if any, is reported within the Statements of Assets and Liabilities. |
| # | Statements of Operations location: Amounts are included in net realized gain (loss) on: investment transactions, forward contracts, futures contracts, or swap agreements, as applicable. |
| ## | Statements of Operations location: Amounts are included in net change in unrealized appreciation (depreciation) on: investment transactions, forward contracts, futures contracts, or swap agreements, as applicable. |
129
Notes to Financial Statements (Continued)
For the year ended December 31, 2017, the number of contracts, notional amounts, or shares/units for each derivative type was as follows:
| | | | | | | | | | | | | | | | |
| | | Number of Contracts, Notional Amounts, or Shares/Units† | |
| | | Futures
Contracts | | | Forward
Contracts | | | Swap
Agreements | | | Purchased
Swaptions | |
Asset Momentum Fund | | | 140 | | | $ | 5,546,395 | | | $ | - | | | $ | - | |
Inflation-Protected and Income Fund | | | 41 | | | | - | | | | 49,357,500 | | | | 11,116,667 | |
Short-Duration Bond Fund | | | 736 | | | | - | | | | 2,775,833 | | | | 6,235,833 | |
| † | Amount(s) disclosed represent average number of contracts for futures contracts, notional amounts for forward contracts, swap agreements and purchased swaptions, based on absolute values, which is indicative of volume of this derivative type, for the months that the Fund held such derivatives during the year ended December 31, 2017. |
The following table presents derivative assets by counterparty net of amounts available for offset under a master netting agreement (“MNA”), or similar agreement, and net of the related collateral received by the Fund(s) as of December 31, 2017.
Asset Valuation Inputs
| | | | | | | | | | | | | | | | |
Counterparty | | Derivative Assets
Subject to an
MNA by
Counterparty† | | | Financial
Instruments
Available for Offset | | | Collateral
Received*** | | | Net Amount* | |
| Asset Momentum Fund | | | | | | | | | | | | |
HSBC Bank USA | | $ | 139,238 | | | $ | - | | | $ | - | | | $ | 139,238 | |
| | | | | | | | | | | | | | | | |
| Inflation-Protected and Income Fund | | | | | | | | | | | | |
Bank of America N.A. | | $ | 20,708 | | | $ | (20,708 | ) | | $ | - | | | $ | - | |
Barclays Bank PLC | | | 1,627,707 | | | | - | | | | (1,627,707 | ) | | | - | |
Goldman Sachs International | | | 97,761 | | | | (97,761 | ) | | | - | | | | - | |
JP Morgan Chase Bank N.A. | | | 198,888 | | | | (100,961 | ) | | | - | | | | 97,927 | |
| | | | | | | | | | | | | | | | |
| | $ | 1,945,064 | | | $ | (219,430 | ) | | $ | (1,627,707 | ) | | $ | 97,927 | |
| | | | | | | | | | | | | | | | |
| Short-Duration Bond Fund | | | | | | | | | | | | |
Barclays Bank PLC | | $ | 918,326 | | | $ | - | | | $ | (918,326 | ) | | $ | - | |
| | | | | | | | | | | | | | | | |
The following table presents derivative liabilities by counterparty net of amounts available for offset under an MNA, or similar agreement, and net of the related collateral pledged by the Fund(s) as of December 31, 2017.
Liability Valuation Inputs
| | | | | | | | | | | | | | | | |
Counterparty | | Derivative Liabilities
Subject to an
MNA by
Counterparty† | | | Financial
Instruments
Available for Offset | | | Collateral
Pledged*** | | | Net Amount** | |
| Asset Momentum Fund | | | | | | | | | | | | |
Barclays Bank PLC | | $ | (1,946 | ) | | $ | - | | | $ | - | | | $ | (1,946 | ) |
JP Morgan Chase Bank N.A. | | | (18,047 | ) | | | - | | | | - | | | | (18,047 | ) |
| | | | | | | | | | | | | | | | |
| | $ | (19,993 | ) | | $ | - | | | $ | - | | | $ | (19,993 | ) |
| | | | | | | | | | | | | | | | |
| Inflation-Protected and Income Fund | | | | | | | | | | | | |
Bank of America N.A. | | $ | (40,404 | ) | | $ | 20,708 | | | $ | - | | | $ | (19,696 | ) |
Goldman Sachs International | | | (412,619 | ) | | | 97,761 | | | | 260,232 | | | | (54,626 | ) |
JP Morgan Chase Bank N.A. | | | (100,961 | ) | | | 100,961 | | | | - | | | | - | |
| | | | | | | | | | | | | | | | |
| | $ | (553,984 | ) | | $ | 219,430 | | | $ | 260,232 | | | $ | (74,322 | ) |
| | | | | | | | | | | | | | | | |
130
Notes to Financial Statements (Continued)
| | | | | | | | | | | | | | | | |
Counterparty | | Derivative Liabilities
Subject to an
MNA by
Counterparty† | | | Financial
Instruments
Available for Offset | | | Collateral
Pledged*** | | | Net Amount** | |
| Short-Duration Bond Fund | | | | | | | | | | | | |
Goldman Sachs International | | $ | (141,929 | ) | | $ | - | | | $ | - | | | $ | (141,929 | ) |
| | | | | | | | | | | | | | | | |
| * | Represents the net amount receivable from the counterparty in the event of default. |
| ** | Represents the net amount payable to the counterparty in the event of default. |
| *** | The amount presented here may be less than the total amount of collateral received/pledged as the net amount of derivative assets and liabilities for a counterparty cannot be less than $0. |
| † | The amount presented here may be less than the total amount shown in the Statements of Assets and Liabilities as some derivatives held by the counterparty are not covered within the master netting agreements. |
Such agreements typically permit a single net payment in the event of default, including the bankruptcy or insolvency of the counterparty. Typically, the Fund(s) and counterparties are not permitted to sell, re-pledge, or use the collateral they receive.
Further details regarding the derivatives and other investments held by the Fund(s) during the year ended December 31, 2017, are discussed below.
Foreign Currency Exchange Transactions
A Fund may engage in foreign currency exchange transactions for hedging purposes in order to protect against uncertainty in the level of future foreign currency exchange rates, or for other, non-hedging purposes.
A Fund may enter into foreign currency exchange transactions, including foreign currency forward contracts. These contracts call for the Fund to deliver in the future an amount of one currency in return for an amount of another currency, at an exchange rate determined at the time the contract is entered into. Forward contracts are private contractual arrangements and a Fund is subject to the risk that its counterparty will not, or will not be able to, perform its obligations. This type of arrangement may require the Fund to post margin. A Fund may enter into foreign currency exchange transactions in order to hedge against changes in the values of the assets or liabilities denominated in one or more foreign currencies, or otherwise to increase or reduce a Fund’s exposure to various foreign currencies. The use of foreign currency exchange transactions may create investment leverage.
Whenever a Fund enters into a foreign currency exchange transaction, it is subject to the risk that the value of the transaction will move in a direction unfavorable to it. When the Fund uses the transactions for hedging purposes, it is likely that the Fund will have an asset or liability that will offset any loss (or gain) on the transactions, at least in part. If a Fund enters into foreign currency exchange transactions other than for hedging purposes (for example, seeking to profit from an anticipated change in the values of currencies by creating directional exposures in the portfolio with respect to one or more currencies), it will generally be subject to the same risks, but is less likely to have assets or liabilities that will offset any losses on the transactions. There can be no assurance that a Fund will be able to terminate any foreign currency exchange transaction prior to its maturity in order to limit its loss on the transaction.
Forward foreign currency contracts are marked to market daily and the change in their value is recorded by the Funds as an unrealized gain or loss. Forward foreign currency contracts are valued at the settlement price established through dealers or other market sources on the day which they are traded. When a forward foreign currency contract is extinguished, through delivery or offset by entering into another forward foreign currency contract, the Funds record a realized gain or loss equal to the difference between the value of the contract at the time it was opened and the value of the contract at the time it was extinguished or offset. The notional or contractual amounts of these instruments do not necessarily represent the amounts potentially subject to risk. The measurement of the risk associated with these instruments is meaningful only when all related and offsetting transactions and counterparty risks are considered.
Forward foreign currency contracts outstanding at the end of the year, if any, are listed in each applicable Fund’s Portfolio of Investments. A Fund’s current exposure to a counterparty is the unrealized appreciation on the contract.
131
Notes to Financial Statements (Continued)
Futures Contracts
A Fund may seek to manage a variety of different risks, such as interest rate risk, equity price risk, and currency risk, through the use of futures contracts. A Fund may use interest rate futures contracts to adjust the interest rate sensitivity (duration) of its portfolio or the credit exposure of the portfolio. Interest rate futures contracts obligate the long or short holder to take or make delivery of a specified quantity of a financial instrument, such as a specific fixed-income security, during a specified future period at a specified price. A Fund may use index futures to hedge against broad market risks to its portfolio or to gain broad market exposure when it holds uninvested cash or as an inexpensive substitute for cash investments directly in securities or other assets. Securities index futures contracts are contracts to buy or sell units of a securities index at a specified future date at a price agreed upon when the contract is made and are settled in cash. Positions in futures may be closed out only on an exchange or board of trade which provides a secondary market for such futures. Because futures contracts are exchange-traded, they typically have minimal exposure to counterparty risk.
Parties to a futures contract are not required to post the entire notional amount of the contract, but rather a small percentage of that amount (by way of margin), both at the time they enter into futures transactions, and then on a daily basis if their positions decline in value; as a result, futures contracts are highly leveraged. Such payments are known as variation margin and are recorded by the Funds as unrealized gains or losses. Because futures markets are highly leveraged, they can be extremely volatile, and there can be no assurance that the pricing of a futures contract will correlate precisely with the pricing of the asset or index underlying it or the asset or liability of the Fund that is the subject of the hedge. It may not always be possible for a Fund to enter into a closing transaction with respect to a futures contract it has entered into, at a favorable time or price. When a Fund enters into a futures transaction, it is subject to the risk that the value of the futures contract will move in a direction unfavorable to it. When a Fund uses futures contracts for hedging purposes, it is likely that the Fund will have an asset or liability that will offset any loss (or gain) on the transactions, at least in part.
When a futures contract is closed, the Fund records a realized gain or loss equal to the difference between the value of the contract at the time it was opened and the value at the time it was closed. Futures contracts are valued at the settlement price established each day by the board of trade or exchange on which they are traded.
Futures contracts outstanding at the end of the year, if any, are listed in each applicable Fund’s Portfolio of Investments.
Swap Agreements
Swap agreements are typically two-party contracts entered into primarily by institutional investors. In a standard “swap” transaction, two parties agree to exchange the returns (or differentials in rates of return) earned or realized on particular predetermined investments or instruments, which may be adjusted for an interest factor. The gross returns to be exchanged or “swapped” between the parties are generally calculated with respect to a “notional amount,” (i.e., the return on or increase in value of a particular dollar amount invested at a particular interest rate or in a “basket” of securities representing a particular index).
Interest Rate Swaps. When a Fund enters into an interest rate swap, it typically agrees to make payments to its counterparty based on a specified long- or short-term interest rate, and will receive payments from its counterparty based on another interest rate. Other forms of interest rate swap agreements include interest rate caps, under which, in return for a specified payment stream, one party agrees to make payments to the other to the extent that interest rates exceed a specified rate, or “cap”; interest rate floors, under which, in return for a specified payment stream, one party agrees to make payments to the other to the extent that interest rates fall below a specified rate, or “floor”; and interest rate collars, under which a party sells a cap and purchases a floor or vice versa in an attempt to protect itself against interest rate movements exceeding given minimum or maximum levels. A Fund may enter into an interest rate swap in order, for example, to hedge against the effect of interest rate changes on the value of specific securities in its portfolio, or to adjust the interest rate sensitivity (duration) or the credit exposure of its portfolio overall, or otherwise as a substitute for a direct investment in debt securities.
Credit Default Swaps. A Fund also may enter into credit default swap transactions, as a “buyer” or “seller” of credit protection. In a credit default swap, one party provides what is in effect insurance against a default or other adverse credit event affecting an issuer of debt securities (typically referred to as a “reference entity”). In general, the buyer of credit protection is obligated to pay the protection seller an upfront amount or a periodic stream of payments over the term of the swap. If a “credit event” occurs, the
132
Notes to Financial Statements (Continued)
buyer has the right to deliver to the seller bonds or other obligations of the reference entity (with a value up to the full notional value of the swap), and to receive a payment equal to the par value of the bonds or other obligations. Credit events that would trigger a request that the seller make payment are specific to each credit default swap agreement, but generally include bankruptcy, failure to pay, restructuring, acceleration, default, or repudiation/moratorium. When a Fund buys protection, it may or may not own securities of the reference entity. If it does own securities of the reference entity, the swap serves as a hedge against a decline in the value of the securities due to the occurrence of a credit event involving the issuer of the securities. If the Fund does not own securities of the reference entity, the credit default swap may be seen to create a short position in the reference entity. If a Fund is a buyer and no credit event occurs, the Fund will typically recover nothing under the swap, but will have had to pay the required upfront payment or stream of continuing payments under the swap. When a Fund sells protection under a credit default swap, the position may have the effect of creating leverage in the Fund’s portfolio through the Fund’s indirect long exposure to the issuer or securities on which the swap is written. When a Fund sells protection, it may do so either to earn additional income or to create a “synthetic” long position.
Whenever a Fund enters into a swap agreement, it takes on counterparty risk — the risk that its counterparty will be unable or unwilling to meet its obligations under the swap agreement. The Fund also takes the risk that the market will move against its position in the swap agreement. In the case of an interest rate swap, the value of the swap may increase or decrease depending on changes in interest rates. In the case of a credit default swap, the swap will become more or less valuable depending on the credit of the issuer of the underlying security, and, if a credit event occurs under a swap where the Fund is the seller of credit protection, the Fund could be required to purchase the security at par value, resulting in a significant loss to the Fund. When the Fund enters into any type of swap for hedging purposes, it is likely that the Fund will have an asset or liability that will offset any loss (or gain) on the swap, at least in part. Swap agreements may be non-transferable or otherwise highly illiquid, and a Fund may not be able to terminate or transfer a swap agreement at any particular time or at an acceptable price.
Swaptions. A Fund may also enter into options on swap agreements (“swaptions”). A swaption is a contract that gives a counterparty the right (but not the obligation) to enter into a new swap agreement or to shorten, extend, cancel, or otherwise modify an existing swap agreement, at some designated future time on specified terms. A Fund may write (sell) and purchase put and call swaptions. Depending on the terms of the particular option agreement, a Fund will generally incur a greater degree of risk when it writes a swaption than it will incur when it purchases a swaption. When a Fund purchases a swaption, it risks losing only the amount of the premium it has paid should it decide to let the option expire unexercised. However, when a Fund writes a swaption, upon exercise of the option the Fund will become obligated according to the terms of the underlying agreement. A Fund may enter into swaptions for the same purposes as swaps. For information regarding the accounting treatment of options, see “Options, Rights, and Warrants” below.
Centrally Cleared Swaps. Certain clearinghouses currently offer clearing for limited types of derivatives transactions, principally certain interest rate swaps, certain index swaps, and credit derivatives. In a cleared derivative transaction, a Fund typically enters into the transaction with a financial institution counterparty, and performance of the transaction is effectively guaranteed by a central clearinghouse, thereby reducing or eliminating the Fund’s exposure to the credit risk of its original counterparty. The Fund will be required to post amounts (“initial margin”) with the clearinghouse or at the instruction of the clearinghouse. The initial margin required by a clearinghouse may be greater than the initial margin the Fund would be required to post in an uncleared transaction. If cash is deposited as the initial margin, it is shown as collateral on a Fund’s Statement of Assets and Liabilities. Swap agreements are marked-to-market daily and subsequent payments (“variation margin”) are made or received by a Fund depending on whether unrealized gains or losses are incurred. These amounts are reflected as receivables or payables on a Fund’s Statement of Assets and Liabilities (“Variation margin on open derivative instruments”) and as a component of net change in unrealized appreciation (depreciation) on a Fund’s Statement of Operations. Only a limited number of transaction types are currently eligible for clearing.
During the term of a swap transaction, changes in the value of the swap are recognized as unrealized gains or losses by marking to market to reflect the market value of the swap. When the swap is terminated, a Fund will record a realized gain or loss equal to the difference, if any, between the proceeds from (or cost of) the closing transaction and a Fund’s basis in the agreement. Upfront swap premium payments paid or received by a Fund, if any, are recorded within the value of the open swap agreement on the Fund’s Statement of Assets and Liabilities and represent payments paid or received upon entering into the swap agreement to compensate for differences between stated terms of the swap agreement and prevailing market conditions (credit spreads, currency exchange
133
Notes to Financial Statements (Continued)
rates, and other relevant factors). These upfront payments are recorded as realized gain or loss on the Fund’s Statement of Operations upon termination or maturity of the swap agreement.
During the term of a swap transaction, the periodic net payments can be made for a set period of time or may be triggered by a predetermined credit event. The net periodic payments may be based on a fixed or variable interest rate, the change in market value of a specified security, basket of securities or index, or the return generated by a security. These periodic payments received or made by the Funds are recorded in the accompanying Statements of Operations as realized gains and losses, respectively.
Swap agreements outstanding at the end of the year, if any, are listed in each applicable Fund’s Portfolio of Investments. A Fund’s current exposure to a counterparty is the fair value of the transaction.
Options, Rights, and Warrants
A Fund may purchase and sell put and call options on securities or an index of securities to enhance investment performance or to protect against changes in market prices. A Fund that invests in debt securities may also purchase and sell put and call options to adjust the interest rate sensitivity of its portfolio or the credit exposure of the portfolio.
Call Options. A call option gives the holder the right to purchase, and obligates the writer to sell, a security at the strike price at any time before the expiration date.
Put Options. A put option gives the holder the right to sell, and obligates the writer to buy, a security at the exercise price at any time before the expiration date.
Writing put and call options. A Fund may write call options on a security it owns, in a “directional” strategy hoping to realize a greater current return through the receipt of premiums. In return for the option premium, the Fund takes the risk that it will have to forego any increase in the value of the security over the strike price. When a Fund has written a call option on a security it does not own, its exposure on such an option is theoretically unlimited. A Fund may enter into closing purchase transactions in order to realize a profit or limit a loss on a previously written call option or, in the case of a call option on a security it owns, to free itself to sell the underlying security or to write another call on the security, or protect a security from being called in an unexpected market rise. Any profits from a closing purchase transaction in the case of a call option on a security a Fund owns may be offset by a decline in the value of the underlying security. Conversely, because increases in the market price of a call option will generally reflect increases in the market price of the underlying security, any loss resulting from a closing purchase transaction relating to a call option on a security a Fund owns is likely to be offset in whole or in part by unrealized appreciation of the underlying security owned by the Fund. A Fund may not be able to close out a call option that it has previously written. A Fund may write put options in order to enhance its current return by taking a long directional position as to a security or index of securities. By writing a put option, the Fund assumes the risk that it may be required to purchase the underlying security for an exercise price higher than its then current market value, resulting in a potential capital loss unless the security later appreciates in value. A Fund may terminate a put option that it has written before it expires by entering into a closing purchase transaction. Any loss from this transaction may be partially or entirely offset by the premium received on the terminated option. A Fund may not be able to close out a put option that it has previously written.
When a Fund writes a call or put option, an amount equal to the premium received is recorded as a liability. Premiums received from writing options which expire are treated as realized gains. Premiums received from writing options which are exercised or closed are added to the proceeds or offset against the amount paid on the underlying investment to determine the realized gain or loss.
Purchasing put and call options. A Fund may purchase put options to protect portfolio holdings against a decline in market value of a security or securities held by it. A Fund may also purchase a put option hoping to profit from an anticipated decline in the value of the underlying security. If the Fund holds the security underlying the option, the option premium and any transaction costs will reduce any profit the Fund might have realized had it sold the underlying security instead of buying the put option. A Fund may purchase call options to hedge against an increase in the price of securities that the Fund wants ultimately to buy. A Fund may also purchase a call option as a long directional investment hoping to profit from an anticipated increase in the value of the
134
Notes to Financial Statements (Continued)
underlying security. In order for a call option to be profitable, the market price of the underlying security must rise sufficiently above the exercise price to cover the premium and transaction costs. These costs will reduce any profit the Fund might have realized had it bought the underlying security at the time it purchased the call option.
When a Fund purchases an option, it runs the risk that it will lose its entire investment in the option in a relatively short period of time, unless the Fund exercises the option or enters into a closing sale transaction before the option’s expiration. If the price of the underlying security does not rise (in the case of a call) or fall (in the case of a put) to an extent sufficient to cover the option premium and transaction costs, the Fund will lose part or all of its investment in the option. This contrasts with an investment by a Fund in the underlying security, since the Fund will not realize a loss if the security’s price does not change. Premiums paid for purchasing options that expire are treated as realized losses.
OTC Options. OTC options purchased or sold by a Fund are not traded on securities or options exchanges or backed by clearinghouses. Rather, they are entered into directly between a Fund and the counterparty to the option. In the case of an OTC option purchased by the Fund, the value of the option to the Fund will depend on the willingness and ability of the option writer to perform its obligations to the Fund. In addition, OTC options may not be transferable and there may be little or no secondary market for them, so they may be considered illiquid. It may not be possible to enter into closing transactions with respect to OTC options or otherwise to terminate such options, and as a result a Fund may be required to remain obligated on an unfavorable OTC option until its expiration. OTC options are valued using prices supplied by a primary pricing source, selected pursuant to procedures approved by the Trustees.
Rights and Warrants. A Fund may purchase or hold warrants or rights in order to gain exposure to the underlying security without owning the security, including, for example, cases where the Fund hopes to lock in the price today of a security it may wish to purchase in the future. Warrants generally give the holder the right, but not the obligation, to buy a security at a stated price. In order for a warrant to be profitable, the market price of the underlying security must rise sufficiently above the exercise price to cover any premium and transaction costs. Rights may similarly confer on the holder the right to purchase or acquire securities, including through participation in a so-called rights offering. Bonds may be issued with warrants or other rights attached to purchase or acquire equity or other debt securities, typically of the bond issuer. The market prices of bonds with warrants or rights attached to purchase equity securities or bonds may, to some degree, reflect changes in the values of the underlying securities.
When a Fund purchases or otherwise acquires warrants or other rights, it runs the risk that it will lose its entire investment in the warrants or rights, unless the Fund exercises the warrant or right, acquires the underlying securities, or enters into a closing transaction before expiration. If the price of the underlying security does not rise to an extent sufficient to cover any premium and transaction costs, the Fund will lose part or all of its investment. Any premiums or purchase price paid for warrants or other rights that expire are treated as realized losses. Warrants and similar rights differ from options in that they are typically written by the issuer of the security underlying the warrant or right. Although some warrants and rights may be non-transferable, others may be traded over-the-counter or on an exchange.
Inflation-Indexed Bonds
The Funds may invest in inflation-indexed bonds, which are fixed income securities whose principal value or coupon is periodically adjusted according to the rate of inflation, as measured by the Consumer Price Index for All Urban Consumers (“CPI-U”) (for U.S. Treasury inflation-indexed bonds) or, generally, by a comparable inflation index calculated by the foreign government issuing the inflation-indexed bonds.
If the periodic adjustment rate measuring inflation falls, the principal value of inflation-indexed bonds will be adjusted downward, and consequently the interest payable on these securities (calculated with respect to a smaller principal amount) will be reduced. Repayment of the original bond principal upon maturity (as adjusted for inflation) is guaranteed in the case of U.S. Treasury inflation-indexed bonds, even during a period of deflation. However, the current market value of the bonds is not guaranteed, and will fluctuate. The Funds may also invest in other inflation related bonds which may or may not provide a similar guarantee. If a guarantee of principal is not provided, the adjusted principal value of the bond repaid at maturity may be less than the original principal. Any adjustments to the principal amount of an inflation-indexed bond due to inflation will be reflected as increases or decreases to interest income. Such adjustments may have a significant impact on the Fund’s distributions.
135
Notes to Financial Statements (Continued)
The value of inflation-indexed bonds is generally based on changes in real interest rates, which in turn are tied to the relationship between nominal interest rates and the rate of inflation. Therefore, if nominal interest rates increased at a faster rate than inflation, real interest rates might rise, leading to a decrease in value of inflation-indexed bonds. While the values of these securities are expected to be protected from long-term inflationary trends, short-term increases in inflation may lead to a decline in value. There can be no assurance that the CPI-U or any foreign inflation index will accurately measure the real rate of inflation, or that the rate of inflation in a foreign country will correlate to the rate of inflation in the United States. Additionally, if interest rates rise due to reasons other than inflation, investors in these securities may not be protected to the extent that the increase is not reflected in the bond’s inflation measure.
Bank Loans
Certain of the Funds may invest in bank loans including, for example, corporate loans, loan participations, direct debt, bank debt, and bridge debt. A Fund may invest in a loan by lending money to a borrower directly as part of a syndicate of lenders. In a syndicated loan, the agent that originated and structured the loan typically administers and enforces the loan on behalf of the syndicate. Failure by the agent to fulfill its obligations may delay or adversely affect receipt of payment by a Fund. A Fund may also invest in loans through novations, assignments, and participation interests. In a novation, a Fund typically assumes all of the rights of a lending institution in a loan, including the right to receive payments of principal and interest and other amounts directly from the borrower and to enforce its rights as a lender directly against the borrower. When a Fund takes an assignment of a loan, the Fund acquires some or all of the interest of another lender (or assignee) in the loan. In such cases, the Fund may be required generally to rely upon the assignor to demand payment and enforce rights under the loan. If a Fund acquires a participation in the loan, the Fund purchases an indirect interest in a loan held by a third party and the Fund typically will have a contractual relationship only with the third party loan investor, not with the borrower. As a result, a Fund may have the right to receive payments of principal, interest, and any fees to which it is entitled only from the loan investor selling the participation and only upon receipt by such loan investor of such payments from the borrower. In such cases, a Fund assumes the credit risk of both the borrower and the loan investor selling the participation, and the Fund may be unable to realize some or all of the value of its interest in the loan in the event of the insolvency of the third party.
Changes in the financial condition of the borrower or economic conditions or other circumstances may reduce the capacity of the borrower to make principal and interest payments on such instruments and may lead to defaults. The value of any collateral securing a bank loan may decline after the Fund invests, and there is a risk that the value of the collateral may not be sufficient to cover the amount owed to the Fund.
The High Yield Fund entered into certain loan agreements which are unfunded. The High Yield Fund is obligated to fund these commitments at the borrower’s discretion. These commitments are disclosed in the High Yield Fund’s Portfolio of Investments. At December 31, 2017, the High Yield Fund had sufficient cash and/or securities to cover these commitments.
Repurchase Agreements
Each Fund may enter into repurchase agreements with certain banks and broker-dealers whereby a Fund acquires a security for cash and obtains a simultaneous commitment from the seller to repurchase the security at an agreed upon price and date. A Fund, through its custodian, takes possession of the securities collateralizing the repurchase agreement in a segregated account. Repurchase agreements must be fully collateralized at all times, but involve some risk to a Fund if the other party should default on its obligation and the Fund is delayed or prevented from recovering the collateral, or if the Fund is required to return collateral to a borrower at a time when it may realize a loss on the investment of that collateral.
Reverse Repurchase Agreements
Each Fund may enter into reverse repurchase agreements with banks and broker-dealers to enhance return. Reverse repurchase agreements involve sales by a Fund of portfolio securities concurrently with an agreement by the Fund to repurchase the same securities at a later date at a fixed price (typically equal to the original sale price plus interest). During the reverse repurchase agreement period, the Fund continues to receive principal and interest payments on the securities and also has the opportunity to earn a return on the purchase price received by it from the counterparty.
136
Notes to Financial Statements (Continued)
Certain agreements have no stated maturity and can be terminated by either party at any time. Interest on the value of the reverse repurchase agreements issued and outstanding is based upon competitive market rates determined at the time of issuance. A Fund may utilize reverse repurchase agreements when it is anticipated that the interest income to be earned from the investment of the proceeds of the transaction is greater than the interest expense of the transaction. Reverse repurchase agreements generally create investment leverage and involve the risk that the market value of the security that a Fund is obligated to repurchase under the agreement may decline below the repurchase price. For financial reporting purposes, cash received in exchange for securities delivered plus accrued interest payments to be made to the counterparty is recorded as a liability in the Statements of Assets and Liabilities at face value including accrued interest. Due to the short term nature of reverse repurchase agreements, face value approximates fair value. Interest payments made by a Fund to the counterparties are recorded as a component of interest expense in the Statements of Operations. In periods of increased demand for a security, a Fund may receive a fee for use of the security by the counterparty, which may result in interest income to the Fund.
Reverse repurchase transactions are entered into by a Fund under a Master Repurchase Agreement (“MRA”), which permits the Fund, under certain circumstances, including an event of default (such as bankruptcy or insolvency), to offset payables and/or receivables under the MRA with collateral held and/or posted to the counterparty and creates one single net payment due to or from the Fund. With reverse repurchase transactions, typically a Fund and the counterparties are permitted to sell, re-pledge, or use the collateral associated with the transaction. However, bankruptcy or insolvency laws of a particular jurisdiction may impose restrictions on or prohibitions against such a right of offset in the event of an MRA counterparty’s bankruptcy or insolvency. Pursuant to the terms of the MRA, a Fund receives or posts securities as collateral with a market value in excess of the repurchase price to be paid or received by the Fund upon the maturity of the transaction. Upon a bankruptcy or insolvency of the MRA counterparty, the Fund is considered an unsecured creditor with respect to excess collateral and, as such, the return of excess collateral may be delayed.
In the event the buyer of securities under an MRA files for bankruptcy or becomes insolvent, a Fund’s use of the proceeds from the sale of its securities may be restricted or forfeited, and the counterparty may fail to return/resell the securities in question to the Fund.
The following table is a summary of the Fund(s) open reverse repurchase transactions which are subject to an MRA on a net basis at December 31, 2017:
| | | | | | | | | | | | | | | | |
Counterparty | | Reverse
Repurchase
Agreements | | | Fair Value of
Non-Cash
Collateral* | | | Cash
Collateral
Pledged* | | | Net Amount | |
| Inflation-Protected and Income Fund | | | | | | | | | | | | |
BNP Paribas SA | | $ | (74,574,500 | ) | | $ | 74,574,500 | | | $ | - | | | $ | - | |
Daiwa Securities | | | (58,105,000 | ) | | | 58,105,000 | | | | - | | | | - | |
Goldman Sachs & Co. | | | (64,633,711 | ) | | | 64,633,711 | | | | - | | | | - | |
HSBC Bank USA | | | (94,453,250 | ) | | | 94,453,250 | | | | - | | | | - | |
Morgan Stanley & Co. LLC | | | (44,526,425 | ) | | | 44,526,425 | | | | - | | | | - | |
| | | | | | | | | | | | | | | | |
| | $ | (336,292,886 | ) | | $ | 336,292,886 | | | $ | - | | | $ | - | |
| | | | | | | | | | | | | | | | |
| * | Collateral with a value of $346,860,859 has been pledged in connection with open reverse repurchase transactions. Excess collateral pledged to the individual counterparty is not shown for financial reporting purposes. |
Reverse repurchase transactions outstanding at the end of the year, if any, are listed in each applicable Fund’s Portfolio of Investments.
At December 31, 2017, the average balance outstanding for open reverse repurchase agreements for the Inflation-Protected and Income Fund was $330,551,130. The maximum balance outstanding for the Inflation-Protected and Income Fund was $341,095,786 during the year ended December 31, 2017. The weighted average maturity was 65 days, at a weighted average interest rate of 1.17%.
137
Notes to Financial Statements (Continued)
Average balance outstanding was calculated based on daily balances outstanding during the period that the Fund had entered into reverse repurchase transactions.
The type of underlying collateral and the remaining maturity of open reverse repurchase transactions in relation to the reverse repurchase agreements on the Statements of Assets and Liabilities is as follows:
| | | | | | | | | | | | | | | | | | | | |
| | | Remaining Contractual Maturity of the Agreements | |
| | | Overnight and
Continuous | | | Up to 30
days | | | 31-90 days | | | Greater Than
90 days | | | Total | |
| Inflation-Protected and Income Fund | | | | | | | | | | | | | | | |
U.S. Treasury Obligations | | $ | - | | | $ | 44,526,425 | | | $ | 291,766,461 | | �� | $ | - | | | $ | 336,292,886 | |
| | | | | | | | | | | | | | | | | | | | |
Total Borrowings | | $ | - | | | $ | 44,526,425 | | | $ | 291,766,461 | | | $ | - | | | $ | 336,292,886 | |
| | | | | | | | | | | | | | | | | | | | |
When-Issued, Delayed-Delivery, Forward Commitment, and To-Be-Announced Transactions
A Fund may enter into when-issued, delayed-delivery, forward commitment, or to-be-announced (“TBA”) transactions (collectively, the “Forward Transactions”) in order to lock in the purchase price of the underlying security, or in order to adjust the interest rate exposure of the Fund’s existing portfolio. In Forward Transactions, a Fund commits to purchase or sell particular securities, with payment and delivery to take place at a future date. In the case of TBA purchase commitments, the unit price and the estimated principal amount are established when the Fund enters into a commitment, with the actual principal amount being within a specified range of the estimate. Although a Fund does not typically pay for the securities in these types of transactions until they are delivered, it immediately assumes the risks of ownership, including the risk of price fluctuation. As a result, each of these types of transactions may create investment leverage in a Fund’s portfolio and increase the volatility of the Fund. If a Fund’s counterparty fails to deliver a security purchased in a Forward Transaction, there may be a loss, and the Fund may have missed an opportunity to make an alternative investment.
These securities are valued on the basis of valuations furnished by a pricing service, selected pursuant to procedures approved by the Trustees, which determines valuations taking into account appropriate factors such as institutional-size trading in similar groups of securities, yield, quality, coupon rate, maturity, type of issue, trading characteristics, and other market data. Securities for which no market quotation is available are valued at fair value in accordance with procedures approved by the Trustees. The Funds record on a daily basis the unrealized appreciation (depreciation) based upon changes in the values of these securities. When a Forward Transaction is closed, the Funds record a realized gain or loss equal to the difference between the value of the transaction at the time it was opened and the value of the transaction at the time it was closed.
Securities Lending
Each Fund may lend its securities; however, lending cannot exceed 33% of the total assets of the Fund taken at current value. The Funds’ securities lending activities are governed by a Securities Lending Agency Agreement (“Lending Agreement”) between each Fund and the lending agent (“Agent”). The Lending Agreement authorizes the Agent to lend qualifying U.S. and foreign securities held by a Fund to approved borrowers (each, a “Borrower”).
Each Fund expects that in connection with any securities on loan, the loan will be secured continuously by collateral consisting of cash or securities adjusted daily to have market value at least equal to the current market value of the securities loaned. The market value of the loaned securities is determined at the close of business of a Fund and any additional collateral is delivered to the Fund the next business day. The Funds bear the risk of loss with respect to the investment of cash collateral. As with other extensions of credit, the Funds may bear the risk of delay in recovery of the loaned securities or even loss of rights in the collateral should the Borrower of the securities fail financially. Pursuant to the Lending Agreement, the Agent has provided indemnification to the Funds in the event of default by a Borrower with respect to a loan. The Funds receive compensation for lending their securities in the form of a securities loan fee paid by the Borrower, as well as a share of the income earned on investment of the cash collateral received for the loaned securities. At December 31, 2017, the Funds’ collateral was equal to or greater than 100% of the market value of securities on loan.
138
Notes to Financial Statements (Continued)
Security loans can be terminated at the discretion of either the Agent or the Fund and the related securities must be returned within the earlier of the standard trade settlement period for such securities or within three business days. For all Funds, all securities on loan are classified as common stock in the Fund’s Portfolio of Investments at December 31, 2017.
The Funds employ the Agent to implement their securities lending program and the Agent receives a fee from the Funds for its services. In addition, the Funds may be required to pay a rebate to the Borrower. Accordingly, a Fund’s compensation for lending its securities is reduced by any such fees or rebate paid to the Agent or Borrower, respectively. For the year ended December 31, 2017, the Fund(s) earned securities lending net income as follows:
| | | | | | | | | | | | |
| | | Securities
Lending Gross
Income | | | Securities
Lending Fees
and Expenses | | | Securities
Lending Net
Income | |
Small Cap Equity Fund | | $ | 149,658 | | | $ | 29,169 | | | $ | 120,489 | |
Strategic Emerging Markets Fund | | | 8,919 | | | | 1,664 | | | | 7,255 | |
Accounting for Investment Transactions
Investment transactions are accounted for on the trade date. Realized gains and losses on sales of investments and unrealized appreciation and depreciation of investments are computed by the specific identification cost method. Proceeds received from litigation, if any, are included in realized gains on investment transactions for any investments that are no longer held in the portfolio and as a reduction in cost for investments that continue to be held in the portfolio. Interest income, adjusted for amortization of discounts and premiums on debt securities, is earned from the settlement date and is recorded on the accrual basis. Dividend income and realized capital gain distributions are recorded on the ex-dividend date. Withholding taxes on foreign interest, dividends, and capital gains have been provided for in accordance with the applicable country’s tax rules and rates. Foreign dividend income is recorded on the ex-dividend date or as soon as practicable after the Fund determines the existence of a dividend declaration after exercising reasonable due diligence. Distributions received on securities that represent a return of capital or capital gain are recorded as a reduction of cost of investments and/or as a realized gain. The Funds determine the classification of distributions received as return of capital distributions or capital gain distributions.
Foreign Currency Translation
The books and records of the Funds are maintained in U.S. dollars. The market values of foreign currencies, foreign securities, and other assets and liabilities denominated in foreign currencies are translated into U.S. dollars at the mean of the buying and selling rates of such currencies against the U.S. dollar at the end of each business day. Purchases and sales of foreign securities and income and expense items are translated at the rates of exchange prevailing on the respective dates of such transactions. The Funds do not isolate that portion of the results of operations arising from changes in the exchange rates from that portion arising from changes in the market prices of securities. Net realized foreign currency gains and losses resulting from changes in exchange rates include foreign currency gains and losses between trade date and settlement date on investment securities transactions, foreign currency transactions, and the difference between the amounts of dividends or interest recorded on the books of the Funds and the amount actually received.
Allocation of Operating Activity
In maintaining the records for the Funds, the income and expense accounts are allocated daily to each class of shares. Investment income and loss, and unrealized and realized gains or losses are prorated among the classes of shares based on the relative net assets of each. Expenses are allocated to each class of shares depending on the nature of the expenditures. Administration and service fees, if any, which are directly attributable to a class of shares, are charged to that class’s operations. Expenses of a Fund not directly attributable to the operations of any specific class of shares of the Fund are prorated among the classes to which the expense relates based on relative net assets.
139
Notes to Financial Statements (Continued)
Foreign Securities
The Strategic Emerging Markets Fund invests substantially all of its assets in foreign securities. The other Funds may also invest in foreign securities. Foreign securities, including American Depositary Receipts, are subject to additional risks compared to securities of U.S. issuers, including international trade, currency, political, regulatory, and diplomatic risks. In addition, fluctuations in currency exchange rates may adversely affect the values of foreign securities and the price of a Fund’s shares. Emerging markets securities are subject to greater risks than securities issued in developed foreign markets, including less liquidity, greater price volatility, higher relative rates of inflation, greater political, economic, and social instability, greater custody and operational risks, and greater volatility in currency exchange rates.
Federal Income Tax
It is each Fund’s intent to continue to comply with the provisions of subchapter M of the Internal Revenue Code of 1986, as amended, applicable to a regulated investment company. Under such provisions, the Funds would not be subject to federal income taxes on their ordinary income and net realized capital gains to the extent they are distributed or deemed to have been distributed to their shareholders. Therefore, the Funds have not made any provision for federal income tax.
| Dividends | | and Distributions to Shareholders |
Dividends from net investment income are declared and paid quarterly for the Dynamic Bond Fund, High Yield Fund, Inflation-Protected and Income Fund, and Short-Duration Bond Fund and annually for the Asset Momentum Fund, Equity Rotation Fund, Small Cap Equity Fund, Special Situations Fund, and Strategic Emerging Markets Fund and at other times as may be required to satisfy tax or regulatory requirements. Distributions of any net realized capital gains of each Fund are declared and paid annually and at other times as may be required to satisfy tax or regulatory requirements.
Distributions to shareholders are recorded on the ex-dividend date. Income and capital gain distributions are determined in accordance with income tax regulations, which may differ from generally accepted accounting principles. As a result, net investment income and net realized capital gains on investment transactions for a reporting period may differ significantly from distributions during such period.
3. Advisory Fees and Other Transactions
Investment Advisory Fees and Investment Subadvisers
MML Investment Advisers, LLC (“MML Advisers”), a wholly-owned subsidiary of MassMutual, serves as investment adviser to each Fund. Under the investment advisory agreements between MML Advisers and the Trust on behalf of each Fund, MML Advisers is responsible for providing investment management services for each Fund. In return for these services, MML Advisers receives advisory fees, based upon each Fund’s average daily net assets, computed and accrued daily and payable monthly, at the following annual rates:
| | |
Fund | | Investment Advisory Fee |
Asset Momentum Fund | | 0.60% on the first $500 million; and |
| | 0.55% on any excess over $500 million |
Dynamic Bond Fund | | 0.40% on the first $1 billion; and |
| | 0.35% on any excess over $1 billion |
Equity Rotation Fund | | 0.45% on the first $500 million; and |
| | 0.40% on any excess over $500 million |
High Yield Fund | | 0.60% on the first $300 million; and |
| | 0.575% on any excess over $300 million |
140
Notes to Financial Statements (Continued)
| | |
Fund | | Investment Advisory Fee |
Inflation-Protected and Income Fund | | 0.60% on the first $100 million; |
| | 0.55% on the next $200 million; |
| | 0.50% on the next $200 million; and |
| | 0.45% on any excess over $500 million |
Short-Duration Bond Fund | | 0.35% on the first $300 million; and |
| | 0.30% on any excess over $300 million |
Small Cap Equity Fund | | 0.65% on the first $100 million; |
| | 0.60% on the next $100 million; |
| | 0.55% on the next $300 million; and |
| | 0.50% on any excess over $500 million |
Special Situations Fund | | 0.60% on the first $500 million; and |
| | 0.55% on any excess over $500 million |
Strategic Emerging Markets Fund | | 1.05% on the first $500 million; and |
| | 1.00% on any excess over $500 million |
MML Advisers has entered into investment subadvisory agreements with Barings LLC (“Barings”), a wholly-owned subsidiary of MM Asset Management Holding LLC, itself a wholly-owned subsidiary of MassMutual Holding LLC, a controlled subsidiary of MassMutual, on behalf of certain Funds. These agreements provide that Barings manage the investment and reinvestment of assets of these Funds. Barings receives a subadvisory fee from MML Advisers based upon each Fund’s average daily net assets, at the following annual rates:
| | |
Asset Momentum Fund | | 0.475% |
Equity Rotation Fund | | 0.30% |
High Yield Fund | | 0.20% |
Inflation-Protected and Income Fund | | 0.08% |
Short-Duration Bond Fund | | 0.08% |
Special Situations Fund | | 0.45% |
MML Advisers has entered into investment subadvisory agreements with OppenheimerFunds, Inc. (“OFI”), a wholly-owned subsidiary of Oppenheimer Acquisition Corp., itself an indirect majority-owned subsidiary of MassMutual Holding LLC, on behalf of the Small Cap Equity Fund and the Strategic Emerging Markets Fund. These agreements provide that OFI manage the investment and reinvestment of the assets of the Funds. OFI receives a subadvisory fee from MML Advisers, based upon each Fund’s average daily net assets, at the following annual rates:
| | |
Small Cap Equity Fund | | 0.25% |
Strategic Emerging Markets Fund | | 0.70% |
MML Advisers has entered into an investment subadvisory agreement with the unaffiliated investment subadviser, DoubleLine Capital, LP (“DoubleLine”), pursuant to which DoubleLine serves as the subadviser to the Dynamic Bond Fund. This agreement provides that DoubleLine manage the investment and reinvestment of the assets of the Fund. DoubleLine receives a subadvisory fee from MassMutual based upon the average daily net assets of the Fund.
The Funds’ subadvisory fees are paid monthly by MML Advisers out of the advisory fees previously disclosed above.
141
Notes to Financial Statements (Continued)
Administration Fees
For the Asset Momentum Fund, Dynamic Bond Fund, Equity Rotation Fund, High Yield Fund, Short-Duration Bond Fund, Special Situations Fund, and Strategic Emerging Markets Fund, under a separate Administrative and Shareholder Services Agreement between the Funds and MML Advisers, MML Advisers is obligated to provide all necessary administrative and shareholder services and bear some of the Fund specific administrative expenses. In return for these services, MML Advisers receives an administrative services fee, based upon the average daily net assets of the applicable class of shares of the Funds, at the following annual rates:
| | | | |
| | | Class II | | Service Class I |
Asset Momentum Fund | | 0.15% | | 0.15% |
Dynamic Bond Fund | | 0.15% | | 0.15% |
Equity Rotation Fund | | 0.15% | | 0.15% |
High Yield Fund | | 0.15% | | 0.15% |
Short-Duration Bond Fund | | 0.15% | | 0.15% |
Special Situations Fund | | 0.15% | | 0.15% |
Strategic Emerging Markets Fund | | 0.15% | | 0.15% |
Distribution and Service Fees
MML Distributors, LLC (the “Distributor”) acts as distributor to the Funds. Pursuant to a Distribution and Services Plan adopted by the Funds pursuant to Rule 12b-1 under the 1940 Act, Service Class shares and Service Class I shares of the Funds pay an annual fee of 0.25% of the average daily net asset value of Service Class shares and Service Class I shares. This fee, or a portion thereof, is paid to: (i) the Distributor for services provided and expenses incurred by it in connection with the distribution of Service Class shares or Service Class I shares, as applicable, of each Fund; and/or (ii) MassMutual for services provided and expenses incurred by it for purposes of maintaining or providing personal services to Service Class and Service Class I shareholders. The Distributor is a wholly-owned subsidiary of MassMutual.
Expense Caps and Waivers
MML Advisers agreed to cap the fees and expenses of the Funds noted below (other than extraordinary litigation and legal expenses, Acquired Fund Fees and Expenses#, interest expense, short sale dividend and loan expense, or other non-recurring or unusual expenses such as organizational expenses and shareholder meeting expenses) based upon the average daily net assets of the applicable class of shares of the Fund, as follows:
| | | | | | | | |
| | | Class II | | | Service Class I | |
Asset Momentum Fund* | | | 0.80% | | | | 1.05% | |
Dynamic Bond Fund* | | | 0.60% | | | | 0.85% | |
Equity Rotation Fund* | | | 0.65% | | | | 0.90% | |
Short-Duration Bond Fund* | | | 0.55% | | | | 0.80% | |
Special Situations Fund* | | | 0.80% | | | | 1.05% | |
Strategic Emerging Markets Fund** | | | 1.35% | | | | 1.60% | |
| # | Acquired Fund Fees and Expenses are expenses borne indirectly by a Fund through investments in other pooled investment vehicles. |
| * | Expense caps in effect through April 30, 2018. |
| ** | Expense caps in effect through April 30, 2019. Prior to July 1, 2017, the expenses were capped at 1.40% and 1.65%, respectively. |
142
Notes to Financial Statements (Continued)
MML Advisers has agreed to waive 0.10% of the advisory fee of the High Yield Fund through April 30, 2018.
MML Advisers has agreed to voluntarily waive 0.04% of the advisory fee of the Strategic Emerging Markets Fund through April 30, 2018. MML Advisers may amend or discontinue this waiver at any time without advance notice.
Expense caps and waiver amounts are reflected as a reduction of expenses on the Statements of Operations.
Deferred Compensation
Trustees of the Funds who are not officers or employees of MassMutual may elect to defer receipt of their annual fees in accordance with terms of a Non-Qualified Deferred Compensation Plan. Amounts deferred shall accrue interest or earnings and shall be recorded on the Funds’ books as other liabilities. Deferred compensation is included within Trustees’ fees and expenses in the Statements of Assets and Liabilities.
Other
Certain officers and trustees of the Funds may also be employees of MassMutual. The compensation of a trustee who is not an employee of MassMutual is borne by the Funds.
Elaine A. Sarsynski resigned as a Trustee of the Trust effective as of February 1, 2017. Teresa Hassara became a Trustee of the Trust effective as of June 6, 2017.
| 4. | | Purchases and Sales of Investments |
Cost of purchases and proceeds from sales of investment securities (excluding short-term investments) for the year ended December 31, 2017, were as follows:
| | | | | | | | | | | | | | | | |
| | | Purchases | | | Sales | |
| | | Long-Term U.S.
Government
Securities | | | Other
Long-Term
Securities | | | Long-Term U.S.
Government
Securities | | | Other
Long-Term
Securities | |
Asset Momentum Fund | | $ | - | | | $ | 8,656,861 | | | $ | - | | | $ | 3,792,989 | |
Dynamic Bond Fund | | | 259,421,861 | | | | 180,754,450 | | | | 264,621,500 | | | | 148,621,143 | |
Equity Rotation Fund | | | - | | | | 17,155,248 | | | | - | | | | 16,414,002 | |
High Yield Fund | | | - | | | | 84,382,897 | | | | - | | | | 79,620,450 | |
Inflation-Protected and Income Fund | | | 77,889,577 | | | | 110,637,356 | | | | 86,619,515 | | | | 134,548,566 | |
Short-Duration Bond Fund | | | 28,996,296 | | | | 83,360,857 | | | | 51,443,270 | | | | 94,471,046 | |
Small Cap Equity Fund | | | - | | | | 52,636,039 | | | | - | | | | 58,434,834 | |
Special Situations Fund | | | - | | | | 11,024,230 | | | | - | | | | 10,284,476 | |
Strategic Emerging Markets Fund | | | - | | | | 37,711,748 | | | | - | | | | 53,555,908 | |
The Funds may purchase from, or sell securities to, other affiliated Funds under procedures adopted by the Trustees. These policies have been designed to ensure that cross-trades conducted by the Funds comply with Rule 17a-7 under the 1940 Act. These trades are included within the respective purchases and sales amounts shown in the table above, as applicable.
143
Notes to Financial Statements (Continued)
| 5. | | Capital Share Transactions |
Changes in shares outstanding for each Fund were as follows:
| | | | | | | | | | | | | | | | |
| | | Year Ended December 31, 2017 | | | Year Ended December 31, 2016 | |
| | | | |
| | | Shares | | | Amount | | | Shares | | | Amount | |
Asset Momentum Fund Class II | |
Sold | | | - | | | $ | - | | | | - | | | $ | - | |
Issued as reinvestment of dividends | | | 222,641 | | | | 2,729,754 | | | | 13,802 | | | | 143,267 | |
Redeemed | | | - | | | | - | | | | - | | | | - | |
| | | | | | | | | | | | | | | | |
Net increase (decrease) | | | 222,641 | | | $ | 2,729,754 | | | | 13,802 | | | $ | 143,267 | |
| | | | | | | | | | | | | | | | |
Asset Momentum Fund Service Class I | |
Sold | | | 47,139 | | | $ | 540,352 | | | | 79,133 | | | $ | 769,914 | |
Issued as reinvestment of dividends | | | 11,829 | | | | 144,546 | | | | 472 | | | | 4,891 | |
Redeemed | | | (26,810 | ) | | | (306,897 | ) | | | (13,993 | ) | | | (139,613 | ) |
| | | | | | | | | | | | | | | | |
Net increase (decrease) | | | 32,158 | | | $ | 378,001 | | | | 65,612 | | | $ | 635,192 | |
| | | | | | | | | | | | | | | | |
Dynamic Bond Fund Class II | |
Sold | | | 687,953 | | | $ | 6,869,531 | | | | 1,967,334 | | | $ | 19,730,005 | |
Issued as reinvestment of dividends | | | 1,639,034 | | | | 16,309,191 | | | | 1,238,887 | | | | 12,384,957 | |
Redeemed | | | (10 | ) | | | (106 | ) | | | (1,811,608 | ) | | | (18,518,299 | ) |
| | | | | | | | | | | | | | | | |
Net increase (decrease) | | | 2,326,977 | | | $ | 23,178,616 | | | | 1,394,613 | | | $ | 13,596,663 | |
| | | | | | | | | | | | | | | | |
Dynamic Bond Fund Service Class I | |
Sold | | | 180,547 | | | $ | 1,803,315 | | | | 306,722 | | | $ | 3,060,637 | |
Issued as reinvestment of dividends | | | 13,347 | | | | 132,594 | | | | 6,138 | | | | 61,280 | |
Redeemed | | | (43,886 | ) | | | (438,026 | ) | | | (58,001 | ) | | | (585,364 | ) |
| | | | | | | | | | | | | | | | |
Net increase (decrease) | | | 150,008 | | | $ | 1,497,883 | | | | 254,859 | | | $ | 2,536,553 | |
| | | | | | | | | | | | | | | | |
Equity Rotation Fund Class II | |
Sold | | | - | | | $ | - | | | | - | | | $ | - | |
Issued as reinvestment of dividends | | | 114,382 | | | | 1,587,623 | | | | 22,578 | | | | 257,157 | |
Redeemed | | | - | | | | - | | | | - | | | | - | |
| | | | | | | | | | | | | | | | |
Net increase (decrease) | | | 114,382 | | | $ | 1,587,623 | | | | 22,578 | | | $ | 257,157 | |
| | | | | | | | | | | | | | | | |
Equity Rotation Fund Service Class I | |
Sold | | | 67,346 | | | $ | 852,925 | | | | 26,050 | | | $ | 261,848 | |
Issued as reinvestment of dividends | | | 5,312 | | | | 73,519 | | | | 376 | | | | 4,270 | |
Redeemed | | | (7,287 | ) | | | (91,594 | ) | | | (1,273 | ) | | | (13,560 | ) |
| | | | | | | | | | | | | | | | |
Net increase (decrease) | | | 65,371 | | | $ | 834,850 | | | | 25,153 | | | $ | 252,558 | |
| | | | | | | | | | | | | | | | |
High Yield Fund Class II | |
Sold | | | 72,493 | | | $ | 736,500 | | | | 295,975 | | | $ | 2,921,195 | |
Issued as reinvestment of dividends | | | 666,037 | | | | 6,733,125 | | | | 854,296 | | | | 8,197,683 | |
Redeemed | | | (766,585 | ) | | | (7,841,780 | ) | | | (3,988,962 | ) | | | (39,527,479 | ) |
| | | | | | | | | | | | | | | | |
Net increase (decrease) | | | (28,055 | ) | | $ | (372,155 | ) | | | (2,838,691 | ) | | $ | (28,408,601 | ) |
| | | | | | | | | | | | | | | | |
High Yield Fund Service Class I | |
Sold | | | 1,123,560 | | | $ | 11,449,809 | | | | 598,074 | | | $ | 5,781,914 | |
Issued as reinvestment of dividends | | | 250,466 | | | | 2,522,628 | | | | 206,300 | | | | 1,979,564 | |
Redeemed | | | (591,403 | ) | | | (6,027,452 | ) | | | (568,429 | ) | | | (5,393,673 | ) |
| | | | | | | | | | | | | | | | |
Net increase (decrease) | | | 782,623 | | | $ | 7,944,985 | | | | 235,945 | | | $ | 2,367,805 | |
| | | | | | | | | | | | | | | | |
144
Notes to Financial Statements (Continued)
| | | | | | | | | | | | | | | | |
| | | Year Ended December 31, 2017 | | | Year Ended December 31, 2016 | |
| | | | |
| | | Shares | | | Amount | | | Shares | | | Amount | |
Inflation-Protected and Income Fund Initial Class | |
Sold | | | 4,320,401 | | | $ | 44,155,126 | | | | 3,173,898 | | | $ | 32,854,113 | |
Issued as reinvestment of dividends | | | 1,242,674 | | | | 12,591,573 | | | | 874,258 | | | | 9,077,612 | |
Redeemed | | | (5,205,339 | ) | | | (53,302,611 | ) | | | (5,541,789 | ) | | | (57,254,526 | ) |
| | | | | | | | | | | | | | | | |
Net increase (decrease) | | | 357,736 | | | $ | 3,444,088 | | | | (1,493,633 | ) | | $ | (15,322,801 | ) |
| | | | | | | | | | | | | | | | |
Inflation-Protected and Income Fund Service Class | |
Sold | | | 566,179 | | | $ | 5,768,415 | | | | 556,761 | | | $ | 5,721,767 | |
Issued as reinvestment of dividends | | | 143,782 | | | | 1,450,545 | | | | 98,067 | | | | 1,014,617 | |
Redeemed | | | (790,642 | ) | | | (8,053,934 | ) | | | (861,017 | ) | | | (8,847,076 | ) |
| | | | | | | | | | | | | | | | |
Net increase (decrease) | | | (80,681 | ) | | $ | (834,974 | ) | | | (206,189 | ) | | $ | (2,110,692 | ) |
| | | | | | | | | | | | | | | | |
Short-Duration Bond Fund Class II | |
Sold | | | 4,891,268 | | | $ | 47,856,521 | | | | 8,113,707 | | | $ | 79,725,554 | |
Issued as reinvestment of dividends | | | 570,980 | | | | 5,576,475 | | | | 382,932 | | | | 3,741,339 | |
Redeemed | | | (4,364,667 | ) | | | (42,785,841 | ) | | | (3,648,831 | ) | | | (35,740,980 | ) |
| | | | | | | | | | | | | | | | |
Net increase (decrease) | | | 1,097,581 | | | $ | 10,647,155 | | | | 4,847,808 | | | $ | 47,725,913 | |
| | | | | | | | | | | | | | | | |
Short-Duration Bond Fund Service Class I | |
Sold | | | 1,194,751 | | | $ | 11,699,414 | | | | 1,611,348 | | | $ | 15,759,014 | |
Issued as reinvestment of dividends | | | 78,763 | | | | 768,427 | | | | 57,403 | | | | 560,359 | |
Redeemed | | | (1,353,260 | ) | | | (13,244,624 | ) | | | (892,832 | ) | | | (8,732,232 | ) |
| | | | | | | | | | | | | | | | |
Net increase (decrease) | | | (79,746 | ) | | $ | (776,783 | ) | | | 775,919 | | | $ | 7,587,141 | |
| | | | | | | | | | | | | | | | |
Small Cap Equity Fund Initial Class | |
Sold | | | 748,535 | | | $ | 7,413,356 | | | | 810,550 | | | $ | 6,946,646 | |
Issued as reinvestment of dividends | | | 488,738 | | | | 4,581,957 | | | | 344,289 | | | | 2,985,481 | |
Redeemed | | | (1,666,648 | ) | | | (16,508,349 | ) | | | (1,650,378 | ) | | | (14,045,628 | ) |
| | | | | | | | | | | | | | | | |
Net increase (decrease) | | | (429,375 | ) | | $ | (4,513,036 | ) | | | (495,539 | ) | | $ | (4,113,501 | ) |
| | | | | | | | | | | | | | | | |
Small Cap Equity Fund Service Class | |
Sold | | | 498,369 | | | $ | 4,891,993 | | | | 196,340 | | | $ | 1,662,742 | |
Issued as reinvestment of dividends | | | 76,502 | | | | 706,144 | | | | 42,763 | | | | 365,594 | |
Redeemed | | | (258,722 | ) | | | (2,520,735 | ) | | | (182,294 | ) | | | (1,519,077 | ) |
| | | | | | | | | | | | | | | | |
Net increase (decrease) | | | 316,149 | | | $ | 3,077,402 | | | | 56,809 | | | $ | 509,259 | |
| | | | | | | | | | | | | | | | |
Special Situations Fund Class II | |
Sold | | | - | | | $ | - | | | | - | | | $ | - | |
Issued as reinvestment of dividends | | | 2,999 | | | | 34,572 | | | | 11,263 | | | | 110,492 | |
Redeemed | | | - | | | | - | | | | - | | | | - | |
| | | | | | | | | | | | | | | | |
Net increase (decrease) | | | 2,999 | | | $ | 34,572 | | | | 11,263 | | | $ | 110,492 | |
| | | | | | | | | | | | | | | | |
Special Situations Fund Service Class I | |
Sold | | | 17,958 | | | $ | 185,012 | | | | 16,009 | | | $ | 140,095 | |
Issued as reinvestment of dividends | | | - | | | | - | | | | 144 | | | | 1,404 | |
Redeemed | | | (2,646 | ) | | | (27,502 | ) | | | (897 | ) | | | (8,232 | ) |
| | | | | | | | | | | | | | | | |
Net increase (decrease) | | | 15,312 | | | $ | 157,510 | | | | 15,256 | | | $ | 133,267 | |
| | | | | | | | | | | | | | | | |
Strategic Emerging Markets Fund Class II | |
Sold | | | 428,946 | | | $ | 4,394,256 | | | | 1,403,238 | | | $ | 11,815,350 | |
Issued as reinvestment of dividends | | | 7,498 | | | | 81,649 | | | | 44,808 | | | | 401,484 | |
Redeemed | | | (2,184,104 | ) | | | (22,897,472 | ) | | | (1,811,377 | ) | | | (15,695,357 | ) |
| | | | | | | | | | | | | | | | |
Net increase (decrease) | | | (1,747,660 | ) | | $ | (18,421,567 | ) | | | (363,331 | ) | | $ | (3,478,523 | ) |
| | | | | | | | | | | | | | | | |
145
Notes to Financial Statements (Continued)
| | | | | | | | | | | | | | | | |
| | | Year Ended December 31, 2017 | | | Year Ended December 31, 2016 | |
| | | | |
| | | Shares | | | Amount | | | Shares | | | Amount | |
Strategic Emerging Markets Fund Service Class I | |
Sold | | | 340,961 | | | $ | 3,526,710 | | | | 288,730 | | | $ | 2,431,282 | |
Issued as reinvestment of dividends | | | - | | | | - | | | | 2,531 | | | | 22,753 | |
Redeemed | | | (211,553 | ) | | | (2,213,746 | ) | | | (175,761 | ) | | | (1,511,499 | ) |
| | | | | | | | | | | | | | | | |
Net increase (decrease) | | | 129,408 | | | $ | 1,312,964 | | | | 115,500 | | | $ | 942,536 | |
| | | | | | | | | | | | | | | | |
| 6. | | Federal Income Tax Information |
At December 31, 2017, the aggregate cost of investments and the unrealized appreciation (depreciation) in the value of all investments owned by the Fund(s), as computed on a federal income tax basis, were as follows:
| | | | | | | | | | | | | | | | |
| | | Federal Income
Tax Cost | | | Tax Basis
Unrealized
Appreciation | | | Tax Basis
Unrealized
(Depreciation) | | | Net Unrealized
Appreciation
(Depreciation) | |
Asset Momentum Fund | | $ | 25,259,074 | | | $ | 4,460,035 | | | $ | (61,330 | ) | | $ | 4,398,705 | |
Dynamic Bond Fund | | | 452,242,978 | | | | 6,653,114 | | | | (7,883,307 | ) | | | (1,230,193 | ) |
Equity Rotation Fund | | | 24,908,199 | | | | 6,438,725 | | | | (161,335 | ) | | | 6,277,390 | |
High Yield Fund | | | 135,649,618 | | | | 4,861,012 | | | | (5,126,657 | ) | | | (265,645 | ) |
Inflation-Protected and Income Fund | | | 763,978,832 | | | | 5,221,733 | | | | (4,014,287 | ) | | | 1,207,446 | |
Short-Duration Bond Fund | | | 245,888,939 | | | | 2,061,658 | | | | (3,110,976 | ) | | | (1,049,318 | ) |
Small Cap Equity Fund | | | 106,295,454 | | | | 26,535,288 | | | | (3,520,836 | ) | | | 23,014,452 | |
Special Situations Fund | | | 19,432,705 | | | | 4,709,938 | | | | (122,812 | ) | | | 4,587,126 | |
Strategic Emerging Markets Fund | | | 88,481,077 | | | | 27,653,779 | | | | (4,491,468 | ) | | | 23,162,311 | |
Net capital loss carryforwards may be applied against any net realized taxable gains in succeeding years, subject to the carryforward period limitations, where applicable. On December 22, 2010, the Regulated Investment Company Modernization Act of 2010 (the “Modernization Act”) was signed by the President. The Modernization Act changed the capital loss carryforward rules as they relate to regulated investment companies. Capital losses generated in tax years beginning after the date of enactment may now be carried forward indefinitely, and retain the character of the original loss. Under pre-enactment law, capital losses could be carried forward for up to eight tax years as short-term capital losses. The provisions affecting the utilization of capital loss carryforwards under the Modernization Act also require the utilization of post-enactment losses prior to the utilization of pre-enactment losses.
At December 31, 2017, for federal income tax purposes, there were no unused capital losses.
At December 31, 2017, the following Fund(s) had post-enactment accumulated capital loss carryforwards:
| | | | | | | | |
| | | Short Term
Capital Loss
Carryforward | | | Long term
Capital Loss
Carryforward | |
Dynamic Bond Fund | | $ | 477,711 | | | $ | 631,504 | |
High Yield Fund | | | 39,518 | | | | 2,291,957 | |
Inflation-Protected and Income Fund | | | 1,637,710 | | | | 2,714,967 | |
Short-Duration Bond Fund | | | 33,440 | | | | 3,785,367 | |
Special Situations Fund | | | 1,387,962 | | | | - | |
Strategic Emerging Markets Fund | | | 3,375,497 | | | | 3,837,956 | |
Net capital loss carryforwards for the Fund(s) shown in the above table are from post-enactment years and are, therefore, not subject to the eight-year carryforward period and possible expiration.
146
Notes to Financial Statements (Continued)
Generally accepted accounting principles in the United States of America require that only distributions in excess of tax basis earnings and profits be reported in the financial statements as a return of capital.
The tax character of distributions (including capital gain dividends, if any, designated pursuant to Section 852 of the Code) paid during the year December 31, 2017, was as follows:
| | | | | | | | | | | | |
| | | Ordinary
Income | | | Long Term
Capital Gain | | | Return of
Capital | |
Asset Momentum Fund | | $ | 926,326 | | | $ | 1,947,974 | | | $ | - | |
Dynamic Bond Fund | | | 15,868,305 | | | | 573,480 | | | | - | |
Equity Rotation Fund | | | 202,311 | | | | 1,458,831 | | | | - | |
High Yield Fund | | | 8,673,722 | | | | - | | | | 582,031 | |
Inflation-Protected and Income Fund | | | 11,359,432 | | | | - | | | | 2,682,686 | |
Short-Duration Bond Fund | | | 6,273,558 | | | | - | | | | 71,344 | |
Small Cap Equity Fund | | | 935,676 | | | | 4,352,425 | | | | - | |
Special Situations Fund | | | 34,572 | | | | - | | | | - | |
Strategic Emerging Markets Fund | | | 81,649 | | | | - | | | | - | |
The tax character of distributions (including capital gain dividends, if any, designated pursuant to Section 852 of the Code) paid during the year ended December 31, 2016, was as follows:
| | | | | | | | | | | | |
| | | Ordinary
Income | | | Long Term
Capital Gain | | | Return of
Capital | |
Asset Momentum Fund | | $ | 148,158 | | | $ | - | | | $ | - | |
Dynamic Bond Fund | | | 12,446,237 | | | | - | | | | - | |
Equity Rotation Fund | | | 261,427 | | | | - | | | | - | |
High Yield Fund | | | 10,177,247 | | | | - | | | | - | |
Inflation-Protected and Income Fund | | | 10,092,229 | | | | - | | | | - | |
Short-Duration Bond Fund | | | 4,301,698 | | | | - | | | | - | |
Small Cap Equity Fund | | | 1,043,899 | | | | 2,307,176 | | | | - | |
Special Situations Fund | | | 76,278 | | | | - | | | | 35,618 | |
Strategic Emerging Markets Fund | | | 424,237 | | | | - | | | | - | |
The following Fund(s) have elected to pass through the foreign tax credit for the year ended December 31, 2017:
| | | | |
| | | Amount | |
Strategic Emerging Markets Fund | | $ | 166,707 | |
Capital accounts within the financial statements are periodically adjusted for permanent differences between book and tax accounting. These adjustments have no impact on net assets or the results of operations. Temporary book and tax accounting differences will reverse in subsequent periods. At December 31, 2017, temporary book and tax accounting differences were primarily attributable to investments in forward contracts, futures contracts, swap agreements, premium amortization accruals, passive foreign investment companies, non-taxable dividends basis adjustments, partnership basis adjustments, treasury inflation protected securities, the deferral of wash sale losses, and deferred Trustee compensation.
147
Notes to Financial Statements (Continued)
At December 31, 2017, the components of distributable earnings on a tax basis were as follows:
| | | | | | | | | | | | | | | | |
| | | Undistributed
Ordinary
Income | | | Undistributed
Long Term
Capital Gain
(Capital Loss
Carryover) | | | Other
Temporary
Differences | | | Unrealized
Appreciation
(Depreciation) | |
Asset Momentum Fund | | $ | 337,029 | | | $ | 464,159 | | | $ | (1,264 | ) | | $ | 4,420,706 | |
Dynamic Bond Fund | | | 191,195 | | | | (1,109,215 | ) | | | (24,606 | ) | | | (1,230,193 | ) |
Equity Rotation Fund | | | 9,351 | | | | 1,839,108 | | | | (1,315 | ) | | | 6,277,390 | |
High Yield Fund | | | - | | | | (2,331,475 | ) | | | (19,309 | ) | | | (265,645 | ) |
Inflation-Protected and Income Fund | | | - | | | | (4,352,677 | ) | | | (84,665 | ) | | | 1,484,399 | |
Short-Duration Bond Fund | | | - | | | | (3,818,807 | ) | | | (32,251 | ) | | | (1,049,318 | ) |
Small Cap Equity Fund | | | 4,007,933 | | | | 11,571,735 | | | | (31,985 | ) | | | 23,014,452 | |
Special Situations Fund | | | - | | | | (1,387,962 | ) | | | (1,142 | ) | | | 4,587,126 | |
Strategic Emerging Markets Fund | | | 170,688 | | | | (7,213,453 | ) | | | (11,624 | ) | | | 23,140,249 | |
During the year ended December 31, 2017, the following amounts were reclassified due to permanent differences between book and tax accounting:
| | | | | | | | | | | | |
| | | Paid-in
Capital | | | Accumulated
Net Realized
Gain (Loss) on
Investments | | | Undistributed
Net Investment
Income (Loss) | |
Asset Momentum Fund | | $ | (555 | ) | | $ | (231,789 | ) | | $ | 232,344 | |
Dynamic Bond Fund | | | 68 | | | | (697,832 | ) | | | 697,764 | |
Equity Rotation Fund | | | (38,398 | ) | | | 39,147 | | | | (749 | ) |
High Yield Fund | | | (581,961 | ) | | | 157,631 | | | | 424,330 | |
Inflation-Protected and Income Fund | | | (2,682,374 | ) | | | (1,251,863 | ) | | | 3,934,237 | |
Short-Duration Bond Fund | | | (71,228 | ) | | | (1,032,067 | ) | | | 1,103,295 | |
Small Cap Equity Fund | | | (909 | ) | | | 90,832 | | | | (89,923 | ) |
Special Situations Fund | | | 7,402 | | | | (15,301 | ) | | | 7,899 | |
Strategic Emerging Markets Fund | | | 39 | | | | (311,070 | ) | | | 311,031 | |
The Funds did not have any unrecognized tax benefits at December 31, 2017, nor were there any increases or decreases in unrecognized tax benefits for the year then ended. The Funds recognize interest and penalties, if any, related to unrecognized tax benefits as an income tax expense in the Statements of Operations. During the year ended December 31, 2017, the Funds did not incur any such interest or penalties. The Funds are subject to examination by U.S. federal and state tax authorities for returns filed for the prior three fiscal years, or the returns filed to date for Funds in existence less than three years. Foreign taxes are provided for based on the Funds’ understanding of the tax rules and rates that exist in the foreign markets in which they invest.
Under the Funds’ organizational documents, current and former Trustees and Officers are provided with specified rights to indemnification against liabilities arising in connection with the performance of their duties to the Funds, and shareholders are indemnified against personal liability for obligations of the Funds. In the normal course of business, the Funds may also enter into contracts that provide general indemnifications. The Funds’ maximum exposure under these arrangements is unknown as this would be dependent on future claims that may be made against the Funds. The risk of material loss from such claims is considered remote.
148
Notes to Financial Statements (Continued)
| 8. | | New Accounting Pronouncements |
In October 2016, the Securities and Exchange Commission (“SEC”) released its Final Rule on Investment Company Reporting Modernization (the “Rule”). The Rule, which introduces two new regulatory reporting forms for investment companies — Form N-PORT and Form N-CEN — also contains amendments to Regulation S-X which impact financial statement presentation, particularly the presentation of derivative investments, for all reporting periods ending after August 1, 2017. Management is still evaluating the impact of the Rule; however, the Funds have adopted the Rule’s Regulation S-X amendments and the Funds’ financial statements are in compliance with those amendments.
In November 2016, The Financial Accounting Standards Board (“FASB”) issued Accounting Standards Update No. 2016-18, “Statement of Cash Flows (Topic 230), Restricted Cash, a consensus of the FASB’s Emerging Issues Task Force” (“ASU 2016- 18”). ASU 2016-18 requires that a statement of cash flows explain the change during the period in the total of cash, cash equivalents, and amounts generally described as restricted cash or restricted cash equivalents. Therefore, amounts generally described as restricted cash and restricted cash equivalents should be included with cash and cash equivalents when reconciling the beginning-of-period and end-of-period total amounts shown on the statement of cash flows. The amendments in ASU 2016-18 do not provide a definition of restricted cash or restricted cash equivalents. ASU 2016-18 is effective for interim and annual reporting periods beginning after December 15, 2017. Management is currently evaluating the implication, if any, of these changes and its impact on the Funds’ financial statements.
In March 2017, FASB issued Accounting Standards Update 2017-08, Receivables — Nonrefundable Fees and Other Costs (Subtopic 310-20): Premium Amortization on Purchased Callable Debt Securities (“ASU 2017-08”). For entities that hold callable debt securities at a premium, ASU 2017-08 requires that the premium be amortized to the earliest call date. ASU 2017-08 would first be effective for fiscal years beginning after December 15, 2018, and interim periods within those fiscal years. Management is currently evaluating the implication, if any, of these changes and its impact on the Funds’ financial statements.
On December 7, 2010, the Trust was named as a defendant and putative member of the proposed defendant class of shareholders named in an adversary proceeding brought by The Official Committee of Unsecured Creditors of Tribune Company (the “Official Committee”) in the U.S. Bankruptcy Court for the District of Delaware, in connection with Tribune Company’s Chapter 11 bankruptcy proceeding (In re Tribune Company). The proceeding relates to a leveraged buyout (“LBO”) transaction by which Tribune Company converted to a privately-held company in 2007, and the putative defendant class is comprised of beneficial owners of shares of Tribune Company who received proceeds (the “Proceeds”) of the LBO. The Official Committee seeks to recover payments of those Proceeds.
The potential amount sought to be recovered from the Small Cap Equity Fund, plus interest and the Official Committee’s court costs, is approximately $93,500.
The Fund cannot predict the outcome of this proceeding. Accordingly, the Fund has not accrued any amounts related to this proceeding. If the proceeding were to be decided in a manner adverse to the Fund, or if the Fund was to enter into a settlement agreement with the Official Committee, the payment of such judgment or settlement could potentially have a material adverse effect on the Fund’s net asset value depending on the net assets of the Fund at the time of such judgment or settlement.
149
Report of Independent Registered Public Accounting Firm
To the Board of Trustees of MML Series Investment Fund II and Shareholders of MML Asset Momentum Fund, MML Dynamic Bond Fund, MML Equity Rotation Fund, MML High Yield Fund, MML Inflation-Protected and Income Fund, MML Short-Duration Bond Fund, MML Small Cap Equity Fund, MML Special Situations Fund, and MML Strategic Emerging Markets Fund (collectively, the “Funds”):
Opinion on the Financial Statements and Financial Highlights
We have audited the accompanying statements of assets and liabilities of the Funds, including the portfolios of investments, as of December 31, 2017, and the related statements of operations for the year then ended, the statement of cash flows for MML Inflation-Protected and Income Fund for the year then ended, the statements of changes in net assets for each of the two years in the period then ended, the financial highlights for each of the periods presented, and the related notes. In our opinion, the financial statements and financial highlights present fairly, in all material respects, the financial position of each of the Funds constituting the MML Series Investment Fund II as of December 31, 2017, and the results of their operations for the year then ended, the cash flows of MML Inflation-Protected and Income Fund for the year then ended, the changes in their net assets for each of the two years in the period then ended, and the financial highlights for each of the periods presented, in conformity with accounting principles generally accepted in the United States of America.
Basis for Opinion
These financial statements and financial highlights are the responsibility of the Funds’ management. Our responsibility is to express an opinion on the Funds’ financial statements and financial highlights based on our audits. We are a public accounting firm registered with the Public Company Accounting Oversight Board (United States) (PCAOB) and are required to be independent with respect to the Funds in accordance with the U.S. federal securities laws and the applicable rules and regulations of the Securities and Exchange Commission and the PCAOB.
We conducted our audits in accordance with the standards of the PCAOB. Those standards require that we plan and perform the audit to obtain reasonable assurance about whether the financial statements and financial highlights are free of material misstatement, whether due to error or fraud. The Funds are not required to have, nor were we engaged to perform, an audit of their internal control over financial reporting. As part of our audits we are required to obtain an understanding of internal control over financial reporting but not for the purpose of expressing an opinion on the effectiveness of the Funds’ internal control over financial reporting. Accordingly, we express no such opinion.
Our audits included performing procedures to assess the risks of material misstatement of the financial statements and financial highlights, whether due to error or fraud, and performing procedures that respond to those risks. Such procedures included examining, on a test basis, evidence regarding the amounts and disclosures in the financial statements and financial highlights. Our audits also included evaluating the accounting principles used and significant estimates made by management, as well as evaluating the overall presentation of the financial statements and financial highlights. Our procedures included confirmation of securities owned as of December 31, 2017, by correspondence with the custodian and brokers; when replies were not received from brokers, we performed other auditing procedures. We believe that our audits provide a reasonable basis for our opinion.
Deloitte & Touche LLP
Boston, Massachusetts
February 21, 2018
We have served as the auditor of one or more of the MassMutual investment companies since 1995.
150
Trustees and Officers (Unaudited)
The following table lists the Trust’s Trustees and Officers; their address and age; their position with the Trust; the length of time holding that position with the Trust; their principal occupation(s) during the past five years; the number of portfolios in the fund complex they oversee; and other directorships they hold in companies subject to registration or reporting requirements of the Securities Exchange Act of 1934 (generally called “public companies”) or in registered investment companies. The Trust’s Statement of Additional Information includes additional information about the Trust’s Trustees and is available, without charge, upon request by calling 1-888-309-3539 or by writing MML Series Investment Fund II, c/o Massachusetts Mutual Life Insurance Company, 100 Bright Meadow Blvd., Enfield, Connecticut 06082-1981, Attention: MassMutual U.S. Product and Marketing.
Disinterested Trustees
| | | | | | | | | | |
Name, Address*, and Age | | Position(s)
Held with
Trust | | Term of
Office** and
Length of
Time Served | | Principal Occupation(s)
During Past 5 Years | | Number of
Portfolios in
Fund Complex
Overseen by Trustee | | Other Directorships Held by Trustee |
Allan W. Blair
Age: 69 | | Trustee | | Since 2012 | | Retired; President and Chief Executive Officer (1996-2014), Economic Development Council of Western Massachusetts (non-profit development company); President and Chief Executive Officer (1984-2014), Westover Metropolitan Development Corporation (quasi-public development company). | | 93 | | Trustee (since 2003), MassMutual Select Funds (open-end investment company); Trustee (since 2003), MML Series Investment Fund (open-end investment company); Trustee (since 2012), MassMutual Premier Funds (open-end investment company). |
| | | | | |
Nabil N. El-Hage
Age: 59 | | Trustee Chairman | | Since 2005 2006-2012 | | Founder and sole member of PR Academy of Executive Education, LLC (since 2016); Chairman (2011-2016), Academy of Executive Education, LLC (predecessor to PR Academy of Executive Education, LLC). | | 93 | | Director (2011-2015), Argo Group International Holdings, Ltd. (underwriter of specialty insurance and reinsurance products); Trustee (since 2012), MassMutual Select Funds (open-end investment company); Trustee (since 2012), MML Series Investment Fund (open-end investment company); Trustee (since 2003), Chairman (2006-2012), MassMutual Premier Funds (open-end investment company). |
| | | | | |
Maria D. Furman
Age: 63 | | Trustee | | Since 2005 | | Retired. | | 93 | | Trustee (since 2011), GMO Series Trust (open-end investment company); Trustee (since 2012), MassMutual Select Funds (open-end investment company); Trustee (since 2012), MML Series Investment Fund (open-end investment company); Trustee (since 2004), MassMutual Premier Funds (open-end investment company). |
| | | | | |
R. Alan Hunter, Jr.
Age: 71 | | Chairperson Trustee | | Since 2016 Since 2012 | | Retired. | | 93 | | Director (since 2007), Actuant Corporation (diversified industrial company); Chairperson (since 2016), Trustee (since 2003), MassMutual Select Funds (open-end investment company); Chairperson (since 2016), Trustee (since 2003), MML Series Investment Fund (open-end investment company); Chairperson (since 2016), Trustee (since 2012), MassMutual Premier Funds (open-end investment company). |
151
Trustees and Officers (Unaudited) (Continued)
| | | | | | | | | | |
Name, Address*, and Age | | Position(s)
Held with
Trust | | Term of
Office** and
Length of
Time Served | | Principal Occupation(s)
During Past 5 Years | | Number of
Portfolios in
Fund Complex
Overseen by Trustee | | Other Directorships Held by Trustee |
C. Ann Merrifield
Age: 66 | | Trustee | | Since 2005 | | Retired; President and Chief Executive Officer (2012-2014), PathoGenetix (genomics company). | | 93 | | Director (since 2015), Juniper Pharmaceuticals Inc. (specialty pharmaceutical company); Director (since 2014), Flexion Therapeutics (specialty pharmaceutical company); Chairperson (since 2017) and Director (since 2014), InVivo Therapeutics (research and clinical-stage biomaterials and biotechnology company); Trustee (since 2012), MassMutual Select Funds (open-end investment company); Trustee (since 2012), MML Series Investment Fund (open-end investment company); Trustee (since 2004), MassMutual Premier Funds (open-end investment company). |
| | | | | |
Susan B. Sweeney
Age: 65 | | Trustee | | Since 2012 | | Retired; Senior Vice President and Chief Investment Officer (2010-2014), Selective Insurance Group (property and casualty company. | | 95^ | | Trustee (since 2012), Barings Corporate Investors (closed-end investment company); Trustee (since 2012), Barings Participation Investors (closed-end investment company); Trustee (since 2009), MassMutual Select Funds (open-end investment company); Trustee (since 2009), MML Series Investment Fund (open-end investment company); Trustee (since 2012), MassMutual Premier Funds (open-end investment company). |
Interested Trustees
| | | | | | | | | | |
Name, Address*, and Age | | Position(s)
Held with
Trust | | Term of
Office** and
Length of
Time Served | | Principal Occupation(s)
During Past 5 Years | | Number of
Portfolios in
Fund Complex
Overseen by Trustee | | Other Directorships Held by Trustee |
Teresa Hassara^^
Age: 55 | | Trustee | | Since 2017 | | Head of Workplace Solutions (since 2017), MassMutual; President of Institutional Retirement (2009-2016), TIAA-CREF. | | 93 | | Director (since 2017), MML Advisers; Trustee (since 2017), MassMutual Select Funds (open-end investment company); Trustee (since 2017), MML Series Investment Fund (open-end investment company); Trustee (since 2017), MassMutual Premier Funds (open-end investment company). |
| | | | | |
Robert E. Joyal^^^
Age: 72 | | Trustee | | Since 2012 | | Retired. | | 95^ | | Director (since 2013), Leucadia National Corporation (holding company); Director (2012-2017), Ormat Technologies, Inc. (provider of alternative and renewable energy technology); Director (2006-2014), Jefferies Group LLC (investment bank); Trustee (since 2003), Barings Corporate Investors (closed-end investment company); Trustee (since 2003), Barings Participation Investors (closed-end investment company); Trustee (since 2003), MassMutual Select Funds (open-end investment company); Trustee (since 2003), MML Series Investment Fund (open-end investment company); Trustee (since 2012), MassMutual Premier Funds (open-end investment company). |
152
Trustees and Officers (Unaudited) (Continued)
Principal Officers who are Not Trustees
| | | | | | | | |
Name, Address*, and Age | | Position(s)
Held with Trust | | Term of
Office# and
Length of
Time Served | | Principal Occupation(s) During Past 5 Years | | Number of
Portfolios in
Fund Complex
Overseen by Officer |
Joseph Fallon
Age: 42 | | Vice President Assistant Vice President | | Since
2017 2015-
2017 | | Investment Director (since 2014), MML Advisers; Head of Investment Consulting & Strategy (since 2017), Investment Director (2006-2017), MassMutual; Vice President (since 2017), Assistant Vice President (2015-2017), MassMutual Select Funds (open-end investment company); Vice President (since 2017), Assistant Vice President (2015-2017), MML Series Investment Fund (open-end investment company); Vice President (since 2017), Assistant Vice President (2015-2017), MassMutual Premier Funds (open-end investment company). | | 93 |
| | | | |
Andrew M. Goldberg
Age: 51 | | Vice President, Secretary (formerly known as “Clerk”), and Chief Legal Officer Assistant Clerk | | Since
2008 2005-
2008 | | Assistant Vice President and Counsel (since 2004), MassMutual; Secretary (since 2015), Assistant Secretary (2013-2015), MML Advisers; Vice President, Secretary, and Chief Legal Officer (since 2008), Assistant Secretary (2001-2008), MassMutual Select Funds (open-end investment company); Vice President, Secretary, and Chief Legal Officer (since 2008), Assistant Secretary (2001-2008), MML Series Investment Fund (open-end investment company); Vice President, Secretary, (formerly known as “Clerk”), and Chief Legal Officer (since 2008), Assistant Clerk (2004-2008), MassMutual Premier Funds (open-end investment company). | | 93 |
| | | | |
Renee Hitchcock
Age: 47 | | Chief Financial Officer and Treasurer Assistant Treasurer | | Since
2016 2007-
2016 | | Assistant Vice President (since 2015), Director (2007-2015), MassMutual; Chief Financial Officer and Treasurer (since 2016), Assistant Treasurer (2007-2016), MassMutual Select Funds (open-end investment company); Chief Financial Officer and Treasurer (since 2016), Assistant Treasurer (2007-2016), MML Series Investment Fund (open-end investment company); Chief Financial Officer and Treasurer (since 2016), Assistant Treasurer (2007-2016), MassMutual Premier Funds (open-end investment company). | | 93 |
| | | | |
Jill Nareau Robert
Age: 45 | | Vice President and Assistant Secretary Assistant Secretary (formerly known as “Assistant Clerk”) | | Since
2017 2008-
2017 | | Assistant Vice President and Counsel (since 2009), MassMutual; Assistant Secretary (since 2015), MML Advisers; Vice President and Assistant Secretary (since 2017), Assistant Secretary (2008-2017), MassMutual Select Funds (open-end investment company); Vice President and Assistant Secretary (since 2017), Assistant Secretary (2008-2017), MML Series Investment Fund (open-end investment company); Vice President and Assistant Secretary (since 2017), Assistant Secretary (formerly known as “Assistant Clerk”) (2008-2017), MassMutual Premier Funds (open-end investment company). | | 93 |
| | | | |
Douglas Steele
Age: 42 | | Vice President | | Since
2016 | | Vice President and Head of Investment Management (since 2017), Head of Investment Due Diligence (2016-2017), MML Advisers; Head of Investment Management (since 2017), Assistant Vice President (2013-2017), Investment Director (2005-2013), MassMutual; Vice President (since 2016), MassMutual Select Funds (open-end investment company); Vice President (since 2016), MML Series Investment Fund (open-end investment company); Vice President (since 2016), MassMutual Premier Funds (open-end investment company). | | 93 |
153
Trustees and Officers (Unaudited) (Continued)
| | | | | | | | |
Name, Address*, and Age | | Position(s)
Held with Trust | | Term of
Office# and
Length of
Time Served | | Principal Occupation(s) During Past 5 Years | | Number of
Portfolios in
Fund Complex
Overseen by Officer |
Philip S. Wellman
Age: 53 | | Vice President and Chief Compliance Officer | | Since
2007 | | Vice President and Chief Compliance Officer (since 2013), MML Advisers; Vice President, Associate General Counsel, and Chief Compliance Officer (Mutual Funds) (since 2014), Vice President, Associate General Counsel, and Chief Compliance Officer (Mutual Funds and Investment Advisory) (2008-2014), MassMutual; Vice President and Chief Compliance Officer (since 2007), MassMutual Select Funds (open-end investment company); Vice President and Chief Compliance Officer (since 2007), MML Series Investment Fund (open-end investment company); Vice President and Chief Compliance Officer (since 2007), MassMutual Premier Funds (open-end investment company). | | 93 |
| | | | |
Eric H. Wietsma
Age: 51 | | Vice President | | Since
2006
| | Director and President (since 2013), MML Advisers; Senior Vice President (since 2010), MassMutual; President (since 2008), Vice President (2006-2008), MassMutual Select Funds (open-end investment company); Vice President (since 2006), MML Series Investment Fund (open-end investment company); President (since 2008), Vice President (2006-2008), MassMutual Premier Funds (open-end investment company). | | 93 |
| | | | |
Tina Wilson
Age: 47 | | Vice President | | Since
2016 | | Vice President and Head of Investments (since 2016), MML Advisers; Senior Vice President (since 2014), Vice President (2009-2014), MassMutual; Vice President (since 2016), MassMutual Select Funds (open-end investment company); President (since 2017), Vice President (2016-2017), MML Series Investment Fund (open-end investment company); Vice President (since 2016), MassMutual Premier Funds (open-end investment company). | | 93 |
| * | The address of each Trustee and Principal Officer is the same as that for the Trust; 100 Bright Meadow Blvd., Enfield, CT 06082-1981. |
| ** | Each Trustee of the Trust serves until the next meeting of shareholders called for the purpose of electing Trustees and until the election and qualification of his or her successor or until he or she dies, resigns, or is removed. Notwithstanding the foregoing, unless the Trustees determine that it is desirable and in the best interest of the Trust that an exception to the retirement policy of the Trust be made, a Trustee shall retire and cease to serve as a Trustee upon the conclusion of the calendar year in which such Trustee attains the age of seventy-five years, however, with the exception of Mr. Robert E. Joyal, an interested Trustee of the Trust shall no longer serve as a Trustee if or when they are no longer an employee of MassMutual or an affiliate. |
| | The Chairperson is elected to hold such office for a term of three years or until their successor is elected and qualified to carry out the duties and responsibilities of their office, or until he or she retires, dies, resigns, is removed, or becomes disqualified. The Chairperson shall hold office at the pleasure of the Trustees. |
| ^ | Barings Participation Investors and Barings Corporate Investors are deemed to be a part of the Fund Complex, because they are managed by Barings LLC, an affiliate of MML Advisers. |
| ^^ | Ms. Hassara is an “Interested Person,” as that term is defined in the 1940 Act, as an employee of MassMutual. |
| ^^^ | Mr. Joyal is an “Interested Person,” as that term is defined in the 1940 Act, through his position as a director of Leucadia National Corporation, which controls Jefferies Group LLC, a broker-dealer that may execute portfolio transactions and/or engage in principal transactions with the Funds, other investment companies advised by MML Advisers or holding themselves out to investors as related companies for purposes of investment or investor services, or any other advisory accounts over which MML Advisers has brokerage placement discretion. |
| # | The President, Treasurer, and Secretary and such other officers as the Trustees may in their discretion from time to time elect are elected to hold such office until their successor is elected and qualified to carry out the duties and responsibilities of their office, or until he or she dies, resigns, is removed, or becomes disqualified. Each officer shall hold office at the pleasure of the Trustees. |
154
Federal Tax Information (Unaudited)
For corporate shareholders, a portion of the ordinary dividends paid during the Fund(s)’ year ended December 31, 2017, qualified for the dividends received deduction, as follows:
| | | | |
| |
| | | Dividends Received
Deductions | |
Asset Momentum Fund | | | 6.56% | |
Equity Rotation Fund | | | 100.00% | |
Small Cap Equity Fund | | | 97.53% | |
Special Situations Fund | | | 100.00% | |
Strategic Emerging Markets Fund | | | 9.09% | |
For the year ended December 31, 2017, the following Fund(s) earned the following foreign sources of income:
| | | | |
| |
| | | Amount | |
Strategic Emerging Markets Fund | | $ | 1,834,150 | |
155
Other Information (Unaudited)
Proxy Voting
A description of the policies and procedures that each Fund’s investment adviser and subadvisers use to vote proxies relating to the Fund’s portfolio securities is available, without charge, upon request, by calling 1-888-309-3539, and on the SEC’s EDGAR database on its website at http://www.sec.gov.
Information regarding how the Funds voted proxies relating to portfolio securities during the most recent 12-month period ended June 30 is available, without charge, upon request, on the MassMutual website at http://www.massmutual.com/funds and on the SEC’s EDGAR database on its website at http://www.sec.gov.
Quarterly Reporting
The Funds file their complete schedule of portfolio holdings with the SEC for the first and third quarters of each fiscal year on Form N-Q. The Funds’ Forms N-Q are available on the SEC’s EDGAR database on its website at http://www.sec.gov and may be reviewed and copied at the SEC’s Public Reference Room in Washington D.C. Information on the operation of the SEC’s Public Reference Room may be obtained by calling 1-800-SEC-0330.
Trustees’ Approval of Investment Advisory Contracts
At their meeting in September 2017, the Trustees, including the Trustees who are not “interested persons” (as such term is defined in the 1940 Act) of the Trust, MML Advisers, or the subadvisers (the “Independent Trustees”), reviewed and approved a proposal to make changes to the existing subadvisory agreement between MML Advisers and OppenheimerFunds, Inc. for the Strategic Emerging Markets Fund to clarify its terms with respect to foreign currency transactions (the “Amended Agreement”).
Prior to the vote being taken to approve the Amended Agreement, the Independent Trustees met separately in executive session to discuss the appropriateness of the contract. The Independent Trustees weighed the foregoing matters in light of the advice given to them by their independent legal counsel as to the law applicable to the review of investment advisory contracts. In arriving at a decision, the Trustees, including the Independent Trustees, did not identify any single matter as all-important or controlling. The foregoing summary does not detail all of the matters considered.
The Amended Agreement became effective on September 14, 2017.
156
Other Information (Unaudited) (Continued)
Fund Expenses December 31, 2017
Expense Examples:
The following information is in regards to expenses for the six months ended December 31, 2017:
As a shareholder of the Funds, you incur ongoing costs, including advisory fees, distribution and/or service (12b-1) fees, and other Fund expenses. These examples are intended to help you understand your ongoing costs (in dollars) of investing in the Funds and to compare these costs with the ongoing costs of investing in other mutual funds. These examples are based on an investment of $1,000 invested for the six months ended December 31, 2017.
Actual Expenses:
The first four columns of the table below provide information about actual account values and actual expenses. You may use this information, together with the amount you invested, to estimate the expenses that you paid over the period. Simply divide your account value by $1,000 (for example, an $8,600 account value divided by $1,000 = 8.6), then multiply the result by the number under the heading entitled “Operating Expenses Incurred” to estimate the expenses you paid on your account during this period.
Hypothetical Example for Comparison Purposes:
The last two columns of the table below provide information about hypothetical account values and hypothetical expenses based on the Fund’s actual expense ratio and an assumed rate of return of 5% per year before expenses, which is not the Fund’s actual return. The hypothetical account values and expenses may not be used to estimate the actual ending account balance or expenses you paid for the period. You may use this information to compare the ongoing costs of investing in the Fund and other funds. To do so, compare this 5% hypothetical example with the 5% hypothetical examples that appear in the shareholder reports of the other funds.
Please note that the expenses shown in the table are meant to highlight your ongoing costs only and do not reflect any transactional costs. Therefore, the last two columns of the table are useful in comparing ongoing costs only, and will not help you determine the relative total costs of owning different funds. In addition, if these transactional costs were included, your costs would have been higher.
| | | | | | | | | | | | | | | | | | | | | | | | |
| | | Beginning
Value | | | Annualized
Expense
Ratio | | | Ending
Value (Based
on Actual
Returns and
Expenses) | | | Operating
Expenses
Incurred* | | | Ending
Value (Based
on
Hypothetical
Returns and
Expenses) | | | Operating
Expenses
Incurred* | |
| Asset Momentum Fund | | | | | | | | | | | | | | | | | | | | | | | | |
Class II | | $ | 1,000 | | | | 0.80 | % | | $ | 1,181.30 | | | $ | 4.40 | | | $ | 1,021.20 | | | $ | 4.08 | |
Service Class I | | | 1,000 | | | | 1.05 | % | | | 1,180.50 | | | | 5.77 | | | | 1,019.90 | | | | 5.35 | |
| Dynamic Bond Fund | | | | | | | | | | | | | | | | | | | | | | | | |
Class II | | | 1,000 | | | | 0.59 | % | | | 1,013.40 | | | | 2.99 | | | | 1,022.20 | | | | 3.01 | |
Service Class I | | | 1,000 | | | | 0.84 | % | | | 1,011.60 | | | | 4.26 | | | | 1,021.00 | | | | 4.28 | |
| Equity Rotation Fund | | | | | | | | | | | | | | | | | | | | | | | | |
Class II | | | 1,000 | | | | 0.65 | % | | | 1,162.70 | | | | 3.54 | | | | 1,021.90 | | | | 3.31 | |
Service Class I | | | 1,000 | | | | 0.90 | % | | | 1,161.80 | | | | 4.90 | | | | 1,020.70 | | | | 4.58 | |
| High Yield Fund | | | | | | | | | | | | | | | | | | | | | | | | |
Class II | | | 1,000 | | | | 0.74 | % | | | 1,019.20 | | | | 3.77 | | | | 1,021.50 | | | | 3.77 | |
Service Class I | | | 1,000 | | | | 0.99 | % | | | 1,017.40 | | | | 5.03 | | | | 1,020.20 | | | | 5.04 | |
157
Other Information (Unaudited) (Continued)
| | | | | | | | | | | | | | | | | | | | | | | | |
| | | Beginning
Value | | | Annualized
Expense
Ratio | | | Ending
Value (Based
on Actual
Returns and
Expenses) | | | Operating
Expenses
Incurred* | | | Ending
Value (Based
on
Hypothetical
Returns and
Expenses) | | | Operating
Expenses
Incurred* | |
| Inflation-Protected and Income Fund | | | | | | | | | | | | | | | | | | | | | | | | |
Initial Class | | $ | 1,000 | | | | 0.59 | % | | $ | 1,021.30 | | | $ | 3.01 | | | $ | 1,022.20 | | | $ | 3.01 | |
Service Class | | | 1,000 | | | | 0.84 | % | | | 1,020.40 | | | | 4.28 | | | | 1,021.00 | | | | 4.28 | |
| Short-Duration Bond Fund | | | | | | | | | | | | | | | | | | | | | | | | |
Class II | | | 1,000 | | | | 0.55 | % | | | 1,007.80 | | | | 2.78 | | | | 1,022.40 | | | | 2.80 | |
Service Class I | | | 1,000 | | | | 0.80 | % | | | 1,006.00 | | | | 4.04 | | | | 1,021.20 | | | | 4.08 | |
| Small Cap Equity Fund | | | | | | | | | | | | | | | | | | | | | | | | |
Initial Class | | | 1,000 | | | | 0.71 | % | | | 1,067.90 | | | | 3.70 | | | | 1,021.60 | | | | 3.62 | |
Service Class | | | 1,000 | | | | 0.96 | % | | | 1,066.60 | | | | 5.00 | | | | 1,020.40 | | | | 4.89 | |
| Special Situations Fund | | | | | | | | | | | | | | | | | | | | | | | | |
Class II | | | 1,000 | | | | 0.80 | % | | | 1,104.00 | | | | 4.24 | | | | 1,021.20 | | | | 4.08 | |
Service Class I | | | 1,000 | | | | 1.05 | % | | | 1,102.70 | | | | 5.56 | | | | 1,019.90 | | | | 5.35 | |
| Strategic Emerging Markets Fund | | | | | | | | | | | | | | | | | | | | | | | | |
Class II | | | 1,000 | | | | 1.35 | % | | | 1,135.20 | | | | 7.27 | | | | 1,018.40 | | | | 6.87 | |
Service Class I | | | 1,000 | | | | 1.60 | % | | | 1,135.20 | | | | 8.61 | | | | 1,017.10 | | | | 8.13 | |
| * | Expenses are calculated using the annualized expense ratio for the six months ended December 31, 2017, multiplied by the average account value over the period, multiplied by 184 days in the period, divided by 365 days in the year, unless stated otherwise. The annualized expense ratio does not reflect expenses deducted under the variable life insurance or variable annuity contract through which the Funds are invested in. Inclusion of these expenses would increase the annualized expense ratios shown. |
158
| | |
Underwriter: MML Distributors, LLC 100 Bright Meadow Blvd. Enfield, CT 06082-1981 | | |

| | |
© 2018 Massachusetts Mutual Life Insurance Company (MassMutual), Springfield, MA 01111-0001. All rights reserved. www.massmutual.com. Investment Adviser: MML Investment Advisers, LLC | | RS-44299-00 |
Item 2. Code of Ethics.
As of December 31, 2017, the Registrant adopted a Code of Ethics that applies to the Principal Executive Officer and Principal Financial Officer pursuant to the Sarbanes-Oxley Act of 2002. For the year ended December 31, 2017, there were no reportable amendments to a provision of the Code of Ethics. A copy of its Code of Ethics is filed with this Form N-CSR under Item 13(a)(1).
Item 3. Audit Committee Financial Expert.
The Registrant’s Board of Trustees has determined that Susan B. Sweeney and Nabil N. El-Hage, both members of the Audit Committee, are audit committee financial experts as defined by the Securities and Exchange Commission (the “SEC”). Ms. Sweeney and Mr. El-Hage are both “independent” as defined by the SEC for purposes of audit committee financial expert determinations.
Item 4. Principal Accountant Fees and Services.
References below to Deloitte & Touche LLP include its affiliates where applicable.
| | (a) | AUDIT FEES: The aggregate fees billed to the Registrant for professional services rendered by its independent auditors, Deloitte & Touche LLP, for the audit of the Registrant’s annual financial statements for the fiscal years ended 2017 and 2016 were $405,855 and $396,013, respectively. |
| | (b) | AUDIT RELATED FEES: No such fees were billed to the Registrant by Deloitte & Touche LLP for the fiscal years ended 2017 and 2016. No such fees were billed to the Registrant’s adviser and any entity controlling, controlled by, or under common control with the adviser that provides ongoing services to the Registrant by Deloitte & Touche LLP* for the fiscal years ended 2017 and 2016. |
| | (c) | TAX FEES: The aggregate fees billed to the Registrant for professional services rendered by Deloitte & Touche LLP for the review of Form 1120-RIC, Form 8613, excise distribution projections, distribution calculation and reasonable out of pocket expenses for the fiscal years ended 2017 and 2016 were $82,164 and $79,857, respectively. No such fees were billed to the Registrant’s adviser and any entity controlling, controlled by, or under common control with the adviser that provides ongoing services to the Registrant by Deloitte & Touche LLP* for the fiscal years ended 2017 and 2016. |
| | (d) | ALL OTHER FEES: No such fees were billed to the Registrant by Deloitte & Touche LLP for the fiscal years ended 2017 and 2016. No such fees were billed to the Registrant’s adviser and any entity controlling, controlled by, or under common control with the adviser that provides ongoing services to the Registrant by Deloitte & Touche LLP* for the fiscal years ended 2017 and 2016. |
| | (e) | (1) AUDIT COMMITTEE PRE-APPOVAL POLICY: All services to be performed for the Registrant by Deloitte & Touche LLP must be pre-approved by the audit committee. All services performed during the fiscal years ended 2017 and 2016 were pre-approved by the committee. |
(2) Not applicable.
| | (g) | The aggregate non-audit fees billed by Deloitte & Touche LLP for services rendered to the Registrant, the Registrant’s adviser and any entity controlling, controlled by, or under common control with the adviser that provides ongoing services to the Registrant, for the fiscal years ended 2017 and 2016 were $12,495,135 and $13,284,827, respectively. |
| | (h) | The audit committee considers whether the provision of non-audit services by Deloitte & Touche LLP to the Registrant’s adviser and any entity controlling, controlled by, or under common control with the adviser that provides ongoing services to the Registrant that were not pre-approved pursuant to paragraph (c)(7)(ii) of Rule 2-01 of Regulation S-X is compatible with maintaining Deloitte & Touche LLP’s independence. |
| | * | Refers to fees that were required to be approved by the audit committee for services that relate directly to the operations and financial reporting of the Registrant. |
Item 5. Audit Committee of Listed Registrants.
Not applicable to this filing.
Item 6. Investments.
Please see portfolio of investments contained in the Reports to Stockholders included under Item 1 of this form N-CSR.
Item 7. Disclosure of Proxy Voting Policies and Procedures for Closed-End Management Investment Companies.
Not applicable to this filing.
Item 8. Portfolio Managers of Closed-End Management Investment Companies.
Not applicable to this filing.
Item 9. Purchases of Equity Securities by Closed-End Management Investment Company and Affiliated Purchasers.
Not applicable to this filing.
Item 10. Submission of Matters to a Vote of Security Holders.
Not applicable to this filing.
Item 11. Controls and Procedures.
(a) The Registrant’s Principal Executive Officer and Principal Financial Officer have concluded that the Registrant’s disclosure controls and procedures (as defined in Rule 30a-3(c) under the Investment Company Act of 1940, as amended (the “1940 Act”) (17 CFR 270.30a-3(c))) are effective, as of a date within 90 days of the filing date of this Form N-CSR, to provide reasonable assurance that the information required to be disclosed by the Registrant on Form N-CSR is recorded, processed, summarized, and reported within the time periods specified in the SEC’s rules and forms, based on their evaluation of these disclosure controls and procedures required by Rule 30a-3(b) under the 1940 Act (17 CFR 270.30a-3(b)) and Rules 13a-15(b) or 15d-15(b) under the Securities Exchange Act of 1934 (17 CFR 240.13a-15(b) or 240.15d-15(b)).
(b) There were no changes in the Registrant’s internal control over financial reporting (as defined in Rule 30a-3(d) under the 1940 Act (17 CFR 270.30a-3(d))) that occurred during the Registrant’s most recent fiscal quarter that has materially affected, or is reasonably likely to materially affect, the Registrant’s internal control over financial reporting.
Item 12. Disclosure of Securities Lending Activities for Closed-End Management Investment Companies
Not applicable to this filing.
Item 13. Exhibits.
(a)(1) Code of Ethics (Item 2) is attached.
(a)(2) Certifications of the Principal Executive Officer and Principal Financial Officer of the Registrant as required by Rule 30a-2(a) under the 1940 Act (17 CFR 270.30a-2(a)) are attached hereto as Exhibit 99CERT.
(a)(3) Not applicable to this filing.
(a)(4) Not applicable to this filing.
(b) Certifications pursuant to Section 906 of the Sarbanes-Oxley Act of 2002 as required by Rule 30a-2(b), under the 1940 Act (17 CFR 270.30a-2(b)), Rule 15d-14(b) under the Securities Exchange Act of 1934 (17 CFR 240.15d-
14(b)) and Section 1350 of Chapter 63 of Title 18 of the United States Code (18 U.S.C. 1350) are attached hereto as Exhibit 99.906CERT.
SIGNATURES
Pursuant to the requirements of the Securities Exchange Act of 1934 and the Investment Company Act of 1940, the registrant has duly caused this report to be signed on its behalf by the undersigned, thereunto duly authorized.
| | |
(Registrant) | | MML Series Investment Fund II |
| | |
By (Signature and Title) | | /s/ Tina Wilson |
| | Tina Wilson, President and Principal Executive Officer |
Date 2/21/2018
Pursuant to the requirements of the Securities Exchange Act of 1934 and the Investment Company Act of 1940, this report has been signed below by the following persons on behalf of the registrant and in the capacities and on the dates indicated.
| | |
By (Signature and Title) | | /s/ Tina Wilson |
| | Tina Wilson, President and Principal Executive Officer |
Date 2/21/2018
| | |
| By (Signature and Title) | | /s/ Renee Hitchcock |
| | Renee Hitchcock, Treasurer and Principal Financial Officer |
Date 2/21/2018