UNITED STATES
SECURITIES AND EXCHANGE COMMISSION
Washington, D.C. 20549
FORM N-CSR
CERTIFIED SHAREHOLDER REPORT OF REGISTERED
MANAGEMENT INVESTMENT COMPANIES
Investment Company Act file number 811-21714
MML Series Investment Fund II
(Exact name of registrant as specified in charter)
100 Bright Meadow Blvd., Enfield, CT 06082
(Address of principal executive offices) (Zip code)
Brian Haendiges
100 Bright Meadow Blvd., Enfield, CT 06082
(Name and address of agent for service)
Registrant’s telephone number, including area code: (860) 562-1000
Date of fiscal year end: 12/31/2016
Date of reporting period: 12/31/2016
Item 1. Reports to Stockholders.
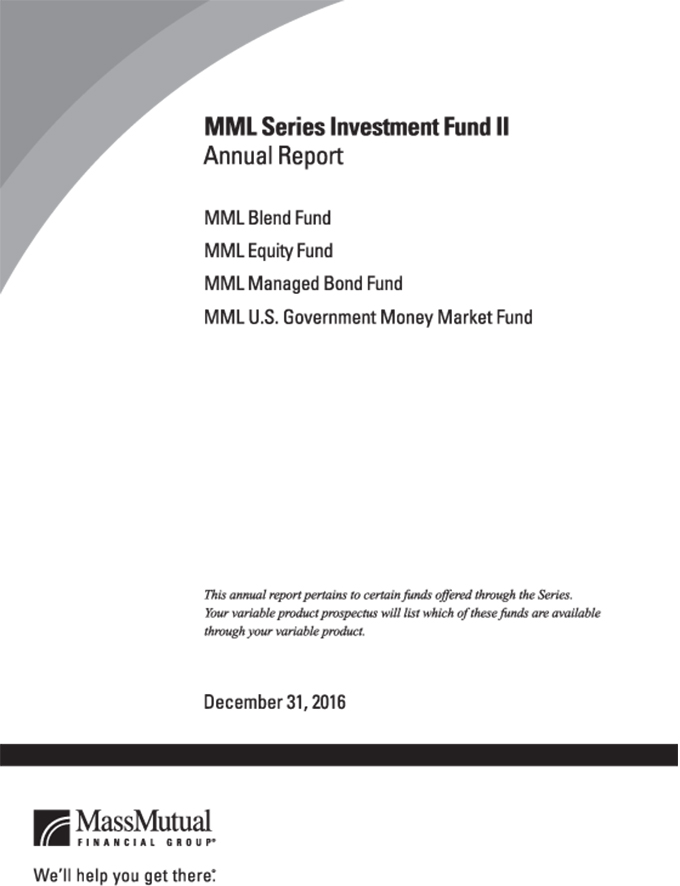
Table of Contents
This material must be preceded or accompanied by a current prospectus (or summary prospectus, if available) for the MML Series Investment Fund II. Investors should consider a Fund’s investment objective, risks, and charges and expenses carefully before investing. This and other information about the investment company is available in the prospectus (or summary prospectus, if available). Read it carefully before investing.
MML Series Investment Fund II – President’s Letter to Shareholders (Unaudited)
To Our Shareholders

Brian Haendiges
“MassMutual believes that changing market conditions are a way of life for retirement investors – but these same conditions have the potential to reward patient investors who maintain a long-term perspective, instead of reacting to short-term market movements.���
December 31, 2016
Continued strength in U.S. markets in a challenging market environment
I am pleased to present you with the MML Series Investment Fund II Annual Report, covering the year ended December 31, 2016 (the “fiscal year”). Domestic stocks outperformed most international equities during the fiscal year, as a strong market environment in the U.S. accelerated. Much of the strength occurred late in the reporting period, due to the surprising Republican victory in the race for the White House – as investors were buoyed by President-elect Trump’s promises for tax abatements and infrastructure spending. Economic difficulties elsewhere in the world – such as the challenging interest rate environment in Japan, uncertainty in Europe and the United Kingdom’s surprising Brexit vote that ratified an eventual exit from the European Union – had virtually no impact on U.S. stock indexes. Nevertheless, during the reporting period, recurring market volatility served as a general reminder for investors that market conditions are cyclical and can change anytime.
In MassMutual’s view, the ongoing uncertainties in markets today highlight the importance of taking a long-term perspective and not reacting to current events or short-term market changes. We also believe retirement investors who follow certain investment guidelines, such as the ones below, may increase their chances of reaching their retirement income goals.
Suggestions for retirement investors under any market conditions
Contribute as much as you can
While it is impossible to control your investments’ performance, you can control how often and how much you save. Contributing to your retirement account on a regular basis and increasing your contribution level as often as you are able, may be one way to help you realize your long-term investment objectives.*
Continue to invest
Some of the most sophisticated investors believe that individuals who can withstand a market downturn have the potential to be rewarded by accumulating larger positions at more favorable prices (relative to those who do not continue investing during a down market). That’s why most financial professionals believe it’s important to stay in the market, regardless of short-term results.
Time may be on your side
For most people, investing for retirement occurs over many decades. While retirement investors often know that the financial markets will be volatile from time to time, seasoned investors tend to understand the wisdom of taking a long-term approach. They know that this can help them navigate the market’s downturns, leverage its upturns, and successfully grow their account balances.
Monitor your asset allocation and diversify
Stocks, bonds, and short-term/money market investments are investment types that typically behave differently depending upon the economic and market environment. Each of these categories contains an even greater array of sub-categories, such as small-cap stocks, international stocks, and high-yield bonds. Many financial professionals believe that investors can take advantage of different opportunities in the market and reduce the risk of over-exposure to one or two poorly performing investment types by maintaining a portfolio that includes a mix of investment types and sub-categories.
| | * | Systematic investing and asset allocation do not ensure a profit or protect against loss in a declining market. Systematic investing involves continuous investment in securities regardless of fluctuating price levels. Investors should consider their ability to continue investing through periods of low price levels. |
(Continued)
1
MML Series Investment Fund II – President’s Letter to Shareholders (Unaudited) (Continued)
Make informed choices and seek professional guidance
Many financial advisors will suggest that retirement investors select an appropriate combination of investments that aligns with their retirement income goals. Doing so can help you weather the inevitable ups and downs of the markets.
For retirement investors who work with a financial professional
If you work with a financial professional, this may be an excellent time to contact him or her for assistance in assessing whether or not you:
| • | | are saving enough for retirement based on your long-term needs; |
| • | | are invested properly, based on your goals and objectives and where you are in your retirement planning journey; and |
| • | | feel you are taking the right steps to help reduce the risk you could outlive your retirement savings. |
Protect who matters most
MassMutual believes that nothing matters more than the safety and well-being of your loved ones. That’s why we have always been committed to helping our customers put themselves on the path to a more secure financial future. And it’s why we have always encouraged retirement investors to maintain perspective over the long term. In our view, changing market conditions are a way of life for retirement investors, but these same conditions have the potential to reward patient investors who maintain a long-term perspective, instead of reacting to short-term market movements. Thank you for your continued trust in MassMutual.
Sincerely,

Brian Haendiges
President
The information provided is the opinion of MassMutual Funds Investment Management Group as of 1/1/17 and is subject to change without notice. It is not to be construed as tax, legal or investment advice. Of course, past performance does not guarantee future results.
2
MML Series Investment Fund II – Economic and Market Overview (Unaudited)
December 31, 2016
Economic Overview and Market Commentary
We note three significant and unexpected events that were followed by meaningful market movements in 2016. The first followed Federal Reserve (Fed) Board Chair Janet Yellen’s testimony before the U.S. Senate Committee on Banking, Housing, and Urban Affairs on February 11, 2016, where she confirmed a “slower for longer” plan for interest rate hikes going forward. The second followed the United Kingdom’s surprising June 23 referendum to leave the European Union – commonly referred to as “Brexit” (an abbreviation for “British exit”). The third followed Donald J. Trump’s election as the 45th President of the United States on November 8.
Throughout 2016, the initially sluggish domestic economy started to return more positive reports as modest gross domestic product (GDP) estimates were revised upward. (GDP reflects the total value of goods and services produced in the United States.) Investors responded favorably and domestic equity markets delivered broad positive returns for the fiscal year. Equity returns in the foreign and emerging markets ended the year more mixed.
For the year, the Dow Jones Industrial AverageSM (Dow) grew 16.50% and the broader S&P 500® Index (S&P 500) of large-capitalization U.S. stocks gained 11.96%. The technology-focused NASDAQ Composite® Index managed an 8.87% return, as tech stocks lagged the other indexes following the U.S. election. Small-cap equities outperformed for the year, with the Russell 2000® Index of small-capitalization stocks adding 21.31%. In foreign markets, the MSCI EAFE® Index, a barometer for foreign stocks in developed markets, gained only 1.00%, though the MSCI Emerging Markets Index, a measure of the performance of emerging stock markets throughout the world, rose 11.19%.* While developed foreign markets struggled under the weight of Brexit and longer-term fiscal burdens, emerging markets derived more of their value from domestic interactions and benefited more from that alignment.
Bonds performed well for much of the year, but dropped sharply following the U.S. election, as investors tried to anticipate what political policy might mean for bond markets in 2017 and beyond. The Bloomberg Barclays U.S. Aggregate Bond Index, a broad measure of the U.S. investment-grade bond markets, rose as much as 6% in July, but ended the year up only 2.65%. The performance of shorter-term debt investments continued to reflect the unrelenting low interest rate environment. Yields on the 2-year U.S. Treasury bond closed the year at 1.19%, while 10-year Treasury bonds yielded 2.44% at year end. These higher year-over-year yields reflect the turbulence in the fixed-income markets following the U.S. election. A “risk-on” environment developed as the year unfolded and high-yield bonds benefited. The Bloomberg Barclays U.S. Corporate High-Yield Index, which measures the performance of fixed-rate, below-investment-grade debt from corporate sectors, returned 17.13%.*
These returns were not without market volatility and surprises, however. Before rebounding, major indexes fell sharply through January and into February – until the Fed’s announcement triggered a more sustained period of growth. Markets stuttered briefly in May over concerns that Apple might not be able to sustain its growth in the smartphone market. Following a brief post-Brexit drop in late June, neither the surprising Brexit outcome nor global economic turbulence could disrupt the upward momentum in U.S. markets. Particularly noteworthy is the fact that domestic equity markets added nearly half of their annual returns in the final seven weeks of the year, as investors cheered President-elect Trump’s promises for tax abatements and infrastructure spending.
Q1 2016 – The inflection point
Headwinds affecting markets in late 2015 continued into January and early February of 2016. China’s slowing economy and falling crude oil prices, along with a weak January employment report, stoked fears that a U.S. recession could be on the near-term horizon. By February 11, the S&P 500 had dropped to 1,810. At this point, Fed Chair Janet Yellen signaled that the central bank would be patient in beginning to normalize policy interest rates and that it was unlikely that economic conditions would warrant an increase in the target range for the federal funds rate for at least the next few Open Market Committee meetings. (The federal funds rate is the interest rate that banks and financial institutions charge each other for borrowing funds overnight.)
Headwinds ultimately shifted to tailwinds. The S&P 500 gained nearly 250 points by the end of the first quarter, initiating a rally that would more or less be sustained throughout the second and third quarters of 2016. The employment picture improved, as February’s non-farm payrolls came in stronger than the previous two months, and December 2015 and January 2016 payroll numbers were revised upward. Once again, the quarter recovered what it had lost and ended essentially where it started the year. Despite this, the climate had changed.
| * | Indexes are unmanaged, do not incur fees or expenses and cannot be purchased directly for investment. |
3
MML Series Investment Fund II – Economic and Market Overview (Unaudited) (Continued)
Q2 2016 – Domestic markets override negative interest rates and Brexit
While Britain’s historic Brexit vote dominated news at the end of the second quarter, the unusual arrival of negative interest rates for Japan’s sovereign debt proved puzzling for many investors early in the quarter. Both seemed to feed a “flight to quality” reaction that resulted in a stronger U.S. dollar. Neither event, however, derailed the strengthening U.S. economy. By the end of the second quarter, concerns about China’s economy and falling oil prices moderated. U.S. GDP firmed up and the Fed softened its interest rate strategy, taking a more cautious approach. May’s disappointing jobs report created investor concerns that the Fed could seriously consider suspending any interest rate hikes for at least a year. Nevertheless, the quarter ended with broad-based gains across a variety of asset classes, improved consumer spending, low unemployment rates, and better-than-expected corporate earnings reports.
On June 23, global economic focus shifted to the United Kingdom. The Brexit vote pushed European stocks more deeply into negative territory on concerns that the immediate impact might slow growth in the U.K. and the larger European region. Investors also worried that the British vote might encourage other countries to follow suit. Interestingly, emerging market and Pacific country stocks delivered positive returns for the quarter and year-to-date.
Q3 2016 – Campaign rhetoric overshadows economic momentum
By the end of July, it seemed markets had shrugged off Brexit fears. The U.S. economy was gathering steam, as evidenced on several fronts. The U.S. labor market continued to show strength as job openings rose in June and hiring increased. U.S. consumer confidence hit a 12-month high in August, according to the Conference Board’s Consumer Confidence Index®, which reflected improved consumer assessment of economic conditions and the six-month economic outlook. Corporate earnings came in better than expected for the second consecutive quarter, even though it was the fifth consecutive declining quarter. In mid-September, the U.S. Census Bureau announced that real median household income had jumped 5%, the biggest annual increase since they first started gathering this data in 1968. The two major U.S. presidential candidates accepted their party’s nominations in July. As September came to a close, it became more evident that the upcoming election would be both hotly contested and divisive.
Q4 2016 – The Fed takes a back seat
Prior to the November elections, the Fed held the throttle on the markets. In October, speculation about the next rate hike (whether it would happen before the end of the year and how frequently subsequent rate hikes might occur) dominated investor thinking. At the same time, increasingly heated campaign rhetoric served as a drag while investors tried to figure out what the next four years might look like in either case. On the morning following the U.S. election, market futures pointed sharply downward, as the widely expected presidential winner, Hillary Clinton, conceded electoral vote defeat to Donald J. Trump. When markets opened on November 9, buyers surged, however, as investors anticipated the economic impacts of the President-elect delivering on his pro-business and pro-domestic campaign rhetoric. This buoyant investor sentiment launched a year-end rally that pushed the S&P 500 up 5.3% by year-end, with nearly half of the Index’s 11.96% return occurring in the last seven weeks of the year. In December, the Fed did, indeed, raise policy interest rates, but the market throttle now appeared to be in other hands.
Going into 2017, markets have yet to digest the upcoming Trump presidency in an environment where the Fed is forecasting multiple rate hikes. Turning to the global stage, by the end of March 2017, Britain’s Prime Minister, Theresa May, plans to trigger Article 50 of the Lisbon Treaty, which would initiate the two-year process of withdrawing the U.K. from the European Union. Terrorism and military posturing add further tensions to the global environment.
Domestic equity markets delivered solid returns for investors in 2016, but investors endured a steady stream of uncertainty, surprises and volatility throughout. Long-term investors with a view to saving for retirement income pay attention to such things, but maintain a thoughtful and disciplined response to them. Many retirement investors wisely subscribe to the value of a well-diversified portfolio, using an appropriate mix of available strategies to benefit from market expansions and mitigate the risks inherent in unexpected events.
The information provided is the opinion of MassMutual Funds Investment Management Group as of 12/31/16 and is subject to change without notice. It is not to be construed as tax, legal or investment advice. Of course, past performance does not guarantee future results.
4
MML Blend Fund – Portfolio Manager Report (Unaudited)
What is the investment approach of MML Blend Fund, and who is the Fund’s subadviser?
The Fund seeks to achieve as high a level of total rate of return over an extended period of time as is considered consistent with prudent investment risk and the preservation of capital. The Fund invests across different asset classes (equity securities, fixed income securities, including bank loans and Rule 144A securities, and money market instruments), each represented by a different segment of the Fund’s portfolio. The subadviser typically adjusts the allocation among the three segments, based on its judgment about each segment’s potential for returns in comparison with those of other segments and corresponding risk. Effective September 12, 2016, Babson Capital Management LLC, subadviser to the Fund, changed its name to “Barings LLC.” The investment objective of the Fund remains the same.
How did the Fund perform during the 12 months ended December 31, 2016?
The Fund’s Initial Class shares returned 9.42%, underperforming the 11.96% return of the S&P 500® Index (the “stock component’s benchmark”), a widely recognized, unmanaged index representative of common stocks of larger capitalized U.S. companies. The Fund outperformed the 2.65% return of the Bloomberg Barclays U.S. Aggregate Bond Index (the “bond component’s benchmark”), an unmanaged index of fixed-rate investment-grade securities with at least one year to maturity, combining the Bloomberg Barclays U.S. Treasury Bond Index, the Bloomberg Barclays U.S. Government-Related Bond Index, the Bloomberg Barclays U.S. Corporate Bond Index, and the Bloomberg Barclays U.S. Securitized Bond Index. The Fund outperformed the 7.20% return of the Lipper Balanced Fund Index, an unmanaged, equally weighted index of the 30 largest mutual funds within the Lipper Balanced Category. Finally, the Fund outperformed the 8.21% return of the Custom Balanced Index (the “blend benchmark”), which comprises the stock component’s benchmark and the bond component’s benchmark. The weightings of each index are 60% and 40%, respectively.
For a discussion on the economic and market environment during the 12-month period ended December 31, 2016, please see the Economic and Market Overview, beginning on page 3.
Subadviser discussion of factors that contributed to the Fund’s performance
With respect to the Fund’s stock versus bond allocation, for the year ended December 31, 2016, the Fund held an overweight allocation to equities, and this helped the Fund’s absolute performance in an environment when stocks significantly outperformed fixed-income investments.
The Fund’s equity portfolio outperformed the stock component’s benchmark. Fund holding Regions Financials, a regional bank, rose 52% for the year. The Fund was underweight, relative to the stock component’s benchmark, in consumer staples companies like Kimberly-Clark, the tissue maker. These often-perceived “safety” stocks underperformed the rest of the market for the year, and that helped the Fund’s stock component’s performance. Mining and gold stocks were significantly higher in 2016 as the price of metals rose. The Fund’s stock component did not own the gold and copper miner Freeport-McMoRan, which rose 95% for the year – hampering performance, relative to the stock component’s benchmark.
The Fund’s underweight allocation to fixed-income investments helped performance as bonds trailed stocks in 2016. In the bond component’s portfolio, agency mortgage-backed securities were the primary contributors to performance during the fiscal year. (“Agency” refers to government-sponsored entities that issue bonds backed by mortgage loans, including Ginnie Mae, Fannie Mae, Freddie Mac, and the Federal Home Loan Banks.) An overweight to investment-grade securities and an out-of-benchmark allocation to high-yield corporate bonds rated BB were the primary detractors from Fund performance during the year.
The Fund uses derivative instruments for yield curve, duration, downside hedging, or to gain exposure to securities or markets in which it might not be able to invest directly. (Derivatives are securities that derive their value from the performance of one or more other investments and take the form of a contract between two or more parties.) In aggregate, derivatives contributed to performance over the year.
5
MML Blend Fund – Portfolio Manager Report (Unaudited) (Continued)
Subadviser outlook
We believe that in late 2015 and early 2016, the market priced in a recession when there was none. The interesting thing was that, at the same time, a more “classic” economic recovery seemed to be getting underway. Following the Great Recession, housing, employment, and bank balance sheets were so low that it took about six years to get back to normal levels. Recently, normalcy was achieved as incomes began to rise. This means that the economy is acting in a more familiar pattern as income gains have generated more spending and more growth. Generally, imbalances are what bring an end to economic cycles, so we are heartened that this process has only just begun, and there are only a few imbalances in the system. We think this may be a longer-than-normal economic cycle. Our view is that the market could do well in this type of environment as profits could continue to grow.
| | | | |
MML Blend Fund
Portfolio Characteristics
(% of Net Assets) on 12/31/16 | |
| | |
Common Stock | | | 71.4 | % |
Corporate Debt | | | 10.5 | % |
Non-U.S. Government Agency Obligations | | | 8.9 | % |
U.S. Government Agency Obligations and Instrumentalities | | | 7.2 | % |
U.S. Treasury Obligations | | | 1.0 | % |
Sovereign Debt Obligations | | | 0.3 | % |
Municipal Obligations | | | 0.3 | % |
Preferred Stock | | | 0.1 | % |
Rights | | | 0.0 | % |
| | | | | |
Total Long-Term Investments | | | 99.7 | % |
Short-Term Investments and Other Assets and Liabilities | | | 0.3 | % |
| | | | | |
Net Assets | | | 100.0 | % |
| | | | | |
6
MML Blend Fund – Portfolio Manager Report (Unaudited) (Continued)
Growth of a $10,000 Investment
Hypothetical Investments in MML Blend Fund Initial Class, the S&P 500 Index, the Bloomberg Barclays U.S. Aggregate Bond Index, the Lipper Balanced Fund Index, and the Custom Balanced Index.
| | | | | | | | | | | | |
| | | | |
| TOTAL RETURN | | One Year
1/1/16 -
12/31/16 | | | Five Year
Average
Annual
1/1/12 -
12/31/16 | | | Ten Year
Average
Annual
1/1/07 -
12/31/16 | |
| Initial Class | | | 9.42% | | | | 10.50% | | | | 6.72% | |
| S&P 500 Index* | | | 11.96% | | | | 14.66% | | | | 6.95% | |
Bloomberg Barclays U.S. Aggregate Bond Index | | | 2.65% | | | | 2.23% | | | | 4.34% | |
| Lipper Balanced Fund Index | | | 7.20% | | | | 8.32% | | | | 5.01% | |
| Custom Balanced Index | | | 8.21% | | | | 9.68% | | | | 6.31% | |
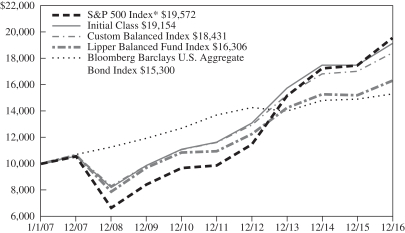
Hypothetical Investments in MML Blend Fund Service Class, the S&P 500 Index, the Bloomberg Barclays U.S. Aggregate Bond Index, the Lipper Balanced Fund Index, and the Custom Balanced Index.
| | | | | | | | | | | | |
| | | | |
| TOTAL RETURN | | One Year
1/1/16 -
12/31/16 | | | Five Year
Average
Annual
1/1/12 -
12/31/16 | | | Since
Inception
Average
Annual
8/15/08 -
12/31/16 | |
| Service Class | | | 9.15% | | | | 10.22% | | | | 7.89% | |
| S&P 500 Index* | | | 11.96% | | | | 14.66% | | | | 9.13% | |
Bloomberg Barclays U.S. Aggregate Bond Index | | | 2.65% | | | | 2.23% | | | | 4.22% | |
| Lipper Balanced Fund Index | | | 7.20% | | | | 8.32% | | | | 6.19% | |
| Custom Balanced Index | | | 8.21% | | | | 9.68% | | | | 7.59% | |
GROWTH OF $10,000 INVESTMENT FOR THE PAST 10 YEARS
GROWTH OF $10,000 INVESTMENT SINCE INCEPTION
Generally accepted accounting principles require adjustments to be made to the net assets of the Fund at period end for financial reporting purposes only, and as such, the total return based on the unadjusted net asset value per share may differ from the total return reported in the financial highlights.
* Benchmark
Performance data quoted represents past performance; past performance is not predictive of future results. The investment return and principal value of shares of the Fund will fluctuate with market conditions so that shares of the Fund, when redeemed, may be worth more or less than their original cost. Current performance of the Fund may be lower or higher than the performance quoted. Performance data current to the most recent month end may be obtained by accessing the website at www.massmutual.com.
Investors should note that the Fund is a professionally managed mutual fund, while the S&P 500 Index, the Bloomberg Barclays U.S. Aggregate Bond Index, the Lipper Balanced Fund Index, and the Custom Balanced Index are unmanaged, do not incur expenses, and cannot be purchased directly by investors. Investors should read the Fund’s prospectus with regard to the Fund’s investment objective, risks, and charges and expenses in conjunction with these financial statements. The Fund’s return reflects changes in the net asset value per share without the deduction of any product charges (e.g., cost of insurance, mortality and expense risk charges, administrative fees, and CDSL). The inclusion of these charges would have reduced the performance shown here.
7
MML Equity Fund – Portfolio Manager Report (Unaudited)
What is the investment approach of MML Equity Fund, and who are the Fund’s subadvisers?
The Fund’s primary objective is to achieve a superior total rate of return over an extended period of time from both capital appreciation and current income. Its secondary objective is the preservation of capital when business and economic conditions indicate that investing for defensive purposes is appropriate. The Fund invests primarily in common stocks of companies that the subadvisers believe are undervalued in the marketplace, with a focus on securities of larger size companies. Under normal circumstances, the Fund invests at least 80% of its net assets (plus the amount of any borrowings for investment purposes) in common stocks, preferred stocks, securities convertible into common or preferred stocks, and other securities, such as warrants and stock rights, whose value is based on stock prices. The Fund’s two subadvisers are OppenheimerFunds, Inc. (OFI), which managed approximately 58% of the Fund’s portfolio; and Loomis, Sayles & Company, L.P. (Loomis Sayles), which was responsible for approximately 42% of the Fund’s portfolio, as of December 31, 2016.
How did the Fund perform during the 12 months ended December 31, 2016?
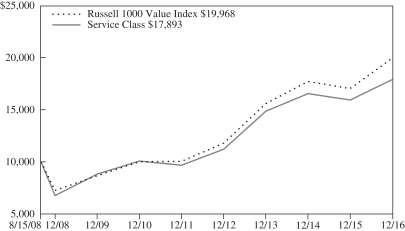
The Fund’s Initial Class shares returned 12.59%, underperforming the 17.34% return of the Russell 1000® Value Index (the “benchmark”), an unmanaged index consisting of those Russell 1000 securities (representing the 1,000 largest U.S. companies, based on market capitalization) with greater than average value orientation that tend to exhibit lower price-to-book ratios and lower forecasted growth rates than securities in the growth universe.
For a discussion on the economic and market environment during the 12-month period ended December 31, 2016, please see the Economic and Market Overview, beginning on page 3.
Subadviser discussion of factors that contributed to the Fund’s performance
For the year ended December 31, 2016, the OFI component of the Fund underperformed the Russell 1000 Value Index, primarily due to weaker relative stock selection in the benchmark sectors. An overweight position, relative to the benchmark, and stock selection in the consumer discretionary sector also detracted from performance. The Fund component outperformed the benchmark in the telecommunication services, utilities, and energy sectors, largely as a result of stock selection. Fund component holdings that contributed to performance included Bank of America Corp. and JP Morgan Chase & Co., both in the financials sector. Financial stocks rallied after the November 2016 presidential election, as markets seemed to anticipate faster economic growth, higher interest rates and inflation, and lower taxes. On the downside, top detractors from performance included Fund component holdings Teva Pharmaceutical Industries Ltd. in the health care sector; and Citigroup, Inc. in the financials sector. Teva Pharmaceutical underperformed in 2016, but in Fund management’s view, growth in the company’s generics business could provide a catalyst for better-than-expected earnings growth. Citigroup experienced declines over the first quarter of the year. The Fund subsequently shifted some of its investment in Citigroup to Bank of America. The Fund’s resulting underweight exposure to Citigroup resulted in underperformance when financial stocks rallied in the wake of the presidential election – although the positive performance of Bank of America still outweighed the underperformance of Citi.
Detracting most from performance with respect to the Loomis Sayles component of the Fund were Fund component holdings Teva Pharmaceutical Industries and Marathon Oil. Energy sector stock Marathon sold off aggressively – in tandem with oil – at the beginning of the year, as investors were spooked by the amount of debt on their balance sheet. Lacking conviction to add, the Fund component sold its position in Marathon and rotated the proceeds into Hess Corporation. On top of poor sentiment in the generic drug industry, pharmaceutical company Teva also had some stock-specific issues that weighed heavily on the company – including price deflation, concerns about Teva’s acquisition of Allergan’s generic business, and a litigation risk that could invalidate the company’s intellectual property on its most profitable drug. On the positive side, Loomis Sayles’s best-performing holdings included Halliburton and JP Morgan Chase & Co. Oil and gas service company Halliburton, a component of the energy sector, rallied as investors viewed the failed merger with Baker Hughes positively. Subsequent to the deal breaking, North American land drilling and completion activity showed improvement right as Halliburton’s market share was reaching new highs. Although the bank rally began in July after the Brexit-induced sell-off, the presidential election results helped propel stocks such as JP Morgan and Bank of America even higher on the prospects of better economic growth, higher interest rates, lower corporate taxes and less-stifling regulation. (“Brexit” – an abbreviation for “British exit” – was the United Kingdom’s surprising June 23, 2016 referendum to leave the European Union.)
8
MML Equity Fund – Portfolio Manager Report (Unaudited) (Continued)
Subadviser outlook
In the view of OFI, the market continues to be driven primarily by macroeconomic forces. Whether it is the election in the U.S. or the latest statements from the Federal Reserve (the Fed), the Bank of Japan or the European Central Bank, equity market performance has been dominated by the “big picture.” As a result, management has positioned this Fund component more towards stock-specific, idiosyncratic opportunities by concentrating the Fund into management’s highest-conviction ideas. At the same time, Fund management continues to manage the risk profile of the portfolio to help minimize exposure to unintended market risks.
Looking ahead, Loomis Sayles believes that the incoming administration’s agenda items, tax reform, and higher infrastructure spending have led investors to raise growth expectations for the next few years. With market expectations of two Fed rate hikes in 2017, Loomis Sayles’s view is that the financial sector appears poised to benefit from higher rates and a growing economy. Given the strong post-election rally, investor optimism is running high, yet much is still unknown. This could provide buying opportunities in the first half of 2017.
| | | | |
MML Equity Fund
Largest Holdings
(% of Net Assets) on 12/31/16 | |
| | |
JP Morgan Chase & Co. | | | 4.4 | % |
Bank of America Corp. | | | 4.2 | % |
Chevron Corp. | | | 2.7 | % |
American International Group, Inc. | | | 2.7 | % |
UnitedHealth Group, Inc. | | | 2.2 | % |
MetLife, Inc. | | | 2.0 | % |
Comcast Corp. Class A | | | 1.9 | % |
Pfizer, Inc. | | | 1.9 | % |
Microsoft Corp. | | | 1.8 | % |
Johnson Controls International PLC | | | 1.8 | % |
| | | | | |
| | | | 25.6 | % |
| | | | | |
| | | | |
MML Equity Fund
Sector Table
(% of Net Assets) on 12/31/16 | |
| | |
Financial | | | 27.9 | % |
Consumer, Non-cyclical | | | 15.0 | % |
Industrial | | | 14.2 | % |
Energy | | | 12.0 | % |
Technology | | | 8.4 | % |
Communications | | | 7.3 | % |
Consumer, Cyclical | | | 6.8 | % |
Basic Materials | | | 3.3 | % |
Utilities | | | 2.9 | % |
Mutual Funds | | | 2.3 | % |
| | | | | |
Total Long-Term Investments | | | 100.1 | % |
Short-Term Investments and Other Assets and Liabilities | | | (0.1 | )% |
| | | | | |
Net Assets | | | 100.0 | % |
| | | | | |
9
MML Equity Fund – Portfolio Manager Report (Unaudited) (Continued)
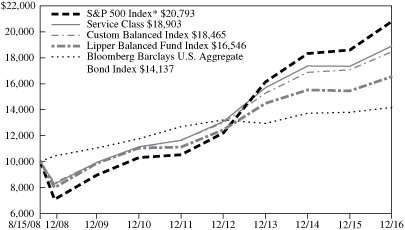
Growth of a $10,000 Investment
Hypothetical Investments in MML Equity Fund Initial Class and the Russell 1000 Value Index.
| | | | | | | | | | | | |
| | | | |
| TOTAL RETURN | | One Year
1/1/16 -
12/31/16 | | | Five Year
Average
Annual
1/1/12 -
12/31/16 | | | Ten Year
Average
Annual
1/1/07 -
12/31/16 | |
| Initial Class | | | 12.59% | | | | 13.41% | | | | 5.11% | |
| Russell 1000 Value Index | | | 17.34% | | | | 14.80% | | | | 5.72% | |
Hypothetical Investments in MML Equity Fund Service Class and the Russell 1000 Value Index.
| | | | | | | | | | | | |
| | | | |
| TOTAL RETURN | | One Year
1/1/16 -
12/31/16 | | | Five Year
Average
Annual
1/1/12 -
12/31/16 | | | Since
Inception
Average
Annual
8/15/08 -
12/31/16 | |
| Service Class | | | 12.31% | | | | 13.13% | | | | 7.19% | |
| Russell 1000 Value Index | | | 17.34% | | | | 14.80% | | | | 8.60% | |
GROWTH OF $10,000 INVESTMENT FOR THE PAST 10 YEARS
GROWTH OF $10,000 INVESTMENT SINCE INCEPTION
Generally accepted accounting principles require adjustments to be made to the net assets of the Fund at period end for financial reporting purposes only, and as such, the total return based on the unadjusted net asset value per share may differ from the total return reported in the financial highlights.
Performance data quoted represents past performance; past performance is not predictive of future results. The investment return and principal value of shares of the Fund will fluctuate with market conditions so that shares of the Fund, when redeemed, may be worth more or less than their original cost. Current performance of the Fund may be lower or higher than the performance quoted. Performance data current to the most recent month end may be obtained by accessing the website at www.massmutual.com.
Investors should note that the Fund is a professionally managed mutual fund, while the Russell 1000 Value Index is unmanaged, does not incur expenses, and cannot be purchased directly by investors. Investors should read the Fund’s prospectus with regard to the Fund’s investment objective, risks, and charges and expenses in conjunction with these financial statements. The Fund’s return reflects changes in the net asset value per share without the deduction of any product charges (e.g., cost of insurance, mortality and expense risk charges, administrative fees, and CDSL). The inclusion of these charges would have reduced the performance shown here.
10
MML Managed Bond Fund – Portfolio Manager Report (Unaudited)
What is the investment approach of MML Managed Bond Fund, and who is the Fund’s subadviser?
The Fund’s investment objective is to achieve as high a total rate of return on an annual basis as is considered consistent with the preservation of capital. Under normal circumstances, the Fund invests at least 80% of its net assets (plus the amount of any borrowings for investment purposes) in investment grade fixed income securities (rated Baa3 or higher by Moody’s, BBB- or higher by Standard & Poor’s or the equivalent by any NRSRO, or, if unrated, determined to be of comparable quality by the subadviser). Effective September 12, 2016, Babson Capital Management LLC, subadviser to the Fund, changed its name to “Barings LLC.” The investment objective of the Fund remains the same.
How did the Fund perform during the 12 months ended December 31, 2016?
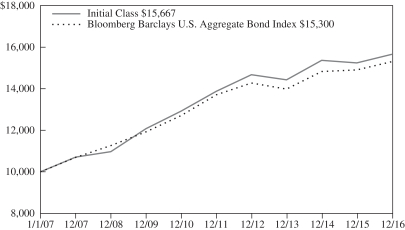
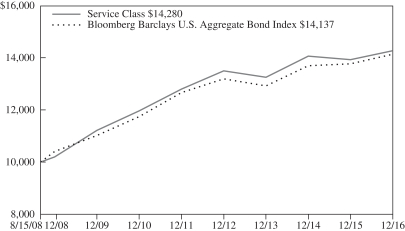
The Fund’s Initial Class shares returned 2.75%, modestly outperforming the 2.65% return of the Bloomberg Barclays U.S. Aggregate Bond Index (the “benchmark”), an unmanaged index of fixed-rate investment-grade securities with at least one year to maturity, combining the Bloomberg Barclays U.S. Treasury Bond Index, the Bloomberg Barclays U.S. Government-Related Bond Index, the Bloomberg Barclays U.S. Corporate Bond Index, and the Bloomberg Barclays U.S. Securitized Bond Index.
For a discussion on the economic and market environment during the 12-month period ended December 31, 2016, please see the Economic and Market Overview, beginning on page 3.
Subadviser discussion of factors that contributed to the Fund’s performance
Agency mortgage-backed securities (MBS) were the primary contributors to performance during the year ended December 31, 2016. (“Agency” refers to government-sponsored entities that issue bonds backed by mortgage loans, including Ginnie Mae, Fannie Mae, Freddie Mac, and the Federal Home Loan Banks.) The Fund’s positioning in lower-coupon securities benefited performance, as did a modest allocation to Agency collateralized mortgage obligation (CMO) securities. The Fund sometimes uses CMOs in lieu of higher-coupon, pricier Agency MBS.
The Fund successfully navigated between 30- and 15-year mortgages over the period, based on relative value pricing, which benefited performance. Asset-backed securities (ABS) also contributed, helped by commercial collateral such as whole business franchise loans and consumer holdings in government-guaranteed FFELP student loans. (Bond issuers create securitized bonds by pooling various types of contractual debt – such as mortgages, auto loans, or credit card debt.) A modest overweight to commercial mortgage-backed securities (CMBS), relative to the benchmark, was the primary detractor in the securitized sector.
An overweight to investment-grade bonds and an out-of-benchmark allocation to high-yield corporate bonds rated BB were the primary detractors from Fund performance. Exposure to the energy industry was the main driver of the Fund’s underperformance. The majority of the performance drag was experienced in the beginning of the first quarter of 2016. The Fund’s banking sub-sector allocation also detracted from performance. Within the corporate bond sector, Fund holdings in information technology and metals & mining were the primary contributors.
The Fund uses derivative instruments for yield curve, duration, downside hedging, or to gain exposure to securities or markets in which it might not be able to invest directly. (Derivatives are securities that derive their value from the performance of one or more other investments and take the form of a contract between two or more parties. Most derivatives are used for hedging, speculation, or both.) In aggregate, derivatives contributed to performance over the year.
Subadviser outlook
Unexpected election outcomes, global central banks, and commodity price volatility all took center stage in 2016. The result has been a repricing of investor interest rate expectations due to potentially higher inflation resulting in a shift to fiscal policy. The question is, what will the new administration be able to accomplish in its first 100 days? In our view, the answer to that question will influence the path of interest rates in 2017.
Consumer households have been in the mode of reducing leverage since the financial crisis, while corporate fundamentals have softened. The Fund is focusing on yield opportunities, often post-merger and acquisition events, where we believe bonds provide
11
MML Managed Bond Fund – Portfolio Manager Report (Unaudited) (Continued)
attractive opportunities. The Fund plans to maintain its overweight allocations to sectors such as corporates and securitized, relative to liquid products, such as governments and agencies – and seeks to add return in excess of the benchmark by investing in sectors where we have competitive advantages, such as consumer and commercial ABS, collateralized loan obligations, and emerging markets.
| | | | |
MML Managed Bond Fund
Portfolio Characteristics
(% of Net Assets) on 12/31/16 | |
| | |
Corporate Debt | | | 36.5 | % |
Non-U.S. Government Agency Obligations | | | 31.1 | % |
U.S. Government Agency Obligations and Instrumentalities | | | 24.9 | % |
U.S. Treasury Obligations | | | 4.0 | % |
Municipal Obligations | | | 1.0 | % |
Sovereign Debt Obligations | | | 0.9 | % |
Preferred Stock | | | 0.2 | % |
| | | | | |
Total Long-Term Investments | | | 98.6 | % |
Short-Term Investments and Other Assets and Liabilities | | | 1.4 | % |
| | | | | |
Net Assets | | | 100.0 | % |
| | | | | |
12
MML Managed Bond Fund – Portfolio Manager Report (Unaudited) (Continued)
Growth of a $10,000 Investment
Hypothetical Investments in MML Managed Bond Fund Initial Class and the Bloomberg Barclays U.S. Aggregate Bond Index.
| | | | | | | | | | | | |
| | | | |
| TOTAL RETURN | | One Year
1/1/16 -
12/31/16 | | | Five Year
Average
Annual
1/1/12 -
12/31/16 | | | Ten Year
Average
Annual
1/1/07 -
12/31/16 | |
| Initial Class | | | 2.75% | | | | 2.46% | | | | 4.59% | |
Bloomberg Barclays U.S. Aggregate Bond Index | | | 2.65% | | | | 2.23% | | | | 4.34% | |
Hypothetical Investments in MML Managed Bond Fund Service Class and the Bloomberg Barclays U.S. Aggregate Bond Index.
| | | | | | | | | | | | |
| | | | |
| TOTAL RETURN | | One Year
1/1/16 -
12/31/16 | | | Five Year
Average
Annual
1/1/12 -
12/31/16 | | | Since
Inception
Average
Annual
8/15/08 -
12/31/16 | |
| Service Class | | | 2.49% | | | | 2.21% | | | | 4.34% | |
Bloomberg Barclays U.S. Aggregate Bond Index | | | 2.65% | | | | 2.23% | | | | 4.22% | |
GROWTH OF $10,000 INVESTMENT FOR THE PAST 10 YEARS
GROWTH OF $10,000 INVESTMENT SINCE INCEPTION
Generally accepted accounting principles require adjustments to be made to the net assets of the Fund at period end for financial reporting purposes only, and as such, the total return based on the unadjusted net asset value per share may differ from the total return reported in the financial highlights.
Performance data quoted represents past performance; past performance is not predictive of future results. The investment return and principal value of shares of the Fund will fluctuate with market conditions so that shares of the Fund, when redeemed, may be worth more or less than their original cost. Current performance of the Fund may be lower or higher than the performance quoted. Performance data current to the most recent month end may be obtained by accessing the website at www.massmutual.com.
Investors should note that the Fund is a professionally managed mutual fund, while the Bloomberg Barclays U.S. Aggregate Bond Index is unmanaged, does not incur expenses, and cannot be purchased directly by investors. Investors should read the Fund’s prospectus with regard to the Fund’s investment objective, risks, and charges and expenses in conjunction with these financial statements. The Fund’s return reflects changes in the net asset value per share without the deduction of any product charges (e.g., cost of insurance, mortality and expense risk charges, administrative fees, and CDSL). The inclusion of these charges would have reduced the performance shown here.
13
MML U.S. Government Money Market Fund – Portfolio Manager Report (Unaudited)
What is the investment approach of MML U.S. Government Money Market Fund (formerly known as MML Money Market Fund), and who is the Fund’s subadviser?
Please note that prior to May 1, 2016, the Fund was known as the MML Money Market Fund. The Fund’s investment objective and investment strategy also changed on May 1, 2016.
The Fund’s investment objective is to achieve current income consistent with preservation of capital and liquidity. The Fund normally invests at least 99.5% of its total assets in cash, U.S. Government securities, and/or repurchase agreements fully collateralized by cash or U.S. Government securities. It is important to note that this Fund seeks to maintain, but does not guarantee, a stable $1.00 share price. Under normal circumstances, the Fund invests at least 80% of its net assets in U.S. Government securities and repurchase agreements that are fully collateralized by U.S. Government securities. You could lose money by investing in the Fund. Although the Fund seeks to preserve the value of your investment at $1.00 per share, it cannot guarantee it will do so. An investment in the Fund is not insured or guaranteed by the Federal Deposit Insurance Corporation or any other government agency. The Fund’s sponsor has no legal obligation to provide financial support to the Fund, and you should not expect that the sponsor will provide financial support to the Fund at any time. Effective September 12, 2016, Babson Capital Management LLC, subadviser to the Fund, changed its name to “Barings LLC.” The investment objective of the Fund remains the same.
How did the Fund perform during the 12 months ended December 31, 2016?
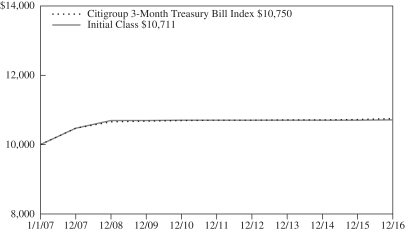
The Fund’s Initial Class shares returned 0.11%, underperforming the 0.27% return of the Citigroup 3-Month Treasury Bill Index (the “benchmark”), an unmanaged index representing the performance of 3-month U.S. Treasury bills that reflects reinvestment of all distributions and changes in market prices. During the period, the Fund waived certain fees and made a capital contribution to allow it to achieve the 0.11% return. The Fund’s Initial Class shares would have had a lower return if the capital contribution had not been made and would have had a negative return if the fee waiver had not been in effect.
For a discussion on the economic and market environment during the 12-month period ended December 31, 2016, please see the Economic and Market Overview, beginning on page 3.
Subadviser discussion of factors that contributed to the Fund’s performance
Short-term interest rates that, for the most part, stayed at historically low levels continued to result in low nominal yields for the Fund for the year ended December 31, 2016. Money market reform that went into effect on October 14, 2016 also contributed to low government yields due to strong flows to government funds.
On May 1, 2016, the Fund converted to a government-only fund from a prime fund. This change allowed the Fund to strive to maintain a stable $1.00 Net Asset Value (NAV), without subjecting investors to potential liquidity and redemption fees should they wish to exit the Fund during times of potential market volatility. Under the new Fund structure, holdings include United States government securities or securities from one of the U.S. government agencies, but the Fund can no longer invest in corporate commercial paper to help add income. Commercial paper is the commonly used name for short-term unsecured promissory notes sold by banks and corporations to meet short-term debt obligations.
During the year, the Fund bought a large amount of floating agency paper after the conversion to help maximize yield, while keeping the weighted average maturity at a manageable level. (Agency paper is debt issued by the federal government for financing purposes.) At year end, the weighted average maturity of the Fund was 36 days. These floating-rate bonds allowed the Fund to earn more yield than a traditional one-month agency discount note, but they also provided the added benefit of shielding the Fund from some interest rate risk, giving it certain protection if the Federal Reserve (the Fed) should hike interest rates.
Subadviser outlook
At the beginning of 2016, the Fed narrative called for as many as four potential rate hikes in the coming year – but the central bank ultimately produced only one. Looking to 2017, we believe we could face a similar environment, with the Fed indicating the possibility of multiple hikes, while demonstrating the potential scenarios where they might not follow through. In our view, one storyline that could postpone immediate further tightening is the uncertainty of the economic policies of the incoming Trump administration. Consequently, we are positioning the Fund with enough floating-rate securities to protect it in the event of a Fed hike, while buying longer-dated securities to help enhance the Fund’s yield in case the anticipated rate hikes fail to materialize.
14
MML U.S. Government Money Market Fund – Portfolio Manager Report (Unaudited) (Continued)
| | | | |
MML U.S. Government
Money Market Fund
Portfolio Characteristics
(% of Net Assets) on 12/31/2016 | |
| | |
Discount Notes | | | 78.1 | % |
Repurchase Agreement | | | 12.0 | % |
U.S. Government Obligations | | | 10.0 | % |
Time Deposits | | | 0.0 | % |
| | | | | |
Total Short-Term Investments | | | 100.1 | % |
Other Assets and Liabilities | | | (0.1 | )% |
| | | | | |
Net Assets | | | 100.0 | % |
| | | | | |
15
MML U.S. Government Money Market Fund – Portfolio Manager Report (Unaudited) (Continued)
Growth of a $10,000 Investment
Hypothetical Investments in MML U.S. Government Money Market Fund Initial Class and the Citigroup 3-Month Treasury Bill Index.
| | | | | | | | | | | | |
| | | | |
| TOTAL RETURN | | One Year
1/1/16 -
12/31/16 | | | Five Year
Average
Annual
1/1/12 -
12/31/16 | | | Ten Year
Average
Annual
1/1/07 -
12/31/16 | |
| Initial Class | | | 0.11% | | | | 0.02% | | | | 0.69% | |
| Citigroup 3-Month Treasury Bill Index | | | 0.27% | | | | 0.09% | | | | 0.73% | |
GROWTH OF $10,000 INVESTMENT FOR THE PAST 10 YEARS
Generally accepted accounting principles require adjustments to be made to the net assets of the Fund at period end for financial reporting purposes only, and as such, the total return based on the unadjusted net asset value per share may differ from the total return reported in the financial highlights.
Performance data quoted represents past performance; past performance is not predictive of future results. The investment return and principal value of shares of the Fund will fluctuate with market conditions so that shares of the Fund, when redeemed, may be worth more or less than their original cost. Current performance of the Fund may be lower or higher than the performance quoted. Performance data current to the most recent month end may be obtained by accessing the website at www.massmutual.com.
Investors should note that the Fund is a professionally managed mutual fund, while the Citigroup 3-Month Treasury Bill Index is unmanaged, does not incur expenses, and cannot be purchased directly by investors. Investors should read the Fund’s prospectus with regard to the Fund’s investment objective, risks, and charges and expenses in conjunction with these financial statements. The Fund’s return reflects changes in the net asset value per share without the deduction of any product charges (e.g., cost of insurance, mortality and expense risk charges, administrative fees, and CDSL). The inclusion of these charges would have reduced the performance shown here. An investment in the MML U.S. Government Money Market Fund is not insured or guaranteed by the Federal Deposit Insurance Corporation or any other government agency. Although the Fund seeks to maintain a stable net asset value per share, it is possible to lose money by investing in the Fund.
16
MML Blend Fund – Portfolio of Investments
December 31, 2016
| | | | | | | | |
| | | Number of
Shares | | | Value | |
| EQUITIES — 71.5% | |
|
| COMMON STOCK — 71.4% | |
| Basic Materials — 1.9% | | | | | | | | |
| Chemicals — 1.6% | | | | | | | | |
Air Products & Chemicals, Inc. | | | 5 | | | $ | 719 | |
CF Industries Holdings, Inc. | | | 27,190 | | | | 855,941 | |
The Dow Chemical Co. | | | 30,573 | | | | 1,749,387 | |
E.I. du Pont de Nemours & Co. | | | 15,560 | | | | 1,142,104 | |
Eastman Chemical Co. | | | 25,770 | | | | 1,938,162 | |
Ecolab, Inc. | | | 2 | | | | 234 | |
FMC Corp. | | | 27,400 | | | | 1,549,744 | |
LyondellBasell Industries NV Class A | | | 8,600 | | | | 737,708 | |
Monsanto Co. | | | 6,694 | | | | 704,276 | |
The Mosaic Co. | | | 59,200 | | | | 1,736,336 | |
PPG Industries, Inc. | | | 18 | | | | 1,706 | |
Praxair, Inc. | | | 6 | | | | 703 | |
The Sherwin-Williams Co. | | | 3 | | | | 806 | |
| | | | | | | | |
| | | | | | | 10,417,826 | |
| | | | | | | | |
| Forest Products & Paper — 0.0% | |
International Paper Co. | | | 3,587 | | | | 190,326 | |
| | | | | | | | |
| Iron & Steel — 0.2% | | | | | | | | |
Nucor Corp. | | | 14,956 | | | | 890,181 | |
| | | | | | | | |
| Mining — 0.1% | | | | | | | | |
Freeport-McMoRan, Inc. (a) | | | 64 | | | | 844 | |
Newmont Mining Corp. | | | 23,670 | | | | 806,437 | |
Vulcan Materials Co. | | | 65 | | | | 8,135 | |
| | | | | | | | |
| | | | | | | 815,416 | |
| | | | | | | | |
| | | | | | | 12,313,749 | |
| | | | | | | | |
| Communications — 8.1% | | | | | | | | |
| Advertising — 0.1% | | | | | | | | |
The Interpublic Group of Companies, Inc. | | | 6,922 | | | | 162,044 | |
Nielsen Holdings PLC | | | 10,600 | | | | 444,670 | |
Omnicom Group, Inc. | | | 3,747 | | | | 318,907 | |
| | | | | | | | |
| | | | | | | 925,621 | |
| | | | | | | | |
| Internet — 2.9% | | | | | | | | |
Akamai Technologies, Inc. (a) | | | 19,026 | | | | 1,268,654 | |
Alphabet, Inc. Class A (a) | | | 6,710 | | | | 5,317,340 | |
Alphabet, Inc. Class C (a) | | | 731 | | | | 564,200 | |
Amazon.com, Inc. (a) | | | 3,830 | | | | 2,872,002 | |
eBay, Inc. (a) | | | 49,277 | | | | 1,463,034 | |
Expedia, Inc. | | | 5,157 | | | | 584,185 | |
F5 Networks, Inc. (a) | | | 12,990 | | | | 1,879,913 | |
Facebook, Inc. Class A (a) | | | 21,460 | | | | 2,468,973 | |
Netflix, Inc. (a) | | | 233 | | | | 28,845 | |
The Priceline Group, Inc. (a) | | | 1 | | | | 1,466 | |
Symantec Corp. | | | 68,555 | | | | 1,637,779 | |
TripAdvisor, Inc. (a) | | | 37 | | | | 1,716 | |
| | | | | | | | |
| | | Number of
Shares | | | Value | |
VeriSign, Inc. (a) | | | 1,291 | | | $ | 98,206 | |
Yahoo!, Inc. (a) | | | 15,529 | | | | 600,506 | |
| | | | | | | | |
| | | | | | | 18,786,819 | |
| | | | | | | | |
| Media — 2.1% | | | | | | | | |
CBS Corp. Class B | | | 11,457 | | | | 728,894 | |
Charter Communications, Inc. Class A (a) | | | 2,321 | | | | 668,262 | |
Comcast Corp. Class A | | | 25,212 | | | | 1,740,889 | |
Discovery Communications, Inc. Series A (a) | | | 61,800 | | | | 1,693,938 | |
Discovery Communications, Inc. Series C (a) | | | 6,900 | | | | 184,782 | |
News Corp. Class A | | | 6,866 | | | | 78,684 | |
Scripps Networks Interactive Class A | | | 25,372 | | | | 1,810,800 | |
TEGNA, Inc. | | | 48,712 | | | | 1,041,950 | |
Time Warner, Inc. | | | 27,015 | | | | 2,607,758 | |
Twenty-First Century Fox, Inc. Class A | | | 19,567 | | | | 548,659 | |
Twenty-First Century Fox, Inc. Class B | | | 42,500 | | | | 1,158,125 | |
Viacom, Inc. Class B | | | 26,310 | | | | 923,481 | |
The Walt Disney Co. | | | 2,582 | | | | 269,096 | |
| | | | | | | | |
| | | | | | | 13,455,318 | |
| | | | | | | | |
| Telecommunications — 3.0% | | | | | | | | |
AT&T, Inc. | | | 70,453 | | | | 2,996,366 | |
CenturyLink, Inc. | | | 61,128 | | | | 1,453,624 | |
Cisco Systems, Inc. | | | 147,542 | | | | 4,458,719 | |
Corning, Inc. | | | 63,267 | | | | 1,535,490 | |
Frontier Communications Corp. | | | 295,756 | | | | 999,656 | |
Juniper Networks, Inc. | | | 1,389 | | | | 39,253 | |
Motorola Solutions, Inc. | | | 26,237 | | | | 2,174,785 | |
Verizon Communications, Inc. | | | 101,755 | | | | 5,431,682 | |
| | | | | | | | |
| | | | | | | 19,089,575 | |
| | | | | | | | |
| | | | | | | 52,257,333 | |
| | | | | | | | |
| Consumer, Cyclical — 8.0% | | | | | | | | |
| Airlines — 0.8% | | | | | | | | |
Alaska Air Group, Inc. | | | 27,300 | | | | 2,422,329 | |
American Airlines Group, Inc. | | | 28,200 | | | | 1,316,658 | |
Delta Air Lines, Inc. | | | 23,200 | | | | 1,141,208 | |
Southwest Airlines Co. | | | 10,383 | | | | 517,489 | |
| | | | | | | | |
| | | | | | | 5,397,684 | |
| | | | | | | | |
| Apparel — 0.5% | | | | | | | | |
Michael Kors Holdings Ltd. (a) | | | 29,700 | | | | 1,276,506 | |
Nike, Inc. Class B | | | 9,084 | | | | 461,740 | |
Ralph Lauren Corp. | | | 18,450 | | | | 1,666,404 | |
| | | | | | | | |
| | | | | | | 3,404,650 | |
| | | | | | | | |
| Auto Manufacturers — 0.6% | | | | | | | | |
Ford Motor Co. | | | 128,513 | | | | 1,558,862 | |
General Motors Co. | | | 53,200 | | | | 1,853,488 | |
The accompanying notes are an integral part of the financial statements.
17
MML Blend Fund – Portfolio of Investments (Continued)
| | | | | | | | |
| | | Number of
Shares | | | Value | |
PACCAR, Inc. | | | 5,322 | | | $ | 340,076 | |
| | | | | | | | |
| | | | | | | 3,752,426 | |
| | | | | | | | |
| Automotive & Parts — 0.4% | | | | | | | | |
BorgWarner, Inc. | | | 22,100 | | | | 871,624 | |
Delphi Automotive PLC | | | 9,300 | | | | 626,355 | |
The Goodyear Tire & Rubber Co. | | | 42,151 | | | | 1,301,201 | |
| | | | | | | | |
| | | | | | | 2,799,180 | |
| | | | | | | | |
| Distribution & Wholesale — 0.1% | | | | | | | | |
Fastenal Co. | | | 82 | | | | 3,852 | |
Genuine Parts Co. | | | 2,834 | | | | 270,760 | |
W.W. Grainger, Inc. | | | 2 | | | | 465 | |
| | | | | | | | |
| | | | | | | 275,077 | |
| | | | | | | | |
| Home Builders — 0.0% | | | | | | | | |
D.R. Horton, Inc. | | | 1,947 | | | | 53,211 | |
PulteGroup, Inc. | | | 73 | | | | 1,342 | |
| | | | | | | | |
| | | | | | | 54,553 | |
| | | | | | | | |
| Home Furnishing — 0.1% | | | | | | | | |
Harman International Industries, Inc. | | | 1,869 | | | | 207,758 | |
Whirlpool Corp. | | | 1,573 | | | | 285,924 | |
| | | | | | | | |
| | | | | | | 493,682 | |
| | | | | | | | |
| Leisure Time — 0.1% | | | | | | | | |
Harley-Davidson, Inc. | | | 8,702 | | | | 507,675 | |
Royal Caribbean Cruises Ltd. | | | 100 | | | | 8,204 | |
| | | | | | | | |
| | | | | | | 515,879 | |
| | | | | | | | |
| Lodging — 0.5% | | | | | | | | |
Marriott International, Inc. Class A | | | 7,321 | | | | 605,300 | |
Wyndham Worldwide Corp. | | | 13,209 | | | | 1,008,772 | |
Wynn Resorts Ltd. | | | 19,908 | | | | 1,722,241 | |
| | | | | | | | |
| | | | | | | 3,336,313 | |
| | | | | | | | |
| Retail — 4.8% | | | | | | | | |
AutoNation, Inc. (a) | | | 10,799 | | | | 525,371 | |
AutoZone, Inc. (a) | | | 494 | | | | 390,156 | |
Bed Bath & Beyond, Inc. | | | 18,164 | | | | 738,185 | |
Best Buy Co., Inc. | | | 41,392 | | | | 1,766,197 | |
Coach, Inc. | | | 6,220 | | | | 217,824 | |
Costco Wholesale Corp. | | | 1,460 | | | | 233,761 | |
CVS Health Corp. | | | 28,994 | | | | 2,287,916 | |
Darden Restaurants, Inc. | | | 9,854 | | | | 716,583 | |
Dollar General Corp. | | | 3,200 | | | | 237,024 | |
Dollar Tree, Inc. (a) | | | 48 | | | | 3,705 | |
The Gap, Inc. | | | 70,590 | | | | 1,584,040 | |
The Home Depot, Inc. | | | 10,327 | | | | 1,384,644 | |
Kohl’s Corp. | | | 29,230 | | | | 1,443,377 | |
L Brands, Inc. | | | 2,200 | | | | 144,848 | |
Lowe’s Cos., Inc. | | | 14,295 | | | | 1,016,660 | |
Macy’s, Inc. | | | 24,751 | | | | 886,333 | |
McDonald’s Corp. | | | 25,900 | | | | 3,152,548 | |
Nordstrom, Inc. | | | 24,308 | | | | 1,165,082 | |
O’Reilly Automotive, Inc. (a) | | | 3,343 | | | | 930,725 | |
| | | | | | | | |
| | | Number of
Shares | | | Value | |
PVH Corp. | | | 16,520 | | | $ | 1,490,765 | |
Ross Stores, Inc. | | | 14,044 | | | | 921,286 | |
Staples, Inc. | | | 184,065 | | | | 1,665,788 | |
Starbucks Corp. | | | 8,654 | | | | 480,470 | |
Target Corp. | | | 15,086 | | | | 1,089,662 | |
Tiffany & Co. | | | 802 | | | | 62,099 | |
The TJX Cos., Inc. | | | 14,106 | | | | 1,059,784 | |
Urban Outfitters, Inc. (a) | | | 22,700 | | | | 646,496 | |
Wal-Mart Stores, Inc. | | | 34,922 | | | | 2,413,809 | |
Walgreens Boots Alliance, Inc. | | | 16,557 | | | | 1,370,257 | |
Yum! Brands, Inc. | | | 14,435 | | | | 914,169 | |
| | | | | | | | |
| | | | | | | 30,939,564 | |
| | | | | | | | |
| Textiles — 0.0% | | | | | | | | |
Cintas Corp. | | | 1,878 | | | | 217,022 | |
| | | | | | | | |
| Toys, Games & Hobbies — 0.1% | | | | | | | | |
Hasbro, Inc. | | | 3,861 | | | | 300,347 | |
Mattel, Inc. | | | 2,090 | | | | 57,580 | |
| | | | | | | | |
| | | | | | | 357,927 | |
| | | | | | | | |
| | | | | | | 51,543,957 | |
| | | | | | | | |
| Consumer, Non-cyclical — 14.2% | | | | | | | | |
| Agriculture — 0.8% | | | | | | | | |
Altria Group, Inc. | | | 18,259 | | | | 1,234,674 | |
Archer-Daniels-Midland Co. | | | 48,892 | | | | 2,231,920 | |
Philip Morris International, Inc. | | | 13,276 | | | | 1,214,621 | |
Reynolds American, Inc. | | | 3,576 | | | | 200,399 | |
| | | | | | | | |
| | | | | | | 4,881,614 | |
| | | | | | | | |
| Beverages — 1.1% | | | | | | | | |
Brown-Forman Corp. Class B | | | 12 | | | | 539 | |
The Coca-Cola Co. | | | 85,830 | | | | 3,558,512 | |
Coca-Cola European Partners PLC | | | 10,178 | | | | 319,589 | |
Constellation Brands, Inc. Class A | | | 262 | | | | 40,167 | |
Dr. Pepper Snapple Group, Inc. | | | 4,404 | | | | 399,311 | |
PepsiCo, Inc. | | | 23,400 | | | | 2,448,342 | |
| | | | | | | | |
| | | | | | | 6,766,460 | |
| | | | | | | | |
| Biotechnology — 1.5% | | | | | | | | |
Amgen, Inc. | | | 24,721 | | | | 3,614,458 | |
Biogen, Inc. (a) | | | 3,662 | | | | 1,038,470 | |
Celgene Corp. (a) | | | 11,216 | | | | 1,298,252 | |
Gilead Sciences, Inc. | | | 54,610 | | | | 3,910,622 | |
| | | | | | | | |
| | | | | | | 9,861,802 | |
| | | | | | | | |
| Commercial Services — 1.0% | | | | | | | | |
Automatic Data Processing, Inc. | | | 4,809 | | | | 494,269 | |
Equifax, Inc. | | | 6,042 | | | | 714,346 | |
Global Payments, Inc. | | | 2,300 | | | | 159,643 | |
H&R Block, Inc. | | | 26,763 | | | | 615,282 | |
Moody’s Corp. | | | 3,330 | | | | 313,919 | |
Paychex, Inc. | | | 5,164 | | | | 314,384 | |
PayPal Holdings, Inc. (a) | | | 77 | | | | 3,039 | |
Quanta Services, Inc. (a) | | | 13,913 | | | | 484,868 | |
Robert Half International, Inc. | | | 26 | | | | 1,268 | |
The accompanying notes are an integral part of the financial statements.
18
MML Blend Fund – Portfolio of Investments (Continued)
| | | | | | | | |
| | | Number of
Shares | | | Value | |
S&P Global, Inc. | | | 48 | | | $ | 5,162 | |
Total System Services, Inc. | | | 2,707 | | | | 132,724 | |
United Rentals, Inc. (a) | | | 13,880 | | | | 1,465,451 | |
Visa, Inc. Class A | | | 2,112 | | | | 164,778 | |
The Western Union Co. | | | 85,588 | | | | 1,858,971 | |
| | | | | | | | |
| | | | | | | 6,728,104 | |
| | | | | | | | |
| Cosmetics & Personal Care — 1.0% | |
Colgate-Palmolive Co. | | | 17,906 | | | | 1,171,769 | |
The Estee Lauder Cos., Inc. Class A | | | 7,910 | | | | 605,036 | |
The Procter & Gamble Co. | | | 59,229 | | | | 4,979,974 | |
| | | | | | | | |
| | | | | | | 6,756,779 | |
| | | | | | | | |
| Foods — 1.4% | | | | | | | | |
Campbell Soup Co. | | | 14,924 | | | | 902,454 | |
Conagra Brands, Inc. | | | 28,474 | | | | 1,126,147 | |
General Mills, Inc. | | | 12,462 | | | | 769,778 | |
The Hershey Co. | | | 1,647 | | | | 170,349 | |
Hormel Foods Corp. | | | 15,732 | | | | 547,631 | |
The J.M. Smucker Co. | | | 6,735 | | | | 862,484 | |
Kellogg Co. | | | 8,428 | | | | 621,228 | |
The Kraft Heinz Co. | | | 4,958 | | | | 432,932 | |
The Kroger Co. | | | 6,058 | | | | 209,062 | |
McCormick & Co., Inc. | | | 161 | | | | 15,026 | |
Mondelez International, Inc. Class A | | | 31,775 | | | | 1,408,586 | |
Sysco Corp. | | | 21,534 | | | | 1,192,337 | |
Tyson Foods, Inc. Class A | | | 4,301 | | | | 265,286 | |
Whole Foods Market, Inc. | | | 17,250 | | | | 530,610 | |
| | | | | | | | |
| | | | | | | 9,053,910 | |
| | | | | | | | |
| Health Care – Products — 2.4% | | | | | | | | |
Abbott Laboratories | | | 29,522 | | | | 1,133,940 | |
Baxter International, Inc. | | | 47,461 | | | | 2,104,421 | |
Becton, Dickinson & Co. | | | 1,470 | | | | 243,358 | |
Boston Scientific Corp. (a) | | | 30,900 | | | | 668,367 | |
C.R. Bard, Inc. | | | 202 | | | | 45,381 | |
Edwards Lifesciences Corp. (a) | | | 980 | | | | 91,826 | |
Hologic, Inc. (a) | | | 7,400 | | | | 296,888 | |
Intuitive Surgical, Inc. (a) | | | 96 | | | | 60,880 | |
Johnson & Johnson | | | 69,112 | | | | 7,962,394 | |
Medtronic PLC | | | 23,600 | | | | 1,681,028 | |
St. Jude Medical, Inc. | | | 91 | | | | 7,297 | |
Stryker Corp. | | | 4,680 | | | | 560,711 | |
Varian Medical Systems, Inc. (a) | | | 2,097 | | | | 188,269 | |
Zimmer Biomet Holdings, Inc. | | | 2,455 | | | | 253,356 | |
| | | | | | | | |
| | | | | | | 15,298,116 | |
| | | | | | | | |
| Health Care – Services — 1.8% | | | | | | | | |
Aetna, Inc. | | | 6,227 | | | | 772,210 | |
Anthem, Inc. | | | 5,796 | | | | 833,291 | |
Centene Corp. (a) | | | 700 | | | | 39,557 | |
Cigna Corp. | | | 712 | | | | 94,974 | |
DaVita, Inc. (a) | | | 13,930 | | | | 894,306 | |
DENTSPLY SIRONA, Inc. | | | 10,656 | | | | 615,171 | |
Envision Healthcare Corp. (a) | | | 9,600 | | | | 607,584 | |
| | | | | | | | |
| | | Number of
Shares | | | Value | |
HCA Holdings, Inc. (a) | | | 29,600 | | | $ | 2,190,992 | |
Humana, Inc. | | | 1,084 | | | | 221,168 | |
Laboratory Corporation of America Holdings (a) | | | 2 | | | | 257 | |
Quest Diagnostics, Inc. | | | 3,309 | | | | 304,097 | |
Thermo Fisher Scientific, Inc. | | | 3,971 | | | | 560,308 | |
UnitedHealth Group, Inc. | | | 22,424 | | | | 3,588,737 | |
Universal Health Services, Inc. Class B | | | 6,440 | | | | 685,087 | |
| | | | | | | | |
| | | | | | | 11,407,739 | |
| | | | | | | | |
| Household Products — 0.1% | | | | | | | | |
Avery Dennison Corp. | | | 1,915 | | | | 134,471 | |
The Clorox Co. | | | 5,043 | | | | 605,261 | |
Kimberly-Clark Corp. | | | 665 | | | | 75,890 | |
| | | | | | | | |
| | | | | | | 815,622 | |
| | | | | | | | |
| Pharmaceuticals — 3.1% | | | | | | | | |
AbbVie, Inc. | | | 47,922 | | | | 3,000,876 | |
Allergan PLC (a) | | | 7,890 | | | | 1,656,979 | |
AmerisourceBergen Corp. | | | 25,907 | | | | 2,025,668 | |
Bristol-Myers Squibb Co. | | | 11,567 | | | | 675,975 | |
Cardinal Health, Inc. | | | 6,678 | | | | 480,616 | |
Eli Lilly & Co. | | | 3,614 | | | | 265,810 | |
Endo International PLC (a) | | | 83,100 | | | | 1,368,657 | |
Express Scripts Holding Co. (a) | | | 28,501 | | | | 1,960,584 | |
Mallinckrodt PLC (a) | | | 27,700 | | | | 1,380,014 | |
McKesson Corp. | | | 7,525 | | | | 1,056,886 | |
Mead Johnson Nutrition Co. | | | 7,212 | | | | 510,321 | |
Merck & Co., Inc. | | | 51,583 | | | | 3,036,691 | |
Mylan NV (a) | | | 10,147 | | | | 387,108 | |
Patterson Cos., Inc. | | | 86 | | | | 3,528 | |
Pfizer, Inc. | | | 62,241 | | | | 2,021,588 | |
| | | | | | | | |
| | | | | | | 19,831,301 | |
| | | | | | | | |
| | | | | | | 91,401,447 | |
| | | | | | | | |
| Diversified — 0.0% | | | | | | | | |
| Holding Company – Diversified — 0.0% | |
Leucadia National Corp. | | | 37 | | | | 860 | |
| | | | | | | | |
| Energy — 4.4% | | | | | | | | |
| Energy – Alternate Sources — 0.3% | | | | | | | | |
First Solar, Inc. (a) | | | 52,700 | | | | 1,691,143 | |
| | | | | | | | |
| Oil & Gas — 3.2% | | | | | | | | |
Anadarko Petroleum Corp. | | | 48 | | | | 3,347 | |
Apache Corp. | | | 3,821 | | | | 242,519 | |
Cabot Oil & Gas Corp. | | | 48 | | | | 1,121 | |
Chesapeake Energy Corp. (a) | | | 90 | | | | 632 | |
Chevron Corp. | | | 40,508 | | | | 4,767,792 | |
ConocoPhillips | | | 12,739 | | | | 638,734 | |
Devon Energy Corp. | | | 447 | | | | 20,415 | |
EOG Resources, Inc. | | | 8 | | | | 809 | |
EQT Corp. | | | 97 | | | | 6,344 | |
The accompanying notes are an integral part of the financial statements.
19
MML Blend Fund – Portfolio of Investments (Continued)
| | | | | | | | |
| | | Number of
Shares | | | Value | |
Exxon Mobil Corp. | | | 73,797 | | | $ | 6,660,917 | |
Helmerich & Payne, Inc. | | | 60 | | | | 4,644 | |
Hess Corp. | | | 9,032 | | | | 562,603 | |
Marathon Oil Corp. | | | 9,427 | | | | 163,181 | |
Marathon Petroleum Corp. | | | 22,806 | | | | 1,148,282 | |
Murphy Oil Corp. | | | 11 | | | | 342 | |
Newfield Exploration Co. (a) | | | 14,500 | | | | 587,250 | |
Noble Energy, Inc. | | | 56 | | | | 2,131 | |
Occidental Petroleum Corp. | | | 15 | | | | 1,068 | |
Phillips 66 | | | 11,669 | | | | 1,008,318 | |
Pioneer Natural Resources Co. | | | 3,021 | | | | 543,992 | |
Range Resources Corp. | | | 99 | | | | 3,402 | |
Southwestern Energy Co. (a) | | | 6,000 | | | | 64,920 | |
Tesoro Corp. | | | 16,987 | | | | 1,485,513 | |
Valero Energy Corp. | | | 33,500 | | | | 2,288,720 | |
| | | | | | | | |
| | | | | | | 20,206,996 | |
| | | | | | | | |
| Oil & Gas Services — 0.9% | | | | | | | | |
Baker Hughes, Inc. | | | 13,131 | | | | 853,121 | |
FMC Technologies, Inc. (a) | | | 53,540 | | | | 1,902,276 | |
Halliburton Co. | | | 14,467 | | | | 782,520 | |
National Oilwell Varco, Inc. | | | 5,594 | | | | 209,439 | |
Schlumberger Ltd. | | | 5,131 | | | | 430,748 | |
Transocean Ltd. (a) | | | 122,500 | | | | 1,805,650 | |
| | | | | | | | |
| | | | | | | 5,983,754 | |
| | | | | | | | |
| Pipelines — 0.0% | | | | | | | | |
Kinder Morgan, Inc. | | | 38 | | | | 787 | |
Spectra Energy Corp. | | | 64 | | | | 2,630 | |
The Williams Cos., Inc. | | | 48 | | | | 1,495 | |
| | | | | | | | |
| | | | | | | 4,912 | |
| | | | | | | | |
| | | | | | | 27,886,805 | |
| | | | | | | | |
| Financial — 14.2% | | | | | | | | |
| Banks — 5.0% | | | | | | | | |
Bank of America Corp. | | | 270,598 | | | | 5,980,216 | |
The Bank of New York Mellon Corp. | | | 29,707 | | | | 1,407,518 | |
BB&T Corp. | | | 18,566 | | | | 872,973 | |
Capital One Financial Corp. | | | 9,142 | | | | 797,548 | |
Citigroup, Inc. | | | 104,951 | | | | 6,237,238 | |
Citizens Financial Group, Inc. | | | 34,500 | | | | 1,229,235 | |
Comerica, Inc. | | | 4,421 | | | | 301,114 | |
Fifth Third Bancorp | | | 59,421 | | | | 1,602,584 | |
Huntington Bancshares, Inc. | | | 6,800 | | | | 89,896 | |
KeyCorp | | | 9,164 | | | | 167,426 | |
M&T Bank Corp. | | | 1,355 | | | | 211,963 | |
Northern Trust Corp. | | | 5,059 | | | | 450,504 | |
The PNC Financial Services Group, Inc. | | | 12,918 | | | | 1,510,889 | |
Regions Financial Corp. | | | 140,515 | | | | 2,017,795 | |
State Street Corp. | | | 8,176 | | | | 635,439 | |
SunTrust Banks, Inc. | | | 12,100 | | | | 663,685 | |
U.S. Bancorp | | | 29,202 | | | | 1,500,107 | |
Wells Fargo & Co. | | | 95,916 | | | | 5,285,931 | |
| | | | | | | | |
| | | Number of
Shares | | | Value | |
Zions Bancorp | | | 27,141 | | | $ | 1,168,149 | |
| | | | | | | | |
| | | | | | | 32,130,210 | |
| | | | | | | | |
| Diversified Financial — 4.3% | | | | | | | | |
Alliance Data Systems Corp. | | | 3,460 | | | | 790,610 | |
American Express Co. | | | 22,449 | | | | 1,663,022 | |
Ameriprise Financial, Inc. | | | 1,736 | | | | 192,592 | |
BlackRock, Inc. | | | 880 | | | | 334,875 | |
The Charles Schwab Corp. | | | 312 | | | | 12,315 | |
Discover Financial Services | | | 17,783 | | | | 1,281,977 | |
E*TRADE Financial Corp. (a) | | | 54,061 | | | | 1,873,214 | |
Franklin Resources, Inc. | | | 38,387 | | | | 1,519,357 | |
The Goldman Sachs Group, Inc. | | | 13,520 | | | | 3,237,364 | |
Intercontinental Exchange, Inc. | | | 15 | | | | 846 | |
Invesco Ltd. | | | 8,012 | | | | 243,084 | |
JP Morgan Chase & Co. | | | 114,222 | | | | 9,856,216 | |
MasterCard, Inc. Class A | | | 9,020 | | | | 931,315 | |
Morgan Stanley | | | 54,097 | | | | 2,285,598 | |
Nasdaq, Inc. | | | 45 | | | | 3,020 | |
Navient Corp. | | | 121,491 | | | | 1,996,097 | |
Synchrony Financial | | | 20,100 | | | | 729,027 | |
T. Rowe Price Group, Inc. | | | 8,406 | | | | 632,636 | |
| | | | | | | | |
| | | | | | | 27,583,165 | |
| | | | | | | | |
| Insurance — 3.6% | | | | | | | | |
Aflac, Inc. | | | 26,072 | | | | 1,814,611 | |
The Allstate Corp. | | | 12,035 | | | | 892,034 | |
American International Group, Inc. | | | 13,046 | | | | 852,034 | |
Aon PLC | | | 3,445 | | | | 384,221 | |
Assurant, Inc. | | | 396 | | | | 36,772 | |
Berkshire Hathaway, Inc. Class B (a) | | | 15,386 | | | | 2,507,610 | |
Chubb Ltd. | | | 18,748 | | | | 2,476,986 | |
Cincinnati Financial Corp. | | | 4,419 | | | | 334,739 | |
The Hartford Financial Services Group, Inc. | | | 8,152 | | | | 388,443 | |
Lincoln National Corp. | | | 30,851 | | | | 2,044,496 | |
Loews Corp. | | | 30,283 | | | | 1,418,153 | |
Marsh & McLennan Cos., Inc. | | | 5,813 | | | | 392,901 | |
MetLife, Inc. | | | 42,490 | | | | 2,289,786 | |
Principal Financial Group, Inc. | | | 22,229 | | | | 1,286,170 | |
The Progressive Corp. | | | 18,114 | | | | 643,047 | |
Prudential Financial, Inc. | | | 16,827 | | | | 1,751,018 | |
Torchmark Corp. | | | 2,582 | | | | 190,448 | |
The Travelers Cos., Inc. | | | 7,167 | | | | 877,384 | |
Unum Group | | | 49,331 | | | | 2,167,111 | |
XL Group Ltd. | | | 5,188 | | | | 193,305 | |
| | | | | | | | |
| | | | | | | 22,941,269 | |
| | | | | | | | |
| Real Estate — 0.0% | | | | | | | | |
CBRE Group, Inc. Class A (a) | | | 6,287 | | | | 197,978 | |
| | | | | | | | |
| Real Estate Investment Trusts (REITS) — 1.2% | |
American Tower Corp. | | | 589 | | | | 62,246 | |
Apartment Investment & Management Co. Class A | | | 685 | | | | 31,133 | |
The accompanying notes are an integral part of the financial statements.
20
MML Blend Fund – Portfolio of Investments (Continued)
| | | | | | | | |
| | | Number of
Shares | | | Value | |
AvalonBay Communities, Inc. | | | 2,081 | | | $ | 368,649 | |
Boston Properties, Inc. | | | 3 | | | | 377 | |
Equity Residential | | | 12,756 | | | | 820,976 | |
Essex Property Trust, Inc. | | | 1,500 | | | | 348,750 | |
Extra Space Storage, Inc. | | | 7,000 | | | | 540,680 | |
General Growth Properties, Inc. | | | 19,700 | | | | 492,106 | |
HCP, Inc. | | | 21,335 | | | | 634,076 | |
Host Hotels & Resorts, Inc. | | | 27,837 | | | | 524,449 | |
Iron Mountain, Inc. | | | 48 | | | | 1,559 | |
Kimco Realty Corp. | | | 2,767 | | | | 69,618 | |
The Macerich Co. | | | 13,200 | | | | 935,088 | |
Prologis, Inc. | | | 15,338 | | | | 809,693 | |
Public Storage | | | 203 | | | | 45,371 | |
Simon Property Group, Inc. | | | 645 | | | | 114,597 | |
SL Green Realty Corp. | | | 2,300 | | | | 247,365 | |
Ventas, Inc. | | | 8,825 | | | | 551,739 | |
Vornado Realty Trust | | | 1,373 | | | | 143,300 | |
Welltower, Inc. | | | 15,800 | | | | 1,057,494 | |
Weyerhaeuser Co. | | | 26 | | | | 783 | |
| | | | | | | | |
| | | | | | | 7,800,049 | |
| | | | | | | | |
| Savings & Loans — 0.1% | | | | | | | | |
People’s United Financial, Inc. | | | 25,351 | | | | 490,795 | |
| | | | | | | | |
| | | | | | | 91,143,466 | |
| | | | | | | | |
| Industrial — 7.8% | | | | | | | | |
| Aerospace & Defense — 1.8% | | | | | | | | |
Arconic, Inc. | | | 31,208 | | | | 578,596 | |
The Boeing Co. | | | 23,342 | | | | 3,633,883 | |
General Dynamics Corp. | | | 602 | | | | 103,941 | |
Harris Corp. | | | 770 | | | | 78,902 | |
L3 Technologies, Inc. | | | 5,290 | | | | 804,662 | |
Lockheed Martin Corp. | | | 6,610 | | | | 1,652,103 | |
Northrop Grumman Corp. | | | 3,968 | | | | 922,878 | |
Raytheon Co. | | | 5,149 | | | | 731,158 | |
Rockwell Collins, Inc. | | | 68 | | | | 6,308 | |
United Technologies Corp. | | | 29,320 | | | | 3,214,058 | |
| | | | | | | | |
| | | | | | | 11,726,489 | |
| | | | | | | | |
| Airlines — 0.4% | | | | | | | | |
United Continental Holdings, Inc. (a) | | | 32,000 | | | | 2,332,160 | |
| | | | | | | | |
| Building Materials — 0.0% | | | | | | | | |
Martin Marietta Materials, Inc. | | | 490 | | | | 108,550 | |
Masco Corp. | | | 25 | | | | 790 | |
| | | | | | | | |
| | | | | | | 109,340 | |
| | | | | | | | |
| Electrical Components & Equipment — 0.1% | | | | | |
Emerson Electric Co. | | | 15,169 | | | | 845,672 | |
| | | | | | | | |
| Electronics — 0.6% | | | | | | | | |
Agilent Technologies, Inc. | | | 7,963 | | | | 362,794 | |
Allegion PLC | | | 33 | | | | 2,112 | |
Amphenol Corp. Class A | | | 64 | | | | 4,301 | |
FLIR Systems, Inc. | | | 2,852 | | | | 103,214 | |
Fortive Corp. | | | 5,878 | | | | 315,237 | |
| | | | | | | | |
| | | Number of
Shares | | | Value | |
Garmin Ltd. | | | 36,400 | | | $ | 1,765,036 | |
Johnson Controls International PLC | | | 13,765 | | | | 566,980 | |
PerkinElmer, Inc. | | | 2,720 | | | | 141,848 | |
TE Connectivity Ltd. | | | 3,200 | | | | 221,696 | |
Waters Corp. (a) | | | 5,060 | | | | 680,014 | |
| | | | | | | | |
| | | | | | | 4,163,232 | |
| | | | | | | | |
| Engineering & Construction — 0.4% | | | | | | | | |
Fluor Corp. | | | 17,109 | | | | 898,565 | |
Jacobs Engineering Group, Inc. (a) | | | 32,420 | | | | 1,847,940 | |
| | | | | | | | |
| | | | | | | 2,746,505 | |
| | | | | | | | |
| Environmental Controls — 0.0% | | | | | | | | |
Republic Services, Inc. | | | 337 | | | | 19,226 | |
Stericycle, Inc. (a) | | | 97 | | | | 7,473 | |
Waste Management, Inc. | | | 3,073 | | | | 217,906 | |
| | | | | | | | |
| | | | | | | 244,605 | |
| | | | | | | | |
| Hand & Machine Tools — 0.1% | | | | | | | | |
Snap-on, Inc. | | | 1,671 | | | | 286,192 | |
Stanley Black & Decker, Inc. | | | 4,499 | | | | 515,990 | |
| | | | | | | | |
| | | | | | | 802,182 | |
| | | | | | | | |
| Machinery – Construction & Mining — 0.6% | | | | | |
Caterpillar, Inc. | | | 17,475 | | | | 1,620,632 | |
Ingersoll-Rand PLC | | | 26,300 | | | | 1,973,552 | |
| | | | | | | | |
| | | | | | | 3,594,184 | �� |
| | | | | | | | |
| Machinery – Diversified — 0.8% | | | | | | | | |
Cummins, Inc. | | | 12,485 | | | | 1,706,325 | |
Deere & Co. | | | 16,800 | | | | 1,731,072 | |
Flowserve Corp. | | | 2,170 | | | | 104,268 | |
Rockwell Automation, Inc. | | | 9,233 | | | | 1,240,915 | |
Roper Technologies, Inc. | | | 663 | | | | 121,382 | |
Xylem, Inc. | | | 3,355 | | | | 166,140 | |
| | | | | | | | |
| | | | | | | 5,070,102 | |
| | | | | | | | |
| Manufacturing — 1.9% | | | | | | | | |
3M Co. | | | 1,042 | | | | 186,070 | |
Danaher Corp. | | | 11,756 | | | | 915,087 | |
Dover Corp. | | | 3,873 | | | | 290,204 | |
Eaton Corp. PLC | | | 12,566 | | | | 843,053 | |
General Electric Co. | | | 165,686 | | | | 5,235,677 | |
Honeywell International, Inc. | | | 14,722 | | | | 1,705,544 | |
Illinois Tool Works, Inc. | | | 5,425 | | | | 664,345 | |
Leggett & Platt, Inc. | | | 1,686 | | | | 82,412 | |
Parker Hannifin Corp. | | | 12,948 | | | | 1,812,720 | |
Pentair PLC | | | 23 | | | | 1,290 | |
Textron, Inc. | | | 6,372 | | | | 309,424 | |
| | | | | | | | |
| | | | | | | 12,045,826 | |
| | | | | | | | |
| Packaging & Containers — 0.2% | | | | | | | | |
Ball Corp. | | | 2 | | | | 150 | |
Sealed Air Corp. | | | 53 | | | | 2,403 | |
WestRock Co. | | | 19,567 | | | | 993,417 | |
| | | | | | | | |
| | | | | | | 995,970 | |
| | | | | | | | |
The accompanying notes are an integral part of the financial statements.
21
MML Blend Fund – Portfolio of Investments (Continued)
| | | | | | | | |
| | | Number of
Shares | | | Value | |
Transportation — 0.9% | | | | | | | | |
C.H. Robinson Worldwide, Inc. | | | 7,720 | | | $ | 565,567 | |
CSX Corp. | | | 38,007 | | | | 1,365,591 | |
Expeditors International of Washington, Inc. | | | 126 | | | | 6,673 | |
FedEx Corp. | | | 4,220 | | | | 785,764 | |
Norfolk Southern Corp. | | | 7,813 | | | | 844,351 | |
Ryder System, Inc. | | | 9,138 | | | | 680,233 | |
Union Pacific Corp. | | | 7,032 | | | | 729,078 | |
United Parcel Service, Inc. Class B | | | 4,880 | | | | 559,443 | |
| | | | | | | | |
| | | | | | | 5,536,700 | |
| | | | | | | | |
| | | | | | | 50,212,967 | |
| | | | | | | | |
| Technology — 10.4% | | | | | | | | |
| Computers — 4.5% | | | | | | | | |
Accenture PLC Class A | | | 11,530 | | | | 1,350,509 | |
Apple, Inc. | | | 109,467 | | | | 12,678,468 | |
Cognizant Technology Solutions Corp. Class A (a) | | | 9,256 | | | | 518,614 | |
CSRA, Inc. | | | 1,926 | | | | 61,324 | |
Hewlett Packard Enterprise Co. | | | 67,274 | | | | 1,556,720 | |
HP, Inc. | | | 138,574 | | | | 2,056,438 | |
International Business Machines Corp. | | | 24,380 | | | | 4,046,836 | |
NetApp, Inc. | | | 52,398 | | | | 1,848,077 | |
Seagate Technology PLC | | | 49,200 | | | | 1,877,964 | |
Teradata Corp. (a) | | | 53,286 | | | | 1,447,781 | |
Western Digital Corp. | | | 18,647 | | | | 1,267,064 | |
| | | | | | | | |
| | | | | | | 28,709,795 | |
| | | | | | | | |
| Office Equipment/Supplies — 0.4% | | | | | | | | |
Pitney Bowes, Inc. | | | 57,689 | | | | 876,296 | |
Xerox Corp. | | | 190,345 | | | | 1,661,712 | |
| | | | | | | | |
| | | | | | | 2,538,008 | |
| | | | | | | | |
| Semiconductors — 2.2% | | | | | | | | |
Analog Devices, Inc. | | | 54 | | | | 3,921 | |
Applied Materials, Inc. | | | 34,239 | | | | 1,104,893 | |
Broadcom Ltd. | | | 1,959 | | | | 346,292 | |
Intel Corp. | | | 114,523 | | | | 4,153,749 | |
KLA-Tencor Corp. | | | 7,689 | | | | 604,970 | |
Lam Research Corp. | | | 10,423 | | | | 1,102,024 | |
Linear Technology Corp. | | | 1,805 | | | | 112,542 | |
Microchip Technology, Inc. | | | 21 | | | | 1,347 | |
Micron Technology, Inc. (a) | | | 65,717 | | | | 1,440,517 | |
NVIDIA Corp. | | | 8,126 | | | | 867,369 | |
QUALCOMM, Inc. | | | 41,100 | | | | 2,679,720 | |
Skyworks Solutions, Inc. | | | 90 | | | | 6,719 | |
Texas Instruments, Inc. | | | 23,574 | | | | 1,720,195 | |
Xilinx, Inc. | | | 6,356 | | | | 383,712 | |
| | | | | | | | |
| | | | | | | 14,527,970 | |
| | | | | | | | |
| | | | | | | | |
| | | Number of
Shares | | | Value | |
Software — 3.3% | | | | | | | | |
Activision Blizzard, Inc. | | | 15,400 | | | $ | 556,094 | |
Adobe Systems, Inc. (a) | | | 2,790 | | | | 287,231 | |
Autodesk, Inc. (a) | | | 37 | | | | 2,739 | |
CA, Inc. | | | 45,773 | | | | 1,454,208 | |
Citrix Systems, Inc. (a) | | | 7,677 | | | | 685,633 | |
The Dun & Bradstreet Corp. | | | 2,226 | | | | 270,058 | |
Electronic Arts, Inc. (a) | | | 9,037 | | | | 711,754 | |
Fidelity National Information Services, Inc. | | | 1,200 | | | | 90,768 | |
Fiserv, Inc. (a) | | | 1,676 | | | | 178,125 | |
Intuit, Inc. | | | 6,430 | | | | 736,942 | |
Microsoft Corp. | | | 198,195 | | | | 12,315,837 | |
Oracle Corp. | | | 70,657 | | | | 2,716,762 | |
Red Hat, Inc. (a) | | | 3,721 | | | | 259,354 | |
Salesforce.com, Inc. (a) | | | 11,244 | | | | 769,764 | |
| | | | | | | | |
| | | | | | | 21,035,269 | |
| | | | | | | | |
| | | | | | | 66,811,042 | |
| | | | | | | | |
| Utilities — 2.4% | | | | | | | | |
| Electric — 2.3% | | | | | | | | |
The AES Corp. | | | 123,087 | | | | 1,430,271 | |
Ameren Corp. | | | 660 | | | | 34,624 | |
American Electric Power Co., Inc. | | | 8,385 | | | | 527,920 | |
CenterPoint Energy, Inc. | | | 6,431 | | | | 158,460 | |
CMS Energy Corp. | �� | | 7,903 | | | | 328,923 | |
Consolidated Edison, Inc. | | | 2,182 | | | | 160,770 | |
Dominion Resources, Inc. | | | 1,716 | | | | 131,428 | |
DTE Energy Co. | | | 8,860 | | | | 872,799 | |
Duke Energy Corp. | | | 15,190 | | | | 1,179,048 | |
Edison International | | | 8,226 | | | | 592,190 | |
Entergy Corp. | | | 23,998 | | | | 1,763,133 | |
Eversource Energy | | | 812 | | | | 44,847 | |
Exelon Corp. | | | 47,340 | | | | 1,680,096 | |
FirstEnergy Corp. | | | 2,880 | | | | 89,194 | |
NextEra Energy, Inc. | | | 8,540 | | | | 1,020,188 | |
NRG Energy, Inc. | | | 125,800 | | | | 1,542,308 | |
PG&E Corp. | | | 1,316 | | | | 79,973 | |
Pinnacle West Capital Corp. | | | 1,396 | | | | 108,930 | |
PPL Corp. | | | 11,618 | | | | 395,593 | |
Public Service Enterprise Group, Inc. | | | 17,624 | | | | 773,341 | |
SCANA Corp. | | | 3,647 | | | | 267,252 | |
The Southern Co. | | | 20,122 | | | | 989,801 | |
WEC Energy Group, Inc. | | | 4,542 | | | | 266,388 | |
Xcel Energy, Inc. | | | 5,472 | | | | 222,710 | |
| | | | | | | | |
| | | | | | | 14,660,187 | |
| | | | | | | | |
| Gas — 0.1% | | | | | | | | |
NiSource, Inc. | | | 713 | | | | 15,786 | |
The accompanying notes are an integral part of the financial statements.
22
MML Blend Fund – Portfolio of Investments (Continued)
| | | | | | | | |
| | | Number of
Shares | | | Value | |
Sempra Energy | | | 4,261 | | | $ | 428,827 | |
| | | | | | | | |
| | | | | | | 444,613 | |
| | | | | | | | |
| | | | | | | 15,104,800 | |
| | | | | | | | |
| | |
TOTAL COMMON STOCK
(Cost $338,993,633) | | | | | | | 458,676,426 | |
| | | | | |
|
| PREFERRED STOCK — 0.1% | |
| Financial — 0.1% | | | | | | | | |
| Insurance — 0.1% | | | | | | | | |
The Allstate Corp.
5.100%, 3 mo. LIBOR US + 3.165%, VRN | | | 20,000 | | | | 503,400 | |
| | | | | | | | |
| | |
TOTAL PREFERRED STOCK
(Cost $500,000) | | | | | | | 503,400 | |
| | | | | |
| | |
TOTAL EQUITIES
(Cost $339,493,633) | | | | | | | 459,179,826 | |
| | | | | |
| | |
| | | Principal
Amount | | | | |
| BONDS & NOTES — 28.2% | |
|
| CORPORATE DEBT — 10.5% | |
| Advertising — 0.0% | | | | | |
WPP Finance 2010
5.625% 11/15/43 | | $ | 204,000 | | | | 217,927 | |
| | | | | | | | |
| Aerospace & Defense — 0.0% | | | | | |
United Technologies Corp.
6.125% 7/15/38 | | | 80,000 | | | | 101,767 | |
| | | | | | | | |
| Agriculture — 0.2% | | | | | |
Altria Group, Inc.
4.250% 8/09/42 | | | 105,000 | | | | 103,333 | |
Bunge Ltd. Finance Corp.
3.250% 8/15/26 | | | 165,000 | | | | 158,445 | |
Bunge Ltd. Finance Corp.
3.500% 11/24/20 | | | 160,000 | | | | 162,852 | |
Imperial Brands Finance PLC (b)
2.950% 7/21/20 | | | 380,000 | | | | 382,325 | |
Philip Morris International, Inc.
6.375% 5/16/38 | | | 35,000 | | | | 44,879 | |
Reynolds American, Inc.
3.250% 6/12/20 | | | 130,000 | | | | 133,206 | |
Reynolds American, Inc.
5.850% 8/15/45 | | | 120,000 | | | | 142,095 | |
| | | | | | | | |
| | | | | | | 1,127,135 | |
| | | | | | | | |
| Airlines — 0.2% | | | | | |
American Airlines Group, Inc. (b)
5.500% 10/01/19 | | | 454,000 | | | | 468,755 | |
| | | | | | | | |
| | | Principal
Amount | | | Value | |
American Airlines Pass-Through Trust,
Series 2014-1, Class B
4.375% 4/01/24 | | $ | 36,961 | | | $ | 36,869 | |
American Airlines Pass-Through Trust,
Series 2014-1, Class A
3.700% 4/01/28 | | | 92,966 | | | | 92,037 | |
Spirit Airlines Pass-Through Trust,
Series 2015-1, Class A
4.100% 10/01/29 | | | 328,458 | | | | 335,093 | |
United Airlines Pass-Through Trust,
Series 2014-1, Class A
4.000% 10/11/27 | | | 118,978 | | | | 121,357 | |
WestJet Airlines Ltd. (b)
3.500% 6/16/21 | | | 117,000 | | | | 116,951 | |
| | | | | | | | |
| | | | | | | 1,171,062 | |
| | | | | | | | |
| Auto Manufacturers — 0.1% | | | | | |
Ford Motor Co.
5.291% 12/08/46 | | | 80,000 | | | | 81,039 | |
General Motors Financial Co., Inc.
3.100% 1/15/19 | | | 289,000 | | | | 292,067 | |
General Motors Financial Co., Inc.
3.200% 7/13/20 | | | 330,000 | | | | 330,993 | |
Hyundai Capital America (b)
2.550% 2/06/19 | | | 170,000 | | | | 170,995 | |
| | | | | | | | |
| | | | | | | 875,094 | |
| | | | | | | | |
| Automotive & Parts — 0.1% | | | | | |
Lear Corp.
4.750% 1/15/23 | | | 198,000 | | | | 201,960 | |
Lear Corp.
5.375% 3/15/24 | | | 85,000 | | | | 88,931 | |
| | | | | | | | |
| | | | | | | 290,891 | |
| | | | | | | | |
| Banks — 0.9% | | | | | |
Associated Banc-Corp.
2.750% 11/15/19 | | | 460,000 | | | | 461,182 | |
Associated Banc-Corp.
4.250% 1/15/25 | | | 494,000 | | | | 489,561 | |
Bancolombia SA
5.950% 6/03/21 | | | 205,000 | | | | 222,487 | |
Bank of America Corp.
4.183% 11/25/27 | | | 465,000 | | | | 465,297 | |
Bank of America Corp.
4.750% 4/21/45 | | | 220,000 | | | | 223,083 | |
The Bank of Nova Scotia
4.500% 12/16/25 | | | 200,000 | | | | 205,457 | |
First Horizon National Corp.
3.500% 12/15/20 | | | 625,000 | | | | 630,692 | |
First Republic Bank
4.375% 8/01/46 | | | 685,000 | | | | 622,532 | |
The Goldman Sachs Group, Inc.
3.500% 11/16/26 | | | 245,000 | | | | 239,361 | |
The accompanying notes are an integral part of the financial statements.
23
MML Blend Fund – Portfolio of Investments (Continued)
| | | | | | | | |
| | | Principal
Amount | | | Value | |
ICICI Bank Ltd. (b)
4.700% 2/21/18 | | $ | 395,000 | | | $ | 404,465 | |
JP Morgan Chase & Co.
3.375% 5/01/23 | | | 140,000 | | | | 139,499 | |
JP Morgan Chase & Co.
3.625% 12/01/27 | | | 380,000 | | | | 368,671 | |
JP Morgan Chase & Co.
3.875% 9/10/24 | | | 220,000 | | | | 222,604 | |
Regions Financial Corp.
7.500% 5/15/18 | | | 130,000 | | | | 139,273 | |
SVB Financial Group
3.500% 1/29/25 | | | 460,000 | | | | 443,226 | |
SVB Financial Group
5.375% 9/15/20 | | | 75,000 | | | | 81,264 | |
Turkiye Garanti Bankasi AS (b)
4.750% 10/17/19 | | | 210,000 | | | | 208,793 | |
Valley National Bancorp
5.125% 9/27/23 | | | 245,000 | | | | 254,020 | |
| | | | | | | | |
| | | | | | | 5,821,467 | |
| | | | | | | | |
| Beverages — 0.2% | | | | | | | | |
Anheuser-Busch Cos, Inc.
6.500% 2/01/43 | | | 25,000 | | | | 32,265 | |
Anheuser-Busch InBev Finance, Inc.
4.900% 2/01/46 | | | 675,000 | | | | 729,587 | |
Molson Coors Brewing Co.
4.200% 7/15/46 | | | 175,000 | | | | 163,157 | |
| | | | | | | | |
| | | | | | | 925,009 | |
| | | | | | | | |
| Biotechnology — 0.0% | | | | | |
Amgen, Inc.
5.150% 11/15/41 | | | 115,000 | | | | 121,572 | |
| | | | | | | | |
| Building Materials — 0.1% | | | | | |
CRH America, Inc.
8.125% 7/15/18 | | | 220,000 | | | | 240,650 | |
James Hardie International Finance Ltd. (b)
5.875% 2/15/23 | | | 375,000 | | | | 388,125 | |
Martin Marietta Material, Inc.
3 mo. USD LIBOR + 1.100%, FRN
1.937% 6/30/17 | | | 220,000 | | | | 220,379 | |
Owens Corning, Inc.
9.000% 6/15/19 | | | 55,000 | | | | 62,712 | |
| | | | | | | | |
| | | | | | | 911,866 | |
| | | | | | | | |
| Chemicals — 0.2% | | | | | |
CF Industries, Inc.
6.875% 5/01/18 | | | 450,000 | | | | 473,688 | |
Chevron Phillips Chemical Co. LLC/Chevron Phillips Chemical Co. LP (b)
3.400% 12/01/26 | | | 270,000 | | | | 269,541 | |
The Dow Chemical Co.
8.550% 5/15/19 | | | 65,000 | | | | 74,495 | |
| | | | | | | | |
| | | Principal
Amount | | | Value | |
Incitec Pivot Finance LLC (b)
6.000% 12/10/19 | | $ | 110,000 | | | $ | 118,341 | |
Monsanto Co.
4.400% 7/15/44 | | | 100,000 | | | | 96,650 | |
RPM International, Inc.
6.125% 10/15/19 | | | 100,000 | | | | 109,817 | |
RPM International, Inc.
6.500% 2/15/18 | | | 205,000 | | | | 214,849 | |
Valspar Corp.
7.250% 6/15/19 | | | 125,000 | | | | 138,027 | |
| | | | | | | | |
| | | | | | | 1,495,408 | |
| | | | | | | | |
| Commercial Services — 0.2% | | | | | |
The ADT Corp.
6.250% 10/15/21 | | | 440,000 | | | | 477,400 | |
ERAC USA Finance LLC (b)
6.700% 6/01/34 | | | 78,000 | | | | 94,596 | |
Leidos Holdings, Inc.
4.450% 12/01/20 | | | 835,000 | | | | 860,133 | |
| | | | | | | | |
| | | | | | | 1,432,129 | |
| | | | | | | | |
| Computers — 0.2% | | | | | |
Diamond 1 Finance Corp./Diamond 2 Finance Corp. (b)
3.480% 6/01/19 | | | 450,000 | | | | 459,363 | |
Diamond 1 Finance Corp./Diamond 2 Finance Corp. (b)
4.420% 6/15/21 | | | 380,000 | | | | 393,203 | |
Diamond 1 Finance Corp./Diamond 2 Finance Corp. (b)
6.020% 6/15/26 | | | 76,000 | | | | 82,330 | |
| | | | | | | | |
| | | | | | | 934,896 | |
| | | | | | | | |
| Cosmetics & Personal Care — 0.0% | | | | | |
The Procter & Gamble Co.
5.800% 8/15/34 | | | 45,000 | | | | 58,363 | |
| | | | | | | | |
| Distribution & Wholesale — 0.0% | | | | | | | | |
Arrow Electronics, Inc.
4.500% 3/01/23 | | | 80,000 | | | | 81,521 | |
Ingram Micro, Inc. STEP
5.450% 12/15/24 | | | 203,000 | | | | 191,020 | |
| | | | | | | | |
| | | | | | | 272,541 | |
| | | | | | | | |
| Diversified Financial — 1.5% | | | | | |
AerCap Ireland Capital Ltd./AerCap Global Aviation Trust
4.500% 5/15/21 | | | 765,000 | | | | 792,808 | |
Affiliated Managers Group, Inc.
3.500% 8/01/25 | | | 290,000 | | | | 273,629 | |
Air Lease Corp.
3.000% 9/15/23 | | | 465,000 | | | | 444,254 | |
Air Lease Corp.
3.375% 1/15/19 | | | 375,000 | | | | 381,358 | |
Air Lease Corp.
3.375% 6/01/21 | | | 355,000 | | | | 359,919 | |
The accompanying notes are an integral part of the financial statements.
24
MML Blend Fund – Portfolio of Investments (Continued)
| | | | | | | | |
| | | Principal
Amount | | | Value | |
Air Lease Corp.
3.875% 4/01/21 | | $ | 265,000 | | | $ | 272,264 | |
Air Lease Corp. STEP
5.625% 4/01/17 | | | 80,000 | | | | 80,700 | |
Ally Financial, Inc.
3.250% 11/05/18 | | | 485,000 | | | | 485,606 | |
Ally Financial, Inc.
3.600% 5/21/18 | | | 129,000 | | | | 129,968 | |
Ally Financial, Inc.
4.750% 9/10/18 | | | 260,000 | | | | 267,800 | |
Ares Finance Co. LLC (b)
4.000% 10/08/24 | | | 355,000 | | | | 328,411 | |
BGC Partners, Inc.
5.125% 5/27/21 | | | 545,000 | | | | 560,833 | |
CIT Group Inc
3.875% 2/19/19 | | | 287,000 | | | | 293,099 | |
CIT Group, Inc. (b)
5.500% 2/15/19 | | | 160,000 | | | | 168,800 | |
Citigroup, Inc.
3.875% 3/26/25 | | | 737,000 | | | | 732,135 | |
Citigroup, Inc.
8.125% 7/15/39 | | | 90,000 | | | | 133,734 | |
The Goldman Sachs Group, Inc.
5.375% 3/15/20 | | | 225,000 | | | | 244,122 | |
The Goldman Sachs Group, Inc.
5.750% 1/24/22 | | | 200,000 | | | | 224,843 | |
The Goldman Sachs Group, Inc.
5.950% 1/15/27 | | | 294,000 | | | | 335,064 | |
The Goldman Sachs Group, Inc.
6.250% 2/01/41 | | | 60,000 | | | | 74,374 | |
The Goldman Sachs Group, Inc.
6.750% 10/01/37 | | | 75,000 | | | | 92,614 | |
Hyundai Capital America (b)
2.875% 8/09/18 | | | 135,000 | | | | 136,572 | |
Icahn Enterprises LP/Icahn Enterprises Finance Corp.
3.500% 3/15/17 | | | 1,015,000 | | | | 1,016,903 | |
International Lease Finance Corp.
3.875% 4/15/18 | | | 270,000 | | | | 275,062 | |
International Lease Finance Corp.
6.250% 5/15/19 | | | 15,000 | | | | 16,125 | |
JP Morgan Chase & Co.
4.500% 1/24/22 | | | 200,000 | | | | 215,686 | |
JP Morgan Chase & Co.
4.950% 3/25/20 | | | 50,000 | | | | 53,873 | |
JP Morgan Chase & Co.
5.600% 7/15/41 | | | 195,000 | | | | 233,181 | |
Lazard Group LLC
3.625% 3/01/27 | | | 355,000 | | | | 336,407 | |
Lazard Group LLC
4.250% 11/14/20 | | | 600,000 | | | | 628,055 | |
Legg Mason, Inc.
5.625% 1/15/44 | | | 165,000 | | | | 160,676 | |
| | | | | | | | |
| | | Principal
Amount | | | Value | |
Merrill Lynch & Co., Inc.
7.750% 5/14/38 | | $ | 95,000 | | | $ | 130,796 | |
| | | | | | | | |
| | | | | | | 9,879,671 | |
| | | | | | | | |
| Electric — 0.8% | | | | | |
Appalachian Power Co.
3.400% 6/01/25 | | | 355,000 | | | | 359,516 | |
Duke Energy Corp.
3.750% 9/01/46 | | | 195,000 | | | | 175,540 | |
Entergy Arkansas, Inc.
3.500% 4/01/26 | | | 70,000 | | | | 71,333 | |
Entergy Louisiana LLC
4.950% 1/15/45 | | | 165,000 | | | | 169,369 | |
Florida Power & Light Co.
4.950% 6/01/35 | | | 125,000 | | | | 142,610 | |
IPALCO Enterprises, Inc.
3.450% 7/15/20 | | | 800,000 | | | | 814,000 | |
Israel Electric Corp. Ltd. (b)
7.250% 1/15/19 | | | 200,000 | | | | 215,978 | |
Majapahit Holding BV (b)
7.750% 1/20/20 | | | 195,000 | | | | 218,887 | |
Metropolitan Edison Co. (b)
4.000% 4/15/25 | | | 215,000 | | | | 216,451 | |
Nevada Power Co. Series N
6.650% 4/01/36 | | | 135,000 | | | | 178,262 | |
Niagara Mohawk Power Corp. (b)
2.721% 11/28/22 | | | 200,000 | | | | 199,059 | |
NiSource Finance Corp.
5.800% 2/01/42 | | | 175,000 | | | | 203,652 | |
Oncor Electric Delivery Co.
7.500% 9/01/38 | | | 40,000 | | | | 57,614 | |
Pacific Gas & Electric Co.
5.800% 3/01/37 | | | 120,000 | | | | 146,397 | |
Pennsylvania Electric Co. (b)
4.150% 4/15/25 | | | 295,000 | | | | 297,207 | |
PPL Capital Funding, Inc.
5.000% 3/15/44 | | | 190,000 | | | | 200,927 | |
Progress Energy, Inc.
7.000% 10/30/31 | | | 25,000 | | | | 32,412 | |
Puget Energy, Inc.
3.650% 5/15/25 | | | 350,000 | | | | 344,931 | |
Puget Energy, Inc.
6.500% 12/15/20 | | | 271,000 | | | | 305,522 | |
Transelec SA (b)
4.625% 7/26/23 | | | 175,000 | | | | 181,653 | |
Tri-State Generation & Transmission Association, Series 2003, Class A (b)
6.040% 1/31/18 | | | 64,190 | | | | 64,968 | |
Virginia Electric and Power Co.
6.350% 11/30/37 | | | 150,000 | | | | 193,197 | |
Wisconsin Public Service Corp.
5.650% 11/01/17 | | | 225,000 | | | | 232,371 | |
| | | | | | | | |
| | | | | | | 5,021,856 | |
| | | | | | | | |
The accompanying notes are an integral part of the financial statements.
25
MML Blend Fund – Portfolio of Investments (Continued)
| | | | | | | | |
| | | Principal
Amount | | | Value | |
Electronics — 0.1% | | | | | |
Amphenol Corp.
4.000% 2/01/22 | | $ | 100,000 | | | $ | 104,644 | |
Arrow Electronics, Inc.
3.500% 4/01/22 | | | 255,000 | | | | 252,461 | |
Avnet, Inc.
3.750% 12/01/21 | | | 30,000 | | | | 30,185 | |
Avnet, Inc.
4.875% 12/01/22 | | | 123,000 | | | | 127,886 | |
FLIR Systems, Inc.
3.125% 6/15/21 | | | 195,000 | | | | 195,515 | |
| | | | | | | | |
| | | | | | | 710,691 | |
| | | | | | | | |
| Engineering & Construction — 0.1% | | | | | |
SBA Tower Trust (b)
3.156% 10/15/20 | | | 210,000 | | | | 211,176 | |
SBA Tower Trust (b)
2.877% 7/15/21 | | | 200,000 | | | | 198,296 | |
| | | | | | | | |
| | | | | | | 409,472 | |
| | | | | | | | |
| Environmental Controls — 0.0% | | | | | |
Clean Harbors, Inc.
5.250% 8/01/20 | | | 183,000 | | | | 187,346 | |
| | | | | | | | |
| Foods — 0.2% | | | | | |
Ingredion, Inc.
3.200% 10/01/26 | | | 215,000 | | | | 210,421 | |
Kraft Foods, Inc.
6.500% 2/09/40 | | | 63,000 | | | | 77,722 | |
Kraft Heinz Foods Co.
3.000% 6/01/26 | | | 515,000 | | | | 483,501 | |
Tyson Foods, Inc.
2.650% 8/15/19 | | | 65,000 | | | | 65,620 | |
Tyson Foods, Inc.
4.875% 8/15/34 | | | 105,000 | | | | 106,999 | |
| | | | | | | | |
| | | | | | | 944,263 | |
| | | | | | | | |
| Forest Products & Paper — 0.1% | | | | | |
Sappi Papier Holding GmbH (b)
7.750% 7/15/17 | | | 635,000 | | | | 642,938 | |
| | | | | | | | |
| Gas — 0.1% | | | | | |
Boston Gas Co. (b)
4.487% 2/15/42 | | | 100,000 | | | | 102,254 | |
Spire, Inc.
4.700% 8/15/44 | | | 290,000 | | | | 282,684 | |
| | | | | | | | |
| | | | | | | 384,938 | |
| | | | | | | | |
| Hand & Machine Tools — 0.0% | | | | | |
Kennametal, Inc.
2.650% 11/01/19 | | | 150,000 | | | | 149,176 | |
| | | | | | | | |
| Health Care – Products — 0.1% | | | | | |
Abbott Laboratories
2.900% 11/30/21 | | | 205,000 | | | | 204,416 | |
Abbott Laboratories
3.750% 11/30/26 | | | 125,000 | | | | 124,136 | |
| | | | | | | | |
| | | Principal
Amount | | | Value | |
Abbott Laboratories
4.900% 11/30/46 | | $ | 115,000 | | | $ | 118,029 | |
Becton Dickinson & Co.
4.685% 12/15/44 | | | 125,000 | | | | 129,493 | �� |
Johnson & Johnson
5.850% 7/15/38 | | | 40,000 | | | | 52,455 | |
| | | | | | | | |
| | | | | | | 628,529 | |
| | | | | | | | |
| Health Care – Services — 0.1% | | | | | |
Aetna, Inc.
3.200% 6/15/26 | | | 320,000 | | | | 316,566 | |
Aetna, Inc.
4.375% 6/15/46 | | | 75,000 | | | | 75,311 | |
Kaiser Foundation Hospitals
3.500% 4/01/22 | | | 75,000 | | | | 77,396 | |
UnitedHealth Group, Inc.
3.950% 10/15/42 | | | 55,000 | | | | 53,562 | |
UnitedHealth Group, Inc.
6.875% 2/15/38 | | | 110,000 | | | | 149,688 | |
| | | | | | | | |
| | | | | | | 672,523 | |
| | | | | | | | |
| Home Builders — 0.1% | | | | | |
Lennar Corp.
4.500% 11/15/19 | | | 516,000 | | | | 535,995 | |
| | | | | | | | |
| Home Furnishing — 0.0% | | | | | |
Whirlpool Corp.
5.150% 3/01/43 | | | 50,000 | | | | 53,345 | |
| | | | | | | | |
| Housewares — 0.1% | | | | | |
Newell Brands, Inc.
3.850% 4/01/23 | | | 335,000 | | | | 347,498 | |
| | | | | | | | |
| Insurance — 0.8% | | | | | |
The Allstate Corp.
3 mo. USD LIBOR + 2.938%, VRN
5.750% 8/15/53 | | | 336,000 | | | | 347,390 | |
Arch Capital Finance LLC
4.011% 12/15/26 | | | 155,000 | | | | 157,231 | |
Arch Capital Group US, Inc.
5.144% 11/01/43 | | | 170,000 | | | | 179,491 | |
AXIS Specialty Finance PLC
2.650% 4/01/19 | | | 95,000 | | | | 95,655 | |
Brown & Brown, Inc.
4.200% 9/15/24 | | | 70,000 | | | | 70,517 | |
The Chubb Corp.
3 mo. USD LIBOR + 2.250%, VRN
6.375% 4/15/37 | | | 50,000 | | | | 47,000 | |
CNA Financial Corp.
7.350% 11/15/19 | | | 180,000 | | | | 204,142 | |
Five Corners Funding Trust (b)
4.419% 11/15/23 | | | 215,000 | | | | 227,302 | |
MetLife Capital Trust IV (b)
7.875% 12/15/37 | | | 345,000 | | | | 415,897 | |
Prudential Financial, Inc.
3 mo. USD LIBOR + 3.040%, VRN
5.200% 3/15/44 | | | 134,000 | | | | 132,415 | |
The accompanying notes are an integral part of the financial statements.
26
MML Blend Fund – Portfolio of Investments (Continued)
| | | | | | | | |
| | | Principal
Amount | | | Value | |
Prudential Financial, Inc.
3 mo. USD LIBOR + 3.920%, VRN
5.625% 6/15/43 | | $ | 245,000 | | | $ | 254,494 | |
QBE Insurance Group Ltd. (b)
2.400% 5/01/18 | | | 115,000 | | | | 115,126 | |
Reinsurance Group of America, Inc.
3.950% 9/15/26 | | | 360,000 | | | | 356,159 | |
Reinsurance Group of America, Inc.
4.700% 9/15/23 | | | 225,000 | | | | 238,578 | |
Reinsurance Group of America, Inc.
5.000% 6/01/21 | | | 225,000 | | | | 243,147 | |
Reinsurance Group of America, Inc.
6.450% 11/15/19 | | | 220,000 | | | | 244,074 | |
Trinity Acquisition PLC
3.500% 9/15/21 | | | 270,000 | | | | 272,635 | |
Trinity Acquisition PLC
4.400% 3/15/26 | | | 70,000 | | | | 70,858 | |
Unum Group
3.000% 5/15/21 | | | 150,000 | | | | 149,562 | |
USF&G Capital I (b)
8.500% 12/15/45 | | | 150,000 | | | | 190,184 | |
Willis North America, Inc.
7.000% 9/29/19 | | | 97,000 | | | | 107,921 | |
Willis Towers Watson PLC
5.750% 3/15/21 | | | 230,000 | | | | 251,327 | |
XLIT Ltd.
4.450% 3/31/25 | | | 170,000 | | | | 168,567 | |
XLIT Ltd.
5.750% 10/01/21 | | | 115,000 | | | | 127,803 | |
XLIT Ltd.
6.375% 11/15/24 | | | 325,000 | | | | 379,340 | |
| | | | | | | | |
| | | | | | | 5,046,815 | |
| | | | | | | | |
| Internet — 0.1% | | | | | |
Expedia, Inc.
7.456% 8/15/18 | | | 425,000 | | | | 459,658 | |
| | | | | | | | |
| Investment Companies — 0.1% | | | | | |
Ares Capital Corp.
3.875% 1/15/20 | | | 505,000 | | | | 512,056 | |
FS Investment Corp.
4.000% 7/15/19 | | | 390,000 | | | | 391,005 | |
| | | | | | | | |
| | | | | | | 903,061 | |
| | | | | | | | |
| Iron & Steel — 0.2% | | | | | |
ArcelorMittal
5.125% 6/01/20 | | | 320,000 | | | | 335,200 | |
ArcelorMittal STEP
6.250% 8/05/20 | | | 285,000 | | | | 309,937 | |
Glencore Funding LLC (b)
4.625% 4/29/24 | | | 55,000 | | | | 56,238 | |
Reliance Steel & Aluminum Co.
4.500% 4/15/23 | | | 145,000 | | | | 145,882 | |
| | | | | | | | |
| | | Principal
Amount | | | Value | |
Vale Overseas Ltd.
6.875% 11/21/36 | | $ | 95,000 | | | $ | 93,575 | |
| | | | | | | | |
| | | | | | | 940,832 | |
| | | | | | | | |
| Lodging — 0.0% | | | | | |
Marriott International, Inc.
6.750% 5/15/18 | | | 40,000 | | | | 42,641 | |
| | | | | | | | |
| Machinery – Diversified — 0.2% | | | | | |
CNH Industrial Capital LLC
3.250% 2/01/17 | | | 105,000 | | | | 105,000 | |
CNH Industrial Capital LLC
3.375% 7/15/19 | | | 230,000 | | | | 230,575 | |
CNH Industrial Capital LLC
3.625% 4/15/18 | | | 116,000 | | | | 117,450 | |
CNH Industrial Capital LLC
3.875% 10/15/21 | | | 500,000 | | | | 491,875 | |
Xylem, Inc.
3.250% 11/01/26 | | | 120,000 | | | | 116,526 | |
Xylem, Inc.
4.875% 10/01/21 | | | 100,000 | | | | 107,957 | |
| | | | | | | | |
| | | | | | | 1,169,383 | |
| | | | | | | | |
| Manufacturing — 0.0% | | | | | |
General Electric Co.
4.125% 10/09/42 | | | 270,000 | | | | 272,390 | |
| | | | | | | | |
| Media — 0.2% | | | | | |
21st Century Fox America, Co.
6.900% 8/15/39 | | | 100,000 | | | | 125,575 | |
Charter Communications Operating LLC/Charter Communications Operating Capital
3.579% 7/23/20 | | | 270,000 | | | | 275,463 | |
Charter Communications Operating LLC/Charter Communications Operating Capital
6.484% 10/23/45 | | | 225,000 | | | | 260,118 | |
Comcast Corp.
3.400% 7/15/46 | | | 305,000 | | | | 266,360 | |
NBCUniversal Media LLC
6.400% 4/30/40 | | | 20,000 | | | | 25,862 | |
Time Warner Cable, Inc.
6.750% 6/15/39 | | | 110,000 | | | | 127,884 | |
Time Warner Cable, Inc.
8.250% 4/01/19 | | | 45,000 | | | | 50,567 | |
Time Warner Cable, Inc.
8.750% 2/14/19 | | | 65,000 | | | | 73,251 | |
Time Warner, Inc.
4.700% 1/15/21 | | | 125,000 | | | | 133,610 | |
Time Warner, Inc.
6.250% 3/29/41 | | | 25,000 | | | | 29,170 | |
Viacom, Inc.
2.250% 2/04/22 | | | 170,000 | | | | 159,756 | |
| | | | | | | | |
| | | | | | | 1,527,616 | |
| | | | | | | | |
The accompanying notes are an integral part of the financial statements.
27
MML Blend Fund – Portfolio of Investments (Continued)
| | | | | | | | |
| | | Principal
Amount | | | Value | |
Mining — 0.0% | | | | | |
Glencore Canada Corp.
5.500% 6/15/17 | | $ | 175,000 | | | $ | 177,807 | |
| | | | | | | | |
| Office Equipment/Supplies — 0.1% | | | | | |
Pitney Bowes, Inc.
3.375% 10/01/21 | | | 485,000 | | | | 470,879 | |
Pitney Bowes, Inc.
4.750% 5/15/18 | | | 20,000 | | | | 20,593 | |
Pitney Bowes, Inc.
5.750% 9/15/17 | | | 31,000 | | | | 31,795 | |
| | | | | | | | |
| | | | | | | 523,267 | |
| | | | | | | | |
| Office Furnishings — 0.0% | | | | | |
Steelcase, Inc.
6.375% 2/15/21 | | | 100,000 | | | | 111,772 | |
| | | | | | | | |
| Oil & Gas — 0.5% | | | | | |
Anadarko Petroleum Corp.
5.550% 3/15/26 | | | 165,000 | | | | 184,678 | |
ConocoPhillips Co.
2.400% 12/15/22 | | | 140,000 | | | | 135,369 | |
ConocoPhillips Co.
2.875% 11/15/21 | | | 484,000 | | | | 487,690 | |
Encana Corp.
3.900% 11/15/21 | | | 150,000 | | | | 151,077 | |
Encana Corp.
6.500% 5/15/19 | | | 125,000 | | | | 134,529 | |
Helmerich & Payne International Drilling Co.
4.650% 3/15/25 | | | 190,000 | | | | 196,322 | |
Nabors Industries, Inc. (b)
5.500% 1/15/23 | | | 60,000 | | | | 62,475 | |
Pemex Project Funding Master Trust
6.625% 6/15/38 | | | 37,000 | | | | 35,798 | |
Petroleos Mexicanos
3.125% 1/23/19 | | | 50,000 | | | | 49,575 | |
Petroleos Mexicanos
5.500% 1/21/21 | | | 285,000 | | | | 293,194 | |
Petroleos Mexicanos
6.375% 1/23/45 | | | 80,000 | | | | 72,800 | |
Petroleos Mexicanos (b)
6.500% 3/13/27 | | | 60,000 | | | | 61,890 | |
Phillips 66
5.875% 5/01/42 | | | 335,000 | | | | 396,658 | |
Pioneer Natural Resources Co.
4.450% 1/15/26 | | | 320,000 | | | | 339,060 | |
Tesoro Corp. (b)
5.125% 12/15/26 | | | 285,000 | | | | 288,249 | |
| | | | | | | | |
| | | | | | | 2,889,364 | |
| | | | | | | | |
| Oil & Gas Services — 0.0% | | | | | |
Weatherford International Ltd.
6.000% 3/15/18 | | | 75,000 | | | | 74,250 | |
| | | | | | | | |
| | | | | | | | |
| | | Principal
Amount | | | Value | |
Packaging & Containers — 0.2% | | | | | |
Amcor Finance USA, Inc. (b)
3.625% 4/28/26 | | $ | 490,000 | | | $ | 479,943 | |
Brambles USA, Inc. (b)
4.125% 10/23/25 | | | 134,000 | | | | 136,422 | |
Brambles USA, Inc., Series A (b)
5.350% 4/01/20 | | | 90,000 | | | | 97,049 | |
Crown Americas LLC/Crown Americas Capital Corp. IV
4.500% 1/15/23 | | | 375,000 | | | | 382,500 | |
Graphic Packaging International, Inc.
4.750% 4/15/21 | | | 100,000 | | | | 105,000 | |
Graphic Packaging International, Inc.
4.875% 11/15/22 | | | 60,000 | | | | 61,500 | |
| | | | | | | | |
| | | | | | | 1,262,414 | |
| | | | | | | | |
| Pharmaceuticals — 0.4% | | | | | |
AbbVie, Inc.
4.400% 11/06/42 | | | 75,000 | | | | 70,556 | |
AbbVie, Inc.
4.700% 5/14/45 | | | 285,000 | | | | 279,622 | |
Actavis Funding SCS
3.000% 3/12/20 | | | 300,000 | | | | 304,159 | |
Actavis Funding SCS
4.750% 3/15/45 | | | 190,000 | | | | 186,529 | |
Baxalta, Inc.
3.600% 6/23/22 | | | 105,000 | | | | 105,804 | |
Baxalta, Inc.
4.000% 6/23/25 | | | 290,000 | | | | 290,847 | |
Baxalta, Inc.
5.250% 6/23/45 | | | 140,000 | | | | 149,438 | |
McKesson Corp.
2.284% 3/15/19 | | | 95,000 | | | | 95,356 | |
McKesson Corp.
4.750% 3/01/21 | | | 150,000 | | | | 160,831 | |
McKesson Corp.
4.883% 3/15/44 | | | 60,000 | | | | 61,036 | |
McKesson Corp.
6.000% 3/01/41 | | | 125,000 | | | | 144,626 | |
Merck Sharp & Dohme Corp.
5.850% 6/30/39 | | | 45,000 | | | | 56,711 | |
Mylan NV (b)
3.150% 6/15/21 | | | 275,000 | | | | 269,881 | |
Mylan NV (b)
3.950% 6/15/26 | | | 480,000 | | | | 449,207 | |
Shire Acquisitions Investments Ireland DAC
2.875% 9/23/23 | | | 95,000 | | | | 90,292 | |
Teva Pharmaceutical Finance Netherlands III BV
4.100% 10/01/46 | | | 75,000 | | | | 64,265 | |
| | | | | | | | |
| | | | | | | 2,779,160 | |
| | | | | | | | |
The accompanying notes are an integral part of the financial statements.
28
MML Blend Fund – Portfolio of Investments (Continued)
| | | | | | | | |
| | | Principal
Amount | | | Value | |
Pipelines — 0.4% | | | | | |
Boardwalk Pipelines LLC
5.500% 2/01/17 | | $ | 175,000 | | | $ | 175,466 | |
CenterPoint Energy Resources Corp.
4.500% 1/15/21 | | | 100,000 | | | | 104,922 | |
EnLink Midstream Partners LP
4.850% 7/15/26 | | | 75,000 | | | | 75,655 | |
Enterprise Products Operating Co.
3.700% 2/15/26 | | | 340,000 | | | | 341,233 | |
Enterprise Products Operating Co.
5.950% 2/01/41 | | | 150,000 | | | | 169,335 | |
Kinder Morgan Energy Partners LP
6.000% 2/01/17 | | | 130,000 | | | | 130,394 | |
Kinder Morgan Energy Partners LP
6.500% 2/01/37 | | | 120,000 | | | | 131,501 | |
Kinder Morgan Energy Partners LP
6.950% 1/15/38 | | | 10,000 | | | | 11,600 | |
Kinder Morgan Finance Co. LLC (b)
6.000% 1/15/18 | | | 150,000 | | | | 156,180 | |
Kinder Morgan, Inc.
4.300% 6/01/25 | | | 165,000 | | | | 169,878 | |
Magellan Midstream Partners LP
5.150% 10/15/43 | | | 460,000 | | | | 478,102 | |
MPLX LP
4.875% 12/01/24 | | | 150,000 | | | | 154,454 | |
MPLX LP
4.875% 6/01/25 | | | 155,000 | | | | 159,363 | |
Plains All American Pipeline LP/PAA Finance Corp.
4.500% 12/15/26 | | | 210,000 | | | | 213,034 | |
Southern Natural Gas Co. LLC STEP (b)
5.900% 4/01/17 | | | 250,000 | | | | 252,603 | |
| | | | | | | | |
| | | | | | | 2,723,720 | |
| | | | | | | | |
| Real Estate Investment Trusts (REITS) — 0.3% | |
American Tower Corp.
3.450% 9/15/21 | | | 425,000 | | | | 430,499 | |
American Tower Corp.
4.400% 2/15/26 | | | 140,000 | | | | 143,059 | |
Brandywine Operating Partners LP
4.950% 4/15/18 | | | 200,000 | | | | 206,745 | |
DDR Corp.
4.750% 4/15/18 | | | 60,000 | | | | 61,708 | |
Duke Realty LP
3.250% 6/30/26 | | | 120,000 | | | | 116,051 | |
Federal Realty Investment Trust
5.900% 4/01/20 | | | 55,000 | | | | 60,781 | |
Healthcare Trust of America Holdings LP
3.500% 8/01/26 | | | 200,000 | | | | 191,126 | |
Highwoods Realty LP
7.500% 4/15/18 | | | 265,000 | | | | 282,726 | |
Host Hotels & Resorts LP
3.750% 10/15/23 | | | 40,000 | | | | 39,269 | |
| | | | | | | | |
| | | Principal
Amount | | | Value | |
Host Hotels & Resorts LP
4.000% 6/15/25 | | $ | 100,000 | | | $ | 98,492 | |
Tanger Properties LP
3.125% 9/01/26 | | | 400,000 | | | | 375,737 | |
Weingarten Realty Investors
3.250% 8/15/26 | | | 85,000 | | | | 80,187 | |
| | | | | | | | |
| | | | | | | 2,086,380 | |
| | | | | | | | |
| Retail — 0.4% | | | | | | | | |
AutoNation, Inc.
4.500% 10/01/25 | | | 120,000 | | | | 121,402 | |
Bed Bath & Beyond, Inc.
5.165% 8/01/44 | | | 101,000 | | | | 91,918 | |
CVS Health Corp.
6.125% 9/15/39 | | | 175,000 | | | | 214,242 | |
CVS Pass-Through Trust (b)
5.926% 1/10/34 | | | 283,925 | | | | 324,334 | |
Dollar Tree, Inc.
5.750% 3/01/23 | | | 470,000 | | | | 497,645 | |
El Puerto de Liverpool SAB de CV (b)
3.950% 10/02/24 | | | 445,000 | | | | 422,750 | |
The Home Depot, Inc.
5.950% 4/01/41 | | | 150,000 | | | | 190,690 | |
QVC, Inc.
3.125% 4/01/19 | | | 155,000 | | | | 156,613 | |
QVC, Inc.
4.375% 3/15/23 | | | 150,000 | | | | 148,876 | |
QVC, Inc.
4.450% 2/15/25 | | | 245,000 | | | | 235,501 | |
QVC, Inc.
5.125% 7/02/22 | | | 30,000 | | | | 31,055 | |
Tiffany & Co.
4.900% 10/01/44 | | | 165,000 | | | | 153,859 | |
Walgreens Boots Alliance, Inc.
2.700% 11/18/19 | | | 110,000 | | | | 111,459 | |
| | | | | | | | |
| | | | | | | 2,700,344 | |
| | | | | | | | |
| Semiconductors — 0.1% | | | | | | | | |
Lam Research Corp.
2.750% 3/15/20 | | | 215,000 | | | | 215,445 | |
Lam Research Corp.
3.800% 3/15/25 | | | 300,000 | | | | 300,327 | |
| | | | | | | | |
| | | | | | | 515,772 | |
| | | | | | | | |
| Software — 0.2% | | | | | | | | |
Broadridge Financial Solutions, Inc.
3.400% 6/27/26 | | | 165,000 | | | | 159,228 | |
Broadridge Financial Solutions, Inc.
3.950% 9/01/20 | | | 110,000 | | | | 115,337 | |
Microsoft Corp.
4.450% 11/03/45 | | | 330,000 | | | | 351,589 | |
Oracle Corp.
4.000% 7/15/46 | | | 575,000 | | | | 549,985 | |
| | | | | | | | |
| | | | | | | 1,176,139 | |
| | | | | | | | |
The accompanying notes are an integral part of the financial statements.
29
MML Blend Fund – Portfolio of Investments (Continued)
| | | | | | | | |
| | | Principal
Amount | | | Value | |
| Telecommunications — 0.3% | | | | | | | | |
AT&T, Inc.
4.750% 5/15/46 | | $ | 260,000 | | | $ | 246,329 | |
AT&T, Inc.
6.550% 2/15/39 | | | 25,000 | | | | 28,943 | |
CenturyLink, Inc.
6.150% 9/15/19 | | | 140,000 | | | | 149,800 | |
Cisco Systems, Inc.
5.500% 1/15/40 | | | 55,000 | | | | 67,001 | |
Crown Castle Towers LLC (b)
6.113% 1/15/40 | | | 170,000 | | | | 184,188 | |
Rogers Communications, Inc.
7.500% 8/15/38 | | | 30,000 | | | | 39,455 | |
Telefonica Emisiones SAU
5.462% 2/16/21 | | | 125,000 | | | | 136,259 | |
Verizon Communications, Inc.
2.625% 2/21/20 | | | 262,000 | | | | 264,513 | |
Verizon Communications, Inc.
4.862% 8/21/46 | | | 207,000 | | | | 209,752 | |
Verizon Communications, Inc.
5.012% 8/21/54 | | | 181,000 | | | | 180,052 | |
Verizon Communications, Inc.
6.550% 9/15/43 | | | 182,000 | | | | 227,314 | |
| | | | | | | | |
| | | | | | | 1,733,606 | |
| | | | | | | | |
| Transportation — 0.1% | | | | | | | | |
Asciano Finance (b)
4.625% 9/23/20 | | | 105,000 | | | | 108,634 | |
Asciano Finance Ltd. (b)
5.000% 4/07/18 | | | 250,000 | | | | 256,852 | |
Autoridad del Canal de Panama (b)
4.950% 7/29/35 | | | 210,000 | | | | 221,550 | |
Norfolk Southern Corp.
6.000% 5/23/2111 | | | 100,000 | | | | 116,982 | |
| | | | | | | | |
| | | | | | | 704,018 | |
| | | | | | | | |
| Trucking & Leasing — 0.2% | | | | | | | | |
Aviation Capital Group Corp. (b)
2.875% 9/17/18 | | | 905,000 | | | | 916,312 | |
GATX Corp.
4.750% 6/15/22 | | | 150,000 | | | | 161,442 | |
| | | | | | | | |
| | | | | | | 1,077,754 | |
| | | | | | | | |
| | |
TOTAL CORPORATE DEBT
(Cost $66,324,571) | | | | | | | 67,223,531 | |
| | | | | |
|
| MUNICIPAL OBLIGATIONS — 0.3% | |
JobsOhio Beverage System Series B
4.532% 1/01/35 | | | 325,000 | | | | 348,039 | |
Orange County Local Transportation Authority BAB
6.908% 2/15/41 | | | 230,000 | | | | 308,906 | |
| | | | | | | | |
| | | Principal
Amount | | | Value | |
Panhandle-Plains Student Finance Corp., Series 2001-A2, FRN
2.290% 12/01/31 | | $ | 300,000 | | | $ | 288,147 | |
State of California BAB
7.550% 4/01/39 | | | 120,000 | | | | 177,558 | |
State of California BAB
7.600% 11/01/40 | | | 105,000 | | | | 158,160 | |
State of Illinois
5.365% 3/01/17 | | | 575,000 | | | | 578,421 | |
| | | | | | | | |
| | | | | | | 1,859,231 | |
| | | | | | | | |
| | |
TOTAL MUNICIPAL OBLIGATIONS
(Cost $1,816,286) | | | | | | | 1,859,231 | |
| | | | | |
|
| NON-U.S. GOVERNMENT AGENCY OBLIGATIONS — 8.9% | |
| Auto Floor Plan ABS — 0.0% | | | | | | | | |
NCF Dealer Floorplan Master Trust, Series 2014-1A, Class A, 1 mo. LIBOR + 1.500%, FRN (b)
2.061% 10/20/20 | | | 230,000 | | | | 230,000 | |
| | | | | | | | |
| Automobile ABS — 0.4% | | | | | | | | |
CPS Auto Trust, Series 2014-A,
Class A (b)
1.210% 8/15/18 | | | 7,880 | | | | 7,875 | |
CPS Auto Trust, Series 2016-C, Class A (b)
1.620% 1/15/20 | | | 126,963 | | | | 126,965 | |
Drive Auto Receivables Trust, Series 2016-BA, Class B (b)
2.560% 6/15/20 | | | 160,000 | | | | 160,626 | |
First Investors Auto Owner Trust, Series 2016-2A, Class B (b)
2.210% 7/15/22 | | | 450,000 | | | | 445,811 | |
Flagship Credit Auto Trust, Series 2013-2, Class A (b)
1.940% 1/15/19 | | | 3,495 | | | | 3,495 | |
GLS Auto Receivables Trust, Series 2015-1A, Class A (b)
2.250% 12/15/20 | | | 71,240 | | | | 71,126 | |
Oscar US Funding Trust II, Series 2015-1A, Class A4 (b)
2.440% 6/15/22 | | | 350,000 | | | | 344,672 | |
Oscar US Funding Trust IV, Series 2016-1A, Class A2B, 1 mo. USD LIBOR + 1.700%, FRN (b)
2.403% 7/15/20 | | | 227,805 | | | | 227,877 | |
Oscar US Funding Trust V, Series 2016-2A, Class A4 (b)
2.990% 12/15/23 | | | 630,000 | | | | 617,478 | |
Santander Drive Auto Receivables Trust, Series 2015-4, Class C
2.970% 3/15/21 | | | 250,000 | | | | 251,999 | |
| | | | | | | | |
| | | | | | | 2,257,924 | |
| | | | | | | | |
The accompanying notes are an integral part of the financial statements.
30
MML Blend Fund – Portfolio of Investments (Continued)
| | | | | | | | |
| | | Principal
Amount | | | Value | |
Commercial MBS — 0.9% | | | | | | | | |
Banc of America Commercial Mortgage, Inc., Series 2007-4, Class A4, VRN
5.747% 2/10/51 | | $ | 225,358 | | | $ | 228,467 | |
Banc of America Commercial Mortgage, Inc., Series 2007-4, Class AM, VRN
5.814% 2/10/51 | | | 220,000 | | | | 224,080 | |
Banc of America Commercial Mortgage, Inc., Series 2008-1, Class A4, VRN
6.235% 2/10/51 | | | 241,864 | | | | 248,400 | |
Banc of America Commercial Mortgage, Inc., Series 2008-1, Class AM, VRN
6.278% 2/10/51 | | | 215,000 | | | | 221,605 | |
Bear Stearns Commercial Mortgage Securities, Series 2007-PW17, Class A4, VRN
5.694% 6/11/50 | | | 197,018 | | | | 200,376 | |
Bear Stearns Commercial Mortgage Securities, Series 2007-PW18, Class A4
5.700% 6/11/50 | | | 236,506 | | | | 240,739 | |
Commercial Mortgage Pass Through Certificates, Series 2012-CR4, Class B (b)
3.703% 10/15/45 | | | 195,000 | | | | 198,109 | |
Commercial Mortgage Pass Through Certificates, Series 2014-UBS2, Class A5
3.961% 3/10/47 | | | 319,000 | | | | 335,747 | |
Commercial Mortgage Pass Through Certificates, Series 2015-CR23, Class C, VRN
4.255% 5/10/48 | | | 140,000 | | | | 124,794 | |
Commercial Mortgage Pass-Through Certificates, Series 2007-C9, Class A4, VRN
5.811% 12/10/49 | | | 367,544 | | | | 370,713 | |
DBCCRE Mortgage Trust, Series 2014-ARCP, Class A (b)
4.238% 1/10/34 | | | 165,000 | | | | 167,937 | |
DBRR Trust, Series 2013-EZ3, Class A, VRN (b)
1.635% 12/18/49 | | | 16,297 | | | | 16,281 | |
DBUBS Mortgage Trust, Series 2011-LC1A, Class B, VRN (b)
5.471% 11/10/46 | | | 110,000 | | | | 120,708 | |
GCCFC Commercial Mortgage Trust, Series 2006-GG7, Class AM, VRN
5.758% 7/10/38 | | | 191,651 | | | | 191,704 | |
GS Mortgage Securities Corp. II, Series 2012-GC6, Class AS (b)
4.948% 1/10/45 | | | 100,000 | | | | 109,690 | |
JP Morgan Chase Commercial Mortgage Securities Corp., Series 2007-CB18, Class AM, VRN
5.466% 6/12/47 | | | 265,000 | | | | 266,365 | |
| | | | | | | | |
| | | Principal
Amount | | | Value | |
ML-CFC Commercial Mortgage Trust,
Series 2007-9, Class AM, VRN
5.856% 9/12/49 | | $ | 260,000 | | | $ | 268,246 | |
Morgan Stanley Capital I, Series 2011-C2, Class B, VRN (b)
5.200% 6/15/44 | | | 250,000 | | | | 267,984 | |
Morgan Stanley Capital I,
Series 2007-HQ11, Class AM, VRN
5.478% 2/12/44 | | | 277,675 | | | | 277,427 | |
STRIPs Ltd., Series 2012-1A, Class A (b)
1.500% 12/25/44 | | | 6,991 | | | | 6,970 | |
TIAA Seasoned Commercial Mortgage Trust, Series 2007-C4, Class AJ, VRN
5.473% 8/15/39 | | | 30,954 | | | | 30,997 | |
Velocity Commercial Capital Loan Trust, Series 2016-2, Class AFX, VRN
2.996% 10/25/46 | | | 324,273 | | | | 321,120 | |
VNO Mortgage Trust, Series 2013-PENN, Class A (b)
3.808% 12/13/29 | | | 240,000 | | | | 251,850 | |
Wachovia Bank Commercial Mortgage Trust, Series 2007-C31, Class A4
5.509% 4/15/47 | | | 506,823 | | | | 508,221 | |
Wachovia Bank Commercial Mortgage Trust, Series 2007-C31, Class AM, VRN
5.591% 4/15/47 | | | 200,000 | | | | 201,133 | |
Wachovia Bank Commercial Mortgage Trust, Series 2007-C33, Class A4, VRN
5.969% 2/15/51 | | | 116,021 | | | | 116,747 | |
Wachovia Bank Commercial Mortgage Trust, Series 2007-C33, Class AM, VRN
5.969% 2/15/51 | | | 235,000 | | | | 237,585 | |
Wells Fargo Commercial Mortgage Trust, Series 2010-C1, Class A1 (b)
3.349% 11/15/43 | | | 30,236 | | | | 30,975 | |
WF-RBS Commercial Mortgage Trust,
Series 2012-C8, Class B
4.311% 8/15/45 | | | 190,000 | | | | 198,149 | |
| | | | | | | | |
| | | | | | | 5,983,119 | |
| | | | | | | | |
| Home Equity ABS — 0.1% | | | | | | | | |
Aames Mortgage Investment Trust,
Series 2005-1, Class M4, 1 mo. USD LIBOR + 1.125%, FRN
1.717% 6/25/35 | | | 95,895 | | | | 95,543 | |
ACE Securities Corp., Series 2005-AG1, Class A1B1, 1 mo. USD LIBOR + .270%, FRN
0.862% 8/25/35 | | | 8,443 | | | | 8,442 | |
The accompanying notes are an integral part of the financial statements.
31
MML Blend Fund – Portfolio of Investments (Continued)
| | | | | | | | |
| | | Principal
Amount | | | Value | |
Countrywide Asset-Backed Certificates, Series 2004-5, Class 3A, 1 mo. USD LIBOR + .460%, FRN
1.044% 9/25/34 | | $ | 42,294 | | | $ | 42,097 | |
First Franklin Mortgage Loan Trust,
Series 2005-FF6, Class M1, 1 mo. USD LIBOR + .630%, FRN
1.222% 5/25/36 | | | 44,098 | | | | 43,992 | |
Fremont Home Loan Trust, Series 2005-E, Class 2A3, 1 mo. USD LIBOR + .240%, FRN
0.832% 1/25/36 | | | 31,149 | | | | 30,956 | |
GSAMP Trust, Series 2005-AHL, Class M1,
1 mo. USD LIBOR + .645%, FRN
1.401% 4/25/35 | | | 46,676 | | | | 46,834 | |
Home Equity Asset Trust, Series 2006-4, Class 2A3, 1 mo. USD LIBOR + .170%, FRN
0.754% 8/25/36 | | | 19,443 | | | | 19,458 | |
Long Beach Mortgage Loan Trust,
Series 2005-WL1, Class M2, 1 mo. USD LIBOR + .825%, FRN
1.581% 6/25/35 | | | 154,978 | | | | 154,393 | |
MASTR Asset-Backed Securities Trust, Series 2005-WMC1, Class M3, 1 mo. USD LIBOR + .720%, FRN
1.304% 3/25/35 | | | 203,880 | | | | 203,868 | |
NovaStar Mortgage Funding Trust,
Series 2005-3, Class A2D, 1 mo. LIBOR + .370%, FRN
1.126% 1/25/36 | | | 118,134 | | | | 117,697 | |
Park Place Securities, Inc.,
Series 2005-WHQ4, Class A1A, 1 mo. USD LIBOR + .260%, FRN
0.852% 9/25/35 | | | 29,797 | | | | 29,834 | |
Residential Asset Securities Corp.,
Series 2005-EMX4, Class M1, 1 mo. USD LIBOR + .430%, FRN
1.186% 11/25/35 | | | 59,594 | | | | 59,624 | |
| | | | | | | | |
| | | | | | | 852,738 | |
| | | | | | | | |
| Other ABS — 4.8% | | | | | | | | |
321 Henderson Receivables I LLC,
Series 2015-1A, Class A (b)
3.260% 9/15/72 | | | 55,178 | | | | 51,730 | |
321 Henderson Receivables LLC,
Series 2005-1A, Class A1, 1 mo. USD LIBOR + .230%, FRN (b)
0.933% 11/15/40 | | | 99,205 | | | | 94,165 | |
Aames Mortgage Investment Trust,
Series 2004-1, Class M5, 1 mo. USD LIBOR + 1.725%, FRN
2.317% 1/25/35 | | | 171,724 | | | | 171,234 | |
| | | | | | | | |
| | | Principal
Amount | | | Value | |
AIMCO CLO Ltd., Series 2014-AA, Class A, 3 mo. USD LIBOR + 1.540%, FRN (b)
2.421% 7/20/26 | | $ | 360,000 | | | $ | 360,013 | |
ALM VII Ltd., Series 2012-7A, Class A1R, 3 mo. USD LIBOR + 1.480%, FRN (b)
2.333% 10/15/28 | | | 410,000 | | | | 411,221 | |
ALM XIV Ltd., Series 2014-14A, Class A1, 3 mo. USD LIBOR + 1.430%, FRN (b)
2.320% 7/28/26 | | | 660,000 | | | | 659,997 | |
Alterna Funding I LLC, Series 2014-1A, Class NOTE (b)
1.639% 2/15/21 | | | 88,667 | | | | 86,173 | |
Alterna Funding II LLC, Series 2015-1A, Class A (b)
2.500% 2/15/24 | | | 174,716 | | | | 171,549 | |
Apidos CLO XV, Series 2013-15A, Class A1, 3 mo. USD LIBOR + 1.350%, FRN (b)
2.231% 10/20/25 | | | 500,000 | | | | 500,008 | |
Apidos CLO XXV, Series 2016-25A, Class A1, 3 mo. USD LIBOR + 1.460%, FRN (b)
2.202% 10/20/28 | | | 250,000 | | | | 250,038 | |
Applebee’s/IHOP Funding LLC, Series 2014-1, Class A2 (b)
4.277% 9/05/44 | | | 210,000 | | | | 207,761 | |
Arbys Funding LLC, Series 2015-1A,
Class A2 (b)
4.969% 10/30/45 | | | 316,800 | | | | 320,166 | |
ARL Second LLC, Series 2014-1A,
Class A1 (b)
2.920% 6/15/44 | | | 155,084 | | | | 150,891 | |
Avery Point CLO Ltd., Series 2014-5A, Class A, 3 mo. USD LIBOR + 1.460%, FRN (b)
2.340% 7/17/26 | | | 350,000 | | | | 350,003 | |
Avery Point III CLO Ltd., Series 2013-3A, Class A, 3 mo. USD LIBOR + 1.400%, FRN (b)
2.281% 1/18/25 | | | 250,000 | | | | 250,003 | |
Avery Point VI CLO Ltd., Series 2015-6A, Class A, 3 mo. USD LIBOR + 1.450%, FRN (b)
2.330% 8/05/27 | | | 570,000 | | | | 570,621 | |
BCC Funding VIII LLC, Series 2014-1A, Class A (b)
1.794% 6/20/20 | | | 21,672 | | | | 21,659 | |
Birchwood Park CLO Ltd., Series 2014-1A, Class A, 3 mo. USD LIBOR + 1.440%, FRN (b)
2.320% 7/15/26 | | | 345,000 | | | | 345,028 | |
The accompanying notes are an integral part of the financial statements.
32
MML Blend Fund – Portfolio of Investments (Continued)
| | | | | | | | |
| | | Principal
Amount | | | Value | |
Blackbird Capital Aircraft Lease Securitization Ltd., Series 2016-1A, Class AA, STEP (b)
2.487% 12/16/41 | | $ | 290,000 | | | $ | 290,453 | |
BlueMountain CLO Ltd., Series 2013-2A, Class A, 3 mo. USD LIBOR + 1.200%, FRN (b)
2.081% 1/22/25 | | | 250,000 | | | | 249,999 | |
BlueMountain CLO Ltd., Series 2015-2A, Class A1, 3 mo. USD LIBOR + 1.430%, FRN (b)
2.311% 7/18/27 | | | 380,000 | | | | 380,907 | |
BlueVirgo Trust, Series 2015-1A, Class NOTE (b)
3.000% 12/15/22 | | | 378,831 | | | | 382,828 | |
CAN Capital Funding LLC, Series 2014-1A, Class A (b)
3.117% 4/15/20 | | | 152,837 | | | | 151,683 | |
Capital Automotive REIT, Series 2014-1A, Class A (b)
3.660% 10/15/44 | | | 160,000 | | | | 154,675 | |
Capital Automotive REIT, Series 2012-1A, Class A (b)
4.700% 7/15/42 | | | 223,620 | | | | 225,017 | |
Carlyle Global Market Strategies,
Series 2014-4A, Class A1, 3 mo. USD LIBOR + 1.500%, FRN (b)
2.380% 10/15/26 | | | 250,000 | | | | 250,165 | |
Cazenovia Creek Funding I LLC,
Series 2015-1A, Class A (b)
2.000% 12/10/23 | | | 103,890 | | | | 103,046 | |
Citi Held For Asset Issuance, Series 2015-PM1, Class A (b)
1.850% 12/15/21 | | | 6,323 | | | | 6,320 | |
Citigroup Mortgage Loan Trust,
Series 2006-SHL1, Class A1, 1 mo. USD LIBOR + .200%, FRN (b)
0.792% 11/25/45 | | | 34,784 | | | | 34,793 | |
CKE Restaurant Holdings, Inc., Series 2013-1A, Class A2 (b)
4.474% 3/20/43 | | | 165,156 | | | | 163,904 | |
Consumers Securitization Funding LLC, Series 2014-A, Class A2
2.962% 11/01/25 | | | 190,000 | | | | 191,644 | |
Cronos Containers Program I Ltd.,
Series 2014-2A, Class A (b)
3.270% 11/18/29 | | | 230,556 | | | | 220,732 | |
DB Master Finance LLC, Series 2015-1A, Class A2I (b)
3.262% 2/20/45 | | | 343,875 | | | | 345,793 | |
Diamond Resorts Owner Trust, Series 2013-2, Class A (b)
2.270% 5/20/26 | | | 471,021 | | | | 467,745 | |
| | | | | | | | |
| | | Principal
Amount | | | Value | |
Diamond Resorts Owner Trust, Series 2014-1, Class A (b)
2.540% 5/20/27 | | $ | 70,202 | | | $ | 70,062 | |
Diamond Resorts Owner Trust,
Series 2015-1, Class A (b)
2.730% 7/20/27 | | | 168,684 | | | | 167,661 | |
Diamond Resorts Owner Trust,
Series 2016-1, Class A (b)
3.080% 11/20/28 | | | 919,682 | | | | 914,028 | |
Domino’s Pizza Master Issuer LLC,
Series 2015-1A, Class A2I (b)
3.484% 10/25/45 | | | 504,900 | | | | 497,080 | |
Domino’s Pizza Master Issuer LLC,
Series 2015-1A, Class A2II (b)
4.474% 10/25/45 | | | 534,600 | | | | 508,504 | |
Drug Royalty Corp., Inc., Series 2012-1, Class A2 (b)
5.800% 7/15/24 | | | 27,564 | | | | 27,815 | |
Dryden XXXI Senior Loan Fund,
Series 2014-31A, Class A, 3 mo. USD LIBOR + 1.350%, FRN (b)
2.231% 4/18/26 | | | 475,000 | | | | 475,020 | |
Eaton Vance CLO, Series 2014-1A, Class A,
3 mo. USD LIBOR + 1.450%, FRN (b)
2.330% 7/15/26 | | | 450,000 | | | | 450,849 | |
Elara HGV Timeshare Issuer LLC, Series 2016-A, Class A (b)
2.810% 4/25/28 | | | 387,556 | | | | 380,151 | |
Element Rail Leasing II LLC, Series 2015-1A, Class A1 (b)
2.707% 2/19/45 | | | 81,098 | | | | 78,568 | |
Element Rail Leasing II LLC, Series 2016-1A, Class A1 (b)
3.968% 3/19/46 | | | 214,119 | | | | 214,686 | |
Entegry New Orleans Storm Recovery Funding I LLC, Series 2015-1, Class A
2.670% 6/01/27 | | | 101,695 | | | | 102,688 | |
Fairway Outdoor Funding LLC, Series 2012-1A, Class A2 (b)
4.212% 10/15/42 | | | 392,458 | | | | 392,475 | |
First Franklin Mortgage Loan Trust,
Series 2004-FFH4, Class M6, 1 mo. USD LIBOR + 1.725%, FRN
2.481% 1/25/35 | | | 420,000 | | | | 418,961 | |
Galaxy XX CLO Ltd., Series 2015-20A, Class A, 3 mo. USD LIBOR + 1.450%, FRN (b)
2.331% 7/20/27 | | | 425,000 | | | | 425,550 | |
Global SC Finance II SRL, Series 2014-1A, Class A1 (b)
3.190% 7/17/29 | | | 189,583 | | | | 182,050 | |
The accompanying notes are an integral part of the financial statements.
33
MML Blend Fund – Portfolio of Investments (Continued)
| | | | | | | | |
| | | Principal
Amount | | | Value | |
Global SC Finance II SRL, Series 2013-2A, Class A (b)
3.670% 11/17/28 | | $ | 180,995 | | | $ | 174,680 | |
Global SC Funding One Ltd., Series 2015-1, Class B1 (b)
2.740% 1/18/30 | | | 62,416 | | | | 62,416 | |
GoldenTree Loan Opportunities VII Ltd., Series 2013-7A, Class A, 3 mo. USD LIBOR + 1.150%, FRN (b)
2.031% 4/25/25 | | | 565,000 | | | | 564,566 | |
GoldenTree Loan Opportunities VII Ltd., Series 2014-8A, Class A, 3 mo. USD LIBOR + 1.450%, FRN (b)
2.327% 4/19/26 | | | 355,000 | | | | 355,014 | |
Goodgreen Trust, Series 2016-1A,
Class A (b)
3.230% 10/15/52 | | | 469,721 | | | | 469,619 | |
HERO Funding Trust, Series 2016-3A, Class A1 (b)
3.080% 9/20/42 | | | 308,983 | | | | 304,540 | |
HERO Funding Trust, Series 2016-4A, Class A1 (b)
3.570% 9/20/47 | | | 680,000 | | | | 677,817 | |
Hilton Grand Vacations Trust, Series 2013-A, Class A (b)
2.280% 1/25/26 | | | 66,783 | | | | 66,495 | |
ING Investment Management CLO Ltd.,
Series 2013-3A, Class A1, 3 mo. USD LIBOR + 1.450%, FRN (b)
2.331% 1/18/26 | | | 260,000 | | | | 260,049 | |
J.G. Wentworth XXXV LLC,
Series 2015-2A, Class A (b)
3.870% 3/15/58 | | | 98,167 | | | | 96,192 | |
LCM Ltd., Series 10AR, Class AR,
3 mo. USD LIBOR + 1.260%, FRN (b)
1.581% 4/15/22 | | | 191,400 | | | | 191,440 | |
LCM Ltd., Series 16A, Class A,
3 mo. USD LIBOR + 1.500%, FRN (b)
2.380% 7/15/26 | | | 460,000 | | | | 460,127 | |
Long Beach Mortgage Loan Trust,
Series 2005-1, Class M2, 1 mo. USD LIBOR + .795%, FRN
1.551% 2/25/35 | | | 115,327 | | | | 114,633 | |
Madison Park Funding XII Ltd.,
Series 2014-12A, Class A, 3 mo. USD LIBOR + 1.500%, FRN (b)
2.381% 7/20/26 | | | 465,000 | | | | 465,125 | |
Marlette Funding Trust, Series 2016-1A, Class A (b)
3.060% 1/17/23 | | | 353,235 | | | | 352,904 | |
Miramax LLC, Series 2014-1A, Class A2 (b)
3.340% 7/20/26 | | | 174,384 | | | | 173,416 | |
| | | | | | | | |
| | | Principal
Amount | | | Value | |
Morgan Stanley ABS Capital I, Inc. Trust, Series 2005-WMC6, Class M2, 1 mo. USD LIBOR + .750%, FRN
1.506% 7/25/35 | | $ | 44,851 | | | $ | 45,299 | |
Nations Equipment Finance Funding II LLC, Series 2014-1A, Class A (b)
1.558% 7/20/18 | | | 44,339 | | | | 44,311 | |
NRZ Advance Receivables Trust,
Series 2016-T4, Class AT4 (b)
3.106% 12/15/50 | | | 450,000 | | | | 439,467 | |
NRZ Advance Receivables Trust Advance Receivables Backe,
Series 2016-T3, Class AT3 (b)
2.833% 10/16/51 | | | 1,650,000 | | | | 1,606,406 | |
Oak Hill Credit Partners VIII Ltd.,
Series 2013-8A, Class A, 3 mo. USD LIBOR + 1.120%, FRN (b)
2.001% 4/20/25 | | | 355,000 | | | | 354,656 | |
OHA Loan Funding Ltd., Series 2013-1A, Class A, 3 mo. USD LIBOR + 1.250%, FRN (b)
2.131% 7/23/25 | | | 270,000 | | | | 269,884 | |
OnDeck Asset Securitization Trust II LLC, Series 2016-1A, Class A (b)
4.210% 5/17/20 | | | 130,000 | | | | 128,353 | |
Orange Lake Timeshare Trust,
Series 2014-AA, Class A (b)
2.290% 7/09/29 | | | 54,548 | | | | 53,725 | |
Orange Lake Timeshare Trust,
Series 2016-A, Class B (b)
2.910% 3/08/29 | | | 247,483 | | | | 244,682 | |
Oxford Finance Funding Trust,
Series 2016-1A, Class A (b)
3.968% 6/17/24 | | | 220,000 | | | | 219,091 | |
Race Point VIII CLO Ltd., Series 2013-8A, Class A, 3 mo. USD LIBOR + 1.250%, FRN (b)
2.161% 2/20/25 | | | 250,000 | | | | 249,879 | |
Sierra Receivables Funding Co. LLC, Series 2012-1A, Class A (b)
2.840% 11/20/28 | | | 33,384 | | | | 33,385 | |
Sierra Receivables Funding Co. LLC, Series 2015-3A, Class B (b)
3.080% 9/20/32 | | | 55,802 | | | | 54,895 | |
SoFi Consumer Loan Program LLC,
Series 2016-3, Class A (b)
3.050% 12/26/25 | | | 386,420 | | | | 384,890 | |
SoFi Consumer Loan Program LLC,
Series 2016-5, Class A (b)
3.060% 9/25/28 | | | 1,800,000 | | | | 1,796,618 | |
SoFi Consumer Loan Program LLC,
Series 2016-2A, Class A (b)
3.090% 10/27/25 | | | 603,474 | | | | 601,660 | |
The accompanying notes are an integral part of the financial statements.
34
MML Blend Fund – Portfolio of Investments (Continued)
| | | | | | | | |
| | | Principal
Amount | | | Value | |
SoFi Consumer Loan Program LLC,
Series 2016-1A, Class A (b)
3.260% 8/25/25 | | $ | 752,864 | | | $ | 753,827 | |
Spirit Master Funding LLC,
Series 2014-4A, Class A1 (b)
3.501% 1/20/45 | | | 160,000 | | | | 155,483 | |
SpringCastle America Funding LLC, Series 2016-AA, Class A (b)
3.050% 4/25/29 | | | 272,971 | | | | 274,336 | |
SPS Servicer Advance Receivables Trust, Series 2016-T2, Class AT2 (b)
2.750% 11/15/49 | | | 670,000 | | | | 666,636 | |
SPS Servicer Advance Receivables Trust, Series 2015-T3, Class AT3 (b)
2.920% 7/15/47 | | | 200,000 | | | | 200,159 | |
Structured Receivables Finance LLC, Series 2010-B, Class A (b)
3.730% 8/15/36 | | | 105,117 | | | | 105,367 | |
Symphony CLO XV Ltd., Series 2014-15A, Class A, 3 mo. USD LIBOR + 1.450%, FRN (b)
2.330% 10/17/26 | | | 430,000 | | | | 430,110 | |
Taco Bell Funding LLC, Series 2016-1A, Class A2I (b)
3.832% 5/25/46 | | | 389,025 | | | | 391,516 | |
TCI-Symphony CLO Ltd., Series 2016-1A, Class A, 3 mo. USD LIBOR + 1.480%, FRN (b)
2.399% 10/13/29 | | | 340,000 | | | | 341,040 | |
Treman Park CLO Ltd., Series 2015-1A, Class AR, 3 mo. USD LIBOR + 1.370%, FRN (b)
2.251% 4/20/27 | | | 490,000 | | | | 489,755 | |
Trip Rail Master Funding LLC,
Series 2011-1A, Class A1A (b)
4.370% 7/15/41 | | | 79,418 | | | | 79,022 | |
VSE VOI Mortgage LLC, Series 2016-A, Class A (b)
2.540% 7/20/33 | | | 404,894 | | | | 400,697 | |
Welk Resorts LLC, Series 2015-AA, Class A (b)
2.790% 6/16/31 | | | 155,765 | | | | 154,494 | |
Wendys Funding LLC, Series 2015-1A, Class A2I (b)
3.371% 6/15/45 | | | 469,063 | | | | 473,292 | |
Wendys Funding LLC, Series 2015-1A, Class A2II (b)
4.080% 6/15/45 | | | 306,125 | | | | 300,757 | |
Wendys Funding LLC, Series 2015-1A, Class A23 (b)
4.497% 6/15/45 | | | 419,688 | | | | 398,067 | |
| | | | | | | | |
| | | | | | | 30,828,904 | |
| | | | | | | | |
| | | | | | | | |
| | | Principal
Amount | | | Value | |
| Student Loans ABS — 2.6% | | | | | | | | |
Academic Loan Funding Trust, Series 2012-1A, Class A2, 1 mo. USD LIBOR + 1.100%, FRN (b)
1.684% 12/27/44 | | $ | 495,000 | | | $ | 476,600 | |
Access Group, Inc., Series 2003-A, Class A3, 3 mo. Treasury + 1.200%, FRN
1.509% 7/01/38 | | | 196,863 | | | | 193,817 | |
College Loan Corp. Trust I, Series 2007-1, Class B2, 28 day ARS, FRN
2.016% 1/25/47 | | | 130,000 | | | | 99,273 | |
DRB Prime Student Loan Trust, Series 2016-R, Class A1, 1 mo. USD LIBOR + 1.900%, FRN (b)
2.431% 10/25/44 | | | 899,274 | | | | 899,274 | |
DRB Prime Student Loan Trust, Series 2015-B, Class A1, 1 mo. USD LIBOR + 1.900%, FRN (b)
2.492% 10/27/31 | | | 70,191 | | | | 71,528 | |
DRB Prime Student Loan Trust, Series 2016-B, Class A2 (b)
2.890% 6/25/40 | | | 326,632 | | | | 316,546 | |
DRB Prime Student Loan Trust, Series 2016-R, Class A2 (b)
3.070% 10/25/44 | | | 899,274 | | | | 899,274 | |
DRB Prime Student Loan Trust, Series 2015-B, Class A2 (b)
3.170% 7/25/31 | | | 234,078 | | | | 233,861 | |
Earnest Student Loan Program LLC, Series 2016-C, Class A1, 1 mo. USD LIBOR + 1.850%, FRN (b)
2.442% 10/27/36 | | | 695,263 | | | | 695,262 | |
Earnest Student Loan Program LLC,
Series 2016-D, Class A2 (b)
2.720% 1/25/41 | | | 385,566 | | | | 379,321 | |
Earnest Student Loan Program LLC,
Series 2016-B, Class A2 (b)
3.020% 5/25/34 | | | 276,248 | | | | 270,221 | |
ECMC Group Student Loan Trust,
Series 2016-1A, Class A, 1 mo. USD LIBOR + 1.350%, FRN (b)
1.942% 7/26/66 | | | 677,782 | | | | 675,783 | |
EdLinc Student Loan Funding Trust,
Series 2012-1, Class B, 1 mo. USD LIBOR + 4.240%, FRN (b)
4.824% 11/26/40 | | | 270,000 | | | | 290,111 | |
Education Funding Capital Trust I, Series 2004-1, Class A4, 28 day ARS, FRN
1.943% 6/15/43 | | | 500,000 | | | | 497,779 | |
The accompanying notes are an integral part of the financial statements.
35
MML Blend Fund – Portfolio of Investments (Continued)
| | | | | | | | |
| | | Principal
Amount | | | Value | |
Goal Capital Funding Trust,
Series 2006-1, Class B, 3 mo. USD LIBOR + .450%, FRN
1.380% 8/25/42 | | $ | 178,016 | | | $ | 160,401 | |
KeyCorp Student Loan Trust, Series 2004-A, Class 2A2, 3 mo. USD LIBOR + .300%, FRN
1.185% 10/28/41 | | | 26,491 | | | | 26,433 | |
KnowledgeWorks Foundation, Series 2010-1, Class A, 3 mo. USD LIBOR + .950%, FRN
1.880% 2/25/42 | | | 198,464 | | | | 193,297 | |
National Collegiate Student Loan Trust, Series 2005-1, Class A4, 1 mo. USD LIBOR + .240%, FRN
0.824% 11/27/28 | | | 56,345 | | | | 55,945 | |
Navient Student Loan Trust, Series 2016-5A, Class A, 1 mo. USD LIBOR + 1.250%, FRN (b)
1.000% 6/25/65 | | | 528,300 | | | | 536,046 | |
Navient Student Loan Trust, Series 2016-1A, Class A, 1 mo. USD LIBOR + .700%, FRN (b)
1.284% 2/25/70 | | | 534,935 | | | | 520,591 | |
Navient Student Loan Trust, Series 2016-6A, Class A3, 1 mo. USD LIBOR + 1.300%, FRN (b)
1.820% 3/25/66 | | | 2,150,000 | | | | 2,150,018 | |
Navient Student Loan Trust, Series 2014-8, Class B, 1 mo. USD LIBOR + 1.500%, FRN
2.084% 7/26/49 | | | 155,000 | | | | 139,413 | |
Navient Student Loan Trust, Series 2014-1, Class B, 1 mo. USD LIBOR + 1.500%, FRN
2.256% 6/25/48 | | | 220,000 | | | | 192,573 | |
Navient Student Loan Trust, Series 2015-3, Class B, 1 mo. USD LIBOR + 1.500%, FRN
2.256% 10/25/58 | | | 150,000 | | | | 122,583 | |
Nelnet Private Education Loan Trust,
Series 2016-A, Class A1B (b)
3.600% 12/26/40 | | | 280,000 | | | | 279,673 | |
Nelnet Student Loan Trust, Series 2005-2, Class A5, 3 mo. USD LIBOR + .100%, FRN
1.096% 3/23/37 | | | 343,025 | | | | 331,794 | |
Nelnet Student Loan Trust, Series 2006-3, Class B, 3 mo. USD LIBOR + .250%, FRN
1.106% 6/25/41 | | | 128,586 | | | | 108,169 | |
| | | | | | | | |
| | | Principal
Amount | | | Value | |
Nelnet Student Loan Trust, Series 2013-5A, Class A, 1 mo. USD LIBOR + .630%, FRN (b)
1.214% 1/25/37 | | $ | 218,430 | | | $ | 214,609 | |
Nelnet Student Loan Trust, Series 2005-4, Class A4R2, 28 day ARS, FRN
1.404% 3/22/32 | | | 200,000 | | | | 181,231 | |
Nelnet Student Loan Trust, Series 2015-3A, Class B, 1 mo. USD LIBOR + 1.500%, FRN (b)
2.084% 6/25/54 | | | 150,000 | | | | 130,086 | |
North Carolina State Education Assistance Authority, Series 2011-2, Class A3, 3 mo. USD LIBOR + ..800%, FRN 1.681% 7/25/36 | | | 250,000 | | | | 238,289 | |
PHEAA Student Loan Trust, Series 2016-2A, Class A, 1 mo. USD LIBOR + .950%, FRN (b)
1.504% 11/25/65 | | | 640,000 | | | | 639,919 | |
SLC Private Student Loan Trust,
Series 2006-A, Class A5, 3 mo. USD LIBOR + .170%, FRN
1.050% 7/15/36 | | | 52,665 | | | | 52,640 | |
SLC Private Student Loan Trust, Series 2006-A, Class C, 3 mo. USD LIBOR + .450%, FRN
1.330% 7/15/36 | | | 230,000 | | | | 208,270 | |
SLC Student Loan Trust, Series 2006-A, Class B, 3 mo. USD LIBOR + .300%, FRN
1.180% 7/15/36 | | | 125,000 | | | | 122,062 | |
SLM Student Loan Trust, Series 2005-5, Class A4, 3 mo. USD LIBOR + .140%, FRN
1.021% 10/25/28 | | | 330,000 | | | | 321,068 | |
SLM Student Loan Trust, Series 2005-3, Class B, 3 mo. USD LIBOR + .150%, FRN
1.031% 4/25/40 | | | 200,241 | | | | 168,093 | |
SLM Student Loan Trust, Series 2005-5, Class A5, 3 mo. USD LIBOR + .750%, FRN
1.631% 10/25/40 | | | 300,000 | | | | 282,932 | |
SLM Student Loan Trust, Series 2003-5, Class A7, 28 day ARS, FRN
2.950% 6/17/30 | | | 50,000 | | | | 50,000 | |
SLM Student Loan Trust, Series 2003-5, Class A9, 28 day ARS, FRN
3.024% 6/17/30 | | | 350,000 | | | | 350,000 | |
SLM Student Loan Trust, Series 2002-7, Class A10, 28 day ARS, FRN
3.027% 3/15/28 | | | 136,000 | | | | 136,000 | |
The accompanying notes are an integral part of the financial statements.
36
MML Blend Fund – Portfolio of Investments (Continued)
| | | | | | | | |
| | | Principal
Amount | | | Value | |
SLM Student Loan Trust,
Series 2002-7, Class A11, 28 day ARS, FRN
3.030% 3/15/28 | | $ | 260,000 | | | $ | 260,000 | |
SMB Private Education Loan Trust,
Series 2015-B, Class A2B, 1 mo. USD LIBOR + 1.200%, FRN (b)
1.903% 7/15/27 | | | 200,000 | | | | 201,861 | |
SMB Private Education Loan Trust,
Series 2016-B, Class A2A (b)
2.430% 2/17/32 | | | 245,000 | | | | 237,967 | |
SMB Private Education Loan Trust,
Series 2016-A, Class A2A (b)
2.700% 5/15/31 | | | 450,000 | | | | 434,945 | |
SoFi Professional Loan Program LLC, Series 2016-D, Class A1, 1 mo. USD LIBOR + .950%, FRN (b)
1.534% 1/25/39 | | | 162,285 | | | | 162,813 | |
SoFi Professional Loan Program LLC, Series 2016-B, Class A1, 1 mo. USD LIBOR + 1.200%, FRN (b)
1.784% 6/25/33 | | | 391,403 | | | | 395,664 | |
SoFi Professional Loan Program LLC, Series 2016-B, Class A2B (b)
2.740% 10/25/32 | | | 300,000 | | | | 299,114 | |
South Carolina Student Loan Corp.,
Series 2014-1, Class A2, 1 mo. USD LIBOR + 1.000%, FRN
1.616% 1/03/33 | | | 290,000 | | | | 280,415 | |
South Carolina Student Loan Corp.,
Series 2010-1, Class A3, 3 mo. USD LIBOR + 1.050%, FRN
1.931% 10/27/36 | | | 170,000 | | | | 168,649 | |
| | | | | | | | |
| | | | | | | 16,352,213 | |
| | | | | | | | |
WL Collateral CMO — 0.1% | | | | | | | | |
Countrywide Home Loans, Inc.,
Series 2004-2, Class 1A1, VRN
2.935% 2/25/34 | | | 19,777 | | | | 19,539 | |
Countrywide Home Loans, Inc.,
Series 2003-42, Class 1A1, VRN
3.293% 9/25/33 | | | 7,719 | | | | 7,305 | |
GSR Mortgage Loan Trust,
Series 2004-9, Class 2A1, VRN
3.285% 8/25/34 | | | 11,734 | | | | 11,811 | |
IndyMac Index Mortgage Loan Trust,
Series 2004-AR4, Class 1A, VRN
2.936% 8/25/34 | | | 58,631 | | | | 53,043 | |
Merrill Lynch Mortgage Investors, Inc., Series 2005-A8, Class A3A2, 1 mo.
USD LIBOR + .250%, FRN
1.006% 8/25/36 | | | 2,378 | | | | 2,373 | |
| | | | | | | | |
| | | Principal
Amount | | | Value | |
Merrill Lynch Mortgage Investors, Inc., Series 2003-A4, Class IA, VRN
3.097% 7/25/33 | | $ | 4,382 | | | $ | 4,461 | |
Merrill Lynch Mortgage Investors, Inc., Series 2004-A1, Class IA, VRN
3.315% 2/25/34 | | | 7,674 | | | | 7,774 | |
Morgan Stanley Mortgage Loan Trust, Series 2004-2AR, Class 1A, VRN
2.875% 2/25/34 | | | 247 | | | | 259 | |
Structured Adjustable Rate Mortgage Loan Trust, Series 2004-2, Class 2A, VRN
3.055% 3/25/34 | | | 40,623 | | | | 41,444 | |
Structured Agency Credit Risk Debt Notes, Series 2015-DNA3, Class M1, 1 mo. USD LIBOR + 1.350%, FRN
1.942% 4/25/28 | | | 38,181 | | | | 38,197 | |
Structured Agency Credit Risk Debt Notes, Series 2016-DNA1, Class M1, 1 mo. USD LIBOR + 1.450%, FRN
2.034% 7/25/28 | | | 170,776 | | | | 171,231 | |
Washington Mutual Mortgage Pass-Through Certificates, Series 2004-AR2, Class A, 12 mo. MTA + 1.400%, FRN
1.967% 4/25/44 | | | 85,471 | | | | 84,164 | |
| | | | | | | | |
| | | | | | | 441,601 | |
| | | | | | | | |
WL Collateral PAC — 0.0% | | | | | | | | |
Structured Asset Securities Corp.,
Series 2002-11A, Class 2A1, VRN
3.355% 6/25/32 | | | 23,682 | | | | 23,354 | |
| | | | | | | | |
| | |
TOTAL NON-U.S. GOVERNMENT AGENCY OBLIGATIONS
(Cost $57,281,570) | | | | | | | 56,969,853 | |
| | | | | |
|
| SOVEREIGN DEBT OBLIGATIONS — 0.3% | |
Colombia Government International Bond
6.125% 1/18/41 | | | 620,000 | | | | 669,600 | |
Mexico Government International Bond
4.750% 3/08/44 | | | 590,000 | | | | 536,487 | |
Peruvian Government International Bond 6.550% 3/14/37 | | | 95,000 | | | | 119,273 | |
Poland Government International Bond
6.375% 7/15/19 | | | 230,000 | | | | 255,530 | |
Province of Quebec Canada
7.500% 9/15/29 | | | 90,000 | | | | 126,108 | |
United Mexican States
5.125% 1/15/20 | | | 200,000 | | | | 214,700 | |
The accompanying notes are an integral part of the financial statements.
37
MML Blend Fund – Portfolio of Investments (Continued)
| | | | | | | | |
| | | Principal
Amount | | | Value | |
United Mexican States
6.750% 9/27/34 | | $ | 160,000 | | | $ | 189,600 | |
| | | | | | | | |
| | | | | | | 2,111,298 | |
| | | | | | | | |
| | |
TOTAL SOVEREIGN DEBT OBLIGATIONS
(Cost $2,097,586) | | | | | | | 2,111,298 | |
| | | | | |
|
| U.S. GOVERNMENT AGENCY OBLIGATIONS AND INSTRUMENTALITIES — 7.2% | |
| Collateralized Mortgage Obligations — 0.5% | | | | | |
Federal Home Loan Mortgage Corp. | |
Series 4303, Class AP
3.000% 8/15/43 | | | 567,312 | | | | 576,143 | |
Series 4290, Class CA
3.500% 12/15/38 | | | 355,915 | | | | 365,148 | |
Series 2617, Class Z
5.500% 5/15/33 | | | 287,373 | | | | 320,029 | |
Series 2693, Class Z
5.500% 10/15/33 | | | 512,723 | | | | 561,876 | |
Series 3423, Class PB
5.500% 3/15/38 | | | 109,882 | | | | 121,271 | |
Federal National Mortgage Association | |
Series 2014-7, Class VA
3.500% 5/25/25 | | | 236,654 | | | | 245,890 | |
Series 2014-48, Class AB
4.000% 10/25/40 | | | 497,236 | | | | 517,186 | |
Series 2007-32, Class Z
5.500% 4/25/37 | | | 165,977 | | | | 181,773 | |
Series 2010-60, Class HJ
5.500% 5/25/40 | | | 109,308 | | | | 118,545 | |
Federal National Mortgage Association REMIC Series 2007-B2, Class ZA
5.500% 6/25/37 | | | 141,575 | | | | 154,060 | |
U.S. Department of Veteran Affairs Series 1992-1, Class 2Z
7.750% 5/15/22 | | | 112,033 | | | | 122,891 | |
| | | | | | | | |
| | | | | | | 3,284,812 | |
| | | | | | | | |
| Pass-Through Securities — 6.7% | | | | | | | | |
Federal Home Loan Mortgage Corp. | |
Pool #Q37467 3.500%
11/01/45 | | | 1,114,018 | | | | 1,146,003 | |
Pool #Q37468 3.500%
11/01/45 | | | 833,133 | | | | 857,834 | |
Pool #Q41916 3.500%
7/01/46 | | | 336,069 | | | | 347,083 | |
Pool #Q42045 3.500%
7/01/46 | | | 138,965 | | | | 143,519 | |
Pool #Q44275 3.500%
11/01/46 | | | 259,617 | | | | 268,207 | |
Pool #Q44277 3.500%
11/01/46 | | | 119,821 | | | | 123,485 | |
| | | | | | | | |
| | | Principal
Amount | | | Value | |
Pool #C03537 4.500%
8/01/40 | | $ | 279,776 | | | $ | 302,137 | |
Pool #G06057 4.500%
10/01/40 | | | 200,967 | | | | 216,558 | |
Pool #G60485 4.500%
10/01/41 | | | 256,737 | | | | 276,574 | |
Pool #G60469 4.500%
1/01/42 | | | 165,861 | | | | 178,832 | |
Pool #G60342 4.500%
5/01/42 | | | 885,075 | | | | 953,737 | |
Pool #G60172 4.500%
9/01/43 | | | 265,777 | | | | 286,936 | |
Pool #G11431 6.000%
2/01/18 | | | 540 | | | | 544 | |
Pool #C55867 7.500%
2/01/30 | | | 57,058 | | | | 65,583 | |
Pool #C01079 7.500%
10/01/30 | | | 8,408 | | | | 9,905 | |
Pool #C01135 7.500%
2/01/31 | | | 25,233 | | | | 29,644 | |
Pool #C00470 8.000%
8/01/26 | | | 17,972 | | | | 21,057 | |
Pool #G00924 8.000%
3/01/28 | | | 19,495 | | | | 22,840 | |
Pool #554904 9.000%
3/01/17 | | | 9 | | | | 9 | |
Federal Home Loan Mortgage Corp. TBA | |
Pool #3395 3.000%
8/01/44 (c) | | | 1,300,000 | | | | 1,291,570 | |
Pool #4434 4.000%
1/01/43 (c) | | | 2,000,000 | | | | 2,097,891 | |
Federal National Mortgage Association | |
Pool #725692 2.704%
10/01/33 1 year CMT + 2.144%, FRN | | | 71,645 | | | | 75,220 | |
Pool #888586 2.752%
10/01/34 1 year CMT + 2.205%, FRN | | | 101,809 | | | | 107,086 | |
Pool #AV2325 3.500%
12/01/28 | | | 201,652 | | | | 211,120 | |
Pool #AS1304 3.500%
12/01/28 | | | 361,150 | | | | 378,220 | |
Pool #AV1897 3.500%
12/01/28 | | | 53,063 | | | | 55,571 | |
Pool #AS6187 3.500%
11/01/45 | | | 2,582,759 | | | | 2,658,324 | |
Pool #AS6306 3.500%
12/01/45 | | | 866,444 | | | | 892,607 | |
Pool #AS6477 3.500%
1/01/46 | | | 884,649 | | | | 910,809 | |
Pool #AS6475 3.500%
1/01/46 | | | 696,242 | | | | 718,135 | |
The accompanying notes are an integral part of the financial statements.
38
MML Blend Fund – Portfolio of Investments (Continued)
| | | | | | | | |
| | | Principal
Amount | | | Value | |
Pool #AS6476 3.500%
1/01/46 | | $ | 748,364 | | | $ | 771,195 | |
Pool #AZ7917 4.000%
3/01/41 | | | 93,069 | | | | 98,439 | |
Pool #AL2441 4.000%
9/01/42 | | | 595,888 | | | | 631,479 | |
Pool #AL8422 4.000%
1/01/43 | | | 88,900 | | | | 94,070 | |
Pool #BC5984 4.000%
4/01/46 | | | 188,387 | | | | 198,138 | |
Pool #AB1466 4.500%
9/01/40 | | | 111,889 | | | | 120,766 | |
Pool #AH6787 4.500%
3/01/41 | | | 211,021 | | | | 228,290 | |
Pool #AL7566 4.500%
10/01/42 | | | 213,919 | | | | 230,757 | |
Pool #AL6997 4.500%
11/01/42 | | | 432,069 | | | | 467,427 | |
Pool #AD6437 5.000%
6/01/40 | | | 120,029 | | | | 131,469 | |
Pool #AD6996 5.000%
7/01/40 | | | 833,522 | | | | 912,967 | |
Pool #AL8173 5.000%
2/01/44 | | | 320,286 | | | | 350,513 | |
Pool #564594 7.000%
1/01/31 | | | 11,091 | | | | 12,836 | |
Pool #572844 7.000%
4/01/31 | | | 24,460 | | | | 28,530 | |
Pool #253795 7.000%
5/01/31 | | | 71,511 | | | | 83,180 | |
Pool #499386 7.500%
9/01/29 | | | 1,749 | | | | 2,064 | |
Pool #521006 7.500%
12/01/29 | | | 677 | | | | 797 | |
Pool #522769 7.500%
12/01/29 | | | 68 | | | | 81 | |
Pool #252981 7.500%
1/01/30 | | | 9,102 | | | | 10,717 | |
Pool #524874 7.500%
2/01/30 | | | 228 | | | | 234 | |
Pool #531196 7.500%
2/01/30 | | | 1,030 | | | | 1,218 | |
Pool #524317 7.500%
3/01/30 | | | 1,117 | | | | 1,324 | |
Pool #530299 7.500%
3/01/30 | | | 282 | | | | 326 | |
Pool #530520 7.500%
3/01/30 | | | 11,974 | | | | 14,041 | |
Pool #253183 7.500%
4/01/30 | | | 3,531 | | | | 4,160 | |
Pool #253265 7.500%
5/01/30 | | | 2,214 | | | | 2,581 | |
| | | | | | | | |
| | | Principal
Amount | | | Value | |
Pool #536999 8.000%
3/01/30 | | $ | 3 | | | $ | 3 | |
Pool #526380 8.000%
5/01/30 | | | 6,128 | | | | 7,356 | |
Pool #536949 8.000%
5/01/30 | | | 1,523 | | | | 1,835 | |
Pool #535351 8.000%
6/01/30 | | | 3,804 | | | | 4,541 | |
Pool #253481 8.000%
10/01/30 | | | 2,849 | | | | 3,418 | |
Pool #190317 8.000%
8/01/31 | | | 1,077 | | | | 1,288 | |
Pool #596656 8.000%
8/01/31 | | | 1,012 | | | | 1,101 | |
Pool #602008 8.000%
8/01/31 | | | 3,592 | | | | 4,288 | |
Federal National Mortgage Association TBA | |
Pool #3348 2.500%
3/01/29 (c) | | | 10,525,000 | | | | 10,548,845 | |
Pool #4241 3.000%
5/01/44 (c) | | | 2,525,000 | | | | 2,510,402 | |
Pool #1963 3.500%
1/01/44 (c) | | | 5,025,000 | | | | 5,150,625 | |
Pool #9174 4.000%
12/01/42 (c) | | | 1,800,000 | | | | 1,892,250 | |
Pool #3534 4.500%
7/01/40 (c) | | | 825,000 | | | | 885,876 | |
Government National Mortgage Association | |
Pool #783896 3.500%
5/15/44 | | | 842,608 | | | | 880,789 | |
Pool #359587 7.000%
6/15/23 | | | 408 | | | | 446 | |
Pool #337539 7.000%
7/15/23 | | | 696 | | | | 775 | |
Pool #363066 7.000%
8/15/23 | | | 9,431 | | | | 10,568 | |
Pool #354674 7.000%
10/15/23 | | | 5,538 | | | | 6,132 | |
Pool #362651 7.000%
10/15/23 | | | 6,906 | | | | 7,397 | |
Pool #368814 7.000%
10/15/23 | | | 1,431 | | | | 1,537 | |
Pool #371967 7.000%
11/15/23 | | | 358 | | | | 402 | |
Pool #352021 7.000%
11/15/23 | | | 2,686 | | | | 2,990 | |
Pool #213760 7.500%
6/15/17 | | | 239 | | | | 240 | |
Government National Mortgage Association II | |
Pool #82462 2.000%
1/20/40 1 year CMT + 1.500%, FRN | | | 98,244 | | | | 101,985 | |
The accompanying notes are an integral part of the financial statements.
39
MML Blend Fund – Portfolio of Investments (Continued)
| | | | | | | | |
| | | Principal
Amount | | | Value | |
Pool #82488 2.000%
3/20/40 1 year CMT + 1.500%, FRN | | $ | 135,055 | | | $ | 139,346 | |
Pool #784026 3.500%
12/20/44 | | | 234,827 | | | | 244,532 | |
Government National Mortgage Association II TBA
Pool #307 2.500%
6/01/45 (c) | | | 1,875,000 | | | | 1,821,094 | |
| | | | | | | | |
| | | | | | | 43,274,700 | |
| | | | | | | | |
| | |
TOTAL U.S. GOVERNMENT
AGENCY OBLIGATIONS AND INSTRUMENTALITIES
(Cost $46,807,431) | | | | | | | 46,559,512 | |
| | | | | |
|
| U.S. TREASURY OBLIGATIONS — 1.0% | |
| U.S. Treasury Bonds & Notes — 1.0% | |
U.S. Treasury Bond
2.500% 5/15/46 | | | 1,260,000 | | | | 1,119,776 | |
U.S. Treasury Bond (d)
3.500% 2/15/39 | | | 1,470,000 | | | | 1,607,037 | |
U.S. Treasury Inflation Index
0.125% 7/15/26 | | | 1,915,998 | | | | 1,852,772 | |
U.S. Treasury Note
1.250% 3/31/21 | | | 910,000 | | | | 888,938 | |
U.S. Treasury Note
1.625% 5/15/26 | | | 670,000 | | | | 624,782 | |
U.S. Treasury Note
2.000% 11/15/26 | | | 300,000 | | | | 288,703 | |
| | | | | | | | |
| | | | | | | 6,382,008 | |
| | | | | | | | |
| | |
TOTAL U.S. TREASURY
OBLIGATIONS
(Cost $6,622,740) | | | | | | | 6,382,008 | |
| | | | | |
| | |
TOTAL BONDS & NOTES
(Cost $180,950,184) | | | | | | | 181,105,433 | |
| | | | | |
| | |
| | | Number of
Shares | | | | |
| RIGHTS — 0.0% | |
| Consumer, Cyclical — 0.0% | | | | | | | | |
| Retail — 0.0% | | | | | | | | |
Safeway Casa Ley Contingent Value (a) (e) | | | 18,800 | | | | 18,988 | |
Safeway PDC LLC Contingent Value (a) (e) | | | 18,800 | | | | 940 | |
| | | | | | | | |
| | | | | | | 19,928 | |
| | | | | | | | |
| | |
TOTAL RIGHTS
(Cost $19,928) | | | | | | | 19,928 | |
| | | | | |
| | |
TOTAL LONG-TERM
INVESTMENTS
(Cost $520,463,745) | | | | | | | 640,305,187 | |
| | | | | |
| | | | | | | | |
| | | Principal
Amount | | | Value | |
| SHORT-TERM INVESTMENTS — 4.3% | |
| Commercial Paper — 4.3% | | | | | | | | |
CDP Financial, Inc. (b)
1.200% 3/07/17 | | $ | 3,800,000 | | | $ | 3,794,767 | |
Cox Enterprises, Inc. (b)
0.900% 1/03/17 | | | 4,320,000 | | | | 4,319,632 | |
Ford Motor Credit Co. (b)
1.120% 3/02/17 | | | 3,000,000 | | | | 2,994,611 | |
Fortive Corp. (b)
1.090% 1/09/17 | | | 3,000,000 | | | | 2,999,339 | |
Hyundai Capital America (b)
1.300% 3/15/17 | | | 4,000,000 | | | | 3,990,167 | |
Marriott International, Inc. (b)
1.150% 1/30/17 | | | 3,390,000 | | | | 3,387,218 | |
Molex Electronic Technologies (b)
1.150% 1/24/17 | | | 2,000,000 | | | | 1,998,742 | |
TELUS Corp. (b)
1.250% 3/28/17 | | | 4,000,000 | | | | 3,987,357 | |
| | | | | | | | |
| | | | | | | 27,471,833 | |
| | | | | | | | |
| Repurchase Agreement — 0.0% | | | | | | | | |
State Street Bank & Trust Co. Repurchase Agreement, dated 12/30/16, 0.010%, due 1/03/17 (f) | | | 106,536 | | | | 106,536 | |
| | | | | | | | |
| Time Deposit — 0.0% | | | | | | | | |
Euro Time Deposit
0.010% 1/03/17 | | | 18,259 | | | | 18,259 | |
| | | | | | | | |
| | |
TOTAL SHORT-TERM
INVESTMENTS
(Cost $27,592,920) | | | | | | | 27,596,628 | |
| | | | | |
| | |
TOTAL INVESTMENTS — 104.0%
(Cost $548,056,665) (g) | | | | | | | 667,901,815 | |
| | |
| Other Assets/(Liabilities) — (4.0)% | | | | | | | (25,911,992 | ) |
| | | | | |
| | |
| NET ASSETS — 100.0% | | | | | | $ | 641,989,823 | |
| | | | | |
Notes to Portfolio of Investments
Percentages are stated as a percent of net assets.
| CLO | Collateralized Loan Obligation |
| CMO | Collateralized Mortgage Obligation |
| CMT | Constant Maturity Treasury Index |
| MBS | Mortgage-Backed Security |
| MTA | Monthly Treasury Average Index |
| PAC | Planned Amortization Class |
The accompanying notes are an integral part of the financial statements.
40
MML Blend Fund – Portfolio of Investments (Continued)
Notes to Portfolio of Investments (Continued)
| (a) | Non-income producing security. |
| (b) | Securities exempt from registration under rule 144A of the Securities Act of 1933. These securities may be resold in transactions exempt from registration, normally to qualified institutional buyers. At December 31, 2016, these securities amounted to a value of $84,507,493 or 13.16% of net assets. |
| (c) | A portion of this security is purchased on a when-issued, delayed-delivery or forward commitment basis. (Note 2). |
| (d) | A portion of this security is pledged as collateral for open futures contracts and pledged for open swaps agreements. |
| (e) | This security is fair valued in good faith in accordance with procedures approved by the Board of Trustees. At December 31, 2016, these securities amounted to a value of $19,928 or 0.00% of net assets. |
| (f) | Maturity value of $106,536. Collateralized by U.S. Government Agency obligations with a rate of 3.125%, maturity date of 5/15/21, and an aggregate market value, including accrued interest, of $110,902. |
| (g) | See Note 6 for aggregate cost for federal tax purposes. |
The accompanying notes are an integral part of the financial statements.
41
MML Equity Fund – Portfolio of Investments
December 31, 2016
| | | | | | | | |
| | | Number of
Shares | | | Value | |
| EQUITIES — 97.8% | |
|
| COMMON STOCK — 97.8% | |
| Basic Materials — 3.3% | | | | | |
| Chemicals — 1.5% | | | | | |
E.I. du Pont de Nemours & Co. | | | 68,739 | | | $ | 5,045,442 | |
Eastman Chemical Co. | | | 89,030 | | | | 6,695,946 | |
| | | | | | | | |
| | | | | | | 11,741,388 | |
| | | | | | | | |
| Iron & Steel — 0.7% | | | | | | | | |
Nucor Corp. | | | 97,160 | | | | 5,782,963 | |
| | | | | | | | |
| Mining — 1.1% | | | | | | | | |
Goldcorp, Inc. (a) | | | 373,300 | | | | 5,076,880 | |
Vulcan Materials Co. | | | 32,076 | | | | 4,014,312 | |
| | | | | | | | |
| | | | | | | 9,091,192 | |
| | | | | | | | |
| | | | | | | 26,615,543 | |
| | | | | | | | |
| Communications — 7.3% | | | | | | | | |
| Advertising — 0.6% | | | | | | | | |
Nielsen Holdings PLC | | | 108,100 | | | | 4,534,795 | |
| | | | | | | | |
| Internet — 1.3% | | | | | | | | |
Alphabet, Inc. Class A (b) | | | 4,550 | | | | 3,605,647 | |
Liberty Interactive Corp. QVC Group Class A (b) | | | 171,504 | | | | 3,426,650 | |
Symantec Corp. | | | 149,108 | | | | 3,562,190 | |
| | | | | | | | |
| | | | | | | 10,594,487 | |
| | | | | | | | |
| Media — 2.9% | | | | | | | | |
Comcast Corp. Class A | | | 226,509 | | | | 15,640,447 | |
DISH Network Corp. Class A (b) | | | 53,870 | | | | 3,120,689 | |
The Walt Disney Co. | | | 45,750 | | | | 4,768,065 | |
| | | | | | | | |
| | | | | | | 23,529,201 | |
| | | | | | | | |
| Telecommunications — 2.5% | | | | | | | | |
Cisco Systems, Inc. | | | 187,322 | | | | 5,660,871 | |
T-Mobile US, Inc. (b) | | | 126,640 | | | | 7,283,066 | |
Verizon Communications, Inc. | | | 93,063 | | | | 4,967,703 | |
Vodafone Group PLC Sponsored ADR (United Kingdom) | | | 114,770 | | | | 2,803,831 | |
| | | | | | | | |
| | | | | | | 20,715,471 | |
| | | | | | | | |
| | | | | | | 59,373,954 | |
| | | | | | | | |
| Consumer, Cyclical — 6.8% | | | | | | | | |
| Airlines — 1.4% | | | | | | | | |
Delta Air Lines, Inc. | | | 151,620 | | | | 7,458,188 | |
Southwest Airlines Co. | | | 78,980 | | | | 3,936,363 | |
| | | | | | | | |
| | | | | | | 11,394,551 | |
| | | | | | | | |
| Apparel — 0.3% | | | | | | | | |
Ralph Lauren Corp. | | | 31,021 | | | | 2,801,817 | |
| | | | | | | | |
| Auto Parts & Equipment — 0.2% | | | | | | | | |
Adient PLC (b) | | | 24,815 | | | | 1,454,159 | |
| | | | | | | | |
| | | | | | | | |
| | | Number of
Shares | | | Value | |
| Home Furnishing — 0.5% | | | | | | | | |
Whirlpool Corp. | | | 22,770 | | | $ | 4,138,903 | |
| | | | | | | | |
| Housewares — 0.5% | | | | | | | | |
Newell Brands, Inc. | | | 89,738 | | | | 4,006,802 | |
| | | | | | | | |
| Leisure Time — 0.8% | | | | | | | | |
Carnival Corp. | | | 56,660 | | | | 2,949,719 | |
Harley-Davidson, Inc. | | | 60,065 | | | | 3,504,192 | |
| | | | | | | | |
| | | | | | | 6,453,911 | |
| | | | | | | | |
| Retail — 3.1% | | | | | | | | |
Advance Auto Parts, Inc. | | | 26,501 | | | | 4,481,849 | |
CVS Health Corp. | | | 57,390 | | | | 4,528,645 | |
Dollar General Corp. | | | 54,640 | | | | 4,047,185 | |
Wal-Mart Stores, Inc. | | | 51,310 | | | | 3,546,547 | |
Walgreens Boots Alliance, Inc. | | | 101,530 | | | | 8,402,623 | |
| | | | | | | | |
| | | | | | | 25,006,849 | |
| | | | | | | | |
| | | | | | | 55,256,992 | |
| | | | | | | | |
| Consumer, Non-cyclical — 15.0% | | | | | | | | |
| Agriculture — 0.6% | | | | | | | | |
Philip Morris International, Inc. | | | 58,153 | | | | 5,320,418 | |
| | | | | | | | |
| Beverages — 1.1% | | | | | | | | |
The Coca-Cola Co. | | | 95,240 | | | | 3,948,651 | |
PepsiCo, Inc. | | | 45,686 | | | | 4,780,126 | |
| | | | | | | | |
| | | | | | | 8,728,777 | |
| | | | | | | | |
| Biotechnology — 0.9% | | | | | | | | |
Amgen, Inc. | | | 35,340 | | | | 5,167,061 | |
Gilead Sciences, Inc. | | | 27,070 | | | | 1,938,483 | |
| | | | | | | | |
| | | | | | | 7,105,544 | |
| | | | | | | | |
| Cosmetics & Personal Care — 1.0% | | | | | | | | |
The Procter & Gamble Co. | | | 92,760 | | | | 7,799,261 | |
| | | | | | | | |
| Foods — 0.9% | | | | | | | | |
The Kroger Co. | | | 68,590 | | | | 2,367,041 | |
Mondelez International, Inc. Class A | | | 113,795 | | | | 5,044,532 | |
| | | | | | | | |
| | | | | | | 7,411,573 | |
| | | | | | | | |
| Health Care – Products — 1.9% | | | | | | | | |
Abbott Laboratories | | | 80,213 | | | | 3,080,981 | |
Medtronic PLC | | | 75,409 | | | | 5,371,383 | |
Zimmer Biomet Holdings, Inc. | | | 62,870 | | | | 6,488,184 | |
| | | | | | | | |
| | | | | | | 14,940,548 | |
| | | | | | | | |
| Health Care – Services — 3.1% | | | | | | | | |
Aetna, Inc. | | | 19,826 | | | | 2,458,622 | |
Humana, Inc. | | | 13,340 | | | | 2,721,760 | |
Thermo Fisher Scientific, Inc. | | | 18,050 | | | | 2,546,855 | |
UnitedHealth Group, Inc. | | | 110,411 | | | | 17,670,177 | |
| | | | | | | | |
| | | | | | | 25,397,414 | |
| | | | | | | | |
The accompanying notes are an integral part of the financial statements.
42
MML Equity Fund – Portfolio of Investments (Continued)
| | | | | | | | |
| | | Number of
Shares | | | Value | |
Pharmaceuticals — 5.5% | | | | | | | | |
Allergan PLC (b) | | | 21,280 | | | $ | 4,469,013 | |
Cardinal Health, Inc. | | | 54,250 | | | | 3,904,372 | |
Eli Lilly & Co. | | | 50,721 | | | | 3,730,530 | |
Merck & Co., Inc. | | | 103,475 | | | | 6,091,573 | |
Pfizer, Inc. | | | 467,899 | | | | 15,197,360 | |
Teva Pharmaceutical Industries Ltd. Sponsored ADR (Israel) | | | 303,329 | | | | 10,995,676 | |
| | | | | | | | |
| | | | | | | 44,388,524 | |
| | | | | | | | |
| | | | | | | 121,092,059 | |
| | | | | | | | |
| Energy — 12.0% | | | | | | | | |
| Oil & Gas — 8.8% | | | | | | | | |
Anadarko Petroleum Corp. | | | 81,002 | | | | 5,648,269 | |
Apache Corp. | | | 89,333 | | | | 5,669,965 | |
Chevron Corp. | | | 185,162 | | | | 21,793,567 | |
Concho Resources, Inc. (b) | | | 36,881 | | | | 4,890,421 | |
ConocoPhillips | | | 82,684 | | | | 4,145,776 | |
Hess Corp. | | | 161,241 | | | | 10,043,702 | |
Marathon Petroleum Corp. | | | 76,336 | | | | 3,843,518 | |
Newfield Exploration Co. (b) | | | 49,843 | | | | 2,018,641 | |
Phillips 66 | | | 39,952 | | | | 3,452,252 | |
Royal Dutch Shell PLC A Shares Sponsored ADR (United Kingdom) | | | 64,802 | | | | 3,523,933 | |
Suncor Energy, Inc. | | | 200,040 | | | | 6,539,308 | |
| | | | | | | | |
| | | | | | | 71,569,352 | |
| | | | | | | | |
| Oil & Gas Services — 2.5% | | | | | | | | |
Baker Hughes, Inc. | | | 39,902 | | | | 2,592,433 | |
Halliburton Co. | | | 244,638 | | | | 13,232,469 | |
Schlumberger Ltd. | | | 56,050 | | | | 4,705,398 | |
| | | | | | | | |
| | | | | | | 20,530,300 | |
| | | | | | | | |
| Pipelines — 0.7% | | | | | | | | |
Enbridge, Inc. (a) | | | 128,659 | | | | 5,419,117 | |
| | | | | | | | |
| | | | | | | 97,518,769 | |
| | | | | | | | |
| Financial — 27.9% | | | | | | | | |
| Banks — 9.5% | | | | | | | | |
Bank of America Corp. | | | 1,553,853 | | | | 34,340,151 | |
The Bank of New York Mellon Corp. | | | 101,620 | | | | 4,814,756 | |
Citigroup, Inc. | | | 136,949 | | | | 8,138,879 | |
Fifth Third Bancorp | | | 154,480 | | | | 4,166,326 | |
KeyCorp | | | 259,040 | | | | 4,732,661 | |
The PNC Financial Services Group, Inc. | | | 63,998 | | | | 7,485,206 | |
State Street Corp. | | | 45,396 | | | | 3,528,177 | |
Wells Fargo & Co. | | | 178,509 | | | | 9,837,631 | |
| | | | | | | | |
| | | | | | | 77,043,787 | |
| | | | | | | | |
| Diversified Financial — 9.4% | | | | | | | | |
Alliance Data Systems Corp. | | | 19,842 | | | | 4,533,897 | |
Ally Financial, Inc. | | | 240,200 | | | | 4,568,604 | |
| | | | | | | | |
| | | Number of
Shares | | | Value | |
American Express Co. | | | 47,337 | | | $ | 3,506,725 | |
Ameriprise Financial, Inc. | | | 57,892 | | | | 6,422,538 | |
Discover Financial Services | | | 66,640 | | | | 4,804,078 | |
FNF Group | | | 117,817 | | | | 4,001,065 | |
JP Morgan Chase & Co. | | | 408,747 | | | | 35,270,779 | |
Nasdaq, Inc. | | | 100,600 | | | | 6,752,272 | |
Synchrony Financial | | | 172,390 | | | | 6,252,585 | |
| | | | | | | | |
| | | | | | | 76,112,543 | |
| | | | | | | | |
| Insurance — 6.7% | | | | | | | | |
American International Group, Inc. | | | 331,219 | | | | 21,631,913 | |
Aon PLC | | | 36,960 | | | | 4,122,149 | |
MetLife, Inc. | | | 299,218 | | | | 16,124,858 | |
The Travelers Cos., Inc. | | | 41,192 | | | | 5,042,724 | |
Unum Group | | | 98,260 | | | | 4,316,562 | |
XL Group Ltd. | | | 83,900 | | | | 3,126,114 | |
| | | | | | | | |
| | | | | | | 54,364,320 | |
| | | | | | | | |
| Real Estate — 0.5% | | | | | | | | |
CBRE Group, Inc. Class A (b) | | | 112,832 | | | | 3,553,080 | |
| | | | | | | | |
| Real Estate Investment Trusts (REITS) — 1.8% | |
Crown Castle International Corp. | | | 22,160 | | | | 1,922,823 | |
Digital Realty Trust, Inc. | | | 22,590 | | | | 2,219,693 | |
HCP, Inc. | | | 149,070 | | | | 4,430,360 | |
Outfront Media, Inc. | | | 70,079 | | | | 1,742,865 | |
Weyerhaeuser Co. | | | 143,085 | | | | 4,305,428 | |
| | | | | | | | |
| | | | | | | 14,621,169 | |
| | | | | | | | |
| | | | | | | 225,694,899 | |
| | | | | | | | |
| Industrial — 14.2% | | | | | | | | |
| Aerospace & Defense — 3.0% | | | | | | | | |
Harris Corp. | | | 48,827 | | | | 5,003,303 | |
Lockheed Martin Corp. | | | 30,251 | | | | 7,560,935 | |
Northrop Grumman Corp. | | | 21,809 | | | | 5,072,337 | |
United Technologies Corp. | | | 63,836 | | | | 6,997,702 | |
| | | | | | | | |
| | | | | | | 24,634,277 | |
| | | | | | | | |
| Electronics — 2.5% | | | | | | | | |
Johnson Controls International PLC | | | 345,844 | | | | 14,245,314 | |
TE Connectivity Ltd. | | | 85,530 | | | | 5,925,519 | |
| | | | | | | | |
| | | | | | | 20,170,833 | |
| | | | | | | | |
| Environmental Controls — 0.3% | | | | | | | | |
Waste Management, Inc. | | | 38,550 | | | | 2,733,581 | |
| | | | | | | | |
| Machinery – Construction & Mining — 0.4% | |
Caterpillar, Inc. | | | 37,180 | | | | 3,448,073 | |
| | | | | | | | |
| Manufacturing — 4.8% | | | | | | | | |
Danaher Corp. | | | 70,028 | | | | 5,450,979 | |
Eaton Corp. PLC | | | 197,782 | | | | 13,269,194 | |
Honeywell International, Inc. | | | 44,689 | | | | 5,177,221 | |
Parker Hannifin Corp. | | | 45,383 | | | | 6,353,620 | |
Pentair PLC | | | 145,783 | | | | 8,174,053 | |
| | | | | | | | |
| | | | | | | 38,425,067 | |
| | | | | | | | |
The accompanying notes are an integral part of the financial statements.
43
MML Equity Fund – Portfolio of Investments (Continued)
| | | | | | | | |
| | | Number of
Shares | | | Value | |
Packaging & Containers — 0.9% | | | | | | | | |
Sealed Air Corp. | | | 100,778 | | | $ | 4,569,275 | |
WestRock Co. | | | 59,160 | | | | 3,003,553 | |
| | | | | | | | |
| | | | | | | 7,572,828 | |
| | | | | | | | |
| Transportation — 2.3% | | | | | | | | |
FedEx Corp. | | | 24,330 | | | | 4,530,246 | |
Norfolk Southern Corp. | | | 45,265 | | | | 4,891,789 | |
XPO Logistics, Inc. (b) (a) | | | 204,520 | | | | 8,827,083 | |
| | | | | | | | |
| | | | | | | 18,249,118 | |
| | | | | | | | |
| | | | | | | 115,233,777 | |
| | | | | | | | |
| Technology — 8.4% | | | | | | | | |
| Computers — 2.7% | | | | | | | | |
Apple, Inc. | | | 103,272 | | | | 11,960,963 | |
Synopsys, Inc. (b) | | | 98,740 | | | | 5,811,836 | |
Western Digital Corp. | | | 57,760 | | | | 3,924,792 | |
| | | | | | | | |
| | | | | | | 21,697,591 | |
| | | | | | | | |
| Semiconductors — 2.9% | | | | | | | | |
Broadcom Ltd. | | | 48,382 | | | | 8,552,486 | |
Micron Technology, Inc. (b) | | | 102,316 | | | | 2,242,767 | |
NXP Semiconductor NV (b) | | | 33,250 | | | | 3,258,833 | |
QUALCOMM, Inc. | | | 77,084 | | | | 5,025,877 | |
Texas Instruments, Inc. | | | 59,050 | | | | 4,308,878 | |
| | | | | | | | |
| | | | | | | 23,388,841 | |
| | | | | | | | |
| Software — 2.8% | | | | | | | | |
First Data Corp. Class A (b) | | | 223,890 | | | | 3,176,999 | |
Microsoft Corp. | | | 237,519 | | | | 14,759,431 | |
Oracle Corp. | | | 137,980 | | | | 5,305,331 | |
| | | | | | | | |
| | | | | | | 23,241,761 | |
| | | | | | | | |
| | | | | | | 68,328,193 | |
| | | | | | | | |
| Utilities — 2.9% | | | | | | | | |
| Electric — 2.9% | | | | | | | | |
Edison International | | | 182,960 | | | | 13,171,290 | |
NextEra Energy, Inc. | | | 41,955 | | | | 5,011,944 | |
PG&E Corp. | | | 79,876 | | | | 4,854,065 | |
| | | | | | | | |
| | | | | | | 23,037,299 | |
| | | | | | | | |
| | |
TOTAL COMMON STOCK
(Cost $608,330,285) | | | | | | | 792,151,485 | |
| | | | | | | | |
| | |
TOTAL EQUITIES
(Cost $608,330,285) | | | | | | | 792,151,485 | |
| | | | | | | | |
|
| MUTUAL FUNDS — 2.3% | |
| Diversified Financial — 2.3% | | | | | | | | |
State Street Navigator Securities Lending Prime Portfolio (c)
| | | 18,768,071 | | | | 18,768,071 | |
| | | | | | | | |
| | |
TOTAL MUTUAL FUNDS
(Cost $18,768,071) | | | | | | | 18,768,071 | |
| | | | | | | | |
| | |
TOTAL LONG-TERM
INVESTMENTS
(Cost $627,098,356) | | | | | | | 810,919,556 | |
| | | | | | | | |
| | | | | | | | |
| | | Principal
Amount | | | Value | |
| SHORT-TERM INVESTMENTS — 2.0% | |
| Repurchase Agreement — 2.0% | | | | | | | | |
State Street Bank & Trust Co. Repurchase Agreement, dated 12/30/16, 0.010%, due 1/03/17 (d) | | $ | 15,995,072 | | | $ | 15,995,072 | |
| | | | | | | | |
| Time Deposit — 0.0% | | | | | | | | |
Euro Time Deposit 0.010% 1/03/17 | | | 36,240 | | | | 36,240 | |
| | | | | | | | |
| | |
TOTAL SHORT-TERM
INVESTMENTS
(Cost $16,031,312) | | | | | | | 16,031,312 | |
| | | | | | | | |
| | |
TOTAL INVESTMENTS — 102.1%
(Cost $643,129,668) (e) | | | | | | | 826,950,868 | |
| | |
| Other Assets/(Liabilities) — (2.1)% | | | | | | | (17,365,442 | ) |
| | | | | | | | |
| | |
| NET ASSETS — 100.0% | | | | | | $ | 809,585,426 | |
| | | | | |
Notes to Portfolio of Investments
Percentages are stated as a percent of net assets.
| ADR | American Depositary Receipt |
| (a) | Denotes all or a portion of security on loan. The total value of securities on loan as of December 31, 2016, was $18,311,526 or 2.26% of net assets. Total securities on loan may not correspond with the amounts identified in the Portfolio of Investments because pending sales may be in the process of recall from the brokers. (Note 2). |
| (b) | Non-income producing security. |
| (c) | Represents investment of security lending collateral. (Note 2). |
| (d) | Maturity value of $15,995,090. Collateralized by U.S. Government Agency obligations with a rate of 1.625%, maturity dates ranging from 4/30/19 – 12/31/19, and an aggregate market value, including accrued interest, of $16,320,811. |
| (e) | See Note 6 for aggregate cost for federal tax purposes. |
Country weightings, as a percentage of net assets, is as follows:
| | | | |
United States | | | 85.3 | % |
Ireland | | | 5.8 | % |
Canada | | | 2.1 | % |
United Kingdom | | | 1.9 | % |
Israel | | | 1.4 | % |
Singapore | | | 1.1 | % |
Netherlands | | | 1.0 | % |
Switzerland | | | 0.7 | % |
Bermuda | | | 0.4 | % |
Panama | | | 0.4 | % |
| | | | |
Total Long-Term Investments | | | 100.1 | % |
Short-Term Investments and Other Assets and Liabilities | | | (0.1 | )% |
| | | | |
Net Assets | | | 100.0 | % |
| | | | |
The accompanying notes are an integral part of the financial statements.
44
MML Managed Bond Fund – Portfolio of Investments
December 31, 2016
| | | | | | | | |
| | | Number of
Shares | | | Value | |
| EQUITIES — 0.2% | |
|
| PREFERRED STOCK — 0.2% | |
| Financial — 0.2% | | | | | | | | |
| Insurance — 0.2% | | | | | | | | |
The Allstate Corp. 5.100%, 3 mo. LIBOR US + 3.165%, VRN | | | 95,000 | | | $ | 2,391,150 | |
| | | | | | | | |
| | |
TOTAL PREFERRED STOCK
(Cost $2,375,000) | | | | | | | 2,391,150 | |
| | | | | |
| | |
TOTAL EQUITIES
(Cost $2,375,000) | | | | | | | 2,391,150 | |
| | | | | |
| | |
| | | Principal
Amount | | | | |
| BONDS & NOTES — 98.4% | |
|
| CORPORATE DEBT — 36.5% | |
| Advertising — 0.1% | | | | | | | | |
WPP Finance 2010
5.625% 11/15/43 | | $ | 1,205,000 | | | | 1,287,267 | |
| | | | | | | | |
| Aerospace & Defense — 0.0% | | | | | | | | |
United Technologies Corp.
6.125% 7/15/38 | | | 350,000 | | | | 445,233 | |
| | | | | | | | |
| Agriculture — 0.6% | | | | | | | | |
Altria Group, Inc.
4.250% 8/09/42 | | | 515,000 | | | | 506,822 | |
Altria Group, Inc.
9.700% 11/10/18 | | | 112,000 | | | | 128,078 | |
Bunge Ltd. Finance Corp.
3.250% 8/15/26 | | | 1,050,000 | | | | 1,008,288 | |
Bunge Ltd. Finance Corp.
3.500% 11/24/20 | | | 955,000 | | | | 972,023 | |
Imperial Brands Finance PLC (a)
2.950% 7/21/20 | | | 2,170,000 | | | | 2,183,276 | |
Philip Morris International, Inc.
6.375% 5/16/38 | | | 160,000 | | | | 205,159 | |
Reynolds American, Inc.
3.250% 6/12/20 | | | 840,000 | | | | 860,718 | |
Reynolds American, Inc.
5.850% 8/15/45 | | | 760,000 | | | | 899,936 | |
| | | | | | | | |
| | | | | | | 6,764,300 | |
| | | | | | | | |
| Airlines — 0.5% | | | | | | | | |
American Airlines Group, Inc. (a)
5.500% 10/01/19 | | | 2,961,000 | | | | 3,057,233 | |
American Airlines Pass-Through Trust, Series 2014-1, Class B
4.375% 4/01/24 | | | 225,875 | | | | 225,310 | |
American Airlines Pass-Through Trust, Series 2014-1, Class A
3.700% 4/01/28 | | | 562,225 | | | | 556,603 | |
| | | | | | | | |
| | | Principal
Amount | | | Value | |
Spirit Airlines Pass-Through Trust, Series 2015-1, Class A
4.100% 10/01/29 | | $ | 1,888,633 | | | $ | 1,926,783 | |
WestJet Airlines Ltd. (a)
3.500% 6/16/21 | | | 735,000 | | | | 734,693 | |
| | | | | | | | |
| | | | | | | 6,500,622 | |
| | | | | | | | |
| Auto Manufacturers — 0.8% | | | | | | | | |
Ford Motor Co.
5.291% 12/08/46 | | | 530,000 | | | | 536,885 | |
General Motors Financial Co., Inc.
3.100% 1/15/19 | | | 5,964,000 | | | | 6,027,296 | |
General Motors Financial Co., Inc.
3.200% 7/13/20 | | | 1,895,000 | | | | 1,900,700 | |
Hyundai Capital America (a)
2.550% 2/06/19 | | | 1,045,000 | | | | 1,051,113 | |
| | | | | | | | |
| | | | | | | 9,515,994 | |
| | | | | | | | |
| Automotive & Parts — 0.1% | | | | | | | | |
Lear Corp.
4.750% 1/15/23 | | | 1,222,000 | | | | 1,246,440 | |
Lear Corp.
5.375% 3/15/24 | | | 535,000 | | | | 559,744 | |
| | | | | | | | |
| | | | | | | 1,806,184 | |
| | | | | | | | |
| Banks — 3.6% | | | | | | | | |
Associated Banc-Corp.
2.750% 11/15/19 | | | 2,805,000 | | | | 2,812,206 | |
Associated Banc-Corp.
4.250% 1/15/25 | | | 2,991,000 | | | | 2,964,126 | |
Bancolombia SA
5.950% 6/03/21 | | | 1,280,000 | | | | 1,389,184 | |
Bank of America Corp.
4.183% 11/25/27 | | | 3,015,000 | | | | 3,016,927 | |
Bank of America Corp.
4.750% 4/21/45 | | | 1,540,000 | | | | 1,561,581 | |
Bank of America Corp.
5.650% 5/01/18 | | | 1,230,000 | | | | 1,288,747 | |
Bank of America Corp.
5.750% 12/01/17 | | | 780,000 | | | | 807,962 | |
Bank of America Corp.
5.875% 2/07/42 | | | 470,000 | | | | 568,064 | |
The Bank of Nova Scotia
4.500% 12/16/25 | | | 1,295,000 | | | | 1,330,337 | |
Compass Bank
3.875% 4/10/25 | | | 886,000 | | | | 843,154 | |
Discover Bank
2.000% 2/21/18 | | | 1,385,000 | | | | 1,384,748 | |
First Horizon National Corp.
3.500% 12/15/20 | | | 3,580,000 | | | | 3,612,607 | |
First Republic Bank
4.375% 8/01/46 | | | 4,360,000 | | | | 3,962,394 | |
The accompanying notes are an integral part of the financial statements.
45
MML Managed Bond Fund – Portfolio of Investments (Continued)
| | | | | | | | |
| | | Principal
Amount | | | Value | |
The Goldman Sachs Group, Inc.
3.500% 11/16/26 | | $ | 1,585,000 | | | $ | 1,548,521 | |
ICICI Bank Ltd. (a)
4.700% 2/21/18 | | | 1,250,000 | | | | 1,279,951 | |
JP Morgan Chase & Co.
3.625% 12/01/27 | | | 2,460,000 | | | | 2,386,657 | |
JP Morgan Chase & Co.
3.875% 9/10/24 | | | 1,420,000 | | | | 1,436,808 | |
MUFG Union Bank NA
2.625% 9/26/18 | | | 500,000 | | | | 505,465 | |
Regions Bank
2.250% 9/14/18 | | | 2,870,000 | | | | 2,879,419 | |
Regions Financial Corp.
7.500% 5/15/18 | | | 765,000 | | | | 819,567 | |
SVB Financial Group
3.500% 1/29/25 | | | 2,960,000 | | | | 2,852,061 | |
SVB Financial Group
5.375% 9/15/20 | | | 475,000 | | | | 514,673 | |
Turkiye Garanti Bankasi AS (a)
4.750% 10/17/19 | | | 1,355,000 | | | | 1,347,209 | |
Valley National Bancorp
5.125% 9/27/23 | | | 1,530,000 | | | | 1,586,330 | |
| | | | | | | | |
| | | | | | | 42,698,698 | |
| | | | | | | | |
| Beverages — 0.6% | | | | | | | | |
Anheuser-Busch Cos, Inc.
6.500% 2/01/43 | | | 125,000 | | | | 161,324 | |
Anheuser-Busch InBev Finance, Inc.
4.900% 2/01/46 | | | 4,375,000 | | | | 4,728,806 | |
Molson Coors Brewing Co.
4.200% 7/15/46 | | | 1,085,000 | | | | 1,011,573 | |
Pernod Ricard SA (a)
2.950% 1/15/17 | | | 1,400,000 | | | | 1,400,754 | |
| | | | | | | | |
| | | | | | | 7,302,457 | |
| | | | | | | | |
| Biotechnology — 0.0% | | | | | | | | |
Amgen, Inc.
5.150% 11/15/41 | | | 475,000 | | | | 502,147 | |
| | | | | | | | |
| Building Materials — 0.5% | | | | | | | | |
CRH America, Inc.
8.125% 7/15/18 | | | 1,195,000 | | | | 1,307,169 | |
James Hardie International Finance Ltd. (a)
5.875% 2/15/23 | | | 2,881,000 | | | | 2,981,835 | |
Martin Marietta Material, Inc.
3 mo. USD LIBOR + 1.100%, FRN
1.937% 6/30/17 | | | 1,365,000 | | | | 1,367,349 | |
Owens Corning, Inc.
9.000% 6/15/19 | | | 590,000 | | | | 672,725 | |
| | | | | | | | |
| | | | | | | 6,329,078 | |
| | | | | | | | |
| Chemicals — 0.8% | | | | | | | | |
Ashland, Inc.
6.875% 5/15/43 | | | 302,000 | | | | 311,815 | |
| | | | | | | | |
| | | Principal
Amount | | | Value | |
CF Industries, Inc.
6.875% 5/01/18 | | $ | 2,890,000 | | | $ | 3,042,130 | |
Chevron Phillips Chemical Co. LLC/Chevron Phillips Chemical Co. LP (a)
3.400% 12/01/26 | | | 1,745,000 | | | | 1,742,037 | |
The Dow Chemical Co.
8.550% 5/15/19 | | | 250,000 | | | | 286,520 | |
Incitec Pivot Finance LLC (a)
6.000% 12/10/19 | | | 640,000 | | | | 688,532 | |
Monsanto Co.
4.400% 7/15/44 | | | 650,000 | | | | 628,222 | |
RPM International, Inc.
6.125% 10/15/19 | | | 550,000 | | | | 603,991 | |
RPM International, Inc.
6.500% 2/15/18 | | | 1,390,000 | | | | 1,456,778 | |
Valspar Corp.
7.250% 6/15/19 | | | 315,000 | | | | 347,828 | |
| | | | | | | | |
| | | | | | | 9,107,853 | |
| | | | | | | | |
| Commercial Services — 0.8% | | | | | | | | |
The ADT Corp.
6.250% 10/15/21 | | | 2,875,000 | | | | 3,119,375 | |
ERAC USA Finance LLC (a)
2.800% 11/01/18 | | | 395,000 | | | | 399,952 | |
ERAC USA Finance LLC (a)
6.700% 6/01/34 | | | 125,000 | | | | 151,596 | |
Leidos Holdings, Inc.
4.450% 12/01/20 | | | 5,665,000 | | | | 5,835,516 | |
| | | | | | | | |
| | | | | | | 9,506,439 | |
| | | | | | | | |
| Computers — 0.5% | | | | | | | | |
Diamond 1 Finance Corp./Diamond 2 Finance Corp. (a)
3.480% 6/01/19 | | | 2,975,000 | | | | 3,036,898 | |
Diamond 1 Finance Corp./Diamond 2 Finance Corp. (a)
4.420% 6/15/21 | | | 2,435,000 | | | | 2,519,604 | |
Diamond 1 Finance Corp./Diamond 2 Finance Corp. (a)
6.020% 6/15/26 | | | 487,000 | | | | 527,565 | |
Electronic Data Systems LLC
7.450% 10/15/29 | | | 300,000 | | | | 357,013 | |
| | | | | | | | |
| | | | | | | 6,441,080 | |
| | | | | | | | |
| Cosmetics & Personal Care — 0.0% | | | | | | | | |
The Procter & Gamble Co.
5.800% 8/15/34 | | | 175,000 | | | | 226,969 | |
| | | | | | | | |
| Distribution & Wholesale — 0.1% | | | | | | | | |
Ingram Micro, Inc. STEP
5.450% 12/15/24 | | | 1,288,000 | | | | 1,211,991 | |
| | | | | | | | |
| Diversified Financial — 5.0% | | | | | | | | |
AerCap Ireland Capital Ltd./AerCap Global Aviation Trust
4.500% 5/15/21 | | | 4,735,000 | | | | 4,907,117 | |
The accompanying notes are an integral part of the financial statements.
46
MML Managed Bond Fund – Portfolio of Investments (Continued)
| | | | | | | | |
| | | Principal
Amount | | | Value | |
Affiliated Managers Group, Inc.
3.500% 8/01/25 | | $ | 2,080,000 | | | $ | 1,962,582 | |
Air Lease Corp.
3.000% 9/15/23 | | | 2,980,000 | | | | 2,847,050 | |
Air Lease Corp.
3.375% 1/15/19 | | | 2,270,000 | | | | 2,308,490 | |
Air Lease Corp.
3.375% 6/01/21 | | | 2,470,000 | | | | 2,504,222 | |
Air Lease Corp.
3.875% 4/01/21 | | | 1,630,000 | | | | 1,674,678 | |
Air Lease Corp. STEP
5.625% 4/01/17 | | | 535,000 | | | | 539,681 | |
Ally Financial, Inc.
3.250% 11/05/18 | | | 3,060,000 | | | | 3,063,825 | |
Ally Financial, Inc.
3.600% 5/21/18 | | | 810,000 | | | | 816,075 | |
Ally Financial, Inc.
4.750% 9/10/18 | | | 1,690,000 | | | | 1,740,700 | |
Ares Finance Co. LLC (a)
4.000% 10/08/24 | | | 2,080,000 | | | | 1,924,210 | |
BGC Partners, Inc.
5.125% 5/27/21 | | | 3,435,000 | | | | 3,534,790 | |
CIT Group Inc
3.875% 2/19/19 | | | 1,858,000 | | | | 1,897,483 | |
CIT Group, Inc. (a)
5.500% 2/15/19 | | | 1,065,000 | | | | 1,123,575 | |
Citigroup, Inc.
5.375% 8/09/20 | | | 1,100,000 | | | | 1,199,734 | |
General Electric Capital Corp.
6.875% 1/10/39 | | | 298,000 | | | | 420,163 | |
The Goldman Sachs Group, Inc.
5.375% 3/15/20 | | | 950,000 | | | | 1,030,737 | |
The Goldman Sachs Group, Inc.
5.750% 1/24/22 | | | 950,000 | | | | 1,068,004 | |
The Goldman Sachs Group, Inc.
5.950% 1/15/27 | | | 1,958,000 | | | | 2,231,480 | |
The Goldman Sachs Group, Inc.
6.125% 2/15/33 | | | 335,000 | | | | 404,889 | |
The Goldman Sachs Group, Inc.
6.150% 4/01/18 | | | 150,000 | | | | 157,787 | |
The Goldman Sachs Group, Inc.
6.750% 10/01/37 | | | 345,000 | | | | 426,022 | |
Hyundai Capital America (a)
2.875% 8/09/18 | | | 800,000 | | | | 809,314 | |
Icahn Enterprises LP/Icahn Enterprises Finance Corp.
3.500% 3/15/17 | | | 6,450,000 | | | | 6,462,094 | |
International Lease Finance Corp.
3.875% 4/15/18 | | | 1,515,000 | | | | 1,543,406 | |
International Lease Finance Corp. STEP 8.750% 3/15/17 | | | 675,000 | | | | 684,281 | |
JP Morgan Chase & Co.
4.500% 1/24/22 | | | 950,000 | | | | 1,024,510 | |
| | | | | | | | |
| | | Principal
Amount | | | Value | |
JP Morgan Chase & Co.
4.950% 3/25/20 | | $ | 1,655,000 | | | $ | 1,783,193 | |
JP Morgan Chase & Co.
5.600% 7/15/41 | | | 1,125,000 | | | | 1,345,274 | |
Lazard Group LLC
3.625% 3/01/27 | | | 2,295,000 | | | | 2,174,802 | |
Lazard Group LLC
4.250% 11/14/20 | | | 3,710,000 | | | | 3,883,472 | |
Legg Mason, Inc.
5.625% 1/15/44 | | | 1,015,000 | | | | 988,403 | |
Merrill Lynch & Co., Inc.
7.750% 5/14/38 | | | 400,000 | | | | 550,722 | |
Morgan Stanley
6.625% 4/01/18 | | | 1,000,000 | | | | 1,057,528 | |
| | | | | | | | |
| | | | | | | 60,090,293 | |
| | | | | | | | |
| Electric — 2.3% | | | | | | | | |
Appalachian Power Co.
3.400% 6/01/25 | | | 2,395,000 | | | | 2,425,469 | |
Duke Energy Corp.
3.750% 9/01/46 | | | 1,235,000 | | | | 1,111,756 | |
Entergy Arkansas, Inc.
3.500% 4/01/26 | | | 435,000 | | | | 443,285 | |
Entergy Louisiana LLC
4.950% 1/15/45 | | | 1,005,000 | | | | 1,031,611 | |
Florida Power & Light Co.
4.950% 6/01/35 | | | 630,000 | | | | 718,753 | |
IPALCO Enterprises, Inc.
3.450% 7/15/20 | | | 4,910,000 | | | | 4,995,925 | |
Israel Electric Corp. Ltd. (a)
7.250% 1/15/19 | | | 1,250,000 | | | | 1,349,865 | |
Majapahit Holding BV (a)
7.750% 1/20/20 | | | 1,220,000 | | | | 1,369,450 | |
Metropolitan Edison Co. (a)
4.000% 4/15/25 | | | 1,345,000 | | | | 1,354,076 | |
Nevada Power Co. Series N
6.650% 4/01/36 | | | 550,000 | | | | 726,252 | |
NiSource Finance Corp.
5.800% 2/01/42 | | | 950,000 | | | | 1,105,538 | |
Oncor Electric Delivery Co.
7.500% 9/01/38 | | | 495,000 | | | | 712,970 | |
Pacific Gas & Electric Co.
5.800% 3/01/37 | | | 543,000 | | | | 662,444 | |
Pennsylvania Electric Co. (a)
4.150% 4/15/25 | | | 1,860,000 | | | | 1,873,918 | |
PPL Capital Funding, Inc.
5.000% 3/15/44 | | | 1,180,000 | | | | 1,247,863 | |
Progress Energy, Inc.
7.000% 10/30/31 | | | 485,000 | | | | 628,797 | |
Puget Energy, Inc.
3.650% 5/15/25 | | | 2,345,000 | | | | 2,311,035 | |
Puget Energy, Inc.
6.500% 12/15/20 | | | 1,580,000 | | | | 1,781,275 | |
The accompanying notes are an integral part of the financial statements.
47
MML Managed Bond Fund – Portfolio of Investments (Continued)
| | | | | | | | |
| | | Principal
Amount | | | Value | |
Tri-State Generation & Transmission Association, Series 2003, Class A (a)
6.040% 1/31/18 | | $ | 78,372 | | | $ | 79,321 | |
Tri-State Generation & Transmission Association, Series 2003, Class B (a)
7.144% 7/31/33 | | | 480,000 | | | | 521,472 | |
Virginia Electric and Power Co.
6.350% 11/30/37 | | | 640,000 | | | | 824,307 | |
Wisconsin Public Service Corp.
5.650% 11/01/17 | | | 380,000 | | | | 392,448 | |
| | | | | | | | |
| | | | | | | 27,667,830 | |
| | | | | | | | |
| Electronics — 0.4% | | | | | | | | |
Amphenol Corp.
4.000% 2/01/22 | | | 475,000 | | | | 497,057 | |
Arrow Electronics, Inc.
3.500% 4/01/22 | | | 1,680,000 | | | | 1,663,271 | |
Avnet, Inc.
3.750% 12/01/21 | | | 405,000 | | | | 407,502 | |
FLIR Systems, Inc.
3.125% 6/15/21 | | | 1,235,000 | | | | 1,238,263 | |
Tech Data Corp.
3.750% 9/21/17 | | | 885,000 | | | | 895,892 | |
| | | | | | | | |
| | | | | | | 4,701,985 | |
| | | | | | | | |
| Engineering & Construction — 0.2% | | | | | |
SBA Tower Trust (a)
3.156% 10/15/20 | | | 1,200,000 | | | | 1,206,720 | |
SBA Tower Trust (a)
2.877% 7/15/21 | | | 1,200,000 | | | | 1,189,776 | |
| | | | | | | | |
| | | | | | | 2,396,496 | |
| | | | | | | | |
| Environmental Controls — 0.1% | | | | | | | | |
Clean Harbors, Inc.
5.250% 8/01/20 | | | 1,196,000 | | | | 1,224,405 | |
| | | | | | | | |
| Foods — 0.6% | | | | | | | | |
Delhaize America, Inc.
9.000% 4/15/31 | | | 855,000 | | | | 1,197,285 | |
General Mills, Inc.
5.400% 6/15/40 | | | 70,000 | | | | 79,400 | |
Ingredion, Inc.
3.200% 10/01/26 | | | 1,385,000 | | | | 1,355,501 | |
Kraft Foods, Inc.
6.500% 2/09/40 | | | 260,000 | | | | 320,760 | |
Kraft Heinz Foods Co.
3.000% 6/01/26 | | | 3,275,000 | | | | 3,074,691 | |
Tyson Foods, Inc.
2.650% 8/15/19 | | | 430,000 | | | | 434,099 | |
Tyson Foods, Inc.
4.875% 8/15/34 | | | 660,000 | | | | 672,566 | |
| | | | | | | | |
| | | | | | | 7,134,302 | |
| | | | | | | | |
| Forest Products & Paper — 0.4% | | | | | | | | |
Sappi Papier Holding GmbH (a)
7.750% 7/15/17 | | | 4,195,000 | | | | 4,247,438 | |
| | | | | | | | |
| | | | | | | | |
| | | Principal
Amount | | | Value | |
Gas — 0.2% | | | | | | | | |
Boston Gas Co. (a)
4.487% 2/15/42 | | $ | 450,000 | | | $ | 460,141 | |
Spire, Inc.
4.700% 8/15/44 | | | 1,840,000 | | | | 1,793,584 | |
| | | | | | | | |
| | | | | | | 2,253,725 | |
| | | | | | | | |
| Hand & Machine Tools — 0.2% | | | | | | | | |
Kennametal, Inc.
2.650% 11/01/19 | | | 800,000 | | | | 795,606 | |
Stanley Black & Decker, Inc.
2.451% 11/17/18 | | | 1,600,000 | | | | 1,613,710 | |
| | | | | | | | |
| | | | | | | 2,409,316 | |
| | | | | | | | |
| Health Care – Products — 0.3% | | | | | | | | |
Abbott Laboratories
2.900% 11/30/21 | | | 1,320,000 | | | | 1,316,238 | |
Abbott Laboratories
3.750% 11/30/26 | | | 810,000 | | | | 804,404 | |
Abbott Laboratories
4.900% 11/30/46 | | | 755,000 | | | | 774,883 | |
Becton Dickinson & Co.
4.685% 12/15/44 | | | 825,000 | | | | 854,654 | |
Johnson & Johnson
5.850% 7/15/38 | | | 175,000 | | | | 229,491 | |
| | | | | | | | |
| | | | | | | 3,979,670 | |
| | | | | | | | |
| Health Care – Services — 0.3% | | | | | | | | |
Aetna, Inc.
3.200% 6/15/26 | | | 2,025,000 | | | | 2,003,269 | |
Aetna, Inc.
4.375% 6/15/46 | | | 495,000 | | | | 497,053 | |
UnitedHealth Group, Inc.
3.950% 10/15/42 | | | 350,000 | | | | 340,851 | |
UnitedHealth Group, Inc.
6.875% 2/15/38 | | | 580,000 | | | | 789,263 | |
| | | | | | | | |
| | | | | | | 3,630,436 | |
| | | | | | | | |
| Home Builders — 0.3% | | | | | | | | |
Lennar Corp.
4.500% 11/15/19 | | | 3,390,000 | | | | 3,521,363 | |
| | | | | | | | |
| Home Furnishing — 0.0% | | | | | | | | |
Whirlpool Corp.
5.150% 3/01/43 | | | 290,000 | | | | 309,403 | |
| | | | | | | | |
| Housewares — 0.2% | | | | | | | | |
Newell Brands, Inc.
3.850% 4/01/23 | | | 2,070,000 | | | | 2,147,225 | |
| | | | | | | | |
| Insurance — 3.1% | | | | | | | | |
The Allstate Corp.
3 mo. USD LIBOR + 2.938%, VRN
5.750% 8/15/53 | | | 2,190,000 | | | | 2,264,241 | |
Arch Capital Finance LLC
4.011% 12/15/26 | | | 1,025,000 | | | | 1,039,751 | |
The accompanying notes are an integral part of the financial statements.
48
MML Managed Bond Fund – Portfolio of Investments (Continued)
| | | | | | | | |
| | | Principal
Amount | | | Value | |
Arch Capital Group US, Inc.
5.144% 11/01/43 | | $ | 1,040,000 | | | $ | 1,098,062 | |
AXIS Specialty Finance PLC
2.650% 4/01/19 | | | 590,000 | | | | 594,066 | |
Brown & Brown, Inc.
4.200% 9/15/24 | | | 412,000 | | | | 415,042 | |
The Chubb Corp.
3 mo. USD LIBOR + 2.250%, VRN
6.375% 4/15/37 | | | 374,000 | | | | 351,560 | |
CNA Financial Corp.
7.350% 11/15/19 | | | 670,000 | | | | 759,862 | |
CNO Financial Group, Inc.
4.500% 5/30/20 | | | 1,602,000 | | | | 1,642,050 | |
CNO Financial Group, Inc.
5.250% 5/30/25 | | | 1,911,000 | | | | 1,908,611 | |
Five Corners Funding Trust (a)
4.419% 11/15/23 | | | 1,315,000 | | | | 1,390,242 | |
MetLife Capital Trust IV (a)
7.875% 12/15/37 | | | 1,960,000 | | | | 2,362,780 | |
Prudential Financial, Inc.
3 mo. USD LIBOR + 3.040%, VRN
5.200% 3/15/44 | | | 787,000 | | | | 777,690 | |
Prudential Financial, Inc.
3 mo. USD LIBOR + 3.920%, VRN
5.625% 6/15/43 | | | 1,680,000 | | | | 1,745,100 | |
QBE Insurance Group Ltd. (a)
2.400% 5/01/18 | | | 655,000 | | | | 655,717 | |
Reinsurance Group of America, Inc.
3.950% 9/15/26 | | | 2,260,000 | | | | 2,235,886 | |
Reinsurance Group of America, Inc.
4.700% 9/15/23 | | | 1,480,000 | | | | 1,569,315 | |
Reinsurance Group of America, Inc.
5.000% 6/01/21 | | | 1,220,000 | | | | 1,318,397 | |
Reinsurance Group of America, Inc.
6.450% 11/15/19 | | | 1,305,000 | | | | 1,447,803 | |
Trinity Acquisition PLC
3.500% 9/15/21 | | | 1,540,000 | | | | 1,555,029 | |
Trinity Acquisition PLC
4.400% 3/15/26 | | | 445,000 | | | | 450,453 | |
Unum Group
3.000% 5/15/21 | | | 985,000 | | | | 982,123 | |
USF&G Capital I (a)
8.500% 12/15/45 | | | 885,000 | | | | 1,122,089 | |
Willis North America, Inc.
7.000% 9/29/19 | | | 566,000 | | | | 629,726 | |
Willis Towers Watson PLC
5.750% 3/15/21 | | | 1,690,000 | | | | 1,846,709 | |
WR Berkley Corp.
4.625% 3/15/22 | | | 2,600,000 | | | | 2,781,069 | |
XLIT Ltd.
5.750% 10/01/21 | | | 1,260,000 | | | | 1,400,278 | |
| | | | | | | | |
| | | Principal
Amount | | | Value | |
XLIT Ltd.
6.375% 11/15/24 | | $ | 2,590,000 | | | $ | 3,023,045 | |
| | | | | | | | |
| | | | | | | 37,366,696 | |
| | | | | | | | |
| Internet — 0.4% | | | | | | | | |
Baidu, Inc.
3.250% 8/06/18 | | | 1,690,000 | | | | 1,718,543 | |
Expedia, Inc.
7.456% 8/15/18 | | | 2,550,000 | | | | 2,757,947 | |
| | | | | | | | |
| | | | | | | 4,476,490 | |
| | | | | | | | |
| Investment Companies — 0.5% | | | | | | | | |
Ares Capital Corp.
3.875% 1/15/20 | | | 3,250,000 | | | | 3,295,412 | |
FS Investment Corp.
4.000% 7/15/19 | | | 2,450,000 | | | | 2,456,314 | |
| | | | | | | | |
| | | | | | | 5,751,726 | |
| | | | | | | | |
| Iron & Steel — 0.4% | | | | | | | | |
ArcelorMittal
5.125% 6/01/20 | | | 2,165,000 | | | | 2,267,837 | |
ArcelorMittal STEP
6.250% 8/05/20 | | | 1,200,000 | | | | 1,305,000 | |
Glencore Funding LLC (a)
4.625% 4/29/24 | | | 340,000 | | | | 347,650 | |
Vale Overseas Ltd.
6.875% 11/21/36 | | | 630,000 | | | | 620,550 | |
| | | | | | | | |
| | | | | | | 4,541,037 | |
| | | | | | | | |
| Lodging — 0.0% | | | | | | | | |
Marriott International, Inc.
6.750% 5/15/18 | | | 220,000 | | | | 234,523 | |
| | | | | | | | |
| Machinery – Diversified — 0.7% | | | | | | | | |
CNH Industrial Capital LLC
3.250% 2/01/17 | | | 1,650,000 | | | | 1,650,000 | |
CNH Industrial Capital LLC
3.375% 7/15/19 | | | 1,530,000 | | | | 1,533,825 | |
CNH Industrial Capital LLC
3.625% 4/15/18 | | | 655,000 | | | | 663,187 | |
CNH Industrial Capital LLC
3.875% 10/15/21 | | | 3,280,000 | | | | 3,226,700 | |
Xylem, Inc.
3.250% 11/01/26 | | | 760,000 | | | | 737,999 | |
Xylem, Inc.
4.875% 10/01/21 | | | 375,000 | | | | 404,840 | |
| | | | | | | | |
| | | | | | | 8,216,551 | |
| | | | | | | | |
| Manufacturing — 0.2% | | | | | | | | |
General Electric Co.
4.125% 10/09/42 | | | 1,430,000 | | | | 1,442,657 | |
Ingersoll-Rand Global Holding Co. Ltd. 6.875% 8/15/18 | | | 310,000 | | | | 334,887 | |
Tyco Electronics Group SA
7.125% 10/01/37 | | | 335,000 | | | | 436,263 | |
| | | | | | | | |
| | | | | | | 2,213,807 | |
| | | | | | | | |
The accompanying notes are an integral part of the financial statements.
49
MML Managed Bond Fund – Portfolio of Investments (Continued)
| | | | | | | | |
| | | Principal
Amount | | | Value | |
Media — 0.8% | | | | | | | | |
21st Century Fox America, Co.
6.900% 8/15/39 | | $ | 420,000 | | | $ | 527,416 | |
Charter Communications Operating LLC/Charter Communications Operating Capital
3.579% 7/23/20 | | | 1,560,000 | | | | 1,591,567 | |
Charter Communications Operating LLC/Charter Communications Operating Capital
6.484% 10/23/45 | | | 1,285,000 | | | | 1,485,561 | |
Comcast Corp.
3.400% 7/15/46 | | | 1,645,000 | | | | 1,436,598 | |
Comcast Corp.
6.950% 8/15/37 | | | 515,000 | | | | 702,415 | |
NBCUniversal Media LLC
6.400% 4/30/40 | | | 65,000 | | | | 84,053 | |
Time Warner Cable, Inc.
6.750% 6/15/39 | | | 985,000 | | | | 1,145,142 | |
Time Warner Cable, Inc.
8.250% 4/01/19 | | | 75,000 | | | | 84,277 | |
Time Warner Cable, Inc.
8.750% 2/14/19 | | | 325,000 | | | | 366,257 | |
Time Warner, Inc.
4.700% 1/15/21 | | | 650,000 | | | | 694,770 | |
Time Warner, Inc.
6.250% 3/29/41 | | | 210,000 | | | | 245,024 | |
Viacom, Inc.
2.250% 2/04/22 | | | 1,110,000 | | | | 1,043,116 | |
| | | | | | | | |
| | | | | | | 9,406,196 | |
| | | | | | | | |
| Mining — 0.1% | | | | | | | | |
Glencore Canada Corp.
5.500% 6/15/17 | | | 900,000 | | | | 914,434 | |
| | | | | | | | |
| Office Equipment/Supplies — 0.3% | | | | | | | | |
Pitney Bowes, Inc.
3.375% 10/01/21 | | | 3,005,000 | | | | 2,917,507 | |
Pitney Bowes, Inc.
4.750% 5/15/18 | | | 250,000 | | | | 257,410 | |
Pitney Bowes, Inc.
5.750% 9/15/17 | | | 166,000 | | | | 170,261 | |
| | | | | | | | |
| | | | | | | 3,345,178 | |
| | | | | | | | |
| Office Furnishings — 0.0% | | | | | | | | |
Steelcase, Inc.
6.375% 2/15/21 | | | 100,000 | | | | 111,772 | |
| | | | | | | | |
| Oil & Gas — 1.4% | | | | | | | | |
Anadarko Petroleum Corp.
5.550% 3/15/26 | | | 1,050,000 | | �� | | 1,175,223 | |
ConocoPhillips Co.
2.400% 12/15/22 | | | 910,000 | | | | 879,897 | |
ConocoPhillips Co.
2.875% 11/15/21 | | | 3,065,000 | | | | 3,088,368 | |
| | | | | | | | |
| | | Principal
Amount | | | Value | |
Encana Corp.
3.900% 11/15/21 | | $ | 965,000 | | | $ | 971,929 | |
Encana Corp.
6.500% 5/15/19 | | | 805,000 | | | | 866,369 | |
Nabors Industries, Inc. (a)
5.500% 1/15/23 | | | 390,000 | | | | 406,087 | |
Petroleos Mexicanos
3.125% 1/23/19 | | | 325,000 | | | | 322,238 | |
Petroleos Mexicanos
5.500% 1/21/21 | | | 1,190,000 | | | | 1,224,212 | |
Petroleos Mexicanos
6.375% 1/23/45 | | | 595,000 | | | | 541,450 | |
Petroleos Mexicanos (a)
6.500% 3/13/27 | | | 585,000 | | | | 603,427 | |
Petroleos Mexicanos
6.625% 6/15/35 | | | 140,000 | | | | 137,900 | |
Phillips 66
5.875% 5/01/42 | | | 2,160,000 | | | | 2,557,559 | |
Pioneer Natural Resources Co.
4.450% 1/15/26 | | | 2,000,000 | | | | 2,119,126 | |
Pioneer Natural Resources Co.
7.500% 1/15/20 | | | 350,000 | | | | 397,870 | |
Tesoro Corp. (a)
5.125% 12/15/26 | | | 1,830,000 | | | | 1,850,862 | |
| | | | | | | | |
| | | | | | | 17,142,517 | |
| | | | | | | | |
| Oil & Gas Services — 0.0% | | | | | | | | |
Weatherford International Ltd.
6.000% 3/15/18 | | | 525,000 | | | | 519,750 | |
| | | | | | | | |
| Packaging & Containers — 0.7% | | | | | | | | |
Amcor Finance USA, Inc. (a)
3.625% 4/28/26 | | | 3,105,000 | | | | 3,041,273 | |
Brambles USA, Inc. (a)
4.125% 10/23/25 | | | 772,000 | | | | 785,954 | |
Brambles USA, Inc., Series A (a)
5.350% 4/01/20 | | | 490,000 | | | | 528,376 | |
Crown Americas LLC/Crown Americas Capital Corp. IV
4.500% 1/15/23 | | | 2,412,000 | | | | 2,460,240 | |
Graphic Packaging International, Inc.
4.750% 4/15/21 | | | 590,000 | | | | 619,500 | |
Graphic Packaging International, Inc.
4.875% 11/15/22 | | | 400,000 | | | | 410,000 | |
The WestRock MWV LLC
7.550% 3/01/47 | | | 1,000,000 | | | | 1,179,622 | |
| | | | | | | | |
| | | | | | | 9,024,965 | |
| | | | | | | | |
| Pharmaceuticals — 1.4% | | | | | | | | |
AbbVie, Inc.
4.400% 11/06/42 | | | 500,000 | | | | 470,373 | |
Actavis Funding SCS
3.000% 3/12/20 | | | 2,005,000 | | | | 2,032,795 | |
Actavis Funding SCS
4.750% 3/15/45 | | | 1,270,000 | | | | 1,246,802 | |
The accompanying notes are an integral part of the financial statements.
50
MML Managed Bond Fund – Portfolio of Investments (Continued)
| | | | | | | | |
| | | Principal
Amount | | | Value | |
Baxalta, Inc.
4.000% 6/23/25 | | $ | 1,775,000 | | | $ | 1,780,185 | |
Baxalta, Inc.
5.250% 6/23/45 | | | 885,000 | | | | 944,663 | |
McKesson Corp.
2.284% 3/15/19 | | | 600,000 | | | | 602,247 | |
McKesson Corp.
4.750% 3/01/21 | | | 600,000 | | | | 643,324 | |
McKesson Corp.
4.883% 3/15/44 | | | 625,000 | | | | 635,789 | |
McKesson Corp.
6.000% 3/01/41 | | | 550,000 | | | | 636,354 | |
Merck Sharp & Dohme Corp.
5.850% 6/30/39 | | | 180,000 | | | | 226,844 | |
Mylan NV (a)
3.150% 6/15/21 | | | 1,750,000 | | | | 1,717,427 | |
Mylan NV (a)
3.950% 6/15/26 | | | 3,125,000 | | | | 2,924,525 | |
Pfizer, Inc.
7.200% 3/15/39 | | | 395,000 | | | | 570,572 | |
Shire Acquisitions Investments Ireland DAC
2.875% 9/23/23 | | | 1,085,000 | | | | 1,031,235 | |
Teva Pharmaceutical Finance Netherlands III BV
4.100% 10/01/46 | | | 460,000 | | | | 394,157 | |
Wyeth
6.000% 2/15/36 | | | 360,000 | | | | 448,583 | |
| | | | | | | | |
| | | | | | | 16,305,875 | |
| | | | | | | | |
| Pipelines — 1.3% | | | | | | | | |
Boardwalk Pipelines LLC
5.500% 2/01/17 | | | 200,000 | | | | 200,533 | |
CenterPoint Energy Resources Corp.
4.500% 1/15/21 | | | 475,000 | | | | 498,379 | |
EnLink Midstream Partners LP
4.850% 7/15/26 | | | 465,000 | | | | 469,061 | |
Enterprise Products Operating Co.
3.700% 2/15/26 | | | 2,285,000 | | | | 2,293,285 | |
Enterprise Products Operating Co.
5.950% 2/01/41 | | | 455,000 | | | | 513,650 | |
Kinder Morgan Energy Partners LP
6.000% 2/01/17 | | | 185,000 | | | | 185,560 | |
Kinder Morgan Energy Partners LP
6.500% 2/01/37 | | | 150,000 | | | | 164,376 | |
Kinder Morgan Energy Partners LP
6.950% 1/15/38 | | | 175,000 | | | | 202,995 | |
Kinder Morgan Finance Co. LLC (a)
6.000% 1/15/18 | | | 2,700,000 | | | | 2,811,237 | |
Kinder Morgan, Inc.
4.300% 6/01/25 | | | 1,775,000 | | | | 1,827,481 | |
Magellan Midstream Partners LP
5.150% 10/15/43 | | | 2,575,000 | | | | 2,676,334 | |
| | | | | | | | |
| | | Principal
Amount | | | Value | |
MPLX LP
4.875% 12/01/24 | | $ | 1,035,000 | | | $ | 1,065,733 | |
MPLX LP
4.875% 6/01/25 | | | 1,007,000 | | | | 1,035,344 | |
Plains All American Pipeline LP/PAA Finance Corp.
4.500% 12/15/26 | | | 1,360,000 | | | | 1,379,647 | |
Southern Natural Gas Co. LLC STEP (a)
5.900% 4/01/17 | | | 310,000 | | | | 313,228 | |
| | | | | | | | |
| | | | | | | 15,636,843 | |
| | | | | | | | |
| Real Estate Investment Trusts (REITS) — 1.4% | |
American Tower Corp.
3.450% 9/15/21 | | | 2,690,000 | | | | 2,724,803 | |
American Tower Corp.
4.400% 2/15/26 | | | 860,000 | | | | 878,794 | |
American Tower Corp.
4.500% 1/15/18 | | | 1,375,000 | | | | 1,411,290 | |
Boston Properties LP
3.700% 11/15/18 | | | 475,000 | | | | 489,268 | |
Brandywine Operating Partners LP
4.950% 4/15/18 | | | 800,000 | | | | 826,980 | |
DDR Corp.
4.750% 4/15/18 | | | 1,000,000 | | | | 1,028,463 | |
DDR Corp.
7.500% 4/01/17 | | | 1,000,000 | | | | 1,013,779 | |
Duke Realty LP
3.250% 6/30/26 | | | 770,000 | | | | 744,659 | |
Federal Realty Investment Trust
5.900% 4/01/20 | | | 330,000 | | | | 364,686 | |
Healthcare Trust of America Holdings LP
3.500% 8/01/26 | | | 1,265,000 | | | | 1,208,873 | |
Highwoods Realty LP
5.850% 3/15/17 | | | 1,800,000 | | | | 1,815,219 | |
Highwoods Realty LP
7.500% 4/15/18 | | | 195,000 | | | | 208,044 | |
Host Hotels & Resorts LP
3.750% 10/15/23 | | | 215,000 | | | | 211,069 | |
Host Hotels & Resorts LP
4.000% 6/15/25 | | | 682,000 | | | | 671,716 | |
ProLogis LP
2.750% 2/15/19 | | | 530,000 | | | | 537,671 | |
Tanger Properties LP
3.125% 9/01/26 | | | 2,565,000 | | | | 2,409,415 | |
Weingarten Realty Investors
3.250% 8/15/26 | | | 535,000 | | | | 504,709 | |
| | | | | | | | |
| | | | | | | 17,049,438 | |
| | | | | | | | |
| Retail — 1.4% | | | | | | | | |
AutoNation, Inc.
4.500% 10/01/25 | | | 700,000 | | | | 708,177 | |
The accompanying notes are an integral part of the financial statements.
51
MML Managed Bond Fund – Portfolio of Investments (Continued)
| | | | | | | | |
| | | Principal
Amount | | | Value | |
Bed Bath & Beyond, Inc.
5.165% 8/01/44 | | $ | 600,000 | | | $ | 546,050 | |
CVS Health Corp.
6.125% 9/15/39 | | | 560,000 | | | | 685,573 | |
CVS Pass-Through Trust (a)
5.926% 1/10/34 | | | 1,223,060 | | | | 1,397,131 | |
CVS Pass-Through Trust (a)
7.507% 1/10/32 | | | 8,361 | | | | 10,181 | |
Dollar Tree, Inc.
5.750% 3/01/23 | | | 2,945,000 | | | | 3,118,225 | |
El Puerto de Liverpool SAB de CV (a)
3.950% 10/02/24 | | | 2,620,000 | | | | 2,489,000 | |
The Home Depot, Inc.
5.950% 4/01/41 | | | 600,000 | | | | 762,761 | |
O’Reilly Automotive, Inc.
4.875% 1/14/21 | | | 575,000 | | | | 617,292 | |
QVC, Inc.
3.125% 4/01/19 | | | 960,000 | | | | 969,989 | |
QVC, Inc.
4.450% 2/15/25 | | | 1,380,000 | | | | 1,326,496 | |
QVC, Inc.
5.125% 7/02/22 | | | 545,000 | | | | 564,173 | |
Tiffany & Co.
4.900% 10/01/44 | | | 990,000 | | | | 923,151 | |
Wal-Mart Stores, Inc.
6.200% 4/15/38 | | | 730,000 | | | | 962,282 | |
Wal-Mart Stores, Inc.
6.500% 8/15/37 | | | 515,000 | | | | 697,931 | |
Walgreens Boots Alliance, Inc.
2.700% 11/18/19 | | | 685,000 | | | | 694,087 | |
| | | | | | | | |
| | | | | | | 16,472,499 | |
| | | | | | | | |
| Semiconductors — 0.5% | | | | | | | | |
Applied Materials, Inc.
5.850% 6/15/41 | | | 1,000,000 | | | | 1,196,939 | |
Lam Research Corp.
2.750% 3/15/20 | | | 1,290,000 | | | | 1,292,670 | |
Lam Research Corp.
3.800% 3/15/25 | | | 2,010,000 | | | | 2,012,191 | |
QUALCOMM, Inc.
3.450% 5/20/25 | | | 1,134,000 | | | | 1,153,872 | |
| | | | | | | | |
| | | | | | | 5,655,672 | |
| | | | | | | | |
| Software — 0.6% | | | | | | | | |
Broadridge Financial Solutions, Inc.
3.400% 6/27/26 | | | 1,050,000 | | | | 1,013,270 | |
Broadridge Financial Solutions, Inc.
3.950% 9/01/20 | | | 655,000 | | | | 686,779 | |
Microsoft Corp.
4.450% 11/03/45 | | | 2,064,000 | | | | 2,199,025 | |
Oracle Corp.
4.000% 7/15/46 | | | 3,590,000 | | | | 3,433,820 | |
| | | | | | | | |
| | | | | | | 7,332,894 | |
| | | | | | | | |
| | | | | | | | |
| | | Principal
Amount | | | Value | |
Telecommunications — 0.9% | | | | | | | | |
AT&T, Inc.
4.750% 5/15/46 | | $ | 1,775,000 | | | $ | 1,681,669 | |
AT&T, Inc.
6.550% 2/15/39 | | | 455,000 | | | | 526,761 | |
CenturyLink, Inc.
6.150% 9/15/19 | | | 560,000 | | | | 599,200 | |
Cisco Systems, Inc.
5.500% 1/15/40 | | | 345,000 | | | | 420,278 | |
Crown Castle Towers LLC (a)
3.222% 5/15/42 | | | 1,700,000 | | | | 1,728,101 | |
Embarq Corp.
7.995% 6/01/36 | | | 145,000 | | | | 135,938 | |
Rogers Communications, Inc.
7.500% 8/15/38 | | | 50,000 | | | | 65,758 | |
Telefonica Emisiones SAU
5.462% 2/16/21 | | | 475,000 | | | | 517,784 | |
Turk Telekomunikasyon AS (a)
3.750% 6/19/19 | | | 240,000 | | | | 237,960 | |
Verizon Communications, Inc.
2.625% 2/21/20 | | | 1,650,000 | | | | 1,665,830 | |
Verizon Communications, Inc.
4.862% 8/21/46 | | | 918,000 | | | | 930,204 | |
Verizon Communications, Inc.
5.012% 8/21/54 | | | 1,083,000 | | | | 1,077,327 | |
Verizon Communications, Inc.
6.550% 9/15/43 | | | 1,082,000 | | | | 1,351,393 | |
| | | | | | | | |
| | | | | | | 10,938,203 | |
| | | | | | | | |
| Transportation — 0.4% | | | | | | | | |
Asciano Finance (a)
4.625% 9/23/20 | | | 610,000 | | | | 631,112 | |
Asciano Finance Ltd. (a)
5.000% 4/07/18 | | | 1,150,000 | | | | 1,181,517 | |
Autoridad del Canal de Panama (a)
4.950% 7/29/35 | | | 1,050,000 | | | | 1,107,750 | |
Burlington Northern Santa Fe LLC
6.150% 5/01/37 | | | 720,000 | | | | 919,583 | |
Norfolk Southern Corp.
6.000% 5/23/2111 | | | 375,000 | | | | 438,684 | |
Union Pacific Corp.
5.375% 6/01/33 | | | 520,000 | | | | 593,737 | |
| | | | | | | | |
| | | | | | | 4,872,383 | |
| | | | | | | | |
| Trucking & Leasing — 0.5% | | | | | | | | |
Aviation Capital Group Corp. (a)
2.875% 9/17/18 | | | 5,210,000 | | | | 5,275,125 | |
GATX Corp.
2.375% 7/30/18 | | | 865,000 | | | | 868,830 | |
| | | | | | | | |
| | | | | | | 6,143,955 | |
| | | | | | | | |
| | |
TOTAL CORPORATE DEBT
(Cost $432,023,484) | | | | | | | 439,033,603 | |
| | | | | |
The accompanying notes are an integral part of the financial statements.
52
MML Managed Bond Fund – Portfolio of Investments (Continued)
| | | | | | | | |
| | | Principal
Amount | | | Value | |
| MUNICIPAL OBLIGATIONS — 1.0% | |
JobsOhio Beverage System Series B
4.532% 1/01/35 | | $ | 3,950,000 | | | $ | 4,230,015 | |
New York City Municipal Water Finance Authority BAB
5.882% 6/15/44 | | | 105,000 | | | | 135,827 | |
Orange County Local Transportation Authority BAB
6.908% 2/15/41 | | | 1,350,000 | | | | 1,813,145 | |
Panhandle-Plains Student Finance Corp., Series 2001-A2, FRN
2.290% 12/01/31 | | | 1,800,000 | | | | 1,728,880 | |
State of California BAB
7.550% 4/01/39 | | | 120,000 | | | | 177,558 | |
State of California BAB
7.600% 11/01/40 | | | 1,115,000 | | | | 1,679,502 | |
State of Illinois
5.365% 3/01/17 | | | 2,200,000 | | | | 2,213,090 | |
| | | | | | | | |
| | | | | | | 11,978,017 | |
| | | | | | | | |
| | |
TOTAL MUNICIPAL
OBLIGATIONS
(Cost $11,662,808) | | | | | | | 11,978,017 | |
| | | | | |
|
NON-U.S. GOVERNMENT
AGENCY OBLIGATIONS — 31.1% | |
| Auto Floor Plan ABS — 0.1% | | | | | | | | |
NCF Dealer Floorplan Master Trust, Series 2014-1A, Class A, 1 mo. LIBOR + 1.500%, FRN (a)
2.061% 10/20/20 | | | 1,500,000 | | | | 1,499,999 | |
| | | | | | | | |
| Automobile ABS — 1.2% | | | | | | | | |
American Credit Acceptance Receivables Trust, Series 2016-1A, Class A (a)
2.370% 5/12/20 | | | 610,932 | | | | 612,315 | |
CFC LLC, Series 2014-2A, Class A (a)
1.440% 11/16/20 | | | 443,921 | | | | 443,398 | |
CPS Auto Trust, Series 2014-D, Class A (a)
1.490% 4/15/19 | | | 317,942 | | | | 317,655 | |
CPS Auto Trust, Series 2016-C, Class A (a)
1.620% 1/15/20 | | | 761,777 | | | | 761,794 | |
Drive Auto Receivables Trust, Series 2016-BA, Class B (a)
2.560% 6/15/20 | | | 1,070,000 | | | | 1,074,184 | |
First Investors Auto Owner Trust, Series 2016-2A, Class B (a)
2.210% 7/15/22 | | | 2,990,000 | | | | 2,962,167 | |
Oscar US Funding Trust II, Series 2015-1A, Class A4 (a)
2.440% 6/15/22 | | | 2,250,000 | | | | 2,215,746 | |
| | | | | | | | |
| | | Principal
Amount | | | Value | |
Oscar US Funding Trust IV, Series 2016-1A, Class A2B, 1 mo. USD LIBOR + 1.700%, FRN (a)
2.404% 7/15/20 | | $ | 1,431,918 | | | $ | 1,432,368 | |
Oscar US Funding Trust V, Series 2016-2A, Class A4 (a)
2.990% 12/15/23 | | | 4,000,000 | | | | 3,920,496 | |
| | | | | | | | |
| | | | | | | 13,740,123 | |
| | | | | | | | |
| Commercial MBS — 3.3% | | | | | | | | |
Banc of America Commercial Mortgage, Inc., Series 2007-4, Class A4, VRN
5.747% 2/10/51 | | | 1,265,734 | | | | 1,283,191 | |
Banc of America Commercial Mortgage, Inc., Series 2008-1, Class A4, VRN
6.235% 2/10/51 | | | 1,439,762 | | | | 1,478,670 | |
Banc of America Commercial Mortgage, Inc., Series 2008-1, Class AM, VRN
6.278% 2/10/51 | | | 1,310,000 | | | | 1,350,246 | |
Bear Stearns Commercial Mortgage Securities, Series 2007-T26, Class A4, VRN
5.471% 1/12/45 | | | 374,612 | | | | 374,785 | |
Bear Stearns Commercial Mortgage Securities, Series 2007-T26, Class AM, VRN
5.513% 1/12/45 | | | 2,545,000 | | | | 2,567,726 | |
Bear Stearns Commercial Mortgage Securities, Series 2007-PW18, Class A4
5.700% 6/11/50 | | | 1,204,030 | | | | 1,225,582 | |
Bear Stearns Commercial Mortgage Securities, Series 2007-T28, Class AM, VRN
5.835% 9/11/42 | | | 1,395,000 | | | | 1,421,221 | |
Bear Stearns Commercial Mortgage Securities, Series 2007-PW17, Class AM, VRN
5.887% 6/11/50 | | | 2,870,000 | | | | 2,925,533 | |
Commercial Mortgage Pass Through Certificates, Series 2012-CR4, Class B (a) 3.703% 10/15/45 | | | 1,060,000 | | | | 1,076,900 | |
Commercial Mortgage Pass Through Certificates, Series 2014-UBS2, Class AM
4.199% 3/10/47 | | | 1,375,000 | | | | 1,433,665 | |
Commercial Mortgage Pass Through Certificates, Series 2014-CR14, Class A4, VRN
4.236% 2/10/47 | | | 1,410,000 | | | | 1,521,841 | |
The accompanying notes are an integral part of the financial statements.
53
MML Managed Bond Fund – Portfolio of Investments (Continued)
| | | | | | | | |
| | | Principal
Amount | | | Value | |
Commercial Mortgage Pass Through Certificates, Series 2015-CR23, Class C, VRN
4.256% 5/10/48 | | $ | 1,000,000 | | | $ | 891,387 | |
Commercial Mortgage Pass-Through Certificates, Series 2007-C9, Class AM, VRN
5.650% 12/10/49 | | | 1,335,000 | | | | 1,351,097 | |
Commercial Mortgage Pass-Through Certificates, Series 2007-C9, Class A4, VRN
5.812% 12/10/49 | | | 1,920,340 | | | | 1,936,896 | |
DBCCRE Mortgage Trust,
Series 2014-ARCP, Class A (a)
4.238% 1/10/34 | | | 995,000 | | | | 1,012,711 | |
GCCFC Commercial Mortgage Trust, Series 2006-GG7, Class AM, VRN
5.758% 7/10/38 | | | 1,335,096 | | | | 1,335,467 | |
GS Mortgage Securities Corp. II, Series 2012-GC6, Class AS (a)
4.948% 1/10/45 | | | 488,000 | | | | 535,287 | |
JP Morgan Chase Commercial Mortgage Securities Corp., Series 2007-CB18, Class AM, VRN
5.466% 6/12/47 | | | 1,620,000 | | | | 1,628,345 | |
Merrill Lynch/Countrywide Commercial Mortgage Trust, Series 2007-9, Class A4
5.700% 9/12/49 | | | 1,943,098 | | | | 1,981,082 | |
Morgan Stanley Capital I, Series 2011-C2, Class B, VRN (a)
5.200% 6/15/44 | | | 1,325,000 | | | | 1,420,316 | |
Morgan Stanley Capital I, Series 2007-HQ11, Class AM, VRN
5.478% 2/12/44 | | | 1,406,889 | | | | 1,405,630 | |
Morgan Stanley Capital I, Series 2008-T29, Class A4, VRN
6.275% 1/11/43 | | | 702,723 | | | | 723,170 | |
STRIPs Ltd., Series 2012-1A, Class A (a)
1.500% 12/25/44 | | | 36,542 | | | | 36,432 | |
TIAA Seasoned Commercial Mortgage Trust, Series 2007-C4, Class AJ, VRN
5.474% 8/15/39 | | | 150,902 | | | | 151,110 | |
Velocity Commercial Capital Loan Trust, Series 2016-2, Class AFX, VRN
2.997% 10/25/46 | | | 2,240,430 | | | | 2,218,650 | |
Wachovia Bank Commercial Mortgage Trust, Series 2007-C31, Class A4
5.509% 4/15/47 | | | 837,947 | | | | 840,259 | |
Wachovia Bank Commercial Mortgage Trust, Series 2007-C31, Class AM, VRN
5.591% 4/15/47 | | | 1,400,000 | | | | 1,407,929 | |
| | | | | | | | |
| | | Principal
Amount | | | Value | |
Wachovia Bank Commercial Mortgage Trust, Series 2007-C33, Class AM, VRN
5.969% 2/15/51 | | $ | 1,525,000 | | | $ | 1,541,772 | |
Wachovia Bank Commercial Mortgage Trust, Series 2006-C26, Class AM, VRN
6.074% 6/15/45 | | | 2,667,000 | | | | 2,668,206 | |
Wells Fargo Commercial Mortgage Trust, Series 2010-C1, Class A1 (a)
3.349% 11/15/43 | | | 136,064 | | | | 139,389 | |
| | | | | | | | |
| | | | | | | 39,884,495 | |
| | | | | | | | |
| Home Equity ABS — 0.5% | | | | | | | | |
ACE Securities Corp., Series 2005-AG1, Class A1B1, 1 mo. USD LIBOR + .270%, FRN
0.862% 8/25/35 | | | 31,381 | | | | 31,378 | |
ACE Securities Corp., Series 2005-HE7, Class A2D, 1 mo. USD LIBOR + .660%, FRN
1.252% 11/25/35 | | | 354,377 | | | | 353,039 | |
Aegis Asset-Backed Securities Trust, Series 2005-2, Class M1, 1 mo. USD LIBOR + .420%, FRN
1.012% 6/25/35 | | | 77,964 | | | | 77,950 | |
Bayview Financial Mortgage Pass-Through Trust, Series 2005-C, Class M1, 1 mo. USD LIBOR + .500%, FRN
1.102% 6/28/44 | | | 464,717 | | | | 464,494 | |
Countrywide Asset-Backed Certificates, Series 2004-5, Class 3A, 1 mo. USD LIBOR + .460%, FRN
1.044% 9/25/34 | | | 180,089 | | | | 179,250 | |
Countrywide Partnership Trust, Series 2004-EC1, Class M1, 1 mo. USD LIBOR + .900%, FRN
1.484% 2/25/35 | | | 541,680 | | | | 487,593 | |
First Franklin Mortgage Loan Trust, Series 2005-FF6, Class M1, 1 mo. USD LIBOR + .630%, FRN
1.222% 5/25/36 | | | 306,648 | | | | 305,910 | |
Fremont Home Loan Trust, Series 2005-E, Class 2A3, 1 mo. USD LIBOR + .240%, FRN
0.832% 1/25/36 | | | 128,751 | | | | 127,953 | |
GSAMP Trust, Series 2005-AHL, Class M1, 1 mo. USD LIBOR + ..645%, FRN
1.401% 4/25/35 | | | 186,703 | | | | 187,336 | |
The accompanying notes are an integral part of the financial statements.
54
MML Managed Bond Fund – Portfolio of Investments (Continued)
| | | | | | | | |
| | | Principal
Amount | | | Value | |
Home Equity Asset Trust, Series 2006-4, Class 2A3, 1 mo. USD LIBOR + .170%, FRN
0.754% 8/25/36 | | $ | 82,633 | | | $ | 82,698 | |
Long Beach Mortgage Loan Trust, Series 2005-WL1, Class M2, 1 mo. USD LIBOR + .825%, FRN
1.581% 6/25/35 | | | 937,886 | | | | 934,343 | |
MASTR Asset-Backed Securities Trust, Series 2005-WMC1, Class M3, 1 mo. USD LIBOR + .720%, FRN
1.304% 3/25/35 | | | 1,233,646 | | | | 1,233,576 | |
New Century Home Equity Loan Trust, Series 1997-NC5, Class A6, STEP
6.604% 10/25/28 | | | 22 | | | | 23 | |
NovaStar Mortgage Funding Trust, Series 2005-3, Class A2D, 1 mo. LIBOR + .370%, FRN
1.126% 1/25/36 | | | 735,057 | | | | 732,336 | |
Park Place Securities, Inc.,
Series 2005-WHQ4, Class A1A, 1 mo. USD LIBOR + .260%, FRN
0.852% 9/25/35 | | | 172,836 | | | | 173,049 | |
Residential Asset Securities Corp., Series 2005-EMX4, Class M1, 1 mo. USD LIBOR + .430%, FRN
1.186% 11/25/35 | | | 346,066 | | | | 346,240 | |
| | | | | | | | |
| | | | | | | 5,717,168 | |
| | | | | | | | |
| Other ABS — 16.6% | | | | | | | | |
321 Henderson Receivables I LLC, Series 2007-1A, Class A1, 1 mo. USD LIBOR + .200%, FRN (a)
0.904% 3/15/42 | | | 662,635 | | | | 632,339 | |
321 Henderson Receivables I LLC, Series 2015-1A, Class A (a) 3.260% 9/15/72 | | | 1,324,283 | | | | 1,241,515 | |
Aames Mortgage Investment Trust, Series 2004-1, Class M5, 1 mo. USD LIBOR + 1.725%, FRN
2.317% 1/25/35 | | | 594,430 | | | | 592,732 | |
AIMCO CLO Ltd., Series 2014-AA, Class A, 3 mo. USD LIBOR + 1.540%, FRN (a)
2.421% 7/20/26 | | | 2,250,000 | | | | 2,250,081 | |
ALM VII Ltd., Series 2012-7A, Class A1R, 3 mo. USD LIBOR + 1.480%, FRN (a)
2.334% 10/15/28 | | | 2,620,000 | | | | 2,627,800 | |
ALM VIII Ltd., Series 2013-8A, Class A1R, 3 mo. USD LIBOR + 1.490%, FRN (a)
2.343% 10/15/28 | | | 1,240,000 | | | | 1,242,820 | |
| | | | | | | | |
| | | Principal
Amount | | | Value | |
Alterna Funding I LLC, Series 2014-1A, Class NOTE (a)
1.639% 2/15/21 | | $ | 591,113 | | | $ | 574,488 | |
Alterna Funding II LLC, Series 2015-1A, Class A (a)
2.500% 2/15/24 | | | 1,084,442 | | | | 1,064,786 | |
Apidos CLO XV, Series 2013-15A, Class A1, 3 mo. USD LIBOR + 1.350%, FRN (a)
2.231% 10/20/25 | | | 745,000 | | | | 745,012 | |
Apidos CLO XXV, Series 2016-25A, Class A1, 3 mo. USD LIBOR + 1.460%, FRN (a)
2.203% 10/20/28 | | | 770,000 | | | | 770,118 | |
Applebee’s/IHOP Funding LLC, Series 2014-1, Class A2 (a)
4.277% 9/05/44 | | | 1,450,000 | | | | 1,434,542 | |
Arbys Funding LLC, Series 2015-1A, Class A2 (a)
4.969% 10/30/45 | | | 1,881,000 | | | | 1,900,986 | |
ARL First LLC, Series 2012-1A, Class A1, 1 mo. USD LIBOR + 1.750%, FRN (a)
2.454% 12/15/42 | | | 1,531,761 | | | | 1,488,119 | |
AVANT Loans Funding Trust, Series 2016-C, Class A (a)
2.960% 9/16/19 | | | 784,958 | | | | 784,510 | |
Avery Point CLO Ltd., Series 2014-5A, Class A, 3 mo. USD LIBOR + 1.460%, FRN (a)
2.340% 7/17/26 | | | 2,200,000 | | | | 2,200,020 | |
Avery Point III CLO Ltd., Series 2013-3A, Class A, 3 mo. USD LIBOR + 1.400%, FRN (a)
2.282% 1/18/25 | | | 1,250,000 | | | | 1,250,015 | |
Avery Point VI CLO Ltd., Series 2015-6A, Class A, 3 mo. USD LIBOR + 1.450%, FRN (a)
2.331% 8/05/27 | | | 3,825,000 | | | | 3,829,165 | |
BCC Funding VIII LLC, Series 2014-1A, Class A (a)
1.794% 6/20/20 | | | 119,669 | | | | 119,595 | |
Birchwood Park CLO Ltd., Series 2014-1A, Class A, 3 mo. USD LIBOR + 1.440%, FRN (a)
2.320% 7/15/26 | | | 2,180,000 | | | | 2,180,174 | |
Blackbird Capital Aircraft Lease Securitization Ltd., Series 2016-1A, Class AA, STEP (a)
2.487% 12/16/41 | | | 1,880,000 | | | | 1,882,938 | |
Blue Hill CLO Ltd., Series 2013-1A, Class A, 3 mo. USD LIBOR + 1.480%, FRN (a)
2.360% 1/15/26 | | | 825,000 | | | | 825,252 | |
The accompanying notes are an integral part of the financial statements.
55
MML Managed Bond Fund – Portfolio of Investments (Continued)
| | | | | | | | |
| | | Principal
Amount | | | Value | |
BlueMountain CLO Ltd., Series 2013-2A, Class A, 3 mo. USD LIBOR + 1.200%, FRN (a)
2.082% 1/22/25 | | $ | 930,000 | | | $ | 929,996 | |
BlueMountain CLO Ltd., Series 2013-3A, Class A, 3 mo. USD LIBOR + 1.400%, FRN (a)
2.287% 10/29/25 | | | 650,000 | | | | 650,176 | |
BlueMountain CLO Ltd., Series 2015-2A, Class A1, 3 mo. USD LIBOR + 1.430%, FRN (a)
2.312% 7/18/27 | | | 2,595,000 | | | | 2,601,192 | |
BlueVirgo Trust, Series 2015-1A, Class NOTE (a)
3.000% 12/15/22 | | | 2,235,723 | | | | 2,259,310 | |
CAN Capital Funding LLC, Series 2014-1A, Class A (a)
3.117% 4/15/20 | | | 917,024 | | | | 910,095 | |
Capital Automotive REIT, Series 2014-1A, Class A (a)
3.660% 10/15/44 | | | 900,000 | | | | 870,049 | |
Capital Automotive REIT, Series 2012-1A, Class A (a)
4.700% 7/15/42 | | | 1,160,027 | | | | 1,167,276 | |
Carlyle Global Market Strategies, Series 2013-1A, Class A1, 3 mo. USD LIBOR + 1.300%, FRN (a)
2.202% 2/14/25 | | | 750,000 | | | | 750,011 | |
Citi Held For Asset Issuance, Series 2015-PM1, Class A (a)
1.850% 12/15/21 | | | 31,617 | | | | 31,601 | |
Citigroup Mortgage Loan Trust, Series 2006-SHL1, Class A1, 1 mo. USD LIBOR + .200%, FRN (a)
0.792% 11/25/45 | | | 204,518 | | | | 204,570 | |
CKE Restaurant Holdings, Inc., Series 2013-1A, Class A2 (a)
4.474% 3/20/43 | | | 1,179,688 | | | | 1,170,745 | |
Consumer Installment Loan Trust, Series 2016-LD1, Class A (a)
3.960% 7/15/22 | | | 1,190,780 | | | | 1,193,975 | |
Cronos Containers Program I Ltd., Series 2014-2A, Class A (a)
3.270% 11/18/29 | | | 461,111 | | | | 441,465 | |
DB Master Finance LLC, Series 2015-1A, Class A2I (a)
3.262% 2/20/45 | | | 2,588,888 | | | | 2,603,329 | |
Diamond Resorts Owner Trust, Series 2014-1, Class A (a)
2.540% 5/20/27 | | | 421,213 | | | | 420,375 | |
Diamond Resorts Owner Trust, Series 2015-1, Class A (a)
2.730% 7/20/27 | | | 1,020,331 | | | | 1,014,143 | |
| | | | | | | | |
| | | Principal
Amount | | | Value | |
Diamond Resorts Owner Trust, Series 2015-2, Class A (a)
2.990% 5/22/28 | | $ | 1,140,318 | | | $ | 1,133,347 | |
Diamond Resorts Owner Trust, Series 2016-1, Class A (a)
3.080% 11/20/28 | | | 6,147,347 | | | | 6,109,558 | |
Domino’s Pizza Master Issuer LLC, Series 2015-1A, Class A2I (a)
3.484% 10/25/45 | | | 2,871,000 | | | | 2,826,534 | |
Domino’s Pizza Master Issuer LLC, Series 2015-1A, Class A2II (a)
4.474% 10/25/45 | | | 3,069,000 | | | | 2,919,188 | |
Dong Fang Container Finance II SPV Ltd., Series 2014-1A, Class A1 (a)
1.950% 11/25/39 | | | 958,333 | | | | 942,576 | |
Drug Royalty Corp., Inc., Series 2014-1, Class A2 (a)
3.484% 7/15/23 | | | 475,283 | | | | 470,856 | |
Drug Royalty Corp., Inc., Series 2012-1, Class A2 (a)
5.800% 7/15/24 | | | 110,256 | | | | 111,260 | |
Dryden XXXI Senior Loan Fund, Series 2014-31A, Class A, 3 mo. USD LIBOR + 1.350%, FRN (a)
2.232% 4/18/26 | | | 3,190,000 | | | | 3,190,134 | |
Eaton Vance CLO, Series 2014-1A, Class A, 3 mo. USD LIBOR + 1.450%, FRN (a)
2.330% 7/15/26 | | | 2,925,000 | | | | 2,930,517 | |
Elara HGV Timeshare Issuer LLC, Series 2016-A, Class A (a)
2.810% 4/25/28 | | | 2,378,183 | | | | 2,332,747 | |
Element Rail Leasing II LLC, Series 2015-1A, Class A1 (a)
2.707% 2/19/45 | | | 552,942 | | | | 535,693 | |
Element Rail Leasing II LLC, Series 2016-1A, Class A1 (a)
3.968% 3/19/46 | | | 1,427,462 | | | | 1,431,242 | |
Entegry New Orleans Storm Recovery Funding I LLC, Series 2015-1, Class A 2.670% 6/01/27 | | | 596,904 | | | | 602,732 | |
Fairway Outdoor Funding LLC, Series 2012-1A, Class A2 (a)
4.212% 10/15/42 | | | 2,028,434 | | | | 2,028,521 | |
Galaxy XX CLO Ltd., Series 2015-20A, Class A, 3 mo. USD LIBOR + 1.450%, FRN (a)
2.331% 7/20/27 | | | 2,875,000 | | | | 2,878,717 | |
Global SC Finance II SRL, Series 2014-1A, Class A1 (a)
3.190% 7/17/29 | | | 379,167 | | | | 364,099 | |
Global SC Finance II SRL, Series 2013-2A, Class A (a)
3.670% 11/17/28 | | | 1,109,875 | | | | 1,071,150 | |
The accompanying notes are an integral part of the financial statements.
56
MML Managed Bond Fund – Portfolio of Investments (Continued)
| | | | | | | | |
| | | Principal
Amount | | | Value | |
Global SC Funding One Ltd., Series 2015-1, Class B1 (a)
2.740% 1/18/30 | | $ | 209,717 | | | $ | 209,717 | |
GoldenTree Loan Opportunities VII Ltd., Series 2013-7A, Class A, 3 mo. USD LIBOR + 1.150%, FRN (a)
2.032% 4/25/25 | | | 3,600,000 | | | | 3,597,232 | |
GoldenTree Loan Opportunities VII Ltd., Series 2014-8A, Class A, 3 mo. USD LIBOR + 1.450%, FRN (a)
2.328% 4/19/26 | | | 2,405,000 | | | | 2,405,091 | |
Goodgreen Trust, Series 2016-1A, Class A (a)
3.230% 10/15/52 | | | 3,108,153 | | | | 3,107,482 | |
Hercules Capital Funding Trust, Series 2014-1A, Class A (a)
3.524% 4/16/21 | | | 844,588 | | | | 845,908 | |
HERO Funding Trust, Series 2016-3A, Class A1 (a)
3.080% 9/20/42 | | | 2,008,391 | | | | 1,979,510 | |
HERO Funding Trust, Series 2016-4A, Class A1 (a)
3.570% 9/20/47 | | | 4,520,000 | | | | 4,505,491 | |
Hilton Grand Vacations Trust, Series 2013-A, Class A (a)
2.280% 1/25/26 | | | 876,533 | | | | 872,748 | |
ING Investment Management CLO Ltd., Series 2013-3A, Class A1, 3 mo. USD LIBOR + 1.450%, FRN (a)
2.332% 1/18/26 | | | 1,850,000 | | | | 1,850,352 | |
Labrador Aviation Finance Ltd., Series 2016-1A, Class A1 (a)
4.300% 1/15/42 | | | 2,820,000 | | | | 2,775,387 | |
LCM Ltd., Series 16A, Class A, 3 mo. USD LIBOR + 1.500%, FRN (a)
2.380% 7/15/26 | | | 2,850,000 | | | | 2,850,789 | |
LCM XIV LP, Series 14A, Class A, 3 mo. USD LIBOR + 1.150%, FRN (a)
2.030% 7/15/25 | | | 1,100,000 | | | | 1,096,046 | |
LCM XXIII Ltd., Series 23A, Class A1, 3 mo. USD LIBOR + 1.400%, FRN (a)
2.506% 10/20/29 | | | 3,030,000 | | | | 3,029,976 | |
Long Beach Mortgage Loan Trust, Series 2005-1, Class M2, 1 mo. USD LIBOR + .795%, FRN
1.551% 2/25/35 | | | 477,215 | | | | 474,343 | |
Madison Park Funding XII Ltd., Series 2014-12A, Class A, 3 mo. USD LIBOR + 1.500%, FRN (a)
2.381% 7/20/26 | | | 2,970,000 | | | | 2,970,799 | |
Magnetite CLO Ltd., Series 2016-18A, Class A, 3 mo. USD LIBOR + 1.400%, FRN (a)
2.253% 11/15/28 | | | 760,000 | | | | 759,976 | |
| | | | | | | | |
| | | Principal
Amount | | | Value | |
Marlette Funding Trust,
Series 2016-1A, Class A (a)
3.060% 1/17/23 | | $ | 2,163,565 | | | $ | 2,161,538 | |
Marriott Vacation Club Owner Trust, Series 2012-1A, Class A (a)
2.510% 5/20/30 | | | 296,971 | | | | 294,885 | |
Miramax LLC, Series 2014-1A,
Class A2 (a)
3.340% 7/20/26 | | | 1,214,460 | | | | 1,207,721 | |
Morgan Stanley ABS Capital I, Inc. Trust, Series 2005-WMC6, Class M2, 1 mo. USD LIBOR + .750%, FRN
1.506% 7/25/35 | | | 256,389 | | | | 258,948 | |
MVW Owner Trust, Series 2015-1A, Class A (a)
2.520% 12/20/32 | | | 1,064,283 | | | | 1,056,926 | |
Nations Equipment Finance Funding II LLC, Series 2014-1A, Class A (a)
1.558% 7/20/18 | | | 251,254 | | | | 251,095 | |
Nomad CLO Ltd., Series 2013-1A, Class A1, 3 mo. USD LIBOR + 1.200%, FRN (a)
2.080% 1/15/25 | | | 1,575,000 | | | | 1,574,406 | |
NRZ Advance Receivables Trust,
Series 2016-T4, Class AT4 (a)
3.107% 12/15/50 | | | 3,000,000 | | | | 2,929,777 | |
NRZ Advance Receivables Trust Advance Receivables Backe,
Series 2016-T3, Class AT3 (a)
2.833% 10/16/51 | | | 10,600,000 | | | | 10,319,940 | |
Oak Hill Credit Partners VIII Ltd.,
Series 2013-8A, Class A, 3 mo. USD LIBOR + 1.120%, FRN (a)
2.001% 4/20/25 | | | 2,100,000 | | | | 2,097,963 | |
OHA Loan Funding Ltd., Series 2013-1A, Class A, 3 mo. USD LIBOR + 1.250%, FRN (a)
2.132% 7/23/25 | | | 1,710,000 | | | | 1,709,263 | |
OnDeck Asset Securitization Trust II LLC, Series 2016-1A, Class A (a)
4.210% 5/17/20 | | | 870,000 | | | | 858,981 | |
Orange Lake Timeshare Trust, Series 2014-AA, Class A (a)
2.290% 7/09/29 | | | 340,923 | | | | 335,781 | |
Orange Lake Timeshare Trust,
Series 2016-A, Class A (a)
2.610% 3/08/29 | | | 1,932,279 | | | | 1,910,224 | |
Orange Lake Timeshare Trust,
Series 2016-A, Class B (a)
2.910% 3/08/29 | | | 1,618,157 | | | | 1,599,846 | |
Oxford Finance Funding Trust,
Series 2014-1A, Class A (a)
3.475% 12/15/22 | | | 627,942 | | | | 627,988 | |
The accompanying notes are an integral part of the financial statements.
57
MML Managed Bond Fund – Portfolio of Investments (Continued)
| | | | | | | | |
| | | Principal
Amount | | | Value | |
Oxford Finance Funding Trust,
Series 2016-1A, Class A (a)
3.968% 6/17/24 | | $ | 1,400,000 | | | $ | 1,394,217 | |
Race Point VIII CLO Ltd., Series 2013-8A, Class A, 3 mo. USD LIBOR + 1.250%, FRN (a)
2.161% 2/20/25 | | | 700,000 | | | | 699,661 | |
Residential Asset Mortgage Products, Inc., Series 2005-EFC5, Class M1,
1 mo. USD LIBOR + ..400%, FRN
1.156% 10/25/35 | | | 420,896 | | | | 420,871 | |
Sierra Receivables Funding Co. LLC, Series 2013-2A, Class A (a)
2.280% 11/20/25 | | | 1,105,305 | | | | 1,103,755 | |
Sierra Receivables Funding Co. LLC, Series 2012-1A, Class A (a)
2.840% 11/20/28 | | | 88,370 | | | | 88,373 | |
Sierra Receivables Funding Co. LLC, Series 2015-3A, Class B (a)
3.080% 9/20/32 | | | 355,107 | | | | 349,331 | |
SoFi Consumer Loan Program LLC, Series 2016-3, Class A (a)
3.050% 12/26/25 | | | 2,482,747 | | | | 2,472,917 | |
SoFi Consumer Loan Program LLC, Series 2016-5, Class A (a)
3.060% 9/25/28 | | | 11,800,000 | | | | 11,777,828 | |
SoFi Consumer Loan Program LLC, Series 2016-2A, Class A (a)
3.090% 10/27/25 | | | 3,827,748 | | | | 3,816,240 | |
SoFi Consumer Loan Program LLC, Series 2016-1A, Class A (a)
3.260% 8/25/25 | | | 4,768,136 | | | | 4,774,240 | |
Specialty Underwriting & Residential Finance Trust, Series 2005-AB2, Class M1, 1 mo. USD LIBOR + .450%, FRN 1.042% 6/25/36 | | | 555,000 | | | | 553,058 | |
Spirit Master Funding LLC,
Series 2014-4A, Class A1 (a)
3.501% 1/20/45 | | | 1,000,000 | | | | 971,767 | |
SpringCastle America Funding LLC, Series 2016-AA, Class A (a)
3.050% 4/25/29 | | | 1,760,193 | | | | 1,768,994 | |
SPS Servicer Advance Receivables Trust, Series 2016-T2,
Class AT2 (a)
2.750% 11/15/49 | | | 4,490,000 | | | | 4,467,453 | |
SPS Servicer Advance Receivables Trust, Series 2015-T3,
Class AT3 (a)
2.920% 7/15/47 | | | 1,200,000 | | | | 1,200,954 | |
Structured Receivables Finance LLC, Series 2010-B, Class A (a)
3.730% 8/15/36 | | | 294,326 | | | | 295,028 | |
| | | | | | | | |
| | | Principal
Amount | | | Value | |
Symphony CLO XV Ltd., Series 2014-15A, Class A, 3 mo. USD LIBOR + 1.450%, FRN (a)
2.330% 10/17/26 | | $ | 2,900,000 | | | $ | 2,900,742 | |
Taco Bell Funding LLC,
Series 2016-1A, Class A2I (a)
3.832% 5/25/46 | | | 2,493,750 | | | | 2,509,717 | |
TCI-Symphony CLO Ltd., Series 2016-1A, Class A, 3 mo. USD LIBOR + 1.480%, FRN (a)
2.399% 10/13/29 | | | 2,150,000 | | | | 2,156,577 | |
Textainer Marine Containers III Ltd., Series 2014-1A, Class A (a)
3.270% 10/20/39 | | | 454,333 | | | | 433,569 | |
Treman Park CLO Ltd.,
Series 2015-1A, Class AR, 3 mo. USD LIBOR + 1.370%, FRN (a)
2.251% 4/20/27 | | | 1,750,000 | | | | 1,749,125 | |
Trip Rail Master Funding LLC,
Series 2011-1A, Class A1A (a)
4.370% 7/15/41 | | | 297,817 | | | | 296,334 | |
VSE VOI Mortgage LLC,
Series 2016-A, Class A (a)
2.540% 7/20/33 | | | 2,659,418 | | | | 2,631,851 | |
Wendys Funding LLC,
Series 2015-1A, Class A2I (a)
3.371% 6/15/45 | | | 3,925,313 | | | | 3,960,709 | |
Wendys Funding LLC,
Series 2015-1A, Class A2II (a)
4.080% 6/15/45 | | | 1,807,125 | | | | 1,775,439 | |
Wendys Funding LLC,
Series 2015-1A, Class A23 (a)
4.497% 6/15/45 | | | 2,172,500 | | | | 2,060,580 | |
Westgate Resorts LLC, Series 2015-1A, Class A (a)
2.750% 5/20/27 | | | 1,358,678 | | | | 1,357,493 | |
| | | | | | | | |
| | | | | | | 199,247,138 | |
| | | | | | | | |
| Student Loans ABS — 8.3% | | | | | | | | |
Access Group, Inc., Series 2003-A, Class A3, 3 mo. Treasury + 1.200%, FRN
1.509% 7/01/38 | | | 649,648 | | | | 639,596 | |
College Loan Corp. Trust I,
Series 2007-1, Class B2, 28 day ARS, FRN
2.016% 1/25/47 | | | 900,000 | | | | 687,278 | |
Collegiate Funding Services Education Loan Trust, Series 2005-B, Class A4, 3 mo. USD LIBOR + .160%, FRN
0.783% 3/28/35 | | | 1,500,000 | | | | 1,405,243 | |
The accompanying notes are an integral part of the financial statements.
58
MML Managed Bond Fund – Portfolio of Investments (Continued)
| | | | | | | | |
| | | Principal
Amount | | | Value | |
DRB Prime Student Loan Trust,
Series 2016-R, Class A1, 1 mo. USD LIBOR + 1.900%, FRN (a)
2.431% 10/25/44 | | $ | 5,795,319 | | | $ | 5,795,319 | |
DRB Prime Student Loan Trust,
Series 2015-B, Class A1, 1 mo. USD LIBOR + 1.900%, FRN (a)
2.492% 10/27/31 | | | 350,955 | | | | 357,640 | |
DRB Prime Student Loan Trust,
Series 2016-A, Class A1, 1 mo. USD LIBOR + 2.000%, FRN (a)
2.584% 4/25/40 | | | 1,074,991 | | | | 1,071,999 | |
DRB Prime Student Loan Trust,
Series 2016-B, Class A2 (a)
2.890% 6/25/40 | | | 2,177,550 | | | | 2,110,309 | |
DRB Prime Student Loan Trust,
Series 2015-D, Class A2 (a)
3.200% 1/25/40 | | | 1,157,053 | | | | 1,148,478 | |
Earnest Student Loan Program LLC, Series 2016-C, Class A1, 1 mo. USD LIBOR + 1.850%, FRN (a)
2.442% 10/27/36 | | | 4,619,840 | | | | 4,619,836 | |
Earnest Student Loan Program LLC, Series 2016-D, Class A2 (a)
2.720% 1/25/41 | | | 2,530,897 | | | | 2,489,904 | |
Earnest Student Loan Program LLC, Series 2016-B, Class A2 (a)
3.020% 5/25/34 | | | 1,799,800 | | | | 1,760,532 | |
ECMC Group Student Loan Trust,
Series 2016-1A, Class A, 1 mo. USD LIBOR + 1.350%, FRN (a)
1.942% 7/26/66 | | | 4,410,228 | | | | 4,397,220 | |
Education Funding Capital Trust I,
Series 2004-1, Class A4, 28 day ARS, FRN
1.943% 6/15/43 | | | 1,750,000 | | | | 1,742,226 | |
Education Funding Capital Trust I,
Series 2004-1, Class A5, 28 day ARS, FRN
1.974% 6/15/43 | | | 1,075,000 | | | | 1,066,075 | |
Education Services of America,
Series 2014-4, Class B, 1 mo. USD LIBOR + 1.500%, FRN (a)
2.084% 6/25/48 | | | 1,200,000 | | | | 995,040 | |
Education Services of America,
Series 2015-1, Class B, 1 mo. USD LIBOR + 1.500%, FRN (a)
2.084% 10/25/56 | | | 1,100,000 | | | | 925,313 | |
Educational Funding of the South, Inc.,
Series 2011-1, Class B, 3 mo. USD LIBOR + 3.700%, FRN
4.582% 4/25/46 | | | 625,000 | | | | 672,994 | |
| | | | | | | | |
| | | Principal
Amount | | | Value | |
Higher Education Funding I,
Series 2004-1, Class B1, 28 day ARS, FRN (a)
0.350% 1/01/44 | | $ | 450,000 | | | $ | 391,744 | |
Higher Education Funding I,
Series 2004-1, Class B2, 28 day ARS, FRN (a)
1.918% 1/01/44 | | | 450,000 | | | | 365,248 | |
KeyCorp Student Loan Trust,
Series 2006-A, Class 2A4, 3 mo. USD LIBOR + .310%, FRN
1.162% 9/27/35 | | | 1,029,587 | | | | 1,018,951 | |
National Collegiate Student Loan Trust, Series 2005-1, Class A4, 1 mo. USD LIBOR + .240%, FRN
0.824% 11/27/28 | | | 352,156 | | | | 349,655 | |
Navient Student Loan Trust,
Series 2016-5A, Class A, 1 mo. USD LIBOR + 1.250%, FRN (a)
1.000% 6/25/65 | | | 3,306,770 | | | | 3,355,254 | |
Navient Student Loan Trust,
Series 2016-1A, Class A, 1 mo. USD LIBOR + .700%, FRN (a)
1.284% 2/25/70 | | | 3,209,611 | | | | 3,123,545 | |
Navient Student Loan Trust,
Series 2014-1, Class A4, 1 mo. USD LIBOR + .750%, FRN
1.506% 2/25/39 | | | 3,000,000 | | | | 2,800,910 | |
Navient Student Loan Trust,
Series 2016-6A, Class A3, 1 mo. USD LIBOR + 1.300%, FRN (a)
1.820% 3/25/66 | | | 13,750,000 | | | | 13,750,117 | |
Navient Student Loan Trust,
Series 2016-2, Class A3, 1 mo. USD LIBOR + 1.500%, FRN (a)
2.084% 6/25/65 | | | 2,370,000 | | | | 2,436,377 | |
Navient Student Loan Trust,
Series 2015-3, Class B, 1 mo. USD LIBOR + 1.500%, FRN
2.256% 10/25/58 | | | 940,000 | | | | 768,184 | |
Nelnet Private Education Loan Trust,
Series 2016-A, Class A1B (a)
3.600% 12/26/40 | | | 1,820,000 | | | | 1,817,874 | |
Nelnet Student Loan Trust,
Series 2006-2, Class A6, 3 mo. USD LIBOR + .120%, FRN
1.002% 4/25/31 | �� | | 1,220,000 | | | | 1,196,675 | |
Nelnet Student Loan Trust,
Series 2005-2, Class A5, 3 mo. USD LIBOR + .100%, FRN
1.096% 3/23/37 | | | 1,274,092 | | | | 1,232,377 | |
The accompanying notes are an integral part of the financial statements.
59
MML Managed Bond Fund – Portfolio of Investments (Continued)
| | | | | | | | |
| | | Principal
Amount | | | Value | |
Nelnet Student Loan Trust, Series 2006-3, Class B, 3 mo. USD LIBOR + .250%, FRN
1.106% 6/25/41 | | $ | 932,250 | | | $ | 784,228 | |
Nelnet Student Loan Trust, Series 2013-5A, Class A, 1 mo. USD LIBOR + .630%, FRN (a)
1.214% 1/25/37 | | | 2,402,728 | | | | 2,360,694 | |
Nelnet Student Loan Trust, Series 2005-4, Class A4A, 7 day ARS, FRN
1.535% 3/22/32 | | | 325,000 | | | | 294,503 | |
North Carolina State Education Assistance Authority, Series 2011-2, Class A3, 3 mo. USD LIBOR + .800%, FRN
1.682% 7/25/36 | | | 1,600,000 | | | | 1,525,049 | |
PHEAA Student Loan Trust,
Series 2016-2A, Class A, 1 mo. USD LIBOR + .950%, FRN (a)
1.505% 11/25/65 | | | 4,120,000 | | | | 4,119,476 | |
SLC Student Loan Trust, Series 2006-A, Class B, 3 mo. USD LIBOR + .300%, FRN
1.180% 7/15/36 | | | 378,000 | | | | 369,116 | |
SLM Student Loan Trust, Series 2007-3, Class B, 3 mo. USD LIBOR + .150%, FRN
1.032% 1/25/28 | | | 2,400,000 | | | | 1,740,330 | |
SLM Student Loan Trust, Series 2005-3, Class B, 3 mo. USD LIBOR + .150%, FRN
1.032% 4/25/40 | | | 1,126,355 | | | | 945,522 | |
SLM Student Loan Trust, Series 2005-5, Class A5, 3 mo. USD LIBOR + .750%, FRN
1.632% 10/25/40 | | | 1,056,000 | | | | 995,921 | |
SLM Student Loan Trust, Series 2013-2, Class B, 1 mo. USD LIBOR + 1.500%, FRN
2.256% 6/25/43 | | | 1,420,000 | | | | 1,237,526 | |
SLM Student Loan Trust, Series 2003-5, Class A7, 28 day ARS, FRN
2.950% 6/17/30 | | | 250,000 | | | | 250,000 | |
SLM Student Loan Trust, Series 2003-2, Class A7, 28 day ARS, FRN
3.022% 9/15/28 | | | 650,000 | | | | 650,000 | |
SLM Student Loan Trust, Series 2002-7, Class A10, 28 day ARS, FRN
3.027% 3/15/28 | | | 397,000 | | | | 397,000 | |
SLM Student Loan Trust, Series 2002-7, Class A11, 28 day ARS, FRN
3.030% 3/15/28 | | | 1,518,000 | | | | 1,518,000 | |
| | | | | | | | |
| | | Principal
Amount | | | Value | |
SMB Private Education Loan Trust,
Series 2016-B, Class A2A (a)
2.430% 2/17/32 | | $ | 1,575,000 | | | $ | 1,529,786 | |
SMB Private Education Loan Trust,
Series 2016-A, Class A2A (a)
2.700% 5/15/31 | | | 3,000,000 | | | | 2,899,632 | |
SoFi Professional Loan Program LLC,
Series 2016-B, Class A1, 1 mo. USD LIBOR + 1.200%, FRN (a)
1.784% 6/25/33 | | | 2,522,376 | | | | 2,549,836 | |
SoFi Professional Loan Program LLC,
Series 2016-D, Class A2B (a)
2.340% 4/25/33 | | | 1,300,000 | | | | 1,261,605 | |
SoFi Professional Loan Program LLC,
Series 2016-A, Class A1, 1 mo. USD LIBOR + 1.750%, FRN (a)
2.342% 8/25/36 | | | 1,242,171 | | | | 1,278,777 | |
SoFi Professional Loan Program LLC,
Series 2016-C, Class A2B (a)
2.360% 12/27/32 | | | 570,000 | | | | 548,009 | |
SoFi Professional Loan Program LLC,
Series 2016-E, Class A2B (a)
2.490% 1/25/36 | | | 1,610,000 | | | | 1,595,559 | |
SoFi Professional Loan Program LLC,
Series 2016-B, Class A2B (a)
2.740% 10/25/32 | | | 2,300,000 | | | | 2,293,210 | |
South Carolina Student Loan Corp.,
Series 2014-1, Class A2, 1 mo. USD LIBOR + 1.000%, FRN
1.617% 1/03/33 | | | 1,800,000 | | | | 1,740,508 | |
South Carolina Student Loan Corp.,
Series 2014-1, Class B, 1 mo. USD LIBOR + 1.500%, FRN
2.117% 8/01/35 | | | 1,100,000 | | | | 946,333 | |
South Texas Higher Education Authority, Inc., Series 2012-1, Class A3, 3 mo. USD LIBOR + .850%, FRN
1.726% 10/01/46 | | | 1,700,000 | | | | 1,638,766 | |
| | | | | | | | |
| | | | | | | 99,961,299 | |
| | | | | | | | |
| WL Collateral CMO — 1.1% | | | | | | | | |
Bank of America Mortgage Securities,
Series 2004-G, Class 2A7, VRN
3.303% 8/25/34 | | | 61,110 | | | | 60,291 | |
Connecticut Avenue Securities,
Series 2015-C03, Class 1M1, 1 mo. USD LIBOR + 1.500%, FRN
2.092% 7/25/25 | | | 702,148 | | | | 702,958 | |
Countrywide Home Loans, Inc.,
Series 2004-2, Class 1A1, VRN
2.935% 2/25/34 | | | 18,646 | | | | 18,423 | |
The accompanying notes are an integral part of the financial statements.
60
MML Managed Bond Fund – Portfolio of Investments (Continued)
| | | | | | | | |
| | | Principal
Amount | | | Value | |
Countrywide Home Loans, Inc.,
Series 2003-42, Class 1A1, VRN
3.294% 9/25/33 | | $ | 7,603 | | | $ | 7,195 | |
Federal Home Loan Mortgage Corp. Structured Agency Credit Risk Debt Notes, Series 2016-HQA3, Class M1,
1 mo. USD LIBOR + .800%, FRN
1.392% 3/25/29 | | | 863,906 | | | | 863,337 | |
Federal Home Loan Mortgage Corp. Structured Agency Credit Risk Debt Notes, Series 2016-HQA3, Class M2,
1 mo. USD LIBOR + 1.350%, FRN
1.942% 3/25/29 | | | 790,000 | | | | 787,052 | |
Federal National Mortgage Association Connecticut Avenue Securities,
Series 2016-C06, Class 1M1, 1 mo. USD LIBOR + 1.300%, FRN
1.892% 4/25/29 | | | 2,466,436 | | | | 2,478,553 | |
Federal National Mortgage Association Connecticut Avenue Securities,
Series 2016-C05, Class 2M1, 1 mo. USD LIBOR + 1.350%, FRN
1.942% 1/25/29 | | | 4,655,433 | | | | 4,665,815 | |
Federal National Mortgage Association Connecticut Avenue Securities,
Series 2016-C04, Class 1M1, 1 mo. USD LIBOR + 1.450%, FRN
2.042% 1/25/29 | | | 2,479,348 | | | | 2,489,208 | |
GSR Mortgage Loan Trust, Series 2004-9, Class 2A1, VRN
3.285% 8/25/34 | | | 11,521 | | | | 11,597 | |
IndyMac Index Mortgage Loan Trust,
Series 2004-AR4, Class 1A, VRN
2.936% 8/25/34 | | | 57,223 | | | | 51,770 | |
Merrill Lynch Mortgage Investors, Inc., Series 2005-A8, Class A3A2,
1 mo. USD LIBOR + .250%, FRN
1.006% 8/25/36 | | | 3,987 | | | | 3,979 | |
Merrill Lynch Mortgage Investors, Inc., Series 2003-A4, Class IA, VRN
3.097% 7/25/33 | | | 4,129 | | | | 4,204 | |
Merrill Lynch Mortgage Investors, Inc., Series 2004-A1, Class IA, VRN
3.315% 2/25/34 | | | 7,382 | | | | 7,478 | |
Morgan Stanley Mortgage Loan Trust,
Series 2004-2AR, Class 1A, VRN
2.875% 2/25/34 | | | 237 | | | | 248 | |
Structured Adjustable Rate Mortgage Loan Trust, Series 2004-2, Class 2A, VRN
3.055% 3/25/34 | | | 39,730 | | | | 40,533 | |
| | | | | | | | |
| | | Principal
Amount | | | Value | |
Structured Agency Credit Risk Debt Notes, Series 2015-DNA3, Class M1, 1 mo. USD LIBOR + 1.350%, FRN 1.942% 4/25/28 | | $ | 198,541 | | | $ | 198,626 | |
Structured Agency Credit Risk Debt Notes, Series 2016-DNA1, Class M1, 1 mo. USD LIBOR + 1.450%, FRN 2.034% 7/25/28 | | | 888,034 | | | | 890,401 | |
Washington Mutual Mortgage Pass-Through Certificates, Series 2004-AR2, Class A, 12 mo. MTA + 1.400%, FRN
1.967% 4/25/44 | | | 86,155 | | | | 84,838 | |
| | | | | | | | |
| | | | | | | 13,366,506 | |
| | | | | | | | |
| WL Collateral PAC — 0.0% | | | | | | | | |
Structured Asset Securities Corp.,
Series 2002-11A, Class 2A1, VRN
3.355% 6/25/32 | | | 23,859 | | | | 23,529 | |
| | | | | | | | |
| | |
TOTAL NON-U.S. GOVERNMENT AGENCY OBLIGATIONS
(Cost $376,133,747) | | | | | | | 373,440,257 | |
| | | | | |
| |
| SOVEREIGN DEBT OBLIGATIONS — 0.9% | | | | | |
Colombia Government International Bond
6.125% 1/18/41 | | | 2,480,000 | | | | 2,678,400 | |
Colombia Government International Bond
7.375% 3/18/19 | | | 725,000 | | | | 806,563 | |
Mexico Government International Bond 4.750% 3/08/44 | | | 3,697,000 | | | | 3,361,682 | |
Peruvian Government International Bond
6.550% 3/14/37 | | | 405,000 | | | | 508,478 | |
Poland Government International Bond
6.375% 7/15/19 | | | 690,000 | | | | 766,590 | |
Province of Quebec Canada
7.500% 9/15/29 | | | 390,000 | | | | 546,468 | |
United Mexican States
5.125% 1/15/20 | | | 850,000 | | | | 912,475 | |
United Mexican States
6.750% 9/27/34 | | | 685,000 | | | | 811,725 | |
| | | | | | | | |
| | | | | | | 10,392,381 | |
| | | | | | | | |
| | |
TOTAL SOVEREIGN
DEBT OBLIGATIONS
(Cost $10,480,707) | | | | | | | 10,392,381 | |
| | | | | |
The accompanying notes are an integral part of the financial statements.
61
MML Managed Bond Fund – Portfolio of Investments (Continued)
| | | | | | | | |
| | | Principal
Amount | | | Value | |
U.S. GOVERNMENT AGENCY OBLIGATIONS AND
INSTRUMENTALITIES — 24.9% | |
| Collateralized Mortgage Obligations — 1.6% | | | | | |
Federal Home Loan Mortgage Corp. Series 4303, Class AP
3.000% 8/15/43 | | $ | 3,572,679 | | | $ | 3,628,295 | |
Series 4290, Class CA
3.500% 12/15/38 | | | 2,186,826 | | | | 2,243,554 | |
Series 2617, Class Z
5.500% 5/15/33 | | | 1,818,289 | | | | 2,024,911 | |
Series 2693, Class Z
5.500% 10/15/33 | | | 3,209,447 | | | | 3,517,130 | |
Series 3423, Class PB
5.500% 3/15/38 | | | 703,243 | | | | 776,131 | |
Series 2178, Class PB
7.000% 8/15/29 | | | 71,126 | | | | 79,848 | |
Federal National Mortgage Association Series 2014-7, Class VA
3.500% 5/25/25 | | | 1,489,758 | | | | 1,547,897 | |
Series 2014-48, Class AB
4.000% 10/25/40 | | | 3,125,482 | | | | 3,250,886 | |
Series 2007-32, Class Z
5.500% 4/25/37 | | | 1,027,262 | | | | 1,125,025 | |
Series 2010-60, Class HJ
5.500% 5/25/40 | | | 683,177 | | | | 740,909 | |
Federal National Mortgage Association REMIC Series 2007-B2, Class ZA
5.500% 6/25/37 | | | 898,267 | | | | 977,483 | |
U.S. Department of Veteran Affairs
Series 1992-1, Class 2Z
7.750% 5/15/22 | | | 67,219 | | | | 73,734 | |
| | | | | | | | |
| | | | | | | 19,985,803 | |
| | | | | | | | |
| Pass-Through Securities — 23.3% | | | | | | | | |
Federal Home Loan Mortgage Corp.
Pool #G11630 3.500%
6/01/19 | | | 71,904 | | | | 75,086 | |
Pool #J13972 3.500%
1/01/26 | | | 76,395 | | | | 79,919 | |
Pool #C91344 3.500%
11/01/30 | | | 190,235 | | | | 198,713 | |
Pool #C91424 3.500%
1/01/32 | | | 129,185 | | | | 134,943 | |
Pool #Q37467 3.500%
11/01/45 | | | 6,498,440 | | | | 6,685,016 | |
Pool #Q37468 3.500%
11/01/45 | | | 4,790,516 | | | | 4,932,547 | |
Pool #Q41916 3.500%
7/01/46 | | | 2,174,563 | | | | 2,245,831 | |
Pool #Q42045 3.500%
7/01/46 | | | 942,976 | | | | 973,881 | |
Pool #Q44275 3.500%
11/01/46 | | | 1,697,496 | | | | 1,753,659 | |
| | | | | | | | |
| | | Principal
Amount | | | Value | |
Pool #Q44277 3.500%
11/01/46 | | $ | 499,253 | | | $ | 514,523 | |
Pool #C91239 4.500%
3/01/29 | | | 10,646 | | | | 11,450 | |
Pool #C91251 4.500%
6/01/29 | | | 66,709 | | | | 71,772 | |
Pool #C03537 4.500%
8/01/40 | | | 1,410,539 | | | | 1,523,272 | |
Pool #G06057 4.500%
10/01/40 | | | 1,339,782 | | | | 1,443,720 | |
Pool #G60485 4.500%
10/01/41 | | | 1,684,837 | | | | 1,815,017 | |
Pool #G60469 4.500%
1/01/42 | | | 1,098,828 | | | | 1,184,760 | |
Pool #G60342 4.500%
5/01/42 | | | 5,517,592 | | | | 5,945,637 | |
Pool #G60172 4.500%
9/01/43 | | | 1,779,232 | | | | 1,920,875 | |
Pool #G05253 5.000%
2/01/39 | | | 333,027 | | | | 365,120 | |
Pool #C90939 5.500%
12/01/25 | | | 42,191 | | | | 46,763 | |
Pool #C91026 5.500%
4/01/27 | | | 70,871 | | | | 78,551 | |
Pool #D97258 5.500%
4/01/27 | | | 70,116 | | | | 77,714 | |
Pool #C91074 5.500%
8/01/27 | | | 6,851 | | | | 7,593 | |
Pool #D97417 5.500%
10/01/27 | | | 14,474 | | | | 16,043 | |
Pool #C91128 5.500%
12/01/27 | | | 3,537 | | | | 3,921 | |
Pool #C91148 5.500%
1/01/28 | | | 136,106 | | | | 150,855 | |
Pool #C91176 5.500%
5/01/28 | | | 49,383 | | | | 54,771 | |
Pool #C91217 5.500%
11/01/28 | | | 18,681 | | | | 20,705 | |
Pool #G11431 6.000%
2/01/18 | | | 546 | | | | 550 | |
Pool #C01079 7.500%
10/01/30 | | | 2,353 | | | | 2,772 | |
Pool #C01135 7.500%
2/01/31 | | | 7,078 | | | | 8,316 | |
Pool #554904 9.000%
3/01/17 | | | 3 | | | | 3 | |
Federal Home Loan Mortgage Corp. TBA
Pool #3395 3.000%
8/01/44 (b) | | | 7,450,000 | | | | 7,401,691 | |
Pool #4434 4.000%
1/01/43 (b) | | | 10,950,000 | | | | 11,485,951 | |
The accompanying notes are an integral part of the financial statements.
62
MML Managed Bond Fund – Portfolio of Investments (Continued)
| | | | | | | | |
| | | Principal
Amount | | | Value | |
Federal National Mortgage Association
Pool #725692 2.704%
10/01/33 1 year CMT + 2.144%, FRN | | $ | 193,143 | | | $ | 202,780 | |
Pool #888586 2.752%
10/01/34 1 year CMT + 2.205%, FRN | | | 164,406 | | | | 172,928 | |
Pool #775539 2.850%
5/01/34 12 mo. USD LIBOR + 1.645%, FRN | | | 49,640 | | | | 51,940 | |
Pool #AO8180 3.000%
9/01/42 | | | 47,371 | | | | 47,284 | |
Pool #AP8668 3.000%
12/01/42 | | | 248,411 | | | | 247,955 | |
Pool #AR1975 3.000%
12/01/42 | | | 55,848 | | | | 55,746 | |
Pool #AB7397 3.000%
12/01/42 | | | 209,200 | | | | 208,815 | |
Pool #AB7401 3.000%
12/01/42 | | | 202,468 | | | | 202,096 | |
Pool #AR0306 3.000%
1/01/43 | | | 16,984 | | | | 16,953 | |
Pool #AR5391 3.000%
1/01/43 | | | 138,852 | | | | 138,597 | |
Pool #AL3215 3.000%
2/01/43 | | | 191,952 | | | | 191,600 | |
Pool #AR4109 3.000%
2/01/43 | | | 175,715 | | | | 175,392 | |
Pool #AR4432 3.000%
3/01/43 | | | 71,067 | | | | 70,936 | |
Pool #AT0169 3.000%
3/01/43 | | | 307,963 | | | | 307,397 | |
Pool #AB8809 3.000%
3/01/43 | | | 105,975 | | | | 105,781 | |
Pool #MA1368 3.000%
3/01/43 | | | 349,996 | | | | 349,354 | |
Pool #AR2174 3.000%
4/01/43 | | | 354,157 | | | | 353,617 | |
Pool #AS1304 3.500%
12/01/28 | | | 2,317,381 | | | | 2,426,913 | |
Pool #AV1897 3.500%
12/01/28 | | | 371,441 | | | | 388,998 | |
Pool #AV2325 3.500%
12/01/28 | | | 1,240,933 | | | | 1,299,198 | |
Pool #AS6187 3.500%
11/01/45 | | | 14,850,862 | | | | 15,285,365 | |
Pool #AS6306 3.500%
12/01/45 | | | 5,124,132 | | | | 5,278,856 | |
Pool #AS6475 3.500%
1/01/46 | | | 4,511,645 | | | | 4,653,515 | |
Pool #AS6476 3.500%
1/01/46 | | | 4,714,695 | | | | 4,858,530 | |
| | | | | | | | |
| | | Principal
Amount | | | Value | |
Pool #AS6477 3.500%
1/01/46 | | $ | 5,447,578 | | | $ | 5,608,664 | |
Pool #AZ7917 4.000%
3/01/41 | | | 614,255 | | | | 649,694 | |
Pool #AL2441 4.000%
9/01/42 | | | 3,788,148 | | | | 4,014,401 | |
Pool #AL8422 4.000%
1/01/43 | | | 555,622 | | | | 587,939 | |
Pool #BC5984 4.000%
4/01/46 | | | 1,224,518 | | | | 1,287,896 | |
Pool #AA3980 4.500%
4/01/28 | | | 87,559 | | | | 95,682 | |
Pool #AB1466 4.500%
9/01/40 | | | 671,335 | | | | 724,596 | |
Pool #AH6787 4.500%
3/01/41 | | | 1,266,128 | | | | 1,369,743 | |
Pool #AL7566 4.500%
10/01/42 | | | 1,361,303 | | | | 1,468,452 | |
Pool #AL6997 4.500%
11/01/42 | | | 2,709,583 | | | | 2,931,324 | |
Pool #AD6437 5.000%
6/01/40 | | | 763,821 | | | | 836,623 | |
Pool #AD6996 5.000%
7/01/40 | | | 5,235,560 | | | | 5,734,574 | |
Pool #AL8173 5.000%
2/01/44 | | | 2,081,860 | | | | 2,278,335 | |
Pool #AD0836 5.500%
11/01/28 | | | 127,845 | | | | 142,022 | |
Pool #575667 7.000%
3/01/31 | | | 13,238 | | | | 15,466 | |
Pool #497120 7.500%
8/01/29 | | | 124 | | | | 147 | |
Pool #529453 7.500%
1/01/30 | | | 2,876 | | | | 3,408 | |
Pool #531196 7.500%
2/01/30 | | | 368 | | | | 436 | |
Pool #532418 7.500%
2/01/30 | | | 4,478 | | | | 5,306 | |
Pool #530299 7.500%
3/01/30 | | | 415 | | | | 479 | |
Pool #536386 7.500%
4/01/30 | | | 508 | | | | 598 | |
Pool #535996 7.500%
6/01/31 | | | 9,440 | | | | 11,114 | |
Pool #523499 8.000%
11/01/29 | | | 297 | | | | 353 | |
Pool #252926 8.000%
12/01/29 | | | 267 | | | | 318 | |
Pool #532819 8.000%
3/01/30 | | | 200 | | | | 240 | |
Pool #534703 8.000%
5/01/30 | | | 3,019 | | | | 3,611 | |
Pool #253437 8.000%
9/01/30 | | | 205 | | | | 246 | |
The accompanying notes are an integral part of the financial statements.
63
MML Managed Bond Fund – Portfolio of Investments (Continued)
| | | | | | | | |
| | | Principal
Amount | | | Value | |
Pool #253481 8.000%
10/01/30 | | $ | 131 | | | $ | 158 | |
Pool #190317 8.000%
8/01/31 | | | 4,616 | | | | 5,522 | |
Pool #596656 8.000%
8/01/31 | | | 2,103 | | | | 2,288 | |
Pool #602008 8.000%
8/01/31 | | | 6,211 | | | | 7,414 | |
Pool #597220 8.000%
9/01/31 | | | 3,456 | | | | 4,143 | |
Federal National Mortgage Association TBA
Pool #3348 2.500%
3/01/29 (b) | | | 76,700,000 | | | | 76,873,772 | |
Pool #4241 3.000%
5/01/44 (b) | | | 13,120,000 | | | | 13,044,151 | |
Pool #1963 3.500%
1/01/44 (b) | | | 31,600,000 | | | | 32,390,000 | |
Pool #9174 4.000%
12/01/42 (b) | | | 13,775,000 | | | | 14,480,969 | |
Pool #3534 4.500%
7/01/40 (b) | | | 6,100,000 | | | | 6,550,114 | |
Government National Mortgage Association Pool #783896 3.500%
5/15/44 | | | 5,280,901 | | | | 5,520,191 | |
Pool #371146 7.000%
9/15/23 | | | 549 | | | | 609 | |
Pool #352022 7.000%
11/15/23 | | | 8,469 | | | | 9,463 | |
Pool #374440 7.000%
11/15/23 | | | 577 | | | | 639 | |
Pool #491089 7.000%
12/15/28 | | | 10,533 | | | | 12,002 | |
Pool #480539 7.000%
4/15/29 | | | 478 | | | | 558 | |
Pool #478658 7.000%
5/15/29 | | | 2,404 | | | | 2,821 | |
Pool #488634 7.000%
5/15/29 | | | 2,558 | | | | 2,984 | |
Pool #500928 7.000%
5/15/29 | | | 4,761 | | | | 5,575 | |
Pool #499410 7.000%
7/15/29 | | | 1,392 | | | | 1,637 | |
Pool #508655 7.000%
7/15/29 | | | 147 | | | | 171 | |
Pool #510083 7.000%
7/15/29 | | | 1,572 | | | | 1,834 | |
Pool #493723 7.000%
8/15/29 | | | 7,494 | | | | 8,798 | |
Pool #516706 7.000%
8/15/29 | | | 122 | | | | 132 | |
Pool #581417 7.000%
7/15/32 | | | 25,680 | | | | 30,156 | |
| | | | | | | | |
| | | Principal
Amount | | | Value | |
Pool #203940 7.500%
4/15/17 | | $ | 215 | | | $ | 216 | |
Pool #193870 7.500%
5/15/17 | | | 568 | | | | 572 | |
Pool #192796 7.500%
6/15/17 | | | 100 | | | | 101 | |
Pool #226163 7.500%
7/15/17 | | | 1,180 | | | | 1,192 | |
Government National Mortgage Association II
Pool #008746 2.000%
11/20/25 1 year CMT + 1.500%, FRN | | | 5,882 | | | | 6,002 | |
Pool #080136 2.000%
11/20/27 1 year CMT + 1.500%, FRN | | | 1,150 | | | | 1,177 | |
Pool #82462 2.000%
1/20/40 1 year CMT + 1.500%, FRN | | | 720,453 | | | | 747,887 | |
Pool #82488 2.000%
3/20/40 1 year CMT + 1.500%, FRN | | | 689,054 | | | | 710,948 | |
Pool #784026 3.500%
12/20/44 | | | 1,848,561 | | | | 1,924,958 | |
Government National Mortgage Association II TBA
Pool #307 2.500%
6/01/45 (b) | | | 12,000,000 | | | | 11,655,000 | |
| | | | | | | | |
| | | | | | | 280,098,307 | |
| | | | | | | | |
| | |
TOTAL U.S. GOVERNMENT AGENCY OBLIGATIONS AND INSTRUMENTALITIES
(Cost $301,904,072) | | | | | | | 300,084,110 | |
| | | | | |
|
| U.S. TREASURY OBLIGATIONS — 4.0% | |
| U.S. Treasury Bonds & Notes — 4.0% | | | | | |
U.S. Treasury Bond
2.500% 5/15/46 | | | 19,050,000 | | | | 16,929,943 | |
U.S. Treasury Bond (c)
3.500% 2/15/39 | | | 14,900,000 | | | | 16,289,018 | |
U.S. Treasury Inflation Index
0.125% 7/15/26 | | | 12,403,074 | | | | 11,993,785 | |
U.S. Treasury Note
2.000% 11/15/26 | | | 3,500,000 | | | | 3,368,203 | |
| | | | | | | | |
| | | | | | | 48,580,949 | |
| | | | | | | | |
| | |
TOTAL U.S. TREASURY OBLIGATIONS
(Cost $51,364,859) | | | | | | | 48,580,949 | |
| | | | | |
| | |
TOTAL BONDS & NOTES
(Cost $1,183,569,677) | | | | | | | 1,183,509,317 | |
| | | | | |
| | |
TOTAL LONG-TERM INVESTMENTS
(Cost $1,185,944,677) | | | | | | | 1,185,900,467 | |
| | | | | |
The accompanying notes are an integral part of the financial statements.
64
MML Managed Bond Fund – Portfolio of Investments (Continued)
| | | | | | | | |
| | | Principal
Amount | | | Value | |
| SHORT-TERM INVESTMENTS — 15.8% | |
| Commercial Paper — 15.8% | | | | | | | | |
Amphenol Corp. (a)
1.100% 1/30/17 | | $ | 5,000,000 | | | $ | 4,995,897 | |
Anheuser-Busch InBev Worldwide, Inc. (a)
1.019% 1/13/17 | | | 5,000,000 | | | | 4,998,967 | |
Anheuser-Busch InBev Worldwide, Inc. (a)
1.150% 4/12/17 | | | 2,800,000 | | | | 2,791,468 | |
The Bank of Nova Scotia (a)
1.255% 2/21/17 | | | 15,000,000 | | | | 14,982,201 | |
Bell Canada (a)
1.118% 2/13/17 | | | 6,000,000 | | | | 5,993,250 | |
Bell Canada (a)
1.200% 3/01/17 | | | 12,000,000 | | | | 11,980,480 | |
Bell Canada (a)
1.230% 3/07/17 | | | 2,000,000 | | | | 1,996,203 | |
CDP Financial, Inc. (a)
1.200% 3/07/17 | | | 2,700,000 | | | | 2,696,282 | |
CDP Financial, Inc. (a)
1.220% 3/13/17 | | | 5,000,000 | | | | 4,991,889 | |
CDP Financial, Inc. (a)
1.234% 2/23/17 | | | 5,000,000 | | | | 4,995,012 | |
Cox Enterprises, Inc. (a)
0.900% 1/03/17 | | | 8,200,000 | | | | 8,199,301 | |
Exelon Generation Co. LLC (a)
1.110% 1/04/17 | | | 9,300,000 | | | | 9,299,004 | |
FMC Technologies, Inc. (a)
1.218% 1/13/17 | | | 3,000,000 | | | | 2,999,054 | |
FMC Technologies, Inc. (a)
1.218% 1/18/17 | | | 5,000,000 | | | | 4,997,752 | |
Ford Motor Credit Co. (a)
1.120% 3/02/17 | | | 7,000,000 | | | | 6,987,426 | |
Hewlett Packard Enterprise Co. (a)
1.130% 1/19/17 | | | 2,000,000 | | | | 1,999,448 | |
Hyundai Capital America (a)
1.300% 3/15/17 | | | 10,000,000 | | | | 9,975,417 | |
Hyundai Capital America (a)
1.300% 3/17/17 | | | 10,000,000 | | | | 9,974,397 | |
Marriott International, Inc. (a)
1.150% 1/24/17 | | | 6,000,000 | | | | 5,996,225 | |
Marriott International, Inc. (a)
1.150% 1/30/17 | | | 1,710,000 | | | | 1,708,597 | |
Marriott International, Inc. (a)
1.168% 1/31/17 | | | 6,000,000 | | | | 5,994,896 | |
Molex Electronic Technologies (a)
1.150% 1/23/17 | | | 6,000,000 | | | | 5,996,412 | |
Molex Electronic Technologies (a)
1.150% 1/25/17 | | | 6,000,000 | | | | 5,996,035 | |
ONEOK Partners LP (a)
1.250% 1/09/17 | | | 5,000,000 | | | | 4,998,899 | |
| | | | | | | | |
| | | Principal
Amount | | | Value | |
ONEOK Partners LP (a)
1.250% 1/10/17 | | $ | 5,000,000 | | | $ | 4,998,782 | |
ONEOK Partners LP (a)
1.250% 1/19/17 | | | 4,000,000 | | | | 3,998,084 | |
ONEOK Partners LP (a)
1.268% 1/12/17 | | | 3,000,000 | | | | 2,999,127 | |
Schlumberger Holding Corp. (a)
1.251% 3/23/17 | | | 5,000,000 | | | | 4,986,397 | |
Sempra Energy Holdings (a)
1.020% 2/07/17 | | | 5,000,000 | | | | 4,994,692 | |
Sempra Energy Holdings (a)
1.150% 2/08/17 | | | 5,000,000 | | | | 4,994,539 | |
TELUS Corp. (a)
1.200% 3/07/17 | | | 6,000,000 | | | | 5,987,594 | |
Xylem, Inc. (a)
1.066% 1/17/17 | | | 5,000,000 | | | | 4,997,892 | |
Xylem, Inc. (a)
1.100% 2/03/17 | | | 6,000,000 | | | | 5,994,359 | |
| | | | | | | | |
| | | | | | | 189,495,978 | |
| | | | | | | | |
| | |
TOTAL SHORT-TERM INVESTMENTS
(Cost $189,458,854) | | | | | | | 189,495,978 | |
| | | | | |
| | |
TOTAL INVESTMENTS — 114.4%
(Cost $1,375,403,531) (d) | | | | | | | 1,375,396,445 | |
| | |
| Other Assets/(Liabilities) — (14.4)% | | | | | | | (173,040,967 | ) |
| | | | | |
| | |
| NET ASSETS — 100.0% | | | | | | $ | 1,202,355,478 | |
| | | | | |
Notes to Portfolio of Investments
Percentages are stated as a percent of net assets.
| CLO | Collateralized Loan Obligation |
| CMO | Collateralized Mortgage Obligation |
| CMT | Constant Maturity Treasury Index |
| MBS | Mortgage-Backed Security |
| MTA | Monthly Treasury Average Index |
| PAC | Planned Amortization Class |
| (a) | Securities exempt from registration under rule 144A of the Securities Act of 1933. These securities may be resold in transactions exempt from registration, normally to qualified institutional buyers. At December 31, 2016, these securities amounted to a value of $552,180,197 or 45.92% of net assets. |
| (b) | A portion of this security is purchased on a when-issued, delayed-delivery or forward commitment basis. (Note 2). |
| (c) | A portion of this security is pledged as collateral for open futures contracts and pledged for open swaps agreements. |
| (d) | See Note 6 for aggregate cost for federal tax purposes. |
The accompanying notes are an integral part of the financial statements.
65
MML Managed Bond Fund – Portfolio of Investments (Continued)
Notes to Portfolio of Investments (Continued)
Country weightings, as a percentage of net assets, is as follows:
| | | | |
United States | | | 86.8 | % |
Cayman Islands | | | 5.8 | % |
Ireland | | | 0.9 | % |
Mexico | | | 0.9 | % |
Canada | | | 0.7 | % |
Luxembourg | | | 0.6 | % |
Netherlands | | | 0.5 | % |
United Kingdom | | | 0.5 | % |
Colombia | | | 0.4 | % |
Austria | | | 0.4 | % |
Australia | | | 0.2 | % |
Bermuda | | | 0.2 | % |
Turkey | | | 0.1 | % |
Barbados | | | 0.1 | % |
France | | | 0.1 | % |
India | | | 0.1 | % |
Panama | | | 0.1 | % |
United States Virgin Islands | | | 0.1 | % |
Poland | | | 0.1 | % |
Spain | | | 0.0 | % |
Peru | | | 0.0 | % |
| | | | |
Total Long-Term Investments | | | 98.6 | % |
Short-Term Investments and Other Assets and Liabilities | | | 1.4 | % |
| | | | |
Net Assets | | | 100.0 | % |
| | | | |
The accompanying notes are an integral part of the financial statements.
66
MML U.S. Government Money Market Fund – Portfolio of Investments
December 31, 2016
| | | | | | | | |
| | | Principal
Amount | | | Value | |
| SHORT-TERM INVESTMENTS — 100.1% | |
| Discount Notes — 78.1% | | | | | | | | |
Federal Farm Credit Bank
0.791% 6/29/17 | | $ | 5,000,000 | | | $ | 4,999,993 | |
Federal Farm Credit Bank
0.806% 3/29/17 | | | 2,000,000 | | | | 2,000,129 | |
Federal Farm Credit Discount Notes
0.365% 2/01/17 | | | 1,000,000 | | | | 999,690 | |
Federal Farm Credit Discount Notes
0.425% 1/20/17 | | | 1,000,000 | | | | 999,776 | |
Federal Farm Credit Discount Notes
0.447% 2/17/17 | | | 141,000 | | | | 140,919 | |
Federal Farm Credit Discount Notes
0.455% 1/31/17 | | | 5,000,000 | | | | 4,998,104 | |
Federal Farm Credit Discount Notes
0.480% 1/13/17 | | | 950,000 | | | | 949,848 | |
Federal Farm Credit Discount Notes
0.500% 1/13/17 | | | 1,730,000 | | | | 1,729,712 | |
Federal Farm Credit Discount Notes
0.508% 4/18/17 | | | 557,000 | | | | 556,172 | |
Federal Farm Credit Discount Notes
0.520% 2/02/17 | | | 900,000 | | | | 899,584 | |
Federal Farm Credit Discount Notes
0.528% 2/01/17 | | | 500,000 | | | | 499,776 | |
Federal Farm Credit Discount Notes
0.590% 1/13/17 | | | 115,000 | | | | 114,977 | |
Federal Farm Credit Discount Notes
0.650% 2/01/17 | | | 950,000 | | | | 949,468 | |
Federal Farm Credit Discount Notes
0.662% 8/07/17 | | | 350,000 | | | | 348,622 | |
Federal Farm Credit Discount Notes
0.724% 10/02/17 | | | 1,333,000 | | | | 1,325,797 | |
Federal Home Loan Bank
0.607% 3/16/17 | | | 5,000,000 | | | | 5,000,000 | |
Federal Home Loan Bank
0.625% 5/25/17 | | | 10,000,000 | | | | 10,000,000 | |
Federal Home Loan Bank
0.675% 9/05/17 | | | 4,255,000 | | | | 4,256,756 | |
Federal Home Loan Bank
0.684% 3/10/17 | | | 5,000,000 | | | | 5,000,046 | |
Federal Home Loan Bank
0.725% 8/23/17 | | | 7,500,000 | | | | 7,500,000 | |
Federal Home Loan Bank
0.736% 2/24/17 | | | 2,500,000 | | | | 2,499,874 | |
Federal Home Loan Bank
0.881% 8/21/17 | | | 5,000,000 | | | | 5,007,888 | |
Federal Home Loan Bank Discount Notes
0.345% 1/04/17 | | | 3,000,000 | | | | 2,999,915 | |
Federal Home Loan Bank Discount Notes
0.345% 1/13/17 | | | 500,000 | | | | 499,943 | |
| | | | | | | | |
| | | Principal
Amount | | | Value | |
Federal Home Loan Bank Discount Notes
0.355% 2/10/17 | | $ | 500,000 | | | $ | 499,806 | |
Federal Home Loan Bank Discount Notes
0.370% 1/27/17 | | | 1,800,000 | | | | 1,799,526 | |
Federal Home Loan Bank Discount Notes
0.396% 1/06/17 | | | 5,000,000 | | | | 4,999,729 | |
Federal Home Loan Bank Discount Notes
0.406% 1/27/17 | | | 440,000 | | | | 439,873 | |
Federal Home Loan Bank Discount Notes
0.406% 2/22/17 | | | 1,265,000 | | | | 1,264,269 | |
Federal Home Loan Bank Discount Notes
0.421% 2/03/17 | | | 1,500,000 | | | | 1,499,429 | |
Federal Home Loan Bank Discount Notes
0.447% 1/27/17 | | | 350,000 | | | | 349,889 | |
Federal Home Loan Bank Discount Notes
0.452% 3/17/17 | | | 285,000 | | | | 284,736 | |
Federal Home Loan Bank Discount Notes
0.457% 2/21/17 | | | 1,750,000 | | | | 1,748,884 | |
Federal Home Loan Bank Discount Notes
0.457% 2/21/17 | | | 250,000 | | | | 249,841 | |
Federal Home Loan Bank Discount Notes
0.462% 1/27/17 | | | 2,000,000 | | | | 1,999,343 | |
Federal Home Loan Bank Discount Notes
0.467% 1/27/17 | | | 1,200,000 | | | | 1,199,601 | |
Federal Home Loan Bank Discount Notes
0.477% 2/10/17 | | | 3,800,000 | | | | 3,798,016 | |
Federal Home Loan Bank Discount Notes
0.478% 3/31/17 | | | 2,500,000 | | | | 2,497,095 | |
Federal Home Loan Bank Discount Notes
0.490% 1/25/17 | | | 1,000,000 | | | | 999,673 | |
Federal Home Loan Bank Discount Notes
0.493% 3/31/17 | | | 770,000 | | | | 769,077 | |
Federal Home Loan Bank Discount Notes
0.500% 2/24/17 | | | 100,000 | | | | 99,926 | |
The accompanying notes are an integral part of the financial statements.
67
MML U.S. Government Money Market Fund – Portfolio of Investments (Continued)
| | | | | | | | |
| | | Principal
Amount | | | Value | |
Federal Home Loan Bank Discount Notes
0.500% 2/21/17 | | $ | 2,000,000 | | | $ | 1,998,583 | |
Federal Home Loan Bank Discount Notes
0.503% 4/28/17 | | | 5,000,000 | | | | 4,991,956 | |
Federal Home Loan Bank Discount Notes
0.507% 1/25/17 | | | 4,000,000 | | | | 3,998,667 | |
Federal Home Loan Bank Discount Notes
0.513% 2/22/17 | | | 840,000 | | | | 839,387 | |
Federal Home Loan Bank Discount Notes
0.518% 2/22/17 | | | 2,085,000 | | | | 2,083,464 | |
Federal Home Loan Bank Discount Notes
0.520% 1/31/17 | | | 150,000 | | | | 149,935 | |
Federal Home Loan Bank Discount Notes
0.528% 2/17/17 | | | 675,000 | | | | 674,542 | |
Federal Home Loan Bank Discount Notes
0.528% 2/28/17 | | | 900,000 | | | | 899,246 | |
Federal Home Loan Bank Discount Notes
0.558% 3/24/17 | | | 1,900,000 | | | | 1,897,620 | |
Federal Home Loan Bank Discount Notes
0.569% 3/08/17 | | | 756,000 | | | | 755,224 | |
Federal Home Loan Bank Discount Notes
0.579% 3/13/17 | | | 141,000 | | | | 140,842 | |
Federal Home Loan Bank Discount Notes
0.599% 4/28/17 | | | 2,350,000 | | | | 2,345,494 | |
Federal Home Loan Bank Discount Notes
0.609% 2/28/17 | | | 200,000 | | | | 199,807 | |
Federal Home Loan Bank Discount Notes
0.640% 2/10/17 | | | 2,000,000 | | | | 1,998,578 | |
Federal Home Loan Bank Discount Notes
0.713% 8/03/17 | | | 500,000 | | | | 497,919 | |
Federal Home Loan Bank Discount Notes
0.765% 9/21/17 | | | 200,000 | | | | 198,904 | |
Federal Home Loan Mortgage Corp.
0.305% 2/06/17 | | | 275,000 | | | | 274,918 | |
Federal Home Loan Mortgage Corp.
0.457% 2/07/17 | | | 5,000,000 | | | | 4,997,688 | |
| | | | | | | | |
| | | Principal
Amount | | | Value | |
Federal Home Loan Mortgage Corp.
0.457% 2/21/17 | | $ | 834,000 | | | $ | 833,468 | |
Federal Home Loan Mortgage Corp.
0.467% 2/21/17 | | | 950,000 | | | | 949,381 | |
Federal Home Loan Mortgage Corp.
0.470% 1/05/17 | | | 2,500,000 | | | | 2,499,869 | |
Federal Home Loan Mortgage Corp.
0.488% 4/06/17 | | | 6,000,000 | | | | 5,992,400 | |
Federal Home Loan Mortgage Corp.
0.507% 1/09/17 | | | 850,000 | | | | 849,906 | |
Federal Home Loan Mortgage Corp.
0.507% 1/19/17 | | | 731,000 | | | | 730,817 | |
Federal Home Loan Mortgage Corp.
0.508% 3/21/17 | | | 170,000 | | | | 169,813 | |
| | | | | | | | |
| | | | | | | 129,744,130 | |
| | | | | | | | |
| Repurchase Agreement — 12.0% | | | | | | | | |
HSBC Securities (USA) Inc. Repurchase Agreement, dated 12/30/16, 0.450%, due 1/03/17 (a) | | | 20,000,000 | | | | 20,000,000 | |
| | | | | | | | |
| Time Deposit — 0.0% | | | | | | | | |
Euro Time Deposit
0.010% 1/03/17 | | | 955 | | | | 955 | |
| | | | | | | | |
| U.S. Government Obligations — 10.0% | |
U.S. Treasury Note
0.630% 4/30/17 | | | 7,500,000 | | | | 7,500,099 | |
U.S. Treasury Note
0.640% 1/31/17 | | | 7,450,000 | | | | 7,450,152 | |
U.S. Treasury Note
3.125% 1/31/17 | | | 1,600,000 | | | | 1,603,430 | |
| | | | | | | | |
| | | | 16,553,681 | |
| | | | | |
| | |
TOTAL SHORT-TERM INVESTMENTS
(Cost $166,298,766) | | | | | | | 166,298,766 | |
| | | | | |
| | |
TOTAL INVESTMENTS — 100.1%
(Cost $166,298,766) (b) | | | | | | | 166,298,766 | |
| | |
| Other Assets/(Liabilities) — (0.1)% | | | | | | | (162,764 | ) |
| | | | | |
| | |
| NET ASSETS — 100.0% | | | | | | $ | 166,136,002 | |
| | | | | |
Notes to Portfolio of Investments
Percentages are stated as a percent of net assets.
| (a) | Maturity value of $20,001,000. Collateralized by U.S. Government Agency obligations with a rate of 3.375%, maturity date of 5/15/44, and an aggregate market value, including accrued interest, of $20,402,499. |
| (b) | See Note 6 for aggregate cost for federal tax purposes. |
The accompanying notes are an integral part of the financial statements.
68
THIS PAGE INTENTIONALLY LEFT BLANK
69
MML Series Investment Fund II – Financial Statements
Statements of Assets and Liabilities
December 31, 2016
| | | | | | | | | | | | | | | | |
| | | MML
Blend Fund | | | MML
Equity Fund | | | MML
Managed Bond
Fund | | | MML
U.S. Government
Money Market
Fund | |
| Assets: | |
Investments, at value (Note 2) (a) | | $ | 640,305,187 | | | $ | 810,919,556 | | | $ | 1,185,900,467 | | | $ | - | |
Repurchase agreements, at value (b) | | | 106,536 | | | | 15,995,072 | | | | - | | | | 20,000,000 | |
Other short-term investments, at value (Note 2) (c) | | | 27,490,092 | | | | 36,240 | | | | 189,495,978 | | | | 146,298,766 | |
| | | | | | | | | | | | | | | | |
Total investments (d) | | | 667,901,815 | | | | 826,950,868 | | | | 1,375,396,445 | | | | 166,298,766 | |
| | | | | | | | | | | | | | | | |
Receivables from: | |
Investments sold | | | - | | | | 3,261,321 | | | | - | | | | - | |
Investments sold on a when-issued basis (Note 2) | | | 2,964,829 | | | | - | | | | 17,923,477 | | | | - | |
Investment adviser (Note 3) | | | - | | | | - | | | | - | | | | 12,550 | |
Fund shares sold | | | 36,784 | | | | 33,804 | | | | 187,855 | | | | 67,863 | |
Variation margin on open derivative instruments (Note 2) | | | 65,409 | | | | - | | | | 438,188 | | | | - | |
Interest and dividends | | | 1,593,060 | | | | 935,748 | | | | 6,835,772 | | | | 54,676 | |
Foreign taxes withheld | | | - | | | | 42,804 | | | | - | | | | - | |
| | | | | | | | | | | | | | | | |
Total assets | | | 672,561,897 | | | | 831,224,545 | | | | 1,400,781,737 | | | | 166,433,855 | |
| | | | | | | | | | | | | | | | |
| Liabilities: | |
Payables for: | |
Investments purchased | | | 387,495 | | | | 1,939,702 | | | | 4,624,867 | | | | - | |
Investments purchased on a when-issued basis (Note 2) | | | 29,224,215 | | | | - | | | | 192,087,527 | | | | - | |
Fund shares repurchased | | | 359,681 | | | | 277,624 | | | | 311,863 | | | | 146,579 | |
Securities on loan (Note 2) | | | - | | | | 18,768,071 | | | | - | | | | - | |
Open swap agreements, at value (Note 2) | | | 61,982 | | | | - | | | | 378,711 | | | | - | |
Trustees’ fees and expenses (Note 3) | | | 200,194 | | | | 252,070 | | | | 223,702 | | | | 52,433 | |
Variation margin on open derivative instruments (Note 2) | | | 650 | | | | - | | | | 4,025 | | | | - | |
Affiliates (Note 3): | |
Investment advisory fees | | | 229,393 | | | | 280,203 | | | | 392,745 | | | | 67,999 | |
Service fees | | | 35,518 | | | | 48,813 | | | | 163,776 | | | | - | |
Due to custodian | | | 1,436 | | | | - | | | | 220,132 | | | | - | |
Accrued expense and other liabilities | | | 71,510 | | | | 72,636 | | | | 18,911 | | | | 30,842 | |
| | | | | | | | | | | | | | | | |
Total liabilities | | | 30,572,074 | | | | 21,639,119 | | | | 198,426,259 | | | | 297,853 | |
| | | | | | | | | | | | | | | | |
Net assets | | $ | 641,989,823 | | | $ | 809,585,426 | | | $ | 1,202,355,478 | | | $ | 166,136,002 | |
| | | | | | | | | | | | | | | | |
| Net assets consist of: | |
Paid-in capital | | $ | 500,126,466 | | | $ | 609,125,102 | | | $ | 1,223,615,414 | | | $ | 166,176,894 | |
Undistributed (accumulated) net investment income (loss) | | | 129,711 | | | | 15,593,338 | | | | 2,417,099 | | | | - | |
Distributions in excess of net investment income | | | - | | | | - | | | | - | | | | (46,335 | ) |
Accumulated net realized gain (loss) on investments and foreign currency transactions | | | 22,023,915 | | | | 1,045,786 | | | | (22,926,176 | ) | | | 5,443 | |
Net unrealized appreciation (depreciation) on investments and foreign currency translations | | | 119,709,731 | | | | 183,821,200 | | | | (750,859 | ) | | | - | |
| | | | | | | | | | | | | | | | |
Net assets | | $ | 641,989,823 | | | $ | 809,585,426 | | | $ | 1,202,355,478 | | | $ | 166,136,002 | |
| | | | | | | | | | | | | | | | |
| | | | | | | | | | | | | | | | |
(a) Cost of investments: | | $ | 520,463,745 | | | $ | 627,098,356 | | | $ | 1,185,944,677 | | | $ | - | |
(b) Cost of repurchase agreements: | | $ | 106,536 | | | $ | 15,995,072 | | | $ | - | | | $ | 20,000,000 | |
(c) Cost of other short-term investments: | | $ | 27,486,384 | | | $ | 36,240 | | | $ | 189,458,854 | | | $ | 146,298,766 | |
(d) Securities on loan with market value of: | | $ | - | | | $ | 18,311,526 | | | $ | - | | | $ | - | |
The accompanying notes are an integral part of the financial statements.
70
MML Series Investment Fund II – Financial Statements (Continued)
Statements of Assets and Liabilities
December 31, 2016
| | | | | | | | | | | | | | | | |
| | | MML
Blend Fund | | | MML
Equity Fund | | | MML
Managed Bond
Fund | | | MML
U.S. Government
Money Market
Fund | |
| Initial Class shares: | |
Net assets | | $ | 581,972,165 | | | $ | 727,540,102 | | | $ | 941,620,771 | | | $ | 166,136,002 | |
| | | | | | | | | | | | | | | | |
Shares outstanding (a) | | | 27,014,244 | | | | 25,911,017 | | | | 76,915,072 | | | | 166,134,508 | |
| | | | | | | | | | | | | | | | |
Net asset value, offering price and redemption price per share | | $ | 21.54 | | | $ | 28.08 | | | $ | 12.24 | | | $ | 1.00 | |
| | | | | | | | | | | | | | | | |
| Service Class shares: | |
Net assets | | $ | 60,017,658 | | | $ | 82,045,324 | | | $ | 260,734,707 | | | $ | - | |
| | | | | | | | | | | | | | | | |
Shares outstanding (a) | | | 2,791,668 | | | | 2,954,614 | | | | 21,338,155 | | | | - | |
| | | | | | | | | | | | | | | | |
Net asset value, offering price and redemption price per share | | $ | 21.50 | | | $ | 27.77 | | | $ | 12.22 | | | $ | - | |
| | | | | | | | | | | | | | | | |
| (a) | Authorized unlimited number of shares with no par value. |
The accompanying notes are an integral part of the financial statements.
71
MML Series Investment Fund II – Financial Statements (Continued)
Statements of Operations
For the Year Ended December 31, 2016
| | | | | | | | | | | | | | | | |
| | | MML
Blend Fund | | | MML
Equity Fund | | | MML
Managed Bond
Fund | | | MML
U.S. Government
Money Market
Fund | |
| Investment income (Note 2): | |
Dividends (a) | | $ | 9,782,321 | | | $ | 19,484,292 | | | $ | 145,305 | | | $ | - | |
Interest | | | 5,748,501 | | | | 1,373 | | | | 36,910,858 | | | | 668,073 | |
Securities lending net income | | | - | | | | 168,481 | | | | - | | | | - | |
| | | | | | | | | | | | | | | | |
Total investment income | | | 15,530,822 | | | | 19,654,146 | | | | 37,056,163 | | | | 668,073 | |
| | | | | | | | | | | | | | | | |
| Expenses (Note 3): | |
Investment advisory fees | | | 2,637,390 | | | | 3,111,354 | | | | 4,772,792 | | | | 794,403 | |
Custody fees | | | 87,502 | | | | 70,907 | | | | - | * | | | 24,350 | |
Audit fees | | | 35,858 | | | | 35,144 | | | | 37,053 | | | | 30,526 | |
Legal fees | | | 5,319 | | | | 6,428 | | | | - | * | | | 11,816 | |
Proxy fees | | | 986 | | | | 985 | | | | - | * | | | 985 | |
Shareholder reporting fees | | | 55,930 | | | | 68,093 | | | | - | * | | | 17,229 | |
Trustees’ fees | | | 34,722 | | | | 42,047 | | | | 52,729 | | | | 9,002 | |
| | | | | | | | | | | | | | | | |
| | | 2,857,707 | | | | 3,334,958 | | | | 4,862,574 | | | | 888,311 | |
Service fees: | | | | | | | | | | | | | | | | |
Service Class | | | 128,396 | | | | 179,475 | | | | 637,351 | | | | - | |
| | | | | | | | | | | | | | | | |
Total expenses | | | 2,986,103 | | | | 3,514,433 | | | | 5,499,925 | | | | 888,311 | |
Expenses waived: | | | | | | | | | | | | | | | | |
Initial Class fees reimbursed by adviser | | | - | | | | - | | | | - | | | | (220,459 | ) |
| | | | | | | | | | | | | | | | |
Net expenses | | | 2,986,103 | | | | 3,514,433 | | | | 5,499,925 | | | | 667,852 | |
| | | | | | | | | | | | | | | | |
Net investment income (loss) | | | 12,544,719 | | | | 16,139,713 | | | | 31,556,238 | | | | 221 | |
| | | | | | | | | | | | | | | | |
| Realized and unrealized gain (loss): | |
Net realized gain (loss) on: | | | | | | | | | | | | | | | | |
Investment transactions | | | 28,236,859 | | | | 6,305,244 | | | | (16,085,953 | ) | | | 3,790 | |
Futures contracts | | | (193,183 | ) | | | - | | | | 1,626,297 | | | | - | |
Swap agreements | | | (4,395 | ) | | | - | | | | (32,694 | ) | | | - | |
Foreign currency transactions | | | - | | | | 2,030 | | | | - | | | | - | |
| | | | | | | | | | | | | | | | |
Net realized gain (loss) | | | 28,039,281 | | | | 6,307,274 | | | | (14,492,350 | ) | | | 3,790 | |
| | | | | | | | | | | | | | | | |
Net change in unrealized appreciation (depreciation) on: | | | | | | | | | | | | | | | | |
Investment transactions | | | 15,748,587 | | | | 68,646,016 | | | | 17,069,965 | | | | - | |
Futures contracts | | | (144,472 | ) | | | - | | | | (713,269 | ) | | | - | |
Swap agreements | | | 1,094 | | | | - | | | | (1,400 | ) | | | - | |
Translation of assets and liabilities in foreign currencies | | | 1 | | | | - | | | | - | | | | - | |
| | | | | | | | | | | | | | | | |
Net change in unrealized appreciation (depreciation) | | | 15,605,210 | | | | 68,646,016 | | | | 16,355,296 | | | | - | |
| | | | | | | | | | | | | | | | |
Net realized gain (loss) and change in unrealized appreciation (depreciation) | | | 43,644,491 | | | | 74,953,290 | | | | 1,862,946 | | | | 3,790 | |
| | | | | | | | | | | | | | | | |
Net increase (decrease) in net assets resulting from operations | | $ | 56,189,210 | | | $ | 91,093,003 | | | $ | 33,419,184 | | | $ | 4,011 | |
| | | | | | | | | | | | | | | | |
| | | | | | | | | | | | | | | | |
(a) Net of foreign withholding tax of: | | $ | - | | | $ | 184,392 | | | $ | - | | | $ | - | |
| * | Paid by MassMutual pursuant to investment advisory agreement dated 12/15/11 for a period of at least three years. The agreement can only be amended or terminated after that period upon approval of a majority of the Independent Trustees. |
The accompanying notes are an integral part of the financial statements.
72
THIS PAGE INTENTIONALLY LEFT BLANK
73
MML Series Investment Fund II – Financial Statements (Continued)
Statements of Changes in Net Assets
| | | | | | | | |
| | | MML Blend Fund | |
| | | Year
Ended
December 31, 2016 | | | Year
Ended
December 31, 2015 | |
| Increase (Decrease) in Net Assets: | |
| Operations: | |
Net investment income (loss) | | $ | 12,544,719 | | | $ | 13,601,353 | |
Net realized gain (loss) on investment transactions | | | 28,039,281 | | | | 60,655,773 | |
Net change in unrealized appreciation (depreciation) on investments | | | 15,605,210 | | | | (73,670,434 | ) |
| | | | | | | | |
Net increase (decrease) in net assets resulting from operations | | | 56,189,210 | | | | 586,692 | |
| | | | | | | | |
| Distributions to shareholders (Note 2): | |
From net investment income: | |
Initial Class | | | (12,269,213 | ) | | | (13,201,262 | ) |
Service Class | | | (1,001,145 | ) | | | (858,932 | ) |
| | | | | | | | |
Total distributions from net investment income | | | (13,270,358 | ) | | | (14,060,194 | ) |
| | | | | | | | |
From net realized gains: | |
Initial Class | | | (54,825,750 | ) | | | (46,953,015 | ) |
Service Class | | | (4,650,473 | ) | | | (3,152,201 | ) |
| | | | | | | | |
Total distributions from net realized gains | | | (59,476,223 | ) | | | (50,105,216 | ) |
| | | | | | | | |
| Net fund share transactions (Note 5): | |
Initial Class | | | 11,426,537 | | | | 677,625 | |
Service Class | | | 13,484,118 | | | | 11,324,049 | |
| | | | | | | | |
Increase (decrease) in net assets from fund share transactions | | | 24,910,655 | | | | 12,001,674 | |
| | | | | | | | |
Capital Contribution | | | - | | | | - | |
| | | | | | | | |
Total increase (decrease) in net assets | | | 8,353,284 | | | | (51,577,044 | ) |
| Net assets | |
Beginning of year | | | 633,636,539 | | | | 685,213,583 | |
| | | | | | | | |
End of year | | $ | 641,989,823 | | | $ | 633,636,539 | |
| | | | | | | | |
Undistributed (accumulated) net investment income (loss) included in net assets at end of year | | $ | 129,711 | | | $ | - | |
| | | | | | | | |
Distributions in excess of net investment income included in net assets at end of year | | $ | - | | | $ | (130,021 | ) |
| | | | | | | | |
The accompanying notes are an integral part of the financial statements.
74
| | | | | | | | | | | | | | | | | | | | | | |
| MML Equity Fund | | | MML Managed Bond Fund | | | MML U.S. Government
Money Market Fund | |
Year
Ended
December 31, 2016 | | | Year
Ended
December 31, 2015 | | | Year
Ended
December 31, 2016 | | | Year
Ended
December 31, 2015 | | | Year
Ended
December 31, 2016 | | | Year
Ended
December 31, 2015 | |
| | | | | | | | | | | | | | | | | | | | | | |
| | | | | | | | | | | | | | | | | | | | | | |
| $ | 16,139,713 | | | $ | 13,778,670 | | | $ | 31,556,238 | | | $ | 34,097,020 | | | $ | 221 | | | $ | - | |
| | 6,307,274 | | | | 48,316,548 | | | | (14,492,350 | ) | | | 11,968,100 | | | | 3,790 | | | | 2,061 | |
| | 68,646,016 | | | | (90,001,566 | ) | | | 16,355,296 | | | | (55,389,268 | ) | | | - | | | | - | |
| | | | | | | | | | | | | | | | | | | | | | |
| | 91,093,003 | | | | (27,906,348 | ) | | | 33,419,184 | | | | (9,324,148 | ) | | | 4,011 | | | | 2,061 | |
| | | | | | | | | | | | | | | | | | | | | | |
| | | | | | | | | | | | | | | | | | | | | | |
| | | | | | | | | | | | | | | | | | | | | | |
| | (11,993,394 | ) | | | (15,870,664 | ) | | | (27,667,303 | ) | | | (30,066,192 | ) | | | (222 | ) | | | (9,207 | ) |
| | (1,123,086 | ) | | | (1,232,199 | ) | | | (6,650,943 | ) | | | (6,172,793 | ) | | | - | | | | - | |
| | | | | | | | | | | | | | | | | | | | | | |
| | (13,116,480 | ) | | | (17,102,863 | ) | | | (34,318,246 | ) | | | (36,238,985 | ) | | | (222 | ) | | | (9,207 | ) |
| | | | | | | | | | | | | | | | | | | | | | |
| | | | | | | | | | | | | | | | | | | | | | |
| | (43,851,037 | ) | | | (34,664,123 | ) | | | (4,333,772 | ) | | | (5,019,665 | ) | | | - | | | | (177 | ) |
| | (4,678,832 | ) | | | (2,957,887 | ) | | | (1,095,099 | ) | | | (922,401 | ) | | | - | | | | - | |
| | | | | | | | | | | | | | | | | | | | | | |
| | (48,529,869 | ) | | | (37,622,010 | ) | | | (5,428,871 | ) | | | (5,942,066 | ) | | | - | | | | (177 | ) |
| | | | | | | | | | | | | | | | | | | | | | |
| | | | | | | | | | | | | | | | | | | | | | |
| | (8,210,073 | ) | | | (13,792,049 | ) | | | (30,773,399 | ) | | | (199,761,615 | ) | | | (1,944,234 | ) | | | (84,793,576 | ) |
| | 9,935,719 | | | | 18,928,564 | | | | 17,106,810 | | | | 37,617,830 | | | | - | | | | - | |
| | | | | | | | | | | | | | | | | | | | | | |
| | 1,725,646 | | | | 5,136,515 | | | | (13,666,589 | ) | | | (162,143,785 | ) | | | (1,944,234 | ) | | | (84,793,576 | ) |
| | | | | | | | | | | �� | | | | | | | | | | | |
| | - | | | | - | | | | - | | | | - | | | | 176,276 | | | | - | |
| | | | | | | | | | | | | | | | | | | | | | |
| | 31,172,300 | | | | (77,494,706 | ) | | | (19,994,522 | ) | | | (213,648,984 | ) | | | (1,764,169 | ) | | | (84,800,899 | ) |
| | | | | | | | | | | | | | | | | | | | | | |
| | 778,413,126 | | | | 855,907,832 | | | | 1,222,350,000 | | | | 1,435,998,984 | | | | 167,900,171 | | | | 252,701,070 | |
| | | | | | | | | | | | | | | | | | | | | | |
| $ | 809,585,426 | | | $ | 778,413,126 | | | $ | 1,202,355,478 | | | $ | 1,222,350,000 | | | $ | 166,136,002 | | | $ | 167,900,171 | |
| | | | | | | | | | | | | | | | | | | | | | |
$ |
15,593,338 |
| | $ | 13,534,450 | | | $ | 2,417,099 | | | $ | 1,745,901 | | | $ | - | | | $ | - | |
| | | | | | | | | | | | | | | | | | | | | | |
| $ | - | | | $ | - | | | $ | | - | | $ | - | | | $ | (46,335 | ) | | $ | (46,326 | ) |
| | | | | | | | | | | | | | | | | | | | | | |
75
MML Series Investment Fund II – Financial Statements (Continued)
Financial Highlights (For a share outstanding throughout each period)
MML Blend Fund
| | | | | | | | | | | | | | | | | | | | | | | | | | | | | | | | | | | | | | | | | | | | | | | | |
| | | | | | Income (loss) from investment
operations | | | Less distributions to shareholders | | | | | | | | | Ratios / Supplemental Data | |
| | | Net asset
value,
beginning
of the
period | | | Net
investment
income
(loss)c | | | Net
realized
and
unrealized
gain (loss)
on
investments | | | Total
income
(loss) from
investment
operations | | | From net
investment
income | | | From net
realized
gains | | | Total
distributions | | | Net
asset
value,
end of
the
period | | | Total
returnm | | | Net
assets,
end of
the
period
(000’s) | | | Ratio of
expenses
to average
daily net
assets | | | Net
investment
income
(loss) to
average
daily net
assets | |
| Initial Class | | | | | | | | | | | | | | | | | | | | | | | | | | | | | | | | | |
| 12/31/16 | | $ | 22.22 | | | $ | 0.43 | | | $ | 1.48 | | | $ | 1.91 | | | $ | (0.46 | ) | | $ | (2.13 | ) | | $ | (2.59 | ) | | $ | 21.54 | | | | 9.42% | | | $ | 581,972 | | | | 0.46% | | | | 2.03% | |
| 12/31/15 | | | 24.51 | | | | 0.48 | | | | (0.45 | ) | | | 0.03 | | | | (0.50 | ) | | | (1.82 | ) | | | (2.32 | ) | | | 22.22 | | | | 0.08% | | | | 586,082 | | | | 0.45% | | | | 2.07% | |
| 12/31/14 | | | 22.78 | | | | 0.45 | | | | 2.01 | | | | 2.46 | | | | (0.49 | ) | | | (0.24 | ) | | | (0.73 | ) | | | 24.51 | | | | 10.99% | | | | 644,881 | | | | 0.45% | | | | 1.92% | |
| 12/31/13 | | | 19.33 | | | | 0.41 | | | | 3.48 | | | | 3.89 | | | | (0.44 | ) | | | - | | | | (0.44 | ) | | | 22.78 | | | | 20.31% | | | | 639,537 | | | | 0.46% | | | | 1.94% | |
| 12/31/12 | | | 17.52 | | | | 0.39 | | | | 1.82 | | | | 2.21 | | | | (0.40 | ) | | | - | | | | (0.40 | ) | | | 19.33 | | | | 12.65% | | | | 584,660 | | | | 0.46% | | | | 2.09% | |
| Service Class | | | | | | | | | | | | | | | | | | | | | | | | | | | | | | | | | |
| 12/31/16 | | $ | 22.18 | | | $ | 0.37 | | | $ | 1.48 | | | $ | 1.85 | | | $ | (0.40 | ) | | $ | (2.13 | ) | | $ | (2.53 | ) | | $ | 21.50 | | | | 9.15% | | | $ | 60,018 | | | | 0.71% | | | | 1.78% | |
| 12/31/15 | | | 24.48 | | | | 0.42 | | | | (0.46 | ) | | | (0.04 | ) | | | (0.44 | ) | | | (1.82 | ) | | | (2.26 | ) | | | 22.18 | | | | (0.17% | ) | | | 47,555 | | | | 0.70% | | | | 1.83% | |
| 12/31/14 | | | 22.75 | | | | 0.39 | | | | 2.01 | | | | 2.40 | | | | (0.43 | ) | | | (0.24 | ) | | | (0.67 | ) | | | 24.48 | | | | 10.71% | | | | 40,333 | | | | 0.70% | | | | 1.68% | |
| 12/31/13 | | | 19.30 | | | | 0.36 | | | | 3.47 | | | | 3.83 | | | | (0.38 | ) | | | - | | | | (0.38 | ) | | | 22.75 | | | | 20.01% | | | | 30,932 | | | | 0.71% | | | | 1.70% | |
| 12/31/12 | | | 17.50 | | | | 0.35 | | | | 1.80 | | | | 2.15 | | | | (0.35 | ) | | | - | | | | (0.35 | ) | | | 19.30 | | | | 12.36% | | | | 22,114 | | | | 0.71% | | | | 1.85% | |
| | | | | | | | | | | | | | | | | | | | |
| | | Year ended December 31 | |
| | | 2016 | | | 2015 | | | 2014 | | | 2013 | | | 2012 | |
Portfolio turnover rate | | | 175 | % | | | 209 | % | | | 183 | % | | | 235 | % | | | 251 | % |
| c | Per share amount calculated on the average shares method. |
| m | Total return does not reflect expenses that apply at the separate account level or to related insurance products. Inclusion of these charges would reduce the total return figures for all periods shown. |
The accompanying notes are an integral part of the financial statements.
76
MML Series Investment Fund II – Financial Statements (Continued)
Financial Highlights (For a share outstanding throughout each period)
MML Equity Fund
| | | | | | | | | | | | | | | | | | | | | | | | | | | | | | | | | | | | | | | | | | | | | | | | |
| | | | | | Income (loss) from investment
operations | | | Less distributions to shareholders | | | | | | | | | Ratios / Supplemental Data: | |
| | | Net asset
value,
beginning
of the
period | | | Net
investment
income
(loss)c | | | Net
realized
and
unrealized
gain (loss)
on
investments | | | Total
income
(loss) from
investment
operations | | | From net
investment
income | | | From net
realized gains | | | Total
distributions | | | Net
asset
value,
end of
the
period | | | Total
returnm | | | Net
assets,
end of
the
period
(000’s) | | | Ratio of
expenses
to average
daily net
assets | | | Net
investment
income
(loss) to
average
daily net
assets | |
Initial Class | | | | | | | | | | | | | | | | | | | | | | | | | | | | | | | | | | | | | | | | | |
| 12/31/16 | | $ | 27.08 | | | $ | 0.58 | | | $ | 2.69 | | | $ | 3.27 | | | $ | (0.49 | ) | | $ | (1.78 | ) | | $ | (2.27 | ) | | $ | 28.08 | | | | 12.59% | | | $ | 727,540 | | | | 0.44% | | | | 2.15% | |
| 12/31/15 | | | 30.28 | | | | 0.50 | | | | (1.67 | ) | | | (1.17 | ) | | | (0.64 | ) | | | (1.39 | ) | | | (2.03 | ) | | | 27.08 | | | | (3.43% | ) | | | 709,315 | | | | 0.43% | | | | 1.69% | |
| 12/31/14 | | | 27.55 | | | | 0.61 | | | | 2.57 | | | | 3.18 | | | | (0.45 | ) | | | - | | | | (0.45 | ) | | | 30.28 | | | | 11.57% | | | | 799,222 | | | | 0.43% | | | | 2.12% | |
| 12/31/13 | | | 21.07 | | | | 0.41 | | | | 6.54 | | | | 6.95 | | | | (0.47 | ) | | | - | | | | (0.47 | ) | | | 27.55 | | | | 33.27% | | | | 787,449 | | | | 0.44% | | | | 1.69% | |
| 12/31/12 | | | 18.51 | | | | 0.38 | | | | 2.58 | | | | 2.96 | | | | (0.40 | ) | | | - | | | | (0.40 | ) | | | 21.07 | | | | 16.05% | | | | 709,969 | | | | 0.44% | | | | 1.92% | |
Service Class | | | | | | | | | | | | | | | | | | | | | | | | | | | | | | | | | | | | | | | | | |
| 12/31/16 | | $ | 26.81 | | | $ | 0.50 | | | $ | 2.67 | | | $ | 3.17 | | | $ | (0.43 | ) | | $ | (1.78 | ) | | $ | (2.21 | ) | | $ | 27.77 | | | | 12.31% | | | $ | 82,045 | | | | 0.69% | | | | 1.90% | |
| 12/31/15 | | | 30.01 | | | | 0.42 | | | | (1.65 | ) | | | (1.23 | ) | | | (0.58 | ) | | | (1.39 | ) | | | (1.97 | ) | | | 26.81 | | | | (3.67% | ) | | | 69,098 | | | | 0.68% | | | | 1.45% | |
| 12/31/14 | | | 27.34 | | | | 0.52 | | | | 2.56 | | | | 3.08 | | | | (0.41 | ) | | | - | | | | (0.41 | ) | | | 30.01 | | | | 11.29% | | | | 56,685 | | | | 0.68% | | | | 1.82% | |
| 12/31/13 | | | 20.93 | | | | 0.35 | | | | 6.49 | | | | 6.84 | | | | (0.43 | ) | | | - | | | | (0.43 | ) | | | 27.34 | | | | 32.94% | | | | 41,591 | | | | 0.69% | | | | 1.44% | |
| 12/31/12 | | | 18.41 | | | | 0.34 | | | | 2.54 | | | | 2.88 | | | | (0.36 | ) | | | - | | | | (0.36 | ) | | | 20.93 | | | | 15.76% | | | | 26,073 | | | | 0.69% | | | | 1.69% | |
| | | | | | | | | | | | | | | | | | | | |
| | | Year ended December 31 | |
| | | 2016 | | | 2015 | | | 2014 | | | 2013 | | | 2012 | |
Portfolio turnover rate | | | 47 | % | | | 39 | % | | | 38 | % | | | 100 | % | | | 65 | % |
| c | Per share amount calculated on the average shares method. |
| m | Total return does not reflect expenses that apply at the separate account level or to related insurance products. Inclusion of these charges would reduce the total return figures for all periods shown. |
The accompanying notes are an integral part of the financial statements.
77
MML Series Investment Fund II – Financial Statements (Continued)
Financial Highlights (For a share outstanding throughout each period)
MML Managed Bond Fund
| | | | | | | | | | | | | | | | | | | | | | | | | | | | | | | | | | | | | | | | | | | | | | | | |
| | | | | | Income (loss) from investment
operations | | | Less distributions to shareholders | | | | | | | | | Ratios / Supplemental Data | |
| | | Net asset
value,
beginning
of the
period | | | Net
investment
income
(loss)c | | | Net
realized
and
unrealized
gain (loss)
on
investments | | | Total
income
(loss) from
investment
operations | | | From net
investment
income | | | From
net
realized
gains | | | Total
distributions | | | Net
asset
value,
end of
the
period | | | Total
returnm | | | Net
assets,
end of
the
period
(000’s) | | | Ratio of
expenses
to average
daily net
assets | | | Net
investment
income
(loss) to
average
daily net
assets | |
Initial Class | | | | | | | | | | | | | | | | | | | | | | | | | | | | | | | | | | | | | | | | | |
| 12/31/16 | | $ | 12.31 | | | $ | 0.33 | | | $ | 0.02 | | | $ | 0.35 | | | $ | (0.36 | ) | | $ | (0.06 | ) | | $ | (0.42 | ) | | $ | 12.24 | | | | 2.75% | | | $ | 941,621 | | | | 0.39% | | | | 2.61% | |
| 12/31/15 | | | 12.82 | | | | 0.33 | | | | (0.43 | ) | | | (0.10 | ) | | | (0.36 | ) | | | (0.05 | ) | | | (0.41 | ) | | | 12.31 | | | | (0.75% | ) | | | 976,932 | | | | 0.39% | | | | 2.59% | |
| 12/31/14 | | | 12.44 | | | | 0.32 | | | | 0.47 | | | | 0.79 | | | | (0.41 | ) | | | - | | | | (0.41 | ) | | | 12.82 | | | | 6.46% | | | | 1,218,504 | | | | 0.39% | | | | 2.47% | |
| 12/31/13 | | | 13.20 | | | | 0.31 | | | | (0.52 | ) | | | (0.21 | ) | | | (0.40 | ) | | | (0.15 | ) | | | (0.55 | ) | | | 12.44 | | | | (1.64% | ) | | | 1,123,545 | | | | 0.39% | | | | 2.46% | |
| 12/31/12 | | | 12.99 | | | | 0.35 | | | | 0.38 | | | | 0.73 | | | | (0.38 | ) | | | (0.14 | ) | | | (0.52 | ) | | | 13.20 | | | | 5.77% | | | | 1,027,945 | | | | 0.40% | | | | 2.66% | |
Service Class | | | | | | | | | | | | | | | | | | | | | | | | | | | | | | | | | | | | | | | | | |
| 12/31/16 | | $ | 12.29 | | | $ | 0.29 | | | $ | 0.03 | | | $ | 0.32 | | | $ | (0.33 | ) | | $ | (0.06 | ) | | $ | (0.39 | ) | | $ | 12.22 | | | | 2.49% | | | $ | 260,735 | | | | 0.64% | | | | 2.36% | |
| 12/31/15 | | | 12.80 | | | | 0.30 | | | | (0.43 | ) | | | (0.13 | ) | | | (0.33 | ) | | | (0.05 | ) | | | (0.38 | ) | | | 12.29 | | | | (1.00% | ) | | | 245,418 | | | | 0.64% | | | | 2.36% | |
| 12/31/14 | | | 12.42 | | | | 0.28 | | | | 0.48 | | | | 0.76 | | | | (0.38 | ) | | | - | | | | (0.38 | ) | | | 12.80 | | | | 6.19% | | | | 217,495 | | | | 0.64% | | | | 2.22% | |
| 12/31/13 | | | 13.18 | | | | 0.28 | | | | (0.52 | ) | | | (0.24 | ) | | | (0.37 | ) | | | (0.15 | ) | | | (0.52 | ) | | | 12.42 | | | | (1.88% | ) | | | 178,346 | | | | 0.64% | | | | 2.21% | |
| 12/31/12 | | | 12.97 | | | | 0.32 | | | | 0.38 | | | | 0.70 | | | | (0.35 | ) | | | (0.14 | ) | | | (0.49 | ) | | | 13.18 | | | | 5.51% | | | | 149,124 | | | | 0.65% | | | | 2.40% | |
| | | | | | | | | | | | | | | | | | | | |
| | | Year ended December 31 | |
| | | 2016 | | | 2015 | | | 2014 | | | 2013 | | | 2012 | |
Portfolio turnover rate | | | 314 | % | | | 358 | % | | | 368 | % | | | 313 | % | | | 279 | % |
| c | Per share amount calculated on the average shares method. |
| m | Total return does not reflect expenses that apply at the separate account level or to related insurance products. Inclusion of these charges would reduce the total return figures for all periods shown |
The accompanying notes are an integral part of the financial statements.
78
MML Series Investment Fund II – Financial Statements (Continued)
Financial Highlights (For a share outstanding throughout each period)
MML U. S. Government Money Market Fund
| | | | | | | | | | | | | | | | | | | | | | | | | | | | | | | | | | | | | | | | | | | | | | | | |
| | | | | | Income (loss) from investment
operations | | | Less distributions to shareholders | | | | | | | | | Ratios / Supplemental Data | |
| | | Net asset
value,
beginning
of the
period | | | Net
investment
income
(loss)c,j | | | Net
realized
and
unrealized
gain (loss)
on
investments | | | Total
income
(loss) from
investment
operations | | | From net
investment
income | | | From
net
realized
gains | | | Total
distributions | | | Net
asset
value,
end of
the
period | | | Total
returnm | | | Net
assets,
end of
the
period
(000’s) | | | Ratio of
expenses
to average
daily net
assets
before
expense
waivers | | | Ratio of
expenses
to average
daily net
assets
after
expense
waiversj | |
Initial Class | | | | | | | | | | | | | | | | | | | | | | | | | | | | | | | | | | | | | | | | | |
| 12/31/16 | | $ | 1.00 | | | $ | 0.00 | d | | $ | 0.00 | d | | $ | 0.00 | d | | $ | (0.00 | )d | | $ | - | | | $ | (0.00 | )d | | $ | 1.00 | | | | 0.11% | | | $ | 166,136 | | | | 0.54% | | | | 0.40% | |
| 12/31/15 | | | 1.00 | | | | - | | | | 0.00 | d | | | 0.00 | d | | | (0.00 | )d | | | (0.00 | )d | | | (0.00 | )d | | | 1.00 | | | | 0.00% | e | | | 167,900 | | | | 0.52% | | | | 0.15% | |
| 12/31/14 | | | 1.00 | | | | - | | | | 0.00 | d | | | 0.00 | d | | | (0.00 | )d | | | (0.00 | )d | | | (0.00 | )d | | | 1.00 | | | | 0.00% | e | | | 252,701 | | | | 0.51% | | | | 0.11% | |
| 12/31/13 | | | 1.00 | | | | - | | | | 0.00 | d | | | 0.00 | d | | | (0.00 | )d | | | - | | | | (0.00 | )d | | | 1.00 | | | | 0.00% | e | | | 272,401 | | | | 0.51% | | | | 0.14% | |
| 12/31/12 | | | 1.00 | | | | - | | | | 0.00 | d | | | 0.00 | d | | | (0.00 | )d | | | (0.00 | )d | | | (0.00 | )d | | | 1.00 | | | | 0.00% | e | | | 299,944 | | | | 0.52% | | | | 0.16% | |
| c | Per share amount calculated on the average shares method. |
| d | Amount is less than $0.005 per share. |
| e | Amount is less than 0.005%. |
| j | Computed after giving effect to an agreement by MML Advisers and/or MassMutual to waive certain fees and expenses of the Fund. |
| m | Total return does not reflect expenses that apply at the separate account level or to related insurance products. Inclusion of these charges would reduce the total return figures for all periods shown. |
The accompanying notes are an integral part of the financial statements.
79
Notes to Financial Statements
MML Series Investment Fund II (the “Trust”) is registered under the Investment Company Act of 1940, as amended (the “1940 Act”), as a no-load, open-end, management investment company. The Trust is organized under the laws of the Commonwealth of Massachusetts as a Massachusetts business trust pursuant to an Agreement and Declaration of Trust dated February 8, 2005, which was amended and restated as of February 28, 2005 and December 15, 2011, as it may be further amended from time to time. The following are four series of the Trust (each individually referred to as a “Fund” or collectively as the “Funds”):
MML Blend Fund (“Blend Fund”)
MML Equity Fund (“Equity Fund”)
MML Managed Bond Fund (“Managed Bond Fund”)
MML U.S. Government Money Market Fund (formerly known as MML Money Market Fund) (“U.S. Government Money Market Fund”)
The Trust makes shares of the Funds available for the investment of assets of various separate investment accounts established by Massachusetts Mutual Life Insurance Company (“MassMutual”) and by life insurance companies which are subsidiaries of MassMutual. Shares of the Trust are not offered to the general public. MassMutual, MML Bay State Life Insurance Company, C.M. Life Insurance Company, and the MML Allocation Funds, which are “funds of funds” series of MML Series Investment Fund, another open-end management investment company sponsored by MassMutual, are the record owners of all of the outstanding shares of the Funds.
Each share class of a Fund represents an interest in the same portfolio of assets. The principal difference among the classes is the level of shareholder and distribution service expenses borne by the classes. Because each class will have different fees and expenses, performance and share prices will vary between the classes. The classes of shares are offered to different types of investors, as outlined in the Funds’ Prospectus.
U.S. Government Money Market Fund’s name, investment objective, and investment strategy changed on May 1, 2016 when the Fund changed from a money market fund to a government money market fund.
| 2. | | Significant Accounting Policies |
The following is a summary of significant accounting policies followed consistently by each Fund in the preparation of the financial statements in conformity with accounting principles generally accepted in the United States of America (“generally accepted accounting principles”). The preparation of the financial statements in accordance with generally accepted accounting principles requires management to make estimates and assumptions that affect the reported amounts and disclosures in the financial statements. Actual results could differ from those estimates.
Investment Valuation
The net asset value of each Fund’s shares is determined once daily as of the close of regular trading on the New York Stock Exchange (“NYSE”), on each day the NYSE is open for trading (a “business day”). The NYSE normally closes at 4:00 p.m. Eastern Time, but may close earlier on some days.
Equity securities and derivative contracts that are actively traded on a national securities exchange or contract market are valued on the basis of information furnished by a pricing service, which provides the last reported sale price, or, in the case of futures contracts, the settlement price, for securities or derivatives listed on the exchange or contract market or the official closing price on the NASDAQ National Market System (“NASDAQ System”), or in the case of over-the-counter (“OTC”) securities for which an official closing price is unavailable or not reported on the NASDAQ System, the last reported bid price. Portfolio securities traded on more than one national securities exchange are valued at the last price at the close of the exchange representing the principal market for such securities. Debt securities (with the exception of debt securities held by the U.S. Government Money Market Fund) are valued on the basis of valuations furnished by a pricing service, which generally determines valuations taking into account factors such as institutional-size trading in similar securities, yield, quality, coupon rate, maturity, type of issue, trading characteristics, and other market data. Shares of other open-end mutual funds are valued at their closing net asset values as reported on each business day. The U.S. Government Money Market Fund’s debt securities are typically valued at amortized cost, but may be valued using a vendor quote
80
Notes to Financial Statements (Continued)
if the Fund’s investment adviser determines it more closely approximates current market value, in accordance with Rule 2a-7 under the 1940 Act pursuant to which the U.S. Government Money Market Fund must adhere to certain conditions. It is the intention of the U.S. Government Money Market Fund to maintain a stable net asset value per share of $1.00, although this cannot be assured.
Investments for which market quotations are readily available are marked to market daily based on those quotations. Market quotations may be provided by third-party vendors or market makers, and may be determined on the basis of a variety of factors, such as broker quotations, financial modeling, and other market data, such as market indexes and yield curves, counterparty information, and foreign exchange rates. U.S. Government and agency securities may be valued on the basis of market quotations or using a model that may incorporate market observable data such as reported sales of similar securities, broker quotes, yields, bids, offers, quoted market prices, and reference data. The fair values of OTC derivative contracts, including forward, swap, and option contracts related to interest rates, foreign currencies, credit standing of reference entities, equity prices, or commodity prices, may be based on market quotations or may be modeled using a series of techniques, including simulation models, depending on the contract and the terms of the transaction. The fair values of asset-backed securities and mortgage-backed securities are estimated based on models that consider the estimated cash flows of each debt tranche of the issuer, established benchmark yield, and estimated tranche-specific spread to the benchmark yield based on the unique attributes of the tranche, including, but not limited to, prepayment speed assumptions and attributes of the collateral. Restricted securities are generally valued at a discount to similar publicly traded securities.
Investments for which market quotations are not available or for which a pricing service or vendor does not provide a value, or for which such market quotations or values are considered by the investment adviser or subadviser to be unreliable (including, for example, certain foreign securities, thinly-traded securities, certain restricted securities, certain initial public offerings, or securities whose values may have been affected by a significant event) are stated at fair valuations determined in good faith by the Funds’ Valuation Committee1 in accordance with procedures approved annually by the Board of Trustees (“Trustees”), and under the general oversight of the Trustees. The Funds’ Valuation Committee employs various methods to determine fair valuations including a regular review of significant inputs and assumptions and review of any related market activity. The Funds’ Valuation Committee reports to the Trustees at their regularly scheduled meetings. It is possible that fair value prices will be used by the Funds to a significant extent. The value determined for an investment using the Funds’ fair value procedures may differ from recent market prices for the investment and may be significantly different from the value realized upon the sale of such investment.
The Funds may invest in securities that are traded principally in foreign markets and that trade on weekends and other days when the Funds do not price their shares. As a result, the values of the Funds’ portfolio securities may change on days when the prices of the Funds’ shares are not calculated. The prices of the Funds’ shares will reflect any such changes when the prices of the Funds’ shares are next calculated, which is the next business day. The Funds may use fair value pricing more frequently for securities primarily traded in foreign markets because, among other things, most foreign markets close well before the Funds value their securities. The earlier close of these foreign markets gives rise to the possibility that significant events, including broad market moves, may have occurred in the interim. The Funds’ investments may be priced based on fair values provided by a third-party vendor, based on certain factors and methodologies applied by such vendor, in the event that there is movement in the U.S. market, between the close of the foreign market and the time the Funds calculate their net asset values. All assets and liabilities expressed in foreign currencies are converted into U.S. dollars at the mean between the buying and selling rates of such currencies against the U.S. dollar at the end of each business day.
Fair value is defined as the price that would be received to sell an asset or paid to transfer a liability in an orderly transaction between market participants at the measurement date. A three-tier hierarchy is utilized to maximize the use of observable market data inputs and minimize the use of unobservable inputs and to establish classification of fair value measurements for disclosure purposes. Inputs refer broadly to the assumptions that market participants would use in pricing the asset or liability, including assumptions about risk, for example, the risk inherent in a particular valuation technique used to measure fair value (such as a pricing model) and/or the risk inherent in the inputs to the valuation technique. Inputs may be observable or unobservable. Observable inputs are inputs that reflect the assumptions market participants would use in pricing the asset or liability and are
| 1 | The Valuation Committee consists of the President, Treasurer, Assistant Treasurers, Vice Presidents (except for the CCO), Assistant Vice Presidents, Secretary, and Assistant Secretaries of the Trust, as well as such alternate members as the Trustees may from time to time designate. The Valuation Committee reviews and determines the fair valuation of portfolio securities and the Funds’ pricing procedures in general. |
81
Notes to Financial Statements (Continued)
developed based on market data obtained from sources independent of the reporting entity. Unobservable inputs are inputs that reflect the reporting entity’s own assumptions about the assumptions market participants would use in pricing the asset or liability and are developed based on the best information available in the circumstances. The three-tier hierarchy of inputs is summarized in the three broad Levels listed below. The inputs or methodology used for valuing investments are not necessarily an indication of the risk associated with investing in those investments and the determination of the significance of a particular input to the fair value measurement in its entirety requires judgment and consideration of factors specific to each security.
Level 1 – quoted prices (unadjusted) in active markets for identical investments that the Funds can access at the measurement date
The types of assets and liabilities categorized in Level 1 generally include actively traded domestic and certain foreign equity securities, derivatives actively traded on a national securities exchange (such as some warrants, rights, futures, and options), and shares of open-end mutual funds.
Level 2 – other significant observable inputs (including quoted prices for similar investments, interest rates, prepayment speeds, credit risk, etc.)
The types of assets and liabilities categorized in Level 2 generally include debt securities such as U.S. Government and agency securities, mortgage-backed securities, asset-backed securities, municipal obligations, sovereign debt obligations, bank loans, corporate bonds, and those securities valued at amortized cost; OTC derivatives such as swaps, options, swaptions, and forward foreign currency exchange contracts; certain restricted securities; and non-exchange traded equity securities and certain foreign equity securities traded on particular foreign exchanges that close before the Funds determine their net asset values.
Level 3 – significant unobservable inputs (including the Funds’ own assumptions in determining the fair value of investments)
The types of assets and liabilities categorized in Level 3 generally include securities for which prices, spreads, or any of the other aforementioned significant inputs are unobservable. Generally, securities whose trading has been suspended or that have been de-listed from their current primary trading exchange; securities in default or bankruptcy proceedings for which there is no current market quotation; securities and certain derivatives valued by broker quotes which may include brokers’ assumptions; and any illiquid Rule 144A securities or restricted securities issued by non-public entities are categorized in Level 3.
The availability of observable inputs can vary from security to security and is affected by a wide variety of factors, including, for example, the type of security, whether the security is new and not yet established in the marketplace, the liquidity of markets, and other characteristics particular to the security. To the extent that valuation is based on models or inputs that are less observable or unobservable in the market, the determination of fair value requires more judgment. Accordingly, the degree of judgment exercised in determining fair value is greatest for instruments categorized in Level 3.
Changes in valuation techniques may result in transfers in or out of an investment’s assigned Level within the hierarchy. In addition, in periods of market dislocation, the observability of prices and inputs may be reduced for many instruments. This condition, as well as changes related to liquidity of investments, could cause a security to be reclassified between Level 1, Level 2, or Level 3.
In certain cases, the inputs used to measure fair value may fall into different levels of the fair value hierarchy. In such cases, for disclosure purposes the level in the fair value hierarchy within which the fair value measurement falls is determined based on the lowest level input that is significant to the overall fair value measurement.
The U.S. Government Money Market Fund characterized all investments at Level 2, as of December 31, 2016. The Equity Fund characterized all long-term investments at Level 1, and all short-term investments at Level 2, as of December 31, 2016. For each Fund noted in the preceding sentences, the level classification by major category of investments is the same as the category presentation in the Portfolio of Investments.
82
Notes to Financial Statements (Continued)
The following is the aggregate value by input level, as of December 31, 2016, for the remaining Funds’ investments:
| | | | | | | | | | | | | | | | |
| | | Level 1 | | | Level 2 | | | Level 3 | | | Total | |
Blend Fund | | | | | | | | | | | | | | | | |
Asset Investments | | | | | | | | | | | | | | | | |
Common Stock | | $ | 458,676,426 | | | $ | - | | | $ | - | | | $ | 458,676,426 | |
Preferred Stock | | | 503,400 | | | | - | | | | - | | | | 503,400 | |
Corporate Debt | | | - | | | | 67,223,531 | | | | - | | | | 67,223,531 | |
Municipal Obligations | | | - | | | | 1,859,231 | | | | - | | | | 1,859,231 | |
Non-U.S. Government Agency Obligations | | | - | | | | 56,969,853 | | | | - | | | | 56,969,853 | |
Sovereign Debt Obligations | | | - | | | | 2,111,298 | | | | - | | | | 2,111,298 | |
U.S. Government Agency Obligations and Instrumentalities | | | - | | | | 46,559,512 | | | | - | | | | 46,559,512 | |
U.S. Treasury Obligations | | | - | | | | 6,382,008 | | | | - | | | | 6,382,008 | |
Rights | | | - | | | | - | | | | 19,928 | * | | | 19,928 | |
Short-Term Investments | | | - | | | | 27,596,628 | | | | - | | | | 27,596,628 | |
| | | | | | | | | | | | | | | | |
| Total Investments | | $ | 459,179,826 | | | $ | 208,702,061 | | | $ | 19,928 | | | $ | 667,901,815 | |
| | | | | | | | | | | | | | | | |
Liability Derivatives | | | | | | | | | | | | | | | | |
Futures Contracts | | $ | (120,490 | ) | | $ | - | | | $ | - | | | $ | (120,490 | ) |
Swap Agreements | | | - | | | | (101,625 | ) | | | - | | | | (101,625 | ) |
| | | | | | | | | | | | | | | | |
| Total | | $ | (120,490 | ) | | $ | (101,625 | ) | | $ | - | | | $ | (222,115 | ) |
| | | | | | | | | | | | | | | | |
| | | | |
Managed Bond Fund | | | | | | | | | | | | | | | | |
Asset Investments | | | | | | | | | | | | | | | | |
Preferred Stock | | $ | 2,391,150 | | | $ | - | | | $ | - | | | $ | 2,391,150 | |
Corporate Debt | | | - | | | | 439,033,603 | | | | - | | | | 439,033,603 | |
Municipal Obligations | | | - | | | | 11,978,017 | | | | - | | | | 11,978,017 | |
Non-U.S. Government Agency Obligations | | | - | | | | 373,440,257 | | | | - | | | | 373,440,257 | |
Sovereign Debt Obligations | | | - | | | | 10,392,381 | | | | - | | | | 10,392,381 | |
U.S. Government Agency Obligations and Instrumentalities | | | - | | | | 300,084,110 | | | | - | | | | 300,084,110 | |
U.S. Treasury Obligations | | | - | | | | 48,580,949 | | | | - | | | | 48,580,949 | |
Short-Term Investments | | | - | | | | 189,495,978 | | | | - | | | | 189,495,978 | |
| | | | | | | | | | | | | | | | |
| Total Investments | | $ | 2,391,150 | | | $ | 1,373,005,295 | | | $ | - | | | $ | 1,375,396,445 | |
| | | | | | | | | | | | | | | | |
Liability Derivatives | | | | | | | | | | | | | | | | |
Futures Contracts | | $ | (639,824 | ) | | $ | - | | | $ | - | | | $ | (639,824 | ) |
Swap Agreements | | | - | | | | (627,767 | ) | | | - | | | | (627,767 | ) |
| | | | | | | | | | | | | | | | |
| Total | | $ | (639,824 | ) | | $ | (627,767 | ) | | $ | - | | | $ | (1,267,591 | ) |
| | | | | | | | | | | | | | | | |
| * | None of the unobservable inputs for Level 3 assets, individually or collectively, had a material impact on the Fund(s). Level 3 investments at the beginning and/or end of the period in relation to net assets were not significant and accordingly, a reconciliation of Level 3 assets for the year ended December 31, 2016 is not presented. |
The following table shows Fund(s) with certain assets and liabilities, which approximate fair value and would be categorized at Level 2 as of December 31, 2016.
| | | | | | |
Statements of Asset and Liabilities location: | | Blend Fund | | Equity Fund | | Managed Bond Fund |
| | | | |
Receivables from: | | | | | | |
Investments sold on a when-issued basis | | X | | | | X |
| | | | |
Payables for: | | | | | | |
Investments purchased on a when-issued basis | | X | | | | X |
Securities on loan | | | | X | | |
Due to custodian | | X | | | | X |
83
Notes to Financial Statements (Continued)
The Fund(s) had no transfers between Level 1, Level 2, and Level 3 of the fair value hierarchy during the year ended December 31, 2016. The Fund(s) recognize transfers between the Levels as of the beginning of the year.
None of the unobservable inputs, individually or collectively, had a material impact on the Fund(s). Level 3 investments at the beginning and/or end of the period in relation to net assets were not significant and accordingly, a reconciliation of Level 3 assets for the year ended December 31, 2016 is not presented.
Derivative Instruments
Derivatives are financial instruments whose values are based on the values of one or more indicators, such as a security, asset, currency, interest rate, or index. Derivative transactions can create investment leverage and may be highly volatile. Gains or losses from derivatives can be substantially greater than their original cost and can sometimes be unlimited. A Fund may not be able to close out a derivative transaction at a favorable time or price. For those Funds that held derivatives during the year ended December 31, 2016, the following table shows how the Fund used these types of derivatives during the period (marked with an “A”), as well as additional uses, if any, it may have for them in the future (marked with an “M”).
| | | | |
Type of Derivatives and Objective for Use | | Blend Fund | | Managed Bond fund |
Futures Contracts* | | | | |
Hedging/Risk Management | | A | | A |
Duration/Credit Quality Management | | A | | A |
Substitution for Direct Investment | | A | | A |
Intention to Create Investment Leverage in Portfolio | | M | | M |
| | | |
Credit Default Swaps (Protection Buyer) | | | | |
Hedging/Risk Management | | A | | A |
Duration/Credit Quality Management | | A | | A |
Income | | A | | A |
Substitution for Direct Investment | | A | | A |
Intention to Create Investment Leverage in Portfolio | | M | | M |
| | | |
Credit Default Swaps (Protection Seller) | | | | |
Hedging/Risk Management | | A | | A |
Duration/Credit Quality Management | | A | | A |
Income | | A | | A |
Substitution for Direct Investment | | A | | A |
Intention to Create Investment Leverage in Portfolio | | M | | M |
| | | |
Options (Purchased) | | | | |
Hedging/Risk Management | | A | | A |
Duration/Credit Quality Management | | A | | A |
Substitution for Direct Investment | | A | | A |
Directional Investment | | A | | A |
Intention to Create Investment Leverage in Portfolio | | M | | M |
| * | Includes any options purchased or written on futures contracts, if applicable. |
84
Notes to Financial Statements (Continued)
At December 31, 2016, and during the year then ended, the Fund(s) had the following derivatives and transactions in derivatives, grouped into the indicated risk categories:
| | | | | | | | | | | | | | | | |
| | | Credit
Risk | | | Equity
Risk | | | Interest
Rate
Risk | | | Total | |
| Blend Fund | |
| Liability Derivatives | |
Futures Contracts^^ | | $ | - | | | $ | - | | | $ | (120,490 | ) | | $ | (120,490 | ) |
Swap Agreements^ | | | (61,982 | ) | | | - | | | | - | | | | (61,982 | ) |
Swap Agreements^^,^^^ | | | (39,643 | ) | | | - | | | | - | | | | (39,643 | ) |
| | | | | | | | | | | | | | | | |
Total Value | | $ | (101,625 | ) | | $ | - | | | $ | (120,490 | ) | | $ | (222,115 | ) |
| | | | | | | | | | | | | | | | |
| Realized Gain (Loss)# | |
Purchased Options | | $ | 72,963 | | | $ | - | | | $ | - | | | $ | 72,963 | |
Futures Contracts | | | - | | | | (341,263 | ) | | | 148,080 | | | | (193,183 | ) |
Swap Agreements | | | (4,395 | ) | | | - | | | | - | | | | (4,395 | ) |
| | | | | | | | | | | | | | | | |
Total Realized Gain (Loss) | | $ | 68,568 | | | $ | (341,263 | ) | | $ | 148,080 | | | $ | (124,615 | ) |
| | | | | | | | | | | | | | | | |
| Change in Appreciation (Depreciation)## | | | | | | | | | | | | | | | | |
Purchased Options | | $ | 50,741 | | | $ | - | | | $ | - | | | $ | 50,741 | |
Futures Contracts | | | - | | | | - | | | | (144,472 | ) | | | (144,472 | ) |
Swap Agreements | | | 1,094 | | | | - | | | | - | | | | 1,094 | |
| | | | | | | | | | | | | | | | |
Total Change in Appreciation (Depreciation) | | $ | 51,835 | | | $ | - | | | $ | (144,472 | ) | | $ | (92,637 | ) |
| | | | | | | | | | | | | | | | |
Managed Bond Fund | |
| Liability Derivatives | |
Futures Contracts^^ | | $ | - | | | $ | - | | | $ | (639,824 | ) | | $ | (639,824 | ) |
Swap Agreements^ | | | (378,711 | ) | | | - | | | | - | | | | (378,711 | ) |
Swap Agreements^^,^^^ | | | (249,056 | ) | | | - | | | | - | | | | (249,056 | ) |
| | | | | | | | | | | | | | | | |
Total Value | | $ | (627,767 | ) | | $ | - | | | $ | (639,824 | ) | | $ | (1,267,591 | ) |
| | | | | | | | | | | | | | | | |
Realized Gain (Loss)# | |
Purchased Options | | $ | 446,330 | | | $ | - | | | $ | - | | | $ | 446,330 | |
Futures Contracts | | | - | | | | - | | | | 1,626,297 | | | | 1,626,297 | |
Swap Agreements | | | (32,694 | ) | | | - | | | | - | | | | (32,694 | ) |
| | | | | | | | | | | | | | | | |
Total Realized Gain (Loss) | | $ | 413,636 | | | $ | - | | | $ | 1,626,297 | | | $ | 2,039,933 | |
| | | | | | | | | | | | | | | | |
Change in Appreciation (Depreciation)## | |
Purchased Options | | $ | 310,362 | | | $ | - | | | $ | - | | | $ | 310,362 | |
Futures Contracts | | | - | | | | - | | | | (713,269 | ) | | | (713,269 | ) |
Swap Agreements | | | (1,400 | ) | | | - | | | | - | | | | (1,400 | ) |
| | | | | | | | | | | | | | | | |
Total Change in Appreciation (Depreciation) | | $ | 308,962 | | | $ | - | | | $ | (713,269 | ) | | $ | (404,307 | ) |
| | | | | | | | | | | | | | | | |
| ^ | Statements of Assets and Liabilities location: Payables for: open swap agreements, at value. |
| ^^ | Cumulative appreciation (depreciation) on futures contracts and centrally cleared swaps is reported in “Futures Contracts” and “Swap Agreements” below. Only current day’s variation margin, if any, is reported within the Statements of Assets and Liabilities. |
| ^^^ | Represents centrally cleared swaps which are not subject to a master netting agreement. |
| # | Statements of Operations location: Amounts are included in net realized gain (loss) on: investment transactions, futures contracts, or swap agreements, as applicable. |
| ## | Statements of Operations location: Amounts are included in net change in unrealized appreciation (depreciation) on: investment transactions, futures contracts, or swap agreements, as applicable. |
85
Notes to Financial Statements (Continued)
For the year ended December 31, 2016, the number of contracts, notional amounts, or shares/units for each derivative type was as follows:
| | | | | | | | | | | | |
| | | Number of Contracts, Notional Amounts,
or Shares/Units† | |
| | | Futures
Contracts | | | Purchased
Options | | | Swap
Agreements | |
MML Blend Fund | | | 274 | | | $ | 56,650,000 | | | $ | 2,618,333 | |
MML Managed Bond Fund | | | 1,564 | | | | 346,500,000 | | | | 16,261,667 | |
| † | Amount(s) disclosed represent average number of contracts for futures contracts, notional amounts for purchased options and swap agreements, which is indicative of volume of this derivative type, for the months that the Fund held such derivatives during the year ended December 31, 2016. |
The following table presents derivative liabilities by counterparty net of amounts available for offset under a master netting agreement (“MNA”), or similar agreement, and net of the related collateral pledged by the Fund(s) as of December 31, 2016.
| | | | | | | | | | | | | | | | |
Counterparty | | Derivative Liabilities
Subject to an
MNA by
Counterparty† | | | Financial
Instruments
Available for Offset | | | Collateral
Pledged** | | | Net Amount* | |
| Blend Fund | | | | | | | | | | | | | | | | |
Goldman Sachs International | | $ | (61,982 | ) | | $ | - | | | $ | - | | | $ | (61,982 | ) |
| | | | | | | | | | | | | | | | |
| Managed Bond Fund | | | | | | | | | | | | | | | | |
Goldman Sachs International | | $ | (378,711 | ) | | $ | - | | | $ | - | | | $ | (378,711 | ) |
| | | | | | | | | | | | | | | | |
| * | Represents the net amount payable to the counterparty in the event of default. |
| ** | The amount presented here may be less than the total amount of collateral pledged as the net amount of derivative assets and liabilities for a counterparty cannot be less than $0. |
| † | The amount presented here may be less than the total amount shown in the Statements of Assets and Liabilities as some derivatives held by the counterparty are not covered within the master netting agreements. |
Such agreements typically permit a single net payment in the event of default, including the bankruptcy or insolvency of the counterparty. Typically, the Fund(s) and counterparties are not permitted to sell, re-pledge, or use the collateral they receive.
Further details regarding the derivatives and other investments held by the Fund(s) during the year ended December 31, 2016, are discussed below.
Futures Contracts
A Fund may seek to manage a variety of different risks, such as interest rate risk, equity price risk, and currency risk, through the use of futures contracts. A Fund may use interest rate futures contracts to adjust the interest rate sensitivity (duration) of its portfolio or the credit exposure of the portfolio. Interest rate futures contracts obligate the long or short holder to take or make delivery of a specified quantity of a financial instrument, such as a specific fixed-income security, during a specified future period at a specified price. A Fund may use index futures to hedge against broad market risks to its portfolio or to gain broad market exposure when it holds uninvested cash or as an inexpensive substitute for cash investments directly in securities or other assets. Securities index futures contracts are contracts to buy or sell units of a securities index at a specified future date at a price agreed upon when the contract is made and are settled in cash. Positions in futures may be closed out only on an exchange or board of trade which provides a secondary market for such futures. Because futures contracts are exchange-traded, they typically have minimal exposure to counterparty risk.
Parties to a futures contract are not required to post the entire notional amount of the contract, but rather a small percentage of that amount (by way of margin), both at the time they enter into futures transactions, and then on a daily basis if their positions decline
86
Notes to Financial Statements (Continued)
in value; as a result, futures contracts are highly leveraged. Such payments are known as variation margin and are recorded by the Funds as unrealized gains or losses. Because futures markets are highly leveraged, they can be extremely volatile, and there can be no assurance that the pricing of a futures contract will correlate precisely with the pricing of the asset or index underlying it or the asset or liability of the Fund that is the subject of the hedge. It may not always be possible for a Fund to enter into a closing transaction with respect to a futures contract it has entered into, at a favorable time or price. When a Fund enters into a futures transaction, it is subject to the risk that the value of the futures contract will move in a direction unfavorable to it. When a Fund uses futures contracts for hedging purposes, it is likely that the Fund will have an asset or liability that will offset any loss (or gain) on the transactions, at least in part.
When a futures contract is closed, the Fund records a realized gain or loss equal to the difference between the value of the contract at the time it was opened and the value at the time it was closed. Futures contracts are valued at the settlement price established each day by the board of trade or exchange on which they are traded.
The Fund(s) listed in the following table had open futures contracts at December 31, 2016:
| | | | | | | | | | | | | | | | |
| | | Expiration
Date | | | Number of
Contracts | | | Notional
Amount | | | Net Unrealized
Appreciation/
(Depreciation) | |
Blend Fund | | | | | | | | | | | | | | | | |
Futures Contracts — Long | | | | | | | | | | | | | | | | |
U.S. Long Bond | | | 03/22/17 | | | | 8 | | | $ | 1,205,250 | | | $ | (12,964 | ) |
U.S. Treasury Ultra 10 Year | | | 03/22/17 | | | | 3 | | | | 402,188 | | | | (1,557 | ) |
U.S. Ultra Bond | | | 03/22/17 | | | | 35 | | | | 5,608,750 | | | | (45,741 | ) |
U.S. Treasury Note 2 Year | | | 03/31/17 | | | | 26 | | | | 5,633,875 | | | | (4,954 | ) |
U.S. Treasury Note 5 Year | | | 03/31/17 | | | | 151 | | | | 17,767,274 | | | | (55,274 | ) |
| | | | | | | | | | | | | | | | |
| | | $ | (120,490 | ) |
| | | | | | | | | | | | | | | | |
Managed Bond Fund | | | | | | | | | | | | | | | | |
Futures Contracts — Long | | | | | | | | | | | | | | | | |
U.S. Long Bond | | | 03/22/17 | | | | 79 | | | $ | 11,901,844 | | | $ | (22,070 | ) |
U.S. Treasury Ultra 10 Year | | | 03/22/17 | | | | 89 | | | | 11,931,562 | | | | (58,829 | ) |
U.S. Ultra Bond | | | 03/22/17 | | | | 144 | | | | 23,076,000 | | | | (129,070 | ) |
U.S. Treasury Note 2 Year | | | 03/31/17 | | | | 111 | | | | 24,052,313 | | | | (18,340 | ) |
U.S. Treasury Note 5 Year | | | 03/31/17 | | | | 1,226 | | | | 144,256,141 | | | | (411,515 | ) |
| | | | | | | | | | | | | | | | |
| | | $ | (639,824 | ) |
| | | | | | | | | | | | | | | | |
Swap Agreements
Swap agreements are typically two-party contracts entered into primarily by institutional investors. In a standard “swap” transaction, two parties agree to exchange the returns (or differentials in rates of return) earned or realized on particular predetermined investments or instruments, which may be adjusted for an interest factor. The gross returns to be exchanged or “swapped” between the parties are generally calculated with respect to a “notional amount,” (i.e., the return on or increase in value of a particular dollar amount invested at a particular interest rate or in a “basket” of securities representing a particular index).
A Fund may enter into credit default swap transactions, as a “buyer” or “seller” of credit protection. In a credit default swap, one party provides what is in effect insurance against a default or other adverse credit event affecting an issuer of debt securities (typically referred to as a “reference entity”). In general, the buyer of credit protection is obligated to pay the protection seller an upfront amount or a periodic stream of payments over the term of the swap. If a “credit event” occurs, the buyer has the right to deliver to the seller bonds or other obligations of the reference entity (with a value up to the full notional value of the swap), and to receive a payment equal to the par value of the bonds or other obligations. Credit events that would trigger a request that the seller make payment are specific to each credit default swap agreement, but generally include bankruptcy, failure to pay, restructuring,
87
Notes to Financial Statements (Continued)
acceleration, default, or repudiation/moratorium. When a Fund buys protection, it may or may not own securities of the reference entity. If it does own securities of the reference entity, the swap serves as a hedge against a decline in the value of the securities due to the occurrence of a credit event involving the issuer of the securities. If the Fund does not own securities of the reference entity, the credit default swap may be seen to create a short position in the reference entity. If a Fund is a buyer and no credit event occurs, the Fund will typically recover nothing under the swap, but will have had to pay the required upfront payment or stream of continuing payments under the swap. When a Fund sells protection under a credit default swap, the position may have the effect of creating leverage in the Fund’s portfolio through the Fund’s indirect long exposure to the issuer or securities on which the swap is written. When a Fund sells protection, it may do so either to earn additional income or to create a “synthetic” long position.
Whenever a Fund enters into a swap agreement, it takes on counterparty risk — the risk that its counterparty will be unable or unwilling to meet its obligations under the swap agreement. The Fund also takes the risk that the market will move against its position in the swap agreement. In the case of a credit default swap, the swap will become more or less valuable depending on the credit of the issuer of the underlying security, and, if a credit event occurs under a swap where the Fund is the seller of credit protection, the Fund could be required to purchase the security at par value, resulting in a significant loss to the Fund. When the Fund enters into any type of swap for hedging purposes, it is likely that the Fund will have an asset or liability that will offset any loss (or gain) on the swap, at least in part. Swap agreements may be non-transferable or otherwise highly illiquid, and a Fund may not be able to terminate or transfer a swap agreement at any particular time or at an acceptable price.
Swaptions. A Fund may also enter into options on swap agreements (“swaptions”). A swaption is a contract that gives a counterparty the right (but not the obligation) to enter into a new swap agreement or to shorten, extend, cancel, or otherwise modify an existing swap agreement, at some designated future time on specified terms. A Fund may write (sell) and purchase put and call swaptions. Depending on the terms of the particular option agreement, a Fund will generally incur a greater degree of risk when it writes a swaption than it will incur when it purchases a swaption. When a Fund purchases a swaption, it risks losing only the amount of the premium it has paid should it decide to let the option expire unexercised. However, when a Fund writes a swaption, upon exercise of the option the Fund will become obligated according to the terms of the underlying agreement. A Fund may enter into swaptions for the same purposes as swaps. For information regarding the accounting treatment of options, see “Options, Rights, and Warrants” below.
Centrally Cleared Swaps. Certain clearinghouses currently offer clearing for limited types of derivatives transactions, principally certain interest rate swaps, certain index swaps, and credit derivatives. In a cleared derivative transaction, a Fund typically enters into the transaction with a financial institution counterparty, and performance of the transaction is effectively guaranteed by a central clearinghouse, thereby reducing or eliminating the Fund’s exposure to the credit risk of its original counterparty. The Fund will be required to post amounts (“initial margin”) with the clearinghouse or at the instruction of the clearinghouse. The initial margin required by a clearinghouse may be greater than the initial margin the Fund would be required to post in an uncleared transaction. If cash is deposited as the initial margin, it is shown as collateral on a Fund’s Statement of Assets and Liabilities. Swap agreements are marked-to-market daily and subsequent payments (“variation margin”) are made or received by a Fund depending on whether unrealized gains or losses are incurred. These amounts are reflected as receivables or payables on a Fund’s Statement of Assets and Liabilities (“Variation margin on open derivative instruments”) and as a component of net change in unrealized appreciation (depreciation) on a Fund’s Statement of Operations. Only a limited number of transaction types are currently eligible for clearing.
During the term of a swap transaction, changes in the value of the swap are recognized as unrealized gains or losses by marking to market to reflect the market value of the swap. When the swap is terminated, a Fund will record a realized gain or loss equal to the difference, if any, between the proceeds from (or cost of) the closing transaction and a Fund’s basis in the agreement. Upfront swap premium payments paid or received by a Fund, if any, are recorded within the value of the open swap agreement on the Fund’s Statement of Assets and Liabilities and represent payments paid or received upon entering into the swap agreement to compensate for differences between stated terms of the swap agreement and prevailing market conditions (credit spreads, currency exchange rates, and other relevant factors). These upfront payments are recorded as realized gain or loss on the Fund’s Statement of Operations upon termination or maturity of the swap agreement.
During the term of a swap transaction, the periodic net payments can be made for a set period of time or may be triggered by a predetermined credit event. The net periodic payments may be based on a fixed or variable interest rate, the change in market value of a specified security, basket of securities or index, or the return generated by a security. These periodic payments received or made by the Funds are recorded in the accompanying Statements of Operations as realized gains and losses, respectively.
88
Notes to Financial Statements (Continued)
The Fund(s) listed in the following table had open swap transactions at December 31, 2016. A Fund’s current exposure to a counterparty is the fair value of the transaction.
| | | | | | | | | | | | | | | | | | | | | | | | | | |
Counterparty | | Currency | | Notional
Amount | | | Expiration
Date | | | Receive (Pay)
Fixed Rate | | Deliverable on Default | | Unrealized
Appreciation
(Depreciation) | | | Premium
(Received)
Paid | | | Value | |
Blend Fund* | |
Credit Default Swaps — Buy Protection | |
Centrally Cleared Swaps | |
| | USD | | | 2,620,000 | | | | 12/20/21 | | | (1.000%) | | CDX.NA.IG.27 | | $ | (2,696 | ) | | $ | (36,947 | ) | | $ | (39,643 | ) |
| | | | | | | | | | | | | | | | | | | | | | | | | | |
Credit Default Swaps — Sell Protection† | |
OTC Swaps | |
| Goldman Sachs International | | USD | | | 500,000 | | | | 5/11/63 | | | 3.000% | | CMBX.NA.BBB-.6†† (Rating: BBB-) | | $ | (28,741 | ) | | $ | 308 | | | $ | (28,433 | ) |
| Goldman Sachs International | | USD | | | 160,000 | | | | 5/11/63 | | | 3.000% | | CMBX.NA.BBB-.6†† (Rating: BBB-) | | | 3,721 | | | | (12,819 | ) | | | (9,098 | ) |
| Goldman Sachs International | | USD | | | 430,000 | | | | 5/11/63 | | | 3.000% | | CMBX.NA.BBB-.6†† (Rating: BBB-) | | | 12,787 | | | | (37,238 | ) | | | (24,451 | ) |
| | | | | | | | | | | | | | | | | | | | | | | | | | |
| | | | | | | | | | | | | | | | $ | (12,233 | ) | | $ | (49,749 | ) | | $ | (61,982 | ) |
| | | | | | | | | | | | | | | | | | | | | | | | | | |
Managed Bond Fund** | |
Credit Default Swaps — Buy Protection | |
Centrally Cleared Swaps | |
| | USD | | | 16,460,000 | | | | 12/20/21 | | | (1.000%) | | CDX.NA.IG.27 | | $ | (16,940 | ) | | $ | (232,116 | ) | | $ | (249,056 | ) |
| | | | | | | | | | | | | | | | | | | | | | | | | | |
Credit Default Swaps — Sell Protection† | |
OTC Swaps | |
| Goldman Sachs International | | USD | | | 920,000 | | | | 5/11/63 | | | 3.000% | | CMBX.NA.BBB-.6†† (Rating: BBB-) | | $ | 21,395 | | | $ | (73,710 | ) | | $ | (52,315 | ) |
| Goldman Sachs International | | USD | | | 2,540,000 | | | | 5/11/63 | | | 3.000% | | CMBX.NA.BBB-.6†† (Rating: BBB-) | | | 75,531 | | | | (219,964 | ) | | | (144,433 | ) |
| Goldman Sachs International | | USD | | | 3,200,000 | | | | 5/11/63 | | | 3.000% | | CMBX.NA.BBB-.6†† (Rating: BBB-) | | | (183,935 | ) | | | 1,972 | | | | (181,963 | ) |
| | | | | | | | | | | | | | | | | | | | | | | | | | |
| | $ | (87,009 | ) | | $ | (291,702 | ) | | $ | (378,711 | ) |
| | | | | | | | | | | | | | | | | | | | | | | | | | |
| * | Collateral for swap agreements held by Credit Suisse International amounted to $34,600 in securities at December 31, 2016. |
| ** | Collateral for swap agreements held by Credit Suisse International amounted to $173,000 in securities at December 31, 2016. |
| † | For each credit derivative with sold protection, the credit ratings of the entities referenced, as rated by any rating organization, are included in the equivalent Standard & Poor’s Ratings Group rating category. The reference entity rating represents the likelihood of a potential payment by the Fund if the referenced entity experiences a credit event as of period end. Notional amounts represent the maximum potential amount of future payments (undiscounted) the Fund could be required to make under the credit derivatives with sold protection |
| †† | Payment is based on a percentage of the index. Reference entities are a number of individual issuers comprising the index. |
Options, Rights, and Warrants
A Fund may purchase and sell put and call options on securities or an index of securities to enhance investment performance or to protect against changes in market prices. A Fund that invests in debt securities may also purchase and sell put and call options to adjust the interest rate sensitivity of its portfolio or the credit exposure of the portfolio.
Call Options. A call option gives the holder the right to purchase, and obligates the writer to sell, a security at the strike price at any time before the expiration date.
Put Options. A put option gives the holder the right to sell, and obligates the writer to buy, a security at the exercise price at any time before the expiration date.
89
Notes to Financial Statements (Continued)
Writing put and call options. A Fund may write call options on a security it owns, in a “directional” strategy hoping to realize a greater current return through the receipt of premiums. In return for the option premium, the Fund takes the risk that it will have to forego any increase in the value of the security over the strike price. When a Fund has written a call option on a security it does not own, its exposure on such an option is theoretically unlimited. A Fund may enter into closing purchase transactions in order to realize a profit or limit a loss on a previously written call option or, in the case of a call option on a security it owns, to free itself to sell the underlying security or to write another call on the security, or protect a security from being called in an unexpected market rise. Any profits from a closing purchase transaction in the case of a call option on a security a Fund owns may be offset by a decline in the value of the underlying security. Conversely, because increases in the market price of a call option will generally reflect increases in the market price of the underlying security, any loss resulting from a closing purchase transaction relating to a call option on a security a Fund owns is likely to be offset in whole or in part by unrealized appreciation of the underlying security owned by the Fund. A Fund may not be able to close out a call option that it has previously written. A Fund may write put options in order to enhance its current return by taking a long directional position as to a security or index of securities. By writing a put option, a Fund assumes the risk that it may be required to purchase the underlying security for an exercise price higher than its then current market value, resulting in a potential capital loss unless the security later appreciates in value. A Fund may terminate a put option that it has written before it expires by entering into a closing purchase transaction. Any loss from this transaction may be partially or entirely offset by the premium received on the terminated option. A Fund may not be able to close out a put option that it has previously written.
When a Fund writes a call or put option, an amount equal to the premium received is recorded as a liability. Premiums received from writing options which expire are treated as realized gains. Premiums received from writing options which are exercised or closed are added to the proceeds or offset against the amount paid on the underlying investment to determine the realized gain or loss.
Purchasing put and call options. A Fund may purchase put options to protect portfolio holdings against a decline in market value of a security or securities held by it. A Fund may also purchase a put option hoping to profit from an anticipated decline in the value of the underlying security. If the Fund holds the security underlying the option, the option premium and any transaction costs will reduce any profit the Fund might have realized had it sold the underlying security instead of buying the put option. A Fund may purchase call options to hedge against an increase in the price of securities that the Fund wants ultimately to buy. A Fund may also purchase a call option as a long directional investment hoping to profit from an anticipated increase in the value of the underlying security. In order for a call option to be profitable, the market price of the underlying security must rise sufficiently above the exercise price to cover the premium and transaction costs. These costs will reduce any profit the Fund might have realized had it bought the underlying security at the time it purchased the call option.
When a Fund purchases an option, it runs the risk that it will lose its entire investment in the option in a relatively short period of time, unless the Fund exercises the option or enters into a closing sale transaction before the option’s expiration. If the price of the underlying security does not rise (in the case of a call) or fall (in the case of a put) to an extent sufficient to cover the option premium and transaction costs, the Fund will lose part or all of its investment in the option. This contrasts with an investment by a Fund in the underlying security, since the Fund will not realize a loss if the security’s price does not change. Premiums paid for purchasing options that expire are treated as realized losses.
OTC Options. OTC options purchased or sold by a Fund are not traded on securities or options exchanges or backed by clearinghouses. Rather, they are entered into directly between a Fund and the counterparty to the option. In the case of an OTC option purchased by the Fund, the value of the option to the Fund will depend on the willingness and ability of the option writer to perform its obligations to the Fund. In addition, OTC options may not be transferable and there may be little or no secondary market for them, so they may be considered illiquid. It may not be possible to enter into closing transactions with respect to OTC options or otherwise to terminate such options, and as a result a Fund may be required to remain obligated on an unfavorable OTC option until its expiration. OTC options are valued using prices supplied by a primary pricing source, selected pursuant to procedures approved by the Trustees.
Rights and Warrants. A Fund may purchase or hold warrants or rights in order to gain exposure to the underlying security without owning the security, including, for example, cases where the Fund hopes to lock in the price today of a security it may wish to purchase in the future. Warrants generally give the holder the right, but not the obligation, to buy a security at a stated price. In order for a warrant to be profitable, the market price of the underlying security must rise sufficiently above the exercise price to
90
Notes to Financial Statements (Continued)
cover any premium and transaction costs. Rights may similarly confer on the holder the right to purchase or acquire securities, including through participation in a so-called rights offering. Bonds may be issued with warrants or other rights attached to purchase or acquire equity or other debt securities, typically of the bond issuer. The market prices of bonds with warrants or rights attached to purchase equity securities or bonds may, to some degree, reflect changes in the values of the underlying securities.
When a Fund purchases or otherwise acquires warrants or other rights, it runs the risk that it will lose its entire investment in the warrants or rights, unless the Fund exercises the warrant or right, acquires the underlying securities, or enters into a closing transaction before expiration. If the price of the underlying security does not rise to an extent sufficient to cover any premium and transaction costs, the Fund will lose part or all of its investment. Any premiums or purchase price paid for warrants or other rights that expire are treated as realized losses. Warrants and similar rights differ from options in that they are typically written by the issuer of the security underlying the warrant or right. Although some warrants and rights may be non-transferable, others may be traded over-the-counter or on an exchange.
Inflation-Indexed Bonds
The Funds may invest in inflation-indexed bonds, which are fixed income securities whose principal value or coupon is periodically adjusted according to the rate of inflation, as measured by the Consumer Price Index for All Urban Consumers (“CPI-U”) (for U.S. Treasury inflation-indexed bonds) or, generally, by a comparable inflation index calculated by the foreign government issuing the inflation-indexed bonds.
If the periodic adjustment rate measuring inflation falls, the principal value of inflation-indexed bonds will be adjusted downward, and consequently the interest payable on these securities (calculated with respect to a smaller principal amount) will be reduced. Repayment of the original bond principal upon maturity (as adjusted for inflation) is guaranteed in the case of U.S. Treasury inflation-indexed bonds, even during a period of deflation. However, the current market value of the bonds is not guaranteed, and will fluctuate. The Funds may also invest in other inflation related bonds which may or may not provide a similar guarantee. If a guarantee of principal is not provided, the adjusted principal value of the bond repaid at maturity may be less than the original principal. Any adjustments to the principal amount of an inflation-indexed bond due to inflation will be reflected as increases or decreases to interest income. Such adjustments may have a significant impact on the Fund’s distributions.
The value of inflation-indexed bonds is generally based on changes in real interest rates, which in turn are tied to the relationship between nominal interest rates and the rate of inflation. Therefore, if nominal interest rates increased at a faster rate than inflation, real interest rates might rise, leading to a decrease in value of inflation-indexed bonds. While the values of these securities are expected to be protected from long-term inflationary trends, short-term increases in inflation may lead to a decline in value. There can be no assurance that the CPI-U or any foreign inflation index will accurately measure the real rate of inflation, or that the rate of inflation in a foreign country will correlate to the rate of inflation in the United States. Additionally, if interest rates rise due to reasons other than inflation, investors in these securities may not be protected to the extent that the increase is not reflected in the bond’s inflation measure.
Repurchase Agreements
Each Fund may enter into repurchase agreements with certain banks and broker-dealers whereby a Fund acquires a security for cash and obtains a simultaneous commitment from the seller to repurchase the security at an agreed upon price and date. A Fund, through its custodian, takes possession of the securities collateralizing the repurchase agreement in a segregated account. Repurchase agreements must be fully collateralized at all times, but involve some risk to a Fund if the other party should default on its obligation and the Fund is delayed or prevented from recovering the collateral, or if the Fund is required to return collateral to a borrower at a time when it may realize a loss on the investment of that collateral. Collateral for certain tri-party repurchase agreements is held at the Fund’s custodian or sub-custodian in a segregated account for the benefit of the Fund and the counterparty.
When-Issued, Delayed-Delivery, Forward Commitment, and To-Be-Announced Transactions
A Fund may enter into when-issued, delayed-delivery, forward commitment, or to-be-announced (“TBA”) transactions (collectively, the “Forward Transactions”) in order to lock in the purchase price of the underlying security, or in order to adjust the
91
Notes to Financial Statements (Continued)
interest rate exposure of the Fund’s existing portfolio. In Forward Transactions, a Fund commits to purchase or sell particular securities, with payment and delivery to take place at a future date. In the case of TBA purchase commitments, the unit price and the estimated principal amount are established when the Fund enters into a commitment, with the actual principal amount being within a specified range of the estimate. Although a Fund does not typically pay for the securities in these types of transactions until they are delivered, it immediately assumes the risks of ownership, including the risk of price fluctuation. As a result, each of these types of transactions may create investment leverage in a Fund’s portfolio and increase the volatility of the Fund. If a Fund’s counterparty fails to deliver a security purchased in a Forward Transaction, there may be a loss, and the Fund may have missed an opportunity to make an alternative investment.
These securities are valued on the basis of valuations furnished by a pricing service, selected pursuant to procedures approved by the Trustees, which determines valuations taking into account appropriate factors such as institutional-size trading in similar groups of securities, yield, quality, coupon rate, maturity, type of issue, trading characteristics, and other market data. Securities for which no market quotation is available are valued at fair value in accordance with procedures approved by the Trustees. The Funds record on a daily basis the unrealized appreciation (depreciation) based upon changes in the values of these securities. When a Forward Transaction is closed, the Funds record a realized gain or loss equal to the difference between the value of the transaction at the time it was opened and the value of the transaction at the time it was closed.
Dollar Roll Transactions
A Fund may enter into dollar roll transactions, in which the Fund sells mortgage-backed securities for delivery in the current month and simultaneously contracts to purchase substantially similar securities on a specified future date from the same party. A Fund may invest in dollar rolls in order to benefit from anticipated changes in pricing for the mortgage-backed securities during the term of the transaction, or for the purpose of creating investment leverage. In a dollar roll, the securities that are to be purchased will be of the same type as the securities sold, but will be supported by different pools of mortgages.
Dollar rolls involve the risk that the Fund’s counterparty will be unable to deliver the mortgage-backed securities underlying the dollar roll at the fixed time. If the counterparty files for bankruptcy or becomes insolvent, a Fund’s use of the transaction proceeds may be restricted pending a determination by the counterparty or its representative, whether to enforce the Fund’s obligation to repurchase the securities. A Fund can incur a loss on a dollar roll transaction (either because its counterparty fails to perform or because the value of the mortgages subject to the transaction declines) and on the investments made by the Fund with the proceeds of the dollar roll transaction.
A Fund accounts for a dollar roll transaction as a purchase and sale whereby the difference in the sales price and purchase price of the security sold is recorded as a realized gain (loss). If certain criteria are met, these dollar roll transactions may be considered financing transactions, whereby the difference in the sales price and the future purchase price is recorded as an adjustment to interest income. Dollar roll transactions generally have the effect of creating leverage in a Fund’s portfolio.
Securities Lending
The Blend Fund, Equity Fund, and Managed Bond Fund may lend their securities; however, lending cannot exceed 10% of the total assets of the Managed Bond Fund taken at current value, and 33% of the total assets of the Blend Fund and Equity Fund, respectively, taken at current value. The Funds’ securities lending activities are governed by a Securities Lending Agency Agreement (“Lending Agreement”) between each Fund and the lending agent (“agent”). The Lending Agreement authorizes the agent to lend qualifying U.S. and foreign securities held by a Fund to approved borrowers (each a “Borrower”).
Each Fund expects that in connection with any securities on loan, the loan will be secured continuously by collateral consisting of cash or securities adjusted daily to have market value at least equal to the current market value of the securities loaned. The market value of the loaned securities is determined at the close of business of a Fund and any additional collateral is delivered to the Fund the next business day. The Funds bear the risk of loss with respect to the investment of cash collateral. As with other extensions of credit, the Funds may bear the risk of delay in recovery of the loaned securities or even loss of rights in the collateral should the Borrower of the securities fail financially. Pursuant to the Lending Agreement, the agent has provided indemnification to the Funds in the event of default by a borrower with respect to a loan. The Funds receive compensation for lending their securities in the form
92
Notes to Financial Statements (Continued)
of a securities loan fee paid by the Borrower, as well as a share of the income earned on investment of the cash collateral received for the loaned securities. At December 31, 2016, the Funds’ collateral was equal to or greater than 100% of the market value of securities on loan.
Security loans can be terminated at the discretion of either the lending agent or the Fund and the related securities must be returned within the earlier of the standard trade settlement period for such securities or within three business days. For all Funds, all securities on loan are classified as common stock in the Fund’s Portfolio of Investments at December 31, 2016.
The Funds employ the agent to implement their securities lending program and the agent receives a fee from the Funds for its services. In addition, the Funds may be required to pay a rebate to the Borrower. Accordingly, a Fund’s compensation for lending its securities is reduced by any such fees or rebate paid to the securities lending agent or Borrower, respectively. For the year ended December 31, 2016, the Fund(s) earned securities lending net income as follows:
| | | | | | | | | | | | |
| | | Securities
Lending Gross
Income | | | Securities
Lending Fees
and Expenses | | | Securities
Lending Net
Income | |
Equity Fund | | $ | 210,945 | | | $ | 42,464 | | | $ | 168,481 | |
Accounting for Investment Transactions
Investment transactions are accounted for on the trade date. Realized gains and losses on sales of investments and unrealized appreciation and depreciation of investments are computed by the specific identification cost method. Proceeds received from litigation, if any, are included in realized gains on investment transactions for any investments that are no longer held in the portfolio and as a reduction in cost for investments that continue to be held in the portfolio. Interest income, adjusted for amortization of discounts and premiums on debt securities, is earned from the settlement date and is recorded on the accrual basis. Dividend income is recorded on the ex-dividend date. Withholding taxes on foreign interest, dividends, and capital gains have been provided for in accordance with the applicable country’s tax rules and rates. Foreign dividend income is recorded on the ex-dividend date or as soon as practicable after the Fund determines the existence of a dividend declaration after exercising reasonable due diligence. Distributions received on securities that represent a return of capital or capital gain are recorded as a reduction of cost of investments and/or as a realized gain. The Funds determine the classification of distributions received as return of capital distributions or capital gain distributions.
Foreign Currency Translation
The books and records of the Funds are maintained in U.S. dollars. The market values of foreign currencies, foreign securities, and other assets and liabilities denominated in foreign currencies are translated into U.S. dollars at the mean of the buying and selling rates of such currencies against the U.S. dollar at the end of each business day. Purchases and sales of foreign securities and income and expense items are translated at the rates of exchange prevailing on the respective dates of such transactions. The Funds do not isolate that portion of the results of operations arising from changes in the exchange rates from that portion arising from changes in the market prices of securities. Net realized foreign currency gains and losses resulting from changes in exchange rates include foreign currency gains and losses between trade date and settlement date on investment securities transactions, foreign currency transactions, and the difference between the amounts of dividends or interest recorded on the books of the Funds and the amount actually received.
Allocation of Operating Activity
In maintaining the records for the Funds, the income and expense accounts are allocated daily to each class of shares. Investment income and loss, and unrealized and realized gains or losses are prorated among the classes of shares based on the relative net assets of each. Expenses are allocated to each class of shares depending on the nature of the expenditures. Expenses of a Fund not directly attributable to the operations of any specific class of shares of the Fund are prorated among classes to which the expense relates based on relative net assets.
93
Notes to Financial Statements (Continued)
Foreign Securities
The Funds may invest in foreign securities. Foreign securities, including American Depositary Receipts, are subject to additional risks compared to securities of U.S. issuers, including international trade, currency, political, regulatory, and diplomatic risks. In addition, fluctuations in currency exchange rates may adversely affect the values of foreign securities and the price of a Fund’s shares. Emerging markets securities are subject to greater risks than securities issued in developed foreign markets, including less liquidity, greater price volatility, higher relative rates of inflation, greater political, economic, and social instability, greater custody and operational risks, and greater volatility in currency exchange rates.
Federal Income Tax
It is each Fund’s intent to continue to comply with the provisions of subchapter M of the Internal Revenue Code of 1986, as amended, applicable to a regulated investment company. Under such provisions, the Funds would not be subject to federal income taxes on their ordinary income and net realized capital gains to the extent they are distributed or deemed to have been distributed to their shareholders. Therefore, the Funds have not made any provision for federal income tax.
Dividends and Distributions to Shareholders
Dividends from net investment income are declared and paid quarterly for the Blend Fund and Managed Bond Fund and annually for the Equity Fund and at other times as may be required to satisfy tax or regulatory requirements. Dividends from net investment income are declared daily and paid monthly for the U.S. Government Money Market Fund. Distributions of any net realized capital gains of each Fund are declared and paid annually and at other times as may be required to satisfy tax or regulatory requirements.
Distributions to shareholders are recorded on the ex-dividend date. Income and capital gain distributions are determined in accordance with income tax regulations, which may differ from generally accepted accounting principles. As a result, net investment income and net realized capital gains on investment transactions for a reporting period may differ significantly from distributions during such period.
| 3. | | Advisory Fees and Other Transactions |
Investment Advisory Fees and Investment Subadvisers
MML Investment Advisers, LLC (“MML Advisers”), a wholly-owned subsidiary of MassMutual, serves as investment adviser to each Fund. Under investment advisory agreements between MML Advisers and the Trust on behalf of each Fund, MML Advisers is responsible for providing investment management services for each Fund. In return for these services, MML Advisers receives advisory fees, based upon each Fund’s average daily net assets, at the following annual rates:
|
0.50% on the first $100 million; |
0.45% on the next $200 million; |
0.40% on the next $200 million; and |
0.35% on any excess over $500 million |
MML Advisers has entered into investment subadvisory agreements with Barings LLC (“Barings”), a wholly-owned subsidiary of MM Asset Management Holding LLC, itself a wholly-owned subsidiary of MassMutual Holding LLC, a controlled subsidiary of MassMutual, on behalf of certain Funds. These agreements provide that Barings manage the investment and reinvestment of assets of these Funds. Barings receives a subadvisory fee from MML Advisers, based upon each Fund’s average daily net assets at the following annual rates:
| | |
Blend Fund | | 0.13% (Equity Segment) 0.09% (Money Market and Bond Segments) |
Managed Bond Fund | | 0.10% |
U.S. Government Money Market Fund | | 0.05% |
94
Notes to Financial Statements (Continued)
In addition, prior to December 30, 2016, Barings Real Estate Advisers LLC (“Barings Real Estate”) served as sub-subadviser for the High Yield Fund, Inflation-Protected and Income Fund, and Short-Duration Bond Fund and was primarily responsible for managing each Fund’s commercial mortgage-backed securities. Barings Real Estate was a wholly-owned subsidiary of Barings. The appointment of Barings Real Estate as a sub-subadviser to each Fund did not relieve Barings of any obligation or liability to any of the Funds that it would otherwise have had pursuant to investment subadvisory agreements between MML Advisers and Barings with respect to each Fund, and any and all acts and omissions of Barings Real Estate in respect to any Fund were considered the acts and omissions of Barings. Effective December 30, 2016, Barings Real Estate merged with and into Barings and, as a result, no longer serves as a sub-subadviser to any of the Funds.
MML Advisers has entered into an investment subadvisory agreement with OppenheimerFunds, Inc. (“OFI”), a wholly-owned subsidiary of Oppenheimer Acquisition Corp., itself an indirect majority-owned subsidiary of MassMutual Holding LLC, pursuant to which OFI serves as one of the subadvisers to the Equity Fund. This agreement provides that OFI manage the investment and reinvestment of a portion of the assets of the Fund. OFI receives a subadvisory fee from MML Advisers, based upon the average daily net assets of the portion of the Fund that OFI manages, at the following annual rate:
MML Advisers has entered into an investment subadvisory agreement with the unaffiliated investment subadviser, Loomis, Sayles & Company, L.P. (“Loomis Sayles”), pursuant to which Loomis Sayles serves as one of the subadvisers to the Equity Fund. This agreement provides that Loomis Sayles manage the investment and reinvestment of a portion of the assets of the Fund. Loomis Sayles receives a subadvisory fee from MassMutual based upon the average daily net assets of the portion of the Fund that Loomis Sayles manages.
The Funds’ subadvisory fees are paid by MML Advisers out of the advisory fees previously disclosed above.
Distribution and Service Fees
MML Distributors, LLC (the “Distributor”) acts as distributor to the Funds. Pursuant to a Distribution and Services Plan adopted by the Funds pursuant to Rule 12b-1 under the 1940 Act, Service Class shares of the Funds pay an annual fee of 0.25% of the average daily net asset value of Service Class shares. This fee, or a portion thereof, is paid to: (i) the Distributor for services provided and expenses incurred by it in connection with the distribution of Service Class shares, if available, of each Fund; and/or (ii) MassMutual for services provided and expenses incurred by it for purposes of maintaining or providing personal services to Service Class shareholders. The Distributor is a wholly-owned subsidiary of MassMutual.
Expense Caps and Waivers
For the U.S. Government Money Market Fund, MML Advisers has agreed to voluntarily waive some or all of its advisory fees and, if necessary, reimburse some or all of the Fund’s other expenses, in an attempt to allow the Initial Class shares of the Fund to maintain a 1-day yield of at least approximately 0.00%. MML Advisers may amend or discontinue this waiver at any time without advance notice.
Expense caps and waiver amounts are reflected as a reduction of expenses on the Statements of Operations.
Deferred Compensation
Trustees of the Funds who are not officers or employees of MassMutual may elect to defer receipt of their annual fees in accordance with terms of a Non-Qualified Deferred Compensation Plan. Amounts deferred shall accrue interest or earnings and shall be recorded on the Funds’ books as other liabilities. Deferred compensation is included within Trustees’ fees and expenses in the Statements of Assets and Liabilities.
95
Notes to Financial Statements (Continued)
Other
Certain officers and trustees of the Funds may also be employees of MassMutual. The compensation of a trustee who is not an employee of MassMutual is borne by the Funds.
| 4. | | Purchases and Sales of Investments |
Cost of purchases and proceeds from sales of investment securities (excluding short-term investments) for the year ended December 31, 2016, were as follows:
| | | | | | | | | | | | | | | | |
| | | Purchases | | | Sales | |
| | | Long-Term U.S.
Government
Securities | | | Other
Long-Term
Securities | | | Long-Term U.S.
Government
Securities | | | Other
Long-Term
Securities | |
Blend Fund | | $ | 537,490,091 | | | $ | 557,235,093 | | | $ | 538,790,745 | | | $ | 584,951,701 | |
Equity Fund | | | - | | | | 353,625,307 | | | | - | | | | 402,785,533 | |
Managed Bond Fund | | | 3,360,491,092 | | | | 475,506,823 | | | | 3,334,825,752 | | | | 517,838,472 | |
| 5. | | Capital Share Transactions |
Changes in shares outstanding for each Fund were as follows:
| | | | | | | | | | | | | | | | |
| | | Year Ended December 31, 2016 | | | Year Ended December 31, 2015 | |
| | | | |
| | | Shares | | | Amount | | | Shares | | | Amount | |
Blend Fund Initial Class | |
Sold | | | 678,616 | | | $ | 14,246,804 | | | | 558,566 | | | $ | 12,967,545 | |
Issued as reinvestment of dividends | | | 3,286,450 | | | | 67,094,963 | | | | 2,657,363 | | | | 60,154,277 | |
Redeemed | | | (3,323,286 | ) | | | (69,915,230 | ) | | | (3,149,277 | ) | | | (72,444,197 | ) |
| | | | | | | | | | | | | | | | |
Net increase (decrease) | | | 641,780 | | | $ | 11,426,537 | | | | 66,652 | | | $ | 677,625 | |
| | | | | | | | | | | | | | | | |
Blend Fund Service Class | |
Sold | | | 570,292 | | | $ | 12,018,067 | | | | 498,005 | | | $ | 11,397,767 | |
Issued as reinvestment of dividends | | | 277,336 | | | | 5,651,618 | | | | 177,510 | | | | 4,011,133 | |
Redeemed | | | (199,529 | ) | | | (4,185,567 | ) | | | (179,731 | ) | | | (4,084,851 | ) |
| | | | | | | | | | | | | | | | |
Net increase (decrease) | | | 648,099 | | | $ | 13,484,118 | | | | 495,784 | | | $ | 11,324,049 | |
| | | | | | | | | | | | | | | | |
Equity Fund Initial Class | |
Sold | | | 679,955 | | | $ | 18,346,000 | | | | 1,164,275 | | | $ | 33,102,215 | |
Issued as reinvestment of dividends | | | 2,111,189 | | | | 55,844,431 | | | | 1,986,810 | | | | 50,534,787 | |
Redeemed | | | (3,072,954 | ) | | | (82,400,504 | ) | | | (3,354,740 | ) | | | (97,429,051 | ) |
| | | | | | | | | | | | | | | | |
Net increase (decrease) | | | (281,810 | ) | | $ | (8,210,073 | ) | | | (203,655 | ) | | $ | (13,792,049 | ) |
| | | | | | | | | | | | | | | | |
Equity Fund Service Class | |
Sold | | | 374,309 | | | $ | 9,937,363 | | | | 611,431 | | | $ | 17,362,110 | |
Issued as reinvestment of dividends | | | 221,602 | | | | 5,801,918 | | | | 166,229 | | | | 4,190,086 | |
Redeemed | | | (218,237 | ) | | | (5,803,562 | ) | | | (89,521 | ) | | | (2,623,632 | ) |
| | | | | | | | | | | | | | | | |
Net increase (decrease) | | | 377,674 | | | $ | 9,935,719 | | | | 688,139 | | | $ | 18,928,564 | |
| | | | | | | | | | | | | | | | |
Managed Bond Fund Initial Class | |
Sold | | | 9,441,992 | | | $ | 118,221,404 | | | | 10,863,933 | | | $ | 138,277,347 | |
Issued as reinvestment of dividends | | | 2,566,362 | | | | 32,001,075 | | | | 2,774,468 | | | | 35,085,857 | |
Redeemed | | | (14,434,430 | ) | | | (180,995,878 | ) | | | (29,355,584 | ) | | | (373,124,819 | ) |
| | | | | | | | | | | | | | | | |
Net increase (decrease) | | | (2,426,076 | ) | | $ | (30,773,399 | ) | | | (15,717,183 | ) | | $ | (199,761,615 | ) |
| | | | | | | | | | | | | | | | |
96
Notes to Financial Statements (Continued)
| | | | | | | | | | | | | | | | |
| | | Year Ended December 31, 2016 | | | Year Ended December 31, 2015 | |
| | | | |
| | | Shares | | | Amount | | | Shares | | | Amount | |
Managed Bond Fund Service Class | |
Sold | | | 2,445,350 | | | $ | 30,561,975 | | | | 3,475,099 | | | $ | 43,993,043 | |
Issued as reinvestment of dividends | | | 622,475 | | | | 7,746,042 | | | | 563,251 | | | | 7,095,194 | |
Redeemed | | | (1,697,341 | ) | | | (21,201,207 | ) | | | (1,067,298 | ) | | | (13,470,407 | ) |
| | | | | | | | | | | | | | | | |
Net increase (decrease) | | | 1,370,484 | | | $ | 17,106,810 | | | | 2,971,052 | | | $ | 37,617,830 | |
| | | | | | | | | | | | | | | | |
U.S. Government Money Market Fund Initial Class | |
Sold | | | 76,950,748 | | | $ | 76,922,227 | | | | 51,118,737 | | | $ | 51,065,731 | |
Issued as reinvestment of dividends | | | 222 | | | | 222 | | | | 9,394 | | | | 9,384 | |
Redeemed | | | (78,896,714 | ) | | | (78,866,683 | ) | | | (136,009,378 | ) | | | (135,868,691 | ) |
| | | | | | | | | | | | | | | | |
Net increase (decrease) | | | (1,945,744 | ) | | $ | (1,944,234 | ) | | | (84,881,247 | ) | | $ | (84,793,576 | ) |
| | | | | | | | | | | | | | | | |
| 6. | | Federal Income Tax Information |
At December 31, 2016, the cost of securities and the unrealized appreciation (depreciation) in the value of investments owned by the Fund(s), as computed on a federal income tax basis, were as follows:
| | | | | | | | | | | | | | | | |
| | | Federal Income
Tax Cost | | | Tax Basis
Unrealized
Appreciation | | | Tax Basis
Unrealized
(Depreciation) | | | Net Unrealized
Appreciation
(Depreciation) | |
Blend Fund | | $ | 552,539,090 | | | $ | 123,707,125 | | | $ | (8,344,400 | ) | | $ | 115,362,725 | |
Equity Fund | | | 646,198,525 | | | | 196,891,794 | | | | (16,139,451 | ) | | | 180,752,343 | |
Managed Bond Fund | | | 1,379,502,687 | | | | 18,073,572 | | | | (22,179,814 | ) | | | (4,106,242 | ) |
Note: The aggregate cost for investments for the U.S. Government Money Market Fund at December 31, 2016, is the same for financial reporting and federal income tax purposes.
Net capital loss carryforwards may be applied against any net realized taxable gains in succeeding years, subject to the carryforward period limitations, where applicable. On December 22, 2010, the Regulated Investment Company Modernization Act of 2010 (the “Modernization Act”) was signed by the President. The Modernization Act changed the capital loss carryforward rules as they relate to regulated investment companies. Capital losses generated in tax years beginning after the date of enactment may now be carried forward indefinitely, and retain the character of the original loss. Under pre-enactment law, capital losses could be carried forward for up to eight tax years as short-term capital losses. The provisions affecting the utilization of capital loss carryforwards under the Modernization Act also require the utilization of post-enactment losses prior to the utilization of pre-enactment losses.
At December 31, 2016, for federal income tax purposes, there were no unused capital losses.
At December 31, 2016, the following Fund(s) had post-enactment accumulated capital loss carryforwards:
| | | | | | | | |
| | | Short Term
Capital Loss
Carryforward | | | Long term
Capital Loss
Carryforward | |
Managed Bond Fund | | $ | 4,489,399 | | | $ | 14,977,443 | |
Net capital loss carryforwards for the Fund(s) shown in the above table are from post-enactment years and are, therefore, not subject to the eight-year carryforward period and possible expiration.
97
Notes to Financial Statements (Continued)
Generally accepted accounting principles in the United States of America require that only distributions in excess of tax basis earnings and profits be reported in the financial statements as a return of capital.
The tax character of distributions (including capital gain dividends, if any, designated pursuant to Section 852 of the Code) paid during the year ended December 31, 2016, was as follows:
| | | | | | | | | | | | |
| | | Ordinary
Income | | | Long Term
Capital Gain | | | Return of
Capital | |
Blend Fund | | $ | 13,270,358 | | | $ | 59,476,223 | | | $ | - | |
Equity Fund | | | 13,116,480 | | | | 48,529,869 | | | | - | |
Managed Bond Fund | | | 36,359,150 | | | | 3,387,967 | | | | - | |
Money Market Fund | | | 222 | | | | - | | | | - | |
The tax character of distributions (including capital gain dividends, if any, designated pursuant to Section 852 of the Code) paid during the year ended December 31, 2015, was as follows:
| | | | | | | | | | | | |
| | | Ordinary
Income | | | Long Term
Capital Gain | | | Return of
Capital | |
Blend Fund | | $ | 33,620,457 | | | $ | 30,544,953 | | | $ | - | |
Equity Fund | | | 17,102,863 | | | | 37,622,010 | | | | - | |
Managed Bond Fund | | | 42,181,051 | | | | - | | | | - | |
U.S. Government Money Market Fund | | | 9,384 | | | | - | | | | - | |
Capital accounts within the financial statements are periodically adjusted for permanent differences between book and tax accounting. These adjustments have no impact on net assets or the results of operations. Temporary book and tax accounting differences will reverse in subsequent periods. At December 31, 2016, temporary book and tax accounting differences were primarily attributable to investments in futures contracts, swap agreements, premium amortization accruals, non-taxable dividends basis adjustments, the deferral of wash sale losses, and deferred Trustee compensation.
At December 31, 2016, the components of distributable earnings on a tax basis were as follows:
| | | | | | | | | | | | | | | | |
| | | Undistributed
Ordinary
Income | | | Undistributed
Long Term
Capital Gain
(Capital Loss
Carryover) | | | Other
Temporary
Differences | | | Unrealized
Appreciation
(Depreciation) | |
Blend Fund | | $ | 5,084,563 | | | $ | 21,615,222 | | | $ | (199,154 | ) | | $ | 115,362,726 | |
Equity Fund | | | 15,841,122 | | | | 4,114,643 | | | | (247,784 | ) | | | 180,752,343 | |
Managed Bond Fund | | | 2,545,195 | | | | (19,466,842 | ) | | | (232,047 | ) | | | (4,106,242 | ) |
Money Market Fund | | | 10,617 | | | | - | | | | (51,509 | ) | | | - | |
98
Notes to Financial Statements (Continued)
During the year ended December 31, 2016, the following amounts were reclassified due to permanent differences between book and tax accounting:
| | | | | | | | | | | | |
| | | Paid-in
Capital | | | Accumulated
Net Realized
Gain (Loss) on
Investments | | | Undistributed
Net Investment
Income (Loss) | |
Blend Fund | | $ | 667,194 | | | $ | (1,652,565 | ) | | $ | 985,371 | |
Equity Fund | | | 2,224,800 | | | | (1,260,455 | ) | | | (964,345 | ) |
Managed Bond Fund | | | 41 | | | | (3,433,247 | ) | | | 3,433,206 | |
Money Market Fund | | | 8 | | | | - | | | | (8 | ) |
The Funds did not have any unrecognized tax benefits at December 31, 2016, nor were there any increases or decreases in unrecognized tax benefits for the year then ended. The Funds recognize interest and penalties, if any, related to unrecognized tax benefits as an income tax expense in the Statements of Operations. During the year ended December 31, 2016, the Funds did not incur any such interest or penalties. The Funds are subject to examination by U.S. federal and state tax authorities for returns filed for the prior three fiscal years. Foreign taxes are provided for based on the Funds’ understanding of the tax rules and rates that exist in the foreign markets in which they invest.
Under the Funds’ organizational documents, current and former Trustees and Officers are provided with specified rights to indemnification against liabilities arising in connection with the performance of their duties to the Funds, and shareholders are indemnified against personal liability for obligations of the Funds. In the normal course of business, the Funds may also enter into contracts that provide general indemnifications. The Funds’ maximum exposure under these arrangements is unknown as this would be dependent on future claims that may be made against the Funds. The risk of material loss from such claims is considered remote.
On December 7, 2010, the Trust was named as a defendant and putative member of the proposed defendant class of shareholders named in an adversary proceeding brought by The Official Committee of Unsecured Creditors of Tribune Company (the “Official Committee”) in the U.S. Bankruptcy Court for the District of Delaware, in connection with Tribune Company’s Chapter 11 bankruptcy proceeding (In re Tribune Company). The proceeding relates to a leveraged buyout (“LBO”) transaction by which Tribune Company converted to a privately-held company in 2007, and the putative defendant class is comprised of beneficial owners of shares of Tribune Company who received proceeds (the “Proceeds”) of the LBO. The Official Committee seeks to recover payments of those Proceeds.
The potential amount sought to be recovered from the Blend Fund plus interest and the Official Committee’s court costs, is approximately $207,400.
In addition, on June 2, 2011, the Blend Fund was named as a defendant in a closely related, parallel adversary proceeding brought in connection with the Tribune Company’s LBO by Deutsche Bank Trust Company Americas, in its capacity as successor indenture trustee for a certain series of Senior Notes, Law Debenture Trust Company of New York, in its capacity as successor indenture trustee for a certain series of Senior Notes, and Wilmington Trust Company, in its capacity as successor indenture trustee for the PHONES Notes (together, the “Plaintiffs”), in the United States District Court for the District of Massachusetts. The Plaintiffs also seek to recover payments of the Proceeds.
The Fund cannot predict the outcome of these proceedings. Accordingly, the Fund has not accrued any amounts related to these proceedings. If the proceedings were to be decided in a manner adverse to the Fund, or if the Fund was to enter into a settlement agreement with the Official Committee or the Plaintiffs, as applicable, the payment of such judgment or settlement could potentially have a material adverse effect on the Fund’s net asset value depending on the net assets of the Fund at the time of such judgment or settlement.
99
Notes to Financial Statements (Continued)
In preparation of these financial statements, management has evaluated the events and transactions subsequent to December 31, 2016, through the date when the financial statements were issued, and determined that there are no subsequent events or transactions that would require adjustments to or disclosures in the Funds’ financial statements other than those disclosed below.
Elaine A. Sarsynski resigned as a Trustee of the Trust effective as of February 1, 2017.
100
Report of Independent Registered Public Accounting Firm
To the Board of Trustees of MML Series Investment Fund II and Shareholders of MML Blend Fund, MML Equity Fund, MML Managed Bond Fund, and MML U.S. Government Money Market Fund (formerly known as MML Money Market Fund) (collectively, the “Funds”):
We have audited the accompanying statements of assets and liabilities of the Funds, including the portfolios of investments, as of December 31, 2016, and the related statements of operations for the year then ended, the statements of changes in net assets for each of the two years in the period then ended, and the financial highlights for each of the periods presented. These financial statements and financial highlights are the responsibility of the Funds’ management. Our responsibility is to express an opinion on these financial statements and financial highlights based on our audits.
We conducted our audits in accordance with the standards of the Public Company Accounting Oversight Board (United States). Those standards require that we plan and perform the audit to obtain reasonable assurance about whether the financial statements and financial highlights are free of material misstatement. The Funds are not required to have, nor were we engaged to perform, an audit of their internal control over financial reporting. Our audits included consideration of internal control over financial reporting as a basis for designing audit procedures that are appropriate in the circumstances, but not for the purpose of expressing an opinion on the effectiveness of the Funds’ internal control over financial reporting. Accordingly, we express no such opinion. An audit also includes examining, on a test basis, evidence supporting the amounts and disclosures in the financial statements, assessing the accounting principles used and significant estimates made by management, as well as evaluating the overall financial statement presentation. Our procedures included confirmation of securities owned as of December 31, 2016, by correspondence with the custodian and brokers; when replies were not received from brokers, we performed other auditing procedures. We believe that our audits provide a reasonable basis for our opinion.
In our opinion, such financial statements and financial highlights referred to above present fairly, in all material respects, the financial position of each of the Funds as of December 31, 2016, the results of their operations for the year then ended, the changes in their net assets for each of the two years in the period then ended, and the financial highlights for each of the periods presented, in conformity with accounting principles generally accepted in the United States of America.
Deloitte & Touche LLP
Boston, Massachusetts
February 21, 2017
101
Trustees and Officers (Unaudited)
The following table lists the Trust’s Trustees and Officers; their address and age; their position with the Trust; the length of time holding that position with the Trust; their principal occupation(s) during the past five years; the number of portfolios in the fund complex they oversee; and other directorships they hold in companies subject to registration or reporting requirements of the Securities Exchange Act of 1934 (generally called “public companies”) or in registered investment companies. The Trust’s Statements of Additional Information include additional information about the Trust’s Trustees and are available, without charge, upon request by calling 1-888-309-3539 or by writing MML Series Investment Fund II, c/o Massachusetts Mutual Life Insurance Company, 100 Bright Meadow Blvd., Enfield, Connecticut 06082-1981, Attention: MassMutual U.S. Product and Marketing.
Disinterested Trustees
| | | | | | | | | | |
Name, Address*, and Age | | Position(s)
Held with
Trust | | Term of
Office** and
Length of
Time Served | | Principal Occupation(s)
During Past 5 Years | | Number of
Portfolios in
Fund Complex
Overseen by Trustee | | Other Directorships Held by Trustee |
Allan W. Blair
Age: 68 | | Trustee | | Since 2012 | | Retired; President and Chief Executive Officer (1996-2014), Economic Development Council of Western Massachusetts (non-profit development company); President and Chief Executive Officer (1984-2014), Westover Metropolitan Development Corporation (quasi-public development company). | | 94 | | Trustee (since 2003), MassMutual Select Funds (open-end investment company); Trustee (since 2003), MML Series Investment Fund (open-end investment company); Trustee (since 2012), MassMutual Premier Funds (open-end investment company). |
| | | | | |
Nabil N. El-Hage
Age: 58 | | Trustee Chairman | | Since 2005 (2006-2012) | | Founder and sole member of PR Academy of Executive Education, LLC (since 2016); Chairman (2011-2016), Academy of Executive Education, LLC (predecessor to PR Academy of Executive Education, LLC). | | 94 | | Director (2011-2015), Argo Group International Holdings, Ltd. (underwriter of specialty insurance and reinsurance products); Trustee (since 2012), MassMutual Select Funds (open-end investment company); Trustee (since 2012), MML Series Investment Fund (open-end investment company); Trustee (since 2003), Chairman (2006-2012), MassMutual Premier Funds (open-end investment company). |
| | | | | |
Maria D. Furman
Age: 62 | | Trustee | | Since 2005 | | Retired. | | 94 | | Trustee (since 2011), GMO Series Trust (open-end investment company); Trustee (since 2012), MassMutual Select Funds (open-end investment company); Trustee (since 2012), MML Series Investment Fund (open-end investment company); Trustee (since 2004), MassMutual Premier Funds (open-end investment company). |
| | | | | |
R. Alan Hunter, Jr.
Age: 70 | | Chairperson Trustee | | Since 2016 Since 2012 | | Retired. | | 94 | | Director (since 2007), Actuant Corporation (diversified industrial company); Chairperson (since 2016), Trustee (since 2003), MassMutual Select Funds (open-end investment company); Chairperson (since 2016), Trustee (since 2003), MML Series Investment Fund (open-end investment company); Chairperson (since 2016), Trustee (since 2012), MassMutual Premier Funds (open-end investment company). |
102
Trustees and Officers (Unaudited) (Continued)
| | | | | | | | | | |
Name, Address*, and Age | | Position(s)
Held with
Trust | | Term of
Office** and
Length of
Time Served | | Principal Occupation(s)
During Past 5 Years | | Number of
Portfolios in
Fund Complex
Overseen by Trustee | | Other Directorships Held by Trustee |
C. Ann Merrifield
Age: 65 | | Trustee | | Since 2005 | | Retired; President and Chief Executive Officer (2012-2014), PathoGenetix (genomics company). | | 94 | | Director (since 2015), Juniper Pharmaceuticals Inc. (specialty pharmaceutical company); Director (since 2014), Flexion Therapeutics (specialty pharmaceutical company); Director (since 2014), InVivo Therapeutics (research and clinical-stage biomaterials and biotechnology company); Trustee (since 2012), MassMutual Select Funds (open-end investment company); Trustee (since 2012), MML Series Investment Fund (open-end investment company); Trustee (since 2004), MassMutual Premier Funds (open-end investment company). |
| | | | | |
Susan B. Sweeney
Age: 64 | | Trustee | | Since 2012 | | Retired; Senior Vice President and Chief Investment Officer (2010-2014), Selective Insurance Group (property and casualty company. | | 96^ | | Trustee (since 2012), Barings Corporate Investors (closed-end investment company); Trustee (since 2012), Barings Participation Investors (closed-end investment company); Trustee (since 2009), MassMutual Select Funds (open-end investment company); Trustee (since 2009), MML Series Investment Fund (open-end investment company); Trustee (since 2012), MassMutual Premier Funds (open-end investment company). |
Interested Trustee
| | | | | | | | | | |
Name, Address*, and Age | | Position(s)
Held with
Trust | | Term of
Office** and
Length of
Time Served | | Principal Occupation(s)
During Past 5 Years | | Number of
Portfolios in
Fund Complex
Overseen by Trustee | | Other Directorships Held by Trustee |
Robert E. Joyal^^
Age: 71 | | Trustee | | Since 2012 | | Retired. | | 96^ | | Director (since 2013), Leucadia National Corporation (holding company); Director (since 2012), Ormat Technologies, Inc. (provider of alternative and renewable energy technology); Director (2006-2014), Jefferies Group LLC (investment bank); Trustee (since 2003), Barings Corporate Investors (closed-end investment company); Trustee (since 2003), Barings Participation Investors (closed-end investment company); Trustee (since 2003), MassMutual Select Funds (open-end investment company); Trustee (since 2003), MML Series Investment Fund (open-end investment company); Trustee (since 2012), MassMutual Premier Funds (open-end investment company). |
103
Trustees and Officers (Unaudited) (Continued)
Principal Officers who are Not Trustees
| | | | | | | | |
Name, Address*, and Age | | Position(s) Held
with Trust | | Term of
Office# and
Length of
Time Served | | Principal Occupation(s) During Past 5 Years | | Number of
Portfolios in
Fund Complex
Overseen by Officer |
Michael C. Eldredge
Age: 52 | | Vice President | | Since
2009 | | Head of Asset Allocation Funds (since 2016), portfolio manager (2014-2016), Head of Investments (2014-2016), MML Advisers; Vice President (since 2008), MassMutual; Vice President (since 2009), MassMutual Select Funds (open-end investment company); Vice President (since 2009), MML Series Investment Fund (open-end investment company); Vice President (since 2009), MassMutual Premier Funds (open-end investment company). | | 94 |
| | | | |
Andrew M. Goldberg
Age: 50 | | Vice President, Secretary, and Chief Legal Officer Assistant Clerk | | Since
2008 (2005-
2008) | | Assistant Vice President and Counsel (since 2004), MassMutual; Secretary (since 2015), Assistant Secretary (2013-2015), MML Advisers; Vice President, Secretary, and Chief Legal Officer (since 2008), Assistant Secretary (2001-2008), MassMutual Select Funds (open-end investment company); Vice President, Secretary, and Chief Legal Officer (since 2008), Assistant Secretary (2001-2008), MML Series Investment Fund (open-end investment company); Vice President, Secretary, (formerly known as “Clerk”), and Chief Legal Officer (since 2008), Assistant Clerk (2004-2008), MassMutual Premier Funds (open-end investment company). | | 94 |
| | | | |
Brian K. Haendiges
Age: 56 | | President Vice President | | Since
2016(2014-
2016) | | Vice President (since 2014) MML Advisers; Senior Vice President (since 2014), Vice President (2010-2014), MassMutual; Vice President (since 2014), MassMutual Select Funds (open-end investment company); President (since 2016), Vice President (2014-2016), MML Series Investment Fund (open-end investment company); Vice President (since 2014), MassMutual Premier Funds (open-end investment company). | | 94 |
| | | | |
Renee Hitchcock
Age: 46 | | Chief Financial Officer and Treasurer Assistant Treasurer | | Since
2016 2007-
2016 | | Assistant Vice President (since 2015), Director (2007-2015), MassMutual; Chief Financial Officer and Treasurer (since 2016), Assistant Treasurer (2007-2016), MassMutual Select Funds (open-end investment company); Chief Financial Officer and Treasurer (since 2016), Assistant Treasurer (2007-2016), MML Series Investment Fund (open-end investment company); Chief Financial Officer and Treasurer (since 2016), Assistant Treasurer (2007-2016), MassMutual Premier Funds (open-end investment company). | | 94 |
| | | | |
Douglas Steele
Age: 41 | | Vice President | | Since
2016 | | Head of Investment Due Diligence (since 2016), MML Advisers; Assistant Vice President (since 2013), Investment Director (2005-2013), MassMutual; Vice President (since 2016), MassMutual Select Funds (open-end investment company); Vice President (since 2016), MML Series Investment Fund (open-end investment company); Vice President (since 2016), MassMutual Premier Funds (open-end investment company). | | 94 |
| | | | |
Philip S. Wellman
Age: 52 | | Vice President and Chief Compliance Officer | | Since
2007 | | Vice President and Chief Compliance Officer (since 2013), MML Advisers; Vice President, Associate General Counsel, and Chief Compliance Officer (Mutual Funds) (since 2014), Vice President, Associate General Counsel, and Chief Compliance Officer (Mutual Funds and Investment Advisory) (2008-2014), MassMutual; Vice President and Chief Compliance Officer (since 2007), MassMutual Select Funds (open-end investment company); Vice President and Chief Compliance Officer (since 2007), MML Series Investment Fund (open-end investment company); Vice President and Chief Compliance Officer (since 2007), MassMutual Premier Funds (open-end investment company). | | 94 |
104
Trustees and Officers (Unaudited) (Continued)
| | | | | | | | |
Name, Address*, and Age | | Position(s) Held
with Trust | | Term of
Office# and
Length of
Time Served | | Principal Occupation(s) During Past 5 Years | | Number of
Portfolios in
Fund Complex
Overseen by Officer |
Eric H. Wietsma
Age: 50 | | Vice President | | Since
2006
| | Director and President (since 2013), MML Advisers; Senior Vice President (since 2010), MassMutual; President (since 2008), Vice President (2006-2008), MassMutual Select Funds (open-end investment company); Vice President (since 2006), MML Series Investment Fund (open-end investment company); President (since 2008), Vice President (2006-2008), MassMutual Premier Funds (open-end investment company). | | 94 |
| | | | |
Tina Wilson
Age: 46 | | Vice President | | Since
2016 | | Vice President and Head of Investments (since 2016), MML Advisers; Senior Vice President (since 2014), Vice President (2009-2014), MassMutual; Vice President (since 2016), MassMutual Select Funds (open-end investment company); Vice President (since 2016), MML Series Investment Fund (open-end investment company); Vice President (since 2016), MassMutual Premier Funds (open-end investment company). | | 94 |
| * | The address of each Trustee and Principal Officer is the same as that for the Trust; 100 Bright Meadow Blvd., Enfield, CT 06082-1981. |
| ** | Each Trustee of the Trust serves until the next meeting of shareholders called for the purpose of electing Trustees and until the election and qualification of his or her successor or until he or she dies, resigns, or is removed. Notwithstanding the foregoing, unless the Trustees determine that it is desirable and in the best interest of the Trust that an exception to the retirement policy of the Trust be made, a Trustee shall retire and cease to serve as a Trustee upon the conclusion of the calendar year in which such Trustee attains the age of seventy-two years. |
| | The Chairperson is elected to hold such office for a term of three years or until their successor is elected and qualified to carry out the duties and responsibilities of their office, or until he or she retires, dies, resigns, is removed, or becomes disqualified. The Chairperson shall hold office at the pleasure of the Trustees. |
| ^ | Barings Participation Investors and Barings Corporate Investors are deemed to be a part of the Fund Complex, because they are managed by Barings LLC (formerly known as Babson Capital Management LLC), an affiliate of MML Advisers. |
| ^^ | Mr. Joyal is an “Interested Person,” as that term is defined in the 1940 Act, through his position as a director of Leucadia National Corporation, which controls Jefferies Group LLC, a broker-dealer that may execute portfolio transactions and/or engage in principal transactions with the Funds, other investment companies advised by MML Advisers or holding themselves out to investors as related companies for purposes of investment or investor services, or any other advisory accounts over which MML Advisers has brokerage placement discretion. |
| # | The President, Treasurer, and Secretary and such other officers as the Trustees may in their discretion from time to time elect are elected to hold such office until their successor is elected and qualified to carry out the duties and responsibilities of their office, or until he or she dies, resigns, is removed, or becomes disqualified. Each officer shall hold office at the pleasure of the Trustees. |
105
Federal Tax Information (Unaudited)
For corporate shareholders, a portion of the ordinary dividends paid during the Fund(s)’ year ended December 31, 2016, qualified for the dividends received deduction, as follows:
| | | | |
| |
| | | Dividends Received
Deductions | |
| Blend Fund | | | 50.08% | |
| Equity Fund | | | 98.95% | |
| Managed Bond Fund | | | 0.45% | |
106
Other Information (Unaudited)
Proxy Voting
A description of the policies and procedures that each Fund’s investment adviser and subadvisers use to vote proxies relating to the Fund’s portfolio securities is available, without charge, upon request, by calling 1-888-309-3539, and on the Securities and Exchange Commission’s (“SEC”) EDGAR database on its website at http://www.sec.gov.
Information regarding how the Funds voted proxies relating to portfolio securities during the most recent 12-month period ended June 30 is available, without charge, upon request, on the MassMutual website at http://www.massmutual.com/funds and on the SEC’s EDGAR database on its website at http://www.sec.gov.
Quarterly Reporting
The Funds file their complete schedule of portfolio holdings with the SEC for the first and third quarters of each fiscal year on Form N-Q. The Funds’ Forms N-Q are available on the SEC’s EDGAR database on its website at http://www.sec.gov and may be reviewed and copied at the SEC’s Public Reference Room in Washington D.C. Information on the operation of the SEC’s Public Reference Room may be obtained by calling 1-800-SEC-0330.
107
Other Information (Unaudited) (Continued)
Fund Expenses December 31, 2016
Expense Examples:
The following information is in regards to expenses for the six months ended December 31, 2016:
As a shareholder of the Funds, you incur ongoing costs, including advisory fees, distribution and/or service (12b-1) fees, and other Fund expenses. These examples are intended to help you understand your ongoing costs (in dollars) of investing in the Funds and to compare these costs with the ongoing costs of investing in other mutual funds. These examples are based on an investment of $1,000 invested for the six months ended December 31, 2016.
Actual Expenses:
The first four columns of the table below provide information about actual account values and actual expenses. You may use this information, together with the amount you invested, to estimate the expenses that you paid over the period. Simply divide your account value by $1,000 (for example, an $8,600 account value divided by $1,000 = 8.6), then multiply the result by the number under the heading entitled “Operating Expenses Incurred” to estimate the expenses you paid on your account during this period.
Hypothetical Example for Comparison Purposes:
The last two columns of the table below provide information about hypothetical account values and hypothetical expenses based on the Fund’s actual expense ratio and an assumed rate of return of 5% per year before expenses, which is not the Fund’s actual return. The hypothetical account values and expenses may not be used to estimate the actual ending account balance or expenses you paid for the period. You may use this information to compare the ongoing costs of investing in the Fund and other funds. To do so, compare this 5% hypothetical example with the 5% hypothetical examples that appear in the shareholder reports of the other funds.
Please note that the expenses shown in the table are meant to highlight your ongoing costs only and do not reflect any transactional costs. Therefore, the last two columns of the table are useful in comparing ongoing costs only, and will not help you determine the relative total costs of owning different funds. In addition, if these transactional costs were included, your costs would have been higher.
| | | | | | | | | | | | | | | | | | | | | | | | |
| | | Beginning
Value | | | Annualized
Expense
Ratio | | | Ending
Value (Based
on Actual
Returns and
Expenses) | | | Operating
Expenses
Incurred* | | | Ending
Value (Based
on
Hypothetical
Returns and
Expenses) | | | Operating
Expenses
Incurred* | |
| Blend Fund | | | | | | | | | | | | | | | | | | | | | | | | |
Initial Class | | $ | 1,000 | | | | 0.45 | % | | $ | 1,064.00 | | | $ | 2.33 | | | $ | 1,022.90 | | | $ | 2.29 | |
Service Class | | | 1,000 | | | | 0.71 | % | | | 1,062.60 | | | | 3.68 | | | | 1,021.60 | | | | 3.61 | |
| Equity Fund | | | | | | | | | | | | | | | | | | | | | | | | |
Initial Class | | | 1,000 | | | | 0.44 | % | | | 1,109.10 | | | | 2.33 | | | | 1,022.90 | | | | 2.24 | |
Service Class | | | 1,000 | | | | 0.69 | % | | | 1,107.70 | | | | 3.66 | | | | 1,021.70 | | | | 3.51 | |
| Managed Bond Fund | | | | | | | | | | | | | | | | | | | | | | | | |
Initial Class | | | 1,000 | | | | 0.39 | % | | | 980.90 | | | | 1.94 | | | | 1,023.20 | | | | 1.98 | |
Service Class | | | 1,000 | | | | 0.64 | % | | | 979.70 | | | | 3.18 | | | | 1,021.90 | | | | 3.25 | |
| U.S. Government Money Market Fund | | | | | | | | | | | | | | | | | | | | | | | | |
Initial Class | | | 1,000 | | | | 0.43 | % | | | 1,000.00 | | | | 2.16 | | | | 1,023.00 | | | | 2.19 | |
| * | Expenses are calculated using the annualized expense ratio for the six months ended December 31, 2016, multiplied by the average account value over the period, multiplied by 184 days in the period, divided by 366 days in the year, unless stated otherwise. The annualized expense ratio does not reflect expenses deducted under the variable life insurance or variable annuity contract through which the Funds are invested in. Inclusion of these expenses would increase the annualized expense ratios shown. |
108
| | |
Underwriter: MML Distributors, LLC 100 Bright Meadow Blvd. Enfield, CT 06082-1981 | |  |

| | |
| © 2017 Massachusetts Mutual Life Insurance Company, Springfield, MA 01111-0001. All rights reserved. www.massmutual.com. MassMutual Financial Group is a marketing name for Massachusetts Mutual Life Insurance Company (MassMutual) and its affiliated companies and sales representatives. Investment Adviser: MML Investment Advisers, LLC | | RS-41646-01 |
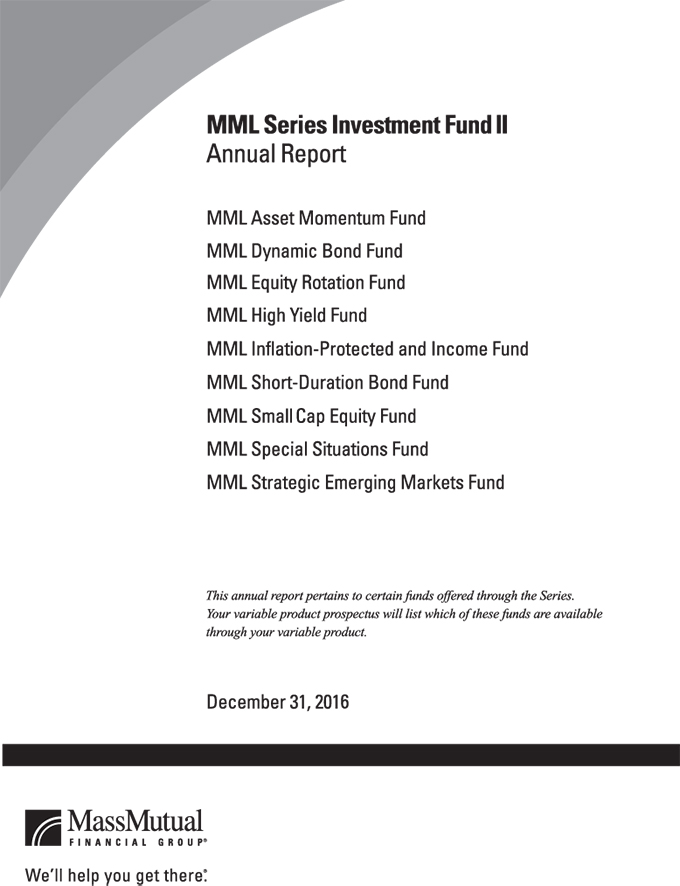
Table of Contents
This material must be preceded or accompanied by a current prospectus (or summary prospectus, if available) for the MML Series Investment Fund II. Investors should consider a Fund’s investment objective, risks, and charges and expenses carefully before investing. This and other information about the investment company is available in the prospectus (or summary prospectus, if available). Read it carefully before investing.
MML Series Investment Fund II – President’s Letter to Shareholders (Unaudited)
To Our Shareholders

Brian Haendiges
“MassMutual believes that changing market conditions are a way of life for retirement investors – but these same conditions have the potential to reward patient investors who maintain a long-term perspective, instead of reacting to short-term market movements.”
January 1, 2017
Continued strength in U.S. markets in a challenging market environment
I am pleased to present you with the MML Series Investment Fund II Annual Report, covering the year ended December 31, 2016 (the “fiscal year”). Domestic stocks outperformed most international equities during the fiscal year, as a strong market environment in the U.S. accelerated. Much of the strength occurred late in the reporting period, due to the surprising Republican victory in the race for the White House – as investors were buoyed by President-elect Trump’s promises for tax abatements and infrastructure spending. Economic difficulties elsewhere in the world – such as the challenging interest rate environment in Japan, uncertainty in Europe and the United Kingdom’s surprising Brexit vote that ratified an eventual exit from the European Union – had virtually no impact on U.S. stock indexes. Nevertheless, during the reporting period, recurring market volatility served as a general reminder for investors that market conditions are cyclical and can change anytime.
In MassMutual’s view, the ongoing uncertainties in markets today highlight the importance of taking a long-term perspective and not reacting to current events or short-term market changes. We also believe retirement investors who follow certain investment guidelines, such as the ones below, may increase their chances of reaching their retirement income goals.
Suggestions for retirement investors under any market conditions
Contribute as much as you can
While it is impossible to control your investments’ performance, you can control how often and how much you save. Contributing to your retirement account on a regular basis and increasing your contribution level as often as you are able, may be one way to help you realize your long-term investment objectives.*
Continue to invest
Some of the most sophisticated investors believe that individuals who can withstand a market downturn have the potential to be rewarded by accumulating larger positions at more favorable prices (relative to those who do not continue investing during a down market). That’s why most financial professionals believe it’s important to stay in the market, regardless of short-term results.
Time may be on your side
For most people, investing for retirement occurs over many decades. While retirement investors often know that the financial markets will be volatile from time to time, seasoned investors tend to understand the wisdom of taking a long-term approach. They know that this can help them navigate the market’s downturns, leverage its upturns, and successfully grow their account balances.
Monitor your asset allocation and diversify
Stocks, bonds, and short-term/money market investments are investment types that typically behave differently depending upon the economic and market environment. Each of these categories contains an even greater array of sub-categories, such as small-cap stocks, international stocks, and high-yield
| | * | Systematic investing and asset allocation do not ensure a profit or protect against loss in a declining market. Systematic investing involves continuous investment in securities regardless of fluctuating price levels. Investors should consider their ability to continue investing through periods of low price levels. |
(Continued)
1
MML Series Investment Fund II – President’s Letter to Shareholders (Unaudited) (Continued)
bonds. Many financial professionals believe that investors can take advantage of different opportunities in the market and reduce the risk of over-exposure to one or two poorly performing investment types by maintaining a portfolio that includes a mix of investment types and sub-categories.
Make informed choices and seek professional guidance
Many financial advisors will suggest that retirement investors select an appropriate combination of investments that aligns with their retirement income goals. Doing so can help you weather the inevitable ups and downs of the markets.
For retirement investors who work with a financial professional
If you work with a financial professional, this may be an excellent time to contact him or her for assistance in assessing whether or not you:
| • | | are saving enough for retirement based on your long-term needs; |
| • | | are invested properly, based on your goals and objectives and where you are in your retirement planning journey; and |
| • | | feel you are taking the right steps to help reduce the risk you could outlive your retirement savings. |
Protect who matters most
MassMutual believes that nothing matters more than the safety and well-being of your loved ones. That’s why we have always been committed to helping our customers put themselves on the path to a more secure financial future. And it’s why we have always encouraged retirement investors to maintain perspective over the long term. In our view, changing market conditions are a way of life for retirement investors, but these same conditions have the potential to reward patient investors who maintain a long-term perspective, instead of reacting to short-term market movements. Thank you for your continued trust in MassMutual.
Sincerely,

Brian Haendiges
President
The information provided is the opinion of MassMutual Funds Investment Management Group as of 1/1/17 and is subject to change without notice. It is not to be construed as tax, legal or investment advice. Of course, past performance does not guarantee future results.
2
MML Series Investment Fund II – Economic and Market Overview (Unaudited)
January 1, 2017
Economic Overview and Market Commentary
We note three significant and unexpected events that were followed by meaningful market movements in 2016. The first followed Federal Reserve (Fed) Board Chair Janet Yellen’s testimony before the U.S. Senate Committee on Banking, Housing, and Urban Affairs on February 11, 2016, where she confirmed a “slower for longer” plan for interest rate hikes going forward. The second followed the United Kingdom’s surprising June 23 referendum to leave the European Union – commonly referred to as “Brexit” (an abbreviation for “British exit”). The third followed Donald J. Trump’s election as the 45th President of the United States on November 8.
Throughout 2016, the initially sluggish domestic economy started to return more positive reports as modest gross domestic product (GDP) estimates were revised upward. (GDP reflects the total value of goods and services produced in the United States.) Investors responded favorably and domestic equity markets delivered broad positive returns for the fiscal year. Equity returns in the foreign and emerging markets ended the year more mixed.
For the year, the Dow Jones Industrial AverageSM (Dow) grew 16.50% and the broader S&P 500® Index (S&P 500) of large-capitalization U.S. stocks gained 11.96%. The technology-focused NASDAQ Composite® Index managed an 8.87% return, as tech stocks lagged the other indexes following the U.S. election. Small-cap equities outperformed for the year, with the Russell 2000® Index of small-capitalization stocks adding 21.31%. In foreign markets, the MSCI EAFE® Index, a barometer for foreign stocks in developed markets, gained only 1.00%, though the MSCI Emerging Markets Index, a measure of the performance of emerging stock markets throughout the world, rose 11.19%.* While developed foreign markets struggled under the weight of Brexit and longer-term fiscal burdens, emerging markets derived more of their value from domestic interactions and benefited more from that alignment.
Bonds performed well for much of the year, but dropped sharply following the U.S. election, as investors tried to anticipate what political policy might mean for bond markets in 2017 and beyond. The Bloomberg Barclays U.S. Aggregate Bond Index, a broad measure of the U.S. investment-grade bond markets, rose as much as 6% in July, but ended the year up only 2.65%. The performance of shorter-term debt investments continued to reflect the unrelenting low interest rate environment. Yields on the 2-year U.S. Treasury bond closed the year at 1.19%, while 10-year Treasury bonds yielded 2.44% at year end. These higher year-over-year yields reflect the turbulence in the fixed-income markets following the U.S. election. A “risk-on” environment developed as the year unfolded and high-yield bonds benefited. The Bloomberg Barclays U.S. Corporate High-Yield Index, which measures the performance of fixed-rate, below-investment-grade debt from corporate sectors, returned 17.13%.*
These returns were not without market volatility and surprises, however. Before rebounding, major indexes fell sharply through January and into February – until the Fed’s announcement triggered a more sustained period of growth. Markets stuttered briefly in May over concerns that Apple might not be able to sustain its growth in the smartphone market. Following a brief post-Brexit drop in late June, neither the surprising Brexit outcome nor global economic turbulence could disrupt the upward momentum in U.S. markets. Particularly noteworthy is the fact that domestic equity markets added nearly half of their annual returns in the final seven weeks of the year, as investors cheered President-elect Trump’s promises for tax abatements and infrastructure spending.
Q1 2016 – The inflection point
Headwinds affecting markets in late 2015 continued into January and early February of 2016. China’s slowing economy and falling crude oil prices, along with a weak January employment report, stoked fears that a U.S. recession could be on the near-term horizon. By February 11, the S&P 500 had dropped to 1,810. At this point, Fed Chair Janet Yellen signaled that the central bank would be patient in beginning to normalize policy interest rates and that it was unlikely that economic conditions would warrant an increase in the target range for the federal funds rate for at least the next few Open Market Committee meetings. (The federal funds rate is the interest rate that banks and financial institutions charge each other for borrowing funds overnight.)
Headwinds ultimately shifted to tailwinds. The S&P 500 gained nearly 250 points by the end of the first quarter, initiating a rally that would more or less be sustained throughout the second and third quarters of 2016. The employment picture improved, as February’s non-farm payrolls came in stronger than the previous two months, and December 2015 and January 2016 payroll
| * | Indexes are unmanaged, do not incur fees or expenses and cannot be purchased directly for investment. |
3
MML Series Investment Fund II – Economic and Market Overview (Unaudited) (Continued)
numbers were revised upward. Once again, the quarter recovered what it had lost and ended essentially where it started the year. Despite this, the climate had changed.
Q2 2016 – Domestic markets override negative interest rates and Brexit
While Britain’s historic Brexit vote dominated news at the end of the second quarter, the unusual arrival of negative interest rates for Japan’s sovereign debt proved puzzling for many investors early in the quarter. Both seemed to feed a “flight to quality” reaction that resulted in a stronger U.S. dollar. Neither event, however, derailed the strengthening U.S. economy. By the end of the second quarter, concerns about China’s economy and falling oil prices moderated. U.S. GDP firmed up and the Fed softened its interest rate strategy, taking a more cautious approach. May’s disappointing jobs report created investor concerns that the Fed could seriously consider suspending any interest rate hikes for at least a year. Nevertheless, the quarter ended with broad-based gains across a variety of asset classes, improved consumer spending, low unemployment rates, and better-than-expected corporate earnings reports.
On June 23, global economic focus shifted to the United Kingdom. The Brexit vote pushed European stocks more deeply into negative territory on concerns that the immediate impact might slow growth in the U.K. and the larger European region. Investors also worried that the British vote might encourage other countries to follow suit. Interestingly, emerging market and Pacific country stocks delivered positive returns for the quarter and year-to-date.
Q3 2016 – Campaign rhetoric overshadows economic momentum
By the end of July, it seemed markets had shrugged off Brexit fears. The U.S. economy was gathering steam, as evidenced on several fronts. The U.S. labor market continued to show strength as job openings rose in June and hiring increased. U.S. consumer confidence hit a 12-month high in August, according to the Conference Board’s Consumer Confidence Index®, which reflected improved consumer assessment of economic conditions and the six-month economic outlook. Corporate earnings came in better than expected for the second consecutive quarter, even though it was the fifth consecutive declining quarter. In mid-September, the U.S. Census Bureau announced that real median household income had jumped 5%, the biggest annual increase since they first started gathering this data in 1968. The two major U.S. presidential candidates accepted their party’s nominations in July. As September came to a close, it became more evident that the upcoming election would be both hotly contested and divisive.
Q4 2016 – The Fed takes a back seat
Prior to the November elections, the Fed held the throttle on the markets. In October, speculation about the next rate hike (whether it would happen before the end of the year and how frequently subsequent rate hikes might occur) dominated investor thinking. At the same time, increasingly heated campaign rhetoric served as a drag while investors tried to figure out what the next four years might look like in either case. On the morning following the U.S. election, market futures pointed sharply downward, as the widely expected presidential winner, Hillary Clinton, conceded electoral vote defeat to Donald J. Trump. When markets opened on November 9, buyers surged, however, as investors anticipated the economic impacts of the President-elect delivering on his pro-business and pro-domestic campaign rhetoric. This buoyant investor sentiment launched a year-end rally that pushed the S&P 500 up 5.3% by year-end, with nearly half of the Index’s 11.96% return occurring in the last seven weeks of the year. In December, the Fed did, indeed, raise policy interest rates, but the market throttle now appeared to be in other hands.
Going into 2017, markets have yet to digest the upcoming Trump presidency in an environment where the Fed is forecasting multiple rate hikes. Turning to the global stage, by the end of March 2017, Britain’s Prime Minister, Theresa May, plans to trigger Article 50 of the Lisbon Treaty, which would initiate the two-year process of withdrawing the U.K. from the European Union. Terrorism and military posturing add further tensions to the global environment.
Domestic equity markets delivered solid returns for investors in 2016, but investors endured a steady stream of uncertainty, surprises and volatility throughout. Long-term investors with a view to saving for retirement income pay attention to such things, but maintain a thoughtful and disciplined response to them. Many retirement investors wisely subscribe to the value of a well-diversified portfolio, using an appropriate mix of available strategies to benefit from market expansions and mitigate the risks inherent in unexpected events.
The information provided is the opinion of MassMutual Funds Investment Management Group as of 12/31/16 and is subject to change without notice. It is not to be construed as tax, legal or investment advice. Of course, past performance does not guarantee future results.
4
MML Asset Momentum Fund – Portfolio Manager Report (Unaudited)
What is the investment approach of MML Asset Momentum Fund, and who is the Fund’s subadviser?
The Fund seeks growth of capital over the long-term by investing in asset classes the Fund’s subadviser considers to exhibit “bull market” characteristics. These “bull market” characteristics may include, for example, upward trending prices and relatively low volatility. The Fund expects that it will allocate its investment among the following asset classes: equity investments, debt investments, property investments, alternative investments, currency, and cash on deposit, excluding short term instruments. The Fund may invest in securities of issuers anywhere in the world, including emerging market countries. Effective September 12, 2016, Babson Capital Management LLC, subadviser to the Fund, changed its name to “Barings LLC.” The investment objective of the Fund remains the same.
How did the Fund perform during the 12 months ended December 31, 2016?
The Fund’s Class II shares returned 10.20%, underperforming the 11.96% return of the S&P 500® Index (the “benchmark”), a widely recognized, unmanaged index representative of common stocks of larger capitalized U.S. companies.
For a discussion on the economic and market environment during the 12-month period ended December 31, 2016, please see the Economic and Market Overview, beginning on page 3.
Subadviser discussion of factors that contributed to the Fund’s performance
The first of the two political surprises of the year came on June 23, when the United Kingdom voted to leave the European Union. The vote, commonly referred to as “Brexit,” drove bond yields to record lows and gold to new highs. The Fund liquidated its gold and silver positions in the summer and avoided the subsequent precious metals’ correction when interest rates rose. The year wound down with another political surprise when Donald Trump won the U.S. presidential election. The Fund had hedged some of its equity positions before the election; however, stock investors quickly warmed to the idea of a Republican Congress and Trump presidency. Consequently, stocks rose to all-time highs, as investors focused on the benefits of tax cuts, deregulation, and fiscal stimulus – and ignored the negatives of a potential global trade war. The Fund’s hedge on stocks ultimately caused it to underperform the benchmark for the year. Performance was also hampered by Fund holdings in Japan and Europe.
For the year ended December 31, 2016, currencies, commodities, and U.S. and emerging-market equities fueled the Fund’s returns. The performance contribution from bonds was flat, since the Fund didn’t invest in bonds with maturities of two or more years.
During the year, the Fund gained its oil exposure through emerging-market currencies and equities. In particular, it held a large position in the Ruble (the Russian currency) and Russian equities. Oil prices rose from a low of $26.21 in February to $53.72 at year end. The higher price was supported by a production cut agreement from major oil producers. As oil prices surged, the Russian Ruble and stocks experienced a major run-up. The Fund’s investment in Brazilian currency (the Real) and equities paid off as well. Besides rising commodity prices, the Brazilian economy benefited from the election of a new government that put behind it years of political scandals. Both Russia and Brazil were top-performing countries for the Fund in 2016.
The Fund uses derivative instruments to gain exposure to global assets and to hedge downside risk of securities. (Derivatives are securities that derive their value from the performance of one or more other investments and take the form of a contract between two or more parties. Most derivatives are used for hedging, speculation, or both.) In 2016, the Fund used futures and forward contracts to gain exposures to currencies, commodities, and global equities. In aggregate, these positions contributed to performance over the year.
Subadviser outlook
We expect normalization of the business cycle to reinforce the reflation trade: sell bonds and buy U.S. stocks. (Reflation trade is a fiscal or monetary policy that’s designed to expand a country’s ouput and help limit the effects of deflation). In the past, the Federal Reserve’s (the Fed) decision on the federal funds rate would have included some reference to the very low German bund and Japanese government bond yields. (The federal funds rate is the interest rate that banks and financial institutions charge each other for borrowing funds overnight.) Emerging markets, especially China, also influenced the Fed’s decision. Going forward, the Trump administration’s economic policy will heavily influence U.S. interest rates. In our view, a Republican Congress and
5
MML Asset Momentum Fund – Portfolio Manager Report (Unaudited) (Continued)
administration could institute a stimulus package and increase government borrowing. Lower taxes and more spending could boost inflation and growth. A strong economy, tightening labor market, and fiscal stimulus would, we believe, indicate that rates are more likely to rise than to fall. Further, there may be a bounce in capital spending if there are tax cuts and deregulation. Companies may put more money into business investment and less money on share buybacks and dividends if these changes occur. Our opinion is that the U.S. stock market rally may continue due to a rebound in corporate profits, an acceleration of economic growth, and potential tax cuts and fiscal stimulus.
| | | | |
MML Asset Momentum Fund
Portfolio Characteristics
(% of Net Assets) on 12/31/16 | |
| | |
Common Stock | | | 38.8 | % |
Mutual Funds | | | 34.2 | % |
Corporate Debt | | | 13.9 | % |
U.S. Treasury Obligations | | | 4.6 | % |
| | | | | |
Total Long-Term Investments | | | 91.5 | % |
Short-Term Investments and Other Assets and Liabilities | | | 8.5 | % |
| | | | | |
Net Assets | | | 100.0 | % |
| | | | | |
6
MML Asset Momentum Fund – Portfolio Manager Report (Unaudited) (Continued)
Growth of a $10,000 Investment
Hypothetical Investments in MML Asset Momentum Fund Class II, Service Class I, and the S&P 500 Index.
| | | | | | | | |
| | | |
TOTAL RETURN | | One Year
1/1/16 -
12/31/16 | | | Since
Inception
5/15/15 -
12/31/16 | |
Class II | | | 10.20% | | | | 2.43% | |
Service Class I | | | 9.85% | | | | 2.12% | |
S&P 500 Index | | | 11.96% | | | | 5.63% | |
GROWTH OF $10,000 INVESTMENT SINCE INCEPTION
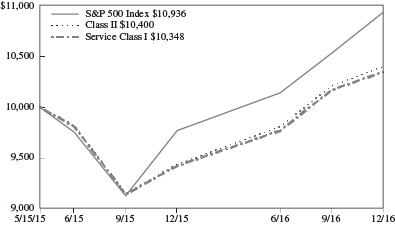
Generally accepted accounting principles require adjustments to be made to the net assets of the Fund at period end for financial reporting purposes only, and as such, the total return based on the unadjusted net asset value per share may differ from the total return reported in the financial highlights.
Performance data quoted represents past performance; past performance is not predictive of future results. The investment return and principal value of shares of the Fund will fluctuate with market conditions so that shares of the Fund, when redeemed, may be worth more or less than their original cost. Current performance of the Fund may be lower or higher than the performance quoted. Performance data current to the most recent month end may be obtained by accessing the website at www.massmutual.com.
Investors should note that the Fund is a professionally managed mutual fund, while the S&P 500 Index is unmanaged, does not incur expenses, and cannot be purchased directly by investors. Investors should read the Fund’s prospectus with regard to the Fund’s investment objective, risks, and charges and expenses in conjunction with these financial statements. The Fund’s return reflects changes in the net asset value per share without the deduction of any product charges (e.g., cost of insurance, mortality and expense risk charges, administrative fees, and CDSL). The inclusion of these charges would have reduced the performance shown here.
7
MML Dynamic Bond Fund – Portfolio Manager Report (Unaudited)
What is the investment approach of MML Dynamic Bond Fund, and who is the Fund’s subadviser?
The Fund seeks to maximize current income and total return by investing, under normal circumstances, at least 80% of its net assets (plus the amount of any borrowings for investment purposes) in bonds, which may include securities issued or guaranteed by the U.S. Government, its agencies, instrumentalities, or sponsored corporations; corporate obligations (including foreign hybrid securities); mortgage-backed securities; asset-backed securities; foreign securities (corporate and government); emerging market securities (corporate and government); bank loans and assignments; and other securities bearing fixed or variable interest rates of any maturity. The Fund may invest a portion of its net assets in inverse floaters and interest-only and principal-only securities, which may experience high volatility in response to changes in interest rates. The Fund may invest in other investment companies, including other open-end or closed-end investment companies, exchange-traded funds (“ETFs”), and domestic or foreign private investment vehicles, including investment companies sponsored or managed by the Fund’s subadviser and its affiliates. The Fund’s subadviser is DoubleLine Capital LP (DoubleLine).
How did the Fund perform during the 12 months ended December 31, 2016?
The Fund’s Class II shares returned 4.94%, outperforming the 2.65% return of the Bloomberg Barclays U.S. Aggregate Bond Index (the “benchmark”), an unmanaged index of fixed-rate investment-grade securities with at least one year to maturity, combining the Bloomberg Barclays U.S. Treasury Bond Index, the Bloomberg Barclays U.S. Government-Related Bond Index, the Bloomberg Barclays U.S. Corporate Bond Index, and the Bloomberg Barclays U.S. Securitized Bond Index.
For a discussion on the economic and market environment during the 12-month period ended December 31, 2016, please see the Economic and Market Overview, beginning on page 3.
Subadviser discussion of factors that contributed to the Fund’s performance
Overall, 2016 was positive for risk assets, and the Fund’s allocations to emerging-market and high-yield corporate bonds were the strongest drivers of the Fund’s full-year performance.
Emerging markets was the best-performing sector for the year, benefiting from strong central bank support and improved commodity prices. Strong demand from investors drove emerging-market prices up and spreads lower, eventually reaching multi-year lows in the third quarter of 2016, according to the J.P. Morgan EMBI Global Diversified Index.
Investment-grade and high-yield corporate bonds were both positive contributors to Fund performance in 2016. Within these two sectors, industrials was the best-performing sub-sector. From a ratings quality perspective, lower-rated bonds outperformed their higher-rated counterparts.
Within residential mortgage-backed securities (RMBS), both agency and non-agency RMBS contributed positively for the year. (“Agency” refers to government-sponsored entities that issue bonds backed by mortgage loans, including Ginnie Mae, Fannie Mae, Freddie Mac, and the Federal Home Loan Banks.) Within agency RMBS, pass-through bonds were the strongest performers. (Mortgage pass-throughs are securities that represent a group of residential mortgage loans. With this type of security, monthly payments of principal and interest are “passed through” to investors each month.) Non-agency performance was bolstered by rising home prices and improved credit conditions.
Collateralized loan obligations (CLOs) and bank loans were positive contributors in 2016, as both benefited from increases in valuations. Both sectors benefited from improving commodity prices and the demand for higher-yielding assets.
U.S. Treasuries and municipal bonds posted positive returns; however, they lagged the more credit-sensitive sectors in 2016. Both Treasuries and municipals were strong performers in the first half of 2016, with interest rates much lower than where they started the year. In the second half of 2016, Treasury and municipal bond prices suffered as interest rates rose on stronger economic data, the increased federal funds rate, and Federal Reserve guidance. (The federal funds rate is the interest rate that banks and financial institutions charge each other for borrowing funds overnight.) Municipals ended up underperforming the benchmark in 2016.
8
MML Dynamic Bond Fund – Portfolio Manager Report (Unaudited) (Continued)
Subadviser outlook
In 2017, we will continue to monitor relative value across all fixed-income sectors. At current levels, emerging-market bonds appear attractive to us, as they have missed out on much of the risk asset rally following the U.S. presidential election. Also, recent upward moves in inflation measures (such as average hourly earnings and Core CPI) have begun to exert upward pressure on future U.S. Treasury breakeven rates. (Breakeven inflation rates are the rates of inflation that need to prevail for Treasury inflation-protected securities [TIPS] to break even to nominal Treasuries.) As a result, we have shifted our short- to medium-term outlook on inflation and maintain a favorable outlook regarding TIPS. Additionally, we continue to believe that the credit cycle is deteriorating; therefore, we remain cautious regarding the Fund’s allocation to high-yield corporate bonds.
| | | | |
MML Dynamic Bond Fund
Portfolio Characteristics
(% of Net Assets) on 12/31/16 | |
| | |
U.S. Treasury Obligations | | | 28.9 | % |
Non-U.S. Government Agency Obligations | | | 28.2 | % |
Corporate Debt | | | 23.2 | % |
U.S. Government Agency Obligations and Instrumentalities | | | 11.9 | % |
Mutual Funds | | | 2.0 | % |
Sovereign Debt Obligations | | | 1.2 | % |
Municipal Obligations | | | 0.5 | % |
Common Stock | | | 0.0 | % |
| | | | | |
Total Long-Term Investments | | | 95.9 | % |
Short-Term Investments and Other Assets and Liabilities | | | 4.1 | % |
| | | | | |
Net Assets | | | 100.0 | % |
| | | | | |
9
MML Dynamic Bond Fund – Portfolio Manager Report (Unaudited) (Continued)
Growth of a $10,000 Investment
Hypothetical Investments in MML Dynamic Bond Fund Class II, Service Class I, and the Bloomberg Barclays U.S. Aggregate Bond Index.
| | | | | | | | |
| | | |
TOTAL RETURN | | One Year
1/1/16 -
12/31/16 | | | Since
Inception
5/15/15 -
12/31/16 | |
Class II | | | 4.94% | | | | 2.15% | |
Service Class I | | | 4.67% | | | | 1.92% | |
Bloomberg Barclays U.S. Aggregate Bond Index | | | 2.65% | | | | 1.69% | |
GROWTH OF $10,000 INVESTMENT SINCE INCEPTION
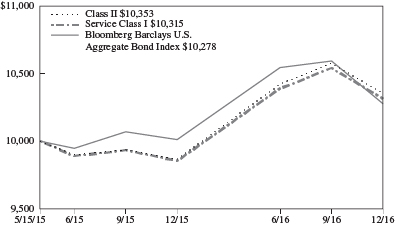
Generally accepted accounting principles require adjustments to be made to the net assets of the Fund at period end for financial reporting purposes only, and as such, the total return based on the unadjusted net asset value per share may differ from the total return reported in the financial highlights.
Performance data quoted represents past performance; past performance is not predictive of future results. The investment return and principal value of shares of the Fund will fluctuate with market conditions so that shares of the Fund, when redeemed, may be worth more or less than their original cost. Current performance of the Fund may be lower or higher than the performance quoted. Performance data current to the most recent month end may be obtained by accessing the website at www.massmutual.com.
Investors should note that the Fund is a professionally managed mutual fund, while the Bloomberg Barclays U.S. Aggregate Bond Index is unmanaged, does not incur expenses, and cannot be purchased directly by investors. Investors should read the Fund’s prospectus with regard to the Fund’s investment objective, risks, and charges and expenses in conjunction with these financial statements. The Fund’s return reflects changes in the net asset value per share without the deduction of any product charges (e.g., cost of insurance, mortality and expense risk charges, administrative fees, and CDSL). The inclusion of these charges would have reduced the performance shown here.
10
MML Equity Rotation Fund – Portfolio Manager Report (Unaudited)
What is the investment approach of MML Equity Rotation Fund, and who is the Fund’s subadviser?
The Fund seeks growth of capital over the long-term by investing primarily in common stocks of large- and medium-capitalization U.S. companies. The Fund’s subadviser does not typically invest in companies with market capitalizations, at the time of purchase, of less than $1 billion. Under normal circumstances, the Fund invests at least 80% of its net assets (plus the amount of any borrowings for investment purposes) in equity securities. Effective September 12, 2016, Babson Capital Management LLC, subadviser to the Fund, changed its name to “Barings LLC.” The investment objective of the Fund remains the same.
How did the Fund perform during the 12 months ended December 31, 2016?
The Fund’s Class II shares returned 17.48%, substantially outperforming the 11.96% return of the S&P 500® Index (the “benchmark”), a widely recognized, unmanaged index representative of common stocks of larger capitalized U.S. companies.
For a discussion on the economic and market environment during the 12-month period ended December 31, 2016, please see the Economic and Market Overview, beginning on page 3.
Subadviser discussion of factors that contributed to the Fund’s performance
In its first substantial rotation, the Fund moved into value in February, as Fund management saw significant value in the energy and financials sectors. Financials were much more highly correlated with interest rates than they have been historically. As rates fell and financial stocks declined, value opportunities surfaced. They also offered about 8% total yield, including share repurchases, which was compelling.
There were risks in buying into the value Fund management perceived, because at the time, investors were worried about bank debt that was used to purchase energy infrastructure, which seemed worthless as oil prices dropped. However, Fund management perceived it to be a classic value opportunity, so the Fund was able to purchase the assets at a fraction of book value. Although financials turned out to be one of the best-performing sectors in 2016, that outcome was far from certain for much of the year. The same was true with the energy sector. Stocks within that market segment were also trading at a fraction of book value at the start of the year, but instead of interest rates, they were following oil prices. Fund management felt that the Fund was being paid sufficiently to own these stocks as the energy market worked towards equilibrium. Given the volatile nature of the commodity, we don’t know if that equilibrium has been reached, but certainly others have taken note of the value in these shares, which has boosted share prices. In both cases, Fund management did not try to handicap the exogenous factors (i.e., rates and oil prices), but rather identified value and that value was realized.
The Fund held an overweight stake, relative to the benchmark, in energy and finance in 2016, and that helped performance. In the energy sector, the Fund was overweight in oil exploration company Encana, a Fund holding that was up 133% for the year, which helped drive performance. In finance, the Fund had an overweight allocation to banks like Fifth Third Bank, which was up 46% for the year, and this also fueled the Fund’s full-year results.
The Fund’s worst-performing sector during the fiscal year was software, where the Fund experienced less-than-favorable stock selection. Fund holding Nuance, a speech conversion company which was down 20% for the year, hampered performance.
Subadviser outlook
Although value has performed well in 2016, we don’t think that its run has ended. We believe that in late 2015 and early 2016, the market priced in a recession when there was none. The interesting thing was that, at the same time, a more “classic” economic recovery seemed to be getting underway. Following the Great Recession, housing, employment, and bank balance sheets were so low that it took about six years to get back to normal levels. Recently, normalcy was achieved as incomes began to rise. This means that the economy is acting in a more familiar pattern as income gains have generated more spending and more growth. Generally, imbalances are what bring an end to economic cycles, so we are heartened that this process has only just begun, and there are only a few imbalances in the system. We think this may be a longer-than-normal economic cycle. Our view is that the market could do well in this type of environment as profits could continue to grow.
11
MML Equity Rotation Fund – Portfolio Manager Report (Unaudited) (Continued)
| | | | |
MML Equity Rotation Fund
Largest Holdings
(% of Net Assets) on 12/31/16 | |
| | |
Amazon.com, Inc. | | | 5.1 | % |
Lockheed Martin Corp. | | | 2.7 | % |
Caterpillar, Inc. | | | 2.1 | % |
JP Morgan Chase & Co. | | | 2.1 | % |
Citigroup, Inc. | | | 2.1 | % |
NVIDIA Corp. | | | 2.1 | % |
Fifth Third Bancorp | | | 2.0 | % |
Applied Materials, Inc. | | | 1.9 | % |
Vantiv, Inc. Class A | | | 1.8 | % |
NetApp, Inc. | | | 1.6 | % |
| | | | | |
| | | | 23.5 | % |
| | | | | |
| | | | |
MML Equity Rotation Fund
Sector Table
(% of Net Assets) on 12/31/16 | |
| | |
Financial | | | 19.1 | % |
Technology | | | 16.9 | % |
Communications | | | 14.6 | % |
Industrial | | | 13.4 | % |
Consumer, Non-cyclical | | | 12.3 | % |
Consumer, Cyclical | | | 9.0 | % |
Energy | | | 6.0 | % |
Basic Materials | | | 5.5 | % |
Utilities | | | 0.2 | % |
| | | | | |
Total Long-Term Investments | | | 97.0 | % |
Short-Term Investments and Other Assets and Liabilities | | | 3.0 | % |
| | | | | |
Net Assets | | | 100.0 | % |
| | | | | |
12
MML Equity Rotation Fund – Portfolio Manager Report (Unaudited) (Continued)
Growth of a $10,000 Investment
Hypothetical Investments in MML Equity Rotation Fund Class II, Service Class I, and the S&P 500 Index.
| | | | | | | | |
| | | |
TOTAL RETURN | | One Year
1/1/16 -
12/31/16 | | | Since
Inception
5/15/15 -
12/31/16 | |
Class II | | | 17.48% | | | | 8.89% | |
Service Class I | | | 17.22% | | | | 8.65% | |
S&P 500 Index | | | 11.96% | | | | 5.63% | |
GROWTH OF $10,000 INVESTMENT SINCE INCEPTION
Generally accepted accounting principles require adjustments to be made to the net assets of the Fund at period end for financial reporting purposes only, and as such, the total return based on the unadjusted net asset value per share may differ from the total return reported in the financial highlights.
Performance data quoted represents past performance; past performance is not predictive of future results. The investment return and principal value of shares of the Fund will fluctuate with market conditions so that shares of the Fund, when redeemed, may be worth more or less than their original cost. Current performance of the Fund may be lower or higher than the performance quoted. Performance data current to the most recent month end may be obtained by accessing the website at www.massmutual.com.
Investors should note that the Fund is a professionally managed mutual fund, while the S&P 500 Index is unmanaged, does not incur expenses, and cannot be purchased directly by investors. Investors should read the Fund’s prospectus with regard to the Fund’s investment objective, risks, and charges and expenses in conjunction with these financial statements. The Fund’s return reflects changes in the net asset value per share without the deduction of any product charges (e.g., cost of insurance, mortality and expense risk charges, administrative fees, and CDSL). The inclusion of these charges would have reduced the performance shown here.
13
MML High Yield Fund – Portfolio Manager Report (Unaudited)
What is the investment approach of MML High Yield Fund, and who is the Fund’s subadviser?
The Fund seeks to achieve a high level of total return, with an emphasis on current income, by investing primarily in high yield debt and related securities. The Fund invests primarily in lower rated U.S. debt securities (“junk” or “high yield” bonds), including securities in default. Under normal circumstances, the Fund invests at least 80% of its net assets (plus the amount of any borrowings for investment purposes) in lower rated fixed income securities (rated below Baa3 by Moody’s, below BBB- by Standard & Poor’s or the equivalent by any NRSRO (using the lower rating) or, if unrated, determined to be of below investment grade quality by the Fund’s subadviser. Effective September 12, 2016, Babson Capital Management LLC, subadviser to the Fund, changed its name to “Barings LLC.” The investment objective of the Fund remains the same.
How did the Fund perform during the 12 months ended December 31, 2016?
The Fund’s Class II shares returned 16.48%, underperforming the 17.13% return of the Bloomberg Barclays U.S. Corporate High-Yield Bond Index (the “benchmark”), which covers the universe of fixed rate, non-investment-grade debt from corporate sectors.
For a discussion on the economic and market environment during the 12-month period ended December 31, 2016, please see the Economic and Market Overview, beginning on page 3.
Subadviser discussion of factors that contributed to the Fund’s performance
During 2016, high yield experienced a historic rally, driven by a notable sentiment reversal around commodity-related sectors, central bank stimulus, and a shift toward risk and yield that prompted lower-rated credits to experience significant capital appreciation. As expected, those industries and issuers that were hit hardest in the commodity downturn outperformed in 2016, as the market’s risk-on mentality buoyed lower-rated credits, commodity-centric issuers, and fallen angels. (“Fallen angels” are investment-grade companies that were downgraded into the high-yield category.)
From a sector perspective, the Fund underperformed the benchmark in the basic industry sector, which includes metals & mining. While the Fund finished the year with an overweight position, relative to the benchmark, in that market segment, it includes some of the most commodity-dependent issuers in the high-yield market, many of whom traded down to distressed levels in January and early February before reversing course and rallying back by year-end. In the energy sector, despite a slightly underweight position, the Fund outperformed the benchmark, driven by superior credit selection with a preference for stable operators over higher-risk and smaller issuers that were more volatile during the year.
From a credit quality perspective, the Fund finished the year with a skew toward lower-quality bonds, carrying an overweight position to issues in the B and CCC ratings categories. The Fund’s overweight position allowed its Fund holdings rated CCC and B to outperform the benchmark based on each rating segment’s contribution to overall return. While bonds rated BB still produced historically strong returns for both the Fund and the benchmark, the Fund’s underweight position relative to the benchmark also proved prudent, as bonds rated BB lagged all other primary ratings groups.
In terms of individual Fund holdings, the biggest detractor was Pinnacle Operating Company, an agricultural input supply and distribution business. The company struggled throughout the year as the combination of a weak agriculture market and an aggressive acquisition strategy put pressure on the company’s capital structure. In December, the company’s sponsor began the process of initiating a restructuring negotiation, further weighing on secondary levels. On the other end of the spectrum, the bulk of the Fund’s top performers came from the energy and metals & mining sectors, led by Fund holding Fieldwood Energy, an oil and gas exploration and production company with operations in the Gulf of Mexico. After reaching distressed levels early in the year, Fieldwood completed a much-needed debt refinancing which, coupled with the commodity rally and improved operational performance, prompted a strong rebound.
Subadviser outlook
As we enter 2017, we believe that political developments will continue to dominate headlines and remain at the forefront of the market’s attention. With the federal government now under Republican control, our view is that policy positions and political appointments could diverge significantly from what we have seen under the Obama administration. We believe that, despite the
14
MML High Yield Fund – Portfolio Manager Report (Unaudited) (Continued)
market’s exuberance over the expected policy moves of the new administration, much remains unknown and volatility has the potential to resurface should any major political surprises appear. In particular, our opinion is that industries that have traded on policy speculation, such as banking and energy, which have rallied since the election, and health care and pharmaceuticals, which have fallen, are likely to experience additional volatility as policy initiatives begin to materialize. Moreover, Federal Reserve action will remain an area of focus during 2017, as market watchers believe that at least two additional interest rate increases could occur during the year, after an extended period of near zero interest rates in the U.S.
| | | | |
MML High Yield Fund
Portfolio Characteristics
(% of Net Assets) on 12/31/16 | |
| | |
Corporate Debt | | | 90.6 | % |
Bank Loans | | | 5.5 | % |
| | | | | |
Total Long-Term Investments | | | 96.1 | % |
Short-Term Investments and Other Assets and Liabilities | | | 3.9 | % |
| | | | | |
Net Assets | | | 100.0 | % |
| | | | | |
15
MML High Yield Fund – Portfolio Manager Report (Unaudited) (Continued)
Growth of a $10,000 Investment
Hypothetical Investments in MML High Yield Fund Class II, Service Class I, and the Bloomberg Barclays U.S. Corporate High-Yield Bond Index.
| | | | | | | | | | | | |
| | | | |
TOTAL RETURN | | One Year
1/1/16 -
12/31/16 | | | Five Year
Average
Annual
1/1/12 -
12/31/16 | | | Since
Inception
Average
Annual
5/3/10 -
12/31/16 | |
Class II | | | 16.48% | | | | 8.53% | | | | 8.34% | |
Service Class I | | | 16.25% | | | | 8.27% | | | | 8.07% | |
Bloomberg Barclays U.S. Corporate High-Yield Bond Index | | | 17.13% | | | | 7.36% | | | | 7.41% | |
GROWTH OF $10,000 INVESTMENT SINCE INCEPTION
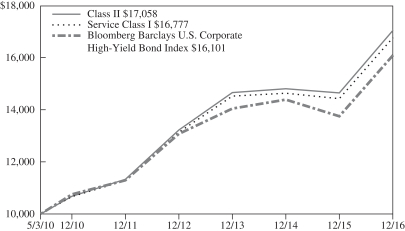
Generally accepted accounting principles require adjustments to be made to the net assets of the Fund at period end for financial reporting purposes only, and as such, the total return based on the unadjusted net asset value per share may differ from the total return reported in the financial highlights.
Performance data quoted represents past performance; past performance is not predictive of future results. The investment return and principal value of shares of the Fund will fluctuate with market conditions so that shares of the Fund, when redeemed, may be worth more or less than their original cost. Current performance of the Fund may be lower or higher than the performance quoted. Performance data current to the most recent month end may be obtained by accessing the website at www.massmutual.com.
Investors should note that the Fund is a professionally managed mutual fund, while the Bloomberg Barclays U.S. Corporate High-Yield Bond Index is unmanaged, does not incur expenses, and cannot be purchased directly by investors. Investors should read the Fund’s prospectus with regard to the Fund’s investment objective, risks, and charges and expenses in conjunction with these financial statements. The Fund’s return reflects changes in the net asset value per share without the deduction of any product charges (e.g., cost of insurance, mortality and expense risk charges, administrative fees, and CDSL). The inclusion of these charges would have reduced the performance shown here.
16
MML Inflation-Protected and Income Fund – Portfolio Manager Report (Unaudited)
What is the investment approach of MML Inflation-Protected and Income Fund, and who is the Fund’s subadviser?
The Fund seeks to achieve as high a total rate of real return on an annual basis as is considered consistent with prudent investment risk and the preservation of capital. Under normal circumstances, the Fund invests at least 80% of its net assets (plus the amount of any borrowings for investment purposes) in inflation-indexed bonds and other income-producing securities. Effective September 12, 2016, Babson Capital Management LLC, subadviser to the Fund, changed its name to “Barings LLC.” The investment objective of the Fund remains the same.
How did the Fund perform during the 12 months ended December 31, 2016?
The Fund’s Initial Class shares returned 5.21%, outperforming the 4.68% return of the Bloomberg Barclays U.S. Treasury Inflation Protected Securities (TIPS) Index (Series-L) (the “benchmark”), an unmanaged index that measures the broad performance of U.S. Treasury inflation-indexed bonds.
How do inflation-indexed bonds protect against inflation?
Like many other fixed-income securities, inflation-indexed bonds pay income twice a year, based on a stated coupon rate. However, both the principal and the interest payment are adjusted for the level of inflation. The inflation rate – as measured by the Consumer Price Index for All Urban Consumers (“CPI-U”) – results in an adjustment to the principal amount of an inflation-protected security. The coupon rate is then applied to the adjusted principal amount to determine the interest payment. For example, assuming an inflation rate of 3%, a security with a par value of $1,000 and an annual coupon rate of 1.75%, the adjusted principal amount after one year would be $1,030 ($1,000 increased by 3%). The semi-annual interest payment would be calculated by multiplying $1,030 by 1.75% and dividing by 2 instead of using the original $1,000 par value to calculate the amount of interest.
For a discussion on the economic and market environment during the 12-month period ended December 31, 2016, please see the Economic and Market Overview, beginning on page 3.
Subadviser discussion of factors that contributed to the Fund’s performance
Consumer prices, as measured by the U.S. Bureau of Labor Statistics, were up year over year through November, as unadjusted Headline Consumer Price Index (CPI) came in at 1.7%, up from 0.7%. (CPI measures changes in the price of a market basket of consumer goods and services.) Core CPI, which excludes energy and food prices, was unchanged at 2.1%.
TIPS positioning in aggregate contributed to Fund performance during the period. In addition to TIPS, the Fund also invested in high-quality income-producing securities, including asset-backed securities (ABS) and money market securities. (Bond issuers create securitized bonds by pooling various types of contractual debt – such as mortgages, auto loans, or credit card debt.) The income earned by these asset classes contributed positively to Fund results, with ABS being the main driver of performance. The Fund’s holdings in auto loans and student loans within the ABS sector were the primary contributors. An allocation to high-quality commercial paper also proved beneficial. (Commercial paper is the commonly used name for short-term unsecured promissory notes sold by banks and corporations to meet short-term debt obligations.)
The Fund may use derivative instruments for yield curve and duration management, as well as for replicating cash bonds and gaining market exposure in order to implement manager views. (Derivatives are securities that derive their value from the performance of one or more other investments and take the form of a contract between two or more parties. Most derivatives are used for hedging, speculation, or both.) During the year, derivatives such as repurchase agreements, Treasury futures, and swaps were used to manage the Fund. Derivatives, in aggregate, contributed to Fund performance.
Subadviser outlook
U.S. breakeven inflation rates (the rates of inflation that need to prevail for TIPS to break even to nominal Treasuries) have surged following the presidential election, and we expect them to provide further support for inflation expectations. In our view, global inflationary pressures are abating. In the December 2016 Federal Open Market Committee (FOMC) statement, the
17
MML Inflation-Protected and Income Fund – Portfolio Manager Report (Unaudited) (Continued)
Committee indicated that real gross domestic product (GDP) was expanding at a moderate pace and labor conditions continued to strengthen. (GDP reflects the total value of goods and services produced in the United States.) CPI increased, but was still running below the Committee’s objective of 2%, restrained by earlier declines in energy prices and in prices of non-energy imports. Given the progress that had been made toward maximum employment and inflation, Committee members agreed to raise the target range for the federal funds rate from 0.50% to 0.75%. (The federal funds rate is the interest rate that banks and financial institutions charge each other for borrowing funds overnight.)
Despite global developments, the U.S. presidential elections, and an increased chance that the FOMC could fulfill its forecast for three interest rate increases in 2017, we remain constructive and opportunistic on the TIPS market, given volatility and relative value opportunities.
| | | | |
MML Inflation-Protected and
Income Fund
Portfolio Characteristics
(% of Net Assets) on 12/31/16 | |
| | |
U.S. Treasury Obligations | | | 90.8 | % |
Non-U.S. Government Agency Obligations | | | 45.0 | % |
Corporate Debt | | | 3.6 | % |
U.S. Government Agency Obligations and Instrumentalities | | | 0.3 | % |
Municipal Obligations | | | 0.1 | % |
| | | | | |
Total Long-Term Investments | | | 139.8 | % |
Short-Term Investments and Other Assets and Liabilities | | | (39.8 | )% |
| | | | | |
Net Assets | | | 100.0 | % |
| | | | | |
18
MML Inflation-Protected and Income Fund – Portfolio Manager Report (Unaudited) (Continued)
Growth of a $10,000 Investment
Hypothetical Investments in MML Inflation-Protected and Income Fund Initial Class and the Bloomberg Barclays U.S. Treasury Inflation Protected Securities (TIPS) Index (Series-L).
| | | | | | | | | | | | |
| | | | |
TOTAL RETURN | | One Year
1/1/16 -
12/31/16 | | | Five Year
Average
Annual
1/1/12 -
12/31/16 | | | Ten Year
Average
Annual
1/1/07 -
12/31/16 | |
Initial Class | | | 5.21% | | | | 0.91% | | | | 3.76% | |
Bloomberg Barclays U.S. Treasury Inflation Protected Securities (TIPS) Index (Series-L) | | | 4.68% | | | | 0.89% | | | | 4.36% | |
Hypothetical Investments in MML Inflation-Protected and Income Fund Service Class and the Bloomberg Barclays U.S. Treasury Inflation Protected Securities (TIPS) Index (Series-L).
| | | | | | | | | | | | |
| | | | |
TOTAL RETURN | | One Year
1/1/16 -
12/31/16 | | | Five Year
Average
Annual
1/1/12 -
12/31/16 | | | Since
Inception
Average
Annual
8/15/08 -
12/31/16 | |
Service Class | | | 4.90% | | | | 0.66% | | | | 2.89% | |
Bloomberg Barclays U.S. Treasury Inflation Protected Securities (TIPS) Index (Series-L) | | | 4.68% | | | | 0.89% | | | | 3.28% | |
GROWTH OF $10,000 INVESTMENT FOR THE PAST 10 YEARS
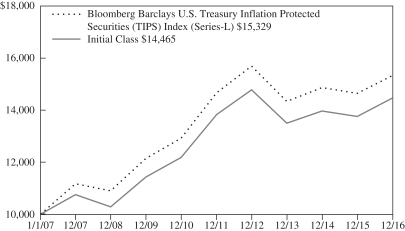
GROWTH OF $10,000 INVESTMENT SINCE INCEPTION
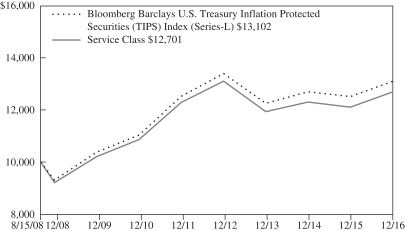
Generally accepted accounting principles require adjustments to be made to the net assets of the Fund at period end for financial reporting purposes only, and as such, the total return based on the unadjusted net asset value per share may differ from the total return reported in the financial highlights.
Performance data quoted represents past performance; past performance is not predictive of future results. The investment return and principal value of shares of the Fund will fluctuate with market conditions so that shares of the Fund, when redeemed, may be worth more or less than their original cost. Current performance of the Fund may be lower or higher than the performance quoted. Performance data current to the most recent month end may be obtained by accessing the website at www.massmutual.com.
Investors should note that the Fund is a professionally managed mutual fund, while the Bloomberg Barclays U.S. Treasury Inflation Protected Securities (TIPS) Index (Series-L) is unmanaged, does not incur expenses, and cannot be purchased directly by investors. Investors should read the Fund’s prospectus with regard to the Fund’s investment objective, risks, and charges and expenses in conjunction with these financial statements. The Fund’s return reflects changes in the net asset value per share without the deduction of any product charges (e.g., cost of insurance, mortality and expense risk charges, administrative fees, and CDSL). The inclusion of these charges would have reduced the performance shown here.
19
MML Short-Duration Bond Fund – Portfolio Manager Report (Unaudited)
What is the investment approach of MML Short-Duration Bond Fund, and who is the Fund’s subadviser?
The Fund seeks to achieve a high total rate of return primarily from current income while minimizing fluctuations in capital values by investing primarily in a diversified portfolio of short-term investment grade fixed income securities. Under normal circumstances, the Fund invests at least 80% of its net assets (plus the amount of any borrowings for investment purposes) in investment grade fixed income securities (rated Baa or higher by Moody’s, BBB- or higher by Standard & Poor’s or the equivalent by any NRSRO, or, if unrated, determined to be of comparable quality by the subadviser). Effective September 12, 2016, Babson Capital Management LLC, subadviser to the Fund, changed its name to “Barings LLC.” The investment objective of the Fund remains the same.
How did the Fund perform during the 12 months ended December 31, 2016?
The Fund’s Class II shares returned 2.80%, outperforming the 0.87% return of the Bloomberg Barclays U.S. 1-3 Year Government Bond Index (the “benchmark”), an unmanaged index of U.S. government bonds with one to three years remaining to the scheduled payment of principal.
For a discussion on the economic and market environment during the 12-month period ended December 31, 2016, please see the Economic and Market Overview, beginning on page 3.
Subadviser discussion of factors that contributed to the Fund’s performance
Bond duration and maturity positioning benefited the Fund during the year ended December 31, 2016. In the first half of the year, the slope of the yield curve declined and flattened, and the duration of the Fund decreased from 2.9 years to 1.5 years. (The yield curve is a graph showing the term structure of interest rates by plotting the yields of all bonds of comparable quality with maturities ranging from the shortest – typically one month – to the longest – typically 30 years – available. The resulting curve shows whether short-term interest rates are higher or lower than long-term rates. Duration is a measure of a bond fund’s sensitivity to interest rates. The longer the duration, the greater the price impact on the bond or portfolio when interest rates rise or fall.) The shift in portfolio positioning from a longer-duration posture to a shorter one helped performance.
Elsewhere, the Fund’s allocation to corporate bonds was the primary positive contributor to performance, as both investment-grade and high-yield Fund holdings rated BB advanced. Fund holdings in banking and leasing companies were the best-performing sub-sectors.
Asset-backed securities (ABS) were the primary contributors to performance within the securitized sector. (Bond issuers create securitized bonds by pooling various types of contractual debt – such as mortgages, auto loans, or credit card debt.) Allocations to government-guaranteed FFELP student loans and commercial ABS collateral were the largest contributing sub-sectors. Allocations to Agency collateralized mortgage obligation (CMO) securities and commercial mortgage-backed securities (CMBS) also benefited performance. “Agency” refers to government-sponsored entities that issue bonds backed by mortgage loans, including Ginnie Mae, Fannie Mae, Freddie Mac, and the Federal Home Loan Banks.
Hampering returns for the year were Fund holdings in the energy and metals & mining sub-sectors, which had lagging performance, particularly in the first quarter of 2016. Convertible securities were the primary detractors, driven largely by the sell-off in metals & mining and oil & gas producers during the first quarter. The Fund exited its convertibles position during the first and second quarters.
The Fund uses derivative instruments on occasion for yield curve, duration, downside risk management or to gain exposure to securities or markets in which it might not be able to invest directly. (Derivatives are securities that derive their value from the performance of one or more other investments and take the form of a contract between two or more parties. Most derivatives are used for hedging, speculation, or both.) Derivatives contributed to performance over 2016.
Subadviser outlook
Unexpected election outcomes, global central banks, and commodity price volatility all took center stage in 2016. The result has been a repricing of investor interest rate expectations due to potentially higher inflation resulting in a shift to fiscal policy. The
20
MML Short-Duration Bond Fund – Portfolio Manager Report (Unaudited) (Continued)
question is, what will the new administration be able to accomplish in its first 100 days? In our view, the answer to that question will influence the path of interest rates in 2017.
Consumer households have been in the mode of reducing leverage since the financial crisis, while corporate fundamentals have softened. The Fund is focusing on yield opportunities, often post-merger and acquisition events, where we believe bonds provide attractive opportunities. The Fund plans to maintain its overweight allocations, relative to the benchmark, to sectors such as corporates and securitized, relative to liquid products, such as governments and agencies – and seeks to add return in excess of the benchmark by investing in sectors where we have competitive advantages, such as consumer and commercial ABS, collateralized loan obligations, and emerging markets.
| | | | |
MML Short-Duration Bond Fund
Portfolio Characteristics
(% of Net Assets) on 12/31/16 | |
| | |
Corporate Debt | | | 42.8 | % |
Non-U.S. Government Agency Obligations | | | 38.8 | % |
U.S. Treasury Obligations | | | 12.0 | % |
U.S. Government Agency Obligations and Instrumentalities | | | 4.8 | % |
Municipal Obligations | | | 0.0 | % |
| | | | | |
Total Long-Term Investments | | | 98.4 | % |
Short-Term Investments and Other Assets and Liabilities | | | 1.6 | % |
| | | | | |
Net Assets | | | 100.0 | % |
| | | | | |
21
MML Short-Duration Bond Fund – Portfolio Manager Report (Unaudited) (Continued)
Growth of a $10,000 Investment
Hypothetical Investments in MML Short-Duration Bond Fund Class II, Service Class I, and the Bloomberg Barclays U.S. 1-3 Year Government Bond Index.
| | | | | | | | | | | | |
| | | | |
TOTAL RETURN | | One Year
1/1/16 -
12/31/16 | | | Five Year
Average
Annual
1/1/12 -
12/31/16 | | | Since
Inception
Average
Annual
5/3/10 -
12/31/16 | |
Class II | | | 2.80% | | | | 1.81% | | | | 2.33% | |
Service Class I | | | 2.55% | | | | 1.57% | | | | 2.08% | |
Bloomberg Barclays U.S. 1-3 Year Government Bond Index | | | 0.87% | | | | 0.59% | | | | 0.89% | |
GROWTH OF $10,000 INVESTMENT SINCE INCEPTION
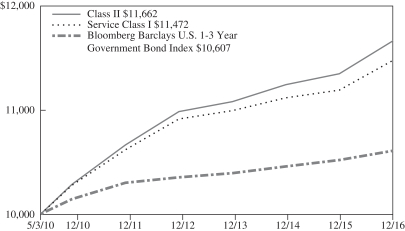
Generally accepted accounting principles require adjustments to be made to the net assets of the Fund at period end for financial reporting purposes only, and as such, the total return based on the unadjusted net asset value per share may differ from the total return reported in the financial highlights.
Performance data quoted represents past performance; past performance is not predictive of future results. The investment return and principal value of shares of the Fund will fluctuate with market conditions so that shares of the Fund, when redeemed, may be worth more or less than their original cost. Current performance of the Fund may be lower or higher than the performance quoted. Performance data current to the most recent month end may be obtained by accessing the website at www.massmutual.com.
Investors should note that the Fund is a professionally managed mutual fund, while the Bloomberg Barclays U.S. 1-3 Year Government Bond Index is unmanaged, does not incur expenses, and cannot be purchased directly by investors. Investors should read the Fund’s prospectus with regard to the Fund’s investment objective, risks, and charges and expenses in conjunction with these financial statements. The Fund’s return reflects changes in the net asset value per share without the deduction of any product charges (e.g., cost of insurance, mortality and expense risk charges, administrative fees, and CDSL). The inclusion of these charges would have reduced the performance shown here.
22
MML Small Cap Equity Fund – Portfolio Manager Report (Unaudited)
What is the investment approach of MML Small Cap Equity Fund, and who is the Fund’s subadviser?
The Fund seeks capital appreciation by investing primarily in common stocks of small-capitalization U.S. companies that the Fund’s subadviser believes have favorable business trends or prospects based on fundamental analysis. Under normal circumstances, the Fund invests at least 80% of its net assets (plus the amount of any borrowings for investment purposes) in securities of companies whose market capitalizations at the time of purchase are within the market capitalization range of companies included in the Russell 2000® Index. The Fund’s subadviser is OppenheimerFunds, Inc. (OFI).
How did the Fund perform during the 12 months ended December 31, 2016?
The Fund’s Initial Class shares returned 18.21%, underperforming the 21.31% return of the Russell 2000 Index (the “benchmark), a widely recognized, unmanaged index representative of common stocks of smaller capitalized U.S. companies.
For a discussion on the economic and market environment during the 12-month period ended December 31, 2016, please see the Economic and Market Overview, beginning on page 3.
Subadviser discussion of factors that contributed to the Fund’s performance
For the year ended December 31, 2016, the Fund’s underperformance of the benchmark was primarily due to weaker relative stock selection in the information technology, materials, and industrials sectors. The Fund outperformed the benchmark in the health care, energy, and utilities sectors, where stock selection benefited.
Fund holdings that were top detractors from performance included MDC Partners, Inc. (in the consumer discretionary sector); Imperva, Inc. (information technology); and Diplomat Pharmacy, Inc. (health care). The Fund sold its stakes in these three stocks before year end. Advertising agency MDC Partners failed to miss revenue goals over the third quarter of 2016. Imperva develops protection software and services for databases and business applications. Over the first half of the year, positive quarterly results were overshadowed by a conservative outlook relative to lofty expectations. Its shares fell again late in the period after reports indicated a hold put on the company’s potential sale. Shares of Diplomat Pharmacy fell after the company reported weak third-quarter earnings.
Fund holdings that contributed to performance during the year included WellCare Health Plans, Inc. (health care); Burlington Stores, Inc. (consumer discretionary); and MKS Instruments, Inc. (information technology). WellCare is a managed-care company for government-sponsored health care coverage with a focus on Medicare and Medicaid programs. Investors reacted favorably over the first quarter 2016 when the company updated its longer-term growth goals of doubling its revenue within five years and attaining an after-tax margin of at least 2%. Burlington owns and operates branded apparel retail stores throughout the U.S. and Puerto Rico. During the fourth quarter of 2015, both weather and secular issues negatively impacted apparel retailers and department stores – pushing earnings down by 10% to 15% for many. In contrast, Burlington executed extremely well and grew earnings, despite being in the early stages of a transition to an off-price retail model. MKS Instruments is a global provider of instruments, subsystems, and process control solutions that measure, control, power, monitor, and analyze critical parameters of advanced manufacturing processes to improve process performance and productivity. During the reporting period, the company benefited from completing its acquisition of Newport Corporation, a worldwide leader in photonics solutions. MKS Instruments also reported several quarters of strong earnings.
Subadviser outlook
In our view, the U.S. economy continues its “slow and steady” growth, driven by favorable employment and inflation data, while home prices and innovation also continue to help drive the economy higher. However, we believe that the potential for protectionist trade policies by the incoming Trump administration could cause global contagion by slowing global trade.
In our opinion, U.S. corporate revenues, earnings, and free cash flow seem to have topped out for the near term, but earnings growth may resume if tax cuts and stimulative fiscal spending materialize under President Trump. Election results aside, the energy and industrials sectors seem to have shown signs of bottoming. We believe the risks inherent to this market include the misallocation of capital, fueled by an environment of ongoing relatively low interest rates and possibly leading to “bubble-like” valuations for some companies.
23
MML Small Cap Equity Fund – Portfolio Manager Report (Unaudited) (Continued)
Traditionally, during periods of economic uncertainty and heightened market volatility, investors favor stocks of higher-quality companies – with greater consistency and stability of revenue and earnings – leading to relatively better stock performance of those companies. We think focusing on companies with economic moats and skilled management teams could position the Fund well, should this environment come to pass.
| | | | |
MML Small Cap Equity Fund
Largest Holdings
(% of Net Assets) on 12/31/16 | |
| | |
Korn/Ferry International | | | 2.2 | % |
On Assignment, Inc. | | | 2.2 | % |
Prestige Brands Holdings, Inc. | | | 2.1 | % |
MB Financial, Inc. | | | 2.0 | % |
CACI International, Inc. Class A | | | 1.8 | % |
Webster Financial Corp. | | | 1.7 | % |
Sonic Corp. | | | 1.7 | % |
Portland General Electric Co. | | | 1.7 | % |
Group 1 Automotive, Inc. | | | 1.6 | % |
BankUnited, Inc. | | | 1.6 | % |
| | | | | |
| | | | 18.6 | % |
| | | | | |
| | | | |
MML Small Cap Equity Fund
Sector Table
(% of Net Assets) on 12/31/16 | |
| | |
Consumer, Non-cyclical | | | 24.3 | % |
Financial | | | 21.1 | % |
Consumer, Cyclical | | | 13.4 | % |
Industrial | | | 12.8 | % |
Technology | | | 11.9 | % |
Mutual Funds | | | 5.4 | % |
Energy | | | 4.9 | % |
Basic Materials | | | 4.3 | % |
Communications | | | 2.5 | % |
Utilities | | | 1.7 | % |
Diversified | | | 0.7 | % |
| | | | | |
Total Long-Term Investments | | | 103.0 | % |
Short-Term Investments and Other Assets and Liabilities | | | (3.0 | )% |
| | | | | |
Net Assets | | | 100.0 | % |
| | | | | |
24
MML Small Cap Equity Fund – Portfolio Manager Report (Unaudited) (Continued)
Growth of a $10,000 Investment
Hypothetical Investments in MML Small Cap Equity Fund Initial Class and the Russell 2000 Index.
| | | | | | | | | | | | |
| | | | |
TOTAL RETURN | | One Year
1/1/16 -
12/31/16 | | | Five Year
Average
Annual
1/1/12 -
12/31/16 | | | Ten Year
Average
Annual
1/1/07 -
12/31/16 | |
Initial Class | | | 18.21% | | | | 15.87% | | | | 7.71% | |
Russell 2000 Index | | | 21.31% | | | | 14.46% | | | | 7.07% | |
Hypothetical Investments in MML Small Cap Equity Fund Service Class and the Russell 2000 Index.
| | | | | | | | | | | | |
| | | | |
TOTAL RETURN | | One Year
1/1/16 -
12/31/16 | | | Five Year
Average
Annual
1/1/12 -
12/31/16 | | | Since
Inception
Average
Annual
8/15/08 -
12/31/16 | |
Service Class | | | 17.92% | | | | 15.58% | | | | 9.68% | |
Russell 2000 Index | | | 21.31% | | | | 14.46% | | | | 8.79% | |
GROWTH OF $10,000 INVESTMENT FOR THE PAST 10 YEARS
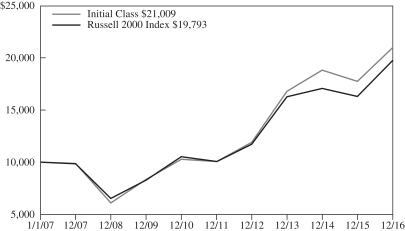
GROWTH OF $10,000 INVESTMENT SINCE INCEPTION
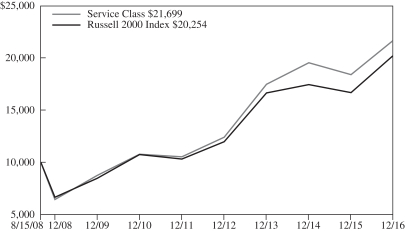
Generally accepted accounting principles require adjustments to be made to the net assets of the Fund at period end for financial reporting purposes only, and as such, the total return based on the unadjusted net asset value per share may differ from the total return reported in the financial highlights.
Performance data quoted represents past performance; past performance is not predictive of future results. The investment return and principal value of shares of the Fund will fluctuate with market conditions so that shares of the Fund, when redeemed, may be worth more or less than their original cost. Current performance of the Fund may be lower or higher than the performance quoted. Performance data current to the most recent month end may be obtained by accessing the website at www.massmutual.com.
Investors should note that the Fund is a professionally managed mutual fund, while the Russell 2000 Index is unmanaged, does not incur expenses, and cannot be purchased directly by investors. Investors should read the Fund’s prospectus with regard to the Fund’s investment objective, risks, and charges and expenses in conjunction with these financial statements. The Fund’s return reflects changes in the net asset value per share without the deduction of any product charges (e.g., cost of insurance, mortality and expense risk charges, administrative fees, and CDSL). The inclusion of these charges would have reduced the performance shown here.
25
MML Special Situations Fund – Portfolio Manager Report (Unaudited)
What is the investment approach of MML Special Situations Fund, and who is the Fund’s subadviser?
The Fund seeks growth of capital over the long-term by investing primarily in common stocks of U.S. companies that are involved in “special situations.” A special situation might include, for example, a recently announced spin-off or divestiture, a change in dividend policy, involvement in a merger or acquisition transaction, a change in management, a significant change in ownership, or changes due to bankruptcy or insolvency process. The Fund’s subadviser expects that the Fund’s portfolio will initially emphasize “large capitalization” issuers, which are considered to be companies with market capitalizations at the time of purchase within the market capitalization range of companies included within the Russell 1000® Index, although the Fund’s holdings of securities of different market capitalizations will vary over time, depending on market conditions generally and on the companies involved at the time (or that the subadviser expects to be involved) in special situations. The Fund will typically invest primarily in common stocks, however, when the subadviser determines that there are an insufficient number of companies involved (or likely to be involved) in special situations, it may invest in any equity securities it considers to be consistent with the Fund’s objective of growth of capital over the long term. It may also invest in exchange-traded funds (“ETFs”) providing broad equity exposures or in derivatives, including swaps, futures contracts, and options, to gain broad exposures to equity markets. Effective September 12, 2016, Babson Capital Management LLC, subadviser to the Fund, changed its name to “Barings LLC.” The investment objective of the Fund remains the same.
How did the Fund perform during the 12 months ended December 31, 2016?
The Fund’s Class II shares returned 15.84%, outperforming the 11.96% return of the S&P 500® Index (the “benchmark”), a widely recognized, unmanaged index representative of common stocks of larger capitalized U.S. companies.
For a discussion on the economic and market environment during the 12-month period ended December 31, 2016, please see the Economic and Market Overview, beginning on page 3.
Subadviser discussion of factors that contributed to the Fund’s performance
Special situation stocks are disproportionately owned by hedge fund managers. While many may have preconceptions of whether that is good or bad, in general, it makes things happen more quickly. That is, if there is value in a stock, it will be realized faster, or if the market has a view, it will be expressed in these stocks faster. During 2016, the market’s view changed substantially from the beginning of the year to the end. At the start, investors had concerns about the Chinese economy, emerging-market debt that was used to purchase energy infrastructure, and the potential for another banking contagion. Those worries manifested in stock performance, as cyclical stocks were sold in favor of more defensive issues. The market’s trough eventually came in February, but most of the year’s gains came after the U.S. presidential election.
The change in tone in the market also changed the stocks that would outperform. The securities that were down the most at the start of the year generally ended the year up sharply. The pariah industries up until February were mining, energy, chemicals, and industrials – which ultimately were some of the best-performing industries for the year. In a nutshell, it was a year where value investing paid off, since there were clearly value opportunities, but the macroeconomic backdrop once again scared investors away from these opportunities. The value was realized later in the year when oil stabilized and the election took place.
With respect to specific Fund holdings, Science Applications International (SAIC) was spun off of Leidos Holdings. SAIC, an engineering firm that does a lot of work for the U.S. government, sports a 10% free cash flow yield, but its growth had stagnated over the past few years. Fund management believed there was value in the company, and this view paid off, as SAIC advanced 89% for the year. Another Fund holding, Vista Outdoor (VSTO), was spun off from Alliant Techsystems in 2015. VSTO makes outdoor products for hunting and sporting. It has been growing its business in the 20% range, yet it trades at a substantial discount to market valuation measures. VSTO declined 14% during 2016, which hurt the Fund’s full-year performance.
Subadviser outlook
We believe that in late 2015 and early 2016, the market priced in a recession when there was none. The interesting thing was that, at the same time, a more “classic” economic recovery seemed to be getting underway. Following the Great Recession, housing, employment and bank balance sheets were so low that it took about six years to get back to normal levels. Recently, normalcy was achieved as incomes began to rise. This means that the economy is acting in a more familiar pattern as income gains have
26
MML Special Situations Fund – Portfolio Manager Report (Unaudited) (Continued)
generated more spending and more growth. Generally, imbalances are what bring an end to economic cycles, so we are heartened that this process has only just begun, and there are only a few imbalances in the system. We think this may be a longer-than-normal economic cycle. Our view is that the market could do well in this type of environment as profits could continue to grow.
| | | | |
MML Special Situations Fund
Largest Holdings
(% of Net Assets) on 12/31/16 | |
| | |
Science Applications International Corp. | | | 7.1 | % |
Zoetis, Inc. | | | 5.3 | % |
Fortive Corp. | | | 4.9 | % |
Hewlett Packard Enterprise Co. | | | 4.3 | % |
NCR Corp. | | | 4.1 | % |
Ingevity Corp. | | | 3.5 | % |
CDK Global, Inc. | | | 3.2 | % |
Oshkosh Corp. | | | 3.1 | % |
Kimball Electronics, Inc. | | | 2.8 | % |
GCP Applied Technologies, Inc. | | | 2.8 | % |
| | | | | |
| | | | 41.1 | % |
| | | | | |
| | | | |
MML Special Situations Fund
Sector Table
(% of Net Assets) on 12/31/16 | |
| | |
Industrial | | | 23.9 | % |
Technology | | | 19.6 | % |
Consumer, Non-cyclical | | | 15.5 | % |
Consumer, Cyclical | | | 12.5 | % |
Financial | | | 9.6 | % |
Basic Materials | | | 7.6 | % |
Communications | | | 6.3 | % |
Utilities | | | 2.4 | % |
Energy | | | 1.6 | % |
| | | | | |
Total Long-Term Investments | | | 99.0 | % |
Short-Term Investments and Other Assets and Liabilities | | | 1.0 | % |
| | | | | |
Net Assets | | | 100.0 | % |
| | | | | |
27
MML Special Situations Fund – Portfolio Manager Report (Unaudited) (Continued)
Growth of a $10,000 Investment
Hypothetical Investments in MML Special Situations Fund Class II, Service Class I, and the S&P 500 Index.
| | | | | | | | |
| | | |
TOTAL RETURN | | One Year
1/1/16 -
12/31/16 | | | Since
Inception
5/15/15 -
12/31/16 | |
Class II | | | 15.84% | | | | -1.43% | |
Service Class I | | | 15.54% | | | | -1.67% | |
S&P 500 Index | | | 11.96% | | | | 5.63% | |
GROWTH OF $10,000 INVESTMENT SINCE INCEPTION
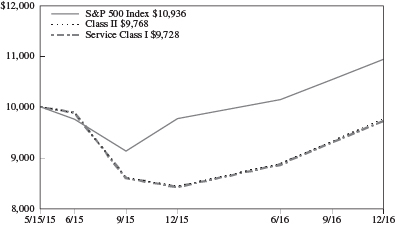
Generally accepted accounting principles require adjustments to be made to the net assets of the Fund at period end for financial reporting purposes only, and as such, the total return based on the unadjusted net asset value per share may differ from the total return reported in the financial highlights.
Performance data quoted represents past performance; past performance is not predictive of future results. The investment return and principal value of shares of the Fund will fluctuate with market conditions so that shares of the Fund, when redeemed, may be worth more or less than their original cost. Current performance of the Fund may be lower or higher than the performance quoted. Performance data current to the most recent month end may be obtained by accessing the website at www.massmutual.com.
Investors should note that the Fund is a professionally managed mutual fund, while the S&P 500 Index is unmanaged, does not incur expenses, and cannot be purchased directly by investors. Investors should read the Fund’s prospectus with regard to the Fund’s investment objective, risks, and charges and expenses in conjunction with these financial statements. The Fund’s return reflects changes in the net asset value per share without the deduction of any product charges (e.g., cost of insurance, mortality and expense risk charges, administrative fees, and CDSL). The inclusion of these charges would have reduced the performance shown here.
28
MML Strategic Emerging Markets Fund – Portfolio Manager Report (Unaudited)
What is the investment approach of MML Strategic Emerging Markets Fund, and who is the Fund’s subadviser?
The Fund seeks long-term capital growth by investing mainly in common stocks of issuers in developing and emerging markets throughout the world and at times, up to 100% of its total assets in foreign securities. Under normal market conditions, the Fund will invest at least 80% of its net assets (plus the amount of any borrowings for investment purposes) in equity securities of issuers whose principal activities are in a developing (or emerging) market, i.e., are in a developing market or are economically tied to a developing market country. The Fund will invest in at least three developing markets. The Fund focuses on companies with above-average earnings growth. In general, countries may be considered developing or emerging markets if they are included in any one of the Morgan Stanley Capital Index (“MSCI”) emerging markets indices, classified as a developing or emerging market, or classified under a similar or corresponding classification, by organizations such as the World Bank and the International Monetary Fund, or have economies, industries, and stock markets with similar characteristics. The Fund’s subadviser is OppenheimerFunds, Inc. (OFI).
How did the Fund perform during the 12 months ended December 31, 2016?
The Fund’s Class II Shares returned 6.49%, underperforming the 11.19% return of the MSCI EM® Index (the “benchmark”), an unmanaged market capitalization-weighted index of equity securities of companies domiciled in various countries. The index is designed to represent the performance of emerging stock markets throughout the world and excludes certain market segments unavailable to U.S.-based investors.
For a discussion on the economic and market environment during the 12-month period ended December 31, 2016, please see the Economic and Market Overview, beginning on page 3.
Subadviser discussion of factors that contributed to the Fund’s performance
For the year ended December 31, 2016, the Fund’s underperformance of the benchmark was primarily due to stock selection in the information technology, financials, and consumer staples sectors. An underweight position in energy, relative to the benchmark, also detracted. The Fund outperformed the benchmark in the consumer discretionary and real estate sectors due to stock selection. Underweight exposure to telecommunication services and not having any exposure to utilities also benefited the Fund’s relative performance. On a country basis, underperformers for the Fund included stock selection in Brazil, stock selection and an overweight position in India, and stock selection in Hong Kong. Top contributors were an overweight position in Russia, stock selection and an underweight position in China, and an underweight position in South Korea.
From a Fund holding perspective, the top detractors included JD.com, Inc. (in the consumer discretionary sector) (China); Embraer S.A. (industrials) (Brazil); and Baidu, Inc. (information technology) (China). JD.com, Inc. is the second-largest e-commerce operator in China. The stock was weak in 2016 due to concerns about slowing growth and its ability to compete effectively against Alibaba. Based on Fund management’s extensive research, which seemed to point to JD.com’s inability to significantly disrupt Alibaba’s dominance, the Fund sold its stake in JD.com. Embraer – which designs, manufactures, and sells aircraft and aircraft parts – was negatively impacted when customer Republic Airways filed for Chapter 11 bankruptcy. Baidu, the leading internet search provider in China, was impacted by negative news flow and adjustments to guidance. The Chinese government launched an investigation into Baidu’s medical advertising practices following the death of a student who used the search engine to find treatment for a rare form of cancer. Consequently, Baidu experienced a dramatic pullback by medical advertisers, which led the company to adjust its guidance on revenues.
Top-performing Fund holdings in 2016 included Novatek OAO (energy) (Russia); Tencent Holdings Ltd. (information technology) (China); and Taiwan Semiconductor Manufacturing Co., Ltd. (information technology) (Taiwan). Novatek is the largest independent natural gas producer in Russia (one of the best-performing emerging markets over the fourth quarter of 2016). Novatek was able to outpace market performance on the back of a solid third-quarter earnings announcement and confirmation that its important Yamal LNG project was on track and on budget. The performance of Tencent Holdings Ltd., one of China’s leading internet companies, was driven, in part, by better-than-expected results, as the online gaming and social networking company delivered strong growth. Taiwan Semiconductor Manufacturing (TSMC) is the largest semiconductor foundry with 50% share of global revenues. Fund management believes that TSMC is well positioned to benefit from increasing mobile connectivity and, in the long run, the growth of next-generation networks and data centers.
29
MML Strategic Emerging Markets Fund – Portfolio Manager Report (Unaudited) (Continued)
Subadviser outlook
The outcome of the U.S. election has been broadly interpreted as a negative for emerging markets. Speculation about new policies – and uncertainty surrounding if and how they will be implemented – has impacted emerging-market equities and buoyed the U.S. dollar. In our view, policy creation and implementation could take time to play out and require patience on the part of investors. In the meantime, we continue to believe that emerging markets should be an increasingly core allocation for global investors, since emerging markets now represent a meaningful portion of global GDP – and are the largest contributors to global growth. Most investors are grossly under-allocated to the asset class and, especially for those who invest through passive vehicles, to the areas of emerging markets that we believe exhibit the most attractive growth characteristics.
| | | | |
MML Strategic Emerging Markets Fund
Largest Holdings
(% of Net Assets) on 12/31/16 | |
| | |
Alibaba Group Holding Ltd. Sponsored ADR (Cayman Islands) | | | 4.9 | % |
Housing Development Finance Corp. | | | 4.7 | % |
Tencent Holdings Ltd. | | | 4.4 | % |
Taiwan Semiconductor Manufacturing Co. Ltd. | | | 4.2 | % |
Magnit OJSC | | | 3.8 | % |
Baidu, Inc. Sponsored ADR (Cayman Islands) | | | 3.5 | % |
NovaTek PJSC Sponsored GDR (Russia) | | | 3.4 | % |
Infosys Ltd. | | | 2.7 | % |
Lojas Americanas SA 0.670% | | | 2.3 | % |
AIA Group Ltd. | | | 2.1 | % |
| | | | | |
| | | | 36.0 | % |
| | | | | |
| | | | |
MML Strategic Emerging Markets Fund
Sector Table
(% of Net Assets) on 12/31/16 | |
| | |
Financial | | | 23.4 | % |
Consumer, Non-cyclical | | | 18.4 | % |
Communications | | | 17.4 | % |
Consumer, Cyclical | | | 14.3 | % |
Technology | | | 9.0 | % |
Industrial | | | 4.2 | % |
Energy | | | 3.4 | % |
Diversified | | | 3.4 | % |
Basic Materials | | | 1.9 | % |
Mutual Funds | | | 1.4 | % |
| | | | | |
Total Long-Term Investments | | | 96.8 | % |
Short-Term Investments and Other Assets and Liabilities | | | 3.2 | % |
| | | | | |
Net Assets | | | 100.0 | % |
| | | | | |
30
MML Strategic Emerging Markets Fund – Portfolio Manager Report (Unaudited) (Continued)
Growth of a $10,000 Investment
Hypothetical Investments in MML Strategic Emerging Markets Fund Service Class I and the MSCI EM Index.
| | | | | | | | | | | | |
| | | | |
TOTAL RETURN | | One Year
1/1/16 -
12/31/16 | | | Five Year
Average
Annual
1/1/12 -
12/31/16 | | | Since
Inception
Average
Annual
8/27/08 -
12/31/16 | |
Service Class I | | | 6.11% | | | | -1.50% | | | | -0.06% | |
MSCI EM Index | | | 11.19% | | | | 1.28% | | | | 1.40% | |
Hypothetical Investments in MML Strategic Emerging Markets Fund Class II and the MSCI EM Index.
| | | | | | | | | | | | |
| | | | |
TOTAL RETURN | | One Year
1/1/16 -
12/31/16 | | | Five Year
Average
Annual
1/1/12 -
12/31/16 | | | Since
Inception
Average
Annual
5/1/09 -
12/31/16 | |
Class II | | | 6.49% | | | | -1.24% | | | | 3.65% | |
MSCI EM Index | | | 11.19% | | | | 1.28% | | | | 6.02% | |
GROWTH OF $10,000 INVESTMENT SINCE INCEPTION

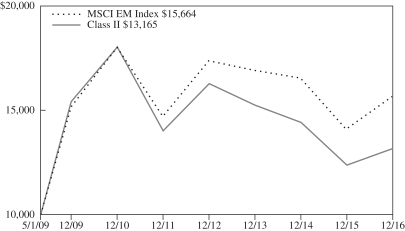
Generally accepted accounting principles require adjustments to be made to the net assets of the Fund at period end for financial reporting purposes only, and as such, the total return based on the unadjusted net asset value per share may differ from the total return reported in the financial highlights.
Performance data quoted represents past performance; past performance is not predictive of future results. The investment return and principal value of shares of the Fund will fluctuate with market conditions so that shares of the Fund, when redeemed, may be worth more or less than their original cost. Current performance of the Fund may be lower or higher than the performance quoted. Performance data current to the most recent month end may be obtained by accessing the website at www.massmutual.com.
Investors should note that the Fund is a professionally managed mutual fund, while the MSCI EM Index is unmanaged, does not incur expenses, and cannot be purchased directly by investors. Investors should read the Fund’s prospectus with regard to the Fund’s investment objective, risks, and charges and expenses in conjunction with these financial statements. The Fund’s return reflects changes in the net asset value per share without the deduction of any product charges (e.g., cost of insurance, mortality and expense risk charges, administrative fees, and CDSL). The inclusion of these charges would have reduced the performance shown here.
31
MML Asset Momentum Fund – Portfolio of Investments
December 31, 2016
| | | | | | | | |
| | | Number of
Shares | | | Value | |
| EQUITIES — 38.8% | |
|
| COMMON STOCK — 38.8% | |
| Basic Materials — 1.9% | | | | | | | | |
| Chemicals — 1.0% | | | | | | | | |
Air Products & Chemicals, Inc. | | | 1,400 | | | $ | 201,348 | |
| | | | | | | | |
| Mining — 0.9% | | | | | | | | |
Vulcan Materials Co. | | | 1,600 | | | | 200,240 | |
| | | | | | | | |
| | | | | | | 401,588 | |
| | | | | | | | |
| Communications — 1.3% | | | | | | | | |
| Telecommunications — 1.3% | | | | | | | | |
Drillisch AG | | | 3,800 | | | | 163,210 | |
NTT DOCOMO, Inc. | | | 5,600 | | | | 127,348 | |
| | | | | | | | |
| | | | | | | 290,558 | |
| | | | | | | | |
| Consumer, Cyclical — 11.5% | | | | | | | | |
| Distribution & Wholesale — 2.5% | | | | | | | | |
Pool Corp. | | | 5,100 | | | | 532,134 | |
| | | | | | | | |
| Home Builders — 4.6% | | | | | | | | |
NVR, Inc. (a) | | | 600 | | | | 1,001,400 | |
| | | | | | | | |
| Retail — 3.6% | | | | | | | | |
Fielmann AG | | | 1,400 | | | | 92,309 | |
The TJX Cos., Inc. | | | 9,200 | | | | 691,196 | |
| | | | | | | | |
| | | | | | | 783,505 | |
| | | | | | | | |
| Textiles — 0.8% | | | | | | | | |
Mohawk Industries, Inc. (a) | | | 800 | | | | 159,744 | |
| | | | | | | | |
| | | | | | | 2,476,783 | |
| | | | | | | | |
| Consumer, Non-cyclical — 7.6% | | | | | | | | |
| Agriculture — 0.8% | | | | | | | | |
Reynolds American, Inc. | | | 3,000 | | | | 168,120 | |
| | | | | | | | |
| Biotechnology — 0.9% | | | | | | | | |
CSL Ltd. | | | 2,800 | | | | 202,272 | |
| | | | | | | | |
| Foods — 1.2% | | | | | | | | |
Nestle SA | | | 1,300 | | | | 93,244 | |
Saputo, Inc. | | | 4,500 | | | | 159,234 | |
| | | | | | | | |
| | | | | | | 252,478 | |
| | | | | | | | |
| Health Care – Products — 0.7% | | | | | | | | |
Advanced Medical Solutions Group PLC | | | 54,300 | | | | 148,294 | |
| | | | | | | | |
| Health Care – Services — 2.8% | | | | | | | | |
Fresenius SE & Co. KGaA | | | 5,900 | | | | 460,874 | |
Ramsay Health Care Ltd. | | | 3,000 | | | | 147,885 | |
| | | | | | | | |
| | | | | | | 608,759 | |
| | | | | | | | |
| Household Products — 1.2% | | | | | | | | |
Henkel AG & Co. KGaA | | | 2,000 | | | | 207,733 | |
Portmeirion Group PLC | | | 5,600 | | | | 64,530 | |
| | | | | | | | |
| | | | | | | 272,263 | |
| | | | | | | | |
| | | | | | | 1,652,186 | |
| | | | | | | | |
| | | | | | | | |
| | | Number of
Shares | | | Value | |
| Financial — 2.4% | | | | | | | | |
| Diversified Financial — 1.8% | | | | | | | | |
MasterCard, Inc. Class A | | | 3,800 | | | $ | 392,350 | |
| | | | | | | | |
| Diversified Financial Services — 0.6% | |
Onex Corp. | | | 1,700 | | | | 115,701 | |
| | | | | | | | |
| | | | | | | 508,051 | |
| | | | | | | | |
| Industrial — 11.2% | | | | | | | | |
| Aerospace & Defense — 3.8% | | | | | | | | |
General Dynamics Corp. | | | 1,200 | | | | 207,192 | |
Lockheed Martin Corp. | | | 800 | | | | 199,952 | |
Northrop Grumman Corp. | | | 900 | | | | 209,322 | |
Raytheon Co. | | | 1,400 | | | | 198,800 | |
| | | | | | | | |
| | | | | | | 815,266 | |
| | | | | | | | |
| Building Materials — 1.3% | | | | | | | | |
Breedon Aggregates Ltd. (a) | | | 88,100 | | | | 77,381 | |
Martin Marietta Materials, Inc. | | | 900 | | | | 199,377 | |
| | | | | | | | |
| | | | | | | 276,758 | |
| | | | | | | | |
| Electronics — 0.9% | | | | | | | | |
Halma PLC | | | 17,600 | | | | 193,984 | |
| | | | | | | | |
| Hand & Machine Tools — 1.5% | | | | | | | | |
Schindler Holding AG | | | 700 | | | | 123,265 | |
Snap-on, Inc. | | | 1,200 | | | | 205,524 | |
| | | | | | | | |
| | | | | | | 328,789 | |
| | | | | | | | |
| Machinery – Diversified — 1.9% | | | | | | | | |
Cummins, Inc. | | | 1,500 | | | | 205,005 | |
Wabtec Corp. | | | 2,400 | | | | 199,248 | |
| | | | | | | | |
| | | | | | | 404,253 | |
| | | | | | | | |
| Manufacturing — 0.9% | | | | | | | | |
Illinois Tool Works, Inc. | | | 1,700 | | | | 208,182 | |
| | | | | | | | |
| Miscellaneous – Manufacturing — 0.9% | |
A.O. Smith Corp. | | | 4,200 | | | | 198,870 | |
| | | | | | | | |
| | | | | | | 2,426,102 | |
| | | | | | | | |
| Technology — 2.9% | | | | | | | | |
| Computers — 1.4% | | | | | | | | |
Amdocs Ltd. | | | 5,200 | | | | 302,900 | |
| | | | | | | | |
| Software — 1.5% | | | | | | | | |
EMIS Group PLC | | | 11,800 | | | | 140,275 | |
Nexus AG | | | 3,400 | | | | 64,036 | |
Open Text Corp. | | | 2,100 | | | | 129,693 | |
| | | | | | | | |
| | | | | | | 334,004 | |
| | | | | | | | |
| | | | | | | 636,904 | |
| | | | | | | | |
| |
TOTAL COMMON STOCK
(Cost $8,433,582) | | | | 8,392,172 | |
| | | | | |
| |
TOTAL EQUITIES
(Cost $8,433,582) | | | | 8,392,172 | |
| | | | | |
The accompanying notes are an integral part of the financial statements.
32
MML Asset Momentum Fund – Portfolio of Investments (Continued)
| | | | | | | | |
| | | Principal
Amount | | | Value | |
| BONDS & NOTES — 18.5% | |
|
| CORPORATE DEBT — 13.9% | |
| Diversified Financial — 13.9% | | | | | | | | |
Federal Home Loan Mortgage Corp.
1.000% 7/28/17 | | $ | 3,000,000 | | | $ | 3,003,843 | |
| | | | | | | | |
| | |
TOTAL CORPORATE DEBT
(Cost $3,010,500) | | | | | | | 3,003,843 | |
| | | | | |
|
| U.S. TREASURY OBLIGATIONS — 4.6% | |
| U.S. Treasury Bonds & Notes — 4.6% | |
U.S. Treasury Note (b)
0.750% 4/30/18 | | | 1,000,000 | | | | 996,689 | |
| | | | | | | | |
| | |
TOTAL U.S. TREASURY OBLIGATIONS
(Cost $998,125) | | | | | | | 996,689 | |
| | | | | |
| | |
TOTAL BONDS & NOTES
(Cost $4,008,625) | | | | | | | 4,000,532 | |
| | | | | |
| | |
| | | Number of
Shares | | | | |
| MUTUAL FUNDS — 34.2% | |
| Diversified Financial — 34.2% | | | | | | | | |
iShares MSCI Canada Index Fund | | | 24,100 | | | | 630,215 | |
iShares MSCI India ETF | | | 6,600 | | | | 176,946 | |
VanEck Vectors Russia ETF | | | 52,400 | | | | 1,111,928 | |
Vanguard Total Stock Market ETF | | | 47,500 | | | | 5,477,700 | |
| | | | | | | | |
| | | | | | | 7,396,789 | |
| | | | | | | | |
| | |
TOTAL MUTUAL FUNDS
(Cost $7,167,781) | | | | | | | 7,396,789 | |
| | | | | |
| | |
TOTAL LONG-TERM INVESTMENTS
(Cost $19,609,988) | | | | | | | 19,789,493 | |
| | | | | |
| | |
| | | Principal
Amount | | | | |
| SHORT-TERM INVESTMENTS — 8.4% | |
| Repurchase Agreement — 8.4% | | | | | | | | |
State Street Bank & Trust Co. Repurchase Agreement, dated 12/30/16, 0.010%, due 1/03/17 (c) | | $ | 1,806,566 | | | | 1,806,566 | |
| | | | | | | | |
| | |
TOTAL SHORT-TERM INVESTMENTS
(Cost $1,806,566) | | | | | | | 1,806,566 | |
| | | | | |
| | |
TOTAL INVESTMENTS — 99.9%
(Cost $21,416,554) (d) | | | | | | | 21,596,059 | |
| | |
| Other Assets/(Liabilities) — 0.1% | | | | | | | 20,361 | |
| | | | | |
| | |
| NET ASSETS — 100.0% | | | | | | $ | 21,616,420 | |
| | | | | |
Notes to Portfolio of Investments
Percentages are stated as a percent of net assets.
| (a) | Non-income producing security. |
| (b) | A portion of this security is pledged as collateral for open futures contracts. (Note 2). |
| (c) | Maturity value of $1,806,568. Collateralized by U.S. Government Agency obligations with a rate of 1.625%, maturity date of 4/30/19, and an aggregate market value, including accrued interest, of $1,847,522. |
| (d) | See Note 6 for aggregate cost for federal tax purposes. |
The accompanying notes are an integral part of the financial statements.
33
MML Dynamic Bond Fund – Portfolio of Investments
December 31, 2016
| | | | | | | | |
| | | Number of
Shares | | | Value | |
| EQUITIES — 0.0% | |
|
| COMMON STOCK — 0.0% | |
| Energy — 0.0% | | | | | | | | |
| Oil & Gas — 0.0% | | | | | | | | |
SandRidge Energy, Inc. (a) | | | 287 | | | $ | 6,759 | |
| | | | | | | | |
| | |
TOTAL COMMON STOCK
(Cost $8,328) | | | | | | | 6,759 | |
| | | | | |
| | |
TOTAL EQUITIES
(Cost $8,328) | | | | | | | 6,759 | |
| | | | | |
| | |
| | | Principal
Amount | | | | |
| BONDS & NOTES — 93.9% | |
|
| CORPORATE DEBT — 23.2% | |
| Advertising — 0.1% | | | | | | | | |
Omnicom Group, Inc.
3.600% 4/15/26 | | $ | 585,000 | | | | 578,958 | |
| | | | | | | | |
| Aerospace & Defense — 0.3% | | | | | | | | |
The Boeing Co.
6.875% 3/15/39 | | | 405,000 | | | | 572,183 | |
Lockheed Martin Corp.
4.700% 5/15/46 | | | 440,000 | | | | 478,599 | |
TransDigm, Inc.
6.000% 7/15/22 | | | 125,000 | | | | 130,000 | |
| | | | | | | | |
| | | | | | | 1,180,782 | |
| | | | | | | | |
| Agriculture — 0.2% | | | | | | | | |
IOI Investment L Bhd (b)
4.375% 6/27/22 | | | 300,000 | | | | 303,186 | |
Reynolds American, Inc.
4.000% 6/12/22 | | | 545,000 | | | | 570,028 | |
| | | | | | | | |
| | | | | | | 873,214 | |
| | | | | | | | |
| Airlines — 0.1% | | | | | | | | |
Avianca Holdings SA/Avianca Leasing LLC/Grupo Taca Holdings Ltd. (b)
8.375% 5/10/20 | | | 300,000 | | | | 304,500 | |
| | | | | | | | |
| Apparel — 0.0% | | | | | | | | |
Levi Strauss & Co.
5.000% 5/01/25 | | | 50,000 | | | | 50,000 | |
| | | | | | | | |
| Auto Manufacturers — 0.4% | | | | | | | | |
Ford Motor Co.
7.450% 7/16/31 | | | 515,000 | | | | 646,348 | |
General Motors Financial Co., Inc.
2.400% 5/09/19 | | | 475,000 | | | | 473,742 | |
General Motors Financial Co., Inc.
3.200% 7/13/20 | | | 325,000 | | | | 325,977 | |
| | | | | | | | |
| | | Principal
Amount | | | Value | |
General Motors Financial Co., Inc.
3.200% 7/06/21 | | $ | 135,000 | | | $ | 133,874 | |
| | | | | | | | |
| | | | | | | 1,579,941 | |
| | | | | | | | |
| Automotive & Parts — 0.2% | | | | | | | | |
Allison Transmission, Inc. (c)
5.000% 10/01/24 | | | 45,000 | | | | 45,450 | |
American Axle & Manufacturing Inc, Series A
6.625% 10/15/22 | | | 120,000 | | | | 123,744 | |
Dana, Inc.
5.500% 12/15/24 | | | 65,000 | | | | 66,300 | |
Delphi Automotive PLC
4.250% 1/15/26 | | | 104,000 | | | | 107,674 | |
Delphi Corp.
4.150% 3/15/24 | | | 455,000 | | | | 468,981 | |
The Goodyear Tire & Rubber Co.
5.125% 11/15/23 | | | 130,000 | | | | 133,900 | |
| | | | | | | | |
| | | | | | | 946,049 | |
| | | | | | | | |
| Banks — 4.9% | | | | | | | | |
Agromercantil Senior Trust (b)
6.250% 4/10/19 | | | 200,000 | | | | 205,108 | |
Australia & New Zealand Banking Group Ltd. (c)
4.875% 1/12/21 | | | 540,000 | | | | 584,330 | |
Banco de Costa Rica (b)
5.250% 8/12/18 | | | 750,000 | | | | 756,525 | |
Banco de Credito del Peru (c)
2.250% 10/25/19 | | | 200,000 | | | | 197,500 | |
Banco de Reservas de la Republica Dominicana (c)
7.000% 2/01/23 | | | 200,000 | | | | 200,038 | |
Banco GNB Sudameris SA (b)
7.500% 7/30/22 | | | 300,000 | | | | 316,500 | |
Banco Nacional de Comercio Exterior SNC 5 year CMT + 3.000%, VRN (b)
3.800% 8/11/26 | | | 500,000 | | | | 468,125 | |
Banco Nacional de Costa Rica (b)
4.875% 11/01/18 | | | 800,000 | | | | 806,560 | |
Banco Santander Mexico SA Institucion de Banca Multiple Grupo Financiero Santand 5 year CMT + 4.580%, VRN (b)
5.950% 1/30/24 | | | 900,000 | | | | 915,750 | |
Bank of America Corp.
2.000% 1/11/18 | | | 450,000 | | | | 451,035 | |
Bank of America Corp.
2.503% 10/21/22 | | | 450,000 | | | | 435,207 | |
Bank of Montreal
1.900% 8/27/21 | | | 600,000 | | | | 581,414 | |
BB&T Corp.
2.050% 5/10/21 | | | 360,000 | | | | 353,322 | |
The accompanying notes are an integral part of the financial statements.
34
MML Dynamic Bond Fund – Portfolio of Investments (Continued)
| | | | | | | | |
| | | Principal
Amount | | | Value | |
BB&T Corp.
2.450% 1/15/20 | | $ | 525,000 | | | $ | 529,114 | |
BBVA Bancomer SA VRN (b)
6.008% 5/17/22 | | | 500,000 | | | | 500,000 | |
Citigroup, Inc.
2.700% 3/30/21 | | | 950,000 | | | | 947,826 | |
CorpGroup Banking SA (b)
6.750% 3/15/23 | | | 750,000 | | | | 712,597 | |
DBS Group Holdings Ltd. USD 5 year swap rate + 2.390%, VRN (b)
3.600% 12/29/49 | | | 500,000 | | | | 481,511 | |
Global Bank Corp. (b)
5.125% 10/30/19 | | | 700,000 | | | | 714,000 | |
The Goldman Sachs Group, Inc.
2.350% 11/15/21 | | | 655,000 | | | | 636,372 | |
Industrial Senior Trust (b)
5.500% 11/01/22 | | | 500,000 | | | | 479,670 | |
JP Morgan Chase & Co.
2.972% 1/15/23 | | | 615,000 | | | | 612,940 | |
JP Morgan Chase & Co.
4.250% 10/01/27 | | | 570,000 | | | | 585,634 | |
Malayan Banking Bhd 5 year CMT + 2.600%, VRN (b)
3.250% 9/20/22 | | | 300,000 | | | | 301,250 | |
Morgan Stanley
2.500% 4/21/21 | | | 185,000 | | | | 182,989 | |
Morgan Stanley
2.625% 11/17/21 | | | 400,000 | | | | 395,185 | |
Morgan Stanley
3.125% 7/27/26 | | | 300,000 | | | | 286,613 | |
Morgan Stanley
3.875% 1/27/26 | | | 355,000 | | | | 358,588 | |
Oversea-Chinese Banking Corp. Ltd. USD 5 year swap rate + 2.203%, VRN (b)
4.000% 10/15/24 | | | 900,000 | | | | 924,106 | |
PNC Funding Corp.
3.300% 3/08/22 | | | 560,000 | | | | 575,700 | |
Royal Bank of Canada
2.500% 1/19/21 | | | 140,000 | | | | 140,342 | |
State Street Corp.
2.650% 5/19/26 | | | 375,000 | | | | 355,660 | |
State Street Corp.
3.550% 8/18/25 | | | 285,000 | | | | 291,771 | |
Sumitomo Mitsui Financial Group, Inc.
2.058% 7/14/21 | | | 385,000 | | | | 372,368 | |
Sumitomo Mitsui Financial Group, Inc.
2.934% 3/09/21 | | | 570,000 | | | | 572,984 | |
The Toronto-Dominion Bank
1.800% 7/13/21 | | | 970,000 | | | | 939,317 | |
United Overseas Bank Ltd. USD 5 year swap rate + 1.995%, VRN (b)
3.750% 9/19/24 | | | 700,000 | | | | 713,125 | |
| | | | | | | | |
| | | Principal
Amount | | | Value | |
Wells Fargo & Co.
3.000% 4/22/26 | | $ | 475,000 | | | $ | 453,260 | |
Wells Fargo & Co.
3.000% 10/23/26 | | | 555,000 | | | | 528,580 | |
Wells Fargo & Co.
3.550% 9/29/25 | | | 250,000 | | | | 249,586 | |
Westpac Banking Corp.
2.000% 8/19/21 | | | 70,000 | | | | 67,953 | |
Westpac Banking Corp.
2.600% 11/23/20 | | | 520,000 | | | | 522,102 | |
| | | | | | | | |
| | | | | | | 20,702,557 | |
| | | | | | | | |
| Beverages — 0.4% | | | | | | | | |
Anheuser-Busch InBev Finance, Inc.
4.900% 2/01/46 | | | 275,000 | | | | 297,239 | |
Central American Bottling Corp. (b)
6.750% 2/09/22 | | | 200,000 | | | | 204,000 | |
The Coca-Cola Co.
1.550% 9/01/21 | | | 610,000 | | | | 592,743 | |
PepsiCo, Inc.
3.450% 10/06/46 | | | 665,000 | | | | 605,806 | |
| | | | | | | | |
| | | | | | | 1,699,788 | |
| | | | | | | | |
| Biotechnology — 0.1% | | | | | | | | |
Celgene Corp.
3.875% 8/15/25 | | | 285,000 | | | | 289,078 | |
| | | | | | | | |
| Building Materials — 0.0% | | | | | | | | |
Builders FirstSource, Inc. (c)
5.625% 9/01/24 | | | 45,000 | | | | 45,225 | |
| | | | | | | | |
| Chemicals — 0.2% | | | | | | | | |
Ashland LLC STEP
4.750% 8/15/22 | | | 60,000 | | | | 62,250 | |
Grupo Idesa SA de CV (b)
7.875% 12/18/20 | | | 850,000 | | | | 769,250 | |
Potash Corp. of Saskatchewan, Inc.
4.000% 12/15/26 | | | 125,000 | | | | 125,791 | |
PQ Corp. (c)
6.750% 11/15/22 | | | 60,000 | | | | 64,200 | |
| | | | | | | | |
| | | | | | | 1,021,491 | |
| | | | | | | | |
| Commercial Services — 0.5% | | | | | | | | |
Adani Ports & Special Economic Zone Ltd. (b)
3.500% 7/29/20 | | | 600,000 | | | | 597,007 | |
ENA Norte Trust (b)
4.950% 4/25/28 | | | 809,720 | | | | 838,060 | |
Live Nation Entertainment, Inc. (c)
4.875% 11/01/24 | | | 85,000 | | | | 85,212 | |
Prime Security Services Borrower LLC/Prime Finance, Inc. (c)
9.250% 5/15/23 | | | 120,000 | | | | 130,650 | |
S&P Global, Inc.
4.400% 2/15/26 | | | 285,000 | | | | 301,489 | |
The accompanying notes are an integral part of the financial statements.
35
MML Dynamic Bond Fund – Portfolio of Investments (Continued)
| | | | | | | | |
| | | Principal
Amount | | | Value | |
The ServiceMaster Co. LLC (c)
5.125% 11/15/24 | | $ | 45,000 | | | $ | 45,675 | |
Team Health, Inc. (c)
7.250% 12/15/23 | | | 55,000 | | | | 62,562 | |
| | | | | | | | |
| | | | | | | 2,060,655 | |
| | | | | | | | |
| Computers — 0.1% | | | | | | | | |
Diamond 1 Finance Corp./Diamond 2 Finance Corp. (c)
7.125% 6/15/24 | | | 90,000 | | | | 99,916 | |
Hewlett Packard Enterprise Co. STEP
3.600% 10/15/20 | | | 455,000 | | | | 462,878 | |
Western Digital Corp. (c)
7.375% 4/01/23 | | | 35,000 | | | | 38,500 | |
| | | | | | | | |
| | | | | | | 601,294 | |
| | | | | | | | |
| Cosmetics & Personal Care — 0.0% | | | | | | | | |
Revlon Consumer Products Corp. STEP
5.750% 2/15/21 | | | 86,000 | | | | 86,430 | |
Revlon Consumer Products Corp.
6.250% 8/01/24 | | | 15,000 | | | | 15,375 | |
| | | | | | | | |
| | | | | | | 101,805 | |
| | | | | | | | |
| Diversified Financial — 1.4% | | | | | | | | |
Air Lease Corp.
3.750% 2/01/22 | | | 585,000 | | | | 602,577 | |
Ally Financial, Inc.
4.125% 3/30/20 | | | 555,000 | | | | 560,550 | |
Ally Financial, Inc.
4.250% 4/15/21 | | | 30,000 | | | | 30,281 | |
American Express Credit Corp.
2.250% 8/15/19 | | | 175,000 | | | | 175,974 | |
American Express Credit Corp.
2.250% 5/05/21 | | | 1,050,000 | | | | 1,037,488 | |
Bantrab Senior Trust (b)
9.000% 11/14/20 | | | 300,000 | | | | 260,310 | |
CIMPOR Financial Operations BV (b)
5.750% 7/17/24 | | | 400,000 | | | | 332,040 | |
Guanay Finance Ltd. (b)
6.000% 12/15/20 | | | 823,086 | | | | 831,317 | |
Interoceanica IV Finance Ltd. (b)
0.000% 11/30/25 | | | 713,734 | | | | 581,693 | |
National Rural Utilities Cooperative Finance Corp.
2.000% 1/27/20 | | | 440,000 | | | | 436,821 | |
Nationstar Mortgage LLC/Nationstar Capital Corp.
6.500% 7/01/21 | | | 40,000 | | | | 40,500 | |
Peru Enhanced Pass-Through Finance Ltd. (b)
0.000% 6/02/25 | | | 250,000 | | | | 202,220 | |
SUAM Finance BV (b)
4.875% 4/17/24 | | | 200,000 | | | | 202,500 | |
| | | | | | | | |
| | | Principal
Amount | | | Value | |
Synchrony Financial
3.000% 8/15/19 | | $ | 555,000 | | | $ | 562,192 | |
| | | | | | | | |
| | | | | | | 5,856,463 | |
| | | | | | | | |
| Electric — 1.6% | | | | | | | | |
Abengoa Transmision Sur SA (b)
6.875% 4/30/43 | | | 299,370 | | | | 306,854 | |
AES Andres BV/Dominican Power Partners/Empresa Generadora de Electricidad It (c)
7.950% 5/11/26 | | | 500,000 | | | | 515,860 | |
Calpine Corp.
5.750% 1/15/25 | | | 45,000 | | | | 43,425 | |
Comision Federal de Electricidad (b)
4.750% 2/23/27 | | | 600,000 | | | | 576,000 | |
Duke Energy Corp.
3.750% 9/01/46 | | | 215,000 | | | | 193,545 | |
Duke Energy Progress, Inc.
4.150% 12/01/44 | | | 470,000 | | | | 466,951 | |
Empresa de Energia de Bogota SA ESP (b)
6.125% 11/10/21 | | | 600,000 | | | | 618,000 | |
Exelon Corp.
3.400% 4/15/26 | | | 1,040,000 | | | | 1,020,425 | |
Fortis, Inc. (c)
2.100% 10/04/21 | | | 590,000 | | | | 570,244 | |
Israel Electric Corp. Ltd. (b)
5.000% 11/12/24 | | | 700,000 | | | | 728,399 | |
Midamerican Energy Holdings Co.
6.500% 9/15/37 | | | 594,000 | | | | 773,198 | |
NRG Energy, Inc. (c)
7.250% 5/15/26 | | | 85,000 | | | | 84,575 | |
The Southern Co.
2.450% 9/01/18 | | | 875,000 | | | | 883,985 | |
| | | | | | | | |
| | | | | | | 6,781,461 | |
| | | | | | | | |
| Engineering & Construction — 0.3% | | | | | | | | |
Aeropuerto Internacional de Tocumen SA
5.750% 10/09/23 | | | 1,250,000 | | | | 1,303,125 | |
| | | | | | | | |
| Entertainment — 0.1% | | | | | | | | |
AMC Entertainment Holdings, Inc. (c)
5.875% 11/15/26 | | | 40,000 | | | | 40,900 | |
GLP Capital LP/GLP Financing II, Inc.
5.375% 4/15/26 | | | 40,000 | | | | 41,716 | |
Pinnacle Entertainment, Inc. (c)
5.625% 5/01/24 | | | 85,000 | | | | 85,213 | |
Scientific Games International, Inc. (c)
7.000% 1/01/22 | | | 45,000 | | | | 48,263 | |
WMG Acquisition Corp. (c)
6.750% 4/15/22 | | | 105,000 | | | | 110,512 | |
| | | | | | | | |
| | | | | | | 326,604 | |
| | | | | | | | |
The accompanying notes are an integral part of the financial statements.
36
MML Dynamic Bond Fund – Portfolio of Investments (Continued)
| | | | | | | | |
| | | Principal
Amount | | | Value | |
| Environmental Controls — 0.1% | | | | | | | | |
Waste Management, Inc.
4.100% 3/01/45 | | $ | 475,000 | | | $ | 470,095 | |
| | | | | | | | |
| Foods — 1.2% | | | | | | | | |
Albertsons Cos. LLC/Safeway, Inc./New Albertson’s, Inc./Albertson’s LLC (c)
5.750% 3/15/25 | | | 85,000 | | | | 84,150 | |
Cencosud SA (b)
5.150% 2/12/25 | | | 600,000 | | | | 606,462 | |
Cosan Overseas Ltd. (b)
8.250% 11/29/49 | | | 700,000 | | | | 697,900 | |
JBS USA LLC/JBS USA Finance, Inc. (c)
5.750% 6/15/25 | | | 65,000 | | | | 65,812 | |
Kraft Heinz Foods Co.
1.600% 6/30/17 | | | 355,000 | | | | 355,285 | |
Kraft Heinz Foods Co.
2.000% 7/02/18 | | | 235,000 | | | | 235,053 | |
The Kroger Co.
3.400% 4/15/22 | | | 725,000 | | | | 739,037 | |
Marfrig Holdings Europe BV (c)
8.000% 6/08/23 | | | 200,000 | | | | 207,020 | |
Minerva Luxembourg SA 5 year CMT + 7.046%, VRN (b)
8.750% 12/29/49 | | | 500,000 | | | | 511,875 | |
Pilgrim’s Pride Corp. (c)
5.750% 3/15/25 | | | 130,000 | | | | 129,675 | |
TreeHouse Foods, Inc. (c)
6.000% 2/15/24 | | | 40,000 | | | | 42,000 | |
Tyson Foods, Inc.
3.950% 8/15/24 | | | 1,200,000 | | | | 1,222,553 | |
| | | | | | | | |
| | | | | | | 4,896,822 | |
| | | | | | | | |
| Forest Products & Paper — 0.3% | | | | | | | | |
Georgia-Pacific LLC (c)
3.600% 3/01/25 | | | 1,125,000 | | | | 1,137,845 | |
International Paper Co.
3.000% 2/15/27 | | | 270,000 | | | | 254,729 | |
| | | | | | | | |
| | | | | | | 1,392,574 | |
| | | | | | | | |
| Gas — 0.3% | | | | | | | | |
Fermaca Enterprises S de RL de CV (b)
6.375% 3/30/38 | | | 381,485 | | | | 375,762 | |
National Gas Co., of Trinidad & Tobago Ltd. (b)
6.050% 1/15/36 | | | 800,000 | | | | 808,000 | |
NGL Energy Partners LP/NGL Energy Finance Corp. (c)
7.500% 11/01/23 | | | 40,000 | | | | 41,300 | |
| | | | | | | | |
| | | | | | | 1,225,062 | |
| | | | | | | | |
| Hand & Machine Tools — 0.0% | | | | | | | | |
Milacron LLC/Mcron Finance Corp. (c)
7.750% 2/15/21 | | | 120,000 | | | | 123,300 | |
| | | | | | | | |
| | | | | | | | |
| | | Principal
Amount | | | Value | |
| Health Care – Products — 0.4% | | | | | | | | |
DJO Finco, Inc./DJO Finance LLC/DJO Finance Corp. (c)
8.125% 6/15/21 | | $ | 15,000 | | | $ | 13,013 | |
Thermo Fisher Scientific, Inc.
3.300% 2/15/22 | | | 895,000 | | | | 909,296 | |
Zimmer Biomet Holdings, Inc.
1.450% 4/01/17 | | | 565,000 | | | | 565,136 | |
| | | | | | | | |
| | | | | | | 1,487,445 | |
| | | | | | | | |
| Health Care – Services — 0.8% | | | | | | | | |
Acadia Healthcare Co., Inc.
5.625% 2/15/23 | | | 85,000 | | | | 85,000 | |
Anthem, Inc.
2.300% 7/15/18 | | | 585,000 | | | | 588,824 | |
Centene Corp.
4.750% 1/15/25 | | | 95,000 | | | | 92,744 | |
Centene Corp.
5.625% 2/15/21 | | | 45,000 | | | | 47,313 | |
Envision Healthcare Corp. (c)
6.250% 12/01/24 | | | 105,000 | | | | 110,775 | |
HCA, Inc.
5.875% 2/15/26 | | | 45,000 | | | | 46,350 | |
Laboratory Corp. of America Holdings
2.500% 11/01/18 | | | 575,000 | | | | 580,067 | |
Laboratory Corp. of America Holdings
4.700% 2/01/45 | | | 600,000 | | | | 592,645 | |
LifePoint Health, Inc. (c)
5.375% 5/01/24 | | | 45,000 | | | | 44,078 | |
MPH Acquisition Holdings LLC (c)
7.125% 6/01/24 | | | 125,000 | | | | 131,575 | |
RegionalCare Hospital Partners Holdings, Inc. (c)
8.250% 5/01/23 | | | 40,000 | | | | 39,900 | |
Select Medical Corp.
6.375% 6/01/21 | | | 130,000 | | | | 130,000 | |
Tenet Healthcare Corp.
6.750% 6/15/23 | | | 130,000 | | | | 114,725 | |
UnitedHealth Group, Inc.
4.200% 1/15/47 | | | 575,000 | | | | 581,611 | |
| | | | | | | | |
| | | | | | | 3,185,607 | |
| | | | | | | | |
| Holding Company – Diversified — 0.3% | | | | | | | | |
Argos Merger Sub, Inc. (c)
7.125% 3/15/23 | | | 105,000 | | | | 107,100 | |
Hutchison Whampoa International 12 Ltd. 5 year CMT + 5.176%, VRN (b)
6.000% 5/29/49 | | | 400,000 | | | | 404,000 | |
MUFG Americas Holdings Corp.
1.625% 2/09/18 | | | 560,000 | | | | 558,034 | |
| | | | | | | | |
| | | | | | | 1,069,134 | |
| | | | | | | | |
The accompanying notes are an integral part of the financial statements.
37
MML Dynamic Bond Fund – Portfolio of Investments (Continued)
| | | | | | | | |
| | | Principal
Amount | | | Value | |
| Household Products — 0.0% | | | | | | | | |
Kronos Acquisition Holdings, Inc. (c)
9.000% 8/15/23 | | $ | 40,000 | | | $ | 39,900 | |
Spectrum Brands, Inc.
5.750% 7/15/25 | | | 120,000 | | | | 124,500 | |
| | | | | | | | |
| | | | | | | 164,400 | |
| | | | | | | | |
| Housewares — 0.0% | | | | | | | | |
Newell Brands, Inc.
3.150% 4/01/21 | | | 135,000 | | | | 137,389 | |
| | | | | | | | |
| Insurance — 0.3% | | | | | | | | |
Liberty Mutual Group, Inc. (c)
6.500% 5/01/42 | | | 730,000 | | | | 865,511 | |
TIAA Asset Management Finance Co. LLC (c)
2.950% 11/01/19 | | | 570,000 | | | | 579,839 | |
| | | | | | | | |
| | | | | | | 1,445,350 | |
| | | | | | | | |
| Internet — 0.1% | | | | | | | | |
Amazon.com, Inc.
3.800% 12/05/24 | | | 270,000 | | | | 283,724 | |
| | | | | | | | |
| Investment Companies — 0.3% | | | | | | | | |
Grupo Aval Ltd. (b)
4.750% 9/26/22 | | | 800,000 | | | | 789,200 | |
GrupoSura Finance SA (b)
5.500% 4/29/26 | | | 300,000 | | | | 307,200 | |
| | | | | | | | |
| | | | | | | 1,096,400 | |
| | | | | | | | |
| Iron & Steel — 0.0% | | | | | | | | |
Signode Industrial Group Lux SA/Signode Industrial Group US, Inc. (c)
6.375% 5/01/22 | | | 85,000 | | | | 84,788 | |
| | | | | | | | |
| Leisure Time — 0.1% | | | | | | | | |
NCL Corp. Ltd. (c)
4.750% 12/15/21 | | | 90,000 | | | | 89,944 | |
Sabre GLBL, Inc. (c)
5.250% 11/15/23 | | | 85,000 | | | | 87,284 | |
Viking Cruises Ltd. (c)
8.500% 10/15/22 | | | 120,000 | | | | 124,500 | |
| | | | | | | | |
| | | | | | | 301,728 | |
| | | | | | | | |
| Lodging — 0.1% | | | | | | | | |
Hilton Domestic Operating Co., Inc. (c)
4.250% 9/01/24 | | | 95,000 | | | | 92,150 | |
Jack Ohio Finance LLC/Jack Ohio Finance 1 Corp. (c)
6.750% 11/15/21 | | | 85,000 | | | | 86,062 | |
MGM Growth Properties Operating Partnership LP/MGP Escrow Co-Issuer, Inc. (c)
5.625% 5/01/24 | | | 25,000 | | | | 26,188 | |
MGM Resorts International
4.625% 9/01/26 | | | 65,000 | | | | 62,562 | |
| | | | | | | | |
| | | Principal
Amount | | | Value | |
Station Casinos LLC
7.500% 3/01/21 | | $ | 80,000 | | | $ | 83,800 | |
| | | | | | | | |
| | | | | | | 350,762 | |
| | | | | | | | |
| Machinery – Construction & Mining — 0.0% | |
Terex Corp.
6.000% 5/15/21 | | | 110,000 | | | | 112,475 | |
| | | | | | | | |
| Manufacturing — 0.0% | | | | | | | | |
Gates Global LLC/Gates Global Co. (c)
6.000% 7/15/22 | | | 90,000 | | | | 88,020 | |
| | | | | | | | |
| Media — 0.5% | | | | | | | | |
CCO Holdings LLC/CCO Holdings Capital Corp. (c)
5.125% 5/01/23 | | | 30,000 | | | | 30,900 | |
CCO Holdings LLC/CCO Holdings Capital Corp.
5.250% 9/30/22 | | | 70,000 | | | | 72,450 | |
Cequel Communications Holdings I LLC/Cequel Capital Corp. (c)
6.375% 9/15/20 | | | 125,000 | | | | 128,750 | |
Comcast Corp.
4.400% 8/15/35 | | | 560,000 | | | | 585,837 | |
CSC Holdings LLC
5.250% 6/01/24 | | | 45,000 | | | | 43,988 | |
CSC Holdings LLC (c)
5.500% 4/15/27 | | | 40,000 | | | | 40,500 | |
Gray Television, Inc. (c)
5.125% 10/15/24 | | | 45,000 | | | | 43,538 | |
Gray Television, Inc. (c)
5.875% 7/15/26 | | | 70,000 | | | | 69,475 | |
Nexstar Escrow Corp. (c)
5.625% 8/01/24 | | | 65,000 | | | | 64,513 | |
Sinclair Television Group, Inc. (c)
5.625% 8/01/24 | | | 125,000 | | | | 127,812 | |
Sirius XM Radio, Inc. (c)
5.375% 7/15/26 | | | 125,000 | | | | 122,187 | |
TEGNA, Inc. (c)
4.875% 9/15/21 | | | 125,000 | | | | 127,187 | |
TV Azteca SAB de CV (b)
7.500% 5/25/18 | | | 550,000 | | | | 489,500 | |
| | | | | | | | |
| | | | | | | 1,946,637 | |
| | | | | | | | |
| Metal Fabricate & Hardware — 0.0% | | | | | | | | |
Grinding Media, Inc./MC Grinding Media Canada, Inc. (c)
7.375% 12/15/23 | | | 25,000 | | | | 26,265 | |
Novelis Corp. (c)
5.875% 9/30/26 | | | 25,000 | | | | 25,250 | |
Novelis Corp. (c)
6.250% 8/15/24 | | | 60,000 | | | | 63,600 | |
| | | | | | | | |
| | | | | | | 115,115 | |
| | | | | | | | |
The accompanying notes are an integral part of the financial statements.
38
MML Dynamic Bond Fund – Portfolio of Investments (Continued)
| | | | | | | | |
| | | Principal
Amount | | | Value | |
| Mining — 0.0% | | | | | | | | |
Lundin Mining Corp. (c)
7.500% 11/01/20 | | $ | 80,000 | | | $ | 85,100 | |
| | | | | | | | |
| Office Equipment/Supplies — 0.1% | | | | | | | | |
Xerox Corp.
2.950% 3/15/17 | | | 555,000 | | | | 556,672 | |
| | | | | | | | |
| Oil & Gas — 1.8% | | | | | | | | |
Apache Corp.
4.750% 4/15/43 | | | 330,000 | | | | 339,909 | |
Bharat Petroleum Corp. Ltd. (b)
4.625% 10/25/22 | | | 200,000 | | | | 209,196 | |
BP Capital Markets PLC
3.017% 1/16/27 | | | 205,000 | | | | 197,838 | |
BP Capital Markets PLC
3.723% 11/28/28 | | | 440,000 | | | | 447,075 | |
Chevron Corp.
1.365% 3/02/18 | | | 353,000 | | | | 352,653 | |
Chevron Corp.
1.561% 5/16/19 | | | 270,000 | | | | 268,891 | |
CNOOC Finance Australia Pty Ltd.
2.625% 5/05/20 | | | 300,000 | | | | 298,793 | |
CNOOC Finance Ltd. (b)
4.250% 1/26/21 | | | 200,000 | | | | 208,369 | |
Delek & Avner Tamar Bond Ltd. (c)
4.435% 12/30/20 | | | 800,000 | | | | 814,000 | |
EOG Resources, Inc.
4.150% 1/15/26 | | | 280,000 | | | | 293,019 | |
Extraction Oil & Gas Holdings LLC/Extraction Finance Corp. (c)
7.875% 7/15/21 | | | 40,000 | | | | 42,800 | |
Memorial Production Partners LP/Memorial Production Finance Corp.
6.875% 8/01/22 | | | 150,000 | | | | 71,250 | |
Noble Holding International Ltd.
7.750% 1/15/24 | | | 25,000 | | | | 23,515 | |
Occidental Petroleum Corp.
3.400% 4/15/26 | | | 145,000 | | | | 146,094 | |
ONGC Videsh Vankorneft Pte Ltd. (b)
3.750% 7/27/26 | | | 450,000 | | | | 428,003 | |
PDC Energy, Inc. (c)
6.125% 9/15/24 | | | 30,000 | | | | 30,675 | |
Petroleos Mexicanos (b)
5.500% 2/04/19 | | | 200,000 | | | | 207,178 | |
Petroleos Mexicanos (c)
6.750% 9/21/47 | | | 290,000 | | | | 273,992 | |
Petronas Global Sukuk Ltd. (b)
2.707% 3/18/20 | | | 800,000 | | | | 798,759 | |
Phillips 66
4.875% 11/15/44 | | | 50,000 | | | | 52,803 | |
Phillips 66
5.875% 5/01/42 | | | 200,000 | | | | 236,811 | |
| | | | | | | | |
| | | Principal
Amount | | | Value | |
Reliance Holding USA, Inc. (b)
5.400% 2/14/22 | | $ | 500,000 | | | $ | 540,551 | |
Sanchez Energy Corp.
6.125% 1/15/23 | | | 50,000 | | | | 47,500 | |
SandRidge Energy, Inc., Convertible
0.000% 10/04/20 | | | 6,777 | | | | 8,442 | |
SandRidge Energy, Inc. (c) (e)
8.750% 6/01/20 | | | 30,000 | | | | - | |
Shell International Finance BV
1.375% 5/10/19 | | | 600,000 | | | | 594,588 | |
Sinopec Group Overseas Development 2015 Ltd. (c)
2.500% 4/28/20 | | | 400,000 | | | | 397,348 | |
Sinopec Group Overseas Development 2016 Ltd. (c)
2.000% 9/29/21 | | | 400,000 | | | | 380,970 | |
| | | | | | | | |
| | | | | | | 7,711,022 | |
| | | | | | | | |
| Oil & Gas Services — 0.1% | | | | | | | | |
Schlumberger Holding Corp. (c)
2.350% 12/21/18 | | | 285,000 | | | | 287,351 | |
| | | | | | | | |
| Packaging & Containers — 0.1% | | | | | | | | |
Berry Plastics Corp.
5.500% 5/15/22 | | | 90,000 | | | | 93,600 | |
Plastipak Holdings, Inc. (c)
6.500% 10/01/21 | | | 80,000 | | | | 83,600 | |
Reynolds Group Issuer, Inc./Reynolds Group Issuer LLC STEP
8.250% 2/15/21 | | | 69,359 | | | | 71,613 | |
| | | | | | | | |
| | | | | | | 248,813 | |
| | | | | | | | |
| Pharmaceuticals — 1.2% | | | | | | | | |
AbbVie, Inc.
4.700% 5/14/45 | | | 635,000 | | | | 623,017 | |
Actavis Funding SCS Co.
2.350% 3/12/18 | | | 586,000 | | | | 589,388 | |
AstraZeneca PLC
2.375% 11/16/20 | | | 285,000 | | | | 284,031 | |
Cardinal Health, Inc.
1.950% 6/15/18 | | | 585,000 | | | | 586,272 | |
Eli Lilly & Co.
3.700% 3/01/45 | | | 420,000 | | | | 398,420 | |
Endo Finance LLC/Endo Finco, Inc. STEP (c)
5.375% 1/15/23 | | | 100,000 | | | | 84,750 | |
Express Scripts Holding Co.
3.400% 3/01/27 | | | 135,000 | | | | 126,483 | |
Express Scripts Holding Co.
4.500% 2/25/26 | | | 285,000 | | | | 293,400 | |
inVentiv Group Holdings, Inc./inVentiv Health, Inc./inVentiv Health Clinical, Inc. (c)
7.500% 10/01/24 | | | 85,000 | | | | 89,029 | |
The accompanying notes are an integral part of the financial statements.
39
MML Dynamic Bond Fund – Portfolio of Investments (Continued)
| | | | | | | | |
| | | Principal
Amount | | | Value | |
Mylan NV (c)
3.150% 6/15/21 | | $ | 605,000 | | | $ | 593,739 | |
Quintiles Transnational Corp. (c)
4.875% 5/15/23 | | | 85,000 | | | | 86,275 | |
Shire Acquisitions Investments Ireland DAC
2.875% 9/23/23 | | | 695,000 | | | | 660,561 | |
Teva Pharmaceutical Finance Co. BV
2.950% 12/18/22 | | | 535,000 | | | | 515,525 | |
Teva Pharmaceutical Finance Netherlands III BV
2.800% 7/21/23 | | | 245,000 | | | | 231,915 | |
Vizient, Inc. (c)
10.375% 3/01/24 | | | 80,000 | | | | 90,600 | |
| | | | | | | | |
| | | | | | | 5,253,405 | |
| | | | | | | | |
| Pipelines — 0.7% | |
Access Midstream Partners LP/ACMP Finance Corp.
4.875% 3/15/24 | | | 85,000 | | | | 85,832 | |
Energy Transfer Equity LP
5.500% 6/01/27 | | | 65,000 | | | | 63,375 | |
Energy Transfer Partners LP
4.750% 1/15/26 | | | 605,000 | | | | 625,474 | |
Fermaca Enterprises S de RL de CV (c)
6.375% 3/30/38 | | | 238,428 | | | | 234,852 | |
Kinder Morgan Energy Partners LP
6.950% 1/15/38 | | | 535,000 | | | | 620,583 | |
Sunoco Logistics Partners Operations LP
3.900% 7/15/26 | | | 750,000 | | | | 725,954 | |
Targa Resources Partners LP/Targa Resources Partners Finance Corp. (c)
5.375% 2/01/27 | | | 50,000 | | | | 49,500 | |
Transportadora de Gas Internacional SA ESP (b)
5.700% 3/20/22 | | | 500,000 | | | | 515,000 | |
| | | | | | | | |
| | | | | | | 2,920,570 | |
| | | | | | | | |
| Real Estate Investment Trusts (REITS) — 0.5% | |
American Tower Corp.
4.400% 2/15/26 | | | 750,000 | | | | 766,390 | |
Boston Properties LP
4.125% 5/15/21 | | | 540,000 | | | | 570,534 | |
Equinix, Inc.
5.875% 1/15/26 | | | 80,000 | | | | 84,200 | |
ESH Hospitality, Inc. (c)
5.250% 5/01/25 | | | 125,000 | | | | 124,375 | |
Simon Property Group LP
3.300% 1/15/26 | | | 510,000 | | | | 507,481 | |
| | | | | | | | |
| | | | | | | 2,052,980 | |
| | | | | | | | |
| Retail — 0.3% | |
Asbury Automotive Group, Inc.
6.000% 12/15/24 | | | 65,000 | | | | 66,463 | |
| | | | | | | | |
| | | Principal
Amount | | | Value | |
CVS Health Corp.
2.875% 6/01/26 | | $ | 300,000 | | | $ | 285,950 | |
Dollar Tree, Inc.
5.750% 3/01/23 | | | 31,000 | | | | 32,823 | |
Grupo Elektra SAB DE CV (b)
7.250% 8/06/18 | | | 182,000 | | | | 182,546 | |
Rite Aid Corp. (c)
6.125% 4/01/23 | | | 80,000 | | | | 86,000 | |
Sally Holdings LLC/Sally Capital, Inc.
5.750% 6/01/22 | | | 115,000 | | | | 119,456 | |
The Home Depot, Inc.
3.000% 4/01/26 | | | 380,000 | | | | 379,271 | |
The Home Depot, Inc.
3.350% 9/15/25 | | | 260,000 | | | | 266,645 | |
| | | | | | | | |
| | | | | | | 1,419,154 | |
| | | | | | | | |
| Semiconductors — 0.2% | |
Analog Devices, Inc.
2.500% 12/05/21 | | | 610,000 | | | | 604,403 | |
Intel Corp.
4.100% 5/19/46 | | | 305,000 | | | | 302,309 | |
Microsemi Corp. (c)
9.125% 4/15/23 | | | 25,000 | | | | 29,125 | |
NXP BV/NXP Funding LLC (c)
4.125% 6/01/21 | | | 95,000 | | | | 98,087 | |
| | | | | | | | |
| | | | | | | 1,033,924 | |
| | | | | | | | |
| Software — 0.7% | |
Camelot Finance SA (c)
7.875% 10/15/24 | | | 60,000 | | | | 62,100 | |
Cengage Learning, Inc. (c)
9.500% 6/15/24 | | | 80,000 | | | | 71,000 | |
Ensemble S Merger Sub, Inc. (c)
9.000% 9/30/23 | | | 125,000 | | | | 132,812 | |
Fidelity National Information Services, Inc.
3.625% 10/15/20 | | | 420,000 | | | | 434,813 | |
First Data Corp. (c)
5.750% 1/15/24 | | | 60,000 | | | | 61,913 | |
First Data Corp. (c)
7.000% 12/01/23 | | | 60,000 | | | | 63,900 | |
Genesys Telecommunications Laboratories, Inc./Greeneden Lux 3 Sarl/Greeneden US Ho (c)
10.000% 11/30/24 | | | 95,000 | | | | 100,937 | |
Infor US, Inc.
6.500% 5/15/22 | | | 85,000 | | | | 88,613 | |
Microsoft Corp.
4.450% 11/03/45 | | | 595,000 | | | | 633,924 | |
Open Text Corp. (c)
5.875% 6/01/26 | | | 85,000 | | | | 89,675 | |
Oracle Corp.
1.900% 9/15/21 | | | 640,000 | | | | 625,404 | |
The accompanying notes are an integral part of the financial statements.
40
MML Dynamic Bond Fund – Portfolio of Investments (Continued)
| | | | | | | | |
| | | Principal
Amount | | | Value | |
Oracle Corp.
4.125% 5/15/45 | | $ | 590,000 | | | $ | 571,804 | |
Solera LLC/ Solera Finance, Inc. (c)
10.500% 3/01/24 | | | 60,000 | | | | 67,500 | |
| | | | | | | | |
| | | | | | | 3,004,395 | |
| | | | | | | | |
| Telecommunications — 1.2% | |
Axiata SPV2 Bhd (b)
3.466% 11/19/20 | | | 200,000 | | | | 201,184 | |
British Telecommunications PLC
5.950% 1/15/18 | | | 1,025,000 | | | | 1,068,257 | |
Cincinnati Bell, Inc. (c)
7.000% 7/15/24 | | | 105,000 | | | | 111,037 | |
Cisco Systems, Inc.
1.850% 9/20/21 | | | 610,000 | | | | 595,339 | |
CommScope, Inc. (c)
5.000% 6/15/21 | | | 125,000 | | | | 128,750 | |
Digicel Group Ltd. (b)
7.125% 4/01/22 | | | 700,000 | | | | 543,018 | |
Embarq Corp.
7.995% 6/01/36 | | | 75,000 | | | | 70,313 | |
Intelsat Jackson Holdings SA
5.500% 8/01/23 | | | 70,000 | | | | 47,166 | |
Intelsat Jackson Holdings SA (c)
8.000% 2/15/24 | | | 40,000 | | | | 41,100 | |
Level 3 Communications, Inc.
5.750% 12/01/22 | | | 125,000 | | | | 128,437 | |
Orange SA
2.750% 2/06/19 | | | 564,000 | | | | 571,464 | |
Telefonica Celular del Paraguay SA (b)
6.750% 12/13/22 | | | 500,000 | | | | 508,750 | |
Telesat Canada/Telesat LLC (c)
8.875% 11/15/24 | | | 65,000 | | | | 67,763 | |
Verizon Communications, Inc.
4.400% 11/01/34 | | | 1,075,000 | | | | 1,061,010 | |
| | | | | | | | |
| | | | | | | 5,143,588 | |
| | | | | | | | |
| Transportation — 0.6% | |
Air Medical Merger Sub Corp. (c)
6.375% 5/15/23 | | | 130,000 | | | | 124,800 | |
Burlington Northern Santa Fe LLC
4.550% 9/01/44 | | | 555,000 | | | | 590,103 | |
CSX Corp.
3.800% 11/01/46 | | | 645,000 | | | | 597,967 | |
FedEx Corp.
4.750% 11/15/45 | | | 525,000 | | | | 543,728 | |
Lima Metro Line 2 Finance Ltd. (b)
5.875% 7/05/34 | | | 750,000 | | | | 791,250 | |
OPE KAG Finance Sub, Inc. (c)
7.875% 7/31/23 | | | 45,000 | | | | 45,450 | |
| | | | | | | | |
| | | | | | | 2,693,298 | |
| | | | | | | | |
| |
TOTAL CORPORATE DEBT
(Cost $99,215,084) | | | | 98,690,089 | |
| | | | | |
| | | | | | | | |
| | | Principal
Amount | | | Value | |
| MUNICIPAL OBLIGATIONS — 0.5% | |
City of Houston TX Combined Utility System Revenue
5.000% 11/15/35 | | $ | 580,000 | | | $ | 667,673 | |
Los Angeles County Metropolitan Transportation Authority
5.000% 6/01/33 | | | 320,000 | | | | 376,115 | |
Massachusetts School Building Authority 5.000% 11/15/34 | | | 370,000 | | | | 433,784 | |
North Texas Municipal Water District Water System Revenue
5.000% 9/01/35 | | | 310,000 | | | | 357,972 | |
State of California
5.000% 8/01/33 | | | 340,000 | | | | 388,685 | |
| | | | | | | | |
| | | | | | | 2,224,229 | |
| | | | | | | | |
| | |
TOTAL MUNICIPAL OBLIGATIONS
(Cost $2,201,001) | | | | | | | 2,224,229 | |
| | | | | |
|
| NON-U.S. GOVERNMENT AGENCY OBLIGATIONS — 28.2% | |
| Commercial MBS — 8.1% | | | | | | | | |
BXHTL Mortgage Trust, Series 2015-JWRZ, 1 mo. LIBOR + 1.230%, FRN (c)
1.934% 5/15/29 | | | 700,000 | | | | 700,575 | |
CFCRE Commercial Mortgage Trust, Series 2016-C3, Class XA, VRN
1.091% 1/10/48 | | | 5,838,966 | | | | 423,009 | |
CFCRE Commercial Mortgage Trust, Series 2016-C7, Class A3
3.839% 12/10/54 | | | 545,000 | | | | 562,989 | |
Citigroup Commercial Mortgage Trust, Series 2015-GC35, Class XA, VRN
0.903% 11/10/48 | | | 5,348,095 | | | | 282,205 | |
Citigroup Commercial Mortgage Trust, Series 2016-P4, Class XA, VRN
2.017% 7/10/49 | | | 3,772,704 | | | | 503,344 | |
Citigroup Commercial Mortgage Trust, Series 2016-P4, Class A4
2.902% 7/10/49 | | | 547,000 | | | | 529,217 | |
Citigroup Commercial Mortgage Trust, Series 2015-GC27, Class A5
3.137% 2/10/48 | | | 276,000 | | | | 275,484 | |
Citigroup Commercial Mortgage Trust, Series 2016-SMPL, Class D, VRN (c)
3.520% 9/10/31 | | | 534,000 | | | | 516,196 | |
Citigroup Commercial Mortgage Trust, Series 2016-P6, Class A5, VRN
3.720% 12/10/49 | | | 435,000 | | | | 448,730 | |
The accompanying notes are an integral part of the financial statements.
41
MML Dynamic Bond Fund – Portfolio of Investments (Continued)
| | | | | | | | |
| | | Principal
Amount | | | Value | |
Citigroup Commercial Mortgage Trust, Series 2015-GC31, Class C, VRN
4.064% 6/10/48 | | $ | 700,000 | | | $ | 628,318 | |
Citigroup Commercial Mortgage Trust, Series 2015-GC35, Class C
4.501% 11/10/48 | | | 413,000 | | | | 397,920 | |
COMM Mortgage Trust, Series 2016-DC2, Class XA, VRN
1.078% 2/10/49 | | | 994,709 | | | | 67,324 | |
COMM Mortgage Trust, Series 2015-CR22, Class D, VRN (c)
4.126% 3/10/48 | | | 650,000 | | | | 510,228 | |
COMM Mortgage Trust, Series 2015-LC23, Class C, VRN
4.645% 10/10/53 | | | 470,000 | | | | 450,857 | |
COMM Mortgage Trust, Series 2016-CR28, Class C, VRN
4.647% 2/10/49 | | | 517,000 | | | | 500,443 | |
Commercial Mortgage Trust, Series 2007-GG9, Class AMFX, 1 mo. LIBOR + 0.165%, FRN (c)
5.475% 3/10/39 | | | 417,339 | | | | 416,868 | |
Commercial Mortgage Trust, Series 2007-GG11, Class AM, VRN
5.867% 12/10/49 | | | 650,000 | | | | 660,800 | |
Cosmopolitan Hotel Trust, Series 2016-CSMO, Class C, 1 mo. LIBOR + 2.650%, FRN (c)
3.354% 11/15/33 | | | 370,000 | | | | 371,373 | |
Credit Suisse Commercial Mortgage Trust, Series 2007-C4, Class A1AM, VRN
5.935% 9/15/39 | | | 800,000 | | | | 806,100 | |
Credit Suisse Commercial Mortgage Trust, Series 2008-C1, Class AM, VRN (c)
6.062% 2/15/41 | | | 700,000 | | | | 719,439 | |
CSAIL Commercial Mortgage Trust, Series 2015-C1, Class XA, VRN
0.958% 4/15/50 | | | 9,289,229 | | | | 513,009 | |
CSAIL Commercial Mortgage Trust, Series 2015-C4, Class C, VRN
4.585% 11/15/48 | | | 427,000 | | | | 410,829 | |
GS Mortgage Securities Corp. II, Series 2013-GC10, Class XA, VRN
1.595% 2/10/46 | | | 5,635,212 | | | | 408,256 | |
GS Mortgage Securities Trust, Series 2015-GS1, Class XA, VRN
0.836% 11/10/48 | | | 8,197,076 | | | | 465,433 | |
GS Mortgage Securities Trust, Series 2014-GC20, Class XA, VRN
1.157% 4/10/47 | | | 7,733,227 | | | | 433,824 | |
GS Mortgage Securities Trust, Series 2014-GC26, Class D, VRN (c)
4.511% 11/10/47 | | | 267,000 | | | | 215,315 | |
| | | | | | | | |
| | | Principal
Amount | | | Value | |
JP Morgan Chase Commercial Mortgage Securities Trust, Series 2015-JP1, Class XA, VRN
1.151% 1/15/49 | | $ | 5,408,538 | | | $ | 322,453 | |
JP Morgan Chase Commercial Mortgage Securities Trust, Series 2016-JP2, Class XA, VRN
1.866% 8/15/49 | | | 3,229,885 | | | | 429,712 | |
JP Morgan Chase Commercial Mortgage Securities Trust, Series 2016-JP2, Class B, VRN
3.460% 8/15/49 | | | 174,000 | | | | 170,932 | |
JP Morgan Chase Commercial Mortgage Securities Trust, Series 2016-JP2, Class C, VRN
3.796% 8/15/49 | | | 134,000 | | | | 127,875 | |
JP Morgan Chase Commercial Mortgage Securities Trust, Series 2007-LDPX, Class AM, VRN
5.464% 1/15/49 | | | 549,600 | | | | 543,243 | |
JP Morgan Chase Commercial Mortgage Securities Trust, Series 2007-LD12, Class AM, VRN
6.039% 2/15/51 | | | 540,000 | | | | 551,442 | |
JP Morgan Chase Commercial Mortgage Securities Trust, Series 2007-CB20, Class AJ, VRN
6.152% 2/12/51 | | | 510,000 | | | | 514,072 | |
JPMBB Commercial Mortgage Securities Trust, Series 2015-C30, Class XA, VRN
0.704% 7/15/48 | | | 11,113,516 | | | | 395,263 | |
JPMBB Commercial Mortgage Securities Trust, Series 2015-C29, Class XA, VRN
0.946% 5/15/48 | | | 12,340,784 | | | | 502,214 | |
JPMBB Commercial Mortgage Securities Trust, Series 2014-C25, Class XA, VRN
0.998% 11/15/47 | | | 5,189,584 | | | | 274,793 | |
JPMBB Commercial Mortgage Securities Trust, Series 2015-C28, Class XA, VRN
1.195% 10/15/48 | | | 8,917,074 | | | | 523,893 | |
JPMBB Commercial Mortgage Securities Trust, Series 2015-C30, Class B, VRN
4.310% 7/15/48 | | | 610,000 | | | | 587,537 | |
JPMBB Commercial Mortgage Securities Trust, Series 2015-C33, Class C, VRN
4.618% 12/15/48 | | | 527,000 | | | | 521,251 | |
The accompanying notes are an integral part of the financial statements.
42
MML Dynamic Bond Fund – Portfolio of Investments (Continued)
| | | | | | | | |
| | | Principal
Amount | | | Value | |
JPMBB Commercial Mortgage Securities Trust, Series 2015-C32, Class C, VRN
4.668% 11/15/48 | | $ | 100,000 | | | $ | 91,036 | |
JPMBB Commercial Mortgage Securities Trust, Series 2016-C1, Class C, VRN
4.905% 3/15/49 | | | 466,000 | | | | 464,290 | |
LB-UBS Commercial Mortgage Trust, Series 2007-C1, Class AJ
5.484% 2/15/40 | | | 1,160,000 | | | | 1,160,557 | |
LB-UBS Commercial Mortgage Trust, Series 2007-C2, Class AM, VRN
5.493% 2/15/40 | | | 700,000 | | | | 704,785 | |
Morgan Stanley Bank of America Merrill Lynch Trust, Series 2015-C26, Class D (c)
3.060% 10/15/48 | | | 650,000 | | | | 450,461 | |
Morgan Stanley Bank of America Merrill Lynch Trust, Series 2015-C27, Class D, VRN (c)
3.237% 12/15/47 | | | 504,000 | | | | 311,105 | |
Morgan Stanley Bank of America Merrill Lynch Trust, Series 2015-C20, Class A4
3.249% 2/15/48 | | | 175,000 | | | | 174,504 | |
Morgan Stanley Bank of America Merrill Lynch Trust, Series 2016-C32, Class A4
3.720% 12/15/49 | | | 454,000 | | | | 464,654 | |
Morgan Stanley Bank of America Merrill Lynch Trust, Series 2014-C19, Class C 4.000% 12/15/47 | | | 650,000 | | | | 582,044 | |
Morgan Stanley Bank of America Merrill Lynch Trust, Series 2015-C23, Class C, VRN
4.135% 7/15/50 | | | 650,000 | | | | 606,381 | |
Morgan Stanley Bank of America Merrill Lynch Trust, Series 2015-C27, Class C, VRN
4.537% 12/15/47 | | | 351,000 | | | | 321,913 | |
Morgan Stanley Bank of America Merrill Lynch Trust, Series 2016-C29, Class C, VRN
4.753% 5/15/49 | | | 475,000 | | | | 462,982 | |
Morgan Stanley Capital I, Series 2015-UBS8, Class XA, VRN
0.975% 12/15/48 | | | 6,646,704 | | | | 419,412 | |
Morgan Stanley Capital I, Series 2015-XLF2, Class AFSC, 1 mo. LIBOR + 3.000%, FRN (c)
3.704% 8/15/26 | | | 478,000 | | | | 477,400 | |
Morgan Stanley Capital I, Series 2007-HQ11, Class AJ, VRN
5.508% 2/12/44 | | | 470,000 | | | | 470,000 | |
| | | | | | | | |
| | | Principal
Amount | | | Value | |
Morgan Stanley Capital I Trust, Series 2016-UB11, Class XA, VRN
1.683% 8/15/49 | | $ | 1,611,687 | | | $ | 170,049 | |
MSCG Trust, Series 2016-SNR, Class C (c)
5.205% 11/15/34 | | | 539,000 | | | | 538,648 | |
SG Commercial Mortgage Securities Trust,
Series 2016-C5, Class XA, VRN
2.032% 10/10/48 | | | 3,986,647 | | | | 500,514 | |
THL Credit Wind River CLO Ltd., Series 2012-1A, Class DR, 1 mo. LIBOR + 4.100%, FRN (c)
4.980% 1/15/26 | | | 1,000,000 | | | | 999,981 | |
Wachovia Bank Commercial Mortgage Trust Series,
Series 2007-C30, Class AM
5.383% 12/15/43 | | | 650,000 | | | | 650,308 | |
Wachovia Bank Commercial Mortgage Trust Series, Series 2007-C30, Class AJ, VRN
5.413% 12/15/43 | | | 544,000 | | | | 546,817 | |
Wachovia Bank Commercial Mortgage Trust Series, Series 2006-C28, Class AJ, VRN
5.632% 10/15/48 | | | 1,028,862 | | | | 1,025,034 | |
Wachovia Bank Commercial Mortgage Trust Series, Series 2007-C32, Class AMFX (c)
5.703% 6/15/49 | | | 415,000 | | | | 419,033 | |
Wells Fargo Commercial Mortgage Trust, Series 2015-NXS2,
Class XA, VRN
0.794% 7/15/58 | | | 12,874,757 | | | | 557,207 | |
Wells Fargo Commercial Mortgage Trust, Series 2015-P2, Class XA, VRN
1.029% 12/15/48 | | | 5,499,059 | | | | 345,331 | |
Wells Fargo Commercial Mortgage Trust, Series 2015-C31,
Class XA, VRN
1.112% 11/15/48 | | | 6,744,068 | | | | 470,513 | |
Wells Fargo Commercial Mortgage Trust, Series 2016-NXS6,
Class XA, VRN
1.663% 11/15/49 | | | 2,411,560 | | | | 255,545 | |
Wells Fargo Commercial Mortgage Trust, Series 2015-P2, Class A4
3.809% 12/15/48 | | | 392,000 | | | | 409,334 | |
Wells Fargo Commercial Mortgage Trust, Series 2014-LC16, Class D (c)
3.938% 8/15/50 | | | 560,000 | | | | 428,548 | |
The accompanying notes are an integral part of the financial statements.
43
MML Dynamic Bond Fund – Portfolio of Investments (Continued)
| | | | | | | | |
| | | Principal
Amount | | | Value | |
Wells Fargo Commercial Mortgage Trust, Series 2015-LC22, Class C, VRN
4.540% 9/15/58 | | $ | 390,000 | | | $ | 386,511 | |
Wells Fargo Commercial Mortgage Trust, Series 2015-NXS4, Class C, VRN
4.602% 12/15/48 | | | 421,000 | | | | 419,104 | |
Wells Fargo Commercial Mortgage Trust, Series 2015-C31, Class C, VRN
4.611% 11/15/48 | | | 468,000 | | | | 465,667 | |
WFRBS Commercial Mortgage Trust IO, Series 2014-C21, Class XA, VRN
1.157% 8/15/47 | | | 12,792,149 | | | | 760,313 | |
| | | | | | | | |
| | | | | | | 34,192,746 | |
| | | | | | | | |
| Home Equity ABS — 0.9% | |
GSAA Home Equity Trust, Series 2007-10, Class A2A
6.500% 11/25/37 | | | 5,424,013 | | | | 3,902,954 | |
| | | | | | | | |
| Other ABS — 8.0% | | | | | | | | |
Adams Mill CLO Ltd., Series 2014-1A, Class A1, 3 mo. USD LIBOR + 1.480%, FRN (c)
2.360% 7/15/26 | | | 500,000 | | | | 500,510 | |
ALM VII R Ltd., Series 2013-7RA, Class CR, 3 mo. USD LIBOR + 4.040%, FRN (c)
4.775% 10/15/28 | | | 1,000,000 | | | | 977,500 | |
ALM XIX LLC, Series 2016-19A, Class B, 3 mo. USD LIBOR + 3.000%, FRN (c)
3.634% 7/15/28 | | | 500,000 | | | | 505,528 | |
ALM XIX LLC, Series 2016-19A, Class C, 3 mo. USD LIBOR + 4.350%, FRN (c)
4.984% 7/15/28 | | | 500,000 | | | | 503,098 | |
Anchorage Capital CLO Ltd., Series 2014-5A, Class A, 3 mo. USD LIBOR + 1.600%, FRN (c)
2.480% 10/15/26 | | | 1,000,000 | | | | 1,000,502 | |
Blackbird Capital Aircraft Lease Securitization Ltd., Series 2016-1A, Class B, STEP (c)
5.682% 12/16/41 | | | 1,000,000 | | | | 986,875 | |
BlueMountain CLO II Ltd., Series 2006-2A, Class C, 3 mo. USD LIBOR + 0.800%, FRN (c)
1.731% 7/15/18 | | | 1,025,000 | | | | 1,017,144 | |
| | | | | | | | |
| | | Principal
Amount | | | Value | |
BlueMountain CLO Ltd., Series 2015-2A, Class C, 3 mo. USD LIBOR + 2.700%, FRN (c)
3.582% 7/18/27 | | $ | 1,000,000 | | | $ | 1,003,898 | |
BlueMountain CLO Ltd., Series 2015-3A, Class B, 3 mo. USD LIBOR + 3.100%, FRN (c)
3.981% 10/20/27 | | | 1,000,000 | | | | 1,005,172 | |
BlueMountain CLO Ltd., Series 2013-1A, Class CR, 3 mo. USD LIBOR + 4.150%, FRN (c)
4.306% 1/20/29 | | | 1,000,000 | | | | 999,873 | |
BlueMountain CLO Ltd., Series 2015-3A, Class C, 3 mo. USD LIBOR + 3.550%, FRN (c)
4.431% 10/20/27 | | | 1,000,000 | | | | 965,453 | |
BlueMountain CLO Ltd., Series 2015-2A, Class D, 3 mo. USD LIBOR + 3.550%, FRN (c)
4.432% 7/18/27 | | | 1,000,000 | | | | 956,167 | |
Carlyle Global Market Strategies CLO Ltd., Series 2016-2A, Class D2, 3 mo. USD LIBOR + 6.450%, FRN (c)
7.084% 7/15/27 | | | 500,000 | | | | 491,851 | |
Castle Aircraft SecuritizationTrust, Series 2015-1A, Class A (c)
4.703% 12/15/40 | | | 978,373 | | | | 990,604 | |
Dryden XXV Senior Loan Fund, Series 2012-25A, Class D, 3 mo. USD LIBOR + 4.000%, FRN (c)
4.880% 1/15/25 | | | 833,000 | | | | 832,985 | |
Global SC Finance II SRL, Series 2014-1A, Class A1 (c)
3.190% 7/17/29 | | | 276,792 | | | | 265,792 | |
Goldentree Loan Opportunities X Ltd., Series 2015-10A, Class D, 3 mo. USD LIBOR + 3.350%, FRN (c)
4.231% 7/20/27 | | | 1,000,000 | | | | 948,726 | |
HERO Funding Trust,
Series 2016-4A, Class A2 (c)
4.290% 9/20/47 | | | 500,000 | | | | 502,110 | |
LCM XVIII LP,
Series 19A, Class D, 3 mo. USD LIBOR + 3.450%, FRN (c)
4.330% 7/15/27 | | | 1,000,000 | | | | 947,925 | |
Limerock CLO I, Series 2007-1A, Class B, 3 mo. LIBOR + ..630%, FRN (c)
1.512% 4/24/23 | | | 1,000,000 | | | | 999,600 | |
The accompanying notes are an integral part of the financial statements.
44
MML Dynamic Bond Fund – Portfolio of Investments (Continued)
| | | | | | | | |
| | | Principal
Amount | | | Value | |
Madison Park Funding Ltd., Series 2007-6A, Class C, 3 mo. USD LIBOR + 1.000%, FRN (c)
1.884% 7/26/21 | | $ | 1,000,000 | | | $ | 980,296 | |
Madison Park Funding XIV Ltd., Series 2014-14A, Class D, 3 mo. USD LIBOR + 3.600%, FRN (c)
4.481% 7/20/26 | | | 1,000,000 | | | | 987,960 | |
Madison Park Funding XVIII Ltd., Series 2015-18A, Class D2, 3 mo. USD LIBOR + 3.950%, FRN (c)
4.831% 10/21/26 | | | 1,000,000 | | | | 1,000,130 | |
MAPS CLO Fund II Ltd., Series 2007-2A, Class B, 3 mo. USD LIBOR + 0.900%, FRN (c)
1.781% 7/20/22 | | | 500,000 | | | | 489,497 | |
Merrill Lynch Mortgage Investors Trust Series, Series 2006-OPT1, Class A2C, 1 mo. USD LIBOR + 0.150%, FRN
0.734% 8/25/37 | | | 3,242,722 | | | | 2,789,924 | |
OneMain Financial Issuance Trust, Series 2015-2A, Class A (c)
2.570% 7/18/25 | | | 200,000 | | | | 199,881 | |
OneMain Financial Issuance Trust, Series 2015-1A, Class A (c)
3.190% 3/18/26 | | | 3,000,000 | | | | 3,019,472 | |
Race Point VIII CLO Ltd., Series 2013-8A, Class B, 3 mo. USD LIBOR + 1.900%, FRN (c)
2.811% 2/20/25 | | | 500,000 | | | | 500,147 | |
Springleaf Funding Trust, Series 2015-AA, Class A (c)
3.160% 11/15/24 | | | 3,000,000 | | | | 3,018,363 | |
TAL Advantage V LLC,
Series 2013-1A, Class A (c)
2.830% 2/22/38 | | | 308,333 | | | | 293,553 | |
TAL Advantage V LLC,
Series 2014-1A, Class A (c)
3.510% 2/22/39 | | | 493,067 | | | | 474,238 | |
TCI-Cent CLO Ltd.,
Series 2016-1A, Class C, 3 mo. USD LIBOR + 4.000%, FRN (c)
4.934% 12/21/29 | | | 1,000,000 | | | | 970,222 | |
THL Credit Wind River CLO Ltd., Series 2016-1A, Class C, 3 mo. USD LIBOR + 3.200%, FRN (c)
4.080% 7/15/28 | | | 500,000 | | | | 502,531 | |
Venture VI CDO Ltd.,
Series 2006-1A, Class B, 3 mo. USD LIBOR + 0.640%, FRN (c)
1.521% 8/03/20 | | | 1,000,000 | | | | 973,827 | |
| | | | | | | | |
| | | Principal
Amount | | | Value | |
Venture XVII CLO Ltd., Series 2014-17A, Class B2, 3 mo. USD LIBOR + 2.100%, FRN (c)
2.980% 7/15/26 | | $ | 1,000,000 | | | $ | 1,000,697 | |
Westcott Park Clo Ltd., Series 2016-1A, Class D, 3 mo. USD LIBOR + 4.350%, FRN (c)
5.231% 7/20/28 | | | 500,000 | | | | 503,354 | |
| | | | | | | | |
| | | | | | | 34,105,405 | |
| | | | | | | | |
| WL Collateral CMO — 10.5% | | | | | | | | |
Citigroup Mortgage Loan Trust, Series 2007-AR5, Class 1A2A, VRN
3.108% 4/25/37 | | | 4,320,347 | | | | 3,816,381 | |
CitiMortgage Alternative Loan Trust, Series 2006-A1, Class 1A5
5.500% 4/25/36 | | | 4,133,402 | | | | 3,884,488 | |
Countrywide Alternative Loan Trust, Series 2006-13T1, Class A11
6.000% 5/25/36 | | | 3,141,959 | | | | 2,569,521 | |
Countrywide Alternative Loan Trust, Series 2006-36T2, Class 2A1
6.250% 12/25/36 | | | 5,251,811 | | | | 3,773,180 | |
Countrywide Home Loans Mortgage Pass-Through Trust, Series 2007-HYB2, Class 3A1, VRN
3.141% 2/25/47 | | | 2,752,519 | | | | 2,300,447 | |
Countrywide Home Loans Mortgage Pass-Through Trust, Series 2007-14, Class A6
6.000% 9/25/37 | | | 2,625,653 | | | | 2,376,116 | |
CSMC Trust,
Series 2015-RPL3, Class A1, STEP (c)
3.750% 12/25/56 | | | 5,369,217 | | | | 5,388,157 | |
HarborView Mortgage Loan Trust, Series 2006-11, Class A1A, 1 mo. USD LIBOR + 0.170%, FRN
0.906% 12/19/36 | | | 2,166,367 | | | | 1,738,772 | |
IndyMac INDX Mortgage Loan Trust, Series 2007-AR5, Class 2A1, VRN
3.174% 5/25/37 | | | 4,625,897 | | | | 3,785,267 | |
Morgan Stanley Mortgage Loan Trust, Series 2005-3AR, Class 2A1, VRN
2.966% 7/25/35 | | | 1,154,344 | | | | 1,011,359 | |
Nomura Asset Acceptance Corp. Alternative Loan Trust Series, Series 2006-AR1, Class 2A1, VRN
3.591% 2/25/36 | | | 4,229,463 | | | | 3,447,085 | |
RBSSP Resecuritization Trust, Series 2009-5, Class 2A3, VRN (c)
6.499% 10/26/37 | | | 1,644,912 | | | | 1,333,228 | |
The accompanying notes are an integral part of the financial statements.
45
MML Dynamic Bond Fund – Portfolio of Investments (Continued)
| | | | | | | | |
| | | Principal
Amount | | | Value | |
RFMSI Series Trust,
Series 2007-S4, Class A5, 1 mo. USD LIBOR + 0.600%, FRN
6.000% 4/25/37 | | $ | 827,127 | | | $ | 822,243 | |
Structured Adjustable Rate Mortgage Loan Trust, Series 2008-1, Class A2, FRN
3.027% 10/25/37 | | | 2,481,725 | | | | 2,289,201 | |
Towd Point Mortgage Trust, Series 2015-2, Class 1A13, VRN (c)
2.500% 11/25/60 | | | 4,485,806 | | | | 4,523,539 | |
Washington Mutual Mortgage Pass-Through Certificates Trust, Series 2006-4, Class 3A5, STEP
6.350% 5/25/36 | | | 1,822,894 | | | | 1,377,641 | |
| | | | | | | | |
| | | | | | | 44,436,625 | |
| | | | | | | | |
| WL Collateral PAC — 0.7% | | | | | | | | |
Countrywide Alternative Loan Trust, Series 2006-19CB, Class A15
6.000% 8/25/36 | | | 3,214,752 | | | | 2,864,559 | |
| | | | | | | | |
| | |
TOTAL NON-U.S. GOVERNMENT AGENCY OBLIGATIONS
(Cost $122,374,177) | | | | | | | 119,502,289 | |
| | | | | |
|
| SOVEREIGN DEBT OBLIGATIONS — 1.2% | |
Colombia Government International Bond
4.500% 1/28/26 | | | 200,000 | | | | 206,000 | |
Dominican Republic International Bond (b)
6.850% 1/27/45 | | | 100,000 | | | | 94,472 | |
Guatemala Government Bond (b)
4.875% 2/13/28 | | | 200,000 | | | | 193,012 | |
Hungary Government International Bond
4.000% 3/25/19 | | | 300,000 | | | | 310,500 | |
Indonesia Government International Bond (c)
4.350% 1/08/27 | | | 500,000 | | | | 501,061 | |
Instituto Costarricense de Electricidad (b)
6.950% 11/10/21 | | | 200,000 | | | | 208,300 | |
Mexico Government International Bond
4.125% 1/21/26 | | | 200,000 | | | | 198,400 | |
Mexico Government International Bond
4.750% 3/08/44 | | | 100,000 | | | | 90,930 | |
Panama Government International Bond
3.875% 3/17/28 | | | 400,000 | | | | 391,000 | |
| | | | | | | | |
| | | Principal
Amount | | | Value | |
Panama Government International Bond 4.300% 4/29/53 | | $ | 200,000 | | | $ | 179,000 | |
Panama Government International Bond 5.200% 1/30/20 | | | 500,000 | | | | 537,000 | |
Poland Government International Bond
5.125% 4/21/21 | | | 400,000 | | | | 436,372 | |
Qatar Government International Bond (b)
2.375% 6/02/21 | | | 800,000 | | | | 782,539 | |
United Mexican States
4.000% 10/02/23 | | | 830,000 | | | | 831,992 | |
| | |
TOTAL SOVEREIGN DEBT OBLIGATIONS
(Cost $5,053,190) | | | | | | | 4,960,578 | |
| | | | | |
|
| U.S. GOVERNMENT AGENCY OBLIGATIONS AND INSTRUMENTALITIES — 11.9% | |
| Collateralized Mortgage Obligations — 6.5% | |
Federal Home Loan Mortgage Corp. | | | | | | | | |
Series 4481, Class B
3.000% 12/15/42 | | | 8,390,069 | | | | 8,472,462 | |
Series 4483, Class CA
3.000% 6/15/44 | | | 8,058,476 | | | | 8,134,738 | |
Federal Home Loan Mortgage Corp. Multifamily Structured Pass Through Certificates | | | | | | | | |
Series K722, Class X1
1.311% 3/25/23 VRN | | | 6,733,674 | | | | 443,012 | |
Series K053, Class A2
2.995% 12/25/25 | | | 463,000 | | | | 466,666 | |
Series K050, Class A2
3.334% 8/25/25 VRN | | | 350,000 | | | | 361,991 | |
Federal National Mortgage Association | |
Series 2016-M3, Class A2
2.702% 2/25/26 | | | 465,000 | | | | 456,452 | |
Series 2015-9, Class HA
3.000% 1/25/45 | | | 1,354,091 | | | | 1,386,431 | |
Government National Mortgage Association | | | | | | | | |
Series 2015-74, Class LZ
3.500% 5/20/45 | | | 3,027,205 | | | | 2,946,369 | |
Series 2015-92, Class CZ
3.500% 6/20/45 | | | 4,816,741 | | | | 4,704,548 | |
| | | | | | | | |
| | | | | | | 27,372,669 | |
| | | | | | | | |
| Pass-Through Securities — 5.4% | |
Federal Home Loan Mortgage Corp. | | | | | | | | |
Pool #G08658 3.000%
8/01/45 | | | 4,424,824 | | | | 4,403,909 | |
Pool #G08632 3.500%
3/01/45 | | | 3,751,479 | | | | 3,845,120 | |
The accompanying notes are an integral part of the financial statements.
46
MML Dynamic Bond Fund – Portfolio of Investments (Continued)
| | | | | | | | |
| | | Principal
Amount | | | Value | |
Federal National Mortgage Association | | | | | | | | |
Pool #MA2248 3.000%
4/01/45 | | $ | 3,079,396 | | | $ | 3,035,250 | |
Pool #AS7661 3.000%
8/01/46 | | | 1,906,355 | | | | 1,879,026 | |
Pool #MA2711 3.000%
8/01/46 | | | 6,727,965 | | | | 6,631,514 | |
Pool #AX2501 4.000%
10/01/44 | | | 3,095,558 | | | | 3,255,777 | |
| | | | | | | | |
| | | | | | | 23,050,596 | |
| | | | | | | | |
| | |
TOTAL U.S. GOVERNMENT
AGENCY OBLIGATIONS AND INSTRUMENTALITIES
(Cost $50,534,771) | | | | | | | 50,423,265 | |
| | | | | |
|
| U.S. TREASURY OBLIGATIONS — 28.9% | |
| U.S. Treasury Bonds & Notes — 28.9% | |
U.S. Treasury Bond
2.750% 11/15/42 | | | 3,710,000 | | | | 3,503,486 | |
U.S. Treasury Inflation Index
0.125% 4/15/21 | | | 3,518,586 | | | | 3,538,723 | |
U.S. Treasury Inflation Index
0.125% 7/15/24 | | | 8,021,840 | | | | 7,880,616 | |
U.S. Treasury Inflation Index
0.125% 7/15/26 | | | 5,314,373 | | | | 5,139,004 | |
U.S. Treasury Inflation Index
0.625% 1/15/24 | | | 5,127,953 | | | | 5,218,056 | |
U.S. Treasury Inflation Index
1.000% 2/15/46 | | | 8,304,021 | | | | 8,339,114 | |
U.S. Treasury Note
0.500% 1/31/17 | | | 3,840,000 | | | | 3,839,644 | |
U.S. Treasury Note
0.625% 5/31/17 | | | 5,130,000 | | | | 5,129,699 | |
U.S. Treasury Note
1.000% 2/15/18 | | | 11,420,000 | | | | 11,424,015 | |
U.S. Treasury Note
1.000% 5/15/18 | | | 690,000 | | | | 689,761 | |
U.S. Treasury Note
1.500% 2/28/23 | | | 190,000 | | | | 182,756 | |
U.S. Treasury Note
1.500% 3/31/23 | | | 7,610,000 | | | | 7,314,518 | |
U.S. Treasury Note
1.750% 12/31/20 | | | 300,000 | | | | 299,889 | |
U.S. Treasury Note
1.750% 3/31/22 | | | 8,010,000 | | | | 7,903,851 | |
U.S. Treasury Note
2.000% 11/30/20 | | | 14,450,000 | | | | 14,597,464 | |
U.S. Treasury Note
2.000% 8/15/25 | | | 210,000 | | | | 203,456 | |
U.S. Treasury Note
2.125% 1/31/21 | | | 12,880,000 | | | | 13,050,308 | |
| | | | | | | | |
| | | Principal
Amount | | | Value | |
U.S. Treasury Note
2.125% 5/15/25 | | $ | 9,270,000 | | | $ | 9,089,670 | |
U.S. Treasury Note
2.250% 3/31/21 | | | 15,030,000 | | | | 15,301,831 | |
| | | | | | | | |
| | | | | | | 122,645,861 | |
| | | | | | | | |
| | |
TOTAL U.S. TREASURY OBLIGATIONS
(Cost $125,294,976) | | | | | | | 122,645,861 | |
| | | | | |
| | |
TOTAL BONDS & NOTES
(Cost $404,673,199) | | | | | | | 398,446,311 | |
| | | | | |
|
| MUTUAL FUNDS — 2.0% | |
| Diversified Financial — 2.0% | |
DoubleLine Floating Rate Fund | | | 859,180 | | | | 8,531,659 | |
| | | | | | | | |
| | |
TOTAL DIVERSIFIED FINANCIAL
(Cost $8,754,937) | | | | | | | 8,531,659 | |
| | | | | |
| | |
TOTAL MUTUAL FUNDS
(Cost $8,754,937) | | | | | | | 8,531,659 | |
| | | | | |
| | |
TOTAL LONG-TERM INVESTMENTS
(Cost $413,436,464) | | | | | | | 406,984,729 | |
| | | | | |
|
| SHORT-TERM INVESTMENTS — 3.6% | |
| Repurchase Agreement — 3.6% | | | | | | | | |
State Street Bank & Trust Co. Repurchase Agreement, dated 12/30/16, 0.010%, due 1/03/17 (f) | | | 15,139,327 | | | | 15,139,327 | |
| | | | | | | | |
| Time Deposit — 0.0% | | | | | | | | |
Euro Time Deposit
0.010% 1/03/17 | | | 74,857 | | | | 74,857 | |
| | | | | | | | |
| | |
TOTAL SHORT-TERM INVESTMENTS
(Cost $15,214,184) | | | | | | | 15,214,184 | |
| | | | | |
| | |
TOTAL INVESTMENTS — 99.5%
(Cost $428,650,648) (g) | | | | | | | 422,198,913 | |
| | |
| Other Assets/(Liabilities) — 0.5% | | | | | | | 2,332,130 | |
| | | | | |
| | |
| NET ASSETS — 100.0% | | | | | | $ | 424,531,043 | |
| | | | | |
Notes to Portfolio of Investments
Percentages are stated as a percent of net assets.
| CDO | Collateralized Debt Obligation |
| CLO | Collateralized Loan Obligation |
The accompanying notes are an integral part of the financial statements.
47
MML Dynamic Bond Fund – Portfolio of Investments (Continued)
Notes to Portfolio of Investments (Continued)
| CMO | Collateralized Mortgage Obligation |
| CMT | Constant Maturity Treasury Index |
| MBS | Mortgage-Backed Security |
| PAC | Planned Amortization Class |
| (a) | Non-income producing security. |
| (b) | Security exempt from registration under Regulation S of the Securities Act of 1933, which exempts from registration securities offered and sold outside the United States. Security may not be offered or sold in the United States except pursuant to an exemption from, or in a transaction not subject to, the registration requirements of the Securities Act of 1933. At December 31, 2016, these securities amounted to a value of $27,352,189 or 6.44% of net assets. |
| (c) | Securities exempt from registration under rule 144A of the Securities Act of 1933. These securities may be resold in transactions exempt from registration, normally to qualified institutional buyers. At December 31, 2016, these securities amounted to a value of $63,634,072 or 14.99% of net assets. |
| (d) | Security is currently in default due to bankruptcy or failure to make payment of principal or interest of the issuer. Income is not being accrued. At December 31, 2016, these securities amounted to a value of $8,442 or 0.00% of net assets. |
| (e) | This security is fair valued in good faith in accordance with procedures approved by the Board of Trustees. At December 31, 2016, these securities amounted to a value of $0 or 0.00% of net assets. |
| (f) | Maturity value of $15,139,344. Collateralized by U.S. Government Agency obligations with rates ranging from 1.625% – 8.125%, maturity dates ranging from 4/30/19 – 8/15/21, and an aggregate market value, including accrued interest, of $15,444,351. |
| (g) | See Note 6 for aggregate cost for federal tax purposes. |
Country weightings, as a percentage of net assets, is as follows:
| | | | |
United States | | | 79.6 | % |
Cayman Islands | | | 6.6 | % |
Mexico | | | 1.4 | % |
Panama | | | 1.0 | % |
Canada | | | 0.6 | % |
Netherlands | | | 0.6 | % |
Singapore | | | 0.6 | % |
United Kingdom | | | 0.5 | % |
Australia | | | 0.5 | % |
Colombia | | | 0.4 | % |
Costa Rica | | | 0.4 | % |
Malaysia | | | 0.4 | % |
Israel | | | 0.4 | % |
Chile | | | 0.3 | % |
Luxembourg | | | 0.3 | % |
British Virgin Islands | | | 0.3 | % |
Japan | | | 0.2 | % |
Trinidad And Tobago | | | 0.2 | % |
| | | | |
India | | | 0.2 | % |
Qatar | | | 0.2 | % |
Bermuda | | | 0.2 | % |
Ireland | | | 0.2 | % |
France | | | 0.1 | % |
Paraguay | | | 0.1 | % |
Peru | | | 0.1 | % |
Indonesia | | | 0.1 | % |
Poland | | | 0.1 | % |
Hungary | | | 0.1 | % |
Dominican Republic | | | 0.1 | % |
Barbados | | | 0.1 | % |
Guatemala | | | 0.0 | % |
| | | | |
Total Long-Term Investments | | | 95.9 | % |
Short-Term Investments and Other Assets and Liabilities | | | 4.1 | % |
| | | | |
Net Assets | | | 100.0 | % |
| | | | |
The accompanying notes are an integral part of the financial statements.
48
MML Equity Rotation Fund – Portfolio of Investments
December 31, 2016
| | | | | | | | |
| | | Number of
Shares | | | Value | |
| EQUITIES — 97.0% | |
|
| COMMON STOCK — 97.0% | |
| Basic Materials — 5.5% | | | | | | | | |
| Chemicals — 1.3% | | | | | | | | |
Eastman Chemical Co. | | | 300 | | | $ | 22,563 | |
Ingevity Corp. (a) | | | 4,900 | | | | 268,814 | |
Praxair, Inc. | | | 200 | | | | 23,438 | |
| | | | | | | | |
| | | | | | | 314,815 | |
| | | | | | | | |
| Foods — 0.8% | | | | | | | | |
BHP Billiton Ltd. Sponsored ADR (Australia) | | | 5,000 | | | | 178,900 | |
| | | | | | | | |
| Iron & Steel — 3.4% | | | | | | | | |
ArcelorMittal (a) | | | 46,900 | | | | 342,370 | |
Nucor Corp. | | | 4,800 | | | | 285,696 | |
Reliance Steel & Aluminum Co. | | | 2,100 | | | | 167,034 | |
| | | | | | | | |
| | | | | | | 795,100 | |
| | | | | | | | |
| | | | | | | 1,288,815 | |
| | | | | | | | |
| Communications — 14.6% | | | | | | | | |
| Internet — 9.7% | | | | | | | | |
Akamai Technologies, Inc. (a) | | | 2,300 | | | | 153,364 | |
Alphabet, Inc. Class A (a) | | | 280 | | | | 221,886 | |
Alphabet, Inc. Class C (a) | | | 50 | | | | 38,591 | |
Amazon.com, Inc. (a) | | | 1,590 | | | | 1,192,293 | |
Facebook, Inc. Class A (a) | | | 3,110 | | | | 357,806 | |
MercadoLibre, Inc. | | | 1,030 | | | | 160,824 | |
VeriSign, Inc. (a) | | | 1,900 | | | | 144,533 | |
| | | | | | | | |
| | | | | | | 2,269,297 | |
| | | | | | | | |
| Media — 0.9% | | | | | | | | |
News Corp. Class A | | | 2,400 | | | | 27,504 | |
Scripps Networks Interactive Class A | | | 2,600 | | | | 185,562 | |
| | | | | | | | |
| | | | | | | 213,066 | |
| | | | | | | | |
| Telecommunications — 4.0% | | | | | | | | |
AT&T, Inc. | | | 5,000 | | | | 212,650 | |
Cisco Systems, Inc. | | | 6,000 | | | | 181,320 | |
Corning, Inc. | | | 13,600 | | | | 330,072 | |
Sprint Corp. (a) | | | 9,300 | | | | 78,306 | |
Zayo Group Holdings, Inc. (a) | | | 3,900 | | | | 128,154 | |
| | | | | | | | |
| | | | | | | 930,502 | |
| | | | | | | | |
| | | | | | | 3,412,865 | |
| | | | | | | | |
| Consumer, Cyclical — 9.0% | |
| Auto Manufacturers — 1.0% | |
General Motors Co. | | | 6,800 | | | | 236,912 | |
| | | | | | | | |
| Automotive & Parts — 1.5% | |
The Goodyear Tire & Rubber Co. | | | 4,800 | | | | 148,176 | |
Lear Corp. | | | 1,490 | | | | 197,231 | |
| | | | | | | | |
| | | | | | | 345,407 | |
| | | | | | | | |
| | | | | | | | |
| | | Number of
Shares | | | Value | |
| Home Builders — 1.4% | |
Lennar Corp. Class A | | | 3,300 | | | $ | 141,669 | |
Thor Industries, Inc. | | | 1,900 | | | | 190,095 | |
| | | | | | | | |
| | | | | | | 331,764 | |
| | | | | | | | |
| Home Furnishing — 0.4% | |
Sony Corp. Sponsored ADR (Japan) | | | 3,600 | | | | 100,908 | |
| | | | | | | | |
| Housewares — 0.6% | |
The Toro Co. | | | 2,400 | | | | 134,280 | |
| | | | | | | | |
| Lodging — 0.5% | |
MGM Resorts International (a) | | | 3,600 | | | | 103,788 | |
| | | | | | | | |
| Retail — 3.6% | |
Burlington Stores, Inc. (a) | | | 900 | | | | 76,275 | |
Darden Restaurants, Inc. | | | 1,600 | | | | 116,352 | |
Domino’s Pizza, Inc. | | | 1,250 | | | | 199,050 | |
The Home Depot, Inc. | | | 2,000 | | | | 268,160 | |
Target Corp. | | | 2,500 | | | | 180,575 | |
| | | | | | | | |
| | | | | | | 840,412 | |
| | | | | | | | |
| | | | | | | 2,093,471 | |
| | | | | | | | |
| Consumer, Non-cyclical — 12.3% | |
| Biotechnology — 3.4% | |
Amgen, Inc. | | | 1,040 | | | | 152,058 | |
Biogen, Inc. (a) | | | 1,170 | | | | 331,789 | |
Celgene Corp. (a) | | | 1,540 | | | | 178,255 | |
Gilead Sciences, Inc. | | | 1,750 | | | | 125,317 | |
| | | | | | | | |
| | | | | | | 787,419 | |
| | | | | | | | |
| Commercial Services — 5.5% | |
Global Payments, Inc. | | | 1,700 | | | | 117,997 | |
Quanta Services, Inc. (a) | | | 5,400 | | | | 188,190 | |
United Rentals, Inc. (a) | | | 3,000 | | | | 316,740 | |
Vantiv, Inc. Class A (a) | | | 7,100 | | | | 423,302 | |
Visa, Inc. Class A | | | 600 | | | | 46,812 | |
The Western Union Co. | | | 8,500 | | | | 184,620 | |
| | | | | | | | |
| | | | | | | 1,277,661 | |
| | | | | | | | |
| Health Care – Products — 1.2% | |
Johnson & Johnson | | | 2,420 | | | | 278,808 | |
| | | | | | | | |
| Health Care – Services — 0.9% | |
Aetna, Inc. | | | 1,730 | | | | 214,537 | |
| | | | | | | | |
| Pharmaceuticals — 1.3% | |
AbbVie, Inc. | | | 1,600 | | | | 100,192 | |
McKesson Corp. | | | 1,110 | | | | 155,900 | |
Merck & Co., Inc. | | | 300 | | | | 17,661 | |
Pfizer, Inc. | | | 800 | | | | 25,984 | |
| | | | | | | | |
| | | | | | | 299,737 | |
| | | | | | | | |
| | | | | | | 2,858,162 | |
| | | | | | | | |
| Energy — 6.0% | |
| Oil & Gas — 5.7% | |
Apache Corp. | | | 400 | | | | 25,388 | |
The accompanying notes are an integral part of the financial statements.
49
MML Equity Rotation Fund – Portfolio of Investments (Continued)
| | | | | | | | |
| | | Number of
Shares | | | Value | |
Chevron Corp. | | | 200 | | | $ | 23,540 | |
Devon Energy Corp. | | | 1,100 | | | | 50,237 | |
Exxon Mobil Corp. | | | 3,900 | | | | 352,014 | |
Helmerich & Payne, Inc. | | | 4,600 | | | | 356,040 | |
Marathon Petroleum Corp. | | | 2,600 | | | | 130,910 | |
Rowan Cos. PLC Class A | | | 7,000 | | | | 132,230 | |
Tesoro Corp. | | | 2,900 | | | | 253,605 | |
| | | | | | | | |
| | | | | | | 1,323,964 | |
| | | | | | | | |
| Oil & Gas Services — 0.3% | |
Baker Hughes, Inc. | | | 1,000 | | | | 64,970 | |
| | | | | | | | |
| | | | | | | 1,388,934 | |
| | | | | | | | |
| Financial — 19.1% | |
| Banks — 12.7% | |
Bank of America Corp. | | | 7,000 | | | | 154,700 | |
Bank of Montreal | | | 1,900 | | | | 136,648 | |
Citigroup, Inc. | | | 8,100 | | | | 481,383 | |
Fifth Third Bancorp | | | 17,400 | | | | 469,278 | |
Huntington Bancshares, Inc. | | | 23,600 | | | | 311,992 | |
KeyCorp | | | 13,000 | | | | 237,510 | |
PacWest Bancorp | | | 5,400 | | | | 293,976 | |
The PNC Financial Services Group, Inc. | | | 2,600 | | | | 304,096 | |
State Street Corp. | | | 3,100 | | | | 240,932 | |
SunTrust Banks, Inc. | | | 2,600 | | | | 142,610 | |
Wells Fargo & Co. | | | 500 | | | | 27,555 | |
Zions Bancorp | | | 4,000 | | | | 172,160 | |
| | | | | | | | |
| | | | | | | 2,972,840 | |
| | | | | | | | |
| Diversified Financial — 3.7% | |
The Goldman Sachs Group, Inc. | | | 1,200 | | | | 287,340 | |
JP Morgan Chase & Co. | | | 5,600 | | | | 483,224 | |
Legg Mason, Inc. | | | 2,900 | | | | 86,739 | |
| | | | | | | | |
| | | | | | | 857,303 | |
| | | | | | | | |
| Insurance — 2.6% | |
Aflac, Inc. | | | 1,800 | | | | 125,280 | |
Berkshire Hathaway, Inc. Class B (a) | | | 300 | | | | 48,894 | |
Lincoln National Corp. | | | 5,400 | | | | 357,858 | |
Torchmark Corp. | | | 700 | | | | 51,632 | |
The Travelers Cos., Inc. | | | 200 | | | | 24,484 | |
| | | | | | | | |
| | | | | | | 608,148 | |
| | | | | | | | |
| Real Estate Investment Trusts (REITS) — 0.1% | |
Simon Property Group, Inc. | | | 100 | | | | 17,767 | |
| | | | | | | | |
| | | | | | | 4,456,058 | |
| | | | | | | | |
| Industrial — 13.4% | |
| Aerospace & Defense — 3.4% | |
Lockheed Martin Corp. | | | 2,560 | | | | 639,846 | |
Spirit AeroSystems Holdings, Inc. Class A | | | 2,500 | | | | 145,875 | |
| | | | | | | | |
| | | | | | | 785,721 | |
| | | | | | | | |
| | | | | | | | |
| | | Number of
Shares | | | Value | |
| Building Materials — 0.5% | |
Owens Corning, Inc. | | | 2,500 | | | $ | 128,900 | |
| | | | | | | | |
| Electrical Components & Equipment — 0.2% | |
Energizer Holdings, Inc. | | | 1,070 | | | | 47,733 | |
| | | | | | | | |
| Electronics — 0.9% | |
Waters Corp. (a) | | | 1,520 | | | | 204,273 | |
| | | | | | | | |
| Engineering & Construction — 1.0% | |
Fluor Corp. | | | 4,600 | | | | 241,592 | |
| | | | | | | | |
| Hand & Machine Tools — 0.8% | |
Regal Beloit Corp. | | | 2,700 | | | | 186,975 | |
| | | | | | | | |
| Machinery – Construction & Mining — 2.1% | |
Caterpillar, Inc. | | | 5,400 | | | | 500,796 | |
| | | | | | | | |
| Machinery – Diversified — 0.5% | |
BWX Technologies, Inc. | | | 2,800 | | | | 111,160 | |
| | | | | | | | |
| Manufacturing — 1.0% | |
3M Co. | | | 400 | | | | 71,428 | |
Carlisle Cos., Inc. | | | 1,400 | | | | 154,406 | |
| | | | | | | | |
| | | | | | | 225,834 | |
| | | | | | | | |
| Miscellaneous – Manufacturing — 0.4% | |
A.O. Smith Corp. | | | 1,800 | | | | 85,230 | |
| | | | | | | | |
| Packaging & Containers — 1.7% | |
Graphic Packaging Holding Co. | | | 8,400 | | | | 104,832 | |
Packaging Corporation of America | | | 3,400 | | | | 288,388 | |
| | | | | | | | |
| | | | | | | 393,220 | |
| | | | | | | | |
| Shipbuilding — 0.8% | |
Huntington Ingalls Industries, Inc. | | | 1,000 | | | | 184,190 | |
| | | | | | | | |
| Transportation — 0.1% | |
Union Pacific Corp. | | | 200 | | | | 20,736 | |
| | | | | | | | |
| | | | | | | 3,116,360 | |
| | | | | | | | |
| Technology — 16.9% | |
| Computers — 4.0% | |
Apple, Inc. | | | 1,210 | | | | 140,142 | |
Cadence Design Systems, Inc. (a) | | | 11,300 | | | | 284,986 | |
NCR Corp. (a) | | | 3,600 | | | | 146,016 | |
NetApp, Inc. | | | 10,300 | | | | 363,281 | |
| | | | | | | | |
| | | | | | | 934,425 | |
| | | | | | | | |
| Internet — 0.5% | |
Check Point Software Technologies Ltd. (a) | | | 1,400 | | | | 118,244 | |
| | | | | | | | |
| Semiconductors — 7.9% | |
Applied Materials, Inc. | | | 13,600 | | | | 438,872 | |
ASML Holding NV | | | 810 | | | | 90,882 | |
Broadcom Ltd. | | | 500 | | | | 88,385 | |
Lam Research Corp. | | | 2,900 | | | | 306,617 | |
Micron Technology, Inc. (a) | | | 2,900 | | | | 63,568 | |
NVIDIA Corp. | | | 4,500 | | | | 480,330 | |
NXP Semiconductor NV (a) | | | 590 | | | | 57,826 | |
Skyworks Solutions, Inc. | | | 2,000 | | | | 149,320 | |
The accompanying notes are an integral part of the financial statements.
50
MML Equity Rotation Fund – Portfolio of Investments (Continued)
| | | | | | | | |
| | | Number of
Shares | | | Value | |
Taiwan Semiconductor Manufacturing Co. Ltd. Sponsored ADR (Taiwan) | | | 1,200 | | | $ | 34,500 | |
Texas Instruments, Inc. | | | 1,900 | | | | 138,643 | |
| | | | | | | | |
| | | | | | | 1,848,943 | |
| | | | | | | | |
| Software — 4.5% | |
Activision Blizzard, Inc. | | | 5,300 | | | | 191,383 | �� |
Electronic Arts, Inc. (a) | | | 3,800 | | | | 299,288 | |
Fidelity National Information Services, Inc. | | | 1,000 | | | | 75,640 | |
Intuit, Inc. | | | 1,360 | | | | 155,870 | |
Leidos Holdings, Inc. | | | 2,100 | | | | 107,394 | |
Microsoft Corp. | | | 900 | | | | 55,926 | |
Nuance Communications, Inc. (a) | | | 4,500 | | | | 67,050 | |
Veeva Systems, Inc. Class A (a) | | | 2,100 | | | | 85,470 | |
| | | | | | | | |
| | | | | | | 1,038,021 | |
| | | | | | | | |
| | | | | | | 3,939,633 | |
| | | | | | | | |
| Utilities — 0.2% | |
| Electric — 0.2% | |
The Southern Co. | | | 900 | | | | 44,271 | |
| | | | | | | | |
| | |
TOTAL COMMON STOCK
(Cost $18,906,275) | | | | | | | 22,598,569 | |
| | | | | |
| | |
TOTAL EQUITIES
(Cost $18,906,275) | | | | | | | 22,598,569 | |
| | | | | |
| | |
TOTAL LONG-TERM INVESTMENTS
(Cost $18,906,275) | | | | | | | 22,598,569 | |
| | | | | |
| | |
| | | Principal
Amount | | | | |
| SHORT-TERM INVESTMENTS — 3.1% | |
| Repurchase Agreement — 3.1% | |
State Street Bank & Trust Co. Repurchase Agreement, dated 12/30/16, 0.010%, due 1/03/17 (b) | | $ | 722,904 | | | | 722,904 | |
| | | | | | | | |
| | |
TOTAL SHORT-TERM INVESTMENTS
(Cost $722,904) | | | | | | | 722,904 | |
| | | | | | | | |
| | |
TOTAL INVESTMENTS — 100.1%
(Cost $19,629,179) (c) | | | | | | | 23,321,473 | |
| | |
| Other Assets/(Liabilities) — (0.1)% | | | | | | | (11,864 | ) |
| | | | | | | | |
| | |
| NET ASSETS — 100.0% | | | | | | $ | 23,309,609 | |
| | | | | |
Notes to Portfolio of Investments
Percentages are stated as a percent of net assets.
| ADR | American Depositary Receipt |
| (a) | Non-income producing security. |
| (b) | Maturity value of $722,905. Collateralized by U.S. Government Agency obligations with a rate of 1.625%, maturity date of 4/30/19, and an aggregate market value, including accrued interest, of $742,038. |
| (c) | See Note 6 for aggregate cost for federal tax purposes. |
The accompanying notes are an integral part of the financial statements.
51
MML High Yield Fund – Portfolio of Investments
December 31, 2016
| | | | | | | | |
| | | Principal
Amount | | | Value | |
| BONDS & NOTES — 96.1% | |
|
| BANK LOANS — 5.5% | |
| Oil & Gas — 5.5% | |
Caelus Energy Alaska O3 LLC, 2nd Lien Term Loan
8.750% 4/15/20 | | $ | 3,139,220 | | | $ | 2,511,376 | |
Chemours Co. (The), Term Loan B
3.750% 5/12/22 | | | 352,113 | | | | 349,694 | |
Fieldwood Energy LLC, 1st Lien Last Out Term Loan
8.375% 9/30/20 | | | 1,687,384 | | | | 1,463,805 | |
Fieldwood Energy LLC, 2nd Lien Term Loan
8.375% 9/30/20 | | | 2,013,087 | | | | 1,409,160 | |
Fieldwood Energy LLC, New 1st Lien Term Loan
8.000% 8/31/20 | | | 1,274,554 | | | | 1,204,454 | |
| | | | | | | | |
| | | | | | | 6,938,489 | |
| | | | | | | | |
| | |
TOTAL BANK LOANS
(Cost $6,409,848) | | | | | | | 6,938,489 | |
| | | | | |
|
| CORPORATE DEBT — 90.6% | |
| Agriculture — 0.8% | |
Pinnacle Operating Corp. (a)
9.000% 11/15/20 | | | 2,204,000 | | | | 969,760 | |
| | | | | | | | |
| Airlines — 1.1% | |
American Airlines Group, Inc. (a)
5.500% 10/01/19 | | | 1,391,000 | | | | 1,436,208 | |
| | | | | | | | |
| Apparel — 1.6% | |
Hanesbrands, Inc. (a)
4.625% 5/15/24 | | | 266,000 | | | | 258,020 | |
Hanesbrands, Inc. (a)
4.875% 5/15/26 | | | 1,026,000 | | | | 1,002,915 | |
Perry Ellis International, Inc.
7.875% 4/01/19 | | | 730,000 | | | | 730,000 | |
| | | | | | | | |
| | | | | | | 1,990,935 | |
| | | | | | | | |
| Auto Manufacturers — 2.3% | |
Allied Specialty Vehicles, Inc. (a)
8.500% 11/01/19 | | | 2,808,000 | | | | 2,885,220 | |
| | | | | | | | |
| Automotive & Parts — 3.5% | |
Allison Transmission, Inc. (a)
5.000% 10/01/24 | | | 294,000 | | | | 296,940 | |
Deck Chassis Acquisition, Inc. (a)
10.000% 6/15/23 | | | 2,013,000 | | | | 2,078,422 | |
International Automotive Components Group SA (a)
9.125% 6/01/18 | | | 2,100,000 | | | | 2,047,500 | |
| | | | | | | | |
| | | | | | | 4,422,862 | |
| | | | | | | | |
| | | | | | | | |
| | | Principal
Amount | | | Value | |
| Building Materials — 0.2% | | | | | | | | |
Boise Cascade Co. (a)
5.625% 9/01/24 | | $ | 260,000 | | | $ | 258,050 | |
| | | | | | | | |
| Chemicals — 2.7% | | | | | | | | |
A Schulman, Inc. (a)
6.875% 6/01/23 | | | 1,612,000 | | | | 1,684,540 | |
Kissner Holdings LP/Kissner Milling Co. Ltd./BSC Holding, Inc./Kissner USA (a)
8.375% 12/01/22 | | | 1,225,000 | | | | 1,237,250 | |
Platform Specialty Products Corp. (a)
6.500% 2/01/22 | | | 423,000 | | | | 426,172 | |
| | | | | | | | |
| | | | | | | 3,347,962 | |
| | | | | | | | |
| Coal — 1.4% | | | | | | | | |
SunCoke Energy Partners LP/SunCoke Energy Partners Finance Corp.
7.375% 2/01/20 | | | 1,769,000 | | | | 1,760,155 | |
| | | | | | | | |
| Commercial Services — 2.4% | | | | | | | | |
AMN Healthcare, Inc. (a)
5.125% 10/01/24 | | | 387,000 | | | | 386,032 | |
Prime Security Services Borrower LLC/Prime Finance, Inc. (a)
9.250% 5/15/23 | | | 1,121,000 | | | | 1,220,489 | |
Ritchie Bros Auctioneers, Inc. (a)
5.375% 1/15/25 | | | 187,000 | | | | 190,740 | |
StoneMor Partners LP/Cornerstone Family Services of West Virginia Subsidiary
7.875% 6/01/21 | | | 1,385,000 | | | | 1,260,350 | |
| | | | | | | | |
| | | | | | | 3,057,611 | |
| | | | | | | | |
| Computers — 1.5% | | | | | | | | |
Diamond 1 Finance Corp./Diamond 2 Finance Corp. (a)
7.125% 6/15/24 | | | 569,000 | | | | 631,691 | |
Western Digital Corp. (a)
10.500% 4/01/24 | | | 1,112,000 | | | | 1,314,940 | |
| | | | | | | | |
| | | | | | | 1,946,631 | |
| | | | | | | | |
| Diversified Financial — 3.1% | | | | | | | | |
Aircastle Ltd.
5.000% 4/01/23 | | | 113,000 | | | | 115,260 | |
Aircastle Ltd.
5.500% 2/15/22 | | | 113,000 | | | | 119,780 | |
Ally Financial, Inc.
8.000% 11/01/31 | | | 1,230,000 | | | | 1,426,702 | |
Icahn Enterprises LP/Icahn Enterprises Finance Corp.
5.875% 2/01/22 | | | 1,500,000 | | | | 1,488,750 | |
National Financial Partners Corp. (a)
9.000% 7/15/21 | | | 657,000 | | | | 693,135 | |
| | | | | | | | |
| | | | | | | 3,843,627 | |
| | | | | | | | |
The accompanying notes are an integral part of the financial statements.
52
MML High Yield Fund – Portfolio of Investments (Continued)
| | | | | | | | |
| | | Principal
Amount | | | Value | |
| Electric — 0.5% | | | | | | | | |
NRG Energy, Inc. (a)
6.625% 1/15/27 | | $ | 702,000 | | | $ | 663,390 | |
| | | | | | | | |
| Engineering & Construction — 0.9% | | | | | | | | |
Zachry Holdings, Inc. (a)
7.500% 2/01/20 | | | 1,090,000 | | | | 1,118,613 | |
| | | | | | | | |
| Entertainment — 1.0% | |
Lions Gate Entertainment Corp. (a)
5.875% 11/01/24 | | | 282,000 | | | | 286,230 | |
WMG Acquisition Corp. (a)
5.000% 8/01/23 | | | 262,000 | | | | 263,310 | |
WMG Acquisition Corp. (a)
6.750% 4/15/22 | | | 700,000 | | | | 736,750 | |
| | | | | | | | |
| | | | | | | 1,286,290 | |
| | | | | | | | |
| Foods — 1.1% | |
Post Holdings, Inc. (a)
7.750% 3/15/24 | | | 741,000 | | | | 822,510 | |
Post Holdings, Inc. (a)
8.000% 7/15/25 | | | 485,000 | | | | 543,200 | |
| | | | | | | | |
| | | | | | | 1,365,710 | |
| | | | | | | | |
| Forest Products & Paper — 1.0% | |
Appvion, Inc. (a)
9.000% 6/01/20 | | | 2,157,000 | | | | 1,207,920 | |
| | | | | | | | |
| Gas — 0.9% | |
LBC Tank Terminals Holding Netherlands BV (a)
6.875% 5/15/23 | | | 1,111,000 | | | | 1,135,998 | |
| | | | | | | | |
| Health Care – Products — 3.5% | |
Alere, Inc.
6.500% 6/15/20 | | | 1,485,000 | | | | 1,462,725 | |
Halyard Health, Inc.
6.250% 10/15/22 | | | 1,300,000 | | | | 1,339,000 | |
Kinetic Concepts, Inc./KCI USA, Inc. (a)
9.625% 10/01/21 | | | 1,500,000 | | | | 1,586,250 | |
| | | | | | | | |
| | | | | | | 4,387,975 | |
| | | | | | | | |
| Health Care – Services — 1.9% | |
HCA, Inc.
5.875% 2/15/26 | | | 1,138,000 | | | | 1,172,140 | |
RegionalCare Hospital Partners Holdings, Inc. (a)
8.250% 5/01/23 | | | 176,000 | | | | 175,560 | |
Tenet Healthcare Corp.
8.125% 4/01/22 | | | 1,040,000 | | | | 981,240 | |
| | | | | | | | |
| | | | | | | 2,328,940 | |
| | | | | | | | |
| Home Builders — 1.8% | |
Brookfield Residential Properties, Inc. (a)
6.375% 5/15/25 | | | 491,000 | | | | 489,772 | |
Lennar Corp.
4.750% 5/30/25 | | | 1,101,000 | | | | 1,073,475 | |
| | | | | | | | |
| | | Principal
Amount | | | Value | |
William Lyon Homes, Inc.
7.000% 8/15/22 | | $ | 684,000 | | | $ | 707,940 | |
| | | | | | | | |
| | | | | | | 2,271,187 | |
| | | | | | | | |
| Insurance — 0.8% | |
Onex York Acquisition Corp. (a)
8.500% 10/01/22 | | | 1,212,000 | | | | 1,012,020 | |
| | | | | | | | |
| Internet — 1.2% | |
Netflix, Inc. (a)
4.375% 11/15/26 | | | 1,611,000 | | | | 1,562,670 | |
| | | | | | | | |
| Leisure Time — 4.2% | |
Brunswick Corp.
7.375% 9/01/23 | | | 285,000 | | | | 325,613 | |
Brunswick Corp.
7.125% 8/01/27 | | | 2,245,000 | | | | 2,621,037 | |
Carlson Travel, Inc. (a)
6.750% 12/15/23 | | | 396,000 | | | | 411,840 | |
Carlson Travel, Inc. (a)
9.500% 12/15/24 | | | 462,000 | | | | 483,368 | |
Carlson Wagonlit BV (a)
6.875% 6/15/19 | | | 1,409,000 | | | | 1,457,441 | |
| | | | | | | | |
| | | | | | | 5,299,299 | |
| | | | | | | | |
| Machinery – Diversified — 0.6% | |
Gardner Denver, Inc. (a)
6.875% 8/15/21 | | | 776,000 | | | | 772,120 | |
| | | | | | | | |
| Manufacturing — 4.9% | |
Amsted Industries, Inc. (a)
5.375% 9/15/24 | | | 850,000 | | | | 835,125 | |
CTP Transportation Products LLC/CTP Finance, Inc. (a)
8.250% 12/15/19 | | | 825,000 | | | | 711,563 | |
EnPro Industries, Inc.
5.875% 9/15/22 | | | 1,271,000 | | | | 1,305,952 | |
JB Poindexter & Co., Inc. (a)
9.000% 4/01/22 | | | 2,990,000 | | | | 3,139,500 | |
LSB Industries, Inc. STEP
8.500% 8/01/19 | | | 255,000 | | | | 234,600 | |
| | | | | | | | |
| | | | | | | 6,226,740 | |
| | | | | | | | |
| Media — 6.0% | |
Altice Financing SA (a)
7.500% 5/15/26 | | | 741,000 | | | | 770,640 | |
CCO Holdings LLC/CCO Holdings Capital Corp (a)
5.875% 4/01/24 | | | 1,500,000 | | | | 1,601,250 | |
DISH DBS Corp.
7.750% 7/01/26 | | | 987,000 | | | | 1,112,842 | |
MHGE Parent LLC/MHGE Parent Finance, Inc. (a)
8.500% 8/01/19 | | | 1,500,000 | | | | 1,507,500 | |
Midcontinent Communications & Midcontinent Finance Corp. (a)
6.875% 8/15/23 | | | 864,000 | | | | 920,160 | |
The accompanying notes are an integral part of the financial statements.
53
MML High Yield Fund – Portfolio of Investments (Continued)
| | | | | | | | |
| | | Principal
Amount | | | Value | |
SFR Group SA (a)
6.250% 5/15/24 | | $ | 260,000 | | | $ | 261,300 | |
Sirius XM Radio, Inc. (a)
5.375% 4/15/25 | | | 1,457,000 | | | | 1,449,715 | |
| | | | | | | | |
| | | | | | | 7,623,407 | |
| | | | | | | | |
| Metal Fabricate & Hardware — 0.1% | |
Grinding Media, Inc./MC Grinding Media Canada, Inc. (a)
7.375% 12/15/23 | | | 135,000 | | | | 141,831 | |
| | | | | | | | |
| Mining — 2.3% | |
Hecla Mining Co.
6.875% 5/01/21 | | | 1,271,000 | | | | 1,299,597 | |
Kinross Gold Corp.
5.950% 3/15/24 | | | 441,000 | | | | 446,513 | |
Kinross Gold Corp.
6.875% 9/01/41 | | | 476,000 | | | | 439,705 | |
Teck Resources Ltd. (a)
8.000% 6/01/21 | | | 274,000 | | | | 301,400 | |
Teck Resources Ltd. (a)
8.500% 6/01/24 | | | 342,000 | | | | 394,155 | |
| | | | | | | | |
| | | | | | | 2,881,370 | |
| | | | | | | | |
| Oil & Gas — 8.5% | | | | | | | | |
Chesapeake Energy Corp. (a)
8.000% 1/15/25 | | | 898,000 | | | | 915,960 | |
Citgo Holding, Inc. (a)
10.750% 2/15/20 | | | 1,677,000 | | | | 1,798,583 | |
Continental Resources, Inc.
5.000% 9/15/22 | | | 601,000 | | | | 606,643 | |
EP Energy LLC/Everest Acquisition Finance, Inc.
9.375% 5/01/20 | | | 1,129,000 | | | | 1,040,791 | |
Jupiter Resources, Inc. (a)
8.500% 10/01/22 | | | 2,310,000 | | | | 1,992,375 | |
Kosmos Energy Ltd. (a)
7.875% 8/01/21 | | | 1,823,000 | | | | 1,813,885 | |
PBF Holding Co. LLC/PBF Finance Corp. (a)
7.000% 11/15/23 | | | 47,000 | | | | 46,765 | |
Rowan Cos., Inc.
7.375% 6/15/25 | | | 244,000 | | | | 248,880 | |
Summit Midstream Holdings LLC/Summit Midstream Finance Corp.
5.500% 8/15/22 | | | 641,000 | | | | 624,975 | |
Summit Midstream Holdings LLC/Summit Midstream Finance Corp.
7.500% 7/01/21 | | | 640,000 | | | | 672,000 | |
Tullow Oil PLC (a)
6.250% 4/15/22 | | | 1,045,000 | | | | 971,850 | |
| | | | | | | | |
| | | | | | | 10,732,707 | |
| | | | | | | | |
| | | | | | | | |
| | | Principal
Amount | | | Value | |
| Packaging & Containers — 1.8% | | | | | | | | |
Coveris Holdings SA (a)
7.875% 11/01/19 | | $ | 2,217,000 | | | $ | 2,200,372 | |
| | | | | | | | |
| Pharmaceuticals — 1.7% | | | | | | | | |
Horizon Pharma, Inc./Horizon Pharma USA, Inc. (a)
8.750% 11/01/24 | | | 262,000 | | | | 265,275 | |
Valeant Pharmaceuticals International, Inc. (a)
5.500% 3/01/23 | | | 452,000 | | | | 339,000 | |
Valeant Pharmaceuticals International, Inc. (a)
6.125% 4/15/25 | | | 2,118,000 | | | | 1,591,147 | |
| | | | | | | | |
| | | | | | | 2,195,422 | |
| | | | | | | | |
| Pipelines — 1.7% | | | | | | | | |
Genesis Energy LP/Genesis Energy Finance Corp.
6.000% 5/15/23 | | | 1,171,000 | | | | 1,191,492 | |
Genesis Energy LP/Genesis Energy Finance Corp.
6.750% 8/01/22 | | | 270,000 | | | | 280,530 | |
Sabine Pass Liquefaction LLC (a)
5.000% 3/15/27 | | | 189,000 | | | | 190,654 | |
Sabine Pass Liquefaction LLC (a)
5.875% 6/30/26 | | | 462,000 | | | | 497,805 | |
| | | | | | | | |
| | | | | | | 2,160,481 | |
| | | | | | | | |
| Real Estate Investment Trusts (REITS) — 1.3% | |
CoreCivic, Inc.
5.000% 10/15/22 | | | 803,000 | | | | 800,993 | |
RHP Hotel Properties LP/RHP Finance Corp.
5.000% 4/15/23 | | | 789,000 | | | | 796,890 | |
| | | | | | | | |
| | | | | | | 1,597,883 | |
| | | | | | | | |
| Retail — 1.7% | | | | | | | | |
Dollar Tree, Inc.
5.750% 3/01/23 | | | 1,375,000 | | | | 1,455,878 | |
Ferrellgas Partners LP/Ferrellgas Partners Finance Corp.
8.625% 6/15/20 | | | 742,000 | | | | 730,870 | |
| | | | | | | | |
| | | | | | | 2,186,748 | |
| | | | | | | | |
| Savings & Loans — 1.5% | | | | | | | | |
Consolidated Energy Finance SA (a)
6.750% 10/15/19 | | | 1,935,000 | | | | 1,935,000 | |
| | | | | | | | |
| Semiconductors — 0.6% | | | | | | | | |
NXP BV/NXP Funding LLC (a)
4.625% 6/01/23 | | | 746,000 | | | | 783,300 | |
| | | | | | | | |
| Software — 1.2% | | | | | | | | |
Infor Software Parent LLC/Infor Software Parent, Inc. (a)
7.125% 5/01/21 | | | 1,267,000 | | | | 1,305,010 | |
The accompanying notes are an integral part of the financial statements.
54
MML High Yield Fund – Portfolio of Investments (Continued)
| | | | | | | | |
| | | Principal
Amount | | | Value | |
JDA Escrow LLC/JDA Bond Finance, Inc. (a)
7.375% 10/15/24 | | $ | 191,000 | | | $ | 198,163 | |
| | | | | | | | |
| | | | | | | 1,503,173 | |
| | | | | | | | |
| Telecommunications — 11.0% | | | | | | | | |
Altice Financing SA (a)
6.500% 1/15/22 | | | 875,000 | | | | 912,187 | |
Altice Finco SA (a)
8.125% 1/15/24 | | | 615,000 | | | | 636,525 | |
Altice SA (a)
7.750% 5/15/22 | | | 1,210,000 | | | | 1,291,675 | |
CPI International, Inc. STEP
8.750% 2/15/18 | | | 1,979,000 | | | | 2,008,685 | |
Digicel Ltd. (a)
6.000% 4/15/21 | | | 1,025,000 | | | | 927,082 | |
GCI, Inc.
6.875% 4/15/25 | | | 1,550,000 | | | | 1,573,250 | |
GTT Escrow Corp. (a)
7.875% 12/31/24 | | | 644,000 | | | | 671,499 | |
Hughes Satellite Systems Corp. (a)
5.250% 8/01/26 | | | 805,000 | | | | 788,900 | |
Hughes Satellite Systems Corp. (a)
6.625% 8/01/26 | | | 478,000 | | | | 480,390 | |
Sprint Corp.
7.250% 9/15/21 | | | 745,000 | | | | 791,563 | |
Sprint Corp.
7.875% 9/15/23 | | | 1,290,000 | | | | 1,377,075 | |
T-Mobile USA, Inc.
6.000% 4/15/24 | | | 453,000 | | | | 477,349 | |
T-Mobile USA, Inc.
6.500% 1/15/26 | | | 679,000 | | | | 734,169 | |
West Corp. (a)
5.375% 7/15/22 | | | 1,270,000 | | | | 1,227,137 | |
| | | | | | | | |
| | | | | | | 13,897,486 | |
| | | | | | | | |
| Transportation — 6.3% | | | | | | | | |
Hornbeck Offshore Services, Inc.
5.000% 3/01/21 | | | 1,250,000 | | | | 837,500 | |
OPE KAG Finance Sub, Inc. (a)
7.875% 7/31/23 | | | 3,200,000 | | | | 3,232,000 | |
Topaz Marine SA (a)
8.625% 11/01/18 | | | 1,509,000 | | | | 1,463,730 | |
Watco Cos. LLC/Watco Finance Corp. (a)
6.375% 4/01/23 | | | 1,531,000 | | | | 1,584,585 | |
| | | | | | | | |
| | | Principal
Amount | | | Value | |
XPO Logistics, Inc. (a)
6.500% 6/15/22 | | $ | 750,000 | | | $ | 787,500 | |
| | | | | | | | |
| | | | | | | 7,905,315 | |
| | | | | | | | |
| | |
TOTAL CORPORATE DEBT
(Cost $113,639,391) | | | | | | | 114,302,388 | |
| | | | | |
| | |
TOTAL BONDS & NOTES
(Cost $120,049,239) | | | | | | | 121,240,877 | |
| | | | | |
| | |
TOTAL LONG-TERM INVESTMENTS
(Cost $120,049,239) | | | | | | | 121,240,877 | |
| | | | | |
|
| SHORT-TERM INVESTMENTS — 2.6% | |
| Time Deposit — 2.6% | | | | | | | | |
Euro Time Deposit
0.010% 1/03/17 | | | 3,227,005 | | | | 3,227,005 | |
| | | | | | | | |
| | |
TOTAL SHORT-TERM INVESTMENTS
(Cost $3,227,005) | | | | | | | 3,227,005 | |
| | | | | |
| | |
TOTAL INVESTMENTS — 98.7%
(Cost $123,276,244) (b) | | | | | | | 124,467,882 | |
| | |
| Other Assets/(Liabilities) — 1.3% | | | | | | | 1,657,926 | |
| | | | | |
| | |
| NET ASSETS — 100.0% | | | | | | $ | 126,125,808 | |
| | | | | |
Notes to Portfolio of Investments
Percentages are stated as a percent of net assets.
| (a) | Securities exempt from registration under rule 144A of the Securities Act of 1933. These securities may be resold in transactions exempt from registration, normally to qualified institutional buyers. At December 31, 2016, these securities amounted to a value of $76,629,479 or 60.76% of net assets. |
| (b) | See Note 6 for aggregate cost for federal tax purposes. |
Country weightings, as a percentage of net assets, is as follows:
| | | | |
United States | | | 75.0 | % |
Luxembourg | | | 8.9 | % |
Canada | | | 6.1 | % |
Netherlands | | | 2.7 | % |
Bermuda | | | 2.4 | % |
United Kingdom | | | 0.8 | % |
France | | | 0.2 | % |
| | | | |
Total Long-Term Investments | | | 96.1 | % |
Short-Term Investments and Other Assets and Liabilities | | | 3.9 | % |
| | | | |
Net Assets | | | 100.0 | % |
| | | | |
The accompanying notes are an integral part of the financial statements.
55
MML Inflation-Protected and Income Fund – Portfolio of Investments
December 31, 2016
| | | | | | | | |
| | | Principal
Amount | | | Value | |
| BONDS & NOTES — 139.8% | |
|
| CORPORATE DEBT — 3.6% | |
| Auto Manufacturers — 0.7% | | | | | | | | |
General Motors Financial Co., Inc. 3 mo. USD LIBOR + 2.060%, FRN
2.940% 1/15/19 | | $ | 1,720,000 | | | $ | 1,750,394 | |
Nissan Motor Acceptance Corp. 3 mo. USD LIBOR + .550%, FRN (a)
1.491% 3/03/17 | | | 1,400,000 | | | | 1,401,241 | |
| | | | | | | | |
| | | | | | | 3,151,635 | |
| | | | | | | | |
| Banks — 0.2% | | | | | | | | |
The Huntington National Bank 3 mo. USD LIBOR + .425%, FRN
1.306% 4/24/17 | | | 935,000 | | | | 935,139 | |
| | | | | | | | |
| Computers — 0.7% | | | | | | | | |
Diamond 1 Finance Corp./Diamond 2 Finance Corp. (a)
3.480% 6/01/19 | | | 1,100,000 | | | | 1,122,887 | |
Hewlett Packard Enterprise Co. 3 mo. USD LIBOR + 1.930%, FRN
3.037% 10/05/18 | | | 1,700,000 | | | | 1,737,104 | |
| | | | | | | | |
| | | | | | | 2,859,991 | |
| | | | | | | | |
| Diversified Financial — 1.3% | | | | | | | | |
The Goldman Sachs Group, Inc. 3 mo. USD LIBOR + .625%, FRN
1.566% 6/04/17 | | | 1,875,000 | | | | 1,877,989 | |
The Goldman Sachs Group, Inc. 3 mo. USD LIBOR + .800%, FRN
1.763% 12/15/17 | | | 1,750,000 | | | | 1,755,563 | |
Ally Financial, Inc.
3.600% 5/21/18 | | | 1,705,000 | | | | 1,717,787 | |
| | | | | | | | |
| | | | | | | 5,351,339 | |
| | | | | | | | |
| Holding Company – Diversified — 0.3% | |
MUFG Americas Holdings Corp. 3 mo. USD LIBOR + .570%, FRN
1.456% 2/09/18 | | | 1,130,000 | | | | 1,128,082 | |
| | | | | | | | |
| Pharmaceuticals — 0.4% | | | | | | | | |
Actavis Funding SCS 3 mo.
USD LIBOR + 1.080%, FRN
2.033% 3/12/18 | | | 1,750,000 | | | | 1,760,166 | |
| | | | | | | | |
| | |
TOTAL CORPORATE DEBT
(Cost $10,741,809) | | | | | | | 15,186,352 | |
| | | | | |
| | | | | | | | |
| | | Principal
Amount | | | Value | |
| MUNICIPAL OBLIGATIONS — 0.1% | |
Louisiana State Public Facilities Authority, Series 2011-A,
Class A2 FRN
1.614% 4/26/27 | | $ | 211,453 | | | $ | 210,523 | |
| | | | | | | | |
| | |
TOTAL MUNICIPAL OBLIGATIONS
(Cost $211,453) | | | | | | | 210,523 | |
| | | | | | | | |
|
NON-U.S. GOVERNMENT
AGENCY OBLIGATIONS — 45.0% | |
| Auto Floor Plan ABS — 0.5% | | | | | | | | |
Ally Master Owner Trust, Series 2015-2, Class A1, 1 mo. LIBOR + .570%, FRN 1.273% 1/15/21 | | | 1,200,000 | | | | 1,204,092 | |
Navistar Financial Dealer Note Master Owner Trust II, Series 2016-1, Class A, 1 mo. LIBOR + 1.350%, FRN (a)
1.942% 9/27/21 | | | 780,000 | | | | 780,625 | |
NCF Dealer Floorplan Master Trust,
Series 2014-1A, Class A, 1 mo.
LIBOR + 1.500%, FRN (a)
2.061% 10/20/20 | | | 330,000 | | | | 330,000 | |
| | | | | | | | |
| | | | | | | 2,314,717 | |
| | | | | | | | |
| Automobile ABS — 13.0% | | | | | | | | |
American Credit Acceptance Receivables Trust, Series 2015-2, Class A (a)
1.570% 6/12/19 | | | 161,375 | | | | 161,385 | |
American Credit Acceptance Receivables Trust, Series 2015-3, Class A (a)
1.950% 9/12/19 | | | 656,201 | | | | 657,251 | |
American Credit Acceptance Receivables Trust, Series 2016-2, Class A (a)
2.220% 7/13/20 | | | 298,427 | | | | 298,819 | |
American Credit Acceptance Receivables Trust, Series 2016-1A, Class A (a)
2.370% 5/12/20 | | | 216,372 | | | | 216,862 | |
ARI Fleet Lease Trust, Series 2016-A, Class A1 (a)
0.800% 3/15/17 | | | 127,644 | | | | 127,624 | |
Bank of The West Auto Trust,
Series 2014-1, Class A4 (a)
1.650% 3/16/20 | | | 600,000 | | | | 601,412 | |
California Republic Auto Receivables Trust, Series 2013-2, Class A2
1.230% 3/15/19 | | | 106,330 | | | | 106,260 | |
California Republic Auto Receivables Trust, Series 2013-1, Class A2 (a)
1.410% 9/17/18 | | | 129,333 | | | | 130,144 | |
California Republic Auto Receivables Trust, Series 2015-4, Class A2 (a)
1.600% 9/17/18 | | | 875,542 | | | | 876,321 | |
The accompanying notes are an integral part of the financial statements.
56
MML Inflation-Protected and Income Fund – Portfolio of Investments (Continued)
| | | | | | | | |
| | | Principal
Amount | | | Value | |
CFC LLC, Series 2014-2A, Class A (a)
1.440% 11/16/20 | | $ | 115,419 | | | $ | 115,283 | |
CFC LLC, Series 2015-1A, Class A (a)
1.750% 6/15/21 | | | 300,052 | | | | 300,163 | |
Chesapeake Funding II LLC,
Series 2016-2A, Class A2, 1 mo. USD LIBOR + 1.000%, FRN (a)
1.703% 6/15/28 | | | 1,960,000 | | | | 1,967,906 | |
Chesapeake Funding LLC, Series 2015-1A, Class B, 1 mo. LIBOR + .950%, FRN (a)
1.601% 2/07/27 | | | 350,000 | | | | 346,952 | |
CPS Auto Trust, Series 2014-B, Class A (a)
1.110% 11/15/18 | | | 98,271 | | | | 98,040 | |
CPS Auto Trust, Series 2014-A, Class A (a)
1.210% 8/15/18 | | | 13,754 | | | | 13,746 | |
CPS Auto Trust, Series 2014-C, Class A (a)
1.310% 2/15/19 | | | 145,732 | | | | 145,555 | |
CPS Auto Trust, Series 2013-A, Class A (a)
1.310% 6/15/20 | | | 215,246 | | | | 214,291 | |
CPS Auto Trust, Series 2012-D, Class A (a)
1.480% 3/16/20 | | | 90,661 | | | | 90,502 | |
CPS Auto Trust, Series 2014-D, Class A (a)
1.490% 4/15/19 | | | 644,476 | | | | 643,895 | |
CPS Auto Trust, Series 2015-A, Class A (a)
1.530% 7/15/19 | | | 210,649 | | | | 210,687 | |
CPS Auto Trust, Series 2016-C, Class A (a)
1.620% 1/15/20 | | | 317,407 | | | | 317,414 | |
CPS Auto Trust, Series 2015-B, Class A (a)
1.650% 11/15/19 | | | 466,468 | | | | 466,488 | |
CPS Auto Trust, Series 2015-C, Class A (a)
1.770% 6/17/19 | | | 312,146 | | | | 312,546 | |
CPS Auto Trust, Series 2013-B, Class A (a)
1.820% 9/15/20 | | | 276,898 | | | | 275,924 | |
CPS Auto Trust, Series 2016-B, Class A (a)
2.070% 11/15/19 | | | 211,695 | | | | 211,949 | |
CPS Auto Trust, Series 2016-A, Class A (a)
2.250% 10/15/19 | | | 416,175 | | | | 417,797 | |
| | | | | | | | |
| | | Principal
Amount | | | Value | |
CPS Auto Trust, Series 2012-C, Class A (a)
2.260% 12/16/19 | | $ | 96,243 | | | $ | 96,206 | |
CPS Auto Trust, Series 2015-C, Class B (a)
2.550% 2/18/20 | | | 630,000 | | | | 633,101 | |
Credit Acceptance Auto Loan Trust,
Series 2014-2A, Class A (a)
1.880% 3/15/22 | | | 589,692 | | | | 589,529 | |
Drive Auto Receivables Trust,
Series 2016-CA, Class A1 (a)
0.900% 12/15/17 | | | 3,601,615 | | | | 3,601,571 | |
Drive Auto Receivables Trust,
Series 2016-BA, Class A2 (a)
1.380% 8/15/18 | | | 940,646 | | | | 940,621 | |
Drive Auto Receivables Trust,
Series 2016-BA, Class A3 (a)
1.670% 7/15/19 | | | 800,000 | | | | 799,704 | |
Drive Auto Receivables Trust,
Series 2016-AA, Class A3 (a)
2.110% 5/15/19 | | | 1,744,192 | | | | 1,744,926 | |
Drive Auto Receivables Trust,
Series 2016-BA, Class B (a)
2.560% 6/15/20 | | | 360,000 | | | | 361,408 | |
DT Auto Owner Trust, Series 2015-3A, Class A (a)
1.660% 3/15/19 | | | 121,391 | | | | 121,400 | |
DT Auto Owner Trust, Series 2016-2A, Class A (a)
1.730% 8/15/19 | | | 589,316 | | | | 588,728 | |
DT Auto Owner Trust, Series 2016-3A, Class A (a)
1.750% 11/15/19 | | | 382,235 | | | | 382,195 | |
DT Auto Owner Trust, Series 2016-1A, Class A (a)
2.000% 9/16/19 | | | 973,619 | | | | 973,417 | |
DT Auto Owner Trust, Series 2016-1A, Class B (a)
2.790% 5/15/20 | | | 2,150,000 | | | | 2,162,374 | |
Enterprise Fleet Financing LLC,
Series 2016-2, Class A1 (a)
0.850% 7/20/17 | | | 2,435,087 | | | | 2,430,858 | |
Enterprise Fleet Financing LLC,
Series 2014-1, Class A2 (a)
0.870% 9/20/19 | | | 34,700 | | | | 34,674 | |
Enterprise Fleet Financing LLC, Series 2016-1, Class A2 (a)
1.830% 9/20/21 | | | 986,097 | | | | 986,909 | |
Exeter Automobile Receivables Trust,
Series 2014-3A, Class A (a)
1.320% 1/15/19 | | | 8,496 | | | | 8,493 | |
The accompanying notes are an integral part of the financial statements.
57
MML Inflation-Protected and Income Fund – Portfolio of Investments (Continued)
| | | | | | | | |
| | | Principal
Amount | | | Value | |
Exeter Automobile Receivables Trust,
Series 2015-2A, Class A (a)
1.540% 11/15/19 | | $ | 159,570 | | | $ | 159,584 | |
Exeter Automobile Receivables Trust,
Series 2015-1A, Class A (a)
1.600% 6/17/19 | | | 103,933 | | | | 103,940 | |
Exeter Automobile Receivables Trust,
Series 2015-3A, Class A (a)
2.000% 3/16/20 | | | 560,740 | | | | 561,679 | |
Exeter Automobile Receivables Trust,
Series 2016-3A, Class B (a)
2.840% 8/16/21 | | | 420,000 | | | | 418,346 | |
First Investors Auto Owner Trust,
Series 2015-1A, Class A2 (a)
1.210% 4/15/19 | | | 89,761 | | | | 89,743 | |
First Investors Auto Owner Trust,
Series 2015-2A, Class A1 (a)
1.590% 12/16/19 | | | 607,684 | | | | 608,023 | |
First Investors Auto Owner Trust,
Series 2016-1A, Class A1 (a)
1.920% 5/15/20 | | | 906,948 | | | | 908,915 | |
Flagship Credit Auto Trust, Series 2014-1, Class A (a)
1.210% 4/15/19 | | | 42,110 | | | | 42,073 | |
Flagship Credit Auto Trust, Series 2014-2, Class A (a)
1.430% 12/16/19 | | | 118,808 | | | | 118,615 | |
Flagship Credit Auto Trust, Series 2016-3, Class A1 (a)
1.610% 12/15/19 | | | 1,118,183 | | | | 1,116,602 | |
Flagship Credit Auto Trust, Series 2015-1, Class A (a)
1.630% 6/15/20 | | | 329,404 | | | | 328,024 | |
Flagship Credit Auto Trust, Series 2013-2, Class A (a)
1.940% 1/15/19 | | | 11,291 | | | | 11,291 | |
Flagship Credit Auto Trust, Series 2015-2, Class A (a)
1.980% 10/15/20 | | | 761,519 | | | | 762,562 | |
Flagship Credit Auto Trust, Series 2015-3, Class A (a)
2.380% 10/15/20 | | | 1,164,939 | | | | 1,168,849 | |
Flagship Credit Auto Trust, Series 2016-4, Class C (a)
2.710% 11/15/22 | | | 680,000 | | | | 672,143 | |
Flagship Credit Auto Trust, Series 2016-1, Class A (a)
2.770% 12/15/20 | | | 727,038 | | | | 732,218 | |
Flagship Credit Auto Trust, Series 2013-2, Class B (a)
3.210% 8/15/19 | | | 690,000 | | | | 692,430 | |
| | | | | | | | |
| | | Principal
Amount | | | Value | |
GLS Auto Receivables Trust, Series 2015-1A, Class A (a)
2.250% 12/15/20 | | $ | 463,062 | | | $ | 462,323 | |
Hertz Fleet Lease Funding LP, Series 2016-1, Class A1, 1 mo. USD LIBOR + 1.100%, FRN (a)
1.763% 4/10/30 | | | 1,470,000 | | | | 1,471,665 | |
NextGear Floorplan Master Owner Trust, Series 2016-1A, Class A1, 1 mo. LIBOR + 1.700%, FRN (a)
2.403% 4/15/21 | | | 960,000 | | | | 972,987 | |
Oscar US Funding Trust II, Series 2015-1A, Class A4 (a)
2.440% 6/15/22 | | | 750,000 | | | | 738,582 | |
Oscar US Funding Trust IV, Series 2016-1A, Class A2B, 1 mo. USD LIBOR + 1.700%, FRN (a)
2.403% 7/15/20 | | | 504,426 | | | | 504,584 | |
Oscar US Funding Trust V, Series 2016-2A, Class A1 (a)
0.900% 9/17/17 | | | 996,574 | | | | 995,865 | |
Prestige Auto Receivables Trust, Series 2015-1, Class B (a)
2.040% 4/15/21 | | | 700,000 | | | | 698,037 | |
Santander Drive Auto Receivables Trust, Series 2015-4, Class A2B, 1 mo. USD LIBOR + .700%, FRN
1.403% 12/17/18 | | | 114,959 | | | | 114,957 | |
Santander Drive Auto Receivables Trust, Series 2016-1, Class A2B, 1 mo. USD LIBOR + .780%, FRN
1.483% 7/15/19 | | | 1,503,857 | | | | 1,504,252 | |
Santander Drive Auto Receivables Trust, Series 2014-2, Class C
2.330% 11/15/19 | | | 3,100,000 | | | | 3,115,531 | |
Santander Drive Auto Receivables Trust, Series 2014-1, Class C
2.360% 4/15/20 | | | 578,712 | | | | 581,447 | |
Santander Drive Auto Receivables Trust, Series 2015-2, Class C
2.440% 4/15/21 | | | 1,200,000 | | | | 1,206,360 | |
Tidewater Auto Receivables Trust, Series 2016-AA, Class A2 (a)
2.300% 9/15/19 | | | 943,421 | | | | 943,115 | |
Westlake Automobile Receivables Trust, Series 2016-2A, Class A1 (a)
0.850% 6/15/17 | | | 147,157 | | | | 147,147 | |
Westlake Automobile Receivables Trust, Series 2016-3A, Class A1 (a)
0.950% 10/16/17 | | | 2,595,711 | | | | 2,595,478 | |
Westlake Automobile Receivables Trust, Series 2015-2A, Class A2A (a)
1.280% 7/16/18 | | | 128,666 | | | | 128,565 | |
The accompanying notes are an integral part of the financial statements.
58
MML Inflation-Protected and Income Fund – Portfolio of Investments (Continued)
| | | | | | | | |
| | | Principal
Amount | | | Value | |
Westlake Automobile Receivables Trust, Series 2016-2A, Class A2 (a)
1.570% 6/17/19 | | $ | 790,000 | | | $ | 790,685 | |
Westlake Automobile Receivables Trust, Series 2016-1A, Class A2B, 1 mo. USD LIBOR + 1.050%, FRN (a)
1.753% 1/15/19 | | | 2,332,280 | | | | 2,334,380 | |
Wheels SPV 2 LLC, Series 2016-1A, Class A1 (a)
0.010% 8/20/17 | | | 1,482,791 | | | | 1,482,204 | |
| | | | | | | | |
| | | | | | | 55,064,531 | |
| | | | | | | | |
| Commercial MBS — 0.6% | |
Banc of America Commercial Mortgage, Inc., Series 2007-3, Class A4, VRN
5.549% 6/10/49 | | | 340,784 | | | | 342,401 | |
Commercial Mortgage Pass-Through Certificates, Series 2014-BBG, Class A, 1 mo. LIBOR + .800%, FRN (a)
1.504% 3/15/29 | | | 1,185,000 | | | | 1,174,725 | |
DBRR Trust, Series 2013-EZ3, Class A, VRN (a)
1.635% 12/18/49 | | | 28,643 | | | | 28,616 | |
GCCFC Commercial Mortgage Trust, Series 2006-GG7, Class AM, VRN
5.758% 7/10/38 | | | 430,676 | | | | 430,796 | |
JP Morgan Chase Commercial Mortgage Securities Trust, Series 2006-LDP7, Class AM, VRN 5.904% 4/17/45 | | | 72,995 | | | | 72,995 | |
Morgan Stanley Capital I, Series 2007-HQ11, Class AJ, VRN
5.508% 2/12/44 | | | 470,000 | | | | 470,000 | |
STRIPs Ltd., Series 2012-1A, Class A (a)
1.500% 12/25/44 | | | 68,715 | | | | 68,509 | |
| | | | | | | | |
| | | | | | | 2,588,042 | |
| | | | | | | | |
| Credit Card ABS — 2.5% | |
Chase Issuance Trust, Series 2014-A1, Class A1
1.150% 1/15/19 | | | 10,700,000 | | | | 10,700,031 | |
| | | | | | | | |
| Home Equity ABS — 0.2% | |
ACE Securities Corp., Series 2005-AG1, Class A1B1, 1 mo. USD LIBOR + .270%, FRN
0.862% 8/25/35 | | | 15,055 | | | | 15,054 | |
ACE Securities Corp., Series 2005-HE5, Class M2, 1 mo. USD LIBOR + .735%, FRN
1.327% 8/25/35 | | | 223,365 | | | | 223,641 | |
| | | | | | | | |
| | | Principal
Amount | | | Value | |
Countrywide Asset-Backed Certificates, Series 2004-5, Class 3A, 1 mo. USD LIBOR + .460%, FRN
1.044% 9/25/34 | | $ | 83,564 | | | $ | 83,175 | |
First Franklin Mortgage Loan Trust, Series 2005-FF6, Class M1, 1 mo. USD LIBOR + .630%, FRN
1.222% 5/25/36 | | | 86,838 | | | | 86,629 | |
Long Beach Mortgage Loan Trust, Series 2005-WL1, Class M2, 1 mo. USD LIBOR + .825%, FRN
1.581% 6/25/35 | | | 288,580 | | | | 287,490 | |
| | | | | | | | |
| | | | | | | 695,989 | |
| | | | | | | | |
| Other ABS — 15.4% | |
321 Henderson Receivables I LLC, Series 2006-1A, Class A1, 1 mo. USD LIBOR + .200%, FRN (a)
0.903% 3/15/41 | | | 905,619 | | | | 881,440 | |
321 Henderson Receivables I LLC, Series 2006-2A, Class A1, 1 mo. USD LIBOR + .200%, FRN (a)
0.903% 6/15/41 | | | 2,294,779 | | | | 2,235,354 | |
321 Henderson Receivables I LLC, Series 2006-4A, Class A1, 1 mo. USD LIBOR + .200%, FRN (a)
0.903% 12/15/41 | | | 552,583 | | | | 544,362 | |
321 Henderson Receivables I LLC, Series 2007-1A, Class A1, 1 mo. USD LIBOR + .200%, FRN (a)
0.903% 3/15/42 | | | 851,959 | | | | 813,007 | |
321 Henderson Receivables II LLC, Series 2006-3A, Class A1, 1 mo. USD LIBOR + .200%, FRN (a)
0.642% 9/15/41 | | | 259,704 | | | | 244,936 | |
Alterna Funding I LLC, Series 2014-1A, Class NOTE (a)
1.639% 2/15/21 | | | 1,188,137 | | | | 1,154,721 | |
Apidos CLO XXII, Series 2015-22A, Class X, 3 mo. USD LIBOR + 1.000%, FRN (a)
1.881% 10/20/27 | | | 250,000 | | | | 249,989 | |
ARL First LLC, Series 2012-1A, Class A1, 1 mo. USD LIBOR + 1.750%, FRN (a)
2.453% 12/15/42 | | | 1,180,256 | | | | 1,146,629 | |
Ascentium Equipment Receivables LLC, Series 2015-2A, Class A2 (a)
1.570% 12/11/17 | | | 677,575 | | | | 677,621 | |
AVANT Loans Funding Trust, Series 2016-C, Class A (a)
2.960% 9/16/19 | | | 265,773 | | | | 265,622 | |
The accompanying notes are an integral part of the financial statements.
59
MML Inflation-Protected and Income Fund – Portfolio of Investments (Continued)
| | | | | | | | |
| | | Principal
Amount | | | Value | |
AVANT Loans Funding Trust, Series 2016-A, Class A (a)
4.110% 5/15/19 | | $ | 446,787 | | | $ | 447,744 | |
BCC Funding VIII LLC, Series 2014-1A, Class A (a)
1.794% 6/20/20 | | | 36,749 | | | | 36,726 | |
BCC Funding X LLC, Series 2015-1, Class A2 (a)
2.224% 10/20/20 | | | 618,409 | | | | 617,769 | |
BCC Funding XIII LLC, Series 2016-1, Class A1 (a)
1.100% 9/20/17 | | | 2,988,426 | | | | 2,981,061 | |
Blackbird Capital Aircraft Lease Securitization Ltd., Series 2016-1A, Class AA, STEP (a)
2.487% 12/16/41 | | | 660,000 | | | | 661,032 | |
BlueVirgo Trust, Series 2015-1A, Class NOTE (a)
3.000% 12/15/22 | | | 1,366,275 | | | | 1,380,689 | |
Cazenovia Creek Funding I LLC, Series 2015-1A, Class A (a)
2.000% 12/10/23 | | | 1,058,141 | | | | 1,049,544 | |
Citi Held For Asset Issuance, Series 2015-PM1, Class A (a)
1.850% 12/15/21 | | | 13,550 | | | | 13,543 | |
Citi Held For Asset Issuance, Series 2015-PM2, Class A (a)
2.350% 3/15/22 | | | 164,717 | | | | 164,595 | |
Citi Held For Asset Issuance, Series 2015-PM3, Class A (a)
2.560% 5/16/22 | | | 89,132 | | | | 89,035 | |
Citigroup Mortgage Loan Trust, Series 2005-OPT3, Class M2, 1 mo. USD LIBOR + .675%, FRN
1.431% 5/25/35 | | | 545,170 | | | | 544,964 | |
Consumer Credit Origination Loan Trust, Series 2015-1, Class A (a)
2.820% 3/15/21 | | | 20,789 | | | | 20,917 | |
Consumer Installment Loan Trust, Series 2016-LD1, Class A (a)
3.960% 7/15/22 | | | 408,267 | | | | 409,363 | |
DB Master Finance LLC, Series 2015-1A, Class A2I (a)
3.262% 2/20/45 | | | 962,850 | | | | 968,221 | |
Dell Equipment Finance Trust, Series 2015-2, Class A2B, 1 mo. USD LIBOR + .900%, FRN (a)
1.649% 12/22/17 | | | 888,410 | | | | 889,051 | |
Diamond Resorts Owner Trust, Series 2013-1, Class A (a)
1.950% 1/20/25 | | | 524,246 | | | | 521,106 | |
| | | | | | | | |
| | | Principal
Amount | | | Value | |
Diamond Resorts Owner Trust, Series 2013-2, Class A (a)
2.270% 5/20/26 | | $ | 878,391 | | | $ | 872,282 | |
Diamond Resorts Owner Trust, Series 2015-1, Class A (a)
2.730% 7/20/27 | | | 148,113 | | | | 147,214 | |
Diamond Resorts Owner Trust, Series 2015-2, Class B (a)
3.540% 5/22/28 | | | 288,880 | | | | 289,172 | |
Domino’s Pizza Master Issuer LLC, Series 2012-1A, Class A2 (a)
5.216% 1/25/42 | | | 1,024,320 | | | | 1,043,091 | |
Dong Fang Container Finance II SPV Ltd., Series 2014-1A, Class A1 (a)
1.950% 11/25/39 | | | 383,333 | | | | 377,030 | |
Drug Royalty Corp., Inc., Series 2014-1, Class A1, 3 mo. USD LIBOR + 2.850%, FRN (a)
3.730% 7/15/23 | | | 487,165 | | | | 490,531 | |
Elara HGV Timeshare Issuer LLC, Series 2014-A, Class B (a)
3.020% 2/25/27 | | | 359,361 | | | | 354,695 | |
Element Rail Leasing II LLC, Series 2016-1A, Class A1 (a)
3.968% 3/19/46 | | | 481,768 | | | | 483,044 | |
FNA Trust, Series 2014-1A, Class A (a)
1.296% 12/10/22 | | | 311,659 | | | | 308,932 | |
FNA Trust, Series 2015-1, Class A (a)
3.240% 12/10/23 | | | 488,189 | | | | 485,308 | |
Global SC Funding One Ltd., Series 2015-1, Class B1 (a)
2.740% 1/18/30 | | | 149,798 | | | | 149,798 | |
GoldenTree Loan Opportunities IV Ltd., Series 2007-4A, Class A1B, 3 mo. USD LIBOR + .230%, FRN (a)
1.138% 8/18/22 | | | 333,635 | | | | 333,490 | |
Green Tree Agency Advance Funding Trust I, Series 2015-T2, Class AT2 (a)
3.094% 10/15/48 | | | 840,000 | | | | 840,000 | |
Hilton Grand Vacations Trust, Series 2014-AA, Class A (a)
1.770% 11/25/26 | | | 218,762 | | | | 214,724 | |
ING Investment Management CLO V Ltd., Series 2007-5A, Class A1A, 3 mo. USD LIBOR + .230%, FRN (a)
1.115% 5/01/22 | | | 44,113 | | | | 44,093 | |
LCM XIV LP, Series 14A, Class A, 3 mo. USD LIBOR + 1.150%, FRN (a)
2.030% 7/15/25 | | | 1,500,000 | | | | 1,494,607 | |
LCM XXIII Ltd., Series 23A, Class X, 3 mo. USD LIBOR + 1.200%, FRN (a)
2.306% 10/20/29 | | | 1,160,000 | | | | 1,159,992 | |
The accompanying notes are an integral part of the financial statements.
60
MML Inflation-Protected and Income Fund – Portfolio of Investments (Continued)
| | | | | | | | |
| | | Principal
Amount | | | Value | |
Leaf Receivables Funding LLC, Series 2016-1, Class A1 (a)
1.000% 6/15/17 | | $ | 1,117,015 | | | $ | 1,116,214 | |
Marlette Funding Trust, Series 2016-1A, Class A (a)
3.060% 1/17/23 | | | 1,067,065 | | | | 1,066,065 | |
Miramax LLC, Series 2014-1A, Class A2 (a)
3.340% 7/20/26 | | | 744,246 | | | | 740,116 | |
Morgan Stanley ABS Capital I, Inc. Trust, Series 2005-WMC4, Class M4, 1 mo. USD LIBOR + ..945%, FRN
1.537% 4/25/35 | | | 354,307 | | | | 354,273 | |
Nations Equipment Finance Funding II LLC, Series 2014-1A, Class A (a)
1.558% 7/20/18 | | | 73,898 | | | | 73,851 | |
Nations Equipment Finance Funding III LLC, Series 2016-1A, Class A (a)
3.610% 2/20/21 | | | 665,331 | | | | 664,998 | |
Navitas Equipment Receivables LLC, Series 2015-1, Class A2 (a)
2.120% 11/15/18 | | | 521,394 | | | | 521,376 | |
New Residential Advance Receivables Trust, Series 2016-T2, Class AT2 (a)
2.575% 10/15/49 | | | 3,800,000 | | | | 3,754,919 | |
New Residential Advance Receivables Trust, Series 2016-T1, Class AT1 (a)
2.751% 6/15/49 | | | 500,000 | | | | 499,999 | |
NYCTL Trust, Series 2016-A, Class A (a)
1.470% 11/10/29 | | | 3,848,450 | | | | 3,823,830 | |
OHA Credit Partners XIII Ltd., Series 2016-13A, Class X, 3 mo. USD LIBOR + 1.250%, FRN (a)
2.349% 1/21/30 | | | 1,170,000 | | | | 1,169,981 | |
OneMain Financial Issuance Trust, Series 2014-1A, Class A (a)
2.430% 6/18/24 | | | 128,743 | | | | 128,895 | |
Orange Lake Timeshare Trust, Series 2016-A, Class A (a)
2.610% 3/08/29 | | | 675,822 | | | | 668,108 | |
Oxford Finance Funding Trust, Series 2014-1A, Class A (a)
3.475% 12/15/22 | | | 200,942 | | | | 200,956 | |
Oxford Finance Funding Trust, Series 2016-1A, Class A (a)
3.968% 6/17/24 | | | 500,000 | | | | 497,935 | |
PFS Financing Corp., Series 2014-AA, Class A, 1 mo. LIBOR + .600%, FRN (a)
1.303% 2/15/19 | | | 1,900,000 | | | | 1,899,365 | |
| | | | | | | | |
| | | Principal
Amount | | | Value | |
PFS Financing Corp., Series 2014-BA, Class A, 1 mo. LIBOR + .600%, FRN (a)
1.303% 10/15/19 | | $ | 1,100,000 | | | $ | 1,097,698 | |
RAAC, Series 2006-RP2, Class A, 1 mo. USD LIBOR + .250%, FRN (a)
0.784% 2/25/37 | | | 201,823 | | | | 200,497 | |
Sierra Receivables Funding Co. LLC, Series 2014-2A, Class A (a)
2.050% 6/20/31 | | | 453,278 | | | | 452,661 | |
Sierra Receivables Funding Co. LLC, Series 2013-2A, Class A (a)
2.280% 11/20/25 | | | 380,665 | | | | 380,131 | |
Sierra Receivables Funding Co. LLC, Series 2014-3A, Class A (a)
2.300% 10/20/31 | | | 465,646 | | | | 464,105 | |
Sierra Receivables Funding Co. LLC, Series 2012-1A, Class A (a)
2.840% 11/20/28 | | | 399,139 | | | | 399,150 | |
Sierra Receivables Funding Co. LLC, Series 2015-3A, Class B (a)
3.080% 9/20/32 | | | 101,459 | | | | 99,809 | |
Sierra Timeshare Receivables Funding LLC, Series 2013-1A, Class A (a)
1.590% 11/20/29 | | | 125,572 | | | | 125,280 | |
Sierra Timeshare Receivables Funding LLC, Series 2015-2A, Class B (a)
3.020% 6/20/32 | | | 193,645 | | | | 190,625 | |
SoFi Consumer Loan Program LLC,
Series 2016-3, Class A (a)
3.050% 12/26/25 | | | 869,444 | | | | 866,002 | |
SoFi Consumer Loan Program LLC,
Series 2016-5, Class A (a)
3.060% 9/25/28 | | | 4,200,000 | | | | 4,192,108 | |
SoFi Consumer Loan Program LLC,
Series 2016-2A, Class A (a)
3.090% 10/27/25 | | | 1,310,400 | | | | 1,306,461 | |
SoFi Consumer Loan Program LLC,
Series 2016-1A, Class A (a)
3.260% 8/25/25 | | | 1,698,126 | | | | 1,700,299 | |
SpringCastle America Funding LLC,
Series 2016-AA, Class A (a)
3.050% 4/25/29 | | | 1,506,048 | | | | 1,513,578 | |
Springleaf Funding Trust, Series 2016-AA, Class A (a)
2.900% 11/15/29 | | | 1,830,000 | | | | 1,825,912 | |
SPS Servicer Advance Receivables Trust, Series 2015-T3, Class AT3 (a)
2.920% 7/15/47 | | | 420,000 | | | | 420,334 | |
SVO VOI Mortgage LLC, Series 2012-AA, Class A (a)
2.000% 9/20/29 | | | 818,779 | | | | 809,273 | |
The accompanying notes are an integral part of the financial statements.
61
MML Inflation-Protected and Income Fund – Portfolio of Investments (Continued)
| | | | | | | | |
| | | Principal
Amount | | | Value | |
Taco Bell Funding LLC, Series 2016-1A, Class A2I (a)
3.832% 5/25/46 | | $ | 847,875 | | | $ | 853,304 | |
TAL Advantage LLC, Series 2014-2A, Class A1 (a)
1.700% 5/20/39 | | | 432,253 | | | | 426,640 | |
Trip Rail Master Funding LLC,
Series 2011-1A, Class A1B, 1 mo.
USD LIBOR + 2.500%, FRN (a)
3.203% 7/15/41 | | | 416,944 | | | | 411,889 | |
Trip Rail Master Funding LLC,
Series 2011-1A, Class A1A (a)
4.370% 7/15/41 | | | 397,089 | | | | 395,112 | |
Westgate Resorts LLC, Series 2014-1A, Class A (a)
2.150% 12/20/26 | | | 326,031 | | | | 320,693 | |
Westgate Resorts LLC, Series 2015-1A, Class A (a)
2.750% 5/20/27 | | | 426,733 | | | | 426,361 | |
Westgate Resorts LLC, Series 2015-2A, Class A (a)
3.200% 7/20/28 | | | 716,782 | | | | 714,299 | |
| | | | | | | | |
| | | | | | | 64,870,146 | |
| | | | | | | | |
| Student Loans ABS — 11.9% | | | | | | | | |
Academic Loan Funding Trust,
Series 2013-1A, Class A, 1 mo.
USD LIBOR + .800%, FRN (a)
1.384% 12/26/44 | | | 2,684,920 | | | | 2,662,742 | |
Access Group, Inc., Series 2006-1, Class A2, 3 mo.
USD LIBOR + .110%, FRN
1.040% 8/25/23 | | | 218,567 | | | | 218,039 | |
Access Group, Inc., Series 2005-2, Class A3, 3 mo.
USD LIBOR + .180%, FRN
1.096% 11/22/24 | | | 282,148 | | | | 280,095 | |
Access Group, Inc., Series 2004-A, Class A2, 3 mo. USD LIBOR + .260%, FRN
1.141% 4/25/29 | | | 126,331 | | | | 125,948 | |
Access Group, Inc., Series 2003-A, Class A3, 3 mo. Treasury + 1.200%, FRN
1.509% 7/01/38 | | | 196,863 | | | | 193,817 | |
Brazos Higher Education Authority, Inc., Series 2006-2, Class A10 FRN, 3 mo. USD LIBOR + .120%, FRN
0.445% 6/25/26 | | | 450,000 | | | | 426,618 | |
CIT Education Loan Trust, Series 2005-1, Class A3, 3 mo.
USD LIBOR + .120%, FRN
1.083% 3/15/26 | | | 1,065,058 | | | | 1,058,310 | |
| | | | | | | | |
| | | Principal
Amount | | | Value | |
College Loan Corp. Trust I, Series 2005-2, Class B, 3 mo.
USD LIBOR + .490%, FRN
1.370% 1/15/37 | | $ | 700,337 | | | $ | 603,422 | |
Collegiate Funding Services Education Loan Trust, Series 2004-A, Class A3,
3 mo. LIBOR + .210%, FRN
1.207% 9/28/26 | | | 127,371 | | | | 127,157 | |
DRB Prime Student Loan Trust,
Series 2015-D, Class A1, 1 mo.
USD LIBOR + 1.700%, FRN (a)
2.284% 1/25/40 | | | 1,205,839 | | | | 1,199,801 | |
DRB Prime Student Loan Trust,
Series 2015-A, Class A3
2.320% 4/25/30 | | | 222,370 | | | | 221,373 | |
DRB Prime Student Loan Trust,
Series 2016-R, Class A1, 1 mo.
USD LIBOR + 1.900%, FRN (a)
2.431% 10/25/44 | | | 1,998,386 | | | | 1,998,386 | |
DRB Prime Student Loan Trust,
Series 2015-B, Class A3 (a)
2.540% 4/27/26 | | | 357,604 | | | | 353,693 | |
DRB Prime Student Loan Trust,
Series 2016-A, Class A1, 1 mo.
USD LIBOR + 2.000%, FRN (a)
2.584% 4/25/40 | | | 372,112 | | | | 371,077 | |
DRB Prime Student Loan Trust,
Series 2016-B, Class A2 (a)
2.890% 6/25/40 | | | 861,947 | | | | 835,331 | |
Earnest Student Loan Program LLC,
Series 2016-C, Class A1, 1 mo. USD LIBOR + 1.850%, FRN (a)
2.442% 10/27/36 | | | 1,573,490 | | | | 1,573,489 | |
Earnest Student Loan Program LLC,
Series 2016-B, Class A1, 1 mo.
USD LIBOR + 2.050%, FRN (a)
2.634% 2/26/35 | | | 1,123,311 | | | | 1,123,310 | |
ECMC Group Student Loan Trust,
Series 2016-1A, Class A, 1 mo.
USD LIBOR + 1.350%, FRN (a)
1.942% 7/26/66 | | | 1,504,120 | | | | 1,499,683 | |
Education Funding Capital Trust I,
Series 2004-1, Class A4, 28 Day ARS, FRN
1.943% 6/15/43 | | | 1,300,000 | | | | 1,294,226 | |
Education Funding Capital Trust I,
Series 2004-1, Class A5, 28 Day ARS, FRN
1.974% 6/15/43 | | | 800,000 | | | | 793,358 | |
Educational Services of America,
Series 2015-1, Class A, 1 mo.
USD LIBOR + .800%, FRN (a)
1.384% 10/25/56 | | | 729,771 | | | | 711,530 | |
The accompanying notes are an integral part of the financial statements.
62
MML Inflation-Protected and Income Fund – Portfolio of Investments (Continued)
| | | | | | | | |
| | | Principal
Amount | | | Value | |
Educational Services of America,
Series 2015-2, Class B FRN, 1 mo.
USD LIBOR + 1.500%, FRN (a)
2.084% 12/25/58 | | $ | 1,000,000 | | | $ | 923,264 | |
GCO Education Loan Funding Trust,
Series 2007-1A, Class A5L, 3 mo. LIBOR + .070%, FRN (a)
1.000% 5/25/23 | | | 20,221 | | | | 20,200 | |
Goal Capital Funding Trust, Series 2010-1, Class A, 3 mo. USD LIBOR + .700%, FRN (a)
1.630% 8/25/48 | | | 550,963 | | | | 533,294 | |
Kentucky Higher Education Student Loan Corp., Series 2015-1, Class A1, 1 mo. USD LIBOR + .750%, FRN
1.367% 12/01/31 | | | 538,276 | | | | 530,509 | |
KeyCorp Student Loan Trust,
Series 2006-A, Class 2A4, 3 mo.
USD LIBOR + .310%, FRN
1.162% 9/27/35 | | | 1,293,584 | | | | 1,280,220 | |
KeyCorp Student Loan Trust,
Series 2004-A, Class 2A2, 3 mo.
USD LIBOR + .300%, FRN
1.185% 10/28/41 | | | 279,224 | | | | 278,620 | |
KeyCorp Student Loan Trust,
Series 2000-A, Class A2, 3 mo.
USD LIBOR + .320%, FRN
1.250% 5/25/29 | | | 692,580 | | | | 670,308 | |
National Collegiate Student Loan Trust, Series 2005-1, Class A4, 1 mo.
USD LIBOR + .240%, FRN
0.824% 11/27/28 | | | 193,686 | | | | 192,310 | |
Navient Private Education Loan Trust, Series 2015-AA, Class A1, 1 mo.
USD LIBOR + .500%, FRN (a)
1.203% 12/15/21 | | | 290,283 | | | | 290,139 | |
Navient Private Education Loan Trust, Series 2015-BA, Class A1, 1 mo.
USD LIBOR + .600%, FRN (a)
1.303% 5/15/23 | | | 4,873 | | | | 4,872 | |
Navient Private Education Loan Trust, Series 2016-3A, Class A2, 1 mo.
USD LIBOR + .850%, FRN (a)
1.434% 6/25/65 | | | 750,000 | | | | 749,930 | |
Navient Private Education Loan Trust, Series 2015-AA, Class A2B, 1 mo.
USD LIBOR + 1.200%, FRN (a)
1.903% 12/15/28 | | | 900,000 | | | | 907,176 | |
Navient Student Loan Trust,
Series 2016-5A, Class A, 1 mo.
USD LIBOR + 1.250%, FRN (a)
1.000% 6/25/65 | | | 3,081,753 | | | | 3,126,938 | |
| | | | | | | | |
| | | Principal
Amount | | | Value | |
Navient Student Loan Trust,
Series 2016-6A, Class A3, 1 mo.
USD LIBOR + 1.300%, FRN (a)
1.820% 3/25/66 | | $ | 2,200,000 | | | $ | 2,200,019 | |
Nelnet Private Education Loan Trust,
Series 2016-A, Class A1A, 1 mo.
USD LIBOR + 1.750%, FRN (a)
2.370% 12/26/40 | | | 1,260,000 | | | | 1,259,621 | |
Nelnet Student Loan Trust, Series 2006-2, Class A6, 3 mo. USD LIBOR + .120%, FRN
1.001% 4/25/31 | | | 650,000 | | | | 637,573 | |
Nelnet Student Loan Trust, Series 2006-3, Class B, 3 mo.
USD LIBOR + .250%, FRN
1.106% 6/25/41 | | | 501,486 | | | | 421,861 | |
Nelnet Student Loan Trust, Series 2010-4A, Class A, 1 mo. USD LIBOR + .800%, FRN (a)
1.384% 4/25/46 | | | 133,450 | | | | 133,031 | |
Nelnet Student Loan Trust, Series 2014-2A, Class B, 1 mo. USD LIBOR + 1.500%, FRN (a)
2.084% 6/25/41 | | | 375,000 | | | | 329,235 | |
Pennsylvania Higher Education Assistance Agency, Series 2004-1, Class A2, 28 Day ARS, FRN
1.986% 4/25/44 | | | 600,000 | | | | 584,281 | |
SLC Private Student Loan Trust,
Series 2006-A, Class A5, 3 mo.
USD LIBOR + .170%, FRN
1.050% 7/15/36 | | | 2,741,204 | | | | 2,739,927 | |
SLM Private Education Loan Trust, Series 2011-A, Class A3, 1 mo.
USD LIBOR + 2.500%, FRN (a)
3.203% 1/15/43 | | | 440,000 | | | | 451,804 | |
SLM Student Loan Trust, Series 2007-5, Class A6, 3 mo. USD LIBOR + .110%, FRN
0.991% 1/26/43 | | | 600,000 | | | | 520,656 | |
SLM Student Loan Trust, Series 2004-3, Class B, 3 mo. USD LIBOR + .470%, FRN
1.000% 10/25/64 | | | 417,874 | | | | 361,162 | |
SLM Student Loan Trust, Series 2005-5, Class A4, 3 mo. USD LIBOR + .140%, FRN
1.021% 10/25/28 | | | 700,000 | | | | 681,053 | |
SLM Student Loan Trust, Series 2006-5, Class B, 3 mo. USD LIBOR + .210%, FRN
1.091% 10/25/40 | | | 533,357 | | | | 459,831 | |
The accompanying notes are an integral part of the financial statements.
63
MML Inflation-Protected and Income Fund – Portfolio of Investments (Continued)
| | | | | | | | |
| | | Principal
Amount | | | Value | |
SLM Student Loan Trust, Series 2006-2, Class B, 3 mo. USD LIBOR + .220%, FRN
1.101% 1/25/41 | | $ | 545,145 | | | $ | 469,874 | |
SLM Student Loan Trust, Series 2003-14, Class A6, 3 mo. USD LIBOR + .300%, FRN
1.181% 7/25/25 | | | 400,000 | | | | 391,309 | |
SLM Student Loan Trust, Series 2005-8, Class B, 3 mo. USD LIBOR + .310%, FRN
1.191% 1/25/40 | | | 551,783 | | | | 472,486 | |
SLM Student Loan Trust, Series 2003-12, Class A5, 3 mo.
USD LIBOR + .280%, FRN (a)
1.243% 9/15/22 | | | 322,107 | | | | 321,389 | |
SLM Student Loan Trust, Series 2014-A, Class A1, 1 mo.
USD LIBOR + .600%, FRN (a)
1.303% 7/15/22 | | | 370,281 | | | | 370,104 | |
SLM Student Loan Trust, Series 2012-E, Class A1, 1 mo.
USD LIBOR + .750%, FRN (a)
1.453% 10/16/23 | | | 11,685 | | | | 11,684 | |
SLM Student Loan Trust, Series 2003-11, Class B, 3 mo.
USD LIBOR + .650%, FRN
1.613% 12/15/38 | | | 618,959 | | | | 555,195 | |
SLM Student Loan Trust, Series 2005-6, Class A5B, 3 mo.
USD LIBOR + 1.200%, FRN
2.081% 7/27/26 | | | 492,592 | | | | 495,005 | |
SLM Student Loan Trust, Series 2012-A, Class A1, 1 mo.
USD LIBOR + 1.400%, FRN (a)
2.103% 8/15/25 | | | 28,349 | | | | 28,372 | |
SLM Student Loan Trust, Series 2003-5, Class A7, 28 Day ARS, FRN
2.950% 6/17/30 | | | 550,000 | | | | 550,000 | |
SLM Student Loan Trust, Series 2003-2, Class A7, 28 Day ARS, FRN
3.022% 9/15/28 | | | 750,000 | | | | 750,000 | |
SLM Student Loan Trust, Series 2003-5, Class A9, 28 Day ARS, FRN
3.024% 6/17/30 | | | 700,000 | | | | 700,000 | |
SLM Student Loan Trust, Series 2002-7, Class A11, 28 Day ARS, FRN
3.030% 3/15/28 | | | 490,000 | | | | 490,000 | |
| | | | | | | | |
| | | Principal
Amount | | | Value | |
SMB Private Education Loan Trust,
Series 2014-A, Class A1, 1 mo.
USD LIBOR + .500%, FRN (a)
1.203% 9/15/21 | | $ | 231,451 | | | $ | 231,429 | |
SMB Private Education Loan Trust,
Series 2016-A, Class A1, 1 mo.
USD LIBOR + .700%, FRN (a)
1.403% 5/15/23 | | | 1,150,329 | | | | 1,152,294 | |
SMB Private Education Loan Trust, Series 2016-C, Class A2B, 1 mo. USD LIBOR + 1.100%, FRN (a)
1.803% 9/15/34 | | | 380,000 | | | | 380,008 | |
SoFi Professional Loan Program LLC, Series 2016-C, Class A2A (a)
1.480% 5/26/31 | | | 1,493,462 | | | | 1,489,158 | |
SoFi Professional Loan Program LLC, Series 2016-B, Class A2A (a)
1.680% 3/25/31 | | | 2,004,041 | | | | 2,000,040 | |
SoFi Professional Loan Program LLC, Series 2015-A, Class A1, 1 mo. USD LIBOR + 1.200%, FRN (a)
1.792% 3/25/33 | | | 371,116 | | | | 363,428 | |
SoFi Professional Loan Program LLC, Series 2016-A, Class A1, 1 mo. USD LIBOR + 1.750%, FRN (a)
2.342% 8/25/36 | | | 1,055,439 | | | | 1,086,543 | |
| | | | | | | | |
| | | | | | | 50,267,557 | |
| | | | | | | | |
| WL Collateral CMO — 0.9% | | | | | | | | |
Connecticut Avenue Securities, Series 2015-C02, Class 1M1, 1 mo. USD LIBOR + 1.150%, FRN
1.742% 5/25/25 | | | 47,087 | | | | 47,094 | |
Connecticut Avenue Securities, Series 2015-C03, Class 1M1, 1 mo. USD LIBOR + 1.500%, FRN
2.092% 7/25/25 | | | 447,694 | | | | 448,211 | |
Credit Suisse First Boston Mortgage Securities Corp., Series 2005-CF1, Class M1, 1 mo. USD LIBOR + .700%, FRN (a)
1.284% 3/25/45 | | | 322,496 | | | | 315,682 | |
Federal National Mortgage Association Connecticut Avenue Securities, Series 2016-C06, Class 1M1, 1 mo. USD LIBOR + 1.300%, FRN
1.892% 4/25/29 | | | 891,483 | | | | 895,863 | |
Federal National Mortgage Association Connecticut Avenue Securities, Series 2016-C05, Class 2M1, 1 mo. USD LIBOR + 1.350%, FRN
1.942% 1/25/29 | | | 748,368 | | | | 750,037 | |
The accompanying notes are an integral part of the financial statements.
64
MML Inflation-Protected and Income Fund – Portfolio of Investments (Continued)
| | | | | | | | |
| | | Principal
Amount | | | Value | |
Federal National Mortgage Association Connecticut Avenue Securities, Series 2016-C04, Class 1M1, 1 mo. USD LIBOR + 1.450%, FRN
2.042% 1/25/29 | | $ | 849,225 | | | $ | 852,603 | |
Structured Agency Credit Risk Debt Notes, Series 2015-DNA1, Class M1, 1 mo. USD LIBOR + .900%, FRN
1.484% 10/25/27 | | | 296,999 | | | | 297,192 | |
| | | | | | | | |
| | | | | | | 3,606,682 | |
| | | | | | | | |
| | |
TOTAL NON-U.S. GOVERNMENT AGENCY OBLIGATIONS
(Cost $190,131,676) | | | | | | | 190,107,695 | |
| | | | | |
|
| U.S. GOVERNMENT AGENCY OBLIGATIONS AND INSTRUMENTALITIES — 0.3% | |
| Pass-Through Securities — 0.3% | | | | | | | | |
Federal Home Loan Mortgage Corp., Pool #1Q0239, 1 year CMT + 2.251%, FRN
2.852% 3/01/37 | | | 943,925 | | | | 998,128 | |
Government National Mortgage Association II, Pool #82462, 1 year CMT + 1.500%, FRN
2.000% 1/20/40 | | | 207,403 | | | | 215,301 | |
| | | | | | | | |
| | | | | | | 1,213,429 | |
| | | | | | | | |
| | |
TOTAL U.S. GOVERNMENT AGENCY OBLIGATIONS AND INSTRUMENTALITIES
(Cost $1,182,090) | | | | | | | 1,213,429 | |
| | | | | |
|
| U.S. TREASURY OBLIGATIONS — 90.8% | |
| U.S. Treasury Bonds & Notes — 90.8% | |
U.S. Treasury Inflation Index
0.125% 4/15/19 | | | 10,547,906 | | | | 10,679,575 | |
U.S. Treasury Inflation Index (b)
0.125% 4/15/20 | | | 19,766,439 | | | | 19,971,812 | |
U.S. Treasury Inflation Index (b)
0.125% 4/15/21 | | | 14,532,707 | | | | 14,615,878 | |
U.S. Treasury Inflation Index (b)
0.125% 1/15/22 | | | 16,297,222 | | | | 16,324,862 | |
U.S. Treasury Inflation Index (b)
0.125% 7/15/22 | | | 17,043,911 | | | | 17,087,049 | |
U.S. Treasury Inflation Index (b)
0.125% 1/15/23 | | | 16,881,045 | | | | 16,756,362 | |
U.S. Treasury Inflation Index (b)
0.125% 7/15/24 | | | 16,410,181 | | | | 16,121,280 | |
| | | | | | | | |
| | | Principal
Amount | | | Value | |
U.S. Treasury Inflation Index (b)
0.125% 7/15/26 | | $ | 20,773,452 | | | $ | 20,087,949 | |
U.S. Treasury Inflation Index (b)
0.250% 1/15/25 | | | 16,461,339 | | | | 16,189,447 | |
U.S. Treasury Inflation Index (b)
0.375% 7/15/23 | | | 16,764,307 | | | | 16,914,431 | |
U.S. Treasury Inflation Index (b)
0.375% 7/15/25 | | | 16,053,818 | | | | 15,966,613 | |
U.S. Treasury Inflation Index (b)
0.625% 7/15/21 | | | 14,666,164 | | | | 15,134,015 | |
U.S. Treasury Inflation Index (b)
0.625% 1/15/24 | | | 16,725,425 | | | | 17,019,307 | |
U.S. Treasury Inflation Index (b)
0.625% 1/15/26 | | | 15,259,350 | | | | 15,393,342 | |
U.S. Treasury Inflation Index (b)
0.625% 2/15/43 | | | 6,297,646 | | | | 5,765,829 | |
U.S. Treasury Inflation Index (b)
0.750% 2/15/42 | | | 7,493,586 | | | | 7,094,342 | |
U.S. Treasury Inflation Index (b)
0.750% 2/15/45 | | | 9,597,682 | | | | 9,030,852 | |
U.S. Treasury Inflation Index
1.000% 2/15/46 | | | 4,590,675 | | | | 4,610,075 | |
U.S. Treasury Inflation Index (b) (c)
1.125% 1/15/21 | | | 14,607,968 | | | | 15,324,708 | |
U.S. Treasury Inflation Index (b)
1.250% 7/15/20 | | | 13,333,691 | | | | 14,082,164 | |
U.S. Treasury Inflation Index (b)
1.375% 1/15/20 | | | 8,316,432 | | | | 8,746,508 | |
U.S. Treasury Inflation Index (b)
1.375% 2/15/44 | | | 8,520,269 | | | | 9,298,264 | |
U.S. Treasury Inflation Index (b)
1.750% 1/15/28 | | | 6,922,860 | | | | 7,729,581 | |
U.S. Treasury Inflation Index (b)
1.875% 7/15/19 | | | 6,928,330 | | | | 7,377,161 | |
U.S. Treasury Inflation Index (b)
2.000% 1/15/26 | | | 8,159,729 | | | | 9,192,457 | |
U.S. Treasury Inflation Index (b)
2.125% 2/15/40 | | | 3,690,555 | | | | 4,570,789 | |
U.S. Treasury Inflation Index (b)
2.125% 2/15/41 | | | 4,426,198 | | | | 5,510,006 | |
U.S. Treasury Inflation Index (b)
2.375% 1/15/25 | | | 10,906,399 | | | | 12,522,793 | |
U.S. Treasury Inflation Index (b)
2.375% 1/15/27 | | | 6,508,507 | | | | 7,624,396 | |
U.S. Treasury Inflation Index (b)
2.500% 1/15/29 | | | 6,552,447 | | | | 7,903,254 | |
U.S. Treasury Inflation Index (b)
3.375% 4/15/32 | | | 2,723,600 | | | | 3,764,993 | |
U.S. Treasury Inflation Index (b)
3.625% 4/15/28 | | | 4,483,470 | | | | 5,895,413 | |
The accompanying notes are an integral part of the financial statements.
65
MML Inflation-Protected and Income Fund – Portfolio of Investments (Continued)
| | | | | | | | |
| | | Principal
Amount | | | Value | |
U.S. Treasury Inflation Index (b)
3.875% 4/15/29 | | $ | 6,587,258 | | | $ | 9,006,079 | |
| | | | | | | | |
| | | | | | | 383,311,586 | |
| | | | | | | | |
| | |
TOTAL U.S. TREASURY OBLIGATIONS
(Cost $384,249,794) | | | | | | | 383,311,586 | |
| | | | | |
| | |
TOTAL BONDS & NOTES
(Cost $586,516,822) | | | | | | | 590,029,585 | |
| | | | | |
| | |
TOTAL LONG-TERM INVESTMENTS
(Cost $586,516,822) | | | | | | | 590,029,585 | |
| | | | | |
|
| SHORT-TERM INVESTMENTS — 35.9% | |
| Commercial Paper — 35.9% | |
Anheuser-Busch InBev Worldwide, Inc. (a)
1.019% 1/13/17 | | | 7,000,000 | | | | 6,998,554 | |
Anheuser-Busch InBev Worldwide, Inc. (a)
1.500% 6/20/17 | | | 1,200,000 | | | | 1,193,160 | |
The Bank of Nova Scotia (a)
1.255% 2/21/17 | | | 11,000,000 | | | | 10,986,947 | |
Becton, Dickinson & Co. (a)
1.220% 3/22/17 | | | 5,000,000 | | | | 4,985,866 | |
Bell Canada (a)
1.118% 2/13/17 | | | 6,500,000 | | | | 6,492,687 | |
CDP Financial, Inc. (a)
1.234% 2/23/17 | | | 10,000,000 | | | | 9,990,024 | |
CenterPoint Energy, Inc. (a)
1.150% 2/07/17 | | | 2,000,000 | | | | 1,997,877 | |
Cox Enterprises, Inc. (a)
0.900% 1/03/17 | | | 4,150,000 | | | | 4,149,646 | |
CVS Health Corp. (a)
1.100% 2/06/17 | | | 7,000,000 | | | | 6,992,781 | |
Dominion Resources, Inc. (a)
1.275% 4/18/17 | | | 6,500,000 | | | | 6,471,857 | |
Exelon Generation Co. LLC (a)
1.110% 1/04/17 | | | 6,000,000 | | | | 5,999,358 | |
FMC Technologies, Inc. (a)
1.200% 1/12/17 | | | 7,000,000 | | | | 6,997,963 | |
Ford Motor Credit Co. (a)
1.129% 2/01/17 | | | 6,500,000 | | | | 6,494,399 | |
Fortive Corp. (a)
1.090% 1/09/17 | | | 7,000,000 | | | | 6,998,458 | |
Hewlett Packard Enterprise Co. (a)
1.130% 1/19/17 | | | 4,000,000 | | | | 3,998,896 | |
HP, Inc. (a)
1.140% 1/13/17 | | | 5,000,000 | | | | 4,999,071 | |
Hyundai Capital America (a)
1.300% 3/15/17 | | | 7,000,000 | | | | 6,982,792 | |
Marriott International, Inc. (a)
1.150% 1/24/17 | | | 6,500,000 | | | | 6,495,910 | |
| | | | | | | | |
| | | Principal
Amount | | | Value | |
Molex Electronic Technologies (a)
1.150% 1/25/17 | | $ | 7,000,000 | | | $ | 6,995,374 | |
ONEOK Partners LP (a)
1.250% 1/09/17 | | | 5,000,000 | | | | 4,998,899 | |
ONEOK Partners LP (a)
1.250% 1/18/17 | | | 2,000,000 | | | | 1,999,101 | |
Sempra Energy Holdings (a)
1.150% 2/01/17 | | | 1,935,000 | | | | 1,933,297 | |
Sempra Energy Holdings (a)
1.150% 2/08/17 | | | 5,000,000 | | | | 4,994,539 | |
Spectra Energy Capital LLC (a)
1.100% 1/19/17 | | | 7,000,000 | | | | 6,996,648 | |
TELUS Corp. (a)
1.200% 3/07/17 | | | 7,000,000 | | | | 6,985,526 | |
Volvo Group Treasury NA (a)
1.100% 1/10/17 | | | 1,000,000 | | | | 999,756 | |
Xylem, Inc. (a)
1.066% 1/17/17 | | | 6,500,000 | | | | 6,497,260 | |
| | | | | | | | |
| | | | | | | 151,626,646 | |
| | | | | | | | |
| | |
TOTAL SHORT-TERM INVESTMENTS
(Cost $151,604,226) | | | | | | | 151,626,646 | |
| | | | | |
| | |
TOTAL INVESTMENTS — 175.7%
(Cost $738,121,048) (d) | | | | | | | 741,656,231 | |
| | |
| Other Assets/(Liabilities) — (75.7)% | | | | | | | (319,496,686 | ) |
| | | | | |
| | |
| NET ASSETS — 100.0% | | | | | | $ | 422,159,545 | |
| | | | | | | | |
Notes to Portfolio of Investments
Percentages are stated as a percent of net assets.
| CLO | Collateralized Loan Obligation |
| CMO | Collateralized Mortgage Obligation |
| CMT | Constant Maturity Treasury Index |
| MBS | Mortgage-Backed Security |
| (a) | Securities exempt from registration under rule 144A of the Securities Act of 1933. These securities may be resold in transactions exempt from registration, normally to qualified institutional buyers. At December 31, 2016, these securities amounted to a value of $299,948,578 or 71.05% of net assets. |
| (b) | All or a portion of this security is held as collateral for open reverse repurchase agreements. (Note 2). |
| (c) | A portion of this security is pledged as collateral for open futures contracts and pledged for open swaps agreements. (Note 2). |
| (d) | See Note 6 for aggregate cost for federal tax purposes. |
The accompanying notes are an integral part of the financial statements.
66
MML Short-Duration Bond Fund – Portfolio of Investments
December 31, 2016
| | | | | | | | |
| | | Principal
Amount | | | Value | |
| BONDS & NOTES — 98.4% | |
|
| CORPORATE DEBT — 42.8% | |
| Aerospace & Defense — 0.9% | | | | | | | | |
Harris Corp.
2.700% 4/27/20 | | $ | 1,034,000 | | | $ | 1,032,862 | |
L-3 Communications Corp.
5.200% 10/15/19 | | | 1,065,000 | | | | 1,145,478 | |
| | | | | | | | |
| | | | | | | 2,178,340 | |
| | | | | | | | |
| Agriculture — 1.0% | | | | | | | | |
Bunge Ltd. Finance Corp.
3.200% 6/15/17 | | | 830,000 | | | | 836,249 | |
Bunge Ltd. Finance Corp.
3.500% 11/24/20 | | | 330,000 | | | | 335,882 | |
Imperial Brands Finance PLC (a)
2.950% 7/21/20 | | | 1,087,000 | | | | 1,093,651 | |
| | | | | | | | |
| | | | | | | 2,265,782 | |
| | | | | | | | |
| Airlines — 0.2% | | | | | | | | |
American Airlines Pass-Through Trust, Series 2014-1, Class B
4.375% 4/01/24 | | | 32,855 | | | | 32,772 | |
WestJet Airlines Ltd. (a)
3.500% 6/16/21 | | | 525,000 | | | | 524,781 | |
| | | | | | | | |
| | | | | | | 557,553 | |
| | | | | | | | |
| Auto Manufacturers — 1.6% | | | | | | | | |
Ford Motor Credit Co. LLC
2.240% 6/15/18 | | | 1,200,000 | | | | 1,201,626 | |
General Motors Co.
3.500% 10/02/18 | | | 205,000 | | | | 209,080 | |
General Motors Financial Co., Inc.
2.400% 5/09/19 | | | 110,000 | | | | 109,708 | |
General Motors Financial Co., Inc.
3.100% 1/15/19 | | | 520,000 | | | | 525,519 | |
General Motors Financial Co., Inc.
3.200% 7/13/20 | | | 85,000 | | | | 85,256 | |
Hyundai Capital America (a)
2.000% 7/01/19 | | | 65,000 | | | | 64,497 | |
Hyundai Capital America (a)
2.550% 2/06/19 | | | 240,000 | | | | 241,404 | |
Hyundai Capital America (a)
3.000% 10/30/20 | | | 800,000 | | | | 800,068 | |
Nissan Motor Acceptance Corp. (a)
1.900% 9/14/21 | | | 560,000 | | | | 540,374 | |
| | | | | | | | |
| | | | | | | 3,777,532 | |
| | | | | | | | |
| Automotive & Parts — 1.0% | | | | | | | | |
The Goodyear Tire & Rubber Co.
5.125% 11/15/23 | | | 1,110,000 | | | | 1,143,300 | |
Lear Corp.
4.750% 1/15/23 | | | 1,110,000 | | | | 1,132,200 | |
| | | | | | | | |
| | | | | | | 2,275,500 | |
| | | | | | | | |
| | | | | | | | |
| | | Principal
Amount | | | Value | |
| Banks — 3.9% | | | | | | | | |
ANZ New Zealand Int’l Ltd. (a)
2.250% 2/01/19 | | $ | 1,290,000 | | | $ | 1,293,019 | |
Bancolombia SA
5.950% 6/03/21 | | | 345,000 | | | | 374,429 | |
CIT Group, Inc.
4.250% 8/15/17 | | | 1,270,000 | | | | 1,287,462 | |
Citigroup, Inc.
2.350% 8/02/21 | | | 1,155,000 | | | | 1,129,820 | |
First Horizon National Corp.
3.500% 12/15/20 | | | 1,280,000 | | | | 1,291,658 | |
Itau Unibanco Holding SA (a)
2.850% 5/26/18 | | | 270,000 | | | | 270,675 | |
Macquarie Bank Ltd. (a)
2.850% 1/15/21 | | | 130,000 | | | | 130,542 | |
Mitsubishi UFJ Trust & Banking Corp. (a)
2.650% 10/19/20 | | | 1,110,000 | | | | 1,106,066 | |
Regions Financial Corp.
3.200% 2/08/21 | | | 1,095,000 | | | | 1,110,494 | |
Regions Financial Corp.
7.500% 5/15/18 | | | 130,000 | | | | 139,273 | |
Sumitomo Mitsui Financial Group, Inc.
2.058% 7/14/21 | | | 585,000 | | | | 565,806 | |
SVB Financial Group
5.375% 9/15/20 | | | 75,000 | | | | 81,264 | |
Turkiye Garanti Bankasi AS (a)
4.750% 10/17/19 | | | 370,000 | | | | 367,873 | |
| | | | | | | | |
| | | | | | | 9,148,381 | |
| | | | | | | | |
| Beverages — 0.9% | | | | | | | | |
Anheuser-Busch InBev Finance, Inc.
2.650% 2/01/21 | | | 660,000 | | | | 663,792 | |
Coca-Cola Femsa SAB de CV
2.375% 11/26/18 | | | 1,000,000 | | | | 1,006,945 | |
Molson Coors Brewing Co.
2.100% 7/15/21 | | | 330,000 | | | | 321,391 | |
| | | | | | | | |
| | | | | | | 1,992,128 | |
| | | | | | | | |
| Biotechnology — 0.6% | | | | | | | | |
Celgene Corp.
2.250% 5/15/19 | | | 70,000 | | | | 70,040 | |
Celgene Corp.
2.875% 8/15/20 | | | 1,270,000 | | | | 1,284,548 | |
| | | | | | | | |
| | | | | | | 1,354,588 | |
| | | | | | | | |
| Building Materials — 1.4% | | | | | | | | |
Holcim US Finance Sarl & Cie SCS (a)
6.000% 12/30/19 | | | 1,160,000 | | | | 1,270,888 | |
James Hardie International Finance Ltd. (a)
5.875% 2/15/23 | | | 550,000 | | | | 569,250 | |
The accompanying notes are an integral part of the financial statements.
67
MML Short-Duration Bond Fund – Portfolio of Investments (Continued)
| | | | | | | | |
| | | Principal
Amount | | | Value | |
Martin Marietta Material, Inc. 3 mo. USD LIBOR + 1.100%, FRN
1.937% 6/30/17 | | $ | 205,000 | | | $ | 205,353 | |
Masco Corp.
3.500% 4/01/21 | | | 620,000 | | | | 621,550 | |
Masco Corp.
7.125% 3/15/20 | | | 500,000 | | | | 562,500 | |
| | | | | | | | |
| | | | | | | 3,229,541 | |
| | | | | | | | |
| Chemicals — 2.3% | |
Air Liquide Finance SA (a)
1.750% 9/27/21 | | | 200,000 | | | | 192,038 | |
Airgas, Inc.
3.050% 8/01/20 | | | 965,000 | | | | 986,620 | |
CF Industries, Inc.
6.875% 5/01/18 | | | 1,075,000 | | | | 1,131,588 | |
The Dow Chemical Co.
8.550% 5/15/19 | | | 125,000 | | | | 143,260 | |
Ecolab, Inc.
2.000% 1/14/19 | | | 555,000 | | | | 555,426 | |
LyondellBasell Industries NV
5.000% 4/15/19 | | | 1,160,000 | | | | 1,225,716 | |
RPM International, Inc.
6.125% 10/15/19 | | | 1,008,000 | | | | 1,106,951 | |
RPM International, Inc.
6.500% 2/15/18 | | | 85,000 | | | | 89,084 | |
| | | | | | | | |
| | | | | | | 5,430,683 | |
| | | | | | | | |
| Commercial Services — 0.5% | |
Leidos Holdings, Inc.
4.450% 12/01/20 | | | 525,000 | | | | 540,803 | |
S&P Global, Inc.
3.300% 8/14/20 | | | 635,000 | | | | 647,438 | |
| | | | | | | | |
| | | | | | | 1,188,241 | |
| | | | | | | | |
| Computers — 0.3% | |
Diamond 1 Finance Corp./Diamond 2 Finance Corp. (a)
3.480% 6/01/19 | | | 430,000 | | | | 438,947 | |
Diamond 1 Finance Corp./Diamond 2 Finance Corp. (a)
4.420% 6/15/21 | | | 345,000 | | | | 356,987 | |
| | | | | | | | |
| | | | | | | 795,934 | |
| | | | | | | | |
| Diversified Financial — 5.3% | |
AerCap Ireland Capital Ltd./AerCap Global Aviation Trust
4.500% 5/15/21 | | | 1,010,000 | | | | 1,046,714 | |
Air Lease Corp.
2.125% 1/15/20 | | | 300,000 | | | | 295,523 | |
Air Lease Corp.
3.375% 1/15/19 | | | 365,000 | | | | 371,189 | |
Air Lease Corp. STEP
5.625% 4/01/17 | | | 465,000 | | | | 469,069 | |
| | | | | | | | |
| | | Principal
Amount | | | Value | |
Ally Financial, Inc.
3.600% 5/21/18 | | $ | 440,000 | | | $ | 443,300 | |
Ally Financial, Inc.
4.750% 9/10/18 | | | 920,000 | | | | 947,600 | |
BGC Partners, Inc.
5.125% 5/27/21 | | | 765,000 | | | | 787,224 | |
General Motors Financial Co., Inc.
2.625% 7/10/17 | | | 190,000 | | | | 191,028 | |
The Goldman Sachs Group, Inc.
2.875% 2/25/21 | | | 2,260,000 | | | | 2,270,450 | |
Icahn Enterprises LP/Icahn Enterprises Finance Corp.
3.500% 3/15/17 | | | 1,085,000 | | | | 1,087,034 | |
International Lease Finance Corp.
3.875% 4/15/18 | | | 100,000 | | | | 101,875 | |
Lazard Group LLC
4.250% 11/14/20 | | | 645,000 | | | | 675,159 | |
Merrill Lynch & Co., Inc.
5.700% 5/02/17 | | | 1,900,000 | | | | 1,925,891 | |
Morgan Stanley
2.450% 2/01/19 | | | 1,825,000 | | | | 1,837,532 | |
| | | | | | | | |
| | | | | | | 12,449,588 | |
| | | | | | | | |
| Electric — 2.0% | |
Ameren Corp.
2.700% 11/15/20 | | | 555,000 | | | | 557,979 | |
Duke Energy Corp.
1.800% 9/01/21 | | | 600,000 | | | | 577,982 | |
EDP Finance BV (a)
4.125% 1/15/20 | | | 1,150,000 | | | | 1,175,208 | |
EDP Finance BV (a)
4.900% 10/01/19 | | | 108,000 | | | | 113,172 | |
Entergy Texas, Inc.
2.550% 6/01/21 | | | 75,000 | | | | 74,751 | |
Entergy Texas, Inc.
7.125% 2/01/19 | | | 580,000 | | | | 638,285 | |
IPALCO Enterprises, Inc.
5.000% 5/01/18 | | | 315,000 | | | | 325,238 | |
Israel Electric Corp. Ltd. (a)
7.250% 1/15/19 | | | 350,000 | | | | 377,962 | |
Majapahit Holding BV (a)
7.750% 1/20/20 | | | 330,000 | | | | 370,425 | |
The Southern Co.
1.850% 7/01/19 | | | 135,000 | | | | 134,582 | |
The Southern Co.
2.350% 7/01/21 | | | 440,000 | | | | 432,526 | |
| | | | | | | | |
| | | | | | | 4,778,110 | |
| | | | | | | | |
| Electronics — 0.2% | |
FLIR Systems, Inc.
3.125% 6/15/21 | | | 480,000 | | | | 481,268 | |
Jabil Circuit, Inc.
8.250% 3/15/18 | | | 90,000 | | | | 96,396 | |
| | | | | | | | |
| | | | | | | 577,664 | |
| | | | | | | | |
The accompanying notes are an integral part of the financial statements.
68
MML Short-Duration Bond Fund – Portfolio of Investments (Continued)
| | | | | | | | |
| | | Principal
Amount | | | Value | |
| Environmental Controls — 0.2% | |
Clean Harbors, Inc.
5.250% 8/01/20 | | $ | 415,000 | | | $ | 424,856 | |
| | | | | | | | |
| Foods — 0.9% | | | | | | | | |
Danone SA (a)
2.077% 11/02/21 | | | 1,340,000 | | | | 1,301,270 | |
JBS Investments GmbH (a)
7.750% 10/28/20 | | | 200,000 | | | | 212,260 | |
Mondelez International Holdings Netherlands BV (a)
2.000% 10/28/21 | | | 595,000 | | | | 570,034 | |
Tyson Foods, Inc.
2.650% 8/15/19 | | | 60,000 | | | | 60,572 | |
| | | | | | | | |
| | | | | | | 2,144,136 | |
| | | | | | | | |
| Forest Products & Paper — 0.5% | |
Sappi Papier Holding GmbH (a)
7.750% 7/15/17 | | | 1,200,000 | | | | 1,215,000 | |
| | | | | | | | |
| Hand & Machine Tools — 0.4% | |
Stanley Black & Decker, Inc.
1.622% 11/17/18 | | | 345,000 | | | | 342,876 | |
Stanley Black & Decker, Inc.
2.451% 11/17/18 | | | 630,000 | | | | 635,398 | |
| | | | | | | | |
| | | | | | | 978,274 | |
| | | | | | | | |
| Health Care – Products — 0.9% | |
Abbott Laboratories
2.350% 11/22/19 | | | 600,000 | | | | 600,707 | |
Abbott Laboratories
2.900% 11/30/21 | | | 605,000 | | | | 603,276 | |
Boston Scientific Corp.
2.850% 5/15/20 | | | 255,000 | | | | 258,803 | |
Zimmer Biomet Holdings, Inc.
2.000% 4/01/18 | | | 528,000 | | | | 528,645 | |
| | | | | | | | |
| | | | | | | 1,991,431 | |
| | | | | | | | |
| Health Care – Services — 2.0% | |
Aetna, Inc.
1.900% 6/07/19 | | | 695,000 | | | | 693,406 | |
Cigna Corp.
4.000% 2/15/22 | | | 316,000 | | | | 330,133 | |
Cigna Corp.
4.500% 3/15/21 | | | 690,000 | | | | 733,389 | |
HCA, Inc.
3.750% 3/15/19 | | | 1,130,000 | | | | 1,161,075 | |
Laboratory Corp. of America Holdings
2.625% 2/01/20 | | | 570,000 | | | | 569,441 | |
UnitedHealth Group, Inc.
1.700% 2/15/19 | | | 1,155,000 | | | | 1,151,528 | |
| | | | | | | | |
| | | | | | | 4,638,972 | |
| | | | | | | | |
| Home Builders — 0.5% | |
Lennar Corp.
4.500% 11/15/19 | | | 1,088,000 | | | | 1,130,160 | |
| | | | | | | | |
| | | | | | | | |
| | | Principal
Amount | | | Value | |
| Housewares — 0.4% | |
Newell Brands, Inc.
2.600% 3/29/19 | | $ | 910,000 | | | $ | 919,985 | |
| | | | | | | | |
| Insurance — 1.8% | |
American International Group, Inc.
3.300% 3/01/21 | | | 550,000 | | | | 563,356 | |
CNA Financial Corp.
5.750% 8/15/21 | | | 93,000 | | | | 103,890 | |
Lincoln National Corp.
6.250% 2/15/20 | | | 400,000 | | | | 441,767 | |
Reinsurance Group of America, Inc.
5.625% 3/15/17 | | | 450,000 | | | | 453,660 | |
TIAA Asset Management Finance Co. LLC (a)
2.950% 11/01/19 | | | 1,075,000 | | | | 1,093,556 | |
Trinity Acquisition PLC
3.500% 9/15/21 | | | 330,000 | | | | 333,220 | |
Unum Group
3.000% 5/15/21 | | | 135,000 | | | | 134,606 | |
Willis North America, Inc.
6.200% 3/28/17 | | | 270,000 | | | | 273,005 | |
Willis Towers Watson PLC
5.750% 3/15/21 | | | 370,000 | | | | 404,309 | |
XLIT Ltd.
5.750% 10/01/21 | | | 465,000 | | | | 516,769 | |
| | | | | | | | |
| | | | | | | 4,318,138 | |
| | | | | | | | |
| Internet — 0.5% | |
Expedia, Inc.
7.456% 8/15/18 | | | 1,048,000 | | | | 1,133,462 | |
| | | | | | | | |
| Investment Companies — 0.4% | |
Ares Capital Corp.
3.875% 1/15/20 | | | 548,000 | | | | 555,657 | |
FS Investment Corp.
4.000% 7/15/19 | | | 365,000 | | | | 365,941 | |
| | | | | | | | |
| | | | | | | 921,598 | |
| | | | | | | | |
| Leisure Time — 0.5% | |
Brunswick Corp. (a)
4.625% 5/15/21 | | | 1,088,000 | | | | 1,100,240 | |
| | | | | | | | |
| Lodging — 0.4% | |
Marriott International, Inc.
2.300% 1/15/22 | | | 30,000 | | | | 29,102 | |
Marriott International, Inc.
2.875% 3/01/21 | | | 875,000 | | | | 878,945 | |
| | | | | | | | |
| | | | | | | 908,047 | |
| | | | | | | | |
| Machinery – Diversified — 0.5% | |
CNH Industrial Capital LLC
3.375% 7/15/19 | | | 308,000 | | | | 308,770 | |
CNH Industrial Capital LLC
3.625% 4/15/18 | | | 100,000 | | | | 101,250 | |
CNH Industrial Capital LLC
3.875% 10/15/21 | | | 635,000 | | | | 624,681 | |
The accompanying notes are an integral part of the financial statements.
69
MML Short-Duration Bond Fund – Portfolio of Investments (Continued)
| | | | | | | | |
| | | Principal
Amount | | | Value | |
CNH Industrial Capital LLC
4.875% 4/01/21 | | $ | 115,000 | | | $ | 119,600 | |
| | | | | | | | |
| | | | | | | 1,154,301 | |
| | | | | | | | |
| Manufacturing — 0.3% | |
Tyco Electronics Group SA
6.550% 10/01/17 | | | 700,000 | | | | 726,075 | |
| | | | | | | | |
| Media — 0.9% | |
Charter Communications Operating LLC/Charter Communications Operating Capital
3.579% 7/23/20 | | | 605,000 | | | | 617,242 | |
Sirius XM Radio, Inc. (a)
4.250% 5/15/20 | | | 900,000 | | | | 913,500 | |
Viacom, Inc.
2.250% 2/04/22 | | | 95,000 | | | | 89,276 | |
Viacom, Inc.
6.125% 10/05/17 | | | 550,000 | | | | 565,735 | |
| | | | | | | | |
| | | | | | | 2,185,753 | |
| | | | | | | | |
| Mining — 0.5% | |
Glencore Canada Corp.
5.500% 6/15/17 | | | 890,000 | | | | 904,274 | |
Glencore Finance Canada Ltd. (a)
2.700% 10/25/17 | | | 233,000 | | | | 234,782 | |
| | | | | | | | |
| | | | | | | 1,139,056 | |
| | | | | | | | |
| Office Equipment/Supplies — 0.6% | |
Pitney Bowes, Inc.
3.375% 10/01/21 | | | 590,000 | | | | 572,821 | |
Pitney Bowes, Inc.
4.750% 5/15/18 | | | 750,000 | | | | 772,231 | |
Pitney Bowes, Inc.
5.750% 9/15/17 | | | 33,000 | | | | 33,847 | |
| | | | | | | | |
| | | | | | | 1,378,899 | |
| | | | | | | | |
| Oil & Gas Services — 0.1% | |
Cameron International Corp.
1.400% 6/15/17 | | | 300,000 | | | | 299,884 | |
| | | | | | | | |
| Packaging & Containers — 0.5% | |
Graphic Packaging International, Inc.
4.750% 4/15/21 | | | 1,094,000 | | | | 1,148,700 | |
| | | | | | | | |
| Pharmaceuticals — 1.9% | | | | | | | | |
AbbVie, Inc.
1.800% 5/14/18 | | | 1,065,000 | | | | 1,065,800 | |
Actavis Funding SCS Co.
2.350% 3/12/18 | | | 590,000 | | | | 593,411 | |
Baxalta, Inc.
2.000% 6/22/18 | | | 485,000 | | | | 485,026 | |
Express Scripts Holding Co.
3.300% 2/25/21 | | | 1,105,000 | | | | 1,125,737 | |
Shire Acquisitions Investments Ireland DAC
2.400% 9/23/21 | | | 235,000 | | | | 227,007 | |
| | | | | | | | |
| | | Principal
Amount | | | Value | |
Teva Pharmaceutical Finance Netherlands III BV
2.200% 7/21/21 | | $ | 1,075,000 | | | $ | 1,028,438 | |
| | | | | | | | |
| | | | | | | 4,525,419 | |
| | | | | | | | |
| Real Estate Investment Trusts (REITS) — 1.9% | |
American Tower Corp.
2.250% 1/15/22 | | | 415,000 | | | | 397,516 | |
American Tower Corp.
3.300% 2/15/21 | | | 745,000 | | | | 753,485 | |
Crown Castle International Corp.
3.400% 2/15/21 | | | 714,000 | | | | 724,532 | |
DDR Corp.
7.500% 7/15/18 | | | 925,000 | | | | 996,514 | |
Digital Realty Trust LP
3.400% 10/01/20 | | | 320,000 | | | | 325,508 | |
Highwoods Realty LP
5.850% 3/15/17 | | | 275,000 | | | | 277,325 | |
Highwoods Realty LP
7.500% 4/15/18 | | | 25,000 | | | | 26,672 | |
Simon Property Group LP
2.350% 1/30/22 | | | 700,000 | | | | 690,598 | |
Weyerhaeuser Co.
7.375% 10/01/19 | | | 135,000 | | | | 151,549 | |
| | | | | | | | |
| | | | | | | 4,343,699 | |
| | | | | | | | |
| Retail — 1.3% | | | | | | | | |
AutoNation, Inc.
3.350% 1/15/21 | | | 255,000 | | | | 256,233 | |
CVS Health Corp.
2.125% 6/01/21 | | | 810,000 | | | | 794,241 | |
Dollar Tree, Inc.
5.750% 3/01/23 | | | 1,090,000 | | | | 1,154,114 | |
The Home Depot, Inc.
2.000% 4/01/21 | | | 580,000 | | | | 575,390 | |
QVC, Inc.
3.125% 4/01/19 | | | 347,000 | | | | 350,610 | |
| | | | | | | | |
| | | | | | | 3,130,588 | |
| | | | | | | | |
| Semiconductors — 0.6% | | | | | | | | |
Analog Devices, Inc.
2.500% 12/05/21 | | | 245,000 | | | | 242,752 | |
KLA-Tencor Corp.
2.375% 11/01/17 | | | 455,000 | | | | 457,726 | |
NXP BV/NXP Funding LLC (a)
4.125% 6/01/21 | | | 770,000 | | | | 795,025 | |
| | | | | | | | |
| | | | | | | 1,495,503 | |
| | | | | | | | |
| Telecommunications — 0.1% | | | | | | | | |
Verizon Communications, Inc.
1.750% 8/15/21 | | | 245,000 | | | | 235,029 | |
| | | | | | | | |
| Transportation — 0.9% | | | | | | | | |
Asciano Finance Ltd. (a)
5.000% 4/07/18 | | | 547,000 | | | | 561,991 | |
The accompanying notes are an integral part of the financial statements.
70
MML Short-Duration Bond Fund – Portfolio of Investments (Continued)
| | | | | | | | |
| | | Principal
Amount | | | Value | |
Ryder System, Inc.
2.250% 9/01/21 | | $ | 425,000 | | | $ | 415,047 | |
Ryder System, Inc.
2.500% 3/01/18 | | | 475,000 | | | | 478,446 | |
Ryder System, Inc.
2.550% 6/01/19 | | | 65,000 | | | | 65,489 | |
Ryder System, Inc.
2.875% 9/01/20 | | | 340,000 | | | | 343,697 | |
TTX Co. (a)
2.250% 2/01/19 | | | 300,000 | | | | 299,828 | |
| | | | | | | | |
| | | | | | | 2,164,498 | |
| | | | | | | | |
| Trucking & Leasing — 1.2% | | | | | | | | |
Aviation Capital Group Corp. (a)
2.875% 9/17/18 | | | 1,070,000 | | | | 1,083,375 | |
GATX Corp.
2.600% 3/30/20 | | | 575,000 | | | | 567,910 | |
Penske Truck Leasing Co. LP/PTL Finance Corp. (a)
2.500% 6/15/19 | | | 370,000 | | | | 370,896 | |
Penske Truck Leasing Co. LP/PTL Finance Corp. (a)
3.050% 1/09/20 | | | 615,000 | | | | 621,721 | |
Penske Truck Leasing Co. LP/PTL Finance Corp. (a)
3.300% 4/01/21 | | | 150,000 | | | | 151,686 | |
| | | | | | | | |
| | | | | | | 2,795,588 | |
| | | | | | | | |
| | |
TOTAL CORPORATE DEBT
(Cost $99,969,868) | | | | | | | 100,546,856 | |
| | | | | | | | |
|
| MUNICIPAL OBLIGATIONS — 0.0% | |
Louisiana State Public Facilities Authority, Series 2011-A, Class A2 FRN
1.614% 4/26/27 | | | 89,280 | | | | 88,887 | |
| | | | | | | | |
| | |
TOTAL MUNICIPAL OBLIGATIONS
(Cost $89,280) | | | | | | | 88,887 | |
| | | | | | | | |
|
NON-U.S. GOVERNMENT
AGENCY OBLIGATIONS — 38.8% | |
| Auto Floor Plan ABS — 0.5% | | | | | | | | |
Navistar Financial Dealer Note Master Owner Trust II, Series 2016-1, Class A, 1 mo. LIBOR + 1.350%, FRN (a)
1.942% 9/27/21 | | | 520,000 | | | | 520,417 | |
NCF Dealer Floorplan Master Trust, Series 2014-1A, Class A, 1 mo. LIBOR + 1.500%, FRN (a)
2.061% 10/20/20 | | | 200,000 | | | | 200,000 | |
| | | | | | | | |
| | | Principal
Amount | | | Value | |
NextGear Floorplan Master Owner Trust, Series 2016-2A, Class A2 (a)
2.190% 9/15/21 | | $ | 480,000 | | | $ | 476,124 | |
| | | | | | | | |
| | | | | | | 1,196,541 | |
| | | | | | | | |
| Automobile ABS — 5.8% | | | | | | | | |
American Credit Acceptance Receivables Trust, Series 2015-2, Class A (a)
1.570% 6/12/19 | | | 64,550 | | | | 64,554 | |
American Credit Acceptance Receivables Trust, Series 2015-3, Class A (a)
1.950% 9/12/19 | | | 151,431 | | | | 151,673 | |
American Credit Acceptance Receivables Trust, Series 2016-2, Class A (a)
2.220% 7/13/20 | | | 256,647 | | | | 256,984 | |
American Credit Acceptance Receivables Trust, Series 2016-1A, Class A (a)
2.370% 5/12/20 | | | 84,852 | | | | 85,044 | |
AmeriCredit Automobile Receivables Trust, Series 2014-1, Class D
2.540% 6/08/20 | | | 210,000 | | | | 211,363 | |
Avis Budget Rental Car Funding AESOP LLC, Series 2012-3A, Class A (a)
2.100% 3/20/19 | | | 200,000 | | | | 200,184 | |
CFC LLC, Series 2015-1A, Class A (a)
1.750% 6/15/21 | | | 104,669 | | | | 104,708 | |
CPS Auto Receivables Trust,
Series 2016-C, Class B (a)
2.480% 9/15/20 | | | 190,000 | | | | 189,910 | |
CPS Auto Trust, Series 2014-B, Class A (a)
1.110% 11/15/18 | | | 39,309 | | | | 39,216 | |
CPS Auto Trust, Series 2014-C, Class A (a)
1.310% 2/15/19 | | | 55,054 | | | | 54,988 | |
CPS Auto Trust, Series 2014-D, Class A (a)
1.490% 4/15/19 | | | 42,965 | | | | 42,926 | |
CPS Auto Trust, Series 2015-C, Class A (a)
1.770% 6/17/19 | | | 73,929 | | | | 74,024 | |
CPS Auto Trust, Series 2013-B, Class A (a)
1.820% 9/15/20 | | | 142,858 | | | | 142,356 | |
CPS Auto Trust, Series 2015-C, Class B (a)
2.550% 2/18/20 | | | 250,000 | | | | 251,231 | |
Credit Acceptance Auto Loan Trust, Series 2014-2A, Class A (a)
1.880% 3/15/22 | | | 259,745 | | | | 259,673 | |
Drive Auto Receivables Trust, Series 2016-CA, Class A1 (a)
0.900% 12/15/17 | | | 1,054,131 | | | | 1,054,118 | |
The accompanying notes are an integral part of the financial statements.
71
MML Short-Duration Bond Fund – Portfolio of Investments (Continued)
| | | | | | | | |
| | | Principal
Amount | | | Value | |
Drive Auto Receivables Trust, Series 2016-BA, Class B (a)
2.560% 6/15/20 | | $ | 140,000 | | | $ | 140,548 | |
DT Auto Owner Trust, Series 2015-3A, Class A (a)
1.660% 3/15/19 | | | 52,292 | | | | 52,296 | |
DT Auto Owner Trust, Series 2016-1A, Class A (a)
2.000% 9/16/19 | | | 204,146 | | | | 204,104 | |
DT Auto Owner Trust, Series 2016-1A, Class B (a)
2.790% 5/15/20 | | | 450,000 | | | | 452,590 | |
DT Auto Owner Trust, Series 2016-2A, Class B (a)
2.920% 5/15/20 | | | 230,000 | | | | 229,316 | |
Enterprise Fleet Financing LLC, Series 2016-1, Class A2 (a)
1.830% 9/20/21 | | | 435,043 | | | | 435,401 | |
Exeter Automobile Receivables Trust, Series 2014-3A, Class A (a)
1.320% 1/15/19 | | | 4,248 | | | | 4,247 | |
Exeter Automobile Receivables Trust, Series 2015-2A, Class A (a)
1.540% 11/15/19 | | | 68,387 | | | | 68,393 | |
Exeter Automobile Receivables Trust, Series 2015-3A, Class A (a)
2.000% 3/16/20 | | | 107,835 | | | | 108,015 | |
Exeter Automobile Receivables Trust, Series 2016-3A, Class B (a)
2.840% 8/16/21 | | | 260,000 | | | | 258,976 | |
Exeter Automobile Receivables Trust, Series 2015-2A, Class C (a)
3.900% 3/15/21 | | | 650,000 | | | | 657,050 | |
First Investors Auto Owner Trust, Series 2013-3A, Class A3 (a)
1.440% 10/15/19 | | | 26,014 | | | | 26,012 | |
First Investors Auto Owner Trust, Series 2015-2A, Class A1 (a)
1.590% 12/16/19 | | | 76,395 | | | | 76,437 | |
First Investors Auto Owner Trust, Series 2016-1A, Class A1 (a)
1.920% 5/15/20 | | | 236,356 | | | | 236,869 | |
First Investors Auto Owner Trust, Series 2016-2A, Class B (a)
2.210% 7/15/22 | | | 540,000 | | | | 534,973 | |
Flagship Credit Auto Trust, Series 2014-2, Class A (a)
1.430% 12/16/19 | | | 59,404 | | | | 59,307 | |
Flagship Credit Auto Trust, Series 2013-2, Class A (a)
1.940% 1/15/19 | | | 3,387 | | | | 3,388 | |
| | | | | | | | |
| | | Principal
Amount | | | Value | |
Flagship Credit Auto Trust, Series 2015-2, Class A (a)
1.980% 10/15/20 | | $ | 128,506 | | | $ | 128,682 | |
Flagship Credit Auto Trust, Series 2015-3, Class A (a)
2.380% 10/15/20 | | | 143,465 | | | | 143,947 | |
Flagship Credit Auto Trust, Series 2016-4, Class B (a)
2.410% 10/15/21 | | | 910,000 | | | | 902,626 | |
Flagship Credit Auto Trust, Series 2016-4, Class C (a)
2.710% 11/15/22 | | | 410,000 | | | | 405,263 | |
Flagship Credit Auto Trust, Series 2016-1, Class A (a)
2.770% 12/15/20 | | | 330,472 | | | | 332,826 | |
Flagship Credit Auto Trust, Series 2013-2, Class B (a)
3.210% 8/15/19 | | | 280,000 | | | | 280,986 | |
GLS Auto Receivables Trust, Series 2015-1A, Class A (a)
2.250% 12/15/20 | | | 64,116 | | | | 64,014 | |
NextGear Floorplan Master Owner Trust, Series 2015-2A, Class A (a)
2.380% 10/15/20 | | | 250,000 | | | | 251,323 | |
NextGear Floorplan Master Owner Trust, Series 2016-1A, Class A1, 1 mo. LIBOR + 1.700%, FRN (a)
2.404% 4/15/21 | | | 370,000 | | | | 375,005 | |
Oscar US Funding Trust, Series 2015-1A, Class A3 (a)
1.860% 10/15/19 | | | 750,000 | | | | 745,526 | |
Oscar US Funding Trust II, Series 2015-1A, Class A4 (a)
2.440% 6/15/22 | | | 300,000 | | | | 295,433 | |
Oscar US Funding Trust IV, Series 2016-1A, Class A2B, 1 mo. USD LIBOR + 1.700%, FRN (a)
2.404% 7/15/20 | | | 203,398 | | | | 203,461 | |
Oscar US Funding Trust V, Series 2016-2A, Class A1 (a)
0.900% 9/17/17 | | | 199,315 | | | | 199,173 | |
Oscar US Funding Trust V, Series 2016-2A, Class A2A (a)
2.310% 11/15/19 | | | 420,000 | | | | 420,251 | |
Santander Drive Auto Receivables Trust, Series 2016-1, Class A3
1.620% 3/16/20 | | | 180,000 | | | | 180,018 | |
Santander Drive Auto Receivables Trust, Series 2015-2, Class C
2.440% 4/15/21 | | | 470,000 | | | | 472,491 | |
Santander Drive Auto Receivables Trust, Series 2016-1, Class B
2.470% 12/15/20 | | | 340,000 | | | | 342,873 | |
The accompanying notes are an integral part of the financial statements.
72
MML Short-Duration Bond Fund – Portfolio of Investments (Continued)
| | | | | | | | |
| | | Principal
Amount | | | Value | |
Santander Drive Auto Receivables Trust, Series 2014-4, Class D
3.100% 11/16/20 | | $ | 200,000 | | | $ | 202,412 | |
Santander Drive Auto Receivables Trust, Series 2016-1, Class D
4.020% 4/15/22 | | | 500,000 | | | | 519,019 | |
Westlake Automobile Receivables Trust, Series 2016-1A, Class A2B, 1 mo. USD LIBOR + 1.050%, FRN (a)
1.754% 1/15/19 | | | 490,377 | | | | 490,818 | |
| | | | | | | | |
| | | | | | | 13,687,021 | |
| | | | | | | | |
| Commercial MBS — 2.3% | |
Banc of America Commercial Mortgage, Inc., Series 2007-3, Class A4, VRN
5.549% 6/10/49 | | | 149,093 | | | | 149,801 | |
Banc of America Commercial Mortgage, Inc., Series 2007-4, Class A4, VRN
5.747% 2/10/51 | | | 195,311 | | | | 198,004 | |
Banc of America Commercial Mortgage, Inc., Series 2007-4, Class AM, VRN
5.814% 2/10/51 | | | 180,000 | | | | 183,338 | |
Banc of America Commercial Mortgage, Inc., Series 2008-1, Class A4, VRN
6.235% 2/10/51 | | | 319,126 | | | | 327,750 | |
Bear Stearns Commercial Mortgage Securities, Series 2007-T26, Class A4, VRN
5.471% 1/12/45 | | | 199,013 | | | | 199,105 | |
Bear Stearns Commercial Mortgage Securities, Series 2007-PW17, Class A4, VRN
5.694% 6/11/50 | | | 92,221 | | | | 93,793 | |
Bear Stearns Commercial Mortgage Securities, Series 2007-PW17, Class AM, VRN
5.887% 6/11/50 | | | 425,000 | | | | 433,224 | |
Commercial Mortgage Pass-Through Certificates, Series 2014-BBG, Class A, 1 mo. LIBOR + .800%, FRN (a)
1.504% 3/15/29 | | | 365,000 | | | | 361,835 | |
Commercial Mortgage Pass-Through Certificates, Series 2014-CR14, Class A2
3.147% 2/10/47 | | | 290,000 | | | | 296,090 | |
Commercial Mortgage Pass-Through Certificates, Series 2007-C9, Class A4, VRN
5.812% 12/10/49 | | | 301,139 | | | | 303,735 | |
| | | | | | | | |
| | | Principal
Amount | | | Value | |
DBRR Trust, Series 2013-EZ3, Class A, VRN (a)
1.635% 12/18/49 | | $ | 16,791 | | | $ | 16,775 | |
GCCFC Commercial Mortgage Trust, Series 2006-GG7, Class AM, VRN
5.758% 7/10/38 | | | 172,270 | | | | 172,318 | |
JP Morgan Chase Commercial Mortgage Securities Corp., Series 2007-CB20, Class AM, VRN
5.955% 2/12/51 | | | 270,000 | | | | 276,822 | |
Merrill Lynch/Countrywide Commercial Mortgage Trust, Series 2007-9, Class A4
5.700% 9/12/49 | | | 370,113 | | | | 377,348 | |
ML-CFC Commercial Mortgage Trust, Series 2007-9, Class AM, VRN
5.856% 9/12/49 | | | 250,000 | | | | 257,929 | |
Morgan Stanley Capital I,
Series 2007-HQ11, Class AM, VRN
5.478% 2/12/44 | | | 277,675 | | | | 277,427 | |
Morgan Stanley Capital I,
Series 2007-HQ11, Class AJ, VRN
5.508% 2/12/44 | | | 190,000 | | | | 190,000 | |
Morgan Stanley Capital I,
Series 2008-T29, Class A4, VRN
6.275% 1/11/43 | | | 119,782 | | | | 123,268 | |
STRIPs Ltd., Series 2012-1A, Class A (a)
1.500% 12/25/44 | | | 4,369 | | | | 4,356 | |
TIAA Seasoned Commercial Mortgage Trust, Series 2007-C4, Class AJ, VRN
5.474% 8/15/39 | | | 30,954 | | | | 30,997 | |
Velocity Commercial Capital Loan Trust, Series 2016-2, Class AFX, VRN
2.997% 10/25/46 | | | 461,843 | | | | 457,353 | |
Wachovia Bank Commercial Mortgage Trust, Series 2007-C31, Class A4
5.509% 4/15/47 | | | 158,804 | | | | 159,243 | |
Wachovia Bank Commercial Mortgage Trust, Series 2007-C33, Class AM, VRN
5.969% 2/15/51 | | | 440,000 | | | | 444,839 | |
| | | | | | | | |
| | | | | | | 5,335,350 | |
| | | | | | | | |
| Credit Card ABS — 1.9% | | | | | | | | |
Chase Issuance Trust, Series 2014-A1, Class A1
1.150% 1/15/19 | | | 4,460,000 | | | | 4,460,013 | |
| | | | | | | | |
| Home Equity ABS — 0.6% | | | | | | | | |
ACE Securities Corp., Series 2005-AG1, Class A1B1, 1 mo. USD
LIBOR + .270%, FRN
0.862% 8/25/35 | | | 7,324 | | | | 7,323 | |
The accompanying notes are an integral part of the financial statements.
73
MML Short-Duration Bond Fund – Portfolio of Investments (Continued)
| | | | | | | | |
| | | Principal
Amount | | | Value | |
ACE Securities Corp., Series 2005-HE7, Class A2D, 1 mo. USD LIBOR + .660%, FRN
1.252% 11/25/35 | | $ | 59,698 | | | $ | 59,473 | |
ACE Securities Corp., Series 2005-HE5, Class M2, 1 mo. USD LIBOR + .735%, FRN
1.327% 8/25/35 | | | 108,080 | | | | 108,213 | |
Bear Stearns Asset-Backed Securities I Trust, Series 2005-HE12, Class M1, 1 mo. USD LIBOR + ..480%, FRN
1.064% 12/25/35 | | | 221,031 | | | | 221,038 | |
Countrywide Asset-Backed Certificates, Series 2004-5, Class 3A, 1 mo.
USD LIBOR + .460%, FRN
1.044% 9/25/34 | | | 34,449 | | | | 34,288 | |
Countrywide Partnership Trust, Series 2004-EC1, Class M1, 1 mo. USD LIBOR + .900%, FRN
1.484% 2/25/35 | | | 102,644 | | | | 92,395 | |
Credit Suisse Seasoned Loan Trust, Series 2006-1, Class A, 1 mo. USD LIBOR + .240%, FRN (a)
0.824% 10/25/34 | | | 157,736 | | | | 157,163 | |
First Franklin Mortgage Loan Trust, Series 2005-FF6, Class M1, 1 mo. USD LIBOR + .630%, FRN
1.222% 5/25/36 | | | 37,992 | | | | 37,900 | |
Fremont Home Loan Trust, Series 2005-E, Class 2A3, 1 mo. USD LIBOR + .240%, FRN
0.832% 1/25/36 | | | 31,149 | | | | 30,956 | |
GSAMP Trust, Series 2005-AHL, Class M1, 1 mo. USD LIBOR + ..645%, FRN
1.401% 4/25/35 | | | 46,676 | | | | 46,834 | |
Home Equity Asset Trust, Series 2006-4, Class 2A3, 1 mo. USD LIBOR + .170%, FRN
0.754% 8/25/36 | | | 17,823 | | | | 17,837 | |
JP Morgan Mortgage Acquisition Corp., Series 2005-FRE1, Class A2V2, 1 mo. USD LIBOR + .220%, FRN
0.812% 10/25/35 | | | 124,645 | | | | 124,842 | |
Long Beach Mortgage Loan Trust, Series 2005-WL1, Class M2, 1 mo. USD LIBOR + .825%, FRN
1.581% 6/25/35 | | | 146,962 | | | | 146,407 | |
New Century Home Equity Loan Trust, Series 1997-NC5, Class A6, STEP
6.604% 10/25/28 | | | 4 | | | | 4 | |
| | | | | | | | |
| | | Principal
Amount | | | Value | |
NovaStar Mortgage Funding Trust, Series 2005-3, Class A2D, 1 mo. LIBOR + .370%, FRN
1.126% 1/25/36 | | $ | 105,008 | | | $ | 104,619 | |
Option One Mortgage Loan Trust, Series 2005-5, Class A3, 1 mo. USD LIBOR + .210%, FRN
0.966% 12/25/35 | | | 132,041 | | | | 131,873 | |
Park Place Securities, Inc.,
Series 2005-WHQ4, Class A1A, 1 mo. USD LIBOR + .260%, FRN
0.852% 9/25/35 | | | 29,673 | | | | 29,710 | |
Residential Asset Securities Corp., Series 2005-EMX4, Class M1, 1 mo. USD LIBOR + .430%, FRN
1.186% 11/25/35 | | | 59,594 | | | | 59,625 | |
| | | | | | | | |
| | | | | | | 1,410,500 | |
| | | | | | | | |
| Other ABS — 18.2% | |
321 Henderson Receivables I LLC, Series 2006-1A, Class A1, 1 mo. USD LIBOR + .200%, FRN (a)
0.904% 3/15/41 | | | 111,461 | | | | 108,485 | |
321 Henderson Receivables I LLC, Series 2010-3A, Class A (a)
3.820% 12/15/48 | | | 313,414 | | | | 316,022 | |
AIMCO CLO Ltd., Series 2014-AA, Class A, 3 mo. USD LIBOR + 1.540%, FRN (a)
2.421% 7/20/26 | | | 350,000 | | | | 350,013 | |
ALM VII Ltd., Series 2012-7A, Class A1R, 3 mo. USD LIBOR + 1.480%, FRN (a)
2.334% 10/15/28 | | | 370,000 | | | | 371,101 | |
Alterna Funding I LLC, Series 2014-1A, Class NOTE (a)
1.639% 2/15/21 | | | 319,201 | | | | 310,224 | |
Apidos CLO XXV, Series 2016-25A, Class A1, 3 mo. USD LIBOR + 1.460%, FRN (a)
2.203% 10/20/28 | | | 520,000 | | | | 520,080 | |
Arbys Funding LLC, Series 2015-1A, Class A2 (a)
4.969% 10/30/45 | | | 297,000 | | | | 300,156 | |
ARL First LLC, Series 2012-1A, Class A1, 1 mo. USD LIBOR + 1.750%, FRN (a)
2.454% 12/15/42 | | | 314,354 | | | | 305,398 | |
AVANT Loans Funding Trust, Series 2016-C, Class A (a)
2.960% 9/16/19 | | | 105,073 | | | | 105,013 | |
The accompanying notes are an integral part of the financial statements.
74
MML Short-Duration Bond Fund – Portfolio of Investments (Continued)
| | | | | | | | |
| | | Principal
Amount | | | Value | |
AVANT Loans Funding Trust, Series 2016-A, Class A (a)
4.110% 5/15/19 | | $ | 273,179 | | | $ | 273,763 | |
BCC Funding VIII LLC, Series 2014-1A, Class A (a)
1.794% 6/20/20 | | | 20,730 | | | | 20,717 | |
BCC Funding X LLC, Series 2015-1, Class A2 (a)
2.224% 10/20/20 | | | 249,742 | | | | 249,484 | |
BCC Funding XIII LLC, Series 2016-1, Class A1 (a)
1.100% 9/20/17 | | | 548,895 | | | | 547,542 | |
Birchwood Park CLO Ltd., Series 2014-1A, Class A, 3 mo. USD LIBOR + 1.440%, FRN (a)
2.320% 7/15/26 | | | 340,000 | | | | 340,027 | |
Blackbird Capital Aircraft Lease Securitization Ltd., Series 2016-1A, Class AA, STEP (a)
2.487% 12/16/41 | | | 380,000 | | | | 380,594 | |
Blue Hill CLO Ltd., Series 2013-1A, Class A, 3 mo. USD LIBOR + 1.480%, FRN (a)
2.360% 1/15/26 | | | 765,000 | | | | 765,233 | |
BlueMountain CLO Ltd., Series 2015-2A, Class A1, 3 mo. USD LIBOR + 1.430%, FRN (a)
2.312% 7/18/27 | | | 475,000 | | | | 476,133 | |
BlueVirgo Trust, Series 2015-1A, Class NOTE (a)
3.000% 12/15/22 | | | 571,351 | | | | 577,379 | |
CAN Capital Funding LLC, Series 2014-1A, Class A (a)
3.117% 4/15/20 | | | 152,837 | | | | 151,682 | |
Capital Automotive REIT, Series 2012-1A, Class A (a)
4.700% 7/15/42 | | | 191,009 | | | | 192,202 | |
Cazenovia Creek Funding I LLC, Series 2015-1A, Class A (a)
2.000% 12/10/23 | | | 230,867 | | | | 228,991 | |
CCG Receivables Trust, Series 2014-1, Class A2 (a)
1.060% 11/15/21 | | | 48,188 | | | | 48,134 | |
Citi Held For Asset Issuance, Series 2015-PM1, Class A (a)
1.850% 12/15/21 | | | 5,420 | | | | 5,417 | |
Citi Held For Asset Issuance, Series 2015-PM2, Class A (a)
2.350% 3/15/22 | | | 70,279 | | | | 70,227 | |
Citi Held For Asset Issuance, Series 2015-PM3, Class A (a)
2.560% 5/16/22 | | | 38,199 | | | | 38,158 | |
| | | | | | | | |
| | | Principal
Amount | | | Value | |
CKE Restaurant Holdings, Inc., Series 2013-1A, Class A2 (a)
4.474% 3/20/43 | | $ | 481,313 | | | $ | 477,664 | |
Credit-Based Asset Servicing and Securitization LLC, Series 2006-RP2, Class A3, 1 mo. LIBOR + .300%, FRN (a)
1.056% 7/25/36 | | | 89,026 | | | | 88,847 | |
DB Master Finance LLC, Series 2015-1A, Class A2I (a)
3.262% 2/20/45 | | | 402,825 | | | | 405,072 | |
Diamond Resorts Owner Trust, Series 2013-2, Class A (a)
2.270% 5/20/26 | | | 140,033 | | | | 139,059 | |
Diamond Resorts Owner Trust, Series 2014-1, Class A (a)
2.540% 5/20/27 | | | 59,672 | | | | 59,553 | |
Diamond Resorts Owner Trust, Series 2015-1, Class A (a)
2.730% 7/20/27 | | | 148,113 | | | | 147,214 | |
Diamond Resorts Owner Trust, Series 2015-2, Class A (a)
2.990% 5/22/28 | | | 187,519 | | | | 186,373 | |
Diamond Resorts Owner Trust, Series 2016-1, Class A (a)
3.080% 11/20/28 | | | 1,306,916 | | | | 1,298,882 | |
Diamond Resorts Owner Trust, Series 2015-2, Class B (a)
3.540% 5/22/28 | | | 126,702 | | | | 126,830 | |
Domino’s Pizza Master Issuer LLC, Series 2015-1A, Class A2I (a)
3.484% 10/25/45 | | | 425,700 | | | | 419,107 | |
Domino’s Pizza Master Issuer LLC, Series 2012-1A, Class A2 (a)
5.216% 1/25/42 | | | 320,100 | | | | 325,966 | |
Dong Fang Container Finance II SPV Ltd., Series 2014-1A, Class A1 (a)
1.950% 11/25/39 | | | 143,750 | | | | 141,386 | |
Drug Royalty Corp., Inc., Series 2014-1, Class A1, 3 mo. USD LIBOR + 2.850%, FRN (a)
3.730% 7/15/23 | | | 166,349 | | | | 167,498 | |
Drug Royalty Corp., Inc., Series 2012-1, Class A1, 3 mo. USD LIBOR + 5.250%, FRN (a)
6.130% 7/15/24 | | | 71,667 | | | | 72,677 | |
Eaton Vance CLO, Series 2014-1A, Class A, 3 mo. USD LIBOR + 1.450%, FRN (a)
2.330% 7/15/26 | | | 450,000 | | | | 450,849 | |
Elara HGV Timeshare Issuer LLC, Series 2016-A, Class A (a)
2.810% 4/25/28 | | | 308,283 | | | | 302,393 | |
The accompanying notes are an integral part of the financial statements.
75
MML Short-Duration Bond Fund – Portfolio of Investments (Continued)
| | | | | | | | |
| | | Principal
Amount | | | Value | |
Elara HGV Timeshare Issuer LLC, Series 2014-A, Class B (a)
3.020% 2/25/27 | | $ | 145,456 | | | $ | 143,567 | |
Element Rail Leasing I LLC, Series 2014-1A, Class A1 (a)
2.299% 4/19/44 | | | 157,243 | | | | 153,043 | |
Element Rail Leasing II LLC, Series 2015-1A, Class A1 (a)
2.707% 2/19/45 | | | 73,726 | | | | 71,426 | |
Element Rail Leasing II LLC, Series 2016-1A, Class A1 (a)
3.968% 3/19/46 | | | 187,354 | | | | 187,850 | |
Entegry New Orleans Storm Recovery Funding I LLC, Series 2015-1, Class A 2.670% 6/01/27 | | | 88,430 | | | | 89,294 | |
FNA Trust, Series 2014-1A, Class A (a)
1.296% 12/10/22 | | | 126,612 | | | | 125,504 | |
FNA Trust, Series 2015-1, Class A (a)
3.240% 12/10/23 | | | 117,165 | | | | 116,474 | |
FRS I LLC, Series 2013-1A, Class A1 (a)
1.800% 4/15/43 | | | 61,790 | | | | 60,555 | |
Galaxy XX CLO Ltd., Series 2015-20A, Class A, 3 mo. USD LIBOR + 1.450%, FRN (a)
2.331% 7/20/27 | | | 475,000 | | | | 475,614 | |
Global SC Finance II SRL, Series 2013-1A, Class A (a)
2.980% 4/17/28 | | | 186,833 | | | | 177,544 | |
Global SC Funding One Ltd., Series 2015-1, Class B1 (a)
2.740% 1/18/30 | | | 62,416 | | | | 62,416 | |
GoldenTree Loan Opportunities VII Ltd., Series 2013-7A, Class A, 3 mo. USD LIBOR + 1.150%, FRN (a)
2.032% 4/25/25 | | | 535,000 | | | | 534,589 | |
Goodgreen Trust, Series 2016-1A, Class A (a)
3.230% 10/15/52 | | | 569,662 | | | | 569,538 | |
Green Tree Agency Advance Funding Trust I, Series 2015-T2, Class AT2 (a)
3.095% 10/15/48 | | | 340,000 | | | | 340,000 | |
Hercules Capital Funding Trust, Series 2014-1A, Class A (a)
3.524% 4/16/21 | | | 211,147 | | | | 211,477 | |
HERO Funding Trust, Series 2016-4A, Class A1 (a)
3.570% 9/20/47 | | | 880,000 | | | | 877,175 | |
HERO Funding Trust, Series 2015-1A, Class A (a)
3.840% 9/21/40 | | | 1,051,230 | | | | 1,069,626 | |
Hilton Grand Vacations Trust, Series 2014-AA, Class A (a)
1.770% 11/25/26 | | | 186,180 | | | | 182,744 | |
| | | | | | | | |
| | | Principal
Amount | | | Value | |
Hilton Grand Vacations Trust, Series 2013-A, Class A (a)
2.280% 1/25/26 | | $ | 160,280 | | | $ | 159,588 | |
ING Investment Management CLO Ltd., Series 2013-3A, Class A1, 3 mo. USD LIBOR + 1.450%, FRN (a)
2.332% 1/18/26 | | | 260,000 | | | | 260,049 | |
ING Investment Management CLO Ltd., Series 2007-5A, Class A1A, 3 mo. USD LIBOR + .230%, FRN (a)
1.116% 5/01/22 | | | 33,085 | | | | 33,070 | |
LCM Ltd., Series 10AR, Class AR, 3 mo. USD LIBOR + 1.260%, FRN (a)
1.581% 4/15/22 | | | 191,400 | | | | 191,440 | |
LCM Ltd., Series 16A, Class A, 3 mo. USD LIBOR + 1.500%, FRN (a)
2.380% 7/15/26 | | | 430,000 | | | | 430,119 | |
LCM XI LP, Series 11A, Class A, 3 mo. USD LIBOR + 1.300%, FRN (a)
2.178% 4/19/22 | | | 709,642 | | | | 709,787 | |
LCM XIV LP, Series 14A, Class A, 3 mo. USD LIBOR + 1.150%, FRN (a)
2.030% 7/15/25 | | | 700,000 | | | | 697,483 | |
LCM XXIII Ltd., Series 23A, Class A1, 3 mo. USD LIBOR + 1.400%, FRN (a)
2.506% 10/20/29 | | | 590,000 | | | | 589,995 | |
Leaf Receivables Funding LLC, Series 2016-1, Class A1 (a)
1.000% 6/15/17 | | | 159,574 | | | | 159,459 | |
Madison Park Funding Ltd., Series 2016-22A, Class A, 3 mo. USD LIBOR + 1.480%, FRN (a)
2.382% 10/25/29 | | | 420,000 | | | | 420,930 | |
Madison Park Funding XII Ltd., Series 2014-12A, Class A, 3 mo. USD LIBOR + 1.500%, FRN (a)
2.381% 7/20/26 | | | 430,000 | | | | 430,116 | |
Madison Park Funding XIV Ltd., Series 2014-14A, Class A2, 3 mo. USD LIBOR + 1.450%, FRN (a)
2.331% 7/20/26 | | | 290,000 | | | | 290,060 | |
Magnetite CLO Ltd., Series 2016-18A, Class A, 3 mo. USD LIBOR + 1.400%, FRN (a)
2.253% 11/15/28 | | | 390,000 | | | | 389,988 | |
Marlette Funding Trust, Series 2016-1A, Class A (a)
3.060% 1/17/23 | | | 846,293 | | | | 845,500 | |
Miramax LLC, Series 2014-1A, Class A2 (a)
3.340% 7/20/26 | | | 137,016 | | | | 136,256 | |
The accompanying notes are an integral part of the financial statements.
76
MML Short-Duration Bond Fund – Portfolio of Investments (Continued)
| | | | | | | | |
| | | Principal
Amount | | | Value | |
Morgan Stanley ABS Capital I, Inc. Trust, Series 2005-WMC6, Class M2, 1 mo. USD LIBOR + .750%, FRN
1.506% 7/25/35 | | $ | 37,488 | | | $ | 37,862 | |
Morgan Stanley ABS Capital I, Inc. Trust, Series 2005-WMC4, Class M4, 1 mo. USD LIBOR + .945%, FRN
1.537% 4/25/35 | | | 197,569 | | | | 197,550 | |
MVW Owner Trust, Series 2013-1A, Class A (a)
2.150% 4/22/30 | | | 139,121 | | | | 137,852 | |
MVW Owner Trust, Series 2014-2, Class A (a)
2.250% 9/22/31 | | | 219,247 | | | | 216,593 | |
MVW Owner Trust, Series 2016-1A, Class A (a)
2.250% 12/20/33 | | | 94,591 | | | | 92,705 | |
Nations Equipment Finance Funding II LLC, Series 2014-1A, Class A (a)
1.558% 7/20/18 | | | 36,949 | | | | 36,926 | |
Nations Equipment Finance Funding III LLC, Series 2016-1A, Class A (a)
3.610% 2/20/21 | | | 266,132 | | | | 265,999 | |
Navitas Equipment Receivables LLC, Series 2015-1, Class A2 (a)
2.120% 11/15/18 | | | 213,905 | | | | 213,898 | |
New Residential Advance Receivables Trust, Series 2016-T2, Class AT2 (a)
2.575% 10/15/49 | | | 1,950,000 | | | | 1,926,867 | |
NRZ Advance Receivables Trust, Series 2016-T4, Class AT4 (a)
3.107% 12/15/50 | | | 700,000 | | | | 683,615 | |
OHA Loan Funding Ltd., Series 2015-1A, Class AR, 3 mo. USD LIBOR + 1.410%, FRN (a)
2.347% 8/15/29 | | | 590,000 | | | | 589,998 | |
OnDeck Asset Securitization Trust II LLC, Series 2016-1A, Class A (a)
4.210% 5/17/20 | | | 120,000 | | | | 118,480 | |
Orange Lake Timeshare Trust, Series 2014-AA, Class A (a)
2.290% 7/09/29 | | | 54,548 | | | | 53,725 | |
Orange Lake Timeshare Trust, Series 2016-A, Class A (a)
2.610% 3/08/29 | | | 323,633 | | | | 319,939 | |
Oxford Finance Funding Trust, Series 2014-1A, Class A (a)
3.475% 12/15/22 | | | 83,726 | | | | 83,732 | |
Oxford Finance Funding Trust, Series 2016-1A, Class A (a)
3.968% 6/17/24 | | | 200,000 | | | | 199,174 | |
| | | | | | | | |
| | | Principal
Amount | | | Value | |
PFS Financing Corp., Series 2014-AA, Class A, 1 mo. LIBOR + .600%, FRN (a)
1.304% 2/15/19 | | $ | 840,000 | | | $ | 839,719 | |
RAAC, Series 2006-RP2, Class A, 1 mo. USD LIBOR + .250%, FRN (a)
0.784% 2/25/37 | | | 117,057 | | | | 116,288 | |
Sierra Receivables Funding Co. LLC, Series 2014-2A, Class A (a)
2.050% 6/20/31 | | | 210,641 | | | | 210,354 | |
Sierra Receivables Funding Co. LLC, Series 2013-2A, Class A (a)
2.280% 11/20/25 | | | 41,277 | | | | 41,219 | |
Sierra Receivables Funding Co. LLC, Series 2014-3A, Class A (a)
2.300% 10/20/31 | | | 192,681 | | | | 192,043 | |
Sierra Receivables Funding Co. LLC, Series 2015-1A, Class A (a)
2.400% 3/22/32 | | | 359,114 | | | | 358,397 | |
Sierra Receivables Funding Co. LLC, Series 2015-3A, Class A (a)
2.580% 9/20/32 | | | 131,897 | | | | 130,114 | |
Sierra Receivables Funding Co. LLC, Series 2012-1A, Class A (a)
2.840% 11/20/28 | | | 27,002 | | | | 27,003 | |
Sierra Receivables Funding Co. LLC, Series 2015-3A, Class B (a)
3.080% 9/20/32 | | | 50,730 | | | | 49,905 | |
SoFi Consumer Loan Program LLC, Series 2016-3, Class A (a)
3.050% 12/26/25 | | | 425,062 | | | | 423,379 | |
SoFi Consumer Loan Program LLC, Series 2016-5, Class A (a)
3.060% 9/25/28 | | | 2,300,000 | | | | 2,295,678 | |
SoFi Consumer Loan Program LLC, Series 2016-2A, Class A (a)
3.090% 10/27/25 | | | 508,642 | | | | 507,113 | |
SoFi Consumer Loan Program LLC, Series 2016-1A, Class A (a)
3.260% 8/25/25 | | | 1,003,818 | | | | 1,005,103 | |
SpringCastle America Funding LLC, Series 2016-AA, Class A (a)
3.050% 4/25/29 | | | 687,134 | | | | 690,570 | |
Springleaf Funding Trust, Series 2016-AA, Class A (a)
2.900% 11/15/29 | | | 1,460,000 | | | | 1,456,739 | |
SPS Servicer Advance Receivables Trust, Series 2016-T1, Class AT1 (a)
2.530% 11/16/48 | | | 1,040,000 | | | | 1,037,311 | |
SPS Servicer Advance Receivables Trust, Series 2015-T3, Class AT3 (a)
2.920% 7/15/47 | | | 180,000 | | | | 180,143 | |
The accompanying notes are an integral part of the financial statements.
77
MML Short-Duration Bond Fund – Portfolio of Investments (Continued)
| | | | | | | | |
| | | Principal
Amount | | | Value | |
Symphony CLO XV Ltd., Series 2014-15A, Class A, 3 mo. USD LIBOR + 1.450%, FRN (a)
2.330% 10/17/26 | | $ | 365,000 | | | $ | 365,093 | |
Taco Bell Funding LLC, Series 2016-1A, Class A2I (a)
3.832% 5/25/46 | | | 379,050 | | | | 381,477 | |
TAL Advantage LLC, Series 2014-2A, Class A1 (a)
1.700% 5/20/39 | | | 119,219 | | | | 117,670 | |
TCI-Symphony CLO Ltd., Series 2016-1A, Class A, 3 mo. USD LIBOR + 1.480%, FRN (a)
2.399% 10/13/29 | | | 300,000 | | | | 300,918 | |
Treman Park CLO Ltd., Series 2015-1A, Class AR, 3 mo. USD LIBOR + 1.370%, FRN (a)
2.251% 4/20/27 | | | 950,000 | | | | 949,525 | |
Trip Rail Master Funding LLC, Series 2011-1A, Class A1B, 1 mo. USD LIBOR + 2.500%, FRN (a)
3.204% 7/15/41 | | | 208,472 | | | | 205,944 | |
Trip Rail Master Funding LLC, Series 2011-1A, Class A1A (a)
4.370% 7/15/41 | | | 59,563 | | | | 59,267 | |
Voya CLO Ltd., Series 2014-2A, Class A1, 3 mo. USD LIBOR + 1.450%, FRN (a)
2.330% 7/17/26 | | | 345,000 | | | | 345,002 | |
VSE VOI Mortgage LLC, Series 2016-A, Class A (a)
2.540% 7/20/33 | | | 809,788 | | | | 801,394 | |
Welk Resorts LLC, Series 2015-AA, Class A (a)
2.790% 6/16/31 | | | 135,448 | | | | 134,343 | |
Wendys Funding LLC, Series 2015-1A, Class A2I (a)
3.371% 6/15/45 | | | 913,438 | | | | 921,675 | |
Westgate Resorts LLC, Series 2014-1A, Class A (a)
2.150% 12/20/26 | | | 156,316 | | | | 153,757 | |
Westgate Resorts LLC, Series 2015-2A, Class A (a)
3.200% 7/20/28 | | | 314,019 | | | | 312,931 | |
| | | | | | | | |
| | | | | | | 42,838,810 | |
| | | | | | | | |
| Student Loans ABS — 7.7% | | | | | |
Access Group, Inc., Series 2004-A, Class A2, 3 mo. USD LIBOR + .260%, FRN
1.142% 4/25/29 | | | 68,688 | | | | 68,480 | |
| | | | | | | | |
| | | Principal
Amount | | | Value | |
Access Group, Inc., Series 2015-1, Class A, 1 mo. USD LIBOR + .700%, FRN (a)
1.292% 7/25/56 | | $ | 338,070 | | | $ | 334,103 | |
Access Group, Inc., Series 2003-A, Class A3, 3 mo. Treasury + 1.200%, FRN
1.509% 7/01/38 | | | 98,432 | | | | 96,908 | |
Access Group, Inc., Series 2015-1, Class B, 1 mo. USD LIBOR + 1.500%, FRN (a)
2.092% 7/25/58 | | | 140,000 | | | | 115,917 | |
Brazos Student Finance Corp., Series 2003-A, Class A3, 28 Day ARS, FRN
1.729% 7/01/38 | | | 200,000 | | | | 192,566 | |
College Loan Corp. Trust I, Series 2005-2, Class B, 3 mo. USD LIBOR + .490%, FRN
1.370% 1/15/37 | | | 280,135 | | | | 241,369 | |
Credit Suisse ABS Repackaging Trust, Series 2013-A, Class B (a)
2.500% 1/25/30 | | | 211,792 | | | | 197,217 | |
DRB Prime Student Loan Trust, Series 2015-D, Class A1, 1 mo. USD LIBOR + 1.700%, FRN (a)
2.284% 1/25/40 | | | 345,623 | | | | 343,892 | |
DRB Prime Student Loan Trust, Series 2015-A, Class A3
2.320% 4/25/30 | | | 177,896 | | | | 177,099 | |
DRB Prime Student Loan Trust, Series 2016-R, Class A1, 1 mo. USD LIBOR + 1.900%, FRN (a)
2.431% 10/25/44 | | | 1,099,112 | | | | 1,099,112 | |
DRB Prime Student Loan Trust, Series 2015-B, Class A3 (a)
2.540% 4/27/26 | | | 145,277 | | | | 143,688 | |
DRB Prime Student Loan Trust, Series 2016-A, Class A1, 1 mo. USD LIBOR + 2.000%, FRN (a)
2.584% 4/25/40 | | | 339,036 | | | | 338,092 | |
DRB Prime Student Loan Trust, Series 2016-B, Class A2 (a)
2.890% 6/25/40 | | | 290,340 | | | | 281,375 | |
DRB Prime Student Loan Trust, Series 2015-A, Class A2 (a)
3.060% 7/25/31 | | | 170,405 | | | | 165,416 | |
DRB Prime Student Loan Trust, Series 2015-B, Class A2 (a)
3.170% 7/25/31 | | | 151,462 | | | | 151,322 | |
DRB Prime Student Loan Trust, Series 2015-D, Class A2 (a)
3.200% 1/25/40 | | | 980,281 | | | | 973,016 | |
The accompanying notes are an integral part of the financial statements.
78
MML Short-Duration Bond Fund – Portfolio of Investments (Continued)
| | | | | | | | |
| | | Principal
Amount | | | Value | |
Earnest Student Loan Program LLC, Series 2016-B, Class A1, 1 mo. USD LIBOR + 2.050%, FRN (a)
2.634% 2/26/35 | | $ | 457,645 | | | $ | 457,645 | |
Earnest Student Loan Program LLC, Series 2016-C, Class A2 (a)
2.680% 7/25/35 | | | 578,997 | | | | 562,832 | |
Earnest Student Loan Program LLC, Series 2016-D, Class A2 (a)
2.720% 1/25/41 | | | 533,861 | | | | 525,214 | |
ECMC Group Student Loan Trust, Series 2016-1A, Class A, 1 mo. USD LIBOR + 1.350%, FRN (a)
1.942% 7/26/66 | | | 622,074 | | | | 620,239 | |
Education Funding Capital Trust I, Series 2004-1, Class A4, 28 Day ARS, FRN
1.943% 6/15/43 | | | 250,000 | | | | 248,890 | |
Education Loan Asset-Backed Trust I, Series 2013-1, Class A1, 1 mo. USD LIBOR + .800%, FRN (a)
1.392% 6/25/26 | | | 723,025 | | | | 715,590 | |
GCO Education Loan Funding Trust, Series 2007-1A, Class A5L, 3 mo. LIBOR + .070%, FRN (a)
1.000% 5/25/23 | | | 10,677 | | | | 10,666 | |
Higher Education Funding I, Series 2004-1, Class B1, 28 Day ARS, FRN (a)
0.350% 1/01/44 | | | 950,000 | | | | 827,015 | |
KeyCorp Student Loan Trust, Series 2006-A, Class 2A4, 3 mo. USD LIBOR + .310%, FRN
1.162% 9/27/35 | | | 171,598 | | | | 169,825 | |
KeyCorp Student Loan Trust, Series 2004-A, Class 2A2, 3 mo. USD LIBOR + .300%, FRN
1.186% 10/28/41 | | | 16,181 | | | | 16,146 | |
National Collegiate Student Loan Trust, Series 2005-1, Class A4, 1 mo. USD LIBOR + .240%, FRN
0.824% 11/27/28 | | | 79,235 | | | | 78,672 | |
Navient Private Education Loan Trust, Series 2015-BA, Class A1, 1 mo. USD LIBOR + .600%, FRN (a)
1.304% 5/15/23 | | | 1,949 | | | | 1,949 | |
Navient Private Education Loan Trust, Series 2014-AA, Class A2A (a)
2.740% 2/15/29 | | | 330,292 | | | | 327,287 | |
Navient Student Loan Trust, Series 2016-5A, Class A, 1 mo. USD LIBOR + 1.250%, FRN (a)
1.000% 6/25/65 | | | 880,501 | | | | 893,411 | |
| | | | | | | | |
| | | Principal
Amount | | | Value | |
Navient Student Loan Trust, Series 2016-6A, Class A3, 1 mo. USD LIBOR + 1.300%, FRN (a)
1.820% 3/25/66 | | $ | 1,060,000 | | | $ | 1,060,009 | |
Nelnet Private Education Loan Trust, Series 2016-A, Class A1A, 1 mo. USD LIBOR + 1.750%, FRN (a)
2.370% 12/26/40 | | | 500,000 | | | | 499,849 | |
Nelnet Private Education Loan Trust, Series 2016-A, Class A1B (a)
3.600% 12/26/40 | | | 360,000 | | | | 359,580 | |
Nelnet Student Loan Trust, Series 2014-6A, Class A, 1 mo. USD LIBOR + .650%, FRN (a)
0.831% 11/25/52 | | | 416,202 | | | | 404,595 | |
Nelnet Student Loan Trust, Series 2015-3A, Class B, 1 mo. USD LIBOR + 1.500%, FRN (a)
2.084% 6/25/54 | | | 130,000 | | | | 112,741 | |
Nelnet Student Loan Trust, Series 2014-1A, Class B, 1 mo. USD LIBOR + 1.500%, FRN (a)
2.092% 10/25/47 | | | 170,000 | | | | 151,429 | |
North Carolina State Education Assistance Authority, Series 2011-1, Class A2, 3 mo. USD LIBOR + .900%, FRN
1.614% 1/26/26 | | | 109,071 | | | | 108,897 | |
Northstar Education Finance, Inc., Series 2005-1, Class A5, 3 mo. LIBOR + .750%, FRN
1.640% 10/30/45 | | | 269,368 | | | | 255,563 | |
PHEAA Student Loan Trust, Series 2016-2A, Class A, 1 mo. USD LIBOR + .950%, FRN (a)
1.505% 11/25/65 | | | 810,000 | | | | 809,897 | |
SLC Private Student Loan Trust, Series 2006-A, Class A5, 3 mo. USD LIBOR + .170%, FRN
1.050% 7/15/36 | | | 71,098 | | | | 71,064 | |
SLM Student Loan Trust, Series 2007-5, Class A6, 3 mo. USD LIBOR + .110%, FRN
0.992% 1/26/43 | | | 120,000 | | | | 104,131 | |
SLM Student Loan Trust, Series 2005-5, Class A4, 3 mo. USD LIBOR + .140%, FRN
1.022% 10/25/28 | | | 280,000 | | | | 272,421 | |
SLM Student Loan Trust, Series 2006-5, Class B, 3 mo. USD LIBOR + .210%, FRN
1.092% 10/25/40 | | | 533,357 | | | | 459,831 | |
The accompanying notes are an integral part of the financial statements.
79
MML Short-Duration Bond Fund – Portfolio of Investments (Continued)
| | | | | | | | |
| | | Principal
Amount | | | Value | |
SLM Student Loan Trust, Series 2006-10, Class B, 3 mo. USD LIBOR + .220%, FRN
1.102% 3/25/44 | | $ | 150,476 | | | $ | 124,297 | |
SLM Student Loan Trust, Series 2003-14, Class A6, 3 mo. USD LIBOR + .300%, FRN
1.182% 7/25/25 | | | 150,000 | | | | 146,741 | |
SLM Student Loan Trust, Series 2005-8, Class B, 3 mo. USD LIBOR + .310%, FRN
1.192% 1/25/40 | | | 221,982 | | | | 190,081 | |
SLM Student Loan Trust, Series 2012-A, Class A1, 1 mo. USD LIBOR + 1.400%, FRN (a)
2.104% 8/15/25 | | | 15,265 | | | | 15,277 | |
SLM Student Loan Trust, Series 2013-4, Class B, 1 mo. USD LIBOR + 1.500%, FRN
2.256% 12/28/43 | | | 120,000 | | | | 103,666 | |
SLM Student Loan Trust, Series 2003-5, Class A7, 28 Day ARS, FRN
2.950% 6/17/30 | | | 50,000 | | | | 50,000 | |
SMB Private Education Loan Trust, Series 2016-A, Class A1, 1 mo. USD LIBOR + .700%, FRN (a)
1.404% 5/15/23 | | | 452,942 | | | | 453,716 | |
SMB Private Education Loan Trust, Series 2016-C, Class A2B, 1 mo. USD LIBOR + 1.100%, FRN (a)
1.804% 9/15/34 | | | 290,000 | | | | 290,006 | |
SMB Private Education Loan Trust, Series 2016-B, Class A2B, 1 mo. USD LIBOR + 1.450%, FRN (a)
2.154% 2/17/32 | | | 144,000 | | | | 144,000 | |
SoFi Professional Loan Program LLC, Series 2016-D, Class A1, 1 mo. USD LIBOR + .950%, FRN (a)
1.534% 1/25/39 | | | 210,016 | | | | 210,699 | |
SoFi Professional Loan Program LLC, Series 2016-B, Class A2A (a)
1.680% 3/25/31 | | | 282,050 | | | | 281,487 | |
SoFi Professional Loan Program LLC, Series 2016-B, Class A1, 1 mo. USD LIBOR + 1.200%, FRN (a)
1.784% 6/25/33 | | | 347,914 | | | | 351,701 | |
SoFi Professional Loan Program LLC, Series 2016-A, Class A1, 1 mo.
USD LIBOR + 1.750%, FRN (a)
2.342% 8/25/36 | | | 340,988 | | | | 351,037 | |
| | | | | | | | |
| | | Principal
Amount | | | Value | |
SoFi Professional Loan Program LLC, Series 2016-E, Class A2B (a)
2.490% 1/25/36 | | $ | 330,000 | | | $ | 327,040 | |
| | | | | | | | |
| | | | | | | 18,084,708 | |
| | | | | | | | |
| WL Collateral CMO — 1.8% | | | | | | | | |
Bank of America Mortgage Securities, Series 2004-G, Class 2A7, VRN
3.303% 8/25/34 | | | 11,640 | | | | 11,484 | |
Connecticut Avenue Securities,
Series 2015-C02, Class 1M1, 1 mo.
USD LIBOR + 1.150%, FRN
1.742% 5/25/25 | | | 17,123 | | | | 17,125 | |
Connecticut Avenue Securities,
Series 2015-C03, Class 1M1, 1 mo.
USD LIBOR + 1.500%, FRN
2.092% 7/25/25 | | | 178,838 | | | | 179,044 | |
Connecticut Avenue Securities,
Series 2015-C04, Class 1M1, 1 mo.
USD LIBOR + 1.600%, FRN
2.192% 4/25/28 | | | 222,745 | | | | 223,165 | |
Countrywide Home Loans, Inc.,
Series 2004-2, Class 1A1, VRN
2.935% 2/25/34 | | | 3,552 | | | | 3,509 | |
Countrywide Home Loans, Inc.,
Series 2003-42, Class 1A1, VRN
3.294% 9/25/33 | | | 1,427 | | | | 1,351 | |
Federal National Mortgage Association Connecticut Avenue Securities,
Series 2016-C06, Class 1M1, 1 mo.
USD LIBOR + 1.300%, FRN
1.892% 4/25/29 | | | 445,741 | | | | 447,931 | |
Federal National Mortgage Association Connecticut Avenue Securities,
Series 2016-C05, Class 2M1, 1 mo.
USD LIBOR + 1.350%, FRN
1.942% 1/25/29 | | | 758,087 | | | | 759,778 | |
Federal National Mortgage Association Connecticut Avenue Securities,
Series 2016-C04, Class 1M1, 1 mo.
USD LIBOR + 1.450%, FRN
2.042% 1/25/29 | | | 722,330 | | | | 725,202 | |
GSR Mortgage Loan Trust, Series 2004-9, Class 2A1, VRN
3.285% 8/25/34 | | | 2,198 | | | | 2,212 | |
IndyMac Index Mortgage Loan Trust, Series 2004-AR4, Class 1A, VRN
2.936% 8/25/34 | | | 10,788 | | | | 9,760 | |
Merrill Lynch Mortgage Investors, Inc., Series 2005-A8, Class A3A2, 1 mo.
USD LIBOR + .250%, FRN
1.006% 8/25/36 | | | 768 | | | | 767 | |
The accompanying notes are an integral part of the financial statements.
80
MML Short-Duration Bond Fund – Portfolio of Investments (Continued)
| | | | | | | | |
| | | Principal
Amount | | | Value | |
Merrill Lynch Mortgage Investors, Inc., Series 2003-A4, Class IA, VRN
3.097% 7/25/33 | | $ | 783 | | | $ | 798 | |
Merrill Lynch Mortgage Investors, Inc., Series 2004-A1, Class IA, VRN
3.315% 2/25/34 | | | 1,389 | | | | 1,407 | |
Morgan Stanley Mortgage Loan Trust, Series 2004-2AR, Class 1A, VRN
2.875% 2/25/34 | | | 46 | | | | 48 | |
New Residential Mortgage Loan Trust, Series 2016-4A, Class A1, VRN (a)
3.750% 11/25/56 | | | 488,542 | | | | 503,557 | |
Shellpoint Co-Originator Trust,
Series 2016-1, Class 2A3, VRN (a)
3.000% 10/25/31 | | | 1,064,721 | | | | 1,060,935 | |
Structured Adjustable Rate Mortgage Loan Trust, Series 2004-2, Class 2A, VRN
3.055% 3/25/34 | | | 7,589 | | | | 7,742 | |
Structured Agency Credit Risk Debt Notes, Series 2015-DNA1, Class M1, 1 mo. USD LIBOR + .900%, FRN
1.484% 10/25/27 | | | 145,588 | | | | 145,682 | |
Structured Agency Credit Risk Debt Notes, Series 2016-DNA1, Class M1, 1 mo. USD LIBOR + 1.450%, FRN
2.034% 7/25/28 | | | 170,776 | | | | 171,231 | |
Washington Mutual Mortgage Pass-Through Certificates, Series 2004-AR2, Class A, 12 mo. MTA + 1.400%, FRN
1.967% 4/25/44 | | | 16,410 | | | | 16,160 | |
| | | | | | | | |
| | | | | | | 4,288,888 | |
| | | | | | | | |
| WL Collateral PAC — 0.0% | | | | | | | | |
Structured Asset Securities Corp.,
Series 2002-11A, Class 2A1, VRN
3.355% 6/25/32 | | | 4,559 | | | | 4,496 | |
| | | | | | | | |
| | |
TOTAL NON-U.S. GOVERNMENT AGENCY OBLIGATIONS
(Cost $92,308,151) | | | | | | | 91,306,327 | |
| | | | | | | | |
|
| U.S. GOVERNMENT AGENCY OBLIGATIONS AND INSTRUMENTALITIES — 4.8% | |
| Agency Collateral CMO — 4.7% | | | | | |
Federal Home Loan Mortgage Corp. | |
Series 4291, Class K
3.000% 5/15/38 | | | 717,486 | | | | 723,666 | |
Series 4447, Class PA
3.000% 12/15/44 | | | 198,277 | | | | 202,094 | |
Series 3990, Class VA
3.500% 1/15/25 | | | 515,603 | | | | 538,225 | |
| | | | | | | | |
| | | Principal
Amount | | | Value | |
Series 4213, Class VE
3.500% 6/15/26 | | $ | 456,383 | | | $ | 473,660 | |
Series 4290, Class CA
3.500% 12/15/38 | | | 1,016,412 | | | | 1,042,779 | |
Series 4443, Class BA
3.500% 4/15/41 | | | 250,714 | | | | 256,456 | |
Series 4328, Class DA
4.000% 1/15/36 | | | 850,601 | | | | 885,094 | |
Series 4325, Class MA
4.000% 9/15/39 | | | 1,002,451 | | | | 1,042,357 | |
Series 4336, Class MA
4.000% 1/15/40 | | | 1,543,496 | | | | 1,605,683 | |
Series 4323, Class CA
4.000% 3/15/40 | | | 551,799 | | | | 575,265 | |
Series 2178, Class PB
7.000% 8/15/29 | | | 13,380 | | | | 15,021 | |
Federal National Mortgage Association | |
Series 2016-62, Class FC
1.256% 9/25/46 1 mo. LIBOR + .500%, FRN | | | 541,875 | | | | 538,627 | |
Series 2016-74, Class GF
1.256% 10/25/46 1 mo. LIBOR + .500%, FRN | | | 837,567 | | | | 832,267 | |
Series 2015-58, Class JP
2.500% 3/25/37 | | | 340,845 | | | | 340,912 | |
Series 2015-20, Class EV
3.500% 7/25/26 | | | 520,980 | | | | 541,905 | |
Series 2014-14, Class A
3.500% 2/25/37 | | | 536,468 | | | | 549,854 | |
Series 2015-62, Class VA
4.000% 10/25/26 | | | 152,288 | | | | 161,152 | |
Series 2014-48, Class AB
4.000% 10/25/40 | | | 466,793 | | | | 485,522 | |
Government National Mortgage Association, Series 2014-131, Class BW VRN
2.990% 5/20/41 | | | 212,171 | | | | 216,325 | |
U.S. Department of Veteran Affairs,
Series 1992-1, Class 2Z
7.750% 5/15/22 | | | 12,804 | | | | 14,045 | |
| | | | | | | | |
| | | | | | | 11,040,909 | |
| | | | | | | | |
Pass-Through Securities — 0.1% | | | | | |
Federal Home Loan Mortgage Corp. | |
Pool #G11431 6.000%
2/01/18 | | | 106 | | | | 107 | |
Pool #C01079 7.500%
10/01/30 | | | 450 | | | | 529 | |
Pool #C01135 7.500%
2/01/31 | | | 1,335 | | | | 1,568 | |
The accompanying notes are an integral part of the financial statements.
81
MML Short-Duration Bond Fund – Portfolio of Investments (Continued)
| | | | | | | | |
| | | Principal
Amount | | | Value | |
Federal National Mortgage Association | | | | | | | | |
Pool #725692 2.704%
10/01/33 1 year CMT + 2.144%, FRN | | $ | 36,718 | | | $ | 38,550 | |
Pool #888586 2.752%
10/01/34 1 year CMT + 2.205%, FRN | | | 31,102 | | | | 32,714 | |
Pool #775539 2.850%
5/01/34 12 mo. USD LIBOR + 1.645%, FRN | | | 9,455 | | | | 9,893 | |
Pool #575667 7.000%
3/01/31 | | | 2,522 | | | | 2,946 | |
Pool #497120 7.500%
8/01/29 | | | 21 | | | | 25 | |
Pool #529453 7.500%
1/01/30 | | | 548 | | | | 650 | |
Pool #531196 7.500%
2/01/30 | | | 73 | | | | 86 | |
Pool #532418 7.500%
2/01/30 | | | 844 | | | | 1,000 | |
Pool #530299 7.500%
3/01/30 | | | 78 | | | | 90 | |
Pool #536386 7.500%
4/01/30 | | | 92 | | | | 108 | |
Pool #535996 7.500%
6/01/31 | | | 1,794 | | | | 2,112 | |
Pool #523499 8.000%
11/01/29 | | | 59 | | | | 71 | |
Pool #252926 8.000%
12/01/29 | | | 41 | | | | 49 | |
Pool #532819 8.000%
3/01/30 | | | 47 | | | | 57 | |
Pool #534703 8.000%
5/01/30 | | | 562 | | | | 672 | |
Pool #253437 8.000%
9/01/30 | | | 42 | | | | 50 | |
Pool #253481 8.000%
10/01/30 | | | 20 | | | | 24 | |
Pool #602008 8.000%
8/01/31 | | | 1,181 | | | | 1,410 | |
Pool #190317 8.000%
8/01/31 | | | 862 | | | | 1,031 | |
Pool #596656 8.000%
8/01/31 | | | 407 | | | | 443 | |
Pool #597220 8.000%
9/01/31 | | | 673 | | | | 806 | |
Government National Mortgage Association | |
Pool #371146 7.000%
9/15/23 | | | 337 | | | | 374 | |
Pool #352022 7.000%
11/15/23 | | | 1,705 | | | | 1,905 | |
Pool #491089 7.000%
12/15/28 | | | 2,030 | | | | 2,314 | |
Pool #478658 7.000%
5/15/29 | | | 458 | | | | 537 | |
| | | | | | | | |
| | | Principal
Amount | | | Value | |
Pool #500928 7.000%
5/15/29 | | $ | 882 | | | $ | 1,033 | |
Pool #499410 7.000%
7/15/29 | | | 265 | | | | 312 | |
Pool #510083 7.000%
7/15/29 | | | 299 | | | | 349 | |
Pool #493723 7.000%
8/15/29 | | | 1,407 | | | | 1,652 | |
Pool #581417 7.000%
7/15/32 | | | 4,891 | | | | 5,744 | |
Pool #203940 7.500%
4/15/17 | | | 41 | | | | 42 | |
Pool #193870 7.500%
5/15/17 | | | 107 | | | | 107 | |
Pool #226163 7.500%
7/15/17 | | | 225 | | | | 227 | |
Government National Mortgage Association II | | | | | | | | |
Pool #008746 2.000%
11/20/25 1 year CMT + 1.500%, FRN | | | 1,124 | | | | 1,147 | |
Pool #080136 2.000%
11/20/27 1 year CMT + 1.500%, FRN | | | 211 | | | | 216 | |
Pool #82462 2.000%
1/20/40 1 year CMT + 1.500%, FRN | | | 87,328 | | | | 90,653 | |
Pool #82488 2.000%
3/20/40 1 year CMT + 1.500%, FRN | | | 108,870 | | | | 112,330 | |
| | | | | | | | |
| | | | | | | 313,933 | |
| | | | | | | | |
| | |
TOTAL U.S. GOVERNMENT
AGENCY OBLIGATIONS AND INSTRUMENTALITIES
(Cost $11,615,427) | | | | | | | 11,354,842 | |
| | | | | | | | |
| U.S. TREASURY OBLIGATIONS — 12.0% | |
| U.S. Treasury Bonds & Notes — 12.0% | |
U.S. Treasury Inflation Index
0.125% 4/15/21 | | | 2,345,632 | | | | 2,359,056 | |
U.S. Treasury Note
0.625% 6/30/18 | | | 6,200,000 | | | | 6,161,007 | |
U.S. Treasury Note
0.750% 10/31/18 | | | 5,500,000 | | | | 5,460,281 | |
U.S. Treasury Note (b)
0.875% 7/31/19 | | | 6,800,000 | | | | 6,720,844 | |
The accompanying notes are an integral part of the financial statements.
82
MML Short-Duration Bond Fund – Portfolio of Investments (Continued)
| | | | | | | | |
| | | Principal
Amount | | | Value | |
U.S. Treasury Note
1.750% 10/31/18 | | $ | 7,470,000 | | | $ | 7,548,822 | |
| | | | | | | | |
| | | | | | | 28,250,010 | |
| | | | | | | | |
| | |
TOTAL U.S. TREASURY
OBLIGATIONS
(Cost $28,407,958) | | | | | | | 28,250,010 | |
| | | | | | | | |
| | |
TOTAL BONDS & NOTES
(Cost $232,390,684) | | | | | | | 231,546,922 | |
| | | | | | | | |
| | |
TOTAL LONG-TERM
INVESTMENTS
(Cost $232,390,684) | | | | | | | 231,546,922 | |
| | | | | | | | |
|
| SHORT-TERM INVESTMENTS — 1.1% | |
| Commercial Paper — 0.9% | | | | | | | | |
Kroger Co. (a)
0.900% 1/03/17 | | | 2,000,000 | | | | 1,999,830 | |
| | | | | | | | |
| Time Deposit — 0.2% | | | | | | | | |
Euro Time Deposit
0.010% 1/03/17 | | | 369,933 | | | | 369,933 | |
| | | | | | | | |
| | |
TOTAL SHORT-TERM
INVESTMENTS
(Cost $2,369,833) | | | | | | | 2,369,763 | |
| | | | | | | | |
| | |
TOTAL INVESTMENTS — 99.5%
(Cost $234,760,517) (c) | | | | | | | 233,916,685 | |
| | |
| Other Assets/(Liabilities) — 0.5% | | | | | | | 1,163,598 | |
| | | | | | | | |
| | |
| NET ASSETS — 100.0% | | | | | | $ | 235,080,283 | |
| | | | | | | | |
Notes to Portfolio of Investments
Percentages are stated as a percent of net assets.
| CLO | Collateralized Loan Obligation |
| CMO | Collateralized Mortgage Obligation |
| CMT | Constant Maturity Treasury Index |
| MBS | Mortgage-Backed Security |
| MTA | Monthly Treasury Average Index |
| PAC | Planned Amortization Class |
| (a) | Securities exempt from registration under rule 144A of the Securities Act of 1933. These securities may be resold in transactions exempt from registration, normally to qualified institutional buyers. At December 31, 2016, these securities amounted to a value of $96,304,993 or 40.97% of net assets. |
| (b) | A portion of this security is pledged as collateral for open futures contracts and pledged for open swaps agreements. (Note 2). |
| (c) | See Note 6 for aggregate cost for federal tax purposes. |
Country weightings, as a percentage of net assets, is as follows:
| | | | |
United States | | | 83.9 | % |
Cayman Islands | | | 5.0 | % |
Netherlands | | | 2.2 | % |
Luxembourg | | | 1.1 | % |
Ireland | | | 1.0 | % |
Japan | | | 0.7 | % |
Canada | | | 0.7 | % |
France | | | 0.6 | % |
Austria | | | 0.6 | % |
United Kingdom | | | 0.6 | % |
New Zealand | | | 0.6 | % |
Mexico | | | 0.4 | % |
Australia | | | 0.3 | % |
Colombia | | | 0.2 | % |
Turkey | | | 0.2 | % |
Brazil | | | 0.1 | % |
Barbados | | | 0.1 | % |
United States Virgin Islands | | | 0.1 | % |
Bermuda | | | 0.0 | % |
| | | | |
Total Long-Term Investments | | | 98.4 | % |
Short-Term Investments and Other Assets and Liabilities | | | 1.6 | % |
| | | | |
Net Assets | | | 100.0 | % |
| | | | |
The accompanying notes are an integral part of the financial statements.
83
MML Small Cap Equity Fund – Portfolio of Investments
December 31, 2016
| | | | | | | | |
| | | Number of
Shares | | | Value | |
| EQUITIES — 97.6% | |
|
| COMMON STOCK — 97.6% | |
| Basic Materials — 4.3% | |
| Chemicals — 0.7% | |
Ingevity Corp. (a) | | | 15,050 | | | $ | 825,643 | |
| | | | | | | | |
| Forest Products & Paper — 1.6% | |
P.H. Glatfelter Co. | | | 71,980 | | | | 1,719,602 | |
| | | | | | | | |
| Mining — 2.0% | |
Century Aluminum Co. (a) | | | 62,840 | | | | 537,911 | |
Kaiser Aluminum Corp. | | | 21,810 | | | | 1,694,419 | |
| | | | | | | | |
| | | | | | | 2,232,330 | |
| | | | | | | | |
| | | | | | | 4,777,575 | |
| | | | | | | | |
| Communications — 2.5% | |
| Internet — 1.4% | |
Yelp, Inc. (a) | | | 18,130 | | | | 691,297 | |
Zynga, Inc. Class A (a) | | | 335,700 | | | | 862,749 | |
| | | | | | | | |
| | | | | | | 1,554,046 | |
| | | | | | | | |
| Media — 0.5% | |
Houghton Mifflin Harcourt Co. (a) | | | 52,470 | | | | 569,300 | |
| | | | | | | | |
| Telecommunications — 0.6% | |
RigNet, Inc. (a) | | | 29,770 | | | | 689,175 | |
| | | | | | | | |
| | | | | | | 2,812,521 | |
| | | | | | | | |
| Consumer, Cyclical — 13.4% | |
| Airlines — 1.4% | |
Spirit Airlines, Inc. (a) | | | 26,010 | | | | 1,504,939 | |
| | | | | | | | |
| Automotive & Parts — 1.2% | |
Visteon Corp. | | | 16,390 | | | | 1,316,773 | |
| | | | | | | | |
| Distribution & Wholesale — 0.5% | |
SiteOne Landscape Supply, Inc. (a) | | | 16,830 | | | | 584,506 | |
| | | | | | | | |
| Entertainment — 0.9% | |
International Speedway Corp. Class A | | | 5,470 | | | | 201,296 | |
The Madison Square Garden Co. Class A (a) | | | 4,680 | | | | 802,667 | |
| | | | | | | | |
| | | | | | | 1,003,963 | |
| | | | | | | | |
| Retail — 8.7% | |
Burlington Stores, Inc. (a) | | | 12,500 | | | | 1,059,375 | |
DSW, Inc. Class A | | | 36,420 | | | | 824,913 | |
Group 1 Automotive, Inc. | | | 22,980 | | | | 1,791,061 | |
Popeyes Louisiana Kitchen, Inc. (a) | | | 24,630 | | | | 1,489,622 | |
Sally Beauty Holdings, Inc. (a) | | | 54,060 | | | | 1,428,265 | |
Sonic Corp. | | | 70,100 | | | | 1,858,351 | |
Texas Roadhouse, Inc. | | | 25,870 | | | | 1,247,969 | |
| | | | | | | | |
| | | | | | | 9,699,556 | |
| | | | | | | | |
| Storage & Warehousing — 0.7% | |
Wesco Aircraft Holdings, Inc. (a) | | | 53,950 | | | | 806,552 | |
| | | | | | | | |
| | | | | | | 14,916,289 | |
| | | | | | | | |
| | | | | | | | |
| | | Number of
Shares | | | Value | |
| Consumer, Non-cyclical — 24.3% | |
| Beverages — 0.7% | |
The Boston Beer Co., Inc. Class A (a) (b) | | | 4,920 | | | $ | 835,662 | |
| | | | | | | | |
| Biotechnology — 1.1% | |
Exelixis, Inc. (a) | | | 10,230 | | | | 152,529 | |
Sage Therapeutics, Inc. (a) (b) | | | 8,670 | | | | 442,690 | |
Ultragenyx Pharmaceutical, Inc. (a) (b) | | | 8,370 | | | | 588,495 | |
| | | | | | | | |
| | | | | | | 1,183,714 | |
| | | | | | | | |
| Commercial Services — 9.2% | |
ABM Industries, Inc. | | | 39,950 | | | | 1,631,558 | |
Booz Allen Hamilton Holding Corp. | | | 33,030 | | | | 1,191,392 | |
James River Group Holdings Ltd. | | | 33,700 | | | | 1,400,235 | |
Korn/Ferry International | | | 84,281 | | | | 2,480,390 | |
On Assignment, Inc. (a) | | | 55,830 | | | | 2,465,453 | |
Paylocity Holding Corp. (a) | | | 33,890 | | | | 1,017,039 | |
| | | | | | | | |
| | | | | | | 10,186,067 | |
| | | | | | | | |
| Foods — 1.0% | |
Pinnacle Foods, Inc. | | | 21,240 | | | | 1,135,278 | |
| | | | | | | | |
| Health Care – Products — 3.1% | |
Intersect ENT, Inc. (a) | | | 30,870 | | | | 373,527 | |
NuVasive, Inc. (a) | | | 15,360 | | | | 1,034,649 | |
NxStage Medical, Inc. (a) | | | 45,470 | | | | 1,191,769 | |
The Spectranetics Corp. (a) | | | 34,230 | | | | 838,635 | |
| | | | | | | | |
| | | | | | | 3,438,580 | |
| | | | | | | | |
| Health Care – Services — 3.4% | |
Addus HomeCare Corp. (a) | | | 11,440 | | | | 400,972 | |
Amedisys, Inc. (a) | | | 22,460 | | | | 957,470 | |
HealthSouth Corp. | | | 31,701 | | | | 1,307,349 | |
WellCare Health Plans, Inc. (a) | | | 8,113 | | | | 1,112,130 | |
| | | | | | | | |
| | | | | | | 3,777,921 | |
| | | | | | | | |
| Household Products — 3.5% | |
Acco Brands Corp. (a) | | | 121,410 | | | | 1,584,401 | |
Prestige Brands Holdings, Inc. (a) | | | 43,981 | | | | 2,291,410 | |
| | | | | | | | |
| | | | | | | 3,875,811 | |
| | | | | | | | |
| Pharmaceuticals — 2.3% | |
Acadia Pharmaceuticals, Inc. (a) (b) | | | 16,500 | | | | 475,860 | |
Akorn, Inc. (a) | | | 15,210 | | | | 332,034 | |
Axovant Sciences Ltd. (a) | | | 16,130 | | | | 200,335 | |
Clovis Oncology, Inc. (a) (b) | | | 7,980 | | | | 354,472 | |
TherapeuticsMD, Inc. (a) (b) | | | 78,030 | | | | 450,233 | |
VWR Corp. (a) | | | 29,820 | | | | 746,394 | |
| | | | | | | | |
| | | | | | | 2,559,328 | |
| | | | | | | | |
| | | | | | | 26,992,361 | |
| | | | | | | | |
The accompanying notes are an integral part of the financial statements.
84
MML Small Cap Equity Fund – Portfolio of Investments (Continued)
| | | | | | | | |
| | | Number of
Shares | | | Value | |
| Diversified — 0.7% | |
| Holding Company – Diversified — 0.7% | |
FCB Financial Holdings, Inc. Class A (a) | | | 16,850 | | | $ | 803,745 | |
| | | | | | | | |
| Energy — 4.9% | |
| Energy – Alternate Sources — 1.0% | |
Renewable Energy Group, Inc. (a) | | | 111,519 | | | | 1,081,734 | |
| | | | | | | | |
| Oil & Gas — 1.3% | |
Matador Resources Co. (a) (b) | | | 20,946 | | | | 539,569 | |
Suburban Propane Partners LP | | | 28,830 | | | | 866,630 | |
| | | | | | | | |
| | | | | | | 1,406,199 | |
| | | | | | | | |
| Oil & Gas Services — 1.2% | |
HollyFrontier Corp. | | | 42,388 | | | | 1,388,631 | |
| | | | | | | | |
| Pipelines — 1.4% | |
Cone Midstream Partners LP | | | 37,010 | | | | 871,585 | |
Noble Midstream Partners LP (a) | | | 19,275 | | | | 693,900 | |
| | | | | | | | |
| | | | | | | 1,565,485 | |
| | | | | | | | |
| | | | | | | 5,442,049 | |
| | | | | | | | |
| Financial — 21.1% | |
| Banks — 7.0% | |
Chemical Financial Corp. | | | 20,132 | | | | 1,090,550 | |
Customers Bancorp, Inc. (a) | | | 22,500 | | | | 805,950 | |
IBERIABANK Corp. | | | 20,710 | | | | 1,734,463 | |
MB Financial, Inc. | | | 48,170 | | | | 2,275,069 | |
Webster Financial Corp. | | | 34,710 | | | | 1,884,059 | |
| | | | | | | | |
| | | | | | | 7,790,091 | |
| | | | | | | | |
| Diversified Financial — 1.0% | |
Stifel Financial Corp. (a) | | | 21,770 | | | | 1,087,412 | |
| | | | | | | | |
| Real Estate — 2.0% | |
Four Corners Property Trust, Inc. | | | 69,160 | | | | 1,419,163 | |
Realogy Holdings Corp. | | | 33,310 | | | | 857,066 | |
| | | | | | | | |
| | | | | | | 2,276,229 | |
| | | | | | | | |
| Real Estate Investment Trusts (REITS) — 6.3% | |
Brandywine Realty Trust | | | 99,670 | | | | 1,645,552 | |
CYS Investments, Inc. | | | 185,060 | | | | 1,430,514 | |
DiamondRock Hospitality Co. | | | 110,780 | | | | 1,277,293 | |
DuPont Fabros Technology, Inc. | | | 29,300 | | | | 1,287,149 | |
National Storage Affiliates Trust | | | 59,830 | | | | 1,320,448 | |
| | | | | | | | |
| | | | | | | 6,960,956 | |
| | | | | | | | |
| Savings & Loans — 4.8% | | | | | | | | |
BankUnited, Inc. | | | 47,209 | | | | 1,779,307 | |
Beneficial Bancorp, Inc. | | | 42,560 | | | | 783,104 | |
Berkshire Hills Bancorp, Inc. | | | 22,520 | | | | 829,862 | |
Oritani Financial Corp. | | | 71,380 | | | | 1,338,375 | |
WSFS Financial Corp. | | | 11,780 | | | | 546,003 | |
| | | | | | | | |
| | | | | | | 5,276,651 | |
| | | | | | | | |
| | | | | | | 23,391,339 | |
| | | | | | | | |
| | | | | | | | |
| | | Number of
Shares | | | Value | |
| Industrial — 12.8% | | | | | | | | |
| Building Materials — 3.2% | | | | | | | | |
Boise Cascade Co. (a) | | | 46,070 | | | $ | 1,036,575 | |
Masonite International Corp. (a) | | | 20,470 | | | | 1,346,926 | |
Summit Materials, Inc. Class A (a) | | | 49,127 | | | | 1,168,723 | |
| | | | | | | | |
| | | | | | | 3,552,224 | |
| | | | | | | | |
| Electrical Components & Equipment — 1.3% | |
Generac Holdings, Inc. (a) | | | 36,110 | | | | 1,471,121 | |
| | | | | | | | |
| Electronics — 0.6% | | | | | | | | |
Vishay Intertechnology, Inc. | | | 44,040 | | | | 713,448 | |
| | | | | | | | |
| Engineering & Construction — 1.9% | |
Dycom Industries, Inc. (a) (b) | | | 13,200 | | | | 1,059,828 | |
KBR, Inc. | | | 62,390 | | | | 1,041,289 | |
| | | | | | | | |
| | | | | | | 2,101,117 | |
| | | | | | | | |
| Environmental Controls — 0.7% | | | | | | | | |
Advanced Disposal Services, Inc. (a) | | | 32,350 | | | | 718,817 | |
| | | | | | | | |
| Machinery – Diversified — 0.5% | | | | | | | | |
The Manitowoc Co., Inc. (a) | | | 94,250 | | | | 563,615 | |
| | | | | | | | |
| Manufacturing — 1.3% | | | | | | | | |
Matthews International Corp. Class A | | | 19,410 | | | | 1,491,658 | |
| | | | | | | | |
| Metal Fabricate & Hardware — 0.8% | |
Rexnord Corp. (a) | | | 42,840 | | | | 839,236 | |
| | | | | | | | |
| Miscellaneous – Manufacturing — 0.6% | |
Hexcel Corp. | | | 13,090 | | | | 673,350 | |
| | | | | | | | |
| Transportation — 1.2% | | | | | | | | |
Genesee & Wyoming, Inc. Class A (a) | | | 19,370 | | | | 1,344,472 | |
| | | | | | | | |
| Trucking & Leasing — 0.7% | | | | | | | | |
The Greenbrier Cos., Inc. (b) | | | 17,890 | | | | 743,329 | |
| | | | | | | | |
| | | | | | | 14,212,387 | |
| | | | | | | | |
| Technology — 11.9% | | | | | | | | |
| Computers — 3.4% | | | | | | | | |
CACI International, Inc. Class A (a) | | | 16,480 | | | | 2,048,464 | |
j2 Global, Inc. | | | 20,491 | | | | 1,676,164 | |
| | | | | | | | |
| | | | | | | 3,724,628 | |
| | | | | | | | |
| Semiconductors — 3.6% | |
Brooks Automation, Inc. | | | 53,260 | | | | 909,148 | |
Cypress Semiconductor Corp. | | | 56,033 | | | | 641,017 | |
MaxLinear, Inc. Class A (a) | | | 50,820 | | | | 1,107,876 | |
MKS Instruments, Inc. | | | 23,300 | | | | 1,384,020 | |
| | | | | | | | |
| | | | | | | 4,042,061 | |
| | | | | | | | |
| Software — 4.9% | |
Black Knight Financial Services, Inc. Class A (a) (b) | | | 35,820 | | | | 1,353,996 | |
Guidewire Software, Inc. (a) | | | 17,880 | | | | 882,020 | |
Pegasystems, Inc. | | | 31,630 | | | | 1,138,680 | |
Proofpoint, Inc. (a) | | | 13,680 | | | | 966,492 | |
The accompanying notes are an integral part of the financial statements.
85
MML Small Cap Equity Fund – Portfolio of Investments (Continued)
| | | | | | | | |
| | | Number of
Shares | | | Value | |
SYNNEX Corp. | | | 9,270 | | | $ | 1,121,856 | |
| | | | | | | | |
| | | | | | | 5,463,044 | |
| | | | | | | | |
| | | | | | | 13,229,733 | |
| | | | | | | | |
| Utilities — 1.7% | |
| Electric — 1.7% | |
Portland General Electric Co. | | | 42,290 | | | | 1,832,426 | |
| | | | | | | | |
| | |
TOTAL COMMON STOCK
(Cost $85,595,717) | | | | | | | 108,410,425 | |
| | | | | |
| | |
TOTAL EQUITIES
(Cost $85,595,717) | | | | | | | 108,410,425 | |
| | | | | |
|
| MUTUAL FUNDS — 5.4% | |
| Diversified Financial — 5.4% | | | | | | | | |
State Street Navigator Securities Lending Prime Portfolio (c)
| | | 5,951,250 | | | | 5,951,250 | |
| | | | | | | | |
| | |
TOTAL MUTUAL FUNDS
(Cost $5,951,250) | | | | | | | 5,951,250 | |
| | | | | |
| | |
TOTAL LONG-TERM INVESTMENTS
(Cost $91,546,967) | | | | | | | 114,361,675 | |
| | | | | |
| | |
| | | Principal
Amount | | | | |
|
| SHORT-TERM INVESTMENTS — 3.4% | |
| Repurchase Agreement — 3.4% | |
State Street Bank & Trust Co. Repurchase Agreement, dated 12/30/16, 0.010%, due 1/03/17 (d) | | $ | 3,763,226 | | | | 3,763,226 | |
| | | | | | | | |
| | |
TOTAL SHORT-TERM INVESTMENTS
(Cost $3,763,226) | | | | | | | 3,763,226 | |
| | | | | |
| | |
TOTAL INVESTMENTS — 106.4%
(Cost $95,310,193) (e) | | | | | | | 118,124,901 | |
| | |
| Other Assets/(Liabilities) — (6.4)% | | | | | | | (7,099,207 | ) |
| | | | | | | | |
| | |
| NET ASSETS — 100.0% | | | | | | $ | 111,025,694 | |
| | | | | | | | |
Notes to Portfolio of Investments
Percentages are stated as a percent of net assets.
| (a) | Non-income producing security. |
| (b) | Denotes all or a portion of security on loan. The total value of securities on loan as of December 31, 2016, was $5,808,886 or 5.23% of net assets. Total securities on loan may not correspond with the amounts identified in the Portfolio of Investments because pending sales may be in the process of recall from the brokers. (Note 2). |
| (c) | Represents investment of security lending collateral. (Note 2). |
| (d) | Maturity value of $3,763,230. Collateralized by U.S. Government Agency obligations with a rate of 3.125%, maturity date of 5/15/21, and an aggregate market value, including accrued interest, of $3,839,305. |
| (e) | See Note 6 for aggregate cost for federal tax purposes. |
The accompanying notes are an integral part of the financial statements.
86
MML Special Situations Fund – Portfolio of Investments
December 31, 2016
| | | | | | | | |
| | | Number of
Shares | | | Value | |
| EQUITIES — 99.0% | |
|
| COMMON STOCK — 99.0% | |
| Basic Materials — 7.6% | |
| Chemicals — 7.0% | |
AdvanSix, Inc. (a) | | | 6,000 | | | $ | 132,840 | |
GCP Applied Technologies, Inc. (a) | | | 20,715 | | | | 554,126 | |
Ingevity Corp. (a) | | | 12,600 | | | | 691,236 | |
| | | | | | | | |
| | | | | | | 1,378,202 | |
| | | | | | | | |
| Mining — 0.6% | |
Alcoa Corp. | | | 4,500 | | | | 126,360 | |
| | | | | | | | |
| | | | | | | 1,504,562 | |
| | | | | | | | |
| Communications — 6.3% | |
| Internet — 0.6% | |
Liberty Expedia Holdings, Inc. Class A (a) | | | 1,360 | | | | 53,951 | |
Liberty Ventures Series A (a) | | | 2,040 | | | | 75,215 | |
| | | | | | | | |
| | | | | | | 129,166 | |
| | | | | | | | |
| Media — 4.8% | |
Cable One, Inc. | | | 500 | | | | 310,865 | |
Liberty Broadband Corp. Class A (a) | | | 3,500 | | | | 253,610 | |
Liberty SiriusXM Group Class A (a) | | | 5,600 | | | | 193,312 | |
Liberty SiriusXM Group Class C (a) | | | 5,600 | | | | 189,952 | |
| | | | | | | | |
| | | | | | | 947,739 | |
| | | | | | | | |
| Telecommunications — 0.9% | |
Windstream Holdings, Inc. | | | 23,800 | | | | 174,454 | |
| | | | | | | | |
| | | | | | | 1,251,359 | |
| | | | | | | | |
| Consumer, Cyclical — 12.5% | |
| Auto Manufacturers — 3.1% | | | | | | | | |
Oshkosh Corp. | | | 9,500 | | | | 613,795 | |
| | | | | | | | |
| Auto Parts & Equipment — 0.3% | |
Adient PLC (a) | | | 1,000 | | | | 58,600 | |
| | | | | | | | |
| Automotive & Parts — 1.3% | |
Allison Transmission Holdings, Inc. | | | 7,600 | | | | 256,044 | |
| | | | | | | | |
| Distribution & Wholesale — 1.6% | |
WESCO International, Inc. (a) | | | 4,750 | | | | 316,113 | |
| | | | | | | | |
| Entertainment — 5.7% | |
Gaming and Leisure Properties, Inc. | | | 13,900 | | | | 425,618 | |
Lions Gate Entertainment Corp. Class B (a) | | | 7,767 | | | | 190,602 | |
The Madison Square Garden Co. Class A (a) | | | 3,010 | | | | 516,245 | |
| | | | | | | | |
| | | | | | | 1,132,465 | |
| | | | | | | | |
| Retail — 0.5% | |
Yum China Holdings, Inc. (a) | | | 3,700 | | | | 96,644 | |
| | | | | | | | |
| | | | | | | 2,473,661 | |
| | | | | | | | |
| | | | | | | | |
| | | Number of
Shares | | | Value | |
| Consumer, Non-cyclical — 15.5% | |
| Biotechnology — 1.5% | |
Gilead Sciences, Inc. | | | 3,400 | | | $ | 243,474 | |
Theravance Biopharma, Inc. (a) | | | 1,800 | | | | 57,384 | |
| | | | | | | | |
| | | | | | | 300,858 | |
| | | | | | | | |
| Commercial Services — 1.1% | |
Global Payments, Inc. | | | 3,200 | | | | 222,112 | |
| | | | | | | | |
| Foods — 2.2% | |
Conagra Brands, Inc. | | | 8,500 | | | | 336,175 | |
Lamb Weston Holdings, Inc. (a) | | | 2,833 | | | | 107,229 | |
| | | | | | | | |
| | | | | | | 443,404 | |
| | | | | | | | |
| Health Care – Products — 2.5% | |
Halyard Health, Inc. (a) | | | 6,100 | | | | 225,578 | |
West Pharmaceutical Services, Inc. | | | 3,100 | | | | 262,973 | |
| | | | | | | | |
| | | | | | | 488,551 | |
| | | | | | | | |
| Household Products — 0.9% | |
Avery Dennison Corp. | | | 2,400 | | | | 168,528 | |
| | | | | | | | |
| Pharmaceuticals — 7.3% | |
AbbVie, Inc. | | | 6,300 | | | | 394,506 | |
Zoetis, Inc. | | | 19,700 | | | | 1,054,541 | |
| | | | | | | | |
| | | | | | | 1,449,047 | |
| | | | | | | | |
| | | | | | | 3,072,500 | |
| | | | | | | | |
| Energy — 1.6% | |
| Oil & Gas — 1.6% | |
Murphy USA, Inc. (a) | | | 5,000 | | | | 307,350 | |
| | | | | | | | |
| Financial — 9.6% | | | | | | | | |
| Diversified Financial — 2.1% | |
Synchrony Financial | | | 11,700 | | | | 424,359 | |
| | | | | | | | |
| Insurance — 0.4% | |
The Travelers Cos., Inc. | | | 700 | | | | 85,694 | |
| | | | | | | | |
| Real Estate — 1.1% | | | | | | | | |
Four Corners Property Trust, Inc. | | | 10,300 | | | | 211,356 | |
| | | | | | | | |
| Real Estate Investment Trusts (REITS) — 3.4% | |
Colony Starwood Homes | | | 7,600 | | | | 218,956 | |
Communications Sales & Leasing, Inc. (a) | | | 6,000 | | | | 152,460 | |
Mack-Cali Realty Corp. | | | 10,600 | | | | 307,612 | |
| | | | | | | | |
| | | | | | | 679,028 | |
| | | | | | | | |
| Savings & Loans — 2.6% | | | | | | | | |
Beneficial Bancorp, Inc. | | | 22,400 | | | | 412,160 | |
Poage Bankshares, Inc. | | | 5,400 | | | | 98,010 | |
| | | | | | | | |
| | | | | | | 510,170 | |
| | | | | | | | |
| | | | | | | 1,910,607 | |
| | | | | | | | |
| Industrial — 23.9% | | | | | | | | |
| Aerospace & Defense — 2.1% | | | | | | | | |
KLX, Inc. (a) | | | 9,000 | | | | 405,990 | |
| | | | | | | | |
The accompanying notes are an integral part of the financial statements.
87
MML Special Situations Fund – Portfolio of Investments (Continued)
| | | | | | | | |
| | | Number of
Shares | | | Value | |
| Building Materials — 1.4% | | | | | | | | |
Armstrong Flooring, Inc. (a) | | | 14,080 | | | $ | 280,333 | |
| | | | | | | | |
| Electrical Components & Equipment — 1.3% | |
Energizer Holdings, Inc. | | | 5,700 | | | | 254,277 | |
| | | | | | | | |
| Electronics — 12.2% | | | | | | | | |
Allegion PLC | | | 8,500 | | | | 544,000 | |
Fortive Corp. | | | 18,100 | | | | 970,703 | |
Kimball Electronics, Inc. (a) | | | 30,483 | | | | 554,790 | |
Knowles Corp. (a) | | | 20,600 | | | | 344,226 | |
| | | | | | | | |
| | | | | | | 2,413,719 | |
| | | | | | | | |
| Machinery – Diversified — 1.6% | | | | | | | | |
AGCO Corp. | | | 5,500 | | | | 318,230 | |
| | | | | | | | |
| Manufacturing — 5.3% | | | | | | | | |
Danaher Corp. | | | 3,500 | | | | 272,440 | |
Pentair PLC | | | 5,200 | | | | 291,564 | |
Trinseo SA | | | 8,300 | | | | 492,190 | |
| | | | | | | | |
| | | | | | | 1,056,194 | |
| | | | | | | | |
| | | | | | | 4,728,743 | |
| | | | | | | | |
| Technology — 19.6% | | | | | | | | |
| Computers — 16.3% | | | | | | | | |
Hewlett Packard Enterprise Co. | | | 36,400 | | | | 842,296 | |
Lumentum Holdings, Inc. (a) | | | 4,500 | | | | 173,925 | |
NCR Corp. (a) | | | 20,000 | | | | 811,200 | |
Science Applications International Corp. | | | 16,600 | | | | 1,407,680 | |
| | | | | | | | |
| | | | | | | 3,235,101 | |
| | | | | | | | |
| Software — 3.3% | | | | | | | | |
CDK Global, Inc. | | | 10,750 | | | | 641,668 | |
| | | | | | | | |
| | | | | | | 3,876,769 | |
| | | | | | | | |
| Utilities — 2.4% | | | | | | | | |
| Gas — 2.4% | | | | | | | | |
ONE Gas, Inc. | | | 7,300 | | | | 466,908 | |
| | | | | | | | |
| | |
TOTAL COMMON STOCK
(Cost $17,502,127) | | | | | | | 19,592,459 | |
| | | | | | | | |
| | |
TOTAL EQUITIES
(Cost $17,502,127) | | | | | | | 19,592,459 | |
| | | | | | | | |
| | |
TOTAL LONG-TERM INVESTMENTS
(Cost $17,502,127) | | | | | | | 19,592,459 | |
| | | | | | | | |
| | | | | | | | |
| | | Principal
Amount | | | Value | |
| SHORT-TERM INVESTMENTS — 1.1% | |
| Repurchase Agreement — 1.1% | |
State Street Bank & Trust Co. Repurchase Agreement, dated 12/30/16, 0.010%, due 1/03/17 (b) | | $ | 221,636 | | | $ | 221,636 | |
| | | | | | | | |
| | |
TOTAL SHORT-TERM INVESTMENTS
(Cost $221,636) | | | | | | | 221,636 | |
| | | | | | | | |
| | |
TOTAL INVESTMENTS — 100.1%
(Cost $17,723,763) (c) | | | | | | | 19,814,095 | |
| | |
| Other Assets/(Liabilities) — (0.1)% | | | | | | | (14,364 | ) |
| | | | | | | | |
| | |
| NET ASSETS — 100.0% | | | | | | $ | 19,799,731 | |
| | | | | |
Notes to Portfolio of Investments
Percentages are stated as a percent of net assets.
| (a) | Non-income producing security. |
| (b) | Maturity value of $221,636. Collateralized by U.S. Government Agency obligations with a rate of 1.625%, maturity date of 4/30/19, and an aggregate market value, including accrued interest, of $227,154. |
| (c) | See Note 6 for aggregate cost for federal tax purposes. |
The accompanying notes are an integral part of the financial statements.
88
MML Strategic Emerging Markets Fund – Portfolio of Investments
December 31, 2016
| | | | | | | | |
| | | Number of
Shares | | | Value | |
| EQUITIES — 94.8% | |
|
| COMMON STOCK — 92.5% | |
| Bermuda — 1.7% | |
Credicorp Ltd. | | | 720 | | | $ | 113,659 | |
Jardine Strategic Holdings Ltd. | | | 45,062 | | | | 1,494,352 | |
| | | | | | | | |
| | | | | | | 1,608,011 | |
| | | | | | | | |
| Brazil — 5.5% | | | | | | | | |
Ambev SA ADR (Brazil) | | | 179,220 | | | | 879,970 | |
BM&FBovespa SA-Bolsa de Valores Mercadorias e Futuros | | | 327,900 | | | | 1,653,128 | |
Cielo SA | | | 10,700 | | | | 91,319 | |
Embraer SA Sponsored ADR (Brazil) | | | 40,860 | | | | 786,555 | |
Estacio Participacoes SA | | | 154,000 | | | | 743,862 | |
Kroton Educacional SA | | | 145,519 | | | | 591,535 | |
Sul America SA | | | 95,900 | | | | 530,557 | |
| | | | | | | | |
| | | | | | | 5,276,926 | |
| | | | | | | | |
| Cayman Islands — 19.4% | | | | | | | | |
3SBio, Inc. (a) (b) | | | 95,000 | | | | 92,350 | |
Alibaba Group Holding Ltd. Sponsored ADR (Cayman Islands) (a) | | | 53,996 | | | | 4,741,389 | |
Baidu, Inc. Sponsored ADR (Cayman Islands) (a) | | | 20,710 | | | | 3,404,931 | |
China Lodging Group Ltd. Sponsored ADR (Cayman Islands) | | | 16,698 | | | | 865,624 | |
Ctrip.com International Ltd. ADR (Cayman Islands) (a) | | | 40,800 | | | | 1,632,000 | |
Melco Crown Entertainment Ltd. ADR (Cayman Islands) | | | 77,370 | | | | 1,230,183 | |
New Oriental Education & Technology Group, Inc. Sponsored ADR (Cayman Islands) (a) | | | 25,650 | | | | 1,079,865 | |
SOHO China Ltd. | | | 586,000 | | | | 287,984 | |
Tencent Holdings Ltd. | | | 173,559 | | | | 4,212,308 | |
Tingyi Cayman Islands Holding Corp. | | | 360,000 | | | | 435,773 | |
Want Want China Holdings Ltd. | | | 1,096,000 | | | | 700,425 | |
| | | | | | | | |
| | | | | | | 18,682,832 | |
| | | | | | | | |
| China — 1.4% | | | | | | | | |
China Pacific Insurance Group Co. Ltd. Class H | | | 64,200 | | | | 222,029 | |
Sinopharm Group Co. Ltd. Class H | | | 276,400 | | | | 1,134,003 | |
| | | | | | | | |
| | | | | | | 1,356,032 | |
| | | | | | | | |
| Colombia — 1.7% | | | | | | | | |
Grupo Aval Acciones y Valores SA (c) | | | 114,310 | | | | 907,622 | |
Grupo de Inversiones Suramericana SA | | | 59,854 | | | | 760,779 | |
| | | | | | | | |
| | | | | | | 1,668,401 | |
| | | | | | | | |
| | | | | | | | |
| | | Number of
Shares | | | Value | |
| Egypt — 0.5% | | | | | | | | |
Commercial International Bank | | | 126,752 | | | $ | 510,713 | |
| | | | | | | | |
| France — 3.4% | | | | | | | | |
Kering | | | 6,725 | | | | 1,507,643 | |
LVMH Moet Hennessy Louis Vuitton SE | | | 9,236 | | | | 1,761,096 | |
| | | | | | | | |
| | | | | | | 3,268,739 | |
| | | | | | | | |
| Hong Kong — 3.1% | | | | | | | | |
AIA Group Ltd. | | | 365,400 | | | | 2,044,875 | |
Hang Lung Group Ltd. | | | 103,000 | | | | 358,059 | |
Hong Kong Exchanges and Clearing Ltd. | | | 26,091 | | | | 613,972 | |
| | | | | | | | |
| | | | | | | 3,016,906 | |
| | | | | | | | |
| India — 14.9% | | | | | | | | |
Apollo Hospitals Enterprise Ltd. | | | 37,798 | | | | 657,526 | |
Asian Paints Ltd. | | | 8,634 | | | | 113,199 | |
Biocon Ltd. | | | 13,255 | | | | 183,985 | |
Cholamandalam Investment and Finance Co. Ltd. | | | 16,236 | | | | 225,373 | |
Dr Reddy’s Laboratories Ltd. | | | 24,756 | | | | 1,113,628 | |
Glenmark Pharmaceuticals Ltd. | | | 38,622 | | | | 505,724 | |
Housing Development Finance Corp. | | | 245,728 | | | | 4,563,446 | |
Infosys Ltd. | | | 175,169 | | | | 2,605,342 | |
Kotak Mahindra Bank Ltd. | | | 91,571 | | | | 968,176 | |
Tata Consultancy Services Ltd. | | | 32,356 | | | | 1,125,205 | |
UltraTech Cement Ltd. | | | 13,794 | | | | 658,138 | |
Zee Entertainment Enterprises Ltd. | | | 237,920 | | | | 1,584,023 | |
| | | | | | | | |
| | | | | | | 14,303,765 | |
| | | | | | | | |
| Indonesia — 2.2% | | | | | | | | |
Astra International Tbk PT | | | 1,316,500 | | | | 805,103 | |
Bank Mandiri Persero Tbk PT | | | 808,200 | | | | 691,087 | |
Indocement Tunggal Prakarsa Tbk PT | | | 382,000 | | | | 435,955 | |
Semen Indonesia Persero Tbk PT | | | 242,000 | | | | 164,105 | |
| | | | | | | | |
| | | | | | | 2,096,250 | |
| | | | | | | | |
| Italy — 1.6% | | | | | | | | |
Prada SpA | | | 448,500 | | | | 1,513,589 | |
| | | | | | | | |
| Japan — 2.3% | | | | | | | | |
Fast Retailing Co., Ltd. | | | 2,800 | | | | 998,975 | |
Murata Manufacturing Co. Ltd. | | | 9,500 | | | | 1,265,088 | |
| | | | | | | | |
| | | | | | | 2,264,063 | |
| | | | | | | | |
| Malaysia — 1.7% | | | | | | | | |
Genting Bhd | | | 671,900 | | | | 1,196,863 | |
Genting Malaysia Bhd | | | 465,700 | | | | 474,805 | |
| | | | | | | | |
| | | | | | | 1,671,668 | |
| | | | | | | | |
| Mexico — 4.6% | | | | | | | | |
Fomento Economico Mexicano SAB de CV | | | 131,246 | | | | 999,018 | |
The accompanying notes are an integral part of the financial statements.
89
MML Strategic Emerging Markets Fund – Portfolio of Investments (Continued)
| | | | | | | | |
| | | Number of
Shares | | | Value | |
Fomento Economico Mexicano SAB de CV, Series B Sponsored ADR (Mexico) | | | 7,670 | | | $ | 584,531 | |
Grupo Aeroportuario del Sureste SAB de CV Class B | | | 37,425 | | | | 538,745 | |
Grupo Financiero Banorte SAB de CV Class O | | | 216,353 | | | | 1,065,606 | |
Grupo Financiero Inbursa SAB de CV Class O | | | 634,115 | | | | 961,130 | |
Kimberly-Clark de Mexico SAB de CV Class A (Mexico) | | | 131,268 | | | | 236,388 | |
| | | | | | | | |
| | | | | | | 4,385,418 | |
| | | | | | | | |
| Nigeria — 0.6% | | | | | | | | |
Nigerian Breweries PLC | | | 732,161 | | | | 343,005 | |
Zenith Bank PLC | | | 4,544,220 | | | | 209,158 | |
| | | | | | | | |
| | | | | | | 552,163 | |
| | | | | | | | |
| Philippines — 3.4% | | | | | | | | |
Ayala Land, Inc. | | | 606,700 | | | | 390,076 | |
BDO Unibank, Inc. | | | 46,960 | | | | 105,786 | |
Jollibee Foods Corp. | | | 148,270 | | | | 577,361 | |
SM Investments Corp. | | | 91,935 | | | | 1,209,218 | |
SM Prime Holdings, Inc. | | | 1,715,500 | | | | 976,432 | |
| | | | | | | | |
| | | | | | | 3,258,873 | |
| | | | | | | | |
| Poland — 1.0% | | | | | | | | |
Bank Pekao SA | | | 33,029 | | | | 992,906 | |
| | | | | | | | |
| Republic of Korea — 2.2% | | | | | | | | |
LG Household & Health Care Ltd. | | | 1,184 | | | | 838,914 | |
NAVER Corp. | | | 1,595 | | | | 1,021,553 | |
Samsung Biologics Co. Ltd. (a) | | | 1,757 | | | | 219,661 | |
| | | | | | | | |
| | | | | | | 2,080,128 | |
| | | | | | | | |
| Russia — 9.4% | | | | | | | | |
Alrosa AO (a) | | | 502,127 | | | | 792,841 | |
Magnit OJSC (a) | | | 20,269 | | | | 3,622,944 | |
NovaTek PJSC Sponsored GDR (Russia) (d) | | | 25,384 | | | | 3,288,392 | |
Sberbank of Russia PJSC Sponsored ADR (Russia) | | | 120,250 | | | | 1,388,625 | |
| | | | | | | | |
| | | | | | | 9,092,802 | |
| | | | | | | | |
| Taiwan — 4.2% | | | | | | | | |
Taiwan Semiconductor Manufacturing Co. Ltd. | | | 714,000 | | | | 3,998,427 | |
| | | | | | | | |
| Thailand — 0.7% | | | | | | | | |
Airports of Thailand PCL | | | 17,600 | | | | 195,607 | |
CP ALL PCL | | | 276,700 | | | | 482,924 | |
| | | | | | | | |
| | | | | | | 678,531 | |
| | | | | | | | |
| Turkey — 0.9% | | | | | | | | |
Anadolu Efes Biracilik Ve Malt Sanayii AS | | | 79,751 | | | | 398,528 | |
| | | | | | | | |
| | | Number of
Shares | | | Value | |
BIM Birlesik Magazalar AS | | | 33,745 | | | $ | 468,541 | |
| | | | | | | | |
| | | | | | | 867,069 | |
| | | | | | | | |
| United Arab Emirates — 1.7% | | | | | | | | |
DP World Ltd. | | | 74,060 | | | | 1,296,791 | |
Emaar Properties PJSC | | | 173,045 | | | | 335,056 | |
| | | | | | | | |
| | | | | | | 1,631,847 | |
| | | | | | | | |
| United Kingdom — 2.6% | | | | | | | | |
Glencore PLC (a) | | | 262,511 | | | | 882,324 | |
Hikma Pharmaceuticals PLC | | | 8,960 | | | | 207,836 | |
Mediclinic International PLC | | | 32,220 | | | | 304,486 | |
Old Mutual PLC | | | 443,324 | | | | 1,110,620 | |
| | | | | | | | |
| | | | | | | 2,505,266 | |
| | | | | | | | |
| United States — 1.8% | | | | | | | | |
Cognizant Technology Solutions Corp. Class A (a) | | | 17,280 | | | | 968,198 | |
MercadoLibre, Inc. (c) | | | 740 | | | | 115,544 | |
Tiffany & Co. (c) | | | 8,470 | | | | 655,832 | |
| | | | | | | | |
| | | | | | | 1,739,574 | |
| | | | | | | | |
| | |
TOTAL COMMON STOCK
(Cost $89,354,346) | | | | | | | 89,020,899 | |
| | | | | | | | |
| | |
| PREFERRED STOCK — 2.3% | | | | | | | | |
| Brazil — 2.2% | | | | | | | | |
Lojas Americanas SA 0.670% | | | 417,400 | | | | 2,168,927 | |
| | | | | | | | |
| India — 0.1% | | | | | | | | |
Zee Entertainment Enterprises Ltd. 6.000% | | | 503,840 | | | | 72,677 | |
| | | | | | | | |
| | |
TOTAL PREFERRED STOCK
(Cost $1,989,869) | | | | | | | 2,241,604 | |
| | | | | | | | |
| | |
TOTAL EQUITIES
(Cost $91,344,215) | | | | | | | 91,262,503 | |
| | | | | | | | |
|
| MUTUAL FUNDS — 1.4% | |
| United States — 1.4% | | | | | | | | |
State Street Navigator Securities Lending Prime Portfolio (e) | | | 1,316,063 | | | | 1,316,063 | |
| | | | | | | | |
| | |
TOTAL MUTUAL FUNDS
(Cost $1,316,063) | | | | | | | 1,316,063 | |
| | | | | | | | |
|
| RIGHTS — 0.6% | |
| Russia — 0.6% | | | | | | | | |
Moscow Exchange OAO (a) | | | 280,742 | | | | 572,051 | |
| | | | | | | | |
| | |
TOTAL RIGHTS
(Cost $509,770) | | | | | | | 572,051 | |
| | | | | | | | |
The accompanying notes are an integral part of the financial statements.
90
MML Strategic Emerging Markets Fund – Portfolio of Investments (Continued)
| | | | | | | | |
| | | Number of
Shares | | | Value | |
| WARRANTS — 0.0% | |
| Malaysia — 0.0% | | | | | | | | |
Genting BHD, Expires 12/18/18, Strike Price 7.96 (a) | | | 81,500 | | | $ | 25,253 | |
| | | | | | | | |
| | |
TOTAL WARRANTS
(Cost $38,401) | | | | | | | 25,253 | |
| | | | | | | | |
| | |
TOTAL LONG-TERM INVESTMENTS
(Cost $93,208,449) | | | | | | | 93,175,870 | |
| | | | | | | | |
| | |
| | | Principal
Amount | | | | |
| SHORT-TERM INVESTMENTS — 4.9% | |
| Repurchase Agreement — 4.9% | | | | | | | | |
State Street Bank & Trust Co. Repurchase Agreement, dated 12/30/16, 0.010%, due 1/03/17 (f) | | $ | 4,666,018 | | | | 4,666,018 | |
| | | | | | | | |
| | |
TOTAL SHORT-TERM INVESTMENTS
(Cost $4,666,018) | | | | | | | 4,666,018 | |
| | | | | | | | |
| | |
TOTAL INVESTMENTS — 101.7%
(Cost $97,874,467) (g) | | | | | | | 97,841,888 | |
| | |
| Other Assets/(Liabilities) — (1.7)% | | | | | | | (1,639,791 | ) |
| | | | | | | | |
| | |
| NET ASSETS — 100.0% | | | | | | $ | 96,202,097 | |
| | | | | | | | |
Notes to Portfolio of Investments
Percentages are stated as a percent of net assets.
| ADR | American Depositary Receipt |
| GDR | Global Depositary Receipt |
| (a) | Non-income producing security. |
| (b) | Securities exempt from registration under rule 144A of the Securities Act of 1933. These securities may be resold in transactions exempt from registration, normally to qualified institutional buyers. At December 31, 2016, these securities amounted to a value of $92,350 or 0.10% of net assets. |
| (c) | Denotes all or a portion of security on loan. The total value of securities on loan as of December 31, 2016, was $1,280,264 or 1.33% of net assets. Total securities on loan may not correspond with the amounts identified in the Portfolio of Investments because pending sales may be in the process of recall from the brokers. (Note 2). |
| (d) | Security exempt from registration under Regulation S of the Securities Act of 1933, which exempts from registration securities offered and sold outside the United States. Security may not be offered or sold in the United States except pursuant to an exemption from, or in a transaction not subject to, the registration requirements of the Securities Act of 1933. At December 31, 2016, these securities amounted to a value of $3,288,392 or 3.42% of net assets. |
| (e) | Represents investment of security lending collateral. (Note 2). |
| (f) | Maturity value of $4,666,023. Collateralized by U.S. Government Agency obligations with a rate of 1.500%, maturity date of 11/30/19, and an aggregate market value, including accrued interest, of $4,761,267. |
| (g) | See Note 6 for aggregate cost for federal tax purposes. |
The accompanying notes are an integral part of the financial statements.
91
MML Series Investment Fund II – Financial Statements
Statements of Assets and Liabilities
December 31, 2016
| | | | | | | | |
| | | MML Asset
Momentum
Fund | | | MML
Dynamic Bond
Fund | |
| Assets: | | | | | | | | |
Investments, at value (Note 2) (a) | | $ | 19,789,493 | | | $ | 406,984,729 | |
Repurchase agreements, at value (b) | | | 1,806,566 | | | | 15,139,327 | |
Other short-term investments, at value (Note 2) (c) | | | - | | | | 74,857 | |
| | | | | | | | |
Total investments (d) | | | 21,596,059 | | | | 422,198,913 | |
| | | | | | | | |
Foreign currency, at value (e) | | | - | | | | - | |
Receivables from: | | | | | | | | |
Investments sold | | | - | | | | 228,273 | |
Collateral pledged for reverse repurchase agreements (Note 2) | | | - | | | | - | |
Open forward foreign currency contracts (Note 2) | | | 130,530 | | | | - | |
Investment adviser (Note 3) | | | 3,270 | | | | - | |
Fund shares sold | | | - | | | | 9,890 | |
Interest and dividends | | | 21,183 | | | | 2,364,280 | |
Foreign taxes withheld | | | 2,238 | | | | - | |
Open swap agreements, at value (Note 2) | | | - | | | | - | |
| | | | | | | | |
Total assets | | | 21,753,280 | | | | 424,801,356 | |
| | | | | | | | |
| Liabilities: | | | | | | | | |
Payables for: | | | | | | | | |
Investments purchased | | | - | | | | - | |
Reverse repurchase agreements (Note 2) | | | - | | | | - | |
Interest for reverse repurchase agreements (Note 2) | | | - | | | | - | |
Open forward foreign currency contracts (Note 2) | | | 52,630 | | | | - | |
Fund shares repurchased | | | 49 | | | | 72 | |
Securities on loan (Note 2) | | | - | | | | - | |
Open swap agreements, at value (Note 2) | | | - | | | | - | |
Trustees’ fees and expenses (Note 3) | | | 825 | | | | 17,179 | |
Variation margin on open derivative instruments (Note 2) | | | 50,278 | | | | - | |
Affiliates (Note 3): | | | | | | | | |
Investment advisory fees | | | 10,957 | | | | 143,260 | |
Administration fees | | | 2,739 | | | | 53,723 | |
Service fees | | | 513 | | | | 1,672 | |
Due to custodian | | | - | | | | - | |
Accrued expense and other liabilities | | | 18,869 | | | | 54,407 | |
| | | | | | | | |
Total liabilities | | | 136,860 | | | | 270,313 | |
| | | | | | | | |
Net assets | | $ | 21,616,420 | | | $ | 424,531,043 | |
| | | | | | | | |
| Net assets consist of: | | | | | | | | |
Paid-in capital | | $ | 20,918,515 | | | $ | 429,053,860 | |
Undistributed (accumulated) net investment income (loss) | | | - | | | | 1,060,255 | |
Distributions in excess of net investment income | | | (23,661 | ) | | | - | |
Accumulated net realized gain (loss) on investments and foreign currency transactions | | | 496,481 | | | | 868,663 | |
Net unrealized appreciation (depreciation) on investments and foreign currency translations | | | 225,085 | | | | (6,451,735 | ) |
| | | | | | | | |
Net assets | | $ | 21,616,420 | | | $ | 424,531,043 | |
| | | | | | | | |
| | | | | | | | |
(a) Cost of investments: | | $ | 19,609,988 | | | $ | 413,436,464 | |
(b) Cost of repurchase agreements: | | $ | 1,806,566 | | | $ | 15,139,327 | |
(c) Cost of other short-term investments: | | $ | - | | | $ | 74,857 | |
(d) Securities on loan with market value of: | | $ | - | | | $ | - | |
(e) Cost of foreign currency: | | $ | - | | | $ | - | |
The accompanying notes are an integral part of the financial statements.
92
| | | | | | | | | | | | | | | | | | | | | | | | | | |
MML Equity
Rotation Fund | | | MML High
Yield Fund | | | MML
Inflation-
Protected and
Income Fund | | | MML Short-
Duration Bond
Fund | | | MML Small
Cap Equity
Fund | | | MML Special
Situations
Fund | | | MML
Strategic
Emerging
Markets Fund | |
| | | | | | | | | | | | | | | | | | | | | | | | | | |
| $ | 22,598,569 | | | $ | 121,240,877 | | | $ | 590,029,585 | | | $ | 231,546,922 | | | $ | 114,361,675 | | | $ | 19,592,459 | | | $ | 93,175,870 | |
| | 722,904 | | | | - | | | | - | | | | - | | | | 3,763,226 | | | | 221,636 | | | | 4,666,018 | |
| | - | | | | 3,227,005 | | | | 151,626,646 | | | | 2,369,763 | | | | - | | | | - | | | | - | |
| | | | | | | | | | | | | | | | | | | | | | | | | | |
| | 23,321,473 | | | | 124,467,882 | | | | 741,656,231 | | | | 233,916,685 | | | | 118,124,901 | | | | 19,814,095 | | | | 97,841,888 | |
| | | | | | | | | | | | | | | | | | | | | | | | | | |
| | - | | | | - | | | | - | | | | - | | | | - | | | | - | | | | 76,555 | |
| | | | | | | | | | | | | | | | | | | | | | | | | | |
| | - | | | | - | | | | 2,826,843 | | | | - | | | | 4,125 | | | | - | | | | 12,085 | |
| | - | | | | - | | | | 8,086,080 | | | | - | | | | - | | | | - | | | | - | |
| | - | | | | - | | | | - | | | | - | | | | - | | | | - | | | | - | |
| | 1,267 | | | | 10,542 | | | | - | | | | 2,080 | | | | - | | | | 1,460 | | | | 2,493 | |
| | - | | | | 10,528 | | | | 65,974 | | | | 260,906 | | | | 15,057 | | | | - | | | | 45,008 | |
| | 16,350 | | | | 2,178,987 | | | | 1,563,847 | | | | 1,228,372 | | | | 112,689 | | | | 14,144 | | | | 99,664 | |
| | - | | | | - | | | | - | | | | - | | | | - | | | | - | | | | 17,543 | |
| | - | | | | - | | | | 474,351 | | | | - | | | | - | | | | - | | | | - | |
| | | | | | | | | | | | | | | | | | | | | | | | | | |
| | 23,339,090 | | | | 126,667,939 | | | | 754,673,326 | | | | 235,408,043 | | | | 118,256,772 | | | | 19,829,699 | | | | 98,095,236 | |
| | | | | | | | | | | | | | | | | | | | | | | | | | |
| | | | | | | | | | | | | | | | | | | | | | | | | | |
| | | | | | | | | | | | | | | | | | | | | | | | | | |
| | - | | | | 349,912 | | | | 666,897 | | | | - | | | | 1,109,319 | | | | - | | | | 329,653 | |
| | - | | | | - | | | | 328,724,339 | | | | - | | | | - | | | | - | | | | - | |
| | - | | | | - | | | | 444,357 | | | | - | | | | - | | | | - | | | | - | |
| | - | | | | - | | | | - | | | | - | | | | - | | | | - | | | | - | |
| | 22 | | | | 32,771 | | | | 126,300 | | | | 58,000 | | | | 43,578 | | | | 15 | | | | 5,320 | |
| | - | | | | - | | | | - | | | | - | | | | 5,951,250 | | | | - | | | | 1,316,063 | |
| | - | | | | - | | | | 199,591 | | | | 55,158 | | | | - | | | | - | | | | - | |
| | 839 | | | | 17,626 | | | | 79,596 | | | | 28,658 | | | | 30,863 | | | | 764 | | | | 9,958 | |
| | - | | | | - | | | | 27,664 | | | | 28,339 | | | | - | | | | - | | | | - | |
| | | | | | | | | | | | | | | | | | | | | | | | | | |
| | 8,942 | | | | 63,256 | | | | 193,932 | | | | 69,186 | | | | 60,433 | | | | 10,096 | | | | 83,275 | |
| | 2,981 | | | | 15,813 | | | | - | | | | 29,651 | | | | - | | | | 2,524 | | | | 11,897 | |
| | 248 | | | | 18,563 | | | | 30,176 | | | | 19,382 | | | | 7,704 | | | | 210 | | | | 6,260 | |
| | - | | | | - | | | | 1,957,137 | | | | 150 | | | | - | | | | - | | | | - | |
| | 16,449 | | | | 44,190 | | | | 63,792 | | | | 39,236 | | | | 27,931 | | | | 16,359 | | | | 130,713 | |
| | | | | | | | | | | | | | | | | | | | | | | | | | |
| | 29,481 | | | | 542,131 | | | | 332,513,781 | | | | 327,760 | | | | 7,231,078 | | | | 29,968 | | | | 1,893,139 | |
| | | | | | | | | | | | | | | | | | | | | | | | | | |
| $ | 23,309,609 | | | $ | 126,125,808 | | | $ | 422,159,545 | | | $ | 235,080,283 | | | $ | 111,025,694 | | | $ | 19,799,731 | | | $ | 96,202,097 | |
| | | | | | | | | | | | | | | | | | | | | | | | | | |
| | | | | | | | | | | | | | | | | | | | | | | | | | |
| $ | 20,671,562 | | | $ | 130,191,790 | | | $ | 427,114,327 | | | $ | 239,654,248 | | | $ | 82,551,530 | | | $ | 20,296,404 | | | $ | 111,154,800 | |
| | 32 | | | | 69,663 | | | | 600,143 | | | | 426,410 | | | | 1,327,553 | | | | - | | | | - | |
| | - | | | | - | | | | - | | | | - | | | | - | | | | (661 | ) | | | (659,710 | ) |
| | (1,054,279 | ) | | | (5,327,283 | ) | | | (9,484,652 | ) | | | (4,183,087 | ) | | | 4,331,903 | | | | (2,586,344 | ) | | | (14,224,912 | ) |
| | 3,692,294 | | | | 1,191,638 | | | | 3,929,727 | | | | (817,288 | ) | | | 22,814,708 | | | | 2,090,332 | | | | (68,081 | ) |
| | | | | | | | | | | | | | | | | | | | | | | | | | |
| $ | 23,309,609 | | | $ | 126,125,808 | | | $ | 422,159,545 | | | $ | 235,080,283 | | | $ | 111,025,694 | | | $ | 19,799,731 | | | $ | 96,202,097 | |
| | | | | | | | | | | | | | | | | | | | | | | | | | |
| | | | | | | | | | | | | | | | | | | | | | | | | | |
| $ | 18,906,275 | | | $ | 120,049,239 | | | $ | 586,516,822 | | | $ | 232,390,684 | | | $ | 91,546,967 | | | $ | 17,502,127 | | | $ | 93,208,449 | |
| $ | 722,904 | | | $ | - | | | $ | - | | | $ | - | | | $ | 3,763,226 | | | $ | 221,636 | | | $ | 4,666,018 | |
| $ | - | | | $ | 3,227,005 | | | $ | 151,604,226 | | | $ | 2,369,833 | | | $ | - | | | $ | - | | | $ | - | |
| $ | - | | | $ | - | | | $ | - | | | $ | - | | | $ | 5,808,886 | | | $ | - | | | $ | 1,280,264 | |
| $ | - | | | $ | - | | | $ | - | | | $ | - | | | $ | - | | | $ | - | | | $ | 76,423 | |
93
MML Series Investment Fund II – Financial Statements (Continued)
Statements of Assets and Liabilities
December 31, 2016
| | | | | | | | |
| | | MML Asset
Momentum
Fund | | | MML
Dynamic Bond
Fund | |
| Initial Class shares: | | | | | | | | |
Net assets | | $ | - | | | $ | - | |
| | | | | | | | |
Shares outstanding (a) | | | - | | | | - | |
| | | | | | | | |
Net asset value, offering price and redemption price per share | | $ | - | | | $ | - | |
| | | | | | | | |
| Class II shares: | | | | | | | | |
Net assets | | $ | 20,687,637 | | | $ | 421,624,442 | |
| | | | | | | | |
Shares outstanding (a) | | | 2,005,476 | | | | 42,613,945 | |
| | | | | | | | |
Net asset value, offering price and redemption price per share | | $ | 10.32 | | | $ | 9.89 | |
| | | | | | | | |
| Service Class shares: | | | | | | | | |
Net assets | | $ | - | | | $ | - | |
| | | | | | | | |
Shares outstanding (a) | | | - | | | | - | |
| | | | | | | | |
Net asset value, offering price and redemption price per share | | $ | - | | | $ | - | |
| | | | | | | | |
| Service Class I shares: | | | | | | | | |
Net assets | | $ | 928,783 | | | $ | 2,906,601 | |
| | | | | | | | |
Shares outstanding (a) | | | 90,228 | | | | 294,209 | |
| | | | | | | | |
Net asset value, offering price and redemption price per share | | $ | 10.29 | | | $ | 9.88 | |
| | | | | | | | |
| (a) | Authorized unlimited number of shares with no par value. |
The accompanying notes are an integral part of the financial statements.
94
| | | | | | | | | | | | | | | | | | | | | | | | | | |
MML Equity
Rotation Fund | | | MML High
Yield Fund | | | MML
Inflation-
Protected and
Income Fund | | | MML Short-
Duration Bond
Fund | | | MML Small
Cap Equity
Fund | | | MML Special
Situations
Fund | | | MML
Strategic
Emerging
Markets Fund | |
$ | - | | | $ | - | | | $ | 375,134,730 | | | $ | - | | | $ | 97,746,575 | | | $ | - | | | $ | - | |
| | | | | | | | | | | | | | | | | | | | | | | | | | |
| | - | | | | - | | | | 36,852,325 | | | | - | | | | 10,339,882 | | | | - | | | | - | |
| | | | | | | | | | | | | | | | | | | | | | | | | | |
| $ | - | | | $ | - | | | $ | 10.18 | | | $ | - | | | $ | 9.45 | | | $ | - | | | $ | - | |
| | | | | | | | | | | | | | | | | | | | | | | | | | |
$ | 22,878,486 | | | $ | 95,180,051 | | | $ | - | | | $ | 203,293,760 | | | $ | - | | | $ | 19,441,008 | | | $ | 86,288,873 | |
| | | | | | | | | | | | | | | | | | | | | | | | | | |
| | 2,027,376 | | | | 9,581,263 | | | | - | | | | 20,853,735 | | | | - | | | | 2,001,854 | | | | 9,989,168 | |
| | | | | | | | | | | | | | | | | | | | | | | | | | |
| $ | 11.28 | | | $ | 9.93 | | | $ | - | | | $ | 9.75 | | | $ | - | | | $ | 9.71 | | | $ | 8.64 | |
| | | | | | | | | | | | | | | | | | | | | | | | | | |
$ | - | | | $ | - | | | $ | 47,024,815 | | | $ | - | | | $ | 13,279,119 | | | $ | - | | | $ | - | |
| | | | | | | | | | | | | | | | | | | | | | | | | | |
| | - | | | | - | | | | 4,638,254 | | | | - | | | | 1,425,988 | | | | - | | | | - | |
| | | | | | | | | | | | | | | | | | | | | | | | | | |
| $ | - | | | $ | - | | | $ | 10.14 | | | $ | - | | | $ | 9.31 | | | $ | - | | | $ | - | |
| | | | | | | | | | | | | | | | | | | | | | | | | | |
$ | 431,123 | | | $ | 30,945,757 | | | $ | - | | | $ | 31,786,523 | | | $ | - | | | $ | 358,723 | | | $ | 9,913,224 | |
| | | | | | | | | | | | | | | | | | | | | | | | | | |
| | 38,258 | | | | 3,124,596 | | | | - | | | | 3,263,659 | | | | - | | | | 37,004 | | | | 1,144,272 | |
| | | | | | | | | | | | | | | | | | | | | | | | | | |
| $ | 11.27 | | | $ | 9.90 | | | $ | - | | | $ | 9.74 | | | $ | - | | | $ | 9.69 | | | $ | 8.66 | |
| | | | | | | | | | | | | | | | | | | | | | | | | | |
95
MML Series Investment Fund II – Financial Statements (Continued)
Statements of Operations
For the Year Ended December 31, 2016
| | | | | | | | |
| | | MML Asset
Momentum
Fund | | | MML
Dynamic Bond
Fund | |
| Investment income (Note 2): | | | | | | | | |
Dividends (a) | | $ | 192,543 | | | $ | 304,503 | |
Interest (b) | | | 17,192 | | | | 15,797,053 | |
Securities lending net income | | | - | | | | - | |
| | | | | | | | |
Total investment income | | | 209,735 | | | | 16,101,556 | |
| | | | | | | | |
| Expenses (Note 3): | | | | | | | | |
Investment advisory fees | | | 119,798 | | | | 1,666,191 | |
Custody fees | | | 9,160 | | | | 42,656 | |
Interest expense | | | - | | | | - | |
Audit fees | | | 29,639 | | | | 58,074 | |
Legal fees | | | 182 | | | | 7,215 | |
Proxy fees | | | 985 | | | | 985 | |
Shareholder reporting fees | | | 2,229 | | | | 36,158 | |
Trustees’ fees | | | 1,124 | | | | 23,536 | |
| | | | | | | | |
| | | 163,117 | | | | 1,834,815 | |
Administration fees: | | | | | | | | |
Class II | | | 29,058 | | | | 622,072 | |
Service Class I | | | 891 | | | | 2,750 | |
Service fees: | | | | | | | | |
Service Class | | | - | | | | - | |
Service Class I | | | 1,485 | | | | 4,582 | |
| | | | | | | | |
Total expenses | | | 194,551 | | | | 2,464,219 | |
Expenses waived: | | | | | | | | |
Class II fees reimbursed by adviser | | | (32,337 | ) | | | - | |
Service Class I fees reimbursed by adviser | | | (1,001 | ) | | | - | |
Class II advisory fees waived | | | - | | | | - | |
Service Class I advisory fees waived | | | - | | | | - | |
| | | | | | | | |
Net expenses | | | 161,213 | | | | 2,464,219 | |
| | | | | | | | |
Net investment income (loss) | | | 48,522 | | | | 13,637,337 | |
| | | | | | | | |
| Realized and unrealized gain (loss): | | | | | | | | |
Net realized gain (loss) on: | | | | | | | | |
Investment transactions | | | 137,545 | | | | 2,556,483 | |
Futures contracts | | | 1,701,114 | | | | - | |
Swap agreements | | | - | | | | - | |
Foreign currency transactions | | | 76,267 | | | | - | |
| | | | | | | | |
Net realized gain (loss) | | | 1,914,926 | | | | 2,556,483 | |
| | | | | | | | |
Net change in unrealized appreciation (depreciation) on: | | | | | | | | |
Investment transactions | | | (23,744 | ) | | | 3,883,530 | |
Futures contracts | | | (35,937 | ) | | | - | |
Swap agreements | | | - | | | | - | |
Translation of assets and liabilities in foreign currencies | | | 77,765 | | | | - | |
| | | | | | | | |
Net change in unrealized appreciation (depreciation) | | | 18,084 | | | | 3,883,530 | |
| | | | | | | | |
Net realized gain (loss) and change in unrealized appreciation (depreciation) | | | 1,933,010 | | | | 6,440,013 | |
| | | | | | | | |
Net increase (decrease) in net assets resulting from operations | | $ | 1,981,532 | | | $ | 20,077,350 | |
| | | | | | | | |
| | | | | | | | |
(a) Net of foreign withholding tax of: | | $ | 4,259 | | | $ | - | |
(b) Net of foreign withholding tax of: | | $ | - | | | $ | - | |
| * | Net decrease in accrued foreign capital gains tax of $203,859. |
The accompanying notes are an integral part of the financial statements.
96
| | | | | | | | | | | | | | | | | | | | | | | | | | |
MML Equity
Rotation Fund | | | MML High
Yield Fund | | | MML
Inflation-
Protected and
Income Fund | | | MML Short-
Duration Bond
Fund | | | MML Small
Cap Equity
Fund | | | MML Special
Situations
Fund | | | MML
Strategic
Emerging
Markets Fund | |
| | | | | | | | | | | | | | | | | | | | | | | | | | |
| $ | 395,878 | | | $ | - | | | $ | - | | | $ | 3,203 | | | $ | 1,911,867 | | | $ | 219,369 | | | $ | 1,566,295 | |
| | 55 | | | | 11,692,702 | | | | 13,427,601 | | | | 4,509,531 | | | | 235 | | | | 27 | | | | 514 | |
| | - | | | | - | | | | - | | | | - | | | | 31,099 | | | | - | | | | 11,759 | |
| | | | | | | | | | | | | | | | | | | | | | | | | | |
| | 395,933 | | | | 11,692,702 | | | | 13,427,601 | | | | 4,512,734 | | | | 1,943,201 | | | | 219,396 | | | | 1,578,568 | |
| | | | | | | | | | | | | | | | | | | | | | | | | | |
| | | | | | | | | | | | | | | | | | | | | | | | | | |
| | 92,472 | | | | 860,133 | | | | 2,344,459 | | | | 661,675 | | | | 651,664 | | | | 107,389 | | | | 980,544 | |
| | 4,424 | | | | 59,069 | | | | 98,448 | | | | 45,242 | | | | 21,051 | | | | 3,175 | | | | 207,394 | |
| | - | | | | - | | | | 2,280,753 | | | | - | | | | - | | | | - | | | | - | |
| | 23,887 | | | | 36,152 | | | | 37,754 | | | | 36,704 | | | | 35,377 | | | | 25,416 | | | | 52,956 | |
| | 186 | | | | 1,252 | | | | 3,677 | | | | 1,509 | | | | 844 | | | | 163 | | | | 798 | |
| | 985 | | | | 985 | | | | 985 | | | | 985 | | | | 985 | | | | 985 | | | | 985 | |
| | 2,190 | | | | 16,679 | | | | 38,978 | | | | 16,266 | | | | 9,411 | | | | 2,086 | | | | 8,849 | |
| | 1,151 | | | | 8,148 | | | | 24,076 | | | | 10,376 | | | | 5,525 | | | | 994 | | | | 5,213 | |
| | | | | | | | | | | | | | | | | | | | | | | | | | |
| | 125,295 | | | | 982,418 | | | | 4,829,130 | | | | 772,757 | | | | 724,857 | | | | 140,208 | | | | 1,256,739 | |
| | | | | | | | | | | | | | | | | | | | | | | | | | |
| | 30,399 | | | | 173,794 | | | | - | | | | 241,902 | | | | - | | | | 26,433 | | | | 126,082 | |
| | 425 | | | | 41,239 | | | | - | | | | 41,673 | | | | - | | | | 414 | | | | 13,995 | |
| | | | | | | | | | | | | | | | | | | | | | | | | | |
| | - | | | | - | | | | 121,491 | | | | - | | | | 28,602 | | | | - | | | | - | |
| | 708 | | | | 68,732 | | | | - | | | | 69,454 | | | | - | | | | 690 | | | | 23,326 | |
| | | | | | | | | | | | | | | | | | | | | | | | | | |
| | 156,827 | | | | 1,266,183 | | | | 4,950,621 | | | | 1,125,786 | | | | 753,459 | | | | 167,745 | | | | 1,420,142 | |
| | | | | | | | | | | | | | | | | | | | | | | | | | |
| | (22,247 | ) | | | - | | | | - | | | | (14,052 | ) | | | - | | | | (23,510 | ) | | | (60,475 | ) |
| | (305 | ) | | | - | | | | - | | | | (2,510 | ) | | | - | | | | (362 | ) | | | (6,631 | ) |
| | - | | | | (115,839 | ) | | | - | | | | - | | | | - | | | | - | | | | (20,010 | ) |
| | - | | | | (27,516 | ) | | | - | | | | - | | | | - | | | | - | | | | (2,300 | ) |
| | | | | | | | | | | | | | | | | | | | | | | | | | |
| | 134,275 | | | | 1,122,828 | | | | 4,950,621 | | | | 1,109,224 | | | | 753,459 | | | | 143,873 | | | | 1,330,726 | |
| | | | | | | | | | | | | | | | | | | | | | | | | | |
| | 261,658 | | | | 10,569,874 | | | | 8,476,980 | | | | 3,403,510 | | | | 1,189,742 | | | | 75,523 | | �� | | 247,842 | |
| | | | | | | | | | | | | | | | | | | | | | | | | | |
| | | | | | | | | | | | | | | | | | | | | | | | | | |
| | | | | | | | | | | | | | | | | | | | | | | | | | |
| | (852,786 | ) | | | (1,015,880 | ) | | | 2,460,589 | | | | (1,377,523 | ) | | | 6,364,126 | | | | (833,481 | ) | | | (3,747,401 | ) |
| | 28,729 | | | | - | | | | (256,650 | ) | | | 1,354,237 | | | | - | | | | - | | | | - | |
| | - | | | | - | | | | (116,558 | ) | | | 952 | | | | - | | | | - | | | | - | |
| | 55 | | | | - | | | | - | | | | - | | | | (913 | ) | | | - | | | | (140,064 | ) |
| | | | | | | | | | | | | | | | | | | | | | | | | | |
| | (824,002 | ) | | | (1,015,880 | ) | | | 2,087,381 | | | | (22,334 | ) | | | 6,363,213 | | | | (833,481 | ) | | | (3,887,465 | ) |
| | | | | | | | | | | | | | | | | | | | | | | | | | |
| | | | | | | | | | | | | | | | | | | | | | | | | | |
| | 4,034,860 | | | | 12,493,725 | | | | 10,650,859 | | | | 1,173,580 | | | | 9,716,413 | | | | 3,466,670 | | | | 10,036,041 | * |
| | - | | | | - | | | | 28,018 | | | | 199,572 | | | | - | | | | - | | | | - | |
| | - | | | | - | | | | 403,297 | | | | 3,225 | | | | - | | | | - | | | | - | |
| | - | | | | - | | | | - | | | | - | | | | (4 | ) | | | - | | | | 1,369 | |
| | | | | | | | | | | | | | | | | | | | | | | | | | |
| | 4,034,860 | | | | 12,493,725 | | | | 11,082,174 | | | | 1,376,377 | | | | 9,716,409 | | | | 3,466,670 | | | | 10,037,410 | |
| | | | | | | | | | | | | | | | | | | | | | | | | | |
| | 3,210,858 | | | | 11,477,845 | | | | 13,169,555 | | | | 1,354,043 | | | | 16,079,622 | | | | 2,633,189 | | | | 6,149,945 | |
| | | | | | | | | | | | | | | | | | | | | | | | | | |
| $ | 3,472,516 | | | $ | 22,047,719 | | | $ | 21,646,535 | | | $ | 4,757,553 | | | $ | 17,269,364 | | | $ | 2,708,712 | | | $ | 6,397,787 | |
| | | | | | | | | | | | | | | | | | | | | | | | | | |
| | | | | | | | | | | | | | | | | | | | | | | | | | |
| $ | 2,097 | | | $ | - | | | $ | - | | | $ | - | | | $ | 1,603 | | | $ | - | | | $ | 124,426 | |
| $ | - | | | $ | - | | | $ | - | | | $ | 171 | | | $ | - | | | $ | - | | | $ | - | |
97
MML Series Investment Fund II – Financial Statements (Continued)
Statements of Changes in Net Assets
| | | | | | | | |
| | | MML Asset Momentum Fund | |
| | | Year
Ended
December 31, 2016
| | | Period
Ended
December 31, 2015+ | |
| Increase (Decrease) in Net Assets: | | | | | | | | |
| Operations: | | | | | | | | |
Net investment income (loss) | | $ | 48,522 | | | $ | 1,159 | |
Net realized gain (loss) on investment transactions | | | 1,914,926 | | | | (1,342,512 | ) |
Net change in unrealized appreciation (depreciation) on investments | | | 18,084 | | | | 207,001 | |
| | | | | | | | |
Net increase (decrease) in net assets resulting from operations | | | 1,981,532 | | | | (1,134,352 | ) |
| | | | | | | | |
| Distributions to shareholders (Note 2): | | | | | | | | |
From net investment income: | | | | | | | | |
Class II | | | (143,267 | ) | | | (1,117 | ) |
Service Class I | | | (4,891 | ) | | | - | |
| | | | | | | | |
Total distributions from net investment income | | | (148,158 | ) | | | (1,117 | ) |
| | | | | | | | |
Tax return of capital: | | | | | | | | |
Class II | | | - | | | | (14,648 | ) |
Service Class I | | | - | | | | - | |
| | | | | | | | |
Total tax return of capital | | | - | | | | (14,648 | ) |
| | | | | | | | |
| Net fund share transactions (Note 5): | | | | | | | | |
Class II | | | 143,267 | | | | 19,915,765 | |
Service Class I | | | 635,192 | | | | 238,939 | |
| | | | | | | | |
Increase (decrease) in net assets from fund share transactions | | | 778,459 | | | | 20,154,704 | |
| | | | | | | | |
Total increase (decrease) in net assets | | | 2,611,833 | | | | 19,004,587 | |
| Net assets | | | | | | | | |
Beginning of year | | | 19,004,587 | | | | - | |
| | | | | | | | |
End of year | | $ | 21,616,420 | | | $ | 19,004,587 | |
| | | | | | | | |
Undistributed (accumulated) net investment income (loss) included in net assets at end of year | | $ | - | | | $ | - | |
| | | | | | | | |
Distributions in excess of net investment income included in net assets at end of year | | $ | (23,661 | ) | | $ | (292 | ) |
| | | | | | | | |
| + | Fund commenced operations on May 15, 2015. |
The accompanying notes are an integral part of the financial statements.
98
| | | | | | | | | | | | | | |
| MML Dynamic Bond Fund | | | MML Equity Rotation Fund | |
Year
Ended
December 31, 2016 | | | Period
Ended
December 31, 2015+ | | | Year
Ended
December 31, 2016 | | | Period
Ended
December 31, 2015+ | |
| | | | | | | | | | | | | | |
| | | | | | | | | | | | | | |
| $ | 13,637,337 | | | $ | 7,056,117 | | | $ | 261,658 | | | $ | 132,107 | |
| | 2,556,483 | | | | (1,959,485 | ) | | | (824,002 | ) | | | (230,384 | ) |
| | 3,883,530 | | | | (10,335,265 | ) | | | 4,034,860 | | | | (342,566 | ) |
| | | | | | | | | | | | | | |
| | 20,077,350 | | | | (5,238,633 | ) | | | 3,472,516 | | | | (440,843 | ) |
| | | | | | | | | | | | | | |
| | | | | | | | | | | | | | |
| | | | | | | | | | | | | | |
| | (12,384,957 | ) | | | (6,371,746 | ) | | | (257,157 | ) | | | (131,849 | ) |
| | (61,280 | ) | | | (2,208 | ) | | | (4,270 | ) | | | (553 | ) |
| | | | | | | | | | | | | | |
| | (12,446,237 | ) | | | (6,373,954 | ) | | | (261,427 | ) | | | (132,402 | ) |
| | | | | | | | | | | | | | |
| | | | | | | | | | | | | | |
| | - | | | | - | | | | - | | | | (11,546 | ) |
| | - | | | | - | | | | - | | | | (48 | ) |
| | | | | | | | | | | | | | |
| | - | | | | - | | | | - | | | | (11,594 | ) |
| | | | | | | | | | | | | | |
| | | | | | | | | | | | | | |
| | 13,596,663 | | | | 411,992,570 | | | | 257,157 | | | | 20,043,395 | |
| | 2,536,553 | | | | 386,731 | | | | 252,558 | | | | 130,249 | |
| | | | | | | | | | | | | | |
| | 16,133,216 | | | | 412,379,301 | | | | 509,715 | | | | 20,173,644 | |
| | | | | | | | | | | | | | |
| | 23,764,329 | | | | 400,766,714 | | | | 3,720,804 | | | | 19,588,805 | |
| | | | | | | | | | | | | | |
| | 400,766,714 | | | | - | | | | 19,588,805 | | | | - | |
| | | | | | | | | | | | | | |
| $ | 424,531,043 | | | $ | 400,766,714 | | | $ | 23,309,609 | | | $ | 19,588,805 | |
| | | | | | | | | | | | | | |
$ | 1,060,255 | | | $ | 1,202,691 | | | $ | 32 | | | $ | - | |
| | | | | | | | | | | | | | |
| $ | - | | | $ | - | | | $ | - | | | $ | (295 | ) |
| | | | | | | | | | | | | | |
99
MML Series Investment Fund II – Financial Statements (Continued)
Statements of Changes in Net Assets
| | | | | | | | |
| | | MML High Yield Fund | |
| | | Year
Ended
December 31, 2016 | | | Year
Ended
December 31, 2015 | |
| Increase (Decrease) in Net Assets: | | | | | | | | |
| Operations: | | | | | | | | |
Net investment income (loss) | | $ | 10,569,874 | | | $ | 9,448,332 | |
Net realized gain (loss) on investment transactions | | | (1,015,880 | ) | | | (4,291,500 | ) |
Net change in unrealized appreciation (depreciation) on investments | | | 12,493,725 | | | | (6,827,441 | ) |
| | | | | | | | |
Net increase (decrease) in net assets resulting from operations | | | 22,047,719 | | | | (1,670,609 | ) |
| | | | | | | | |
| Distributions to shareholders (Note 2): | | | | | | | | |
From net investment income: | | | | | | | | |
Initial Class | | | - | | | | - | |
Class II | | | (8,197,683 | ) | | | (7,859,288 | ) |
Service Class | | | - | | | | - | |
Service Class I | | | (1,979,564 | ) | | | (1,692,539 | ) |
| | | | | | | | |
Total distributions from net investment income | | | (10,177,247 | ) | | | (9,551,827 | ) |
| | | | | | | | |
From net realized gains: | | | | | | | | |
Class II | | | - | | | | (666,362 | ) |
Service Class I | | | - | | | | (143,984 | ) |
| | | | | | | | |
Total distributions from net realized gains | | | - | | | | (810,346 | ) |
| | | | | | | | |
Tax return of capital: | | | | | | | | |
Class II | | | - | | | | (21,491 | ) |
Service Class I | | | - | | | | (4,628 | ) |
| | | | | | | | |
Total tax return of capital | | | - | | | | (26,119 | ) |
| | | | | | | | |
| Net fund share transactions (Note 5): | | | | | | | | |
Initial Class | | | - | | | | - | |
Class II | | | (28,408,601 | ) | | | 7,410,299 | |
Service Class | | | - | | | | - | |
Service Class I | | | 2,367,805 | | | | 3,413,102 | |
| | | | | | | | |
Increase (decrease) in net assets from fund share transactions | | | (26,040,796 | ) | | | 10,823,401 | |
| | | | | | | | |
Total increase (decrease) in net assets | | | (14,170,324 | ) | | | (1,235,500 | ) |
| Net assets | | | | | | | | |
Beginning of year | | | 140,296,132 | | | | 141,531,632 | |
| | | | | | | | |
End of year | | $ | 126,125,808 | | | $ | 140,296,132 | |
| | | | | | | | |
Undistributed (accumulated) net investment income (loss) included in net assets at end of year | | $ | 69,663 | | | $ | - | |
| | | | | | | | |
Distributions in excess of net investment income included in net assets at end of year | | $ | - | | | $ | (14,037 | ) |
| | | | | | | | |
The accompanying notes are an integral part of the financial statements.
100
| | | | | | | | | | | | | | |
MML Inflation-Protected and
Income Fund | | | MML Short-Duration Bond Fund | |
Year
Ended
December 31, 2016 | | | Year
Ended
December 31, 2015 | | | Year
Ended
December 31, 2016 | | | Year
Ended
December 31, 2015 | |
| | | | | | | | | | | | | | |
| | | | | | | | | | | | | | |
| $ | 8,476,980 | | | $ | 2,504,208 | | | $ | 3,403,510 | | | $ | 3,156,165 | |
| | 2,087,381 | | | | 345,441 | | | | (22,334 | ) | | | 666,757 | |
| | 11,082,174 | | | | (9,229,662 | ) | | | 1,376,377 | | | | (2,175,913 | ) |
| | | | | | | | | | | | | | |
| | 21,646,535 | | | | (6,380,013 | ) | | | 4,757,553 | | | | 1,647,009 | |
| | | | | | | | | | | | | | |
| | | | | | | | | | | | | | |
| | | | | | | | | | | | | | |
| | (9,077,612 | ) | | | (4,521,221 | ) | | | - | | | | - | |
| | - | | | | - | | | | (3,741,339 | ) | | | (3,766,756 | ) |
| | (1,014,617 | ) | | | (512,261 | ) | | | - | | | | - | |
| | - | | | | - | | | | (560,359 | ) | | | (508,301 | ) |
| | | | | | | | | | | | | | |
| | (10,092,229 | ) | | | (5,033,482 | ) | | | (4,301,698 | ) | | | (4,275,057 | ) |
| | | | | | | | | | | | | | |
| | | | | | | | | | | | | | |
| | - | | | | - | | | | - | | | | - | |
| | - | | | | - | | | | - | | | | - | |
| | | | | | | | | | | | | | |
| | - | | | | - | | | | - | | �� | | - | |
| | | | | | | | | | | | | | |
| | | | | | | | | | | | | | |
| | - | | | | - | | | | - | | | | - | |
| | - | | | | - | | | | - | | | | - | |
| | | | | | | | | | | | | | |
| | - | | | | - | | | | - | | | | - | |
| | | | | | | | | | | | | | |
| | | | | | | | | | | | | | |
| | (15,322,801 | ) | | | (22,569,481 | ) | | | - | | | | - | |
| | - | | | | - | | | | 47,725,913 | | | | (8,961,900 | ) |
| | (2,110,692 | ) | | | (2,846,921 | ) | | | - | | | | - | |
| | - | | | | - | | | | 7,587,141 | | | | 175,349 | |
| | | | | | | | | | | | | | |
| | (17,433,493 | ) | | | (25,416,402 | ) | | | 55,313,054 | | | | (8,786,551 | ) |
| | | | | | | | | | | | | | |
| | (5,879,187 | ) | | | (36,829,897 | ) | | | 55,768,909 | | | | (11,414,599 | ) |
| | | | | | | | | | | | | | |
| | 428,038,732 | | | | 464,868,629 | | | | 179,311,374 | | | | 190,725,973 | |
| | | | | | | | | | | | | | |
| $ | 422,159,545 | | | $ | 428,038,732 | | | $ | 235,080,283 | | | $ | 179,311,374 | |
| | | | | | | | | | | | | | |
$ | 600,143 | | | $ | 335,687 | | | $ | 426,410 | | | $ | 203,481 | |
| | | | | | | | | | | | | | |
| $ | - | | | $ | - | | | $ | - | | | $ | - | |
| | | | | | | | | | | | | | |
101
MML Series Investment Fund II – Financial Statements (Continued)
Statements of Changes in Net Assets
| | | | | | | | |
| | | MML Small Cap Equity Fund | |
| | | Year
Ended
December 31, 2016 | | | Year
Ended
December 31, 2015 | |
| Increase (Decrease) in Net Assets: | | | | | | | | |
| Operations: | | | | | | | | |
Net investment income (loss) | | $ | 1,189,742 | | | $ | 957,836 | |
Net realized gain (loss) on investment transactions | | | 6,363,213 | | | | 4,227,177 | |
Net change in unrealized appreciation (depreciation) on investments | | | 9,716,409 | | | | (11,239,637 | ) |
| | | | | | | | |
Net increase (decrease) in net assets resulting from operations | | | 17,269,364 | | | | (6,054,624 | ) |
| | | | | | | | |
| Distributions to shareholders (Note 2): | | | | | | | | |
From net investment income: | | | | | | | | |
Initial Class | | | (946,569 | ) | | | (831,938 | ) |
Class II | | | - | | | | - | |
Service Class | | | (97,330 | ) | | | (74,514 | ) |
Service Class I | | | - | | | | - | |
| | | | | | | | |
Total distributions from net investment income | | | (1,043,899 | ) | | | (906,452 | ) |
| | | | | | | | |
From net realized gains: | | | | | | | | |
Initial Class | | | (2,038,912 | ) | | | (15,107,079 | ) |
Service Class | | | (268,264 | ) | | | (1,752,680 | ) |
| | | | | | | | |
Total distributions from net realized gains | | | (2,307,176 | ) | | | (16,859,759 | ) |
| | | | | | | | |
Tax return of capital: | | | | | | | | |
Class II | | | - | | | | - | |
Service Class I | | | - | | | | - | |
| | | | | | | | |
Total tax return of capital | | | - | | | | - | |
| | | | | | | | |
| Net fund share transactions (Note 5): | | | | | | | | |
Initial Class | | | (4,113,501 | ) | | | 6,125,603 | |
Class II | | | - | | | | - | |
Service Class | | | 509,259 | | | | 3,745,895 | |
Service Class I | | | - | | | | - | |
| | | | | | | | |
Increase (decrease) in net assets from fund share transactions | | | (3,604,242 | ) | | | 9,871,498 | |
| | | | | | | | |
Total increase (decrease) in net assets | | | 10,314,047 | | | | (13,949,337 | ) |
| Net assets | | | | | | | | |
Beginning of year | | | 100,711,647 | | | | 114,660,984 | |
| | | | | | | | |
End of year | | $ | 111,025,694 | | | $ | 100,711,647 | |
| | | | | | | | |
Undistributed (accumulated) net investment income (loss) included in net assets at end of year | | $ | 1,327,553 | | | $ | 1,146,604 | |
| | | | | | | | |
Distributions in excess of net investment income included in net assets at end of year | | $ | - | | | $ | - | |
| | | | | | | | |
| + | Fund commenced operations on May 15, 2015. |
The accompanying notes are an integral part of the financial statements.
102
| | | | | | | | | | | | | | |
| MML Special Situations Fund | | | MML Strategic Emerging Markets Fund | |
Year
Ended
December 31, 2016 | | | Period
Ended
December 31, 2015+ | | | Year
Ended
December 31, 2016 | | | Year
Ended
December 31, 2015 | |
$ | 75,523 | | | $ | (8,791 | ) | | $ | 247,842 | | | $ | 313,948 | |
| | (833,481 | ) | | | (1,755,248 | ) | | | (3,887,465 | ) | | | (9,108,746 | ) |
| | 3,466,670 | | | | (1,376,338 | ) | | | 10,037,410 | | | | (6,093,994 | ) |
| | | | | | | | | | | | | | |
| | 2,708,712 | | | | (3,140,377 | ) | | | 6,397,787 | | | | (14,888,792 | ) |
| | | | | | | | | | | | | | |
|
- |
| | | - | | | | - | | | | - | |
| | (75,321 | ) | | | - | | | | (401,484 | ) | | | (1,066,654 | ) |
| | - | | | | - | | | | - | | | | - | |
| | (957 | ) | | | - | | | | (22,753 | ) | | | (78,067 | ) |
| | | | | | | | | | | | | | |
| | (76,278 | ) | | | - | | | | (424,237 | ) | | | (1,144,721 | ) |
| | | | | | | | | | | | | | |
|
- |
| | | - | | | | - | | | | - | |
| | - | | | | - | | | | - | | | | - | |
| | | | | | | | | | | | | | |
| | - | | | | - | | | | - | | | | - | |
| | | | | | | | | | | | | | |
|
(35,171 |
) | | | (4,967 | ) | | | - | | | | - | |
| | (447 | ) | | | - | | | | - | | | | - | |
| | | | | | | | | | | | | | |
| | (35,618 | ) | | | (4,967 | ) | | | - | | | | - | |
| | | | | | | | | | | | | | |
|
- |
| | | - | | | | - | | | | - | |
| | 110,492 | | | | 19,904,967 | | | | (3,478,523 | ) | | | 13,116,397 | |
| | - | | | | - | | | | - | | | | - | |
| | 133,267 | | | | 199,533 | | | | 942,536 | | | | 728,273 | |
| | | | | | | | | | | | | | |
| | 243,759 | | | | 20,104,500 | | | | (2,535,987 | ) | | | 13,844,670 | |
| | | | | | | | | | | | | | |
| | 2,840,575 | | | | 16,959,156 | | | | 3,437,563 | | | | (2,188,843 | ) |
|
16,959,156 |
| | | - | | | | 92,764,534 | | | | 94,953,377 | |
| | | | | | | | | | | | | | |
| $ | 19,799,731 | | | $ | 16,959,156 | | | $ | 96,202,097 | | | $ | 92,764,534 | |
| | | | | | | | | | | | | | |
| $ | - | | | $ | (288 | ) | | $ | - | | | $ | - | |
| | | | | | | | | | | | | | |
| $ | (661 | ) | | $ | - | | | $ | (659,710 | ) | | $ | (414,032 | ) |
| | | | | | | | | | | | | | |
103
MML Series Investment Fund II – Financial Statements (Continued)
Statement of Cash Flows
For the Year Ended December 31, 2016
| | | | |
| | | MML
Inflation-
Protected and
Income Fund | |
| Cash flows from operating activities: | | | | |
Net increase (decrease) in net assets resulting from operations | | $ | 21,646,535 | |
Adjustments to reconcile net increase in net assets resulting from operations to net cash provided by (used in) operating activities: | | | | |
Investments purchased | | | (256,725,444 | ) |
Investments sold | | | 298,305,023 | |
(Increase ) Decrease to the principal amount of inflation-indexed bonds | | | (5,836,506 | ) |
(Purchase) Sale of short-term investments, net | | | (475,222 | ) |
Amortization (accretion) of discount and premium, net | | | 1,541,014 | |
(Increase) Decrease in receivable from interest and dividends | | | 391,178 | |
(Increase) Decrease in receivable for open swap agreements | | | (428,089 | ) |
Increase (Decrease) in payable for Trustees’ fees and expenses | | | 7,311 | |
Increase (Decrease) in payable for investment advisory fees | | | (3,628 | ) |
Increase (Decrease) in payable for service fees | | | (488 | ) |
Increase (Decrease) in payable for open swap agreements | | | 127,616 | |
Increase (Decrease) in collateral held for open swap agreements | | | (280,000 | ) |
Increase (Decrease) in variation margin payable on open derivative instrument | | | 9,754 | |
Increase (Decrease) in payable for accrued expenses and other liabilities | | | 7,890 | |
Net change in unrealized (appreciation) depreciation on investments | | | (10,650,859 | ) |
Net realized (gain) loss from investments | | | (2,460,589 | ) |
| | | | |
Net cash from (used in) operating activities | | | 45,175,496 | |
| | | | |
| Cash flows from (used in) financing activities: | | | | |
Increase (Decrease) in due to custodian | | | 1,957,137 | |
Proceeds from shares sold | | | 43,487,471 | |
Payment on shares redeemed | | | (66,024,740 | ) |
Net increase (decrease) in reverse repurchase agreements | | | (22,324,588 | ) |
Increase (Decrease) in collateral pledged for reverse repurchase agreements | | | (2,338,981 | ) |
Increase (Decrease) in payable for interest for reverse repurchase agreements | | | 68,205 | |
| | | | |
Net cash from (used in) financing activities | | | (45,175,496 | ) |
| | | | |
| |
Net increase (decrease) in cash | | | - | |
Cash at beginning of period | | | - | |
| | | | |
Cash at end of period | | $ | - | |
| | | | |
| |
Non cash financing activities not included herein consist of: | | | | |
Reinvestment of all distributions | | $ | 10,092,229 | |
Cash paid out for interest on reverse repurchase agreements | | $ | 2,212,548 | |
The accompanying notes are an integral part of the financial statements.
104
MML Series Investment Fund II – Financial Statements (Continued)
Financial Highlights (For a share outstanding throughout each period)
MML Asset Momentum Fund
| | | | | | | | | | | | | | | | | | | | | | | | | | | | | | | | | | | | | | | | | | | | | | | | | | | | |
| | | | | | Income (loss) from investment
operations | | | Less distributions to
shareholders | | | | | | | | | Ratios / Supplemental Data | |
| | | Net
asset
value,
beginning
of the
period | | | Net
investment
income
(loss)c,j | | | Net
realized
and
unrealized
gain (loss)
on
investments | | | Total
income
(loss) from
investment
operations | | | From net
investment
income | | | Tax
return
of
capital | | | Total
distributions | | | Net
asset
value,
end of
the
period | | | Total
returnm | | | Net
assets,
end of
the
period
(000’s) | | | Ratio of
expenses
to average
daily net
assets
before
expense
waivers | | | Ratio of
expenses
to average
daily net
assets
after
expense
waiversj | | | Net
investment
income
(loss) to
average
daily net
assets | |
Class II | | | | | | | | | | | | | | | | | | | | | | | | | | | | | | | | | | | | | | | | | | | | | |
12/31/16 | | $ | 9.43 | | | $ | 0.02 | | | $ | 0.94 | | | $ | 0.96 | | | $ | (0.07 | ) | | $ | - | | | $ | (0.07 | ) | | $ | 10.32 | | | | 10.20% | | | $ | 20,688 | | | | 0.97% | | | | 0.80% | | | | 0.25% | |
| 12/31/15g | | | 10.00 | | | | 0.00 | d | | | (0.56 | ) | | | (0.56 | ) | | | (0.00 | )d | | | (0.01 | ) | | | (0.01 | ) | | | 9.43 | | | | (5.62% | )b | | | 18,773 | | | | 1.25% | a | | | 0.80% | a | | | 0.01% | a |
Service Class I | | | | | | | | | | | | | | | | | | | | | | | | | | | | | | | | | | | | | | | | | | | | | |
12/31/16 | | $ | 9.42 | | | $ | 0.01 | | | $ | 0.92 | | | $ | 0.93 | | | $ | (0.06 | ) | | $ | - | | | $ | (0.06 | ) | | $ | 10.29 | | | | 9.85% | | | $ | 929 | | | | 1.22% | | | | 1.05% | | | | 0.13% | |
| 12/31/15g | | | 10.00 | | | | (0.02 | ) | | | (0.56 | ) | | | (0.58 | ) | | | - | | | | - | | | | - | | | | 9.42 | | | | (5.80% | )b | | | 232 | | | | 1.50% | a | | | 1.05% | a | | | (0.25% | )a |
| | | | | | | | |
| | | Year ended
December 31, 2016 | | | Period ended
December 31, 2015b | |
Portfolio turnover rate | | | 82 | % | | | 141 | % |
| b | Percentage represents the results for the period and is not annualized. |
| c | Per share amount calculated on the average shares method. |
| d | Amount is less than $0.005 per share. |
| g | For the period May 15, 2015 (commencement of operations) through December 31, 2015. |
| j | Computed after giving effect to an agreement by MML Advisers to waive certain fees and expenses of the Fund. |
| m | Total return does not reflect expenses that apply at the separate account level or to related insurance products. Inclusion of these charges would reduce the total return figures for all periods shown. |
The accompanying notes are an integral part of the financial statements.
105
MML Series Investment Fund II – Financial Statements (Continued)
Financial Highlights (For a share outstanding throughout each period)
MML Dynamic Bond Fund
| | | | | | | | | | | | | | | | | | | | | | | | | | | | | | | | | | | | | | | | | | | | | | | | |
| | | | | | Income (loss) from investment
operations | | | Less distributions to
shareholders | | | | | | | | | Ratios / Supplemental Data | |
| | | Net
asset
value,
beginning
of the
period | | | Net
investment
income
(loss)c,j | | | Net
realized
and
unrealized
gain (loss)
on
investments | | | Total
income
(loss) from
investment
operations | | | From net
investment
income | | | Total
distributions | | | Net
asset
value,
end of
the
period | | | Total
returnm | | | Net
assets,
end of
the
period
(000’s) | | | Ratio of
expenses
to average
daily net
assets
before
expense
waivers | | | Ratio of
expenses
to average
daily net
assets
after
expense
waiversj | | | Net
investment
income
(loss) to
average
daily net
assets | |
Class II | | | | | | | | | | | | | | | | | | | | | | | | | | | | | | | | | | | | | | | | | |
12/31/16 | | $ | 9.71 | | | $ | 0.33 | | | $ | 0.15 | | | $ | 0.48 | | | $ | (0.30 | ) | | $ | (0.30 | ) | | $ | 9.89 | | | | 4.94% | | | $ | 421,624 | | | | 0.59% | | | | 0.59% | l | | | 3.27% | |
| 12/31/15g | | | 10.00 | | | | 0.17 | | | | (0.30 | ) | | | (0.13 | ) | | | (0.16 | ) | | | (0.16 | ) | | | 9.71 | | | | (1.34% | )b | | | 400,385 | | | | 0.61% | a | | | 0.60% | a | | | 2.78% | a |
Service Class I | | | | | | | | | | | | | | | | | | | | | | | | | | | | | | | | | | | | | | | | | |
12/31/16 | | $ | 9.71 | | | $ | 0.31 | | | $ | 0.14 | | | $ | 0.45 | | | $ | (0.28 | ) | | $ | (0.28 | ) | | $ | 9.88 | | | | 4.67% | | | $ | 2,907 | | | | 0.84% | | | | 0.84% | l | | | 3.14% | |
| 12/31/15g | | | 10.00 | | | | 0.15 | | | | (0.29 | ) | | | (0.14 | ) | | | (0.15 | ) | | | (0.15 | ) | | | 9.71 | | | | (1.45% | )b | | | 382 | | | | 0.86% | a | | | 0.85% | a | | | 2.39% | a |
| | | | | | | | |
| | | Year ended
December 31, 2016 | | | Period ended
December 31, 2015b | |
Portfolio turnover rate | | | 79 | % | | | 106 | % |
| b | Percentage represents the results for the period and is not annualized. |
| c | Per share amount calculated on the average shares method. |
| g | For the period May 15, 2015 (commencement of operations) through December 31, 2015. |
| j | Computed after giving effect to an agreement by MML Advisers to waive certain fees and expenses of the Fund. |
| l | Expenses incurred during the period fell under the expense cap. |
| m | Total return does not reflect expenses that apply at the separate account level or to related insurance products. Inclusion of these charges would reduce the total return figures for all periods shown. |
The accompanying notes are an integral part of the financial statements.
106
MML Series Investment Fund II – Financial Statements (Continued)
Financial Highlights (For a share outstanding throughout each period)
MML Equity Rotation Fund
| | | | | | | | | | | | | | | | | | | | | | | | | | | | | | | | | | | | | | | | | | | | | | | | | | | | |
| | | | | | Income (loss) from investment
operations | | | Less distributions to
shareholders | | | | | | | | | Ratios / Supplemental Data | |
| | | Net
asset
value,
beginning
of the
period | | | Net
investment
income
(loss)c,j | | | Net
realized
and
unrealized
gain (loss)
on
investments | | | Total
income
(loss) from
investment
operations | | | From net
investment
income | | | Tax
return
of
capital | | | Total
distributions | | | Net
asset
value,
end of
the
period | | | Total
returnm | | | Net
assets,
end of
the
period
(000’s) | | | Ratio of
expenses
to average
daily net
assets
before
expense
waivers | | | Ratio of
expenses
to average
daily net
assets
after
expense
waiversj | | | Net
investment
income
(loss) to
average
daily net
assets | |
Class II | |
12/31/16 | | $ | 9.71 | | | $ | 0.13 | | | $ | 1.57 | | | $ | 1.70 | | | $ | (0.13 | ) | | $ | - | | | $ | (0.13 | ) | | $ | 11.28 | | | | 17.48% | | | $ | 22,878 | | | | 0.76% | | | | 0.65% | | | | 1.28% | |
| 12/31/15g | | | 10.00 | | | | 0.07 | | | | (0.29 | ) | | | (0.22 | ) | | | (0.06 | ) | | | (0.01 | ) | | | (0.07 | ) | | | 9.71 | | | | (2.18% | )b | | | 19,462 | | | | 0.96% | a | | | 0.65% | a | | | 1.06% | a |
Service Class I | |
12/31/16 | | $ | 9.71 | | | $ | 0.09 | | | $ | 1.58 | | | $ | 1.67 | | | $ | (0.11 | ) | | $ | - | | | $ | (0.11 | ) | | $ | 11.27 | | | | 17.22% | | | $ | 431 | | | | 1.01% | | | | 0.90% | | | | 0.92% | |
| 12/31/15g | | | 10.00 | | | | 0.05 | | | | (0.28 | ) | | | (0.23 | ) | | | (0.06 | ) | | | (0.00 | )d | | | (0.06 | ) | | | 9.71 | | | | (2.32% | )b | | | 127 | | | | 1.21% | a | | | 0.90% | a | | | 0.80% | a |
| | | | | | | | |
| | | Year ended
December 31, 2016 | | | Period ended
December 31, 2015b | |
Portfolio turnover rate | | | 90 | % | | | 39 | % |
| b | Percentage represents the results for the period and is not annualized. |
| c | Per share amount calculated on the average shares method. |
| d | Amount is less than $0.005 per share. |
| g | For the period May 15, 2015 (commencement of operations) through December 31, 2015. |
| j | Computed after giving effect to an agreement by MML Advisers to waive certain fees and expenses of the Fund. |
| m | Total return does not reflect expenses that apply at the separate account level or to related insurance products. Inclusion of these charges would reduce the total return figures for all periods shown. |
The accompanying notes are an integral part of the financial statements.
107
MML Series Investment Fund II – Financial Statements (Continued)
Financial Highlights (For a share outstanding throughout each period)
MML High Yield Fund
| | | | | | | | | | | | | | | | | | | | | | | | | | | | | | | | | | | | | | | | | | | | | | | | | | | | | | | | |
| | | | | | Income (loss) from investment
operations | | | Less distributions to shareholders | | | | | | | | | Ratios / Supplemental Data | |
| | | Net
asset
value,
beginning
of the
period | | | Net
investment
income
(loss)c,j | | | Net
realized
and
unrealized
gain (loss)
on
investments | | | Total
income
(loss) from
investment
operations | | | From net
investment
income | | | From net
realized
gains | | | Tax
return
of
capital | | | Total
distributions | | | Net
asset
value,
end of
the
period | | | Total
returnm | | | Net
assets,
end of
the
period
(000’s) | | | Ratio of
expenses
to average
daily net
assets
before
expense
waivers | | | Ratio of
expenses
to average
daily net
assets
after
expense
waiversj | | | Net
investment
income
(loss) to
average
daily net
assets | |
Class II | | | | | | | | | | | | | | | | | | | | | | | | | | | | | | | | | | | | | | | | | | | | | | | | | |
12/31/16 | | $ | 9.17 | | | $ | 0.71 | | | $ | 0.76 | | | $ | 1.47 | | | $ | (0.71 | ) | | $ | - | | | $ | - | | | $ | (0.71 | ) | | $ | 9.93 | | | | 16.48% | | | $ | 95,180 | | | | 0.84% | | | | 0.74% | | | | 7.42% | |
| 12/31/15 | | | 9.98 | | | | 0.65 | | | | (0.74 | ) | | | (0.09 | ) | | | (0.66 | ) | | | (0.06 | ) | | | (0.00 | )d | | | (0.72 | ) | | | 9.17 | | | | (1.13% | ) | | | 113,880 | | | | 0.83% | | | | 0.71% | | | | 6.56% | |
| 12/31/14 | | | 11.03 | | | | 0.72 | | | | (0.57 | ) | | | 0.15 | | | | (0.74 | ) | | | (0.46 | ) | | | - | | | | (1.20 | ) | | | 9.98 | | | | 1.05% | | | | 116,277 | | | | 0.83% | | | | 0.69% | | | | 6.62% | |
| 12/31/13 | | | 10.93 | | | | 0.76 | | | | 0.38 | | | | 1.14 | | | | (0.74 | ) | | | (0.30 | ) | | | - | | | | (1.04 | ) | | | 11.03 | | | | 10.84% | | | | 129,251 | | | | 0.84% | | | | 0.69% | | | | 6.88% | |
| 12/31/12 | | | 10.03 | | | | 0.74 | | | | 0.89 | | | | 1.63 | | | | (0.67 | ) | | | (0.06 | ) | | | - | | | | (0.73 | ) | | | 10.93 | | | | 16.76% | | | | 122,192 | | | | 0.86% | | | | 0.69% | | | | 7.01% | |
Service Class I | | | | | | | | | | | | | | | | | | | | | | | | | | | | | | | | | | | | | | | | | | | | | | | | | |
12/31/16 | | $ | 9.14 | | | $ | 0.69 | | | $ | 0.75 | | | $ | 1.44 | | | $ | (0.68 | ) | | $ | - | | | $ | - | | | $ | (0.68 | ) | | $ | 9.90 | | | | 16.25% | | | $ | 30,946 | | | | 1.09% | | | | 0.99% | | | | 7.19% | |
| 12/31/15 | | | 9.95 | | | | 0.62 | | | | (0.73 | ) | | | (0.11 | ) | | | (0.64 | ) | | | (0.06 | ) | | | (0.00 | )d | | | (0.70 | ) | | | 9.14 | | | | (1.39% | ) | | | 26,416 | | | | 1.08% | | | | 0.97% | | | | 6.31% | |
| 12/31/14 | | | 11.01 | | | | 0.69 | | | | (0.58 | ) | | | 0.11 | | | | (0.71 | ) | | | (0.46 | ) | | | - | | | | (1.17 | ) | | | 9.95 | | | | 0.71% | | | | 25,255 | | | | 1.08% | | | | 0.94% | | | | 6.38% | |
| 12/31/13 | | | 10.91 | | | | 0.73 | | | | 0.38 | | | | 1.11 | | | | (0.71 | ) | | | (0.30 | ) | | | - | | | | (1.01 | ) | | | 11.01 | | | | 10.59% | | | | 22,141 | | | | 1.09% | | | | 0.94% | | | | 6.63% | |
| 12/31/12 | | | 10.01 | | | | 0.72 | | | | 0.89 | | | | 1.61 | | | | (0.65 | ) | | | (0.06 | ) | | | - | | | | (0.71 | ) | | | 10.91 | | | | 16.53% | | | | 16,699 | | | | 1.11% | | | | 0.94% | | | | 6.77% | |
| | | | | | | | | | | | | | | | | | | | |
| | | Year ended December 31 | |
| | | 2016 | | | 2015 | | | 2014 | | | 2013 | | | 2012 | |
Portfolio turnover rate | | | 59 | % | | | 70 | % | | | 79 | % | | | 113 | % | | | 95 | % |
| c | Per share amount calculated on the average shares method. |
| d | Amount is less than $0.005 per share. |
| j | Computed after giving effect to an agreement by MML Advisers and/or MassMutual to waive certain fees and expenses of the Fund. |
| m | Total return does not reflect expenses that apply at the separate account level or to related insurance products. Inclusion of these charges would reduce the total return figures for all periods shown. |
The accompanying notes are an integral part of the financial statements.
108
MML Series Investment Fund II – Financial Statements (Continued)
Financial Highlights (For a share outstanding throughout each period)
MML Inflation-Protected and Income Fund
| | | | | | | | | | | | | | | | | | | | | | | | | | | | | | | | | | | | | | | | | | | | | | | | | | | | |
| | | | | | Income (loss) from investment
operations | | | Less distributions to shareholders | | | | | | | | | Ratios / Supplemental Data | |
| | | Net
asset
value,
beginning
of the
period | | | Net
investment
income
(loss)c | | | Net
realized
and
unrealized
gain (loss)
on
investments | | | Total
income
(loss) from
investment
operations | | | From net
investment
income | | | From net
realized
gains | | | Total
distributions | | | Net
asset
value,
end of
the
period | | | Total
returnm | | | Net
assets,
end of
the
period
(000’s) | | | Ratio of
expenses
to average
daily net
assetsn | | | Interest
expenses
to average
daily net
assetsp | | | Net
investment
income
(loss) to
average
daily net
assetsn | |
Initial Class | | | | | | | | | | | | | | | | | | | | | | | | | | | | | | | | | | | | | | | | | | | | | |
| 12/31/16 | | $ | 9.92 | | | $ | 0.21 | | | $ | 0.30 | | | $ | 0.51 | | | $ | (0.25 | ) | | $ | - | | | $ | (0.25 | ) | | $ | 10.18 | | | | 5.10% | | | $ | 375,135 | | | | 1.13% | | | | 0.53% | | | | 2.00% | |
| 12/31/15 | | | 10.18 | | | | 0.06 | | | | (0.20 | ) | | | (0.14 | ) | | | (0.12 | ) | | | - | | | | (0.12 | ) | | | 9.92 | | | | (1.41% | ) | | | 380,221 | | | | 0.84% | | | | 0.25% | | | | 0.58% | |
| 12/31/14 | | | 10.35 | | | | 0.19 | | | | 0.16 | | | | 0.35 | | | | (0.29 | ) | | | (0.23 | ) | | | (0.52 | ) | | | 10.18 | | | | 3.45% | | | | 412,861 | | | | 0.73% | | | | 0.13% | | | | 1.85% | |
| 12/31/13 | | | 11.86 | | | | 0.16 | | | | (1.16 | ) | | | (1.00 | ) | | | (0.21 | ) | | | (0.30 | ) | | | (0.51 | ) | | | 10.35 | | | | (8.68% | ) | | | 326,380 | | | | 0.77% | | | | 0.17% | | | | 1.45% | |
| 12/31/12 | | | 11.56 | | | | 0.32 | | | | 0.47 | | | | 0.79 | | | | (0.38 | ) | | | (0.11 | ) | | | (0.49 | ) | | | 11.86 | | | | 6.89% | | | | 365,094 | | | | 0.81% | | | | 0.21% | | | | 2.70% | |
Service Class | | | | | | | | | | | | | | | | | | | | | | | | | | | | | | | | | | | | | | | | | | | | | |
| 12/31/16 | | $ | 9.87 | | | $ | 0.18 | | | $ | 0.31 | | | $ | 0.49 | | | $ | (0.22 | ) | | $ | - | | | $ | (0.22 | ) | | $ | 10.14 | | | | 4.90% | | | $ | 47,025 | | | | 1.38% | | | | 0.53% | | | | 1.77% | |
| 12/31/15 | | | 10.14 | | | | 0.03 | | | | (0.20 | ) | | | (0.17 | ) | | | (0.10 | ) | | | - | | | | (0.10 | ) | | | 9.87 | | | | (1.65% | ) | | | 47,818 | | | | 1.09% | | | | 0.25% | | | | 0.33% | |
| 12/31/14 | | | 10.32 | | | | 0.18 | | | | 0.14 | | | | 0.32 | | | | (0.27 | ) | | | (0.23 | ) | | | (0.50 | ) | | | 10.14 | | | | 3.16% | | | | 52,008 | | | | 0.98% | | | | 0.13% | | | | 1.75% | |
| 12/31/13 | | | 11.83 | | | | 0.13 | | | | (1.16 | ) | | | (1.03 | ) | | | (0.18 | ) | | | (0.30 | ) | | | (0.48 | ) | | | 10.32 | | | | (8.95% | ) | | | 53,902 | | | | 1.02% | | | | 0.17% | | | | 1.20% | |
| 12/31/12 | | | 11.53 | | | | 0.29 | | | | 0.47 | | | | 0.76 | | | | (0.35 | ) | | | (0.11 | ) | | | (0.46 | ) | | | 11.83 | | | | 6.65% | | | | 65,419 | | | | 1.06% | | | | 0.21% | | | | 2.44% | |
| | | | | | | | | | | | | | | | | | | | |
| | | Year ended December 31 | |
| | | 2016 | | | 2015 | | | 2014 | | | 2013 | | | 2012 | |
Portfolio turnover rate | | | 41 | % | | | 50 | % | | | 67 | % | | | 57 | % | | | 31 | % |
| c | Per share amount calculated on the average shares method. |
| m | Total return does not reflect expenses that apply at the separate account level or to related insurance products. Inclusion of these charges would reduce the total return figures for all periods shown. |
| n | Includes interest expense. |
| p | Interest expense incurred as a result of entering into reverse repurchase agreements is included in the Fund’s net expenses in the Statements of Operations. Income earned on investing proceeds from reverse repurchase agreements is included in interest income in the Statements of Operations. |
The accompanying notes are an integral part of the financial statements.
109
MML Series Investment Fund II – Financial Statements (Continued)
Financial Highlights (For a share outstanding throughout each period)
MML Short-Duration Bond Fund
| | | | | | | | | | | | | | | | | | | | | | | | | | | | | | | | | | | | | | | | | | | | | | | | | | | | |
| | | | | | Income (loss) from investment
operations | | | Less distributions to shareholders | | | | | | | | | Ratios / Supplemental Data | |
| | | Net
asset
value,
beginning
of the
period | | | Net
investment
income
(loss)c,j | | | Net
realized
and
unrealized
gain (loss)
on
investments | | | Total
income
(loss) from
investment
operations | | | From net
investment
income | | | From net
realized
gains | | | Total
distributions | | | Net
asset
value,
end of
the
period | | | Total
returnm | | | Net
assets,
end of
the
period
(000’s) | | | Ratio of
expenses
to average
daily net
assets
before
expense
waivers | | | Ratio of
expenses
to average
daily net
assets
after
expense
waiversj | | | Net
investment
income
(loss) to
average
daily net
assets | |
Class II | | | | | | | | | | | | | | | | | | | | | | | | | | | | | | | | | | | | | | | | | | | | | |
12/31/16 | | $ | 9.70 | | | $ | 0.18 | | | $ | 0.09 | | | $ | 0.27 | | | $ | (0.22 | ) | | $ | - | | | $ | (0.22 | ) | | $ | 9.75 | | | | 2.80% | | | $ | 203,294 | | | | 0.56% | | | | 0.55% | | | | 1.84% | |
| 12/31/15 | | | 9.84 | | | | 0.17 | | | | (0.08 | ) | | | 0.09 | | | | (0.23 | ) | | | - | | | | (0.23 | ) | | | 9.70 | | | | 0.93% | | | | 155,210 | | | | 0.55% | | | | 0.55% | k | | | 1.73% | |
| 12/31/14 | | | 9.94 | | | | 0.15 | | | | (0.01 | ) | | | 0.14 | | | | (0.24 | ) | | | (0.00 | )d | | | (0.24 | ) | | | 9.84 | | | | 1.46% | | | | 166,438 | | | | 0.55% | | | | 0.55% | k | | | 1.50% | |
| 12/31/13 | | | 10.10 | | | | 0.14 | | | | (0.05 | ) | | | 0.09 | | | | (0.20 | ) | | | (0.05 | ) | | | (0.25 | ) | | | 9.94 | | | | 0.89% | | | | 195,279 | | | | 0.55% | | | | 0.55% | k | | | 1.38% | |
| 12/31/12 | | | 10.25 | | | | 0.16 | | | | 0.14 | | | | 0.30 | | | | (0.20 | ) | | | (0.25 | ) | | | (0.45 | ) | | | 10.10 | | | | 3.00% | | | | 166,054 | | | | 0.58% | | | | 0.55% | | | | 1.58% | |
Service Class I | | | | | | | | | | | | | | | | | | | | | | | | | | | | | | | | | | | | | | | | | | | | | |
12/31/16 | | $ | 9.69 | | | $ | 0.16 | | | $ | 0.09 | | | $ | 0.25 | | | $ | (0.20 | ) | | $ | - | | | $ | (0.20 | ) | | $ | 9.74 | | | | 2.55% | | | $ | 31,787 | | | | 0.81% | | | | 0.80% | | | | 1.60% | |
| 12/31/15 | | | 9.83 | | | | 0.15 | | | | (0.08 | ) | | | 0.07 | | | | (0.21 | ) | | | - | | | | (0.21 | ) | | | 9.69 | | | | 0.68% | | | | 24,101 | | | | 0.80% | | | | 0.80% | k | | | 1.48% | |
| 12/31/14 | | | 9.94 | | | | 0.12 | | | | (0.01 | ) | | | 0.11 | | | | (0.22 | ) | | | (0.00 | )d | | | (0.22 | ) | | | 9.83 | | | | 1.11% | | | | 24,288 | | | | 0.80% | | | | 0.80% | k | | | 1.26% | |
| 12/31/13 | | | 10.09 | | | | 0.11 | | | | (0.03 | ) | | | 0.08 | | | | (0.18 | ) | | | (0.05 | ) | | | (0.23 | ) | | | 9.94 | | | | 0.74% | | | | 21,697 | | | | 0.80% | | | | 0.80% | k | | | 1.13% | |
| 12/31/12 | | | 10.24 | | | | 0.14 | | | | 0.14 | | | | 0.28 | | | | (0.18 | ) | | | (0.25 | ) | | | (0.43 | ) | | | 10.09 | | | | 2.77% | | | | 20,825 | | | | 0.83% | | | | 0.80% | | | | 1.35% | |
| | | | | | | | | | | | | | | | | | | | |
| | | Year ended December 31 | |
| | | 2016 | | | 2015 | | | 2014 | | | 2013 | | | 2012 | |
Portfolio turnover rate | | | 96 | % | | | 51 | % | | | 86 | % | | | 114 | % | | | 322 | % |
| c | Per share amount calculated on the average shares method. |
| d | Amount is less than $0.005 per share. |
| j | Computed after giving effect to an agreement by MML Advisers and/or MassMutual to waive certain fees and expenses of the Fund. |
| k | Amount waived had no impact on the ratio of expenses to average daily net assets. |
| m | Total return does not reflect expenses that apply at the separate account level or to related insurance products. Inclusion of these charges would reduce the total return figures for all periods shown. |
The accompanying notes are an integral part of the financial statements.
110
MML Series Investment Fund II – Financial Statements (Continued)
Financial Highlights (For a share outstanding throughout each period)
MML Small Cap Equity Fund
| | | | | | | | | | | | | | | | | | | | | | | | | | | | | | | | | | | | | | | | | | | | | | | | |
| | | | | | Income (loss) from investment
operations | | | Less distributions to shareholders | | | | | | | | | Ratios / Supplemental Data | |
| | | Net
asset
value,
beginning
of the
period | | | Net
investment
income
(loss)c | | | Net
realized
and
unrealized
gain (loss)
on
investments | | | Total
income
(loss) from
investment
operations | | | From net
investment
income | | | From net
realized
gains | | | Total
distributions | | | Net
asset
value,
end of
the
period | | | Total
returnm | | | Net
assets,
end of
the
period
(000’s) | | | Ratio of
expenses
to average
daily net
assets | | | Net
investment
income
(loss) to
average
daily net
assets | |
Initial Class | |
12/31/16 | | $ | 8.27 | | | $ | 0.10 | | | $ | 1.37 | | | $ | 1.47 | | | $ | (0.09 | ) | | $ | (0.20 | ) | | $ | (0.29 | ) | | $ | 9.45 | | | | 18.21 | % | | $ | 97,747 | | | | 0.72 | % | | | 1.21 | % |
| 12/31/15 | | | 10.64 | | | | 0.09 | | | | (0.73 | ) | | | (0.64 | ) | | | (0.09 | ) | | | (1.64 | ) | | | (1.73 | ) | | | 8.27 | | | | (5.63 | %) | | | 89,557 | | | | 0.71 | % | | | 0.89 | % |
| 12/31/14 | | | 10.97 | | | | 0.13 | | | | 1.11 | | | | 1.24 | | | | (0.11 | ) | | | (1.46 | ) | | | (1.57 | ) | | | 10.64 | | | | 12.16 | % | | | 104,745 | | | | 0.70 | % | | | 1.19 | % |
| 12/31/13 | | | 8.82 | | | | 0.09 | | | | 3.39 | | | | 3.48 | | | | (0.11 | ) | | | (1.22 | ) | | | (1.33 | ) | | | 10.97 | | | | 41.02 | % | | | 104,147 | | | | 0.72 | % | | | 0.86 | % |
| 12/31/12 | | | 7.57 | | | | 0.09 | | | | 1.29 | | | | 1.38 | | | | - | | | | (0.13 | ) | | | (0.13 | ) | | | 8.82 | | | | 18.39 | % | | | 82,675 | | | | 0.82 | % | | | 1.09 | % |
Service Class | |
12/31/16 | | $ | 8.15 | | | $ | 0.08 | | | $ | 1.35 | | | $ | 1.43 | | | $ | (0.07 | ) | | $ | (0.20 | ) | | $ | (0.27 | ) | | $ | 9.31 | | | | 17.92 | % | | $ | 13,279 | | | | 0.97 | % | | | 0.96 | % |
| 12/31/15 | | | 10.52 | | | | 0.06 | | | | (0.72 | ) | | | (0.66 | ) | | | (0.07 | ) | | | (1.64 | ) | | | (1.71 | ) | | | 8.15 | | | | (5.87 | %) | | | 11,155 | | | | 0.96 | % | | | 0.67 | % |
| 12/31/14 | | | 10.87 | | | | 0.10 | | | | 1.10 | | | | 1.20 | | | | (0.09 | ) | | | (1.46 | ) | | | (1.55 | ) | | | 10.52 | | | | 11.88 | % | | | 9,916 | | | | 0.95 | % | | | 0.94 | % |
| 12/31/13 | | | 8.76 | | | | 0.06 | | | | 3.36 | | | | 3.42 | | | | (0.09 | ) | | | (1.22 | ) | | | (1.31 | ) | | | 10.87 | | | | 40.67 | % | | | 7,674 | | | | 0.97 | % | | | 0.63 | % |
| 12/31/12 | | | 7.53 | | | | 0.08 | | | | 1.28 | | | | 1.36 | | | | - | | | | (0.13 | ) | | | (0.13 | ) | | | 8.76 | | | | 18.09 | % | | | 4,545 | | | | 1.07 | % | | | 0.96 | % |
| | | | | | | | | | | | | | | | | | | | |
| | | Year ended December 31 | |
| | | 2016 | | | 2015 | | | 2014 | | | 2013 | | | 2012 | |
Portfolio turnover rate | | | 63 | % | | | 40 | % | | | 65 | % | | | 65 | % | | | 92 | % |
| c | Per share amount calculated on the average shares method. |
| m | Total return does not reflect expenses that apply at the separate account level or to related insurance products. Inclusion of these charges would reduce the total return figures for all periods shown. |
The accompanying notes are an integral part of the financial statements.
111
MML Series Investment Fund II – Financial Statements (Continued)
Financial Highlights (For a share outstanding throughout each period)
MML Special Situations Fund
| | | | | | | | | | | | | | | | | | | | | | | | | | | | | | | | | | | | | | | | | | | | | | | | | | | | |
| | | | | | Income (loss) from investment
operations | | | Less distributions to shareholders | | | | | | | | | Ratios / Supplemental Data | |
| | | Net
asset
value,
beginning
of the
period | | | Net
investment
income
(loss)c,j | | | Net
realized
and
unrealized
gain (loss)
on
investments | | | Total
income
(loss) from
investment
operations | | | From net
investment
income | | | Tax return
of capital | | | Total
distributions | | | Net
asset
value,
end of
the
period | | | Total
returnm | | | Net
assets,
end of
the
period
(000’s) | | | Ratio of
expenses
to average
daily net
assets
before
expense
waivers | | | Ratio of
expenses
to average
daily net
assets
after
expense
waiversj | | | Net
investment
income
(loss) to
average
daily net
assets | |
Class II | | | | | | | | | | | | | | | | | | | | | | | | | | | | | | | | | | | | | | | | | | | | | |
12/31/16 | | $ | 8.43 | | | $ | 0.04 | | | $ | 1.30 | | | $ | 1.34 | | | $ | (0.04 | ) | | $ | (0.02 | ) | | $ | (0.06 | ) | | $ | 9.71 | | | | 15.84% | | | $ | 19,441 | | | | 0.93% | | | | 0.80% | | | | 0.43% | |
| 12/31/15g | | | 10.00 | | | | (0.00 | )d | | | (1.57 | ) | | | (1.57 | ) | | | - | | | | (0.00 | )d | | | (0.00 | )d | | | 8.43 | | | | (15.67% | )b | | | 16,776 | | | | 1.13% | a | | | 0.80% | a | | | (0.07% | )a |
Service Class I | | | | | | | | | | | | | | | | | | | | | | | | | | | | | | | | | | | | | | | | | | | | | |
12/31/16 | | $ | 8.42 | | | $ | 0.02 | | | $ | 1.29 | | | $ | 1.31 | | | $ | (0.03 | ) | | $ | (0.01 | ) | | $ | (0.04 | ) | | $ | 9.69 | | | | 15.54% | | | $ | 359 | | | | 1.18% | | | | 1.05% | | | | 0.18% | |
| 12/31/15g | | | 10.00 | | | | (0.02 | ) | | | (1.56 | ) | | | (1.58 | ) | | | - | | | | - | | | | - | | | | 8.42 | | | | (15.80% | )b | | | 183 | | | | 1.38% | a | | | 1.05% | a | | | (0.30% | )a |
| | | | | | | | |
| | | Year ended
December 31, 2016 | | | Period ended
December 31, 2015b | |
Portfolio turnover rate | | | 74 | % | | | 87 | % |
| b | Percentage represents the results for the period and is not annualized. |
| c | Per share amount calculated on the average shares method. |
| d | Amount is less than $0.005 per share. |
| g | For the period May 15, 2015 (commencement of operations) through December 31, 2015. |
| j | Computed after giving effect to an agreement by MML Advisers to waive certain fees and expenses of the Fund. |
| m | Total return does not reflect expenses that apply at the separate account level or to related insurance products. Inclusion of these charges would reduce the total return figures for all periods shown. |
The accompanying notes are an integral part of the financial statements.
112
MML Series Investment Fund II – Financial Statements (Continued)
Financial Highlights (For a share outstanding throughout each period)
MML Strategic Emerging Markets Fund
| | | | | | | | | | | | | | | | | | | | | | | | | | | | | | | | | | | | | | | | | | | | | | | | |
| | | | | | Income (loss) from investment
operations | | | Less distributions to
shareholders | | | | | | | | | Ratios / Supplemental Data | |
| | | Net
asset
value,
beginning
of the
period | | | Net
investment
income
(loss)c,j | | | Net
realized
and
unrealized
gain (loss)
on
investments | | | Total
income
(loss) from
investment
operations | | | From net
investment
income | | | Total
distributions | | | Net
asset
value,
end of
the
period | | | Total
returnm | | | Net
assets,
end of
the
period
(000’s) | | | Ratio of
expenses
to average
daily net
assets
before
expense
waivers | | | Ratio of
expenses
to average
daily net
assets
after
expense
waiversj | | | Net
investment
income
(loss) to
average
daily net
assets | |
Class II | | | | | | | | | | | | | | | | | | | | | | | | | | | | | | | | | | | | | | | | | |
12/31/16 | | $ | 8.15 | | | $ | 0.02 | | | $ | 0.51 | | | $ | 0.53 | | | $ | (0.04 | ) | | $ | (0.04 | ) | | $ | 8.64 | | | | 6.49% | | | $ | 86,289 | | | | 1.50% | | | | 1.40% | | | | 0.29% | |
| 12/31/15 | | | 9.63 | | | | 0.03 | | | | (1.41 | ) | | | (1.38 | ) | | | (0.10 | ) | | | (0.10 | ) | | | 8.15 | | | | (14.23% | ) | | | 84,356 | | | | 1.60% | | | | 1.40% | | | | 0.34% | |
| 12/31/14 | | | 10.21 | | | | 0.04 | | | | (0.59 | ) | | | (0.55 | ) | | | (0.03 | ) | | | (0.03 | ) | | | 9.63 | | | | (5.41% | ) | | | 85,833 | | | | 1.70% | | | | 1.40% | | | | 0.42% | |
| 12/31/13 | | | 10.91 | | | | 0.08 | | | | (0.78 | ) | | | (0.70 | ) | | | - | | | | - | | | | 10.21 | | | | (6.42% | ) | | | 91,651 | | | | 1.56% | | | | 1.40% | | | | 0.82% | |
| 12/31/12 | | | 9.43 | | | | 0.06 | | | | 1.47 | | | | 1.53 | | | | (0.05 | ) | | | (0.05 | ) | | | 10.91 | | | | 16.20% | | | | 46,830 | | | | 1.63% | | | | 1.40% | | | | 0.56% | |
Service Class I | | | | | | | | | | | | | | | | | | | | | | | | | | | | | | | | | | | | | | | | | |
12/31/16 | | $ | 8.17 | | | $ | 0.00 | d | | $ | 0.51 | | | $ | 0.51 | | | $ | (0.02 | ) | | $ | (0.02 | ) | | $ | 8.66 | | | | 6.24% | | | $ | 9,913 | | | | 1.75% | | | | 1.65% | | | | 0.03% | |
| 12/31/15 | | | 9.65 | | | | 0.01 | | | | (1.41 | ) | | | (1.40 | ) | | | (0.08 | ) | | | (0.08 | ) | | | 8.17 | | | | (14.46% | ) | | | 8,409 | | | | 1.85% | | | | 1.65% | | | | 0.09% | |
| 12/31/14 | | | 10.23 | | | | 0.01 | | | | (0.59 | ) | | | (0.58 | ) | | | (0.00 | )d | | | (0.00 | )d | | | 9.65 | | | | (5.63% | ) | | | 9,120 | | | | 1.95% | | | | 1.65% | | | | 0.14% | |
| 12/31/13 | | | 10.97 | | | | 0.08 | | | | (0.82 | ) | | | (0.74 | ) | | | - | | | | - | | | | 10.23 | | | | (6.75% | ) | | | 9,122 | | | | 1.81% | | | | 1.65% | | | | 0.76% | |
| 12/31/12 | | | 9.48 | | | | 0.03 | | | | 1.48 | | | | 1.51 | | | | (0.02 | ) | | | (0.02 | ) | | | 10.97 | | | | 15.91% | | | | 8,851 | | | | 1.88% | | | | 1.65% | | | | 0.26% | |
| | | | | | | | | | | | | | | | | | | | |
| | | Year ended December 31 | |
| | | 2016 | | | 2015 | | | 2014 | | | 2013 | | | 2012 | |
Portfolio turnover rate | | | 32 | % | | | 39 | % | | | 44 | % | | | 145 | % | | | 62 | % |
| c | Per share amount calculated on the average shares method. |
| d | Amount is less than $0.005 per share. |
| j | Computed after giving effect to an agreement by MML Advisers and/or MassMutual to waive certain fees and expenses of the Fund. |
| m | Total return does not reflect expenses that apply at the separate account level or to related insurance products. Inclusion of these charges would reduce the total return figures for all periods shown. |
The accompanying notes are an integral part of the financial statements.
113
Notes to Financial Statements
MML Series Investment Fund II (the “Trust”) is registered under the Investment Company Act of 1940, as amended (the “1940 Act”), as a no-load, open-end, management investment company. The Trust is organized under the laws of the Commonwealth of Massachusetts as a Massachusetts business trust pursuant to an Agreement and Declaration of Trust dated February 8, 2005, which was amended and restated as of February 28, 2005 and December 15, 2011, as it may be further amended from time to time. The following are nine series of the Trust (each individually referred to as a “Fund” or collectively as the “Funds”):
MML Asset Momentum Fund (“Asset Momentum Fund”)
MML Dynamic Bond Fund (“Dynamic Bond Fund”)
MML Equity Rotation Fund (“Equity Rotation Fund”)
MML High Yield Fund (“High Yield Fund”)
MML Inflation-Protected and Income Fund (“Inflation-Protected and Income Fund”)
MML Short-Duration Bond Fund (“Short-Duration Bond Fund”)
MML Small Cap Equity Fund (“Small Cap Equity Fund”)
MML Special Situations Fund (“Special Situations Fund”)
MML Strategic Emerging Markets Fund (“Strategic Emerging Markets Fund”)
The Trust makes shares of the Funds available for the investment of assets of various separate investment accounts established by Massachusetts Mutual Life Insurance Company (“MassMutual”) and by life insurance companies which are subsidiaries of MassMutual. Shares of the Trust are not offered to the general public. MassMutual, MML Bay State Life Insurance Company, C.M. Life Insurance Company, and the MML Allocation Funds, which are “funds of funds” series of MML Series Investment Fund, another open-end management investment company sponsored by MassMutual, are the record owners of all of the outstanding shares of the Funds.
Each share class of a Fund represents an interest in the same portfolio of assets. The principal difference among the classes is the level of service and administration fees, and shareholder and distribution service expenses borne by the classes. Because each class will have different fees and expenses, performance and share prices will vary between the classes. The classes of shares are offered to different types of investors, as outlined in the Funds’ Prospectus.
| 2. | | Significant Accounting Policies |
The following is a summary of significant accounting policies followed consistently by each Fund in the preparation of the financial statements in conformity with accounting principles generally accepted in the United States of America (“generally accepted accounting principles”). The preparation of the financial statements in accordance with generally accepted accounting principles requires management to make estimates and assumptions that affect the reported amounts and disclosures in the financial statements. Actual results could differ from those estimates.
Investment Valuation
The net asset value of each Fund’s shares is determined once daily as of the close of regular trading on the New York Stock Exchange (“NYSE”), on each day the NYSE is open for trading (a “business day”). The NYSE normally closes at 4:00 p.m. Eastern Time, but may close earlier on some days.
Equity securities and derivative contracts that are actively traded on a national securities exchange or contract market are valued on the basis of information furnished by a pricing service, which provides the last reported sale price, or, in the case of futures contracts, the settlement price, for securities or derivatives listed on the exchange or contract market or the official closing price on the NASDAQ National Market System (“NASDAQ System”), or in the case of over-the-counter (“OTC”) securities for which an official closing price is unavailable or not reported on the NASDAQ System, the last reported bid price. Portfolio securities traded on more than one national securities exchange are valued at the last price at the close of the exchange representing the principal market for such securities. Debt securities are valued on the basis of valuations furnished by a pricing service, which generally determines valuations taking into account factors such as institutional-size trading in similar securities, yield, quality, coupon rate, maturity, type of issue, trading characteristics, and other market data. Shares of other open-end mutual funds are valued at their closing net asset values as reported on each business day.
114
Notes to Financial Statements (Continued)
Investments for which market quotations are readily available are marked to market daily based on those quotations. Market quotations may be provided by third-party vendors or market makers, and may be determined on the basis of a variety of factors, such as broker quotations, financial modeling, and other market data, such as market indexes and yield curves, counterparty information, and foreign exchange rates. U.S. Government and agency securities may be valued on the basis of market quotations or using a model that may incorporate market observable data such as reported sales of similar securities, broker quotes, yields, bids, offers, quoted market prices, and reference data. The fair values of OTC derivative contracts, including forward, swap, and option contracts related to interest rates, foreign currencies, credit standing of reference entities, equity prices, or commodity prices, may be based on market quotations or may be modeled using a series of techniques, including simulation models, depending on the contract and the terms of the transaction. The fair values of asset-backed securities and mortgage-backed securities are estimated based on models that consider the estimated cash flows of each debt tranche of the issuer, established benchmark yield, and estimated tranche-specific spread to the benchmark yield based on the unique attributes of the tranche, including, but not limited to, prepayment speed assumptions and attributes of the collateral. Restricted securities are generally valued at a discount to similar publicly traded securities.
Investments for which market quotations are not available or for which a pricing service or vendor does not provide a value, or for which such market quotations or values are considered by the investment adviser or subadviser to be unreliable (including, for example, certain foreign securities, thinly-traded securities, certain restricted securities, certain initial public offerings, or securities whose values may have been affected by a significant event) are stated at fair valuations determined in good faith by the Funds’ Valuation Committee1 in accordance with procedures approved annually by the Board of Trustees (“Trustees”), and under the general oversight of the Trustees. The Funds’ Valuation Committee employs various methods to determine fair valuations including a regular review of significant inputs and assumptions and review of any related market activity. The Funds’ Valuation Committee reports to the Trustees at their regularly scheduled meetings. It is possible that fair value prices will be used by the Funds to a significant extent. The value determined for an investment using the Funds’ fair value procedures may differ from recent market prices for the investment and may be significantly different from the value realized upon the sale of such investment.
The Funds may invest in securities that are traded principally in foreign markets and that trade on weekends and other days when the Funds do not price their shares. As a result, the values of the Funds’ portfolio securities may change on days when the prices of the Funds’ shares are not calculated. The prices of the Funds’ shares will reflect any such changes when the prices of the Funds’ shares are next calculated, which is the next business day. The Funds may use fair value pricing more frequently for securities primarily traded in foreign markets because, among other things, most foreign markets close well before the Funds value their securities. The earlier close of these foreign markets gives rise to the possibility that significant events, including broad market moves, may have occurred in the interim. The Funds’ investments may be priced based on fair values provided by a third-party vendor, based on certain factors and methodologies applied by such vendor, in the event that there is movement in the U.S. market, between the close of the foreign market and the time the Funds calculate their net asset values. All assets and liabilities expressed in foreign currencies are converted into U.S. dollars at the mean between the buying and selling rates of such currencies against the U.S. dollar at the end of each business day.
Fair value is defined as the price that would be received to sell an asset or paid to transfer a liability in an orderly transaction between market participants at the measurement date. A three-tier hierarchy is utilized to maximize the use of observable market data inputs and minimize the use of unobservable inputs and to establish classification of fair value measurements for disclosure purposes. Inputs refer broadly to the assumptions that market participants would use in pricing the asset or liability, including assumptions about risk, for example, the risk inherent in a particular valuation technique used to measure fair value (such as a pricing model) and/or the risk inherent in the inputs to the valuation technique. Inputs may be observable or unobservable. Observable inputs are inputs that reflect the assumptions market participants would use in pricing the asset or liability and are developed based on market data obtained from sources independent of the reporting entity. Unobservable inputs are inputs that reflect the reporting entity’s own assumptions about the assumptions market participants would use in pricing the asset or liability and are developed based on the best information available in the circumstances. The three-tier hierarchy of inputs is summarized in the three broad Levels listed below. The inputs or methodology used for valuing investments are not necessarily an indication of
| 1 | The Valuation Committee consists of the President, Treasurer, Assistant Treasurers, Vice Presidents (except for the CCO), Assistant Vice Presidents, Secretary, and Assistant Secretaries of the Trust, as well as such alternate members as the Trustees may from time to time designate. The Valuation Committee reviews and determines the fair valuation of portfolio securities and the Funds’ pricing procedures in general. |
115
Notes to Financial Statements (Continued)
the risk associated with investing in those investments and the determination of the significance of a particular input to the fair value measurement in its entirety requires judgment and consideration of factors specific to each security.
Level 1 – quoted prices (unadjusted) in active markets for identical investments that the Funds can access at the measurement date
The types of assets and liabilities categorized in Level 1 generally include actively traded domestic and certain foreign equity securities, derivatives actively traded on a national securities exchange (such as some warrants, rights, futures, and options), and shares of open-end mutual funds.
Level 2 – other significant observable inputs (including quoted prices for similar investments, interest rates, prepayment speeds, credit risk, etc.)
The types of assets and liabilities categorized in Level 2 generally include debt securities such as U.S. Government and agency securities, mortgage-backed securities, asset-backed securities, municipal obligations, sovereign debt obligations, bank loans, corporate bonds, and those securities valued at amortized cost; OTC derivatives such as swaps, options, swaptions, and forward foreign currency exchange contracts; certain restricted securities; and non-exchange traded equity securities and certain foreign equity securities traded on particular foreign exchanges that close before the Funds determine their net asset values.
Level 3 – significant unobservable inputs (including the Funds’ own assumptions in determining the fair value of investments)
The types of assets and liabilities categorized in Level 3 generally include securities for which prices, spreads, or any of the other aforementioned significant inputs are unobservable. Generally, securities whose trading has been suspended or that have been de-listed from their current primary trading exchange; securities in default or bankruptcy proceedings for which there is no current market quotation; securities and certain derivatives valued by broker quotes which may include brokers’ assumptions; and any illiquid Rule 144A securities or restricted securities issued by non-public entities are categorized in Level 3.
The availability of observable inputs can vary from security to security and is affected by a wide variety of factors, including, for example, the type of security, whether the security is new and not yet established in the marketplace, the liquidity of markets, and other characteristics particular to the security. To the extent that valuation is based on models or inputs that are less observable or unobservable in the market, the determination of fair value requires more judgment. Accordingly, the degree of judgment exercised in determining fair value is greatest for instruments categorized in Level 3.
Changes in valuation techniques may result in transfers in or out of an investment’s assigned Level within the hierarchy. In addition, in periods of market dislocation, the observability of prices and inputs may be reduced for many instruments. This condition, as well as changes related to liquidity of investments, could cause a security to be reclassified between Level 1, Level 2, or Level 3.
In certain cases, the inputs used to measure fair value may fall into different levels of the fair value hierarchy. In such cases, for disclosure purposes the level in the fair value hierarchy within which the fair value measurement falls is determined based on the lowest level input that is significant to the overall fair value measurement.
The High Yield Fund characterized all investments at Level 2, as of December 31, 2016. The Equity Rotation Fund, Small Cap Equity Fund and Special Situations Fund characterized all long-term investments at Level 1, and all short-term investments at Level 2, as of December 31, 2016. For each Fund noted in the preceding sentences, the level classification by major category of investments is the same as the category presentation in the Portfolio of Investments.
116
Notes to Financial Statements (Continued)
The following is the aggregate value by input level, as of December 31, 2016, for the remaining Funds’ investments:
| | | | | | | | | | | | | | | | |
| | | Level 1 | | | Level 2 | | | Level 3 | | | Total | |
Asset Momentum Fund | | | | | | | | | | | | | | | | |
Asset Investments | | | | | | | | | | | | | | | | |
Common Stock | | $ | 6,085,532 | | | $ | 2,306,640 | * | | $ | - | | | $ | 8,392,172 | |
Corporate Debt | | | - | | | | 3,003,843 | | | | - | | | | 3,003,843 | |
U.S. Treasury Obligations | | | - | | | | 996,689 | | | | - | | | | 996,689 | |
Mutual Funds | | | 7,396,789 | | | | - | | | | - | | | | 7,396,789 | |
Short-Term Investments | | | - | | | | 1,806,566 | | | | - | | | | 1,806,566 | |
| | | | | | | | | | | | | | | | |
| Total Investments | | $ | 13,482,321 | | | $ | 8,113,738 | | | $ | - | | | $ | 21,596,059 | |
| | | | | | | | | | | | | | | | |
Asset Derivatives | | | | | | | | | | | | | | | | |
Forward Contracts | | $ | - | | | $ | 130,530 | | | $ | - | | | $ | 130,530 | |
| | | | | | | | | | | | | | | | |
Liability Derivatives | | | | | | | | | | | | | | | | |
Forward Contracts | | $ | - | | | $ | (52,630 | ) | | $ | - | | | $ | (52,630 | ) |
Futures Contracts | | | (32,181 | ) | | | - | | | | - | | | | (32,181 | ) |
| | | | | | | | | | | | | | | | |
| Total | | $ | (32,181 | ) | | $ | (52,630 | ) | | $ | - | | | $ | (84,811 | ) |
| | | | | | | | | | | | | | | | |
| | | | |
Dynamic Bond Fund | | | | | | | | | | | | | | | | |
Asset Investments | | | | | | | | | | | | | | | | |
Common Stock | | $ | 6,759 | | | $ | - | | | $ | - | | | $ | 6,759 | |
Corporate Debt | | | - | | | | 98,690,089 | | | | - | | | | 98,690,089 | |
Municipal Obligations | | | - | | | | 2,224,229 | | | | - | | | | 2,224,229 | |
Non-U.S. Government Agency Obligations | | | - | | | | 119,502,289 | | | | - | | | | 119,502,289 | |
Sovereign Debt Obligations | | | - | | | | 4,960,578 | | | | - | | | | 4,960,578 | |
U.S. Government Agency Obligations and Instrumentalities | | | - | | | | 50,423,265 | | | | - | | | | 50,423,265 | |
U.S. Treasury Obligations | | | - | | | | 122,645,861 | | | | - | | | | 122,645,861 | |
Mutual Funds | | | 8,531,659 | | | | - | | | | - | | | | 8,531,659 | |
Short-Term Investments | | | - | | | | 15,214,184 | | | | - | | | | 15,214,184 | |
| | | | | | | | | | | | | | | | |
| Total Investments | | $ | 8,538,418 | | | $ | 413,660,495 | | | $ | - | | | $ | 422,198,913 | |
| | | | | | | | | | | | | | | | |
| | | | |
Inflation-Protected and Income Fund | | | | | | | | | | | | | | | | |
Asset Investments | | | | | | | | | | | | | | | | |
Corporate Debt | | $ | - | | | $ | 15,186,352 | | | $ | - | | | $ | 15,186,352 | |
Municipal Obligations | | | - | | | | 210,523 | | | | - | | | | 210,523 | |
Non-U.S. Government Agency Obligations | | | - | | | | 190,107,695 | | | | - | | | | 190,107,695 | |
U.S. Government Agency Obligations and Instrumentalities | | | - | | | | 1,213,429 | | | | - | | | | 1,213,429 | |
U.S. Treasury Obligations | | | - | | | | 383,311,586 | | | | - | | | | 383,311,586 | |
Short-Term Investments | | | - | | | | 151,626,646 | | | | - | | | | 151,626,646 | |
| | | | | | | | | | | | | | | | |
| Total Investments | | $ | - | | | $ | 741,656,231 | | | $ | - | | | $ | 741,656,231 | |
| | | | | | | | | | | | | | | | |
Asset Derivatives | | | | | | | | | | | | | | | | |
Futures Contracts | | $ | 18,796 | | | $ | - | | | $ | - | | | $ | 18,796 | |
Swap Agreements | | | - | | | | 474,351 | | | | - | | | | 474,351 | |
| | | | | | | | | | | | | | | | |
| Total | | $ | 18,796 | | | $ | 474,351 | | | $ | - | | | $ | 493,147 | |
| | | | | | | | | | | | | | | | |
Liability Derivatives | | | | | | | | | | | | | | | | |
Swap Agreements | | $ | - | | | $ | (209,729 | ) | | $ | - | | | $ | (209,729 | ) |
| | | | | | | | | | | | | | | | |
117
Notes to Financial Statements (Continued)
| | | | | | | | | | | | | | | | |
| | | Level 1 | | | Level 2 | | | Level 3 | | | Total | |
Short-Duration Bond Fund | | | | | | | | | | | | | | | | |
Asset Investments | | | | | | | | | | | | | | | | |
Corporate Debt | | $ | - | | | $ | 100,546,856 | | | $ | - | | | $ | 100,546,856 | |
Municipal Obligations | | | - | | | | 88,887 | | | | - | | | | 88,887 | |
Non-U.S. Government Agency Obligations | | | - | | | | 91,306,327 | | | | - | | | | 91,306,327 | |
U.S. Government Agency Obligations and Instrumentalities | | | - | | | | 11,354,842 | | | | - | | | | 11,354,842 | |
U.S. Treasury Obligations | | | - | | | | 28,250,010 | | | | - | | | | 28,250,010 | |
Short-Term Investments | | | - | | | | 2,369,763 | | | | - | | | | 2,369,763 | |
| | | | | | | | | | | | | | | | |
| Total Investments | | $ | - | | | $ | 233,916,685 | | | $ | - | | | $ | 233,916,685 | |
| | | | | | | | | | | | | | | | |
Asset Derivatives | | | | | | | | | | | | | | | | |
Futures Contracts | | $ | 69,494 | | | $ | - | | | $ | - | | | $ | 69,494 | |
| | | | | | | | | | | | | | | | |
Liability Derivatives | | | | | | | | | | | | | | | | |
Futures Contracts | | $ | (33,036 | ) | | $ | - | | | $ | - | | | $ | (33,036 | ) |
Swap Agreements | | | - | | | | (84,966 | ) | | | - | | | | (84,966 | ) |
| | | | | | | | | | | | | | | | |
| Total | | $ | (33,036 | ) | | $ | (84,966 | ) | | $ | - | | | $ | (118,002 | ) |
| | | | | | | | | | | | | | | | |
| | | | |
Strategic Emerging Markets Fund | | | | | | | | | | | | | | | | |
Asset Investments | | | | | | | | | | | | | | | | |
| Common Stock* | | | | | | | | | | | | | | | | |
Bermuda | | $ | 113,659 | | | $ | 1,494,352 | | | $ | - | | | $ | 1,608,011 | |
Brazil | | | 1,666,525 | | | | 3,610,401 | | | | - | | | | 5,276,926 | |
Cayman Islands | | | 12,953,992 | | | | 5,728,840 | | | | - | | | | 18,682,832 | |
China | | | - | | | | 1,356,032 | | | | - | | | | 1,356,032 | |
Colombia | | | 907,622 | | | | 760,779 | | | | - | | | | 1,668,401 | |
Egypt | | | - | | | | 510,713 | | | | - | | | | 510,713 | |
France | | | - | | | | 3,268,739 | | | | - | | | | 3,268,739 | |
Hong Kong | | | - | | | | 3,016,906 | | | | - | | | | 3,016,906 | |
India | | | - | | | | 14,303,765 | | | | - | | | | 14,303,765 | |
Indonesia | | | - | | | | 2,096,250 | | | | - | | | | 2,096,250 | |
Italy | | | - | | | | 1,513,589 | | | | - | | | | 1,513,589 | |
Japan | | | - | | | | 2,264,063 | | | | - | | | | 2,264,063 | |
Malaysia | | | - | | | | 1,671,668 | | | | - | | | | 1,671,668 | |
Mexico | | | 4,385,418 | | | | - | | | | - | | | | 4,385,418 | |
Nigeria | | | - | | | | 552,163 | | | | - | | | | 552,163 | |
Philippines | | | - | | | | 3,258,873 | | | | - | | | | 3,258,873 | |
Poland | | | - | | | | 992,906 | | | | - | | | | 992,906 | |
Republic of Korea | | | - | | | | 2,080,128 | | | | - | | | | 2,080,128 | |
Russia | | | - | | | | 9,092,802 | | | | - | | | | 9,092,802 | |
Taiwan | | | - | | | | 3,998,427 | | | | - | | | | 3,998,427 | |
Thailand | | | - | | | | 678,531 | | | | - | | | | 678,531 | |
Turkey | | | - | | | | 867,069 | | | | - | | | | 867,069 | |
United Arab Emirates | | | - | | | | 1,631,847 | | | | - | | | | 1,631,847 | |
United Kingdom | | | - | | | | 2,505,266 | | | | - | | | | 2,505,266 | |
United States | | | 1,739,574 | | | | - | | | | - | | | | 1,739,574 | |
| Preferred Stock* | | | | | | | | | | | | | | | | |
Brazil | | | - | | | | 2,168,927 | | | | - | | | | 2,168,927 | |
India | | | 72,677 | | | | - | | | | - | | | | 72,677 | |
| Mutual Funds | | | 1,316,063 | | | | - | | | | - | | | | 1,316,063 | |
| Rights | | | - | | | | 572,051 | | | | - | | | | 572,051 | |
| Warrants | | | - | | | | 25,253 | | | | - | | | | 25,253 | |
| Short-Term Investments | | | - | | | | 4,666,018 | | | | - | | | | 4,666,018 | |
| | | | | | | | | | | | | | | | |
| Total Investments | | $ | 23,155,530 | | | $ | 74,686,358 | | | $ | - | | | $ | 97,841,888 | |
| | | | | | | | | | | | | | | | |
118
Notes to Financial Statements (Continued)
| * | Includes foreign equity securities whose values were adjusted to reflect market trading of comparable securities or other correlated instruments after the close of trading in their applicable foreign markets. |
The following table shows Fund(s) with certain assets and liabilities, which approximate fair value and would be categorized at Level 2 as of December 31, 2016.
| | | | | | | | |
Statement of Assets and Liabilities location: | | Inflation-
Protected
and income
Fund | | Short- Duration Bond Fund | | Small Cap
Equity
Fund | | Strategic Emerging Markets Fund |
Receivables for: | | | | | | | | |
Collateral pledged for reverse repurchase agreements | | X | | | | | | |
| | | | | |
Payables for: | | | | | | | | |
Reverse repurchase agreements | | X | | | | | | |
Securities on loan | | | | | | X | | X |
Due to custodian | | X | | X | | | | |
The Fund(s) had no transfers between Level 1, Level 2, and Level 3 of the fair value hierarchy during the year ended. The Fund(s) recognize transfers between the Levels as of the beginning of the year.
None of the unobservable inputs, individually or collectively, had a material impact on the Fund(s). Level 3 investments at the beginning and/or end of the period in relation to net assets were not significant and accordingly, a reconciliation of Level 3 assets for the year ended December 31, 2016 is not presented.
Derivative Instruments
Derivatives are financial instruments whose values are based on the values of one or more indicators, such as a security, asset, currency, interest rate, or index. Derivative transactions can create investment leverage and may be highly volatile. Gains or losses from derivatives can be substantially greater than their original cost and can sometimes be unlimited. A Fund may not be able to close out a derivative transaction at a favorable time or price. For those Funds that held derivatives during the year ended December 31, 2016, the following table shows how the Fund used these types of derivatives during the period (marked with an “A”), as well as additional uses, if any, it may have for them in the future (marked with an “M”).
| | | | | | | | |
Type of Derivative and Objective for Use | | Asset Momentum Fund | | Equity Rotation Fund | | Inflation-
Protected
and
Income
Fund | | Short-
Duration
Bond
Fund |
Foreign Currency Exchange Transactions* | | | | | | | | |
Hedging/Risk Management | | M | | | | | | |
Directional Exposure to Currencies | | A | | | | | | |
Intention to Create Investment Leverage in Portfolio | | M | | | | | | |
| | | | | |
Futures Contracts** | | | | | | | | |
Hedging/Risk Management | | A | | A | | A | | A |
Duration/Credit Quality Management | | M | | M | | A | | A |
Substitution for Direct Investment | | A | | A | | A | | A |
Intention to Create Investment Leverage in Portfolio | | M | | M | | M | | M |
119
Notes to Financial Statements (Continued)
| | | | | | | | |
Type of Derivative and Objective for Use | | Asset Momentum Fund | | Equity Rotation Fund | | Inflation-
Protected
and
Income
Fund | | Short-
Duration
Bond
Fund |
Interest Rate Swaps*** | | | | | | | | |
Hedging/Risk Management | | | | | | A | | |
Duration Management | | | | | | A | | |
Asset/Liability Management | | | | | | M | | |
Substitution for Direct Investment | | | | | | M | | |
Intention to Create Investment Leverage in Portfolio | | | | | | M | | |
| | | | | |
Credit Default Swaps (Protection Buyer) | | | | | | | | |
Hedging/Risk Management | | | | | | A | | A |
Duration/Credit Quality Management | | | | | | A | | A |
Income | | | | | | A | | A |
Substitution for Direct Investment | | | | | | A | | M |
Intention to Create Investment Leverage in Portfolio | | | | | | M | | M |
| | | | | |
Credit Default Swaps (Protection Seller) | | | | | | | | |
Hedging/Risk Management | | | | | | A | | A |
Duration/Credit Quality Management | | | | | | A | | A |
Income | | | | | | A | | A |
Substitution for Direct Investment | | | | | | A | | A |
Intention to Create Investment Leverage in Portfolio | | | | | | M | | M |
| | | | | |
Options (Purchased) | | | | | | | | |
Hedging/Risk Management | | A | | | | A | | A |
Duration/Credit Quality Management | | M | | | | A | | A |
Substitution for Direct Investment | | M | | | | A | | A |
Directional Investment | | M | | | | A | | A |
Intention to Create Investment Leverage in Portfolio | | M | | | | M | | M |
| * | Includes any options purchased or written, futures contracts, forward contracts, and swap agreements, if applicable. |
| ** | Includes any options purchased or written on futures contracts, if applicable. |
| *** | Includes any caps, floors, and collars, and related purchased or written options, if applicable. |
At December 31, 2016, and during the year then ended, the Fund(s) had the following derivatives and transactions in derivatives, grouped into the indicated risk categories:
| | | | | | | | | | | | | | | | | | | | | | | | |
| | | Credit
Risk | | | Commodity
Risk | | | Equity
Risk | | | Foreign
Exchange
Risk | | | Interest
Rate
Risk | | | Total | |
| Asset Momentum Fund | |
| Asset Derivatives | |
Forward Contracts* | | $ | - | | | $ | - | | | $ | - | | | $ | 130,530 | | | $ | - | | | $ | 130,530 | |
| | | | | | | | | | | | | | | | | | | | | | | | |
| Liability Derivatives | |
Forward Contracts^ | | $ | - | | | $ | - | | | $ | - | | | $ | (52,630 | ) | | $ | - | | | $ | (52,630 | ) |
Futures Contracts^^ | | | - | | | | - | | | | (32,181 | ) | | | - | | | | - | | | | (32,181 | ) |
| | | | | | | | | | | | | | | | | | | | | | | | |
Total Value | | $ | - | | | $ | - | | | $ | (32,181 | ) | | $ | (52,630 | ) | | $ | - | | | $ | (84,811 | ) |
| | | | | | | | | | | | | | | | | | | | | | | | |
120
Notes to Financial Statements (Continued)
| | | | | | | | | | | | | | | | | | | | | | | | |
| | | Credit
Risk | | | Commodity
Risk | | | Equity
Risk | | | Foreign
Exchange
Risk | | | Interest
Rate
Risk | | | Total | |
| Asset Momentum Fund (Continued) | |
| Realized Gain (Loss)# | |
Purchased Options | | $ | - | | | $ | - | | | $ | (35,770 | ) | | $ | - | | | $ | - | | | $ | (35,770 | ) |
Forward Contracts | | | - | | | | - | | | | - | | | | 75,981 | | | | - | | | | 75,981 | |
Futures Contracts | | | - | | | | 126,193 | | | | 1,574,921 | | | | - | | | | - | | | | 1,701,114 | |
| | | | | | | | | | | | | | | | | | | | | | | | |
Total Realized Gain (Loss) | | $ | - | | | $ | 126,193 | | | $ | 1,539,151 | | | $ | 75,981 | | | $ | - | | | $ | 1,741,325 | |
| | | | | | | | | | | | | | | | | | | | | | | | |
| Change in Appreciation (Depreciation)## | |
Purchased Options | | $ | - | | | $ | - | | | $ | (11,400 | ) | | $ | - | | | $ | - | | | $ | (11,400 | ) |
Forward Contracts | | | - | | | | - | | | | - | | | | 77,900 | | | | - | | | | 77,900 | |
Futures Contracts | | | - | | | | 1,394 | | | | (37,331 | ) | | | - | | | | - | | | | (35,937 | ) |
| | | | | | | | | | | | | | | | | | | | | | | | |
Total Change in Appreciation (Depreciation) | | $ | - | | | $ | 1,394 | | | $ | (48,731 | ) | | $ | 77,900 | | | $ | - | | | $ | 30,563 | |
| | | | | | | | | | | | | | | | | | | | | | | | |
|
| Equity Rotation Fund | |
| Realized Gain (Loss)# | |
Futures Contracts | | $ | - | | | $ | - | | | $ | 28,729 | | | $ | - | | | $ | - | | | $ | 28,729 | |
| | | | | | | | | | | | | | | | | | | | | | | | |
|
| Inflation-Protected and Income Fund | |
| Asset Derivatives | |
Futures Contracts^^ | | $ | - | | | $ | - | | | $ | - | | | $ | - | | | $ | 18,796 | | | $ | 18,796 | |
Swap Agreements* | | | - | | | | - | | | | - | | | | - | | | | 474,351 | | | | 474,351 | |
| | | | | | | | | | | | | | | | | | | | | | | | |
Total Value | | $ | - | | | $ | - | | | $ | - | | | $ | - | | | $ | 493,147 | | | $ | 493,147 | |
| | | | | | | | | | | | | | | | | | | | | | | | |
| Liability Derivatives | |
Swap Agreements^ | | $ | (199,591 | ) | | $ | - | | | $ | - | | | $ | - | | | $ | - | | | $ | (199,591 | ) |
Swap Agreements^^,^^^ | | | (10,138 | ) | | | - | | | | - | | | | - | | | | - | | | | (10,138 | ) |
| | | | | | | | | | | | | | | | | | | | | | | | |
Total Value | | $ | (209,729 | ) | | $ | - | | | $ | - | | | $ | - | | | $ | - | | | $ | (209,729 | ) |
| | | | | | | | | | | | | | | | | | | | | | | | |
| Realized Gain (Loss)# | |
Purchased Options | | $ | 77,280 | | | $ | - | | | $ | - | | | $ | 370,779 | | | $ | - | | | $ | 448,059 | |
Futures Contracts | | | - | | | | - | | | | - | | | | - | | | | (256,650 | ) | | | (256,650 | ) |
Swap Agreements | | | 96,077 | | | | - | | | | - | | | | - | | | | (212,635 | ) | | | (116,558 | ) |
| | | | | | | | | | | | | | | | | | | | | | | | |
Total Realized Gain (Loss) | | $ | 173,357 | | | $ | - | | | $ | - | | | $ | 370,779 | | | $ | (469,285 | ) | | $ | 74,851 | |
| | | | | | | | | | | | | | | | | | | | | | | | |
| Change in Appreciation (Depreciation)## | |
Purchased Options | | $ | 53,745 | | | $ | - | | | $ | - | | | $ | (288,882 | ) | | $ | - | | | $ | (235,137 | ) |
Futures Contracts | | | - | | | | - | | | | - | | | | - | | | | 28,018 | | | | 28,018 | |
Swap Agreements | | | (24,792 | ) | | | - | | | | - | | | | - | | | | 428,089 | | | | 403,297 | |
| | | | | | | | | | | | | | | | | | | | | | | | |
Total Change in Appreciation (Depreciation) | | $ | 28,953 | | | $ | - | | | $ | - | | | $ | (288,882 | ) | | $ | 456,107 | | | $ | 196,178 | |
| | | | | | | | | | | | | | | | | | | | | | | | |
|
| Short-Duration Bond Fund | |
| Asset Derivatives | |
Futures Contracts^^ | | $ | - | | | $ | - | | | $ | - | | | $ | - | | | $ | 69,494 | | | $ | 69,494 | |
| | | | | | | | | | | | | | | | | | | | | | | | |
121
Notes to Financial Statements (Continued)
| | | | | | | | | | | | | | | | | | | | | | | | |
| | | Credit
Risk | | | Commodity
Risk | | | Equity
Risk | | | Foreign
Exchange
Risk | | | Interest
Rate
Risk | | | Total | |
| Short-Duration Bond Fund (Continued) | |
| Liability Derivatives | |
Futures Contracts^^ | | $ | - | | | $ | - | | | $ | - | | | $ | - | | | $ | (33,036 | ) | | $ | (33,036 | ) |
Swap Agreements^ | | | (55,158 | ) | | | - | | | | - | | | | - | | | | - | | | | (55,158 | ) |
Swap Agreements^^,^^^ | | | (29,808 | ) | | | - | | | | - | | | | - | | | | - | | | | (29,808 | ) |
| | | | | | | | | | | | | | | | | | | | | | | | |
Total Value | | $ | (84,966 | ) | | $ | - | | | $ | - | | | $ | - | | | $ | (33,036 | ) | | $ | (118,002 | ) |
| | | | | | | | | | | | | | | | | | | | | | | | |
| Realized Gain (Loss)# | |
Purchased Options | | $ | 46,926 | | | $ | - | | | $ | - | | | $ | - | | | $ | - | | | $ | 46,926 | |
Futures Contracts | | | - | | | | - | | | | - | | | | - | | | | 1,354,237 | | | | 1,354,237 | |
Swap Agreements | | | 952 | | | | - | | | | - | | | | - | | | | - | | | | 952 | |
| | | | | | | | | | | | | | | | | | | | | | | | |
Total Realized Gain (Loss) | | $ | 47,878 | | | $ | - | | | $ | - | | | $ | - | | | $ | 1,354,237 | | | $ | 1,402,115 | |
| | | | | | | | | | | | | | | | | | | | | | | | |
| Change in Appreciation (Depreciation)## | |
Purchased Options | | $ | 32,641 | | | $ | - | | | $ | - | | | $ | - | | | $ | - | | | $ | 32,641 | |
Futures Contracts | | | - | | | | - | | | | - | | | | - | | | | 199,572 | | | | 199,572 | |
Swap Agreements | | | 3,225 | | | | - | | | | - | | | | - | | | | - | | | | 3,225 | |
| | | | | | | | | | | | | | | | | | | | | | | | |
Total Change in Appreciation (Depreciation) | | $ | 35,866 | | | $ | - | | | $ | - | | | $ | - | | | $ | 199,572 | | | $ | 235,438 | |
| | | | | | | | | | | | | | | | | | | | | | | | |
| * | Statements of Assets and Liabilities location: Receivables from: open forward foreign currency contracts or open swap agreements at value, as applicable. |
| ^ | Statements of Assets and Liabilities location: Payables for: open forward foreign currency contracts or open swap agreements, at value, as applicable. |
| ^^ | Cumulative appreciation (depreciation) on futures contracts and centrally cleared swaps is reported in “Futures Contracts” and “Swap Agreements” below. Only current day’s variation margin, if any, is reported within the Statements of Assets and Liabilities. |
| ^^^ | Represents centrally cleared swaps which are not subject to a master netting agreement. |
| # | Statements of Operations location: Amounts are included in net realized gain (loss) on: investment transactions, futures contracts, swap agreements, or foreign currency transactions, as applicable. |
| ## | Statements of Operations location: Amounts are included in net change in unrealized appreciation (depreciation) on: investment transactions, futures contracts, swap agreements, or translation of assets and liabilities in foreign currencies, as applicable. |
For the year ended December 31, 2016, the number of contracts, notional amounts, or shares/units for each derivative type was as follows:
| | | | | | | | | | | | | | | | |
| | | Number of Contracts, Notional
Amounts, or Shares/Units† | |
| | | Futures
Contracts | | | Forward
Contracts | | | Swap
Agreements | | | Purchased
Options | |
Asset Momentum Fund | | | 135 | | | $ | 2,177,494 | | | $ | - | | | | 95 | |
Equity Rotation Fund | | | 4 | | | | - | | | | - | | | | - | |
Inflation-Protected and Income Fund | | | 204 | | | | - | | | | 39,492,500 | | | $ | 81,300,000 | |
Short-Duration Bond Fund | | | 483 | | | | - | | | | 2,119,167 | | | | 36,450,000 | |
| † | Amount(s) disclosed represent average number of contracts for futures contracts, notional amounts for forward contracts, swap agreements, and purchased options, or shares/units outstanding for purchased options, which is indicative of volume of this derivative type, for the months that the Fund held such derivatives during the year ended December 31, 2016. |
122
Notes to Financial Statements (Continued)
The following table presents derivative assets by counterparty net of amounts available for offset under a master netting agreement (“MNA”), or similar agreement, and net of the related collateral received by the Fund(s) as of December 31, 2016.
Asset Valuation Inputs
| | | | | | | | | | | | | | | | |
Counterparty | | Derivative Assets
Subject to an MNA
by Counterparty† | | | Financial Instruments
Available for Offset | | | Collateral Received*** | | | Net Amount* | |
Asset Momentum Fund | | | | | | | | | | | | | | | | |
Barclays Bank PLC | | $ | 18,276 | | | $ | (10,805 | ) | | $ | - | | | $ | 7,471 | |
HSBC Bank USA | | | 26,053 | | | | (19,764 | ) | | | - | | | | 6,289 | |
JP Morgan Chase Bank N.A. | | | 86,201 | | | | (22,061 | ) | | | - | | | | 64,140 | |
| | | | | | | | | | | | | | | | |
| | $ | 130,530 | | | $ | (52,630 | ) | | $ | - | | | $ | 77,900 | |
| | | | | | | | | | | | | | | | |
Inflation-Protected and Income Fund | | | | | | | | | | | | | | | | |
Bank of America N.A. | | $ | 104,309 | | | $ | - | | | $ | - | | | $ | 104,309 | |
Goldman Sachs International | | | 194,093 | | | | (160,355 | ) | | | - | | | | 33,738 | |
JP Morgan Chase Bank N.A. | | | 175,949 | | | | (39,236 | ) | | | - | | | | 136,713 | |
| | | | | | | | | | | | | | | | |
| | $ | 474,351 | | | $ | (199,591 | ) | | $ | - | | | $ | 274,760 | |
| | | | | | | | | | | | | | | | |
The following table presents derivative liabilities by counterparty net of amounts available for offset under an MNA, or similar agreement, and net of the related collateral pledged by the Fund(s) as of December 31, 2016.
Liability Valuation Inputs
| | | | | | | | | | | | | | | | |
Counterparty | | Derivative Liabilities
Subject to an MNA
by Counterparty† | | | Financial Instruments
Available for Offset | | | Collateral Pledged*** | | | Net Amount** | |
Asset Momentum Fund | | | | | | | | | | | | | | | | |
Barclays Bank PLC | | $ | (10,805 | ) | | $ | 10,805 | | | $ | - | | | $ | - | |
HSBC Bank USA | | | (19,764 | ) | | | 19,764 | | | | - | | | | - | |
JP Morgan Chase Bank N.A. | | | (22,061 | ) | | | 22,061 | | | | - | | | | - | |
| | | | | | | | | | | | | | | | |
| | $ | (52,630 | ) | | $ | 52,630 | | | $ | - | | | $ | - | |
| | | | | | | | | | | | | | | | |
Inflation-Protected and Income Fund | | | | | | | | | | | | | | | | |
Goldman Sachs International | | $ | (160,355 | ) | | $ | 160,355 | | | $ | - | | | $ | - | |
JP Morgan Chase Bank N.A. | | | (39,236 | ) | | | 39,236 | | | | - | | | | - | |
| | | | | | | | | | | | | | | | |
| | $ | (199,591 | ) | | $ | 199,591 | | | $ | - | | | $ | - | |
| | | | | | | | | | | | | | | | |
Short-Duration Bond Fund | | | | | | | | | | | | | | | | |
Goldman Sachs International | | $ | (55,158 | ) | | $ | - | | | $ | - | | | $ | (55,158 | ) |
| | | | | | | | | | | | | | | | |
| * | Represents the net amount receivable from the counterparty in the event of default. |
| ** | Represents the net amount payable to the counterparty in the event of default. |
| *** | The amount presented here may be less than the total amount of collateral received/pledged as the net amount of derivative assets and liabilities for a counterparty cannot be less than $0. |
| † | The amount presented here may be less than the total amount shown in the Statements of Assets and Liabilities as some derivatives held by the counterparty are not covered within the master netting agreements. |
Such agreements typically permit a single net payment in the event of default, including the bankruptcy or insolvency of the counterparty. Typically, the Fund(s) and counterparties are not permitted to sell, re-pledge, or use the collateral they receive.
Further details regarding the derivatives and other investments held by the Fund(s) during the year ended December 31, 2016, are discussed below.
123
Notes to Financial Statements (Continued)
Foreign Currency Exchange Transactions
A Fund may engage in foreign currency exchange transactions for hedging purposes in order to protect against uncertainty in the level of future foreign currency exchange rates, or for other, non-hedging purposes.
A Fund may enter into foreign currency exchange transactions, including foreign currency forward contracts. These contracts call for the Fund to deliver in the future an amount of one currency in return for an amount of another currency, at an exchange rate determined at the time the contract is entered into. Forward contracts are private contractual arrangements and a Fund is subject to the risk that its counterparty will not, or will not be able to, perform its obligations. This type of arrangement may require the Fund to post margin. A Fund may enter into foreign currency exchange transactions in order to hedge against changes in the values of the assets or liabilities denominated in one or more foreign currencies, or otherwise to increase or reduce a Fund’s exposure to various foreign currencies. The use of foreign currency exchange transactions may create investment leverage.
Whenever a Fund enters into a foreign currency exchange transaction, it is subject to the risk that the value of the transaction will move in a direction unfavorable to it. When the Fund uses the transactions for hedging purposes, it is likely that the Fund will have an asset or liability that will offset any loss (or gain) on the transactions, at least in part. If a Fund enters into foreign currency exchange transactions other than for hedging purposes (for example, seeking to profit from an anticipated change in the values of currencies by creating directional exposures in the portfolio with respect to one or more currencies), it will generally be subject to the same risks, but is less likely to have assets or liabilities that will offset any losses on the transactions. There can be no assurance that a Fund will be able to terminate any foreign currency exchange transaction prior to its maturity in order to limit its loss on the transaction.
Forward foreign currency contracts are marked to market daily and the change in their value is recorded by the Funds as an unrealized gain or loss. Forward foreign currency contracts are valued at the settlement price established through dealers or other market sources on the day which they are traded. When a forward foreign currency contract is extinguished, through delivery or offset by entering into another forward foreign currency contract, the Funds record a realized gain or loss equal to the difference between the value of the contract at the time it was opened and the value of the contract at the time it was extinguished or offset. The notional or contractual amounts of these instruments do not necessarily represent the amounts potentially subject to risk. The measurement of the risk associated with these instruments is meaningful only when all related and offsetting transactions and counterparty risks are considered.
The Fund(s) listed in the following table had open forward foreign currency contracts at December 31, 2016. A Fund’s current exposure to a counterparty is the unrealized appreciation on the contract.
| | | | | | | | | | | | | | | | | | | | |
| | | | | | Counterparty | | Settlement
Date | | | | | In Exchange
for | | | Unrealized
Appreciation/
(Depreciation) | |
| Asset Momentum Fund | | | | | | | | | | | | | | |
| Contracts to Buy | | | | | | | | | | | | | | |
| BRL | | | 764,720 | | | Barclays Bank PLC* | | | 06/08/17 | | | | | $ | 207,263 | | | $ | 18,276 | |
| NOK | | | 1,633,379 | | | Barclays Bank PLC* | | | 01/27/17 | | | | | | 200,000 | | | | (10,805 | ) |
| | | | | | | | | | | | | | | | | | | | |
| | | | | | | | | | | | 407,263 | | | | 7,471 | |
| | | | | | | | | | | | | | | | | | | | |
| | | | | | |
| BRL | | | 2,086,960 | | | HSBC Bank USA* | | | 06/08/17 | | | | | $ | 600,000 | | | $ | 15,508 | |
| CAD | | | 253,819 | | | HSBC Bank USA* | | | 01/20/17 | | | | | | 200,000 | | | | (10,915 | ) |
| | | | | | | | | | | | | | | | | | | | |
| | | | | | | | | | | | 800,000 | | | | 4,593 | |
| | | | | | | | | | | | | | | | | | | | |
| | | | | | | | | | | | 1,207,263 | | | | 12,064 | |
| | | | | | | | | | | | | | | | | | | | |
|
| Cross Currency Forwards | |
| EUR | | | 930,000 | | | HSBC Bank USA* | | | 06/08/17 | | | GBP | | | 789,067 | | | $ | 10,545 | |
| NOK | | | 1,600,000 | | | HSBC Bank USA* | | | 02/16/17 | | | THB | | | 6,956,000 | | | | (8,849 | ) |
| | | | | | | | | | | | | | | | | | | | |
| | | | 1,696 | |
| | | | | | | | | | | | | | | | | | | | |
124
Notes to Financial Statements (Continued)
| | | | | | | | | | | | | | | | | | | | |
| | | | | | Counterparty | | Settlement
Date | | | | | In Exchange
for | | | Unrealized
Appreciation/
(Depreciation) | |
| Asset Momentum Fund (Continued) | | | | | | | | | | | | | | |
| Cross Currency Forwards (Continued) | | | | | | | | | | | | | | |
| CAD | | | 254,000 | | | JP Morgan Chase Bank N.A.* | | | 02/16/17 | | | TWD | | | 6,489,192 | | | | (12,442 | ) |
| RUB | | | 62,460,000 | | | JP Morgan Chase Bank N.A.* | | | 06/08/17 | | | SEK | | | 9,000,000 | | | | (9,619 | ) |
| RUB | | | 14,039,152 | | | JP Morgan Chase Bank N.A.* | | | 07/13/17 | | | EUR | | | 180,000 | | | | 28,945 | |
| RUB | | | 13,746,704 | | | JP Morgan Chase Bank N.A.* | | | 07/13/17 | | | EUR | | | 180,000 | | | | 24,357 | |
| RUB | | | 13,428,928 | | | JP Morgan Chase Bank N.A.* | | | 07/13/17 | | | SEK | | | 1,712,000 | | | | 20,776 | |
| RUB | | | 13,994,650 | | | JP Morgan Chase Bank N.A.* | | | 07/13/17 | | | SEK | | | 1,870,000 | | | | 12,123 | |
| | | | | | | | | | | | | | | | | | | | |
| | | | | | | | | | | | | | | | 64,140 | |
| | | | | | | | | | | | | | | | | | | | |
| | | | | | | | | | | | | | | $ | 65,836 | |
| | | | | | | | | | | | | | | | | | | | |
| * | Contracts are subject to an MNA. |
Futures Contracts
A Fund may seek to manage a variety of different risks, such as interest rate risk, equity price risk, and currency risk, through the use of futures contracts. A Fund may use interest rate futures contracts to adjust the interest rate sensitivity (duration) of its portfolio or the credit exposure of the portfolio. Interest rate futures contracts obligate the long or short holder to take or make delivery of a specified quantity of a financial instrument, such as a specific fixed-income security, during a specified future period at a specified price. A Fund may use index futures to hedge against broad market risks to its portfolio or to gain broad market exposure when it holds uninvested cash or as an inexpensive substitute for cash investments directly in securities or other assets. Securities index futures contracts are contracts to buy or sell units of a securities index at a specified future date at a price agreed upon when the contract is made and are settled in cash. Positions in futures may be closed out only on an exchange or board of trade which provides a secondary market for such futures. Because futures contracts are exchange-traded, they typically have minimal exposure to counterparty risk.
Parties to a futures contract are not required to post the entire notional amount of the contract, but rather a small percentage of that amount (by way of margin), both at the time they enter into futures transactions, and then on a daily basis if their positions decline in value; as a result, futures contracts are highly leveraged. Such payments are known as variation margin and are recorded by the Funds as unrealized gains or losses. Because futures markets are highly leveraged, they can be extremely volatile, and there can be no assurance that the pricing of a futures contract will correlate precisely with the pricing of the asset or index underlying it or the asset or liability of the Fund that is the subject of the hedge. It may not always be possible for a Fund to enter into a closing transaction with respect to a futures contract it has entered into, at a favorable time or price. When a Fund enters into a futures transaction, it is subject to the risk that the value of the futures contract will move in a direction unfavorable to it. When a Fund uses futures contracts for hedging purposes, it is likely that the Fund will have an asset or liability that will offset any loss (or gain) on the transactions, at least in part.
When a futures contract is closed, the Fund records a realized gain or loss equal to the difference between the value of the contract at the time it was opened and the value at the time it was closed. Futures contracts are valued at the settlement price established each day by the board of trade or exchange on which they are traded.
125
Notes to Financial Statements (Continued)
The Fund(s) listed in the following table had open futures contracts at December 31, 2016:
| | | | | | | | | | | | | | | | |
| | | Expiration
Date | | | Number of
Contracts | | | Notional
Amount | | | Net Unrealized
Appreciation/
(Depreciation) | |
Asset Momentum Fund | | | | | | | | | | | | | | | | |
Future Contract — Long | | | | | | | | | | | | | | | | |
S&P 500 E Mini Index | | | 03/17/17 | | | | 113 | | | $ | 12,634,530 | | | $ | (32,181 | ) |
| | | | | | | | | | | | | | | | |
Inflation-Protected and Income Fund | | | | | | | | | | | | | | | | |
Future Contract — Short | | | | | | | | | | | | | | | | |
U.S. Treasury Note 10 Year | | | 03/22/17 | | | | 78 | | | $ | (9,693,938 | ) | | $ | 18,796 | |
| | | | | | | | | | | | | | | | |
Short-Duration Bond Fund | | | | | | | | | | | | | | | | |
Future Contract — Long | | | | | | | | | | | | | | | | |
U.S. Treasury Note 2 Year | | | 03/31/17 | | | | 314 | | | $ | 68,039,875 | | | $ | (33,036 | ) |
| | | | | | | | | | | | | | | | |
Futures Contracts — Short | | | | | | | | | | | | | | | | |
U.S. Treasury Note 10 Year | | | 03/22/17 | | | | 78 | | | $ | (9,693,938 | ) | | $ | 21,078 | |
U.S. Treasury Ultra 10 Year | | | 03/22/17 | | | | 7 | | | | (938,437 | ) | | | 5,720 | |
U.S. Treasury Note 5 Year | | | 03/31/17 | | | | 100 | | | | (11,766,406 | ) | | | 42,696 | |
| | | | | | | | | | | | | | | | |
| | | | | | | | | | | | | | $ | 69,494 | |
| | | | | | | | | | | | | | | | |
Swap agreements are typically two-party contracts entered into primarily by institutional investors. In a standard “swap” transaction, two parties agree to exchange the returns (or differentials in rates of return) earned or realized on particular predetermined investments or instruments, which may be adjusted for an interest factor. The gross returns to be exchanged or “swapped” between the parties are generally calculated with respect to a “notional amount,” (i.e., the return on or increase in value of a particular dollar amount invested at a particular interest rate or in a “basket” of securities representing a particular index).
Interest Rate Swaps. When a Fund enters into an interest rate swap, it typically agrees to make payments to its counterparty based on a specified long- or short-term interest rate, and will receive payments from its counterparty based on another interest rate. Other forms of interest rate swap agreements include interest rate caps, under which, in return for a specified payment stream, one party agrees to make payments to the other to the extent that interest rates exceed a specified rate, or “cap”; interest rate floors, under which, in return for a specified payment stream, one party agrees to make payments to the other to the extent that interest rates fall below a specified rate, or “floor”; and interest rate collars, under which a party sells a cap and purchases a floor or vice versa in an attempt to protect itself against interest rate movements exceeding given minimum or maximum levels. A Fund may enter into an interest rate swap in order, for example, to hedge against the effect of interest rate changes on the value of specific securities in its portfolio, or to adjust the interest rate sensitivity (duration) or the credit exposure of its portfolio overall, or otherwise as a substitute for a direct investment in debt securities.
Credit Default Swaps. A Fund also may enter into credit default swap transactions, as a “buyer” or “seller” of credit protection. In a credit default swap, one party provides what is in effect insurance against a default or other adverse credit event affecting an issuer of debt securities (typically referred to as a “reference entity”). In general, the buyer of credit protection is obligated to pay the protection seller an upfront amount or a periodic stream of payments over the term of the swap. If a “credit event” occurs, the buyer has the right to deliver to the seller bonds or other obligations of the reference entity (with a value up to the full notional value of the swap), and to receive a payment equal to the par value of the bonds or other obligations. Credit events that would trigger a request that the seller make payment are specific to each credit default swap agreement, but generally include bankruptcy, failure to pay, restructuring, acceleration, default, or repudiation/moratorium. When a Fund buys protection, it may or may not own securities of the reference entity. If it does own securities of the reference entity, the swap serves as a hedge against a decline in the value of the securities due to the occurrence of a credit event involving the issuer of the securities. If the Fund does not own securities of the reference entity, the credit default swap may be seen to create a short position in the reference entity. If a Fund is a
126
Notes to Financial Statements (Continued)
buyer and no credit event occurs, the Fund will typically recover nothing under the swap, but will have had to pay the required upfront payment or stream of continuing payments under the swap. When a Fund sells protection under a credit default swap, the position may have the effect of creating leverage in the Fund’s portfolio through the Fund’s indirect long exposure to the issuer or securities on which the swap is written. When a Fund sells protection, it may do so either to earn additional income or to create a “synthetic” long position.
Whenever a Fund enters into a swap agreement, it takes on counterparty risk — the risk that its counterparty will be unable or unwilling to meet its obligations under the swap agreement. The Fund also takes the risk that the market will move against its position in the swap agreement. In the case of an interest rate swap, the value of the swap may increase or decrease depending on changes in interest rates. In the case of a credit default swap, the swap will become more or less valuable depending on the credit of the issuer of the underlying security, and, if a credit event occurs under a swap where the Fund is the seller of credit protection, the Fund could be required to purchase the security at par value, resulting in a significant loss to the Fund. When the Fund enters into any type of swap for hedging purposes, it is likely that the Fund will have an asset or liability that will offset any loss (or gain) on the swap, at least in part. Swap agreements may be non-transferable or otherwise highly illiquid, and a Fund may not be able to terminate or transfer a swap agreement at any particular time or at an acceptable price.
Swaptions. A Fund may also enter into options on swap agreements (“swaptions”). A swaption is a contract that gives a counterparty the right (but not the obligation) to enter into a new swap agreement or to shorten, extend, cancel, or otherwise modify an existing swap agreement, at some designated future time on specified terms. A Fund may write (sell) and purchase put and call swaptions. Depending on the terms of the particular option agreement, a Fund will generally incur a greater degree of risk when it writes a swaption than it will incur when it purchases a swaption. When a Fund purchases a swaption, it risks losing only the amount of the premium it has paid should it decide to let the option expire unexercised. However, when a Fund writes a swaption, upon exercise of the option the Fund will become obligated according to the terms of the underlying agreement. A Fund may enter into swaptions for the same purposes as swaps. For information regarding the accounting treatment of options, see “Options, Rights, and Warrants” below.
Centrally Cleared Swaps. Certain clearinghouses currently offer clearing for limited types of derivatives transactions, principally certain interest rate swaps, certain index swaps, and credit derivatives. In a cleared derivative transaction, a Fund typically enters into the transaction with a financial institution counterparty, and performance of the transaction is effectively guaranteed by a central clearinghouse, thereby reducing or eliminating the Fund’s exposure to the credit risk of its original counterparty. The Fund will be required to post amounts (“initial margin”) with the clearinghouse or at the instruction of the clearinghouse. The initial margin required by a clearinghouse may be greater than the initial margin the Fund would be required to post in an uncleared transaction. If cash is deposited as the initial margin, it is shown as collateral on a Fund’s Statement of Assets and Liabilities. Swap agreements are marked-to-market daily and subsequent payments (“variation margin”) are made or received by a Fund depending on whether unrealized gains or losses are incurred. These amounts are reflected as receivables or payables on a Fund’s Statement of Assets and Liabilities (“Variation margin on open derivative instruments”) and as a component of net change in unrealized appreciation (depreciation) on a Fund’s Statement of Operations. Only a limited number of transaction types are currently eligible for clearing.
During the term of a swap transaction, changes in the value of the swap are recognized as unrealized gains or losses by marking to market to reflect the market value of the swap. When the swap is terminated, a Fund will record a realized gain or loss equal to the difference, if any, between the proceeds from (or cost of) the closing transaction and a Fund’s basis in the agreement. Upfront swap premium payments paid or received by a Fund, if any, are recorded within the value of the open swap agreement on the Fund’s Statement of Assets and Liabilities and represent payments paid or received upon entering into the swap agreement to compensate for differences between stated terms of the swap agreement and prevailing market conditions (credit spreads, currency exchange rates, and other relevant factors). These upfront payments are recorded as realized gain or loss on the Fund’s Statement of Operations upon termination or maturity of the swap agreement.
During the term of a swap transaction, the periodic net payments can be made for a set period of time or may be triggered by a predetermined credit event. The net periodic payments may be based on a fixed or variable interest rate, the change in market value of a specified security, basket of securities or index, or the return generated by a security. These periodic payments received or made by the Funds are recorded in the accompanying Statements of Operations as realized gains and losses, respectively.
127
Notes to Financial Statements (Continued)
The Fund(s) listed in the following table had open swap transactions at December 31, 2016. A Fund’s current exposure to a counterparty is the fair value of the transaction.
| | | | | | | | | | | | | | | | | | | | | | | | | | |
Counterparty | | Currency | | Notional
Amount | | | Expiration
Date | | | Receive (Pay)
Fixed Rate | | Deliverable on Default | | Unrealized
Appreciation
(Depreciation) | | | Premium
(Received)
Paid | | | Value | |
Inflation-Protected and Income Fund* | | | | | | | | | | | | | | |
Credit Default Swaps — Buy Protection | | | | | | | | | | | | | | |
Centrally Cleared Swaps | | | | | | | | | | | | | | |
| | USD | | | 670,000 | | | | 12/20/21 | | | (1.000%) | | CDX.NA.IG.27 | | $ | (690 | ) | | $ | (9,448 | ) | | $ | (10,138 | ) |
| | | | | | | | | | | | | | | | | | | | | | | | | | |
Credit Default Swaps — Sell Protection† | | | | | | | | | | | | | | | | | |
OTC Swaps | | | | | | | | | | | | | | | | | |
| Goldman Sachs International | | USD | | | 1,600,000 | | | | 5/11/63 | | | 3.000% | | CMBX.NA.BBB-.6†† (Rating: BBB-) | | $ | (91,967 | ) | | $ | 985 | | | $ | (90,982 | ) |
| Goldman Sachs International | | USD | | | 330,000 | | | | 5/11/63 | | | 3.000% | | CMBX.NA.BBB-.6†† (Rating: BBB-) | | | 7,675 | | | | (26,439 | ) | | | (18,764 | ) |
| Goldman Sachs International | | USD | | | 890,000 | | | | 5/11/63 | | | 3.000% | | CMBX.NA.BBB-.6†† (Rating: BBB-) | | | 26,465 | | | | (77,074 | ) | | | (50,609 | ) |
| JP Morgan Chase Bank N.A. | | USD | | | 690,000 | | | | 5/11/63 | | | 3.000% | | CMBX.NA.BBB-.6†† (Rating: BBB-) | | | (40,086 | ) | | | 850 | | | | (39,236 | ) |
| | | | | | | | | | | | | | | | | | | | | | | | | | |
| | | | | | | | | | | | | | | | | (97,913 | ) | | | (101,678 | ) | | | (199,591 | ) |
| | | | | | | | | | | | | | | | | | | | | | | | | | |
| | | | | | | | |
Counterparty | | Currency | | Notional
Amount | | | Expiration
Date | | | Payments
Made by
Fund | | Payments Received by Fund | | Unrealized
Appreciation
(Depreciation) | | | Premium
Received
(Paid) | | | Value | |
Interest Rate Swaps | |
OTC Swaps | |
| Goldman Sachs International | | USD | | | 8,500,000 | | | | 10/13/17 | | | 1.125% | | USA-CPI-U | | $ | 82,519 | | | $ | - | | | $ | 82,519 | |
| Bank of America N.A. | | USD | | | 11,000,000 | | | | 11/06/17 | | | 1.275% | | USA-CPI-U | | | 104,309 | | | | - | | | | 104,309 | |
| Goldman Sachs International | | USD | | | 8,300,000 | | | | 1/13/18 | | | 1.295% | | USA-CPI-U | | | 111,574 | | | | - | | | | 111,574 | |
| JP Morgan Chase Bank N.A. | | USD | | | 8,500,000 | | | | 2/17/18 | | | 1.033% | | USA-CPI-U | | | 175,949 | | | | - | | | | 175,949 | |
| | | | | | | | | | | | | | | | | | | | | | | | | | |
| | | | | | | | | | | | | | | | | 474,351 | | | | - | | | | 474,351 | |
| | | | | | | | | | | | | | | | | | | | | | | | | | |
| | | | | | | | |
Counterparty | | Currency | | Notional
Amount | | | Expiration
Date | | | Receive (Pay)
Fixed Rate | | Deliverable on Default | | Unrealized
Appreciation
(Depreciation) | | | Premium
(Received)
Paid | | | Value | |
Short-Duration Bond Fund** | | | | | | | | | | | | | | | | | |
Credit Default Swaps — Buy Protection | | | | | | | | | | | | | | |
Centrally Cleared Swaps | |
| | USD | | | 1,970,000 | | | | 12/20/21 | | | (1.000%) | | CDX.NA.IG.27 | | $ | (2,027 | ) | | $ | (27,781 | ) | | $ | (29,808 | ) |
| | | | | | | | | | | | | | | | | | | | | | | | | | |
Credit Default Swaps — Sell Protection† | |
OTC Swaps | |
| Goldman Sachs International | | USD | | | 410,000 | | | | 5/11/63 | | | 3.000% | | CMBX.NA.BBB-.6†† (Rating: BBB-) | | $ | (23,567 | ) | | $ | 253 | | | $ | (23,314 | ) |
| Goldman Sachs International | | USD | | | 150,000 | | | | 5/11/63 | | | 3.000% | | CMBX.NA.BBB-.6†† (Rating: BBB-) | | | 3,488 | | | | (12,018 | ) | | | (8,530 | ) |
| Goldman Sachs International | | USD | | | 410,000 | | | | 5/11/63 | | | 3.000% | | CMBX.NA.BBB-.6†† (Rating: BBB-) | | | 12,192 | | | | (35,506 | ) | | | (23,314 | ) |
| | | | | | | | | | | | | | | | | | | | | | | | | | |
| | | | | | | | | | | | | | | | | (7,887 | ) | | | (47,271 | ) | | | (55,158 | ) |
| | | | | | | | | | | | | | | | | | | | | | | | | | |
| * | Collateral for swap agreements held by Credit Suisse International amounted to $11,274 in securities at December 31, 2016. |
| ** | Collateral for swap agreements held by Credit Suisse International amounted to $24,044 in securities at December 31, 2016. |
128
Notes to Financial Statements (Continued)
| † | For each credit derivative with sold protection, the credit ratings of the entities referenced, as rated by any rating organization, are included in the equivalent Standard & Poor’s Ratings Group rating category. The reference entity rating represents the likelihood of a potential payment by the Fund if the referenced entity experiences a credit event as of period end. Notional amounts represent the maximum potential amount of future payments (undiscounted) the Fund could be required to make under the credit derivatives with sold protection. |
| †† | Payment is based on a percentage of the index. Reference entities are a number of individual issuers comprising the index. |
Options, Rights, and Warrants
A Fund may purchase and sell put and call options on securities or an index of securities to enhance investment performance or to protect against changes in market prices. A Fund that invests in debt securities may also purchase and sell put and call options to adjust the interest rate sensitivity of its portfolio or the credit exposure of the portfolio.
Call Options. A call option gives the holder the right to purchase, and obligates the writer to sell, a security at the strike price at any time before the expiration date.
Put Options. A put option gives the holder the right to sell, and obligates the writer to buy, a security at the exercise price at any time before the expiration date.
Writing put and call options. A Fund may write call options on a security it owns, in a “directional” strategy hoping to realize a greater current return through the receipt of premiums. In return for the option premium, the Fund takes the risk that it will have to forego any increase in the value of the security over the strike price. When a Fund has written a call option on a security it does not own, its exposure on such an option is theoretically unlimited. A Fund may enter into closing purchase transactions in order to realize a profit or limit a loss on a previously written call option or, in the case of a call option on a security it owns, to free itself to sell the underlying security or to write another call on the security, or protect a security from being called in an unexpected market rise. Any profits from a closing purchase transaction in the case of a call option on a security a Fund owns may be offset by a decline in the value of the underlying security. Conversely, because increases in the market price of a call option will generally reflect increases in the market price of the underlying security, any loss resulting from a closing purchase transaction relating to a call option on a security a Fund owns is likely to be offset in whole or in part by unrealized appreciation of the underlying security owned by the Fund. A Fund may not be able to close out a call option that it has previously written. A Fund may write put options in order to enhance its current return by taking a long directional position as to a security or index of securities. By writing a put option, a Fund assumes the risk that it may be required to purchase the underlying security for an exercise price higher than its then current market value, resulting in a potential capital loss unless the security later appreciates in value. A Fund may terminate a put option that it has written before it expires by entering into a closing purchase transaction. Any loss from this transaction may be partially or entirely offset by the premium received on the terminated option. A Fund may not be able to close out a put option that it has previously written.
When a Fund writes a call or put option, an amount equal to the premium received is recorded as a liability. Premiums received from writing options which expire are treated as realized gains. Premiums received from writing options which are exercised or closed are added to the proceeds or offset against the amount paid on the underlying investment to determine the realized gain or loss.
Purchasing put and call options. A Fund may purchase put options to protect portfolio holdings against a decline in market value of a security or securities held by it. A Fund may also purchase a put option hoping to profit from an anticipated decline in the value of the underlying security. If the Fund holds the security underlying the option, the option premium and any transaction costs will reduce any profit the Fund might have realized had it sold the underlying security instead of buying the put option. A Fund may purchase call options to hedge against an increase in the price of securities that the Fund wants ultimately to buy. A Fund may also purchase a call option as a long directional investment hoping to profit from an anticipated increase in the value of the underlying security. In order for a call option to be profitable, the market price of the underlying security must rise sufficiently above the exercise price to cover the premium and transaction costs. These costs will reduce any profit the Fund might have realized had it bought the underlying security at the time it purchased the call option.
When a Fund purchases an option, it runs the risk that it will lose its entire investment in the option in a relatively short period of time, unless the Fund exercises the option or enters into a closing sale transaction before the option’s expiration. If the price of the
129
Notes to Financial Statements (Continued)
underlying security does not rise (in the case of a call) or fall (in the case of a put) to an extent sufficient to cover the option premium and transaction costs, the Fund will lose part or all of its investment in the option. This contrasts with an investment by a Fund in the underlying security, since the Fund will not realize a loss if the security’s price does not change. Premiums paid for purchasing options that expire are treated as realized losses.
Exchange Traded Options. Exchange traded options purchased or sold by a Fund may be traded on a securities or options exchange or market. Such options typically have minimal exposure to counterparty risk. However, an exchange or market may at times find it necessary to impose restrictions on particular types of options transactions, such as opening transactions. If an underlying security ceases to meet qualifications imposed by the market or the Options Clearing Corporation, new series of options on that security will no longer be opened to replace expiring series, and opening transactions in existing series may be prohibited. Exchange traded options are valued at the last sale price, or if no sales are reported, the last bid price.
OTC Options. OTC options purchased or sold by a Fund are not traded on securities or options exchanges or backed by clearinghouses. Rather, they are entered into directly between a Fund and the counterparty to the option. In the case of an OTC option purchased by the Fund, the value of the option to the Fund will depend on the willingness and ability of the option writer to perform its obligations to the Fund. In addition, OTC options may not be transferable and there may be little or no secondary market for them, so they may be considered illiquid. It may not be possible to enter into closing transactions with respect to OTC options or otherwise to terminate such options, and as a result a Fund may be required to remain obligated on an unfavorable OTC option until its expiration. OTC options are valued using prices supplied by a primary pricing source, selected pursuant to procedures approved by the Trustees.
Rights and Warrants. A Fund may purchase or hold warrants or rights in order to gain exposure to the underlying security without owning the security, including, for example, cases where the Fund hopes to lock in the price today of a security it may wish to purchase in the future. Warrants generally give the holder the right, but not the obligation, to buy a security at a stated price. In order for a warrant to be profitable, the market price of the underlying security must rise sufficiently above the exercise price to cover any premium and transaction costs. Rights may similarly confer on the holder the right to purchase or acquire securities, including through participation in a so-called rights offering. Bonds may be issued with warrants or other rights attached to purchase or acquire equity or other debt securities, typically of the bond issuer. The market prices of bonds with warrants or rights attached to purchase equity securities or bonds may, to some degree, reflect changes in the values of the underlying securities.
When a Fund purchases or otherwise acquires warrants or other rights, it runs the risk that it will lose its entire investment in the warrants or rights, unless the Fund exercises the warrant or right, acquires the underlying securities, or enters into a closing transaction before expiration. If the price of the underlying security does not rise to an extent sufficient to cover any premium and transaction costs, the Fund will lose part or all of its investment. Any premiums or purchase price paid for warrants or other rights that expire are treated as realized losses. Warrants and similar rights differ from options in that they are typically written by the issuer of the security underlying the warrant or right. Although some warrants and rights may be non-transferable, others may be traded over-the-counter or on an exchange.
Inflation-Indexed Bonds
The Funds may invest in inflation-indexed bonds, which are fixed income securities whose principal value or coupon is periodically adjusted according to the rate of inflation, as measured by the Consumer Price Index for All Urban Consumers (“CPI-U”) (for U.S. Treasury inflation-indexed bonds) or, generally, by a comparable inflation index calculated by the foreign government issuing the inflation-indexed bonds.
If the periodic adjustment rate measuring inflation falls, the principal value of inflation-indexed bonds will be adjusted downward, and consequently the interest payable on these securities (calculated with respect to a smaller principal amount) will be reduced. Repayment of the original bond principal upon maturity (as adjusted for inflation) is guaranteed in the case of U.S. Treasury inflation-indexed bonds, even during a period of deflation. However, the current market value of the bonds is not guaranteed, and will fluctuate. The Funds may also invest in other inflation related bonds which may or may not provide a similar guarantee. If a guarantee of principal is not provided, the adjusted principal value of the bond repaid at maturity may be less than the original principal. Any adjustments to the principal amount of an inflation-indexed bond due to inflation will be reflected as increases or decreases to interest income. Such adjustments may have a significant impact on the Fund’s distributions.
130
Notes to Financial Statements (Continued)
The value of inflation-indexed bonds is generally based on changes in real interest rates, which in turn are tied to the relationship between nominal interest rates and the rate of inflation. Therefore, if nominal interest rates increased at a faster rate than inflation, real interest rates might rise, leading to a decrease in value of inflation-indexed bonds. While the values of these securities are expected to be protected from long-term inflationary trends, short-term increases in inflation may lead to a decline in value. There can be no assurance that the CPI-U or any foreign inflation index will accurately measure the real rate of inflation, or that the rate of inflation in a foreign country will correlate to the rate of inflation in the United States. Additionally, if interest rates rise due to reasons other than inflation, investors in these securities may not be protected to the extent that the increase is not reflected in the bond’s inflation measure.
Bank Loans
Certain of the Funds may invest in bank loans including, for example, corporate loans, loan participations, direct debt, bank debt, and bridge debt. A Fund may invest in a loan by lending money to a borrower directly as part of a syndicate of lenders. In a syndicated loan, the agent that originated and structured the loan typically administers and enforces the loan on behalf of the syndicate. Failure by the agent to fulfill its obligations may delay or adversely affect receipt of payment by a Fund. A Fund may also invest in loans through novations, assignments, and participation interests. In a novation, a Fund typically assumes all of the rights of a lending institution in a loan, including the right to receive payments of principal and interest and other amounts directly from the borrower and to enforce its rights as a lender directly against the borrower. When a Fund takes an assignment of a loan, the Fund acquires some or all of the interest of another lender (or assignee) in the loan. In such cases, the Fund may be required generally to rely upon the assignor to demand payment and enforce rights under the loan. If a Fund acquires a participation in the loan, the Fund purchases an indirect interest in a loan held by a third party and the Fund typically will have a contractual relationship only with the third party loan investor, not with the borrower. As a result, a Fund may have the right to receive payments of principal, interest, and any fees to which it is entitled only from the loan investor selling the participation and only upon receipt by such loan investor of such payments from the borrower. In such cases, a Fund assumes the credit risk of both the borrower and the loan investor selling the participation, and the Fund may be unable to realize some or all of the value of its interest in the loan in the event of the insolvency of the third party.
Changes in the financial condition of the borrower or economic conditions or other circumstances may reduce the capacity of the borrower to make principal and interest payments on such instruments and may lead to defaults. The value of any collateral securing a bank loan may decline after the Fund invests, and there is a risk that the value of the collateral may not be sufficient to cover the amount owed to the Fund.
At December 31, 2016, the Funds had no unfunded loan commitments.
Repurchase Agreements
Each Fund may enter into repurchase agreements with certain banks and broker-dealers whereby a Fund acquires a security for cash and obtains a simultaneous commitment from the seller to repurchase the security at an agreed upon price and date. A Fund, through its custodian, takes possession of the securities collateralizing the repurchase agreement in a segregated account. Repurchase agreements must be fully collateralized at all times, but involve some risk to a Fund if the other party should default on its obligation and the Fund is delayed or prevented from recovering the collateral, or if the Fund is required to return collateral to a borrower at a time when it may realize a loss on the investment of that collateral.
Reverse Repurchase Agreements
Each Fund may enter into reverse repurchase agreements with banks and broker-dealers to enhance return. Reverse repurchase agreements involve sales by a Fund of portfolio securities concurrently with an agreement by the Fund to repurchase the same securities at a later date at a fixed price (typically equal to the original sale price plus interest). During the reverse repurchase agreement period, the Fund continues to receive principal and interest payments on the securities and also has the opportunity to earn a return on the purchase price received by it from the counterparty.
Certain agreements have no stated maturity and can be terminated by either party at any time. Interest on the value of the reverse repurchase agreements issued and outstanding is based upon competitive market rates determined at the time of issuance. A Fund
131
Notes to Financial Statements (Continued)
may utilize reverse repurchase agreements when it is anticipated that the interest income to be earned from the investment of the proceeds of the transaction is greater than the interest expense of the transaction. Reverse repurchase agreements generally create investment leverage and involve the risk that the market value of the security that a Fund is obligated to repurchase under the agreement may decline below the repurchase price. For financial reporting purposes, cash received in exchange for securities delivered plus accrued interest payments to be made to the counterparty is recorded as a liability in the Statements of Assets and Liabilities at face value including accrued interest. Due to the short term nature of reverse repurchase agreements, face value approximates fair value. Interest payments made by a Fund to the counterparties are recorded as a component of interest expense in the Statements of Operations. In periods of increased demand for a security, a Fund may receive a fee for use of the security by the counterparty, which may result in interest income to the Fund.
Reverse repurchase transactions are entered into by a Fund under a Master Repurchase Agreement (“MRA”), which permits the Fund, under certain circumstances, including an event of default (such as bankruptcy or insolvency), to offset payables and/or receivables under the MRA with collateral held and/or posted to the counterparty and creates one single net payment due to or from the Fund. With reverse repurchase transactions, typically a Fund and the counterparties are permitted to sell, re-pledge, or use the collateral associated with the transaction. However, bankruptcy or insolvency laws of a particular jurisdiction may impose restrictions on or prohibitions against such a right of offset in the event of an MRA counterparty’s bankruptcy or insolvency. Pursuant to the terms of the MRA, a Fund receives or posts securities as collateral with a market value in excess of the repurchase price to be paid or received by the Fund upon the maturity of the transaction. Upon a bankruptcy or insolvency of the MRA counterparty, the Fund is considered an unsecured creditor with respect to excess collateral and, as such, the return of excess collateral may be delayed.
In the event the buyer of securities under an MRA files for bankruptcy or becomes insolvent, a Fund’s use of the proceeds from the sale of its securities may be restricted or forfeited, and the counterparty may fail to return/resell the securities in question to the Fund.
The following table is a summary of the Fund(s) open reverse repurchase transactions which are subject to an MRA on a net basis at December 31, 2016:
| | | | | | | | | | | | | | | | |
Counterparty | | Reverse
Repurchase
Agreements | | | Fair Value of
Non-Cash
Collateral* | | | Cash
Collateral
Pledged* | | | Net
Amount | |
| Inflation-Protected and Income Fund | | | | | | | | | | | | | | | | |
Banque Paribas Securities Corp. | | $ | (70,004,125 | ) | | $ | 67,977,125 | | | $ | 2,027,000 | | | $ | - | |
Daiwa Bank Securities Inc. | | | (57,058,750 | ) | | | 55,331,670 | | | | 1,727,080 | | | | - | |
Goldman Sachs & Co. | | | (86,591,917 | ) | | | 83,558,917 | | | | 3,033,000 | | | | - | |
HSBC Securities (USA) Inc. | | | (98,190,625 | ) | | | 97,487,625 | | | | 703,000 | | | | - | |
Morgan Stanley & Co. | | | (16,878,922 | ) | | | 16,282,922 | | | | 596,000 | | | | - | |
| | | | | | | | | | | | | | | | |
| | $ | (328,724,339 | ) | | $ | 320,638,259 | | | $ | 8,086,080 | | | $ | - | |
| | | | | | | | | | | | | | | | |
| * | Collateral with a value of $329,760,418 has been pledged in connection with open reverse repurchase transactions. Excess collateral pledged to the individual counterparty is not shown for financial reporting purposes. |
132
Notes to Financial Statements (Continued)
The Fund(s) listed in the following table had open reverse repurchase transactions during the year ended December 31, 2016:
| | | | |
Description | | Value | |
| Inflation-Protected and Income Fund | |
Agreement with Banque Paribas Securities Corp., dated 10/04/16, 0.790%, to be repurchased on demand until 1/05/17 at value plus accrued interest. | | | 70,004,125 | |
Agreement with Daiwa Bank Securities Inc., dated 11/04/16, 0.900%, to be repurchased on demand until 2/02/17 at value plus accrued interest. | | | 57,058,750 | |
Agreement with Goldman Sachs & Co., dated 11/09/16, 1.070%, to be repurchased on demand until 1/06/17 at value plus accrued interest. | | | 86,591,917 | |
Agreement with HSBC Securities (USA) Inc., dated 12/02/16, 0.910%, to be repurchased on demand until 3/02/17 at value plus accrued interest. | | | 98,190,625 | |
Agreement with Morgan Stanley & Co. LLC, dated 11/02/16, 0.880%, to be repurchased on demand until 2/02/17 at value plus accrued interest. | | | 16,878,922 | |
| | | | |
| | $ | 328,724,339 | |
| | | | |
Average balance outstanding | | $ | 338,427,418 | |
Maximum balance outstanding | | $ | 351,048,927 | |
Average interest rate | | | 0.67% | |
Weighted average maturity | | | 56 days | |
Average balance outstanding was calculated based on daily balances outstanding during the period that the Fund had entered into reverse repurchase transactions.
The type of underlying collateral and the remaining maturity of open reverse repurchase transactions in relation to the reverse repurchase agreements on the Statements of Assets and Liabilities is as follows:
| | | | | | | | | | | | | | | | | | | | |
| | | Remaining Contractual Maturity of the Agreements
| |
| | | Overnight and
Continuous | | | Up to 30 days | | | 31-90 days | | | Greater Than
90 days | | | Total | |
| Inflation-Protected and Income Fund | | | | | | | | | | | | | | | | | | | | |
Reverse Repurchase Transactions | | | | | | | | | | | | | | | | | | | | |
U.S. Treasury Obligations | | $ | - | | | $ | 156,596,042 | | | $ | 172,128,297 | | | $ | - | | | $ | 328,724,339 | |
| | | | | | | | | | | | | | | | | | | | |
Total Borrowings | | $ | - | | | $ | 156,596,042 | | | $ | 172,128,297 | | | $ | - | | | $ | 328,724,339 | |
| | | | | | | | | | | | | | | | | | | | |
When-Issued, Delayed-Delivery, Forward Commitment, and To-Be-Announced Transactions
A Fund may enter into when-issued, delayed-delivery, forward commitment, or to-be-announced (“TBA”) transactions (collectively, the “Forward Transactions”) in order to lock in the purchase price of the underlying security, or in order to adjust the interest rate exposure of the Fund’s existing portfolio. In Forward Transactions, a Fund commits to purchase or sell particular securities, with payment and delivery to take place at a future date. In the case of TBA purchase commitments, the unit price and the estimated principal amount are established when the Fund enters into a commitment, with the actual principal amount being within a specified range of the estimate. Although a Fund does not typically pay for the securities in these types of transactions until they are delivered, it immediately assumes the risks of ownership, including the risk of price fluctuation. As a result, each of these types of transactions may create investment leverage in a Fund’s portfolio and increase the volatility of the Fund. If a Fund’s counterparty fails to deliver a security purchased in a Forward Transaction, there may be a loss, and the Fund may have missed an opportunity to make an alternative investment.
These securities are valued on the basis of valuations furnished by a pricing service, selected pursuant to procedures approved by the Trustees, which determines valuations taking into account appropriate factors such as institutional-size trading in similar groups of securities, yield, quality, coupon rate, maturity, type of issue, trading characteristics, and other market data. Securities for which no market quotation is available are valued at fair value in accordance with procedures approved by the Trustees. The Funds record on a daily basis the unrealized appreciation (depreciation) based upon changes in the values of these securities. When a
133
Notes to Financial Statements (Continued)
Forward Transaction is closed, the Funds record a realized gain or loss equal to the difference between the value of the transaction at the time it was opened and the value of the transaction at the time it was closed.
Dollar Roll Transactions
A Fund may enter into dollar roll transactions, in which the Fund sells mortgage-backed securities for delivery in the current month and simultaneously contracts to purchase substantially similar securities on a specified future date from the same party. A Fund may invest in dollar rolls in order to benefit from anticipated changes in pricing for the mortgage-backed securities during the term of the transaction, or for the purpose of creating investment leverage. In a dollar roll, the securities that are to be purchased will be of the same type as the securities sold, but will be supported by different pools of mortgages.
Dollar rolls involve the risk that the Fund’s counterparty will be unable to deliver the mortgage-backed securities underlying the dollar roll at the fixed time. If the counterparty files for bankruptcy or becomes insolvent, a Fund’s use of the transaction proceeds may be restricted pending a determination by the counterparty or its representative, whether to enforce the Fund’s obligation to repurchase the securities. A Fund can incur a loss on a dollar roll transaction (either because its counterparty fails to perform or because the value of the mortgages subject to the transaction declines) and on the investments made by the Fund with the proceeds of the dollar roll transaction.
A Fund accounts for a dollar roll transaction as a purchase and sale whereby the difference in the sales price and purchase price of the security sold is recorded as a realized gain (loss). If certain criteria are met, these dollar roll transactions may be considered financing transactions, whereby the difference in the sales price and the future purchase price is recorded as an adjustment to interest income. Dollar roll transactions generally have the effect of creating leverage in a Fund’s portfolio.
Securities Lending
Each Fund may lend its securities; however, lending cannot exceed 33% of the total assets of the Fund taken at current value. The Funds’ securities lending activities are governed by a Securities Lending Agency Agreement (“Lending Agreement”) between each Fund and the lending agent (“agent”). The Lending Agreement authorizes the agent to lend qualifying U.S. and foreign securities held by a Fund to approved borrowers (each, a “Borrower”).
Each Fund expects that in connection with any securities on loan, the loan will be secured continuously by collateral consisting of cash or securities adjusted daily to have market value at least equal to the current market value of the securities loaned. The market value of the loaned securities is determined at the close of business of a Fund and any additional collateral is delivered to the Fund the next business day. The Funds bear the risk of loss with respect to the investment of cash collateral. As with other extensions of credit, the Funds may bear the risk of delay in recovery of the loaned securities or even loss of rights in the collateral should the Borrower of the securities fail financially. Pursuant to the Lending Agreement, the agent has provided indemnification to the Funds in the event of default by a borrower with respect to a loan. The Funds receive compensation for lending their securities in the form of a securities loan fee paid by the Borrower, as well as a share of the income earned on investment of the cash collateral received for the loaned securities. At December 31, 2016, the Funds’ collateral was equal to or greater than 100% of the market value of securities on loan.
Security loans can be terminated at the discretion of either the lending agent or the Fund and the related securities must be returned within the earlier of the standard trade settlement period for such securities or within three business days. For all Funds, all securities on loan are classified as common stock in the Fund’s Portfolio of Investments at December 31, 2016.
The Funds employ the agent to implement their securities lending program and the agent receives a fee from the Funds for its services. In addition, the Funds may be required to pay a rebate to the Borrower. Accordingly, a Fund’s compensation for lending its securities is reduced by any such fees or rebate paid to the securities lending agent or Borrower, respectively. For the year ended December 31, 2016, the Fund(s) earned securities lending net income as follows:
| | | | | | | | | | | | |
| | | Securities
Lending Gross
Income | | | Securities
Lending Fees
and Expenses | | | Securities
Lending Net
Income | |
Small Cap Equity Fund | | $ | 39,052 | | | $ | 7,953 | | | $ | 31,099 | |
Strategic Emerging Markets Fund | | | 14,851 | | | | 3,092 | | | | 11,759 | |
134
Notes to Financial Statements (Continued)
Accounting for Investment Transactions
Investment transactions are accounted for on the trade date. Realized gains and losses on sales of investments and unrealized appreciation and depreciation of investments are computed by the specific identification cost method. Proceeds received from litigation, if any, are included in realized gains on investment transactions for any investments that are no longer held in the portfolio and as a reduction in cost for investments that continue to be held in the portfolio. Interest income, adjusted for amortization of discounts and premiums on debt securities, is earned from the settlement date and is recorded on the accrual basis. Dividend income is recorded on the ex-dividend date. Withholding taxes on foreign interest, dividends, and capital gains have been provided for in accordance with the applicable country’s tax rules and rates. Foreign dividend income is recorded on the ex-dividend date or as soon as practicable after the Fund determines the existence of a dividend declaration after exercising reasonable due diligence. Distributions received on securities that represent a return of capital or capital gain are recorded as a reduction of cost of investments and/or as a realized gain. The Funds determine the classification of distributions received as return of capital distributions or capital gain distributions.
Foreign Currency Translation
The books and records of the Funds are maintained in U.S. dollars. The market values of foreign currencies, foreign securities, and other assets and liabilities denominated in foreign currencies are translated into U.S. dollars at the mean of the buying and selling rates of such currencies against the U.S. dollar at the end of each business day. Purchases and sales of foreign securities and income and expense items are translated at the rates of exchange prevailing on the respective dates of such transactions. The Funds do not isolate that portion of the results of operations arising from changes in the exchange rates from that portion arising from changes in the market prices of securities. Net realized foreign currency gains and losses resulting from changes in exchange rates include foreign currency gains and losses between trade date and settlement date on investment securities transactions, foreign currency transactions, and the difference between the amounts of dividends or interest recorded on the books of the Funds and the amount actually received.
Allocation of Operating Activity
In maintaining the records for the Funds, the income and expense accounts are allocated daily to each class of shares. Investment income and loss, and unrealized and realized gains or losses are prorated among the classes of shares based on the relative net assets of each. Expenses are allocated to each class of shares depending on the nature of the expenditures. Administration and service fees, if any, which are directly attributable to a class of shares, are charged to that class’s operations. Expenses of a Fund not directly attributable to the operations of any specific class of shares of the Fund are prorated among the classes to which the expense relates based on relative net assets.
Foreign Securities
The Strategic Emerging Markets Fund invests substantially all of its assets in foreign securities. The other Funds may also invest in foreign securities. Foreign securities, including American Depositary Receipts, are subject to additional risks compared to securities of U.S. issuers, including international trade, currency, political, regulatory, and diplomatic risks. In addition, fluctuations in currency exchange rates may adversely affect the values of foreign securities and the price of a Fund’s shares. Emerging markets securities are subject to greater risks than securities issued in developed foreign markets, including less liquidity, greater price volatility, higher relative rates of inflation, greater political, economic, and social instability, greater custody and operational risks, and greater volatility in currency exchange rates.
Federal Income Tax
It is each Fund’s intent to continue to comply with the provisions of subchapter M of the Internal Revenue Code of 1986, as amended, applicable to a regulated investment company. Under such provisions, the Funds would not be subject to federal income taxes on their ordinary income and net realized capital gains to the extent they are distributed or deemed to have been distributed to their shareholders. Therefore, the Funds have not made any provision for federal income tax.
135
Notes to Financial Statements (Continued)
Dividends and Distributions to Shareholders
Dividends from net investment income are declared and paid quarterly for the Dynamic Bond Fund, High Yield Fund, Inflation-Protected and Income Fund, and Short-Duration Bond Fund and annually for the Asset Momentum Fund, Equity Rotation Fund, Small Cap Equity Fund, Special Situations Fund, and Strategic Emerging Markets Fund and at other times as may be required to satisfy tax or regulatory requirements. Distributions of any net realized capital gains of each Fund are declared and paid annually and at other times as may be required to satisfy tax or regulatory requirements.
Distributions to shareholders are recorded on the ex-dividend date. Income and capital gain distributions are determined in accordance with income tax regulations, which may differ from generally accepted accounting principles. As a result, net investment income and net realized capital gains on investment transactions for a reporting period may differ significantly from distributions during such period.
| 3. | | Advisory Fees and Other Transactions |
Investment Advisory Fees and Investment Subadvisers
MML Investment Advisers, LLC (“MML Advisers”), a wholly-owned subsidiary of MassMutual, serves as investment adviser to each Fund. Under the investment advisory agreements between MML Advisers and the Trust on behalf of each Fund, MML Advisers is responsible for providing investment management services for each Fund. In return for these services, MML Advisers receives advisory fees, based upon each Fund’s average daily net assets, at the following annual rates:
| | |
Fund | | Investment Advisory Fee |
Asset Momentum Fund | | 0.60% on the first $500 million; and |
| | 0.55% on any excess over $500 million |
Dynamic Bond Fund | | 0.40% on the first $1 billion; and |
| | 0.35% on any excess over $1 billion |
Equity Rotation Fund | | 0.45% on the first $500 million; and |
| | 0.40% on any excess over $500 million |
High Yield Fund | | 0.60% on the first $300 million; and |
| | 0.575% on any excess over $300 million |
Inflation-Protected and Income Fund | | 0.60% on the first $100 million; |
| | 0.55% on the next $200 million; |
| | 0.50% on the next $200 million; and |
| | 0.45% on any excess over $500 million |
Short-Duration Bond Fund | | 0.35% on the first $300 million; and |
| | 0.30% on any excess over $300 million |
Small Cap Equity Fund | | 0.65% on the first $100 million; |
| | 0.60% on the next $100 million; |
| | 0.55% on the next $300 million; and |
| | 0.50% on any excess over $500 million |
Special Situations Fund | | 0.60% on the first $500 million; and |
| | 0.55% on any excess over $500 million |
Strategic Emerging Markets Fund | | 1.05% on the first $500 million; and |
| | 1.00% on any excess over $500 million |
136
Notes to Financial Statements (Continued)
MML Advisers has entered into investment subadvisory agreements with Barings LLC (“Barings”), a wholly-owned subsidiary of MM Asset Management Holding LLC, itself a wholly-owned subsidiary of MassMutual Holding LLC, a controlled subsidiary of MassMutual, on behalf of certain Funds. These agreements provide that Barings manage the investment and reinvestment of assets of these Funds. Barings receives a subadvisory fee from MML Advisers based upon each Fund’s average daily net assets, at the following annual rates:
| | | | |
Asset Momentum Fund | | 0.475% | | |
Equity Rotation Fund | | 0.30% | | |
High Yield Fund | | 0.20% | | |
Inflation-Protected and Income Fund | | 0.08% | | |
Short-Duration Bond Fund | | 0.08% | | |
Special Situations Fund | | 0.45% | | |
In addition, prior to December 30, 2016, Barings Real Estate Advisers LLC (“Barings Real Estate”) served as sub-subadviser for the High Yield Fund, Inflation-Protected and Income Fund, and Short-Duration Bond Fund and was primarily responsible for managing each Fund’s commercial mortgage-backed securities. Barings Real Estate was a wholly-owned subsidiary of Barings. The appointment of Barings Real Estate as a sub-subadviser to each Fund did not relieve Barings of any obligation or liability to any of the Funds that it would otherwise have had pursuant to investment subadvisory agreements between MML Advisers and Barings with respect to each Fund, and any and all acts and omissions of Barings Real Estate in respect to any Fund were considered the acts and omissions of Barings. Effective December 30, 2016, Barings Real Estate merged with and into Barings and, as a result, no longer serves as a sub-subadviser to any of the Funds.
MML Advisers has entered into investment subadvisory agreements with OppenheimerFunds, Inc. (“OFI”), a wholly-owned subsidiary of Oppenheimer Acquisition Corp., itself an indirect majority-owned subsidiary of MassMutual Holding LLC, on behalf of the Small Cap Equity Fund and the Strategic Emerging Markets Fund. These agreements provide that OFI manage the investment and reinvestment of the assets of the Funds. OFI receives a subadvisory fee from MML Advisers, based upon each Fund’s average daily net assets, at the following annual rates:
| | |
Small Cap Equity Fund | | 0.25% |
Strategic Emerging Markets Fund | | 0.70% |
MML Advisers has entered into an investment subadvisory agreement with the unaffiliated investment subadviser, DoubleLine Capital, LP (“DoubleLine”), pursuant to which DoubleLine serves as the subadviser to the Dynamic Bond Fund. This agreement provides that DoubleLine manage the investment and reinvestment of the assets of the Fund. DoubleLine receives a subadvisory fee from MassMutual based upon the average daily net assets of the Fund.
The Funds’ subadvisory fees are paid by MML Advisers out of the advisory fees previously disclosed above.
Administration Fees
For the Asset Momentum Fund, Dynamic Bond Fund, Equity Rotation Fund, High Yield Fund, Short-Duration Bond Fund, Special Situations Fund, and Strategic Emerging Markets Fund, under a separate Administrative and Shareholder Services Agreement between the Funds and MML Advisers, MML Advisers is obligated to provide all necessary administrative and shareholder services and bear some of the Fund specific administrative expenses. In return for these services, MML Advisers receives an administrative services fee, based upon the average daily net assets of the applicable class of shares of the Funds, at the following annual rates:
| | | | |
| | | Class II | | Service Class I |
Asset Momentum Fund | | 0.15% | | 0.15% |
Dynamic Bond Fund | | 0.15% | | 0.15% |
Equity Rotation Fund | | 0.15% | | 0.15% |
High Yield Fund | | 0.15% | | 0.15% |
Short-Duration Bond Fund | | 0.15% | | 0.15% |
Special Situations Fund | | 0.15% | | 0.15% |
Strategic Emerging Markets Fund | | 0.15% | | 0.15% |
137
Notes to Financial Statements (Continued)
Distribution and Service Fees
MML Distributors, LLC (the “Distributor”) acts as distributor to the Funds. Pursuant to a Distribution and Services Plan adopted by the Funds pursuant to Rule 12b-1 under the 1940 Act, Service Class shares and Service Class I shares of the Funds pay an annual fee of 0.25% of the average daily net asset value of Service Class shares and Service Class I shares. This fee, or a portion thereof, is paid to: (i) the Distributor for services provided and expenses incurred by it in connection with the distribution of Service Class shares or Service Class I shares, as applicable, of each Fund; and/or (ii) MassMutual for services provided and expenses incurred by it for purposes of maintaining or providing personal services to Service Class and Service Class I shareholders. The Distributor is a wholly-owned subsidiary of MassMutual.
Expense Caps and Waivers
MML Advisers agreed to cap the fees and expenses of the Funds noted below (other than extraordinary litigation and legal expenses, Acquired Fund Fees and Expenses#, interest expense, short sale dividend and loan expense, or other non-recurring or unusual expenses such as organizational expenses and shareholder meeting expenses) based upon the average daily net assets of the applicable class of shares of the Fund, as follows:
| | | | | | | | |
| | | Class II | | | Service Class I | |
Asset Momentum Fund* | | | 0.80% | | | | 1.05% | |
Dynamic Bond Fund* | | | 0.60% | | | | 0.85% | |
Equity Rotation Fund* | | | 0.65% | | | | 0.90% | |
Short-Duration Bond Fund* | | | 0.55% | | | | 0.80% | |
Special Situations Fund* | | | 0.80% | | | | 1.05% | |
Strategic Emerging Markets Fund* | | | 1.40% | | | | 1.65% | |
| # | Acquired Fund Fees and Expenses are expenses borne indirectly by a Fund through investments in other pooled investment vehicles. |
| * | Expense caps in effect through April 30, 2017. |
MML Advisers has agreed to waive 0.10% of the advisory fee of the High Yield Fund through April 30, 2017.
Effective June 1, 2016, MML Advisers has agreed to voluntarily waive 0.04% of the advisory fee of the Strategic Emerging Markets Fund through April 30, 2017. MML Advisers may amend or discontinue this waiver at any time without advance notice.
Expense caps and waiver amounts are reflected as a reduction of expenses on the Statements of Operations.
Deferred Compensation
Trustees of the Funds who are not officers or employees of MassMutual may elect to defer receipt of their annual fees in accordance with terms of a Non-Qualified Deferred Compensation Plan. Amounts deferred shall accrue interest or earnings and shall be recorded on the Funds’ books as other liabilities. Deferred compensation is included within Trustees’ fees and expenses in the Statements of Assets and Liabilities.
Other
Certain officers and trustees of the Funds may also be employees of MassMutual. The compensation of a trustee who is not an employee of MassMutual is borne by the Funds.
138
Notes to Financial Statements (Continued)
| 4. | | Purchases and Sales of Investments |
Cost of purchases and proceeds from sales of investment securities (excluding short-term investments) for the year ended December 31, 2016, were as follows:
| | | | | | | | | | | | | | | | |
| | | Purchases | | | Sales | |
| | | Long-Term U.S.
Government
Securities | | | Other
Long-Term
Securities | | | Long-Term U.S.
Government
Securities | | | Other
Long-Term
Securities | |
Asset Momentum Fund | | $ | - | | | $ | 14,697,071 | | | $ | - | | | $ | 10,338,248 | |
Dynamic Bond Fund | | | 227,761,810 | | | | 99,949,050 | | | | 196,749,859 | | | | 111,046,765 | |
Equity Rotation Fund | | | - | | | | 18,717,213 | | | | - | | | | 18,198,277 | |
High Yield Fund | | | - | | | | 80,187,853 | | | | - | | | | 102,961,566 | |
Inflation-Protected and Income Fund | | | 71,999,408 | | | | 185,392,933 | | | | 110,424,979 | | | | 190,891,047 | |
Short-Duration Bond Fund | | | 89,355,050 | | | | 144,538,429 | | | | 99,887,662 | | | | 79,606,948 | |
Small Cap Equity Fund | | | - | | | | 62,558,183 | | | | - | | | | 68,322,375 | |
Special Situations Fund | | | - | | | | 14,222,265 | | | | - | | | | 13,158,457 | |
Strategic Emerging Markets Fund | | | - | | | | 28,843,478 | | | | - | | | | 30,904,527 | |
| 5. | | Capital Share Transactions |
Changes in shares outstanding for each Fund were as follows:
| | | | | | | | | | | | | | | | |
| | | Year Ended December 31, 2016 | | | Year Ended December 31, 2015 | |
| | | | |
| | | Shares | | | Amount | | | Shares | | | Amount | |
Asset Momentum Fund Class II* | |
Sold | | | - | | | $ | - | | | | 1,990,000 | | | $ | 19,900,000 | |
Issued as reinvestment of dividends | | | 13,802 | | | | 143,267 | | | | 1,674 | | | | 15,765 | |
Redeemed | | | - | | | | - | | | | - | | | | - | |
| | | | | | | | | | | | | | | | |
Net increase (decrease) | | | 13,802 | | | $ | 143,267 | | | | 1,991,674 | | | $ | 19,915,765 | |
| | | | | | | | | | | | | | | | |
Asset Momentum Fund Service Class I* | |
Sold | | | 79,133 | | | $ | 769,914 | | | | 24,620 | | | $ | 238,982 | |
Issued as reinvestment of dividends | | | 472 | | | | 4,891 | | | | - | | | | - | |
Redeemed | | | (13,993 | ) | | | (139,613 | ) | | | (4 | ) | | | (43 | ) |
| | | | | | | | | | | | | | | | |
Net increase (decrease) | | | 65,612 | | | $ | 635,192 | | | | 24,616 | | | $ | 238,939 | |
| | | | | | | | | | | | | | | | |
Dynamic Bond Fund Class II* | |
Sold | | | 1,967,334 | | | $ | 19,730,005 | | | | 80,863,897 | | | $ | 804,944,229 | |
Issued as reinvestment of dividends | | | 1,238,887 | | | | 12,384,957 | | | | 649,870 | | | | 6,371,746 | |
Redeemed | | | (1,811,608 | ) | | | (18,518,299 | ) | | | (40,294,435 | ) | | | (399,323,405 | ) |
| | | | | | | | | | | | | | | | |
Net increase (decrease) | | | 1,394,613 | | | $ | 13,596,663 | | | | 41,219,332 | | | $ | 411,992,570 | |
| | | | | | | | | | | | | | | | |
Dynamic Bond Fund Service Class I* | |
Sold | | | 306,722 | | | $ | 3,060,637 | | | | 39,135 | | | $ | 384,626 | |
Issued as reinvestment of dividends | | | 6,138 | | | | 61,280 | | | | 226 | | | | 2,208 | |
Redeemed | | | (58,001 | ) | | | (585,364 | ) | | | (11 | ) | | | (103 | ) |
| | | | | | | | | | | | | | | | |
Net increase (decrease) | | | 254,859 | | | $ | 2,536,553 | | | | 39,350 | | | $ | 386,731 | |
| | | | | | | | | | | | | | | | |
139
Notes to Financial Statements (Continued)
| | | | | | | | | | | | | | | | |
| | | Year Ended December 31, 2016 | | | Year Ended December 31, 2015 | |
| | | | |
| | | Shares | | | Amount | | | Shares | | | Amount | |
Equity Rotation Fund Class II* | |
Sold | | | - | | | $ | - | | | | 1,990,000 | | | $ | 19,900,000 | |
Issued as reinvestment of dividends | | | 22,578 | | | | 257,157 | | | | 14,798 | | | | 143,395 | |
Redeemed | | | - | | | | - | | | | - | | | | - | |
| | | | | | | | | | | | | | | | |
Net increase (decrease) | | | 22,578 | | | $ | 257,157 | | | | 2,004,798 | | | $ | 20,043,395 | |
| | | | | | | | | | | | | | | | |
Equity Rotation Fund Service Class I* | |
Sold | | | 26,050 | | | $ | 261,848 | | | | 13,407 | | | $ | 133,279 | |
Issued as reinvestment of dividends | | | 376 | | | | 4,270 | | | | 62 | | | | 601 | |
Redeemed | | | (1,273 | ) | | | (13,560 | ) | | | (364 | ) | | | (3,631 | ) |
| | | | | | | | | | | | | | | | |
Net increase (decrease) | | | 25,153 | | | $ | 252,558 | | | | 13,105 | | | $ | 130,249 | |
| | | | | | | | | | | | | | | | |
High Yield Fund Class II | | | | | | | | | | | | | | | | |
Sold | | | 295,975 | | | $ | 2,921,195 | | | | 120,724 | | | $ | 1,229,963 | |
Issued as reinvestment of dividends | | | 854,296 | | | | 8,197,683 | | | | 882,358 | | | | 8,547,141 | |
Redeemed | | | (3,988,962 | ) | | | (39,527,479 | ) | | | (236,042 | ) | | | (2,366,805 | ) |
| | | | | | | | | | | | | | | | |
Net increase (decrease) | | | (2,838,691 | ) | | $ | (28,408,601 | ) | | | 767,040 | | | $ | 7,410,299 | |
| | | | | | | | | | | | | | | | |
High Yield Fund Service Class I | | | | | | | | | | | | | | | | |
Sold | | | 598,074 | | | $ | 5,781,914 | | | | 585,686 | | | $ | 5,772,998 | |
Issued as reinvestment of dividends | | | 206,300 | | | | 1,979,564 | | | | 190,803 | | | | 1,841,151 | |
Redeemed | | | (568,429 | ) | | | (5,393,673 | ) | | | (424,963 | ) | | | (4,201,047 | ) |
| | | | | | | | | | | | | | | | |
Net increase (decrease) | | | 235,945 | | | $ | 2,367,805 | | | | 351,526 | | | $ | 3,413,102 | |
| | | | | | | | | | | | | | | | |
Inflation-Protected and Income Fund Initial Class | | | | | | | | | | | | | | | | |
Sold | | | 3,173,898 | | | $ | 32,854,113 | | | | 3,406,567 | | | $ | 34,665,245 | |
Issued as reinvestment of dividends | | | 874,258 | | | | 9,077,612 | | | | 450,242 | | | | 4,521,221 | |
Redeemed | | | (5,541,789 | ) | | | (57,254,526 | ) | | | (6,070,810 | ) | | | (61,755,947 | ) |
| | | | | | | | | | | | | | | | |
Net increase (decrease) | | | (1,493,633 | ) | | $ | (15,322,801 | ) | | | (2,214,001 | ) | | $ | (22,569,481 | ) |
| | | | | | | | | | | | | | | | |
Inflation-Protected and Income Fund Service Class | | | | | | | | | | | | | | | | |
Sold | | | 556,761 | | | $ | 5,721,767 | | | | 363,650 | | | $ | 3,693,995 | |
Issued as reinvestment of dividends | | | 98,067 | | | | 1,014,617 | | | | 51,277 | | | | 512,261 | |
Redeemed | | | (861,017 | ) | | | (8,847,076 | ) | | | (697,048 | ) | | | (7,053,177 | ) |
| | | | | | | | | | | | | | | | |
Net increase (decrease) | | | (206,189 | ) | | $ | (2,110,692 | ) | | | (282,121 | ) | | $ | (2,846,921 | ) |
| | | | | | | | | | | | | | | | |
Short-Duration Bond Fund Class II | | | | | | | | | | | | | | | | |
Sold | | | 8,113,707 | | | $ | 79,725,554 | | | | 1,582,820 | | | $ | 15,630,609 | |
Issued as reinvestment of dividends | | | 382,932 | | | | 3,741,339 | | | | 383,289 | | | | 3,766,756 | |
Redeemed | | | (3,648,831 | ) | | | (35,740,980 | ) | | | (2,871,135 | ) | | | (28,359,265 | ) |
| | | | | | | | | | | | | | | | |
Net increase (decrease) | | | 4,847,808 | | | $ | 47,725,913 | | | | (905,026 | ) | | $ | (8,961,900 | ) |
| | | | | | | | | | | | | | | | |
Short-Duration Bond Fund Service Class I | | | | | | | | | | | | | | | | |
Sold | | | 1,611,348 | | | $ | 15,759,014 | | | | 651,692 | | | $ | 6,426,885 | |
Issued as reinvestment of dividends | | | 57,403 | | | | 560,359 | | | | 51,783 | | | | 508,301 | |
Redeemed | | | (892,832 | ) | | | (8,732,232 | ) | | | (685,724 | ) | | | (6,759,837 | ) |
| | | | | | | | | | | | | | | | |
Net increase (decrease) | | | 775,919 | | | $ | 7,587,141 | | | | 17,751 | | | $ | 175,349 | |
| | | | | | | | | | | | | | | | |
140
Notes to Financial Statements (Continued)
| | | | | | | | | | | | | | | | |
| | | Year Ended December 31, 2016 | | | Year Ended December 31, 2015 | |
| | | | |
| | | Shares | | | Amount | | | Shares | | | Amount | |
| | | | |
Small Cap Equity Fund Initial Class | | | | | | | | | | | | | | | | |
Sold | | | 810,550 | | | $ | 6,946,646 | | | | 294,879 | | | $ | 2,871,917 | |
Issued as reinvestment of dividends | | | 344,289 | | | | 2,985,481 | | | | 1,978,626 | | | | 15,939,017 | |
Redeemed | | | (1,650,378 | ) | | | (14,045,628 | ) | | | (1,279,524 | ) | | | (12,685,331 | ) |
| | | | | | | | | | | | | | | | |
Net increase (decrease) | | | (495,539 | ) | | $ | (4,113,501 | ) | | | 993,981 | | | $ | 6,125,603 | |
| | | | | | | | | | | | | | | | |
Small Cap Equity Fund Service Class | | | | | | | | | | | | | | | | |
Sold | | | 196,340 | | | $ | 1,662,742 | | | | 288,567 | | | $ | 2,825,692 | |
Issued as reinvestment of dividends | | | 42,763 | | | | 365,594 | | | | 229,904 | | | | 1,827,194 | |
Redeemed | | | (182,294 | ) | | | (1,519,077 | ) | | | (91,788 | ) | | | (906,991 | ) |
| | | | | | | | | | | | | | | | |
Net increase (decrease) | | | 56,809 | | | $ | 509,259 | | | | 426,683 | | | $ | 3,745,895 | |
| | | | | | | | | | | | | | | | |
| | | | | | | | | | | | | | | | |
Special Situations Fund Class II* | | | | | | | | | | | | | | | | |
Sold | | | - | | | $ | - | | | | 1,990,000 | | | $ | 19,900,000 | |
Issued as reinvestment of dividends | | | 11,263 | | | | 110,492 | | | | 591 | | | | 4,967 | |
Redeemed | | | - | | | | - | | | | - | | | | - | |
| | | | | | | | | | | | | | | | |
Net increase (decrease) | | | 11,263 | | | $ | 110,492 | | | | 1,990,591 | | | $ | 19,904,967 | |
| | | | | | | | | | | | | | | | |
Special Situations Fund Service Class I* | | | | | | | | | | | | | | | | |
Sold | | | 16,009 | | | $ | 140,095 | | | | 21,754 | | | $ | 199,585 | |
Issued as reinvestment of dividends | | | 144 | | | | 1,404 | | | | - | | | | - | |
Redeemed | | | (897 | ) | | | (8,232 | ) | | | (6 | ) | | | (52 | ) |
| | | | | | | | | | | | | | | | |
Net increase (decrease) | | | 15,256 | | | $ | 133,267 | | | | 21,748 | | | $ | 199,533 | |
| | | | | | | | | | | | | | | | |
Strategic Emerging Markets Fund Class II | | | | | | | | | | | | | | | | |
Sold | | | 1,403,238 | | | $ | 11,815,350 | | | | 2,410,308 | | | $ | 22,158,133 | |
Issued as reinvestment of dividends | | | 44,808 | | | | 401,484 | | | | 137,633 | | | | 1,066,654 | |
Redeemed | | | (1,811,377 | ) | | | (15,695,357 | ) | | | (1,111,667 | ) | | | (10,108,390 | ) |
| | | | | | | | | | | | | | | | |
Net increase (decrease) | | | (363,331 | ) | | $ | (3,478,523 | ) | | | 1,436,274 | | | $ | 13,116,397 | |
| | | | | | | | | | | | | | | | |
Strategic Emerging Markets Fund Service Class I | | | | | | | | | | | | | | | | |
Sold | | | 288,730 | | | $ | 2,431,282 | | | | 241,272 | | | $ | 2,171,162 | |
Issued as reinvestment of dividends | | | 2,531 | | | | 22,753 | | | | 10,034 | | | | 78,067 | |
Redeemed | | | (175,761 | ) | | | (1,511,499 | ) | | | (167,482 | ) | | | (1,520,956 | ) |
| | | | | | | | | | | | | | | | |
Net increase (decrease) | | | 115,500 | | | $ | 942,536 | | | | 83,824 | | | $ | 728,273 | |
| | | | | | | | | | | | | | | | |
| * | Fund commenced operations on May 15, 2015. |
141
Notes to Financial Statements (Continued)
| 6. | | Federal Income Tax Information |
At December 31, 2016, the cost of securities and the unrealized appreciation (depreciation) in the value of investments owned by the Fund(s), as computed on a federal income tax basis, were as follows:
| | | | | | | | | | | | | | | | |
| | | Federal Income
Tax Cost | | | Tax Basis
Unrealized
Appreciation | | | Tax Basis
Unrealized
(Depreciation) | | | Net Unrealized
Appreciation
(Depreciation) | |
Asset Momentum Fund | | $ | 21,429,964 | | | $ | 538,422 | | | $ | (372,327 | ) | | $ | 166,095 | |
Dynamic Bond Fund | | | 429,422,408 | | | | 3,345,272 | | | | (10,568,767 | ) | | | (7,223,495 | ) |
Equity Rotation Fund | | | 19,669,229 | | | | 3,980,486 | | | | (328,242 | ) | | | 3,652,244 | |
High Yield Fund | | | 123,224,270 | | | | 5,463,390 | | | | (4,219,778 | ) | | | 1,243,612 | |
Inflation-Protected and Income Fund | | | 743,802,863 | | | | 8,763,394 | | | | (10,910,026 | ) | | | (2,146,632 | ) |
Short-Duration Bond Fund | | | 235,914,745 | | | | 2,385,424 | | | | (4,383,484 | ) | | | (1,998,060 | ) |
Small Cap Equity Fund | | | 95,414,858 | | | | 24,515,885 | | | | (1,805,842 | ) | | | 22,710,043 | |
Special Situations Fund | | | 17,845,799 | | | | 2,354,212 | | | | (385,916 | ) | | | 1,968,296 | |
Strategic Emerging Markets Fund | | | 99,500,817 | | | | 8,849,700 | | | | (10,508,629 | ) | | | (1,658,929 | ) |
Net capital loss carryforwards may be applied against any net realized taxable gains in succeeding years, subject to the carryforward period limitations, where applicable. On December 22, 2010, the Regulated Investment Company Modernization Act of 2010 (the “Modernization Act”) was signed by the President. The Modernization Act changed the capital loss carryforward rules as they relate to regulated investment companies. Capital losses generated in tax years beginning after the date of enactment may now be carried forward indefinitely, and retain the character of the original loss. Under pre-enactment law, capital losses could be carried forward for up to eight tax years as short-term capital losses. The provisions affecting the utilization of capital loss carryforwards under the Modernization Act also require the utilization of post-enactment losses prior to the utilization of pre-enactment losses.
At December 31, 2016, for federal income tax purposes, there were no unused capital losses.
At December 31, 2016, the following Fund(s) had post-enactment accumulated capital loss carryforwards:
| | | | | | | | |
| | | Short Term
Capital Loss
Carryforward | | | Long Term
Capital Loss
Carryforward | |
Equity Rotation Fund | | $ | 947,113 | | | $ | 67,116 | |
High Yield Fund | | | 1,782,122 | | | | 3,597,135 | |
Inflation-Protected and Income Fund | | | 1,113,437 | | | | 2,670,484 | |
Short-Duration Bond Fund | | | - | | | | 2,992,400 | |
Special Situations Fund | | | 2,340,615 | | | | 123,693 | |
Strategic Emerging Markets Fund | | | 4,346,122 | | | | 8,984,330 | |
Net capital loss carryforwards for the Fund(s) shown in the above table are from post-enactment years and are, therefore, not subject to the eight-year carryforward period and possible expiration.
Generally accepted accounting principles in the United States of America require that only distributions in excess of tax basis earnings and profits be reported in the financial statements as a return of capital.
142
Notes to Financial Statements (Continued)
The tax character of distributions (including capital gain dividends, if any, designated pursuant to Section 852 of the Code) paid during the year ended December 31, 2016, was as follows:
| | | | | | | | | | | | |
| | | Ordinary
Income | | | Long Term
Capital Gain | | | Return of
Capital | |
Asset Momentum Fund | | $ | 148,158 | | | $ | - | | | $ | - | |
Dynamic Bond Fund | | | 12,446,237 | | | | - | | | | - | |
Equity Rotation Fund | | | 261,427 | | | | - | | | | - | |
High Yield Fund | | | 10,177,247 | | | | - | | | | - | |
Inflation-Protected and Income Fund | | | 10,092,229 | | | | - | | | | - | |
Short-Duration Bond Fund | | | 4,301,698 | | | | - | | | | - | |
Small Cap Equity Fund | | | 1,043,899 | | | | 2,307,176 | | | | - | |
Special Situations Fund | | | 76,278 | | | | - | | | | 35,618 | |
Strategic Emerging Markets Fund | | | 424,237 | | | | - | | | | - | |
The tax character of distributions (including capital gain dividends, if any, designated pursuant to Section 852 of the Code) paid during the year ended December 31, 2015, was as follows:
| | | | | | | | | | | | |
| | | Ordinary
Income | | | Long Term
Capital Gain | | | Return of
Capital | |
Asset Momentum Fund | | $ | 1,117 | | | $ | - | | | $ | 14,648 | |
Dynamic Bond Fund | | | 6,373,954 | | | | - | | | | - | |
Equity Rotation Fund | | | 132,402 | | | | - | | | | 11,594 | |
High Yield Fund | | | 10,031,031 | | | | 331,142 | | | | 26,119 | |
Inflation-Protected and Income Fund | | | 5,033,482 | | | | - | | | | - | |
Short-Duration Bond Fund | | | 4,275,057 | | | | - | | | | - | |
Small Cap Equity Fund | | | 906,452 | | | | 16,859,759 | | | | - | |
Special Situations Fund | | | - | | | | - | | | | 4,967 | |
Strategic Emerging Markets Fund | | | 1,144,721 | | | | - | | | | - | |
The following Fund(s) have elected to pass through the foreign tax credit for the year ended December 31, 2016:
| | | | |
| | | Amount | |
Strategic Emerging Markets Fund | | $ | 115,234 | |
Capital accounts within the financial statements are periodically adjusted for permanent differences between book and tax accounting. These adjustments have no impact on net assets or the results of operations. Temporary book and tax accounting differences will reverse in subsequent periods. At December 31, 2016, temporary book and tax accounting differences were primarily attributable to investments in forward contracts, futures contracts, options contracts, swap agreements, premium amortization accruals, passive foreign investment companies, non-taxable dividends basis adjustments, the deferral of wash sale losses, and deferred Trustee compensation.
143
Notes to Financial Statements (Continued)
At December 31, 2016, the components of distributable earnings on a tax basis were as follows:
| | | | | | | | | | | | | | | | |
| | | Undistributed
Ordinary
Income | | | Undistributed
Long Term
Capital Gain
(Capital Loss
Carryover) | | | Other
Temporary
Differences | | | Unrealized
Appreciation
(Depreciation) | |
Asset Momentum Fund | | $ | 76,241 | | | $ | 477,709 | | | $ | (711 | ) | | $ | 144,666 | |
Dynamic Bond Fund | | | 2,142,034 | | | | 573,480 | | | | (14,837 | ) | | | (7,223,494 | ) |
Equity Rotation Fund | | | 755 | | | | (1,014,229 | ) | | | (723 | ) | | | 3,652,244 | |
High Yield Fund | | | 86,450 | | | | (5,379,257 | ) | | | (16,787 | ) | | | 1,243,612 | |
Inflation-Protected and Income Fund | | | 580,281 | | | | (3,783,921 | ) | | | 19,863 | | | | (1,771,005 | ) |
Short-Duration Bond Fund | | | 446,042 | | | | (2,992,400 | ) | | | (29,547 | ) | | | (1,998,060 | ) |
Small Cap Equity Fund | | | 1,270,461 | | | | 4,523,958 | | | | (30,299 | ) | | | 22,710,044 | |
Special Situations Fund | | | - | | | | (2,464,308 | ) | | | (661 | ) | | | 1,968,296 | |
Strategic Emerging Markets Fund | | | 81,599 | | | | (13,330,452 | ) | | | (9,419 | ) | | | (1,694,431 | ) |
During the year ended December 31, 2016, the following amounts were reclassified due to permanent differences between book and tax accounting:
| | | | | | | | | | | | |
| | | Paid-in
Capital | | | Accumulated
Net Realized
Gain (Loss) on
Investments | | | Undistributed
Net Investment
Income (Loss) | |
Asset Momentum Fund | | $ | - | | | $ | (76,267 | ) | | $ | 76,267 | |
Dynamic Bond Fund | | | 541,340 | | | | 792,196 | | | | (1,333,536 | ) |
Equity Rotation Fund | | | (203 | ) | | | 107 | | | | 96 | |
High Yield Fund | | | 5 | | | | 308,922 | | | | (308,927 | ) |
Inflation-Protected and Income Fund | | | 14 | | | | (1,879,719 | ) | | | 1,879,705 | |
Short-Duration Bond Fund | | | 6 | | | | (1,121,123 | ) | | | 1,121,117 | |
Small Cap Equity Fund | | | (268 | ) | | | (34,838 | ) | | | 35,106 | |
Special Situations Fund | | | (38,385 | ) | | | 2,385 | | | | 36,000 | |
Strategic Emerging Markets Fund | | | 2 | | | | 69,281 | | | | (69,283 | ) |
The Funds did not have any unrecognized tax benefits at December 31, 2016, nor were there any increases or decreases in unrecognized tax benefits for the year then ended. The Funds recognize interest and penalties, if any, related to unrecognized tax benefits as an income tax expense in the Statements of Operations. During the year ended December 31, 2016, the Funds did not incur any such interest or penalties. The Funds are subject to examination by U.S. federal and state tax authorities for returns filed for the prior three fiscal years, or the returns filed to date for Funds in existence less than three years. Foreign taxes are provided for based on the Funds’ understanding of the tax rules and rates that exist in the foreign markets in which they invest.
Under the Funds’ organizational documents, current and former Trustees and Officers are provided with specified rights to indemnification against liabilities arising in connection with the performance of their duties to the Funds, and shareholders are indemnified against personal liability for obligations of the Funds. In the normal course of business, the Funds may also enter into contracts that provide general indemnifications. The Funds’ maximum exposure under these arrangements is unknown as this would be dependent on future claims that may be made against the Funds. The risk of material loss from such claims is considered remote.
144
Notes to Financial Statements (Continued)
| 8. | | New Accounting Pronouncements |
In November 2016, The Financial Accounting Standards Board (“FASB”) issued Accounting Standards Update No. 2016-18, “Statement of Cash Flows (Topic 230), Restricted Cash, a consensus of the FASB’s Emerging Issues Task Force” (“ASU 2016-18”). ASU 2016-18 requires that a statement of cash flows explain the change during the period in the total of cash, cash equivalents, and amounts generally described as restricted cash or restricted cash equivalents. Therefore, amounts generally described as restricted cash and restricted cash equivalents should be included with cash and cash equivalents when reconciling the beginning-of-period and end-of-period total amounts shown on the statement of cash flows. The amendments in ASU 2016-18 do not provide a definition of restricted cash or restricted cash equivalents. ASU 2016-18 is effective for interim and annual reporting periods beginning after December 15, 2017. Management is currently evaluating the implications of these changes and their impact on the financial statements.
On December 7, 2010, the Trust was named as a defendant and putative member of the proposed defendant class of shareholders named in an adversary proceeding brought by The Official Committee of Unsecured Creditors of Tribune Company (the “Official Committee”) in the U.S. Bankruptcy Court for the District of Delaware, in connection with Tribune Company’s Chapter 11 bankruptcy proceeding (In re Tribune Company). The proceeding relates to a leveraged buyout (“LBO”) transaction by which Tribune Company converted to a privately-held company in 2007, and the putative defendant class is comprised of beneficial owners of shares of Tribune Company who received proceeds (the “Proceeds”) of the LBO. The Official Committee seeks to recover payments of those Proceeds.
The potential amount sought to be recovered from the Small Cap Equity Fund, plus interest and the Official Committee’s court costs, is approximately $93,500.
The Fund cannot predict the outcome of this proceeding. Accordingly, the Fund has not accrued any amounts related to this proceeding. If the proceeding were to be decided in a manner adverse to the Fund, or if the Fund was to enter into a settlement agreement with the Official Committee, the payment of such judgment or settlement could potentially have a material adverse effect on the Fund’s net asset value depending on the net assets of the Fund at the time of such judgment or settlement.
In preparation of these financial statements, management has evaluated the events and transactions subsequent to December 31, 2016, through the date when the financial statements were issued, and determined that there are no subsequent events or transactions that would require adjustments to or disclosures in the Funds’ financial statements other than those disclosed below.
Elaine A. Sarsynski resigned as a Trustee of the Trust effective as of February 1, 2017.
145
Report of Independent Registered Public Accounting Firm
To the Board of Trustees of MML Series Investment Fund II and Shareholders of MML Asset Momentum Fund, MML Dynamic Bond Fund, MML Equity Rotation Fund, MML High Yield Fund, MML Inflation-Protected and Income Fund, MML Short-Duration Bond Fund, MML Small Cap Equity Fund, MML Special Situations Fund, and MML Strategic Emerging Markets Fund (collectively, the “Funds”):
We have audited the accompanying statements of assets and liabilities of the Funds, including the portfolios of investments, as of December 31, 2016, and the related statements of operations for the year then ended, the statement of cash flows for the MML Inflation-Protected and Income Fund for the year then ended, the statements of changes in net assets for each of the two years in the period then ended, and the financial highlights for each of the periods presented. These financial statements and financial highlights are the responsibility of the Funds’ management. Our responsibility is to express an opinion on these financial statements and financial highlights based on our audits.
We conducted our audits in accordance with the standards of the Public Company Accounting Oversight Board (United States). Those standards require that we plan and perform the audit to obtain reasonable assurance about whether the financial statements and financial highlights are free of material misstatement. The Funds are not required to have, nor were we engaged to perform, an audit of their internal control over financial reporting. Our audits included consideration of internal control over financial reporting as a basis for designing audit procedures that are appropriate in the circumstances, but not for the purpose of expressing an opinion on the effectiveness of the Funds’ internal control over financial reporting. Accordingly, we express no such opinion. An audit also includes examining, on a test basis, evidence supporting the amounts and disclosures in the financial statements, assessing the accounting principles used and significant estimates made by management, as well as evaluating the overall financial statement presentation. Our procedures included confirmation of securities owned as of December 31, 2016, by correspondence with the custodian and brokers; when replies were not received from brokers, we performed other auditing procedures. We believe that our audits provide a reasonable basis for our opinion.
In our opinion, such financial statements and financial highlights referred to above present fairly, in all material respects, the financial position of each of the Funds as of December 31, 2016, the results of their operations for the year then ended, the cash flows of the MML Inflation-Protected and Income Fund for the year then ended, the changes in their net assets for each of the two years in the period then ended, and the financial highlights for each of the periods presented, in conformity with accounting principles generally accepted in the United States of America.
Deloitte & Touche LLP
Boston Massachusetts
February 21, 2017
146
Trustees and Officers (Unaudited)
The following table lists the Trust’s Trustees and Officers; their address and age; their position with the Trust; the length of time holding that position with the Trust; their principal occupation(s) during the past five years; the number of portfolios in the fund complex they oversee; and other directorships they hold in companies subject to registration or reporting requirements of the Securities Exchange Act of 1934 (generally called “public companies”) or in registered investment companies. The Trust’s Statements of Additional Information include additional information about the Trust’s Trustees and are available, without charge, upon request by calling 1-888-309-3539 or by writing MML Series Investment Fund II, c/o Massachusetts Mutual Life Insurance Company, 100 Bright Meadow Blvd., Enfield, Connecticut 06082-1981, Attention: MassMutual U.S. Product and Marketing.
Disinterested Trustees
| | | | | | | | | | |
Name, Address*, and Age | | Position(s)
Held with
Trust | | Term of
Office** and
Length of
Time Served | | Principal Occupation(s)
During Past 5 Years | | Number of
Portfolios in
Fund Complex
Overseen by Trustee | | Other Directorships Held by Trustee |
Allan W. Blair
Age: 68 | | Trustee | | Since 2012 | | Retired; President and Chief Executive Officer (1996-2014), Economic Development Council of Western Massachusetts (non-profit development company); President and Chief Executive Officer (1984-2014), Westover Metropolitan Development Corporation (quasi-public development company). | | 94 | | Trustee (since 2003), MassMutual Select Funds (open-end investment company); Trustee (since 2003), MML Series Investment Fund (open-end investment company); Trustee (since 2012), MassMutual Premier Funds (open-end investment company). |
| | | | | |
Nabil N. El-Hage
Age: 58 | | Trustee Chairman | | Since 2005 (2006-2012) | | Founder and sole member of PR Academy of Executive Education, LLC (since 2016); Chairman (2011-2016), Academy of Executive Education, LLC (predecessor to PR Academy of Executive Education, LLC). | | 94 | | Director (2011-2015), Argo Group International Holdings, Ltd. (underwriter of specialty insurance and reinsurance products); Trustee (since 2012), MassMutual Select Funds (open-end investment company); Trustee (since 2012), MML Series Investment Fund (open-end investment company); Trustee (since 2003), Chairman (2006-2012), MassMutual Premier Funds (open-end investment company). |
| | | | | |
Maria D. Furman
Age: 62 | | Trustee | | Since 2005 | | Retired. | | 94 | | Trustee (since 2011), GMO Series Trust (open-end investment company); Trustee (since 2012), MassMutual Select Funds (open-end investment company); Trustee (since 2012), MML Series Investment Fund (open-end investment company); Trustee (since 2004), MassMutual Premier Funds (open-end investment company). |
| | | | | |
R. Alan Hunter, Jr.
Age: 70 | | Chairperson Trustee | | Since 2016 Since 2012 | | Retired. | | 94 | | Director (since 2007), Actuant Corporation (diversified industrial company); Chairperson (since 2016), Trustee (since 2003), MassMutual Select Funds (open-end investment company); Chairperson (since 2016), Trustee (since 2003), MML Series Investment Fund (open-end investment company); Chairperson (since 2016), Trustee (since 2012), MassMutual Premier Funds (open-end investment company). |
147
Trustees and Officers (Unaudited) (Continued)
| | | | | | | | | | |
Name, Address*, and Age | | Position(s)
Held with
Trust | | Term of
Office** and
Length of
Time Served | | Principal Occupation(s)
During Past 5 Years | | Number of
Portfolios in
Fund Complex
Overseen by Trustee | | Other Directorships Held by Trustee |
C. Ann Merrifield
Age: 65 | | Trustee | | Since 2005 | | Retired; President and Chief Executive Officer (2012-2014), PathoGenetix (genomics company). | | 94 | | Director (since 2015), Juniper Pharmaceuticals Inc. (specialty pharmaceutical company); Director (since 2014), Flexion Therapeutics (specialty pharmaceutical company); Director (since 2014), InVivo Therapeutics (research and clinical-stage biomaterials and biotechnology company); Trustee (since 2012), MassMutual Select Funds (open-end investment company); Trustee (since 2012), MML Series Investment Fund (open-end investment company); Trustee (since 2004), MassMutual Premier Funds (open-end investment company). |
| | | | | |
Susan B. Sweeney
Age: 64 | | Trustee | | Since 2012 | | Retired; Senior Vice President and Chief Investment Officer (2010-2014), Selective Insurance Group (property and casualty company. | | 96^ | | Trustee (since 2012), Barings Corporate Investors (closed-end investment company); Trustee (since 2012), Barings Participation Investors (closed-end investment company); Trustee (since 2009), MassMutual Select Funds (open-end investment company); Trustee (since 2009), MML Series Investment Fund (open-end investment company); Trustee (since 2012), MassMutual Premier Funds (open-end investment company). |
Interested Trustee
| | | | | | | | | | |
Name, Address*, and
Age | | Position(s) Held
with Trust | | Term of
Office** and
Length of
Time Served | | Principal Occupation(s)
During Past 5 Years | | Number of
Portfolios in
Fund Complex
Overseen by Trustee | | Other Directorships Held by Trustee |
Robert E. Joyal^^
Age: 71 | | Trustee | | Since 2012 | | Retired. | | 96^ | | Director (since 2013), Leucadia National Corporation (holding company); Director (since 2012), Ormat Technologies, Inc. (provider of alternative and renewable energy technology); Director (2006-2014), Jefferies Group LLC (investment bank); Trustee (since 2003), Barings Corporate Investors (closed-end investment company); Trustee (since 2003), Barings Participation Investors (closed-end investment company); Trustee (since 2003), MassMutual Select Funds (open-end investment company); Trustee (since 2003), MML Series Investment Fund (open-end investment company); Trustee (since 2012), MassMutual Premier Funds (open-end investment company). |
148
Trustees and Officers (Unaudited) (Continued)
Principal Officers who are Not Trustees
| | | | | | | | |
Name, Address*, and Age | | Position(s)
Held with Trust | | Term of
Office# and
Length of
Time Served | | Principal Occupation(s) During Past 5 Years | | Number of
Portfolios in
Fund Complex
Overseen by Officer |
Michael C. Eldredge
Age: 52 | | Vice President | | Since
2009 | | Head of Asset Allocation Funds (since 2016), portfolio manager (2014-2016), Head of Investments (2014-2016), MML Advisers; Vice President (since 2008), MassMutual; Vice President (since 2009), MassMutual Select Funds (open-end investment company); Vice President (since 2009), MML Series Investment Fund (open-end investment company); Vice President (since 2009), MassMutual Premier Funds (open-end investment company). | | 94 |
| | | | |
Andrew M. Goldberg
Age: 50 | | Vice President, Secretary, and Chief Legal Officer Assistant Clerk | | Since
2008 (2005-
2008) | | Assistant Vice President and Counsel (since 2004), MassMutual; Secretary (since 2015), Assistant Secretary (2013-2015), MML Advisers; Vice President, Secretary, and Chief Legal Officer (since 2008), Assistant Secretary (2001-2008), MassMutual Select Funds (open-end investment company); Vice President, Secretary, and Chief Legal Officer (since 2008), Assistant Secretary (2001-2008), MML Series Investment Fund (open-end investment company); Vice President, Secretary, (formerly known as “Clerk”), and Chief Legal Officer (since 2008), Assistant Clerk (2004-2008), MassMutual Premier Funds (open-end investment company). | | 94 |
| | | | |
Brian K. Haendiges
Age: 56 | | President Vice President | | Since
2016(2014-
2016) | | Vice President (since 2014) MML Advisers; Senior Vice President (since 2014), Vice President (2010-2014), MassMutual; Vice President (since 2014), MassMutual Select Funds (open-end investment company); President (since 2016), Vice President (2014-2016), MML Series Investment Fund (open-end investment company); Vice President (since 2014), MassMutual Premier Funds (open-end investment company). | | 94 |
| | | | |
Renee Hitchcock
Age: 46 | | Chief Financial Officer and Treasurer Assistant Treasurer | | Since
2016 2007-
2016 | | Assistant Vice President (since 2015), Director (2007-2015), MassMutual; Chief Financial Officer and Treasurer (since 2016), Assistant Treasurer (2007-2016), MassMutual Select Funds (open-end investment company); Chief Financial Officer and Treasurer (since 2016), Assistant Treasurer (2007-2016), MML Series Investment Fund (open-end investment company); Chief Financial Officer and Treasurer (since 2016), Assistant Treasurer (2007-2016), MassMutual Premier Funds (open-end investment company). | | 94 |
| | | | |
Douglas Steele
Age: 41 | | Vice President | | Since
2016 | | Head of Investment Due Diligence (since 2016), MML Advisers; Assistant Vice President (since 2013), Investment Director (2005-2013), MassMutual; Vice President (since 2016), MassMutual Select Funds (open-end investment company); Vice President (since 2016), MML Series Investment Fund (open-end investment company); Vice President (since 2016), MassMutual Premier Funds (open-end investment company). | | 94 |
| | | | |
Philip S. Wellman
Age: 52 | | Vice President and Chief Compliance Officer | | Since
2007 | | Vice President and Chief Compliance Officer (since 2013), MML Advisers; Vice President, Associate General Counsel, and Chief Compliance Officer (Mutual Funds) (since 2014), Vice President, Associate General Counsel, and Chief Compliance Officer (Mutual Funds and Investment Advisory) (2008-2014), MassMutual; Vice President and Chief Compliance Officer (since 2007), MassMutual Select Funds (open-end investment company); Vice President and Chief Compliance Officer (since 2007), MML Series Investment Fund (open-end investment company); Vice President and Chief Compliance Officer (since 2007), MassMutual Premier Funds (open-end investment company). | | 94 |
149
Trustees and Officers (Unaudited) (Continued)
| | | | | | | | |
Name, Address*, and Age | | Position(s)
Held with Trust | | Term of
Office# and
Length of
Time Served | | Principal Occupation(s) During Past 5 Years | | Number of
Portfolios in
Fund Complex
Overseen by Officer |
Eric H. Wietsma
Age: 50 | | Vice President | | Since
2006
| | Director and President (since 2013), MML Advisers; Senior Vice President (since 2010), MassMutual; President (since 2008), Vice President (2006-2008), MassMutual Select Funds (open-end investment company); Vice President (since 2006), MML Series Investment Fund (open-end investment company); President (since 2008), Vice President (2006-2008), MassMutual Premier Funds (open-end investment company). | | 94 |
| | | | |
Tina Wilson
Age: 46 | | Vice President | | Since
2016 | | Vice President and Head of Investments (since 2016), MML Advisers; Senior Vice President (since 2014), Vice President (2009-2014), MassMutual; Vice President (since 2016), MassMutual Select Funds (open-end investment company); Vice President (since 2016), MML Series Investment Fund (open-end investment company); Vice President (since 2016), MassMutual Premier Funds (open-end investment company). | | 94 |
| * | The address of each Trustee and Principal Officer is the same as that for the Trust; 100 Bright Meadow Blvd., Enfield, CT 06082-1981. |
| ** | Each Trustee of the Trust serves until the next meeting of shareholders called for the purpose of electing Trustees and until the election and qualification of his or her successor or until he or she dies, resigns, or is removed. Notwithstanding the foregoing, unless the Trustees determine that it is desirable and in the best interest of the Trust that an exception to the retirement policy of the Trust be made, a Trustee shall retire and cease to serve as a Trustee upon the conclusion of the calendar year in which such Trustee attains the age of seventy-two years. |
| | The Chairperson is elected to hold such office for a term of three years or until their successor is elected and qualified to carry out the duties and responsibilities of their office, or until he or she retires, dies, resigns, is removed, or becomes disqualified. The Chairperson shall hold office at the pleasure of the Trustees. |
| ^ | Barings Participation Investors and Barings Corporate Investors are deemed to be a part of the Fund Complex, because they are managed by Barings LLC (formerly known as Babson Capital Management LLC), an affiliate of MML Advisers. |
| ^^ | Mr. Joyal is an “Interested Person,” as that term is defined in the 1940 Act, through his position as a director of Leucadia National Corporation, which controls Jefferies Group LLC, a broker-dealer that may execute portfolio transactions and/or engage in principal transactions with the Funds, other investment companies advised by MML Advisers or holding themselves out to investors as related companies for purposes of investment or investor services, or any other advisory accounts over which MML Advisers has brokerage placement discretion. |
| # | The President, Treasurer, and Secretary and such other officers as the Trustees may in their discretion from time to time elect are elected to hold such office until their successor is elected and qualified to carry out the duties and responsibilities of their office, or until he or she dies, resigns, is removed, or becomes disqualified. Each officer shall hold office at the pleasure of the Trustees. |
150
Federal Tax Information (Unaudited)
For corporate shareholders, a portion of the ordinary dividends paid during the Fund(s)’ year ended December 31, 2016, qualified for the dividends received deduction, as follows:
| | | | |
| |
| | | Dividends Received
Deductions | |
Asset Momentum Fund | | | 24.16% | |
Equity Rotation Fund | | | 100.00% | |
Short-Duration Bond Fund | | | 0.10% | |
Small Cap Equity Fund | | | 87.55% | |
Special Situations Fund | | | 100.00% | |
Strategic Emerging Markets Fund | | | 9.34% | |
For the year ended December 31, 2016, the following Fund(s) earned the following foreign sources of income:
| | | | |
| |
| | | Amount | |
Strategic Emerging Markets Fund | | $ | 1,537,506 | |
151
Other Information (Unaudited)
Proxy Voting
A description of the policies and procedures that each Fund’s investment adviser and subadvisers use to vote proxies relating to the Fund’s portfolio securities is available, without charge, upon request, by calling 1-888-309-3539, and on the Securities and Exchange Commission’s (“SEC”) EDGAR database on its website at http://www.sec.gov.
Information regarding how the Funds voted proxies relating to portfolio securities during the most recent 12-month period ended June 30 is available, without charge, upon request, on the MassMutual website at http://www.massmutual.com/funds and on the SEC’s EDGAR database on its website at http://www.sec.gov.
Quarterly Reporting
The Funds file their complete schedule of portfolio holdings with the SEC for the first and third quarters of each fiscal year on Form N-Q. The Funds’ Forms N-Q are available on the SEC’s EDGAR database on its website at http://www.sec.gov and may be reviewed and copied at the SEC’s Public Reference Room in Washington D.C. Information on the operation of the SEC’s Public Reference Room may be obtained by calling 1-800-SEC-0330.
152
Other Information (Unaudited)
Fund Expenses December 31, 2016
Expense Examples:
The following information is in regards to expenses for the six months ended December 31, 2016:
As a shareholder of the Funds, you incur ongoing costs, including advisory fees, distribution and/or service (12b-1) fees, and other Fund expenses. These examples are intended to help you understand your ongoing costs (in dollars) of investing in the Funds and to compare these costs with the ongoing costs of investing in other mutual funds. These examples are based on an investment of $1,000 invested for the six months ended December 31, 2016.
Actual Expenses:
The first four columns of the table below provide information about actual account values and actual expenses. You may use this information, together with the amount you invested, to estimate the expenses that you paid over the period. Simply divide your account value by $1,000 (for example, an $8,600 account value divided by $1,000 = 8.6), then multiply the result by the number under the heading entitled “Operating Expenses Incurred” to estimate the expenses you paid on your account during this period.
Hypothetical Example for Comparison Purposes:
The last two columns of the table below provide information about hypothetical account values and hypothetical expenses based on the Fund’s actual expense ratio and an assumed rate of return of 5% per year before expenses, which is not the Fund’s actual return. The hypothetical account values and expenses may not be used to estimate the actual ending account balance or expenses you paid for the period. You may use this information to compare the ongoing costs of investing in the Fund and other funds. To do so, compare this 5% hypothetical example with the 5% hypothetical examples that appear in the shareholder reports of the other funds.
Please note that the expenses shown in the table are meant to highlight your ongoing costs only and do not reflect any transactional costs. Therefore, the last two columns of the table are useful in comparing ongoing costs only, and will not help you determine the relative total costs of owning different funds. In addition, if these transactional costs were included, your costs would have been higher.
| | | | | | | | | | | | | | | | | | | | | | | | |
| | | Beginning
Value | | | Annualized
Expense
Ratio | | | Ending
Value (Based
on Actual
Returns and
Expenses) | | | Operating
Expenses
Incurred* | | | Ending
Value (Based
on
Hypothetical
Returns and
Expenses) | | | Operating
Expenses
Incurred* | |
| Asset Momentum Fund | | | | | | | | | | | | | | | | | | | | | | | | |
Class II | | $ | 1,000 | | | | 0.80 | % | | $ | 1,060.40 | | | $ | 4.14 | | | $ | 1,021.10 | | | $ | 4.06 | |
Service Class I | | | 1,000 | | | | 1.05 | % | | | 1,059.20 | | | | 5.43 | | | | 1,019.90 | | | | 5.33 | |
| Dynamic Bond Fund | | | | | | | | | | | | | | | | | | | | | | | | |
Class II | | | 1,000 | | | | 0.59 | % | | | 993.40 | | | | 2.96 | | | | 1,022.20 | | | | 3.00 | |
Service Class I | | | 1,000 | | | | 0.84 | % | | | 992.80 | | | | 4.21 | | | | 1,020.90 | | | | 4.27 | |
| Equity Rotation Fund | | | | | | | | | | | | | | | | | | | | | | | | |
Class II | | | 1,000 | | | | 0.65 | % | | | 1,155.70 | | | | 3.52 | | | | 1,021.90 | | | | 3.30 | |
Service Class I | | | 1,000 | | | | 0.90 | % | | | 1,154.40 | | | | 4.87 | | | | 1,020.60 | | | | 4.57 | |
| High Yield Fund | | | | | | | | | | | | | | | | | | | | | | | | |
Class II | | | 1,000 | | | | 0.74 | % | | | 1,082.70 | | | | 3.87 | | | | 1,021.40 | | | | 3.76 | |
Service Class I | | | 1,000 | | | | 0.99 | % | | | 1,081.10 | | | | 5.18 | | | | 1,020.20 | | | | 5.03 | |
| Inflation-Protected and Income Fund | | | | | | | | | | | | | | | | | | | | | | | | |
Initial Class | | | 1,000 | | | | 0.60 | % | | | 987.40 | | | | 3.00 | | | | 1,022.10 | | | | 3.05 | |
Service Class | | | 1,000 | | | | 0.85 | % | | | 985.80 | | | | 4.24 | | | | 1,020.90 | | | | 4.32 | |
153
Other Information (Unaudited) (Continued)
| | | | | | | | | | | | | | | | | | | | | | | | |
| | | Beginning
Value | | | Annualized
Expense
Ratio | | | Ending
Value (Based
on Actual
Returns and
Expenses) | | | Operating
Expenses
Incurred* | | | Ending
Value (Based
on
Hypothetical
Returns and
Expenses) | | | Operating
Expenses
Incurred* | |
| Short-Duration Bond Fund | | | | | | | | | | | | | | | | | | | | | | | | |
Class II | | $ | 1,000 | | | | 0.55 | % | | $ | 1,004.50 | | | $ | 2.77 | | | $ | 1,022.40 | | | $ | 2.80 | |
Service Class I | | | 1,000 | | | | 0.80 | % | | | 1,003.60 | | | | 4.03 | | | | 1,021.10 | | | | 4.06 | |
| Small Cap Equity Fund | | | | | | | | | | | | | | | | | | | | | | | | |
Initial Class | | | 1,000 | | | | 0.72 | % | | | 1,148.10 | | | | 3.89 | | | | 1,021.50 | | | | 3.66 | |
Service Class | | | 1,000 | | | | 0.97 | % | | | 1,146.70 | | | | 5.23 | | | | 1,020.30 | | | | 4.93 | |
| Special Situations Fund | | | | | | | | | | | | | | | | | | | | | | | | |
Class II | | | 1,000 | | | | 0.80 | % | | | 1,099.70 | | | | 4.22 | | | | 1,021.10 | | | | 4.06 | |
Service Class I | | | 1,000 | | | | 1.05 | % | | | 1,098.00 | | | | 5.54 | | | | 1,019.90 | | | | 5.33 | |
| Strategic Emerging Markets Fund | | | | | | | | | | | | | | | | | | | | | | | | |
Class II | | | 1,000 | | | | 1.40 | % | | | 1,028.30 | | | | 7.14 | | | | 1,018.10 | | | | 7.10 | |
Service Class I | | | 1,000 | | | | 1.65 | % | | | 1,026.00 | | | | 8.40 | | | | 1,016.80 | | | | 8.36 | |
| * | Expenses are calculated using the annualized expense ratio for the six months ended December 31, 2016, multiplied by the average account value over the period, multiplied by 184 days in the period, divided by 366 days in the year, unless stated otherwise. The annualized expense ratio does not reflect expenses deducted under the variable life insurance or variable annuity contract through which the Funds are invested in. Inclusion of these expenses would increase the annualized expense ratios shown. |
154
Underwriter:
MML Distributors, LLC
100 Bright Meadow Blvd.
Enfield, CT 06082-1981

| | |
| © 2017 Massachusetts Mutual Life Insurance Company, Springfield, MA 01111-0001. All rights reserved. www.massmutual.com. MassMutual Financial Group is a marketing name for Massachusetts Mutual Life Insurance Company (MassMutual) and its affiliated companies and sales representatives. Investment Adviser: MML Investment Advisers, LLC | | RS-41647-00 |
Item 2. Code of Ethics.
As of December 31, 2016, the Registrant adopted a Code of Ethics that applies to the Principal Executive Officer and Principal Financial Officer pursuant to the Sarbanes-Oxley Act of 2002. For the year ended December 31, 2016, there were no reportable amendments to a provision of the Code of Ethics. A copy of its Code of Ethics is filed with this Form N-CSR under Item 12(a)(1).
Item 3. Audit Committee Financial Expert.
The Registrant’s Board of Trustees has determined that Susan B. Sweeney and Nabil N. El-Hage, both members of the Audit Committee, are audit committee financial experts as defined by the Securities and Exchange Commission (the “SEC”). Ms. Sweeney and Mr. El-Hage are both “independent” as defined by the SEC for purposes of audit committee financial expert determinations.
Item 4. Principal Accountant Fees and Services.
References below to Deloitte & Touche LLP include its affiliates where applicable.
| | (a) | AUDIT FEES: The aggregate fees billed to the Registrant for professional services rendered by its independent auditors, Deloitte & Touche LLP, for the audit of the Registrant’s annual financial statements for the fiscal years ended 2016 and 2015 were $396,013 and $405,930, respectively. |
| | (b) | AUDIT RELATED FEES: No such fees were billed to the Registrant by Deloitte & Touche LLP for the fiscal years ended 2016 and 2015. No such fees were billed to the Registrant’s adviser and any entity controlling, controlled by, or under common control with the adviser that provides ongoing services to the Registrant by Deloitte & Touche LLP* for the fiscal years ended 2016 and 2015. |
| | (c) | TAX FEES: The aggregate fees billed to the Registrant for professional services rendered by Deloitte & Touche LLP for the review of Form 1120-RIC, Form 8613, excise distribution projections, distribution calculation and reasonable out of pocket expenses for the fiscal years ended 2016 and 2015 were $79,857 and $85,057, respectively. No such fees were billed to the Registrant’s adviser and any entity controlling, controlled by, or under common control with the adviser that provides ongoing services to the Registrant by Deloitte & Touche LLP* for the fiscal years ended 2016 and 2015. |
| | (d) | ALL OTHER FEES: No such fees were billed to the Registrant by Deloitte & Touche LLP for the fiscal years ended 2016 and 2015. No such fees were billed to the Registrant’s adviser and any entity controlling, controlled by, or under common control with the adviser that provides ongoing services to the Registrant by Deloitte & Touche LLP* for the fiscal years ended 2016 and 2015. |
| | (e) | (1) AUDIT COMMITTEE PRE-APPROVAL POLICY: All services to be performed for the Registrant by Deloitte & Touche LLP must be pre-approved by the audit committee. All services performed during the fiscal years ended 2016 and 2015 were pre-approved by the committee. |
(2) Not applicable.
| | (g) | The aggregate non-audit fees billed by Deloitte & Touche LLP for services rendered to the Registrant, the Registrant’s adviser and any entity controlling, controlled by, or under common control with the adviser that provides ongoing services to the Registrant, for the fiscal years ended 2016 and 2015 were $7,270,391 and $698,822, respectively. |
| | (h) | The audit committee considers whether the provision of non-audit services by Deloitte & Touche LLP to the Registrant’s adviser and any entity controlling, controlled by, or under common control with the adviser that provides ongoing services to the Registrant that were not pre-approved pursuant to paragraph (c)(7)(ii) of Rule 2-01 of Regulation S-X is compatible with maintaining Deloitte & Touche LLP’s independence. |
| | * | Refers to fees that were required to be approved by the audit committee for services that relate directly to the operations and financial reporting of the Registrant. |
Item 5. Audit Committee of Listed Registrants.
Not applicable to this filing.
Item 6. Investments.
Please see portfolio of investments contained in the Reports to Stockholders included under Item 1 of this form N-CSR.
Item 7. Disclosure of Proxy Voting Policies and Procedures for Closed-End Management Investment Companies.
Not applicable to this filing.
Item 8. Portfolio Managers of Closed-End Management Investment Companies.
Not applicable to this filing.
Item 9. Purchases of Equity Securities by Closed-End Management Investment Company and Affiliated Purchasers.
Not applicable to this filing.
Item 10. Submission of Matters to a Vote of Security Holders.
Not applicable to this filing.
Item 11. Controls and Procedures.
(a) The Registrant’s Principal Executive Officer and Principal Financial Officer have concluded that the Registrant’s disclosure controls and procedures (as defined in Rule 30a-3(c) under the Investment Company Act of 1940, as amended (the “1940 Act”) (17 CFR 270.30a-3(c))) are effective, as of a date within 90 days of the filing date of this Form N-CSR, to provide reasonable assurance that the information required to be disclosed by the Registrant on Form N-CSR is recorded, processed, summarized, and reported within the time periods specified in the SEC’s rules and forms, based on their evaluation of these disclosure controls and procedures required by Rule 30a-3(b) under the 1940 Act (17 CFR 270.30a-3(b)) and Rules 13a-15(b) or 15d-15(b) under the Securities Exchange Act of 1934 (17 CFR 240.13a-15(b) or 240.15d-15(b)).
(b) There were no changes in the Registrant’s internal control over financial reporting (as defined in Rule 30a-3(d) under the 1940 Act (17 CFR 270.30a-3(d))) that occurred during the Registrant’s most recent fiscal quarter that has materially affected, or is reasonably likely to materially affect, the Registrant’s internal control over financial reporting.
Item 12. Exhibits.
(a)(1) Code of Ethics (Item 2) is attached.
(a)(2) Certifications of the Principal Executive Officer and Principal Financial Officer of the Registrant as required by Rule 30a-2(a) under the 1940 Act (17 CFR 270.30a-2(a)) are attached hereto as Exhibit 99CERT.
(a)(3) Not applicable to this filing.
(b) Certifications pursuant to Section 906 of the Sarbanes-Oxley Act of 2002 as required by Rule 30a-2(b), under the 1940 Act (17 CFR 270.30a-2(b)), Rule 15d-14(b) under the Securities Exchange Act of 1934 (17 CFR 240.15d-14(b)) and Section 1350 of Chapter 63 of Title 18 of the United States Code (18 U.S.C. 1350) are attached hereto as Exhibit 99.906CERT.
SIGNATURES
Pursuant to the requirements of the Securities Exchange Act of 1934 and the Investment Company Act of 1940, the registrant has duly caused this report to be signed on its behalf by the undersigned, thereunto duly authorized.
(Registrant) MML Series Investment Fund II
By (Signature and Title) /s/ Brian Haendiges
Brian Haendiges, President and Principal Executive Officer
Date 2/21/17
Pursuant to the requirements of the Securities Exchange Act of 1934 and the Investment Company Act of 1940, this report has been signed below by the following persons on behalf of the registrant and in the capacities and on the dates indicated.
By (Signature and Title) /s/ Brian Haendiges
Brian Haendiges, President and Principal Executive Officer
Date 2/21/17
By (Signature and Title) /s/ Renee Hitchcock
Renee Hitchcock, Treasurer and Principal Financial Officer
Date 2/21/17