Washington, D.C. 20549
Joseph V. Amato
Arthur C. Delibert, Esq.
1601 K Street, N.W.
Washington, D.C. 20006-1600
Form N-CSR is to be used by management investment companies to file reports with the Commission not later than 10 days after the transmission to stockholders of any report that is required to be transmitted to stockholders under Rule 30e-1 under the Investment Company Act of 1940as amended (“Act”) (17 CFR 270.30e-1). The Commission may use the information provided on Form N-CSR in its regulatory, disclosure review, inspection, and policymaking roles.
A registrant is required to disclose the information specified by Form N-CSR, and the Commission will make this information public. A registrant is not required to respond to the collection of information contained in Form N-CSR unless the Form displays a currently valid Office of Management and Budget (“OMB”) control number. Please direct comments concerning the accuracy of the information collection burden estimate and any suggestions for reducing the burden to Secretary, Securities and Exchange Commission, 100 F Street, NE, Washington, DC 20549-0609. The OMB has reviewed this collection of information under the clearance requirements of 44 U.S.C. § 3507.
Item 1. Report to Shareholders.
Following are copies of the annual reports transmitted to shareholders pursuant to Rule 30e-1 under the Act.

Neuberger Berman
Alternative and Multi-Asset Class Funds
Institutional Class Shares
Class A Shares
Class C Shares
Class R6 Shares
Commodity Strategy Fund
Global Allocation Fund
Hedged Option Premium Strategy Fund
Long Short Fund
Long Short Credit Fund
Multi-Asset Income Fund
Multi-Style Premia Fund
U.S. Equity Index PutWrite Strategy Fund
Annual Report
October 31, 2018
Beginning on January 1, 2021, as permitted by regulations adopted by the U.S. Securities and Exchange Commission, paper copies of the Fund's annual and semi-annual shareholder reports will no longer be sent by mail, unless you specifically request paper copies of the reports. Instead, the reports will be made available on the Fund's website www.nb.com/fundliterature, and you will be notified by mail each time a report is posted and provided with a website link to access the report.
If you already elected to receive shareholder reports electronically, you will not be affected by this change and you need not take any action. You may elect to receive shareholder reports and other communications from the Fund electronically anytime by contacting your financial intermediary (such as a broker-dealer or bank) or, if you are a direct investor, by calling 800.877.9700 or by sending an e-mail request to fundinfo@nb.com.
Beginning on January 1, 2019, you may elect to receive all future reports in paper free of charge. If you invest through a financial intermediary, you can contact your financial intermediary to request that you continue to receive paper copies of your shareholder reports. If you invest directly with the Fund, you can call 800.877.9700 or send an email request to fundinfo@nb.com to inform the Fund that you wish to continue receiving paper copies of your shareholder reports. Your election to receive reports in paper will apply to all funds held in your account if you invest through your financial intermediary or all funds held with the fund complex if you invest directly with the Fund.
Contents
THE FUNDS | |
President's Letter | | | 1 | | |
PORTFOLIO COMMENTARY | |
Commodity Strategy Fund | | | 2 | | |
Global Allocation Fund | | | 5 | | |
Hedged Option Premium Strategy Fund | | | 8 | | |
Long Short Fund | | | 11 | | |
Long Short Credit Fund | | | 14 | | |
Multi-Asset Income Fund | | | 18 | | |
Multi-Style Premia Fund | | | 22 | | |
U.S. Equity Index PutWrite Strategy Fund | | | 25 | | |
FUND EXPENSE INFORMATION | | | 33 | | |
SCHEDULE OF INVESTMENTS | |
Commodity Strategy Fund | | | 35 | | |
Global Allocation Fund | | | 42 | | |
Positions by Industry | | | 49 | | |
Hedged Option Premium Strategy Fund | | | 62 | | |
Long Short Fund | | | 67 | | |
Long Short Credit Fund | | | 86 | | |
Multi-Asset Income Fund | | | 94 | | |
Multi-Style Premia Fund | | | 116 | | |
Positions by Industry | | | 118 | | |
U.S. Equity Index PutWrite Strategy Fund | | | 165 | | |
FINANCIAL STATEMENTS | | | 168 | | |
FINANCIAL HIGHLIGHTS (ALL CLASSES)/
PER SHARE DATA | |
Commodity Strategy Fund | | | 220 | | |
Global Allocation Fund | | | 222 | | |
Hedged Option Premium Strategy Fund | | | 222 | | |
Long Short Fund | | | 224 | | |
Long Short Credit Fund | | | 226 | | |
Multi-Asset Income Fund | | | 228 | | |
Multi-Style Premia Fund | | | 230 | | |
U.S. Equity Index PutWrite Strategy Fund | | | 232 | | |
Report of Independent Registered Public Accounting Firms | | | 236 | | |
Directory | | | 239 | | |
Trustees and Officers | | | 240 | | |
Proxy Voting Policies and Procedures | | | 250 | | |
Quarterly Portfolio Schedule | | | 250 | | |
Board Consideration of the Management Agreement | | | 251 | | |
Notice to Shareholders | | | 260 | | |
The "Neuberger Berman" name and logo and "Neuberger Berman Investment Advisers LLC" name are registered service marks of Neuberger Berman Group LLC. The individual Fund names in this piece are either service marks or registered service marks of Neuberger Berman Investment Advisers LLC, an affiliate of Neuberger Berman BD LLC, distributor, member FINRA. ©2018 Neuberger Berman BD LLC, distributor. All rights reserved.
Dear Shareholder,
I am pleased to present this annual shareholder report for Neuberger Berman Alternative and Multi-Asset Class Funds.
The global financial market generated mixed results over the 12 months ended October 31, 2018. Despite periods of volatility and a weak finish, U.S. equities posted a solid return during the reporting period. Robust corporate profits and the boost from the December 2017 tax reform bill led to overall positive investor demand. These positive factors more than offset continued U.S. Federal Reserve Board (Fed) monetary policy tightening and concerns over a global trade war. In contrast, equities outside the U.S. generated poor results amid signs of decelerating growth, trade war fears and a number of geopolitical uncertainties.
Meanwhile, the U.S. fixed income market generated weak results over the reporting period. Both short- and long-term Treasury yields moved higher as the economy continued to grow and inflation ticked higher. In addition, the Fed indicated that it would remain on its path to tightening monetary policy in 2019 (although more recent statements by some Fed officials have suggested a less aggressive approach). Elsewhere, central banks in developed countries outside the U.S. largely maintained their accommodative monetary policies. However, the Bank of England raised rates twice over the period and the European Central Bank announced that it would end its bond buying program by the end of the year.
All told, the U.S. equity market, as measured by the S&P 500® Index, gained 7.35% over the reporting period. International developed and emerging market equities, as measured by the MSCI EAFE® and MSCI Emerging Market Indices, returned –6.85% and –12.52%, respectively, over the 12 months ended October 31, 2018. Meanwhile, the overall U.S. bond market, as measured by the Bloomberg Barclays U.S. Aggregate Bond Index, returned –2.05% during the period. Finally, inflation moved higher but was generally well contained over the period.
Looking ahead, if the economy gets through the remainder of 2018 without being derailed by geopolitical issues, Brexit, a trade war, rising U.S. inflation, or a failure of China to stimulate or of Europe and Japan to regain their growth impetus, we think that would bode well for a continuation of the business cycle through 2019 and 2020. That reads like a long list of risks, but many are interconnected and we regard all of them as containable. When the picture does clear, if things look positive, the rebound in sentiment could be sharp. That being said, some of the fog from the potential issues listed above could persist into the new year.
Thank you for your continued support and trust. We look forward to continue serving your investment needs in the years to come.
Sincerely,

JOSEPH V. AMATO
PRESIDENT AND CEO
NEUBERGER BERMAN MUTUAL FUNDS
1
Commodity Strategy Fund* Commentary (Unaudited)
Neuberger Berman Commodity Strategy Fund1 (formally Neuberger Berman Risk Balanced Commodity Strategy Fund) Institutional Class generated a total return of 1.19% for the 12 months ended October 31, 2018 and outperformed its benchmark, the Bloomberg Commodity Index (the Index), which posted a –1.73% return for the same period. (Performance for all share classes is provided in the table immediately following this letter.)
The overall commodity market generated mixed results over the reporting period. On one hand, energy-related commodities were highly resilient and generated positive results. However, this did not spill over to other commodities; non-energy commodities largely generated negative returns, as they were dragged down by periods of investor risk aversion, global trade war concerns and tightening monetary policy by the U.S. Federal Reserve Board. The weakest performers over the period included soybeans and soybean oil, zinc, lead, coffee and sugar.
Looking at the commodity sectors in which the Fund invests, energy was the largest contributor to performance relative to the benchmark. In particular, an out-of-benchmark allocation to gas oil and overweights to both gasoline and heating oil were additive for returns. Within the agriculture sector, the Fund's underweights to soybeans and soybean oil were beneficial for returns. Their prices fell sharply amid growing trade tensions between the U.S. and China, the latter of which is the world's largest soybean importer. Elsewhere, an overweight to cotton was additive for results, as were underweights to sugar and coffee. On the downside, out-of-benchmark allocations to lead and platinum detracted from returns as they performed poorly over the period.
The Fund seeks to gain exposure to the commodity markets by investing, directly or indirectly, in futures contracts on individual commodities and other commodity-linked derivative instruments. The Fund's tactical positioning in commodity futures detracted from performance during the reporting period.
Despite recent challenges, we continue to believe that fundamentals are generally healthy for much of the commodities complex. We are optimistic, but cautious, as we believe that trade war and China slowdown fears may prove overblown. We believe that higher inflation expectations and geopolitical hedging will provide support for precious metals. We remain cautious on agricultural and soft commodities based on what we view as the low chance of supply reduction in the near term.
On top of this, if assets in the equity markets continue to stretch their already expensive valuations, we anticipate marginal investment dollars will start to search for cheaper diversifying sources of returns. As always, in this complex market environment, we advocate for an actively managed, risk-aware approach to commodities investing, in order to dynamically adjust to the uncertainty that lies ahead.
Sincerely,
HAKAN KAYA, THOMAS SONTAG AND DAVID YI WAN
PORTFOLIO MANAGERS
* As previously announced, effective November 8, 2018, the name of Neuberger Berman Risk Balanced Commodity Strategy Fund changed to Neuberger Berman Commodity Strategy Fund.
1 Much of the Fund's investment exposure is accomplished through the use of derivatives which may not require the Fund to deposit the full notional amount of the investment with its counterparties, such as a futures commission merchant. The Fund's resulting cash balances are invested in a variety of conservative fixed income securities.
Information about principal risks of investing in the Fund is set forth in the prospectus and statement of additional information.
The portfolio composition, industries and holdings of the Fund are subject to change without notice.
The opinions expressed are those of the Fund's portfolio managers. The opinions are as of the date of this report and are subject to change without notice.
2
Commodity Strategy Fund (Unaudited)
TICKER SYMBOLS
Institutional Class | | NRBIX | |
Class A | | NRBAX | |
Class C | | NRBCX | |
PORTFOLIO BY TYPE OF SECURITY
(as a % of Total Net Assets) | |
Asset-Backed Securities | | | 22.0 | % | |
Corporate Bonds | | | 65.6 | | |
Short-Term Investments | | | 8.0 | | |
Other Assets Less Liabilities | | | 4.4 | * | |
Total | | | 100.0 | % | |
* Includes the impact of the Fund's open positions in derivatives (other than Options Purchased), if any.
(as a % of Total Notional Value) | |
Commodity Futures: | |
Agriculture | | | 21.2 | % | |
Energy | | | 34.0 | | |
Industrial Metals | | | 15.6 | | |
Livestock | | | 6.4 | | |
Precious Metals | | | 17.7 | | |
Softs | | | 5.1 | | |
Total | | | 100.0 | % | |
PERFORMANCE HIGHLIGHTS3
| | Inception | | Average Annual Total Return
Ended 10/31/2018 | |
| | Date | | 1 Year | | 5 Years | | Life of Fund | |
At NAV | |
Institutional Class | | 08/27/2012 | | | 1.19 | % | | | –6.51 | % | | | –6.88 | % | |
Class A | | 08/27/2012 | | | 0.81 | % | | | –6.85 | % | | | –7.22 | % | |
Class C | | 08/27/2012 | | | 0.15 | % | | | –7.67 | % | | | –8.03 | % | |
With Sales Charge | |
Class A | | | | | –4.98 | % | | | –7.95 | % | | | –8.11 | % | |
Class C | | | | | –0.83 | % | | | –7.67 | % | | | –8.03 | % | |
Index | |
| Bloomberg Commodity Index1,2 | | | | | –1.73 | % | | | –7.31 | % | | | –8.18 | % | |
The performance data quoted represent past performance and do not indicate future results. Current performance may be lower or higher than the performance data quoted. For performance data current to the most recent month-end, please visit www.nb.com/performance.
The results shown in the table reflect the reinvestment of income dividends and other distributions, if any. The results do not reflect the effect of taxes a shareholder would pay on Fund distributions or on the redemption of Fund shares.
The investment return and principal value of an investment will fluctuate and shares, when redeemed, may be worth more or less than their original cost.
Returns would have been lower if Neuberger Berman Investment Advisers LLC ("Management") had not reimbursed certain expenses and/or waived a portion of the investment management fees during certain of the periods shown. Repayment by a class (of expenses previously reimbursed and/or fees previously waived by Management) will decrease the class's returns. Please see Note B in the Notes to Financial Statements for specific information regarding expense reimbursement and/or fee waiver arrangements.
As stated in the Fund's most recent prospectus, the total annual operating expense ratios for fiscal year 2017 were 1.18%,1.56% and 3.20% for Institutional Class, Class A and Class C shares, respectively (before expense reimbursements and/or fee waivers, if any). The total annual operating expense ratios were 0.73%, 1.09% and 1.84% for Institutional Class, Class A and Class C shares, respectively, after expense reimbursements and/or fee waivers. The expense ratios for the annual period ended October 31, 2018 can be found in the Financial Highlights section of this report.
Returns shown with a sales charge reflect the deduction of the current maximum initial sales charge of 5.75% for Class A shares and the contingent deferred sales charge (CDSC) for Class C shares. The CDSC for Class C shares is 1%, which is reduced to 0% after 1 year. The performance of the Fund's share classes will differ primarily due to different sales charge structures and class expenses. Please see the prospectus for more information about sales charge structures, if any, and class expenses for your share class.
3
Commodity Strategy Fund (Unaudited)
COMPARISON OF A $1,000,000 INVESTMENT
(000's omitted)
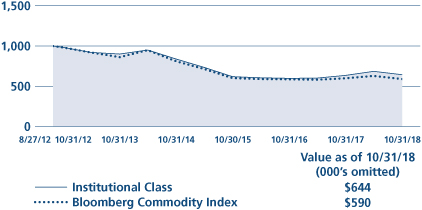
This graph shows the change in value of a hypothetical $1,000,000 investment in the Fund over the past 10 fiscal years, or since the Fund's inception if it has not operated for 10 years. The graph is based on the Institutional Class shares only; the performance of the Fund's share classes will differ primarily due to different sales charge structures and class expenses (see Performance Highlights chart on previous page). The result is compared with benchmarks, which include a broad-based market index and may include a more narrowly based index. Market indices have not been reduced to reflect any of the fees and costs of investing. The results shown in the graph reflect the reinvestment of income dividends and other distributions, if any. The results do not reflect the effect of taxes a shareholder would pay on Fund distributions or on the redemption of Fund shares. Results represent past performance and do not indicate future results.
4
Global Allocation Fund Commentary (Unaudited)
Neuberger Berman Global Allocation Fund Institutional Class generated a –3.14% total return for the 12 month reporting period ended October 31, 2018, underperforming its benchmark, a custom blend consisting of 60% MSCI All Country World Index (Net) and 40% Bloomberg Barclays Global Aggregate Index (together, the Index), which provided a –1.01% return for the same period. (Performance for all share classes is provided in the table immediately following this letter.)
Global equities posted mixed results over the 12 month period. The 2017 calendar year ended with steady gains that continued into the new year. However, despite an improving global macroeconomic backdrop, the threat of rising inflation and the possibility of faster rate hikes by the U.S. Federal Reserve Board spooked global markets, which triggered a sharp sell-off in the first half of February. Although a v-shaped recovery in global markets ensued, rising interest rates and inflation expectations led to higher volatility, and a more challenging environment for markets. The rise of anti-globalization rhetoric by the U.S. presidential administration through proposed tariffs, and the resulting threats of retaliation sparked a wave of uncertainty across global trade relations. During the third quarter of 2018, global equity markets found some steady footing as the U.S. economy continued to demonstrate healthy economic fundamentals combined with strong corporate earnings. However, toward the end of the 12 month period, the U.S. equity market posted steep losses in October as global slowdown fears overshadowed fundamentals, bringing down the global equity markets.
The fixed income markets struggled as Treasury yields moved higher over the year and spread widening negatively impacted credit sector performance. Inflation failed to trend meaningfully higher resulting in Treasury Inflation-Protected Securities (TIPS) lagging. Additionally, emerging market (EM) debt exposure faced headwinds stemming from global trade concerns and country-specific events; namely, in Turkey and Argentina.
Over the period, the Fund struggled across asset classes. Gains from U.S. equity exposure were not enough to offset losses from non-U.S. developed and EM equities. Within fixed income, credit, TIPS and EM debt were detractors. The Fund also posted losses from its opportunistic investments, including its allocation to commodities and a systematic tactical asset allocation strategy.
The Fund's aggregate use of futures, forward foreign currency, swap and option contracts detracted from performance during the reporting period.
Looking back over the 12 month period, markets have experienced unprecedented divergence across regions and styles and within asset class (two examples: the S&P 500® Index has outperformed the MSCI EM Index by almost 20% and the Russell 1000® Growth Index has outperformed the Russell 1000® Value Index by over 7%). Looking forward, we believe it's crucial for investors to consider whether these relationships will continue to diverge, or will re-converge to a historically more "normal" state. The portfolio management team believes that global markets will re-converge, and as such, continues to be positioned with overweights to EM equity and debt, which we think stand to be notable beneficiaries if markets do indeed re-converge. The Fund's exposure to non-U.S. developed equity has also increased based on the reconvergence theme. We have increased exposure to interest rate duration given the recent rise in yields, but remain shorter than benchmark in anticipation of higher risk premiums given central bank plans toward policy normalization. Also, corporate spreads have recently widened, which we think presents an opportunity if, as we anticipate, fundamentals remain healthy and the economic business cycle extends.
We continue to believe that a flexible, multi-dimensional approach to a diversified portfolio is prudent. Our multi-asset class solution offers a "global go-anywhere" strategy, complemented with historically uncorrelated sources of return and a risk framework at both the security and portfolio level, in addition to independent firm oversight.
Sincerely,
ERIK KNUTZEN, BRADLEY TANK AND AJAY JAIN
PORTFOLIO MANAGERS
Information about principal risks of investing in the Fund is set forth in the prospectus and statement of additional information.
The portfolio composition, industries and holdings of the Fund are subject to change without notice.
The opinions expressed are those of the Fund's portfolio managers. The opinions are as of the date of this report and are subject to change without notice.
5
Global Allocation Fund (Unaudited)
TICKER SYMBOLS
Institutional Class | | NGLIX | |
Class A | | NGLAX | |
Class C | | NGLCX | |
PERFORMANCE HIGHLIGHTS3
| | Inception | | Average Annual Total Return
Ended 10/31/2018 | |
| | Date | | 1 Year | | 5 Year | | Life of Fund | |
At NAV | |
Institutional Class | | 12/29/2010 | | | –3.14 | % | | | 2.63 | % | | | 5.05 | % | |
Class A | | 12/29/2010 | | | –3.49 | % | | | 2.26 | % | | | 4.68 | % | |
Class C | | 12/29/2010 | | | –4.25 | % | | | 1.50 | % | | | 3.90 | % | |
With Sales Charge | |
Class A | | | | | –9.00 | % | | | 1.05 | % | | | 3.89 | % | |
Class C | | | | | –5.16 | % | | | 1.50 | % | | | 3.90 | % | |
Index | |
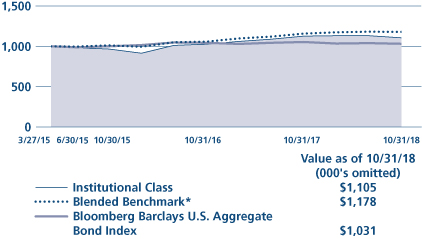
| Blended Benchmark*1,2 | | | | | –1.01 | % | | | 3.91 | % | | | 5.09 | % | |
| MSCI All Country World Index (Net)1,2 | | | | | –0.52 | % | | | 6.15 | % | | | 7.29 | % | |
* Blended Benchmark is composed of 60% MSCI All Country World Index (Net) and 40% Bloomberg Barclays Global Aggregate Index.
The performance data quoted represent past performance and do not indicate future results. Current performance may be lower or higher than the performance data quoted. For performance data current to the most recent month-end, please visit www.nb.com/performance.
The results shown in the table reflect the reinvestment of income dividends and other distributions, if any. The results do not reflect the effect of taxes a shareholder would pay on Fund distributions or on the redemption of Fund shares.
The investment return and principal value of an investment will fluctuate and shares, when redeemed, may be worth more or less than their original cost.
Returns would have been lower if Neuberger Berman Investment Advisers LLC ("Management") had not reimbursed certain expenses and/or waived a portion of the investment management fees during certain of the periods shown. Repayment by a class (of expenses previously reimbursed and/or fees previously waived by Management) will decrease the class's returns. Please see Note B in the Notes to Financial Statements for specific information regarding expense reimbursement and/or fee waiver arrangements.
As stated in the Fund's most recent prospectus, the total annual operating expense ratios for fiscal year 2017 were 4.03%, 4.53% and 5.27% for Institutional Class, Class A and Class C shares, respectively (before expense reimbursements and/or fee waivers, if any). The total annual operating expense ratios were 0.93%, 1.32% and 2.06% for Institutional Class, Class A and Class C shares, respectively, after expense reimbursements and/or fee waivers. The expense ratios for the annual period ended October 31, 2018 can be found in the Financial Highlights section of this report.
Returns shown with a sales charge reflect the deduction of the current maximum initial sales charge of 5.75% for Class A shares and the contingent deferred sales charge (CDSC) for Class C shares. The CDSC for Class C shares is 1%, which is reduced to 0% after 1 year. The performance of the Fund's share classes will differ primarily due to different sales charge structures and class expenses. Please see the prospectus for more information about sales charge structures, if any, and class expenses for your share class.
6
Global Allocation Fund (Unaudited)
COMPARISON OF A $1,000,000 INVESTMENT
(000's omitted)
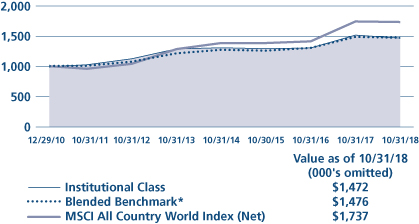
This graph shows the change in value of a hypothetical $1,000,000 investment in the Fund over the past 10 fiscal years, or since the Fund's inception if it has not operated for 10 years. The graph is based on the Institutional Class shares only; the performance of the Fund's share classes will differ primarily due to different sales charge structures and class expenses (see Performance Highlights chart on previous page). The result is compared with benchmarks, which include a broad-based market index and may include a more narrowly based index. Market indices have not been reduced to reflect any of the fees and costs of investing. The results shown in the graph reflect the reinvestment of income dividends and other distributions, if any. The results do not reflect the effect of taxes a shareholder would pay on Fund distributions or on the redemption of Fund shares. Results represent past performance and do not indicate future results.
* Blended Benchmark is composed of 60% MSCI All Country World Index (Net) and 40% Bloomberg Barclays Global Aggregate Index.
7
Hedged Option Premium Strategy Fund Commentary (Unaudited)
Neuberger Berman Hedged Option Premium Strategy Fund Institutional Class generated a total return of –4.74% for the 12 month reporting period ending October 31, 2018, underperforming its primary benchmark, the CBOE S&P 500® Iron Condor Index (the Index), which generated a total return of –3.66% for the same period. (Performance for all share classes is provided in the table immediately following this letter.)
The Fund pursues an absolute return objective and is intended to experience limited correlation to broader equity markets. The Fund seeks to achieve its goal primarily through a strategy of selling (writing) put and call option spreads on U.S. indices, including the S&P 500® Index and the Russell 2000® Index, on exchange traded funds (ETFs) or on equity securities, and through investments in fixed income instruments. The Fund attempts to generate returns through the receipt of premiums from selling put and call option spreads, as well as through investments in fixed income instruments. Collectively, these strategies are intended to reduce volatility relative to what it would be if the Fund held the underlying reference asset (e.g., the underlying index, ETF or security) on which the options are written. In an effort to diversify exposures and limit volatility, the Fund sells put and call option spreads at varying strike prices and with varying expiration dates on various reference assets.
The significant price reversals in the S&P 500 and Russell 2000 Indices in the first and third quarters of 2018 resulted in losses for the Fund. In particular, the rapid increase in the S&P 500 in the first four weeks of the calendar year (+7.6%) resulted in losses from the Fund's short call spread strategy. Subsequently, the Fund suffered additional losses from its put spread strategy during the –10% drawdown in the S&P 500 from January 26 to February 8. Option exposures to the S&P 500 Index outperformed comparable exposures to the Russell 2000 Index for the period despite higher levels of implied volatility for the Russell 2000 as the S&P 500 remained within narrower limits for the year.
The Fund's fixed income collateral holdings of short-term U.S. Treasuries contributed marginally to returns as short-term U.S. Treasury bond yields increased over the period with the 2-Year U.S. Treasury yield increasing by roughly 130 basis points to 2.87%. We continue to roll maturing bond collateral into new two to three year U.S. Treasury notes at yield levels that are markedly higher than a year ago. Despite the significant rise in short term rates, our fixed income collateral holdings have avoided any meaningful losses. Over time we anticipate the strategy to benefit from higher levels of short-term interest rates as the shorter duration exposures of the Fund's fixed income portfolio allow the Fund to capture what we anticipate will be higher yields without experiencing significant duration risk.
As we reflect on our strategy results in 2018, we feel compelled to drop 'cautious' from the 'cautious optimism' we had coming into the year. We are pleased to have avoided a significant erosion of capital suffered by many volatility and risk-premia strategies in 2018, and believe that if we have increased market uncertainty without a full recessionary economic environment, it bodes well for our ability to earn equity index option premiums and short-term bond income relative to a continued dependence on capital appreciation.
Further, we anticipate equity market return dispersion to continue to increase across various regions, sectors and industries—due to a combination of diverse interest rate politics, increased global competition and geopolitics (e.g., U.S. tax reform and Brexit). As a result, we think equity index returns are likely to be at or below longer-term averages which has the potential to lead to higher relative returns for the Fund versus the Fund's benchmark and related U.S. equity market indexes such as the S&P 500 and Russell 2000 Indices.
Sincerely,
DEREK DEVENS
PORTFOLIO MANAGER
Information about principal risks of investing in the Fund is set forth in the prospectus and statement of additional information.
The portfolio composition, industries and holdings of the Fund are subject to change without notice.
The opinions expressed are those of the Fund's portfolio manager. The opinions are as of the date of this report and are subject to change without notice.
8
Hedged Option Premium Strategy Fund (Unaudited)
TICKER SYMBOLS
Institutional Class | | NHOIX | |
Class A | | NHOAX | |
Class C | | NHOCX | |
Class R6 | | NHORX | |
PORTFOLIO BY TYPE OF SECURITY
(as a % of Total Net Assets) | |
U.S. Treasury Obligations | | | 101.6 | % | |
Options Purchased | | | 0.2 | | |
Options Written | | | (2.3 | ) | |
Short-Term Investments | | | 0.7 | | |
Liabilities Less Other Assets | | | (0.2 | ) | |
Total | | | 100.0 | % | |
PERFORMANCE HIGHLIGHTS
| | | | Average Annual Total Return
Ended 10/31/2018 | |
| | Inception
Date | | 1 Year | | Life of
Fund | |
At NAV | |
Institutional Class | | 04/12/2017 | | | –4.74 | % | | | –1.88 | % | |
Class A | | 04/12/2017 | | | –5.12 | % | | | –2.24 | % | |
Class C | | 04/12/2017 | | | –5.84 | % | | | –2.98 | % | |
Class R6 | | 04/12/2017 | | | –4.71 | % | | | –1.84 | % | |
With Sales Charge | |
Class A | | | | | –10.57 | % | | | –5.90 | % | |
Class C | | | | | –6.77 | % | | | –2.98 | % | |
Index | |
| CBOE S&P 500 Iron Condor Index1,2 | | | | | –3.66 | % | | | –1.94 | % | |
| S&P 500® Index1,2 | | | | | 7.35 | % | | | 11.63 | % | |
The performance data quoted represent past performance and do not indicate future results. Current performance may be lower or higher than the performance data quoted. For performance data current to the most recent month-end, please visit www.nb.com/performance.
The results shown in the table reflect the reinvestment of income dividends and other distributions, if any. The results do not reflect the effect of taxes a shareholder would pay on Fund distributions or on the redemption of Fund shares.
The investment return and principal value of an investment will fluctuate and shares, when redeemed, may be worth more or less than their original cost.
Returns would have been lower if Neuberger Berman Investment Advisers LLC ("Management") had not reimbursed certain expenses and/or waived a portion of the investment management fees during certain of the periods shown. Repayment by a class (of expenses previously reimbursed and/or fees previously waived by Management) will decrease the class's returns. Please see Note B in the Notes to Financial Statements for specific information regarding expense reimbursement and/or fee waiver arrangements.
As stated in the Fund's most recent prospectus, the total annual operating expense ratios for the fiscal period ended 2017 are 5.26%, 5.89%, 6.60% and 5.19% for Institutional Class, Class A, Class C and Class R6 shares, respectively (before expense reimbursements and/or fee waivers, if any). The expense ratios for the fiscal period ended 2017 are 0.68%, 1.04%, 1.79% and 0.61% for Institutional Class, Class A, Class C and Class R6 shares, respectively, after expense reimbursements and/or fee waivers. The expense ratios for the fiscal period ended 2017 have been restated to reflect actual expenses excluding organization expenses incurred during that period. The expense ratios for the annual period ended October 31, 2018 can be found in the Financial Highlights section of this report.
Returns shown with a sales charge reflect the deduction of the current maximum initial sales charge of 5.75% for Class A shares and the contingent deferred sales charge (CDSC) for Class C shares. The CDSC for Class C shares is 1%, which is reduced to 0% after 1 year. The performance of the Fund's share classes will differ primarily due to different sales charge structures and class expenses. Please see the prospectus for more information about sales charge structures, if any, and class expenses for your share class.
9
Hedged Option Premium Strategy Fund (Unaudited)
COMPARISON OF A $1,000,000 INVESTMENT
(000's omitted)
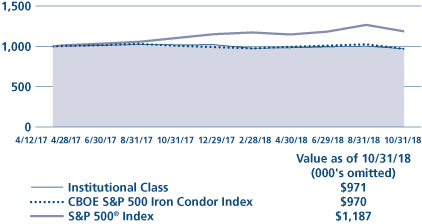
This graph shows the change in value of a hypothetical $1,000,000 investment in the Fund over the past 10 fiscal years, or since the Fund's inception if it has not operated for 10 years. The graph is based on the Institutional Class shares only; the performance of the Fund's share classes will differ primarily due to different sales charge structures and class expenses (see Performance Highlights chart on previous page). The result is compared with benchmarks, which include a broad-based market index and may include a more narrowly based index. Market indices have not been reduced to reflect any of the fees and costs of investing. The results shown in the graph reflect the reinvestment of income dividends and other distributions, if any. The results do not reflect the effect of taxes a shareholder would pay on Fund distributions or on the redemption of Fund shares. Results represent past performance and do not indicate future results.
10
Long Short Fund Commentary (Unaudited)
Neuberger Berman Long Short Fund Institutional Class generated a 2.32% total return for the 12-month reporting period ended October 31, 2018, outperforming its primary benchmark, the HFRX Equity Hedge Index (the Index), which returned –2.99% for the same period. (Performance for all share classes is provided in the table immediately following this letter.)
Despite several setbacks, the U.S. stock market generated a positive return during the reporting period. The market was initially supported by generally solid corporate profits. However, the market fell sharply in February and March 2018, partially due to fears that the U.S. Federal Reserve Board (Fed) would take a more aggressive approach in terms of future interest rate hikes. The market then rallied over the next six months as generally positive economic data and robust corporate profits overshadowed concerns over a global trade war. The market ended the reporting period on a weak note amid renewed worries over Fed monetary policy tightening, fears of moderating economic growth and ongoing trade war rhetoric. All told, the S&P 500® Index gained 7.35% over the 12 months ended October 31, 2018.
The Fund remained constructively positioned, albeit increasingly selective, during the period for an ongoing economic recovery in the U.S. Against this backdrop, the Fund's largest sector weights were in Industrials and Consumer Discretionary.
We categorize our long investment exposure into three groups: Capital Growth, Total Return and Opportunistic. Capital Growth continues to represent our largest allocation followed by Total Return and Opportunistic. We continued to identify compelling opportunities in Capital Growth relative to Total Return, as higher interest rates could negatively impact longer duration assets and cash flows. The portfolio's short exposure includes both single name "Fundamental" shorts and "Market" shorts. During the period, equity long exposure increased against the backdrop of heightened market volatility and greater sector dispersion as fundamentals came back into focus while overall total shorts decreased. Market shorts that consist primarily of sector and market cap-specific indices to help manage broader portfolio exposures decreased slightly during the period.
Equity long exposure added to Fund performance, while Fundamental shorts and the Fund's aggregate use of index futures, options and swaps related to hedging activity detracted from performance during the period given the overall positive move in markets.
Despite recent market gyrations, we believe the economic backdrop in the U.S. remains strong and continues to look positive. Looking ahead, the state of U.S. and global growth will likely be the determining factor of how equities perform. Close attention will be paid on whether rising interest rates and recently enacted tariffs will choke off economic activity. However, we anticipate that the path and timing of these policies will continue to be announced in an erratic manner and, therefore, drive near-term market volatility. Against this backdrop, we believe this will create more dispersion and potential opportunities both long and short. Nevertheless, we are very mindful of the complex world in which we live and invest. The risks of the long-term inflationary effects of continued government intervention, coupled with a myriad of ongoing geopolitical issues around the world, remain top of mind.
Sincerely,
CHARLES KANTOR AND MARC REGENBAUM
PORTFOLIO MANAGERS
Information about principal risks of investing in the Fund is set forth in the prospectus and statement of additional information.
The portfolio composition, industries and holdings of the Fund are subject to change without notice.
The opinions expressed are those of the Fund's portfolio managers. The opinions are as of the date of this report and are subject to change without notice.
11
Long Short Fund (Unaudited)
TICKER SYMBOLS
Institutional Class | | NLSIX | |
Class A | | NLSAX | |
Class C | | NLSCX | |
PORTFOLIO BY TYPE OF SECURITY
(as a % of Total Net Assets)
| | Long | | Short | |
Common Stocks | | | 79.4 | % | | | (12.4 | )% | |
Convertible Bonds | | | 0.2 | | | | — | | |
Corporate Bonds | | | 5.3 | | | | (1.1 | ) | |
Exchange Traded Funds | | | — | | | | (0.6 | ) | |
Master Limited Partnerships | | | 1.4 | | | | (0.3 | ) | |
Options Purchased | | | 0.2 | | | | — | | |
Preferred Stocks | | | 0.9 | | | | — | | |
Short-Term Investments | | | 10.5 | | | | — | | |
Other Assets Less Liabilities | | | 16.5 | * | | | — | | |
Total | | | 114.4 | % | | | (14.4 | )% | |
* Includes the impact of the Fund's open positions in derivatives (other than Options Purchased), if any.
PERFORMANCE HIGHLIGHTS
| | Inception | | Average Annual Total Return
Ended 10/31/2018 | |
| | Date | | 1 Year | | 5 Year | | Life of Fund | |
At NAV | |
Institutional Class | | 12/29/2011 | | | 2.32 | % | | | 3.32 | % | | | 5.91 | % | |
Class A | | 12/29/2011 | | | 2.01 | % | | | 2.95 | % | | | 5.54 | % | |
Class C | | 12/29/2011 | | | 1.27 | % | | | 2.18 | % | | | 4.75 | % | |
With Sales Charge | |
Class A | | | | | –3.85 | % | | | 1.73 | % | | | 4.63 | % | |
Class C | | | | | 0.27 | % | | | 2.18 | % | | | 4.75 | % | |
Index | |
| HFRX Equity Hedge Index1,2 | | | | | –2.99 | % | | | 1.19 | % | | | 2.85 | % | |
| S&P 500® Index1,2 | | | | | 7.35 | % | | | 11.34 | % | | | 14.34 | % | |
The performance data quoted represent past performance and do not indicate future results. Current performance may be lower or higher than the performance data quoted. For performance data current to the most recent month-end, please visit www.nb.com/performance.
The results shown in the table reflect the reinvestment of income dividends and other distributions, if any. The results do not reflect the effect of taxes a shareholder would pay on Fund distributions or on the redemption of Fund shares.
The investment return and principal value of an investment will fluctuate and shares, when redeemed, may be worth more or less than their original cost.
Returns would have been lower if Neuberger Berman Investment Advisers LLC ("Management") had not reimbursed certain expenses and/or waived a portion of the investment management fees during certain of the periods shown. Repayment by a class (of expenses previously reimbursed and/or fees previously waived by Management) will decrease the class's returns. Please see Note B in the Notes to Financial Statements for specific information regarding expense reimbursement and/or fee waiver arrangements.
As stated in the Fund's most recent prospectus, the total annual operating expense ratios for fiscal year 2017 were 1.81%, 2.17% and 2.92% for Institutional Class, Class A and Class C shares, respectively (before expense reimbursements and/or fee waivers, if any). The expense ratios for the annual period ended October 31, 2018 can be found in the Financial Highlights section of this report.
Returns shown with a sales charge reflect the deduction of the current maximum initial sales charge of 5.75% for Class A shares and the contingent deferred sales charge (CDSC) for Class C shares. The CDSC for Class C shares is 1%, which is reduced to 0% after 1 year. The performance of the Fund's share classes will differ primarily due to different sales charge structures and class expenses. Please see the prospectus for more information about sales charge structures, if any, and class expenses for your share class.
12
Long Short Fund (Unaudited)
COMPARISON OF A $1,000,000 INVESTMENT
(000's omitted)
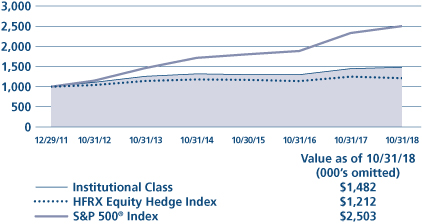
This graph shows the change in value of a hypothetical $1,000,000 investment in the Fund over the past 10 fiscal years, or since the Fund's inception if it has not operated for 10 years. The graph is based on the Institutional Class shares only; the performance of the Fund's share classes will differ primarily due to different sales charge structures and class expenses (see Performance Highlights chart on previous page). The result is compared with benchmarks, which include a broad-based market index and may include a more narrowly based index. Market indices have not been reduced to reflect any of the fees and costs of investing. The results shown in the graph reflect the reinvestment of income dividends and other distributions, if any. The results do not reflect the effect of taxes a shareholder would pay on Fund distributions or on the redemption of Fund shares. Results represent past performance and do not indicate future results.
13
Long Short Credit Fund Commentary (Unaudited)
Neuberger Berman Long Short Credit Fund Institutional Class returned –1.00% for the 12-month reporting period ended October 31 2018, underperforming its primary benchmark, the HRFX Fixed Income-Credit Index (the Index), which returned –0.19%% for the same period. The Fund outperformed the Bloomberg Barclays U.S. Aggregate Bond Index, which returned –2.05% for the period. (Performance for all share classes is provided in the table immediately following this letter.)
Credit markets had a difficult time over the reporting period. Concerns over rising rates, the continuation of tightening monetary policy by the U.S. Federal Reserve Board (Fed), uncertainty on global growth, trade tensions between the U.S. and China and a volatile equity backdrop all contributed to investor nervousness and poor performance. Investors appeared to be concerned about the onset of a global slowdown. In addition, continued concerns about the length of the cycle for both credit markets and the overall U.S. business expansion also had investors concerned. Another influencing factor was the pickup in overall market volatility, both in equity and fixed income markets. We believe investors have become accustomed to low volatility trending markets in both credit and equity. For now it appears as if the concerns highlighted above as well as the increase in U.S. interest rates may be breaking that calming influence on investors' risk appetites.
The increase in U.S. Treasuries during the period has, in our view, played a significant role in credit returns. The 10-year U.S. Treasury yield started the period at 2.38% and ended at 3.15%. This move was driven by a number of factors, primarily strong U.S. GDP growth as well as the communication by the Fed of continued interest rate hikes. The total number of interest rate hikes in the reporting period was four and the market has been pricing in approximately a 90% probability of a further hike in December 2018. The upward move in interest rates does not appear to have been absorbed as well as the interest rate hikes of 2017. There appears to be a concern that the number of hikes may begin to choke off the business cycle and that the tightening of financial conditions may accelerate the onset of a recession.
We believe the Fed policy and the move in interest rates will be a dominant feature in driving credit returns over the next 12 months. In addition, the European Central Bank has signaled that they may begin removing some of their extraordinary monetary accommodation. We are somewhat skeptical that the Fed will raise rates at the same pace over the next 12 months as over the past 12 months. When we look at the U.S. economy, we still believe that the economy is healthy and that while we anticipate growth may slow, it should still be robust, albeit not at the same level as the economy is currently operating at. In addition, from a fundamental perspective, credit appears to us to be fairly priced for the default environment. The issue in our minds is the degree to which one is being paid to take both interest rate and credit risk. We continue to believe in the attractiveness of credit, from the standpoint of fundamentals. We do however worry about the valuation levels and question whether investors are being paid appropriately for the interest rate risks.
Over the period, our gains mainly came from our positioning in the communications, financial and basic materials sectors, while our losses stemmed principally from our short positioning in the consumer non-cyclical and healthcare spaces.
The Fund's aggregate use of futures, forward foreign currency, swap, swaption and option contracts detracted from performance during the reporting period.
We intend to remain invested in credit, without taking too much interest rate risk. We believe the market does offer pockets of value, but we intend to remain invested conservatively. We believe that we are entering an interesting time in credit. Much of the adrenalin from central banks, delivered over the last nine years, may be coming to an end. If global growth resurfaces and inflation measures pick up, we expect that the markets will adjust. We do not believe that the transition will be as smooth as is currently predicted. It is our expectation that volatility in credit will increase and we are hoping to benefit from that. We have constructed a portfolio of single name long and short positions based on fundamental analysis. We hope to be able to capture the idiosyncratic opportunities that we believe are mispriced. This continues to be expressed through relative value trades, capital structure arbitrage trades and directional long and short positions.
14
We do not believe that investors need to be exposed to the full credit market; rather, we think that a balanced book of longs and shorts may perhaps be a better solution for the upcoming changes we are anticipating. The Fund seeks to deliver a stable series of returns that are not correlated to either the volatility or general return of the broad credit markets. We believe that a portfolio of fundamental long and short positions in credit, with little interest rate risk, should be able to help accomplish this in the upcoming year.
Sincerely,
RICK DOWDLE* AND NORMAN MILNER
PORTFOLIO MANAGERS
* As previously disclosed in a supplement to the Fund's prospectus, Rick Dowdle will cease his portfolio management responsibilities on or about December 31, 2018. Norman Milner will continue to manage the Fund.
Information about principal risks of investing in the Fund is set forth in the prospectus and statement of additional information.
The portfolio composition, industries and holdings of the Fund are subject to change without notice.
The opinions expressed are those of the Fund's portfolio managers. The opinions are as of the date of this report and are subject to change without notice.
15
Long Short Credit Fund (Unaudited)
TICKER SYMBOLS
Institutional Class | | NLNIX | |
Class A | | NLNAX | |
Class C | | NLNCX | |
Class R6 | | NRLNX | |
PORTFOLIO BY TYPE OF SECURITY
(as a % of Total Net Assets) | |
Common Stocks | | | 0.1 | % | |
Corporate Bonds | | | 45.9 | | |
Foreign Government Securities | | | 0.3 | | |
Short Term Investments | | | 27.3 | | |
Other Assets Less Liabilities | | | 26.4 | * | |
Total | | | 100.0 | % | |
* Includes the impact of the Fund's open positions in derivatives (other than Options Purchased), if any.
PERFORMANCE HIGHLIGHTS
| | | | Average Annual Total Return
Ended 10/31/2018 | |
| | Inception
Date | | 1 Year | | Life of
Fund | |
At NAV | |
Institutional Class | | 06/29/2015 | | | –1.00 | % | | | 0.56 | % | |
Class A | | 06/29/2015 | | | –1.43 | % | | | 0.20 | % | |
Class C | | 06/29/2015 | | | –2.14 | % | | | –0.50 | % | |
Class R6 | | 06/29/2015 | | | –0.93 | % | | | 0.63 | % | |
With Sales Charge | |
Class A | | | | | –5.64 | % | | | –1.08 | % | |
Class C | | | | | –3.09 | % | | | –0.50 | % | |
Index | |
| HFRX Fixed Income - Credit Index1,2 | | | | | –0.19 | % | | | 0.55 | % | |
Bloomberg Barclays U.S.
Aggregate Bond Index1,2 | | | | | –2.05% | | | | 1.50% | | |
The performance data quoted represent past performance and do not indicate future results. Current performance may be lower or higher than the performance data quoted. For performance data current to the most recent month-end, please visit www.nb.com/performance.
The results shown in the table reflect the reinvestment of income dividends and other distributions, if any. The results do not reflect the effect of taxes a shareholder would pay on Fund distributions or on the redemption of Fund shares.
The investment return and principal value of an investment will fluctuate and shares, when redeemed, may be worth more or less than their original cost.
Returns would have been lower if Neuberger Berman Investment Advisers LLC ("Management") had not reimbursed certain expenses and/or waived a portion of the investment management fees during certain of the periods shown. Repayment by a class (of expenses previously reimbursed and/or fees previously waived by Management) will decrease the class's returns. Please see Note B in the Notes to Financial Statements for specific information regarding expense reimbursement and/or fee waiver arrangements.
As stated in the Fund's most recent prospectus, the total annual operating expense ratios for fiscal year 2017 were 1.99%, 2.43%, 3.15% and 1.96% for Institutional Class, Class A, Class C and Class R6 shares, respectively (before expense reimbursements and/or fee waivers, if any). The total annual operating expense ratios were 0.80%, 1.18%, 1.93% and 0.74% for Institutional Class, Class A, Class C and Class R6 shares, respectively, after expense reimbursements and/or fee waivers. The expense ratios for the annual period ended October 31, 2018 can be found in the Financial Highlights section of this report.
Returns shown with a sales charge reflect the deduction of the current maximum initial sales charge of 4.25% for Class A shares and the contingent deferred sales charge (CDSC) for Class C shares. The CDSC for Class C shares is 1%, which is reduced to 0% after 1 year. The performance of the Fund's share classes will differ primarily due to different sales charge structures and class expenses. Please see the prospectus for more information about sales charge structures, if any, and class expenses for your share class.
16
Long Short Credit Fund (Unaudited)
COMPARISON OF A $1,000,000 INVESTMENT
(000's omitted)

This graph shows the change in value of a hypothetical $1,000,000 investment in the Fund over the past 10 fiscal years, or since the Fund's inception if it has not operated for 10 years. The graph is based on the Institutional Class shares only; the performance of the Fund's share classes will differ primarily due to different sales charge structures and class expenses (see Performance Highlights chart on previous page). The result is compared with benchmarks, which include a broad-based market index and may include a more narrowly based index. Market indices have not been reduced to reflect any of the fees and costs of investing. The results shown in the graph reflect the reinvestment of income dividends and other distributions, if any. The results do not reflect the effect of taxes a shareholder would pay on Fund distributions or on the redemption of Fund shares. Results represent past performance and do not indicate future results.
17
Multi-Asset Income Fund Commentary (Unaudited)
Neuberger Berman Multi-Asset Income Fund Institutional Class generated a –1.92% total return for the 12-month reporting period ended October 31, 2018, underperforming its benchmark, a custom blend consisting of 60% Bloomberg Barclays U.S. Aggregate Bond Index and 40% S&P 500® Index (together, the Index), which provided a 1.77% return for the same period. (Performance for all share classes is provided in the table immediately following this letter.)
Global equities posted mixed results over the 12-month period. The 2017 calendar year ended with steady gains that continued into the new year. However, despite an improving global macroeconomic backdrop, the threat of rising inflation and the possibility of faster rate hikes by the U.S. Federal Reserve Board spooked global markets, which triggered a sharp sell-off in the first half of February. Although a v-shaped recovery in global markets ensued, rising interest rates and inflation expectations led to higher volatility, and a more challenging environment for markets. The rise of anti-globalization rhetoric by the U.S. presidential administration through proposed tariffs, and the resulting threats of retaliation sparked a wave of uncertainty across global trade relations. During the third quarter of 2018, global equity markets found some steady footing as the U.S. economy continued to demonstrate healthy economic fundamentals combined with strong corporate earnings. However, toward the end of the 12-month period, the U.S. equity market posted steep losses in October as global slowdown fears overshadowed fundamentals, bringing down the global equity markets.
The fixed income markets struggled as Treasury yields moved higher over the year and spread widening negatively impacted credit sector performance. Inflation failed to trend meaningfully higher resulting in Treasury Inflation-Protected Securities (TIPS) lagging. Additionally, emerging market (EM) debt exposure faced headwinds stemming from global trade concerns and country-specific events, namely in Turkey and Argentina.
Over the 12-month period ending October 31, 2018 the Fund posted positive contributions to total returns from U.S. equities and real estate investment trusts (REITs) but losses in non-U.S. equities and master limited partnerships (MLPs). Furthermore, our tactical decision to be overweight EM equities weighed on performance. Within fixed income, gains from high yield and bank loans were additive, but unable to stem losses from other asset classes, particularly EM debt and TIPS. In general, our fixed income positioning added value relative to the Barclays U.S. Aggregate Bond Index. With regard to the Fund's opportunistic strategies, the Diversified Currency strategy contributed positively, but allocations to systematic Global Tactical Asset Allocation (GTAA) and the Iron Condor options strategy detracted from performance.
The Fund's aggregate use of futures, forward foreign currency, swap and option contracts detracted from performance during the reporting period.
Looking back over the 12-month period, markets have experienced unprecedented divergence across regions and styles and within asset class (for example: the S&P 500® Index has outperformed the MSCI EM Index by almost 20% and the Russell 1000® Growth Index has outperformed the Russell 1000® Value Index by over 7%). Looking forward, we believe it's crucial for investors to consider whether these relationships will continue to diverge, or will re-converge to a historically more "normal" state. The portfolio management team believes that global markets will re-converge, and as such continues to be positioned with overweights to EM equity and debt, which we think stand to be notable beneficiaries if markets do indeed re-converge. The Fund's exposure to non-U.S. developed equity has also increased based on the reconvergence theme. We have increased exposure to interest rate duration given the recent rise in yields, but remain shorter than benchmark in anticipation of higher risk premiums given central bank plans toward policy normalization. Also, corporate spreads have recently widened, which we think presents an opportunity if, as we expect, fundamentals remain healthy and the economic business cycle extends.
18
We continue to believe that a multi-dimensional approach to yield is prudent. Our multi-asset class approach offers diversified income sources, complemented with historically uncorrelated sources of return and a risk framework that seeks to mitigate volatility and deliver an attractive return and income profile.
Sincerely,
ERIK KNUTZEN, BRADLEY TANK AND AJAY JAIN
PORTFOLIO MANAGERS
Information about principal risks of investing in the Fund is set forth in the prospectus and statement of additional information.
The portfolio composition, industries and holdings of the Fund are subject to change without notice.
The opinions expressed are those of the Fund's portfolio managers. The opinions are as of the date of this report and are subject to change without notice.
19
Multi-Asset Income Fund (Unaudited)
TICKER SYMBOLS
Institutional Class | | NANIX | |
Class A | | NANAX | |
Class C | | NANCX | |
Class R6 | | NRANX | |
PORTFOLIO BY TYPE OF SECURITY
(as a % of Total Net Assets) | |
Asset-Backed Securities | | | 1.8 | % | |
Common Stocks | | | 35.6 | | |
Convertible Bonds | | | 1.2 | | |
Corporate Bonds | | | 9.9 | | |
Exchange Traded Funds | | | 3.0 | | |
Investment Companies | | | 20.8 | | |
Mortgage-Backed Securities | | | 15.5 | | |
Master Limited Partnerships | | | 3.4 | | |
Options Purchased | | | 0.0 | | |
Preferred Stocks | | | 2.1 | | |
U.S. Government Agency Securities | | | 0.5 | | |
U.S. Treasury Obligations | | | 13.2 | | |
Short-Term Investments | | | 4.5 | | |
Liabilities Less Other Assets | | | (11.5 | )* | |
Total | | | 100.0 | % | |
* Includes the impact of the Fund's open positions in derivatives (other than Options Purchased), if any.
PERFORMANCE HIGHLIGHTS
| | | | Average Annual Total Return
Ended 10/31/2018 | |
| | Inception
Date | | 1 Year | | Life of
Fund | |
At NAV | |
Institutional Class | | 03/27/2015 | | | –1.92 | % | | | 2.80 | % | |
Class A | | 03/27/2015 | | | –2.28 | % | | | 2.42 | % | |
Class C | | 03/27/2015 | | | –3.02 | % | | | 1.66 | % | |
Class R6 | | 03/27/2015 | | | –1.86 | % | | | 2.87 | % | |
With Sales Charge | |
Class A | | | | | –6.42 | % | | | 1.21 | % | |
Class C | | | | | –3.96 | % | | | 1.66 | % | |
Index | |
| Blended Benchmark*1,2 | | | | | 1.77 | % | | | 4.65 | % | |
Bloomberg Barclays U.S.
Aggregate Bond Index1,2 | | | | | –2.05% | | | | 0.86% | | |
* Blended Benchmark is composed of 60% Bloomberg Barclays U.S. Aggregate Bond Index and 40% S&P 500® Index.
The performance data quoted represent past performance and do not indicate future results. Current performance may be lower or higher than the performance data quoted. For performance data current to the most recent month-end, please visit www.nb.com/performance.
The results shown in the table reflect the reinvestment of income dividends and other distributions, if any. The results do not reflect the effect of taxes a shareholder would pay on Fund distributions or on the redemption of Fund shares.
The investment return and principal value of an investment will fluctuate and shares, when redeemed, may be worth more or less than their original cost.
Returns would have been lower if Neuberger Berman Investment Advisers LLC ("Management") had not reimbursed certain expenses and/or waived a portion of the investment management fees during certain of the periods shown. Repayment by a class (of expenses previously reimbursed and/or fees previously waived by Management) will decrease the class's returns. Please see Note B in the Notes to Financial Statements for specific information regarding expense reimbursement and/or fee waiver arrangements.
For the period ended October 31, 2018, the 30-day SEC yields were 3.75%, 3.37%, 2.61% and 3.82% for Institutional Class, Class A, Class C and Class R6 shares, respectively. Absent expense reimbursements and/or fee waivers, the 30-day SEC yields would have been 1.96%, 1.52%, 0.82% and 2.03% for Institutional Class, Class A, Class C and Class R6 shares, respectively.
As stated in the Fund's most recent prospectus, the total annual operating expense ratios for fiscal year 2017 were 3.28%, 3.72%, 4.42% and 3.23% for Institutional Class, Class A, Class C and Class R6 shares, respectively (before expense reimbursements and/or fee waivers, if any). The total annual operating expense ratios were 0.75%, 1.12%, 1.87% and 0.68% for Institutional Class, Class A, Class C and Class R6 shares, respectively, after expense reimbursements and/or fee waivers. The expense ratios for the annual period ended October 31, 2018 can be found in the Financial Highlights section of this report.
Returns shown with a sales charge reflect the deduction of the current maximum initial sales charge of 4.25% for Class A shares and the contingent deferred sales charge (CDSC) for Class C shares. The CDSC for Class C shares is 1%, which is reduced to 0% after 1 year. The performance of the Fund's share classes will differ primarily due to different sales charge structures and class expenses. Please see the prospectus for more information about sales charge structures, if any, and class expenses for your share class.
20
Multi-Asset Income Fund (Unaudited)
COMPARISON OF A $1,000,000 INVESTMENT
(000's omitted)
This graph shows the change in value of a hypothetical $1,000,000 investment in the Fund over the past 10 fiscal years, or since the Fund's inception if it has not operated for 10 years. The graph is based on the Institutional Class shares only; the performance of the Fund's share classes will differ primarily due to different sales charge structures and class expenses (see Performance Highlights chart on previous page). The result is compared with benchmarks, which include a broad-based market index and may include a more narrowly based index. Market indices have not been reduced to reflect any of the fees and costs of investing. The results shown in the graph reflect the reinvestment of income dividends and other distributions, if any. The results do not reflect the effect of taxes a shareholder would pay on Fund distributions or on the redemption of Fund shares. Results represent past performance and do not indicate future results.
* Blended Benchmark is composed of 60% Bloomberg Barclays U.S. Aggregate Bond Index and 40% S&P 500® Index.
21
Multi-Style Premia Fund Commentary (Unaudited)
Neuberger Berman Multi-Style Premia Fund Institutional Class generated a –1.16% total return for the period from its inception on May 18, 2018 to October 31, 2018 (the reporting period). In contrast, its benchmark, the ICE BofAML 3-Month U.S. Treasury Bill Index (the Index), provided a 0.91% return during the same period. (Performance for all share classes is provided in the table immediately following this letter.)
The Fund seeks absolute returns with low correlation to traditional asset classes. The Fund invests both long and short in a variety of instruments across multiple asset classes (i.e. equities, fixed income, currencies, commodities and interest rates), as it seeks to generate returns in both up and down markets with low sensitivity to directional market movements.
We experienced a mixed macroeconomic environment during the reporting period. While corporate profits were robust overall, equities experienced a setback late in the period as investor risk aversion increased. This was driven by a number of factors, including escalating trade war rhetoric, continued monetary policy tightening by the U.S. Federal Reserve Board, uncertainties surrounding the U.S. midterm elections and several geopolitical events. Towards the latter part of the period, we began to see a more pronounced rotation in the market from momentum factors to more defensive themes.
The largest detractor from the Fund's performance during the reporting period was its currency positioning. The Fund's long positions in higher yielding emerging market currencies and short positions in lower yielding developed market currencies was a headwind for performance as investor risk aversion increased due to escalating trade concerns. The Fund's commodity exposure was mixed but ended slightly down during the period. In particular, the Fund's long energy positions added value in September as oil prices rallied, but detracted during the October sell-off. The largest contributor to performance was the Fund's equity exposure. While global equity markets struggled in October, the Fund's equity book benefited from short positions in low quality/high risk stocks across the Information Technology, Energy and Communication Services sectors, which fell sharply over the month. Elsewhere, the Fund's volatility strategy, which includes managed futures trend following and equity index put selling, was slightly down overall during the period. The Fund's interest rates strategy ended the reporting period slightly positive.
The Fund's aggregate use of futures, forward foreign currency, swap and option contracts contributed positively to performance during the reporting period.
A number of derivative instruments are used to more efficiently manage the portfolio. The Fund utilizes commodity futures, currency forwards, and equity index derivatives, among others. We believe equity valuations are inflated and that, together with forecasted monetary policy tightening, if it occurs, should set the stage for diversified alternative strategies going forward. We saw hints of this late in the reporting period and, should these trends continue to develop, we believe that we could see a further resurrection of those risk premiums that have delivered healthy risk-adjusted performance to investors for many decades. As the current market cycle continues to move forward, the potential upside of highly market correlated strategies appears to be decreasing. In our view, market dislocations are already creating opportunities to systematically harvest returns from differentiated sources.
Sincerely,
RAY CARROLL, SIMON GRIFFITHS AND FRANK MAEBA
PORTFOLIO MANAGERS
Information about principal risks of investing in the Fund is set forth in the prospectus and statement of additional information.
The portfolio composition, industries and holdings of the Fund are subject to change without notice.
The opinions expressed are those of the Fund's portfolio managers. The opinions are as of the date of this report and are subject to change without notice.
22
Multi-Style Premia Fund (Unaudited)
TICKER SYMBOLS
Institutional Class | | NMLIX | |
Class A | | NMLAX | |
Class C | | NMLCX | |
Class R6 | | NMLRX | |
PERFORMANCE HIGHLIGHTS
| | | | Cumulative Total Return
Ended 10/31/2018 | |
| | Inception
Date | | Life of
Fund | |
At NAV | | | | | |
Institutional Class | | 05/18/2018 | | | –1.16 | % | |
Class A | | 05/18/2018 | | | –1.32 | % | |
Class C | | 05/18/2018 | | | –1.64 | % | |
Class R6 | | 05/18/2018 | | | –1.12 | % | |
With Sales Charge | | | | | |
Class A | | | | | –7.01 | % | |
Class C | | | | | –2.62 | % | |
Index | | | | | |
| ICE BofAML 3-Month U.S. Treasury Bill Index1,2 | | | | | 0.91 | % | |
The performance data quoted represent past performance and do not indicate future results. Current performance may be lower or higher than the performance data quoted. For performance data current to the most recent month-end, please visit www.nb.com/performance.
The results shown in the table reflect the reinvestment of income dividends and other distributions, if any. The results do not reflect the effect of taxes a shareholder would pay on Fund distributions or on the redemption of Fund shares.
The investment return and principal value of an investment will fluctuate and shares, when redeemed, may be worth more or less than their original cost.
Returns would have been lower if Neuberger Berman Investment Advisers LLC ("Management") had not reimbursed certain expenses and/or waived a portion of the investment management fees during certain of the periods shown. Repayment by a class (of expenses previously reimbursed and/or fees previously waived by Management) will decrease the class's returns. Please see Note B in the Notes to Financial Statements for specific information regarding expense reimbursement and/or fee waiver arrangements.
As stated in the Fund's most recent prospectus, the estimated total annual operating expense ratios for fiscal year 2018 are 2.25%, 2.61%, 3.36% and 2.18% for Institutional Class, Class A, Class C and Class R6 shares, respectively (before expense reimbursements and/or fee waivers, if any). The estimated total annual operating expense ratios for fiscal year 2018 are 0.99%, 1.35%, 2.10% and 0.92% for Institutional Class, Class A, Class C and Class R6 shares, respectively, after expense reimbursements and/or fee waivers. The expense ratios for the annual period ended October 31, 2018 can be found in the Financial Highlights section of this report.
Returns shown with a sales charge reflect the deduction of the current maximum initial sales charge of 5.75% for Class A shares and the contingent deferred sales charge (CDSC) for Class C shares. The CDSC for Class C shares is 1%, which is reduced to 0% after 1 year. The performance of the Fund's share classes will differ primarily due to different sales charge structures and class expenses. Please see the prospectus for more information about sales charge structures, if any, and class expenses for your share class.
23
Multi-Style Premia Fund (Unaudited)
COMPARISON OF A $1,000,000 INVESTMENT
(000's omitted)

This graph shows the change in value of a hypothetical $1,000,000 investment in the Fund over the past 10 fiscal years, or since the Fund's inception if it has not operated for 10 years. The graph is based on the Institutional Class shares only; the performance of the Fund's share classes will differ primarily due to different sales charge structures and class expenses (see Performance Highlights chart on previous page). The result is compared with benchmarks, which include a broad-based market index and may include a more narrowly based index. Market indices have not been reduced to reflect any of the fees and costs of investing. The results shown in the graph reflect the reinvestment of income dividends and other distributions, if any. The results do not reflect the effect of taxes a shareholder would pay on Fund distributions or on the redemption of Fund shares. Results represent past performance and do not indicate future results.
24
U.S. Equity Index PutWrite Strategy Fund Commentary (Unaudited)
Neuberger Berman U.S. Equity Index PutWrite Strategy Fund Institutional Class generated a total return of –0.16% for the 12-month reporting period ended October 31, 2018, underperforming its primary benchmark, a blend of 85% CBOE S&P 500 PutWrite Index (PUT) and 15% CBOE Russell 2000 PutWrite Index (PUTR) (together, the Index), which posted a total return of 1.29% for the same period. (Performance for all share classes is provided in the table immediately following this letter.)
Relative performance challenges continue to be residuals of the benchmark price reversals experienced during the first quarter of 2018, rather than a structural change in market conditions. To the contrary, material increases in both equity index option implied volatility levels and short-term U.S. Treasury rates have created a healthy market environment for index put writing strategies.
As we see it, equity markets appear to have transitioned to a more favorable environment for our strategies through a series of small, abruptly painful events rather than a major dislocation. The favorable environment includes a resetting of equity market implied volatility to levels that are materially higher than 2017 averages, the exiting of a number of speculative volatility strategies from the markets, and interest rates that have increased significantly. After the U.S. equity market 'perfection' in 2017, 2018 is a year in which avoiding capital impairment is going to be a reasonable outcome in our view after already suffering two major dislocations. We have been waiting a long time for a less robust equity environment with higher volatility and higher rates, yet we always presumed the transition to that environment would require a more dramatic event. Now that we are here, we believe there is a solid value proposition of allocating to equity strategies with lower market correlation, such as ours.
The Fund posted gains during the second and third quarters, but performance lagged the S&P 500® and Russell 2000® Indices and the Index due to the benchmark's higher market exposure ("beta")1 at the beginning of the quarter. Within the Fund, our S&P 500 and Russell 2000 put writing strategies continued to recover from the 1st quarter and during the most recent drawdown (October 2018), the tides turned. For the month of October, the Fund (–5.00%) outperformed both the PUT (–5.59%) and PUTR (–8.98%), as our diversified risk management benefited from the more orderly/systemic drawdown where volatility remained elevated and the duration of the drawdown was longer as compared to the first quarter dislocation.
The S&P 500 put writing strategy was a positive contributor to the Fund. Despite losses resulting from the first quarter price reversals of the S&P 500 Index, the cumulative premium collection has offset those losses. Net of the short spells of price volatility during the first and third quarters, the S&P 500 Index returned 7.35% over the past 12 months which is a market environment in which we would expect the strategy to underperform.
The Fund's Russell 2000 put writing strategy was a slight detractor to the Fund on an absolute basis. While the Fund's Russell 2000 put writing strategy outperformed PUTR, it underperformed relative to the Russell 2000 Index which had strong second and third quarters, returning 1.85% for the last 12 months.
We continue to roll maturing bond collateral into new two to three year U.S. Treasury notes at yield levels that are markedly higher than a year ago. Despite the significant rise in short term rates, our fixed income collateral holdings have avoided any meaningful losses.
As we reflect on our strategy results in 2018, we feel compelled to drop 'cautious' from the 'cautious optimism' we had coming into the year. We are pleased to have avoided a significant erosion of capital suffered by many volatility and risk-premia strategies year-to-date, and believe that if we have increased market uncertainty without a full recessionary
25
economic environment it bodes well for our ability to earn equity index option premiums and short-term bond income relative to a continued dependence on capital appreciation.
Sincerely,
DEREK DEVENS
PORTFOLIO MANAGER
1 Beta is a measure of the systematic risk of a portfolio. It is the covariance of the portfolio and a market index divided by the variance of the market index. Beta measures the historical sensitivity of a portfolio's returns to movements in the market index. The beta of the market index will always be one. A portfolio with a beta above the market index (i.e. >1) means that the portfolio has greater volatility than the market index. If the beta of the portfolio is 1.2, a market increase in return of 1% implies a 1.2% increase in the portfolio's return. If the beta of the portfolio is 0.8, a market decrease in return of 1% implies a 0.8% decrease in the portfolio's return.
Information about principal risks of investing in the Fund is set forth in the prospectus and statement of additional information.
The portfolio composition, industries and holdings of the Fund are subject to change without notice.
The opinions expressed are those of the Fund's portfolio manager. The opinions are as of the date of this report and are subject to change without notice.
26
U.S. Equity Index PutWrite Strategy Fund (Unaudited)
TICKER SYMBOLS
Institutional Class | | NUPIX | |
Class A | | NUPAX | |
Class C | | NUPCX | |
Class R6 | | NUPRX | |
PORTFOLIO BY TYPE OF SECURITY
(as a % of Total Net Assets) | |
U.S. Treasury Obligations | | | 100.3 | % | |
Put Options Written | | | (2.2 | ) | |
Short-Term Investments | | | 1.9 | | |
Liabilities Less Other Assets | | | — | | |
Total | | | 100.0 | % | |
PERFORMANCE HIGHLIGHTS4
| | | | Average Annual Total Return
Ended 10/31/2018 | |
| | Inception
Date | | 1 Year | | Life of
Fund | |
At NAV | |
Institutional Class | | 09/16/2016 | | | –0.16 | % | | | 6.31 | % | |
Class A | | 09/16/2016 | | | –0.55 | % | | | 5.96 | % | |
Class C | | 09/16/2016 | | | –1.30 | % | | | 5.14 | % | |
Class R6 | | 09/16/2016 | | | –0.09 | % | | | 6.41 | % | |
With Sales Charge | | | | | | | |
Class A | | | | | –6.26 | % | | | 3.05 | % | |
Class C | | | | | –2.23 | % | | | 5.14 | % | |
Index | |
| Blended Benchmark*1,2 | | | | | 1.29 | % | | | 6.57 | % | |
* Blended Benchmark is composed of 85% CBOE S&P 500 PutWrite Index and 15% Russell 2000 PutWrite Index.
The performance data quoted represent past performance and do not indicate future results. Current performance may be lower or higher than the performance data quoted. For performance data current to the most recent month-end, please visit www.nb.com/performance.
The results shown in the table reflect the reinvestment of income dividends and other distributions, if any. The results do not reflect the effect of taxes a shareholder would pay on Fund distributions or on the redemption of Fund shares.
The investment return and principal value of an investment will fluctuate and shares, when redeemed, may be worth more or less than their original cost.
Returns would have been lower if Neuberger Berman Investment Advisers LLC ("Management") had not reimbursed certain expenses and/or waived a portion of the investment management fees during certain of the periods shown. Repayment by a class (of expenses previously reimbursed and/or fees previously waived by Management) will decrease the class's returns. Please see Note B in the Notes to Financial Statements for specific information regarding expense reimbursement and/or fee waiver arrangements.
As stated in the Fund's most recent prospectus, the total annual operating expense ratios for fiscal year 2017 were 0.98%, 1.35%, 2.12% and 0.94% for Institutional Class, Class A, Class C and Class R6 shares, respectively (before expense reimbursements and/or fee waivers, if any). The total annual operating expense ratios were 0.66%, 1.02%, 1.77% and 0.59% for Institutional Class, Class A, Class C and Class R6 shares, respectively, after expense reimbursements and/or fee waivers. The expense ratios for the annual period ended October 31, 2018 can be found in the Financial Highlights section of this report.
Returns shown with a sales charge reflect the deduction of the current maximum initial sales charge of 5.75% for Class A shares and the contingent deferred sales charge (CDSC) for Class C shares. The CDSC for Class C shares is 1%, which is reduced to 0% after 1 year. The performance of the Fund's share classes will differ primarily due to different sales charge structures and class expenses. Please see the prospectus for more information about sales charge structures, if any, and class expenses for your share class.
27
U.S. Equity Index PutWrite Strategy Fund (Unaudited)
COMPARISON OF A $1,000,000 INVESTMENT
(000's omitted)
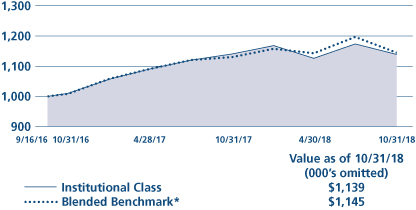
This graph shows the change in value of a hypothetical $1,000,000 investment in the Fund over the past 10 fiscal years, or since the Fund's inception if it has not operated for 10 years. The graph is based on the Institutional Class shares only; the performance of the Fund's share classes will differ primarily due to different sales charge structures and class expenses (see Performance Highlights chart on previous page). The result is compared with benchmarks, which include a broad-based market index and may include a more narrowly based index. Market indices have not been reduced to reflect any of the fees and costs of investing. The results shown in the graph reflect the reinvestment of income dividends and other distributions, if any. The results do not reflect the effect of taxes a shareholder would pay on Fund distributions or on the redemption of Fund shares. Results represent past performance and do not indicate future results.
* Blended Benchmark is composed of 85% CBOE S&P 500 PutWrite Index and 15% Russell 2000 PutWrite Index.
28
1 Please see "Glossary of Indices" on page 30 for a description of indices. Please note that individuals cannot invest directly in any index. The HFRX Equity Hedge Index and HFRX Fixed Income-Credit Index do take into account fees and expenses, but not the tax consequences, of investing since they are based on the underlying hedge funds' net returns. The other indices described in this report do not take into account any fees, expenses or tax consequences of investing in the individual securities that they track. Data about the performance of an index are prepared or obtained by Neuberger Berman Investment Advisers LLC and reflect the reinvestment of income dividends and other distributions, if any. The Fund may invest in securities not included in a described index and generally does not invest in all securities included in a described index.
2 The date used to calculate Life of Fund performance for the index is the inception date of the oldest share class.
3 During the period from December 2010 through April 2011, Neuberger Berman Global Allocation Fund had only one shareholder and the Fund was relatively small, which could have impacted Fund performance. During the period from May 2017 through August 2017, Neuberger Berman Hedged Option Premium Strategy Fund was relatively small, which could have impacted Fund performance. During the period from August 2012 through January 2013, Neuberger Berman Commodity Strategy Fund was relatively small, which could have impacted Fund performance. The same techniques used to produce returns in a small fund may not work to produce similar returns in a larger fund.
4 The investments for the Fund are managed by the same portfolio manager(s) who manage(s) one or more other registered funds that have names, investment objectives and investment styles that are similar to those of the Fund. You should be aware that the Fund is likely to differ from those other mutual fund(s) in size, cash flow pattern and tax matters. Accordingly, the holdings and performance of the Fund can be expected to vary from those of the other mutual fund(s).
For more complete information on any of the Neuberger Berman Alternative and Multi-Asset Class Funds, see the Fund's prospectus, which can be obtained by calling us at (800) 877-9700, or visiting our website at www.nb.com.
29
Bloomberg Barclays Global Aggregate Index: | | The index measures global investment grade debt from twenty-four different local currency markets and includes fixed-rate treasury, government-related, corporate and securitized bonds from both developed and emerging markets issuers. The index is largely comprised of three major regional aggregate components: the Bloomberg Barclays U.S. Aggregate Bond Index, the Bloomberg Barclays Pan-European Aggregate Bond Index, and the Bloomberg Barclays Asian-Pacific Aggregate Index. In addition to securities from these three indices, the Bloomberg Barclays Global Aggregate Index also includes investment grade Eurodollar, Euro-Yen, Canadian, and 144A Index-eligible securities not already in these three indices. | |
Bloomberg Barclays U.S. Aggregate Bond Index: | | The index measures the investment grade, U.S. dollar-denominated, fixed-rate, taxable bond market and includes Treasuries, government-related and corporate securities, mortgage-backed securities (MBS) (agency fixed-rate and hybrid adjustable rate mortgage (ARM) pass-throughs), asset-backed securities (ABS), and commercial mortgage-backed securities (CMBS) (agency and nonagency). | |
60% Bloomberg Barclays U.S. Aggregate Bond Index and 40% S&P 500® Index: | | The blended index is composed of 60% Bloomberg Barclays U.S. Aggregate Bond Index (described above) and 40% S&P 500® Index (described below), and is rebalanced monthly. | |
Bloomberg Commodity Index: | | The index is a rolling index composed of exchange-traded futures contracts on physical commodities. The index relies primarily on liquidity data of futures contracts, along with U.S. dollar-adjusted production data, in determining the relative quantities of included commodities. The index is designed to be a highly liquid and diversified benchmark for commodities investments. The version of the index that is calculated on a total return basis reflects the returns on a fully collateralized investment in the underlying commodity futures contracts, combined with the returns on cash collateral invested in Treasury Bills. | |
CBOE Russell 2000® PutWrite Index: | | The index tracks the value of a passive investment strategy which consists of overlaying Russell 2000 (RUT) short put options over a money market account invested in one-month Treasury bills. The RUT puts are struck at-the-money and are sold on a monthly basis. | |
CBOE S&P 500® Iron Condor Index: | | The index is designed to track the performance of a hypothetical option selling strategy that sells monthly call and put spreads and holds a money market account invested in one-month Treasury bills. The call spread consists of a short position in an out-of-the-money S&P 500 Index call option with a delta of approximately 0.20 and a long position in a further out-of-the-money S&P 500 Index call option with a delta of approximately 0.05. The put spread consists of a short position in an out-of-the-money S&P 500 Index put option with a delta of approximately –0.20 and a long position in a further out-of-the-money S&P 500 Index put option with a delta of approximately –0.05. Call and put spread positions are sized such that their notional strike differences represent 5% of the market value of the money market account. The money market account is rebalanced on option roll days and is designed to limit the downside return of the index. The delta of an option measures its price sensitivity to the price of the underlying asset. For example, if a call option has a delta of 0.20 and the price of the underlying asset increases by $1, the value of the option will increase by $0.20. | |
CBOE S&P 500® PutWrite Index: | | The index tracks the value of a passive investment strategy which consists of overlaying S&P 500 (SPX) short put options over a money market account invested in one- and three-months Treasury bills. The SPX puts are struck at-the-money and are sold on a monthly basis. | |
30
Glossary of Indices (cont'd)
85% CBOE S&P 500® PutWrite Index and 15% CBOE Russell 2000® PutWrite Index: | | The blended index is composed of 85% CBOE S&P 500 PutWrite Index (described above) and 15% CBOE Russell 2000 PutWrite Index (described above), and is rebalanced monthly. | |
HFRX Fixed Income-Credit
Index: | | The index tracks the performance of hedge fund strategies with exposure to credit across a broad continuum of credit sub-strategies, including Corporate, Sovereign, Distressed, Convertible, Asset Backed, Capital Structure Arbitrage, Multi-Strategy and other Relative Value and Event Driven sub-strategies. The investment thesis across all strategies is predicated on realization of a valuation discrepancy between the related credit instruments. Strategies may also include and utilize equity securities, credit derivatives, government fixed income, commodities, currencies or other hybrid securities. Constituent funds are selected from an eligible pool of the more than 7,500 funds worldwide that report to the Hedge Fund Research (HFR) Database. Constituent funds must meet all of the following criteria: report monthly; report performance net of all fees; be U.S. dollar-denominated; be active and accepting new investments; have a minimum 24 months track record; and the fund's manager must have at least $50 million in assets under management. Constituents are weighted by a representative optimization methodology. The index is rebalanced quarterly. | |
HFRX Equity Hedge Index: | | The index comprises equity hedge strategies. Equity hedge strategies maintain positions both long and short in primarily equity and equity derivative securities. A wide variety of investment processes can be employed to arrive at an investment decision, including both quantitative and fundamental techniques; strategies can be broadly diversified or narrowly focused on specific sectors and can range broadly in terms of levels of net exposure, leverage employed, holding period, concentrations of market capitalizations and valuation ranges of typical portfolios. Equity hedge managers would typically maintain at least 50%, and may in some cases be substantially entirely invested, in equities, both long and short. Constituent funds are selected from an eligible pool of the more than 7,500 funds worldwide that report to the Hedge Fund Research (HFR) Database. Constituent funds must meet all of the following criteria: report monthly; report performance net of all fees; be U.S. dollar-denominated; be active and accepting new investments; have a minimum 24 months track record; and the fund's manager must have at least $50 million in assets under management. The index is rebalanced quarterly. | |
ICE BofAML 3-Month U.S. Treasury Bill Index: | | The index is comprised of a single issue purchased at the beginning of the month and held for a full month. At the end of the month that issue is sold and rolled into a newly selected issue. The issue selected at each month-end rebalancing is the outstanding Treasury Bill that matures closest to, but not beyond, three months from the rebalancing date. | |
MSCI All Country World Index (Net): | | The index is a free float-adjusted market capitalization-weighted index that is designed to measure the equity market performance of developed and emerging markets. The index consists of 47 country indexes comprising 23 developed and 24 emerging market country indexes. The developed market country indexes included are: Australia, Austria, Belgium, Canada, Denmark, Finland, France, Germany, Hong Kong, Ireland, Israel, Italy, Japan, the Netherlands, New Zealand, Norway, Portugal, Singapore, Spain, Sweden, Switzerland, the United Kingdom and the United States. The emerging market country indexes included are: Brazil, Chile, China, Colombia, Czech Republic, Egypt, Greece, Hungary, India, Indonesia, Korea, Malaysia, Mexico, Pakistan, Peru, the Philippines, Poland, Qatar, Russia, South Africa, Taiwan, Thailand, Turkey, and the UAE. China A shares are included starting from June 1, 2018 and are partially represented at 5% of their free float-adjusted market capitalization. Net total return indexes reinvest dividends after the deduction of withholding taxes, using (for international indexes) a tax rate applicable to non-resident institutional investors who do not benefit from double taxation treaties. | |
31
Glossary of Indices (cont'd)
60% MSCI All Country World Index (Net) and 40% Bloomberg Barclays Global Aggregate Index: | | The blended index is composed of 60% MSCI All Country World Index (Net) (described above) and 40% Bloomberg Barclays Global Aggregate Index (described above), and is rebalanced monthly. Net total return indexes reinvest dividends after the deduction of withholding taxes, using (for international indexes) a tax rate applicable to non-resident institutional investors who do not benefit from double taxation treaties. | |
S&P 500® Index: | | The index is a float-adjusted market capitalization-weighted index that focuses on the large-cap segment of the U.S. equity market, and includes a significant portion of the total value of the market. | |
32
Information About Your Fund's Expenses (Unaudited)
As a Fund shareholder, you incur two types of costs: (1) transaction costs, including sales charges (loads) on purchase payments or redemption proceeds (if applicable); and (2) ongoing costs, including management fees, distribution and/or service (12b-1) fees (if applicable), and other Fund expenses. This example is intended to help you understand your ongoing costs (in U.S. dollars) of investing in a Fund and compare these costs with the ongoing costs of investing in other mutual funds.
This table is designed to provide information regarding costs related to your investments. The following examples are based on an investment of $1,000 made at the beginning of the six month period ended October 31, 2018 and held for the entire period. The table illustrates the Fund's costs in two ways:
Actual Expenses and Performance: | | The first section of the table provides information about actual account values and actual expenses in dollars, based on the Fund's actual performance during the period indicated. You may use the information in this line, together with the amount you invested, to estimate the expenses you paid over the period. Simply divide your account value by $1,000 (for example, an $8,600 account value divided by $1,000 = 8.6), then multiply the result by the number in the first section of the table under the heading entitled "Expenses Paid During the Period" to estimate the expenses you paid over the period. | |
Hypothetical Example for Comparison Purposes: | | The second section of the table provides information about hypothetical account values and hypothetical expenses based on the Fund's actual expense ratio and an assumed rate of return at 5% per year before expenses. This return is not the Fund's actual return. The hypothetical account values and expenses may not be used to estimate the actual ending account balance or expenses you paid for the period. You may use this information to compare the ongoing costs of investing in a Fund versus other funds. To do so, compare the expenses shown in this 5% hypothetical example with the 5% hypothetical examples that appear in the shareholder reports of other funds. | |
Please note that the expenses in the table are meant to highlight your ongoing costs only and do not include any transaction costs, such as sales charges (loads) (if applicable). Therefore, the information under the heading "Hypothetical (5% annual return before expenses)" is useful in comparing ongoing costs only, and will not help you determine the relative total costs of owning different funds. In addition, if these transaction costs were included, your costs would have been higher.
33
Expense Example (Unaudited)
Neuberger Berman Alternative Funds | |
| | | ACTUAL | | HYPOTHETICAL (5% ANNUAL RETURN BEFORE EXPENSES) | |
| | | Beginning
Account
Value
5/1/18 | | Ending
Account
Value
10/31/18 | | Expenses Paid
During the
Period(1)
5/1/18 - 10/31/18 | | Expense
Ratio | | Beginning
Account
Value
5/1/18 | | Ending
Account
Value
10/31/18 | | Expenses Paid
During the
Period(2)
5/1/18 - 10/31/18 | | Expense
Ratio | |
Commodity Strategy Fund | |
Institutional Class | | $ | 1,000.00 | | | $ | 937.90 | | | $ | 3.61 | | | | 0.74 | % | | $ | 1,000.00 | | | $ | 1,021.48 | | | $ | 3.77 | | | | 0.74 | % | |
Class A | | $ | 1,000.00 | | | $ | 936.70 | | | $ | 5.37 | | | | 1.10 | % | | $ | 1,000.00 | | | $ | 1,019.66 | | | $ | 5.60 | | | | 1.10 | % | |
Class C | | $ | 1,000.00 | | | $ | 932.80 | | | $ | 8.96 | | | | 1.84 | % | | $ | 1,000.00 | | | $ | 1,015.93 | | | $ | 9.35 | | | | 1.84 | % | |
Global Allocation Fund | |
Institutional Class | | $ | 1,000.00 | | | $ | 949.70 | | | $ | 2.21 | | | | 0.45 | % | | $ | 1,000.00 | | | $ | 1,022.94 | | | $ | 2.29 | | | | 0.45 | % | |
Class A | | $ | 1,000.00 | | | $ | 948.50 | | | $ | 3.98 | | | | 0.81 | % | | $ | 1,000.00 | | | $ | 1,021.12 | | | $ | 4.13 | | | | 0.81 | % | |
Class C | | $ | 1,000.00 | | | $ | 944.40 | | | $ | 7.65 | | | | 1.56 | % | | $ | 1,000.00 | | | $ | 1,017.34 | | | $ | 7.93 | | | | 1.56 | % | |
Hedged Option Premium Strategy Fund | |
Institutional Class | | $ | 1,000.00 | | | $ | 987.40 | | | $ | 3.31 | | | | 0.66 | % | | $ | 1,000.00 | | | $ | 1,021.88 | | | $ | 3.36 | | | | 0.66 | % | |
Class A | | $ | 1,000.00 | | | $ | 985.30 | | | $ | 5.05 | | | | 1.01 | % | | $ | 1,000.00 | | | $ | 1,020.11 | | | $ | 5.14 | | | | 1.01 | % | |
Class C | | $ | 1,000.00 | | | $ | 981.50 | | | $ | 8.84 | | | | 1.77 | % | | $ | 1,000.00 | | | $ | 1,016.28 | | | $ | 9.00 | | | | 1.77 | % | |
Class R6 | | $ | 1,000.00 | | | $ | 987.00 | | | $ | 2.95 | | | | 0.59 | % | | $ | 1,000.00 | | | $ | 1,022.23 | | | $ | 3.01 | | | | 0.59 | % | |
Long Short Fund | |
Institutional Class | | $ | 1,000.00 | | | $ | 1,000.00 | | | $ | 7.86 | | | | 1.56 | % | | $ | 1,000.00 | | | $ | 1,017.34 | | | $ | 7.93 | | | | 1.56 | % | |
Class A | | $ | 1,000.00 | | | $ | 998.60 | | | $ | 9.67 | | | | 1.92 | % | | $ | 1,000.00 | | | $ | 1,015.53 | | | $ | 9.75 | | | | 1.92 | % | |
Class C | | $ | 1,000.00 | | | $ | 994.90 | | | $ | 13.43 | | | | 2.67 | % | | $ | 1,000.00 | | | $ | 1,011.75 | | | $ | 13.54 | | | | 2.67 | % | |
Long Short Credit Fund | |
Institutional Class | | $ | 1,000.00 | | | $ | 1,003.50 | | | $ | 5.96 | | | | 1.18 | % | | $ | 1,000.00 | | | $ | 1,019.26 | | | $ | 6.01 | | | | 1.18 | % | |
Class A | | $ | 1,000.00 | | | $ | 1,001.70 | | | $ | 7.67 | | | | 1.52 | % | | $ | 1,000.00 | | | $ | 1,017.54 | | | $ | 7.73 | | | | 1.52 | % | |
Class C | | $ | 1,000.00 | | | $ | 996.90 | | | $ | 11.43 | | | | 2.27 | % | | $ | 1,000.00 | | | $ | 1,013.76 | | | $ | 11.52 | | | | 2.27 | % | |
Class R6 | | $ | 1,000.00 | | | $ | 1,003.90 | | | $ | 5.46 | | | | 1.08 | % | | $ | 1,000.00 | | | $ | 1,019.76 | | | $ | 5.50 | | | | 1.08 | % | |
Multi-Asset Income Fund | |
Institutional Class | | $ | 1,000.00 | | | $ | 979.20 | | | $ | 2.74 | | | | 0.55 | % | | $ | 1,000.00 | | | $ | 1,022.43 | | | $ | 2.80 | | | | 0.55 | % | |
Class A | | $ | 1,000.00 | | | $ | 977.40 | | | $ | 4.59 | | | | 0.92 | % | | $ | 1,000.00 | | | $ | 1,020.57 | | | $ | 4.69 | | | | 0.92 | % | |
Class C | | $ | 1,000.00 | | | $ | 973.70 | | | $ | 8.31 | | | | 1.67 | % | | $ | 1,000.00 | | | $ | 1,016.79 | | | $ | 8.49 | | | | 1.67 | % | |
Class R6 | | $ | 1,000.00 | | | $ | 979.60 | | | $ | 2.40 | | | | 0.48 | % | | $ | 1,000.00 | | | $ | 1,022.79 | | | $ | 2.45 | | | | 0.48 | % | |
Multi-Style Premia Fund | |
Institutional Class | | $ | 1,000.00 | | | $ | 988.40 | | | $ | 4.32 | (3) | | | 0.95 | % | | $ | 1,000.00 | | | $ | 1,018.53 | | | $ | 4.39 | | | | 0.95 | % | |
Class A | | $ | 1,000.00 | | | $ | 986.80 | | | $ | 5.95 | | | | 1.31 | % | | $ | 1,000.00 | | | $ | 1,016.88 | | | $ | 6.04 | | | | 1.31 | % | |
Class C | | $ | 1,000.00 | | | $ | 983.60 | | | $ | 9.35 | | | | 2.06 | % | | $ | 1,000.00 | | | $ | 1,013.45 | | | $ | 9.49 | | | | 2.06 | % | |
Class R6 | | $ | 1,000.00 | | | $ | 988.80 | | | $ | 4.00 | | | | 0.88 | % | | $ | 1,000.00 | | | $ | 1,018.85 | | | $ | 4.06 | | | | 0.88 | % | |
U.S. Equity Index PutWrite Strategy Fund | |
Institutional Class | | $ | 1,000.00 | | | $ | 1,011.30 | | | $ | 3.35 | | | | 0.66 | % | | $ | 1,000.00 | | | $ | 1,021.88 | | | $ | 3.36 | | | | 0.66 | % | |
Class A | | $ | 1,000.00 | | | $ | 1,010.00 | | | $ | 5.17 | | | | 1.02 | % | | $ | 1,000.00 | | | $ | 1,020.06 | | | $ | 5.19 | | | | 1.02 | % | |
Class C | | $ | 1,000.00 | | | $ | 1,005.20 | | | $ | 8.95 | | | | 1.77 | % | | $ | 1,000.00 | | | $ | 1,016.28 | | | $ | 9.00 | | | | 1.77 | % | |
Class R6 | | $ | 1,000.00 | | | $ | 1,011.70 | | | $ | 2.99 | | | | 0.59 | % | | $ | 1,000.00 | | | $ | 1,022.23 | | | $ | 3.01 | | | | 0.59 | % | |
(1) For each class, expenses are equal to the annualized expense ratio for the class, multiplied by the average account value over the period, multiplied by 184/365 (to reflect the one-half year period shown), unless otherwise indicated.
(2) Hypothetical expenses are equal to the annualized expense ratios for each class, multiplied by the average account value over the period (assuming a 5% annual return), multiplied by 184/365 (to reflect the one-half year period shown).
(3) Expenses are equal to the annualized expense ratio for the class, multiplied by the average account value over the period, multiplied by 167/365 (to reflect the period shown of May 18, 2018 (Commencement of Operations) to October 31, 2018).
34
Consolidated Schedule of Investments Commodity Strategy Fund(a)
October 31, 2018
PRINCIPAL AMOUNT | | | | VALUE | |
(000's omitted) | | | | (000's omitted) | |
Asset-Backed Securities 22.0% | | | |
| | | | | Ally Auto Receivables Trust | | | | | |
$ | 534 | | | Ser. 2017-3, Class A2, 1.53%, due 3/16/20 | | $ | 534 | | |
| | 121 | | | Ser. 2016-1, Class A3, 1.47%, due 4/15/20 | | | 121 | | |
| | 528 | | | Ser. 2017-5, Class A2, 1.81%, due 6/15/20 | | | 527 | | |
| | 1,504 | | | Ser. 2018-1, Class A2, 2.14%, due 9/15/20 | | | 1,500 | | |
| | 1,200 | | | Ser. 2018-2, Class A2, 2.64%, due 2/16/21 | | | 1,198 | | |
| | 1,600 | | | Bank of The West Auto Trust, Ser. 2018-1, Class A2, 3.09%, due 4/15/21 | | | 1,600 | (b)(h) | |
| | 138 | | | BMW Vehicle Lease Trust, Ser. 2017-1, Class A2, 1.64%, due 7/22/19 | | | 138 | | |
| | 554 | | | BMW Vehicle Owner Trust, Ser. 2018-A, Class A2A, 2.09%, due 11/25/20 | | | 552 | | |
| | | | | Canadian Pacer Auto Receivables Trust | | | | | |
| | 206 | | | Ser. 2017-1A, Class A2A, 1.77%, due 12/19/19 | | | 206 | (b) | |
| | 602 | | | Ser. 2018-1A, Class A2A, 2.70%, due 8/19/20 | | | 601 | (b) | |
| | 750 | | | Ser. 2018-2A, Class A2A, 3.00%, due 6/21/21 | | | 749 | (b) | |
| 1,200 | | | Chase Issuance Trust, Ser. 2018-A1, Class A1, (1 month USD LIBOR + 0.20%), 2.48%,
due 4/17/23 | | | 1,202 | (c) | |
| | | | | Citibank Credit Card Issuance Trust | | | | | |
| | 1,125 | | | Ser. 2017-A1, Class A1, (1 month USD LIBOR + 0.25%), 2.54%, due 1/19/21 | | | 1,126 | (c) | |
| | 1,000 | | | Ser. 2014-A6, Class A6, 2.15%, due 7/15/21 | | | 995 | | |
| 1,110 | | | Evergreen Credit Card Trust, Ser. 2018-2, Class A, (1 month USD LIBOR + 0.35%),
2.63%, due 7/15/22 | | | 1,112 | (b)(c) | |
| | | | | Ford Credit Auto Owner Trust | | | | | |
| | 34 | | | Ser. 2017-A, Class A2A, 1.33%, due 12/15/19 | | | 34 | | |
| | 2,500 | | | Ser. 2018-B, Class A2A, 2.96%, due 9/15/21 | | | 2,499 | (d) | |
| | | | | GM Financial Consumer Automobile Receivables Trust | | | | | |
| | 735 | | | Ser. 2017-3A, Class A2A, 1.71%, due 9/16/20 | | | 732 | (b) | |
| | 879 | | | Ser. 2018-1, Class A2A, 2.08%, due 1/19/21 | | | 875 | | |
| | 1,220 | | | Ser. 2018-2, Class A2A, 2.55%, due 5/17/21 | | | 1,217 | | |
| | 491 | | | Honda Auto Receivables Owner Trust, Ser. 2017-3, Class A2, 1.57%, due 1/21/20 | | | 490 | | |
| | | | | Navient Student Loan Trust | | | | | |
| | 939 | | | Ser. 2018-2A, Class A1, (1 month USD LIBOR + 0.24%), 2.52%, due 3/25/67 | | | 940 | (b)(c) | |
| | 1,085 | | | Ser. 2018-3A, Class A1, (1 month USD LIBOR + 0.27%), 2.55%, due 3/25/67 | | | 1,086 | (b)(c) | |
| | 750 | | | Ser. 2018-4A, Class A1, (1 month USD LIBOR + 0.25%), 2.39%, due 6/27/67 | | | 750 | (b)(c) | |
| | 656 | | | Nissan Auto Receivables Owner Trust, Ser. 2017-B, Class A2A, 1.56%, due 5/15/20 | | | 654 | | |
| | 204 | | | Securitized Term Auto Receivables Trust, Ser. 2017-2A, Class A2A, 1.78%, due 1/27/20 | | | 204 | (b) | |
| | | | | Toyota Auto Receivables Owner Trust | | | | | |
| | 1,012 | | | Ser. 2017-C, Class A2A, 1.58%, due 7/15/20 | | | 1,008 | | |
| | 775 | | | Ser. 2017-D, Class A2A, 1.74%, due 8/17/20 | | | 772 | | |
| | 1,500 | | | Ser. 2018-B, Class A2A, 2.64%, due 3/15/21 | | | 1,496 | | |
| | 1,140 | | | Ser. 2018-C, Class A2A, 2.77%, due 8/16/21 | | | 1,138 | | |
| | | | | Verizon Owner Trust | | | | | |
| | 1,500 | | | Ser. 2017-1A, Class A, 2.06%, due 9/20/21 | | | 1,486 | (b) | |
| | 1,320 | | | Ser. 2018-1A, Class A1B, (1 month USD LIBOR + 0.26%), 2.54%, due 9/20/22 | | | 1,322 | (b)(c) | |
| | | | | World Omni Auto Receivables Trust | | | | | |
| | 811 | | | Ser.2017-B, Class A2A, 1.61%, due 2/16/21 | | | 806 | | |
| | 965 | | | Ser. 2018-A, Class A2, 2.19%, due 5/17/21 | | | 962 | | |
| | 1,460 | | | Ser. 2018-B, Class A2, 2.57%, due 7/15/21 | | | 1,456 | | |
| | 490 | | | Ser. 2018-C, Class A2, 2.80%, due 1/18/22 | | | 489 | | |
| | | | | Total Asset-Backed Securities (Cost $32,615) | | | 32,577 | | |
See Notes to Financial Statements
35
Consolidated Schedule of Investments Commodity Strategy Fund(a) (cont'd)
PRINCIPAL AMOUNT | | | | VALUE | |
(000's omitted) | | | | (000's omitted) | |
Corporate Bonds 65.6% | | | |
Aerospace & Defense 2.2% | | | |
$ | 1,560 | | | General Dynamics Corp., (3 month USD LIBOR + 0.38%), 2.72%, due 5/11/21 | | $ | 1,565 | (c) | |
| | 1,675 | | | United Technologies Corp., (3 month USD LIBOR + 0.65%), 2.97%, due 8/16/21 | | | 1,677 | (c) | |
| | | | 3,242 | | |
Agriculture 2.0% | | | |
| | 2,965 | | | BAT Capital Corp., (3 month USD LIBOR + 0.59%, Floor 0.00%), 2.91%, due 8/14/20 | | | 2,974 | (b)(c) | |
Auto Manufacturers 5.2% | | | |
| | | | | American Honda Finance Corp. | | | | | |
| | 785 | | | (3 month USD LIBOR + 0.34%), 2.66%, due 2/14/20 | | | 786 | (c) | |
| | 520 | | | (3 month USD LIBOR + 0.27%), 2.74%, due 7/20/20 | | | 521 | (c) | |
| | 1,855 | | | BMW U.S. Capital LLC, (3 month USD LIBOR + 0.37%), 2.69%, due 8/14/20 | | | 1,859 | (b)(c) | |
| | 520 | | | Daimler Finance N.A. LLC, (3 month USD LIBOR + 0.25%), 2.59%, due 11/5/18 | | | 520 | (b)(c) | |
| | 1,965 | | | Harley-Davidson Financial Services, Inc., (3 month USD LIBOR + 0.50%), 2.81%, due 5/21/20 | | | 1,967 | (b)(c) | |
| | 1,720 | | | Nissan Motor Acceptance Corp., (3 month USD LIBOR + 0.63%), 2.98%, due 9/21/21 | | | 1,723 | (b)(c) | |
| | 335 | | | Toyota Motor Credit Corp., (3 month USD LIBOR + 0.82%), 3.14%, due 2/19/19 | | | 336 | (c) | |
| | | | 7,712 | | |
Banks 24.4% | | | |
| | | | | Bank of America Corp. | | | | | |
| | 2,745 | | | (3 month USD LIBOR + 1.42%), 3.87%, due 4/19/21 | | | 2,809 | (c) | |
| | 350 | | | (3 month USD LIBOR + 0.66%), 3.13%, due 7/21/21 | | | 352 | (c) | |
| | | | | Capital One Financial Corp. | | | | | |
| | 225 | | | (3 month USD LIBOR + 0.76%), 3.10%, due 5/12/20 | | | 226 | (c) | |
| | 2,200 | | | (3 month USD LIBOR + 0.45%), 2.97%, due 10/30/20 | | | 2,198 | (c) | |
| | | | | Citigroup, Inc. | | | | | |
| | 2,590 | | | (3 month USD LIBOR + 1.38%), 3.77%, due 3/30/21 | | | 2,643 | (c) | |
| | 855 | | | (3 month USD LIBOR + 1.19%), 3.75%, due 8/2/21 | | | 869 | (c) | |
| | 3,170 | | | Goldman Sachs Group, Inc., (3 month USD LIBOR + 1.36%), 3.85%, due 4/23/21 | | | 3,233 | (c) | |
| | 2,260 | | | HSBC Holdings PLC, (3 month USD LIBOR + 0.60%), 2.92%, due 5/18/21 | | | 2,263 | (c) | |
| | | | | JPMorgan Chase & Co. | | | | | |
| | 2,300 | | | (3 month USD LIBOR + 0.55%), 2.88%, due 3/9/21 | | | 2,303 | (c) | |
| | 625 | | | (3 month USD LIBOR + 1.10%), 3.42%, due 6/7/21 | | | 636 | (c) | |
| | 2,850 | | | Morgan Stanley, (3 month USD LIBOR + 0.55%), 2.89%, due 2/10/21 | | | 2,851 | (c) | |
| | 1,485 | | | National Australia Bank Ltd., (3 month USD LIBOR + 0.51%), 2.82%, due 5/22/20 | | | 1,490 | (b)(c) | |
| | 3,020 | | | Royal Bank of Canada, (3 month USD LIBOR + 0.39%), 2.91%, due 4/30/21 | | | 3,024 | (c) | |
| | 880 | | | Santander UK PLC, (3 month USD LIBOR + 0.62%), 2.94%, due 6/1/21 | | | 883 | (c) | |
| | 765 | | | Sumitomo Mitsui Financial Group, Inc., (3 month USD LIBOR + 1.11%), 3.55%, due 7/14/21 | | | 778 | (c) | |
| | | | | Toronto-Dominion Bank | | | | | |
| | 1,080 | | | (3 month USD LIBOR + 0.24%), 2.73%, due 1/25/21 | | | 1,079 | (c) | |
| | 1,235 | | | (3 month USD LIBOR + 0.43%), 2.76%, due 6/11/21 | | | 1,239 | (c) | |
| | | | | U.S. Bank N.A. | | | | | |
| | 1,135 | | | (3 month USD LIBOR + 0.32%), 2.83%, due 4/26/21 | | | 1,137 | (c) | |
| | 445 | | | (3 month USD LIBOR + 0.29%), 2.60%, due 5/21/21 | | | 445 | (c) | |
| | 3,170 | | | Wells Fargo Bank N.A., (3 month USD LIBOR + 0.50%), 2.98%, due 7/23/21 | | | 3,172 | (c) | |
| | 2,550 | | | Westpac Banking Corp., (3 month USD LIBOR + 0.85%), 3.17%, due 8/19/21 | | | 2,584 | (c) | |
| | | | 36,214 | | |
See Notes to Financial Statements
36
Consolidated Schedule of Investments Commodity Strategy Fund(a) (cont'd)
PRINCIPAL AMOUNT | | | | VALUE | |
(000's omitted) | | | | (000's omitted) | |
Beverages 2.8% | | | |
| | | | | Anheuser-Busch InBev Finance, Inc. | | | | | |
$ | 2,030 | | | (3 month USD LIBOR + 0.40%), 2.94%, due 2/1/19 | | $ | 2,031 | (c) | |
| | 1,305 | | | (3 month USD LIBOR + 1.26%), 3.82%, due 2/1/21 | | | 1,333 | (c) | |
| | 785 | | | Diageo Capital PLC, (3 month USD LIBOR + 0.24%), 2.56%, due 5/18/20 | | | 786 | (c) | |
| | | | 4,150 | | |
Diversified Financial Services 1.6% | | | |
| | 835 | | | AIG Global Funding, (3 month USD LIBOR + 0.48%), 2.88%, due 7/2/20 | | | 836 | (b)(c) | |
| | 1,500 | | | American Express Co., (3 month USD LIBOR + 0.53%), 2.84%, due 5/17/21 | | | 1,502 | (c) | |
| | | | 2,338 | | |
Electric 4.4% | | | |
| | 1,060 | | | Caroline Power & Light Co., 5.30%, due 1/15/19 | | | 1,066 | | |
| | 3,040 | | | Dominion Energy, Inc., (3 month USD LIBOR + 0.55%), 2.87%, due 6/1/19 | | | 3,045 | (b)(c) | |
| | 2,430 | | | Sempra Energy, (3 month USD LIBOR + 0.50%), 2.94%, due 1/15/21 | | | 2,430 | (c) | |
| | | | 6,541 | | |
Healthcare—Services 1.9% | | | |
| | 1,860 | | | Halfmoon Parent, Inc., (3 month USD LIBOR + 0.65%), 2.98%, due 9/17/21 | | | 1,860 | (b)(c) | |
| | 915 | | | UnitedHealth Group, Inc., (3 month USD LIBOR + 0.26%), 2.59%, due 6/15/21 | | | 915 | (c) | |
| | | | 2,775 | | |
Machinery—Construction & Mining 1.2% | | | |
| | 1,785 | | | Caterpillar Financial Services Corp., (3 month USD LIBOR + 0.28%), 2.60%, due 9/7/21 | | | 1,781 | (c) | |
Machinery-Diversified 1.5% | | | |
| | 2,230 | | | John Deere Capital Corp., (3 month USD LIBOR + 0.29%), 2.66%, due 6/22/20 | | | 2,235 | (c) | |
Media 1.4% | | | |
| | 960 | | | Comcast Corp., (3 month USD LIBOR + 0.44%), 2.85%, due 10/1/21 | | | 960 | (c) | |
| | 1,050 | | | NBCUniversal Enterprise, Inc., (3 month USD LIBOR + 0.40%), 2.74%, due 4/1/21 | | | 1,050 | (b)(c) | |
| | | | 2,010 | | |
Miscellaneous Manufacturer 2.3% | | | |
| | 2,010 | | | General Electric Co., (3 month USD LIBOR + 0.51%), 2.95%, due 1/14/19 | | | 2,010 | (c) | |
| | 1,460 | | | Siemens Financieringsmaatschappij NV, (3 month USD LIBOR + 0.34%), 2.67%, due 3/16/20 | | | 1,462 | (b)(c) | |
| | | | 3,472 | | |
Oil & Gas 3.1% | | | |
| | 1,865 | | | BP AMI Leasing, Inc., 5.52%, due 5/8/19 | | | 1,888 | (b) | |
| | 2,020 | | | Phillips 66, (3 month USD LIBOR + 0.65%), 3.09%, due 4/15/19 | | | 2,020 | (b)(c) | |
| | 620 | | | Total Capital Int'l SA, (3 month USD LIBOR + 0.35%), 2.69%, due 6/19/19 | | | 621 | (c) | |
| | | | 4,529 | | |
See Notes to Financial Statements
37
Consolidated Schedule of Investments Commodity Strategy Fund(a) (cont'd)
PRINCIPAL AMOUNT | | | | VALUE | |
(000's omitted) | | | | (000's omitted) | |
Pharmaceuticals 3.4% | | | |
$ | 1,630 | | | Bayer U.S. Finance II LLC, (3 month USD LIBOR + 0.63%), 3.00%, due 6/25/21 | | $ | 1,631 | (b)(c) | |
| | 2,255 | | | CVS Health Corp., (3 month USD LIBOR + 0.72%), 3.05%, due 3/9/21 | | | 2,267 | (c) | |
| | 1,165 | | | GlaxoSmithKline Capital PLC, (3 month USD LIBOR + 0.35%), 2.67%, due 5/14/21 | | | 1,167 | (c) | |
| | | | 5,065 | | |
Pipelines 1.9% | | | |
| | 2,845 | | | Enterprise Products Operating LLC, Ser. N, 6.50%, due 1/31/19 | | | 2,868 | | |
Real Estate Investment Trusts 2.0% | | | |
| | 3,005 | | | Simon Property Group L.P., 2.20%, due 2/1/19 | | | 3,000 | | |
Retail 0.8% | | | |
| | 1,215 | | | Walmart, Inc., (3 month USD LIBOR + 0.23%), 2.60%, due 6/23/21 | | | 1,220 | (c) | |
Telecommunications 3.5% | | | |
| | 2,500 | | | AT&T, Inc., (3 month USD LIBOR + 0.95%), 3.39%, due 7/15/21 | | | 2,527 | (c) | |
| 2,575 | | | Verizon Communications, Inc., (3 month USD LIBOR + 0.55%, Floor 0.00%),
2.86%, due 5/22/20 | | | 2,587 | (c) | |
| | | | 5,114 | | |
| | | | | Total Corporate Bonds (Cost $97,257) | | | 97,240 | | |
NUMBER OF SHARES | | | | | |
Short-Term Investments 8.0% | | | |
Investment Companies 8.0% | | | |
| | 3,478,724 | | | State Street Institutional Treasury Money Market Fund Premier Class, 2.09%(e) | | | 3,479 | (f) | |
| | 8,341,973 | | | State Street Institutional U.S. Government Money Market Fund Premier Class, 2.09%(e) | | | 8,342 | (f) | |
| | | | | Total Short-Term Investments (Cost $11,821) | | | 11,821 | | |
| | | | | Total Investments 95.6% (Cost $141,693) | | | 141,638 | | |
| | | | | Other Assets Less Liabilities 4.4% | | | 6,541 | (g) | |
| | | | | Net Assets 100.0% | | $ | 148,179 | | |
(a) Formerly Risk Balanced Commodity Strategy Fund through November 8, 2018.
(b) Securities were purchased under Rule 144A of the Securities Act of 1933, as amended, or otherwise restricted and, unless registered under the Securities Act of 1933 or exempted from registration, may only be sold to qualified institutional investors or may have other restrictions on resale. At October 31, 2018, these securities amounted to approximately $35,113,000, which represents 23.7% of net assets of the Fund. These securities have been deemed by the investment manager to be liquid.
(c) Variable or floating rate security. The interest rate shown was the current rate as of October 31, 2018 and changes periodically.
See Notes to Financial Statements
38
Consolidated Schedule of Investments Commodity Strategy Fund(a) (cont'd)
Benchmarks for Variable/Floating Rates:
LIBOR - London Interbank Offered Rate
(d) When-issued security. Total value of all such securities at October 31, 2018 amounted to approximately $2,499,000, which represents 1.7% of net assets of the Fund.
(e) Represents 7-day effective yield as of October 31, 2018.
(f) All or a portion of this security is segregated in connection with obligations for futures and/or when-issued securities with a total value of approximately $11,821,000.
(g) Includes the impact of the Fund's open positions in derivatives at October 31, 2018.
(h) Security fair valued as of October 31, 2018 in accordance with procedures approved by the Board of Trustees. Total value of all such securities at October 31, 2018 amounted to approximately $1,600,000, which represents 1.1% of net assets of the Fund.
Derivative Instruments
Futures contracts ("futures")
At October 31, 2018, open positions in futures for the Fund were as follows:
Long Futures:
Expiration
Date | | Number of
Contracts | | Open Contracts | | Notional
Amount | | Value and
Unrealized
Appreciation/
(Depreciation) | |
12/2018 | | | 107 | | | Lead | | $ | 5,144,025 | | | $ | (455,952 | ) | |
12/2018 | | | 62 | | | Nickel | | | 4,265,538 | | | | (794,916 | ) | |
12/2018 | | | 59 | | | Primary Aluminum | | | 2,888,788 | | | | (206,571 | ) | |
12/2018 | | | 138 | | | RBOB Gasoline | | | 10,156,331 | | | | (1,651,685 | ) | |
12/2018 | | | 83 | | | Zinc | | | 5,218,106 | | | | 52,408 | | |
1/2019 | | | 145 | | | Brent Crude Oil | | | 10,888,050 | | | | (1,168,726 | ) | |
1/2019 | | | 42 | | | Feeder Cattle | | | 3,152,625 | | | | (51,374 | ) | |
1/2019 | | | 110 | | | Lead | | | 5,288,250 | | | | (55,044 | ) | |
1/2019 | | | 92 | | | Low Sulphur Gasoil | | | 6,384,800 | | | | (394,275 | ) | |
1/2019 | | | 60 | | | Nickel | | | 4,136,760 | | | | (490,032 | ) | |
1/2019 | | | 187 | | | Platinum | | | 7,882,050 | | | | 466,196 | | |
1/2019 | | | 54 | | | Primary Aluminum | | | 2,630,475 | | | | (120,775 | ) | |
1/2019 | | | 89 | | | Soybean | | | 3,790,288 | | | | (111,442 | ) | |
1/2019 | | | 203 | | | Soybean Meal | | | 6,256,460 | | | | (198,382 | ) | |
1/2019 | | | 138 | | | Soybean Oil | | | 2,338,272 | | | | (102,168 | ) | |
1/2019 | | | 83 | | | Zinc | | | 5,181,794 | | | | (355,862 | ) | |
2/2019 | | | 115 | | | Gold 100 Oz. | | | 14,039,200 | | | | 292,100 | | |
2/2019 | | | 133 | | | Lean Hogs | | | 3,475,290 | | | | (39,522 | ) | |
2/2019 | | | 152 | | | Natural Gas | | | 4,509,840 | | | | (251,699 | ) | |
See Notes to Financial Statements
39
Consolidated Schedule of Investments Commodity Strategy Fund(a) (cont'd)
Expiration
Date | | Number of
Contracts | | Open Contracts | | Notional
Amount | | Value and
Unrealized
Appreciation/
(Depreciation) | |
2/2019 | | | 115 | | | New York Harbor ULSD | | $ | 10,791,186 | | | $ | (769,258 | ) | |
2/2019 | | | 113 | | | Sugar 11 | | | 1,669,326 | | | | 265,103 | | |
2/2019 | | | 152 | | | WTI Crude Oil | | | 9,990,960 | | | | (1,176,690 | ) | |
3/2019 | | | 36 | | | Coffee 'C' | | | 1,572,075 | | | | 675 | | |
3/2019 | | | 104 | | | Copper | | | 6,962,800 | | | | (344,860 | ) | |
3/2019 | | | 66 | | | Cotton No. 2 | | | 2,583,900 | | | | 11,164 | | |
3/2019 | | | 168 | | | Hard Red Winter Wheat | | | 4,351,200 | | | | (211,437 | ) | |
3/2019 | | | 76 | | | Silver | | | 5,471,620 | | | | (37,620 | ) | |
3/2019 | | | 141 | | | Wheat | | | 3,637,800 | | | | (134,662 | ) | |
4/2019 | | | 66 | | | Live Cattle | | | 3,256,440 | | | | 20,906 | | |
5/2019 | | | 88 | | | Cocoa | | | 1,991,440 | | | | 118,660 | | |
5/2019 | | | 651 | | | Corn | | | 12,491,063 | | | | 581 | | |
Total Long Positions | | | | | | $ | 172,396,752 | | | $ | (7,895,159 | ) | |
Short Futures: | |
Expiration
Date | | Number of
Contracts | | Open Contracts | | Notional
Amount | | Value and
Unrealized
Appreciation/
(Depreciation) | |
12/2018 | | | 107 | | | Lead | | $ | (5,144,025 | ) | | $ | 30,721 | | |
12/2018 | | | 62 | | | Nickel | | | (4,265,538 | ) | | | 520,530 | | |
12/2018 | | | 59 | | | Primary Aluminum | | | (2,888,788 | ) | | | 145,771 | | |
12/2018 | | | 83 | | | Zinc | | | (5,218,106 | ) | | | 354,273 | | |
Total Short Positions | | | | | | $ | (17,516,457 | ) | | $ | 1,051,295 | | |
Total Futures | | | | | | | | $ | (6,843,864 | ) | |
At October 31, 2018, the Fund had $13,584,583 deposited in a segregated account to cover margin requirements on open futures.
For the year ended October 31, 2018, the average notional value of futures for the Fund was $151,972,584 for long positions and $(8,073,286) for short positions.
The following is a summary, categorized by Level (see Note A of Notes to Financial Statements), of inputs used to value the Fund's investments as of October 31, 2018:
Asset Valuation Inputs | |
(000's omitted) | | Level 1 | | Level 2 | | Level 3(b) | | Total | |
Investments: | |
Asset-Backed Securities | | $ | — | | | $ | 32,577 | | | $ | — | | | $ | 32,577 | | |
| Corporate Bonds(a) | | | — | | | | 97,240 | | | | — | | | | 97,240 | | |
Short-Term Investments | | | — | | | | 11,821 | | | | — | | | | 11,821 | | |
Total Investments | | $ | — | | | $ | 141,638 | | | $ | — | | | $ | 141,638 | | |
See Notes to Financial Statements
40
Consolidated Schedule of Investments Commodity Strategy Fund(a) (cont'd)
(a) The Consolidated Schedule of Investments provides information on the industry or sector categorization for the portfolio.
(b) The following is a reconciliation between the beginning and ending balances of investments in which unobservable inputs (Level 3) were used in determining the value:
| | | Beginning
balance, as
of 11/1/2017 | | Accrued
discounts/
(premiums) | | Realized
gain/(loss) | | Change
in unrealized
appreciation/
(depreciation) | | Purchases | | Sales | | Transfers
in to
Level 3 | | Transfers
out of
Level 3 | | Balance,
as of
10/31/2018 | | Net change in
unrealized
appreciation/
(depreciation)
from
investments
still held as of
10/31/2018 | |
Investments in Securities: | |
(000's omitted) | |
Asset Backed
Securities(c) | | $ | 480 | | | $ | — | | | $ | — | | | $ | — | | | $ | — | | | $ | — | | | $ | — | | | $ | (480 | ) | | $ | — | | | $ | — | | |
Total | | $ | 480 | | | $ | — | | | $ | — | | | $ | — | | | $ | — | | | $ | — | | | $ | — | | | $ | (480 | ) | | $ | — | | | $ | — | | |
(c) At the beginning of the year, these investments were valued based on a single quotation obtained from a dealer. The Fund held no Level 3 investments at October 31, 2018.
The following is a summary, categorized by Level (see Note A of Notes to Financial Statements), of inputs used to value the Fund's derivatives as of October 31, 2018:
Other Financial Instruments | |
(000's omitted) | | Level 1 | | Level 2 | | Level 3 | | Total | |
| Futures(a) | |
Assets | | $ | 2,279 | | | $ | — | | | $ | — | | | $ | 2,279 | | |
Liabilities | | | (9,123 | ) | | | — | | | | — | | | | (9,123 | ) | |
Total | | $ | (6,844 | ) | | $ | — | | | $ | — | | | $ | (6,844 | ) | |
(a) Futures are reported at the cumulative unrealized appreciation/(depreciation) of the instrument.
See Notes to Financial Statements
41
Schedule of Investments Global Allocation Fund October 31, 2018
| | | Number
of Shares | | Value
(000's
omitted) | |
Common Stocks 26.2% | |
Australia 0.5% | |
Alumina Ltd. | | | 2,141 | | | $ | 4 | | |
Australia &
New Zealand
Banking Group
Ltd. | | | 1,509 | | | | 28 | | |
BHP Billiton PLC | | | 9 | | | | — | | |
Macquarie Group
Ltd. | | | 108 | | | | 9 | | |
Rio Tinto PLC | | | 422 | | | | 20 | | |
Wesfarmers Ltd. | | | 1,017 | | | | 34 | | |
| | | | 95 | | |
Austria 0.1% | |
Telekom Austria
AG | | | 1,641 | | | | 12 | * | |
voestalpine AG | | | 3 | | | | — | | |
| | | | 12 | | |
Belgium 0.1% | |
Ageas | | | 166 | | | | 8 | | |
Colruyt SA | | | 51 | | | | 3 | | |
KBC Group NV | | | 103 | | | | 7 | | |
| | | | 18 | | |
Bermuda 0.1% | |
Marvell Technology
Group Ltd. | | | 847 | | | | 14 | | |
Canada 0.6% | |
Bank of Montreal | | | 111 | | | | 8 | | |
Canadian Imperial
Bank of
Commerce | | | 3 | | | | — | | |
CGI Group, Inc.
Class A | | | 45 | | | | 3 | * | |
Dream Global Real
Estate Investment
Trust | | | 395 | | | | 4 | | |
National Bank of
Canada | | | 275 | | | | 13 | | |
Rogers
Communications,
Inc. Class B | | | 272 | | | | 14 | | |
Royal Bank of
Canada | | | 1 | | | | — | | |
Sun Life Financial,
Inc. | | | 543 | | | | 20 | | |
Toronto-Dominion
Bank | | | 791 | | | | 44 | | |
| | | | 106 | | |
China 0.5% | |
Alibaba Group
Holding Ltd. ADR | | | 379 | | | | 54 | *(a) | |
JD.com, Inc. ADR | | | 2,037 | | | | 48 | * | |
| | | | 102 | | |
| | | Number
of Shares | | Value
(000's
omitted) | |
| Denmark 0.0%(b) | |
Carlsberg A/S
Class B | | | 12 | | | $ | 1 | | |
H Lundbeck A/S | | | 60 | | | | 3 | | |
| | | | 4 | | |
Finland 0.2% | |
Fortum OYJ | | | 383 | | | | 8 | | |
Sampo OYJ,
A Shares | | | 161 | | | | 8 | | |
UPM-Kymmene
OYJ | | | 475 | | | | 15 | | |
| | | | 31 | | |
France 0.4% | |
Capgemini SE | | | 68 | | | | 8 | | |
CNP Assurances | | | 213 | | | | 5 | | |
Eiffage SA | | | 67 | | | | 6 | | |
Engie SA | | | 1,640 | | | | 22 | | |
Orange SA | | | 1,708 | | | | 27 | | |
TOTAL SA | | | 214 | | | | 13 | | |
| | | | 81 | | |
Germany 0.2% | |
Covestro AG | | | 126 | | | | 8 | (c) | |
Deutsche
Lufthansa AG | | | 667 | | | | 13 | | |
E.ON SE | | | 831 | | | | 8 | | |
SAP SE | | | 37 | | | | 4 | | |
Wuestenrot &
Wuerttembergische
AG | | | 331 | | | | 7 | | |
| | | | 40 | | |
Hong Kong 0.3% | |
CLP Holdings Ltd. | | | 1,500 | | | | 17 | | |
Great Eagle
Holdings Ltd. | | | 1,000 | | | | 4 | | |
HKT Trust & HKT
Ltd. | | | 3,000 | | | | 4 | | |
Hongkong Land
Holdings Ltd. | | | 610 | | | | 4 | | |
Jardine Matheson
Holdings Ltd. | | | 36 | | | | 2 | | |
Link REIT | | | 2,000 | | | | 18 | | |
NWS Holdings Ltd. | | | 1,000 | | | | 2 | | |
Swire Pacific Ltd.
Class A | | | 500 | | | | 5 | | |
| | | | 56 | | |
| Israel 0.0%(b) | |
Bank Leumi
Le-Israel BM | | | 1,340 | | | | 8 | | |
Italy 0.2% | |
Assicurazioni
Generali SpA | | | 156 | | | | 3 | | |
| ASTM SpA | | | 102 | | | | 2 | | |
| | | Number
of Shares | | Value
(000's
omitted) | |
Eni SpA | | | 2,041 | | | $ | 36 | | |
Snam SpA | | | 890 | | | | 4 | | |
| | | | 45 | | |
Japan 1.5% | |
AGC, Inc. | | | 200 | | | | 7 | | |
Astellas Pharma,
Inc. | | | 600 | | | | 9 | | |
Canon, Inc. | | | 1,000 | | | | 29 | | |
Daiichi Sankyo Co.
Ltd. | | | 200 | | | | 8 | | |
EDION Corp. | | | 800 | | | | 8 | | |
FUJIFILM Holdings
Corp. | | | 300 | | | | 13 | | |
Haseko Corp. | | | 200 | | | | 3 | | |
Hitachi Ltd. | | | 800 | | | | 24 | | |
ITOCHU Corp. | | | 1,300 | | | | 24 | | |
Japan Tobacco,
Inc. | | | 100 | | | | 3 | | |
JXTG Holdings,
Inc. | | | 800 | | | | 5 | | |
KDDI Corp. | | | 300 | | | | 7 | | |
Marubeni Corp. | | | 1,900 | | | | 15 | | |
Mitsubishi Corp. | | | 800 | | | | 23 | | |
Mitsui & Co. Ltd. | | | 1,400 | | | | 23 | | |
NEC Corp. | | | 500 | | | | 14 | | |
Nippon
Telegraph &
Telephone Corp. | | | 600 | | | | 25 | | |
NTT DOCOMO,
Inc. | | | 1,200 | | | | 30 | | |
Sumitomo Corp. | | | 1,400 | | | | 21 | | |
| | | | 291 | | |
Netherlands 0.4% | |
Heineken
Holding NV | | | 95 | | | | 8 | | |
Koninklijke Ahold
Delhaize NV | | | 1,107 | | | | 26 | | |
Koninklijke
DSM NV | | | 163 | | | | 14 | | |
Royal Dutch Shell
PLC, B Shares | | | 402 | | | | 13 | | |
Wolters Kluwer NV | | | 256 | | | | 15 | | |
| | | | 76 | | |
Norway 0.1% | |
DNB ASA | | | 388 | | | | 7 | | |
Telenor ASA | | | 683 | | | | 13 | | |
| | | | 20 | | |
| Portugal 0.0%(b) | |
EDP—Energias de
Portugal SA | | | 2,305 | | | | 8 | | |
Singapore 0.1% | |
Ascendas Real
Estate Investment
Trust | | | 2,200 | | | | 4 | | |
See Notes to Financial Statements
42
Schedule of Investments Global Allocation Fund (cont'd)
| | | Number
of Shares | | Value
(000's
omitted) | |
Singapore
Telecommunications
Ltd. | | | 3,900 | | | $ | 9 | | |
| | | | 13 | | |
Spain 0.3% | |
Aena SME SA | | | 49 | | | | 8 | (c) | |
Bankinter SA | | | 610 | | | | 5 | | |
Enagas SA | | | 204 | | | | 5 | | |
Endesa SA | | | 282 | | | | 6 | | |
Red Electrica
Corp. SA | | | 382 | | | | 8 | | |
Repsol SA | | | 1,199 | | | | 22 | | |
| | | | 54 | | |
Sweden 0.1% | |
Skandinaviska
Enskilda Banken
AB, Class A | | | 1,441 | | | | 15 | | |
Telia Co. AB | | | 102 | | | | — | | |
| | | | 15 | | |
Switzerland 0.7% | |
ABB Ltd. | | | 55 | | | | 1 | | |
Chocoladefabriken
Lindt & Spruengli
AG | | | 1 | | | | 7 | | |
Ferguson PLC | | | 176 | | | | 12 | | |
Garrett Motion,
Inc. | | | 6 | | | | — | * | |
Novartis AG | | | 631 | | | | 55 | | |
Roche Holding AG | | | 88 | | | | 21 | | |
Swiss Life Holding
AG | | | 25 | | | | 10 | * | |
Zurich Insurance
Group AG | | | 73 | | | | 23 | | |
| | | | 129 | | |
United Kingdom 0.9% | |
Anglo American
PLC | | | 55 | | | | 1 | | |
Aviva PLC | | | 3,126 | | | | 17 | | |
| BP PLC | | | 565 | | | | 4 | | |
Diageo PLC | | | 268 | | | | 9 | | |
Evraz PLC | | | 1,322 | | | | 9 | | |
GlaxoSmithKline
PLC | | | 2,322 | | | | 45 | | |
HSBC Holdings
PLC | | | 29 | | | | — | | |
J Sainsbury PLC | | | 954 | | | | 4 | | |
John Menzies PLC | | | 739 | | | | 5 | | |
Legal & General
Group PLC | | | 5,040 | | | | 16 | | |
Pearson PLC | | | 682 | | | | 8 | | |
Rio Tinto Ltd. | | | 360 | | | | 20 | | |
Royal Mail PLC | | | 811 | | | | 4 | | |
WM Morrison
Supermarkets PLC | | | 7,632 | | | | 24 | | |
| | | | 166 | | |
| | | Number
of Shares | | Value
(000's
omitted) | |
United States 18.9% | |
AbbVie, Inc. | | | 77 | | | $ | 6 | | |
Adobe, Inc. | | | 262 | | | | 64 | * | |
Aetna, Inc. | | | 69 | | | | 14 | (a) | |
Aflac, Inc. | | | 744 | | | | 32 | | |
Agilent
Technologies, Inc. | | | 218 | | | | 14 | | |
AGNC Investment
Corp. | | | 1,109 | | | | 20 | | |
Allergan PLC | | | 355 | | | | 56 | | |
Alphabet, Inc.
Class A | | | 74 | | | | 81 | * | |
Alphabet, Inc.
Class C | | | 22 | | | | 24 | *(a) | |
Amazon.com, Inc. | | | 81 | | | | 129 | *(a) | |
Amgen, Inc. | | | 184 | | | | 35 | (a) | |
Amphenol Corp.
Class A | | | 27 | | | | 2 | | |
Annaly Capital
Management, Inc. | | | 2,958 | | | | 29 | | |
Anthem, Inc. | | | 278 | | | | 77 | | |
Apple, Inc. | | | 827 | | | | 181 | (a) | |
Archer-Daniels-
Midland Co. | | | 587 | | | | 28 | | |
ARMOUR
Residential REIT,
Inc. | | | 269 | | | | 6 | | |
Avnet, Inc. | | | 229 | | | | 9 | | |
AVX Corp. | | | 271 | | | | 5 | | |
Bank of America
Corp. | | | 2,593 | | | | 71 | (a) | |
Baxter
International, Inc. | | | 346 | | | | 22 | | |
Boeing Co. | | | 51 | | | | 18 | | |
Booking Holdings,
Inc. | | | 49 | | | | 92 | * | |
Camden Property
Trust | | | 65 | | | | 6 | | |
Carnival Corp. | | | 233 | | | | 13 | | |
CDW Corp. | | | 138 | | | | 12 | | |
CenterPoint
Energy, Inc. | | | 374 | | | | 10 | | |
Cheniere Energy,
Inc. | | | 1,066 | | | | 64 | *(a) | |
Chevron Corp. | | | 244 | | | | 27 | (a) | |
Chimera
Investment Corp. | | | 57 | | | | 1 | | |
Cisco Systems, Inc. | | | 524 | | | | 24 | (a) | |
Coca-Cola Co. | | | 220 | | | | 11 | | |
Comerica, Inc. | | | 159 | | | | 13 | | |
Corning, Inc. | | | 533 | | | | 17 | (a) | |
Cummins, Inc. | | | 33 | | | | 5 | | |
Danaher Corp. | | | 142 | | | | 14 | (a) | |
Darden
Restaurants, Inc. | | | 113 | | | | 12 | | |
DowDuPont, Inc. | | | 972 | | | | 52 | | |
DTE Energy Co. | | | 53 | | | | 6 | | |
Eaton Corp. PLC | | | 400 | | | | 29 | (a) | |
Emerson
Electric Co. | | | 262 | | | | 18 | | |
Exelon Corp. | | | 119 | | | | 5 | | |
| | | Number
of Shares | | Value
(000's
omitted) | |
Extra Space
Storage, Inc. | | | 68 | | | $ | 6 | | |
Exxon Mobil Corp. | | | 558 | | | | 44 | | |
Facebook, Inc.
Class A | | | 552 | | | | 84 | *(a) | |
Fidelity National
Information
Services, Inc. | | | 179 | | | | 19 | | |
Ford Motor Co. | | | 1,143 | | | | 11 | | |
Gaming and
Leisure Properties,
Inc. | | | 146 | | | | 5 | | |
Garmin Ltd. | | | 90 | | | | 6 | | |
Gilead Sciences,
Inc. | | | 152 | | | | 10 | | |
Harris Corp. | | | 181 | | | | 27 | (a) | |
Hartford Financial
Services Group,
Inc. | | | 23 | | | | 1 | | |
Home Depot, Inc. | | | 198 | | | | 35 | | |
Honeywell
International, Inc. | | | 122 | | | | 18 | | |
Host Hotels &
Resorts, Inc. | | | 289 | | | | 6 | | |
HP, Inc. | | | 226 | | | | 5 | | |
Humana, Inc. | | | 21 | | | | 7 | | |
Huntsman Corp. | | | 45 | | | | 1 | | |
Ingredion, Inc. | | | 33 | | | | 3 | | |
Intel Corp. | | | 1,005 | | | | 47 | (a) | |
International
Paper Co. | | | 95 | | | | 4 | | |
Invesco Mortgage
Capital, Inc. | | | 360 | | | | 5 | | |
Jabil, Inc. | | | 235 | | | | 6 | | |
Johnson &
Johnson | | | 207 | | | | 29 | (a) | |
JPMorgan
Chase & Co. | | | 653 | | | | 71 | (a) | |
Kansas City
Southern | | | 86 | | | | 9 | | |
Kellogg Co. | | | 78 | | | | 5 | | |
Kohl's Corp. | | | 149 | | | | 11 | | |
Lam Research
Corp. | | | 15 | | | | 2 | | |
Las Vegas Sands
Corp. | | | 278 | | | | 14 | | |
Lear Corp. | | | 24 | | | | 3 | | |
Leidos Holdings,
Inc. | | | 85 | | | | 6 | | |
Loews Corp. | | | 277 | | | | 13 | | |
lululemon
Athletica, Inc. | | | 90 | | | | 13 | * | |
LyondellBasell
Industries NV
Class A | | | 300 | | | | 27 | | |
MasterCard, Inc.
Class A | | | 321 | | | | 63 | | |
McDonald's Corp. | | | 301 | | | | 53 | | |
Medtronic PLC | | | 125 | | | | 11 | (a) | |
Merck & Co., Inc. | | | 426 | | | | 31 | | |
MFA Financial, Inc. | | | 1,481 | | | | 10 | | |
See Notes to Financial Statements
43
Schedule of Investments Global Allocation Fund (cont'd)
| | | Number
of Shares | | Value
(000's
omitted) | |
Micron
Technology, Inc. | | | 106 | | | $ | 4 | * | |
Microsoft Corp. | | | 1,242 | | | | 133 | (a) | |
Mohawk
Industries, Inc. | | | 346 | | | | 43 | *(a) | |
Mondelez
International, Inc.
Class A | | | 216 | | | | 9 | | |
Morgan Stanley | | | 189 | | | | 9 | | |
Netflix, Inc. | | | 203 | | | | 61 | * | |
New Residential
Investment Corp. | | | 158 | | | | 3 | | |
Newmont Mining
Corp. | | | 145 | | | | 5 | | |
NIKE, Inc. Class B | | | 297 | | | | 22 | | |
Norfolk Southern
Corp. | | | 39 | | | | 7 | | |
Nucor Corp. | | | 152 | | | | 9 | | |
Occidental
Petroleum Corp. | | | 82 | | | | 6 | | |
OGE Energy Corp. | | | 28 | | | | 1 | | |
ONEOK, Inc. | | | 34 | | | | 2 | | |
Parker-Hannifin
Corp. | | | 12 | | | | 2 | | |
PepsiCo, Inc. | | | 229 | | | | 26 | | |
Pfizer, Inc. | | | 887 | | | | 38 | | |
Phillips 66 | | | 274 | | | | 28 | | |
PNC Financial
Services Group,
Inc. | | | 299 | | | | 38 | (a) | |
Procter & Gamble
Co. | | | 125 | | | | 11 | | |
Prudential
Financial, Inc. | | | 132 | | | | 12 | | |
Quest Diagnostics,
Inc. | | | 93 | | | | 9 | | |
Raytheon Co. | | | 135 | | | | 24 | | |
Reinsurance Group
of America, Inc. | | | 164 | | | | 23 | | |
Reliance Steel &
Aluminum Co. | | | 29 | | | | 2 | | |
Republic Services,
Inc. | | | 190 | | | | 14 | | |
Resideo
Technologies, Inc. | | | 20 | | | | — | * | |
Royal Caribbean
Cruises Ltd. | | | 74 | | | | 8 | | |
Shire PLC ADR | | | 381 | | | | 69 | | |
Sirius XM
Holdings, Inc. | | | 1,319 | | | | 8 | | |
State Street Corp. | | | 180 | | | | 12 | | |
Steel Dynamics,
Inc. | | | 202 | | | | 8 | | |
STERIS PLC | | | 256 | | | | 28 | | |
Sysco Corp. | | | 46 | | | | 3 | | |
T-Mobile US, Inc. | | | 989 | | | | 68 | * | |
Tapestry, Inc. | | | 255 | | | | 11 | | |
Target Corp. | | | 297 | | | | 25 | | |
TE Connectivity
Ltd. | | | 315 | | | | 24 | | |
| | | Number
of Shares | | Value
(000's
omitted) | |
Texas Instruments,
Inc. | | | 249 | | | $ | 23 | (a) | |
U.S. Bancorp | | | 54 | | | | 3 | | |
Union Pacific Corp. | | | 42 | | | | 6 | | |
United
Technologies
Corp. | | | 485 | | | | 60 | | |
UnitedHealth
Group, Inc. | | | 420 | | | | 110 | | |
Universal Health
Services, Inc.
Class B | | | 521 | | | | 63 | | |
Valero Energy
Corp. | | | 310 | | | | 28 | | |
Ventas, Inc. | | | 101 | | | | 6 | | |
Verizon
Communications,
Inc. | | | 772 | | | | 44 | | |
VF Corp. | | | 143 | | | | 12 | | |
Visa, Inc. Class A | | | 566 | | | | 78 | (a) | |
Vishay
Intertechnology,
Inc. | | | 196 | | | | 4 | | |
Walgreens Boots
Alliance, Inc. | | | 119 | | | | 10 | | |
Walmart, Inc. | | | 452 | | | | 45 | (a) | |
Walt Disney Co. | | | 579 | | | | 67 | | |
Waste
Management, Inc. | | | 79 | | | | 7 | | |
WEC Energy
Group, Inc. | | | 242 | | | | 17 | | |
Wells Fargo & Co. | | | 1,328 | | | | 71 | | |
Weyerhaeuser Co. | | | 680 | | | | 18 | | |
WP Carey, Inc. | | | 78 | | | | 5 | | |
Xerox Corp. | | | 723 | | | | 20 | | |
| | | | 3,577 | | |
Total Common Stocks
(Cost $4,795) | | | | | 4,961 | | |
| | | Principal
Amount
(000's
omitted) | | | |
U.S. Treasury Obligations 7.3% | |
U.S. Treasury Bill,
2.03%, due
11/23/18 | | $ | 100 | | | | 100 | (a)(d) | |
U.S. Treasury Bond,
3.88%, due
8/15/40 | | | 25 | | | | 27 | | |
U.S. Treasury
Inflation-Indexed
Bonds(e) | |
| 1/15/26 2.00%, due | | | 277 | | | | 294 | | |
| 4/15/28 3.63%, due | | | 86 | | | | 105 | | |
| | | Principal
Amount
(000's
omitted) | | Value
(000's
omitted) | |
3.88%, due
4/15/29 | | $ | 117
| | | $ | 147
| | |
3.38%, due
4/15/32 | | | 7
| | | | 9
| | |
1.00%, due
2/15/46 | | | 48
| | | | 44
| | |
U.S. Treasury Notes | |
1.38%, due
11/30/18 | | | 190
| | | | 190
| | |
1.00%, due
10/15/19 | | | 255
| | | | 251
| | |
2.13%, due
12/31/21 | | | 25
| | | | 24
| | |
2.38%, due
8/15/24 | | | 15
| | | | 14
| | |
1.63%, due
2/15/26 | | | 5
| | | | 5
| | |
2.25%, due
11/15/27 | | | 190
| | | | 177
| | |
Total U.S. Treasury
Obligations
(Cost $1,415) | | | | | 1,387 | | |
U.S. Government Agency Securities 0.5% | |
Federal Home
Loan Bank,
5.50%, due
7/15/36
(Cost $106) | | | 80 | | | | 99 | | |
Mortgage-Backed Securities 9.3% | |
Collateralized Mortgage
Obligations 2.0% | |
Fannie Mae
Connecticut
Avenue Securities | |
Ser. 2017-C02,
Class 2M2,
(1 month USD
LIBOR + 3.65%),
5.93%, due
9/25/29 | | | 130 | | | | 142 | (f) | |
Ser. 2018-C02,
Class 2M2,
(1 month USD
LIBOR + 2.20%),
4.48% , due
1/25/30–8/25/30 | | | 95 | | | | 97 | (f) | |
Ser. 2017-C03,
Class 1M2,
(1 month USD
LIBOR + 3.00%),
5.28%, due
10/25/29 | | | 25 | | | | 27 | (f) | |
Ser. 2017-C04,
Class 2M2,
(1 month USD
LIBOR + 2.85%),
5.13%, due
11/25/29 | | | 70 | | | | 73 | (f) | |
See Notes to Financial Statements
44
Schedule of Investments Global Allocation Fund (cont'd)
| | | Principal
Amount
(000's
omitted) | | Value
(000's
omitted) | |
Ser. 2017-C06,
Class 1M2,
(1 month USD
LIBOR + 2.65%),
4.93%, due
2/25/30 | | $ | 15 | | | $ | 16 | (f) | |
Ser. 2017-C06,
Class 2M2,
(1 month USD
LIBOR + 2.80%),
5.08%, due
2/25/30 | | | 20 | | | | 21 | (f) | |
Freddie Mac
Multifamily
Structured Pass
Through
Certificates,
Ser. KI02, Class A
(1 month USD
LIBOR + 0.20%),
2.46% due
2/25/21 | | | 4 | | | | 4 | (f) | |
| | | | 380 | | |
Fannie Mae 3.7% | | | |
Pass-Through
Certificates | |
3.50%, TBA,
30 Year Maturity | | | 120 | | | | 117 | (g) | |
4.00%, TBA,
15 Year Maturity | | | 25 | | | | 25 | (g) | |
4.00%, TBA,
30 Year Maturity | | | 390 | | | | 390 | (g) | |
4.50%, TBA,
30 Year Maturity | | | 175 | | | | 179 | (g) | |
| | | | 711 | | |
Freddie Mac 3.1% | | | |
Pass-Through
Certificates | |
3.50%, TBA,
30 Year Maturity | | | 120 | | | | 117 | (g) | |
4.00%, TBA,
30 Year Maturity | | | 315 | | | | 315 | (g) | |
4.50%, TBA,
30 Year Maturity | | | 115 | | | | 118 | (g) | |
5.00%, TBA,
30 Year Maturity | | | 40 | | | | 42 | (g) | |
| | | | 592 | | |
Ginnie Mae 0.5% | | | |
Pass-Through
Certificates | |
4.50%, TBA,
30 Year Maturity | | | 85 | | | | 87 | (g) | |
Total Mortgage-
Backed
Securities
(Cost $1,760) | | | | | 1,770 | | |
| | | Principal
Amount
(000's
omitted) | | Value
(000's
omitted) | |
Corporate Bonds 6.4% | |
Australia 0.2% | |
Westpac Banking
Corp., (5 year
USD ICE Swap +
2.89%), 5.00%,
due 9/21/27 | | $ | 35 | | | $ | 31 | (f)(h) | |
Belgium 0.2% | |
Anheuser-Busch
InBev Finance,
Inc., 4.70%,
due 2/1/36 | | | 10 | | | | 10 | | |
Anheuser-Busch
InBev Worldwide,
Inc. | |
4.60%, due
4/15/48 | | | 15
| | | | 13
| | |
4.75%, due
4/15/58 | | | 25
| | | | 22
| | |
| | | | 45 | | |
Brazil 0.1% | |
Vale Overseas Ltd.,
6.25%, due
8/10/26 | | | 15 | | | | 16 | | |
Mexico 0.2% | |
Grupo Bimbo
SAB de CV,
4.70%, due
11/10/47 | | | 25 | | | | 22 | (i) | |
Petroleos
Mexicanos,
6.50%, due
3/13/27 | | | 10 | | | | 10 | | |
| | | | 32 | | |
Spain 0.1% | |
Banco Santander
SA, 3.80%,
due 2/23/28 | | | 20 | | | | 18 | | |
United Kingdom 0.8% | |
Barclays PLC,
4.38%, due
1/12/26 | | | 45 | | | | 43 | | |
BAT Capital Corp.,
4.54%, due
8/15/47 | | | 40 | | | | 35 | (i) | |
HSBC Holdings
PLC, (5 year USD
ICE Swap +
3.75%), 6.00%,
due 5/22/27 | | | 30 | | | | 28 | (f)(h) | |
Nationwide
Building Society,
(3 month USD
LIBOR + 1.45%),
4.30%, due
3/8/29 | | | 10 | | | | 9 | (f)(i) | |
| | | Principal
Amount
(000's
omitted) | | Value
(000's
omitted) | |
Royal Bank of
Scotland Group
PLC, (3 month
USD LIBOR +
1.91%), 5.08%,
due 1/27/30 | | $ | 10 | | | $ | 10 | (f) | |
Vodafone Group
PLC, 3.75%,
due 1/16/24 | | | 25 | | | | 24 | | |
| | | | 149 | | |
United States 4.8% | | | |
AbbVie, Inc.,
4.70%, due
5/14/45 | | | 20 | | | | 18 | | |
Apple, Inc.,
4.65%, due
2/23/46 | | | 20 | | | | 21 | | |
AT&T, Inc. | |
4.75%, due | | | 20 | | | | 17 | | |
5/15/46 | | | | | | | | | |
5.45%, due | | | 30 | | | | 28 | | |
3/1/47 | | | | | | | | | |
AXA Equitable
Holdings, Inc.,
5.00%, due
4/20/48 | | | 20 | | | | 18 | (i) | |
Bank of America
Corp. | |
(3 month USD
LIBOR + 0.37%),
2.74%, due
1/23/22 | | | 20 | | | | 20 | (f) | |
(3 month USD
LIBOR + 1.07%),
3.97%, due
3/5/29 | | | 20 | | | | 19 | (f) | |
Broadcom Corp./
Broadcom
Cayman Finance
Ltd., 3.88%,
due 1/15/27 | | | 80 | | | | 73 | | |
Charter
Communications
Operating
LLC/Charter
Communications
Operating Capital | |
4.91%, due | | | 30 | | | | 30 | | |
7/23/25 | | | | | | | | | |
5.38%, due | | | 5 | | | | 4 | | |
5/1/47 | | | | | | | | | |
5.75%, due | | | 10 | | | | 9 | | |
4/1/48 | | | | | | | | | |
Citigroup, Inc. | |
(3 month USD
LIBOR + 1.56%),
3.89%, due
1/10/28 | | | 10 | | | | 10 | (f) | |
See Notes to Financial Statements
45
Schedule of Investments Global Allocation Fund (cont'd)
| | | Principal
Amount
(000's
omitted) | | Value
(000's
omitted) | |
(3 month USD
LIBOR + 1.15%),
3.52%, due
10/27/28 | | $ | 10 | | | $ | 9 | (f) | |
Comcast Corp. | | | | | |
3.70%, due
4/15/24 | | | 20 | | | | 20 | | |
4.00%, due
8/15/47 | | | 20 | | | | 17 | | |
4.95%, due
10/15/58 | | | 25 | | | | 24 | | |
Concho Resources,
Inc., 4.88%,
due 10/1/47 | | | 15 | | | | 14 | | |
CVS Health Corp. | | | | | |
4.30%, due
3/25/28 | | | 20 | | | | 20 | | |
5.05%, due
3/25/48 | | | 45 | | | | 44 | | |
Diamond 1
Finance Corp./
Diamond 2
Finance Corp. | | | | | |
5.45%, due
6/15/23 | | | 30 | | | | 31 | (i) | |
6.02%, due
6/15/26 | | | 15 | | | | 16 | (i) | |
Energy Transfer
Partners L.P. | | | | | |
Ser. B, (3 month
USD LIBOR +
4.16%), 6.63%,
due 2/15/28 | | | 30 | | | | 28 | (f)(h) | |
5.80%, due
6/15/38 | | | 10 | | | | 10 | | |
General Electric
Co., Ser. D,
(3 month USD
LIBOR + 3.33%),
5.00%, due
1/21/21 | | | 80 | | | | 74 | (f)(h) | |
Goldman Sachs
Group, Inc. | | | | | |
2.60%, due
4/23/20 | | | 10 | | | | 10 | | |
(3 month USD
LIBOR + 1.51%),
3.69%, due
6/5/28 | | | 20 | | | | 19 | (f) | |
(3 month USD
LIBOR + 1.16%),
3.81%, due
4/23/29 | | | 35 | | | | 33 | (f) | |
(3 month USD
LIBOR + 1.37%),
4.02%, due
10/31/38 | | | 20 | | | | 18 | (f) | |
5.15%, due
5/22/45 | | | 15 | | | | 15 | | |
| | | Principal
Amount
(000's
omitted) | | Value
(000's
omitted) | |
HP Enterprise Co. | |
3.60%, due
10/15/20 | | $ | 20 | | | $ | 20 | | |
4.90%, due
10/15/25 | | | 15 | | | | 15 | | |
JPMorgan
Chase & Co. | | | | | |
(3 month USD
LIBOR + 1.12%),
4.01%, due
4/23/29 | | | 30 | | | | 29 | (f) | |
(3 month USD
LIBOR + 1.36%),
3.88%, due
7/24/38 | | | 15 | | | | 14 | (f) | |
(3 month USD
LIBOR + 1.22%),
3.90%, due
1/23/49 | | | 15 | | | | 13 | (f) | |
Kinder Morgan
Energy Partners
L.P., 4.15%, due
2/1/24 | | | 20 | | | | 20 | | |
Kinder Morgan,
Inc., 5.55%, due
6/1/45 | | | 25 | | | | 25 | | |
Marathon Oil
Corp., 4.40%,
due 7/15/27 | | | 5 | | | | 5 | | |
Morgan Stanley,
(3 month USD
LIBOR + 1.34%),
3.59%, due
7/22/28 | | | 30 | | | | 28 | (f) | |
MPLX L.P., 4.70%,
due 4/15/48 | | | 30 | | | | 26 | | |
Shire Acquisitions
Investments
Ireland DAC,
2.40%, due
9/23/21 | | | 25 | | | | 24 | | |
Synchrony
Financial, 2.70%,
due 2/3/20 | | | 10 | | | | 10 | | |
Wabtec Corp.,
4.15%, due
3/15/24 | | | 20 | | | | 20 | | |
| | | | 918 | | |
Total Corporate Bonds
(Cost $1,293) | | | | | 1,209 | | |
| | | Principal
Amount
(000's
omitted) | | Value
(000's
omitted) | |
Asset-Backed Securities 0.6% | |
Ally Auto
Receivables Trust,
Ser. 2017-3,
Class A2, 1.53%,
due 3/16/20 | | $ | 2 | | | $ | 2 | | |
Bear Stearns Asset
Backed Securities
Trust, Ser.
2006-SD2,
Class M2,
(1 month USD
LIBOR + 0.80%),
3.08%, due
6/25/36 | | | 100 | | | | 100 | (f) | |
Capital One
Multi-Asset
Execution Trust,
Ser. 2016-A1,
Class A1,
(1 month USD
LIBOR + 0.45%),
2.73%, due
2/15/22 | | | 10 | | | | 10 | (f) | |
Toyota Auto
Receivables
Owner Trust,
Ser. 2017-B,
Class A2A,
1.46%, due
1/15/20 | | | 7 | | | | 7 | | |
Total Asset-Backed
Securities
(Cost $111) | | | | | 119 | | |
| | | Number
of Shares | | | |
Exchange-Traded Funds 2.4% | |
iShares TIPS Bond
ETF | | | 2,850 | | | | 310 | | |
SPDR Bloomberg
Barclays Short
Term High Yield
Bond ETF | | | 5,506 | | | | 149 | | |
Total Exchange-
Traded Funds
(Cost $472) | | | | | 459 | | |
See Notes to Financial Statements
46
Schedule of Investments Global Allocation Fund (cont'd)
| | | Number
of Shares | | Value
(000's
omitted) | |
| Investment Companies 53.3%(j) | |
Neuberger Berman
Commodity
Strategy Fund
Institutional Class | | | 211,186 | | | $ | 1,307 | | |
Neuberger Berman
Emerging Markets
Debt Fund
Institutional Class | | | 128,548 | | | | 1,032 | | |
Neuberger Berman
Emerging Markets
Equity Fund
Class R6 | | | 66,315 | | | | 1,155 | | |
Neuberger Berman
Floating Rate
Income Fund
Institutional Class | | | 30,013 | | | | 296 | | |
Neuberger Berman
Genesis Fund
Class R6 | | | 11,702 | | | | 683 | | |
Neuberger
Berman High
Income Bond
Fund Class R6 | | | 117,176 | | | | 980 | | |
| | | Number
of Shares | | Value
(000's
omitted) | |
Neuberger
Berman
International
Select Fund
Class R6 | | | 239,312 | | | $ | 2,783 | (k) | |
Neuberger
Berman Long
Short Credit
Fund Class R6 | | | 43,992 | | | | 402 | | |
Neuberger
Berman Short
Duration High
Income
Fund Institutional
Class | | | 15,948 | | | | 150 | | |
Neuberger
Berman U.S.
Equity Index
PutWrite
Strategy
Fund Class R6 | | | 124,493 | | | | 1,327 | | |
Total Investment
Companies
(Cost $10,149) | | | | | 10,115 | | |
| | | Number
of Shares | | Value
(000's
omitted) | |
Total Options Purchased(m) 0.0%(b)
(Cost $4) | | $2 | |
Short-Term Investments 1.0% | |
Investment Companies 1.0% | |
State Street
Institutional U.S.
Government
Money Market
Fund Premier
Class, 2.09%(l)
(Cost $182) | | | 182,028 | | | | 182 | (k) | |
Total Investments 107.0%
(Cost $20,287) | | | 20,303 | | |
Liabilities Less Other
Assets (7.0%) | | | | | (1,336 | )(n) | |
Net Assets 100.0% | | $ | 18,967 | | |
* Non-income producing security.
(a) All or a portion of the security is pledged as collateral for futures and/or options writtten.
(b) Represents less than 0.05% of net assets.
(c) Security exempt from registration pursuant to Regulation S under the Securities Act of 1933, as amended. Regulation S applies to securities offerings that are made outside of the United States and do not involve direct selling efforts in the United States and as such may have restrictions on resale. Total value of all such securities at October 31, 2018 amounted to approximately $16,000, which represents 0.1% of net assets of the Fund.
(d) Rate shown was the discount rate at the date of purchase.
(e) Index-linked bond whose principal amount adjusts according to a government retail price index.
(f) Variable or floating rate security. The interest rate shown was the current rate as of October 31, 2018 and changes periodically.
Benchmarks for Variable / Floating Rates:
LIBOR = London Interbank Offered Rate
ICE = Intercontinental Exchange
(g) TBA (To Be Announced) Securities are purchased/sold on a forward commitment basis with an approximate principal amount and no defined maturity date. The actual principal and maturity date will be determined upon settlement when the specific mortgage pools are assigned. Total value of all such securities (excluding forward sales contracts, if any) at October 31, 2018 amounted to approximately $1,390,000, which represents 7.3% of net assets of the Fund.
See Notes to Financial Statements
47
Schedule of Investments Global Allocation Fund (cont'd)
(h) Perpetual Bond Security. The rate reflected was the rate in effect on October 31, 2018. The maturity date reflects the next call date.
(i) Securities were purchased under Rule 144A of the Securities Act of 1933, as amended, or are otherwise restricted and, unless registered under the Securities Act of 1933 or exempted from registration, may only be sold to qualified institutional investors or may have other restrictions on resale. At October 31, 2018, these securities amounted to approximately $131,000 or 0.7% of net assets of the Fund. These securities have been deemed by the investment manager to be liquid.
(j) Affiliated company as defined under the Investment Company Act of 1940, as amended (see Note F of Notes to Financial Statements).
(k) All or a portion of this security is segregated in connection with obligations for to be announced securities, options written, futures, forward foreign currency contracts and/or swaps with a total value of approximately $2,965,000.
(l) Represents 7-day effective yield as of October 31, 2018.
(m) See "Purchased option contracts" under Derivative Instruments.
(n) Includes the impact of the Fund's open positions in derivatives at October 31, 2018.
See Notes to Financial Statements
48
Schedule of Investments Global Allocation Fund (cont'd)
POSITIONS BY INDUSTRY
Industry | | Investments at
Value
(000's omitted) | | Percentage of
Net Assets | |
Investment Companies* | | $ | 10,115 | | | | 53.3 | % | |
Mortgage-Backed Securities | | | 1,770 | | | | 9.3 | % | |
U.S. Treasury Obligations | | | 1,387 | | | | 7.3 | % | |
Banks | | | 769 | | | | 4.1 | % | |
Exchange-Traded Funds | | | 459 | | | | 2.4 | % | |
Pharmaceuticals | | | 401 | | | | 2.1 | % | |
Internet & Direct Marketing Retail | | | 323 | | | | 1.7 | % | |
Oil, Gas & Consumable Fuels | | | 301 | | | | 1.6 | % | |
Health Care Providers & Services | | | 280 | | | | 1.5 | % | |
Technology Hardware, Storage & Peripherals | | | 262 | | | | 1.4 | % | |
Insurance | | | 216 | | | | 1.1 | % | |
Software | | | 201 | | | | 1.1 | % | |
Interactive Media & Services | | | 189 | | | | 1.0 | % | |
IT Services | | | 177 | | | | 0.9 | % | |
Food & Staples Retailing | | | 149 | | | | 0.8 | % | |
Diversified Telecommunication Services | | | 134 | | | | 0.7 | % | |
Aerospace & Defense | | | 129 | | | | 0.7 | % | |
Entertainment | | | 128 | | | | 0.7 | % | |
Biotechnology | | | 120 | | | | 0.6 | % | |
Media | | | 120 | | | | 0.6 | % | |
Asset-Backed Securities | | | 119 | | | | 0.6 | % | |
Wireless Telecommunication Services | | | 119 | | | | 0.6 | % | |
Trading Companies & Distributors | | | 118 | | | | 0.6 | % | |
Pipelines | | | 109 | | | | 0.6 | % | |
Computers | | | 103 | | | | 0.5 | % | |
Electronic Equipment, Instruments & Components | | | 103 | | | | 0.5 | % | |
Chemicals | | | 102 | | | | 0.5 | % | |
Beverages | | | 100 | | | | 0.5 | % | |
Hotels, Restaurants & Leisure | | | 100 | | | | 0.5 | % | |
U.S. Government Agency Securities | | | 99 | | | | 0.5 | % | |
Semiconductors & Semiconductor Equipment | | | 90 | | | | 0.5 | % | |
Equity Real Estate Investment Trusts | | | 78 | | | | 0.4 | % | |
Metals & Mining | | | 78 | | | | 0.4 | % | |
Health Care Equipment & Supplies | | | 75 | | | | 0.4 | % | |
Miscellaneous Manufacturers | | | 74 | | | | 0.4 | % | |
Mortgage Real Estate Investment | | | 74 | | | | 0.4 | % | |
Semiconductors | | | 73 | | | | 0.4 | % | |
Telecommunications | | | 69 | | | | 0.4 | % | |
Multi-Utilities | | | 63 | | | | 0.3 | % | |
Textiles, Apparel & Luxury Goods | | | 58 | | | | 0.3 | % | |
Electric Utilities | | | 53 | | | | 0.3 | % | |
Food Products | | | 52 | | | | 0.3 | % | |
Household Durables | | | 52 | | | | 0.3 | % | |
Electrical Equipment | | | 48 | | | | 0.2 | % | |
Specialty Retail | | | 43 | | | | 0.2 | % | |
Multiline Retail | | | 36 | | | | 0.2 | % | |
Agriculture | | | 35 | | | | 0.2 | % | |
Capital Markets | | | 30 | | | | 0.2 | % | |
Oil & Gas | | | 29 | | | | 0.2 | % | |
Communications Equipment | | | 24 | | | | 0.1 | % | |
Food | | | 22 | | | | 0.1 | % | |
Industrial Conglomerates | | | 22 | | | | 0.1 | % | |
See Notes to Financial Statements
49
Schedule of Investments Global Allocation Fund (cont'd)
POSITIONS BY INDUSTRY (cont'd)
Industry | | Investments at
Value
(000's omitted) | | Percentage of
Net Assets | |
Road & Rail | | $ | 22 | | | | 0.1 | % | |
Commercial Services & Supplies | | | 21 | | | | 0.1 | % | |
Machinery-Diversified | | | 20 | | | | 0.1 | % | |
Iron—Steel | | | 16 | | | | 0.1 | % | |
Paper & Forest Products | | | 15 | | | | 0.1 | % | |
Professional Services | | | 15 | | | | 0.1 | % | |
Life Sciences Tools & Services | | | 14 | | | | 0.1 | % | |
Airlines | | | 13 | | | | 0.1 | % | |
Real Estate Management & Development | | | 13 | | | | 0.1 | % | |
Automobiles | | | 11 | | | | 0.1 | % | |
Household Products | | | 11 | | | | 0.1 | % | |
Diversified Financial Services | | | 10 | | | | 0.1 | % | |
Transportation Infrastructure | | | 10 | | | | 0.1 | % | |
Savings & Loans | | | 9 | | | | 0.1 | % | |
Building Products | | | 7 | | | | 0.0 | % | |
Machinery | | | 7 | | | | 0.0 | % | |
Construction & Engineering | | | 6 | | | | 0.0 | % | |
Distributors | | | 5 | | | | 0.0 | % | |
Air Freight & Logistics | | | 4 | | | | 0.0 | % | |
Containers & Packaging | | | 4 | | | | 0.0 | % | |
Auto Components | | | 3 | | | | 0.0 | % | |
Tobacco | | | 3 | | | | 0.0 | % | |
Short-Term Investments and Other Liabilities—Net | | | (1,152 | ) | | | (6.0 | )% | |
| | $ | 18,967 | | | | 100.0 | % | |
* Each position is an Investment Company under the 1940 Act, as amended, and is not treated as an industry for purposes of the Fund's policy on industry concentration. This represents the aggregate of all investment companies.
Derivative Instruments
Futures contracts ("futures")
At October 31, 2018, open positions in futures for the Fund were as follows:
Long Futures:
Expiration
Date | | Number of
Contracts | | Open Contracts | | Notional
Amount | | Value and
Unrealized
Appreciation/
(Depreciation) | |
11/2018 | | | 2 | | | IBEX 35 Index | | $ | 201,304 | | | $ | (2,754 | ) | |
11/2018 | | | 2 | | | HSCEI Index | | | 129,215 | | | | (178 | ) | |
12/2018 | | | 4 | | | Euro-Bund | | | 726,074 | | | | 4,688 | | |
12/2018 | | | 1 | | | Euro-OAT | | | 172,117 | | | | 1,316 | | |
12/2018 | | | 3 | | | Topix Index | | | 436,301 | | | | (9,305 | ) | |
12/2018 | | | 13 | | | U.S. Treasury Note, 10 Year | | | 1,539,688 | | | | (23,326 | ) | |
12/2018 | | | 5 | | | Euro STOXX 50 Index | | | 180,884 | | | | (10,624 | ) | |
See Notes to Financial Statements
50
Schedule of Investments Global Allocation Fund (cont'd)
Expiration
Date | | Number of
Contracts | | Open Contracts | | Notional
Amount | | Value and
Unrealized
Appreciation/
(Depreciation) | |
12/2018 | | | 14 | | | MSCI Emerging Markets Index | | $ | 669,690 | | | $ | (53,078 | ) | |
12/2018 | | | 5 | | | S&P 500 E-Mini Index | | | 677,775 | | | | (27,152 | ) | |
12/2018 | | | 4 | | | U.S. Treasury Note, 2 Year | | | 842,625 | | | | (2,362 | ) | |
12/2018 | | | 5 | | | U.S. Treasury Note, 5 Year | | | 561,914 | | | | (4,570 | ) | |
Total Long Positions | | | | | | $ | 6,137,587 | | | $ | (127,345 | ) | |
Short Futures:
Expiration
Date | | Number of
Contracts | | Open Contracts | | Notional
Amount | | Value and
Unrealized
Appreciation/
(Depreciation) | |
12/2018 | | | 4 | | | Euro-Bund | | $ | (726,074 | ) | | $ | 489 | | |
12/2018 | | | 1 | | | Euro-OAT | | | (172,118 | ) | | | 32 | | |
12/2018 | | | 2 | | | U.S. Treasury Note, Ultra 10 Year | | | (250,219 | ) | | | 2,736 | | |
12/2018 | | | 8 | | | U.S. Treasury Long Bond | | | (1,105,000 | ) | | | 34,342 | | |
12/2018 | | | 3 | | | U.S. Treasury Note, 10 Year | | | (355,312 | ) | | | 5,358 | | |
12/2018 | | | 1 | | | U.S. Treasury Ultra Long Bond | | | (149,219 | ) | | | 9,797 | | |
12/2018 | | | 3 | | | Mini DAX Future | | | (194,660 | ) | | | 11,867 | | |
12/2018 | | | 2 | | | FTSE 100 Index | | | (181,786 | ) | | | 9,331 | | |
12/2018 | | | 3 | | | MSCI World Index | | | (174,300 | ) | | | 12,990 | | |
12/2018 | | | 1 | | | United Kingdom Long Gilt Bond | | | (156,464 | ) | | | (1,994 | ) | |
Total Short Positions | | | | | | $ | (3,465,152 | ) | | $ | 84,948 | | |
Total Futures | | | | | | | | $ | (42,397 | ) | |
At October 31, 2018, the Fund had $289,133 deposited in a segregated account to cover margin requirements on open futures. The Fund had securities pledged in the amount of $99,868 to cover collateral requirements on open futures.
For the year ended October 31, 2018, the average notional value of futures for the Fund was $4,697,438 for long positions and $(3,230,924) for short positions.
Forward foreign currency contracts ("forward contracts")
At October 31, 2018, open forward contracts for the Fund were as follows:
Currency Purchased | | Currency Sold | | Counterparty | | Settlement
Date | | Net
Unrealized
Appreciation/
(Depreciation) | |
| | 24,853 | | | AUD | | | | | 17,597 | | | USD | | | | Citibank, N.A. | | 1/17/2019 | | $ | 18 | | |
| | 439,041 | | | AUD | | | | | 311,183 | | | USD | | | | Citibank, N.A. | | 1/17/2019 | | | 4 | | |
| | 144,855 | | | AUD | | | | | 102,670 | | | USD | | | | Citibank, N.A. | | 1/17/2019 | | | 1 | | |
| | 324,147 | | | USD | | | | | 455,977 | | | AUD | | | | Royal Bank of Canada | | 1/17/2019 | | | 955 | | |
| | 33,089 | | | USD | | | | | 46,623 | | | AUD | | | | Royal Bank of Canada | | 1/17/2019 | | | 43 | | |
| | 195,807 | | | USD | | | | | 275,338 | | | AUD | | | | Standard Chartered Bank | | 1/17/2019 | | | 650 | | |
See Notes to Financial Statements
51
Schedule of Investments Global Allocation Fund (cont'd)
Currency Purchased | | Currency Sold | | Counterparty | | Settlement
Date | | Net
Unrealized
Appreciation/
(Depreciation) | |
| | 14,032 | | | USD | | | | | 19,732 | | | AUD | | | | Standard Chartered Bank | | 1/17/2019 | | $ | 47 | | |
| | 132,135 | | | USD | | | | | 185,824 | | | AUD | | | | State Street Bank and Trust Company | | 1/17/2019 | | | 425 | | |
| | 22,418 | | | USD | | | | | 31,527 | | | AUD | | | | State Street Bank and Trust Company | | 1/17/2019 | | | 72 | | |
| | 272,483 | | | USD | | | | | 356,342 | | | CAD | | | | Citibank, N.A. | | 1/17/2019 | | | 1,360 | | |
| | 72,579 | | | USD | | | | | 93,946 | | | CAD | | | | Citibank, N.A. | | 1/17/2019 | | | 1,100 | | |
| | 600,040 | | | USD | | | | | 776,236 | | | CAD | | | | Goldman Sachs International | | 1/17/2019 | | | 9,441 | | |
| | 68,217 | | | USD | | | | | 88,260 | | | CAD | | | | Goldman Sachs International | | 1/17/2019 | | | 1,064 | | |
| | 498,988 | | | USD | | | | | 645,845 | | | CAD | | | | JPMorgan Chase Bank N.A. | | 1/17/2019 | | | 7,597 | | |
| | 342,392 | | | USD | | | | | 442,694 | | | CAD | | | | Royal Bank of Canada | | 1/17/2019 | | | 5,568 | | |
| | 36,710 | | | USD | | | | | 47,677 | | | CAD | | | | Royal Bank of Canada | | 1/17/2019 | | | 435 | | |
| | 127,311 | | | USD | | | | | 166,806 | | | CAD | | | | Royal Bank of Canada | | 1/17/2019 | | | 397 | | |
| | 116,199 | | | USD | | | | | 150,186 | | | CAD | | | | Standard Chartered Bank | | 1/17/2019 | | | 1,930 | | |
| | 473,232 | | | USD | | | | | 611,889 | | | CAD | | | | State Street Bank and Trust Company | | 1/17/2019 | | | 7,676 | | |
| | 35,118 | | | USD | | | | | 45,984 | | | CAD | | | | State Street Bank and Trust Company | | 1/17/2019 | | | 131 | | |
| | 235,748 | | | USD | | | | | 231,993 | | | CHF | | | | Citibank, N.A. | | 1/17/2019 | | | 3,559 | | |
| | 59,814 | | | USD | | | | | 58,861 | | | CHF | | | | Citibank, N.A. | | 1/17/2019 | | | 903 | | |
| | 10,249 | | | USD | | | | | 10,095 | | | CHF | | | | Goldman Sachs International | | 1/17/2019 | | | 145 | | |
| | 12,915 | | | USD | | | | | 12,858 | | | CHF | | | | Goldman Sachs International | | 1/17/2019 | | | 46 | | |
| | 48,219 | | | USD | | | | | 47,422 | | | CHF | | | | JPMorgan Chase Bank N.A. | | 1/17/2019 | | | 757 | | |
| | 40,818 | | | USD | | | | | 40,143 | | | CHF | | | | JPMorgan Chase Bank N.A. | | 1/17/2019 | | | 641 | | |
| | 465,718 | | | USD | | | | | 458,090 | | | CHF | | | | Royal Bank of Canada | | 1/17/2019 | | | 7,241 | | |
| | 743,475 | | | USD | | | | | 730,784 | | | CHF | | | | Societe Generale | | 1/17/2019 | | | 12,073 | | |
| | 252,302 | | | USD | | | | | 248,005 | | | CHF | | | | Standard Chartered Bank | | 1/17/2019 | | | 4,087 | | |
| | 165,371 | | | USD | | | | | 162,643 | | | CHF | | | | State Street Bank and Trust Company | | 1/17/2019 | | | 2,590 | | |
| | 14,293 | | | USD | | | | | 14,153 | | | CHF | | | | State Street Bank and Trust Company | | 1/17/2019 | | | 128 | | |
| | 331,553 | | | USD | | | | | 286,466 | | | EUR | | | | Citibank, N.A. | | 1/17/2019 | | | 4,775 | | |
| | 161,268 | | | USD | | | | | 138,976 | | | EUR | | | | Citibank, N.A. | | 1/17/2019 | | | 2,735 | | |
| | 53,061 | | | USD | | | | | 45,957 | | | EUR | | | | Citibank, N.A. | | 1/17/2019 | | | 637 | | |
| | 514,847 | | | USD | | | | | 444,562 | | | EUR | | | | Goldman Sachs International | | 1/17/2019 | | | 7,726 | | |
| | 179,850 | | | USD | | | | | 154,964 | | | EUR | | | | Goldman Sachs International | | 1/17/2019 | | | 3,080 | | |
| | 40,925 | | | USD | | | | | 35,756 | | | EUR | | | | Goldman Sachs International | | 1/17/2019 | | | 137 | | |
| | 7,436 | | | USD | | | | | 6,421 | | | EUR | | | | Goldman Sachs International | | 1/17/2019 | | | 112 | | |
| | 84,123 | | | USD | | | | | 72,012 | | | EUR | | | | Royal Bank of Canada | | 1/17/2019 | | | 1,978 | | |
| | 34,988 | | | USD | | | | | 30,671 | | | EUR | | | | Royal Bank of Canada | | 1/17/2019 | | | 1 | | |
| | 2,249,951 | | | USD | | | | | 1,941,915 | | | EUR | | | | State Street Bank and Trust Company | | 1/17/2019 | | | 34,768 | | |
| | 13,990 | | | USD | | | | | 12,211 | | | EUR | | | | State Street Bank and Trust Company | | 1/17/2019 | | | 61 | | |
| | 143,792 | | | GBP | | | | | 183,938 | | | USD | | | | Royal Bank of Canada | | 1/17/2019 | | | 608 | | |
| | 9,774 | | | GBP | | | | | 12,534 | | | USD | | | | Royal Bank of Canada | | 1/17/2019 | | | 11 | | |
| | 247,702 | | | USD | | | | | 188,155 | | | GBP | | | | Citibank, N.A. | | 1/17/2019 | | | 6,220 | | |
| | 160,863 | | | USD | | | | | 122,192 | | | GBP | | | | Citibank, N.A. | | 1/17/2019 | | | 4,039 | | |
| | 129,612 | | | USD | | | | | 99,459 | | | GBP | | | | Citibank, N.A. | | 1/17/2019 | | | 1,964 | | |
| | 216,740 | | | USD | | | | | 164,152 | | | GBP | | | | Goldman Sachs International | | 1/17/2019 | | | 6,063 | | |
| | 149,913 | | | USD | | | | | 113,879 | | | GBP | | | | Goldman Sachs International | | 1/17/2019 | | | 3,757 | | |
See Notes to Financial Statements
52
Schedule of Investments Global Allocation Fund (cont'd)
Currency Purchased | | Currency Sold | | Counterparty | | Settlement
Date | | Net
Unrealized
Appreciation/
(Depreciation) | |
| | 112,651 | | | USD | | | | | 85,835 | | | GBP | | | | Goldman Sachs International | | 1/17/2019 | | $ | 2,489 | | |
| | 183,350 | | | USD | | | | | 138,691 | | | GBP | | | | Standard Chartered Bank | | 1/17/2019 | | | 5,350 | | |
| | 155,641 | | | USD | | | | | 117,731 | | | GBP | | | | Standard Chartered Bank | | 1/17/2019 | | | 4,542 | | |
| | 799,536 | | | USD | | | | | 605,058 | | | GBP | | | | State Street Bank and Trust Company | | 1/17/2019 | | | 22,989 | | |
| | 189,288 | | | USD | | | | | 143,246 | | | GBP | | | | State Street Bank and Trust Company | | 1/17/2019 | | | 5,443 | | |
| | 36,644,230 | | | JPY | | | | | 326,237 | | | USD | | | | Citibank, N.A. | | 1/17/2019 | | | 720 | | |
| | 241,370 | | | JPY | | | | | 2,149 | | | USD | | | | Citibank, N.A. | | 1/17/2019 | | | 5 | | |
| | 48,009,672 | | | JPY | | | | | 427,711 | | | USD | | | | Royal Bank of Canada | | 1/17/2019 | | | 654 | | |
| | 50,466,164 | | | JPY | | | | | 449,609 | | | USD | | | | Standard Chartered Bank | | 1/17/2019 | | | 673 | | |
| | 30,152,373 | | | JPY | | | | | 268,539 | | | USD | | | | State Street Bank and Trust Company | | 1/17/2019 | | | 494 | | |
| | 120,163 | | | USD | | | | | 13,426,460 | | | JPY | | | | Citibank, N.A. | | 1/17/2019 | | | 366 | | |
| | 90,529 | | | USD | | | | | 10,116,585 | | | JPY | | | | Citibank, N.A. | | 1/17/2019 | | | 264 | | |
| | 141,521 | | | USD | | | | | 15,688,277 | | | JPY | | | | Royal Bank of Canada | | 1/17/2019 | | | 1,543 | | |
| | 62,152 | | | USD | | | | | 6,963,573 | | | JPY | | | | Royal Bank of Canada | | 1/17/2019 | | | 20 | | |
| | 155,874 | | | USD | | | | | 17,418,233 | | | JPY | | | | State Street Bank and Trust Company | | 1/17/2019 | | | 461 | | |
| | 61,319 | | | USD | | | | | 1,180,153 | | | MXN | | | | Citibank, N.A. | | 1/17/2019 | | | 3,912 | | |
| | 248,581 | | | USD | | | | | 2,047,833 | | | NOK | | | | Citibank, N.A. | | 1/17/2019 | | | 4,767 | | |
| | 76,676 | | | USD | | | | | 627,163 | | | NOK | | | | Goldman Sachs International | | 1/17/2019 | | | 2,006 | | |
| | 12,963 | | | USD | | | | | 108,431 | | | NOK | | | | Goldman Sachs International | | 1/17/2019 | | | 53 | | |
| | 543,097 | | | USD | | | | | 4,473,217 | | | NOK | | | | JPMorgan Chase Bank N.A. | | 1/17/2019 | | | 10,518 | | |
| | 99,574 | | | USD | | | | | 808,390 | | | NOK | | | | Royal Bank of Canada | | 1/17/2019 | | | 3,328 | | |
| | 231,459 | | | USD | | | | | 1,895,813 | | | NOK | | | | Standard Chartered Bank | | 1/17/2019 | | | 5,744 | | |
| | 59,698 | | | USD | | | | | 488,972 | | | NOK | | | | Standard Chartered Bank | | 1/17/2019 | | | 1,482 | | |
| | 61,412 | | | USD | | | | | 503,444 | | | NOK | | | | State Street Bank and Trust Company | | 1/17/2019 | | | 1,472 | | |
| | 761,667 | | | NZD | | | | | 491,747 | | | USD | | | | Citibank, N.A. | | 1/17/2019 | | | 5,708 | | |
| | 1,274,100 | | | NZD | | | | | 823,406 | | | USD | | | | Goldman Sachs International | | 1/17/2019 | | | 8,726 | | |
| | 302,931 | | | NZD | | | | | 195,774 | | | USD | | | | Goldman Sachs International | | 1/17/2019 | | | 2,075 | | |
| | 168,748 | | | NZD | | | | | 108,716 | | | USD | | | | Goldman Sachs International | | 1/17/2019 | | | 1,496 | | |
| | 46,355 | | | NZD | | | | | 29,968 | | | USD | | | | Royal Bank of Canada | | 1/17/2019 | | | 307 | | |
| | 139,125 | | | USD | | | | | 211,918 | | | NZD | | | | Citibank, N.A. | | 1/17/2019 | | | 719 | | |
| | 200,171 | | | USD | | | | | 304,630 | | | NZD | | | | Goldman Sachs International | | 1/17/2019 | | | 1,213 | | |
| | 12,968 | | | USD | | | | | 19,746 | | | NZD | | | | Goldman Sachs International | | 1/17/2019 | | | 72 | | |
| | 163,497 | | | USD | | | | | 249,523 | | | NZD | | | | Royal Bank of Canada | | 1/17/2019 | | | 530 | | |
| | 40,184 | | | USD | | | | | 61,456 | | | NZD | | | | Royal Bank of Canada | | 1/17/2019 | | | 47 | | |
| | 119,517 | | | SEK | | | | | 13,153 | | | USD | | | | Royal Bank of Canada | | 1/17/2019 | | | 6 | | |
| | 180,953 | | | USD | | | | | 1,618,243 | | | SEK | | | | Citibank, N.A. | | 1/17/2019 | | | 2,776 | | |
| | 469,675 | | | USD | | | | | 4,244,026 | | | SEK | | | | Citibank, N.A. | | 1/17/2019 | | | 2,386 | | |
| | 81,133 | | | USD | | | | | 734,258 | | | SEK | | | | Citibank, N.A. | | 1/17/2019 | | | 287 | | |
| | 840,396 | | | USD | | | | | 7,593,397 | | | SEK | | | | Goldman Sachs International | | 1/17/2019 | | | 4,326 | | |
| | 453,118 | | | USD | | | | | 4,094,150 | | | SEK | | | | Goldman Sachs International | | 1/17/2019 | | | 2,332 | | |
| | 103,992 | | | USD | | | | | 924,045 | | | SEK | | | | Goldman Sachs International | | 1/17/2019 | | | 2,250 | | |
| | 57,185 | | | USD | | | | | 516,549 | | | SEK | | | | JPMorgan Chase Bank N.A. | | 1/17/2019 | | | 310 | | |
| | 110,296 | | | USD | | | | | 993,096 | | | SEK | | | | Societe Generale | | 1/17/2019 | | | 951 | | |
Total unrealized appreciation | | | | | | | | | | | | $ | 265,568 | | |
See Notes to Financial Statements
53
Schedule of Investments Global Allocation Fund (cont'd)
Currency Purchased | | Currency Sold | | Counterparty | | Settlement
Date | | Net
Unrealized
Appreciation/
(Depreciation) | |
| | 155,567 | | | AUD | | | | | 110,423 | | | USD | | | | Goldman Sachs International | | 1/17/2019 | | $ | (159 | ) | |
| | 901,419 | | | AUD | | | | | 639,728 | | | USD | | | | Goldman Sachs International | | 1/17/2019 | | | (812 | ) | |
| | 976,910 | | | AUD | | | | | 693,303 | | | USD | | | | Goldman Sachs International | | 1/17/2019 | | | (880 | ) | |
| | 384,370 | | | AUD | | | | | 274,856 | | | USD | | | | Goldman Sachs International | | 1/17/2019 | | | (2,419 | ) | |
| | 161,797 | | | AUD | | | | | 115,050 | | | USD | | | | Societe Generale | | 1/17/2019 | | | (370 | ) | |
| | 132,132 | | | USD | | | | | 186,719 | | | AUD | | | | Citibank, N.A. | | 1/17/2019 | | | (213 | ) | |
| | 253,564 | | | USD | | | | | 358,177 | | | AUD | | | | Citibank, N.A. | | 1/17/2019 | | | (308 | ) | |
| | 138,877 | | | USD | | | | | 195,945 | | | AUD | | | | JPMorgan Chase Bank N.A. | | 1/17/2019 | | | (7 | ) | |
| | 620,311 | | | USD | | | | | 875,212 | | | AUD | | | | JPMorgan Chase Bank N.A. | | 1/17/2019 | | | (30 | ) | |
| | 28,079 | | | CAD | | | | | 21,623 | | | USD | | | | Citibank, N.A. | | 1/17/2019 | | | (259 | ) | |
| | 211,784 | | | CAD | | | | | 162,141 | | | USD | | | | Citibank, N.A. | | 1/17/2019 | | | (1,005 | ) | |
| | 631,548 | | | CAD | | | | | 487,908 | | | USD | | | | Citibank, N.A. | | 1/17/2019 | | | (7,395 | ) | |
| | 167,086 | | | CAD | | | | | 128,486 | | | USD | | | | Goldman Sachs International | | 1/17/2019 | | | (1,358 | ) | |
| | 243,233 | | | CAD | | | | | 188,022 | | | USD | | | | Goldman Sachs International | | 1/17/2019 | | | (2,958 | ) | |
| | 184,972 | | | CAD | | | | | 142,912 | | | USD | | | | JPMorgan Chase Bank N.A. | | 1/17/2019 | | | (2,176 | ) | |
| | 980,499 | | | CAD | | | | | 758,556 | | | USD | | | | Societe Generale | | 1/17/2019 | | | (12,543 | ) | |
| | 100,372 | | | CAD | | | | | 77,658 | | | USD | | | | Standard Chartered Bank | | 1/17/2019 | | | (1,290 | ) | |
| | 19,262 | | | CAD | | | | | 14,717 | | | USD | | | | State Street Bank and Trust Company | | 1/17/2019 | | | (61 | ) | |
| | 372,231 | | | CAD | | | | | 287,882 | | | USD | | | | State Street Bank and Trust Company | | 1/17/2019 | | | (4,670 | ) | |
| | 21,022 | | | CHF | | | | | 21,168 | | | USD | | | | Citibank, N.A. | | 1/17/2019 | | | (128 | ) | |
| | 158,943 | | | CHF | | | | | 161,356 | | | USD | | | | Citibank, N.A. | | 1/17/2019 | | | (2,279 | ) | |
| | 48,144 | | | CHF | | | | | 48,996 | | | USD | | | | Goldman Sachs International | | 1/17/2019 | | | (811 | ) | |
| | 110,902 | | | CHF | | | | | 112,867 | | | USD | | | | Goldman Sachs International | | 1/17/2019 | | | (1,871 | ) | |
| | 517,291 | | | CHF | | | | | 526,441 | | | USD | | | | Goldman Sachs International | | 1/17/2019 | | | (8,712 | ) | |
| | 10,812 | | | CHF | | | | | 10,826 | | | USD | | | | Royal Bank of Canada | | 1/17/2019 | | | (4 | ) | |
| | 10,958 | | | CHF | | | | | 11,021 | | | USD | | | | Royal Bank of Canada | | 1/17/2019 | | | (53 | ) | |
| | 106,551 | | | CHF | | | | | 109,076 | | | USD | | | | Royal Bank of Canada | | 1/17/2019 | | | (2,434 | ) | |
| | 165,674 | | | CHF | | | | | 168,544 | | | USD | | | | Standard Chartered Bank | | 1/17/2019 | | | (2,730 | ) | |
| | 16,438 | | | CHF | | | | | 16,571 | | | USD | | | | State Street Bank and Trust Company | | 1/17/2019 | | | (119 | ) | |
| | 563,071 | | | CHF | | | | | 572,515 | | | USD | | | | State Street Bank and Trust Company | | 1/17/2019 | | | (8,967 | ) | |
| | 134,088 | | | EUR | | | | | 153,993 | | | USD | | | | Citibank, N.A. | | 1/17/2019 | | | (1,036 | ) | |
| | 222,760 | | | EUR | | | | | 255,248 | | | USD | | | | Citibank, N.A. | | 1/17/2019 | | | (1,142 | ) | |
| | 85,730 | | | EUR | | | | | 99,034 | | | USD | | | | Citibank, N.A. | | 1/17/2019 | | | (1,240 | ) | |
| | 214,314 | | | EUR | | | | | 248,045 | | | USD | | | | Citibank, N.A. | | 1/17/2019 | | | (3,572 | ) | |
| | 146,589 | | | EUR | | | | | 170,879 | | | USD | | | | Citibank, N.A. | | 1/17/2019 | | | (3,662 | ) | |
| | 29,935 | | | EUR | | | | | 34,675 | | | USD | | | | Goldman Sachs International | | 1/17/2019 | | | (528 | ) | |
| | 244,276 | | | EUR | | | | | 282,481 | | | USD | | | | JPMorgan Chase Bank N.A. | | 1/17/2019 | | | (3,830 | ) | |
| | 1,333,040 | | | EUR | | | | | 1,541,527 | | | USD | | | | JPMorgan Chase Bank N.A. | | 1/17/2019 | | | (20,901 | ) | |
| | 166,021 | | | EUR | | | | | 189,835 | | | USD | | | | Royal Bank of Canada | | 1/17/2019 | | | (451 | ) | |
| | 71,655 | | | EUR | | | | | 83,002 | | | USD | | | | Royal Bank of Canada | | 1/17/2019 | | | (1,263 | ) | |
| | 9,179 | | | EUR | | | | | 10,639 | | | USD | | | | Societe Generale | | 1/17/2019 | | | (169 | ) | |
| | 51,252 | | | EUR | | | | | 59,412 | | | USD | | | | Standard Chartered Bank | | 1/17/2019 | | | (947 | ) | |
| | 175,426 | | | EUR | | | | | 203,355 | | | USD | | | | Standard Chartered Bank | | 1/17/2019 | | | (3,243 | ) | |
See Notes to Financial Statements
54
Schedule of Investments Global Allocation Fund (cont'd)
Currency Purchased | | Currency Sold | | Counterparty | | Settlement
Date | | Net
Unrealized
Appreciation/
(Depreciation) | |
| | 18,814 | | | EUR | | | | | 21,764 | | | USD | | | | State Street Bank and Trust Company | | 1/17/2019 | | $ | (302 | ) | |
| | 58,595 | | | EUR | | | | | 67,232 | | | USD | | | | State Street Bank and Trust Company | | 1/17/2019 | | | (391 | ) | |
| | 250,052 | | | EUR | | | | | 289,717 | | | USD | | | | State Street Bank and Trust Company | | 1/17/2019 | | | (4,477 | ) | |
| | 7,744 | | | GBP | | | | | 10,102 | | | USD | | | | Citibank, N.A. | | 1/17/2019 | | | (163 | ) | |
| | 179,996 | | | GBP | | | | | 231,703 | | | USD | | | | Citibank, N.A. | | 1/17/2019 | | | (691 | ) | |
| | 117,500 | | | GBP | | | | | 155,135 | | | USD | | | | Goldman Sachs International | | 1/17/2019 | | | (4,333 | ) | |
| | 452,186 | | | GBP | | | | | 597,021 | | | USD | | | | Goldman Sachs International | | 1/17/2019 | | | (16,674 | ) | |
| | 36,325 | | | GBP | | | | | 47,811 | | | USD | | | | JPMorgan Chase Bank N.A. | | 1/17/2019 | | | (1,191 | ) | |
| | 606,313 | | | GBP | | | | | 798,035 | | | USD | | | | JPMorgan Chase Bank N.A. | | 1/17/2019 | | | (19,878 | ) | |
| | 245,824 | | | GBP | | | | | 324,901 | | | USD | | | | Royal Bank of Canada | | 1/17/2019 | | | (9,405 | ) | |
| | 107,798 | | | GBP | | | | | 142,530 | | | USD | | | | Societe Generale | | 1/17/2019 | | | (4,179 | ) | |
| | 7,676 | | | GBP | | | | | 9,883 | | | USD | | | | State Street Bank and Trust Company | | 1/17/2019 | | | (32 | ) | |
| | 12,917 | | | USD | | | | | 10,108 | | | GBP | | | | Goldman Sachs International | | 1/17/2019 | | | (55 | ) | |
| | 1,653,503 | | | JPY | | | | | 14,865 | | | USD | | | | Citibank, N.A. | | 1/17/2019 | | | (111 | ) | |
| | 8,812,808 | | | JPY | | | | | 79,039 | | | USD | | | | Citibank, N.A. | | 1/17/2019 | | | (408 | ) | |
| | 11,880,109 | | | JPY | | | | | 106,735 | | | USD | | | | Citibank, N.A. | | 1/17/2019 | | | (735 | ) | |
| | 2,819,743 | | | JPY | | | | | 25,239 | | | USD | | | | Goldman Sachs International | | 1/17/2019 | | | (80 | ) | |
| | 17,540,594 | | | JPY | | | | | 156,624 | | | USD | | | | Goldman Sachs International | | 1/17/2019 | | | (119 | ) | |
| | 5,909,107 | | | JPY | | | | | 52,838 | | | USD | | | | State Street Bank and Trust Company | | 1/17/2019 | | | (114 | ) | |
| | 6,065,978 | | | JPY | | | | | 54,809 | | | USD | | | | State Street Bank and Trust Company | | 1/17/2019 | | | (686 | ) | |
| | 71,075 | | | USD | | | | | 7,971,289 | | | JPY | | | | Goldman Sachs International | | 1/17/2019 | | | (48 | ) | |
| | 98,247 | | | USD | | | | | 11,018,685 | | | JPY | | | | Goldman Sachs International | | 1/17/2019 | | | (67 | ) | |
| | 318,138 | | | USD | | | | | 35,680,260 | | | JPY | | | | Goldman Sachs International | | 1/17/2019 | | | (218 | ) | |
| | 92,057 | | | USD | | | | | 10,342,149 | | | JPY | | | | JPMorgan Chase Bank N.A. | | 1/17/2019 | | | (221 | ) | |
| | 213,139 | | | USD | | | | | 23,945,221 | | | JPY | | | | JPMorgan Chase Bank N.A. | | 1/17/2019 | | | (511 | ) | |
| | 47,957 | | | USD | | | | | 5,375,093 | | | JPY | | | | Royal Bank of Canada | | 1/17/2019 | | | (2 | ) | |
| | 139,144 | | | USD | | | | | 15,617,632 | | | JPY | | | | Societe Generale | | 1/17/2019 | | | (203 | ) | |
| | 77,111 | | | USD | | | | | 8,655,285 | | | JPY | | | | Standard Chartered Bank | | 1/17/2019 | | | (115 | ) | |
| | 464,986 | | | USD | | | | | 52,210,004 | | | JPY | | | | State Street Bank and Trust Company | | 1/17/2019 | | | (856 | ) | |
| | 1,180,153 | | | MXN | | | | | 61,122 | | | USD | | | | Goldman Sachs International | | 1/17/2019 | | | (3,715 | ) | |
| | 270,311 | | | NOK | | | | | 32,549 | | | USD | | | | Citibank, N.A. | | 1/17/2019 | | | (366 | ) | |
| | 2,249,511 | | | NOK | | | | | 273,036 | | | USD | | | | Citibank, N.A. | | 1/17/2019 | | | (5,210 | ) | |
| | 3,347,426 | | | NOK | | | | | 406,335 | | | USD | | | | Citibank, N.A. | | 1/17/2019 | | | (7,792 | ) | |
| | 212,549 | | | NOK | | | | | 25,783 | | | USD | | | | Goldman Sachs International | | 1/17/2019 | | | (477 | ) | |
| | 402,241 | | | NOK | | | | | 48,805 | | | USD | | | | Goldman Sachs International | | 1/17/2019 | | | (915 | ) | |
| | 1,862,248 | | | NOK | | | | | 225,897 | | | USD | | | | Goldman Sachs International | | 1/17/2019 | | | (4,179 | ) | |
| | 837,957 | | | NOK | | | | | 101,737 | | | USD | | | | JPMorgan Chase Bank N.A. | | 1/17/2019 | | | (1,970 | ) | |
| | 105,331 | | | NOK | | | | | 12,560 | | | USD | | | | Royal Bank of Canada | | 1/17/2019 | | | (20 | ) | |
| | 592,399 | | | NOK | | | | | 70,834 | | | USD | | | | Royal Bank of Canada | | 1/17/2019 | | | (304 | ) | |
| | 1,427,648 | | | NOK | | | | | 174,129 | | | USD | | | | Royal Bank of Canada | | 1/17/2019 | | | (4,154 | ) | |
| | 2,247,380 | | | NOK | | | | | 274,276 | | | USD | | | | Societe Generale | | 1/17/2019 | | | (6,704 | ) | |
| | 1,082,845 | | | NOK | | | | | 132,089 | | | USD | | | | State Street Bank and Trust Company | | 1/17/2019 | | | (3,166 | ) | |
| | 24,995 | | | NZD | | | | | 16,338 | | | USD | | | | Royal Bank of Canada | | 1/17/2019 | | | (13 | ) | |
See Notes to Financial Statements
55
Schedule of Investments Global Allocation Fund (cont'd)
Currency Purchased | | Currency Sold | | Counterparty | | Settlement
Date | | Net
Unrealized
Appreciation/
(Depreciation) | |
| | 27,546 | | | NZD | | | | | 18,018 | | | USD | | | | State Street Bank and Trust Company | | 1/17/2019 | | $ | (27 | ) | |
| | 211,654 | | | USD | | | | | 327,830 | | | NZD | | | | Citibank, N.A. | | 1/17/2019 | | | (2,457 | ) | |
| | 63,285 | | | USD | | | | | 98,029 | | | NZD | | | | JPMorgan Chase Bank N.A. | | 1/17/2019 | | | (739 | ) | |
| | 116,077 | | | USD | | | | | 179,804 | | | NZD | | | | JPMorgan Chase Bank N.A. | | 1/17/2019 | | | (1,355 | ) | |
| | 502,055 | | | USD | | | | | 775,642 | | | NZD | | | | Societe Generale | | 1/17/2019 | | | (4,527 | ) | |
| | 38,615 | | | USD | | | | | 59,649 | | | NZD | | | | Standard Chartered Bank | | 1/17/2019 | | | (343 | ) | |
| | 506,939 | | | USD | | | | | 783,084 | | | NZD | | | | Standard Chartered Bank | | 1/17/2019 | | | (4,504 | ) | |
| | 9,721 | | | USD | | | | | 14,920 | | | NZD | | | | State Street Bank and Trust Company | | 1/17/2019 | | | (24 | ) | |
| | 231,671 | | | USD | | | | | 358,037 | | | NZD | | | | State Street Bank and Trust Company | | 1/17/2019 | | | (2,167 | ) | |
| | 304,538 | | | USD | | | | | 470,649 | | | NZD | | | | State Street Bank and Trust Company | | 1/17/2019 | | | (2,849 | ) | |
| | 913,451 | | | SEK | | | | | 101,089 | | | USD | | | | Citibank, N.A. | | 1/17/2019 | | | (514 | ) | |
| | 1,207,972 | | | SEK | | | | | 135,223 | | | USD | | | | Citibank, N.A. | | 1/17/2019 | | | (2,219 | ) | |
| | 1,344,772 | | | SEK | | | | | 148,885 | | | USD | | | | Goldman Sachs International | | 1/17/2019 | | | (819 | ) | |
| | 5,160 | | | SEK | | | | | 571 | | | USD | | | | JPMorgan Chase Bank N.A. | | 1/17/2019 | | | (3 | ) | |
| | 734,158 | | | SEK | | | | | 82,619 | | | USD | | | | Royal Bank of Canada | | 1/17/2019 | | | (1,784 | ) | |
| | 3,516,399 | | | SEK | | | | | 390,264 | | | USD | | | | Royal Bank of Canada | | 1/17/2019 | | | (3,092 | ) | |
| | 1,064,170 | | | SEK | | | | | 118,180 | | | USD | | | | Standard Chartered Bank | | 1/17/2019 | | | (1,010 | ) | |
| | 2,019,344 | | | SEK | | | | | 224,256 | | | USD | | | | Standard Chartered Bank | | 1/17/2019 | | | (1,916 | ) | |
| | 2,265,787 | | | SEK | | | | | 251,537 | | | USD | | | | State Street Bank and Trust Company | | 1/17/2019 | | | (2,063 | ) | |
| | 15,032,149 | | | SEK | | | | | 1,668,799 | | | USD | | | | State Street Bank and Trust Company | | 1/17/2019 | | | (13,686 | ) | |
| | 12,967 | | | USD | | | | | 117,803 | | | SEK | | | | Goldman Sachs International | | 1/17/2019 | | | (4 | ) | |
| | 17,620 | | | USD | | | | | 160,519 | | | SEK | | | | Royal Bank of Canada | | 1/17/2019 | | | (54 | ) | |
Total unrealized depreciation | | | | | | | | | | | | | | | | | | | | | | $ | (260,411 | ) | |
Total net unrealized appreciation | | | | | | | | | | | | | | | | | | | | | | $ | 5,157 | | |
AUD = Australian Dollar
CAD = Canadian Dollar
CHF = Swiss Franc
EUR = Euro
GBP = Pound Sterling
JPY = Japanese Yen
MXN = Mexican Peso
NOK = Norwegian Krone
NZD = New Zealand Dollar
SEK = Swedish Krona
For the year ended October 31, 2018, the Fund's investments in forward contracts had an average notional value of $32,979,215.
See Notes to Financial Statements
56
Schedule of Investments Global Allocation Fund (cont'd)
Total return swap contracts ("total return swaps")
At October 31, 2018, the Fund had outstanding total return swaps as follows:
Over-the-counter total return swaps — Long
Counterparty | | Reference
Entity | | Notional
Amount(o) | | Maturity
Date | | Variable-
rate(n) | | Unrealized
Appreciation/
(Depreciation) | | Accrued
Net
Interest
Receivable/
(Payable) | | Value | |
Citibank, N.A. | | S&P 500 Financials
Sector Total Return Index | | $ | 100,765 | | | 12/13/2018 | | | 2.45 | %(a) | | $ | (5,070 | ) | | $ | (339 | ) | | $ | (5,409 | ) | |
Citibank, N.A. | | S&P 500 Financials
Sector Total Return Index | | | 99,315 | | | 4/26/2019 | | | 2.58 | %(b) | | | (5,680 | ) | | | (354 | ) | | | (6,034 | ) | |
Goldman Sachs
International | | S&P Industry
Sector Total Return Index | | | 161,299 | | | 12/19/2018 | | | 2.56 | %(c) | | | (3,468 | ) | | | (152 | ) | | | (3,620 | ) | |
JPMorgan Chase
Bank N.A. | | STOXX Europe 600 Travel &
Leisure (Net Return) Index | | EUR | 180,945 | | | 11/15/2018 | | | (0.44 | )%(d) | | | (14,926 | ) | | | 214 | | | | (14,712 | ) | |
JPMorgan Chase
Bank N.A. | | S&P 500 Total Return Index | | $ | 112,759 | | | 4/3/2019 | | | 2.78 | %(e) | | | 5,204 | | | | (399 | ) | | | 4,805 | | |
JPMorgan Chase
Bank N.A. | | MSCI Europe ex UK
Financials (Net Return) Index | | EUR | 75,779 | | | 9/17/2019 | | | (0.69 | )%(f) | | | (5,936 | ) | | | 30 | | | | (5,906 | ) | |
Total | | | | | | | | | | $ | (29,876 | ) | | $ | (1,000 | ) | | $ | (30,876 | ) | |
Over-the-counter total return swaps — Short
Counterparty | | Reference
Entity | | Notional
Amount(o) | | Maturity
Date | | Variable-
rate(n) | | Unrealized
Appreciation/
(Depreciation) | | Accrued
Net
Interest
Receivable/
(Payable) | | Value | |
Citibank, N.A. | | S&P 500 Total Return Index | | $ | (110,978 | ) | | 12/13/2018 | | | 2.27 | %(g) | | $ | 1,815 | | | $ | 324 | | | $ | 2,139 | | |
Citibank, N.A. | | S&P 500 Consumer Discretionary
Sector Total Return Index | | | (113,428 | ) | | 4/26/2019 | | | 2.45 | %(h) | | | 4,475 | | | | 349 | | | | 4,824 | | |
Goldman Sachs
International | | S&P 500 Consumer Durables &
Apparel Group Total Return Index | | | (184,107 | ) | | 12/19/2018 | | | 2.45 | %(i) | | | 15,721 | | | | 149 | | | | 15,870 | | |
JPMorgan Chase
Bank N.A. | | FTSE 100 Net Tax Index | | GBP | (92,949 | ) | | 11/15/2018 | | | (0.34 | )%(j) | | | 4,080 | | | | (85 | ) | | | 3,995 | | |
JPMorgan Chase
Bank N.A. | | STOXX Europe 600
(Net Return) Index | | EUR | (102,381 | ) | | 11/15/2018 | | | (0.66 | )%(k) | | | 4,982 | | | | (162 | ) | | | 4,820 | | |
JPMorgan Chase
Bank N.A. | | S&P 500 Utilities
Sector Total Return Index | | $ | (97,612 | ) | | 4/3/2019 | | | 2.65 | %(l) | | | (9,374 | ) | | | 134 | | | | (9,240 | ) | |
JPMorgan Chase | | MSCI Daily Total Return | | EUR | (84,730 | ) | | 9/17/2019 | | | (0.10 | )%(m) | | | 4,262 | | | | (4 | ) | | | 4,258 | | |
Bank N.A. | | Gross Europe ex UK Index | | | | | | | | | | | | | |
Total | | | | | | | | | | $ | 25,961 | | | $ | 705 | | | $ | 26,666 | | |
(a) Fund pays 3-month USD LIBOR plus 0.12%. Payment frequency—quarterly. Fund receives return on reference entity. Payment frequency—upon termination.
See Notes to Financial Statements
57
Schedule of Investments Global Allocation Fund (cont'd)
(b) Fund pays 3-month USD LIBOR plus 0.25%. Payment frequency—quarterly. Fund receives return on reference entity. Payment frequency—upon termination.
(c) Fund pays 1-month USD LIBOR plus 0.28%. Payment frequency—monthly. Fund receives return on reference entity. Payment frequency—upon termination.
(d) Fund pays 3-month EURIBOR minus 0.12%. Payment frequency—quarterly. Fund receives return on reference entity. Payment frequency—quarterly.
(e) Fund pays 1-month USD LIBOR plus 0.50%. Payment frequency—monthly. Fund receives return on reference entity. Payment frequency—upon termination.
(f) Fund pays 1-month EURIBOR minus 0.32%. Payment frequency—monthly. Fund receives return on reference entity. Payment frequency—upon termination.
(g) Fund receives 3-month USD LIBOR minus 0.06%. Payment frequency—quarterly. Fund pays return on reference entity. Payment frequency—upon termination.
(h) Fund receives 3-month USD LIBOR minus 0.12%. Payment frequency—quarterly. Fund pays return on reference entity. Payment frequency—upon termination.
(i) Fund receives 1-month USD LIBOR plus 0.17%. Payment frequency—monthly. Fund pays return on reference entity. Payment frequency—upon termination.
(j) Fund receives 3-month EURIBOR minus 0.02%. Payment frequency—quarterly in EUR currency. Fund pays return on reference entity. Payment frequency—quarterly in EUR Currency.
(k) Fund receives 3-month EURIBOR minus 0.34%. Payment frequency—quarterly. Fund pays return on reference entity. Payment frequency—quarterly.
(l) Fund receives 1-month USD LIBOR plus 0.37%. Payment frequency—monthly. Fund pays return on reference entity. Payment frequency—upon termination.
(m) Fund receives 1-month EURIBOR plus 0.27%. Payment frequency—monthly. Fund pays return on reference entity. Payment frequency—upon termination.
EURIBOR = Euro Interbank Offered Rate
LIBOR = London Interbank Offered Rate
(n) Effective rate at October 31, 2018.
(o) Notional amount is stated in the currency in which the contract is denominated.
EUR = Euro
For the year ended October 31, 2018, the average notional value of total return swaps was $779,611 for long positions and $(916,880) for short positions.
See Notes to Financial Statements
58
Schedule of Investments Global Allocation Fund (cont'd)
Purchased option contracts ("options purchased")
At October 31, 2018, the Fund had outstanding options purchased as follows:
Description | | Number of
Contracts | | Notional
Amount | | Exercise
Price | | Expiration
Date | | Value | |
Calls | |
Index | |
S&P 500 Mini Index | | | 9 | | | $ | 244,053 | | | $ | 292 | | | 11/7/2018 | | $ | — | (a)(b) | |
S&P 500 Mini Index | | | 9 | | | | 244,053 | | | | 292 | | | 11/21/2018 | | | 68 | | |
S&P 500 Mini Index | | | 8 | | | | 216,936 | | | | 292 | | | 11/14/2018 | | | — | (a)(b) | |
S&P 500 Mini Index | | | 10 | | | | 271,170 | | | | 305 | | | 11/14/2018 | | | — | (a)(b) | |
S&P 500 Mini Index | | | 8 | | | | 216,936 | | | | 307 | | | 11/7/2018 | | | — | (a)(b) | |
S&P 500 Mini Index | | | 8 | | | | 216,936 | | | | 306 | | | 11/7/2018 | | | — | (a)(b) | |
Total calls | | | | | | | | | | $ | 68 | | |
Puts | |
Index | |
S&P 500 Mini Index | | | 9 | | | | 244,053 | | | | 250 | | | 11/14/2018 | | | 540 | | |
S&P 500 Mini Index | | | 16 | | | | 433,872 | | | | 250 | | | 11/7/2018 | | | 376 | | |
S&P 500 Mini Index | | | 8 | | | | 216,936 | | | | 240 | | | 11/14/2018 | | | 200 | | |
S&P 500 Mini Index | | | 9 | | | | 244,053 | | | | 239 | | | 11/7/2018 | | | 85 | | |
S&P 500 Mini Index | | | 9 | | | | 244,053 | | | | 240 | | | 11/21/2018 | | | 374 | | |
Total puts | | | | | | | | | | $ | 1,575 | | |
Total options purchased (cost $4,082) | | | | | | | | | | $ | 1,643 | | |
(a) Security fair valued as of October 31, 2018 in accordance with procedures approved by the Board of Trustees.
(b) Value determined using significant unobservable inputs.
Written option contracts ("options written")
At October 31, 2018, the Fund had outstanding options written as follows:
Description | | Number of
Contracts | | Notional
Amount | | Exercise
Price | | Expiration
Date | | Value | |
Calls | |
Index | |
S&P 500 Mini Index | | | 9 | | | $ | (244,053 | ) | | $ | 271 | | | 11/21/2018 | | $ | (4,279 | ) | |
S&P 500 Mini Index | | | 8 | | | | (216,936 | ) | | | 284 | | | 11/7/2018 | | | (56 | ) | |
S&P 500 Mini Index | | | 8 | | | | (216,936 | ) | | | 283 | | | 11/7/2018 | | | (76 | ) | |
S&P 500 Mini Index | | | 10 | | | | (271,170 | ) | | | 285 | | | 11/14/2018 | | | (190 | ) | |
S&P 500 Mini Index | | | 8 | | | | (216,936 | ) | | | 270 | | | 11/14/2018 | | | (3,760 | ) | |
S&P 500 Mini Index | | | 9 | | | | (244,053 | ) | | | 268 | | | 11/7/2018 | | | (4,563 | ) | |
Total calls | | | | | | | | | | $ | (12,924 | ) | |
See Notes to Financial Statements
59
Schedule of Investments Global Allocation Fund (cont'd)
Description | | Number of
Contracts | | Notional
Amount | | Exercise
Price | | Expiration
Date | | Value | |
Puts | |
Index | |
S&P 500 Mini Index | | | 8 | | | $ | (216,936 | ) | | $ | 262 | | | 11/14/2018 | | $ | (1,552 | ) | |
S&P 500 Mini Index | | | 8 | | | | (216,936 | ) | | | 272 | | | 11/7/2018 | | | (3,180 | ) | |
S&P 500 Mini Index | | | 8 | | | | (216,936 | ) | | | 275 | | | 11/7/2018 | | | (4,572 | ) | |
S&P 500 Mini Index | | | 9 | | | | (244,053 | ) | | | 273 | | | 11/14/2018 | | | (5,031 | ) | |
S&P 500 Mini Index | | | 9 | | | | (244,053 | ) | | | 260 | | | 11/21/2018 | | | (1,899 | ) | |
S&P 500 Mini Index | | | 9 | | | | (244,053 | ) | | | 263 | | | 11/7/2018 | | | (1,121 | ) | |
Total puts | | | | | | | | | | $ | (17,355 | ) | |
Total options written (premium received $33,600) | | | | | | | | | | $ | (30,279 | ) | |
For the year ended October 31, 2018, the Fund had an average market value of $918 in options purchased and $(15,687) in options written. At October 31, 2018, the Fund had securities pledged in the amount of $814,762 to cover collateral requirements for options written.
The following is a summary, categorized by Level (see Note A of Notes to Financial Statements), of inputs used to value the Fund's investments as of October 31, 2018:
Asset Valuation Inputs | |
(000's omitted) | | Level 1 | | Level 2 | | Level 3(c) | | Total | |
Investments: | |
Common Stocks | |
Australia | | $ | 20 | | | $ | 75 | | | $ | — | | | $ | 95 | | |
Hong Kong | | | — | | | | 56 | | | | — | | | | 56 | | |
Japan | | | — | | | | 291 | | | | — | | | | 291 | | |
Singapore | | | — | | | | 13 | | | | — | | | | 13 | | |
United Kingdom | | | 146 | | | | 20 | | | | — | | | | 166 | | |
| Other Common Stocks(a) | | | 4,340 | | | | — | | | | — | | | | 4,340 | | |
Total Common Stocks | | | 4,506 | | | | 455 | | | | — | | | | 4,961 | | |
U.S. Treasury Obligations | | | — | | | | 1,387 | | | | — | | | | 1,387 | | |
U.S. Government Agency Securities | | | — | | | | 99 | | | | — | | | | 99 | | |
| Mortgage-Backed Securities(a) | | | — | | | | 1,770 | | | | — | | | | 1,770 | | |
| Corporate Bonds(a) | | | — | | | | 1,209 | | | | — | | | | 1,209 | | |
Asset-Backed Securities | | | — | | | | 119 | | | | — | | | | 119 | | |
Exchange-Traded Funds | | | 459 | | | | — | | | | — | | | | 459 | | |
Investment Companies | | | — | | | | 10,115 | | | | — | | | | 10,115 | | |
| Options Purchased(b)(d) | | | 2 | | | | — | | | | — | | | | 2 | | |
Short-Term Investments | | | — | | | | 182 | | | | — | | | | 182 | | |
Total Investments | | $ | 4,967 | | | $ | 15,336 | | | $ | — | | | $ | 20,303 | | |
(a) The Schedule of Investments provides a geographic categorization as well as a Positions by Industry summary.
(b) The "Purchased option contracts" table under Derivative Instruments provides information on the industry or sector categorization for the portfolio.
See Notes to Financial Statements
60
Schedule of Investments Global Allocation Fund (cont'd)
(c) The reconciliation between beginning and ending balances of investments in which unobservable inputs (Level 3) were used is not presented as all values rounded to less than $1,000.
(d) As of the year ended October 31, 2018, these investments were valued in accordance with procedures approved by the Board of Trustees. These investments did not have a material impact on the Fund's net assets and, therefore, disclosure of unobservable inputs used in formulating valuations is not presented.
The following is a summary, categorized by Level (see Note A of Notes to Financial Statements), of inputs used to value the Fund's derivatives as of October 31, 2018:
Other Financial Instruments | |
(000's omitted) | | Level 1 | | Level 2 | | Level 3(b) | | Total | |
| Futures(a) | |
Assets | | $ | 93 | | | $ | — | | | $ | — | | | $ | 93 | | |
Liabilities | | | (135 | ) | | | — | | | | — | | | | (135 | ) | |
| Forward Contracts(a) | |
Assets | | | — | | | | 266 | | | | — | | | | 266 | | |
Liabilities | | | — | | | | (261 | ) | | | — | | | | (261 | ) | |
Swaps | |
Assets | | | — | | | | 41 | | | | — | | | | 41 | | |
Liabilities | | | — | | | | (45 | ) | | | — | | | | (45 | ) | |
| Options Written(c) | |
Liabilities | | | (30 | ) | | | — | | | | — | | | | (30 | ) | |
Total | | $ | (72 | ) | | $ | 1 | | | $ | — | | | $ | (71 | ) | |
(a) Futures and forward contracts are reported at the cumulative unrealized appreciation/(depreciation) of the instrument.
(b) The reconciliation between beginning and ending balances of investments in which unobservable inputs (Level 3) were used is not presented as all values rounded to less than $1,000.
(c) As of the year ended October 31, 2018, these investments were valued in accordance with procedures approved by the Board of Trustees. These investments did not have a material impact on the Fund's net assets and, therefore, disclosure of unobservable inputs used in formulating valuations is not presented.
See Notes to Financial Statements
61
Schedule of Investments Hedged Option Premium Strategy Fund
October 31, 2018
PRINCIPAL AMOUNT | | | | VALUE | |
(000's omitted) | | | | (000's omitted) | |
U.S. Treasury Obligations 101.6% | | | |
| | | | | U.S. Treasury Notes | | | | | |
$ | 600 | | | 1.25%, due 12/15/18 | | $ | 599 | (a) | |
| | 700 | | | 1.00%, due 3/15/19 | | | 697 | | |
| | 4,000 | | | 0.88%, due 6/15/19—9/15/19 | | | 3,949 | | |
| | 3,100 | | | 1.38%, due 12/15/19—9/15/20 | | | 3,036 | | |
| | 2,500 | | | 1.63%, due 3/15/20—6/30/20 | | | 2,456 | (b) | |
| | 1,400 | | | 1.50%, due 6/15/20 | | | 1,370 | | |
| | 2,200 | | | 1.88%, due 12/15/20 | | | 2,155 | (b) | |
| | Total U.S. Treasury Obligations (Cost $14,438) | | | | | | 14,262 | | |
| | Total Options Purchased(c) 0.2% (Cost $37) | | | | | | 24 | | |
NUMBER OF SHARES | | | | | |
Short-Term Investments 0.7% | | | |
Investment Companies 0.7% | | | |
| | 96,081 | | | State Street Institutional U.S. Government Money Market Fund Premier Class, 2.09%(d) | | | 96 | (a) | |
| | | | | (Cost $96) | | | |
| | | | | Total Investments 102.5% (Cost $14,571) | | | 14,382 | | |
| | | | | Liabilities Less Other Assets (2.5)% | | | (354 | )(e) | |
| | | | | Net Assets 100.0% | | $ | 14,028 | | |
(a) All or a portion of this security is segregated in connection with obligations for options written with a total value of approximately $695,000.
(b) All or a portion of the security is pledged as collateral for options written.
(c) See "Purchased option contracts" under Derivative Instruments.
(d) Represents 7-day effective yield as of October 31, 2018.
(e) Includes the impact of the Fund's open positions in derivatives at October 31, 2018.
See Notes to Financial Statements
62
Schedule of Investments Hedged Option Premium Strategy Fund
(cont'd)
Derivative Instruments
Purchased option contracts ("options purchased")
At October 31, 2018, the Fund had outstanding options purchased as follows:
Description | | Number of
Contracts | | Notional
Amount | | Exercise
Price | | Expiration
Date | | Value | |
Calls | |
Index | |
Russell 2000 Index | | | 1 | | | $ | 151,141 | | | $ | 1,690 | | | 11/2/2018 | | $ | — | (a)(b) | |
Russell 2000 Index | | | 1 | | | | 151,141 | | | | 1,700 | | | 11/2/2018 | | | — | (a)(b) | |
Russell 2000 Index | | | 2 | | | | 302,283 | | | | 1,800 | | | 11/2/2018 | | | — | (a)(b) | |
Russell 2000 Index | | | 1 | | | | 151,141 | | | | 1,640 | | | 11/9/2018 | | | 32 | | |
Russell 2000 Index | | | 2 | | | | 302,283 | | | | 1,690 | | | 11/9/2018 | | | — | (a)(b) | |
Russell 2000 Index | | | 1 | | | | 151,141 | | | | 1,700 | | | 11/9/2018 | | | 10 | | |
Russell 2000 Index | | | 1 | | | | 151,141 | | | | 1,640 | | | 11/16/2018 | | | 85 | | |
Russell 2000 Index | | | 2 | | | | 302,283 | | | | 1,700 | | | 11/16/2018 | | | 30 | | |
Russell 2000 Index | | | 2 | | | | 302,283 | | | | 1,640 | | | 11/23/2018 | | | 320 | | |
S&P 500 Index | | | 4 | | | | 1,084,696 | | | | 2,960 | | | 11/7/2018 | | | 40 | | |
S&P 500 Index | | | 5 | | | | 1,355,870 | | | | 3,075 | | | 11/7/2018 | | | — | (a)(b) | |
S&P 500 Index | | | 5 | | | | 1,355,870 | | | | 3,100 | | | 11/7/2018 | | | — | (a)(b) | |
S&P 500 Index | | | 5 | | | | 1,355,870 | | | | 2,960 | | | 11/14/2018 | | | 225 | | |
S&P 500 Index | | | 5 | | | | 1,355,870 | | | | 3,010 | | | 11/14/2018 | | | 175 | | |
S&P 500 Index | | | 5 | | | | 1,355,870 | | | | 3,075 | | | 11/14/2018 | | | — | (a)(b) | |
S&P 500 Index | | | 5 | | | | 1,355,870 | | | | 2,950 | | | 11/21/2018 | | | 263 | | |
S&P 500 Index | | | 5 | | | | 1,355,870 | | | | 3,000 | | | 11/21/2018 | | | 225 | | |
S&P 500 Index | | | 5 | | | | 1,355,870 | | | | 3,000 | | | 11/28/2018 | | | 250 | | |
Total calls | | | | | | | | | | $ | 1,655 | | |
Puts | |
Index | |
Russell 2000 Index | | | 1 | | | $ | 151,141 | | | $ | 1,380 | | | 11/2/2018 | | $ | 22 | | |
Russell 2000 Index | | | 1 | | | | 151,141 | | | | 1,390 | | | 11/2/2018 | | | 27 | | |
Russell 2000 Index | | | 2 | | | | 302,283 | | | | 1,470 | | | 11/2/2018 | | | 660 | | |
Russell 2000 Index | | | 1 | | | | 151,141 | | | | 1,340 | | | 11/9/2018 | | | 128 | | |
Russell 2000 Index | | | 2 | | | | 302,283 | | | | 1,380 | | | 11/9/2018 | | | 505 | | |
Russell 2000 Index | | | 1 | | | | 151,141 | | | | 1,390 | | | 11/9/2018 | | | 308 | | |
Russell 2000 Index | | | 1 | | | | 151,141 | | | | 1,340 | | | 11/16/2018 | | | 258 | | |
Russell 2000 Index | | | 2 | | | | 302,283 | | | | 1,390 | | | 11/16/2018 | | | 1,090 | | |
Russell 2000 Index | | | 2 | | | | 302,283 | | | | 1,340 | | | 11/23/2018 | | | 820 | | |
S&P 500 Index | | | 4 | | | | 1,084,696 | | | | 2,420 | | | 11/7/2018 | | | 410 | | |
S&P 500 Index | | | 6 | | | | 1,627,044 | | | | 2,520 | | | 11/7/2018 | | | 1,635 | | |
S&P 500 Index | | | 4 | | | | 1,084,696 | | | | 2,525 | | | 11/7/2018 | | | 1,170 | | |
See Notes to Financial Statements
63
Schedule of Investments Hedged Option Premium Strategy Fund
(cont'd)
Description | | Number of
Contracts | | Notional
Amount | | Exercise
Price | | Expiration
Date | | Value | |
Puts | |
Index | |
S&P 500 Index | | | 5 | | | | 1,355,870 | | | $ | 2,420 | | | 11/14/2018 | | $ | 1,375 | | |
S&P 500 Index | | | 4 | | | | 1,084,696 | | | | 2,460 | | | 11/14/2018 | | | 1,540 | | |
S&P 500 Index | | | 5 | | | | 1,355,870 | | | | 2,520 | | | 11/14/2018 | | | 3,350 | | |
S&P 500 Index | | | 5 | | | | 1,355,870 | | | | 2,425 | | | 11/21/2018 | | | 2,350 | | |
S&P 500 Index | | | 5 | | | | 1,355,870 | | | | 2,460 | | | 11/21/2018 | | | 3,050 | | |
S&P 500 Index | | | 5 | | | | 1,355,870 | | | | 2,460 | | | 11/28/2018 | | | 3,975 | | |
Total puts | | | | | | | | | | $ | 22,673 | | |
Total options purchased (cost $36,993) | | | | | | | | | | $ | 24,328 | | |
(a) Security fair valued as of October 31, 2018 in accordance with procedures approved by the Board of Trustees.
(b) Value determined using significant unobservable inputs.
Written option contracts ("options written")
At October 31, 2018, the Fund had outstanding options written as follows:
Description | | Number of
Contracts | | Notional
Amount | | Exercise
Price | | Expiration
Date | | Value | |
Calls | |
Index | |
Russell 2000 Index | | | 2 | | | $ | (302,283 | ) | | $ | 1,560 | | | 11/2/2018 | | $ | (135 | ) | |
Russell 2000 Index | | | 2 | | | | (302,283 | ) | | | 1,665 | | | 11/2/2018 | | | — | (a)(b) | |
Russell 2000 Index | | | 1 | | | | (151,141 | ) | | | 1,505 | | | 11/9/2018 | | | (3,025 | ) | |
Russell 2000 Index | | | 3 | | | | (453,424 | ) | | | 1,565 | | | 11/9/2018 | | | (1,770 | ) | |
Russell 2000 Index | | | 1 | | | | (151,141 | ) | | | 1,515 | | | 11/16/2018 | | | (2,960 | ) | |
Russell 2000 Index | | | 2 | | | | (302,283 | ) | | | 1,575 | | | 11/16/2018 | | | (1,470 | ) | |
Russell 2000 Index | | | 2 | | | | (302,283 | ) | | | 1,520 | | | 11/23/2018 | | | (6,320 | ) | |
S&P 500 Index | | | 4 | | | | (1,084,696 | ) | | | 2,715 | | | 11/7/2018 | | | (12,420 | ) | |
S&P 500 Index | | | 5 | | | | (1,355,870 | ) | | | 2,845 | | | 11/7/2018 | | | (275 | ) | |
S&P 500 Index | | | 5 | | | | (1,355,870 | ) | | | 2,875 | | | 11/7/2018 | | | (175 | ) | |
S&P 500 Index | | | 5 | | | | (1,355,870 | ) | | | 2,730 | | | 11/14/2018 | | | (16,375 | ) | |
S&P 500 Index | | | 5 | | | | (1,355,870 | ) | | | 2,765 | | | 11/14/2018 | | | (8,650 | ) | |
S&P 500 Index | | | 5 | | | | (1,355,870 | ) | | | 2,860 | | | 11/14/2018 | | | (763 | ) | |
S&P 500 Index | | | 5 | | | | (1,355,870 | ) | | | 2,745 | | | 11/21/2018 | | | (15,650 | ) | |
S&P 500 Index | | | 5 | | | | (1,355,870 | ) | | | 2,775 | | | 11/21/2018 | | | (9,600 | ) | |
S&P 500 Index | | | 5 | | | | (1,355,870 | ) | | | 2,790 | | | 11/28/2018 | | | (8,825 | ) | |
Total calls | | | | | | | | | | $ | (88,413 | ) | |
See Notes to Financial Statements
64
Schedule of Investments Hedged Option Premium Strategy Fund
(cont'd)
Description | | Number of
Contracts | | Notional
Amount | | Exercise
Price | | Expiration
Date | | Value | |
Index | |
Puts | |
Russell 2000 Index | | | 1 | | | $ | (151,141 | ) | | $ | 1,510 | | | 11/2/2018 | | $ | (1,380 | ) | |
Russell 2000 Index | | | 1 | | | | (151,141 | ) | | | 1,530 | | | 11/2/2018 | | | (2,520 | ) | |
Russell 2000 Index | | | 2 | | | | (302,283 | ) | | | 1,600 | | | 11/2/2018 | | | (17,940 | ) | |
Russell 2000 Index | | | 1 | | | | (151,141 | ) | | | 1,475 | | | 11/9/2018 | | | (1,495 | ) | |
Russell 2000 Index | | | 2 | | | | (302,283 | ) | | | 1,505 | | | 11/9/2018 | | | (4,990 | ) | |
Russell 2000 Index | | | 1 | | | | (151,141 | ) | | | 1,520 | | | 11/9/2018 | | | (3,170 | ) | |
Russell 2000 Index | | | 1 | | | | (151,141 | ) | | | 1,470 | | | 11/16/2018 | | | (1,865 | ) | |
Russell 2000 Index | | | 2 | | | | (302,283 | ) | | | 1,515 | | | 11/16/2018 | | | (6,930 | ) | |
Russell 2000 Index | | | 2 | | | | (302,283 | ) | | | 1,460 | | | 11/23/2018 | | | (4,010 | ) | |
S&P 500 Index | | | 4 | | | | (1,084,696 | ) | | | 2,665 | | | 11/7/2018 | | | (7,300 | ) | |
S&P 500 Index | | | 6 | | | | (1,627,044 | ) | | | 2,760 | | | 11/7/2018 | | | (35,850 | ) | |
S&P 500 Index | | | 4 | | | | (1,084,696 | ) | | | 2,765 | | | 11/7/2018 | | | (25,300 | ) | |
S&P 500 Index | | | 5 | | | | (1,355,870 | ) | | | 2,650 | | | 11/14/2018 | | | (12,200 | ) | |
S&P 500 Index | | | 4 | | | | (1,084,696 | ) | | | 2,710 | | | 11/14/2018 | | | (17,440 | ) | |
S&P 500 Index | | | 5 | | | | (1,355,870 | ) | | | 2,745 | | | 11/14/2018 | | | (30,225 | ) | |
S&P 500 Index | | | 5 | | | | (1,355,870 | ) | | | 2,635 | | | 11/21/2018 | | | (13,300 | ) | |
S&P 500 Index | | | 5 | | | | (1,355,870 | ) | | | 2,695 | | | 11/21/2018 | | | (22,075 | ) | |
S&P 500 Index | | | 5 | | | | (1,355,870 | ) | | | 2,680 | | | 11/28/2018 | | | (21,375 | ) | |
Total puts | | | | | | | | | | $ | (229,365 | ) | |
Total options written (premium received $327,362) | | | | | | | | | | $ | (317,778 | ) | |
(a) Security fair valued as of October 31, 2018 in accordance with procedures approved by the Board of Trustees.
(b) Value determined using significant unobservable inputs.
For the year ended October 31, 2018, the Fund had an average market value of $8,921 in options purchased and $(148,996) in options written. At October 31, 2018, the Fund had securities pledged in the amount of $2,352,902 to cover collateral requirements for options written.
The following is a summary, categorized by Level (see Note A of Notes to Financial Statements), of inputs used to value the Fund's investments as of October 31, 2018:
Asset Valuation Inputs | |
(000's omitted) | | Level 1 | | Level 2 | | Level 3(b) | | Total | |
Investments: | |
U.S. Treasury Obligations | | $ | — | | | $ | 14,262 | | | $ | — | | | $ | 14,262 | | |
| Options Purchased(a) | | | 24 | | | | — | | | | — | | | | 24 | | |
Short-Term Investments | | | — | | | | 96 | | | | — | | | | 96 | | |
Total Investments | | $ | 24 | | | $ | 14,358 | | | $ | — | | | $ | 14,382 | | |
(a) The "Purchased option contracts" table under Derivative Instruments provides information on the industry or sector categorization for the portfolio.
See Notes to Financial Statements
65
Schedule of Investments Hedged Option Premium Strategy Fund
(cont'd)
(b) The following is a reconciliation between the beginning and ending balances of investments in which unobservable inputs (Level 3) were used in determining value:
| | | Beginning
balance, as
of 11/01/2017 | | Accrued
discounts/
(premiums) | | Realized
gain/(loss) | | Change
in unrealized
appreciation/
(depreciation) | | Purchases | | Sales | | Transfers
into
Level 3 | | Transfers
out of
Level 3 | | Balance,
as of
10/31/2018 | | Net change in
unrealized
appreciation/
(depreciation)
from
investments
still held as of
10/31/2018 | |
Investments in
Securities:
(000's omitted) | |
Options
Purchased(c) | |
Index | | $ | — | | | $ | — | | | $ | (1 | ) | | $ | — | | | $ | 1 | | | $ | — | | | $ | — | | | $ | — | | | $ | — | | | $ | (1 | ) | |
Total | | $ | — | | | $ | — | | | $ | (1 | ) | | $ | — | | | $ | 1 | | | $ | — | | | $ | — | | | $ | — | | | $ | — | | | $ | (1 | ) | |
(c) As of the year ended October 31, 2018, these investments were valued in accordance with procedures approved by the Board of Trustees. These investments did not have a material impact on the Fund's net assets and, therefore, disclosure of unobservable inputs used in formulating valuations is not presented.
The following is a summary, categorized by Level (see Note A of Notes to Financial Statements), of inputs used to value the Fund's derivatives as of October 31, 2018:
Other Financial Instruments | |
(000's omitted) | | Level 1 | | Level 2 | | Level 3(b) | | Total | |
Options Written | |
Liabilities | | $ | (318 | ) | | $ | — | | | $ | — | | | $ | (318 | ) | |
Total | | $ | (318 | ) | | $ | — | | | $ | — | | | $ | (318 | ) | |
(b) The following is a reconciliation between the beginning and ending balances of investments in which unobservable inputs (Level 3) were used in determining value:
| | | Beginning
balance, as
of 11/01/2017 | | Accrued
discounts/
(premiums) | | Realized
gain/(loss) | | Change
in unrealized
appreciation/
(depreciation) | | Purchases | | Sales | | Transfers
into
Level 3 | | Transfers
out of
Level 3 | | Balance,
as of
10/31/2018 | | Net change in
unrealized
appreciation/
(depreciation)
from
investments
still held as of
10/31/2018 | |
Other Financial
Instruments:
(000's omitted) | |
| Options Written(c) | |
Index | | $ | — | | | $ | — | | | $ | — | | | $ | 3 | | | $ | — | | | $ | (3 | ) | | $ | — | | | $ | — | | | $ | — | | | $ | 3 | | |
Total | | $ | — | | | $ | — | | | $ | — | | | $ | 3 | | | $ | — | | | $ | (3 | ) | | $ | — | | | $ | — | | | $ | — | | | $ | 3 | | |
(c) As of the year ended October 31, 2018, these investments were valued in accordance with procedures approved by the Board of Trustees. These investments did not have a material impact on the Fund's net assets and, therefore, disclosure of unobservable inputs used in formulating valuations is not presented.
See Notes to Financial Statements
66
Schedule of Investments Long Short Fund October 31, 2018
| | | Number
of Shares | | Value
(000's
omitted) | |
Long Positions 97.9% | |
Common Stocks 79.4% | |
Aerospace & Defense 3.0% | |
General
Dynamics
Corp. | | | 386,000 | | | $ | 66,616 | (a) | |
Raytheon
Co. | | | 137,000 | | | | 23,980 | | |
| | | | 90,596 | | |
Airlines 1.3% | |
Delta Air
Lines, Inc. | | | 700,000 | | | | 38,311 | | |
Banks 3.1% | |
Comerica,
Inc. | | | 373,900 | | | | 30,495 | | |
JPMorgan
Chase &
Co. | | | 581,000 | | | | 63,341 | | |
| | | | 93,836 | | |
Biotechnology 1.1% | |
Gilead
Sciences,
Inc. | | | 470,000 | | | | 32,045 | | |
Capital Markets 5.3% | |
BlackRock,
Inc. | | | 118,987 | | | | 48,954 | | |
Brookfield
Asset
Management,
Inc.
Class A | | | 1,020,898 | | | | 41,601 | | |
CME
Group,
Inc. | | | 220,900 | | | | 40,478 | | |
Goldman
Sachs
Group,
Inc. | | | 129,100 | | | | 29,095 | | |
| | | | 160,128 | | |
Chemicals 1.3% | |
Ashland
Global
Holdings,
Inc. | | | 521,500 | | | | 38,581 | | |
Commercial Services 0.7% | |
LegalZoom.com,
Inc. | | | 2,158,660 | | | | 22,623 | *(b)(c)(l) | |
Construction & Engineering 0.5% | |
Valmont
Industries,
Inc. | | | 132,900 | | | | 16,521 | | |
Diversified Financial Services 1.2% | |
CF Corp.
Class A | | | 465,000 | | | | 3,674 | * | |
| | | Number
of Shares | | Value
(000's
omitted) | |
FGL
Holdings | | | 4,324,966 | | | $ | 34,167 | * | |
| | | | 37,841 | | |
Electric Utilities 1.1% | |
NextEra
Energy,
Inc. | | | 189,900 | | | | 32,758 | | |
Electrical Equipment 1.6% | |
Eaton
Corp. PLC | | | 674,000 | | | | 48,306 | | |
Electronic Equipment, Instruments & Components 2.2% | |
Amphenol
Corp.
Class A | | | 240,000 | | | | 21,480 | | |
CDW Corp. | | | 505,200 | | | | 45,473 | | |
| | | | 66,953 | | |
Energy Equipment & Services 1.2% | |
Cactus, Inc.
Class A | | | 476,579 | | | | 15,947 | * | |
Schlumberger
Ltd. | | | 420,000 | | | | 21,550 | | |
| | | | 37,497 | | |
Entertainment 3.5% | |
Activision
Blizzard,
Inc. | | | 511,900 | | | | 35,347 | | |
Spotify
Technology
SA | | | 270,800 | | | | 40,536 | * | |
Twenty-First
Century Fox,
Inc. Class B | | | 676,000 | | | | 30,541 | | |
| | | | 106,424 | | |
Food & Staples Retailing 2.2% | |
Costco
Wholesale
Corp. | | | 94,000 | | | | 21,491 | | |
Sprouts
Farmers
Market, Inc. | | | 707,400 | | | | 19,022 | * | |
Walmart, Inc. | | | 250,700 | | | | 25,140 | | |
| | | | 65,653 | | |
Food Products 3.8% | |
Conagra
Brands, Inc. | | | 2,060,000 | | | | 73,336 | | |
Hain Celestial
Group, Inc. | | | 1,708,700 | | | | 42,513 | * | |
| | | | 115,849 | | |
Health Care Equipment & Supplies 1.0% | |
DENTSPLY
SIRONA, Inc. | | | 869,100 | | | | 30,097 | | |
| | | Number
of Shares | | Value
(000's
omitted) | |
Health Care Providers & Services 2.9% | |
CVS Health
Corp. | | | 608,900 | | | $ | 44,078 | | |
DaVita, Inc. | | | 125,000 | | | | 8,417 | * | |
UnitedHealth
Group, Inc. | | | 130,800 | | | | 34,185 | | |
| | | | 86,680 | | |
Holding Companies—Diversified 0.3% | |
Collier
Creek
Holdings | | | 988,100 | | | | 10,049 | * | |
Hotels, Restaurants & Leisure 3.0% | |
Marriott
International,
Inc. Class A | | | 96,500 | | | | 11,280 | | |
McDonald's
Corp. | | | 313,700 | | | | 55,493 | | |
MGM Resorts
International | | | 430,400 | | | | 11,483 | | |
Papa John's
International,
Inc. | | | 261,000 | | | | 14,235 | (d) | |
| | | | 92,491 | | |
Interactive Media & Services 4.3% | |
Alphabet,
Inc.
Class A | | | 59,000 | | | | 64,344 | * | |
Alphabet,
Inc.
Class C | | | 10,353 | | | | 11,148 | * | |
Facebook,
Inc.
Class A | | | 353,000 | | | | 53,582 | *(a) | |
| | | | 129,074 | | |
Internet & Direct Marketing Retail 4.1% | |
Amazon.com,
Inc. | | | 23,900 | | | | 38,193 | * | |
Booking
Holdings, Inc. | | | 28,900 | | | | 54,175 | * | |
eBay, Inc. | | | 371,500 | | | | 10,785 | * | |
Expedia
Group, Inc. | | | 157,500 | | | | 19,755 | | |
| | | | 122,908 | | |
IT Services 4.6% | |
PayPal
Holdings, Inc. | | | 328,600 | | | | 27,665 | * | |
Visa, Inc.
Class A | | | 579,400 | | | | 79,870 | | |
WEX, Inc. | | | 180,800 | | | | 31,814 | * | |
| | | | 139,349 | | |
Life Sciences Tools & Services 0.5% | |
Mettler-Toledo
International,
Inc. | | | 26,800 | | | | 14,655 | * | |
See Notes to Financial Statements
67
Schedule of Investments Long Short Fund (cont'd)
| | | Number
of Shares | | Value
(000's
omitted) | |
Machinery 0.6% | |
Gates
Industrial
Corp. PLC | | | 1,298,000 | | | $ | 19,535 | * | |
Multi-Utilities 1.9% | |
Brookfield
Infrastructure
Partners LP | | | 1,026,200 | | | | 38,298 | | |
Sempra
Energy | | | 104,100 | | | | 11,463 | | |
WEC Energy
Group, Inc. | | | 110,000 | | | | 7,524 | | |
| | | | 57,285 | | |
Oil, Gas & Consumable Fuels 2.8% | |
Cheniere
Energy, Inc. | | | 228,700 | | | | 13,816 | * | |
Enbridge,
Inc. | | | 2,250,000 | | | | 69,997 | (d) | |
| | | | 83,813 | | |
Professional Services 4.2% | |
Equifax, Inc. | | | 418,000 | | | | 42,402 | | |
IHS Markit
Ltd. | | | 1,326,500 | | | | 69,681 | * | |
Verisk
Analytics,
Inc. | | | 130,300 | | | | 15,615 | * | |
| | | | 127,698 | | |
Road & Rail 1.8% | |
CSX Corp. | | | 620,000 | | | | 42,693 | | |
Norfolk
Southern
Corp. | | | 77,000 | | | | 12,923 | | |
| | | | 55,616 | | |
Semiconductors & Semiconductor Equipment 0.5% | |
ASML
Holding NV | | | 85,500 | | | | 14,737 | | |
Software 1.4% | |
Microsoft
Corp. | | | 400,000 | | | | 42,724 | | |
Specialty Retail 5.3% | |
Asbury
Automotive
Group, Inc. | | | 150,000 | | | | 9,765 | * | |
Home
Depot, Inc. | | | 263,300 | | | | 46,309 | | |
Hudson Ltd.
Class A | | | 1,464,700 | | | | 30,964 | * | |
Lowe's
Cos., Inc. | | | 310,000 | | | | 29,518 | | |
Party City
Holdco, Inc. | | | 2,396,702 | | | | 25,093 | *(d) | |
Tractor
Supply Co. | | | 212,000 | | | | 19,481 | | |
| | | | 161,130 | | |
| | | Number
of Shares | | Value
(000's
omitted) | |
Technology Hardware, Storage & Peripherals 1.5% | |
Apple, Inc. | | | 210,000 | | | $ | 45,961 | | |
Textiles, Apparel & Luxury Goods 2.2% | |
PVH Corp. | | | 555,000 | | | | 67,038 | | |
Tobacco 0.5% | |
Philip
Morris
International,
Inc. | | | 163,700 | | | | 14,417 | | |
Trading Companies & Distributors 2.4% | |
HD Supply
Holdings,
Inc. | | | 1,213,500 | | | | 45,591 | * | |
Univar, Inc. | | | 1,048,100 | | | | 25,804 | * | |
| | | | 71,395 | | |
Water Utilities 0.5% | |
American
Water
Works Co.,
Inc. | | | 180,000 | | | | 15,935 | | |
Total Common Stocks
(Cost $2,053,307) | | | 2,406,509 | | |
Preferred Stocks 0.9% | |
Health Care 0.5% | |
Moderna,
Inc. Ser. F | | | 1,315,490 | | | | 13,234 | *(b)(c)(l) | |
Moderna,
Inc. Ser. G | | | 175,905 | | | | 1,769 | *(b)(c)(l) | |
| | | | 15,003 | | |
Multi-Utilities 0.4% | |
Sempra
Energy,
Ser. B, 6.75% | | | 125,650 | | | | 12,527 | | |
Total Preferred Stocks
(Cost $26,063) | | | 27,530 | | |
| | | Principal
Amount
(000's
omitted) | | | |
Corporate Bonds 5.3% | |
Commercial Services 1.3% | |
APX
Group,
Inc.,
8.75%,
due
12/1/20 | | $ | 19,112 | | | | 18,634 | | |
IHS Markit
Ltd.,
4.00%,
due 3/1/26 | | | 21,540 | | | | 20,272 | (e) | |
| | | | 38,906 | | |
| | | Principal
Amount
(000's
omitted) | | Value
(000's
omitted) | |
Gas 0.8% | |
Rockpoint
Gas
Storage
Canada
Ltd.,
7.00%,
due
3/31/23 | | $ | 23,870 | | | $ | 23,751 | (e) | |
Real Estate 0.4% | |
Five Point
Operating
Co.
LP/Five
Point
Capital
Corp.,
7.88%,
due
11/15/25 | | | 12,422 | | | | 12,306 | (e) | |
Retail 2.2% | |
Party City
Holdings,
Inc.,
6.63%,
due
8/1/26 | | | 7,080 | | | | 6,885 | (d)(e) | |
PetSmart,
Inc. | |
due
6/1/25 5.88%, | | | 46,379 | | | | 36,292 | (e) | |
| due 6/1/25 8.88%, | | | 34,299 | | | | 23,752 | (d)(e) | |
| | | | 66,929 | | |
Semiconductors 0.3% | |
MagnaChip
Semiconductor
SA, 6.63%,
due
7/15/21 | | | 11,252 | | | | 10,577 | | |
Software 0.3% | |
Project
Homestake
Merger
Corp.,
8.88%,
due 3/1/23 | | | 9,360 | | | | 8,588 | (d)(e) | |
Total Corporate Bonds
(Cost $164,945) | | | 161,057 | | |
Convertible Bonds 0.2% | |
Semiconductor 0.2% | |
MagnaChip
Semiconductor
Corp.,
5.00%,
due 3/1/21
(Cost $4,823) | | | 4,020 | | | | 4,890 | | |
See Notes to Financial Statements
68
Schedule of Investments Long Short Fund (cont'd)
| | | Number
of Shares | | Value
(000's
omitted) | |
Master Limited Partnerships 1.4% | |
Capital Markets 1.4% | |
Ares
Management
LP | | | 853,200 | | | $ | 16,731 | | |
Blackstone
Group LP | | | 801,300 | | | | 25,930 | | |
Total Master
Limited
Partnerships
(Cost $47,818) | | | 42,661 | | |
Total Options
Purchased(i) 0.2%
(Cost $9,385) | | | 6,723 | | |
Short-Term Investments 10.5% | |
Investment Companies 10.5% | |
State
Street
Institutional
U.S.
Government
Money
Market
Fund
Premier
Class,
2.09%(f) | | | 244,426,840 | | | | 244,427 | (g) | |
State
Street
Navigator
Securities
Lending
Government
Money
Market
Portfolio,
2.18%(f) | | | 73,894,629 | | | | 73,895 | (h) | |
Total Short-Term
Investments
(Cost $318,322) | | | 318,322 | | |
Total Long
Positions (97.7)%
(Cost $2,624,663) | | | 2,967,692 | | |
| Short Positions ((14.4)%)(j) | |
Common Stocks Sold Short (12.4)% | |
Automobiles (0.4)% | |
Harley-
Davidson,
Inc. | | | (117,356 | ) | | | (4,485 | ) | |
Tesla, Inc. | | | (24,800 | ) | | | (8,366 | )* | |
| | | | (12,851 | ) | |
| | | Number
of Shares | | Value
(000's
omitted) | |
Banks (0.2)% | |
BankUnited,
Inc. | | | (145,500 | ) | | $ | (4,816 | ) | |
Beverages (0.2)% | |
National
Beverage
Corp. | | | (62,600 | ) | | | (5,787 | )* | |
Capital Markets (1.2)% | |
FactSet
Research
Systems,
Inc. | | | (52,500 | ) | | | (11,748 | ) | |
Federated
Investors,
Inc.
Class B | | | (631,100 | ) | | | (15,569 | ) | |
Focus
Financial
Partners,
Inc. Class A | | | (224,000 | ) | | | (8,557 | )* | |
Greenhill &
Co., Inc. | | | (92,200 | ) | | | (2,033 | ) | |
| | | | (37,907 | ) | |
Commercial Services & Supplies (0.4)% | |
Ritchie Bros
Auctioneers,
Inc. | | | (372,000 | ) | | | (12,503 | ) | |
Containers & Packaging (0.4)% | |
Aptar
Group, Inc. | | | (108,900 | ) | | | (11,104 | ) | |
Diversified Telecommunication
Services (0.3)% | |
CenturyLink,
Inc. | | | (400,000 | ) | | | (8,256 | ) | |
Electric Utilities (0.4)% | |
Southern
Co. | | | (260,600 | ) | | | (11,735 | ) | |
Energy Equipment & Services (0.3)% | |
Core
Laboratories
NV | | | (86,100 | ) | | | (7,339 | ) | |
Covia
Holdings
Corp. | | | (284,164 | ) | | | (1,643 | )* | |
| | | | (8,982 | ) | |
Equity Real Estate Investment
Trusts (0.9)% | |
Lamar
Advertising
Co. Class A | | | (154,000 | ) | | | (11,291 | ) | |
Realty
Income
Corp. | | | (277,300 | ) | | | (16,713 | ) | |
| | | | (28,004 | ) | |
| | | Number
of Shares | | Value
(000's
omitted) | |
Food & Staples Retailing (0.6)% | |
BJ's Wholesale
Club
Holdings,
Inc. | | | (503,000 | ) | | $ | (11,141 | )* | |
United
Natural
Foods, Inc. | | | (320,000 | ) | | | (6,954 | )* | |
| | | | (18,095 | ) | |
Food Products (1.1)% | |
General
Mills, Inc. | | | (390,700 | ) | | | (17,113 | ) | |
Kellogg Co. | | | (118,500 | ) | | | (7,759 | ) | |
McCormick &
Co., Inc. | | | (53,100 | ) | | | (7,646 | ) | |
| | | | (32,518 | ) | |
Hotels, Restaurants & Leisure (0.8)% | |
BJ's
Restaurants,
Inc. | | | (61,000 | ) | | | (3,732 | ) | |
Darden
Restaurants,
Inc. | | | (81,000 | ) | | | (8,631 | ) | |
Dine Brands
Global, Inc. | | | (100,000 | ) | | | (8,104 | ) | |
Texas
Roadhouse,
Inc. | | | (72,000 | ) | | | (4,353 | ) | |
| | | | (24,820 | ) | |
Household Durables (0.3)% | |
PulteGroup,
Inc. | | | (371,900 | ) | | | (9,138 | ) | |
IT Services (0.7)% | |
GreenSky,
Inc.
Class A | | | (369,800 | ) | | | (4,874 | )* | |
Western
Union Co. | | | (880,123 | ) | | | (15,877 | ) | |
| | | | (20,751 | ) | |
Machinery (0.6)% | |
Graco,
Inc. | | | (193,000 | ) | | | (7,842 | ) | |
PACCAR,
Inc. | | | (157,500 | ) | | | (9,010 | ) | |
| | | | (16,852 | ) | |
Media (1.0)% | |
Discovery,
Inc.
Class A | | | (520,000 | ) | | | (16,843 | )* | |
New Media
Investment
Group, Inc. | | | (303,000 | ) | | | (4,257 | ) | |
Omnicom
Group, Inc. | | | (132,100 | ) | | | (9,818 | ) | |
| | | | (30,918 | ) | |
See Notes to Financial Statements
69
Schedule of Investments Long Short Fund (cont'd)
| | | Number
of Shares | | Value
(000's
omitted) | |
Multi-Utilities (0.4)% | |
Consolidated
Edison, Inc. | | | (161,400 | ) | | $ | (12,266 | ) | |
Multiline Retail (0.2)% | |
Ollie's
Bargain
Outlet
Holdings,
Inc. | | | (67,300 | ) | | | (6,252 | )* | |
Oil, Gas & Consumable Fuel (0.2)% | |
Tallgrass
Energy LP | | | (290,000 | ) | | | (6,310 | ) | |
Semiconductors & Semiconductor Equipment (0.2)% | |
NVIDIA
Corp. | | | (32,500 | ) | | | (6,852 | ) | |
Software (0.1)% | |
Ellie Mae,
Inc. | | | (57,000 | ) | | | (3,778 | )* | |
Specialty Retail (1.1)% | |
Five Below,
Inc. | | | (53,300 | ) | | | (6,067 | )* | |
Gap, Inc. | | | (113,200 | ) | | | (3,090 | ) | |
Sally
Beauty
Holdings,
Inc. | | | (630,000 | ) | | | (11,220 | )* | |
Williams-
Sonoma,
Inc. | | | (234,400 | ) | | | (13,919 | ) | |
| | | | (34,296 | ) | |
Technology Hardware, Storage & Peripherals (0.2)% | |
Seagate
Technology
PLC | | | (180,000 | ) | | | (7,241 | ) | |
Textiles, Apparel & Luxury Goods (0.2)% | |
Ralph
Lauren
Corp. | | | (45,600 | ) | | | (5,910 | ) | |
Total Common Stocks
Sold Short
(Proceeds $(388,589))(377,942) | | | |
| | | Principal
Amount
(000's
omitted) | | | |
Corporate Bonds Sold Short (1.1)% | |
Energy Equipment & Services (0.1)% | |
Hi-Crush
Partners
LP, 9.50%,
due 8/1/26 | | $ | (4,000 | ) | | | (3,180 | )(e) | |
Media (0.2)% | |
CBS Radio,
Inc., 7.25%,
due 11/1/24 | | | (7,000 | ) | | | (6,659 | )(e) | |
| | | Principal
Amount
(000's
omitted) | | Value
(000's
omitted) | |
Oil & Gas (0.1)% | |
Apache
Corp., 4.25%,
due 1/15/44 | | $ | (4,000 | ) | | $ | (3,371 | ) | |
Retail (0.7)% | |
JC Penney
Corp., Inc.,
5.88%,
due 7/1/23 | | | (2,000 | ) | | | (1,750 | )(e) | |
JC Penney
Corp., Inc.,
8.63%,
due 3/15/25 | | | (2,000 | ) | | | (1,320 | )(e) | |
Bed Bath &
Beyond,
Inc., 3.75%,
due 8/1/24 | | | (3,000 | ) | | | (2,629 | ) | |
Beacon
Roofing
Supply, Inc.,
4.88%,
due 11/1/25 | | | (5,000 | ) | | | (4,531 | )(e) | |
Sally
Holdings
LLC/Sally
Capital, Inc.,
5.63%, due
12/1/25 | | | (10,000 | ) | | | (9,387 | ) | |
| | | | (19,617 | ) | |
Total Corporate Bonds
Sold Short
(Proceeds $(34,987)) | | | (32,827 | ) | |
| | | Number
of Shares | | | |
Exchange-Traded Funds Sold
Short (0.6)% | |
Vanguard
REIT ETF
(Proceeds
$(18,027)) | | | (231,600 | ) | | | (18,139 | ) | |
Master Limited Partnerships Sold
Short (0.3)% | |
Energy Equipment & Services (0.3)% | |
Hi-Crush
Partners LP
(Proceeds
$(15,973)) | | | (1,281,200 | ) | | | (9,647 | ) | |
Total Short Positions
(Proceeds $(457,576)) | | | (438,555
| ) | |
Total Investments 83.5%
(Cost $2,167,087) | | | 2,529,137
| | |
Other Assets
Less Liabilities 16.5% | | | | | 501,583 | (k) | |
Net Assets 100.0% | | $ | 3,030,720 | | |
See Notes to Financial Statements
70
Schedule of Investments Long Short Fund (cont'd)
* Non-income producing security.
(a) All or a portion of the security is pledged as collateral for options written.
(b) Value determined using significant unobservable inputs.
(c) Security fair valued as of October 31, 2018 in accordance with procedures approved by the Board of Trustees. Total value of all such securities at October 31, 2018 amounted to approximately $37,626,000, which represents 1.2% of net assets of the Fund.
(d) The security or a portion of this security is on loan at October 31, 2018. Total value of all such securities at October 31, 2018 amounted to approximately $73,230,000 for the Fund. (see Note A of the Notes to Financial Statements).
(e) Securities were purchased or sold short under Rule 144A of the Securities Act of 1933, as amended, or are otherwise restricted and, unless registered under the Securities Act of 1933 or exempted from registration, may only be sold to qualified institutional investors or may have other restrictions on resale. At October 31, 2018, these securities amounted to approximately $131,846,000 of long positions and $(17,440,000) of short positions, which represents 4.4% and (0.6)%, respectively, of net assets of the Fund. These securities have been deemed by the investment manager to be liquid.
(f) Represents 7-day effective yield as of October 31, 2018.
(g) All or a portion of this security is segregated in connection with obligations for securities sold short, options written, swaps and/or futures with a total value of approximately $244,427,000.
(h) Represents investment of cash collateral received from securities lending.
(i) See "Purchased option contracts" under Derivative Instruments.
(j) At October 31, 2018 the Fund had approximately $615,878,000 deposited, in one or more accounts to satisfy collateral requirements for borrowing in connection with securities sold short.
(k) Includes the impact of the Fund's open positions in derivatives at October 31, 2018.
(l) These securities have been deemed by the investment manager to be illiquid, and are subject to restrictions on resale.
At October 31, 2018, these securities amounted to approximately $37,626,000, which represents 1.2% of net assets of the Fund.
Restricted Security
(000's omitted) | | Acquisition
Date | | Acquisition
Cost | | Acquisition
Cost
Percentage
of Net Assets | | Value as of
10/31/2018 | | Fair Value
Percentage
of Net Assets
as of
10/31/2018 | |
LegalZoom.com, Inc. | | 8/21/2018 | | $ | 22,623 | | | | 0.6 | % | | $ | 22,623 | | | | 0.7 | % | |
Moderna Therapeutics
(Ser. F Preferred Shares) | | 8/10/2016 | | | 11,550 | | | | 0.5 | % | | | 13,234 | | | | 0.4 | % | |
Moderna Therapeutics
(Ser. G Preferred Shares) | | 1/30/2018 | | | 1,769 | | | | 0.1 | % | | | 1,769 | | | | 0.1 | % | |
Total | | | | $ | 35,942 | | | | 1.2 | % | | $ | 37,626 | | | | 1.2 | % | |
See Notes to Financial Statements
71
Schedule of Investments Long Short Fund (cont'd)
Derivative Instruments
Futures contracts ("futures")
At October 31, 2018, open positions in futures for the Fund were as follows:
Short Futures
Expiration Date | | Number of
Contracts | | Open Contracts | | Notional
Amount | | Value and
Unrealized
Appreciation/
(Depreciation) | |
12/2018 | | | 722 | | | NASDAQ 100 E-Mini Index | | $ | (100,726,220 | ) | | $ | 5,429,041 | | |
12/2018 | | | 563 | | | Russell 2000 Mini Index | | | (42,559,971 | ) | | | 3,987,980 | | |
12/2018 | | | 2,100 | | | S&P 500 E-Mini Index | | | (284,665,500 | ) | | | 21,404,236 | | |
12/2018 | | | 50 | | | U.S. Treasury Long Bond | | | (6,906,250 | ) | | | 174,220 | | |
Total Futures | | | | | | $ | (434,857,941 | ) | | $ | 30,995,477 | | |
For the year ended October 31, 2018, the average notional value of futures for the Fund was $(432,880,426) for short positions.
Total return basket swap contracts ("total return basket swaps")
At October 31, 2018, the Fund had outstanding total return basket swaps(a) as follows:
Over-the-counter total return basket swaps — Short
Counterparty | | Description | | Maturity
Date(s) | | Value | |
JPMorgan Chase Bank N.A.
| | The Fund pays the total return on a portfolio of short positions,
and receives a specified LIBOR rate plus or minus a spread*.
The receipts may be denominated in various foreign
currencies based on the local currencies of the positions
within the swaps. | | | | | |
| | | | 5/4/2020 | | $ | (423,870 | ) | |
(a) The following table represents required component disclosures associated with the total return basket swaps with JPMorgan Chase Bank N.A. as of October 31, 2018.
Reference Entity | | Shares | | Notional
Amount | | Unrealized
Appreciation/
(Depreciation) | | Component
Weighting | |
Short Positions | |
| JPNBGCND(b) | |
Amazon.com Inc. | | | (4,131 | ) | | $ | (5,998,820 | ) | | $ | (75,426 | ) | | | 17.8 | % | |
Home Depot Inc./The | | | (9,040 | ) | | | (1,444,820 | ) | | | (18,166 | ) | | | 4.3 | % | |
Toyota Motor Corp. | | | (26,019 | ) | | | (1,383,485 | ) | | | (17,395 | ) | | | 4.1 | % | |
McDonald's Corp. | | | (7,888 | ) | | | (1,267,966 | ) | | | (15,943 | ) | | | 3.8 | % | |
NIKE Inc. | | | (13,556 | ) | | | (924,360 | ) | | | (11,622 | ) | | | 2.7 | % | |
Booking Holdings Inc. | | | (507 | ) | | | (863,238 | ) | | | (10,854 | ) | | | 2.6 | % | |
LVMH Moet Hennessy Louis Vuitton SE | | | (2,964 | ) | | | (818,590 | ) | | | (10,292 | ) | | | 2.4 | % | |
Lowe's Cos. Inc. | | | (8,626 | ) | | | (746,369 | ) | | | (9,384 | ) | | | 2.2 | % | |
See Notes to Financial Statements
72
Schedule of Investments Long Short Fund (cont'd)
Reference Entity | | Shares | | Notional
Amount | | Unrealized
Appreciation/
(Depreciation) | | Component
Weighting | |
Short Positions | |
| JPNBGCND(b) | |
Starbucks Corp. | | | (13,660 | ) | | $ | (723,335 | ) | | $ | (9,095 | ) | | | 2.2 | % | |
TJX Cos. Inc./The | | | (7,088 | ) | | | (707,761 | ) | | | (8,899 | ) | | | 2.1 | % | |
Sony Corp. | | | (13,987 | ) | | | (690,311 | ) | | | (8,680 | ) | | | 2.1 | % | |
Daimler AG | | | (12,017 | ) | | | (646,473 | ) | | | (8,128 | ) | | | 1.9 | % | |
General Motors Co. | | | (15,535 | ) | | | (516,524 | ) | | | (6,494 | ) | | | 1.5 | % | |
Honda Motor Co. Ltd. | | | (19,536 | ) | | | (508,946 | ) | | | (6,399 | ) | | | 1.5 | % | |
Compass Group PLC | | | (25,629 | ) | | | (457,439 | ) | | | (5,752 | ) | | | 1.4 | % | |
Cie Financiere Richemont SA | | | (6,566 | ) | | | (435,712 | ) | | | (5,478 | ) | | | 1.3 | % | |
Ross Stores Inc. | | | (4,831 | ) | | | (434,613 | ) | | | (5,465 | ) | | | 1.3 | % | |
adidas AG | | | (2,031 | ) | | | (433,922 | ) | | | (5,456 | ) | | | 1.3 | % | |
Target Corp. | | | (5,646 | ) | | | (429,041 | ) | | | (5,394 | ) | | | 1.3 | % | |
Ford Motor Co. | | | (47,257 | ) | | | (410,112 | ) | | | (5,156 | ) | | | 1.2 | % | |
Bayerische Motoren Werke AG | | | (4,915 | ) | | | (384,929 | ) | | | (4,840 | ) | | | 1.1 | % | |
Volkswagen AG | | | (2,502 | ) | | | (382,471 | ) | | | (4,809 | ) | | | 1.1 | % | |
Kering SA | | | (926 | ) | | | (374,510 | ) | | | (4,709 | ) | | | 1.1 | % | |
Industria de Diseno Textil SA | | | (13,897 | ) | | | (355,934 | ) | | | (4,475 | ) | | | 1.1 | % | |
Marriott International Inc./MD | | | (3,278 | ) | | | (348,182 | ) | | | (4,378 | ) | | | 1.0 | % | |
Yum! Brands Inc. | | | (4,156 | ) | | | (341,421 | ) | | | (4,293 | ) | | | 1.0 | % | |
Panasonic Corp. | | | (33,522 | ) | | | (336,686 | ) | | | (4,233 | ) | | | 1.0 | % | |
Carnival Corp. | | | (6,502 | ) | | | (331,112 | ) | | | (4,163 | ) | | | 1.0 | % | |
Fast Retailing Co. Ltd. | | | (691 | ) | | | (317,185 | ) | | | (3,988 | ) | | | 0.9 | % | |
VF Corp. | | | (4,202 | ) | | | (316,465 | ) | | | (3,979 | ) | | | 0.9 | % | |
eBay Inc. | | | (11,622 | ) | | | (306,583 | ) | | | (3,855 | ) | | | 0.9 | % | |
Aptiv PLC | | | (4,375 | ) | | | (305,311 | ) | | | (3,839 | ) | | | 0.9 | % | |
O'Reilly Automotive Inc. | | | (1,002 | ) | | | (292,036 | ) | | | (3,672 | ) | | | 0.9 | % | |
Dollar General Corp. | | | (2,869 | ) | | | (290,343 | ) | | | (3,651 | ) | | | 0.9 | % | |
Michelin | | | (3,057 | ) | | | (285,005 | ) | | | (3,583 | ) | | | 0.9 | % | |
Denso Corp. | | | (6,647 | ) | | | (269,823 | ) | | | (3,393 | ) | | | 0.8 | % | |
Bridgestone Corp. | | | (7,605 | ) | | | (266,721 | ) | | | (3,354 | ) | | | 0.8 | % | |
Oriental Land Co. Ltd./Japan | | | (3,124 | ) | | | (266,591 | ) | | | (3,352 | ) | | | 0.8 | % | |
Subaru Corp. | | | (10,581 | ) | | | (259,677 | ) | | | (3,265 | ) | | | 0.8 | % | |
Hilton Worldwide Holdings Inc. | | | (3,804 | ) | | | (246,018 | ) | | | (3,093 | ) | | | 0.7 | % | |
Hermes International | | | (473 | ) | | | (245,335 | ) | | | (3,085 | ) | | | 0.7 | % | |
Suzuki Motor Corp. | | | (5,336 | ) | | | (242,342 | ) | | | (3,047 | ) | | | 0.7 | % | |
Magna International Inc. | | | (5,341 | ) | | | (239,041 | ) | | | (3,006 | ) | | | 0.7 | % | |
Continental AG | | | (1,574 | ) | | | (236,007 | ) | | | (2,967 | ) | | | 0.7 | % | |
AutoZone Inc. | | | (349 | ) | | | (232,823 | ) | | | (2,927 | ) | | | 0.7 | % | |
Swatch Group AG/The | | | (759 | ) | | | (232,785 | ) | | | (2,927 | ) | | | 0.7 | % | |
Royal Caribbean Cruises Ltd. | | | (2,294 | ) | | | (218,355 | ) | | | (2,745 | ) | | | 0.6 | % | |
Best Buy Co. Inc. | | | (3,359 | ) | | | (214,146 | ) | | | (2,693 | ) | | | 0.6 | % | |
Persimmon PLC | | | (8,009 | ) | | | (212,963 | ) | | | (2,678 | ) | | | 0.6 | % | |
See Notes to Financial Statements
73
Schedule of Investments Long Short Fund (cont'd)
Reference Entity | | Shares | | Notional
Amount | | Unrealized
Appreciation/
(Depreciation) | | Component
Weighting | |
Short Positions | |
| JPNBGCND(b) | |
Dollar Tree Inc. | | | (2,768 | ) | | $ | (212,069 | ) | | $ | (2,666 | ) | | | 0.6 | % | |
Genuine Parts Co. | | | (2,362 | ) | | | (210,152 | ) | | | (2,642 | ) | | | 0.6 | % | |
Nissan Motor Co. Ltd. | | | (25,428 | ) | | | (210,019 | ) | | | (2,641 | ) | | | 0.6 | % | |
Taylor Wimpey PLC | | | (111,095 | ) | | | (207,944 | ) | | | (2,615 | ) | | | 0.6 | % | |
Expedia Group Inc. | | | (1,816 | ) | | | (207,012 | ) | | | (2,603 | ) | | | 0.6 | % | |
Whitbread PLC | | | (4,038 | ) | | | (205,897 | ) | | | (2,589 | ) | | | 0.6 | % | |
Toyota Industries Corp. | | | (4,580 | ) | | | (204,302 | ) | | | (2,569 | ) | | | 0.6 | % | |
Hennes & Mauritz AB | | | (12,514 | ) | | | (200,599 | ) | | | (2,522 | ) | | | 0.6 | % | |
Tiffany & Co. | | | (1,955 | ) | | | (197,777 | ) | | | (2,487 | ) | | | 0.6 | % | |
Sekisui House Ltd. | | | (14,774 | ) | | | (197,377 | ) | | | (2,482 | ) | | | 0.6 | % | |
Ulta Beauty Inc. | | | (781 | ) | | | (194,788 | ) | | | (2,449 | ) | | | 0.6 | % | |
Restaurant Brands International Inc. | | | (3,877 | ) | | | (193,103 | ) | | | (2,428 | ) | | | 0.6 | % | |
Sumitomo Electric Industries Ltd. | | | (15,292 | ) | | | (189,547 | ) | | | (2,383 | ) | | | 0.6 | % | |
MGM Resorts International | | | (7,778 | ) | | | (188,581 | ) | | | (2,371 | ) | | | 0.6 | % | |
Lennar Corp. | | | (4,684 | ) | | | (182,942 | ) | | | (2,300 | ) | | | 0.5 | % | |
DR Horton Inc. | | | (5,585 | ) | | | (182,520 | ) | | | (2,295 | ) | | | 0.5 | % | |
Hasbro Inc. | | | (2,166 | ) | | | (180,514 | ) | | | (2,270 | ) | | | 0.5 | % | |
Advance Auto Parts Inc. | | | (1,231 | ) | | | (178,721 | ) | | | (2,247 | ) | | | 0.5 | % | |
InterContinental Hotels Group PLC | | | (3,707 | ) | | | (176,598 | ) | | | (2,220 | ) | | | 0.5 | % | |
CarMax Inc. | | | (2,770 | ) | | | (170,929 | ) | | | (2,149 | ) | | | 0.5 | % | |
Chipotle Mexican Grill Inc. | | | (403 | ) | | | (168,506 | ) | | | (2,119 | ) | | | 0.5 | % | |
Macy's Inc. | | | (5,226 | ) | | | (162,855 | ) | | | (2,048 | ) | | | 0.5 | % | |
Canadian Tire Corp Ltd | | | (1,589 | ) | | | (162,615 | ) | | | (2,045 | ) | | | 0.5 | % | |
Fiat Chrysler Automobiles NV | | | (11,545 | ) | | | (158,528 | ) | | | (1,993 | ) | | | 0.5 | % | |
Bandai Namco Holdings Inc. | | | (4,816 | ) | | | (155,431 | ) | | | (1,954 | ) | | | 0.5 | % | |
Ralph Lauren Corp. | | | (1,302 | ) | | | (153,294 | ) | | | (1,927 | ) | | | 0.5 | % | |
LKQ Corp. | | | (5,718 | ) | | | (141,706 | ) | | | (1,782 | ) | | | 0.4 | % | |
Nokian Renkaat OYJ | | | (4,832 | ) | | | (139,405 | ) | | | (1,753 | ) | | | 0.4 | % | |
Next PLC | | | (2,214 | ) | | | (133,512 | ) | | | (1,679 | ) | | | 0.4 | % | |
L Brands Inc. | | | (4,396 | ) | | | (129,508 | ) | | | (1,628 | ) | | | 0.4 | % | |
Newell Brands Inc. | | | (8,473 | ) | | | (122,263 | ) | | | (1,537 | ) | | | 0.4 | % | |
| | | | | $ | (33,711,651 | ) | | $ | (423,870 | ) | | | |
Accrued Net Interest Receivable/(Payable) | | | | | | | — | | | | |
Total Return Basket Swaps, at Value | | | | | | $ | (423,870 | ) | | | |
(b) Fund receives 3-month LIBOR minus 0.65% (effective rate at 10/31/2018 was 1.89%). Payment frequency-quarterly. Fund pays return on reference entity. Payment frequency-upon termination.
* Benchmark Floating Rates
LIBOR - London Interbank Offered Rate
See Notes to Financial Statements
74
Schedule of Investments Long Short Fund (cont'd)
Total return swap contracts ("total return swaps")
At October 31, 2018, the Fund had outstanding over-the-counter total return swaps as follows:
Over-the-counter total return swaps — Short
Counterparty | | Reference Entity | | Notional
Amount | | Maturity
Date | | Variable-Rate(j) | | Unrealized
Appreciation/
(Depreciation) | | Accrued
Net
Interest
Receivable/
(Payable) | | Value | |
Citibank, N.A. | | Dow Jones
Industrial Average
Index | | $ | (12,596,650 | ) | | 5/15/2019 | | | 2.09 | %(a) | | $ | (590,084 | ) | | $ | 12,984 | | | $ | (577,100 | ) | |
Goldman Sachs
International | | iShares S&P 500
Value ETF | | | (33,741,477 | ) | | 11/29/2019 | | | 2.62 | %(b) | | | (529,937 | ) | | | 42,474 | | | | (487,463 | )(k) | |
Goldman Sachs
International | | Russell Mid-Cap
Index | | | (33,267,101 | ) | | 1/28/2019 | | | 1.73 | %(c) | | | (2,298,197 | ) | | | 29,047 | | | | (2,269,150 | ) | |
Citibank, N.A. | | S&P 500
Growth Index | | | (104,358,388 | ) | | 5/13/2019 | | | 2.09 | %(a) | | | 1,520,856 | | | | 86,112 | | | | 1,606,968 | (l) | |
Citibank, N.A. | | S&P 500
Growth Index | | | (35,562,290 | ) | | 5/13/2019 | | | 2.09 | %(a) | | | 518,263 | | | | 29,344 | | | | 547,607 | (m) | |
Citibank, N.A. | | S&P 500
Growth Index | | | (12,489,138 | ) | | 5/13/2019 | | | 2.09 | %(a) | | | 182,009 | | | | 10,305 | | | | 192,314 | | |
Citibank, N.A. | | SPDR S&P Retail ETF | | | (19,423,800 | ) | | 1/22/2019 | | | 0.88 | %(d) | | | 166,050 | | | | 6,612 | | | | 172,662 | | |
Citibank, N.A. | | Tallgrass Energy
Partners LP | | | (7,394,828 | ) | | 8/8/2019 | | | (0.21 | )%(e) | | | (983,510 | ) | | | (872 | ) | | | (984,382 | ) | |
Citibank, N.A. | | Trupanion, Inc. | | | (1,302,358 | ) | | 3/9/2020 | | | (2.72 | )%(f) | | | 196,499 | | | | (1,421 | ) | | | 195,078 | | |
Citibank, N.A. | | Trupanion, Inc. | | | (1,995,132 | ) | | 3/9/2020 | | | (2.07 | )%(g) | | | 427,540 | | | | (2,754 | ) | | | 424,786 | | |
Citibank, N.A. | | Trupanion, Inc. | | | (935,468 | ) | | 3/9/2020 | | | (3.72 | )%(h) | | | 215,096 | | | | (1,266 | ) | | | 213,830 | | |
Citibank, N.A. | | Trupanion, Inc. | | | (1,239,240 | ) | | 3/9/2020 | | | (3.72 | )%(h) | | | 240,720 | | | | (1,754 | ) | | | 238,966 | | |
Citibank, N.A. | | Trupanion, Inc. | | | (1,496,971 | ) | | 3/9/2020 | | | (3.72 | )%(h) | | | 324,838 | | | | (2,059 | ) | | | 322,779 | | |
Citibank, N.A. | | Trupanion, Inc. | | | (1,909,888 | ) | | 3/9/2020 | | | (3.72 | )%(h) | | | 402,280 | | | | (2,649 | ) | | | 399,631 | | |
Citibank, N.A. | | Trupanion, Inc. | | | (1,486,487 | ) | | 3/9/2020 | | | (3.72 | )%(h) | | | 327,920 | | | | (2,035 | ) | | | 325,885 | | |
Citibank, N.A. | | Trupanion, Inc. | | | (385,647 | ) | | 3/9/2020 | | | (3.72 | )%(h) | | | 89,014 | | | | (1,663 | ) | | | 87,351 | | |
Citibank, N.A. | | Trupanion, Inc. | | | (1,298,637 | ) | | 3/9/2020 | | | (3.72 | )%(h) | | | 282,982 | | | | (1,785 | ) | | | 281,197 | | |
Citibank, N.A. | | Utilities Select
Sector SPDR Fund | | | (23,192,670 | ) | | 9/19/2019 | | | 0.53 | %(i) | | | (215,330 | ) | | | 5,853 | | | | (209,477 | ) | |
Total | | | | | | | | | | $ | 277,009 | | | $ | 204,473 | | | $ | 481,482 | | |
(a) Fund receives 3-month USD LIBOR minus 0.35%. Payment frequency—quarterly. Fund pays return on reference entity. Payment frequency—quarterly.
(b) Fund receives 1-month USD LIBOR plus 0.35%. Payment frequency—monthly. Fund pays return on reference entity. Payment frequency—upon termination.
(c) Fund receives 1-month USD LIBOR minus 0.55%. Payment frequency—monthly. Fund pays return on reference entity. Payment frequency—upon termination.
(d) Fund receives 1-month USD LIBOR minus 1.40%. Payment frequency—monthly. Fund pays return on reference entity. Payment frequency—monthly.
See Notes to Financial Statements
75
Schedule of Investments Long Short Fund (cont'd)
(e) Fund receives 1-month USD LIBOR minus 2.50%. Payment frequency—monthly. Fund pays return on reference entity. Payment frequency—upon termination.
(f) Fund receives 1-month USD LIBOR minus 5.00%. Payment frequency—monthly. Fund pays return on reference entity. Payment frequency—upon termination.
(g) Fund receives 1-month USD LIBOR minus 4.35%. Payment frequency—monthly. Fund pays return on reference entity. Payment frequency—upon termination.
(h) Fund receives 1-month USD LIBOR minus 6.00%. Payment frequency—monthly. Fund pays return on reference entity. Payment frequency—upon termination.
(i) Fund receives 1-month USD LIBOR minus 1.75%. Payment frequency—monthly. Fund pays return on reference entity. Payment frequency—upon termination.
LIBOR = London Interbank Offered Rate
(j) Effective rate at October 31, 2018.
(k) The following table represents required component disclosures associated with the S&P 500 Value Index swap as of October 31, 2018:
Description | | Index Shares | | Component
Weighting | | Fund Value | |
Berkshire Hathaway Inc. Class B | | | (251 | ) | | | 3.8 | % | | $ | (18,569 | ) | |
JPMorgan Chase & Co. | | | (230 | ) | | | 3.5 | % | | | (17,002 | ) | |
Exxon Mobil Corporation | | | (211 | ) | | | 3.2 | % | | | (15,654 | ) | |
Verizon Communications Inc. | | | (148 | ) | | | 2.2 | % | | | (10,946 | ) | |
Wells Fargo & Company | | | (145 | ) | | | 2.2 | % | | | (10,706 | ) | |
AT&T Inc. | | | (140 | ) | | | 2.1 | % | | | (10,338 | ) | |
Chevron Corporation | | | (134 | ) | | | 2.0 | % | | | (9,927 | ) | |
Johnson & Johnson | | | (108 | ) | | | 1.6 | % | | | (8,016 | ) | |
Citigroup Inc. | | | (103 | ) | | | 1.6 | % | | | (7,644 | ) | |
Walmart Inc. | | | (90 | ) | | | 1.4 | % | | | (6,678 | ) | |
Procter & Gamble Company | | | (87 | ) | | | 1.3 | % | | | (6,453 | ) | |
Pfizer Inc. | | | (85 | ) | | | 1.3 | % | | | (6,325 | ) | |
Bank of America Corp | | | (83 | ) | | | 1.3 | % | | | (6,164 | ) | |
DowDuPont Inc. | | | (78 | ) | | | 1.2 | % | | | (5,773 | ) | |
Merck & Co., Inc. | | | (77 | ) | | | 1.2 | % | | | (5,723 | ) | |
Cisco Systems, Inc. | | | (71 | ) | | | 1.1 | % | | | (5,240 | ) | |
International Business Machines Corporation | | | (66 | ) | | | 1.0 | % | | | (4,889 | ) | |
Coca-Cola Company | | | (63 | ) | | | 1.0 | % | | | (4,677 | ) | |
Costco Wholesale Corporation | | | (63 | ) | | | 1.0 | % | | | (4,652 | ) | |
United Technologies Corporation | | | (59 | ) | | | 0.9 | % | | | (4,335 | ) | |
Intel Corporation | | | (58 | ) | | | 0.9 | % | | | (4,313 | ) | |
Walt Disney Company | | | (57 | ) | | | 0.9 | % | | | (4,200 | ) | |
General Electric Company | | | (55 | ) | | | 0.8 | % | | | (4,073 | ) | |
Comcast Corporation Class A | | | (55 | ) | | | 0.8 | % | | | (4,046 | ) | |
ConocoPhillips | | | (51 | ) | | | 0.8 | % | | | (3,769 | ) | |
PepsiCo, Inc. | | | (51 | ) | | | 0.8 | % | | | (3,761 | ) | |
U.S. Bancorp | | | (50 | ) | | | 0.8 | % | | | (3,714 | ) | |
Goldman Sachs Group, Inc. | | | (50 | ) | | | 0.8 | % | | | (3,672 | ) | |
See Notes to Financial Statements
76
Schedule of Investments Long Short Fund (cont'd)
Description | | Index Shares | | Component
Weighting | | Fund Value | |
CVS Health Corporation | | | (46 | ) | | | 0.7 | % | | $ | (3,420 | ) | |
Schlumberger NV | | | (44 | ) | | | 0.7 | % | | | (3,295 | ) | |
Medtronic plc | | | (43 | ) | | | 0.7 | % | | | (3,208 | ) | |
Philip Morris International Inc. | | | (43 | ) | | | 0.7 | % | | | (3,176 | ) | |
Oracle Corporation | | | (42 | ) | | | 0.6 | % | | | (3,139 | ) | |
Walgreens Boots Alliance Inc. | | | (42 | ) | | | 0.6 | % | | | (3,122 | ) | |
Mondelez International, Inc. Class A | | | (39 | ) | | | 0.6 | % | | | (2,857 | ) | |
Danaher Corporation | | | (38 | ) | | | 0.6 | % | | | (2,840 | ) | |
Morgan Stanley | | | (38 | ) | | | 0.6 | % | | | (2,809 | ) | |
PNC Financial Services Group, Inc. | | | (37 | ) | | | 0.6 | % | | | (2,768 | ) | |
Duke Energy Corporation | | | (37 | ) | | | 0.6 | % | | | (2,731 | ) | |
Chubb Limited | | | (36 | ) | | | 0.6 | % | | | (2,685 | ) | |
QUALCOMM Incorporated | | | (36 | ) | | | 0.5 | % | | | (2,668 | ) | |
Express Scripts Holding Company | | | (34 | ) | | | 0.5 | % | | | (2,530 | ) | |
Altria Group Inc. | | | (34 | ) | | | 0.5 | % | | | (2,503 | ) | |
Union Pacific Corporation | | | (33 | ) | | | 0.5 | % | | | (2,408 | ) | |
Occidental Petroleum Corporation | | | (32 | ) | | | 0.5 | % | | | (2,380 | ) | |
Amgen Inc. | | | (32 | ) | | | 0.5 | % | | | (2,374 | ) | |
Allergan plc | | | (32 | ) | | | 0.5 | % | | | (2,339 | ) | |
General Motors Company | | | (30 | ) | | | 0.5 | % | | | (2,228 | ) | |
Twenty-First Century Fox, Inc. Class A | | | (30 | ) | | | 0.5 | % | | | (2,226 | ) | |
Marathon Petroleum Corporation | | | (30 | ) | | | 0.4 | % | | | (2,192 | ) | |
(l) The following table represents required component disclosures associated with the S&P 500 Growth Index swap as of October 31, 2018:
Description | | Index Shares | | Component
Weighting | | Fund Value | |
Apple Inc. | | | (2,258 | ) | | | 8.1 | % | | $ | 129,920 | | |
Microsoft Corporation | | | (1,842 | ) | | | 6.6 | % | | | 105,962 | | |
Amazon.com, Inc. | | | (1,472 | ) | | | 5.3 | % | | | 84,702 | | |
Facebook, Inc. Class A | | | (823 | ) | | | 2.9 | % | | | 47,360 | | |
Alphabet Inc. Class C | | | (746 | ) | | | 2.7 | % | | | 42,892 | | |
Alphabet Inc. Class A | | | (733 | ) | | | 2.6 | % | | | 42,174 | | |
UnitedHealth Group Incorporated | | | (566 | ) | | | 2.0 | % | | | 32,543 | | |
Visa Inc. Class A | | | (551 | ) | | | 2.0 | % | | | 31,685 | | |
Johnson & Johnson | | | (456 | ) | | | 1.6 | % | | | 26,237 | | |
Home Depot, Inc. | | | (453 | ) | | | 1.6 | % | | | 26,034 | | |
Boeing Company | | | (426 | ) | | | 1.5 | % | | | 24,529 | | |
Mastercard Incorporated Class A | | | (406 | ) | | | 1.5 | % | | | 23,330 | | |
McDonald's Corporation | | | (309 | ) | | | 1.1 | % | | | 17,755 | | |
Netflix, Inc. | | | (296 | ) | | | 1.1 | % | | | 17,001 | | |
NVIDIA Corporation | | | (288 | ) | | | 1.0 | % | | | 16,584 | | |
Intel Corporation | | | (277 | ) | | | 1.0 | % | | | 15,941 | | |
Bank of America Corp | | | (276 | ) | | | 1.0 | % | | | 15,863 | | |
Abbott Laboratories | | | (272 | ) | | | 1.0 | % | | | 15,647 | | |
Adobe Inc. | | | (271 | ) | | | 1.0 | % | | | 15,569 | | |
AbbVie, Inc. | | | (265 | ) | | | 0.9 | % | | | 15,251 | | |
See Notes to Financial Statements
77
Schedule of Investments Long Short Fund (cont'd)
Description | | Index Shares | | Component
Weighting | | Fund Value | |
Pfizer Inc. | | | (261 | ) | | | 0.9 | % | | $ | 15,022 | | |
| 3M Company | | | (251 | ) | | | 0.9 | % | | | 14,439 | | |
salesforce.com, inc. | | | (234 | ) | | | 0.8 | % | | | 13,435 | | |
PayPal Holdings Inc. | | | (224 | ) | | | 0.8 | % | | | 12,893 | | |
Broadcom Inc. | | | (217 | ) | | | 0.8 | % | | | 12,481 | | |
Cisco Systems, Inc. | | | (216 | ) | | | 0.8 | % | | | 12,446 | | |
Texas Instruments Incorporated | | | (203 | ) | | | 0.7 | % | | | 11,676 | | |
Booking Holdings Inc. | | | (200 | ) | | | 0.7 | % | | | 11,513 | | |
Comcast Corporation Class A | | | (196 | ) | | | 0.7 | % | | | 11,281 | | |
Coca-Cola Company | | | (185 | ) | | | 0.7 | % | | | 10,669 | | |
Procter & Gamble Company | | | (184 | ) | | | 0.7 | % | | | 10,566 | | |
Walt Disney Company | | | (180 | ) | | | 0.6 | % | | | 10,384 | | |
PepsiCo, Inc. | | | (175 | ) | | | 0.6 | % | | | 10,076 | | |
Amgen Inc. | | | (166 | ) | | | 0.6 | % | | | 9,525 | | |
Merck & Co., Inc. | | | (163 | ) | | | 0.6 | % | | | 9,371 | | |
Oracle Corporation | | | (158 | ) | | | 0.6 | % | | | 9,109 | | |
American Tower Corporation | | | (154 | ) | | | 0.6 | % | | | 8,886 | | |
Altria Group Inc. | | | (154 | ) | | | 0.6 | % | | | 8,883 | | |
Philip Morris International Inc. | | | (154 | ) | | | 0.6 | % | | | 8,856 | | |
Thermo Fisher Scientific Inc. | | | (152 | ) | | | 0.5 | % | | | 8,767 | | |
NIKE, Inc. Class B | | | (145 | ) | | | 0.5 | % | | | 8,329 | | |
Accenture Plc Class A | | | (143 | ) | | | 0.5 | % | | | 8,232 | | |
Honeywell International Inc. | | | (143 | ) | | | 0.5 | % | | | 8,209 | | |
Eli Lilly and Company | | | (142 | ) | | | 0.5 | % | | | 8,180 | | |
Automatic Data Processing, Inc. | | | (142 | ) | | | 0.5 | % | | | 8,166 | | |
Becton, Dickinson and Company | | | (139 | ) | | | 0.5 | % | | | 7,979 | | |
Intuitive Surgical, Inc. | | | (133 | ) | | | 0.5 | % | | | 7,670 | | |
Gilead Sciences, Inc. | | | (129 | ) | | | 0.5 | % | | | 7,433 | | |
Charter Communications, Inc. Class A | | | (129 | ) | | | 0.5 | % | | | 7,400 | | |
Union Pacific Corporation | | | (126 | ) | | | 0.5 | % | | | 7,274 | | |
(m) The following table represents required component disclosures associated with the S&P 500 Growth Index swap as of October 31, 2018:
Description | | Index Shares | | Component
Weighting | | Fund Value | |
Apple Inc. | | | (679 | ) | | | 8.1 | % | | $ | 44,273 | | |
Microsoft Corporation | | | (554 | ) | | | 6.6 | % | | | 36,109 | | |
Amazon.com, Inc. | | | (443 | ) | | | 5.3 | % | | | 28,864 | | |
Facebook, Inc. Class A | | | (248 | ) | | | 2.9 | % | | | 16,139 | | |
Alphabet Inc. Class C | | | (224 | ) | | | 2.7 | % | | | 14,616 | | |
Alphabet Inc. Class A | | | (220 | ) | | | 2.6 | % | | | 14,372 | | |
UnitedHealth Group Incorporated | | | (170 | ) | | | 2.0 | % | | | 11,090 | | |
Visa Inc. Class A | | | (166 | ) | | | 2.0 | % | | | 10,797 | | |
Johnson & Johnson | | | (137 | ) | | | 1.6 | % | | | 8,941 | | |
Home Depot, Inc. | | | (136 | ) | | | 1.6 | % | | | 8,872 | | |
Boeing Company | | | (128 | ) | | | 1.5 | % | | | 8,359 | | |
Mastercard Incorporated Class A | | | (122 | ) | | | 1.5 | % | | | 7,950 | | |
See Notes to Financial Statements
78
Schedule of Investments Long Short Fund (cont'd)
Description | | Index Shares | | Component
Weighting | | Fund Value | |
McDonald's Corporation | | | (93 | ) | | | 1.1 | % | | $ | 6,050 | | |
Netflix, Inc. | | | (89 | ) | | | 1.1 | % | | | 5,794 | | |
NVIDIA Corporation | | | (87 | ) | | | 1.0 | % | | | 5,651 | | |
Intel Corporation | | | (83 | ) | | | 1.0 | % | | | 5,432 | | |
Bank of America Corp | | | (83 | ) | | | 1.0 | % | | | 5,406 | | |
Abbott Laboratories | | | (82 | ) | | | 1.0 | % | | | 5,332 | | |
Adobe Inc. | | | (81 | ) | | | 1.0 | % | | | 5,305 | | |
AbbVie, Inc. | | | (80 | ) | | | 0.9 | % | | | 5,197 | | |
Pfizer Inc. | | | (79 | ) | | | 0.9 | % | | | 5,119 | | |
| 3M Company | | | (75 | ) | | | 0.9 | % | | | 4,920 | | |
salesforce.com, inc. | | | (70 | ) | | | 0.8 | % | | | 4,578 | | |
PayPal Holdings Inc. | | | (67 | ) | | | 0.8 | % | | | 4,393 | | |
Broadcom Inc. | | | (65 | ) | | | 0.8 | % | | | 4,253 | | |
Cisco Systems, Inc. | | | (65 | ) | | | 0.8 | % | | | 4,241 | | |
Texas Instruments Incorporated | | | (61 | ) | | | 0.7 | % | | | 3,979 | | |
Booking Holdings Inc. | | | (60 | ) | | | 0.7 | % | | | 3,923 | | |
Comcast Corporation Class A | | | (59 | ) | | | 0.7 | % | | | 3,844 | | |
Coca-Cola Company | | | (56 | ) | | | 0.7 | % | | | 3,636 | | |
Procter & Gamble Company | | | (55 | ) | | | 0.7 | % | | | 3,601 | | |
Walt Disney Company | | | (54 | ) | | | 0.6 | % | | | 3,539 | | |
PepsiCo, Inc. | | | (53 | ) | | | 0.6 | % | | | 3,434 | | |
Amgen Inc. | | | (50 | ) | | | 0.6 | % | | | 3,246 | | |
Merck & Co., Inc. | | | (49 | ) | | | 0.6 | % | | | 3,193 | | |
Oracle Corporation | | | (48 | ) | | | 0.6 | % | | | 3,104 | | |
American Tower Corporation | | | (46 | ) | | | 0.6 | % | | | 3,028 | | |
Altria Group Inc. | | | (46 | ) | | | 0.6 | % | | | 3,027 | | |
Philip Morris International Inc. | | | (46 | ) | | | 0.6 | % | | | 3,018 | | |
Thermo Fisher Scientific Inc. | | | (46 | ) | | | 0.5 | % | | | 2,987 | | |
NIKE, Inc. Class B | | | (44 | ) | | | 0.5 | % | | | 2,838 | | |
Accenture Plc Class A | | | (43 | ) | | | 0.5 | % | | | 2,805 | | |
Honeywell International Inc. | | | (43 | ) | | | 0.5 | % | | | 2,797 | | |
Eli Lilly and Company | | | (43 | ) | | | 0.5 | % | | | 2,788 | | |
Automatic Data Processing, Inc. | | | (43 | ) | | | 0.5 | % | | | 2,783 | | |
Becton, Dickinson and Company | | | (42 | ) | | | 0.5 | % | | | 2,719 | | |
Intuitive Surgical, Inc. | | | (40 | ) | | | 0.5 | % | | | 2,614 | | |
Gilead Sciences, Inc. | | | (39 | ) | | | 0.5 | % | | | 2,533 | | |
Charter Communications, Inc. Class A | | | (39 | ) | | | 0.5 | % | | | 2,522 | | |
Union Pacific Corporation | | | (38 | ) | | | 0.5 | % | | | 2,479 | | |
At October 31, 2018, the Fund had cash collateral of $1,720,000 deposited in a segregated account for Goldman Sachs International and received cash collateral of $150,000 from Citibank, N.A., respectively to cover collateral requirements on over-the-counter derivatives.
For the year ended October 31, 2018, the average notional value of total return basket swaps and total return swaps for the Fund was $(285,409,120) for short positions.
See Notes to Financial Statements
79
Schedule of Investments Long Short Fund (cont'd)
Purchased option contracts ("options purchased")
At October 31, 2018, the Fund had outstanding options purchased as follows:
Description | | Number of
Contracts | | Notional
Amount | | Exercise
Price | | Expiration
Date | | Value | |
Calls | |
Aerospace & Defense | |
General Dynamics Corp. | | | 438 | | | $ | 7,559,004 | | | $ | 205 | | | 11/16/2018 | | $ | 1,314 | | |
Capital Markets | |
BlackRock, Inc. | | | 250 | | | | 10,285,500 | | | | 500 | | | 1/18/2019 | | | 31,875 | | |
Energy Equipment & Services | |
Hi-Crush Partners LP | | | 5,503 | | | | 4,143,759 | | | | 12.5 | | | 11/16/2018 | | | 5,503 | | |
Schlumberger Ltd. | | | 1,370 | | | | 7,029,470 | | | | 70 | | | 6/21/2019 | | | 36,990 | | |
| | | | | | | | | | | | 42,493 | | |
Food Products | |
Hain Celestial Group, Inc. | | | 2,723 | | | | 6,774,824 | | | | 31 | | | 11/16/2018 | | | — | (a)(b) | |
Hain Celestial Group, Inc. | | | 1,200 | | | | 2,985,600 | | | | 36 | | | 11/16/2018 | | | — | (a)(b) | |
Hain Celestial Group, Inc. | | | 3,000 | | | | 7,464,000 | | | | 30 | | | 2/15/2019 | | | 217,500 | | |
| | | | | | | | | | | | 217,500 | | |
Index | |
S&P 500 Index | | | 1,014 | | | | 274,970,436 | | | | 3,000 | | | 12/21/2018 | | | 141,960 | | |
Machinery | |
Caterpillar, Inc. | | | 940 | | | | 11,404,080 | | | | 150 | | | 11/16/2018 | | | 4,230 | | |
Oil, Gas & Consumable Fuels | |
Tellurian, Inc. | | | 7,308 | | | | 5,846,400 | | | | 12.5 | | | 4/18/2019 | | | 438,480 | | |
Professional Services | |
Nielsen Holdings PLC | | | 4,570 | | | | 11,872,860 | | | | 30 | | | 2/15/2019 | | | 319,900 | | |
Specialty Retail | |
Lowe's Cos., Inc. | | | 939 | | | | 8,941,158 | | | | 110 | | | 1/18/2019 | | | 87,797 | | |
Party City Holdco, Inc. | | | 2,457 | | | | 2,572,479 | | | | 12.5 | | | 1/18/2019 | | | 110,565 | | |
Party City Holdco, Inc. | | | 4,500 | | | | 4,711,500 | | | | 15 | | | 1/18/2019 | | | 78,750 | | |
| | | | | | | | | | | | 277,112 | | |
Total calls | | | | | | | | | | $ | 1,474,864 | | |
Puts | |
Energy Equipment & Services | |
Hi-Crush Partners LP | | | 4,575 | | | $ | 3,444,975 | | | $ | 12.5 | | | 1/18/2019 | | $ | 2,584,875 | | |
Hi-Crush Partners LP | | | 769 | | | | 579,057 | | | | 15 | | | 1/18/2019 | | | 630,580 | | |
Hi-Crush Partners LP | | | 1,988 | | | | 1,496,964 | | | | 12.5 | | | 3/15/2019 | | | 1,371,720 | | |
Hi-Crush Partners LP | | | 85 | | | | 64,005 | | | | 15 | | | 3/15/2019 | | | 83,725 | | |
| | | | | | | | | | | | 4,670,900 | | |
Entertainment | |
Twenty-First Century Fox, Inc. | | | 2,926 | | | | 13,219,668 | | | | 40 | | | 1/18/2019 | | | 351,120 | | |
Interactive Media & Services | |
Zillow Group, Inc. | | | 1,965 | | | | 7,911,090 | | | | 36.5 | | | 11/9/2018 | | | 225,975 | | |
Total puts | | | | | | | | | | $ | 5,247,995 | | |
Total options purchased (Cost $9,385,184) | | | | | | | | | | $ | 6,722,859 | | |
See Notes to Financial Statements
80
Schedule of Investments Long Short Fund (cont'd)
(a) Security fair valued as of October 31, 2018 in accordance with procedures approved by the Board of Trustees.
(b) Value determined using significant unobservable inputs.
Written option contracts ("options written")
At October 31, 2018, the Fund had outstanding options written as follows:
Description | | Number of
Contracts | | Notional
Amount | | Exercise
Price | | Expiration
Date | | Value | |
Calls | |
Insurance | |
American Equity Investment Life Holding Co. | | | 5,905 | | | $ | (18,435,410 | ) | | $ | 35 | | | 2/15/2019 | | $ | (487,162 | ) | |
Interactive Media & Services | |
Zillow Group, Inc. | | | 982 | | | | (3,953,532 | ) | | | 40 | | | 1/18/2019 | | | (436,990 | ) | |
Zillow Group, Inc. | | | 983 | | | | (3,957,558 | ) | | | 45 | | | 1/18/2019 | | | (223,633 | ) | |
| | | | | | | | | | | | (660,623 | ) | |
IT Services | |
WEX, Inc. | | | 548 | | | | (9,642,608 | ) | | | 200 | | | 11/16/2018 | | | — | (a)(b) | |
Specialty Retail | |
Hudson Ltd. | | | 914 | | | | (1,932,196 | ) | | | 20 | | | 11/16/2018 | | | (148,525 | ) | |
Total calls | | | | | | | | | | $ | (1,296,310 | ) | |
Puts | |
Aerospace & Defense | |
General Dynamics Corp. | | | 438 | | | $ | (7,559,004 | ) | | $ | 180 | | | 11/16/2018 | | $ | (367,920 | ) | |
Banks | |
Comerica, Inc. | | | 625 | | | | (5,097,500 | ) | | | 90 | | | 1/18/2019 | | | (582,813 | ) | |
Capital Markets | |
Blackstone Group LP | | | 2,433 | | | | (7,873,188 | ) | | | 31 | | | 3/15/2019 | | | (385,631 | ) | |
Goldman Sachs Group, Inc. | | | 366 | | | | (8,248,542 | ) | | | 220 | | | 12/21/2018 | | | (225,090 | ) | |
| | | | | | | | | | | | (610,721 | ) | |
Energy Equipment & Services | |
Cactus, Inc. | | | 1,826 | | | | (6,109,796 | ) | | | 35 | | | 2/15/2019 | | | (748,660 | ) | |
Schlumberger Ltd. | | | 1,370 | | | | (7,029,470 | ) | | | 55 | | | 6/21/2019 | | | (907,625 | ) | |
| | | | | | | | | | | | (1,656,285 | ) | |
Entertainment | |
Spotify Technology SA | | | 625 | | | | (9,355,625 | ) | | | 155 | | | 1/18/2019 | | | (978,125 | ) | |
Food Products | |
Hain Celestial Group, Inc. | | | 2,723 | | | | (6,774,824 | ) | | | 25 | | | 11/16/2018 | | | (347,183 | ) | |
Hain Celestial Group, Inc. | | | 1,200 | | | | (2,985,600 | ) | | | 28 | | | 11/16/2018 | | | (402,000 | ) | |
Hain Celestial Group, Inc. | | | 3,000 | | | | (7,464,000 | ) | | | 20 | | | 2/15/2019 | | | (172,500 | ) | |
| | | | | | | | | | | | (921,683 | ) | |
Insurance | |
American Equity Investment Life Holding Co. | | | 1,673 | | | | (5,223,106 | ) | | | 30 | | | 2/15/2019 | | | (288,592 | ) | |
Interactive Media & Services | |
Facebook, Inc. | | | 500 | | | | (7,589,500 | ) | | | 160 | | | 11/16/2018 | | | (468,750 | ) | |
See Notes to Financial Statements
81
Schedule of Investments Long Short Fund (cont'd)
Description | | Number of
Contracts | | Notional
Amount | | Exercise
Price | | Expiration
Date | | Value | |
IT Services | |
PayPal Holdings, Inc. | | | 1,210 | | | $ | (10,186,990 | ) | | $ | 77.5 | | | 1/18/2019 | | $ | (269,225 | ) | |
Visa, Inc. | | | 895 | | | | (12,337,575 | ) | | | 125 | | | 3/15/2019 | | | (311,012 | ) | |
WEX, Inc. | | | 457 | | | | (8,041,372 | ) | | | 180 | | | 2/15/2019 | | | (571,250 | ) | |
| | | | | | | | | | | | (1,151,487 | ) | |
Machinery | |
Caterpillar, Inc. | | | 940 | | | | (11,404,080 | ) | | | 120 | | | 11/16/2018 | | | (305,500 | ) | |
Oil, Gas & Consumable Fuels | |
Cheniere Energy, Inc. | | | 1,826 | | | | (11,030,866 | ) | | | 57.5 | | | 1/18/2019 | | | (458,326 | ) | |
Professional Services | |
Nielsen Holdings PLC. | | | 4,570 | | | | (11,872,860 | ) | | | 22 | | | 2/15/2019 | | | (377,025 | ) | |
Specialty Retail | |
Lowe's Cos., Inc. | | | 939 | | | | (8,941,158 | ) | | | 92.5 | | | 1/18/2019 | | | (377,947 | ) | |
Party City Holdco, Inc. | | | 6,957 | | | | (7,283,979 | ) | | | 10 | | | 4/18/2019 | | | (817,448 | ) | |
| | | | | | | | | | | | (1,195,395 | ) | |
Total puts | | | | | | | | | | $ | (9,362,622 | ) | |
Total options written
(premium received $8,915,127) | | | | | | | | | | $ | (10,658,932 | ) | |
(a) Security fair valued as of October 31, 2018 in accordance with procedures approved by the Board of Trustees.
(b) Value determined using significant unobservable inputs.
At October 31, 2018, the Fund had an average market value of $8,583,211 in options purchased and $(8,019,746) in options written. At October 31, 2018, the Fund had securities pledged in the amount of $98,140,590 to cover collateral requirements for options written.
The following is a summary, categorized by Level (see Note A of Notes to Financial Statements), of inputs used to value the Fund's investments as of October 31, 2018:
Asset Valuation Inputs | |
(000's omitted) | | Level 1 | | Level 2 | | Level 3(c) | | Total | |
Investments: | |
Common Stocks | |
Commercial Services | | $ | — | | | $ | — | | | $ | 22,623 | | | $ | 22,623 | | |
| Other Common Stocks(a) | | | 2,383,886 | | | | — | | | | — | | | | 2,383,886 | | |
Total Common Stocks | | | 2,383,886 | | | | — | | | | 22,623 | | | | 2,406,509 | | |
Preferred Stocks | |
Health Care | | | — | | | | — | | | | 15,003 | | | | 15,003 | | |
| Other Preferred Stocks(a) | | | — | | | | 12,527 | | | | — | | | | 12,527 | | |
Total Preferred Stocks | | | — | | | | 12,527 | | | | 15,003 | | | | 27,530 | | |
| Corporate Bonds(a) | | | — | | | | 161,057 | | | | — | | | | 161,057 | | |
| Convertible Bonds(a) | | | — | | | | 4,890 | | | | — | | | | 4,890 | | |
| Master Limited Partnerships(a) | | | 42,661 | | | | — | | | | — | | | | 42,661 | | |
See Notes to Financial Statements
82
Schedule of Investments Long Short Fund (cont'd)
Asset Valuation Inputs | |
| | | Level 1 | | Level 2 | | Level 3(c) | | Total | |
Options Purchased | |
Food Products | | $ | 218 | | | $ | — | | | $ | — | | | $ | 218 | | |
| Other Options Purchased(b) | | | 6,505 | | | | — | | | | — | | | | 6,505 | | |
Total Options Purchased | | | 6,723 | | | | — | | | | — | | | | 6,723 | | |
Short-Term Investments | | | — | | | | 318,322 | | | | — | | | | 318,322 | | |
Total Long Positions | | $ | 2,433,270 | | | $ | 496,796 | | | $ | 37,626 | | | $ | 2,967,692 | | |
(a) The Schedule of Investments provides information on the industry or sector categorization for the portfolio.
(b) The "Purchased option contracts" table under Derivative Instruments provides information on the industry or sector categorization for the portfolio.
(c) The following is a reconciliation between the beginning and ending balances of investments in which unobservable inputs (Level 3) were used in determining value:
| | | Beginning
balance, as
of 11/1/2017 | | Accrued
discounts/
(premiums) | | Realized
gain/(loss) | | Change
in unrealized
appreciation/
(depreciation) | | Purchases | | Sales | | Transfers
into
Level 3 | | Transfers
out of
Level 3 | | Balance,
as of
10/31/2018 | | Net change in
unrealized
appreciation/
(depreciation)
from
investments
still held as of
10/31/2018 | |
Investments in
Securities:
(000's omitted) | |
Common Stocks(d) | |
Commercial
Services | | $ | — | | | $ | — | | | $ | — | | | $ | — | | | $ | 22,623 | | | $ | — | | | $ | — | | | $ | — | | | $ | 22,623 | | | $ | — | | |
Preferred Stocks(d) | |
Health Care | | | 11,550 | | | | — | | | | — | | | | 1,684 | | | | 1,769 | | | | — | | | | — | | | | — | | | | 15,003 | | | | 1,684 | | |
Options
Purchased(f) | |
Food Products | | | — | | | | — | | | | — | | | | (654 | ) | | | 654 | | | | — | | | | — | | | | — | | | | — | | | | (654 | ) | |
Total | | $ | 11,550 | | | $ | — | | | $ | — | | | $ | 1,030 | | | $ | 25,046 | | | $ | — | | | $ | — | | | $ | — | | | $ | 37,626 | | | $ | 1,030 | | |
(d) The following table presents additional information about valuation approach and inputs used for investments that are measured at fair value and categorized within Level 3 as of as of October 31, 2018:
Asset class | | Fair value
at 10/31/2018 | | Valuation approach | | Unobservable
input | | Amount or
range
per unit | | Input value
per unit | | Impact to
valuation
from
increase
in input(e) | |
Common Stocks | | $ | 22,623 | | | Market Approach | | Transaction Price | | $ | 10.48 | | | $ | 10.48 | | | Increase | |
Preferred Stocks | | | 13,234 | | | Market Approach | | Transaction Price | | | 10.06 | | | | 10.06 | | | Increase | |
Preferred Stocks | | | 1,769 | | | Market Approach | | Transaction Price | | | 10.06 | | | | 10.06 | | | Increase | |
See Notes to Financial Statements
83
Schedule of Investments Long Short Fund (cont'd)
(e) Represents the expected directional change in the fair value of the Level 3 investments that would result from an increase in the corresponding input. A decrease to the unobservable input would have the opposite effect. Significant changes in these inputs could result in significantly higher or lower fair value measurements.
(f) As of the year ended October 31, 2018, these investments were valued in accordance with procedures approved by the Board of Trustees. These investments did not have a material impact on the Fund's net assets and, therefore, disclosure of unobservable inputs used in formulating valuations is not presented.
The following is a summary, categorized by Level (see Note A of Notes to Financial Statements), of inputs used to value the Fund's investments as of October 31, 2018:
Liabilities Valuation Inputs | |
(000's omitted) | | Level 1 | | Level 2 | | Level 3 | | Total | |
Investments: | |
| Common Stocks Sold Short(a) | | $ | (377,942 | ) | | $ | — | | | $ | — | | | $ | (377,942 | ) | |
| Corporate Bonds Sold Short(a) | | | — | | | | (32,827 | ) | | | — | | | | (32,827 | ) | |
Exchange-Traded Funds Sold Short | | | (18,139 | ) | | | — | | | | — | | | | (18,139 | ) | |
| Master Limited Partnerships Sold Short(a) | | | (9,647 | ) | | | — | | | | — | | | | (9,647 | ) | |
Total Short Positions | | $ | (405,728 | ) | | $ | (32,827 | ) | | $ | — | | | $ | (438,555 | ) | |
(a) The Schedule of Investments provides information on the industry or sector categorization for the portfolio.
The following is a summary, categorized by Level (see Note A of Notes to Financial Statements), of inputs used to value the Fund's derivatives as of October 31, 2018:
Other Financial Instruments | |
(000's omitted) | | Level 1 | | Level 2 | | Level 3(b) | | Total | |
| Futures(a) | |
Assets | | $ | 30,995 | | | $ | — | | | $ | — | | | $ | 30,995 | | |
Swaps | |
Assets | | | — | | | | 5,009 | | | | — | | | | 5,009 | | |
Liabilities | | | — | | | | (4,951 | ) | | | — | | | | (4,951 | ) | |
Options Written | |
Liabilities | | | (10,659 | ) | | | — | | | | — | | | | (10,659 | ) | |
Total | | $ | 20,336 | | | $ | 58 | | | $ | — | | | $ | 20,394 | | |
(a) Futures are reported at the cumulative unrealized appreciation/(depreciation) of the instrument.
See Notes to Financial Statements
84
Schedule of Investments Long Short Fund (cont'd)
(b) The following is a reconciliation between the beginning and ending balances of investments in which unobservable inputs (Level 3) were used in determining value:
| | | Beginning
balance, as
of 11/1/2017 | | Accrued
discounts/
(premiums) | | Realized
gain/(loss) | | Change
in unrealized
appreciation/
(depreciation) | | Purchases | | Sales | | Transfers
into
Level 3 | | Transfers
out of
Level 3 | | Balance,
as of
10/31/2018 | | Net change in
unrealized
appreciation/
(depreciation)
from
investments
still held as of
10/31/2018 | |
Other Financial
Instruments:
(000's omitted) | |
| Options Written(c) | |
IT Services | | $ | — | | | $ | — | | | $ | — | | | $ | 358 | | | $ | — | | | $ | (358 | ) | | $ | — | | | $ | — | | | $ | — | | | $ | 358 | | |
Total | | $ | — | | | $ | — | | | $ | — | | | $ | 358 | | | $ | — | | | $ | (358 | ) | | $ | — | | | $ | — | | | $ | — | | | $ | 358 | | |
(c) As of the year ended October 31, 2018, these investments were valued in accordance with procedures approved by the Board of Trustees. These investments did not have a material impact on the Fund's net assets and, therefore, disclosure of unobservable inputs used in formulating valuations is not presented.
See Notes to Financial Statements
85
Schedule of Investments Long Short Credit Fund October 31, 2018
NUMBER OF SHARES | | | | VALUE | |
| | | | | (000's omitted) | |
Common Stock 0.1% | | | |
Energy Equipment & Services 0.1% | | | |
| | 869 | | | Seadrill Ltd. (Cost $—) | | $ | 16 | *(n) | |
| PRINCIPAL AMOUNT(a) | | | | | |
(000's omitted) | | | | | |
Corporate Bonds 45.9% | | | |
Banks 5.4% | | | |
$ | 250 | | | Barclays Bank PLC, 7.63%, due 11/21/22 | | | 267 | | |
| | 250 | | | HSBC Holdings PLC, (5 year USD ICE Swap + 5.51%), 6.88%, due 6/1/21 | | | 259 | (b)(c) | |
| | 359 | | | JPMorgan Chase & Co., Ser. 1, (3 month USD LIBOR + 3.47%), 5.99%, due 1/30/19 | | | 360 | (b)(c) | |
| | | | 886 | | |
Commercial Services 1.3% | | | |
| | 200 | | | Prime Security Services Borrower LLC/Prime Finance, Inc., 9.25%, due 5/15/23 | | | 212 | (d) | |
Electric 0.6% | | | |
| | 100 | | | Pampa Energia SA, 7.38%, due 7/21/23 | | | 92 | (d) | |
Food 2.5% | | | |
| | 400 | | | JBS USA LUX SA/JBS USA Finance, Inc., 7.25%, due 6/1/21 | | | 404 | (d) | |
Healthcare—Services 1.2% | | | |
| | 200 | | | HCA, Inc., 4.50%, due 2/15/27 | | | 195 | | |
Iron/Steel 3.4% | | | |
| | 550 | | | Steel Dynamics, Inc., 5.13%, due 10/1/21 | | | 554 | | |
Media 10.7% | | | |
| | 350 | | | Altice Luxembourg SA, 7.75%, due 5/15/22 | | | 324 | (d) | |
| | 350 | | | CCO Holdings LLC/CCO Holdings Capital Corp., 5.13%, due 5/1/23 | | | 348 | (d) | |
| | 400 | | | Cequel Communications Holdings I LLC/Cequel Capital Corp., 5.13%, due 12/15/21 | | | 399 | (d) | |
| | | | | Comcast Corp. | | | | | |
| | 250 | | | (3 month USD LIBOR + 0.33%), 2.74%, due 10/1/20 | | | 250 | (c) | |
| | 250 | | | 3.30%, due 10/1/20 | | | 250 | | |
| | 200 | | | DISH DBS Corp., 5.00%, due 3/15/23 | | | 175 | | |
| | | | 1,746 | | |
Mining 1.8% | | | |
| | 150 | | | First Quantum Minerals Ltd., 7.00%, due 2/15/21 | | | 147 | (d) | |
| | 150 | | | Hudbay Minerals, Inc., 7.25%, due 1/15/23 | | | 149 | (d) | |
| | | | 296 | | |
See Notes to Financial Statements
86
Schedule of Investments Long Short Credit Fund (cont'd)
| PRINCIPAL AMOUNT(a) | | | | VALUE | |
(000's omitted) | | | | (000's omitted) | |
Oil & Gas 3.3% | | | |
$ | 116 | | | Antero Resources Corp., 5.38%, due 11/1/21 | | $ | 116 | | |
| | 200 | | | PBF Holding Co. LLC/PBF Finance Corp., 7.00%, due 11/15/23 | | | 207 | | |
| | 250 | | | Seadrill Ltd., 6.13%, due 9/15/17 | | | — | (e)(f)(m) | |
| | 12 | | | Seadrill New Finance Ltd., 4.00% Cash/8.00% PIK, 12.00%, due 7/15/25 | | | 13 | (d)(g) | |
| | 200 | | | YPF SA, 8.50%, due 3/23/21 | | | 202 | (d) | |
| | | | 538 | | |
Packaging & Containers 1.2% | | | |
| | 209 | | | ARD Securities Finance SARL, 8.75% Cash/8.75% PIK, due 1/31/23 | | | 201 | (d)(g) | |
Pharmaceuticals 2.8% | | | |
| | 500 | | | Teva Pharmaceutical Finance Netherlands III BV, 2.20%, due 7/21/21 | | | 467 | | |
Semiconductors 1.2% | | | |
| | 200 | | | NXP BV/NXP Funding LLC, 4.63%, due 6/1/23 | | | 198 | (d) | |
Software 3.8% | | | |
| | 250 | | | Infor Software Parent LLC/Infor Software Parent, Inc., 7.13% Cash/7.88% PIK, 7.13%, due 5/1/21 | | | 251 | (d)(g) | |
| | 246 | | | Project Homestake Merger Corp., 8.88%, due 3/1/23 | | | 226 | (d) | |
| | 150 | | | Rackspace Hosting, Inc., 8.63%, due 11/15/24 | | | 141 | (d) | |
| | | | 618 | | |
Storage/Warehousing 1.4% | | | |
EUR | 200 | | | Algeco Global Finance PLC, 6.50%, due 2/15/23 | | | 234 | (d) | |
Telecommunications 5.3% | | | |
$ | 500 | | | Intelsat Jackson Holdings SA, 5.50%, due 8/1/23 | | | 448 | | |
| | 400 | | | Qwest Corp., 6.75%, due 12/1/21 | | | 417 | | |
| | | | 865 | | |
| | | | | Total Corporate Bonds (Cost $7,722) | | | 7,506 | | |
Foreign Government Securities 0.3% | | | |
| | 100 | | | Argentine Republic Government International Bond, 2.50%, due 12/31/38 (Cost $74) | | | 56 | (h) | |
| Total Swaptions Purchased 0.1%(i) (Cost $20) | | | 7 | | |
See Notes to Financial Statements
87
Schedule of Investments Long Short Credit Fund (cont'd)
NUMBER OF SHARES | | | | VALUE | |
| | | | | (000's omitted) | |
Short-Term Investments 27.3% | | | |
Investment Companies 27.3% | | | |
| | 4,466,120 | | | State Street Institutional U.S. Government Money Market Fund Premier Class, 2.09%(j)(Cost $4,466) | | $ | 4,466 | (k) | |
| | | | | Total Investments 73.6% (Cost $12,282) | | | 12,051 | | |
| | | | | Other Assets Less Liabilities 26.4% | | | 4,298 | (l) | |
| | | | | Net Assets 100.0% | | $ | 16,349 | | |
* Non-income producing security.
(a) Principal amount is stated in the currency in which the security is denominated.
EUR = Euro
(b) Perpetual Bond Security. The rate reflected was the rate in effect on October 31, 2018. The maturity date reflects the next call date.
(c) Variable or floating rate security. The interest rate shown was the current rate as of October 31, 2018 and changes periodically.
Benchmarks for Variable/Floating Rates:
LIBOR - London Interbank Offered Rate
ICE - Intercontinental Exchange
(d) Securities were purchased under Rule 144A of the Securities Act of 1933, as amended, or are otherwise restricted and, unless registered under the Securities Act of 1933 or exempted from registration, may only be sold to qualified institutional investors or may have other restrictions on resale. At October 31, 2018, these securities amounted to approximately $3,541,000, which represents 21.7% of net assets of the Fund. Securities denoted with (d) but without (e) have been deemed by the investment manager to be liquid.
(e) Illiquid security.
(f) Value determined using significant unobservable inputs.
(g) Payment-in-kind (PIK) security.
(h) Step Bond. Coupon rate is a fixed rate for an initial period that either resets at a specific date or may reset in the future contingent upon a predetermined trigger. The interest rate shown was the current rate as of October 31, 2018.
(i) See "Purchased swaption contracts" under Derivative Instruments.
(j) Represents 7-day effective yield as of October 31, 2018.
(k) All or a portion of this security is segregated in connection with obligations for forward foreign currency contracts, futures and/or swaps with a total value of approximately $4,466,000.
(l) Includes the impact of the Fund's open positions in derivatives at October 31, 2018.
(m) Security fair valued as of October 31, 2018 in accordance with procedures approved by the Board of Trustees. Total value of all such securities at October 31, 2018 amounted to approximately $0, which represents 0.0% of net assets of the Fund.
See Notes to Financial Statements
88
Schedule of Investments Long Short Credit Fund (cont'd)
(n) This security has been deemed by the investment manager to be illiquid, and is subject to restrictions on resale.
At October 31, 2018, this security amounted to approximately $16,000, which represents 0.10% of net assets of the Fund.
Restricted Security
(000's omitted) | | Acquisition
Date | | Acquisition
Cost | | Acquisition
Cost
Percentage
of Net Assets | | Value as of
10/31/2018 | | Fair Value
Percentage
of Net Assets
as of
10/31/2018 | |
Seadrill Ltd. (Restricted Common Shares) | | 7/3/2018 | | $ | 7,998.00 | | | | 0.1 | % | | $ | 16,285 | | | | 0.1 | % | |
Reverse Repurchase Agreements
There were no open reverse repurchase agreements outstanding as of October 31, 2018. For the year ended October 31, 2018, the average interest rate paid and the average principal amount were 2.37% and $4,965,955, respectively.
Derivative Instruments
Futures contracts ("futures")
At October 31, 2018, open positions in futures for the Fund were as follows:
Long Futures:
Expiration Date | | Number of
Contracts | | Open Contracts | | Notional
Amount | | Value and
Unrealized
Appreciation/
(Depreciation) | |
12/2018 | | | 10 | | | U.S. Treasury Note, 5 year | | $ | 1,000,000 | | | $ | (937 | ) | |
Total Futures | | | | | | $ | 1,000,000 | | | $ | (937 | ) | |
At October 31, 2018, the Fund had $6,250 deposited in a segregated account to cover margin requirements on open futures. For the year ended October 31, 2018, the average notional value of futures for the Fund was $1,248,883 for long positions and $(3,722,504) for short positions.
Forward foreign currency contracts ("forward contracts")
At October 31, 2018, open forward contracts for the Fund were as follows:
Currency Purchased | | Currency Sold | | Counterparty | | Settlement
Date | | Net
Unrealized
Appreciation/
(Depreciation) | |
| | 463,384 | | | USD | | | | | 400,000 | | | EUR | | | | Goldman Sachs International | | 1/17/2019 | | $ | 7,096 | | |
| | 205,378 | | | USD | | | | | 177,285 | | | EUR | | | | Goldman Sachs International | | 1/17/2019 | | | 3,145 | | |
| | 15,851 | | | USD | | | | | 13,651 | | | EUR | | | | Goldman Sachs International | | 1/17/2019 | | | 279 | | |
Total unrealized appreciation | | | | | | | | | | | | $ | 10,520 | | |
| | 175,936 | | | EUR | | | | | 204,190 | | | USD | | | | Goldman Sachs International | | 1/17/2019 | | $ | (3,496 | ) | |
| | 200,000 | | | EUR | | | | | 231,724 | | | USD | | | | Goldman Sachs International | | 1/17/2019 | | | (3,580 | ) | |
Total unrealized depreciation | | | | | | | | | | | | $ | (7,076 | ) | |
Total net unrealized appreciation | | | | | | | | | | | | $ | 3,444 | | |
EUR = Euro
See Notes to Financial Statements
89
Schedule of Investments Long Short Credit Fund (cont'd)
For the year ended October 31, 2018, the Fund's investments in forward contracts had an average notional value of $261,678.
Credit default swap contracts ("credit default swaps")
At October 31, 2018, the Fund had outstanding credit default swaps as follows:
Over-the-counter credit default swaps — Sell Protection
Swap
Counterparty | | Reference
Entity | | Notional
Amount | | Financing
Rate Paid
by the Fund(a) | | Maturity
Date | | Upfront
Payments
(Receipts) | | Unrealized
Appreciation/
(Depreciation) | | Accrued
Net
Interest
Receivable/
(Payable) | | Value | |
Citibank N.A.
| | Petróleo
Brasileiro S.A.
Senior Securities | | $ | 300,000
| | | | 1.00
| % | | 12/20/2023
| | $ | (31,984
| ) | | $ | 8,936
| | | $ | 350
| | | $ | (22,698
| ) | |
(a) Payment frequency—quarterly.
Centrally Cleared credit default swaps — Sell Protection
Clearinghouse | | Reference
Entity | | Notional
Amount | | Financing
Rate
Received by
the Fund(a) | | Maturity
Date | | Upfront
Payments
(Receipts) | | Unrealized
Appreciation/
(Depreciation) | | Accrued
Net
Interest
Receivable/
(Payable) | | Value | |
ICE Clear Credit LLC
| | CDX Emerging
Markets
Index Ser. 30 V1 | | $ | 3,000,000
| | | | 1.00
| % | | 12/20/2023
| | $ | (140,756
| ) | | $ | (1,726
| ) | | $ | 3,500
| | | $ | (138,982
| ) | |
ICE Clear Credit. LLC
| | CDX North American
Investment Grade
Index Ser. 31 V1 | | | 5,000,000
| | | | 1.00
| % | | 12/20/2023
| | | 72,004
| | | | 1,706
| | | | 5,833
| | | | 79,543
| | |
ICE Clear Credit LLC
| | CDX North American
High Yield Index
Ser. 31 V1 | | | 2,000,000
| | | | 5.00
| % | | 12/20/2023
| | | 97,402
| | | | 8,010
| | | | 11,667
| | | | 117,079
| | |
Total | | | | | | | | | | $ | 28,650 | | | $ | 7,990 | | | $ | 21,000 | | | $ | 57,640 | | |
(a) Payment frequency—quarterly.
At October 31, 2018, the Fund had cash collateral of $504,823 deposited in a segregated account for Goldman Sachs to cover collateral requirements on centrally cleared swaps.
For the year ended October 31, 2018, the average notional value of credit default swaps for the Fund was $3,476,758 for buy protection and $7,232,599 for sell protection.
See Notes to Financial Statements
90
Schedule of Investments Long Short Credit Fund (cont'd)
Total return swap contracts ("total return swaps")
At October 31, 2018, the Fund had outstanding total return swaps as follows:
Over-the-counter total return swaps — Long
| Counterparty | | Reference
Entity | | Notional
Amount | | Maturity
Date | | Variable-
Rate(b) | | Unrealized
Appreciation/
(Depreciation) | | Accrued
Net
Interest
Receivable/
(Payable) | | Value | |
BNP Paribas S.A.
| | Antero Resources Corp.,
Senior Unsecured Notes,
5.38%, due 11/1/2021 | | $ | 148,602
| | | 4/15/2019
| | | 3.13 | %(a) | | $ | (6,182
| ) | | $ | (216
| ) | | $ | (6,398
| ) | |
BNP Paribas S.A.
| | Chesapeake Energy Corp.,
Senior Unsecured Notes,
5.60%, due 4/15/2019 | | | 522,709
| | | 6/17/2019
| | | 3.13
| %(a) | | | 3,344
| | | | (635
| ) | | | 2,709
| | |
Total | | | | | | | | | | $ | (2,838 | ) | | $ | (851 | ) | | $ | (3,689 | ) | |
(a) Fund pays 1-month USD LIBOR plus 0.85%. Payment frequency—monthly. Fund receives return on reference entity. Payment frequency—upon termination.
(b) Effective rate at October 31, 2018.
Over-the-counter total return swaps — Short
| Counterparty | | Reference
Entity | | Notional
Amount | | Maturity
Date | | Variable-
Rate(c) | | Unrealized
Appreciation/
(Depreciation) | | Accrued
Net
Interest
Receivable/
(Payable) | | Value | |
BNP Paribas S.A.
| | Macy's Retail Holdings, Inc.,
Senior Unsecured Notes,
3.88%, due 1/15/2022 | | $ | (506,653
| ) | | 11/15/2018
| | | 2.78
| %(a) | | $ | 6,035
| | | $ | 618
| | | $ | 6,653
| | |
BNP Paribas S.A.
| | Michael's Stores, Inc.,
Senior Subordinated Notes,
5.88%, due 12/15/2020 | | | (508,566
| ) | | 11/15/2018
| | | 1.78
| %(b) | | | 8,171
| | | | 395
| | | | 8,566
| | |
BNP Paribas S.A.
| | SBA Communications Corp.,
Senior Unsecured Notes,
4.88%, due 7/15/2022 | | | (259,091
| ) | | 11/15/2018
| | | 1.78
| %(b) | | | 8,893
| | | | 198
| | | | 9,091
| | |
BNP Paribas S.A.
| | Sabra Health Care LP,
Senior Unsecured Notes,
5.13%, due 8/15/2026 | | | (200,003
| ) | | 11/13/2019
| | | 1.78
| %(b) | | | (136
| ) | | | 139
| | | | 3
| | |
Total | | | | | | | | | | $ | 22,963 | | | $ | 1,350 | | | $ | 24,313 | | |
(a) Fund receives 1-month USD LIBOR plus 0.50%. Payment frequency—monthly. Fund pays return on reference entity. Payment frequency—upon termination.
(b) Fund receives 1-month USD LIBOR minus 0.50%. Payment frequency—monthly. Fund pays return on reference entity. Payment frequency—upon termination.
(c) Effective rate at October 31, 2018.
For the year ended October 31, 2018, the average notional value of total return swaps was $4,259,481 for long positions and $(5,552,958) for short positions.
At October 31, 2018, the Fund had cash collateral of $470,000 deposited in a segregated account for BNP Paribas SA to cover collateral requirements on over-the-counter derivatives.
See Notes to Financial Statements
91
Schedule of Investments Long Short Credit Fund (cont'd)
Purchased option contracts ("options purchased")
At October 31, 2018, the Fund did not have any outstanding options purchased. For the year ended October 31, 2018, the Fund had an average market value of $10,550 in options purchased.
Purchased swaption contracts ("swaptions purchased")
At October 31, 2018, the Fund had outstanding swaptions purchased as follows:
Description | | Notional
Amount | | Exercise
Price | | Expiration
Date | | Value | |
Puts | |
Index | |
CDX North American Investment Grade
Index Ser. 31 V1, 5 year Swaption(a) | | $ | 20,000,000 | | | $ | 80 | | | 11/21/2018 | | $ | 7,253 | | |
Total swaptions purchased (cost $19,600) | | | | | | | | | |
(a) OTC swaption. Counterparty is Goldman Sachs International.
For the year ended October 31, 2018, the Fund had an average market value of $31,274 in swaptions purchased.
Written option contracts ("options written") and written swaptions
At October 31, 2018, the Fund did not have any outstanding options written or swaptions written. For the year ended October 31, 2018, the Fund had an average market value of $(15,475) in options written and $(26,786) in swaptions written, respectively.
The following is a summary, categorized by Level (see Note A of Notes to Financial Statements), of inputs used to value the Fund's investments as of October 31, 2018:
Asset Valuation Inputs | |
(000's omitted) | | Level 1 | | Level 2 | | Level 3(c) | | Total | |
Investments: | |
Common Stock—Oil & Gas | | $ | — | | | $ | 16 | | | $ | — | | | $ | 16 | | |
Corporate Bonds | |
Oil & Gas | | | — | | | | 538 | | | | — | | | | 538 | | |
| Other Corporate Bonds(a) | | | — | | | | 6,968 | | | | — | | | | 6,968 | | |
Total Corporate Bonds | | | — | | | | 7,506 | | | | — | | | | 7,506 | | |
Foreign Government Securities | | | — | | | | 56 | | | | — | | | | 56 | | |
| Swaptions purchased(b) | | | — | | | | 7 | | | | — | | | | 7 | | |
Short-Term Investments | | | — | | | | 4,466 | | | | — | | | | 4,466 | | |
Total Investments | | $ | — | | | $ | 12,051 | | | $ | — | | | $ | 12,051 | | |
(a) The Schedule of Investments provides information on the industry or sector categorization for the portfolio.
(b) The "Purchased swaption contracts" table under Derivative Instruments provides information on the industry or sector categorization for the portfolio.
See Notes to Financial Statements
92
Schedule of Investments Long Short Credit Fund (cont'd)
(c) The following is a reconciliation between the beginning and ending balances of investments in which unobservable inputs (Level 3) were used in determining value:
(000's omitted) | | Beginning
balance, as
of 11/1/2017 | | Accrued
discounts/
(premiums) | | Realized
gain/(loss) | | Change
in unrealized
appreciation/
(depreciation) | | Purchases | | Sales | | Transfers
in to
Level 3 | | Transfers
out of
Level 3 | | Balance,
as of
10/31/2018 | | Net change in
unrealized
appreciation/
(depreciation)
from
investments
still held as of
10/31/2018 | |
Investments in
Securities: | |
| Loan Assignments(c) | |
Steel | | $ | 204 | | | $ | — | | | $ | 4 | | | $ | (6 | ) | | $ | — | | | $ | (202 | ) | | $ | — | | | $ | — | | | $ | — | | | $ | — | | |
Total | | $ | 204 | | | $ | — | | | $ | 4 | | | $ | (6 | ) | | $ | — | | | $ | (202 | ) | | $ | — | | | $ | — | | | $ | — | | | $ | — | | |
(c) Securities categorized as Level 3 are valued based on a single quotation obtained from a dealer. The Fund does not have access to unobservable inputs and therefore cannot disclose such inputs used in formulating such quotation.
The following is a summary, categorized by Level (see Note A of Notes to Financial Statements), of inputs used to value the Fund's derivatives as of October 31, 2018:
Other Financial Instruments | |
(000's omitted) | | Level 1 | | Level 2 | | Level 3 | | Total | |
| Futures(a) | |
Liabilities | | $ | (1 | ) | | $ | — | | | $ | — | | | $ | (1 | ) | |
| Forward Contracts(a) | |
Assets | | | — | | | | 11 | | | | — | | | | 11 | | |
Liabilities | | | — | | | | (7 | ) | | | — | | | | (7 | ) | |
Swaps | |
Assets | | | — | | | | 223 | | | | — | | | | 223 | | |
Liabilities | | | — | | | | (168 | ) | | | — | | | | (168 | ) | |
Total | | $ | (1 | ) | | $ | 59 | | | $ | — | | | $ | 58 | | |
(a) Futures and forward contracts are reported at the cumulative unrealized appreciation/(depreciation) of the instrument.
See Notes to Financial Statements
93
Schedule of Investments Multi-Asset Income Fund October 31, 2018
| | | Number
of Shares | | Value
(000's
omitted) | |
Common Stocks 35.6% | |
Aerospace & Defense 0.5% | |
Boeing Co. | | | 89 | | | $ | 32 | | |
Lockheed Martin
Corp. | | | 240 | | | | 70 | | |
Raytheon Co. | | | 76 | | | | 13 | | |
| | | | 115 | | |
Air Freight & Logistics 0.2% | |
Cia de
Distribucion
Integral Logista
Holdings SA | | | 422 | | | | 10 | | |
Oesterreichische
Post AG | | | 443 | | | | 18 | | |
Royal Mail PLC | | | 3,391 | | | | 16 | | |
| | | | 44 | | |
| Airlines 0.0%(a) | |
Copa Holdings
SA Class A | | | 87 | | | | 6 | | |
Auto Components 0.1% | |
Nokian Renkaat
OYJ | | | 525 | | | | 17 | | |
Automobiles 0.5% | |
Bayerische
Motoren
Werke AG | | | 59 | | | | 5 | | |
Bayerische
Motoren Werke
AG, Preference
Shares | | | 133 | | | | 10 | | |
Daimler AG | | | 309 | | | | 18 | | |
Ford Motor Co. | | | 3,163 | | | | 30 | | |
Honda Motor
Co. Ltd. | | | 200 | | | | 6 | | |
Nissan Motor
Co. Ltd. | | | 2,100 | | | | 19 | | |
Renault SA | | | 248 | | | | 19 | | |
| | | | 107 | | |
Banks 1.9% | |
Aozora Bank Ltd. | | | 500 | | | | 17 | | |
Australia &
New Zealand
Banking Group
Ltd. | | | 711 | | | | 13 | | |
Bank of NT
Butterfield &
Son Ltd. | | | 155 | | | | 6 | | |
BB&T Corp. | | | 576 | | | | 28 | | |
Citigroup, Inc. | | | 350 | | | | 23 | | |
Credit Agricole
SA | | | 737 | | | | 9 | | |
Danske Bank A/S | | | 134 | | | | 3 | | |
First Hawaiian,
Inc. | | | 980 | | | | 24 | | |
Huntington
Bancshares, Inc. | | | 458 | | | | 7 | | |
| | | Number
of Shares | | Value
(000's
omitted) | |
ING Groep NV | | | 844 | | | $ | 10 | | |
Intesa Sanpaolo
SpA | | | 4,527 | | | | 10 | | |
JPMorgan
Chase & Co. | | | 625 | | | | 68 | | |
KBC Group NV | | | 242 | | | | 17 | | |
Nordea Bank
Abp | | | 882 | | | | 8 | | |
People's United
Financial, Inc. | | | 977 | | | | 15 | | |
PNC Financial
Services Group,
Inc. | | | 208 | | | | 27 | | |
Royal Bank of
Canada | | | 258 | | | | 19 | | |
Skandinaviska
Enskilda
Banken AB,
Class A | | | 438 | | | | 4 | | |
SunTrust Banks,
Inc. | | | 679 | | | | 43 | | |
U.S. Bancorp | | | 528 | | | | 28 | | |
Umpqua
Holdings Corp. | | | 2,090 | | | | 40 | | |
Wells Fargo & Co. | | | 478 | | | | 25 | | |
| | | | 444 | | |
Beverages 0.5% | |
Coca-Cola
Amatil Ltd. | | | 2,359 | | | | 17 | | |
Coca-Cola Co. | | | 706 | | | | 34 | | |
PepsiCo, Inc. | | | 529 | | | | 59 | | |
| | | | 110 | | |
Biotechnology 0.2% | |
Gilead Sciences,
Inc. | | | 625 | | | | 43 | | |
| Building Products 0.0%(a) | |
Resideo
Technologies,
Inc. | | | 17 | | | | — | * | |
Capital Markets 0.4% | |
Bank of
New York
Mellon Corp. | | | 143 | | | | 7 | | |
CME Group, Inc. | | | 177 | | | | 32 | | |
Virtu Financial,
Inc. Class A | | | 1,775 | | | | 42 | | |
| | | | 81 | | |
Chemicals 0.8% | |
BASF SE | | | 92 | | | | 7 | | |
Celanese Corp.
Series A | | | 297 | | | | 29 | | |
Chemours Co. | | | 249 | | | | 8 | | |
Eastman
Chemical Co. | | | 355 | | | | 28 | | |
Evonik Industries
AG | | | 462 | | | | 14 | | |
| | | Number
of Shares | | Value
(000's
omitted) | |
Huntsman Corp. | | | 728 | | | $ | 16 | | |
Linde PLC | | | 139 | | | | 23 | | |
LyondellBasell
Industries NV
Class A | | | 298 | | | | 27 | | |
Nutrien Ltd. | | | 450 | | | | 24 | | |
PolyOne Corp. | | | 196 | | | | 6 | | |
Trinseo SA | | | 102 | | | | 5 | | |
| | | | 187 | | |
Commercial Services & Supplies 0.4% | |
KAR Auction
Services, Inc. | | | 396 | | | | 23 | | |
Republic
Services, Inc. | | | 155 | | | | 11 | | |
Societe BIC SA | | | 220 | | | | 21 | | |
Waste
Management,
Inc. | | | 337 | | | | 30 | | |
| | | | 85 | | |
Communications Equipment 0.4% | |
Cisco Systems,
Inc. | | | 1,503 | | | | 69 | | |
Nokia OYJ | | | 1,684 | | | | 9 | | |
VTech Holdings
Ltd. | | | 1,800 | | | | 21 | | |
| | | | 99 | | |
Construction & Engineering 0.1% | |
Ferrovial SA | | | 1,349 | | | | 27 | | |
Containers & Packaging 0.4% | |
Amcor Ltd. | | | 534 | | | | 5 | | |
Avery Dennison
Corp. | | | 260 | | | | 23 | | |
Bemis Co., Inc. | | | 264 | | | | 12 | | |
International
Paper Co. | | | 571 | | | | 26 | | |
Sonoco
Products Co. | | | 289 | | | | 16 | | |
| | | | 82 | | |
Diversified Telecommunication Services 1.2% | |
AT&T, Inc. | | | 918 | | | | 28 | | |
BCE, Inc. | | | 487 | | | | 19 | | |
Bezeq Israeli
Telecommunication
Corp. Ltd. | | | 7,655 | | | | 9 | | |
CenturyLink, Inc. | | | 671 | | | | 14 | | |
Cogent
Communications
Holdings, Inc. | | | 127 | | | | 7 | | |
Elisa OYJ | | | 528 | | | | 21 | | |
Koninklijke
KPN NV | | | 2,051 | | | | 5 | | |
Nippon
Telegraph &
Telephone Corp. | | | 100 | | | | 4 | | |
See Notes to Financial Statements
94
Schedule of Investments Multi-Asset Income Fund (cont'd)
| | | Number
of Shares | | Value
(000's
omitted) | |
Orange SA | | | 1,186 | | | $ | 18 | | |
Singapore
Telecommunications
Ltd. | | | 4,600 | | | | 10 | | |
Sunrise
Communications
Group AG | | | 268 | | | | 24 | *(b) | |
Swisscom AG | | | 45 | | | | 21 | | |
Telia Co. AB | | | 1,130 | | | | 5 | | |
Verizon
Communications,
Inc. | | | 1,614 | | | | 92 | | |
| | | | 277 | | |
Electric Utilities 1.9% | |
CK Infrastructure
Holdings Ltd. | | | 500 | | | | 4 | | |
CLP Holdings Ltd. | | | 1,000 | | | | 11 | | |
EDP—Energias
de Portugal SA | | | 2,034 | | | | 7 | | |
Endesa SA | | | 950 | | | | 20 | | |
Evergy, Inc. | | | 907 | | | | 51 | | |
Exelon Corp. | | | 1,357 | | | | 59 | | |
FirstEnergy Corp. | | | 930 | | | | 35 | | |
Fortum OYJ | | | 1,013 | | | | 21 | | |
Hawaiian Electric
Industries, Inc. | | | 104 | | | | 4 | | |
HK Electric
Investments &
HK Electric
Investments Ltd. | | | 10,500 | | | | 10 | (b) | |
IDACORP, Inc. | | | 147 | | | | 14 | | |
Mercury NZ Ltd. | | | 1,108 | | | | 2 | | |
NextEra Energy,
Inc. | | | 391 | | | | 67 | | |
OGE Energy Corp. | | | 595 | | | | 22 | | |
Portland General
Electric Co. | | | 262 | | | | 12 | | |
Power Assets
Holdings Ltd. | | | 3,000 | | | | 20 | | |
PPL Corp. | | | 889 | | | | 27 | | |
Southern Co. | | | 450 | | | | 20 | | |
SSE PLC | | | 1,176 | | | | 17 | | |
| | | | 423 | | |
Electrical Equipment 0.2% | |
Eaton Corp. PLC | | | 375 | | | | 27 | | |
Emerson Electric
Co. | | | 421 | | | | 29 | | |
| | | | 56 | | |
Energy Equipment & Services 0.1% | |
Helmerich &
Payne, Inc. | | | 325 | | | | 20 | | |
Schlumberger Ltd. | | | 17 | | | | 1 | | |
| | | | 21 | | |
| Entertainment 0.0%(a) | |
Cinemark
Holdings, Inc. | | | 3 | | | | — | | |
| | | Number
of Shares | | Value
(000's
omitted) | |
Equity Real Estate Investment Trusts 5.5% | |
Alexandria Real
Estate Equities,
Inc. | | | 462 | | | $ | 56 | | |
American
Campus
Communities,
Inc. | | | 532 | | | | 21 | | |
American Tower
Corp. | | | 297 | | | | 46 | | |
Apple Hospitality
REIT, Inc. | | | 657 | | | | 11 | | |
Ascendas
Real Estate
Investment
Trust | | | 5,200 | | | | 9 | | |
British Land Co.
PLC | | | 609 | | | | 5 | | |
Camden
Property Trust | | | 85 | | | | 8 | | |
CapitaLand
Commercial
Trust | | | 2,000 | | | | 3 | | |
CapitaLand Mall
Trust | | | 12,000 | | | | 18 | | |
Colony Capital,
Inc. | | | 230 | | | | 1 | | |
CoreSite Realty
Corp. | | | 245 | | | | 23 | | |
Covivio | | | 49 | | | | 5 | | |
Crown Castle
International
Corp. | | | 1,002 | | | | 109 | | |
CubeSmart | | | 105 | | | | 3 | | |
Digital Realty
Trust, Inc. | | | 240 | | | | 25 | | |
Douglas Emmett,
Inc. | | | 650 | | | | 24 | | |
Equinix, Inc. | | | 30 | | | | 11 | | |
Equity Lifestyle
Properties, Inc. | | | 250 | | | | 24 | | |
Extra Space
Storage, Inc. | | | 653 | | | | 59 | | |
Four Corners
Property Trust,
Inc. | | | 550 | | | | 14 | | |
Gaming and
Leisure
Properties, Inc. | | | 586 | | | | 20 | | |
H&R Real Estate
Investment Trust | | | 1,262 | | | | 19 | | |
Highwoods
Properties, Inc. | | | 548 | | | | 23 | | |
Host Hotels &
Resorts, Inc. | | | 2,400 | | | | 46 | | |
Iron Mountain,
Inc. | | | 291 | | | | 9 | | |
Kimco Realty
Corp. | | | 1,482 | | | | 24 | | |
Klepierre SA | | | 362 | | | | 12 | | |
| | | Number
of Shares | | Value
(000's
omitted) | |
Lamar
Advertising Co.
Class A | | | 20 | | | $ | 1 | | |
LaSalle Hotel
Properties | | | 484 | | | | 16 | | |
Life Storage, Inc. | | | 136 | | | | 13 | | |
Macerich Co. | | | 325 | | | | 17 | | |
Medical
Properties
Trust, Inc. | | | 2,409 | | | | 36 | | |
Merlin Properties
Socimi SA | | | 380 | | | | 5 | | |
Mid-America
Apartment
Communities,
Inc. | | | 248 | | | | 24 | | |
Mirvac Group | | | 10,992 | | | | 17 | | |
National Health
Investors, Inc. | | | 93 | | | | 7 | | |
National Retail
Properties, Inc. | | | 300 | | | | 14 | | |
OMEGA
Healthcare
Investors, Inc. | | | 1,174 | | | | 39 | | |
Park Hotels &
Resorts, Inc. | | | 1,122 | | | | 33 | | |
Piedmont Office
Realty Trust, Inc.
Class A | | | 360 | | | | 6 | | |
Prologis, Inc. | | | 545 | | | | 35 | | |
Public Storage | | | 122 | | | | 25 | | |
RioCan
Real Estate
Investment Trust | | | 1,192 | | | | 22 | | |
Senior Housing
Properties Trust | | | 714 | | | | 11 | | |
Simon Property
Group, Inc. | | | 109 | | | | 20 | | |
Spirit Realty
Capital, Inc. | | | 943 | | | | 7 | | |
STAG Industrial,
Inc. | | | 1,076 | | | | 28 | | |
Stockland | | | 5,693 | | | | 15 | | |
Sun
Communities,
Inc. | | | 427 | | | | 43 | | |
Ventas, Inc. | | | 858 | | | | 50 | | |
VEREIT, Inc. | | | 982 | | | | 7 | | |
VICI Properties,
Inc. | | | 362 | | | | 8 | | |
Vicinity Centres | | | 7,137 | | | | 13 | | |
Welltower, Inc. | | | 710 | | | | 47 | | |
Weyerhaeuser
Co. | | | 1,740 | | | | 46 | | |
WP Carey, Inc. | | | 312 | | | | 21 | | |
| | | | 1,254 | | |
Food & Staples Retailing 0.7% | |
Axfood AB | | | 257 | | | | 5 | | |
ICA Gruppen AB | | | 176 | | | | 6 | | |
See Notes to Financial Statements
95
Schedule of Investments Multi-Asset Income Fund (cont'd)
| | | Number
of Shares | | Value
(000's
omitted) | |
Kesko OYJ,
B Shares | | | 384 | | | $ | 22 | | |
METRO AG | | | 1,372 | | | | 21 | | |
Sysco Corp. | | | 410 | | | | 29 | | |
Walgreens Boots
Alliance, Inc. | | | 110 | | | | 9 | | |
Walmart, Inc. | | | 553 | | | | 55 | | |
Wesfarmers Ltd. | | | 683 | | | | 23 | | |
| | | | 170 | | |
Food Products 0.8% | |
Archer-Daniels-
Midland Co. | | | 556 | | | | 26 | | |
Flowers Foods,
Inc. | | | 1,512 | | | | 29 | | |
Hershey Co. | | | 302 | | | | 33 | | |
Kellogg Co. | | | 440 | | | | 29 | | |
Nestle SA | | | 203 | | | | 17 | | |
Orkla ASA | | | 2,357 | | | | 20 | | |
Salmar ASA | | | 234 | | | | 12 | | |
Tate & Lyle PLC | | | 690 | | | | 6 | | |
| | | | 172 | | |
Gas Utilities 0.1% | |
AltaGas Ltd. | | | 228 | | | | 3 | | |
APA Group | | | 2,343 | | | | 16 | | |
Gas Natural SDG SA | | | 196 | | | | 5 | | |
| | | | 24 | | |
Health Care Equipment & Supplies 0.1% | |
Medtronic PLC | | | 351 | | | | 32 | | |
Health Care Providers & Services 0.2% | |
Cardinal Health,
Inc. | | | 226 | | | | 12 | | |
Encompass
Health Corp. | | | 93 | | | | 6 | | |
Patterson Cos.,
Inc. | | | 284 | | | | 6 | | |
Quest Diagnostics,
Inc. | | | 289 | | | | 27 | | |
| | | �� | 51 | | |
Hotels, Restaurants & Leisure 0.9% | |
Carnival Corp. | | | 1,296 | | | | 73 | | |
Carnival PLC | | | 309 | | | | 17 | | |
Cracker Barrel
Old Country
Store, Inc. | | | 69 | | | | 11 | | |
Crown Resorts
Ltd. | | | 2,074 | | | | 18 | | |
Darden
Restaurants, Inc. | | | 83 | | | | 9 | | |
Extended Stay
America, Inc. | | | 576 | | | | 9 | | |
Genting
Singapore Ltd. | | | 6,000 | | | | 4 | | |
Las Vegas Sands
Corp. | | | 466 | | | | 24 | | |
McDonald's Corp. | | | 170 | | | | 30 | | |
| | | Number
of Shares | | Value
(000's
omitted) | |
Six Flags
Entertainment
Corp. | | | 218 | | | $ | 12 | | |
| | | | 207 | | |
Household Durables 0.2% | |
Berkeley Group
Holdings PLC | | | 391 | | | | 17 | | |
Garmin Ltd. | | | 492 | | | | 33 | | |
| | | | 50 | | |
Household Products 0.1% | |
Kimberly-Clark
Corp. | | | 64 | | | | 7 | | |
Procter &
Gamble Co. | | | 275 | | | | 24 | | |
| | | | 31 | | |
Independent Power and Renewable Electricity Producers 1.0% | |
AES Corp. | | | 1,978 | | | | 29 | | |
Clearway Energy,
Inc. | | | 4,100 | | | | 81 | | |
NextEra Energy
Partners LP | | | 2,599 | | | | 118 | | |
| | | | 228 | | |
Industrial Conglomerates 0.2% | |
Honeywell
International,
Inc. | | | 100 | | | | 15 | | |
Hopewell
Holdings Ltd. | | | 3,000 | | | | 9 | | |
NWS Holdings
Ltd. | | | 4,000 | | | | 8 | | |
Siemens AG
ADR | | | 400 | | | | 23 | | |
| | | | 55 | | |
Insurance 0.6% | |
Ageas | | | 207 | | | | 10 | | |
Baloise Holding
AG | | | 33 | | | | 5 | | |
Fidelity National
Financial, Inc. | | | 367 | | | | 12 | | |
First American
Financial Corp. | | | 134 | | | | 6 | | |
Legal & General
Group PLC | | | 5,710 | | | | 18 | | |
MetLife, Inc. | | | 154 | | | | 6 | | |
Poste Italiane
SpA | | | 2,735 | | | | 20 | (b) | |
Power Corp. of
Canada | | | 957 | | | | 20 | | |
Power Financial
Corp. | | | 377 | | | | 8 | | |
Swiss Life
Holding AG | | | 15 | | | | 6 | * | |
Swiss Re AG | | | 109 | | | | 10 | | |
| | | Number
of Shares | | Value
(000's
omitted) | |
UNIQA Insurance
Group AG | | | 700 | | | $ | 7 | | |
Zurich Insurance
Group AG | | | 19 | | | | 6 | | |
| | | | 134 | | |
IT Services 0.4% | |
Automatic Data
Processing, Inc. | | | 170 | | | | 25 | | |
IBM Corp. | | | 210 | | | | 24 | | |
Paychex, Inc. | | | 447 | | | | 29 | | |
Western Union
Co. | | | 1,322 | | | | 24 | | |
| | | | 102 | | |
Machinery 0.2% | |
Cummins, Inc. | | | 204 | | | | 28 | | |
Kone OYJ Class B | | | 6 | | | | — | | |
Pentair PLC | | | 491 | | | | 20 | | |
| | | | 48 | | |
Media 0.8% | |
Comcast Corp.
Class A | | | 623 | | | | 24 | | |
Interpublic Group
of Cos., Inc. | | | 2,781 | | | | 64 | | |
John Wiley &
Sons, Inc.
Class A | | | 139 | | | | 8 | | |
Mediaset Espana
Comunicacion
SA | | | 1,043 | | | | 7 | | |
Nexstar Media
Group, Inc.
Class A | | | 140 | | | | 10 | | |
NOS SGPS SA | | | 1,344 | | | | 8 | | |
Omnicom
Group, Inc. | | | 448 | | | | 33 | | |
RTL Group SA | | | 287 | | | | 18 | | |
Tribune Media
Co. Class A | | | 200 | | | | 8 | | |
| | | | 180 | | |
Metals & Mining 0.9% | |
Alumina Ltd. | | | 10,423 | | | | 19 | | |
BHP Billiton Ltd. | | | 964 | | | | 22 | | |
BHP Billiton PLC | | | 1,070 | | | | 22 | | |
Evraz PLC | | | 704 | | | | 5 | | |
Fortescue Metals
Group Ltd. | | | 3,932 | | | | 11 | | |
Franco-Nevada
Corp. | | | 335 | | | | 21 | | |
JFE Holdings, Inc. | | | 100 | | | | 2 | | |
Nucor Corp. | | | 120 | | | | 7 | | |
Rio Tinto PLC | | | 414 | | | | 20 | | |
Rio Tinto PLC
ADR | | | 900 | | | | 44 | | |
Southern
Copper Corp. | | | 775 | | | | 30 | | |
| | | | 203 | | |
See Notes to Financial Statements
96
Schedule of Investments Multi-Asset Income Fund (cont'd)
| | | Number
of Shares | | Value
(000's
omitted) | |
Mortgage Real Estate Investment 0.9% | |
AGNC Investment
Corp. | | | 2,169 | | | $ | 39 | | |
Annaly Capital
Management,
Inc. | | | 5,642 | | | | 56 | | |
Apollo
Commercial
Real Estate
Finance, Inc. | | | 354 | | | | 7 | | |
Blackstone
Mortgage Trust,
Inc. Class A | | | 1,276 | | | | 43 | | |
Chimera
Investment Corp. | | | 551 | | | | 10 | | |
MFA Financial, Inc. | | | 902 | | | | 6 | | |
New Residential
Investment Corp. | | | 562 | | | | 10 | | |
Starwood Property
Trust, Inc. | | | 1,637 | | | | 35 | | |
Two Harbors
Investment Corp. | | | 760 | | | | 11 | | |
| | | | 217 | | |
Multi-Utilities 1.3% | |
A2A SpA | | | 2,710 | | | | 4 | | |
Ameren Corp. | | | 450 | | | | 29 | | |
CenterPoint
Energy, Inc. | | | 1,153 | | | | 31 | | |
Centrica PLC | | | 11,200 | | | | 21 | | |
Dominion
Resources, Inc. | | | 325 | | | | 23 | | |
DTE Energy Co. | | | 200 | | | | 23 | | |
Engie SA | | | 1,363 | | | | 18 | | |
Innogy SE | | | 15 | | | | 1 | (b) | |
NiSource, Inc. | | | 850 | | | | 22 | | |
NorthWestern
Corp. | | | 120 | | | | 7 | | |
Sempra Energy | | | 800 | | | | 88 | | |
WEC Energy
Group, Inc. | | | 486 | | | | 33 | | |
| | | | 300 | | |
Multiline Retail 0.2% | |
Marks & Spencer
Group PLC | | | 1,403 | | | | 5 | | |
Target Corp. | | | 450 | | | | 38 | | |
| | | | 43 | | |
Oil, Gas & Consumable Fuels 4.2% | |
Antero Midstream
GP LP | | | 3,000 | | | | 48 | | |
| BP PLC | | | 3,036 | | | | 22 | | |
Caltex Australia
Ltd. | | | 196 | | | | 4 | | |
Chevron Corp. | | | 241 | | | | 27 | | |
CVR Energy, Inc. | | | 266 | | | | 11 | | |
Enagas SA | | | 781 | | | | 21 | | |
| | | Number
of Shares | | Value
(000's
omitted) | |
Enbridge Income
Fund Holdings,
Inc. | | | 890 | | | $ | 21 | | |
Eni SpA | | | 1,246 | | | | 22 | | |
Exxon Mobil
Corp. | | | 391 | | | | 31 | | |
Galp Energia
SGPS SA | | | 224 | | | | 4 | | |
Marathon
Petroleum Corp. | | | 424 | | | | 30 | | |
Occidental
Petroleum Corp. | | | 407 | | | | 27 | | |
ONEOK, Inc. | | | 3,406 | | | | 223 | | |
Pembina
Pipeline Corp. | | | 1,100 | | | | 36 | | |
Phillips 66 | | | 291 | | | | 30 | | |
Repsol SA | | | 812 | | | | 15 | | |
Royal Dutch
Shell PLC,
A Shares | | | 636 | | | | 20 | | |
Snam SpA | | | 5,273 | | | | 22 | | |
Suncor Energy,
Inc. | | | 2,174 | | | | 72 | | |
Targa Resources
Corp. | | | 1,750 | | | | 90 | | |
TOTAL SA | | | 337 | | | | 20 | | |
Total SA ADR | | | 575 | | | | 34 | | |
Valero Energy
Corp. | | | 327 | | | | 30 | | |
Washington H
Soul Pattinson &
Co. Ltd. | | | 121 | | | | 3 | | |
Williams Cos.,
Inc. | | | 3,877 | | | | 94 | | |
| | | | 957 | | |
Paper & Forest Products 0.2% | |
Louisiana Pacific
Corp. | | | 329 | | | | 7 | | |
Navigator Co. SA | | | 4,157 | | | | 21 | | |
UPM-Kymmene
OYJ | | | 664 | | | | 21 | | |
| | | | 49 | | |
Personal Products 0.1% | |
Unilever PLC | | | 369 | | | | 20 | | |
Pharmaceuticals 1.7% | |
AstraZeneca PLC | | | 311 | | | | 24 | | |
AstraZeneca PLC
ADR | | | 950 | | | | 37 | | |
Bristol-Myers
Squibb Co. | | | 559 | | | | 28 | | |
Eli Lilly & Co. | | | 372 | | | | 40 | | |
GlaxoSmithKline
PLC | | | 1,196 | | | | 23 | | |
Johnson &
Johnson | | | 341 | | | | 48 | | |
Merck & Co.,
Inc. | | | 513 | | | | 38 | | |
Novartis AG | | | 283 | | | | 25 | | |
| | | Number
of Shares | | Value
(000's
omitted) | |
Pfizer, Inc. | | | 1,781 | | | $ | 77 | | |
Roche Holding
AG | | | 81 | | | | 20 | | |
Sanofi | | | 265 | | | | 23 | | |
| | | | 383 | | |
Professional Services 0.1% | |
Nielsen Holdings
PLC | | | 110 | | | | 3 | | |
RELX PLC | | | 1,039 | | | | 20 | | |
| | | | 23 | | |
Real Estate Management & Development 0.4% | |
Brookfield
Property
Partners LP | | | 1,548 | | | | 30 | * | |
Castellum AB | | | 21 | | | | — | | |
First Capital
Realty, Inc. | | | 1,294 | | | | 19 | | |
Swire Pacific Ltd.
Class A | | | 1,500 | | | | 16 | | |
Swire Pacific Ltd.
Class B | | | 2,500 | | | | 4 | | |
Swiss Prime
Site AG | | | 230 | | | | 19 | * | |
| | | | 88 | | |
Road & Rail 0.2% | |
CSX Corp. | | | 575 | | | | 40 | | |
Semiconductors & Semiconductor Equipment 0.7% | |
ASM Pacific
Technology Ltd. | | | 1,000 | | | | 9 | | |
KLA-Tencor Corp. | | | 297 | | | | 27 | | |
Lam Research
Corp. | | | 43 | | | | 6 | | |
Maxim
Integrated
Products, Inc. | | | 1,067 | | | | 53 | | |
QUALCOMM,
Inc. | | | 350 | | | | 22 | | |
Taiwan
Semiconductor
Manufacturing
Co. Ltd. ADR | | | 550 | | | | 21 | | |
Texas
Instruments,
Inc. | | | 277 | | | | 26 | | |
| | | | 164 | | |
Software 0.5% | |
CA, Inc. | | | 798 | | | | 35 | | |
Micro Focus
International
PLC | | | 621 | | | | 10 | | |
Microsoft Corp. | | | 625 | | | | 67 | | |
| | | | 112 | | |
See Notes to Financial Statements
97
Schedule of Investments Multi-Asset Income Fund (cont'd)
| | | Number
of Shares | | Value
(000's
omitted) | |
Specialty Retail 0.5% | |
Foot Locker, Inc. | | | 1,000 | | | $ | 47 | | |
Home Depot, Inc. | | | 289 | | | | 51 | | |
Williams-Sonoma,
Inc. | | | 425 | | | | 25 | | |
| | | | 123 | | |
Technology Hardware, Storage & Peripherals 0.8% | |
Apple, Inc. | | | 425 | | | | 93 | | |
Canon, Inc. | | | 700 | | | | 20 | | |
HP, Inc. | | | 1,346 | | | | 33 | | |
Seagate
Technology PLC | | | 447 | | | | 18 | | |
Western Digital
Corp. | | | 402 | | | | 17 | | |
| | | | 181 | | |
Textiles, Apparel & Luxury Goods 0.1% | |
HUGO BOSS AG | | | 241 | | | | 17 | | |
Pandora A/S | | | 64 | | | | 4 | | |
| | | | 21 | | |
Thrifts & Mortgage Finance 0.1% | |
Genworth MI
Canada, Inc. | | | 137 | | | | 5 | | |
New York
Community
Bancorp, Inc. | | | 1,406 | | | | 13 | | |
TFS Financial Corp. | | | 204 | | | | 3 | | |
| | | | 21 | | |
Tobacco 0.4% | |
Altria Group, Inc. | | | 514 | | | | 33 | | |
Imperial Brands
PLC | | | 500 | | | | 17 | | |
Japan Tobacco,
Inc. | | | 700 | | | | 18 | | |
Philip Morris
International, Inc. | | | 117 | | | | 10 | | |
Vector Group Ltd. | | | 340 | | | | 5 | | |
| | | | 83 | | |
Trading Companies & Distributors 0.4% | |
ITOCHU Corp. | | | 1,200 | | | | 22 | | |
Marubeni Corp. | | | 3,000 | | | | 24 | | |
Mitsubishi Corp. | | | 500 | | | | 14 | | |
Mitsui & Co. Ltd. | | | 1,300 | | | | 22 | | |
Sumitomo Corp. | | | 300 | | | | 5 | | |
Watsco, Inc. | | | 80 | | | | 12 | | |
| | | | 99 | | |
| Transportation Infrastructure 0.0%(a) | |
Atlantia SpA | | | 149 | | | | 3 | | |
Hutchison Port
Holdings Trust | | | 2,700 | | | | 1 | | |
Sydney Airport | | | 1,600 | | | | 7 | | |
| | | | 11 | | |
| | | Number
of Shares | | Value
(000's
omitted) | |
Water Utilities 0.1% | |
United Utilities
Group PLC | | | 1,857 | | | $ | 17 | | |
Wireless Telecommunication Services 0.2% | |
NTT DOCOMO,
Inc. | | | 800 | | | | 20 | | |
Rogers
Communications,
Inc. Class B | | | 165 | | | | 9 | | |
Vodafone Group
PLC | | | 7,573 | | | | 14 | | |
| | | | 43 | | |
Total Common Stocks
(Cost $7,907) | | | 8,160 | | |
Preferred Stocks 2.1% | |
Equity Real Estate Investment Trusts 2.1% | |
American
Homes 4 Rent,
Ser. D, 6.50% | | | 746 | | | | 18 | | |
Ashford
Hospitality
Trust, Inc.,
Ser. F, 7.38% | | | 600 | | | | 14 | | |
Ashford
Hospitality
Trust, Inc.,
Ser. H, 7.50% | | | 1,579 | | | | 37 | | |
Brookfield
Property REIT,
Inc., Ser. A,
6.38% | | | 1,226 | | | | 29 | | |
Cedar Realty
Trust, Inc.,
Ser. B, 7.25% | | | 156 | | | | 4 | | |
Colony Capital,
Inc., Ser. J,
7.13% | | | 793 | | | | 18 | | |
Digital Realty
Trust, Inc.,
Ser. C, 6.63% | | | 1,923 | | | | 50 | | |
Hersha
Hospitality Trust,
Ser. C, 6.88% | | | 764 | | | | 18 | | |
Hersha
Hospitality Trust,
Ser. D, 6.50% | | | 675 | | | | 14 | | |
National Retail
Properties, Inc.,
Ser. F, 5.20% | | | 2,025 | | | | 44 | | |
Pebblebrook
Hotel Trust,
Ser. D, 6.38% | | | 2,221 | | | | 54 | | |
Pennsylvania
Real Estate
Investment Trust,
Ser. D, 6.88% | | | 500 | | | | 11 | | |
| | | Number
of Shares | | Value
(000's
omitted) | |
PS Business
Parks, Inc.,
Ser. U, 5.75% | | | 800 | | | $ | 19 | | |
Public Storage,
Ser. E, 4.90% | | | 1,725 | | | | 38 | | |
QTS Realty Trust,
Inc., Ser. A,
7.13% | | | 250 | | | | 6 | | |
Rexford
Industrial
Realty, Inc.,
Ser. A, 5.88% | | | 533 | | | | 12 | | |
Saul Centers,
Inc., Ser. D,
6.13% | | | 600 | | | | 13 | | |
Sunstone Hotel
Investors, Inc.,
Ser. E, 6.95% | | | 1,500 | | | | 38 | | |
UMH Properties,
Inc., Ser. D,
6.38% | | | 375 | | | | 8 | | |
VEREIT, Inc.,
Ser. F, 6.70% | | | 1,014 | | | | 25 | | |
Vornado Realty
Trust, Ser. K,
5.70% | | | 1,050 | | | | 25 | | |
Total Preferred Stocks
(Cost $519) | | | 495 | | |
| | | Principal
Amount
(000's
omitted) | | | |
Convertible Bonds 1.2% | |
| Biotechnology 0.0%(a) | |
BioMarin
Pharmaceutical,
Inc., 0.60%,
due 8/1/24 | | $ | 10 | | | | 10 | | |
| Communications Equipment 0.0%(a) | |
Finisar Corp.,
0.50%,
due 12/15/36 | | | 5 | | | | 4 | | |
Equity Real Estate Investment Trusts 0.3% | |
Extra Space
Storage LP,
3.13%,
due 10/1/35 | | | 50 | | | | 54 | (c) | |
IH Merger Sub
LLC, 3.50%,
due 1/15/22 | | | 10 | | | | 11 | | |
| | | | 65 | | |
See Notes to Financial Statements
98
Schedule of Investments Multi-Asset Income Fund (cont'd)
| | | Principal
Amount
(000's
omitted) | | Value
(000's
omitted) | |
Independent Power and Renewable Electricity Producers 0.1% | |
NextEra Energy
Partners L.P.,
1.50%, due
9/15/20 | | $ | 15 | | | $ | 15 | (c) | |
| Internet & Direct Marketing Retail 0.0%(a) | |
Liberty Expedia
Holdings, Inc.,
1.00%, due
6/30/47 | | | 10 | | | | 10 | (c) | |
Internet Software & Services 0.1% | |
Envestnet, Inc.,
1.75%, due
6/1/23 | | | 20 | | | | 20 | (c) | |
Zillow Group, Inc.,
2.00%, due
12/1/21 | | | 10 | | | | 11 | | |
| | | | 31 | | |
Media 0.2% | |
Gannett Co., Inc.,
4.75%, due
4/15/24 | | | 10 | | | | 10 | (c) | |
Liberty Media
Corp.,
2.13%, due
3/31/48 | | | 25 | | | | 25 | (c) | |
| | | | 35 | | |
Metals & Mining 0.1% | |
Endeavour Mining
Corp.,
3.00%, due
2/15/23 | | | 20 | | | | 19 | (c) | |
Oil Field Equipment & Services 0.1% | |
Ensco Jersey
Finance Ltd.,
3.00%, due
1/31/24 | | | 20 | | | | 18 | | |
Oil, Gas & Consumable Fuels 0.1% | |
Golar LNG Ltd.,
2.75%, due
2/15/22 | | | 15 | | | | 15 | | |
Teekay Corp.,
5.00%, due
1/15/23 | | | 10 | | | | 9 | (c) | |
| | | | 24 | | |
Software 0.2% | |
DocuSign, Inc.,
0.50%, due
9/15/23 | | | 5 | | | | 5 | (c) | |
Guidewire
Software, Inc.,
1.25%, due
3/15/25 | | | 20 | | | | 20 | | |
| | | Principal
Amount
(000's
omitted) | | Value
(000's
omitted) | |
PROS Holdings,
Inc.,
2.00%, due
6/1/47 | | $ | 10 | | | $ | 9 | | |
Splunk, Inc.,
0.50%, due
9/15/23 | | | 5 | | | | 5 | (c) | |
| | | | 39 | | |
Total Convertible Bonds
(Cost $270) | | | 270 | | |
Corporate Bonds 9.9% | | | |
Agriculture 0.3% | | | |
BAT Capital Corp.,
4.54%, due
8/15/47 | | | 75 | | | | 65 | (c) | |
Banks 2.8% | | | |
Banco Santander
SA,
3.80%, due
2/23/28 | | | 40 | | | | 36 | | |
Bank of America
Corp.
(3 month
USD LIBOR +
0.37%), 2.74%,
due 1/23/22 | | | 45 | | | | 44 | (d) | |
(3 month USD
LIBOR + 1.07%),
3.97%, due
3/5/29 | | | 40 | | | | 38 | (d) | |
Citigroup, Inc.
(3 month USD
LIBOR + 1.56%),
3.89%, due
1/10/28 | | | 15 | | | | 14 | (d) | |
(3 month USD
LIBOR + 1.15%),
3.52%, due
10/27/28 | | | 20 | | | | 19 | (d) | |
Goldman Sachs
Group, Inc.
2.60%, due
4/23/20 | | | 20 | | | | 20 | | |
(3 month USD
LIBOR + 1.51%),
3.69%, due
6/5/28 | | | 40 | | | | 38 | (d) | |
(3 month USD
LIBOR + 1.16%),
3.81%, due
4/23/29 | | | 75 | | | | 70 | (d) | |
(3 month USD
LIBOR + 1.37%),
4.02%, due
10/31/38 | | | 35 | | | | 31 | (d) | |
5.15%, due
5/22/45 | | | 30 | | | | 29 | | |
| | | Principal
Amount
(000's
omitted) | | Value
(000's
omitted) | |
HSBC Holdings
PLC, (5 year
USD ICE Swap +
3.75%), 6.00%,
due 5/22/27 | | $ | 65 | | | $ | 60 | (d)(e) | |
JPMorgan
Chase & Co.
(3 month USD
LIBOR + 1.12%),
4.01%, due
4/23/29 | | | 60 | | | | 58 | (d) | |
(3 month USD
LIBOR + 1.36%),
3.88%, due
7/24/38 | | | 30 | | | | 27 | (d) | |
(3 month USD
LIBOR + 1.22%),
3.90%, due
1/23/49 | | | 25 | | | | 22 | (d) | |
Morgan Stanley,
(3 month USD
LIBOR + 1.34%),
3.59%, due
7/22/28 | | | 60 | | | | 56 | (d) | |
Royal Bank of
Scotland Group
PLC, (3 month
USD LIBOR +
1.91%), 5.08%,
due 1/27/30 | | | 20 | | | | 20 | (d) | |
Westpac Banking
Corp., (5 year
USD ICE Swap +
2.89%), 5.00%,
due 9/21/27 | | | 65 | | | | 57 | (d)(e) | |
| | | | 639 | | |
Beverages 0.4% | | | |
Anheuser-Busch
InBev Finance,
Inc., 4.70%,
due 2/1/36 | | | 20 | | | | 19 | | |
Anheuser-Busch
InBev
Worldwide, Inc.
4.60%, due
4/15/48 | | | 25 | | | | 22 | | |
4.75%, due
4/15/58 | | | 55 | | | | 49 | | |
| | | | 90 | | |
Computers 0.9% | | | |
Apple, Inc.,
4.65%, due
2/23/46 | | | 35 | | | | 36 | | |
See Notes to Financial Statements
99
Schedule of Investments Multi-Asset Income Fund (cont'd)
| | | Principal
Amount
(000's
omitted) | | Value
(000's
omitted) | |
Diamond 1
Finance Corp./
Diamond 2
Finance Corp.
5.45%, due
6/15/23 | | $ | 65 | | | $ | 67 | (c) | |
6.02%, due
6/15/26 | | | 35 | | | | 36 | (c) | |
HP Enterprise Co.
3.60%, due
10/15/20 | | | 40 | | | | 40 | | |
4.90%, due
10/15/25 | | | 30 | | | | 31 | | |
| | | | 210 | | |
Diversified Financial Services 0.1% | | | |
Synchrony
Financial,
2.70%, due
2/3/20 | | | 20 | | | | 20 | | |
Food 0.2% | | | |
Grupo Bimbo
SAB de CV,
4.70%, due
11/10/47 | | | 55 | | | | 48 | (c) | |
Insurance 0.1% | | | |
AXA Equitable
Holdings, Inc.,
5.00%, due
4/20/48 | | | 35 | | | | 31 | (c) | |
Iron—Steel 0.1% | | | |
Vale Overseas
Ltd., 6.25%,
due 8/10/26 | | | 30 | | | | 32 | | |
Machinery-Diversified 0.1% | | | |
Wabtec Corp.,
4.15%, due
3/15/24 | | | 35 | | | | 34 | | |
Media 0.9% | | | |
Charter
Communications
Operating
LLC/Charter
Communications
Operating
Capital
4.91%, due
7/23/25 | | | 55 | | | | 55 | | |
5.38%, due
5/1/47 | | | 15 | | | | 14 | | |
5.75%, due
4/1/48 | | | 20 | | | | 19 | | |
Comcast Corp. | |
3.70%, due
4/15/24 | | | 35 | | | | 35 | | |
4.00%, due
8/15/47 | | | 40 | | | | 35 | | |
| | | Principal
Amount
(000's
omitted) | | Value
(000's
omitted) | |
4.95%, due
10/15/58 | | $ | 45 | | | $ | 44 | | |
| | | | 202 | | |
Miscellaneous Manufacturers 0.6% | | | |
General Electric
Co., Ser. D,
(3 month USD
LIBOR + 3.33%),
5.00%, due
1/21/21 | | | 145 | | | | 134 | (d)(e) | |
Oil & Gas 0.3% | | | |
Concho
Resources,
Inc., 4.88%,
due 10/1/47 | | | 25 | | | | 24 | | |
Marathon Oil
Corp., 4.40%,
due 7/15/27 | | | 15 | | | | 15 | | |
Petroleos
Mexicanos,
6.50%, due
3/13/27 | | | 25 | | | | 24 | | |
| | | | 63 | | |
Pharmaceuticals 0.9% | | | |
AbbVie, Inc.,
4.70%, due
5/14/45 | | | 40 | | | | 36 | | |
CVS Health
Corp.4.30%,
due 3/25/28 | | | 35 | | | | 34 | | |
5.05%, due
3/25/48 | | | 90 | | | | 88 | | |
Shire
Acquisitions
Investments
Ireland DAC,
2.40%, due
9/23/21 | | | 45 | | | | 43 | | |
| | | | 201 | | |
Pipelines 1.0% | | | |
Energy Transfer
Partners L.P.
Ser. B, (3 month
USD LIBOR +
4.16%), 6.63%,
due 2/15/28 | | | 55 | | | | 51 | (d)(e) | |
5.80%, due
6/15/38 | | | 20 | | | | 20 | | |
Kinder Morgan
Energy Partners
L.P., 4.15%,
due 2/1/24 | | | 45 | | | | 45 | | |
Kinder Morgan,
Inc., 5.55%,
due 6/1/45 | | | 50 | | | | 50 | | |
| | | Principal
Amount
(000's
omitted) | | Value
(000's
omitted) | |
MPLX L.P.,
4.70%, due
4/15/48 | | $ | 60 | | | $ | 53 | | |
| | | | 219 | | |
Savings & Loans 0.1% | |
Nationwide
Building Society,
(3 month USD
LIBOR + 1.45%),
4.30%, due
3/8/29 | | | 20 | | | | 19 | (c)(d) | |
Semiconductors 0.5% | |
Broadcom Corp./
Broadcom
Cayman Finance
Ltd., 3.88%,
due 1/15/27 | | | 130 | | | | 119 | | |
Telecommunications 0.6% | |
AT&T, Inc. | |
4.75%, due
5/15/46 | | | 35 | | | | 30 | | |
5.45%, due
3/1/47 | | | 65 | | | | 62 | | |
Vodafone Group
PLC, 3.75%,
due 1/16/24 | | | 55 | | | | 54 | | |
| | | | 146 | | |
Total Corporate Bonds
(Cost $2,401) | | | 2,272 | | |
Mortgage-Backed Securities 15.5% | |
Collateralized Mortgage Obligations 3.3% | |
Fannie Mae
Connecticut
Avenue
Securities
Ser. 2017-C02,
Class 2M2,
(1 month USD
LIBOR + 3.65%),
5.93%, due
9/25/29 | | | 230 | | | | 252(d) | | |
Ser. 2017-C03,
Class 1M2,
(1 month USD
LIBOR + 3.00%),
5.28%, due
10/25/29 | | | 45 | | | | 48 | (d) | |
Ser. 2017-C04,
Class 2M2,
(1 month USD
LIBOR + 2.85%),
5.13%, due
11/25/29 | | | 120 | | | | 126 | (d) | |
See Notes to Financial Statements
100
Schedule of Investments Multi-Asset Income Fund (cont'd)
| | | Principal
Amount
(000's
omitted) | | Value
(000's
omitted) | |
Ser. 2017-C05,
Class 1M2,
(1 month USD
LIBOR + 2.20%),
4.48%, due
1/25/30 | | $ | 35 | | | $ | 36 | (d) | |
Freddie Mac
Multifamily
Structured
Pass-Through
Certificates,
Ser. KI02,
Class A,
(1 month USD
LIBOR + 0.20%),
2.46%, due
2/25/23 | | | 13 | | | | 13 | (d) | |
Freddie Mac
Structured
Agency Credit
Risk Debt Notes,
Ser. 2017-DNA2,
Class M2,
(1 month USD
LIBOR + 3.45%),
5.73%, due
10/25/29 | | | 250 | | | | 273 | (d) | |
| | | | 748 | | |
Fannie Mae 6.2% | | | |
Pass-Through
Certificates | |
3.50%, TBA,
30 Year
Maturity | | | 240 | | | | 234 | (f) | |
4.00%, TBA,
15 Year
Maturity | | | 50 | | | | 51 | (f) | |
4.00%, TBA,
30 Year
Maturity | | | 785 | | | | 785 | (f) | |
4.50%, TBA,
30 Year
Maturity | | | 350 | | | | 358 | (f) | |
| | | | 1,428 | | |
Freddie Mac 5.2% | | | |
Pass-Through
Certificates | |
3.50%, TBA,
30 Year
Maturity | | | 235 | | | | 229 | (f) | |
4.00%, TBA,
30 Year
Maturity | | | 650 | | | | 650 | (f) | |
4.50%, TBA,
30 Year
Maturity | | | 230 | | | | 236 | (f) | |
| | | Principal
Amount
(000's
omitted) | | Value
(000's
omitted) | |
5.00%, TBA,
30 Year
Maturity | | $ | 80 | | | $ | 83 | (f) | |
| | | | 1,198 | | |
Ginnie Mae 0.8% | | | |
Pass-Through
Certificates,
4.50%, TBA,
30 Year
Maturity | | | 165 | | | | 169 | (f) | |
Total Mortgage-Backed
Securities
(Cost $3,510) | | | 3,543 | | |
U.S. Treasury Obligations 13.2% | | | |
U.S. Treasury Bill,
2.03%, due
11/23/18 | | | 100 | | | | 100 | (g)(h) | |
U.S. Treasury
Bonds | |
5.38%, due
2/15/31 | | | 100 | | | | 122 | | |
4.50%, due
2/15/36 | | | 121 | | | | 141 | | |
3.88%, due
8/15/40 | | | 171 | | | | 185 | | |
U.S. Treasury
Inflation-Indexed
Bonds(i) | |
2.00%, due
1/15/26 | | | 582 | | | | 618 | (h) | |
1.75%, due
1/15/28 | | | 12 | | | | 13 | | |
3.63%, due
4/15/28 | | | 78 | | | | 95 | | |
3.88%, due
4/15/29 | | | 152 | | | | 192 | (h) | |
3.38%, due
4/15/32 | | | 21 | | | | 27 | | |
1.00%, due
2/15/46 | | | 101 | | | | 94 | | |
U.S. Treasury
Notes | |
0.88%, due
7/31/19 | | | 850 | | | | 839 | | |
2.13%, due
12/31/21 | | | 150 | | | | 146 | | |
2.38%, due
8/15/24 | | | 40 | | | | 39 | | |
1.63%, due
2/15/26 | | | 30 | | | | 27 | | |
2.25% , due
11/15/27-8/15/46 | | | 415 | | | | 383 | | |
Total U.S. Treasury
Obligations
(Cost $3,128) | | | 3,021 | | |
| | | Principal
Amount
(000's
omitted) | | Value
(000's
omitted) | |
U.S. Government Agency Securities 0.5% | |
Federal Home
Loan Bank,
5.50%, due
7/15/36
(Cost $134) | | $ | 95 | | | $ | 118 | | |
Asset-Backed Securities 1.8% | |
Ally Auto
Receivables
Trust, Ser.
2017-3,
Class A2,
1.53%, due
3/16/20 | | | 5 | | | | 5 | | |
Bear Stearns
Asset Backed
Securities Trust,
Ser. 2006-SD2,
Class M2,
(1 month USD
LIBOR + 0.80%),
3.08%, due
6/25/36 | | | 170 | | | | 169 | (d) | |
Capital One
Multi-Asset
Execution Trust,
Ser. 2016-A1,
Class A1,
(1 month
LIBOR + 0.45%),
2.73%, due
2/15/22 | | | 20 | | | | 20 | (d) | |
Toyota Auto
Receivables
Owner Trust,
Ser. 2017-B,
Class A2A,
1.46%, due
1/15/20 | | | 12 | | | | 12 | | |
Verizon Owner
Trust, Ser.
2017-1A,
Class A,
2.06%, due
9/20/21 | | | 200 | | | | 198 | (c) | |
Total Asset-Backed
Securities
(Cost $391) | | | 404 | | |
| | | Number
of Shares | | | |
Exchange-Traded Funds 3.0% | |
SPDR Bloomberg
Barclays
Short Term High
Yield Bond ETF
(Cost $689) | | | 25,155 | | | | 680 | | |
See Notes to Financial Statements
101
Schedule of Investments Multi-Asset Income Fund (cont'd)
| | | Number
of Shares | | Value
(000's
omitted) | |
Master Limited Partnerships 3.4% | |
Hotels, Restaurants & Leisure 0.4% | |
Cedar Fair LP | | | 1,600 | | | $ | 82 | | |
Oil, Gas & Consumable Fuels 3.0% | |
Antero
Midstream
Partners LP | | | 2,300 | | | | 69 | | |
Dominion Energy
Midstream
Partners LP | | | 3,975 | | | | 72 | | |
Energy Transfer
Equity LP | | | 9,560 | | | | 149 | | |
Enterprise
Products
Partners LP | | | 5,100 | | | | 137 | | |
EQT GP
Holdings LP | | | 2,200 | | | | 35 | | |
EQT Midstream
Partners LP | | | 1,725 | | | | 79 | | |
NuStar Energy LP | | | 900 | | | | 21 | | |
Western Gas
Equity Partners
LP | | | 4,450 | | | | 128 | | |
| | | | 690 | | |
Total Master Limited
Partnerships
(Cost $952) | | | 772 | | |
| | | Number
of Shares | | Value
(000's
omitted) | |
| Investment Companies(j) 20.8% | |
Neuberger
Berman
Emerging
Markets Debt
Fund
Institutional
Class | | | 183,733 | | | $ | 1,475 | (k) | |
Neuberger
Berman
Floating
Rate Income
Fund
Institutional
Class | | | 93,067 | | | | 917 | (k) | |
Neuberger
Berman High
Income Bond
Fund Class R6 | | | 229,178 | | | | 1,916 | (k) | |
Neuberger
Berman Long
Short Credit
Fund Class R6 | | | 51,167 | | | | 468 | (k) | |
Total Investment
Companies
(Cost $4,981) | | | 4,776 | | |
Total Options
Purchased(l) 0.0%(a)
(Cost $4) | | | 2 | | |
| | | Number
of Shares | | Value
(000's
omitted) | |
Short-Term Investments 4.5% | |
Investment Companies 4.5% | |
State Street
Institutional U.S.
Government
Money Market
Fund Premier
Class, 2.09%(m)
(Cost $1,026) | | | 1,026,118 | | | $ | 1,026 | (k) | |
Total
Investments 111.5%
(Cost $25,912) | | | 25,539 | | |
Liabilities Less Other
Assets (11.5)% | | | | | (2,641 | )(n) | |
Net Assets 100.0% | | $ | 22,898 | | |
* Non-income producing security.
(a) Represents less than 0.05% of net assets.
(b) Security exempt from registration pursuant to Regulation S under the Securities Act of 1933, as amended. Regulation S applies to securities offerings that are made outside of the United States and do not involve direct selling efforts in the United States and as such may have restrictions on resale. Total value of all such securities at October 31, 2018 amounted to approximately $55,000, which represents 0.2% of net assets of the Fund.
(c) Securities were purchased under Rule 144A of the Securities Act of 1933, as amended, or are otherwise restricted and, unless registered under the Securities Act of 1933 or exempted from registration, may only be sold to qualified institutional investors or may have other restrictions on resale. At October 31, 2018, these securities amounted to approximately $636,000, which represents 2.8% of net assets of the Fund. These securities have been deemed by the investment manager to be liquid.
(d) Variable or floating rate security. The interest rate shown was the current rate as of October 31, 2018 and changes periodically.
Benchmarks for Variable/Floating Rates:
ICE = Intercontinental Exchange
LIBOR = London Interbank Offered Rate
(e) Perpetual Bond Security. The rate reflected was the rate in effect on October 31, 2018. The maturity date reflects the next call date.
See Notes to Financial Statements
102
Schedule of Investments Multi-Asset Income Fund (cont'd)
(f) TBA (To Be Announced) Securities are purchased/sold on a forward commitment basis with an approximate principal amount and no defined maturity date. The actual principal and maturity date will be determined upon settlement when the specific mortgage pools are assigned. Total value of all such securities (excluding forward sales contracts, if any) at October 31, 2018 amounted to approximately $2,795,000, which represents 12.2% of net assets of the Fund.
(g) Rate shown was the discount rate at the date of purchase.
(h) All or a portion of the security is pledged as collateral for futures and/or options written.
(i) Index-linked bond whose principal amount adjusts according to a government retail price index.
(j) Affiliated company as defined under the Investment Company Act of 1940, as amended (see Note F of Notes to Financial Statements).
(k) All or a portion of this security is segregated in connection with obligations for to be announced securities, futures, forward foreign currency contracts, options written and/or swaps with a total value of approximately $5,800,000.
(l) See "Purchased option contracts" under Derivative Instruments.
(m) Represents 7-day effective yield as of October 31, 2018.
(n) Includes the impact of the Fund's open positions in derivatives at October 31, 2018.
Derivative Instruments
Futures contracts ("futures")
At October 31, 2018, open positions in futures for the Fund were as follows:
Long Futures:
Expiration
Date | | Number of
Contracts | | Open Contracts | | Notional
Amount | | Value and
Unrealized
Appreciation/
(Depreciation) | |
11/2018 | | | 2 | | | HSCEI Index | | $ | 129,215 | | | $ | (179 | ) | |
11/2018 | | | 2 | | | IBEX 35 Index | | | 201,304 | | | | (2,754 | ) | |
12/2018 | | | 5 | | | Euro-Bund | | | 907,593 | | | | 4,575 | | |
12/2018 | | | 1 | | | Euro-OAT | | | 172,118 | | | | 1,319 | | |
12/2018 | | | 6 | | | Euro STOXX 50 Index | | | 217,061 | | | | (12,765 | ) | |
12/2018 | | | 25 | | | MSCI Emerging Markets Index | | | 1,195,875 | | | | (92,223 | ) | |
12/2018 | | | 5 | | | S&P 500 E-Mini Index | | | 677,775 | | | | (27,152 | ) | |
12/2018 | | | 3 | | | Topix Index | | | 436,301 | | | | (9,305 | ) | |
12/2018 | | | 1 | | | U.S. Treasury Ultra Long Bond | | | 125,109 | | | | (672 | ) | |
12/2018 | | | 14 | | | U.S. Treasury Note, 10 Year | | | 1,658,125 | | | | (25,154 | ) | |
12/2018 | | | 14 | | | U.S. Treasury Note, 2 Year | | | 2,949,188 | | | | (8,265 | ) | |
12/2018 | | | 12 | | | U.S. Treasury Note, 5 Year | | | 1,348,594 | | | | (10,968 | ) | |
Total Long Positions | | | | | | $ | 10,018,258 | | | $ | (183,543 | ) | |
See Notes to Financial Statements
103
Schedule of Investments Multi-Asset Income Fund (cont'd)
Short Futures:
Expiration
Date | | Number of
Contracts | | Open Contracts | | Notional
Amount | | Value and
Unrealized
Appreciation/
(Depreciation) | |
12/2018 | | | 4 | | | Euro-Bund | | $ | (726,074 | ) | | $ | 489 | | |
12/2018 | | | 2 | | | Euro-OAT | | | (344,235 | ) | | | 74 | | |
12/2018 | | | 2 | | | FTSE100 Index | | | (181,786 | ) | | | 9,344 | | |
12/2018 | | | 3 | | | Mini-DAX Index | | | (194,660 | ) | | | 11,867 | | |
12/2018 | | | 3 | | | MSCI World Index | | | (174,300 | ) | | | 12,990 | | |
12/2018 | | | 1 | | | United Kingsom Long Gilt Bond | | | (156,465 | ) | | | (1,994 | ) | |
12/2018 | | | 15 | | | U.S. Treasury Long Bond | | | (2,071,875 | ) | | | 78,035 | | |
12/2018 | | | 3 | | | U.S. Treasury Note, 10 Year | | | (355,313 | ) | | | 5,358 | | |
12/2018 | | | 5 | | | U.S. Treasury Ultra Long Bond | | | (746,094 | ) | | | 39,948 | | |
Total Short Positions | | | | | | $ | (4,950,802 | ) | | $ | 156,111 | | |
Total Futures | | | | | | | | $ | (27,432 | ) | |
At October 31, 2018, the Fund had $317,279 deposited in a segregated account to cover margin requirements on open futures. The Fund had securities pledged in the amount of $99,868 to cover collateral requirements on open futures.
For the year ended October 31, 2018, the average notional value of futures for the Fund was $7,499,663 for long positions and $(4,908,498) for short positions.
Forward foreign currency contracts ("forward contracts")
At October 31, 2018, open forward contracts for the Fund were as follows:
Currency Purchased | | Currency Sold | | Counterparty | | Settlement
Date | | Net
Unrealized
Appreciation/
(Depreciation) | |
| | 501,582 | | | AUD | | | 355,511 | | | USD | | Citibank, N.A. | | 1/17/2019 | | $ | 4 | | |
| | 170,264 | | | AUD | | | 120,680 | | | USD | | Citibank, N.A. | | 1/17/2019 | | | 1 | | |
| | 377,589 | | | USD | | | 531,154 | | | AUD | | Royal Bank of Canada | | 1/17/2019 | | | 1,113 | | |
| | 40,590 | | | USD | | | 57,193 | | | AUD | | Royal Bank of Canada | | 1/17/2019 | | | 52 | | |
| | 227,873 | | | USD | | | 320,428 | | | AUD | | Standard Chartered Bank | | 1/17/2019 | | | 757 | | |
| | 14,268 | | | USD | | | 20,063 | | | AUD | | Standard Chartered Bank | | 1/17/2019 | | | 47 | | |
| | 70,785 | | | USD | | | 99,546 | | | AUD | | State Street Bank and Trust Company | | 1/17/2019 | | | 228 | | |
| | 25,663 | | | USD | | | 36,090 | | | AUD | | State Street Bank and Trust Company | | 1/17/2019 | | | 83 | | |
| | 323,460 | | | USD | | | 423,008 | | | CAD | | Citibank, N.A. | | 1/17/2019 | | | 1,615 | | |
| | 81,779 | | | USD | | | 105,855 | | | CAD | | Citibank, N.A. | | 1/17/2019 | | | 1,239 | | |
| | 505,178 | | | USD | | | 653,518 | | | CAD | | Goldman Sachs International | | 1/17/2019 | | | 7,949 | | |
| | 80,542 | | | USD | | | 104,207 | | | CAD | | Goldman Sachs International | | 1/17/2019 | | | 1,256 | | |
| | 555,630 | | | USD | | | 719,158 | | | CAD | | JPMorgan Chase Bank N.A. | | 1/17/2019 | | | 8,459 | | |
| | 96,215 | | | USD | | | 124,401 | | | CAD | | Royal Bank of Canada | | 1/17/2019 | | | 1,565 | | |
| | 44,758 | | | USD | | | 58,130 | | | CAD | | Royal Bank of Canada | | 1/17/2019 | | | 530 | | |
| | 153,905 | | | USD | | | 201,650 | | | CAD | | Royal Bank of Canada | | 1/17/2019 | | | 480 | | |
| | 135,127 | | | USD | | | 174,650 | | | CAD | | Standard Chartered Bank | | 1/17/2019 | | | 2,244 | | |
See Notes to Financial Statements
104
Schedule of Investments Multi-Asset Income Fund (cont'd)
Currency Purchased | | Currency Sold | | Counterparty | | Settlement
Date | | Net
Unrealized
Appreciation/
(Depreciation) | |
| | 548,377 | | | USD | | | 709,051 | | | CAD | | State Street Bank and Trust Company | | 1/17/2019 | | $ | 8,895 | | |
| | 40,202 | | | USD | | | 52,641 | | | CAD | | State Street Bank and Trust Company | | 1/17/2019 | | | 150 | | |
| | 223,483 | | | USD | | | 219,923 | | | CHF | | Citibank, N.A. | | 1/17/2019 | | | 3,374 | | |
| | 63,924 | | | USD | | | 62,906 | | | CHF | | Citibank, N.A. | | 1/17/2019 | | | 965 | | |
| | 15,061 | | | USD | | | 14,835 | | | CHF | | Goldman Sachs International | | 1/17/2019 | | | 214 | | |
| | 77,841 | | | USD | | | 76,554 | | | CHF | | JPMorgan Chase Bank N.A. | | 1/17/2019 | | | 1,222 | | |
| | 55,953 | | | USD | | | 55,028 | | | CHF | | JPMorgan Chase Bank N.A. | | 1/17/2019 | | | 878 | | |
| | 498,648 | | | USD | | | 490,480 | | | CHF | | Royal Bank of Canada | | 1/17/2019 | | | 7,753 | | |
| | 511,996 | | | USD | | | 503,256 | | | CHF | | Societe Generale | | 1/17/2019 | | | 8,314 | | |
| | 279,149 | | | USD | | | 274,395 | | | CHF | | Standard Chartered Bank | | 1/17/2019 | | | 4,522 | | |
| | 175,546 | | | USD | | | 172,650 | | | CHF | | State Street Bank and Trust Company | | 1/17/2019 | | | 2,750 | | |
| | 14,890 | | | USD | | | 14,744 | | | CHF | | State Street Bank and Trust Company | | 1/17/2019 | | | 133 | | |
| | 387,296 | | | USD | | | 334,629 | | | EUR | | Citibank, N.A. | | 1/17/2019 | | | 5,578 | | |
| | 189,737 | | | USD | | | 163,510 | | | EUR | | Citibank, N.A. | | 1/17/2019 | | | 3,218 | | |
| | 62,801 | | | USD | | | 54,393 | | | EUR | | Citibank, N.A. | | 1/17/2019 | | | 754 | | |
| | 602,927 | | | USD | | | 520,617 | | | EUR | | Goldman Sachs International | | 1/17/2019 | | | 9,048 | | |
| | 213,260 | | | USD | | | 183,751 | | | EUR | | Goldman Sachs International | | 1/17/2019 | | | 3,652 | | |
| | 169,658 | | | USD | | | 146,497 | | | EUR | | Goldman Sachs International | | 1/17/2019 | | | 2,546 | | |
| | 49,002 | | | USD | | | 42,813 | | | EUR | | Goldman Sachs International | | 1/17/2019 | | | 164 | | |
| | 97,747 | | | USD | | | 83,674 | | | EUR | | Royal Bank of Canada | | 1/17/2019 | | | 2,298 | | |
| | 41,561 | | | USD | | | 36,433 | | | EUR | | Royal Bank of Canada | | 1/17/2019 | | | 2 | | |
| | 10,460 | | | USD | | | 9,024 | | | EUR | | Societe Generale | | 1/17/2019 | | | 166 | | |
| | 2,355,242 | | | USD | | | 2,032,791 | | | EUR | | State Street Bank and Trust Company | | 1/17/2019 | | | 36,396 | | |
| | 15,804 | | | USD | | | 13,794 | | | EUR | | State Street Bank and Trust Company | | 1/17/2019 | | | 68 | | |
| | 172,050 | | | GBP | | | 220,086 | | | USD | | Royal Bank of Canada | | 1/17/2019 | | | 727 | | |
| | 12,589 | | | GBP | | | 16,143 | | | USD | | Royal Bank of Canada | | 1/17/2019 | | | 14 | | |
| | 177,035 | | | USD | | | 134,476 | | | GBP | | Citibank, N.A. | | 1/17/2019 | | | 4,445 | | |
| | 154,445 | | | USD | | | 118,515 | | | GBP | | Citibank, N.A. | | 1/17/2019 | | | 2,340 | | |
| | 81,282 | | | USD | | | 61,742 | | | GBP | | Citibank, N.A. | | 1/17/2019 | | | 2,041 | | |
| | 251,008 | | | USD | | | 190,106 | | | GBP | | Goldman Sachs International | | 1/17/2019 | | | 7,021 | | |
| | 176,359 | | | USD | | | 133,969 | | | GBP | | Goldman Sachs International | | 1/17/2019 | | | 4,420 | | |
| | 129,269 | | | USD | | | 98,497 | | | GBP | | Goldman Sachs International | | 1/17/2019 | | | 2,856 | | |
| | 205,934 | | | USD | | | 155,774 | | | GBP | | Standard Chartered Bank | | 1/17/2019 | | | 6,009 | | |
| | 176,573 | | | USD | | | 133,565 | | | GBP | | Standard Chartered Bank | | 1/17/2019 | | | 5,153 | | |
| | 833,953 | | | USD | | | 631,104 | | | GBP | | State Street Bank and Trust Company | | 1/17/2019 | | | 23,979 | | |
| | 224,126 | | | USD | | | 169,610 | | | GBP | | State Street Bank and Trust Company | | 1/17/2019 | | | 6,444 | | |
| | 42,638,255 | | | JPY | | | 379,601 | | | USD | | Citibank, N.A. | | 1/17/2019 | | | 837 | | |
| | 43,097,207 | | | JPY | | | 383,946 | | | USD | | Royal Bank of Canada | | 1/17/2019 | | | 587 | | |
| | 57,356,420 | | | JPY | | | 510,995 | | | USD | | Standard Chartered Bank | | 1/17/2019 | | | 765 | | |
| | 34,465,737 | | | JPY | | | 306,954 | | | USD | | State Street Bank and Trust Company | | 1/17/2019 | | | 565 | | |
| | 143,254 | | | USD | | | 16,006,579 | | | JPY | | Citibank, N.A. | | 1/17/2019 | | | 436 | | |
| | 107,090 | | | USD | | | 11,967,329 | | | JPY | | Citibank, N.A. | | 1/17/2019 | | | 312 | | |
| | 165,602 | | | USD | | | 18,357,690 | | | JPY | | Royal Bank of Canada | | 1/17/2019 | | | 1,806 | | |
See Notes to Financial Statements
105
Schedule of Investments Multi-Asset Income Fund (cont'd)
Currency Purchased | | Currency Sold | | Counterparty | | Settlement
Date | | Net
Unrealized
Appreciation/
(Depreciation) | |
| | 75,460 | | | USD | | | 8,454,577 | | | JPY | | Royal Bank of Canada | | 1/17/2019 | | $ | 25 | | |
| | 185,734 | | | USD | | | 20,754,993 | | | JPY | | State Street Bank and Trust Company | | 1/17/2019 | | | 549 | | |
| | 51,956 | | | USD | | | 999,944 | | | MXN | | Citibank, N.A. | | 1/17/2019 | | | 3,315 | | |
| | 289,838 | | | USD | | | 2,387,711 | | | NOK | | Citibank, N.A. | | 1/17/2019 | | | 5,558 | | |
| | 89,279 | | | USD | | | 730,253 | | | NOK | | Goldman Sachs International | | 1/17/2019 | | | 2,336 | | |
| | 15,521 | | | USD | | | 129,835 | | | NOK | | Goldman Sachs International | | 1/17/2019 | | | 63 | | |
| | 588,303 | | | USD | | | 4,845,559 | | | NOK | | JPMorgan Chase Bank N.A. | | 1/17/2019 | | | 11,394 | | |
| | 114,567 | | | USD | | | 930,103 | | | NOK | | Royal Bank of Canada | | 1/17/2019 | | | 3,829 | | |
| | 273,044 | | | USD | | | 2,236,421 | | | NOK | | Standard Chartered Bank | | 1/17/2019 | | | 6,777 | | |
| | 68,042 | | | USD | | | 557,316 | | | NOK | | Standard Chartered Bank | | 1/17/2019 | | | 1,689 | | |
| | 40,655 | | | USD | | | 333,284 | | | NOK | | State Street Bank and Trust Company | | 1/17/2019 | | | 974 | | |
| | 12,024 | | | USD | | | 100,156 | | | NOK | | State Street Bank and Trust Company | | 1/17/2019 | | | 100 | | |
| | 945,674 | | | NZD | | | 610,546 | | | USD | | Citibank, N.A. | | 1/17/2019 | | | 7,086 | | |
| | 1,425,280 | | | NZD | | | 921,109 | | | USD | | Goldman Sachs International | | 1/17/2019 | | | 9,761 | | |
| | 352,107 | | | NZD | | | 227,554 | | | USD | | Goldman Sachs International | | 1/17/2019 | | | 2,411 | | |
| | 192,998 | | | NZD | | | 124,339 | | | USD | | Goldman Sachs International | | 1/17/2019 | | | 1,711 | | |
| | 135,549 | | | NZD | | | 87,708 | | | USD | | State Street Bank and Trust Company | | 1/17/2019 | | | 821 | | |
| | 168,669 | | | USD | | | 256,920 | | | NZD | | Citibank, N.A. | | 1/17/2019 | | | 871 | | |
| | 237,844 | | | USD | | | 361,963 | | | NZD | | Goldman Sachs International | | 1/17/2019 | | | 1,441 | | |
| | 15,528 | | | USD | | | 23,644 | | | NZD | | Goldman Sachs International | | 1/17/2019 | | | 86 | | |
| | 199,949 | | | USD | | | 305,154 | | | NZD | | Royal Bank of Canada | | 1/17/2019 | | | 649 | | |
| | 50,953 | | | USD | | | 77,925 | | | NZD | | Royal Bank of Canada | | 1/17/2019 | | | 59 | | |
| | 193,721 | | | SEK | | | 21,319 | | | USD | | Royal Bank of Canada | | 1/17/2019 | | | 10 | | |
| | 200,974 | | | USD | | | 1,797,287 | | | SEK | | Citibank, N.A. | | 1/17/2019 | | | 3,084 | | |
| | 534,636 | | | USD | | | 4,831,024 | | | SEK | | Citibank, N.A. | | 1/17/2019 | | | 2,717 | | |
| | 85,054 | | | USD | | | 769,737 | | | SEK | | Citibank, N.A. | | 1/17/2019 | | | 302 | | |
| | 924,792 | | | USD | | | 8,355,958 | | | SEK | | Goldman Sachs International | | 1/17/2019 | | | 4,760 | | |
| | 536,689 | | | USD | | | 4,849,252 | | | SEK | | Goldman Sachs International | | 1/17/2019 | | | 2,762 | | |
| | 116,759 | | | USD | | | 1,037,497 | | | SEK | | Goldman Sachs International | | 1/17/2019 | | | 2,526 | | |
| | 66,426 | | | USD | | | 600,029 | | | SEK | | JPMorgan Chase Bank N.A. | | 1/17/2019 | | | 360 | | |
| | 98,772 | | | USD | | | 889,331 | | | SEK | | Societe Generale | | 1/17/2019 | | | 852 | | |
Total unrealized appreciation | | | | | | | | | | | | $ | 280,317 | | |
| | 185,378 | | | AUD | | | 131,583 | | | USD | | Goldman Sachs International | | 1/17/2019 | | | (189 | ) | |
| | 1,033,769 | | | AUD | | | 733,656 | | | USD | | Goldman Sachs International | | 1/17/2019 | | | (931 | ) | |
| | 1,072,167 | | | AUD | | | 760,906 | | | USD | | Goldman Sachs International | | 1/17/2019 | | | (966 | ) | |
| | 462,760 | | | AUD | | | 330,912 | | | USD | | Goldman Sachs International | | 1/17/2019 | | | (2,913 | ) | |
| | 115,029 | | | AUD | | | 81,794 | | | USD | | Societe Generale | | 1/17/2019 | | | (263 | ) | |
| | 18,793 | | | AUD | | | 13,324 | | | USD | | State Street Bank and Trust Company | | 1/17/2019 | | | (3 | ) | |
| | 27,165 | | | AUD | | | 19,302 | | | USD | | State Street Bank and Trust Company | | 1/17/2019 | | | (48 | ) | |
| | 148,361 | | | USD | | | 209,653 | | | AUD | | Citibank, N.A. | | 1/17/2019 | | | (239 | ) | |
| | 295,188 | | | USD | | | 416,974 | | | AUD | | Citibank, N.A. | | 1/17/2019 | | | (359 | ) | |
| | 160,264 | | | USD | | | 226,121 | | | AUD | | JPMorgan Chase Bank N.A. | | 1/17/2019 | | | (8 | ) | |
| | 697,871 | | | USD | | | 984,643 | | | AUD | | JPMorgan Chase Bank N.A. | | 1/17/2019 | | | (34 | ) | |
See Notes to Financial Statements
106
Schedule of Investments Multi-Asset Income Fund (cont'd)
Currency Purchased | | Currency Sold | | Counterparty | | Settlement
Date | | Net
Unrealized
Appreciation/
(Depreciation) | |
| | 12,181 | | | USD | | | 17,210 | | | AUD | | State Street Bank and Trust Company | | 1/17/2019 | | $ | (17 | ) | |
| | 32,620 | | | CAD | | | 25,120 | | | USD | | Citibank, N.A. | | 1/17/2019 | | | (301 | ) | |
| | 247,334 | | | CAD | | | 189,358 | | | USD | | Citibank, N.A. | | 1/17/2019 | | | (1,174 | ) | |
| | 746,472 | | | CAD | | | 576,693 | | | USD | | Citibank, N.A. | | 1/17/2019 | | | (8,740 | ) | |
| | 194,403 | | | CAD | | | 149,492 | | | USD | | Goldman Sachs International | | 1/17/2019 | | | (1,580 | ) | |
| | 287,822 | | | CAD | | | 222,490 | | | USD | | Goldman Sachs International | | 1/17/2019 | | | (3,501 | ) | |
| | 208,794 | | | CAD | | | 161,317 | | | USD | | JPMorgan Chase Bank N.A. | | 1/17/2019 | | | (2,456 | ) | |
| | 688,453 | | | CAD | | | 532,616 | | | USD | | Societe Generale | | 1/17/2019 | | | (8,807 | ) | |
| | 103,485 | | | CAD | | | 80,066 | | | USD | | Standard Chartered Bank | | 1/17/2019 | | | (1,330 | ) | |
| | 22,457 | | | CAD | | | 17,158 | | | USD | | State Street Bank and Trust Company | | 1/17/2019 | | | (71 | ) | |
| | 211,539 | | | CAD | | | 163,603 | | | USD | | State Street Bank and Trust Company | | 1/17/2019 | | | (2,654 | ) | |
| | 18,656 | | | CHF | | | 18,785 | | | USD | | Citibank, N.A. | | 1/17/2019 | | | (114 | ) | |
| | 187,004 | | | CHF | | | 189,843 | | | USD | | Citibank, N.A. | | 1/17/2019 | | | (2,681 | ) | |
| | 12,055 | | | CHF | | | 12,268 | | | USD | | Goldman Sachs International | | 1/17/2019 | | | (203 | ) | |
| | 123,565 | | | CHF | | | 125,754 | | | USD | | Goldman Sachs International | | 1/17/2019 | | | (2,085 | ) | |
| | 576,034 | | | CHF | | | 586,223 | | | USD | | Goldman Sachs International | | 1/17/2019 | | | (9,701 | ) | |
| | 120,164 | | | CHF | | | 123,011 | | | USD | | Royal Bank of Canada | | 1/17/2019 | | | (2,745 | ) | |
| | 188,640 | | | CHF | | | 191,908 | | | USD | | Standard Chartered Bank | | 1/17/2019 | | | (3,109 | ) | |
| | 19,136 | | | CHF | | | 19,291 | | | USD | | State Street Bank and Trust Company | | 1/17/2019 | | | (139 | ) | |
| | 289,063 | | | CHF | | | 293,911 | | | USD | | State Street Bank and Trust Company | | 1/17/2019 | | | (4,604 | ) | |
| | 158,306 | | | EUR | | | 181,807 | | | USD | | Citibank, N.A. | | 1/17/2019 | | | (1,224 | ) | |
| | 262,653 | | | EUR | | | 300,960 | | | USD | | Citibank, N.A. | | 1/17/2019 | | | (1,346 | ) | |
| | 102,862 | | | EUR | | | 118,825 | | | USD | | Citibank, N.A. | | 1/17/2019 | | | (1,488 | ) | |
| | 249,630 | | | EUR | | | 288,919 | | | USD | | Citibank, N.A. | | 1/17/2019 | | | (4,161 | ) | |
| | 168,572 | | | EUR | | | 196,504 | | | USD | | Citibank, N.A. | | 1/17/2019 | | | (4,211 | ) | |
| | 32,217 | | | EUR | | | 37,319 | | | USD | | Goldman Sachs International | | 1/17/2019 | | | (568 | ) | |
| | 283,252 | | | EUR | | | 327,553 | | | USD | | JPMorgan Chase Bank N.A. | | 1/17/2019 | | | (4,441 | ) | |
| | 1,451,664 | | | EUR | | | 1,678,704 | | | USD | | JPMorgan Chase Bank N.A. | | 1/17/2019 | | | (22,761 | ) | |
| | 198,446 | | | EUR | | | 226,911 | | | USD | | Royal Bank of Canada | | 1/17/2019 | | | (539 | ) | |
| | 114,038 | | | EUR | | | 132,096 | | | USD | | Royal Bank of Canada | | 1/17/2019 | | | (2,011 | ) | |
| | 53,345 | | | EUR | | | 61,838 | | | USD | | Standard Chartered Bank | | 1/17/2019 | | | (986 | ) | |
| | 214,314 | | | EUR | | | 248,434 | | | USD | | Standard Chartered Bank | | 1/17/2019 | | | (3,962 | ) | |
| | 17,212 | | | EUR | | | 19,911 | | | USD | | State Street Bank and Trust Company | | 1/17/2019 | | | (276 | ) | |
| | 69,642 | | | EUR | | | 79,907 | | | USD | | State Street Bank and Trust Company | | 1/17/2019 | | | (465 | ) | |
| | 296,135 | | | EUR | | | 343,109 | | | USD | | State Street Bank and Trust Company | | 1/17/2019 | | | (5,302 | ) | |
| | 9,166 | | | GBP | | | 11,957 | | | USD | | Citibank, N.A. | | 1/17/2019 | | | (193 | ) | |
| | 212,708 | | | GBP | | | 273,812 | | | USD | | Citibank, N.A. | | 1/17/2019 | | | (817 | ) | |
| | 132,294 | | | GBP | | | 174,668 | | | USD | | Goldman Sachs International | | 1/17/2019 | | | (4,878 | ) | |
| | 348,990 | | | GBP | | | 460,772 | | | USD | | Goldman Sachs International | | 1/17/2019 | | | (12,869 | ) | |
| | 42,294 | | | GBP | | | 55,668 | | | USD | | JPMorgan Chase Bank N.A. | | 1/17/2019 | | | (1,387 | ) | |
| | 697,411 | | | GBP | | | 917,939 | | | USD | | JPMorgan Chase Bank N.A. | | 1/17/2019 | | | (22,865 | ) | |
| | 250,977 | | | GBP | | | 331,712 | | | USD | | Royal Bank of Canada | | 1/17/2019 | | | (9,602 | ) | |
| | 103,937 | | | GBP | | | 137,425 | | | USD | | Societe Generale | | 1/17/2019 | | | (4,030 | ) | |
See Notes to Financial Statements
107
Schedule of Investments Multi-Asset Income Fund (cont'd)
Currency Purchased | | Currency Sold | | Counterparty | | Settlement
Date | | Net
Unrealized
Appreciation/
(Depreciation) | |
| | 9,308 | | | GBP | | | 11,985 | | | USD | | State Street Bank and Trust Company | | 1/17/2019 | | $ | (39 | ) | |
| | 15,468 | | | USD | | | 12,104 | | | GBP | | Goldman Sachs International | | 1/17/2019 | | | (66 | ) | |
| | 1,957,058 | | | JPY | | | 17,594 | | | USD | | Citibank, N.A. | | 1/17/2019 | | | (132 | ) | |
| | 10,449,861 | | | JPY | | | 93,722 | | | USD | | Citibank, N.A. | | 1/17/2019 | | | (483 | ) | |
| | 14,061,111 | | | JPY | | | 126,330 | | | USD | | Citibank, N.A. | | 1/17/2019 | | | (870 | ) | |
| | 3,218,525 | | | JPY | | | 28,808 | | | USD | | Goldman Sachs International | | 1/17/2019 | | | (91 | ) | |
| | 21,002,979 | | | JPY | | | 187,541 | | | USD | | Goldman Sachs International | | 1/17/2019 | | | (143 | ) | |
| | 6,884,596 | | | JPY | | | 61,561 | | | USD | | State Street Bank and Trust Company | | 1/17/2019 | | | (133 | ) | |
| | 7,275,467 | | | JPY | | | 65,737 | | | USD | | State Street Bank and Trust Company | | 1/17/2019 | | | (822 | ) | |
| | 32,794 | | | USD | | | 3,683,547 | | | JPY | | Citibank, N.A. | | 1/17/2019 | | | (72 | ) | |
| | 87,673 | | | USD | | | 9,832,746 | | | JPY | | Goldman Sachs International | | 1/17/2019 | | | (60 | ) | |
| | 89,286 | | | USD | | | 10,013,650 | | | JPY | | Goldman Sachs International | | 1/17/2019 | | | (61 | ) | |
| | 367,285 | | | USD | | | 41,192,273 | | | JPY | | Goldman Sachs International | | 1/17/2019 | | | (252 | ) | |
| | 106,029 | | | USD | | | 11,911,893 | | | JPY | | JPMorgan Chase Bank N.A. | | 1/17/2019 | | | (254 | ) | |
| | 258,707 | | | USD | | | 29,064,526 | | | JPY | | JPMorgan Chase Bank N.A. | | 1/17/2019 | | | (620 | ) | |
| | 58,313 | | | USD | | | 6,535,802 | | | JPY | | Royal Bank of Canada | | 1/17/2019 | | | (2 | ) | |
| | 131,401 | | | USD | | | 14,748,487 | | | JPY | | Societe Generale | | 1/17/2019 | | | (192 | ) | |
| | 83,681 | | | USD | | | 9,392,736 | | | JPY | | Standard Chartered Bank | | 1/17/2019 | | | (125 | ) | |
| | 424,220 | | | USD | | | 47,632,682 | | | JPY | | State Street Bank and Trust Company | | 1/17/2019 | | | (781 | ) | |
| | 999,944 | | | MXN | | | 51,789 | | | USD | | Goldman Sachs International | | 1/17/2019 | | | (3,148 | ) | |
| | 361,563 | | | NOK | | | 43,536 | | | USD | | Citibank, N.A. | | 1/17/2019 | | | (489 | ) | |
| | 2,666,547 | | | NOK | | | 323,654 | | | USD | | Citibank, N.A. | | 1/17/2019 | | | (6,176 | ) | |
| | 3,564,005 | | | NOK | | | 432,625 | | | USD | | Citibank, N.A. | | 1/17/2019 | | | (8,296 | ) | |
| | 480,082 | | | NOK | | | 58,250 | | | USD | | Goldman Sachs International | | 1/17/2019 | | | (1,091 | ) | |
| | 727,219 | | | NOK | | | 88,214 | | | USD | | Goldman Sachs International | | 1/17/2019 | | | (1,632 | ) | |
| | 2,147,908 | | | NOK | | | 260,548 | | | USD | | Goldman Sachs International | | 1/17/2019 | | | (4,819 | ) | |
| | 970,604 | | | NOK | | | 117,842 | | | USD | | JPMorgan Chase Bank N.A. | | 1/17/2019 | | | (2,282 | ) | |
| | 151,927 | | | NOK | | | 18,117 | | | USD | | Royal Bank of Canada | | 1/17/2019 | | | (28 | ) | |
| | 684,874 | | | NOK | | | 81,892 | | | USD | | Royal Bank of Canada | | 1/17/2019 | | | (351 | ) | |
| | 1,510,617 | | | NOK | | | 184,249 | | | USD | | Royal Bank of Canada | | 1/17/2019 | | | (4,395 | ) | |
| | 2,030,667 | | | NOK | | | 247,827 | | | USD | | Societe Generale | | 1/17/2019 | | | (6,057 | ) | |
| | 125,727 | | | NOK | | | 15,061 | | | USD | | State Street Bank and Trust Company | | 1/17/2019 | | | (92 | ) | |
| | 1,266,597 | | | NOK | | | 154,503 | | | USD | | State Street Bank and Trust Company | | 1/17/2019 | | | (3,703 | ) | |
| | 20,763 | | | NZD | | | 13,572 | | | USD | | Royal Bank of Canada | | 1/17/2019 | | | (11 | ) | |
| | 31,237 | | | NZD | | | 20,432 | | | USD | | State Street Bank and Trust Company | | 1/17/2019 | | | (31 | ) | |
| | 247,876 | | | USD | | | 383,935 | | | NZD | | Citibank, N.A. | | 1/17/2019 | | | (2,877 | ) | |
| | 132,850 | | | USD | | | 205,786 | | | NZD | | JPMorgan Chase Bank N.A. | | 1/17/2019 | | | (1,551 | ) | |
| | 541,570 | | | USD | | | 838,896 | | | NZD | | JPMorgan Chase Bank N.A. | | 1/17/2019 | | | (6,324 | ) | |
| | 107,833 | | | USD | | | 166,797 | | | NZD | | Royal Bank of Canada | | 1/17/2019 | | | (1,104 | ) | |
| | 366,673 | | | USD | | | 566,486 | | | NZD | | Societe Generale | | 1/17/2019 | | | (3,306 | ) | |
| | 45,667 | | | USD | | | 70,543 | | | NZD | | Standard Chartered Bank | | 1/17/2019 | | | (406 | ) | |
| | 554,680 | | | USD | | | 856,832 | | | NZD | | Standard Chartered Bank | | 1/17/2019 | | | (4,928 | ) | |
| | 16,034 | | | USD | | | 24,610 | | | NZD | | State Street Bank and Trust Company | | 1/17/2019 | | | (39 | ) | |
See Notes to Financial Statements
108
Schedule of Investments Multi-Asset Income Fund (cont'd)
Currency Purchased | | Currency Sold | | Counterparty | | Settlement
Date | | Net
Unrealized
Appreciation/
(Depreciation) | |
| | 349,517 | | | USD | | | 540,161 | | | NZD | | State Street Bank and Trust Company | | 1/17/2019 | | $ | (3,270 | ) | |
| | 949,841 | | | SEK | | | 105,116 | | | USD | | Citibank, N.A. | | 1/17/2019 | | | (534 | ) | |
| | 1,478,454 | | | SEK | | | 165,501 | | | USD | | Citibank, N.A. | | 1/17/2019 | | | (2,716 | ) | |
| | 1,620,592 | | | SEK | | | 179,423 | | | USD | | Goldman Sachs International | | 1/17/2019 | | | (987 | ) | |
| | 151,378 | | | SEK | | | 16,758 | | | USD | | JPMorgan Chase Bank N.A. | | 1/17/2019 | | | (91 | ) | |
| | 831,580 | | | SEK | | | 93,582 | | | USD | | Royal Bank of Canada | | 1/17/2019 | | | (2,021 | ) | |
| | 3,440,601 | | | SEK | | | 381,852 | | | USD | | Royal Bank of Canada | | 1/17/2019 | | | (3,025 | ) | |
| | 1,313,544 | | | SEK | | | 145,874 | | | USD | | Standard Chartered Bank | | 1/17/2019 | | | (1,246 | ) | |
| | 1,946,597 | | | SEK | | | 216,177 | | | USD | | Standard Chartered Bank | | 1/17/2019 | | | (1,847 | ) | |
| | 2,789,507 | | | SEK | | | 309,678 | | | USD | | State Street Bank and Trust Company | | 1/17/2019 | | | (2,540 | ) | |
| | 17,448,826 | | | SEK | | | 1,937,087 | | | USD | | State Street Bank and Trust Company | | 1/17/2019 | | | (15,886 | ) | |
| | 15,527 | | | USD | | | 141,056 | | | SEK | | Goldman Sachs International | | 1/17/2019 | | | (4 | ) | |
| | 20,807 | | | USD | | | 189,548 | | | SEK | | Royal Bank of Canada | | 1/17/2019 | | | (63 | ) | |
Total unrealized depreciation | | | | | | | | | | | | $ | (274,911 | ) | |
Total net unrealized appreciation | | | | | | | | | | | | $ | 5,406 | | |
AUD = Australian Dollar
CAD = Canadian Dollar
CHF = Swiss Franc
EUR = Euro
GBP = Pound Sterling
JPY = Japanese Yen
MXN = Mexican Peso
NOK = Norwegian Krone
NZD = New Zealand Dollar
SEK = Swedish Krona
For the year ended October 31, 2018, the Fund's instruments in forward contracts had an average notional value of $34,390,614.
See Notes to Financial Statements
109
Schedule of Investments Multi-Asset Income Fund (cont'd)
Total return swap contracts ("total return swaps")
At October 31, 2018, the Fund had outstanding total return swaps as follows:
Over-the-counter total return swaps — Long
| Counterparty | | Reference Entity | | Notional
Amount(o) | | Maturity
Date | | Variable-Rate(n) | | Unrealized
Appreciation/
(Depreciation) | | Accrued
Net
Interest
Receivable/
(Payable) | | Value | |
| Citibank, N.A. | | S&P 500
Financials Sector
Total Return Index | | $ | 113,814 | | | 4/26/2019 | | | 2.53 | %(a) | | $ | (6,510 | ) | | $ | (198 | ) | | $ | (6,708 | ) | |
| Citibank, N.A. | | S&P 500
Financials Sector
Total Return Index | | | 114,539 | | | 12/13/2018 | | | 2.45 | %(b) | | | (5,763 | ) | | | (451 | ) | | | (6,214 | ) | |
Goldman Sachs
International | | S&P Industry
Sector Total
Return Index | | | 183,121 | | | 12/19/2018 | | | 2.56 | %(c) | | | (3,938 | ) | | | (203 | ) | | | (4,141 | ) | |
JPMorgan
Chase Bank N.A. | | STOXX
Europe 600
Travel & Leisure
(Net Return) Index | | EUR | 183,811 | | | 11/15/2018 | | | (0.44 | )%(d) | | | (15,162 | ) | | | 217 | | | | (14,945 | ) | |
JPMorgan
Chase Bank N.A. | | S&P 500 Total
Return Index | | $ | 123,498 | | | 4/3/2019 | | | 2.78 | %(e) | | | 5,700 | | | | (513 | ) | | | 5,187 | | |
JPMorgan
Chase Bank N.A. | | MSCI Europe
ex UK Financials
(Net Return) Index | | EUR | 87,016 | | | 9/17/2019 | | | (0.69 | )%(f) | | | (6,816 | ) | | | 35 | | | | (6,781 | ) | |
Total | | | | | | | | | | $ | (32,489 | ) | | $ | (1,113 | ) | | $ | (33,602 | ) | |
Over-the-counter total return swaps — Short
| Counterparty | | Reference Entity | | Notional
Amount(o) | | Maturity
Date | | Variable-Rate(n) | | Unrealized
Appreciation/
(Depreciation) | | Accrued
Net
Interest
Receivable/
(Payable) | | Value | |
| Citibank, N.A. | | S&P 500
Total Return Index | | $ | (122,076 | ) | | 12/13/2018 | | | 2.27 | %(g) | | $ | 1,997 | | | $ | 410 | | | $ | 2,407 | | |
| Citibank, N.A. | | S&P 500
Consumer
Discretionary
Sector Total
Return Index | | | (129,632 | ) | | 4/26/2019 | | | 2.45 | %(h) | | | 5,115 | | | | 399 | | | | 5,514 | | |
Goldman Sachs
International | | S&P 500
Consumer
Durables &
Apparel
Group Total
Return Index | | | (209,599 | ) | | 12/19/2018 | | | 2.45 | %(i) | | | 17,898 | | | | 170 | | | | 18,068 | | |
See Notes to Financial Statements
110
Schedule of Investments Multi-Asset Income Fund (cont'd)
| Counterparty | | Reference Entity | | Notional
Amount(o) | | Maturity
Date | | Variable-Rate(n) | | Unrealized
Appreciation/
(Depreciation) | | Accrued
Net
Interest
Receivable/
(Payable) | | Value | |
JPMorgan
Chase Bank N.A. | | FTSE 100
Net Tax Index | | GBP | (94,4 | 27) | | 11/15/2018 | | | (0.34 | )%(j) | | $ | 4,144 | | | $ | (101 | ) | | $ | 4,043 | | |
JPMorgan
Chase Bank N.A. | | STOXX
Europe 600
(Net Return) Index | | EUR | (104,002 | ) | | 11/15/2018 | | | (0.66 | )%(k) | | | 5,060 | | | | (192 | ) | | | 4,868 | | |
JPMorgan
Chase Bank N.A. | | S&P 500
Utilities Sector
Total Return Index | | $ | (107,194 | ) | | 4/3/2019 | | | 2.65 | %(l) | | | (10,294 | ) | | | 147 | | | | (10,147 | ) | |
JPMorgan
Chase Bank N.A. | | MSCI Daily
Total Return
Gross Europe
ex UK Index | | EUR | (97,223 | ) | | 9/17/2019 | | | (0.10 | )%(m) | | | 4,891 | | | | (6 | ) | | | 4,885 | | |
Total | | | | | | | | | | $ | 28,811 | | | $ | 827 | | | $ | 29,638 | | |
(a) Fund pays 1-month USD LIBOR plus 0.25%. Payment frequency—monthly. Fund receives return on reference entity. Payment frequency—upon termination.
(b) Fund pays 3-month USD LIBOR plus 0.12%. Payment frequency—quarterly. Fund receives return on reference entity. Payment frequency—upon termination.
(c) Fund pays 1-month USD LIBOR plus 0.28%. Payment frequency—monthly. Fund receives return on reference entity. Payment frequency—upon termination.
(d) Fund receives 3-month EURIBOR minus 0.12%. Payment frequency—quarterly. Fund pays return on reference entity. Payment frequency—quarterly.
(e) Fund pays 1-month USD LIBOR plus 0.50%. Payment frequency—monthly. Fund receives return on reference entity. Payment frequency—upon termination.
(f) Fund receives 1-month EURIBOR minus 0.32%. Payment frequency—monthly. Fund pays return on reference entity. Payment frequency—upon termination.
(g) Fund receives 3-month USD LIBOR minus 0.06%. Payment frequency—quarterly. Fund pays return on reference entity. Payment frequency—upon termination.
(h) Fund receives 3-month USD LIBOR plus 0.12%. Payment frequency—quarterly. Fund pays return on reference entity. Payment frequency—upon termination.
(i) Fund receives 1-month USD LIBOR plus 0.17%. Payment frequency—monthly. Fund pays return on reference entity. Payment frequency—upon termination.
(j) Fund pays 3-month EURIBOR minus 0.02%. Payment frequency—quarterly in EUR currency. Fund receives return on reference entity. Payment frequency—quarterly in EUR currency.
(k) Fund pays 3-month EURIBOR minus 0.34%. Payment frequency—quarterly. Fund receives return on reference entity. Payment frequency—quarterly.
(l) Fund receives 1-month USD LIBOR plus 0.37%. Payment frequency—monthly. Fund pays return on reference entity. Payment frequency—upon termination.
See Notes to Financial Statements
111
Schedule of Investments Multi-Asset Income Fund (cont'd)
(m) Fund pays 1-month EURIBOR plus 0.27%. Payment frequency—monthly. Fund receives return on reference entity. Payment frequency—upon termination.
(n) Effective rate at October 31, 2018.
(o) Notional amount is stated in the currency in which the contract is denominated.
EUR = Euro
For the year ended October 31, 2018, the average notional value of total return swaps was $853,400 for long positions and $(1,038,114) for short positions.
Purchased option contracts ("options purchased")
At October 31, 2018, the Fund had outstanding options purchased as follows:
Description | | Number of
Contracts | | Notional
Amount | | Exercise
Price | | Expiration
Date | | Value | |
Calls | |
Index | |
S&P 500 Mini Index | | | 9 | | | $ | 244,053 | | | $ | 292 | | | 11/7/2018 | | $ | — | (a)(b) | |
S&P 500 Mini Index | | | 9 | | | | 244,053 | | | | 306 | | | 11/7/2018 | | | — | (a)(b) | |
S&P 500 Mini Index | | | 9 | | | | 244,053 | | | | 307 | | | 11/7/2018 | | | — | (a)(b) | |
S&P 500 Mini Index | | | 9 | | | | 244,053 | | | | 292 | | | 11/14/2018 | | | — | (a)(b) | |
S&P 500 Mini Index | | | 10 | | | | 271,170 | | | | 305 | | | 11/14/2018 | | | — | (a)(b) | |
S&P 500 Mini Index | | | 10 | | | | 271,170 | | | | 292 | | | 11/21/2018 | | | 75 | | |
Total calls | | | | | | | | | | $ | 75 | | |
Puts | |
Index | |
S&P 500 Mini Index | | | 8 | | | $ | 216,936 | | | $ | 239 | | | 11/7/2018 | | $ | 76 | | |
S&P 500 Mini Index | | | 18 | | | | 488,106 | | | | 250 | | | 11/7/2018 | | | 423 | | |
S&P 500 Mini Index | | | 9 | | | | 244,053 | | | | 250 | | | 11/14/2018 | | | 540 | | |
S&P 500 Mini Index | | | 9 | | | | 244,053 | | | | 240 | | | 11/14/2018 | | | 225 | | |
S&P 500 Mini Index | | | 11 | | | | 298,287 | | | | 240 | | | 11/21/2018 | | | 457 | | |
Total puts | | | | | | | | | | $ | 1,721 | | |
Total options purchased (cost $4,496) | | | | | | | | | | $ | 1,796 | | |
(a) Security fair valued as of October 31, 2018 in accordance with procedures approved by the Board of Trustees.
(b) Value determined using significant unobservable inputs.
Written option contracts ("options written")
At October 31, 2018, the Fund had outstanding options written as follows:
Description | | Number of
Contracts | | Notional
Amount | | Exercise
Price | | Expiration
Date | | Value | |
Calls | |
Index | |
S&P 500 Mini Index | | | 9 | | | $ | (244,053 | ) | | $ | 268 | | | 11/7/2018 | | $ | (4,563 | ) | |
S&P 500 Mini Index | | | 9 | | | | (244,053 | ) | | | 283 | | | 11/7/2018 | | | (86 | ) | |
See Notes to Financial Statements
112
Schedule of Investments Multi-Asset Income Fund (cont'd)
Description | | Number of
Contracts | | Notional
Amount | | Exercise
Price | | Expiration
Date | | Value | |
Calls | |
Index | |
S&P 500 Mini Index | | | 9 | | | $ | (244,053 | ) | | $ | 284 | | | 11/7/2018 | | $ | (63 | ) | |
S&P 500 Mini Index | | | 9 | | | | (244,053 | ) | | | 270 | | | 11/14/2018 | | | (4,230 | ) | |
S&P 500 Mini Index | | | 10 | | | | (271,170 | ) | | | 285 | | | 11/14/2018 | | | (190 | ) | |
S&P 500 Mini Index | | | 10 | | | | (271,170 | ) | | | 271 | | | 11/21/2018 | | | (4,755 | ) | |
Total calls | | | | | | | | $(13,887) | |
Puts | |
Index | |
S&P 500 Mini Index | | | 8 | | | $ | (216,936 | ) | | $ | 263 | | | 11/7/2018 | | $ | (996 | ) | |
S&P 500 Mini Index | | | 9 | | | | (244,053 | ) | | | 272 | | | 11/7/2018 | | | (3,578 | ) | |
S&P 500 Mini Index | | | 9 | | | | (244,053 | ) | | | 275 | | | 11/7/2018 | | | (5,144 | ) | |
S&P 500 Mini Index | | | 9 | | | | (244,053 | ) | | | 262 | | | 11/14/2018 | | | (1,746 | ) | |
S&P 500 Mini Index | | | 9 | | | | (244,053 | ) | | | 273 | | | 11/14/2018 | | | (5,031 | ) | |
S&P 500 Mini Index | | | 11 | | | | (298,287 | ) | | | 260 | | | 11/21/2018 | | | (2,321 | ) | |
Total puts | | | | | | | | $(18,816) | |
Total options written (premium received $36,300) | | | | | | | | $(32,703) | |
For the year ended October 31, 2018, the Fund had an average market value of $955 in options purchased and $(16,751) in options written. At October 31, 2018, the Fund had securities pledged in the amount of $611,468 to cover collateral requirements for options written.
The following is a summary, categorized by Level (see Note A of Notes to Financial Statements), of inputs used to value the Fund's investments as of October 31, 2018:
Asset Valuation Inputs | |
(000's omitted) | | Level 1 | | Level 2 | | Level 3(c) | | Total | |
Investments: | |
Common Stocks | |
Automobiles | | $ | 82 | | | $ | 25 | | | $ | — | | | $ | 107 | | |
Banks | | | 414 | | | | 30 | | | | — | | | | 444 | | |
Beverages | | | 93 | | | | 17 | | | | — | | | | 110 | | |
Communications Equipment | | | 78 | | | | 21 | | | | — | | | | 99 | | |
Containers & Packaging | | | 77 | | | | 5 | | | | — | | | | 82 | | |
Diversified Telecommunication Services | | | 263 | | | | 14 | | | | — | | | | 277 | | |
Electric Utilities | | | 376 | | | | 47 | | | | — | | | | 423 | | |
Equity Real Estate Investment Trusts | | | 1,179 | | | | 75 | | | | — | | | | 1,254 | | |
Food & Staples Retailing | | | 147 | | | | 23 | | | | — | | | | 170 | | |
Gas Utilities | | | 8 | | | | 16 | | | | — | | | | 24 | | |
Hotels, Restaurants & Leisure | | | 185 | | | | 22 | | | | — | | | | 207 | | |
Industrial Conglomerates | | | 38 | | | | 17 | | | | — | | | | 55 | | |
Metals & Mining | | | 149 | | | | 54 | | | | — | | | | 203 | | |
Oil, Gas & Consumable Fuels | | | 950 | | | | 7 | | | | — | | | | 957 | | |
See Notes to Financial Statements
113
Schedule of Investments Multi-Asset Income Fund (cont'd)
Asset Valuation Inputs (cont'd) | |
(000's omitted) | | Level 1 | | Level 2 | | Level 3(c) | | Total | |
Real Estate Management & Development | | $ | 68 | | | $ | 20 | | | $ | — | | | $ | 88 | | |
Semiconductors & Semiconductor Equipment | | | 155 | | | | 9 | | | | — | | | | 164 | | |
Technology Hardware, Storage & Peripherals | | | 161 | | | | 20 | | | | — | | | | 181 | | |
Tobacco | | | 65 | | | | 18 | | | | — | | | | 83 | | |
Trading Companies & Distributors | | | 12 | | | | 87 | | | | — | | | | 99 | | |
Transportation Infrastructure | | | 3 | | | | 8 | | | | — | | | | 11 | | |
Wireless Telecommunication Services | | | 23 | | | | 20 | | | | — | | | | 43 | | |
| Other Common Stocks(a) | | | 3,079 | | | | — | | | | — | | | | 3,079 | | |
Total Common Stocks | | | 7,605 | | | | 555 | | | | — | | | | 8,160 | | |
| Preferred Stocks(a) | | | 495 | | | | — | | | | — | | | | 495 | | |
| Convertible Bonds(a) | | | — | | | | 270 | | | | — | | | | 270 | | |
| Corporate Bonds(a) | | | — | | | | 2,272 | | | | — | | | | 2,272 | | |
| Mortgage-Backed Securities(a) | | | — | | | | 3,543 | | | | — | | | | 3,543 | | |
U.S. Treasury Obligations | | | — | | | | 3,021 | | | | — | | | | 3,021 | | |
U.S. Government Agency Securities | | | — | | | | 118 | | | | — | | | | 118 | | |
Asset-Backed Securities | | | — | | | | 404 | | | | — | | | | 404 | | |
Exchange-Traded Funds | | | 680 | | | | — | | | | — | | | | 680 | | |
| Master Limited Partnerships(a) | | | 772 | | | | — | | | | — | | | | 772 | | |
Investment Companies | | | — | | | | 4,776 | | | | — | | | | 4,776 | | |
| Options Purchased(b)(d) | | | 2 | | | | — | | | | — | | | | 2 | | |
Short-Term Investments | | | — | | | | 1,026 | | | | — | | | | 1,026 | | |
Total Investments | | $ | 9,554 | | | $ | 15,985 | | | $ | — | | | $ | 25,539 | | |
(a) The Schedule of Investments provides information on the industry categorization for the portfolio.
(b) The "Purchased option contracts" table under Derivative Instruments provides information on the industry or sector categorization for the portfolio.
(c) The reconciliation between beginning and ending balances of investments in which unobservable inputs (Level 3) were used is not presented as all values rounded to less than $1,000.
(d) As of the year ended October 31, 2018, these investments were valued in accordance with procedures approved by the Board of Trustees. These investments did not have a material impact on the Fund's net assets and, therefore, disclosure of unobservable inputs used in formulating valuations is not presented.
The following is a summary, categorized by Level (see Note A of Notes to Financial Statements), of inputs used to value the Fund's derivatives as of October 31, 2018:
Other Financial Instruments | |
(000's omitted) | | Level 1 | | Level 2 | | Level 3(b) | | Total | |
| Futures(a) | |
Assets | | $ | 164 | | | $ | — | | | $ | — | | | $ | 164 | | |
Liabilities | | | (191 | ) | | | — | | | | — | | | | (191 | ) | |
See Notes to Financial Statements
114
Schedule of Investments Multi-Asset Income Fund (cont'd)
Other Financial Instruments (cont'd) | |
(000's omitted) | | Level 1 | | Level 2 | | Level 3(b) | | Total | |
| Forward Contracts(a) | |
Assets | | $ | — | | | $ | 280 | | | $ | — | | | $ | 280 | | |
Liabilities | | | — | | | | (275 | ) | | | — | | | | (275 | ) | |
Swaps | |
Assets | | | — | | | | 45 | | | | — | | | | 45 | | |
Liabilities | | | — | | | | (49 | ) | | | — | | | | (49 | ) | |
| Options Written(c) | |
Liabilities | | | (33 | ) | | | — | | | | — | | | | (33 | ) | |
Total | | $ | (60 | ) | | $ | 1 | | | $ | — | | | $ | (59 | ) | |
(a) Futures and forward contracts are reported at the cumulative unrealized appreciation/(depreciation) of the instrument.
(b) The reconciliation between beginning and ending balances of investments in which unobservable inputs (Level 3) were used is not presented as all values rounded to less than $1,000.
(c) As of the year ended October 31, 2018, these investments were valued in accordance with procedures approved by the Board of Trustees. These investments did not have a material impact on the Fund's net assets and, therefore, disclosure of unobservable inputs used in formulating valuations is not presented.
See Notes to Financial Statements
115
Consolidated Schedule of Investments Multi-Style Premia Fund
October 31, 2018
| | | Number
of Shares | | Value
(000's
omitted) | |
Common Stocks 33.4% | |
Austria 1.2% | |
IMMOFINANZ AG | | | 391 | | | $ | 9 | * | |
Oesterreichische
Post AG | | | 1,923 | | | | 78 | | |
Telekom Austria AG | | | 4,023 | | | | 30 | * | |
UNIQA Insurance
Group AG | | | 7,636 | | | | 72 | | |
| | | | 189 | | |
Belgium 1.2% | |
Ageas | | | 1,030 | | | | 51 | | |
Colruyt SA | | | 995 | | | | 58 | | |
KBC Group NV | | | 9 | | | | 1 | | |
UCB SA | | | 960 | | | | 81 | | |
| | | | 191 | | |
France 3.6% | |
Capgemini SE | | | 183 | | | | 22 | | |
Credit Agricole SA | | | 6,620 | | | | 85 | | |
Dassault
Systemes SA | | | 174 | | | | 22 | | |
Eiffage SA | | | 300 | | | | 29 | | |
Engie SA | | | 5,860 | | | | 78 | | |
Klepierre SA | | | 1,975 | | | | 67 | | |
Orange SA | | | 5,719 | | | | 90 | | |
Renault SA | | | 355 | | | | 27 | | |
Sanofi | | | 1,143 | | | | 102 | | |
SCOR SE | | | 396 | | | | 18 | | |
TOTAL SA | | | 364 | | | | 22 | | |
| | | | 562 | | |
Germany 2.2% | |
Bayerische Motoren
Werke AG | | | 527 | | | | 45 | | |
Bayerische Motoren
Werke AG,
Preference Shares | | | 1,125 | | | | 85 | | |
Covestro AG | | | 706 | | | | 46 | (a) | |
E.ON SE | | | 1,623 | | | | 16 | | |
Evonik
Industries AG | | | 473 | | | | 15 | | |
HUGO BOSS AG | | | 750 | | | | 53 | | |
Talanx AG | | | 1,818 | | | | 65 | | |
Vonovia SE | | | 387 | | | | 18 | | |
| | | | 343 | | |
Italy 0.4% | |
Eni SpA | | | 2,455 | | | | 44 | | |
Poste Italiane SpA | | | 2,697 | | | | 19 | (a) | |
| | | | 63 | | |
Japan 9.4% | |
Aisin Seiki Co. Ltd. | | | 800 | | | | 31 | | |
Astellas Pharma,
Inc. | | | 5,100 | | | | 79 | | |
Canon, Inc. | | | 2,000 | | | | 57 | | |
Chubu Electric
Power Co., Inc. | | | 4,000 | | | | 58 | | |
| | | Number
of Shares | | Value
(000's
omitted) | |
Daiichi Sankyo Co.
Ltd. | | | 900 | | | $ | 34 | | |
Haseko Corp. | | | 1,200 | | | | 15 | | |
ITOCHU Corp. | | | 4,000 | | | | 74 | | |
Japan Post Bank
Co. Ltd. | | | 4,900 | | | | 57 | | |
Japan Post
Holdings Co. Ltd. | | | 5,300 | | | | 63 | | |
Japan Post
Insurance Co. Ltd. | | | 1,500 | | | | 36 | | |
Japan Retail Fund
Investment Corp. | | | 38 | | | | 70 | | |
Japan Tobacco, Inc. | | | 2,400 | | | | 62 | | |
JXTG Holdings, Inc. | | | 8,500 | | | | 57 | | |
KDDI Corp. | | | 1,100 | | | | 27 | | |
Kewpie Corp. | | | 2,700 | | | | 62 | | |
Marubeni Corp. | | | 2,300 | | | | 19 | | |
Mitsubishi Chemical
Holdings Corp. | | | 2,100 | | | | 16 | | |
Mitsui & Co. Ltd. | | | 4,300 | | | | 72 | | |
Mizuho Financial
Group, Inc. | | | 33,900 | | | | 58 | | |
NEC Corp. | | | 600 | | | | 17 | | |
Nippon Telegraph &
Telephone Corp. | | | 1,600 | | | | 66 | | |
Nissan Motor Co.
Ltd. | | | 5,600 | | | | 51 | | |
Nomura Real Estate
Master Fund, Inc. | | | 9 | | | | 12 | | |
NTT DOCOMO, Inc. | | | 2,900 | | | | 72 | | |
Orix JREIT, Inc. | | | 6 | | | | 9 | | |
Sekisui House Ltd. | | | 4,600 | | | | 68 | | |
Sumitomo Corp. | | | 4,400 | | | | 67 | | |
Teijin Ltd. | | | 2,600 | | | | 45 | | |
Tokio Marine
Holdings, Inc. | | | 300 | | | | 14 | | |
Toyota Motor Corp. | | | 800 | | | | 47 | | |
United Urban
Investment Corp. | | | 11 | | | | 17 | | |
Yamada Denki Co.
Ltd. | | | 3,700 | | | | 17 | | |
| | | | 1,449 | | |
Netherlands 2.8% | |
ASM International
NV | | | 508 | | | | 22 | | |
| ASR Nederland NV | | | 516 | | | | 23 | | |
Heineken Holding
NV | | | 806 | | | | 70 | | |
Koninklijke Ahold
Delhaize NV | | | 3,850 | | | | 88 | | |
Koninklijke DSM
NV | | | 896 | | | | 79 | | |
Royal Dutch Shell
PLC, A Shares | | | 2,552 | | | | 81 | | |
Wolters Kluwer NV | | | 1,350 | | | | 77 | | |
| | | | 440 | | |
Portugal 0.7% | |
EDP—Energias
de Portugal SA | | | 18,939 | | | | 66 | | |
| | | Number
of Shares | | Value
(000's
omitted) | |
NOS SGPS SA | | | 8,349 | | | $ | 47 | | |
| | | | 113 | | |
Russia 0.5% | |
Evraz PLC | | | 10,328 | | | | 72 | | |
South Africa 0.4% | |
Anglo American
PLC | | | 2,907 | | | | 62 | | |
Spain 2.1% | |
Aena SME SA | | | 202 | | | | 32 | (a) | |
Amadeus IT
Group SA | | | 276 | | | | 22 | | |
Bankinter SA | | | 7,973 | | | | 66 | | |
Cia de Distribucion
Integral Logista
Holdings SA | | | 1,809 | | | | 44 | | |
Enagas SA | | | 784 | | | | 21 | | |
Endesa SA | | | 1,517 | | | | 32 | | |
Merlin Properties
Socimi SA | | | 2,976 | | | | 37 | | |
Repsol SA | | | 558 | | | | 10 | | |
Telefonica SA | | | 7,348 | | | | 60 | | |
| | | | 324 | | |
Switzerland 0.4% | |
Ferguson PLC | | | 833 | | | | 56 | | |
United Kingdom 8.2% | |
Aviva PLC | | | 8,330 | | | | 46 | | |
Berkeley Group
Holdings PLC | | | 1,477 | | | | 66 | | |
| BP PLC | | | 7,866 | | | | 57 | | |
British Land Co.
PLC | | | 6,492 | | | | 49 | | |
Centrica PLC | | | 8,241 | | | | 16 | | |
Derwent London
PLC | | | 1,389 | | | | 52 | | |
Direct Line
Insurance Group
PLC | | | 14,997 | | | | 63 | | |
GlaxoSmithKline
PLC | | | 3,172 | | | | 61 | | |
HSBC Holdings PLC | | | 7,760 | | | | 64 | | |
Imperial Brands
PLC | | | 1,452 | | | | 49 | | |
International
Consolidated
Airlines Group SA | | | 8,644 | | | | 67 | | |
Land Securities
Group PLC | | | 2,213 | | | | 24 | | |
Legal & General
Group PLC | | | 15,619 | | | | 50 | | |
Lloyds Banking
Group PLC | | | 80,437 | | | | 59 | | |
Marks & Spencer
Group PLC | | | 1,930 | | | | 7 | | |
National Grid PLC | | | 5,965 | | | | 63 | | |
Pearson PLC | | | 6,043 | | | | 70 | | |
Phoenix Group
Holdings | | | 7,341 | | | | 57 | | |
See Notes to Financial Statements
116
Consolidated Schedule of Investments Multi-Style Premia Fund (cont'd)
| | | Number
of Shares | | Value
(000's
omitted) | |
RELX PLC | | | 92 | | | $ | 2 | | |
Rio Tinto PLC | | | 1,074 | | | | 52 | | |
Royal Mail PLC | | | 3,260 | | | | 15 | | |
SSE PLC | | | 2,768 | | | | 40 | | |
Tate & Lyle PLC | | | 7,245 | | | | 62 | | |
Tesco PLC | | | 22,687 | | | | 62 | | |
Vodafone Group
PLC | | | 28,669 | | | | 54 | | |
WM Morrison
Supermarkets PLC | | | 17,529 | | | | 56 | | |
| | | | 1,263 | | |
United States 0.3% | |
Carnival PLC | | | 911 | | | | 49 | | |
Total Common Stocks
(Cost $5,645) | | | 5,176 | | |
| | | Number
of Shares | | Value
(000's
omitted) | |
Short-Term Investments 30.1% | |
Investment Companies 30.1% | |
State Street
Institutional
Treasury Money
Market Fund
Premier Class,
2.09%(b)
(Cost $4,655) | | | 4,654,919 | | | $ | 4,655 | (c) | |
Total Investments 63.5%
(Cost $10,300) | | | 9,831 | | |
Other Assets Less
Liabilities 36.5% | | | | | 5,644 | (d) | |
Net Assets 100.0% | | $ | 15,475 | | |
* Non-income producing security.
(a) Security exempt from registration pursuant to Regulation S under the Securities Act of 1933, as amended. Regulation S applies to securities offerings that are made outside of the United States and do not involve direct selling efforts in the United States and as such may have restrictions on resale. Total value of all such securities at October 31, 2018 amounted to approximately $97,000, which represents 0.6% of net assets of the Fund.
(b) Represents 7-day effective yield as of October 31, 2018.
(c) All or a portion of this security is segregated in connection with obligations for options written, futures, forward foreign currency contracts and/or swaps with a total value of approximately $4,655,000.
(d) Includes the impact of the Fund's open positions in derivatives at October 31, 2018.
See Notes to Financial Statements
117
Consolidated Schedule of Investments Multi-Style Premia Fund (cont'd)
POSITIONS BY INDUSTRY
| Industry | | Investments at
Value
(000's omitted) | | Percentage of
Net Assets | |
Insurance | | $ | 577 | | | | 3.7 | % | |
Banks | | | 390 | | | | 2.5 | % | |
Pharmaceuticals | | | 357 | | | | 2.3 | % | |
Equity Real Estate Investment Trusts | | | 337 | | | | 2.2 | % | |
Oil, Gas & Consumable Fuels | | | 292 | | | | 1.9 | % | |
Trading Companies & Distributors | | | 288 | | | | 1.9 | % | |
Food & Staples Retailing | | | 264 | | | | 1.7 | % | |
Automobiles | | | 255 | | | | 1.6 | % | |
Diversified Telecommunication Services | | | 246 | | | | 1.6 | % | |
Chemicals | | | 201 | | | | 1.3 | % | |
Electric Utilities | | | 196 | | | | 1.3 | % | |
Metals & Mining | | | 186 | | | | 1.2 | % | |
Multi-Utilities | | | 173 | | | | 1.1 | % | |
Wireless Telecommunication Services | | | 153 | | | | 1.0 | % | |
Household Durables | | | 149 | | | | 1.0 | % | |
Air Freight & Logistics | | | 137 | | | | 0.9 | % | |
Food Products | | | 124 | | | | 0.8 | % | |
Media | | | 117 | | | | 0.8 | % | |
Tobacco | | | 111 | | | | 0.7 | % | |
Professional Services | | | 79 | | | | 0.5 | % | |
Technology Hardware, Storage & Peripherals | | | 74 | | | | 0.5 | % | |
Beverages | | | 70 | | | | 0.5 | % | |
Airlines | | | 67 | | | | 0.4 | % | |
Textiles, Apparel & Luxury Goods | | | 53 | | | | 0.3 | % | |
Hotels, Restaurants & Leisure | | | 49 | | | | 0.3 | % | |
IT Services | | | 44 | | | | 0.3 | % | |
Transportation Infrastructure | | | 32 | | | | 0.2 | % | |
Auto Components | | | 31 | | | | 0.2 | % | |
Construction & Engineering | | | 29 | | | | 0.2 | % | |
Real Estate Management & Development | | | 27 | | | | 0.2 | % | |
Semiconductors & Semiconductor Equipment | | | 22 | | | | 0.1 | % | |
Software | | | 22 | | | | 0.1 | % | |
Specialty Retail | | | 17 | | | | 0.1 | % | |
Multiline Retail | | | 7 | | | | 0.0 | % | |
Short-Term Investments and Other Assets—Net | | | 10,299 | | | | 66.6 | % | |
| | $ | 15,475 | | | | 100.0 | % | |
See Notes to Financial Statements
118
Consolidated Schedule of Investments Multi-Style Premia Fund (cont'd)
Derivative Instruments
Futures contracts ("futures")
At October 31, 2018, open positions in futures for the Fund were as follows:
Long Futures:
Expiration
Date | | Number of
Contracts | | Open Contracts | | Notional
Amount | | Value and
Unrealized
Appreciation/
(Depreciation) | |
11/2018 | | | 1 | | | Low Sulphur Gasoil | | $ | 70,925 | | | $ | (325 | ) | |
12/2018 | | | 9 | | | WTI Crude Oil | | | 587,790 | | | | (56,390 | ) | |
12/2018 | | | 1 | | | New York Harbor ULSD | | | 94,559 | | | | (2,407 | ) | |
12/2018 | | | 9 | | | Cotton No.2 | | | 345,870 | | | | (42,300 | ) | |
12/2018 | | | 8 | | | Euro-BTP | | | 1,102,205 | | | | (1,155 | ) | |
12/2018 | | | 6 | | | Euro-Bund | | | 1,089,111 | | | | 4,474 | | |
12/2018 | | | 7 | | | Euro-OAT | | | 1,204,823 | | | | 612 | | |
12/2018 | | | 8 | | | Low Sulphur Gasoil | | | 559,200 | | | | 1,400 | | |
12/2018 | | | 1 | | | Nikkei 225 Index | | | 108,975 | | | | (4,525 | ) | |
12/2018 | | | 3 | | | Soybean Meal | | | 91,920 | | | | (4,770 | ) | |
12/2018 | | | 1 | | | SPI 200 Future | | | 102,646 | | | | (6,249 | ) | |
12/2018 | | | 1 | | | NASDAQ 100 E-Mini Index | | | 139,510 | | | | (12,351 | ) | |
12/2018 | | | 1 | | | S&P 500 E-Mini Index | | | 135,555 | | | | (10,495 | ) | |
1/2019 | | | 8 | | | Brent Crude Oil | | | 600,320 | | | | (9,840 | ) | |
3/2019 | | | 9 | | | Cocoa | | | 202,770 | | | | 4,090 | | |
Total Long Positions | | | | | | $ | 6,436,179 | | | $ | (140,231 | ) | |
Short Futures:
Expiration
Date | | Number of
Contracts | | Open Contracts | | Notional
Amount | | Value and
Unrealized
Appreciation/
(Depreciation) | |
12/2018 | | | 1 | | | Cocoa | | $ | (22,340 | ) | | $ | (477 | ) | |
12/2018 | | | 1 | | | Japanese Government Bond, 10 Year | | | (1,334,958 | ) | | | (4,343 | ) | |
12/2018 | | | 22 | | | Corn | | | (399,575 | ) | | | 4,937 | | |
12/2018 | | | 8 | | | Lean Hogs | | | (187,040 | ) | | | (11,665 | ) | |
12/2018 | | | 6 | | | Australian Dollar | | | (424,620 | ) | | | 750 | | |
12/2018 | | | 2 | | | Euro | | | (283,888 | ) | | | 7,813 | | |
12/2018 | | | 4 | | | Japanese Yen | | | (443,775 | ) | | | 7,400 | | |
12/2018 | | | 2 | | | Mexican Peso | | | (48,920 | ) | | | 2,060 | | |
12/2018 | | | 6 | | | New Zealand Dollar | | | (391,380 | ) | | | (995 | ) | |
12/2018 | | | 4 | | | Pound Sterling | | | (319,900 | ) | | | 6,250 | | |
12/2018 | | | 1 | | | Swiss Franc | | | (124,475 | ) | | | 2,212 | | |
12/2018 | | | 13 | | | Canadian Bond, 10 Year | | | (1,304,987 | ) | | | 22,249 | | |
See Notes to Financial Statements
119
Consolidated Schedule of Investments Multi-Style Premia Fund (cont'd)
Expiration
Date | | Number of
Contracts | | Open Contracts | | Notional
Amount | | Value and
Unrealized
Appreciation/
(Depreciation) | |
12/2018 | | | 3 | | | Canadian Dollar | | $ | (227,985 | ) | | $ | 465 | | |
12/2018 | | | 7 | | | Coffee 'C' | | | (295,838 | ) | | | (17,990 | ) | |
12/2018 | | | 3 | | | U.S. Treasury Long Bond | | | (414,375 | ) | | | 2,594 | | |
12/2018 | | | 18 | | | U.S. Treasury Note, 10 Year | | | (2,131,875 | ) | | | 20,641 | | |
12/2018 | | | 1 | | | Euro STOXX 50 Index | | | (36,177 | ) | | | (1,167 | ) | |
12/2018 | | | 1 | | | Copper | | | (66,475 | ) | | | 1,188 | | |
12/2018 | | | 1 | | | Gold 100 Oz. | | | (121,500 | ) | | | 450 | | |
12/2018 | | | 1 | | | Silver | | | (71,410 | ) | | | 2,185 | | |
12/2018 | | | 2 | | | U.K. Long Gilt Bond | | | (312,929 | ) | | | (5,598 | ) | |
12/2018 | | | 4 | | | Live Cattle | | | (187,120 | ) | | | 1,434 | | |
1/2019 | | | 11 | | | Soybean | | | (468,463 | ) | | | 24,000 | | |
Total Short Positions | | | | | | $ | (9,620,005 | ) | | $ | 64,393 | | |
Total Futures | | | | | | | | $ | (75,838 | ) | |
At October 31, 2018, the Fund had $494,513 deposited in a segregated account to cover margin requirements on open futures.
For the year ended October 31, 2018, the average notional value of futures for the Fund was $4,353,428 for long positions and $(4,525,053) for short positions.
Forward foreign currency contracts ("forward contracts")
At October 31, 2018, open forward contracts for the Fund were as follows:
Currency Purchased | | Currency Sold | | Counterparty | | Settlement
Date | | Net
Unrealized
Appreciation/
(Depreciation) | |
| | 300,000 | | | USD | | | | | 298,845 | | | CHF | | | | Morgan Stanley Capital Services LLC | | 12/21/2018 | | $ | 1,797 | | |
| | 100,000 | | | USD | | | | | 68,275,000 | | | CLP | | | | Morgan Stanley Capital Services LLC | | 12/3/2018 | | | 1,873 | | |
| | 200,000 | | | USD | | | | | 1,392,103 | | | CNY | | | | Morgan Stanley Capital Services LLC | | 12/3/2018 | | | 607 | | |
| | 100,000 | | | USD | | | | | 2,260,973 | | | CZK | | | | Morgan Stanley Capital Services LLC | | 12/3/2018 | | | 1,199 | | |
| | 1,100,000 | | | USD | | | | | 963,792 | | | EUR | | | | Morgan Stanley Capital Services LLC | | 12/21/2018 | | | 3,502 | | |
| | 800,000 | | | USD | | | | | 622,786 | | | GBP | | | | Morgan Stanley Capital Services LLC | | 12/21/2018 | | | 1,933 | | |
| | 300,000 | | | USD | | | | | 85,304,520 | | | HUF | | | | Morgan Stanley Capital Services LLC | | 12/21/2018 | | | 1,267 | | |
| | 100,000 | | | USD | | | | | 365,774 | | | ILS | | | | Morgan Stanley Capital Services LLC | | 12/3/2018 | | | 1,429 | | |
| | 100,000 | | | USD | | | | | 113,324,400 | | | KRW | | | | Morgan Stanley Capital Services LLC | | 12/3/2018 | | | 636 | | |
| | 1,100,000 | | | USD | | | | | 9,997,108 | | | SEK | | | | Morgan Stanley Capital Services LLC | | 12/21/2018 | | | 2,331 | | |
| | 100,000 | | | USD | | | | | 3,281,060 | | | THB | | | | Morgan Stanley Capital Services LLC | | 12/3/2018 | | | 954 | | |
| | 5,228,583 | | | TRY | | | | | 900,000 | | | USD | | | | Morgan Stanley Capital Services LLC | | 12/21/2018 | | | 7,811 | | |
| | 200,000 | | | USD | | | | | 6,173,560 | | | TWD | | | | Morgan Stanley Capital Services LLC | | 12/3/2018 | | | 144 | | |
Total unrealized appreciation | | | | | | | | | | | | $ | 25,483 | | |
| | 1,849,450 | | | BRL | | | | | 500,000 | | | USD | | | | Morgan Stanley Capital Services LLC | | 12/21/2018 | | | (5,064 | ) | |
| | 695,539 | | | CNY | | | | | 100,000 | | | USD | | | | Morgan Stanley Capital Services LLC | | 12/3/2018 | | | (377 | ) | |
| | 17,622,269 | | | MXN | | | | | 900,000 | | | USD | | | | Morgan Stanley Capital Services LLC | | 12/21/2018 | | | (39,003 | ) | |
See Notes to Financial Statements
120
Consolidated Schedule of Investments Multi-Style Premia Fund (cont'd)
Currency Purchased | | Currency Sold | | Counterparty | | Settlement
Date | | Net
Unrealized
Appreciation/
(Depreciation) | |
| | 59,302,080 | | | RUB | | | | | 900,000 | | | USD | | | | Morgan Stanley Capital Services LLC | | 12/21/2018 | | $ | (4,996 | ) | |
| | 3,287,120 | | | THB | | | | | 100,000 | | | USD | | | | Morgan Stanley Capital Services LLC | | 12/3/2018 | | | (771 | ) | |
| | 3,085,840 | | | TWD | | | | | 100,000 | | | USD | | | | Morgan Stanley Capital Services LLC | | 12/3/2018 | | | (102 | ) | |
| | 1,100,000 | | | USD | | | | | 33,954,360 | | | TWD | | | | Morgan Stanley Capital Services LLC | | 12/21/2018 | | | (742 | ) | |
Total unrealized depreciation | | | | | | | | | | | | $ | (51,055 | ) | |
Total net unrealized depreciation | | | | | | | | | | | | $ | (25,572 | ) | |
BRL = Brazilian Real(a)
CHF = Swiss Franc
CLP = Chilean Peso(a)
CNY = Chinese Yuan Renminbi(a)
CZK = Czech Koruna
EUR = Euro
GBP = Pound Sterling
HUF = Hungarian Forint
ILS = Israeli Shekel
KRW = South Korean Won(a)
MXN = Mexican Peso
RUB = Russian Ruble(a)
SEK = Swedish Krona
THB = Thai Baht
TRY = Turkish Lira
TWD = New Taiwan Dollar(a)
(a) Non-deliverable forward contracts.
For the year ended October 31, 2018, the Fund's investments in forward contracts had an average notional value of $11,627,752.
See Notes to Financial Statements
121
Consolidated Schedule of Investments Multi-Style Premia Fund (cont'd)
Total return swap contracts ("total return swaps")
At October 31, 2018, the Fund had outstanding total return swaps as follows:
Over-the-counter total return swaps — Long
| Counterparty | | Reference
Entity | | Notional
Amount | | Maturity
Date | | Variable-
Rate(a) | | Unrealized
Appreciation/
(Depreciation) | | Accrued
Net
Interest
Receivable/
(Payable) | | Value | |
Morgan Stanley & Co.
International PLC | | Accenture PLC
| | $ | 102,611
| | | 11/18/2019
| | | 2.73
| %(b) | | $ | 2,652
| | | $ | (129
| ) | | $ | 2,523
| | |
Morgan Stanley & Co.
International PLC | | Accenture PLC
| | | 2,837
| | | 11/18/2019
| | | 2.73
| %(b) | | | (31
| ) | | | (4
| ) | | | (35
| ) | |
Morgan Stanley & Co.
International PLC | | Aetna, Inc.
| | | 27,776
| | | 11/18/2019
| | | 2.73
| %(b) | | | 3,184
| | | | (32
| ) | | | 3,152
| | |
Morgan Stanley & Co.
International PLC | | Aflac, Inc.
| | | 26,660
| | | 11/18/2019
| | | 2.73
| %(b) | | | (933
| ) | | | (36
| ) | | | (969
| ) | |
Morgan Stanley & Co.
International PLC | | AGNC Investment
Corp. | | | 112,767
| | | 11/18/2019
| | | 2.73
| %(b) | | | (8,448
| ) | | | (156
| ) | | | (8,604
| ) | |
Morgan Stanley & Co.
International PLC | | Allstate Corp.
| | | 32,162
| | | 11/18/2019
| | | 2.73
| %(b) | | | 495
| | | | (41
| ) | | | 454
| | |
Morgan Stanley & Co.
International PLC | | Amazon.com, Inc.
| | | 86,293
| | | 11/18/2019
| | | 2.73
| %(b) | | | (803
| ) | | | (112
| ) | | | (915
| ) | |
Morgan Stanley & Co.
International PLC | | Amazon.com, Inc.
| | | 4,794
| | | 11/18/2019
| | | 2.74
| %(b) | | | (666
| ) | | | (6
| ) | | | (672
| ) | |
Morgan Stanley & Co.
International PLC | | American Electric
Power Co., Inc. | | | 26,043
| | | 11/18/2019
| | | 2.73
| %(b) | | | 108
| | | | (33
| ) | | | 75
| | |
Morgan Stanley & Co.
International PLC | | American Electric
Power Co., Inc. | | | 25,603
| | | 11/18/2019
| | | 2.73
| %(b) | | | (30
| ) | | | (14
| ) | | | (44
| ) | |
Morgan Stanley & Co.
International PLC | | Amphenol Corp.
| | | 24,255
| | | 11/18/2019
| | | 2.73
| %(b) | | | (51
| ) | | | (31
| ) | | | (82
| ) | |
Morgan Stanley & Co.
International PLC | | Amphenol Corp.
| | | 24,523
| | | 11/18/2019
| | | 2.73
| %(b) | | | 637
| | | | (31
| ) | | | 606
| | |
Morgan Stanley & Co.
International PLC | | Amphenol Corp.
| | | 27,119
| | | 11/18/2019
| | | 2.73
| %(b) | | | 843
| | | | (34
| ) | | | 809
| | |
Morgan Stanley & Co.
International PLC | | Amphenol Corp.
| | | 25,597
| | | 11/18/2019
| | | 2.73
| %(b) | | | 64
| | | | (33
| ) | | | 31
| | |
Morgan Stanley & Co.
International PLC | | Amphenol Corp.
| | | 4,386
| | | 11/18/2019
| | | 2.73
| %(b) | | | 30
| | | | (6
| ) | | | 24
| | |
Morgan Stanley & Co.
International PLC | | Annaly Capital
Management, Inc. | | | 111,255
| | | 11/18/2019
| | | 2.73
| %(b) | | | (7,738
| ) | | | (153
| ) | | | (7,891
| ) | |
Morgan Stanley & Co.
International PLC | | Apollo Commercial
Real Estate Finance, Inc. | | | 29,169
| | | 11/18/2019
| | | 2.73
| %(b) | | | 99
| | | | (37
| ) | | | 62
| | |
Morgan Stanley & Co.
International PLC | | Apollo Commercial
Real Estate Finance, Inc. | | | 17,288
| | | 11/18/2019
| | | 2.74
| %(b) | | | (126
| ) | | | (18
| ) | | | (144
| ) | |
Morgan Stanley & Co.
International PLC | | Apple Hospitality
REIT, Inc. | | | 93,721
| | | 11/18/2019
| | | 2.73
| %(b) | | | (17,020
| ) | | | (143
| ) | | | (17,163
| ) | |
See Notes to Financial Statements
122
Consolidated Schedule of Investments Multi-Style Premia Fund (cont'd)
| Counterparty | | Reference
Entity | | Notional
Amount | | Maturity
Date | | Variable-
Rate(a) | | Unrealized
Appreciation/
(Depreciation) | | Accrued
Net
Interest
Receivable/
(Payable) | | Value | |
Morgan Stanley & Co.
International PLC | | Apple, Inc.
| | $ | 140,289
| | | 11/18/2019
| | | 2.73
| %(b) | | $ | 19,841
| | | $ | (155
| ) | �� | $ | 19,686
| | |
Morgan Stanley & Co.
International PLC | | Archer-Daniels-
Midland Co. | | | 105,368
| | | 11/18/2019
| | | 2.73
| %(b) | | | 7,701
| | | | (126
| ) | | | 7,575
| | |
Morgan Stanley & Co.
International PLC | | Avangrid, Inc.
| | | 1,269
| | | 11/18/2019
| | | 2.73
| %(b) | | | (168
| ) | | | (2
| ) | | | (170
| ) | |
Morgan Stanley & Co.
International PLC | | Bank of
NT Butterfield & Son Ltd. | | | 67,002
| | | 11/18/2019
| | | 2.73
| %(b) | | | (11,086
| ) | | | (101
| ) | | | (11,187
| ) | |
Morgan Stanley & Co.
International PLC | | Bank of
NT Butterfield & Son Ltd. | | | 15,189
| | | 11/18/2019
| | | 2.73
| %(b) | | | (2,837
| ) | | | (23
| ) | | | (2,860
| ) | |
Morgan Stanley & Co.
International PLC | | Bank of
NT Butterfield & Son Ltd. | | | 4,553
| | | 11/18/2019
| | | 2.73
| %(b) | | | (753
| ) | | | (7
| ) | | | (760
| ) | |
Morgan Stanley & Co.
International PLC | | BB&T Corp.
| | | 74,772
| | | 11/18/2019
| | | 2.73
| %(b) | | | (5,044
| ) | | | (103
| ) | | | (5,147
| ) | |
Morgan Stanley & Co.
International PLC | | BB&T Corp.
| | | 5,014
| | | 11/18/2019
| | | 2.73
| %(b) | | | (169
| ) | | | (7
| ) | | | (176
| ) | |
Morgan Stanley & Co.
International PLC | | Blackstone Mortgage
Trust, Inc. | | | 25,339
| | | 11/18/2019
| | | 2.73
| %(b) | | | 1,369
| | | | (31
| ) | | | 1,338
| | |
Morgan Stanley & Co.
International PLC | | Blackstone Mortgage
Trust, Inc. | | | 25,710
| | | 11/18/2019
| | | 2.73
| %(b) | | | 490
| | | | (136
| ) | | | 354
| | |
Morgan Stanley & Co.
International PLC | | Blackstone Mortgage
Trust, Inc. | | | 28,375
| | | 11/18/2019
| | | 2.73
| %(b) | | | 457
| | | | (48
| ) | | | 409
| | |
Morgan Stanley & Co.
International PLC | | Blackstone Mortgage
Trust, Inc. | | | 24,563
| | | 11/18/2019
| | | 2.74
| %(b) | | | 323
| | | | (26
| ) | | | 297
| | |
Morgan Stanley & Co.
International PLC | | Booz Allen Hamilton
Holding Corp | | | 24,126
| | | 11/18/2019
| | | 2.73
| %(b) | | | (1,040
| ) | | | (32
| ) | | | (1,072
| ) | |
Morgan Stanley & Co.
International PLC | | Booz Allen Hamilton
Holding Corp. | | | 24,572
| | | 11/18/2019
| | | 2.73
| %(b) | | | (1,020
| ) | | | (33
| ) | | | (1,053
| ) | |
Morgan Stanley & Co.
International PLC | | Booz Allen Hamilton
Holding Corp. | | | 25,662
| | | 11/18/2019
| | | 2.73
| %(b) | | | (148
| ) | | | (33
| ) | | | (181
| ) | |
Morgan Stanley & Co.
International PLC | | Booz Allen Hamilton
Holding Corp. | | | 25,860
| | | 11/18/2019
| | | 2.73
| %(b) | | | 85
| | | | (14
| ) | | | 71
| | |
Morgan Stanley & Co.
International PLC | | Bristol-Myers Squibb Co.
| | | 106,134
| | | 11/18/2019
| | | 2.73
| %(b) | | | (3,647
| ) | | | (141
| ) | | | (3,788
| ) | |
Morgan Stanley & Co.
International PLC | | Broadridge Financial
Solutions, Inc. | | | 8,420
| | | 11/18/2019
| | | 2.73
| %(b) | | | 198
| | | | (11
| ) | | | 187
| | |
Morgan Stanley & Co.
International PLC | | Broadridge Financial
Solutions, Inc. | | | 22,452
| | | 11/18/2019
| | | 2.73
| %(b) | | | (2,528
| ) | | | (134
| ) | | | (2,662
| ) | |
Morgan Stanley & Co.
International PLC | | Cable One, Inc.
| | | 16,123
| | | 11/18/2019
| | | 2.73
| %(b) | | | 352
| | | | (12
| ) | | | 340
| | |
Morgan Stanley & Co.
International PLC | | Carnival Corp.
| | | 97,285
| | | 11/18/2019
| | | 2.73
| %(b) | | | (11,313
| ) | | | (140
| ) | | | (11,453
| ) | |
See Notes to Financial Statements
123
Consolidated Schedule of Investments Multi-Style Premia Fund (cont'd)
| Counterparty | | Reference
Entity | | Notional
Amount | | Maturity
Date | | Variable-
Rate(a) | | Unrealized
Appreciation/
(Depreciation) | | Accrued
Net
Interest
Receivable/
(Payable) | | Value | |
Morgan Stanley & Co.
International PLC | | CDW Corp.
| | $ | 110,622
| | | 11/18/2019
| | | 2.73
| %(b) | | $ | 11,200
| | | $ | (128
| ) | | $ | 11,072
| | |
Morgan Stanley & Co.
International PLC | | CDW Corp.
| | | 4,140
| | | 11/18/2019
| | | 2.73
| %(b) | | | 360
| | | | (5
| ) | | | 355
| | |
Morgan Stanley & Co.
International PLC | | CenterPoint
Energy, Inc. | | | 84,055
| | | 11/18/2019
| | | 2.73
| %(b) | | | 3,621
| | | | (104
| ) | | | 3,517
| | |
Morgan Stanley & Co.
International PLC | | Chevron Corp.
| | | 117,344
| | | 11/18/2019
| | | 2.73
| %(b) | | | (10,244
| ) | | | (164
| ) | | | (10,408
| ) | |
Morgan Stanley & Co.
International PLC | | Chimera Investment
Corp. | | | 132,060
| | | 11/18/2019
| | | 2.73
| %(b) | | | 2,155
| | | | (167
| ) | | | 1,988
| | |
Morgan Stanley & Co.
International PLC | | Cigna Corp.
| | | 142,184
| | | 11/18/2019
| | | 2.73
| %(b) | | | 27,414
| | | | (148
| ) | | | 27,266
| | |
Morgan Stanley & Co.
International PLC | | Cinemark Holdings, Inc.
| | | 27,145
| | | 11/18/2019
| | | 2.73
| %(b) | | | 1,263
| | | | (20
| ) | | | 1,243
| | |
Morgan Stanley & Co.
International PLC | | Cinemark Holdings, Inc.
| | | 27,311
| | | 11/18/2019
| | | 2.73
| %(b) | | | 1,520
| | | | (20
| ) | | | 1,500
| | |
Morgan Stanley & Co.
International PLC | | Cinemark Holdings, Inc.
| | | 26,771
| | | 11/18/2019
| | | 2.73
| %(b) | | | 794
| | | | (20
| ) | | | 774
| | |
Morgan Stanley & Co.
International PLC | | Cisco Systems, Inc.
| | | 118,675
| | | 11/18/2019
| | | 2.73
| %(b) | | | 7,194
| | | | (144
| ) | | | 7,050
| | |
Morgan Stanley & Co.
International PLC | | Cogent Communications
Holdings, Inc. | | | 23,807
| | | 11/18/2019
| | | 2.73
| %(b) | | | (1,858
| ) | | | (33
| ) | | | (1,891
| ) | |
Morgan Stanley & Co.
International PLC | | Cognizant Technology
Solutions Corp. | | | 2,623
| | | 11/18/2019
| | | 2.73
| %(b) | | | (205
| ) | | | (4
| ) | | | (209
| ) | |
Morgan Stanley & Co.
International PLC | | Cognizant Technology
Solutions Corp. | | | 22,297
| | | 11/18/2019
| | | 2.73
| %(b) | | | (2,586
| ) | | | (32
| ) | | | (2,618
| ) | |
Morgan Stanley & Co.
International PLC | | Cognizant Technology
Solutions Corp. | | | 20,640
| | | 11/18/2019
| | | 2.73
| %(b) | | | (3,043
| ) | | | (31
| ) | | | (3,074
| ) | |
Morgan Stanley & Co.
International PLC | | Cognizant Technology
Solutions Corp. | | | 19,812
| | | 11/18/2019
| | | 2.73
| %(b) | | | (2,705
| ) | | | (29
| ) | | | (2,734
| ) | |
Morgan Stanley & Co.
International PLC | | Cognizant Technology
Solutions Corp. | | | 3,659
| | | 11/18/2019
| | | 2.73
| %(b) | | | (675
| ) | | | (6
| ) | | | (681
| ) | |
Morgan Stanley & Co.
International PLC | | Columbia
Sportswear Co. | | | 25,549
| | | 11/18/2019
| | | 2.73
| %(b) | | | (107
| ) | | | (20
| ) | | | (127
| ) | |
Morgan Stanley & Co.
International PLC | | Comcast Corp.
| | | 27,690
| | | 11/18/2019
| | | 2.73
| %(b) | | | 1,955
| | | | (33
| ) | | | 1,922
| | |
Morgan Stanley & Co.
International PLC | | Comerica, Inc.
| | | 20,798
| | | 11/18/2019
| | | 2.73
| %(b) | | | (3,113
| ) | | | (31
| ) | | | (3,144
| ) | |
Morgan Stanley & Co.
International PLC | | Comerica, Inc.
| | | 20,798
| | | 11/18/2019
| | | 2.73
| %(b) | | | (3,600
| ) | | | (19
| ) | | | (3,619
| ) | |
Morgan Stanley & Co.
International PLC | | Comerica, Inc.
| | | 20,635
| | | 11/18/2019
| | | 2.73
| %(b) | | | (3,480
| ) | | | (31
| ) | | | (3,511
| ) | |
See Notes to Financial Statements
124
Consolidated Schedule of Investments Multi-Style Premia Fund (cont'd)
| Counterparty | | Reference
Entity | | Notional
Amount | | Maturity
Date | | Variable-
Rate(a) | | Unrealized
Appreciation/
(Depreciation) | | Accrued
Net
Interest
Receivable/
(Payable) | | Value | |
Morgan Stanley & Co.
International PLC | | Comerica, Inc.
| | $ | 21,450
| | | 11/18/2019
| | | 2.73
| %(b) | | $ | (2,960
| ) | | $ | (31
| ) | | $ | (2,991
| ) | |
Morgan Stanley & Co.
International PLC | | Comerica, Inc.
| | | 6,362
| | | 11/18/2019
| | | 2.73
| %(b) | | | (1,200
| ) | | | (10
| ) | | | (1,210
| ) | |
Morgan Stanley & Co.
International PLC | | Comerica, Inc.
| | | 8,319
| | | 11/18/2019
| | | 2.74
| %(b) | | | (239
| ) | | | (9
| ) | | | (248
| ) | |
Morgan Stanley & Co.
International PLC | | Comerica, Inc.
| | | 4,649
| | | 11/18/2019
| | | 2.73
| %(b) | | | 29
| | | | (2
| ) | | | 27
| | |
Morgan Stanley & Co.
International PLC | | Conagra Brands, Inc.
| | | 110,360
| | | 11/18/2019
| | | 2.73
| %(b) | | | (5,476
| ) | | | (149
| ) | | | (5,625
| ) | |
Morgan Stanley & Co.
International PLC | | Cracker Barrel
Old Country Store, Inc. | | | 635
| | | 11/18/2019
| | | 2.73
| %(b) | | | 7
| | | | (1
| ) | | | 6
| | |
Morgan Stanley & Co.
International PLC | | Cummins, Inc.
| | | 98,007
| | | 11/18/2019
| | | 2.73
| %(b) | | | (5,604
| ) | | | (134
| ) | | | (5,738
| ) | |
Morgan Stanley & Co.
International PLC | | Deckers Outdoor Corp.
| | | 59,007
| | | 11/18/2019
| | | 2.73
| %(b) | | | 9,147
| | | | (64
| ) | | | 9,083
| | |
Morgan Stanley & Co.
International PLC | | Deckers Outdoor Corp.
| | | 24,544
| | | 11/18/2019
| | | 2.73
| %(b) | | | 1,522
| | | | (18
| ) | | | 1,504
| | |
Morgan Stanley & Co.
International PLC | | Deckers Outdoor Corp.
| | | 25,307
| | | 11/18/2019
| | | 2.73
| %(b) | | | 2,341
| | | | (30
| ) | | | 2,311
| | |
Morgan Stanley & Co.
International PLC | | Deckers Outdoor Corp.
| | | 11,700
| | | 11/18/2019
| | | 2.74
| %(b) | | | 1,499
| | | | (11
| ) | | | 1,488
| | |
Morgan Stanley & Co.
International PLC | | Dollar General Corp.
| | | 26,063
| | | 11/18/2019
| | | 2.74
| %(b) | | | 99
| | | | (28
| ) | | | 71
| | |
Morgan Stanley & Co.
International PLC | | Dollar General Corp.
| | | 26,174
| | | 11/18/2019
| | | 2.73
| %(b) | | | 231
| | | | (14
| ) | | | 217
| | |
Morgan Stanley & Co.
International PLC | | Eaton Corp. PLC
| | | 107,218
| | | 11/18/2019
| | | 2.73
| %(b) | | | (7,894
| ) | | | (148
| ) | | | (8,042
| ) | |
Morgan Stanley & Co.
International PLC | | Emerson Electric Co
| | | 123,881
| | | 11/18/2019
| | | 2.73
| %(b) | | | (5,286
| ) | | | (166
| ) | | | (5,452
| ) | |
Morgan Stanley & Co.
International PLC | | Encompass Health Corp.
| | | 114,343
| | | 11/18/2019
| | | 2.73
| %(b) | | | 5,511
| | | | (140
| ) | | | 5,371
| | |
Morgan Stanley & Co.
International PLC | | Exelon Corp.
| | | 25,541
| | | 11/18/2019
| | | 2.73
| %(b) | | | (231
| ) | | | (33
| ) | | | (264
| ) | |
Morgan Stanley & Co.
International PLC | | Exelon Corp.
| | | 26,505
| | | 11/18/2019
| | | 2.73
| %(b) | | | 740
| | | | (33
| ) | | | 707
| | |
Morgan Stanley & Co.
International PLC | | Exelon Corp.
| | | 25,892
| | | 11/18/2019
| | | 2.73
| %(b) | | | (128
| ) | | | (33
| ) | | | (161
| ) | |
Morgan Stanley & Co.
International PLC | | Exelon Corp.
| | | 25,410
| | | 11/18/2019
| | | 2.73
| %(b) | | | 159
| | | | (13
| ) | | | 146
| | |
Morgan Stanley & Co.
International PLC | | Exxon Mobil Corp.
| | | 111,950
| | | 11/18/2019
| | | 2.73
| %(b) | | | 1,761
| | | | (142
| ) | | | 1,619
| | |
See Notes to Financial Statements
125
Consolidated Schedule of Investments Multi-Style Premia Fund (cont'd)
| Counterparty | | Reference
Entity | | Notional
Amount | | Maturity
Date | | Variable-
Rate(a) | | Unrealized
Appreciation/
(Depreciation) | | Accrued
Net
Interest
Receivable/
(Payable) | | Value | |
Morgan Stanley & Co.
International PLC | | Fidelity National
Information Services, Inc. | | $ | 54,548
| | | 11/18/2019
| | | 2.73
| %(b) | | $ | 898
| | | $ | (69
| ) | | $ | 829
| | |
Morgan Stanley & Co.
International PLC | | Fidelity National
Information Services, Inc. | | | 24,672
| | | 11/18/2019
| | | 2.73
| %(b) | | | (158
| ) | | | (32
| ) | | | (190
| ) | |
Morgan Stanley & Co.
International PLC | | Fidelity National
Information Services, Inc. | | | 14,262
| | | 11/18/2019
| | | 2.73
| %(b) | | | (452
| ) | | | (19
| ) | | | (471
| ) | |
Morgan Stanley & Co.
International PLC | | Fidelity National
Information Services, Inc. | | | 9,057
| | | 11/18/2019
| | | 2.73
| %(b) | | | (218
| ) | | | (12
| ) | | | (230
| ) | |
Morgan Stanley & Co.
International PLC | | Fidelity National
Information Services, Inc. | | | 3,227
| | | 11/18/2019
| | | 2.73
| %(b) | | | 30
| | | | (4
| ) | | | 26
| | |
Morgan Stanley & Co.
International PLC | | First Hawaiian, Inc.
| | | 23,467
| | | 11/18/2019
| | | 2.73
| %(b) | | | (3,302
| ) | | | (35
| ) | | | (3,337
| ) | |
Morgan Stanley & Co.
International PLC | | FirstEnergy Corp.
| | | 25,686
| | | 11/18/2019
| | | 2.73
| %(b) | | | 1,622
| | | | (31
| ) | | | 1,591
| | |
Morgan Stanley & Co.
International PLC | | FirstEnergy Corp.
| | | 24,679
| | | 11/18/2019
| | | 2.73
| %(b) | | | 671
| | | | (31
| ) | | | 640
| | |
Morgan Stanley & Co.
International PLC | | FirstEnergy Corp.
| | | 17,186
| | | 11/18/2019
| | | 2.73
| %(b) | | | (496
| ) | | | (23
| ) | | | (519
| ) | |
Morgan Stanley & Co.
International PLC | | FirstEnergy Corp.
| | | 6,002
| | | 11/18/2019
| | | 2.73
| %(b) | | | (156
| ) | | | (3
| ) | | | (159
| ) | |
Morgan Stanley & Co.
International PLC | | Flowers Foods, Inc.
| | | 31,224
| | | 11/18/2019
| | | 2.73
| %(b) | | | (1,142
| ) | | | (25
| ) | | | (1,167
| ) | |
Morgan Stanley & Co.
International PLC | | Flowers Foods, Inc.
| | | 22,438
| | | 11/18/2019
| | | 2.73
| %(b) | | | (1,425
| ) | | | (18
| ) | | | (1,443
| ) | |
Morgan Stanley & Co.
International PLC | | Ford Motor Co.
| | | 11,374
| | | 11/18/2019
| | | 2.73
| %(b) | | | (2,259
| ) | | | (18
| ) | | | (2,277
| ) | |
Morgan Stanley & Co.
International PLC | | Gaming and Leisure
Properties, Inc. | | | 24,594
| | | 11/18/2019
| | | 2.73
| %(b) | | | (976
| ) | | | (33
| ) | | | (1,009
| ) | |
Morgan Stanley & Co.
International PLC | | Garmin Ltd.
| | | 122,793
| | | 11/18/2019
| | | 2.73
| %(b) | | | 10,604
| | | | (145
| ) | | | 10,459
| | |
Morgan Stanley & Co.
International PLC | | Garrett Motion, Inc.
| | | 576
| | | 11/18/2019
| | | 2.73
| %(b) | | | (122
| ) | | | (1
| ) | | | (123
| ) | |
Morgan Stanley & Co.
International PLC | | Hawaiian Electric
Industries, Inc. | | | 103,619
| | | 11/18/2019
| | | 2.73
| %(b) | | | 9,427
| | | | (121
| ) | | | 9,306
| | |
Morgan Stanley & Co.
International PLC | | Hill-Rom Holdings, Inc.
| | | 82,567
| | | 11/18/2019
| | | 2.73
| %(b) | | | (6,723
| ) | | | (115
| ) | | | (6,838
| ) | |
Morgan Stanley & Co.
International PLC | | Hill-Rom Holdings, Inc.
| | | 6,222
| | | 11/18/2019
| | | 2.73
| %(b) | | | (661
| ) | | | (9
| ) | | | (670
| ) | |
Morgan Stanley & Co.
International PLC | | Hill-Rom Holdings, Inc.
| | | 8,156
| | | 11/18/2019
| | | 2.74
| %(b) | | | (555
| ) | | | (9
| ) | | | (564
| ) | |
Morgan Stanley & Co.
International PLC | | Hill-Rom Holdings, Inc.
| | | 3,027
| | | 11/18/2019
| | | 2.73
| %(b) | | | (56
| ) | | | (2
| ) | | | (58
| ) | |
See Notes to Financial Statements
126
Consolidated Schedule of Investments Multi-Style Premia Fund (cont'd)
| Counterparty | | Reference
Entity | | Notional
Amount | | Maturity
Date | | Variable-
Rate(a) | | Unrealized
Appreciation/
(Depreciation) | | Accrued
Net
Interest
Receivable/
(Payable) | | Value | |
Morgan Stanley & Co.
International PLC | | HollyFrontier Corp.
| | $ | 35,271
| | | 11/18/2019
| | | 2.73
| %(b) | | $ | (3,879
| ) | | $ | (50
| ) | | $ | (3,929
| ) | |
Morgan Stanley & Co.
International PLC | | Honeywell
International, Inc. | | | 55,611
| | | 11/18/2019
| | | 2.73
| %(b) | | | (1,300
| ) | | | (73
| ) | | | (1,373
| ) | |
Morgan Stanley & Co.
International PLC | | Honeywell International,
Inc. | | | 24,330
| | | 11/18/2019
| | | 2.73
| %(b) | | | (972
| ) | | | (13
| ) | | | (985
| ) | |
Morgan Stanley & Co.
International PLC | | Hospitality Properties Trust
| | | 87,697
| | | 11/18/2019
| | | 2.73
| %(b) | | | (10,770
| ) | | | (127
| ) | | | (10,897
| ) | |
Morgan Stanley & Co.
International PLC | | Humana, Inc.
| | | 66,004
| | | 11/18/2019
| | | 2.73
| %(b) | | | 5,777
| | | | (78
| ) | | | 5,699
| | |
Morgan Stanley & Co.
International PLC | | International Business
Machines Corp. | | | 76,068
| | | 11/18/2019
| | | 2.73
| %(b) | | | (17,000
| ) | | | (120
| ) | | | (17,120
| ) | |
Morgan Stanley & Co.
International PLC | | International Paper Co.
| | | 68,766
| | | 11/18/2019
| | | 2.73
| %(b) | | | (11,501
| ) | | | (104
| ) | | | (11,605
| ) | |
Morgan Stanley & Co.
International PLC | | Interpublic Group of
Cos, Inc. | | | 25,777
| | | 11/18/2019
| | | 2.73
| %(b) | | | (208
| ) | | | (33
| ) | | | (241
| ) | |
Morgan Stanley & Co.
International PLC | | Interpublic Group of
Cos, Inc. | | | 25,870
| | | 11/18/2019
| | | 2.73
| %(b) | | | 49
| | | | (33
| ) | | | 16
| | |
Morgan Stanley & Co.
International PLC | | Intuit, Inc.
| | | 5,275
| | | 11/18/2019
| | | 2.73
| %(b) | | | 222
| | | | (6
| ) | | | 216
| | |
Morgan Stanley & Co.
International PLC | | Intuit, Inc.
| | | 18,146
| | | 11/18/2019
| | | 2.73
| %(b) | | | 536
| | | | (23
| ) | | | 513
| | |
Morgan Stanley & Co.
International PLC | | Intuit, Inc.
| | | 25,953
| | | 11/18/2019
| | | 2.73
| %(b) | | | 312
| | | | (33
| ) | | | 279
| | |
Morgan Stanley & Co.
International PLC | | Intuit, Inc.
| | | 1,688
| | | 11/18/2019
| | | 2.73
| %(b) | | | (44
| ) | | | (2
| ) | | | (46
| ) | |
Morgan Stanley & Co.
International PLC | | Intuit, Inc.
| | | 5,697
| | | 11/18/2019
| | | 2.73
| %(b) | | | (130
| ) | | | (7
| ) | | | (137
| ) | |
Morgan Stanley & Co.
International PLC | | Intuit, Inc.
| | | 9,917
| | | 11/18/2019
| | | 2.73
| %(b) | | | 317
| | | | (12
| ) | | | 305
| | |
Morgan Stanley & Co.
International PLC | | Investors BanCorp., Inc.
| | | 22,762
| | | 11/18/2019
| | | 2.73
| %(b) | | | (3,169
| ) | | | (33
| ) | | | (3,202
| ) | |
Morgan Stanley & Co.
International PLC | | John Wiley & Sons, Inc.
| | | 23,106
| | | 11/18/2019
| | | 2.73
| %(b) | | | (2,797
| ) | | | (20
| ) | | | (2,817
| ) | |
Morgan Stanley & Co.
International PLC | | John Wiley & Sons, Inc.
| | | 24,137
| | | 11/18/2019
| | | 2.73
| %(b) | | | (1,333
| ) | | | (19
| ) | | | (1,352
| ) | |
Morgan Stanley & Co.
International PLC | | Johnson & Johnson
| | | 25,758
| | | 11/18/2019
| | | 2.74
| %(b) | | | 630
| | | | (27
| ) | | | 603
| | |
Morgan Stanley & Co.
International PLC | | JPMorgan Chase & Co.
| | | 110,328
| | | 11/18/2019
| | | 2.73
| %(b) | | | 3,121
| | | | (138
| ) | | | 2,983
| | |
Morgan Stanley & Co.
International PLC | | Kansas City Southern
| | | 53,529
| | | 11/18/2019
| | | 2.73
| %(b) | | | (4,172
| ) | | | (74
| ) | | | (4,246
| ) | |
See Notes to Financial Statements
127
Consolidated Schedule of Investments Multi-Style Premia Fund (cont'd)
| Counterparty | | Reference
Entity | | Notional
Amount | | Maturity
Date | | Variable-
Rate(a) | | Unrealized
Appreciation/
(Depreciation) | | Accrued
Net
Interest
Receivable/
(Payable) | | Value | |
Morgan Stanley & Co.
International PLC | | KAR Auction Services,
Inc. | | $ | 28,242
| | | 11/18/2019
| | | 2.73
| %(b) | | $ | 2,016
| | | $ | (34
| ) | | $ | 1,982
| | |
Morgan Stanley & Co.
International PLC | | Kimberly-Clark Corp.
| | | 94,183
| | | 11/18/2019
| | | 2.73
| %(b) | | | (484
| ) | | | (122
| ) | | | (606
| ) | |
Morgan Stanley & Co.
International PLC | | Kohl's Corp.
| | | 119,881
| | | 11/18/2019
| | | 2.73
| %(b) | | | 14,300
| | | | (136
| ) | | | 14,164
| | |
Morgan Stanley & Co.
International PLC | | Leidos Holdings, Inc.
| | | 30,187
| | | 11/18/2019
| | | 2.73
| %(b) | | | 2,322
| | | | (36
| ) | | | 2,286
| | |
Morgan Stanley & Co.
International PLC | | Leidos Holdings, Inc.
| | | 25,653
| | | 11/18/2019
| | | 2.73
| %(b) | | | 1,134
| | | | (32
| ) | | | 1,102
| | |
Morgan Stanley & Co.
International PLC | | Lockheed Martin Corp.
| | | 24,096
| | | 11/18/2019
| | | 2.73
| %(b) | | | (1,915
| ) | | | (33
| ) | | | (1,948
| ) | |
Morgan Stanley & Co.
International PLC | | LyondellBasell
Industries NV | | | 97,929
| | | 11/18/2019
| | | 2.73
| %(b) | | | (24,339
| ) | | | (158
| ) | | | (24,497
| ) | |
Morgan Stanley & Co.
International PLC | | Marathon Petroleum
Corp. | | | 33,393
| | | 11/18/2019
| | | 2.73
| %(b) | | | (3,397
| ) | | | (47
| ) | | | (3,444
| ) | |
Morgan Stanley & Co.
International PLC | | Marathon Petroleum
Corp. | | | 23,389
| | | 11/18/2019
| | | 2.74
| %(b) | | | (3,196
| ) | | | (28
| ) | | | (3,224
| ) | |
Morgan Stanley & Co.
International PLC | | Marathon Petroleum
Corp. | | | 16,133
| | | 11/18/2019
| | | 2.73
| %(b) | | | (377
| ) | | | (9
| ) | | | (386
| ) | |
Morgan Stanley & Co.
International PLC | | Maxim Integrated
Products, Inc. | | | 51,521
| | | 11/18/2019
| | | 2.73
| %(b) | | | (9,122
| ) | | | (78
| ) | | | (9,200
| ) | |
Morgan Stanley & Co.
International PLC | | McDonald's Corp.
| | | 122,946
| | | 11/18/2019
| | | 2.73
| %(b) | | | 11,310
| | | | (144
| ) | | | 11,166
| | |
Morgan Stanley & Co.
International PLC | | Medical Properties
Trust, Inc. | | | 51,341
| | | 11/18/2019
| | | 2.73
| %(b) | | | 4,884
| | | | (60
| ) | | | 4,824
| | |
Morgan Stanley & Co.
International PLC | | Medical Properties
Trust, Inc. | | | 17,951
| | | 11/18/2019
| | | 2.73
| %(b) | | | (92
| ) | | | (23
| ) | | | (115
| ) | |
Morgan Stanley & Co.
International PLC | | Medical Properties
Trust, Inc. | | | 28,710
| | | 11/18/2019
| | | 2.73
| %(b) | | | 277
| | | | (15
| ) | | | 262
| | |
Morgan Stanley & Co.
International PLC | | Merck & Co., Inc.
| | | 67,942
| | | 11/18/2019
| | | 2.73
| %(b) | | | 14,033
| | | | (70
| ) | | | 13,963
| | |
Morgan Stanley & Co.
International PLC | | MFA Financial, Inc.
| | | 116,958
| | | 11/18/2019
| | | 2.73
| %(b) | | | (14,286
| ) | | | (169
| ) | | | (14,455
| ) | |
Morgan Stanley & Co.
International PLC | | Microsoft Corp.
| | | 25,741
| | | 11/18/2019
| | | 2.73
| %(b) | | | 1,861
| | | | (31
| ) | | | 1,830
| | |
Morgan Stanley & Co.
International PLC | | Microsoft Corp.
| | | 25,741
| | | 11/18/2019
| | | 2.73
| %(b) | | | (206
| ) | | | (33
| ) | | | (239
| ) | |
Morgan Stanley & Co.
International PLC | | Microsoft Corp.
| | | 24,887
| | | 11/18/2019
| | | 2.73
| %(b) | | | (484
| ) | | | (33
| ) | | | (517
| ) | |
Morgan Stanley & Co.
International PLC | | Microsoft Corp.
| | | 21,896
| | | 11/18/2019
| | | 2.73
| %(b) | | | (565
| ) | | | (121
| ) | | | (686
| ) | |
See Notes to Financial Statements
128
Consolidated Schedule of Investments Multi-Style Premia Fund (cont'd)
| Counterparty | | Reference
Entity | | Notional
Amount | | Maturity
Date | | Variable-
Rate(a) | | Unrealized
Appreciation/
(Depreciation) | | Accrued
Net
Interest
Receivable/
(Payable) | | Value | |
Morgan Stanley & Co.
International PLC | | Mondelez International,
Inc. | | $ | 25,524
| | | 11/18/2019
| | | 2.74
| %(b) | | $ | 422
| | | $ | (27
| ) | | $ | 395
| | |
Morgan Stanley & Co.
International PLC | | Mondelez International,
Inc. | | | 26,279
| | | 11/18/2019
| | | 2.73
| %(b) | | | 447
| | | | (14
| ) | | | 433
| | |
Morgan Stanley & Co.
International PLC | | Motorola Solutions, Inc.
| | | 111,652
| | | 11/18/2019
| | | 2.73
| %(b) | | | 11,728
| | | | (129
| ) | | | 11,599
| | |
Morgan Stanley & Co.
International PLC | | MSC Industrial Direct
Co., Inc. | | | 25,210
| | | 11/18/2019
| | | 2.74
| %(b) | | | (475
| ) | | | (27
| ) | | | (502
| ) | |
Morgan Stanley & Co.
International PLC | | MSC Industrial Direct
Co., Inc. | | | 26,263
| | | 11/18/2019
| | | 2.73
| %(b) | | | 468
| | | | (14
| ) | | | 454
| | |
Morgan Stanley & Co.
International PLC | | New Residential
Investment Corp. | | | 29,574
| | | 11/18/2019
| | | 2.73
| %(b) | | | (424
| ) | | | (39
| ) | | | (463
| ) | |
Morgan Stanley & Co.
International PLC | | Newmont Mining Corp.
| | | 7,854
| | | 11/18/2019
| | | 2.73
| %(b) | | | (2,036
| ) | | | (13
| ) | | | (2,049
| ) | |
Morgan Stanley & Co.
International PLC | | Newmont Mining Corp.
| | | 19,634
| | | 11/18/2019
| | | 2.73
| %(b) | | | (4,849
| ) | | | (32
| ) | | | (4,881
| ) | |
Morgan Stanley & Co.
International PLC | | Newmont Mining Corp.
| | | 22,850
| | | 11/18/2019
| | | 2.73
| %(b) | | | (4,261
| ) | | | (35
| ) | | | (4,296
| ) | |
Morgan Stanley & Co.
International PLC | | Newmont Mining Corp.
| | | 11,348
| | | 11/18/2019
| | | 2.73
| %(b) | | | (1,892
| ) | | | (17
| ) | | | (1,909
| ) | |
Morgan Stanley & Co.
International PLC | | Newmont Mining Corp.
| | | 25,447
| | | 11/18/2019
| | | 2.73
| %(b) | | | 678
| | | | (32
| ) | | | 646
| | |
Morgan Stanley & Co.
International PLC | | Newmont Mining Corp.
| | | 19,634
| | | 11/18/2019
| | | 2.73
| %(b) | | | 815
| | | | (24
| ) | | | 791
| | |
Morgan Stanley & Co.
International PLC | | Nexstar Media Group, Inc.
| | | 23,665
| | | 11/18/2019
| | | 2.73
| %(b) | | | (2,249
| ) | | | (33
| ) | | | (2,282
| ) | |
Morgan Stanley & Co.
International PLC | | Nexstar Media Group, Inc.
| | | 24,189
| | | 11/18/2019
| | | 2.73
| %(b) | | | (1,569
| ) | | | (33
| ) | | | (1,602
| ) | |
Morgan Stanley & Co.
International PLC | | Nexstar Media Group, Inc.
| | | 24,714
| | | 11/18/2019
| | | 2.74
| %(b) | | | (906
| ) | | | (27
| ) | | | (933
| ) | |
Morgan Stanley & Co.
International PLC | | NextEra Energy, Inc.
| | | 26,565
| | | 11/18/2019
| | | 2.73
| %(b) | | | 2,032
| | | | (32
| ) | | | 2,000
| | |
Morgan Stanley & Co.
International PLC | | NextEra Energy, Inc.
| | | 25,358
| | | 11/18/2019
| | | 2.73
| %(b) | | | 1,396
| | | | (31
| ) | | | 1,365
| | |
Morgan Stanley & Co.
International PLC | | NextEra Energy, Inc.
| | | 25,013
| | | 11/18/2019
| | | 2.73
| %(b) | | | 830
| | | | (31
| ) | | | 799
| | |
Morgan Stanley & Co.
International PLC | | NextEra Energy, Inc.
| | | 5,348
| | | 11/18/2019
| | | 2.73
| %(b) | | | 157
| | | | (7
| ) | | | 150
| | |
Morgan Stanley & Co.
International PLC | | NextEra Energy, Inc.
| | | 16,388
| | | 11/18/2019
| | | 2.73
| %(b) | | | 217
| | | | (21
| ) | | | 196
| | |
Morgan Stanley & Co.
International PLC | | NIKE, Inc.
| | | 82,769
| | | 11/18/2019
| | | 2.73
| %(b) | | | 4,537
| | | | (101
| ) | | | 4,436
| | |
See Notes to Financial Statements
129
Consolidated Schedule of Investments Multi-Style Premia Fund (cont'd)
| Counterparty | | Reference
Entity | | Notional
Amount | | Maturity
Date | | Variable-
Rate(a) | | Unrealized
Appreciation/
(Depreciation) | | Accrued
Net
Interest
Receivable/
(Payable) | | Value | |
Morgan Stanley & Co.
International PLC | | Norfolk Southern Corp.
| | $ | 34,405
| | | 11/18/2019
| | | 2.73
| %(b) | | $ | 3,318
| | | $ | (40
| ) | | $ | 3,278
| | |
Morgan Stanley & Co.
International PLC | | Norfolk Southern Corp.
| | | 23,664
| | | 11/18/2019
| | | 2.73
| %(b) | | | (1,164
| ) | | | (32
| ) | | | (1,196
| ) | |
Morgan Stanley & Co.
International PLC | | Norfolk Southern Corp.
| | | 26,181
| | | 11/18/2019
| | | 2.73
| %(b) | | | (1,586
| ) | | | (36
| ) | | | (1,622
| ) | |
Morgan Stanley & Co.
International PLC | | Norfolk Southern Corp.
| | | 11,580
| | | 11/18/2019
| | | 2.73
| %(b) | | | (1,303
| ) | | | (17
| ) | | | (1,320
| ) | |
Morgan Stanley & Co.
International PLC | | Norfolk Southern Corp.
| | | 9,398
| | | 11/18/2019
| | | 2.73
| %(b) | | | 608
| | | | (5
| ) | | | 603
| | |
Morgan Stanley & Co.
International PLC | | Nucor Corp.
| | | 80,167
| | | 11/18/2019
| | | 2.73
| %(b) | | | (4,890
| ) | | | (110
| ) | | | (5,000
| ) | |
Morgan Stanley & Co.
International PLC | | Occidental Petroleum
Corp. | | | 23,273
| | | 11/18/2019
| | | 2.74
| %(b) | | | (2,102
| ) | | | (27
| ) | | | (2,129
| ) | |
Morgan Stanley & Co.
International PLC | | Occidental Petroleum
Corp. | | | 24,346
| | | 11/18/2019
| | | 2.73
| %(b) | | | (1,298
| ) | | | (14
| ) | | | (1,312
| ) | |
Morgan Stanley & Co.
International PLC | | Omnicom Group, Inc.
| | | 27,498
| | | 11/18/2019
| | | 2.73
| %(b) | | | 1,537
| | | | (33
| ) | | | 1,504
| | |
Morgan Stanley & Co.
International PLC | | Omnicom Group, Inc.
| | | 26,681
| | | 11/18/2019
| | | 2.73
| %(b) | | | 938
| | | | (33
| ) | | | 905
| | |
Morgan Stanley & Co.
International PLC | | ONEOK, Inc.
| | | 36,933
| | | 11/18/2019
| | | 2.73
| %(b) | | | (398
| ) | | | (48
| ) | | | (446
| ) | |
Morgan Stanley & Co.
International PLC | | ONEOK, Inc.
| | | 25,584
| | | 11/18/2019
| | | 2.74
| %(b) | | | (728
| ) | | | (28
| ) | | | (756
| ) | |
Morgan Stanley & Co.
International PLC | | ONEOK, Inc.
| | | 25,650
| | | 11/18/2019
| | | 2.73
| %(b) | | | (120
| ) | | | (14
| ) | | | (134
| ) | |
Morgan Stanley & Co.
International PLC | | Park Hotels & Resorts,
Inc. | | | 24,913
| | | 11/18/2019
| | | 2.74
| %(b) | | | (674
| ) | | | (27
| ) | | | (701
| ) | |
Morgan Stanley & Co.
International PLC | | Paychex, Inc.
| | | 327
| | | 11/18/2019
| | | 2.73
| %(b) | | | (1
| ) | | | (0
| ) | | | (1
| ) | |
Morgan Stanley & Co.
International PLC | | PBF Energy, Inc.
| | | 11,634
| | | 11/18/2019
| | | 2.73
| %(b) | | | (1,008
| ) | | | (16
| ) | | | (1,024
| ) | |
Morgan Stanley & Co.
International PLC | | PepsiCo, Inc.
| | | 20,678
| | | 11/18/2019
| | | 2.73
| %(b) | | | (483
| ) | | | (27
| ) | | | (510
| ) | |
Morgan Stanley & Co.
International PLC | | PepsiCo., Inc.
| | | 84,285
| | | 11/18/2019
| | | 2.73
| %(b) | | | 8,455
| | | | (98
| ) | | | 8,357
| | |
Morgan Stanley & Co.
International PLC | | Pfizer, Inc.
| | | 126,166
| | | 11/18/2019
| | | 2.73
| %(b) | | | 21,546
| | | | (135
| ) | | | 21,411
| | |
Morgan Stanley & Co.
International PLC | | Phillips 66
| | | 119,991
| | | 11/18/2019
| | | 2.73
| %(b) | | | (16,334
| ) | | | (176
| ) | | | (16,510
| ) | |
Morgan Stanley & Co.
International PLC | | PNC Financial Services
Group, Inc. | | | 116,155
| | | 11/18/2019
| | | 2.73
| %(b) | | | (11,541
| ) | | | (165
| ) | | | (11,706
| ) | |
See Notes to Financial Statements
130
Consolidated Schedule of Investments Multi-Style Premia Fund (cont'd)
| Counterparty | | Reference
Entity | | Notional
Amount | | Maturity
Date | | Variable-
Rate(a) | | Unrealized
Appreciation/
(Depreciation) | | Accrued
Net
Interest
Receivable/
(Payable) | | Value | |
Morgan Stanley & Co.
International PLC | | Portland General
Electric Co. | | $ | 27,003
| | | 11/18/2019
| | | 2.73
| %(b) | | $ | 1,961
| | | $ | (32
| ) | | $ | 1,929
| | |
Morgan Stanley & Co.
International PLC | | Quest Diagnostics, Inc.
| | | 108,509
| | | 11/18/2019
| | | 2.73
| %(b) | | | (14,120
| ) | | | (158
| ) | | | (14,278
| ) | |
Morgan Stanley & Co.
International PLC | | Raytheon Co.
| | | 77,543
| | | 11/18/2019
| | | 2.73
| %(b) | | | (15,060
| ) | | | (119
| ) | | | (15,179
| ) | |
Morgan Stanley & Co.
International PLC | | Raytheon Co.
| | | 9,277
| | | 11/18/2019
| | | 2.73
| %(b) | | | (1,000
| ) | | | (13
| ) | | | (1,013
| ) | |
Morgan Stanley & Co.
International PLC | | Raytheon Co.
| | | 2,100
| | | 11/18/2019
| | | 2.73
| %(b) | | | (270
| ) | | | (13
| ) | | | (283
| ) | |
Morgan Stanley & Co.
International PLC | | Raytheon Co.
| | | 4,901
| | | 11/18/2019
| | | 2.73
| %(b) | | | (458
| ) | | | (3
| ) | | | (461
| ) | |
Morgan Stanley & Co.
International PLC | | Resideo Technologies,
Inc. | | | 1,937
| | | 11/18/2019
| | | 2.75
| %(b) | | | (439
| ) | | | —
| | | | (439
| ) | |
Morgan Stanley & Co.
International PLC | | Select, Income REIT
| | | 62,365
| | | 11/18/2019
| | | 2.73
| %(b) | | | (8,563
| ) | | | (91
| ) | | | (8,654
| ) | |
Morgan Stanley & Co.
International PLC | | Service Corp.
International | | | 55,031
| | | 11/18/2019
| | | 2.73
| %(b) | | | 6,122
| | | | (63
| ) | | | 6,059
| | |
Morgan Stanley & Co.
International PLC | | Service Corp.
International | | | 14,639
| | | 11/18/2019
| | | 2.73
| %(b) | | | 1,999
| | | | (16
| ) | | | 1,983
| | |
Morgan Stanley & Co.
International PLC | | Shutterfly, Inc.
| | | 17,050
| | | 11/18/2019
| | | 2.73
| %(b) | | | (14,324
| ) | | | (40
| ) | | | (14,364
| ) | |
Morgan Stanley & Co.
International PLC | | Sirius XM Holdings, Inc.
| | | 23,406
| | | 11/18/2019
| | | 2.73
| %(b) | | | (3,758
| ) | | | (35
| ) | | | (3,793
| ) | |
Morgan Stanley & Co.
International PLC | | Sirius XM Holdings, Inc.
| | | 25,380
| | | 11/18/2019
| | | 2.73
| %(b) | | | (1,039
| ) | | | (28
| ) | | | (1,067
| ) | |
Morgan Stanley & Co.
International PLC | | Spirit Realty Capital, Inc.
| | | 23,241
| | | 11/18/2019
| | | 2.73
| %(b) | | | (1,446
| ) | | | (32
| ) | | | (1,478
| ) | |
Morgan Stanley & Co.
International PLC | | Spirit Realty Capital, Inc.
| | | 26,830
| | | 11/18/2019
| | | 2.74
| %(b) | | | 321
| | | | (28
| ) | | | 293
| | |
Morgan Stanley & Co.
International PLC | | Spirit Realty Capital, Inc.
| | | 25,869
| | | 11/18/2019
| | | 2.73
| %(b) | | | (154
| ) | | | (14
| ) | | | (168
| ) | |
Morgan Stanley & Co.
International PLC | | Steel Dynamics, Inc.
| | | 46,411
| | | 11/18/2019
| | | 2.73
| %(b) | | | (10,626
| ) | | | (73
| ) | | | (10,699
| ) | |
Morgan Stanley & Co.
International PLC | | STERIS PLC
| | | 24,595
| | | 11/18/2019
| | | 2.73
| %(b) | | | 1,200
| | | | (30
| ) | | | 1,170
| | |
Morgan Stanley & Co.
International PLC | | Synovus Financial Corp.
| | | 19,381
| | | 11/18/2019
| | | 2.73
| %(b) | | | (6,593
| ) | | | (33
| ) | | | (6,626
| ) | |
Morgan Stanley & Co.
International PLC | | Synovus Financial Corp.
| | | 19,156
| | | 11/18/2019
| | | 2.73
| %(b) | | | (6,230
| ) | | | (136
| ) | | | (6,366
| ) | |
Morgan Stanley & Co.
International PLC | | Synovus Financial Corp.
| | | 10,930
| | | 11/18/2019
| | | 2.73
| %(b) | | | (3,974
| ) | | | (19
| ) | | | (3,993
| ) | |
See Notes to Financial Statements
131
Consolidated Schedule of Investments Multi-Style Premia Fund (cont'd)
| Counterparty | | Reference
Entity | | Notional
Amount | | Maturity
Date | | Variable-
Rate(a) | | Unrealized
Appreciation/
(Depreciation) | | Accrued
Net
Interest
Receivable/
(Payable) | | Value | |
Morgan Stanley & Co.
International PLC | | Synovus Financial Corp.
| | $ | 19,832
| | | 11/18/2019
| | | 2.73
| %(b) | | $ | (4,919
| ) | | $ | (32
| ) | | $ | (4,951
| ) | |
Morgan Stanley & Co.
International PLC | | Target Corp.
| | | 138,909
| | | 11/18/2019
| | | 2.73
| %(b) | | | 19,805
| | | | (154
| ) | | | 19,651
| | |
Morgan Stanley & Co.
International PLC | | Telephone & Data
Systems, Inc. | | | 25,589
| | | 11/18/2019
| | | 2.73
| %(b) | | | (304
| ) | | | (33
| ) | | | (337
| ) | |
Morgan Stanley & Co.
International PLC | | Texas Instruments, Inc.
| | | 105,919
| | | 11/18/2019
| | | 2.73
| %(b) | | | (20,671
| ) | | | (163
| ) | | | (20,834
| ) | |
Morgan Stanley & Co.
International PLC | | Textron, Inc.
| | | 20,272
| | | 11/18/2019
| | | 2.73
| %(b) | | | (4,690
| ) | | | (32
| ) | | | (4,722
| ) | |
Morgan Stanley & Co.
International PLC | | Textron, Inc.
| | | 20,004
| | | 11/18/2019
| | | 2.73
| %(b) | | | (6,690
| ) | | | (34
| ) | | | (6,724
| ) | |
Morgan Stanley & Co.
International PLC | | Textron, Inc.
| | | 1,502
| | | 11/18/2019
| | | 2.73
| %(b) | | | (523
| ) | | | (3
| ) | | | (526
| ) | |
Morgan Stanley & Co.
International PLC | | Textron, Inc.
| | | 25,045
| | | 11/18/2019
| | | 2.73
| %(b) | | | (750
| ) | | | (14
| ) | | | (764
| ) | |
Morgan Stanley & Co.
International PLC | | TJX Cos., Inc.
| | | 14,394
| | | 11/18/2019
| | | 2.73
| %(b) | | | 388
| | | | (7
| ) | | | 381
| | |
Morgan Stanley & Co.
International PLC | | T-Mobile US, Inc.
| | | 25,912
| | | 11/18/2019
| | | 2.73
| %(b) | | | 32
| | | | (33
| ) | | | (1
| ) | |
Morgan Stanley & Co.
International PLC | | Travelers Cos., Inc.
| | | 112,742
| | | 11/18/2019
| | | 2.73
| %(b) | | | (2,781
| ) | | | (149
| ) | | | (2,930
| ) | |
Morgan Stanley & Co.
International PLC | | Twenty-First Century
Fox, Inc. | | | 25,218
| | | 11/18/2019
| | | 2.73
| %(b) | | | (735
| ) | | | (33
| ) | | | (768
| ) | |
Morgan Stanley & Co.
International PLC | | Twenty-First Century
Fox, Inc. | | | 25,946
| | | 11/18/2019
| | | 2.73
| %(b) | | | 8
| | | | (33
| ) | | | (25
| ) | |
Morgan Stanley & Co.
International PLC | | UnitedHealth Group, Inc.
| | | 135,379
| | | 11/18/2019
| | | 2.73
| %(b) | | | 9,932
| | | | (162
| ) | | | 9,770
| | |
Morgan Stanley & Co.
International PLC | | Valero Energy Corp.
| | | 91,545
| | | 11/18/2019
| | | 2.73
| %(b) | | | (28,528
| ) | | | (155
| ) | | | (28,683
| ) | |
Morgan Stanley & Co.
International PLC | | Valero Energy Corp.
| | | 9,382
| | | 11/18/2019
| | | 2.73
| %(b) | | | (59
| ) | | | (5
| ) | | | (64
| ) | |
Morgan Stanley & Co.
International PLC | | Verizon Communications,
Inc. | | | 142,725
| | | 11/18/2019
| | | 2.73
| %(b) | | | 22,209
| | | | (155
| ) | | | 22,054
| | |
Morgan Stanley & Co.
International PLC | | Viacom, Inc.
| | | 24,880
| | | 11/18/2019
| | | 2.73
| %(b) | | | (1,048
| ) | | | (33
| ) | | | (1,081
| ) | |
Morgan Stanley & Co.
International PLC | | Viacom, Inc.
| | | 24,976
| | | 11/18/2019
| | | 2.73
| %(b) | | | (661
| ) | | | (33
| ) | | | (694
| ) | |
Morgan Stanley & Co.
International PLC | | Visa, Inc.
| | | 24,675
| | | 11/18/2019
| | | 2.73
| %(b) | | | 489
| | | | (31
| ) | | | 458
| | |
Morgan Stanley & Co.
International PLC | | Visa, Inc.
| | | 25,089
| | | 11/18/2019
| | | 2.73
| %(b) | | | 963
| | | | (31
| ) | | | 932
| | |
See Notes to Financial Statements
132
Consolidated Schedule of Investments Multi-Style Premia Fund (cont'd)
| Counterparty | | Reference
Entity | | Notional
Amount | | Maturity
Date | | Variable-
Rate(a) | | Unrealized
Appreciation/
(Depreciation) | | Accrued
Net
Interest
Receivable/
(Payable) | | Value | |
Morgan Stanley & Co.
International PLC | | Visa, Inc.
| | $ | 23,710
| | | 11/18/2019
| | | 2.73
| %(b) | | $ | (309
| ) | | $ | (31
| ) | | $ | (340
| ) | |
Morgan Stanley & Co.
International PLC | | Visa, Inc.
| | | 3,722
| | | 11/18/2019
| | | 2.73
| %(b) | | | 30
| | | | (5
| ) | | | 25
| | |
Morgan Stanley & Co.
International PLC | | Visa, Inc.
| | | 20,540
| | | 11/18/2019
| | | 2.73
| %(b) | | | (363
| ) | | | (27
| ) | | | (390
| ) | |
Morgan Stanley & Co.
International PLC | | Walgreens Boots
Alliance, Inc. | | | 14,119
| | | 11/18/2019
| | | 2.73
| %(b) | | | 2,987
| | | | (14
| ) | | | 2,973
| | |
Morgan Stanley & Co.
International PLC | | Walgreens Boots
Alliance, Inc. | | | 28,159
| | | 11/18/2019
| | | 2.73
| %(b) | | | 3,920
| | | | (130
| ) | | | 3,790
| | |
Morgan Stanley & Co.
International PLC | | Walgreens Boots
Alliance, Inc. | | | 30,313
| | | 11/18/2019
| | | 2.73
| %(b) | | | 3,376
| | | | (35
| ) | | | 3,341
| | |
Morgan Stanley & Co.
International PLC | | Walgreens Boots
Alliance, Inc. | | | 26,882
| | | 11/18/2019
| | | 2.74
| %(b) | | | 1,174
| | | | (27
| ) | | | 1,147
| | |
Morgan Stanley & Co.
International PLC | | Walgreens Boots
Alliance, Inc. | | | 5,823
| | | 11/18/2019
| | | 2.73
| %(b) | | | 183
| | | | (3
| ) | | | 180
| | |
Morgan Stanley & Co.
International PLC | | Walmart, Inc.
| | | 151,222
| | | 11/18/2019
| | | 2.73
| %(b) | | | 26,953
| | | | (160
| ) | | | 26,793
| | |
Morgan Stanley & Co.
International PLC | | Walt Disney Co.
| | | 25,377
| | | 11/18/2019
| | | 2.73
| %(b) | | | (461
| ) | | | (33
| ) | | | (494
| ) | |
Morgan Stanley & Co.
International PLC | | Walt Disney Co.
| | | 25,492
| | | 11/18/2019
| | | 2.73
| %(b) | | | (459
| ) | | | (33
| ) | | | (492
| ) | |
Morgan Stanley & Co.
International PLC | | Waste Management, Inc.
| | | 92,959
| | | 11/18/2019
| | | 2.73
| %(b) | | | 7,079
| | | | (111
| ) | | | 6,968
| | |
Morgan Stanley & Co.
International PLC | | WatsCo., Inc.
| | | 36,749
| | | 11/18/2019
| | | 2.73
| %(b) | | | (8,637
| ) | | | (58
| ) | | | (8,695
| ) | |
Morgan Stanley & Co.
International PLC | | Western Digital Corp.
| | | 15,419
| | | 11/18/2019
| | | 2.73
| %(b) | | | (8,838
| ) | | | (31
| ) | | | (8,869
| ) | |
Morgan Stanley & Co.
International PLC | | Western Digital Corp.
| | | 16,668
| | | 11/18/2019
| | | 2.73
| %(b) | | | (8,486
| ) | | | (32
| ) | | | (8,518
| ) | |
Morgan Stanley & Co.
International PLC | | Weyerhaeuser Co.
| | | 82,500
| | | 11/18/2019
| | | 2.73
| %(b) | | | (31,620
| ) | | | (147
| ) | | | (31,767
| ) | |
Morgan Stanley & Co.
International PLC | | Weyerhaeuser Co.
| | | 13,049
| | | 11/18/2019
| | | 2.74
| %(b) | | | (1,027
| ) | | | (15
| ) | | | (1,042
| ) | |
Morgan Stanley & Co.
International PLC | | Weyerhaeuser Co.
| | | 3,249
| | | 11/18/2019
| | | 2.73
| %(b) | | | (211
| ) | | | (2
| ) | | | (213
| ) | |
Morgan Stanley & Co.
International PLC | | Zoetis, Inc.
| | | 27,766
| | | 11/18/2019
| | | 2.73
| %(b) | | | 1,128
| | | | (34
| ) | | | 1,094
| | |
Total | | | | | | | | | | $ | (175,596 | ) | | $ | (12,983 | ) | | $ | (188,579 | ) | |
(a) Effective rate of October 31, 2018.
(b) Fund pays 1-month USD LIBOR plus 0.45%. Payment frequency—monthly. Fund receives return on reference entity. Payment frequency—upon termination.
See Notes to Financial Statements
133
Consolidated Schedule of Investments Multi-Style Premia Fund (cont'd)
(c) Fund pays 1-month USD LIBOR minus 0.45%. Payment frequency—monthly. Fund receives return on reference entity. Payment frequency—upon termination.
Over-the-counter total return swaps — Short
| Counterparty | | Reference
Entity | | Notional
Amount(a) | | Maturity
Date | | Variable-
Rate(al) | | Unrealized
Appreciation/
(Depreciation) | | Accrued
Net
Interest
Receivable/
(Payable) | | Value | |
Morgan Stanley & Co.
International PLC | | 2U, Inc.
| | $ | (22,642
| ) | | 11/18/2019
| | | 1.83
| %(b) | | $ | 5,061
| | | $ | 15
| | | $ | 5,076
| | |
Morgan Stanley & Co.
International PLC | | 2U, Inc.
| | | (23,980
| ) | | 11/18/2019
| | | 1.83
| %(b) | | | 5,951
| | | | 16
| | | | 5,967
| | |
Morgan Stanley & Co.
International PLC | | 3
i Group PLC | | GBP | (21,595
| ) | | 11/18/2019
| | | 0.37
| %(c) | | | 1,997
| | | | 5
| | | | 2,002
| | |
Morgan Stanley & Co.
International PLC | | ABIOMED, Inc.
| | $ | (19,544
| ) | | 11/18/2019
| | | 1.83
| %(b) | | | 1,413
| | | | 6
| | | | 1,419
| | |
Morgan Stanley & Co.
International PLC | | Acuity Brands, Inc.
| | | (37,926
| ) | | 11/18/2019
| | | 1.83
| %(b) | | | (2,270
| ) | | | 35
| | | | (2,235
| ) | |
Morgan Stanley & Co.
International PLC | | ADT, Inc.
| | | (13,832
| ) | | 11/18/2019
| | | 0.43
| %(d) | | | (553
| ) | | | 3
| | | | (550
| ) | |
Morgan Stanley & Co.
International PLC | | Advanced Micro
Devices, Inc. | | | (24,964
| ) | | 11/18/2019
| | | 1.13
| %(e) | | | (14,268
| ) | | | 21
| | | | (14,247
| ) | |
Morgan Stanley & Co.
International PLC | | Aerie Pharmaceuticals,
Inc. | | | (20,229
| ) | | 11/18/2019
| | | 1.83
| %(b) | | | 3,627
| | | | 21
| | | | 3,648
| | |
Morgan Stanley & Co.
International PLC | | Aerie Pharmaceuticals,
Inc. | | | (21,573
| ) | | 11/18/2019
| | | 1.83
| %(b) | | | 3,129
| | | | 16
| | | | 3,145
| | |
Morgan Stanley & Co.
International PLC | | Albemarle Corp.
| | | (13,286
| ) | | 11/18/2019
| | | 1.83
| %(b) | | | (749
| ) | | | 12
| | | | (737
| ) | |
Morgan Stanley & Co.
International PLC | | Albemarle Corp.
| | | (15,550
| ) | | 11/18/2019
| | | 1.83
| %(b) | | | (1,155
| ) | | | 14
| | | | (1,141
| ) | |
Morgan Stanley & Co.
International PLC | | Alcoa Corp.
| | | (18,392
| ) | | 11/18/2019
| | | 1.83
| %(b) | | | 1,078
| | | | 6
| | | | 1,084
| | |
Morgan Stanley & Co.
International PLC | | Align Technology, Inc.
| | | (23,547
| ) | | 11/18/2019
| | | 1.83
| %(b) | | | 6,244
| | | | 15
| | | | 6,259
| | |
Morgan Stanley & Co.
International PLC | | Align Technology, Inc.
| | | (23,877
| ) | | 11/18/2019
| | | 1.83
| %(b) | | | 6,519
| | | | 15
| | | | 6,534
| | |
Morgan Stanley & Co.
International PLC | | Align Technology, Inc.
| | | (25,096
| ) | | 11/18/2019
| | | 1.83
| %(b) | | | 6,908
| | | | 16
| | | | 6,924
| | |
Morgan Stanley & Co.
International PLC | | Align Technology, Inc.
| | | (22,193
| ) | | 11/18/2019
| | | 1.83
| %(b) | | | 6,341
| | | | 55
| | | | 6,396
| | |
Morgan Stanley & Co.
International PLC | | Align Technology, Inc.
| | | (8,293
| ) | | 11/18/2019
| | | 1.83
| %(b) | | | 2,156
| | | | 5
| | | | 2,161
| | |
Morgan Stanley & Co.
International PLC | | Align Technology, Inc.
| | | (3,141
| ) | | 11/18/2019
| | | 1.84
| %(b) | | | 796
| | | | 2
| | | | 798
| | |
Morgan Stanley & Co.
International PLC | | Alleghany Corp.
| | | (1,653
| ) | | 11/18/2019
| | | 1.83
| %(b) | | | (75
| ) | | | 2
| | | | (73
| ) | |
See Notes to Financial Statements
134
Consolidated Schedule of Investments Multi-Style Premia Fund (cont'd)
| Counterparty | | Reference
Entity | | Notional
Amount(a) | | Maturity
Date | | Variable-
Rate(al) | | Unrealized
Appreciation/
(Depreciation) | | Accrued
Net
Interest
Receivable/
(Payable) | | Value | |
Morgan Stanley & Co.
International PLC | | Alleghany Corp.
| | $ | (15,826
| ) | | 11/18/2019
| | | 1.83
| %(b) | | $ | (497
| ) | | $ | 14
| | | $ | (483
| ) | |
Morgan Stanley & Co.
International PLC | | Alleghany Corp.
| | | (17,603
| ) | | 11/18/2019
| | | 1.83
| %(b) | | | (809
| ) | | | 16
| | | | (793
| ) | |
Morgan Stanley & Co.
International PLC | | Alleghany Corp.
| | | (17,563
| ) | | 11/18/2019
| | | 1.83
| %(b) | | | 72
| | | | 15
| | | | 87
| | |
Morgan Stanley & Co.
International PLC | | Altran Technologies SA
| | EUR | (7,243
| ) | | 11/18/2019
| | | (0.77
| )%(f) | | | (2,619
| ) | | | (2
| ) | | | (2,621
| ) | |
Morgan Stanley & Co.
International PLC | | AMERCO
| | $ | (39,888
| ) | | 11/18/2019
| | | 1.83
| %(b) | | | 2,804
| | | | 32
| | | | 2,836
| | |
Morgan Stanley & Co.
International PLC | | American International
Group, Inc. | | | (39,411
| ) | | 11/18/2019
| | | 1.83
| %(b) | | | 6,802
| | | | 28
| | | | 6,830
| | |
Morgan Stanley & Co.
International PLC | | Amundi SA
| | EUR | (39,116
| ) | | 11/18/2019
| | | (0.77
| )%(f) | | | 6,075
| | | | (14
| ) | | | 6,061
| | |
Morgan Stanley & Co.
International PLC | | Amundi SA
| | EUR | (14,439
| ) | | 11/18/2019
| | | (0.77
| )%(f) | | | 2,520
| | | | (5
| ) | | | 2,515
| | |
Morgan Stanley & Co.
International PLC | | Aqua America, Inc.
| | $ | (43,807
| ) | | 11/18/2019
| | | 1.83
| %(b) | | | 3,052
| | | | 35
| | | | 3,087
| | |
Morgan Stanley & Co.
International PLC | | Arconic, Inc.
| | | (14,493
| ) | | 11/18/2019
| | | 1.83
| %(b) | | | (2,248
| ) | | | 14
| | | | (2,234
| ) | |
Morgan Stanley & Co.
International PLC | | Arconic, Inc.
| | | (15,182
| ) | | 11/18/2019
| | | 1.83
| %(b) | | | (2,604
| ) | | | 15
| | | | (2,589
| ) | |
Morgan Stanley & Co.
International PLC | | Arconic, Inc.
| | | (17,339
| ) | | 11/18/2019
| | | 1.83
| %(b) | | | (1,048
| ) | | | 16
| | | | (1,032
| ) | |
Morgan Stanley & Co.
International PLC | | Arconic, Inc.
| | | (7,502
| ) | | 11/18/2019
| | | 1.83
| %(b) | | | 214
| | | | 6
| | | | 220
| | |
Morgan Stanley & Co.
International PLC | | Arconic, Inc.
| | | (3,850
| ) | | 11/18/2019
| | | 1.83
| %(b) | | | 65
| | | | 13
| | | | 78
| | |
Morgan Stanley & Co.
International PLC | | ASOS PLC
| | GBP | (40,074
| ) | | 11/18/2019
| | | 0.37
| %(c) | | | 7,651
| | | | 8
| | | | 7,659
| | |
Morgan Stanley & Co.
International PLC | | ASOS PLC
| | GBP | (4,516
| ) | | 11/18/2019
| | | 0.37
| %(c) | | | 306
| | | | 0
| | | | 306
| | |
Morgan Stanley & Co.
International PLC | | Atlassian Corp. PLC
| | $ | (48,953
| ) | | 11/18/2019
| | | 1.83
| %(b) | | | (13,061
| ) | | | 54
| | | | (13,007
| ) | |
Morgan Stanley & Co.
International PLC | | Autodesk, Inc.
| | | (83,315
| ) | | 11/18/2019
| | | 1.83
| %(b) | | | 233
| | | | 95
| | | | 328
| | |
Morgan Stanley & Co.
International PLC | | Avis Budget Group, Inc.
| | | (20,071
| ) | | 11/18/2019
| | | 1.83
| %(b) | | | 3,272
| | | | 14
| | | | 3,286
| | |
Morgan Stanley & Co.
International PLC | | Avis Budget Group, Inc.
| | | (20,004
| ) | | 11/18/2019
| | | 1.83
| %(b) | | | 2,381
| | | | 15
| | | | 2,396
| | |
Morgan Stanley & Co.
International PLC | | Axalta Coating
Systems Ltd. | | | (21,185
| ) | | 11/18/2019
| | | 1.83
| %(b) | | | 3,201
| | | | 15
| | | | 3,216
| | |
See Notes to Financial Statements
135
Consolidated Schedule of Investments Multi-Style Premia Fund (cont'd)
| Counterparty | | Reference
Entity | | Notional
Amount(a) | | Maturity
Date | | Variable-
Rate(al) | | Unrealized
Appreciation/
(Depreciation) | | Accrued
Net
Interest
Receivable/
(Payable) | | Value | |
Morgan Stanley & Co.
International PLC | | Axalta Coating
Systems Ltd. | | $ | (20,186
| ) | | 11/18/2019
| | | 1.83
| %(b) | | $ | 3,183
| | | $ | 15
| | | $ | 3,198
| | |
Morgan Stanley & Co.
International PLC | | Axalta Coating
Systems Ltd. | | | (21,281
| ) | | 11/18/2019
| | | 1.83
| %(b) | | | 3,261
| | | | 16
| | | | 3,277
| | |
Morgan Stanley & Co.
International PLC | | Banca Generali SpA
| | EUR | (614
| ) | | 11/18/2019
| | | (0.87
| )%(g) | | | 107
| | | | (0
| ) | | | 107
| | |
Morgan Stanley & Co.
International PLC | | Banca Generali SpA
| | EUR | (9,355
| ) | | 11/18/2019
| | | (0.87
| )%(g) | | | 1,653
| | | | (4
| ) | | | 1,649
| | |
Morgan Stanley & Co.
International PLC | | Banco BPM SpA
| | EUR | (35,205
| ) | | 11/18/2019
| | | (0.95
| )%(am) | | | 8,010
| | | | (13
| ) | | | 7,997
| | |
Morgan Stanley & Co.
International PLC | | Banco BPM SpA
| | EUR | (1,220
| ) | | 11/18/2019
| | | (0.95
| )%(am) | | | 137
| | | | (1
| ) | | | 136
| | |
Morgan Stanley & Co.
International PLC | | Banco BPM SpA
| | EUR | (13,394
| ) | | 11/18/2019
| | | (0.95
| )%(am) | | | (228
| ) | | | (3
| ) | | | (231
| ) | |
Morgan Stanley & Co.
International PLC | | Bank OZK
| | $ | (106,404
| ) | | 11/18/2019
| | | 1.83
| %(b) | | | 31,492
| | | | 65
| | | | 31,557
| | |
Morgan Stanley & Co.
International PLC | | Bankia SA
| | EUR | (16,308
| ) | | 11/18/2019
| | | (0.87
| )%(g) | | | 2,675
| | | | (7
| ) | | | 2,668
| | |
Morgan Stanley & Co.
International PLC | | Barclays PLC
| | GBP | (3,579
| ) | | 11/18/2019
| | | 0.37
| %(c) | | | 303
| | | | 1
| | | | 304
| | |
Morgan Stanley & Co.
International PLC | | Barclays PLC
| | GBP | (3,601
| ) | | 11/18/2019
| | | 0.37
| %(c) | | | 319
| | | | 1
| | | | 320
| | |
Morgan Stanley & Co.
International PLC | | Barclays PLC
| | GBP | (3,797
| ) | | 11/18/2019
| | | 0.37
| %(c) | | | (208
| ) | | | 0
| | | | (208
| ) | |
Morgan Stanley & Co.
International PLC | | Bayer AG
| | EUR | (12,795
| ) | | 11/18/2019
| | | (0.77
| )%(f) | | | 298
| | | | (2
| ) | | | 296
| | |
Morgan Stanley & Co.
International PLC | | Berkshire Hathaway,
Inc. | | $ | (17,541
| ) | | 11/18/2019
| | | 1.83
| %(b) | | | 46
| | | | 15
| | | | 61
| | |
Morgan Stanley & Co.
International PLC | | Berkshire Hathaway, Inc.
| | | (19,793
| ) | | 11/18/2019
| | | 1.83
| %(b) | | | 967
| | | | 16
| | | | 983
| | |
Morgan Stanley & Co.
International PLC | | Boston Beer Co.,
Inc. | | | (17,688
| ) | | 11/18/2019
| | | 1.83
| %(b) | | | (682
| ) | | | 16
| | | | (666
| ) | |
Morgan Stanley & Co.
International PLC | | Brembo SpA
| | EUR | (37,586
| ) | | 11/18/2019
| | | (0.87
| )%(g) | | | 7,115
| | | | (15
| ) | | | 7,100
| | |
Morgan Stanley & Co.
International PLC | | Brighthouse Financial,
Inc. | | $ | (17,855
| ) | | 11/18/2019
| | | 1.83
| %(b) | | | 1,120
| | | | 21
| | | | 1,141
| | |
Morgan Stanley & Co.
International PLC | | Brighthouse Financial,
Inc. | | | (18,516
| ) | | 11/18/2019
| | | 1.83
| %(b) | | | 1,035
| | | | 15
| | | | 1,050
| | |
Morgan Stanley & Co.
International PLC | | Brighthouse Financial,
Inc. | | | (19,012
| ) | | 11/18/2019
| | | 1.83
| %(b) | | | 728
| | | | 16
| | | | 744
| | |
Morgan Stanley & Co.
International PLC | | Brighthouse Financial,
Inc. | | | (18,981
| ) | | 11/18/2019
| | | 1.83
| %(b) | | | 1,525
| | | | 15
| | | | 1,540
| | |
See Notes to Financial Statements
136
Consolidated Schedule of Investments Multi-Style Premia Fund (cont'd)
| Counterparty | | Reference
Entity | | Notional
Amount(a) | | Maturity
Date | | Variable-
Rate(al) | | Unrealized
Appreciation/
(Depreciation) | | Accrued
Net
Interest
Receivable/
(Payable) | | Value | |
Morgan Stanley & Co.
International PLC | | Brighthouse Financial,
Inc. | | $ | (3,710
| ) | | 11/18/2019
| | | 1.83
| %(b) | | $ | 210
| | | $ | 3
| | | $ | 213
| | |
Morgan Stanley & Co.
International PLC | | British American
Tobacco PLC | | GBP | (8,681
| ) | | 11/18/2019
| | | 0.37
| %(c) | | | 1,210
| | | | 2
| | | | 1,212
| | |
Morgan Stanley & Co.
International PLC | | British American
Tobacco PLC | | GBP | (8,370
| ) | | 11/18/2019
| | | 0.37
| %(c) | | | 903
| | | | 2
| | | | 905
| | |
Morgan Stanley & Co.
International PLC | | British American
Tobacco PLC | | GBP | (8,408
| ) | | 11/18/2019
| | | 0.37
| %(c) | | | 797
| | | | 2
| | | | 799
| | |
Morgan Stanley & Co.
International PLC | | British American
Tobacco PLC | | GBP | (7,407
| ) | | 11/18/2019
| | | 0.37
| %(c) | | | 829
| | | | 2
| | | | 831
| | |
Morgan Stanley & Co.
International PLC | | British American
Tobacco PLC | | GBP | (3,641
| ) | | 11/18/2019
| | | 0.37
| %(c) | | | 527
| | | | 1
| | | | 528
| | |
Morgan Stanley & Co.
International PLC | | British American
Tobacco PLC | | GBP | (2,472
| ) | | 11/18/2019
| | | 0.37
| %(c) | | | 170
| | | | 1
| | | | 171
| | |
Morgan Stanley & Co.
International PLC | | British American
Tobacco PLC | | GBP | (2,193
| ) | | 11/18/2019
| | | 0.37
| %(c) | | | 122
| | | | 1
| | | | 123
| | |
Morgan Stanley & Co.
International PLC | | Brookfield Property
Partners LP | | $ | (30,636
| ) | | 11/18/2019
| | | 1.83
| %(b) | | | 11,968
| | | | 16
| | | | 11,984
| | |
Morgan Stanley & Co.
International PLC | | Buzzi Unicem SpA
| | EUR | (12,357
| ) | | 11/18/2019
| | | (0.87
| )%(g) | | | 2,115
| | | | (5
| ) | | | 2,110
| | |
Morgan Stanley & Co.
International PLC | | Buzzi Unicem SpA
| | EUR | (14,512
| ) | | 11/18/2019
| | | (0.87
| )%(g) | | | 586
| | | | (5
| ) | | | 581
| | |
Morgan Stanley & Co.
International PLC | | Caesars Entertainment
Corp. | | $ | (25,195
| ) | | 11/18/2019
| | | 1.83
| %(b) | | | 5,833
| | | | 17
| | | | 5,850
| | |
Morgan Stanley & Co.
International PLC | | Caesars Entertainment
Corp. | | | (22,354
| ) | | 11/18/2019
| | | 1.83
| %(b) | | | 4,490
| | | | 15
| | | | 4,505
| | |
Morgan Stanley & Co.
International PLC | | Caesars Entertainment
Corp. | | | (20,282
| ) | | 11/18/2019
| | | 1.83
| %(b) | | | 2,088
| | | | 16
| | | | 2,104
| | |
Morgan Stanley & Co.
International PLC | | Caesars Entertainment
Corp. | | | (18,225
| ) | | 11/18/2019
| | | 1.84
| %(b) | | | 939
| | | | 12
| | | | 951
| | |
Morgan Stanley & Co.
International PLC | | Caesars Entertainment
Corp. | | | (4,653
| ) | | 11/18/2019
| | | 1.81
| %(h) | | | 213
| | | | 1
| | | | 214
| | |
Morgan Stanley & Co.
International PLC | | Capita PLC
| | GBP | (9,668
| ) | | 11/18/2019
| | | 0.37
| %(c) | | | 1,299
| | | | 2
| | | | 1,301
| | |
Morgan Stanley & Co.
International PLC | | Capita PLC
| | GBP | (6,547
| ) | | 11/18/2019
| | | 0.37
| %(c) | | | (812
| ) | | | 1
| | | | (811
| ) | |
Morgan Stanley & Co.
International PLC | | Capital & Counties
Properties PLC | | GBP | (18,881
| ) | | 11/18/2019
| | | 0.37
| %(c) | | | 3,629
| | | | 4
| | | | 3,633
| | |
Morgan Stanley & Co.
International PLC | | Capital & Counties
Properties PLC | | GBP | (9,824
| ) | | 11/18/2019
| | | 0.37
| %(c) | | | 818
| | | | 2
| | | | 820
| | |
Morgan Stanley & Co.
International PLC | | Capital & Counties
Properties PLC | | GBP | (8,719
| ) | | 11/18/2019
| | | 0.37
| %(c) | | | 426
| | | | 8
| | | | 434
| | |
See Notes to Financial Statements
137
Consolidated Schedule of Investments Multi-Style Premia Fund (cont'd)
| Counterparty | | Reference
Entity | | Notional
Amount(a) | | Maturity
Date | | Variable-
Rate(al) | | Unrealized
Appreciation/
(Depreciation) | | Accrued
Net
Interest
Receivable/
(Payable) | | Value | |
Morgan Stanley & Co.
International PLC | | Capital & Counties
Properties PLC | | GBP | (3,246
| ) | | 11/18/2019
| | | 0.37
| %(c) | | $ | 123
| | | $ | 1
| | | $ | 124
| | |
Morgan Stanley & Co.
International PLC | | Carrefour SA
| | EUR | (23,510
| ) | | 11/18/2019
| | | (0.77
| )%(f) | | | (3,373
| ) | | | (11
| ) | | | (3,384
| ) | |
Morgan Stanley & Co.
International PLC | | Carrefour SA
| | EUR | (5,379
| ) | | 11/18/2019
| | | (0.77
| )%(f) | | | (1,937
| ) | | | (3
| ) | | | (1,940
| ) | |
Morgan Stanley & Co.
International PLC | | Carrefour SA
| | EUR | (7,041
| ) | | 11/18/2019
| | | (0.77
| )%(f) | | | (1,267
| ) | | | (15
| ) | | | (1,282
| ) | |
Morgan Stanley & Co.
International PLC | | Catalent, Inc.
| | $ | (17,950
| ) | | 11/18/2019
| | | 1.83
| %(b) | | | 282
| | | | 6
| | | | 288
| | |
Morgan Stanley & Co.
International PLC | | CBRE Group, Inc.
| | | (18,454
| ) | | 11/18/2019
| | | 1.83
| %(b) | | | 2,196
| | | | 14
| | | | 2,210
| | |
Morgan Stanley & Co.
International PLC | | Centennial Resource
Development, Inc. | | | (19,243
| ) | | 11/18/2019
| | | 1.83
| %(b) | | | 961
| | | | 16
| | | | 977
| | |
Morgan Stanley & Co.
International PLC | | Centennial Resource
Development, Inc. | | | (6,869
| ) | | 11/18/2019
| | | 1.83
| %(b) | | | 149
| | | | 2
| | | | 151
| | |
Morgan Stanley & Co.
International PLC | | Ceridian HCM
Holding, Inc. | | | (17,572
| ) | | 11/18/2019
| | | 1.50
| %(i) | | | 357
| | | | 7
| | | | 364
| | |
Morgan Stanley & Co.
International PLC | | Charles Schwab Corp.
| | | (102,891
| ) | | 11/18/2019
| | | 1.83
| %(b) | | | 14,292
| | | | 77
| | | | 14,369
| | |
Morgan Stanley & Co.
International PLC | | Charter
Communications, Inc. | | | (49,899
| ) | | 11/18/2019
| | | 1.83
| %(b) | | | (12,694
| ) | | | 54
| | | | (12,640
| ) | |
Morgan Stanley & Co.
International PLC | | Charter
Communications, Inc. | | | (4,019
| ) | | 11/18/2019
| | | 1.83
| %(b) | | | (1,034
| ) | | | 4
| | | | (1,030
| ) | |
Morgan Stanley & Co.
International PLC | | Chiba Bank Ltd.
| | JPY | (948,047
| ) | | 11/18/2019
| | | (0.50
| )%(j) | | | 76
| | | | (2
| ) | | | 74
| | |
Morgan Stanley & Co.
International PLC | | Chiba Bank Ltd.
| | JPY | (1,352,335
| ) | | 11/18/2019
| | | (0.50
| )%(j) | | | 916
| | | | (3
| ) | | | 913
| | |
Morgan Stanley & Co.
International PLC | | Cleveland-Cliffs, Inc.
| | $ | (12,442
| ) | | 11/18/2019
| | | 1.83
| %(b) | | | (4,426
| ) | | | 15
| | | | (4,411
| ) | |
Morgan Stanley & Co.
International PLC | | Cleveland-Cliffs, Inc.
| | | (11,580
| ) | | 11/18/2019
| | | 1.83
| %(b) | | | (5,282
| ) | | | 15
| | | | (5,267
| ) | |
Morgan Stanley & Co.
International PLC | | Cleveland-Cliffs, Inc.
| | | (23,037
| ) | | 11/18/2019
| | | 1.83
| %(b) | | | 3,282
| | | | 17
| | | | 3,299
| | |
Morgan Stanley & Co.
International PLC | | Cloudera, Inc.
| | | (35,912
| ) | | 11/18/2019
| | | 1.83
| %(b) | | | 4,189
| | | | 27
| | | | 4,216
| | |
Morgan Stanley & Co.
International PLC | | Cloudera, Inc.
| | | (23,213
| ) | | 11/18/2019
| | | 1.83
| %(b) | | | 4,321
| | | | 16
| | | | 4,337
| | |
Morgan Stanley & Co.
International PLC | | Cognex Corp.
| | | (21,509
| ) | | 11/18/2019
| | | 1.83
| %(b) | | | 3,407
| | | | 16
| | | | 3,423
| | |
Morgan Stanley & Co.
International PLC | | Commerzbank AG
| | EUR | (14,121
| ) | | 11/18/2019
| | | (0.77
| )%(f) | | | (41
| ) | | | (6
| ) | | | (47
| ) | |
See Notes to Financial Statements
138
Consolidated Schedule of Investments Multi-Style Premia Fund (cont'd)
| Counterparty | | Reference
Entity | | Notional
Amount(a) | | Maturity
Date | | Variable-
Rate(al) | | Unrealized
Appreciation/
(Depreciation) | | Accrued
Net
Interest
Receivable/
(Payable) | | Value | |
Morgan Stanley & Co.
International PLC | | Commerzbank AG
| | EUR | (15,197
| ) | | 11/18/2019
| | | (0.77
| )%(f) | | $ | 574
| | | $ | (6
| ) | | $ | 568
| | |
Morgan Stanley & Co.
International PLC | | Concho Resources, Inc.
| | $ | (42,048
| ) | | 11/18/2019
| | | 1.83
| %(b) | | | (1,091
| ) | | | 37
| | | | (1,054
| ) | |
Morgan Stanley & Co.
International PLC | | Concordia Financial
Group Ltd. | | JPY | (1,697,728
| ) | | 11/18/2019
| | | (0.50
| )%(j) | | | 2,014
| | | | (3
| ) | | | 2,011
| | |
Morgan Stanley & Co.
International PLC | | ConvaTec Group PLC
| | GBP | (26,054
| ) | | 11/18/2019
| | | 0.37
| %(c) | | | 7,692
| | | | 5
| | | | 7,697
| | |
Morgan Stanley & Co.
International PLC | | ConvaTec Group PLC
| | GBP | (2,364
| ) | | 11/18/2019
| | | 0.37
| %(c) | | | 481
| | | | 1
| | | | 482
| | |
Morgan Stanley & Co.
International PLC | | ConvaTec Group PLC
| | GBP | (6,239
| ) | | 11/18/2019
| | | 0.37
| %(c) | | | 1,176
| | | | 1
| | | | 1,177
| | |
Morgan Stanley & Co.
International PLC | | Cornerstone
OnDemand, Inc. | | $ | (40,008
| ) | | 11/18/2019
| | | 1.83
| %(b) | | | (361
| ) | | | 35
| | | | (326
| ) | |
Morgan Stanley & Co.
International PLC | | Coty, Inc.
| | | (91,193
| ) | | 11/18/2019
| | | 1.83
| %(b) | | | 16,152
| | | | 86
| | | | 16,238
| | |
Morgan Stanley & Co.
International PLC | | Coty, Inc.
| | | (4,866
| ) | | 11/18/2019
| | | 1.83
| %(b) | | | 455
| | | | 15
| | | | 470
| | |
Morgan Stanley & Co.
International PLC | | CyberAgent, Inc.
| | JPY | (1,424,793
| ) | | 11/18/2019
| | | (0.50
| )%(j) | | | 2,068
| | | | (3
| ) | | | 2,065
| | |
Morgan Stanley & Co.
International PLC | | CyberAgent, Inc.
| | JPY | (686,411
| ) | | 11/18/2019
| | | (0.50
| )%(j) | | | 919
| | | | (1
| ) | | | 918
| | |
Morgan Stanley & Co.
International PLC | | CyberAgent, Inc.
| | JPY | (1,484,762
| ) | | 11/18/2019
| | | (0.50
| )%(j) | | | 2,334
| | | | (3
| ) | | | 2,331
| | |
Morgan Stanley & Co.
International PLC | | CYBG PLC
| | GBP | (223
| ) | | 11/18/2019
| | | 0.37
| %(c) | | | 17
| | | | (0
| ) | | | 17
| | |
Morgan Stanley & Co.
International PLC | | CyrusOne, Inc.
| | $ | (55,665
| ) | | 11/18/2019
| | | 1.83
| %(b) | | | 1,404
| | | | 28
| | | | 1,432
| | |
Morgan Stanley & Co.
International PLC | | Darling Ingredients, Inc.
| | | (2,080
| ) | | 11/18/2019
| | | 1.83
| %(b) | | | (117
| ) | | | 2
| | | | (115
| ) | |
Morgan Stanley & Co.
International PLC | | Darling Ingredients, Inc.
| | | (12,394
| ) | | 11/18/2019
| | | 1.83
| %(b) | | | (373
| ) | | | 11
| | | | (362
| ) | |
Morgan Stanley & Co.
International PLC | | Darling Ingredients, Inc.
| | | (16,644
| ) | | 11/18/2019
| | | 1.83
| %(b) | | | (686
| ) | | | 15
| | | | (671
| ) | |
Morgan Stanley & Co.
International PLC | | Darling Ingredients, Inc.
| | | (1,303
| ) | | 11/18/2019
| | | 1.83
| %(b) | | | 1
| | | | 1
| | | | 2
| | |
Morgan Stanley & Co.
International PLC | | Deere & Co.
| | | (19,253
| ) | | 11/18/2019
| | | 1.83
| %(b) | | | 2,109
| | | | 15
| | | | 2,124
| | |
Morgan Stanley & Co.
International PLC | | Deere & Co.
| | | (20,129
| ) | | 11/18/2019
| | | 1.83
| %(b) | | | 2,480
| | | | 15
| | | | 2,495
| | |
Morgan Stanley & Co.
International PLC | | Deere & Co.
| | | (18,958
| ) | | 11/18/2019
| | | 1.83
| %(b) | | | 1,149
| | | | 15
| | | | 1,164
| | |
See Notes to Financial Statements
139
Consolidated Schedule of Investments Multi-Style Premia Fund (cont'd)
| Counterparty | | Reference
Entity | | Notional
Amount(a) | | Maturity
Date | | Variable-
Rate(al) | | Unrealized
Appreciation/
(Depreciation) | | Accrued
Net
Interest
Receivable/
(Payable) | | Value | |
Morgan Stanley & Co.
International PLC | | Deere & Co.
| | $ | (16,738
| ) | | 11/18/2019
| | | 1.73
| %(b) | | $ | 378
| | | $ | 74
| | | $ | 452
| | |
Morgan Stanley & Co.
International PLC | | Delivery Hero SE
| | EUR | (44,207
| ) | | 11/18/2019
| | | (0.77
| )%(f) | | | 4,268
| | | | (19
| ) | | | 4,249
| | |
Morgan Stanley & Co.
International PLC | | Delivery Hero SE
| | EUR | (14,521
| ) | | 11/18/2019
| | | (0.77
| )%(f) | | | 312
| | | | (6
| ) | | | 306
| | |
Morgan Stanley & Co.
International PLC | | Deutsche Bank AG
| | EUR | (42,882
| ) | | 11/18/2019
| | | (0.77
| )%(f) | | | 2,524
| | | | (19
| ) | | | 2,505
| | |
Morgan Stanley & Co.
International PLC | | Deutsche Bank AG
| | EUR | (13,569
| ) | | 11/18/2019
| | | (0.77
| )%(f) | | | 1,737
| | | | (5
| ) | | | 1,732
| | |
Morgan Stanley & Co.
International PLC | | Deutsche Post AG
| | EUR | (6,242
| ) | | 11/18/2019
| | | (0.77
| )%(f) | | | 575
| | | | (11
| ) | | | 564
| | |
Morgan Stanley & Co.
International PLC | | DexCom, Inc.
| | $ | (29,726
| ) | | 11/18/2019
| | | 1.83
| %(b) | | | (32,669
| ) | | | 54
| | | | (32,615
| ) | |
Morgan Stanley & Co.
International PLC | | Dialog Semiconductor
PLC | | EUR | (3,818
| ) | | 11/18/2019
| | | (0.77
| )%(f) | | | (1,401
| ) | | | (2
| ) | | | (1,403
| ) | |
Morgan Stanley & Co.
International PLC | | Diebold Nixdorf, Inc.
| | $ | (47,969
| ) | | 11/18/2019
| | | 0.18
| %(k) | | | 19,209
| | | | 2
| | | | 19,211
| | |
Morgan Stanley & Co.
International PLC | | Digital Realty Trust, Inc.
| | | (20,516
| ) | | 11/18/2019
| | | 1.83
| %(b) | | | 2,669
| | | | 15
| | | | 2,684
�� | | |
Morgan Stanley & Co.
International PLC | | Discovery, Inc.
| | | (17,904
| ) | | 11/18/2019
| | | 1.15
| %(l) | | | (20
| ) | | | 10
| | | | (10
| ) | |
Morgan Stanley & Co.
International PLC | | DISH Network Corp.
| | | (66,708
| ) | | 11/18/2019
| | | 1.83
| %(b) | | | (1,090
| ) | | | 59
| | | | (1,031
| ) | |
Morgan Stanley & Co.
International PLC | | DISH Network Corp.
| | | (2,863
| ) | | 11/18/2019
| | | 1.83
| %(b) | | | (136
| ) | | | 3
| | | | (133
| ) | |
Morgan Stanley & Co.
International PLC | | Distribuidora Internacional
de Alimentacion SA | | EUR | (43,302
| ) | | 11/18/2019
| | | (0.87
| )%(g) | | | 21,358
| | | | (11
| ) | | | 21,347
| | |
Morgan Stanley & Co.
International PLC | | Distribuidora Internacional
de Alimentacion SA | | EUR | (22,368
| ) | | 11/18/2019
| | | (0.87
| )%(g) | | | 10,803
| | | | (6
| ) | | | 10,797
| | |
Morgan Stanley & Co.
International PLC | | Distribuidora Internacional
de Alimentacion SA | | EUR | (27,109
| ) | | 11/18/2019
| | | (0.87
| )%(g) | | | 13,204
| | | | (7
| ) | | | 13,197
| | |
Morgan Stanley & Co.
International PLC | | DocuSign, Inc.
| | $ | (16,961
| ) | | 11/18/2019
| | | (0.65
| )%(m) | | | (180
| ) | | | 11
| | | | (169
| ) | |
Morgan Stanley & Co.
International PLC | | Don Quijote Holdings
Co. Ltd. | | JPY | (2,417,100
| ) | | 11/18/2019
| | | (0.50
| )%(j) | | | (4,266
| ) | | | (6
| ) | | | (4,272
| ) | |
Morgan Stanley & Co.
International PLC | | Don Quijote Holdings
Co. Ltd. | | JPY | (1,060,456
| ) | | 11/18/2019
| | | (0.50
| )%(j) | | | (4,287
| ) | | | (3
| ) | | | (4,290
| ) | |
Morgan Stanley & Co.
International PLC | | Don Quijote Holdings
Co. Ltd. | | JPY | (337,494
| ) | | 11/18/2019
| | | (0.50
| )%(j) | | | (1,500
| ) | | | (1
| ) | | | (1,501
| ) | |
Morgan Stanley & Co.
International PLC | | DS Smith PLC
| | GBP | (306
| ) | | 11/18/2019
| | | 0.37
| %(c) | | | 88
| | | | —
| | | | 88
| | |
See Notes to Financial Statements
140
Consolidated Schedule of Investments Multi-Style Premia Fund (cont'd)
| Counterparty | | Reference
Entity | | Notional
Amount(a) | | Maturity
Date | | Variable-
Rate(al) | | Unrealized
Appreciation/
(Depreciation) | | Accrued
Net
Interest
Receivable/
(Payable) | | Value | |
Morgan Stanley & Co.
International PLC | | DS Smith PLC
| | GBP | (9,925
| ) | | 11/18/2019
| | | 0.37
| %(c) | | $ | 2,239
| | | $ | 2
| | | $ | 2,241
| | |
Morgan Stanley & Co.
International PLC | | DS Smith PLC
| | GBP | (34
| ) | | 11/18/2019
| | | 0.37
| %(c) | | | (6
| ) | | | —
| | | | (6
| ) | |
Morgan Stanley & Co.
International PLC | | DS Smith PLC
| | GBP | (9,786
| ) | | 11/18/2019
| | | 0.37
| %(c) | | | 2,284
| | | | 2
| | | | 2,286
| | |
Morgan Stanley & Co.
International PLC | | DS Smith PLC
| | GBP | (9,982
| ) | | 11/18/2019
| | | 0.37
| %(c) | | | 2,221
| | | | 8
| | | | 2,229
| | |
Morgan Stanley & Co.
International PLC | | DS Smith PLC
| | GBP | (10,176
| ) | | 11/18/2019
| | | 0.37
| %(c) | | | 2,244
| | | | 2
| | | | 2,246
| | |
Morgan Stanley & Co.
International PLC | | DS Smith PLC
| | GBP | (4,615
| ) | | 11/18/2019
| | | 0.37
| %(c) | | | 880
| | | | 1
| | | | 881
| | |
Morgan Stanley & Co.
International PLC | | DS Smith PLC
| | GBP | (3,408
| ) | | 11/18/2019
| | | 0.37
| %(c) | | | 189
| | | | 1
| | | | 190
| | |
Morgan Stanley & Co.
International PLC | | DS Smith PLC
| | GBP | (1,900
| ) | | 11/18/2019
| | | 0.37
| %(c) | | | (212
| ) | | | 0
| | | | (212
| ) | |
Morgan Stanley & Co.
International PLC | | eBay, Inc.
| | $ | (9,351
| ) | | 11/18/2019
| | | 1.83
| %(b) | | | 1,090
| | | | 7
| | | | 1,097
| | |
Morgan Stanley & Co.
International PLC | | Edgewell Personal
Care Co. | | | (14,909
| ) | | 11/18/2019
| | | 1.83
| %(b) | | | 1,961
| | | | 31
| | | | 1,992
| | |
Morgan Stanley & Co.
International PLC | | Edgewell Personal
Care Co. | | | (17,464
| ) | | 11/18/2019
| | | 1.83
| %(b) | | | (552
| ) | | | 16
| | | | (536
| ) | |
Morgan Stanley & Co.
International PLC | | Electricite de
France SA | | EUR | (13,404
| ) | | 11/18/2019
| | | (0.77
| )%(f) | | | (6,154
| ) | | | (8
| ) | | | (6,162
| ) | |
Morgan Stanley & Co.
International PLC | | Electronic Arts, Inc.
| | $ | (21,977
| ) | | 11/18/2019
| | | 1.83
| %(b) | | | 3,938
| | | | 16
| | | | 3,954
| | |
Morgan Stanley & Co.
International PLC | | Electronic Arts, Inc.
| | | (20,862
| ) | | 11/18/2019
| | | 1.83
| %(b) | | | 3,016
| | | | 15
| | | | 3,031
| | |
Morgan Stanley & Co.
International PLC | | Elior Group SA
| | EUR | (15,693
| ) | | 11/18/2019
| | | (0.77
| )%(f) | | | 1,945
| | | | (6
| ) | | | 1,939
| | |
Morgan Stanley & Co.
International PLC | | Elior Group SA
| | EUR | (15,045
| ) | | 11/18/2019
| | | (0.77
| )%(f) | | | 598
| | | | (6
| ) | | | 592
| | |
Morgan Stanley & Co.
International PLC | | Ellie Mae, Inc.
| | $ | (124,762
| ) | | 11/18/2019
| | | 1.83
| %(b) | | | 34,378
| | | | 103
| | | | 34,481
| | |
Morgan Stanley & Co.
International PLC | | Endo
International PLC | | | 22,680
| | | 11/18/2019
| | | 1.83
| %(b) | | | (56,087
| ) | | | 29
| | | | (56,058
| ) | |
Morgan Stanley & Co.
International PLC | | EQT Corp.
| | | (23,596
| ) | | 11/18/2019
| | | 1.83
| %(b) | | | 5,089
| | | | 16
| | | | 5,105
| | |
Morgan Stanley & Co.
International PLC | | EQT Corp.
| | | (23,040
| ) | | 11/18/2019
| | | 1.83
| %(b) | | | 4,896
| | | | 16
| | | | 4,912
| | |
Morgan Stanley & Co.
International PLC | | EQT Corp.
| | | (21,190
| ) | | 11/18/2019
| | | 1.83
| %(b) | | | 3,529
| | | | 6
| | | | 3,535
| | |
See Notes to Financial Statements
141
Consolidated Schedule of Investments Multi-Style Premia Fund (cont'd)
| Counterparty | | Reference
Entity | | Notional
Amount(a) | | Maturity
Date | | Variable-
Rate(al) | | Unrealized
Appreciation/
(Depreciation) | | Accrued
Net
Interest
Receivable/
(Payable) | | Value | |
Morgan Stanley & Co.
International PLC | | Eurofins Scientific SE
| | EUR | (4,320
| ) | | 11/18/2019
| | | (0.77
| )%(f) | | $ | (82
| ) | | $ | (2
| ) | | $ | (84
| ) | |
Morgan Stanley & Co.
International PLC | | Eurofins Scientific SE
| | EUR | (14,779
| ) | | 11/18/2019
| | | (0.77
| )%(f) | | | 533
| | | | (6
| ) | | | 527
| | |
Morgan Stanley & Co.
International PLC | | Eurofins Scientific SE
| | EUR | (13,555
| ) | | 11/18/2019
| | | (0.77
| )%(f) | | | (666
| ) | | | (6
| ) | | | (672
| ) | |
Morgan Stanley & Co.
International PLC | | Facebook, Inc.
| | $ | (19,722
| ) | | 11/18/2019
| | | 1.83
| %(b) | | | 2,120
| | | | 15
| | | | 2,135
| | |
Morgan Stanley & Co.
International PLC | | Facebook, Inc.
| | | (20,410
| ) | | 11/18/2019
| | | 1.83
| %(b) | | | 2,843
| | | | 81
| | | | 2,924
| | |
Morgan Stanley & Co.
International PLC | | Facebook, Inc.
| | | (5,138
| ) | | 11/18/2019
| | | 1.84
| %(b) | | | 216
| | | | 4
| | | | 220
| | |
Morgan Stanley & Co.
International PLC | | Fiat Chrysler
Automobiles NV | | EUR | (12,615
| ) | | 11/18/2019
| | | (0.87
| )%(g) | | | 3,352
| | | | (5
| ) | | | 3,347
| | |
Morgan Stanley & Co.
International PLC | | FireEye, Inc.
| | $ | (79,305
| ) | | 11/18/2019
| | | 1.83
| %(b) | | | (11,629
| ) | | | 105
| | | | (11,524
| ) | |
Morgan Stanley & Co.
International PLC | | First Horizon National
Corp. | | | (43,950
| ) | | 11/18/2019
| | | 1.83
| %(b) | | | 4,713
| | | | 34
| | | | 4,747
| | |
Morgan Stanley & Co.
International PLC | | First Horizon National
Corp. | | | (18,680
| ) | | 11/18/2019
| | | 1.83
| %(b) | | | 2,198
| | | | 14
| | | | 2,212
| | |
Morgan Stanley & Co.
International PLC | | First Horizon National
Corp. | | | (18,171
| ) | | 11/18/2019
| | | 1.83
| %(b) | | | 1,031
| | | | 15
| | | | 1,046
| | |
Morgan Stanley & Co.
International PLC | | First Republic Bank
| | | (3,156
| ) | | 11/18/2019
| | | 1.83
| %(b) | | | 213
| | | | 3
| | | | 216
| | |
Morgan Stanley & Co.
International PLC | | First Republic Bank
| | | (18,791
| ) | | 11/18/2019
| | | 1.83
| %(b) | | | 1,161
| | | | 15
| | | | 1,176
| | |
Morgan Stanley & Co.
International PLC | | First Solar, Inc.
| | | (21,256
| ) | | 11/18/2019
| | | 1.83
| %(b) | | | 3,564
| | | | 15
| | | | 3,579
| | |
Morgan Stanley & Co.
International PLC | | Five Below, Inc.
| | | (18,201
| ) | | 11/18/2019
| | | 1.83
| %(b) | | | 336
| | | | 6
| | | | 342
| | |
Morgan Stanley & Co.
International PLC | | Foot Locker, Inc.
| | | (50,937
| ) | | 11/18/2019
| | | 1.83
| %(b) | | | 6,094
| | | | 39
| | | | 6,133
| | |
Morgan Stanley & Co.
International PLC | | Foot Locker, Inc.
| | | (20,520
| ) | | 11/18/2019
| | | 1.83
| %(b) | | | 1,916
| | | | 16
| | | | 1,932
| | |
Morgan Stanley & Co.
International PLC | | Foot Locker, Inc.
| | | (14,837
| ) | | 11/18/2019
| | | 1.83
| %(b) | | | 489
| | | | 12
| | | | 501
| | |
Morgan Stanley & Co.
International PLC | | Fresenius SE &
Co. KGaA | | EUR | (15,321
| ) | | 11/18/2019
| | | (0.77
| )%(f) | | | 2,080
| | | | (26
| ) | | | 2,054
| | |
Morgan Stanley & Co.
International PLC | | Fresenius SE &
Co. KGaA | | EUR | (15,928
| ) | | 11/18/2019
| | | (0.77
| )%(f) | | | 1,531
| | | | (6
| ) | | | 1,525
| | |
Morgan Stanley & Co.
International PLC | | Fresenius SE &
Co. KGaA | | EUR | (16,151
| ) | | 11/18/2019
| | | (0.77
| )%(f) | | | 2,837
| | | | (5
| ) | | | 2,832
| | |
See Notes to Financial Statements
142
Consolidated Schedule of Investments Multi-Style Premia Fund (cont'd)
| Counterparty | | Reference
Entity | | Notional
Amount(a) | | Maturity
Date | | Variable-
Rate(al) | | Unrealized
Appreciation/
(Depreciation) | | Accrued
Net
Interest
Receivable/
(Payable) | | Value | |
Morgan Stanley & Co.
International PLC | | Fresenius SE &
Co. KGaA | | EUR | (14,444
| ) | | 11/18/2019
| | | (0.77
| )%(f) | | $ | 786
| | | $ | (2
| ) | | $ | 784
| | |
Morgan Stanley & Co.
International PLC | | General Electric Co.
| | $ | (21,602
| ) | | 11/18/2019
| | | 1.83
| %(b) | | | 3,453
| | | | 16
| | | | 3,469
| | |
Morgan Stanley & Co.
International PLC | | General Motors Co.
| | | (16,672
| ) | | 11/18/2019
| | | 1.83
| %(b) | | | (1,379
| ) | | | 16
| | | | (1,363
| ) | |
Morgan Stanley & Co.
International PLC | | General Motors Co.
| | | (15,669
| ) | | 11/18/2019
| | | 1.83
| %(b) | | | (2,155
| ) | | | 15
| | | | (2,140
| ) | |
Morgan Stanley & Co.
International PLC | | Glencore PLC
| | GBP | (8,177
| ) | | 11/18/2019
| | | 0.37
| %(c) | | | (142
| ) | | | 2
| | | | (140
| ) | |
Morgan Stanley & Co.
International PLC | | Groupon, Inc.
| | $ | (11,934
| ) | | 11/18/2019
| | | 1.83
| %(b) | | | 2,391
| | | | 8
| | | | 2,399
| | |
Morgan Stanley & Co.
International PLC | | Hain Celestial Group,
Inc. | | | (19,779
| ) | | 11/18/2019
| | | 1.83
| %(b) | | | 2,376
| | | | 80
| | | | 2,456
| | |
Morgan Stanley & Co.
International PLC | | Hain Celestial Group,
Inc. | | | (19,629
| ) | | 11/18/2019
| | | 1.83
| %(b) | | | 969
| | | | 16
| | | | 985
| | |
Morgan Stanley & Co.
International PLC | | Henkel AG &
Co KGaA | | EUR | (14,005
| ) | | 11/18/2019
| | | (0.77
| )%(f) | | | 1,409
| | | | (5
| ) | | | 1,404
| | |
Morgan Stanley & Co.
International PLC | | Henkel AG &
Co KGaA | | EUR | (14,359
| ) | | 11/18/2019
| | | (0.77
| )%(f) | | | 1,315
| | | | (5
| ) | | | 1,310
| | |
Morgan Stanley & Co.
International PLC | | Hitachi Metals
Ltd. | | JPY | (1,374,628
| ) | | 11/18/2019
| | | (0.50
| )%(j) | | | 189
| | | | (2
| ) | | | 187
| | |
Morgan Stanley & Co.
International PLC | | Hitachi Metals
Ltd. | | JPY | (1,283,941
| ) | | 11/18/2019
| | | (0.50
| )%(j) | | | 377
| | | | (2
| ) | | | 375
| | |
Morgan Stanley & Co.
International PLC | | Hitachi Metals
Ltd. | | JPY | (685,315
| ) | | 11/18/2019
| | | (0.50
| )%(j) | | | 86
| | | | (1
| ) | | | 85
| | |
Morgan Stanley & Co.
International PLC | | Hologic, Inc.
| | $ | (13,683
| ) | | 11/18/2019
| | | 1.83
| %(b) | | | 779
| | | | 11
| | | | 790
| | |
Morgan Stanley & Co.
International PLC | | Horizon Pharma PLC
| | | (69,904
| ) | | 11/18/2019
| | | 1.83
| %(b) | | | (9,134
| ) | | | 90
| | | | (9,044
| ) | |
Morgan Stanley & Co.
International PLC | | Howard Hughes Corp.
| | | (19,279
| ) | | 11/18/2019
| | | 1.83
| %(b) | | | 2,335
| | | | 15
| | | | 2,350
| | |
Morgan Stanley & Co.
International PLC | | Howard Hughes Corp.
| | | (20,559
| ) | | 11/18/2019
| | | 1.83
| %(b) | | | 2,473
| | | | 16
| | | | 2,489
| | |
Morgan Stanley & Co.
International PLC | | Howard Hughes Corp.
| | | (21,519
| ) | | 11/18/2019
| | | 1.83
| %(b) | | | 2,228
| | | | 17
| | | | 2,245
| | |
Morgan Stanley & Co.
International PLC | | Howard Hughes Corp.
| | | (19,850
| ) | | 11/18/2019
| | | 1.83
| %(b) | | | 1,896
| | | | 15
| | | | 1,911
| | |
Morgan Stanley & Co.
International PLC | | Howard Hughes Corp.
| | | (4,681
| ) | | 11/18/2019
| | | 1.83
| %(b) | | | 277
| | | | 4
| | | | 281
| | |
Morgan Stanley & Co.
International PLC | | HubSpot, Inc.
| | | (17,779
| ) | | 11/18/2019
| | | 1.83
| %(b) | | | 4
| | | | 15
| | | | 19
| | |
See Notes to Financial Statements
143
Consolidated Schedule of Investments Multi-Style Premia Fund (cont'd)
| Counterparty | | Reference
Entity | | Notional
Amount(a) | | Maturity
Date | | Variable-
Rate(al) | | Unrealized
Appreciation/
(Depreciation) | | Accrued
Net
Interest
Receivable/
(Payable) | | Value | |
Morgan Stanley & Co.
International PLC | | Iberdrola SA
| | EUR | (293
| ) | | 11/18/2019
| | | (0.87
| )%(g) | | $ | 14
| | | $ | (0
| ) | | $ | 14
| | |
Morgan Stanley & Co.
International PLC | | II-VI, Inc.
| | $ | (25,091
| ) | | 11/18/2019
| | | 1.83
| %(b) | | | 3,573
| | | | 25
| | | | 3,598
| | |
Morgan Stanley & Co.
International PLC | | Iliad SA
| | EUR | (48,564
| ) | | 11/18/2019
| | | (0.77
| )%(f) | | | 12,509
| | | | (19
| ) | | | 12,490
| | |
Morgan Stanley & Co.
International PLC | | Iliad SA
| | EUR | (17,969
| ) | | 11/18/2019
| | | (0.77
| )%(f) | | | 3,576
| | | | (6
| ) | | | 3,570
| | |
Morgan Stanley & Co.
International PLC | | Iliad SA
| | EUR | (9,710
| ) | | 11/18/2019
| | | (0.77
| )%(f) | | | 1,794
| | | | (3
| ) | | | 1,791
| | |
Morgan Stanley & Co.
International PLC | | Iliad SA
| | EUR | (5,153
| ) | | 11/18/2019
| | | (0.77
| )%(f) | | | 197
| | | | (2
| ) | | | 195
| | |
Morgan Stanley & Co.
International PLC | | Indivior PLC
| | GBP | (12,352
| ) | | 11/18/2019
| | | 0.37
| %(c) | | | 5,969
| | | | 2
| | | | 5,971
| | |
Morgan Stanley & Co.
International PLC | | Indivior PLC
| | GBP | (6,190
| ) | | 11/18/2019
| | | 0.37
| %(c) | | | 2,542
| | | | 1
| | | | 2,543
| | |
Morgan Stanley & Co.
International PLC | | Indivior PLC
| | GBP | (13,041
| ) | | 11/18/2019
| | | 0.37
| %(c) | | | 5,566
| | | | 2
| | | | 5,568
| | |
Morgan Stanley & Co.
International PLC | | Indivior PLC
| | GBP | (10,998
| ) | | 11/18/2019
| | | 0.37
| %(c) | | | 3,787
| | | | 2
| | | | 3,789
| | |
Morgan Stanley & Co.
International PLC | | Indivior PLC
| | GBP | (11,463
| ) | | 11/18/2019
| | | 0.37
| %(c) | | | 3,843
| | | | 9
| | | | 3,852
| | |
Morgan Stanley & Co.
International PLC | | Indivior PLC
| | GBP | (5,415
| ) | | 11/18/2019
| | | 0.37
| %(c) | | | 1,527
| | | | 1
| | | | 1,528
| | |
Morgan Stanley & Co.
International PLC | | Indivior PLC
| | GBP | (5,415
| ) | | 11/18/2019
| | | 0.37
| %(c) | | | 1,462
| | | | 1
| | | | 1,463
| | |
Morgan Stanley & Co.
International PLC | | Indivior PLC
| | GBP | (5,976
| ) | | 11/18/2019
| | | 0.37
| %(c) | | | (59
| ) | | | 1
| | | | (58
| ) | |
Morgan Stanley & Co.
International PLC | | Industria de Diseno
Textil SA | | EUR | (11,333
| ) | | 11/18/2019
| | | (0.87
| )%(g) | | | 1,138
| | | | (5
| ) | | | 1,133
| | |
Morgan Stanley & Co.
International PLC | | Infineon Technologies
AG | | EUR | (15,033
| ) | | 11/18/2019
| | | (0.77
| )%(f) | | | 1,032
| | | | (5
| ) | | | 1,027
| | |
Morgan Stanley & Co.
International PLC | | Infineon Technologies
AG | | EUR | (13,041
| ) | | 11/18/2019
| | | (0.77
| )%(f) | | | (418
| ) | | | (2
| ) | | | (420
| ) | |
Morgan Stanley & Co.
International PLC | | Ingenico Group SA
| | EUR | (15,411
| ) | | 11/18/2019
| | | (0.77
| )%(f) | | | 1,349
| | | | (6
| ) | | | 1,343
| | |
Morgan Stanley & Co.
International PLC | | Inpex Corp.
| | JPY | (1,060,305
| ) | | 11/18/2019
| | | (0.50
| )%(j) | | | (1,060
| ) | | | (3
| ) | | | (1,063
| ) | |
Morgan Stanley & Co.
International PLC | | Inpex Corp.
| | JPY | (1,037,317
| ) | | 11/18/2019
| | | (0.50
| )%(j) | | | (1,162
| ) | | | (3
| ) | | | (1,165
| ) | |
Morgan Stanley & Co.
International PLC | | Inpex Corp.
| | JPY | (1,144,346
| ) | | 11/18/2019
| | | (0.50
| )%(j) | | | (1,263
| ) | | | (12
| ) | | | (1,275
| ) | |
See Notes to Financial Statements
144
Consolidated Schedule of Investments Multi-Style Premia Fund (cont'd)
| Counterparty | | Reference
Entity | | Notional
Amount(a) | | Maturity
Date | | Variable-
Rate(al) | | Unrealized
Appreciation/
(Depreciation) | | Accrued
Net
Interest
Receivable/
(Payable) | | Value | |
Morgan Stanley & Co.
International PLC | | Inpex Corp.
| | JPY | (301,217
| ) | | 11/18/2019
| | | (0.50
| )%(j) | | $ | 183
| | | $ | (1
| ) | | $ | 182
| | |
Morgan Stanley & Co.
International PLC | | Insulet Corp.
| | $ | (66,230
| ) | | 11/18/2019
| | | 1.83
| %(b) | | | 3,962
| | | | 54
| | | | 4,016
| | |
Morgan Stanley & Co.
International PLC | | Insulet Corp.
| | | (5,861
| ) | | 11/18/2019
| | | 1.83
| %(b) | | | 416
| | | | 5
| | | | 421
| | |
Morgan Stanley & Co.
International PLC | | Insulet Corp.
| | | (9,601
| ) | | 11/18/2019
| | | 1.83
| %(b) | | | (95
| ) | | | 8
| | | | (87
| ) | |
Morgan Stanley & Co.
International PLC | | Intermediate Capital
Group PLC | | GBP | (37,849
| ) | | 11/18/2019
| | | 0.37
| %(c) | | | 6,987
| | | | 7
| | | | 6,994
| | |
Morgan Stanley & Co.
International PLC | | Intermediate Capital
Group PLC | | GBP | (2,815
| ) | | 11/18/2019
| | | 0.37
| %(c) | | | 351
| | | | 1
| | | | 352
| | |
Morgan Stanley & Co.
International PLC | | Intermediate Capital
Group PLC | | GBP | (2,775
| ) | | 11/18/2019
| | | 0.37
| %(c) | | | 265
| | | | 1
| | | | 266
| | |
Morgan Stanley & Co.
International PLC | | Intuitive Surgical, Inc.
| | $ | (19,256
| ) | | 11/18/2019
| | | 1.83
| %(b) | | | 1,289
| | | | 15
| | | | 1,304
| | |
Morgan Stanley & Co.
International PLC | | IPG Photonics Corp.
| | | (20,997
| ) | | 11/18/2019
| | | 1.83
| %(b) | | | 2,953
| | | | 16
| | | | 2,969
| | |
Morgan Stanley & Co.
International PLC | | IPG Photonics Corp.
| | | (17,133
| ) | | 11/18/2019
| | | 1.83
| %(b) | | | 153
| | | | 15
| | | | 168
| | |
Morgan Stanley & Co.
International PLC | | IPG Photonics Corp.
| | | (17,294
| ) | | 11/18/2019
| | | 1.83
| %(b) | | | (167
| ) | | | 6
| | | | (161
| ) | |
Morgan Stanley & Co.
International PLC | | IQVIA Holdings, Inc.
| | | (19,148
| ) | | 11/18/2019
| | | 1.83
| %(b) | | | 1,030
| | | | 9
| | | | 1,039
| | |
Morgan Stanley & Co.
International PLC | | IWG PLC
| | GBP | (30,732
| ) | | 11/18/2019
| | | 0.37
| %(c) | | | 8,105
| | | | 6
| | | | 8,111
| | |
Morgan Stanley & Co.
International PLC | | JD Sports Fashion PLC
| | GBP | (27,413
| ) | | 11/18/2019
| | | 0.37
| %(c) | | | (2,760
| ) | | | 7
| | | | (2,753
| ) | |
Morgan Stanley & Co.
International PLC | | Jefferies Financial
Group, Inc. | | $ | (34,735
| ) | | 11/18/2019
| | | 1.83
| %(b) | | | 1,082
| | | | 38
| | | | 1,120
| | |
Morgan Stanley & Co.
International PLC | | JetBlue Airways Corp.
| | | (88,101
| ) | | 11/18/2019
| | | 1.83
| %(b) | | | 10,022
| | | | 89
| | | | 10,111
| | |
Morgan Stanley & Co.
International PLC | | John Wood
Group PLC | | GBP | (32,331
| ) | | 11/18/2019
| | | 0.37
| %(c) | | | (2,898
| ) | | | 8
| | | | (2,890
| ) | |
Morgan Stanley & Co.
International PLC | | Johnson Matthey
PLC | | GBP | (17,980
| ) | | 11/18/2019
| | | 0.37
| %(c) | | | 3,054
| | | | 4
| | | | 3,058
| | |
Morgan Stanley & Co.
International PLC | | Johnson Matthey
PLC | | GBP | (9,424
| ) | | 11/18/2019
| | | 0.37
| %(c) | | | 2,127
| | | | 2
| | | | 2,129
| | |
Morgan Stanley & Co.
International PLC | | Johnson Matthey
PLC | | GBP | (7,614
| ) | | 11/18/2019
| | | 0.37
| %(c) | | | 1,483
| | | | 4
| | | | 1,487
| | |
Morgan Stanley & Co.
International PLC | | Johnson Matthey
PLC | | GBP | (3,752
| ) | | 11/18/2019
| | | 0.37
| %(c) | | | 688
| | | | 1
| | | | 689
| | |
See Notes to Financial Statements
145
Consolidated Schedule of Investments Multi-Style Premia Fund (cont'd)
| Counterparty | | Reference
Entity | | Notional
Amount(a) | | Maturity
Date | | Variable-
Rate(al) | | Unrealized
Appreciation/
(Depreciation) | | Accrued
Net
Interest
Receivable/
(Payable) | | Value | |
Morgan Stanley & Co.
International PLC | | Johnson Matthey
PLC | | GBP | (3,578
| ) | | 11/18/2019
| | | 0.37
| %(c) | | $ | 576
| | | $ | 1
| | | $ | 577
| | |
Morgan Stanley & Co.
International PLC | | Johnson Matthey
PLC | | GBP | (2,328
| ) | | 11/18/2019
| | | 0.37
| %(c) | | | 63
| | | | 0
| | | | 63
| | |
Morgan Stanley & Co.
International PLC | | Johnson Matthey
PLC | | GBP | (2,189
| ) | | 11/18/2019
| | | 0.37
| %(c) | | | (121
| ) | | | 0
| | | | (121
| ) | |
Morgan Stanley & Co.
International PLC | | Jones Lang LaSalle,
Inc. | | $ | (52,528
| ) | | 11/18/2019
| | | 1.83
| %(b) | | | 8,409
| | | | 50
| | | | 8,459
| | |
Morgan Stanley & Co.
International PLC | | Just Eat PLC
| | GBP | (6,764
| ) | | 11/18/2019
| | | 0.37
| %(c) | | | 1,123
| | | | 1
| | | | 1,124
| | |
Morgan Stanley & Co.
International PLC | | K&S AG
| | EUR | (3,839
| ) | | 11/18/2019
| | | (2.99
| )%(n) | | | 953
| | | | (9
| ) | | | 944
| | |
Morgan Stanley & Co.
International PLC | | Kansai Electric
Power Co., Inc. | | JPY | (3,359,840
| ) | | 11/18/2019
| | | (0.50
| )%(j) | | | (3,515
| ) | | | (8
| ) | | | (3,523
| ) | |
Morgan Stanley & Co.
International PLC | | KION Group AG
| | EUR | (59,458
| ) | | 11/18/2019
| | | (0.77
| )%(f) | | | 13,739
| | | | (20
| ) | | | 13,719
| | |
Morgan Stanley & Co.
International PLC | | KION Group AG
| | EUR | (4,965
| ) | | 11/18/2019
| | | (0.77
| )%(f) | | | 1,202
| | | | (2
| ) | | | 1,200
| | |
Morgan Stanley & Co.
International PLC | | KION Group AG
| | EUR | (11,897
| ) | | 11/18/2019
| | | (0.77
| )%(f) | | | 1,234
| | | | (23
| ) | | | 1,211
| | |
Morgan Stanley & Co.
International PLC | | KION Group AG
| | EUR | (10,734
| ) | | 11/18/2019
| | | (0.77
| )%(f) | | | (2,970
| ) | | | (2
| ) | | | (2,972
| ) | |
Morgan Stanley & Co.
International PLC | | Knight-Swift
Transportation Holdings,
Inc. | | $ | (42,465
| ) | | 11/18/2019
| | | 1.83
| %(b) | | | 6,961
| | | | 41
| | | | 7,002
| | |
Morgan Stanley & Co.
International PLC | | Knight-Swift
Transportation Holdings,
Inc. | | | (17,258
| ) | | 11/18/2019
| | | 1.83
| %(b) | | | 741
| | | | 14
| | | | 755
| | |
Morgan Stanley & Co.
International PLC | | Knight-Swift
Transportation Holdings,
Inc. | | | (20,039
| ) | | 11/18/2019
| | | 1.83
| %(b) | | | 323
| | | | 17
| | | | 340
| | |
Morgan Stanley & Co.
International PLC | | Knight-Swift
Transportation Holdings,
Inc. | | | (7,663
| ) | | 11/18/2019
| | | 1.84
| %(b) | | | 71
| | | | 5
| | | | 76
| | |
Morgan Stanley & Co.
International PLC | | Knight-Swift
Transportation Holdings,
Inc. | | | (1,959
| ) | | 11/18/2019
| | | 1.83
| %(b) | | | (125
| ) | | | 1
| | | | (124
| ) | |
Morgan Stanley & Co.
International PLC | | Kose Corp.
| | JPY | (6,089,266
| ) | | 11/18/2019
| | | (0.50
| )%(j) | | | 12,030
| | | | (7
| ) | | | 12,023
| | |
Morgan Stanley & Co.
International PLC | | Kose Corp.
| | JPY | (2,882,714
| ) | | 11/18/2019
| | | (0.50
| )%(j) | | | 5,298
| | | | (5
| ) | | | 5,293
| | |
Morgan Stanley & Co.
International PLC | | Kroger Co.
| | $ | (28,975
| ) | | 11/18/2019
| | | 1.83
| %(b) | | | (7,937
| ) | | | 42
| | | | (7,895
| ) | |
See Notes to Financial Statements
146
Consolidated Schedule of Investments Multi-Style Premia Fund (cont'd)
| Counterparty | | Reference
Entity | | Notional
Amount(a) | | Maturity
Date | | Variable-
Rate(al) | | Unrealized
Appreciation/
(Depreciation) | | Accrued
Net
Interest
Receivable/
(Payable) | | Value | |
Morgan Stanley & Co.
International PLC | | LendingTree, Inc.
| | $ | (18,640
| ) | | 11/18/2019
| | | 1.54
| %(o) | | $ | 1,858
| | | $ | 13
| | | $ | 1,871
| | |
Morgan Stanley & Co.
International PLC | | LendingTree, Inc.
| | | (21,287
| ) | | 11/18/2019
| | | 1.54
| %(o) | | | 2,475
| | | | 9
| | | | 2,484
| | |
Morgan Stanley & Co.
International PLC | | LendingTree, Inc.
| | | (20,129
| ) | | 11/18/2019
| | | 1.54
| %(o) | | | 2,098
| | | | 10
| | | | 2,108
| | |
Morgan Stanley & Co.
International PLC | | Leonardo SpA
| | EUR | (19,364
| ) | | 11/18/2019
| | | (0.87
| )%(g) | | | (2,433
| ) | | | (10
| ) | | | (2,443
| ) | |
Morgan Stanley & Co.
International PLC | | Leonardo SpA
| | EUR | (12,485
| ) | | 11/18/2019
| | | (0.87
| )%(g) | | | 423
| | | | (6
| ) | | | 417
| | |
Morgan Stanley & Co.
International PLC | | Leonardo SpA
| | EUR | (16,463
| ) | | 11/18/2019
| | | (0.87
| )%(g) | | | 1,188
| | | | (6
| ) | | | 1,182
| | |
Morgan Stanley & Co.
International PLC | | Leonardo SpA
| | EUR | (3,722
| ) | | 11/18/2019
| | | (0.87
| )%(g) | | | 99
| | | | (1
| ) | | | 98
| | |
Morgan Stanley & Co.
International PLC | | Liberty Media Corp.-
Liberty Formula One | | $ | (75,725
| ) | | 11/18/2019
| | | 1.83
| %(b) | | | (5,406
| ) | | | 93
| | | | (5,313
| ) | |
Morgan Stanley & Co.
International PLC | | LINE Corp.
| | JPY | (3,021,236
| ) | | 11/18/2019
| | | (1.19
| )%(p) | | | 2,283
| | | | (7
| ) | | | 2,276
| | |
Morgan Stanley & Co.
International PLC | | LINE Corp.
| | JPY | (1,582,672
| ) | | 11/18/2019
| | | (1.19
| )%(p) | | | 2,254
| | | | (2
| ) | | | 2,252
| | |
Morgan Stanley & Co.
International PLC | | LINE Corp.
| | JPY | (919,156
| ) | | 11/18/2019
| | | (1.19
| )%(p) | | | 900
| | | | (10
| ) | | | 890
| | |
Morgan Stanley & Co.
International PLC | | Lion Corp.
| | JPY | (745,604
| ) | | 11/18/2019
| | | (0.50
| )%(j) | | | (454
| ) | | | (2
| ) | | | (456
| ) | |
Morgan Stanley & Co.
International PLC | | Lion Corp.
| | JPY | (1,199,964
| ) | | 11/18/2019
| | | (0.50
| )%(j) | | | (319
| ) | | | (3
| ) | | | (322
| ) | |
Morgan Stanley & Co.
International PLC | | Lion Corp.
| | JPY | (348,009
| ) | | 11/18/2019
| | | (0.50
| )%(j) | | | (337
| ) | | | (1
| ) | | | (338
| ) | |
Morgan Stanley & Co.
International PLC | | LKQ Corp.
| | $ | (19,306
| ) | | 11/18/2019
| | | 1.83
| %(b) | | | 1,472
| | | | 15
| | | | 1,487
| | |
Morgan Stanley & Co.
International PLC | | LKQ Corp.
| | | (18,903
| ) | | 11/18/2019
| | | 1.84
| %(b) | | | 1,284
| | | | 13
| | | | 1,297
| | |
Morgan Stanley & Co.
International PLC | | LPL Financial
Holdings, Inc. | | | (19,250
| ) | | 11/18/2019
| | | 1.83
| %(b) | | | 2,233
| | | | 15
| | | | 2,248
| | |
Morgan Stanley & Co.
International PLC | | Lumentum
Holdings, Inc. | | | (95,101
| ) | | 11/18/2019
| | | 1.73
| %(q) | | | 11,072
| | | | 91
| | | | 11,163
| | |
Morgan Stanley & Co.
International PLC | | M3, Inc.
| | JPY | (6,563,334
| ) | | 11/18/2019
| | | (0.50
| )%(j) | | | 9,748
| | | | (12
| ) | | | 9,736
| | |
Morgan Stanley & Co.
International PLC | | Macy's, Inc.
| | $ | (17,139
| ) | | 11/18/2019
| | | 1.83
| %(b) | | | (672
| ) | | | 15
| | | | (657
| ) | |
Morgan Stanley & Co.
International PLC | | Macy's, Inc.
| | | (16,835
| ) | | 11/18/2019
| | | 1.83
| %(b) | | | (961
| ) | | | 6
| | | | (955
| ) | |
See Notes to Financial Statements
147
Consolidated Schedule of Investments Multi-Style Premia Fund (cont'd)
| Counterparty | | Reference
Entity | | Notional
Amount(a) | | Maturity
Date | | Variable-
Rate(al) | | Unrealized
Appreciation/
(Depreciation) | | Accrued
Net
Interest
Receivable/
(Payable) | | Value | |
Morgan Stanley & Co.
International PLC | | MarketAxess
Holdings, Inc. | | $ | (29,071
| ) | | 11/18/2019
| | | 1.83
| %(b) | | $ | 173
| | | $ | 25
| | | $ | 198
| | |
Morgan Stanley & Co.
International PLC | | Marriott International,
Inc./MD | | | (19,180
| ) | | 11/18/2019
| | | 1.83
| %(r) | | | 1,116
| | | | 16
| | | | 1,132
| | |
Morgan Stanley & Co.
International PLC | | Mattel, Inc.
| | | (13,244
| ) | | 11/18/2019
| | | 1.06
| %(b) | | | 1,271
| | | | 6
| | | | 1,277
| | |
Morgan Stanley & Co.
International PLC | | Mattel, Inc.
| | | (19,362
| ) | | 11/18/2019
| | | 1.06
| %(r) | | | 1,126
| | | | 11
| | | | 1,137
| | |
Morgan Stanley & Co.
International PLC | | Mattel, Inc.
| | | (18,854
| ) | | 11/18/2019
| | | 1.07
| %(r) | | | 1,469
| | | | 9
| | | | 1,478
| | |
Morgan Stanley & Co.
International PLC | | Mattel, Inc.
| | | (18,077
| ) | | 11/18/2019
| | | 1.06
| %(r) | | | 375
| | | | 4
| | | | 379
| | |
Morgan Stanley & Co.
International PLC | | Mediaset SpA
| | EUR | (8,264
| ) | | 11/18/2019
| | | (2.12
| )%(s) | | | 579
| | | | (15
| ) | | | 564
| | |
Morgan Stanley & Co.
International PLC | | Medicines Co.
| | $ | (115,258
| ) | | 11/18/2019
| | | 1.83
| %(b) | | | 26,519
| | | | 102
| | | | 26,621
| | |
Morgan Stanley & Co.
International PLC | | MetLife, Inc.
| | | (1,375
| ) | | 11/18/2019
| | | 1.83
| %(b) | | | 111
| | | | 1
| | | | 112
| | |
Morgan Stanley & Co.
International PLC | | Metro Bank PLC
| | GBP | (10,433
| ) | | 11/18/2019
| | | (1.40
| )%(t) | | | 3,312
| | | | (9
| ) | | | 3,303
| | |
Morgan Stanley & Co.
International PLC | | Metro Bank PLC
| | GBP | (11,153
| ) | | 11/18/2019
| | | (1.40
| )%(t) | | | 2,749
| | | | (10
| ) | | | 2,739
| | |
Morgan Stanley & Co.
International PLC | | Metro Bank PLC
| | GBP | (9,019
| ) | | 11/18/2019
| | | (1.40
| )%(t) | | | 2,195
| | | | (5
| ) | | | 2,190
| | |
Morgan Stanley & Co.
International PLC | | Metrovacesa SA
| | EUR | (16,515
| ) | | 11/18/2019
| | | (0.87
| )%(g) | | | 3,990
| | | | (6
| ) | | | 3,984
| | |
Morgan Stanley & Co.
International PLC | | MGM Resorts
International | | $ | (58,708
| ) | | 11/18/2019
| | | 1.83
| %(b) | | | 7,543
| | | | 44
| | | | 7,587
| | |
Morgan Stanley & Co.
International PLC | | MGM Resorts
International | | | (18,459
| ) | | 11/18/2019
| | | 1.83
| %(b) | | | 2,199
| | | | 14
| | | | 2,213
| | |
Morgan Stanley & Co.
International PLC | | MGM Resorts
International | | | (1,976
| ) | | 11/18/2019
| | | 1.83
| %(b) | | | 267
| | | | 2
| | | | 269
| | |
Morgan Stanley & Co.
International PLC | | MGM Resorts
International | | | (5,572
| ) | | 11/18/2019
| | | 1.83
| %(b) | | | 545
| | | | 4
| | | | 549
| | |
Morgan Stanley & Co.
International PLC | | MGM Resorts
International | | | (782
| ) | | 11/18/2019
| | | 1.83
| %(b) | | | 57
| | | | 2
| | | | 59
| | |
Morgan Stanley & Co.
International PLC | | Michael Kors
Holdings Ltd. | | | (69,189
| ) | | 11/18/2019
| | | 1.83
| %(b) | | | 10,934
| | | | 66
| | | | 11,000
| | |
Morgan Stanley & Co.
International PLC | | Michael Kors
Holdings Ltd. | | | (10,459
| ) | | 11/18/2019
| | | 1.83
| %(b) | | | 1,185
| | | | 8
| | | | 1,193
| | |
Morgan Stanley & Co.
International PLC | | Micro Focus
International PLC | | GBP | (34,708
| ) | | 11/18/2019
| | | 0.37
| %(c) | | | 3,491
| | | | 7
| | | | 3,498
| | |
See Notes to Financial Statements
148
Consolidated Schedule of Investments Multi-Style Premia Fund (cont'd)
| Counterparty | | Reference
Entity | | Notional
Amount(a) | | Maturity
Date | | Variable-
Rate(al) | | Unrealized
Appreciation/
(Depreciation) | | Accrued
Net
Interest
Receivable/
(Payable) | | Value | |
Morgan Stanley & Co.
International PLC | | Micro Focus
International PLC | | GBP | (3,752
| ) | | 11/18/2019
| | | 0.37
| %(c) | | $ | 147
| | | $ | 1
| | | $ | 148
| | |
Morgan Stanley & Co.
International PLC | | MISUMI Group,
Inc. | | JPY | (1,197,262
| ) | | 11/18/2019
| | | (0.50
| )%(j) | | | 2,293
| | | | (2
| ) | | | 2,291
| | |
Morgan Stanley & Co.
International PLC | | MISUMI Group,
Inc. | | JPY | (2,370,996
| ) | | 11/18/2019
| | | (0.50
| )%(j) | | | 3,477
| | | | (4
| ) | | | 3,473
| | |
Morgan Stanley & Co.
International PLC | | MISUMI Group,
Inc. | | JPY | (1,383,641
| ) | | 11/18/2019
| | | (0.50
| )%(j) | | | 2,114
| | | | (2
| ) | | | 2,112
| | |
Morgan Stanley & Co.
International PLC | | MISUMI Group,
Inc. | | JPY | (972,362
| ) | | 11/18/2019
| | | (0.50
| )%(j) | | | 1,296
| | | | (2
| ) | | | 1,294
| | |
Morgan Stanley & Co.
International PLC | | MISUMI Group,
Inc. | | JPY | (578,277
| ) | | 11/18/2019
| | | (0.50
| )%(j) | | | 554
| | | | (1
| ) | | | 553
| | |
Morgan Stanley & Co.
International PLC | | Mitsubishi Estate
Co. Ltd. | | JPY | (6,004,668
| ) | | 11/18/2019
| | | (0.50
| )%(j) | | | 4,206
| | | | (12
| ) | | | 4,194
| | |
Morgan Stanley & Co.
International PLC | | Mitsui Fudosan
Co. Ltd. | | JPY | (1,136,510
| ) | | 11/18/2019
| | | (0.50
| )%(j) | | | 527
| | | | (2
| ) | | | 525
| | |
Morgan Stanley & Co.
International PLC | | Mitsui Fudosan
Co. Ltd. | | JPY | (1,533,849
| ) | | 11/18/2019
| | | (0.50
| )%(j) | | | 33
| | | | (3
| ) | | | 30
| | |
Morgan Stanley & Co.
International PLC | | Monolithic Power
Systems, Inc. | | $ | (3,189
| ) | | 11/18/2019
| | | 1.83
| %(b) | | | 295
| | | | 3
| | | | 298
| | |
Morgan Stanley & Co.
International PLC | | MonotaRO Co.
Ltd. | | JPY | (4,151,880
| ) | | 11/18/2019
| | | (1.35
| )%(u) | | | (1,471
| ) | | | (27
| ) | | | (1,498
| ) | |
Morgan Stanley & Co.
International PLC | | Monster Beverage
Corp. | | $ | (31,270
| ) | | 11/18/2019
| | | 1.83
| %(b) | | | (2,439
| ) | | | 29
| | | | (2,410
| ) | |
Morgan Stanley & Co.
International PLC | | Monster Beverage
Corp. | | | (16,719
| ) | | 11/18/2019
| | | 1.83
| %(b) | | | 934
| | | | 14
| | | | 948
| | |
Morgan Stanley & Co.
International PLC | | Monster Beverage
Corp. | | | (13,859
| ) | | 11/18/2019
| | | 1.83
| %(b) | | | 1,645
| | | | 11
| | | | 1,656
| | |
Morgan Stanley & Co.
International PLC | | Monster Beverage
Corp. | | | (3,428
| ) | | 11/18/2019
| | | 1.83
| %(b) | | | 340
| | | | 3
| | | | 343
| | |
Morgan Stanley & Co.
International PLC | | Monster Beverage
Corp. | | | (2,394
| ) | | 11/18/2019
| | | 1.83
| %(b) | | | 193
| | | | 2
| | | | 195
| | |
Morgan Stanley & Co.
International PLC | | Monster Beverage
Corp. | | | (3,787
| ) | | 11/18/2019
| | | 1.84
| %(b) | | | 17
| | | | 3
| | | | 20
| | |
Morgan Stanley & Co.
International PLC | | Moody's Corp.
| | | (20,789
| ) | | 11/18/2019
| | | 1.83
| %(b) | | | 2,684
| | | | 16
| | | | 2,700
| | |
Morgan Stanley & Co.
International PLC | | Moody's Corp.
| | | (20,658
| ) | | 11/18/2019
| | | 1.83
| %(b) | | | 2,692
| | | | 15
| | | | 2,707
| | |
Morgan Stanley & Co.
International PLC | | Mosaic Co.
| | | (52,799
| ) | | 11/18/2019
| | | 1.83
| %(b) | | | (6,660
| ) | | | 51
| | | | (6,609
| ) | |
Morgan Stanley & Co.
International PLC | | Mylan NV
| | | (18,126
| ) | | 11/18/2019
| | | 1.83
| %(b) | | | 469
| | | | 6
| | | | 475
| | |
See Notes to Financial Statements
149
Consolidated Schedule of Investments Multi-Style Premia Fund (cont'd)
| Counterparty | | Reference
Entity | | Notional
Amount(a) | | Maturity
Date | | Variable-
Rate(al) | | Unrealized
Appreciation/
(Depreciation) | | Accrued
Net
Interest
Receivable/
(Payable) | | Value | |
Morgan Stanley & Co.
International PLC | | National Beverage
Corp. | | $ | (22,278
| ) | | 11/18/2019
| | | 1.83
| %(b) | | $ | 4,159
| | | $ | 16
| | | $ | 4,175
| | |
Morgan Stanley & Co.
International PLC | | National Beverage
Corp. | | | (21,563
| ) | | 11/18/2019
| | | 1.83
| %(b) | | | 3,478
| | | | 16
| | | | 3,494
| | |
Morgan Stanley & Co.
International PLC | | Navistar International
Corp. | | | (48,343
| ) | | 11/18/2019
| | | 1.83
| %(b) | | | 4,915
| | | | 38
| | | | 4,953
| | |
Morgan Stanley & Co.
International PLC | | Nektar Therapeutics
| | | (42,927
| ) | | 11/18/2019
| | | 1.83
| %(b) | | | 14,366
| | | | 25
| | | | 14,391
| | |
Morgan Stanley & Co.
International PLC | | Nektar Therapeutics
| | | (20,367
| ) | | 11/18/2019
| | | 1.83
| %(b) | | | 3,395
| | | | 15
| | | | 3,410
| | |
Morgan Stanley & Co.
International PLC | | Netflix, Inc.
| | | (41,755
| ) | | 11/18/2019
| | | 1.83
| %(b) | | | 5,034
| | | | 32
| | | | 5,066
| | |
Morgan Stanley & Co.
International PLC | | Netflix, Inc.
| | | (22,120
| ) | | 11/18/2019
| | | 1.83
| %(b) | | | 2,912
| | | | 17
| | | | 2,929
| | |
Morgan Stanley & Co.
International PLC | | Netflix, Inc.
| | | (19,159
| ) | | 11/18/2019
| | | 1.84
| %(b) | | | 2,186
| | | | 12
| | | | 2,198
| | |
Morgan Stanley & Co.
International PLC | | Nevro Corp.
| | | (17,903
| ) | | 11/18/2019
| | | 1.83
| %(b) | | | 4,904
| | | | 11
| | | | 4,915
| | |
Morgan Stanley & Co.
International PLC | | Newell Brands, Inc.
| | | (25,427
| ) | | 11/18/2019
| | | 1.83
| %(b) | | | 6,734
| | | | 16
| | | | 6,750
| | |
Morgan Stanley & Co.
International PLC | | Newfield Exploration Co.
| | | (27,829
| ) | | 11/18/2019
| | | 1.83
| %(b) | | | 6,016
| | | | 19
| | | | 6,035
| | |
Morgan Stanley & Co.
International PLC | | Newfield Exploration Co.
| | | (22,116
| ) | | 11/18/2019
| | | 1.83
| %(b) | | | 4,352
| | | | 15
| | | | 4,367
| | |
Morgan Stanley & Co.
International PLC | | Newfield Exploration Co.
| | | (22,964
| ) | | 11/18/2019
| | | 1.83
| %(b) | | | 4,887
| | | | 16
| | | | 4,903
| | |
Morgan Stanley & Co.
International PLC | | Nippon Paint Holdings
Co. Ltd. | | JPY | (1,443,221
| ) | | 11/18/2019
| | | (0.73
| )%(v) | | | 1,696
| | | | (2
| ) | | | 1,694
| | |
Morgan Stanley & Co.
International PLC | | Nitori Holdings
Co. Ltd. | | JPY | (4,535,256
| ) | | 11/18/2019
| | | (0.50
| )%(j) | | | 7,037
| | | | (8
| ) | | | 7,029
| | |
Morgan Stanley & Co.
International PLC | | Nitori Holdings
Co. Ltd. | | JPY | (2,304,610
| ) | | 11/18/2019
| | | (0.50
| )%(j) | | | 3,682
| | | | (4
| ) | | | 3,678
| | |
Morgan Stanley & Co.
International PLC | | NRG Energy, Inc.
| | $ | (8,840
| ) | | 11/18/2019
| | | 1.83
| %(b) | | | (701
| ) | | | 8
| | | | (693
| ) | |
Morgan Stanley & Co.
International PLC | | Nuance
Communications, Inc. | | | (16,900
| ) | | 11/18/2019
| | | 1.83
| %(b) | | | (567
| ) | | | 60
| | | | (507
| ) | |
Morgan Stanley & Co.
International PLC | | Nutanix, Inc.
| | | (112,456
| ) | | 11/18/2019
| | | 1.83
| %(b) | | | 18,786
| | | | 107
| | | | 18,893
| | |
Morgan Stanley & Co.
International PLC | | NVIDIA Corp.
| | | (22,845
| ) | | 11/18/2019
| | | 1.83
| %(b) | | | 4,781
| | | | 16
| | | | 4,797
| | |
Morgan Stanley & Co.
International PLC | | NVR, Inc.
| | | (6,322
| ) | | 11/18/2019
| | | 1.83
| %(b) | | | (197
| ) | | | 2
| | | | (195
| ) | |
See Notes to Financial Statements
150
Consolidated Schedule of Investments Multi-Style Premia Fund (cont'd)
| Counterparty | | Reference
Entity | | Notional
Amount(a) | | Maturity
Date | | Variable-
Rate(al) | | Unrealized
Appreciation/
(Depreciation) | | Accrued
Net
Interest
Receivable/
(Payable) | | Value | |
Morgan Stanley & Co.
International PLC | | Oasis Petroleum, Inc.
| | $ | (66,535
| ) | | 11/18/2019
| | | 1.83
| %(b) | | $ | 10,356
| | | $ | 48
| | | $ | 10,404
| | |
Morgan Stanley & Co.
International PLC | | Obrascon Huarte
Lain SA | | EUR | (1,160
| ) | | 11/18/2019
| | | (5.74
| )%(w) | | | 535
| | | | (0
| ) | | | 535
| | |
Morgan Stanley & Co.
International PLC | | Ocado Group PLC
| | GBP | (10,879
| ) | | 11/18/2019
| | | 0.37
| %(c) | | | 2,546
| | | | 2
| | | | 2,548
| | |
Morgan Stanley & Co.
International PLC | | Ocado Group PLC
| | GBP | (9,801
| ) | | 11/18/2019
| | | 0.37
| %(c) | | | 667
| | | | 2
| | | | 669
| | |
Morgan Stanley & Co.
International PLC | | Ocado Group PLC
| | GBP | (9,263
| ) | | 11/18/2019
| | | 0.37
| %(c) | | | 503
| | | | 2
| | | | 505
| | |
Morgan Stanley & Co.
International PLC | | Ocado Group PLC
| | GBP | (3,684
| ) | | 11/18/2019
| | | 0.37
| %(c) | | | (520
| ) | | | 1
| | | | (519
| ) | |
Morgan Stanley & Co.
International PLC | | Ocado Group PLC
| | GBP | (6,454
| ) | | 11/18/2019
| | | 0.37
| %(c) | | | (226
| ) | | | 1
| | | | (225
| ) | |
Morgan Stanley & Co.
International PLC | | OCI NV
| | EUR | (37,913
| ) | | 11/18/2019
| | | (1.49
| )%(x) | | | (3,317
| ) | | | (38
| ) | | | (3,355
| ) | |
Morgan Stanley & Co.
International PLC | | Okta, Inc.
| | $ | (18,180
| ) | | 11/18/2019
| | | 1.83
| %(b) | | | 394
| | | | 15
| | | | 409
| | |
Morgan Stanley & Co.
International PLC | | Okta, Inc.
| | | (9,998
| ) | | 11/18/2019
| | | 1.83
| %(b) | | | (195
| ) | | | 4
| | | | (191
| ) | |
Morgan Stanley & Co.
International PLC | | Omega Healthcare
Investors, Inc. | | | (8,672
| ) | | 11/18/2019
| | | 0.88
| %(y) | | | (950
| ) | | | 4
| | | | (946
| ) | |
Morgan Stanley & Co.
International PLC | | OMV AG
| | EUR | (4,848
| ) | | 11/18/2019
| | | (0.87
| )%(g) | | | (538
| ) | | | (2
| ) | | | (540
| ) | |
Morgan Stanley & Co.
International PLC | | OSRAM Licht AG
| | EUR | (10,805
| ) | | 11/18/2019
| | | (0.77
| )%(f) | | | 2,753
| | | | (2
| ) | | | 2,751
| | |
Morgan Stanley & Co.
International PLC | | Pandora Media, Inc.
| | $ | (52,937
| ) | | 11/18/2019
| | | 1.83
| %(b) | | | (14,684
| ) | | | 58
| | | | (14,626
| ) | |
Morgan Stanley & Co.
International PLC | | Parsley Energy, Inc.
| | | (108,786
| ) | | 11/18/2019
| | | 1.83
| %(b) | | | 17,752
| | | | 79
| | | | 17,831
| | |
Morgan Stanley & Co.
International PLC | | PDC Energy, Inc.
| | | (71,356
| ) | | 11/18/2019
| | | 1.83
| %(b) | | | 17,297
| | | | 47
| | | | 17,344
| | |
Morgan Stanley & Co.
International PLC | | Persol Holdings
Co. Ltd. | | JPY | (736,710
| ) | | 11/18/2019
| | | (0.51
| )%(j) | | | 409
| | | | (1
| ) | | | 408
| | |
Morgan Stanley & Co.
International PLC | | PG&E Corp.
| | $ | (14,575
| ) | | 11/18/2019
| | | 1.83
| %(b) | | | (1,723
| ) | | | 14
| | | | (1,709
| ) | |
Morgan Stanley & Co.
International PLC | | PG&E Corp.
| | | (14,354
| ) | | 11/18/2019
| | | 1.83
| %(b) | | | (3,402
| ) | | | 15
| | | | (3,387
| ) | |
Morgan Stanley & Co.
International PLC | | PG&E Corp.
| | | (14,330
| ) | | 11/18/2019
| | | 1.83
| %(b) | | | (1,565
| ) | | | 14
| | | | (1,551
| ) | |
Morgan Stanley & Co.
International PLC | | PG&E Corp.
| | | (14,419
| ) | | 11/18/2019
| | | 1.83
| %(b) | | | (1,099
| ) | | | 13
| | | | (1,086
| ) | |
See Notes to Financial Statements
151
Consolidated Schedule of Investments Multi-Style Premia Fund (cont'd)
| Counterparty | | Reference
Entity | | Notional
Amount(a) | | Maturity
Date | | Variable-
Rate(al) | | Unrealized
Appreciation/
(Depreciation) | | Accrued
Net
Interest
Receivable/
(Payable) | | Value | |
Morgan Stanley & Co.
International PLC | | PG&E Corp.
| | $ | (3,563
| ) | | 11/18/2019
| | | 1.83
| %(b) | | $ | (395
| ) | | $ | 3
| | | $ | (392
| ) | |
Morgan Stanley & Co.
International PLC | | Pilgrim's Pride Corp.
| | | (60,658
| ) | | 11/18/2019
| | | 1.83
| %(b) | | | 7,962
| | | | 46
| | | | 8,008
| | |
Morgan Stanley & Co.
International PLC | | Pilgrim's Pride Corp.
| | | (4,159
| ) | | 11/18/2019
| | | 1.83
| %(b) | | | 225
| | | | 3
| | | | 228
| | |
Morgan Stanley & Co.
International PLC | | Pilgrim's Pride Corp.
| | | (19,088
| ) | | 11/18/2019
| | | 1.83
| %(b) | | | 1,103
| | | | 15
| | | | 1,118
| | |
Morgan Stanley & Co.
International PLC | | Pilgrim's Pride Corp.
| | | (3,782
| ) | | 11/18/2019
| | | 1.83
| %(b) | | | 81
| | | | 3
| | | | 84
| | |
Morgan Stanley & Co.
International PLC | | Pinnacle Financial
Partners, Inc. | | | (16,379
| ) | | 11/18/2019
| | | 1.83
| %(b) | | | 2,855
| | | | 12
| | | | 2,867
| | |
Morgan Stanley & Co.
International PLC | | Pinnacle Financial
Partners, Inc. | | | (6,772
| ) | | 11/18/2019
| | | 1.83
| %(b) | | | 1,059
| | | | 20
| | | | 1,079
| | |
Morgan Stanley & Co.
International PLC | | Platform Specialty
Products Corp. | | | (81,747
| ) | | 11/18/2019
| | | 1.83
| %(b) | | | 3,918
| | | | 89
| | | | 4,007
| | |
Morgan Stanley & Co.
International PLC | | Post Holdings, Inc.
| | | (11,860
| ) | | 11/18/2019
| | | 1.83
| %(b) | | | (1,940
| ) | | | 12
| | | | (1,928
| ) | |
Morgan Stanley & Co.
International PLC | | Provident
Financial PLC | | GBP | (9,725
| ) | | 11/18/2019
| | | (1.15
| )%(z) | | | 2,365
| | | | (8
| ) | | | 2,357
| | |
Morgan Stanley & Co.
International PLC | | Provident Financial PLC
| | GBP | (9,704
| ) | | 11/18/2019
| | | (1.15
| )%(z) | | | 2,505
| | | | (8
| ) | | | 2,497
| | |
Morgan Stanley & Co.
International PLC | | Prudential PLC
| | GBP | (10,149
| ) | | 11/18/2019
| | | 0.37
| %(c) | | | 1,467
| | | | 2
| | | | 1,469
| | |
Morgan Stanley & Co.
International PLC | | Prudential PLC
| | GBP | (2,117
| ) | | 11/18/2019
| | | 0.37
| %(c) | | | (22
| ) | | | 0
| | | | (22
| ) | |
Morgan Stanley & Co.
International PLC | | Prudential PLC
| | GBP | (8,168
| ) | | 11/18/2019
| | | 0.37
| %(c) | | | (481
| ) | | | 1
| | | | (480
| ) | |
Morgan Stanley & Co.
International PLC | | Public Service Enterprise
Group, Inc. | | $ | (22,748
| ) | | 11/18/2019
| | | 1.83
| %(b) | | | (354
| ) | | | 20
| | | | (334
| ) | |
Morgan Stanley & Co.
International PLC | | PVH Corp.
| | | (17,672
| ) | | 11/18/2019
| | | 1.83
| %(b) | | | (42
| ) | | | 6
| | | | (36
| ) | |
Morgan Stanley & Co.
International PLC | | QEP Resources, Inc.
| | | (68,202
| ) | | 11/18/2019
| | | 1.83
| %(b) | | | 14,695
| | | | 46
| | | | 14,741
| | |
Morgan Stanley & Co.
International PLC | | Raiffeisen Bank
International AG | | EUR | (42,562
| ) | | 11/18/2019
| | | (0.87
| )%(g) | | | 5,530
| | | | (18
| ) | | | 5,512
| | |
Morgan Stanley & Co.
International PLC | | Rakuten, Inc.
| | JPY | (2,304,946
| ) | | 11/18/2019
| | | (0.50
| )%(j) | | | (958
| ) | | | (5
| ) | | | (963
| ) | |
Morgan Stanley & Co.
International PLC | | Randgold Resources
Ltd. | | GBP | (6,481
| ) | | 11/18/2019
| | | 0.37
| %(c) | | | (2,421
| ) | | | 2
| | | | (2,419
| ) | |
Morgan Stanley & Co.
International PLC | | Randgold Resources
Ltd. | | GBP | (5,669
| ) | | 11/18/2019
| | | 0.37
| %(c) | | | (3,451
| ) | | | 2
| | | | (3,449
| ) | |
See Notes to Financial Statements
152
Consolidated Schedule of Investments Multi-Style Premia Fund (cont'd)
| Counterparty | | Reference
Entity | | Notional
Amount(a) | | Maturity
Date | | Variable-
Rate(al) | | Unrealized
Appreciation/
(Depreciation) | | Accrued
Net
Interest
Receivable/
(Payable) | | Value | |
Morgan Stanley & Co.
International PLC | | Randgold Resources
Ltd. | | GBP | (6,166
| ) | | 11/18/2019
| | | 0.37
| %(c) | | $ | (3,369
| ) | | $ | 2
| | | $ | (3,367
| ) | |
Morgan Stanley & Co.
International PLC | | Reckitt Benckiser
Group PLC | | GBP | (28,093
| ) | | 11/18/2019
| | | 0.37
| %(c) | | | (3,981
| ) | | | 7
| | | | (3,974
| ) | |
Morgan Stanley & Co.
International PLC | | Regency Centers Corp.
| | $ | (34,629
| ) | | 11/18/2019
| | | 1.83
| %(b) | | | (3,531
| ) | | | 33
| | | | (3,498
| ) | |
Morgan Stanley & Co.
International PLC | | RenaissanceRe
Holdings Ltd. | | | (20,003
| ) | | 11/18/2019
| | | 1.83
| %(b) | | | 290
| | | | 17
| | | | 307
| | |
Morgan Stanley & Co.
International PLC | | RenaissanceRe
Holdings Ltd. | | | (19,033
| ) | | 11/18/2019
| | | 1.83
| %(b) | | | 1,271
| | | | 15
| | | | 1,286
| | |
Morgan Stanley & Co.
International PLC | | Renesas Electronics
Corp. | | JPY | (7,824,590
| ) | | 11/18/2019
| | | (0.50
| )%(j) | | | 21,419
| | | | (11
| ) | | | 21,408
| | |
Morgan Stanley & Co.
International PLC | | Renesas Electronics
Corp. | | JPY | (1,272,931
| ) | | 11/18/2019
| | | (0.50
| )%(j) | | | 1,930
| | | | (2
| ) | | | 1,928
| | |
Morgan Stanley & Co.
International PLC | | Renesas Electronics
Corp. | | JPY | (399,648
| ) | | 11/18/2019
| | | (0.50
| )%(j) | | | 446
| | | | (1
| ) | | | 445
| | |
Morgan Stanley & Co.
International PLC | | Renesas Electronics
Corp. | | JPY | (206,808
| ) | | 11/18/2019
| | | (0.50
| )%(j) | | | 121
| | | | (0
| ) | | | 121
| | |
Morgan Stanley & Co.
International PLC | | Rentokil Initial PLC
| | GBP | (6,579
| ) | | 11/18/2019
| | | 0.37
| %(c) | | | 454
| | | | 1
| | | | 455
| | |
Morgan Stanley & Co.
International PLC | | Rentokil Initial PLC
| | GBP | (9,063
| ) | | 11/18/2019
| | | 0.37
| %(c) | | | (141
| ) | | | 2
| | | | (139
| ) | |
Morgan Stanley & Co.
International PLC | | Rentokil Initial PLC
| | GBP | (7,246
| ) | | 11/18/2019
| | | 0.37
| %(c) | | | (345
| ) | | | 1
| | | | (344
| ) | |
Morgan Stanley & Co.
International PLC | | Rentokil Initial PLC
| | GBP | (7,394
| ) | | 11/18/2019
| | | 0.37
| %(c) | | | (1,127
| ) | | | 1
| | | | (1,126
| ) | |
Morgan Stanley & Co.
International PLC | | RingCentral, Inc.
| | $ | (16,881
| ) | | 11/18/2019
| | | 1.83
| %(b) | | | (965
| ) | | | 15
| | | | (950
| ) | |
Morgan Stanley & Co.
International PLC | | Rolls-Royce Holdings
PLC | | GBP | (170
| ) | | 11/18/2019
| | | 0.37
| %(c) | | | —
| | | | —
| | | | —
| | |
Morgan Stanley & Co.
International PLC | | Rolls-Royce Holdings
PLC | | GBP | (29,915
| ) | | 11/18/2019
| | | 0.37
| %(c) | | | (700
| ) | | | 7
| | | | (693
| ) | |
Morgan Stanley & Co.
International PLC | | Royal Bank of Scotland
Group PLC | | GBP | (3,838
| ) | | 11/18/2019
| | | 0.37
| %(c) | | | 603
| | | | 1
| | | | 604
| | |
Morgan Stanley & Co.
International PLC | | Royal Bank of Scotland
Group PLC | | GBP | (4,376
| ) | | 11/18/2019
| | | 0.37
| %(c) | | | 271
| | | | 1
| | | | 272
| | |
Morgan Stanley & Co.
International PLC | | Royal Bank of Scotland
Group PLC | | GBP | (8,673
| ) | | 11/18/2019
| | | 0.37
| %(c) | | | 354
| | | | 2
| | | | 356
| | |
Morgan Stanley & Co.
International PLC | | Royal Bank of Scotland
Group PLC | | GBP | (6,138
| ) | | 11/18/2019
| | | 0.37
| %(c) | | | 230
| | | | 1
| | | | 231
| | |
Morgan Stanley & Co.
International PLC | | Royal Bank of Scotland
Group PLC | | GBP | (8,762
| ) | | 11/18/2019
| | | 0.37
| %(c) | | | 448
| | | | 2
| | | | 450
| | |
See Notes to Financial Statements
153
Consolidated Schedule of Investments Multi-Style Premia Fund (cont'd)
| Counterparty | | Reference
Entity | | Notional
Amount(a) | | Maturity
Date | | Variable-
Rate(al) | | Unrealized
Appreciation/
(Depreciation) | | Accrued
Net
Interest
Receivable/
(Payable) | | Value | |
Morgan Stanley & Co.
International PLC | | Royal Bank of Scotland
Group PLC | | GBP | (3,763
| ) | | 11/18/2019
| | | 0.37
| %(c) | | $ | 184
| | | $ | 1
| | | $ | 185
| | |
Morgan Stanley & Co.
International PLC | | Royal Bank of Scotland
Group PLC | | GBP | (1,833
| ) | | 11/18/2019
| | | 0.37
| %(c) | | | 87
| | | | 0
| | | | 87
| | |
Morgan Stanley & Co.
International PLC | | RWE AG
| | EUR | (4,082
| ) | | 11/18/2019
| | | (0.77
| )%(f) | | | 801
| | | | (1
| ) | | | 800
| | |
Morgan Stanley & Co.
International PLC | | RWE AG
| | EUR | (16,495
| ) | | 11/18/2019
| | | (0.77
| )%(f) | | | 2,984
| | | | (6
| ) | | | 2,978
| | |
Morgan Stanley & Co.
International PLC | | RWE AG
| | EUR | (9,007
| ) | | 11/18/2019
| | | (0.77
| )%(f) | | | 1,756
| | | | (3
| ) | | | 1,753
| | |
Morgan Stanley & Co.
International PLC | | RWE AG
| | EUR | (17,277
| ) | | 11/18/2019
| | | (0.77
| )%(f) | | | 3,340
| | | | (6
| ) | | | 3,334
| | |
Morgan Stanley & Co.
International PLC | | RWE AG
| | EUR | (16,312
| ) | | 11/18/2019
| | | (0.77
| )%(f) | | | 2,881
| | | | (6
| ) | | | 2,875
| | |
Morgan Stanley & Co.
International PLC | | Sage Group PLC
| | GBP | (37,116
| ) | | 11/18/2019
| | | 0.37
| %(c) | | | 7,157
| | | | 7
| | | | 7,164
| | |
Morgan Stanley & Co.
International PLC | | Sage Group PLC
| | GBP | (4,063
| ) | | 11/18/2019
| | | 0.37
| %(c) | | | 596
| | | | 1
| | | | 597
| | |
Morgan Stanley & Co.
International PLC | | Sage Group PLC
| | GBP | (2,632
| ) | | 11/18/2019
| | | 0.37
| %(c) | | | 193
| | | | 1
| | | | 194
| | |
Morgan Stanley & Co.
International PLC | | Sage Group PLC
| | GBP | (2,212
| ) | | 11/18/2019
| | | 0.37
| %(c) | | | (51
| ) | | | 0
| | | | (51
| ) | |
Morgan Stanley & Co.
International PLC | | Sartorius AG
| | EUR | (15,184
| ) | | 11/18/2019
| | | (3.07
| )%(aa) | | | 1,206
| | | | (7
| ) | | | 1,199
| | |
Morgan Stanley & Co.
International PLC | | Sartorius AG
| | EUR | (16,573
| ) | | 11/18/2019
| | | (3.07
| )%(aa) | | | 1,920
| | | | (11
| ) | | | 1,909
| | |
Morgan Stanley & Co.
International PLC | | Sartorius Stedim
Biotech | | EUR | (20,551
| ) | | 11/18/2019
| | | (0.77
| )%(f) | | | (9,655
| ) | | | (12
| ) | | | (9,667
| ) | |
Morgan Stanley & Co.
International PLC | | SBI Holdings, Inc.
| | JPY | (895,206
| ) | | 11/18/2019
| | | (0.50
| )%(j) | | | 31
| | | | (2
| ) | | | 29
| | |
Morgan Stanley & Co.
International PLC | | SBM Offshore NV
| | EUR | (12,658
| ) | | 11/18/2019
| | | (0.77
| )%(f) | | | (1,806
| ) | | | (6
| ) | | | (1,812
| ) | |
Morgan Stanley & Co.
International PLC | | SBM Offshore NV
| | EUR | (5,899
| ) | | 11/18/2019
| | | (0.77
| )%(f) | | | 199
| | | | (2
| ) | | | 197
| | |
Morgan Stanley & Co.
International PLC | | SCANA Corp.
| | $ | (2,747
| ) | | 11/18/2019
| | | 1.83
| %(b) | | | (389
| ) | | | 3
| | | | (386
| ) | |
Morgan Stanley & Co.
International PLC | | SCANA Corp.
| | | (17,550
| ) | | 11/18/2019
| | | 1.83
| %(b) | | | (16
| ) | | | 15
| | | | (1
| ) | |
Morgan Stanley & Co.
International PLC | | SCANA Corp.
| | | (7,829
| ) | | 11/18/2019
| | | 1.83
| %(b) | | | (651
| ) | | | 29
| | | | (622
| ) | |
Morgan Stanley & Co.
International PLC | | SCANA Corp.
| | | (16,936
| ) | | 11/18/2019
| | | 1.83
| %(b) | | | (964
| ) | | | 15
| | | | (949
| ) | |
See Notes to Financial Statements
154
Consolidated Schedule of Investments Multi-Style Premia Fund (cont'd)
| Counterparty | | Reference
Entity | | Notional
Amount(a) | | Maturity
Date | | Variable-
Rate(al) | | Unrealized
Appreciation/
(Depreciation) | | Accrued
Net
Interest
Receivable/
(Payable) | | Value | |
Morgan Stanley & Co.
International PLC | | SCANA Corp.
| | $ | (17,638
| ) | | 11/18/2019
| | | 1.83
| %(b) | | $ | (1,314
| ) | | $ | 7
| | | $ | (1,307
| ) | |
Morgan Stanley & Co.
International PLC | | Seibu Holdings,
Inc. | | JPY | (1,145,399
| ) | | 11/18/2019
| | | (0.50
| )%(j) | | | (367
| ) | | | (11
| ) | | | (378
| ) | |
Morgan Stanley & Co.
International PLC | | Serco Group PLC
| | GBP | (20,899
| ) | | 11/18/2019
| | | 0.37
| %(c) | | | (967
| ) | | | 5
| | | | (962
| ) | |
Morgan Stanley & Co.
International PLC | | Serco Group PLC
| | GBP | (2,989
| ) | | 11/18/2019
| | | 0.37
| %(c) | | | (339
| ) | | | 1
| | | | (338
| ) | |
Morgan Stanley & Co.
International PLC | | ServiceNow, Inc.
| | $ | (20,586
| ) | | 11/18/2019
| | | 1.83
| %(b) | | | (570
| ) | | | 18
| | | | (552
| ) | |
Morgan Stanley & Co.
International PLC | | ServiceNow, Inc.
| | | (17,393
| ) | | 11/18/2019
| | | 1.83
| %(b) | | | 459
| | | | 15
| | | | 474
| | |
Morgan Stanley & Co.
International PLC | | ServiceNow, Inc.
| | | (17,715
| ) | | 11/18/2019
| | | 1.83
| %(b) | | | 77
| | | | 15
| | | | 92
| | |
Morgan Stanley & Co.
International PLC | | ServiceNow, Inc.
| | | (13,949
| ) | | 11/18/2019
| | | 1.83
| %(b) | | | 1,000
| | | | 11
| | | | 1,011
| | |
Morgan Stanley & Co.
International PLC | | SG Holdings Co.
Ltd. | | JPY | (417,906
| ) | | 11/18/2019
| | | (0.50
| )%(j) | | | (669
| ) | | | (1
| ) | | | (670
| ) | |
Morgan Stanley & Co.
International PLC | | Sharp Corp.
| | JPY | (643,165
| ) | | 11/18/2019
| | | (10.35
| )%(ab) | | | 1,315
| | | | (31
| ) | | | 1,284
| | |
Morgan Stanley & Co.
International PLC | | Sharp Corp.
| | JPY | (1,520,551
| ) | | 11/18/2019
| | | (10.35
| )%(ab) | | | 2,134
| | | | (68
| ) | | | 2,066
| | |
Morgan Stanley & Co.
International PLC | | Sharp Corp.
| | JPY | (1,309,489
| ) | | 11/18/2019
| | | (10.35
| )%(ab) | | | 1,199
| | | | (50
| ) | | | 1,149
| | |
Morgan Stanley & Co.
International PLC | | Sharp Corp.
| | JPY | (1,155,9
| 87) | | 11/18/2019
| | | (10.36
| )%(ab) | | | 519
| | | | (23
| ) | | | 496
| | |
Morgan Stanley & Co.
International PLC | | Shimadzu Corp.
| | JPY | (2,207,796
| ) | | 11/18/2019
| | | (0.50
| )%(j) | | | 933
| | | | (4
| ) | | | 929
| | |
Morgan Stanley & Co.
International PLC | | Shin-Etsu Chemical
Co. Ltd. | | JPY | (6,150,056
| ) | | 11/18/2019
| | | (0.50
| )%(j) | | | 6,272
| | | | (12
| ) | | | 6,260
| | |
Morgan Stanley & Co.
International PLC | | Siemens Gamesa
Renewable Energy SA | | EUR | (60,870
| ) | | 11/18/2019
| | | (2.87
| )%(ac) | | | 14,025
| | | | (75
| ) | | | 13,950
| | |
Morgan Stanley & Co.
International PLC | | Siemens Gamesa
Renewable Energy SA | | EUR | (3,278
| ) | | 11/18/2019
| | | (2.87
| )%(ac) | | | 770
| | | | (1
| ) | | | 769
| | |
Morgan Stanley & Co.
International PLC | | Siemens Gamesa
Renewable Energy SA | | EUR | (7,800
| ) | | 11/18/2019
| | | (2.87
| )%(ac) | | | 1,112
| | | | (4
| ) | | | 1,108
| | |
Morgan Stanley & Co.
International PLC | | Siemens Gamesa
Renewable Energy SA | | EUR | (5,257
| ) | | 11/18/2019
| | | (2.87
| )%(ac) | | | 748
| | | | (3
| ) | | | 745
| | |
Morgan Stanley & Co.
International PLC | | Siemens Gamesa
Renewable Energy SA | | EUR | (7,731
| ) | | 11/18/2019
| | | (2.87
| )%(ac) | | | (8
| ) | | | (12
| ) | | | (20
| ) | |
Morgan Stanley & Co.
International PLC | | Signature Bank
| | $ | (78,730
| ) | | 11/18/2019
| | | 1.83
| %(b) | | | 9,637
| | | | 60
| | | | 9,697
| | |
See Notes to Financial Statements
155
Consolidated Schedule of Investments Multi-Style Premia Fund (cont'd)
| Counterparty | | Reference
Entity | | Notional
Amount(a) | | Maturity
Date | | Variable-
Rate(al) | | Unrealized
Appreciation/
(Depreciation) | | Accrued
Net
Interest
Receivable/
(Payable) | | Value | |
Morgan Stanley & Co.
International PLC | | Signature Bank
| | $ | (1,416
| ) | | 11/18/2019
| | | 1.83
| %(b) | | $ | 159
| | | $ | 1
| | | $ | 160
| | |
Morgan Stanley & Co.
International PLC | | Signature Bank
| | | (3,484
| ) | | 11/18/2019
| | | 1.83
| %(b) | | | 368
| | | | 3
| | | | 371
| | |
Morgan Stanley & Co.
International PLC | | Signature Bank
| | | (7,865
| ) | | 11/18/2019
| | | 1.83
| %(b) | | | (134
| ) | | | 3
| | | | (131
| ) | |
Morgan Stanley & Co.
International PLC | | Skechers U.S.A., Inc.
| | | (4,404
| ) | | 11/18/2019
| | | 1.83
| %(b) | | | 174
| | | | 4
| | | | 178
| | |
Morgan Stanley & Co.
International PLC | | SM Energy Co.
| | | (9,461
| ) | | 11/18/2019
| | | 1.83
| %(b) | | | 337
| | | | 8
| | | | 345
| | |
Morgan Stanley & Co.
International PLC | | SoftBank Group Corp.
| | JPY | (3,237,118
| ) | | 11/18/2019
| | | (0.50
| )%(j) | | | (5,701
| ) | | | (8
| ) | | | (5,709
| ) | |
Morgan Stanley & Co.
International PLC | | Sotheby's
| | $ | (15,175
| ) | | 11/18/2019
| | | 1.83
| %(b) | | | 2,947
| | | | 11
| | | | 2,958
| | |
Morgan Stanley & Co.
International PLC | | Southern Co.
| | | (51,789
| ) | | 11/18/2019
| | | 1.83
| %(b) | | | (876
| ) | | | 46
| | | | (830
| ) | |
Morgan Stanley & Co.
International PLC | | Southwest Airlines Co.
| | | (34,583
| ) | | 11/18/2019
| | | 1.83
| %(b) | | | 1,530
| | | | 29
| | | | 1,559
| | |
Morgan Stanley & Co.
International PLC | | Spirit Airlines, Inc.
| | | (41,735
| ) | | 11/18/2019
| | | 1.83
| %(b) | | | (26,828
| ) | | | 59
| | | | (26,769
| ) | |
Morgan Stanley & Co.
International PLC | | Spirit Airlines, Inc.
| | | (630
| ) | | 11/18/2019
| | | 1.83
| %(b) | | | (48
| ) | | | 1
| | | | (47
| ) | |
Morgan Stanley & Co.
International PLC | | Sprint Corp.
| | | (26,438
| ) | | 11/18/2019
| | | 0.47
| %(ad) | | | (6,384
| ) | | | 7
| | | | (6,377
| ) | |
Morgan Stanley & Co.
International PLC | | Sprint Corp.
| | | (13,623
| ) | | 11/18/2019
| | | 0.47
| %(ad) | | | (2,867
| ) | | | 14
| | | | (2,853
| ) | |
Morgan Stanley & Co.
International PLC | | Sprint Corp.
| | | (13,642
| ) | | 11/18/2019
| | | 0.47
| %(ad) | | | (2,124
| ) | | | 13
| | | | (2,111
| ) | |
Morgan Stanley & Co.
International PLC | | St James's Place PLC
| | GBP | (274
| ) | | 11/18/2019
| | | 0.37
| %(c) | | | 45
| | | | 0
| | | | 45
| | |
Morgan Stanley & Co.
International PLC | | Standard Chartered
PLC | | GBP | (37,169
| ) | | 11/18/2019
| | | 0.37
| %(c) | | | 10,139
| | | | 7
| | | | 10,146
| | |
Morgan Stanley & Co.
International PLC | | Standard Chartered
PLC | | GBP | (4,538
| ) | | 11/18/2019
| | | 0.37
| %(c) | | | 972
| | | | 1
| | | | 973
| | |
Morgan Stanley & Co.
International PLC | | Standard Chartered
PLC | | GBP | (3,028
| ) | | 11/18/2019
| | | 0.37
| %(c) | | | 586
| | | | 1
| | | | 587
| | |
Morgan Stanley & Co.
International PLC | | Standard Chartered
PLC | | GBP | (2,876
| ) | | 11/18/2019
| | | 0.37
| %(c) | | | 479
| | | | 1
| | | | 480
| | |
Morgan Stanley & Co.
International PLC | | Standard Chartered
PLC | | GBP | (2,839
| ) | | 11/18/2019
| | | 0.37
| %(c) | | | 430
| | | | 1
| | | | 431
| | |
Morgan Stanley & Co.
International PLC | | Standard Chartered
PLC | | GBP | (2,060
| ) | | 11/18/2019
| | | 0.37
| %(c) | | | 70
| | | | 0
| | | | 70
| | |
See Notes to Financial Statements
156
Consolidated Schedule of Investments Multi-Style Premia Fund (cont'd)
| Counterparty | | Reference
Entity | | Notional
Amount(a) | | Maturity
Date | | Variable-
Rate(al) | | Unrealized
Appreciation/
(Depreciation) | | Accrued
Net
Interest
Receivable/
(Payable) | | Value | |
Morgan Stanley & Co.
International PLC | | Standard Chartered
PLC | | GBP | (1,331
| ) | | 11/18/2019
| | | 0.37
| %(c) | | $ | (70
| ) | | $ | 0
| | | $ | (70
| ) | |
Morgan Stanley & Co.
International PLC | | Sterling BanCorp
| | $ | (10,536
| ) | | 11/18/2019
| | | 1.83
| %(b) | | | 2,193
| | | | 7
| | | | 2,200
| | |
Morgan Stanley & Co.
International PLC | | Sterling BanCorp
| | | (5,762
| ) | | 11/18/2019
| | | 1.83
| %(b) | | | 1,038
| | | | 4
| | | | 1,042
| | |
Morgan Stanley & Co.
International PLC | | Sterling BanCorp
| | | (23,247
| ) | | 11/18/2019
| | | 1.83
| %(b) | | | 4,135
| | | | 16
| | | | 4,151
| | |
Morgan Stanley & Co.
International PLC | | STMicroelectronics
NV | | EUR | (15,372
| ) | | 11/18/2019
| | | (0.77
| )%(f) | | | 1,653
| | | | (6
| ) | | | 1,647
| | |
Morgan Stanley & Co.
International PLC | | SVB Financial Group
| | $ | (758
| ) | | 11/18/2019
| | | 1.83
| %(b) | | | 142
| | | | 1
| | | | 143
| | |
Morgan Stanley & Co.
International PLC | | SVB Financial Group
| | | (22,692
| ) | | 11/18/2019
| | | 1.83
| %(b) | | | 4,941
| | | | 15
| | | | 4,956
| | |
Morgan Stanley & Co.
International PLC | | SVB Financial Group
| | | (23,772
| ) | | 11/18/2019
| | | 1.83
| %(b) | | | 4,769
| | | | 16
| | | | 4,785
| | |
Morgan Stanley & Co.
International PLC | | Syneos Health, Inc.
| | | (42,433
| ) | | 11/18/2019
| | | 1.83
| %(b) | | | (3,196
| ) | | | 39
| | | | (3,157
| ) | |
Morgan Stanley & Co.
International PLC | | Syneos Health, Inc.
| | | (16,009
| ) | | 11/18/2019
| | | 1.84
| %(b) | | | 544
| | | | 11
| | | | 555
| | |
Morgan Stanley & Co.
International PLC | | Syneos Health, Inc.
| | | (5,752
| ) | | 11/18/2019
| | | 1.83
| %(b) | | | 321
| | | | 5
| | | | 326
| | |
Morgan Stanley & Co.
International PLC | | Sysmex Corp.
| | JPY | (5,843,096
| ) | | 11/18/2019
| | | (0.50
| )%(j) | | | 8,334
| | | | (10
| ) | | | 8,324
| | |
Morgan Stanley & Co.
International PLC | | Tableau Software, Inc.
| | $ | (54,835
| ) | | 11/18/2019
| | | 1.83
| %(b) | | | (5,334
| ) | | | 52
| | | | (5,282
| ) | |
Morgan Stanley & Co.
International PLC | | Tapestry, Inc.
| | | (17,874
| ) | | 11/18/2019
| | | 1.83
| %(b) | | | 52
| | | | 6
| | | | 58
| | |
Morgan Stanley & Co.
International PLC | | TD Ameritrade Holding
Corp. | | | (95,744
| ) | | 11/18/2019
| | | 1.83
| %(b) | | | 9,702
| | | | 98
| | | | 9,800
| | |
Morgan Stanley & Co.
International PLC | | Technicolor SA
| | EUR | (6,519
| ) | | 11/18/2019
| | | (9.99
| )%(ae) | | | 1,407
| | | | (4
| ) | | | 1,403
| | |
Morgan Stanley & Co.
International PLC | | TechnipFMC PLC
| | EUR | (55,097
| ) | | 11/18/2019
| | | (0.77
| )%(f) | | | 7,002
| | | | (20
| ) | | | 6,982
| | |
Morgan Stanley & Co.
International PLC | | TechnipFMC PLC
| | EUR | (10,153
| ) | | 11/18/2019
| | | (0.77
| )%(f) | | | 1,334
| | | | (4
| ) | | | 1,330
| | |
Morgan Stanley & Co.
International PLC | | Teladoc Health, Inc.
| | $ | (19,283
| ) | | 11/18/2019
| | | 1.61
| %(af) | | | 1,321
| | | | 11
| | | | 1,332
| | |
Morgan Stanley & Co.
International PLC | | Teladoc Health, Inc.
| | | (20,460
| ) | | 11/18/2019
| | | 1.61
| %(af) | | | 1,840
| | | | 16
| | | | 1,856
| | |
Morgan Stanley & Co.
International PLC | | Teladoc Health, Inc.
| | | (16,382
| ) | | 11/18/2019
| | | 1.61
| %(af) | | | (546
| ) | | | 6
| | | | (540
| ) | |
See Notes to Financial Statements
157
Consolidated Schedule of Investments Multi-Style Premia Fund (cont'd)
| Counterparty | | Reference
Entity | | Notional
Amount(a) | | Maturity
Date | | Variable-
Rate(al) | | Unrealized
Appreciation/
(Depreciation) | | Accrued
Net
Interest
Receivable/
(Payable) | | Value | |
Morgan Stanley & Co.
International PLC | | Telecom Italia SpA
| | EUR | (12,785
| ) | | 11/18/2019
| | | (0.87
| )%(g) | | $ | 2,842
| | | $ | (5
| ) | | $ | 2,837
| | |
Morgan Stanley & Co.
International PLC | | Tenaris SA
| | EUR | (16,690
| ) | | 11/18/2019
| | | (0.87
| )%(g) | | | 2,378
| | | | (7
| ) | | | 2,371
| | |
Morgan Stanley & Co.
International PLC | | Tenaris SA
| | EUR | (9,836
| ) | | 11/18/2019
| | | (0.87
| )%(g) | | | 1,643
| | | | (4
| ) | | | 1,639
| | |
Morgan Stanley & Co.
International PLC | | Texas Capital
Bancshares, Inc. | | $ | (49,542
| ) | | 11/18/2019
| | | 1.83
| %(b) | | | 12,084
| | | | 32
| | | | 12,116
| | |
Morgan Stanley & Co.
International PLC | | Texas Capital
Bancshares, Inc. | | | (20,517
| ) | | 11/18/2019
| | | 1.83
| %(b) | | | 4,812
| | | | 14
| | | | 4,826
| | |
Morgan Stanley & Co.
International PLC | | Texas Capital
Bancshares, Inc. | | | (23,431
| ) | | 11/18/2019
| | | 1.83
| %(b) | | | 5,193
| | | | 16
| | | | 5,209
| | |
Morgan Stanley & Co.
International PLC | | Texas Capital
Bancshares, Inc. | | | (6,314
| ) | | 11/18/2019
| | | 1.83
| %(b) | | | 1,331
| | | | 4
| | | | 1,335
| | |
Morgan Stanley & Co.
International PLC | | Texas Capital
Bancshares, Inc. | | | (3,093
| ) | | 11/18/2019
| | | 1.83
| %(b) | | | 601
| | | | 2
| | | | 603
| | |
Morgan Stanley & Co.
International PLC | | thyssenkrupp AG
| | EUR | (54,332
| ) | | 11/18/2019
| | | (0.77
| )%(f) | | | 9,240
| | | | (22
| ) | | | 9,218
| | |
Morgan Stanley & Co.
International PLC | | thyssenkrupp AG
| | EUR | (15,008
| ) | | 11/18/2019
| | | (0.77
| )%(f) | | | 1,673
| | | | (6
| ) | | | 1,667
| | |
Morgan Stanley & Co.
International PLC | | Toshiba Corp.
| | JPY | (1,206,720
| ) | | 11/18/2019
| | | (0.50
| )%(j) | | | (644
| ) | | | (3
| ) | | | (647
| ) | |
Morgan Stanley & Co.
International PLC | | Transocean Ltd.
| | $ | (20,208
| ) | | 11/18/2019
| | | 1.73
| %(q) | | | 2,755
| | | | 15
| | | | 2,770
| | |
Morgan Stanley & Co.
International PLC | | Transocean Ltd.
| | | (18,218
| ) | | 11/18/2019
| | | 1.73
| %(q) | | | 819
| | | | 59
| | | | 878
| | |
Morgan Stanley & Co.
International PLC | | Transocean Ltd.
| | | (18,212
| ) | | 11/18/2019
| | | 1.73
| %(q) | | | 491
| | | | 15
| | | | 506
| | |
Morgan Stanley & Co.
International PLC | | Transocean Ltd.
| | | (21,425
| ) | | 11/18/2019
| | | 1.73
| %(q) | | | 1,525
| | | | 17
| | | | 1,542
| | |
Morgan Stanley & Co.
International PLC | | TreeHouse Foods, Inc.
| | | (73,056
| ) | | 11/18/2019
| | | 1.83
| %(b) | | | 2,472
| | | | 61
| | | | 2,533
| | |
Morgan Stanley & Co.
International PLC | | TripAdvisor, Inc.
| | | (15,492
| ) | | 11/18/2019
| | | 1.83
| %(b) | | | 472
| | | | 13
| | | | 485
| | |
Morgan Stanley & Co.
International PLC | | TripAdvisor, Inc.
| | | (16,510
| ) | | 11/18/2019
| | | 1.83
| %(b) | | | (1,652
| ) | | | 16
| | | | (1,636
| ) | |
Morgan Stanley & Co.
International PLC | | TripAdvisor, Inc.
| | | (16,015
| ) | | 11/18/2019
| | | 1.84
| %(b) | | | (1,664
| ) | | | 13
| | | | (1,651
| ) | |
Morgan Stanley & Co.
International PLC | | TripAdvisor, Inc.
| | | (12,567
| ) | | 11/18/2019
| | | 1.83
| %(b) | | | (1,303
| ) | | | 5
| | | | (1,298
| ) | |
Morgan Stanley & Co.
International PLC | | Tullow Oil PLC
| | GBP | (8,625
| ) | | 11/18/2019
| | | 0.37
| %(c) | | | 1,050
| | | | 2
| | | | 1,052
| | |
See Notes to Financial Statements
158
Consolidated Schedule of Investments Multi-Style Premia Fund (cont'd)
| Counterparty | | Reference
Entity | | Notional
Amount(a) | | Maturity
Date | | Variable-
Rate(al) | | Unrealized
Appreciation/
(Depreciation) | | Accrued
Net
Interest
Receivable/
(Payable) | | Value | |
Morgan Stanley & Co.
International PLC | | Tullow Oil PLC
| | GBP | (9,566
| ) | | 11/18/2019
| | | 0.37
| %(c) | | $ | 126
| | | $ | 2
| | | $ | 128
| | |
Morgan Stanley & Co.
International PLC | | Tullow Oil PLC
| | GBP | (8,295
| ) | | 11/18/2019
| | | 0.37
| %(c) | | | (1
| ) | | | 2
| | | | 1
| | |
Morgan Stanley & Co.
International PLC | | Twilio, Inc.
| | $ | (17,073
| ) | | 11/18/2019
| | | 1.83
| %(b) | | | (11,096
| ) | | | 24
| | | | (11,072
| ) | |
Morgan Stanley & Co.
International PLC | | Twilio, Inc.
| | | (17,178
| ) | | 11/18/2019
| | | 1.83
| %(b) | | | 127
| | | | 15
| | | | 142
| | |
Morgan Stanley & Co.
International PLC | | Twilio, Inc.
| | | (17,378
| ) | | 11/18/2019
| | | 1.83
| %(b) | | | (1,503
| ) | | | 7
| | | | (1,496
| ) | |
Morgan Stanley & Co.
International PLC | | Twitter, Inc.
| | | (6,330
| ) | | 11/18/2019
| | | 1.83
| %(b) | | | (136
| ) | | | 6
| | | | (130
| ) | |
Morgan Stanley & Co.
International PLC | | Ubisoft
Entertainment SA | | EUR | (7,818
| ) | | 11/18/2019
| | | (0.77
| )%(f) | | | 1,096
| | | | (3
| ) | | | 1,093
| | |
Morgan Stanley & Co.
International PLC | | Ubisoft
Entertainment SA | | EUR | (11,418
| ) | | 11/18/2019
| | | (0.77
| )%(f) | | | 1,289
| | | | (4
| ) | | | 1,285
| | |
Morgan Stanley & Co.
International PLC | | UGI Corp.
| | $ | (3,868
| ) | | 11/18/2019
| | | 1.83
| %(b) | | | (215
| ) | | | 4
| | | | (211
| ) | |
Morgan Stanley & Co.
International PLC | | Under Armour, Inc.
| | | (79,047
| ) | | 11/18/2019
| | | 0.63
| %(ag) | | | (5,788
| ) | | | 25
| | | | (5,763
| ) | |
Morgan Stanley & Co.
International PLC | | UniCredit SpA
| | EUR | (57,165
| ) | | 11/18/2019
| | | (0.87
| )%(g) | | | 10,749
| | | | (22
| ) | | | 10,727
| | |
Morgan Stanley & Co.
International PLC | | UniCredit SpA
| | EUR | (7,960
| ) | | 11/18/2019
| | | (0.87
| )%(g) | | | 1,618
| | | | (3
| ) | | | 1,615
| | |
Morgan Stanley & Co.
International PLC | | UniCredit SpA
| | EUR | (6,751
| ) | | 11/18/2019
| | | (0.87
| )%(g) | | | 946
| | | | (3
| ) | | | 943
| | |
Morgan Stanley & Co.
International PLC | | UniCredit SpA
| | EUR | (3,302
| ) | | 11/18/2019
| | | (0.87
| )%(g) | | | 204
| | | | (1
| ) | | | 203
| | |
Morgan Stanley & Co.
International PLC | | UniCredit SpA
| | EUR | (2,840
| ) | | 11/18/2019
| | | (0.87
| )%(g) | | | (13
| ) | | | (1
| ) | | | (14
| ) | |
Morgan Stanley & Co.
International PLC | | United Continental
Holdings, Inc. | | $ | (58,066
| ) | | 11/18/2019
| | | 1.83
| %(b) | | | (17,356
| ) | | | 65
| | | | (17,291
| ) | |
Morgan Stanley & Co.
International PLC | | United Rentals, Inc.
| | | (16,963
| ) | | 11/18/2019
| | | 1.83
| %(b) | | | (884
| ) | | | 6
| | | | (878
| ) | |
Morgan Stanley & Co.
International PLC | | Uniti Group, Inc.
| | | (38,312
| ) | | 11/18/2019
| | | 1.63
| %(ah) | | | 1,834
| | | | 28
| | | | 1,862
| | |
Morgan Stanley & Co.
International PLC | | Uniti Group, Inc.
| | | (7,786
| ) | | 11/18/2019
| | | 1.63
| %(ah) | | | (1,026
| ) | | | 8
| | | | (1,018
| ) | |
Morgan Stanley & Co.
International PLC | | Valeo SA
| | EUR | (46,661
| ) | | 11/18/2019
| | | (0.77
| )%(f) | | | 17,005
| | | | (13
| ) | | | 16,992
| | |
Morgan Stanley & Co.
International PLC | | Valeo SA
| | EUR | (18,698
| ) | | 11/18/2019
| | | (0.77
| )%(f) | | | 6,841
| | | | (5
| ) | | | 6,836
| | |
See Notes to Financial Statements
159
Consolidated Schedule of Investments Multi-Style Premia Fund (cont'd)
| Counterparty | | Reference
Entity | | Notional
Amount(a) | | Maturity
Date | | Variable-
Rate(al) | | Unrealized
Appreciation/
(Depreciation) | | Accrued
Net
Interest
Receivable/
(Payable) | | Value | |
Morgan Stanley & Co.
International PLC | | Valeo SA
| | EUR | (19,146
| ) | | 11/18/2019
| | | (0.77
| )%(f) | | $ | 4,992
| | | $ | (28
| ) | | $ | 4,964
| | |
Morgan Stanley & Co.
International PLC | | ViaSat, Inc.
| | $ | (13,592
| ) | | 11/18/2019
| | | 1.23
| %(ai) | | | (154
| ) | | | 8
| | | | (146
| ) | |
Morgan Stanley & Co.
International PLC | | Vulcan Materials Co.
| | | (46,139
| ) | | 11/18/2019
| | | 1.83
| %(b) | | | 7,848
| | | | 33
| | | | 7,881
| | |
Morgan Stanley & Co.
International PLC | | Wabtec Corp.
| | | (34,065
| ) | | 11/18/2019
| | | 1.73
| %(q) | | | 4,524
| | | | 24
| | | | 4,548
| | |
Morgan Stanley & Co.
International PLC | | Weatherford
| | | (101,450
| ) | | 11/18/2019
| | | 1.38
| %(aj) | | | 37,833
| | | | 41
| | | | 37,874
| | |
Morgan Stanley & Co.
International PLC | | Weir Group PLC
| | GBP | (1,844
| ) | | 11/18/2019
| | | 0.37
| %(c) | | | 509
| | | | 0
| | | | 509
| | |
Morgan Stanley & Co.
International PLC | | Weir Group PLC
| | GBP | (7,233
| ) | | 11/18/2019
| | | 0.37
| %(c) | | | 1,632
| | | | 1
| | | | 1,633
| | |
Morgan Stanley & Co.
International PLC | | Weir Group PLC
| | GBP | (7,184
| ) | | 11/18/2019
| | | 0.37
| %(c) | | | (1,287
| ) | | | 1
| | | | (1,286
| ) | |
Morgan Stanley & Co.
International PLC | | Welcia Holdings
Co. Ltd. | | JPY | (507,451
| ) | | 11/18/2019
| | | (0.50
| )%(j) | | | (304
| ) | | | (1
| ) | | | (305
| ) | |
Morgan Stanley & Co.
International PLC | | Welcia Holdings
Co. Ltd. | | JPY | (1,202,822
| ) | | 11/18/2019
| | | (0.50
| )%(j) | | | 225
| | | | (3
| ) | | | 222
| | |
Morgan Stanley & Co.
International PLC | | Western Alliance
BanCorp | | $ | (30,407
| ) | | 11/18/2019
| | | 1.83
| %(b) | | | 4,953
| | | | 22
| | | | 4,975
| | |
Morgan Stanley & Co.
International PLC | | Western Alliance
BanCorp | | | (20,653
| ) | | 11/18/2019
| | | 1.83
| %(b) | | | 2,825
| | | | 15
| | | | 2,840
| | |
Morgan Stanley & Co.
International PLC | | Western Alliance
BanCorp | | | (21,460
| ) | | 11/18/2019
| | | 1.83
| %(b) | | | 2,867
| | | | 16
| | | | 2,883
| | |
Morgan Stanley & Co.
International PLC | | Western Alliance
BanCorp | | | (17,765
| ) | | 11/18/2019
| | | 1.83
| %(b) | | | 31
| | | | 6
| | | | 37
| | |
Morgan Stanley & Co.
International PLC | | Williams-Sonoma, Inc.
| | | (18,162
| ) | | 11/18/2019
| | | 1.50
| %(i) | | | 619
| | | | 8
| | | | 627
| | |
Morgan Stanley & Co.
International PLC | | Williams-Sonoma, Inc.
| | | (18,497
| ) | | 11/18/2019
| | | 1.51
| %(i) | | | 906
| | | | 7
| | | | 913
| | |
Morgan Stanley & Co.
International PLC | | Workday, Inc.
| | | (37,825
| ) | | 11/18/2019
| | | 1.83
| %(b) | | | (774
| ) | | | 33
| | | | (741
| ) | |
Morgan Stanley & Co.
International PLC | | WPP PLC
| | GBP | (21,218
| ) | | 11/18/2019
| | | 0.37
| %(c) | | | 5,908
| | | | 4
| | | | 5,912
| | |
Morgan Stanley & Co.
International PLC | | Wright Medical
Group NV | | $ | (19,643
| ) | | 11/18/2019
| | | 1.83
| %(b) | | | (1,726
| ) | | | 19
| | | | (1,707
| ) | |
Morgan Stanley & Co.
International PLC | | Wynn Resorts Ltd.
| | | (24,994
| ) | | 11/18/2019
| | | 1.83
| %(b) | | | 7,015
| | | | 15
| | | | 7,030
| | |
Morgan Stanley & Co.
International PLC | | Wynn Resorts Ltd.
| | | (22,806
| ) | | 11/18/2019
| | | 1.83
| %(b) | | | 5,367
| | | | 15
| | | | 5,382
| | |
See Notes to Financial Statements
160
Consolidated Schedule of Investments Multi-Style Premia Fund (cont'd)
| Counterparty | | Reference
Entity | | Notional
Amount(a) | | Maturity
Date | | Variable-
Rate(al) | | Unrealized
Appreciation/
(Depreciation) | | Accrued
Net
Interest
Receivable/
(Payable) | | Value | |
Morgan Stanley & Co.
International PLC | | Wynn Resorts Ltd.
| | $ | (22,244
| ) | | 11/18/2019
| | | 1.83
| %(b) | | $ | 2,973
| | | $ | 17
| | | $ | 2,990
| | |
Morgan Stanley & Co.
International PLC | | Wynn Resorts Ltd.
| | | (19,987
| ) | | 11/18/2019
| | | 1.84
| %(b) | | | 2,549
| | | | 12
| | | | 2,561
| | |
Morgan Stanley & Co.
International PLC | | Wynn Resorts Ltd.
| | | (11,629
| ) | | 11/18/2019
| | | 1.83
| %(b) | | | 231
| | | | 4
| | | | 235
| | |
Morgan Stanley & Co.
International PLC | | Yamato Holdings
Co. Ltd. | | JPY | (2,208,414
| ) | | 11/18/2019
| | | (0.50
| )%(j) | | | 201
| | | | (5
| ) | | | 196
| | |
Morgan Stanley & Co.
International PLC | | Zalando SE
| | EUR | (66,179
| ) | | 11/18/2019
| | | (2.30
| )%(ak) | | | 14,939
| | | | (55
| ) | | | 14,884
| | |
Morgan Stanley & Co.
International PLC | | Zalando SE
| | EUR | (14,026
| ) | | 11/18/2019
| | | (2.30
| )%(ak) | | | 79
| | | | (10
| ) | | | 69
| | |
Morgan Stanley & Co.
International PLC | | Zalando SE
| | EUR | (2,064
| ) | | 11/18/2019
| | | (2.30
| )%(ak) | | | (148
| ) | | | (2
| ) | | | (150
| ) | |
Morgan Stanley & Co.
International PLC | | Zendesk, Inc.
| | $ | (77,034
| ) | | 11/18/2019
| | | 1.83
| %(b) | | | 1,770
| | | | 65
| | | | 1,835
| | |
Morgan Stanley & Co.
International PLC | | ZOZO, Inc.
| | JPY | (5,816,658
| ) | | 11/18/2019
| | | (0.50
| )%(j) | | | 11,315
| | | | (10
| ) | | | 11,305
| | |
Morgan Stanley & Co.
International PLC | | ZOZO, Inc.
| | JPY | (1,103,340
| ) | | 11/18/2019
| | | (0.50
| )%(j) | | | 1,274
| | | | (2
| ) | | | 1,272
| | |
Total | | | | | | | | | | $ | 905,804 | | | $ | 5,398 | | | $ | 911,202 | | |
(a) Notional amount is stated in the currency in which the contract is denominated.
EUR - Euro
GBP - Pound Sterling
JPY - Japanese Yen
(b) Fund receives 1-month USD LIBOR minus 0.45%. Payment frequency—monthly. Fund pays return on reference entity. Payment frequency—upon termination.
(c) Fund receives 1-month GBP LIBOR minus 0.35%. Payment frequency—monthly. Fund pays return on reference entity. Payment frequency—upon termination.
(d) Fund receives 1-month USD LIBOR minus 1.85%. Payment frequency—monthly. Fund pays return on reference entity. Payment frequency—upon termination.
(e) Fund receives 1-month USD LIBOR minus 1.15%. Payment frequency—monthly. Fund pays return on reference entity. Payment frequency—upon termination.
(f) Fund receives 1-month EURIBOR minus 0.40%. Payment frequency—monthly. Fund pays return on reference entity. Payment frequency—upon termination.
(g) Fund receives 1-month EURIBOR minus 0.50%. Payment frequency—monthly. Fund pays return on reference entity. Payment frequency—upon termination.
See Notes to Financial Statements
161
Consolidated Schedule of Investments Multi-Style Premia Fund (cont'd)
(h) Fund receives 1-month USD LIBOR minus 0.47%. Payment frequency—monthly. Fund pays return on reference entity. Payment frequency—upon termination.
(i) Fund receives 1-month USD LIBOR minus 0.78%. Payment frequency—monthly. Fund pays return on reference entity. Payment frequency—upon termination.
(j) Fund receives 1-month JPY LIBOR minus 0.40%. Payment frequency—monthly. Fund pays return on reference entity. Payment frequency—upon termination.
(k) Fund receives 1-month USD LIBOR minus 2.10%. Payment frequency—monthly. Fund pays return on reference entity. Payment frequency—upon termination.
(l) Fund receives 1-month USD LIBOR minus 1.13%. Payment frequency—monthly. Fund pays return on reference entity. Payment frequency—upon termination.
(m) Fund receives 1-month USD LIBOR minus 2.93%. Payment frequency—monthly. Fund pays return on reference entity. Payment frequency—upon termination.
(n) Fund receives 1-month EURIBOR minus 2.63%. Payment frequency—monthly. Fund pays return on reference entity. Payment frequency—upon termination.
(o) Fund receives 1-month USD LIBOR minus 0.74%. Payment frequency—monthly. Fund pays return on reference entity. Payment frequency—upon termination.
(p) Fund receives 1-month JPY LIBOR minus 1.08%. Payment frequency—monthly. Fund pays return on reference entity. Payment frequency—upon termination.
(q) Fund receives 1-month USD LIBOR minus 0.55%. Payment frequency—monthly. Fund pays return on reference entity. Payment frequency—upon termination.
(r) Fund receives 1-month USD LIBOR minus 1.22%. Payment frequency—monthly. Fund pays return on reference entity. Payment frequency—upon termination.
(s) Fund receives 1-month EURIBOR minus 1.75%. Payment frequency—monthly. Fund pays return on reference entity. Payment frequency—upon termination.
(t) Fund receives 1-month GBP LIBOR minus 2.13%. Payment frequency—monthly. Fund pays return on reference entity. Payment frequency—upon termination.
(u) Fund receives 1-month JPY LIBOR minus 1.25%. Payment frequency—monthly. Fund pays return on reference entity. Payment frequency—upon termination.
(v) Fund receives 1-month JPY LIBOR minus 0.63%. Payment frequency—monthly. Fund pays return on reference entity. Payment frequency—upon termination.
(w) Fund receives 1-month EURIBOR minus 5.38%. Payment frequency—monthly. Fund pays return on reference entity. Payment frequency—upon termination.
(x) Fund receives 1-month EURIBOR minus 1.13%. Payment frequency—monthly. Fund pays return on reference entity. Payment frequency—upon termination.
(y) Fund receives 1-month USD LIBOR minus 1.40%. Payment frequency—monthly. Fund pays return on reference entity. Payment frequency—upon termination.
(z) Fund receives 1-month GBP LIBOR minus 1.88%. Payment frequency—monthly. Fund pays return on reference entity. Payment frequency—upon termination.
(aa) Fund receives 1-month EURIBOR minus 2.70%. Payment frequency—monthly. Fund pays return on reference entity. Payment frequency—upon termination.
See Notes to Financial Statements
162
Consolidated Schedule of Investments Multi-Style Premia Fund (cont'd)
(ab) Fund receives 1-month JPY LIBOR minus 10.25%. Payment frequency—monthly. Fund pays return on reference entity. Payment frequency—upon termination.
(ac) Fund receives 1-month EURIBOR minus 2.50%%. Payment frequency—monthly. Fund pays return on reference entity. Payment frequency—upon termination.
(ad) Fund receives 1-month USD LIBOR minus 1.81%. Payment frequency—monthly. Fund pays return on reference entity. Payment frequency—upon termination.
(ae) Fund receives 1-month EURIBOR minus 9.63%. Payment frequency—monthly. Fund pays return on reference entity. Payment frequency—upon termination.
(af) Fund receives 1-month USD LIBOR minus 0.67%. Payment frequency—monthly. Fund pays return on reference entity. Payment frequency—upon termination.
(ag) Fund receives 1-month USD LIBOR minus 1.65%. Payment frequency—monthly. Fund pays return on reference entity. Payment frequency—upon termination.
(ah) Fund receives 1-month USD LIBOR minus 0.65%. Payment frequency—monthly. Fund pays return on reference entity. Payment frequency—upon termination.
(ai) Fund receives 1-month USD LIBOR minus 1.05%. Payment frequency—monthly. Fund pays return on reference entity. Payment frequency—upon termination.
(aj) Fund receives 1-month USD LIBOR minus 0.90%. Payment frequency—monthly. Fund pays return on reference entity. Payment frequency—upon termination.
(ak) Fund receives 1-month EURIBOR minus 1.93%. Payment frequency—monthly. Fund pays return on reference entity. Payment frequency—upon termination.
(al) Effective rate at October 31, 2018.
(am) Fund receives 1-month EURIBOR minus 0.59%. Payment frequency—monthly. Fund pays return on reference entity. Payment frequency—upon termination.
Benchmark Floating Rates:
LIBOR - London Interbank Offered Rate
EURIBOR - Euro Interbank Offered Rate
For the year ended October 31, 2018, the average notional value of total return swaps for the Fund was $9,815,962 for long positions and $(9,935,925) for short positions.
At October 31, 2018, the Fund had cash collateral of $2,990,000 deposited in a segregated account for Morgan Stanley Capital Services LLC to cover collateral requirements on over-the-counter derivatives.
See Notes to Financial Statements
163
Consolidated Schedule of Investments Multi-Style Premia Fund (cont'd)
Written option contracts ("options written")
At October 31, 2018, the Fund had outstanding options written as follows:
Description | | Number of
Contracts | | Notional
Amount | | Exercise
Price | | Expiration
Date | | Value | |
Puts | |
Index | |
S&P 500 Index | | | 15 | | | $ | (4,067,610 | ) | | $ | 2,550 | | | 11/23/2018 | | $ | (19,950 | ) | |
S&P 500 Index | | | 10 | | | | (2,711,740 | ) | | | 2,680 | | | 11/16/2018 | | | (35,500 | ) | |
S&P 500 Index | | | 5 | | | | (1,355,870 | ) | | | 2,590 | | | 11/16/2018 | | | (7,675 | ) | |
Total options written (premium received $90,913) | | | | | | | | $(63,125) | |
For the year ended October 31, 2018, the Fund had an average market value of $(45,888) in options written.
At October 31, 2018, the Fund had $1,365,610 deposited in a segregated account to cover collateral requirements for options written.
The following is a summary, categorized by Level (see Note A of Notes to Financial Statements), of inputs used to value the Fund's investments as of October 31, 2018:
Asset Valuation Inputs | |
(000's omitted) | | Level 1 | | Level 2 | | Level 3 | | Total | |
Investments: | |
| Common Stocks(a) | | $ | 3,727 | | | $ | 1,449 | | | $ | — | | | $ | 5,176 | | |
Short-Term Investments | | | — | | | | 4,655 | | | | — | | | | 4,655 | | |
Total Investments | | $ | 3,727 | | | $ | 6,104 | | | $ | — | | | $ | 9,831 | | |
(a)�� The Schedule of Investments provides information on the industry or sector categorization for the portfolio.
The following is a summary, categorized by Level (see Note A of Notes to Financial Statements), of inputs used to value the Fund's derivatives as of October 31, 2018:
Other Financial Instruments | |
(000's omitted) | | Level 1 | | Level 2 | | Level 3 | | Total | |
| Futures(a) | |
Assets | | $ | 117 | | | $ | — | | | $ | — | | | $ | 117 | | |
Liabilities | | | (193 | ) | | | — | | | | — | | | | (193 | ) | |
| Forward Contracts(a) | |
Assets | | | — | | | | 25 | | | | — | | | | 25 | | |
Liabilities | | | — | | | | (51 | ) | | | — | | | | (51 | ) | |
Swaps | |
Assets | | | — | | | | 1,711 | | | | — | | | | 1,711 | | |
Liabilities | | | — | | | | (989 | ) | | | — | | | | (989 | ) | |
Options Written | |
Liabilities | | | (63 | ) | | | — | | | | — | | | | (63 | ) | |
Total | | $ | (139 | ) | | $ | 696 | | | $ | — | | | $ | 557 | | |
(a) Futures and forward contracts are reported at the cumulative unrealized appreciation/(depreciation) of the instrument.
See Notes to Financial Statements
164
Schedule of Investments U.S. Equity Index PutWrite Strategy Fund
October 31, 2018
PRINCIPAL AMOUNT | | | | VALUE | |
(000's omitted) | | | | (000's omitted) | |
U.S. Treasury Obligations 100.3% | | | |
| | | | | U.S. Treasury Notes | | | | | |
$ | 49,000 | | | 0.88%, due 6/15/19—9/15/19 | | $ | 48,375 | (a) | |
| | 19,400 | | | 1.00%, due 3/15/19 | | | 19,303 | | |
| | 22,900 | | | 1.25%, due 12/15/18 | | | 22,874 | (a) | |
| | 47,600 | | | 1.38%, due 12/15/19—9/15/20 | | | 46,592 | | |
| | 22,600 | | | 1.50%, due 6/15/20 | | | 22,122 | | |
| | 32,200 | | | 1.63%, due 3/15/20—6/30/20 | | | 31,655 | | |
| | 45,500 | | | 1.88%, due 12/15/20 | | | 44,562 | (a)(b) | |
| | 20,400 | | | 2.38%, due 3/15/21 | | | 20,157 | | |
| | 300 | | | 2.63%, due 6/15/21 | | | 298 | | |
| | | | | Total U.S. Treasury Obligations (Cost $257,596) | | | 255,938 | | |
NUMBER OF SHARES | | | | | |
Short-Term Investments 1.9% | | | |
Investment Companies 1.9% | | | |
| 4,830,990
| | | State Street Institutional U.S. Government Money Market Fund Premier Class, 2.09%(c)
(Cost $4,831) | | | 4,831
| (b) | |
| | | | | Total Investments 102.2% (Cost $262,427) | | | 260,769 | | |
| | | | | Liabilities Less Other Assets (2.2)% | | | (5,678 | )(d) | |
| | | | | Net Assets 100.0% | | $ | 255,091 | | |
(a) All or a portion of the security is pledged as collateral for options written.
(b) All or a portion of this security is segregated in connection with obligations for options written with a total value of approximately $7,769,000.
(c) Represents 7-day effective yield as of October 31, 2018.
(d) Includes the impact of the Fund's open positions in derivatives at October 31, 2018.
See Notes to Financial Statements
165
Schedule of Investments U.S. Equity Index PutWrite Strategy Fund (cont'd)
Derivative Instruments
Written option contracts ("options written")
At October 31, 2018, the Fund had outstanding options written as follows:
Description | | Number of
Contracts | | Notional
Amount | | Exercise
Price | | Expiration
Date | | Value | |
Puts | |
Index | |
Russell 2000 Index | | | 10 | | | $ | (1,511,413 | ) | | $ | 1,550 | | | 11/16/2018 | | $ | (54,200 | ) | |
Russell 2000 Index | | | 18 | | | | (2,720,543 | ) | | | 1,595 | | | 11/9/2018 | | | (155,790 | ) | |
Russell 2000 Index | | | 7 | | | | (1,057,989 | ) | | | 1,530 | | | 11/16/2018 | | | (29,610 | ) | |
Russell 2000 Index | | | 21 | | | | (3,173,967 | ) | | | 1,530 | | | 11/9/2018 | | | (77,490 | ) | |
Russell 2000 Index | | | 10 | | | | (1,511,413 | ) | | | 1,570 | | | 11/9/2018 | | | (64,850 | ) | |
Russell 2000 Index | | | 9 | | | | (1,360,272 | ) | | | 1,490 | | | 11/9/2018 | | | (17,460 | ) | |
Russell 2000 Index | | | 25 | | | | (3,778,533 | ) | | | 1,530 | | | 11/2/2018 | | | (63,000 | ) | |
Russell 2000 Index | | | 3 | | | | (453,424 | ) | | | 1,535 | | | 11/2/2018 | | | (8,655 | ) | |
Russell 2000 Index | | | 2 | | | | (302,283 | ) | | | 1,535 | | | 11/23/2018 | | | (9,750 | ) | |
Russell 2000 Index | | | 57 | | | | (8,615,054 | ) | | | 1,490 | | | 11/23/2018 | | | (165,870 | ) | |
Russell 2000 Index | | | 4 | | | | (604,565 | ) | | | 1,490 | | | 11/2/2018 | | | (2,760 | ) | |
Russell 2000 Index | | | 1 | | | | (151,141 | ) | | | 1,500 | | | 11/23/2018 | | | (3,275 | ) | |
Russell 2000 Index | | | 4 | | | | (604,565 | ) | | | 1,500 | | | 11/9/2018 | | | (9,200 | ) | |
Russell 2000 Index | | | 2 | | | | (302,283 | ) | | | 1,500 | | | 11/2/2018 | | | (1,980 | ) | |
Russell 2000 Index | | | 11 | | | | (1,662,554 | ) | | | 1,490 | | | 11/30/2018 | | | (36,630 | ) | |
Russell 2000 Index | | | 13 | | | | (1,964,837 | ) | | | 1,550 | | | 11/2/2018 | | | (54,080 | ) | |
Russell 2000 Index | | | 22 | | | | (3,325,109 | ) | | | 1,585 | | | 11/16/2018 | | | (176,880 | ) | |
Russell 2000 Index | | | 3 | | | | (453,424 | ) | | | 1,555 | | | 11/2/2018 | | | (13,815 | ) | |
Russell 2000 Index | | | 6 | | | | (906,848 | ) | | | 1,555 | | | 11/23/2018 | | | (36,510 | ) | |
Russell 2000 Index | | | 6 | | | | (906,848 | ) | | | 1,560 | | | 11/2/2018 | | | (30,510 | ) | |
Russell 2000 Index | | | 22 | | | | (3,325,109 | ) | | | 1,555 | | | 11/16/2018 | | | (126,830 | ) | |
S&P 500 Index | | | 1 | | | | (271,174 | ) | | | 2,725 | | | 11/30/2018 | | | (6,280 | ) | |
S&P 500 Index | | | 123 | | | | (33,354,402 | ) | | | 2,780 | | | 11/16/2018 | | | (1,037,505 | ) | |
S&P 500 Index | | | 64 | | | | (17,355,136 | ) | | | 2,650 | | | 11/30/2018 | | | (231,040 | ) | |
S&P 500 Index | | | 22 | | | | (5,965,828 | ) | | | 2,805 | | | 11/16/2018 | | | (227,260 | ) | |
S&P 500 Index | | | 11 | | | | (2,982,914 | ) | | | 2,675 | | | 11/30/2018 | | | (47,740 | ) | |
S&P 500 Index | | | 86 | | | | (23,320,964 | ) | | | 2,730 | | | 11/9/2018 | | | (403,770 | ) | |
S&P 500 Index | | | 13 | | | | (3,525,262 | ) | | | 2,730 | | | 11/16/2018 | | | (71,045 | ) | |
S&P 500 Index | | | 3 | | | | (813,522 | ) | | | 2,700 | | | 11/9/2018 | | | (10,140 | ) | |
S&P 500 Index | | | 31 | | | | (8,406,394 | ) | | | 2,760 | | | 11/16/2018 | | | (220,565 | ) | |
S&P 500 Index | | | 30 | | | | (8,135,220 | ) | | | 2,700 | | | 11/23/2018 | | | (138,900 | ) | |
S&P 500 Index | | | 36 | | | | (9,762,264 | ) | | | 2,730 | | | 11/2/2018 | | | (105,480 | ) | |
S&P 500 Index | | | 22 | | | | (5,965,828 | ) | | | 2,825 | | | 11/9/2018 | | | (256,520 | ) | |
S&P 500 Index | | | 26 | | | | (7,050,524 | ) | | | 2,755 | | | 11/2/2018 | | | (122,850 | ) | |
S&P 500 Index | | | 2 | | | | (542,348 | ) | | | 2,715 | | | 11/9/2018 | | | (7,980 | ) | |
See Notes to Financial Statements
166
Schedule of Investments U.S. Equity Index PutWrite Strategy Fund (cont'd)
Description | | Number of
Contracts | | Notional
Amount | | Exercise
Price | | Expiration
Date | | Value | |
Puts | |
Index | |
S&P 500 Index | | | 13 | | | $ | (3,525,262 | ) | | $ | 2,700 | | | 11/2/2018 | | $ | (20,020 | ) | |
S&P 500 Index | | | 5 | | | | (1,355,870 | ) | | | 2,685 | | | 11/2/2018 | | | (5,500 | ) | |
S&P 500 Index | | | 7 | | | | (1,898,218 | ) | | | 2,715 | | | 11/2/2018 | | | (14,945 | ) | |
S&P 500 Index | | | 38 | | | | (10,304,612 | ) | | | 2,765 | | | 11/2/2018 | | | (212,040 | ) | |
S&P 500 Index | | | 23 | | | | (6,237,002 | ) | | | 2,650 | | | 11/9/2018 | | | (44,160 | ) | |
S&P 500 Index | | | 46 | | | | (12,474,004 | ) | | | 2,675 | | | 11/9/2018 | | | (117,530 | ) | |
S&P 500 Index | | | 1 | | | | (271,174 | ) | | | 2,685 | | | 11/9/2018 | | | (2,860 | ) | |
S&P 500 Index | | | 17 | | | | (4,609,958 | ) | | | 2,765 | | | 11/9/2018 | | | (114,835 | ) | |
S&P 500 Index | | | 10 | | | | (2,711,740 | ) | | | 2,795 | | | 11/16/2018 | | | (95,350 | ) | |
S&P 500 Index | | | 77 | | | | (20,880,398 | ) | | | 2,715 | | | 11/23/2018 | | | (403,480 | ) | |
S&P 500 Index | | | 92 | | | | (24,948,008 | ) | | | 2,685 | | | 11/23/2018 | | | (376,280 | ) | |
S&P 500 Index | | | 2 | | | | (542,348 | ) | | | 2,780 | | | 11/23/2018 | | | (17,550 | ) | |
S&P 500 Index | | | 6 | | | | (1,627,044 | ) | | | 2,755 | | | 11/23/2018 | | | (43,350 | ) | |
S&P 500 Index | | | 7 | | | | (1,898,218 | ) | | | 2,685 | | | 11/30/2018 | | | (32,690 | ) | |
Total options written (premium received $5,127,599) | | | | | | | | | | $ | (5,526,810 | ) | |
For the year ended October 31, 2018, the Fund had an average market value of $(3,401,254) in options written. The Fund had securities pledged in the amount of $84,737,175 to cover collateral requirements for options written.
The following is a summary, categorized by Level (see Note A of Notes to Financial Statements), of inputs used to value the Fund's investments as of October 31, 2018:
Asset Valuation Inputs | |
(000's omitted) | | Level 1 | | Level 2 | | Level 3 | | Total | |
Investments: | |
U.S. Treasury Obligations | | $ | — | | | $ | 255,938 | | | $ | — | | | $ | 255,938 | | |
Short-Term Investments | | | — | | | | 4,831 | | | | — | | | | 4,831 | | |
Total Investments | | $ | — | | | $ | 260,769 | | | $ | — | | | $ | 260,769 | | |
The following is a summary, categorized by Level (see Note A of Notes to Financial Statements), of inputs used to value the Fund's derivatives as of October 31, 2018:
Other Financial Instruments | |
(000's omitted) | | Level 1 | | Level 2 | | Level 3 | | Total | |
Options Written | |
Liabilities | | $ | (5,527 | ) | | $ | — | | | $ | — | | | $ | (5,527 | ) | |
Total | | $ | (5,527 | ) | | $ | — | | | $ | — | | | $ | (5,527 | ) | |
See Notes to Financial Statements
167
Statements of Assets and Liabilities
Neuberger Berman Alternative Funds
(000's omitted except per share amounts)
| | | COMMODITY
STRATEGY
FUND** | | GLOBAL
ALLOCATION
FUND | | HEDGED
OPTION
PREMIUM
STRATEGY
FUND | | LONG SHORT
FUND | | LONG SHORT
CREDIT FUND | | MULTI-ASSET
INCOME FUND | | MULTI-STYLE
PREMIA FUND** | | U.S. EQUITY
INDEX
PUTWRITE
STRATEGY
FUND | |
| | | October 31,
2018 | | October 31,
2018 | | October 31,
2018 | | October 31,
2018 | | October 31,
2018 | | October 31,
2018 | | October 31,
2018 | | October 31,
2018 | |
Assets | |
Investments in securities, at value*† (Notes A & F)—see Schedule of Investments: | |
| Unaffiliated issuers(a) | | $ | 141,638 | | | $ | 10,188 | | | $ | 14,382 | | | $ | 2,967,692 | | | $ | 12,051 | | | $ | 20,763 | | | $ | 9,831 | | | $ | 260,769 | | |
| Affiliated issuers(b) | | | — | | | | 10,115 | | | | — | | | | — | | | | — | | | | 4,776 | | | | — | | | | — | | |
| | | | 141,638 | | | | 20,303 | | | | 14,382 | | | | 2,967,692 | | | | 12,051 | | | | 25,539 | | | | 9,831 | | | | 260,769 | | |
Cash | | | 1,000 | | | | 1 | | | | — | | | | — | | | | 9 | | | | 1 | | | | 244 | | | | — | | |
| Foreign currency(c) | | | — | | | | 1 | | | | — | | | | — | | | | — | | | | — | | | | 17 | | | | — | | |
Cash collateral segregated for short sales (Note A) | | | — | | | | — | | | | — | | | | 615,878 | | | | — | | | | — | | | | — | | | | — | | |
Cash collateral segregated for futures contracts (Note A) | | | 13,585 | | | | 289 | | | | — | | | | — | | | | 6 | | | | 317 | | | | 494 | | | | — | | |
Cash collateral segregated for option contracts (Note A) | | | — | | | | — | | | | — | | | | — | | | | — | | | | — | | | | 1,366 | | | | — | | |
Cash collateral segregated for centrally cleared swap contracts (Note A) | | | — | | | | — | | | | — | | | | — | | | | 505 | | | | — | | | | 2,990 | | | | — | | |
Cash collateral segregated for over-the-counter derivatives (Note A) | | | — | | | | — | | | | — | | | | 1,720 | | | | 470 | | | | — | | | | — | | | | — | | |
Receivable from broker | | | — | | | | — | | | | 80 | | | | 2 | | | | — | | | | — | | | | — | | | | — | | |
Dividends and interest receivable | | | 528 | | | | 44 | | | | 57 | | | | 6,264 | | | | 143 | | | | 92 | | | | 50 | | | | 1,047 | | |
Receivable for securities sold | | | — | | | | 87 | | | | — | | | | 86,316 | | | | 3,170 | | | | 192 | | | | — | | | | 6 | | |
Receivable for Fund shares sold | | | 77 | | | | — | | | | — | | | | 5,158 | | | | — | | | | — | | | | — | | | | 377 | | |
Receivable from Management—net (Note B) | | | — | | | | 29 | | | | 21 | | | | — | | | | 24 | | | | 32 | | | | — | | | | — | | |
Receivable for securities lending income (Note A) | | | — | | | | — | | | | — | | | | 62 | | | | — | | | | — | | | | — | | | | — | | |
Receivable for accumulated variation margin on futures contracts (Note A) | | | — | | | | — | | | | — | | | | 30,995 | | | | — | | | | — | | | | — | | | | — | | |
Receivable for accumulated variation margin on open centrally cleared
swap contracts(d)(e) (Note A) | | | — | | | | — | | | | — | | | | — | | | | 57 | | | | — | | | | — | | | | — | | |
| Over-the-counter swap contracts, at value(f) (Note A) | | | — | | | | 41 | | | | — | | | | 5,009 | | | | 27 | | | | 45 | | | | 1,712 | | | | — | | |
Receivable for forward foreign currency contracts (Note A) | | | — | | | | 266 | | | | — | | | | — | | | | 11 | | | | 280 | | | | 25 | | | | — | | |
Prepaid expenses and other assets | | | 29 | | | | 18 | | | | 16 | | | | 191 | | | | 15 | | | | 14 | | | | 46 | | | | 56 | | |
Total Assets | | | 156,857 | | | | 21,079 | | | | 14,556 | | | | 3,719,287 | | | | 16,488 | | | | 26,512 | | | | 16,775 | | | | 262,255 | | |
Liabilities | |
| Investments sold short, at value(g) (Note A) | | | — | | | | — | | | | — | | | | 438,555 | | | | — | | | | — | | | | — | | | | — | | |
| Over-the-counter swap contracts, at value(f) (Note A) | | | — | | | | 45 | | | | — | | | | 4,951 | | | | 29 | | | | 49 | | | | 989 | | | | — | | |
Dividends and interest payable for short sales | | | — | | | | — | | | | — | | | | 1,343 | | | | — | | | | — | | | | — | | | | — | | |
Cash collateral segregated for futures contracts due to broker (Note A) | | | — | | | | — | | | | — | | | | 16,928 | | | | — | | | | — | | | | — | | | | — | | |
Cash collateral segregated for over-the-counter derivatives due to broker (Note A) | | | — | | | | — | | | | — | | | | 150 | | | | — | | | | — | | | | — | | | | — | | |
Payable to investment manager—net (Notes A & B) | | | 66 | | | | 4 | | | | 6 | | | | 2,893 | | | | 8 | | | | 7 | | | | 9 | | | | 129 | | |
| Option contracts written, at value(h) (Note A) | | | — | | | | 30 | | | | 318 | | | | 10,659 | | | | — | | | | 33 | | | | 63 | | | | 5,527 | | |
Due to custodian | | | — | | | | — | | | | — | | | | 11,760 | | | | — | | | | 10 | | | | — | | | | 511 | | |
Payable for securities purchased | | | 1,600 | | | | 1,506 | | | | 125 | | | | 118,856 | | | | — | | | | 3,017 | | | | — | | | | — | | |
Payable for Fund shares redeemed | | | 5 | | | | 100 | | | | — | | | | 7,894 | | | | — | | | | 50 | | | | — | | | | 876 | | |
Payable to administrator—net (Note B) | | | 23 | | | | — | | | | — | | | | 500 | | | | — | | | | — | | | | 16 | | | | 23 | | |
Payable to trustees | | | 2 | | | | 2 | | | | 2 | | | | 1 | | | | 2 | | | | 2 | | | | 11 | | | | 2 | | |
Payable for loaned securities collateral (Note A) | | | — | | | | — | | | | — | | | | 73,895 | | | | — | | | | — | | | | — | | | | — | | |
Payable for accumulated variation margin on futures contracts (Note A) | | | 6,844 | | | | 42 | | | | — | | | | — | | | | 1 | | | | 27 | | | | 76 | | | | — | | |
Payable for forward foreign currency contracts (Note A) | | | — | | | | 261 | | | | — | | | | — | | | | 7 | | | | 275 | | | | 51 | | | | — | | |
Distributions payable | | | — | | | | — | | | | — | | | | — | | | | — | | | | 11 | | | | — | | | | — | | |
Accrued expenses and other payables | | | 138 | | | | 122 | | | | 77 | | | | 182 | | | | 92 | | | | 133 | | | | 85 | | | | 96 | | |
Total Liabilities | | | 8,678 | | | | 2,112 | | | | 528 | | | | 688,567 | | | | 139 | | | | 3,614 | | | | 1,300 | | | | 7,164 | | |
Net Assets | | $ | 148,179 | | | $ | 18,967 | | | $ | 14,028 | | | $ | 3,030,720 | | | $ | 16,349 | | | $ | 22,898 | | | $ | 15,475 | | | $ | 255,091 | | |
See Notes to Financial Statements
168
169
Statements of Assets and Liabilities (cont'd)
Neuberger Berman Alternative Funds (cont'd)
(000's omitted except per share amounts)
| | | COMMODITY
STRATEGY
FUND** | | GLOBAL
ALLOCATION
FUND | | HEDGED
OPTION
PREMIUM
STRATEGY
FUND | | LONG SHORT
FUND | | LONG SHORT
CREDIT FUND | | MULTI-ASSET
INCOME FUND | | MULTI-STYLE
PREMIA FUND** | | U.S. EQUITY
INDEX
PUTWRITE
STRATEGY
FUND | |
| | | October 31,
2018 | | October 31,
2018 | | October 31,
2018 | | October 31,
2018 | | October 31,
2018 | | October 31,
2018 | | October 31,
2018 | | October 31,
2018 | |
Net Assets consist of: | |
Paid-in capital | | $ | 158,116 | | | $ | 18,239 | | | $ | 14,964 | | | $ | 2,569,967 | | | $ | 18,458 | | | $ | 23,370 | | | $ | 15,481 | | | $ | 257,160 | | |
Total distributable earnings/(losses) | | | (9,937 | ) | | | 728 | | | | (936 | ) | | | 460,753 | | | | (2,109 | ) | | | (472 | ) | | | (6 | ) | | | (2,069 | ) | |
Net Assets | | $ | 148,179 | | | $ | 18,967 | | | $ | 14,028 | | | $ | 3,030,720 | | | $ | 16,349 | | | $ | 22,898 | | | $ | 15,475 | | | $ | 255,091 | | |
Net Assets | |
Institutional Class | | $ | 100,287 | | | $ | 13,814 | | | $ | 12,117 | | | $ | 2,847,261 | | | $ | 8,467 | | | $ | 17,671 | | | $ | 15,401 | | | $ | 217,574 | | |
Class A | | | 47,860 | | | | 2,846 | | | | 24 | | | | 105,896 | | | | 2,005 | | | | 719 | | | | 25 | | | | 18,447 | | |
Class C | | | 32 | | | | 2,307 | | | | 33 | | | | 77,563 | | | | 1,131 | | | | 650 | | | | 24 | | | | 1,170 | | |
Class R6 | | | — | | | | — | | | | 1,854 | | | | — | | | | 4,746 | | | | 3,858 | | | | 25 | | | | 17,900 | | |
Shares Outstanding ($.001 par value; unlimited shares authorized) | |
Institutional Class | | | 16,201 | | | | 1,238 | | | | 510 | | | | 195,789 | | | | 926 | | | | 1,844 | | | | 623 | | | | 20,425 | | |
Class A | | | 7,883 | | | | 258 | | | | 1 | | | | 7,284 | (i) | | | 219 | | | | 75 | | | | 1 | | | | 1,734 | | |
Class C | | | 6 | | | | 216 | | | | 1 | | | | 5,340 | (i) | | | 124 | | | | 68 | | | | 1 | | | | 111 | | |
Class R6 | | | — | | | | — | | | | 78 | | | | — | | | | 519 | | | | 403 | | | | 1 | | | | 1,680 | | |
Net Asset Value, offering and redemption price per share | |
Institutional Class | | $ | 6.19 | | | $ | 11.15 | | | $ | 23.78 | | | $ | 14.54 | | | $ | 9.15 | | | $ | 9.58 | | | $ | 24.71 | | | $ | 10.65 | | |
Class R6 | | | — | | | | — | | | | 23.77 | | | | — | | | | 9.15 | | | | 9.58 | | | | 24.72 | | | | 10.66 | | |
Net Asset Value and redemption price per share | |
Class A | | $ | 6.07 | | | $ | 11.05 | | | $ | 23.77 | | | $ | 14.54 | (i) | | $ | 9.15 | | | $ | 9.58 | | | $ | 24.67 | | | $ | 10.64 | | |
Offering Price per share | |
Class A‡ | | $ | 6.44 | | | $ | 11.72 | | | $ | 25.22 | | | $ | 15.43 | (i) | | $ | 9.56 | | | $ | 10.01 | | | $ | 26.18 | | | $ | 11.29 | | |
Net Asset Value and offering price per share | |
Class C^ | | $ | 5.83 | | | $ | 10.70 | | | $ | 23.63 | | | $ | 14.53 | (i) | | $ | 9.13 | | | $ | 9.58 | | | $ | 24.59 | | | $ | 10.51 | | |
†Securities on loan, at value: | |
Unaffiliated issuers | | $ | — | | | $ | — | | | $ | — | | | $ | 73,230 | | | $ | — | | | $ | — | | | $ | — | | | $ | — | | |
*Cost of Investments: | |
(a) Unaffiliated issuers | | $ | 141,693 | | | $ | 10,138 | | | $ | 14,571 | | | $ | 2,624,663 | | | $ | 12,282 | | | $ | 20,931 | | | $ | 10,300 | | | $ | 262,427 | | |
(b) Affiliated issuers | | | — | | | | 10,149 | | | | — | | | | — | | | | — | | | | 4,981 | | | | — | | | | — | | |
Total cost of investments | | $ | 141,693 | | | $ | 20,287 | | | $ | 14,571 | | | $ | 2,624,663 | | | $ | 12,282 | | | $ | 25,912 | | | $ | 10,300 | | | $ | 262,427 | | |
(c) Total cost of foreign currency | | $ | — | | | $ | 1 | | | $ | — | | | $ | — | | | $ | — | | | $ | — | | | $ | 17 | | | $ | — | | |
(d) Unamortized upfront receipts on centrally cleared swap contracts | | $ | — | | | $ | — | | | $ | — | | | $ | — | | | $ | (141 | ) | | $ | — | | | $ | — | | | $ | — | | |
(e) Unamortized upfront payments on centrally cleared swap contracts | | $ | — | | | $ | — | | | $ | — | | | $ | — | | | $ | 169 | | | $ | — | | | $ | — | | | $ | — | | |
(f) Unamortized upfront receipts on over-the-counter swap contracts | | $ | — | | | $ | — | | | $ | — | | | $ | — | | | $ | (27 | ) | | $ | — | | | $ | — | | | $ | — | | |
(g) Proceeds from investments sold short | | $ | — | | | $ | — | | | $ | — | | | $ | 457,576 | | | $ | — | | | $ | — | | | $ | — | | | $ | — | | |
(h) Premium received from option contracts written | | $ | — | | | $ | 34 | | | $ | 327 | | | $ | 8,915 | | | $ | — | | | $ | 36 | | | $ | 91 | | | $ | 5,128 | | |
** Consolidated financial statement, see Note A of the Notes to Financial Statements for additional information.
‡ On single retail sales of less than $50,000. On sales of $50,000 or more or in certain other circumstances described in the Fund's prospectus, offering price is reduced.
^ Redemption price per share is equal to net asset value less any applicable contingent deferred sales charge.
(i) After the close of business on December 7, 2018, the Fund's A and C classes underwent a reverse stock split. The shares outstanding and per share data presented here have been adjusted to reflect the split. The per share data presented here has been adjusted to reflect this split. See Note I of the Notes to Financial Statements.
See Notes to Financial Statements
170
171
Neuberger Berman Alternative Funds
(000's omitted)
| | | COMMODITY
STRATEGY
FUND(a) | | GLOBAL
ALLOCATION
FUND | | HEDGED
OPTION
PREMIUM
STRATEGY
FUND | | LONG SHORT
FUND | | LONG SHORT
CREDIT FUND | | MULTI-ASSET
INCOME FUND | | MULTI-STYLE
PREMIA FUND(a) | | U.S. EQUITY
INDEX
PUTWRITE
STRATEGY
FUND | |
| | | For the
Year Ended
October 31,
2018 | | For the
Year Ended
October 31,
2018 | | For the
Year Ended
October 31,
2018 | | For the
Year Ended
October 31,
2018 | | For the
Year Ended
October 31,
2018 | | For the
Year Ended
October 31,
2018 | | Period from
May 18, 2018
(Commencement
of Operations) to
October 31,
2018 | | For the
Year Ended
October 31,
2018 | |
Investment Income: | |
Income (Note A): | |
Dividend income—unaffiliated issuers | | $ | — | | | $ | 144 | | | $ | — | | | $ | 40,145 | | | $ | 27 | | | $ | 447 | | | $ | 81 | | | $ | — | | |
Dividend income—affiliated issuers (Note F) | | | — | | | | 247 | | | | — | | | | — | | | | — | | | | 218 | | | | — | | | | — | | |
Interest and other income—unaffiliated issuers | | | 2,938 | | | | 122 | | | | 257 | | | | 21,714 | | | | 1,390 | | | | 256 | | | | 53 | | | | 5,303 | | |
Income from securities loaned—net (Note A) | | | — | | | | — | | | | — | | | | 95 | | | | — | | | | — | | | | — | | | | — | | |
Foreign taxes withheld (Note A) | | | — | | | | (7 | ) | | | — | | | | (686 | ) | | | — | | | | (12 | ) | | | (8 | ) | | | — | | |
Total income | | $ | 2,938 | | | $ | 506 | | | $ | 257 | | | $ | 61,268 | | | $ | 1,417 | | | $ | 909 | | | $ | 126 | | | $ | 5,303 | | |
Expenses: | |
Investment management fees (Note B) | | | 717 | | | | 114 | | | | 70 | | | | 37,013 | | | | 145 | | | | 106 | | | | 45 | | | | 1,364 | | |
Administration fees (Note B): | |
Institutional Class | | | 143 | | | | 22 | | | | 20 | | | | 4,704 | | | | 20 | | | | 27 | | | | 10 | | | | 414 | | |
Class A | | | 125 | | | | 9 | | | | — | | | | 328 | | | | 7 | | | | 2 | | | | — | | | | 23 | | |
Class C | | | — | | | | 7 | | | | — | | | | 228 | | | | 3 | | | | 2 | | | | — | | | | 3 | | |
Class R6 | | | — | | | | — | | | | 2 | | | | — | | | | 4 | | | | 3 | | | | — | | | | 14 | | |
Distribution fees (Note B): | |
Class A | | | 120 | | | | 8 | | | | — | | | | 315 | | | | 6 | | | | 2 | | | | — | | | | 22 | | |
Class C | | | — | | | | 28 | | | | — | | | | 877 | | | | 11 | | | | 7 | | | | — | | | | 10 | | |
Shareholder servicing agent fees: | |
Institutional Class | | | 1 | | | | — | | | | — | | | | 49 | | | | — | | | | — | | | | — | | | | 2 | | |
Class A | | | 5 | | | | 1 | | | | — | | | | 6 | | | | 1 | | | | — | | | | — | | | | 1 | | |
Class C | | | — | | | | — | | | | — | | | | 2 | | | | — | | | | 1 | | | | — | | | | — | | |
Organization expense (Note A) | | | — | | | | — | | | | — | | | | — | | | | — | | | | — | | | | 163 | | | | — | | |
Subsidiary Administration Fees | | | 50 | | | | — | | | | — | | | | — | | | | — | | | | — | | | | 23 | | | | — | | |
Audit fees | | | 81 | | | | 70 | | | | 40 | | | | 37 | | | | 58 | | | | 71 | | | | 40 | | | | 55 | | |
Custodian and accounting fees | | | 92 | | | | 191 | | | | 84 | | | | 612 | | | | 94 | | | | 192 | | | | 73 | | | | 111 | | |
Insurance expense | | | 4 | | | | 1 | | | | — | | | | 97 | | | | 1 | | | | 1 | | | | — | | | | 7 | | |
Legal fees | | | 82 | | | | 85 | | | | 80 | | | | 117 | | | | 82 | | | | 87 | | | | 28 | | | | 82 | | |
Registration and filing fees | | | 59 | | | | 64 | | | | 99 | | | | 349 | | | | 62 | | | | 60 | | | | 29 | | | | 93 | | |
Shareholder reports | | | 24 | | | | 2 | | | | 1 | | | | 200 | | | | 2 | | | | 2 | | | | 1 | | | | 12 | | |
Trustees' fees and expenses | | | 45 | | | | 45 | | | | 45 | | | | 50 | | | | 45 | | | | 45 | | | | 25 | | | | 45 | | |
Dividend and interest expense on securities sold short and reverse
repurchase agreements (Note A) | | | — | | | | — | | | | — | | | | 9,782 | | | | 84 | | | | — | | | | — | | | | — | | |
Interest expense | | | 7 | | | | 1 | | | | — | | | | 31 | | | | 11 | | | | — | | | | — | | | | — | | |
Miscellaneous | | | 25 | | | | 26 | | | | — | | | | 205 | | | | 7 | | | | 5 | | | | 2 | | | | 19 | | |
Total expenses | | | 1,580 | | | | 674 | | | | 441 | | | | 55,002 | | | | 643 | | | | 613 | | | | 439 | | | | 2,277 | | |
See Notes to Financial Statements
172
173
Statements of Operations (cont'd)
Neuberger Berman Alternative Funds (cont'd)
(000's omitted)
| | | COMMODITY
STRATEGY
FUND(a) | | GLOBAL
ALLOCATION
FUND | | HEDGED
OPTION
PREMIUM
STRATEGY
FUND | | LONG SHORT
FUND | | LONG SHORT
CREDIT FUND | | MULTI-ASSET
INCOME FUND | | MULTI-STYLE
PREMIA FUND(a) | | U.S. EQUITY
INDEX
PUTWRITE
STRATEGY
FUND | |
| | | For the
Year Ended
October 31,
2018 | | For the
Year Ended
October 31,
2018 | | For the
Year Ended
October 31,
2018 | | For the
Year Ended
October 31,
2018 | | For the
Year Ended
October 31,
2018 | | For the
Year Ended
October 31,
2018 | | Period from
May 18, 2018
(Commencement
of Operations) to
October 31,
2018 | | For the
Year Ended
October 31,
2018 | |
Expenses reimbursed by Management (Note B) | | | (346 | ) | | | (473 | ) | | | (340 | ) | | | — | | | | (322 | ) | | | (450 | ) | | | (374 | ) | | | (265 | ) | |
Investment management fees waived (Note A) | | | — | | | | (63 | ) | | | — | | | | — | | | | — | | | | (25 | ) | | | — | | | | — | | |
Total net expenses | | | 1,234 | | | | 138 | | | | 101 | | | | 55,002 | | | | 321 | | | | 138 | | | | 65 | | | | 2,012 | | |
Net investment income/(loss) | | $ | 1,704 | | | $ | 368 | | | $ | 156 | | | $ | 6,266 | | | $ | 1,096 | | | $ | 771 | | | $ | 61 | | | $ | 3,291 | | |
Realized and Unrealized Gain/(Loss) on Investments (Note A): | |
Net realized gain/(loss) on: | |
Transactions in investment securities of unaffiliated issuers | | | 111 | | | | 456 | | | | (286 | ) | | | 179,848 | | | | (836 | ) | | | 338 | | | | (80 | ) | | | (1,229 | ) | |
Transactions in investment securities of affiliated issuers | | | — | | | | 225 | | | | — | | | | 369 | | | | — | | | | (1 | ) | | | — | | | | — | | |
Realized gain distributions from affiliated issuers | | | — | | | | 186 | | | | — | | | | — | | | | — | | | | — | | | | — | | | | — | | |
Settlement of forward foreign currency contracts | | | — | | | | 60 | | | | — | | | | — | | | | 13 | | | | 57 | | | | (49 | ) | | | — | | |
Settlement of foreign currency transactions | | | — | | | | (6 | ) | | | — | | | | (10 | ) | | | 13 | | | | (8 | ) | | | (1 | ) | | | — | | |
Expiration or closing of futures contracts | | | 8,024 | | | | (75 | ) | | | — | | | | (74,804 | ) | | | (61 | ) | | | (110 | ) | | | (60 | ) | | | — | | |
Expiration or closing of option contracts and swaptions written | | | — | | | | (56 | ) | | | (471 | ) | | | 21,558 | | | | 63 | | | | (66 | ) | | | (135 | ) | | | 662 | | |
Expiration or closing of swap contracts | | | — | | | | (17 | ) | | | — | | | | (23,221 | ) | | | (367 | ) | | | (13 | ) | | | (95 | ) | | | — | | |
Change in net unrealized appreciation/(depreciation) in value of: | |
Investment securities of unaffiliated issuers | | | (157 | ) | | | (696 | ) | | | (157 | ) | | | (128,475 | ) | | | (313 | ) | | | (1,077 | ) | | | (469 | ) | | | (1,072 | ) | |
Investment securities of affiliated issuers | | | — | | | | (1,071 | ) | | | — | | | | 4,284 | | | | — | | | | (278 | ) | | | — | | | | — | | |
Short positions of unaffiliated issuers | | | — | | | | — | | | | — | | | | 47,409 | | | | — | | | | — | | | | — | | | | — | | |
Forward foreign currency contracts | | | — | | | | (10 | ) | | | — | | | | — | | | | 2 | | | | (4 | ) | | | (26 | ) | | | — | | |
Foreign currency translations | | | — | | | | (2 | ) | | | — | | | | — | | | | 1 | | | | (2 | ) | | | — | | | | — | | |
Futures contracts | | | (9,090 | ) | | | (50 | ) | | | — | | | | 51,355 | | | | 10 | | | | (51 | ) | | | (76 | ) | | | — | | |
Option contracts and swaptions written | | | — | | | | (1 | ) | | | (11 | ) | | | (1,504 | ) | | | — | | | | (1 | ) | | | 28 | | | | (863 | ) | |
Swap contracts | | | — | | | | (5 | ) | | | — | | | | 2,248 | | | | (4 | ) | | | (6 | ) | | | 722 | | | | — | | |
Net gain/(loss) on investments | | | (1,112 | ) | | | (1,062 | ) | | | (925 | ) | | | 79,057 | | | | (1,479 | ) | | | (1,222 | ) | | | (241 | ) | | | (2,502 | ) | |
Net increase/(decrease) in net assets resulting from operations | | $ | 592 | | | $ | (694 | ) | | $ | (769 | ) | | $ | 85,323 | | | $ | (383 | ) | | $ | (451 | ) | | $ | (180 | ) | | $ | 789 | | |
(a) Consolidated financial statement, see Note A of the Notes to Financial Statements for additional information.
See Notes to Financial Statements
174
175
Statements of Changes in Net Assets
Neuberger Berman Alternative Funds
(000's omitted)
| | | COMMODITY STRATEGY
FUND(a) | | GLOBAL ALLOCATION FUND | | HEDGED OPTION PREMIUM
STRATEGY FUND | | LONG SHORT FUND | | LONG SHORT CREDIT FUND | | MULTI-ASSET INCOME FUND | |
| | | Year Ended
October 31,
2018 | | Year Ended
October 31,
2017 | | Year Ended
October 31,
2018 | | Year Ended
October 31,
2017 | | Year Ended
October 31,
2018 | | Period from
April 12, 2017
(Commencement
of Operations) to
October 31,
2017 | | Year Ended
October 31,
2018 | | Year Ended
October 31,
2017 | | Year Ended
October 31,
2018 | | Year Ended
October 31,
2017 | | Year Ended
October 31,
2018 | | Year Ended
October 31,
2017 | |
Increase/(Decrease) in Net Assets: | |
From Operations: | |
Net investment income/(loss) (Note A) | | $ | 1,704 | | | $ | 222 | | | $ | 368 | | | $ | 281 | | | $ | 156 | | | $ | 21 | | | $ | 6,266 | | | $ | 1,564 | | | $ | 1,096 | | | $ | 1,065 | | | $ | 771 | | | $ | 677 | | |
Net realized gain/(loss) on investments (Note A) | | | 8,135 | | | | 4,087 | | | | 773 | | | | 1,076 | | | | (757 | ) | | | 100 | | | | 103,740 | | | | 60,662 | | | | (1,175 | ) | | | 330 | | | | 197 | | | | 331 | | |
Net increase from payments by affiliates (Note B) | | | — | | | | — | | | | — | | | | — | | | | — | | | | — | | | | — | | | | 37 | | | | — | | | | — | | | | — | | | | — | | |
Change in net unrealized appreciation/(depreciation) of
investments (Note A) | | | (9,247 | ) | | | 1,630 | | | | (1,835 | ) | | | 1,743 | | | | (168 | ) | | | (11 | ) | | | (24,683 | ) | | | 206,680 | | | | (304 | ) | | | 39 | | | | (1,419 | ) | | | 994 | | |
Net increase/(decrease) in net assets resulting from operations | | | 592 | | | | 5,939 | | | | (694 | ) | | | 3,100 | | | | (769 | ) | | | 110 | | | | 85,323 | | | | 268,943 | | | | (383 | ) | | | 1,434 | | | | (451 | ) | | | 2,002 | | |
Distributions to Shareholders From (Note A): | |
Distributable earnings: | |
Institutional Class | | | (3,165 | ) | | | — | | | | (691 | ) | | | (44 | ) | | | (225 | ) | | | (11 | ) | | | — | | | | — | | | | (517 | ) | | | (659 | ) | | | (624 | ) | | | (548 | ) | |
Class A | | | (1,487 | ) | | | — | | | | (194 | ) | | | — | | | | (1 | ) | | | — | | | | — | | | | — | | | | (75 | ) | | | (100 | ) | | | (22 | ) | | | (18 | ) | |
Class C | | | (1 | ) | | | — | | | | (125 | ) | | | — | | | | — | | | | — | | | | — | | | | — | | | | (33 | ) | | | (28 | ) | | | (17 | ) | | | (16 | ) | |
Class R6 | | | — | | | | — | | | | — | | | | — | | | | (36 | ) | | | (6 | ) | | | — | | | | — | | | | (201 | ) | | | (251 | ) | | | (143 | ) | | | (142 | ) | |
Tax return of capital: | |
Institutional Class | | | — | | | | — | | | | — | | | | — | | | | — | | | | — | | | | — | | | | — | | | | (46 | ) | | | — | | | | (124 | ) | | | (16 | ) | |
Class A | | | — | | | | — | | | | — | | | | — | | | | — | | | | — | | | | — | | | | — | | | | (9 | ) | | | — | | | | (5 | ) | | | (1 | ) | |
Class C | | | — | | | | — | | | | — | | | | — | | | | — | | | | — | | | | — | | | | — | | | | (4 | ) | | | — | | | | (5 | ) | | | (1 | ) | |
Class R6 | | | — | | | | — | | | | — | | | | — | | | | — | | | | — | | | | — | | | | — | | | | (17 | ) | | | — | | | | (28 | ) | | | (4 | ) | |
Total distributions to shareholders | | | (4,653 | ) | | | — | | | | (1,010 | ) | | | (44 | ) | | | (262 | ) | | | (17 | ) | | | — | | | | — | | | | (902 | ) | | | (1,038 | ) | | | (968 | ) | | | (746 | ) | |
From Fund Share Transactions (Note D): | |
Proceeds from shares sold: | |
Institutional Class | | | 33,074 | | | | 45,513 | | | | 4,229 | | | | 6,799 | | | | 12,489 | | | | 8,498 | | | | 1,075,133 | | | | 1,209,220 | | | | 5,698 | | | | 5,003 | | | | 2,640 | | | | 5,407 | | |
Class A | | | 15,377 | | | | 16,494 | | | | 204 | | | | 1,344 | | | | — | | | | 25 | | | | 32,941 | | | | 46,543 | | | | 1,122 | | | | 2,136 | | | | 234 | | | | 11 | | |
Class C | | | 7 | | | | — | | | | 24 | | | | 215 | | | | — | | | | 35 | | | | 6,391 | | | | 8,792 | | | | 185 | | | | 25 | | | | — | | | | 59 | | |
Class R6 | | | — | | | | — | | | | — | | | | — | | | | — | | | | 1,950 | | | | — | | | | — | | | | 20 | | | | 220 | | | | — | | | | — | | |
Proceeds from reinvestment of dividends and distributions: | |
Institutional Class | | | 3,133 | | | | — | | | | 691 | | | | 44 | | | | 224 | | | | 11 | | | | — | | | | — | | | | 563 | | | | 660 | | | | 749 | | | | 564 | | |
Class A | | | 1,487 | | | | — | | | | 193 | | | | — | | | | — | | | | — | | | | — | | | | — | | | | 47 | | | | 65 | | | | 6 | | | | 3 | | |
Class C | | | 1 | | | | — | | | | 125 | | | | — | | | | — | | | | — | | | | — | | | | — | | | | 7 | | | | 1 | | | | 6 | | | | 5 | | |
Class R6 | | | — | | | | — | | | | — | | | | — | | | | — | | | | — | | | | — | | | | — | | | | 40 | | | | 56 | | | | — | | | | — | | |
Payments for shares redeemed: | |
Institutional Class | | | (16,338 | ) | | | (15,387 | ) | | | (3,760 | ) | | | (4,963 | ) | | | (8,258 | ) | | | (8 | ) | | | (1,161,349 | ) | | | (672,348 | ) | | | (12,634 | ) | | | (12,619 | ) | | | (1,972 | ) | | | (1,978 | ) | |
Class A | | | (9,994 | ) | | | (9,373 | ) | | | (1,156 | ) | | | (4,053 | ) | | | — | | | | — | | | | (76,039 | ) | | | (124,652 | ) | | | (2,054 | ) | | | (207 | ) | | | (77 | ) | | | (11 | ) | |
Class C | | | (4 | ) | | | (57 | ) | | | (804 | ) | | | (2,268 | ) | | | — | | | | — | | | | (22,990 | ) | | | (43,665 | ) | | | (5 | ) | | | (11 | ) | | | (49 | ) | | | (13 | ) | |
Class R6 | | | — | | | | — | | | | — | | | | — | | | | — | | | | — | | | | — | | | | — | | | | (1,070 | ) | | | (473 | ) | | | — | | | | — | | |
Net increase/(decrease) from Fund share transactions | | | 26,743 | | | | 37,190 | | | | (254 | ) | | | (2,882 | ) | | | 4,455 | | | | 10,511 | | | | (145,913 | ) | | | 423,890 | | | | (8,081 | ) | | | (5,144 | ) | | | 1,537 | | | | 4,047 | | |
Net Increase/(Decrease) in Net Assets | | | 22,682 | | | | 43,129 | | | | (1,958 | ) | | | 174 | | | | 3,424 | | | | 10,604 | | | | (60,590 | ) | | | 692,833 | | | | (9,366 | ) | | | (4,748 | ) | | | 118 | | | | 5,303 | | |
Net Assets: | |
Beginning of year | | | 125,497 | | | | 82,368 | | | | 20,925 | | | | 20,751 | | | | 10,604 | | | | — | | | | 3,091,310 | | | | 2,398,477 | | | | 25,715 | | | | 30,463 | | | | 22,780 | | | | 17,477 | | |
End of year | | $ | 148,179 | | | $ | 125,497 | | | $ | 18,967 | | | $ | 20,925 | | | $ | 14,028 | | | $ | 10,604 | | | $ | 3,030,720 | | | $ | 3,091,310 | | | $ | 16,349 | | | $ | 25,715 | | | $ | 22,898 | | | $ | 22,780 | | |
(a) Consolidated financial statement, see Note A of the Notes to Financial Statements for additional information.
See Notes to Financial Statements
176
177
Statements of Changes in Net Assets (cont'd)
Neuberger Berman Alternative Funds (cont'd)
(000's omitted)
| | | MULTI-STYLE
PREMIA FUND(a) | | U.S. EQUITY INDEX PUTWRITE
STRATEGY FUND | |
| | | Period from
May 18, 2018
(Commencement
of Operations) to
October 31,
2018 | | Year Ended
October 31,
2018 | | Year Ended
October 31,
2017 | |
Increase/(Decrease) in Net Assets: | |
From Operations: | |
Net investment income/(loss) (Note A) | | $ | 61 | | | $ | 3,291 | | | $ | 496 | | |
Net realized gain/(loss) on investments (Note A) | | | (420 | ) | | | (567 | ) | | | 10,197 | | |
Net increase from payments by affiliates (Note B) | | | — | | | | — | | | | — | | |
Change in net unrealized appreciation/(depreciation) of
investments (Note A) | | | 179 | | | | (1,935 | ) | | | (47 | ) | |
Net increase/(decrease) in net assets resulting
from operations | | | (180 | ) | | | 789 | | | | 10,646 | | |
Distributions to Shareholders From (Note A): | |
Distributable earnings: | |
Institutional Class | | | — | | | | (11,110 | ) | | | (472 | ) | |
Class A | | | — | | | | (327 | ) | | | (4 | ) | |
Class C | | | — | | | | (46 | ) | | | — | | |
Class R6 | | | — | | | | (961 | ) | | | (59 | ) | |
Tax return of capital: | |
Institutional Class | | | — | | | | — | | | | — | | |
Class A | | | — | | | | — | | | | — | | |
Class C | | | — | | | | — | | | | — | | |
Class R6 | | | — | | | | — | | | | — | | |
Total distributions to shareholders | | | — | | | | (12,444 | ) | | | (535 | ) | |
From Fund Share Transactions (Note D): | |
Proceeds from shares sold: | |
Institutional Class | | | 15,580 | | | | 237,195 | | | | 137,312 | | |
Class A | | | 25 | | | | 18,444 | | | | 3,952 | | |
Class C | | | 25 | | | | 957 | | | | 403 | | |
Class R6 | | | 25 | | | | 9,482 | | | | 10,681 | | |
Proceeds from reinvestment of dividends and distributions: | |
Institutional Class | | | — | | | | 10,976 | | | | 471 | | |
Class A | | | — | | | | 298 | | | | 3 | | |
Class C | | | — | | | | 35 | | | | — | | |
Class R6 | | | — | | | | 961 | | | | 54 | | |
Payments for shares redeemed: | |
Institutional Class | | | — | | | | (172,560 | ) | | | (15,953 | ) | |
Class A | | | — | | | | (3,653 | ) | | | (503 | ) | |
Class C | | | — | | | | (276 | ) | | | (2 | ) | |
Class R6 | | | — | | | | (3,941 | ) | | | (4,235 | ) | |
Net increase/(decrease) from Fund share transactions | | | 15,655 | | | | 97,918 | | | | 132,183 | | |
Net Increase/(Decrease) in Net Assets | | | 15,475 | | | | 86,263 | | | | 142,294 | | |
Net Assets: | |
Beginning of year | | | — | | | | 168,828 | | | | 26,534 | | |
End of year | | $ | 15,475 | | | $ | 255,091 | | | $ | 168,828 | | |
(a) Consolidated financial statement, see Note A of the Notes to Financial Statements for additional information.
See Notes to Financial Statements
178
Neuberger Berman Alternative Funds
(000's omitted)
| | | Long Short
Credit Fund | |
| | For the Year Ended
October 31, 2018 | |
Increase/(decrease) in cash: | |
Cash flows from operating activities: | |
Net decrease in net assets resulting from operations | | $ | (383 | ) | |
Adjustments to reconcile net decrease in net assets resulting from operations to net cash used in
operating activities: | |
Changes in assets and liabilities: | |
Purchase of investment securities | | | (24,082 | ) | |
Proceeds from disposition of investment securities | | | 42,013 | | |
Purchase/sale of short-term investment securities, net | | | (4,457 | ) | |
Increase in receivable/(payable) for accumulated variation margin on centrally cleared swap contracts | | | (24 | ) | |
Unrealized appreciation of swap contracts | | | 148 | | |
Decrease in interest receivable | | | 251 | | |
Increase in receivable/(payable) for accumulated variation margin on futures contracts | | | 79 | | |
Proceeds for option contracts and swaptions written | | | 63 | | |
Proceeds for foreign currency translations and forward foreign currency contracts | | | 27 | | |
Decrease in prepaid expenses and other assets | | | 67 | | |
Decrease in receivable from Management—net | | | 8 | | |
Increase in receivable for securities sold | | | (2,429 | ) | |
Increase in cash collateral | | | (137 | ) | |
Decrease in payable for securities purchased | | | (1,884 | ) | |
Net amortization of premium/(discount) on investments | | | 101 | | |
Decrease in accrued expenses and other payables | | | (23 | ) | |
Decrease in payable to investment manager | | | (10 | ) | |
Unrealized depreciation on investment securities of unaffiliated issuers | | | 313 | | |
Unrealized appreciation on forward foreign currency contracts | | | (2 | ) | |
Unrealized appreciation on foreign currency translations | | | (1 | ) | |
Unrealized depreciation on swap contracts | | | (106 | ) | |
Net realized loss from transactions in investment securities of unaffiliated issuers | | | 836 | | |
Net realized loss from settlement of forward foreign currency contracts | | | (13 | ) | |
Net realized gain from settlement of foreign currency transactions | | | (13 | ) | |
Net realized gain from expiration or closing of option contracts and swaptions written | | | (63 | ) | |
Net cash provided by (used in) operating activities | | $ | 10,279 | | |
| Cash flows from financing activities: | |
Proceeds from shares sold | | | 7,025 | | |
Payment for shares redeemed | | | (15,769 | ) | |
Cash distributions paid | | | (245 | ) | |
Net cash provided by (used in) financing activities | | | (8,989 | ) | |
Net increase/(decrease) in cash | | | 1,290 | | |
| Cash and foreign currency/due to custodian: | |
Beginning balance | | | (1,281 | ) | |
Ending balance | | $ | 9 | | |
Supplemental disclosure | |
Cash paid for interest | | $ | 95 | | |
See Notes to Financial Statements
179
Notes to Financial Statements Alternative Fundsß
Note A—Summary of Significant Accounting Policies:
1 General: Neuberger Berman Alternative Funds (the "Trust") is a Delaware statutory trust organized pursuant to an Amended and Restated Trust Instrument dated March 27, 2014. The Trust is registered as an open-end management investment company under the Investment Company Act of 1940, as amended (the "1940 Act"), and its shares are registered under the Securities Act of 1933, as amended (the "1933 Act"). Each of Neuberger Berman Commodity Strategy Fund ("Commodity Strategy") (formerly, Neuberger Berman Risk Balanced Commodity Strategy Fund), Neuberger Berman Global Allocation Fund ("Global Allocation"), Neuberger Berman Hedged Option Premium Strategy Fund ("Hedged Option Premium Strategy"), Neuberger Berman Long Short Fund ("Long Short"), Neuberger Berman Long Short Credit Fund ("Long Short Credit"), Neuberger Berman Multi-Asset Income Fund ("Multi-Asset Income"), Neuberger Berman Multi-Style Premia Fund ("Multi-Style Premia") and Neuberger Berman U.S. Equity Index PutWrite Strategy Fund ("U.S. Equity Index PutWrite Strategy"), (each individually a "Fund," and collectively, the "Funds") is a separate operating series of the Trust. Multi-Style Premia is non-diversified. Under the 1940 Act, the status of a Fund that was registered as non-diversified may, under certain circumstances, change to that of a diversified Fund (Commodity Strategy, Global Allocation and Long Short became diversified in August 2015, December 2013 and December 2014, respectively). Hedged Option Premium Strategy, Long Short Credit, Multi-Asset Income and U.S. Equity Index PutWrite Strategy are each diversified. Multi-Style Premia had no operations until May 18, 2018, other than matters relating to its organization and its registration of shares under the 1933 Act. Hedged Option Premium Strategy had no operations until April 12, 2017, other than matters relating to its organization and its registration of shares under the 1933 Act. Each Fund offers Institutional Class shares, Class A shares and Class C shares. Hedged Option Premium Strategy, Long Short Credit, Multi-Asset Income, Multi-Style Premia and U.S. Equity Index PutWrite Strategy also offer Class R6 shares. The Trust's Board of Trustees (the "Board") may establish additional series or classes of shares without the approval of shareholders.
A balance indicated with a "—", either reflects a zero balance or a balance that rounds to less than $1,000.
The assets of each Fund belong only to that Fund, and the liabilities of each Fund are borne solely by that Fund and no other.
Each Fund is an investment company and accordingly follows the investment company accounting and reporting guidance of the Financial Accounting Standards Board ("FASB") Accounting Standards Codification ("ASC") Topic 946 "Financial Services—Investment Companies."
The preparation of financial statements in accordance with U.S. generally accepted accounting principles ("GAAP") requires Neuberger Berman Investment Advisers LLC ("Management") to make estimates and assumptions at the date of the financial statements. Actual results could differ from those estimates.
Commodity Strategy invests in commodity-related instruments through Neuberger Berman Cayman Commodity Fund I Ltd. (the "CS Subsidiary"), which is organized under the laws of the Cayman Islands. Subscription agreements were entered into between the Fund and the CS Subsidiary with the intent that Commodity Strategy will remain the sole shareholder of the CS Subsidiary. The CS Subsidiary is governed by its own Board of Directors.
As of October 31, 2018, the value of Commodity Strategy's investment in the CS Subsidiary was as follows:
Investment in
CS Subsidiary | | Percentage of
Net Assets | |
| $ | 15,133,431 | | | | 10.2 | % | |
Multi-Style Premia invests in commodity-related instruments through Neuberger Berman Cayman MSP Fund I Ltd. (the "MSP Subsidiary"), which is organized under the laws of the Cayman Islands. Subscription agreements
ß Consolidated Notes to Financial Statements for Commodity Strategy and Multi-Style Premia
180
were entered into between the Fund and the MSP Subsidiary with the intent that Multi-Style Premia will remain the sole shareholder of the MSP Subsidiary. The MSP Subsidiary is governed by its own Board of Directors.
As of October 31, 2018, the value of Multi-Style Premia's investment in the MSP Subsidiary was as follows:
Investment in
MSP Subsidiary | | Percentage of
Net Assets | |
| $ | 876,794 | | | | 5.7 | % | |
2 Consolidation: The accompanying financial statements of Commodity Strategy and Multi-Style Premia present the consolidated accounts of Commodity Strategy and the CS Subsidiary and Multi-Style Premia and the MSP Subsidiary, respectively. All intercompany accounts and transactions have been eliminated in consolidation.
3 Portfolio valuation: In accordance with ASC 820 "Fair Value Measurement" ("ASC 820"), all investments held by each of the Funds are carried at the value that Management believes a Fund would receive upon selling an investment in an orderly transaction to an independent buyer in the principal or most advantageous market for the investment under current market conditions. Various inputs, including the volume and level of activity for the asset or liability in the market, are considered in valuing the Funds' investments, some of which are discussed below. Significant Management judgment may be necessary to value investments in accordance with ASC 820.
ASC 820 established a three-tier hierarchy of inputs to create a classification of value measurements for disclosure purposes. The three-tier hierarchy of inputs is summarized in the three broad Levels listed below.
• Level 1 – quoted prices in active markets for identical investments
• Level 2 – other observable inputs (including quoted prices for similar investments, interest rates, prepayment speeds, credit risk, amortized cost, etc.)
• Level 3 – unobservable inputs (including a Fund's own assumptions in determining the fair value of investments)
The inputs or methodology used for valuing an investment are not necessarily an indication of the risk associated with investing in those securities.
The value of the Funds' investments (long and short positions) in equity securities, convertible preferred stocks, exchange-traded funds ("ETFs"), preferred stocks, master limited partnerships and exchange-traded options purchased and options written, for which market quotations are readily available, is generally determined by Management by obtaining valuations from independent pricing services based on the latest sale price quoted on a principal exchange or market for that security (Level 1 inputs). Securities traded primarily on the NASDAQ Stock Market are normally valued at the NASDAQ Official Closing Price ("NOCP") provided by NASDAQ each business day. The NOCP is the most recently reported price as of 4:00:02 p.m., Eastern Time, unless that price is outside the range of the "inside" bid and asked prices (i.e., the bid and asked prices that dealers quote to each other when trading for their own accounts); in that case, NASDAQ will adjust the price to equal the inside bid or asked price, whichever is closer. Because of delays in reporting trades, the NOCP may not be based on the price of the last trade to occur before the market closes. If there is no sale of a security on a particular day, the independent pricing services may value the security based on market quotations.
The value of the Funds' investments for long and short positions in debt securities is determined by Management primarily by obtaining valuations from independent pricing services based on readily available bid or offer quotations, respectively, or if quotations are not available, by methods which include various considerations based on security type (generally Level 2 inputs). In addition to the consideration of yields or prices of securities of comparable quality, coupon, maturity and type, indications as to values from dealers, and general market conditions, the following is a description of other Level 2 inputs and related valuation techniques used by independent pricing services to value certain types of debt securities held by the Funds:
Corporate Bonds. Inputs used to value corporate debt securities generally include relative credit information, observed market movements, sector news, U.S. Treasury yield curve or relevant benchmark curve, and other
181
market information, which may include benchmark yields, reported trades, broker-dealer quotes, issuer spreads, benchmark securities, bids, offers, and reference data, such as market research publications, when available ("Other Market Information").
Convertible Bonds. Inputs used to value convertible bonds generally include underlying stock data, dealer quotes, conversion premiums, listed bond and preferred stock prices and other market information, which may include benchmark curves, trade execution data, and sensitivity analysis, when available.
U.S. Treasury Obligations. Inputs used to value U.S. Treasury securities generally include quotes from several inter-dealer brokers and Other Market Information.
U.S. Government Agency Securities. Inputs used to value U.S. Government Agency securities generally include obtaining benchmark quotes and Other Market Information.
Asset-Backed Securities and Mortgage-Backed Securities. Inputs used to value asset-backed securities and mortgage-backed securities generally include models that consider a number of factors, which may include the following: prepayment speeds, cash flows, spread adjustments and Other Market Information.
Emerging Markets Debt, Sovereign Debt, and Quasi-Sovereign Debt. Inputs used to value emerging markets debt, sovereign debt and quasi-sovereign debt generally include dealer quotes, bond market activity, discounted cash flow models, and other relevant information such as credit spreads, benchmark curves and Other Market Information.
The value of loan assignments is determined by Management primarily by obtaining valuations from independent pricing services based on broker quotes (generally Level 2 or Level 3 inputs depending on the number of quotes available).
The value of futures is determined by Management by obtaining valuations from independent pricing services at the settlement price at the market close (Level 1 inputs).
The value of forward contracts is determined by Management by obtaining valuations from independent pricing services based on actual traded currency rates on independent pricing services' networks, along with other traded and quoted currency rates provided to the pricing services by leading market participants (Level 2 inputs).
The value of credit default swaps is determined by Management by obtaining valuations from independent pricing services using a model that considers a number of factors, which may include default probabilities, credit curves, recovery rates and cash flows (Level 2 inputs).
The value of swaptions is determined by Management by obtaining valuations from independent pricing services using market data and an industry standard model that considers a number of factors, which may include underlying curve/spread data, default-adjusted forward spread, data sources, delta adjustment, volatility skews and skew fallbacks (Level 2 inputs).
The value of total return swaps and total return basket swaps is determined by Management by obtaining valuations from independent pricing services using the underlying asset and stated benchmark interest rate (Level 2 inputs).
Management has developed a process to periodically review information provided by independent pricing services for all types of securities.
Investments in non-exchange traded investment companies are valued using the respective fund's daily calculated net asset value ("NAV") per share (Level 2 inputs).
If a valuation is not available from an independent pricing service, or if Management has reason to believe that the valuation received does not represent the amount a Fund might reasonably expect to receive on a current sale in an orderly transaction, Management seeks to obtain quotations from brokers or dealers (generally considered Level 2 or Level 3 inputs depending on the number of quotes available). If such quotations are not readily available, the
182
security is valued using methods the Board has approved in the good-faith belief that the resulting valuation will reflect the fair value of the security. Numerous factors may be considered when determining the fair value of a security based on Level 2 or Level 3 inputs, including available analyst, media or other reports, securities within the same industry with recent highly correlated performance, trading in futures or American Depositary Receipts and whether the issuer of the security being fair valued has other securities outstanding.
The value of the Funds' investments in foreign securities is generally determined using the same valuation methods and inputs as other Fund investments, as discussed above. Foreign security prices expressed in local currency values are normally translated from the local currency into U.S. dollars using the exchange rates as of 4:00 p.m., Eastern Time on days the New York Stock Exchange ("NYSE") is open for business. The Board has approved the use of ICE Data Pricing and Reference Data LLC ("ICE") to assist in determining the fair value of foreign equity securities when changes in the value of a certain index suggest that the closing prices on the foreign exchanges may no longer represent the amount that a Fund could expect to receive for those securities or on days when foreign markets are closed and U.S. markets are open. In each of these events, ICE will provide adjusted prices for certain foreign equity securities using a statistical analysis of historical correlations of multiple factors (Level 2 inputs). The Board has also approved the use of ICE to evaluate the prices of foreign debt securities as of the time as of which a Fund's share price is calculated. ICE utilizes benchmark spread and yield curves and evaluates available market activity from the local close to the time as of which a Fund's share price is calculated (Level 2 inputs) to assist in determining prices for certain foreign debt securities. In the case of both foreign equity and foreign debt securities, in the absence of precise information about the market values of these foreign securities as of the time as of which a Fund's share price is calculated, the Board has determined on the basis of available data that prices adjusted or evaluated in this way are likely to be closer to the prices a Fund could realize on a current sale than are the prices of those securities established at the close of the foreign markets in which the securities primarily trade.
Fair value prices are necessarily estimates, and there is no assurance that such a price will be at or close to the price at which the security is next quoted or next trades.
4 Foreign currency translations: The accounting records of the Funds, CS Subsidiary and MSP Subsidiary are maintained in U.S. dollars. Foreign currency amounts are normally translated into U.S. dollars using the exchange rate as of 4:00 p.m. Eastern Time, on days the NYSE is open for business, to determine the value of investments, other assets and liabilities. Purchase and sale prices of securities, and income and expenses, are translated into U.S. dollars at the prevailing rate of exchange on the respective dates of such transactions. Net unrealized foreign currency gain/(loss), if any, arises from changes in the value of assets and liabilities, other than investments in securities, as a result of changes in exchange rates and is stated separately in the Statements of Operations.
5 Securities transactions and investment income: Securities transactions are recorded on trade date for financial reporting purposes. Dividend income is recorded on the ex-dividend date or, for certain foreign dividends, as soon as a Fund becomes aware of the dividends. Non-cash dividends included in dividend income, if any, are recorded at the fair market value of the securities received. Interest income, including accretion of discount (adjusted for original issue discount, where applicable) and amortization of premium, where applicable, is recorded on the accrual basis. Realized gains and losses from securities transactions and foreign currency transactions, if any, are recorded on the basis of identified cost and stated separately in the Statements of Operations. Included in net realized gain/(loss) on investments are proceeds from the settlements of class action litigation in which Global Allocation and Long Short participated as a class member. The amounts of such proceeds for the year ended October 31, 2018 was $365 and $29,400 for Global Allocation and Long Short, respectively.
6 Income tax information: Each Fund is treated as a separate entity for U.S. federal income tax purposes. It is the policy of each Fund, except Multi-Style Premia, to continue to, and the intention of Multi-Style Premia to, qualify for treatment as a regulated investment company ("RIC") by complying with the requirements of the U.S. Internal Revenue Code applicable to RICs and to distribute substantially all of its net investment income and net realized
183
capital gains to its shareholders. To the extent a Fund distributes substantially all of its net investment income and net realized capital gains to shareholders, no federal income or excise tax provision is required.
The Funds have adopted the provisions of ASC 740 "Income Taxes" ("ASC 740"). ASC 740 sets forth a minimum threshold for financial statement recognition of a tax position taken, or expected to be taken, in a tax return. The Funds recognize interest and penalties, if any, related to unrecognized tax positions as an income tax expense in the Statements of Operations. The Funds are subject to examination by U.S. federal and state tax authorities for returns filed for the tax years for which the applicable statutes of limitations have not yet expired. As of October 31, 2018, the Funds did not have any unrecognized tax positions.
The CS Subsidiary and the MSP Subsidiary are controlled foreign corporations under the U.S. Internal Revenue Code. As a U.S. shareholder of a controlled foreign corporation, Commodity Strategy and Multi-Style Premia each will include in its taxable income its share of the CS Subsidiary's and the MSP Subsidiary's current earnings and profits (including net realized gains). Any deficit generated by the CS Subsidiary and the MSP Subsidiary will be disregarded for purposes of computing Commodity Strategy's and Multi-Style Premia's taxable income in the current period and also disregarded for all future periods.
At October 31, 2018, selected Fund information for all long security positions, short security positions and derivative instruments (if any) for U.S. federal income tax purposes was as follows:
| (000's omitted) | | Cost | | Gross
Unrealized
Appreciation | | Gross
Unrealized
Depreciation | | Net Unrealized
Appreciation/
(Depreciation) | |
Commodity Strategy | | $ | 147,707 | | | $ | 87 | | | $ | 7,515 | | | $ | (7,428 | ) | |
Global Allocation | | | 20,310 | | | | 1,126 | | | | 1,142 | | | | (16 | ) | |
Hedged Option Premium Strategy | | | 14,571 | | | | 86 | | | | 263 | | | | (177 | ) | |
Long Short | | | 2,645,803 | | | | 528,420 | | | | 188,515 | | | | 339,905 | | |
Long Short Credit | | | 12,311 | | | | 64 | | | | 323 | | | | (259 | ) | |
Multi-Asset Income | | | 25,859 | | | | 1,231 | | | | 1,560 | | | | (329 | ) | |
Multi-Style Premia | | | 10,305 | | | | 903 | | | | 1,473 | | | | (570 | ) | |
U.S. Equity Index PutWrite Strategy | | | 262,427 | | | | 948 | | | | 2,606 | | | | (1,658 | ) | |
Income distributions and capital gain distributions are determined in accordance with income tax regulations, which may differ from GAAP. These differences are primarily due to differing treatments of income and gains on various investment securities held by each Fund, timing differences and differing characterization of distributions made by each Fund. The Funds may also utilize earnings and profits distributed to shareholders on redemption of their shares as a part of the dividends-paid deduction for income tax purposes.
As determined on October 31, 2018, permanent differences resulting primarily from different book and tax accounting were reclassified at year end. Such differences may be attributed to the tax treatment of one or more of the following: net operating loss written-off, CS Subsidiary and MSP Subsidiary income and gain (loss), non-deductible stock issuance fees, deemed distributions on shareholder redemptions, partnership non-deductible expenses and non-deductible excise tax. These reclassifications had no effect on net income, NAV or NAV per
184
share of each Fund. For the year ended October 31, 2018, the Funds recorded the following permanent reclassifications:
| | | Paid-in Capital | | Total Distributable
Earnings/(Losses) | |
Commodity Strategy | | $ | 8,168,817 | | | $ | (8,168,817 | ) | |
Global Allocation | | | 196,743 | | | | (196,743 | ) | |
Hedged Option Premium Strategy | | | — | | | | — | | |
Long Short | | | 2,918,142 | | | | (2,918,142 | ) | |
Long Short Credit | | | (908 | ) | | | 908 | | |
Multi-Asset Income | | | (4,380 | ) | | | 4,380 | | |
Multi-Style Premia | | | (173,991 | ) | | | 173,991 | | |
U.S. Equity Index PutWrite Strategy | | | — | | | | — | | |
The tax character of distributions paid during the years ended October 31, 2018 and October 31, 2017 was as follows:
| | Distributions Paid From: | |
| | Taxable
Income | | Long-Term
Capital Gain | | Return of
Capital | | Total | |
| | 2018 | | 2017 | | 2018 | | 2017 | | 2018 | | 2017 | | 2018 | | 2017 | |
Commodity Strategy | | $ | 4,653,294 | | | $ | — | | | $ | — | | | $ | — | | | $ | — | | | $ | — | | | $ | 4,653,294 | | | $ | — | | |
Global Allocation | | | 641,484 | | | | 44,404 | | | | 368,403 | | | | — | | | | — | | | | — | | | | 1,009,887 | | | | 44,404 | | |
Hedged Option
Premium Strategy | | | 191,283 | | | | 16,672 | (a) | | | 70,070 | | | | — | (a) | | | — | | | | — | (a) | | | 261,353 | | | | 16,672 | (a) | |
Long Short | | | — | | | | — | | | | — | | | | — | | | | — | | | | — | | | | — | | | | — | | |
Long Short Credit | | | 826,181 | | | | 1,038,403 | | | | — | | | | — | | | | 75,453 | | | | — | | | | 901,634 | | | | 1,038,403 | | |
Multi-Asset Income | | | 806,348 | | | | 723,961 | | | | — | | | | — | | | | 161,966 | | | | 22,515 | | | | 968,314 | | | | 746,476 | | |
Multi-Style Premia | | | — | (b) | | | — | | | | — | (b) | | | — | | | | — | (b) | | | — | | | | — | (b) | | | — | | |
U.S. Equity Index
PutWrite Strategy | | | 6,625,107 | | | | 473,142 | | | | 5,819,643 | | | | 61,645 | | | | — | | | | — | | | | 12,444,750 | | | | 534,787 | | |
(a) Period from April 12, 2017 (Commencement of Operations) to October 31, 2017.
(b) Period from May 18, 2018 (Commencement of Operations) to October 31, 2018.
As of October 31, 2018, the components of distributable earnings (accumulated losses) on a U.S. federal income tax basis were as follows:
| | Undistributed
Ordinary
Income | | Undistributed
Long-Term
Capital Gain | | Unrealized
Appreciation/
(Depreciation) | | Loss
Carryforwards
and Deferrals | | Other
Temporary
Differences | | Total | |
Commodity Strategy | | $ | 2,976,172 | | | $ | — | | | $ | (7,427,902 | ) | | $ | — | | | $ | (5,485,225 | ) | | $ | (9,936,955 | ) | |
Global Allocation | | | 332,951 | | | | 422,047 | | | | (18,457 | ) | | | — | | | | (8,355) | | | | 728,186 | | |
Hedged Option
Premium Strategy | | | 20,016 | | | | — | | | | (176,689 | ) | | | (776,862 | ) | | | (2,126 | ) | | | (935,661 | ) | |
Long Short | | | — | | | | 146,765,947 | | | | 339,904,816 | | | | — | | | | (25,917,954 | ) | | | 460,752,809 | | |
Long Short Credit | | | — | | | | — | | | | (258,943 | ) | | | (1,831,688 | ) | | | (17,616 | ) | | | (2,108,247 | ) | |
Multi-Asset Income | | | — | | | | — | | | | (329,608 | ) | | | (125,741 | ) | | | (16,991 | ) | | | (472,340 | ) | |
Multi-Style Premia | | | 808,920 | | | | — | | | | (569,556 | ) | | | (220,366 | ) | | | (24,657 | ) | | | (5,659) | | |
U.S. Equity Index
PutWrite Strategy | | | 1,023,272 | | | | — | | | | (1,657,839 | ) | | | (1,430,111 | ) | | | (4,473 | ) | | | (2,069,151 | ) | |
185
The temporary differences between book basis and tax basis distributable earnings are primarily due to: losses disallowed and recognized on wash sales, straddles and unsettled short sales; timing differences of fund level distributions, mark-to-market adjustments on swaps, futures contracts and forward and option contracts; late-year ordinary loss deferrals, unamortized organization expenses and tax adjustments related to REITs, TIPs, PFICs, short sales, partnerships, swap contracts and other investments.
To the extent each Fund's net realized capital gains, if any, can be offset by capital loss carryforwards, it is the policy of each Fund not to distribute such gains. Capital loss carryforward rules allow for RICs to carry forward capital losses indefinitely and to retain the character of capital loss carryforwards as short-term or long-term. As determined at October 31, 2018, the Funds had unused capital loss carryforwards available for federal income tax purposes to offset net realized capital gains, if any, as follows:
| | | Capital Loss Carryforwards | |
| | | Long-Term | | Short-Term | |
Commodity Strategy | | $ | — | | | $ | — | | |
Hedged Option Premium Strategy | | | 464,679 | | | | 312,183 | | |
Long Short Credit | | | 268,621 | | | | 1,563,067 | | |
Multi-Asset Income | | | — | | | | 125,741 | | |
Mulit-Style Premia | | | 13,195 | | | | 207,171 | | |
U.S. Equity Index PutWrite Strategy | | | 1,186,445 | | | | 243,666 | | |
During the year ended October 31, 2018, Commodity Strategy, Long Short and Multi-Asset Income had utilized capital loss carryforwards of $84,076, $36,742,044 and $81,605, respectively.
7 Foreign taxes: Foreign taxes withheld, if any, represent amounts withheld by foreign tax authorities, net of refunds recoverable.
Foreign capital gains on certain foreign securities may be subject to foreign taxes, which are accrued as applicable. At October 31, 2018, there were no outstanding balances of accrued capital gains taxes for any Fund.
8 Distributions to shareholders: Each Fund may earn income, net of expenses, daily on its investments. Distributions from net investment income, if any, are recorded on the ex-date and generally distributed once a year (usually in December) for Commodity Strategy, Global Allocation, Long Short, Multi-Style Premia, monthly for Multi-Asset Income and quarterly for Hedged Option Premium Strategy, Long Short Credit and U.S. Equity Index PutWrite Strategy. Distributions from net realized capital gains, if any, generally are distributed once a year (usually in December) and are recorded on the ex-date.
It is the policy of each of Long Short and Multi-Asset Income to pass through to its shareholders substantially all REIT distributions and other income it receives, less operating expenses. The distributions received from REITs are generally composed of income, capital gains, and/or return of REIT capital, but the REITs do not report this information to these Funds until the following calendar year. At October 31, 2018, these Funds estimated these amounts for the period January 1, 2018 to October 31, 2018 within the financial statements because the 2018 information is not available from the REITs until after each Fund's fiscal period. All estimates are based upon REIT information sources available to these Funds together with actual IRS Forms 1099-DIV received to date. For the year ended October 31, 2018, the character of distributions, if any, paid to shareholders of these Funds disclosed within the Statements of Changes in Net Assets is based on estimates made at that time. Based on past experience it is possible that a portion of these Funds' distributions during the current fiscal year, if any, will be considered tax return of capital, but the actual amount of the tax return of capital, if any, is not determinable until after each Fund's fiscal year-end. After calendar year-end, when these Funds learn the nature of the distributions paid by REITs during that year, distributions previously identified as income are often recharacterized as return of capital and/or capital gain. After all applicable REITs have informed these Funds of the actual breakdown of distributions
186
paid to these Funds during their fiscal year, estimates previously recorded are adjusted on the books of these Funds to reflect actual results. As a result, the composition of these Funds' distributions as reported herein may differ from the final composition determined after calendar year-end and reported to these Funds shareholders on IRS Form 1099-DIV.
9 Expense allocation: Certain expenses are applicable to multiple funds within the complex of related investment companies. Expenses directly attributable to a fund are charged to that fund. Expenses of the Trust that are not directly attributable to a particular series of the Trust (e.g., a Fund) are allocated among the series of the Trust, on the basis of relative net assets, except where a more appropriate allocation of expenses to each of the series can otherwise be made fairly. Expenses borne by the complex of related investment companies, which includes open-end and closed-end investment companies for which Management serves as investment manager, that are not directly attributable to a particular investment company in the complex (e.g., the Trust) or series thereof are allocated among the investment companies in the complex or series thereof on the basis of relative net assets, except where a more appropriate allocation of expenses to each of the investment companies in the complex or series thereof can otherwise be made fairly. Each Fund's expenses (other than those specific to each class) are allocated proportionally each day among the classes based upon the relative net assets of each class.
10 Investments in foreign securities: Investing in foreign securities may involve sovereign and other risks, in addition to the credit and market risks normally associated with domestic securities. These additional risks include the possibility of adverse political and economic developments (including political instability, nationalization, expropriation, or confiscatory taxation) and the potentially adverse effects of unavailability of public information regarding issuers, less governmental supervision and regulation of financial markets, reduced liquidity of certain financial markets, and the lack of uniform accounting, auditing, and financial reporting standards or the application of standards that are different or less stringent than those applied in the United States. Foreign securities also may experience greater price volatility, higher rates of inflation, and delays in settlement.
11 Dollar rolls: The Funds may enter into dollar roll transactions with respect to mortgage-backed securities. In a dollar roll transaction, a Fund sells securities for delivery in the current month and simultaneously agrees to repurchase substantially similar (i.e., same type and coupon) securities on a specified future date from the same party. During the period before this repurchase, a Fund forgoes principal and interest payments on the securities. A Fund is compensated by the difference between the current sales price and the forward price for the future purchase (often referred to as the "drop"), as well as by the interest earned on the cash proceeds of the initial sale. Dollar rolls may increase fluctuations in a Fund's NAV and may be viewed as a form of leverage. There is a risk that the counterparty will be unable or unwilling to complete the transaction as scheduled, which may result in losses to a Fund.
12 Reverse repurchase agreements: In a reverse repurchase agreement, a Fund sells portfolio securities to another party and agrees to repurchase the securities at an agreed-upon price and date, which reflects an interest payment. In periods of increased demand for a security, the Fund may receive a payment from the counterparty for the use of the security, which is recorded as interest income. Reverse repurchase agreements involve the risk that the other party will fail to return the securities in a timely manner, or at all, which may result in losses to a Fund. A Fund could lose money if it is unable to recover the securities and the value of the collateral held by the Fund is less than the value of the securities. Reverse repurchase agreements also involve the risk that the market value of the securities sold will decline below the price at which a Fund is obligated to repurchase them. Reverse repurchase agreements may be viewed as a form of borrowing by a Fund. When the Fund enters into a reverse repurchase agreement, any fluctuations in the market value of either the securities transferred to another party or the securities in which the proceeds may be invested would affect the market value of the Fund's assets. During the term of the agreement, the Fund may also be obligated to pledge additional cash and/or securities in the event of a decline in the fair value of the transferred security.
13 Securities sold short: Each Fund may engage in short sales, which are sales of securities which have been borrowed from a third party on the expectation that the market price will decline. If the price of the securities decreases, a Fund will make a profit by purchasing the securities in the open market at a price lower than the one at
187
which it sold the securities. If the price of the securities increases, a Fund may have to cover its short positions at a price higher than the short sale price, resulting in a loss. Gains are limited to the price at which a Fund sold the security short, while losses are potentially unlimited in size. The Funds pledge securities and/or other assets, which may include cash collateral from securities lending activities, to the lender as collateral. Proceeds received from short sales may be maintained by the lender as collateral or may be released to the Funds and used to purchase additional securities or for any other purpose. Proceeds maintained by the lender are included in the "Cash collateral segregated for short sales" on the Statements of Assets and Liabilities. The Funds are required to segregate an amount of cash or liquid securities in an amount at least equal to the current market value of the securities sold short (less any additional collateral pledged to the lender). The Funds are contractually responsible to remit to the lender any dividends and interest payable on securities while those securities are being borrowed by the Fund. The Funds may receive or pay the net of the interest charged by the prime broker on the borrowed securities and a financing charge for the difference in the market value of the short position and the cash collateral deposited with the broker. This income or fee is calculated daily based upon the market value of each borrowed security and a variable rate that is dependent on the availability of the security. These costs related to short sales (i.e., dividend and interest remitted to the lender and interest charged by the prime broker) are recorded as an expense of the Funds and are excluded from the contractual expense limitation. A net negative expense, if any, represents a gain to the Fund as the total cash rebates received exceeded the other costs related to short sales. The net amount of fees incurred during the year ended October 31, 2018, are included in the "Dividend and interest expense on securities sold short and reverse repurchase agreements" on the Statements of Operations and are as follows:
At October 31, 2018, Long Short had cash pledged in the amount of $615,878,084 to State Street Bank and Trust Company ('State Street") to cover collateral requirements for borrowing in connection with securities sold short.
14 Securities Lending: Each Fund, using State Street as its lending agent, may loan securities to qualified brokers and dealers in exchange for negotiated lender's fees. These fees, if any, would be disclosed within the Statements of Operations under the caption "Income from securities loaned-net" and are net of expenses retained by State Street as compensation for its services as lending agent. For the year ended October 31, 2018, the Fund listed below received income under the securities lending arrangement as follows:
(000's omitted) | |
Long Short | | $ | 95 | | |
The initial cash collateral received by a Fund at the beginning of each transaction shall have a value equal to at least 102% of the prior day's market value of the loaned securities (105% in the case of international securities). Thereafter, the value of the cash collateral is monitored on a daily basis, and cash collateral is moved daily between a counterparty and a Fund until the close of the transaction. A Fund may only receive collateral in the form of cash (U.S. dollars). Cash collateral is generally invested in a money market fund registered under the 1940 Act that is managed by an affiliate of State Street. The risks associated with lending portfolio securities include, but are not limited to, possible delays in receiving additional collateral or in the recovery of the loaned securities. Any increase or decrease in the fair value of the securities loaned and any interest earned or dividends paid or owed on those securities during the term of the loan would accrue to the Fund.
As of October 31, 2018, the Fund listed below had outstanding loans of securities to certain approved brokers each with a value as follows:
| (000's omitted) | | Value of Securities
Loaned | |
Long Short | | $ | 73,230 | | |
188
As of October 31, 2018, the Fund listed below had outstanding loans of securities to certain approved brokers for which it received collateral as follows:
| | Remaining Contractual Maturity of the Agreements | |
| (000's omitted) | | Overnight and
Continuous | | Less Than 30
Days | | Between 30 &
90 Days | | Greater Than
90 Days | | Total | |
Securities Lending
Transactions(a) | | | | | | | | | | | |
Common Stocks | | | | | | | | | | | |
Long Short | | $ | 73,895 | | | $ | — | | | $ | — | | | $ | — | | | $ | 73,895 | | |
(a) Amounts represent the payable for loaned securities collateral received.
15 Derivative instruments: Certain Funds' use of derivatives during the year ended October 31, 2018, is described below. Please see the Schedule of Investments for each Fund's open positions in derivatives, if any, at October 31, 2018. The Funds have adopted the provisions of ASC 815 "Derivatives and Hedging" ("ASC 815"). The disclosure requirements of ASC 815 distinguish between derivatives that qualify for hedge accounting and those that do not. Because investment companies value their derivatives at fair value and recognize changes in fair value through the Statements of Operations, they do not qualify for hedge accounting. Accordingly, even though a Fund's investments in derivatives may represent economic hedges, they are considered non-hedge transactions for purposes of this disclosure.
Futures contracts: During the year ended October 31, 2018, Commodity Strategy used commodity futures contracts (through investments in the CS Subsidiary) to provide investment exposure to individual commodities, as well as to manage and/or adjust the risk profile of the Fund. During the year ended October 31, 2018, Global Allocation used futures in an effort to enhance total return and to manage or adjust the risk profile and the investment exposure of the Fund to certain asset classes, countries and regions. In addition, Global Allocation also utilized futures to provide investment exposure to certain indices and markets other than the benchmark indices. During the year ended October 31, 2018, Long Short used futures on broader market indices and U.S. Treasuries in an effort either to enhance returns or to manage or adjust the risk profile and the investment exposure of the Fund. During the year ended October 31, 2018, Long Short Credit used futures to manage or adjust the risk profile of the Fund or the risk of individual positions, to adjust the duration of the Fund's portfolio, to hedge risk and to alter the Fund's exposure to currencies, interest rates, sectors and individual issuers. During the year ended October 31, 2018, Multi-Asset Income used futures to enhance total return and to manage or adjust the risk profile and the investment exposure of the Fund to certain asset classes, countries and regions. In addition, Multi-Asset Income also utilized futures to provide investment exposure to certain indices and markets other than the benchmark indices. During the period ended October 31, 2018, Multi-Style Premia used commodity futures contracts (through investments in the MSP Subsidiary) to enhance total return, to provide investment exposure to certain asset classes, indices and markets. Multi-Style Premia also used futures to adjust the risk profile of the Fund.
At the time a Fund, CS Subsidiary or MSP Subsidiary enters into a futures contract, it is required to deposit with the futures commission merchant a specified amount of cash or liquid securities, known as "initial margin," which is a percentage of the value of the futures contract being traded that is set by the exchange upon which the futures contract is traded. Each day, the futures contract is valued at the official settlement price of the board of trade or U.S. commodity exchange on which such futures contract is traded. Subsequent payments, known as "variation margin," to and from the broker are made on a daily basis, or as needed, as the market price of the futures contract fluctuates. Daily variation margin adjustments, arising from this "mark to market," are recorded by a Fund, CS Subsidiary or MSP Subsidiary as unrealized gains or losses.
Although some futures by their terms call for actual delivery or acquisition of the underlying securities or currency, in most cases the contracts are closed out prior to delivery by offsetting purchases or sales of matching futures. When the contracts are closed, a Fund recognizes a gain or loss. Risks of entering into futures contracts include the possibility there may be an illiquid market, possibly at a time of rapidly declining prices, and/or a change in the value of the contract may not correlate with changes in the value of the underlying securities. Futures executed on
189
regulated futures exchanges have minimal counterparty risk to a Fund because the exchange's clearinghouse assumes the position of the counterparty in each transaction. Thus, a Fund is exposed to risk only in connection with the clearinghouse and not in connection with the original counterparty to the transaction.
For U.S. federal income tax purposes, the futures transactions undertaken by a Fund, CS Subsidiary or MSP Subsidiary may cause the Fund, CS Subsidiary or MSP Subsidiary to recognize gains or losses from marking contracts to market even though its positions have not been sold or terminated, may affect the character of the gains or losses recognized as long-term or short-term, and may affect the timing of some capital gains and losses realized by the Fund, CS Subsidiary or MSP Subsidiary . Also, a Fund's, CS Subsidiary's or MSP Subsidiary's losses on transactions involving futures contracts may be deferred rather than being taken into account currently in calculating such Fund's, CS Subsidiary's or MSP Subsidiary's taxable income.
Forward foreign currency contracts: During the year ended October 31, 2018, Global Allocation used forward contracts to obtain or reduce exposure to certain markets, establish net short or long positions for currencies and alter the Fund's exposure to markets and currencies. During the year ended October 31, 2018, Long Short Credit used forward contracts to alter the Fund's exposure to currencies, interest rates, sectors and individual issuers. During the year ended October 31, 2018, Multi-Asset Income used forward contracts to obtain or reduce exposure to certain markets, establish net short or long positions for currencies and alter the Fund's exposure to markets and currencies. During the period ended October 31, 2018, Multi-Style Premia used forward contracts to provide investment exposure to certain markets and to establish net short or net long positions in certain currencies.
A forward contract is an agreement between two parties to buy or sell a specific currency for another at a set price on a future date, and is individually negotiated and privately traded by currency traders and their customers in the interbank market. The market value of a forward contract fluctuates with changes in forward currency exchange rates. Forward contracts are marked to market daily, and the change in value is recorded by a Fund as an unrealized gain or loss. At the consummation of a forward contract to purchase or sell currency, a Fund may either exchange the currencies specified at the maturity of the forward contract or enter into a closing transaction involving the purchase or sale of an offsetting forward contract. Closing transactions with respect to forward contracts are usually performed with the counterparty to the original forward contract. The gain or loss arising from the difference between the U.S. dollar cost of the original contract and the value of the foreign currency in U.S. dollars upon closing a contract is included in "Net realized gain/(loss) on settlement of forward foreign currency contracts" in the Statements of Operations. These contracts may involve market risk in excess of the unrealized gain or loss reflected in a Fund's Statement of Assets and Liabilities. In addition, a Fund could be exposed to risks associated with fluctuations in foreign currency and the risk the counterparty will fail to fulfill its obligation.
Credit default swap contracts: During the year ended October 31, 2018, Long Short Credit used credit default swaps to replace more traditional direct investments, to establish net short or long positions for individual markets, currencies or securities and to hedge risk. When a Fund is the buyer of an over-the-counter ("OTC") credit default swap contract, it is entitled to receive the notional amount of the swap from the counterparty if a credit event occurs. In return, the Fund pays the counterparty a periodic stream of payments over the term of the contract provided that no credit event has occurred. If no credit event occurs, the Fund would have spent the stream of payments and received no proceeds from the contract. When a Fund is the seller of an OTC credit default swap contract, it receives the stream of payments, but is obligated to pay to the buyer of the protection an amount up to the notional amount of the swap and in certain instances take delivery of securities of the reference entity upon the occurrence of a credit event, as defined under the terms of that particular swap agreement. Credit events are contract specific but may include bankruptcy, failure to pay, restructuring, obligation acceleration and repudiation/moratorium. If a Fund is a seller of protection and a credit event occurs, the maximum potential amount of future payments that the Fund could be required to make (or the risk of loss) would be an amount equal to the notional amount of the agreement. This potential amount would be partially offset by any recovery value of the respective referenced obligation, or net amount received from the settlement of a buy protection credit default swap agreement entered into by the Fund for the same referenced obligation. As the seller, the Fund may add economic leverage to its portfolio because, in addition to its total net assets, the Fund is subject to investment exposure on the notional amount of the swap. The net periodic payments paid or
190
received on the swap contract are accrued daily as a component of unrealized appreciation/(depreciation) and are recorded as realized gain upon receipt or realized loss upon payment. The Fund also records an increase or decrease to unrealized appreciation/(depreciation) in an amount equal to the daily valuation of swaps. For financial reporting purposes, unamortized upfront payments/(receipts), if any, are netted with unrealized appreciation or (depreciation) and net interest received or paid on swap contracts to determine the fair value of swaps.
Centrally cleared swap contracts: Certain clearinghouses currently offer clearing for limited types of derivative transactions, including certain credit default swaps. In a cleared derivative transaction, a Fund typically enters into the transaction with a financial institution counterparty that is then cleared through a central clearinghouse. Upon acceptance of a swap by a central clearinghouse, the original swap is extinguished and replaced with a swap with the clearinghouse, thereby reducing or eliminating the Fund's exposure to the credit risk of the original counterparty. A Fund typically will be required to post specified levels of both initial and variation margin with the clearinghouse or at the instruction of the clearinghouse. The daily change in valuation is recorded as a receivable or payable for variation margin and settled in cash with the centrally clearing party. For financial reporting purposes, unamortized upfront/(receipts) payments, if any, are netted with unrealized appreciation or (depreciation) and net interest received or paid on swap contracts to determine the fair value of swaps.
Total return basket swap contracts: During the year ended October 31, 2018, Long Short used total return basket swaps to increase returns, reduce risks and for hedging purposes. During the year ended October 31, 2018, Long Short Credit used total return basket swaps to replace more traditional direct investments and to hedge risk. Certain Funds may enter into a total return basket swap agreement to obtain exposure to a portfolio of long and short securities. Under the terms of the agreement, the swap is designed to function as a portfolio of direct investments in long and short equity or fixed income positions. The Funds have the ability to trade in and out of long and short positions within the swap and will receive all of the economic benefits and risks equivalent to direct investments in these positions such as: capital appreciation/(depreciation), corporate actions, and dividends and interest received and paid, all of which are reflected in the swap value. The swap value also includes interest charges and credits related to the notional values of the long and short positions and cash balances within the swap. These interest charges and credits are based on defined market rates plus or minus a specified spread and are referred to herein as "financing costs". Positions within the swap are reset periodically, and financing costs are reset monthly. During a reset, any unrealized gains (losses) on positions and accrued financing costs become available for cash settlement between the Funds and the swap counterparty. Cash settlement in and out of the swap may occur at a reset date or any other date, at the discretion of the Funds and the counterparty, over the life of the agreement, and is generally determined based on limits and thresholds established as part of an International Swaps and Derivatives Association (ISDA) agreement between the Funds and the counterparty. A change in the market value of a total return basket swap contract is recognized as a change in unrealized appreciation/(depreciation) on swap contracts in the Statements of Operations. Cash settlements between a Fund and the counterparty are recognized as realized gains (losses) on closing of swap contracts in the Statements of Operations.
Total return swap contracts: During the year ended October 31, 2018, Global Allocation used total return swaps to enhance total return and obtain or reduce exposure to certain markets. During the year ended October 31, 2018, Long Short used total return swaps to increase returns, reduce risks and for hedging purposes. During the year ended October 31, 2018, Long Short Credit used total return swaps to replace more traditional direct investments and to hedge risk. During the year ended October 31, 2018, Multi-Asset Income used total return swaps to enhance total return and obtain or reduce exposure to certain markets. During the period ended October 31, 2018, Multi-Style Premia used total return swaps to increase returns, reduce risks and to replace more traditional direct investments. Total return swaps involve commitments to pay fixed or floating rate interest in exchange for a market-linked return based on a notional amount. To the extent the total return of the reference security or index underlying the total return swap exceeds or falls short of the offsetting interest rate obligation, a Fund will receive a payment or make a payment to the counterparty, respectively. For financial reporting purposes, unamortized upfront payments/(receipts), if any, are netted with unrealized appreciation or (depreciation) and net interest received or paid on swap contracts to determine the fair value of swaps, respectively. Certain risks may arise when entering into total return swap transactions, including counterparty default, liquidity or unfavorable changes in the value of the
191
underlying reference security or index. The value of the swap is adjusted daily and the change in value, if any, is recorded as unrealized appreciation or (depreciation) in the Statements of Assets and Liabilities. Payments received or made at the end of each measurement period are recorded as realized gain or loss in the Statements of Operations.
Options: During the year ended October 31, 2018, Global Allocation used options written to enhance total return, manage or adjust the risk profile of the Fund or the risk of individual positions, replace more traditional direct investments and obtain exposure to certain markets. During the year ended October 31, 2018, Global Allocation used options purchased to enhance total return, manage or adjust the risk profile of the Fund and replace more traditional direct investments. During the year ended October 31, 2018, Hedged Option Premium Strategy used options written primarily to gain exposure to securities, markets, sectors or geographical areas and also to enhance total return and gain exposure more efficiently than through a direct purchase of the underlying security. During the year ended October 31, 2018, Hedged Option Premium Strategy used options purchased primarily to hedge exposures to securities, markets, sectors or geographical areas while attempting to limit risk. During the year ended October 31, 2018, Long Short used options written to generate incremental returns. During the year ended October 31, 2018, Long Short used options purchased either for hedging purposes or to generate incremental returns. During the year ended October 31, 2018, Long Short Credit used options written (including swaptions) to establish net short or long positions for individual markets, currencies or securities, hedge risk and alter the Fund's exposure to currencies, interest rates, sectors and individual issuers. During the year ended October 31, 2018, Long Short Credit used options purchased (including swaptions and options on futures) either for hedging purposes or to generate incremental returns. During the year ended October 31, 2018, Multi-Asset Income used options written to enhance total return, manage or adjust the risk profile of the Fund, and replace more traditional direct investments. During the year ended October 31, 2018, Multi-Asset Income used options purchased to enhance total return, manage or adjust the risk profile of the Fund, and replace more traditional direct investments. During the period ended October 31, 2018, Multi-Style Premia used options written to enhance total return, manage or adjust the risk profile of the Fund or the risk of individual positions, replace more traditional direct investments and obtain exposure to certain markets. During the year ended October 31, 2018, U.S. Equity Index PutWrite Strategy used options written primarily to gain exposure to securities, markets, sectors or geographical areas and also to enhance total return and gain exposure more efficiently than through a direct purchase of the underlying security.
Premiums paid by a Fund upon purchasing a call or put option are recorded in the asset section of the Fund's Statement of Assets and Liabilities and are subsequently adjusted to the current market value. When an option is exercised, closed, or expired, a Fund realizes a gain or loss and the asset is eliminated. For purchased call options, a Fund's loss is limited to the amount of the option premium paid.
Premiums received by a Fund upon writing a call option or a put option are recorded in the liability section of the Fund's Statement of Assets and Liabilities and are subsequently adjusted to the current market value. When an option is exercised, closed, or expired, a Fund realizes a gain or loss and the liability is eliminated.
When a fund writes a call option on an underlying asset it does not own, its exposure on such an option is theoretically unlimited. When writing a covered call option, a Fund, in return for the premium, gives up the opportunity for profit from a price increase in the underlying security above the exercise price, but conversely retains the risk of loss should the price of the security decline. When writing a put option, a Fund, in return for the premium, takes the risk that it must purchase the underlying security at a price that may be higher than the current market price of the security. If a call or put option that a Fund has written expires unexercised, a Fund will realize a gain in the amount of the premium. All securities covering outstanding written options are held in escrow by the custodian bank.
Swaptions are similar to options on securities except that instead of selling or purchasing the right to buy or sell a security, the writer or purchaser of the swaptions is granting or buying the right to enter into a previously agreed upon interest rate or credit default swap agreement at any time before the expiration of the option.
A Fund may write or purchase options on exchange-traded futures contracts ("futures option") to hedge an existing position or future investment, for speculative purposes or to manage exposure to market movements. A futures option is an option contract in which the underlying instrument is a specific futures contract.
192
At October 31, 2018, the Funds had the following derivatives (which did not qualify as hedging instruments under ASC 815), grouped by primary risk exposure:
Asset Derivatives
(000's omitted) | |
Derivative
Type | | Statements of
Assets and
Liabilities Location | | Interest
Rate Risk | | Currency
Risk | | Equity Risk | | Credit Risk | | Commodity
Risk | | Total | |
Commodity Strategy | |
Futures
| | Receivable/Payable
for accumulated
variation margin on
futures contracts | | $ | —
| | | $ | —
| | | $ | —
| | | $ | —
| | | $ | 2,279
| | | $ | 2,279
| | |
Total Value—Assets | | | | $ | — | | | $ | — | | | $ | — | | | $ | — | | | $ | 2,279 | | | $ | 2,279 | | |
Global Allocation | |
Futures
| | Receivable/Payable
for accumulated
variation margin on
futures contracts | | $ | 59
| | | $ | —
| | | $ | 34
| | | $ | —
| | | $ | —
| | | $ | 93
| | |
Forward
contracts
| | Receivable for
forward foreign
currency contracts | | | —
| | | | 266
| | | | —
| | | | —
| | | | —
| | | | 266
| | |
Over-the-
counter
swaps | | Over-the-counter
swap contracts,
at value(a) | | | —
| | | | —
| | | | 41
| | | | —
| | | | —
| | | | 41
| | |
Options
purchased | | Investments in
securities, at value | | | —
| | | | —
| | | | 2
| | | | —
| | | | —
| | | | 2
| | |
Total Value—Assets | | | | $ | 59 | | | $ | 266 | | | $ | 77 | | | $ | — | | | $ | — | | | $ | 402 | | |
Hedged Option Premium Strategy | |
Options
purchased | | Investments in
securities, at value | | $ | —
| | | $ | —
| | | $ | 24
| | | $ | —
| | | $ | —
| | | $ | 24
| | |
Total Value—Assets | | | | $ | — | | | $ | — | | | $ | 24 | | | $ | — | | | $ | — | | | $ | 24 | | |
Long Short | |
Futures
| | Receivable/Payable
for accumulated
variation margin on
futures contracts | | $ | 174
| | | $ | —
| | | $ | 30,821
| | | $ | —
| | | $ | —
| | | $ | 30,995
| | |
Over-the-
counter
swaps | | Over-the-counter
swap contracts,
at value(a) | | | —
| | | | —
| | | | 5,009
| | | | —
| | | | —
| | | | 5,009
| | |
Options
purchased | | Investments in
securities, at value | | | —
| | | | —
| | | | 6,723
| | | | —
| | | | —
| | | | 6,723
| | |
Total Value—Assets | | | | $ | 174 | | | $ | — | | | $ | 42,553 | | | $ | — | | | $ | — | | | $ | 42,727 | | |
193
Derivative
Type | | Statements of
Assets and
Liabilities Location | | Interest
Rate Risk | | Currency
Risk | | Equity Risk | | Credit Risk | | Commodity
Risk | | Total | |
Long Short Credit | |
Forward
contracts
| | Receivable for
forward foreign
currency contracts | | $ | —
| | | $ | 11
| | | $ | —
| | | $ | —
| | | $ | —
| | | $ | 11
| | |
Centrally
cleared
swaps
| | Receivable/Payable
for variation margin
on centrally cleared
swap contracts(a) | | | —
| | | | —
| | | | —
| | | | 196
| | | | —
| | | | 196
| | |
Over-the-
counter
swaps | | Over-the-counter
swap contracts,
at value(a) | | | —
| | | | —
| | | | —
| | | | 27
| | | | —
| | | | 27
| | |
Swaptions
purchased | | Investments in
securities, at value | | | —
| | | | —
| | | | —
| | | | 7
| | | | —
| | | | 7
| | |
Total Value—Assets | | | | $ | — | | | $ | 11 | | | $ | — | | | $ | 230 | | | $ | — | | | $ | 241 | | |
Multi-Asset Income | |
Futures
| | Receivable/Payable
for accumulated
variation margin on
futures contracts | | $ | 130
| | | $ | —
| | | $ | 34
| | | $ | —
| | | $ | —
| | | $ | 164
| | |
Forward
contracts
| | Receivable for
forward foreign
currency contracts | | | —
| | | | 280
| | | | —
| | | | —
| | | | —
| | | | 280
| | |
Over-the-
counter
swaps | | Over-the-counter
swap contracts,
at value(a) | | | —
| | | | —
| | | | 45
| | | | —
| | | | —
| | | | 45
| | |
Options
purchased | | Investments in
securities, at value | | | —
| | | | —
| | | | 2
| | | | —
| | | | —
| | | | 2
| | |
Total Value—Assets | | | | $ | 130 | | | $ | 280 | | | $ | 81 | | | $ | — | | | $ | — | | | $ | 491 | | |
Multi-Style Premia | |
Futures
| | Receivable/Payable
for accumulated
variation margin on
futures contracts | | $ | 51
| | | $ | 27
| | | $ | —
| | | $ | —
| | | $ | 39
| | | $ | 117
| | |
Forward
contracts
| | Receivable for
forward foreign
currency contracts | | | —
| | | | 25
| | | | —
| | | | —
| | | | —
| | | | 25
| | |
Over-the-
counter
swaps | | Over-the-counter
swap contracts,
at value(a) | | | —
| | | | —
| | | | 1,712
| | | | —
| | | | —
| | | | 1,712
| | |
Total Value—Assets | | | | $ | 51 | | | $ | 52 | | | $ | 1,712 | | | $ | — | | | $ | 39 | | | $ | 1,854 | | |
194
Liability Derivatives
(000's omitted) | |
Derivative
Type | | Statements of
Assets and
Liabilities Location | | Interest
Rate Risk | | Currency
Risk | | Equity Risk | | Credit Risk | | Commodity
Risk | | Total | |
Commodity Strategy | |
Futures
| | Receivable/Payable
for accumulated
variation margin on
futures contracts | | $ | —
| | | $ | —
| | | $ | —
| | | $ | —
| | | $ | (9,123
| ) | | $ | (9,123
| ) | |
Total Value—Liabilities | | | | $ | — | | | $ | — | | | $ | — | | | $ | — | | | $ | (9,123 | ) | | $ | (9,123 | ) | |
Global Allocation | |
Futures
| | Receivable/Payable
for accumulated
variation margin on
futures contracts | | $ | (32
| ) | | $ | —
| | | $ | (103
| ) | | $ | —
| | | $ | —
| | | $ | (135
| ) | |
Forward
contracts
| | Payable for
forward foreign
currency contracts | | | —
| | | | (261
| ) | | | —
| | | | —
| | | | —
| | | | (261
| ) | |
Over-the-
counter
swaps | | Over-the-counter
swap contracts,
at value(a) | | | —
| | | | —
| | | | (45
| ) | | | —
| | | | —
| | | | (45
| ) | |
Options
written | | Option contracts
written, at value | | | —
| | | | —
| | | | (30
| ) | | | —
| | | | —
| | | | (30
| ) | |
Total Value—Liabilities | | | | $ | (32 | ) | | $ | (261 | ) | | $ | (178 | ) | | $ | — | | | $ | — | | | $ | (471 | ) | |
Hedged Option Premium Strategy | |
Options
written | | Option contracts
written, at value | | $ | —
| | | $ | —
| | | $ | (318
| ) | | $ | —
| | | $ | —
| | | $ | (318
| ) | |
Total Value—Liabilities | | | | $ | — | | | $ | — | | | $ | (318 | ) | | $ | — | | | $ | — | | | $ | (318 | ) | |
Long Short | |
Over-the-
counter
swaps | | Over-the-counter
swap contracts,
at value(a) | | $ | —
| | | $ | —
| | | $ | (4,951
| ) | | $ | —
| | | $ | —
| | | $ | (4,951
| ) | |
Options
written | | Option contracts
written, at value | | | —
| | | | —
| | | | (10,659
| ) | | | —
| | | | —
| | | | (10,659
| ) | |
Total Value—Liabilities | | | | $ | — | | | $ | — | | | $ | (15,610 | ) | | $ | — | | | $ | — | | | $ | (15,610 | ) | |
195
Derivative
Type | | Statements of
Assets and
Liabilities Location | | Interest
Rate Risk | | Currency
Risk | | Equity Risk | | Credit Risk | | Commodity
Risk | | Total | |
Long Short Credit | |
Futures
| | Receivable/Payable
for accumulated
variation margin on
futures contracts | | $ | (1
| ) | | $ | —
| | | $ | —
| | | $ | —
| | | $ | —
| | | $ | (1
| ) | |
Forward
contracts
| | Payable for
forward foreign
currency contracts | | | —
| | | | (7
| ) | | | —
| | | | —
| | | | —
| | | | (7
| ) | |
Over-the-
counter
swaps | | Over-the-counter
swap contracts,
at value(a) | | | —
| | | | —
| | | | —
| | | | (29
| ) | | | —
| | | | (29
| ) | |
Centrally
cleared
swaps
| | Payable for
variation margin on
centrally cleared
swap contracts(a) | | | —
| | | | —
| | | | —
| | | | (139
| ) | | | —
| | | | (139
| ) | |
Total Value—Liabilities | | | | $ | (1 | ) | | $ | (7 | ) | | $ | — | | | $ | (168 | ) | | $ | — | | | $ | (176 | ) | |
Multi-Asset Income | |
Futures
| | Receivable/Payable
for accumulated
variation margin on
futures contracts | | $ | (47
| ) | | $ | —
| | | $ | (144
| ) | | $ | —
| | | $ | —
| | | $ | (191
| ) | |
Forward
contracts
| | Payable for
forward foreign
currency contracts | | | —
| | | | (275
| ) | | | —
| | | | —
| | | | —
| | | | (275
| ) | |
Over-the-
counter
swaps | | Over-the-counter
swap contracts,
at value(a) | | | —
| | | | —
| | | | (49
| ) | | | —
| | | | —
| | | | (49
| ) | |
Options
written | | Option contracts
written, at value | | | —
| | | | —
| | | | (33
| ) | | | —
| | | | —
| | | | (33
| ) | |
Total Value—Liabilities | | | | $ | (47 | ) | | $ | (275 | ) | | $ | (226 | ) | | $ | — | | | $ | — | | | $ | (548 | ) | |
196
Derivative
Type | | Statements of
Assets and
Liabilities Location | | Interest
Rate Risk | | Currency
Risk | | Equity Risk | | Credit Risk | | Commodity
Risk | | Total | |
Multi-Style Premia | |
Futures
| | Receivable/Payable
for accumulated
variation margin on
futures contracts | | $ | (11
| ) | | $ | (1
| ) | | $ | (35
| ) | | $ | —
| | | $ | (146
| ) | | $ | (193
| ) | |
Forward
contracts
| | Payable for
forward foreign
currency contracts | | | —
| | | | (51
| ) | | | —
| | | | —
| | | | —
| | | | (51
| ) | |
Over-the-
counter
swaps | | Over-the-counter
swap contracts,
at value(a) | | | —
| | |
| | | (989
| ) | | | —
| | | | —
| | | | (989
| ) | |
Options
written | | Option contracts
written, at value | | | —
| | | | | | | | (63
| ) | | | —
| | | | —
| | | | (63
| ) | |
Total Value—Liabilities | | | | $ | (11 | ) | | $ | (52 | ) | | $ | (1,087 | ) | | $ | — | | | $ | (146 | ) | | $ | (1,296 | ) | |
U.S. Equity Index PutWrite Strategy | |
Options
written | | Option contracts
written, at value | | $ | —
| | | $ | —
| | | $ | (5,527
| ) | | $ | —
| | | $ | —
| | | $ | (5,527
| ) | |
Total Value—Liabilities | | | | $ | — | | | $ | — | | | $ | (5,527 | ) | | $ | — | | | $ | — | | | $ | (5,527 | ) | |
(a) "Centrally cleared swaps" and "Over-the-counter swaps" reflect the cumulative unrealized appreciation/(depreciation) of the centrally cleared swap or Over-the-counter swap contracts plus accrued interest as of October 31, 2018, which are reflected in the Statements of Assets and Liabilities under the captions "Receivable/Payable for accumulated variation margin on centrally cleared swap contracts" and "Over-the-counter swap contracts, at value", respectively.
197
The impact of the use of these derivative instruments on the Statements of Operations during the year ended October 31, 2018, was as follows:
Realized Gain/(Loss)
(000's omitted) | |
Derivative
Type | | Statements of
Operations Location | | Interest
Rate Risk | | Currency
Risk | | Equity
Risk | | Credit
Risk | | Commodity
Risk | | Total | |
Commodity Strategy | |
Futures
| | Net realized gain/(loss) on:
expiration or closing
of futures contracts | | $ | —
| | | $ | —
| | | $ | —
| | | $ | —
| | | $ | 8,024
| | | $ | 8,024
| | |
Total Realized
Gain/(Loss) | | | | $ | — | | | $ | — | | | $ | — | | | $ | — | | | $ | 8,024 | | | $ | 8,024 | | |
Global Allocation | |
Futures
| | Net realized gain/(loss) on:
expiration or closing
of futures contracts | | $ | (16
| ) | | $ | 1
| | | $ | (60
| ) | | $ | —
| | | $ | —
| | | $ | (75
| ) | |
Forward
contracts
| | Net realized gain/(loss) on:
settlement of forward
foreign currency contracts | | | —
| | | | 60
| | | | —
| | | | —
| | | | —
| | | | 60
| | |
Swaps
| | Net realized gain/(loss) on:
expiration or closing of
swap contracts | | | —
| | | | —
| | | | (17
| ) | | | —
| | | | —
| | | | (17
| ) | |
Options
purchased
| | Net realized gain/(loss) on:
sales of investment securities
of unaffiliated issuers | | | —
| | | | —
| | | | (29
| ) | | | —
| | | | —
| | | | (29
| ) | |
Options
written
| | Net realized gain/(loss) on:
expiration or closing of
option contracts and
swaptions written | | | —
| | | | —
| | | | (56
| ) | | | —
| | | | —
| | | | (56
| ) | |
Total Realized
Gain/(Loss) | | | | $ | (16 | ) | | $ | 61 | | | $ | (162 | ) | | $ | — | | | $ | — | | | $ | (117 | ) | |
Hedged Option Premium Strategy | |
Options
purchased
| | Net realized gain/(loss) on:
sales of investment securities
of unaffiliated issuers | | $ | —
| | | $ | —
| | | $ | (277
| ) | | $ | —
| | | $ | —
| | | $ | (277
| ) | |
Options
written
| | Net realized gain/(loss) on:
expiration or closing of
option contracts and
swaptions written | | | —
| | | | —
| | | | (471
| ) | | | —
| | | | —
| | | | (471
| ) | |
Total Realized
Gain/(Loss) | | | | $ | — | | | $ | — | | | $ | (748 | ) | | $ | — | | | $ | — | | | $ | (748 | ) | |
198
Derivative
Type | | Statements of
Operations Location | | Interest
Rate Risk | | Currency
Risk | | Equity
Risk | | Credit
Risk | | Commodity
Risk | | Total | |
Long Short | |
Futures
| | Net realized gain/(loss) on:
expiration or closing of
futures contracts | | $ | 530
| | | $ | —
| | | $ | (75,334
| ) | | $ | —
| | | $ | —
| | | $ | (74,804
| ) | |
Swaps
| | Net realized gain/(loss) on:
expiration or closing of
swap contracts | | | —
| | | | —
| | | | (23,221
| ) | | | —
| | | | —
| | | | (23,221
| ) | |
Options
purchased
| | Net realized gain/(loss) on:
sales of investment securities
of unaffiliated issuers | | | —
| | | | —
| | | | 13,015
| | | | —
| | | | —
| | | | 13,015
| | |
Options
written
| | Net realized gain/(loss) on:
expiration or closing of
option contracts and
swaptions written | | | —
| | | | —
| | | | 21,558
| | | | —
| | | | —
| | | | 21,558
| | |
Total Realized
Gain/(Loss) | | | | $ | 530 | | | $ | — | | | $ | (63,982 | ) | | $ | — | | | $ | — | | | $ | (63,452 | ) | |
Long Short Credit | |
Futures
| | Net realized gain/(loss) on:
expiration or closing of
futures contracts | | $ | (33
| ) | | $ | —
| | | $ | (28
| ) | | $ | —
| | | $ | —
| | | $ | (61
| ) | |
Forward
contracts
| | Net realized gain/(loss) on:
settlement of forward
foreign currency contracts | | | —
| | | | 13
| | | | —
| | | | —
| | | | —
| | | | 13
| | |
Swaps
| | Net realized gain/(loss) on:
expiration or closing of
swap contracts | | | —
| | | | —
| | | | (112
| ) | | | (255
| ) | | | —
| | | | (367
| ) | |
Options and
swaptions
purchased
| | Net realized gain/(loss) on:
transactions in investment
securities of
unaffiliated issuers | | | (7
| ) | | | —
| | | | 43
| | | | (14
| ) | | | —
| | | | 22
| | |
Options and
swaptions
written
| | Net realized gain/(loss) on:
expiration or closing of
option contracts and
swaptions written | | | 6
| | | | —
| | | | 5
| | | | 52
| | | | —
| | | | 63
| | |
Total Realized
Gain/(Loss) | | | | $ | (34 | ) | | $ | 13 | | | $ | (92 | ) | | $ | (217 | ) | | $ | — | | | $ | (330 | ) | |
199
Derivative
Type | | Statements of
Operations Location | | Interest
Rate Risk | | Currency
Risk | | Equity
Risk | | Credit
Risk | | Commodity
Risk | | Total | |
Multi-Asset Income | |
Futures
| | Net realized gain/(loss) on:
expiration or closing of
futures contracts | | $ | (4
| ) | | $ | (3
| ) | | $ | (103
| ) | | $ | —
| | | $ | —
| | | $ | (110
| ) | |
Forward
contracts
| | Net realized gain/(loss) on:
settlement of forward
foreign currency contracts | | | —
| | | | 57
| | | | —
| | | | —
| | | | —
| | | | 57
| | |
Swaps
| | Net realized gain/(loss) on:
expiration or closing of
swap contracts | | | —
| | | | —
| | | | (13
| ) | | | —
| | | | —
| | | | (13
| ) | |
Options
purchased
| | Net realized gain/(loss) on:
sales of investment securities
of unaffiliated issuers | | | —
| | | | —
| | | | (31
| ) | | | —
| | | | —
| | | | (31
| ) | |
Options
written
| | Net realized gain/(loss) on:
expiration or closing of
option contracts and
swaptions written | | | —
| | | | —
| | | | (66
| ) | | | —
| | | | —
| | | | (66
| ) | |
Total Realized
Gain/(Loss) | | | | $ | (4 | ) | | $ | 54 | | | $ | (213 | ) | | $ | — | | | $ | — | | | $ | (163 | ) | |
Multi-Style Premia | |
Futures
| | Net realized gain/(loss) on:
expiration or closing of
futures contracts | | $ | 15
| | | $ | 41
| | | $ | 15
| | | $ | —
| | | $ | (131
| ) | | $ | (60
| ) | |
Forward
contracts
| | Net realized gain/(loss) on:
settlement of forward
foreign currency contracts | | | —
| | | | (49
| ) | | | —
| | | | —
| | | | —
| | | | (49
| ) | |
Swaps
| | Net realized gain/(loss) on:
expiration or closing of
swap contracts | | | —
| | | | —
| | | | (95
| ) | | | —
| | | | —
| | | | (95
| ) | |
Options
written
| | Net realized gain/(loss) on:
expiration or closing of
option contracts and
swaptions written | | | —
| | | | —
| | | | (135
| ) | | | —
| | | | —
| | | | (135
| ) | |
Total Realized
Gain/(Loss) | | | | $ | 15 | | | $ | (8 | ) | | $ | (215 | ) | | $ | — | | | $ | (131 | ) | | $ | (339 | ) | |
U.S. Equity Index PutWrite Strategy | |
Options
written
| | Net realized gain/(loss) on:
expiration or closing of
option contracts and
swaptions written | | $ | —
| | | $ | —
| | | $ | 662
| | | $ | —
| | | $ | —
| | | $ | 662
| | |
Total Realized
Gain/(Loss) | | | | $ | — | | | $ | — | | | $ | 662 | | | $ | — | | | $ | — | | | $ | 662 | | |
200
Change in Appreciation/(Depreciation)
(000's omitted) | |
Derivative
Type | | Statements of
Operations Location | | Interest
Rate Risk | | Currency
Risk | | Equity
Risk | | Credit
Risk | | Commodity
Risk | | Total | |
Commodity Strategy | |
Futures
| | Change in net unrealized
appreciation/(depreciation)
in value of: futures contracts | | $ | —
| | | $ | —
| | | $ | —
| | | $ | —
| | | $ | (9,090
| ) | | $ | (9,090
| ) | |
Total Change in
Appreciation/
(Depreciation) | | | | $ | — | | | $ | — | | | $ | — | | | $ | — | | | $ | (9,090 | ) | | $ | (9,090 | ) | |
Global Allocation | |
Futures
| | Change in net unrealized
appreciation/(depreciation)
in value of: futures contracts | | $ | 47
| | | $ | 6
| | | $ | (103
| ) | | $ | —
| | | $ | —
| | | $ | (50
| ) | |
Forward
contracts
| | Change in net unrealized
appreciation/(depreciation)
in value of: forward
foreign currency contracts | | | —
| | | | (10
| ) | | | —
| | | | —
| | | | —
| | | | (10
| ) | |
Swaps
| | Change in net unrealized
appreciation/(depreciation)
in value of: swap contracts | | | —
| | | | —
| | | | (5
| ) | | | —
| | | | —
| | | | (5
| ) | |
Options
purchased
| | Change in net unrealized
appreciation/(depreciation)
in value of: investment
securities of unaffiliated
issuers | | | —
| | | | —
| | | | (2
| ) | | | —
| | | | —
| | | | (2
| ) | |
Options
written
| | Change in net unrealized
appreciation/(depreciation)
in value of: option contracts
and swaptions written | | | —
| | | | —
| | | | (1
| ) | | | —
| | | | —
| | | | (1
| ) | |
Total Change in
Appreciation/
(Depreciation) | | | | $ | 47 | | | $ | (4 | ) | | $ | (111 | ) | | $ | — | | | $ | — | | | $ | (68 | ) | |
201
Derivative
Type | | Statements of
Operations Location | | Interest
Rate Risk | | Currency
Risk | | Equity
Risk | | Credit
Risk | | Commodity
Risk | | Total | |
Hedged Option Premium Strategy | |
Options
purchased
| | Change in net unrealized
appreciation/(depreciation)
in value of: investment
securities of unaffiliated
issuers | | $ | —
| | | $ | —
| | | $ | (9
| ) | | $ | —
| | | $ | —
| | | $ | (9
| ) | |
Options
written
| | Change in net unrealized
appreciation/(depreciation)
in value of: option contracts
and swaptions written | | | —
| | | | —
| | | | (11
| ) | | | —
| | | | —
| | | | (11
| ) | |
Total Change in
Appreciation/
(Depreciation) | | | | $ | — | | | $ | — | | | $ | (20 | ) | | $ | — | | | $ | — | | | $ | (20 | ) | |
Long Short | |
Futures
| | Change in net unrealized
appreciation/(depreciation)
in value of: futures contracts | | $ | (2
| ) | | $ | —
| | | $ | 51,357
| | | $ | —
| | | $ | —
| | | $ | 51,355
| | |
Swaps
| | Change in net unrealized
appreciation/(depreciation)
in value of: swap contracts | | | —
| | | | —
| | | | 2,248
| | | | —
| | | | —
| | | | 2,248
| | |
Options
purchased
| | Change in net unrealized
appreciation/(depreciation)
in value of: investment
securities of unaffiliated
issuers | | | —
| | | | —
| | | | (2,282
| ) | | | —
| | | | —
| | | | (2,282
| ) | |
Options
written
| | Change in net unrealized
appreciation/(depreciation)
in value of: option contracts
and swaptions written | | | —
| | | | —
| | | | (1,504
| ) | | | —
| | | | —
| | | | (1,504
| ) | |
Total Change in
Appreciation/
(Depreciation) | | | | $ | (2 | ) | | $ | — | | | $ | 49,819 | | | $ | — | | | $ | — | | | $ | 49,817 | | |
202
Derivative
Type | | Statements of
Operations Location | | Interest
Rate Risk | | Currency
Risk | | Equity
Risk | | Credit
Risk | | Commodity
Risk | | Total | |
Long Short Credit | |
Futures
| | Change in net unrealized
appreciation/(depreciation)
in value of: futures contracts | | $ | 19
| | | $ | —
| | | $ | (9
| ) | | $ | —
| | | $ | —
| | | $ | 10
| | |
Forward
contracts
| | Change in net unrealized
appreciation/(depreciation)
in value of: forward foreign
currency contracts | | | —
| | | | 2
| | | | —
| | | | —
| | | | —
| | | | 2
| | |
Swaps
| | Change in net unrealized
appreciation/(depreciation)
in value of: swap contracts | | | —
| | | | —
| | | | (44
| ) | | | 40
| | | | —
| | | | (4
| ) | |
Swaptions
purchased
| | Change in net unrealized
appreciation/(depreciation)
in value of: investment
securities of unaffiliated
issuers | | | —
| | | | —
| | | | —
| | | | (12
| ) | | | —
| | | | (12
| ) | |
Total Change in
Appreciation/
(Depreciation) | | | | $ | 19 | | | $ | 2 | | | $ | (53 | ) | | $ | 28 | | | $ | — | | | $ | (4 | ) | |
Multi-Asset Income | |
Futures
| | Change in net unrealized
appreciation/(depreciation)
in value of: futures contracts | | $ | 96
| | | $ | 7
| | | $ | (154
| ) | | $ | —
| | | $ | —
| | | $ | (51
| ) | |
Forward
contracts
| | Change in net unrealized
appreciation/(depreciation)
in value of: forward foreign
currency contracts | | | —
| | | | (4
| ) | | | —
| | | | —
| | | | —
| | | | (4
| ) | |
Swaps
| | Change in net unrealized
appreciation/(depreciation)
in value of: swap contracts | | | 1
| | | | —
| | | | (7
| ) | | | —
| | | | —
| | | | (6
| ) | |
Options
purchased
| | Change in net unrealized
appreciation/(depreciation)
in value of: investment
securities of
unaffiliated issuers | | | —
| | | | —
| | | | (2
| ) | | | —
| | | | —
| | | | (2
| ) | |
Options
written
| | Change in net unrealized
appreciation/(depreciation)
in value of: option contracts
and swaptions written | | | —
| | | | —
| | | | (1
| ) | | | —
| | | | —
| | | | (1
| ) | |
Total Change in
Appreciation/
(Depreciation) | | | | $ | 97 | | | $ | 3 | | | $ | (164 | ) | | $ | — | | | $ | — | | | $ | (64 | ) | |
203
Derivative
Type | | Statements of
Operations Location | | Interest
Rate Risk | | Currency
Risk | | Equity
Risk | | Credit
Risk | | Commodity
Risk | | Total | |
Multi-Style Premia | |
Futures
| | Change in net unrealized
appreciation/(depreciation)
in value of: futures contracts | | $ | 39
| | | $ | 26
| | | $ | (35
| ) | | $ | —
| | | $ | (106
| ) | | | (76
| ) | |
Forward
contracts
| | Change in net unrealized
appreciation/(depreciation)
in value of: forward foreign
currency contracts | | | —
| | | | (26
| ) | | | —
| | | | —
| | | | —
| | | | (26
| ) | |
Swaps
| | Change in net unrealized
appreciation/(depreciation)
in value of: swap contracts | | | —
| | | | —
| | | | 722
| | | | —
| | | | —
| | | | 722
| | |
Options
written
| | Change in net unrealized
appreciation/(depreciation)
in value of: option contracts
and swaptions written | | | —
| | | | —
| | | | 28
| | | | —
| | | | —
| | | | 28
| | |
Total Change in
Appreciation/
(Depreciation) | | | | $ | 39 | | | $ | — | | | $ | 715 | | | $ | — | | | $ | (106 | ) | | $ | 648 | | |
U.S. Equity Index PutWrite Strategy | |
Options
written
| | Change in net unrealized
appreciation/(depreciation)
in value of: option contracts
and swaptions written | | $ | —
| | | $ | —
| | | $ | (863
| ) | | $ | —
| | | $ | —
| | | $ | (863
| ) | |
Total Change in
Appreciation/
(Depreciation) | | | | $ | — | | | $ | — | | | $ | (863 | ) | | $ | — | | | $ | — | | | $ | (863 | ) | |
While the Funds may receive redeemable preference shares, rights and warrants in connection with their investments in securities, these preference shares, rights and warrants are not considered "derivative instruments" under ASC 815.
The Funds are required to disclose both gross and net information for assets and liabilities related to derivatives, repurchase and reverse repurchase agreements, and securities lending and securities borrowing transactions that are eligible for offset or subject to an enforceable master netting or similar agreement. Global Allocation, Long Short, Long Short Credit, Multi-Asset Income and Multi-Style Premia held investments in these securities at October 31, 2018. The Funds' derivative and security lending assets and liabilities at fair value by type are reported gross in the Statements of Assets and Liabilities. The following tables present derivative and security lending assets and liabilities, by counterparty, net of amounts available for offset under a master netting or similar agreement and net of the related collateral received by a Fund for assets and pledged by a Fund for liabilities as of October 31, 2018.
204
Description
(000's omitted) | | Gross Amounts of
Recognized Assets | | Gross Amounts Offset
in the Statements of
Assets and Liabilities | | Net Amounts of Assets
Presented in the Statements
of Assets and Liabilities | |
Global Allocation | |
Forward contracts | | $ | 266 | | | $ | — | | | $ | 266 | | |
Over-the-counter swap contracts | | | 41 | | | | — | | | | 41 | | |
Total | | $ | 307 | | | $ | — | | | $ | 307 | | |
Long Short | |
Over-the-counter swap contracts | | $ | 5,009 | | | $ | — | | | $ | 5,009 | | |
Securities lending | | | 73,230 | | | | — | | | | 73,230 | | |
Total | | $ | 78,239 | | | $ | — | | | $ | 78,239 | | |
Long Short Credit | |
Forward contracts | | $ | 11 | | | $ | — | | | $ | 11 | | |
Over-the-counter swap contracts | | | 27 | | | | — | | | | 27 | | |
Swaptions purchased | | | 7 | | | | — | | | | 7 | | |
Total | | $ | 45 | | | $ | — | | | $ | 45 | | |
Multi-Asset Income | |
Forward contracts | | $ | 280 | | | $ | — | | | $ | 280 | | |
Over-the-counter swap contracts | | | 45 | | | | — | | | | 45 | | |
Total | | $ | 325 | | | $ | — | | | $ | 325 | | |
Multi-Style Premia | |
Forward contracts | | $ | 25 | | | $ | — | | | $ | 25 | | |
Over-the-counter swap contracts | | | 1,712 | | | | — | | | | 1,712 | | |
Total | | $ | 1,737 | | | $ | — | | | $ | 1,737 | | |
Gross Amounts Not Offset in the Statements of Assets and Liabilities
Counterparty
(000's omitted) | | Net Amounts of
Assets Presented in
the Statements of Assets
and Liabilities | | Liabilities
Available
for Offset | | Cash Collateral
Received(a) | | Net Amount(b) | |
Global Allocation | |
Citibank N.A. | | $ | 56 | | | $ | (54 | ) | | $ | — | | | $ | 2 | | |
Goldman Sachs International | | | 74 | | | | (56 | ) | | | — | | | | 18 | | |
JPMorgan Chase Bank N.A. | | | 38 | | | | (38 | ) | | | — | | | | — | | |
Royal Bank of Canada | | | 24 | | | | (23 | ) | | | — | | | | 1 | | |
Societe Generale | | | 13 | | | | (13 | ) | | | — | | | | — | | |
Standard Chartered Bank | | | 25 | | | | (16 | ) | | | — | | | | 9 | | |
State Street Bank and Trust Company | | | 77 | | | | (45 | ) | | | — | | | | 32 | | |
Total | | $ | 307 | | | $ | (245 | ) | | $ | — | | | $ | 62 | | |
Long Short | |
Citibank N.A. | | $ | 5,009 | | | $ | (1,771 | ) | | $ | (150 | ) | | $ | 3,088 | | |
State Street Bank and Trust Company | | | 73,230 | | | | — | | | | (73,230 | ) | | | — | | |
Total | | $ | 78,239 | | | $ | (1,771 | ) | | $ | (73,380 | ) | | $ | 3,088 | | |
205
Gross Amounts Not Offset in the Statements of Assets and Liabilities
Counterparty
(000's omitted) | | Net Amounts of
Assets Presented in
the Statements of Assets
and Liabilities | | Liabilities
Available
for Offset | | Cash Collateral
Received(a) | | Net Amount(b) | |
Long Short Credit | |
BNP Paribas SA | | $ | 27 | | | $ | (6 | ) | | $ | — | | | $ | 21 | | |
Goldman Sachs International | | | 18 | | | | (7 | ) | | | — | | | | 11 | | |
Total | | $ | 45 | | | $ | (13 | ) | | $ | — | | | $ | 32 | | |
Multi-Asset Income | |
Citibank N.A. | | $ | 58 | | | $ | (58 | ) | | $ | — | | | $ | — | | |
Goldman Sachs International | | | 85 | | | | (57 | ) | | | — | | | | 28 | | |
JPMorgan Chase Bank N.A. | | | 41 | | | | (41 | ) | | | — | | | | — | | |
Royal Bank of Canada | | | 22 | | | | (22 | ) | | | — | | | | — | | |
Societe Generale | | | 9 | | | | (9 | ) | | | — | | | | — | | |
Standard Chartered Bank | | | 28 | | | | (18 | ) | | | — | | | | 10 | | |
State Street Bank and Trust Company | | | 82 | | | | (41 | ) | | | — | | | | 41 | | |
Total | | $ | 325 | | | $ | (246 | ) | | $ | — | | | $ | 79 | | |
Multi-Style Premia | |
Morgan Stanley Capital Services LLC | | $ | 1,737 | | | $ | (1,040 | ) | | $ | — | | | $ | 697 | | |
Total | | $ | 1,737 | | | $ | (1,040 | ) | | $ | — | | | $ | 697 | | |
Description
(000's omitted) | | Gross Amounts of
Recognized Liabilities | | Gross Amounts Offset
in the Statements of
Assets and Liabilities | | Net Amounts of Liabilities
Presented in the Statements
of Assets and Liabilities | |
Global Allocation | |
Forward contracts | | $ | (261 | ) | | $ | — | | | $ | (261 | ) | |
Over-the-counter swap contracts | | | (45 | ) | | | — | | | | (45 | ) | |
Total | | $ | (306 | ) | | $ | — | | | $ | (306 | ) | |
Long Short | |
Over-the-counter swap contracts | | $ | (4,951 | ) | | $ | — | | | $ | (4,951 | ) | |
Total | | $ | (4,951 | ) | | $ | — | | | $ | (4,951 | ) | |
Long Short Credit | |
Forward contracts | | $ | (7 | ) | | $ | — | | | $ | (7 | ) | |
Over-the-counter swap contracts | | | (29 | ) | | | — | | | | (29 | ) | |
Total | | $ | (36 | ) | | $ | — | | | $ | (36 | ) | |
Multi-Asset Income | |
Forward contracts | | $ | (275 | ) | | $ | — | | | $ | (275 | ) | |
Over-the-counter swap contracts | | | (49 | ) | | | — | | | | (49 | ) | |
Total | | $ | (324 | ) | | $ | — | | | $ | (324 | ) | |
Multi-Style Premia | |
Forward contracts | | $ | (51 | ) | | $ | — | | | $ | (51 | ) | |
Over-the-counter swap contracts | | | (989 | ) | | | — | | | | (989 | ) | |
Total | | $ | (1,040 | ) | | $ | — | | | $ | (1,040 | ) | |
206
Gross Amounts Not Offset in the Statements of Assets and Liabilities
Counterparty
(000's omitted) | | Net Amounts of
Liabilities Presented in
the Statements of Assets
and Liabilities | | Assets
Available
for Offset | | Cash Collateral
Pledged(a) | | Net Amount(c) | |
Global Allocation | |
Citibank N.A. | | $ | (54 | ) | | $ | 54 | | | $ | — | | | $ | — | | |
Goldman Sachs International | | | (56 | ) | | | 56 | | | | — | | | | — | | |
JPMorgan Chase Bank N.A. | | | (83 | ) | | | 38 | | | | — | | | | (45 | ) | |
Royal Bank of Canada | | | (23 | ) | | | 23 | | | | — | | | | — | | |
Societe Generale | | | (29 | ) | | | 13 | | | | — | | | | (16 | ) | |
Standard Chartered Bank | | | (16 | ) | | | 16 | | | | — | | | | — | | |
State Street Bank and Trust Company | | | (45 | ) | | | 45 | | | | — | | | | — | | |
Total | | $ | (306 | ) | | $ | 245 | | | $ | — | | | $ | (61 | ) | |
Long Short | |
Citibank N.A. | | $ | (1,771 | ) | | $ | 1,771 | | | $ | — | | | $ | — | | |
Goldman Sachs International | | | (2,756 | ) | | | — | | | | 1,720 | | | | (1,036 | ) | |
JPMorgan Chase Bank N.A. | | | (424 | ) | | | — | | | | — | | | | (424 | ) | |
Total | | $ | (4,951 | ) | | $ | 1,771 | | | $ | 1,720 | | | $ | (1,460 | ) | |
Long Short Credit | |
BNP Paribas SA | | $ | (6 | ) | | $ | 6 | | | $ | — | | | $ | — | | |
Citibank N.A. | | | (23 | ) | | | — | | | | — | | | | (23 | ) | |
Goldman Sachs International | | | (7 | ) | | | 7 | | | | — | | | | — | | |
Total | | $ | (36 | ) | | $ | 13 | | | $ | — | | | $ | (23 | ) | |
Multi-Asset Income | |
Citibank N.A. | | $ | (62 | ) | | $ | 58 | | | $ | — | | | $ | (4 | ) | |
Goldman Sachs International | | | (57 | ) | | | 57 | | | | — | | | | — | | |
JPMorgan Chase Bank N.A. | | | (97 | ) | | | 41 | | | | — | | | | (56 | ) | |
Royal Bank of Canada | | | (26 | ) | | | 22 | | | | — | | | | (4 | ) | |
Societe Generale | | | (23 | ) | | | 9 | | | | — | | | | (14 | ) | |
Standard Chartered Bank | | | (18 | ) | | | 18 | | | | — | | | | — | | |
State Street Bank and Trust Company | | | (41 | ) | | | 41 | | | | — | | | | — | | |
Total | | $ | (324 | ) | | $ | 246 | | | $ | — | | | $ | (78 | ) | |
Multi-Style Premia | |
Morgan Stanley Capital Services LLC | | $ | (1,040 | ) | | $ | 1,040 | | | $ | — | | | $ | — | | |
Total | | $ | (1,040 | ) | | $ | 1,040 | | | $ | — | | | $ | — | | |
(a) Collateral received (or pledged) is limited to an amount not to exceed 100% of the net amount of assets (or liabilities) in the tables presented above, for each respective counterparty.
(b) Net Amount represents amounts subject to loss as of October 31, 2018, in the event of a counterparty failure.
(c) Net Amount represents amounts under-collateralized to each counterparty as of October 31, 2018.
207
16 Indemnifications: Like many other companies, the Trust's organizational documents provide that its officers ("Officers") and trustees ("Trustees") are indemnified against certain liabilities arising out of the performance of their duties to the Trust. In addition, both in some of its principal service contracts and in the normal course of its business, the Trust enters into contracts that provide indemnifications to other parties for certain types of losses or liabilities. The Trust's maximum exposure under these arrangements is unknown as this could involve future claims against the Trust.
17 Transactions with other funds managed by Neuberger Berman Investment Advisers LLC: The Funds and Management have obtained an exemptive order from the Securities and Exchange Commission ("SEC") that permits the Funds to invest in both affiliated and unaffiliated investment companies, including ETFs, in excess of the limits in Section 12(d)(1)(A) of the 1940 Act, subject to the terms and conditions of such order ("Exemptive Order"). Through October 31, 2018, Global Allocation invested in Commodity Strategy, Neuberger Berman Emerging Markets Debt Fund, Neuberger Berman Emerging Markets Equity Fund, Neuberger Berman Floating Rate Income Fund, Neuberger Berman Genesis Fund, Neuberger Berman High Income Bond Fund, Neuberger Berman International Select Fund, Long Short Credit, Neuberger Berman Short Duration High Income Fund and U.S. Equity Index PutWrite Strategy (collectively the "Underlying Funds"). Through October 31, 2018, Multi-Asset Income invested in Neuberger Berman Emerging Markets Debt Fund, Neuberger Berman Floating Rate Income Fund, Neuberger Berman High Income Bond Fund and Long Short Credit (collectively the "Underlying Funds") (See Note F).
For the Funds' investments in the Underlying Funds, Management waived a portion of its management fee equal to the management fee it received from the Underlying Funds on those assets (the "Arrangement"). For the year ended October 31, 2018, management fees waived under this Arrangement are reflected in the Statements of Operations under the caption "Investment management fees waived." For the year ended October 31, 2018, distributions from income and capital gains received from the Underlying Funds on Global Allocation's and Multi-Asset Income's investments is reflected in the Statements of Operations under the caption "Dividend income-affiliated issuers" and "Realized gain distributions from affiliated issuers". For the year ended October 31, 2018, management fees waived under this Arrangement and distributions from income and capital gains received from Global Allocation's and Multi-Asset Income's investments in the Underlying Funds were as follows:
| | | Management Fees Waived | | Distributions from Income
and Capital Gains | |
Global Allocation | | $ | 63,278 | | | $ | 454,525 | | |
Multi-Asset Income | | | 25,381 | | | | 247,695 | | |
18 Investment company securities and exchange-traded funds: The Funds may invest in shares of other registered investment companies, including ETFs, within the limitations prescribed by the 1940 Act, Exemptive Order or the ETF's exemptive order. Some ETFs seek to track the performance of a particular market index. These indices include both broad-based market indices and more narrowly-based indices, including those relating to particular sectors, markets, regions or industries. However, some ETFs have an actively-managed investment objective. ETF shares are traded like traditional equity securities on a national securities exchange or NASDAQ. A Fund will indirectly bear its proportionate share of any management fees and other expenses paid by such other investment companies, which will increase expenses and decrease returns.
19 Organization expenses: Costs incurred by Multi-Style Premia in connection with its organization, which amounted to $163,142 and are reflected in Organization expense in the Statements of Operations, have been expensed as incurred.
20 Other: All net investment income and realized and unrealized capital gains and losses of each Fund are allocated, on the basis of relative net assets, pro rata among its respective classes.
208
Note B—Investment Management Fees, Administration Fees, Distribution Arrangements, and Other Transactions With Affiliates:
Each Fund retains Management as its investment manager under a Management Agreement. For such investment management services, each Fund pays Management a fee according to the following table:
Investment Management Fee as a Percentage of Average Daily Net Assets(a):
| | First
$250
million | | Next
$250
million | | Next
$250
million | | Next
$250
million | | Next
$500
million | | Next
$500
million | | Next
$2
billion | | Thereafter | |
| For Commodity Strategy and CS Subsidiary:(b) | | | |
| | | | | | 0.50 | % | | | 0.475 | % | | | 0.45 | % | | | 0.425 | % | | | 0.40 | % | | | 0.375 | % | | | 0.375 | % | | | 0.35 | % | |
| For Global Allocation:(c) | | | |
| | | | | | 0.55 | % | | | 0.55 | % | | | 0.55 | % | | | 0.55 | % | | | 0.525 | % | | | 0.525 | % | | | 0.50 | % | | | 0.50 | % | |
For Hedged Option Premium Strategy: | | | |
| | | | | | 0.45 | % | | | 0.45 | % | | | 0.45 | % | | | 0.45 | % | | | 0.45 | % | | | 0.45 | % | | | 0.45 | % | | | 0.45 | % | |
For Long Short: | | | |
| | | | | | 1.20 | % | | | 1.175 | % | | | 1.15 | % | | | 1.125 | % | | | 1.10 | % | | | 1.075 | % | | | 1.075 | % | | | 1.05 | % | |
| For Long Short Credit:(d) | | | |
| | | | | | 0.55 | % | | | 0.55 | % | | | 0.55 | % | | | 0.55 | % | | | 0.55 | % | | | 0.55 | % | | | 0.55 | % | | | 0.55 | % | |
For Multi-Asset Income: | | | |
| | | | | | 0.45 | % | | | 0.425 | % | | | 0.40 | % | | | 0.375 | % | | | 0.35 | % | | | 0.325 | % | | | 0.325 | % | | | 0.30 | % | |
For Multi-Style Premia and MSP Subsidiary: | | | |
| | | | | | 0.65 | % | | | 0.65 | % | | | 0.65 | % | | | 0.65 | % | | | 0.65 | % | | | 0.65 | % | | | 0.65 | % | | | 0.65 | % | |
For U.S. Equity Index PutWrite Strategy: | | | |
| | | | | | 0.45 | % | | | 0.45 | % | | | 0.45 | % | | | 0.45 | % | | | 0.45 | % | | | 0.45 | % | | | 0.45 | % | | | 0.45 | % | |
(a) Less the net asset value of the CS Subsidiary for Commodity Strategy and the MSP Subsidiary for Multi-Style Premia.
(b) 0.70% of the first $250 million of the Fund's average daily net assets, 0.675% of the next $250 million, 0.65% of the next $250 million, 0.625% of the next $250 million, 0.60% of the next $500 million, 0.575% of the next $2.5 billion, and 0.55% of average daily net assets in excess of $4 billion prior to February 28, 2017.
(c) 0.65% of the first $1 billion of the Fund's average daily net assets, 0.625% of the next $1 billion and 0.600% of average daily net assets in excess of $2 billion prior to February 28, 2017.
(d) 0.80% prior to February 28, 2018.
Accordingly, for the year ended October 31, 2018, the investment management fee pursuant to the Management Agreement was equivalent to an annual effective rate of each Fund's average daily net assets(a), as follows:
| | | Effective Rate | |
Commodity Strategy | | | 0.50 | % | |
CS Subsidiary | | | 0.50 | % | |
Global Allocation | | | 0.24 | % | |
Long Short | | | 1.10 | % | |
Long Short Credit | | | 0.65 | % | |
Multi-Asset Income | | | 0.34 | % | |
(a) Less the net asset value of the CS Subsidiary for Commodity Strategy.
209
Each Fund retains Management as its administrator under an Administration Agreement. Prior to July 1, 2017, each Fund paid Management an administration fee at the annual rate of 0.06% of its average daily net assets under this agreement in addition to an annual fee for certain class level services (specifically, 0.20% for each of Class A and Class C of each of Commodity Strategy, Global Allocation, Hedged Option Premium Strategy, Long Short and U.S. Equity Index PutWrite Strategy; 0.21% for each of Class A and Class C of each of Long Short Credit and Multi-Asset Income; 0.09% for Institutional Class and 0.02% for Class R6, each as a percentage of average daily net assets). Effective July 1, 2017, the administration fee is assessed at the Class level and each share class of a Fund, as applicable, pays Management an annual administration fee equal to the following: 0.26% for each of Class A and Class C of each of Commodity Strategy, Global Allocation, Hedged Option Premium Strategy, Long Short, Multi-Style Premia and U.S. Equity Index PutWrite Strategy; 0.27% for each of Class A and Class C of each of Long Short Credit and Multi-Asset Income; 0.15% for Institutional Class; and 0.08% for Class R6 (effective December 6, 2018, the administration fee for Class R6 is 0.05%), each as a percentage of its average daily net assets. This did not result in an increase in any administration expense for any Fund or share class. Additionally, Management retains State Street as its sub-administrator under a Sub-Administration Agreement. Management pays State Street a fee for all services received under the Sub-Administration Agreement.
Management has contractually agreed to waive fees and/or reimburse certain expenses of the Institutional Class, Class A, Class C and Class R6 of each Fund so that the total annual operating expenses of those classes do not exceed the expense limitations as detailed in the following table. These undertakings exclude interest, taxes, brokerage commissions, acquired fund fees and expenses, extraordinary expenses, and dividend and interest expenses relating to short sales, if any (commitment fees relating to borrowings are treated as interest for purposes of this exclusion) ("annual operating expenses"); consequently, net expenses may exceed the contractual expense limitations. The expenses of the CS Subsidiary and the MSP Subsidiary are included in the total expenses used to calculate the reimbursement, which Commodity Strategy and Multi-Style Premia have agreed to share with the CS Subsidiary and the MSP Subsidiary, respectively. For the period ended October 31, 2018 and the year ended October 31, 2018, the expenses of the CS Subsidiary and MSP Subsidiary amounted to $160,530 and $50,038, respectively.
At October 31, 2018, contingent liabilities to Management under the agreements were as follows:
| | | | | | | Expenses Reimbursed In
Year Ended October 31, | |
| | | | | | | 2016 | | 2017 | | 2018 | |
| | | | | | | Subject to Repayment until
October 31, | |
Class | | Contractual
Expense
Limitation(a) | | Expiration | | 2019 | | 2020 | | 2021 | |
Commodity Strategy Institutional Class | | | 0.73 | %(b) | | 10/31/21 | | $ | 171,296 | | | $ | 211,468 | | | $ | 227,405 | | |
Commodity Strategy Class A | | | 1.09 | %(b) | | 10/31/21 | | | 150,132 | | | | 131,093 | | | | 118,368 | | |
Commodity Strategy Class C | | | 1.84 | %(b) | | 10/31/21 | | | 7,166 | | | | 545 | | | | 159 | | |
Global Allocation Institutional Class | | | 0.75 | %(c) | | 10/31/21 | | | 249,350 | | | | 346,296 | | | | 329,169 | | |
Global Allocation Class A | | | 1.11 | %(c) | | 10/31/21 | | | 182,783 | | | | 131,054 | | | | 79,935 | | |
Global Allocation Class C | | | 1.86 | %(c) | | 10/31/21 | | | 149,577 | | | | 110,994 | | | | 63,702 | | |
Hedged Option Premium Strategy Institutional Class | | | 0.65 | % | | 10/31/21 | | | — | | | | 163,736 | (d) | | | 296,971 | | |
Hedged Option Premium Strategy Class A | | | 1.01 | % | | 10/31/21 | | | — | | | | 1,070 | (d) | | | 543 | | |
Hedged Option Premium Strategy Class C | | | 1.76 | % | | 10/31/21 | | | — | | | | 1,213 | (d) | | | 762 | | |
Hedged Option Premium Strategy Class R6 | | | 0.58 | %(i) | | 10/31/21 | | | — | | | | 80,469 | (d) | | | 42,194 | | |
Long Short Institutional Class | | | 1.70 | % | | 10/31/21 | | | — | | | | — | | | | — | | |
Long Short Class A | | | 2.06 | % | | 10/31/21 | | | — | | | | — | | | | — | | |
Long Short Class C | | | 2.81 | % | | 10/31/21 | | | — | | | | — | | | | — | | |
210
| | | | | | | Expenses Reimbursed In
Year Ended October 31, | |
| | | | | | 2016 | | 2017 | | 2018 | |
| | | | | | Subject to Repayment until
October 31, | |
| Class | | Contractual
Expense
Limitation(a) | | Expiration | | 2019 | | 2020 | | 2021 | |
Long Short Credit Institutional Class | | | 0.75 | %(e)(f) | | 10/31/21 | | $ | 283,260 | | | $ | 178,900 | | | $ | 191,336 | | |
Long Short Credit Class A | | | 1.12 | %(e)(f) | | 10/31/21 | | | 14,957 | | | | 28,780 | | | | 37,252 | | |
Long Short Credit Class C | | | 1.87 | %(e)(f) | | 10/31/21 | | | 10,932 | | | | 10,218 | | | | 17,006 | | |
Long Short Credit Class R6 | | | 0.68 | %(e)(f)(i) | | 10/31/21 | | | 56,434 | | | | 63,573 | | | | 76,199 | | |
Multi-Asset Income Institutional Class | | | 0.65 | % | | 10/31/21 | | | 349,252 | | | | 372,208 | | | | 345,192 | | |
Multi-Asset Income Class A | | | 1.02 | % | | 10/31/21 | | | 16,514 | | | | 14,267 | | | | 14,442 | | |
Multi-Asset Income Class C | | | 1.77 | % | | 10/31/21 | | | 15,614 | | | | 16,358 | | | | 13,693 | | |
Multi-Asset Income Class R6 | | | 0.58 | %(i) | | 10/31/21 | | | 119,681 | | | | 94,517 | | | | 77,052 | | |
Multi-Style Premia Institutional Class | | | 0.95 | % | | 10/31/21 | | | — | | | | — | | | | 372,173 | (g) | |
Multi-Style Premia Class A | | | 1.31 | % | | 10/31/21 | | | — | | | | — | | | | 667 | (g) | |
Multi-Style Premia Class C | | | 2.06 | % | | 10/31/21 | | | — | | | | — | | | | 666 | (g) | |
Multi-Style Premia Class R6 | | | 0.88 | %(i) | | 10/31/21 | | | — | | | | — | | | | 667 | (g) | |
U.S. Equity Index PutWrite Strategy Institutional Class | | | 0.65 | % | | 10/31/21 | | | 154,906 | (h) | | | 290,602 | | | | 238,341 | | |
U.S. Equity Index PutWrite Strategy Class A | | | 1.01 | % | | 10/31/21 | | | 2,299 | (h) | | | 6,844 | | | | 8,937 | | |
U.S. Equity Index PutWrite Strategy Class C | | | 1.76 | % | | 10/31/21 | | | 912 | (h) | | | 628 | | | | 1,190 | | |
U.S. Equity Index PutWrite Strategy Class R6 | | | 0.58 | %(i) | | 10/31/21 | | | 46,827 | (h) | | | 31,856 | | | | 16,306 | | |
(a) Expense limitation per annum of the respective class' average daily net assets.
(b) Prior to February 28, 2017, the contractual expense limitation was 1.10% for Institutional Class, 1.46% for Class A and 2.21% for Class C.
(c) Prior to February 28, 2017, the contractual expense limitation was 0.90% for Institutional Class, 1.26% for Class A and 2.01% for Class C.
(d) Period from April 12, 2017 (Commencement of Operations) to October 31, 2017.
(e) In addition, Management voluntarily waived its fees as necessary to maintain a minimum yield for Long Short Credit on several days in 2016, for Institutional Class, Class A, Class C and Class R6. For the year ended October 31, 2016, voluntary reimbursements for Institutional Class, Class A, Class C and Class R6 of Long Short Credit amounted to $26,236, $2,133, $2,908 and $4,880, respectively.
(f) Prior to February 28, 2018, the contractual expense limitation was 1.20% for Institutional Class, 1.57% for Class A, 2.32% for Class C and 1.13% for Class R6.
(g) Period from May 18, 2018 (Commencement of Operations) to October 31, 2018.
(h) Period from September 16, 2016 (Commencement of Operations) to October 31, 2016.
(i) Effective December 6, 2018, the contractual expense limitation for Class R6 of Hedged Option Premium Strategy, Long Short Credit, Multi-Asset Income, Multi-Style Premia and U.S. Equity Index PutWrite Strategy is 0.55%, 0.65%, 0.55%, 0.85% and 0.55%, respectively.
Each Fund has agreed that each of its respective classes will repay Management for fees and expenses waived or reimbursed for that class provided that repayment does not cause that class' annual operating expenses to exceed its contractual expense limitation in place at the time the fees and expenses were waived or reimbursed, or the expense
211
limitation in place at the time the Fund repays Management, whichever is lower. Any such repayment must be made within three years after the year in which Management incurred the expense.
During the year ended October 31, 2018, there was no repayment to Management under these agreements.
Each Fund also has a distribution agreement with Neuberger Berman BD LLC (the "Distributor") with respect to each class of shares. The Distributor acts as agent in arranging for the sale of class shares without sales commission or other compensation, except as described below for Class A and Class C shares, and bears the advertising and promotion expenses.
However, the Distributor receives fees from Class A and Class C under their distribution plans (each a "Plan", collectively the "Plans") pursuant to Rule 12b-1 under the 1940 Act. The Plans provide that, as compensation for administrative and other services provided to these classes, the Distributor's activities and expenses related to the sale and distribution of these classes, and ongoing services provided to investors in these classes, the Distributor receives from each of these classes a fee at the annual rate of 0.25% of Class A's and 1.00% of Class C's average daily net assets. The Distributor receives this amount to provide distribution and shareholder servicing for these classes and pays a portion of it to institutions that provide such services. Those institutions may use the payments for, among other purposes, compensating employees engaged in sales and/or shareholder servicing. The amount of fees paid by each class during any year may be more or less than the cost of distribution and other services provided to that class. FINRA rules limit the amount of annual distribution fees that may be paid by a mutual fund and impose a ceiling on the cumulative distribution fees paid. The Trust's Plans comply with those rules.
Class A shares of each Fund (except Long Short Credit and Multi-Asset Income) are generally sold with an initial sales charge of up to 5.75%. Class A shares of Long Short Credit and Multi-Asset Income are generally sold with an initial sales charge of up to 4.25%. Class A shares of each Fund are generally sold with no contingent deferred sales charge ("CDSC"), except that a CDSC of 1.00% applies to certain redemptions made within 18 months following purchases of $1 million or more without an initial sales charge. Class C shares of each Fund are sold with no initial sales charge and a 1.00% CDSC if shares are sold within one year after purchase.
For the year ended October 31, 2018, Neuberger Berman, acting as underwriter and broker-dealer, received net initial sales charges from the purchase of Class A shares and CDSCs from the redemption of Class A and Class C shares as follows:
| | | Underwriter | | Broker-Dealer | |
| | | Net Initial
Sales Charge | | CDSC | | Net Initial
Sales Charge | | CDSC | |
Commodity Strategy Class A | | $ | 150 | | | $ | — | | | $ | — | | | $ | — | | |
Commodity Strategy Class C | | | — | | | | 30 | | | | — | | | | — | | |
Global Allocation Class A | | | 300 | | | | — | | | | — | | | | — | | |
Global Allocation Class C | | | — | | | | 77 | | | | — | | | | — | | |
Hedged Option Premium Strategy Class A | | | — | | | | — | | | | — | | | | — | | |
Hedged Option Premium Strategy Class C | | | — | | | | — | | | | — | | | | — | | |
Long Short Class A | | | 26,230 | | | | — | | | | — | | | | — | | |
Long Short Class C | | | — | | | | 2,074 | | | | — | | | | — | | |
Long Short Credit Class A | | | 85 | | | | — | | | | — | | | | — | | |
Long Short Credit Class C | | | — | | | | — | | | | — | | | | — | | |
Multi-Asset Income Class A | | | 39 | | | | — | | | | — | | | | — | | |
Multi-Asset Income Class C | | | — | | | | — | | | | — | | | | — | | |
| Multi-Style Premia Class A(a) | | | — | | | | — | | | | — | | | | — | | |
| Multi-Style Premia Class C(a) | | | — | | | | — | | | | — | | | | — | | |
U.S. Equity Index PutWrite Strategy Class A | | | 7,957 | | | | — | | | | — | | | | — | | |
U.S. Equity Index PutWrite Strategy Class C | | | — | | | | — | | | | — | | | | — | | |
(a) Period from May 18, 2018 (Commencement of Operations) to October 31, 2018.
212
For the year ended October 31, 2017, Long Short recorded a capital contribution from Management in the amount of $37,124. This amount was paid in connection with losses incurred in the execution of trades.
Note C—Securities Transactions:
During the year ended October 31, 2018, there were purchase and sale transactions of long-term securities (excluding swaps, futures, forward contracts, swaptions and option contracts) as follows:
(000's omitted) | | Purchases of
U.S. Government
and Agency
Obligations | | Purchases
Excluding
U.S. Government
and
Agency
Obligations | | Securities
Sold Short | | Sales and
Maturities of
U.S. Government
and
Agency
Obligations | | Sales and
Maturities
Excluding
U.S. Government
and
Agency
Obligations | | Covers on
Securities
Sold
Short | |
Commodity Strategy | | $ | — | | | $ | 143,483 | | | $ | — | | | $ | — | | | $ | 104,463 | | | $ | — | | |
Global Allocation | | | 17,715 | | | | 9,226 | | | | — | | | | 17,215 | | | | 10,126 | | | | — | | |
Hedged Option
Premium Strategy | | | 6,374 | | | | — | | | | — | | | | 1,790 | | | | — | | | | — | | |
Long Short | | | — | | | | 2,004,072 | | | | 760,778 | | | | — | | | | 1,935,061 | | | | 848,457 | | |
Long Short Credit | | | — | | | | 20,837 | | | | — | | | | — | | | | 37,918 | | | | — | | |
Multi-Asset Income | | | 34,734 | | | | 12,647 | | | | — | | | | 33,972 | | | | 12,006 | | | | — | | |
| Multi-Style Premia(a) | | | — | | | | 7,625 | | | | — | | | | — | | | | 1,901 | | | | — | | |
U.S. Equity Index
PutWrite Strategy | | | 231,153 | | | | — | | | | — | | | | 149,025 | | | | — | | | | — | | |
(a) Period from May 18, 2018 (Commencement of Operations) to October 31, 2018.
During the year ended October 31, 2018, no brokerage commissions on securities transactions were paid to affiliated brokers.
Note D—Fund Share Transactions:
Share activity for the years ended October 31, 2018 and October 31, 2017 was as follows:
| | | For the Year Ended October 31, 2018 | | For the Year Ended October 31, 2017 | |
| (000's omitted) | | Shares
Sold | | Shares
Issued on
Reinvestment
of Dividends
and
Distributions | | Shares
Redeemed | | Total | | Shares
Sold | | Shares
Issued on
Reinvestment
of Dividends
and
Distributions | | Shares
Redeemed | | Total | |
Commodity Strategy | |
Institutional Class | | | 5,173 | | | | 516 | | | | (2,559 | ) | | | 3,130 | | | | 7,424 | | | | — | | | | (2,530 | ) | | | 4,894 | | |
Class A | | | 2,442 | | | | 249 | | | | (1,602 | ) | | | 1,089 | | | | 2,710 | | | | — | | | | (1,568 | ) | | | 1,142 | | |
Class C | | | 1 | | | | — | | | | — | | | | 1 | | | | — | | | | — | | | | (10 | ) | | | (10 | ) | |
Global Allocation | |
Institutional Class | | | 357 | | | | 59 | | | | (320 | ) | | | 96 | | | | 615 | | | | 4 | | | | (441 | ) | | | 178 | | |
Class A | | | 17 | | | | 16 | | | | (98 | ) | | | (65 | ) | | | 123 | | | | — | | | | (373 | ) | | | (250 | ) | |
Class C | | | 2 | | | | 11 | | | | (69 | ) | | | (56 | ) | | | 20 | | | | — | | | | (211 | ) | | | (191 | ) | |
213
| | For the Year Ended October 31, 2018 | | For the Year Ended October 31, 2017 | |
| (000's omitted) | | Shares
Sold | | Shares
Issued on
Reinvestment
of Dividends
and
Distributions | | Shares
Redeemed | | Total | | Shares
Sold | | Shares
Issued on
Reinvestment
of Dividends
and
Distributions | | Shares
Redeemed | | Total | |
Hedged Option Premium
Strategy | |
Institutional Class | | | 503 | | | | 9 | | | | (339 | ) | | | 173 | | | | 337 | | | | — | | | | — | | | | 337 | (a) | |
Class A | | | — | | | | — | | | | — | | | | — | | | | 1 | | | | — | | | | — | | | | 1 | (a) | |
Class C | | | — | | | | — | | | | — | | | | — | | | | 1 | | | | — | | | | — | | | | 1 | (a) | |
Class R6 | | | — | | | | — | | | | — | | | | — | | | | 78 | | | | — | | | | — | | | | 78 | (a) | |
| Long Short(c) | |
Institutional Class | | | 72,843 | | | | — | | | | (77,887 | ) | | | (5,044 | ) | | | 88,065 | | | | — | | | | (50,080 | ) | | | 37,985 | | |
Class A | | | 2,232 | | | | — | | | | (5,159 | ) | | | (2,927 | ) | | | 3,456 | | | | — | | | | (9,334 | ) | | | (5,878 | ) | |
Class C | | | 431 | | | | — | | | | (1,555 | ) | | | (1,124 | ) | | | 642 | | | | — | | | | (3,198 | ) | | | (2,556 | ) | |
Long Short Credit | |
Institutional Class | | | 597 | | | | 60 | | | | (1,353 | ) | | | (696 | ) | | | 522 | | | | 69 | | | | (1,312 | ) | | | (721 | ) | |
Class A | | | 116 | | | | 5 | | | | (216 | ) | | | (95 | ) | | | 224 | | | | 7 | | | | (22 | ) | | | 209 | | |
Class C | | | 19 | | | | 2 | | | | (1 | ) | | | 20 | | | | 2 | | | | — | | | | (1 | ) | | | 1 | | |
Class R6 | | | 2 | | | | 4 | | | | (111 | ) | | | (105 | ) | | | 23 | | | | 6 | | | | (49 | ) | | | (20 | ) | |
Multi-Asset Income | |
Institutional Class | | | 262 | | | | 74 | | | | (196 | ) | | | 140 | | | | 553 | | | | 57 | | | | (198 | ) | | | 412 | | |
Class A | | | 23 | | | | 1 | | | | (8 | ) | | | 16 | | | | 1 | | | | — | | | | (1 | ) | | | — | | |
Class C | | | — | | | | 1 | | | | (5 | ) | | | (4 | ) | | | 6 | | | | — | | | | (1 | ) | | | 5 | | |
Class R6 | | | — | | | | — | | | | — | | | | — | | | | — | | | | 5 | | | | (3 | ) | | | 2 | | |
Multi-Style Premia | |
| Institutional Class(b) | | | 623 | | | | — | | | | — | | | | 623 | | | | — | | | | — | | | | — | | | | — | | |
| Class A(b) | | | 1 | | | | — | | | | — | | | | 1 | | | | — | | | | — | | | | — | | | | — | | |
| Class C(b) | | | 1 | | | | — | | | | — | | | | 1 | | | | — | | | | — | | | | — | | | | — | | |
| Class R6(b) | | | 1 | | | | — | | | | — | | | | 1 | | | | — | | | | — | | | | — | | | | — | | |
U.S. Equity Index
PutWrite Strategy | |
Institutional Class | | | 21,985 | | | | 1,007 | | | | (15,980 | ) | | | 7,012 | | | | 12,745 | | | | 43 | | | | (1,475 | ) | | | 11,313 | | |
Class A | | | 1,683 | | | | 27 | | | | (336 | ) | | | 1,374 | | | | 364 | | | | — | | | | (46 | ) | | | 318 | | |
Class C | | | 87 | | | | 3 | | | | (25 | ) | | | 65 | | | | 36 | | | | — | | | | — | | | | 36 | | |
Class R6 | | | 871 | | | | 88 | | | | (357 | ) | | | 602 | | | | 998 | | | | 5 | | | | (401 | ) | | | 602 | | |
(a) Period from April 12, 2017 (Commencement of Operations) to October 31, 2017.
(b) Period from May 18, 2018 (Commencement of Operations) to October 31, 2018.
(c) After the close of business on December 7, 2018, the Fund's A and C classes underwent a reverse stock split. The shares outstanding and per share data presented here have been adjusted to reflect the split. The capital share activity presented here has been adjusted to reflect this split. See Note I of the Notes to Financial Statements.
214
Note E—Line of Credit:
At October 31, 2018, each Fund was a participant in a syndicated committed, unsecured $700,000,000 line of credit (the "Credit Facility"), to be used only for temporary or emergency purposes. Series of other investment companies managed by Management also participate in this line of credit on substantially the same terms. Interest is charged on borrowings under this Credit Facility at the highest of (a) a federal funds effective rate plus 1.00% per annum, (b) a Eurodollar rate for a one-month period plus 1.00% per annum, and (c) an overnight bank funding rate plus 1.00% per annum. The Credit Facility has an annual commitment fee of 0.15% per annum of the available line of credit, which is paid quarterly. Each Fund that is a participant has agreed to pay its pro rata share of the annual commitment fee, based on the ratio of its individual net assets to the net assets of all participants at the time the fee is due, and interest charged on any borrowing made by such Fund and other costs incurred by such Fund. Because several mutual funds participate in the Credit Facility, there is no assurance that an individual Fund will have access to all or any part of the $700,000,000 at any particular time. There were no loans outstanding under the Credit Facility at October 31, 2018. During the year ended October 31, 2018, no Fund utilized the Credit Facility.
Note F—Investments in Affiliates(a):
| | | Balance of
Shares Held
October 31,
2017 | | Gross
Purchases
and
Additions | | Gross
Sales
and
Reductions | | Balance of
Shares Held
October 31,
2018 | | Value
October 31,
2018 | | Distributions
from
Investments
in Affiliated
Issuers(b) | | Net Realized
Gain/(Loss)
from
Investments
in Affiliated
Issuers | | Change in
Net Unrealized
Appreciation/
(Depreciation)
from
Investments
in Affiliated
Issuers | |
Global Allocation | |
Commodity
Strategy
Institutional Class | | | 144,206 | | | | 77,860 | | | | 10,880 | | | | 211,186 | | | $ | 1,307,241 | | | $ | 33,237 | | | $ | (8,770 | ) | | $ | (34,375 | ) | |
Neuberger Berman
Emerging Markets
Debt Fund
Institutional Class | | | 56,739 | | | | 71,809 | | | | — | | | | 128,548 | | | | 1,032,241 | | | | 29,321 | | | | — | | | | (111,451 | ) | |
Neuberger Berman
Emerging Markets
Equity Fund
Class R6 | | | 60,542 | | | | 10,102 | | | | 4,329 | | | | 66,315 | | | | 1,154,542 | | | | 8,129 | | | | 20,256 | | | | (228,885 | ) | |
Neuberger Berman
Floating Rate
Income Fund
Institutional Class | | | 43,487 | | | | 1,678 | | | | 15,152 | | | | 30,013 | | | | 295,631 | | | | 16,347 | | | | 1,180 | | | | (4,872 | ) | |
Neuberger Berman
Genesis Fund
Class R6 | | | 21,225 | | | | 3,581 | | | | 13,104 | | | | 11,702 | | | | 682,952 | | | | 165,517 | | | | 71,300 | | | | (131,668 | ) | |
Neuberger Berman
High Income Bond
Fund Class R6 | | | 133,662 | | | | 6,529 | | | | 23,015 | | | | 117,176 | | | | 979,593 | | | | 55,342 | | | | (568 | ) | | | (53,453 | ) | |
215
| | | Balance of
Shares Held
October 31,
2017 | | Gross
Purchases
and
Additions | | Gross
Sales
and
Reductions | | Balance of
Shares Held
October 31,
2018 | | Value
October 31,
2018 | | Distributions
from
Investments
in Affiliated
Issuers(b) | | Net Realized
Gain/(Loss)
from
Investments
in Affiliated
Issuers | | Change in
Net Unrealized
Appreciation/
(Depreciation)
from
Investments
in Affiliated
Issuers | |
International Select
Fund Class R6 | | | 279,073 | | | | 23,519 | | | | 63,280 | | | | 239,312 | | | $ | 2,783,196 | | | $ | 41,040 | | | $ | 132,567 | | | $ | (419,985 | ) | |
Long Short Credit
Class R6 | | | 73,328 | | | | 4,167 | | | | 33,503 | | | | 43,992 | | | | 402,091 | | | | 19,385 | | | | 2,727 | | | | (27,637 | ) | |
Neuberger Berman
Short Duration
High Income Fund
Institutional Class | | | — | | | | 15,948 | | | | — | | | | 15,948 | | | | 150,386 | | | | 2,527 | | | | — | | | | (1,592 | ) | |
U.S. Equity Index
PutWrite Strategy
Class R6 | | | 91,300 | | | | 44,383 | | | | 11,190 | | | | 124,493 | | | | 1,327,090 | | | | 62,449 | | | | 5,945 | | | | (56,644 | ) | |
Sub-total for
affiliates held as
of 10/31/18(c) | | | | | | | | | | $ | 10,114,963 | | | $ | 433,294 | | | $ | 224,637 | | | $ | (1,070,562 | ) | |
Long Short | |
Hudson Ltd.
Class A | | | — | | | | 2,783,800 | | | | 1,319,100 | | | | 1,464,700 | | | $ | 30,963,758 | | | $ | — | * | | $ | 369,177 | | | $ | 4,284,129 | | |
| Total(d) | | | | | | | | | | $ | 30,963,758 | | | $ | — | | | $ | 369,177 | | | $ | 4,284,129 | | |
Multi-Asset Income | |
Neuberger Berman
Emerging Markets
Debt Fund
Institutional Class | | | 114,486 | | | | 69,247 | | | | — | | | | 183,733 | | | $ | 1,475,376 | | | $ | 46,390 | | | | — | | | $ | (140,642 | ) | |
Neuberger Berman
Floating Rate
Income Fund
Institutional Class | | | 106,866 | | | | 4,383 | | | | 18,182 | | | | 93,067 | | | | 916,713 | | | | 43,478 | | | | (559 | ) | | | (9,474 | ) | |
Neuberger Berman
High Income Bond
Fund Class R6 | | | 245,375 | | | | 12,572 | | | | 28,769 | | | | 229,178 | | | | 1,915,932 | | | | 107,145 | | | | (470 | ) | | | (103,251 | ) | |
Long Short Credit
Class R6 | | | 48,970 | | | | 2,197 | | | | — | | | | 51,167 | | | | 467,667 | | | | 20,410 | | | | — | | | | (25,308 | ) | |
Sub-total for
affiliates held as
of 10/31/18(c) | | | | | | | | | | $ | 4,775,688 | | | $ | 217,423 | | | $ | (1,029 | ) | | $ | (278,675 | ) | |
(a) Affiliated issuers, as defined in the 1940 Act.
216
(b) Distributions received include distributions from net investment income and net realized capital gains, if any, from the Underlying Fund.
(c) At October 31, 2018, these securities amounted to approximately 53.34% and 20.85% of net assets of Global Allocation and Multi-Asset Income, respectively.
(d) At October 31, 2018, the issuers of these securities were no longer affiliated with Long Short.
* Security did not produce income during the period.
Other: At October 31, 2018, Global Allocation held 0.88%, 2.46% and 0.52% of the outstanding shares of Commodity Strategy, Long Short Credit and U.S. Equity Index PutWrite Strategy, respectively. Multi-Asset Income held 2.86% of the outstanding shares of Long Short Credit.
In addition, at October 31, 2018, there were affiliated investors owning 0.35%, 0.15%, 33.89%, 34.81%, 60.03%, 95.78% and 0.04% of Commodity Strategy, Global Allocation's, Hedged Option Premium Strategy's, Long Short Credit's, Multi-Asset Income's, Multi-Style Premia's and U.S. Equity Index PutWrite Strategy's outstanding shares, respectively.
Note G—Custodian Out-of-Pocket Expenses Refunded:
In May 2016, Long Short's custodian, State Street, announced that it had identified inconsistencies in the way in which Long Short was invoiced for categories of expenses, particularly those deemed "out-of-pocket" costs, from the Fund's inception through November 2015. The amounts in the table below represent the refunded expenses and interest determined to be payable to Long Short for the period in question. These amounts were refunded to Long Short by State Street during the year ended October 31, 2017.
| | Expenses Refunded | | Interest Paid to the Fund | |
Long Short | | $ | 5,171 | | | $ | 32 | | |
Note H—Recent Accounting Pronouncements:
As of November 5, 2018, pursuant to the SEC Release #33-10532 "Disclosure Update and Simplification", funds are no longer required to disclose whether the distributions from earnings are either from net investment income or net realized capital gains. The presentation for the Year Ended October 31, 2017 has been adjusted for this change in the Statements of Changes in Net Assets. At October 31, 2017, the distributions from net investment income, net realized gains from investments, undistributed net investment income (loss) and distributions in excess of net investment income were as follows:
(000's omitted) | |
| Net Investment Income | | Institutional
Class | | Class A | | Class C | | Class R6 | |
Commodity Strategy | | $ | — | | | $ | — | | | $ | — | | | $ | — | | |
Global Allocation | | | (44 | ) | | | — | | | | — | | | | — | | |
Hedged Option Premium Strategy | | | (11 | ) | | | — | | | | — | | | | (6 | ) | |
Long Short | | | — | | | | — | | | | — | | | | — | | |
Long Short Credit | | | (659 | ) | | | (100 | ) | | | (28 | ) | | | (251 | ) | |
Multi-Asset Income | | | (548 | ) | | | (18 | ) | | | (16 | ) | | | (142 | ) | |
U.S. Equity Index PutWrite Strategy | | | (385 | ) | | | (2 | ) | | | — | | | | (45 | ) | |
217
(000's omitted) | |
| Net Realized Gain on investments | | Institutional
Class | | Class A | | Class C | | Class R6 | |
Commodity Strategy | | $ | — | | | $ | — | | | $ | — | | | $ | — | | |
Global Allocation | | | — | | | | — | | | | — | | | | — | | |
Hedged Option Premium Strategy | | | — | | | | — | | | | — | | | | — | | |
Long Short | | | — | | | | — | | | | — | | | | — | | |
Long Short Credit | | | — | | | | — | | | | — | | | | — | | |
Multi-Asset Income | | | — | | | | — | | | | — | | | | — | | |
U.S. Equity Index PutWrite Strategy | | | (87 | ) | | | (2 | ) | | | — | | | | (14 | ) | |
(000's omitted) | |
| | Undistributed Net
Investment
Income/(Loss) at
10/31/2017 | | Distributions in Excess of
Net Investment Income at
10/31/2017 | |
Commodity Strategy | | $ | 29 | | | $ | — | | |
Global Allocation | | | 176 | | | | — | | |
Hedged Option Premium Strategy | | | 6 | | | | — | | |
Long Short | | | — | | | | (6,496 | ) | |
Long Short Credit | | | — | | | | (94 | ) | |
Multi-Asset Income | | | — | | | | (88 | ) | |
U.S. Equity Index PutWrite Strategy | | | 73 | | | | — | | |
On August 26, 2016, FASB issued a new ASU No. 2016-15, "Statement of Cash Flows (Topic 230), Classification of Certain Cash Receipts and Cash Payments, a consensus of the FASB's Emerging Issues Task Force" ("ASU 2016-15"). ASU 2016-15 is intended to reduce diversity in practice in how certain transactions are classified in the statement of cash flows. The types of transactions addressed in ASU 2016-15 are debt prepayment or debt extinguishment costs, settlement of zero-coupon debt instruments, contingent consideration payments made after a business combination, proceeds from the settlement of insurance claims, proceeds from the settlement of corporate-owned life insurance, distributions received from equity method investees, and beneficial interests in securitization transactions. The amendments also clarify how the predominance principle should be applied. ASU 2016-15 is effective for interim and annual reporting periods beginning after December 15, 2017. Management is currently evaluating the impact, if any, of applying this provision.
In November 2016, FASB issued a new ASU No. 2016-18, "Statement of Cash Flows (Topic 230), Restricted Cash" ("ASU 2016-18"). ASU 2016-18 requires that a statement of cash flows show the changes during the period in the total of cash, cash equivalents, restricted cash and restricted cash equivalents. ASU 2016-18 is effective for interim and annual reporting periods beginning after December 15, 2017. Management is currently evaluating the impact, if any, of applying this guidance.
In March 2017, FASB issued Accounting Standards Update No. 2017-08, "Receivables—Nonrefundable Fees and Other Costs (Subtopic 310-20), Premium Amortization on Purchased Callable Debt Securities" ("ASU 2017-08"). ASU 2017-08 shortens the amortization period to the earliest call date for certain purchased callable debt securities held at a premium. The guidance is effective for fiscal years, and interim periods within those fiscal years, beginning after December 15, 2018. Management is currently evaluating the impact of applying this guidance.
In August 2018, FASB issued Accounting Standards Update No. 2018-13, "Fair Value Measurement (Topic 820: Disclosure Framework—Changes to the Disclosure Requirements for Fair Value Measurement" ("ASU 2018-13"). ASU 2018-13 eliminates the requirement to disclose the amount of and reasons for transfers between Level 1 and Level 2 of the fair value hierarchy, the timing of transfers between levels of the fair value hierarchy and the
218
valuation processes for Level 3 fair value measurements. ASU 2018-13 will require the need to disclose the range and weighted average used to develop significant unobservable inputs for Level 3 fair value measurements and the changes in unrealized gains and losses for recurring Level 3 fair value measurements. ASU 2018-13 will also require that information is provided about the measurement uncertainty of Level 3 fair value measurements as of the reporting date. The guidance is effective for fiscal years, and interim periods within those fiscal years, beginning after December 15, 2019 and allows for early adoption of either the entire standard or only the provisions that eliminate or modify the requirements. Management has elected to adopt early the provisions that eliminate the disclosure requirements. Management is still currently evaluating the impact of applying the rest of the guidance.
Note I—Subsequent Event:
As previously announced, the Board approved a reverse stock split (the "Stock Split") of the issued and outstanding shares of certain classes of Long Short (the "Stock Split Fund"). The Stock Split occurred after the close of the business on December 7, 2018. The Stock Split was carried out in accordance with a stock split ratio calculated to result in NAVs that better aligned the share class prices of the Stock Split Fund.
| Fund Class | | Stock Split
Ratio
(old to New) | |
Long Short Class A | | | 1 | : 0.9792 | |
Long Short Class C | | | 1 | : 0.9328 | |
219
The following tables include selected data for a share outstanding throughout each year and other performance information derived from the Financial Statements. Amounts that do not round to $0.01 or $(0.01) per share are presented as $0.00 or $(0.00), respectively. Ratios that do not round to 0.01% or (0.01)% are presented as 0.00% or (0.00)%, respectively. Net Asset amounts with a zero balance, if any, may reflect actual amounts rounding to less than
$0.1 million. A "—" indicates that the line item was not applicable in the corresponding period.
| | | Net Asset
Value,
Beginning
of Year | | Net
Investment
Income
(Loss)@ | | Net Gains
or
Losses on
Securities
(both
realized
and
unrealized) | | Total From
Investment
Operations | | Dividends
from Net
Investment
Income | | Distributions
from Net
Realized
Capital
Gains | | Tax
Return
of
Capital | | Total
Distributions | | Voluntary
Contribution
from
Management | | Net Asset
Value,
End of
Year | | Total
Returna | | Net Assets,
End of
Year
(in millions) | | Ratio
of Gross
Expenses to
Average
Net
Assets# | | Ratio
of Gross
Expenses
to Average
Net Assets
(excluding
dividend
and interest
expense
relating to
short sales
and reverse
repurchase
agreements)# | | Ratio
of Net
Expenses to
Average
Net
Assets | | Ratio
of Net
Expenses
to Average
Net Assets
(excluding
dividend
and interest
expense
relating to
short sales
and reverse
repurchase
agreements) | | Ratio
of Net
Investment
Income/
(Loss)
to
Average
Net
Assets | | Portfolio
Turnover
Rate
(including
securities
sold
short) | | Portfolio
Turnover
Rate
(excluding
securities
sold
short) | |
| Commodity Strategy Fundb | |
Institutional Class | |
10/31/2018 | | $ | 6.36 | | | $ | 0.08 | | | $ | (0.01 | ) | | $ | 0.07 | | | $ | (0.24 | ) | | $ | — | | | $ | — | | | $ | (0.24 | ) | | $ | — | | | $ | 6.19 | | | | 1.19 | % | | $ | 100.3 | | | | 0.98 | % | | | 0.98 | %Ø | | | 0.74 | % | | | 0.74 | %Ø | | | 1.31 | % | | | 107 | % | | | 107 | %Ø | |
10/31/2017 | | $ | 5.99 | | | $ | 0.02 | | | $ | 0.35 | | | $ | 0.37 | | | $ | — | | | $ | — | | | $ | — | | | $ | — | | | $ | — | | | $ | 6.36 | | | | 6.18 | % | | $ | 83.1 | | | | 1.18 | % | | | 1.18 | %Ø | | | 0.85 | % | | | 0.85 | %Ø | | | 0.36 | % | | | 105 | % | | | 105 | %Ø | |
10/31/2016 | | $ | 6.20 | | | $ | (0.03 | ) | | $ | (0.18 | ) | | $ | (0.21 | ) | | $ | — | | | $ | — | | | $ | — | | | $ | — | | | $ | — | | | $ | 5.99 | | | | (3.39 | )% | | $ | 49.0 | | | | 1.65 | % | | | 1.65 | %Ø | | | 1.10 | % | | | 1.10 | %Ø | | | (0.44 | )% | | | 58 | % | | | 58 | %Ø | |
10/31/2015 | | $ | 8.39 | | | $ | (0.05 | ) | | $ | (2.14 | ) | | $ | (2.19 | ) | | $ | — | | | $ | (0.00 | ) | | $ | — | | | $ | (0.00 | ) | | $ | — | | | $ | 6.20 | | | | (26.09 | )% | | $ | 31.8 | | | | 1.47 | % | | | 1.47 | %Ø | | | 1.10 | % | | | 1.10 | %Ø | | | (0.67 | )% | | | 35 | % | | | 35 | %Ø | |
10/31/2014 | | $ | 9.01 | | | $ | (0.07 | ) | | $ | (0.55 | ) | | $ | (0.62 | ) | | $ | — | | | $ | — | | | $ | — | | | $ | — | | | $ | — | | | $ | 8.39 | | | | (6.88 | )% | | $ | 20.5 | | | | 1.62 | % | | | 1.62 | %Ø | | | 1.10 | % | | | 1.10 | %Ø | | | (0.73 | )% | | | 21 | % | | | 21 | %Ø | |
Class A | |
10/31/2018 | | $ | 6.24 | | | $ | 0.06 | | | $ | (0.01 | ) | | $ | 0.05 | | | $ | (0.22 | ) | | $ | — | | | $ | — | | | $ | (0.22 | ) | | $ | — | | | $ | 6.07 | | | | 0.81 | % | | $ | 47.9 | | | | 1.35 | % | | | 1.35 | %Ø | | | 1.10 | % | | | 1.10 | %Ø | | | 0.95 | % | | | 107 | % | | | 107 | %Ø | |
10/31/2017 | | $ | 5.90 | | | $ | (0.00 | ) | | $ | 0.34 | | | $ | 0.34 | | | $ | — | | | $ | — | | | $ | — | | | $ | — | | | $ | — | | | $ | 6.24 | | | | 5.76 | % | | $ | 42.4 | | | | 1.56 | % | | | 1.56 | %Ø | | | 1.21 | % | | | 1.21 | %Ø | | | (0.02 | )% | | | 105 | % | | | 105 | %Ø | |
10/31/2016 | | $ | 6.12 | | | $ | (0.05 | ) | | $ | (0.17 | ) | | $ | (0.22 | ) | | $ | — | | | $ | — | | | $ | — | | | $ | — | | | $ | — | | | $ | 5.90 | | | | (3.59 | )% | | $ | 33.3 | | | | 2.04 | % | | | 2.04 | %Ø | | | 1.46 | % | | | 1.46 | %Ø | | | (0.82 | )% | | | 58 | % | | | 58 | %Ø | |
10/31/2015 | | $ | 8.32 | | | $ | (0.07 | ) | | $ | (2.13 | ) | | $ | (2.20 | ) | | $ | — | | | $ | (0.00 | ) | | $ | — | | | $ | (0.00 | ) | | $ | — | | | $ | 6.12 | | | | (26.43 | )% | | $ | 35.5 | | | | 1.84 | % | | | 1.84 | %Ø | | | 1.46 | % | | | 1.46 | %Ø | | | (1.05 | )% | | | 35 | % | | | 35 | %Ø | |
10/31/2014 | | $ | 8.97 | | | $ | (0.10 | ) | | $ | (0.55 | ) | | $ | (0.65 | ) | | $ | — | | | $ | — | | | $ | — | | | $ | — | | | $ | — | | | $ | 8.32 | | | | (7.25 | )% | | $ | 66.8 | | | | 1.98 | % | | | 1.98 | %Ø | | | 1.46 | % | | | 1.46 | %Ø | | | (1.09 | )% | | | 21 | % | | | 21 | %Ø | |
Class C | |
10/31/2018 | | $ | 5.95 | | | $ | 0.01 | | | $ | — | | | $ | 0.01 | | | $ | (0.13 | ) | | $ | — | | | $ | — | | | $ | (0.13 | ) | | $ | — | | | $ | 5.83 | | | | 0.15 | % | | $ | 0.0 | | | | 2.34 | % | | | 2.34 | %Ø | | | 1.85 | % | | | 1.85 | %Ø | | | 0.19 | % | | | 107 | % | | | 107 | %Ø | |
10/31/2017 | | $ | 5.71 | | | $ | (0.05 | ) | | $ | 0.29 | | | $ | 0.24 | | | $ | — | | | $ | — | | | $ | — | | | $ | — | | | $ | — | | | $ | 5.95 | | | | 4.20 | % | | $ | 0.0 | | | | 3.20 | % | | | 3.20 | %Ø | | | 2.03 | % | | | 2.03 | %Ø | | | (0.92 | )% | | | 105 | % | | | 105 | %Ø | |
10/31/2016 | | $ | 5.98 | | | $ | (0.09 | ) | | $ | (0.18 | ) | | $ | (0.27 | ) | | $ | — | | | $ | — | | | $ | — | | | $ | — | | | $ | — | | | $ | 5.71 | | | | (4.52 | )% | | $ | 0.1 | | | | 3.06 | % | | | 3.06 | %Ø | | | 2.21 | % | | | 2.21 | %Ø | | | (1.65 | )% | | | 58 | % | | | 58 | %Ø | |
10/31/2015 | | $ | 8.19 | | | $ | (0.12 | ) | | $ | (2.09 | ) | | $ | (2.21 | ) | | $ | — | | | $ | (0.00 | ) | | $ | — | | | $ | (0.00 | ) | | $ | — | | | $ | 5.98 | | | | (26.98 | )% | | $ | 3.1 | | | | 2.70 | % | | | 2.70 | %Ø | | | 2.21 | % | | | 2.21 | %Ø | | | (1.79 | )% | | | 35 | % | | | 35 | %Ø | |
10/31/2014 | | $ | 8.88 | | | $ | (0.16 | ) | | $ | (0.53 | ) | | $ | (0.69 | ) | | $ | — | | | $ | — | | | $ | ��� | | | $ | — | | | $ | — | | | $ | 8.19 | | | | (7.77 | )% | | $ | 4.2 | | | | 2.84 | % | | | 2.84 | %Ø | | | 2.21 | % | | | 2.21 | %Ø | | | (1.84 | )% | | | 21 | % | | | 21 | %Ø | |
See Notes to Financial Highlights
220
221
Financial Highlights (cont'd)
| | | Net Asset
Value,
Beginning
of Year | | Net
Investment
Income
(Loss)@ | | Net Gains
or
Losses on
Securities
(both
realized
and
unrealized) | | Total From
Investment
Operations | | Dividends
from Net
Investment
Income | | Distributions
from Net
Realized
Capital
Gains | | Tax
Return
of
Capital | | Total
Distributions | | Voluntary
Contribution
from
Management | | Net Asset
Value,
End of
Year | | Total
Returna | | Net Assets,
End of
Year
(in millions) | | Ratio
of Gross
Expenses to
Average
Net
Assets# | | Ratio
of Gross
Expenses
to Average
Net Assets
(excluding
dividend
and interest
expense
relating to
short sales
and reverse
repurchase
agreements)# | | Ratio
of Net
Expenses to
Average
Net
Assets | | Ratio
of Net
Expenses
to Average
Net Assets
(excluding
dividend
and interest
expense
relating to
short sales
and reverse
repurchase
agreements) | | Ratio
of Net
Investment
Income/
(Loss)
to
Average
Net
Assets | | Portfolio
Turnover
Rate
(including
securities
sold
short) | | Portfolio
Turnover
Rate
(excluding
securities
sold
short) | |
Global Allocation Fund | |
Institutional Class | |
10/31/2018 | | $ | 12.14 | | | $ | 0.23 | | | $ | (0.58 | ) | | $ | (0.35 | ) | | $ | (0.22 | ) | | $ | (0.42 | ) | | $ | — | | | $ | (0.64 | ) | | $ | — | | | $ | 11.15 | | | | (3.14 | )%d | | $ | 13.8 | | | | 3.04 | % | | | 3.04 | % | | | 0.46 | % | | | 0.46 | % | | | 1.96 | % | | | 59 | %c | | | 59 | %cØ | |
10/31/2017 | | $ | 10.49 | | | $ | 0.18 | | | $ | 1.52 | | | $ | 1.70 | | | $ | (0.05 | ) | | $ | — | | | $ | — | | | $ | (0.05 | ) | | $ | — | | | $ | 12.14 | | | | 16.24 | % | | $ | 13.9 | | | | 3.59 | %e | | | 3.56 | % | | | 0.49 | %e | | | 0.46 | % | | | 1.63 | %e | | | 113 | %c | | | 101 | %c | |
10/31/2016 | | $ | 10.42 | | | $ | 0.10 | | | $ | (0.01 | ) | | $ | 0.09 | | | $ | (0.00 | ) | | $ | (0.02 | ) | | $ | — | | | $ | (0.02 | ) | | $ | — | | | $ | 10.49 | | | | 0.87 | % | | $ | 10.1 | | | | 4.17 | % | | | 3.66 | % | | | 1.11 | % | | | 0.60 | % | | | 0.97 | % | | | 176 | %c | | | 174 | %c | |
10/31/2015 | | $ | 10.81 | | | $ | 0.06 | | | $ | (0.17 | ) | | $ | (0.11 | ) | | $ | (0.28 | ) | | $ | (0.00 | ) | | $ | — | | | $ | (0.28 | ) | | $ | — | | | $ | 10.42 | | | | (1.12 | )% | | $ | 8.9 | | | | 3.29 | % | | | 2.94 | % | | | 1.03 | % | | | 0.69 | % | | | 0.51 | % | | | 195 | %c | | | 185 | %c | |
10/31/2014 | | $ | 11.63 | | | $ | (0.12 | ) | | $ | 0.29 | | | $ | 0.17 | | | $ | (0.99 | ) | | $ | — | | | $ | — | �� | | $ | (0.99 | ) | | $ | 0.00 | | | $ | 10.81 | | | | 1.37 | %f | | $ | 12.5 | | | | 3.25 | % | | | 2.72 | % | | | 1.50 | % | | | 0.98 | % | | | (1.12 | )% | | | 228 | % | | | 216 | % | |
Class A | |
10/31/2018 | | $ | 12.04 | | | $ | 0.20 | | | $ | (0.59 | ) | | $ | (0.39 | ) | | $ | (0.18 | ) | | $ | (0.42 | ) | | $ | — | | | $ | (0.60 | ) | | $ | — | | | $ | 11.05 | | | | (3.49 | )%d | | $ | 2.8 | | | | 3.46 | % | | | 3.46 | % | | | 0.82 | % | | | 0.82 | % | | | 1.70 | % | | | 59 | %c | | | 59 | %cØ | |
10/31/2017 | | $ | 10.40 | | | $ | 0.14 | | | $ | 1.50 | | | $ | 1.64 | | | $ | — | | | $ | — | | | $ | — | | | $ | — | | | $ | — | | | $ | 12.04 | | | | 15.77 | % | | $ | 3.9 | | | | 4.10 | %e | | | 4.05 | % | | | 0.89 | %e | | | 0.84 | % | | | 1.27 | %e | | | 113 | %c | | | 101 | %c | |
10/31/2016 | | $ | 10.36 | | | $ | 0.06 | | | $ | (0.00 | ) | | $ | 0.06 | | | $ | — | | | $ | (0.02 | ) | | $ | — | | | $ | (0.02 | ) | | $ | — | | | $ | 10.40 | | | | 0.59 | % | | $ | 5.9 | | | | 4.53 | % | | | 4.01 | % | | | 1.49 | % | | | 0.96 | % | | | 0.64 | % | | | 176 | %c | | | 174 | %c | |
10/31/2015 | | $ | 10.76 | | | $ | 0.02 | | | $ | (0.18 | ) | | $ | (0.16 | ) | | $ | (0.24 | ) | | $ | (0.00 | ) | | $ | — | | | $ | (0.24 | ) | | $ | — | | | $ | 10.36 | | | | (1.52 | )% | | $ | 8.1 | | | | 3.69 | % | | | 3.34 | % | | | 1.39 | % | | | 1.04 | % | | | 0.16 | % | | | 195 | %c | | | 185 | %c | |
10/31/2014 | | $ | 11.57 | | | $ | (0.16 | ) | | $ | 0.29 | | | $ | 0.13 | | | $ | (0.94 | ) | | $ | — | | | $ | — | | | $ | (0.94 | ) | | $ | 0.00 | | | $ | 10.76 | | | | 1.03 | %f | | $ | 9.6 | | | | 3.68 | % | | | 3.16 | % | | | 1.86 | % | | | 1.35 | % | | | (1.49 | )% | | | 228 | % | | | 216 | % | |
Class C | |
10/31/2018 | | $ | 11.66 | | | $ | 0.11 | | | $ | (0.58 | ) | | $ | (0.47 | ) | | $ | (0.07 | ) | | $ | (0.42 | ) | | $ | — | | | $ | (0.49 | ) | | $ | — | | | $ | 10.70 | | | | (4.25 | )%d | | $ | 2.3 | | | | 4.18 | % | | | 4.18 | % | | | 1.57 | % | | | 1.57 | % | | | 0.92 | % | | | 59 | %c | | | 59 | %cØ | |
10/31/2017 | | $ | 10.14 | | | $ | 0.05 | | | $ | 1.47 | | | $ | 1.52 | | | $ | — | | | $ | — | | | $ | — | | | $ | — | | | $ | — | | | $ | 11.66 | | | | 14.99 | % | | $ | 3.2 | | | | 4.84 | %e | | | 4.79 | % | | | 1.63 | %e | | | 1.59 | % | | | 0.50 | %e | | | 113 | %c | | | 101 | %c | |
10/31/2016 | | $ | 10.18 | | | $ | (0.01 | ) | | $ | (0.01 | ) | | $ | (0.02 | ) | | $ | — | | | $ | (0.02 | ) | | $ | — | | | $ | (0.02 | ) | | $ | — | | | $ | 10.14 | | | | (0.19 | )% | | $ | 4.7 | | | | 5.26 | % | | | 4.74 | % | | | 2.24 | % | | | 1.71 | % | | | (0.10 | )% | | | 176 | %c | | | 174 | %c | |
10/31/2015 | | $ | 10.60 | | | $ | (0.06 | ) | | $ | (0.18 | ) | | $ | (0.24 | ) | | $ | (0.18 | ) | | $ | (0.00 | ) | | $ | — | | | $ | (0.18 | ) | | $ | — | | | $ | 10.18 | | | | (2.29 | )% | | $ | 6.6 | | | | 4.45 | % | | | 4.10 | % | | | 2.14 | % | | | 1.79 | % | | | (0.57 | )% | | | 195 | %c | | | 185 | %c | |
10/31/2014 | | $ | 11.43 | | | $ | (0.25 | ) | | $ | 0.30 | | | $ | 0.05 | | | $ | (0.88 | ) | | $ | — | | | $ | — | | | $ | (0.88 | ) | | $ | 0.00 | | | $ | 10.60 | | | | 0.30 | %f | | $ | 7.0 | | | | 4.46 | % | | | 3.95 | % | | | 2.63 | % | | | 2.11 | % | | | (2.27 | )% | | | 228 | % | | | 216 | % | |
Hedged Option Premium Strategy Fund | |
Institutional Class | |
10/31/2018 | | $ | 25.41 | | | $ | 0.24 | | | $ | (1.43 | ) | | $ | (1.19 | ) | | $ | (0.22 | ) | | $ | (0.22 | ) | | $ | — | | | $ | (0.44 | ) | | $ | — | | | $ | 23.78 | | | | (4.74 | )% | | $ | 12.1 | | | | 2.83 | % | | | 2.83 | %Ø | | | 0.66 | % | | | 0.66 | %Ø | | | 0.99 | % | | | 13 | % | | | 13 | %Ø | |
Period from
4/12/2017^
to 10/31/2017 | | $ | 25.00 | | | $ | 0.09 | | | $ | 0.39 | | | $ | 0.48 | | | $ | (0.07 | ) | | $ | — | | | $ | — | | | $ | (0.07 | ) | | $ | — | | | $ | 25.41 | | | | 1.92 | %* | | $ | 8.6 | | | | 6.75 | %‡** | | | 6.75 | %؇** | | | 0.65 | %‡** | | | 0.65 | %؇** | | | 0.62 | %‡** | | | 0 | %* | | | 0 | %Ø* | |
See Notes to Financial Highlights
222
223
Financial Highlights (cont'd)
| | | Net Asset
Value,
Beginning
of Year | | Net
Investment
Income
(Loss)@ | | Net Gains
or
Losses on
Securities
(both
realized
and
unrealized) | | Total From
Investment
Operations | | Dividends
from Net
Investment
Income | | Distributions
from Net
Realized
Capital
Gains | | Tax
Return
of
Capital | | Total
Distributions | | Voluntary
Contribution
from
Management | | Net Asset
Value,
End of
Year | | Total
Returna | | Net Assets,
End of
Year
(in millions) | | Ratio
of Gross
Expenses to
Average
Net
Assets# | | Ratio
of Gross
Expenses
to Average
Net Assets
(excluding
dividend
and interest
expense
relating to
short sales
and reverse
repurchase
agreements)# | | Ratio
of Net
Expenses to
Average
Net
Assets | | Ratio
of Net
Expenses
to Average
Net Assets
(excluding
dividend
and interest
expense
relating to
short sales
and reverse
repurchase
agreements) | | Ratio
of Net
Investment
Income/
(Loss)
to
Average
Net
Assets | | Portfolio
Turnover
Rate
(including
securities
sold
short) | | Portfolio
Turnover
Rate
(excluding
securities
sold
short) | |
Hedged Option Premium Strategy Fund (cont'd) | |
Class A | |
10/31/2018 | | $ | 25.41 | | | $ | 0.15 | | | $ | (1.44 | ) | | $ | (1.29 | ) | | $ | (0.13 | ) | | $ | (0.22 | ) | | $ | — | | | $ | (0.35 | ) | | $ | — | | | $ | 23.77 | | | | (5.12 | )% | | $ | 0.0 | | | | 3.23 | % | | | 3.23 | %Ø | | | 1.01 | % | | | 1.01 | %Ø | | | 0.61 | % | | | 13 | % | | | 13 | %Ø | |
Period from
4/12/2017^
to 10/31/2017 | | $ | 25.00 | | | $ | 0.03 | | | $ | 0.41 | | | $ | 0.44 | | | $ | (0.03 | ) | | $ | — | | | $ | — | | | $ | (0.03 | ) | | $ | — | | | $ | 25.41 | | | | 1.74 | %* | | $ | 0.0 | | | | 7.39 | %‡** | | | 7.39 | %؇** | | | 1.01 | %‡** | | | 1.01 | %؇** | | | 0.24 | %‡** | | | 0 | %* | | | 0 | %Ø* | |
Class C | |
10/31/2018 | | $ | 25.33 | | | $ | (0.03 | ) | | $ | (1.44 | ) | | $ | (1.47 | ) | | $ | (0.01 | ) | | $ | (0.22 | ) | | $ | — | | | $ | (0.23 | ) | | $ | — | | | $ | 23.63 | | | | (5.84 | )% | | $ | 0.0 | | | | 4.00 | % | | | 4.00 | %Ø | | | 1.76 | % | | | 1.76 | %Ø | | | (0.14 | )% | | | 13 | % | | | 13 | %Ø | |
Period from
4/12/2017^
to 10/31/2017 | | $ | 25.00 | | | $ | (0.07 | ) | | $ | 0.40 | | | $ | 0.33 | | | $ | — | | | $ | — | | | $ | — | | | $ | — | | | $ | — | | | $ | 25.33 | | | | 1.32 | %* | | $ | 0.0 | | | | 8.10 | %‡** | | | 8.10 | %؇** | | | 1.76 | %‡** | | | 1.76 | %؇** | | | (0.50 | )%‡** | | | 0 | %* | | | 0 | %Ø* | |
Class R6 | |
10/31/2018 | | $ | 25.41 | | | $ | 0.25 | | | $ | (1.43 | ) | | $ | (1.18 | ) | | $ | (0.24 | ) | | $ | (0.22 | ) | | $ | — | | | $ | (0.46 | ) | | $ | — | | | $ | 23.77 | | | | (4.71 | )% | | $ | 1.9 | | | | 2.79 | % | | | 2.79 | %Ø | | | 0.59 | % | | | 0.59 | %Ø | | | 1.04 | % | | | 13 | % | | | 13 | %Ø | |
Period from
4/12/2017^
to 10/31/2017 | | $ | 25.00 | | | $ | 0.09 | | | $ | 0.40 | | | $ | 0.49 | | | $ | (0.08 | ) | | $ | — | | | $ | — | | | $ | (0.08 | ) | | $ | — | | | $ | 25.41 | | | | 1.95 | %* | | $ | 2.0 | | | | 6.69 | %‡** | | | 6.69 | %؇** | | | 0.58 | %‡** | | | 0.58 | %؇** | | | 0.67 | %‡** | | | 0 | %* | | | 0 | %Ø* | |
Long Short Fund | |
Institutional Class | |
10/31/2018 | | $ | 14.21 | | | $ | 0.03 | | | $ | 0.30 | | | $ | 0.33 | | | $ | — | | | $ | — | | | $ | — | | | $ | — | | | $ | — | | | $ | 14.54 | | | | 2.32 | %d | | $ | 2,847.3 | | | | 1.60 | % | | | 1.31 | % | | | 1.60 | % | | | 1.31 | % | | | 0.23 | % | | | 83 | % | | | 69 | % | |
10/31/2017 | | $ | 12.74 | | | $ | 0.02 | | | $ | 1.45 | | | $ | 1.47 | | | $ | — | | | $ | — | | | $ | — | | | $ | — | | | $ | 0.00 | | | $ | 14.21 | | | | 11.54 | %gh | | $ | 2,853.0 | | | | 1.80 | % | | | 1.33 | % | | | 1.80 | %i | | | 1.32 | %i | | | 0.12 | %i | | | 80 | % | | | 64 | % | |
10/31/2016 | | $ | 12.76 | | | $ | (0.03 | ) | | $ | 0.01 | | | $ | (0.02 | ) | | $ | (0.00 | ) | | $ | — | | | $ | — | | | $ | (0.00 | ) | | $ | — | | | $ | 12.74 | | | | (0.14 | )% | | $ | 2,074.7 | | | | 1.91 | % | | | 1.33 | % | | | 1.91 | % | | | 1.33 | % | | | (0.22 | )% | | | 86 | % | | | 72 | % | |
10/31/2015 | | $ | 13.02 | | | $ | 0.02 | | | $ | (0.21 | ) | | $ | (0.19 | ) | | $ | (0.02 | ) | | $ | (0.05 | ) | | $ | — | | | $ | (0.07 | ) | | $ | — | | | $ | 12.76 | | | | (1.45 | )% | | $ | 2,719.8 | | | | 1.66 | % | | | 1.31 | % | | | 1.66 | % | | | 1.31 | % | | | 0.16 | % | | | 91 | % | | | 69 | % | |
10/31/2014 | | $ | 12.48 | | | $ | 0.02 | | | $ | 0.58 | | | $ | 0.60 | | | $ | — | | | $ | (0.06 | ) | | $ | — | | | $ | (0.06 | ) | | $ | 0.00 | | | $ | 13.02 | | | | 4.83 | %f | | $ | 2,627.8 | | | | 1.72 | % | | | 1.48 | % | | | 1.72 | % | | | 1.48 | % | | | 0.17 | % | | | 61 | % | | | 44 | % | |
Class A | |
| 10/31/2018j | | $ | 14.26 | | | $ | (0.02 | ) | | $ | 0.30 | | | $ | 0.28 | | | $ | — | | | $ | — | | | $ | — | | | $ | — | | | $ | — | | | $ | 14.54 | | | | 2.01 | %d | | $ | 105.9 | | | | 1.96 | % | | | 1.67 | % | | | 1.96 | % | | | 1.67 | % | | | (0.13 | )% | | | 83 | % | | | 69 | % | |
| 10/31/2017j | | $ | 12.83 | | | $ | (0.02 | ) | | $ | 1.45 | | | $ | 1.43 | | | $ | — | | | $ | — | | | $ | — | | | $ | — | | | $ | 0.00 | | | $ | 14.26 | | | | 11.15 | %h | | $ | 145.6 | | | | 2.16 | % | | | 1.68 | % | | | 2.16 | %i | | | 1.68 | %i | | | (0.18 | )%i | | | 80 | % | | | 64 | % | |
| 10/31/2016j | | $ | 12.89 | | | $ | (0.07 | ) | | $ | 0.01 | | | $ | (0.06 | ) | | $ | — | | | $ | — | | | $ | — | | | $ | — | | | $ | — | | | $ | 12.83 | | | | (0.48 | )% | | $ | 206.4 | | | | 2.28 | % | | | 1.69 | % | | | 2.28 | % | | | 1.69 | % | | | (0.59 | )% | | | 86 | % | | | 72 | % | |
| 10/31/2015j | | $ | 13.18 | | | $ | (0.03 | ) | | $ | (0.21 | ) | | $ | (0.24 | ) | | $ | — | | | $ | (0.05 | ) | | $ | — | | | $ | (0.05 | ) | | $ | — | | | $ | 12.89 | | | | (1.89 | )% | | $ | 361.7 | | | | 2.03 | % | | | 1.68 | % | | | 2.03 | % | | | 1.68 | % | | | (0.20 | )% | | | 91 | % | | | 69 | % | |
| 10/31/2014j | | $ | 12.67 | | | $ | (0.03 | ) | | $ | 0.59 | | | $ | 0.56 | | | $ | — | | | $ | (0.05 | ) | | $ | — | | | $ | (0.05 | ) | | $ | 0.00 | | | $ | 13.18 | | | | 4.47 | %f | | $ | 388.6 | | | | 2.09 | % | | | 1.85 | % | | | 2.09 | % | | | 1.85 | % | | | (0.20 | )% | | | 61 | % | | | 44 | % | |
See Notes to Financial Highlights
224
225
Financial Highlights (cont'd)
| | | Net Asset
Value,
Beginning
of Year | | Net
Investment
Income
(Loss)@ | | Net Gains
or
Losses on
Securities
(both
realized
and
unrealized) | | Total From
Investment
Operations | | Dividends
from Net
Investment
Income | | Distributions
from Net
Realized
Capital
Gains | | Tax
Return
of
Capital | | Total
Distributions | | Voluntary
Contribution
from
Management | | Net Asset
Value,
End of
Year | | Total
Returna | | Net Assets,
End of
Year
(in millions) | | Ratio
of Gross
Expenses to
Average
Net
Assets# | | Ratio
of Gross
Expenses
to Average
Net Assets
(excluding
dividend
and interest
expense
relating to
short sales
and reverse
repurchase
agreements)# | | Ratio
of Net
Expenses to
Average
Net
Assets | | Ratio
of Net
Expenses
to Average
Net Assets
(excluding
dividend
and interest
expense
relating to
short sales
and reverse
repurchase
agreements) | | Ratio
of Net
Investment
Income/
(Loss)
to
Average
Net
Assets | | Portfolio
Turnover
Rate
(including
securities
sold
short) | | Portfolio
Turnover
Rate
(excluding
securities
sold
short) | |
Long Short Fund (cont'd) | |
Class C | |
| 10/31/2018j | | $ | 14.34 | | | $ | (0.13 | ) | | $ | 0.32 | | | $ | 0.19 | | | $ | — | | | $ | — | | | $ | — | | | $ | — | | | $ | — | | | $ | 14.53 | | | | 1.27 | %d | | $ | 77.6 | | | | 2.71 | % | | | 2.42 | % | | | 2.71 | % | | | 2.42 | % | | | (0.88 | )% | | | 83 | % | | | 69 | % | |
| 10/31/2017j | | $ | 13.00 | | | $ | (0.13 | ) | | $ | 1.47 | | | $ | 1.34 | | | $ | — | | | $ | — | | | $ | — | | | $ | — | | | $ | 0.00 | | | $ | 14.34 | | | | 10.31 | %gh | | $ | 92.7 | | | | 2.90 | % | | | 2.43 | % | | | 2.90 | %i | | | 2.43 | %i | | | (0.94 | )%i | | | 80 | % | | | 64 | % | |
| 10/31/2016j | | $ | 13.18 | | | $ | (0.18 | ) | | $ | 0.00 | | | $ | (0.18 | ) | | $ | — | | | $ | — | | | $ | — | | | $ | — | | | $ | — | | | $ | 13.00 | | | | (1.30 | )% | | $ | 117.3 | | | | 3.02 | % | | | 2.44 | % | | | 3.02 | % | | | 2.44 | % | | | (1.33 | )% | | | 86 | % | | | 72 | % | |
| 10/31/2015j | | $ | 13.57 | | | $ | (0.13 | ) | | $ | (0.21 | ) | | $ | (0.34 | ) | | $ | — | | | $ | (0.05 | ) | | $ | — | | | $ | (0.05 | ) | | $ | — | | | $ | 13.18 | | | | (2.56 | )% | | $ | 190.6 | | | | 2.77 | % | | | 2.42 | % | | | 2.77 | % | | | 2.42 | % | | | (0.94 | )% | | | 91 | % | | | 69 | % | |
| 10/31/2014j | | $ | 13.14 | | | $ | (0.13 | ) | | $ | 0.61 | | | $ | 0.48 | | | $ | — | | | $ | (0.05 | ) | | $ | — | | | $ | (0.05 | ) | | $ | 0.00 | | | $ | 13.57 | | | | 3.71 | %f | | $ | 211.0 | | | | 2.84 | % | | | 2.60 | % | | | 2.84 | % | | | 2.60 | % | | | (0.94 | )% | | | 61 | % | | | 44 | % | |
Long Short Credit Fund | |
Institutional Class | |
10/31/2018 | | $ | 9.65 | | | $ | 0.47 | | | $ | (0.57 | ) | | $ | (0.10 | ) | | $ | (0.37 | ) | | $ | — | | | $ | (0.03 | ) | | $ | (0.40 | ) | | $ | — | | | $ | 9.15 | | | | (1.00 | )% | | $ | 8.5 | | | | 2.77 | % | | | 2.39 | % | | | 1.36 | % | | | 0.98 | % | | | 5.01 | % | | | 91 | % | | | 91 | %Ø | |
10/31/2017 | | $ | 9.53 | | | $ | 0.37 | | | $ | 0.13 | | | $ | 0.50 | | | $ | (0.38 | ) | | $ | — | | | $ | — | | | $ | (0.38 | ) | | $ | — | | | $ | 9.65 | | | | 5.36 | % | | $ | 15.7 | | | | 2.23 | % | | | 2.19 | %Ø | | | 1.24 | % | | | 1.21 | %Ø | | | 3.84 | % | | | 123 | % | | | 123 | %Ø | |
10/31/2016 | | $ | 9.75 | | | $ | 0.15 | | | $ | (0.18 | ) | | $ | (0.03 | ) | | $ | (0.19 | ) | | $ | — | | | $ | — | | | $ | (0.19 | ) | | $ | — | | | $ | 9.53 | | | | (0.28 | )% | | $ | 22.3 | | | | 3.22 | % | | | 2.36 | % | | | 1.97 | % | | | 1.10 | % | | | 1.54 | % | | | 190 | % | | | 197 | % | |
Period from
6/29/2015^
to 10/31/2015 | | $ | 10.00 | | | $ | 0.02 | | | $ | (0.23 | ) | | $ | (0.21 | ) | | $ | (0.04 | ) | | $ | — | | | $ | — | | | $ | (0.04 | ) | | $ | — | | | $ | 9.75 | | | | (2.06 | )%* | | $ | 22.8 | | | | 3.50 | %‡** | | | 3.45 | %‡** | | | 1.21 | %‡** | | | 1.15 | %‡** | | | 0.64 | %‡** | | | 32 | %* | | | 18 | %* | |
Class A | |
10/31/2018 | | $ | 9.65 | | | $ | 0.43 | | | $ | (0.57 | ) | | $ | (0.14 | ) | | $ | (0.33 | ) | | $ | — | | | $ | (0.03 | ) | | $ | (0.36 | ) | | $ | — | | | $ | 9.15 | | | | (1.43 | )% | | $ | 2.0 | | | | 3.19 | % | | | 2.81 | % | | | 1.73 | % | | | 1.36 | % | | | 4.61 | % | | | 91 | % | | | 91 | %Ø | |
10/31/2017 | | $ | 9.53 | | | $ | 0.34 | | | $ | 0.13 | | | $ | 0.47 | | | $ | (0.35 | ) | | $ | — | | | $ | — | | | $ | (0.35 | ) | | $ | — | | | $ | 9.65 | | | | 4.98 | % | | $ | 3.0 | | | | 2.68 | % | | | 2.63 | %Ø | | | 1.62 | % | | | 1.58 | %Ø | | | 3.52 | % | | | 123 | % | | | 123 | %Ø | |
10/31/2016 | | $ | 9.75 | | | $ | 0.11 | | | $ | (0.17 | ) | | $ | (0.06 | ) | | $ | (0.16 | ) | | $ | — | | | $ | — | | | $ | (0.16 | ) | | $ | — | | | $ | 9.53 | | | | (0.55 | )% | | $ | 1.0 | | | | 3.72 | % | | | 2.82 | % | | | 2.29 | % | | | 1.40 | % | | | 1.16 | % | | | 190 | % | | | 197 | % | |
Period from
6/29/2015^
to 10/31/2015 | | $ | 10.00 | | | $ | 0.01 | | | $ | (0.23 | ) | | $ | (0.22 | ) | | $ | (0.03 | ) | | $ | — | | | $ | — | | | $ | (0.03 | ) | | $ | — | | | $ | 9.75 | | | | (2.17 | )%* | | $ | 1.3 | | | | 4.28 | %‡** | | | 4.23 | %‡** | | | 1.55 | %‡** | | | 1.50 | %‡** | | | 0.28 | %‡** | | | 32 | %* | | | 18 | %* | |
Class C | |
10/31/2018 | | $ | 9.64 | | | $ | 0.36 | | | $ | (0.56 | ) | | $ | (0.20 | ) | | $ | (0.28 | ) | | $ | — | | | $ | (0.03 | ) | | $ | (0.31 | ) | | $ | — | | | $ | 9.13 | | | | (2.14 | )% | | $ | 1.1 | | | | 3.97 | % | | | 3.59 | % | | | 2.44 | % | | | 2.06 | % | | | 3.85 | % | | | 91 | % | | | 91 | %Ø | |
10/31/2017 | | $ | 9.53 | | | $ | 0.26 | | | $ | 0.12 | | | $ | 0.38 | | | $ | (0.27 | ) | | $ | — | | | $ | — | | | $ | (0.27 | ) | | $ | — | | | $ | 9.64 | | | | 4.10 | % | | $ | 1.0 | | | | 3.40 | % | | | 3.36 | %Ø | | | 2.37 | % | | | 2.33 | %Ø | | | 2.74 | % | | | 123 | % | | | 123 | %Ø | |
10/31/2016 | | $ | 9.75 | | | $ | 0.06 | | | $ | (0.17 | ) | | $ | (0.11 | ) | | $ | (0.11 | ) | | $ | — | | | $ | — | | | $ | (0.11 | ) | | $ | — | | | $ | 9.53 | | | | (1.10 | )% | | $ | 1.0 | | | | 4.30 | % | | | 3.47 | % | | | 2.85 | % | | | 2.02 | % | | | 0.64 | % | | | 190 | % | | | 197 | % | |
Period from
6/29/2015^
to 10/31/2015 | | $ | 10.00 | | | $ | (0.01 | ) | | $ | (0.23 | ) | | $ | (0.24 | ) | | $ | (0.01 | ) | | $ | — | | | $ | — | | | $ | (0.01 | ) | | $ | — | | | $ | 9.75 | | | | (2.41 | )%* | | $ | 1.0 | | | | 5.04 | %‡** | | | 4.98 | %‡** | | | 2.26 | %‡** | | | 2.20 | %‡** | | | (0.43 | )%‡** | | | 32 | % | | | 18 | %* | |
See Notes to Financial Highlights
226
227
Financial Highlights (cont'd)
| | | Net Asset
Value,
Beginning
of Year | | Net
Investment
Income
(Loss)@ | | Net Gains
or
Losses on
Securities
(both
realized
and
unrealized) | | Total From
Investment
Operations | | Dividends
from Net
Investment
Income | | Distributions
from Net
Realized
Capital
Gains | | Tax
Return
of
Capital | | Total
Distributions | | Voluntary
Contribution
from
Management | | Net Asset
Value,
End of
Year | | Total
Returna | | Net Assets,
End of
Year
(in millions) | | Ratio
of Gross
Expenses to
Average
Net
Assets# | | Ratio
of Gross
Expenses
to Average
Net Assets
(excluding
dividend
and interest
expense
relating to
short sales
and reverse
repurchase
agreements)# | | Ratio
of Net
Expenses to
Average
Net
Assets | | Ratio
of Net
Expenses
to Average
Net Assets
(excluding
dividend
and interest
expense
relating to
short sales
and reverse
repurchase
agreements) | | Ratio
of Net
Investment
Income/
(Loss)
to
Average
Net
Assets | | Portfolio
Turnover
Rate
(including
securities
sold
short) | | Portfolio
Turnover
Rate
(excluding
securities
sold
short) | |
Long Short Credit Fund (cont'd) | |
Class R6 | |
10/31/2018 | | $ | 9.65 | | | $ | 0.47 | | | $ | (0.56 | ) | | $ | (0.09 | ) | | $ | (0.38 | ) | | $ | — | | | $ | (0.03 | ) | | $ | (0.41 | ) | | $ | — | | | $ | 9.15 | | | | (0.93 | )% | | $ | 4.7 | | | | 2.73 | % | | | 2.37 | % | | | 1.25 | % | | | 0.90 | % | | | 4.99 | % | | | 91 | % | | | 91 | %Ø | |
10/31/2017 | | $ | 9.54 | | | $ | 0.38 | | | $ | 0.12 | | | $ | 0.50 | | | $ | (0.39 | ) | | $ | — | | | $ | — | | | $ | (0.39 | ) | | $ | — | | | $ | 9.65 | | | | 5.33 | % | | $ | 6.0 | | | | 2.20 | % | | | 2.16 | %Ø | | | 1.18 | % | | | 1.14 | %Ø | | | 3.93 | % | | | 123 | % | | | 123 | %Ø | |
10/31/2016 | | $ | 9.75 | | | $ | 0.16 | | | $ | (0.18 | ) | | $ | (0.02 | ) | | $ | (0.19 | ) | | $ | — | | | $ | — | | | $ | (0.19 | ) | | $ | — | | | $ | 9.54 | | | | (0.12 | )% | | $ | 6.1 | | | | 3.05 | % | | | 2.26 | % | | | 1.83 | % | | | 1.04 | % | | | 1.71 | % | | | 190 | % | | | 197 | % | |
Period from
6/29/2015^
to 10/31/2015 | | $ | 10.00 | | | $ | 0.02 | | | $ | (0.22 | ) | | $ | (0.20 | ) | | $ | (0.05 | ) | | $ | — | | | $ | — | | | $ | (0.05 | ) | | $ | — | | | $ | 9.75 | | | | (2.03 | )%* | | $ | 4.9 | | | | 3.49 | %‡** | | | 3.44 | %‡** | | | 1.14 | %‡** | | | 1.08 | %‡** | | | 0.69 | %‡** | | | 32 | %* | | | 18 | %* | |
Multi-Asset Income Fund | |
Institutional Class | |
10/31/2018 | | $ | 10.18 | | | $ | 0.33 | | | $ | (0.51 | ) | | $ | (0.18 | ) | | $ | (0.35 | ) | | $ | — | | | $ | (0.07 | ) | | $ | (0.42 | ) | | $ | — | | | $ | 9.58 | | | | (1.92 | )% | | $ | 17.7 | | | | 2.56 | % | | | 2.56 | %Ø | | | 0.55 | % | | | 0.55 | %Ø | | | 3.29 | % | | | 74 | % | | | 74 | %cØ | |
10/31/2017 | | $ | 9.60 | | | $ | 0.32 | | | $ | 0.62 | | | $ | 0.94 | | | $ | (0.35 | ) | | $ | — | | | $ | (0.01 | ) | | $ | (0.36 | ) | | $ | — | | | $ | 10.18 | | | | 9.93 | % | | $ | 17.3 | | | | 3.03 | % | | | 3.03 | %Ø | | | 0.50 | % | | | 0.50 | %Ø | | | 3.28 | % | | | 84 | % | | | 84 | %cØ | |
10/31/2016 | | $ | 9.43 | | | $ | 0.31 | | | $ | 0.25 | | | $ | 0.56 | | | $ | (0.30 | ) | | $ | — | | | $ | (0.09 | ) | | $ | (0.39 | ) | | $ | — | | | $ | 9.60 | | | | 6.09 | % | | $ | 12.4 | | | | 3.86 | % | | | 3.86 | %Ø | | | 0.44 | % | | | 0.44 | %Ø | | | 3.33 | % | | | 94 | % | | | 94 | %Ø | |
Period from
3/27/2015^
to 10/31/2015 | | $ | 10.00 | | | $ | 0.23 | | | $ | (0.57 | ) | | $ | (0.34 | ) | | $ | (0.23 | ) | | $ | — | | | $ | — | | | $ | (0.23 | ) | | $ | — | | | $ | 9.43 | | | | (3.43 | )%* | | $ | 10.6 | | | | 3.66 | %‡** | | | 3.66 | %؇** | | | 0.43 | %‡** | | | 0.43 | %؇** | | | 3.87 | %‡** | | | 33 | %* | | | 33 | %Ø* | |
Class A | |
10/31/2018 | | $ | 10.18 | | | $ | 0.29 | | | $ | (0.51 | ) | | $ | (0.22 | ) | | $ | (0.31 | ) | | $ | — | | | $ | (0.07 | ) | | $ | (0.38 | ) | | $ | — | | | $ | 9.58 | | | | (2.28 | )% | | $ | 0.7 | | | | 2.97 | % | | | 2.97 | %Ø | | | 0.92 | % | | | 0.92 | %Ø | | | 2.94 | % | | | 74 | % | | | 74 | %cØ | |
10/31/2017 | | $ | 9.60 | | | $ | 0.29 | | | $ | 0.61 | | | $ | 0.90 | | | $ | (0.31 | ) | | $ | — | | | $ | (0.01 | ) | | $ | (0.32 | ) | | $ | — | | | $ | 10.18 | | | | 9.53 | % | | $ | 0.6 | | | | 3.47 | % | | | 3.47 | %Ø | | | 0.86 | % | | | 0.86 | %Ø | | | 2.90 | % | | | 84 | % | | | 84 | %cØ | |
10/31/2016 | | $ | 9.43 | | | $ | 0.28 | | | $ | 0.24 | | | $ | 0.52 | | | $ | (0.26 | ) | | $ | — | | | $ | (0.09 | ) | | $ | (0.35 | ) | | $ | — | | | $ | 9.60 | | | | 5.70 | % | | $ | 0.6 | | | | 4.27 | % | | | 4.27 | %Ø | | | 0.81 | % | | | 0.81 | %Ø | | | 2.98 | % | | | 94 | % | | | 94 | %Ø | |
Period from
3/27/2015^
to 10/31/2015 | | $ | 10.00 | | | $ | 0.20 | | | $ | (0.56 | ) | | $ | (0.36 | ) | | $ | (0.21 | ) | | $ | — | | | $ | — | | | $ | (0.21 | ) | | $ | — | | | $ | 9.43 | | | | (3.64 | )%* | | $ | 0.5 | | | | 4.55 | %‡** | | | 4.55 | %؇** | | | 0.79 | %‡** | | | 0.79 | %؇** | | | 3.50 | %‡** | | | 33 | %* | | | 33 | %Ø* | |
See Notes to Financial Highlights
228
229
Financial Highlights (cont'd)
| | | Net Asset
Value,
Beginning
of Year | | Net
Investment
Income
(Loss)@ | | Net Gains
or
Losses on
Securities
(both
realized
and
unrealized) | | Total From
Investment
Operations | | Dividends
from Net
Investment
Income | �� | Distributions
from Net
Realized
Capital
Gains | | Tax
Return
of
Capital | | Total
Distributions | | Voluntary
Contribution
from
Management | | Net Asset
Value,
End of
Year | | Total
Returna | | Net Assets,
End of
Year
(in millions) | | Ratio
of Gross
Expenses to
Average
Net
Assets# | | Ratio
of Gross
Expenses
to Average
Net Assets
(excluding
dividend
and interest
expense
relating to
short sales
and reverse
repurchase
agreements)# | | Ratio
of Net
Expenses to
Average
Net
Assets | | Ratio
of Net
Expenses
to Average
Net Assets
(excluding
dividend
and interest
expense
relating to
short sales
and reverse
repurchase
agreements) | | Ratio
of Net
Investment
Income/
(Loss)
to
Average
Net
Assets | | Portfolio
Turnover
Rate
(including
securities
sold
short) | | Portfolio
Turnover
Rate
(excluding
securities
sold
short) | |
Multi-Asset Income Fund (cont'd) | |
Class C | |
10/31/2018 | | $ | 10.18 | | | $ | 0.22 | | | $ | (0.52 | ) | | $ | (0.30 | ) | | $ | (0.23 | ) | | $ | — | | | $ | (0.07 | ) | | $ | (0.30 | ) | | $ | — | | | $ | 9.58 | | | | (3.02 | )% | | $ | 0.6 | | | | 3.69 | % | | | 3.69 | %Ø | | | 1.67 | % | | | 1.67 | %Ø | | | 2.17 | % | | | 74 | % | | | 74 | %cØ | |
10/31/2017 | | $ | 9.60 | | | $ | 0.21 | | | $ | 0.62 | | | $ | 0.83 | | | $ | (0.24 | ) | | $ | — | | | $ | (0.01 | ) | | $ | (0.25 | ) | | $ | — | | | $ | 10.18 | | | | 8.71 | % | | $ | 0.7 | | | | 4.16 | % | | | 4.16 | %Ø | | | 1.62 | % | | | 1.62 | %Ø | | | 2.15 | % | | | 84 | % | | | 84 | %cØ | |
10/31/2016 | | $ | 9.43 | | | $ | 0.20 | | | $ | 0.25 | | | $ | 0.45 | | | $ | (0.19 | ) | | $ | — | | | $ | (0.09 | ) | | $ | (0.28 | ) | | $ | — | | | $ | 9.60 | | | | 4.91 | % | | $ | 0.6 | | | | 4.99 | % | | | 4.99 | %Ø | | | 1.56 | % | | | 1.56 | %Ø | | | 2.20 | % | | | 94 | % | | | 94 | %Ø | |
Period from
3/27/2015^
to 10/31/2015 | | $ | 10.00 | | | $ | 0.16 | | | $ | (0.56 | ) | | $ | (0.40 | ) | | $ | (0.17 | ) | | $ | — | | | $ | — | | | $ | (0.17 | ) | | $ | — | | | $ | 9.43 | | | | (4.07 | )%* | | $ | 0.5 | | | | 5.29 | %‡** | | | 5.29 | %؇** | | | 1.53 | %‡** | | | 1.53 | %؇** | | | 2.76 | %‡** | | | 33 | %* | | | 33 | %Ø* | |
Class R6 | |
10/31/2018 | | $ | 10.18 | | | $ | 0.34 | | | $ | (0.52 | ) | | $ | (0.18 | ) | | $ | (0.35 | ) | | $ | — | | | $ | (0.07 | ) | | $ | (0.42 | ) | | $ | — | | | $ | 9.58 | | | | (1.86 | )% | | $ | 3.9 | | | | 2.49 | % | | | 2.49 | %Ø | | | 0.48 | % | | | 0.48 | %Ø | | | 3.36 | % | | | 74 | % | | | 74 | %cØ | |
10/31/2017 | | $ | 9.60 | | | $ | 0.33 | | | $ | 0.61 | | | $ | 0.94 | | | $ | (0.35 | ) | | $ | — | | | $ | (0.01 | ) | | $ | (0.36 | ) | | $ | — | | | $ | 10.18 | | | | 10.01 | % | | $ | 4.1 | | | | 2.97 | % | | | 2.97 | %Ø | | | 0.42 | % | | | 0.42 | %Ø | | | 3.34 | % | | | 84 | % | | | 84 | %cØ | |
10/31/2016 | | $ | 9.43 | | | $ | 0.32 | | | $ | 0.24 | | | $ | 0.56 | | | $ | (0.30 | ) | | $ | — | | | $ | (0.09 | ) | | $ | (0.39 | ) | | $ | — | | | $ | 9.60 | | | | 6.16 | % | | $ | 3.9 | | | | 3.78 | % | | | 3.78 | %Ø | | | 0.37 | % | | | 0.37 | %Ø | | | 3.42 | % | | | 94 | % | | | 94 | %Ø | |
Period from
3/27/2015^
to 10/31/2015 | | $ | 10.00 | | | $ | 0.23 | | | $ | (0.57 | ) | | $ | (0.34 | ) | | $ | (0.23 | ) | | $ | — | | | $ | — | | | $ | (0.23 | ) | | $ | — | | | $ | 9.43 | | | | (3.39 | )%* | | $ | 3.8 | | | | 3.63 | %‡** | | | 3.63 | %؇** | | | 0.36 | %‡** | | | 0.36 | %؇** | | | 3.93 | %‡** | | | 33 | %* | | | 33 | %Ø* | |
| Multi-Style Premia Fundb | |
Institutional Class | |
5/18/2018^
to 10/31/2018 | | $ | 25.00 | | | $ | 0.10 | | | $ | (0.39 | ) | | $ | (0.29 | ) | | $ | — | | | $ | — | | | $ | — | | | $ | — | | | $ | — | | | $ | 24.71 | | | | (1.16 | )%* | | $ | 15.4 | | | | 5.05 | %‡** | | | 5.05 | %؇** | | | 0.95 | %‡** | | | 0.95 | %؇** | | | 0.87 | %‡** | | | 31 | %* | | | 31 | %Ø* | |
Class A | |
5/18/2018^
to 10/31/2018 | | $ | 25.00 | | | $ | 0.06 | | | $ | (0.39 | ) | | $ | (0.33 | ) | | $ | — | | | $ | — | | | $ | — | | | $ | — | | | $ | — | | | $ | 24.67 | | | | (1.32 | )%* | | $ | 0.0 | | | | 5.87 | %‡** | | | 5.87 | %؇** | | | 1.31 | %‡** | | | 1.31 | %؇** | | | 0.57 | %‡** | | | 31 | %* | | | 31 | %Ø* | |
Class C | |
5/18/2018^
to 10/31/2018 | | $ | 25.00 | | | $ | (0.02 | ) | | $ | (0.39 | ) | | $ | (0.41 | ) | | $ | — | | | $ | — | | | $ | — | | | $ | — | | | $ | — | | | $ | 24.59 | | | | (1.64 | )%* | | $ | 0.0 | | | | 6.62 | %‡** | | | 6.62 | %؇** | | | 2.06 | %‡** | | | 2.06 | %؇** | | | (0.18 | )%‡** | | | 31 | %* | | | 31 | %Ø* | |
Class R6 | |
5/18/2018^
to 10/31/2018 | | $ | 25.00 | | | $ | 0.11 | | | $ | (0.39 | ) | | $ | (0.28 | ) | | $ | — | | | $ | — | | | $ | — | | | $ | — | | | $ | — | | | $ | 24.72 | | | | (1.12 | )%* | | $ | 0.0 | | | | 5.44 | %‡** | | | 5.44 | %؇** | | | 0.88 | %‡** | | | 0.88 | %؇** | | | 1.00 | %‡** | | | 31 | %* | | | 31 | %Ø* | |
See Notes to Financial Highlights
230
231
Financial Highlights (cont'd)
| | | Net Asset
Value,
Beginning
of Year | | Net
Investment
Income
(Loss)@ | | Net Gains
or
Losses on
Securities
(both
realized
and
unrealized) | | Total From
Investment
Operations | | Dividends
from Net
Investment
Income | | Distributions
from Net
Realized
Capital
Gains | | Tax
Return
of
Capital | | Total
Distributions | | Voluntary
Contribution
from
Management | | Net Asset
Value,
End of
Year | | Total
Returna | | Net Assets,
End of
Year
(in millions) | | Ratio
of Gross
Expenses to
Average
Net
Assets# | | Ratio
of Gross
Expenses
to Average
Net Assets
(excluding
dividend
and interest
expense
relating to
short sales
and reverse
repurchase
agreements)# | | Ratio
of Net
Expenses to
Average
Net
Assets | | Ratio
of Net
Expenses
to Average
Net Assets
(excluding
dividend
and interest
expense
relating to
short sales
and reverse
repurchase
agreements) | | Ratio
of Net
Investment
Income/
(Loss)
to
Average
Net
Assets | | Portfolio
Turnover
Rate
(including
securities
sold
short) | | Portfolio
Turnover
Rate
(excluding
securities
sold
short) | |
U.S. Equity Index PutWrite Strategy Fund | |
Institutional Class | |
10/31/2018 | | $ | 11.33 | | | $ | 0.12 | | | $ | (0.13 | ) | | $ | (0.01 | ) | | $ | (0.08 | ) | | $ | (0.59 | ) | | $ | — | | | $ | (0.67 | ) | | $ | — | | | $ | 10.65 | | | | (0.16 | )% | | $ | 217.6 | | | | 0.74 | % | | | 0.74 | %Ø | | | 0.65 | % | | | 0.65 | %Ø | | | 1.09 | % | | | 56 | % | | | 56 | % | |
10/31/2017 | | $ | 10.09 | | | $ | 0.05 | | | $ | 1.26 | | | $ | 1.31 | | | $ | (0.04 | ) | | $ | (0.03 | ) | | $ | — | | | $ | (0.07 | ) | | $ | — | | | $ | 11.33 | | | | 13.05 | % | | $ | 152.0 | | | | 0.98 | % | | | 0.98 | %Ø | | | 0.65 | % | | | 0.65 | %Ø | | | 0.49 | % | | | 0 | % | | | 0 | %Ø | |
Period from
9/16/2016^
to 10/31/2016 | | $ | 10.00 | | | $ | 0.00 | | | $ | 0.09 | | | $ | 0.09 | | | $ | — | | | $ | — | | | $ | — | | | $ | — | | | $ | — | | | $ | 10.09 | | | | 0.90 | %* | | $ | 21.2 | | | | 3.84 | %‡** | | | 3.84 | %؇** | | | 0.65 | %‡** | | | 0.65 | %؇** | | | 0.26 | %‡** | | | 0 | %* | | | 0 | %Ø* | |
Class A | |
10/31/2018 | | $ | 11.33 | | | $ | 0.11 | | | $ | (0.16 | ) | | $ | (0.05 | ) | | $ | (0.05 | ) | | $ | (0.59 | ) | | $ | — | | | $ | (0.64 | ) | | $ | — | | | $ | 10.64 | | | | (0.55 | )% | | $ | 18.4 | | | | 1.11 | % | | | 1.11 | %Ø | | | 1.01 | % | | | 1.01 | %Ø | | | 0.97 | % | | | 56 | % | | | 56 | % | |
10/31/2017 | | $ | 10.09 | | | $ | 0.01 | | | $ | 1.27 | | | $ | 1.28 | | | $ | (0.01 | ) | | $ | (0.03 | ) | | $ | — | | | $ | (0.04 | ) | | $ | — | | | $ | 11.33 | | | | 12.70 | % | | $ | 4.1 | | | | 1.35 | % | | | 1.35 | %Ø | | | 1.01 | % | | | 1.01 | %Ø | | | 0.13 | % | | | 0 | % | | | 0 | %Ø | |
Period from
9/16/2016^
to 10/31/2016 | | $ | 10.00 | | | $ | (0.00 | ) | | $ | 0.09 | | | $ | 0.09 | | | $ | — | | | $ | — | | | $ | — | | | $ | — | | | $ | — | | | $ | 10.09 | | | | 0.90 | %* | | $ | 0.4 | | | | 4.26 | %‡** | | | 4.26 | %؇** | | | 1.01 | %‡** | | | 1.01 | %؇** | | | (0.05 | )%‡** | | | 0 | %* | | | 0 | %Ø* | |
Class C | |
10/31/2018 | | $ | 11.24 | | | $ | (0.00 | ) | | $ | (0.13 | ) | | $ | (0.13 | ) | | $ | (0.01 | ) | | $ | (0.59 | ) | | $ | — | | | $ | (0.60 | ) | | $ | — | | | $ | 10.51 | | | | (1.30 | )% | | $ | 1.2 | | | | 1.89 | % | | | 1.89 | %Ø | | | 1.76 | % | | | 1.76 | %Ø | | | (0.04 | )% | | | 56 | % | | | 56 | % | |
10/31/2017 | | $ | 10.08 | | | $ | (0.07 | ) | | $ | 1.26 | | | $ | 1.19 | | | $ | — | | | $ | (0.03 | ) | | $ | — | | | $ | (0.03 | ) | | $ | — | | | $ | 11.24 | | | | 11.81 | % | | $ | 0.5 | | | | 2.12 | % | | | 2.12 | %Ø | | | 1.76 | % | | | 1.76 | %Ø | | | (0.63 | )% | | | 0 | % | | | 0 | %Ø | |
Period from
9/16/2016^
to 10/31/2016 | | $ | 10.00 | | | $ | (0.01 | ) | | $ | 0.09 | | | $ | 0.08 | | | $ | — | | | $ | — | | | $ | — | | | $ | — | | | $ | — | | | $ | 10.08 | | | | 0.80 | %* | | $ | 0.1 | | | | 5.10 | %‡** | | | 5.10 | %؇** | | | 1.76 | %‡** | | | 1.76 | %؇** | | | (0.86 | )%‡** | | | 0 | %* | | | 0 | %Ø* | |
Class R6 | |
10/31/2018 | | $ | 11.34 | | | $ | 0.12 | | | $ | (0.12 | ) | | $ | 0.00 | | | $ | (0.09 | ) | | $ | (0.59 | ) | | $ | — | | | $ | (0.68 | ) | | $ | — | | | $ | 10.66 | | | | (0.09 | )% | | $ | 17.9 | | | | 0.68 | % | | | 0.68 | %Ø | | | 0.58 | % | | | 0.58 | %Ø | | | 1.12 | % | | | 56 | % | | | 56 | % | |
10/31/2017 | | $ | 10.10 | | | $ | 0.06 | | | $ | 1.26 | | | $ | 1.32 | | | $ | (0.05 | ) | | $ | (0.03 | ) | | $ | — | | | $ | (0.08 | ) | | $ | — | | | $ | 11.34 | | | | 13.08 | % | | $ | 12.2 | | | | 0.93 | % | | | 0.93 | %Ø | | | 0.58 | % | | | 0.58 | %Ø | | | 0.55 | % | | | 0 | % | | | 0 | %Ø | |
Period from
9/16/2016^
to 10/31/2016 | | $ | 10.00 | | | $ | 0.00 | | | $ | 0.10 | | | $ | 0.10 | | | $ | — | | | $ | — | | | $ | — | | | $ | — | | | $ | — | | | $ | 10.10 | | | | 1.00 | %* | | $ | 4.8 | | | | 3.77 | %‡** | | | 3.77 | %؇** | | | 0.58 | %‡** | | | 0.58 | %؇** | | | 0.26 | %‡** | | | 0 | %* | | | 0 | %Ø* | |
See Notes to Financial Highlights
232
233
Notes to Financial Highlights
@ Calculated based on the average number of shares outstanding during each fiscal period.
# Represents the annualized ratios of net expenses to average daily net assets if Management had not reimbursed certain expenses and/or waived a portion of the investment management fee and/or if certain Funds did not receive the Custodian Out-of-Pocket Expenses Refunded, as listed in Note G of the Notes to Financial Statements.
** Annualized.
^ The date investment operations commenced.
* Not annualized.
‡ Organization expense, which is a non-recurring expense, is included in these ratios on a non-annualized basis.
Ø Commodity Strategy, Hedged Option Premium Strategy, Multi-Asset Income, Multi-Style Premia and U.S. Equity Index PutWrite Strategy did not engage in short sales. For the years ended October 31, 2018 and 2017, Long Short Credit did not engage in short sales. For the year ended October 31, 2018, Global Allocation did not engage in short sales.
a Total return based on per share NAV reflects the effects of changes in NAV on the performance of each Fund during each fiscal period. Returns assume income dividends and other distributions, if any, were reinvested, but do not reflect the effect of sales charges. Results represent past performance and do not indicate future results. Current returns may be lower or higher than the performance data quoted. Investment returns and principal will fluctuate and shares when redeemed may be worth more or less than original cost. Total return would have been lower if Management had not reimbursed and/or waived certain expenses. Total return would have been higher if Management had not recouped previously reimbursed and/or waived expenses.
b Consolidated financial highlights, see Note A in the Notes to Financial Statements.
c The portfolio turnover rate including mortgage dollar roll transactions was 129% for the year ended October 31, 2018 for Global Allocation. The portfolio turnover rates including mortgage dollar roll transactions, including and excluding securities sold short, 165% and 154%, respectively, for the year ended October 31, 2017, 182% and 183%, respectively, for the year ended October 31, 2016 and 198% and 189%, respectively, for the year ended October 31, 2015, for Global Allocation. The portfolio turnover rate including mortgage dollar roll transactions were 192% and 165% for the years ended October 31, 2018 and 2017, respectively, for Multi-Asset Income.
d The class action proceeds listed in Note A of the Notes to Financial Statements had no impact on the Funds' total returns for the year ended October 31, 2018.
e Dividend and interest expense relating to short sales, which is a non-recurring expense for Global Allocation, is included in these ratios on a non-annualized basis.
f The voluntary contribution received in 2014 had no impact on the Funds' total returns for the year ended October 31, 2014.
g The voluntary contribution listed in Note B of the Notes to Financial Statements had no impact on the Fund's total returns for the year ended October 31, 2017.
h The Custodian Out-of-Pocket Expenses Refunded listed in Note G of the Notes to Financial Statements had no impact on the Long Short's total returns for the year ended October 31, 2017.
234
Notes to Financial Highlights (cont'd)
i Custodian Out-of-Pocket Expenses Refunded, as listed in Note G of the Notes to Financial Statements, is
non-recurring, and is included in these ratios. Had Long Short not received the refund the annualized ratios of net expenses to average net assets and net investment income/(loss) to average net assets would have been:
| | | Ratio of Net
Expenses to
Average Net
Assets | | Ratio of Net
Expenses to
Average
Net Assets
(excluding
dividend and
interest
expense
relating to
short sales
and reverse
repurchase
agreements) | | Ratio of Net
Investment
Income/
(Loss) to
Average
Net Assets | |
| | | Year Ended October 31, 2017 | |
Long Short Institutional Class | | | 1.80 | % | | | 1.32 | % | | | 0.12 | % | |
Long Short Class A | | | 2.16 | % | | | 1.68 | % | | | (0.18 | )% | |
Long Short Class C | | | 2.90 | % | | | 2.43 | % | | | (0.94 | )% | |
j After the close of business on December 7, 2018, the Fund's applicable classes underwent a stock split. The per share data presented here has been adjusted to reflect this split. See Note I of the Notes to Financial Statements.
235
Report of Independent Registered Public Accounting Firm
To the Shareholders of Neuberger Berman Commodity Strategy Fund, Neuberger Berman Global Allocation Fund, Neuberger Berman Hedged Option Premium Strategy Fund, Neuberger Berman Long Short Credit Fund, Neuberger Berman Multi-Asset Income Fund, Neuberger Berman Multi-Style Premia Fund and Neuberger Berman U.S. Equity Index PutWrite Strategy Fund and the Board of Trustees of Neuberger Berman Alternative Funds
Opinion on the Financial Statements
We have audited the accompanying consolidated statements of assets and liabilities of Neuberger Berman Commodity Strategy Fund (formerly, Neuberger Berman Risk Balanced Commodity Strategy Fund) and Neuberger Berman Multi-Style Premia Fund, two of the series constituting the Neuberger Berman Alternatives Funds (the "Trust"), including the consolidated schedules of investments, as of October 31, 2018, and the related consolidated statements of operations, the consolidated statements of changes in net assets and the consolidated financial highlights for each of the periods indicated in the table below and the related notes (collectively referred to as the "consolidated financial statements"). We have also audited the accompanying statements of assets and liabilities of Neuberger Berman Global Allocation Fund, Neuberger Berman Hedged Option Premium Strategy Fund, Neuberger Berman Long Short Credit Fund, Neuberger Berman Multi-Asset Income Fund, and Neuberger Berman U.S. Equity Index PutWrite Strategy Fund, five of the series constituting the Trust, including the schedules of investments, as of October 31, 2018 and the related statements of operations and cash flows, the statements of changes in net assets, and the financial highlights for each of the periods indicated in the table below and the related notes (collectively referred to as the "financial statements"). Neuberger Berman Commodity Strategy Fund, Neuberger Berman Global Allocation Fund, Neuberger Berman Hedged Option Premium Strategy Fund, Neuberger Berman Long Short Credit Fund, Neuberger Berman Multi-Asset Income Fund, Neuberger Berman Multi-Style Premia Fund and Neuberger Berman U.S. Equity Index PutWrite Strategy Fund are collectively referred to as the "Funds". In our opinion, the consolidated financial statements and financial statements present fairly, in all material respects, the financial position of the Funds (seven of the series constituting Neuberger Berman Alternative Funds) at October 31, 2018, the results of their consolidated operations or operations and cash flows, the consolidated changes in net assets or changes in net assets and their consolidated financial highlights or financial highlights for each of the periods indicated in the table below, in conformity with U.S. generally accepted accounting principles.
Individual Funds constituting
Neuberger Berman
Alternative Funds | | Statement of
operations | | Statements of
changes in net assets | | Financial highlights | |
Neuberger Berman Commodity Strategy Fund
Neuberger Berman Global Allocation Fund | | For the year ended October 31, 2018 | | For each of the two years in the period ended October 31, 2018 | | For each of the five years in the period ended October 31, 2018 | |
Neuberger Berman Hedged Option Premium Strategy Fund | | For the year ended October 31, 2018 | | For the year ended October 31, 2018 and the period from April 12, 2017 (commencement of operations) through October 31, 2017 | |
Neuberger Berman Multi-Asset Income Fund | | For the year ended October 31, 2018 | | For each of the two years in the period ended October 31, 2018 | | For each of the three years in the period ended October 31, 2018 and the period from March 27, 2015 (commencement of operations) through October 31, 2015 | |
Neuberger Berman Multi-Style Premia Fund | | For the period from May 18, 2018 (commencement of operations) through October 31, 2018 | |
236
Individual Funds constituting
Neuberger Berman
Alternative Funds | | Statement of
operations | | Statements of
changes in net assets | | Financial highlights | |
Neuberger Berman U.S. Equity Index PutWrite Strategy Fund | | For the year ended October 31, 2018 | | For each of the two years in the period ended October 31, 2018 | | For each of the two years in the period ended October 31, 2018 and the period from September 16, 2016 (commencement of operations) through October 31, 2016 | |
| | Statements of
operations and
cash flows | | Statements of
changes in net assets | | Financial highlights | |
Neuberger Berman Long Short Credit Fund | | For the year ended October 31, 2018 | | For each of the two years in the period ended October 31, 2018 | | For each of the three years in the period ended October 31, 2018 and the period from June 29, 2015 (commencement of operations) through October 31, 2015 | |
Basis for Opinion
These consolidated financial statements and financial statements are the responsibility of the Trust's management. Our responsibility is to express an opinion on each of the Funds' consolidated financial statements and financial statements based on our audits. We are a public accounting firm registered with the Public Company Accounting Oversight Board (United States) ("PCAOB") and are required to be independent with respect to the Trust in accordance with the U.S. federal securities laws and the applicable rules and regulations of the Securities and Exchange Commission and the PCAOB.
We conducted our audits in accordance with the standards of the PCAOB. Those standards require that we plan and perform the audit to obtain reasonable assurance about whether the financial statements are free of material misstatement, whether due to error or fraud. The Trust is not required to have, nor were we engaged to perform, an audit of the Trust's internal control over financial reporting. As part of our audits, we are required to obtain an understanding of internal control over financial reporting, but not for the purpose of expressing an opinion on the effectiveness of the Trust's internal control over financial reporting. Accordingly, we express no such opinion.
Our audits included performing procedures to assess the risks of material misstatement of the consolidated financial statements and financial statements, whether due to error or fraud, and performing procedures that respond to those risks. Such procedures included examining, on a test basis, evidence regarding the amounts and disclosures in the consolidated financial statements and financial statements. Our procedures included confirmation of securities owned as of October 31, 2018, by correspondence with the custodian and others or by other appropriate auditing procedures where replies from others were not received. Our audits also included evaluating the accounting principles used and significant estimates made by management, as well as evaluating the overall presentation of the consolidated financial statements and financial statements. We believe that our audits provide a reasonable basis for our opinion.

We have served as the auditor of one or more Neuberger Berman investment companies since 1954.
Boston, Massachusetts
December 26, 2018
237
Report of Independent Registered Public Accounting Firm
To the Board of Trustees of Neuberger Berman Alternative Funds
and Shareholders of Neuberger Berman Long Short Fund
Opinion on the Financial Statements
We have audited the accompanying statement of assets and liabilities of Neuberger Berman Long Short Fund (the "Fund"), a series of Neuberger Berman Alternative Funds, including the schedule of investments, as of October 31, 2018, the related statement of operations for the year then ended, the statements of changes in net assets for each of the two years in the period then ended, and financial highlights for each of the five years in the period then ended, and the related notes (collectively referred to as the "financial statements"). In our opinion, the financial statements present fairly, in all material respects, the financial position of the Fund as of October 31, 2018, the results of its operations for the year then ended, the changes in its net assets for each of the two years in the period then ended, and the financial highlights for each of the five years in the period then ended, in conformity with accounting principles generally accepted in the United States of America.
Basis for Opinion
These financial statements are the responsibility of the Fund's management. Our responsibility is to express an opinion on the Fund's financial statements based on our audits. We are a public accounting firm registered with the Public Company Accounting Oversight Board (United States) ("PCAOB") and are required to be independent with respect to the Fund in accordance with the U.S. federal securities laws and the applicable rules and regulations of the Securities and Exchange Commission and the PCAOB. We have served as the Fund's auditor since 2012
We conducted our audits in accordance with the standards of the PCAOB. Those standards require that we plan and perform the audit to obtain reasonable assurance about whether the financial statements are free of material misstatement, whether due to error or fraud. The Fund is not required to have, nor were we engaged to perform, an audit of its internal control over financial reporting. As part of our audits we are required to obtain an understanding of internal control over financial reporting, but not for the purpose of expressing an opinion on the effectiveness of the Fund's internal control over financial reporting. Accordingly, we express no such opinion.
Our audits included performing procedures to assess the risks of material misstatement of the financial statements, whether due to error or fraud, and performing procedures that respond to those risks. Such procedures included examining, on a test basis, evidence regarding the amounts and disclosures in the financial statements. Our audits also included evaluating the accounting principles used and significant estimates made by management, as well as evaluating the overall presentation of the financial statements. Our procedures included confirmation of securities owned as of October 31, 2018 by correspondence with the custodian and brokers; when replies were not received from brokers, we performed other auditing procedures. We believe that our audits provide a reasonable basis for our opinion.

Philadelphia, Pennsylvania
December 26, 2018
238
Investment Manager and Administrator
Neuberger Berman Investment Advisers LLC
1290 Avenue of the Americas
New York, NY 10104-0002
800.877.9700 or 212.476.8800
Intermediary Client Services 800.366.6264
Distributor
Neuberger Berman BD LLC
1290 Avenue of the Americas
New York, NY 10104-0002
800.877.9700 or 212.476.8800
Intermediary Client Services 800.366.6264
Custodian
State Street Bank and Trust Company
One Lincoln Street
Boston, MA 02111
Shareholder Servicing Agent
DST Asset Manager Solutions Inc.
430 West 7th Street, Suite 21989
Kansas City, MO 64105-1407
For Institutional Class Shareholders
Address correspondence to:
Neuberger Berman Investment Advisers LLC
1290 Avenue of the Americas, 22nd Floor
New York, NY 10104-0002
Intermediary Client Services 800.366.6264
For Class A, Class C and Class R6 Shareholders:
Please contact your investment provider
Legal Counsel
K&L Gates LLP
1601 K Street, NW
Washington, DC 20006-1600
Independent Registered Public Accounting Firms
Ernst & Young LLP
200 Clarendon Street
Boston, MA 02116
Tait, Weller & Baker LLP
Two Liberty Place
50 South 16th Street, Suite 2900
Philadelphia, PA 19102
239
The following tables set forth information concerning the Trustees and Officers of each of the Funds. All persons named as Trustees and Officers also serve in similar capacities for other funds administered or managed by Neuberger Berman Investment Advisers LLC ("NBIA") (formerly, Neuberger Berman Fixed Income LLC ("NBFI") and including predecessor entities). Each Fund's Statement of Additional Information includes additional information about the Trustees as of the time of the Fund's most recent public offering and is available upon request, without charge, by calling (800) 877-9700.
Information about the Board of Trustees
Name, (Year of Birth),
and Address(1) | | Position(s)
and Length of
Time Served(2) | | Principal Occupation(s)(3) | | Number of
Funds in
Fund Complex
Overseen by
Fund Trustee | | Other Directorships Held
Outside Fund Complex by
Fund Trustee(3) | |
Independent Fund Trustees | | | | | | | | | |
Michael J. Cosgrove (1949) | | Trustee since 2015 | | President, Carragh Consulting USA, since 2014; formerly, Executive, General Electric Company, 1970 to 2014, including President, Mutual Funds and Global Investment Programs, GE Asset Management, 2011 to 2014, President and Chief Executive Officer, Mutual Funds and Intermediary Business, GE Asset Management, 2007 to 2011, President, Institutional Sales and Marketing, GE Asset Management, 1998 to 2007, and Chief Financial Officer, GE Asset Management, and Deputy Treasurer, GE Company, 1988 to 1993. | | | 57 | | | Director, America Press, Inc. (not-for-profit Jesuit publisher), since 2015; Director, Fordham University, since 2001; formerly, Director, The Gabelli Go Anywhere Trust, June 2015 to June 2016; formerly, Director, Skin Cancer Foundation (not-for-profit), 2006 to 2015; formerly, Director, GE Investments Funds, Inc., 1997 to 2014; formerly, Trustee, GE Institutional Funds, 1997 to 2014; formerly, Director, GE Asset Management, 1988 to 2014; formerly, Director, Elfun Trusts, 1988 to 2014; formerly, Trustee, GE Pension & Benefit Plans, 1988 to 2014. | |
240
Name, (Year of Birth),
and Address(1) | | Position(s)
and Length of
Time Served(2) | | Principal Occupation(s)(3) | | Number of
Funds in
Fund Complex
Overseen by
Fund Trustee | | Other Directorships Held
Outside Fund Complex by
Fund Trustee(3) | |
Marc Gary (1952) | | Trustee since 2015 | | Executive Vice Chancellor and Chief Operating Officer, Jewish Theological Seminary, since 2012; formerly, Executive Vice President and General Counsel, Fidelity Investments, 2007 to 2012; formerly, Executive Vice President and General Counsel, BellSouth Corporation, 2004 to 2007; formerly, Vice President and Associate General Counsel, BellSouth Corporation, 2000 to 2004; formerly, Associate, Partner, and National Litigation Practice Co-Chair, Mayer, Brown LLP, 1981 to 2000; formerly, Associate Independent Counsel, Office of Independent Counsel, 1990 to 1992. | | | 57 | | | Trustee, Jewish Theological Seminary, since 2015; Director, Counsel on Call (privately held for-profit company), since 2012; Director, Lawyers Committee for Civil Rights Under Law (not-for-profit), since 2005; formerly, Director, Equal Justice Works (not-for-profit), 2005 to 2014; formerly, Director, Corporate Counsel Institute, Georgetown University Law Center, 2007 to 2012; formerly, Director, Greater Boston Legal Services
(not-for-profit),
2007 to 2012. | |
241
Name, (Year of Birth),
and Address(1) | | Position(s)
and Length of
Time Served(2) | | Principal Occupation(s)(3) | | Number of
Funds in
Fund Complex
Overseen by
Fund Trustee | | Other Directorships Held
Outside Fund Complex by
Fund Trustee(3) | |
Martha C. Goss (1949) | | Trustee since 2007 | | President, Woodhill Enterprises Inc./Chase Hollow Associates LLC (personal investment vehicle), since 2006; formerly, Consultant, Resources Global Professionals (temporary staffing), 2002 to 2006; formerly, Chief Financial Officer, Booz-Allen & Hamilton, Inc., 1995 to 1999; formerly, Enterprise Risk Officer, Prudential Insurance, 1994 to1995; formerly, President, Prudential Asset Management Company, 1992 to 1994; formerly, President, Prudential Power Funding (investments in electric and gas utilities and alternative energy projects), 1989 to 1992; formerly, Treasurer, Prudential Insurance Company, 1983 to 1989. | | | 57 | | | Director, American Water (water utility), since 2003; Director, Allianz Life of New York (insurance), since 2005; Director, Berger Group Holdings, Inc. (engineering consulting firm), since 2013; Director, Financial Women's Association of New York (not-for-profit association), since 2003; Trustee Emerita, Brown University, since 1998; Director, Museum of American Finance
(not-for-profit), since 2013; formerly, Non-Executive Chair and Director, Channel Reinsurance (financial guaranty reinsurance), 2006 to 2010; formerly, Director, Ocwen Financial Corporation (mortgage servicing), 2005 to 2010; formerly, Director, Claire's Stores, Inc. (retailer), 2005 to 2007; formerly, Director, Parsons Brinckerhoff Inc. (engineering consulting firm), 2007 to 2010; formerly, Director, Bank Leumi (commercial bank), 2005 to 2007; formerly, Advisory Board Member, Attensity (software developer), 2005 to 2007. | |
Michael M. Knetter (1960) | | Trustee since 2007 | | President and Chief Executive Officer, University of Wisconsin Foundation, since October 2010; formerly, Dean, School of Business, University of Wisconsin—Madison; formerly, Professor of International Economics and Associate Dean, Amos Tuck School of Business—Dartmouth College, 1998 to 2002. | | | 57 | | | Board Member, American Family Insurance (a mutual company, not publicly traded), since March 2009; formerly, Trustee, Northwestern Mutual Series Fund, Inc., 2007 to 2011; formerly, Director, Wausau Paper, 2005 to 2011; formerly, Director, Great Wolf Resorts, 2004 to 2009. | |
242
Name, (Year of Birth),
and Address(1) | | Position(s)
and Length of
Time Served(2) | | Principal Occupation(s)(3) | | Number of
Funds in
Fund Complex
Overseen by
Fund Trustee | | Other Directorships Held
Outside Fund Complex by
Fund Trustee(3) | |
Deborah C. McLean (1954) | | Trustee since 2015 | | Member, Circle Financial Group (private wealth management membership practice), since 2011; Managing Director, Golden Seeds LLC (an angel investing group), since 2009; Adjunct Professor, Columbia University School of International and Public Affairs, since 2008; formerly, Visiting Assistant Professor, Fairfield University, Dolan School of Business, Fall 2007; formerly, Adjunct Associate Professor of Finance, Richmond, The American International University in London, 1999 to 2007. | | | 57 | | | Board member, Norwalk Community College Foundation, since 2014; Dean's Advisory Council, Radcliffe Institute for Advanced Study, since 2014; formerly, Director and Treasurer, At Home in Darien (not-for-profit), 2012 to 2014; formerly, Director, National Executive Service Corps (not-for-profit), 2012 to 2013; formerly, Trustee, Richmond, The American International University in London, 1999 to 2013. | |
George W. Morriss (1947) | | Trustee since 2007 | | Adjunct Professor, Columbia University School of International and Public Affairs, since October 2012; formerly, Executive Vice President and Chief Financial Officer, People's United Bank, Connecticut (a financial services company), 1991 to 2001. | | | 57 | | | Formerly, Trustee, Steben Alternative Investment Funds, Steben Select Multi-Strategy Fund, and Steben Select Multi-Strategy Master Fund, 2013 to 2017; formerly, Treasurer, National Association of Corporate Directors, Connecticut Chapter, 2011 to 2015; formerly, Manager, Larch Lane Multi-Strategy Fund complex (which consisted of three funds), 2006 to 2011; formerly, Member, NASDAQ Issuers' Affairs Committee, 1995 to 2003. | |
243
Name, (Year of Birth),
and Address(1) | | Position(s)
and Length of
Time Served(2) | | Principal Occupation(s)(3) | | Number of
Funds in
Fund Complex
Overseen by
Fund Trustee | | Other Directorships Held
Outside Fund Complex by
Fund Trustee(3) | |
Tom D. Seip (1950) | | Trustee since inception; Chairman of the Board since 2008; formerly Lead Independent Trustee from 2006 to 2008 | | Formerly, Managing Member, Ridgefield Farm LLC (a private investment vehicle), 2004 to 2016; formerly, President and CEO, Westaff, Inc. (temporary staffing), May 2001 to January 2002; formerly, Senior Executive, The Charles Schwab Corporation, 1983 to 1998, including Chief Executive Officer, Charles Schwab Investment Management, Inc.; Trustee, Schwab Family of Funds and Schwab Investments, 1997 to 1998; and Executive Vice President-Retail Brokerage, Charles Schwab & Co., Inc., 1994 to 1997. | | | 57 | | | Formerly, Director, H&R Block, Inc. (tax services company), 2001 to 2018; formerly, Director, Talbot Hospice Inc., 2013 to 2016; formerly, Chairman, Governance and Nominating Committee, H&R Block, Inc., 2011 to 2015; formerly, Chairman, Compensation Committee, H&R Block, Inc., 2006 to 2010; formerly, Director, Forward Management, Inc. (asset management company), 1999 to 2006. | |
James G. Stavridis (1955) | | Trustee since 2015 | | Commentator, NBC News, since 2015; Dean, Fletcher School of Law and Diplomacy, Tufts University since 2013; formerly, Admiral, United States Navy, 2006 to 2013, including Supreme Allied Commander, NATO and Commander, European Command, 2009 to 2013, and Commander, United States Southern Command, 2006 to 2009. | | | 57 | | | Director, American Water (water utility), since 2018; Director, NFP Corp. (insurance broker and consultant), since 2017; Director, Utilidata Inc., since 2015; Director, U.S. Naval Institute, since 2014; Director, Onassis Foundation USA, since 2014; Director, BMC Software Federal, LLC, since 2014; Director, Vertical Knowledge, LLC, since 2013; formerly, Director, Navy Federal Credit Union, 2000-2002. | |
244
Name, (Year of Birth),
and Address(1) | | Position(s)
and Length of
Time Served(2) | | Principal Occupation(s)(3) | | Number of
Funds in
Fund Complex
Overseen by
Fund Trustee | | Other Directorships Held
Outside Fund Complex by
Fund Trustee(3) | |
Candace L. Straight (1947) | | Trustee since inception | | Private investor and consultant specializing in the insurance industry; formerly, Advisory Director, Securitas Capital LLC (a global private equity investment firm dedicated to making investments in the insurance sector), 1998 to 2003. | | | 57 | | | Formerly, Public Member, Board of Governors and Board of Trustees, Rutgers University, 2011 to 2016; formerly, Director, Montpelier Re Holdings Ltd. (reinsurance company), 2006 to 2015; formerly, Director, National Atlantic Holdings Corporation (property and casualty insurance company), 2004 to 2008; formerly, Director, The Proformance Insurance Company (property and casualty insurance company), 2004 to 2008; formerly, Director, Providence Washington Insurance Company (property and casualty insurance company), 1998 to 2006; formerly, Director, Summit Global Partners (insurance brokerage firm), 2000 to 2005. | |
Peter P. Trapp (1944) | | Trustee since inception | | Retired; formerly, Regional Manager for Mid-Southern Region, Ford Motor Credit Company, September 1997 to 2007; formerly, President, Ford Life Insurance Company, April 1995 to August 1997. | | | 57 | | | None. | |
245
Name, (Year of Birth),
and Address(1) | | Position(s)
and Length of
Time Served(2) | | Principal Occupation(s)(3) | | Number of
Funds in
Fund Complex
Overseen by
Fund Trustee | | Other Directorships Held
Outside Fund Complex by
Fund Trustee(3) | |
Fund Trustees who are "Interested Persons" | | | | | | | | | |
Joseph V. Amato* (1962) | | Chief Executive Officer and President since 2018 and Trustee since 2009 | | President and Director, Neuberger Berman Group LLC, since 2009; President and Chief Executive Officer, Neuberger Berman BD LLC ("Neuberger Berman") and Neuberger Berman Holdings LLC (including its predecessor, Neuberger Berman Inc.), since 2007; Chief Investment Officer (Equities) and President (Equities), NBIA (formerly, Neuberger Berman Fixed Income LLC ("NBFI") and including predecessor entities), since 2007, and Board Member of NBIA since 2006; formerly, Global Head of Asset Management of Lehman Brothers Holdings Inc.'s ("LBHI") Investment Management Division, 2006 to 2009; formerly, member of LBHI's Investment Management Division's Executive Management Committee, 2006 to 2009; formerly, Managing Director, Lehman Brothers Inc. ("LBI"), 2006 to 2008; formerly, Chief Recruiting and Development Officer, LBI, 2005 to 2006; formerly, Global Head of LBI's Equity Sales and a Member of its Equities Division Executive Committee, 2003 to 2005; President and Chief Executive Officer, twenty-six registered investment companies for which NBIA acts as investment manager and/or administrator. | | | 57 | | | Member of Board of Advisors, McDonough School of Business, Georgetown University, since 2001; Member of New York City Board of Advisors, Teach for America, since 2005; Trustee, Montclair Kimberley Academy (private school), since 2007; Member of Board of Regents, Georgetown University, since 2013. | |
246
Name, (Year of Birth),
and Address(1) | | Position(s)
and Length of
Time Served(2) | | Principal Occupation(s)(3) | | Number of
Funds in
Fund Complex
Overseen by
Fund Trustee | | Other Directorships Held
Outside Fund Complex by
Fund Trustee(3) | |
Robert Conti* (1956) | | Trustee since 2008; formerly, Chief Executive Officer and President 2008 to 2018 | | Formerly, Managing Director, Neuberger Berman, 2007 to 2018; formerly, President—Mutual Funds, NBIA, 2008 to 2018; formerly, Senior Vice President, Neuberger Berman, 2003 to 2006; formerly, Vice President, Neuberger Berman, 1999 to 2003. | | | 57 | | | Director, Staten Island Mental Health Society, since 1994; formerly, Chairman of the Board, Staten Island Mental Health Society, 2008 to 2011. | |
(1) The business address of each listed person is 1290 Avenue of the Americas, New York, NY 10104.
(2) Pursuant to the Trust's Amended and Restated Trust Instrument, subject to any limitations on the term of service imposed by the By-Laws or any retirement policy adopted by the Fund Trustees, each Fund Trustee shall hold office for life or until his or her successor is elected or the Trust terminates; except that (a) any Fund Trustee may resign by delivering a written resignation; (b) any Fund Trustee may be removed with or without cause at any time by a written instrument signed by at least two-thirds of the other Fund Trustees; (c) any Fund Trustee who requests to be retired, or who has become unable to serve, may be retired by a written instrument signed by a majority of the other Fund Trustees; and (d) any Fund Trustee may be removed at any shareholder meeting by a vote of at least two-thirds of the outstanding shares.
(3) Except as otherwise indicated, each individual has held the positions shown during at least the last five years.
* Indicates a Fund Trustee who is an "interested person" within the meaning of the 1940 Act. Mr. Amato is an interested person of the Trust by virtue of the fact that he is an officer of NBIA and/or its affiliates. Mr. Conti is an interested person of the Trust by virtue of the fact that he was an officer of NBIA and/or its affiliates until June 2018.
247
Information about the Officers of the Trust
Name, (Year of Birth),
and Address(1) | | Position(s)
and Length of
Time Served(2) | | Principal Occupation(s)(3) | |
Claudia A. Brandon (1956) | | Executive Vice President since 2008 and Secretary since inception | | Senior Vice President, Neuberger Berman, since 2007 and Employee since 1999; Senior Vice President, NBIA, since 2008 and Assistant Secretary since 2004; formerly, Vice President, Neuberger Berman, 2002 to 2006; formerly, Vice President—Mutual Fund Board Relations, NBIA, 2000 to 2008; formerly, Vice President, NBIA, 1986 to 1999 and Employee, 1984 to 1999; Executive Vice President and Secretary, twenty-six registered investment companies for which NBIA acts as investment manager and/or administrator. | |
Agnes Diaz (1971) | | Vice President since 2013 | | Senior Vice President, Neuberger Berman, since 2012; Senior Vice President, NBIA, since 2012 and Employee since 1996; formerly, Vice President, Neuberger Berman, 2007 to 2012; Vice President, ten registered investment companies for which NBIA acts as investment manager and/or administrator. | |
Anthony DiBernardo (1979) | | Assistant Treasurer since 2011 | | Senior Vice President, Neuberger Berman, since 2014; Senior Vice President, NBIA, since 2014, and Employee since 2003; formerly, Vice President, Neuberger Berman, 2009 to 2014; Assistant Treasurer, ten registered investment companies for which NBIA acts as investment manager and/or administrator. | |
Savonne Ferguson (1973) | | Chief Compliance Officer since 2018 | | Senior Vice President, Chief Compliance Officer (Mutual Funds) and Associate General Counsel, NBIA, since November 2018; formerly, Vice President T. Rowe Price Group, Inc. (2018), Vice President and Senior Legal Counsel, T. Rowe Price Associates, Inc. (2014-2018), Vice President and Director of Regulatory Fund Administration, PNC Capital Advisors, LLC (2009-2014), Secretary, PNC Funds and PNC Advantage Funds (2010-2014); Chief Compliance Officer, twenty-six registered investment companies for which NBIA acts as investment manager and/or administrator. | |
Corey A. Issing (1978) | | Chief Legal Officer since 2016 (only for purposes of sections 307 and 406 of the Sarbanes-Oxley Act of 2002) | | General Counsel and Head of Compliance—Mutual Funds since 2016 and Managing Director, NBIA, since 2017; formerly, Associate General Counsel (2015 to 2016), Counsel (2007 to 2015), Senior Vice President (2013-2016), Vice President (2009-2013); Chief Legal Officer (only for purposes of sections 307 and 406 of the Sarbanes-Oxley Act of 2002), twenty-six registered investment companies for which NBIA acts as investment manager and/or administrator. | |
Sheila R. James (1965) | | Assistant Secretary since inception | | Vice President, Neuberger Berman, since 2008 and Employee since 1999; Vice President, NBIA, since 2008; formerly, Assistant Vice President, Neuberger Berman, 2007; Employee, NBIA, 1991 to 1999; Assistant Secretary, twenty-six registered investment companies for which NBIA acts as investment manager and/or administrator. | |
248
Name, (Year of Birth),
and Address(1) | | Position(s)
and Length of
Time Served(2) | | Principal Occupation(s)(3) | |
Brian Kerrane (1969) | | Chief Operating Officer since 2015 and Vice President since 2008 | | Managing Director, Neuberger Berman, since 2013; Chief Operating Officer—Mutual Funds and Managing Director, NBIA, since 2015; formerly, Senior Vice President, Neuberger Berman, 2006 to 2014; Vice President, NBIA, 2008 to 2015 and Employee since 1991; Chief Operating Officer, ten registered investment companies for which NBIA acts as investment manager and/or administrator; Vice President, twenty-six registered investment companies for which NBIA acts as investment manager and/or administrator. | |
Anthony Maltese (1959) | | Vice President since 2015 | | Senior Vice President, Neuberger Berman, since 2014 and Employee since 2000; Senior Vice President, NBIA, since 2014; Vice President, ten registered investment companies for which NBIA acts as investment manager and/or administrator. | |
Josephine Marone (1963) | | Assistant Secretary since 2017 | | Senior Paralegal, Neuberger Berman, since 2007 and Employee since 2007; Assistant Secretary, twenty-six registered investment companies for which NBIA acts as investment manager and/or administrator. | |
Owen F. McEntee, Jr. (1961) | | Vice President since 2008 | | Vice President, Neuberger Berman, since 2006; Vice President, NBIA, since 2006 and Employee since 1992; Vice President, ten registered investment companies for which NBIA acts as investment manager and/or administrator. | |
John M. McGovern (1970) | | Treasurer and Principal Financial and Accounting Officer since inception | | Senior Vice President, Neuberger Berman, since 2007; Senior Vice President, NBIA, since 2007 and Employee since 1993; formerly, Vice President, Neuberger Berman, 2004 to 2006; formerly, Assistant Treasurer, 2002 to 2005; Treasurer and Principal Financial and Accounting Officer, twenty-six registered investment companies for which NBIA acts as investment manager and/or administrator. | |
Frank Rosato (1971) | | Assistant Treasurer since inception | | Vice President, Neuberger Berman, since 2006; Vice President, NBIA, since 2006 and Employee since 1995; Assistant Treasurer, ten registered investment companies for which NBIA acts as investment manager and/or administrator. | |
Niketh Velamoor (1979) | | Anti-Money Laundering Compliance Officer since 2018 | | Senior Vice President and Associate General Counsel, Neuberger Berman, since July 2018; Assistant United States Attorney, Southern District of New York, 2009 to 2018; Anti-Money Laundering Compliance Officer, four registered investment companies for which NBIA acts as investment manager and/or administrator. | |
(1) The business address of each listed person is 1290 Avenue of the Americas, New York, NY 10104.
(2) Pursuant to the By-Laws of the Trust, each officer elected by the Fund Trustees shall hold office until his or her successor shall have been elected and qualified or until his or her earlier death, inability to serve, or resignation. Officers serve at the pleasure of the Fund Trustees and may be removed at any time with or without cause.
(3) Except as otherwise indicated, each individual has held the positions shown during at least the last five years.
249
Proxy Voting Policies and Procedures
A description of the policies and procedures that the Trust uses to determine how to vote proxies relating to portfolio securities is available, without charge, by calling 800-877-9700 (toll-free) and on the SEC's website at www.sec.gov. Information regarding how the Trust voted proxies relating to portfolio securities during the most recent 12-month period ended June 30 is also available, without charge upon request, by calling 800-877-9700 (toll-free), on the SEC's website at www.sec.gov, and on Management's website at www.nb.com.
Quarterly Portfolio Schedule
The Trust files a complete schedule of portfolio holdings for each Fund with the SEC for the first and third quarters of each fiscal year on Form N-Q. The Trust's Forms N-Q are available on the SEC's website at www.sec.gov and may be reviewed and copied at the SEC's Public Reference Room in Washington, DC. Information on the operation of the Public Reference Room may be obtained by calling 800-SEC-0330. The information on Form N-Q is available upon request, without charge, by calling 800-877-9700 (toll-free).
250
Board Consideration of the Management Agreement
On an annual basis, the Board of Trustees (the "Board") of Neuberger Berman Alternative Funds (the "Trust"), including the Trustees who are not "interested persons" of the Trust or of Neuberger Berman Investment Advisers LLC ("Management") (including its affiliates) ("Independent Fund Trustees"), considers whether to continue the management agreement with Management (the "Agreement") with respect to each series except Neuberger Berman Absolute Return Multi-Manager Fund and Neuberger Berman Multi-Style Premia Fund (each a "Fund"). Throughout the process, the Independent Fund Trustees are advised by counsel that is experienced in Investment Company Act of 1940 matters and that is independent of Management ("Independent Counsel"). At a meeting held on October 11, 2018, the Board, including the Independent Fund Trustees, approved the continuation of the Agreement for each Fund.
In evaluating the Agreement with respect to each Fund, the Board, including the Independent Fund Trustees, reviewed extensive materials provided by Management in response to questions submitted by the Independent Fund Trustees and Independent Counsel, and met with senior representatives of Management regarding its personnel, operations, and financial condition as they relate to the Funds. The annual contract review extends over at least two regular meetings of the Board to ensure that Management has time to respond to any questions the Independent Fund Trustees may have on their initial review of the materials and that the Independent Fund Trustees have time to consider those responses.
In connection with its deliberations, the Board also considered the broad range of information relevant to the annual contract review that is provided to the Board (including its various standing committees) at meetings throughout the year, including reports on investment performance, portfolio risk, and other portfolio information for each Fund, including the use of derivatives if used as part of the Fund's strategy, as well as periodic reports on, among other matters, pricing and valuation; quality and cost of portfolio trade execution; compliance; and shareholder and other services provided by Management and its affiliates. The Contract Review Committee, which is comprised of Independent Fund Trustees, was established by the Board to assist in its deliberations regarding the annual contract review. The Board has also established other committees that focus throughout the year on specific areas relevant to the annual contract review, such as Fund performance or compliance matters, and that are charged with specific responsibilities regarding the annual contract review. Those committees provide reports to the Contract Review Committee and the full Board, which consider that information as part of the annual contract review process. The Board's Contract Review Committee annually considers and updates the questions it asks of Management in light of legal advice furnished to them by Independent Counsel; their own business judgment; and developments in the industry, in the markets, in mutual fund regulation and litigation, and in Management's business model.
The Independent Fund Trustees received from Independent Counsel a memorandum discussing the legal standards for their consideration of the proposed continuation of the Agreement. During the course of the year and during their deliberations regarding the annual contract review, the Contract Review Committee and the Independent Fund Trustees met with Independent Counsel separately from representatives of Management.
Provided below is a description of the Board's contract approval process and material factors that the Board considered at its meetings regarding renewals of the Agreement and the compensation to be paid thereunder. In connection with its approval of the continuation of the Agreement, the Board evaluated the terms of the Agreement, the overall fairness of the Agreement to each Fund and whether the Agreement was in the best interests of each Fund and Fund shareholders. The Board's determination to approve the continuation of the Agreement was based on a comprehensive consideration of all information provided to the Board throughout the year and specifically in connection with the annual contract review. The Board considered each Fund's investment management agreement separately from those of the other Funds.
This description is not intended to include all of the factors considered by the Board. The Board members did not identify any particular information or factor that was all-important or controlling, and each Trustee may have attributed different weights to the various factors. The Board focused on the costs and benefits of the Agreement to each Fund and, through the Fund, its shareholders.
251
Nature, Extent, and Quality of Services
With respect to the nature, extent, and quality of the services provided, the Board considered the investment philosophy and decision-making processes of, and the qualifications, experience, and capabilities of, and the resources available to, the portfolio management personnel of Management who perform services for the Funds. The Board noted that Management also provides certain administrative services, including fund accounting and compliance services. The Board also considered Management's policies and practices regarding brokerage, commissions and other trading costs, and allocation of portfolio transactions and reviewed the quality of the execution services that Management had provided. Moreover, the Board considered Management's approach to potential conflicts of interest both generally and between the Funds' investments and those of other funds or accounts managed by Management. The Board also noted that Management had increased its research capabilities with respect to environmental, social, and corporate governance matters and how those factors may relate to investment performance.
The Board noted the extensive range of services that Management provides to the Funds beyond the investment management services. The Board noted that Management is also responsible for monitoring compliance with the Fund's investment objectives, policies and restrictions, as well as compliance with applicable law, including implementing rulemaking initiatives of the U.S. Securities and Exchange Commission. The Board considered that Management assumes significant ongoing risks with respect to all Funds, for which it is entitled to reasonable compensation. Specifically, Management's responsibilities include continual management of investment, operational, enterprise, legal, regulatory, and compliance risks as they relate to the Funds, and the Board considers on a regular basis information regarding Management's processes for monitoring and managing risk. In addition, the Board also noted that when Management launches a new fund or share class, it assumes entrepreneurial risk with respect to that fund or share class, and that some funds and share classes have been liquidated without ever having been profitable to Management.
The Board also noted Management's activities under its contractual obligation to oversee the Funds' various outside service providers, including its renegotiation of certain service providers' fees and its evaluation of service providers' infrastructure, cybersecurity programs, compliance programs, and business continuity programs, among other matters. The Board also considered Management's ongoing development of its own infrastructure and information technology to support the Funds through, among other things, cybersecurity, business continuity planning, and risk management. In addition, the Board noted the positive compliance history of Management, as no significant compliance problems were reported to the Board with respect to Management. The Board also considered the general structure of the portfolio managers' compensation and whether this structure provides appropriate incentives to act in the best interests of the Funds. The Board also considered the ability of Management to attract and retain qualified personnel to service the Funds.
As in past years, the Board also considered the manner in which Management addressed various matters that arose during the year, some of them a result of developments in the broader fund industry or the regulations governing it. In addition, the Board considered actions taken by Management in response to recent market conditions and considered the overall performance of Management in this context.
Fund Performance
The Board requested a report from an outside consulting firm that specializes in the analysis of fund industry data that compared each Fund's performance, along with its fees and other expenses, to a group of industry peers and a broader universe of funds pursuing generally similar strategies with the same investment classification and/or objective. The Board considered each Fund's performance and fees in light of the limitations inherent in the methodology for constructing such comparative groups and determining which investment companies should be included in the comparative groups.
With respect to investment performance, the Board considered information regarding each Fund's short-, intermediate- and long-term performance, as applicable, net of the Fund's fees and expenses both on an absolute basis and relative to an appropriate benchmark index that does not deduct the fees or expenses of investing, compared to the performance of the industry peer group and a broader universe of funds, each constructed by the consulting firm. The Board also reviewed performance in relation to certain measures of the degree of investment risk undertaken by the portfolio managers.
252
In the case of those Funds that the Board identified as having underperformed their benchmark indices, industry peer groups, and/or a broader universe of funds to an extent, or over a period of time, that the Board felt warranted additional inquiry, the Board discussed with Management each such Fund's performance, potential reasons for the underperformance, and, if necessary, steps that Management had taken, or intended to take, to improve performance. The Board also met with the portfolio managers of certain Funds during the 12 months prior to voting on the contract renewal to discuss the Funds' performance. The Board also considered Management's responsiveness with respect to the Funds that experienced lagging performance. In this regard, the Board noted that performance, especially short-term performance, is only one of the factors that it deems relevant to its consideration of the Agreement and that, after considering all relevant factors, it may be appropriate to approve the continuation of the Agreement notwithstanding a Fund's underperformance.
Fee Rates, Profitability, and Fall-out Benefits
With respect to the overall fairness of the Agreement, the Board considered the fee structure for each Fund under the Agreement as compared to the peer group provided by the consulting firm. The Board reviewed a comparison of each Fund's management fee to a peer group of comparable funds. The Board noted that the comparative management fee analysis includes, in each Fund's management fee, the separate administrative fees paid to Management. However, the Board noted that some funds in the peer group pay directly from fund assets for certain services that Management covers out of the administration fees for the Funds. Accordingly, the Board also considered each Fund's total expense ratio as compared with its peer group as a way of taking account of these differences.
The Board compared each Fund's contractual and actual management fees to the median of the contractual and actual management fees, respectively, of that Fund's peer group. (The actual management fees are the contractual management fees reduced by any fee waivers or other adjustments.) The Board also compared each Fund's total expenses to the median of the total expenses of that Fund's peer group. Where a Fund's management fee or total expenses were higher than the peer group median, the Board considered whether specific portfolio management, administration or oversight needs contributed to the Fund's management fee or total expenses. The Board also noted that for some classes of certain Funds, the overall expense ratio is maintained through a contractual or voluntary fee cap and/or expense reimbursements by Management.
In concluding that the benefits accruing to Management and its affiliates by virtue of their relationship with each Fund were reasonable in light of the costs of providing the investment advisory and other services and the benefits accruing to that Fund, the Board reviewed specific data as to Management's estimated profit or loss on each Fund for a recent period on a pre-tax basis without regard to distribution expenses, including year-over-year changes in each of Management's reported expense categories. (The Board also reviewed data on Management's estimated profit or loss on each Fund after distribution expenses and taxes were factored in, as indicators of the health of the business and the extent to which Management is directing its profits into the growth of the business.) The Board considered the cost allocation methodology that Management used in developing its estimated profitability figures. In 2017, the Board engaged an independent forensic accountant to review the profitability methodology utilized by Management when preparing this information and discussed with the consultant its conclusion that Management's process for calculating and reporting its estimated profit or loss was not unreasonable. Recognizing that there is no uniform methodology within the asset management industry for determining profitability for this purpose and that the use of different reasonable methodologies can give rise to different profit and loss results, the Board requested from Management examples of profitability calculated by different methods and noted that the estimated profitability levels were still reasonable when calculated by these other methods. The Board further noted Management's representation that its estimate of profitability is derived using methodology that is consistent with the methodology used to assess and/or report measures of profitability elsewhere at the firm. In addition, the Board recognized that Management's calculations regarding its costs may not reflect all risks, including regulatory, legal, operational, reputational, and, where appropriate, entrepreneurial risks, associated with offering and managing a mutual fund in the current regulatory and market environment. The Board also considered any fall-out (i.e., indirect) benefits likely to accrue to Management or its affiliates from their relationship with each Fund. The Board recognized that Management and its affiliates should be entitled to earn a reasonable level of
253
profits for services they provide to each Fund and, based on its review, concluded that Management's reported level of estimated profitability, if any, on each Fund was reasonable.
Information Regarding Services to Other Clients
The Board also considered whether there were other funds or separate accounts that were advised or sub-advised by Management or its affiliates with investment objectives, policies, and strategies that were similar to those of any of the Funds. In the cases where such funds or separate accounts exist, the Board compared the fees charged to the Fund to the fees charged to such comparable funds and/or separate accounts. The Board considered the appropriateness and reasonableness of any differences between the fees charged to a Fund and such comparable funds and/or separate accounts, and determined that differences in fees and fee structures were consistent with the differences in the management and other services provided. The Board explored with Management its assertion that although, generally, the rates of fees paid by such accounts were lower than the fee rates paid by the corresponding Funds, the differences reflected Management's greater level of responsibilities and significantly broader scope of services regarding the Funds, the more extensive regulatory obligations and risks associated with managing the Funds, and other financial considerations with respect to creation and sponsorship of the Funds.
Economies of Scale
The Board also evaluated apparent or anticipated economies of scale in relation to the services Management provides to each Fund. The Board considered whether each Fund's fee structure provides for a reduction of payments resulting from the use of breakpoints, the size of any breakpoints in each Fund's advisory fees, and whether any such breakpoints are set at appropriate asset levels. The Board also compared the breakpoint structure to that of the peer group. In addition, the Board considered the expense limitation and/or fee waiver arrangements that reduce many Funds expenses at all asset levels which can have an effect similar to breakpoints in sharing economies of scale with shareholders and provide protection from an increase in expenses if a Fund's assets decline. In addition, for Funds that do not have breakpoints, the Board considered that setting competitive fee rates and pricing a Fund to scale before it has actually experienced an increase in assets are other means of sharing potential economies of scale with shareholders. The Board also considered that Management has provided, at no added cost to the Funds, certain additional services, including but not limited to, services required by new regulations or regulatory interpretations, services impelled by changes in the securities markets or the business landscape, and/or services requested by the Board. The Board considered that this is a way of sharing economies of scale with the Funds and their shareholders.
Fund-by-Fund Analysis
With regard to the investment performance of each Fund and the fees charged to each Fund, the Board considered the following information. The broader universes of funds referenced in this section are those identified by the consulting firm, as discussed above, and the risk/return ratios referenced are the Sharpe ratios provided by the consulting firm. In the case of underperformance for the periods reflected, the Board considered the magnitude of that underperformance relative to the broader universe and the benchmark (e.g., the amount by which a Fund underperformed, including, for example, whether the Fund slightly underperformed or significantly underperformed its benchmark). With respect to performance quintile rankings for a Fund compared to its broader universe ("Performance Universe"), the first quintile represents the highest (best) performance and the fifth quintile represents the lowest performance. With respect to the quintile rankings for fees and total expenses (net of waivers or other adjustments, if any) for a Fund compared to its peer group ("Expense Group"), the first quintile represents the lowest fees and/or total expenses and the fifth quintile represents the highest fees and/or total expenses. Where a Fund has more than one class of shares outstanding, information for Institutional Class has been provided as identified below. The Board reviewed the expense structures of all the other classes of shares of the Funds, some of which have higher fees and expenses that reflect their separate distribution and servicing arrangements and the differing needs of different investors. As a proxy for the class expense
254
structure, the Board reviewed the expenses of each class for one Fund in the Trust in comparison to Expense Groups for those classes. The Board noted the effect of higher expenses on the performance of the other classes of shares.
• Neuberger Berman Global Allocation Fund (Institutional Class)—The Board considered that, based on performance data for the periods ended December 31, 2017: (1) as compared to its benchmark, the Fund's performance was higher for the 1-year period and lower for the 3- and 5-year periods; and (2) as compared to its Performance Universe, the Fund's performance was in the first quintile for the 1- and 5-year periods and in the second quintile for the 3-year period. The Fund was launched in 2010 and therefore does not have 10-year performance. The Board considered that, as compared to its Expense Group, the Fund's contractual management fee, actual management fee net of fees waived by Management, and total expenses each ranked in the first quintile.
• Neuberger Berman Hedged Option Premium Strategy Fund (Institutional Class)—The Board considered that, based on performance data for the periods ended December 31, 2017: (1) as compared to its benchmark, the Fund's performance was higher for the period since the Fund's inception; and (2) as compared to its Performance Universe, the Fund's performance was in the fourth quintile for the period since the Fund's inception on April 12, 2017. The Fund was launched in 2017 and therefore does not have 1-, 3-, 5-, or 10-year performance as of December 31, 2017. The Board considered that, as compared to its Expense Group, the Fund's contractual management fee, actual management fee net of fees waived by Management, and total expenses each ranked in the first quintile.
• Neuberger Berman Long Short Fund (Institutional Class)—The Board considered that, based on performance data for the periods ended December 31, 2017: (1) as compared to its benchmark, the Fund's performance was higher for the 1-, 3-, and 5-year periods; and (2) as compared to its Performance Universe, the Fund's performance was in the second quintile for the 1-year period and in the fourth quintile for the 3- and 5-year periods. The Fund was launched in 2011 and therefore does not have 10-year performance. The Board considered that, as compared to its Expense Group, the Fund's contractual management fee, actual management fee net of fees waived by Management, and total expenses each ranked in the second quintile. In determining to renew the Management Agreement, the Board took into account that the Fund showed a risk/return ratio that was better than the median of its Performance Universe for the 3-year period, meaning that per unit of risk taken versus the benchmark, the Fund achieved a higher level of return than the median of its Performance Universe for that period.
• Neuberger Berman Long Short Credit Fund (Institutional Class)—The Board considered that, based on performance data for the periods ended December 31, 2017: (1) as compared to its benchmark, the Fund's performance was higher for the 1-year period; and (2) as compared to its Performance Universe, the Fund's performance was in the second quintile for the 1-year period. The Fund was launched in 2015 and therefore does not have 3-, 5- or 10-year performance as of December 31, 2017. The Board considered that, as compared to its Expense Group, the Fund's contractual management fee ranked in the third quintile, the actual management fee net of fees waived by Management ranked in the first quintile, and total expenses ranked in the third quintile. The Board also took into account that Management reduced the Fund's contractual management fee and expense limit in 2018.
• Neuberger Berman Multi-Asset Income Fund (Institutional Class)—The Board considered that, based on performance data for the periods ended December 31, 2017: (1) as compared to its benchmark, the Fund's performance was higher for the 1-year period; and (2) as compared to its Performance Universe, the Fund's performance was in the third quintile for the 1-year period. The Fund was launched in 2015 and therefore does not have 3-, 5- or 10-year performance as of December 31, 2017. The Board considered that, as compared to its Expense Group, the Fund's contractual management fee, actual management fee net of fees waived by Management, and total expenses each ranked in the first quintile.
255
• Neuberger Berman Risk Balanced Commodity Strategy Fund1 (Institutional Class)—The Board considered that, based on performance data for the periods ended December 31, 2017: (1) as compared to its benchmark, the Fund's performance was higher for the 1-, 3-, and 5-year periods; and (2) as compared to its Performance Universe, the Fund's performance was in the first quintile for the 1-year period, in the second quintile for the 3-year period, and in the third quintile for the 5-year period. The Fund was launched in 2012 and therefore does not have 10-year performance. The Board considered that, as compared to its Expense Group, the Fund's contractual management fee ranked second out of three funds, the actual management fee net of fees waived by Management ranked lowest out of three funds, and total expenses ranked lowest out of three funds.
• Neuberger Berman U.S. Equity Index PutWrite Strategy Fund (Institutional Class)—The Board considered that, based on performance data for the periods ended December 31, 2017: (1) as compared to its benchmark, the Fund's performance was higher for the 1-year period; and (2) as compared to its Performance Universe, the Fund's performance was in the third quintile for the 1-year period. The Fund was launched in 2016 and therefore does not have 3-, 5-, or 10-year performance. The Board considered that, as compared to its Expense Group, the Fund's contractual management fee, actual management fee net of fees waived by Management, and total expenses each ranked in the first quintile.
Conclusions
In approving the continuation of the Agreement, the Board concluded that, in its business judgment, the terms of the Agreement are fair and reasonable to each Fund and that approval of the continuation of the Agreement is in the best interests of each Fund and its shareholders. In reaching this determination, the Board considered that Management could be expected to continue to provide a high level of service to each Fund; that the performance of each Fund was satisfactory over time, or, in the case of an underperforming Fund, that the Board retained confidence in Management's capabilities to manage the Fund; that each Fund's fee structure appeared to the Board to be reasonable given the nature, extent, and quality of services provided; and that the benefits accruing to Management and its affiliates by virtue of their relationship with each Fund were reasonable in light of the costs of providing the investment advisory and other services and the benefits accruing to each Fund. The Board's conclusions may be based in part on its consideration of materials prepared in connection with the approval or continuance of the Agreement in prior years and on the Board's ongoing regular review of Fund performance and operations throughout the year, in addition to material prepared specifically for the most recent annual review of the Agreement.
1 Effective November 8, 2018, the Fund is named Neuberger Berman Commodity Strategy Fund.
256
Neuberger Berman Multi-Style Premia Fund: Initial Consideration of the Management Agreement
Prior to approving the management agreement with Neuberger Berman Investment Advisers LLC ("Management") (the "Agreement") with respect to Neuberger Berman Multi-Style Premia Fund (the "Fund"), the Board of Trustees (the "Board") of Neuberger Berman Alternative Funds (the "Trust"), including the Trustees who are not "interested persons" of Management (including its affiliates) or of the Trust ("Independent Fund Trustees"), evaluated the Agreement. Throughout the process, the Independent Fund Trustees were advised by counsel that is experienced in Investment Company Act of 1940 matters and that is independent of Management ("Independent Counsel").
In evaluating the Agreement, the Board, including the Independent Fund Trustees, reviewed materials provided by Management and met with senior representatives of Management regarding its personnel, operations, and financial condition as they relate to the Fund.
In connection with its deliberations, the Board also considered the broad range of information relevant to the Agreement that is provided to the Board (including its various standing committees) at meetings throughout the year and for the annual consideration of continuance of contracts for other series of the Trust, including reports on investment performance, portfolio risk, and other portfolio information for those series. The Contract Review Committee, which is comprised of Independent Fund Trustees, was established by the Board to assist in its deliberations regarding contracts. The Board has also established other committees that focus throughout the year on specific areas relevant to contract review, such as performance or compliance matters, and that are charged with specific responsibilities regarding the annual contract review. Those committees provide reports to the Contract Review Committee and the full Board, which consider that information as part of a contract review process.
The Independent Fund Trustees receive, at least annually, from Independent Counsel a memorandum discussing the legal standards for their consideration of the management agreements. During the course of their deliberations regarding their review of the Agreement, the Independent Fund Trustees met with Independent Counsel separately from representatives of Management.
In connection with its approval of the Agreement, the Board evaluated the terms of the Agreement, the overall fairness of the Agreement to the Fund and whether the Agreement was in the best interests of the Fund and its shareholders. The Board considered all factors it deemed relevant with respect to the Fund, including the following factors: (1) the nature, extent, and quality of the services to be provided by Management; (2) the expected costs of the services to be provided by Management; (3) the extent to which economies of scale might be realized as the Fund grows; and (4) whether proposed fee levels reflect any such potential economies of scale for the benefit of the Fund's shareholders. The Board's determination to approve the Agreement was based on a comprehensive consideration of all information provided to the Board. This description is not intended to include all of the factors considered by the Board. The Board members did not identify any particular information or factor that was all-important or controlling, and each Trustee may have attributed different weights to the various factors. The Board focused on the costs and benefits of the Agreement to the Fund and, through the Fund, its shareholders.
With respect to the nature, extent and quality of the services to be provided, the Board considered the investment philosophy and decision-making processes of, and the qualifications, experience, and capabilities of, and the resources available to, the portfolio management personnel of Management who would perform services for the Fund. The Board noted that Management also would provide certain administrative services, including fund accounting and compliance services. The Board also considered Management's policies and practices regarding brokerage and allocation of portfolio transactions for the Fund. Moreover, the Board considered Management's approach to potential conflicts of interest both generally and between a fund's investments and those of other funds or accounts managed by Management. The Board also noted that Management had increased its research capabilities with respect to environmental, social, and corporate governance matters and how those factors may relate to investment performance. The Board noted the extensive range of services that Management will provide to the Fund beyond the investment management services. The Board noted that
257
Management is also responsible for monitoring compliance with the Fund's investment objectives, policies and restrictions, as well as compliance with applicable law, including implementing rulemaking initiatives of the U.S. Securities and Exchange Commission. The Board considered that Management will assume significant ongoing risks with respect to the Fund, for which it is entitled to reasonable compensation. Specifically, Management's responsibilities include continual management of investment, operational, enterprise, legal, regulatory and compliance risks as they relate to the Fund, and the Board considers on a regular basis information regarding Management's processes for monitoring and managing risk. In addition, the Board also noted that when Management launches a new fund or share class, it assumes entrepreneurial risk with respect to that fund or share class, and that some funds and share classes have been liquidated without ever having been profitable to Management.
The Board also noted Management's activities under its contractual obligation to oversee the Fund's various outside service providers, including its renegotiation of certain service providers' fees and its evaluation of service providers' infrastructure, cybersecurity programs, compliance programs, and business continuity programs, among other matters. The Board also considered Management's ongoing development of its own infrastructure and information technology to support the Fund through, among other things, cybersecurity, business continuity planning, and risk management. In addition, the Board noted the positive compliance history of Management, as no significant compliance problems were reported to the Board with respect to Management. The Board also considers annually the general structure of the portfolio managers' compensation and whether this structure provides appropriate incentives to act in the best interests of the funds. The Board also considered the ability of Management to attract and retain qualified personnel to service the Fund.
The Board also considered the manner in which Management addressed various matters that have arisen during the year, some of them a result of developments in the broader fund industry or the regulations governing it. In addition, the Board considered actions taken by Management in response to recent market conditions and considered the overall performance of Management in this context.
With respect to the overall fairness of the Agreement, the Board considered the fee structures proposed for the Fund under the Agreement for the four classes of shares to be registered initially as compared to a peer group of funds having comparable investment programs, but most of which had net assets of between $100 million and $5 billion. The Board also considered any fall-out (i.e., indirect) benefits likely to accrue to Management or its affiliates from their relationship with the Fund. The Board reviewed a comparison of the Fund's proposed management fee to the peer group of comparable funds. The Board noted that the comparative management fee analysis includes, in the Fund's management fee, the separate administrative fees paid to Management. However, the Board noted that some funds in the peer group may pay directly from fund assets for certain services that Management would cover out of the administration fees for the Fund. Accordingly, the Board also considered the Fund's total expense ratio as compared with its peer group as a way of taking account of these differences. The Board noted that the total expenses projected for two of the four classes were below the median relative to the peer group and two of the four classes were above the median relative to the peer group. In addition, the Board considered the proposed contractual limit on expenses of each class of the Fund. The Board also considered whether it would be appropriate to evaluate any anticipated economies of scale in relation to the services Management would provide to the Fund, noting that, at the start-up phase of a fund, it may be too soon to anticipate the economies of scale in anything more than a general manner. The Board considered that the Fund's fee structure does not provide for a reduction of payments resulting from the use of breakpoints, and concluded that the fee structure was reasonable in part based on the nature of the Fund and its investment strategy, in part based on the proposed contractual limit on expenses of each class of the Fund and in part based on the observation that the Fund was priced to scale—that is, the projected expense ratios for most of the classes were comparable to those of much larger funds. The Board concluded that the benefits expected to accrue to Management and its affiliates by virtue of their relationship to the Fund were reasonable in light of the reasonably anticipated costs of providing the investment advisory and other services and the benefits expected to accrue to the Fund.
258
Conclusions
In approving the Agreement, the Board concluded that, in its business judgment, the terms of the Agreement are fair and reasonable to the Fund and that approval of the Agreement is in the best interests of the Fund and its shareholders. In reaching this determination, the Board considered that Management could be expected to provide a high level of service to the Fund; that the Fund's proposed fee structure appeared to the Board to be reasonable given the nature, extent, and quality of services expected to be provided; and that the benefits expected to accrue to Management and its affiliates by virtue of their relationship with the Fund were reasonable in light of the reasonably anticipated costs of providing the investment advisory and other services and the benefits expected to accrue to the Fund.
259
Notice to Shareholders
In early 2019 you will receive information to be used in filing your 2018 tax returns, which will include a notice of the exact tax status of all distributions paid to you by the Fund during calendar year 2018. Please consult your own tax advisor for details as to how this information should be reflected on your tax returns.
For the fiscal year ended October 31, 2018, each Fund makes the following designation, or up to the maximum amount of such dividends allowable pursuant to the Internal Revenue Code, as qualified dividend income eligible for reduced tax rates. These lower rates range from 5% to 15% depending upon an individual's tax bracket. Complete information regarding each Funds distributions during the calendar year 2018 will be reported in conjunction with Form 1099-DIV.
Fund | | Qualified
Dividend Income | |
Global Allocation | | $ | 411,921 | | |
Long Short | | | 40,159,407 | | |
Multi-Asset Income | | | 664,167 | | |
Multi-Style Premia | | | 218,566 | | |
Global Allocation, Hedged Option Premium Strategy, Long Short and U.S. Equity Index PutWrite Strategy hereby designate $564,195, $70,070, $19,172,684 and $5,819,643, respectively, as a capital gain distribution.
260
This page has been left blank intentionally
261
This page has been left blank intentionally
262
Neuberger Berman Investment Advisers LLC
1290 Avenue of the Americas
New York, NY 10104-0002
Retail Services: 800.877.9700
Broker-Dealer and Institutional Services: 800.366.6264/888.556.9030
Web site: www.nb.com
Statistics and projections in this report are derived from sources deemed to be reliable but cannot be regarded as a representation of future results of the Funds. This report is prepared for the general information of shareholders and is not an offer of shares of the Funds. Shares are sold only through the currently effective prospectus which you can obtain by calling 877.628.2583. An investor should consider carefully a Fund's investment objectives, risks and fees and expenses, which are described in its prospectus, before investing.
 L0265 12/18
Neuberger Berman
Alternative and Multi-Asset Class Funds
Institutional Class Shares
Class A Shares
Class C Shares
Class R6 Shares
Absolute Return Multi-Manager Fund
Annual Report
October 31, 2018
Beginning on January 1, 2021, as permitted by regulations adopted by the U.S. Securities and Exchange Commission, paper copies of the Fund's annual and semi-annual shareholder reports will no longer be sent by mail, unless you specifically request paper copies of the reports. Instead, the reports will be made available on the Fund's website www.nb.com/fundliterature, and you will be notified by mail each time a report is posted and provided with a website link to access the report.
If you already elected to receive shareholder reports electronically, you will not be affected by this change and you need not take any action. You may elect to receive shareholder reports and other communications from the Fund electronically anytime by contacting your financial intermediary (such as a broker-dealer or bank) or, if you are a direct investor, by calling 800.877.9700 or by sending an e-mail request to fundinfo@nb.com.
Beginning on January 1, 2019, you may elect to receive all future reports in paper free of charge. If you invest through a financial intermediary, you can contact your financial intermediary to request that you continue to receive paper copies of your shareholder reports. If you invest directly with the Fund, you can call 800.877.9700 or send an email request to fundinfo@nb.com to inform the Fund that you wish to continue receiving paper copies of your shareholder reports. Your election to receive reports in paper will apply to all funds held in your account if you invest through your financial intermediary or all funds held with the fund complex if you invest directly with the Fund.
Contents
PRESIDENT'S LETTER | | | 1 | | |
PORTFOLIO COMMENTARY | | | 2 | | |
FUND EXPENSE INFORMATION | | | 7 | | |
CONSOLIDATED SCHEDULE OF INVESTMENTS | | | 9 | | |
CONSOLIDATED FINANCIAL STATEMENTS | | | 39 | | |
FINANCIAL HIGHLIGHTS (ALL CLASSES)/
PER SHARE DATA | | | 61 | | |
Report of Independent Registered Public Accounting Firm | | | 65 | | |
Directory | | | 66 | | |
Trustees and Officers | | | 67 | | |
Proxy Voting Policies and Procedures | | | 77 | | |
Quarterly Portfolio Schedule | | | 77 | | |
Notice to Shareholders | | | 77 | | |
Board Consideration of the Management and
Sub-Advisory Agreements | | | 78 | | |
The "Neuberger Berman" name and logo and "Neuberger Berman Investment Advisers LLC" name are registered service marks of Neuberger Berman Group LLC. The individual Fund name in this piece is either a service mark or registered service mark of Neuberger Berman Investment Advisers LLC, an affiliate of Neuberger Berman BD LLC, distributor, member FINRA. ©2018 Neuberger Berman BD LLC, distributor. All rights reserved.
Dear Shareholder,
I am pleased to present this annual shareholder report for Neuberger Berman Absolute Return Multi-Manager Fund.
The global financial markets generated mixed results over the 12 months ended October 31, 2018. Despite periods of volatility and a weak finish, U.S. equities posted a solid return during the reporting period. Robust corporate profits and the boost from the December 2017 tax reform bill led to overall positive investor demand. These positive factors more than offset continued U.S. Federal Reserve Board (Fed) monetary policy tightening and concerns over a global trade war. In contrast, equities outside the U.S. generated poor results amid signs of decelerating growth, trade war fears and a number of geopolitical uncertainties.
Meanwhile, the U.S. fixed income market generated weak results over the reporting period. Both short- and long-term Treasury yields moved higher as the economy continued to grow and inflation ticked higher. In addition, the Fed indicated that it would remain on its path to tightening monetary policy in 2019 (although more recent statements by some Fed officials have suggested a less aggressive approach). Elsewhere, central banks in developed countries outside the U.S. largely maintained their accommodative monetary policies. However, the Bank of England raised rates twice over the period and the European Central Bank announced that it would end its bond buying program by the end of the year.
All told, the U.S. equity market, as measured by the S&P 500® Index, gained 7.35% over the reporting period. International developed and emerging market equities, as measured by the MSCI EAFE® and MSCI Emerging Market Indices, returned –6.85% and –12.52%, respectively, over the 12 months ended October 31, 2018. Meanwhile, the overall U.S. bond market, as measured by the Bloomberg Barclays U.S. Aggregate Bond Index, declined –2.05% during the period. Finally, inflation moved higher but was generally well contained over the period.
Thank you for your continued support and trust. We look forward to continue serving your investment needs in the years to come.
Sincerely,
JOSEPH V. AMATO
PRESIDENT AND CEO
NEUBERGER BERMAN MUTUAL FUNDS
1
Absolute Return Multi-Manager Fund Commentary (Unaudited)
Neuberger Berman Absolute Return Multi-Manager Fund Institutional Class generated a –0.56% total return for the 12 months ended October 31, 2018. The Fund outperformed its primary benchmark, the HFRX Global Hedge Fund Index (the Index), which posted a –3.53% total return for the same period. (Performance for all share classes is provided in the table following this letter.)
Global equity market performance was mixed during the period, with U.S. markets rallying while markets in Europe and Asia traded lower. Equity market volatility initially subsided and was elevated later in the period. U.S. Treasury yields moved higher broadly and the curve flattened. The U.S. dollar strengthened throughout the period. Meanwhile, commodity pricing was mixed as gold prices declined while crude oil and natural gas prices moved higher.
The Fund's allocations to global macro/managed futures, credit and event driven/merger arbitrage strategies contributed to performance, while the allocation to long/short equity detracted from results. From a risk management perspective, we were pleased that the Fund's volatility and beta1 versus the S&P 500® and Bloomberg Barclays U.S. Aggregate Bond Indices were all in line with our expectations.
The allocation to the global macro/managed futures strategy was the largest contributor for the period. Within this category, the allocation to the systematic currency trading strategy was responsible for the majority of gains. This was driven by the strategy's long U.S. dollar positioning versus the Euro and Australian dollar. The managed futures allocation was slightly positive, with gains from currency positioning outpacing losses from other asset classes.
The Fund's allocation to credit strategies was the next largest contributor. The asset-backed securities strategy was positive for the period with gains spread across sectors. The corporate credit long/short strategy detracted as gains from long positions in floating rate bank loans and bonds were outweighed by losses from shorts via credit default swaps and equities.
The merger arbitrage/event driven allocation contributed positively to results as a number of deals closed during the period.
The allocation to long/short equity strategies detracted from returns, with mixed performance across subadvisers. Losses from longs outpaced gains from shorts during the reporting period.
During the reporting period we decided to liquidate the nominal allocation to Levin, the event driven sub-adviser.
The Fund's aggregate use of futures, forward foreign currency, swap and option contracts contributed positively to performance during the period.
We continue to position the portfolio to perform in line with expectations if interest rates and volatility remain at current levels with the potential to outperform if interest rates and/or volatility increase. The largest strategy allocation in the Fund is long/short equity, driven by our view that rising rates will generate opportunities to short companies with low margins and high debt. Credit strategies is the next largest allocation, with a focus on short duration via long positions in floating rate bank loans and short positions in fixed rate bonds. We trimmed the allocation to credit strategies during the period as spreads tightened and other strategies became relatively more attractive. We increased the allocation to global macro/managed futures strategies during the period given our expectations for rising volatility, an environment in which these strategies have historically outperformed. Finally, we marginally reduced the allocation to merger arbitrage/event driven strategies as a result of our continued negative view on crowded trades and due to merger arbitrage spread tightening.
Sincerely,
DAVID KUPPERMAN, JEFF MAJIT AND FRED INGHAM
PORTFOLIO MANAGERS
1Beta is a measure of the systematic risk of a portfolio. It is the covariance of the portfolio and a market index divided by the variance of the market index. Beta measures the historical sensitivity of a portfolio's returns to movements in the market index. The beta of the market index will always be one. A portfolio with a beta above the market index (i.e. >1) means that the portfolio has greater volatility than the market index. If the beta of the portfolio is 1.2, a market increase in return of 1% implies a 1.2% increase in the portfolio's return. If the beta of the portfolio is 0.8, a market decrease in return of 1% implies a 0.8% decrease in the portfolio's return.
Information about principal risks of investing in the Fund is set forth in the prospectus and statement of additional information.
The portfolio composition, industries and holdings of the Fund are subject to change without notice.
The opinions expressed are those of the Fund's portfolio managers and subadvisers. The opinions are as of the date of this report and are subject to change without notice.
2
Absolute Return Multi-Manager Fund (Unaudited)
TICKER SYMBOLS
Institutional Class | | NABIX | |
Class A | | NABAX | |
Class C | | NABCX | |
Class R6 | | NRABX | |
PORTFOLIO BY TYPE OF SECURITY
(as a % of Total Net Assets)
| | Long | | Short | |
Asset-Backed Securities | | | 8.7 | % | | | — | % | |
Closed End Funds | | | 0.3 | | | | — | | |
Collateralized Mortgage
Obligations | | | 2.6 | | | | — | | |
Commercial Mortgage-Backed
Securities | | | 4.9 | | | | — | | |
Common Stocks | | | 37.5 | | | | (7.9 | ) | |
Convertible Bonds | | | 1.3 | | | | — | | |
Convertible Preferred Stocks | | | — | | | | — | | |
Corporate Bonds | | | 3.1 | | | | (0.8 | ) | |
Exchange Traded Funds | | | — | | | | (1.3 | ) | |
Loan Assignments | | | 4.3 | | | | — | | |
Master Limited Partnerships | | | 2.2 | | | | (0.0 | ) | |
Options Purchased | | | 0.1 | | | | — | | |
Preferred Stocks | | | 0.0 | | | | — | | |
Rights | | | 0.0 | | | | — | | |
U.S. Treasury Obligations | | | 0.1 | | | | — | | |
Warrants | | | 0.0 | | | | — | | |
Short-Term Investments | | | 29.7 | | | | — | | |
Other Assets Less Liabilities | | | 15.2 | * | | | — | | |
Total | | | 110.0 | % | | | (10.0 | )% | |
* Includes the impact of the Fund's open positions in derivatives (other than Options Purchased), if any.
PERFORMANCE HIGHLIGHTS
| | Average Annual Total Return
Ended 10/31/2018 | |
| | Inception
Date | | 1 Year | | 5 Years | | Life of
Fund | |
At NAV | | | | | | | | | |
Institutional Class | | 05/15/2012 | | | –0.56 | % | | | 0.67 | % | | | 1.89 | % | |
Class A | | 05/15/2012 | | | –0.94 | % | | | 0.30 | % | | | 1.52 | % | |
Class C | | 05/15/2012 | | | –1.76 | % | | | –0.47 | % | | | 0.75 | % | |
| Class R63 | | 12/31/2013 | | | –0.56 | % | | | 0.69 | % | | | 1.91 | % | |
With Sales Charge | |
Class A | | | | | –6.64 | % | | | –0.88 | % | | | 0.59 | % | |
Class C | | | | | –2.74 | % | | | –0.47 | % | | | 0.75 | % | |
Index | |
| HFRX Global Hedge Fund Index1,2 | | | | | –3.53 | % | | | 0.14 | % | | | 1.16 | % | |
| S&P 500® Index1,2 | | | | | 7.35 | % | | | 11.34 | % | | | 13.89 | % | |
Bloomberg Barclays U.S. Aggregate
Bond Index1,2 | | | | | –2.05 | % | | | 1.83 | % | | | 1.60 | % | |
The performance data quoted represent past performance and do not indicate future results. Current performance may be lower or higher than the performance data quoted. For performance data current to the most recent month-end, please visit www.nb.com/performance.
The results shown in the table reflect the reinvestment of income dividends and other distributions, if any. The results do not reflect the effect of taxes a shareholder would pay on Fund distributions or on the redemption of Fund shares.
The investment return and principal value of an investment will fluctuate and shares, when redeemed, may be worth more or less than their original cost.
Returns would have been lower if Neuberger Berman Investment Advisers LLC ("Management") had not reimbursed certain expenses and/or waived a portion of the investment management fees during certain of the periods shown. Repayment by a class (of expenses previously reimbursed and/or fees previously waived by Management) will decrease the class's returns. Please see Note B in the Consolidated Notes to Financial Statements for specific information regarding expense reimbursement and/or fee waiver arrangements.
As stated in the Fund's most recent prospectus, as amended, the total annual operating expense ratios for fiscal year 2017 were 2.72%, 3.16%, 3.85% and 2.40% for Institutional Class, Class A, Class C and Class R6 shares, respectively (before expense reimbursements and/or fee waivers, if any). The total annual operating expense ratios were 2.60%, 3.02%, 3.72% and 2.37% for Institutional Class, Class A, Class C and Class R6 shares, respectively, after expense reimbursements and/or fee waivers. The expense ratios for the annual period ended October 31, 2018 can be found in the Financial Highlights section of this report.
Returns shown with a sales charge reflect the deduction of the current maximum initial sales charge of 5.75% for Class A shares and the contingent deferred sales charge (CDSC) for Class C shares. The CDSC for Class C shares is 1%, which is reduced to 0% after 1 year. The performance of the Fund's share classes will differ primarily due to different sales charge structures and class expenses. Please see the prospectus for more information about sales charge structures, if any, and class expenses for your share class.
3
Absolute Return Multi-Manager Fund (Unaudited)
COMPARISON OF A $1,000,000 INVESTMENT
(000's omitted)
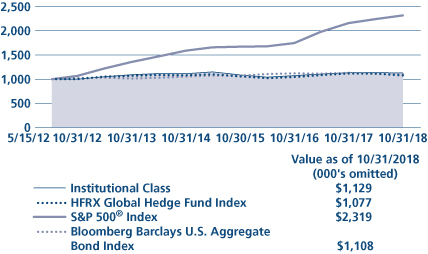
This graph shows the change in value of a hypothetical $1,000,000 investment in the Fund over the past 10 fiscal years, or since the Fund's inception if it has not operated for 10 years. The graph is based on the Institutional Class shares only; the performance of the Fund's share classes will differ primarily due to different sales charge structures and class expenses (see Performance Highlights chart on previous page). The result is compared with benchmarks, which include a broad-based market index and may include a more narrowly based index. Market indices have not been reduced to reflect any of the fees and costs of investing. The results shown in the graph reflect the reinvestment of income dividends and other distributions, if any. The results do not reflect the effect of taxes a shareholder would pay on Fund distributions or on the redemption of Fund shares. Results represent past performance and do not indicate future results.
4
1 Please see "Glossary of Indices" on page 6 for a description of indices. Please note that individuals cannot invest directly in any index. The S&P 500® and the Bloomberg Barclays U.S. Aggregate Bond Indices do not take into account any fees, expenses or tax consequences of investing in the individual securities that they track. The HFRX Global Hedge Fund Index does take into account fees and expenses, but not tax consequences, of investing since it is based on the underlying hedge funds' net returns. Data about the performance of an index are prepared or obtained by Neuberger Berman Investment Advisers LLC and reflect the reinvestment of income dividends and other distributions, if any. The Fund may invest in securities not included in a described index and generally does not invest in all securities included in a described index.
2 The date used to calculate Life of Fund performance for the index is the inception date of the oldest share class.
3 The performance information for Class R6 prior to the class's inception date is that of the Institutional Class of Neuberger Berman Absolute Return Multi-Manager Fund. The performance information for the Institutional Class has not been adjusted to take into account differences in class specific operating expenses. The Institutional Class has higher expenses and typically lower returns than Class R6.
For more complete information on any of the Neuberger Berman Alternative and Multi-Asset Class Funds, see the Fund's prospectus, which can be obtained by calling us at (800) 877-9700, or visiting our website at www.nb.com.
5
Bloomberg Barclays U.S. Aggregate Bond Index: | | The index measures the investment grade, U.S. dollar-denominated, fixed-rate, taxable bond market and includes Treasuries, government-related and corporate securities, mortgage-backed securities (MBS) (agency fixed-rate and hybrid adjustable rate mortgage (ARM) pass-throughs), asset-backed securities (ABS), and commercial mortgage-backed securities (CMBS) (agency and nonagency). | |
HFRX Global Hedge Fund Index: | | The index is designed to be representative of the overall composition of the hedge fund universe. It is comprised of all eligible hedge fund strategies; including but not limited to convertible arbitrage, distressed securities, equity hedge, equity market neutral, event driven, macro, merger arbitrage, and relative value arbitrage. The strategies are asset weighted based on the distribution of assets in the hedge fund industry. Constituent funds are selected from an eligible pool of the more than 7,500 funds worldwide that report to the Hedge Fund Research (HFR) Database. Constituent funds must meet all of the following criteria: report monthly; report performance net of all fees; be U.S. dollar denominated; be active and accepting new investments; have a minimum 24 months track record; and the fund's manager must have at least $50 million in assets under management. The index is rebalanced quarterly. | |
| S&P 500® Index: | | The index is a float-adjusted market capitalization-weighted index that focuses on the large-cap segment of the U.S. equity market, and includes a significant portion of the total value of the market. | |
6
Information About Your Fund's Expenses (Unaudited)
As a Fund shareholder, you incur two types of costs: (1) transaction costs, including sales charges (loads) on purchase payments or redemption proceeds (if applicable); and (2) ongoing costs, including management fees, distribution and/or service (12b-1) fees (if applicable), and other Fund expenses. This example is intended to help you understand your ongoing costs (in U.S. dollars) of investing in a Fund and compare these costs with the ongoing costs of investing in other mutual funds.
This table is designed to provide information regarding costs related to your investments. The following examples are based on an investment of $1,000 made at the beginning of the six month period ended October 31, 2018 and held for the entire period. The table illustrates each Fund's costs in two ways:
Actual Expenses and Performance: | | The first section of the table provides information about actual account values and actual expenses in dollars, based on the Fund's actual performance during the period indicated. You may use the information in this line, together with the amount you invested, to estimate the expenses you paid over the period. Simply divide your account value by $1,000 (for example, an $8,600 account value divided by $1,000 = 8.6), then multiply the result by the number in the first section of the table under the heading entitled "Expenses Paid During the Period" to estimate the expenses you paid over the period. | |
Hypothetical Example for Comparison Purposes: | | The second section of the table provides information about hypothetical account values and hypothetical expenses based on the Fund's actual expense ratio and an assumed rate of return at 5% per year before expenses. This return is not the Fund's actual return. The hypothetical account values and expenses may not be used to estimate the actual ending account balance or expenses you paid for the period. You may use this information to compare the ongoing costs of investing in a Fund versus other funds. To do so, compare the expenses shown in this 5% hypothetical example with the 5% hypothetical examples that appear in the shareholder reports of other funds | |
Please note that the expenses in the table are meant to highlight your ongoing costs only and do not include any transaction costs, such as sales charges (loads) (if applicable). Therefore, the information under the heading "Hypothetical (5% annual return before expenses)" is useful in comparing ongoing costs only, and will not help you determine the relative total costs of owning different funds. In addition, if these transaction costs were included, your costs would have been higher.
7
Expense Example (Unaudited)
Neuberger Berman Alternative Funds | |
| | | ACTUAL | | HYPOTHETICAL (5% ANNUAL RETURN BEFORE EXPENSES) | |
| | | Beginning
Account
Value
5/1/2018 | | Ending
Account
Value
10/31/2018 | | Expenses Paid
During the
Period
5/1/2018 -
10/31/2018(1) | | Expense
Ratio | | Beginning
Account
Value
5/1/2018 | | Ending
Account
Value
10/31/2018 | | Expenses Paid
During the
Period
5/1/2018 -
10/31/2018(2) | | Expense
Ratio | |
Absolute Return Multi-Manager Fund | |
Institutional Class | | $ | 1,000.00 | | | $ | 993.50 | | | $ | 11.61 | (3) | | | 2.31 | % | | $ | 1,000.00 | | | $ | 1,013.56 | | | $ | 11.72 | (3) | | | 2.31 | % | |
Class A | | $ | 1,000.00 | | | $ | 991.50 | | | $ | 12.55 | (3) | | | 2.50 | % | | $ | 1,000.00 | | | $ | 1,012.60 | | | $ | 12.68 | (3) | | | 2.50 | % | |
Class C | | $ | 1,000.00 | | | $ | 987.20 | | | $ | 17.18 | (3) | | | 3.43 | % | | $ | 1,000.00 | | | $ | 1,007.91 | | | $ | 17.36 | (3) | | | 3.43 | % | |
Class R6 | | $ | 1,000.00 | | | $ | 992.60 | | | $ | 11.25 | (3) | | | 2.24 | % | | $ | 1,000.00 | | | $ | 1,013.91 | | | $ | 11.37 | (3) | | | 2.24 | % | |
(1) For each class, expenses are equal to the annualized expense ratio for the class, multiplied by the average account value over the period, multiplied by 184/365 (to reflect the one-half year period shown), unless otherwise indicated.
(2) Hypothetical expenses are equal to the annualized expense ratios for each class, multiplied by the average account value over the period (assuming 5% annual return), multiplied by 184/365 (to reflect the one-half year period shown).
(3) Includes expenses of the Fund's subsidiary (See Note A of the Notes to Consolidated Financial Statements).
8
Consolidated Schedule of Investments Neuberger Berman Absolute Return Multi-Manager Fund October 31, 2018
Investments | | Shares | | Value
(000) | |
Long Positions 94.8% | |
Common Stocks 37.5% | |
Aerospace & Defense 0.8% | |
Esterline
Technologies Corp.* | | | 700 | | | $ | 82 | | |
General Dynamics Corp. | | | 1,352 | | | | 233 | | |
Raytheon Co. | | | 2,278 | | | | 399 | | |
| Rockwell Collins, Inc.(a) | | | 10,300 | | | | 1,319 | | |
| Sparton Corp.*(a) | | | 4,600 | | | | 57 | | |
| | | | 2,090 | | |
Air Freight & Logistics 0.4% | |
FedEx Corp. | | | 4,131 | | | | 910 | | |
| Airlines 0.0%(b) | |
American Airlines
Group, Inc.
Escrow*(c)(d)(f) | | | 14,383 | | | | 17 | | |
Auto Components 0.2% | |
Aptiv plc | | | 5,680 | | | | 436 | | |
Automobiles 0.2% | |
General Motors Co. | | | 12,925 | | | | 473 | | |
Banks 1.1% | |
Barclays plc
(United Kingdom) | | | 51,988 | | | | 115 | | |
Boston Private
Financial Holdings,
Inc. | | | 44,455 | | | | 600 | | |
Citigroup, Inc. | | | 10,100 | | | | 661 | | |
Comerica, Inc. | | | 4,461 | | | | 364 | | |
JPMorgan Chase & Co. | | | 5,590 | | | | 609 | | |
MBT Financial Corp. | | | 4,300 | | | | 49 | | |
Societe Generale SA
(France) | | | 7,557 | | | | 278 | | |
| | | | 2,676 | | |
Beverages 0.2% | |
Constellation Brands,
Inc., Class A | | | 2,015 | | | | 401 | | |
Biotechnology 0.8% | |
BioMarin
Pharmaceutical,
Inc.* | | | 4,225 | | | | 389 | | |
China Biologic Products
Holdings, Inc.
(China)*(a) | | | 100 | | | | 7 | | |
Gilead Sciences, Inc. | | | 6,195 | | | | 422 | | |
Grifols SA, ADR
(Spain)(a) | | | 6,100 | | | | 125 | | |
| Shire plc, ADR(a) | | | 5,132 | | | | 933 | | |
| | | | 1,876 | | |
Building Products 0.2% | |
| USG Corp.(a) | | | 9,300 | | | | 393 | | |
Capital Markets 0.7% | |
Forum Merger II
Corp.*(a) | | | 9,700 | | | | 98 | | |
Goldman Sachs Group,
Inc. (The) | | | 2,762 | | | | 622 | | |
Investments | | Shares | | Value
(000) | |
J2 Acquisition
Ltd.*(e) | | | 6,800 | | | $ | 62 | | |
Modern Media
Acquisition Corp.*(a) | | | 13,200 | | | | 134 | | |
Mudrick Capital
Acquisition Corp.,
Class A* | | | 17,596 | | | | 172 | | |
Nebula Acquisition
Corp., Class A*(a) | | | 7,098 | | | | 70 | | |
Pensare Acquisition
Corp.*(a) | | | 5,800 | | | | 58 | | |
S&P Global, Inc. | | | 2,569 | | | | 468 | | |
Trinity Merger Corp.,
Class A*(a) | | | 10,800 | | | | 106 | | |
VectoIQ Acquisition
Corp.*(a) | | | 6,400 | | | | 61 | | |
| | | | 1,851 | | |
Chemicals 1.3% | |
Air Products &
Chemicals, Inc. | | | 6,455 | | | | 996 | | |
DowDuPont, Inc. | | | 20,158 | | | | 1,087 | | |
WR Grace & Co. | | | 15,667 | | | | 1,015 | | |
| | | | 3,098 | | |
Commercial Services & Supplies 0.5% | |
| Cenveo Corp.*(c)(i) | | | 8,093 | | | | 235 | | |
Clean Harbors, Inc.* | | | 14,785 | | | | 1,006 | | |
| | | | 1,241 | | |
Communications Equipment 1.0% | |
Cisco Systems, Inc. | | | 12,190 | | | | 558 | | |
Extreme
Networks, Inc.* | | | 73,570 | | | | 408 | | |
Mitel Networks
Corp.* | | | 56,700 | | | | 622 | | |
Motorola
Solutions, Inc. | | | 5,981 | | | | 733 | | |
Oclaro, Inc.* | | | 10,800 | | | | 89 | | |
| | | | 2,410 | | |
Construction Materials 0.2% | |
HeidelbergCement
AG (Germany) | | | 8,560 | | | | 582 | | |
Containers & Packaging 0.1% | |
Ball Corp. | | | 5,430 | | | | 243 | | |
Diversified Telecommunication
Services 0.2% | |
| AT&T, Inc.(a) | | | 5,670 | | | | 174 | | |
Intelsat SA* | | | 9,631 | | | | 251 | | |
| | | | 425 | | |
Electric Utilities 0.7% | |
American Electric
Power Co., Inc. | | | 2,106 | | | | 155 | | |
Emera, Inc. (Canada) | | | 3,223 | | | | 99 | | |
Evergy, Inc. | | | 12,187 | | | | 682 | | |
Exelon Corp. | | | 3,690 | | | | 162 | | |
FirstEnergy Corp. | | | 5,384 | | | | 201 | | |
Investments | | Shares | | Value
(000) | |
NextEra Energy,
Inc. | | | 1,271 | | | $ | 219 | | |
PG&E Corp.* | | | 5,216 | | | | 244 | | |
| | | | 1,762 | | |
Electrical Equipment 0.1% | |
TPI Composites, Inc.* | | | 6,675 | | | | 168 | | |
Vivint Solar, Inc.* | | | 7,078 | | | | 37 | | |
| | | | 205 | | |
Electronic Equipment, Instruments & Components 0.4% | |
Electro Scientific
Industries, Inc.* | | | 700 | | | | 20 | | |
FLIR Systems, Inc. | | | 7,533 | | | | 349 | | |
Itron, Inc.* | | | 3,365 | | | | 175 | | |
Orbotech Ltd.
(Israel)*(a) | | | 8,200 | | | | 459 | | |
| | | | 1,003 | | |
Energy Equipment & Services 0.2% | |
C&J Energy
Services, Inc.* | | | 25,241 | | | | 474 | | |
Ocean Rig UDW, Inc.,
Class A (Angola)* | | | 3,600 | | | | 109 | | |
| | | | 583 | | |
Entertainment 1.1% | |
Activision Blizzard, Inc. | | | 7,870 | | | | 543 | | |
Global Eagle
Entertainment, Inc.* | | | 68,293 | | | | 177 | | |
Netflix, Inc.* | | | 1,503 | | | | 454 | | |
Pandora Media, Inc.* | | | 4,800 | | | | 41 | | |
Take-Two Interactive
Software, Inc.* | | | 3,700 | | | | 477 | | |
Twenty-First
Century Fox,
Inc., Class B | | | 13,638 | | | | 616 | | |
Walt Disney Co. (The) | | | 3,985 | | | | 458 | | |
| | | | 2,766 | | |
Equity Real Estate Investment Trusts (REITs) 0.5% | |
Forest City Realty Trust,
Inc., Class A | | | 17,000 | | | | 428 | | |
InfraREIT, Inc. | | | 1,100 | | | | 23 | | |
LaSalle Hotel
Properties | | | 10,400 | | | | 343 | | |
VICI Properties, Inc. | | | 18,795 | | | | 406 | | |
| | | | 1,200 | | |
Food & Staples Retailing 0.2% | |
Cia Brasileira
de Distribuicao,
ADR (Brazil)* | | | 4,044 | | | | 85 | | |
Magnit PJSC, GDR
(Russia)(e) | | | 3,981 | | | | 53 | | |
| Rite Aid Corp.*(a) | | | 6,925 | | | | 8 | | |
Wal-Mart de Mexico
SAB de CV (Mexico) | | | 48,724 | | | | 124 | | |
See Notes to Consolidated Financial Statements
9
Consolidated Schedule of Investments Neuberger Berman Absolute Return Multi-Manager Fund (cont'd)
Investments | | Shares | | Value
(000) | |
X5 Retail Group NV,
GDR (Russia)(e) | | | 10,671 | | | $ | 251 | | |
| | | | 521 | | |
Health Care Equipment & Supplies 1.1% | |
Danaher Corp. | | | 9,872 | | | | 981 | | |
K2M Group Holdings,
Inc.* | | | 11,600 | | | | 318 | | |
Mazor Robotics Ltd.,
ADR (Israel)* | | | 7,900 | | | | 460 | | |
NxStage Medical,
Inc.*(a) | | | 9,000 | | | | 255 | | |
Smith & Nephew plc
(United Kingdom) | | | 4,002 | | | | 65 | | |
West Pharmaceutical
Services, Inc. | | | 1,731 | | | | 183 | | |
Zimmer Biomet
Holdings, Inc. | | | 3,105 | | | | 353 | | |
| | | | 2,615 | | |
Health Care Providers & Services 1.5% | |
| Aetna, Inc.(a) | | | 9,305 | | | | 1,846 | | |
Cigna Corp. | | | 2,294 | | | | 491 | | |
Express Scripts
Holding Co.* | | | 9,900 | | | | 960 | | |
Humana, Inc. | | | 980 | | | | 314 | | |
Shanghai
Pharmaceuticals
Holding Co. Ltd.,
Class H (China) | | | 31,801 | | | | 70 | | |
Sinopharm Group
Co. Ltd., Class H
(China) | | | 17,852 | | | | 87 | | |
| | | | 3,768 | | |
Hotels, Restaurants & Leisure 0.5% | |
Belmond Ltd., Class A
(United Kingdom)*(a) | | | 3,000 | | | | 51 | | |
Boyd Gaming Corp. | | | 20,067 | | | | 533 | | |
Caesars
Entertainment
Corp.* | | | 25,224 | | | | 217 | | |
Sonic Corp. | | | 2,500 | | | | 108 | | |
| Vail Resorts, Inc.(a) | | | 1,230 | | | | 309 | | |
| | | | 1,218 | | |
Household Durables 0.3% | |
| Lennar Corp., Class B(a) | | | 1,787 | | | | 64 | | |
SodaStream
International Ltd.
(Israel)* | | | 5,100 | | | | 731 | | |
| | | | 795 | | |
Independent Power and Renewable Electricity Producers 0.5% | |
Atlantica Yield plc
(Spain) | | | 25,220 | | | | 495 | | |
Azure Power Global
Ltd. (India)* | | | 54,654 | | | | 656 | | |
Clearway Energy,
Inc., Class C | | | 688 | | | | 14 | | |
Investments | | Shares | | Value
(000) | |
NextEra Energy
Partners LP | | | 4,175 | | | $ | 190 | | |
| | | | 1,355 | | |
Industrial Conglomerates 0.4% | |
Carlisle Cos., Inc. | | | 8,125 | | | | 785 | | |
Smiths Group plc
(United Kingdom) | | | 4,766 | | | | 85 | | |
| | | | 870 | | |
Insurance 1.1% | |
AIA Group Ltd.
(Hong Kong) | | | 89,890 | | | | 684 | | |
American
International
Group, Inc. | | | 11,551 | | | | 477 | | |
Aon plc | | | 2,980 | | | | 465 | | |
Aspen Insurance
Holdings Ltd.
(Bermuda) | | | 4,900 | | | | 205 | | |
Genworth Financial,
Inc., Class A* | | | 8,700 | | | | 37 | | |
Health Insurance
Innovations, Inc.,
Class A* | | | 7,775 | | | | 380 | | |
Navigators Group, Inc.
(The) | | | 600 | | | | 42 | | |
RSA Insurance
Group plc
(United Kingdom) | | | 50,588 | | | | 365 | | |
| | | | 2,655 | | |
Interactive Media & Services 1.6% | |
| Actua Corp.*(c)(d)(f) | | | 6,700 | | | | 4 | | |
Alphabet, Inc.,
Class A* | | | 1,311 | | | | 1,430 | | |
Baidu, Inc.,
ADR (China)* | | | 966 | | | | 184 | | |
Facebook, Inc.,
Class A* | | | 8,009 | | | | 1,216 | | |
Mail.Ru Group Ltd.,
GDR (Russia)*(e) | | | 3,171 | | | | 84 | | |
Tencent Holdings
Ltd. (China) | | | 19,970 | | | | 684 | | |
| XO Group, Inc.*(a) | | | 6,900 | | | | 239 | | |
Yandex NV,
Class A (Russia)* | | | 3,471 | | | | 104 | | |
| | | | 3,945 | | |
Internet & Direct Marketing Retail 1.9% | |
Alibaba Group
Holding Ltd.,
ADR (China)* | | | 7,923 | | | | 1,127 | | |
Alibaba Group
Holding Ltd., ADR
(China)* | | | 1,634 | | | | 233 | | |
Amazon.com, Inc.* | | | 462 | | | | 738 | | |
ASOS plc
(United Kingdom)* | | | 1,139 | | | | 79 | | |
Booking Holdings, Inc.* | | | 201 | | | | 377 | | |
Investments | | Shares | | Value
(000) | |
eBay, Inc.* | | | 5,424 | | | $ | 158 | | |
Expedia Group, Inc. | | | 11,170 | | | | 1,401 | | |
MercadoLibre, Inc.
(Argentina) | | | 1,197 | | | | 388 | | |
zooplus AG (Germany)* | | | 953 | | | | 158 | | |
| | | | 4,659 | | |
IT Services 0.9% | |
Carbonite, Inc.* | | | 8,760 | | | | 300 | | |
Everi Holdings, Inc.* | | | 37,567 | | | | 270 | | |
First Data Corp.,
Class A* | | | 34,465 | | | | 646 | | |
MoneyGram
International,
Inc.*(a) | | | 8,800 | | | | 37 | | |
PayPal Holdings, Inc.* | | | 5,424 | | | | 457 | | |
Visa, Inc., Class A | | | 3,503 | | | | 483 | | |
| | | | 2,193 | | |
Life Sciences Tools & Services 0.7% | |
Eurofins Scientific SE
(Luxembourg) | | | 250 | | | | 126 | | |
Gerresheimer AG
(Germany) | | | 16,668 | | | | 1,175 | | |
Thermo Fisher
Scientific, Inc. | | | 1,616 | | | | 378 | | |
| | | | 1,679 | | |
Machinery 0.4% | |
Dover Corp. | | | 11,397 | | | | 944 | | |
Evoqua Water
Technologies Corp.* | | | 7,646 | | | | 74 | | |
| | | | 1,018 | | |
Media 1.7% | |
Discovery, Inc.,
Class C*(a) | | | 1,400 | | | | 41 | | |
DISH Network Corp.,
Class A* | | | 7,607 | | | | 234 | | |
GCI Liberty, Inc.,
Class A*(a) | | | 1,789 | | | | 85 | | |
Gray Television, Inc.* | | | 45,435 | | | | 786 | | |
ITV plc
(United Kingdom) | | | 279,027 | | | | 531 | | |
Liberty Global plc,
Class C
(United Kingdom)* | | | 5,494 | | | | 138 | | |
Loral Space &
Communications,
Inc.*(a) | | | 9,668 | | | | 432 | | |
Stroeer SE & Co.
KGaA (Germany) | | | 28,911 | | | | 1,512 | | |
Tribune Co.
Litigation,
Class 1C*(c)(d)(f) | | | 300,000 | | | | — | | |
Tribune Media Co.,
Class A(a) | | | 13,300 | | | | 505 | | |
| | | | 4,264 | | |
See Notes to Consolidated Financial Statements
10
Consolidated Schedule of Investments Neuberger Berman Absolute Return Multi-Manager Fund (cont'd)
Investments | | Shares | | Value
(000) | |
Metals & Mining 0.5% | |
Constellium
NV, Class A* | | | 43,076 | | | $ | 390 | | |
Nevsun Resources
Ltd. (Canada) | | | 61,900 | | | | 275 | | |
Pretium Resources,
Inc. (Canada)* | | | 58,941 | | | | 470 | | |
| | | | 1,135 | | |
Multi-Utilities 0.4% | |
Ameren Corp. | | | 1,472 | | | | 95 | | |
| Avista Corp.(a) | | | 5,600 | | | | 288 | | |
| Vectren Corp.(a) | | | 8,700 | | | | 622 | | |
| | | | 1,005 | | |
Oil, Gas & Consumable Fuels 3.0% | |
Alta Mesa Resources,
Inc., Class A*(a) | | | 200 | | | | 1 | | |
Antero
Midstream GP LP | | | 4,593 | | | | 74 | | |
Cheniere Energy, Inc.* | | | 11,483 | | | | 694 | | |
Devon Energy Corp. | | | 13,050 | | | | 423 | | |
Enbridge Energy
Management LLC*(c)(f) | | | 2,531 | | | | — | (g) | |
Energen Corp.* | | | 2,000 | | | | 144 | | |
EOG Resources, Inc. | | | 2,814 | | | | 296 | | |
Falcon Minerals
Corp.*(a) | | | 2,200 | | | | 22 | | |
Golar LNG Ltd.
(Bermuda) | | | 11,967 | | | | 321 | | |
Halcon
Resources Corp.* | | | 82,191 | | | | 273 | | |
Kinder Morgan
Canada Ltd.
(Canada)(e) | | | 5,393 | | | | 65 | | |
Kinder Morgan, Inc. | | | 26,285 | | | | 447 | | |
Marathon
Petroleum Corp. | | | 8 | | | | 1 | | |
Midstates
Petroleum Co., Inc.* | | | 63,383 | | | | 457 | | |
NextDecade Corp.* | | | 57,050 | | | | 296 | | |
ONEOK, Inc. | | | 8,359 | | | | 548 | | |
Pembina Pipeline
Corp. (Canada) | | | 16,003 | | | | 518 | | |
Phillips 66 | | | 4,141 | | | | 426 | | |
Plains GP Holdings
LP, Class A* | | | 30,859 | | | | 659 | | |
Renewable Energy
Group, Inc.* | | | 2,585 | | | | 80 | | |
SandRidge
Energy, Inc.* | | | 8,179 | | | | 73 | | |
SM Energy Co. | | | 11,829 | | | | 288 | | |
Targa Resources Corp. | | | 9,563 | | | | 494 | | |
Tellurian, Inc.* | | | 6,415 | | | | 51 | | |
Williams Cos.,
Inc. (The) | | | 31,091 | | | | 756 | | |
| | | | 7,407 | | |
Paper & Forest Products 0.2% | |
KapStone Paper
and Packaging Corp. | | | 14,700 | | | | 515 | | |
Investments | | Shares | | Value
(000) | |
Personal Products 0.3% | |
Edgewell
Personal Care Co.* | | | 17,978 | | | $ | 863 | | |
Pharmaceuticals 0.9% | |
| Akorn, Inc.*(a) | | | 6,240 | | | | 42 | | |
Allergan plc | | | 8,322 | | | | 1,315 | | |
Aralez
Pharmaceuticals,
Inc. (Canada)*(a) | | | 345 | | | | — | (g) | |
Bristol-Myers
Squibb Co. | | | 5,214 | | | | 264 | | |
Corium
International, Inc.* | | | 12,200 | | | | 154 | | |
Dr Reddy's
Laboratories Ltd.,
ADR (India) | | | 3,213 | | | | 109 | | |
| Endocyte, Inc.*(a) | | | 8,500 | | | | 201 | | |
Hikma
Pharmaceuticals
plc (Jordan) | | | 7,895 | | | | 192 | | |
Teva Pharmaceutical
Industries Ltd.,
ADR (Israel) | | | 1,755 | | | | 35 | | |
| | | | 2,312 | | |
Professional Services 2.1% | |
Dun &
Bradstreet Corp.
(The) | | | 3,500 | | | | 498 | | |
Equifax, Inc. | | | 5,309 | | | | 539 | | |
IHS Markit Ltd.* | | | 11,890 | | | | 625 | | |
Intertek Group plc
(United Kingdom) | | | 2,413 | | | | 145 | | |
Intertrust NV
(Netherlands)(e)(h) | | | 118,611 | | | | 1,914 | | |
Nielsen Holdings plc | | | 15,645 | | | | 406 | | |
| TriNet Group, Inc.*(a) | | | 22,738 | | | | 1,068 | | |
| | | | 5,195 | | |
Road & Rail 0.1% | |
CSX Corp. | | | 4,960 | | | | 342 | | |
Semiconductors & Semiconductor Equipment 0.6% | |
Broadcom, Inc. | | | 1,162 | | | | 260 | | |
Integrated Device
Technology, Inc.* | | | 5,200 | | | | 243 | | |
NXP Semiconductors
NV (Netherlands) | | | 11,650 | | | | 874 | | |
| | | | 1,377 | | |
Software 1.6% | |
CA, Inc. | | | 14,800 | | | | 657 | | |
CommVault
Systems, Inc.* | | | 10,375 | | | | 604 | | |
Dell Technologies,
Inc., Class V*(a) | | | 950 | | | | 86 | | |
Imperva, Inc.* | | | 5,000 | | | | 277 | | |
Micro Focus
International plc, ADR
(United Kingdom)(a) | | | 555 | | | | 8 | | |
Investments | | Shares | | Value
(000) | |
Microsoft Corp. | | | 13,918 | | | $ | 1,487 | | |
Red Hat, Inc.* | | | 1,700 | | | | 292 | | |
salesforce.com, Inc.* | | | 2,998 | | | | 411 | | |
| | | | 3,822 | | |
Specialty Retail 1.1% | |
AutoZone, Inc.* | | | 972 | | | | 713 | | |
Pets at Home
Group plc
(United Kingdom) | | | 166,954 | | | | 235 | | |
Rent-A-Center, Inc.* | | | 4,500 | | | | 64 | | |
Sports Direct
International plc
(United Kingdom)* | | | 292,465 | | | | 1,220 | | |
| Tiffany & Co.(a) | | | 4,515 | | | | 502 | | |
| | | | 2,734 | | |
Technology Hardware, Storage & Peripherals 0.8% | |
Apple, Inc. | | | 6,066 | | | | 1,328 | | |
Samsung Electronics
Co. Ltd., GDR
(South Korea)(e) | | | 381 | | | | 355 | | |
Western Digital Corp. | | | 5,184 | | | | 223 | | |
| Xerox Corp.(a) | | | 2,800 | | | | 78 | | |
| | | | 1,984 | | |
Textiles, Apparel & Luxury Goods 0.9% | |
G-III Apparel
Group Ltd.* | | | 22,715 | | | | 905 | | |
Michael Kors
Holdings Ltd.* | | | 4,723 | | | | 262 | | |
PVH Corp. | | | 6,332 | | | | 765 | | |
Tapestry, Inc. | | | 7,765 | | | | 329 | | |
| | | | 2,261 | | |
Tobacco 0.4% | |
Philip Morris
International, Inc. | | | 10,605 | | | | 934 | | |
Trading Companies & Distributors 0.6% | |
Brenntag AG
(Germany) | | | 26,556 | | | | 1,389 | | |
| Transportation Infrastructure 0.0%(b) | |
Macquarie
Infrastructure Corp. | | | 3,194 | | | | 118 | | |
Water Utilities 0.1% | |
American Water
Works Co., Inc. | | | 504 | | | | 45 | | |
AquaVenture
Holdings Ltd.* | | | 7,060 | | | | 118 | | |
Connecticut
Water Service, Inc.(a) | | | 400 | | | | 28 | | |
| | | | 191 | | |
Wireless Telecommunication
Services 0.2% | |
Gogo, Inc.* | | | 17,749 | | | | 101 | | |
T-Mobile US, Inc.* | | | 4,884 | | | | 335 | | |
| | | | 436 | | |
Total Common Stocks
(Cost $92,949) | | | | | 92,216 | | |
See Notes to Consolidated Financial Statements
11
Consolidated Schedule of Investments Neuberger Berman Absolute Return Multi-Manager Fund (cont'd)
Investments | | Principal
Amount | | Value
(000) | |
Asset-Backed Securities 8.7% | |
ALM XVIII Ltd.
Series 2016-18A,
Class CR, (ICE
LIBOR USD 3
Month + 3.00%),
5.44%,
1/15/2028(i)(j) | | $ | 1,000,000 | | | $ | 998 | | |
Atlas Senior Loan
Fund IV Ltd.
Series 2013-2A,
Class B2LR,
(ICE LIBOR
USD 3 Month
+ 4.90%),
7.21%,
2/17/2026(i)(j) | | | 1,000,000 | | | | 1,000 | | |
Atlas Senior
Loan Fund V Ltd.
Series 2014-1A,
Class DR2,
(ICE LIBOR
USD 3 Month +
4.00%), 6.44%,
7/16/2029(i)(j) | | | 1,000,000 | | | | 1,009 | | |
Carlyle Global
Market Strategies
CLO Ltd.
Series 2013-3A,
Class CR,
(ICE LIBOR
USD 3 Month +
2.45%), 4.89%,
10/15/2030(i)(j) | | | 1,000,000 | | | | 976 | | |
Series 2014-2RA,
Class C, (ICE
LIBOR
USD 3 Month +
2.80%), 5.11%,
5/15/2031(i)(j) | | | 2,000,000 | | | | 1,987 | | |
CarVal CLO Ltd.
Series 2018-1A,
Class D, (ICE
LIBOR
USD 3 Month +
2.89%), 5.22%,
7/16/2031(i)(j) | | | 1,000,000 | | | | 984 | | |
Catamaran CLO
Ltd. Series
2015-1A,
Class DR,
(ICE LIBOR
USD 3 Month +
2.80%), 5.27%,
4/22/2027(i)(j) | | | 1,000,000 | | | | 1,000 | | |
Class DR, (ICE
LIBOR
USD 3 Month +
2.80%), 5.31%,
1/27/2028(i)(j) Series 2013-1A, | | | 1,000,000 | | | | 991 | | |
Investments | | Principal
Amount | | Value
(000) | |
CWABS Asset-
Backed
Certificates
Trust
Series 2005-7,
Class AF4, 4.87%,
9/25/2034(k) | | $ | 92,717 | | | $ | 93 | | |
DT Auto
Owner Trust
Series 2015-1A,
Class D, 4.26%,
2/15/2022(i) | | | 815,151 | | | | 817 | | |
Class D, 4.53%,
10/17/2022(i) Series 2015-3A, | | | 922,382 | | | | 929 | | |
Garrison Funding
Ltd. Series
2015-1A,
Class CR,
(ICE LIBOR USD
3 Month +
3.90%),
6.21%,
9/21/2029(i)(j) | | | 1,000,000 | | | | 1,011 | | |
Jamestown CLO V
Ltd. Series
2014-5A,
Class B2R,
3.84%,
1/17/2027(i) | | | 1,000,000 | | | | 991 | | |
JP Morgan
Mortgage
Acquisition Trust
Series 2007-CH1,
Class AF6,
4.93%,
11/25/2036(l) | | | 102,950 | | | | 105 | | |
Mountain View
CLO LLC
Series 2017-1A,
Class D, (ICE
LIBOR
USD 3 Month +
3.60%), 6.04%,
10/16/2029(i)(j) | | | 1,000,000 | | | | 1,006 | | |
Octagon
Investment
Partners XIV Ltd.
Series 2012-1A,
Class CR,
(ICE LIBOR
USD 3 Month +
4.00%), 6.44%,
7/15/2029(i)(j) | | | 1,000,000 | | | | 1,010 | | |
OFSI Fund V Ltd.
Series 2013-5A,
Class B2L, (ICE
LIBOR USD
3 Month +
5.25%), 7.70%,
4/17/2025(i)(j) | | | 1,000,000 | | | | 1,000 | | |
Investments | | Principal
Amount | | Value
(000) | |
OneMain
Financial
Issuance Trust
Series 2015-2A,
Class D, 5.64%,
7/18/2025(i) | | $ | 1,500,000 | | | $ | 1,510 | | |
TICP CLO II-2 Ltd.
Series 2018-IIA,
Class C, (ICE LIBOR
USD 3 Month +
2.95%, 2.95%
Floor), 5.42%,
4/20/2028(i)(j) | | | 1,000,000 | | | | 989 | | |
WhiteHorse
X Ltd. Series
2015-10A,
Class DR, (ICE
LIBOR USD
3 Month + 3.00%,
3.00% Floor),
5.45%,
4/17/2027(i)(j) | | | 1,000,000 | | | | 1,000 | | |
Z Capital Credit
Partners CLO Ltd.
Series 2015-1A,
Class DR, (ICE
LIBOR USD
3 Month + 3.10%,
3.10% Floor),
5.54%,
7/16/2027(i)(j) | | | 2,000,000 | | | | 2,001 | | |
Total Asset-Backed Securities
(Cost $21,479) | | | | | 21,407 | | |
Commercial Mortgage-Backed
Securities 4.9% | |
BAMLL 2014-ICTS,
Class E, Escrow,
5.02%,
6/15/2028(d)(f)(i) | | | 3,000,000 | | | | — | | |
Caesars Palace 1,000,000 979
Las Vegas Trust
Series 2017-VICI,
Class E, 4.35%,
10/15/2034(i)(k)
CHT Mortgage
Trust Series
2017-CSMO,
Class F, (ICE
LIBOR USD
1 Month +
3.74%, 3.80%
Floor), 6.02%,
11/15/2036(i)(j) | | | 1,000,000 | | | | 1,004 | | |
COMM Mortgage
Trust Series
2014-PAT,
Class E, (ICE
LIBOR USD
1 Month +
3.15%, 3.15%
Floor), 5.43%,
8/13/2027(h)(i)(j) | | | 4,800,000 | | | | 4,851 | | |
See Notes to Consolidated Financial Statements
12
Consolidated Schedule of Investments Neuberger Berman Absolute Return Multi-Manager Fund (cont'd)
Investments | | Principal
Amount | | Value
(000) | |
JP Morgan Chase
Commercial
Mortgage
Securities Trust
Series 2018-PHH,
Class E, (ICE
LIBOR USD
1 Month +
2.41%, 2.26%
Floor), 4.69%,
6/15/2035(i)(j) | | $ | 1,000,000 | | | $ | 999 | | |
Lone Star
Portfolio Trust
Series 2015-LSP,
Class E, (ICE
LIBOR USD
1 Month +
5.60%,
5.60% Floor),
8.13%,
9/15/2028(i)(j) | | | 1,109,189 | | | | 1,115 | | |
Morgan Stanley
Capital I Trust
Series 2018-BOP,
Class F, (ICE
LIBOR USD
1 Month +
2.50%, 2.50%
Floor), 4.78%,
8/15/2033(i)(j) | | | 1,000,000 | | | | 1,001 | | |
JWDR, Class E,
(ICE LIBOR USD
1 Month +
3.05%, 3.05%
Floor), 5.33%,
11/15/2034(i)(j) Series 2017- | | | 1,000,000 | | | | 1,002 | | |
Palisades Center
Trust Series
2016-PLSD,
Class D, 4.74%,
4/13/2033(i) | | | 1,000,000 | | | | 978 | | |
Total Commercial
Mortgage-Backed
Securities
(Cost $11,931) | | | | | 11,929 | | |
Loan Assignments 4.3% | |
Capital Markets 0.3% | |
Financial & Risk
US Holdings, Inc.,
Term Loan
(ICE LIBOR
USD 1 Month
+ 3.75%),
6.05%,
10/1/2025(j) | | | 631,000 | | | | 624 | | |
Investments | | Principal
Amount | | Value
(000) | |
Commercial Services & Supplies 0.2% | |
APX Group, Inc.
Term Loan B
(ICE LIBOR USD
3 Month +
5.00%), 7.32%,
4/1/2024(d)(j) | | $ | 213,000 | | | $ | 211 | | |
Cenveo Corp.,
1st Lien
Term Loan
(ICE LIBOR USD
1 Month +
9.00%), 11.28%,
6/7/2023(c)(j) | | | 142,000 | | | | 137 | | |
PSC Industrial
Holdings Corp.,
2nd Lien
Term Loan
(ICE LIBOR USD
1 Month +
8.50%), 10.79%,
10/11/2025(d)(j) | | | 218,000 | | | | 216 | | |
| | | | 564 | | |
Communications Equipment 0.2% | |
4L Holdings Corp.,
Term Loan B
(ICE LIBOR USD
1 Month +
4.50%), 6.79%,
5/8/2020(j) | | | 443,789 | | | | 432 | | |
Diversified Consumer Services 0.1% | |
Cengage Learning,
Inc., Term Loan
(ICE LIBOR USD 1
Month + 4.25%),
6.53%,
6/7/2023(j) | | | 345,000 | | | | 319 | | |
Diversified Telecommunication
Services 0.3% | |
Intelsat Jackson
Holdings SA,
Term Loan
(ICE LIBOR USD
1 Month +
3.75%), 6.04%,
11/27/2023(j) | | | 68,000 | | | | 68 | | |
Mission
Broadcasting,
Inc., Term Loan
1/17/2024(m)(n) | | | 2,620 | | | | 3 | | |
Securus Holdings,
Inc., Term Loan
(ICE LIBOR USD
1 Month +
8.25%), 10.55%,
11/1/2025(j) | | | 271,000 | | | | 270 | | |
Investments | | Principal
Amount | | Value
(000) | |
US TelePacific
Corp., Term
Loan (ICE LIBOR
USD 3 Month
+ 5.00%),
7.39%,
5/2/2023(j) | | $ | 350,667 | | | $ | 339 | | |
| | | | 680 | | |
Electric Utilities 0.3% | |
Sandy Creek
Energy
Associates
LP, Term Loan B
(ICE LIBOR USD
3 Month +
4.00%), 6.39%,
11/9/2020(j) | | | 798,050 | | | | 706 | | |
Energy Equipment & Services 0.4% | |
Seadrill Operating
LP, Term Loan B
(ICE LIBOR USD
3 Month +
6.00%), 8.39%,
2/21/2021(j) | | | 970,661 | | | | 899 | | |
Food & Staples Retailing 0.1% | |
GOBP Holdings,
Inc., Term Loan
(ICE LIBOR USD
6 Month +
3.75%), 6.03%,
10/22/2025(j) | | | 3,000 | | | | 3 | | |
United Natural
Foods, Inc.,
Term Loan B
(ICE LIBOR USD
1 Month +
4.25%), 6.55%,
10/18/2025(j) | | | 183,000 | | | | 171 | | |
| | | | 174 | | |
Food Products 0.1% | |
Give & Go
Prepared Foods
Corp., 1st Lien
Term Loan
(ICE LIBOR USD
3 Month +
4.25%), 6.64%,
7/29/2023(j) | | | 353,430 | | | | 314 | | |
Health Care Equipment & Supplies 0.1% | |
Lifescan Global
Corp., Term Loan
(ICE LIBOR USD
3 Month +
6.00%), 8.40%,
10/1/2024(j) | | | 212,000 | | | | 207 | | |
See Notes to Consolidated Financial Statements
13
Consolidated Schedule of Investments Neuberger Berman Absolute Return Multi-Manager Fund (cont'd)
Investments | | Principal
Amount | | Value
(000) | |
| Household Durables 0.0%(b) | |
Traeger Pellet
Grills LLC,
2nd Lien
Term Loan
(ICE LIBOR USD
3 Month +
8.50%), 10.89%,
9/25/2025(d)(j) | | $ | 114,000 | | | $ | 112 | | |
Insurance 1.0% | |
AmTrust Financial
Services, Inc.,
2nd Lien
Term Loan
(ICE LIBOR USD
1 Month +
8.50%), 10.80%,
3/2/2026(d)(j) | | | 225,000 | | | | 222 | | |
Confie Seguros
Holding II Co.,
2nd Lien Term
Loan (ICE LIBOR
USD 1 Month +
9.50%), 11.80%,
5/8/2019(d)(j) | | | 1,218,000 | | | | 1,209 | | |
Confie Seguros
Holding II Co.,
Term Loan B
(ICE LIBOR USD
1 Month +
5.25%), 7.55%,
4/19/2022(j) | | | 855,758 | | | | 856 | | |
Confie Seguros
Holding,
Term Loan
12/30/2024(d)(m)(n) | | | 175,000 | | | | 172 | | |
| | | | 2,459 | | |
Leisure Products 0.1% | |
Recess Holdings,
Inc., 2nd Lien
Term Loan
(ICE LIBOR USD
1 Month +
7.75%; ICE
LIBOR USD
3 Month +
7.75%), 10.10%,
9/29/2025(d)(j) | | | 191,000 | | | | 185 | | |
| Media 0.0%(b) | |
Acosta, Inc.,
Term Loan B
(ICE LIBOR USD
1 Month +
3.25%), 5.55%,
9/26/2021(j) | | | 68,644 | | | | 51 | | |
Investments | | Principal
Amount | | Value
(000) | |
NEP/NCP Holdco,
Inc., 2nd Lien
Term Loan
(ICE LIBOR USD
1 Month +
7.00%), 9.30%,
10/5/2026(j) | | $ | 60,000 | | | $ | 60 | | |
Nexstar
Broadcasting,
Inc., 2nd Lien
Term Loan
1/17/2024(m)(n) | | | 16,380 | | | | 16 | | |
| | | | 127 | | |
Multiline Retail 0.2% | |
JC Penney Corp.,
Inc., Term Loan
(ICE LIBOR USD
3 Month +
4.25%), 6.57%,
6/23/2023(j) | | | 671,934 | | | | 600 | | |
Oil, Gas & Consumable Fuels 0.4% | |
Southcross Energy
Partners LP,
1st Lien Term
Loan (ICE LIBOR
USD 3 Month +
4.25%), 6.64%,
8/4/2021(j)(m)(n) | | | 1,091,396 | | | | 972 | | |
Real Estate Management &
Development 0.1% | |
Toys 'R' Us
Property Co. I
LLC, Term Loan
(ICE LIBOR USD
1 Month +
5.00%), 7.24%,
8/21/2019(j) | | | 242,000 | | | | 211 | | |
Software 0.3% | |
Mcafee LLC, 1st
Lien Term Loan
(ICE LIBOR USD
1 Month +
4.50%), 6.79%,
9/30/2024(j) | | | 343,530 | | | | 344 | | |
Mcafee LLC,
Term Loan
(ICE LIBOR USD
1 Month +
8.50%), 10.79%,
9/29/2025(j) | | | 260,000 | | | | 264 | | |
Mitchell
International,
Inc., 1st Lien
Term Loan
(ICE LIBOR USD
1 Month +
3.25%),
11/29/2024(j)(m)(n) | | | 125,000 | | | | 125 | | |
| | | | 733 | | |
Investments | | Principal
Amount | | Value
(000) | |
Specialty Retail 0.1% | |
DBP Holding
Corp., Term
Loan B (ICE
LIBOR USD
3 Month +
4.00%), 6.32%,
10/11/2019(j) | | $ | 349,000 | | | $ | 272 | | |
Total Loan Assignments
(Cost $10,634) | | | | | 10,590 | | |
Corporate Bonds 3.1% | |
Chemicals 0.5% | |
Hexion, Inc.
6.63%,
4/15/2020 | | | 871,000 | | | | 771 | | |
| 4/15/2020 10.00%, | | | 215,000 | | | | 201 | | |
| 11/15/2020 9.00%, | | | 188,000 | | | | 113 | | |
| 2/1/2022(i) 10.38%, | | | 215,000 | | | | 193 | | |
Momentive
Performance
Materials, Inc.
Escrow 10.00%,
10/15/2020(c)(d)(f)(o) | | | 613,000 | | | | — | | |
| | | | 1,278 | | |
Communications Equipment 0.1% | |
Riverbed
Technology, Inc.
8.88%,
3/1/2023(i) | | | 258,000 | | | | 237 | | |
Construction & Engineering 0.1% | |
ABG Orphan
Holdco Sarl
(Spain)
5.00%,
2/28/2021(e)(p) | | | 249,297 | | | | 258 | | |
Diversified Telecommunication
Services 1.1% | |
Frontier
Communications
Corp. 9.00%,
8/15/2031 | | | 431,000 | | | | 265 | | |
Intelsat Jackson
Holdings SA
(Luxembourg) | |
| 10/15/2024(i) 8.50%, | | | 242,000 | | | | 238 | | |
| 7/15/2025(i) 9.75%, | | | 1,576,000 | | | | 1,651 | | |
See Notes to Consolidated Financial Statements
14
Consolidated Schedule of Investments Neuberger Berman Absolute Return Multi-Manager Fund (cont'd)
Investments | | Principal
Amount | | Value
(000) | |
Oi SA (Brazil)
10.00%,
7/27/2025(p) | | $ | 420,000 | | | $ | 439 | | |
| | | | 2,593 | | |
Energy Equipment & Services 0.1% | |
McDermott
Technology
Americas, Inc.
10.63%, 5/1/2024(i) | | | 279,000 | | | | 251 | | |
Equity Real Estate Investment
Trusts (REITs) 0.1% | |
VICI Properties 1
LLC 8.00%,
10/15/2023 | | | 190,842 | | | | 209 | | |
| Food Products 0.0%(b) | |
Campbell Soup
Co. 4.80%,
3/15/2048 | | | 97,000 | | | | 82 | | |
Health Care Providers & Services 0.1% | |
Community
Health Systems,
Inc. 6.25%,
3/31/2023 | | | 351,000 | | | | 323 | | |
Independent Power and Renewable Electricity Producers 0.5% | |
GenOn Energy,
Inc. | |
| 10/15/2018(o) 9.50%, | | | 284,000 | | | | 194 | | |
| 10/15/2020(o) 9.88%, | | | 1,655,000 | | | | 1,129 | | |
| | | | 1,323 | | |
Leisure Products 0.1% | |
Mattel, Inc.
6.20%,
10/1/2040 | | | 217,000 | | | | 177 | | |
Marine 0.1% | |
Navios Maritime
Holdings, Inc.
(Greece)
11.25%,
8/15/2022(i) | | | 303,000 | | | | 264 | | |
Oil, Gas & Consumable Fuels 0.3% | |
Denbury
Resources, Inc.
9.00%,
5/15/2021(i) | | | 144,000 | | | | 150 | | |
| 3/31/2022(i) 9.25%, | | | 412,000 | | | | 430 | | |
Jones Energy
Holdings LLC | |
| 3/15/2023(i) 9.25%, | | | 118,000 | | | | 118 | | |
Investments | | Principal
Amount | | Value
(000) | |
Midstates
Petroleum Co.,
Inc. Escrow
10.00%,
6/1/2020(c)(d)(f)(o) | | $ | 1,848,000 | | | $ | — | | |
| | | | 698 | | |
Total Corporate Bonds
(Cost $7,915) | | | | | 7,693 | | |
Collateralized Mortgage
Obligations 2.6% | |
Alternative
Loan Trust
Series 2005-21CB,
Class A17, 6.00%,
6/25/2035 | | | 928,124 | | | | 890 | | |
Chase Mortgage
Finance Trust
Series 2007-A2,
Class 3A2, 4.15%,
7/25/2037(f)(k) | | | 234,665 | | | | 234 | | |
Citicorp Mortgage
Securities Trust
Series 2006-3,
Class 1A10,
6.25%,
6/25/2036 | | | 1,345,740 | | | | 1,382 | | |
FNMA
Series 2016-C05,
Class 2M2,
(ICE LIBOR USD
1 Month +
4.45%, 4.45%
Floor), 6.73%,
1/25/2029(j) | | | 1,000,000 | | | | 1,111 | | |
Class 1M2, (ICE
LIBOR USD
1 Month +
2.15%, 2.15%
Floor), 4.43%,
10/25/2030(j) Series 2018-C03, | | | 1,000,000 | | | | 998 | | |
MASTR
Alternative Loan
Trust Series
2004-10,
Class 4A1,
6.00%,
9/25/2019 | | | 30,862 | | | | 31 | | |
STACR Trust
Series 2018-HRP1,
Class M2,
(ICE LIBOR USD
1 Month +
1.65%), 3.93%,
4/25/2043(i)(j) | | | 959,523 | | | | 965 | | |
Investments | | Principal
Amount | | Value
(000) | |
WaMu Mortgage
Pass-Through
Certificates Trust
Series 2004-S1,
Class 1A11,
5.50%,
3/25/2034 | | $ | 81,507 | | | $ | 81 | | |
Washington
Mutual Mortgage
Pass-Through
Certificates
WMALT Trust
Series 2005-1,
Class 1A1,
5.50%,
3/25/2035 | | | 370,783 | | | | 363 | | |
Wells Fargo
Mortgage
Backed Securities
Trust Series
2007-14,
Class 1A1,
6.00%,
10/25/2037 | | | 369,625 | | | | 363 | | |
Total Collateralized
Mortgage Obligations
(Cost $6,429) | | | | | 6,418 | | |
| | | Shares | | | |
Master Limited Partnerships 2.2% | |
Capital Markets 0.2% | |
Blackstone Group
LP (The) | | | 13,795 | | | | 446 | | |
Energy Equipment & Services 0.1% | |
USA Compression
Partners LP | | | 28,140 | | | | 412 | | |
Oil, Gas & Consumable Fuels 1.9% | |
American
Midstream
Partners LP(a) | | | 650 | | | | 4 | | |
Crestwood Equity
Partners LP | | | 16,959 | | | | 572 | | |
DCP Midstream LP | | | 8,442 | | | | 304 | | |
Enable Midstream
Partners LP | | | 2,408 | | | | 36 | | |
Energy Transfer LP | | | 77,838 | | | | 1,210 | | |
Enterprise Products
Partners LP | | | 34,374 | | | | 922 | | |
Magellan
Midstream
Partners LP | | | 7,032 | | | | 434 | | |
| MPLX LP | | | 4,705 | | | | 158 | | |
Noble Midstream
Partners LP | | | 11,144 | | | | 380 | | |
Oasis Midstream
Partners LP | | | 13,685 | | | | 301 | | |
Spectra Energy
Partners LP | | | 845 | | | | 29 | | |
See Notes to Consolidated Financial Statements
15
Consolidated Schedule of Investments Neuberger Berman Absolute Return Multi-Manager Fund (cont'd)
Investments | | Shares | | Value
(000) | |
Western Gas
Equity Partners LP | | | 2,035 | | | $ | 58 | | |
Western Gas
Partners LP | | | 6,525 | | | | 258 | | |
| | | | 4,666 | | |
Total Master Limited
Partnerships
(Cost $5,852) | | | | | 5,524 | | |
| | | Principal
Amount | | | |
Convertible Bonds 1.3% | |
Diversified Telecommunication
Services 0.4% | |
Inmarsat plc
(United Kingdom)
3.88%,
9/9/2023(e) | | $ | 800,000 | | | | 891 | | |
Intelsat SA
4.50%,
6/15/2025(i) | | | 56,000 | | | | 94 | | |
| | | | 985 | | |
Interactive Media & Services 0.3% | |
Twitter, Inc.
0.25%,
9/15/2019 | | | 743,000 | | | | 718 | | |
Media 0.5% | |
DISH Network
Corp.
3.38%,
8/15/2026 | | | 1,554,000 | | | | 1,385 | | |
Wireless Telecommunication
Services 0.1% | |
Gogo, Inc.
3.75%, 3/1/2020 | | | 239,000 | | | | 224 | | |
Total Convertible Bonds
(Cost $3,612) | | | | | 3,312 | | |
| | | Shares | | | |
Closed End Funds 0.3% | |
Internet & Direct Marketing Retail 0.3% | |
Altaba, Inc.*(a)
(Cost $428) | | | 11,600 | | | | 697 | | |
| | | Principal
Amount | | | |
U.S. Treasury Obligations 0.1% | |
U.S. Treasury Bonds
3.00%, 2/15/2047
(Cost $193) | | $ | 185,000 | | | | 172 | | |
Investments | | No. of
Rights | | Value
(000) | |
| Rights 0.0%(b) | |
| Biotechnology 0.0%(b) | |
Ambit Biosciences
Corp. (Daiichi
Sankyo Co. Ltd.),
CVR*(c)(d)(f) | | | 70,000 | | | $ | 42 | | |
Tobira Therapeutics,
Inc., CVR*(c)(d)(f) | | | 6,900 | | | | 1 | | |
| | | | 43 | | |
| Food Products 0.0%(b) | |
Schuman, Inc.,
CVR*(c)(d)(f) | | | 9,200 | | | | 18 | | |
| Health Care Providers & Services 0.0%(b) | |
Community
Health
Systems, Inc.,
CVR*(a) | | | 19,082 | | | | — | (g) | |
Media 0.0% | |
Media General,
Inc., CVR*(c)(d)(f) | | | 76,116 | | | | — | | |
Pharmaceuticals 0.0% | |
Omthera
Pharmaceuticals,
Inc. (AstraZeneca
plc), CVR
(United
Kingdom)*(c)(d)(f) | | | 100 | | | | — | | |
Total Rights
(Cost $24) | | | | | 61 | | |
| | | Shares | | | |
| Preferred Stocks 0.0%(b) | |
| Media 0.0%(b) | |
GCI Liberty, Inc.,
Series A, 7.00%,
3/10/2039(a)(q)
(Cost $36) | | | 1,860 | | | | 46 | | |
| | | No. of
Warrants | | | |
| Warrants 0.0%(b) | |
| Capital Markets 0.0%(b) | |
J2 Acquisition
Ltd., expiring
9/7/2027* | | | 9,800 | | | | 4 | | |
Matlin and
Partners
Acquisition
Corp., expiring
5/28/2021* | | | 21,837 | | | | 13 | | |
Mudrick Capital
Acquisition Corp.,
expiring
3/12/2019* | | | 17,596 | | | | 11 | | |
Investments | | No. of
Warrants | | Value
(000) | |
Nebula
Acquisition
Corp., expiring
1/12/2023* | | | 2,366 | | | $ | 2 | | |
Trinity Merger
Corp., expiring
5/31/2023*(a) | | | 10,800 | | | | 5 | | |
VectoIQ
Acquisition
Corp., expiring
6/11/2023*(a) | | | 6,400 | | | | 4 | | |
| | | | 39 | | |
| Thrifts & Mortgage Finance 0.0%(b) | |
Ditech Holding
Corp., expiring
2/9/2028* | | | 3,869 | | | | — | (g) | |
Total Warrants
(Cost $5) | | | | | 39 | | |
| | | Shares | | | |
Short-Term Investments 29.7% | |
Investment Companies 29.7% | |
Dreyfus Treasury
Securities Cash
Management
Institutional
Class, 2.02%(h)(r) | | | 458,227 | | | | 458 | | |
Morgan Stanley
Institutional
Liquidity Funds
Treasury Portfolio
Institutional Class,
2.01%(h)(r) | | | 72,727,667 | | | | 72,728 | | |
Total Investment
Companies
(Cost $73,186) | | | | | 73,186 | | |
Total Options
Purchased 0.1%(s)
(Cost $178) | | | | | 142 | | |
Total Long
Positions
(Cost $234,851) | | | | | 233,432 | | |
| Short Positions (10.0)%(t) | |
Common Stocks (7.9)% | |
Aerospace & Defense (0.2)% | |
United
Technologies
Corp. | | | (3,601 | ) | | | (447 | ) | |
Airlines (0.4)% | |
Allegiant Travel Co. | | | (4,737 | ) | | | (541 | ) | |
Exchange Income
Corp. (Canada) | | | (20,195 | ) | | | (463 | ) | |
| | | | (1,004 | ) | |
See Notes to Consolidated Financial Statements
16
Consolidated Schedule of Investments Neuberger Berman Absolute Return Multi-Manager Fund (cont'd)
Investments | | Shares | | Value
(000) | |
Automobiles (0.1)% | |
Tesla, Inc.* | | | (940 | ) | | $ | (317 | ) | |
Banks (1.4)% | |
Banco Bilbao
Vizcaya Argentaria
SA (Spain) | | | (82,760 | ) | | | (458 | ) | |
Canadian Imperial
Bank of
Commerce
(Canada) | | | (3,570 | ) | | | (308 | ) | |
First Merchants
Corp. | | | (1,184 | ) | | | (49 | ) | |
Laurentian Bank
of Canada
(Canada) | | | (11,240 | ) | | | (355 | ) | |
Lloyds Banking
Group plc (United
Kingdom) | | | (506,900 | ) | | | (371 | ) | |
Royal Bank of
Canada (Canada) | | | (3,605 | ) | | | (263 | ) | |
Royal Bank of
Scotland Group
plc (United
Kingdom) | | | (106,500 | ) | | | (322 | ) | |
Societe Generale
SA (France) | | | (7,065 | ) | | | (260 | ) | |
Svenska
Handelsbanken
AB, Class A
(Sweden) | | | (23,005 | ) | | | (250 | ) | |
UniCredit SpA
(Italy) | | | (33,170 | ) | | | (425 | ) | |
Wells Fargo & Co. | | | (4,834 | ) | | | (257 | ) | |
| | | | (3,318 | ) | |
Biotechnology (0.1)% | |
AbbVie, Inc. | | | (3,904 | ) | | | (304 | ) | |
Building Products (0.1)% | |
Fortune Brands
Home & Security,
Inc. | | | (3,170 | ) | | | (142 | ) | |
Chemicals (0.2)% | |
Valvoline, Inc. | | | (19,756 | ) | | | (394 | ) | |
Commercial Services & Supplies (0.1)% | |
Stericycle, Inc.* | | | (7,161 | ) | | | (358 | ) | |
| Communications Equipment (0.0)%(b) | |
Lumentum
Holdings, Inc.* | | | (686 | ) | | | (38 | ) | |
Construction & Engineering (0.4)% | |
Badger
Daylighting Ltd.
(Canada) | | | (44,210 | ) | | | (893 | ) | |
Containers & Packaging (0.2)% | |
Avery Dennison | | | (2,663 | ) | | | (241 | ) | |
Corp. | |
Packaging Corp.
of America | | | (2,872 | ) | | | (264 | ) | |
| | | | (505 | ) | |
Investments | | Shares | | Value
(000) | |
Diversified Consumer Services (0.3)% | |
Adtalem Global
Education, Inc.* | | | (7,012 | ) | | $ | (355 | ) | |
Sotheby's* | | | (7,430 | ) | | | (312 | ) | |
| | | | (667 | ) | |
Diversified Telecommunication
Services (0.1)% | |
Inmarsat plc
(United Kingdom) | | | (26,787 | ) | | | (156 | ) | |
Electrical Equipment (0.2)% | |
Acuity Brands, Inc. | | | (3,865 | ) | | | (486 | ) | |
Energy Equipment & Services (0.2)% | |
Helmerich & Payne, Inc. | | | (955 | ) | | | (60 | ) | |
Keane Group, Inc.* | | | (6,558 | ) | | | (82 | ) | |
Patterson-UTI
Energy, Inc. | | | (2,429 | ) | | | (40 | ) | |
ProPetro Holding
Corp.* | | | (7,326 | ) | | | (129 | ) | |
RPC, Inc. | | | (6,617 | ) | | | (99 | ) | |
Superior Energy
Services, Inc.* | | | (4,862 | ) | | | (38 | ) | |
Transocean Ltd.* | | | (4,200 | ) | | | (46 | ) | |
| | | | (494 | ) | |
Equity Real Estate Investment
Trusts (REITs) (0.4)% | |
AvalonBay
Communities,
Inc. | | | (2,260 | ) | | | (396 | ) | |
Pebblebrook
Hotel Trust | | | (3,413 | ) | | | (115 | ) | |
Simon Property
Group, Inc. | | | (2,490 | ) | | | (457 | ) | |
| | | | (968 | ) | |
Health Care Providers & Services (0.4)% | |
Cigna Corp. | | | (2,409 | ) | | | (515 | ) | |
CVS Health Corp. | | | (5,716 | ) | | | (414 | ) | |
| | | | (929 | ) | |
Hotels, Restaurants & Leisure (0.1)% | |
Papa John's
International,
Inc. | | | (5,563 | ) | | | (303 | ) | |
| Household Durables (0.0)%(b) | |
Lennar Corp., Class A | | | (1,431 | ) | | | (62 | ) | |
Industrial Conglomerates (0.2)% | |
General Electric Co. | | | (42,463 | ) | | | (429 | ) | |
Insurance (0.1)% | |
Trupanion, Inc.* | | | (11,517 | ) | | | (291 | ) | |
Interactive Media & Services (0.2)% | |
Zillow Group, Inc.,
Class C* | | | (13,679 | ) | | | (551 | ) | |
Investments | | Shares | | Value
(000) | |
Internet & Direct Marketing Retail (0.2)% | |
Alibaba Group
Holding Ltd., ADR
(China)* | | | (3,596 | ) | | $ | (512 | ) | |
IT Services (0.3)% | |
Alliance Data
Systems
Corp. | | | (2,000 | ) | | | (413 | ) | |
Western Union
Co. (The) | | | (23,457 | ) | | | (423 | ) | |
| | | | (836 | ) | |
Leisure Products (0.1)% | |
Mattel, Inc.* | | | (24,769 | ) | | | (336 | ) | |
Machinery (0.1)% | |
Illinois Tool Works, Inc. | | | (2,008 | ) | | | (256 | ) | |
Media (0.6)% | |
Discovery, Inc.,
Class A* | | | (1,282 | ) | | | (41 | ) | |
EW Scripps Co.
(The), Class A | | | (25,198 | ) | | | (424 | ) | |
New Media
Investment
Group, Inc. | | | (25,353 | ) | | | (356 | ) | |
Omnicom
Group, Inc. | | | (7,463 | ) | | | (555 | ) | |
| | | | (1,376 | ) | |
Oil, Gas & Consumable Fuels (0.1)% | |
Concho
Resources, Inc.* | | | (1,137 | ) | | | (158 | ) | |
Personal Products (0.1)% | |
Estee Lauder Cos.,
Inc. (The), Class A | | | (2,084 | ) | | | (286 | ) | |
Real Estate Management &
Development (0.1)% | |
Realogy Holdings
Corp. | | | (13,200 | ) | | | (252 | ) | |
Semiconductors & Semiconductor Equipment (0.1)% | |
KLA-Tencor Corp. | | | (2,050 | ) | | | (188 | ) | |
Software (0.3)% | |
Ellie Mae, Inc.* | | | (5,030 | ) | | | (333 | ) | |
Micro Focus
International plc
(United Kingdom) | | | (555 | ) | | | (9 | ) | |
Oracle Corp. | | | (6,896 | ) | | | (337 | ) | |
VMware, Inc., Class A* | | | (366 | ) | | | (52 | ) | |
| | | | (731 | ) | |
Specialty Retail (0.1)% | |
Sally Beauty
Holdings, Inc.* | | | (12,328 | ) | | | (219 | ) | |
Signet Jewelers Ltd. | | | (2,117 | ) | | | (119 | ) | |
| | | | (338 | ) | |
See Notes to Consolidated Financial Statements
17
Consolidated Schedule of Investments Neuberger Berman Absolute Return Multi-Manager Fund (cont'd)
Investments | | Shares | | Value
(000) | |
Textiles, Apparel & Luxury Goods (0.1)% | |
Under Armour,
Inc.,
Class C* | | | (13,353 | ) | | $ | (265 | ) | |
Thrifts & Mortgage Finance (0.3)% | |
Genworth MI
Canada,
Inc. (Canada) | | | (12,300 | ) | | | (404 | ) | |
Home Capital
Group, Inc.
(Canada)* | | | (33,455 | ) | | | (331 | ) | |
| | | | (735 | ) | |
Total Common Stocks
(Proceeds $(21,062)) | | | | | (19,325 | ) | |
Exchange Traded Funds (1.3)% | |
Alerian MLP ETF | | | (145,155 | ) | | | (1,425 | ) | |
iShares Russell
2000 ETF | | | (6,150 | ) | | | (923 | ) | |
SPDR S&P Oil &
Gas Equipment &
Services ETF | | | (8,678 | ) | | | (118 | ) | |
SPDR S&P Oil &
Gas Exploration &
Production ETF | | | (15,856 | ) | | | (572 | ) | |
VanEck Vectors Oil
Services ETF | | | (1,914 | ) | | | (39 | ) | |
Total Exchange
Traded Funds
(Proceeds $(3,266)) | | | | | (3,077 | ) | |
Investments | | Principal
Amount | | Value
(000) | |
Corporate Bonds (0.8)% | |
Diversified Telecommunication
Services (0.2)% | |
Frontier
Communications
Corp. 10.50%,
9/15/2022 | | $ | (433,000 | ) | | $ | (365 | ) | |
Equity Real Estate Investment
Trusts (REITs) (0.2)% | |
CBL & Associates LP | |
5.25%, 12/1/2023 | | | (222,000 | ) | | | (188 | ) | |
5.95%, 12/15/2026 | | | (294,000 | ) | | | (246 | ) | |
| | | | (434 | ) | |
| Food Products (0.0)%(b) | |
Campbell Soup Co.
3.80%, 8/2/2042 | | | (97,000 | ) | | | (72 | ) | |
Health Care Providers & Services (0.1)% | |
Community Health
Systems, Inc.
5.13%, 8/1/2021 | | | (351,000 | ) | | | (336 | ) | |
Media (0.1)% | |
AMC Networks, | | | (326,000 | ) | | | (305 | ) | |
Inc. 4.75%,
8/1/2025 | |
Multiline Retail (0.1)% | |
Macy's Retail
Holdings, Inc.
4.50%,
12/15/2034 | | | (406,000 | ) | | | (325 | ) | |
Investments | | Principal
Amount | | Value
(000) | |
| Oil, Gas & Consumable Fuels (0.0)%(b) | |
SM Energy Co.
6.75%,
9/15/2026 | | $ | (115,000 | ) | | $ | (117 | ) | |
Specialty Retail (0.1)% | |
L Brands, Inc.
6.88%, 11/1/2035 | | | (162,000) | | | | (139) | | |
Total Corporate Bonds
(Proceeds $(2,167)) | | | | | (2,093) | | |
| | | Shares | | | |
| Master Limited Partnerships (0.0)%(b) | |
| Oil, Gas & Consumable Fuels (0.0)%(b) | |
EQGP Holdings LP | | | (2,595 | ) | | | (41 | ) | |
EQM Midstream
Partners LP | | | (649 | ) | | | (30 | ) | |
Genesis Energy LP | | | (1,296 | ) | | | (28 | ) | |
Total Master
Limited Partnerships
(Proceeds $(105)) | | | | | (99 | ) | |
Total Short Positions
(Proceeds $(26,600)) | | | | | (24,594 | ) | |
Total Investments 84.8%
(Cost $208,251) | | | | | 208,838 | | |
Other Assets Less
Liabilities 15.2%(u) | | | | | 37,310 | | |
Net Assets 100.0% | | | | $ | 246,148 | | |
* Non-income producing security.
(a) All or a portion of this security is pledged with the custodian for securities sold short and/or options written.
(b) Represents less than 0.05% of net assets.
(c) Illiquid security.
(d) Value determined using significant unobservable inputs.
(e) Security exempt from registration pursuant to Regulation S under the Securities Act of 1933, as amended. Regulation S applies to securities offerings that are made outside of the United States and do not involve direct selling efforts in the United States and as such may have restrictions on resale. At October 31, 2018, the total value of these securities amounted to approximately $3,933,000, which represents 1.6% of net assets of the Fund.
(f) Security fair valued as of October 31, 2018 in accordance with procedures approved by the Board of Trustees. Total value of all such securities at October 31, 2018 amounted to approximately $316,000, which represents 0.1% of net assets of the Fund.
(g) Amount less than one thousand.
(h) All or a portion of this security is segregated in connection with obligations for futures, swaps, options written, and/or forward foreign currency contracts with a total value of approximately $77,347,000.
See Notes to Consolidated Financial Statements
18
Consolidated Schedule of Investments Neuberger Berman Absolute Return Multi-Manager Fund (cont'd)
(i) Securities were purchased or sold short under Rule 144A of the Securities Act of 1933, as amended (the "1933 Act"), or are otherwise restricted and, unless registered under the 1933 Act or exempted from registration, may only be sold to qualified institutional investors or may have other restrictions on resale. At October 31, 2018, these securities amounted to approximately $37,729,000 of long positions, which represents 15.3% of net assets of the Fund. Securities denoted with "(i)" but without "(c)" have been deemed by the investment manager to be liquid.
(j) Variable or floating rate security. The interest rate shown was the current rate as of October 31, 2018 and changes periodically.
(k) Variable or floating rate security where the stated interest rate is not based on a published reference rate and spread. Rather, the interest rate adjusts periodically based on changes in current interest rates and prepayments on the underlying pool of assets. The interest rate shown was the current rate as of October 31, 2018.
(l) Step bond. Coupon rate is a fixed rate for an initial period that either resets at a specific date or may reset in the future contingent upon a predetermined trigger. The interest rate shown was the current rate as of October 31, 2018.
(m) All or a portion of this security was purchased on a delayed delivery basis.
(n) All or a portion of this security had not settled as of October 31, 2018 and thus may not have an interest rate in effect. Interest rates do not take effect until settlement.
(o) Defaulted security.
(p) Payment in-kind security.
(q) Perpetual security. The rate reflected was the rate in effect on October 31, 2018. The maturity date reflects the next call date.
(r) Represents 7-day effective yield as of October 31, 2018.
(s) See "Purchased option contracts" under Derivative Instruments.
(t) At October 31, 2018, the Fund had approximately $25,627,000 deposited in one or more accounts to satisfy collateral requirements for borrowing in connection with securities sold short.
(u) Includes the impact of the Fund's open positions in derivatives at October 31, 2018.
Abbreviations
ADR American Depositary Receipt
CLO Collateralized Loan Obligations
CVR Contingent Value Rights
ETF Exchange Traded Fund
FNMA Federal National Mortgage Association
GDR Global Depositary Receipt
ICE Intercontinental Exchange
LIBOR London Interbank Offered Rate
PJSC Public Joint Stock Company
SA Société Anonyme
SpA Società per Azioni
SPDR Standard & Poor's Depositary Receipt
USD United States Dollar
See Notes to Consolidated Financial Statements
19
Consolidated Schedule of Investments Neuberger Berman Absolute Return Multi-Manager Fund (cont'd)
Derivative Instruments
Futures contracts ("futures")
At October 31, 2018, open positions in futures for the Fund were as follows:
Description | | Number of
Contracts | | Expiration
Date | | Notional
Amount | | Value and
Unrealized
Appreciation/
(Depreciation) | |
Long Contracts | |
Brent Crude Oil | | | 5 | | | 11/2018 | | $ | 375,200 | | | $ | (14,296 | ) | |
Natural Gas | | | 10 | | | 11/2018 | | | 326,100 | | | | 4,120 | | |
NY Harbor ULSD | | | 8 | | | 11/2018 | | | 756,470 | | | | (15,581 | ) | |
WTI Crude Oil | | | 2 | | | 11/2018 | | | 130,620 | | | | (3,264 | ) | |
Australia 10 Year Bond | | | 15 | | | 12/2018 | | | 1,374,654 | | | | 3,111 | | |
Australia 3 Year Bond | | | 61 | | | 12/2018 | | | 4,813,727 | | | | 9,777 | | |
Brent Crude Oil | | | 3 | | | 12/2018 | | | 225,180 | | | | (20,844 | ) | |
CBOE Volatility Index | | | 8 | | | 12/2018 | | | 158,200 | �� | | | (5,658 | ) | |
Coffee 'C' | | | 1 | | | 12/2018 | | | 42,263 | | | | (3,828 | ) | |
Euro-Bobl | | | 48 | | | 12/2018 | | | 7,146,024 | | | | 11,168 | | |
Euro-Bund | | | 4 | | | 12/2018 | | | 726,074 | | | | 6,978 | | |
Euro-Bund | | | 26 | | | 12/2018 | | | 4,719,480 | | | | 15,643 | | |
Euro-Buxl | | | 8 | | | 12/2018 | | | 1,602,926 | | | | 13,765 | | |
Euro-OAT | | | 2 | | | 12/2018 | | | 344,235 | | | | 2,887 | | |
Euro-OAT | | | 21 | | | 12/2018 | | | 3,614,467 | | | | 8,679 | | |
Euro-Schatz | | | 129 | | | 12/2018 | | | 16,360,873 | | | | 5,364 | | |
Foreign Exchange JPY/USD | | | 21 | | | 12/2018 | | | 2,329,819 | | | | (44,241 | ) | |
Foreign Exchange USD/NOK | | | 2 | | | 12/2018 | | | 199,692 | | | | 1,965 | | |
Foreign Exchange USD/SEK | | | 1 | | | 12/2018 | | | 99,732 | | | | 1,518 | | |
Live Cattle | | | 2 | | | 12/2018 | | | 93,560 | | | | (1,045 | ) | |
Long Gilt | | | 3 | | | 12/2018 | | | 469,393 | | | | 2,398 | | |
Long Gilt | | | 17 | | | 12/2018 | | | 2,659,896 | | | | 2,746 | | |
Low Sulphur Gasoil | | | 15 | | | 12/2018 | | | 1,048,500 | | | | (8,619 | ) | |
Milling Wheat No. 2 | | | 7 | | | 12/2018 | | | 78,691 | | | | (1,079 | ) | |
Palladium | | | 4 | | | 12/2018 | | | 427,400 | | | | 12,486 | | |
Brent Crude Oil | | | 3 | | | 1/2019 | | | 225,270 | | | | (3,364 | ) | |
Rapeseed | | | 1 | | | 1/2019 | | | 21,280 | | | | (144 | ) | |
Robusta Coffee | | | 4 | | | 1/2019 | | | 67,000 | | | | (3,194 | ) | |
Sugar No. 11 | | | 5 | | | 2/2019 | | | 73,864 | | | | (3,620 | ) | |
| 3 Month Sterling | | | 77 | | | 6/2019 | | | 12,178,418 | | | | (2,029 | ) | |
3 Month Euro Euribor | | | 68 | | | 9/2019 | | | 19,298,372 | | | | 2,505 | | |
| 3 Month Sterling | | | 67 | | | 9/2019 | | | 10,589,312 | | | | (4,393 | ) | |
3 Month Euro Euribor | | | 55 | | | 3/2020 | | | 15,584,060 | | | | 2,340 | | |
| 3 Month Sterling | | | 61 | | | 3/2020 | | | 9,629,320 | | | | (4,762 | ) | |
| 3 Month Sterling | | | 71 | | | 9/2020 | | | 11,196,553 | | | | (5,538 | ) | |
3 Month Euro Euribor | | | 50 | | | 3/2021 | | | 14,115,650 | | | | 3,357 | | |
| 3 Month Sterling | | | 47 | | | 3/2021 | | | 7,405,044 | | | | (1,670 | ) | |
Total Long Contracts | | | | | | $ | 150,507,319 | | | $ | (36,362 | ) | |
See Notes to Consolidated Financial Statements
20
Consolidated Schedule of Investments Neuberger Berman Absolute Return Multi-Manager Fund (cont'd)
Description | | Number of
Contracts | | Expiration
Date | | Notional
Amount | | Value and
Unrealized
Appreciation/
(Depreciation) | |
Short Contracts | |
CAC 40 10 Euro Index | | | (2 | ) | | 11/2018 | | $ | (115,304 | ) | | $ | (1,200 | ) | |
HSCEI | | | (3 | ) | | 11/2018 | | | (193,823 | ) | | | 877 | | |
MSCI Singapore Index | | | (3 | ) | | 11/2018 | | | (74,288 | ) | | | (73 | ) | |
MSCI Taiwan Index | | | (1 | ) | | 11/2018 | | | (36,490 | ) | | | 139 | | |
OMXS30 Index | | | (4 | ) | | 11/2018 | | | (66,964 | ) | | | (1,084 | ) | |
RBOB Gasoline | | | (3 | ) | | 11/2018 | | | (220,676 | ) | | | 8,197 | | |
SGX FTSE China A50 Index | | | (8 | ) | | 11/2018 | | | (89,380 | ) | | | 745 | | |
SGX NIFTY 50 Index | | | (4 | ) | | 11/2018 | | | (83,096 | ) | | | (221 | ) | |
| 100 oz Gold | | | (8 | ) | | 12/2018 | | | (972,000 | ) | | | 5,414 | | |
Canada 10 Year Bond | | | (4 | ) | | 12/2018 | | | (401,534 | ) | | | 957 | | |
Canada 10 Year Bond | | | (4 | ) | | 12/2018 | | | (401,534 | ) | | | (2,796 | ) | |
Cocoa | | | (4 | ) | | 12/2018 | | | (89,360 | ) | | | (1,191 | ) | |
Copper | | | (9 | ) | | 12/2018 | | | (598,275 | ) | | | 22,520 | | |
Corn | | | (12 | ) | | 12/2018 | | | (217,950 | ) | | | (1,980 | ) | |
Cotton No. 2 | | | (1 | ) | | 12/2018 | | | (38,430 | ) | | | 647 | | |
| EURO STOXX 50 Index | | | (3 | ) | | 12/2018 | | | (108,531 | ) | | | 956 | | |
Euro-BTP | | | (6 | ) | | 12/2018 | | | (826,653 | ) | | | (11,864 | ) | |
Euro-BTP | | | (5 | ) | | 12/2018 | | | (688,878 | ) | | | (5,003 | ) | |
Foreign Exchange AUD/USD | | | (85 | ) | | 12/2018 | | | (6,015,450 | ) | | | 31,991 | | |
Foreign Exchange CAD/USD | | | (2 | ) | | 12/2018 | | | (151,990 | ) | | | 275 | | |
Foreign Exchange EUR/USD | | | (205 | ) | | 12/2018 | | | (29,098,468 | ) | | | 791,597 | | |
Foreign Exchange GBP/USD | | | (2 | ) | | 12/2018 | | | (159,950 | ) | | | 3,595 | | |
Foreign Exchange MXN/USD | | | (5 | ) | | 12/2018 | | | (122,300 | ) | | | 5,637 | | |
Foreign Exchange NZD/USD | | | (2 | ) | | 12/2018 | | | (130,460 | ) | | | 15 | | |
Foreign Exchange ZAR/USD | | | (14 | ) | | 12/2018 | | | (472,500 | ) | | | (18,411 | ) | |
FTSE 100 Index | | | (1 | ) | | 12/2018 | | | (90,893 | ) | | | (854 | ) | |
FTSE/JSE Top 40 Index | | | (2 | ) | | 12/2018 | | | (62,895 | ) | | | 4,520 | | |
Japan 10 Year Bond | | | (20 | ) | | 12/2018 | | | (26,699,161 | ) | | | (87,764 | ) | |
KC HRW Wheat | | | (4 | ) | | 12/2018 | | | (98,650 | ) | | | 4,071 | | |
MSCI Emerging Markets E-Mini Index | | | (2 | ) | | 12/2018 | | | (95,670 | ) | | | 8,168 | | |
Nikkei 225 Mini Index | | | (4 | ) | | 12/2018 | | | (77,565 | ) | | | (1,807 | ) | |
Russell 2000 E-Mini Index | | | (1 | ) | | 12/2018 | | | (75,595 | ) | | | 733 | | |
S&P 500 E-Mini Index | | | (24 | ) | | 12/2018 | | | (3,253,320 | ) | | | 179,553 | | |
Silver | | | (14 | ) | | 12/2018 | | | (999,740 | ) | | | 16,932 | | |
Soybean Meal | | | (7 | ) | | 12/2018 | | | (214,480 | ) | | | 333 | | |
Soybean Oil | | | (21 | ) | | 12/2018 | | | (353,052 | ) | | | 4,431 | | |
U.S. Treasury 10 Year Note | | | (20 | ) | | 12/2018 | | | (2,368,750 | ) | | | (7,682 | ) | |
U.S. Treasury 10 Year Note | | | (9 | ) | | 12/2018 | | | (1,065,938 | ) | | | (2,408 | ) | |
U.S. Treasury 2 Year Note | | | (31 | ) | | 12/2018 | | | (6,530,344 | ) | | | (1,922 | ) | |
U.S. Treasury 5 Year Note | | | (29 | ) | | 12/2018 | | | (3,259,102 | ) | | | (7,815 | ) | |
U.S. Treasury Long Bond | | | (10 | ) | | 12/2018 | | | (1,381,250 | ) | | | 9,987 | | |
U.S. Treasury Ultra Bond | | | (6 | ) | | 12/2018 | | | (895,313 | ) | | | 32,213 | | |
See Notes to Consolidated Financial Statements
21
Consolidated Schedule of Investments Neuberger Berman Absolute Return Multi-Manager Fund (cont'd)
Description | | Number of
Contracts | | Expiration
Date | | Notional
Amount | | Value and
Unrealized
Appreciation/
(Depreciation) | |
Wheat | | | (5 | ) | | 12/2018 | | $ | (125,125 | ) | | $ | 1,938 | | |
Canola | | | (15 | ) | | 1/2019 | | | (110,752 | ) | | | 2,712 | | |
Platinum | | | (7 | ) | | 1/2019 | | | (295,050 | ) | | | (3,992 | ) | |
Soybean | | | (5 | ) | | 1/2019 | | | (212,938 | ) | | | 1,970 | | |
3 Month Canadian Bankers Acceptance | | | (45 | ) | | 6/2019 | | | (8,316,258 | ) | | | 9,587 | | |
3 Month Canadian Bankers Acceptance | | | (37 | ) | | 9/2019 | | | (6,831,137 | ) | | | 6,110 | | |
| 3 Month Eurodollar | | | (59 | ) | | 3/2020 | | | (14,275,787 | ) | | | (6,442 | ) | |
| 3 Month Eurodollar | | | (33 | ) | | 9/2020 | | | (7,986,000 | ) | | | (5,696 | ) | |
| 3 Month Eurodollar | | | (26 | ) | | 3/2021 | | | (6,292,975 | ) | | | (4,571 | ) | |
| 3 Month Eurodollar | | | (22 | ) | | 3/2022 | | | (5,325,925 | ) | | | (2,814 | ) | |
Total Short Contracts | | | | | | $ | (138,667,949 | ) | | $ | 979,230 | | |
Total Futures | | | | | | | | $ | 942,868 | | |
For the year ended October 31, 2018, the average notional value of futures for the Fund was $60,147,001 for long positions and $(125,492,718) for short positions. The Fund had $2,064,918 deposited in segregated accounts to cover margin requirements on open futures.
Forward foreign currency contracts ("forward contracts")
At October 31, 2018, open forward contracts for the Fund were as follows:
Currency Purchased | | Currency Sold | | Counterparty | | Settlement
Date | | Unrealized
Appreciation/
(Depreciation) | |
| USD | | | 944,471 | | | CHF | | | | | 930,581 | | | JPMorgan Chase Bank, NA | | 11/16/2018 | | $ | 19,343 | | |
| USD | | | 4,959,537 | | | EUR | | | | | 4,276,104 | | | JPMorgan Chase Bank, NA | | 11/16/2018 | | | 110,888 | | |
| USD | | | 3,582,593 | | | GBP | | | | | 2,709,902 | | | JPMorgan Chase Bank, NA | | 11/16/2018 | | | 116,700 | | |
| USD | | | 2,050,941 | | | HKD | | | | | 16,063,560 | | | JPMorgan Chase Bank, NA | | 11/16/2018 | | | 1,426 | | |
| AUD | | | 440,000 | | | JPY | | | | | 34,872,391 | | | Societe Generale | | 12/19/2018 | | | 1,399 | | |
| AUD | | | 260,000 | | | USD | | | | | 184,059 | | | Societe Generale | | 12/19/2018 | | | 155 | | |
| BRL** | | | 10,070,000 | | | USD | | | | | 2,495,905 | | | Societe Generale | | 12/19/2018 | | | 198,458 | | |
| CHF | | | 50,000 | | | USD | | | | | 49,867 | | | Societe Generale | | 12/19/2018 | | | 23 | | |
| CLP** | | | 66,900,000 | | | USD | | | | | 95,697 | | | Societe Generale | | 12/19/2018 | | | 493 | | |
| EUR | | | 4,303,327 | | | PLN | | | | | 18,620,000 | | | Societe Generale | | 12/19/2018 | | | 36,059 | | |
| EUR | | | 110,000 | | | USD | | | | | 124,973 | | | Societe Generale | | 12/19/2018 | | | 158 | | |
| GBP | | | 100,000 | | | USD | | | | | 127,840 | | | Societe Generale | | 12/19/2018 | | | 297 | | |
| HUF | | | 10,280,000 | | | USD | | | | | 36,000 | | | Societe Generale | | 12/19/2018 | | | 12 | | |
| INR** | | | 32,030,000 | | | USD | | | | | 427,254 | | | Societe Generale | | 12/19/2018 | | | 2,618 | | |
| JPY | | | 302,383,773 | | | AUD | | | | | 3,770,000 | | | Societe Generale | | 12/19/2018 | | | 19,974 | | |
| JPY | | | 172,470,000 | | | USD | | | | | 1,526,375 | | | Societe Generale | | 12/19/2018 | | | 8,533 | | |
| KRW** | | | 13,150,000 | | | USD | | | | | 11,521 | | | Societe Generale | | 12/19/2018 | | | 16 | | |
| NOK | | | 90,000 | | | USD | | | | | 10,685 | | | Societe Generale | | 12/19/2018 | | | 15 | | |
| NZD | | | 220,000 | | | USD | | | | | 142,737 | | | Societe Generale | | 12/19/2018 | | | 897 | | |
| PHP** | | | 66,400,000 | | | USD | | | | | 1,224,444 | | | Societe Generale | | 12/19/2018 | | | 16,330 | | |
| SEK | | | 1,120,000 | | | USD | | | | | 122,556 | | | Societe Generale | | 12/19/2018 | | | 403 | | |
| SGD | | | 30,000 | | | USD | | | | | 21,669 | | | Societe Generale | | 12/19/2018 | | | 11 | | |
| THB | | | 400,000 | | | USD | | | | | 12,010 | | | Societe Generale | | 12/19/2018 | | | 75 | | |
See Notes to Consolidated Financial Statements
22
Consolidated Schedule of Investments Neuberger Berman Absolute Return Multi-Manager Fund (cont'd)
Currency Purchased | | Currency Sold | | Counterparty | | Settlement
Date | | Unrealized
Appreciation/
(Depreciation) | |
| TRY | | | 3,165,634 | | | EUR | | | | | 440,000 | | | Societe Generale | | 12/19/2018 | | $ | 49,478 | | |
| TRY | | | 2,050,000 | | | USD | | | | | 329,189 | | | Societe Generale | | 12/19/2018 | | | 26,983 | | |
| TRY | | | 1,280,000 | | | ZAR | | | | | 3,031,440 | | | Societe Generale | | 12/19/2018 | | | 18,118 | | |
| USD | | | 6,849,633 | | | AUD | | | | | 9,600,000 | | | Societe Generale | | 12/19/2018 | | | 47,848 | | |
| USD | | | 37,612 | | | BRL | ** | | | | 140,000 | | | Societe Generale | | 12/19/2018 | | | 153 | | |
| USD | | | 6,781,692 | | | CAD | | | | | 8,830,000 | | | Societe Generale | | 12/19/2018 | | | 67,509 | | |
| USD | | | 4,570,098 | | | CHF | | | | | 4,460,000 | | | Societe Generale | | 12/19/2018 | | | 119,911 | | |
| USD | | | 2,226,900 | | | CLP | ** | | | | 1,530,520,000 | | | Societe Generale | | 12/19/2018 | | | 26,298 | | |
| USD | | | 13,715,901 | | | EUR | | | | | 11,770,000 | | | Societe Generale | | 12/19/2018 | | | 326,830 | | |
| USD | | | 7,332,730 | | | GBP | | | | | 5,620,000 | | | Societe Generale | | 12/19/2018 | | | 131,502 | | |
| USD | | | 1,936,930 | | | HUF | | | | | 540,110,000 | | | Societe Generale | | 12/19/2018 | | | 44,866 | | |
| USD | | | 2,669,726 | | | ILS | | | | | 9,600,000 | | | Societe Generale | | 12/19/2018 | | | 79,226 | | |
| USD | | | 4,719,798 | | | INR | ** | | | | 347,200,000 | | | Societe Generale | | 12/19/2018 | | | 60,082 | | |
| USD | | | 8,998,988 | | | JPY | | | | | 1,000,580,000 | | | Societe Generale | | 12/19/2018 | | | 94,261 | | |
| USD | | | 4,523,680 | | | KRW | ** | | | | 5,099,560,000 | | | Societe Generale | | 12/19/2018 | | | 49,565 | | |
| USD | | | 3,172,890 | | | MXN | | | | | 61,270,000 | | | Societe Generale | | 12/19/2018 | | | 180,604 | | |
| USD | | | 5,108,737 | | | NOK | | | | | 42,230,000 | | | Societe Generale | | 12/19/2018 | | | 87,852 | | |
| USD | | | 697,319 | | | NZD | | | | | 1,060,000 | | | Societe Generale | | 12/19/2018 | | | 5,261 | | |
| USD | | | 4,355,245 | | | PLN | | | | | 16,220,000 | | | Societe Generale | | 12/19/2018 | | | 122,331 | | |
| USD | | | 3,451,025 | | | SEK | | | | | 30,980,000 | | | Societe Generale | | 12/19/2018 | | | 49,887 | | |
| USD | | | 12,490,405 | | | SGD | | | | | 17,160,000 | | | Societe Generale | | 12/19/2018 | | | 89,525 | | |
| USD | | | 1,847,039 | | | THB | | | | | 60,440,000 | | | Societe Generale | | 12/19/2018 | | | 21,016 | | |
| USD | | | 328,211 | | | ZAR | | | | | 4,800,000 | | | Societe Generale | | 12/19/2018 | | | 4,770 | | |
| ZAR | | | 580,000 | | | USD | | | | | 38,963 | | | Societe Generale | | 12/19/2018 | | | 119 | | |
| USD | | | 894,540 | | | CAD | | | | | 1,169,000 | | | JPMorgan Chase Bank, NA | | 12/20/2018 | | | 5,627 | | |
| USD | | | 915,340 | | | EUR | | | | | 785,000 | | | JPMorgan Chase Bank, NA | | 12/20/2018 | | | 22,254 | | |
| USD | | | 184,564 | | | GBP | | | | | 140,000 | | | JPMorgan Chase Bank, NA | | 12/20/2018 | | | 5,162 | | |
| USD | | | 280,278 | | | SEK | | | | | 2,444,000 | | | JPMorgan Chase Bank, NA | | 12/20/2018 | | | 11,929 | | |
| USD | | | 388,999 | | | CAD | | | | | 504,400 | | | JPMorgan Chase Bank, NA | | 12/28/2018 | | | 5,365 | | |
| USD | | | 31,434 | | | JPY | | | | | 3,526,300 | | | JPMorgan Chase Bank, NA | | 12/28/2018 | | | 18 | | |
| USD | | | 645,713 | | | SEK | | | | | 5,641,600 | | | JPMorgan Chase Bank, NA | | 12/28/2018 | | | 25,634 | | |
Total unrealized appreciation | | | | | | | | | | | | $ | 2,314,267 | | |
| Currency Purchased | | Currency Sold | | Counterparty | | Settlement
Date | | Unrealized
Appreciation/
(Depreciation) | |
| EUR | | | 800,000 | | | USD | | | | | 919,381 | | | JPMorgan Chase Bank, NA | | 11/16/2018 | | $ | (12,266 | ) | |
| GBP | | | 500,000 | | | USD | | | | | 651,396 | | | JPMorgan Chase Bank, NA | | 11/16/2018 | | | (11,909 | ) | |
| HKD | | | 4,100,000 | | | USD | | | | | 523,229 | | | JPMorgan Chase Bank, NA | | 11/16/2018 | | | (119 | ) | |
| USD | | | 10,792 | | | TRY | | | | | 65,815 | | | JPMorgan Chase Bank, NA | | 11/16/2018 | | | (880 | ) | |
| AUD | | | 7,850,000 | | | JPY | | | | | 632,322,738 | | | Societe Generale | | 12/19/2018 | | | (65,531 | ) | |
| AUD | | | 5,620,000 | | | USD | | | | | 4,046,299 | | | Societe Generale | | 12/19/2018 | | | (64,425 | ) | |
| BRL** | | | 1,480,000 | | | USD | | | | | 398,877 | | | Societe Generale | | 12/19/2018 | | | (2,885 | ) | |
| CAD | | | 6,640,000 | | | USD | | | | | 5,131,983 | | | Societe Generale | | 12/19/2018 | | | (83,040 | ) | |
| CHF | | | 2,240,000 | | | USD | | | | | 2,322,878 | | | Societe Generale | | 12/19/2018 | | | (87,809 | ) | |
| CLP** | | | 773,010,000 | | | USD | | | | | 1,165,315 | | | Societe Generale | | 12/19/2018 | | | (53,870 | ) | |
See Notes to Consolidated Financial Statements
23
Consolidated Schedule of Investments Neuberger Berman Absolute Return Multi-Manager Fund (cont'd)
Currency Purchased | | Currency Sold | | Counterparty | | Settlement
Date | | Unrealized
Appreciation/
(Depreciation) | |
| EUR | | | 480,000 | | | TRY | | | | | 3,731,413 | | | Societe Generale | | 12/19/2018 | | $ | (102,275 | ) | |
| EUR | | | 6,570,000 | | | USD | | | | | 7,707,367 | | | Societe Generale | | 12/19/2018 | | | (233,603 | ) | |
| GBP | | | 3,270,000 | | | USD | | | | | 4,306,753 | | | Societe Generale | | 12/19/2018 | | | (116,715 | ) | |
| HUF | | | 201,860,000 | | | USD | | | | | 731,006 | | | Societe Generale | | 12/19/2018 | | | (23,871 | ) | |
| ILS | | | 4,650,000 | | | USD | | | | | 1,301,247 | | | Societe Generale | | 12/19/2018 | | | (46,473 | ) | |
| INR** | | | 166,660,000 | | | USD | | | | | 2,262,318 | | | Societe Generale | | 12/19/2018 | | | (25,605 | ) | |
| JPY | | | 533,381,756 | | | AUD | | | | | 6,750,000 | | | Societe Generale | | 12/19/2018 | | | (35,633 | ) | |
| JPY | | | 671,500,000 | | | USD | | | | | 6,018,349 | | | Societe Generale | | 12/19/2018 | | | (42,284 | ) | |
| KRW** | | | 3,233,560,000 | | | USD | | | | | 2,893,608 | | | Societe Generale | | 12/19/2018 | | | (56,632 | ) | |
| MXN | | | 60,170,000 | | | USD | | | | | 3,145,139 | | | Societe Generale | | 12/19/2018 | | | (206,572 | ) | |
| NOK | | | 25,970,000 | | | USD | | | | | 3,185,081 | | | Societe Generale | | 12/19/2018 | | | (97,408 | ) | |
| NZD | | | 2,650,000 | | | USD | | | | | 1,755,014 | | | Societe Generale | | 12/19/2018 | | | (24,868 | ) | |
| PHP** | | | 21,150,000 | | | USD | | | | | 395,852 | | | Societe Generale | | 12/19/2018 | | | (635 | ) | |
| PLN | | | 13,720,000 | | | EUR | | | | | 3,182,648 | | | Societe Generale | | 12/19/2018 | | | (39,962 | ) | |
| PLN | | | 8,520,000 | | | USD | | | | | 2,311,335 | | | Societe Generale | | 12/19/2018 | | | (87,882 | ) | |
| SEK | | | 14,390,000 | | | USD | | | | | 1,636,889 | | | Societe Generale | | 12/19/2018 | | | (57,083 | ) | |
| SGD | | | 8,720,000 | | | USD | | | | | 6,372,631 | | | Societe Generale | | 12/19/2018 | | | (71,016 | ) | |
| THB | | | 52,600,000 | | | USD | | | | | 1,621,738 | | | Societe Generale | | 12/19/2018 | | | (32,582 | ) | |
| TRY | | | 258,591 | | | EUR | | | | | 40,000 | | | Societe Generale | | 12/19/2018 | | | (575 | ) | |
| TRY | | | 210,000 | | | USD | | | | | 36,965 | | | Societe Generale | | 12/19/2018 | | | (480 | ) | |
| TRY | | | 800,000 | | | ZAR | | | | | 2,083,578 | | | Societe Generale | | 12/19/2018 | | | (1,406 | ) | |
| USD | | | 487,859 | | | AUD | | | | | 690,000 | | | Societe Generale | | 12/19/2018 | | | (1,020 | ) | |
| USD | | | 2,306,124 | | | BRL | ** | | | | 9,560,000 | | | Societe Generale | | 12/19/2018 | | | (251,781 | ) | |
| USD | | | 35,527 | | | CLP | ** | | | | 24,760,000 | | | Societe Generale | | 12/19/2018 | | | (73 | ) | |
| USD | | | 38,333 | | | GBP | | | | | 30,000 | | | Societe Generale | | 12/19/2018 | | | (107 | ) | |
| USD | | | 295,362 | | | INR | ** | | | | 22,040,000 | | | Societe Generale | | 12/19/2018 | | | (434 | ) | |
| USD | | | 1,173,173 | | | JPY | | | | | 132,109,998 | | | Societe Generale | | 12/19/2018 | | | (2,549 | ) | |
| USD | | | 109,742 | | | KRW | ** | | | | 125,310,000 | | | Societe Generale | | 12/19/2018 | | | (199 | ) | |
| USD | | | 9,508 | | | NOK | | | | | 80,000 | | | Societe Generale | | 12/19/2018 | | | (4 | ) | |
| USD | | | 3,219,899 | | | NZD | | | | | 4,940,000 | | | Societe Generale | | 12/19/2018 | | | (5,351 | ) | |
| USD | | | 2,595,961 | | | PHP | ** | | | | 141,510,000 | | | Societe Generale | | 12/19/2018 | | | (48,346 | ) | |
| USD | | | 38,377 | | | SEK | | | | | 350,000 | | | Societe Generale | | 12/19/2018 | | | (48 | ) | |
| USD | | | 458,207 | | | THB | | | | | 15,240,000 | | | Societe Generale | | 12/19/2018 | | | (2,226 | ) | |
| USD | | | 447,817 | | | TRY | | | | | 2,930,000 | | | Societe Generale | | 12/19/2018 | | | (61,247 | ) | |
| USD | | | 862,748 | | | ZAR | | | | | 13,120,000 | | | Societe Generale | | 12/19/2018 | | | (21,325 | ) | |
| ZAR | | | 5,382,124 | | | TRY | | | | | 2,430,000 | | | Societe Generale | | 12/19/2018 | | | (59,526 | ) | |
| ZAR | | | 7,950,000 | | | USD | | | | | 552,443 | | | Societe Generale | | 12/19/2018 | | | (16,741 | ) | |
| CAD | | | 5,097,000 | | | USD | | | | | 3,917,433 | | | JPMorgan Chase Bank, NA | | 12/20/2018 | | | (41,652 | ) | |
| EUR | | | 1,546,000 | | | USD | | | | | 1,819,320 | | | JPMorgan Chase Bank, NA | | 12/20/2018 | | | (60,453 | ) | |
| GBP | | | 674,000 | | | USD | | | | | 881,348 | | | JPMorgan Chase Bank, NA | | 12/20/2018 | | | (17,656 | ) | |
| SEK | | | 5,000,000 | | | USD | | | | | 565,196 | | | JPMorgan Chase Bank, NA | | 12/20/2018 | | | (16,201 | ) | |
| CAD | | | 143,523 | | | USD | | | | | 109,397 | | | JPMorgan Chase Bank, NA | | 12/28/2018 | | | (237 | ) | |
| SEK | | | 5,641,600 | | | USD | | | | | 628,586 | | | JPMorgan Chase Bank, NA | | 12/28/2018 | | | (8,506 | ) | |
Total unrealized depreciation | | | | | | | | | | | | $ | (2,301,976 | ) | |
Net unrealized appreciation | | | | | | | | | | | | $ | 12,291 | | |
See Notes to Consolidated Financial Statements
24
Consolidated Schedule of Investments Neuberger Berman Absolute Return Multi-Manager Fund (cont'd)
** Non-deliverable forward.
For the year ended October 31, 2018, the average notional value of forward contracts for the Fund was $4,563,289. The Fund had cash collateral of $53,804 and $2,262,826 deposited in a segregated account for JPMorgan Chase Bank, NA and Societe Generale, respectively, to cover collateral requirements on forward contracts.
Credit default swap contracts ("credit default swaps")
At October 31, 2018, the Fund had outstanding credit default swap contracts as follows:
Over the counter Credit Default Swaps—Buy Protection
Reference
Entity | | Financing
Rate Paid
by the
Fund | | Payment
Frequency | | Counterparty | | Maturity
Date | | Notional
Amount | | Upfront
Payments/
(Receipts) | | Unrealized
Appreciation/
(Depreciation) | | Accrued
Net
Interest
Receivable/
(Payable) | | Value | |
Assured
Guaranty
Municipal
Corp., debt
obligations | | | 5.00 | % | | quarterly | | JPMorgan
Chase
Bank, NA | | 12/20/2021 | | $ | 2,000,000 | | | $ | (186,202 | ) | | $ | (87,871 | ) | | $ | (11,666 | ) | | $ | (285,739 | ) | |
Gap, Inc. (The),
5.95%,
04/12/2021 | | | 1.00 | | | quarterly | | JPMorgan
Chase
Bank, NA | | 12/20/2021 | | | 1,000,000 | | | | 72,522 | | | | (83,379 | ) | | | (1,167 | ) | | | (12,024 | ) | |
Hertz Corp.
(The), 5.88%,
10/15/2020 | | | 5.00 | | | quarterly | | JPMorgan
Chase
Bank, NA | | 12/20/2020 | | | 1,000,000 | | | | — | | | | (18,111 | ) | | | (5,833 | ) | | | (23,944 | ) | |
International
Lease Finance
Corp., 8.25%,
12/15/2020 | | | 5.00 | | | quarterly | | JPMorgan
Chase
Bank, NA | | 12/20/2021 | | | 1,000,000 | | | | (93,195 | ) | | | (39,629 | ) | | | (5,833 | ) | | | (138,657 | ) | |
Kohl's Corp.,
4.00%,
11/01/2021 | | | 1.00 | | | quarterly | | JPMorgan
Chase
Bank, NA | | 12/20/2021 | | | 1,000,000 | | | | 39,994 | | | | (55,467 | ) | | | (1,167 | ) | | | (16,640 | ) | |
Macy's, Inc.,
3.45%,
01/15/2021 | | | 1.00 | | | quarterly | | JPMorgan
Chase
Bank, NA | | 12/20/2022 | | | 1,000,000 | | | | 86,265 | | | | (81,672 | ) | | | (1,167 | ) | | | 3,426 | | |
Nordstrom,
Inc., 6.95%,
03/15/2028 | | | 1.00 | | | quarterly | | JPMorgan
Chase
Bank, NA | | 12/20/2021 | | | 1,000,000 | | | | 17,316 | | | | (32,196 | ) | | | (1,167 | ) | | | (16,047 | ) | |
Staples, Inc.,
2.75%,
9/15/25 | | | 1.00 | | | quarterly | | JPMorgan
Chase
Bank, NA | | 12/20/2021 | | | 2,000,000 | | | | 80,733 | | | | 41,984 | | | | (2,333 | ) | | | 120,384 | | |
Total credit default swaps | | | | | | | | | | | | $ | 17,433 | | | $ | (356,341 | ) | | $ | (30,333 | ) | | $ | (369,241 | ) | |
For the year ended October 31, 2018, the average notional value of credit default swaps for the Fund was $11,153,846 for buy protection.
See Notes to Consolidated Financial Statements
25
Consolidated Schedule of Investments Neuberger Berman Absolute Return Multi-Manager Fund (cont'd)
Currency Abbreviations
AUD Australian Dollar
BRL Brazilian Real
CAD Canadian Dollar
CHF Swiss Franc
CLP Chilean Peso
EUR Euro
GBP Pound Sterling
HKD Hong Kong Dollar
HUF Hungarian Forint
ILS Israeli New Shekel
INR Indian Rupee
JPY Japanese Yen
KRW Korean Won
MXN Mexican Peso
NOK Norwegian Krone
NZD New Zealand Dollar
PHP Philippine Peso
PLN Poland Zloty
SEK Swedish Krona
SGD Singapore Dollar
THB Thailand Baht
TRY Turkish Lira
USD United States Dollar
ZAR South African Rand
Equity swap contracts ("equity swaps")
At October 31, 2018, the Fund had outstanding equity swaps* as follows:
Counterparty | | Description | | Maturity
Dates | | Absolute
Notional
Value | | Net Unrealized
Appreciation/
(Depreciation) | | Financing
Costs
and Other
Receivables/
(Payables) | | Value | |
JPMorgan
Chase Bank, NA
| | The Fund receives the total return
on a portfolio of long positions and
pays a floating rate plus or minus a
specified spread. The Fund pays the total
return on a portfolio of short positions
and receives a floating rate plus or minus
a specified spread. The specified spreads
range from –3.05% to 0.75%. The
payments/receipts, based on the
specified benchmark floating rates (see
table below), may be denominated in
various foreign currencies based on the
local currencies of the positions within
the swaps. Payments/receipts, if any,
will be made at maturity. | | 11/7/2018-
11/1/2019 | | | $27,862,361 | | | | $(290,559) | | | | $22,017 | | | | $(268,542) | | |
* The following table represents required component disclosures associated with the equity swaps as of October 31, 2018.
Reference Entity | | Shares | | Notional
Amount(a) | | Net Unrealized
Appreciation/
(Depreciation) | |
Long Positions | |
Australia | |
Investa Office Fund | | | 2,300 | | | $ | 9,040 | | | $ | 814 | | |
MYOB Group Ltd. | | | 11,900 | | | | 28,399 | | | | (791 | ) | |
| | | | | | | | 23 | | |
See Notes to Consolidated Financial Statements
26
Consolidated Schedule of Investments Neuberger Berman Absolute Return Multi-Manager Fund (cont'd)
Reference Entity | | Shares | | Notional
Amount(a) | | Net Unrealized
Appreciation/
(Depreciation) | |
Germany | |
Innogy SE | | | 1,250 | | | $ | 52,130 | | | $ | 234 | | |
Innogy SE | | | 2,248 | | | | 99,302 | | | | 6,581 | | |
| | | | | | | | 6,815 | | |
Italy | |
Buzzi Unicem SpA | | | 8,570 | | | | 96,292 | | | | (5,962 | ) | |
Luxottica Group SpA | | | 1,500 | | | | 94,327 | | | | 6,889 | | |
| | | | | | | | 927 | | |
Netherlands | |
Gemalto NV | | | 10,200 | | | | 581,811 | | | | 9,691 | | |
Portugal | |
EDP—Energias de Portugal SA | | | 14,484 | | | | 50,922 | | | | (374 | ) | |
Spain | |
Obrascon Huarte Lain SA | | | 2,425 | | | | 2,774 | | | | (10,042 | ) | |
United Kingdom | |
Jardine Lloyd Thompson Group plc | | | 10,125 | | | | 244,082 | | | | 1,992 | | |
Ladbrokes Coral Group plc, CVR | | | 22,680 | | | | 725 | | | | 820 | (b)(c)(d) | |
Linde plc | | | 462 | | | | 75,798 | | | | 11,719 | | |
NEX Group plc | | | 10,600 | | | | 153,916 | | | | 20,118 | | |
Spire Healthcare Group plc | | | 7,267 | | | | 10,905 | | | | (11,593 | ) | |
| | | | | | | | 23,056 | | |
United States | |
Associated Banc-Corp. | | | 30,689 | | | | 711,371 | | | | (54,847 | ) | |
Broadcom, Inc. | | | 1,435 | | | | 320,708 | | | | (36,140 | ) | |
Cott Corp. | | | 43,130 | | | | 648,675 | | | | (13,588 | ) | |
CSX Corp. | | | 13,760 | | | | 947,514 | | | | 160,793 | | |
DowDuPont, Inc. | | | 2,000 | | | | 107,840 | | | | (33,704 | ) | |
DXC Technology Co. | | | 28,285 | | | | 2,059,997 | | | | (347,784 | ) | |
EQT Corp. | | | 14,035 | | | | 476,769 | | | | (188,494 | ) | |
Tiffany & Co. | | | 1,655 | | | | 184,201 | | | | 22,348 | | |
United Technologies Corp. | | | 6,070 | | | | 753,955 | | | | (62,358 | ) | |
Wells Fargo & Co. | | | 23,701 | | | | 1,261,604 | | | | (46,633 | ) | |
Zayo Group Holdings, Inc. | | | 19,045 | | | | 569,065 | | | | (117,378 | ) | |
Zimmer Biomet Holdings, Inc. | | | 5,650 | | | | 641,783 | | | | (18,885 | ) | |
| | | | | | | | (736,670 | ) | |
Total Long Positions of Equity Swaps | | | | | | $ | (706,574 | ) | |
See Notes to Consolidated Financial Statements
27
Consolidated Schedule of Investments Neuberger Berman Absolute Return Multi-Manager Fund (cont'd)
Reference Entity | | Shares | | Notional
Amount(a) | | Net Unrealized
Appreciation/
(Depreciation) | |
Short Positions | |
Canada | |
Canadian Tire Corp. Ltd. | | | (2,700 | ) | | $ | (303,831 | ) | | $ | 17,765 | | |
National Bank of Canada | | | (13,600 | ) | | | (617,369 | ) | | | 47,234 | | |
| | | | | | | | 64,999 | | |
Denmark | |
Vestas Wind Systems A/S | | | (5,530 | ) | | | (346,816 | ) | | | 17,703 | | |
France | |
EssilorLuxottica SA | | | (691 | ) | | | (94,506 | ) | | | (5,510 | ) | |
Publicis Groupe SA | | | (4,634 | ) | | | (268,943 | ) | | | 32,963 | | |
| | | | | | | | 27,453 | | |
Italy | |
Buzzi Unicem SpA | | | (3,361 | ) | | | (64,621 | ) | | | 7,050 | | |
Japan | |
Takeda Pharmaceutical Co. Ltd. | | | (7,896 | ) | | | (319,801 | ) | | | 8,605 | | |
Netherlands | |
Signify NV | | | (8,660 | ) | | | (213,831 | ) | | | 36,373 | | |
Spain | |
Grifols SA | | | (4,248 | ) | | | (121,202 | ) | | | 6,355 | | |
Siemens Gamesa Renewable Energy SA | | | (29,050 | ) | | | (322,191 | ) | | | 93,297 | | |
| | | | | | | | 99,652 | | |
Sweden | |
Volvo AB | | | (26,515 | ) | | | (396,371 | ) | | | 34,783 | | |
Switzerland | |
Garrett Motion, Inc. | | | (25,847 | ) | | | (392,099 | ) | | | 49,466 | | |
Roche Holding AG | | | (3,136 | ) | | | (763,177 | ) | | | (30,037 | ) | |
| | | | | | | | 19,429 | | |
United Kingdom | |
Linde plc | | | (462 | ) | | | (76,447 | ) | | | (5,654 | ) | |
United States | |
Altria Group, Inc. | | | (9,839 | ) | | | (639,929 | ) | | | (68,933 | ) | |
AutoNation, Inc. | | | (5,685 | ) | | | (230,129 | ) | | | (4,944 | ) | |
Brunswick Corp. | | | (6,730 | ) | | | (349,893 | ) | | | 61,160 | | |
Carter's, Inc. | | | (3,099 | ) | | | (297,442 | ) | | | 28,930 | | |
CME Group, Inc. | | | (472 | ) | | | (86,489 | ) | | | (16,713 | ) | |
Dollar General Corp. | | | (2,128 | ) | | | (237,017 | ) | | | (36,667 | ) | |
Estee Lauder Cos., Inc. (The) | | | (4,690 | ) | | | (644,594 | ) | | | (22,277 | ) | |
F5 Networks, Inc. | | | (1,855 | ) | | | (325,144 | ) | | | 6,167 | | |
Fastenal Co. | | | (5,665 | ) | | | (291,238 | ) | | | 8,948 | | |
See Notes to Consolidated Financial Statements
28
Consolidated Schedule of Investments Neuberger Berman Absolute Return Multi-Manager Fund (cont'd)
Reference Entity | | Shares | | Notional
Amount(a) | | Net Unrealized
Appreciation/
(Depreciation) | |
Flowers Foods, Inc. | | | (34,450 | ) | | $ | (665,230 | ) | | $ | 22,249 | | |
Focus Financial Partners, Inc. | | | (3,865 | ) | | | (147,643 | ) | | | 8,454 | | |
Fossil Group, Inc. | | | (9,990 | ) | | | (216,883 | ) | | | 17,436 | | |
Fulton Financial Corp. | | | (27,080 | ) | | | (433,551 | ) | | | 38,962 | | |
Hershey Co. (The) | | | (3,185 | ) | | | (341,273 | ) | | | (39,329 | ) | |
Hillenbrand, Inc. | | | (5,020 | ) | | | (240,458 | ) | | | 5,704 | | |
Home Depot, Inc. (The) | | | (2,825 | ) | | | (496,861 | ) | | | 44,571 | | |
Hormel Foods Corp. | | | (9,190 | ) | | | (401,052 | ) | | | (84,395 | ) | |
Ingredion, Inc. | | | (1,665 | ) | | | (168,465 | ) | | | (13,308 | ) | |
Kohl's Corp. | | | (2,130 | ) | | | (161,305 | ) | | | (6,478 | ) | |
Landstar System, Inc. | | | (2,005 | ) | | | (200,680 | ) | | | 22,547 | | |
Lear Corp. | | | (3,635 | ) | | | (483,092 | ) | | | 5,212 | | |
LyondellBasell Industries NV | | | (3,296 | ) | | | (294,234 | ) | | | 58,176 | | |
Maxim Integrated Products, Inc. | | | (5,780 | ) | | | (289,116 | ) | | | 35,740 | | |
Mercury Systems, Inc. | | | (5,880 | ) | | | (275,537 | ) | | | (29,293 | ) | |
Nordson Corp. | | | (2,480 | ) | | | (304,222 | ) | | | 9,806 | | |
Nuance Communications, Inc. | | | (18,610 | ) | | | (323,628 | ) | | | (6,874 | ) | |
Omnicom Group, Inc. | | | (6,235 | ) | | | (463,385 | ) | | | 12,677 | | |
PACCAR, Inc. | | | (7,376 | ) | | | (421,981 | ) | | | 41,692 | | |
Realogy Holdings Corp. | | | (11,215 | ) | | | (213,870 | ) | | | 50,262 | | |
Robert Half International, Inc. | | | (5,726 | ) | | | (346,595 | ) | | | 31,056 | | |
Rockwell Automation, Inc. | | | (1,840 | ) | | | (303,103 | ) | | | 8,477 | | |
Semtech Corp. | | | (3,281 | ) | | | (147,448 | ) | | | (170 | ) | |
Silicon Laboratories, Inc. | | | (3,725 | ) | | | (303,699 | ) | | | (8,636 | ) | |
Sleep Number Corp. | | | (8,705 | ) | | | (316,601 | ) | | | (30,327 | ) | |
Tenneco, Inc. | | | (6,445 | ) | | | (221,901 | ) | | | 20,033 | | |
Ulta Beauty, Inc. | | | (580 | ) | | | (159,222 | ) | | | 224 | | |
UMB Financial Corp. | | | (7,080 | ) | | | (452,058 | ) | | | 17,086 | | |
Urban Outfitters, Inc. | | | (7,910 | ) | | | (312,129 | ) | | | (5,191 | ) | |
VF Corp. | | | (5,085 | ) | | | (421,445 | ) | | | (18,200 | ) | |
Walgreens Boots Alliance, Inc. | | | (4,205 | ) | | | (335,433 | ) | | | (54,047 | ) | |
WR Berkley Corp. | | | (5,445 | ) | | | (413,276 | ) | | | (4,165 | ) | |
| | | | | | | | 105,622 | | |
Total Short Positions of Equity Swaps | | | | | | $ | 416,015 | | |
Total Long and Short Positions of Equity
Swaps with JPMorgan Chase Bank, NA | | | | | | $ | (290,559 | ) | |
See Notes to Consolidated Financial Statements
29
Consolidated Schedule of Investments Neuberger Berman Absolute Return Multi-Manager Fund (cont'd)
Counterparty | | Description | | Maturity
Dates | | Absolute
Notional
Value | | Net Unrealized
Appreciation/
(Depreciation) | | Financing
Costs
and Other
Receivables/
(Payables) | | Value | |
Morgan Stanley
Capital
Services LLC | | The Fund receives the total return
on a portfolio of long positions and
pays a floating rate plus or minus a
specified spread. The Fund pays the total
return on a portfolio of short positions
and receives a floating rate plus or minus
a specified spread. The specified spreads
range from –1.88% to 1.40%. The
payments/receipts, based on the
specified benchmark floating rates (see
table below), may be denominated in
various foreign currencies based on the
local currencies of the positions within
the swaps. Payments/receipts, if any,
will be made at maturity. | | 12/6/2018-
12/3/2019 | | | $13,448,483 | | | | $(813,275) | | | | $(99,194) | | | | $(912,469) | | |
* The following table represents required component disclosures associated with the equity swaps as of October 31, 2018.
Reference Entity | | Shares | | Notional
Amount(a) | | Net Unrealized
Appreciation/
(Depreciation) | |
Long Positions | |
Brazil | |
Hypera SA | | | 14,669 | | | $ | 117,384 | | | $ | 22,100 | | |
France | |
Amundi SA | | | 1,968 | | | | 117,204 | | | | 23,334 | | |
BNP Paribas SA | | | 6,240 | | | | 326,035 | | | | (20,111 | ) | |
Danone SA | | | 14,026 | | | | 994,180 | | | | (21,097 | ) | |
Iliad SA | | | 5,565 | | | | 644,502 | | | | (478,591 | ) | |
Publicis Groupe SA | | | 3,983 | | | | 231,161 | | | | (50,066 | ) | |
| | | | | | | | (546,531 | ) | |
Ireland | |
Ryanair Holdings plc | | | 27,666 | | | | 374,151 | | | | (83,632 | ) | |
Luxembourg | |
Eurofins Scientific SE | | | 1,851 | | | | 935,893 | | | | 146,050 | | |
South Africa | |
Aspen Pharmacare Holdings Ltd. | | | 5,590 | | | | 59,111 | | | | (46,175 | ) | |
South Korea | |
NAVER Corp. | | | 1,145 | | | | 115,048 | | | | (8,084 | ) | |
Switzerland | |
LafargeHolcim Ltd. (Registered) | | | 10,563 | | | | 489,266 | | | | 22,028 | | |
Nestle SA (Registered) | | | 14,889 | | | | 1,258,354 | | | | 151,325 | | |
| | | | | | | | 173,353 | | |
See Notes to Consolidated Financial Statements
30
Consolidated Schedule of Investments Neuberger Berman Absolute Return Multi-Manager Fund (cont'd)
Reference Entity | | Shares | | Notional
Amount(a) | | Net Unrealized
Appreciation/
(Depreciation) | |
Turkey | |
Migros Ticaret A/S | | | 18,670 | | | $ | 48,833 | | | $ | (102,430 | ) | |
United Kingdom | |
Barclays plc | | | 47,721 | | | | 105,220 | | | | (12,816 | ) | |
ITV plc | | | 26,308 | | | | 50,087 | | | | (3,644 | ) | |
Pets at Home Group plc | | | 15,218 | | | | 21,397 | | | | (13,267 | ) | |
Smith & Nephew plc | | | 3,480 | | | | 56,647 | | | | 2,397 | | |
Sports Direct International plc | | | 65,638 | | | | 273,845 | | | | (41,636 | ) | |
| | | | | | | | (68,966 | ) | |
Total Long Positions of Equity Swaps | | | | | | $ | (514,315 | ) | |
Short Positions | |
Belgium | |
Colruyt SA | | | (9,737 | ) | | | (565,988 | ) | | | (43,538 | ) | |
France | |
Electricite de France SA | | | (10,879 | ) | | | (180,888 | ) | | | (79,622 | ) | |
Lagardere SCA | | | (9,267 | ) | | | (253,905 | ) | | | 17,474 | | |
LVMH Moet Hennessy Louis Vuitton SE | | | (1,295 | ) | | | (394,271 | ) | | | (141,623 | ) | |
Orange SA | | | (43,976 | ) | | | (688,366 | ) | | | 62,919 | | |
Pernod Ricard SA | | | (4,950 | ) | | | (755,772 | ) | | | 26,175 | | |
| | | | | | | | (114,677 | ) | |
Germany | |
Deutsche Telekom AG (Registered) | | | (19,510 | ) | | | (320,311 | ) | | | 41,563 | | |
Italy | |
Eni SpA | | | (16,536 | ) | | | (294,166 | ) | | | (38,675 | ) | |
Netherlands | |
Koninklijke Ahold Delhaize NV | | | (23,574 | ) | | | (540,163 | ) | | | 22,964 | | |
Sweden | |
Hennes & Mauritz AB | | | (7,905 | ) | | | (139,715 | ) | | | (1,550 | ) | |
Switzerland | |
Givaudan SA (Registered) | | | (173 | ) | | | (419,810 | ) | | | (92,459 | ) | |
Roche Holding AG | | | (470 | ) | | | (114,379 | ) | | | 8,612 | | |
| | | | | | | | (83,847 | ) | |
United Kingdom | |
Bunzl plc | | | (12,584 | ) | | | (371,721 | ) | | | (33,391 | ) | |
GlaxoSmithKline plc | | | (9,897 | ) | | | (191,172 | ) | | | (31,480 | ) | |
Marks & Spencer Group plc | | | (293,574 | ) | | | (1,110,729 | ) | | | 68,531 | | |
Next plc | | | (1,991 | ) | | | (132,436 | ) | | | 5,021 | | |
Unilever NV | | | (8,608 | ) | | | (463,362 | ) | | | (6,545 | ) | |
| | | | | | | | 2,136 | | |
See Notes to Consolidated Financial Statements
31
Consolidated Schedule of Investments Neuberger Berman Absolute Return Multi-Manager Fund (cont'd)
Reference Entity | | Shares | | Notional
Amount(a) | | Net Unrealized
Appreciation/
(Depreciation) | |
United States | |
Merck & Co., Inc. | | | (1,987 | ) | | $ | (146,263 | ) | | $ | (42,074 | ) | |
Pfizer, Inc. | | | (3,408 | ) | | | (146,748 | ) | | | (41,262 | ) | |
| | | | | | | | (83,336 | ) | |
Total Short Positions of Equity Swaps | | | | | | $ | (298,960 | ) | |
Total Long and Short Positions of Equity
Swaps with Morgan Stanley Capital Services LLC | | | | | | $ | (813,275 | ) | |
(a) For the year ended October 31, 2018, the average notional value of equity swaps for the Fund was $21,380,148 for long positions and $(24,971,885) for short positions.
(b) Illiquid security.
(c) Value determined using significant unobservable inputs.
(d) Security fair valued as of October 31, 2018, in accordance with procedures approved by the Board of Trustees.
At October 31, 2018, the Fund had cash collateral of $6,176,279 and $3,910,000 deposited in a segregated account for JPMorgan Chase Bank, NA and Morgan Stanley Capital Services LLC, respectively, to cover collateral requirements on over the counter swaps.
Benchmark Floating Rates | | Value at
Period End | |
Australian Bank-Bill Swap Reference Rate | | | 1.85 | % | |
CDOR—Canadian Dollar Offered Rate | | | 2.08 | | |
CIBOR—Copenhagen Interbank Rate | | | (0.38 | ) | |
EONIA—Euro Overnight Index Average Rate | | | (0.34 | ) | |
EURIBOR—Euro Interbank Offered Rate | | | (0.37 | ) | |
Federal Funds Floating Rate | | | 2.20 | | |
LIBOR (CHF)—London Interbank Offered Rate | | | (0.78 | ) | |
LIBOR (EUR)—London Interbank Offered Rate | | | (0.40 | ) | |
LIBOR (GBP)—London Interbank Offered Rate | | | 0.73 | | |
LIBOR (USD)—London Interbank Offered Rate | | | 2.31 | | |
SARON—Swiss Average Overnight Rate | | | (0.74 | ) | |
SONIA—Sterling Overnight Index Average Rate | | | 0.70 | | |
STIBOR—Stockholm Interbank Offered Rate | | | (0.46 | ) | |
Purchased option contracts ("options purchased")
At October 31, 2018, the Fund had outstanding options purchased as follows:
Description | | Number of
Contracts | | Notional
Amount | | Exercise
Price | | Expiration
Date | | Value | |
Calls | |
Energy Equipment & Services | |
USA Compression Partners LP | | | 18 | | | $ | 26,370 | | | $ | 17.5 | | | 3/15/2019 | | $ | 225 | | |
See Notes to Consolidated Financial Statements
32
Consolidated Schedule of Investments Neuberger Berman Absolute Return Multi-Manager Fund (cont'd)
Description | | Number of
Contracts | | Notional
Amount | | Exercise
Price | | Expiration
Date | | Value | |
Leisure Products | |
Mattel, Inc. | | | 279 | | | $ | 378,882 | | | $ | 18 | | | 1/18/2019 | | $ | 2,093 | | |
Oil, Gas & Consumable Fuels | |
Antero Midstream GP LP | | | 51 | | | | 82,161 | | | | 17.5 | | | 1/18/2019 | | | 2,550 | | |
Antero Resources Corp. | | | 57 | | | | 90,573 | | | | 17.5 | | | 11/16/2018 | | | 1,425 | | |
Antero Resources Corp. | | | 14 | | | | 22,246 | | | | 20 | | | 11/16/2018 | | | 70 | | |
| Enable Midstream Partners LP(a) | | | 173 | | | | 255,521 | | | | 17.5 | | | 11/16/2018 | | | — | | |
Enable Midstream Partners LP | | | 21 | | | | 31,017 | | | | 17.5 | | | 2/15/2019 | | | 315 | | |
Energy Transfer LP | | | 66 | | | | 102,564 | | | | 18 | | | 1/18/2019 | | | 1,452 | | |
| EnLink Midstream Partners LP(a) | | | 81 | | | | 122,796 | | | | 18 | | | 11/16/2018 | | | — | | |
Noble Midstream Partners LP | | | 20 | | | | 68,280 | | | | 40 | | | 11/16/2018 | | | 2,850 | | |
Noble Midstream Partners LP | | | 51 | | | | 174,114 | | | | 45 | | | 11/16/2018 | | | 3,442 | | |
Noble Midstream Partners LP | | | 2 | | | | 6,828 | | | | 45 | | | 2/15/2019 | | | 300 | | |
Pembina Pipeline Corp. | | | 71 | | | | 229,472 | | | | 35 | | | 11/16/2018 | | | 710 | | |
Western Gas Equity Partners LP | | | 24 | | | | 69,024 | | | | 30 | | | 11/16/2018 | | | 2,820 | | |
| Western Gas Equity Partners LP(a) | | | 43 | | | | 123,668 | | | | 35 | | | 11/16/2018 | | | — | | |
| | | | | | | | | | | | 15,934 | | |
Total calls | | | | | | | | | | $ | 18,252 | | |
Puts | |
Diversified Telecommunication Services | |
Intelsat SA | | | 93 | | | | 242,358 | | | | 20 | | | 1/18/2019 | | | 19,530 | | |
Exchange Traded Funds | |
iShares Russell 2000 ETF | | | 101 | | | | 1,515,303 | | | | 146 | | | 12/31/2018 | | | 40,350 | | |
iShares Russell 2000 ETF | | | 101 | | | | 1,515,303 | | | | 146 | | | 3/29/2019 | | | 63,933 | | |
| | | | | | | | | | | | 104,283 | | |
Total puts | | | | | | | | | | $ | 123,813 | | |
Total options purchased (cost $178,048) | | | | | | | | | | $ | 142,065 | | |
(a) Value determined using significant unobservable inputs.
Written option contracts ("options written")
At October 31, 2018, the Fund had outstanding options written as follows:
Description | | Number of
Contracts | | Notional
Amount | | Exercise
Price | | Expiration
Date | | Value | |
Calls | |
Pharmaceuticals | |
Endocyte, Inc. | | | 24 | | | $ | (56,760 | ) | | $ | 24 | | | 4/18/2019 | | $ | (540 | ) | |
Technology Hardware, Storage & Peripherals | |
Xerox Corp. | | | 16 | | | | (44,592 | ) | | | 28 | | | 11/16/2018 | | | (1,120 | ) | |
Total calls | | | | | | | | | | $ | (1,660 | ) | |
See Notes to Consolidated Financial Statements
33
Consolidated Schedule of Investments Neuberger Berman Absolute Return Multi-Manager Fund (cont'd)
Description | | Number of
Contracts | | Notional
Amount | | Exercise
Price | | Expiration
Date | | Value | |
Puts | |
Exchange Traded Funds | |
iShares Russell 2000 ETF | | | 101 | | | $ | (1,515,303 | ) | | $ | 125 | | | 12/31/2018 | | $ | (6,615 | ) | |
iShares Russell 2000 ETF | | | 101 | | | | (1,515,303 | ) | | | 125 | | | 3/29/2019 | | | (19,443 | ) | |
Total puts | | | | | | | | | | $ | (26,058 | ) | |
Total options written (premium received $27,125) | | | | | | | | | | $ | (27,718 | ) | |
For the year ended October 31, 2018, the Fund had an average notional value of $129,220 in options purchased and $(17,270) in options written.
The following is a summary, categorized by Level (see Note A of Notes to Consolidated Financial Statements), of inputs used to value the Fund's investments as of October 31, 2018:
Asset Valuation Inputs | |
(000's omitted) | | Level 1 | | Level 2 | | Level 3* | | Total | |
Investments: | |
Common Stocks | |
Airlines | | $ | — | | | $ | — | | | $ | 17 | | | $ | 17 | | |
Commercial Services & Supplies | | | 1,006 | | | | 235 | | | | — | | | | 1,241 | | |
Health Care Providers & Services | | | 3,611 | | | | 157 | | | | — | | | | 3,768 | | |
Insurance | | | 1,971 | | | | 684 | | | | — | | | | 2,655 | | |
Interactive Media & Services | | | 3,257 | | | | 684 | | | | 4 | | | | 3,945 | | |
Media | | | 4,264 | | | | — | | | | — | | | | 4,264 | | |
Oil, Gas & Consumable Fuels | | | 7,407 | | | | — | | | | — | | | | 7,407 | | |
| Other Common Stocks(a) | | | 68,919 | | | | — | | | | — | | | | 68,919 | | |
Total Common Stocks | | | 90,435 | | | | 1,760 | | | | 21 | | | | 92,216 | | |
| Asset-Backed Securities(a) | | | — | | | | 21,407 | | | | — | | | | 21,407 | | |
Commercial Mortgage-Backed Securities | | | — | | | | 11,929 | | | | — | | | | 11,929 | | |
Loan Assignments | |
Commercial Services & Supplies | | | — | | | | 137 | | | | 427 | | | | 564 | | |
Household Durables | | | — | | | | — | | | | 112 | | | | 112 | | |
Insurance | | | — | | | | 856 | | | | 1,603 | | | | 2,459 | | |
Leisure Products | | | — | | | | — | | | | 185 | | | | 185 | | |
| Other Loan Assignments(a) | | | — | | | | 7,270 | | | | — | | | | 7,270 | | |
Total Loan Assignments | | | — | | | | 8,263 | | | | 2,327 | | | | 10,590 | | |
Corporate Bonds | |
Chemicals | | | — | | | | 1,278 | | | | — | | | | 1,278 | | |
Oil, Gas & Consumable Fuels | | | — | | | | 698 | | | | — | | | | 698 | | |
Other Corporate Bonds(a) | | | — | | | | 5,717 | | | | — | | | | 5,717 | | |
Total Corporate Bonds | | | — | | | | 7,693 | | | | — | | | | 7,693 | | |
Collateralized Mortgage Obligations | | | — | | | | 6,418 | | | | — | | | | 6,418 | | |
| Master Limited Partnerships(a) | | | 5,524 | | | | — | | | | — | | | | 5,524 | | |
| Convertible Bonds(a) | | | — | | | | 3,312 | | | | — | | | | 3,312 | | |
See Notes to Consolidated Financial Statements
34
Consolidated Schedule of Investments Neuberger Berman Absolute Return Multi-Manager Fund (cont'd)
Asset Valuation Inputs | |
(000's omitted) | | Level 1 | | Level 2 | | Level 3* | | Total | |
| Closed End Funds(a) | | $ | 697 | | | $ | — | | | $ | — | | | $ | 697 | | |
U.S. Treasury Obligations | | | — | | | | 172 | | | | — | | | | 172 | | |
Rights | |
Biotechnology | | | — | | | | — | | | | 43 | | | | 43 | | |
Food Products | | | — | | | | — | | | | 18 | | | | 18 | | |
Total Rights | | | — | | | | — | | | | 61 | | | | 61 | | |
| Preferred Stocks(a) | | | 46 | | | | — | | | | — | | | | 46 | | |
| Warrants(a) | | | 39 | | | | — | | | | — | | | | 39 | | |
Options Purchased | |
Diversified Telecommunication Services | | | 20 | | | | — | | | | — | | | | 20 | | |
Exchange Traded Funds | | | 104 | | | | — | | | | — | | | | 104 | | |
Leisure Products | | | 2 | | | | — | | | | — | | | | 2 | | |
Oil, Gas & Consumable Fuels | | | 16 | | | | — | | | | — | | | | 16 | | |
Total Options Purchased | | | 142 | | | | — | | | | — | | | | 142 | | |
Short-Term Investments | | | — | | | | 73,186 | | | | — | | | | 73,186 | | |
Total Long Positions | | $ | 96,883 | | | $ | 134,140 | | | $ | 2,409 | | | $ | 233,432 | | |
(a) The Consolidated Schedule of Investments provides information on the industry categorization for the portfolio.
* The following is a reconciliation between the beginning and ending balances of investments in which unobservable inputs (Level 3) were used in determining value:
| | Beginning
balance as
of 11/1/2017 | | Accrued
discounts/
(premiums) | | Realized
gain/loss
and change
in unrealized
appreciation/
(depreciation) | | Purchases | | Sales | | Transfers
into
Level 3 | | Transfers
out of
Level 3 | | Balance
as of
10/31/2018 | | Net change in
unrealized
appreciation/
(depreciation)
from
investments
still held as of
10/31/2018 | |
Investments in Securities: | |
(000's omitted) | |
Common Stocks | |
| Airlines(a)(b) | | $ | 19 | | | $ | — | | | $ | (2 | ) | | $ | — | | | $ | — | | | $ | — | | | $ | — | | | $ | 17 | | | $ | (2 | ) | |
Interactive Media &
Services(a) | | | — | | | | — | | | | (84 | ) | | | 53 | | | | (4 | ) | | | 39 | | | | — | | | | 4 | | | | (76 | ) | |
| Media(a) | | | 1 | | | | — | | | | (1 | ) | | | — | | | | — | | | | — | | | | — | | | | — | | | | (1 | ) | |
Loan Assignments | |
Commercial
Services & Supplies(b) | | | 464 | | | | — | | | | 3 | | | | 212 | | | | (466 | ) | | | 214 | | | | — | | | | 427 | | | | — | | |
Food Products | | | 490 | | | | — | | | | — | | | | — | | | | — | | | | — | | | | (490 | ) | | | — | | | | — | | |
| Household Durables(b) | | | 60 | | | | — | | | | (3 | ) | | | — | | | | (59 | ) | | | 114 | | | | — | | | | 112 | | | | (2 | ) | |
| Insurance(b) | | | — | | | | 24 | | | | (4 | ) | | | 422 | | | | (29 | ) | | | 1,190 | | | | — | | | | 1,603 | | | | (5 | ) | |
| Leisure Products(b) | | | 235 | | | | — | | | | (4 | ) | | | — | | | | (46 | ) | | | — | | | | — | | | | 185 | | | | (3 | ) | |
See Notes to Consolidated Financial Statements
35
Consolidated Schedule of Investments Neuberger Berman Absolute Return Multi-Manager Fund (cont'd)
| | Beginning
balance as
of 11/1/2017 | | Accrued
discounts/
(premiums) | | Realized
gain/loss
and change
in unrealized
appreciation/
(depreciation) | | Purchases | | Sales | | Transfers
into
Level 3 | | Transfers
out of
Level 3 | | Balance
as of
10/31/2018 | | Net change in
unrealized
appreciation/
(depreciation)
from
investments
still held as of
10/31/2018 | |
(000's omitted) | |
Media | | $ | 274 | | | $ | — | | | $ | (18 | ) | | $ | 19 | | | $ | (275 | ) | | $ | — | | | $ | — | | | $ | — | | | $ | — | | |
Semiconductors &
Semiconductor
Equipment | | | 3,504 | | | | (3 | ) | | | (203 | ) | | | 295 | | | | (3,593 | ) | | | — | | | | — | | | | — | | | | — | | |
Corporate Bonds | |
Banks | | | 5,560 | | | | 40 | | | | 720 | | | | — | | | | (6,320 | ) | | | — | | | | — | | | | — | | | | — | | |
Capital Markets | | | 8,030 | | | | 42 | | | | 824 | | | | — | | | | (8,896 | ) | | | — | | | | — | | | | — | | | | — | | |
Collateralized Mortgage
Obligations | | | 1,027 | | | | — | | | | (7 | ) | | | — | | | | (1,020 | ) | | | — | | | | — | | | | — | | | | — | | |
Rights | |
| Biotechnology(a) | | | 87 | | | | — | | | | 117 | | | | — | | | | (161 | ) | | | — | | | | — | | | | 43 | | | | — | | |
Food & Staples
Retailing | | | 60 | | | | — | | | | 40 | | | | — | | | | (100 | ) | | | — | | | | — | | | | — | | | | — | | |
| Food Products(a) | | | — | | | | — | | | | 18 | | | | — | | | | — | | | | — | | | | — | | | | 18 | | | | 18 | | |
| Media(a) | | | — | | | | — | | | | — | | | | 4 | | | | (4 | ) | | | — | | | | — | | | | — | | | | — | | |
Options Purchased | |
Oil, Gas &
Consumable Fuels | | | — | | | | — | | | | (16 | ) | | | 16 | | | | — | | | | — | | | | — | | | | — | | | | (16 | ) | |
Total | | $ | 19,811 | | | $ | 103 | | | $ | 1,380 | | | $ | 1,021 | | | $ | (20,973 | ) | | $ | 1,557 | | | $ | (490 | ) | | $ | 2,409 | | | $ | (87 | ) | |
(a) As of the year ended October 31, 2018, these securities were fair valued in accordance with procedures approved by the Board of Trustees. These investments did not have a material impact on the Fund's net assets and, therefore, disclosure of unobservable inputs used in formulating valuations is not presented.
(b) As of the year ended October 31, 2018, these securities were valued based on a single quotation obtained from a dealer. The Fund does not have access to unobservable inputs and therefore cannot disclose such inputs used in formulating such quotation.
The following is a summary, categorized by Level (see Note A of Notes to Consolidated Financial Statements), of inputs used to value the Fund's investments as of October 31, 2018:
Liability Valuation Inputs | |
(000's omitted) | | Level 1 | | Level 2 | | Level 3* | | Total | |
Investments: | |
| Common Stocks Sold Short(a) | | $ | (19,325 | ) | | $ | — | | | $ | — | | | $ | (19,325 | ) | |
Exchange Traded Funds Sold Short | | | (3,077 | ) | | | — | | | | — | | | | (3,077 | ) | |
| Corporate Bonds Sold Short(a) | | | — | | | | (2,093 | ) | | | — | | | | (2,093 | ) | |
| Master Limited Partnerships Sold Short(a) | | | (99 | ) | | | — | | | | — | | | | (99 | ) | |
Total Short Positions | | $ | (22,501 | ) | | $ | (2,093 | ) | | $ | — | | | $ | (24,594 | ) | |
See Notes to Consolidated Financial Statements
36
Consolidated Schedule of Investments Neuberger Berman Absolute Return Multi-Manager Fund (cont'd)
(a) The Consolidated Schedule of Investments provides information on the industry categorization for the portfolio.
* The following is a reconciliation between the beginning and ending balances of short investments in which unobservable inputs (Level 3) were used in determining value:
| | Beginning
balance as
of 11/1/2017 | | Accrued
discounts/
(premiums) | | Realized
gain/loss
and change
in unrealized
appreciation/
(depreciation) | | Purchases | | Sales | | Transfers
into
Level 3 | | Transfers
out of
Level 3 | | Balance
as of
10/31/2018 | | Net change in
unrealized
appreciation/
(depreciation)
from
investments
still held as of
10/31/2018 | |
Investments in Securities: | |
(000's omitted) | |
Common Stocks Sold Short | |
IT Services | | $ | (61 | ) | | $ | — | | | $ | (204 | ) | | $ | — | | | $ | 265 | | | $ | — | | | $ | — | | | $ | — | | | $ | — | | |
Preferred Stock Sold Short | |
IT Services | | | (121 | ) | | | — | | | | (52 | ) | | | (23 | ) | | | 196 | | | | — | | | | — | | | | — | | | | — | | |
Total | | $ | (182 | ) | | $ | — | | | $ | (256 | ) | | $ | (23 | ) | | $ | 461 | | | $ | — | | | $ | — | | | $ | — | | | $ | — | | |
The following is a summary, categorized by Level (see Note A of Notes to Consolidated Financial Statements), of inputs used to value the Fund's derivatives as of October 31, 2018:
Other Financial Instruments | |
(000's omitted) | | Level 1 | | Level 2 | | Level 3* | | Total | |
| Futures(a) | |
Assets | | $ | 1,268 | | | $ | — | | | $ | — | | | $ | 1,268 | | |
Liabilities | | | (325 | ) | | | — | | | | — | | | | (325 | ) | |
| Forward contracts(a) | |
Assets | | | — | | | | 2,314 | | | | — | | | | 2,314 | | |
Liabilities | | | — | | | | (2,302 | ) | | | — | | | | (2,302 | ) | |
| Swaps(a) | |
Assets | | | — | | | | 1,915 | | | | 1 | | | | 1,916 | | |
Liabilities | | | — | | | | (3,466 | ) | | | — | | | | (3,466 | ) | |
Options written | |
Liabilities | | | (28 | ) | | | — | | | | — | | | | (28 | ) | |
Total | | $ | 915 | | | $ | (1,539 | ) | | $ | 1 | | | $ | (623 | ) | |
(a) Futures and forward contracts are reported at the cumulative unrealized appreciation/(depreciation) of the instrument. Equity swaps are reported at the cumulative unrealized appreciation/(depreciation) including financing costs and other receivables/payables. Credit default swaps are reported in the table at value.
See Notes to Consolidated Financial Statements
37
Consolidated Schedule of Investments Neuberger Berman Absolute Return Multi-Manager Fund (cont'd)
* The following is a reconciliation between the beginning and ending balances of derivative investments in which unobservable inputs (Level 3) were used in determining value:
| | Beginning
balance as
of 11/1/2017 | | Accrued
discounts/
(premiums) | | Realized
gain/loss
and change
in unrealized
appreciation/
(depreciation) | | Purchases | | Sales | | Transfers
into
Level 3 | | Transfers
out of
Level 3 | | Balance
as of
10/31/2018 | | Net change in
unrealized
appreciation/
(depreciation)
from
investments
still held as of
10/31/2018 | |
Other Financial Instruments: | |
(000's omitted) | |
Equity Swaps | |
| United Kingdom(a) | | $ | — | | | $ | — | | | $ | 1 | | | $ | — | | | $ | — | | | $ | — | | | $ | — | | | $ | 1 | | | $ | 1 | | |
United States | | | 230 | | | | — | | | | 172 | | | | — | | | | (402 | ) | | | — | | | | — | | | | — | | | | — | | |
Total | | $ | 230 | | | $ | — | | | $ | 173 | | | $ | — | | | $ | (402 | ) | | $ | — | | | $ | — | | | $ | 1 | | | $ | 1 | | |
(a) As of the year ended October 31, 2018, this investment was fair valued in accordance with procedures approved by the Board of Trustees. The Fund does not have access to unobservable inputs; however, this investment did not have a material impact on the Fund's net assets and, therefore, disclosure of unobservable inputs used in formulating a valuation is not presented.
See Notes to Consolidated Financial Statements
38
Consolidated Statement of Assets and Liabilities
Neuberger Berman Alternative Funds
(000's omitted, except per share amounts)
| | | ABSOLUTE RETURN
MULTI-MANAGER
FUND | |
| | | October 31, 2018 | |
Assets | |
Investments in securities, at value* (Note A)—see Schedule of Investments: | |
| Unaffiliated issuers(a) | | $ | 233,432 | | |
Cash | | | 5,587 | | |
Cash collateral segregated for short sales (Note A) | | | 25,627 | | |
Cash collateral segregated for swap contracts (Note A) | | | 10,086 | | |
Cash collateral segregated for forward foreign currency contracts (Note A) | | | 2,317 | | |
Dividends and interest receivable | | | 931 | | |
Receivable for securities sold | | | 1,707 | | |
Receivable for Fund shares sold | | | 337 | | |
Deposits with brokers for futures contracts (Note A) | | | 2,065 | | |
Receivable for variation margin on futures contracts (Note A) | | | 309 | | |
| Over the counter swap contracts, at value(f) (Note A) | | | 1,916 | | |
Receivable for forward foreign currency contracts (Note A) | | | 2,314 | | |
Prepaid expenses and other assets | | | 23 | | |
Total Assets | | | 286,651 | | |
Liabilities | |
| Due to custodian, foreign currency(b) | | | 6,047 | | |
| Investments sold short, at value(c) (Note A) | | | 24,594 | | |
| Options contracts written, at value(d) (Note A) | | | 28 | | |
Dividends and interest payable for short sales | | | 75 | | |
| Over the counter swap contracts, at value(e)(f) (Note A) | | | 3,466 | | |
Payable to administrator—net (Note B) | | | 7 | | |
Payable to investment manager (Note B) | | | 364 | | |
Payable for securities purchased | | | 2,866 | | |
Payable for Fund shares redeemed | | | 302 | | |
Payable for forward foreign currency contracts (Note A) | | | 2,302 | | |
Accrued expenses and other payables | | | 452 | | |
Total Liabilities | | | 40,503 | | |
Net Assets | | $ | 246,148 | | |
Net Assets consist of: | |
Paid-in capital | | $ | 357,088 | | |
Total distributable earnings/(losses) | | | (110,940 | ) | |
Net Assets | | $ | 246,148 | | |
Net Assets | |
Institutional Class | | $ | 201,051 | | |
Class A | | | 18,112 | | |
Class C | | | 11,648 | | |
Class R6 | | | 15,337 | | |
See Notes to Consolidated Financial Statements
39
Consolidated Statement of Assets and Liabilities (cont'd)
Neuberger Berman Alternative Funds (cont'd)
(000's omitted, except per share amounts)
| | | ABSOLUTE RETURN
MULTI-MANAGER
FUND | |
| | | October 31, 2018 | |
Shares Outstanding ($.001 par value; unlimited shares authorized) | | | |
Institutional Class | | | 18,779 | | |
Class A | | | 1,717 | | |
Class C | | | 1,157 | | |
Class R6 | | | 1,432 | | |
Net Asset Value, offering and redemption price per share | | | |
Institutional Class | | $ | 10.71 | | |
Class R6 | | $ | 10.71 | | |
Net Asset Value and redemption price per share | | | |
Class A | | $ | 10.55 | | |
Offering Price per share | | | |
Class A‡ | | $ | 11.19 | | |
Net Asset Value and offering price per share | | | |
Class C^ | | $ | 10.06 | | |
*Cost of Investments: | | | |
(a) Unaffiliated issuers | | $ | 234,851 | | |
(b) Total cost of foreign currency | | $ | (6,049 | ) | |
(c) Proceeds from investments sold short | | $ | 26,600 | | |
(d) Premium received from option contracts written | | $ | 27 | | |
(e) Unamortized upfront receipts on Over the counter swap contracts | | $ | (279 | ) | |
(f) Unamortized upfront payments on Over the counter swap contracts | | $ | 297 | | |
‡ On single retail sales of less than $50,000. On sales of $50,000 or more or in certain other circumstances described in the Fund's prospectus, offering price is reduced.
^ Redemption price per share is equal to net asset value less any applicable contingent deferred sales charge.
See Notes to Consolidated Financial Statements
40
Consolidated Statement of Operations
Neuberger Berman Alternative Funds
(000's omitted)
| | | ABSOLUTE RETURN
MULTI-MANAGER
FUND | |
| | | For the
Year Ended
October 31, 2018 | |
Investment Income: | |
Income (Note A): | |
Dividend income—unaffiliated issuers | | $ | 4,206 | | |
Interest and other income—unaffiliated issuers | | | 5,310 | | |
Foreign taxes withheld (Note A) | | | (38 | ) | |
Total income | | $ | 9,478 | | |
Expenses: | |
Investment management fees (Note B) | | | 5,024 | | |
Administration fees (Note B): | |
Institutional Class | | | 372 | | |
Class A | | | 49 | | |
Class C | | | 37 | | |
Class R6 | | | 12 | | |
Distribution fees (Note B): | | | |
Class A | | | 47 | | |
Class C | | | 144 | | |
Shareholder servicing agent fees: | |
Institutional Class | | | 5 | | |
Class A | | | 6 | | |
Class C | | | 2 | | |
Audit fees | | | 145 | | |
Custodian and accounting fees | | | 396 | | |
Insurance expense | | | 12 | | |
Legal fees | | | 170 | | |
Registration and filing fees | | | 84 | | |
Shareholder reports | | | 62 | | |
Trustees' fees and expenses | | | 46 | | |
Dividend and interest expense on securities sold short (Note A) | | | 1,061 | | |
Miscellaneous | | | 22 | | |
Total expenses | | | 7,696 | | |
Expenses reimbursed by Management (Note B) | | | (576 | ) | |
Expenses reduced by custodian fee expense offset arrangement (Note A) | | | (2 | ) | |
Total net expenses | | | 7,118 | | |
Net investment income/(loss) | | $ | 2,360 | | |
See Notes to Consolidated Financial Statements
41
Consolidated Statement of Operations (cont'd)
Neuberger Berman Alternative Funds (cont'd)
(000's omitted)
| | | ABSOLUTE RETURN
MULTI-MANAGER
FUND | |
| | | For the
Year Ended
October 31, 2018 | |
Realized and Unrealized Gain/(Loss) on Investments (Note A): | |
Net realized gain/(loss) on: | |
Transactions in investment securities of unaffiliated issuers | | | 9,044 | | |
Closed short positions of unaffiliated issuers | | | (4,746 | ) | |
Settlement of forward foreign currency contracts | | | 280 | | |
Settlement of foreign currency transactions | | | 730 | | |
Expiration or closing of futures contracts | | | 1,806 | | |
Expiration or closing of option contracts written | | | 91 | | |
Expiration or closing of swap contracts | | | 1,197 | | |
Change in net unrealized appreciation/(depreciation) in value of: | |
Investment securities of unaffiliated issuers | | | (11,071 | ) | |
Short positions of unaffiliated issuers | | | 1,189 | | |
Forward foreign currency contracts | | | 458 | | |
Foreign currency translations | | | (264 | ) | |
Futures contracts | | | (50 | ) | |
Option contracts written | | | (3 | ) | |
Swap contracts | | | (1,886 | ) | |
Net gain/(loss) on investments | | | (3,225 | ) | |
Net increase/(decrease) in net assets resulting from operations | | $ | (865 | ) | |
See Notes to Consolidated Financial Statements
42
Consolidated Statements of Changes in Net Assets
Neuberger Berman Alternative Funds
(000's omitted)
| | | ABSOLUTE RETURN
MULTI-MANAGER FUND | |
| | Year Ended
October 31, 2018 | | Year Ended
October 31, 2017 | |
Increase/(Decrease) in Net Assets: | |
From Operations (Note A): | |
Net investment income/(loss) | | $ | 2,360 | | | $ | 2,285 | | |
Net realized gain/(loss) on investments | | | 8,402 | | | | 3,423 | | |
Change in net unrealized appreciation/(depreciation) of investments | | | (11,627 | ) | | | 20,589 | | |
Net increase/(decrease) in net assets resulting from operations | | | (865 | ) | | | 26,297 | | |
From Fund Share Transactions (Note D): | |
Proceeds from shares sold: | |
Institutional Class | | | 65,360 | | | | 109,581 | | |
Class A | | | 10,453 | | | | 4,382 | | |
Class C | | | 458 | | | | 503 | | |
Class R6 | | | 11,017 | | | | 11,240 | | |
Payments for shares redeemed: | |
Institutional Class | | | (159,661 | ) | | | (322,155 | ) | |
Class A | | | (12,723 | ) | | | (48,877 | ) | |
Class C | | | (6,507 | ) | | | (24,827 | ) | |
Class R6 | | | (8,232 | ) | | | (2,275 | ) | |
Net increase/(decrease) from Fund share transactions | | | (99,835 | ) | | | (272,428 | ) | |
Net Increase/(Decrease) in Net Assets | | | (100,700 | ) | | | (246,131 | ) | |
Net Assets: | |
Beginning of year | | | 346,848 | | | | 592,979 | | |
End of year | | $ | 246,148 | | | $ | 346,848 | | |
See Notes to Consolidated Financial Statements
43
Notes to Consolidated Financial Statements Absolute
Return Multi-Manager Fund
Note A—Summary of Significant Accounting Policies:
1 General: Neuberger Berman Alternative Funds (the "Trust") is a Delaware statutory trust organized pursuant to an Amended and Restated Trust Instrument dated March 27, 2014. The Trust is registered as an open-end management investment company under the Investment Company Act of 1940, as amended (the "1940 Act"), and its shares are registered under the Securities Act of 1933, as amended (the "1933 Act"). Neuberger Berman Absolute Return Multi-Manager Fund ("Absolute Return Multi-Manager", or the "Fund") is a separate operating series of the Trust, and is diversified. The Fund offers Institutional Class shares, Class A shares, Class C shares and Class R6 shares. The Trust's Board of Trustees (the "Board") may establish additional series or classes of shares without the approval of shareholders.
A balance indicated with a "—", either reflects a zero balance or a balance rounding to less than $1,000.
The assets of the Fund belong only to the Fund, and the liabilities of the Fund are borne solely by the Fund and no other.
The Fund is an investment company and accordingly follows the investment company accounting and reporting guidance of the Financial Accounting Standards Board ("FASB") Accounting Standard Codification ("ASC") Topic 946 "Financial Services—Investment Companies."
The preparation of financial statements in accordance with U.S. generally accepted accounting principles ("GAAP") requires Neuberger Berman Investment Advisers LLC ("Management") to make estimates and assumptions at the date of the financial statements. Actual results could differ from those estimates.
The Fund invests in commodity-related instruments through the Neuberger Berman ARMM Fund I Ltd. (the "Subsidiary"), which is organized under the laws of the Cayman Islands. The Fund is and expects to be the sole shareholder of the Subsidiary. The Subsidiary is governed by its own Board of Directors.
As of October 31, 2018, the value of the Fund's investment in the Subsidiary was as follows:
Investment in
Subsidiary | | Percentage of
Net Assets | |
| $ | 25,037,663 | | | | 10.2 | % | |
2 Consolidation: The accompanying financial statements of the Fund present the consolidated accounts of the Fund and the Subsidiary. All intercompany accounts and transactions have been eliminated in consolidation.
3 Portfolio valuation: In accordance with ASC 820 "Fair Value Measurement" ("ASC 820"), all investments held by the Fund are carried at the value that Management believes the Fund would receive upon selling an investment in an orderly transaction to an independent buyer in the principal or most advantageous market for the investment under current market conditions. Various inputs, including the volume and level of activity for the asset or liability in the market, are considered in valuing the Fund's investments, some of which are discussed below. Significant Management judgment may be necessary to value investments in accordance with ASC 820.
ASC 820 established a three-tier hierarchy of inputs to create a classification of value measurements for disclosure purposes. The three-tier hierarchy of inputs is summarized in the three broad Levels listed below.
• Level 1 – quoted prices in active markets for identical investments
• Level 2 – other observable inputs (including quoted prices for similar investments, interest rates, prepayment speeds, credit risk, amortized cost, etc.)
• Level 3 – unobservable inputs (including the Fund's own assumptions in determining the fair value of investments)
44
The inputs or methodology used for valuing an investment are not necessarily an indication of the risk associated with investing in those securities.
The value of the Fund's investments (long and short positions) in equity securities, preferred stocks, exchange traded funds ("ETFs"), exchange traded options purchased and written, master limited partnerships, closed-end funds, rights, and warrants, for which market quotations are readily available, is generally determined by Management by obtaining valuations from independent pricing services based on the latest sale price quoted on a principal exchange or market for that security (Level 1 inputs). Securities traded primarily on the NASDAQ Stock Market are normally valued at the NASDAQ Official Closing Price ("NOCP") provided by NASDAQ each business day. The NOCP is the most recently reported price as of 4:00:02 p.m., Eastern Time, unless that price is outside the range of the "inside" bid and asked prices (i.e., the bid and asked prices that dealers quote to each other when trading for their own accounts); in that case, NASDAQ will adjust the price to equal the inside bid or asked price, whichever is closer. Because of delays in reporting trades, the NOCP may not be based on the price of the last trade to occur before the market closes. If there is no sale of a security on a particular day, the independent pricing services may value the security based on market quotations.
The value of the Fund's investments for long and short positions in debt securities is determined by Management primarily by obtaining valuations from independent pricing services based on readily available bid or offer quotations, respectively, or if quotations are not available, by methods which include various considerations based on security type (generally Level 2 inputs). In addition to the consideration of yields or prices of securities of comparable quality, coupon, maturity and type, indications as to values from dealers, and general market conditions, the following is a description of other Level 2 inputs and related valuation techniques used by independent pricing services to value certain types of debt securities held by the Fund:
Corporate Bonds. Inputs used to value corporate debt securities generally include relative credit information, observed market movements, sector news, U.S. Treasury yield curve or relevant benchmark curve and other market information, which may include benchmark yields, reported trades, broker-dealer quotes, issuer spreads, benchmark securities, bids, offers, and reference data, such as market research publications, when available ("Other Market Information").
Asset-Backed Securities and Mortgage-Backed Securities. Inputs used to value asset-backed securities and mortgage-backed securities generally include models that consider a number of factors, which may include the following: prepayment speeds, cash flows, spread adjustments and Other Market Information.
U.S. Treasury Obligations. Inputs used to value U.S. Treasury securities generally include quotes from several inter-dealer brokers and Other Market Information.
Convertible Bonds. Inputs used to value convertible bonds generally include underlying stock data, dealer quotes, conversion premiums, listed bond and preferred stock prices and other market information, which may include benchmark curves, trade execution data, and sensitivity analysis, when available.
The value of loan assignments is determined by Management primarily by obtaining valuations from independent pricing services based on broker quotes (generally Level 2 or Level 3 inputs depending on the number of quotes available).
The value of futures is determined by Management by obtaining valuations from independent pricing services at the settlement price at the market close (Level 1 inputs).
The value of forward contracts is determined by Management by obtaining valuations from independent pricing services based on actual traded currency rates on independent pricing services' networks, along with other traded and quoted currency rates provided to the pricing services by leading market participants (Level 2 inputs).
The value of equity swaps is determined by Management by obtaining valuations from independent pricing services using the underlying asset and stated London Interbank Offered Rate ("LIBOR") or Federal Funds floating rate (generally Level 2 or Level 3 inputs).
45
The value of credit default swaps is determined by Management by obtaining valuations from independent pricing services using a model that considers a number of factors, which may include default probabilities, credit curves, recovery rates and cash flows (Level 2 inputs).
Management has developed a process to periodically review information provided by independent pricing services for all types of securities.
Investments in non-exchange traded investment companies are valued using the respective fund's daily calculated net asset value ("NAV") per share (Level 2 inputs).
If a valuation is not available from an independent pricing service, or if Management has reason to believe that the valuation received does not represent the amount the Fund might reasonably expect to receive on a current sale in an orderly transaction, Management seeks to obtain quotations from brokers or dealers (generally considered Level 2 or Level 3 inputs depending on the number of quotes available). If such quotations are not readily available, the security is valued using methods the Board has approved in the good-faith belief that the resulting valuation will reflect the fair value of the security. Numerous factors may be considered when determining the fair value of a security based on Level 2 or Level 3 inputs, including available analyst, media or other reports, securities within the same industry with recent highly correlated performance, trading in futures or American Depositary Receipts and whether the issuer of the security being fair valued has other securities outstanding.
The value of the Fund's investments in foreign securities is generally determined using the same valuation methods and inputs as other Fund investments, as discussed above. Foreign security prices expressed in local currency values are normally translated from the local currency into U.S. dollars using the exchange rates as of 4:00 p.m. Eastern Time on days the New York Stock Exchange ("NYSE") is open for business. The Board has approved the use of ICE Data Pricing and Reference Data LLC ("ICE") to assist in determining the fair value of foreign equity securities when changes in the value of a certain index suggest that the closing prices on the foreign exchanges may no longer represent the amount that the Fund could expect to receive for those securities or on days when foreign markets are closed and U.S. markets are open. In each of these events, ICE will provide adjusted prices for certain foreign equity securities using a statistical analysis of historical correlations of multiple factors (Level 2 inputs). The Board has also approved the use of ICE to evaluate the prices of foreign debt securities as of the time as of which the Fund's share price is calculated. ICE utilizes benchmark spread and yield curves and evaluates available market activity from the local close to the time as of which the Fund's share price is calculated (Level 2 inputs) to assist in determining prices for certain foreign debt securities. In the case of both foreign equity and foreign debt securities, in the absence of precise information about the market values of these foreign securities as of the time as of which the Fund's share price is calculated, the Board has determined on the basis of available data that prices adjusted or evaluated in this way are likely to be closer to the prices the Fund could realize on a current sale than are the prices of those securities established at the close of the foreign markets in which the securities primarily trade.
Fair value prices are necessarily estimates, and there is no assurance that such a price will be at or close to the price at which the security is next quoted or next trades.
4 Foreign currency translations: The accounting records of the Fund and Subsidiary are maintained in U.S. dollars. Foreign currency amounts are normally translated into U.S. dollars using the exchange rate as of 4:00 p.m. Eastern Time, on days the NYSE is open for business, to determine the value of investments, other assets and liabilities. Purchase and sale prices of securities, and income and expenses, are translated into U.S. dollars at the prevailing rate of exchange on the respective dates of such transactions. Net unrealized foreign currency gain (loss), if any, arises from changes in the value of assets and liabilities, other than investments in securities, as a result of changes in exchange rates and is stated separately in the Consolidated Statement of Operations.
5 Securities transactions and investment income: Securities transactions are recorded on trade date for financial reporting purposes. Dividend income is recorded on the ex-dividend date or, for certain foreign dividends, as soon as the Fund becomes aware of the dividends. Non-cash dividends included in dividend income, if any, are recorded
46
at the fair market value of the securities received. Interest income, including accretion of discount (adjusted for original issue discount, where applicable) and amortization of premium, where applicable, and accretion of discount on short-term investments, if any, is recorded on the accrual basis. Realized gains and losses from securities transactions and foreign currency transactions, if any, are recorded on the basis of identified cost and stated separately in the Consolidated Statement of Operations. Included in net realized gain (loss) on investments are proceeds from the settlement of class action litigations in which the Fund participated as a class member. The amounts of such proceeds for the year ended October 31, 2018, was $12,659.
6 Income tax information: The Fund is treated as a separate entity for U.S. federal income tax purposes. It is the policy of the Fund to continue to qualify for treatment as a regulated investment company ("RIC") by complying with the requirements of the U.S. Internal Revenue Code applicable to RICs and to distribute substantially all of its net investment income and net realized capital gains to its shareholders. To the extent the Fund distributes substantially all of its net investment income and net realized capital gains to shareholders, no federal income or excise tax provision is required.
The Fund has adopted the provisions of ASC 740 "Income Taxes" ("ASC 740"). ASC 740 sets forth a minimum threshold for financial statement recognition of a tax position taken, or expected to be taken, in a tax return. The Fund recognizes interest and penalties, if any, related to unrecognized tax positions as an income tax expense in the Consolidated Statement of Operations. The Fund is subject to examination by U.S. federal and state tax authorities for returns filed for the tax years for which the applicable statutes of limitations have not yet expired. As of October 31, 2018, the Fund did not have any unrecognized tax positions.
The Subsidiary is a controlled foreign corporation under the U.S. Internal Revenue Code. As a U.S. shareholder of a controlled foreign corporation, the Fund will include in its taxable income its share of the Subsidiary's current earnings and profits (including net realized gains). Any deficit generated by the Subsidiary will be disregarded for purposes of computing the Fund's taxable income in the current period and also disregarded for all future periods.
At October 31, 2018 the cost of long security positions and short security positions for U.S. federal income tax purposes was $214,557,046. Gross unrealized appreciation of long security positions, short security positions and derivative instruments was $12,745,373 and gross unrealized depreciation of long security positions, short security positions and derivative instruments was $(19,199,072), resulting in net unrealized depreciation of $(6,453,699) based on cost for U.S. federal income tax purposes.
Income distributions and capital gain distributions are determined in accordance with income tax regulations, which may differ from GAAP. These differences are primarily due to differing treatments of income and gains on various investment securities held by the Fund, timing differences and differing characterization of distributions made by the Fund.
As determined on October 31, 2018, permanent differences resulting primarily from different book and tax accounting were reclassified at year end. Such differences may be attributed to the tax treatment of net operating loss written-off and book income earned by the subsidiary. For the year ended October 31, 2018, the Fund recorded the following permanent reclassifications:
| Paid-in Capital | | Total
Distributable
Earnings/(Losses) | |
| $ | 455,484 | | | $ | (455,484 | ) | |
47
The tax character of distributions paid during the years ended October 31, 2018 and October 31, 2017 was as follows:
| | | Distributions Paid From: | | | | | |
Ordinary Income | | Tax-Exempt
Income | | Long-Term
Capital Gain | | Return of
Capital | | Total | |
| 2018 | | 2017 | | 2018 | | 2017 | | 2018 | | 2017 | | 2018 | | 2017 | | 2018 | | 2017 | |
| $ | — | | | $ | — | | | $ | — | | | $ | — | | | $ | — | | | $ | — | | | $ | — | | | $ | — | | | $ | — | | | $ | — | | |
As of October 31, 2018, the components of distributable earnings (accumulated losses) on a U.S. federal income tax basis were as follows:
Undistributed
Ordinary
Income/(Loss) | | Undistributed
Long-Term
Capital Gain | | Unrealized
Appreciation/
(Depreciation) | | Loss
Carryforwards
and Deferrals | | Other
Temporary
Differences | | Total | |
| $ | — | | | $ | — | | | $ | (6,337,664 | ) | | $ | (103,407,762 | ) | | $ | (1,194,803 | ) | | $ | (110,940,229 | ) | |
The temporary differences between book basis and tax basis distributable earnings are primarily due to: losses disallowed and recognized on wash sales, straddles and unsettled short sales, nontaxable dividends, investments in subsidiary, constructive sales, capital loss carryover, timing differences of fund level distributions, mark-to-market adjustments on swaps, futures, forward and option contracts; late-year ordinary loss deferrals, unamortized organization expenses, and tax adjustments related to PFICs, partnerships, swap contracts and other investments.
To the extent the Fund's net realized capital gains, if any, can be offset by capital loss carryforwards, if any, it is the policy of the Fund not to distribute such gains. Capital loss carryforward rules allow for RICs to carry forward capital losses indefinitely and to retain the character of capital loss carryforwards as short-term or long-term. As determined at October 31, 2018, the Fund had unused capital loss carryforwards available for federal income tax purposes to offset net realized capital gains, if any, as follows:
| Long-Term | | Short-Term | |
| $ | 38,537,476 | | | $ | 64,776,750 | | |
During the year ended October 31, 2018, the Fund utilized short-term capital loss carryforwards in the amount of $1,802,245 and long-term capital loss carryforwards in the amount of $4,570,833.
In accordance with U.S. Treasury regulations, the Fund has incurred and elected to defer $93,536 as qualified late year ordinary losses incurred after December 31, 2017. Such losses are treated as arising on November 1, 2018.
7 Foreign taxes: Foreign taxes withheld, if any, represent amounts withheld by foreign tax authorities, net of refunds recoverable.
Foreign capital gains on certain foreign securities may be subject to foreign taxes, which are accrued as applicable. At October 31, 2018, there were no outstanding balances of accrued capital gains taxes for the Fund.
8 Distributions to shareholders: The Fund may earn income, net of expenses, daily on its investments.
Distributions from net investment income and net realized capital gains, if any, are generally distributed once a year (usually in December) and are recorded on the ex-date.
It is the policy of the Fund to pass through to its shareholders substantially all REIT distributions and other income it receives, less operating expenses. The distributions received from REITs are generally composed of income, capital gains, and/or return of REIT capital, but the REITs do not report this information to the Fund until the following calendar year. At October 31, 2018, the Fund estimated these amounts for the period January 1, 2018 to October 31, 2018 within the financial statements because the 2018 information is not available from the REITs until after the Fund's fiscal year-end. All estimates are based upon REIT information sources available to the Fund together with actual IRS Forms 1099-DIV received to date. For the year ended October 31, 2018, the character of distributions paid to shareholders of the Fund disclosed within the Consolidated Statements of Changes in Net
48
Assets is based on estimates made at that time. Based on past experience it is possible that a portion of the Fund's distributions during the current fiscal year, if any, will be considered tax return of capital, but the actual amount of the tax return of capital, if any, is not determinable until after the Fund's fiscal year-end. After calendar year-end, when the Fund learns the nature of the distributions paid by REITs during that year, distributions previously identified as income are often recharacterized as return of capital and/or capital gain. After all applicable REITs have informed the Fund of the actual breakdown of distributions paid to the Fund during its fiscal year, estimates previously recorded are adjusted on the books of the Fund to reflect actual results. As a result, the composition of the Fund's distributions as reported herein may differ from the final composition determined after calendar year-end and reported to the Fund shareholders on IRS Form 1099-DIV.
9 Expense allocation: Certain expenses are applicable to multiple funds within the complex of related investment companies. Expenses directly attributable to a fund are charged to that fund. Expenses of the Trust that are not directly attributable to a particular series of the Trust (e.g., the Fund) are allocated among the series of the Trust, on the basis of relative net assets, except where a more appropriate allocation of expenses to each of the series can otherwise be made fairly. Expenses borne by the complex of related investment companies, which includes open-end and closed-end investment companies for which Management serves as investment manager, that are not directly attributable to a particular investment company in the complex (e.g., the Trust) or series thereof are allocated among the investment companies in the complex or series thereof on the basis of relative net assets, except where a more appropriate allocation of expenses to each of the investment companies in the complex or series thereof can otherwise be made fairly. The Fund's expenses (other than those specific to each class) are allocated proportionally each day among the classes based upon the relative net assets of each class.
10 Investments in foreign securities: Investing in foreign securities may involve sovereign and other risks, in addition to the credit and market risks normally associated with domestic securities. These additional risks include the possibility of adverse political and economic developments (including political instability, nationalization, expropriation, or confiscatory taxation) and the potentially adverse effects of unavailability of public information regarding issuers, less governmental supervision and regulation of financial markets, reduced liquidity of certain financial markets, and the lack of uniform accounting, auditing, and financial reporting standards or the application of standards that are different or less stringent than those applied in the United States. Foreign securities also may experience greater price volatility, higher rates of inflation, and delays in settlement.
11 Securities sold short: The Fund may engage in short sales, which are sales of securities which have been borrowed from a third party on the expectation that the market price will decline. If the price of the securities decreases, the Fund will make a profit by purchasing the securities in the open market at a price lower than the one at which it sold the securities. If the price of the securities increases, the Fund may have to cover its short positions at a price higher than the short sale price, resulting in a loss. Gains are limited to the price at which the Fund sold the security short, while losses are potentially unlimited in size. The Fund pledges securities and/or other assets to the lender as collateral. Proceeds received from short sales may be maintained by the lender as collateral or may be released to the Fund and used to purchase additional securities or for any other purpose. Proceeds maintained by the lender are included in the "Cash collateral segregated for short sales" on the Consolidated Statement of Assets and Liabilities. The Fund is required to segregate an amount of cash or liquid securities in an amount at least equal to the current market value of the securities sold short (less any additional collateral pledged to the lender). The Fund is contractually responsible to remit to the lender any dividends and interest payable on securities while those securities are being borrowed by the Fund. The Fund may receive or pay the net of the interest charged by the prime broker on the borrowed securities and a financing charge for the difference in the market value of the short position and the cash collateral deposited with the broker. This income or fee is calculated daily based upon the market value of each borrowed security and a variable rate that is dependent on the availability of the security. These costs related to short sales (i.e., dividend and interest remitted to the lender and interest charged by the prime broker) are recorded as an expense of the Fund and are excluded from the contractual expense limitation. A net negative expense, if any, represents a gain to the Fund as the total cash rebates received exceeded the other costs related to short sales. The net amount of fees incurred are included in the "Dividend and interest expense on securities sold short" on the Consolidated Statement of Operations and were $105,042 for the year ended October 31, 2018.
49
At October 31, 2018, the Fund had cash pledged in the amount of $25,626,933 to JPMorgan Chase Bank, NA ("JPM"), as collateral for short sales. In addition, JPM has a perfected security interest in these assets. At October 31, 2018, the Fund had securities pledged in the amount of $8,868,180 to JPM to cover collateral requirements for borrowing in connection with securities sold short and options written.
12 Investment company securities, ETFs and exchange traded notes: The Fund may invest in shares of other registered investment companies, including exchange traded funds ("ETFs"), within the limitations prescribed by the 1940 Act or pursuant to an exemptive order from the Securities and Exchange Commission that permits the Fund to invest in both affiliated and unaffiliated investment companies, including ETFs, in excess of the limits in Section 12(d)(1)(A) of the 1940 Act, subject to the terms and conditions of such order. Some ETFs seek to track the performance of a particular market index. These indices include both broad-based market indices and more narrowly-based indices, including those relating to particular sectors, markets, regions or industries. However, some ETFs have actively-managed investment objectives. ETF shares are traded like traditional equity securities on a national securities exchange or NASDAQ. The Fund will indirectly bear its proportionate share of any management fees and other expenses paid by such other investment companies, which will increase expenses and decrease returns. The Fund may also invest in exchange traded notes ("ETNs"). ETNs are senior, unsecured, unsubordinated debt securities that are linked to the performance of a particular market index or strategy. The issuer of the ETN pays the Fund an amount based on the returns of the underlying index or strategy, plus principal at maturity. The Fund will bear any applicable fees to the issuer upon redemption or maturity, which will increase expenses and decrease returns.
13 Derivative instruments: The Fund's use of derivatives during the year ended October 31, 2018, is described below. Please see the Consolidated Schedule of Investments for the Fund's open positions in derivatives, if any, at October 31, 2018. The Fund has adopted the provisions of ASC 815 "Derivatives and Hedging" ("ASC 815"). The disclosure requirements of ASC 815 distinguish between derivatives that qualify for hedge accounting and those that do not. Because investment companies value their derivatives at fair value and recognize changes in fair value through the Consolidated Statement of Operations, they do not qualify for hedge accounting. Accordingly, even though the Fund's investments in derivatives may represent economic hedges, they are considered non-hedge transactions for purposes of this disclosure.
Credit default swap contracts: During the year ended October 31, 2018, the Fund used credit default swaps as part of its investment strategies, to enhance returns and to hedge against unfavorable changes in the value of investments and to protect against adverse movements in interest rates or credit performance with counterparties.
Over the counter ("OTC") credit default swap contracts: When the Fund is the buyer of an OTC credit default swap contract, it is entitled to receive the notional amount of the swap from the counterparty if a credit event occurs. In return, the Fund pays the counterparty a periodic stream of payments over the term of the contract provided that no credit event has occurred. If no credit event occurs, the Fund would have spent the stream of payments and received no proceeds from the contract. When the Fund is the seller of an OTC credit default swap contract, it receives the stream of payments, but is obligated to pay to the buyer of the protection an amount up to the notional amount of the swap and in certain instances take delivery of securities of the reference entity upon the occurrence of a credit event, as defined under the terms of that particular swap agreement. Credit events are contract specific but may include bankruptcy, failure to pay, restructuring, obligation acceleration and repudiation/moratorium. If the Fund is a seller of protection and a credit event occurs, the maximum potential amount of future payments that the Fund could be required to make (or the risk of loss) would be an amount equal to the notional amount of the agreement. This potential amount would be partially offset by any recovery value of the respective referenced obligation, or net amount received from the settlement of a buy protection credit default swap agreement entered into by the Fund for the same referenced obligation. As the seller, the Fund may add economic leverage to its portfolio because, in addition to its total net assets, the Fund is subject to investment exposure on the notional amount of the swap. The net periodic payments paid or received on the swap contract are accrued daily as a component of unrealized appreciation/(depreciation) and are recorded as realized gain upon receipt or realized loss upon payment. The Fund also records an increase or decrease to unrealized appreciation/(depreciation) in an amount equal to the daily valuation of the swap. Cash settlement in and out of the swap may occur at a reset date or any other date, at the discretion of the Fund and the counterparty, over the life of the
50
agreement, and is generally determined based on limits and thresholds established as part of an International Swaps and Derivatives Association (ISDA) agreement between the Fund and the counterparty. For financial reporting purposes, unamortized upfront payments/(receipts), if any, are netted with unrealized appreciation or depreciation and net interest received or paid on swap contracts to determine the fair value of swaps.
Futures contracts: During the year ended October 31, 2018, the Fund used futures for economic hedging purposes and to enhance returns.
At the time the Fund or Subsidiary enters into a futures contract, it is required to deposit with the futures commission merchant a specified amount of cash or liquid securities, known as "initial margin," which is a percentage of the value of the futures contract being traded that is set by the exchange upon which the futures contract is traded. Each day, the futures contract is valued at the official settlement price of the board of trade or U.S. commodity exchange on which such futures contract is traded. Subsequent payments, known as "variation margin," to and from the broker are made on a daily basis, or as needed, as the market price of the futures contract fluctuates. Daily variation margin adjustments, arising from this "mark to market," are recorded by the Fund or Subsidiary as unrealized gains or losses.
Although some futures by their terms call for actual delivery or acquisition of the underlying securities or currency, in most cases the contracts are closed out prior to delivery by offsetting purchases or sales of matching futures. When the contracts are closed, the Fund recognizes a gain or loss. Risks of entering into futures contracts include the possibility there may be an illiquid market, possibly at a time of rapidly declining prices, and/or a change in the value of the contract may not correlate with changes in the value of the underlying securities. Futures executed on regulated futures exchanges have minimal counterparty risk to the Fund because the exchange's clearinghouse assumes the position of the counterparty in each transaction. Thus, the Fund is exposed to risk only in connection with the clearinghouse and not in connection with the original counterparty to the transaction.
For U.S. federal income tax purposes, futures transactions undertaken by the Fund may cause the Fund to recognize gains or losses from marking contracts to market even though its positions have not been sold or terminated, may affect the character of the gains or losses recognized as long-term or short-term, and may affect the timing of some capital gains and losses realized by the Fund. Also, the Fund's losses on transactions involving futures contracts may be deferred rather than being taken into account currently in calculating the Fund's taxable income.
Equity swap contracts: During the year ended October 31, 2018, the Fund used equity swaps to provide investment exposure to certain investments, primarily foreign securities.
Equity swaps are two-party contracts in which counterparties exchange the return on a specified reference security, basket of securities, security index or index component for the return based on a fixed or floating interest rate during the period of the swap. Equity swaps are marked to market daily based on the value of the underlying reference entity and the change, if any, is recorded as an unrealized gain or loss. Equity swaps normally do not involve the delivery of securities or other underlying assets. Cash settlement in and out of the swap may occur at a reset date or any other date, at the discretion of the Fund and the counterparty, over the life of the agreement, and is generally determined based on limits and thresholds established as part of an ISDA agreement between the Fund and the counterparty. If the other party to an equity swap defaults, the Fund's risk of loss consists of the net amount of payments that the Fund is contractually entitled to receive, if any. Equity swaps are derivatives and their value can be very volatile. To the extent that future market trends, the values of assets or economic factors are not accurately analyzed and predicted, the Fund may suffer a loss, which may exceed the related amounts shown in the Consolidated Statement of Assets and Liabilities. Periodic payments received or paid by the Fund are recorded as realized gains or losses.
Forward foreign currency contracts: During the year ended October 31, 2018, the Fund used forward foreign currency contracts to hedge foreign currency and to enhance returns.
A forward contract is an agreement between two parties to buy or sell a specific currency for another at a set price on a future date, and is individually negotiated and privately traded by currency traders and their customers in the interbank market. The market value of a forward contract fluctuates with changes in forward currency exchange
51
rates. Forward contracts are marked to market daily, and the change in value is recorded by the Fund as an unrealized gain or loss. At the consummation of a forward contract to purchase or sell currency, the Fund may either exchange the currencies specified at the maturity of the forward contract or enter into a closing transaction involving the purchase or sale of an offsetting forward contract. Closing transactions with respect to forward contracts are usually performed with the counterparty to the original forward contract. The gain or loss arising from the difference between the U.S. dollar cost of the original contract and the value of the foreign currency in U.S. dollars upon closing a contract is included in "Net realized gain (loss) on settlement of forward foreign currency contracts" in the Consolidated Statement of Operations. These contracts may involve market risk in excess of the unrealized gain or loss reflected in the Fund's Consolidated Statement of Assets and Liabilities. In addition, the Fund could be exposed to risks associated with fluctuations in foreign currency and the risk the counterparty will fail to fulfill its obligation.
Options: For the year ended October 31, 2018, the Fund used options written to generate incremental returns. The Fund used purchased options to manage or adjust the risk profile and the investment exposure of the Fund to certain securities and to enhance returns.
Premiums paid by the Fund upon purchasing a call or put option are recorded in the asset section of the Fund's Consolidated Statement of Assets and Liabilities and are subsequently adjusted to the current market value. When an option is exercised, closed, or expired, the Fund realizes a gain or loss and the asset is eliminated. For purchased call options, the Fund's loss is limited to the amount of the option premium paid.
Premiums received by the Fund upon writing a call option or a put option are recorded in the liability section of the Fund's Consolidated Statement of Assets and Liabilities and are subsequently adjusted to the current market value. When an option is exercised, closed, or expired, the Fund realizes a gain or loss and the liability is eliminated.
When the Fund writes a call option on an underlying asset it does not own, its exposure on such an option is theoretically unlimited. When writing a covered call option, the Fund, in return for the premium, gives up the opportunity for profit from a price increase in the underlying security above the exercise price, but conversely retains the risk of loss should the price of the security decline. When writing a put option, the Fund, in return for the premium, takes the risk that it must purchase the underlying security at a price that may be higher than the current market price of the security. If a covered call or put option that the Fund has written expires unexercised, the Fund will realize a gain in the amount of the premium.
The Fund may write or purchase options on exchange traded futures contracts ("futures option") to hedge an existing position or future investment, for speculative purposes or to manage exposure to market movements. A futures option is an option contract in which the underlying instrument is a specific futures contract.
At October 31, 2018, the Fund had the following derivatives (which did not qualify as hedging instruments under ASC 815), grouped by primary risk exposure:
Asset Derivatives
(000's omitted)
Derivative
Type | | Consolidated
Statement of
Assets and
Liabilities Location | | Credit Risk | | Currency Risk | | Equity Risk | | Interest
Rate Risk | | Commodity
Risk | | Total | |
OTC swaps
| | OTC swap contracts,
at value(1) | | $ | 124
| | | $ | —
| | | $ | 1,792
| | | $ | —
| | | $ | —
| | | $ | 1,916
| | |
Futures
| | Receivable/Payable
for variation margin
on futures contracts(2) | | | —
| | | | 837
| | | | 196
| | | | 149
| | | | 86
| | | | 1,268
| | |
52
Derivative
Type | | Consolidated
Statement of
Assets and
Liabilities Location | | Credit Risk | | Currency Risk | | Equity Risk | | Interest
Rate Risk | | Commodity
Risk | | Total | |
Forward
contracts
| | Receivable for forward
foreign currency
contracts | | $ | —
| | | $ | 2,314
| | | $ | —
| | | $ | —
| | | $ | —
| | | $ | 2,314
| | |
Options
purchased | | Investments in
securities, at value | | | —
| | | | —
| | | | 142
| | | | —
| | | | —
| | | | 142
| | |
Total Value—Assets | | | | $ | 124 | | | $ | 3,151 | | | $ | 2,130 | | | $ | 149 | | | $ | 86 | | | $ | 5,640 | | |
Liability Derivatives
(000's omitted)
Derivative
Type | | Consolidated
Statement of
Assets and
Liabilities Location | | Credit Risk | | Currency Risk | | Equity Risk | | Interest
Rate Risk | | Commodity
Risk | | Total | |
OTC swaps
| | OTC swap contracts,
at value(1) | | $ | (493
| ) | | $ | —
| | | $ | (2,973
| ) | | $ | —
| | | $ | —
| | | $ | (3,466
| ) | |
Futures
| | Receivable/Payable
for variation margin
on futures contracts(2) | | | —
| | | | (63
| ) | | | (11
| ) | | | (165
| ) | | | (86
| ) | | | (325
| ) | |
Forward
contracts
| | Payable for forward
foreign currency
contracts | | | —
| | | | (2,302
| ) | | | —
| | | | —
| | | | —
| | | | (2,302
| ) | |
Options
written | | Option contracts
written, at value | | | —
| | | | —
| | | | (28
| ) | | | —
| | | | —
| | | | (28
| ) | |
Total Value—Liabilities | | | | $ | (493 | ) | | $ | (2,365 | ) | | $ | (3,012 | ) | | $ | (165 | ) | | $ | (86 | ) | | $ | (6,121 | ) | |
(1) "OTC swap contracts" reflects the unrealized appreciation/(depreciation) of the OTC swap contracts plus accrued interest as of October 31, 2018, which is reflected in the Consolidated Statement of Assets and Liabilities under the caption "OTC swap contracts, at value."
(2) "Futures" reflects the cumulative unrealized appreciation/(depreciation) of futures as of October 31, 2018, which is reflected in the Consolidated Statement of Assets and Liabilities under the caption "Total distributable earnings/(losses)." The current day's variation margin as of October 31, 2018, if any, is reflected in the Consolidated Statement of Assets and Liabilities under the caption "Receivable/Payable for variation margin on futures contracts."
The impact of the use of these derivative instruments on the Consolidated Statement of Operations during the fiscal year ended October 31, 2018, was as follows:
Realized Gain/(Loss)
(000's omitted)
Derivative
Type | | Consolidated
Statement of
Operations Location | | Credit Risk | | Currency Risk | | Equity Risk | | Interest
Rate Risk | | Commodity
Risk | | Total | |
Forward
contracts | | Net realized gain/(loss) on:
Settlement of forward
foreign currency contracts | | $ | — | | | $ | 280 | | | $ | — | | | $ | — | | | $ | — | | | $ | 280 | | |
53
Derivative
Type | | Consolidated
Statement of
Operations Location | | Credit Risk | | Currency Risk | | Equity Risk | | Interest
Rate Risk | | Commodity
Risk | | Total | |
Futures | | Net realized gain/(loss) on:
Expiration or closing
of futures contracts | | $ | — | | | $ | 2,151 | | | $ | (27 | ) | | $ | (537 | ) | | $ | 219 | | | $ | 1,806 | | |
Options | | Net realized gain/(loss) on: | | | — | | | | — | | | | (265 | ) | | | — | | | | — | | | | (265 | ) | |
purchased | | Transactions in
investment securities
of unaffiliated issuers | | | | | | | | | | | | | |
Options | | Net realized gain/(loss) on: | | | — | | | | — | | | | 91 | | | | — | | | | — | | | | 91 | | |
written | | Expiration or closing of
option contracts written | | | | | | | | | | | | | |
Swaps | | Net realized gain/(loss)
on: Expiration or closing of
swaps contracts | | | (923 | ) | | | — | | | | 2,120 | | | | — | | | | — | | | | 1,197 | | |
Total Realized Gain/(Loss) | | | | $ | (923 | ) | | $ | 2,431 | | | $ | 1,919 | | | $ | (537 | ) | | $ | 219 | | | $ | 3,109 | | |
Change in Appreciation/(Depreciation)
Derivative
Type | | Consolidated
Statement of
Operations Location | | Credit Risk | | Currency Risk | | Equity Risk | | Interest
Rate Risk | | Commodity
Risk | | Total | |
Forward
contracts | | Change in net unrealized
appreciation/(depreciation)
in value of: Forward foreign
currency contracts | | $ | — | | | $ | 458 | | | $ | — | | | $ | — | | | $ | — | | | $ | 458 | | |
Futures | | Change in net unrealized
appreciation/(depreciation)
in value of: Futures contracts | | | — | | | | (395 | ) | | | 652 | | | | (117 | ) | | | (190 | ) | | | (50 | ) | |
Option
contracts
purchased | | Change in net unrealized
appreciation/(depreciation)
in value of: Investment
securities of unaffiliated
issuers | | | — | | | | — | | | | 168 | | | | — | | | | — | | | | 168 | | |
Options
written | | Change in net unrealized
appreciation/(depreciation)
in value of: Option
contracts written | | | — | | | | — | | | | (3 | ) | | | — | | | | — | | | | (3 | ) | |
Swaps | | Change in net unrealized
appreciation/(depreciation)
in value of: Swap contracts | | | 119 | | | | — | | | | (2,005 | ) | | | — | | | | — | | | | (1,886 | ) | |
Total Change in Appreciation/
(Depreciation) | | | | $ | 119 | | | $ | 63 | | | $ | (1,188 | ) | | $ | (117 | ) | | $ | (190 | ) | | $ | (1,313 | ) | |
While the Fund may receive rights and warrants in connection with their investments in securities, these rights and warrants are not considered "derivative instruments" under ASC 815.
54
The Fund is required to disclose both gross and net information for assets and liabilities related to derivatives, repurchase and reverse repurchase agreements, and securities lending and securities borrowing transactions that are eligible for offset or subject to an enforceable master netting or similar agreement. The Fund's derivative assets and liabilities at fair value by type are reported gross in the Consolidated Statement of Assets and Liabilities. The following tables present the Fund's derivative assets and liabilities by counterparty, net of amounts available for offset under a master netting or similar agreement and net of the related collateral received by the Fund for assets and pledged by the Fund for liabilities as of October 31, 2018.
Description
(000's omitted) | | Gross Amounts of
Recognized Assets | | Gross Amounts Offset
in the Consolidated
Statement of
Assets and Liabilities | | Net Amounts of Assets
Presented in the
Consolidated Statement
of Assets and Liabilities | |
OTC swap contracts | | $ | 1,916 | | | $ | — | | | $ | 1,916 | | |
Forward contracts | | | 2,314 | | | | — | | | | 2,314 | | |
Total | | $ | 4,230 | | | $ | — | | | $ | 4,230 | | |
Gross Amounts Not Offset in the Consolidated Statement of Assets and Liabilities
Counterparty
(000's omitted) | | Net Amounts of
Assets Presented in
the Consolidated
Statement of
Assets and Liabilities | | Liabilities
Available
for Offset | | Cash Collateral
Received(a) | | Net Amount(b) | |
Societe Generale | | $ | 1,990 | | | $ | (1,990 | ) | | $ | — | | | $ | — | | |
JPMorgan Chase Bank, NA | | | 1,620 | | | | (1,620 | ) | | | — | | | | — | | |
Morgan Stanley Capital Services LLC | | | 620 | | | | (620 | ) | | | — | | | | — | | |
| | $ | 4,230 | | | $ | (4,230 | ) | | $ | — | | | $ | — | | |
Description
(000's omitted) | | Gross Amounts of
Recognized Liabilites | | Gross Amounts Offset
in the Consolidated
Statement of
Assets and Liabilities | | Net Amounts of Liabilities
Presented in the
Consolidated Statement
of Assets and Liabilities | |
OTC swap contracts | | $ | (3,466 | ) | | $ | — | | | $ | (3,466 | ) | |
Forward contracts | | | (2,302 | ) | | | — | | | | (2,302 | ) | |
Total | | $ | (5,768 | ) | | $ | — | | | $ | (5,768 | ) | |
Gross Amounts Not Offset in the Consolidated Statement of Assets and Liabilities
Counterparty
(000's omitted) | | Net Amounts of
Liabilites Presented in
the Consolidated
Statement of
Assets and Liabilities | | Assets
Available
for Offset | | Cash Collateral
Pledged(a) | | Net Amount(c) | |
Societe Generale | | $ | (2,132 | ) | | $ | 1,990 | | | $ | 142 | | | $ | — | | |
JPMorgan Chase Bank, NA | | | (2,103 | ) | | | 1,620 | | | | 483 | | | | — | | |
Morgan Stanley Capital Services LLC | | | (1,533 | ) | | | 620 | | | | 913 | | | | — | | |
| | $ | (5,768 | ) | | $ | 4,230 | | | $ | 1,538 | | | $ | — | | |
(a) Collateral received (or pledged) is limited to an amount not to exceed 100% of the net amount of assets (or liabilities) in the tables presented above, for each respective counterparty.
(b) Net Amount represents amounts subject to loss as of October 31, 2018, in the event of a counterparty failure.
(c) Net Amount represents amounts under-collateralized by the Fund to each counterparty as of October 31, 2018.
55
14 Indemnifications: Like many other companies, the Trust's organizational documents provide that its officers ("Officers") and trustees ("Trustees") are indemnified against certain liabilities arising out of the performance of their duties to the Trust. In addition, both in some of its principal service contracts and in the normal course of its business, the Trust enters into contracts that provide indemnifications to other parties for certain types of losses or liabilities. The Trust's maximum exposure under these arrangements is unknown as this could involve future claims against the Trust.
15 Unfunded loan commitments: The Fund may enter into certain credit agreements all or a portion of which may be unfunded. The Fund is obligated to fund these commitments at the borrower's discretion. As of October 31, 2018, there were no outstanding unfunded loan commitments.
16 Expense offset arrangement: The Fund has an expense offset arrangement in connection with its custodian contract. For the year ended October 31, 2018, the impact of this arrangement was a reduction of expenses of $1,620.
17 Other: All net investment income and realized and unrealized capital gains and losses of the Fund are allocated, on the basis of relative net assets, pro rata among its respective classes.
Note B—Investment Management Fees, Administration Fees, Distribution Arrangements, and Other Transactions with Affiliates:
The Fund retains Management as its investment manager under a Management Agreement. For such investment management services, the Fund pays Management a fee at the annual rate of 1.700% of the first $250 million of the Fund's average daily net assets, 1.675% of the next $250 million, 1.650% of the next $250 million, 1.625% of the next $250 million, 1.600% of the next $500 million, 1.575% of the next $2.5 billion, and 1.550% of average daily net assets in excess of $4 billion. Accordingly, for the year ended October 31, 2018, the investment management fee pursuant to the Management Agreement was equivalent to an annual effective rate of 1.70% of the Fund's average daily net assets.
The Fund retains Management as its administrator under an Administration Agreement. Prior to July 1, 2017, the Fund paid Management an administration fee at the annual rate of 0.06% of its average daily net assets under this agreement. Additionally, the Institutional Class of the Fund paid Management an administration fee at the annual rate of 0.09% of its average daily net assets, Class A and Class C of the Fund paid Management an administration fee at the annual rate of 0.20% of its average daily net assets and Class R6 of the Fund paid Management an administration fee at the annual rate of 0.02% of its average daily net assets under this agreement. Effective July 1, 2017, the administration fee is only assessed at the Class level and each share class of the Fund, as applicable, pays Management an annual administration fee equal to the following: 0.15% for Institutional Class; 0.26% for each of, Class A and Class C; and 0.08% for Class R6 (effective December 6, 2018, the administration fee for Class R6 is 0.05%), each as a percentage of its average daily net assets. This did not result in an increase in the administration fee for any share class. Additionally, Management retains JPM as its sub-administrator under a Sub-Administration Agreement. Management pays JPM a fee for all services received under the agreement.
Management has contractually agreed to waive fees and/or reimburse certain expenses of the Institutional Class, Class A, Class C and Class R6 of the Fund so that the total annual operating expenses of those classes do not exceed the expense limitations as detailed in the following table. These undertakings exclude interest, taxes, brokerage commissions, acquired fund fees and expenses, extraordinary expenses, dividend and interest expenses relating to short sales, if any (commitment fees relating to borrowings are treated as interest for purposes of this exclusion ("annual operating expenses")); consequently, net expenses may exceed the contractual expense limitations. The Fund has agreed that each of its respective classes will repay Management for fees and expenses waived or reimbursed for that class provided that repayment does not cause that class' annual operating expenses to exceed its contractual expense limitation in place at the time the fees and expenses were waived or reimbursed. Any such repayment must be made within three years after the year in which Management incurred the expense. The expenses of the Subsidiary are included in the total expenses used to calculate the reimbursement, which the Fund has agreed to share with the Subsidiary. For the year ended October 31, 2018, these Subsidiary expenses amounted to $92,060.
56
At October 31, 2018, contingent liabilities to Management under the agreements were as follows:
| | | | | Expenses Reimbursed in
Year Ending, October 31, | |
| | | | | | | 2016 | | 2017 | | 2018 | |
| | | | | Subject to Repayment until
October 31, | |
Contractual
Expense | | Limitation(1) | | Expiration | | 2019 | | 2020 | | 2021 | |
Institutional Class | | | 1.97 | % | | 10/31/21 | | $ | 377,847 | | | $ | 453,077 | | | $ | 477,171 | | |
Class A | | | 2.33 | % | | 10/31/21 | | | 89,779 | | | | 48,418 | | | | 41,612 | | |
Class C | | | 3.08 | % | | 10/31/21 | | | 40,256 | | | | 33,125 | | | | 29,237 | | |
Class R6 | | | 1.90 | %(2) | | 10/31/21 | | | 1,667 | | | | 1,142 | | | | 28,071 | | |
(1) Expense limitation per annum of the respective class' average daily net assets.
(2) Effective December 6, 2018, the contractual expense limitation for Class R6 is 1.87%.
At October 31, 2018, Management engaged BH-DG Systematic Trading LLP, Cramer Rosenthal McGlynn, LLC, GAMCO Asset Management Inc., Good Hill Partners LP, Levin Capital Strategies, L.P. (effective December 14, 2018, Levin is no longer a subadviser to the Fund), P/E Global, LLC, Portland Hill Asset Management Limited, Sound Point Capital Management, L.P., and TPH Asset Management LP as subadvisers of the Fund to provide investment management services. Management compensates the subadvisers out of the investment advisory fees it receives from the Fund.
The Fund also has a distribution agreement with Neuberger Berman BD LLC (the "Distributor") with respect to each class of shares. The Distributor acts as agent in arranging for the sale of class shares without sales commission or other compensation, except as described below for Class A and Class C shares, and bears advertising and promotion expenses.
However, the Distributor receives fees from Class A and Class C under their distribution plans (each a "Plan", collectively, the "Plans") pursuant to Rule 12b-1 under the 1940 Act. The Plans provide that, as compensation for administrative and other services provided to these classes, the Distributor activities and expenses related to the sale and distribution of these classes, and ongoing services provided to investors in these classes, the Distributor receives from each of these respective classes a fee at the annual rate of 0.25% of Class A's and 1.00% of Class C's average daily net assets. The Distributor receives this amount to provide distribution and shareholder servicing for these classes and pays a portion of it to institutions that provide such services. Those institutions may use the payments for, among other purposes, compensating employees engaged in sales and/or shareholder servicing. The amount of fees paid by each class during any year may be more or less than the cost of distribution and other services provided to that class. FINRA rules limit the amount of annual distribution fees that may be paid by a mutual fund and impose a ceiling on the cumulative distribution fees paid. The Trust's Plans comply with those rules.
Class A shares of the Fund are generally sold with an initial sales charge of up to 5.75% and no contingent deferred sales charge ("CDSC"), except that a CDSC of 1.00% applies to certain redemptions made within 18 months following purchases of $1 million or more without an initial sales charge. Class C shares of the Fund are sold with no initial sales charge and a 1.00% CDSC if shares are sold within one year after purchase.
57
For the year ended October 31, 2018, Neuberger Berman, acting as underwriter and broker-dealer, received net initial sales charges from the purchase of Class A shares and CDSCs from the redemption of Class A and Class C shares as follows:
| | | Underwriter | | Broker-Dealer | |
| | | Net Initial
Sales Charges | | CDSC | | Net Initial
Sales Charges | | CDSC | |
Class A | | $ | 710 | | | $ | — | | | $ | — | | | $ | — | | |
Class C | | | — | | | | 70 | | | | — | | | | — | | |
Note C—Securities Transactions:
During the year ended October 31, 2018, there were purchase and sale transactions of long-term securities (excluding swaps, forward contracts, futures and option contracts) as follows:
| (000's omitted) | | Purchases of
U.S. Government
and Agency
Obligations | | Purchases
excluding
U.S. Government
and Agency
Obligations | | Securities
Sold Short
excluding
U.S. Government
and Agency
Obligations | | Sales and
Maturities of
U.S. Government
and Agency
Obligations | | Sales and
Maturities
excluding
U.S. Government
and Agency
Obligations | | Covers on
Securities
Sold Short
excluding
U.S. Government
and Agency
Obligations | |
| | | — | | | $ | 509,683 | | | $ | 65,556 | | | | — | | | $ | 607,982 | | | $ | 107,544 | | |
During the year ended October 31, 2018, no brokerage commissions on securities transactions were paid to affiliated brokers.
Note D—Fund Share Transactions:
Share activity for the year ended October 31, 2018 and for the year ended October 31, 2017 was as follows:
| | | For the Year Ended October 31, 2018 | | For the Year Ended October 31, 2017 | |
(000's omitted) | | Shares
Sold | | Shares
Issued on
Reinvestment
of Dividends
and
Distributions | | Shares
Redeemed | | Total | | Shares
Sold | | Shares
Issued on
Reinvestment
of Dividends
and
Distributions | | Shares
Redeemed | | Total | |
Institutional Class | | | 6,009 | | | | — | | | | (14,689 | ) | | | (8,680 | ) | | | 10,473 | | | | — | | | | (30,747 | ) | | | (20,274 | ) | |
Class A | | | 970 | | | | — | | | | (1,186 | ) | | | (216 | ) | | | 423 | | | | — | | | | (4,717 | ) | | | (4,294 | ) | |
Class C | | | 44 | | | | — | | | | (633 | ) | | | (589 | ) | | | 50 | | | | — | | | | (2,485 | ) | | | (2,435 | ) | |
Class R6 | | | 1,017 | | | | — | | | | (760 | ) | | | 257 | | | | 1,058 | | | | — | | | | (217 | ) | | | 841 | | |
Other: At October 31, 2018, there were no affiliated investors owning the Fund's outstanding shares.
Note E—Line of Credit:
At October 31, 2018, the Fund was a participant in a syndicated committed, unsecured $700,000,000 line of credit (the "Credit Facility"), to be used only for temporary or emergency purposes. Series of other investment companies managed by Management also participate in this line of credit on substantially the same terms. Interest is charged on borrowings under this Credit Facility at the highest of (a) a federal funds effective rate plus 1.00% per annum,
58
(b) a Eurodollar rate for a one-month period plus 1.00% per annum, and (c) an overnight bank funding rate plus 1.00% per annum. The Credit Facility has an annual commitment fee of 0.15% per annum of the available line of credit, which is paid quarterly. The Fund that is a participant has agreed to pay its pro rata share of the annual commitment fee, based on the ratio of its individual net assets to the net assets of all participants at the time the fee is due, and interest charged on any borrowing made by the Fund and other costs incurred by the Fund. Because several mutual funds participate in the Credit Facility, there is no assurance that an individual Fund will have access to all or any part of the $700,000,000 at any particular time. There were no loans outstanding under the Credit Facility at October 31, 2018. During the year ended October 31, 2018, the Fund did not utilize the Credit Facility.
Note F—Recent Accounting Pronouncements:
In March 2017, FASB issued Accounting Standards Update No. 2017-08, "Receivables—Nonrefundable Fees and Other Costs (Subtopic 310-20), Premium Amortization on Purchased Callable Debt Securities" ("ASU 2017-08"). ASU 2017-08 shortens the amortization period to the earliest call date for certain purchased callable debt securities held at a premium. The guidance is effective for fiscal years, and interim periods within those fiscal years, beginning after December 15, 2018. Management is currently evaluating the impact of applying this guidance.
In August 2018, FASB issued Accounting Standards Update No. 2018-13, "Fair Value Measurement (Topic 820: Disclosure Framework—Changes to the Disclosure Requirements for Fair Value Measurement" ("ASU 2018-13"). ASU 2018-13 eliminates the requirement to disclose the amount of and reasons for transfers between Level 1 and Level 2 of the fair value hierarchy, the timing of transfers between levels of the fair value hierarchy and the valuation processes for Level 3 fair value measurements. ASU 2018-13 will require the need to disclose the range and weighted average used to develop significant unobservable inputs for Level 3 fair value measurements and the changes in unrealized gains and losses for recurring Level 3 fair value measurements. ASU 2018-13 will also require that information is provided about the measurement uncertainty of Level 3 fair value measurements as of the reporting date. The guidance is effective for fiscal years, and interim periods within those fiscal years, beginning after December 15, 2019 and allows for early adoption of either the entire standard or only the provisions that eliminate or modify the requirements. Management has elected to adopt early the provisions that eliminate disclosure requirements. Management is still currently evaluating the impact of applying the rest of the guidance.
59
This page has been left blank intentionally
60
Absolute Return Multi-Manager Fund
The following tables include selected data for a share outstanding throughout each year and other performance information derived from the Financial Statements. Amounts that do not round to $0.01 or $(0.01) per share are presented as $0.00 or $(0.00), respectively. Ratios that do not round to 0.01% or (0.01)% are presented as 0.00% or (0.00)%, respectively. Net Asset amounts with a zero balance, if any, may reflect actual amounts rounding to less than $0.1 million. A "—" indicates that the line item was not applicable in the corresponding period.
| | | Net Asset
Value,
Beginning
of year | | Net
Investment
Income/
(Loss)@ | | Net Gains or
Losses on
Securities
(both realized
and
unrealized) | | Total From
Investment
Operations | | Dividends
from Net
Investment
Income | | Distributions
from Net
Realized
Capital
Gains | | Tax
Return of
Capital | | Total
Distributions | | Net Asset
Value,
End of
year | | Total
Return† | | Net Assets,
End of
year
(in millions) | | Ratio
of Gross
Expenses to
Average
Net
Assets# | | Ratio
of Gross
Expenses
to Average
Net Assets
(excluding
dividend
and interest
expense
relating to
short sales)# | | Ratio
of Net
Expenses to
Average
Net
AssetsØ | | Ratio
of Net
Expenses
to Average
Net Assets
(excluding
dividend
and interest
expense
relating to
short sales)Ø | | Ratio
of Net
Investment
Income/
(Loss) to
Average
Net
Assets | | Portfolio
Turnover
Rate
(including
securities
sold short) | | Portfolio
Turnover
Rate
(excluding
securities
sold short) | |
Institutional Class | |
| 10/31/2018ß | | $ | 10.77 | | | $ | 0.09 | | | $ | (0.15 | ) | | $ | (0.06 | ) | | $ | — | | | $ | — | | | $ | — | | | $ | — | | | $ | 10.71 | | | | (0.56 | )%d | | $ | 201.1 | | | | 2.53 | % | | | 2.16 | % | | | 2.34 | % | | | 1.97 | % | | | 0.86 | % | | | 194 | % | | | 179 | % | |
| 10/31/2017ß | | $ | 10.18 | | | $ | 0.06 | | | $ | 0.53 | | | $ | 0.59 | | | $ | — | | | $ | — | | | $ | — | | | $ | — | | | $ | 10.77 | | | | 5.80 | % | | $ | 295.7 | | | | 2.69 | % | | | 2.09 | % | | | 2.57 | % | | | 1.97 | % | | | 0.61 | % | | | 382 | % | | | 357 | % | |
| 10/31/2016ß | | $ | 10.47 | | | $ | 0.02 | | | $ | (0.18 | ) | | $ | (0.16 | ) | | $ | (0.03 | ) | | $ | (0.10 | ) | | $ | — | | | $ | (0.13 | ) | | $ | 10.18 | | | | (1.57 | )% | | $ | 485.8 | | | | 2.83 | %‡ | | | 2.02 | %‡ | | | 2.78 | %§‡ | | | 1.97 | %§‡ | | | 0.18 | %‡ | | | 485 | % | | | 474 | % | |
10/31/2015 | | $ | 11.00 | | | $ | (0.04 | ) | | $ | (0.19 | ) | | $ | (0.23 | ) | | $ | (0.07 | ) | | $ | (0.23 | ) | | $ | — | | | $ | (0.30 | ) | | $ | 10.47 | | | | (2.10 | )% | | $ | 1,343.3 | | | | 2.71 | % | | | 1.97 | % | | | 2.71 | %§ | | | 1.97 | %§ | | | (0.40 | )% | | | 433 | % | | | 452 | % | |
10/31/2014 | | $ | 10.86 | | | $ | (0.01 | ) | | $ | 0.22 | | | $ | 0.21 | | | $ | — | | | $ | (0.07 | ) | | $ | — | | | $ | (0.07 | ) | | $ | 11.00 | | | | 1.96 | % | | $ | 1,275.3 | | | | 2.64 | % | | | 2.13 | % | | | 0.03 | % | | | 0.02 | % | | | (0.10 | )% | | | 329 | % | | | 257 | % | |
Class A | |
| 10/31/2018ß | | $ | 10.65 | | | $ | 0.06 | | | $ | (0.16 | ) | | $ | (0.10 | ) | | $ | — | | | $ | — | | | $ | — | | | $ | — | | | $ | 10.55 | | | | (0.94 | )%d | | $ | 18.1 | | | | 2.83 | % | | | 2.55 | % | | | 2.61 | % | | | 2.33 | % | | | 0.60 | % | | | 194 | % | | | 179 | % | |
| 10/31/2017ß | | $ | 10.10 | | | $ | 0.02 | | | $ | 0.53 | | | $ | 0.55 | | | $ | — | | | $ | — | | | $ | — | | | $ | — | | | $ | 10.65 | | | | 5.45 | % | | $ | 20.6 | | | | 3.13 | % | | | 2.47 | % | | | 2.99 | % | | | 2.33 | % | | | 0.17 | % | | | 382 | % | | | 357 | % | |
| 10/31/2016ß | | $ | 10.40 | | | $ | (0.02 | ) | | $ | (0.18 | ) | | $ | (0.20 | ) | | $ | — | | | $ | (0.10 | ) | | $ | — | | | $ | (0.10 | ) | | $ | 10.10 | | | | (1.91 | )% | | $ | 62.9 | | | | 3.20 | %‡ | | | 2.40 | %‡ | | | 3.13 | %§‡ | | | 2.33 | %§‡ | | | (0.16 | )%‡ | | | 485 | % | | | 474 | % | |
10/31/2015 | | $ | 10.92 | | | $ | (0.08 | ) | | $ | (0.18 | ) | | $ | (0.26 | ) | | $ | (0.03 | ) | | $ | (0.23 | ) | | $ | — | | | $ | (0.26 | ) | | $ | 10.40 | | | | (2.47 | )% | | $ | 210.6 | | | | 3.06 | % | | | 2.33 | % | | | 3.06 | %§ | | | 2.33 | %§ | | | (0.71 | )% | | | 433 | % | | | 452 | % | |
10/31/2014 | | $ | 10.82 | | | $ | (0.04 | ) | | $ | 0.21 | | | $ | 0.17 | | | $ | — | | | $ | (0.07 | ) | | $ | — | | | $ | (0.07 | ) | | $ | 10.92 | | | | 1.60 | % | | $ | 242.2 | | | | 3.02 | % | | | 2.49 | % | | | 2.90 | % | | | 2.38 | % | | | (0.40 | )% | | | 329 | % | | | 257 | % | |
Class C | |
| 10/31/2018ß | | $ | 10.24 | | | $ | (0.03 | ) | | $ | (0.15 | ) | | $ | (0.18 | ) | | $ | — | | | $ | — | | | $ | — | | | $ | — | | | $ | 10.06 | | | | (1.76 | )%d | | $ | 11.6 | | | | 3.65 | % | | | 3.28 | % | | | 3.45 | % | | | 3.08 | % | | | (0.24 | )% | | | 194 | % | | | 179 | % | |
| 10/31/2017ß | | $ | 9.78 | | | $ | (0.05 | ) | | $ | 0.51 | | | $ | 0.46 | | | $ | — | | | $ | — | | | $ | — | | | $ | — | | | $ | 10.24 | | | | 4.70 | % | | $ | 17.9 | | | | 3.82 | % | | | 3.21 | % | | | 3.69 | % | | | 3.08 | % | | | (0.53 | )% | | | 382 | % | | | 357 | % | |
| 10/31/2016ß | | $ | 10.15 | | | $ | (0.09 | ) | | $ | (0.18 | ) | | $ | (0.27 | ) | | $ | — | | | $ | (0.10 | ) | | $ | — | | | $ | (0.10 | ) | | $ | 9.78 | | | | (2.66 | )% | | $ | 40.9 | | | | 3.96 | %‡ | | | 3.15 | %‡ | | | 3.89 | %§‡ | | | 3.08 | %§‡ | | | (0.96 | )%‡ | | | 485 | % | | | 474 | % | |
10/31/2015 | | $ | 10.72 | | | $ | (0.16 | ) | | $ | (0.18 | ) | | $ | (0.34 | ) | | $ | — | | | $ | (0.23 | ) | | $ | — | | | $ | (0.23 | ) | | $ | 10.15 | | | | (3.21 | )% | | $ | 87.1 | | | | 3.81 | % | | | 3.08 | % | | | 3.81 | %§ | | | 3.08 | %§ | | | (1.48 | )% | | | 433 | % | | | 452 | % | |
10/31/2014 | | $ | 10.71 | | | $ | (0.13 | ) | | $ | 0.21 | | | $ | 0.08 | | | $ | — | | | $ | (0.07 | ) | | $ | — | | | $ | (0.07 | ) | | $ | 10.72 | | | | 0.77 | % | | $ | 95.3 | | | | 3.77 | % | | | 3.26 | % | | | 3.66 | % | | | 3.15 | % | | | (1.18 | )% | | | 329 | % | | | 257 | % | |
Class R6 | |
| 10/31/2018ß | | $ | 10.77 | | | $ | 0.10 | | | $ | (0.16 | ) | | $ | (0.06 | ) | | $ | — | | | $ | — | | | $ | — | | | $ | — | | | $ | 10.71 | | | | (0.56 | )%d | | $ | 15.3 | | | | 2.45 | % | | | 2.09 | % | | | 2.26 | % | | | 1.90 | % | | | 0.93 | % | | | 194 | % | | | 179 | % | |
| 10/31/2017ß | | $ | 10.17 | | | $ | 0.05 | | | $ | 0.55 | | | $ | 0.60 | | | $ | — | | | $ | — | | | $ | — | | | $ | — | | | $ | 10.77 | | | | 5.90 | % | | $ | 12.7 | | | | 2.40 | % | | | 1.93 | % | | | 2.37 | % | | | 1.90 | % | | | 0.51 | % | | | 382 | % | | | 357 | % | |
| 10/31/2016ß | | $ | 10.47 | | | $ | 0.04 | | | $ | (0.21 | ) | | $ | (0.17 | ) | | $ | (0.03 | ) | | $ | (0.10 | ) | | $ | — | | | $ | (0.13 | ) | | $ | 10.17 | | | | (1.58 | )% | | $ | 3.4 | | | | 2.71 | %‡ | | | 1.92 | %‡ | | | 2.69 | %§‡ | | | 1.90 | %§‡ | | | 0.37 | %‡ | | | 485 | % | | | 474 | % | |
10/31/2015 | | $ | 11.01 | | | $ | (0.01 | ) | | $ | (0.22 | ) | | $ | (0.23 | ) | | $ | (0.08 | ) | | $ | (0.23 | ) | | $ | — | | | $ | (0.31 | ) | | $ | 10.47 | | | | (2.14 | )% | | $ | 17.4 | | | | 2.66 | % | | | 1.90 | % | | | 2.66 | %§ | | | 1.90 | %§ | | | (0.08 | )% | | | 433 | % | | | 452 | % | |
Period from 12/31/2013^
to 10/31/2014 | | $ | 10.99 | | | $ | 0.01 | | | $ | 0.01 | | | $ | 0.02 | | | $ | — | | | $ | — | | | $ | — | | | $ | — | | | $ | 11.01 | | | | 0.18 | %** | | $ | 32.5 | | | | 2.56 | %* | | | 2.08 | %* | | | 2.46 | %* | | | 1.98 | %* | | | 0.10 | %* | | | 329 | %ØØ | | | 257 | %ØØ | |
See Notes to Financial Highlights
61
62
Notes to Financial Highlights
@ Calculated based on the average number of shares outstanding during each fiscal period.
† Total return based on per share NAV reflects the effects of changes in NAV on the performance of the Fund during each fiscal period. Returns assume income dividends and other distributions, if any, were reinvested, but do not reflect the effect of sales charges. Results represent past performance and do not indicate future results. Current returns may be lower or higher than the performance data quoted. Investment returns and principal will fluctuate and shares, when redeemed, may be worth more or less than original cost. Total return would have been lower if Management had not reimbursed and/or waived certain expenses. Total return would have been higher if Management had not recouped previously reimbursed and/or waived expenses.
d The class action proceeds listed in Note A of the Notes to Consolidated Financial Statements, if any, had no impact on the Fund's total returns for the period ended October 31, 2018.
# Represents the annualized ratios of net expenses to average daily net assets if Management had not reimbursed certain expenses and/or waived a portion of the investment management fee.
‡ Organization expense, which is a non-recurring expense, is included in these ratios on a non-annualized basis.
** Not annualized.
* Annualized.
^ The date investment operations commenced.
ß Consolidated financial highlights (see Note A in the Notes to Consolidated Financial Statements).
Ø After reimbursement of expenses and/or waiver of a portion of the investment management fee by Management. The Fund is required to calculate an expense ratio without taking into consideration any expense reductions related to expense offset arrangements. Had the Fund not received expense reductions related to expense offset arrangements, the annualized ratios of net expenses to average daily net assets would have been:
| | | Including
Dividend
and
Interest
Expense
Relating to
Short Sales | | Excluding
Dividend
and
Interest
Expense
Relating to
Short Sales | | Including
Dividend
and
Interest
Expense
Relating to
Short Sales | | Excluding
Dividend
and
Interest
Expense
Relating to
Short Sales | | Including
Dividend
and
Interest
Expense
Relating to
Short Sales | | Excluding
Dividend
and
Interest
Expense
Relating to
Short Sales | | Including
Dividend
and
Interest
Expense
Relating to
Short Sales | | Excluding
Dividend
and
Interest
Expense
Relating to
Short Sales | | Including
Dividend
and
Interest
Expense
Relating to
Short Sales | | Excluding
Dividend
and
Interest
Expense
Relating to
Short Sales | |
| | | Year Ended
October 31, 2018 | | Year Ended
October 31, 2017 | | Year Ended
October 31, 2016 | | Year Ended
October 31, 2015 | | Year Ended
October 31, 2014 | |
Institutional Class | | | 2.33 | % | | | 1.97 | % | | | 2.57 | % | | | 1.97 | % | | | 2.78 | % | | | 1.97 | % | | | 2.71 | % | | | 1.97 | % | | | 2.55 | % | | | 2.04 | % | |
Class A | | | 2.61 | % | | | 2.33 | % | | | 2.99 | % | | | 2.33 | % | | | 3.13 | % | | | 2.33 | % | | | 3.06 | % | | | 2.33 | % | | | 2.90 | % | | | 2.38 | % | |
Class C | | | 3.45 | % | | | 3.08 | % | | | 3.69 | % | | | 3.08 | % | | | 3.89 | % | | | 3.08 | % | | | 3.81 | % | | | 3.08 | % | | | 3.66 | % | | | 3.15 | % | |
Class R6 | | | 2.26 | % | | | 1.90 | % | | | 2.37 | % | | | 1.90 | % | | | 2.69 | % | | | 1.90 | % | | | 2.66 | % | | | 1.90 | % | | | 2.46 | %(1) | | | 1.98 | %(1) | |
(1) Period from December 31, 2013 (Commencement of Operations) to October 31, 2014.
ØØ Portfolio turnover is calculated at the Fund level. Percentage indicated was calculated for the year ended October 31, 2014 for the Fund.
63
Notes to Financial Highlights (cont'd)
§ After repayment of expenses previously reimbursed and/or fees previously waived by Management, as applicable. Had the Fund not made such repayments, the annualized ratios of net expenses to average daily net assets would have been:
| | | Including
Dividend
and
Interest
Expense
Relating to
Short Sales | | Excluding
Dividend
and
Interest
Expense
Relating to
Short Sales | | Including
Dividend
and
Interest
Expense
Relating to
Short Sales | | Excluding
Dividend
and
Interest
Expense
Relating to
Short Sales | |
| | | Year Ended
October 31, 2016 | | Year Ended
October 31, 2015 | |
Institutional Class | | | 2.77 | % | | | 1.96 | % | | | 2.64 | % | | | 1.90 | % | |
Class A | | | 3.13 | % | | | 2.33 | % | | | 3.02 | % | | | 2.29 | % | |
Class C | | | 3.88 | % | | | 3.07 | % | | | 3.75 | % | | | 3.02 | % | |
Class R6 | | | 2.68 | % | | | 1.89 | % | | | 2.59 | % | | | 1.83 | % | |
64
Report of Independent Registered Public Accounting Firm
To the Board of Trustees of Neuberger Berman Alternative Funds and Shareholders of
Neuberger Berman Absolute Return Multi-Manager Fund
We have audited the accompanying statement of assets and liabilities, including the schedule of investments, of Neuberger Berman Absolute Return Multi-Manager Fund (the "Trust"), one of the series constituting the Neuberger Berman Alternative Funds as of October 31, 2018, the related statement of operations for the year then ended, and the statements of changes in net assets for each of the two years in the period then ended and the financial highlights for each of the five years in the period then ended. These financial statements and financial highlights are the responsibility of the Trust's management. Our responsibility is to express an opinion on these financial statements and financial highlights based on our audits.
We conducted our audits in accordance with the standards of the Public Company Accounting Oversight Board (United States). Those standards require that we plan and perform the audit to obtain reasonable assurance about whether the financial statements and financial highlights are free of material misstatement. We were not engaged to perform an audit of the Trust's internal control over financial reporting. Our audits included consideration of internal control over financial reporting as a basis for designing audit procedures that are appropriate in the circumstances, but not for the purpose of expressing an opinion on the effectiveness of the Trust's internal control over financial reporting. Accordingly, we express no such opinion. An audit also includes examining, on a test basis, evidence supporting the amounts and disclosures in the financial statements and financial highlights, assessing the accounting principles used and significant estimates made by management, and evaluating the overall financial statement presentation. Our procedures included confirmation of securities owned as of October 31, 2018 by correspondence with the custodian and others or by other appropriate auditing procedures where replies from others were not received. We believe that our audits provide a reasonable basis for our opinion.
In our opinion, the financial statements and financial highlights referred to above present fairly, in all material respects, the financial position of Neuberger Berman Absolute Return Multi-Manager Fund, at October 31, 2018, the results of its operations for the year then ended, the changes in its net assets for each of the two years in the period then ended and the financial highlights for each of the five years in the period then ended, in conformity with U.S. generally accepted accounting principles.
Boston, Massachusetts
December 21, 2018
65
Investment Manager and Administrator
Neuberger Berman Investment Advisers LLC
1290 Avenue of the Americas
New York, NY 10104-0002
800.877.9700 or 212.476.8800
Intermediary Client Services 800.366.6264
Distributor
Neuberger Berman BD LLC
1290 Avenue of the Americas
New York, NY 10104-0002
800.877.9700 or 212.476.8800
Intermediary Client Services 800.366.6264
Sub-Advisers
BH-DG Systematic Trading LLP
10 Grosvenor Street
London W1K 4QB, United Kingdom
Cramer Rosenthal McGlynn, LLC
520 Madison Avenue, 20th Floor
New York, NY 10022
GAMCO Asset Management Inc.
One Corporate Center
Rye, NY 10580
Good Hill Partners LP
One Greenwich Office Park
Greenwich, CT 06831
Levin Capital Strategies, L.P.
(effective December 14, 2018, Levin is no longer a subadviser to the Fund)
595 Madison Avenue, 17th Floor
New York, NY 10022
P/E Global, LLC
75 State Street, 31st Floor
Boston, MA 02109
Portland Hill Asset Management Limited
21 Knightsbridge
London SW1X7LY, United Kingdom
Sound Point Capital Management, L.P.
375 Park Avenue
New York, NY 10152
TPH Asset Management, LP
Heritage Plaza
1111 Bagby, Suite 4920
Houston, Texas 77002
Custodian
J.P. Morgan Chase Bank, N.A.
14201 Dallas Parkway
Dallas, TX 75254
Shareholder Servicing Agent
DST Asset Manager Solutions Inc.
430 West 7th Street, Suite 21989
Kansas City, MO 64105-1407
For Institutional Class Shareholders
Address correspondence to:
Neuberger Berman Investment Advisers LLC
1290 Avenue of the Americas 22nd Floor
New York, NY 10104-0002
Intermediary Client Services 800.366.6264
For Class A, Class C and Class R6 Shareholders:
Please contact your investment provider
Legal Counsel
K&L Gates LLP
1601 K Street, NW
Washington, DC 20006-1600
Independent Registered Public Accounting Firm
Ernst & Young LLP
200 Clarendon Street
Boston, MA 02116
66
The following tables set forth information concerning the Trustees and Officers of each of the Funds. All persons named as Trustees and Officers also serve in similar capacities for other funds administered or managed by NBIA (formerly, Neuberger Berman Fixed Income LLC ("NBFI") and including predecessor entities). Each Fund's Statement of Additional Information includes additional information about the Trustees as of the time of the Fund's most recent public offering and is available upon request, without charge, by calling (800) 877-9700.
Information about the Board of Trustees
Name, (Year of Birth),
and Address(1) | | Position(s)
and Length of
Time Served(2) | | Principal Occupation(s)(3) | | Number of
Funds in
Fund Complex
Overseen by
Fund Trustee | | Other Directorships Held
Outside Fund Complex by
Fund Trustee(3) | |
Independent Fund Trustees | | | | | | | | | |
Michael J. Cosgrove (1949) | | Trustee since 2015 | | President, Carragh Consulting USA, since 2014; formerly, Executive, General Electric Company, 1970 to 2014, including President, Mutual Funds and Global Investment Programs, GE Asset Management, 2011 to 2014, President and Chief Executive Officer, Mutual Funds and Intermediary Business, GE Asset Management, 2007 to 2011, President, Institutional Sales and Marketing, GE Asset Management, 1998 to 2007, and Chief Financial Officer, GE Asset Management, and Deputy Treasurer, GE Company, 1988 to 1993. | | | 57 | | | Director, America Press, Inc. (not-for-profit Jesuit publisher), since 2015; Director, Fordham University, since 2001; formerly, Director, The Gabelli Go Anywhere Trust, June 2015 to June 2016; formerly, Director, Skin Cancer Foundation (not-for-profit), 2006 to 2015; formerly, Director, GE Investments Funds, Inc., 1997 to 2014; formerly, Trustee, GE Institutional Funds, 1997 to 2014; formerly, Director, GE Asset Management, 1988 to 2014; formerly, Director, Elfun Trusts, 1988 to 2014; formerly, Trustee, GE Pension & Benefit Plans, 1988 to 2014. | |
67
Name, (Year of Birth),
and Address(1) | | Position(s)
and Length of
Time Served(2) | | Principal Occupation(s)(3) | | Number of
Funds in
Fund Complex
Overseen by
Fund Trustee | | Other Directorships Held
Outside Fund Complex by
Fund Trustee(3) | |
Marc Gary (1952) | | Trustee since 2015 | | Executive Vice Chancellor and Chief Operating Officer, Jewish Theological Seminary, since 2012; formerly, Executive Vice President and General Counsel, Fidelity Investments, 2007 to 2012; formerly, Executive Vice President and General Counsel, BellSouth Corporation, 2004 to 2007; formerly, Vice President and Associate General Counsel, BellSouth Corporation, 2000 to 2004; formerly, Associate, Partner, and National Litigation Practice Co-Chair, Mayer, Brown LLP, 1981 to 2000; formerly, Associate Independent Counsel, Office of Independent Counsel, 1990 to 1992. | | | 57 | | | Trustee, Jewish Theological Seminary, since 2015; Director, Counsel on Call (privately held for-profit company), since 2012; Director, Lawyers Committee for Civil Rights Under Law (not-for-profit), since 2005; formerly, Director, Equal Justice Works (not-for-profit), 2005 to 2014; formerly, Director, Corporate Counsel Institute, Georgetown University Law Center, 2007 to 2012; formerly, Director, Greater Boston Legal Services (not-for-profit), 2007 to 2012. | |
68
Name, (Year of Birth),
and Address(1) | | Position(s)
and Length of
Time Served(2) | | Principal Occupation(s)(3) | | Number of
Funds in
Fund Complex
Overseen by
Fund Trustee | | Other Directorships Held
Outside Fund Complex by
Fund Trustee(3) | |
Martha C. Goss (1949) | | Trustee since 2007 | | President, Woodhill Enterprises Inc./Chase Hollow Associates LLC (personal investment vehicle), since 2006; formerly, Consultant, Resources Global Professionals (temporary staffing), 2002 to 2006; formerly, Chief Financial Officer, Booz-Allen & Hamilton, Inc., 1995 to 1999; formerly, Enterprise Risk Officer, Prudential Insurance, 1994 to1995; formerly, President, Prudential Asset Management Company, 1992 to 1994; formerly, President, Prudential Power Funding (investments in electric and gas utilities and alternative energy projects), 1989 to 1992; formerly, Treasurer, Prudential Insurance Company, 1983 to 1989. | | | 57 | | | Director, American Water (water utility), since 2003; Director, Allianz Life of New York (insurance), since 2005; Director, Berger Group Holdings, Inc. (engineering consulting firm), since 2013; Director, Financial Women's Association of New York (not-for-profit association), since 2003; Trustee Emerita, Brown University, since 1998; Director, Museum of American Finance (not-for-profit), since 2013; formerly, Non-Executive Chair and Director, Channel Reinsurance (financial guaranty reinsurance), 2006 to 2010; formerly, Director, Ocwen Financial Corporation (mortgage servicing), 2005 to 2010; formerly, Director, Claire's Stores, Inc. (retailer), 2005 to 2007; formerly, Director, Parsons Brinckerhoff Inc. (engineering consulting firm), 2007 to 2010; formerly, Director, Bank Leumi (commercial bank), 2005 to 2007; formerly, Advisory Board Member, Attensity (software developer), 2005 to 2007. | |
Michael M. Knetter (1960) | | Trustee since 2007 | | President and Chief Executive Officer, University of Wisconsin Foundation, since October 2010; formerly, Dean, School of Business, University of Wisconsin—Madison; formerly, Professor of International Economics and Associate Dean, Amos Tuck School of Business—Dartmouth College, 1998 to 2002. | | | 57 | | | Board Member, American Family Insurance (a mutual company, not publicly traded), since March 2009; formerly, Trustee, Northwestern Mutual Series Fund, Inc., 2007 to 2011; formerly, Director, Wausau Paper, 2005 to 2011; formerly, Director, Great Wolf Resorts, 2004 to 2009. | |
69
Name, (Year of Birth),
and Address(1) | | Position(s)
and Length of
Time Served(2) | | Principal Occupation(s)(3) | | Number of
Funds in
Fund Complex
Overseen by
Fund Trustee | | Other Directorships Held
Outside Fund Complex by
Fund Trustee(3) | |
Deborah C. McLean (1954) | | Trustee since 2015 | | Member, Circle Financial Group (private wealth management membership practice), since 2011; Managing Director, Golden Seeds LLC (an angel investing group), since 2009; Adjunct Professor, Columbia University School of International and Public Affairs, since 2008; formerly, Visiting Assistant Professor, Fairfield University, Dolan School of Business, Fall 2007; formerly, Adjunct Associate Professor of Finance, Richmond, The American International University in London, 1999 to 2007. | | | 57 | | | Board member, Norwalk Community College Foundation, since 2014; Dean's Advisory Council, Radcliffe Institute for Advanced Study, since 2014; formerly, Director and Treasurer, At Home in Darien (not-for-profit), 2012 to 2014; formerly, Director, National Executive Service Corps (not-for-profit), 2012 to 2013; formerly, Trustee, Richmond, The American International University in London, 1999 to 2013. | |
George W. Morriss (1947) | | Trustee since 2007 | | Adjunct Professor, Columbia University School of International and Public Affairs, since October 2012; formerly, Executive Vice President and Chief Financial Officer, People's United Bank, Connecticut (a financial services company), 1991 to 2001. | | | 57 | | | Formerly, Trustee, Steben Alternative Investment Funds, Steben Select Multi-Strategy Fund, and Steben Select Multi-Strategy Master Fund, 2013 to 2017; formerly, Treasurer, National Association of Corporate Directors, Connecticut Chapter, 2011 to 2015; formerly, Manager, Larch Lane Multi-Strategy Fund complex (which consisted of three funds), 2006 to 2011; formerly, Member, NASDAQ Issuers' Affairs Committee, 1995 to 2003. | |
70
Name, (Year of Birth),
and Address(1) | | Position(s)
and Length of
Time Served(2) | | Principal Occupation(s)(3) | | Number of
Funds in
Fund Complex
Overseen by
Fund Trustee | | Other Directorships Held
Outside Fund Complex by
Fund Trustee(3) | |
Tom D. Seip (1950) | | Trustee since inception; Chairman of the Board since 2008; formerly Lead Independent Trustee from 2006 to 2008 | | Formerly, Managing Member, Ridgefield Farm LLC (a private investment vehicle), 2004 to 2016; formerly, President and CEO, Westaff, Inc. (temporary staffing), May 2001 to January 2002; formerly, Senior Executive, The Charles Schwab Corporation, 1983 to 1998, including Chief Executive Officer, Charles Schwab Investment Management, Inc.; Trustee, Schwab Family of Funds and Schwab Investments, 1997 to 1998; and Executive Vice President-Retail Brokerage, Charles Schwab & Co., Inc., 1994 to 1997. | | | 57 | | | Formerly, Director, H&R Block, Inc. (tax services company), 2001 to 2018; formerly, Director, Talbot Hospice Inc., 2013 to 2016; formerly, Chairman, Governance and Nominating Committee, H&R Block, Inc., 2011 to 2015; formerly, Chairman, Compensation Committee, H&R Block, Inc., 2006 to 2010; formerly, Director, Forward Management, Inc. (asset management company), 1999 to 2006. | |
James G. Stavridis (1955) | | Trustee since 2015 | | Commentator, NBC News, since 2015; Dean, Fletcher School of Law and Diplomacy, Tufts University since 2013; formerly, Admiral, United States Navy, 2006 to 2013, including Supreme Allied Commander, NATO and Commander, European Command, 2009 to 2013, and Commander, United States Southern Command, 2006 to 2009. | | | 57 | | | Director, American Water (water utility), since 2018; Director, NFP Corp. (insurance broker and consultant), since 2017; Director, Utilidata Inc., since 2015; Director, U.S. Naval Institute, since 2014; Director, Onassis Foundation USA, since 2014; Director, BMC Software Federal, LLC, since 2014; Director, Vertical Knowledge, LLC, since 2013; formerly, Director, Navy Federal Credit Union, 2000-2002. | |
71
Name, (Year of Birth),
and Address(1) | | Position(s)
and Length of
Time Served(2) | | Principal Occupation(s)(3) | | Number of
Funds in
Fund Complex
Overseen by
Fund Trustee | | Other Directorships Held
Outside Fund Complex by
Fund Trustee(3) | |
Candace L. Straight (1947) | | Trustee since inception | | Private investor and consultant specializing in the insurance industry; formerly, Advisory Director, Securitas Capital LLC (a global private equity investment firm dedicated to making investments in the insurance sector), 1998 to 2003. | | | 57 | | | Formerly, Public Member, Board of Governors and Board of Trustees, Rutgers University, 2011 to 2016; formerly, Director, Montpelier Re Holdings Ltd. (reinsurance company), 2006 to 2015; formerly, Director, National Atlantic Holdings Corporation (property and casualty insurance company), 2004 to 2008; formerly, Director, The Proformance Insurance Company (property and casualty insurance company), 2004 to 2008; formerly, Director, Providence Washington Insurance Company (property and casualty insurance company), 1998 to 2006; formerly, Director, Summit Global Partners (insurance brokerage firm), 2000 to 2005. | |
Peter P. Trapp (1944) | | Trustee since inception | | Retired; formerly, Regional Manager for Mid-Southern Region, Ford Motor Credit Company, September 1997 to 2007; formerly, President, Ford Life Insurance Company, April 1995 to August 1997. | | | 57 | | | None. | |
72
Name, (Year of Birth),
and Address(1) | | Position(s)
and Length of
Time Served(2) | | Principal Occupation(s)(3) | | Number of
Funds in
Fund Complex
Overseen by
Fund Trustee | | Other Directorships Held
Outside Fund Complex by
Fund Trustee(3) | |
Fund Trustees who are "Interested Persons" | | | | | | | | | |
Joseph V. Amato* (1962) | | Chief Executive Officer and President since 2018 and Trustee since 2009 | | President and Director, Neuberger Berman Group LLC, since 2009; President and Chief Executive Officer, Neuberger Berman BD LLC ("Neuberger Berman") and Neuberger Berman Holdings LLC (including its predecessor, Neuberger Berman Inc.), since 2007; Chief Investment Officer (Equities) and President (Equities), NBIA (formerly, Neuberger Berman Fixed Income LLC ("NBFI") and including predecessor entities), since 2007, and Board Member of NBIA since 2006; formerly, Global Head of Asset Management of Lehman Brothers Holdings Inc.'s ("LBHI") Investment Management Division, 2006 to 2009; formerly, member of LBHI's Investment Management Division's Executive Management Committee, 2006 to 2009; formerly, Managing Director, Lehman Brothers Inc. ("LBI"), 2006 to 2008; formerly, Chief Recruiting and Development Officer, LBI, 2005 to 2006; formerly, Global Head of LBI's Equity Sales and a Member of its Equities Division Executive Committee, 2003 to 2005; President and Chief Executive Officer, twenty-six registered investment companies for which NBIA acts as investment manager and/or administrator. | | | 57 | | | Member of Board of Advisors, McDonough School of Business, Georgetown University, since 2001; Member of New York City Board of Advisors, Teach for America, since 2005; Trustee, Montclair Kimberley Academy (private school), since 2007; Member of Board of Regents, Georgetown University, since 2013. | |
73
Name, (Year of Birth),
and Address(1) | | Position(s)
and Length of
Time Served(2) | | Principal Occupation(s)(3) | | Number of
Funds in
Fund Complex
Overseen by
Fund Trustee | | Other Directorships Held
Outside Fund Complex by
Fund Trustee(3) | |
Robert Conti* (1956) | | Trustee since 2008; formerly, Chief Executive Officer and President 2008 to 2018 | | Formerly, Managing Director, Neuberger Berman, 2007 to 2018; formerly, President—Mutual Funds, NBIA, 2008 to 2018; formerly, Senior Vice President, Neuberger Berman, 2003 to 2006; formerly, Vice President, Neuberger Berman, 1999 to 2003. | | | 57 | | | Director, Staten Island Mental Health Society, since 1994; formerly, Chairman of the Board, Staten Island Mental Health Society, 2008 to 2011. | |
(1) The business address of each listed person is 1290 Avenue of the Americas, New York, NY 10104.
(2) Pursuant to the Trust's Amended and Restated Trust Instrument, subject to any limitations on the term of service imposed by the By-Laws or any retirement policy adopted by the Fund Trustees, each Fund Trustee shall hold office for life or until his or her successor is elected or the Trust terminates; except that (a) any Fund Trustee may resign by delivering a written resignation; (b) any Fund Trustee may be removed with or without cause at any time by a written instrument signed by at least two-thirds of the other Fund Trustees; (c) any Fund Trustee who requests to be retired, or who has become unable to serve, may be retired by a written instrument signed by a majority of the other Fund Trustees; and (d) any Fund Trustee may be removed at any shareholder meeting by a vote of at least two-thirds of the outstanding shares.
(3) Except as otherwise indicated, each individual has held the positions shown during at least the last five years.
* Indicates a Fund Trustee who is an "interested person" within the meaning of the 1940 Act. Mr. Amato is an interested person of the Trust by virtue of the fact that he is an officer of NBIA and/or its affiliates. Mr. Conti is an interested person of the Trust by virtue of the fact that he was an officer of NBIA and/or its affiliates until June 2018.
74
Information about the Officers of the Trust
Name, (Year of Birth),
and Address(1) | | Position(s)
and Length of
Time Served(2) | | Principal Occupation(s)(3) | |
Claudia A. Brandon (1956) | | Executive Vice President since 2008 and Secretary since inception | | Senior Vice President, Neuberger Berman, since 2007 and Employee since 1999; Senior Vice President, NBIA, since 2008 and Assistant Secretary since 2004; formerly, Vice President, Neuberger Berman, 2002 to 2006; formerly, Vice President—Mutual Fund Board Relations, NBIA, 2000 to 2008; formerly, Vice President, NBIA, 1986 to 1999 and Employee, 1984 to 1999; Executive Vice President and Secretary, twenty-six registered investment companies for which NBIA acts as investment manager and/or administrator. | |
Agnes Diaz (1971) | | Vice President since 2013 | | Senior Vice President, Neuberger Berman, since 2012; Senior Vice President, NBIA, since 2012 and Employee since 1996; formerly, Vice President, Neuberger Berman, 2007 to 2012; Vice President, ten registered investment companies for which NBIA acts as investment manager and/or administrator. | |
Anthony DiBernardo (1979) | | Assistant Treasurer since 2011 | | Senior Vice President, Neuberger Berman, since 2014; Senior Vice President, NBIA, since 2014, and Employee since 2003; formerly, Vice President, Neuberger Berman, 2009 to 2014; Assistant Treasurer, ten registered investment companies for which NBIA acts as investment manager and/or administrator. | |
Savonne Ferguson (1973) | | Chief Compliance Officer since 2018 | | Senior Vice President, Chief Compliance Officer (Mutual Funds) and Associate General Counsel, NBIA, since November 2018; formerly, Vice President T. Rowe Price Group, Inc. (2018), Vice President and Senior Legal Counsel, T. Rowe Price Associates, Inc. (2014-2018), Vice President and Director of Regulatory Fund Administration, PNC Capital Advisors, LLC (2009-2014), Secretary, PNC Funds and PNC Advantage Funds (2010-2014); Chief Compliance Officer, twenty-six registered investment companies for which NBIA acts as investment manager and/or administrator. | |
Corey A. Issing (1978) | | Chief Legal Officer since 2016 (only for purposes of sections 307 and 406 of the Sarbanes-Oxley Act of 2002) | | General Counsel and Head of Compliance—Mutual Funds since 2016 and Managing Director, NBIA, since 2017; formerly, Associate General Counsel (2015 to 2016), Counsel (2007 to 2015), Senior Vice President (2013-2016), Vice President (2009-2013); Chief Legal Officer (only for purposes of sections 307 and 406 of the Sarbanes-Oxley Act of 2002), twenty-six registered investment companies for which NBIA acts as investment manager and/or administrator. | |
Sheila R. James (1965) | | Assistant Secretary since inception | | Vice President, Neuberger Berman, since 2008 and Employee since 1999; Vice President, NBIA, since 2008; formerly, Assistant Vice President, Neuberger Berman, 2007; Employee, NBIA, 1991 to 1999; Assistant Secretary, twenty-six registered investment companies for which NBIA acts as investment manager and/or administrator. | |
75
Name, (Year of Birth),
and Address(1) | | Position(s)
and Length of
Time Served(2) | | Principal Occupation(s)(3) | |
Brian Kerrane (1969) | | Chief Operating Officer since 2015 and Vice President since 2008 | | Managing Director, Neuberger Berman, since 2013; Chief Operating Officer—Mutual Funds and Managing Director, NBIA, since 2015; formerly, Senior Vice President, Neuberger Berman, 2006 to 2014; Vice President, NBIA, 2008 to 2015 and Employee since 1991; Chief Operating Officer, ten registered investment companies for which NBIA acts as investment manager and/or administrator; Vice President, twenty-six registered investment companies for which NBIA acts as investment manager and/or administrator. | |
Anthony Maltese (1959) | | Vice President since 2015 | | Senior Vice President, Neuberger Berman, since 2014 and Employee since 2000; Senior Vice President, NBIA, since 2014; Vice President, ten registered investment companies for which NBIA acts as investment manager and/or administrator. | |
Josephine Marone (1963) | | Assistant Secretary since 2017 | | Senior Paralegal, Neuberger Berman, since 2007 and Employee since 2007; Assistant Secretary, twenty-six registered investment companies for which NBIA acts as investment manager and/or administrator. | |
Owen F. McEntee, Jr. (1961) | | Vice President since 2008 | | Vice President, Neuberger Berman, since 2006; Vice President, NBIA, since 2006 and Employee since 1992; Vice President, ten registered investment companies for which NBIA acts as investment manager and/or administrator. | |
John M. McGovern (1970) | | Treasurer and Principal Financial and Accounting Officer since inception | | Senior Vice President, Neuberger Berman, since 2007; Senior Vice President, NBIA, since 2007 and Employee since 1993; formerly, Vice President, Neuberger Berman, 2004 to 2006; formerly, Assistant Treasurer, 2002 to 2005; Treasurer and Principal Financial and Accounting Officer, twenty-six registered investment companies for which NBIA acts as investment manager and/or administrator. | |
Frank Rosato (1971) | | Assistant Treasurer since inception | | Vice President, Neuberger Berman, since 2006; Vice President, NBIA, since 2006 and Employee since 1995; Assistant Treasurer, ten registered investment companies for which NBIA acts as investment manager and/or administrator. | |
Niketh Velamoor (1979) | | Anti-Money Laundering Compliance Officer since 2018 | | Senior Vice President and Associate General Counsel, Neuberger Berman, since July 2018; Assistant United States Attorney, Southern District of New York, 2009 to 2018; Anti-Money Laundering Compliance Officer, four registered investment companies for which NBIA acts as investment manager and/or administrator. | |
(1) The business address of each listed person is 1290 Avenue of the Americas, New York, NY 10104.
(2) Pursuant to the By-Laws of the Trust, each officer elected by the Fund Trustees shall hold office until his or her successor shall have been elected and qualified or until his or her earlier death, inability to serve, or resignation. Officers serve at the pleasure of the Fund Trustees and may be removed at any time with or without cause.
(3) Except as otherwise indicated, each individual has held the positions shown during at least the last five years.
76
Proxy Voting Policies and Procedures
A description of the policies and procedures that the Trust uses to determine how to vote proxies relating to portfolio securities is available, without charge, by calling 800-877-9700 (toll-free) and on the Securities and Exchange Commission's website, at www.sec.gov. Information regarding how the Trust voted proxies relating to portfolio securities during the most recent 12-month period ended June 30 is also available upon request, without charge, by calling 800-877-9700 (toll-free), on the Securities and Exchange Commission's website at www.sec.gov, and on Management's website at www.nb.com.
Quarterly Portfolio Schedule
The Trust files a complete schedule of portfolio holdings for each Fund with the Securities and Exchange Commission for the first and third quarters of each fiscal year on Form N-Q. The Trust's Forms N-Q are available on the Securities and Exchange Commission's website at www.sec.gov and may be reviewed and copied at the Securities and Exchange Commission's Public Reference Room in Washington, DC. Information on the operation of the Public Reference Room may be obtained by calling 800-SEC-0330. The information on Form N-Q is available upon request, without charge, by calling 800-877-9700 (toll-free).
Notice to Shareholders
In early 2019 you will receive information to be used in filing your 2018 tax returns, which will include a notice of the exact tax status of all distributions paid to you by a Fund during calendar year 2018. Please consult your own tax advisor for details as to how this information should be reflected on your tax returns.
For the fiscal year ended October 31, 2018, each Fund makes the following designation, or up to the maximum amount of such dividends allowable pursuant to the Internal Revenue Code, as qualified dividend income eligible for reduced tax rates. These lower rates range from 5% to 15% depending upon an individual's tax bracket. Complete information regarding each Funds distributions during the calendar year 2018 will be reported in conjunction with Form 1099-DIV.
77
Board Consideration of the Management and Sub-Advisory Agreements
On an annual basis, the Board of Trustees (the "Board") of Neuberger Berman Alternative Funds (the "Trust"), including the Trustees who are not "interested persons" of the Trust or of Neuberger Berman Investment Advisers LLC ("Management") (including its affiliates) ("Independent Fund Trustees"), considers whether to continue the management agreement with Management (the "Management Agreement") and the separate sub-advisory agreements between Management and each sub-adviser (each a "Sub-Adviser") with respect to Neuberger Berman Absolute Return Multi-Manager Fund ("ARMM" or "Fund"). The Board considered the sub-advisory agreements between Management and each of the following Sub-Advisers: BH-DG Systematic Trading LLP, Cramer Rosenthal McGlynn, LLC, GAMCO Asset Management Inc., Good Hill Partners LP, Levin Capital Strategies, L.P., P/E Global, LLC, Portland Hill Asset Management Limited, Sound Point Capital Management, L.P., and TPH Asset Management, LP (each a "Sub-Advisory Agreement"; collectively with the Management Agreement, the "Agreements"). Throughout the process, the Independent Fund Trustees are advised by counsel that is experienced in Investment Company Act of 1940 matters and that is independent of Management ("Independent Counsel"). At a meeting held on October 11, 2018, the Board, including the Independent Fund Trustees, approved the continuation of the Agreements for the Fund.
In evaluating the Agreements with respect to the Fund, the Board, including the Independent Fund Trustees, reviewed extensive materials provided by Management and each Sub-Adviser in response to questions submitted by the Independent Fund Trustees and Independent Counsel, and (for the Sub-Advisers), by Management, and met with senior representatives of Management regarding its personnel, operations, and financial condition as they relate to the Fund. The annual contract review extends over at least two regular meetings of the Board to ensure that Management and each Sub-Adviser have time to respond to any questions the Independent Fund Trustees may have on their initial review of the materials and that the Independent Fund Trustees have time to consider those responses.
In connection with its deliberations, the Board also considered the broad range of information relevant to the annual contract review that is provided to the Board (including its various standing committees) at meetings throughout the year, including reports on investment performance, portfolio risk, and other portfolio information for the Fund, including the use of derivatives if used as part of a Sub-Adviser's strategy, as well as periodic reports on, among other matters, pricing and valuation; quality and cost of portfolio trade execution; compliance; and shareholder and other services provided by Management and its affiliates. The Contract Review Committee, which is comprised of Independent Fund Trustees, was established by the Board to assist in its deliberations regarding the annual contract review. The Board has also established other committees that focus throughout the year on specific areas relevant to the annual contract review, such as Fund performance or compliance matters, and that are charged with specific responsibilities regarding the annual contract review. Each quarter, the Ethics and Compliance Committee received and reviewed a summary of the quarterly compliance questionnaire completed by each Sub-Adviser that was prepared by the Fund's Chief Compliance Officer, in addition to any other information provided between meetings. The Board also considered the size and staffing of certain Sub-Advisers, as warranted, particularly the staffing of the portfolio management and compliance functions. Those committees provide reports to the Contract Review Committee and the full Board, which consider that information as part of the annual contract review process. The Board's Contract Review Committee annually considers and updates the questions it asks of Management and the Sub-Advisers in light of legal advice furnished to them by Independent Counsel; their own business judgment; and developments in the industry, in the markets, in mutual fund regulation and litigation, and in Management's and the Sub-Advisers' business models.
The Independent Fund Trustees received from Independent Counsel memoranda discussing the legal standards for their consideration of the proposed continuation of the Agreements. During the course of the year and during their deliberations regarding the annual contract review, the Contract Review Committee and the Independent Fund Trustees met with Independent Counsel separately from representatives of Management and the Sub-Advisers.
Provided below is a description of the Board's contract approval process and material factors that the Board considered at its meetings regarding renewals of the Agreements and the compensation to be paid thereunder. In connection with its approval of the continuation of the Agreements, the Board evaluated the terms of the Agreements, the overall fairness of the Agreements to the Fund and whether the Agreements were in the best interests of the Fund and Fund shareholders.
78
The Board's determination to approve the continuation of the Agreements was based on a comprehensive consideration of all information provided to the Board throughout the year and specifically in connection with the annual contract review.
This description is not intended to include all of the factors considered by the Board. The Board members did not identify any particular information or factor that was all-important or controlling, and each Trustee may have attributed different weights to the various factors. The Board focused on the costs and benefits of the Agreements to the Fund and, through the Fund, its shareholders.
Nature, Extent, and Quality of Services
With respect to the nature, extent, and quality of the services provided, the Board considered the investment philosophy and decision-making processes of, and the qualifications, experience, and capabilities of, and the resources available to, the portfolio management personnel of Management and each Sub-Adviser who perform services for the Fund.
The Board noted that Management and the Fund had obtained from the U.S. Securities and Exchange Commission an exemptive order that permitted Management to add or replace sub-advisers to the Fund without a shareholder vote, provided the Independent Fund Trustees approve the new sub-adviser and certain other steps are taken. In this context, the Board considered Management's responsibilities for designing an overall investment program for the Fund and then identifying the sub-advisers who will carry out the different portions of that program based on Management's due diligence of those sub-advisers. The Board noted that under the multi-manager arrangement, Management is continually assessing the need for new sub-advisers and the appropriateness of potential candidates, and noted the likelihood that Management would in the future have to conduct "due diligence" on additional sub-advisers. The Board noted that Management is responsible for making the investments for the portion of the portfolio that it manages, allocating the Fund's portfolio among the various Sub-Advisers and itself, and determining when and how to rebalance the allocations among the Sub-Advisers and itself in the wake of disparate growth and changes in the markets and the broader economy, and to make certain other investment decisions and to engage in transactions to hedge or balance risks in the Sub-Advisers' portfolios. The Board noted that Management is also responsible for coordinating and managing the flow of information and communications relating to the Fund among the Sub-Advisers, and coordinating responses to regulatory agency inquiries related to the operations of the Trust.
The Board further noted that Management is responsible for overseeing the Sub-Advisers pursuant to the Agreements and related sub-adviser oversight policies and procedures approved by the Board. Under these procedures, Management is responsible for overseeing the investment performance of the Sub-Advisers and evaluating the risk and return of each Sub-Adviser and the Fund as a whole, in addition to other significant oversight responsibilities. The Board noted that Management is also responsible for monitoring compliance with the Fund's investment objectives, policies, and restrictions, as well as compliance with applicable law, including implementing rulemaking initiatives of the U.S. Securities and Exchange Commission.
The Board noted that Management also provides certain administrative services, including fund accounting and compliance services. The Board also considered the policies and practices regarding brokerage, commissions and other trading costs, and allocation of portfolio transactions of Management and each of the Sub-Advisers and noted that Management monitored the quality of the execution services provided by each Sub-Adviser. Moreover, the Board considered Management's approach to potential conflicts of interest both generally and between the Fund's investments and those of other funds or accounts managed by Management or the Sub-Advisers. The Board also noted that Management had increased its research capabilities with respect to environmental, social, and corporate governance matters and how those factors may relate to investment performance.
The Board noted the extensive range of services that Management provides to the Fund beyond the investment management and Sub-Adviser oversight services. It also noted Management's activities under its contractual obligation to oversee the Fund's various outside service providers, including its renegotiation of certain service providers' fees and its evaluation of service providers' infrastructure, cybersecurity programs, compliance programs, and business continuity
79
programs, among other matters. The Board noted Management's extensive activities in selecting and overseeing the Sub-Advisers, including questionnaires, site visits, analyses of performance, compliance monitoring, and evaluating third party reviews of potential sub-advisers, and the quarterly and annual reports that Management provides to the Board on the Sub-Advisers' performance and compliance. In addition, the Board considered the scope and compliance history of the compliance programs of Management and each Sub-Adviser, including the Fund's Chief Compliance Officer's and Management's assessment of the compliance programs of the Sub-Advisers. The Board discussed that Management's Chief Information Security Officer had evaluated the Sub-Advisers' responses on questions of cybersecurity, business continuity, and disaster recovery. The Board also considered Management's ongoing development of its own infrastructure and information technology to support the Fund through, among other things, cybersecurity, business continuity planning, and risk management.
In addition, the Board noted the positive compliance history of Management and each Sub-Adviser as no significant compliance problems were reported to the Board with respect to any of the firms. The Board also considered whether there were any pending lawsuits, enforcement proceedings, or regulatory investigations involving Management or any Sub-Adviser, and reviewed information regarding their financial condition, history of operations, and any conflicts of interests in managing the Fund. The Board also considered the general structure of the portfolio managers' compensation and whether this structure provides appropriate incentives to act in the best interests of the Fund. The Board also considered the ability of Management to attract and retain qualified personnel to service the Fund.
The Board considered that Management assumes significant ongoing risks with respect to the Fund, for which Management is entitled to reasonable compensation. Specifically, Management's responsibilities include continual management of investment, operational, enterprise, litigation, regulatory, and compliance risks as they relate to the Fund, and the Board considers on a regular basis information regarding Management's processes for monitoring and managing risk. In addition, the Board also noted that when Management launches a new fund or share class, it assumes entrepreneurial risk with respect to that fund or class, and that some new funds and share classes have been liquidated without ever having been profitable to Management.
As in past years, the Board also considered the manner in which Management addressed various matters that arose during the year, some of them a result of developments in the broader fund industry or the regulations governing it. In addition, the Board considered actions taken by Management in response to recent market conditions and considered the overall performance of Management in this context.
Fund Performance
The Board requested a report from an outside consulting firm that specializes in the analysis of fund industry data that compared the Fund's performance, along with its fees and other expenses, to a group of industry peers and a broader universe of funds pursuing generally similar strategies with the same investment classification and/or objective. The Board considered the Fund's performance and fees in light of the limitations inherent in the methodology for constructing such a comparative group and determining which investment companies should be included in the comparative group.
With respect to investment performance, the Board considered information regarding the Fund's short-, intermediate- and long-term performance, as applicable, net of the Fund's fees and expenses both on an absolute basis and relative to an appropriate benchmark index that does not deduct the fees or expenses of investing, compared to the performance of the industry peer group and a broader universe of funds, each constructed by the consulting firm. The Board also considered information regarding each Sub-Adviser's performance. The Board also reviewed performance in relation to certain measures of the degree of investment risk undertaken by the portfolio managers.
The broader universe of funds referenced in this section are those identified by the consulting firm, as discussed above, and the risk/return ratios referenced are the Sharpe ratios provided by the consulting firm. In the case of underperformance for the periods reflected, the Board considered the magnitude of that underperformance relative to the broader universe and the benchmark (e.g., the amount by which the Fund underperformed, including, for example, whether the Fund slightly underperformed or significantly underperformed its benchmark). With respect to
80
performance quintile rankings for the Fund compared to its broader universe ("Performance Universe"), the first quintile represents the highest (best) performance and the fifth quintile represents the lowest performance. The Fund has more than one class of shares outstanding and information for Institutional Class has been provided as identified below. The Board reviewed the expense structures of all the other classes of shares of the Fund, some of which have higher fees and expenses that reflect their separate distribution and servicing arrangements and the differing needs of different investors. As a proxy for the class expense structure, the Board reviewed the expenses of each class for one Fund in the Trust in comparison to Expense Groups for those classes. The Board noted the effect of higher expenses on the performance of the other classes of shares.
The Board considered that, based on performance data for the periods ended December 31, 2017: (1) as compared to its benchmark, the Fund's performance was lower for the 1- and 3- year periods and higher for the 5-year period; and (2) as compared to its Performance Universe, the Fund's performance was in the third quintile for the 1-year period and in the fourth quintile for the 3- and 5-year periods. The Fund was launched in 2012 and therefore does not have 10-year performance.
The Board discussed with Management the Fund's performance, potential reasons for any underperformance, and steps that Management had taken, or intended to take, to improve performance, including its willingness to replace or terminate a Sub-Adviser. In considering the Fund's performance, the Board noted Management's representations that hedge fund strategies like those the various Sub-Advisers pursue have been out of favor in recent periods. The Board also considered the Fund's outperformance versus its benchmark during the 7-month period ending July 31, 2018. The Board also met with a member of the portfolio management team in June 2018 to discuss the Fund's performance and volatility. The Board considered Management's responsiveness with respect to the lagging performance as compared to the benchmark. In this regard, the Board noted that performance, especially short-term performance, is only one of the factors that it deems relevant to its consideration of the Agreements and that, after considering all relevant factors, it may be appropriate to approve the continuation of the Agreements notwithstanding the Fund's underperformance.
Fee Rates, Profitability, and Fall-out Benefits
With respect to the overall fairness of the Agreements, the Board considered the fee structure for the Fund under the Agreements as compared to the peer group provided by the consulting firm. The Board reviewed a comparison of the Fund's management fee to a peer group of comparable funds. The Board noted that the comparative management fee analysis includes, in the Fund's management fee, the separate administrative fees paid to Management. However, the Board noted that some funds in the peer group pay directly from fund assets for certain services that Management covers out of the administration fees for the Funds. Accordingly, the Board also considered the Fund's total expense ratio as compared with its peer group as a way of taking account of these differences.
The Board compared the Fund's contractual and actual management fees to the median of the contractual and actual management fees, respectively, of the Fund's peer group. (The actual management fees are the contractual management fees reduced by any fee waivers or other adjustments. The information provided herein relating to the Fund's management fees is for the Fund's Institutional Class.) The Board also compared the Fund's total expenses to the median of the total expenses of the Fund's peer group. With respect to the quintile rankings for fees and total expenses (net of waivers or other adjustments, if any) for the Fund compared to its peer group ("Expense Group"), the first quintile represents the lowest fees and/or total expenses and the fifth quintile represents the highest fees and/or total expenses. The Board considered that, as compared to its Expense Group, the Fund's contractual management fee ranked in the fourth quintile, the actual management fee net of fees waived by Management ranked in the fifth quintile, and the total expenses ranked in the fifth quintile. In determining to renew the Management Agreement, the Board took into account Management's representations regarding the effect that the composition of the Fund's Expense Group had on the Fund's fee and expense comparisons relative to its peers due to, among other matters, that a multi-manager fund requires oversight of numerous unaffiliated advisors, which is not the case for certain of the funds included in the Expense Group. The Board noted that the multi-manager structure, which is typically more expensive to manage, allows Management the ability to pursue a variety of different strategies and to seek out specialists in each strategy.
81
In concluding that the benefits accruing to Management and its affiliates by virtue of their relationship with the Fund were reasonable in light of the costs of providing the investment advisory and other services and the benefits accruing to the Fund, the Board reviewed specific data as to Management's estimated loss on the Fund for a recent period on a pre-tax basis without regard to distribution expenses, including year-over-year changes in each of Management's reported expense categories. (The Board also reviewed data on Management's estimated loss on the Fund after distribution expenses and taxes were factored in, as indicators of the health of the business and the extent to which Management is directing its profits into the growth of the business.) The Board considered the cost allocation methodology that Management used in developing its estimated profitability figures. In 2017, the Board engaged an independent forensic accountant to review the profitability methodology utilized by Management when preparing this information and discussed with the consultant its conclusion that Management's process for calculating and reporting its estimated loss was not unreasonable. Recognizing that there is no uniform methodology within the asset management industry for determining profitability for this purpose and that the use of different reasonable methodologies can give rise to different profit and loss results, the Board requested from Management examples of profitability calculated by different methods and noted that the estimated profitability levels were still reasonable when calculated by these other methods. The Board further noted Management's representation that its estimate of profitability is derived using methodology that is consistent with the methodology used to assess and/or report measures of profitability elsewhere at the firm. In addition, the Board recognized that Management's calculations regarding its costs may not reflect all risks, including regulatory, legal, operational, reputational, and, where appropriate, entrepreneurial risks, associated with offering and managing a mutual fund in the current regulatory and market environment.
The Board also monitors throughout the year the potential effect on the profitability of Management resulting from changes in Sub-Advisers and/or their fees. The Board did not give substantial weight to estimated profitability data from the Sub-Advisers because the Board did not view this data as being a key factor to its deliberations given the arm's-length nature of the relationship between Management and the Sub-Advisers with respect to the negotiation of sub-advisory fee rates. To test its assumption of an arm's-length fee rate, the Board requested from Management information about any other business relationships it has with any of the Sub-Advisers. In addition, the Board noted that the Sub-Advisers may not account for their profits on an account-by-account basis and those that do typically employ different methodologies in connection with these calculations. The Board also considered any fall-out (i.e., indirect) benefits likely to accrue to Management or its affiliates from their relationship with the Fund. The Board also considered the expected effect on profitability of having Management manage a sleeve of the Fund.
Information Regarding Services to Other Clients
The Board also considered whether there were other funds or separate accounts that were advised or sub-advised by Management or its affiliates with investment objectives, policies, and strategies that were similar to those of the Fund. In this regard, in prior years, the Board considered fees charged to an unregistered fund of funds managed by Management that uses some of the same strategies used by the Funds and noted differences that reduced the usefulness of the comparison. The Board also considered the fees the Sub-Advisers charge for products with investment objectives, policies, and strategies that were similar to those of the Fund, if any. The Board noted that in many cases, those products were hedge funds, which typically charge fees substantially higher than mutual funds.
Economies of Scale
The Board also evaluated apparent or anticipated economies of scale in relation to the services Management provides to the Fund. The Board considered whether the Fund's fee structure provides for a reduction of payments resulting from the use of breakpoints, the size of any breakpoints in the Fund's advisory fees, and whether any such breakpoints are set at appropriate asset levels. The Board also compared the breakpoint structure to that of the peer group. In addition, the Board considered the expense limitation and/or fee waiver arrangement that reduce the Fund's expenses at all asset levels which can have an effect similar to breakpoints in sharing economies of scale with shareholders and provide protection from an increase in expenses if the Fund's assets decline. The Board considered that breakpoints in a Sub-Adviser's fee
82
schedule would inure to the benefit of Management, and evaluated that fact in light of Management's overall profitability on the Fund, a subject on which the Board receives quarterly reports. The Board also considered that Management has provided, at no added cost to the Fund, certain additional services, including but not limited to, services required by new regulations or regulatory interpretations, services impelled by changes in the securities markets or the business landscape, and/or services requested by the Board. The Board considered that this is a way of sharing economies of scale with the Fund and its shareholders.
Conclusions
In approving the continuation of the Agreements, the Board concluded that, in its business judgment, the terms of each Agreement are fair and reasonable to the Fund and that approval of the continuation of the Agreements is in the best interests of the Fund and its shareholders. In reaching this determination, the Board considered that Management and each Sub-Adviser could be expected to continue to provide a high level of service to the Fund; that the performance of the Fund was satisfactory over time, or, in the case of underperformance by a Sub-Adviser, that the Board retained confidence in Management's and each Sub-Adviser's capabilities to manage the Fund; that the Fund's fee structure appeared to the Board to be reasonable given the nature, extent, and quality of services provided; and that the benefits accruing to Management and its affiliates by virtue of their relationship with the Fund were reasonable in light of the costs of providing the investment advisory and other services and the benefits accruing to the Fund. The Board's conclusions may be based in part on its consideration of materials prepared in connection with the approval or continuance of the Agreements in prior years and on the Board's ongoing regular review of Fund performance and operations throughout the year, in addition to material prepared specifically for the most recent annual review of the Agreements.
83
Neuberger Berman Investment Advisers LLC
1290 Avenue of the Americas
New York, NY 10104–0002
Retail Services: 800.877.9700
Broker-Dealer and Institutional Services: 800.366.6264/888.556.9030
www.nb.com
Statistics and projections in this report are derived from sources deemed to be reliable but cannot be regarded as a representation of future results of the Fund. This report is prepared for the general information of shareholders and is not an offer of shares of the Fund. Shares are sold only through the currently effective prospectus which you can obtain by calling 877.628.2583. An investor should consider carefully a Fund's investment objectives, risks and fees and expenses, which are described in its prospectus, before investing.
M0257 12/18
Item 2. Code of Ethics.
The Board of Trustees (“Board”) of Neuberger Berman Alternative Funds (“Registrant”) has adopted a code of ethics that applies to the Registrant’s principal executive officer, principal financial officer, principal accounting officer or controller, or persons performing similar functions (“Code of Ethics”). During the period covered by this Form N-CSR, there were no substantive amendments to the Code of Ethics and there were no waivers from the Code of Ethics granted to the Registrant’s principal executive officer, principal financial officer, principal accounting officer or controller, or persons performing similar functions.
A copy of the Code of Ethics is incorporated by reference to Neuberger Berman Advisers Management Trust’s Form N-CSRS, Investment Company Act file number 811-04255 (filed August 25, 2016). The Code of Ethics is also available, without charge, by calling 1-800-877-9700 (toll-free).
Item 3. Audit Committee Financial Expert.
The Board has determined that the Registrant has three audit committee financial experts serving on its audit committee. The Registrant’s audit committee financial experts are Michael J. Cosgrove, Martha C. Goss, and Deborah C. McLean. Mr. Cosgrove, Ms. Goss and Ms. McLean are independent trustees as defined by Form N-CSR.
Item 4. Principal Accountant Fees and Services.
Ernst & Young LLP (“E&Y”) serves as independent registered public accounting firm to Neuberger Berman Absolute Return Multi-Manager Fund, Neuberger Berman Commodity Strategy Fund, Neuberger Berman Global Allocation Fund, Neuberger Berman Hedged Option Premium Strategy Fund, Neuberger Berman Long Short Credit Fund, Neuberger Berman Multi-Asset Income Fund, Neuberger Berman Multi-Style Premia Fund and Neuberger Berman U.S. Equity Index PutWrite Strategy Fund. Neuberger Berman Absolute Return Multi-Manager Fund, Neuberger Berman Commodity Strategy Fund, Neuberger Berman Global Allocation Fund, Neuberger Berman Hedged Option Premium Strategy Fund, Neuberger Berman Long Short Credit Fund, Neuberger Berman Multi-Asset Income Fund, Neuberger Berman Multi-Style Premia Fund and Neuberger Berman U.S. Equity Index PutWrite Strategy Fund commenced operations on May 15, 2012, August 27, 2012, December 29, 2010, April 12, 2017, June 29, 2015, March 27, 2015, May 16, 2018 and September 16, 2016, respectively.
Tait, Weller & Baker LLP (“Tait Weller”) serves as independent registered public accounting firm to Neuberger Berman Long Short Fund. Neuberger Berman Long Short Fund commenced operations on December 29, 2011.
The aggregate fees billed for professional services rendered by E&Y for the audit of the annual financial statements or services that are normally provided by E&Y in connection with statutory and regulatory filings or engagements were $377,700 and $433,950 for the fiscal years ended 2017 and 2018, respectively.
The aggregate fees billed for professional services rendered by Tait Weller for the audit of the annual financial statements or services that are normally provided by Tait Weller in connection with statutory and regulatory filings or engagements were $29,755 and $30,650 for the fiscal years ended 2017 and 2018, respectively.
The aggregate fees billed to the Registrant for assurance and related services by E&Y that are reasonably related to the performance of the audit of the Registrant’s financial statements and are not reported above in
Audit Fees were $0 and $0 for the fiscal years ended 2017 and 2018, respectively. The Audit Committee approved 0% and 0% of these services provided by E&Y for the fiscal years ended 2017 and 2018, respectively, pursuant to the waiver provisions of Rule 2-01(c)(7)(i)(C) of Regulation S-X.
The fees billed to other entities in the investment company complex for assurance and related services by E&Y that are reasonably related to the performance of the audit that the Audit Committee was required to approve because the engagement related directly to the operations and financial reporting of the Registrant were $0 and $0 for the fiscal years ended 2017 and 2018, respectively. The Audit Committee approved 0% and 0% of these services provided by E&Y for the fiscal years ended 2017 and 2018, respectively, pursuant to the waiver provisions of Rule 2-01(c)(7)(i)(C) of Regulation S-X.
The aggregate fees billed to the Registrant for assurance and related services by Tait Weller that are reasonably related to the performance of the audit of the Registrant’s financial statements and are not reported above in Audit Fees were $0 and $0 for the fiscal years ended 2017 and 2018, respectively. The Audit Committee approved 0% and 0% of these services provided by Tait Weller for the fiscal years ended 2017 and 2018, respectively, pursuant to the waiver provisions of Rule 2-01(c)(7)(i)(C) of Regulation S-X.
The fees billed to other entities in the investment company complex for assurance and related services by Tait Weller that are reasonably related to the performance of the audit that the Audit Committee was required to approve because the engagement related directly to the operations and financial reporting of the Registrant were $0 and $0 for the fiscal years ended 2017 and 2018, respectively. The Audit Committee approved 0% and 0% of these services provided by Tait Weller for the fiscal years ended 2017 and 2018, respectively, pursuant to the waiver provisions of Rule 2-01(c)(7)(i)(C) of Regulation S-X.
The aggregate fees billed to the Registrant for professional services rendered by E&Y for tax compliance, tax advice, and tax planning were $119,200 and $111,890 for the fiscal years ended 2017 and 2018, respectively. The nature of the services provided includes preparation of the Federal and State tax extensions and tax returns, review of annual excise tax calculations, and preparation of form 8613, in addition to guidance with the identification of Passive Foreign Investment Companies ("PFICs"), assistance with determination of various foreign withholding taxes, and assistance with Internal Revenue Code and tax regulation requirements for fund investments. The Audit Committee approved 0% and 0% of these services provided by E&Y for the fiscal years ended 2017 and 2018, respectively, pursuant to the waiver provisions of Rule 2-01(c)(7)(i)(C) of Regulation S-X.
The fees billed to other entities in the investment company complex for professional services rendered by E&Y for tax compliance, tax advice, and tax planning that the Audit Committee was required to approve because the engagement related directly to the operations and financial reporting of the Registrant were $0 and $0 for the fiscal years ended 2017 and 2018, respectively. The Audit Committee approved 0% and 0% of these services provided by E&Y for the fiscal years ended 2017 and 2018, respectively, pursuant to the waiver provisions of Rule 2-01(c)(7)(i)(C) of Regulation S-X.
The aggregate fees billed to the Registrant for professional services rendered by Tait Weller for tax compliance, tax advice, and tax planning were $6,095 and $6,280 for the fiscal years ended 2017 and 2018, respectively. The nature of the services provided includes preparation of the Federal and State tax extensions and tax returns, review of annual excise tax calculations, and preparation of form 8613, in addition to guidance with the identification of PFICs, assistance with determination of various foreign withholding taxes, and assistance with Internal Revenue Code and tax regulation requirements for fund investments. The Audit Committee approved 0% and 0% of these services provided by Tait Weller for the fiscal years ended 2017 and 2018, respectively, pursuant to the waiver provisions of Rule 2-01(c)(7)(i)(C) of Regulation S-X.
The fees billed to other entities in the investment company complex for professional services rendered by Tait Weller for tax compliance, tax advice, and tax planning that the Audit Committee was required to approve because the engagement related directly to the operations and financial reporting of the Registrant were $0 and $0 for the fiscal years ended 2017 and 2018, respectively. The Audit Committee approved 0% and 0% of these services provided by Tait Weller for the fiscal years ended 2017 and 2018, respectively, pursuant to the waiver provisions of Rule 2-01(c)(7)(i)(C) of Regulation S-X.
The aggregate fees billed to the Registrant for products and services provided by E&Y, other than services reported in Audit Fees, Audit-Related Fees, and Tax Fees were $0 and $0 for the fiscal years ended 2017 and 2018, respectively. The Audit Committee approved 0% and 0% of these services provided by E&Y for the fiscal years ended 2017 and 2018, respectively, pursuant to the waiver provisions of Rule 2-01(c)(7)(i)(C) of Regulation S-X.
The fees billed to other entities in the investment company complex for products and services provided by E&Y, other than services reported in Audit Fees, Audit-Related Fees, and Tax Fees that the Audit Committee was required to approve because the engagement related directly to the operations and financial reporting of the Registrant were $0 and $0 for the fiscal years ended 2017 and 2018, respectively. The Audit Committee approved 0% and 0% of these services provided by E&Y for the fiscal years ended 2017 and 2018, respectively, pursuant to the waiver provisions of Rule 2-01(c)(7)(i)(C) of Regulation S-X.
The aggregate fees billed to the Registrant for products and services provided by Tait Weller, other than services reported in Audit Fees, Audit-Related Fees, and Tax Fees were $0 and $0 for the fiscal years ended 2017 and 2018, respectively. The Audit Committee approved 0% and 0% of these services provided by Tait Weller for the fiscal years ended 2017 and 2018, respectively, pursuant to the waiver provisions of Rule 2-01(c)(7)(i)(C) of Regulation S-X.
The fees billed to other entities in the investment company complex for products and services provided by Tait Weller, other than services reported in Audit Fees, Audit-Related Fees, and Tax Fees that the Audit Committee was required to approve because the engagement related directly to the operations and financial reporting of the Registrant were $0 and $0 for the fiscal years ended 2017 and 2018, respectively. The Audit Committee approved 0% and 0% of these services provided by Tait Weller for the fiscal years ended 2017 and 2018, respectively, pursuant to the waiver provisions of Rule 2-01(c)(7)(i)(C) of Regulation S-X.
(1) The Audit Committee’s pre-approval policies and procedures for the Registrant to engage an accountant to render audit and non-audit services delegate to each member of the Committee the power to pre-approve services between meetings of the Committee.
(2) None of the services described in paragraphs (b) through (d) above were approved by the Audit Committee pursuant to paragraph (c)(7)(i)(C) of Rule 2-01 of Regulation S-X.
Not applicable.
Non-audit fees billed by E&Y for services rendered to the Registrant were $119,200 and $111,890 for the fiscal years ended 2017 and 2018, respectively.
Non-audit fees billed by E&Y for services rendered to the Registrant’s investment adviser and any entity controlling, controlled by, or under common control with the adviser that provides ongoing services to the Registrant were $0 and $0 for the fiscal years ended 2017 and 2018, respectively.
Non-audit fees billed by Tait Weller for services rendered to the Registrant were $0 and $0 for the fiscal years ended 2017 and 2018, respectively.
Non-audit fees billed by Tait Weller for services rendered to the Registrant’s investment adviser and any entity controlling, controlled by, or under common control with the adviser that provides ongoing services to the Registrant were $0 and $0 for the fiscal years ended 2017 and 2018, respectively.
(h) The Audit Committee of the Board considered whether the provision of non-audit services rendered to the Registrant’s investment adviser and any entity controlling, controlled by, or under common control with the adviser that provides ongoing services to the Registrant that were not pre-approved by the Audit Committee because the engagement did not relate directly to the operations and financial reporting of the Registrant is compatible with maintaining E&Y’s and Tait Weller’s independence.
Item 5. Audit Committee of Listed Registrants.
Not applicable to the Registrant.
Item 6. Schedule of Investments.
The complete schedule of investments for each series is disclosed in the Registrant’s applicable annual report included as Item 1 of this Form N-CSR.
Item 7. Disclosure of Proxy Voting Policies and Procedures for Closed-End Management Investment Companies.
Not applicable to the Registrant.
Item 8. Portfolio Managers of Closed-End Management Investment Companies.
Not applicable to the Registrant.
Item 9. Purchases of Equity Securities by Closed-End Management Investment Company and Affiliated Purchasers.
Not applicable to the Registrant.
Item 10. Submission of Matters to a Vote of Security Holders.
There were no changes to the procedures by which shareholders may recommend nominees to the Board.
Item 11. Controls and Procedures.
Item 12. Disclosure of Securities Lending Activities for Closed-End Management Investment Companies.
Not applicable to the Registrant.
Item 13. Exhibits.
The certification furnished pursuant to Rule 30a-2(b) under the Act and Section 906 of the Sarbanes-Oxley Act will not be deemed “filed” for purposes of Section 18 of the Securities Exchange Act of 1934, as amended (“Exchange Act”), or otherwise subject to the liability of that section. Such certification will not be deemed to be incorporated by reference into any filing under the Securities Act of 1933, as amended, or the Exchange Act, except to the extent that the Registrant specifically incorporates it by reference.
Pursuant to the requirements of the Securities Exchange Act of 1934 and the Investment Company Act of 1940, the Registrant has duly caused this report to be signed on its behalf by the undersigned, thereunto duly authorized.