Neuberger Berman
Alternative and Multi-Asset Class Funds
Institutional Class Shares
Class A Shares
Class C Shares
Class R6 Shares
Flexible Select Fund
Global Allocation Fund
Inflation Managed Fund
(Formerly Inflation Navigator Fund)
Long Short Fund
Long Short Credit Fund
Multi-Asset Income Fund
Annual Report
October 31, 2015
Contents
THE FUNDS | |
President's Letter | | | 1 | | |
PORTFOLIO COMMENTARY | |
Flexible Select Fund | | | 2 | | |
Global Allocation Fund | | | 6 | | |
Inflation Managed Fund (Formerly Inflation Navigator Fund) | | | 9 | | |
Long Short Fund | | | 12 | | |
Long Short Credit Fund | | | 15 | | |
Multi-Asset Income Fund | | | 18 | | |
FUND EXPENSE INFORMATION | | | 24 | | |
SCHEDULE OF INVESTMENTS | |
Flexible Select Fund | | | 26 | | |
Global Allocation Fund | | | 28 | | |
Positions by Industry | | | 39 | | |
Inflation Managed Fund (Formerly Inflation Navigator Fund) | | | 42 | | |
Long Short Fund | | | 46 | | |
Long Short Credit Fund | | | 50 | | |
Multi-Asset Income Fund | | | 52 | | |
FINANCIAL STATEMENTS | | | 68 | | |
FINANCIAL HIGHLIGHTS (ALL CLASSES)/
PER SHARE DATA | |
Flexible Select Fund | | | 124 | | |
Global Allocation Fund | | | 124 | | |
Inflation Managed Fund (Formerly Inflation Navigator Fund) | | | 126 | | |
Long Short Fund | | | 128 | | |
Long Short Credit Fund | | | 130 | | |
Multi-Asset Income Fund | | | 130 | | |
Reports of Independent Registered Public Accounting Firms | | | 133 | | |
Directory | | | 135 | | |
Trustees and Officers | | | 136 | | |
Proxy Voting Policies and Procedures | | | 145 | | |
Quarterly Portfolio Schedule | | | 145 | | |
Board Consideration of the Management and
Sub-Advisory Agreements | | | 146 | | |
Notice to Shareholders | | | 150 | | |
The "Neuberger Berman" name and logo are registered service marks of Neuberger Berman Group LLC. "Neuberger Berman Management LLC" and the individual Fund names in this piece are either service marks or registered service marks of Neuberger Berman Management LLC. ©2015 Neuberger Berman Management LLC. All rights reserved.
Dear Shareholder,
I am pleased to present this annual shareholder report for Neuberger Berman Flexible Select Fund, Neuberger Berman Global Allocation Fund, Neuberger Berman Inflation Managed Fund, Neuberger Berman Long Short Fund and Neuberger Berman Multi-Asset Income Fund. This report also includes the new Neuberger Berman Long Short Credit Fund, which was launched on June 29, 2015.
The global financial markets were volatile at times and generated mixed results during the 12 months ended October 31, 2015. Investor risk appetite fluctuated given incoming global economic data, uncertainties regarding central bank monetary policy, falling commodity prices and numerous geopolitical issues. Despite experiencing its first correction (a decline of at least 10%) since 2011, the U.S. equity market, as measured by the S&P 500® Index, gained 5.20% over the 12-month period. In contrast, international developed market equities were largely flat, while emerging markets equities fell sharply. Within fixed income, longer-term U.S. Treasury yields declined and the overall bond market, as measured by the Barclays U.S. Aggregate Bond Index, gained 1.96% during the period. Finally, inflation remained tepid, partially a reflection of moderating growth in many countries and lower commodity prices.
Looking ahead, we believe the U.S. economy will continue to expand. However, growth could remain relatively muted, while inflation could edge somewhat higher as the year progresses. Against this backdrop, we expect the U.S. Federal Reserve (Fed) to move toward policy normalization. In our view, the Fed will be very gradual in its tightening cycle and we anticipate two to three rate hikes over the next 12 months, with a fed funds rate of 0.75%—1.0% by the end of 2016. From an investment perspective, the last few months have been challenging, but we maintain high conviction in our portfolio managers and believe they are well positioned for the current and coming environment.
Thank you for your continued support and trust. We look forward to continue serving your investment needs in the years to come.
Sincerely,

ROBERT CONTI
PRESIDENT AND CEO
NEUBERGER BERMAN MUTUAL FUNDS
Flexible Select Fund Commentary (Unaudited)
Neuberger Berman Flexible Select Fund Institutional Class generated a 0.13% total return for the 12 months ended October 31, 2015 but underperformed its benchmark, the Russell 3000® Index, which provided a 4.49% return. (Performance for all share classes is provided in the table immediately following this letter.)
Effective October 1, 2015, the Flexible Select Fund underwent a number of structural changes and enhancements. The Fund is now being co-managed by Joseph V. Amato, who has been managing the Fund since its inception in 2013, and Erik Knutzen, CFA, CAIA, Neuberger Berman's Multi-Asset Class Chief Investment Officer. The portfolio managers determine the Fund's asset allocation using a variety of fundamental and quantitative analyses, and may use Neuberger Berman's fundamental research capabilities, as well as the views of Neuberger Berman's Asset Allocation Committee.
The method for determining the equity sleeve of the Flexible Select Fund has been redesigned to result in a more concentrated, highest-conviction portfolio, consisting of approximately 45–65 names. In selecting the underlying equity securities, the Fund now employs a methodology to systematically extract security selection insights from a select group of underlying managers with a track record of security selection skill. These insights are packaged and delivered in a portfolio that we seek to optimize for risk/reward subject to target levels of risk, as well as limits on sector, market capitalization and individual security weight deviations from the Russell 3000 Index.
The range of eligible strategies for implementing the fixed income allocation of the Fund has been broadened to include a larger group of Neuberger Berman bond funds across different types and maturities of fixed income instruments. In addition to the Neuberger Berman Core Bond Fund, eligible strategies include the Neuberger Berman High Income Bond Fund, Neuberger Berman Short Duration Bond Fund, Neuberger Berman Short Duration High Income Fund, Neuberger Berman Floating Rate Income Fund, Neuberger Berman Emerging Markets Debt Fund and Neuberger Berman Unconstrained Bond Fund.
As of October 31, 2015, the allocation was approximately 85.0% equity, 11.8% fixed income and 3.2% cash and cash equivalents.
A wave of policy-related developments in the U.S. were instrumental in stabilizing investor sentiment and supporting risk assets during October after a pronounced sell-off in August and September. Positive resolutions were reached with respect to the debt ceiling (suspended through March 2017) and budget (agreement for fiscal years 2016 and 2017) and Paul Ryan assumed the position of Speaker of the House of Representatives. The U.S. continues to be among the strongest developed economies as domestic growth remains positive.
Since the Fund's repositioning on October 1, 2015 through the end of the reporting period, industry sector allocations in the equity portion of the portfolio delivered positive contributions to relative performance led by an underweight to Utilities and an overweight to Energy. Security selection had a negative contribution to relative performance, driven by holdings in the Health Care and Industrials sectors. Our fixed income holdings contributed positively to absolute performance during the month.
Over the 12-month reporting period, industry sector allocation in the equity portion of the portfolio had a positive contribution to relative performance, led by underweights to Utilities and Telecommunication Services. Security selection had a negative contribution to relative performance, driven by holdings in the Consumer Discretionary and Energy sectors. The portfolio's fixed income holdings contributed positively to absolute performance during the 12-month period.
Recent economic data have reflected a more resilient growth backdrop. In the U.S., October's employment report was strong on nearly every metric—the headline payroll figure increased by 271,000, the prior two months were revised higher by 12,000 and the unemployment rate edged down to 5.0%. Perhaps most encouraging was the gain in average hourly earnings, which were up 0.4% month-over-month and 2.5% year-over-year. Overall, we anticipate a stable growth backdrop. We remain constructive on risk assets, with a bias towards equities and to credit over government securities.
Sincerely,
JOSEPH V. AMATO AND ERIK KNUTZEN*
PORTFOLIO MANAGERS
Information about principal risks of investing in the Fund is set forth in the prospectus and statement of additional information.
The portfolio composition, industries and holdings of the Fund are subject to change without notice.
The opinions expressed are those of the Fund's portfolio managers. The opinions are as of the date of this report and are subject to change without notice.
* Erik Knutzen became a Portfolio Manager of Neuberger Berman Flexible Select Fund effective October 1, 2015.
TICKER SYMBOLS
Institutional Class | | NFLIX | |
Class A | | NFLAX | |
Class C | | NFLCX | |
SECTOR ALLOCATION
(as a % of Total Investments*) | |
Consumer Discretionary | | | 10.2 | % | |
Consumer Staples | | | 6.2 | | |
Energy | | | 7.1 | | |
Financials | | | 16.8 | | |
Health Care | | | 14.2 | | |
Industrials | | | 11.1 | | |
Information Technology | | | 17.3 | | |
Materials | | | 1.5 | | |
Utilities | | | 0.5 | | |
Mutual Funds | | | 11.8 | | |
Short-Term Investments | | | 3.3 | | |
Total | | | 100.0 | % | |
* Derivatives, if any, are excluded from this chart.
PERFORMANCE HIGHLIGHTS
| | | | | Average Annual Total
Return Ended 10/31/2015 | |
| | | Inception
Date | | 1 Year | | Life of
Fund | |
At NAV | |
Institutional Class | | 05/31/2013 | | | 0.13 | % | | | 7.90 | % | |
Class A | | 05/31/2013 | | | –0.23 | % | | | 7.51 | % | |
Class C | | 05/31/2013 | | | –0.95 | % | | | 6.70 | % | |
With Sales Charge | |
Class A | | | | | | | –5.99 | % | | | 4.91 | % | |
Class C | | | | | | | –1.92 | % | | | 6.70 | % | |
Index | |
| Russell 3000® Index1,2 | | | | | | | 4.49 | % | | | 11.77 | % | |
The performance data quoted represent past performance and do not indicate future results. Current performance may be lower or higher than the performance data quoted. For performance data current to the most recent month-end, please visit www.nb.com/performance.
The results shown in the table reflect the reinvestment of income dividends and other distributions, if any. The results do not reflect the effect of taxes a shareholder would pay on Fund distributions or on the redemption of Fund shares.
The investment return and principal value of an investment will fluctuate and shares, when redeemed, may be worth more or less than their original cost.
Returns would have been lower if Neuberger Berman Management LLC (Management) had not reimbursed certain expenses and/or waived a portion of the investment management fees during certain of the periods shown. Repayment by a class (of expenses previously reimbursed and/or fees previously waived by Management) will decrease the class's returns. Please see Note B in the Notes to Financial Statements for specific information regarding expense reimbursement and/or fee waiver arrangements.
As stated in the Fund's most recent prospectus, the total annual operating expense ratios for fiscal year 2014 were 1.22%, 1.70% and 2.44% for Institutional Class, Class A and Class C shares, respectively (before expense reimbursements and/or fee waivers, if any). The expense ratios were 0.89%, 1.25% and 2.00% for Institutional Class, Class A and Class C shares, respectively, after expense reimbursements and/or fee waivers. The expense ratios for the annual period ending October 31, 2015 can be found in the Financial Highlights section of this report.
Returns shown with a sales charge reflect the deduction of the current maximum initial sales charge of 5.75% for Class A shares and the contingent deferred sales charge (CDSC) for Class C shares. The CDSC for Class C shares is 1%, which is reduced to 0% after 1 year. The performance of the Fund's share classes will differ primarily due to different sales charge structures and class expenses. Please see the prospectus for more information about sales charge structures, if any, and class expenses for your share class.
COMPARISON OF A $1,000,000 INVESTMENT
(000's omitted)
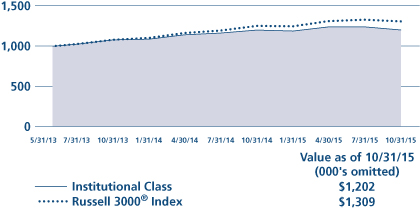
This graph shows the change in value of a hypothetical $1,000,000 investment in the Fund over the past 10 fiscal years, or since the Fund's inception if it has not operated for 10 years. The graph is based on the Institutional Class shares only; the performance of the Fund's share classes will differ primarily due to different sales charge structures and class expenses (see Performance Highlights chart on previous page). The result is compared with benchmarks, which include a broad-based market index and may include a more narrowly based index. Market indices have not been reduced to reflect any of the fees and costs of investing. The results shown in the graph reflect the reinvestment of income dividends and other distributions, if any. The results do not reflect the effect of taxes a shareholder would pay on Fund distributions or on the redemption of Fund shares. Results represent past performance and do not indicate future results.
Global Allocation Fund Commentary (Unaudited)
Neuberger Berman Global Allocation Fund Institutional Class generated a –1.12% total return for the 12 months ended October 31, 2015 and underperformed its custom benchmark, a 60/40 combination of the MSCI All Country World Index and the Barclays Global Aggregate Index, which provided a –0.73% return for the period. (Performance for all share classes is provided in the table immediately following this letter.) The benchmark changed during the reporting period; the prior custom benchmark was a 50/50 combination of the MSCI World Index and the J.P. Morgan Global Government Bond Index.
In January of 2015, the Fund was enhanced to include broader access to the firm's entire investment platform and two new portfolio managers were added to the portfolio. The Fund employs a diversified, flexible approach to accessing opportunities across the global marketplace and incorporates both strategic and tactical asset allocation decision making and active management. As part of the change, the benchmark was modified as noted above.
The global equity markets generated mixed returns during the reporting period. U.S. stocks outperformed other regions; non-U.S. developed stocks performed positively, while emerging markets stocks were challenged. In the fixed income markets, returns for non-U.S. and emerging markets were negative, while U.S. fixed income generated positive returns. The U.S. continues to be among the strongest developed economies as domestic growth remains positive. The eurozone is benefiting from the European Central Bank's monetary policies as business conditions have improved amidst lower oil prices and a weaker euro, contributing to increased GDP growth. Japan is aided by stimulus from the Bank of Japan and a weaker yen, but the economy faces threats from slowing growth in China, stagnating business and consumer confidence, and low wage inflation.
In the period since the Fund's enhancement mentioned above, equities have been the largest positive contributors to the Fund's performance. The overweight to the asset class as a whole added to performance, particularly security selection within non-U.S. developed equities. Security selection within U.S. equity markets was a drag on returns.
During the period, the Fund was underweighted to fixed income relative to its benchmark, a decision that added to performance as equity markets broadly outperformed fixed income markets. Security selection within fixed income detracted from returns primarily due to allocations within non-U.S. developed bonds and to emerging markets debt. The Fund's aggregate use of derivatives (futures contracts, forward contracts and swaps) detracted from performance.
Looking ahead, we are optimistic on the global economy, although financial markets remain dynamic and risks, of course, remain. Recent economic data have reflected a more resilient growth backdrop. In the U.S., October's employment report was strong on nearly every metric. Data outside of the U.S. is also showing signs of improvement as the purchasing manager indices for China, the eurozone and Japan all rose in October. Overall, we anticipate a more stable growth backdrop in the U.S. and abroad as the positive effects of additional monetary stimulus, low interest rates and low commodity prices work their way through the global economy. We remain constructive on risk assets, with a bias towards equities, particularly in the U.S. and Europe. In fixed income, we currently favor credit over developed market government securities. We are cautious on both emerging markets equities and debt.
Sincerely,
ERIK KNUTZEN, BRADLEY TANK, WAI LEE AND AJAY JAIN
PORTFOLIO MANAGERS
Information about principal risks of investing in the Fund is set forth in the prospectus and statement of additional information.
The portfolio composition, industries and holdings of the Fund are subject to change without notice.
The opinions expressed are those of the Fund's portfolio managers. The opinions are as of the date of this report and are subject to change without notice.
TICKER SYMBOLS
Institutional Class | | NGLIX | |
Class A | | NGLAX | |
Class C | | NGLCX | |
PERFORMANCE HIGHLIGHTS3
| | | | | Average Annual Total
Return Ended 10/31/2015 | |
| | | Inception
Date | | 1 Year | | Life of
Fund | |
At NAV | |
Institutional Class | | 12/29/2010 | | | –1.12 | % | | | 5.50 | % | |
Class A | | 12/29/2010 | | | –1.52 | % | | | 5.13 | % | |
Class C | | 12/29/2010 | | | –2.29 | % | | | 4.34 | % | |
With Sales Charge | |
Class A | | | | | | | –7.22 | % | | | 3.85 | % | |
Class C | | | | | | | –3.25 | % | | | 4.34 | % | |
Index | |
60% MSCI All Country World Index and
40% Barclays Global Aggregate Index1,2 | | | | | | | –0.73 | % | | | 5.28 | % | |
| MSCI All Country World Index1,2 | | | | | 0.50 | % | | | 7.58 | % | |
50% MSCI World Index and
50% J.P. Morgan
Global Government Bond Index1,2 | | | | | | | 0.20 | % | | | 5.12 | % | |
| MSCI World Index1,2 | | | | | | | 2.33 | % | | | 9.04 | % | |
The performance data quoted represent past performance and do not indicate future results. Current performance may be lower or higher than the performance data quoted. For performance data current to the most recent month-end, please visit www.nb.com/performance.
The results shown in the table reflect the reinvestment of income dividends and other distributions, if any. The results do not reflect the effect of taxes a shareholder would pay on Fund distributions or on the redemption of Fund shares.
The investment return and principal value of an investment will fluctuate and shares, when redeemed, may be worth more or less than their original cost.
Returns would have been lower if Neuberger Berman Management LLC (Management) had not reimbursed certain expenses and/or waived a portion of the investment management fees during certain of the periods shown. Repayment by a class (of expenses previously reimbursed and/or fees previously waived by Management) will decrease the class's returns. Please see Note B in the Notes to Financial Statements for specific information regarding expense reimbursement and/or fee waiver arrangements.
As stated in the Fund's most recent prospectus, the total annual operating expense ratios for fiscal year 2014 were 3.13%, 3.51% and 4.26% for Institutional Class, Class A and Class C shares, respectively (before expense reimbursements and/or fee waivers, if any). The expense ratios were 1.53%, 1.89% and 2.64% for Institutional Class, Class A and Class C shares, respectively, after expense reimbursements and/or fee waivers. The expense ratios for the annual period ending October 31, 2015 can be found in the Financial Highlights section of this report.
Returns shown with a sales charge reflect the deduction of the current maximum initial sales charge of 5.75% for Class A shares and the contingent deferred sales charge (CDSC) for Class C shares. The CDSC for Class C shares is 1%, which is reduced to 0% after 1 year. The performance of the Fund's share classes will differ primarily due to different sales charge structures and class expenses. Please see the prospectus for more information about sales charge structures, if any, and class expenses for your share class.
COMPARISON OF A $1,000,000 INVESTMENT
(000's omitted)

This graph shows the change in value of a hypothetical $1,000,000 investment in the Fund over the past 10 fiscal years, or since the Fund's inception if it has not operated for 10 years. The graph is based on the Institutional Class shares only; the performance of the Fund's share classes will differ primarily due to different sales charge structures and class expenses (see Performance Highlights chart on previous page). The result is compared with benchmarks, which include a broad-based market index and may include a more narrowly based index. Market indices have not been reduced to reflect any of the fees and costs of investing. The results shown in the graph reflect the reinvestment of income dividends and other distributions, if any. The results do not reflect the effect of taxes a shareholder would pay on Fund distributions or on the redemption of Fund shares. Results represent past performance and do not indicate future results.
Inflation Managed Fund Commentary* (Unaudited)
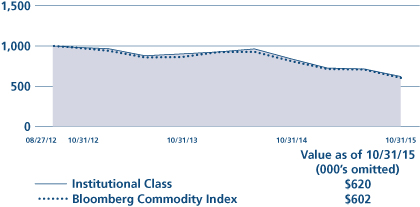
Neuberger Berman Inflation Managed Fund Institutional Class generated a –9.98% total return for the 12 months ended October 31, 2015. During this same time period, the Barclays U.S. 1-10 Year Treasury Inflation-Protected Securities (TIPS) Index provided a –1.24% return while the U.S. Consumer Price Index was up 0.2%.1 (Performance for all share classes is provided in the table immediately following this letter.)
Despite periods of volatility, the overall fixed income market posted a positive return over the 12-month period. Short-term Treasury yields rose in anticipation of the first U.S. Federal Reserve (Fed) interest rate hike in nearly a decade. In contrast, longer-term rates declined given several flights to quality, triggered by signs of moderating global growth and numerous geopolitical issues. The yield on the 10-year Treasury began the period at 2.35% and fell to as low as 1.68% in late January 2015, before ending the period at 2.16%. Most non-Treasury securities produced modest gains but generated mixed results versus equal-duration Treasuries during the period. Inflation expectations remained muted during the period.
The Fund's underperformance during the reporting period was largely driven by its allocations to commodities, master limited partnerships (MLPs) and energy- and materials-related equities. The Fund's emerging markets equity exposure was also a headwind for performance. On the upside, the Fund's exposures to real estate investment trusts (REITs) and senior floating rate loans contributed the most to its performance. Elsewhere, the Fund's dynamic overlay (flexible use of strategies in an attempt to capitalize on short-term changes in inflation expectations) did not meaningfully impact performance during the period.
The Fund's use of financial futures contracts had a positive impact on its performance.
Looking ahead, we anticipate that growth in the U.S. will continue to be driven by solid consumer spending, supported by stronger corporate balance sheets, lower energy costs and subdued inflation. In our view, the U.S. economy could expand by 2.5% (+/– 0.5%) in 2016. The sharp decline in energy prices has kept inflation muted, but the base effects of this downward spiral are set to dissipate, which should put upward pressure on the Consumer Price Index. All told, we believe inflation could move up to 2.0% (+/– 0.3) in 2016. In terms of the Fed, we have long felt that the timing of its initial rate hike was not as important as the pace and magnitude of future rate hikes. While we believe a decision on rate hikes will be data dependent, we see this as being a very slow and moderate process, likely taking several years before normalization ultimately occurs.
Sincerely,
THANOS BARDAS, ANDREW JOHNSON AND THOMAS J. MARTHALER
PORTFOLIO MANAGERS
Information about principal risks of investing in the Fund is set forth in the prospectus and statement of additional information.
The portfolio composition, industries and holdings of the Fund are subject to change without notice.
The opinions expressed are those of the Fund's portfolio managers. The opinions are as of the date of this report and are subject to change without notice.
1 Consumer Price Index (CPI) is a measure that examines the weighted average of prices of a basket of consumer goods and services, such as transportation, food and medical care. The CPI is one of the most frequently used statistics for identifying periods of inflation or deflation. The CPI is available monthly, so the value shown is from October 31, 2014 to October 31, 2015, and is not seasonally adjusted.
* Effective February 28, 2015, Neuberger Berman Inflation Navigator Fund changed its name to Neuberger Berman Inflation Managed Fund.
TICKER SYMBOLS
Institutional Class | | NDRIX | |
Class A | | NDRAX | |
Class C | | NDRCX | |
PORTFOLIO BY TYPE OF
INVESTMENT STRATEGY
(as a % of Total Investment Strategies)
Commodities | | | 9.1 | % | |
Emerging Markets | | | 5.3 | | |
Global Treasury Inflation Protected Securities | | | 28.2 | | |
High Yield Securities | | | 10.2 | | |
Loans | | | 3.7 | | |
Master Limited Partnerships | | | 13.1 | | |
Real Estate Investment Trusts | | | 9.3 | | |
S&P Energy | | | 10.8 | | |
S&P Materials | | | 10.3 | | |
Total | | | 100.0 | % | |
PORTFOLIO BY TYPE OF SECURITY
(as a % of Total Net Assets)
Common Stocks | | | 43.4 | % | |
Government Securities | | | 12.9 | | |
U.S. Treasury Securities | | | 13.7 | | |
Mutual Funds | | | 28.3 | | |
Short-Term Investments | | | 1.0 | | |
Cash, receivables and other assets,
less liabilities | | | 0.7 | * | |
Total | | | 100.0 | % | |
* Percentage includes appreciation/depreciation from derivatives, if any.
PERFORMANCE HIGHLIGHTS4
| | | | | Average Annual Total
Return Ended 10/31/2015 | |
| | | Inception
Date | | 1 Year | | Life of
Fund | |
At NAV | |
Institutional Class | | 12/19/2012 | | | –9.98 | % | | | –0.42 | % | |
Class A | | 12/19/2012 | | | –10.21 | % | | | –0.72 | % | |
Class C | | 12/19/2012 | | | –10.92 | % | | | –1.49 | % | |
| Class R65 | | 05/11/2015 | | | –9.88 | % | | | –0.39 | % | |
With Sales Charge | |
Class A | | | | | | | –15.35 | % | | | –2.75 | % | |
Class C | | | | | | | –11.80 | % | | | –1.49 | % | |
Index | |
Barclays U.S. 1-10 Year
Treasury TIPS Index1,2 | | | | | | | –1.24 | % | | | –1.56 | % | |
The performance data quoted represent past performance and do not indicate future results. Current performance may be lower or higher than the performance data quoted. For performance data current to the most recent month-end, please visit www.nb.com/performance.
The results shown in the table reflect the reinvestment of income dividends and other distributions, if any. The results do not reflect the effect of taxes a shareholder would pay on Fund distributions or on the redemption of Fund shares.
The investment return and principal value of an investment will fluctuate and shares, when redeemed, may be worth more or less than their original cost.
Returns would have been lower if Neuberger Berman Management LLC (Management) had not reimbursed certain expenses and/or waived a portion of the investment management fees during certain of the periods shown. Repayment by a class (of expenses previously reimbursed and/or fees previously waived by Management) will decrease the class's returns. Please see Note B in the Notes to Financial Statements for specific information regarding expense reimbursement and/or fee waiver arrangements.
As stated in the Fund's most recent prospectus, the total annual operating expense ratios for fiscal year 2014 were 3.53%, 3.95% and 4.74% for Institutional Class, Class A and Class C shares, respectively (before expense reimbursements and/or fee waivers, if any). The expense ratios were 1.00%, 1.36% and 2.11% for Institutional Class, Class A and Class C shares, respectively, after expense reimbursements and/or fee waivers. The expense ratios for the annual period ending October 31, 2015 can be found in the Financial Highlights section of this report.
Returns shown with a sales charge reflect the deduction of the current maximum initial sales charge of 5.75% for Class A shares and the contingent deferred sales charge (CDSC) for Class C shares. The CDSC for Class C shares is 1%, which is reduced to 0% after 1 year. The performance of the Fund's share classes will differ primarily due to different sales charge structures and class expenses. Please see the prospectus for more information about sales charge structures, if any, and class expenses for your share class.
COMPARISON OF A $1,000,000 INVESTMENT
(000's omitted)
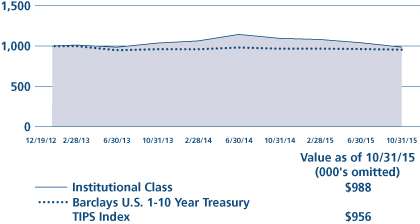
This graph shows the change in value of a hypothetical $1,000,000 investment in the Fund over the past 10 fiscal years, or since the Fund's inception if it has not operated for 10 years. The graph is based on the Institutional Class shares only; the performance of the Fund's share classes will differ primarily due to different sales charge structures and class expenses (see Performance Highlights chart on previous page). The result is compared with benchmarks, which include a broad-based market index and may include a more narrowly based index. Market indices have not been reduced to reflect any of the fees and costs of investing. The results shown in the graph reflect the reinvestment of income dividends and other distributions, if any. The results do not reflect the effect of taxes a shareholder would pay on Fund distributions or on the redemption of Fund shares. Results represent past performance and do not indicate future results.
Long Short Fund Commentary (Unaudited)
Neuberger Berman Long Short Fund Institutional Class generated a –1.45% total return for the 12 months ended October 31, 2015 and underperformed its primary benchmark, the HFRX Equity Hedge Index, which returned –0.96% for the period. The Fund also underperformed the S&P 500® Index, which provided a 5.20% return for the period. (Performance for all share classes is provided in the table immediately following this letter.)
The global financial markets generally posted modest gains during the reporting period. The markets experienced periods of elevated volatility due to mixed economic data, uncertainties surrounding monetary policy, falling commodity prices and a host of geopolitical issues. Economic growth in the U.S. was uneven but remained in expansionary mode while inflation remained benign. During the period, expectations increased that the U.S. Federal Reserve (Fed) was getting closer to raising rates for the first time in nearly a decade. Elsewhere, growth was generally muted in Europe and Japan, whereas China's growth expansion moderated during the period.
We maintained our positive outlook on risk assets such as equities and high yield bonds during the reporting period. This was reflected in the Fund's net notional long exposure, which began the period at approximately 55% net long, then moved to a low of about 50%, before closing the period at roughly 52%. Given our outlook for an ongoing economic expansion in the U.S., we continued to favor more cyclical industries, including those within the Consumer Discretionary and Industrials sectors.
We categorize our long investment exposure into three groups: Capital Growth, Total Return and Opportunistic. During the period we reduced our allocation to Total Return in favor of Capital Growth. We found what seemed to us to be more compelling opportunities in Capital Growth relative to Total Return, as higher interest rates could negatively impact longer duration assets and cash flows. The portfolio's short exposure includes "Fundamental" shorts and "Market" shorts. During the period, our Market shorts consisted primarily of sector-based exchange traded funds, coupled with short futures positions on broad-based U.S. equity indices and U.S. Treasuries. During the period, we found more shorting opportunities based on underlying company fundamentals.
The Fund's aggregate use of derivatives (futures contracts, option contracts and swap contracts) detracted from performance during the period.
Looking ahead, we maintain our view that a mix of higher risk assets such as U.S. equities and high yield bonds can present attractive risk-adjusted returns for those market participants that can afford to take on longer-term time horizons, or who believe in the gradual normalization of future growth. We believe the U.S. economy will continue to grow steadily, while a still highly accommodative Fed may create a longer-than-expected (albeit certainly slower than expected) U.S. business cycle. Should more robust growth eventually appear, we believe markets are much more prepared today for an eventual interest rate hike, especially for monetary tightening related to higher inflation. For now, however, it seems to us that the market worry leans toward too little growth (stagnation) as opposed to too much growth (potential for more inflation).
Sincerely,
CHARLES KANTOR
PORTFOLIO MANAGER
Information about principal risks of investing in the Fund is set forth in the prospectus and statement of additional information.
The portfolio composition, industries and holdings of the Fund are subject to change without notice.
The opinions expressed are those of the Fund's portfolio manager. The opinions are as of the date of this report and are subject to change without notice.
TICKER SYMBOLS
Institutional Class | | NLSIX | |
Class A | | NLSAX | |
Class C | | NLSCX | |
PORTFOLIO BY TYPE OF SECURITY
(as a % of Total Net Assets)
| | | Long | | Short | |
Common Stocks | | | 72.1 | % | | | (8.0 | )% | |
Corporate Debt Securities | | | 4.0 | | | | — | | |
Exchange Traded Funds | | | — | | | | (3.9 | ) | |
Purchased Options | | | 0.0 | | | | — | | |
Short-Term Investments | | | 22.1 | | | | — | | |
Cash, receivables and other
assets, less liabilities | | | 13.7 | * | | | — | | |
Total | | | 111.9 | % | | | (11.9 | )% | |
* Percentage includes appreciation/depreciation from derivatives, if any.
PERFORMANCE HIGHLIGHTS
| | | | | Average Annual Total
Return Ended 10/31/2015 | |
| �� | | Inception
Date | | 1 Year | | Life of
Fund | |
At NAV | |
Institutional Class | | 12/29/2011 | | | –1.45 | % | | | 7.07 | % | |
Class A | | 12/29/2011 | | | –1.89 | % | | | 6.67 | % | |
Class C | | 12/29/2011 | | | –2.56 | % | | | 5.90 | % | |
With Sales Charge | |
Class A | | | | | | | –7.55 | % | | | 5.04 | % | |
Class C | | | | | | | –3.53 | % | | | 5.90 | % | |
Index | |
| HFRX Equity Hedge Index1,2 | | | | | | | –0.96 | % | | | 4.15 | % | |
| S&P 500® Index1,2 | | | | | | | 5.20 | % | | | 16.60 | % | |
The performance data quoted represent past performance and do not indicate future results. Current performance may be lower or higher than the performance data quoted. For performance data current to the most recent month-end, please visit www.nb.com/performance.
The results shown in the table reflect the reinvestment of income dividends and other distributions, if any. The results do not reflect the effect of taxes a shareholder would pay on Fund distributions or on the redemption of Fund shares.
The investment return and principal value of an investment will fluctuate and shares, when redeemed, may be worth more or less than their original cost.
Returns would have been lower if Neuberger Berman Management LLC (Management) had not reimbursed certain expenses and/or waived a portion of the investment management fees during certain of the periods shown. Repayment by a class (of expenses previously reimbursed and/or fees previously waived by Management) will decrease the class's returns. Please see Note B in the Notes to Financial Statements for specific information regarding expense reimbursement and/or fee waiver arrangements.
As stated in the Fund's most recent prospectus, the total annual operating expense ratios for fiscal year 2014 were 1.73%, 2.11% and 2.85% for Institutional Class, Class A and Class C shares, respectively (before expense reimbursements and/or fee waivers, if any). The expense ratios for the annual period ending October 31, 2015 can be found in the Financial Highlights section of this report.
Returns shown with a sales charge reflect the deduction of the current maximum initial sales charge of 5.75% for Class A shares and the contingent deferred sales charge (CDSC) for Class C shares. The CDSC for Class C shares is 1%, which is reduced to 0% after 1 year. The performance of the Fund's share classes will differ primarily due to different sales charge structures and class expenses. Please see the prospectus for more information about sales charge structures, if any, and class expenses for your share class.
COMPARISON OF A $1,000,000 INVESTMENT
(000's omitted)
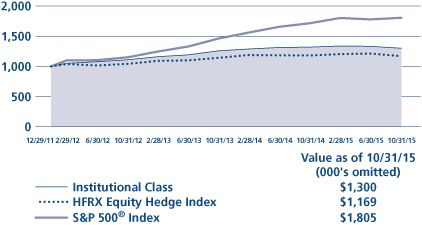
This graph shows the change in value of a hypothetical $1,000,000 investment in the Fund over the past 10 fiscal years, or since the Fund's inception if it has not operated for 10 years. The graph is based on the Institutional Class shares only; the performance of the Fund's share classes will differ primarily due to different sales charge structures and class expenses (see Performance Highlights chart on previous page). The result is compared with benchmarks, which include a broad-based market index and may include a more narrowly based index. Market indices have not been reduced to reflect any of the fees and costs of investing. The results shown in the graph reflect the reinvestment of income dividends and other distributions, if any. The results do not reflect the effect of taxes a shareholder would pay on Fund distributions or on the redemption of Fund shares. Results represent past performance and do not indicate future results.
Long Short Credit Fund Commentary (Unaudited)
We are pleased to provide the first annual report for Neuberger Berman Long Short Credit Fund, which was launched on June 29, 2015. The Fund seeks total return, including current income, consistent with managing volatility and preservation of capital.
For the period since its inception through October 31, 2015, the Fund's Institutional Class generated a –2.06% total return, resulting in mixed performance versus its benchmarks. During the period, the Fund outperformed the HFRX Fixed Income-Credit Index, which provided a –2.68% return, and the BofA Merrill Lynch U.S. High Yield Master II Index, which provided a –2.69% return. The Fund underperformed the Barclays U.S. Aggregate Bond Index, which provided a 1.88% return. (Performance for all share classes is provided in the table immediately following this letter.)
The credit markets have been quite volatile since June. From June through September, the Merrill Lynch High Yield Index posted four consecutive months of negative returns, only the second time ever that this has occurred, the last time being 1994. U.S. Federal Reserve (Fed) induced macro gyrations, continued concerns over commodity prices, deteriorating growth trajectories in China and a sense of dread on earnings estimates for the third quarter of 2015 all contributed to the volatility. In October, we saw the high yield bond market, together with other risk assets, post a solid rally. Following months of weakness, we believed that risk assets were in a technically oversold position and investor sentiment was as bearish as we can remember. One spark that helped ignite the rally was the weak September payroll numbers, which helped allay concerns of a Fed rate hike. Together with the stabilization in Chinese growth data, we believed that this produced the foundation for the rally. As earnings season in the U.S. progressed and companies began to beat lowered expectations, we saw growth fears further allayed and the rally became a feeding frenzy, culminating in the historic rally.
The Fund's performance during the period was driven by the Energy, Mining and Materials sectors where there was overall downward pressure, as well as the Industrials sector, where we saw some adverse idiosyncratic events.
The Fund's aggregate use of derivatives (such as option contracts, swaptions, futures contracts, swap contracts and forward contracts) as overlay hedges to the portfolio had a negative impact to the Fund's performance.
Looking forward, we will continue to build a portfolio that we believe can capture significant idiosyncratic opportunities. As risk premiums and volatility in credit have increased, we see increased return possibilities. This has far reaching implications. While we can rationalize market behavior, it is not our intent to sell you a series of returns you can buy through the market. Our portfolio is meant to benefit from both long and short fundamental idiosyncratic positioning. We are encouraged by what we believe we can achieve in the current environment and are of the view that the portfolio has the potential to be handsomely rewarded from both our long and short positioning.
Sincerely,
RICK DOWDLE AND NORMAN MILNER
PORTFOLIO MANAGERS
Information about principal risks of investing in the Fund is set forth in the prospectus and statement of additional information.
The portfolio composition, industries and holdings of the Fund are subject to change without notice.
The opinions expressed are those of the Fund's portfolio managers. The opinions are as of the date of this report and are subject to change without notice.
TICKER SYMBOLS
Institutional Class | | NLNIX | |
Class A | | NLNAX | |
Class C | | NLNCX | |
Class R6 | | NRLNX | |
PORTFOLIO BY TYPE OF SECURITY
(as a % of Total Net Assets)
| | | Long | | Short | |
Common Stocks | | | 0.6 | % | | | — | % | |
Corporate Debt Securities | | | 26.9 | | | | (2.5 | ) | |
Government Securities | | | — | | | | (0.7 | ) | |
Cash, receivables and other
assets, less liabilities | | | 75.7 | * | | | — | | |
Total | | | 103.2 | % | | | (3.2 | )% | |
* Percentage includes appreciation/depreciation from derivatives, if any.
PERFORMANCE HIGHLIGHTS
| | | Inception
Date | | Cumulative Total Return
Ended 10/31/2015
Life of Fund | |
At NAV | | | | | |
Institutional Class | | 06/29/2015 | | | –2.06 | % | |
Class A | | 06/29/2015 | | | –2.17 | % | |
Class C | | 06/29/2015 | | | –2.41 | % | |
Class R6 | | 06/29/2015 | | | –2.03 | % | |
With Sales Charge | |
Class A | | | | | | | –6.30 | % | |
Class C | | | | | | | –3.39 | % | |
Index | |
| HFRX Fixed Income-Credit Index1,2 | | | | | | | –2.68 | % | |
| Barclays U.S. Aggregate Bond Index1,2 | | | | | | | 1.88 | % | |
BofA Merrill Lynch U.S. High Yield
Master II Index1,2 | | | | | | | –2.69 | % | |
The performance data quoted represent past performance and do not indicate future results. Current performance may be lower or higher than the performance data quoted. For performance data current to the most recent month-end, please visit www.nb.com/performance.
The results shown in the table reflect the reinvestment of income dividends and other distributions, if any. The results do not reflect the effect of taxes a shareholder would pay on Fund distributions or on the redemption of Fund shares.
The investment return and principal value of an investment will fluctuate and shares, when redeemed, may be worth more or less than their original cost.
Returns would have been lower if Neuberger Berman Management LLC (Management) had not reimbursed certain expenses and/or waived a portion of the investment management fees during the period shown. Repayment by a class (of expenses previously reimbursed and/or fees previously waived by Management) will decrease the class's returns. Please see Note B in the Notes to Financial Statements for specific information regarding expense reimbursement and/or fee waiver arrangements.
For the period ended October 31, 2015, the 30-day SEC yields were 1.93%, 1.48%, 0.82% and 2.00% for Institutional Class, Class A, Class C and Class R6 shares, respectively. Absent expense reimbursements and/or fee waivers, the 30-day SEC yields would have been 1.47%, 0.82% and 2.32% for Class A, Class C and Class R6 shares, respectively. Absent repayment, the 30-day SEC yield would have been 2.63% for Institutional Class shares.
As stated in the Fund's most recent prospectus, the estimated total annual operating expense ratios for fiscal year 2015 were 1.52%, 1.89%, 2.64% and 1.45% for Institutional Class, Class A, Class C and Class R6 shares, respectively (before expense reimbursements and/or fee waivers, if any). The estimated total annual operating expense ratios are 1.20%, 1.57%, 2.32% and 1.13% for Institutional Class, Class A, Class C and Class R6 shares, respectively, after expense reimbursements and/or fee waivers. The expense ratios for the period from June 29, 2015 through October 31, 2015 can be found in the Financial Highlights section of this report.
Returns shown with a sales charge reflect the deduction of the current maximum initial sales charge of 4.25% for Class A shares and the contingent deferred sales charge (CDSC) for Class C shares. The CDSC for Class C shares is 1%, which is reduced to 0% after 1 year. The performance of the Fund's share classes will differ primarily due to different sales charge structures and class expenses. Please see the prospectus for more information about sales charge structures, if any, and class expenses for your share class.
COMPARISON OF A $1,000,000 INVESTMENT
(000's omitted)
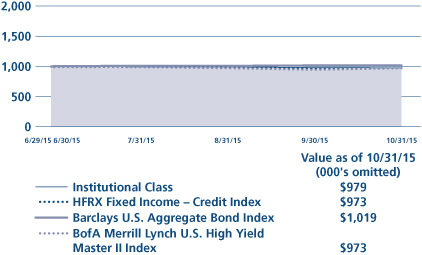
This graph shows the change in value of a hypothetical $1,000,000 investment in the Fund over the past 10 fiscal years, or since the Fund's inception if it has not operated for 10 years. The graph is based on the Institutional Class shares only; the performance of the Fund's share classes will differ primarily due to different sales charge structures and class expenses (see Performance Highlights chart on previous page). The result is compared with benchmarks, which include a broad-based market index and may include a more narrowly based index. Market indices have not been reduced to reflect any of the fees and costs of investing. The results shown in the graph reflect the reinvestment of income dividends and other distributions, if any. The results do not reflect the effect of taxes a shareholder would pay on Fund distributions or on the redemption of Fund shares. Results represent past performance and do not indicate future results.
Multi-Asset Income Fund Commentary (Unaudited)
Since its inception on March 27, 2015 through October 31, 2015, the Neuberger Berman Multi-Asset Income Fund Institutional Class generated a –3.43% total return and underperformed its custom benchmark, a 60/40 combination of the Barclays U.S. Aggregate Bond Index and the S&P 500® Index, which provided a 1.07% return for the period. (Performance for all share classes is provided in the table immediately following this letter.)
Global equity markets generated mixed returns since the Fund's inception. U.S. stocks outperformed other regions, as non-U.S. developed and emerging markets stocks were challenged. In fixed income markets, non-U.S. developed fixed income was negative and U.S. fixed income was flat. The U.S. continues to be among the strongest developed economies as domestic growth remains positive. The eurozone appears to be benefiting from the European Central Bank's monetary policy actions as business conditions improve amidst lower oil prices and a weaker euro, contributing to increased GDP growth. Japan was aided by stimulus from the Bank of Japan and a weaker yen, but the economy faces threats from slowing growth in China, stagnating business and consumer confidence, and low wage inflation.
Since the Fund's launch, its overweight position to equities contributed positively to performance, as equities outperformed fixed income. Allocations to Master Limited Partnerships and non-U.S. developed equities, however, detracted from performance. Within equities, the Fund's holdings emphasized securities that, in our view, offered the potential for higher yields than the benchmark index. The Fund's underweight position to fixed income contributed positively to performance, but allocations to credit sectors hurt. Within fixed income, the Fund's holdings were focused less on government securities than was the benchmark index. The Fund's aggregate use of derivatives (futures contracts, forward contracts and option contracts), had a positive impact on performance.
Looking ahead, we are optimistic on the global economy, although financial markets remain dynamic and risks, of course, remain. Recent economic data have reflected a more resilient growth backdrop. In the U.S., October's employment report was strong on nearly every metric. Data outside of the U.S. is also showing signs of improvement as purchasing manager indices for China, the eurozone and Japan all rose in October. Overall, we anticipate a more stable growth backdrop in the U.S. and abroad as the positive effects of additional monetary stimulus, low interest rates and low commodity prices work their way through the global economy. We remain constructive on risk asset classes (e.g., high yield bonds, equities, currencies), with a bias towards equities, particularly in the U.S. and Europe, and currently favor credit over developed market government securities. We are cautious on both emerging markets equities and debt.
Sincerely,
ERIK KNUTZEN, BRADLEY TANK, WAI LEE AND AJAY JAIN
PORTFOLIO MANAGERS
Information about principal risks of investing in the Fund is set forth in the prospectus and statement of additional information.
The portfolio composition, industries and holdings of the Fund are subject to change without notice.
The opinions expressed are those of the Fund's portfolio managers. The opinions are as of the date of this report and are subject to change without notice.
TICKER SYMBOLS
Institutional Class | | NANIX | |
Class A | | NANAX | |
Class C | | NANCX | |
Class R6 | | NRANX | |
PORTFOLIO BY TYPE OF SECURITY
(as a % of Total Net Assets)
Common Stocks | | | 40.9 | % | |
Convertible Bonds | | | 0.3 | | |
Exchange Traded Funds | | | 5.7 | | |
Mutual Funds | | | 43.3 | | |
Preferred Stocks | | | 2.0 | | |
U.S. Government Agency Securities | | | 0.8 | | |
U.S. Treasury Securities | | | 6.3 | | |
Short-Term Investments | | | 1.0 | | |
Liabilities, less cash, receivables and
other assets | | | (0.3 | )* | |
Total | | | 100.0 | % | |
* Percentage includes appreciation/depreciation from derivatives, if any.
PERFORMANCE HIGHLIGHTS2
| | | Inception
Date | | Cumulative Total Return
Ended 10/31/2015
Life of Fund | |
At NAV | |
Institutional Class | | 03/27/2015 | | | –3.43 | % | |
Class A | | 03/27/2015 | | | –3.64 | % | |
Class C | | 03/27/2015 | | | –4.07 | % | |
Class R6 | | 03/27/2015 | | | –3.39 | % | |
With Sales Charge | |
Class A | | | | | | | –7.70 | % | |
Class C | | | | | | | –5.01 | % | |
Index | |
60% Barclays U.S. Aggregate Bond Index
and 40% S&P 500 Index1,2 | | | | | | | 1.07 | % | |
| Barclays U.S. Aggregate Bond Index1,2 | | | | | | | –0.02 | % | |
The performance data quoted represent past performance and do not indicate future results. Current performance may be lower or higher than the performance data quoted. For performance data current to the most recent month-end, please visit www.nb.com/performance.
The results shown in the table reflect the reinvestment of income dividends and other distributions, if any. The results do not reflect the effect of taxes a shareholder would pay on Fund distributions or on the redemption of Fund shares.
The investment return and principal value of an investment will fluctuate and shares, when redeemed, may be worth more or less than their original cost.
Returns would have been lower if Neuberger Berman Management LLC (Management) had not reimbursed certain expenses and/or waived a portion of the investment management fees during the period shown. Repayment by a class (of expenses previously reimbursed and/or fees previously waived by Management) will decrease the class's returns. Please see Note B in the Notes to Financial Statements for specific information regarding expense reimbursement and/or fee waiver arrangements.
For the period ended October 31, 2015, the 30-day SEC yields were 3.84%, 3.33%, 2.73% and 3.92% for Institutional Class, Class A, Class C and Class R6 shares, respectively. Absent expense reimbursements and/or fee waivers, the 30-day SEC yields would have been 0.07%, –0.30%, –0.97% and 0.43% for Institutional Class, Class A, Class C and Class R6 shares, respectively.
As stated in the Fund's most recent prospectus, the estimated total annual operating expense ratios for fiscal year 2015 were 1.36%, 1.73%, 2.48% and 1.29% for Institutional Class, Class A, Class C and Class R6 shares, respectively (before expense reimbursements and/or fee waivers, if any). The estimated total annual operating expense ratios are 0.78%, 1.15%, 1.90% and 0.71% for Institutional Class, Class A, Class C and Class R6 shares, respectively, after expense reimbursements and/or fee waivers. The expense ratios for the period from March 27, 2015 through October 31, 2015 can be found in the Financial Highlights section of this report.
Returns shown with a sales charge reflect the deduction of the current maximum initial sales charge of 4.25% for Class A shares and the contingent deferred sales charge (CDSC) for Class C shares. The CDSC for Class C shares is 1%, which is reduced to 0% after 1 year. The performance of the Fund's share classes will differ primarily due to different sales charge structures and class expenses. Please see the prospectus for more information about sales charge structures, if any, and class expenses for your share class.
COMPARISON OF A $1,000,000 INVESTMENT
(000's omitted)
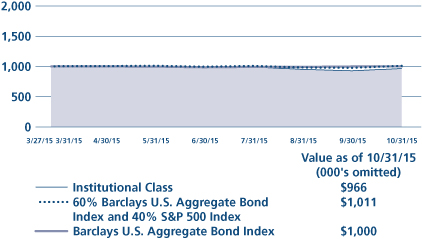
This graph shows the change in value of a hypothetical $1,000,000 investment in the Fund over the past 10 fiscal years, or since the Fund's inception if it has not operated for 10 years. The graph is based on the Institutional Class shares only; the performance of the Fund's share classes will differ primarily due to different sales charge structures and class expenses (see Performance Highlights chart on previous page). The result is compared with benchmarks, which include a broad-based market index and may include a more narrowly based index. Market indices have not been reduced to reflect any of the fees and costs of investing. The results shown in the graph reflect the reinvestment of income dividends and other distributions, if any. The results do not reflect the effect of taxes a shareholder would pay on Fund distributions or on the redemption of Fund shares. Results represent past performance and do not indicate future results.
1 Please see "Glossary of Indices" on page 22 for a description of indices. Please note that individuals cannot invest directly in any index. The HFRX Equity Hedge Index takes into account fees and expenses of investing since it is based on the underlying hedge funds' net returns. The other indices described in this report do not take into account any fees, expenses or tax consequences of investing in the individual securities that they track. Data about the performance of an index are prepared or obtained by Neuberger Berman Management LLC* and reflect the reinvestment of income dividends and other distributions, if any. The Fund may invest in securities not included in a described index and generally does not invest in all securities included in a described index.
2 The date used to calculate Life of Fund performance for the index is the inception date of the oldest share class.
3 During the period from December 29, 2010 through April 30, 2011, Neuberger Berman Global Allocation Fund had only one shareholder and the Fund was relatively small, which could have impacted Fund performance. The same techniques used to produce returns in a small fund may not work to produce similar returns in a larger fund.
4 Effective February 28, 2015, Neuberger Berman Inflation Navigator Fund changed its name to Neuberger Berman Inflation Managed Fund.
5 The performance information for Class R6 prior to the class' inception date is that of the Institutional Class of Neuberger Berman Inflation Managed Fund. The performance information for the Institutional Class has not been adjusted to take into account differences in class specific operating expenses. The Institutional Class has higher expenses and typically lower returns than Class R6.
* On or about January 1, 2016, it is anticipated that Neuberger Berman Management LLC (NBM) and Neuberger Berman LLC (NB LLC) will transfer to Neuberger Berman Fixed Income LLC (NBFI) their rights and obligations pertaining to all services they provide to any Fund under any investment management, investment sub-advisory, and/or administration agreement, as applicable (the "Agreements"). Following such transfer, NBFI will be renamed Neuberger Berman Investment Advisers LLC (NBIA). In addition, on the date of the transfer, the services previously provided by NB Alternative Investment Management LLC (NBAIM) will be provided by NBIA.
NBM currently serves as each Fund's investment manager and administrator and each of NB LLC, NBFI and NBAIM currently serve as certain Funds' adviser or sub-adviser. Following the consolidation, the investment professionals of NBM, NB LLC, NBFI and NBAIM who currently provide services to the Funds under the Agreements will continue to provide the same services, except that they will provide those services in their new capacities as investment professionals of NBIA. Further, the consolidation will not result in any change in the investment processes currently employed by any Fund, the nature or level of services provided to any Fund, or the fees any Fund pays under its Agreements.
For more complete information on any of the Neuberger Berman Alternative and Multi-Asset Class Funds, call Neuberger Berman Management LLC at (800) 877-9700, or visit our website at www.nb.com.
Barclays Global Aggregate Index: | | The index measures global investment grade debt from twenty-four different local currency markets and includes fixed-rate treasury, government-related, corporate and securitized bonds from both developed and emerging markets issuers. The index is largely comprised of three major regional aggregate components: the Barclays U.S. Aggregate Bond Index, the Barclays Pan-European Aggregate Bond Index, and the Barclays Asian-Pacific Aggregate Index. In addition to securities from these three indices, the Barclays Global Aggregate Index also includes investment grade Eurodollar, Euro-Yen, Canadian, and 144A Index-eligible securities not already in these three indices. | |
Barclays U.S. Aggregate Bond Index: | | The index measures the investment grade, U.S. dollar-denominated, fixed-rate, taxable bond market and includes Treasuries, government-related and corporate securities, mortgage-backed securities (MBS) (agency fixed-rate and hybrid adjustable rate mortgage (ARM) pass-throughs), asset-backed securities (ABS), and commercial mortgage-backed securities (CMBS) (agency and nonagency). | |
60% Barclays U.S. Aggregate Bond Index and 40% S&P 500® Index: | | The blended index is composed of 60% Barclays U.S. Aggregate Bond Index (described above) and 40% S&P 500® Index (described on following page), and is rebalanced monthly. | |
Barclays U.S. 1-10 Year Treasury Inflation-Protected Securities (TIPS) Index: | | The index is the 1-10 year component of the Barclays U.S. TIPS Index (Series-L). The Barclays U.S. TIPS Index (Series-L) tracks the performance of inflation-protection securities issued by the U.S. Treasury. | |
BofA Merrill Lynch U.S. High Yield Index: | | The index is an unmanaged market value-weighted index of all domestic and Yankee high-yield bonds, including deferred interest bonds and payment-in-kind securities. Qualifying bonds must have at least one year remaining to maturity, a fixed coupon schedule and a minimum amount outstanding of $100 million. Qualifying bonds are capitalization weighted, provided the total allocation to an individual issuer does not exceed 2%. | |
HFRX Fixed Income-Credit Index: | | The index tracks the performance of hedge fund strategies with exposure to credit across a broad continuum of credit sub-strategies, including Corporate, Sovereign, Distressed, Convertible, Asset Backed, Capital Structure Arbitrage, Multi-Strategy and other Relative Value and Event Driven sub-strategies. The investment thesis across all strategies is predicated on realization of a valuation discrepancy between the related credit instruments. Strategies may also include and utilize equity securities, credit derivatives, government fixed income, commodities, currencies or other hybrid securities. Constituent funds are selected from an eligible pool of the more than 7,500 funds worldwide that report to the Hedge Fund Research (HFR) Database. Constituent funds must meet all of the following criteria: report monthly; report performance net of all fees; be U.S. dollar-denominated; be active and accepting new investments; have a minimum 24 months track record; and the fund's manager must have at least $50 million in assets under management. Constituents are weighted by a representative optimization methodology. The index is rebalanced quarterly. | |
Glossary of Indices (cont'd)
HFRX Equity Hedge Index: | | The index comprises equity hedge strategies. Equity hedge strategies maintain positions both long and short in primarily equity and equity derivative securities. A wide variety of investment processes can be employed to arrive at an investment decision, including both quantitative and fundamental techniques; strategies can be broadly diversified or narrowly focused on specific sectors and can range broadly in terms of levels of net exposure, leverage employed, holding period, concentrations of market capitalizations and valuation ranges of typical portfolios. Equity hedge managers would typically maintain at least 50%, and may in some cases be substantially entirely invested, in equities, both long and short. Constituent funds are selected from an eligible pool of the more than 7,500 funds worldwide that report to the Hedge Fund Research (HFR) Database. Constituent funds must meet all of the following criteria: report monthly; report performance net of all fees; be U.S. dollar-denominated; be active and accepting new investments; have a minimum 24 months track record; and the fund's manager must have at least $50 million in assets under management. The index is rebalanced quarterly. | |
MSCI All Country World Index: | | The index is a free float-adjusted market capitalization weighted index that is designed to measure the equity market performance of developed and emerging markets. The index consists of 46 country indices comprising 23 developed and 23 emerging market country indices. The developed market country indices included are: Australia, Austria, Belgium, Canada, Denmark, Finland, France, Germany, Hong Kong, Ireland, Israel, Italy, Japan, the Netherlands, New Zealand, Norway, Portugal, Singapore, Spain, Sweden, Switzerland, the United Kingdom and the United States. The emerging market country indices included are: Brazil, Chile, China, Colombia, Czech Republic, Egypt, Greece, Hungary, India, Indonesia, Korea, Malaysia, Mexico, Peru, the Philippines, Poland, Qatar, Russia, South Africa, Taiwan, Thailand, Turkey, and the UAE. | |
60% MSCI All Country World Index and 40% Barclays Global Aggregate Index: | | The blended index is composed of 60% MSCI All Country World Index (described above) and 40% Barclays Global Aggregate Index (described above), and is rebalanced monthly. | |
MSCI World Index: | | The index is a free float-adjusted market capitalization-weighted index that is designed to measure the equity market performance of developed markets. The index consists of the following 23 developed market country indices: Australia, Austria, Belgium, Canada, Denmark, Finland, France, Germany, Hong Kong, Ireland, Israel, Italy, Japan, the Netherlands, New Zealand, Norway, Portugal, Singapore, Spain, Sweden, Switzerland, the United Kingdom, and the United States. | |
50% MSCI World Index and 50% J.P. Morgan Global Government Bond Index: | | The blended index is composed of 50% MSCI World Index (described above) and 50% J.P. Morgan Global Government Bond Index, and is rebalanced monthly. The J.P. Morgan Global Government Bond Index tracks the performance of local currency denominated bonds issued by developed market governments. The index consists of issues from the following 13 developed international bond markets: Australia, Belgium, Canada, Denmark, France, Germany, Italy, Japan, Netherlands, Spain, Sweden, United Kingdom and United States. | |
| Russell 3000® Index: | | The index is a float-adjusted market capitalization-weighted index that measures the performance of the 3,000 largest U.S. public companies based on total market capitalization. The index is rebalanced annually in June. | |
| S&P 500® Index: | | The index is a float-adjusted market capitalization-weighted index that focuses on the large-cap segment of the U.S. equity market, and includes a significant portion of the total value of the market. | |
Information About Your Fund's Expenses (Unaudited)
As a Fund shareholder, you incur two types of costs: (1) transaction costs, including sales charges (loads) on purchase payments or redemption proceeds (if applicable); and (2) ongoing costs, including management fees, distribution and/or service (12b-1) fees (if applicable), and other Fund expenses. This example is intended to help you understand your ongoing costs (in U.S. dollars) of investing in a Fund and compare these costs with the ongoing costs of investing in other mutual funds.
This table is designed to provide information regarding costs related to your investments. The following examples are based on an investment of $1,000 made at the beginning of the six month period ended October 31, 2015 and held for the entire period. The table illustrates each Fund's costs in two ways:
Actual Expenses and Performance: | | The first section of the table provides information about actual account values and actual expenses in dollars, based on the Fund's actual performance during the period indicated. You may use the information in this line, together with the amount you invested, to estimate the expenses you paid over the period. Simply divide your account value by $1,000 (for example, an $8,600 account value divided by $1,000 = 8.6), then multiply the result by the number in the first section of the table under the heading entitled "Expenses Paid During the Period" to estimate the expenses you paid over the period. | |
Hypothetical Example for Comparison Purposes: | | The second section of the table provides information about hypothetical account values and hypothetical expenses based on the Fund's actual expense ratio and an assumed rate of return at 5% per year before expenses. This return is not the Fund's actual return. The hypothetical account values and expenses may not be used to estimate the actual ending account balance or expenses you paid for the period. You may use this information to compare the ongoing costs of investing in a Fund versus other funds. To do so, compare the expenses shown in this 5% hypothetical example with the 5% hypothetical examples that appear in the shareholder reports of other funds. | |
Please note that the expenses in the table are meant to highlight your ongoing costs only and do not include any transaction costs, such as sales charges (loads) (if applicable). Therefore, the information under the heading "Hypothetical (5% annual return before expenses)" is useful in comparing ongoing costs only, and will not help you determine the relative total costs of owning different funds. In addition, if these transaction costs were included, your costs would have been higher.
Expense Information as of 10/31/15 (Unaudited)
Neuberger Berman Alternative Funds | |
| | | ACTUAL | | HYPOTHETICAL (5% ANNUAL RETURN BEFORE EXPENSES)(5) | |
| | | Beginning
Account
Value
5/1/15 | | Ending
Account
Value
10/31/15 | | Expenses Paid
During the
Period(1)
5/1/15 - 10/31/15 | | Expense
Ratio | | Beginning
Account
Value
5/1/15 | | Ending
Account
Value
10/31/15 | | Expenses Paid
During the
Period(1)
5/1/15 - 10/31/15 | | Expense
Ratio | |
Flexible Select Fund | |
Institutional Class | | $ | 1,000.00 | | | $ | 969.20 | | | $ | 4.12 | | | | 0.83 | % | | $ | 1,000.00 | | | $ | 1,021.02 | | | $ | 4.03 | | | | 0.83 | % | |
Class A | | $ | 1,000.00 | | | $ | 967.40 | | | $ | 5.95 | | | | 1.20 | % | | $ | 1,000.00 | | | $ | 1,019.16 | | | $ | 6.11 | | | | 1.20 | % | |
Class C | | $ | 1,000.00 | | | $ | 963.00 | | | $ | 9.60 | | | | 1.94 | % | | $ | 1,000.00 | | | $ | 1,015.43 | | | $ | 9.86 | | | | 1.94 | % | |
Global Allocation Fund | |
Institutional Class | | $ | 1,000.00 | | | $ | 943.80 | | | $ | 4.80 | | | | 0.98 | % | | $ | 1,000.00 | | | $ | 1,020.27 | | | $ | 4.99 | | | | 0.98 | % | |
Class A | | $ | 1,000.00 | | | $ | 941.80 | | | $ | 6.56 | | | | 1.34 | % | | $ | 1,000.00 | | | $ | 1,018.45 | | | $ | 6.82 | | | | 1.34 | % | |
Class C | | $ | 1,000.00 | | | $ | 938.20 | | | $ | 10.21 | | | | 2.09 | % | | $ | 1,000.00 | | | $ | 1,014.67 | | | $ | 10.61 | | | | 2.09 | % | |
| Inflation Managed Fund(2) | |
Institutional Class | | $ | 1,000.00 | | | $ | 903.80 | | | $ | 3.41 | | | | 0.71 | % | | $ | 1,000.00 | | | $ | 1,021.63 | | | $ | 3.62 | | | | 0.71 | % | |
Class A | | $ | 1,000.00 | | | $ | 903.40 | | | $ | 5.13 | | | | 1.07 | % | | $ | 1,000.00 | | | $ | 1,019.81 | | | $ | 5.45 | | | | 1.07 | % | |
Class C | | $ | 1,000.00 | | | $ | 899.60 | | | $ | 8.71 | | | | 1.82 | % | | $ | 1,000.00 | | | $ | 1,016.03 | | | $ | 9.25 | | | | 1.82 | % | |
Class R6 | | $ | 1,000.00 | | | $ | 907.30 | | | $ | 2.96 | (3) | | | 0.65 | % | | $ | 1,000.00 | | | $ | 1,021.93 | | | $ | 3.31 | | | | 0.65 | % | |
Long Short Fund | |
Institutional Class | | $ | 1,000.00 | | | $ | 967.40 | | | $ | 8.18 | | | | 1.65 | % | | $ | 1,000.00 | | | $ | 1,016.89 | | | $ | 8.39 | | | | 1.65 | % | |
Class A | | $ | 1,000.00 | | | $ | 965.60 | | | $ | 10.01 | | | | 2.02 | % | | $ | 1,000.00 | | | $ | 1,015.02 | | | $ | 10.26 | | | | 2.02 | % | |
Class C | | $ | 1,000.00 | | | $ | 962.40 | | | $ | 13.65 | | | | 2.76 | % | | $ | 1,000.00 | | | $ | 1,011.29 | | | $ | 13.99 | | | | 2.76 | % | |
Long Short Credit Fund | |
Institutional Class | | $ | 1,000.00 | | | $ | 979.40 | | | $ | 3.90 | (4) | | | 1.15 | % | | $ | 1,000.00 | | | $ | 1,019.41 | | | $ | 5.85 | | | | 1.15 | % | |
Class A | | $ | 1,000.00 | | | $ | 978.30 | | | $ | 5.08 | (4) | | | 1.50 | % | | $ | 1,000.00 | | | $ | 1,017.64 | | | $ | 7.63 | | | | 1.50 | % | |
Class C | | $ | 1,000.00 | | | $ | 975.90 | | | $ | 7.44 | (4) | | | 2.20 | % | | $ | 1,000.00 | | | $ | 1,014.12 | | | $ | 11.17 | | | | 2.20 | % | |
Class R6 | | $ | 1,000.00 | | | $ | 979.70 | | | $ | 3.66 | (4) | | | 1.08 | % | | $ | 1,000.00 | | | $ | 1,019.76 | | | $ | 5.50 | | | | 1.08 | % | |
Multi-Asset Income Fund | |
Institutional Class | | $ | 1,000.00 | | | $ | 954.00 | | | $ | 2.12 | | | | 0.43 | % | | $ | 1,000.00 | | | $ | 1,023.04 | | | $ | 2.19 | | | | 0.43 | % | |
Class A | | $ | 1,000.00 | | | $ | 952.30 | | | $ | 3.94 | | | | 0.80 | % | | $ | 1,000.00 | | | $ | 1,021.17 | | | $ | 4.08 | | | | 0.80 | % | |
Class C | | $ | 1,000.00 | | | $ | 948.60 | | | $ | 7.61 | | | | 1.55 | % | | $ | 1,000.00 | | | $ | 1,017.39 | | | $ | 7.88 | | | | 1.55 | % | |
Class R6 | | $ | 1,000.00 | | | $ | 954.40 | | | $ | 1.77 | | | | 0.36 | % | | $ | 1,000.00 | | | $ | 1,023.39 | | | $ | 1.84 | | | | 0.36 | % | |
(1) For each class, expenses are equal to the annualized expense ratio for the class, multiplied by the average account value over the period, multiplied by 184/365 (to reflect the one-half year period shown), unless otherwise indicated.
(2) Effective February 28, 2015. Formerly, Inflation Navigator Fund through February 27, 2015.
(3) For each class, expenses are equal to the annualized expense ratio for the class, multiplied by the average account value over the period, multiplied by 174/365 (to reflect the period May 11, 2015 (Commecement of Operations) to October 31, 2015).
(4) For each class, expenses are equal to the annualized expense ratio for the class, multiplied by the average account value over the period, multiplied by 125/365 (to reflect the period June 29, 2015 (Commecement of Operations) to October 31, 2015).
(5) Hypothetical expenses are equal to the annualized expense ratios for each class, multiplied by the average account value over the period (assuming a 5% annual return), multiplied by 184/365 (to reflect the one-half year period shown).
Schedule of Investments Flexible Select Fund 10/31/15
| | |
Number
of Shares | |
Value† | |
Road & Rail (1.5%) | |
Avis
Budget Group,
Inc. | | | 29,916 | | | $ | 1,494,005 | * | |
Semiconductors & Semiconductor Equipment (2.4%) | |
ASML
Holding NV | | | 13,778 | | | | 1,278,461 | | |
NXP
Semiconductors
NV | | | 13,247 | | | | 1,037,902 | * | |
| | | | 2,316,363 | | |
Software (8.8%) | |
Activision
Blizzard, Inc. | | | 90,940 | | | | 3,161,074 | | |
Adobe
Systems, Inc. | | | 18,023 | | | | 1,597,919 | * | |
Check Point
Software
Technologies Ltd. | | | 8,388 | | | | 712,477 | * | |
Intuit, Inc. | | | 26,436 | | | | 2,575,660 | | |
Mobileye NV | | | 12,948 | | | | 589,393 | * | |
| | | | 8,636,523 | | |
Specialty Retail (2.1%) | |
Express, Inc. | | | 36,495 | | | | 704,354 | * | |
Lithia
Motors, Inc.
Class A | | | 11,493 | | | | 1,349,163 | | |
| | | | 2,053,517 | | |
Technology Hardware, Storage & Peripherals (4.9%) | |
Apple, Inc. | | | 24,062 | | | | 2,875,409 | | |
SanDisk Corp. | | | 25,619 | | | | 1,972,663 | | |
| | | | 4,848,072 | | |
Textiles, Apparel & Luxury Goods (2.3%) | |
Deckers
Outdoor Corp. | | | 22,131 | | | | 1,231,811 | * | |
Luxottica
Group SpA ADR | | | 8,451 | | | | 592,922 | | |
Under
Armour, Inc.
Class A | | | 4,161 | | | | 395,628 | * | |
| | | | 2,220,361 | | |
Trading Companies &
Distributors (1.3%) | |
AerCap
Holdings NV | | | 29,921 | | | | 1,241,721 | * | |
Total Common Stocks
(Cost $77,571,601) | | | | | 83,799,706 | | |
Mutual Funds (11.8%) | |
Neuberger
Berman Core
Bond Fund
Institutional
Class | | | 840,510 | | | | 8,730,925 | §§ | |
See Notes to Schedule of Investments
Schedule of Investments Flexible Select Fund (cont'd)
| | |
Number
of Shares | |
Value† | |
Neuberger
Berman
Unconstrained
Bond Fund
Institutional
Class | | | 313,065 | | | $ | 2,934,884 | §§ | |
Total Mutual Funds
(Cost $11,632,509) | | | | | 11,665,809 | | |
Short-Term Investments (3.3%) | |
State Street
Institutional
Treasury Money
Market Fund
Premier
Class, 0.00%
(Cost $3,211,986) | | | 3,211,986 | | | | 3,211,986 | d | |
Total Investments (100.1%)
(Cost $92,416,096) | | | | | 98,677,501 | ## | |
Liabilities, less
cash, receivables
and other
assets [(0.1%)] | | | | | (71,343) | | |
Total Net Assets (100.0%) | | | | | | $ | 98,606,158 | | |
See Notes to Schedule of Investments
Schedule of Investments Global Allocation Fund 10/31/15
| | |
Number
of Shares | |
Value† | |
Long Positions (109.7%) | |
Common Stocks (54.6%) | |
Australia (0.9%) | |
BHP Billiton
Ltd. ADR | | | 906 | | | $ | 29,798 | È | |
Dexus
Property
Group | | | 3,183 | | | | 17,473 | | |
Echo
Entertainment
Group Ltd. | | | 4,811 | | | | 17,388 | | |
Fortescue
Metals Group
Ltd. | | | 9,152 | | | | 13,523 | ØØ | |
Goodman
Group | | | 4,383 | | | | 18,805 | | |
GPT
Group | | | 3,587 | | | | 12,148 | | |
Harvey
Norman
Holdings Ltd. | | | 1,830 | | | | 5,141 | | |
Qantas
Airways Ltd. | | | 19,156 | | | | 53,958 | * | |
Scentre
Group | | | 15,512 | | | | 45,499 | | |
| | | | 213,733 | | |
Austria (0.4%) | |
OMV AG | | | 1,992 | | | | 53,010 | | |
voestalpine
AG | | | 1,075 | | | | 38,933 | | |
| | | | 91,943 | | |
Belgium (0.2%) | |
Cie d'Entreprises
CFE | | | 130 | | | | 16,125 | | |
D'ieteren
SA | | | 662 | | | | 22,407 | | |
| | | | 38,532 | | |
Canada (1.0%) | |
Alimentation
Couche-Tard,
Inc. Class B | | | 456 | | | | 19,616 | ØØ | |
CGI Group,
Inc. Class A | | | 555 | | | | 20,615 | * | |
Empire
Co. Ltd., A
Shares | | | 978 | | | | 20,486 | | |
Finning
International,
Inc. | | | 948 | | | | 15,152 | | |
George
Weston Ltd. | | | 134 | | | | 11,285 | | |
H&R Real
Estate
Investment
Trust | | | 1,117 | | | | 17,922 | | |
Hudson's
Bay Co. | | | 952 | | | | 16,549 | | |
| | |
Number
of Shares | |
Value† | |
Kinross
Gold Corp. | | | 6,463 | | | $ | 12,999 | *ØØ | |
Loblaw
Cos. Ltd. | | | 106 | | | | 5,585 | | |
Magna
International,
Inc. | | | 528 | | | | 27,846 | ØØ | |
Metro,
Inc. | | | 1,799 | | | | 51,441 | | |
Valeant
Pharmaceuticals
International,
Inc. | | | 72 | | | | 6,720 | * | |
| | | | 226,216 | | |
Denmark (0.1%) | |
AP Moeller—
Maersk A/S
Class A | | | 9 | | | | 12,892 | | |
AP Moeller—
Maersk A/S
Class B | | | 5 | | | | 7,372 | | |
| | | | 20,264 | | |
Finland (0.4%) | |
Fortum OYJ | | | 1,171 | | | | 17,577 | | |
Orion
Oyj Class B | | | 380 | | | | 13,589 | | |
UPM—
Kymmene
OYJ | | | 2,982 | | | | 55,910 | | |
| | | | 87,076 | | |
France (0.5%) | |
Renault SA | | | 715 | | | | 67,405 | | |
Sanofi | | | 160 | | | | 16,160 | | |
Sanofi ADR | | | 831 | | | | 41,833 | ØØ | |
| | | | 125,398 | | |
Germany (0.5%) | |
Daimler AG | | | 295 | | | | 25,618 | ØØ | |
Freenet AG | | | 795 | | | | 26,821 | | |
Hannover
Rueck SE | | | 302 | | | | 34,936 | ØØ | |
Kabel
Deutschland
Holding AG | | | 154 | | | | 19,602 | ØØ | |
Porsche
Automobil
Holding SE
(Preference
Shares) | | | 84 | | | | 3,935 | | |
| | | | 110,912 | | |
Hong Kong (0.3%) | |
Cathay
Pacific Airways
Ltd. | | | 6,000 | | | | 11,869 | | |
MTR Corp. Ltd. | | | 2,000 | | | | 9,074 | | |
| | |
Number
of Shares | |
Value† | |
SmarTone
Telecommunications
Holdings Ltd. | | | 4,500 | | | $ | 7,909 | | |
WH Group Ltd. | | | 32,000 | | | | 17,605 | ñ* | |
Wharf
Holdings Ltd. | | | 4,000 | | | | 23,853 | | |
| | | | 70,310 | | |
Ireland (0.2%) | |
Ryanair
Holdings PLC | | | 1,566 | | | | 23,248 | | |
Ryanair
Holdings PLC
ADR | | | 465 | | | | 36,364 | | |
| | | | 59,612 | | |
Israel (0.7%) | |
Check Point
Software
Technologies
Ltd. | | | 458 | | | | 38,902 | *ØØ | |
Teva
Pharmaceutical
Industries Ltd.
ADR | | | 2,319 | | | | 137,262 | g@ | |
| | | | 176,164 | | |
Italy (1.4%) | |
ACEA SpA | | | 1,432 | | | | 20,581 | | |
Atlantia SpA | | | 926 | | | | 25,661 | | |
Banca
Popolare di
Sondrio
SCARL | | | 1,079 | | | | 4,929 | | |
Banco
Popolare SC | | | 469 | | | | 7,019 | * | |
Buzzi
Unicem SpA | | | 777 | | | | 13,150 | | |
Enel SpA | | | 5,864 | | | | 27,057 | ØØ | |
Eni SpA | | | 3,089 | | | | 50,477 | | |
ERG SpA | | | 1,603 | | | | 22,757 | | |
Finmeccanica
SpA | | | 1,248 | | | | 16,331 | * | |
Intesa
Sanpaolo SpA | | | 2,896 | | | | 10,089 | | |
Luxottica
Group SpA | | | 142 | | | | 9,955 | | |
Luxottica
Group SpA
ADR | | | 461 | | | | 32,344 | ØØ | |
Mediaset SpA | | | 1,265 | | | | 6,427 | | |
Mediobanca
SpA | | | 757 | | | | 7,617 | | |
Recordati SpA | | | 1,606 | | | | 39,930 | | |
Salini Impregilo
SpA | | | 2,082 | | | | 8,631 | | |
Societa
Iniziative
Autostradali e
Servizi SpA | | | 1,068 | | | | 12,249 | | |
See Notes to Schedule of Investments
Schedule of Investments Global Allocation Fund (cont'd)
| | |
Number
of Shares | |
Value† | |
UniCredit
SpA | | | 1,552 | | | $ | 10,035 | | |
Unipol
Gruppo
Finanziario
SpA | | | 3,341 | | | | 15,577 | | |
| | | | 340,816 | | |
Japan (2.5%) | |
Alps
Electric Co.
Ltd. | | | 300 | | | | 9,312 | | |
Dai Nippon
Printing Co.
Ltd. | | | 1,000 | | | | 10,342 | | |
Daiichi
Sankyo Co.
Ltd. | | | 800 | | | | 15,711 | | |
Dentsu, Inc. | | | 200 | | | | 11,244 | | |
Fuji Heavy
Industries Ltd. | | | 500 | | | | 19,337 | | |
FUJIFILM
Holdings
Corp. | | | 400 | | | | 15,955 | | |
Iida Group
Holdings Co.
Ltd. | | | 300 | | | | 5,623 | | |
ITOCHU Corp. | | | 1,100 | | | | 13,764 | | |
Japan
Airlines Co.
Ltd. | | | 1,500 | | | | 56,510 | ØØ | |
JX Holdings,
Inc. | | | 7,200 | | | | 28,272 | | |
Medipal
Holdings
Corp. | | | 2,100 | | | | 36,649 | | |
Mitsubishi
Corp. | | | 2,500 | | | | 45,451 | | |
Mitsubishi
Materials
Corp. | | | 8,000 | | | | 27,907 | | |
Mitsubishi
UFJ Financial
Group, Inc. | | | 1,400 | | | | 9,054 | ØØ | |
MS&AD
Insurance
Group
Holdings, Inc. | | | 300 | | | | 8,844 | | |
Nippon
Telegraph &
Telephone
Corp. | | | 1,200 | | | | 43,994 | | |
Nippon
Yusen KK | | | 10,000 | | | | 26,164 | | |
Nissan Motor
Co. Ltd. | | | 1,400 | | | | 14,513 | | |
NTT
DOCOMO,
Inc. | | | 400 | | | | 7,790 | | |
Otsuka
Holdings Co.
Ltd. | | | 200 | | | | 6,656 | | |
| | |
Number
of Shares | |
Value† | |
Resona
Holdings, Inc. | | | 6,500 | | | $ | 34,394 | ØØ | |
Sojitz Corp. | | | 10,100 | | | | 22,215 | | |
Sumitomo
Corp. | | | 900 | | | | 9,843 | | |
Sumitomo
Mitsui
Financial
Group, Inc. | | | 600 | | | | 23,936 | | |
Tokyo
Broadcasting
System
Holdings, Inc. | | | 1,500 | | | | 22,286 | | |
Tokyo Electric
Power Co.,
Inc. | | | 4,600 | | | | 31,379 | * | |
Toppan
Printing Co.
Ltd. | | | 2,000 | | | | 17,935 | | |
Toyota
Industries
Corp. | | | 200 | | | | 10,510 | | |
| | | | 585,590 | | |
Netherlands (1.7%) | |
Aegon NV | | | 868 | | | | 5,349 | | |
AerCap
Holdings NV | | | 2,373 | | | | 98,479 | *g@ | |
ASML
Holding NV | | | 701 | | | | 65,046 | ÈØØ | |
Heineken
Holding NV | | | 315 | | | | 25,262 | ØØ | |
ING Groep NV | | | 806 | | | | 11,730 | | |
Koninklijke
Ahold NV | | | 1,056 | | | | 21,506 | | |
NN Group NV | | | 1,421 | | | | 44,644 | | |
NXP
Semiconductors
NV | | | 696 | | | | 54,532 | * | |
Randstad
Holding NV | | | 326 | | | | 19,476 | | |
Royal Dutch
Shell PLC,
A Shares | | | 1,695 | | | | 44,160 | | |
| | | | 390,184 | | |
Norway (0.0%) | |
Telenor ASA | | | 262 | | | | 4,943 | | |
Portugal (0.2%) | |
EDP—Energias
de Portugal
SA | | | 4,828 | | | | 17,881 | | |
Jeronimo
Martins SGPS
SA | | | 470 | | | | 6,608 | | |
Portucel SA | | | 2,834 | | | | 11,546 | | |
| | | | 36,035 | | |
Singapore (0.2%) | |
Mapletree
Industrial
Trust | | | 233 | | | | 254 | | |
| | |
Number
of Shares | |
Value† | |
Wilmar
International
Ltd. | | | 20,800 | | | $ | 46,350 | | |
| | | | 46,604 | | |
South Africa (0.1%) | |
Mondi PLC | | | 1,132 | | | | 26,246 | ØØ | |
Spain (0.5%) | |
Abengoa
Yield PLC | | | 481 | | | | 8,913 | È | |
Acciona SA | | | 284 | | | | 23,894 | | |
Gamesa
Corporacion
Tecnologica
SA | | | 1,228 | | | | 19,425 | | |
Iberdrola SA | | | 3,567 | | | | 25,484 | | |
Repsol SA | | | 3,380 | | | | 42,651 | | |
| | | | 120,367 | | |
Sweden (0.5%) | |
Boliden AB | | | 1,245 | | | | 23,841 | | |
Skanska AB,
B Shares | | | 1,020 | | | | 19,878 | ØØ | |
Svenska
Cellulosa AB
SCA,
B Shares | | | 357 | | | | 10,530 | | |
Tele2 AB,
B Shares | | | 2,294 | | | | 22,957 | | |
Telefonaktiebolaget
LM Ericsson
B Shares | | | 4,788 | | | | 46,711 | | |
TeliaSonera
AB | | | 1,039 | | | | 5,318 | | |
| | | | 129,235 | | |
Switzerland (1.3%) | |
Adecco SA | | | 360 | | | | 26,806 | * | |
Baloise Holding
AG | | | 43 | | | | 5,164 | | |
BKW AG | | | 390 | | | | 14,816 | | |
Clariant AG | | | 1,180 | | | | 21,727 | * | |
Coca-Cola HBC
AG | | | 1,043 | | | | 24,922 | * | |
Flughafen
Zuerich AG | | | 27 | | | | 20,459 | | |
Lonza Group
AG | | | 316 | | | | 46,419 | * | |
Novartis AG | | | 54 | | | | 4,909 | | |
Schindler
Holding AG | | | 124 | | | | 20,147 | | |
Swiss Life
Holding AG | | | 253 | | | | 60,431 | * | |
Swiss Re AG | | | 539 | | | | 50,113 | ØØ | |
| | | | 295,913 | | |
United Kingdom (3.6%) | |
| 3i Group PLC | | | 6,820 | | | | 52,674 | | |
Barclays PLC | | | 2,077 | | | | 7,428 | | |
| BP PLC | | | 8,033 | | | | 47,851 | ØØ | |
See Notes to Schedule of Investments
Schedule of Investments Global Allocation Fund (cont'd)
| | |
Number
of Shares | |
Value† | |
BT Group
PLC | | | 4,479 | | | $ | 32,107 | | |
Carillion
PLC | | | 3,893 | | | | 18,334 | | |
Carnival
PLC | | | 370 | | | | 20,631 | ØØ | |
Domino's
Pizza Group
PLC | | | 1,531 | | | | 25,750 | | |
DS Smith
PLC | | | 7,552 | | | | 45,055 | | |
Fiat Chrysler
Automobiles
NV | | | 2,381 | | | | 35,137 | * | |
G4S PLC | | | 60 | | | | 224 | | |
GKN PLC | | | 5,138 | | | | 22,748 | | |
Grafton
Group PLC | | | 1,434 | | | | 14,900 | | |
Halfords
Group PLC | | | 3,120 | | | | 20,918 | | |
Home Retail
Group PLC | | | 7,721 | | | | 13,367 | | |
HSBC Holdings
PLC | | | 1,304 | | | | 10,204 | | |
Imperial
Tobacco
Group PLC | | | 566 | | | | 30,530 | ØØ | |
Inchcape
PLC | | | 2,337 | | | | 28,804 | ØØ | |
J Sainsbury
PLC | | | 2,971 | | | | 12,201 | | |
Keller Group
PLC | | | 1,916 | | | | 24,087 | | |
Moneysuper-
market.com
Group PLC | | | 8,548 | | | | 44,040 | | |
National
Express
Group PLC | | | 9,435 | | | | 43,548 | | |
QinetiQ
Group PLC | | | 8,607 | | | | 29,722 | | |
Rentokil
Initial PLC | | | 12,573 | | | | 29,946 | | |
Rexam PLC | | | 2,598 | | | | 21,627 | ØØ | |
Segro PLC | | | 3,205 | | | | 22,224 | ØØ | |
Taylor Wimpey
PLC | | | 10 | | | | 31 | | |
Unilever NV | | | 1,017 | | | | 45,745 | ØØ | |
William
Hill PLC | | | 4,501 | | | | 22,003 | | |
WM Morrison
Supermarkets
PLC | | | 25,054 | | | | 65,080 | | |
Workspace
Group PLC | | | 1,838 | | | | 27,130 | | |
WPP PLC | | | 1,085 | | | | 24,387 | | |
| | | | 838,433 | | |
United States (37.4%) | |
Aaron's, Inc. | | | 245 | | | | 6,044 | | |
Abbott
Laboratories | | | 440 | | | | 19,712 | | |
| | |
Number
of Shares | |
Value† | |
Acadia
Healthcare
Co., Inc. | | | 386 | | | $ | 23,704 | *È | |
Activision
Blizzard, Inc. | | | 4,515 | | | | 156,941 | ØØ | |
Adobe Systems,
Inc. | | | 894 | | | | 79,262 | * | |
Aetna, Inc. | | | 540 | | | | 61,981 | ØØ | |
Alaska Air
Group, Inc. | | | 1,253 | | | | 95,541 | g@ | |
Allergan
PLC | | | 217 | | | | 66,938 | *ØØ | |
Allison
Transmission
Holdings, Inc. | | | 976 | | | | 28,011 | ØØ | |
Allscripts
Healthcare
Solutions, Inc. | | | 3,001 | | | | 42,194 | *È | |
Alphabet, Inc.
Class A | | | 27 | | | | 19,910 | * | |
Alphabet, Inc.
Class C | | | 23 | | | | 16,349 | * | |
Ambarella,
Inc. | | | 156 | | | | 7,713 | *È | |
Amdocs Ltd. | | | 950 | | | | 56,591 | ØØ | |
AMERCO | | | 147 | | | | 59,728 | g@ | |
American
Express Co. | | | 225 | | | | 16,484 | | |
American
Financial
Group, Inc. | | | 532 | | | | 38,405 | | |
American
International
Group, Inc. | | | 1,680 | | | | 105,941 | ÈØØ | |
Amgen, Inc. | | | 112 | | | | 17,716 | | |
Amicus
Therapeutics,
Inc. | | | 757 | | | | 5,678 | *È | |
Anacor
Pharmaceuticals,
Inc. | | | 316 | | | | 35,522 | * | |
Anthem, Inc. | | | 114 | | | | 15,863 | | |
Apple, Inc. | | | 1,855 | | | | 221,672 | g@ | |
Arrow
Electronics,
Inc. | | | 704 | | | | 38,713 | * | |
Ashland, Inc. | | | 198 | | | | 21,725 | ØØ | |
Assurant, Inc. | | | 1,752 | | | | 142,841 | g@ | |
Assured
Guaranty Ltd. | | | 236 | | | | 6,476 | | |
AT&T, Inc. | | | 2,032 | | | | 68,092 | g@ | |
Avery
Dennison
Corp. | | | 371 | | | | 24,104 | | |
Avnet, Inc. | | | 1,757 | | | | 79,821 | g@ | |
AVX Corp. | | | 3,792 | | | | 51,192 | g@ | |
Baker Hughes,
Inc. | | | 250 | | | | 13,170 | | |
Bank of
America Corp. | | | 3,639 | | | | 61,062 | g@ | |
| | |
Number
of Shares | |
Value† | |
Bank of
Hawaii Corp. | | | 130 | | | $ | 8,512 | | |
Bank of the
Ozarks, Inc. | | | 367 | | | | 18,357 | È | |
BankUnited,
Inc. | | | 3,295 | | | | 122,508 | ØØ | |
Bemis Co., Inc. | | | 812 | | | | 37,173 | | |
Berkshire
Hathaway,
Inc. Class B | | | 375 | | | | 51,007 | *g@ | |
Best Buy Co.,
Inc. | | | 1,044 | | | | 36,571 | | |
Boeing Co. | | | 345 | | | | 51,084 | ÈØØ | |
Bristol-Myers
Squibb Co. | | | 602 | | | | 39,702 | | |
Bunge Ltd. | | | 372 | | | | 27,141 | | |
Burlington
Stores, Inc. | | | 804 | | | | 38,656 | *ØØ | |
CA, Inc. | | | 1,335 | | | | 36,993 | ÈØØ | |
Cablevision
Systems Corp.
Class A | | | 374 | | | | 12,189 | | |
Cabot Corp. | | | 703 | | | | 25,266 | | |
Cabot Oil
& Gas Corp. | | | 6,229 | | | | 135,232 | g@ | |
Capital One
Financial
Corp. | | | 402 | | | | 31,718 | ØØ | |
Carnival
Corp. | | | 809 | | | | 43,751 | | |
CDW Corp. | | | 2,031 | | | | 90,765 | g@ | |
Chemtura
Corp. | | | 631 | | | | 20,154 | *È | |
Chimera
Investment
Corp. | | | 728 | | | | 10,250 | | |
Cigna Corp. | | | 192 | | | | 25,736 | | |
Cintas Corp. | | | 303 | | | | 28,206 | È | |
Cisco Systems,
Inc. | | | 3,874 | | | | 111,765 | g@ | |
Citigroup,
Inc. | | | 2,095 | | | | 111,391 | g@ | |
CME Group,
Inc. | | | 1,474 | | | | 139,249 | ØØ | |
Comcast
Corp. Class A | | | 285 | | | | 17,847 | | |
Community
Health
Systems, Inc. | | | 135 | | | | 3,785 | * | |
Compass
Minerals
International,
Inc. | | | 109 | | | | 8,855 | | |
Computer
Sciences
Corp. | | | 373 | | | | 24,838 | | |
ConAgra
Foods, Inc. | | | 485 | | | | 19,667 | | |
Concho
Resources,
Inc. | | | 238 | | | | 27,587 | * | |
See Notes to Schedule of Investments
Schedule of Investments Global Allocation Fund (cont'd)
| | |
Number
of Shares | |
Value† | |
Cooper Tire
& Rubber Co. | | | 228 | | | $ | 9,528 | | |
Costco
Wholesale
Corp. | | | 1,046 | | | | 165,394 | g@ | |
CVS Health
Corp. | | | 2,485 | | | | 245,468 | g@ | |
Deckers
Outdoor
Corp. | | | 1,086 | | | | 60,447 | *Èg@ | |
Delta Air
Lines, Inc. | | | 1,825 | | | | 92,783 | ØØ | |
Domtar Corp. | | | 146 | | | | 6,021 | | |
Dynegy,
Inc. | | | 640 | | | | 12,435 | * | |
Edison
International | | | 184 | | | | 11,136 | | |
Electronic
Arts, Inc. | | | 219 | | | | 15,783 | *È | |
Ensco PLC
Class A | | | 1,102 | | | | 18,326 | È | |
Entergy
Corp. | | | 426 | | | | 29,036 | | |
Eversource
Energy | | | 1,230 | | | | 62,656 | g@ | |
Exelon Corp. | | | 668 | | | | 18,651 | | |
FedEx Corp. | | | 388 | | | | 60,547 | g@ | |
Fiserv,
Inc. | | | 223 | | | | 21,522 | * | |
Flowers
Foods, Inc. | | | 832 | | | | 22,464 | | |
Foot Locker,
Inc. | | | 559 | | | | 37,872 | | |
General
Dynamics
Corp. | | | 263 | | | | 39,077 | ØØ | |
General
Electric Co. | | | 304 | | | | 8,792 | * | |
General
Motors Co. | | | 233 | | | | 8,134 | * | |
Genuine
Parts Co. | | | 259 | | | | 23,507 | | |
Gilead
Sciences, Inc. | | | 211 | | | | 22,815 | | |
GNC Holdings,
Inc. Class A | | | 995 | | �� | | 29,601 | ØØ | |
Goldman
Sachs Group,
Inc. | | | 113 | | | | 21,188 | ØØ | |
Goodyear
Tire & Rubber
Co | | | 794 | | | | 26,075 | | |
Hartford
Financial
Services
Group,Inc. | | | 248 | | | | 11,472 | | |
Hasbro,
Inc. | | | 266 | | | | 20,437 | È | |
HCA Holdings,
Inc. | | | 1,488 | | | | 102,360 | *g@ | |
| | |
Number
of Shares | |
Value† | |
Health Net,
Inc. | | | 87 | | | $ | 5,591 | * | |
Hewlett-
Packard Co. | | | 954 | | | | 25,720 | | |
HollyFrontier
Corp. | | | 223 | | | | 10,920 | | |
Hologic, Inc. | | | 384 | | | | 14,922 | * | |
Home Depot,
Inc. | | | 500 | | | | 61,820 | g@ | |
ICON PLC | | | 589 | | | | 37,619 | *ØØ | |
Infinera Corp. | | | 2,716 | | | | 53,668 | *È | |
Ingredion, Inc. | | | 278 | | | | 26,427 | | |
Intercontinental
Exchange, Inc. | | | 404 | | | | 101,970 | g@ | |
Intuit, Inc. | | | 873 | | | | 85,056 | ØØ | |
Isle of Capri
Casinos, Inc. | | | 493 | | | | 9,431 | * | |
JC Penney
Co., Inc. | | | 2,654 | | | | 24,337 | *È | |
JetBlue
Airways Corp. | | | 3,787 | | | | 94,069 | *ØØ | |
Johnson
& Johnson | | | 343 | | | | 34,653 | | |
JPMorgan
Chase & Co. | | | 4,122 | | | | 264,838 | ÈØØ | |
Juniper
Networks, Inc. | | | 371 | | | | 11,646 | | |
Keurig Green
Mountain, Inc. | | | 320 | | | | 16,240 | È | |
Kohl's Corp. | | | 105 | | | | 4,843 | È | |
Kroger Co. | | | 305 | | | | 11,529 | | |
Lamar
Advertising
Co. Class A | | | 565 | | | | 31,883 | | |
Lennar Corp.
Class A | | | 964 | | | | 48,267 | ØØ | |
Liberty
Interactive
Corp. QVC
Group Class A | | | 1,092 | | | | 29,888 | *ØØ | |
Liberty Media
Corp. Class C | | | 653 | | | | 25,565 | * | |
Lithia Motors,
Inc. Class A | | | 604 | | | | 70,904 | ØØ | |
LyondellBasell
Industries NV
Class A | | | 460 | | | | 42,739 | È | |
Manitowoc
Co., Inc. | | | 3,439 | | | | 52,617 | g@ | |
Manpower
Group, Inc. | | | 237 | | | | 21,752 | | |
Markit Ltd. | | | 2,305 | | | | 70,302 | *ØØ | |
Medtronic PLC | | | 96 | | | | 7,096 | | |
Merck & Co.,
Inc. | | | 379 | | | | 20,716 | | |
MetLife, Inc. | | | 926 | | | | 46,652 | ØØ | |
Microsoft Corp. | | | 605 | | | | 31,847 | È | |
Mobileye NV | | | 558 | | | | 25,400 | * | |
Mondelez
International,
Inc. Class A | | | 1,411 | | | | 65,132 | g@ | |
| | |
Number
of Shares | |
Value† | |
News Corp.
Class A | | | 1,105 | | | $ | 17,017 | | |
NIKE, Inc.
Class B | | | 258 | | | | 33,806 | | |
Nuance
Communications,
Inc. | | | 3,552 | | | | 60,277 | *ÈØØ | |
O'Reilly
Automotive,
Inc. | | | 218 | | | | 60,225 | *g@ | |
ONE Gas, Inc. | | | 754 | | | | 36,825 | È | |
Patterson
Cos., Inc. | | | 736 | | | | 34,886 | ÈØØ | |
PBF Energy,
Inc. Class A | | | 166 | | | | 5,644 | | |
People's
United
Financial, Inc. | | | 1,699 | | | | 27,099 | ÈØØ | |
PepsiCo, Inc. | | | 164 | | | | 16,759 | | |
Pfizer, Inc. | | | 4,244 | | | | 143,532 | ÈØØ | |
Pioneer
Natural
Resources Co. | | | 234 | | | | 32,091 | ØØ | |
PNC Financial
Services
Group, Inc. | | | 961 | | | | 86,740 | g@ | |
Popular,
Inc. | | | 412 | | | | 12,183 | | |
Priceline
Group, Inc. | | | 10 | | | | 14,542 | * | |
Procter
& Gamble Co. | | | 269 | | | | 20,546 | | |
Prologis, Inc. | | | 134 | | | | 5,726 | | |
Prudential
Financial, Inc. | | | 365 | | | | 30,113 | | |
Public Service
Enterprise
Group, Inc. | | | 1,344 | | | | 55,494 | g@ | |
Regions
Financial
Corp. | | | 705 | | | | 6,592 | | |
Reinsurance
Group of
America, Inc. | | | 365 | | | | 32,938 | | |
Rite Aid Corp. | | | 1,655 | | | | 13,041 | * | |
Roper
Technologies,
Inc. | | | 105 | | | | 19,567 | | |
Rowan Cos.
PLC Class A | | | 422 | | | | 8,305 | È | |
Ryder System,
Inc. | | | 319 | | | | 22,898 | È | |
Sabre Corp. | | | 188 | | | | 5,512 | | |
SanDisk Corp. | | | 2,261 | | | | 174,097 | ØØg@ | |
Schlumberger
Ltd. | | | 1,176 | | | | 91,916 | g@ | |
Sensient
Technologies
Corp. | | | 1,083 | | | | 70,687 | ØØ | |
Skechers
U.S.A., Inc.
Class A | | | 229 | | | | 7,145 | * | |
See Notes to Schedule of Investments
Schedule of Investments Global Allocation Fund (cont'd)
| | |
Number
of Shares | |
Value† | |
Spirit Aero
Systems
Holdings, Inc.
Class A | | | 2,835 | | | $ | 149,518 | *ØØ | |
SS&C
Technologies
Holdings, Inc. | | | 256 | | | | 18,982 | | |
Stanley
Black &
Decker, Inc. | | | 304 | | | | 32,218 | | |
Starwood
Property
Trust, Inc. | | | 1,067 | | | | 21,436 | | |
SunTrust
Banks, Inc. | | | 898 | | | | 37,285 | | |
SUPERVALU,
Inc. | | | 1,454 | | | | 9,553 | * | |
SYNNEX Corp. | | | 70 | | | | 6,191 | | |
Synopsys, Inc. | | | 509 | | | | 25,440 | *ØØ | |
T-Mobile
US, Inc. | | | 373 | | | | 14,133 | * | |
Target Corp. | | | 558 | | | | 43,066 | | |
Teleflex, Inc. | | | 266 | | | | 35,378 | ÈØØ | |
Telephone
& Data
Systems, Inc. | | | 1,341 | | | | 38,406 | | |
Teradyne, Inc. | | | 1,190 | | | | 23,229 | g@ | |
Tesoro Corp. | | | 52 | | | | 5,560 | | |
Texas Capital
Bancshares,
Inc. | | | 326 | | | | 17,995 | * | |
Texas
Instruments,
Inc. | | | 635 | | | | 36,017 | ØØ | |
Thermo Fisher
Scientific, Inc. | | | 552 | | | | 72,191 | ØØ | |
Thomson
Reuters Corp. | | | 246 | | | | 10,091 | | |
Time Warner
Cable, Inc. | | | 105 | | | | 19,887 | | |
Time Warner,
Inc. | | | 681 | | | | 51,307 | g@ | |
Time, Inc. | | | 743 | | | | 13,805 | È | |
Total System
Services, Inc. | | | 736 | | | | 38,603 | | |
Triumph
Group, Inc. | | | 399 | | | | 18,585 | | |
Twenty-First
Century Fox,
Inc. Class A | | | 2,805 | | | | 86,085 | ØØ | |
Tyler
Technologies,
Inc. | | | 66 | | | | 11,244 | * | |
Tyson Foods,
Inc. Class A | | | 1,018 | | | | 45,158 | ØØg@ | |
UGI Corp. | | | 768 | | | | 28,163 | ØØ | |
Under Armour,
Inc. Class A | | | 314 | | | | 29,855 | *È | |
United
Continental
Holdings, Inc. | | | 354 | | | | 21,350 | * | |
| | |
Number
of Shares | |
Value† | |
UnitedHealth
Group, Inc. | | | 1,438 | | | $ | 169,368 | g@ | |
Universal
Health
Services, Inc.
Class B | | | 53 | | | | 6,471 | | |
Valero Energy
Corp. | | | 1,784 | | | | 117,601 | ØØ | |
VeriFone
Systems, Inc. | | | 437 | | | | 13,171 | * | |
Verizon
Communications,
Inc. | | | 1,108 | | | | 51,943 | g@ | |
VF Corp. | | | 292 | | | | 19,716 | | |
Voya Financial,
Inc. | | | 636 | | | | 25,803 | | |
Wal-Mart
Stores, Inc. | | | 237 | | | | 13,566 | | |
Walgreens
Boots Alliance,
Inc. | | | 129 | | | | 10,924 | | |
Walt Disney
Co. | | | 1,045 | | | | 118,858 | ØØ | |
Waste
Management,
Inc. | | | 578 | | | | 31,073 | È | |
Weatherford
International
PLC | | | 1,971 | | | | 20,183 | *È | |
Wells Fargo
& Co. | | | 2,023 | | | | 109,525 | g@ | |
WhiteWave
Foods Co. | | | 629 | | | | 25,776 | * | |
Whole Foods
Market, Inc. | | | 287 | | | | 8,599 | | |
Xerox Corp. | | | 2,122 | | | | 19,926 | | |
Zebra
Technologies
Corp. Class A | | | 767 | | | | 58,982 | *Èg@ | |
Zimmer Biomet
Holdings, Inc. | | | 1,320 | | | | 138,032 | ØØ | |
| | | | 8,817,088 | | |
Total Common Stocks
(Cost $12,382,770) | | | | | 12,851,614 | | |
| | | Principal
Amounta | | | |
U.S. Treasury Securities-Backed by the Full Faith and Credit of the U.S. Government (4.6%) | |
U.S.
Treasury
Bonds,
5.50%,
due
8/15/28 | | $ | 30,000 | | | | 40,452 | | |
U.S.
Treasury
Bonds,
4.50%,
due
2/15/36 | | | 25,000 | | | | 32,524 | | |
| | |
Principal
Amounta | |
Value† | |
U.S.
Treasury
Bonds,
3.88%,
due
8/15/40 | | $ | 15,000 | | | $ | 17,772 | | |
U.S.
Treasury
Inflation-
Indexed
Bonds,
0.25%,
due
1/15/25 | | | 10,062 | | | | 9,677 | | |
U.S.
Treasury
Inflation-
Indexed
Bonds,
3.88%,
due
4/15/29 | | | 36,244 | | | | 50,216 | | |
U.S.
Treasury
Inflation-
Indexed
Bonds,
3.38%,
due
4/15/32 | | | 80,561 | | | | 111,266 | | |
U.S.
Treasury
Inflation-
Indexed
Bonds,
2.38%,
due
1/15/25 | | | 25,286 | | | | 29,109 | | |
U.S.
Treasury
Inflation-
Indexed
Bonds,
2.38%,
due
1/15/27 | | | 41,363 | | | | 48,524 | | |
U.S.
Treasury
Inflation-
Indexed
Bonds,
1.75%,
due
1/15/28 | | | 22,752 | | | | 25,286 | | |
U.S.
Treasury
Inflation-
Indexed
Bonds,
2.50%,
due
1/15/29 | | | 22,201 | | | | 26,798 | | |
See Notes to Schedule of Investments
Schedule of Investments Global Allocation Fund (cont'd)
| | |
Principal
Amounta | |
Value† | |
U.S.
Treasury
Inflation-
Indexed
Bonds,
0.63%,
due
1/15/24 | | $ | 51,071 | | | $ | 51,004 | | |
U.S.
Treasury
Inflation-
Indexed
Bonds,
0.63%,
due
2/15/43 | | | 72,563 | | | | 62,633 | | |
U.S.
Treasury
Inflation-
Indexed
Bonds,
0.13%,
due
4/15/17 | | | 47,218 | | | | 47,186 | | |
U.S.
Treasury
Inflation-
Indexed
Bonds,
2.13%,
due
2/15/40 | | | 5,513 | | | | 6,617 | | |
U.S.
Treasury
Inflation-
Indexed
Notes,
0.13%,
due
1/15/22 | | | 10,530 | | | | 10,286 | | |
U.S.
Treasury
Inflation-
Indexed
Notes,
0.13%,
due
1/15/23 | | | 25,813 | | | | 24,962 | | |
U.S.
Treasury
Notes,
4.38%,
due
11/15/39 | | | 25,000 | | | | 31,914 | | |
U.S.
Treasury
Notes,
3.00%,
due
11/15/44 | | | 95,000 | | | | 96,227 | | |
| | |
Principal
Amounta | |
Value† | |
U.S.
Treasury
Notes,
2.38%,
due
8/15/24 | | $ | 55,000 | | | $ | 56,240 | | |
U.S.
Treasury
Notes,
0.75%,
due
2/28/18 | | | 65,000 | | | | 64,805 | | |
U.S.
Treasury
Notes,
2.75%,
due
2/15/24 | | | 10,000 | | | | 10,547 | | |
U.S.
Treasury
Notes,
1.13%,
due
3/31/20 | | | 20,000 | | | | 19,725 | | |
U.S.
Treasury
Notes,
0.38%,
due
3/31/16 | | | 215,000 | | | | 215,115 | | |
Total U.S. Treasury
Securities-Backed
by the Full Faith
and Credit of the
U.S. Government
(Cost $1,109,586) | | | | | | | 1,088,885 | | |
U.S. Government Agency
Securities (0.1%) | |
United States (0.1%) | |
Federal
Home
Loan
Bank,
Bonds,
5.50%,
due
7/15/36
(Cost $35,306) | | | 25,000 | | | | 33,338 | | |
Mortgage-Backed Securities (0.7%) | |
Fannie Mae (0.3%) | |
Pass-
Through
Certificates,
4.50%,
TBA,
30 Year
Maturity | | | 60,000 | | | | 65,004 | Ø | |
| | |
Principal
Amounta | |
Value† | |
Freddie Mac (0.4%) | |
Pass-
Through
Certificates,
4.00%,
TBA,
30 Year
Maturity | | $ | 85,000 | | | $ | 90,292 | Ø | |
Total Mortgage-
Backed Securities
(Cost $155,481) | | | | | | | 155,296 | | |
Government Securities (7.8%) | |
Sovereign (7.8%) | |
Australia
Government
Bond,
Senior
Unsecured
Notes,
2.00%,
due
8/21/35 | | AUD | 25,000 | | | | 21,955 | | |
Australia
Government
Bond,
Senior
Unsecured
Notes,
3.25%,
due
4/21/29 | | AUD | 45,000 | | | | 33,115 | | |
Bundes-
republik
Deutschland,
Bonds,,
2.50%,
due
7/4/44 | | EUR | 5,000 | | | | 7,203 | | |
Canadian
Government
Bond,
Bonds,
4.25%,
due
12/1/21 | | CAD | 22,985 | | | | 22,427 | | |
Canadian
Government
Bond,
Bonds,
4.25%,
due
6/1/18 | | CAD | 190,000 | | | | 158,842 | | |
European
Investment
Bank,
Senior
Unsecured
Euro
Medium-
Term
Notes,
4.63%,
due
4/15/20 | | EUR | 55,000 | | | | 72,946 | | |
See Notes to Schedule of Investments
Schedule of Investments Global Allocation Fund (cont'd)
| | |
Principal
Amounta | |
Value† | |
France
Government
Bond
OAT,
Bonds,
1.75%,
due
11/25/24 | | EUR | 125,000 | | | $ | 150,312 | | |
France
Government
Bond
OAT,
Unsecured
Notes,
0.70%,
due
7/25/30 | | EUR | 10,004 | | | | 12,486 | ñ | |
Ireland
Government
Bond,
Bonds,
2.00%,
due
2/18/45 | | EUR | 10,000 | | | | 10,752 | | |
Ireland
Government
Bond,
Bonds,
2.40%,
due
5/15/30 | | EUR | 10,000 | | | | 12,111 | | |
Italy
Buoni
Poliennali
Del
Tesoro,
Bonds,
2.35%,
due
9/15/35 | | EUR | 5,963 | | | | 8,089 | | |
Italy
Buoni
Poliennali
Del
Tesoro,
Bonds,
4.00%,
due
2/1/37 | | EUR | 30,000 | | | | 41,897 | | |
Italy
Buoni
Poliennali
Del
Tesoro,
Bonds,
2.55%,
due
9/15/41 | | EUR | 32,517 | | | | 45,351 | | |
| | |
Principal
Amounta | |
Value† | |
Japan
Government
Ten
Year
Bond,
Senior
Unsecured
Notes,
0.40%,
due
3/20/25 | | JPY | 11,000,000 | | | $ | 92,307 | | |
Japan
Government
Twenty
Year
Bond,
Senior
Unsecured
Notes,
1.20%,
due
3/20/35 | | JPY | 7,000,000 | | | | 59,610 | | |
Mexican
Bonos,
Senior
Unsecured
Bonds,
Ser. M,
7.75%,
due
11/13/42 | | MXN | 690,000 | | | | 46,875 | | |
New
Zealand
Government
Bond,
Senior
Unsecured
Notes,
Ser. 423,
5.50%,
due
4/15/23 | | NZD | 5,000 | | | | 3,939 | | |
New
Zealand
Government
Bond,
Senior
Unsecured
Notes,
2.00%,
due
9/20/25 | | NZD | 20,000 | | | | 13,966 | | |
New
Zealand
Government
Bond,
Senior
Unsecured
Notes,
2.50%,
due
9/20/35 | | NZD | 60,000 | | | | 42,088 | | |
| | |
Principal
Amounta | |
Value† | |
New
Zealand
Government
Bond,
Senior
Unsecured
Notes,
Ser.
427,
4.50%,
due
4/15/27 | | NZD | 120,000 | | | $ | 90,273 | | |
South
Africa
Government
Bond,
Bonds,
Ser.
R214,
6.50%,
due
2/28/41 | | ZAR | 730,000 | | | | 39,587 | | |
Spain
Government
Bond,
Senior
Unsecured
Notes,
4.65%,
due
7/30/25 | | EUR | 50,000 | | | | 69,740 | ñ | |
Spain
Government
Bond,
Bonds,
5.15%,
due
10/31/44 | | EUR | 15,000 | | | | 24,188 | ñ | |
Spain
Government
Inflation
Linked
Bond,
Senior
Unsecured
Notes,
1.00%,
due
11/30/30 | | EUR | 19,925 | | | | 21,725 | ñ | |
United
Kingdom
Gilt,
Bonds,
1.75%,
due
7/22/19 | | GBP | 180,000 | | | | 284,414 | | |
United
Kingdom
Gilt,
Bonds,
4.25%,
due
12/7/27 | | GBP | 60,000 | | | | 114,421 | | |
See Notes to Schedule of Investments
Schedule of Investments Global Allocation Fund (cont'd)
| | |
Principal
Amounta | |
Value† | |
United
Kingdom
Gilt,
Bonds,
1.75%,
due
9/7/22 | | GBP | 115,000 | | | $ | 179,395 | | |
United
Kingdom
Gilt
Inflation
Linked
Bonds,
Senior
Unsecured
Notes,
0.13%,
due
3/22/29 | | GBP | 5,471 | | | | 9,385 | | |
United
Kingdom
Gilt
Inflation
Linked
Bonds,
Bonds,
0.13%,
due
3/22/44 | | GBP | 42,861 | | | | 83,889 | | |
United
Kingdom
Gilt
Inflation
Linked
Bonds,
Bonds,
0.25%,
due
3/22/52 | | GBP | 16,098 | | | | 35,422 | | |
United
Kingdom
Gilt
Inflation
Linked
Bonds,
Bonds,
0.13%,
due
3/22/24 | | GBP | 10,715 | | | | 17,753 | | |
Total Government
Securities
(Cost $1,873,199) | | | | | 1,826,463 | | |
| | | Number
of Shares | | | |
Exchange Traded Funds (2.3%) | |
iShares
10+ Year
Credit Bond
ETF | | | 1,900 | | | | 109,250 | | |
| | |
Number
of Shares | |
Value† | |
iShares
Core U.S.
Aggregate
Bond
ETF | | | 477 | | | $ | 52,208 | | |
iShares iBoxx
$ Investment
Grade
Corporate
Bond ETF | | | 500 | | | | 58,210 | | |
iShares MSCI
ACWI ETF | | | 2,689 | | | | 156,150 | | |
SPDR Barclays
International
Treasury
Bond ETF | | | 1,001 | | | | 52,342 | | |
SPDR Barclays
Long Term
Corporate
Bond ETF | | | 2,700 | | | | 104,922 | | |
Total Exchange
Traded Funds
(Cost $535,388) | | | | | 533,082 | | |
Mutual Funds (36.9%) | |
Neuberger
Berman
Emerging
Markets
Debt Fund
Institutional
Class | | | 76,021 | | | | 639,154 | §§ØØ | |
Neuberger
Berman
Emerging
Markets
Equity Fund
Institutional
Class | | | 156,647 | | | | 2,297,680 | §§ØØ | |
Neuberger
Berman
High Income
Bond Fund
Institutional
Class | | | 134,797 | | | | 1,147,477 | §§ØØ | |
Neuberger
Berman
International
Equity Fund
Institutional
Class | | | 265,492 | | | | 2,960,732 | §§ØØ | |
Neuberger
Berman
Long Short
Credit Fund
Institutional
Class | | | 105,628 | | | | 1,029,765 | §§ØØ | |
| | |
Number
of Shares | |
Value† | |
Neuberger
Berman
Risk Balanced
Commodity
Strategy Fund
Institutional
Class | | | 101,752 | | | $ | 630,506 | *§§ØØ | |
Total Mutual
Funds
(Cost $9,022,784) | | | | | 8,705,314 | | |
Redeemable Preference Shares (0.0%) | |
Ireland (0.0%) | |
Ryanair
Holdings
PLC, B Shares
(Cost $522) | | | 1,607 | | | | 520 | Ñf* | |
Short-Term Investments (2.7%) | |
State Street
Institutional
Liquid
Reserves
Fund Premier
Class, 0.15%
(Cost $642,894) | | | 642,894 | | | | 642,894 | dØØ | |
Total Long
Positions (109.7%)
(Cost $25,757,930) | | | | | 25,837,406 | ## | |
Short Positions
(see summary below)
((15.7)%) | | | | | (3,689,915 | ) | |
Cash, receivables and
other assets, less
liabilities (6.0%) | | | | | 1,410,776 | e | |
Total Net Assets
(100.0%) | | | | $ | 23,558,267 | | |
| Short Positions ((15.7)%)‡g | |
Common Stocks Sold Short (15.6%) | |
Australia (0.3%) | |
AMP Ltd. | | | (2,371 | ) | | | (9,616 | ) | |
BHP Billiton
PLC | | | (761 | ) | | | (12,207 | ) | |
Commonwealth
Bank of
Australia | | | (194 | ) | | | (10,534 | ) | |
CSL Ltd. | | | (176 | ) | | | (11,699 | ) | |
Sydney Airport | | | (2,679 | ) | | | (12,243 | ) | |
Transurban
Group | | | (1,774 | ) | | | (13,145 | ) | |
| | | | (69,444 | ) | |
See Notes to Schedule of Investments
Schedule of Investments Global Allocation Fund (cont'd)
| | |
Number
of Shares | |
Value† | |
Belgium (0.1%) | |
Anheuser-
Busch
InBev NV | | | (164 | ) | | $ | (19,603 | ) | |
Canada (0.4%) | |
Element
Financial
Corp. | | | (955 | ) | | | (12,350 | )* | |
Enbridge, Inc. | | | (270 | ) | | | (11,541 | ) | |
Gildan
Activewear,
Inc. | | | (438 | ) | | | (12,592 | ) | |
IGM Financial,
Inc. | | | (543 | ) | | | (15,697 | ) | |
MacDonald
Dettwiler &
Associates
Ltd. | | | (208 | ) | | | (12,398 | ) | |
Open Text
Corp. | | | (319 | ) | | | (14,786 | ) | |
Peyto
Exploration
& Development
Corp. | | | (500 | ) | | | (10,324 | ) | |
Potash Corp. of
Saskatchewan,
Inc. | | | (583 | ) | | | (11,806 | ) | |
| | | | (101,494 | ) | |
Chile (0.1%) | |
Antofagasta
PLC | | | (2,247 | ) | | | (18,238 | ) | |
France (0.7%) | |
Accor SA | | | (436 | ) | | | (21,690 | ) | |
Bureau Veritas
SA | | | (1,007 | ) | | | (22,778 | ) | |
Edenred | | | (520 | ) | | | (9,564 | ) | |
Essilor
International
SA | | | (173 | ) | | | (22,753 | ) | |
Imerys SA | | | (266 | ) | | | (18,220 | ) | |
Ingenico
Group SA | | | (121 | ) | | | (14,290 | ) | |
Pernod Ricard
SA | | | (187 | ) | | | (22,044 | ) | |
Remy
Cointreau
SA | | | (233 | ) | | | (16,242 | ) | |
Sodexo SA | | | (174 | ) | | | (15,493 | ) | |
| | | | (163,074 | ) | |
Germany (0.8%) | |
Bayer AG | | | (128 | ) | | | (17,081 | ) | |
Beiersdorf AG | | | (227 | ) | | | (21,575 | ) | |
HUGO BOSS
AG | | | (150 | ) | | | (15,437 | ) | |
LEG Immobilien
AG | | | (259 | ) | | | (20,663 | )* | |
MTU Aero
Engines AG | | | (179 | ) | | | (16,568 | ) | |
| | |
Number
of Shares | |
Value† | |
SAP SE | | | (302 | ) | | $ | (23,871 | ) | |
Symrise AG | | | (359 | ) | | | (23,647 | ) | |
TUI AG | | | (786 | ) | | | (14,649 | ) | |
United Internet
AG | | | (363 | ) | | | (18,863 | ) | |
Vonovia SE | | | (605 | ) | | | (20,185 | ) | |
| | | | (192,539 | ) | |
Hong Kong (0.2%) | |
ASM Pacific
Technology
Ltd. | | | (1,400 | ) | | | (9,941 | ) | |
Haitong
International
Securities
Group Ltd. | | | (24,000 | ) | | | (13,355 | ) | |
Hong Kong
& China Gas
Co. Ltd. | | | (6,000 | ) | | | (12,180 | ) | |
| | | | (35,476 | ) | |
Ireland (0.1%) | |
Glanbia
PLC | | | (1,039 | ) | | | (20,154 | ) | |
James Hardie
Industries PLC | | | (1,097 | ) | | | (14,201 | ) | |
| | | | (34,355 | ) | |
Italy (0.2%) | |
Brunello
Cucinelli SpA | | | (827 | ) | | | (14,978 | ) | |
Salvatore
Ferragamo
SpA | | | (697 | ) | | | (18,932 | ) | |
Yoox Net-A-
Porter
Group SpA | | | (327 | ) | | | (11,093 | )* | |
| | | | (45,003 | ) | |
Japan (0.8%) | |
Honda Motor
Co. Ltd. | | | (490 | ) | | | (16,210 | ) | |
Hulic Co. Ltd. | | | (1,813 | ) | | | (16,933 | ) | |
Inpex Corp. | | | (2,207 | ) | | | (21,037 | ) | |
Kubota Corp. | | | (1,000 | ) | | | (15,502 | ) | |
Odakyu
Electric
Railway Co.
Ltd. | | | (2,428 | ) | | | (23,733 | ) | |
Oji Holdings
Corp. | | | (4,000 | ) | | | (20,716 | ) | |
SoftBank
Group Corp. | | | (400 | ) | | | (22,411 | ) | |
Sumitomo
Realty &
Development
Co. Ltd. | | | (1,000 | ) | | | (32,928 | ) | |
Takeda
Pharmaceutical
Co. Ltd. | | | (338 | ) | | | (16,505 | ) | |
| | | | (185,975 | ) | |
| | |
Number
of Shares | |
Value† | |
Jordan (0.1%) | |
Hikma
Pharmaceuticals
PLC | | | (564 | ) | | $ | (18,815 | ) | |
Mexico (0.1%) | |
Fresnillo PLC | | | (2,353 | ) | | | (26,480 | ) | |
Netherlands (0.2%) | |
Arcadis NV | | | (881 | ) | | | (22,234 | ) | |
ASML Holding
NV | | | (161 | ) | | | (14,980 | ) | |
OCI NV | | | (494 | ) | | | (13,974 | )* | |
| | | | (51,188 | ) | |
Singapore (0.1%) | |
Global Logistic
Properties Ltd. | | | (9,400 | ) | | | (15,034 | ) | |
StarHub Ltd. | | | (5,200 | ) | | | (13,340 | ) | |
| | | | (28,374 | ) | |
South Africa (0.1%) | |
Randgold
Resources Ltd. | | | (329 | ) | | | (22,154 | ) | |
Spain (0.4%) | |
Banco Bilbao
Vizcaya
Argentaria
SA | | | (1,096 | ) | | | (9,449 | ) | |
Ferrovial SA | | | (750 | ) | | | (18,936 | ) | |
Gas Natural
SDG SA | | | (917 | ) | | | (19,875 | ) | |
Red Electrica
Corp. SA | | | (265 | ) | | | (23,371 | ) | |
Zardoya
Otis SA | | | (1,727 | ) | | | (21,270 | ) | |
| | | | (92,901 | ) | |
Sweden (0.4%) | |
Alfa Laval AB | | | (1,261 | ) | | | (22,184 | ) | |
Assa Abloy
AB, B Shares | | | (903 | ) | | | (17,968 | ) | |
Hennes &
Mauritz AB,
B shares | | | (522 | ) | | | (20,303 | ) | |
Lundin
Petroleum
AB | | | (1,644 | ) | | | (23,764 | )* | |
Meda AB,
A Shares | | | (742 | ) | | | (10,917 | ) | |
| | | | (95,136 | ) | |
Switzerland (0.6%) | |
Cie Financiere
Richemont SA | | | (263 | ) | | | (22,563 | ) | |
LafargeHolcim
Ltd. | | | (337 | ) | | | (19,008 | )* | |
Nestle SA | | | (255 | ) | | | (19,503 | ) | |
Roche Holding
AG | | | (64 | ) | | | (17,372 | ) | |
SGS SA | | | (12 | ) | | | (22,872 | ) | |
See Notes to Schedule of Investments
Schedule of Investments Global Allocation Fund (cont'd)
| | |
Number
of Shares | |
Value† | |
Syngenta AG | | | (57 | ) | | $ | (19,191 | ) | |
Wolseley PLC | | | (261 | ) | | | (15,358 | ) | |
| | | | (135,867 | ) | |
United Kingdom (2.3%) | |
Admiral
Group PLC | | | (557 | ) | | | (13,850 | ) | |
Amec Foster
Wheeler PLC | | | (1,671 | ) | | | (18,315 | ) | |
AO World
PLC | | | (4,510 | ) | | | (11,013 | )* | |
Associated
British Foods
PLC | | | (385 | ) | | | (20,506 | ) | |
AVEVA Group
PLC | | | (471 | ) | | | (14,914 | ) | |
Babcock
International
Group PLC | | | (1,229 | ) | | | (18,264 | ) | |
British
American
Tobacco PLC | | | (307 | ) | | | (18,266 | ) | |
BTG PLC | | | (1,907 | ) | | | (16,228 | )* | |
Bunzl PLC | | | (643 | ) | | | (18,427 | ) | |
Burberry
Group PLC | | | (634 | ) | | | (12,980 | ) | |
Compass
Group PLC | | | (1,260 | ) | | | (21,736 | ) | |
Diageo PLC | | | (761 | ) | | | (22,038 | ) | |
Drax Group
PLC | | | (2,924 | ) | | | (11,747 | ) | |
Hammerson
PLC | | | (1,713 | ) | | | (16,808 | ) | |
Hargreaves
Lansdown
PLC | | | (714 | ) | | | (15,894 | ) | |
Imagination
Technologies
Group PLC | | | (3,570 | ) | | | (12,190 | )* | |
Informa PLC | | | (2,031 | ) | | | (17,784 | ) | |
Inmarsat PLC | | | (1,024 | ) | | | (15,549 | ) | |
InterContinental
Hotels Group
PLC | | | (404 | ) | | | (16,199 | ) | |
Intertek Group
PLC | | | (434 | ) | | | (17,563 | ) | |
Kier Group
PLC | | | (904 | ) | | | (19,190 | ) | |
Pearson PLC | | | (1,003 | ) | | | (13,321 | ) | |
Pennon Group
PLC | | | (1,478 | ) | | | (18,479 | ) | |
Petrofac Ltd. | | | (1,103 | ) | | | (14,334 | ) | |
RELX PLC | | | (1,318 | ) | | | (23,610 | ) | |
Rolls-Royce
Holdings PLC | | | (1,840 | ) | | | (19,501 | ) | |
Rotork PLC | | | (6,897 | ) | | | (19,925 | ) | |
Smith &
Nephew PLC | | | (1,239 | ) | | | (21,201 | ) | |
Telecity Group
PLC | | | (1,074 | ) | | | (19,454 | ) | |
| | |
Number
of Shares | |
Value† | |
United Utilities
Group PLC | | | (1,349 | ) | | $ | (20,557 | ) | |
Weir Group
PLC | | | (853 | ) | | | (14,031 | ) | |
Whitbread
PLC | | | (264 | ) | | | (20,211 | ) | |
| | | | (554,085 | ) | |
United States (7.6%) | |
Adobe Systems,
Inc. | | | (229 | ) | | | (20,303 | )* | |
Affiliated
Managers
Group, Inc. | | | (88 | ) | | | (15,863 | )* | |
Alliance
Data Systems
Corp. | | | (85 | ) | | | (25,271 | )* | |
Amazon.com,
Inc. | | | (33 | ) | | | (20,655 | )* | |
American
Tower Corp. | | | (205 | ) | | | (20,957 | ) | |
American
Water Works
Co., Inc. | | | (386 | ) | | | (22,141 | ) | |
AMETEK, Inc. | | | (412 | ) | | | (22,586 | ) | |
Amphenol
Corp. Class A | | | (396 | ) | | | (21,471 | ) | |
Anadarko
Petroleum
Corp. | | | (309 | ) | | | (20,666 | ) | |
Analog
Devices, Inc. | | | (337 | ) | | | (20,260 | ) | |
Annaly Capital
Management,
Inc. | | | (1,904 | ) | | | (18,945 | ) | |
Becton
Dickinson
and Co. | | | (137 | ) | | | (19,525 | ) | |
Brown &
Brown, Inc. | | | (401 | ) | | | (12,940 | ) | |
Brown-Forman
Corp. Class B | | | (181 | ) | | | (19,219 | ) | |
Chevron Corp. | | | (270 | ) | | | (24,538 | ) | |
Coca-Cola Co. | | | (329 | ) | | | (13,933 | ) | |
Colgate
Palmolive Co. | | | (301 | ) | | | (19,971 | ) | |
ConocoPhillips | | | (419 | ) | | | (22,354 | ) | |
CONSOL
Energy, Inc. | | | (1,115 | ) | | | (7,426 | ) | |
Cooper Cos.,
Inc. | | | (129 | ) | | | (19,654 | ) | |
CoStar Group,
Inc. | | | (100 | ) | | | (20,307 | )* | |
Crown
Holdings, Inc. | | | (445 | ) | | | (23,603 | )* | |
Dominion
Resources,
Inc. | | | (322 | ) | | | (23,000 | ) | |
Donaldson
Co., Inc. | | | (721 | ) | | | (21,774 | ) | |
| | |
Number
of Shares | |
Value† | |
Emerson
Electric Co. | | | (280 | ) | | $ | (13,224 | ) | |
Exxon Mobil
Corp. | | | (294 | ) | | | (24,326 | ) | |
Facebook,
Inc. Class A | | | (218 | ) | | | (22,229 | )* | |
Fastenal Co. | | | (572 | ) | | | (22,399 | ) | |
Federal
Realty
Investment
Trust | | | (143 | ) | | | (20,519 | ) | |
FleetCor
Technologies,
Inc. | | | (152 | ) | | | (22,019 | )* | |
General
Electric Co. | | | (527 | ) | | | (15,241 | ) | |
Graco, Inc. | | | (332 | ) | | | (24,369 | ) | |
Hershey Co. | | | (240 | ) | | | (21,286 | ) | |
Howard
Hughes
Corp. | | | (166 | ) | | | (20,514 | )* | |
Hudson City
Bancorp, Inc. | | | (1,733 | ) | | | (17,538 | ) | |
IDEX Corp. | | | (305 | ) | | | (23,412 | ) | |
IDEXX
Laboratories,
Inc. | | | (279 | ) | | | (19,145 | )* | |
ITC Holdings
Corp. | | | (700 | ) | | | (22,904 | ) | |
J.B. Hunt
Transport
Services, Inc. | | | (213 | ) | | | (16,267 | ) | |
J.M. Smucker
Co. | | | (175 | ) | | | (20,543 | ) | |
Kansas City
Southern | | | (227 | ) | | | (18,786 | ) | |
Kennedy-
Wilson
Holdings, Inc. | | | (629 | ) | | | (15,423 | ) | |
Kimberly-Clark
Corp. | | | (182 | ) | | | (21,787 | ) | |
Kinder
Morgan, Inc. | | | (605 | ) | | | (16,547 | ) | |
KLA-Tencor
Corp. | | | (400 | ) | | | (26,848 | ) | |
Lennox
International,
Inc. | | | (180 | ) | | | (23,906 | ) | |
Macquarie
Infrastructure
Corp. | | | (265 | ) | | | (21,081 | ) | |
Martin
Marietta
Materials, Inc. | | | (114 | ) | | | (17,687 | ) | |
MasterCard,
Inc. Class A | | | (238 | ) | | | (23,560 | ) | |
McDonald's
Corp. | | | (158 | ) | | | (17,735 | ) | |
Medtronic
PLC | | | (279 | ) | | | (20,624 | ) | |
Monsanto Co. | | | (228 | ) | | | (21,254 | ) | |
See Notes to Schedule of Investments
Schedule of Investments Global Allocation Fund (cont'd)
| | |
Number
of Shares | |
Value† | |
National
Fuel Gas Co. | | | (395 | ) | | $ | (20,749 | ) | |
Netflix, Inc. | | | (154 | ) | | | (16,690 | )* | |
Newell
Rubbermaid,
Inc. | | | (499 | ) | | | (21,173 | ) | |
Nordson Corp. | | | (344 | ) | | | (24,507 | ) | |
Oracle Corp. | | | (541 | ) | | | (21,012 | ) | |
Paychex, Inc. | | | (356 | ) | | | (18,362 | ) | |
Plum Creek
Timber Co.,
Inc. | | | (463 | ) | | | (18,863 | ) | |
PPG Industries,
Inc. | | | (233 | ) | | | (24,293 | ) | |
Precision
Castparts
Corp. | | | (97 | ) | | | (22,389 | ) | |
Priceline
Group, Inc. | | | (18 | ) | | | (26,176 | )* | |
PTC, Inc. | | | (689 | ) | | | (24,418 | )* | |
QUALCOMM,
Inc. | | | (379 | ) | | | (22,520 | ) | |
Realty Income
Corp. | | | (474 | ) | | | (23,444 | ) | |
Restoration
Hardware
Holdings, Inc. | | | (141 | ) | | | (14,536 | )* | |
Rice Energy,
Inc. | | | (535 | ) | | | (8,164 | )* | |
Sempra
Energy | | | (242 | ) | | | (24,783 | ) | |
Signet
Jewelers
Ltd. | | | (158 | ) | | | (23,849 | ) | |
Sirius XM
Holdings, Inc. | | | (4,603 | ) | | | (18,780 | )* | |
Solera
Holdings, Inc. | | | (315 | ) | | | (17,218 | ) | |
Southern Co. | | | (516 | ) | | | (23,272 | ) | |
Southern
Copper Corp. | | | (830 | ) | | | (23,041 | ) | |
Starbucks
Corp. | | | (353 | ) | | | (22,087 | ) | |
Stericycle, Inc. | | | (153 | ) | | | (18,570 | )* | |
TFS Financial
Corp. | | | (985 | ) | | | (17,297 | ) | |
Toro Co. | | | (315 | ) | | | (23,710 | ) | |
Tyco
International
PLC | | | (603 | ) | | | (21,973 | ) | |
Under Armour,
Inc. Class A | | | (233 | ) | | | (22,154 | )* | |
Union Pacific
Corp. | | | (188 | ) | | | (16,798 | ) | |
United
Technologies
Corp. | | | (155 | ) | | | (15,254 | ) | |
Ventas, Inc. | | | (359 | ) | | | (19,285 | ) | |
Vornado
Realty Trust | | | (218 | ) | | | (21,920 | ) | |
| | |
Number
of Shares | |
Value† | |
WEC Energy
Group, Inc. | | | (445 | ) | | $ | (22,944 | ) | |
WhiteWave
Foods Co. | | | (412 | ) | | | (16,884 | )* | |
Williams
Cos., Inc. | | | (471 | ) | | | (18,576 | ) | |
WR Grace
& Co. | | | (226 | ) | | | (22,668 | )* | |
Wynn Resorts
Ltd. | | | (215 | ) | | | (15,039 | ) | |
| | | | (1,781,933 | ) | |
Total Common
Stocks Sold Short
(Proceeds $(3,586,664)) | | | | | (3,672,134 | ) | |
Redeemable Preference Shares
Sold Short (0.0%) | |
United Kingdom (0.0%) | |
Rolls-Royce
Holdings
PLC, C Shares
(Proceeds $(263)) | | | (170,568 | ) | | | (263 | )Ñ*f | |
Rights Sold Short (0.1%) | |
United States (0.1%) | |
Furiex
Pharmaceuticals,
Inc. (Proceeds $(17,518)) | | | (1,793 | ) | | | (17,518 | )Ñ*f | |
Total Short Positions
(Proceeds $(3,604,445)) | | | | | (3,689,915 | ) | |
See Notes to Schedule of Investments
LONG POSITIONS BY INDUSTRY GLOBAL ALLOCATION FUND (UNAUDITED)
Industry | | Investments at
Value† | | Percentage of
Net Assets | |
Mutual Funds | | $ | 8,705,314 | | | | 36.9 | % | |
Government Securities | | | 1,826,463 | | | | 7.8 | % | |
U.S. Treasury Securities-Backed by the Full Faith and Credit of the U.S. Government | | | 1,088,885 | | | | 4.6 | % | |
Diversified Financial Services | | | 755,321 | | | | 3.2 | % | |
Food & Staples Retailing | | | 691,882 | | | | 2.9 | % | |
Insurance | | | 639,896 | | | | 2.7 | % | |
Oil, Gas & Consumable Fuels | | | 623,813 | | | | 2.6 | % | |
Software | | | 586,127 | | | | 2.5 | % | |
Media | | | 556,787 | | | | 2.4 | % | |
Exchange Traded Funds | | | 533,082 | | | | 2.3 | % | |
Pharmaceuticals | | | 526,014 | | | | 2.2 | % | |
Airlines | | | 486,212 | | | | 2.1 | % | |
Health Care Providers & Services | | | 479,923 | | | | 2.0 | % | |
Computers & Peripherals | | | 421,489 | | | | 1.8 | % | |
Aerospace & Defense | | | 402,796 | | | | 1.7 | % | |
Commercial Banks | | | 370,022 | | | | 1.6 | % | |
Food Products | | | 357,705 | | | | 1.5 | % | |
Specialty Retail | | | 286,083 | | | | 1.2 | % | |
Electric Utilities | | | 279,567 | | | | 1.2 | % | |
Electronic Equipment, Instruments & Components | | | 275,994 | | | | 1.2 | % | |
Communications Equipment | | | 223,790 | | | | 0.9 | % | |
Health Care Equipment & Supplies | | | 215,140 | | | | 0.9 | % | |
Diversified Telecommunication Services | | | 206,397 | | | | 0.9 | % | |
Chemicals | | | 202,298 | | | | 0.9 | % | |
Textiles, Apparel & Luxury Goods | | | 193,268 | | | | 0.8 | % | |
Semiconductors & Semiconductor Equipment | | | 186,537 | | | | 0.8 | % | |
IT Services | | | 180,852 | | | | 0.8 | % | |
Automobiles | | | 174,079 | | | | 0.7 | % | |
Life Science Tools & Services | | | 156,229 | | | | 0.7 | % | |
Mortgage-Backed Securities | | | 155,296 | | | | 0.7 | % | |
Metals & Mining | | | 155,856 | | | | 0.7 | % | |
Energy Equipment & Services | | | 151,900 | | | | 0.6 | % | |
Thrifts & Mortgage Finance | | | 149,607 | | | | 0.6 | % | |
Commercial Services & Supplies | | | 141,830 | | | | 0.6 | % | |
Real Estate Investment Trusts | | | 138,495 | | | | 0.6 | % | |
Road & Rail | | | 135,248 | | | | 0.6 | % | |
Machinery | | | 132,993 | | | | 0.6 | % | |
Multiline Retail | | | 132,592 | | | | 0.6 | % | |
Wireless Telecommunication Services | | | 118,016 | | | | 0.5 | % | |
Hotels, Restaurants & Leisure | | | 116,951 | | | | 0.5 | % | |
Trading Companies & Distributors | | | 106,425 | | | | 0.5 | % | |
Containers & Packaging | | | 103,855 | | | | 0.4 | % | |
Paper & Forest Products | | | 99,723 | | | | 0.4 | % | |
Auto Components | | | 96,707 | | | | 0.4 | % | |
Construction & Engineering | | | 87,055 | | | | 0.4 | % | |
Biotechnology | | | 81,731 | | | | 0.3 | % | |
Capital Markets | | | 81,479 | | | | 0.3 | % | |
Internet Software & Services | | | 80,299 | | | | 0.3 | % | |
Office Electronics | | | 78,908 | | | | 0.3 | % | |
Multi-Utilities | | | 76,075 | | | | 0.3 | % | |
Distributors | | | 74,718 | | | | 0.3 | % | |
Beverages | | | 66,943 | | | | 0.3 | % | |
Gas Utilities | | | 64,988 | | | | 0.3 | % | |
See Notes to Schedule of Investments
LONG POSITIONS BY INDUSTRY GLOBAL ALLOCATION FUND (UNAUDITED) (cont'd)
Industry | | Investments at
Value† | | Percentage of
Net Assets | |
Household Durables | | $ | 64,451 | | | | 0.3 | % | |
Pharmaceutical | | | 62,297 | | | | 0.3 | % | |
Air Freight & Logistics | | | 60,547 | | | | 0.3 | % | |
Transportation | | | 58,369 | | | | 0.2 | % | |
Banks | | | 55,985 | | | | 0.2 | % | |
Consumer Finance | | | 48,202 | | | | 0.2 | % | |
Marine | | | 46,428 | | | | 0.2 | % | |
Professional Services | | | 46,282 | | | | 0.2 | % | |
Retail REITs | | | 45,499 | | | | 0.2 | % | |
Health Care Technology | | | 42,194 | | | | 0.2 | % | |
Retail | | | 37,872 | | | | 0.2 | % | |
U.S. Government Agency Securities | | | 33,338 | | | | 0.1 | % | |
Tobacco | | | 30,530 | | | | 0.1 | % | |
Industrial Conglomerates | | | 28,359 | | | | 0.1 | % | |
Industrial & Office REITs | | | 27,950 | | | | 0.1 | % | |
Internet & Catalog Retail | | | 27,909 | | | | 0.1 | % | |
Real Estate Holding & Development | | | 23,853 | | | | 0.1 | % | |
Casinos & Gaming | | | 22,003 | | | | 0.1 | % | |
Business Services | | | 21,752 | | | | 0.1 | % | |
Independent Power and Renewable Electricity Producers | | | 21,348 | | | | 0.1 | % | |
Household Products | | | 20,546 | | | | 0.1 | % | |
Leisure Equipment & Products | | | 20,437 | | | | 0.1 | % | |
Heavy Electrical Equipment | | | 19,425 | | | | 0.1 | % | |
Diversified REITs | | | 18,805 | | | | 0.1 | % | |
Technology Hardware, Storage & Peripherals | | | 15,955 | | | | 0.1 | % | |
Capital Goods | | | 14,900 | | | | 0.1 | % | |
Materials | | | 13,150 | | | | 0.1 | % | |
Medical Services | | | 6,471 | | | | 0.0 | % | |
Short-Term Investments and Other Assets-Net | | | 2,053,670 | | | | 8.7 | % | |
Short Positions (see summary on the next page) | | (3,689,915 | ) | | | (15.7 | )% | |
| | | $ | 23,558,267 | | | | 100.0 | % | |
See Notes to Schedule of Investments
SHORT POSITIONS BY INDUSTRY GLOBAL ALLOCATION FUND (UNAUDITED)
Industry | | Investments at
Value† | | Percentage of
Net Assets | |
Machinery | | $ | (210,684 | ) | | | (0.9 | )% | |
Oil, Gas & Consumable Fuels | | | (209,263 | ) | | | (0.9 | )% | |
Hotels, Restaurants & Leisure | | | (164,839 | ) | | | (0.7 | )% | |
Real Estate Investment Trusts | | | (160,741 | ) | | | (0.7 | )% | |
Real Estate Management & Development | | | (141,680 | ) | | | (0.6 | )% | |
Chemicals | | | (136,833 | ) | | | (0.6 | )% | |
Software | | | (136,522 | ) | | | (0.6 | )% | |
Health Care Equipment & Supplies | | | (122,902 | ) | | | (0.5 | )% | |
Textiles, Apparel & Luxury Goods | | | (119,636 | ) | | | (0.5 | )% | |
Food Products | | | (118,876 | ) | | | (0.5 | )% | |
Pharmaceuticals | | | (114,436 | ) | | | (0.5 | )% | |
Beverages | | | (113,079 | ) | | | (0.5 | )% | |
Metals & Mining | | | (102,120 | ) | | | (0.4 | )% | |
IT Services | | | (89,212 | ) | | | (0.4 | )% | |
Aerospace & Defense | | | (86,373 | ) | | | (0.4 | )% | |
Internet & Catalog Retail | | | (85,627 | ) | | | (0.4 | )% | |
Semiconductors & Semiconductor Equipment | | | (84,219 | ) | | | (0.4 | )% | |
Internet Software & Services | | | (80,853 | ) | | | (0.3 | )% | |
Road & Rail | | | (75,584 | ) | | | (0.3 | )% | |
Media | | | (73,495 | ) | | | (0.3 | )% | |
Multi-Utilities | | | (70,727 | ) | | | (0.3 | )% | |
Electric Utilities | | | (69,547 | ) | | | (0.3 | )% | |
Materials | | | (69,116 | ) | | | (0.3 | )% | |
Commercial Services & Supplies | | | (68,371 | ) | | | (0.3 | )% | |
Professional Services | | | (63,213 | ) | | | (0.3 | )% | |
Water Utilities | | | (61,177 | ) | | | (0.3 | )% | |
Capital Markets | | | (60,809 | ) | | | (0.3 | )% | |
Construction & Engineering | | | (60,360 | ) | | | (0.3 | )% | |
Specialty Retail | | | (58,688 | ) | | | (0.2 | )% | |
Trading Companies & Distributors | | | (56,184 | ) | | | (0.2 | )% | |
Gas Utilities | | | (52,804 | ) | | | (0.2 | )% | |
Transportation | | | (46,469 | ) | | | (0.2 | )% | |
Building Products | | | (41,874 | ) | | | (0.2 | )% | |
Household Products | | | (41,758 | ) | | | (0.2 | )% | |
Insurance | | | (36,406 | ) | | | (0.1 | )% | |
Electrical Equipment | | | (35,810 | ) | | | (0.1 | )% | |
Electronic Equipment, Instruments & Components | | | (35,761 | ) | | | (0.1 | )% | |
Wireless Telecommunication Services | | | (35,751 | ) | | | (0.1 | )% | |
Thrifts & Mortgage Finance | | | (34,835 | ) | | | (0.1 | )% | |
Energy Equipment & Services | | | (32,649 | ) | | | (0.1 | )% | |
Containers & Packaging | | | (23,603 | ) | | | (0.1 | )% | |
Communications Equipment | | | (22,520 | ) | | | (0.1 | )% | |
Personal Products | | | (21,575 | ) | | | (0.1 | )% | |
Household Durables | | | (21,173 | ) | | | (0.1 | )% | |
Paper & Forest Products | | | (20,716 | ) | | | (0.1 | )% | |
Banks | | | (19,983 | ) | | | (0.1 | )% | |
Tobacco | | | (18,266 | ) | | | (0.1 | )% | |
Automobiles | | | (16,210 | ) | | | (0.1 | )% | |
Diversified Telecommunication Services | | | (15,549 | ) | | | (0.1 | )% | |
Industrial Conglomerates | | | (15,241 | ) | | | (0.1 | )% | |
Diversified Financial Services | | | (12,350 | ) | | | (0.1 | )% | |
Independent Power and Renewable Electricity Producers | | (11,747 | ) | | | 0.0 | % | |
Biotechnology | | | (11,699 | ) | | | 0.0 | % | |
Total Common Stocks Sold Short | | $ | (3,689,915 | ) | | | (15.7 | )% | |
See Notes to Schedule of Investments
Schedule of Investments Inflation Managed Fundb 10/31/15
| |
Number
of Shares | |
Value† | |
Common Stocks (43.4%) | |
Chemicals (8.1%) | |
Air Products &
Chemicals,
Inc. | | | 606 | | | $ | 84,222 | | |
Airgas, Inc. | | | 154 | | | | 14,809 | | |
Celanese
Corp.
Class A | | | 81 | | | | 5,755 | | |
CF Industries
Holdings,
Inc. | | | 740 | | | | 37,570 | | |
Chase Corp. | | | 102 | | | | 4,530 | * | |
Chemtura
Corp. | | | 77 | | | | 2,459 | * | |
Core
Molding
Technologies,
Inc. | | | 135 | | | | 2,705 | * | |
Dow
Chemical
Co. | | | 3,587 | | | | 185,340 | | |
E.I. du Pont
de
Nemours &
Co. | | | 3,018 | | | | 191,341 | | |
Eastman
Chemical
Co. | | | 484 | | | | 34,930 | | |
Ecolab, Inc. | | | 796 | | | | 95,799 | | |
FMC Corp. | | | 207 | | | | 8,427 | | |
FutureFuel
Corp. | | | 185 | | | | 2,851 | | |
Hawkins,
Inc. | | | 80 | | | | 3,315 | | |
Innophos
Holdings,
Inc. | | | 22 | | | | 935 | | |
International
Flavors &
Fragrances,
Inc. | | | 206 | | | | 23,908 | | |
KMG
Chemicals,
Inc. | | | 77 | | | | 1,620 | | |
Kraton
Performance
Polymers,
Inc. | | | 197 | | | | 4,017 | * | |
Kronos
Worldwide,
Inc. | | | 74 | | | | 585 | | |
LSB Industries,
Inc. | | | 117 | | | | 1,831 | * | |
LyondellBasell
Industries
NV Class A | | | 1,342 | | | | 124,685 | | |
Monsanto
Co. | | | 1,519 | | | | 141,601 | | |
Mosaic Co. | | | 1,017 | | | | 34,364 | | |
| | |
Number
of Shares | |
Value† | |
OMNOVA
Solutions,
Inc. | | | 1,168 | | | $ | 8,386 | * | |
PPG
Industries,
Inc. | | | 823 | | | | 85,806 | | |
Praxair, Inc. | | | 720 | | | | 79,985 | | |
Rayonier
Advanced
Materials,
Inc. | | | 137 | | | | 1,263 | | |
Sensient
Technologies
Corp. | | | 93 | | | | 6,070 | | |
Sherwin-
Williams Co. | | | 241 | | | | 64,306 | | |
Sigma-
Aldrich
Corp. | | | 253 | | | | 35,349 | | |
Stepan Co. | | | 64 | | | | 3,388 | | |
Trecora
Resources | | | 292 | | | | 4,158 | * | |
Tredegar
Corp. | | | 148 | | | | 2,111 | | |
Trinseo SA | | | 190 | | | | 6,166 | * | |
| | | | 1,304,587 | | |
Construction Materials (0.4%) | |
Martin
Marietta
Materials,
Inc. | | | 147 | | | | 22,807 | | |
United States
Lime &
Minerals,
Inc. | | | 16 | | | | 782 | | |
US Concrete,
Inc. | | | 18 | | | | 998 | * | |
Vulcan
Materials
Co. | | | 367 | | | | 35,445 | | |
| | | | 60,032 | | |
Containers & Packaging (0.9%) | |
AEP
Industries,
Inc. | | | 38 | | | | 3,040 | * | |
AptarGroup,
Inc. | | | 37 | | | | 2,722 | | |
Avery
Dennison
Corp. | | | 352 | | | | 22,869 | | |
Ball Corp. | | | 364 | | | | 24,934 | | |
Greif, Inc.
Class A | | | 52 | | | | 1,705 | | |
Owens-
Illinois, Inc. | | | 520 | | | | 11,206 | * | |
Sealed Air
Corp. | | | 621 | | | | 30,503 | | |
| | |
Number
of Shares | |
Value† | |
WestRock
Co. | | | 835 | | | $ | 44,890 | | |
| | | | 141,869 | | |
Electric Utilities (0.3%) | |
NextEra
Energy, Inc. | | | 450 | | | | 46,197 | | |
Energy Equipment & Services (1.8%) | |
Baker
Hughes, Inc. | | | 616 | | | | 32,451 | | |
Bristow
Group, Inc. | | | 110 | | | | 3,820 | | |
Cameron
International
Corp. | | | 162 | | | | 11,018 | * | |
Ensco PLC
Class A | | | 839 | | | | 13,952 | | |
FMC
Technologies,
Inc. | | | 226 | | | | 7,645 | * | |
Halliburton
Co. | | | 1,120 | | | | 42,986 | | |
Hornbeck
Offshore
Services, Inc. | | | 219 | | | | 2,959 | * | |
ION
Geophysical
Corp. | | | 3,839 | | | | 1,420 | * | |
Key Energy
Services, Inc. | | | 3,104 | | | | 1,631 | * | |
National
Oilwell
Varco, Inc. | | | 498 | | | | 18,745 | | |
Noble Corp.
PLC | | | 580 | | | | 7,813 | | |
PHI, Inc. | | | 419 | | | | 7,978 | * | |
Schlumberger
Ltd. | | | 1,570 | | | | 122,711 | | |
Superior
Energy
Services, Inc. | | | 389 | | | | 5,508 | | |
Tesco Corp. | | | 487 | | | | 3,896 | | |
| | | | 284,533 | | |
Gas Utilities (0.4%) | |
Suburban
Propane
Partners LP | | | 1,750 | | | | 60,200 | | |
Hotels, Restaurants & Leisure (1.2%) | |
Cedar Fair LP | | | 3,000 | | | | 168,000 | | |
Starwood
Hotels &
Resorts
Worldwide,
Inc. | | | 340 | | | | 27,156 | | |
| | | | 195,156 | | |
Independent Power and Renewable Electricity Producers (0.5%) | |
NRG Yield,
Inc. Class C | | | 6,000 | | | | 86,640 | | |
See Notes to Schedule of Investments
Schedule of Investments Inflation Managed Fundb (cont'd)
| | |
Number
of Shares | |
Value† | |
Metals & Mining (0.8%) | |
Alcoa, Inc. | | | 3,947 | | | $ | 35,247 | | |
Century
Aluminum
Co. | | | 106 | | | | 384 | * | |
Cliffs Natural
Resources,
Inc. | | | 103 | | | | 284 | | |
Commercial
Metals Co. | | | 175 | | | | 2,515 | | |
Freeport-
McMoRan,
Inc. | | | 2,437 | | | | 28,683 | | |
Haynes
International | | | 71 | | | | 2,801 | | |
Newmont
Mining Corp. | | | 1,250 | | | | 24,325 | ØØ | |
Nucor Corp. | | | 854 | | | | 36,124 | | |
Real Industry,
Inc. | | | 94 | | | | 893 | * | |
Reliance
Steel &
Aluminum
Co. | | | 11 | | | | 660 | | |
Schnitzer
Steel
Industries,
Inc. Class A | | | 51 | | | | 860 | | |
United States
Steel Corp. | | | 50 | | | | 584 | | |
| | | | 133,360 | | |
Multi-Utilities (0.5%) | |
Sempra
Energy | | | 850 | | | | 87,048 | | |
Oil, Gas & Consumable Fuels (19.0%) | |
Alliance
Holdings
GP LP | | | 4,000 | | | | 117,040 | | |
Alon USA
Energy, Inc. | | | 179 | | | | 2,998 | | |
Anadarko
Petroleum
Corp. | | | 655 | | | | 43,806 | | |
Apache Corp. | | | 538 | | | | 25,356 | | |
Ardmore
Shipping
Corp. | | | 230 | | | | 3,301 | | |
Cabot Oil &
Gas Corp. | | | 231 | | | | 5,015 | | |
Chesapeake
Energy Corp. | | | 637 | | | | 4,542 | | |
Chevron
Corp. | | | 2,596 | | | | 235,924 | | |
Cimarex
Energy Co. | | | 95 | | | | 11,216 | | |
Clean Energy
Fuels Corp. | | | 615 | | | | 3,475 | * | |
ConocoPhillips | | | 1,599 | | | | 85,307 | | |
| | |
Number
of Shares | |
Value† | |
Crestwood
Equity
Partners LP | | | 31,450 | | | $ | 90,890 | | |
Devon
Energy Corp. | | | 590 | | | | 24,739 | | |
Energy
Transfer
Equity LP | | | 9,200 | | | | 198,260 | | |
Energy
Transfer
Partners LP | | | 3,850 | | | | 170,016 | | |
Enterprise
Products
Partners LP | | | 7,700 | | | | 212,751 | | |
EOG
Resources,
Inc. | | | 678 | | | | 58,206 | | |
EQT Corp. | | | 153 | | | | 10,109 | | |
Exxon
Mobil Corp. | | | 5,556 | | | | 459,703 | ØØ | |
Hess Corp. | | | 311 | | | | 17,481 | | |
Kinder
Morgan, Inc. | | | 2,109 | | | | 57,681 | | |
Marathon
Oil Corp. | | | 905 | | | | 16,634 | | |
Marathon
Petroleum
Corp. | | | 753 | | | | 39,005 | | |
Navios
Maritime
Acquisition
Corp. | | | 1,206 | | | | 4,317 | | |
Newfield
Exploration
Co. | | | 318 | | | | 12,780 | * | |
Noble
Energy, Inc. | | | 526 | | | | 18,852 | | |
NuStar GP
Holdings
LLC | | | 2,700 | | | | 78,867 | | |
Occidental
Petroleum
Corp. | | | 1,029 | | | | 76,702 | | |
ONEOK, Inc. | | | 2,604 | | | | 88,328 | | |
PBF Energy,
Inc. Class A | | | 115 | | | | 3,910 | | |
Phillips 66 | | | 745 | | | | 66,342 | | |
Pioneer
Natural
Resources
Co. | | | 175 | | | | 24,000 | | |
Renewable
Energy
Group, Inc. | | | 332 | | | | 2,619 | * | |
REX
American
Resources
Corp. | | | 93 | | | | 5,107 | * | |
Ship Finance
International
Ltd. | | | 258 | | | | 4,409 | | |
| | |
Number
of Shares | |
Value† | |
Southwestern
Energy Co. | | | 323 | | | $ | 3,566 | * | |
Spectra
Energy Corp. | | | 5,136 | | | | 146,736 | | |
Teekay Corp. | | | 3,200 | | | | 102,816 | | |
Teekay LNG
Partners LP | | | 4,900 | | | | 121,716 | | |
Teekay
Tankers Ltd.
Class A | | | 448 | | | | 3,423 | | |
Tesoro Corp. | | | 182 | | | | 19,461 | | |
Valero
Energy Corp. | | | 716 | | | | 47,199 | | |
Western Gas
Partners LP | | | 3,400 | | | | 173,808 | | |
Williams
Cos., Inc. | | | 4,296 | | | | 169,434 | | |
| | | | 3,067,847 | | |
Paper & Forest Products (0.4%) | |
Domtar Corp. | | | 139 | | | | 5,732 | | |
International
Paper Co. | | | 1,234 | | | | 52,680 | | |
Resolute
Forest
Products,
Inc. | | | 68 | | | | 508 | * | |
Wausau
Paper Corp. | | | 140 | | | | 1,429 | | |
| | | | 60,349 | | |
Real Estate Investment Trusts (8.9%) | |
American
Homes 4
Rent Class A | | | 1,459 | | | | 24,074 | | |
American
Tower Corp. | | | 842 | | | | 86,078 | | |
AvalonBay
Communities,
Inc. | | | 424 | | | | 74,128 | | |
Boston
Properties,
Inc. | | | 557 | | | | 70,098 | | |
CoreSite
Realty Corp. | | | 415 | | | | 22,804 | | |
Crown Castle
International
Corp. | | | 644 | | | | 55,036 | | |
DCT Industrial
Trust, Inc. | | | 415 | | | | 15,405 | | |
Digital Realty
Trust, Inc. | | | 308 | | | | 22,780 | | |
Douglas
Emmett, Inc. | | | 796 | | | | 24,318 | | |
Equinix, Inc. | | | 131 | | | | 38,865 | | |
Equity
Commonwealth | | | 674 | | | | 19,351 | * | |
Equity
Lifestyle
Properties,
Inc. | | | 321 | | | | 19,414 | | |
See Notes to Schedule of Investments
Schedule of Investments Inflation Managed Fundb (cont'd)
| | |
Number
of Shares | |
Value† | |
Equity
Residential | | | 1,214 | | | $ | 93,866 | | |
Essex
Property
Trust, Inc. | | | 264 | | | | 58,196 | | |
Extra Space
Storage, Inc. | | | 213 | | | | 16,878 | | |
Federal Realty
Investment
Trust | | | 278
1,377 | | | | 39,890
39,864 | | |
General
Growth
Properties,
Inc. | | | |
HCP, Inc. | | | 583 | | | | 21,688 | ØØ | |
Host Hotels &
Resorts, Inc. | | | 1,907 | | | | 33,048 | | |
Hudson
Pacific
Properties,
Inc. | | | 371 | | | | 10,599 | | |
Kimco Realty
Corp. | | | 1,471 | | | | 39,379 | | |
LaSalle Hotel
Properties | | | 440 | | | | 12,940 | | |
National
Retail
Properties,
Inc. | | | 692 | | | | 26,296 | | |
OMEGA
Healthcare
Investors, Inc. | | | 680 | | | | 23,474 | | |
Plum Creek
Timber Co.,
Inc. | | | 376 | | | | 15,318 | | |
Prologis, Inc. | | | 1,132 | | | | 48,370 | | |
Public
Storage | | | 387 | | | | 88,801 | | |
Regency
Centers
Corp. | | | 403 | | | | 27,388 | | |
Simon
Property
Group, Inc. | | | 735 | | | | 148,073 | | |
SL Green
Realty Corp. | | | 314 | | | | 37,247 | | |
Sovran Self
Storage, Inc. | | | 159 | | | | 15,879 | | |
Taubman
Centers, Inc. | | | 265 | | | | 20,400 | | |
Ventas, Inc. | | | 876 | | | | 47,059 | | |
Vornado
Realty Trust | | | 307 | | | | 30,869 | | |
Welltower,
Inc. | | | 492 | | | | 31,916 | | |
Weyerhaeuser
Co. | | | 1,072 | | | | 31,442 | | |
| | | | 1,431,231 | | |
| | |
Number
of Shares | |
Value† | |
Real Estate Management &
Development (0.2%) | |
Brookfield
Asset
Management,
Inc. Class A | | | 741 | | | $ | 25,913 | | |
Forest City
Enterprises,
Inc. Class A | | | 735 | | | | 16,243 | * | |
| | | | 42,156 | | |
Total Common Stocks
(Cost $7,499,630) | | | | | 7,001,205 | | |
| | | Principal
Amounta | | | |
Government Securities (12.9%) | |
Sovereign (12.9%) | |
Australia
Government
Bond, Senior
Unsecured
Notes,
2.00%, due
8/21/35 | | AUD | 160,000 | | | | 140,510 | | |
Canadian
Government
Bond, Bonds,
1.50%, due
12/1/44 | | CAD | 66,073 | | | | 59,018 | | |
France
Government
Bond OAT,
Unsecured
Notes,
0.70%, due
7/25/30 | | EUR | 75,024 | | | | 93,639 | ñ | |
Italy Buoni
Poliennali
Del Tesoro,
Bonds,
2.55%, due
9/15/41 | | EUR | 162,585 | | | | 226,752 | | |
Mexican
Bonos,
Bonds, Ser.
M, 7.75%,
due
11/13/42 | | MXN | 1,805,000 | | | | 122,622 | | |
New Zealand
Government
Bond, Senior
Unsecured
Notes,
2.00%, due
9/20/25 | | NZD | 248,670 | | | | 173,640 | | |
| | |
Principal
Amounta | |
Value† | |
New Zealand
Government
Bond, Senior
Unsecured
Notes,
2.50%, due
9/20/35 | | NZD | 325,000 | | | $ | 227,975 | | |
South Africa
Government
Bond, Bonds,
6.50%, due
2/28/41 | | ZAR | 1,800,000 | | | | 97,612 | | |
Spain
Government
Inflation
Linked Bond,
Senior
Unsecured
Notes,
1.00%, due
11/30/30 | | EUR | 114,566 | | | | 124,920 | ñ | |
United
Kingdom
Gilt Inflation
Linked
Bonds,
Bonds,
0.13%, due
3/22/24 | | GBP | 101,803 | | | | 168,664 | | |
United
Kingdom
Gilt Inflation
Linked
Bonds,
Bonds,
0.13%, due
3/22/44 | | GBP | 182,158 | | | | 356,528 | | |
United
Kingdom
Gilt Inflation
Linked
Bonds,
Senior
Unsecured
Notes,
0.13%, due
3/22/29 | | GBP | 21,882 | | | | 37,541 | | |
United
Kingdom
Gilt Inflation
Linked,
Bonds,
0.25%, due
3/22/52 | | GBP | 112,683 | | | | 247,955 | | |
Total Government
Securities
(Cost $2,178,819) | | | | | 2,077,376 | | |
See Notes to Schedule of Investments
Schedule of Investments Inflation Managed Fundb (cont'd)
| | |
Principal
Amounta | |
Value† | |
U.S. Treasury Securities-Backed by the Full Faith and Credit of the U.S. Government (13.7%) | |
U.S. Treasury
Inflation-
Indexed
Bonds,
0.13%, due
1/15/22 | | $ | 21,060 | | | $ | 20,572 | | |
U.S. Treasury
Inflation-
Indexed
Bonds,
0.13%, due
7/15/22 | | | 20,727 | | | | 20,260 | | |
U.S. Treasury
Inflation-
Indexed
Bonds,
0.13%, due
1/15/23 | | | 123,901 | | | | 119,820 | | |
U.S. Treasury
Inflation-
Indexed
Bonds,
0.63%, due
1/15/24 | | | 398,350 | | | | 397,831 | | |
U.S. Treasury
Inflation-
Indexed
Bonds,
2.38%, due
1/15/25 | | | 126,436 | | | | 145,553 | | |
U.S. Treasury
Inflation-
Indexed
Bonds,
2.38%, due
1/15/27 | | | 212,724 | | | | 249,552 | | |
U.S. Treasury
Inflation-
Indexed
Bonds,
1.75%, due
1/15/28 | | | 182,019 | | | | 202,290 | | |
U.S. Treasury
Inflation-
Indexed
Bonds,
3.88%, due
4/15/29 | | | 123,228 | | | | 170,735 | | |
U.S. Treasury
Inflation-
Indexed
Bonds,
2.50%, due
1/15/29 | | | 199,809 | | | | 241,183 | | |
| | |
Principal
Amounta | |
Value† | |
U.S. Treasury
Inflation-
Indexed
Bonds,
3.38%, due
4/15/32 | | $ | 187,977 | | | $ | 259,621 | | |
U.S. Treasury
Inflation-
Indexed
Bonds,
2.13%, due
2/15/40 | | | 99,239 | | | | 119,100 | | |
U.S. Treasury
Inflation-
Indexed
Bonds,
0.63%, due
2/15/43 | | | 300,617 | | | | 259,478 | | |
Total U.S. Treasury
Securities-Backed by the
Full Faith and Credit of the
U.S. Government
(Cost $2,250,764) | | | | | 2,205,995 | | |
| | | Number
of Shares | | | |
Mutual Funds (28.3%) | |
Neuberger
Berman
Emerging
Markets
Equity Fund
Institutional
Class | | | 57,674 | | | | 845,956 | §§ | |
Neuberger
Berman
Floating
Rate Income
Fund
Institutional
Class | | | 61,229 | | | | 603,445 | §§ | |
Neuberger
Berman
High Income
Bond Fund
Institutional
Class | | | 193,868 | | | | 1,650,321 | §§ | |
Neuberger
Berman Risk
Balanced
Commodity
Strategy
Fund
Institutional
Class | | | 235,026 | | | | 1,456,338 | *§§ | |
Total Mutual Funds
(Cost $5,372,800) | | | | | 4,556,060 | | |
| | |
Number
of Shares | |
Value† | |
Short-Term Investments (1.0%) | |
State Street
Institutional
Liquid
Reserves
Fund Premier
Class, 0.15%
(Cost $161,218) | | | 161,218 | | | $ | 161,218 | dØØ | |
Total
Investments (99.3%)
(Cost $17,463,231) | | | | | 16,001,854 | ## | |
Cash,
receivables
and other
assets, less
liabilities (0.7%) | | | | | 110,725 | e | |
Total Net Assets (100.0%) | | | | | $16,112,579 | | |
See Notes to Schedule of Investments
Schedule of Investments Long Short Fund 10/31/15
| |
Number
of Shares | |
Value† | |
Long Positions (98.2%) | |
Common Stocks (72.1%) | |
Airlines (1.2%) | |
Delta Air
Lines, Inc. | | | 770,166 | | | $ | 39,155,239 | g@ | |
Banks (2.8%) | |
Citigroup,
Inc. | | | 511,200 | | | | 27,180,504 | | |
JPMorgan
Chase &
Co. | | | 550,236 | | | | 35,352,663 | | |
U.S. Bancorp | | | 725,000 | | | | 30,580,500 | | |
| | | | 93,113,667 | | |
Capital Markets (1.6%) | |
BlackRock,
Inc. | | | 78,900 | | | | 27,770,433 | | |
Invesco
Ltd. | | | 418,393 | | | | 13,878,096 | | |
KKR &
Co. LP | | | 671,442 | | | | 11,515,230 | | |
| | | | 53,163,759 | | |
Chemicals (1.2%) | |
Ashland,
Inc. | | | 342,150 | | | | 37,540,698 | g@ | |
Consumer Finance (1.0%) | |
American
Express Co. | | | 179,300 | | | | 13,135,518 | | |
Springleaf
Holdings,
Inc. | | | 441,000 | | | | 20,687,310 | * | |
Synchrony
Financial | | | 17 | | | | 523 | *g@ | |
| | | | 33,823,351 | | |
Diversified Financial Services (2.4%) | |
CME Group,
Inc. | | | 310,000 | | | | 29,285,700 | | |
Markit Ltd. | | | 1,624,819 | | | | 49,556,979 | * | |
| | | | 78,842,679 | | |
Electric Utilities (3.2%) | |
Brookfield
Infrastructure
Partners LP | | | 2,136,279 | | | | 89,851,895 | | |
Eversource
Energy | | | 272,400 | | | | 13,876,056 | | |
| | | | 103,727,951 | | |
Electrical Equipment (0.6%) | |
Sensata
Technologies
Holding NV | | | 375,774 | | | | 18,070,972 | * | |
Electronic Equipment, Instruments & Components (2.8%) | |
Amphenol
Corp.
Class A | | | 312,200 | | | | 16,927,484 | | |
| | |
Number
of Shares | |
Value† | |
CDW Corp. | | | 943,300 | | | $ | 42,156,077 | | |
Zebra
Technologies
Corp.
Class A | | | 402,239 | | | | 30,932,179 | * | |
| | | | 90,015,740 | | |
Food & Staples Retailing (2.5%) | |
Costco
Wholesale
Corp. | | | 115,600 | | | | 18,278,672 | | |
CVS Health
Corp. | | | 461,600 | | | | 45,596,848 | | |
Fresh Market,
Inc. | | | 740,552 | | | | 18,454,556 | * | |
| | | | 82,330,076 | | |
Food Products (1.5%) | |
ConAgra
Foods, Inc. | | | 1,209,700 | | | | 49,053,335 | | |
Health Care Equipment & Supplies (1.9%) | |
Sirona
Dental
Systems,
Inc. | | | 267,500 | | | | 29,192,275 | * | |
Zimmer
Biomet
Holdings,
Inc. | | | 311,300 | | | | 32,552,641 | g@ | |
| | | | 61,744,916 | | |
Health Care Providers & Services (3.2%) | |
Accretive
Health, Inc. | | | 1,278,675 | | | | 2,621,284 | * | |
DaVita
HealthCare
Partners,
Inc. | | | 1,090,600 | | | | 84,532,406 | *g@ | |
UnitedHealth
Group, Inc. | | | 143,000 | | | | 16,842,540 | | |
| | | | 103,996,230 | | |
Hotels, Restaurants & Leisure (3.8%) | |
Darden
Restaurants,
Inc. | | | 481,600 | | | | 29,806,224 | | |
Hilton
Worldwide
Holdings, Inc. | | | 674,200 | | | | 16,848,258 | | |
McDonald's
Corp. | | | 192,700 | | | | 21,630,575 | | |
Starwood
Hotels &
Resorts
Worldwide,
Inc. | | | 325,000 | | | | 25,957,750 | | |
Wyndham
Worldwide
Corp. | | | 179,000 | | | | 14,561,650 | | |
| | |
Number
of Shares | |
Value† | |
Yum!
Brands, Inc. | | | 209,200 | | | $ | 14,834,372 | | |
| | | | 123,638,829 | | |
Household Durables (1.2%) | |
Lennar
Corp.
Class A | | | 632,600 | | | | 31,674,282 | | |
Newell
Rubbermaid,
Inc. | | | 150,000 | | | | 6,364,500 | | |
| | | | 38,038,782 | | |
Independent Power and Renewable Electricity Producers (0.7%) | |
Calpine
Corp. | | | 315,100 | | | | 4,887,201 | * | |
NRG Energy,
Inc. | | | 178,100 | | | | 2,295,709 | | |
NRG Yield,
Inc. Class A | | | 287,000 | | | | 3,940,510 | | |
NRG Yield,
Inc. Class C | | | 808,000 | | | | 11,667,520 | | |
| | | | 22,790,940 | | |
Internet & Catalog Retail (1.1%) | |
Vipshop
Holdings
Ltd. ADR | | | 1,704,925 | | | | 34,985,061 | *g@ | |
Internet Software & Services (2.5%) | |
Alphabet,
Inc. Class A | | | 54,600 | | | | 40,261,494 | * | |
Alphabet,
Inc. Class C | | | 19,453 | | | | 13,827,387 | * | |
eBay, Inc. | | | 1,012,000 | | | | 28,234,800 | * | |
| | | | 82,323,681 | | |
IT Services (3.3%) | |
First Data
Corp.
Class A | | | 1,931,200 | | | | 30,590,208 | * | |
PayPal
Holdings,
Inc. | | | 138,300 | | | | 4,980,183 | * | |
Visa, Inc.
Class A | | | 689,400 | | | | 53,483,652 | | |
WEX, Inc. | | | 213,600 | | | | 19,204,776 | * | |
| | | | 108,258,819 | | |
Life Sciences Tools & Services (1.2%) | |
Mettler-
Toledo
International | | | 74,400 | | | | 23,137,656 | * | |
Thermo
Fisher
Scientific,
Inc. | | | 129,700 | | | | 16,962,166 | | |
| | | | 40,099,822 | | |
See Notes to Schedule of Investments
Schedule of Investments Long Short Fund (cont'd)
| | |
Number
of Shares | |
Value† | |
Machinery (1.8%) | |
Ingersoll-
Rand PLC | | | 461,000 | | | $ | 27,318,860 | | |
Valmont
Industries,
Inc. | | | 274,900 | | | | 29,810,156 | | |
| | | | 57,129,016 | | |
Multi-Utilities (1.3%) | |
NiSource,
Inc. | | | 570,300 | | | | 10,926,948 | | |
WEC Energy
Group, Inc. | | | 624,900 | | | | 32,219,844 | g@ | |
| | | | 43,146,792 | | |
Multiline Retail (1.2%) | |
Dollar
General
Corp. | | | 597,500 | | | | 40,492,575 | | |
Oil, Gas & Consumable Fuels (4.0%) | |
Cabot Oil
& Gas Corp. | | | 423,900 | | | | 9,202,869 | | |
Columbia
Pipeline
Group, Inc. | | | 273,800 | | | | 5,686,826 | | |
Enbridge,
Inc. | | | 2,111,000 | | | | 90,118,590 | | |
Genesis
Energy LP | | | 271,687 | | | | 10,951,703 | | |
Teekay
Corp. | | | 491,400 | | | | 15,788,682 | | |
| | | | 131,748,670 | | |
Pharmaceuticals (1.2%) | |
Bristol-Myers
Squibb Co. | | | 615,800 | | | | 40,612,010 | g@ | |
Professional Services (2.4%) | |
Nielsen
Holdings
PLC | | | 701,000 | | | | 33,304,510 | | |
Verisk
Analytics,
Inc. | | | 615,542 | | | | 44,078,963 | *g@ | |
| | | | 77,383,473 | | |
Real Estate Investment Trusts (2.1%) | |
General
Growth
Properties,
Inc. | | | 550,200 | | | | 15,928,290 | | |
Outfront
Media, Inc. | | | 647,301 | | | | 15,282,777 | | |
Starwood
Property
Trust, Inc. | | | 723,200 | | | | 14,529,088 | | |
Weyerhaeuser
Co. | | | 794,800 | | | | 23,311,484 | | |
| | | | 69,051,639 | | |
| | |
Number
of Shares | |
Value† | |
Real Estate Management &
Development (1.3%) | |
Brookfield
Asset
Management,
Inc. Class A | | | 1,248,300 | | | $ | 43,653,051 | | |
Road & Rail (0.8%) | |
Canadian
Pacific
Railway Ltd. | | | 194,300 | | | | 27,299,150 | | |
Semiconductors & Semiconductor Equipment (2.1%) | |
Altera
Corp. | | | 353,407 | | | | 18,571,538 | | |
ASML
Holding NV | | | 176,000 | | | | 16,331,040 | | |
Broadcom
Corp.
Class A | | | 642,081 | | | | 33,002,963 | | |
| | | | 67,905,541 | | |
Software (0.7%) | |
Activision
Blizzard,
Inc. | | | 627,400 | | | | 21,808,424 | | |
Specialty Retail (4.6%) | |
Asbury
Automotive
Group, Inc. | | | 242,602 | | | | 19,214,078 | * | |
Five Below,
Inc. | | | 1,144,000 | | | | 39,284,960 | *g@ | |
Home
Depot, Inc. | | | 432,400 | | | | 53,461,936 | g@ | |
Party City
Holdco, Inc. | | | 545,900 | | | | 8,641,597 | * | |
Tractor
Supply Co. | | | 326,000 | | | | 30,119,140 | | |
| | | | 150,721,711 | | |
Technology Hardware, Storage & Peripherals (2.5%) | |
Apple,
Inc. | | | 128,000 | | | | 15,296,000 | | |
EMC Corp. | | | 893,309 | | | | 23,422,562 | | |
SanDisk
Corp. | | | 416,300 | | | | 32,055,100 | | |
Western
Digital
Corp. | | | 163,300 | | | | 10,911,706 | | |
| | | | 81,685,368 | | |
Textiles, Apparel & Luxury Goods (2.7%) | |
lululemon
athletica,
Inc. | | | 537,000 | | | | 26,404,290 | * | |
PVH Corp. | | | 680,000 | | | | 61,846,000 | g@ | |
| | | | 88,250,290 | | |
| | |
Number
of Shares | |
Value† | |
Tobacco (0.6%) | |
Philip
Morris
International,
Inc. | | | 149,131 | | | $ | 13,183,180 | | |
Reynolds
American,
Inc. | | | 160,000 | | | | 7,731,200 | | |
| | | | 20,914,380 | | |
Trading Companies & Distributors (0.3%) | |
AerCap
Holdings NV | | | 266,900 | | | | 11,076,350 | * | |
Transportation Infrastructure (1.0%) | |
Wesco
Aircraft
Holdings,
Inc. | | | 2,698,900 | | | | 33,628,294 | * | |
Water Utilities (1.1%) | |
American
Water
Works
Co., Inc. | | | 600,000 | | | | 34,416,000 | | |
Wireless Telecommunication
Services (0.7%) | |
SBA
Communications
Corp.
Class A | | | 205,000 | | | | 24,399,100 | * | |
Total Common
Stocks
(Cost $2,180,928,969) | | | 2,360,036,381 | | |
| | | Principal
Amount | |
| |
Corporate Debt Securities (4.0%) | |
Healthcare-Services (0.3%) | |
Select
Medical
Corp.,
Guaranteed
Notes, 6.38%,
due 6/1/21 | | $ | 11,103,000 | | | | 9,826,155 | | |
Holding Companies—Diversified (0.4%) | |
Argos
Merger Sub,
Inc., Senior
Unsecured
Notes, 7.13%,
due 3/15/23 | | | 13,775,000 | | | | 14,498,187 | ñ | |
Media (0.2%) | |
Cablevision
Systems
Corp., Senior
Unsecured
Notes, 5.88%,
due 9/15/22 | | | 3,050,000 | | | | 2,531,500 | | |
See Notes to Schedule of Investments
Schedule of Investments Long Short Fund (cont'd)
| | |
Principal
Amount | |
Value† | |
Sinclair
Television
Group, Inc.,
Guaranteed
Notes, 6.13%,
due 10/1/22 | | $ | 3,063,000 | | | $ | 3,147,233 | | |
| | | | 5,678,733 | | |
Oil & Gas (0.3%) | |
Forest
Oil Corp.,
Guaranteed
Notes, 7.25%,
due 6/15/19 | | | 19,771,000 | | | | 2,767,940 | c | |
Gulfport
Energy Corp.,
Guaranteed
Notes, 6.63%,
due 5/1/23 | | | 1,375,000 | | | | 1,258,125 | | |
Gulfport
Energy Corp.,
Guaranteed
Notes, 7.75%,
due 11/1/20 | | | 950,000 | | | | 940,500 | | |
PDC Energy,
Inc.,
Guaranteed
Notes, 7.75%,
due 10/15/22 | | | 4,895,000 | | | | 4,919,475 | | |
| | | | 9,886,040 | | |
Packing & Containers (0.4%) | |
Ball Corp.,
Guaranteed
Notes, 5.25%,
due 7/1/25 | | | 12,800,000 | | | | 13,008,000 | | |
Pipelines (0.8%) | |
Genesis
Energy
LP/Genesis
Energy
Finance Corp.,
Guaranteed
Notes, 6.75%,
due 8/1/22 | | | 12,100,000 | | | | 11,797,500 | | |
Niska Gas
Storage
Canada
ULC/Niska
Gas Storage
Canada
Finance Corp.,
Guaranteed
Notes, 6.50%,
due 4/1/19 | | | 15,656,000 | | | | 13,933,840 | | |
| | | | 25,731,340 | | |
| | |
Principal
Amount | |
Value† | |
Retail (0.3%) | |
Party City
Holdings, Inc.,
Guaranteed
Notes, 6.13%,
due 8/15/23 | | $ | 9,250,000 | | | $ | 9,527,500 | ñ | |
Software (0.4%) | |
First Data
Corp.,
Guaranteed
Notes, 7.00%,
due 12/1/23 | | | 13,785,000 | | | | 14,060,700 | Øñ | |
Telecommunications (0.9%) | |
Level 3
Financing, Inc.,
Guaranteed
Notes, 5.38%,
due 1/15/24 | | | 9,190,000 | | | | 9,304,875 | Øñ | |
Sprint
Capital Corp.,
Guaranteed
Notes, 6.88%,
due 11/15/28 | | | 12,315,000 | | | | 10,221,450 | | |
Sprint
Nextel Corp.,
Senior
Unsecured
Notes, 6.00%,
due 11/15/22 | | | 10,865,000 | | | | 9,284,034 | | |
| | | | 28,810,359 | | |
Total Corporate
Debt Securities
(Cost $152,770,406) | | | 131,027,014 | | |
| | | Contracts | | | |
Options (0.0%) | |
Purchased Options (0.0%) | |
Starwood
Hotels &
Resorts
Worldwide,
Inc., Call
November
2015 @ 92.5 | | | 2,500 | | | | 25,000 | | |
Synchrony
Financial, Call
November
2015 @ 40 | | | 6,904 | | | | 34,520 | | |
Total Options
(Cost $716,789) | | | 59,520 | | |
| | |
Number
of Shares | |
Value† | |
Short-Term Investments (22.1%) | |
State
Street
Institutional
Government
Money Market
Fund Premier
Class, 0.00%
(Cost $721,758,598) | | | 721,758,598 | | | $ | 721,758,598 | dØØ | |
Total Long
Positions (98.2%)
(Cost $3,056,174,762) | | | 3,212,881,513 | ## | |
Cash, receivables
and other assets,
less liabilities (13.7%) | | | | | 448,774,195 | @@e | |
Short Positions
(see summary
below) ((11.9)%) | | | | | (389,579,556 | ) | |
Total
Net Assets (100.0%) | | | | $ | 3,272,076,152 | | |
| Short Positions ((11.9)%)‡g | |
Common Stocks Sold Short (8.0%) | |
Aerospace & Defense (0.1%) | |
KLX, Inc. | | | (100,000 | ) | | | (3,911,000 | )* | |
Capital Markets (0.9%) | |
Franklin
Resources,
Inc. | | | (396,400 | ) | | | (16,157,264 | ) | |
Waddell
& Reed
Financial, Inc. | | | (336,000 | ) | | | (12,411,840 | ) | |
| | | | (28,569,104 | ) | |
Commercial Services & Supplies (0.4%) | |
Ritchie
Bros
Auctioneers,
Inc. | | | (547,600 | ) | | | (14,221,172 | ) | |
Construction & Engineering (0.5%) | |
Fluor Corp. | | | (320,400 | ) | | | (15,318,324 | ) | |
Electric Utilities (0.3%) | |
Southern
Co | | | (190,000 | ) | | | (8,569,000 | ) | |
Electrical Equipment (0.4%) | |
ABB Ltd. | | | (300,000 | ) | | | (5,663,412 | )* | |
AMETEK,
Inc. | | | (160,000 | ) | | | (8,771,200 | ) | |
| | | | (14,434,612 | ) | |
Health Care Providers & Services (0.3%) | |
Laboratory
Corp. of
America
Holdings | | | (42,800 | ) | | | (5,253,272 | )* | |
See Notes to Schedule of Investments
Schedule of Investments Long Short Fund (cont'd)
| | |
Number
of Shares | |
Value† | |
Quest
Diagnostics,
Inc. | | | (76,400 | ) | | $ | (5,191,380 | ) | |
| | | | (10,444,652 | ) | |
Hotels, Restaurants & Leisure (0.3%) | |
BJ's
Restaurants,
Inc. | | | (79,925 | ) | | | (3,431,180 | )* | |
Chuy's
Holdings, Inc. | | | (229,200 | ) | | | (6,236,532 | )* | |
| | | | (9,667,712 | ) | |
IT Services (0.9%) | |
CGI Group,
Inc. | | | (234,262 | ) | | | (8,700,491 | )* | |
Cognizant
Technology
Solutions
Corp. Class A | | | (269,400 | ) | | | (18,348,834 | )* | |
NeuStar,
Inc. Class A | | | (90,000 | ) | | | (2,447,100 | )* | |
| | | | (29,496,425 | ) | |
Multi-Utilities (0.4%) | |
Consolidated
Edison, Inc. | | | (200,000 | ) | | | (13,150,000 | ) | |
Multiline Retail (0.3%) | |
Target
Corp. | | | (108,000 | ) | | | (8,335,440 | ) | |
Oil, Gas & Consumable Fuels (1.1%) | |
Dominion
Midstream
Partners LP | | | (238,084 | ) | | | (7,799,632 | ) | |
Magellan
Midstream
Partners LP | | | (266,600 | ) | | | (17,011,746 | ) | |
Phillips 66
Partners LP | | | (165,503 | ) | | | (10,036,102 | ) | |
| | | | (34,847,480 | ) | |
Semiconductors & Semiconductor Equipment (0.3%) | |
Avago
Technologies
Ltd. | | | (93,452 | ) | | | (11,506,745 | ) | |
Specialty Retail (0.8%) | |
Group 1
Automotive,
Inc. | | | (93,600 | ) | | | (8,138,520 | ) | |
Sally Beauty
Holdings,
Inc. | | | (370,000 | ) | | | (8,698,700 | )* | |
Sonic
Automotive,
Inc. Class A | | | (440,060 | ) | | | (10,975,096 | ) | |
| | | | (27,812,316 | ) | |
| | |
Number
of Shares | |
Value† | |
Technology Hardware, Storage & Peripherals (0.5%) | |
Seagate
Technology
PLC | | | (419,100 | ) | | $ | (15,950,946 | ) | |
Textiles, Apparel & Luxury Goods (0.5%) | |
Ralph Lauren
Corp. | | | (85,800 | ) | | | (9,504,066 | ) | |
Tumi
Holdings, Inc. | | | (330,500 | ) | | | (5,297,915 | )* | |
| | | | (14,801,981 | ) | |
Total Common
Stocks Sold Short
(Proceeds
$(266,428,209)) | | | (261,036,909 | ) | |
Exchange Traded Funds Sold Short (3.9%) | |
Consumer
Discretionary
Select Sector
SPDR Fund | | | (248,000 | ) | | | (20,080,560 | ) | |
iShares
Core S&P
Small-Cap
ETF | | | (77,000 | ) | | | (8,704,850 | ) | |
iShares
Russell 2000
ETF | | | (57,800 | ) | | | (6,666,652 | ) | |
iShares
Russell
Mid-Cap ETF | | | (220,000 | ) | | | (36,324,200 | ) | |
SPDR S&P
Retail ETF | | | (296,500 | ) | | | (13,606,385 | ) | |
Utilities
Select Sector
SPDR Fund | | | (530,000 | ) | | | (23,187,500 | ) | |
Vanguard
REIT ETF | | | (250,000 | ) | | | (19,972,500 | ) | |
Total Exchange
Traded Funds Sold
Short
(Proceeds
$(112,387,791)) | | | (128,542,647 | ) | |
Total Short
Positions
(Proceeds
$(378,816,000)) | | | (389,579,556 | ) | |
See Notes to Schedule of Investments
Schedule of Investments Long Short Credit Fund 10/31/15
| |
Number
of Shares | |
Value† | |
Long Positions (27.5%) | |
Common Stocks (0.6%) | |
Oil, Gas & Consumable Fuels (0.4%) | |
Kinder
Morgan, Inc. | | | 5,000 | | | $ | 136,750 | | |
Real Estate Investment Trusts (0.2%) | |
Annaly Capital
Management,
Inc. | | | 5,000 | | | | 49,750 | | |
Total Common Stocks
(Cost $212,506) | | | 186,500 | | |
| | | Principal
Amounta | |
| |
Corporate Debt Securities (26.9%) | |
Diversified Financial Services (0.9%) | |
Nationstar
Mortgage
LLC/Nationstar
Capital Corp.,
Guaranteed
Notes, 9.63%,
due 5/1/19 | | $ | 250,000 | | | | 257,188 | | |
Media (2.5%) | |
Cablevision
Systems
Corp., Senior
Unsecured
Notes, 8.63%,
due 9/15/17 | | | 250,000 | | | | 266,875 | | |
CSC Holdings
LLC, Senior
Unsecured
Notes, 7.88%,
due 2/15/18 | | | 300,000 | | | | 318,000 | | |
WideOpenWest
Finance LLC/
WideOpenWest
Capital Corp.,
Guaranteed
Notes, 13.38%,
due 10/15/19 | | | 150,000 | | | | 152,625 | | |
| | | | 737,500 | | |
Mining (1.3%) | |
First Quantum
Minerals Ltd.,
Guaranteed
Notes, 7.25%,
due 10/15/19 | | | 200,000 | | | | 156,000 | ñ | |
FMG
Resources
(August
2006) Pty Ltd.,
Guaranteed
Notes, 6.88%,
due 4/1/22 | | | 100,000 | | | | 71,500 | ñ | |
| | |
Principal
Amounta | |
Value† | |
HudBay
Minerals, Inc.,
Guaranteed
Notes, 9.50%,
due 10/1/20 | | $ | 200,000 | | | $ | 174,500 | | |
| | | | 402,000 | | |
Oil & Gas (7.7%) | |
California
Resources
Corp.,
Guaranteed
Notes, 5.00%,
due 1/15/20 | | | 100,000 | | | | 72,750 | | |
Chesapeake
Energy Corp.,
Guaranteed
Notes, 6.50%,
due 8/15/17 | | | 900,000 | | | | 826,875 | | |
Citgo
Holding, Inc.,
Senior
Secured
Notes, 10.75%,
due 2/15/20 | | | 250,000 | | | | 251,250 | ñ | |
Drill Rigs
Holdings,
Inc., Senior
Secured
Notes, 6.50%,
due 10/1/17 | | | 200,000 | | | | 136,376 | ñ | |
Harvest
Operations
Corp.,
Guaranteed
Notes, 6.88%,
due 10/1/17 | | | 250,000 | | | | 210,000 | | |
PBF Holding
Co. LLC/PBF
Finance Corp.,
Senior
Secured
Notes, 8.25%,
due 2/15/20 | | | 415,000 | | | | 435,750 | | |
Seadrill Ltd.,
Senior
Unsecured
Notes, 6.13%,
due 9/15/17 | | | 500,000 | | | | 372,500 | ñ** | |
| | | | 2,305,501 | | |
Packing & Containers (4.8%) | |
Ardagh
Packaging
Finance PLC,
Guaranteed
Notes, 9.25%,
due 10/15/20 | | EUR | 375,000 | | | | 432,885 | | |
| | |
Principal
Amounta | |
Value† | |
Beverage
Packaging
Holdings
Luxembourg II
SA/Beverage
Packaging
Holdings II
Issuer, Inc.,
Guaranteed
Notes, 6.00%,
due 6/15/17 | | $ | 1,000,000 | | | $ | 1,005,000 | ñ | |
| | | | 1,437,885 | | |
Software (1.8%) | |
First Data
Corp.,
Secured
Notes, 8.75%,
due 1/15/22 | | | 250,000 | | | | 263,250 | ñ | |
First Data
Corp.,
Guaranteed
Notes, 12.63%,
due 1/15/21 | | | 250,000 | | | | 286,562 | | |
| | | | 549,812 | | |
Telecommunications (7.9%) | |
EarthLink
Holdings
Corp., Senior
Secured
Notes, 7.38%,
due 6/1/20 | | | 550,000 | | | | 572,000 | | |
EarthLink, Inc.,
Guaranteed
Notes, 8.88%,
due 5/15/19 | | | 150,000 | | | | 154,875 | | |
Intelsat
Jackson
Holdings SA,
Guaranteed
Notes, 7.25%,
due 4/1/19 | | | 250,000 | | | | 235,000 | | |
Intelsat
Luxembourg
SA,
Guaranteed
Notes, 6.75%,
due 6/1/18 | | | 200,000 | | | | 177,500 | | |
Intelsat
Luxembourg
SA,
Guaranteed
Notes, 8.13%,
due 6/1/23 | | | 200,000 | | | | 118,500 | | |
Sprint
Communications,
Inc., Senior
Unsecured
Notes, 8.38%,
due 8/15/17 | | | 650,000 | | | | 665,437 | | |
See Notes to Schedule of Investments
Schedule of Investments Long Short Credit Fund (cont'd)
| | |
Principal
Amounta | |
Value† | |
Sprint Corp., $
Guaranteed Notes, 7.13%,
due 6/15/24 | | | 250,000 | | | $ | 219,688 | | |
Sprint Nextel
Corp.,
Guaranteed
Notes, 9.00%,
due 11/15/18 | | | 200,000 | | | | 219,874 | ñ | |
| | | | 2,362,874 | | |
Total Corporate
Debt Securities
(Cost $8,424,112) | | | 8,052,760 | | |
Total Long
Positions (27.5%)
(Cost $8,636,618) | | | 8,239,260 | ## | |
Cash, receivables
and other assets,
less liabilities (75.7%) | | | | | 22,693,853 | @@ØØe | |
Short Positions
(see summary
below) ((3.2)%) | | | | | (966,854 | ) | |
Total
Net Assets (100.0%) | | | | $ | 29,966,259 | | |
Short Positions ((3.2)%)‡ | |
Corporate Debt Securities Sold Short ((2.5)%) | |
Healthcare—Services (1.8%) | |
HCA, Inc.,
Guaranteed
Notes, 5.38%,
due 2/1/25 | | | (200,000 | ) | | | (206,750 | ) | |
Tenet
Healthcare
Corp., Senior
Unsecured
Notes, 6.75%,
due 6/15/23 | | | (350,000 | ) | | | (353,063 | ) | |
| | | | (559,813 | ) | |
Lodging (0.7%) | |
MGM Resorts
Int'l,
Guaranteed
Notes, 6.00%,
due 3/15/23 | | | (200,000 | ) | | | (205,000 | ) | |
Total Corporate
Debt Securities
Sold Short
(Cost $755,185) | | | (764,813 | ) | |
| | |
Principal
Amounta | |
Value† | |
Government Securities Sold Short (0.7%) | |
Sovereign (0.7%) | |
South Africa
Government
International
Bond, Senior
Unsecured
Notes, 4.67%,
due 1/17/24
(Cost $201,481) | | $ | (200,000 | ) | | $ | (202,041 | ) | |
Total Short
Positions
(Proceeds
$(956,666)) | | | (966,854 | ) | |
See Notes to Schedule of Investments
Schedule of Investments Multi-Asset Income Fund 10/31/15
| |
Number
of Shares | |
Value† | |
Common Stocks (40.9%) | |
Aerospace & Defense (0.8%) | |
BAE Systems
PLC | | | 946 | | | $ | 6,421 | | |
General
Dynamics Corp. | | | 88 | | | | 13,075 | | |
L-3
Communications
Holdings, Inc. | | | 48 | | | | 6,067 | | |
Lockheed
Martin Corp. | | | 370 | | | | 81,337 | | |
Northrop
Grumman Corp. | | | 30 | | | | 5,633 | | |
Raytheon
Co. | | | 16 | | | | 1,878 | | |
| | | | 114,411 | | |
Air Freight & Logistics (0.3%) | |
United Parcel
Service, Inc.
Class B | | | 443 | | | | 45,638 | @ | |
Airlines (0.2%) | |
Cathay Pacific
Airways Ltd. | | | 7,000 | | | | 13,847 | | |
easyJet PLC | | | 188 | | | | 5,072 | | |
Japan Airlines
Co. Ltd. | | | 200 | | | | 7,535 | | |
Singapore
Airlines Ltd. | | | 1,000 | | | | 7,693 | | |
| | | | 34,147 | | |
Automobiles (0.3%) | |
General Motors
Co. | | | 800 | | | | 27,928 | | |
Porsche
Automobil
Holding SE
(Preference
Shares) | | | 41 | | | | 1,920 | | |
Renault SA | | | 102 | | | | 9,616 | | |
| | | | 39,464 | | |
Banks (1.2%) | |
Australia &
New Zealand
Banking Group
Ltd. | | | 1,613 | | | | 31,196 | | |
Banca Popolare
di Sondrio
SCARL | | | 528 | | | | 2,412 | | |
Barclays
PLC | | | 3,244 | | | | 11,602 | | |
BOC Hong Kong
Holdings Ltd. | | | 2,000 | | | | 6,395 | | |
Dah Sing
Banking Group
Ltd. | | | 1,200 | | | | 2,274 | | |
Danske Bank
A/S | | | 116 | | | | 3,190 | | |
DBS Group
Holdings Ltd. | | | 4 | | | | 49 | | |
Hang Seng
Bank Ltd. | | | 300 | | | | 5,488 | | |
| | |
Number
of Shares | |
Value† | |
HSBC Holdings
PLC | | | 3 | | | $ | 24 | | |
ING Groep NV | | | 343 | | | | 4,992 | | |
Intesa Sanpaolo
SpA | | | 712 | | | | 2,275 | | |
Intesa Sanpaolo
SpA | | | 953 | | | | 3,320 | | |
JPMorgan
Chase & Co. | | | 1,021 | | | | 65,599 | | |
Oversea-Chinese
Banking Corp.
Ltd. | | | 8 | | | | 51 | | |
PNC Financial
Services Group,
Inc. | | | 17 | | | | 1,534 | | |
Resona Holdings,
Inc. | | | 400 | | | | 2,117 | | |
Societe Generale
SA | | | 89 | | | | 4,141 | | |
UniCredit SpA | | | 602 | | | | 3,893 | | |
Wells Fargo & Co. | | | 650 | | | | 35,191 | | |
| | | | 185,743 | | |
Beverages (0.5%) | |
Coca-Cola Co. | | | 1,227 | | | | 51,963 | @ | |
PepsiCo, Inc. | | | 308 | | | | 31,475 | ØØ | |
| | | | 83,438 | | |
Biotechnology (0.1%) | |
Amgen, Inc. | | | 103 | | | | 16,293 | @ | |
CSL Ltd. | | | 56 | | | | 3,722 | | |
| | | | 20,015 | | |
Capital Markets (0.4%) | |
| 3i Group PLC | | | 2,047 | | | | 15,810 | | |
BlackRock, Inc. | | | 9 | | | | 3,168 | | |
FS Investment
Corp. | | | 3,150 | | | | 30,744 | | |
Macquarie
Group Ltd. | | | 42 | | | | 2,543 | | |
UBS Group
AG | | | 800 | | | | 16,009 | | |
| | | | 68,274 | | |
Chemicals (1.0%) | |
Air Products &
Chemicals, Inc. | | | 13 | | | | 1,806 | | |
BASF SE | | | 514 | | | | 42,126 | | |
Dow Chemical Co. | | | 382 | | | | 19,738 | @ | |
E.I. du Pont de
Nemours & Co. | | | 692 | | | | 43,873 | | |
LyondellBasell
Industries NV
Class A | | | 480 | | | | 44,597 | | |
| | | | 152,140 | | |
Communications Equipment (0.6%) | |
Cisco Systems,
Inc. | | | 3,249 | | | | 93,734 | @ | |
Telefonaktiebolaget
LM Ericsson
B Shares | | | 236 | | | | 2,302 | | |
| | | | 96,036 | | |
| | |
Number
of Shares | |
Value† | |
Construction & Engineering (0.1%) | |
Vinci SA | | | 261 | | | $ | 17,617 | | |
Containers & Packaging (0.1%) | |
Amcor Ltd. | | | 244 | | | | 2,357 | | |
BillerudKorsnas
AB | | | 152 | | | | 2,756 | | |
DS Smith PLC | | | 1,456 | | | | 8,686 | | |
| | | | 13,799 | | |
Distributors (0.0%) | |
Jardine Cycle &
Carriage Ltd. | | | 200 | | | | 4,631 | | |
Diversified Financial Services (0.5%) | |
CME Group, Inc. | | | 668 | | | | 63,106 | | |
Industrivarden
AB, C Shares | | | 493 | | | | 8,973 | | |
| | | | 72,079 | | |
Diversified Telecommunication Services (1.3%) | |
AT&T, Inc. | | | 1,252 | | | | 41,955 | @ | |
BT Group PLC
ADR | | | 980 | | | | 70,237 | | |
Elisa OYJ | | | 70 | | | | 2,639 | | |
Frontier
Communications
Corp. | | | 5,400 | | | | 27,756 | | |
Nippon
Telegraph &
Telephone Corp. | | | 100 | | | | 3,666 | | |
PCCW Ltd. | | | 4,003 | | | | 2,145 | | |
Singapore
Telecommunications
Ltd. | | | 2,700 | | | | 7,629 | | |
Swisscom AG | | | 5 | | | | 2,580 | | |
TDC A/S | | | 369 | | | | 1,934 | | |
Telenor ASA | | | 788 | | | | 14,866 | | |
TeliaSonera AB | | | 2,772 | | | | 14,188 | | |
Telstra Corp. Ltd. | | | 2,948 | | | | 11,296 | | |
| | | | 200,891 | | |
Electric Utilities (1.6%) | |
American Electric
Power Co., Inc. | | | 62 | | | | 3,512 | | |
BKW AG | | | 61 | | | | 2,318 | | |
Cheung Kong
Infrastructure
Holdings Ltd. | | | 1,000 | | | | 9,309 | | |
CLP Holdings Ltd. | | | 1,000 | | | | 8,726 | | |
Duke Energy
Corp. | | | 160 | | | | 11,435 | | |
EDP—Energias
de Portugal SA | | | 3,471 | | | | 12,855 | | |
Endesa SA | | | 213 | | | | 4,743 | | |
Enel SpA | | | 1,672 | | | | 7,715 | | |
Entergy Corp. | | | 101 | | | | 6,884 | | |
Exelon Corp. | | | 1,050 | | | | 29,316 | | |
FirstEnergy Corp. | | | 51 | | | | 1,591 | | |
Fortum OYJ | | | 318 | | | | 4,773 | | |
Hawaiian Electric
Industries, Inc. | | | 223 | | | | 6,525 | | |
See Notes to Schedule of Investments
Schedule of Investments Multi-Asset Income Fund (cont'd)
| | |
Number
of Shares | |
Value† | |
NextEra Energy,
Inc. | | | 896 | | | $ | 91,984 | | |
Power Assets
Holdings Ltd. | | | 1,000 | | | | 9,959 | | |
PPL Corp. | | | 377 | | | | 12,969 | | |
SSE PLC | | | 642 | | | | 14,994 | | |
Terna Rete
Elettrica
Nazionale SpA | | | 514 | | | | 2,616 | | |
Tohoku Electric
Power Co., Inc. | | | 200 | | | | 2,808 | | |
| | | | 245,032 | | |
Electrical Equipment (0.0%) | |
Eaton Corp. PLC | | | 74 | | | | 4,137 | | |
Emerson Electric
Co. | | | 35 | | | | 1,653 | | |
| | | | 5,790 | | |
Electronic Equipment, Instruments & Components (0.2%) | |
Avnet, Inc. | | | 229 | | | | 10,403 | @ | |
AVX Corp. | | | 767 | | | | 10,355 | | |
Corning, Inc. | | | 249 | | | | 4,631 | | |
| | | | 25,389 | | |
Energy Equipment & Services (0.3%) | |
Schlumberger
Ltd. | | | 600 | | | | 46,896 | | |
Food & Staples Retailing (0.5%) | |
Axfood AB | | | 138 | | | | 2,489 | | |
J Sainsbury PLC | | | 2,733 | | | | 11,224 | | |
Wal-Mart Stores,
Inc. | | | 352 | | | | 20,148 | @ | |
Walgreens Boots
Alliance, Inc. | | | 22 | | | | 1,863 | | |
Wesfarmers Ltd. | | | 646 | | | | 18,065 | | |
WM Morrison
Supermarkets
PLC | | | 3,378 | | | | 8,775 | | |
Woolworths Ltd. | | | 797 | | | | 13,654 | | |
| | | | 76,218 | | |
Food Products (0.2%) | |
Archer-Daniels-
Midland Co. | | | 192 | | | | 8,767 | | |
Campbell Soup
Co. | | | 135 | | | | 6,857 | | |
ConAgra Foods,
Inc. | | | 205 | | | | 8,313 | | |
General Mills, Inc. | | | 51 | | | | 2,963 | | |
Wilmar
International Ltd. | | | 2,300 | | | | 5,125 | | |
| | | | 32,025 | | |
Gas Utilities (0.4%) | |
AGL Resources,
Inc. | | | 129 | | | | 8,063 | | |
AmeriGas
Partners LP | | | 800 | | | | 34,112 | | |
Atmos Energy
Corp. | | | 72 | | | | 4,536 | | |
| | |
Number
of Shares | |
Value† | |
Snam SpA | | | 1,652 | | | $ | 8,556 | | |
| | | | 55,267 | | |
Health Care Providers & Services (0.1%) | |
Anthem, Inc. | | | 45 | | | | 6,262 | | |
Primary Health
Care Ltd. | | | 44 | | | | 116 | | |
Ramsay Health
Care Ltd. | | | 89 | | | | 3,912 | | |
Sonic Healthcare
Ltd. | | | 263 | | | | 3,597 | | |
| | | | 13,887 | | |
Hotels, Restaurants & Leisure (0.7%) | |
Betfair Group
PLC | | | 47 | | | | 2,338 | | |
Carnival Corp. | | | 300 | | | | 16,224 | @ | |
Carnival PLC | | | 47 | | | | 2,621 | | |
Cedar Fair LP | | | 1,000 | | | | 56,000 | | |
Echo
Entertainment
Group Ltd. | | | 1,275 | | | | 4,608 | | |
McDonald's
Corp. | | | 125 | | | | 14,031 | | |
Sands China
Ltd. | | | 400 | | | | 1,440 | | |
Tabcorp
Holdings Ltd. | | | 1,925 | | | | 6,434 | | |
Tatts Group Ltd. | | | 901 | | | | 2,530 | | |
| | | | 106,226 | | |
Household Durables (0.1%) | |
Barratt
Developments
PLC | | | 429 | | | | 4,051 | | |
Iida Group
Holdings Co. Ltd. | | | 100 | | | | 1,874 | | |
Persimmon PLC | | | 279 | | | | 8,576 | * | |
Redrow PLC | | | 316 | | | | 2,261 | | |
Taylor Wimpey
PLC | | | 1,396 | | | | 4,261 | | |
| | | | 21,023 | | |
Household Products (1.2%) | |
Colgate-Palmolive
Co. | | | 26 | | | | 1,725 | | |
Kimberly-Clark
Corp. | | | 579 | | | | 69,312 | | |
Procter &
Gamble Co. | | | 1,349 | | | | 103,037 | @ | |
Svenska Cellulosa
AB SCA, B Shares | | | 110 | | | | 3,244 | | |
| | | | 177,318 | | |
Independent Power and Renewable Electricity Producers (0.5%) | |
NextEra Energy
Partners LP | | | 1,225 | | | | 32,168 | | |
NRG Yield, Inc.
Class A | | | 650 | | | | 8,925 | | |
NRG Yield, Inc.
Class C | | | 1,850 | | | | 26,714 | | |
| | |
Number
of Shares | |
Value† | |
TerraForm Power,
Inc. Class A | | | 800 | | | $ | 14,600 | * | |
| | | | 82,407 | | |
Industrial Conglomerates (0.7%) | |
General Electric
Co. | | | 1,700 | | | | 49,164 | | |
Koninklijke
Philips NV | | | 1,050 | | | | 28,287 | | |
Siemens AG ADR | | | 250 | | | | 25,142 | | |
| | | | 102,593 | | |
Insurance (2.0%) | |
Aegon NV | | | 995 | | | | 6,132 | | |
Aflac, Inc. | | | 88 | | | | 5,610 | | |
Allianz SE | | | 308 | | | | 53,971 | | |
AXA SA | | | 1,326 | | | | 35,469 | | |
Direct Line
Insurance
Group PLC | | | 831 | | | | 5,052 | | |
Insurance
Australia Group
Ltd. | | | 694 | | | | 2,759 | | |
Legal & General
Group PLC | | | 3,055 | | | | 12,320 | | |
MetLife, Inc. | | | 1,053 | | | | 53,050 | | |
Muenchener
Rueckversicherungs-
Gesellschaft AG
in Muenchen | | | 114 | | | | 22,753 | | |
NN Group NV | | | 103 | | | | 3,236 | | |
Old Mutual PLC | | | 4,035 | | | | 13,206 | | |
Progressive Corp. | | | 123 | | | | 4,075 | | |
Prudential
Financial, Inc. | | | 79 | | | | 6,517 | | |
QBE Insurance
Group Ltd. | | | 470 | | | | 4,399 | | |
Sampo Oyj,
A Shares | | | 151 | | | | 7,386 | | |
Standard Life PLC | | | 451 | | | | 2,926 | | |
Swiss Life
Holding AG | | | 10 | | | | 2,389 | * | |
Swiss Re AG | | | 236 | | | | 21,942 | | |
Travelers Cos.,
Inc. | | | 72 | | | | 8,128 | | |
Unipol Gruppo
Finanziario SpA | | | 1,273 | | | | 5,935 | | |
Zurich Insurance
Group AG | | | 98 | | | | 25,907 | * | |
| | | | 303,162 | | |
Internet Software & Services (0.0%) | |
Moneysuper
market.com
Group PLC | | | 705 | | | | 3,632 | | |
IT Services (0.3%) | |
Amdocs Ltd. | | | 131 | | | | 7,804 | | |
Automatic Data
Processing, Inc. | | | 52 | | | | 4,523 | | |
IBM Corp. | | | 185 | | | | 25,915 | @ | |
Xerox Corp. | | | 561 | | | | 5,268 | @ | |
| | | | 43,510 | | |
See Notes to Schedule of Investments
Schedule of Investments Multi-Asset Income Fund (cont'd)
| | |
Number
of Shares | |
Value† | |
Leisure Products (0.3%) | |
Hasbro, Inc. | | | 550 | | | $ | 42,256 | | |
Machinery (0.0%) | |
Stanley Black &
Decker, Inc. | | | 27 | | | | 2,862 | | |
Yangzijiang
Shipbuilding
Holdings Ltd. | | | 3,100 | | | | 2,759 | | |
| | | | 5,621 | | |
Marine (0.1%) | |
AP Moeller—
Maersk A/S
Class A | | | 3 | | | | 4,297 | | |
AP Moeller—
Maersk A/S
Class B | | | 2 | | | | 2,949 | | |
| | | | 7,246 | | |
Media (0.5%) | |
ITV PLC | | | 1,844 | | | | 7,175 | | |
Lagardere SCA | | | 1,100 | | | | 32,067 | | |
Pearson PLC | | | 3 | | | | 40 | | |
ProSiebenSat.1
Media SE | | | 59 | | | | 3,191 | | |
Regal
Entertainment
Group Class A | | | 1,200 | | | | 23,256 | | |
Stroeer SE | | | 41 | | | | 2,587 | | |
Tokyo
Broadcasting
System
Holdings, Inc. | | | 100 | | | | 1,486 | | |
| | | | 69,802 | | |
Metals & Mining (1.1%) | |
Anglo American
PLC | | | 410 | | | | 3,455 | | |
BHP Billiton Ltd. | | | 1,950 | | | | 31,981 | | |
BHP Billiton PLC | | | 818 | | | | 13,121 | | |
Boliden AB | | | 268 | | | | 5,132 | | |
Fortescue Metals
Group Ltd. | | | 4,868 | | | | 7,193 | | |
Franco-Nevada
Corp. | | | 650 | | | | 32,948 | | |
Glencore PLC | | | 1,026 | | | | 1,779 | * | |
Rio Tinto Ltd. | | | 179 | | | | 6,401 | | |
Rio Tinto PLC | | | 833 | | | | 30,287 | | |
Southern Copper
Corp. | | | 1,200 | | | | 33,312 | | |
voestalpine AG | | | 196 | | | | 7,099 | | |
| | | | 172,708 | | |
Multi-Utilities (1.4%) | |
AGL Energy Ltd. | | | 637 | | | | 7,554 | | |
Centrica PLC | | | 3,637 | | | | 12,677 | | |
Consolidated
Edison, Inc. | | | 129 | | | | 8,482 | | |
Dominion
Resources, Inc. | | | 1,075 | | | | 76,787 | | |
National Grid
PLC | | | 1,951 | | | | 27,815 | | |
| | |
Number
of Shares | |
Value† | |
NiSource, Inc. | | | 401 | | | $ | 7,683 | | |
PG&E Corp. | | | 81 | | | | 4,325 | | |
Public Service
Enterprise
Group, Inc. | | | 116 | | | | 4,790 | | |
Sempra Energy | | | 275 | | | | 28,163 | | |
WEC Energy
Group, Inc. | | | 600 | | | | 30,936 | | |
| | | | 209,212 | | |
Multiline Retail (0.4%) | |
Harvey Norman
Holdings Ltd. | | | 1,976 | | | | 5,552 | | |
Marks & Spencer
Group PLC | | | 958 | | | | 7,576 | | |
Target Corp. | | | 576 | | | | 44,456 | | |
| | | | 57,584 | | |
Oil, Gas & Consumable Fuels (7.3%) | |
Alliance Holdings
GP LP | | | 1,325 | | | | 38,769 | | |
American
Midstream
Partners LP | | | 1,500 | | | | 17,040 | | |
| BP PLC | | | 16 | | | | 95 | | |
Chevron Corp. | | | 243 | | | | 22,084 | @ | |
Columbia
Pipeline Group,
Inc. | | | 850 | | | | 17,654 | | |
ConocoPhillips | | | 836 | | | | 44,601 | | |
Crestwood
Equity
Partners LP | | | 10,800 | | | | 31,212 | | |
CVR Energy, Inc. | | | 143 | | | | 6,358 | | |
Energy Transfer
Equity LP | | | 3,050 | | | | 65,727 | | |
Energy Transfer
Partners LP | | | 1,649 | | | | 72,820 | | |
Eni SpA | | | 191 | | | | 3,121 | | |
Enterprise
Products
Partners LP | | | 2,700 | | | | 74,601 | | |
ERG SpA | | | 163 | | | | 2,314 | | |
Exxon Mobil
Corp. | | | 1,101 | | | | 91,097 | @ | |
Golar LNG Ltd. | | | 850 | | | | 24,658 | | |
HollyFrontier
Corp. | | | 177 | | | | 8,668 | | |
Kinder Morgan,
Inc. | | | 900 | | | | 24,615 | | |
NuStar Energy LP | | | 600 | | | | 30,390 | | |
Occidental
Petroleum Corp. | | | 47 | | | | 3,503 | | |
OMV AG | | | 279 | | | | 7,425 | | |
ONEOK, Inc. | | | 1,050 | | | | 35,616 | | |
PBF Energy, Inc.
Class A | | | 167 | | | | 5,678 | @ | |
Phillips 66 | | | 164 | | | | 14,604 | @ | |
Plains GP
Holdings LP
Class A | | | 1,700 | | | | 26,435 | | |
Repsol SA | | | 929 | | | | 11,723 | | |
| | |
Number
of Shares | |
Value† | |
Royal Dutch
Shell PLC,
A Shares | | | 2,121 | | | $ | 55,258 | | |
Royal Dutch
Shell PLC,
B Shares | | | 1,092 | | | | 28,618 | | |
Spectra Energy
Corp. | | | 1,538 | | | | 43,941 | | |
Statoil ASA | | | 664 | | | | 10,644 | | |
Teekay Corp. | | | 1,300 | | | | 41,769 | | |
Teekay LNG
Partners LP | | | 1,725 | | | | 42,849 | | |
Tesoro Corp. | | | 25 | | | | 2,673 | | |
TOTAL SA | | | 1,319 | | | | 64,030 | | |
Valero Energy
Corp. | | | 326 | | | | 21,490 | @ | |
Western Gas
Equity
Partners LP | | | 700 | | | | 30,191 | | |
Western Gas
Partners LP | | | 725 | | | | 37,062 | | |
Western
Refining, Inc. | | | 38 | | | | 1,582 | | |
Williams Cos., Inc. | | | 1,525 | | | | 60,146 | | |
Woodside
Petroleum Ltd. | | | 163 | | | | 3,419 | | |
| | | | 1,124,480 | | |
Paper & Forest Products (0.2%) | |
Domtar Corp. | | | 168 | | | | 6,928 | @ | |
International
Paper Co. | | | 39 | | | | 1,665 | | |
Mondi PLC | | | 259 | | | | 6,005 | | |
Portucel SA | | | 647 | | | | 2,636 | | |
Stora Enso Oyj,
R Shares | | | 273 | | | | 2,535 | | |
UPM-Kymmene
OYJ | | | 870 | | | | 16,312 | | |
| | | | 36,081 | | |
Personal Products (0.3%) | |
Unilever NV | | | 900 | | | | 40,482 | | |
Pharmaceuticals (3.9%) | |
Almirall SA | | | 121 | | | | 2,332 | | |
AstraZeneca PLC | | | 836 | | | | 53,491 | | |
Bristol-Myers
Squibb Co. | | | 996 | | | | 65,686 | @ | |
Eli Lilly & Co. | | | 553 | | | | 45,108 | | |
GlaxoSmithKline
PLC | | | 3,134 | | | | 67,881 | | |
GlaxoSmithKline
PLC ADR | | | 1,150 | | | | 49,519 | | |
Johnson &
Johnson | | | 1,037 | | | | 104,768 | @ | |
Merck & Co., Inc. | | | 615 | | | | 33,616 | @ | |
Pfizer, Inc. | | | 2,300 | | | | 77,786 | @ | |
Recordati SpA | | | 215 | | | | 5,346 | | |
Sanofi | | | 818 | | | | 82,620 | | |
Takeda
Pharmaceutical
Co. Ltd. | | | 300 | | | | 14,650 | | |
| | | | 602,803 | | |
See Notes to Schedule of Investments
Schedule of Investments Multi-Asset Income Fund (cont'd)
| | |
Number
of Shares | |
Value† | |
Real Estate Investment Trusts (4.8%) | |
Altisource
Residential Corp. | | | 640 | | | $ | 9,210 | | |
American
Campus
Communities,
Inc. | | | 350 | | | | 14,199 | | |
Annaly Capital
Management,
Inc. | | | 1,150 | | | | 11,442 | | |
AvalonBay
Communities,
Inc. | | | 200 | | | | 34,966 | | |
Blackstone
Mortgage Trust,
Inc. Class A | | | 450 | | | | 12,384 | | |
Brandywine
Realty Trust | | | 912 | | | | 12,312 | | |
Care Capital
Properties, Inc. | | | 85 | | | | 2,801 | | |
CBL & Associates
Properties, Inc. | | | 1,075 | | | | 15,673 | | |
Corporate
Office Properties
Trust | | | 634 | | | | 14,582 | | |
Crown Castle
International
Corp. | | | 740 | | | | 63,240 | | |
Digital Realty
Trust, Inc. | | | 300 | | | | 22,188 | | |
EPR Properties | | | 265 | | | | 15,055 | | |
Equinix, Inc. | | | 200 | | | | 59,336 | | |
HCP, Inc. | | | 300 | | | | 11,160 | | |
Highwoods
Properties, Inc. | | | 375 | | | | 16,294 | | |
Kimco Realty
Corp. | | | 970 | | | | 25,967 | | |
LaSalle Hotel
Properties | | | 320 | | | | 9,411 | | |
Liberty Property
Trust | | | 430 | | | | 14,629 | | |
Mid-America
Apartment
Communities,
Inc. | | | 200 | | | | 17,038 | | |
National Retail
Properties, Inc. | | | 323 | | | | 12,274 | | |
NorthStar Realty
Finance Corp. | | | 942 | | | | 11,313 | | |
OMEGA
Healthcare
Investors, Inc. | | | 425 | | | | 14,671 | | |
Prologis, Inc. | | | 1,240 | | | | 52,985 | | |
Public Storage | | | 111 | | | | 25,470 | | |
Retail Opportunity
Investments Corp. | | | 475 | | | | 8,612 | | |
RLJ Lodging Trust | | | 260 | | | | 6,523 | | |
Simon Property
Group, Inc. | | | 283 | | | | 57,013 | | |
Spirit Realty
Capital, Inc. | | | 1,210 | | | | 12,318 | | |
STAG Industrial,
Inc. | | | 720 | | | | 14,774 | | |
| | |
Number
of Shares | |
Value† | |
Starwood Property
Trust, Inc. | | | 1,785 | | | $ | 35,861 | | |
Sun Communities,
Inc. | | | 125 | | | | 8,378 | | |
Ventas, Inc. | | | 403 | | | | 21,649 | | |
Welltower, Inc. | | | 234 | | | | 15,180 | | |
Weyerhaeuser Co. | | | 1,645 | | | | 48,248 | | |
WP GLIMCHER,
Inc. | | | 1,100 | | | | 12,782 | | |
| | | | 739,938 | | |
Real Estate Management &
Development (0.1%) | |
Brookfield
Property
Partners LP | | | 650 | | | | 15,301 | * | |
Semiconductors & Semiconductor Equipment (0.7%) | |
ASM
International NV | | | 62 | | | | 2,373 | | |
Intel Corp. | | | 899 | | | | 30,440 | @ | |
KLA-Tencor
Corp. | | | 47 | | | | 3,154 | | |
Maxim Integrated
Products, Inc. | | | 600 | | | | 24,588 | | |
Texas Instruments,
Inc. | | | 726 | | | | 41,179 | @ | |
| | | | 101,734 | | |
Software (1.0%) | |
Microsoft Corp. | | | 2,376 | | | | 125,073 | @ | |
Oracle Corp. | | | 750 | | | | 29,130 | | |
| | | | 154,203 | | |
Specialty Retail (0.4%) | |
Best Buy Co., Inc. | | | 928 | | | | 32,508 | | |
Foot Locker, Inc. | | | 161 | | | | 10,908 | | |
Hennes &
Mauritz AB,
B Shares | | | 200 | | | | 7,779 | | |
Kingfisher PLC | | | 427 | | | | 2,324 | | |
L Brands, Inc. | | | 107 | | | | 10,270 | @ | |
TJX Cos., Inc. | | | 41 | | | | 3,001 | | |
| | | | 66,790 | | |
Technology Hardware, Storage & Peripherals (0.3%) | |
Apple, Inc. | | | 250 | | | | 29,875 | | |
Canon, Inc. | | | 400 | | | | 11,945 | | |
| | | | 41,820 | | |
Thrifts & Mortgage Finance (0.1%) | |
New York
Community
Bancorp, Inc. | | | 434 | | | | 7,170 | | |
Tobacco (1.4%) | |
Altria Group, Inc. | | | 588 | | | | 35,556 | @ | |
British American
Tobacco PLC | | | 1,032 | | | | 61,402 | | |
Imperial Tobacco
Group PLC | | | 659 | | | | 35,547 | | |
| | |
Number
of Shares | |
Value† | |
Imperial Tobacco
Group PLC ADR | | | 350 | | | $ | 37,720 | | |
Philip Morris
International, Inc. | | | 382 | | | | 33,769 | @ | |
Reynolds
American, Inc. | | | 319 | | | | 15,414 | | |
| | | | 219,408 | | |
Transportation Infrastructure (0.0%) | |
Atlantia SpA | | | 120 | | | | 3,325 | | |
Wireless Telecommunication
Services (0.4%) | |
Vodafone Group
PLC | | | 19,301 | | | | 63,749 | | |
Total Common Stocks
(Cost $6,576,567) | | | 6,270,411 | | |
Preferred Stocks (2.0%) | |
Real Estate Investment Trusts (2.0%) | |
Alexandria
Real Estate
Equities, Inc.,
Ser. E, 6.45% | | | 600 | | | | 15,402 | | |
Apartment
Investment &
Management
Co., Ser. A,
6.88% | | | 600 | | | | 15,660 | | |
Ashford
Hospitality
Trust, Inc.,
Ser. D, 8.45% | | | 600 | | | | 15,138 | | |
Cedar Realty
Trust, Inc.,
Ser. B, 7.25% | | | 600 | | | | 14,994 | | |
CubeSmart,
Ser. A, 7.75% | | | 600 | | | | 15,786 | | |
DuPont Fabros
Technology, Inc.,
Ser. B, 7.63% | | | 600 | | | | 15,300 | | |
Equity
Commonwealth,
Ser. E, 7.25% | | | 600 | | | | 15,354 | | |
Essex Property
Trust, Inc.,
Ser. H, 7.13% | | | 600 | | | | 15,438 | | |
First Potomac
Realty Trust,
Ser. A, 7.75% | | | 600 | | | | 15,408 | | |
General Growth
Properties, Inc.,
Ser. A, 6.38% | | | 600 | | | | 15,558 | | |
Hersha Hospitality
Trust, Ser. C,
6.88% | | | 600 | | | | 15,330 | | |
Kilroy Realty
Corp., Ser. G,
6.88% | | | 600 | | | | 15,408 | | |
Kite Realty
Group Trust,
Ser. A, 8.25% | | | 600 | | | | 15,300 | | |
See Notes to Schedule of Investments
Schedule of Investments Multi-Asset Income Fund (cont'd)
| | |
Number
of Shares | |
Value† | |
PS Business
Parks, Inc.,
Ser. S, 6.45% | | | 600 | | | $ | 15,696 | | |
Regency Centers
Corp., Ser. 6,
6.63% | | | 600 | | | | 15,588 | | |
Retail Properties
of America, Inc.,
Ser. A, 7.00% | | | 600 | | | | 15,180 | | |
Sabra Health
Care REIT, Inc.,
Ser. A, 7.13% | | | 600 | | | | 15,372 | | |
SL Green
Realty Corp.,
Ser. I, 6.50% | | | 600 | | | | 15,732 | | |
Sunstone
Hotel Investors,
Inc., Ser. D,
8.00% | | | 600 | | | | 15,294 | | |
VEREIT, Inc.,
Ser. F, 6.70% | | | 600 | | | | 14,886 | | |
Total Preferred Stocks
(Cost $308,135) | | | | | 307,824 | | |
| | | Principal
Amount | |
| |
Convertible Bonds (0.3%) | |
Real Estate Investment Trusts (0.3%) | |
Extra Space
Storage LP,
Company
Guranteed, 3.13%,
due 10/1/35
(Cost $40,000) | | $ | 40,000 | | | | 42,350 | ñ | |
U.S. Treasury Securities-Backed by the Full Faith and Credit of the U.S. Government (6.3%) | |
U.S. Treasury
Bonds, 5.50%,
due 8/15/28 | | | 65,000 | | | | 87,647 | | |
U.S. Treasury
Bonds, 3.88%,
due 8/15/40 | | | 10,000 | | | | 11,848 | | |
U.S. Treasury
Bonds, 4.50%,
due 2/15/36 | | | 20,000 | | | | 26,019 | | |
U.S. Treasury
Bonds, 4.38%,
due 11/15/39 | | | 90,000 | | | | 114,891 | | |
U.S. Treasury
Bonds, 3.00%,
due 11/15/44 | | | 330,000 | | | | 334,263 | h | |
U.S. Treasury
Inflation-Indexed
Bonds, 1.75%,
due 1/15/28 | | | 11,376 | | | | 12,643 | | |
U.S. Treasury
Inflation-Indexed
Bonds, 0.25%,
due 1/15/25 | | | 25,156 | | | | 24,192 | | |
| | |
Principal
Amount | |
Value† | |
U.S. Treasury
Inflation-Indexed
Bonds, 3.38%,
due 4/15/32 | | | 201,404 | | | $ | 278,165 | | |
U.S. Treasury | | | 10,000 | | | | 10,547 | | |
Notes, 2.75%,
due 2/15/24 | |
U.S. Treasury
Notes, 1.63%,
due 11/15/22 | | | 30,000 | | | | 29,463 | | |
U.S. Treasury
Notes, 0.38%,
due 3/31/16 | | | 40,000 | | | | 40,021 | | |
Total U.S. Treasury
Securities-Backed
by the Full Faith and
Credit of the
U.S. Government
(Cost $1,023,244) | | | | | 969,699 | | |
U.S. Government Agency Securities (0.8%) | |
Federal Home
Loan Bank,
Bonds, 5.50%,
due 7/15/36
(Cost $126,386) | | | 90,000 | | | | 120,018 | | |
| | | Number
of Shares | |
| |
Exchange Traded Funds (5.7%) | |
iShares 10+ Year
Credit Bond ETF | | | 6,600 | | | | 379,500 | | |
iShares Core
U.S. Aggregate
Bond ETF | | | 303 | | | | 33,163 | | |
SPDR Barclays
International
Treasury Bond
ETF | | | 621 | | | | 32,472 | * | |
SPDR Barclays
Long Term
Corporate Bond
ETF | | | 9,800 | | | | 380,828 | | |
Vanguard
S&P 500 ETF | | | 241 | | | | 45,925 | | |
Total Exchange
Traded Funds
(Cost $924,174) | | | | | 871,888 | | |
Mutual Funds (43.3%) | |
Neuberger
Berman Emerging
Markets Debt
Fund Institutional
Class | | | 182,438 | | | | 1,533,858 | §§ØØ | |
Neuberger
Berman Floating
Rate Income
Fund Institutional
Class | | | 193,562 | | | | 1,907,671 | §§ØØ | |
| | |
Number
of Shares | |
Value† | |
Neuberger
Berman Global
Long Short Fund
Institutional Class | | | 43,732 | | | $ | 433,404 | §§ØØ | |
Neuberger
Berman High
Income Bond
Fund Institutional
Class | | | 272,506 | | | | 2,319,739 | §§ØØ | |
Neuberger | | | 45,159 | | | | 440,252 | §§ØØ | |
Berman Long
Short Credit
Fund Institutional
Class | |
Total Mutual Funds
(Cost $6,982,970) | | | | | 6,634,924 | | |
Short-Term Investments (1.0%) | |
State Street
Institutional
Liquid Reserves
Fund Premier
Class, 0.15%
(Cost $163,251) | | | 163,251 | | | | 163,251 | dØØ | |
Total
Investments (100.3%)
(Cost $16,144,727) | | | 15,380,365 | ## | |
Liabilities, less cash,
receivables and
other assets [(0.3%)] | | | | | (49,436)e | | |
Total
Net Assets (100.0%) | | | | $ | 15,330,929 | | |
See Notes to Schedule of Investments
Notes to Schedule of Investments
† In accordance with Accounting Standards Codification ("ASC") 820 "Fair Value Measurement" ("ASC 820"), all investments held by each of Neuberger Berman Flexible Select Fund ("Flexible Select"), Neuberger Berman Global Allocation Fund ("Global Allocation") Neuberger Berman Inflation Managed Fund ("Inflation Managed") (formerly, Neuberger Berman Inflation Navigator Fund), Neuberger Berman Long Short Fund ("Long Short"), Neuberger Berman Long Short Credit Fund ("Long Short Credit") and Neuberger Berman Multi-Asset Income Fund ("Multi-Asset Income"), (each individually a "Fund," and collectively, the "Funds") are carried at the value that Neuberger Berman Management LLC ("Management") believes a Fund would receive upon selling an investment in an orderly transaction to an independent buyer in the principal or most advantageous market for the investment under current market conditions. Various inputs, including the volume and level of activity for the asset or liability in the market, are considered in valuing the Funds' investments, some of which are discussed below. Significant Management judgment may be necessary to value investments in accordance with ASC 820.
ASC 820 established a three-tier hierarchy of inputs to create a classification of value measurements for disclosure purposes. The three-tier hierarchy of inputs is summarized in the three broad Levels listed below.
• Level 1 – quoted prices in active markets for identical investments
• Level 2 – other observable inputs (including quoted prices for similar investments, interest rates, prepayment speeds, credit risk, amortized cost, etc.)
• Level 3 – unobservable inputs (including a Fund's own assumptions in determining the fair value of investments)
The inputs or methodology used for valuing an investment are not necessarily an indication of the risk associated with investing in those securities.
The value of the Funds' investments (long and short positions) in equity securities, exchange traded funds, preferred stock, exchange traded purchased option contracts and written option contracts, for which market quotations are readily available, is generally determined by Management by obtaining valuations from independent pricing services based on the latest sale price quoted on a principal exchange or market for that security (Level 1 inputs). Securities traded primarily on the NASDAQ Stock Market are normally valued at the NASDAQ Official Closing Price ("NOCP") provided by NASDAQ each business day. The NOCP is the most recently reported price as of 4:00:02 p.m., Eastern time, unless that price is outside the range of the "inside" bid and asked prices (i.e., the bid and asked prices that dealers quote to each other when trading for their own accounts); in that case, NASDAQ will adjust the price to equal the inside bid or asked price, whichever is closer. Because of delays in reporting trades, the NOCP may not be based on the price of the last trade to occur before the market closes. If there is no reported sale of a security on a particular day, the independent pricing services may value the security based on reported market quotations.
The value of the Funds' investments (long and short positions) in debt securities is determined by Management primarily by obtaining valuations from independent pricing services based on readily available bid quotations, or if quotations are not available, by methods which include various considerations based on security type (generally Level 2 inputs). In addition to the consideration of yields or prices of securities of comparable quality, coupon, maturity and type, indications as to values from dealers, and general market conditions, the following is a description of other Level 2 inputs and related valuation techniques used by independent pricing services to value certain types of debt securities held by the Funds:
Corporate Debt Securities. Inputs used to value corporate debt securities generally include relative credit information, observed market movements, sector news, spread to the U.S. Treasury market, and other market information, which may include benchmark yields, reported trades, broker-dealer quotes, issuer spreads, benchmark securities, bids, offers, and reference data, such as market research publications, when available ("Other Market Information").
See Notes to Financial Statements
Notes to Schedule of Investments (cont'd)
Convertible Bonds. Inputs used to value convertible bonds generally include underlying stock data, dealer quotes, conversion premiums, listed bond and preferred stock prices and other market information, which may include benchmark curves, trade execution data, and sensitivity analysis, when available.
U.S. Treasury Securities. Inputs used to value U.S. Treasury securities generally include quotes from several inter-dealer brokers and Other Market Information.
U.S. Government Agency Securities. Inputs used to value U.S. Government Agency securities generally include obtaining benchmark quotes and Other Market Information.
Emerging Markets Debt, Sovereign Debt and Quasi-Sovereign Debt. Inputs used to value emerging markets debt, sovereign debt and quasi-sovereign debt generally include dealer quotes, bond market activity, discounted cash flow models, and other relevant information such as credit spreads, benchmark curves and Other Market Information.
The value of financial futures contracts ("financial futures") is determined by Management by obtaining valuations from independent pricing services at the settlement price at the market close (Level 1 inputs).
The value of forward foreign currency contracts ("forward contracts") is determined by Management by obtaining valuations from independent pricing services based on actual traded currency rates on independent pricing services' networks, along with other traded and quoted currency rates provided to the pricing services by leading market participants (Level 2 inputs).
The value of credit default swap contracts ("credit default swaps") is determined by Management by obtaining valuations from independent pricing services using a model that considers a number of factors, which may include default probabilities, credit curves, recovery rates and cash flows (Level 2 inputs).
The value of equity swap contracts ("equity swaps"), total return swap contracts ("total return swaps") and total return basket swap contracts ("total return basket swaps") is determined by Management by obtaining valuations from independent pricing services using the underlying index and stated London Interbank Offered Rate ("LIBOR") (Level 2 inputs).
Options and total return swaps on futures contracts that are traded over-the-counter ("OTC") are generally valued on the basis of quotations provided by broker-dealers or prices provided by pricing service providers who use a series of techniques including simulated pricing models and/or curve fitting (bootstrapping), which aids in determining the present value of the contracts. The pricing models use inputs that are observed from actively quoted markets such as issuer details, indices, spreads, interest rates, yield curves, credit curves, volatility surfaces, and exchange rates. These contracts are generally categorized as Level 2 within the fair value hierarchy.
Management has developed a process to periodically review information provided by independent pricing services for all types of securities.
Investments in non-exchange traded investment companies are valued using the respective fund's daily calculated net asset value per share (Level 2 inputs).
If a valuation is not available from an independent pricing service, or if Management has reason to believe that the valuation received does not represent the amount a Fund might reasonably expect to receive on a current sale in an orderly transaction, Management seeks to obtain quotations from brokers or dealers (generally considered Level 2
See Notes to Financial Statements
Notes to Schedule of Investments (cont'd)
or Level 3 inputs depending on the number of quotes available). If such quotations are not readily available, the security is valued using methods the Neuberger Berman Alternative Funds' Board of Trustees (the "Board") has approved in the good-faith belief that the resulting valuation will reflect the fair value of the security. Numerous factors may be considered when determining the fair value of a security based on Level 2 or Level 3 inputs, including available analyst, media or other reports, trading in financial futures or American Depositary Receipts ("ADRs") and whether the issuer of the security being fair valued has other securities outstanding.
The value of the Funds' investments in foreign securities is generally determined using the same valuation methods and inputs as other Fund investments, as discussed above. Foreign security prices expressed in local currency values are translated from the local currency into U.S. dollars using the exchange rates as of the end of regular trading on the New York Stock Exchange ("NYSE") on business days, usually 4:00 p.m., Eastern time. The Board has approved the use of Interactive Data Pricing and Reference Data, Inc. ("Interactive") to assist in determining the fair value of foreign equity securities when changes in the value of a certain index suggest that the closing prices on the foreign exchanges may no longer represent the amount that a Fund could expect to receive for those securities or on days when foreign markets are closed and U.S. markets are open. In each of these events, Interactive will provide adjusted prices for certain foreign equity securities using a statistical analysis of historical correlations of multiple factors (Level 2 inputs). The Board has also approved the use of Interactive to evaluate the prices of foreign income securities as of the close of the NYSE. Interactive utilizes benchmark spread and yield curves and evaluates available market activity from the local close to the close of the NYSE (Level 2 inputs) to assist in determining prices for certain foreign income securities. In the case of both foreign equity and foreign income securities, in the absence of precise information about the market values of these foreign securities as of the close of the NYSE, the Board has determined on the basis of available data that prices adjusted or evaluated in this way are likely to be closer to the prices the Fund could realize on a current sale than are the prices of those securities established at the close of the foreign markets in which the securities primarily trade.
Fair value prices are necessarily estimates, and there is no assurance that such a price will be at or close to the price at which the security is next quoted or next trades.
The following is a summary, categorized by Level, of inputs used to value the Funds' investments as of October 31, 2015:
Asset Valuation Inputs | |
| | | Level 1 | | Level 2 | | Level 3 | | Total | |
Flexible Select | |
Investments: | |
Common Stocks^ | | $ | 83,799,706 | | | $ | — | | | $ | — | | | $ | 83,799,706 | | |
Mutual Funds | | | — | | | | 11,665,809 | | | | — | | | | 11,665,809 | | |
Short-Term Investments | | | — | | | | 3,211,986 | | | | — | | | | 3,211,986 | | |
Total Investments | | | 83,799,706 | | | | 14,877,795 | | | | — | | | | 98,677,501 | | |
Global Allocation | |
Investments: | |
Common Stocks^ | |
Australia | | | 83,756 | | | | 129,977 | | | | — | | | | 213,733 | | |
Hong Kong | | | — | | | | 70,310 | | | | — | | | | 70,310 | | |
Japan | | | — | | | | 585,590 | | | | — | | | | 585,590 | | |
Singapore | | | — | | | | 46,604 | | | | — | | | | 46,604 | | |
Other Common Stocksß | | | 11,935,377 | | | | | | — | | | | 11,935,377 | | |
Total Common Stocks | | | 12,019,133 | | | | 832,481 | | | | — | | | | 12,851,614 | | |
See Notes to Financial Statements
Notes to Schedule of Investments (cont'd)
Asset Valuation Inputs | |
| | | Level 1 | | Level 2 | | Level 3 | | Total | |
U.S. Treasury Securities-Backed by the Full Faith and
Credit of the U.S. Government | | $ | — | | | $ | 1,088,885 | | | $ | — | | | $ | 1,088,885 | | |
U.S. Government Agency Securities | | | — | | | | 33,338 | | | | — | | | | 33,338 | | |
Mortgage-Backed Securities^ | | | — | | | | 155,296 | | | | — | | | | 155,296 | | |
Government Securities^ | | | — | | | | 1,826,463 | | | | — | | | | 1,826,463 | | |
Exchange Traded Funds | | | 533,082 | | | | — | | | | — | | | | 533,082 | | |
Mutual Funds | | | — | | | | 8,705,314 | | | | — | | | | 8,705,314 | | |
Redeemable Preference Shares^ | | | — | | | | 520 | | | | — | | | | 520 | | |
Short-Term Investments | | | — | | | | 642,894 | | | | — | | | | 642,894 | | |
Total Long Positions | | | 12,552,215 | | | | 13,285,191 | | | | — | | | | 25,837,406 | | |
Inflation Managed | |
Investments: | |
Common Stocks^ | | | 7,001,205 | | | | — | | | | — | | | | 7,001,205 | | |
Government Securities | | | — | | | | 2,077,376 | | | | — | | | | 2,077,376 | | |
U.S. Treasury Securities-Backed by the Full Faith and
Credit of the U.S. Government | | | — | | | | 2,205,995 | | | | — | | | | 2,205,995 | | |
Mutual Funds | | | — | | | | 4,556,060 | | | | — | | | | 4,556,060 | | |
Short-Term Investments | | | — | | | | 161,218 | | | | — | | | | 161,218 | | |
Total Investments | | | 7,001,205 | | | | 9,000,649 | | | | — | | | | 16,001,854 | | |
Long Short | |
Investments: | |
Common Stocks^ | | | 2,360,036,381 | | | | — | | | | — | | | | 2,360,036,381 | | |
Corporate Debt Securities^ | | | — | | | | 131,027,014 | | | | — | | | | 131,027,014 | | |
Purchased Options | | | 59,520 | | | | — | | | | — | | | | 59,520 | | |
Short-Term Investments | | | — | | | | 721,758,598 | | | | — | | | | 721,758,598 | | |
Total Long Positions | | | 2,360,095,901 | | | | 852,785,612 | | | | — | | | | 3,212,881,513 | | |
Long Short Credit | |
Investments: | |
Common Stocks^ | | | 186,500 | | | | — | | | | — | | | | 186,500 | | |
Corporate Debt Securities^ | | | — | | | | 8,052,760 | | | | — | | | | 8,052,760 | | |
Total Investments | | | 186,500 | | | | 8,052,760 | | | | — | | | | 8,239,260 | | |
Multi-Asset Income | |
Investments: | |
Common Stocks | |
Airlines | | | 5,072 | | | | 29,075 | | | | — | | | | 34,147 | | |
Banks | | | 138,173 | | | | 47,570 | | | | — | | | | 185,743 | | |
Biotechnology | | | 16,293 | | | | 3,722 | | | | — | | | | 20,015 | | |
Capital Markets | | | 65,731 | | | | 2,543 | | | | — | | | | 68,274 | | |
Containers & Packaging | | | 11,442 | | | | 2,357 | | | | — | | | | 13,799 | | |
See Notes to Financial Statements
Notes to Schedule of Investments (cont'd)
Asset Valuation Inputs | |
| | | Level 1 | | Level 2 | | Level 3 | | Total | |
Distributors | | $ | — | | | $ | 4,631 | | | $ | — | | | $ | 4,631 | | |
Diversified Telecommunication Services | | | 176,155 | | | | 24,736 | | | | — | | | | 200,891 | | |
Electric Utilities | | | 214,230 | | | | 30,802 | | | | — | | | | 245,032 | | |
Food & Staples Retailing | | | 44,499 | | | | 31,719 | | | | — | | | | 76,218 | | |
Food Products | | | 26,900 | | | | 5,125 | | | | — | | | | 32,025 | | |
Health Care Providers & Services | | | 6,262 | | | | 7,625 | | | | — | | | | 13,887 | | |
Hotels, Restaurants & Leisure | | | 91,214 | | | | 15,012 | | | | — | | | | 106,226 | | |
Household Durables | | | 19,149 | | | | 1,874 | | | | — | | | | 21,023 | | |
Insurance | | | 296,004 | | | | 7,158 | | | | — | | | | 303,162 | | |
Machinery | | | 2,862 | | | | 2,759 | | | | — | | | | 5,621 | | |
Media | | | 68,316 | | | | 1,486 | | | | — | | | | 69,802 | | |
Metals & Mining | | | 127,133 | | | | 45,575 | | | | — | | | | 172,708 | | |
Multi-Utilities | | | 201,658 | | | | 7,554 | | | | — | | | | 209,212 | | |
Multiline Retail | | | 52,032 | | | | 5,552 | | | | — | | | | 57,584 | | |
Oil, Gas & Consumable Fuels | | | 1,121,061 | | | | 3,419 | | | | — | | | | 1,124,480 | | |
Pharmaceuticals | | | 588,153 | | | | 14,650 | | | | — | | | | 602,803 | | |
Technology Hardware, Storage & Peripherals | | | 29,875 | | | | 11,945 | | | | — | | | | 41,820 | | |
Other Common Stocks^ | | | 2,661,308 | | | | — | | | | — | | | | 2,661,308 | | |
Total Common Stocks | | | 5,963,522 | | | | 306,889 | | | | — | | | | 6,270,411 | | |
Preferred Stocks^ | | | 307,824 | | | | — | | | | — | | | | 307,824 | | |
Convertible Bonds^ | | | — | | | | 42,350 | | | | — | | | | 42,350 | | |
U.S. Treasury Securities-Backed by the Full Faith and
Credit of the U.S. Government | | | — | | | | 969,699 | | | | — | | | | 969,699 | | |
U.S. Government Agency Securities | | | — | | | | 120,018 | | | | — | | | | 120,018 | | |
Exchange Traded Funds | | | 871,888 | | | | — | | | | — | | | | 871,888 | | |
Mutual Funds | | | — | | | | 6,634,924 | | | | — | | | | 6,634,924 | | |
Short-Term Investments | | | — | | | | 163,251 | | | | — | | | | 163,251 | | |
Total Investments | | $ | 7,143,234 | | | $ | 8,237,131 | | | $ | — | | | $ | 15,380,365 | | |
^ The Schedule of Investments (or Long Positions by Industry for Global Allocation) provides information on the industry categorization for the portfolio.
The following is a summary, categorized by Level, of inputs used to value the Funds' derivatives as of October 31, 2015:
Asset Valuation Inputs | |
| | | Level 1 | | Level 2 | | Level 3 | | Total | |
Global Allocation | |
Forward contracts (unrealized appreciation) | | $ | — | | | $ | 151,897 | | | $ | — | | | $ | 151,897 | | |
Futures contracts (unrealized appreciation) | | | 74,148 | | | | — | | | | — | | | | 74,148 | | |
Total | | $ | 74,148 | | | $ | 151,897 | | | $ | — | | | $ | 226,045 | | |
See Notes to Financial Statements
Notes to Schedule of Investments (cont'd)
Asset Valuation Inputs | |
| | | Level 1 | | Level 2 | | Level 3 | | Total | |
Inflation Managed | |
Futures contracts (unrealized appreciation) | | $ | 8,105 | | | $ | — | | | $ | — | | | $ | 8,105 | | |
Total | | $ | 8,105 | | | $ | — | | | $ | — | | | $ | 8,105 | | |
Long Short | |
Futures contracts (unrealized appreciation) | | $ | 139,820 | | | $ | — | | | $ | — | | | $ | 139,820 | | |
Swap contracts | | | — | | | | 614,218 | | | | — | | | | 614,218 | | |
Total | | $ | 139,820 | | | $ | 614,218 | | | $ | — | | | $ | 754,038 | | |
Long Short Credit | |
Forward contracts (unrealized appreciation) | | $ | — | | | $ | 9,676 | | | $ | — | | | $ | 9,676 | | |
Futures contracts (unrealized appreciation) | | | 4,613 | | | | — | | | | — | | | | 4,613 | | |
Swap contracts | | | — | | | | 144,335 | | | | — | | | | 144,335 | | |
Total | | $ | 4,613 | | | $ | 154,011 | | | $ | — | | | $ | 158,624 | | |
Multi-Asset Income | |
Forward contracts (unrealized appreciation) | | $ | — | | | $ | 83,031 | | | $ | — | | | $ | 83,031 | | |
Futures contracts (unrealized appreciation) | | | 21,990 | | | | — | | | | — | | | | 21,990 | | |
Total | | $ | 21,990 | | | $ | 83,031 | | | $ | — | | | $ | 105,021 | | |
The following is a summary, categorized by Level, of inputs used to value the Funds' short investments as of October 31, 2015:
Liability Valuation Inputs | | Level 1 | | Level 2 | | Level 3§ | | Total | |
Global Allocation | |
Common Stocks Sold Short^ | |
Australia | | $ | (12,207 | ) | | $ | (57,237 | ) | | $ | — | | | $ | (69,444 | ) | |
Hong Kong | | | — | | | | (35,476 | ) | | | — | | | | (35,476 | ) | |
Ireland | | | (20,154 | ) | | | (14,201 | ) | | | — | | | | (34,355 | ) | |
Japan | | | — | | | | (185,975 | ) | | | — | | | | (185,975 | ) | |
Singapore | | | — | | | | (28,374 | ) | | | — | | | | (28,374 | ) | |
Other Common Stocks Sold Shortß | | | (3,318,510 | ) | | | — | | | | — | | | | (3,318,510 | ) | |
Total Common Stocks Sold Short | | | (3,350,871 | ) | | | (321,263 | ) | | | — | | | | (3,672,134 | ) | |
Redeemable Preference Shares Sold Short^ | | | — | | | | (263 | ) | | | — | | | | (263 | ) | |
Rights Sold Short^ | | | — | | | | — | | | | (17,518 | ) | | | (17,518 | ) | |
Total Short Positions | | $ | (3,350,871 | ) | | $ | (321,526 | ) | | $ | (17,518 | ) | | $ | (3,689,915 | ) | |
Long Short | |
Common Stocks Sold Short^ | | $ | (261,036,909 | ) | | $ | — | | | $ | — | | | $ | (261,036,909 | ) | |
Exchange Traded Funds Sold Short | | | (128,542,647 | ) | | | — | | | | — | | | | (128,542,647 | ) | |
Total Short Positions | | $ | (389,579,556 | ) | | $ | — | | | $ | — | | | $ | (389,579,556 | ) | |
Long Short Credit | |
Corporate Debt Securities^ | | $ | — | | | $ | (764,813 | ) | | $ | — | | | $ | (764,813 | ) | |
Government Securities^ | | | — | | | | (202,041 | ) | | | — | | | | (202,041 | ) | |
Total Short Positions | | $ | — | | | $ | (966,854 | ) | | $ | — | | | $ | (966,854 | ) | |
See Notes to Financial Statements
Notes to Schedule of Investments (cont'd)
§ The following is a reconciliation between the beginning and ending balances of investments in which unobservable inputs (Level 3) were used in determining value:
| | Beginning
balance, as
of 11/1/14 | | Accrued
discounts/
(premiums) | | Realized
gain/(loss) | | Change
in unrealized
appreciation/
(depreciation) | | Purchases | | Sales | | Transfers
into
Level 3 | | Transfers
out of
Level 3 | | Balance,
as of
10/31/15 | | Net change
in unrealized
appreciation/
(depreciation)
from
investments
still held as of
10/31/15 | |
Investments in
Securities: | |
Global Allocation | |
Rights
Sold Short‡‡ | |
United States | | $ | — | | | $ | — | | | $ | — | | | $ | — | | | $ | — | | | $ | — | | | $ | (17,518 | ) | | $ | — | | | $ | (17,518 | ) | | $ | — | | |
Total | | $ | — | | | $ | — | | | $ | — | | | $ | — | | | $ | — | | | $ | — | | | $ | (17,518 | ) | | $ | — | | | $ | (17,518 | ) | | $ | — | | |
‡‡ For the year ended October 31, 2015, Global Allocation's Level 3 investments were valued based on using methods the Board has approved in the good-faith belief that the resulting valuation will reflect the fair value of the security. The investments did not have a material impact on the Fund's net assets; therefore, unobservable inputs used in formulating such valuations are not presented.
As of the year ended October 31, 2015, certain securities were transferred from one level (as of October 31, 2014) to another. Based on beginning of period market values as of November 1, 2014, $(17,518) was transferred from Level 2 to Level 3 for Global Allocation. Contingent value rights that transferred in or out of Level 3 were primarily due to the pricing methodology being based on dated inputs by Management (Level 3). In addition, $46,300 in long positions and $(331,324) in short positions were transferred from Level 1 to Level 2 for Global Allocation, respectively. Interactive provided adjusted prices for these securities as of October 31, 2015, as stated in the description of the valuation methods of foreign equity securities in footnote † above.
^ The Schedule of Investments (or Short Positions by Industry for Global Allocation) provides information on the industry categorization for the portfolio.
ß All Level 1 securities that represent multiple geographic locations and/or industries. Please refer to the Schedule of Investments for additional information.
The following is a summary, categorized by Level, of inputs used to value the Funds' derivatives as of October 31, 2015:
Liability Valuation Inputs | | Level 1 | | Level 2 | | Level 3 | | Total | |
Global Allocation | |
Forward contracts (unrealized depreciation) | | $ | — | | | $ | (138,049 | ) | | $ | — | | | $ | (138,049 | ) | |
Futures contracts (unrealized depreciation) | | | (49,942 | ) | | | — | | | | — | | | | (49,942 | ) | |
Total | | $ | (49,942 | ) | | $ | (138,049 | ) | | $ | — | | | $ | (187,991 | ) | |
Inflation Managed | |
Futures contracts (unrealized depreciation) | | $ | (51,673 | ) | | $ | — | | | $ | — | | | $ | (51,673 | ) | |
Total | | $ | (51,673 | ) | | $ | — | | | $ | — | | | $ | (51,673 | ) | |
See Notes to Financial Statements
Notes to Schedule of Investments (cont'd)
Liability Valuation Inputs | | Level 1 | | Level 2 | | Level 3 | | Total | |
Long Short | |
Futures contracts (unrealized depreciation) | | $ | (14,995,765 | ) | | $ | — | | | $ | — | | | $ | (14,995,765 | ) | |
Swap contracts | | | — | | | | (2,896,345 | ) | | | — | | | | (2,896,345 | ) | |
Option contracts | | | (7,387,940 | ) | | | — | | | | — | | | | (7,387,940 | ) | |
Total | | $ | (22,383,705 | ) | | $ | (2,896,345 | ) | | $ | — | | | $ | (25,280,050 | ) | |
Long Short Credit | |
Futures contracts (unrealized depreciation) | | $ | (29,688 | ) | | $ | — | | | $ | — | | | $ | (29,688 | ) | |
Swap contracts | | | — | | | | (384,073 | ) | | | — | | | | (384,073 | ) | |
Option contracts | | | (18,350 | ) | | | — | | | | — | | | | (18,350 | ) | |
Total | | $ | (48,038 | ) | | $ | (384,073 | ) | | $ | — | | | $ | (432,111 | ) | |
Multi-Asset Income | |
Forward contracts (unrealized depreciation) | | $ | — | | | $ | (80,439 | ) | | $ | — | | | $ | (80,439 | ) | |
Futures contracts (unrealized depreciation) | | | (2,710 | ) | | | — | | | | — | | | | (2,710 | ) | |
Option contracts | | | (13,309 | ) | | | — | | | | — | | | | (13,309 | ) | |
Total | | $ | (16,019 | ) | | $ | (80,439 | ) | | $ | — | | | $ | (96,458 | ) | |
## At October 31, 2015, selected fund information on a U.S. federal income tax basis was as follows:
| | | Cost | | Gross
Unrealized
Appreciation | | Gross
Unrealized
Depreciation | | Net Unrealized
Appreciation
(Depreciation) | |
Flexible Select | | $ | 92,562,676 | | | $ | 7,041,279 | | | $ | 926,454 | | | $ | 6,114,825 | | |
Global Allocation | | | 25,914,745 | | | | 849,837 | | | | 927,176 | | | | (77,339 | ) | |
Inflation Managed | | | 17,460,230 | | | | 459,754 | | | | 1,918,130 | | | | (1,458,376 | ) | |
Long Short | | | 3,069,865,684 | | | | 299,537,337 | | | | 156,521,508 | | | | 143,015,829 | | |
Long Short Credit | | 8,636,618 | | | | 34,759 | | | | 432,117 | | | | (397,358 | ) | |
Multi-Asset Income | | | 16,093,079 | | | | 213,898 | | | | 926,612 | | | | (712,714 | ) | |
* Security did not produce income during the last twelve months.
c Security had an event of default.
@@ At October 31, 2015, the Funds had outstanding call and put options written as follows:
Fund | | Name of Issuer | | Contracts | | Exercise
Price | | Expiration Date | | Market Value
of Options | |
Long Short | | Starwood Hotels &
Resorts Worldwide, Inc., Put | | | 2,500 | | | | 77.5 | | | November 2015 | | $ | (587,500 | ) | |
Long Short | | Synchrony Financial, Put | | | 6,904 | | | | 40 | | | November 2015 | | | (6,800,440 | ) | |
Total | | | | | | | | | | $ | (7,387,940 | ) | |
Long Short Credit | | Enterprise Products
Partners LP, Put | | | 50 | | | | 27 | | | November 2015 | | $ | (2,650 | ) | |
Long Short Credit | Kinder Morgan, Inc., Put | | | 50 | | | | 30 | | | November 2015 | | | (13,350 | ) | |
Long Short Credit | Plains All American
Pipeline LP, Put | | | 50 | | | | 30 | | | November 2015 | | | (2,350 | ) | |
Total | | | | | | | | | | $ | (18,350 | ) | |
See Notes to Financial Statements
Notes to Schedule of Investments (cont'd)
| Fund | | Name of Issuer | | Contracts | | Exercise
Price | | Expiration Date | | Market Value
of Options | |
Multi-Asset Income | | Altria Group, Inc., Call | | | 5 | | | | 61.5 | | | November 2015 | | $ | (340 | ) | |
Multi-Asset Income | | Amgen, Inc., Call | | | 1 | | | | 160 | | | November 2015 | | | (298 | ) | |
Multi-Asset Income | | AT&T, Inc., Call | | | 12 | | | | 34.5 | | | November 2015 | | | (132 | ) | |
Multi-Asset Income | | Avnet, Inc., Call | | | 2 | | | | 47 | | | November 2015 | | | (80 | ) | |
Multi-Asset Income | | Bristol-Myers Squibb
Co., Call | | | 3 | | | | 68 | | | November 2015 | | | (228 | ) | |
Multi-Asset Income | | Carnival Corp., Call | | | 3 | | | | 55 | | | November 2015 | | | (213 | ) | |
Multi-Asset Income | | Chevron Corp., Call | | | 2 | | | | 95 | | | November 2015 | | | (128 | ) | |
Multi-Asset Income | | Cisco Systems, Inc., Call | | | 12 | | | | 30 | | | November 2015 | | | (420 | ) | |
Multi-Asset Income | | Coca-Cola Co., Call | | | 7 | | | | 43 | | | November 2015 | | | (280 | ) | |
Multi-Asset Income | | Domtar Corp., Call | | | 1 | | | | 40 | | | November 2015 | | | (175 | ) | |
Multi-Asset Income | | Dow Chemical Co., Call | | | 3 | | | | 50 | | | November 2015 | | | (711 | ) | |
Multi-Asset Income | | Exxon Mobil Corp., Call | | | 6 | | | | 85 | | | November 2015 | | | (336 | ) | |
Multi-Asset Income | | IBM Corp., Call | | | 1 | | | | 155 | | | November 2015 | | | (3 | ) | |
Multi-Asset Income | | Intel Corp., Call | | | 8 | | | | 34 | | | November 2015 | | | (520 | ) | |
Multi-Asset Income | | Johnson & Johnson, Call | | | 5 | | | | 100 | | | November 2015 | | | (1,025 | ) | |
Multi-Asset Income | | L Brands, Inc., Call | | | 1 | | | | 100 | | | November 2015 | | | (86 | ) | |
Multi-Asset Income | | Merck & Co., Inc., Call | | | 6 | | | | 53 | | | November 2015 | | | (1,500 | ) | |
Multi-Asset Income | | Microsoft Corp., Call | | | 10 | | | | 49 | | | November 2015 | | | (3,800 | ) | |
Multi-Asset Income | | PBF Energy, Inc., Call | | | 1 | | | | 35 | | | November 2015 | | | (95 | ) | |
Multi-Asset Income | | Pfizer, Inc., Call | | | 13 | | | | 35.5 | | | November 2015 | | | (325 | ) | |
Multi-Asset Income | | Philip Morris International,
Inc., Call | | | 3 | | | | 90 | | | November 2015 | | | (255 | ) | |
Multi-Asset Income | | Phillips 66, Call | | | 1 | | | | 87.5 | | | November 2015 | | | (310 | ) | |
Multi-Asset Income | | Procter & Gamble Co., Call | | | 6 | | | | 76 | | | November 2015 | | | (774 | ) | |
Multi-Asset Income | | Texas Instruments, Inc., Call | | | 2 | | | | 55 | | | November 2015 | | | (452 | ) | |
Multi-Asset Income | | United Parcel Service,
Inc., Call | | | 1 | | | | 105 | | | November 2015 | | | (51 | ) | |
Multi-Asset Income | | Valero Energy Corp., Call | | | 3 | | | | 65 | | | November 2015 | | | (711 | ) | |
Multi-Asset Income | | Wal-Mart Stores, Inc., Call | | | 3 | | | | 61.5 | | | November 2015 | | | (36 | ) | |
Multi-Asset Income | | Xerox Corp., Call | | | 5 | | | | 11 | | | November 2015 | | | (25 | ) | |
Total | | | | | | | | | | $ | (13,309 | ) | |
At October 31, 2015, Long Short, Long Short Credit and Multi-Asset Income had deposited $26,285,598, $1,049,750 and $15,478 in a segregated account to cover requirements on options written, respectively.
ñ Securities were purchased under Rule 144A of the Securities Act of 1933, as amended (the "1933 Act"), or are otherwise restricted and, unless registered under the 1933 Act or exempted from registration, may only be sold to qualified institutional investors. These securities have been deemed by the investment manager to be liquid. At October 31, 2015, these securities amounted to $145,744 or 0.6% of net assets for Global Allocation, $218,559 or 1.4% of net assets for Inflation Managed, $47,391,262 or 1.4% of net assets for Long Short, $2,475,750 or 8.3% of net assets for Long Short Credit and $42,350 or 0.3% of net assets for Multi-Asset Income.
Ñ These securities have been deemed by the investment manager to be illiquid. At October 31, 2015, these securities amounted to approximately $520 and $(17,781) or 0.0% and (0.1)% of net assets for Global Allocation.
Ø All or a portion of this security was purchased on a when-issued basis. At October 31, 2015, these securities amounted to $155,296 for Global Allocation and $23,365,575 for Long Short. For TBA (to be announced) securities, the maturity date was not known at the time of investment.
@ All or a portion of this security has been pledged as collateral.
È All or a portion of this security is on loan.
See Notes to Financial Statements
Notes to Schedule of Investments (cont'd)
ØØ All or a portion of this security is segregated in connection for when-issued security purchase commitments and/or obligations for common stocks sold short and/or written options and/or forward contracts and/or swap contracts and/or financial futures contracts.
g At October 31, 2015, Global Allocation had pledged securities in the amount of $2,884,661 to cover collateral requirements for borrowing in connection with securities sold short. At October 31, 2015, Long Short had pledged securities in the amount of $50,048,413 to cover collateral requirements for borrowing in connection with securities sold short and written and/or purchased options.
h At October 31, 2015, Multi-Asset Income pledged securities in the amount of $57,076 to cover collateral requirements for borrowing in connection with financial futures.
‡ At October 31, 2015, Global Allocation had deposited $1,383,720 in a segregated account to cover collateral requirements for borrowing in connection with securities sold short. For Global Allocation, this collateral is made up of the proceeds from the securities sold short and collateral received from security lending activities. At October 31, 2015, Long Short and Long Short Credit had deposited $400,341,467 and $967,611 in segregated accounts to cover collateral requirements for borrowing in connection with securities sold short.
** Step Bond: Coupon rate is a fixed rate for an initial period that either resets at a specific date or may reset in the future contingent upon a rating change made by a rating agency.
§§ Affiliated issuer (see Note F of Notes to Financial Statements).
f Value of the security was determined using methods the Board has approved in the good-faith belief that the resulting valuation will reflect the fair value of the security.
a Principal amount is stated in the currency in which security is denominated.
AUD = Australian Dollar
CAD = Canadian Dollar
EUR = Euro
GBP = Pound Sterling
JPY = Japanese Yen
MXN = Mexican Peso
NZD = New Zealand Dollar
ZAR = South African Rand
b Effective February 28, 2015. Formerly, Inflation Navigator Fund through February 27, 2015.
d The rate shown is the annualized seven day yield at year-end.
e See Note A in the Notes to Financial Statements for the Funds' open positions in derivatives at October 31, 2015.
See Notes to Financial Statements
This page has been left blank intentionally
Statements of Asset and Liabilities
Neuberger Berman Alternative Funds
| | | FLEXIBLE
SELECT FUND | | GLOBAL
ALLOCATION
FUND | | INFLATION
MANAGED
FUNDa | |
| | | October 31, 2015 | | October 31, 2015 | | October 31, 2015 | |
Assets | |
Investments in securities, at value*† (Notes A & F)—see Schedule
of Investments: | |
Unaffiliated issuers | | $ | 87,011,692 | | | $ | 17,132,092 | | | $ | 11,445,794 | | |
Affiliated issuers | | | 11,665,809 | | | | 8,705,314 | | | | 4,556,060 | | |
| | | | 98,677,501 | | | | 25,837,406 | | | | 16,001,854 | | |
Cash | | | 22,100 | | | | — | | | | — | | |
Foreign currency* | | | — | | | | 53,145 | | | | 256 | | |
Cash collateral segregated for short sales (Note A) | | | — | | | | 1,150,000 | | | | — | | |
Cash collateral segregated for financial futures contracts (Note A) | | | — | | | | 197,557 | | | | 64,123 | | |
Cash collateral segregated for option contracts (NoteA) | | | — | | | | — | | | | — | | |
Cash collateral segregated for swap contracts (Note A) | | | — | | | | — | | | | — | | |
Dividends and interest receivable | | | 86,923 | | | | 51,576 | | | | 45,918 | | |
Receivable for securities sold | | | 1,357 | | | | 386,488 | | | | 206,090 | | |
Receivable for Fund shares sold | | | — | | | | 22,774 | | | | 2,010 | | |
Receivable from Management-net (Note B) | | | 22,351 | | | | 46,328 | | | | 17,096 | | |
Receivable for variation margin on centrally cleared swap contracts | | | — | | | | — | | | | — | | |
Receivable for variation margin on financial futures (Note A) | | | — | | | | — | | | | — | | |
OTC swap contracts, at value (Note A) | | | — | | | | — | | | | — | | |
Cash collateral for securities loaned (Note A) | | | — | | | | 233,817 | | | | — | | |
Receivable for forward foreign currency contracts (Note A-14) | | | — | | | | 151,897 | | | | — | | |
Prepaid expenses and other assets | | | 16,059 | | | | 18,276 | | | | 28,072 | | |
Total Assets | | | 98,826,291 | | | | 28,149,264 | | | | 16,365,419 | | |
Liabilities | |
Investments sold short, at value** (Note A) | | | — | | | | 3,689,915 | | | | — | | |
OTC swap contracts, at value (Note A) | | | — | | | | — | | | | — | | |
Interest payable for short sales | | | — | | | | 4,667 | | | | — | | |
Payable for collateral on securities loaned (Note A) | | | — | | | | 233,817 | | | | — | | |
Payable to investment manager—net (Notes A & B) | | | 46,247 | | | | 7,230 | | | | 6,538 | | |
Option contracts written, at value*** (Note A) | | | — | | | | — | | | | — | | |
Due to custodian | | | 1,357 | | | | — | | | | — | | |
Payable for securities purchased | | | 39,973 | | | | 265,460 | | | | 107,798 | | |
Payable for Fund shares redeemed | | | — | | | | 28,309 | | | | — | | |
Payable to administrator—net (Note B) | | | — | | | | — | | | | — | | |
Payable to trustees | | | 2,189 | | | | 2,189 | | | | 2,189 | | |
Payable for variation margin on financial futures contracts (Note A) | | | — | | | | 38,948 | | | | 747 | | |
Payable for forward foreign currency contracts (Note A) | | | — | | | | 138,049 | | | | — | | |
Distributions payable | | | — | | | | — | | | | — | | |
Accrued expenses and other payables | | | 130,367 | | | | 182,413 | | | | 135,568 | | |
Total Liabilities | | | 220,133 | | | | 4,590,997 | | | | 252,840 | | |
Net Assets | | $ | 98,606,158 | | | $ | 23,558,267 | | | $ | 16,112,579 | | |
Net Assets consist of: | |
Paid-in capital | | $ | 87,931,836 | | | $ | 23,892,048 | | | $ | 17,939,739 | | |
Undistributed net investment income (loss) | | | 499,392 | | | | — | | | | — | | |
Distributions in excess of net investment income | | | — | | | | (250,183 | ) | | | (847 | ) | |
Accumulated net realized gains (losses) on investments | | | 3,914,546 | | | | (115,314 | ) | | | (321,741 | ) | |
Net unrealized appreciation (depreciation) in value of investments | | | 6,260,384 | | | | 31,716 | | | | (1,504,572 | ) | |
Net Assets | | $ | 98,606,158 | | | $ | 23,558,267 | | | $ | 16,112,579 | | |
See Notes to Financial Statements
Statements of Asset and Liabilities (cont'd)
Neuberger Berman Alternative Funds (cont'd)
| | | FLEXIBLE
SELECT FUND | | GLOBAL
ALLOCATION
FUND | | INFLATION
MANAGED
FUNDa | |
| | | October 31, 2015 | | October 31, 2015 | | October 31, 2015 | |
Net Assets | |
Institutional Class | | $ | 98,097,920 | | | $ | 8,919,476 | | | $ | 14,195,120 | | |
Class A | | | 356,668 | | | | 8,075,808 | | | | 367,210 | | |
Class C | | | 151,570 | | | | 6,562,983 | | | | 261,082 | | |
Class R6 | | | — | | | | — | | | | 1,289,167 | | |
Shares Outstanding ($.001 par value; unlimited shares
authorized) | |
Institutional Class | | | 8,428,165 | | | | 856,390 | | | | 1,480,994 | | |
Class A | | | 30,799 | | | | 779,757 | | | | 38,495 | | |
Class C | | | 13,222 | | | | 644,543 | | | | 27,755 | | |
Class R6 | | | — | | | | — | | | | 134,448 | | |
Net Asset Value, offering and redemption price per share | |
Institutional Class | | $ | 11.64 | | | $ | 10.42 | | | $ | 9.58 | | |
Class R6 | | | — | | | | — | | | | 9.59 | | |
Net Asset Value and redemption price per share | |
Class A | | $ | 11.58 | | | $ | 10.36 | | | $ | 9.54 | | |
Offering Price per share | |
Class A‡ | | $ | 12.29 | | | $ | 10.99 | | | $ | 10.12 | | |
Net Asset Value and offering price per share | |
Class C^ | | $ | 11.46 | | | $ | 10.18 | | | $ | 9.41 | | |
†Securities on loan, at value: | |
Unaffiliated issuers | | $ | — | | | $ | 228,266 | | | $ | — | | |
*Cost of Investments: | |
Unaffiliated issuers | | $ | 80,783,587 | | | $ | 16,735,146 | | | $ | 12,090,431 | | |
Affiliated issuers | | | 11,632,509 | | | | 9,022,784 | | | | 5,372,800 | | |
Total cost of investments | | $ | 92,416,096 | | | $ | 25,757,930 | | | $ | 17,463,231 | | |
Total cost of foreign currency | | $ | — | | | $ | 53,458 | | | $ | 246 | | |
**Proceeds from investments sold short | | $ | — | | | $ | 3,604,445 | | | $ | — | | |
***Premium received from option contracts written | | $ | — | | | $ | — | | | $ | — | | |
‡ On single retail sales of less than $50,000. On sales of $50,000 or more or in certain other circumstances described in the Fund's prospectus, offering price is reduced.
^ Redemption price per share is equal to net asset value less any applicable contingent deferred sales charge.
a Formerly Inflation Navigator Fund. See Note A of Notes to Financial Statements.
See Notes to Financial Statements
Statements of Asset and Liabilities (cont'd)
Neuberger Berman Alternative Funds
| | | LONG SHORT
FUND | | LONG SHORT
CREDIT FUND | | MULTI-ASSET
INCOME FUND | |
| | | October 31, 2015 | | October 31, 2015 | | October 31, 2015 | |
Assets | |
Investments in securities, at value*† (Notes A & F)—see Schedule
of Investments: | |
Unaffiliated issuers | | $ | 3,212,881,513 | | | $ | 8,239,260 | | | $ | 8,745,441 | | |
Affiliated issuers | | | — | | | | — | | | | 6,634,924 | | |
| | | | 3,212,881,513 | | | | 8,239,260 | | | | 15,380,365 | | |
Cash | | | 5,731,640 | | | | 19,632,247 | | | | — | | |
Foreign currency* | | | 49,676 | | | | 103,309 | | | | — | | |
Cash collateral segregated for short sales (Note A) | | | 400,341,467 | | | | 967,611 | | | | — | | |
Cash collateral segregated for financial futures contracts (Note A) | | | 20,582,980 | | | | 59,000 | | | | — | | |
Cash collateral segregated for option contracts (Note A) | | | 26,285,598 | | | | 1,049,750 | | | | 15,478 | | |
Cash collateral segregated for swap contracts (Note A) | | | 1,750,000 | | | | 699,027 | | | | — | | |
Dividends and interest receivable | | | 4,082,655 | | | | 178,674 | | | | 53,747 | | |
Receivable for securities sold | | | 73,247,787 | | | | — | | | | — | | |
Receivable for Fund shares sold | | | 5,878,273 | | | | 625,040 | | | | — | | |
Receivable from Management-net (Note B) | | | — | | | | — | | | | 45,121 | | |
Receivable for variation margin on centrally cleared swap contracts | | | — | | | | 419,057 | | | | — | | |
Receivable for variation margin on financial futures contracts (Note A) | | | 2,196,107 | | | | 4,808 | | | | 2,442 | | |
OTC swap contracts, at value (Note A) | | | 614,218 | | | | 125,920 | | | | — | | |
Cash collateral for securities loaned (Note A) | | | — | | | | — | | | | — | | |
Receivable for forward foreign currency contracts (Note A) | | | — | | | | 9,676 | | | | 83,031 | | |
Prepaid expenses and other assets | | | 112,947 | | | | 47,090 | | | | 36,849 | | |
Total Assets | | | 3,753,754,861 | | | | 32,160,469 | | | | 15,617,033 | | |
Liabilities | |
Investments sold short, at value** (Note A) | | | 389,579,556 | | | | 966,854 | | | | — | | |
OTC swap contracts, at value (Note A) | | | 2,896,345 | | | | 384,073 | | | | — | | |
Interest payable for short sales | | | 474,811 | | | | 15,776 | | | | — | | |
Payable for collateral on securities loaned (Note A) | | | — | | | | — | | | | — | | |
Payable to investment manager—net (Notes A & B) | | | 3,102,516 | | | | 17,924 | | | | 2,422 | | |
Option contracts written, at value*** (Note A) | | | 7,387,940 | | | | 18,350 | | | | 13,309 | | |
Due to custodian | | | — | | | | — | | | | 5,416 | | |
Payable for securities purchased | | | 65,479,204 | | | | 587,751 | | | | 26,780 | | |
Payable for Fund shares redeemed | | | 11,457,493 | | | | 119 | | | | 242 | | |
Payable to administrator—net (Note B) | | | 714,959 | | | | 15,375 | | | | — | | |
Payable to trustees | | | 2,189 | | | | 2,153 | | | | 2,153 | | |
Payable for variation margin on financial futures contracts (Note A) | | | — | | | | — | | | | — | | |
Payable for forward foreign currency contracts (Note A) | | | — | | | | — | | | | 80,439 | | |
Distributions payable | | | — | | | | 31,763 | | | | 36,137 | | |
Accrued expenses and other payables | | | 583,696 | | | | 154,072 | | | | 119,206 | | |
Total Liabilities | | | 481,678,709 | | | | 2,194,210 | | | | 286,104 | | |
Net Assets | | $ | 3,272,076,152 | | | $ | 29,966,259 | | | $ | 15,330,929 | | |
Net Assets consist of: | |
Paid-in capital | | $ | 3,153,108,136 | | | $ | 30,623,544 | | | $ | 16,249,379 | | |
Undistributed net investment income (loss) | | | — | | | | — | | | | — | | |
Distributions in excess of net investment income | | | (6,400,482 | ) | | | (20,891 | ) | | | (6,700 | ) | |
Accumulated net realized gains (losses) on investments | | | (3,489,910 | ) | | | (300,840 | ) | | | (162,665 | ) | |
Net unrealized appreciation (depreciation) in value of investments | | | 128,858,408 | | | | (335,554 | ) | | | (749,085 | ) | |
Net Assets | | $ | 3,272,076,152 | | | $ | 29,966,259 | | | $ | 15,330,929 | | |
See Notes to Financial Statements
Statements of Asset and Liabilities (cont'd)
Neuberger Berman Alternative Funds (cont'd)
| | | LONG SHORT
FUND | | LONG SHORT
CREDIT FUND | | MULTI-ASSET
INCOME FUND | |
| | | October 31, 2015 | | October 31, 2015 | | October 31, 2015 | |
Net Assets | |
Institutional Class | | $ | 2,719,800,083 | | | $ | 22,771,564 | | | $ | 10,595,537 | | |
Class A | | | 361,658,285 | | | | 1,315,827 | | | | 477,806 | | |
Class C | | | 190,617,784 | | | | 1,006,167 | | | | 472,639 | | |
Class R6 | | | — | | | | 4,872,701 | | | | 3,784,947 | | |
Shares Outstanding ($.001 par value; unlimited shares
authorized) | |
Institutional Class | | | 213,176,714 | | | | 2,336,613 | | | | 1,123,328 | | |
Class A | | | 28,646,906 | | | | 135,008 | | | | 50,659 | | |
Class C | | | 15,515,480 | | | | 103,246 | | | | 50,111 | | |
Class R6 | | | — | | | | 500,000 | | | | 401,294 | | |
Net Asset Value, offering and redemption price per share | |
Institutional Class | | $ | 12.76 | | | $ | 9.75 | | | $ | 9.43 | | |
Class R6 | | | — | | | | 9.75 | | | | 9.43 | | |
Net Asset Value and redemption price per share | |
Class A | | $ | 12.62 | | | $ | 9.75 | | | $ | 9.43 | | |
Offering Price per share | |
Class A | | $ | 13.39 | | | $ | 10.18 | | | $ | 9.85 | | |
Net Asset Value and offering price per share | |
Class C | | $ | 12.29 | | | $ | 9.75 | | | $ | 9.43 | | |
†Securities on loan, at value: | |
Unaffiliated issuers | | $ | — | | | $ | — | | | $ | — | | |
*Cost of Investments: | |
Unaffiliated issuers | | $ | 3,056,174,762 | | | $ | 8,636,618 | | | $ | 9,161,757 | | |
Affiliated issuers | | | — | | | | — | | | | 6,982,970 | | |
Total cost of investments | | $ | 3,056,174,762 | | | $ | 8,636,618 | | | $ | 16,144,727 | | |
Total cost of foreign currency | | $ | 50,627 | | | $ | 104,022 | | | $ | — | | |
**Proceeds from investments sold short | | $ | 378,816,000 | | | $ | 956,666 | | | $ | — | | |
***Premium received from option contracts written | | $ | 7,434,936 | | | $ | 13,362 | | | $ | 5,860 | | |
‡ On single retail sales of less than $50,000. On sales of $50,000 or more or in certain other circumstances described in the Fund's prospectus, offering price is reduced.
^ Redemption price per share is equal to net asset value less any applicable contingent deferred sales charge.
See Notes to Financial Statements
Neuberger Berman Alternative Funds
| | | FLEXIBLE
SELECT FUND | | GLOBAL
ALLOCATION
FUND | | INFLATION
MANAGED
FUNDa | |
| | | For the
Year Ended
October 31,
2015 | | For the
Year Ended
October 31,
2015 | | For the
Year Ended
October 31,
2015 | |
Investment Income: | |
Income (Note A): | |
Dividend income—unaffiliated issuers | | $ | 1,449,919 | | | $ | 274,976 | | | $ | 307,054 | | |
Dividend income—affiliated issuers (Notes A and F) | | | 163,902 | | | | 112,733 | | | | 150,482 | | |
Interest and other income—unaffiliated issuers | | | 4 | | | | 37,426 | | | | 65,628 | | |
Income from securities loaned—net (Note A) | | | — | | | | 953 | | | | — | | |
Foreign taxes withheld (Note A) | | | (24,086 | ) | | | (10,679 | ) | | | (121 | ) | |
Total income | | $ | 1,589,739 | | | $ | 415,409 | | | $ | 523,043 | | |
Expenses: | |
Investment management fees (Note B) | | | 595,891 | | | | 173,522 | | | | 132,238 | | |
Administration fees (Note B) | | | 59,589 | | | | 16,018 | | | | 12,207 | | |
Administration fees (Note B): | |
Institutional Class | | | 88,692 | | | | 9,724 | | | | 16,073 | | |
Class A | | | 1,206 | | | | 18,116 | | | | 3,565 | | |
Class C | | | 332 | | | | 13,666 | | | | 712 | | |
Class R6 | | | — | | | | — | | | | 69 | | |
Distribution fees (Note B): | |
Class A | | | 1,508 | | | | 22,645 | | | | 4,456 | | |
Class C | | | 1,661 | | | | 68,330 | | | | 3,559 | | |
Shareholder servicing agent fees: | |
Institutional Class | | | 4,541 | | | | 1,084 | | | | 1,014 | | |
Class A | | | 357 | | | | 3,002 | | | | 910 | | |
Class C | | | 109 | | | | 2,011 | | | | 188 | | |
Class R6 | | | — | | | | — | | | | 3,646 | | |
Organization expense (Note A) | | | — | | | | — | | | | — | | |
Audit fees | | | 52,000 | | | | 64,700 | | | | 65,500 | | |
Custodian and accounting fees | | | 103,839 | | | | 226,275 | | | | 97,779 | | |
Insurance expense | | | 2,935 | | | | 934 | | | | 519 | | |
Legal fees | | | 145,213 | | | | 145,382 | | | | 129,125 | | |
Registration and filing fees | | | 48,928 | | | | 59,180 | | | | 64,000 | | |
Shareholder reports | | | 2,178 | | | | 6,900 | | | | 3,008 | | |
Trustees' fees and expenses | | | 34,054 | | | | 33,987 | | | | 33,985 | | |
Short sales expense (Note A) | | | — | | | | 39,664 | | | | — | | |
Dividend and interest expense on securities sold short (Note A) | | | — | | | | 53,228 | | | | — | | |
Interest expense | | | 45 | | | | 1,166 | | | | 879 | | |
Miscellaneous | | | 8,249 | | | | 33,626 | | | | 27,692 | | |
Total expenses | | | 1,151,327 | | | | 993,160 | | | | 601,124 | | |
Expenses reimbursed by Management (Note B) | | | (302,764 | ) | | | (549,467 | ) | | | (406,404 | ) | |
Investment management fees waived (Note A) | | | (15,553 | ) | | | (59,494 | ) | | | (41,178 | ) | |
Total net expenses | | | 833,010 | | | | 384,199 | | | | 153,542 | | |
Net investment income (loss) | | $ | 756,729 | | | $ | 31,210 | | | $ | 369,501 | | |
See Notes to Financial Statements
Statements of Operations (cont'd)
Neuberger Berman Alternative Funds (cont'd)
| | | FLEXIBLE
SELECT FUND | | GLOBAL
ALLOCATION
FUND | | INFLATION
MANAGED
FUNDa | |
| | | For the
Year Ended
October 31,
2015 | | For the
Year Ended
October 31,
2015 | | For the
Year Ended
October 31,
2015 | |
Realized and Unrealized Gain (Loss) on Investments (Note A): | |
Net realized gain (loss) on: | |
Sales of investment securities of unaffiliated issuers | | | 4,076,513 | | | | (632,322 | ) | | | (21,523 | ) | |
Sales of investment securities of affiliated issuers | | | 59,013 | | | | (116,949 | ) | | | (525,281 | ) | |
Sales of investment securities of unaffiliated issuers sold short | | | — | | | | 515,933 | | | | — | | |
Realized gain distributions from affiliated issuers | | | 11,723 | | | | — | | | | 7,209 | | |
Forward foreign currency contracts | | | — | | | | 80,920 | | | | — | | |
Foreign currency | | | 32 | | | | (51,577 | ) | | | (2,164 | ) | |
Financial futures contracts | | | — | | | | 389,347 | | | | 82,554 | | |
Option contracts and swaptions written | | | — | | | | — | | | | — | | |
Swap contracts | | | — | | | | 111,835 | | | | — | | |
Change in net unrealized appreciation (depreciation) in value of: | |
Unaffiliated investment securities | | | (4,659,798 | ) | | | 1,020,711 | | | | (1,877,398 | ) | |
Affiliated investment securities | | | (68,514 | ) | | | (317,470 | ) | | | (586,516 | ) | |
Unaffiliated investment securities sold short | | | — | | | | (691,886 | ) | | | — | | |
Forward foreign currency contracts | | | — | | | | 10,888 | | | | — | | |
Foreign currency | | | (902 | ) | | | 13,536 | | | | (252 | ) | |
Financial futures contracts | | | — | | | | (188,470 | ) | | | (28,887 | ) | |
Option contracts written | | | — | | | | — | | | | — | | |
Swap contracts | | | — | | | | (456,795 | ) | | | — | | |
Net gain (loss) on investments | | | (581,933 | ) | | | (312,299 | ) | | | (2,952,258 | ) | |
Net increase (decrease) in net assets resulting from operations | | $ | 174,796 | | | $ | (281,089 | ) | | $ | (2,582,757 | ) | |
a Formerly Inflation Navigator Fund. See Note A of Notes to Financial Statements.
See Notes to Financial Statements
Statements of Operations (cont'd)
Neuberger Berman Alternative Funds
| | | LONG SHORT
FUND | | LONG SHORT
CREDIT FUND | | MULTI-ASSET
INCOME FUND | |
| | | For the
Year Ended
October 31,
2015 | | Period from
June 29, 2015
(Commencement
of Operations) to
October 31,
2015 | | Period from
March 27, 2015
(Commencement
of Operations) to
October 31,
2015 | |
Investment Income: | |
Income (Note A): | |
Dividend income—unaffiliated issuers | | $ | 35,950,075 | | | $ | 4,050 | | | $ | 201,864 | | |
Dividend income—affiliated issuers (Notes A and F) | | | — | | | | — | | | | 182,742 | | |
Interest and other income—unaffiliated issuers | | | 25,944,714 | | | | 156,365 | | | | 25,001 | | |
Income from securities loaned—net (Note A) | | | — | | | | — | | | | — | | |
Foreign taxes withheld (Note A) | | | (591,744 | ) | | | — | | | | (5,958 | ) | |
Total income | | $ | 61,303,045 | | | $ | 160,415 | | | $ | 403,649 | | |
Expenses: | |
Investment management fees (Note B) | | | 37,201,002 | | | | 69,726 | | | | 42,254 | | |
Administration fees (Note B) | | | 2,020,521 | | | | 5,229 | | | | 5,634 | | |
Administration fees (Note B): | |
Institutional Class | | | 2,492,420 | | | | 5,697 | | | | 5,819 | | |
Class A | | | 782,873 | | | | 737 | | | | 618 | | |
Class C | | | 413,485 | | | | 717 | | | | 614 | | |
Class R6 | | | — | | | | 339 | | | | 467 | | |
Distribution fees (Note B): | |
Class A | | | 978,592 | | | | 877 | | | | 736 | | |
Class C | | | 2,067,423 | | | | 3,413 | | | | 2,924 | | |
Shareholder servicing agent fees: | |
Institutional Class | | | 187,840 | | | | 1,561 | | | | 1,811 | | |
Class A | | | 78,438 | | | | 1,521 | | | | 1,616 | | |
Class C | | | 22,918 | | | | 1,510 | | | | 1,571 | | |
Class R6 | | | — | | | | 1,508 | | | | 1,635 | | |
Organization expense (Note A) | | | — | | | | 99,533 | | | | 64,186 | | |
Audit fees | | | 33,800 | | | | 27,500 | | | | 30,000 | | |
Custodian and accounting fees | | | 543,197 | | | | 38,216 | | | | 101,516 | | |
Insurance expense | | | 88,389 | | | | — | | | | 247 | | |
Legal fees | | | 148,912 | | | | 77,145 | | | | 41,180 | | |
Registration and filing fees | | | 333,850 | | | | 21,793 | | | | 32,274 | | |
Shareholder reports | | | 273,887 | | | | 5,000 | | | | 20,000 | | |
Trustees' fees and expenses | | | 37,117 | | | | 10,405 | | | | 18,598 | | |
Short sales expense (Note A) | | | 3,110,751 | | | | — | | | | — | | |
Dividend and interest expense on securities sold short (Note A) | | | 8,556,654 | | | | 4,914 | | | | — | | |
Interest expense | | | 16,266 | | | | — | | | | 29 | | |
Miscellaneous | | | 153,659 | | | | 1,288 | | | | 2,198 | | |
Total expenses | | | 59,541,994 | | | | 378,629 | | | | 375,927 | | |
Expenses reimbursed by Management (Note B) | | | — | | | | (265,191 | ) | | | (312,045 | ) | |
Investment management fees waived (Note A) | | | — | | | | (4,710 | ) | | | (20,907 | ) | |
Total net expenses | | | 59,541,994 | | | | 108,728 | | | | 42,975 | | |
Net investment income (loss) | | $ | 1,761,051 | | | $ | 51,687 | | | $ | 360,674 | | |
See Notes to Financial Statements
Statements of Operations (cont'd)
Neuberger Berman Alternative Funds (cont'd)
| | | LONG SHORT
FUND | | LONG SHORT
CREDIT FUND | | MULTI-ASSET
INCOME FUND | |
| | | For the
Year Ended
October 31,
2015 | | Period from
June 29, 2015
(Commencement
of Operations) to
October 31,
2015 | | Period from
March 27, 2015
(Commencement
of Operations) to
October 31,
2015 | |
Realized and Unrealized Gain (Loss) on Investments (Note A): | |
Net realized gain (loss) on: | |
Sales of investment securities of unaffiliated issuers | | | (20,623,793 | ) | | | 30,734 | | | | (187,309 | ) | |
Sales of investment securities of affiliated issuers | | | — | | | | — | | | | (9,772 | ) | |
Sales of investment securities of unaffiliated issuers sold short | | | 7,396,816 | | | | — | | | | — | | |
Realized gain distributions from affiliated issuers | | | — | | | | — | | | | — | | |
Forward foreign currency contracts | | | — | | | | (11,476 | ) | | | 66,913 | | |
Foreign currency | | | (70,425 | ) | | | 3,011 | | | | 3,739 | | |
Financial futures contracts | | | (4,413,790 | ) | | | (17,743 | ) | | | (48,714 | ) | |
Option contracts and swaptions written | | | 1,867,223 | | | | 42,895 | | | | 11,544 | | |
Swap contracts | | | (753,311 | ) | | | (311,116 | ) | | | — | | |
Change in net unrealized appreciation (depreciation) in value of: | |
Unaffiliated investment securities | | | (55,338,944 | ) | | | (397,358 | ) | | | (416,316 | ) | |
Affiliated investment securities | | | — | | | | — | | | | (348,046 | ) | |
Unaffiliated investment securities sold short | | | 20,851,664 | | | | (10,188 | ) | | | — | | |
Forward foreign currency contracts | | | — | | | | 9,676 | | | | 2,592 | | |
Foreign currency | | | (951 | ) | | | (302 | ) | | | 854 | | |
Financial futures contracts | | | (5,853,069 | ) | | | (25,075 | ) | | | 19,280 | | |
Option contracts and swaptions written | | | (112,893 | ) | | | (4,988 | ) | | | (7,449 | ) | |
Swap contracts | | | (2,282,127 | ) | | | 92,681 | | | | — | | |
Net gain (loss) on investments | | | (59,333,600 | ) | | | (599,249 | ) | | | (912,684 | ) | |
Net increase (decrease) in net assets resulting from operations | | $ | (57,572,549 | ) | | $ | (547,562 | ) | | $ | (552,010 | ) | |
See Notes to Financial Statements
Statements of Changes in Net Assets
Neuberger Berman Alternative Funds
| | | FLEXIBLE SELECT FUND | | GLOBAL ALLOCATION FUND | | INFLATION MANAGED FUNDa | |
| | | Year Ended
October 31,
2015 | | Year Ended
October 31,
2014 | | Year Ended
October 31,
2015 | | Year Ended
October 31,
2014 | | Year Ended
October 31,
2015 | | Year Ended
October 31,
2014 | |
Increase (Decrease) in Net Assets: | |
From Operations (Note A): | |
Net investment income (loss) | | $ | 756,729 | | | $ | 900,336 | | | $ | 31,210 | | | $ | (460,298 | ) | | $ | 369,501 | | | $ | 265,509 | | |
Net realized gain (loss) on investments | | | 4,147,281 | | | | 1,759,644 | | | | 297,187 | | | | 2,308,067 | | | | (459,205 | ) | | | (38,105 | ) | |
Net increase from payments by affiliates (Note B) | | — | | | | — | | | | — | | | | 10,922 | | | | — | | | | — | | |
Change in net unrealized appreciation (depreciation) of investments | | (4,729,214 | ) | | | 7,109,249 | | | | (609,486 | ) | | | (1,689,740 | ) | | | (2,493,053 | ) | | | 622,153 | | |
Net increase (decrease) in net assets resulting from operations | | 174,796 | | | | 9,769,229 | | | | (281,089 | ) | | | 168,951 | | | | (2,582,757 | ) | | | 849,557 | | |
Distributions to Shareholders From (Note A): | |
Net investment income: | |
Institutional Class | | | (929,244 | ) | | | (335,177 | ) | | | (291,025 | ) | | | (1,423,702 | ) | | | (160,335 | ) | | | (332,927 | ) | |
Class A | | | (5,414 | ) | | | (302 | ) | | | (213,455 | ) | | | (632,740 | ) | | | (17,710 | ) | | | (1,920 | ) | |
Class C | | | (252 | ) | | | (17 | ) | | | (119,683 | ) | | | (373,622 | ) | | | (1,928 | ) | | | (1,167 | ) | |
Class R6 | | | — | | | | — | | | | — | | | | — | | | | — | | | | — | | |
Net realized gain on investments: | |
Institutional Class | | | (1,840,204 | ) | | | — | | | | — | | | | — | | | | — | | | | — | | |
Class A | | | (13,200 | ) | | | — | | | | — | | | | — | | | | — | | | | — | | |
Class C | | | (3,226 | ) | | | — | | | | — | | | | — | | | | — | | | | — | | |
Total distributions to shareholders | | | (2,791,540 | ) | | | (335,496 | ) | | | (624,163 | ) | | | (2,430,064 | ) | | | (179,973 | ) | | | (336,014 | ) | |
From Fund Share Transactions (Note D): | |
Proceeds from shares sold: | |
Institutional Class | | | 1,157,293 | | | | 8,535 | | | | 2,515,508 | | | | 3,525,689 | | | | 9,824,664 | | | | 1,024,850 | | |
Class A | | | 146,287 | | | | 540,373 | | | | 2,375,082 | | | | 7,858,510 | | | | 452,417 | | | | 2,379,608 | | |
Class C | | | 31,250 | | | | 18,500 | | | | 2,005,763 | | | | 4,320,936 | | | | 110,000 | | | | 199,190 | | |
Class R6 | | | — | | | | — | | | | — | | | | — | | | | 2,123,633 | | | | — | | |
Proceeds from reinvestment of dividends and distributions: | |
Institutional Class | | | 2,769,448 | | | | 335,177 | | | | 288,150 | | | | 1,413,385 | | | | 160,335 | | | | 332,927 | | |
Class A | | | 18,353 | | | | 302 | | | | 196,325 | | | | 502,685 | | | | 17,499 | | | | 1,920 | | |
Class C | | | 3,478 | | | | 17 | | | | 112,130 | | | | 359,737 | | | | 1,928 | | | | 1,167 | | |
Class R6 | | | — | | | | — | | | | — | | | | — | | | | — | | | | — | | |
Payments for shares redeemed: | |
Institutional Class | | | — | | | | (162,561 | ) | | | (5,993,667 | ) | | | (8,502,926 | ) | | | (10,219,188 | ) | | | (932,595 | ) | |
Class A | | | (427,326 | ) | | | (76,021 | ) | | | (3,760,596 | ) | | | (6,038,449 | ) | | | (2,054,536 | ) | | | (281,537 | ) | |
Class C | | | (15,000 | ) | | | — | | | | (2,298,236 | ) | | | (2,120,187 | ) | | | (110,204 | ) | | | — | | |
Class R6 | | | — | | | | — | | | | — | | | | — | | | | (812,632 | ) | | | — | | |
Net increase (decrease) from Fund share transactions | | 3,683,783 | | | | 664,322 | | | | (4,559,541 | ) | | | 1,319,380 | | | | (506,084 | ) | | | 2,725,530 | | |
Net Increase (Decrease) in Net Assets | | 1,067,039 | | | | 10,098,055 | | | | (5,464,793 | ) | | | (941,733 | ) | | | (3,268,814 | ) | | | 3,239,073 | | |
Net Assets: | |
Beginning of year | | | 97,539,119 | | | | 87,441,064 | | | | 29,023,060 | | | | 29,964,793 | | | | 19,381,393 | | | | 16,142,320 | | |
End of year | | $ | 98,606,158 | | | $ | 97,539,119 | | | $ | 23,558,267 | | | $ | 29,023,060 | | | $ | 16,112,579 | | | $ | 19,381,393 | | |
Undistributed net investment income (loss) at end of year | $ | 499,392 | | | $ | 704,109 | | | $ | — | | | $ | 148,162 | | | $ | — | | | $ | 3,028 | | |
Distributions in excess of net investment income at end of year | $ | — | | | $ | — | | | $ | (250,183 | ) | | $ | — | | | $ | (847 | ) | | $ | — | | |
a Formerly Inflation Navigator Fund. See Note A of Notes to Financial Statements.
See Notes to Financial Statements
| | | LONG SHORT FUND | | LONG SHORT
CREDIT FUND | | MULTI-ASSET
INCOME FUND | |
| | | Year Ended
October 31,
2015 | | Year Ended
October 31,
2014 | | Period from
June 29, 2015
(Commencement
of Operations) to
October 31,
2015 | | Period from
March 27, 2015
(Commencement
of Operations) to
October 31,
2015 | |
Increase (Decrease) in Net Assets: | |
From Operations (Note A): | |
Net investment income (loss) | | $ | 1,761,051 | | | $ | 130,674 | | | $ | 51,687 | | | $ | 360,674 | | |
Net realized gain (loss) on investments | | | (16,597,280 | ) | | | 19,939,826 | | | | (263,695 | ) | | | (163,599 | ) | |
Net increase from payments by affiliates (Note B) | | | — | | | | 60,836 | | | | — | | | | — | | |
| Change in net unrealized appreciation (depreciation) of investments | | | (42,736,320 | ) | | | 88,112,575 | | | | (335,554 | ) | | | (749,085 | ) | |
Net increase (decrease) in net assets resulting from operations | | | (57,572,549 | ) | | | 108,243,911 | | | | (547,562 | ) | | | (552,010 | ) | |
Distributions to Shareholders From (Note A): | |
Net investment income: | |
Institutional Class | | | (4,409,898 | ) | | | — | | | | (85,053 | ) | | | (255,461 | ) | |
Class A | | | — | | | | — | | | | (3,409 | ) | | | (10,532 | ) | |
Class C | | | — | | | | — | | | | (908 | ) | | | (8,311 | ) | |
Class R6 | | | — | | | | — | | | | (23,469 | ) | | | (93,689 | ) | |
Net realized gain on investments: | |
Institutional Class | | | (10,559,751 | ) | | | (5,606,352 | ) | | | — | | | | — | | |
Class A | | | (1,445,208 | ) | | | (2,452,314 | ) | | | — | | | | — | | |
Class C | | | (779,780 | ) | | | (609,411 | ) | | | — | | | | — | | |
Total distributions to shareholders | | | (17,194,637 | ) | | | (8,668,077 | ) | | | (112,839 | ) | | | (367,993 | ) | |
From Fund Share Transactions (Note D): | |
Proceeds from shares sold: | |
Institutional Class | | | 1,207,863,852 | | | | 2,043,724,867 | | | | 23,253,671 | | | | 11,175,000 | | |
Class A | | | 153,230,211 | | | | 405,081,481 | | | | 1,342,090 | | | | 505,113 | | |
Class C | | | 44,433,285 | | | | 112,535,003 | | | | 1,031,820 | | | | 503,000 | | |
Class R6 | | | — | | | | — | | | | 5,000,000 | | | | 4,000,000 | | |
Proceeds from reinvestment of dividends and distributions: | |
Institutional Class | | | 9,519,935 | | | | 4,822,872 | | | | 4,433 | | | | 57,340 | | |
Class A | | | 1,289,389 | | | | 2,249,144 | | | | 121 | | | | 1,530 | | |
Class C | | | 570,226 | | | | 466,547 | | | | 12 | | | | 1,135 | | |
Class R6 | | | — | | | | — | | | | — | | | | 13,056 | | |
Payments for shares redeemed: | |
Institutional Class | | | (1,066,158,964 | ) | | | (526,844,014 | ) | | | (5,487 | ) | | | (2,296 | ) | |
Class A | | | (172,178,965 | ) | | | (546,927,034 | ) | | | — | | | | — | | |
Class C | | | (59,121,559 | ) | | | (22,735,877 | ) | | | — | | | | (2,946 | ) | |
Class R6 | | | — | | | | — | | | | — | | | | — | | |
Net increase (decrease) from Fund share transactions | | | 119,447,410 | | | | 1,472,372,989 | | | | 30,626,660 | | | | 16,250,932 | | |
Net Increase (Decrease) in Net Assets | | | 44,680,224 | | | | 1,571,948,823 | | | | 29,966,259 | | | | 15,330,929 | | |
Net Assets: | |
Beginning of year | | | 3,227,395,928 | | | | 1,655,447,105 | | | | — | | | | — | | |
End of year | | $ | 3,272,076,152 | | | $ | 3,227,395,928 | | | $ | 29,966,259 | | | $ | 15,330,929 | | |
Undistributed net investment income (loss) at end of year | | $ | — | | | $ | — | | | $ | — | | | $ | — | | |
Distributions in excess of net investment income at end of year | | $ | (6,400,482 | ) | | $ | (2,109,958 | ) | | $ | (20,891 | ) | | $ | (6,700 | ) | |
Notes to Financial Statements Alternative Funds
Note A—Summary of Significant Accounting Policies:
1 General: Neuberger Berman Alternative Funds (the "Trust") is a Delaware statutory trust organized pursuant to an Amended and Restated Trust Instrument dated March 27, 2014. The Trust is registered as an open-end management investment company under the Investment Company Act of 1940, as amended (the "1940 Act"), and its shares are registered under the Securities Act of 1933, as amended (the "1933 Act"). Each Fund is a separate operating series of the Trust. Under the 1940 Act, the status of a Fund that was registered as non-diversified may, under certain circumstances, change to that of a diversified Fund (Global Allocation and Long Short became diversified in December 2013 and December 2014, respectively). Flexible Select, Inflation Managed, Long Short Credit and Multi-Asset Income are each diversified. Inflation Managed had no operations until December 19, 2012, other than matters relating to its organization and its registration of shares under the 1933 Act. Flexible Select had no operations until May 31, 2013, other than matters relating to its organization and its registration of shares under the 1933 Act. Long Short Credit had no operations until June 29, 2015, other than matters relating to its organization and its registration of shares under the 1933 Act. Multi-Asset Income had no operations until March 27, 2015, other than matters relating to its organization and its registration of shares under the 1933 Act. Each Fund offers Institutional Class shares, Class A shares and Class C shares. Long Short Credit, Inflation Managed and Multi-Asset Income also offer Class R6. The Board may establish additional series or classes of shares without the approval of shareholders. Effective February 28, 2015, Neuberger Berman Inflation Navigator Fund changed its name to Neuberger Berman Inflation Managed Fund.
The assets of each Fund belong only to that Fund, and the liabilities of each Fund are borne solely by that Fund and no other.
Each Fund is an investment company and accordingly follows the investment company accounting and reporting guidance of the Financial Accounting Standards Board (FASB) Accounting Standard Codification Topic 946 "Financial Services—Investment Companies."
The preparation of financial statements in accordance with U.S. generally accepted accounting principles ("GAAP") requires Management to make estimates and assumptions at the date of the financial statements. Actual results could differ from those estimates.
2 Portfolio valuation: Investment securities are valued as indicated in the notes following the Funds' Schedule of Investments.
3 Foreign currency translation: The accounting records of the Funds are maintained in U.S. dollars. Foreign currency amounts are translated into U.S. dollars using the exchange rate as of the end of regular trading on the NYSE on business days, usually 4:00 p.m. Eastern time, to determine the value of investments, other assets and liabilities. Purchase and sale prices of securities, and income and expenses, are translated into U.S. dollars at the prevailing rate of exchange on the respective dates of such transactions. Net unrealized foreign currency gain (loss), if any, arises from changes in the value of assets and liabilities, other than investments in securities, as a result of changes in exchange rates and is stated separately in the Statements of Operations.
4 Securities transactions and investment income: Securities transactions are recorded on trade date for financial reporting purposes. Dividend income is recorded on the ex-dividend date or, for certain foreign dividends, as soon as the Fund becomes aware of the dividends. Non-cash dividends included in dividend income, if any, are recorded at the fair market value of the securities received. Interest income, including accretion of discount on securities, accretion of original issue discount, where applicable, and accretion of discount on short-term investments, if any, is recorded on the accrual basis. Realized gains and losses from securities transactions and foreign currency transactions, if any, are recorded on the basis of identified cost and stated separately in the Statements of Operations.
5 Income tax information: Each Fund is treated as a separate entity for U.S. federal income tax purposes. It is the policy of each of Flexible Select, Global Allocation, Inflation Managed and Long Short to continue to, and the
intention of Long Short Credit and Multi-Asset Income to, qualify for treatment as a regulated investment company by complying with the requirements of the U.S. Internal Revenue Code applicable to regulated investment companies and to distribute substantially all of its net investment income and net realized capital gains to its shareholders. To the extent a Fund distributes substantially all of its net investment income and net realized capital gains to shareholders, no federal income or excise tax provision is required.
The Funds have adopted the provisions of ASC 740 "Income Taxes" ("ASC 740"). ASC 740 sets forth a minimum threshold for financial statement recognition of a tax position taken, or expected to be taken, in a tax return. The Funds recognize interest and penalties, if any, related to unrecognized tax positions as an income tax expense in the Statements of Operations. The Funds are subject to examination by U.S. federal and state tax authorities for returns filed for the tax years for which the applicable statutes of limitations have not yet expired. As of October 31, 2015, the Funds did not have any unrecognized tax positions.
Income distributions and capital gain distributions are determined in accordance with income tax regulations, which may differ from GAAP. These differences are primarily due to differing treatments of income and gains on various investment securities held by each Fund, timing differences and differing characterization of distributions made by each Fund.
As determined on October 31, 2015, permanent differences resulting primarily from different book and tax accounting were reclassified at year end. Such differences may be attributed to the tax treatment of one or more of the following: net operating loss netted against short term capital gains or written-off, current and prior year partnership basis adjustments, non-taxable distributions from real estate investment trusts ("REITs") and other underlying investments, paydown losses on mortgage backed and asset backed securities, gains and losses on swap contracts, futures, foreign currency gains and losses, gains and losses from passive foreign investment companies (PFICs), non-deductible stock issuance fees, affiliated capital gain reclass to ordinary income, distributions in excess and re-designated, deemed distributions on shareholder redemptions and deflation adjustments on U.S. Treasury inflation protected bonds (TIPs). For the year ended October 31, 2015, the Funds recorded the following permanent reclassifications:
| | | Paid-in Capital | | Undistributed
Net Investment
Income (Loss) | | Accumulated
Net Realized
Gains Losses)
on Investments | |
Flexible Select | | $ | (1 | ) | | $ | (26,536 | ) | | $ | 26,537 | | |
Global Allocation | | | (1,322 | ) | | | 194,608 | | | | (193,286 | ) | |
Inflation Managed | | | (20,728 | ) | | | (193,403 | ) | | | 214,131 | | |
Long Short | | | (811,504 | ) | | | (1,641,677 | ) | | | 2,453,181 | | |
Long Short Credit | | (3,116 | ) | | | 40,261 | | | | (37,145 | ) | |
Multi-Asset Income | | | (1,553 | ) | | | 619 | | | | 934 | | |
The tax character of distributions paid during the years ended October 31, 2015 and October 31, 2014 was as follows:
| | | Distributions Paid From: | |
| | | Ordinary Income | | Tax-Exempt
Income | | Long-Term
Capital Gain | | Return of
Capital | | Total | |
| | | 2015 | | 2014 | | 2015 | | 2014 | | 2015 | | 2014 | | 2015 | | 2014 | | 2015 | | 2014 | |
Flexible Select | | $ | 1,589,876 | | | $ | 335,496 | | | $ | — | | | $ | — | | | $ | 1,201,664 | | | $ | — | | | $ | — | | | $ | — | | | $ | 2,791,540 | | | $ | 335,496 | | |
Global Allocation | | | 624,099 | | | | 2,430,064 | | | | — | | | | — | | | | 64 | | | | — | | | | — | | | | — | | | | 624,163 | | | | 2,430,064 | | |
Inflation Managed | | | 179,973 | | | | 336,014 | | | | — | | | | — | | | | — | | | | — | | | | — | | | | — | | | | 179,973 | | | | 336,014 | | |
Long Short | | | 4,409,898 | | | | 7,970,437 | | | | — | | | | — | | | | 12,784,739 | | | | 697,640 | | | | — | | | | — | | | | 17,194,637 | | | | 8,668,077 | | |
Long Short Credit | | 112,839 | (2) | | | — | | | | — | (2) | | | — | | | | — | (2) | | | — | | | | — | (2) | | | — | | | | 112,839 | (2) | | | — | | |
Multi-Asset Income | | | 367,993 | (1) | | | — | | | | — | (1) | | | — | | | | — | (1) | | | — | | | | — | (1) | | | — | | | | 367,993 | (1) | | | — | | |
(1) Period from March 27, 2015 (Commencement of Operations) to October 31, 2015.
(2) Period from June 29, 2015 (Commencement of Operations) to October 31, 2015.
As of October 31, 2015, the components of distributable earnings (accumulated losses) on a U.S. federal income tax basis were as follows:
| | | Undistributed
Ordinary
Income | | Undistributed
Long-Term
Capital Gain | | Unrealized
Appreciation
(Depreciation) | | Loss
Carryforwards
and Deferrals | | Other
Temporary
Differences | | Total | |
Flexible Select | | $ | 521,905 | | | $ | 4,061,125 | | | $ | 6,113,804 | | | $ | — | | | $ | (22,512 | ) | | $ | 10,674,322 | | |
Global Allocation | | | — | | | | 43,069 | | | | (126,570 | ) | | | (226,599 | ) | | | (23,681 | ) | | | (333,781 | ) | |
Inflation Managed | | | — | | | | — | | | | (1,452,577 | ) | | | (374,583 | ) | | | — | | | | (1,827,160 | ) | |
Long Short | | | — | | | | — | | | | 132,038,398 | | | | (13,019,050 | ) | | | (51,332 | ) | | | 118,968,016 | | |
Long Short Credit | | 135,375 | | | | — | | | | (412,836 | ) | | | (325,915 | ) | | | (53,909 | ) | | | (657,285 | ) | |
Multi-Asset Income | | | 38,841 | | | | — | | | | (707,932 | ) | | | (199,990 | ) | | | (49,369 | ) | | | (918,450 | ) | |
The differences between book basis and tax basis distributable earnings are primarily due to: losses disallowed and recognized on wash sales, straddles and unsettled short sales; timing differences of distribution payments, swaps, futures contracts and forward contracts; adjustments related to post-October capital loss and late-year ordinary loss deferrals, unamortized organization expenses, and tax adjustments related to REITs, TIPs, PFICs, short sales, partnerships, futures, swap contracts and other investments.
To the extent each Fund's net realized capital gains, if any, can be offset by capital loss carryforwards, it is the policy of each Fund not to distribute such gains. For taxable years beginning after December 22, 2010, the capital loss carryforward rules allow for regulated investment companies to carry forward capital losses indefinitely and to retain the character of capital loss carryforwards as short-term or long-term. As determined at October 31, 2015, the Funds had unused capital loss carryforwards available for federal income tax purposes to offset net realized capital gains, if any, as follows:
| | | Capital Loss Carryforwards (No Expiration Date) | |
| | | Long-Term | | Short-Term | |
Inflation Managed | | $ | — | | | $ | 374,583 | | |
Long Short | | | — | | | | 4,372,583 | | |
Long Short Credit | | | 20,334 | | | | 305,581 | | |
Multi-Asset Income | | | — | | | | 199,990 | | |
During the year ended October 31, 2015, Global Allocation utilized capital loss carryforwards of $68,747.
Under current tax regulations, capital losses realized on investment transactions after October 31 may be deferred and treated as occurring on the first day of the following fiscal year. Under the Act, the Funds may also defer any realized late-year ordinary losses as occurring on the first day of the following fiscal year. Late-year ordinary losses represent ordinary losses realized on investment transactions after December 31 and specified losses (ordinary losses from the sale, exchange, or other disposition of property, net foreign currency losses and net passive foreign investment company mark to market losses) realized on investment transactions after October 31. For the year ended October 31, 2015, Long Short elected to defer the following late-year ordinary losses:
| | | Late-Year
Ordinary Loss | |
| | | Deferral | |
Global Allocation | | $ | 226,599 | | |
Long Short | | | 8,646,467 | | |
6 Foreign taxes: Foreign taxes withheld, if any, represent amounts withheld by foreign tax authorities, net of refunds recoverable.
Foreign capital gains on certain foreign securities may be subject to foreign taxes, which are accrued as applicable. At October 31, 2015, there were no outstanding balances of accrued capital gains taxes for any Fund.
7 Distributions to shareholders: Each Fund may earn income, net of expenses, daily on its investments. Distributions from net investment income and net realized capital gains, if any, generally are distributed once a year (usually in December) and are recorded on the ex-date.
It is the policy of each of Flexible Select, Global Allocation, Inflation Managed, Long Short and Multi-Asset Income to pass through to its shareholders substantially all REIT distributions and other income it receives, less operating expenses. The distributions received from REITs held by Flexible Select, Global Allocation, Inflation Managed, Long Short and Multi-Asset Income are generally composed of income, capital gains, and/or return of REIT capital, but the REITs do not report this information to Flexible Select, Global Allocation, Inflation Managed, Long Short and Multi-Asset Income until the following calendar year. At October 31, 2015, Flexible Select, Global Allocation, Inflation Managed and Long Short estimated these amounts within the financial statements because the information is not available from the REITs until after each Fund's fiscal year-end. At October 31, 2015, Flexible Select, Global Allocation, Inflation Managed, Long Short and Multi-Asset Income estimated these amounts for the period January 1, 2015 to October 31, 2015 within the financial statements because the 2015 information is not available from the REITs until after each Fund's fiscal year-end. All estimates are based upon REIT information sources available to Flexible Select, Global Allocation, Inflation Managed, Long Short and Multi-Asset Income together with actual IRS Forms 1099-DIV received to date. For the year ended October 31, 2015, the character of distributions paid to shareholders of Flexible Select, Global Allocation, Inflation Managed and Long Short disclosed within the Statements of Changes in Net Assets is based on estimates made at that time. Based on past experience it is possible that a portion of Flexible Select's, Global Allocation's, Inflation Managed's, Long Short's and Multi-Asset Income's distributions during the current fiscal year will be considered tax return of capital, but the actual amount of the tax return of capital, if any, is not determinable until after each Fund's fiscal year-end. After calendar year-end, when Flexible Select, Global Allocation, Inflation Managed, Long Short and Multi-Asset Income learn the nature of the distributions paid by REITs during that year, distributions previously identified as income are often recharacterized as return of capital and/or capital gain. After all applicable REITs have informed Flexible Select, Global Allocation, Inflation Managed, Long Short and Multi-Asset Income of the actual breakdown of distributions paid to Flexible Select, Global Allocation, Inflation Managed, Long Short and Multi-Asset Income during its fiscal year, estimates previously recorded are adjusted on the books of Flexible Select, Global Allocation, Inflation Managed, Long Short and Multi-Asset Income to reflect actual results. As a result, the composition of Flexible Select's, Global Allocation's, Inflation Managed's and Long Short's distributions as reported herein may differ from the final composition determined after calendar year-end and reported to Flexible Select, Global Allocation, Inflation Managed and Long Short shareholders on IRS Form 1099-DIV.
8 Organization expenses: Costs incurred by Long Short Credit and Multi-Asset Income in connection with their organization, which amounted to $99,533 and $64,186, respectively, and are reflected in Organization expense in the Statements of Operations, have been expensed as incurred.
9 Expense allocation: Certain expenses are applicable to multiple funds within the complex of related investment companies. Expenses directly attributable to a Fund are charged to that Fund. Expenses of the Trust that are not directly attributable to a particular series of the Trust (e.g., a Fund) are allocated among the series of the Trust, on the basis of relative net assets, except where a more appropriate allocation of expenses to each of the series can otherwise be made fairly. Expenses borne by the complex of related investment companies, which includes open-end and closed-end investment companies for which Management serves as investment manager, that are not directly attributable to a particular investment company in the complex (e.g., the Trust) or series thereof are allocated among the investment companies or series thereof in the complex on the basis of relative net assets, except where a more appropriate allocation of expenses to each of the investment companies or series thereof in the complex can otherwise be made fairly. Each Fund's expenses (other than those specific to each class) are allocated proportionally each day among the classes based upon the relative net assets of each class.
10 Investments in foreign securities: Investing in foreign securities may involve certain sovereign and other risks, in addition to the credit and market risks normally associated with domestic securities. These additional risks include the possibility of adverse political and economic developments (including political instability, nationalization,
expropriation, or confiscatory taxation) and the potentially adverse effects of unavailability of public information regarding issuers, less governmental supervision and regulation of financial markets, reduced liquidity of certain financial markets, and the lack of uniform accounting, auditing, and financial reporting standards or the application of standards that are different or less stringent than those applied in the United States. Foreign securities also may experience greater price volatility, higher rates of inflation, and delays in settlement.
11 Dollar rolls: The Funds may enter into dollar roll transactions with respect to mortgage-backed securities. In a dollar roll transaction, a Fund sells securities for delivery in the current month and simultaneously agrees to repurchase substantially similar (i.e., same type and coupon) securities on a specified future date from the same party. During the period before this repurchase, a Fund forgoes principal and interest payments on the securities. A Fund is compensated by the difference between the current sales price and the forward price for the future purchase (often referred to as the "drop"), as well as by the interest earned on the cash proceeds of the initial sale. Dollar rolls may increase fluctuations in a Fund's NAV and may be viewed as a form of leverage. There is a risk that the counterparty will be unable or unwilling to complete the transaction as scheduled, which may result in losses to a Fund.
12 Securities sold short: Each Fund may engage in short sales, which are sales of securities which have been borrowed from a third party on the expectation that the market price will decline. If the price of the securities decreases, a Fund will make a profit by purchasing the securities in the open market at a price lower than the one at which it sold the securities. If the price of the securities increases, a Fund may have to cover its short positions at a price higher than the short sale price, resulting in a loss. Gains are limited to the price at which a Fund sold the security short, while losses are potentially unlimited in size. The Funds pledge securities and/or other assets, which may include cash collateral from securities lending activities, to the lender as collateral. Proceeds received from short sales may be maintained by the lender as collateral or may be released to the Funds and used to purchase additional securities or for any other purpose. Proceeds maintained by the lender are included in the "Cash collateral segregated for short sales" on the Statements of Assets and Liabilities. The Funds are required to segregate an amount of cash, cash equivalents or other appropriate liquid marketable securities with the custodian in an amount at least equal to the current market value of the securities sold short (less any additional collateral held by the lender) and, for Global Allocation, the amount of any securities lending cash collateral used to finance short sales until the Fund replaces a borrowed security. The Funds are contractually responsible to the lender for any dividends and interest payable on securities while those securities are in a short position. These dividends and interest are recorded as an expense of the Funds and are excluded from the contractual expense limitation. At October 31, 2015, Global Allocation had pledged cash in the amount of $1,150,000 to State Street Bank and Trust Company ("State Street"), as collateral for short sales, in addition to cash collateral received from securities lending activities for the Fund. In addition, State Street has a perfected security interest in these Global Allocation assets. At October 31, 2015, Long Short and Long Short Credit had pledged cash in the amount of $400,341,467 and $967,611 to State Street to cover collateral requirements for borrowing in connection with securities sold short, respectively.
At October 31, 2015, Global Allocation and Long Short had pledged securities in the amount of $2,884,661 and $50,048,390, respectively, to State Street to cover collateral requirements for borrowing in connection with securities sold short.
13 Security lending: Each Fund (except Inflation Managed), using State Street as its lending agent, may loan securities to qualified brokers and dealers in exchange for negotiated lender's fees. These fees disclosed within the Statements of Operations under the caption, "Income from securities loaned-net" are net of expenses retained by State Street as compensation for its services as lending agent. For the year ended October 31, 2015, Global Allocation received net income under the securities lending arrangement of $953. The Funds receive cash collateral at the beginning of each transaction equal to at least 102% of the prior day's market value of the loaned securities (105% in the case of international securities). Some or all of the cash collateral may be used to finance short sales. As of October 31, 2015, approximately 100% of the cash collateral received by Global Allocation was used to finance short sales.
As of October 31, 2015, Global Allocation had outstanding loans of securities to certain approved brokers for which it received collateral as follows:
| | | Value of Loaned
Securities | | Value of
Collateral | |
Global Allocation | | $ | 228,266 | | | $ | 233,817 | | |
14 Investment company securities and exchange-traded funds: The Funds may invest in shares of other registered investment companies, including exchange-traded funds ("ETFs"), within the limitations prescribed by the 1940 Act or pursuant to an exemptive order from the Securities and Exchange Commission ("SEC") that permits the Funds to invest in both affiliated and unaffiliated investment companies, including exchange-traded funds, in excess of the limits in Section 12(d)(1)(A) of the 1940 Act, as amended, subject to the terms and conditions of such order (see Note A-16 for more information about the exemptive order). Some ETFs seek to track the performance of a particular market index. These indices include both broad-based market indices and more narrowly-based indices, including those relating to particular sectors, markets, regions or industries. However, some ETFs have an actively-managed investment objective. ETF shares are traded like traditional equity securities on a national securities exchange or NASDAQ. A Fund will indirectly bear its proportionate share of any management fees and other expenses paid by such other investment companies, which will increase expenses and decrease returns.
15 Derivative instruments: During the year ended October 31, 2015, the Funds' use of derivatives, as described below for each Fund, except for Flexible Select (which did not engage in any derivative use), was limited to total return swaps, total return basket swaps, equity swaps, over the counter ("OTC") credit default swaps, swaptions, centrally cleared credit default swaps, financial futures, forward contracts, and purchased and written option transactions. The Funds have adopted the provisions of ASC 815 "Derivatives and Hedging" ("ASC 815"). The disclosure requirements of ASC 815 distinguish between derivatives that qualify for hedge accounting and those that do not. Because investment companies value their derivatives at fair value and recognize changes in fair value through the Statements of Operations, they do not qualify for hedge accounting. Accordingly, even though a Fund's investments in derivatives may represent economic hedges, they are considered non-hedge transactions for purposes of this disclosure.
Total return swap contracts: During the year ended October 31, 2015, Global Allocation used total return swaps to provide investment exposure to the benchmark indices (which were 50% MSCI World Index and 50% J.P. Morgan Global Government Bond Index at the time Global Allocation used total return swaps). During the year ended October 31, 2015, Long Short used total return swaps in an attempt to increase returns, reduce risks and for hedging purposes. During the period ended October 31, 2015, Long Short Credit used total return swaps to replace more traditional direct investments and to hedge risk. Total return swaps involve commitments to pay fixed or floating rate interest in exchange for a market-linked return based on a notional amount. To the extent the total return of the reference security or index underlying the total return swap exceeds or falls short of the offsetting interest rate obligation, a Fund will receive a payment or make a payment to the counterparty, respectively. Certain risks may arise when entering into total return swap transactions, including counterparty default, liquidity or unfavorable changes in the value of the underlying reference security or index. The value of the swap is adjusted daily and the change in value, if any, is recorded as unrealized appreciation or depreciation in the Statements of Assets and Liabilities. Payments received or made at the end of each measurement period are recorded as realized gain or loss in the Statements of Operations.
At October 31, 2015, there were no total return swap contracts outstanding for Global Allocation. During the year ended October 31, 2015, the average notional value of total return swap contracts was $7,199,072 for Global Allocation.
At October 31, 2015, the Funds had outstanding OTC total return swap contracts as follows:
Long Short
Short Total Return Swaps
Swap
Counterparty | | Reference Entity | | Notional
Value(3) | | Termination
Date | | Variable-rate | | Unrealized
Appreciation
(Depreciation) | | Accrued
Net
Interest
Receivable/
(Payable) | | Total
Fair Value | |
Goldman
Sachs
International | | S&P Oil & Gas
Exploration &
Production Select
Industry Index | | $ | (3,277,467 | ) | | February 13, 2017 | | | (2.254 | )%(1) | | $ | 38,584 | | | $ | (14,473 | ) | | $ | 24,111 | | |
Goldman
Sachs
International | | Alerian MLP
Infrastructure
Index | | $ | (9,759,588 | ) | | February 13, 2017 | | | (0.554 | )%(2) | | | 520,908 | | | | (1,121 | ) | | | 519,787 | | |
| | | | | | | | | | | $ | 559,492 | | | $ | (15,594 | ) | | $ | 543,898 | | |
(1) 1 month LIBOR as of October 13, 2015 minus 2.45%
(2) 1 month LIBOR as of October 13, 2015 minus 0.75%.
(3) Notional value represents the value (including any fees or commissions) of the short positions when they were established.
Long Short Credit
Short Total Return Swaps
Swap
Counterparty | | Reference Entity | | Notional
Value(1) | | Termination
Date | | Unrealized
Appreciation
(Depreciation) | |
Bank of
America N.A | | Bovespa Index
Futures | | $ | (976,611 | ) | | December 16, 2015 | | $ | 13,005 | | |
| | | | | | | | | $ | 13,005 | | |
(1) Notional value represents the value (including any fees or commissions) of the short positions when they were established.
Total return basket swap contracts: During the year ended October 31, 2015, Long Short used total return basket swaps in an attempt to increase returns, reduce risks and for hedging purposes. During the period ended October 31, 2015, Long Short Credit used total return basket swaps to replace more traditional direct investments and to hedge risk. Certain Funds may enter into an total return basket swap agreement to obtain exposure to a portfolio of long and short securities. Under the terms of the agreement, the swap is designed to function as a portfolio of direct investments in long and short equity or fixed income positions. The Funds have the ability to trade in and out of long and short positions within the swap and will receive all of the economic benefits and risks equivalent to direct investments in these positions such as: capital appreciation (depreciation), corporate actions, and dividends and interest received and paid, all of which are reflected in the swap value. The swap value also includes interest charges and credits related to the notional values of the long and short positions and cash balances within the swap. These interest charges and credits are based on defined market rates plus or minus a specified spread and are referred to herein as "financing costs". Positions within the swap are reset periodically, and financing costs are reset monthly. During a reset, any unrealized gains (losses) on positions and accrued financing costs become available for cash settlement between the Funds and the swap counterparty. Cash settlement in and out of the swap may occur at a reset date or any other date, at the discretion of the Funds and the counterparty, over the life of the agreement, and is generally determined based on limits and thresholds established as part of a International Swaps and Derivatives Association (ISDA) agreement between the Funds and the counterparty. A change in the market value of a total return basket swap contract is recognized as a change in
unrealized appreciation (depreciation) on swap contracts in the Statements of Operations. Cash settlements between a Fund and the counterparty are recognized as realized gains (losses) on swap contracts in the Statements of Operations. At October 31, 2015, Long Short and Long Short Credit had total return basket swaps outstanding as follows:
At October 31, 2015, the outstanding OTC total return basket swaps* were as follows:
Long Short
Counterparty | | Description | | Expiration
Date(s) | | Value | |
Goldman Sachs & Co.
| | The Fund pays the total return on short positions and receives
a specified LIBOR or Federal Funds floating rate, which is denominated
in various foreign currencies based on the local currencies of the
positions. | | 10/3/2016-
3/30/2017 | | $ | (2,826,025 | ) | |
* The following table represents the individual short positions and related values of the total return basket swaps as of October 31, 2015.
Reference Entity | | Shares | | Notional
Value(a) | | Net Unrealized
Appreciation
(Depreciation) | |
Short Positions | |
GSCBNMLP INDEX | |
Tesoro Logistics LP | | | (13,255 | ) | | $ | (1,321,195 | ) | | $ | (105,163 | ) | |
Valero Energy Partners LP | | | (12,706 | ) | | | (1,266,466 | ) | | | (100,807 | ) | |
Shell Midstream Partners LP | | | (12,348 | ) | | | (1,230,764 | ) | | | (97,965 | ) | |
Western Gas Partners LP | | | (11,551 | ) | | | (1,151,407 | ) | | | (91,648 | ) | |
Spectra Energy Partners LP | | | (11,031 | ) | | | (1,099,485 | ) | | | (87,516 | ) | |
ONEOK Partners LP | | | (10,449 | ) | | | (1,041,485 | ) | | | (82,899 | ) | |
| MPLX LP | | | (10,190 | ) | | | (1,015,704 | ) | | | (80,847 | ) | |
Targa Resources Partners LP | | | (10,170 | ) | | | (1,013,792 | ) | | | (80,693 | ) | |
| | | (91,700 | ) | | | (9,140,298 | ) | | | (727,538 | ) | |
GSCBNMLP INDEX | |
Tesoro Logistics LP | | | (13,255 | ) | | | (1,266,596 | ) | | | (159,762 | ) | |
Valero Energy Partners LP | | | (12,706 | ) | | | (1,214,128 | ) | | | (153,144 | ) | |
Shell Midstream Partners LP | | | (12,348 | ) | | | (1,179,902 | ) | | | (148,827 | ) | |
Western Gas Partners LP | | | (11,551 | ) | | | (1,103,824 | ) | | | (139,231 | ) | |
Spectra Energy Partners LP | | | (11,031 | ) | | | (1,054,048 | ) | | | (132,953 | ) | |
ONEOK Partners LP | | | (10,449 | ) | | | (998,445 | ) | | | (125,939 | ) | |
| MPLX LP | | | (10,190 | ) | | | (973,729 | ) | | | (122,822 | ) | |
Targa Resources Partners LP | | | (10,170 | ) | | | (971,896 | ) | | | (122,591 | ) | |
| | | (91,700 | ) | | | (8,762,568 | ) | | | (1,105,269 | ) | |
GSCBNUTL INDEX | |
Pattern Energy Group Inc. | | | (8,305 | ) | | | (790,984 | ) | | | (186,711 | ) | |
8Point3 Energy Partners LP | | | (8,304 | ) | | | (790,927 | ) | | | (186,698 | ) | |
TerraForm Power Inc. | | | (8,259 | ) | | | (786,609 | ) | | | (185,679 | ) | |
NextEra Energy Partners LP | | | (7,894 | ) | | | (751,872 | ) | | | (177,479 | ) | |
Abengoa Yield PLC | | | (7,543 | ) | | | (718,423 | ) | | | (169,583 | ) | |
TerraForm Global Inc. | | | (7,195 | ) | | | (685,418 | ) | | | (161,793 | ) | |
| | | (47,500 | ) | | | (4,524,233 | ) | | | (1,067,943 | ) | |
Reference Entity | | Shares | | Notional
Value(a) | | Net Unrealized
Appreciation
(Depreciation) | |
Short Positions | |
GSCBNINV INDEX | |
FS Investment Corp. | | | (14,337 | ) | | $ | (1,403,029 | ) | | $ | (4,165 | ) | |
Prospect Capital Corp. | | | (10,597 | ) | | | (1,036,977 | ) | | | (3,078 | ) | |
Ares Capital Corp. | | | (7,198 | ) | | | (704,398 | ) | | | (2,091 | ) | |
New Mountain Finance Corp. | | | (7,137 | ) | | | (698,424 | ) | | | (2,073 | ) | |
Triangle Capital Corp. | | | (6,872 | ) | | | (672,462 | ) | | | (1,996 | ) | |
Apollo Investment Corp. | | | (6,777 | ) | | | (663,149 | ) | | | (1,969 | ) | |
Fifth Street Finance Corp. | | | (6,395 | ) | | | (625,835 | ) | | | (1,858 | ) | |
PennantPark Investment Corp. | | | (3,683 | ) | | | (360,437 | ) | | | (1,070 | ) | |
THL Credit Inc. | | | (3,572 | ) | | | (349,568 | ) | | | (1,038 | ) | |
Medley Capital Corp. | | | (3,432 | ) | | | (335,886 | ) | | | (997 | ) | |
| | | (70,000 | ) | | | (6,850,165 | ) | | | (20,335 | ) | |
GSCBNINV INDEX | |
FS Investment Corp. | | | (14,440 | ) | | | (1,430,410 | ) | | | 13,165 | | |
Prospect Capital Corp. | | | (10,672 | ) | | | (1,057,215 | ) | | | 9,730 | | |
Ares Capital Corp. | | | (7,249 | ) | | | (718,145 | ) | | | 6,609 | | |
New Mountain Finance Corp. | | | (7,188 | ) | | | (712,054 | ) | | | 6,553 | | |
Triangle Capital Corp. | | | (6,921 | ) | | | (685,586 | ) | | | 6,310 | | |
Apollo Investment Corp. | | | (6,825 | ) | | | (676,090 | ) | | | 6,222 | | |
Fifth Street Finance Corp. | | | (6,441 | ) | | | (638,049 | ) | | | 5,872 | | |
PennantPark Investment Corp. | | | (3,710 | ) | | | (367,471 | ) | | | 3,382 | | |
THL Credit Inc. | | | (3,598 | ) | | | (356,390 | ) | | | 3,280 | | |
Medley Capital Corp. | | | (3,456 | ) | | | (342,440 | ) | | | 3,152 | | |
| | | (70,500 | ) | | | (6,983,850 | ) | | | 64,275 | | |
Total Short Positions of Total Return Basket Swaps | | | | | | $ | (2,856,810 | ) | |
Net Cash and Other Receivables (Payables) | | | | | | | 30,785 | | |
Total Return Basket Swaps, at Value Goldman Sachs & Co. | | | | | | $ | (2,826,025 | ) | |
Long Short Credit | |
Counterparty | | Description | | Expiration
Date | | Value | |
Goldman Sachs & Co.
| | The Fund pays the total return short positions and receives
a specified LIBOR or Federal Funds floating rate, which is denominated in various foreign currencies based on the local currencies of the positions. | | 4/20/2017 | | $ | (6,425 | ) | |
* The following table represents the individual short positions and related values of the total return basket swaps as of October 31, 2015.
Reference Entity | | Shares | | Notional
Value(a) | | Net Unrealized
Appreciation
(Depreciation) | |
Short Positions | |
GSCBOSCS INDEX | |
First Quantum Minerals Ltd. | | | 507 | | | $ | (45,247 | ) | | $ | (3,305 | ) | |
HudBay Minerals, Inc. | | | 493 | | | | (44,017 | ) | | | (3,216 | ) | |
| | | (1,000 | ) | | | (89,264 | ) | | | (6,521 | ) | |
Total Short Positions of Total Return Basket Swaps | | | | | | | (6,521 | ) | |
Net Cash and Other Receivables (Payables) | | | | | | | 96 | | |
Total Return Basket Swaps, at Value Goldman Sachs & Co. | | | | | | $ | (6,425 | ) | |
(a) Notional value represents the value (including any fees or commissions) of the short positions when they were established.
Equity swap contracts: During the period ended October 31, 2015, Long Short Credit used equity swaps to replace more traditional direct investments and to hedge risk.
Equity swaps are two-party contracts in which counterparties exchange the return on a specified reference security, basket of securities, security index or index component for the return based on a fixed or floating interest rate during the period of the swap. Equity swaps are marked to market daily based on the value of the underlying reference entity and the change, if any, is recorded as an unrealized gain or loss. Equity swaps normally do not involve the delivery of securities or other underlying assets. If the other party to an equity swap defaults, the Fund's risk of loss consists of the net amount of payments that the Fund is contractually entitled to receive, if any. Equity swaps are derivatives and their value can be very volatile. To the extent that future market trends, the values of assets or economic factors are not accurately analyzed and predicted, the Fund may suffer a loss, which may exceed the related amounts shown in the Statements of Assets and Liabilities. Periodic payments received or paid by the Fund are recorded as realized gains or losses.
At October 31, 2015, the outstanding OTC equity swaps* for Long Short Credit were as follows:
Counterparty | | Description | | Expiration
Date | | Value | |
Goldman Sachs
International
| | The Fund receives the total return on long positions` and pays a specified
LIBOR or Federal Funds floating rate, which is denominated in various
foreign currencies based on the local currencies of the positions. | | 2/5/2017 | | $ | 38,466 | | |
* The following table represents the individual long positions and related values of the equity swaps as of October 31, 2015.
| Reference Entity | | Shares | | Notional
Value(a) | | Net Unrealized
Appreciation
(Depreciation) | |
Long Positions | |
Vallourec SA | | | 10,000 | | | $ | 148,518 | | | $ | 38,653 | | |
Total Long Positions of Equity Swaps | | | | | | | 38,653 | | |
Financing Costs and Other Payables | | | | | | | (187 | ) | |
Equity Swaps, at Value Goldman Sachs International | | | | | | | 38,466 | | |
(a) Notional value represents the value (including any fees or commissions) of the long positions when they were established.
For the year ended October 31, 2015, the average notional value of total return swaps, total return basket swaps and equity swaps was:
| | Long positions | | Short positions | |
Long Short | | $ | — | | | $ | (10,876,485 | ) | |
Long Short Credit | | $ | 7,833,089 | | | $ | (50,647 | ) | |
Credit default swap contracts: During the period ended October 31, 2015, Long Short Credit used credit default swaps to replace more traditional direct investments, to establish net short or long positions for individual markets, currencies or securities and to hedge risk. When a Fund is the buyer of an OTC credit default swap contract, it is entitled to receive the par (or other agreed-upon) value of a referenced debt obligation (or basket of debt obligations) from the counterparty if a credit event occurs. In return, the Fund pays the counterparty a periodic stream of payments over the term of the contract provided that no credit event has occurred. If no credit event occurs, the Fund would have spent the stream of payments and received no proceeds from the contract. When a Fund is the seller of an OTC credit default swap contract, it receives the stream of payments, but is obligated to pay to the buyer of the protection an amount up to the notional amount of the swap and in certain instances take delivery of securities of the reference entity upon the occurrence of a credit event, as defined under the terms of that particular swap agreement. Credit events are contract specific but may include bankruptcy, failure to pay, restructuring, obligation acceleration and repudiation/moratorium. If a Fund is a seller of protection and a credit event occurs, the maximum potential amount of future payments that the Fund could be required to make (or the risk of loss) would be an amount equal to the notional amount of the agreement. This potential amount would be partially offset by any recovery value of the respective referenced obligation, or net amount received from the settlement of a buy protection credit default swap agreement entered into by the Fund for the same referenced obligation. As the seller, the Fund may add economic leverage to its portfolio because, in addition to its total net assets, the Fund is subject to investment exposure on the notional amount of the swap. The net periodic payments paid or received on the swap contract are accrued daily as a component of unrealized appreciation (depreciation) and are recorded as realized gain upon receipt or realized loss upon payment. The Fund also records an increase or decrease to unrealized appreciation (depreciation) in an amount equal to the daily valuation of swaps.
At October 31, 2015, Long Short Credit had outstanding OTC credit default swaps as follows:
OTC Credit Default Swap Contracts—Buy Protection
Swap
Counterparty | | Reference
Entity | | Notional
Amount | | Contract
Annual
Fixed Rate* | | Termination
Date | | Market
Value | | Unamortized
Upfront
Payments
Received
(Paid) | | Unrealized
Appreciation
(Depreciation) | | Accrued
Net
Interest
Receivable/
(Payable) | | Total
Fair Value | |
Goldman
Sachs & Co. | | Chile
(Republic of) | | $ | 500,000 | | | | 1.00 | % | | December 20,
2020 | | $ | 5,210 | | | $ | (5,560 | ) | | $ | (350 | ) | | $ | (569 | ) | | $ | (919 | ) | |
Goldman
Sachs & Co. | | South Africa
(Republic of) | | | 500,000 | | | | 1.00 | % | | December 20,
2020 | | | 35,470 | | | | (45,415 | ) | | | (9,945 | ) | | | (569 | ) | | | (10,514 | ) | |
Goldman
Sachs & Co. | | Turkey
(Republic of) | | | 500,000 | | | | 1.00 | % | | December 20,
2020 | | | 35,416 | | | | (50,064 | ) | | | (14,648 | ) | | | (570 | ) | | | (15,218 | ) | |
| | Total | | | | | | | | $ | 76,096 | | | $ | (101,039 | ) | | $ | (24,943 | ) | | $ | (1,708 | ) | | $ | (26,651 | ) | |
* The contract annual fixed rate represents the annual fixed rate of interest paid by the Fund (as a buyer of protection) on the notional amount of the credit default index swaps.
OTC Credit Default Swap Contracts—Sell Protection
Swap
Counterparty | | Reference
Entity | | Notional
Amount | | Contract
Annual
Fixed Rate* | | Termination
Date | | Market
Value | | Credit
Spread at
October 31,
2015 | | Unamortized
Upfront
Payments
Received
(Paid) | | Unrealized
Appreciation
(Depreciation) | | Accrued
Net
Interest
Receivable/
(Payable) | | Total
Fair Value | |
Goldman
Sachs & Co. | | Abengoa, S.A. | | $ | 500,000 | | | | 5.00 | % | | December 20,
2020 | | $ | (380,746 | ) | | | 4.943 | | | $ | 433,423 | | | $ | 52,677 | | | $ | 3,194 | | | $ | 55,871 | | |
| | Total | | | | | | | | $ | (380,746 | ) | | | | | | $ | 433,423 | | | $ | 52,677 | | | $ | 3,194 | | | $ | 55,871 | | |
* The contract annual fixed rate represents the annual fixed rate of interest received by the Fund (as a seller of protection) on the notional amount of the credit default index swaps.
For the period ended October 31, 2015, the average notional value of OTC credit default swaps for Long Short Credit was $1,491,967.
Certain clearinghouses currently offer clearing for limited types of derivative transactions, including certain credit default swaps. In a cleared derivative transaction, a Fund typically enters into the transaction with a financial institution counterparty that is then cleared through a central clearinghouse. Upon acceptance of a swap by a central clearinghouse, the original swap is extinguished and replaced with a swap with the clearinghouse, thereby reducing or eliminating the Fund's exposure to the credit risk of the original counterparty. A Fund typically will be required to post specified levels of both initial and variation margin with the clearinghouse or at the instruction of the clearinghouse; the margin required by a clearinghouse may be greater than the margin the Fund would be required to post in an uncleared derivative transaction. The daily change in valuation is recorded as a receivable or payable for variation margin and settled in cash with the centrally clearing party daily. For financial reporting purposes, unamortized upfront payments, if any, are netted with unrealized appreciation or depreciation on swap contracts to determine the market value of swaps.
At October 31, 2015, Long Short Credit had outstanding centrally cleared credit default index swaps as follows:
Centrally Cleared Credit Default Swap Contracts—Sell Protection
| Clearinghouse | | Reference
Entity | | Notional
Amount(1) | | Contract
Annual
Fixed Rate* | | Termination
Date | | Market
Value | | Unamortized
Upfront
Payments
Received
(Paid) | | Unrealized
Appreciation
(Depreciation) | | Accrued
Net
Interest
Receivable/
(Payable) | | Total
Fair Value | |
ICE Clear
Credit LLC | | CDX North
American
High Yield | | $ | 1,00,000 | | | | 5.00 | % | | December 20,
2020 | | $ | 101,844 | | | $ | (89,859 | ) | | $ | 11,985 | | | $ | 6,430 | | | $ | 18,415 | | |
| Total | | | | | | | | | | | | | | | | | | $ | 101,844 | | | $ | (89,859 | ) | | $ | 11,985 | | | $ | 6,430 | | | $ | 18,415 | | |
* The contract annual fixed rate represents the annual fixed rate of interest received by the Fund (as a seller of protection) on the notional amount of the credit default swap contract.
For the period ended October 31, 2015, the average notional value of centrally cleared credit default swaps for Long Short Credit was $5,897,290.
At October 31, 2015, the Funds had deposited the following in segregated accounts to cover margin requirements on credit default swaps, total return swaps, total return basket swaps and equity swaps:
Long Short | | $ | 1,750,000 | | |
Long Short Credit | | $ | 699,027 | | |
Financial futures contracts: During the year ended October 31, 2015, Global Allocation used financial futures in an effort to enhance returns and to manage or adjust the risk profile and the investment exposure of the Fund to certain asset classes, countries and regions. In addition, Global Allocation also utilized financial futures to provide
investment exposure to certain indices and markets other than the benchmark indices. During the year ended October 31, 2015, Inflation Managed used financial futures for economic hedging purposes, including as a maturity or duration management device. During the year ended October 31, 2015, Long Short used financial futures on the broader market index and U.S. Treasuries in an effort either to enhance returns or to manage or adjust the risk profile and the investment exposure of the Fund. During the period ended October 31, 2015, Long Short Credit used futures to manage or adjust the risk profile of the Fund or the risk of individual positions, to adjust the duration of the Fund's portfolio, to hedge risk and to alter the Fund's exposure to currencies, interest rates, sectors and individual issuers. During the period ended October 31, 2015, Multi-Asset Income used financial futures in an effort to adjust the investment exposure and/or risk profile of the portfolio based on the portfolio managers team's market views.
At the time Fund enters into a financial futures contract, it is required to deposit with the futures commission merchant a specified amount of cash or liquid securities, known as "initial margin," which is a percentage of the value of the financial futures being traded that is set by the exchange upon which the futures contract is traded. Each day, the futures contract is valued at the official settlement price of the board of trade or U.S. commodity exchange on which such futures contract is traded. Subsequent payments, known as "variation margin," to and from the broker are made on a daily basis, or as needed, as the market price of the financial futures contract fluctuates. Daily variation margin adjustments, arising from this "mark to market," are recorded by the Fund as unrealized gains or losses.
Although some financial futures by their terms call for actual delivery or acquisition of the underlying securities or currency, in most cases the contracts are closed out prior to delivery by offsetting purchases or sales of matching financial futures. When the contracts are closed, a Fund recognizes a gain or loss. Risks of entering into futures contracts include the possibility there may be an illiquid market, possibly at a time of rapidly declining prices, and/or a change in the value of the contract may not correlate with changes in the value of the underlying securities. Futures executed on regulated futures exchanges have minimal counterparty risk to a Fund because the exchange's clearinghouse assumes the position of the counterparty in each transaction. Thus, a Fund is exposed to risk only in connection with the clearinghouse and not in connection with the original counterparty to the transaction.
For U.S. federal income tax purposes, the futures transactions undertaken by a Fund may cause the Fund to recognize gains or losses from marking contracts to market even though its positions have not been sold or terminated, may affect the character of the gains or losses recognized as long-term or short-term, and may affect the timing of some capital gains and losses realized by the Fund. Also, a Fund's losses on transactions involving futures contracts may be deferred rather than being taken into account currently in calculating the Fund's taxable income.
At October 31, 2015, open positions in financial futures were as follows:
| Fund | | Expiration | | Open Contracts | | Position | | Unrealized
Appreciation
(Depreciation) | |
Global Allocation | | December 2015 | | 2 AUD Currency | | Short | | $ | (1,337 | ) | |
Global Allocation | | December 2015 | | 1 CAD Currency | | Short | | | (808 | ) | |
Global Allocation | | December 2015 | | 1 Canadian Treasury Bond, 10 Year | | Short | | | 2,575 | | |
Global Allocation | | December 2015 | | 3 CHF Currency | | Short | | | 2,119 | | |
Global Allocation | | December 2015 | | 4 GBP Currency | | Short | | | (912 | ) | |
Global Allocation | | December 2015 | | 1 Mini Japanese Government Bond, 10 Year | | Short | | | (790 | ) | |
Global Allocation | | December 2015 | | 10 Mini MSCI Emerging Markets Index | | Short | | | (21,223 | ) | |
Global Allocation | | December 2015 | | 1 NOK Currency | | Short | | | (11 | ) | |
Global Allocation | | December 2015 | | 3 NZD Currency Dollar | | Short | | | (13,659 | ) | |
Global Allocation | | December 2015 | | 1 UK Long Gilt Bond | | Short | | | (340 | ) | |
Fund | | Expiration | | Open Contracts | | Position | | Unrealized
Appreciation
(Depreciation) | |
Global Allocation | | December 2015 | | 1 U.S. Treasury Note, 10 Year | | Short | | $ | (332 | ) | |
Global Allocation | | November 2015 | | 1 AEX-Index | | Long | | | (38 | ) | |
Global Allocation | | December 2015 | | 1 Canadian Treasury Bond, 10 Year | | Long | | | (703 | ) | |
Global Allocation | | December 2015 | | 2 CAD Currency | | Long | | | 944 | | |
Global Allocation | | December 2015 | | 5 Euro FX Currency | | Long | | | (7,451 | ) | |
Global Allocation | | December 2015 | | 1 Euro STOXX 50 Index | | Long | | | 2,045 | | |
Global Allocation | | December 2015 | | 1 EuroYen, 90 Day | | Long | | | (27 | ) | |
Global Allocation | | December 2015 | | 3 FTSE 100 Index | | Long | | | 4,574 | | |
Global Allocation | | December 2015 | | 1 GBP Currency | | Long | | | 216 | | |
Global Allocation | | December 2015 | | 5 JPY Currency | | Long | | | (1,930 | ) | |
Global Allocation | | December 2015 | | 3 Mini Japanese Government Bond, 10 Year | | Long | | | 1,881 | | |
Global Allocation | | December 2015 | | 8 Mini MSCI Emerging Markets Index | | Long | | | 81 | | |
Global Allocation | | December 2015 | | 1 MXN Currency | | Long | | | 617 | | |
Global Allocation | | December 2015 | | 1 NASDAQ 100 E-Mini Index | | Long | | | 27 | | |
Global Allocation | | December 2015 | | 3 Nikkei 225 Index | | Long | | | 256 | | |
Global Allocation | | December 2015 | | 4 Russell 2000 Mini Index | | Long | | | 4,081 | | |
Global Allocation | | December 2015 | | 4 S&P 500 E-Mini Index | | Long | | | 29,449 | | |
Global Allocation | | December 2015 | | 2 TOPIX Index | | Long | | | 22,508 | | |
Global Allocation | | December 2015 | | 4 U.S. Treasury Bond, Long | | Long | | | 1,785 | | |
Global Allocation | | December 2015 | | 1 U.S. Treasury Note, 5 Year | | Long | | | (8 | ) | |
Global Allocation | | December 2015 | | 1 U.S. Treasury Note, 10 Year | | Long | | | 628 | | |
Global Allocation | | December 2015 | | 2 UK Long Gilt Bond | | Long | | | (373 | ) | |
Global Allocation | | December 2016 | | 1 New Zealand Treasury Bill, 90 Day | | Long | | | 362 | | |
Total | | | | | | | | $ | 24,206 | | |
Inflation Managed | | December 2015 | | 2 Canadian Treasury Bond, 10 Year | | Short | | $ | 5,151 | | |
Inflation Managed | | December 2015 | | 2 Euro-OAT | | Short | | | (10,809 | ) | |
Inflation Managed | | December 2015 | | 1 JPY Currency | | Short | | | (278 | ) | |
Inflation Managed | | December 2015 | | 1 MXN Currency | | Short | | | (628 | ) | |
Inflation Managed | | December 2015 | | 1 Mini Japanese Government Bond, 10 Year | | Short | | | (790 | ) | |
Inflation Managed | | December 2015 | | 6 NZD Currency | | Short | | | (27,317 | ) | |
Inflation Managed | | December 2015 | | 1 ZAR Currency | | Short | | | (253 | ) | |
Inflation Managed | | December 2015 | | 1 U.S. Treasury Bond, Long | | Short | | | (1,587 | ) | |
Inflation Managed | | December 2015 | | 1 U.S. Treasury Note, 10 Year | | Short | | | (332 | ) | |
Inflation Managed | | December 2015 | | 1 U.S. Treasury Bond, Ultra Long | | Short | | | (746 | ) | |
Inflation Managed | | December 2015 | | 2 CAD Currency | | Long | | | (426 | ) | |
Inflation Managed | | December 2015 | | 3 EUR FX Currency | | Long | | | (609 | ) | |
Inflation Managed | | December 2015 | | 1 EuroYen, 90 Day | | Long | | | (21 | ) | |
Inflation Managed | | December 2015 | | 5 GBP Currency | | Long | | | 1,545 | | |
Inflation Managed | | December 2015 | | 1 SEK Currency | | Long | | | (7,875 | ) | |
Inflation Managed | | December 2015 | | 1 UK Long Gilt Bond | | Long | | | 322 | | |
Inflation Managed | | December 2016 | | 1 Canadian Banker's Acceptance | | Long | | | (2 | ) | |
Fund | | Expiration | | Open Contracts | | Position | | Unrealized
Appreciation
(Depreciation) | |
Inflation Managed | | December 2016 | | 3 New Zealand Bank Bill, 90 Day | | Long | | $ | 1,087 | | |
Total | | | | | | | | $ | (43,568 | ) | |
Long Short | | December 2015 | | 470 Russell 2000 Mini Index | | Short | | $ | 139,820 | | |
Long Short | | December 2015 | | 3,283 S&P 500 E-Mini Index | | Short | | | (14,658,283 | ) | |
Long Short | | December 2015 | | 160 S&P MidCap 400 E-Mini Index | | Short | | | (337,482 | ) | |
Total | | | | | | | | $ | (14,855,945 | ) | |
Long Short Credit | | December 2015 | | 5 S&P 500 E-Mini Index | | Short | | $ | (29,688 | ) | |
Long Short Credit | | December 2015 | | 40 U.S. Treasury Note, 5 Year | | Long | | | 4,613 | | |
Total | | | | | | | | $ | (25,075 | ) | |
Multi-Asset Income | | December 2015 | | 3 Mini MSCI Emerging Markets Index | | Short | | $ | 3,170 | | |
Multi-Asset Income | | December 2015 | | 1 U.S. Treasury Note, 5 Year | | Short | | | 656 | | |
Multi-Asset Income | | December 2015 | | 1 Canadian Treasury Bond, 10 Year | | Long | | | (637 | ) | |
Multi-Asset Income | | December 2015 | | 1 Euro-Bobl | | Long | | | 395 | | |
Multi-Asset Income | | December 2015 | | 1 Euro-OAT | | Long | | | 1,385 | | |
Multi-Asset Income | | December 2015 | | 2 Euro STOXX 50 Index | | Long | | | 4,091 | | |
Multi-Asset Income | | December 2015 | | 2 Mini Japanese Government Bond, 10 Year | | Long | | | 1,253 | | |
Multi-Asset Income | | December 2015 | | 2 TOPIX Index | | Long | | | 10,760 | | |
Multi-Asset Income | | December 2015 | | 2 UK Long Gilt Bond | | Long | | | (1,620 | ) | |
Multi-Asset Income | | December 2015 | | 1 U.S. Treasury Note, 2 Year | | Long | | | (453 | ) | |
Multi-Asset Income | | December 2015 | | 1 U.S. Treasury Note, 10 Year | | Long | | | 280 | | |
Multi-Asset Income | | December 2015 | | 2 U.S. Treasury Bond, Long | | Long | | | 0 | | |
Total | | | | | | | | $ | 19,280 | | |
For the year ended October 31, 2015, the average notional value of financial futures was:
| | Long positions | | Short positions | |
Global Allocation | $ | 6,440,552 | | | $ | (4,276,122 | ) | |
Inflation Managed | $ | 3,844,100 | | | $ | (2,698,892 | ) | |
Long Short | $ | — | | | $ | (388,237,957 | ) | |
Long Short Credit | $ | 5,228,619 | | | $ | (238,675 | ) | |
Multi-Asset Income | $ | 923,127 | | | $ | (144,777 | ) | |
At October 31, 2015, the notional value of financial futures was:
| Long positions | | Short positions | |
Global Allocation | $ | 6,359,709 | | | $ | (2,383,618 | ) | |
Inflation Managed | $ | 3,878,513 | | | $ | (1,693,699 | ) | |
Long Short | $ | — | | | $ | (417,900,355 | ) | |
Long Short Credit | $ | 4,790,938 | | | $ | (518,425 | ) | |
Multi-Asset Income | $ | 2,019,894 | | | $ | (246,328 | ) | |
At October 31, 2015, the Funds had deposited the following in segregated accounts to cover margin requirements on open financial futures:
Global Allocation | | $ | 197,557 | | |
Inflation Managed | | $ | 64,123 | | |
Long Short | | $ | 20,582,980 | | |
Long Short Credit | | $ | 59,000 | | |
Forward foreign currency contracts: During the year ended October 31, 2015, Global Allocation used forward contracts to manage or adjust the risk profile and investment exposure of the Fund, including altering investment exposures to certain currencies provided by the Fund's total return swaps, described above. During the period ended October 31, 2015, Long Short Credit used forward contracts to alter the Fund's exposure to currencies, interest rates, sectors and individual issuers. During the period ended October 31, 2015, Multi-Asset Income entered into forward contracts to obtain or reduce exposure to certain markets, establish net short or long positions for currencies and alter the Fund's exposure to markets and currencies.
A forward contract is an agreement between two parties to buy or sell a specific currency for another at a set price on a future date, and is individually negotiated and privately traded by currency traders and their customers in the interbank market. The market value of a forward contract fluctuates with changes in forward currency exchange rates. Forward contracts are marked to market daily, and the change in value is recorded by a Fund as an unrealized gain or loss. At the consummation of a forward contract to purchase or sell currency, a Fund may either exchange the currencies specified at the maturity of the forward contract or enter into a closing transaction involving the purchase or sale of an offsetting forward contract. Closing transactions with respect to forward contracts are usually performed with the counterparty to the original forward contract. The gain or loss arising from the difference between the U.S. dollar cost of the original contract and the value of the foreign currency in U.S. dollars upon closing a contract is included in "Net realized gain (loss) from forward foreign currency contracts" in the Statements of Operations. These contracts may involve market risk in excess of the unrealized gain or loss reflected in a Fund's Statement of Assets and Liabilities. In addition, a Fund could be exposed to risk if the counterparties are unable to meet the terms of the contracts or if the value of the currency changes unfavorably to the U.S. dollar.
At October 31, 2015, open forward contracts were as follows:
Global Allocation
| Contracts to Receive | | In Exchange
For | | Counterparty | | Settlement Date | | Net
Unrealized
Appreciation
(Depreciation) | |
| | 45,540 | | | Australian Dollar | | $ | 33,314 | | | Royal Bank of Canada | | 12/18/15 | | $ | (914 | ) | |
| | 99,126 | | | Australian Dollar | | | 71,747 | | | Royal Bank of Canada | | 12/18/15 | | | (1,221 | ) | |
| | 164,866 | | | Australian Dollar | | | 114,750 | | | Societe Generale | | 12/18/15 | | | 2,549 | | |
| | 53,753 | | | Australian Dollar | | | 37,676 | | | Societe Generale | | 12/18/15 | | | 569 | | |
| | 173,205 | | | Australian Dollar | | | 121,711 | | | State Street Bank London | | 12/18/15 | | | 1,520 | | |
| | 35,104 | | | Australian Dollar | | | 24,629 | | | State Street Bank London | | 12/18/15 | | | 347 | | |
| | 160,298 | | | Australian Dollar | | | 114,131 | | | State Street Bank London | | 12/18/15 | | | (82 | ) | |
| | 86,265 | | | Australian Dollar | | | 62,288 | | | State Street Bank London | | 12/18/15 | | | (912 | ) | |
| | 201,014 | | | Australian Dollar | | | 141,650 | | | State Street Bank London | | 12/18/15 | | | 1,367 | | |
| | 107,615 | | | Australian Dollar | | | 76,056 | | | State Street Bank London | | 12/18/15 | | | 510 | | |
| | 321,808 | | | Australian Dollar | | | 231,650 | | | State Street Bank London | | 12/18/15 | | | (2,691 | ) | |
| | 544,471 | | | Brazilian Real | | | 137,949 | | | Barclays Bank PLC Wholesale | | 11/12/15 | | | 2,907 | | |
| | 40,257 | | | Canadian Dollar | | | 30,466 | | | Royal Bank of Canada | | 12/18/15 | | | 313 | | |
Contracts to Receive | | In Exchange For | | Counterparty | | Settlement Date | | Net
Unrealized
Appreciation
(Depreciation) | |
| | 142,620 | | | Canadian Dollar | | $ | 109,428 | | | Royal Bank of Canada | | 12/18/15 | | $ | (387 | ) | |
| | 75,018 | | | Canadian Dollar | | | 57,433 | | | Societe Generale | | 12/18/15 | | | (77 | ) | |
| | 155,641 | | | Canadian Dollar | | | 119,171 | | | Societe Generale | | 12/18/15 | | | (174 | ) | |
| | 32,973 | | | Canadian Dollar | | | 24,940 | | | Societe Generale | | 12/18/15 | | | 269 | | |
| | 19,245 | | | Canadian Dollar | | | 14,522 | | | Societe Generale | | 12/18/15 | | | 192 | | |
| | 187,025 | | | Canadian Dollar | | | 140,493 | | | Societe Generale | | 12/18/15 | | | 2,499 | | |
| | 102,057 | | | Canadian Dollar | | | 77,067 | | | State Street Bank London | | 12/18/15 | | | 962 | | |
| | 152,226 | | | Canadian Dollar | | | 115,533 | | | State Street Bank London | | 12/18/15 | | | 853 | | |
| | 46,452 | | | Canadian Dollar | | | 34,989 | | | State Street Bank London | | 12/18/15 | | | 526 | | |
| | 173,923 | | | Canadian Dollar | | | 129,631 | | | State Street Bank London | | 12/18/15 | | | 3,344 | | |
| | 68,764 | | | Canadian Dollar | | | 52,974 | | | State Street Bank London | | 12/18/15 | | | (400 | ) | |
| | 18,057 | | | Canadian Dollar | | | 13,794 | | | State Street Bank London | | 12/18/15 | | | 12 | | |
| | 165,780 | | | Euro | | | 186,045 | | | Royal Bank of Canada | | 12/18/15 | | | (3,612 | ) | |
| | 46,528 | | | Euro | | | 52,208 | | | Royal Bank of Canada | | 12/18/15 | | | (1,006 | ) | |
| | 26,814 | | | Euro | | | 30,110 | | | Royal Bank of Canada | | 12/18/15 | | | (602 | ) | |
| | 61,142 | | | Euro | | | 70,062 | | | Royal Bank of Canada | | 12/18/15 | | | (2,778 | ) | |
| | 74,463 | | | Euro | | | 82,011 | | | Societe Generale | | 12/18/15 | | | (68 | ) | |
| | 50,003 | | | Euro | | | 56,637 | | | Societe Generale | | 12/18/15 | | | (1,611 | ) | |
| | 143,622 | | | Euro | | | 162,141 | | | State Street Bank London | | 12/18/15 | | | (4,091 | ) | |
| | 80,334 | | | Euro | | | 89,500 | | | State Street Bank London | | 12/18/15 | | | (1,096 | ) | |
| | 121,782 | | | Euro | | | 135,930 | | | State Street Bank London | | 12/18/15 | | | (1,915 | ) | |
| | 37,979 | | | Euro | | | 42,826 | | | State Street Bank London | | 12/18/15 | | | (1,032 | ) | |
| | 15,810 | | | Euro | | | 17,960 | | | State Street Bank London | | 12/18/15 | | | (561 | ) | |
| | 30,155 | | | Euro | | | 34,174 | | | State Street Bank London | | 12/18/15 | | | (989 | ) | |
| | 11,063 | | | Euro | | | 12,134 | | | State Street Bank London | | 12/18/15 | | | 40 | | |
| | 3,020,041,185 | | | Indonesian Rupiah | | | 206,923 | | | Barclays Bank PLC Wholesale | | 11/12/15 | | | 13,125 | | |
| | 6,070,189 | | | Japanese Yen | | | 50,488 | | | Royal Bank of Canada | | 12/18/15 | | | (147 | ) | |
| | 1,667,585 | | | Japanese Yen | | | 13,821 | | | Royal Bank of Canada | | 12/18/15 | | | 8 | | |
| | 10,359,716 | | | Japanese Yen | | | 86,595 | | | Royal Bank of Canada | | 12/18/15 | | | (682 | ) | |
| | 5,214,331 | | | Japanese Yen | | | 43,332 | | | Societe Generale | | 12/18/15 | | | (89 | ) | |
| | 2,824,931 | | | Japanese Yen | | | 23,740 | | | Societe Generale | | 12/18/15 | | | (312 | ) | |
| | 5,938,717 | | | Japanese Yen | | | 49,489 | | | State Street Bank London | | 12/18/15 | | | (239 | ) | |
| | 1,406,382 | | | Japanese Yen | | | 11,680 | | | State Street Bank London | | 12/18/15 | | | (17 | ) | |
| | 8,616,839 | | | Japanese Yen | | | 72,040 | | | State Street Bank London | | 12/18/15 | | | (580 | ) | |
| | 3,330,931 | | | Japanese Yen | | | 27,748 | | | State Street Bank London | | 12/18/15 | | | (124 | ) | |
| | 2,095,742 | | | Japanese Yen | | | 17,434 | | | State Street Bank London | | 12/18/15 | | | (54 | ) | |
| | 2,683,001 | | | Japanese Yen | | | 22,470 | | | State Street Bank London | | 12/18/15 | | | (220 | ) | |
| | 2,376,039 | | | Japanese Yen | | | 19,625 | | | State Street Bank London | | 12/18/15 | | | 79 | | |
| | 3,489,879 | | | Japanese Yen | | | 28,932 | | | State Street Bank London | | 12/18/15 | | | 10 | | |
| | 13,312,097 | | | New Taiwan Dollar | | | 409,477 | | | Barclays Bank PLC Wholesale | | 11/12/15 | | | 493 | | |
| | 37,597 | | | New Zealand Dollar | | | 25,730 | | | Royal Bank of Canada | | 12/18/15 | | | (355 | ) | |
| | 315,029 | | | New Zealand Dollar | | | 196,499 | | | State Street Bank London | | 12/18/15 | | | 16,119 | | |
| | 86,334 | | | New Zealand Dollar | | | 53,916 | | | State Street Bank London | | 12/18/15 | | | 4,353 | | |
| | 227,505 | | | New Zealand Dollar | | | 143,052 | | | State Street Bank London | | 12/18/15 | | | 10,495 | | |
| | 42,263 | | | New Zealand Dollar | | | 26,438 | | | State Street Bank London | | 12/18/15 | | | 2,086 | | |
| | 22,410 | | | New Zealand Dollar | | | 14,520 | | | State Street Bank London | | 12/18/15 | | | 605 | | |
Contracts to Receive | | In Exchange
For | | Counterparty | | Settlement Date | | Net
Unrealized
Appreciation
(Depreciation) | |
| | 154,053 | | | New Zealand Dollar | | $ | 102,753 | | | State Street Bank London | | 12/18/15 | | $ | 1,220 | | |
| | 75,543 | | | New Zealand Dollar | | | 51,126 | | | State Street Bank London | | 12/18/15 | | | (141 | ) | |
| | 21,765 | | | New Zealand Dollar | | | 14,495 | | | State Street Bank London | | 12/18/15 | | | 194 | | |
| | 354,973 | | | Norwegian Krone | | | 42,923 | | | Royal Bank of Canada | | 12/18/15 | | | (1,176 | ) | |
| | 152,986 | | | Norwegian Krone | | | 18,014 | | | Royal Bank of Canada | | 12/18/15 | | | (22 | ) | |
| | 155,329 | | | Norwegian Krone | | | 18,528 | | | Royal Bank of Canada | | 12/18/15 | | | (261 | ) | |
| | 745,343 | | | Norwegian Krone | | | 87,012 | | | Societe Generale | | 12/18/15 | | | 646 | | |
| | 317,711 | | | Norwegian Krone | | | 39,408 | | | Societe Generale | | 12/18/15 | | | (2,043 | ) | |
| | 3,093,044 | | | Norwegian Krone | | | 376,840 | | | State Street Bank London | | 12/18/15 | | | (13,077 | ) | |
| | 146,964 | | | Norwegian Krone | | | 17,831 | | | State Street Bank London | | 12/18/15 | | | (547 | ) | |
| | 412,647 | | | Norwegian Krone | | | 50,459 | | | State Street Bank London | | 12/18/15 | | | (1,929 | ) | |
| | 328,876 | | | Norwegian Krone | | | 40,132 | | | State Street Bank London | | 12/18/15 | | | (1,454 | ) | |
| | 607,078 | | | Norwegian Krone | | | 71,026 | | | State Street Bank London | | 12/18/15 | | | 370 | | |
| | 638,079 | | | Norwegian Krone | | | 78,761 | | | State Street Bank London | | 12/18/15 | | | (3,719 | ) | |
| | 187,782 | | | Norwegian Krone | | | 23,109 | | | State Street Bank London | | 12/18/15 | | | (1,024 | ) | |
| | 111,894 | | | Norwegian Krone | | | 13,032 | | | State Street Bank London | | 12/18/15 | | | 128 | | |
| | 910,308 | | | Norwegian Krone | | | 107,423 | | | State Street Bank London | | 12/18/15 | | | (365 | ) | |
| | 714,966 | | | Polish Zloty | | | 188,530 | | | Barclays Bank PLC Wholesale | | 11/12/15 | | | (3,569 | ) | |
| | 29,907 | | | Pound Sterling | | | 45,336 | | | Royal Bank of Canada | | 12/18/15 | | | 759 | | |
| | 96,372 | | | Pound Sterling | | | 147,890 | | | Royal Bank of Canada | | 12/18/15 | | | 648 | | |
| | 13,650 | | | Pound Sterling | | | 20,990 | | | Royal Bank of Canada | | 12/18/15 | | | 48 | | |
| | 16,804 | | | Pound Sterling | | | 25,502 | | | Royal Bank of Canada | | 12/18/15 | | | 397 | | |
| | 13,241 | | | Pound Sterling | | | 20,358 | | | Societe Generale | | 12/18/15 | | | 50 | | |
| | 43,525 | | | Pound Sterling | | | 66,737 | | | Societe Generale | | 12/18/15 | | | 347 | | |
| | 64,395 | | | Pound Sterling | | | 98,138 | | | Societe Generale | | 12/18/15 | | | 1,114 | | |
| | 69,950 | | | Pound Sterling | | | 107,863 | | | State Street Bank London | | 12/18/15 | | | (50 | ) | |
| | 13,285 | | | Pound Sterling | | | 20,522 | | | State Street Bank London | | 12/18/15 | | | (46 | ) | |
| | 52,432 | | | Pound Sterling | | | 81,048 | | | State Street Bank London | | 12/18/15 | | | (235 | ) | |
| | 11,023 | | | Pound Sterling | | | 16,723 | | | State Street Bank London | | 12/18/15 | | | 267 | | |
| | 57,911 | | | Pound Sterling | | | 87,786 | | | State Street Bank London | | 12/18/15 | | | 1,472 | | |
| | 42,517 | | | Pound Sterling | | | 64,330 | | | State Street Bank London | | 12/18/15 | | | 1,201 | | |
| | 26,322 | | | Pound Sterling | | | 40,312 | | | State Street Bank London | | 12/18/15 | | | 258 | | |
| | 37,904 | | | Pound Sterling | | | 58,553 | | | State Street Bank London | | 12/18/15 | | | (132 | ) | |
| | 1,888,646 | | | South African Rand | | | 137,949 | | | Barclays Bank PLC Wholesale | | 11/12/15 | | | (1,685 | ) | |
| | 216,512 | | | Swedish Krona | | | 25,860 | | | Royal Bank of Canada | | 12/18/15 | | | (490 | ) | |
| | 346,063 | | | Swedish Krona | | | 42,705 | | | Royal Bank of Canada | | 12/18/15 | | | (2,155 | ) | |
| | 616,080 | | | Swedish Krona | | | 74,943 | | | Royal Bank of Canada | | 12/18/15 | | | (2,754 | ) | |
| | 253,046 | | | Swedish Krona | | | 30,520 | | | Royal Bank of Canada | | 12/18/15 | | | (869 | ) | |
| | 236,624 | | | Swedish Krona | | | 28,285 | | | Societe Generale | | 12/18/15 | | | (559 | ) | |
| | 251,683 | | | Swedish Krona | | | 30,536 | | | Societe Generale | | 12/18/15 | | | (1,046 | ) | |
| | 103,977 | | | Swedish Krona | | | 12,754 | | | Societe Generale | | 12/18/15 | | | (571 | ) | |
| | 571,397 | | | Swedish Krona | | | 67,312 | | | Societe Generale | | 12/18/15 | | | (359 | ) | |
| | 142,143 | | | Swedish Krona | | | 17,285 | | | State Street Bank London | | 12/18/15 | | | (630 | ) | |
| | 455,191 | | | Swedish Krona | | | 53,886 | | | State Street Bank London | | 12/18/15 | | | (550 | ) | |
| | 154,868 | | | Swedish Krona | | | 18,988 | | | State Street Bank London | | 12/18/15 | | | (841 | ) | |
| | 507,124 | | | Swedish Krona | | | 61,075 | | | State Street Bank London | | 12/18/15 | | | (1,653 | ) | |
| | 460,522 | | | Swedish Krona | | | 54,715 | | | State Street Bank London | | 12/18/15 | | | (753 | ) | |
Contracts to Receive | | In Exchange For | | Counterparty | | Settlement
Date | | Net
Unrealized
Appreciation
(Depreciation) | |
| | 290,034 | | | Swedish Krona | | $ | 34,193 | | | State Street Bank London | | 12/18/15 | | $ | (209 | ) | |
| | 38,013 | | | Swiss Franc | | | 40,149 | | | Royal Bank of Canada | | 12/18/15 | | | (1,632 | ) | |
| | 105,297 | | | Swiss Franc | | | 108,323 | | | Royal Bank of Canada | | 12/18/15 | | | (1,631 | ) | |
| | 13,902 | | | Swiss Franc | | | 14,324 | | | Societe Generale | | 12/18/15 | | | (238 | ) | |
| | 26,254 | | | Swiss Franc | | | 27,438 | | | Societe Generale | | 12/18/15 | | | (836 | ) | |
| | 29,006 | | | Swiss Franc | | | 29,761 | | | State Street Bank London | | 12/18/15 | | | (371 | ) | |
| | 23,300 | | | Swiss Franc | | | 24,054 | | | State Street Bank London | | 12/18/15 | | | (445 | ) | |
Total | | | | | | | | | | $ | (3,834 | ) | |
Contracts to Deliver | | In Exchange For | | Counterparty | | Settlement
Date | | Net
Unrealized
Appreciation
(Depreciation) | |
| | 53,594 | | | Australian Dollar | | $ | 37,345 | | | Royal Bank of Canada | | 12/18/15 | | $ | (786 | ) | |
| | 105,803 | | | Australian Dollar | | | 74,096 | | | Royal Bank of Canada | | 12/18/15 | | | (1,181 | ) | |
| | 126,385 | | | Australian Dollar | | | 89,515 | | | Royal Bank of Canada | | 12/18/15 | | | (406 | ) | |
| | 113,992 | | | Australian Dollar | | | 81,642 | | | Royal Bank of Canada | | 12/18/15 | | | 539 | | |
| | 106,941 | | | Australian Dollar | | | 75,725 | | | Societe Generale | | 12/18/15 | | | (361 | ) | |
| | 165,062 | | | Australian Dollar | | | 116,876 | | | Societe Generale | | 12/18/15 | | | (562 | ) | |
| | 19,165 | | | Australian Dollar | | | 13,485 | | | State Street Bank London | | 12/18/15 | | | (150 | ) | |
| | 60,215 | | | Australian Dollar | | | 42,641 | | | State Street Bank London | | 12/18/15 | | | (200 | ) | |
| | 370,047 | | | Australian Dollar | | | 263,596 | | | State Street Bank London | | 12/18/15 | | | 315 | | |
| | 113,077 | | | Australian Dollar | | | 78,720 | | | State Street Bank London | | 12/18/15 | | | (1,732 | ) | |
| | 141,883 | | | Australian Dollar | | | 98,992 | | | State Street Bank London | | 12/18/15 | | | (1,955 | ) | |
| | 65,718 | | | Australian Dollar | | | 47,884 | | | State Street Bank London | | 12/18/15 | | | 1,127 | | |
| | 47,284 | | | Australian Dollar | | | 34,211 | | | State Street Bank London | | 12/18/15 | | | 570 | | |
| | 19,434 | | | Australian Dollar | | | 13,713 | | | State Street Bank London | | 12/18/15 | | | (114 | ) | |
| | 703,363 | | | Canadian Dollar | | | 531,111 | | | Royal Bank of Canada | | 12/18/15 | | | (6,652 | ) | |
| | 22,633 | | | Canadian Dollar | | | 16,882 | | | Royal Bank of Canada | | 12/18/15 | | | (422 | ) | |
| | 139,543 | | | Canadian Dollar | | | 106,509 | | | Royal Bank of Canada | | 12/18/15 | | | (180 | ) | |
| | 110,732 | | | Canadian Dollar | | | 85,727 | | | Royal Bank of Canada | | 12/18/15 | | | 1,066 | | |
| | 99,357 | | | Canadian Dollar | | | 75,494 | | | Societe Generale | | 12/18/15 | | | (471 | ) | |
| | 75,549 | | | Canadian Dollar | | | 57,077 | | | State Street Bank London | | 12/18/15 | | | (685 | ) | |
| | 106,063 | | | Canadian Dollar | | | 80,232 | | | State Street Bank London | | 12/18/15 | | | (859 | ) | |
| | 126,110 | | | Canadian Dollar | | | 94,293 | | | State Street Bank London | | 12/18/15 | | | (2,125 | ) | |
| | 99,310 | | | Canadian Dollar | | | 74,834 | | | State Street Bank London | | 12/18/15 | | | (1,095 | ) | |
| | 142,212 | | | Canadian Dollar | | | 108,474 | | | State Street Bank London | | 12/18/15 | | | (255 | ) | |
| | 95,447 | | | Canadian Dollar | | | 72,911 | | | State Street Bank London | | 12/18/15 | | | (64 | ) | |
| | 10,087,133 | | | Chilean Peso | | | 14,715 | | | Barclays Bank PLC Wholesale | | 11/12/15 | | | 141 | | |
| | 3,807,408 | | | Czech Koruna | | | 157,491 | | | Barclays Bank PLC Wholesale | | 11/12/15 | | | 2,958 | | |
| | 31,177 | | | Euro | | | 34,905 | | | Royal Bank of Canada | | 12/18/15 | | | 596 | | |
| | 112,063 | | | Euro | | | 126,847 | | | Royal Bank of Canada | | 12/18/15 | | | 3,527 | | |
| | 70,963 | | | Euro | | | 79,567 | | | Societe Generale | | 12/18/15 | | | 1,476 | | |
| | 22,638 | | | Euro | | | 25,949 | | | Societe Generale | | 12/18/15 | | | 1,037 | | |
| | 151,568 | | | Euro | | | 170,727 | | | Societe Generale | | 12/18/15 | | | 3,933 | | |
| | 139,710 | | | Euro | | | 157,677 | | | State Street Bank London | | 12/18/15 | | | 3,933 | | |
Contracts to Deliver | | In Exchange For | | Counterparty | | Settlement
Date | | Net
Unrealized
Appreciation
(Depreciation) | |
| | 53,219 | | | Euro | | $ | 60,379 | | | State Street Bank London | | 12/18/15 | | $ | 1,814 | | |
| | 159,182 | | | Euro | | | 180,395 | | | State Street Bank London | | 12/18/15 | | | 5,223 | | |
| | 12,596 | | | Euro | | | 14,188 | | | State Street Bank London | | 12/18/15 | | | 326 | | |
| | 70,285 | | | Euro | | | 80,030 | | | State Street Bank London | | 12/18/15 | | | 2,684 | | |
| | 43,228 | | | Euro | | | 48,262 | | | State Street Bank London | | 12/18/15 | | | 691 | | |
| | 92,634,875 | | | Hungarian Forint | | | 332,456 | | | Barclays Bank PLC Wholesale | | 11/12/15 | | | 4,715 | | |
| | 5,057,117 | | | Japanese Yen | | | 42,208 | | | Royal Bank of Canada | | 12/18/15 | | | 269 | | |
| | 2,996,653 | | | Japanese Yen | | | 25,325 | | | Royal Bank of Canada | | 12/18/15 | | | 473 | | |
| | 4,151,264 | | | Japanese Yen | | | 34,842 | | | Royal Bank of Canada | | 12/18/15 | | | 415 | | |
| | 2,978,677 | | | Japanese Yen | | | 24,949 | | | Societe Generale | | 12/18/15 | | | 246 | | |
| | 4,641,836 | | | Japanese Yen | | | 38,789 | | | Societe Generale | | 12/18/15 | | | 294 | | |
| | 8,885,651 | | | Japanese Yen | | | 73,760 | | | Societe Generale | | 12/18/15 | | | 71 | | |
| | 3,249,204 | | | Japanese Yen | | | 26,970 | | | State Street Bank London | | 12/18/15 | | | 24 | | |
| | 2,217,911 | | | Japanese Yen | | | 18,372 | | | State Street Bank London | | 12/18/15 | | | (21 | ) | |
| | 3,484,658 | | | Japanese Yen | | | 29,146 | | | State Street Bank London | | 12/18/15 | | | 248 | | |
| | 1,905,214 | | | Japanese Yen | | | 15,890 | | | State Street Bank London | | 12/18/15 | | | 90 | | |
| | 2,274,234 | | | Mexican Peso | | | 135,879 | | | Barclays Bank PLC Wholesale | | 11/12/15 | | | (1,726 | ) | |
| | 70,813 | | | New Zealand Dollar | | | 44,933 | | | Royal Bank of Canada | | 12/18/15 | | | (2,860 | ) | |
| | 75,884 | | | New Zealand Dollar | | | 48,956 | | | Royal Bank of Canada | | 12/18/15 | | | (2,259 | ) | |
| | 140,273 | | | New Zealand Dollar | | | 92,305 | | | Royal Bank of Canada | | 12/18/15 | | | (2,367 | ) | |
| | 62,205 | | | New Zealand Dollar | | | 42,060 | | | Royal Bank of Canada | | 12/18/15 | | | 76 | | |
| | 63,464 | | | New Zealand Dollar | | | 40,124 | | | Societe Generale | | 12/18/15 | | | (2,709 | ) | |
| | 50,562 | | | New Zealand Dollar | | | 31,750 | | | Societe Generale | | 12/18/15 | | | (2,375 | ) | |
| | 28,260 | | | New Zealand Dollar | | | 18,039 | | | Societe Generale | | 12/18/15 | | | (1,034 | ) | |
| | 82,768 | | | New Zealand Dollar | | | 52,118 | | | Societe Generale | | 12/18/15 | | | (3,744 | ) | |
| | 133,371 | | | New Zealand Dollar | | | 89,697 | | | Societe Generale | | 12/18/15 | | | (317 | ) | |
| | 66,769 | | | New Zealand Dollar | | | 41,964 | | | State Street Bank London | | 12/18/15 | | | (3,099 | ) | |
| | 26,686 | | | New Zealand Dollar | | | 16,802 | | | State Street Bank London | | 12/18/15 | | | (1,209 | ) | |
| | 71,933 | | | New Zealand Dollar | | | 45,476 | | | State Street Bank London | | 12/18/15 | | | (3,073 | ) | |
| | 25,647 | | | New Zealand Dollar | | | 16,427 | | | State Street Bank London | | 12/18/15 | | | (883 | ) | |
| | 343,169 | | | New Zealand Dollar | | | 228,433 | | | State Street Bank London | | 12/18/15 | | | (3,177 | ) | |
| | 88,957 | | | New Zealand Dollar | | | 60,232 | | | State Street Bank London | | 12/18/15 | | | 193 | | |
| | 75,983 | | | New Zealand Dollar | | | 51,215 | | | State Street Bank London | | 12/18/15 | | | (67 | ) | |
| | 555,853 | | | Norwegian Krone | | | 67,895 | | | Royal Bank of Canada | | 12/18/15 | | | 2,523 | | |
| | 200,805 | | | Norwegian Krone | | | 24,884 | | | Royal Bank of Canada | | 12/18/15 | | | 1,268 | | |
| | 416,304 | | | Norwegian Krone | | | 49,250 | | | Societe Generale | | 12/18/15 | | | 289 | | |
| | 271,351 | | | Norwegian Krone | | | 33,275 | | | Societe Generale | | 12/18/15 | | | 1,363 | | |
| | 491,103 | | | Norwegian Krone | | | 60,184 | | | State Street Bank London | | 12/18/15 | | | 2,427 | | |
| | 292,241 | | | Norwegian Krone | | | 35,179 | | | State Street Bank London | | 12/18/15 | | | 809 | | |
| | 267,638 | | | Norwegian Krone | | | 31,569 | | | State Street Bank London | | 12/18/15 | | | 93 | | |
| | 193,234 | | | Norwegian Krone | | | 23,126 | | | State Street Bank London | | 12/18/15 | | | 400 | | |
| | 460,931 | | | Norwegian Krone | | | 55,665 | | | State Street Bank London | | 12/18/15 | | | 1,456 | | |
| | 92,110 | | | Pound Sterling | | | 142,620 | | | Royal Bank of Canada | | 12/18/15 | | | 651 | | |
| | 12,479 | | | Pound Sterling | | | 19,254 | | | Royal Bank of Canada | | 12/18/15 | | | 20 | | |
| | 19,883 | | | Pound Sterling | | | 30,641 | | | State Street Bank London | | 12/18/15 | | | (5 | ) | |
| | 49,740 | | | Pound Sterling | | | 77,256 | | | State Street Bank London | | 12/18/15 | | | 593 | | |
Contracts to Deliver | | In Exchange For | | Counterparty | | Settlement
Date | | Net
Unrealized
Appreciation
(Depreciation) | |
| | 52,923 | | | Pound Sterling | | $ | 81,343 | | | State Street Bank London | | 12/18/15 | | $ | (226 | ) | |
| | 22,244 | | | Pound Sterling | | | 34,399 | | | State Street Bank London | | 12/18/15 | | | 114 | | |
| | 103,323 | | | Pound Sterling | | | 159,045 | | | State Street Bank London | | 12/18/15 | | | (206 | ) | |
| | 8,189 | | | Pound Sterling | | | 12,527 | | | State Street Bank London | | 12/18/15 | | | (95 | ) | |
| | 242,362 | | | Singapore Dollar | | | 170,137 | | | Barclays Bank PLC Wholesale | | 11/12/15 | | | (2,805 | ) | |
| | 313,788,348 | | | South Korean Won | | | 270,379 | | | Barclays Bank PLC Wholesale | | 11/12/15 | | | (4,363 | ) | |
| | 320,758 | | | Swedish Krona | | | 39,057 | | | Royal Bank of Canada | | 12/18/15 | | | 1,472 | | |
| | 293,827 | | | Swedish Krona | | | 35,082 | | | Societe Generale | | 12/18/15 | | | 653 | | |
| | 988,947 | | | Swedish Krona | | | 121,741 | | | Societe Generale | | 12/18/15 | | | 5,862 | | |
| | 182,160 | | | Swedish Krona | | | 21,925 | | | State Street Bank London | | 12/18/15 | | | 581 | | |
| | 252,473 | | | Swedish Krona | | | 30,632 | | | State Street Bank London | | 12/18/15 | | | 1,049 | | |
| | 199,699 | | | Swedish Krona | | | 23,808 | | | State Street Bank London | | 12/18/15 | | | 408 | | |
| | 102,853 | | | Swedish Krona | | | 12,292 | | | State Street Bank London | | 12/18/15 | | | 240 | | |
| | 651,840 | | | Swedish Krona | | | 77,711 | | | State Street Bank London | | 12/18/15 | | | 1,332 | | |
| | 30,014 | | | Swiss Franc | | | 30,904 | | | Royal Bank of Canada | | 12/18/15 | | | 492 | | |
| | 14,555 | | | Swiss Franc | | | 15,087 | | | Royal Bank of Canada | | 12/18/15 | | | 339 | | |
| | 620,679 | | | Swiss Franc | | | 637,870 | | | Societe Generale | | 12/18/15 | | | 8,971 | | |
| | 17,434 | | | Swiss Franc | | | 17,674 | | | Societe Generale | | 12/18/15 | | | 9 | | |
| | 55,175 | | | Swiss Franc | | | 56,767 | | | State Street Bank London | | 12/18/15 | | | 861 | | |
| | 30,386 | | | Swiss Franc | | | 31,428 | | | State Street Bank London | | 12/18/15 | | | 640 | | |
| | 25,837 | | | Swiss Franc | | | 26,725 | | | State Street Bank London | | 12/18/15 | | | 546 | | |
| | 14,822 | | | Swiss Franc | | | 15,262 | | | State Street Bank London | | 12/18/15 | | | 244 | | |
| | 15,136 | | | Swiss Franc | | | 15,603 | | | State Street Bank London | | 12/18/15 | | | 267 | | |
| | 28,248 | | | Swiss Franc | | | 29,175 | | | State Street Bank London | | 12/18/15 | | | 553 | | |
| | 16,386 | | | Swiss Franc | | | 17,172 | | | State Street Bank London | | 12/18/15 | | | 569 | | |
| | 18,958 | | | Swiss Franc | | | 19,140 | | | State Street Bank London | | 12/18/15 | | | (69 | ) | |
| | 144,745 | | | Swiss Franc | | | 147,124 | | | State Street Bank London | | 12/18/15 | | | 462 | | |
Total | | | | | | | | | | $ | 17,682 | | |
Long Short Credit
| | Contracts to Deliver | | In Exchange
For | | Counterparty | | Settlement Date | | Net
Unrealized
Appreciation
(Depreciation) | |
| | 300,000 | | | Euro Currency | | $ | 339,631 | | | J.P. Morgan Chase Bank N.A. | | 11/18/15 | | $ | 9,676 | | |
Multi-Asset Income
| Contracts to Receive | | In Exchange
For | | Counterparty | | Settlement
Date | | Net
Unrealized
Appreciation
(Depreciation) | |
| | 29,159 | | | Australian Dollar | | $ | 21,331 | | | Royal Bank of Canada | | 12/18/15 | | $ | (585 | ) | |
| | 64,039 | | | Australian Dollar | | | 46,351 | | | Royal Bank of Canada | | 12/18/15 | | | (789 | ) | |
| | 35,951 | | | Australian Dollar | | | 25,198 | | | Societe Generale | | 12/18/15 | | | 380 | | |
| | 106,938 | | | Australian Dollar | | | 74,431 | | | Societe Generale | | 12/18/15 | | | 1,653 | | |
| | 115,839 | | | Australian Dollar | | | 81,400 | | | State Street Bank London | | 12/18/15 | | | 1,017 | | |
| | 20,035 | | | Australian Dollar | | | 14,057 | | | State Street Bank London | | 12/18/15 | | | 198 | | |
Contracts to Receive | | In Exchange
For | | Counterparty | | Settlement Date | | Net
Unrealized
Appreciation
(Depreciation) | |
| | 104,939 | | | Australian Dollar | | $ | 74,716 | | | State Street Bank London | | 12/18/15 | | $ | (54 | ) | |
| | 54,849 | | | Australian Dollar | | | 39,604 | | | State Street Bank London | | 12/18/15 | | | (580 | ) | |
| | 129,669 | | | Australian Dollar | | | 91,375 | | | State Street Bank London | | 12/18/15 | | | 882 | | |
| | 69,451 | | | Australian Dollar | | | 49,084 | | | State Street Bank London | | 12/18/15 | | | 329 | | |
| | 208,125 | | | Australian Dollar | | | 149,817 | | | State Street Bank London | | 12/18/15 | | | (1,740 | ) | |
| | 95,251 | | | Canadian Dollar | | | 73,083 | | | Royal Bank of Canada | | 12/18/15 | | | (258 | ) | |
| | 26,871 | | | Canadian Dollar | | | 20,336 | | | Royal Bank of Canada | | 12/18/15 | | | 209 | | |
| | 100,546 | | | Canadian Dollar | | | 76,986 | | | Societe Generale | | 12/18/15 | | | (113 | ) | |
| | 22,109 | | | Canadian Dollar | | | 16,723 | | | Societe Generale | | 12/18/15 | | | 181 | | |
| | 46,278 | | | Canadian Dollar | | | 35,430 | | | Societe Generale | | 12/18/15 | | | (47 | ) | |
| | 120,485 | | | Canadian Dollar | | | 90,508 | | | Societe Generale | | 12/18/15 | | | 1,610 | | |
| | 14,060 | | | Canadian Dollar | | | 10,645 | | | State Street Bank London | | 12/18/15 | | | 104 | | |
| | 67,557 | | | Canadian Dollar | | | 51,015 | | | State Street Bank London | | 12/18/15 | | | 637 | | |
| | 102,055 | | | Canadian Dollar | | | 77,455 | | | State Street Bank London | | 12/18/15 | | | 572 | | |
| | 29,040 | | | Canadian Dollar | | | 21,874 | | | State Street Bank London | | 12/18/15 | | | 329 | | |
| | 112,867 | | | Canadian Dollar | | | 84,124 | | | State Street Bank London | | 12/18/15 | | | 2,170 | | |
| | 40,342 | | | Canadian Dollar | | | 31,079 | | | State Street Bank London | | 12/18/15 | | | (235 | ) | |
| | 11,679 | | | Canadian Dollar | | | 8,922 | | | State Street Bank London | | 12/18/15 | | | 8 | | |
| | 110,873 | | | Euro | | | 124,426 | | | Royal Bank of Canada | | 12/18/15 | | | (2,415 | ) | |
| | 30,563 | | | Euro | | | 34,294 | | | Royal Bank of Canada | | 12/18/15 | | | (661 | ) | |
| | 17,265 | | | Euro | | | 19,387 | | | Royal Bank of Canada | | 12/18/15 | | | (388 | ) | |
| | 39,268 | | | Euro | | | 44,997 | | | Royal Bank of Canada | | 12/18/15 | | | (1,784 | ) | |
| | 31,791 | | | Euro | | | 36,009 | | | Societe Generale | | 12/18/15 | | | (1,024 | ) | |
| | 55,206 | | | Euro | | | 60,802 | | | Societe Generale | | 12/18/15 | | | (50 | ) | |
| | 93,016 | | | Euro | | | 105,009 | | | State Street Bank London | | 12/18/15 | | | (2,650 | ) | |
| | 51,659 | | | Euro | | | 57,553 | | | State Street Bank London | | 12/18/15 | | | (705 | ) | |
| | 78,637 | | | Euro | | | 87,773 | | | State Street Bank London | | 12/18/15 | | | (1,236 | ) | |
| | 24,508 | | | Euro | | | 27,636 | | | State Street Bank London | | 12/18/15 | | | (666 | ) | |
| | 9,471 | | | Euro | | | 10,759 | | | State Street Bank London | | 12/18/15 | | | (336 | ) | |
| | 19,401 | | | Euro | | | 21,986 | | | State Street Bank London | | 12/18/15 | | | (637 | ) | |
| | 2,002,974 | | | Japanese Yen | | | 16,601 | | | Royal Bank of Canada | | 12/18/15 | | | 10 | | |
| | 3,919,620 | | | Japanese Yen | | | 32,601 | | | Royal Bank of Canada | | 12/18/15 | | | (95 | ) | |
| | 6,461,707 | | | Japanese Yen | | | 54,013 | | | Royal Bank of Canada | | 12/18/15 | | | (425 | ) | |
| | 3,485,306 | | | Japanese Yen | | | 28,963 | | | Societe Generale | | 12/18/15 | | | (60 | ) | |
| | 1,833,346 | | | Japanese Yen | | | 15,407 | | | Societe Generale | | 12/18/15 | | | (203 | ) | |
| | 3,821,195 | | | Japanese Yen | | | 31,843 | | | State Street Bank London | | 12/18/15 | | | (154 | ) | |
| | 925,345 | | | Japanese Yen | | | 7,685 | | | State Street Bank London | | 12/18/15 | | | (11 | ) | |
| | 5,592,300 | | | Japanese Yen | | | 46,754 | | | State Street Bank London | | 12/18/15 | | | (377 | ) | |
| | 2,117,948 | | | Japanese Yen | | | 17,643 | | | State Street Bank London | | 12/18/15 | | | (79 | ) | |
| | 1,591,791 | | | Japanese Yen | | | 13,242 | | | State Street Bank London | | 12/18/15 | | | (41 | ) | |
| | 1,768,054 | | | Japanese Yen | | | 14,807 | | | State Street Bank London | | 12/18/15 | | | (145 | ) | |
| | 1,550,484 | | | Japanese Yen | | | 12,806 | | | State Street Bank London | | 12/18/15 | | | 52 | | |
| | 2,266,530 | | | Japanese Yen | | | 18,790 | | | State Street Bank London | | 12/18/15 | | | 7 | | |
| | 23,960 | | | New Zealand Dollar | | | 16,397 | | | Royal Bank of Canada | | 12/18/15 | | | (226 | ) | |
| | 210,691 | | | New Zealand Dollar | | | 131,419 | | | State Street Bank London | | 12/18/15 | | | 10,780 | | |
Contracts to Receive | | In Exchange
For | | Counterparty | | Settlement Date | | Net
Unrealized
Appreciation
(Depreciation) | |
| | 49,194 | | | New Zealand Dollar | | $ | 30,722 | | | State Street Bank London | | 12/18/15 | | $ | 2,480 | | |
| | 144,370 | | | New Zealand Dollar | | | 90,778 | | | State Street Bank London | | 12/18/15 | | | 6,660 | | |
| | 28,135 | | | New Zealand Dollar | | | 17,600 | | | State Street Bank London | | 12/18/15 | | | 1,389 | | |
| | 13,798 | | | New Zealand Dollar | | | 8,940 | | | State Street Bank London | | 12/18/15 | | | 372 | | |
| | 99,508 | | | New Zealand Dollar | | | 66,372 | | | State Street Bank London | | 12/18/15 | | | 788 | | |
| | 49,361 | | | New Zealand Dollar | | | 33,407 | | | State Street Bank London | | 12/18/15 | | | (92 | ) | |
| | 13,525 | | | New Zealand Dollar | | | 9,008 | | | State Street Bank London | | 12/18/15 | | | 121 | | |
| | 89,008 | | | Norwegian Krone | | | 10,480 | | | Royal Bank of Canada | | 12/18/15 | | | (13 | ) | |
| | 104,672 | | | Norwegian Krone | | | 12,486 | | | Royal Bank of Canada | | 12/18/15 | | | (176 | ) | |
| | 236,472 | | | Norwegian Krone | | | 28,594 | | | Royal Bank of Canada | | 12/18/15 | | | (784 | ) | |
| | 219,163 | | | Norwegian Krone | | | 27,184 | | | Societe Generale | | 12/18/15 | | | (1,409 | ) | |
| | 489,073 | | | Norwegian Krone | | | 57,095 | | | Societe Generale | | 12/18/15 | | | 424 | | |
| | 2,068,611 | | | Norwegian Krone | | | 252,028 | | | State Street Bank London | | 12/18/15 | | | (8,746 | ) | |
| | 273,549 | | | Norwegian Krone | | | 33,450 | | | State Street Bank London | | 12/18/15 | | | (1,279 | ) | |
| | 226,580 | | | Norwegian Krone | | | 27,649 | | | State Street Bank London | | 12/18/15 | | | (1,002 | ) | |
| | 396,942 | | | Norwegian Krone | | | 46,441 | | | State Street Bank London | | 12/18/15 | | | 242 | | |
| | 441,866 | | | Norwegian Krone | | | 54,542 | | | State Street Bank London | | 12/18/15 | | | (2,575 | ) | |
| | 127,476 | | | Norwegian Krone | | | 15,687 | | | State Street Bank London | | 12/18/15 | | | (695 | ) | |
| | 80,456 | | | Norwegian Krone | | | 9,370 | | | State Street Bank London | | 12/18/15 | | | 92 | | |
| | 591,238 | | | Norwegian Krone | | | 69,770 | | | State Street Bank London | | 12/18/15 | | | (237 | ) | |
| | 10,403 | | | Pound Sterling | | | 15,788 | | | Royal Bank of Canada | | 12/18/15 | | | 246 | | |
| | 18,778 | | | Pound Sterling | | | 28,466 | | | Royal Bank of Canada | | 12/18/15 | | | 477 | | |
| | 59,237 | | | Pound Sterling | | | 90,903 | | | Royal Bank of Canada | | 12/18/15 | | | 398 | | |
| | 9,095 | | | Pound Sterling | | | 13,986 | | | Royal Bank of Canada | | 12/18/15 | | | 32 | | |
| | 8,955 | | | Pound Sterling | | | 13,768 | | | Societe Generale | | 12/18/15 | | | 34 | | |
| | 41,771 | | | Pound Sterling | | | 63,659 | | | Societe Generale | | 12/18/15 | | | 722 | | |
| | 37,508 | | | Pound Sterling | | | 56,845 | | | Societe Generale | | 12/18/15 | | | 966 | | |
| | 23,562 | | | Pound Sterling | | | 36,128 | | | Societe Generale | | 12/18/15 | | | 188 | | |
| | 7,245 | | | Pound Sterling | | | 10,992 | | | State Street Bank London | | 12/18/15 | | | 175 | | |
| | 27,454 | | | Pound Sterling | | | 41,539 | | | State Street Bank London | | 12/18/15 | | | 775 | | |
| | 20,225 | | | Pound Sterling | | | 30,974 | | | State Street Bank London | | 12/18/15 | | | 198 | | |
| | 46,782 | | | Pound Sterling | | | 72,138 | | | State Street Bank London | | 12/18/15 | | | (33 | ) | |
| | 33,793 | | | Pound Sterling | | | 52,236 | | | State Street Bank London | | 12/18/15 | | | (151 | ) | |
| | 8,543 | | | Pound Sterling | | | 13,197 | | | State Street Bank London | | 12/18/15 | | | (30 | ) | |
| | 24,630 | | | Pound Sterling | | | 38,048 | | | State Street Bank London | | 12/18/15 | | | (86 | ) | |
| | 221,587 | | | Swedish Krona | | | 27,344 | | | Royal Bank of Canada | | 12/18/15 | | | (1,380 | ) | |
| | 397,897 | | | Swedish Krona | | | 48,402 | | | Royal Bank of Canada | | 12/18/15 | | | (1,779 | ) | |
| | 139,397 | | | Swedish Krona | | | 16,649 | | | Royal Bank of Canada | | 12/18/15 | | | (316 | ) | |
| | 163,444 | | | Swedish Krona | | | 19,713 | | | Royal Bank of Canada | | 12/18/15 | | | (561 | ) | |
| | 158,252 | | | Swedish Krona | | | 18,917 | | | Societe Generale | | 12/18/15 | | | (374 | ) | |
| | 374,074 | | | Swedish Krona | | | 44,067 | | | Societe Generale | | 12/18/15 | | | (235 | ) | |
| | 164,108 | | | Swedish Krona | | | 19,911 | | | Societe Generale | | 12/18/15 | | | (682 | ) | |
| | 67,704 | | | Swedish Krona | | | 8,305 | | | Societe Generale | | 12/18/15 | | | (372 | ) | |
| | 91,451 | | | Swedish Krona | | | 11,121 | | | State Street Bank London | | 12/18/15 | | | (405 | ) | |
| | 295,067 | | | Swedish Krona | | | 34,931 | | | State Street Bank London | | 12/18/15 | | | (356 | ) | |
| | 96,764 | | | Swedish Krona | | | 11,864 | | | State Street Bank London | | 12/18/15 | | | (526 | ) | |
Contracts to Receive | | In Exchange
For | | Counterparty | | Settlement
Date | | Net
Unrealized
Appreciation
(Depreciation) | |
| | 327,951 | | | Swedish Krona | | $ | 39,496 | | | State Street Bank London | | 12/18/15 | | $ | (1,069 | ) | |
| | 296,749 | | | Swedish Krona | | | 35,257 | | | State Street Bank London | | 12/18/15 | | | (485 | ) | |
| | 188,358 | | | Swedish Krona | | | 22,206 | | | State Street Bank London | | 12/18/15 | | | (135 | ) | |
| | 66,822 | | | Swiss Franc | | | 68,742 | | | Royal Bank of Canada | | 12/18/15 | | | (1,035 | ) | |
| | 23,483 | | | Swiss Franc | | | 24,802 | | | Royal Bank of Canada | | 12/18/15 | | | (1,008 | ) | |
| | 9,301 | | | Swiss Franc | | | 9,583 | | | Societe Generale | | 12/18/15 | | | (159 | ) | |
| | 15,000 | | | Swiss Franc | | | 15,676 | | | Societe Generale | | 12/18/15 | | | (478 | ) | |
| | 29,629 | | | Swiss Franc | | | 30,400 | | | State Street Bank London | | 12/18/15 | | | (379 | ) | |
| | 16,255 | | | Swiss Franc | | | 16,781 | | | State Street Bank London | | 12/18/15 | | | (311 | ) | |
Total | | | | | | | | | | $ | (10,215 | ) | |
Contracts to Deliver | | In Exchange
For | | Counterparty | | Settlement Date | | Net
Unrealized
Appreciation
(Depreciation) | |
| | 35,846 | | | Australian Dollar | | $ | 24,978 | | | Royal Bank of Canada | | 12/18/15 | | $ | (525 | ) | |
| | 68,344 | | | Australian Dollar | | | 47,862 | | | Royal Bank of Canada | | 12/18/15 | | | (763 | ) | |
| | 81,337 | | | Australian Dollar | | | 57,608 | | | Royal Bank of Canada | | 12/18/15 | | | (261 | ) | |
| | 71,592 | | | Australian Dollar | | | 51,275 | | | Royal Bank of Canada | | 12/18/15 | | | 339 | | |
| | 68,703 | | | Australian Dollar | | | 48,649 | | | Societe Generale | | 12/18/15 | | | (232 | ) | |
| | 107,052 | | | Australian Dollar | | | 75,801 | | | Societe Generale | | 12/18/15 | | | (364 | ) | |
| | 14,163 | | | Australian Dollar | | | 9,965 | | | State Street Bank London | | 12/18/15 | | | (111 | ) | |
| | 38,756 | | | Australian Dollar | | | 27,445 | | | State Street Bank London | | 12/18/15 | | | (129 | ) | |
| | 239,409 | | | Australian Dollar | | | 170,538 | | | State Street Bank London | | 12/18/15 | | | 204 | | |
| | 73,100 | | | Australian Dollar | | | 50,890 | | | State Street Bank London | | 12/18/15 | | | (1,120 | ) | |
| | 92,030 | | | Australian Dollar | | | 64,209 | | | State Street Bank London | | 12/18/15 | | | (1,268 | ) | |
| | 44,457 | | | Australian Dollar | | | 32,392 | | | State Street Bank London | | 12/18/15 | | | 762 | | |
| | 30,890 | | | Australian Dollar | | | 22,350 | | | State Street Bank London | | 12/18/15 | | | 372 | | |
| | 12,289 | | | Australian Dollar | | | 8,671 | | | State Street Bank London | | 12/18/15 | | | (72 | ) | |
| | 470,407 | | | Canadian Dollar | | | 355,205 | | | Royal Bank of Canada | | 12/18/15 | | | (4,449 | ) | |
| | 14,146 | | | Canadian Dollar | | | 10,552 | | | Royal Bank of Canada | | 12/18/15 | | | (264 | ) | |
| | 90,364 | | | Canadian Dollar | | | 68,972 | | | Royal Bank of Canada | | 12/18/15 | | | (117 | ) | |
| | 71,811 | | | Canadian Dollar | | | 55,595 | | | Royal Bank of Canada | | 12/18/15 | | | 691 | | |
| | 65,755 | | | Canadian Dollar | | | 49,962 | | | Societe Generale | | 12/18/15 | | | (311 | ) | |
| | 48,582 | | | Canadian Dollar | | | 36,704 | | | State Street Bank London | | 12/18/15 | | | (440 | ) | |
| | 58,255 | | | Canadian Dollar | | | 44,067 | | | State Street Bank London | | 12/18/15 | | | (472 | ) | |
| | 82,009 | | | Canadian Dollar | | | 61,319 | | | State Street Bank London | | 12/18/15 | | | (1,382 | ) | |
| | 64,125 | | | Canadian Dollar | | | 48,321 | | | State Street Bank London | | 12/18/15 | | | (707 | ) | |
| | 90,380 | | | Canadian Dollar | | | 68,939 | | | State Street Bank London | | 12/18/15 | | | (162 | ) | |
| | 61,992 | | | Canadian Dollar | | | 47,355 | | | State Street Bank London | | 12/18/15 | | | (41 | ) | |
| | 20,888 | | | Euro | | | 23,386 | | | Royal Bank of Canada | | 12/18/15 | | | 399 | | |
| | 71,508 | | | Euro | | | 80,942 | | | Royal Bank of Canada | | 12/18/15 | | | 2,251 | | |
| | 47,423 | | | Euro | | | 53,173 | | | Societe Generale | | 12/18/15 | | | 986 | | |
| | 14,939 | | | Euro | | | 17,124 | | | Societe Generale | | 12/18/15 | | | 684 | | |
| | 98,228 | | | Euro | | | 110,644 | | | Societe Generale | | 12/18/15 | | | 2,549 | | |
| | 91,510 | | | Euro | | | 103,278 | | | State Street Bank London | | 12/18/15 | | | 2,576 | | |
Contracts to Deliver | | In Exchange
For | | Counterparty | | Settlement
Date | | Net
Unrealized
Appreciation
(Depreciation) | |
| | 34,241 | | | Euro | | $ | 38,848 | | | State Street Bank London | | 12/18/15 | | $ | 1,167 | | |
| | 102,342 | | | Euro | | | 115,981 | | | State Street Bank London | | 12/18/15 | | | 3,358 | | |
| | 8,279 | | | Euro | | | 9,325 | | | State Street Bank London | | 12/18/15 | | | 214 | | |
| | 45,228 | | | Euro | | | 51,499 | | | State Street Bank London | | 12/18/15 | | | 1,727 | | |
| | 27,824 | | | Euro | | | 31,064 | | | State Street Bank London | | 12/18/15 | | | 445 | | |
| | 4,267,849 | | | Japanese Yen | | | 35,620 | | | Royal Bank of Canada | | 12/18/15 | | | 227 | | |
| | 1,896,560 | | | Japanese Yen | | | 16,028 | | | Royal Bank of Canada | | 12/18/15 | | | 300 | | |
| | 2,683,559 | | | Japanese Yen | | | 22,523 | | | Royal Bank of Canada | | 12/18/15 | | | 268 | | |
| | 1,905,372 | | | Japanese Yen | | | 15,959 | | | Societe Generale | | 12/18/15 | | | 158 | | |
| | 3,011,988 | | | Japanese Yen | | | 25,170 | | | Societe Generale | | 12/18/15 | | | 191 | | |
| | 5,738,842 | | | Japanese Yen | | | 47,638 | | | Societe Generale | | 12/18/15 | | | 46 | | |
| | 2,136,969 | | | Japanese Yen | | | 17,738 | | | State Street Bank London | | 12/18/15 | | | 16 | | |
| | 1,459,297 | | | Japanese Yen | | | 12,088 | | | State Street Bank London | | 12/18/15 | | | (14 | ) | |
| | 2,262,980 | | | Japanese Yen | | | 18,928 | | | State Street Bank London | | 12/18/15 | | | 161 | | |
| | 1,252,599 | | | Japanese Yen | | | 10,447 | | | State Street Bank London | | 12/18/15 | | | 59 | | |
| | 46,449 | | | New Zealand Dollar | | | 29,473 | | | Royal Bank of Canada | | 12/18/15 | | | (1,876 | ) | |
| | 48,593 | | | New Zealand Dollar | | | 31,349 | | | Royal Bank of Canada | | 12/18/15 | | | (1,447 | ) | |
| | 90,217 | | | New Zealand Dollar | | | 59,366 | | | Royal Bank of Canada | | 12/18/15 | | | (1,522 | ) | |
| | 40,136 | | | New Zealand Dollar | | | 27,138 | | | Royal Bank of Canada | | 12/18/15 | | | 49 | | |
| | 42,447 | | | New Zealand Dollar | | | 26,836 | | | Societe Generale | | 12/18/15 | | | (1,812 | ) | |
| | 31,468 | | | New Zealand Dollar | | | 19,760 | | | Societe Generale | | 12/18/15 | | | (1,478 | ) | |
| | 16,605 | | | New Zealand Dollar | | | 10,599 | | | Societe Generale | | 12/18/15 | | | (608 | ) | |
| | 52,929 | | | New Zealand Dollar | | | 33,328 | | | Societe Generale | | 12/18/15 | | | (2,394 | ) | |
| | 86,943 | | | New Zealand Dollar | | | 58,472 | | | Societe Generale | | 12/18/15 | | | (207 | ) | |
| | 42,984 | | | New Zealand Dollar | | | 27,015 | | | State Street Bank London | | 12/18/15 | | | (1,995 | ) | |
| | 17,566 | | | New Zealand Dollar | | | 11,060 | | | State Street Bank London | | 12/18/15 | | | (796 | ) | |
| | 46,421 | | | New Zealand Dollar | | | 29,347 | | | State Street Bank London | | 12/18/15 | | | (1,983 | ) | |
| | 16,561 | | | New Zealand Dollar | | | 10,607 | | | State Street Bank London | | 12/18/15 | | | (570 | ) | |
| | 221,413 | | | New Zealand Dollar | | | 147,385 | | | State Street Bank London | | 12/18/15 | | | (2,050 | ) | |
| | 58,007 | | | New Zealand Dollar | | | 39,276 | | | State Street Bank London | | 12/18/15 | | | 126 | | |
| | 49,348 | | | New Zealand Dollar | | | 33,262 | | | State Street Bank London | | 12/18/15 | | | (43 | ) | |
| | 383,902 | | | Norwegian Krone | | | 46,892 | | | Royal Bank of Canada | | 12/18/15 | | | 1,742 | | |
| | 123,683 | | | Norwegian Krone | | | 15,327 | | | Royal Bank of Canada | | 12/18/15 | | | 781 | | |
| | 263,593 | | | Norwegian Krone | | | 31,184 | | | Societe Generale | | 12/18/15 | | | 183 | | |
| | 177,839 | | | Norwegian Krone | | | 21,808 | | | Societe Generale | | 12/18/15 | | | 893 | | |
| | 343,206 | | | Norwegian Krone | | | 42,059 | | | State Street Bank London | | 12/18/15 | | | 1,696 | | |
| | 180,072 | | | Norwegian Krone | | | 21,676 | | | State Street Bank London | | 12/18/15 | | | 499 | | |
| | 174,806 | | | Norwegian Krone | | | 20,619 | | | State Street Bank London | | 12/18/15 | | | 61 | | |
| | 137,101 | | | Norwegian Krone | | | 16,408 | | | State Street Bank London | | 12/18/15 | | | 284 | | |
| | 304,599 | | | Norwegian Krone | | | 36,785 | | | State Street Bank London | | 12/18/15 | | | 962 | | |
| | 59,157 | | | Pound Sterling | | | 91,597 | | | Royal Bank of Canada | | 12/18/15 | | | 418 | | |
| | 8,104 | | | Pound Sterling | | | 12,504 | | | Royal Bank of Canada | | 12/18/15 | | | 13 | | |
| | 14,874 | | | Pound Sterling | | | 22,921 | | | State Street Bank London | | 12/18/15 | | | (4 | ) | |
| | 32,792 | | | Pound Sterling | | | 50,933 | | | State Street Bank London | | 12/18/15 | | | 391 | | |
| | 33,649 | | | Pound Sterling | | | 51,719 | | | State Street Bank London | | 12/18/15 | | | (144 | ) | |
| | 13,887 | | | Pound Sterling | | | 21,475 | | | State Street Bank London | | 12/18/15 | | | 71 | | |
Contracts to Deliver | | In Exchange
For | | Counterparty | | Settlement
Date | | Net
Unrealized
Appreciation
(Depreciation) | |
| | 67,193 | | | Pound Sterling | | $ | 103,430 | | | State Street Bank London | | 12/18/15 | | $ | (134 | ) | |
| | 203,783 | | | Swedish Krona | | | 24,814 | | | Royal Bank of Canada | | 12/18/15 | | | 935 | | |
| | 190,154 | | | Swedish Krona | | | 22,704 | | | Societe Generale | | 12/18/15 | | | 423 | | |
| | 636,921 | | | Swedish Krona | | | 78,406 | | | Societe Generale | | 12/18/15 | | | 3,775 | | |
| | 123,200 | | | Swedish Krona | | | 14,829 | | | State Street Bank London | | 12/18/15 | | | 393 | | |
| | 165,238 | | | Swedish Krona | | | 20,048 | | | State Street Bank London | | 12/18/15 | | | 686 | | |
| | 128,403 | | | Swedish Krona | | | 15,308 | | | State Street Bank London | | 12/18/15 | | | 262 | | |
| | 66,764 | | | Swedish Krona | | | 7,979 | | | State Street Bank London | | 12/18/15 | | | 156 | | |
| | 420,904 | | | Swedish Krona | | | 50,179 | | | State Street Bank London | | 12/18/15 | | | 860 | | |
| | 17,298 | | | Swiss Franc | | | 17,811 | | | Royal Bank of Canada | | 12/18/15 | | | 284 | | |
| | 415,108 | | | Swiss Franc | | | 426,605 | | | Societe Generale | | 12/18/15 | | | 6,000 | | |
| | 7,344 | | | Swiss Franc | | | 7,700 | | | Societe Generale | | 12/18/15 | | | 258 | | |
| | 8,077 | | | Swiss Franc | | | 8,340 | | | Societe Generale | | 12/18/15 | | | 156 | | |
| | 12,263 | | | Swiss Franc | | | 12,432 | | | Societe Generale | | 12/18/15 | | | 6 | | |
| | 31,122 | | | Swiss Franc | | | 32,020 | | | State Street Bank London | | 12/18/15 | | | 486 | | |
| | 19,510 | | | Swiss Franc | | | 20,179 | | | State Street Bank London | | 12/18/15 | | | 411 | | |
| | 14,426 | | | Swiss Franc | | | 14,922 | | | State Street Bank London | | 12/18/15 | | | 305 | | |
| | 9,780 | | | Swiss Franc | | | 10,082 | | | State Street Bank London | | 12/18/15 | | | 172 | | |
| | 15,702 | | | Swiss Franc | | | 16,217 | | | State Street Bank London | | 12/18/15 | | | 307 | | |
| | 7,799 | | | Swiss Franc | | | 8,127 | | | State Street Bank London | | 12/18/15 | | | 225 | | |
| | 11,652 | | | Swiss Franc | | | 12,211 | | | State Street Bank London | | 12/18/15 | | | 405 | | |
| | 13,792 | | | Swiss Franc | | | 13,924 | | | State Street Bank London | | 12/18/15 | | | (50 | ) | |
| | 94,009 | | | Swiss Franc | | | 95,554 | | | State Street Bank London | | 12/18/15 | | | 300 | | |
Total | | | | | | | | | | $ | 12,807 | | |
For the year ended October 31, 2015, investments in forward contracts had an average notional value of:
Global Allocation | | $ | 10,404,458 | | |
Long Short Credit | | $ | 334,400 | | |
Multi-Asset Income | | $ | 5,979,088 | | |
Options: During the year ended October 31, 2015, Long Short used written option transactions in an attempt to generate incremental returns. During the period ended October 31, 2015, Long Short Credit used options (including swaptions and options on futures) to establish net short or long positions for individual markets, currencies or securities, hedge risk and alter the Fund's exposure to currencies, interest rates, sectors and individual issuers. During the period ended October 31, 2015 Multi-Asset Income used written option contracts primarily to seek to enhance yield.
Premiums received by a Fund upon writing a covered call option or a put option are recorded in the liability section of the Fund's Statement of Assets and Liabilities and are subsequently adjusted to the current market value. When an option is exercised, closed, or expired, a Fund realizes a gain or loss and the liability is eliminated.
When writing a covered call option, a Fund, in return for the premium, gives up the opportunity for profit from a price increase in the underlying security above the exercise price, but conversely retains the risk of loss should the price of the security decline. When writing a put option, a Fund, in return for the premium, takes the risk that it must purchase the underlying security at a price that may be higher than the current market price of the security. If a covered call or a put option that a Fund has written expires unexercised, a Fund will realize a gain in the amount of the premium. All securities covering outstanding written options are held in escrow by the custodian bank.
Swaptions are similar to options on securities except that instead of selling or purchasing the right to buy or sell a security, the writer or purchaser of the swaptions is granting or buying the right to enter into a previously agreed upon interest rate or credit default swap agreement (interest rate risk and/or credit risk) at any time before the expiration of the option. At October 31, 2015, there were no swaptions outstanding.
Options on Exchange-Traded Financial Futures Contracts: A Fund may write or purchase options on exchange-traded financial futures contracts ("futures option") to hedge an existing position or future investment, for speculative purposes or to manage exposure to market movements. A futures option is an option contract in which the underlying instrument is a specific financial futures contract. At October 31, 2015, there were no futures options outstanding.
Written option transactions for Long Short, Long Short Credit and Multi-Asset Income for the period ended October 31, 2015 were:
Long Short
| | | Number
of Contracts | | Premium
Received | |
Outstanding 10/31/2014 | | | 1,760 | | | $ | 307,729 | | |
Options written | | | 19,757 | | | | 9,295,689 | | |
Options expired | | | (9,300 | ) | | | (1,588,534 | ) | |
Options exercised | | | (1,053 | ) | | | (272,219 | ) | |
Options closed | | | (1,760 | ) | | | (307,729 | ) | |
Outstanding 10/31/2015 | | | 9,404 | | | $ | 7,434,936 | | |
Long Short Credit
| | Number
of Contracts | | Premium
Received | |
Outstanding 6/29/2015 | | | — | | | $ | — | | |
Options written | | | 22,000,315 | | | | 83,861 | | |
Options expired | | | (16,000,050 | ) | | | (28,410 | ) | |
Options exercised | | | (1,000,000 | ) | | | (4,500 | ) | |
Options closed | | | (5,000,115 | ) | | | (37,589 | ) | |
Outstanding 10/31/2015 | | | 150 | | | $ | 13,362 | | |
Multi-Asset Income
| | Number
of Contracts | | Premium
Received | |
Outstanding 3/27/15 | | | — | | | $ | — | | |
Options written | | | 369 | | | | 41,811 | | |
Options expired | | | (78 | ) | | | (3,057 | ) | |
Options exercised | | | — | | | | — | | |
Options closed | | | (165 | ) | | | (32,894 | ) | |
Outstanding 10/31/2015 | | | 126 | | | $ | 5,860 | | |
Premiums paid by a Fund upon purchasing a call or put option are recorded in the asset section of the Fund's Statements of Assets and Liabilities and are subsequently adjusted to the current market value. When an option is exercised, closed, or expired, a Fund realizes a gain or loss and the asset is eliminated.
For purchased call options, a Fund's loss is limited to the amount of the option premium paid.
Purchased option transactions were used either for hedging purposes or in an attempt to generate incremental returns for Long Short for the year ended October 31, 2015.
At October 31, 2015, the Funds had deposited the following in segregated accounts to cover margin requirements on options:
Long Short | | $ | 26,285,598 | | |
Long Short Credit | | $ | 1,049,750 | | |
Multi-Asset Income | | $ | 15,478 | | |
For the year ended October 31, 2015, the average market value of purchased options and written options was:
| | Purchased
Options | | Written
Options | |
Long Short | | $ | 503,917 | | | $ | (1,151,128 | ) | |
Long Short Credit | | $ | 688 | | | $ | (9,874 | ) | |
Multi-Asset Income | | $ | — | | | $ | (4,423 | ) | |
At October 31, 2015, the Funds (except Flexible Select) had the following derivatives (which did not qualify as hedging instruments under ASC 815), grouped by primary risk exposure:
Asset Derivatives
Derivative Type | | Statements of
Assets and
Liabilities Location | | Interest
Rate Risk | | Currency
Risk | | Equity
Risk | | Credit
Risk | | Total | |
Global Allocation | |
Financial futures | | Receivable/Payable for
variation margin on financial
futures contracts(1) | | $ | 7,232 | | | $ | 3,895 | | | $ | 63,021 | | | $ | — | | | $ | 74,148 | | |
Forward contracts | | Receivable for forward
foreign currency contracts | | | — | | | | 151,897 | | | | — | | | | — | | | | 151,897 | | |
Total Value-Assets | | | | $ | 7,232 | | | $ | 155,792 | | | $ | 63,021 | | | $ | — | | | $ | 226,045 | | |
Inflation Managed | |
Financial futures | | Receivable/Payable for
variation margin on financial
futures contracts(1) | | $ | 6,560 | | | $ | 1,545 | | | $ | — | | | $ | — | | | $ | 8,105 | | |
Total Value-Assets | | | | $ | 6,560 | | | $ | 1,545 | | | $ | — | | | $ | — | | | $ | 8,105 | | |
Long Short | |
Financial futures | | Receivable/Payable for
variation margin on financial
futures contracts(1) | | $ | — | | | $ | — | | | $ | 139,820 | | | $ | — | | | $ | 139,820 | | |
OTC Swap contracts | | OTC swap contracts,
at value(2) | | | 614,218 | | | | — | | | | — | | | | — | | | | 614,218 | | |
| Option contracts purchased | | Investments in securities,
at value | | | — | | | | — | | | | 59,520 | | | | — | | | | 59,520 | | |
Total Value-Assets | | | | $ | 614,218 | | | $ | — | | | $ | 199,340 | | | $ | — | | | $ | 813,558 | | |
Derivative Type | | Statements of
Assets and
Liabilities Location | | Interest
Rate Risk | | Currency
Risk | | Equity
Risk | | Credit
Risk | | Total | |
Long Short Credit | |
| OTC Swap contracts | | OTC swap contracts,
at value(2) | | $ | — | | | $ | — | | | $ | 51,531 | | | $ | 74,389 | | | $ | 125,920 | | |
Centrally cleared
swap contracts | | Receivable/Payable for
variation margin on centrally
cleared swap contracts(3) | | | — | | | | — | | | | — | | | | 18,415 | | | | 18,415 | | |
Financial futures | | Receivable/Payable for
variation margin on financial
futures contracts(1) | | | 4,613 | | | | — | | | | — | | | | — | | | | 4,613 | | |
Forward contracts | | Receivable for forward
foreign currency contracts | | | — | | | | 9,676 | | | | — | | | | — | | | | 9,676 | | |
Total Value-Assets | | | | $ | 4,613 | | | $ | 9,676 | | | $ | 51,531 | | | $ | 92,804 | | | $ | 158,624 | | |
Multi-Asset Income | |
Financial futures | | Receivable/Payable for
variation margin on financial
futures contracts(1) | | $ | 21,990 | | | $ | — | | | $ | — | | | $ | — | | | $ | 21,990 | | |
Forward contracts | | Receivable for forward
foreign currency contracts | | | — | | | | 83,031 | | | | — | | | | — | | | | 83,031 | | |
Total Value-Assets | | | | $ | 21,990 | | | $ | 83,031 | | | $ | — | | | $ | — | | | $ | 105,021 | | |
Liability Derivatives
| Derivative Type | | Statements of
Assets and
Liabilities Location | | Interest
Rate Risk | | Currency
Risk | | Equity
Risk | | Credit
Risk | | Total | |
Global Allocation | |
Financial futures | | Receivable/Payable for
variation margin on financial
futures contracts(1) | | $ | (2,573 | ) | | $ | (26,108 | ) | | $ | (21,261 | ) | | $ | — | | | $ | (49,942 | ) | |
Forward contracts | | Payable for forward
foreign currency contracts | | | — | | | | (138,049 | ) | | | — | | | | — | | | | (138,049 | ) | |
Total Value-Liabilities | | | | $ | (2,573 | ) | | $ | (164,157 | ) | | $ | (21,261 | ) | | $ | — | | | $ | (187,991 | ) | |
Inflation Managed | |
Financial futures | | Receivable/Payable for
variation margin on financial
futures contracts(1) | | $ | (14,287 | ) | | $ | (37,386 | ) | | $ | — | | | $ | — | | | $ | (51,673 | ) | |
Total Value-Liabilities | | | | $ | (14,287 | ) | | $ | (37,386 | ) | | $ | — | | | $ | — | | | $ | (51,673 | ) | |
| Derivative Type | | Statements of
Assets and
Liabilities Location | | Interest
Rate Risk | | Currency
Risk | | Equity
Risk | | Credit
Risk | | Total | |
Long Short | |
Financial futures | | Receivable/Payable for
variation margin on financial
futures contracts(1) | | $ | — | | | $ | — | | | $ | (14,995,765 | ) | | $ | — | | | $ | (14,995,765 | ) | |
OTC Swap contracts | | OTC swap contracts,
at value(2) | | | (2,896,345 | ) | | | — | | | | — | | | | — | | | | (2,896,345 | ) | |
Option contracts
written | | Option contracts written,
at value | | | — | | | | — | | | | (7,387,940 | ) | | | — | | | | (7,387,940 | ) | |
Total Value-Liabilities | | | | $ | (2,896,345 | ) | | $ | — | | | $ | (22,383,705 | ) | | $ | — | | | $ | (25,280,050 | ) | |
Long Short Credit | |
OTC Swap contracts | | OTC swap contracts,
at value(2) | | $ | — | | | $ | — | | | $ | (6,521 | ) | | $ | (377,552 | ) | | $ | (384,073 | ) | |
Financial futures | | Receivable/Payable for
variation margin on financial
futures contracts(1) | | | — | | | | — | | | | (29,688 | ) | | | — | | | | (29,688 | ) | |
Option contracts
written | | Option contracts written,
at value | | | — | | | | — | | | | (18,350 | ) | | | — | | | | (18,350 | ) | |
Total Value-Liabilities | | | | $ | — | | | $ | — | | | $ | (54,559 | ) | | $ | (377,552 | ) | | $ | (432,111 | ) | |
Multi-Asset Income | |
Financial futures | | Receivable/Payable for
variation margin on financial
futures contracts(1) | | $ | (2,710 | ) | | $ | — | | | $ | — | | | $ | — | | | $ | (2,710 | ) | |
Forward contracts | | Payable for open forward
foreign currency contracts | | | — | | | | (80,439 | ) | | | — | | | | — | | | | (80,439 | ) | |
Option contracts
written | | Option contracts written,
at value | | | — | | | | — | | | | (13,309 | ) | | | — | | | | (13,309 | ) | |
Total Value-Liabilities | | | | $ | (2,710 | ) | | $ | (80,439 | ) | | $ | (13,309 | ) | | $ | — | | | $ | (96,458 | ) | |
(1) "Financial futures" reflects the cumulative appreciation (depreciation) of futures contracts as of October 31, 2015, which is reflected in the Statements of Assets and Liabilities under the caption "Net unrealized appreciation (depreciation) in value of investments." The outstanding variation margin as of October 31, 2015, if any, is reflected in the Statements of Assets and Liabilities under the caption "Receivable/Payable for variation margin on financial futures contracts."
(2) "OTC Swap Contracts" reflects the appreciation (depreciation) of the OTC swap contracts plus accrued interest as of October 31, 2015 which is reflected in the Statement of Assets and Liabilities under the caption "OTC swap contracts, at value."
(3) "Centrally Cleared Swap Contracts" reflects cumulative unrealized appreciation or (depreciation). Only the current day's variation margin on centrally cleared swaps is reported within the Statement of Assets and Liabilities as "Receivable/Payable for variation margin on centrally cleared swap contracts."
The impact of the use of these derivative instruments on the Statements of Operations during the year ended October 31, 2015, was as follows:
Realized Gain (Loss)
Derivative Type | | Statements of
Operations Location | | Interest
Rate Risk | | Currency
Risk | | Equity
Risk | | Credit
Risk | | Total | |
Global Allocation | |
Swap contracts | | Net realized gain (loss) on:
swap contracts | | $ | — | | | $ | — | | | $ | 111,835 | | | $ | — | | | $ | 111,835 | | |
Financial futures | | Net realized gain (loss) on:
financial futures contracts | | | 189,900 | | | | 265,276 | | | | (65,829 | ) | | | — | | | | 389,347 | | |
Forward contracts | | Net realized gain (loss) on:
forward foreign currency
contracts | | | — | | | | 80,920 | | | | — | | | | — | | | | 80,920 | | |
Total Realized
Gain (Loss) | | | | $ | 189,900 | | | $ | 346,196 | | | $ | 46,006 | | | $ | — | | | $ | 582,102 | | |
Inflation Managed | |
Financial futures | | Net realized gain (loss) on:
financial futures contracts | | $ | (48,113 | ) | | $ | 130,667 | | | $ | — | | | $ | — | | | $ | 82,554 | | |
Total Realized
Gain (Loss) | | | | $ | (48,113 | ) | | $ | 130,667 | | | $ | — | | | $ | — | | | $ | 82,554 | | |
Long Short | |
Financial futures | | Net realized gain (loss) on:
financial futures contracts | | $ | — | | | $ | — | | | $ | (4,413,790 | ) | | $ | — | | | $ | (4,413,790 | ) | |
Option contracts
purchased | | Net realized gain (loss) on:
sales of investment securities
of unaffiliated issuers | | | — | | | | — | | | | (2,367,061 | ) | | | — | | | | (2,367,061 | ) | |
Option contracts
written | | Net realized gain (loss) on:
option contracts and
swaptions written | | | — | | | | — | | | | 1,867,223 | | | | — | | | | 1,867,223 | | |
Swap contracts | | Net realized gain (loss) on:
swap contracts | | | (753,311 | ) | | | — | | | | — | | | | — | | | | (753,311 | ) | |
Total Realized
Gain (Loss) | | | | $ | (753,311 | ) | | $ | — | | | $ | (4,913,628 | ) | | $ | — | | | $ | (5,666,939 | ) | |
| Derivative Type | | Statements of
Operations Location | | Interest
Rate Risk | | Currency
Risk | | Equity
Risk | | Credit
Risk | | Total | |
Long Short Credit | |
Swap contracts | | Net realized gain (loss) on:
swap contracts | | $ | (52,424 | ) | | $ | — | | | $ | (89,725 | ) | | $ | (168,967 | ) | | $ | (311,116 | ) | |
Financial futures | | Net realized gain (loss) on:
financial futures contracts | | | 28,482 | | | | — | | | | (46,225 | ) | | | — | | | | (17,743 | ) | |
Forward contracts | | Net realized gain (loss) on:
forward foreign currency
contracts | | | — | | | | (11,476 | ) | | | — | | | | — | | | | (11,476 | ) | |
Option contracts
purchased | | Net realized gain (loss) on:
sales of investment securities
of unaffiliated issuers | | | (6,125 | ) | | | — | | | | 123,125 | | | | — | | | | 117,000 | | |
Option contracts and
swaptions written | | Net realized gain (loss) on:
option contracts and
swaptions written | | | 10,924 | | | | — | | | | 31,971 | | | | — | | | | 42,895 | | |
Total Realized
Gain (Loss) | | | | $ | (19,143 | ) | | $ | (11,476 | ) | | $ | 19,146 | | | $ | (168,967 | ) | | $ | (180,440 | ) | |
Multi-Asset Income | |
Financial futures | | Net realized gain (loss) on:
financial futures contracts | | $ | 21,401 | | | $ | — | | | $ | (70,115 | ) | | $ | — | | | $ | (48,714 | ) | |
Forward contracts | | Net realized gain (loss) on:
forward foreign currency
contracts | | | — | | | | 66,913 | | | | — | | | | — | | | | 66,913 | | |
Option contracts
written | | Net realized gain (loss) on:
option contracts and
swaptions written | | | — | | | | — | | | | 11,544 | | | | — | | | | 11,544 | | |
Total Realized
Gain (Loss) | | | | $ | 21,401 | | | $ | 66,913 | | | $ | (58,571 | ) | | $ | — | | | $ | 29,743 | | |
Change in Appreciation (Depreciation) | |
Derivative Type | | Statements of
Operations Location | | Interest
Rate Risk | | Currency
Risk | | Equity
Risk | | Credit
Risk | | Total | |
Global Allocation | |
Swap contracts | | Change in net unrealized
appreciation (depreciation)
in value of: swap contracts | | $ | — | | | $ | — | | | $ | (456,795 | ) | | $ | — | | | $ | (456,795 | ) | |
Financial futures | | Change in net unrealized
appreciation (depreciation)
in value of: financial
futures contracts | | | (84,564 | ) | | | (111,534 | ) | | | 7,628 | | | | — | | | | (188,470 | ) | |
Forward contracts | | Change in net unrealized
appreciation (depreciation)
in value of: forward foreign
currency contracts | | | — | | | | 10,888 | | | | — | | | | — | | | | 10,888 | | |
Total Change in
Appreciation
(Depreciation) | | | | $ | (84,564 | ) | | $ | (100,646 | ) | | $ | (449,167 | ) | | $ | — | | | $ | (634,377 | ) | |
Inflation Managed | |
Financial futures | | Change in net unrealized
appreciation (depreciation)
in value of: financial
futures contracts | | $ | 7,299 | | | $ | (36,186 | ) | | $ | — | | | $ | — | | | $ | (28,887 | ) | |
Total Change in
Appreciation
(Depreciation) | | | | $ | 7,299 | | | $ | (36,186 | ) | | $ | — | | | $ | — | | | $ | (28,887 | ) | |
Derivative Type | | Statements of
Operations Location | | Interest
Rate Risk | | Currency
Risk | | Equity
Risk | | Credit
Risk | | Total | |
Long Short | |
Financial futures | | Change in net unrealized
appreciation (depreciation)
in value of: financial
futures contracts | | $ | — | | | $ | — | | | $ | (5,853,069 | ) | | $ | — | | | $ | (5,853,069 | ) | |
Option contracts
purchased | | Change in net unrealized
appreciation (depreciation)
in value of: unaffiliated
investment securities | | | — | | | | — | | | | (606,236) | | | | — | | | | (606,236) | | |
Option contracts
written | | Change in net unrealized
appreciation (depreciation)
in value of: option
contracts written | | | — | | | | — | | | | (112,893) | | | | — | | | | (112,893) | | |
Swap contracts | | Change in net unrealized
appreciation (depreciation)
in value of: swap contracts | | | (2,282,127 | ) | | | — | | | | — | | | | — | | | | (2,282,127 | ) | |
Total Change in
Appreciation
(Depreciation) | | | | $ | (2,282,127 | ) | | $ | — | | | $ | (6,572,198 | ) | | $ | — | | | $ | (8,854,325 | ) | |
Long Short Credit | |
Swap contracts | | Change in net unrealized
appreciation (depreciation)
in value of: swap contracts | | $ | 37,727 | | | $ | — | | | $ | $54,954 | | | $ | 92,681 | | | | |
Financial futures | | Change in net unrealized
appreciation (depreciation)
in value of: financial
futures contracts | | | 4,613 | | | | — | | | | (29,688 | ) | | | — | | | | (25,075 | ) | |
| Forward contracts | | Change in net unrealized
appreciation (depreciation)
in value of: forward foreign
currency contracts | | | — | | | | 9,676 | | | | — | | | | — | | | | 9,676 | | |
Option contracts
written | | Change in net unrealized
appreciation (depreciation)
in value of: option
contracts written | | | — | | | | — | | | | (4,988) | | | | — | | | | (4,988) | | |
Total Change in
Appreciation
(Depreciation) | | | | $ | 42,340 | | | $ | 9,676 | | | $ | (34,676 | ) | | $ | 54,954 | | | $ | 72,294 | | |
| Derivative Type | | Statements of
Operations Location | | Interest
Rate Risk | | Currency
Risk | | Equity
Risk | | Credit
Risk | | Total | |
Multi-Asset Income | |
Financial futures | | Change in net unrealized
appreciation (depreciation)
in value of: financial
futures contracts | | $ | 1,259 | | | $ | — | | | $ | 18,021 | | | $ | — | | | $ | 19,280 | | |
Forward contracts | | Change in net unrealized
appreciation (depreciation)
in value of: forward foreign
currency contracts | | | — | | | | 2,592 | | | | — | | | | — | | | | 2,592 | | |
Options contracts
written | | Change in net unrealized
appreciation (depreciation)
in value of: options
contracts written | | | — | | | | — | | | | (7,449 | ) | | | — | | | | (7,449 | ) | |
Total Change in
Appreciation
(Depreciation) | | | | | $1,259 | | | | $2,592 | | | | $10,572 | | | | $— | | | | $14,423 | | |
While the Funds may receive redeemable preference shares, rights and warrants in connection with their investments in securities, these rights and warrants are not considered "derivative instruments" under ASC 815. Management has concluded that Flexible Select did not hold any derivative instruments during the year ended October 31, 2015 that require additional disclosures pursuant to ASC 815.
The Funds adopted the provisions of Accounting Standards Update 2011-11 Disclosures about Offsetting Assets and Liabilities ("ASU 2011-11"). ASU 2011-11 is intended to enhance disclosure requirements on the offsetting of financial assets and liabilities. Pursuant to ASU 2011-11, an entity is required to disclose both gross and net information for assets and liabilities related to derivatives, repurchase and reverse repurchase agreements, and securities lending and securities borrowing transactions that are eligible for offset or subject to an enforceable master netting or similar agreement. ASU 2011-11 is applicable to the Funds except Flexible Select and Inflation Managed at October 31, 2015. The Funds' derivative assets and liabilities at fair value by type are reported gross in the Statements of Assets and Liabilities. The following tables present derivative assets and liabilities by counterparty, net of amounts available for offset and net of the related collateral received by a Fund for assets and pledged by a Fund for liabilities as of October 31, 2015.
| Description | | Gross Amounts of
Recognized Assets | | Gross Amounts
Offset in the
Statements of
Assets and
Liabilities | | Net Amounts of Assets Presented in the
Statements of Assets and Liabilities | |
Global Allocation | |
Forward contracts | | $ | 151,897 | | | $ | — | | | $ | 151,897 | | |
Securities lending | | | 228,266 | | | | — | | | | 228,266 | | |
Total | | $ | 380,163 | | | $ | — | | | $ | 380,163 | | |
Long Short | |
Swap contracts | | $ | 614,218 | | | $ | — | | | $ | 614,218 | | |
Total | | $ | 614,218 | | | $ | — | | | $ | 614,218 | | |
Description | | Gross Amounts of
Recognized Assets | | Gross Amounts
Offset in the
Statements of
Assets and
Liabilities | | Net Amounts of Assets Presented in the
Statements of Assets and Liabilities | |
Long Short Credit | |
OTC Swap contracts | | $ | 107,342 | | | $ | — | | | $ | 107,342 | | |
Forward contracts | | | 9,676 | | | | | | 9,676 | | |
Total | | $ | 117,018 | | | $ | — | | | $ | 117,018 | | |
Multi-Asset Income | |
Forward contracts | | | 83,031 | | | | — | | | | 83,031 | | |
Total | | $ | 83,031 | | | $ | — | | | $ | 83,031 | | |
| | Gross Amounts Not Offset in the Statements of Assets and Liabilities | |
Counterparty | | Net Amounts of
Assets Presented in
the Statements of
Assets and Liabilities | | Financial
Instruments | | Cash Collateral
Received(a) | | Net Amount(b) | |
Global Allocation | |
Barclays Bank PLC Wholesale | | $ | 24,339 | | | $ | (14,148 | ) | | $ | — | | | $ | 10,191 | | |
Royal Bank of Canada | | | 15,899 | | | | (15,899 | ) | | | — | | | | — | | |
Societe Generale | | | 32,439 | | | | (19,556 | ) | | | — | | | | 12,883 | | |
State Street Bank London | | | 79,220 | | | | (64,538 | ) | | | — | | | | 14,682 | | |
State Street Bank and Trust Company | | | 228,266 | | | | — | | | | (228,266 | ) | | | — | | |
Total | | $ | 380,163 | | | $ | (114,141 | ) | | $ | (228,266 | ) | | $ | 37,756 | | |
Long Short | |
Goldman Sachs International | | $ | 614,218 | | | $ | (614,218 | ) | | $ | — | | | | — | | |
Total | | $ | 614,218 | | | $ | (614,218 | ) | | | — | | | | — | | |
Long Short Credit | |
Bank of America N.A. | | $ | 13,005 | | | $ | — | | | $ | — | | | $ | 13,005 | | |
Goldman Sachs & Co. | | | 94,337 | | | | (33,076 | ) | | | — | | | | 61,261 | | |
J.P. Morgan Chase Bank N.A. | | | 9,676 | | | | | | — | | | | 9,676 | | |
Total | | $ | 117,018 | | | $ | (33,076 | ) | | $ | — | | | $ | 83,942 | | |
Multi-Asset Income | |
Royal Bank of Canada | | $ | 10,069 | | | $ | (10,069 | ) | | $ | — | | | $ | — | | |
Societe Generale | | | 22,466 | | | | (12,612 | ) | | | — | | | | 9,854 | | |
State Street Bank London. | | | 50,496 | | | | (41,925 | ) | | | — | | | | 8,571 | | |
Total | | $ | 83,031 | | | $ | (64,606 | ) | | $ | — | | | $ | 18,425 | | |
Description | | Gross Amounts of
Recognized Liabilities | | Gross Amounts
Offset in the
Statements of
Assets and
Liabilities | | Net Amounts of Liabilities Presented in the
Statements of Assets and Liabilities | |
Global Allocation | |
Forward contracts | | $ | (138,049 | ) | | $ | — | | | $ | (138,049 | ) | |
Total | | $ | (138,049 | ) | | $ | — | | | $ | (138,049 | ) | |
Long Short | |
OTC Swap contracts | | $ | (2,896,345 | ) | | $ | — | | | $ | (2,896,345 | ) | |
Total | | $ | (2,896,345 | ) | | $ | — | | | $ | (2,896,345 | ) | |
Long Short Credit | |
OTC Swap contracts | | $ | (33,076 | ) | | | — | | | $ | (33,076 | ) | |
Total | | $ | (33,076 | ) | | $ | — | | | $ | (33,076 | ) | |
Multi-Asset Income | |
Forward contracts | | $ | (80,439 | ) | | | — | | | $ | (80,439 | ) | |
Total | | $ | (80,439 | ) | | $ | — | | | $ | (80,439 | ) | |
| | | Gross Amounts Not Offset in the Statements of Assets and Liabilities | |
Counterparty | | Net Amounts of
Liabilities Presented in
the Statements of
Assets and Liabilities | | Financial
Instruments | | Cash Collateral
Pledged(a) | | Net Amount(c) | |
Global Allocation | |
Barclays Bank PLC Wholesale | | $ | (14,148 | ) | | $ | 14,148 | | | $ | — | | | $ | — | | |
Royal Bank of Canada | | | (39,807 | ) | | | 15,899 | | | | — | | | | 23,908 | | |
Societe Generale | | | (19,556 | ) | | | 19,556 | | | | — | | | | — | | |
State Street Bank London | | | (64,538 | ) | | | 64,538 | | | | — | | | | — | | |
Total | | $ | (138,049 | ) | | $ | 114,141 | | | $ | — | | | $ | 23,908 | | |
Long Short | |
Goldman Sachs International | | $ | (2,896,345 | ) | | $ | 614,218 | | | $ | 1,750,000 | | | $ | (532,127 | ) | |
Total | | $ | (2,896,345 | ) | | $ | 614,218 | | | $ | 1,750,000 | | | $ | (532,127 | ) | |
Long Short Credit | |
Goldman Sachs & Co. | | $ | (33,076 | ) | | $ | 33,076 | | | $ | — | | | $ | — | | |
Total | | $ | (33,076 | ) | | $ | 33,076 | | | $ | — | | | $ | — | | |
Multi-Asset Income | |
Royal Bank of Canada | | $ | (25,902 | ) | | $ | 10,069 | | | $ | — | | | $ | (15,833 | ) | |
Societe Generale | | | (12,612 | ) | | | 12,612 | | | | — | | | | — | | |
State Street Bank London. | | | (41,925 | ) | | | 41,925 | | | | — | | | | — | | |
Total | | $ | (80,439 | ) | | $ | 64,606 | | | $ | — | | | $ | (15,833 | ) | |
(a) Collateral received (or pledged) is limited to an amount not to exceed 100% of the net amount of assets (or liabilities) in the tables presented above, for each respective counterparty.
(b) Net Amount represents amounts subject to loss as of October 31, 2015, in the event of a counterparty failure.
(c) Net Amount represents amounts under-collateralized by Global Allocation, Long Short and Multi-Asset Income to each counterparty as of October 31, 2015.
16 Indemnifications: Like many other companies, the Trust's organizational documents provide that its officers ("Officers") and trustees ("Trustees") are indemnified against certain liabilities arising out of the performance of their duties to the Trust. In addition, both in some of its principal service contracts and in the normal course of its business, the Trust enters into contracts that provide indemnifications to other parties for certain types of losses or liabilities. The Trust's maximum exposure under these arrangements is unknown as this could involve future claims against the Trust.
17 Transactions with other funds managed by Neuberger Berman Management LLC: Neuberger Berman Alternative Funds and Management have obtained an exemptive order from the Securities and Exchange Commission ("SEC") that permits the Funds to invest in both affiliated and unaffiliated investment companies, including exchange-traded funds, in excess of the limits in Section 12(d)(1)(A) of the 1940 Act, as amended, subject to the terms and conditions of such order. Through October 31, 2015, Flexible Select invested in Neuberger Berman Core Bond Fund and Neuberger Berman Unconstrained (an "Underlying Fund"). Through October 31, 2015 Global Allocation invested in Neuberger Berman Emerging Markets Debt Fund, Neuberger Berman Emerging Markets Equity Fund, Neuberger Berman High Income Bond Fund, Neuberger Berman International Equity Fund, Neuberger Berman Risk Balanced Commodity Strategy Fund and Neuberger Berman Short Duration High Income Fund (collectively the "Underlying Funds"). Through October 31, 2015, Inflation Managed invested in Neuberger Berman Emerging Markets Equity Fund, Neuberger Berman Floating Rate Income Fund, Neuberger Berman High Income Bond Fund, Neuberger Berman Long Short Credit and Neuberger Berman Risk Balanced Commodity Strategy Fund (collectively the "Underlying Funds"). Through October 31, 2015, Multi-Asset Income invested in Neuberger Berman Emerging Markets Debt Fund, Neuberger Berman Floating Rate Income Fund, Neuberger Berman High Income Bond Fund and Neuberger Berman Long Short Credit Fund(collectively the "Underlying Funds") (See Note F).
For the Funds' investments in the Underlying Funds, Management waived a portion of its management fee equal to the management fee it received from the Underlying Funds on those assets (the "Arrangement"). For the fiscal period ended October 31, 2015, management fees waived under this Arrangement are reflected in the Statements of Operations under the caption "Investment management fees waived." For the fiscal period ended October 31, 2015, income earned under this Arrangement on Flexible Select's, Global Allocation's, Inflation Managed's and Multi-Asset Income's investments is reflected in the Statements of Operations under the caption "Dividend income-affiliated issuers." For the fiscal period ended October 31, 2015, management fees waived and income earned under this Arrangement on Flexible Select's, Global Allocation's, Inflation Managed's and Multi-Asset Income's investments in the Underlying Funds were as follows:
| | | Management fees waived | | Income earned | |
Flexible Select | | $ | 15,553 | | | $ | 163,902 | | |
Global Allocation | | | 59,494 | | | | 112,733 | | |
Inflation Managed | | | 41,178 | | | | 150,482 | | |
Multi-Asset Income | | | 20,165 | | | | 182,742 | | |
18 Other: All net investment income and realized and unrealized capital gains and losses of each Fund are allocated, on the basis of relative net assets, pro rata among its respective classes.
Note B—Investment Management Fees, Administration Fees, Distribution Arrangements, and Other Transactions with Affiliates:
Each Fund retains Management as its investment manager under an Investment Management Agreement. For such investment management services, Flexible Select pays Management a fee at the annual rate of 0.600% of the first $250 million of the Fund's average daily net assets, 0.575% of the next $250 million, 0.550% of the next $250 million, 0.525% of the next $250 million, 0.500% of the next $500 million, 0.475% of the next $2.5 billion, and
0.450% of the average daily net assets in excess of $4 billion. Global Allocation pays Management a fee at the annual rate of 0.650% of the first $1 billion of the Fund's average daily net assets, 0.625% of the next $1 billion, and 0.600% of average daily net assets in excess of $2 billion. Inflation Managed pays Management a fee at the annual rate of 0.650% of the first $250 million of the Fund's average daily net assets, 0.625% of the next $250 million, 0.600% of the next $250 million, 0.575% of the next $250 million, 0.550% of the next $500 million, 0.525% of the next $2.5 billion, and 0.500% of the average daily net assets in excess of $4 billion. Long Short pays Management a fee at the annual rate of 1.200% of the first $250 million of the Fund's average daily net assets, 1.175% of the next $250 million, 1.150% of the next $250 million, 1.125% of the next $250 million, 1.100% of the next $500 million, 1.075% of the next $2.5 billion, and 1.050% of average daily net assets in excess of $4 billion. Long Short Credit pays Management a fee at the annual rate of 0.80% of the average daily net assets. Multi-Asset Income pays Management a fee at the annual rate of 0.450% of the first $250 million of the Fund's average daily net assets, 0.425% of the next $250 million, 0.400% of the next $250 million, 0.375% of the next $250 million, 0.350% of the next $500 million, 0.325% of the next $2.5 billion, and 0.300% of average daily net assets in excess of $4 billion. Accordingly, for the year ended October 31, 2015, the fee pursuant to the Investment Management Agreement was equivalent to an annual effective rate of 0.60% (0.59% after management fee waiver (See Note A)), 0.65% (0.48% after management fee waiver (See Note A)), 0.65% (0.45% after management fee waiver (See Note A)), 1.10% and 0.45% (0.27% after management fee waiver (See Note A)) of Flexible Select's, Global Allocation's, Inflation Managed's, Long Short's and Multi-Asset Income's average daily net assets, respectively.
Each Fund retains Management as its administrator under an Administration Agreement. Each Fund pays Management an administration fee at the annual rate of 0.06% of its average daily net assets under this agreement. In addition, Institutional Class of each Fund pays Management an administration fee at the annual rate of 0.09% of its average daily net assets under this agreement and Class A and Class C of each Fund (except Long Short Credit and Multi-Asset Income) pays Management an administration fee at the annual rate of 0.20% (0.21% for Long Short Credit and Multi-Asset Income) of its average daily net assets under this agreement. Long Short Credit's and Multi-Asset Income's Class R6 pays Management an administration fee of 0.02% of its average daily net assets. Additionally, Management retains State Street as its sub-administrator under a Sub-Administration Agreement. Management pays State Street a fee for all services received under the agreement.
Management has contractually agreed to waive fees and/or reimburse certain expenses of the Institutional Class, Class A, Class C and Class R6 of each Fund so that the total annual operating expenses of those classes do not exceed the expense limitations as detailed in the following table. These undertakings apply to a Fund's direct expenses and exclude interest, taxes, brokerage commissions, acquired fund fees and expenses, dividend and interest expenses relating to short sales and extraordinary expenses, if any; consequently, net expenses may exceed the contractual expense limitations. Each Fund has agreed that each of its respective classes will repay Management for fees and expenses waived or reimbursed for that class provided that repayment does not cause that class' annual operating expenses to exceed its contractual expense limitation in place at the time the fees and expenses were waived or reimbursed, or the expense limitation in place at the time the Fund repays Management, whichever is lower. Any such repayment must be made within three years after the year in which Management incurred the expense.
During the year ended October 31, 2015, there was no repayment to Management under these agreements.
At October 31, 2015, contingent liabilities to Management under the agreements were as follows:
| | | | | | | Expenses Reimbursed in
Fiscal Period Ending October 31, | |
| | | | | | | 2013 | | 2014 | | 2015 | |
| | | | | | | Subject to Repayment Until
October 31, | |
Class | | Contractual
Expense
Limitation(1) | | Expiration | | 2016 | | 2017 | | 2018 | |
Flexible Select Institutional Class | | | 0.85 | % | | 10/31/18 | | | 216,729 | (4) | | | 281,744 | | | $ | 300,067 | | |
Flexible Select Class A | | | 1.21 | % | | 10/31/18 | | | 2,426 | (4) | | | 1,301 | | | | 2,093 | | |
Flexible Select Class C | | | 1.96 | % | | 10/31/18 | | | 2,202 | (4) | | | 480 | | | | 604 | | |
Global Allocation Institutional Class | | | 0.90 | %(3) | | 10/31/18 | | | 253,136 | | | | 297,504 | | | | 219,561 | | |
Global Allocation Class A | | | 1.26 | %(3) | | 10/31/18 | | | 141,365 | | | | 168,872 | | | | 187,516 | | |
Global Allocation Class C | | | 2.01 | %(3) | | 10/31/18 | | | 71,481 | | | | 105,371 | | | | 142,390 | | |
Inflation Managed Institutional Class | | | 0.90 | % | | 10/31/18 | | | 438,126 | (2) | | | 374,332 | | | | 352,679 | | |
Inflation Managed Class A | | | 1.26 | % | | 10/31/18 | | | 5,378 | (2) | | | 9,441 | | | | 36,856 | | |
Inflation Managed Class C | | | 2.01 | % | | 10/31/18 | | | 5,378 | (2) | | | 3,221 | | | | 7,233 | | |
Inflation Managed Class R6 | | | 0.83 | % | | 10/31/18 | | | — | | | | — | | | | 9,636 | (7) | |
Long Short Institutional Class | | | 1.70 | % | | 10/31/18 | | | — | | | | — | | | | — | | |
Long Short Class A | | | 2.06 | % | | 10/31/18 | | | — | | | | — | | | | — | | |
Long Short Class C | | | 2.81 | % | | 10/31/18 | | | — | | | | — | | | | — | | |
Long Short Credit Institutional Class | | | 1.20 | %(9) | | 10/31/18 | | | — | | | | — | | | | 189,748 | (8) | |
Long Short Credit Class A | | | 1.57 | %(9) | | 10/31/18 | | | — | | | | — | | | | 11,947 | (8) | |
Long Short Credit Class C | | | 2.32 | %(9) | | 10/31/18 | | | — | | | | — | | | | 11,656 | (8) | |
Long Short Credit Class R6 | | | 1.13 | %(9) | | 10/31/18 | | | — | | | | — | | | | 51,840 | (8) | |
Multi-Asset Income Institutional Class | | | 0.65 | %(6) | | 10/31/18 | | | — | | | | — | | | | 212,134 | (5) | |
Multi-Asset Income Class A | | | 1.02 | %(6) | | 10/31/18 | | | — | | | | — | | | | 11,192 | (5) | |
Multi-Asset Income Class C | | | 1.77 | %(6) | | 10/31/18 | | | — | | | | — | | | | 11,081 | (5) | |
Multi-Asset Income Class R6 | | | 0.58 | %(6) | | 10/31/18 | | | — | | | | — | | | | 77,638 | (5) | |
(1) Expense limitation per annum of the respective class' average daily net assets.
(2) Period from December 19, 2012 (Commencement of Operations) to October 31, 2013.
(3) Prior to February 28, 2013, the contractual expense limitation was 1.20% for Institutional Class, 1.56% for Class A and 2.31% for Class C.
(4) Period from May 31, 2013 (Commencement of Operations) to October 31, 2013.
(5) Period from March 27, 2015 (Commencement of Operations) to October 31, 2015.
(6) In addition, Management voluntarily waived its fees as necessary to maintain a minimum yield for Multi-Asset Income on March 27, 2015, for Institutional Class, Class A, Class C and Class R6 and March 30, 2015, for Class A and Class C. For the period ended October 31, 2015, voluntary reimbursements for Institutional Class, Class A, Class C and Class R6 of Multi-Asset Income amounted to $456, $43, $84 and $159, respectively.
(7) Period from May 11, 2015 (Commencement of Operations) to October 31, 2015.
(8) Period from June 29, 2015 (Commencement of Operations) to October 31, 2015.
(9) In addition, Management voluntarily waived its fees as necessary to maintain a minimum yield for Long Short Credit Income from June 29, 2015 to July 2, 2015, for Institutional Class, Class A, Class C and Class R6. For the
period ended October 31, 2015, voluntary reimbursements for Institutional Class, Class A, Class C and Class R6 of Long Short Credit amounted to $3,229, $257, $394 and $830, respectively.
Neuberger Berman Fixed Income LLC ("NBFI"), as the sub-adviser to Global Allocation, Inflation Managed, Long Short Credit and Multi-Asset Income, is retained by Management to provide day-to-day investment management services and receives a monthly fee paid by Management. As investment manager, Management is responsible for overseeing the investment activities of NBFI. Neuberger Berman LLC ("Neuberger"), as the sub-adviser to Flexible Select and Long Short, is retained by Management to furnish it with investment recommendations and research information without added cost to the Fund. Several individuals who are Officers and/or Trustees of the Trust are also employees of NBFI, Neuberger and/or Management.
Each Fund also has a distribution agreement with Management with respect to each class of shares. Management acts as agent in arranging for the sale of class shares without sales commission or other compensation, except as described below for Class A and Class C shares, and bears advertising and promotion expenses.
However, Management receives fees from Class A and Class C under their distribution plans (each a "Plan", collectively the "Plans") pursuant to Rule 12b-1 under the 1940 Act. The Plans provide that, as compensation for administrative and other services provided to these classes, Management's activities and expenses related to the sale and distribution of these classes, and ongoing services provided to investors in these classes, Management receives from each of these classes a fee at the annual rate of 0.25% of Class A's and 1.00% of Class C's average daily net assets. Management receives this amount to provide distribution and shareholder servicing for these classes and pays a portion of it to institutions that provide such services. Those institutions may use the payments for, among other purposes, compensating employees engaged in sales and/or shareholder servicing. The amount of fees paid by each class during any year may be more or less than the cost of distribution and other services provided to that class. FINRA rules limit the amount of annual distribution fees that may be paid by a mutual fund and impose a ceiling on the cumulative distribution fees paid. The Trust's Plans comply with those rules.
Class A shares of each Fund (except Long Short Credit and Multi-Asset Income) are generally sold with an initial sales charge of up to 5.75%. Class A shares of Long Short Credit and Multi-Asset Income are generally sold with an initial sales charge of up to 4.25%. Class A shares of each Fund are generally sold with no contingent deferred sales charge ("CDSC"), except that a CDSC of 1.00% will apply to certain redemptions made within 18 months following purchases of $1 million or more without an initial sales charge. Class C shares of each Fund are sold with no initial sales charge and a 1.00% CDSC if shares are sold within one year after purchase.
For the year ended October 31, 2015, Management, acting as underwriter and broker-dealer, received net initial sales charges from the purchase of Class A shares and CDSCs from the redemption of Class A and Class C shares as follows:
| | | Underwriter | | Broker-Dealer | |
| | Net Initial
Sales Charge | | CDSC | | Net Initial
Sales Charge | | CDSC | |
Flexible Select Class A | | $ | 112 | | | $ | — | | | $ | — | | | $ | — | | |
Flexible Select Class C | | | — | | | | 46 | | | | — | | | | — | | |
Global Allocation Class A | | | 732 | | | | — | | | | — | | | | — | | |
Global Allocation Class C | | | — | | | | 1,929 | | | | — | | | | — | | |
Inflation Managed Class A | | | — | | | | — | | | | — | | | | — | | |
Inflation Managed Class C | | | — | | | | 30 | | | | — | | | | — | | |
Long Short Class A | | | 135,579 | | | | — | | | | — | | | | — | | |
Long Short Class C | | | — | | | | 67,502 | | | | — | | | | — | | |
| Long Short Credit Class A(2) | | | — | | | | — | | | | — | | | | — | | |
| Long Short Credit Class C(2) | | | — | | | | — | | | | — | | | | — | | |
| Multi-Asset Income Class A(1) | | | — | | | | — | | | | — | | | | — | | |
| Multi-Asset Income Class C(1) | | | — | | | | 29 | | | | — | | | | — | | |
(1) Period from March 27, 2015 (Commencement of Operations) to October 31, 2015.
(2) Period from June 29, 2015 (Commencement of Operations) to October 31, 2015.
On June 3, 2014, Management made a voluntary contribution to certain of the Funds in connection with a payment matter related to the Funds' investment in a State Street money market fund as follows:
| | | Contribution
Amount | |
Global Allocation | | $ | 10,922 | | |
Long Short | | | 60,836 | | |
Note C—Securities Transactions:
During the year ended October 31, 2015, there were purchase and sale transactions of long-term securities (excluding total return swaps, credit default swaps, total return basket swaps, equity swaps, credit default swaptions, financial futures, forward contracts and option contracts) as follows:
| | | Purchases of
U.S. Government
and Agency
Obligations | | Purchases
excluding
U.S. Government
and Agency
Obligations | | Securities
Sold Short | | Sales and
Maturities of
U.S. Government
and Agency
Obligations | | Sales and
Maturities
excluding
U.S. Government
and Agency
Obligations | | Covers on
Securities
Sold Short | |
Flexible Select | | $ | — | | | $ | 118,997,521 | | | $ | — | | | $ | — | | | $ | 112,853,795 | | | $ | — | | |
Global Allocation | | | 6,840,719 | | | | 51,225,894 | | | | 10,427,674 | | | | 3,902,089 | | | | 38,979,698 | | | | 16,649,777 | | |
Inflation Managed | | | 8,507,168 | | | | 11,295,671 | | | | — | | | | 8,844,388 | | | | 11,336,147 | | | | — | | |
Long Short | | | — | | | | 1,845,219,555 | | | | 1,003,212,854 | | | | — | | | | 1,805,305,279 | | | | 940,125,451 | | |
| Long Short Credit(2) | | | — | | | | 8,881,602 | | | | 956,750 | | | | — | | | | 1,120,272 | | | | — | | |
| Multi-Asset Income(1) | | | 1,793,375 | | | | 19,290,316 | | | | — | | | | 655,994 | | | | 4,453,661 | | | | — | | |
(1) Period from March 27, 2015 (Commencement of Operations) to October 31, 2015.
(2) Period from June 29, 2015 (Commencement of Operations) to October 31, 2015.
During the year ended October 31, 2015, no brokerage commissions on securities transactions were paid to affiliated brokers.
Note D—Fund Share Transactions:
Share activity for the years ended October 31, 2015 and October 31, 2014 was as follows:
| | | For the Year Ended October 31, 2015 | | For the Year Ended October 31, 2014 | |
| | | Shares
Sold | | Shares
Issued on
Reinvestment
of Dividends
and
Distributions | | Shares
Redeemed | | Total | | Shares
Sold | | Shares
Issued on
Reinvestment
of Dividends
and
Distributions | | Shares
Redeemed | | Total | |
Flexible Select: | |
Institutional Class | | | 101,398 | | | | 233,709 | | | | — | | | | 335,107 | | | | 769 | | | | 30,471 | | | | (14,743 | ) | | | 16,497 | | |
Class A | | | 12,285 | | | | 1,551 | | | | (36,444 | ) | | | (22,608 | ) | | | 46,439 | | | | 27 | | | | (6,595 | ) | | | 39,871 | | |
Class C | | | 2,639 | | | | 295 | | | | (1,273 | ) | | | 1,661 | | | | 1,559 | | | | 2 | | | | — | | | | 1,561 | | |
Global Allocation: | |
Institutional Class | | | 237,884 | | | | 26,930 | | | | (559,912 | ) | | | (295,098 | ) | | | 320,306 | | | | 129,312 | | | | (780,344 | ) | | | (330,726 | ) | |
Class A | | | 221,902 | | | | 18,400 | | | | (349,899 | ) | | | (109,597 | ) | | | 717,157 | | | | 46,075 | | | | (553,785 | ) | | | 209,447 | | |
Class C | | | 190,599 | | | | 10,618 | | | | (217,008 | ) | | | (15,791 | ) | | | 395,709 | | | | 33,247 | | | | (194,404 | ) | | | 234,552 | | |
Inflation Managed: | |
Institutional Class | | | 935,051 | | | | 15,521 | | | | (1,041,606 | ) | | | (91,034 | ) | | | 95,566 | | | | 32,833 | | | | (90,643 | ) | | | 37,756 | | |
Class A | | | 43,540 | | | | 1,699 | | | | (211,478 | ) | | | (166,239 | ) | | | 220,368 | | | | 189 | | | | (26,069 | ) | | | 194,488 | | |
Class C | | | 10,681 | | | | 189 | | | | (11,509 | ) | | | (639 | ) | | | 18,279 | | | | 115 | | | | — | | | | 18,394 | | |
| Class R6(2) | | | 220,298 | | | | — | | | | (85,850 | ) | | | 134,448 | | | | — | | | | — | | | | — | | | | — | | |
Long Short: | |
Institutional Class | | | 93,006,874 | | | | 735,130 | | | | (82,334,519 | ) | | | 11,407,485 | | | | 159,546,263 | | | | 382,464 | | | | (41,372,231 | ) | | | 118,556,496 | | |
Class A | | | 11,849,324 | | | | 100,264 | | | | (13,400,201 | ) | | | (1,450,613 | ) | | | 32,183,453 | | | | 179,358 | | | | (42,735,854 | ) | | | (10,373,043 | ) | |
Class C | | | 3,514,350 | | | | 45,292 | | | | (4,714,887 | ) | | | (1,155,245 | ) | | | 9,063,806 | | | | 37,716 | | | | (1,825,631 | ) | | | 7,275,891 | | |
Long Short Credit: | |
| Institutional Class(3) | | | 2,336,720 | | | | 453 | | | | (560 | ) | | | 2,336,613 | | | | — | | | | — | | | | — | | | | — | | |
| Class A(3) | | | 134,996 | | | | 12 | | | | — | | | | 135,008 | | | | — | | | | — | | | | — | | | | — | | |
| Class C(3) | | | 103,245 | | | | 1 | | | | — | | | | 103,246 | | | | — | | | | — | | | | — | | | | — | | |
| Class R6(3) | | | 500,000 | | | | — | | | | — | | | | 500,000 | | | | — | | | | — | | | | — | | | | — | | |
Multi-Asset Income: | |
| Institutional Class(1) | | | 1,117,763 | | | | 5,803 | | | | (238 | ) | | | 1,123,328 | | | | — | | | | — | | | | — | | | | — | | |
| Class A(1) | | | 50,507 | | | | 152 | | | | — | | | | 50,659 | | | | — | | | | — | | | | — | | | | — | | |
| Class C(1) | | | 50,298 | | | | 113 | | | | (300 | ) | | | 50,111 | | | | — | | | | — | | | | — | | | | — | | |
| Class R6(1) | | | 400,000 | | | | 1,294 | | | | — | | | | 401,294 | | | | — | | | | — | | | | — | | | | — | | |
(1) Period from March 27, 2015 (Commencement of Operations) to October 31, 2015.
(2) Period from May 11, 2015 (Commencement of Operations) to October 31, 2015.
(3) Period from June 29, 2015 (Commencement of Operations) to October 31, 2015.
Note E—Lines of Credit:
At October 31, 2015, each Fund was a participant in a syndicated committed, unsecured $700,000,000 line of credit (the "Credit Facility"), to be used only for temporary or emergency purposes. Series of other investment companies managed by Management also participate in this line of credit on substantially the same terms except that some do not have access to the full amount of the Credit Facility. Under the terms of the Credit Facility, each Fund has agreed to pay its share of the annual commitment fee, based on the ratio of its individual net assets to the net assets of all participants at the time the fee is due and payable and the level of its access to the Credit Facility, and interest charged on any borrowing made by such Fund and other costs incurred by such Fund. Because several mutual funds participate in the Credit Facility, there is no assurance that an individual Fund will have access to all or any part of the $700,000,000 at any particular time. There were no loans outstanding under the Credit Facility at October 31, 2015. During the period from January 9, 2015 (the commencement date of the Credit Facility) through October 31, 2015, none of the Funds utilized this line of credit. The Credit Facility replaced the State Street lines of credit referred to below.
During the reporting period, from November 1, 2014 through January 9, 2015, each Fund other than Neuberger Berman Multi-Asset Income Fund and Neuberger Berman Long Short Credit Fund, which were not yet operational, was a participant in a committed, unsecured $300,000,000 line of credit with State Street and an uncommitted, unsecured $100,000,000 line of credit with State Street, both to be used only for temporary or emergency purposes. During the period ended October 31, 2015, none of the Funds utilized either line of credit with State Street.
Note F—Investments in Affiliates(1):
| | Balance of
Shares Held
October 31,
2014 | | Gross
Purchases
and
Additions | | Gross
Sales
and
Reductions | | Balance of
Shares Held
October 31,
2015 | | Value
October 31,
2015 | | | Distributions
from
Investments
in Affiliated
Issuers(2) | | | Net Realized
Gain (Loss)
from
Investments
in Affiliated
Issuers | |
Flexible Select | |
Neuberger Berman Core Bond Fund Institutional Class | | 582,729 | | | 907,213 | | 649,432 | | | 840,510 | | $ | 8,730,925 | | | $ | 169,769 | | | $ | 59,013 | |
Neuberger Berman Unconstrained Bond Fund Institutional Class | | — | | | 313,065 | | — | | | 313,065 | | | 2,934,884 | | | | 5,856 | | | | — | |
Total | | | | | | | | | | | | $ | 11,665,809 | | | $ | 175,625 | | | $ | 59,013 | |
Global Allocation | |
Neuberger Berman Emerging Markets Debt Fund Institutional Class | | — | | | 151,920 | | 75,899 | | | 76,021 | | $ | 639,154 | | | $ | 53,249 | | | $ | (77,226 | ) |
Neuberger Berman Emerging Markets Equity Fund Institutional Class | | — | | | 187,444 | | 30,797 | | | 156,647 | | | 2,297,680 | | | | — | | | | (45,669 | ) |
| | Balance of
Shares Held
October 31,
2014 | | Gross
Purchases
and
Additions | | Gross
Sales
and
Reductions | | Balance of
Shares Held
October 31,
2015 | | Value
October 31,
2015 | | Distributions
from
Investments
in Affiliated
Issuers(2) | | Net Realized
Gain (Loss)
from
Investments
in Affiliated
Issuers | |
Neuberger Berman High
Income Bond Fund
Institutional Class | — | | | 157,286 | | | 22,489 | | | 134,797 | | | $ | 1,147,477 | | $ | 53,938 | | $ | (9,246 | ) | |
Neuberger Berman
International Equity
Fund Institutional Class | — | | | 301,887 | | | 36,395 | | | 265,492 | | | | 2,960,732 | | | — | | | 4,214 | | |
Neuberger Berman
Long Short Credit Fund
Institutional Class | — | | | 105,628 | | | — | | | 105,628 | | | | 1,029,765 | | | 2,155 | | | — | | |
Neuberger Berman
Risk Balanced
Commodity Strategy
Fund Institutional Class | — | | | 111,878 | | | 10,126 | | | 101,752 | | | | 630,506 | | | — | | | (8,316 | ) | |
Neuberger Berman
Short Duration High
Income Fund
Institutional Class | — | | | 137,958 | | | 137,958 | | | — | | | | — | | | 3,391 | | | 19,294 | | |
Total | | | | | | | | $ | 8,705,314 | | $ | 112,733 | | $ | (116,949 | ) | |
Inflation Managed | |
Neuberger Berman
Emerging Markets
Equity Fund
Institutional Class | 103,341 | | | 51,382 | | | 97,049 | | | 57,674 | | | $ | 845,956 | | $ | 19,481 | | $ | (161,646 | ) | |
Neuberger Berman
Floating Rate
Income Fund
Institutional Class | 91,688 | | | 53,140 | | | 83,599 | | | 61,229 | | | | 603,445 | | | 36,909 | | | (20,280 | ) | |
Neuberger Berman
High Income Bond
Fund Institutional Class | 102,045 | | | 207,851 | | | 116,028 | | | 193,868 | | | | 1,650,321 | | | 95,108 | | | (50,566 | ) | |
Neuberger Berman
Risk Balanced
Commodity Strategy
Fund Institutional Class | 238,082 | | | 121,966 | | | 125,022 | | | 235,026 | | | | 1,456,338 | | | 203 | | | (292,789 | ) | |
Total | | | | | | | | $ | 4,556,060 | | $ | 151,701 | | $ | (525,281 | ) | |
| | Balance of
Shares Held
October 31,
2014 | | Gross
Purchases
and
Additions | | Gross
Sales
and
Reductions | | Balance of
Shares Held
October 31,
2015 | | Value
October 31,
2015 | | Distributions
from
Investments
in Affiliated
Issuers(2) | | Net Realized
Gain (Loss)
from
Investments
in Affiliated
Issuers | |
| Multi-Asset Income | | | | | | | | | | | | | | | | | | | | | | |
Neuberger Berman
Emerging Markets
Debt Fund Institutional Class | — | | | 187,015 | | | (4,577 | ) | | 182,438 | | | $ | 1,533,858 | | $ | 51,224 | | $ | (1,930 | ) | |
Neuberger Berman
Floating Rate Income
Fund Institutional Class | — | | | 251,272 | | | (57,710 | ) | | 193,562 | | | | 1,907,671 | | | 52,397 | | | (7,015 | ) | |
Neuberger Berman
Global Long Short Fund Institutional Fund Class | — | | | 43,732 | | | — | | | 43,732 | | | | 433,404 | | | — | | | — | | |
Neuberger Berman High Income Fund Institutional Class | — | | | 284,787 | | | (12,281 | ) | | 272,506 | | | | 2,319,739 | | | 77,714 | | | (827 | ) | |
Neuberger Berman
Long Short Credit
Commodity Strategy
Fund Institutional Class | — | | | 45,159 | | | — | | | 45,159 | | | | 440,252 | | | 1,407 | | | — | | |
Total | | | | | | | | $ | 6,634,924 | | $ | 182,742 | | $ | (9,772 | ) | |
(1) Affiliated issuers, as defined in the 1940 Act.
(2) Distributions received include distributions from net investment income and net realized capital gains, if any, from the Underlying Fund.
* Security did not produce income during the last twelve months.
Other: At October 31, 2015, there were affiliated investors owning 0.2%, 70.1% and 86.2% of Flexible Select's, Inflation Managed's and Long Short Credit's outstanding shares, respectively.
Note G—Recent Accounting Pronouncement:
In June 2014, FASB issued ASU 2014-11 Transfers & Servicing (Topic 860): Repurchase-to-Maturity Transactions, Repurchase Financings, and Disclosures to improve the financial reporting of repurchase agreements and other similar transactions. The guidance includes expanded disclosure requirements for entities that enter into repurchase agreements or securities lending transactions. The guidance is effective for financial statements with fiscal years beginning on or after January 1, 2015, and interim periods within those fiscal years. At this time, Management is evaluating the impact, if any, of this guidance on the Funds' financial statement disclosures. ASU 2014-11 is effective for Long Short Credit and Multi-Asset Income as of October 31, 2015; however, no additional disclosure was necessary.
The following tables include selected data for a share outstanding throughout each period and other performance information derived from the Financial Statements. Amounts that round to [$0.00 to less than $0.01] per share or [$(0.01) to less than $0.00] per share are presented as $0.00 or $(0.00), respectively. Ratios that round to [0.00% to less than 0.01%] or [(0.01)% to less than 0.00%] are presented as 0.00% or (0.00)%, respectively. Net Asset amounts with a zero balance, if any, may reflect actual amounts rounding to less than $0.1 million. A "—" indicates that the line item was not applicable in the corresponding period.
| | | Net Asset
Value,
Beginning
of Year | | | Net
Investment
Income
(Loss)@ | | | Net Gains
or
Losses on
Securities
(both
realized
and
unrealized) | | | Total From
Investment
Operations | | | Dividends
from Net
Investment
Income | | | Distributions
from Net
Realized
Capital
Gains | | | Total
Distributions | | | Voluntary
Contributions
from
Management | | | Net Asset
Value,
End of
Year | | | Total
Return†† | | | | | | Net Assets,
End of
Year
(in millions) | | | Ratio
of Gross
Expenses to
Average
Net
Assets# | | | Ratio
of Gross
Expenses
to Average
Net Assets
(excluding
dividend
and interest
expense
relating to
short sales) | | Ratio
of Net
Expenses to
Average
Net
Assets | | | Ratio
of Net
Expenses
to Average
Net Assets
(excluding
dividend
and interest
expense
relating to
short sales) | | Ratio
of Net
Investment
Income/
(Loss) to
Average
Net
Assets | | | Portfolio
Turnover
Rate
(including
securities
sold
short) | | | Portfolio
Turnover
Rate
(excluding
securities
sold
short) |
Flexible Select Fund |
Institutional Class |
10/31/2015 | | $ | 11.96 | | | $ | 0.09 | | | $ | (0.07 | ) | | $ | 0.02 | | | $ | (0.12 | ) | | $ | (0.22 | ) | | $ | (0.34 | ) | | $ | — | | | $ | 11.64 | | | | 0.13 | | | % | | | | | | $ | 98.1 | | | | 1.15 | % | | | 1.15 | | %Ø | | | 0.83 | % | | | 0.83 | | %Ø | | | 0.77 | % | | | 123 | % | | | 123 | | %Ø |
10/31/2014 | | $ | 10.80 | | | $ | 0.11 | | | $ | 1.09 | | | $ | 1.20 | | | $ | (0.04 | ) | | $ | — | | | $ | (0.04 | ) | | $ | — | | | $ | 11.96 | | | | 11.16 | | | % | | | | | | $ | 96.8 | | | | 1.16 | % | | | 1.16 | | %Ø | | | 0.83 | % | | | 0.83 | | %Ø | | | 0.98 | % | | | 50 | % | | | 50 | | %Ø |
Period from
5/31/2013^
to 10/31/2013 | | $ | 10.00 | | | $ | 0.04 | | | $ | 0.76 | | | $ | 0.80 | | | $ | — | | | $ | — | | | $ | — | | | $ | — | | | $ | 10.80 | | | | 8.00 | | | % | | | | | ** | | $ | 87.2 | | | | 1.97 | %‡* | | | 1.97 | | %‡Ø* | | | 0.83 | %‡* | | | 0.83 | | %‡Ø* | | | 0.95 | %‡* | | | 20 | %** | | | 20 | | %Ø** |
Class A |
10/31/2015 | | $ | 11.92 | | | $ | 0.05 | | | $ | (0.07 | ) | | $ | (0.02 | ) | | $ | (0.10 | ) | | $ | (0.22 | ) | | $ | (0.32 | ) | | $ | — | | | $ | 11.58 | | | | (0.23 | | | | ) | | | % | | | $ | 0.4 | | | | 1.56 | % | | | 1.56 | | %Ø | | | 1.20 | % | | | 1.20 | | %Ø | | | 0.44 | % | | | 123 | % | | | 123 | | %Ø |
10/31/2014 | | $ | 10.78 | | | $ | 0.06 | | | $ | 1.10 | | | $ | 1.16 | | | $ | (0.02 | ) | | $ | — | | | $ | (0.02 | ) | | $ | — | | | $ | 11.92 | | | | 10.80 | | | % | | | | | | | $ | 0.6 | | | | 1.64 | % | | | 1.64 | | %Ø | | | 1.19 | % | | | 1.19 | | %Ø | | | 0.50 | % | | | 50 | % | | | 50 | | %Ø |
Period from
5/31/2013^
to 10/31/2013 | | $ | 10.00 | | | $ | 0.02 | | | $ | 0.76 | | | $ | 0.78 | | | $ | — | | | $ | — | | | $ | — | | | $ | — | | | $ | 10.78 | | | | 7.80 | | | % | | | | | ** | | $ | 0.1 | | | | 5.09 | %‡* | | | 5.09 | | %‡Ø* | | | 1.19 | %‡* | | | 1.19 | | %‡Ø* | | | 0.57 | %‡* | | | 20 | %** | | | 20 | | %Ø** |
Class C |
10/31/2015 | | $ | 11.81 | | | $ | (0.04 | ) | | $ | (0.07 | ) | | $ | (0.11 | ) | | $ | (0.02 | ) | | $ | (0.22 | ) | | $ | (0.24 | ) | | $ | — | | | $ | 11.46 | | | | (0.95 | | | | ) | | | % | | | $ | 0.2 | | | | 2.32 | % | | | 2.32 | | %Ø | | | 1.94 | % | | | 1.94 | | %Ø | | | (0.34 | )% | | | 123 | % | | | 123 | | %Ø |
10/31/2014 | | $ | 10.75 | | | $ | (0.02 | ) | | $ | 1.08 | | | $ | 1.06 | | | $ | (0.00 | ) | | $ | — | | | $ | (0.00 | ) | | $ | — | | | $ | 11.81 | | | | 9.88 | | | % | | | | | | | $ | 0.1 | | | | 2.38 | % | | | 2.38 | | %Ø | | | 1.94 | % | | | 1.94 | | %Ø | | | (0.14 | )% | | | 50 | % | | | 50 | | %Ø |
Period from
5/31/2013^
to 10/31/2013 | | $ | 10.00 | | | $ | (0.01 | ) | | $ | 0.76 | | | $ | 0.75 | | | $ | — | | | $ | — | | | $ | — | | | $ | — | | | $ | 10.75 | | | | 7.50 | | | % | | | | | ** | | $ | 0.1 | | | | 6.71 | %‡* | | | 6.71 | | %‡Ø* | | | 1.94 | %‡* | | | 1.94 | | %‡Ø* | | | (0.18 | )%‡* | | | 20 | %** | | | 20 | | %Ø** |
Global Allocation Fund |
Institutional Class |
10/31/2015 | | $ | 10.81 | | | $ | 0.06 | | | $ | (0.17 | ) | | $ | (0.11 | ) | | $ | (0.28 | ) | | $ | (0.00 | ) | | $ | (0.28 | ) | | $ | — | | | $ | 10.42 | | | | (1.12 | | | | ) | | | % | | | $ | 8.9 | | | | 3.29 | % | | | 2.94 | | % | | | 1.03 | % | | | 0.69 | | % | | | 0.51 | % | | | 198 | % | | | 189 | | % |
10/31/2014 | | $ | 11.63 | | | $ | (0.12 | ) | | $ | 0.29 | | | $ | 0.17 | | | $ | (0.99 | ) | | $ | — | | | $ | (0.99 | ) | | $ | 0.00 | | | $ | 10.81 | | | | 1.37 | | | % | | | | | b | | $ | 12.5 | | | | 3.25 | % | | | 2.72 | | % | | | 1.50 | % | | | 0.98 | | % | | | (1.12 | )% | | | 228 | % | | | 216 | | % |
10/31/2013 | | $ | 10.30 | | | $ | (0.09 | ) | | $ | 1.57 | | | $ | 1.48 | | | $ | (0.15 | ) | | $ | — | | | $ | (0.15 | ) | | $ | — | | | $ | 11.63 | | | | 14.56 | | | % | | | | | | | $ | 17.2 | | | | 3.23 | % | | | 2.73 | | % | | | 1.48 | % | | | 0.98 | | % | | | (0.85 | )% | | | 187 | % | | | 158 | | % |
10/31/2012 | | $ | 10.30 | | | $ | (0.12 | ) | | $ | 1.02 | | | $ | 0.90 | | | $ | (0.21 | ) | | $ | (0.69 | ) | | $ | (0.90 | ) | | $ | — | | | $ | 10.30 | | | | 9.60 | | | % | | | | | | | $ | 8.9 | | | | 5.01 | % | | | 4.55 | | % | | | 1.68 | % | | | 1.22 | | % | | | (1.19 | )% | | | 446 | % | | | 423 | | % |
Period from
12/29/2010^
to 10/31/2011 | | $ | 10.00 | | | $ | (0.08 | ) | | $ | 0.38 | | | $ | 0.30 | | | $ | — | | | $ | — | | | $ | — | | | $ | — | | | $ | 10.30 | | | | 3.00 | | | % | | | | | ** | | $ | 5.8 | | | | 18.45 | %‡* | | | 18.31 | | %‡*^^ | | | 1.36 | %‡* | | | 1.21 | | %‡*^^ | | | (0.95 | )%‡* | | | 268 | %** | | | 216 | | %** |
See Notes to Financial Highlights
Financial Highlights (cont'd)
| | | Net Asset
Value,
Beginning
of Year | | Net
Investment
Income
(Loss)@ | | Net Gains
or
Losses on
Securities
(both
realized
and
unrealized) | | Total From
Investment
Operations | | Dividends
from Net
Investment
Income | | Distributions
from Net
Realized
Capital
Gains | | Total
Distributions | | Voluntary
Contributions
from
Management | | Net Asset
Value,
End of
Year | | Total
Return†† | | Net Assets,
End of
Year
(in millions) | | Ratio
of Gross
Expenses to
Average
Net
Assets# | | Ratio
of Gross
Expenses
to Average
Net Assets
(excluding
dividend
and interest
expense
relating to
short sales) | | Ratio
of Net
Expenses to
Average
Net
Assets | | Ratio
of Net
Expenses
to Average
Net Assets
(excluding
dividend
and interest
expense
relating to
short sales) | | Ratio
of Net
Investment
Income/
(Loss) to
Average
Net
Assets | | Portfolio
Turnover
Rate
(including
securities
sold
short) | | Portfolio
Turnover
Rate
(excluding
securities
sold
short) | |
Global Allocation Fund (cont'd) | |
Class A | |
10/31/2015 | | $ | 10.76 | | | $ | 0.02 | | | $ | (0.18 | ) | | $ | (0.16 | ) | | $ | (0.24 | ) | | $ | (0.00 | ) | | $ | (0.24 | ) | | $ | — | | | $ | 10.36 | | | | (1.52 | )% | | $ | 8.1 | | | | 3.69 | % | | | 3.34 | % | | | 1.39 | % | | | 1.04 | % | | | 0.16 | % | | | 198 | % | | | 189 | % | |
10/31/2014 | | $ | 11.57 | | | $ | (0.16 | ) | | $ | 0.29 | | | $ | 0.13 | | | $ | (0.94 | ) | | $ | — | | | $ | (0.94 | ) | | $ | 0.00 | | | $ | 10.76 | | | | 1.03 | %b | | $ | 9.6 | | | | 3.68 | % | | | 3.16 | % | | | 1.86 | % | | | 1.35 | % | | | (1.49 | )% | | | 228 | % | | | 216 | % | |
10/31/2013 | | $ | 10.25 | | | $ | (0.14 | ) | | $ | 1.58 | | | $ | 1.44 | | | $ | (0.12 | ) | | $ | — | | | $ | (0.12 | ) | | $ | — | | | $ | 11.57 | | | | 14.15 | % | | $ | 7.9 | | | | 3.58 | % | | | 3.07 | % | | | 1.84 | % | | | 1.33 | % | | | (1.25 | )% | | | 187 | % | | | 158 | % | |
10/31/2012 | | $ | 10.27 | | | $ | (0.15 | ) | | $ | 1.01 | | | $ | 0.86 | | | $ | (0.19 | ) | | $ | (0.69 | ) | | $ | (0.88 | ) | | $ | — | | | $ | 10.25 | | | | 9.24 | % | | $ | 3.4 | | | | 5.41 | % | | | 4.93 | % | | | 2.07 | % | | | 1.59 | % | | | (1.48 | )% | | | 446 | % | | | 423 | % | |
Period from
12/29/2010^ to 10/31/2011 | | $ | 10.00 | | | $ | (0.14 | ) | | $ | 0.41 | | | $ | 0.27 | | | $ | — | | | $ | — | | | $ | — | | | $ | — | | | $ | 10.27 | | | | 2.70 | %** | | $ | 0.1 | | | | 22.01 | %‡* | | | 21.63 | %‡*^^ | | | 1.96 | %‡* | | | 1.58 | %‡*^^ | | | (1.64 | )%‡* | | | 268 | %** | | | 216 | %** | |
Class C | |
10/31/2015 | | $ | 10.60 | | | $ | (0.06 | ) | | $ | (0.18 | ) | | $ | (0.24 | ) | | $ | (0.18 | ) | | $ | (0.00 | ) | | $ | (0.18 | ) | | $ | — | | | $ | 10.18 | | | | (2.29 | )% | | $ | 6.6 | | | | 4.45 | % | | | 4.10 | % | | | 2.14 | % | | | 1.79 | % | | | (0.57 | )% | | | 198 | % | | | 189 | % | |
10/31/2014 | | $ | 11.43 | | | $ | (0.25 | ) | | $ | 0.30 | | | $ | 0.05 | | | $ | (0.88 | ) | | $ | — | | | $ | (0.88 | ) | | $ | 0.00 | | | $ | 10.60 | | | | 0.30 | %b | | $ | 7.0 | | | | 4.46 | % | | | 3.95 | % | | | 2.63 | % | | | 2.11 | % | | | (2.27 | )% | | | 228 | % | | | 216 | % | |
10/31/2013 | | $ | 10.13 | | | $ | (0.21 | ) | | $ | 1.55 | | | $ | 1.34 | | | $ | (0.04 | ) | | $ | — | | | $ | (0.04 | ) | | $ | — | | | $ | 11.43 | | | | 13.30 | % | | $ | 4.9 | | | | 4.35 | % | | | 3.85 | % | | | 2.59 | % | | | 2.09 | % | | | (1.99 | )% | | | 187 | % | | | 158 | % | |
10/31/2012 | | $ | 10.21 | | | $ | (0.23 | ) | | $ | 1.00 | | | $ | 0.77 | | | $ | (0.16 | ) | | $ | (0.69 | ) | | $ | (0.85 | ) | | $ | — | | | $ | 10.13 | | | | 8.34 | % | | $ | 2.2 | | | | 6.47 | % | | | 6.03 | % | | | 2.78 | % | | | 2.34 | % | | | (2.26 | )% | | | 446 | % | | | 423 | % | |
Period from
12/29/2010^
to 10/31/2011 | | $ | 10.00 | | | $ | (0.18 | ) | | $ | 0.39 | | | $ | 0.21 | | | $ | — | | | $ | — | | | $ | — | | | $ | — | | | $ | 10.21 | | | | 2.10 | %** | | $ | 0.0 | | | | 25.07 | %‡* | | | 24.87 | %‡*^^ | | | 2.52 | %‡* | | | 2.33 | %‡*^^ | | | (2.12 | )%‡* | | | 268 | %** | | | 216 | %** | |
| Inflation Managed Fund§§ | |
Institutional Class | |
10/31/2015 | | $ | 10.74 | | | $ | 0.19 | | | $ | (1.25 | ) | | $ | (1.06 | ) | | $ | (0.10 | ) | | $ | — | | | $ | (0.10 | ) | | $ | — | | | $ | 9.58 | | | | (9.98 | )% | | $ | 14.2 | | | | 2.88 | % | | | 2.88 | %Ø | | | 0.71 | % | | | 0.71 | %Ø | | | 1.87 | % | | | 100 | % | | | 100 | %Ø | |
10/31/2014 | | $ | 10.38 | | | $ | 0.17 | | | $ | 0.41 | | | $ | 0.58 | | | $ | (0.22 | ) | | $ | — | | | $ | (0.22 | ) | | $ | — | | | $ | 10.74 | �� | | | 5.73 | % | | $ | 16.9 | | | | 3.22 | % | | | 3.22 | %Ø | | | 0.69 | % | | | 0.69 | %Ø | | | 1.61 | % | | | 41 | % | | | 41 | %Ø | |
Period from
12/19/2012^ to 10/31/2013 | | $ | 10.00 | | | $ | 0.17 | | | $ | 0.21 | | | $ | 0.38 | | | $ | — | | | $ | — | | | $ | — | | | $ | — | | | $ | 10.38 | | | | 3.80 | %** | | $ | 15.9 | | | | 4.55 | %‡* | | | 4.55 | %‡Ø* | | | 0.69 | %‡* | | | 0.69 | %‡Ø* | | | 1.92 | %‡* | | | 45 | %** | | | 45 | %Ø** | |
Class A | |
10/31/2015 | | $ | 10.71 | | | $ | 0.15 | | | $ | (1.24 | ) | | $ | (1.09 | ) | | $ | (0.08 | ) | | $ | — | | | $ | (0.08 | ) | | $ | — | | | $ | 9.54 | | | | (10.21 | )% | | $ | 0.4 | | | | 3.33 | % | | | 3.33 | %Ø | | | 1.06 | % | | | 1.06 | %Ø | | | 1.47 | % | | | 100 | % | | | 100 | %Ø | |
10/31/2014 | | $ | 10.35 | | | $ | 0.11 | | | $ | 0.44 | | | $ | 0.55 | | | $ | (0.19 | ) | | $ | — | | | $ | (0.19 | ) | | $ | — | | | $ | 10.71 | | | | 5.39 | % | | $ | 2.2 | | | | 3.64 | % | | | 3.64 | %Ø | | | 1.05 | % | | | 1.05 | %Ø | | | 1.01 | % | | | 41 | % | | | 41 | %Ø | |
Period from
12/19/2012^
to 10/31/2013 | | $ | 10.00 | | | $ | 0.14 | | | $ | 0.21 | | | $ | 0.35 | | | $ | — | | | $ | — | | | $ | — | | | $ | — | | | $ | 10.35 | | | | 3.50 | %** | | $ | 0.1 | | | | 6.99 | %‡* | | | 6.99 | %‡Ø* | | | 1.04 | %‡* | | | 1.04 | %‡Ø* | | | 1.59 | %‡* | | | 45 | %** | | | 45 | %Ø** | |
See Notes to Financial Highlights
Financial Highlights (cont'd)
| | | Net Asset
Value,
Beginning
of Year | | Net
Investment
Income
(Loss)@ | | Net Gains
or
Losses on
Securities
(both
realized
and
unrealized) | | Total From
Investment
Operations | | Dividends
from Net
Investment
Income | | Distributions
from Net
Realized
Capital
Gains | | Total
Distributions | | Voluntary
Contributions
from
Management | | Net Asset
Value,
End of
Year | | Total
Return†† | | Net Assets,
End of
Year
(in millions) | | Ratio
of Gross
Expenses to
Average
Net
Assets# | | Ratio
of Gross
Expenses
to Average
Net Assets
(excluding
dividend
and interest
expense
relating to
short sales) | | Ratio
of Net
Expenses to
Average
Net
Assets | | Ratio
of Net
Expenses
to Average
Net Assets
(excluding
dividend
and interest
expense
relating to
short sales) | | Ratio
of Net
Investment
Income/
(Loss) to
Average
Net
Assets | | Portfolio
Turnover
Rate
(including
securities
sold
short) | | Portfolio
Turnover
Rate
(excluding
securities
sold
short) | |
| Inflation Managed Fund§§ (cont'd) | |
Class C | |
10/31/2015 | | $ | 10.63 | | | $ | 0.07 | | | $ | (1.23 | ) | | $ | (1.16 | ) | | $ | (0.06 | ) | | $ | — | | | $ | (0.06 | ) | | $ | — | | | $ | 9.41 | | | | (10.92 | )% | | $ | 0.3 | | | | 4.05 | % | | | 4.05 | %Ø | | | 1.81 | % | | | 1.81 | %Ø | | | 0.71 | % | | | 100 | % | | | 100 | %Ø | |
10/31/2014 | | $ | 10.28 | | | $ | 0.03 | | | $ | 0.44 | | | $ | 0.47 | | | $ | (0.12 | ) | | $ | — | | | $ | (0.12 | ) | | $ | — | | | $ | 10.63 | | | | 4.60 | % | | $ | 0.3 | | | | 4.43 | % | | | 4.43 | %Ø | | | 1.80 | % | | | 1.80 | %Ø | | | 0.33 | % | | | 41 | % | | | 41 | %Ø | |
Period from
12/19/2012^ to 10/31/2013 | | $ | 10.00 | | | $ | 0.07 | | | $ | 0.21 | | | $ | 0.28 | | | $ | — | | | $ | — | | | $ | — | | | $ | — | | | $ | 10.28 | | | | 2.80 | %** | | $ | 0.1 | | | | 7.76 | %‡* | | | 7.76 | %‡Ø* | | | 1.79 | %‡* | | | 1.79 | %‡Ø* | | | 0.84 | %‡* | | | 45 | %** | | | 45 | %Ø** | |
Class R6 | |
Period from
5/11/2015^
to 10/31/2015 | | $ | 10.57 | | | $ | 0.09 | | | $ | (1.07 | ) | | $ | (0.98 | ) | | $ | — | | | $ | — | | | $ | — | | | $ | — | | | $ | 9.59 | | | | (9.27 | )%** | | $ | 1.30 | | | | 3.62 | %* | | | 3.62 | %Ø* | | | 0.65 | %* | | | 0.65 | %Ø* | | | 2.08 | %* | | | 100 | %cØ | | | 100 | %cØ | |
Long Short Fund | |
Institutional Class | |
10/31/2015 | | $ | 13.02 | | | $ | 0.02 | | | $ | (0.21 | ) | | $ | (0.19 | ) | | $ | (0.02 | ) | | $ | (0.05 | ) | | $ | (0.07 | ) | | $ | — | | | $ | 12.76 | | | | (1.45 | )% | | $ | 2,719.8 | | | | 1.66 | % | | | 1.31 | % | | | 1.66 | % | | | 1.31 | % | | | 0.16 | % | | | 91 | % | | | 69 | % | |
10/31/2014 | | $ | 12.48 | | | $ | 0.02 | | | $ | 0.58 | | | $ | 0.60 | | | $ | — | | | $ | (0.06 | ) | | $ | (0.06 | ) | | $ | 0.00 | | | $ | 13.02 | | | | 4.83 | %b | | $ | 2,627.8 | | | | 1.72 | % | | | 1.48 | % | | | 1.72 | % | | | 1.48 | % | | | 0.17 | % | | | 61 | % | | | 44 | % | |
10/31/2013 | | $ | 11.09 | | | $ | 0.01 | | | $ | 1.47 | | | $ | 1.48 | | | $ | (0.01 | ) | | $ | (0.08 | ) | | $ | (0.09 | ) | | $ | — | | | $ | 12.48 | | | | 13.47 | % | | $ | 1,038.2 | | | | 1.75 | % | | | 1.60 | % | | | 1.75 | %§ | | | 1.60 | %§ | | | 0.10 | % | | | 103 | % | | | 52 | % | |
Period from
12/29/2011^
to 10/31/2012 | | $ | 10.00 | | | $ | 0.04 | | | $ | 1.05 | | | $ | 1.09 | | | $ | — | | | $ | — | | | $ | — | | | $ | — | | | $ | 11.09 | | | | 10.90 | %** | | $ | 92.6 | | | | 2.78 | %‡* | | | 2.65 | %‡* | | | 1.83 | %‡* | | | 1.70 | %‡* | | | 0.40 | %‡* | | | 93 | %** | | | 56 | %** | |
Class A | |
10/31/2015 | | $ | 12.91 | | | $ | (0.03 | ) | | $ | (0.21 | ) | | $ | (0.24 | ) | | $ | — | | | $ | (0.05 | ) | | $ | (0.05 | ) | | $ | — | | | $ | 12.62 | | | | (1.89 | )% | | $ | 361.7 | | | | 2.03 | % | | | 1.68 | % | | | 2.03 | % | | | 1.68 | % | | | (0.20 | )% | | | 91 | % | | | 69 | % | |
10/31/2014 | | $ | 12.41 | | | $ | (0.03 | ) | | $ | 0.58 | | | $ | 0.55 | | | $ | — | | | $ | (0.05 | ) | | $ | (0.05 | ) | | $ | 0.00 | | | $ | 12.91 | | | | 4.47 | %b | | $ | 388.6 | | | | 2.09 | % | | | 1.85 | % | | | 2.09 | % | | | 1.85 | % | | | (0.20 | )% | | | 61 | % | | | 44 | % | |
10/31/2013 | | $ | 11.06 | | | $ | (0.03 | ) | | $ | 1.47 | | | $ | 1.44 | | | $ | (0.01 | ) | | $ | (0.08 | ) | | $ | (0.09 | ) | | $ | — | | | $ | 12.41 | | | | 13.08 | % | | $ | 502.1 | | | | 2.08 | % | | | 1.94 | % | | | 2.08 | %§ | | | 1.94 | %§ | | | (0.23 | )% | | | 103 | % | | | 52 | % | |
Period from
12/29/2011^
to 10/31/2012 | | $ | 10.00 | | | $ | 0.00 | | | $ | 1.06 | | | $ | 1.06 | | | $ | — | | | $ | — | | | $ | — | | | $ | — | | | $ | 11.06 | | | | 10.60 | %** | | $ | 27.0 | | | | 3.21 | %‡* | | | 3.11 | %‡* | | | 2.17 | %‡* | | | 2.06 | %‡* | | | 0.05 | %‡* | | | 93 | %** | | | 56 | %** | |
Class C | |
10/31/2015 | | $ | 12.66 | | | $ | (0.12 | ) | | $ | (0.20 | ) | | $ | (0.32 | ) | | $ | — | | | $ | (0.05 | ) | | $ | (0.05 | ) | | $ | — | | | $ | 12.29 | | | | (2.56 | )% | | $ | 190.6 | | | | 2.77 | % | | | 2.42 | % | | | 2.77 | %* | | | 2.42 | % | | | (0.94 | )% | | | 91 | % | | | 69 | % | |
10/31/2014 | | $ | 12.26 | | | $ | (0.12 | ) | | $ | 0.57 | | | $ | 0.45 | | | $ | — | | | $ | (0.05 | ) | | $ | (0.05 | ) | | $ | 0.00 | | | $ | 12.66 | | | | 3.71 | %b | | $ | 211.0 | | | | 2.84 | % | | | 2.60 | % | | | 2.84 | % | | | 2.60 | % | | | (0.94 | )% | | | 61 | % | | | 44 | % | |
10/31/2013 | | $ | 10.99 | | | $ | (0.12 | ) | | $ | 1.46 | | | $ | 1.34 | | | $ | (0.00 | ) | | $ | (0.07 | ) | | $ | (0.07 | ) | | $ | — | | | $ | 12.26 | | | | 12.23 | % | | $ | 115.1 | | | | 2.83 | % | | | 2.68 | % | | | 2.83 | %§ | | | 2.68 | %§ | | | (1.00 | )% | | | 103 | % | | | 52 | % | |
Period from 12/29/2011^
to 10/31/2012 | | $ | 10.00 | | | $ | (0.06 | ) | | $ | 1.05 | | | $ | 0.99 | | | $ | — | | | $ | — | | | $ | — | | | $ | — | | | $ | 10.99 | | | | 9.90 | %** | | $ | 3.4 | | | | 4.34 | %‡* | | | 4.20 | %‡* | | | 2.95 | %‡* | | | 2.81 | %‡* | | | (0.69 | )%‡* | | | 93 | %** | | | 56 | %** | |
See Notes to Financial Highlights
Financial Highlights (cont'd)
| | | Net Asset
Value,
Beginning
of Year | | Net
Investment
Income
(Loss)@ | | Net Gains
or
Losses on
Securities
(both
realized
and
unrealized) | | Total From
Investment
Operations | | Dividends
from Net
Investment
Income | | Distributions
from Net
Realized
Capital
Gains | | Total
Distributions | | Voluntary
Contributions
from
Management | | Net Asset
Value,
End of
Year | | Total
Return†† | | Net Assets,
End of
Year
(in millions) | | Ratio
of Gross
Expenses to
Average
Net
Assets# | | Ratio
of Gross
Expenses
to Average
Net Assets
(excluding
dividend
and interest
expense
relating to
short sales) | | Ratio
of Net
Expenses to
Average
Net
Assets | | Ratio
of Net
Expenses
to Average
Net Assets
(excluding
dividend
and interest
expense
relating to
short sales) | | Ratio
of Net
Investment
Income/
(Loss) to
Average
Net
Assets | | Portfolio
Turnover
Rate
(including
securities
sold
short) | | Portfolio
Turnover
Rate
(excluding
securities
sold
short) | |
Long Short Credit Fund | |
Institutional Class | |
Period from 6/29/2015^
to 10/31/2015 | | $ | 10.00 | | | $ | 0.02 | | | $ | (0.23 | ) | | $ | (0.21 | ) | | $ | (0.04 | ) | | $ | — | | | $ | (0.04 | ) | | $ | — | | | $ | 9.75 | | | | (2.06 | )%** | | $ | 22.8 | | | | 3.50 | %‡* | | | 3.45 | %‡* | | | 1.21 | %‡* | | | 1.15 | %‡* | | | 0.64 | %‡* | | | 32 | %** | | | 18 | %** | |
Class A | |
Period from 6/29/ 2015^
to 10/31/2015 | | $ | 10.00 | | | $ | 0.01 | | | $ | (0.23 | ) | | $ | (0.22 | ) | | $ | (0.03 | ) | | $ | — | | | $ | (0.03 | ) | | $ | — | | | $ | 9.75 | | | | (2.17 | )%** | | $ | 1.3 | | | | 4.28 | %‡* | | | 4.23 | %‡* | | | 1.55 | %‡* | | | 1.50 | %‡* | | | 0.28 | %‡* | | | 32 | %** | | | 18 | %** | |
Class C | |
Period from
6/29/2015^
to 10/31/2015 | | $ | 10.00 | | | $ | (0.01 | ) | | $ | (0.23 | ) | | $ | (0.24 | ) | | $ | (0.01 | ) | | $ | — | | | $ | (0.01 | ) | | $ | — | | | $ | 9.75 | | | | (2.41 | )%** | | $ | 1.0 | | | | 5.04 | %‡* | | | 4.98 | %‡* | | | 2.26 | %‡* | | | 2.20 | %‡* | | | (0.43 | )%‡* | | | 32 | %** | | | 18 | %** | |
Class R6 | |
Period from
6/29/ 2015^
to 10/31/2015 | | $ | 10.00 | | | $ | 0.02 | | | $ | (0.22 | ) | | $ | (0.20 | ) | | $ | (0.05 | ) | | $ | — | | | $ | (0.05 | ) | | $ | — | | | $ | 9.75 | | | | (2.03 | )%** | | $ | 4.9 | | | | 3.49 | %‡* | | | 3.44 | %‡* | | | 1.14 | %‡* | | | 1.08 | %‡* | | | 0.69 | %‡* | | | 32 | %** | | | 18 | %** | |
Multi-Asset Income Fund | |
Institutional Class | |
Period from
3/27/2015^
to 10/31/2015 | | $ | 10.00 | | | $ | 0.23 | | | $ | (0.57 | ) | | $ | (0.34 | ) | | $ | (0.23 | ) | | $ | — | | | $ | (0.23 | ) | | $ | — | | | $ | 9.43 | | | | (3.43 | )%** | | $ | 10.6 | | | | 3.66 | %‡* | | | 3.66 | %؇* | | | 0.43 | %‡* | | | 0.43 | %؇* | | | 3.87 | %‡* | | | 33 | %** | | | 33 | %Ø** | |
Class A | |
Period from
3/27/2015^
to 10/31/2015 | | $ | 10.00 | | | $ | 0.20 | | | $ | (0.56 | ) | | $ | (0.36 | ) | | $ | (0.21 | ) | | $ | — | | | $ | (0.21 | ) | | $ | — | | | $ | 9.43 | | | | (3.64 | )%** | | $ | 0.5 | | | | 4.55 | %‡* | | | 4.55 | %؇* | | | 0.79 | %‡* | | | 0.79 | %؇* | | | 3.50 | %‡* | | | 33 | %** | | | 33 | %Ø** | |
Class C | |
Period from
3/27/2015^
to 10/31/2015 | | $ | 10.00 | | | $ | 0.16 | | | $ | (0.56 | ) | | $ | (0.40 | ) | | $ | (0.17 | ) | | $ | — | | | $ | (0.17 | ) | | $ | — | | | $ | 9.43 | | | | (4.07 | )%** | | $ | 0.5 | | | | 5.29 | %‡* | | | 5.29 | %؇* | | | 1.53 | %‡* | | | 1.53 | %؇* | | | 2.76 | %‡* | | | 33 | %** | | | 33 | %Ø** | |
Class R6 | |
Period from
3/27/2015^
to 10/31/2015 | | $ | 10.00 | | | $ | 0.23 | | | $ | (0.57 | ) | | $ | (0.34 | ) | | $ | (0.23 | ) | | $ | — | | | $ | (0.23 | ) | | $ | — | | | $ | 9.43 | | | | (3.39 | )%** | | $ | 3.8 | | | | 3.63 | %‡* | | | 3.63 | %؇* | | | 0.36 | %‡* | | | 0.36 | %؇* | | | 3.93 | %‡* | | | 33 | %** | | | 33 | %Ø** | |
See Notes to Financial Highlights
Notes to Financial Highlights
†† Total return based on per share NAV reflects the effects of changes in NAV on the performance of each Fund during each fiscal period. Returns assume income dividends and other distributions, if any, were reinvested, but do not reflect the effect of sales charges. Results represent past performance and do not indicate future results. Current returns may be lower or higher than the performance data quoted. Investment returns and principal may fluctuate and shares when redeemed may be worth more or less than original cost. Total return would have been lower if Management had not reimbursed and/or waived certain expenses. Total return would have been higher if Management had not recouped previously reimbursed and/or waived expenses.
^ The date investment operations commenced.
‡ Organization expense, which is a non-recurring expense, is included in these ratios on a non-annualized basis.
@ Calculated based on the average number of shares outstanding during each fiscal period.
§ After repayment of expenses previously reimbursed and/or fees previously waived by Management, as applicable. Had the Fund not made such repayments, the annualized ratios of net expenses to average daily net assets would have been:
| | | Including
Dividend
and Interest
Expense
Relating to
Short Sales | | Excluding
Dividend
and Interest
Expense
Relating to
Short Sales | |
| | | Year Ended October 31, 2013 | |
Long Short Fund Institutional Class | | | 1.69 | % | | | 1.54 | % | |
Long Short Fund Class A | | | 2.06 | % | | | 1.92 | % | |
Long Short Fund Class C | | | 2.81 | % | | | 2.66 | % | |
* Annualized.
** Not annualized.
^^ As of June 22, 2011, Global Allocation's Institutional Class, Class A and Class C contractual expense limitations exclude dividend expenses relating to short sales, if any; consequently, net expenses may exceed the contractual expense limitations.
# Represents the annualized ratios of net expenses to average daily net assets if Management had not reimbursed certain expenses and/or waived a portion of the investment management fee.
Ø Flexible Select, Inflation Managed and Multi-Asset Income did not engage in short sales.
§§ Effective February 28, 2015, Neuberger Berman Inflation Navigator Fund changed its name to Neuberger Berman Inflation Managed Fund.
a The portfolio turnover rates not including mortgage dollar roll transactions, including and excluding securities sold short, were 195% and 185%, respectively, for the year ended October 31, 2015, for Global Allocation.
b The voluntary contribution listed in Note B of the Notes to Financial Statements had no impact on the Funds' total returns for the year ended October 31, 2014.
c Portfolio turnover is calculated at the Fund level. Percentage indicated was calculated for the year ended October 31, 2015 for Inflation Managed.
Report of Independent Registered Public Accounting Firm
To the Board of Trustees of
Neuberger Berman Alternative Funds and
Shareholders of:
Neuberger Berman Inflation Managed Fund
(formerly Inflation Navigator Fund)
Neuberger Berman Flexible Select Fund
Neuberger Berman Global Allocation Fund
Neuberger Berman Long Short Credit Fund
Neuberger Berman Multi-Asset Income Fund
We have audited the accompanying statements of assets and liabilities of Neuberger Berman Inflation Managed Fund (formerly, Neuberger Berman Inflation Navigator Fund), Neuberger Berman Flexible Select Fund, Neuberger Berman Global Allocation Fund, Neuberger Berman Long Short Credit Fund and Neuberger Berman Multi-Asset Income Fund, five of the series constituting the Neuberger Berman Alternative Funds (the "Funds") including the schedules of investments, as of October 31, 2015, and the related statements of operations for the statements of changes in net assets and the financial highlights for each of the periods indicated therein. These financial statements and financial highlights are the responsibility of the Funds' management. Our responsibility is to express an opinion on these financial statements and financial highlights based on our audit.
We conducted our audits in accordance with the standards of the Public Company Accounting Oversight Board (United States). Those standards require that we plan and perform the audit to obtain reasonable assurance about whether the financial statements and financial highlights are free of material misstatement. We were not engaged to perform an audit of the Funds' internal control over financial reporting. Our audits included consideration of internal control over financial reporting as a basis for designing audit procedures that are appropriate in the circumstances, but not for the purpose of expressing an opinion on the effectiveness of the Funds' internal control over financial reporting. Accordingly, we express no such opinion. An audit also includes examining, on a test basis, evidence supporting the amounts and disclosures in the financial statements and financial highlights, assessing the accounting principles used and significant estimates made by management, and evaluating the overall financial statement presentation. Our procedures included confirmation of securities owned as of October 31, 2015 by correspondence with the custodian and others or by other appropriate auditing procedures where replies from others were not received. We believe that our audits provide a reasonable basis for our opinion.
In our opinion, the financial statements and financial highlights referred to above present fairly, in all material respects, the financial position of Neuberger Berman Inflation Managed Fund, Neuberger Berman Flexible Select Fund, Neuberger Berman Global Allocation Fund, Neuberger Berman Long Short Credit Fund and Neuberger Berman Multi-Asset Income Fund, at October 31, 2015, the results of their operations, the changes in their net assets and the financial highlights for each of the periods indicated therein, in conformity with U.S. generally accepted accounting principles.

Boston, Massachusetts
December 23, 2015
Report of Independent Registered Public Accounting Firm
To the Board of Trustees and Shareholders
Neuberger Berman Alternative Funds
We have audited the accompanying statement of assets and liabilities of the Neuberger Berman Long Short Fund, a series of the Neuberger Berman Alternative Funds (the "Trust"), including the schedule of investments, as of October 31, 2015, and the related statement of operations for the year then ended, and the statements of changes in net assets for each of the two years in the period then ended, and the financial highlights for each of the three years in the period then ended and for the period December 29, 2011 (commencement of operations) to October 31, 2012. These financial statements and financial highlights are the responsibility of the Trust's management. Our responsibility is to express an opinion on these financial statements and financial highlights based on our audit.
We conducted our audit in accordance with the standards of the Public Company Accounting Oversight Board (United States). Those standards require that we plan and perform the audit to obtain reasonable assurance about whether the financial statements and financial highlights are free of material misstatement. The Trust is not required to have, nor were we engaged to perform, an audit of its internal control over financial reporting. Our audit included consideration of internal control over financial reporting as a basis for designing audit procedures that are appropriate in the circumstances, but not for the purpose of expressing an opinion on the effectiveness of the Trust's internal control over financial reporting. Accordingly, we express no such opinion. An audit also includes examining, on a test basis, evidence supporting the amounts and disclosures in the financial statements, assessing the accounting principles used and significant estimates made by management, as well as evaluating the overall financial statement presentation. Our procedures included confirmation of securities owned as of October 31, 2015, by correspondence with the custodian and brokers or by other appropriate auditing procedures where replies from brokers were not received. We believe that our audit provides a reasonable basis for our opinion.
In our opinion, the financial statements and financial highlights referred to above present fairly, in all material respects, the financial position of the Neuberger Berman Long Short Fund, as of October 31, 2015, and the results of its operations for the year then ended, and the changes in its net assets for each of the two years in the period then ended, and the financial highlights for each of the two years in the period then ended and for the period December 29, 2011 (commencement of operations) to October 31, 2012, in conformity with accounting principles generally accepted in the United States of America.

Philadelphia, Pennsylvania
December 23, 2015
Investment Manager, Administrator and Distributor
Neuberger Berman Management LLC
605 Third Avenue, 2nd Floor
New York, NY 10158-0180
800.877.9700 or 212.476.8800
Intermediary Client Services 800.366.6264
Sub-Advisers
Neuberger Berman Fixed Income LLC
190 South LaSalle Street
Chicago, IL 60603
Neuberger Berman LLC
605 Third Avenue
New York, NY 10158-3698
Custodian and Shareholder Servicing Agent
State Street Bank and Trust Company
One Lincoln Street
Boston, MA 02111
For Institutional Class Shareholders
Address correspondence to:
Neuberger Berman Management LLC
605 Third Avenue, Mail Drop 2-7
New York, NY 10158-0180
Attn: Intermediary Client Services
800.366.6264
For Class A and Class C Shareholders:
Please contact your investment provider
Legal Counsel
K&L Gates LLP
1601 K Street, NW
Washington, DC 20006-1600
Independent Registered Public Accounting Firms
Ernst & Young LLP
200 Clarendon Street
Boston, MA 02116
Tait, Weller & Baker LLP
1818 Market Street
Suite 2400
Philadelphia, PA 19103
Trustee and Officer Information
The following tables set forth information concerning the Trustees and Officers of each of the Funds. All persons named as Trustees and Officers also serve in similar capacities for other funds administered or managed by Management, NBFI and/or Neuberger. Each Fund's Statement of Additional Information includes additional information about the Trustees as of the time of the Fund's most recent public offering and is available upon request, without charge, by calling (800) 877-9700.
Information about the Board of Trustees
Name, (Year of Birth),
and Address(1) | | Position(s)
and Length of
Time Served(2) | | Principal Occupation(s)(3) | | Number of
Funds in
Fund Complex
Overseen by
Fund Trustee | | Other Directorships Held
Outside Fund Complex by
Fund Trustee(3) | |
Independent Trustees | |
Faith Colish (1935) | | Trustee since inception | | Counsel, Carter Ledyard & Milburn LLP (law firm) since October 2002; formerly, Attorney-at-Law and President, Faith Colish, A Professional Corporation, 1980 to 2002. | | | 59 | | | Formerly, Director, 1997 to 2003, and Advisory Director, 2003 to 2006, ABA Retirement Funds (formerly, American Bar Retirement Association) (not-for-profit membership corporation). | |
Michael J. Cosgrove (1949) | | Trustee since 2015 | | President, Carragh Consulting USA, since 2014; formerly, Executive, General Electric Company, 1982 to 2014, including President, Mutual Funds and Global Investment Programs, GE Asset Management, 2011 to 2014, President and Chief Executive Officer, Mutual Funds and Intermediary Business, GE Asset Management, 2007 to 2011, and President, Institutional Sales and Marketing, GE Asset Management, 1998 to 2007. | | | 59 | | | Director, The Gabelli Go Anywhere Trust, since 2015; Director, America Press, Inc. (not-for-profit Jesuit publisher), since 2015; Director, Fordham University, since 2001; Director, Skin Cancer Foundation (not-for-profit), since 2006; formerly, Director, GE Investments Funds, Inc., 1997 to 2014; Trustee, GE Institutional Funds, 1997 to 2014; Director, GE Asset Management, 1988 to 2014; Director, Elfun Trusts, 1988 to 2014. | |
Name, (Year of Birth),
and Address(1) | | Position(s)
and Length of
Time Served(2) | | Principal Occupation(s)(3) | | Number of
Funds in
Fund Complex
Overseen by
Fund Trustee | | Other Directorships Held
Outside Fund Complex by
Fund Trustee(3) | |
Marc Gary (1952) | | Trustee since 2015 | | Executive Vice Chancellor and Chief Operating Officer, Jewish Theological Seminary, since 2012; formerly, Executive Vice President and General Counsel, Fidelity Investments, 2007 to 2012; Executive Vice President and General Counsel, BellSouth Corporation, 2004 to 2007; Vice President and Associate General Counsel, BellSouth Corporation, 2000 to 2004; Associate, Partner, and National Litigation Practice Co-Chair, Mayer, Brown LLP, 1981 to 2000; Associate Independent Counsel, Office of Independent Counsel, 1990 to 1992. | | | 59 | | | Trustee, Jewish Theological Seminary, since 2015; Director, Counsel on Call (privately held for-profit company), since 2012; Director, Lawyers Committee for Civil Rights Under Law (not-for-profit), since 2005; formerly, Director, Equal Justice Works (not-for-profit), 2005 to 2014; Director, Corporate Counsel Institute, Georgetown University Law Center, 2007 to 2012; Director, Greater Boston Legal Services (not-for-profit), 2007 to 2012. | |
Name, (Year of Birth),
and Address(1) | | Position(s)
and Length of
Time Served(2) | | Principal Occupation(s)(3) | | Number of
Funds in
Fund Complex
Overseen by
Fund Trustee | | Other Directorships Held
Outside Fund Complex by
Fund Trustee(3) | |
Martha C. Goss (1949) | | Trustee since 2007 | | President, Woodhill Enterprises Inc./Chase Hollow Associates LLC (personal investment vehicle), since 2006; formerly, Consultant, Resources Global Professionals (temporary staffing), 2002 to 2006. | | | 59 | | | Director, American Water (water utility), since 2003; Director, Allianz Life of New York (insurance), since 2005; Director, Berger Group Holdings, Inc. (engineering consulting firm), since 2013; Director, Financial Women's Association of New York (not-for-profit association), since 2003; Trustee Emerita, Brown University, since 1998; Director, Museum of American Finance (not-for-profit), since 2013; formerly, Non-Executive Chair and Director, Channel Reinsurance (financial guaranty reinsurance), 2006 to 2010; formerly, Director, Ocwen Financial Corporation (mortgage servicing), 2005 to 2010; formerly, Director, Claire's Stores, Inc. (retailer), 2005 to 2007; formerly, Director, Parsons Brinckerhoff Inc. (engineering consulting firm), 2007 to 2010; formerly, Director, Bank Leumi (commercial bank), 2005 to 2007; formerly, Advisory Board Member, Attensity (software developer), 2005 to 2007. | |
Name, (Year of Birth),
and Address(1) | | Position(s)
and Length of
Time Served(2) | | Principal Occupation(s)(3) | | Number of
Funds in
Fund Complex
Overseen by
Fund Trustee | | Other Directorships Held
Outside Fund Complex by
Fund Trustee(3) | |
Michael M. Knetter (1960) | | Trustee since 2007 | | President and Chief Executive Officer, University of Wisconsin Foundation, since October 2010; formerly, Dean, School of Business, University of Wisconsin—Madison; formerly, Professor of International Economics and Associate Dean, Amos Tuck School of Business—Dartmouth College, 1998 to 2002. | | | 59 | | | Board Member, American Family Insurance (a mutual company, not publicly traded), since March 2009; formerly, Trustee, Northwestern Mutual Series Fund, Inc., 2007 to 2011; formerly, Director, Wausau Paper, 2005 to 2011; formerly, Director, Great Wolf Resorts, 2004 to 2009. | |
Howard A. Mileaf (1937) | | Trustee since inception | | Retired; formerly, Vice President and General Counsel, WHX Corporation (holding company), 1993 to 2001. | | | 59 | | | Formerly, Director, Webfinancial Corporation (holding company), 2002 to 2008; formerly, Director, WHX Corporation (holding company), 2002 to 2005; formerly, Director, State Theatre of New Jersey (not-for-profit theatre), 2000 to 2005. | |
George W. Morriss (1947) | | Trustee since 2007 | | Adjunct Professor, Columbia University School of International and Public Affairs, since October 2012; formerly, Executive Vice President and Chief Financial Officer, People's Bank, Connecticut (a financial services company), 1991 to 2001. | | | 59 | | | Director and Treasurer, National Association of Corporate Directors, Connecticut Chapter, since 2011; Trustee, Steben Alternative Investment Funds, Steben Select Multi-Strategy Fund, and Steben Select Multi-Strategy Master Fund, since 2013; formerly, Manager, Larch Lane Multi-Strategy Fund complex (which consisted of three funds), 2006 to 2011; formerly, Member, NASDAQ Issuers' Affairs Committee, 1995 to 2003. | |
Name, (Year of Birth),
and Address(1) | | Position(s)
and Length of
Time Served(2) | | Principal Occupation(s)(3) | | Number of
Funds in
Fund Complex
Overseen by
Fund Trustee | | Other Directorships Held
Outside Fund Complex by
Fund Trustee(3) | |
Tom D. Seip (1950) | | Trustee since inception; Chairman of the Board since 2008; formerly Lead Independent Trustee from 2006 to 2008 | | General Partner, Ridgefield Farm LLC (a private investment vehicle); formerly, President and CEO, Westaff, Inc. (temporary staffing), May 2001 to January 2002; formerly, Senior Executive, The Charles Schwab Corporation, 1983 to 1998, including Chief Executive Officer, Charles Schwab Investment Management, Inc.; Trustee, Schwab Family of Funds and Schwab Investments, 1997 to 1998; and Executive Vice President-Retail Brokerage, Charles Schwab & Co., Inc., 1994 to 1997. | | | 59 | | | Director, H&R Block, Inc. (financial services company), since May 2001; Chairman, Governance and Nominating Committee, H&R Block, Inc., since 2011; formerly, Chairman, Compensation Committee, H&R Block, Inc., 2006 to 2010; formerly, Director, Forward Management, Inc. (asset management company), 1999 to 2006. | |
Candace L. Straight (1947) | | Trustee since inception | | Private investor and consultant specializing in the insurance industry; formerly, Advisory Director, Securitas Capital LLC (a global private equity investment firm dedicated to making investments in the insurance sector), 1998 to 2003. | | | 59 | | | Public Member, Board of Governors and Board of Trustees, Rutgers University, since 2011; Director, Montpelier Re Holdings Ltd. (reinsurance company), since 2006; formerly, Director, National Atlantic Holdings Corporation (property and casualty insurance company), 2004 to 2008; formerly, Director, The Proformance Insurance Company (property and casualty insurance company), 2004 to 2008; formerly, Director, Providence Washington Insurance Company (property and casualty insurance company), 1998 to 2006; formerly, Director, Summit Global Partners (insurance brokerage firm), 2000 to 2005. | |
Peter P. Trapp (1944) | | Trustee since inception | | Retired; formerly, Regional Manager for Mid-Southern Region, Ford Motor Credit Company, September 1997 to 2007; formerly, President, Ford Life Insurance Company, April 1995 to August 1997. | | | 59 | | | None. | |
Name, (Year of Birth),
and Address(1) | | Position(s)
and Length of
Time Served(2) | | Principal Occupation(s)(3) | | Number of
Funds in
Fund Complex
Overseen by
Fund Trustee | | Other Directorships Held
Outside Fund Complex by
Fund Trustee(3) | |
Trustees who are "Interested Persons" | |
Joseph V. Amato* (1962) | | Trustee since 2009 | | President and Director, Neuberger Berman Group LLC, since 2009; President and Chief Executive Officer, Neuberger and Neuberger Berman Holdings LLC (including its predecessor, Neuberger Berman Inc.), since 2007; Chief Investment Officer (Equities) and Managing Director, Management, since 2009; Managing Director, Neuberger Berman Fixed Income LLC ("NBFI"), since 2007; Board member of NBFI since 2006; formerly, Global Head of Asset Management of Lehman Brothers Holdings Inc.'s ("LBHI") Investment Management Division, 2006 to 2009; formerly, member of LBHI's Investment Management Division's Executive Management Committee, 2006 to 2009; formerly, Managing Director, Lehman Brothers Inc. ("LBI"), 2006 to 2008; formerly, Chief Recruiting and Development Officer, LBI, 2005 to 2006; formerly, Global Head of LBI's Equity Sales and a Member of its Equities Division Executive Committee, 2003 to 2005. | | | 59 | | | Member of Board of Advisors, McDonough School of Business, Georgetown University, since 2001; Member of New York City Board of Advisors, Teach for America, since 2005; Trustee, Montclair Kimberley Academy (private school), since 2007; Member of Board of Regents, Georgetown University, since 2013. | |
Robert Conti* (1956) | | Chief Executive Officer, President and Trustee since 2008; prior thereto, Executive Vice President in 2008 and Vice President from inception to 2008 | | Managing Director, Neuberger, since 2007; Managing Director, NBFI, since 2009; formerly, Senior Vice President, Neuberger, 2003 to 2006; formerly, Vice President, Neuberger, 1999 to 2003; President and Chief Executive Officer, Management, since 2008; formerly, Senior Vice President, Management, 2000 to 2008. | | | 59 | | | Director, Staten Island Mental Health Society, since 1994; formerly, Chairman of the Board, Staten Island Mental Health Society, 2008 to 2011. | |
(1) The business address of each listed person is 605 Third Avenue, New York, New York 10158.
(2) Pursuant to the Trust's Trust Instrument, each of these Trustees shall hold office for life or until his or her successor is elected or the Trust terminates; except that (a) any Trustee may resign by delivering a written resignation; (b) any Trustee may be removed with or without cause at any time by a written instrument signed by at least two-thirds of the other Trustees; (c) any Trustee who requests to be retired, or who has become unable to serve, may be retired by a written instrument signed by a majority of the other Trustees; and (d) any Trustee may be removed at any shareholder meeting by a vote of at least two-thirds of the outstanding shares.
(3) Except as otherwise indicated, each individual has held the positions shown for at least the last five years.
* Indicates a Trustee who is an "interested person" within the meaning of the 1940 Act. Mr. Amato and Mr. Conti are interested persons of the Trust by virtue of the fact that each is an officer of Management, Neuberger and/or their affiliates.
Information about the Officers of the Trust
Name, (Year of Birth),
and Address(1) | | Position(s)
Time Served(2) | | Principal Occupation(s)(3)
and Length of | |
Andrew B. Allard (1961) | | Chief Legal Officer since 2013 (only for purposes of sections 307 and 406 of the Sarbanes-Oxley Act of 2002) and Anti-Money Laundering Compliance Officer since inception | | General Counsel and Senior Vice President, Management, since 2013; Senior Vice President, Neuberger, since 2006 and Employee since 1999; Deputy General Counsel, Neuberger, since 2004; formerly, Vice President, Neuberger, 2000 to 2005; formerly, Employee, Management, 1994 to 1999; Chief Legal Officer (only for purposes of sections 307 and 406 of the Sarbanes-Oxley Act of 2002), ten registered investment companies for which Management acts as investment manager and administrator (ten since 2013); Anti-Money Laundering Compliance Officer, ten registered investment companies for which Management acts as investment manager and administrator (six since 2002, one since 2003, one since 2005, one since 2006 and one since 2013). | |
Claudia A. Brandon (1956) | | Executive Vice President since 2008 and Secretary since inception | | Senior Vice President, Neuberger, since 2007 and Employee since 1999; Senior Vice President, Management, since 2008 and Assistant Secretary since 2004; formerly, Vice President, Neuberger, 2002 to 2006; formerly, Vice President-Mutual Fund Board Relations, Management, 2000 to 2008; formerly, Vice President, Management, 1986 to 1999 and Employee 1984 to 1999; Executive Vice President, ten registered investment companies for which Management acts as investment manager and administrator (nine since 2008 and one since 2013); Secretary, ten registered investment companies for which Management acts as investment manager and administrator (three since 1985, three since 2002, one since 2003, one since 2005, one since 2006 and one since 2013). | |
Agnes Diaz (1971) | | Vice President since 2013 | | Senior Vice President, Neuberger, since 2012; Employee, Management, since 1996; formerly, Vice President, Neuberger, 2007 to 2012; Vice President, ten registered investment companies for which Management acts as investment manager and administrator (ten since 2013). | |
Anthony DiBernardo (1979) | | Assistant Treasurer since 2011 | | Senior Vice President, Neuberger, since 2014; Employee, Management, since 2003; formerly, Vice President, Neuberger, 2009 to 2014; Assistant Treasurer, ten registered investment companies for which Management acts as investment manager and administrator (nine since 2011 and one since 2013). | |
Sheila R. James (1965) | | Assistant Secretary since inception | | Vice President, Neuberger, since 2008 and Employee since 1999; formerly, Assistant Vice President, Neuberger, 2007; formerly, Employee, Management, 1991 to 1999; Assistant Secretary, ten registered investment companies for which Management acts as investment manager and administrator (six since 2002, one since 2003, one since 2005, one since 2006 and one since 2013). | |
Name, (Year of Birth),
and Address(1) | | Position(s)
Time Served(2) | | Principal Occupation(s)(3)
and Length of | |
Brian Kerrane (1969) | | Chief Operating Officer since 2015 and Vice President since 2008 | | Managing Director, Neuberger, since 2014; Vice President, Management, since 2008 and Employee since 1991; formerly, Senior Vice President, Neuberger, 2006 to 2014; Chief Operating Officer, ten registered investment companies for which Management acts as investment manager and administrator (ten since 2015); Vice President, ten registered investment companies for which Management acts as investment manager and administrator (nine since 2008 and one since 2013). | |
Kevin Lyons (1955) | | Assistant Secretary since inception | | Assistant Vice President, Neuberger, since 2008 and Employee since 1999; formerly, Employee, Management, 1993 to 1999; Assistant Secretary, ten registered investment companies for which Management acts as investment manager and administrator (seven since 2003, one since 2005, one since 2006 and one since 2013). | |
Anthony Maltese (1959) | | Vice President since 2015 | | Senior Vice President, Neuberger, since 2014 and Employee since 2000; Vice President, ten registered investment companies for which Management acts as investment manager and administrator (ten since 2015). | |
Owen F. McEntee, Jr. (1961) | | Vice President since 2008 | | Vice President, Neuberger, since 2006; Employee, Management, since 1992; Vice President, ten registered investment companies for which Management acts as investment manager and administrator (nine since 2008 and one since 2013). | |
John M. McGovern (1970) | | Treasurer and Principal Financial and Accounting Officer since inception | | Senior Vice President, Neuberger, since 2007; Employee, Management, since 1993; Treasurer and Principal Financial and Accounting Officer, ten registered investment companies for which Management acts as investment manager and administrator (eight since 2005, one since 2006 and one since 2013); formerly, Vice President, Neuberger, 2004 to 2006; formerly, Assistant Treasurer, eight registered investment companies for which Management acts as investment manager and administrator, 2002 to 2005. | |
Frank Rosato (1971) | | Assistant Treasurer since inception | | Vice President, Neuberger, since 2006; Employee, Management, since 1995; Assistant Treasurer, ten registered investment companies for which Management acts as investment manager and administrator (eight since 2005, one since 2006 and one since 2013). | |
Chamaine Williams (1971) | | Chief Compliance Officer since inception | | Senior Vice President, Neuberger, since 2007; Chief Compliance Officer, Management, since 2006; Chief Compliance Officer, ten registered investment companies for which Management acts as investment manager and administrator (eight since 2005, one since 2006 and one since 2013); formerly, Senior Vice President, LBI, 2007 to 2008; formerly, Vice President, LBI, 2003 to 2006; formerly, Chief Compliance Officer, Lehman Brothers Asset Management Inc., 2003 to 2007; formerly, Chief Compliance Officer, Lehman Brothers Alternative Investment Management LLC, 2003 to 2007 | |
(1) The business address of each listed person is 605 Third Avenue, New York, New York 10158.
(2) Pursuant to the By-Laws of the Trust, each officer elected by the Trustees shall hold office until his or her successor shall have been elected and qualified or until his or her earlier death, inability to serve, or resignation. Officers serve at the pleasure of the Trustees and may be removed at any time with or without cause.
(3) Except as otherwise indicated, each individual has held the positions shown for at least the last five years
Proxy Voting Policies and Procedures
A description of the policies and procedures that the Trust uses to determine how to vote proxies relating to portfolio securities is available, without charge, by calling 800-877-9700 (toll-free) and on the Securities and Exchange Commission's website at www.sec.gov. Information regarding how the Trust voted proxies relating to portfolio securities during the most recent 12-month period ended June 30 is also available, without charge upon request, by calling 800-877-9700 (toll-free), on the Securities and Exchange Commission's website at www.sec.gov, and on Management's website at www.nb.com.
Quarterly Portfolio Schedule
The Trust files a complete schedule of portfolio holdings for each Fund with the Securities and Exchange Commission for the first and third quarters of the fiscal year on Form N-Q. The Trust's Forms N-Q are available on the Securities and Exchange Commission's website at www.sec.gov and may be reviewed and copied at the Securities and Exchange Commission's Public Reference Room in Washington, DC. Information on the operation of the Public Reference Room may be obtained by calling 800-SEC-0330. The information on Form N-Q is available upon request, without charge, by calling 800-877-9700 (toll-free).
Board Consideration of the Management and Sub-Advisory Agreements
On an annual basis, the Board of Trustees ("Board") of Neuberger Berman Alternative Funds ("Trust"), including the Trustees who are not "interested persons" of Neuberger Berman Management LLC ("Management") (including its affiliates) or the Trust ("Independent Fund Trustees"), considers whether to continue the management agreement with Management (the "Management Agreement") and the sub-advisory agreement between Management and Neuberger Berman LLC ("Neuberger") for Neuberger Berman Flexible Select Fund and Neuberger Berman Long Short Fund (each, a "Fund") and between Management and Neuberger Berman Fixed Income LLC ("NBFI") for Neuberger Berman Global Allocation Fund, Neuberger Berman Inflation Managed Fund (formerly Neuberger Berman Inflation Navigator Fund)(each, a "Fund") (each a "Sub-Advisory Agreement," and collectively with the Management Agreement, the "Agreements"). Throughout the process, the Independent Fund Trustees are advised by counsel that is experienced in Investment Company Act of 1940 matters and that is independent of Management ("Independent Counsel"). At a meeting held on September 8, 2015, the Board, including the Independent Fund Trustees, approved the continuation of the Agreements for each Fund.
In evaluating the Agreements with respect to each Fund, the Board, including the Independent Fund Trustees, reviewed extensive materials provided by Management in response to questions submitted by the Independent Fund Trustees and Independent Counsel, and met with senior representatives of Management regarding its personnel, operations and financial condition as they relate to the Funds. The annual contract review extends over at least two regular meetings of the Board to ensure that Management, Neuberger and NBFI have time to respond to any questions the Independent Fund Trustees may have on their initial review of the materials and that the Independent Fund Trustees have time to consider those responses.
In connection with its deliberations, the Board also considered the broad range of information relevant to the annual contract review that is provided to the Board (including its various standing committees) at meetings throughout the year, including investment performance reports and related portfolio information for each Fund, as well as periodic reports on, among other matters, pricing and valuation; brokerage and execution; compliance; and shareholder and other services provided by Management, Neuberger, NBFI and their affiliates. To assist the Board in its deliberations regarding the annual contract review, the Board has established a Contract Review Committee comprised of Independent Fund Trustees, as well as other committees that focus throughout the year on specific areas relevant to the annual contract review, such as Fund performance or compliance matters.
The Independent Fund Trustees received from Independent Counsel a memorandum discussing the legal standards for their consideration of the proposed continuation of the Agreements. During the course of the year and during their deliberations regarding the annual contract review, the Contract Review Committee and the Independent Fund Trustees met with Independent Counsel separately from representatives of Management, Neuberger, and NBFI.
In connection with its approval of the continuation of the Agreements, the Board evaluated the terms of the Agreements, the overall fairness of the Agreements to each Fund and whether the Agreements were in the best interests of each Fund and its shareholders. The Board considered all factors it deemed relevant with respect to each Fund, including the following factors: (1) the nature, extent, and quality of the services provided by Management and Neuberger or NBFI, as applicable; (2) the investment performance of each Fund compared to an appropriate market index and a peer group of investment companies; (3) the costs of the services provided and the profit or loss realized by Management and its affiliates from their relationship with each Fund; (4) the extent to which economies of scale have been or might be realized as each Fund grows; and (5) whether fee levels reflect any such potential economies of scale for the benefit of each Fund's shareholders. The Board's determination to approve the continuation of the Agreements was based on a comprehensive consideration of all information provided to the Board throughout the year and specifically in connection with the annual contract review. The Board members did not identify any particular information or factor that was all-important or controlling, and each Trustee may have attributed different weights to the various factors. The Board focused on the overall costs and benefits of the Agreements to each Fund and, through the Funds, their shareholders.
With respect to the nature, extent and quality of the services provided, the Board considered the investment philosophy and decision-making processes of Management, Neuberger, and NBFI, and the qualifications, experience and,
capabilities of and the resources available to, the portfolio management personnel of Management, Neuberger or NBFI, as applicable, who perform services for the Funds. The Board noted that Management also provides certain administrative services, including fund accounting and compliance oversight. The Board also considered Management's, Neuberger's and NBFI's policies and practices regarding brokerage and allocation of portfolio transactions and reviewed the quality of the execution services that Management had provided. The Board also reviewed whether Management, Neuberger, or NBFI used brokers to execute Fund transactions that provide research and other services to Management, Neuberger, or NBFI and the types of benefits potentially derived from such services by Management, Neuberger, NBFI, the Funds and other clients of Management, Neuberger and NBFI. The Board also considered that Management's responsibilities include daily management of investment, operational, enterprise, legal, regulatory and compliance risks as they relate to the Funds, and considered information regarding Management's processes for managing risk. In addition, the Board noted the positive compliance history of Management, Neuberger, and NBFI, as no significant compliance problems were reported to the Board with respect to any of the firms. The Board also considered the general structure of the portfolio manager compensation program and whether this structure provides appropriate incentives to act in the best interests of the Funds.
As in past years, the Board also considered the manner in which Management addressed various non-routine matters that arose during the year, some of them a result of developments in the broader fund industry or the regulations governing it. In addition, the Board considered actions taken by Management, Neuberger and NBFI in response to recent market conditions, including actions taken in response to regulatory concerns about changes in fixed-income market liquidity and potential volatility, and considered the overall performance of Management, Neuberger and NBFI in this context.
With respect to investment performance, the Board considered information regarding each Fund's short-, intermediate- and long-term performance, as applicable, both on an absolute basis and relative to an appropriate market index (or benchmark) and the average performance of a composite peer group (as constructed by an independent organization) of investment companies pursuing broadly similar strategies. For most of the Funds, the Board also reviewed performance in relation to certain measures of the degree of investment risk undertaken by the portfolio managers. The Board factored into its evaluation of the Funds' performance the limitations inherent in the methodology for constructing peer groups and determining which investment companies should be included in which peer groups. In the case of those Funds that had significantly underperformed their benchmark market indices and/or peer groups, the Board discussed with Management each Fund's performance and steps that Management had taken, or intended to take, to improve performance. The Board also considered Management's responsiveness with respect to the Funds that experienced lagging performance. In this regard, the Board noted that performance, especially short-term performance, is only one of the factors that it deems relevant to its consideration of a Fund's Agreements and that, after considering all relevant factors, it may be appropriate to approve the continuation of the Agreements notwithstanding a Fund's underperformance.
With respect to the overall fairness of the Agreements, the Board considered the fee structure for each Fund under the Agreements as compared to a peer group of comparable funds and any fall-out benefits likely to accrue to Management or NBFI or their affiliates from their relationship with each Fund. With respect to Neuberger Berman Flexible Select Fund and Neuberger Berman Inflation Managed Fund, the Board considered that each Fund invests in affiliated underlying funds pursuant to exemptive relief obtained from the Securities and Exchange Commission. The Board further considered, for any assets that Neuberger Berman Flexible Select Fund and Neuberger Berman Inflation Navigator Fund invest in an affiliated underlying fund, Management's undertaking to waive a portion of each Fund's advisory fee equal to the advisory fee it receives from such affiliated underlying fund. The Board also considered the profitability of Management and its affiliates from their association with the Funds, and year-over-year changes in each of Management's reported expense categories. The Board reviewed a comparison of each Fund's management fee and overall expense ratio to a peer group of comparable funds. The Board noted that the comparative management fee analysis includes, in each Fund's management fee, the separate administrative fee paid to Management, but it was not clear whether this was the case for all funds in the peer group. The Board considered the mean and median of the management fees and expense ratios of each peer group. Where a Fund's management fee was higher than the peer group mean and/or median, the Board considered whether specific portfolio management or administration needs contributed to the size of the management fee. In addition, the Board considered the contractual limit on expenses of certain classes of each Fund. The Board noted that Management incurred a loss on certain of the Funds during the review period.
With regard to the investment performance of each Fund and the costs of the services provided to each Fund, the Board considered the following information. Where a Fund has more than one class of shares outstanding, information for a single class has been provided as identified below and the Board looked at the Institutional Class fees as a proxy for all of the Fund's classes:
• Neuberger Berman Flexible Select Fund (Institutional Class)—The Board considered that, as compared to its peer group, the Fund's contractual management fee and actual management fee net of fees waived by Management were both lower than the median. The Board considered that, as compared to its peer group, the Fund's performance was higher than the median for the 1-year period. The Board also considered that, as compared to its benchmark, the Fund's performance was lower for the 1-year period. The Fund was launched in 2013 and therefore does not have intermediate- and long-term performance.
• Neuberger Berman Global Allocation Fund (Institutional Class)—The Board considered that, as compared to its peer group, the Fund's contractual management fee and actual management fee net of fees waived by Management were both lower than the median. The Board considered that, as compared to its peer group, the Fund's performance was lower than the median for the 1-year period and higher than the median for the 3-year period. The Board also considered that, as compared to its benchmark, the Fund's performance was lower for the 1- and 3-year periods. On January 2, 2015, the Fund began comparing its performance to a different benchmark to better reflect its investment universe. The Fund was launched in December 2010 and therefore does not have long-term performance.
• Neuberger Berman Inflation Managed Fund (Institutional Class)—The Board considered that, as compared to its peer group, the Fund's contractual management fee and actual management fee net of fees waived by Management were both lower than the median. The Board considered that, as compared to its peer group, the Fund's performance was lower than the median for the 1-year period. The Board also considered that, as compared to its benchmark, the Fund's performance was higher for the 1-year period. The Fund was launched in December 2012 and therefore does not have intermediate- and long-term performance.
• Neuberger Berman Long Short Fund (Institutional Class)—The Board considered that, as compared to its peer group, the Fund's contractual management fee was lower than the median but its actual management fee was higher than the median. The Board considered that, as compared to its peer group, the Fund's performance was lower than the median for the 1-year period and higher than the median for the 3-year period. The Board also considered that, as compared to its benchmark, the Fund's performance was higher for the 1- and 3-year periods. The Fund was launched in December 2011 and therefore does not have long-term performance.
The Board also considered whether there were other funds or separate accounts that were advised or sub-advised by Management or its affiliates with investment objectives, policies and strategies that were similar to those of any of the Funds. In the cases where such funds or separate accounts exist, the Board compared the fees charged to the comparable Fund to the fees charged to any such funds and/or separate accounts. The Board considered the appropriateness and reasonableness of any differences between the fees charged to a comparable Fund and any such funds and/or separate accounts, including any breakpoints, and determined that differences in fees and fee structures were consistent with the management and other services provided. The Board also evaluated any apparent or anticipated economies of scale in relation to the services Management provides to each Fund. The Board considered whether each Fund's fee structure provides for a reduction of payments resulting from the use of breakpoints and whether any such breakpoints are set at appropriate asset levels. In concluding that the benefits accruing to Management and its affiliates by virtue of their relationship with each Fund were reasonable in light of the costs of providing the investment advisory and other services and the benefits accruing to each Fund, the Board reviewed specific data as to Management's profit or loss on each Fund for a recent period. The Board also considered Management's cost allocation methodology. The Board recognized that Management should be entitled to earn a reasonable level of profits for services it provides to the Funds and, based on its review, concluded that Management's reported level of profitability on each Fund was reasonable.
Conclusions
In approving the continuation of the Agreements, the Board concluded that the terms of each Agreement are fair and reasonable to each Fund and that approval of the continuation of the Agreements is in the best interests of each Fund and its shareholders. In reaching this determination, the Board considered that Management and Neuberger or NBFI, as applicable, could be expected to provide a high level of service to each Fund; that the performance of each Fund was satisfactory over time, or, in the case of significantly underperforming Funds, that it retained confidence in Management's, Neuberger's and NBFI's capabilities to manage the Funds; that each Fund's fee structure appeared to the Board to be reasonable given the nature, extent and quality of services provided; and that the benefits accruing to Management and its affiliates by virtue of their relationship with the Funds were reasonable in light of the costs of providing the investment advisory and other services and the benefits accruing to each Fund. The Board's conclusions may be based in part on its consideration of materials prepared in connection with the approval or continuance of the Agreements in prior years and on the Board's ongoing regular review of Fund performance and operations throughout the year, in addition to material prepared specifically for the most recent annual review of the Agreements.
Notice to Shareholders
In early 2016 you will receive information to be used in filing your 2015 tax returns, which will include a notice of the exact tax status of all distributions paid to you by the Fund during calendar year 2015. Please consult your own tax advisor for details as to how this information should be reflected on your tax returns.
Under most state tax laws, mutual fund dividends which are derived from direct investments in U.S. Government obligations are not taxable, as long as a Fund meets certain requirements. Some states require that a Fund must provide shareholders with a written notice, within 60 days of the close of a Fund's taxable year, designating the portion of the dividends which represents interest which those states consider to have been earned on U.S. Government obligations. The chart below shows the percentage of income derived from such investments for the twelve months ended October 31, 2015. This information should not be used to complete your tax returns.
| | U.S. Treasury
Obligations | | Other Direct U.S.
Government
Obligations | | Other Indirect
U.S. Government
Obligations | | Repurchase
Agreements | |
Flexible Select | | | 0.0 | % | | | 0.0 | % | | | 0.0 | % | | | 0.0 | % | |
Global Allocation | | | 2.6 | | | | 0.2 | | | | 0.0 | | | | 0.0 | | |
Inflation Managed | | | 2.2 | | | | 0.0 | | | | 0.0 | | | | 0.0 | | |
Long Short | | | 0.0 | | | | 0.0 | | | | 0.0 | | | | 0.0 | | |
Long Short Credit | | | 0.0 | | | | 0.0 | | | | 0.0 | | | | 0.0 | | |
Multi-Asset Income | | | 4.2 | | | | 0.8 | | | | 0.0 | | | | 0.0 | | |
For the fiscal year ended October 31, 2015, each Fund makes the following designation, or up to the maximum amount of such dividends allowable pursuant to the Internal Revenue Code, as qualified dividend income eligible for reduced tax rates. These lower rates range from 5% to 15% depending upon an individual's tax bracket. Complete information regarding each Funds distributions during the calendar year 2015 will be reported in conjunction with Form 1099-DIV.
| Fund | | Qualified
Dividend Income | |
Flexible Select | | $ | 1,602,402 | | |
Global Allocation | | | 352,724 | | |
Inflation Managed | | | 281,846 | | |
Long Short | | | 35,950,075 | | |
Long Short Credit | | | 4,050 | | |
Multi-Asset Income | | | 330,669 | | |
Neuberger Berman Global Allocation Fund and Neuberger Berman Long Short Fund hereby designate $113,576 and $12,784,739, respectively, as a capital gain distribution. Neuberger Berman Global Allocation Fund designates $10 as a 1250 gain distributio
Investment manager: Neuberger Berman Management LLC
Sub-advisers: Neuberger Berman Fixed Income LLC
Neuberger Berman LLC
Neuberger Berman Management LLC
605 Third Avenue 2nd Floor
New York, NY 10158–0180
Shareholder Services
800.877.9700
Institutional Services
800.366.6264
www.nb.com
Statistics and projections in this report are derived from sources deemed to be reliable but cannot be regarded as a representation of future results of the Funds. This report is prepared for the general information of shareholders and is not an offer of shares of the Funds. Shares are sold only through the currently effective prospectus, which must precede or accompany this report.
 L0265 12/15
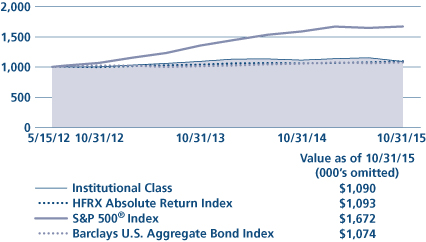
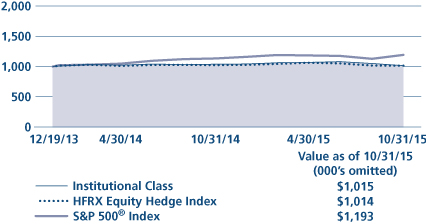


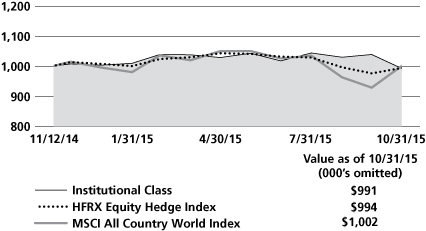

 Q0315 12/15