Washington, D.C. 20549
Arthur C. Delibert, Esq.
1601 K Street, N.W.
Washington, D.C. 20006-1600
Form N-CSR is to be used by management investment companies to file reports with the Commission not later than 10 days after the transmission to stockholders of any report that is required to be transmitted to stockholders under Rule 30e-1 under the Investment Company Act of 1940 (17 CFR 270.30e-1). The Commission may use the information provided on Form N-CSR in its regulatory, disclosure review, inspection, and policymaking roles.
A registrant is required to disclose the information specified by Form N-CSR, and the Commission will make this information public. A registrant is not required to respond to the collection of information contained in Form N-CSR unless the Form displays a currently valid Office of Management and Budget (“OMB”) control number. Please direct comments concerning the accuracy of the information collection burden estimate and any suggestions for reducing the burden to the Secretary, Securities and Exchange Commission, 100 F Street, NE, Washington, DC 20549-0609. The OMB has reviewed this collection of information under the clearance requirements of 44 U.S.C. § 3507.
Item 1. Reports to Shareholders.
Neuberger Berman
Alternative Funds
Institutional Class Shares
Class A Shares
Class C Shares
Risk Balanced Commodity Strategy Fund
Annual Report
October 31, 2012
| Contents | | | | | |
| | | | | | |
| PRESIDENT'S LETTER | | | 1 | | |
PORTFOLIO COMMENTARY | | | 2 | | |
FUND EXPENSE INFORMATION | | | 8 | | |
CONSOLIDATED SCHEDULE OF INVESTMENTS | | | 10 | | |
CONSOLIDATED FINANCIAL STATEMENTS | | | 13 | | |
CONSOLIDATED FINANCIAL HIGHLIGHTS/ PER SHARE DATA | | | 27 | | |
Report of Independent Registered Public Accounting Firm | | | 30 | | |
| Directory | | | 31 | | |
| Trustees and Officers | | | 32 | | |
| Proxy Voting Policies and Procedures | | | 40 | | |
| Quarterly Portfolio Schedule | | | 40 | | |
Board Consideration of the Management and Sub-Advisory Agreements | | | 41 | | |
��
The "Neuberger Berman" name and logo are registered service marks of Neuberger Berman Group LLC. "Neuberger Berman Management LLC" and the individual Fund name in this piece are either service marks or registered service marks of Neuberger Berman Management LLC. ©2012 Neuberger Berman Management LLC. All rights reserved.
President's Letter
Dear Shareholder,
I am pleased to present to you the first annual shareholder report for Neuberger Berman Risk Balanced Commodity Strategy Fund, which was launched on August 27, 2012. The Fund seeks to generate returns that are not highly correlated with other major asset classes and that may improve the overall risk-reward profile of an investment portfolio. As discussed in the commentary that follows, the Fund uses a systematic, risk-based investment process to determine strategic exposures among a number of major commodities. The management team also employs an active strategy to develop short- to medium-term tactical allocations or tilts within the various commodity sectors. We believe the Fund demonstrates our continued interest in providing relevant strategies to our clients to help them achieve their long-term financial objectives.
Overall, commodity markets were volatile during the short period from the Fund's inception on August 27, 2012 through October 31, 2012. Commodities generally moved higher in September, buoyed by the U.S. Federal Reserve's and the European Central Bank's aggressive actions to stimulate economic growth. The market then experienced a setback in October, as investor sentiment weakened given continued signs of moderating global growth.
Looking ahead, we have a generally positive long-term outlook for the commodity markets. This view is driven by current accommodative monetary policy and our expectations for future inflationary pressures, both of which could be supportive of higher commodity prices. In addition, we are encouraged by the fundamental backdrop in the commodities markets. That being said, there could be periods of increased volatility in the financial markets given a number of unresolved macro issues, including the fast approaching fiscal cliff and its potential impact on the economy.
Thank you for your continued support and trust. We look forward to continue serving your investment needs in the years to come.
Sincerely,

ROBERT CONTI
PRESIDENT AND CEO
NEUBERGER BERMAN MUTUAL FUNDS
Risk Balanced Commodity Strategy Fund Commentary (Unaudited)
We are pleased to provide the first annual report for Neuberger Berman Risk Balanced Commodity Strategy Fund, which was launched on August 27, 2012. The Fund seeks to provide investors with returns that are not highly correlated with other major asset classes and that may improve the overall risk-reward profile of an investment portfolio through a diversified commodities portfolio that employs both a core strategy and active strategy. The core strategy uses a systematic, risk-based investment process to determine strategic exposures among six major commodity sectors: agriculture, industrial metals, energy, softs (e.g., coffee, cotton, sugar), precious metals and livestock. The Fund uses exchange-traded futures contracts, a type of derivative, to gain exposure to commodities. Our active strategy seeks to enhance the Fund's performance return by developing views on macroeconomics, supply/demand, the pricing relationships among commodities and the shape of the futures curve. In aggregate, these views allow us to develop short- to medium-term tactical tilts for the portfolio.
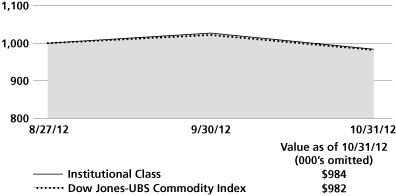
Neuberger Berman Risk Balanced Commodity Strategy Fund Institutional Class generated a –1.60% total return from its inception on August 27, 2012 through October 31, 2012, and outperformed its benchmark, the Dow Jones-UBS Commodity Index, which posted a –1.78% return for the period. (Performance for all share classes is provided in the table immediately following this letter.)
Overall, the commodity markets generated mixed results during the reporting period, rising in September and then declining in October. Industrial and precious metals led the commodity market's gains in September, as investor optimism for a building and manufacturing rebound grew amid central bank stimulus announcements. While agricultural commodities weakened in October, other commodities were relatively flat during the month. September's gains were erased during a sell-off in October, which was primarily driven by signs of slowing global growth, in our view. Against this backdrop, the industrial metals sector posted the weakest results. Energy and precious metals also performed poorly during October.
The Fund's core strategy largely drove its performance during the reporting period, whereas the Active strategy was relatively flat. The core strategy enhanced the Fund's results in September, with the industrial metals and precious metals sectors being the largest contributors to performance. These gains, however, were partially offset by modest declines in the other commodity sectors. In October, the core strategy detracted from performance, with the industrial metals and energy sectors producing the weakest results. Overall during the reporting period, the energy sector was the largest detractor from the Fund's absolute performance, followed by the softs and agricultural sectors. In contrast, the Fund's exposures to the precious metals, industrial metals and livestock sectors modestly contributed to performance.
Overall, our active strategy was slightly negative in September, given our positioning within the energy, softs and precious metals sectors. During October, within the energy our overweight positions in gasoline and crude oil sector detracted from results, whereas our underweight positions in aluminum and zinc within the industrial metals sector added the most value. At the end of the reporting period, the Fund's largest sector weights were in energy, industrial metals and precious metals. The Fund had smaller allocations in the agricultural, livestock and softs sectors.1
Looking ahead, we are cautiously optimistic for the commodity markets. In particular, we feel that current accommodative macroeconomic policies will be supportive of commodities in general. In addition, given rising global deficits, we believe it is a matter of time before we experience inflationary pressures, which could benefit hard assets such as commodities. Fundamentals also appear to us to be supportive for commodity prices, in part due to positive supply/demand characteristics. Risks to this outlook include the U.S. fiscal cliff and its potential impact on the economy in 2013. Should growth moderate or the U.S. fall back into a recession, it would be a headwind for commodities. Nevertheless, this risk is known and acknowledged by fiscal and monetary authorities and we feel a resolution will ultimately be ironed out. If this uncertainty diminishes, we will potentially see market sentiment improve, which could help commodities continue their trend of growth.
Sincerely,
WAI LEE, HAKAN KAYA AND THOMAS SONTAG
PORTFOLIO CO-MANAGERS
Information about the principal risks of investing in the Fund is set forth in the prospectus and statement of additional information.
The portfolio composition, industries and holdings of the Fund are subject to change.
| 1 | Much of the Fund's investment exposure is accomplished through the use of derivatives which may not require the Fund to deposit the full notional amount of the investment with its counterparties, such as a futures commission merchant. The Fund's resulting cash balances are invested in money market mutual funds. |
Risk Balanced Commodity Strategy Fund (Unaudited)
| TICKER SYMBOLS |
| Institutional Class | | NRBIX |
| Class A | | NRBAX |
| Class C | | NRBCX |
| PORTFOLIO BY TYPE OF SECURITY |
| (as a % of Total Investments) | |
Mortgage-Backed Securities | | | 28.3 | % | |
| Short-Term Investments | | | 71.7 | | |
| Total | | | 100.0 | % | |
| PORTFOLIO BY INVESTMENT EXPOSURE TO COMMODITY DERIVATIVES |
| (as a % of Total Notional Value) | |
| Commodity Futures: | | | |
| Agriculture | | | 15.7 | % | |
| Energy | | | 30.2 | | |
| Industrial Metals | | | 20.4 | | |
| Livestock | | | 9.0 | | |
| Precious Metals | | | 19.5 | | |
| Softs | | | 5.2 | | |
| Total | | | 100.0 | % | |
| PERFORMANCE HIGHLIGHTS2 |
| | | Inception Date | | Cumulative Total Return Ended 10/31/2012 Life of Fund |
| At NAV | |
| Institutional Class | | 08/27/2012 | | | –1.60 | % | |
| Class A | | 08/27/2012 | | | –1.60 | % | |
| Class C | | 08/27/2012 | | | –1.70 | % | |
| With Sales Charge | |
| Class A | | | | | | | –7.26 | % | |
| Class C | | | | | | | –2.68 | % | |
| Index | |
Dow Jones-UBS Commodity Index1,3 | | | | | | | –1.78 | % | |
The performance data quoted represent past performance and do not indicate future results. Current performance may be lower or higher than the performance data quoted. For more current performance data, please visit www.nb.com/performance.
The results shown in the table reflect the reinvestment of income dividends and other distributions, if any. The results do not reflect the effect of taxes a shareholder would pay on Fund distributions or on the redemption of Fund shares.
The investment return and principal value of an investment will fluctuate and shares, when redeemed, may be worth more or less than their original cost.
Returns would have been lower if Neuberger Berman Management LLC ("Management") had not reimbursed certain expenses and/or waived a portion of the investment management fees during certain of the periods shown. Repayment by a class (of expenses previously reimbursed and/or fees previously waived by Management) will decrease the class's returns. Please see Note B in the Notes to Financial Statements for specific information regarding expense reimbursement and/or fee waiver arrangements.
Returns shown with a sales charge reflect the deduction of the current maximum initial sales charge of 5.75% for Class A shares and the applicable contingent deferred sales charges (CDSC) for Class C shares. The maximum CDSC for Class C shares is 1%, which is reduced to 0% after 1 year. The performance of the Fund's share classes will differ primarily due to different sales charge structures and class expenses. Please see the prospectus for more information about sales charge structures, if any, and class expenses for your share class.
Risk Balanced Commodity Strategy Fund (Unaudited)
| COMPARISON OF A $1,000,000 INVESTMENT |
(000's omitted)
This graph shows the change in value of a hypothetical $1,000,000 investment in the Fund over the past 10 fiscal years, or since the Fund's inception if it has not operated for 10 years. The graph is based on the Institutional Class shares only; the performance of the Fund's share classes will differ primarily due to different class expenses (see Performance Highlights chart on previous page). The result is compared with benchmarks, which include a broad-based market index and may include a more narrowly based index. Market indices have not been reduced to reflect any of the fees and costs of investing. The results shown in the graph reflect the reinvestment of income dividends and other distributions, if any. The results do not reflect the effect of taxes a shareholder would pay on Fund distributions or on the redemption of Fund shares. Results represent past performance and do not indicate future results.
Endnotes (Unaudited)
| 1 | Please see "Glossary of Index" on page 7 for a description of indices. Please note that indices do not take into account any fees, expenses or tax consequences of investing in the individual securities that they track, and that individuals cannot invest directly in any index. Data about the performance of an index is prepared or obtained by Neuberger Berman Management LLC ("Management") and reflects the reinvestment of income dividends and other distributions, if any. The Fund may invest in securities not included in the described index and/or may not invest in all securities included in the described index. |
| 2 | The Fund was relatively small during the period shown. The same techniques used to produce returns in a small fund may not work to produce similar returns in a larger fund. |
| 3 | The date used to calculate Life of Fund performance for the index is the inception date of the oldest share class. |
For more complete information on any of the Neuberger Berman Alternative Funds, call Management at (800) 877-9700, or visit our website at www.nb.com.
Glossary of Index (Unaudited)
| Dow Jones-UBS Commodity Index: | | This is a rolling index composed of futures contracts on 19 physical commodities traded on U.S. exchanges, with the exception of aluminum, nickel and zinc, which are traded on the London Metal Exchange (LME). Weighting is based on liquidity, or the relative amount of trading activity of a particular commodity; dollar-adjusted production data are secondary. All data used are averaged over a five-year period. The DJ-UBSCI is calculated on an excess return basis, reflecting only the return of its underlying commodity price movements. A total return index reflects the return on a fully collateralized investment of the index. | |
Information About Your Fund's Expenses (Unaudited)
As a Fund shareholder, you incur two types of costs: (1) transaction costs, including sales charges (loads) on purchase payments or redemption proceeds (if applicable); and (2) ongoing costs, including management fees; distribution and/or service (12b-1) fees (if applicable); and other Fund expenses. This example is intended to help you understand your ongoing costs (in dollars) of investing in a Fund and compare these costs with the ongoing costs of investing in other mutual funds.
This table is designed to provide information regarding costs related to your investments. The following examples are based on an investment of $1,000 made at the beginning of the period ended October 31, 2012 (as indicated) and held for the entire period. The table illustrates the Fund's costs in two ways:
| Actual Expenses and Performance: | | The first section of the table provides information about actual account values and actual expenses in dollars, based on the Fund's actual performance during the period. You may use the information in this line, together with the amount you invested, to estimate the expenses you paid over the period. Simply divide your account value by $1,000 (for example, an $8,600 account value divided by $1,000 = 8.6), then multiply the result by the number in the first section of the table under the heading entitled "Expenses Paid During the Period" to estimate the expenses you paid over the period. | |
| Hypothetical Example for Comparison Purposes: | | The second section of the table provides information about hypothetical account values and hypothetical expenses based on the Fund's actual expense ratio and an assumed rate of return at 5% per year before expenses. This return is not the Fund's actual return. The hypothetical account values and expenses may not be used to estimate the actual ending account balance or expenses you paid for the period. You may use this information to compare the ongoing costs of investing in this Fund versus other funds. To do so, compare the expenses shown in this 5% hypothetical example with the 5% hypothetical examples that appear in the shareholder reports of other funds. | |
Please note that the expenses in the table are meant to highlight your ongoing costs only and do not include any transaction costs, such as sales charges (loads) (if applicable). Therefore, the information under the heading "Hypothetical (5% annual return before expenses)" is useful in comparing ongoing costs only, and will not help you determine the relative total costs of owning different funds. In addition, if these transaction costs were included, your costs would have been higher.
Expense Information as of 10/31/12 (Unaudited)
| Neuberger Berman Alternative Funds | |
| | | ACTUAL | | HYPOTHETICAL (5% ANNUAL RETURN BEFORE EXPENSES)(2) | |
| | | Beginning Account Value 8/27/12 | | Ending Account Value 10/31/12 | | Expenses Paid During the Period(1) 8/27/12 - 10/31/12 | | Expense Ratio | | Beginning Account Value 5/1/12 | | Ending Account Value 10/31/12 | | Expenses Paid During the Period(3) 5/1/12 - 10/31/12 | | Expense Ratio | |
Neuberger Risk Balanced Commodity Strategy Fund | |
| Institutional Class | | $ | 1,000.00 | | | $ | 984.00 | | | $ | 1.97 | | | | 1.10 | % | | $ | 1,000.00 | | | $ | 1,019.61 | | | $ | 5.58 | | | | 1.10 | % | |
| Class A | | $ | 1,000.00 | | | $ | 984.00 | | | $ | 2.61 | | | | 1.46 | % | | $ | 1,000.00 | | | $ | 1,017.80 | | | $ | 7.41 | | | | 1.46 | % | |
| Class C | | $ | 1,000.00 | | | $ | 982.00 | | | $ | 4.02 | | | | 2.21 | % | | $ | 1,000.00 | | | $ | 1,014.03 | | | $ | 11.19 | | | | 2.21 | % | |
(1) | For each class, expenses are equal to the annualized expense ratio for the class, including expenses of the Fund's subsidiary (See Note A-1 of Notes to Consolidated Financial Statements) multiplied by the average account value over the period, multiplied by 66/366 (to reflect the period shown of August 27, 2012 (Commencement of Operations) to October 31, 2012). |
| (2) | Hypothetical 5% annual return before expenses is calculated by multiplying the number of days in the most recent period divided by 366. |
| (3) | For each class, expenses are equal to the annualized expense ratio for the class, including expenses of the Fund's subsidiary (See Note A-1 of Notes to Consolidated Financial Statements) multiplied by the average account value over the period, multiplied by 182/366 (to reflect the one-half year period shown), unless otherwise indicated |
Consolidated Schedule of Investments Risk Balanced Commodity Strategy Fund
| PRINCIPAL AMOUNT | | VALUE† | |
| | |
| Mortgage-Backed Securities (26.1%) | |
| | |
| Fannie Mae (10.6%) | |
| $ | 250,000 | | | Fannie Mae, Notes, 3.63%, due 2/12/13 | | $ | 252,414 | | |
| | 300,000 | | | Fannie Mae, Notes, 0.75%, due 2/26/13 | | | 300,565 | | |
| | | | 552,979 | | |
| Freddie Mac (15.5%) | |
| | 250,000 | | | Federal Home Loan Banks, Bonds, 0.38%, due 1/29/13 | | | 250,131 | | |
| | 300,000 | | | Federal Home Loan Banks, Bonds, 3.38%, due 2/27/13 | | | 303,105 | | |
| | 250,000 | | | Freddie Mac, Notes, 4.13%, due 12/21/12 | | | 251,365 | | |
| | | | 804,601 | | |
| | | Total Mortgage-Backed Securities (Cost $1,357,552) | | | 1,357,580 | | |
| | |
| Short-Term Investments (66.0%) | |
| | |
U.S. Treasury Securities-Backed by the Full Faith and Credit of the U.S. Government(a) (51.9%) | |
| | 425,000 | | | U.S. Treasury Bills, Disc. Notes, 0.02%, due 11/23/12 | | | 424,979 | | |
| | 500,000 | | | U.S. Treasury Bills, Disc. Notes, 0.03%, due 11/29/12 | | | 499,967 | | |
| | 425,000 | | | U.S. Treasury Bills, Disc. Notes, 0.03%, due 12/6/12 | | | 424,961 | | |
| | 425,000 | | | U.S. Treasury Bills, Disc. Notes, 0.08%, due 2/7/13 | | | 424,870 | | |
| | 500,000 | | | U.S. Treasury Bills, Disc. Notes, 0.08%, due 2/14/13 | | | 499,832 | | |
| | 425,000 | | | U.S. Treasury Bills, Disc. Notes, 0.08%, due 2/21/13 | | | 424,845 | | |
| | | | | | | | |
| | | Total U.S. Treasury Securities-Backed by the Full Faith and Credit of the U.S. Government (Cost $2,699,397) | | | 2,699,454 | | |
| | | | |
| NUMBER OF SHARES | | | |
| | |
| Money Market Fund (14.1%) | |
| | 734,460 | | | State Street Institutional Government Money Market Fund Institutional Class (Cost $734,460) | | | 734,460 | Ø؆† | |
| | | Total Short-Term Investments (Cost $3,433,857) | | 3,433,914 | | |
| | | Total Investments (92.1%) (Cost $4,791,409) | | | 4,791,494 | ## | |
| | | Cash, receivables and other assets, less liabilities (7.9%) | | | 410,236 | ± | |
| | | Total Net Assets (100.0%) | | $ | 5,201,730 | | |
| See Notes to Schedule of Investments | 10 |
Notes to Consolidated Schedule of Investments
| † | In accordance with Accounting Standards Codification ("ASC") 820 "Fair Value Measurements and Disclosures" ("ASC 820"), all investments held by Neuberger Berman Risk Balanced Commodity Strategy Fund (the "Fund") are carried at the value that Neuberger Berman Management LLC ("Management") believes the Fund would receive upon selling an investment in an orderly transaction to an independent buyer in the principal or most advantageous market for the investment under current market conditions. Various inputs, including the volume and level of activity for the asset or liability in the market, are considered in valuing the Fund's investments, some of which are discussed below. Significant management judgment may be necessary to value investments in accordance with ASC 820. |
| | ASC 820 established a three-tier hierarchy of inputs to create a classification of value measurements for disclosure purposes. The three-tier hierarchy of inputs is summarized in the three broad Levels listed below. |
| | | ● | Level 1 – quoted prices in active markets for identical investments |
| | | | Level 2 – other significant observable inputs (including quoted prices for similar investments, interest rates, prepayment speeds, credit risk, amortized cost, etc.) |
| | | | Level 3 – significant unobservable inputs (including the Fund's own assumptions in determining the fair value of investments) |
| | The inputs or methodology used for valuing an investment are not necessarily an indication of the risk associated with investing in those securities. |
| | The value of the Fund's investments in debt securities is determined by Management primarily by obtaining valuations from independent pricing services based on readily available bid quotations, or if quotations are not available, by methods which include various considerations based on security type (generally Level 2 inputs). In addition to the consideration of yields or prices of securities of comparable quality, coupon, maturity and type; indications as to values from dealers; and general market conditions, the following is a description of other Level 2 inputs and related valuation techniques used by an independent pricing service to value certain types of debt securities of the Fund: |
| | | U.S. Treasury Securities. Inputs used to value U.S. Treasury securities generally include quotes from several inter-dealer brokers and other market information which may include benchmark yields, reported trades, broker-dealer quotes, issuer spreads, benchmark securities, bids, offers, and reference data, such as market research publications, when available ("Other Market Information"). |
| | | Mortgage-Backed Securities. Inputs used to value mortgage-backed securities generally include models that consider a number of factors, which may include the following: prepayment speeds, cash flows, spread adjustments and Other Market Information. |
| | The value of commodity futures contracts is determined by obtaining valuations from independent pricing services at the settlement price at the market close (Level 1 inputs). |
| | Management has developed a process to periodically review information provided by independent pricing services for all types of securities. |
| | Investments in State Street Institutional Government Money Market Fund Institutional Class are valued using the fund's daily calculated net asset value per share (Level 2 inputs). |
| | If a valuation is not available from an independent pricing service, or if Management has reason to believe that the valuation received does not represent the amount the Fund might reasonably expect to receive on a current sale in an orderly transaction, the Fund seeks to obtain quotations from principal market makers (generally considered Level 3 inputs). If such quotations are not readily available, the security is valued using methods the Neuberger Berman Alternative Funds' Board of Trustees (the "Board") has approved on the belief that they reflect fair value. |
| See Notes to Financial Statements | 11 |
Notes to Consolidated Schedule of Investments (cont'd)
| | Numerous factors may be considered when determining the fair value of a security based on Level 2 or 3 inputs, including available analyst, media or other reports, trading in futures or ADRs and whether the issuer of the security being fair valued has other securities outstanding. Fair value prices are necessarily estimates, and there is no assurance that such a price will be at or close to the price at which the security is next quoted or next trades. The following is a summary, categorized by Level, of inputs used to value the Fund's investments as of October 31, 2012: |
| Asset Valuation Inputs | |
| | | Level 1 | | Level 2 | | Level 3 | | Total | |
| Investments: | |
Mortgage-Backed Securities^ | | $ | — | | | $ | 1,357,580 | | | $ | — | | | $ | 1,357,580 | | |
Short-Term Investments^ | | | — | | | | 3,433,914 | | | | — | | | | 3,433,914 | | |
Total Investments | | $ | — | | | $ | 4,791,494 | | | $ | — | | | $ | 4,791,494 | | |
| ^ | The Consolidated Schedule of Investments provides information on the industry categorization for the portfolio. |
| | The following is a summary, categorized by Level, of inputs used to value the Fund's derivatives as of October 31, 2012: |
| Liability Valuation Inputs | |
| | | Level 1 | | Level 2 | | Level 3 | | Total | |
| Futures Contracts | | $ | (35,576 | ) | | $ | — | | | $ | — | | | $ | (35,576 | ) | |
| ## | At October 31, 2012, the cost of investments for U.S. federal income tax purposes was $4,791,409. Gross unrealized appreciation of investments was $109,170 and gross unrealized depreciation of investments was $109,085, resulting in net unrealized appreciation of $85 based on cost for U.S. federal income tax purposes |
| ØØ | All or a portion of this security is segregated in connection with obligations for commodity futures contracts. |
| †† | A portion of this security is held by Neuberger Berman Cayman Commodity Fund I Ltd., (the "Subsidiary") a wholly-owned subsidiary of the Fund. See Note A-1 of the Notes to Consolidated Financial Statements. |
| ± | See Note A-12 in the Notes to Consolidated Financial Statements for the Fund's or Subsidiary's open positions in derivatives at October 31, 2012. |
| (a) | Interest rate represents discount rate at time of purchase, not a coupon rate. |
| See Notes to Financial Statements | 12 |
Consolidated Statement of Asset and Liabilities*
| Neuberger Berman Alternative Funds | |
| | | RISK BALANCED COMMODITY STRATEGY FUND | |
| | | October 31, 2012 | |
| Assets | |
| Investments in securities, at value** (Note A)—see Schedule of Investments: | |
| Unaffiliated issuers | | $ | 4,791,494 | | |
| Cash | | | 100,000 | | |
| Deposits with brokers for futures contracts (Note A-12) | | | 298,141 | | |
| Dividends and interest receivable | | | 8,214 | | |
| Receivable for Fund shares sold | | | 57,521 | | |
| Receivable for variation margin (Note A-12) | | | 21,859 | | |
| Receivable from Management—net (Note B) | | | 97,578 | | |
| Prepaid expenses and other assets | | | 48,776 | | |
Total Assets | | | 5,423,583 | | |
Liabilities | |
| Payable to investment manager (Note B) | | | 3,111 | | |
| Payable for organization costs | | | 83,813 | | |
| Accrued expenses and other payables | | | 134,929 | | |
Total Liabilities | | | 221,853 | | |
Net Assets | | $ | 5,201,730 | | |
Net Assets consist of: | |
| Paid-in capital | | $ | 5,237,996 | | |
| Undistributed net investment income (loss) | | | (775 | ) | |
| Net unrealized appreciation (depreciation) in value of investments | | | (35,491 | ) | |
Net Assets | | $ | 5,201,730 | | |
Net Assets | |
| Institutional Class | | $ | 4,976,556 | | |
| Class A | | | 126,924 | | |
| Class C | | | 98,250 | | |
| See Notes to Financial Statements | 13 |
Consolidated Statement of Asset and Liabilities* (cont'd)
| Neuberger Berman Alternative Funds (cont'd) | |
| | | RISK BALANCED COMMODITY STRATEGY FUND | |
| | | October 31, 2012 | |
| Shares Outstanding ($.001 par value; unlimited shares authorized) | |
| Institutional Class | | | 505,509 | | |
| Class A | | | 12,901 | | |
| Class C | | | 10,000 | | |
Net Asset Value, offering and redemption price per share | |
| Institutional Class | | | | | |
Net Asset Value and redemption price per share | |
| Class A | | | | | |
Offering Price per share | |
| Class A‡ | | | | | |
Net Asset Value and offering price per share | |
| Class C^ | | | | | |
**Cost of Investments | | | | | |
| ‡ | On single retail sales of less than $50,000. On sales of $50,000 or more or in certain other circumstances described in the Fund's prospectus, offering price is reduced. |
| ^ | Redemption price per share is equal to net asset value less any applicable contingent deferred sales charge. |
| * | See Notes A-1 and A-2 of the Notes to Consolidated Financial Statements. |
| See Notes to Financial Statements | 14 |
Consolidated Statement of Operations*
| Neuberger Berman Alternative Funds | |
| | | RISK BALANCED COMMODITY STRATEGY FUND | |
| | | Period from August 27, 2012 (Commencement of Operations) to October 31, 2012 | |
| Investment Income: | |
| Income (Note A): | |
| Interest income—unaffiliated issuers | | | | | |
Expenses: | |
| Investment management fees (Note B) | | | 6,322 | | |
| Administration fees (Note B) | | | 542 | | |
| Administration fees (Note B): | |
| Institutional Class | | | 778 | | |
| Class A | | | 41 | | |
| Class C | | | 37 | | |
| Distribution fees (Note B): | |
| Class A | | | 51 | | |
| Class C | | | 183 | | |
| Shareholder servicing agent fees: | |
| Institutional Class | | | 1,627 | | |
| Class A | | | 1,539 | | |
| Class C | | | 1,534 | | |
| Organization expense (Note A-9) | | | 391,555 | | |
| Subsidiary administration fees (Note B) | | | 8,333 | | |
| Audit fees | | | 83,500 | | |
| Custodian fees (Note A) | | | 5,905 | | |
| Legal fees | | | 18,333 | | |
| Registration and filing fees | | | 6,094 | | |
| Shareholder reports | | | 25,500 | | |
| Trustees' fees and expenses | | | 2,586 | | |
| Miscellaneous | | | 1,011 | | |
Total expenses | | | 555,471 | | |
| Expenses reimbursed by Management (Note B) | | | (545,259 | ) | |
| Expenses reduced by custodian fee expense offset arrangement (Note A-14) | | | (1 | ) | |
Total net expenses | | | 10,211 | | |
Net investment income (loss) | | | | ) | |
Realized and Unrealized Gain (Loss) on Investments (Note A): | |
Net realized gain (loss) on: | |
| Commodity futures contracts | | | (52,003 | ) | |
Change in net unrealized appreciation (depreciation) in value of: | |
| Unaffiliated investment securities | | | 85 | | |
| Commodity futures contracts | | | (35,576 | ) | |
Net gain (loss) on investments | | | (87,494 | ) | |
Net increase (decrease) in net assets resulting from operations | | | | ) | |
* See Notes A-1 and A-2 of the Notes to Consolidated Financial Statements.
| See Notes to Financial Statements | 15 |
Consolidated Statement of Changes in Net Assets*
| Neuberger Berman Alternative Funds | |
| | | RISK BALANCED COMMODITY STRATEGY FUND | |
| | | Period from August 27, 2012 (Commencement of Operations) to October 31, 2012 | |
| Increase (Decrease) in Net Assets: | |
From Operations (Note A): | |
| Net investment income (loss) | | $ | (9,258 | ) | |
| Net realized gain (loss) on investments | | | (52,003 | ) | |
| Change in net unrealized appreciation (depreciation) of investments | | | (35,491 | ) | |
Net increase (decrease) in net assets resulting from operations | | | (96,752 | ) | |
From Fund Share Transactions (Note D): | |
| Proceeds from shares sold: | |
| Institutional Class | | | 5,069,219 | | |
| Class A | | | 129,263 | | |
| Class C | | | 100,000 | | |
Net increase (decrease) from Fund share transactions | | | 5,298,482 | | |
Net Increase (Decrease) in Net Assets | | | 5,201,730 | | |
Net Assets: | |
| Beginning of period | | | — | | |
| End of period | | $ | 5,201,730 | | |
| Undistributed net investment income (loss) at end of period | | $ | (775 | ) | |
* See Notes A-1 and A-2 of the Notes to Consolidated Financial Statements.
| See Notes to Financial Statements | 16 |
Notes to Consolidated Financial Statements Risk Balanced Commodity Strategy Fund
Note A—Summary of Significant Accounting Policies:
| 1 | General: Neuberger Berman Alternative Funds (the "Trust") is a Delaware statutory trust organized pursuant to an Amended and Restated Trust Instrument dated October 14, 2010. The Trust is registered as an open-end management investment company under the Investment Company Act of 1940, as amended (the "1940 Act"), and its shares are registered under the 1933 Act. The Fund is a separate operating series of the Trust and is non-diversified. The Fund had no operations until August 27, 2012, other than matters relating to its organization and registration of shares under the 1933 Act. The Fund offers Institutional Class shares, Class A shares and Class C shares. The Board may establish additional series or classes of shares without the approval of shareholders. |
| | The assets of the Fund belong only to the Fund, and the liabilities of the Fund are borne solely by the Fund and no other. |
| | The Fund invests in commodity-related instruments through the Subsidiary, which is organized under the laws of the Cayman Islands. Subscription agreements were entered into between the Fund and the Subsidiary with the intent that the Fund will remain the sole shareholder and primary beneficiary of the Subsidiary. The Subsidiary is governed by its own Board of Directors. |
| | As of October 31, 2012, the value of the Fund's investment in the Subsidiary was as follows: |
Commencement Date of Subsidiary | | Investment in Subsidiary | | Percentage of Net Assets | |
August 27, 2012 | | $ | 770,439 | | | | 14.8 | % | |
| | The preparation of financial statements in accordance with U.S. generally accepted accounting principles ("GAAP") requires Management to make estimates and assumptions at the date of the financial statements. Actual results could differ from those estimates. |
| 2 | Consolidation: The accompanying financial statements of the Fund present the consolidated accounts of the Fund and the Subsidiary. All intercompany accounts and transactions have been eliminated in consolidation. |
| 3 | Portfolio valuation: Investment securities are valued as indicated in the notes following the Schedule of Investments. |
| 4 | Foreign currency translation: The accounting records of the Fund and Subsidiary are maintained in U.S. dollars. Foreign currency amounts are translated into U.S. dollars using the exchange rate as of 4:00 p.m., Eastern time, to determine the value of investments, other assets and liabilities. Purchase and sale prices of securities, and income and expenses, are translated into U.S. dollars at the prevailing rate of exchange on the respective dates of such transactions. Net unrealized foreign currency gain (loss), if any, arises from changes in the value of assets and liabilities, other than investments in securities, as a result of changes in exchange rates and is stated separately in the Consolidated Statement of Operations. |
| 5 | Securities transactions and investment income: Securities transactions are recorded on trade date for financial reporting purposes. Dividend income is recorded on the ex-dividend date or, for certain foreign dividends, as soon as the Fund becomes aware of the dividends. Non-cash dividends included in dividend income, if any, are recorded at the fair market value of the securities received. Interest income, including accretion of discount (adjusted for original issue discount, where applicable) and amortization of premium, where applicable, is recorded on the accrual basis. Realized gains and losses from securities transactions and foreign currency transactions, if any, are recorded on the basis of identified cost and stated separately in the Consolidated Statement of Operations. |
| 6 | Income tax information: It is the intention of the Fund to qualify for treatment as a regulated investment company by complying with the requirements of the U.S. Internal Revenue Code applicable to regulated investment companies and to distribute substantially all of its net investment income and net realized capital gains to its shareholders. To the extent the Fund distributes substantially all of its net investment income and net realized capital gains to shareholders, no federal income or excise tax provision is required. |
| | The Fund has adopted the provisions of ASC 740 "Income Taxes" ("ASC 740"). ASC 740 sets forth a minimum threshold for financial statement recognition of a tax position taken, or expected to be taken, in a tax return. The Fund recognizes interest and penalties, if any, related to unrecognized tax positions as an income tax expense in the Consolidated Statement of Operations. As of October 31, 2012, the Fund did not have any unrecognized tax positions. |
| | The Subsidiary is a controlled foreign corporation under the U.S. Internal Revenue Code. As a U.S. shareholder of a controlled foreign corporation, the Fund will include in its gross income its share of the Subsidiary's current earnings and profits (including net realized gains). Any deficit generated by the Subsidiary will be disregarded for purposes of computing the Fund's gross income in the current period and also disregarded for all future periods. |
| | Income distributions and capital gain distributions are determined in accordance with income tax regulations, which may differ from GAAP. These differences are primarily due to differing treatments of income and gains on various investment securities held by the Fund, timing differences and differing characterization of distributions made by the Fund. The Fund may also utilize earnings and profits distributed to shareholders on redemption of shares as a part of the dividends-paid deduction for income tax purposes. |
| | As determined on October 31, 2012, permanent differences resulting primarily from different book and tax accounting were reclassified at period end. Such differences may be attributed to one or more of the following: non-deductible Rule 12b-1 fees, and Subsidiary income, gain (loss) and expense adjustments. These reclassifications had no effect on net income, net asset value ("NAV") or NAV per share of the Fund. For the period ended October 31, 2012, the Fund recorded the following permanent reclassifications: |
| Paid-in Capital | | Undistributed Net Investment Income (Loss) | | Accumulated Net Realized Gains (Losses) on Investments | |
| | | | | | | | | | | |
| | For tax purposes, distributions of short-term gains are taxable to shareholders as ordinary income. |
| | As of October 31, 2012, the components of distributable earnings (accumulated losses) on a U.S. federal income tax basis were as follows: |
Undistributed Ordinary Income | | Unrealized Appreciation (Depreciation) | | Loss Carryforwards and Deferrals | | Other Temporary Differences | | Total | |
| | | | | | | | | | | | | | ) | | | | ) | |
| | The difference between book basis and tax basis distributable earnings is primarily due to organizational expenses. |
| | To the extent the Fund's net realized capital gains, if any, can be offset by capital loss carryforwards, it is the policy of the Fund not to distribute such gains. |
| 7 | Distributions to shareholders: The Fund may earn income, net of expenses, daily on its investments. Distributions from net investment income and net realized capital gains, if any, generally are distributed once a year (usually in December) and are recorded on the ex-date. |
| 8 | Foreign taxes: Foreign taxes withheld represent amounts withheld by foreign tax authorities, net of refunds recoverable. |
| 9 | Organization expenses: Costs incurred by the Fund in connection with its organization, which amounted to $391,555, have been expensed as incurred. |
| 10 | Expense allocation: Certain expenses are applicable to multiple funds. Expenses directly attributable to the Fund are charged to the Fund. Expenses of the Trust that are not directly attributable to a particular series of the Trust (e.g., the Fund) are allocated among the series of the Trust, on the basis of relative net assets, except where a more appropriate allocation of expenses to each of the series can otherwise be made fairly. Expenses borne by the complex of related investment companies, which includes open-end and closed-end investment companies for which Management serves as investment manager, that are not directly attributable to a particular investment company in the complex (e.g., the Trust) or series thereof are allocated among the investment companies in the complex or series thereof, on the basis of relative net assets, except where a more appropriate allocation of expenses to each of the investment companies in the complex or series thereof can otherwise be made fairly. The Fund's expenses (other than those specific to each class) are allocated proportionally each day among the classes based upon the relative net assets of each class. |
| 11 | Investments in foreign securities: Investing in foreign securities may involve certain sovereign and other risks, in addition to the credit and market risks normally associated with domestic securities. These additional risks include the possibility of adverse political and economic developments (including political instability, nationalization, expropriation, or confiscatory taxation) and the potentially adverse effects of unavailability of public information regarding issuers, less governmental supervision and regulation of financial markets, reduced liquidity of certain financial markets, and the lack of uniform accounting, auditing, and financial reporting standards or the application of standards that are different or less stringent than those applied in the United States. Foreign securities also may experience greater price volatility, higher rates of inflation, and delays in settlement. |
| 12 | Derivative instruments: During the period ended October 31, 2012, the Fund's use of derivatives was limited to commodity futures contracts. The Fund has adopted the provisions of ASC 815 "Derivatives and Hedging" ("ASC 815"). The disclosure requirements of ASC 815 distinguish between derivatives that qualify for hedge accounting and those that do not. Because investment companies value their derivatives at fair value and recognize changes in fair value through the Consolidated Statement of Operations, they do not qualify for hedge accounting. Accordingly, even though the Fund's investments in derivatives may represent economic hedges, they are considered non-hedge transactions for purposes of this disclosure. |
| | Commodity futures contracts: During the period ended October 31, 2012, the Fund entered into commodity futures contracts (through investments in the Subsidiary) to provide investment exposure to individual commodities, as well as to manage and/or adjust the risk profile of the Fund. |
| | At the time the Fund or Subsidiary enters into a commodity futures contract, it is required to deposit with the futures commission merchant a specified amount of cash or liquid securities, known as "initial margin," which is a percentage of the value of the commodity futures contract being traded that is set by the exchange upon which the futures contract is traded. Each day, the futures contract is valued at the official settlement price of the board of trade or U.S. commodity exchange on which such futures contract is traded. Subsequent payments, known as "variation margin," to and from the broker are made on a daily basis as the market price of the commodity futures contract fluctuates. Daily variation margin adjustments, arising from this "mark to market," are recorded by the Fund or Subsidiary as unrealized gains or losses. |
| | Although some commodity futures contracts by their terms call for actual delivery or acquisition of the underlying securities or currency, in most cases the contracts are closed out prior to delivery by offsetting purchases or sales of matching commodity futures contracts. When the contracts are closed, the Fund or Subsidiary recognizes a gain or loss. Risks of entering into futures contracts include the possibility there may be an illiquid market, possibly at a time of rapidly declining prices, and/or a change in the value of the contract may not correlate with changes in the value of the underlying securities. Futures executed on regulated futures exchanges have minimal counterparty risk to a fund because the exchange's clearinghouse assumes the position of the counterpary in each transaction. Thus, |
the Fund is exposed to risk only in connection with the clearinghouse and not in connection with the original counterpary to the transaction.
For U.S. federal income tax purposes, the futures transactions undertaken by the Fund or Subsidiary may cause the Fund or Subsidiary to recognize gains or losses from marking contracts to market even though its positions have not been sold or terminated, may affect the character of the gains or losses recognized as long-term or short-term, and may affect the timing of some capital gains and losses realized by the Fund or Subsidiary. Also, the Fund's or Subsidiary's losses on transactions involving futures contracts may be deferred rather than being taken into account currently in calculating the Fund's or Subsidiary's taxable income.
At October 31, 2012, open positions in commodity futures contracts(1) were:
| Expiration | | | Open Contracts | | Position | | Unrealized Appreciation (Depreciation) | |
| December 2012 | | | 4 Aluminum High Grade | | Long | | $ | (2,137 | ) | |
| December 2012 | | | 4 Lead | | Long | | | 8,913 | | |
| December 2012 | | | 1 Nickel | | Long | | | (1,212 | ) | |
| December 2012 | | | 4 Zinc | | Long | | | (1,825 | ) | |
| January 2013 | | | 2 Platinum | | Long | | | (2,960 | ) | |
| January 2013 | | | 2 Cattle Feeder | | Long | | | (1,533 | ) | |
| January 2013 | | | 4 Aluminum High Grade | | Long | | | (20,600 | ) | |
| January 2013 | | | 3 Lead | | Long | | | (15,300 | ) | |
| January 2013 | | | 2 Nickel | | Long | | | (25,116 | ) | |
| January 2013 | | | 4 Zinc | | Long | | | (22,700 | ) | |
| February 2013 | | | 3 Natural Gas | | Long | | | (5,030 | ) | |
| February 2013 | | | 4 Aluminum High Grade | | Long | | | (3,494 | ) | |
| February 2013 | | | 4 Lead | | Long | | | 4,550 | | |
| February 2013 | | | 2 Nickel | | Long | | | (2,124 | ) | |
| February 2013 | | | 3 Light Sweet Crude Oil | | Long | | | (1,790 | ) | |
| February 2013 | | | 4 Zinc | | Long | | | 1,225 | | |
| February 2013 | | | 2 Gasoline RBOB | | Long | | | (727 | ) | |
| February 2013 | | | 4 Gas Oil | | Long | | | 2,175 | | |
| February 2013 | | | 3 Gold 100 oz. | | Long | | | (14,490 | ) | |
| February 2013 | | | 3 Lean Hogs | | Long | | | 5,340 | | |
| February 2013 | | | 2 Heating Oil | | Long | | | 1,953 | | |
| February 2013 | | | 4 Live Cattle | | Long | | | 570 | | |
| March 2013 | | | 2 Soybean Meal | | Long | | | 1,940 | | |
| March 2013 | | | 3 Soybean | | Long | | | 400 | | |
| March 2013 | | | 3 Brent Crude Oil | | Long | | | (1,680 | ) | |
| March 2013 | | | 3 Copper High Grade | | Long | | | (16,050 | ) | |
| March 2013 | | | 4 Sugar 11 | | Long | | | (3,192 | ) | |
| March 2013 | | | 6 Corn | | Long | | | 7,600 | | |
| March 2013 | | | 2 Cotton No. 2 | | Long | | | (195 | ) | |
| March 2013 | | | 3 Wheat | | Long | | | (1,362 | ) | |
| March 2013 | | | 1 Coffee | | Long | | | (6,094 | ) | |
| March 2013 | | | 1 Soybean Oil | | Long | | | (726 | ) | |
| March 2013 | | | 2 Cocoa | | Long | | | (1,767 | ) | |
| Expiration | | Open Contracts | | Position | | Unrealized Appreciation (Depreciation) | |
| March 2013 | | 2 Wheat | | Long | | $ | 1,558 | | |
| March 2013 | | 2 Silver | | Long | | | (8,200 | ) | |
| December 2012 | | 4 Aluminum High Grade | | Short | | | 20,900 | | |
| December 2012 | | 4 Lead | | Short | | | 20,850 | | |
| December 2012 | | 1 Nickel | | Short | | | 12,522 | | |
| December 2012 | | 4 Zinc | | Short | | | 23,200 | | |
| January 2013 | | 4 Aluminum High Grade | | Short | | | 7,725 | | |
| January 2013 | | 3 Lead | | Short | | | (3,938 | ) | |
| January 2013 | | 2 Nickel | | Short | | | 1,932 | | |
| January 2013 | | 4 Zinc | | Short | | | 5,313 | | |
| Total | | | | | | $ | (35,576 | ) | |
(1) Commodity futures are held by the Subsidiary. See Note A-1 of the Notes to Financial Statements.
During the period ended October 31, 2012, the average notional value of commodity futures contracts was $5,760,695 for long positions and $(721,238) for short positions.
The notional value of commodity futures contracts at October 31, 2012 was $6,516,921 for long positions and $(1,403,683) for short positions.
At October 31, 2012, the Fund had deposited $298,141 in a segregated account to cover margin requirements on open futures contracts.
At October 31, 2012, the Fund had the following derivatives (which did not qualify as hedging instruments under ASC 815), grouped by primary risk exposure:
Liability Derivatives
| | | Commodity Risk | | Consolidated Statement of Assets and Liabilities Location | |
| Futures Contracts | | $ | (35,576 | ) | | Receivable/Payable for | |
| Total Value | | $ | (35,576 | ) | | variation margin(1) | |
(1) "Futures Contracts" reflects the cumulative appreciation (depreciation) of futures contracts as of October 31, 2012, which is reflected in the Consolidated Statement of Assets and Liabilities under the caption "Net unrealized appreciation (depreciation) in value of investments." The outstanding variation margin as of October 31, 2012, if any, is reflected in the Consolidated Statement of Assets and Liabilities under the caption "Receivable/Payable for variation margin."
The impact of the use of these derivative instruments on the Consolidated Statement of Operations during the period ended October 31, 2012, was as follows:
Realized Gain (Loss)
| | | Commodity Risk | | Consolidated Statement of Operations Location | |
| Futures Contracts | | $ | (52,003 | ) | | Net realized gain (loss) on: commodity | |
| Total Realized Gain (Loss) | | $ | (52,003 | ) | | futures contracts | |
Change in Appreciation (Depreciation)
| | | Commodity Risk | | | |
| Futures Contracts | | $ | (35,576 | ) | | Change in net unrealized appreciation (depreciation) in value of: | |
| Total Change in Appreciation (Depreciation) | $ | (35,576 | ) | | commodity futures contracts | |
13 Indemnifications: Like many other companies, the Trust's organizational documents provide that its officers and trustees are indemnified against certain liabilities arising out of the performance of their duties to the Trust. In addition, both in some of its principal service contracts and in the normal course of its business, the Trust enters into contracts that provide indemnifications to other parties for certain types of losses or liabilities. The Trust's maximum exposure under these arrangements is unknown as this could involve future claims against the Trust.
14 Expense offset arrangement: The Fund has an expense offset arrangement in connection with its custodian contract. For the period ended October 31, 2012, the impact of this arrangement was a reduction of expenses of $1.
15 Other: All net investment income and realized and unrealized capital gains and losses of the Fund are allocated, on the basis of relative net assets, pro rata among its respective classes.
Note B—Management Fees, Administration Fees, Distribution Arrangements, and Other Transactions with Affiliates:
The Fund retains Management as its investment manager under a Management Agreement. For such investment management services, the Fund pays Management a fee at the annual rate of 0.70% of the first $250 million of the Fund's average daily net assets, 0.675% of the next $250 million, 0.65% of the next $250 million, 0.625% of the next $250 million, 0.60% of the next $500 million, 0.575% of the next $2.5 billion and 0.55% of average daily net assets in excess of $4 billion, less the net asset value of the Subsidiary. Accordingly, for the period ended October 31, 2012, the management fee pursuant to the Management Agreement was equivalent to an annual effective rate of 0.70% of the Fund's average daily net assets.
Management also serves as investment adviser to the Subsidiary. For such investment management services, the Subsidiary pays Management a fee at the annual rate of 0.70% of the first $250 million of the Subsidiary's average daily net assets, 0.675% of the next $250 million, 0.65% of the next $250 million, 0.625% of the next $250 million, 0.60% of the next $500 million, 0.575% of the next $2.5 billion and 0.55% of average daily net assets in excess of $4 billion. Accordingly, for the period ended October 31, 2012, the management fee pursuant to the Management Agreement was equivalent to an annual effective rate of 0.70% of the Subsidiary's average daily net assets.
The Fund retains Management as its administrator under an Administration Agreement. The Fund pays Management an administration fee at the annual rate of 0.06% of its average daily net assets under this agreement. In addition, the Fund's Institutional Class pays Management an administration fee at the annual rate of 0.09% of its average daily net assets under this agreement and the Fund's Class A and Class C pays Management an administration fee at the annual rate of 0.20% of its average daily net assets under this agreement. Additionally, Management retains State Street Bank and Trust Company ("State Street") as its sub-administrator under a
Sub-Administration Agreement. Management pays State Street a fee for all services received under this agreement. The Subsidiary also retains Management as its administrator, and State Street as its sub-administrator.
Management has contractually agreed to waive current payment of fees and/or reimburse certain expenses of the Institutional Class, Class A and Class C of the Fund so that the total annual operating expenses of those classes do not exceed the expense limitations as detailed in the following table. These undertakings apply to the Fund's direct expenses and exclude interest, taxes, brokerage commissions, acquired fund fees and expenses, extraordinary expenses, and dividend expense relating to short sales, if any; consequently, net expenses may exceed the contractual expense limitations. The Fund has agreed that each of its respective classes will repay Management for fees and expenses waived or reimbursed for that class provided that repayment does not cause that class' annual operating expenses to exceed its contractual expense limitation at the time the fees and expenses were waived or reimbursed. Any such repayment must be made within three years after the year in which Management incurred the expense. The expenses of the Subsidiary are included in the total expenses used to calculate the reimbursement, which the Fund has agreed to share with the Subsidiary. For the period ended October 31, 2012, these Subsidiary expenses amounted to $111,128.
During the period ended October 31, 2012, there was no reimbursement to Management under this agreement.
At October 31, 2012, contingent liabilities to Management under the contractual expense limitation were as follows:
| | | | | | | Expenses Reimbursed In Fiscal Period Ending, October 31, 2012 | |
| | | | | | | Subject to Repayment until October 31, | |
| | | Contractual Expense Limitation(1) | | Expiration | | 2015 | |
| Institutional Class | | | 1.10 | % | | 10/31/14 | | | 518,969 | (2) | |
Class A | | | 1.46 | % | | 10/31/14 | | | 13,769 | (2) | |
Class C | | | 2.21 | % | | 10/31/14 | | | 12,521 | (2) | |
(1) Expense limitation per annum of the respective class' average daily net assets.
(2) Period from August 27, 2012 (Commencement of Operations) to October 31, 2012.
Neuberger Berman Fixed Income LLC ("NBFI"), as the sub-adviser to the Fund and the Subsidiary, is retained by Management to provide day-to-day investment management services and receives a monthly fee paid by Management. As investment manager, Management is responsible for overseeing the investment activities of NBFI. Several individuals who are officers and/or Trustees of the Trust are also employees of NBFI, Neuberger Berman LLC ("Neuberger") and/or Management.
Management, NBFI and Neuberger are indirect subsidiaries of Neuberger Berman Group LLC (("NBG") and together with its consolidated subsidiaries ("NB Group")). NBSH Acquisition, LLC ("NBSH"), which is owned by portfolio managers, members of the NB Group management team and certain of NB Group's key employees and senior professionals, owns, as of September 30, 2012, approximately 57% of NBG's common units, and Lehman Brothers Holdings Inc. ("LBHI") and certain of its subsidiaries (collectively the "LBHI Parties") own the remaining 43% of such common units. Pursuant to agreements among NBG, NBSH and the LBHI Parties, NBG is entitled to acquire the remaining Class A common units through a process that is expected to end in 2017. In April 2012, NBG exercised its option (the "Redemption Agreement Option") to redeem during 2012 certain of its Class A common units held by the LBHI Parties equal to 10% of NBG's aggregate common units issued and outstanding as of March 16, 2012. The final payment for such Class A common units is due within thirty (30) days of December 31, 2012.
The Fund also has a distribution agreement with Management with respect to each class of shares. Management acts as agent in arranging for the sale of class shares without sales commission or other compensation, except as described below for Class A and Class C shares, and bears advertising and promotion expenses.
However, Management receives fees from Class A and Class C under their distribution plans (each a "Plan", collectively the "Plans") pursuant to Rule 12b-1 under the 1940 Act. The Plans provide that, as compensation for administrative and other services provided to these classes, Management's activities and expenses related to the sale and distribution of these classes of shares, and ongoing services provided to investors in these classes, Management receives from each of these classes a fee at the annual rate of 0.25% of Class A's and 1.00% of Class C's average daily net assets. Management receives this amount to provide distribution and shareholder servicing for these classes and pays a portion of it to institutions that provide such services. Those institutions may use the payments for, among other purposes, compensating employees engaged in sales and/or shareholder servicing. The amount of fees paid by each class during any year may be more or less than the cost of distribution and other services provided to that class. FINRA rules limit the amount of annual distribution fees that may be paid by a mutual fund and impose a ceiling on the cumulative distribution fees paid. The Trust's Plans comply with those rules.
Class A shares are generally sold with an initial sales charge of up to 5.75% and no contingent deferred sales charge ("CDSC"), except that a CDSC of 1.00% applies to certain redemptions made within 18 months following purchases of $1 million or more without an initial sales charge. Class C shares are sold with no initial sales charge and a 1.00% CDSC if shares are sold within one year after purchase.
For the period ended October 31, 2012, Management, acting as underwriter and broker-dealer, received net initial sales charges from the purchase of Class A shares and CDSCs from the redemption of Class A and Class C shares as follows:
| | | Underwriter | | Broker-Dealer | |
| | | Net Initial Sales Charges | | CDSC | | Net Initial Sales Charges | | CDSC | |
| Class A | | $ | — | | | $ | — | | | $ | — | | | $ | — | | |
| Class C | | | — | | | | — | | | | — | | | | — | | |
Note C—Securities Transactions:
For the period ended October 31, 2012, all securities transactions were short-term.
Note D—Fund Share Transactions:
Share activity for the period ended October 31, 2012 was as follows:
| | | Shares Sold | | Total | |
Institutional Class(1) | | | 505,509 | | | | 505,509 | | |
Class A(1) | | | 12,901 | | | | 12,901 | | |
Class C(1) | | | 10,000 | | | | 10,000 | | |
(1) Period from August 27, 2012 (Commencement of Operations) to October 31, 2012.
Note E—Line of Credit:
At October 31, 2012, the Fund was a participant in a single committed, unsecured $200,000,000 line of credit with State Street, to be used only for temporary or emergency purposes. Other investment companies managed by Management also participate in this line of credit on the same terms. Interest is charged on borrowings under this line of credit at the higher of (a) the Federal Funds Rate plus 1.25% per annum or (b) the Overnight LIBOR Rate
plus 1.25% per annum. A commitment fee of 0.10% per annum of the available line of credit is charged, of which each participating Fund has agreed to pay its pro rata share, based on the ratio of its individual net assets to the net assets of all participants at the time the fee is due and payable. The fee is paid quarterly in arrears. Because several mutual funds participate, there is no assurance that an individual Fund will have access to all or any part of the $200,000,000 at any particular time. There were no loans outstanding pursuant to this line of credit at October 31, 2012. During the period ended October 31, 2012, the Fund did not utilize this line of credit.
Note F—Recent Accounting Pronouncement:
In December 2011, the Financial Accounting Standards Board issued Accounting Standards Update 2011-11 Disclosures about Offsetting Assets and Liabilities ("ASU 2011-11"). Effective for annual reporting periods beginning on or after January 1, 2013 and interim periods within those annual periods, ASU 2011-11 is intended to enhance disclosure requirements on the offsetting of financial assets and liabilities. At this time, Management is evaluating the implications of ASU 2011-11 and its impact on the financial statements.
This page has been left blank intentionally
Consolidated Financial Highlights
The following tables include selected data for a share outstanding throughout the period and other performance information derived from the Financial Statements. Per share amounts that round to less than $0.01 or $(0.01) per share are presented as $0.00 or $(0.00) respectively. Net Asset amounts with a zero balance may reflect actual amounts rounding to less than $0.1 million.
| | | Net Asset Value, Beginning of Period | | Net Investment Income (Loss)@ | | Net Gains or Losses on Securities (both realized and unrealized) | | Total From Investment Operations | | Dividends from Net Investment Income | | Distributions from Net Realized Capital Gains | | Total Distributions | |
Risk Balanced Commodity Strategy Fund | |
| Institutional Class | |
Period from 8/27/2012^ to 10/31/2012 | | $ | 10.00 | | | $ | (0.02 | ) | | $ | (0.14 | ) | | $ | (0.16 | ) | | $ | — | | | $ | — | | | $ | — | | |
Class A | |
Period from 8/27/2012^ to 10/31/2012 | | $ | 10.00 | | | $ | (0.03 | ) | | $ | (0.13 | ) | | $ | (0.16 | ) | | $ | — | | | $ | — | | | $ | — | | |
Class C | |
Period from 8/27/2012^ to 10/31/2012 | | $ | 10.00 | | | $ | (0.04 | ) | | $ | (0.13 | ) | | $ | (0.17 | ) | | $ | — | | | $ | — | | | $ | — | | |
| See Notes to Financial Highlights | 27 |
| | | Net Asset Value, End of Period | | Total Return†† | | Net Assets, End of Period (in millions) | | Ratio of Gross Expenses to Average Net Assets# | | Ratio of Net Expenses to Average Net Assets | | Ratio of Net Investment Income/ (Loss) to Average Net Assets | | Portfolio Turnover Rate | |
Risk Balanced Commodity Strategy Fund | |
| Institutional Class | |
Period from 8/27/2012^ to 10/31/2012 | | $ | 9.84 | | | | (1.60 | %)** | | $ | 5.0 | | | | 25.60 | %*‡ | | | 1.10 | %*‡ | | | (.99 | %)*‡ | | | 0 | %** | |
| Class A | |
Period from 8/27/2012^ to 10/31/2012 | | $ | 9.84 | | | | (1.60 | %)** | | $ | 0.1 | | | | 33.04 | %*‡ | | | 1.46 | %*‡ | | | (1.36 | %)*‡ | | | 0 | %** | |
| Class C | |
Period from 8/27/2012^ to 10/31/2012 | | $ | 9.83 | | | | (1.70 | %)** | | $ | 0.1 | | | | 35.12 | %*‡ | | | 2.21 | %*‡ | | | (2.11 | %)*‡ | | | 0 | %** | |
Notes to Financial Highlights
| †† | Total return based on per share NAV reflects the effects of changes in NAV on the performance of the Fund during the fiscal period and assumes income dividends and other distributions, if any, were reinvested, but does not reflect the effect of sales charges. Results represent past performance and do not indicate future results. Current returns may be lower or higher than the performance data quoted. Investment returns and principal may fluctuate and shares when redeemed may be worth more or less than original cost. Total return would have been lower if Management had not reimbursed and/or waived certain expenses. |
| # | Represents the annualized ratios of net expenses to average daily net assets if Management had not reimbursed certain expenses and/or waived a portion of the investment management fee. |
| @ | Calculated based on the average number of shares outstanding during the fiscal period. |
| ^ | The date investment operations commenced. |
| ‡ | Organization expense, which is a non-recurring expense, is included in these ratios on a non-annualized basis. |
| * | Annualized. |
| ** | Not annualized. |
To the Board of Trustees of Neuberger Berman Alternative Funds
and Shareholders of Neuberger Berman Risk Balanced Commodity Strategy Fund
We have audited the accompanying consolidated statement of assets and liabilities of the Neuberger Berman Risk Balanced Commodity Strategy Fund, one of the series constituting the Neuberger Berman Alternative Funds (the "Fund"), including the consolidated schedule of investments, as of October 31, 2012, the related consolidated statements of operations, changes in net assets, and the financial highlights for the period from August 27, 2012 (commencement of operations) through October 31, 2012. These financial statements and financial highlights are the responsibility of the Fund's management. Our responsibility is to express an opinion on these financial statements and financial highlights based on our audit.
We conducted our audit in accordance with the standards of the Public Company Accounting Oversight Board (United States). Those standards require that we plan and perform the audit to obtain reasonable assurance about whether the financial statements and financial highlights are free of material misstatement. We were not engaged to perform an audit of the Fund's internal control over financial reporting. Our audit included consideration of internal control over financial reporting as a basis for designing audit procedures that are appropriate in the circumstances, but not for the purpose of expressing an opinion on the effectiveness of the Fund's internal control over financial reporting. Accordingly, we express no such opinion. An audit also includes examining, on a test basis, evidence supporting the amounts and disclosures in the financial statements and financial highlights, assessing the accounting principles used and significant estimates made by management, and evaluating the overall financial statement presentation. Our procedures included confirmation of securities owned as of October 31, 2012 by correspondence with the custodian and others or by other appropriate auditing procedures where replies from others were not received. We believe that our audit provides a reasonable basis for our opinion.
In our opinion, the financial statements and financial highlights referred to above present fairly, in all material respects, the consolidated financial position of Neuberger Berman Risk Balanced Commodity Strategy Fund, a series of Neuberger Berman Alternative Funds, as of October 31, 2012, and the consolidated results of its operations, the changes in its net assets, and the financial highlights for the period from August 27, 2012 (commencement of operations) through October 31, 2012, in conformity with U.S. generally accepted accounting principles.
Boston, Massachusetts
December 19, 2012
Directory
Investment Manager, Administrator and Distributor Neuberger Berman Management LLC 605 Third Avenue, 2nd Floor New York, NY 10158-0180 800.877.9700 or 212.476.8800 Intermediary Support Services 800.366.6264 Sub-Adviser Neuberger Berman Fixed Income LLC 190 South LaSalle Street Chicago, IL 60603 Custodian and Shareholder Servicing Agent State Street Bank and Trust Company 2 Avenue de Lafayette Boston, MA 02111 | For Institutional Class Shareholders Address correspondence to: Neuberger Berman Management LLC 605 Third Avenue, Mail Drop 2-7 New York, NY 10158-0180 Attn: Intermediary Support Services 800.366.6264 For Class A and Class C Shareholders: Please contact your investment provider Legal Counsel K&L Gates LLP 1601 K Street, NW Washington, DC 20006 Independent Registered Public Accounting Firms Ernst & Young LLP 200 Clarendon Street Boston, MA 02116 |
Trustees and Officers
The following tables set forth information concerning the trustees ("Trustees") and officers ("Officers") of the Fund. All persons named as Trustees and Officers also serve in similar capacities for other funds administered or managed by Management and NBFI. The Fund's Statement of Additional Information includes additional information about the Trustees as of the time of the Fund's most recent public offering and is available upon request, without charge, by calling (800) 877-9700.
Information about the Board of Trustees
Name, (Year of Birth), and Address(1) | | Position(s) and Length of Time Served(2) | | Principal Occupation(s)(3) | | Number of Funds in Fund ComplexOverseen by Fund Trustee | | Other Directorships Held Outside Fund Complex by Fund Trustee(3) | |
Independent Fund Trustees | |
| Faith Colish (1935) | | Trustee since inception | | Counsel, Carter Ledyard & Milburn LLP (law firm) since October 2002; formerly, Attorney-at-Law and President, Faith Colish, A Professional Corporation, 1980 to 2002. | | | 50 | | | Formerly, Director, 1997 to 2003, and Advisory Director, 2003 to 2006, ABA Retirement Funds (formerly, American Bar Retirement Association) (not-for-profit membership corporation). | |
| Martha C. Goss (1949) | | Trustee since 2007 | | President, Woodhill Enterprises Inc./Chase Hollow Associates LLC (personal investment vehicle), since 2006; Chief Operating and Financial Officer, Hopewell Holdings LLC/ Amwell Holdings, LLC (a holding company for investments in the healthcare sector), since 2003; formerly, Consultant, Resources Connection (temporary staffing), 2002 to 2006. | | | 50 | | | Director, American Water (water utility), since 2003; Director, Channel Reinsurance (financial guaranty reinsurance), 2006 to 2010; Director, Allianz Life of New York (insurance), since 2005; Director, Financial Women's Association of New York (not-for-profit association), since 2003; Trustee Emerita, Brown University, since 1998; formerly, Director, Ocwen Financial Corporation (mortgage servicing), 2005 to 2010; formerly, Advisory Board Member, Attensity (software developer), 2005 to 2007; formerly, Director, Bank Leumi (commercial bank), 2005 to 2007; formerly, Director, Claire's Stores, Inc. (retailer), 2005 to 2007. | |
Name, (Year of Birth), and Address(1) | | Position(s) and Length of Time Served(2) | | Principal Occupation(s)(3) | | Number of Funds in Fund Complex | | Other Directorships Held Outside Fund Complex by Fund Trustee(3) Overseen by Fund Trustee | |
| | | | | | | | | | | | |
| Michael M. Knetter (1960) | | Trustee since 2007 | | President and Chief Executive Officer, University of Wisconsin Foundation, since October 2010; formerly, Dean, School of Business, University of Wisconsin—Madison; formerly, Professor of International Economics and Associate Dean, Amos Tuck School of Business—Dartmouth College, 1998 to 2002. | | | 50 | | | Director, American Family Insurance (a mutual company, not publicly traded), since March 2009; formerly, Trustee, Northwestern Mutual Series Fund, Inc., 2007 to 2010; formerly, Director, Wausau Paper, 2005 to 2011; formerly, Director, Great Wolf Resorts, 2004 to 2009. | |
| Howard A. Mileaf (1937) | | Trustee since inception | | Retired; formerly, Vice President and General Counsel, WHX Corporation (holding company), 1993 to 2001. | | | 50 | | | Formerly, Director, Webfinancial Corporation (holding company), 2002 to 2008; formerly, Director, WHX Corporation (holding company), 2002 to 2005; formerly, Director, State Theatre of New Jersey (not-for-profit theatre), 2000 to 2005. | |
| George W. Morriss (1947) | | Trustee since 2007 | | Adjunct Faculty Member, Columbia University School of International Policy and Administration, since October 2012; formerly, Executive Vice President and Chief Financial Officer, People's Bank, Connecticut (a financial services company), 1991 to 2001. | | | 50 | | | Formerly, Manager, Larch Lane Multi-Strategy Fund complex (which consisted of three funds), 2006 to 2011; formerly, Member, NASDAQ Issuers' Affairs Committee, 1995 to 2003. | |
Name, (Year of Birth), and Address(1) | | Position(s) and Length of Time Served(2) | | Principal Occupation(s)(3) | | Number of Funds in Fund Complex | | Other Directorships Held Outside Fund Complex by Fund Trustee(3) Overseen by Fund Trustee | |
| | | | | | | | | | | | |
| Jack L. Rivkin (1940) | | Trustee since inception; President from inception to 2008 | | Formerly, Executive Vice President and Chief Investment Officer, Neuberger Berman Holdings LLC (holding company), 2002 to August 2008 and 2003 to August 2008, respectively; formerly, Managing Director and Chief Investment Officer, Neuberger, December 2005 to August 2008 and 2003 to August 2008, respectively; formerly, Executive Vice President, Neuberger, December 2002 to 2005; formerly, Director and Chairman, Management, December 2002 to August 2008; formerly, Executive Vice President, Citigroup Investments, Inc., September 1995 to February 2002; formerly, Executive Vice President, Citigroup Inc., September 1995 to February 2002. | | | 50 | | | Director, Idealab (private company), since 2009; Director, Distributed World Power (private company), since 2009; Director, Dale Carnegie and Associates, Inc. (private company), since 1999; Director, Solbright, Inc. (private company), since 1998; Director, SA Agricultural Fund, since 2009; Chairman and Director, Essential Brands (consumer products) since 2008; formerly, Director, New York Society of Security Analysts, 2006 to 2008. | |
| Tom D. Seip (1950) | | Trustee since inception; Chairman of the Board since 2008; Lead Independent Trustee from 2006 to 2008 | | General Partner, Ridgefield Farm LLC (a private investment vehicle); formerly, President and CEO, Westaff, Inc. (temporary staffing), May 2001 to January 2002; formerly, Senior Executive, The Charles Schwab Corporation, 1983 to 1998, including Chief Executive Officer, Charles Schwab Investment Management, Inc.; Trustee, Schwab Family of Funds and Schwab Investments, 1997 to 1998; and Executive Vice President-Retail Brokerage, Charles Schwab & Co., Inc., 1994 to 1997. | | | 50 | | | Director, H&R Block, Inc. (financial services company), since May 2001; Chairman, Governance and Nominating Committee, H&R Block, Inc., since 2011; formerly, Chairman, Compensation Committee, H&R Block, Inc., 2006 to 2010; formerly, Director, Forward Management, Inc. (asset management company), 1999 to 2006. | |
Name, (Year of Birth), and Address(1) | | Position(s) and Length of Time Served(2) | | Principal Occupation(s)(3) | | Number of Funds in Fund Complex | | Other Directorships Held Outside Fund Complex by Fund Trustee(3) Overseen by Fund Trustee | |
| | | | | | | | | | | | |
| Candace L. Straight (1947) | | Trustee since inception | | Private investor and consultant specializing in the insurance industry; formerly, Advisory Director, Securitas Capital LLC (a global private equity investment firm dedicated to making investments in the insurance sector), 1998 to December 2003. | | | 50 | | | Public Member, Board of Governors and Board of Trustees, Rutgers University, since 2011; Director, Montpelier Re Holdings Ltd. (reinsurance company), since 2006; formerly, Director, National Atlantic Holdings Corporation (property and casualty insurance company), 2004 to 2008; formerly, Director, The Proformance Insurance Company (property and casualty insurance company), 2004 to 2008; formerly, Director, Providence Washington Insurance Company (property and casualty insurance company), 1998 to 2006; formerly, Director, Summit Global Partners (insurance brokerage firm), 2000 to 2005. | |
| Peter P. Trapp (1944) | | Trustee since inception | | Retired; formerly, Regional Manager for Mid-Southern Region, Ford Motor Credit Company, September 1997 to 2007; formerly, President, Ford Life Insurance Company, April 1995 to August 1997. | | | 50 | | | None. | |
Name, (Year of Birth), and Address(1) | | Position(s) and Length of Time Served(2) | | Principal Occupation(s)(3) | | Number of Funds in Fund ComplexOverseen by Fund Trustee | | Other Directorships Held Outside Fund Complex by Fund Trustee(3) | |
Fund Trustees who are "Interested Persons" | |
| Joseph V. Amato* (1962) | | Trustee since 2009 | | President and Director, NBG, since 2009; President and Chief Executive Officer, Neuberger and Neuberger Berman Holdings LLC (including its predecessor, Neuberger Berman Inc.), since 2007; Chief Investment Officer, Neuberger, since 2009; Chief Investment Officer (Equities) and Managing Director, Management, since 2009; Managing Director, NBFI since 2007; Board member of NBFI since 2006; formerly, Global Head of Asset Management of Lehman Brothers Holdings Inc.'s ("LBHI") Investment Management Division, 2006 to 2009; formerly, member of LBHI's Investment Management Division's Executive Management Committee, 2006 to 2009; formerly, Managing Director, Lehman Brothers Inc. ("LBI"), 2006 to 2008; formerly, Chief Recruiting and Development Officer, LBI, 2005 to 2006; formerly, Global Head of LBI's Equity Sales and a Member of its Equities Division Executive Committee, 2003 to 2005. | | | 50 | | | Member of Board of Advisors, McDonough School of Business, Georgetown University, since 2001; Member of New York City Board of Advisors, Teach for America, since 2005; Trustee, Montclair Kimberley Academy (private school), since 2007. | |
Name, (Year of Birth), and Address(1) | | Position(s) and Length of Time Served(2) | | Principal Occupation(s)(3) | | Number of Funds in Fund Complex | | Other Directorships Held Outside Fund Complex by Fund Trustee(3) Overseen by Fund Trustee | |
| | | | | | | | | | | | |
| Robert Conti* (1956) | | Chief Executive Officer, President and Trustee since 2008; prior thereto, Executive Vice President in 2008 and Vice President from inception to 2008 | | Managing Director, Neuberger, since 2007; formerly, Senior Vice President, Neuberger, 2003 to 2006; formerly, Vice President, Neuberger, 1999 to 2003; President and Chief Executive Officer, Management, since 2008; formerly, Senior Vice President, Management, 2000 to 2008; Managing Director, NBFI, since 2009. | | | 50 | | | Director, Staten Island Mental Health Society, since 2008; formerly, Chairman of the Board, Staten Island Mental Health Society, 2008 to 2011. | |
(1) The business address of each listed person is 605 Third Avenue, New York, New York 10158.
(2) Pursuant to the Trust's Trust Instrument, each of these Fund Trustees shall hold office for life or until his or her successor is elected or the Trust terminates; except that (a) any Fund Trustee may resign by delivering a written resignation; (b) any Fund Trustee may be removed with or without cause at any time by a written instrument signed by at least two-thirds of the other Fund Trustees; (c) any Fund Trustee who requests to be retired, or who has become unable to serve, may be retired by a written instrument signed by a majority of the other Fund Trustees; and (d) any Fund Trustee may be removed at any shareholder meeting by a vote of at least two-thirds of the outstanding shares.
(3) Except as otherwise indicated, each individual has held the positions shown for at least the last five years.
* Indicates a Fund Trustee who is an "interested person" within the meaning of the 1940 Act. Mr. Amato and Mr. Conti are interested persons of the Trust by virtue of the fact that each is an officer of Management, Neuberger and/or their affiliates.
Information about the Officers of the Trust
Name, (Year of Birth), and Address(1) | | Position(s) and Length of Time Served(2) | | Principal Occupation(s)(3) | |
| | | | | | |
| Andrew B. Allard (1961) | | Anti-Money Laundering Compliance Officer since inception | | Senior Vice President, Neuberger, since 2006 and Employee since 1999; Deputy General Counsel, Neuberger, since 2004; formerly, Vice President, Neuberger, 2000 to 2005; formerly, Employee, Management, 1994 to 1999; Anti-Money Laundering Compliance Officer, nine registered investment companies for which Management acts as investment manager and administrator (six since 2002, one since 2003, one since 2005 and one since 2006). | |
| Claudia A. Brandon (1956) | | Executive Vice President since 2008 and Secretary since inception | | Senior Vice President, Neuberger, since 2007 and Employee since 1999; Senior Vice President, Management, since 2008 and Assistant Secretary since 2004; formerly, Vice President, Neuberger, 2002 to 2006; formerly, Vice President Mutual Fund Board Relations, Management, 2000 to 2008; formerly, Vice President, Management, 1986 to 1999 and Employee 1984 to 1999; Executive Vice President, nine registered investment companies for which Management acts as investment manager and administrator (nine since 2008); Secretary, nine registered investment companies for which Management acts as investment manager and administrator (three since 1985, three since 2002, one since 2003, one since 2005 and one since 2006). | |
| Anthony DiBernardo (1979) | | Assistant Treasurer since 2011 | | Vice President, Neuberger, since 2009; Employee, Management, since 2003; Assistant Treasurer, nine registered investment companies for which Management acts as investment manager and administrator (nine since 2011). | |
| Maxine L. Gerson (1950) | | Executive Vice President since 2008 and Chief Legal Officer since inception (only for purposes of sections 307 and 406 of the Sarbanes-Oxley Act of 2002) | | Managing Director, Neuberger, since 2009, and Deputy General Counsel and Assistant Secretary, Neuberger, since 2001; Managing Director, Management, since 2009, and Secretary and General Counsel, Management, since 2004; formerly, Senior Vice President, Neuberger, 2002 to 2009; formerly, Senior Vice President, Management, 2006 to 2009; Executive Vice President, nine registered investment companies for which Management acts as investment manager and administrator (nine since 2008); Chief Legal Officer (only for purposes of sections 307 and 406 of the Sarbanes-Oxley Act of 2002), nine registered investment companies for which Management acts as investment manager and administrator (eight since 2005 and one since 2006). | |
| Sheila R. James (1965) | | Assistant Secretary since inception | | Vice President, Neuberger, since 2008 and Employee since 1999; formerly, Assistant Vice President, Neuberger, 2007; formerly, Employee, Management, 1991 to 1999; Assistant Secretary, nine registered investment companies for which Management acts as investment manager and administrator (six since 2002, one since 2003, one since 2005 and one since 2006). | |
| Brian Kerrane (1969) | | Vice President since 2008 | | Senior Vice President, Neuberger, since 2006; formerly, Vice President, Neuberger, 2002 to 2006; Vice President, Management, since 2008 and Employee since 1991; Vice President, nine registered investment companies for which Management acts as investment manager and administrator (nine since 2008). | |
Name, (Year of Birth), and Address(1) | | Position(s) and Length of Time Served(2) | | Principal Occupation(s)(3) | |
| | | | | | |
| Kevin Lyons (1955) | | Assistant Secretary since inception | | Assistant Vice President, Neuberger, since 2008 and Employee since 1999; formerly, Employee, Management, 1993 to 1999; Assistant Secretary, nine registered investment companies for which Management acts as investment manager and administrator (seven since 2003, one since 2005 and one since 2006). | |
| Owen F. McEntee, Jr. (1961) | | Vice President since 2008 | | Vice President, Neuberger, since 2006; Employee, Management, since 1992; Vice President, nine registered investment companies for which Management acts as investment manager and administrator (nine since 2008). | |
| John M. McGovern (1970) | | Treasurer and Principal Financial and Accounting Officer since inception | | Senior Vice President, Neuberger, since 2007; formerly, Vice President, Neuberger, 2004 to 2006; Employee, Management, since 1993; Treasurer and Principal Financial and Accounting Officer, nine registered investment companies for which Management acts as investment manager and administrator (eight since 2005 and one since 2006); formerly, Assistant Treasurer, eight registered investment companies for which Management acts as investment manager and administrator, 2002 to 2005. | |
| Frank Rosato (1971) | | Assistant Treasurer since inception | | Vice President, Neuberger, since 2006; Employee, Management, since 1995; Assistant Treasurer, nine registered investment companies for which Management acts as investment manager and administrator (eight since 2005 and one since 2006). | |
| Neil S. Siegel (1967) | | Vice President since 2008 | | Managing Director, Management, since 2008; Managing Director, Neuberger, since 2006; formerly, Senior Vice President, Neuberger, 2004 to 2006; Vice President, nine registered investment companies for which Management acts as investment manager and administrator (nine since 2008). | |
| Chamaine Williams (1971) | | Chief Compliance Officer since inception | | Senior Vice President, Neuberger, since 2007; Chief Compliance Officer, Management, since 2006; Chief Compliance Officer, nine registered investment companies for which Management acts as investment manager and administrator (eight since 2005 and one since 2006); formerly, Senior Vice President, LBI, 2007 to 2008; formerly, Vice President, LBI, 2003 to 2006; formerly, Chief Compliance Officer, Lehman Brothers Asset Management Inc., 2003 to 2007; formerly, Chief Compliance Officer, Lehman Brothers Alternative Investment Management LLC, 2003 to 2007. | |
(1) The business address of each listed person is 605 Third Avenue, New York, New York 10158.
(2) Pursuant to the By-Laws of the Trust, each officer elected by the Fund Trustees shall hold office until his or her successor shall have been elected and qualified or until his or her earlier death, inability to serve, or resignation. Officers serve at the pleasure of the Fund Trustees and may be removed at any time with or without cause.
(3) Except as otherwise indicated, each individual has held the positions shown for at least the last five years.
Proxy Voting Policies and Procedures
A description of the policies and procedures that the Trust uses to determine how to vote proxies relating to portfolio securities is available, without charge, by calling 1-800-877-9700 (toll-free) and on the website of the Securities and Exchange Commission, at www.sec.gov. Information regarding how the Trust voted proxies relating to portfolio securities during the most recent 12-month period ended June 30 is also available, without charge, by calling 1-800-877-9700 (toll-free), on the website of the Securities and Exchange Commission at www.sec.gov, and on Management's website at www.nb.com.
Quarterly Portfolio Schedule
The Trust files a complete schedule of portfolio holdings for the Fund with the Securities and Exchange Commission for the first and third quarters of the fiscal year on Form N-Q. The Trust's Forms N-Q are available on the Securities and Exchange Commission's website at www.sec.gov and may be reviewed and copied at the Securities and Exchange Commission's Public Reference Room in Washington, DC. Information on the operation of the Public Reference Room may be obtained by calling 1-800-SEC-0330. The information on Form N-Q is available upon request, without charge, by calling 1-800-877-9700 (toll-free).
Board Consideration of the Management and Sub-Advisory Agreements
At a meeting held on October 13, 2011, the Board of Trustees of Neuberger Berman Alternative Funds ("Board"), including the Trustees who are not "interested persons" of Neuberger Berman Management LLC ("Management") (including its affiliates) or Neuberger Berman Alternative Funds ("Independent Fund Trustees"), approved the Management and Sub-Advisory Agreements ("Agreements") for Neuberger Berman Risk Balanced Commodity Strategy Fund (the "Fund").
In evaluating the Agreements, the Board, including the Independent Fund Trustees, reviewed materials furnished by Management and met with senior representatives of Management regarding personnel, operations and financial conditions of Management and Neuberger Berman Fixed Income LLC ("NBFI"), the Sub-Adviser, as they relate to the Fund. The Independent Fund Trustees were advised by counsel that is experienced in Investment Company Act of 1940 matters and that is independent of Management.
The Board evaluated the terms of the Agreements, the overall fairness of the Agreements to the Fund and whether the Agreements were in the best interests of the Fund and its shareholders. The Board considered the following factors, among others, in connection with its approval of the Agreements: (1) the nature, extent, and quality of the services to be provided by Management and NBFI; (2) the expected costs of the services to be provided; (3) the extent to which economies of scale might be realized as the Fund grows; and (4) whether fee levels reflect any such potential economies of scale for the benefit of investors in the Fund. In their deliberations, the Board members did not identify any particular information that was all-important or controlling, and each Trustee may have attributed different weights to the various factors.
With respect to the nature, extent and quality of the services provided, the Board considered the experience and staffing of the portfolio management personnel of Management and NBFI who perform services for the Fund. The Board also considered the performance of another account which is managed by the same portfolio manager as the Fund using similar investment objectives, policies and strategies as the Fund. The Board noted that Management also provides certain administrative services, including fund accounting and compliance oversight. The Board also considered Management's and NBFI's policies and practices regarding brokerage and allocation of portfolio transactions for the Fund. In addition, the Board noted the positive compliance history of Management and NBFI, as each firm has been free of significant compliance problems. The Board also considered the manner in which Management addressed various non-routine matters that have arisen from time to time, some of them a result of developments in the broader fund industry or the regulations governing it.
With respect to the overall fairness of the Agreements, the Board considered the fee structure for the Fund under the Agreements as compared to a peer group of comparable funds and any fall-out benefits likely to accrue to Management or NBFI or their affiliates from their relationship with the Fund. They considered the extent to which services provided to other accounts managed in a similar style were or were not comparable to those that would be provided to the Fund.
The Board reviewed a comparison of the Fund's management fee and overall expense ratio to a peer group of broadly comparable funds. The Board considered Management's willingness to waive advisory fees to the extent that other entities provide services that overlap with those called for under the Agreement. In addition, the Board considered the contractual limits on the Fund's expenses undertaken by Management for the Fund. The Board also evaluated any anticipated economies of scale in relation to the services Management provides to the Fund, noting that it may be too soon to anticipate all of the economies at the start up phase of a fund. The Board considered whether the Fund's fee structure provides for a reduction of payments resulting from the use of breakpoints and whether those breakpoints are set at appropriate asset levels based on the Fund's expected costs.
Conclusions
In approving the Agreements, the Board concluded that the terms of each Agreement are fair and reasonable to the Fund and that approval of the Agreements is in the best interests of the Fund and its shareholders. In reaching this determination, the Board considered that Management and NBFI could be expected to provide a high level of service to the Fund; that the Fund's fee structure appeared to the Board to be reasonable given the nature and quality of services expected to be provided; and that the expected benefits accruing to Management and its affiliates by virtue of their relationship to the Fund were reasonable in comparison with the expected costs of providing the investment advisory services and the expected benefits accruing to the Fund.
This page has been left blank intentionally
This page has been left blank intentionally
| | Neuberger Berman Management LLC 605 Third Avenue 2nd Floor New York, NY 10158–0180 Shareholder Services 800.877.9700 Institutional Services 800.366.6264 www.nb.com Statistics and projections in this report are derived from sources deemed to be reliable but cannot be regarded as a representation of future results of the Fund. This report is prepared for the general information of shareholders and is not an offer of shares of the Fund. Shares are sold only through the currently effective prospectus, which must precede or accompany this report.  M0258 12/12 M0258 12/12 | |
| | Neuberger Berman
Alternative Funds Institutional Class Shares Class A Shares Class C Shares Absolute Return Multi-Manager Fund |
| | Annual Report October 31, 2012 |
| | Contents | |
| | | |
| | PRESIDENT'S LETTER | 1 |
| | | |
| | PORTFOLIO COMMENTARY | 2 |
| | | |
| | FUND EXPENSE INFORMATION | 8 |
| | | |
| | SCHEDULE OF INVESTMENTS/TOP TEN EQUITY HOLDINGS | 10 |
| | | |
| | FINANCIAL STATEMENTS | 24 |
| | | |
| | FINANCIAL HIGHLIGHTS/PER SHARE DATA | 37 |
| | | |
| | Report of Independent Registered Public Accounting Firm | 40 |
| | | |
| | Directory | 41 |
| | | |
| | Trustees and Officers | 42 |
| | | |
| | Proxy Voting Policies and Procedures | 50 |
| | | |
| | Quarterly Portfolio Schedule | 50 |
| | | |
| | Notice to Shareholders | 50 |
| | | |
| | Board Consideration of the Management and Sub-Advisory Agreements | 51 |
The "Neuberger Berman" name and logo are registered service marks of Neuberger Berman Group LLC. "Neuberger Berman Management LLC" and the individual Fund name in this piece are either service marks or registered service marks of Neuberger Berman Management LLC. ©2012 Neuberger Berman Management LLC. All rights reserved.
President's Letter
Dear Shareholder,
I am pleased to present this shareholder report for the new Neuberger Berman Absolute Return Multi-Manager Fund, which was launched on May 15, 2012. The Fund seeks to achieve long term capital appreciation while preserving capital during broad market drawdowns by investing in a diversified portfolio of assets subadvised by seasoned hedge fund managers across multiple strategies. As an absolute return strategy, we aim for both low volatility and low beta to the broader markets. We pursue these objectives by diversifying across strategies and allocating to several subadvisers that employ relative value strategies or have short books comprised primarily of alpha-generating positions. This approach is intended to enhance the risk-adjusted returns in an asset allocation strategy. The Fund's investable universe includes long/short equity, equity market neutral, event-driven/merger arbitrage, credit long/short, relative value, managed futures, and global macro. While a significant portion of underlying assets are allocated to the U.S., we also allocate to Europe, Asia, and Emerging Markets.
Although markets rallied from the period of the Fund's launch through October 31, 2012, they were often driven by exogenous factors and posed challenges to hedge fund managers as reflected by the HFRX Absolute Return Index, which declined 33 basis points. Increased tensions in the Middle East coupled with the elections in Egypt, Greece and the U.S., and the long-anticipated leadership change in China fueled some of the uncertainty in the market place. Ultimately, though, it was central bank policies in the U.S. and Europe that played the biggest roles in shaping the market, including the European Central Bank's renewed bond purchasing program and the announcement of the Fed's third round of quantitative easing (QE3). In our view, these actions reignited investor confidence as reflected by subsequent equity market rallies, while in the bond markets, the persistency of the low interest rate environment led to a continued thirst for yield, forcing prices higher in more credit-sensitive instruments.
As we approach calendar year end and the global markets await the outcome of the impending fiscal cliff in the U.S. and the resolution of the eurozone debt crisis, we anticipate the upcoming months and quarters will experience policy-driven whipsawing markets. As a result, our subadvisers are conservatively positioned with robust short books and low net exposures. From a strategy perspective, although year-to-date M&A activity is down, we remain bullish on the outlook for increasing M&A activity due to high corporate and private equity cash balances, historically low financing rates, and vibrant credit markets. Accordingly, our portfolio is overweighted to event-driven strategies, including dedicated risk arbitrage. Within credit, we are bullish on bank loans as the spread versus high yield has tightened near record levels. Additionally, we anticipate these instruments will provide a degree of insulation from an uncertain macro environment given their seniority in the capital structure.
Thank you for your continued support and trust. We look forward to continue serving your investment needs in the years to come.
Sincerely,
Robert Conti
President and CEO
Neuberger Berman Mutual Funds
Absolute Return Multi-Manager Fund Commentary (Unaudited)
We are pleased to provide the first annual report for Neuberger Berman Absolute Return Multi-Manager Fund, which was launched on May 15, 2012. We seek to achieve long term capital appreciation with an emphasis on total returns while preserving capital during broad market drawdowns by investing in a diversified portfolio of assets subadvised by seasoned hedge fund managers across multiple strategies.
Neuberger Berman Absolute Return Multi-Manager Fund Institutional Class generated a flat total return from its inception on May 15, 2012 through October 31, 2012 as gains from stressed and distressed credit and event-driven strategies were offset by losses from long/short equity strategies. During the period, the Fund outperformed its benchmark, the HFRX Absolute Return Index, which posted a –0.33% return. (Performance for all share classes is provided in the table following this letter).
The reporting period was a strong one for risk assets as investors responded positively to aggressive actions taken by the Federal Reserve and European Central Bank to stimulate growth. For the period, the S&P 500 Index returned 6.57% and the Barclays U.S. Aggregate Bond Index returned 2.28%, compared to the –0.33% fall of the HFRX Absolute Return Index. After spiking in the second quarter, volatility trended lower over the third quarter on light trading volumes, which typically characterizes the summer months, and volumes have remained relatively low since. Commodity markets were the one exception as dry weather across the globe, particularly in the U.S., caused sharp spikes in the price of agricultural products.
Despite our subadvisers' conservative positioning, five of the portfolio's seven subadvisors generated positive returns for the period. Stressed and distressed credit was the most material positive contributor for the period. While most sectors were positive within the strategy, broadcasting/media names such as Nexstar Broadcasting, Tribune and Journal Communications, to which the Fund was overweighted due to the U.S. election cycle, were some of the largest drivers of returns. The Fund's stressed and distressed credit subadviser remains skewed to being long on senior secured floating rate debt and short unsecured fixed rate debt given the minimal spread differential between the two instruments and the desire to be hedged against an unexpected rise in interest rates.
Event-driven equity strategies, including merger arbitrage, were the next best performers during the period. Two of the portfolio's three subadvisers within this category were positive for the period, with gains coming from merger arbitrage activity, such as United Technologies' acquisition of Goodrich and Realty Income Corp's acquisition of American Realty Trust, as well as de-consolidation trades, where Tyco was a positive contributor. Merger activity picked up during the reporting period with several large announcements, including Chicago Bridge & Iron buying the Shaw Group, CNOOC's bid for Nexen, and Hertz's purchase of Dollar Thrifty. Our subadvisers continue to believe the deal environment, whether that be in mergers, divestitures, spin-offs or tax-enhancing strategies (e.g., Real Estate Investment Trusts), will accelerate given the near record high cash balances at corporations and private equity funds, as well as the attractive financing environment.
Long/short equity experienced mixed performance across the Fund's three subadvisers in the space, and was negative overall during the period. In general, gains from long positions were offset by losses on the short side. From a sector standpoint, pharmaceuticals was a material contributor due in large part to a core long position receiving accelerated FDA approval for a new drug. Losses on the short side were broad-based and were most pronounced in small-cap names. As the period progressed and single stock correlations declined, the Fund's long/short equity subadvisers began to increase both their gross and net exposures.
As an absolute return vehicle targeting limited sensitivity to broader market movements, the performance of the Fund is not predicated on the direction of the equity or fixed income markets. However, there are certain market environments which make it either more or less challenging for hedge fund strategies to generate attractive absolute levels of return. The last 18–24 months of policy-driven market moves that have resulted in high security level correlation, lower capital markets liquidity, and, consequently, lower gross/net exposures for most hedge funds, have been more challenging for
generating strong returns. However, we believe that these adverse conditions are cyclical rather than secular and have created good trading/investment opportunities for hedge fund managers as market activity normalizes. In fact, the last few months have witnessed a notable decline in security level correlation, making stock and bond picking a much more productive activity for our fundamentally driven subadvisers. As such, our subadvisers have found an increasing number of both short and long ideas of late, reflected most concretely in the increased gross exposure of the portfolio from approximately 70% at the end of June to approximately 84% at the end of October. During the period, the Fund's exposure to derivatives, which was relatively small, had a negative impact overall for the portfolio.
Credit long/short continues to be an area we view favorably for multiple reasons. Unabated, strong flows into index-tracking high yield bond mutual funds and exchange-traded funds have created, in our view, a number of attractive relative value opportunities both between non-index and index names as well as between the bank debt and bonds of index constituents. Furthermore, the convergence of spreads between senior secured floating rate bank debt and unsecured, fixed rate bonds has resulted in trading opportunities that we think can benefit from both potential adverse market or company-specific events and expectations of a potential rise in interest rates. As a result, we anticipate maintaining a significant allocation to this space for the remainder of 2012.
As mentioned above, corporate activity has slowly started to pick up after falling off earlier in the year. While acknowledging that macro-driven market volatility is unlikely to remain subdued for long and that global economic uncertainty is not an optimal catalyst for robust capital market activity, we do continue to believe that the coming months could be productive for our event driven managers. The fundamental backdrop of large corporate cash stockpiles and pressures to grow profitability through strategic transactions remain as strong, if not stronger, than earlier in the year. Should the macro picture become clearer, regardless if the result is lower or higher security price levels, the supply of investable situations could, in our opinion, increase substantially.
Sincerely,
Eric Weinstein, Jeff Majit, Fred Ingham, David Kupperman and Ian Haas
Information about the principal risks of investing in the Fund is set forth in the prospectus and statement of additional information.
The portfolio composition, industries and holdings of the Fund are subject to change.
Absolute Return Multi-Manager Fund (Unaudited)
| TICKER SYMBOLS |
| Institutional Class | | NABIX | |
| Class A | | NABAX | |
| Class C | | NABCX | |
| PORTFOLIO BY TYPE OF SECURITY |
| (as a % of Total Net Assets) | | | | | |
| | | Long | | Short | |
| Common Stocks | | | 49.7 | % | | | (16.8 | )% | |
| Bank Loan Obligations | | | 8.9 | | | | — | | |
| Corporate Debt Securities | | | 4.3 | | | | (1.0 | ) | |
| Purchased Options | | | 0.3 | | | | — | | |
| Exchange Traded Funds | | | 0.5 | | | | (2.7 | ) | |
| Warrants | | | 0.0 | | | | — | | |
Cash, receivables and other assets, less liabilities | | | 56.8 | | | | — | | |
| Total | | | 120.5 | % | | | (20.5 | )% | |
| PERFORMANCE HIGHLIGHTS |
| | | Inception Date | | Cumulative Total Return Ended 10/31/2012 Life of Fund | |
| At NAV | | | | | |
| Institutional Class | | 05/15/2012 | | | 0.00 | % | |
| Class A | | 05/15/2012 | | | –0.10 | % | |
| Class C | | 05/15/2012 | | | –0.50 | % | |
| With Sales Charge | | | | | |
| Class A | | | | | | | –5.84 | % | |
| Class C | | | | | | | –1.50 | % | |
| Index | | | | | |
HFRX Absolute Return Index1,2 | | | | | | | –0.33 | % | |
S&P 500 Index1,2 | | | | | | | 6.57 | % | |
The performance data quoted represent past performance and do not indicate future results. Current performance may be lower or higher than the performance data quoted. For more current performance data, please visit www.nb.com/performance.
The results shown in the table reflect the reinvestment of income dividends and other distributions, if any. The results do not reflect the effect of taxes a shareholder would pay on Fund distributions or on the redemption of Fund shares.
The investment return and principal value of an investment will fluctuate and shares, when redeemed, may be worth more or less than their original cost.
Returns would have been lower if Neuberger Berman Management LLC ("Management") had not reimbursed certain expenses and/or waived a portion of the investment management fees during certain of the periods shown. Repayment by a class (of expenses previously reimbursed and/or fees previously waived by Management) will decrease the class's returns. Please see Note B in the Notes to Financial Statements for specific information regarding expense reimbursement and/or fee waiver arrangements.
Returns shown with a sales charge reflect the deduction of the current maximum initial sales charge of 5.75% for Class A shares and the applicable contingent deferred sales charges (CDSC) for Class C shares. The maximum CDSC for Class C shares is 1%, which is reduced to 0% after 1 year. The performance of the Fund's share classes will differ primarily due to different sales charge structures and class expenses. Please see the prospectus for more information about sales charge structures, if any, and class expenses for your share class.
Absolute Return Multi-Manager Fund (Unaudited)
COMPARISON OF A $1,000,000 INVESTMENT |
| (000's omitted) |
|
| This graph shows the change in value of a hypothetical $1,000,000 investment in the Fund over the past 10 fiscal years, or since the Fund's inception if it has not operated for 10 years. The graph is based on the Institutional Class shares only; the performance of the Fund's share classes will differ primarily due to different class expenses (see Performance Highlights chart on previous page). The result is compared with benchmarks, which include a broad-based market index and may include a more narrowly based index. Market indices have not been reduced to reflect any of the fees and costs of investing. The results shown in the graph reflect the reinvestment of income dividends and other distributions, if any. The results do not reflect the effect of taxes a shareholder would pay on Fund distributions or on the redemption of Fund shares. Results represent past performance and do not indicate future results. |
Endnotes (Unaudited)
| 1 | Please see "Glossary of Indices" on page 7 for a description of indices. Please note that indices do not take into account any fees, expenses or tax consequences of investing in the individual securities that they track, and that individuals cannot invest directly in any index. Data about the performance of an index is prepared or obtained by Neuberger Berman Management LLC ("Management") and reflects the reinvestment of income dividends and other distributions, if any. The Fund may invest in securities not included in the described index and/or may not invest in all securities included in the described index. |
| 2 | The date used to calculate Life of Fund performance for the index is the inception date of the oldest share class. |
For more complete information on any of the Neuberger Berman Alternative Funds, call Management at (800) 877-9700, or visit our website at www.nb.com.
Glossary of Indices (Unaudited)
| HFRX Absolute Return Index: | The HFRX Absolute Return Index is designed to be representative of the overall composition of the hedge fund universe. It is comprised of all eligible hedge fund strategies; including but not limited to convertible arbitrage, distressed securities, equity hedge, equity market neutral, event driven, macro, merger arbitrage, and relative value arbitrage. As a component of its optimization process, the index selects constituents which characteristically exhibit lower volatilities and lower correlations to standard directional benchmarks of equity market and hedge fund industry performance. Fund weights are determined by the optimization process. Constituent funds are selected from an eligible pool of the more than 6,800 funds that report performance to the Hedge Fund Research (HFR) database on a voluntary basis, and rebalanced quarterly. Funds included in the index must meet all of the following criteria: report monthly returns net of all fees; be denominated in USD; be active and accepting new investments; have a minimum 24 months track record; and the Fund's manager must have at least $50 million in assets under management. The index is available daily, with finalized month-end performance available two to three business days after the last business day of the month. |
| S&P 500 Index: | The S&P 500 Index is widely regarded as the standard for measuring the performance of large-cap stocks traded on U.S. markets and includes a representative sample of leading companies in leading industries. |
Information About Your Fund's Expenses (Unaudited)
As a Fund shareholder, you incur two types of costs: (1) transaction costs, including sales charges (loads) on purchase payments or redemption proceeds (if applicable); and (2) ongoing costs, including management fees; distribution and/or service (12b-1) fees (if applicable); and other Fund expenses. This example is intended to help you understand your ongoing costs (in dollars) of investing in the Fund and compare these costs with the ongoing costs of investing in other mutual funds.
This table is designed to provide information regarding costs related to your investments. The following examples are based on an investment of $1,000 made at the beginning of the period ended October 31, 2012 and held for the entire period. The table illustrates the Fund's costs in two ways:
Actual Expenses and Performance: | The first section of the table provides information about actual account values and actual expenses in dollars, based on the Fund's actual performance during the period when the Fund was operational. You may use the information in this line, together with the amount you invested, to estimate the expenses you paid over the period. Simply divide your account value by $1,000 (for example, an $8,600 account value divided by $1,000 = 8.6), then multiply the result by the number in the first section of the table under the heading entitled "Expenses Paid During the Period" to estimate the expenses you paid over the period. |
Hypothetical Example for Comparison Purposes: | The second section of the table provides information about hypothetical account values and hypothetical expenses based on the Fund's actual expense ratio and an assumed rate of return at 5% per year before expenses. This return is not the Fund's actual return. The hypothetical account values and expenses may not be used to estimate the actual ending account balance or expenses you paid for the period. You may use this information to compare the ongoing costs of investing in this Fund versus other funds. To do so, compare the expenses shown in this 5% hypothetical example with the 5% hypothetical examples that appear in the shareholder reports of other funds. |
Please note that the expenses in the table are meant to highlight your ongoing costs only and do not include any transaction costs, such as sales charges (loads) (if applicable). Therefore, the information under the heading "Hypothetical (5% annual return before expenses)" is useful in comparing ongoing costs only, and will not help you determine the relative total costs of owning different funds. In addition, if these transaction costs were included, your costs would have been higher.
Expense Information as of 10/31/12 (Unaudited)
| Neuberger Berman Alternative Funds |
| | | ACTUAL | | HYPOTHETICAL (5% ANNUAL RETURN BEFORE EXPENSES)(2) |
| | | Beginning Account Value 5/15/12 | | Ending Account Value 10/31/12 | | Expenses Paid During the Period(1) 5/15/12 - 10/31/12 | | Expense Ratio | | Beginning Account Value 5/1/12 | | Ending Account Value 10/31/12 | | Expenses Paid During the Period(3) 5/1/12 - 10/31/12 | | Expense Ratio |
Neuberger Berman Absolute Return Multi-Manager Fund |
| Institutional Class | | $ | 1,000.00 | | | $ | 1,000.00 | | | $ | 13.05 | | | | 2.81 | % | | $ | 1,000.00 | | | $ | 1,011.01 | | | $ | 14.20 | | | | 2.81 | % |
| Class A | | $ | 1,000.00 | | | $ | 999.00 | | | $ | 14.95 | | | | 3.22 | % | | $ | 1,000.00 | | | $ | 1,008.95 | | | $ | 16.26 | | | | 3.22 | % |
| Class C | | $ | 1,000.00 | | | $ | 995.00 | | | $ | 18.25 | | | | 3.94 | % | | $ | 1,000.00 | | | $ | 1,005.33 | | | $ | 19.86 | | | | 3.94 | % |
| (1) | For each class, expenses are equal to the annualized expense ratio for the class, multiplied by the average account value over the period, multiplied by 170/366 (to reflect the period shown of May 15, 2012 (commencement of operations) to October 31, 2012). |
| (2) | Hypothetical 5% annual return before expenses is calculated by multiplying the number of days in the most recent period divided by 366. |
| (3) | For each class, expenses are equal to the annualized expense ratio for the class, multiplied by the average account value over the period, multiplied by 184/366 (to reflect the one-half year period shown), unless otherwise indicated. |
Schedule of Investments Absolute Return Multi-Manager Fund
| TOP TEN EQUITY HOLDINGS LONG POSITIONS |
| | | | | Country | | Industry | | | |
| 1 | | | Medicis Pharmaceutical Corp. | | United States | | Pharmaceuticals | | | 1.1 | % |
| 2 | | | Nexen, Inc. | | Canada | | Oil, Gas & Consumable Fuels | | | 1.1 | % | |
| 3 | | | Kenexa Corp. | | United States | | Software | | | 1.0 | % | |
| 4 | | | Cooper Industries PLC | | United States | | Electrical Equipment | | | 0.9 | % | |
| 5 | | | Dollar Thrifty Automotive Group, Inc. | | United States | | Road & Rail | | | 0.9 | % | |
| 6 | | | PSS World Medical, Inc. | | United States | | Health Care Providers & Services | | | 0.8 | % | |
| 7 | | | Hudson City Bancorp, Inc. | | United States | | Thrifts & Mortgage Finance | | | 0.8 | % | |
| 8 | | | Pfizer, Inc. | | United States | | Pharmaceuticals | | | 0.8 | % | |
| 9 | | | Ryman Hospitality Properties | | United States | | Hotels, Restaurants & Leisure | | | 0.7 | % | |
| 10 | | | American Realty Capital Trust, Inc. | | United States | | Real Estate Investment Trusts | | | 0.7 | % | |
| TOP TEN EQUITY HOLDINGS SHORT POSITIONS |
| | | | Country | | Industry | | | | |
| 1 | | | Realty Income Corp. | | United States | | Real Estate Investment Trusts | | | (0.7 | )% | |
| 2 | | | M&T Bank Corp. | | United States | | Commercial Banks | | | (0.7 | )% | |
| 3 | | | Eaton Corp. | | United States | | Machinery | | | (0.5 | )% | |
| 4 | | | Robbins & Myers, Inc. | | United States | | Machinery | | | (0.4 | )% | |
| 5 | | | AMCOL International Corp. | | United States | | Metals & Mining | | | (0.3 | )% | |
| 6 | | | The Sherwin-Williams Co. | | United States | | Chemicals | | | (0.3 | )% | |
| 7 | | | Expeditors International of Washington, Inc. | | United States | | Air Freight & Logistics | | | (0.3 | )% | |
| 8 | | | Healthcare Services Group, Inc. | | United States | | Commercial Services & Supplies | | | (0.3 | )% | |
| 9 | | | The Boston Beer Co., Inc. | | United States | | Beverages | | | (0.3 | )% | |
| 10 | | | West Pharmaceutical Services, Inc. | | United States | | Health Care Equipment & Supplies | | | (0.3 | )% | |
| | Number of Shares | | Value† | |
| | | | | |
| Long Positions (63.7%) | | | | |
| | | | | |
| Common Stocks (49.7%) | | | | |
| | | | | |
| Aerospace & Defense (0.7%) | | | | |
| Ceradyne, Inc. | 2,000 | | $ 69,920 | |
| Exelis, Inc. | 6,142 | | 67,931 | |
| Hexcel Corp. | 2,140 | | 54,698 | * |
| Triumph | | | | |
| Group, Inc. | 890 | | 58,224 | |
| | | | 250,773 | |
| Air Freight & Logistics (0.3%) | | | | |
| CH Robinson | | | | |
| Worldwide, Inc. | 740 | | 44,644 | |
| Forward Air Corp. | 1,480 | | 49,388 | |
| TNT Express NV | 2,000 | | 21,065 | |
| | | | 115,097 | |
| Automobiles (0.2%) | | | | |
| Harley-Davidson, | | | | |
Inc. | 1,600 | | 74,816 | |
| | | | | |
| Beverages (0.3%) | | | | |
| Grupo Modelo | | | | |
| SAB de CV | | | | |
| Series C | 13,000 | | 114,572 | |
| | | | | |
| Biotechnology (2.3%) | | | | |
| 3SBio, Inc. ADR | 500 | | 6,705 | * |
| Achillion | | | | |
| Pharmaceuticals, | | | | |
| Inc. | 2,230 | | 21,051 | * |
| Alexion | | | | |
| Pharmaceuticals, | | | | |
| Inc. | 1,530 | | 138,282 | * |
| Ariad | | | | |
| Pharmaceuticals, | | | | |
| Inc. | 3,080 | | 66,374 | *Ø |
| Biogen Idec, Inc. | 440 | | 60,817 | * |
| BioMarin | | | | |
| Pharmaceutical, | | | | |
| Inc. | 550 | | 20,372 | * |
| Cubist | | | | |
| Pharmaceuticals, | | | | |
| Inc. | 2,430 | | 104,247 | *Ø |
| Devgen | 5,000 | | 102,979 | * |
| Incyte Corp. Ltd. | 1,040 | | 16,598 | * |
| Neurocrine | | | | |
| Biosciences, Inc. | 1,970 | | 14,440 | * |
| Onyx | | | | |
| Pharmaceuticals, | | | | |
| Inc. | 1,490 | | 116,756 | * |
| Pharmacyclics, Inc. | 820 | | 50,077 | * |
| QLT, Inc. | 3,400 | | 25,568 | * |
| Sarepta | | | | |
| Therapeutics, Inc. | 270 | | 5,754 | * |
| Synageva | | | | |
| BioPharma Corp. | 810 | | 34,247 | *Ø |
| Synta | | | | |
| Pharmaceuticals | | | | |
| Corp. | 1,430 | | 11,254 | *Ø |
| YM Biosciences, | | | | |
| Inc. | 7,570 | | 11,961 | * |
| | | | 807,482 | |
| Building Products (0.1%) | | | | |
| Fortune Brands | | | | |
| Home & | | | | |
| Security, Inc. | 1,620 | | 46,073 | * |
| | | | | |
| Chemicals (0.9%) | | | | |
| Airgas, Inc. | 600 | | 53,382 | |
| Calgon Carbon | | | | |
| Corp. | 5,340 | | 66,163 | * |
| Spartech Corp. | 500 | | 4,280 | * |
| The Mosaic Co. | 1,920 | | 100,493 | Ø |
| TPC Group, Inc. | 1,000 | | 44,980 | *Ø |
| WR Grace & Co. | 753 | | 48,312 | *Ø |
| | | | 317,610 | |
| | | | | |
| Commercial Banks (0.7%) | | | | |
| First Niagara | | | | |
| Financial | | | | |
| Group, Inc. | 2,777 | | 22,994 | |
| Investors | | | | |
| Bancorp, Inc. | 2,067 | | 37,185 | |
| Pacific Capital | | | | |
| Bancorp | 3,000 | | 137,730 | * |
| Prosperity | | | | |
| Bancshares, Inc. | 1,050 | | 43,953 | |
| | | | 241,862 | |
| Commercial Services & Supplies (1.6%) | | | | |
| Corrections Corp. | | | | |
| of America | 2,955 | | 99,436 | ±Ø |
| Garda World | | | | |
| Security Corp. | | | | |
| Class A | 8,000 | | 95,880 | * |
| The ADT Corp. | 603 | | 25,030 | *Ø |
| See Notes to Schedule of Investments | 10 | |
| | Number of Shares | Value† | |
The Geo Group, Inc. | 3,375 | 93,555 | Ø |
Tyco International Ltd. | 6,757 | 181,561 | |
Waste Connections, Inc. | 1,503 | 49,343 | Ø |
| | | 544,805 | |
| Communications Equipment (1.3%) | | | |
Aruba Networks, Inc. | 2,010 | 36,522 | *Ø |
EchoStar Corp. Class A | 73 | 2,319 | * |
| F5 Networks, Inc. | 460 | 37,941 | * |
Loral Space & Communications, Inc. | 1,500 | 117,990 | |
Motorola Solutions, Inc. | 1,855 | 95,866 | |
| NETGEAR, Inc. | 1,240 | 44,032 | * |
| RADWARE Ltd. | 1,380 | 45,264 | * |
Riverbed Technology, Inc. | 3,369 | 62,225 | * |
| | | 442,159 | |
| Computers & Peripherals (0.9%) | | | |
| EMC Corp. | 3,580 | 87,424 | * |
| Intermec, Inc. | 32,340 | 219,265 | * |
| | | 306,689 | |
| Construction & Engineering (1.1%) | | | |
EMCOR Group, Inc. | 1,520 | 48,883 | Ø |
Foster Wheeler AG | 1,920 | 42,758 | * |
Jacobs Engineering Group, Inc. | 2,130 | 82,197 | * |
The Shaw Group, Inc. | 5,082 | 222,541 | * |
| | | 396,379 | |
| Diversified Consumer Services (0.3%) | | | |
Arbor Memorial Services Class A | 500 | 15,945 | |
| Regis Corp. | 5,600 | 93,296 | |
| | | 109,241 | |
| Diversified Financial Services (0.3%) | | | |
JPMorgan Chase & Co. | 2,670 | 111,286 | Ø |
| | | | |
Diversified Telecommunication Services (0.6%) | | | |
| 2,000 | 91,702 | |
| TELUS Corp. | 1,800 | 115,759 | |
| tw telecom, Inc. | 310 | 7,896 | * |
| | | 215,357 | |
| Electric Utilities (0.2%) | | | |
| Exelon Corp. | 1,547 | 55,352 | |
| | | | |
| Electrical Equipment (1.6%) | | | |
| AMETEK, Inc. | 1,270 | 45,148 | Ø |
Capstone Turbine Corp. | 54,485 | 54,485 | * |
Cooper Industries PLC | 5,771 | 432,479 | Ø |
Roper Industries, Inc. | 410 | 44,760 | |
| | | 576,872 | |
Electronic Equipment, Instruments & Components (0.3%) | | | |
| OSI Systems, Inc. | 830 | 65,777 | * |
Vishay Intertechnology, Inc. | 5,210 | 43,139 | *Ø |
| | | 108,916 | |
| Energy Equipment & Services (0.4%) | | | |
| 1,310 | 26,174 | * |
| Heckmann Corp. | 8,910 | 31,185 | *Ø |
Oil States International, Inc. | 610 | 44,591 | * |
| Unit Corp. | 1,225 | 49,429 | * |
| | | 151,379 | |
| Food & Staples Retailing (0.7%) | | | |
Casey's General Stores, Inc. | 890 | 45,879 | |
Susser Holdings Corp. | 2,725 | 97,937 | *Ø |
United Natural Foods, Inc. | 800 | 42,592 | * |
Whole Foods Market, Inc. | 450 | 42,628 | |
| | | 229,036 | |
| Food Products (0.6%) | | | |
GrainCorp. Ltd. Class A | 500 | 6,368 | |
Ralcorp. Holdings, Inc. | 1,029 | 74,283 | *Ø |
| Rieber & Son AS | 6,000 | 68,669 | |
Smart Balance, Inc. | 5,650 | 67,235 | *Ø |
| | | 216,555 | |
Health Care Equipment & Supplies (2.5%) | | | |
Align Technology, Inc. | 1,220 | 32,428 | * |
| Analogic Corp. | 560 | 41,250 | |
| ArthroCare Corp. | 1,740 | 52,339 | * |
Boston Scientific Corp. | 4,170 | 21,434 | * |
China Kanghui Holdings, Inc. ADR | 1,000 | 30,600 | * |
| CONMED Corp. | 2,510 | 69,426 | |
| Covidien PLC | 1,560 | 85,722 | |
| Cyberonics, Inc. | 820 | 37,925 | * |
| Hologic, Inc. | 4,127 | 85,099 | * |
IDEXX Laboratories, Inc. | 270 | 25,974 | * |
Intuitive Surgical, Inc. | 90 | 48,800 | * |
IRIS International, Inc. | 500 | 9,745 | * |
Sirona Dental Systems, Inc. | 750 | 42,945 | * |
St. Jude Medical, Inc. | 2,135 | 81,685 | |
Syneron Medical Ltd. | 1,590 | 14,755 | * |
| Teleflex, Inc. | 960 | 65,232 | |
The Cooper Cos., Inc. | 940 | 90,221 | |
| Thoratec Corp. | 910 | 32,487 | * |
| | | 868,067 | |
| Health Care Providers & Services (5.6%) | | | |
Accretive Health, Inc. | 2,237 | 26,374 | *Ø |
Air Methods Corp. | 1,190 | 130,460 | *Ø |
AMERIGROUP Corp. | 2,685 | 245,248 | * |
AmerisourceBergen Corp. | 1,140 | 44,962 | |
Bangkok Dusit Medical Services PCL Class F | 9,000 | 31,272 | |
| Catamaran Corp. | 3,020 | 142,423 | *Ø |
| Centene Corp. | 1,260 | 47,855 | * |
Coventry Health Care, Inc. | 3,619 | 157,933 | |
| DaVita, Inc. | 610 | 68,637 | * |
Express Scripts Holding Co. | 1,540 | 94,772 | *Ø |
| Hanger, Inc. | 1,270 | 32,194 | * |
HMS Holdings Corp. | 1,630 | 37,637 | * |
| McKesson Corp. | 1,450 | 135,300 | Ø |
| MEDNAX, Inc. | 630 | 43,457 | * |
Metropolitan Health Networks, Inc. | 5,080 | 55,524 | *Ø |
| PharMerica Corp. | 560 | 6,843 | *Ø |
PSS World Medical, Inc. | 9,796 | 280,362 | * |
Sun Healthcare Group, Inc. | 3,000 | 25,380 | *Ø |
Sunrise Senior Living, Inc. | 12,000 | 172,680 | *Ø |
Team Health Holdings, Inc. | 1,000 | 26,610 | * |
Universal Health Services, Inc. Class B | 1,010 | 41,804 | |
| VCA Antech, Inc. | 1,450 | 28,391 | * |
WellCare Health Plans, Inc. | 2,010 | 95,676 | *Ø |
| | | 1,971,794 | |
| See Notes to Schedule of Investments | 11 | |
| | | Number of Shares | | Value† |
| Health Care Technology (0.2%) |
| Cerner Corp. | | | 900 | | | | $ 68,571 | * |
| |
| Hotels, Restaurants & Leisure (1.1%) |
Orient-Express Hotels Ltd. Class A | | | 3,000 | | | | 35,190 | * |
Papa John's International, Inc. | | | 770 | | | | 41,057 | * |
Ryman Hospitality Properties | | | 6,400 | | | | 249,664 | *Ø |
Six Flags Entertainment Corp. | | | 1,020 | | | | 58,252 | |
| | | | 384,163 | |
| Household Durables (0.3%) |
| Blyth, Inc. | | | 3,407 | | | | 77,816 | |
| Sealy Corp. | | | 4,511 | | | | 10,059 | * |
SodaStream International Ltd. | | | 260 | | | | 9,295 | * |
| | | | 97,170 | |
| Insurance (1.1%) |
Fidelity National Financial, Inc. Class A | | | 2,000 | | | | 42,820 | |
Flagstone Reinsurance Holdings S.A. | | | 1,000 | | | | 8,840 | |
Hartford Financial Services Group, Inc. | | | 5,990 | | | | 130,043 | |
Presidential Life Corp. | | | 9,000 | | | | 125,820 | Ø |
SeaBright Holdings, Inc. | | | 8,000 | | | | 87,760 | Ø |
| | | | 395,283 | |
| Internet & Catalog Retail (0.2%) |
| Groupon, Inc. | | | 9,680 | | | | 39,882 | * |
Liberty Ventures Series A | | | 740 | | | | 42,113 | * |
| | | | 81,995 | |
| Internet Software & Services (2.0%) |
Akamai Technologies, Inc. | | | 2,340 | | | | 88,897 | *Ø |
| Ancestry.com, Inc. | | | 2,500 | | | | 79,000 | * |
| Brightcove, Inc. | | | 3,400 | | | | 42,908 | * |
IAC/InterActive Corp. | | | 1,800 | | | | 87,030 | |
Millennial Media, Inc. | | | 3,020 | | | | 48,411 | * |
Monster Worldwide, Inc. | | | 11,593 | | | | 72,108 | * |
| Responsys, Inc. | | | 4,460 | | | | 39,872 | * |
| Yahoo!, Inc. | | | 13,777 | | | | 231,591 | *Ø |
| | | | 689,817 | |
| IT Services (0.4%) |
| MAXIMUS, Inc. | | | 770 | | | | 42,489 | Ø |
Total System Services, Inc. | | | 1,950 | | | | 43,855 | |
Vantiv, Inc. Class A | | | 2,880 | | | | 58,118 | *Ø |
| | | | 144,462 | |
| Life Sciences Tools & Services (0.2%) |
Agilent Technologies, Inc. | | | 1,160 | | | | 41,748 | Ø |
| Fluidigm Corp. | | | 1,320 | | | | 19,919 | * |
| | | | 61,667 | |
| Machinery (1.7%) |
| Cascade Corp. | | | 200 | | | | 12,998 | |
| Dover Corp. | | | 720 | | | | 41,918 | |
Navistar International Corp. | | | 121 | | | | 2,269 | * |
| Oshkosh Corp. | | | 1,900 | | | | 56,962 | *± |
| Pentair Ltd. | | | 4,182 | | | | 176,648 | |
Robbins & Myers, Inc. | | | 3,200 | | | | 189,696 | |
Stanley Black & Decker, Inc. | | | 1,260 | | | | 87,318 | Ø |
Wabash National Corp. | | | 2,715 | | | | 17,131 | *Ø |
| | | | 584,940 | |
| Media (1.9%) |
Astral Media, Inc. Class A | | | 3,619 | | | | 148,130 | |
CBS Corp. Class B | | | 1,340 | | | | 43,416 | |
Comcast Corp. Class A | | | 2,332 | | | | 84,978 | Ø |
DreamWorks Animation SKG, Inc. Class A | | | 2,280 | | | | 46,444 | *Ø |
Gray Television, Inc. | | | 18,614 | | | | 39,648 | * |
Journal Communications, Inc. Class A | | | 2,000 | | | | 11,220 | * |
Lions Gate Entertainment Corp. | | | 2,980 | | | | 49,706 | * |
Nexstar Broadcasting Group, Inc. Class A | | | 1,929 | | | | 20,968 | * |
The Interpublic Group of Cos., Inc. | | | 5,640 | | | | 56,964 | Ø |
The McGraw-Hill Cos., Inc. | | | 3,047 | | | | 168,438 | |
| | | | 669,912 | |
| Metals & Mining (0.4%) |
Cliffs Natural Resources, Inc. | | | 1,500 | | | | 54,405 | ±Ø |
SunCoke Energy, Inc. | | | 4,947 | | | | 79,498 | *Ø |
| | | | 133,903 | |
| Multiline Retail (0.3%) |
| Nordstrom, Inc. | | | 1,800 | | | | 102,186 | |
| | | | | | | | | |
| Multi-Utilities (0.2%) |
| NiSource, Inc. | | | 2,247 | | | | 57,231 | |
| | | | | | | | | |
| Oil, Gas & Consumable Fuels (2.4%) |
| Cameco Corp. | | | 4,020 | | | | 77,787 | Ø |
Celtic Exploration Ltd. | | | 2,000 | | | | 52,225 | * |
Gulfport Energy Corp. | | | 1,370 | | | | 45,457 | * |
Harvest Natural Resources, Inc. | | | 1,323 | | | | 11,550 | *Ø |
Kinder Morgan, Inc. | | | 464 | | | | 16,105 | |
| Murphy Oil Corp. | | | 1,200 | | | | 72,000 | ±Ø |
| Nexen, Inc. | | | 16,086 | | | | 384,455 | ±Ø |
| PDC Energy, Inc. | | | 1,380 | | | | 41,773 | *Ø |
Progress Energy Resources Corp. | | | 4,000 | | | | 80,581 | |
QEP Resources, Inc. | | | 1,590 | | | | 46,110 | Ø |
| | | | 828,043 | |
| Personal Products (0.2%) |
Elizabeth Arden, Inc. | | | 1,460 | | | | 68,883 | * |
Schiff Nutrition International, Inc. | | | 500 | | | | 16,920 | * |
| | | | 85,803 | |
| Pharmaceuticals (4.8%) |
Abbott Laboratories | | | 1,660 | | | | 108,763 | |
| Allergan, Inc. | | | 1,160 | | | | 104,307 | |
China Medical System Holdings Ltd. | | | 45,150 | | | | 26,041 | |
Elan Corp. PLC ADR | | | 3,740 | | | | 40,392 | * |
| Hospira, Inc. | | | 2,195 | | | | 67,365 | * |
Jazz Pharmaceuticals PLC | | | 930 | | | | 49,969 | * |
Medicis Pharmaceutical Corp. Class A | | | 9,316 | | | | 404,408 | |
| Merck & Co., Inc. | | | 1,230 | | | | 56,125 | |
| Mylan, Inc. | | | 3,530 | | | | 89,450 | * |
| Novartis AG ADR | | | 710 | | | | 42,927 | |
| Perrigo Co. | | | 380 | | | | 43,704 | |
| Pfizer, Inc. | | | 11,036 | | | | 274,465 | |
Roche Holding AG ADR | | | 1,980 | | | | 95,080 | |
Salix Pharmaceuticals Ltd. | | | 1,120 | | | | 43,725 | *Ø |
| Sanofi ADR | | | 1,450 | | | | 63,582 | |
| SHIRE PLC ADR | | | 1,010 | | | | 85,234 | |
| See Notes to Schedule of Investments | 12 | |
| | Number of Shares | | Value† | |
Sino Biopharmaceutical | 67,110 | | 26,757 | |
Taro Pharmaceutical Industries Ltd. | 500 | | 23,125 | * |
| ViroPharma, Inc. | 920 | | 23,230 | * |
Warner Chilcott PLC Class A | 1,621 | | 18,771 | |
| | | | 1,687,420 | |
| Professional Services (0.2%) | | | | |
The Corporate Executive Board Co. | 830 | | 37,317 | |
| TrueBlue, Inc. | 2,760 | | 36,018 | * |
| | | | 73,335 | |
| Real Estate Investment Trusts (1.2%) | | | | |
American Realty Capital Trust, Inc. | 21,238 | | 239,352 | |
General Growth Properties, Inc. | 1,240 | | 24,378 | |
Mid-America Apartment Communities, Inc. | 970 | | 62,769 | |
| Rayonier, Inc. | 1,860 | | 91,159 | |
| | | | 417,658 | |
| Real Estate Management & Development (0.1%) | | | | |
Zillow, Inc. Class A | 1,220 | | 45,579 | * |
| | | | | |
| Road & Rail (0.9%) | | | | |
Dollar Thrifty Automotive Group, Inc. | 4,100 | | 315,700 | * |
| | | | | |
Semiconductors & Semiconductor Equipment (0.4%) | | | | |
| Cymer, Inc. | 600 | | 47,814 | * |
| Entegris, Inc. | 5,150 | | 42,281 | * |
Skyworks Solutions, Inc. | 2,370 | | 55,458 | * |
| | | | 145,553 | |
| Software (2.5%) | | | | |
BMC Software, Inc. | 3,275 | | 133,292 | * |
| Citrix Systems, Inc. | 670 | | 41,413 | * |
Comverse Technology, Inc. Class W | 945 | | 6,228 | * |
Electronic Arts, Inc. | 2,390 | | 29,516 | * |
| Jive Software, Inc. | 2,810 | | 31,472 | *Ø |
| Kenexa Corp. | 7,500 | | 344,700 | *Ø |
Mentor Graphics Corp. | 4,480 | | 69,530 | * |
Nuance Communications, Inc. | 2,900 | | 64,554 | * |
Opnet Technologies, Inc. | 1,000 | | 42,430 | |
Parametric Technology Corp. | 3,840 | | 77,491 | * |
| Synopsys, Inc. | 1,480 | | 47,656 | * |
| | | | 888,282 | |
| Specialty Retail (0.8%) | | | | |
Abercrombie & Fitch Co. Class A | 207 | | 6,330 | |
American Eagle Outfitters, Inc. | 4,025 | | 84,002 | |
Douglas Holding AG | 500 | | 24,413 | |
GNC Holdings, Inc. Class A | 1,070 | | 41,377 | Ø |
| Office Depot, Inc. | 7,747 | | 19,213 | * |
Select Comfort Corp. | 1,410 | | 39,240 | * |
Urban Outfitters, Inc. | 2,170 | | 77,599 | * |
| | | | 292,174 | |
| | | | | |
| Textiles, Apparel & Luxury Goods (0.7%) | | | | |
| Coach, Inc. | 770 | | 43,158 | |
Deckers Outdoor Corp. | 1,800 | | 51,534 | *Ø |
Steven Madden Ltd. | 1,110 | | 47,641 | * |
The Warnaco Group, Inc. | 1,119 | | 78,979 | * |
True Religion Apparel, Inc. | 1,547 | | 39,681 | |
| | | | 260,993 | |
| Thrifts & Mortgage Finance (1.2%) | | | | |
Hudson City Bancorp., Inc. | 32,354 | | 274,524 | |
Oritani Financial Corp. | 3,020 | | 46,146 | Ø |
| TFS Financial Corp. | 8,175 | | 73,166 | * |
ViewPoint Financial Group, Inc. | 550 | | 11,440 | |
| | | | 405,276 | |
| | | | | |
Trading Companies & Distributors (0.1%) | | | | |
| MRC Global, Inc. | 1,880 | | 45,966 | *Ø |
| | | | | |
| Transportation Infrastructure (0.1%) | | | | |
Macquarie Infrastructure Co., LLC | 968 | | 40,356 | |
| | | | | |
Wireless Telecommunication Services (0.6%) | | | | |
MetroPCS Communications, Inc. | 9,830 | | 100,365 | * |
| Sprint Nextel Corp. | 19,495 | | 108,002 | * |
| | | | 208,367 | |
Total Common Stocks (Cost $17,446,367) | | | 17,483,977 | |
| | | | | |
| Exchange Traded Funds (0.5%) | | | | |
PowerShares DB U.S. Dollar Index Bullish Fund (Cost $199,869) | 8,825 | | 193,179 | * |
| | Number of Warrants | | | |
Warrants (0.0%) | | | | |
| | | | | |
| Building Products (0.0%) | | | | |
Owens Corning (Cost $2,765) | 2,126 | | 2,511 | * |
| | Principal Amount | | | |
| Corporate Debt Securities (4.3%) | | | | |
| | | | | |
| Chemicals (0.4%) | | | | |
Montell Finance Co. BV, 8.10%, due 3/15/27 | $ 50,000 | | 67,000 | ñ |
MPM Escrow LLC, 8.88%, due 10/15/20 | 75,000 | | 73,500 | ñ |
| | | | 140,500 | |
| Communications Equipment (0.6%) | | | | |
Nortel Networks Ltd., 5.34%, due 7/15/11 | 200,000 | | 210,000 | ≠ |
| | | | | |
| Diversified Financial Services (0.8%) | | | | |
Lehman Brothers Holdings, Inc., 6.88%, due 5/2/18 | 1,000,000 | | 230,000 | ≠ |
TransUnion Holding Co., Inc., 8.13%, due 6/15/18 | 54,000 | | 54,270 | cñ |
| | | | 284,270 | |
| Media (0.5%) | | | | |
DISH DBS Corp., 5.88%, due 7/15/22 | 40,000 | | 42,000 | |
Lamar Media Corp., 5.00%, due 5/1/23 | 27,000 | | 27,000 | ñ |
Nexstar Broadcasting, Inc., 6.88%, due 11/15/20 | 107,000 | | 107,268 | ñ |
| | | | 176,268 | |
| See Notes to Schedule of Investments | 13 | |
| | | Principal Amount | | Value† |
| Metals & Mining (0.1%) |
Edgen Murray Corp., 8.75%, due 11/1/20 | | $ | 44,000 | | | $ | 43,670 | ñ |
Oil, Gas & Consumable Fuels (0.8%) |
Alpha Natural Resources, Inc., 9.75%, due 4/15/18 | | | 88,000 | | | | 89,100 | |
Plains Exploration & Production Co., 6.50%, due 11/15/20 | | | 54,000 | | | | 54,000 | |
Plains Exploration & Production Co., 6.88%, due 2/15/23 | | | 54,000 | | | | 53,932 | |
Shelf Drilling Holdings Ltd., 8.625%, due 11/1/18 | | | 72,000 | | | | 72,360 | ñ |
| | | | 269,392 | |
| Software (0.2%) |
IMS Health, Inc., 6.00%, due 11/1/20 | | | 54,000 | | | | 54,945 | ñ |
Wireless Telecommunication Services (0.9%) |
Intelsat Luxembourg S.A., 11.25%, due 2/4/17 | | | 300,000 | | | | 315,000 | |
Total Corporate Debt Securities (Cost $1,467,410) | | | | | 1,494,045 | |
Bank Loan Obligationsµ (8.9%) |
Capital Markets (0.3%) |
Oceania Capital Partners Ltd., Extended Term Loan B, 5.13%, due 4/27/15 | | | 100,000 | | | | 96,000 | |
Diversified Financial Services (0.3%) |
AlixPartners LLP, Term Loan B2, 6.50%, due 5/29/19 | | | 99,750 | | | | 100,846 | |
Food Products (0.3%) |
Ferrara Pan Candy Co., Inc., Term Loan, 7.25%, due 6/8/17 | | | 99,750 | | | | 100,436 | |
| Health Care Providers & Services (1.3%) |
Alliance HealthCare Services, Inc., Term Loan, 7.50%, due 6/15/16 | | | 248,206 | | | | 241,174 | |
Genesis HealthCare Corp., Term Loan, due 10/2/17 | | | 250,000 | | | | 240,000 | ¢^^ |
| | | | 481,174 | |
| Health Care Technology (2.8%) |
M*Modal, Term Loan B, 6.75%, due 8/15/19 | | | 500,000 | | | | 494,585 | |
The TriZetto Group Inc., 2nd Lien Term Loan, 8.50%, due 3/27/19 | | | 500,000 | | | | 496,040 | |
| | | | 990,625 | |
| Insurance (2.4%) |
Asurion Corp., 2nd Lien Term Loan, 9.00%, due 5/24/19 | | | 250,000 | | | | 258,170 | |
Cunningham Lindsey Group Ltd., 1st Lien Term Loan, due 10/18/19 | | | 600,000 | | | | 600,000 | ¢^^Ñ |
| | | | 858,170 | |
| Machinery (0.3%) |
Intelligrated Systems LLC, 2nd Lien Term Loan, 10.50%, due 1/19/19 | | | 100,000 | | | | 101,000 | Ñ |
| |
| Media (1.2%) |
Gatehouse Media Operating Inc., Term Loan B, due 8/24/14 | | | 361,018 | | | | 124,551 | ¢^^ |
Gatehouse Media Operating Inc., Term Loan C, due 8/24/14 | | | 61,879 | | | | 21,348 | ¢^^ |
Gatehouse Media Operating Inc., Term Loan L, due 8/24/14 | | | 114,891 | | | | 39,638 | ¢^^ |
| | | | | |
Tribune Co., Term Loan, due 5/17/14 | | $ | 300,000 | | | $ | 227,814 | ¢^^ |
| | | | 413,351 | |
Total Bank Loan Obligations (Cost $3,104,875) | | | | | 3,141,602 | |
| | | Contracts | | |
| Purchased Options (0.3%) |
| |
| Call Options (0.1%) |
Accretive Health, Inc., Call, Dec 2012 @ 14 | | | 20 | | | | 400 | |
Allscripts Healthcare Solutions, Inc., Call, Mar 2013 @ 13 | | | 31 | | | | 4,340 | ± |
AMERICAGROUP Corp., Call, Dec 2012 @ 90 | | | 12 | | | | 1,560 | |
Best Buy Co., Inc., Call, Mar 2013 @ 20 | | | 28 | | | | 1,876 | ± |
Chesapeake Energy Corp., Call, Jan 2013 @ 17.50 | | | 13 | | | | 4,355 | |
Dun & Bradstreet Corp., Call, Nov 2012 @ 90 | | | 19 | | | | 950 | ± |
Humana Inc., Call, Nov 2012 @ 75 | | | 30 | | | | 7,650 | |
MBIA, Inc., Call, Nov 2012 @ 11 | | | 21 | | | | 336 | |
Robbins & Myers Inc., Call, Jan 2013 @ 60 | | | 31 | | | | 155 | |
Sprint Nextel Corp., Call, Nov 2012 @ 6 | | | 31 | | | | 62 | |
The Sherwin- Williams Co., Call, Mar 2013 @ 145 | | | 7 | | | | 5,005 | |
Tyco International Ltd., Call, Apr 2013 @ 30 | | | 17 | | | | 1,088 | |
| | | | 27,777 | |
| See Notes to Schedule of Investments | 14 | |
| | | Contracts | | Value† |
| Put Options (0.2%) |
Dollar Thrifty Automotive Group, Inc., Put, Nov 2012 @ 82.50 | | | 16 | | | $ | 10,400 | |
Hartford Financial Services Group, Inc., Put, Jan 2013 @ 16 | | | 48 | | | | 864 | |
Harvest Natural Resources, Inc., Put, Dec 2012 @ 7.50 | | | 17 | | | | 680 | |
MetroPCS Communications, Inc., Put, Nov 2012 @ 11 | | | 26 | | | | 2,340 | |
MetroPCS Communications, Inc., Put, May 2013 @ 12 | | | 92 | | | | 21,804 | |
Monster Worldwide, Inc., Put, Jan 2013 @ 7.5 | | | 41 | | | | 6,765 | |
Nexen Inc., Put, Mar 2013 @ 24 | | | 31 | | | | 7,440 | |
PSS World Medical, Inc., Put, Nov 2012 @ 20 | | | 21 | | | | 105 | |
SPDR S&P 500 ETF Trust, Put, Dec 2012 @ 140 | | | 27 | | | | 9,180 | ± |
Sprint Nextel Corp., Put, Feb 2013 @ 5.50 | | | 164 | | | | 3,772 | |
The Mosaic Co., Put, Jan 2014 @ 55 | | | 20 | | | | 18,300 | |
The Shaw Group Inc., Put, Jan 2013 @ 43 | | | 31 | | | | 3,720 | |
| | | | 85,370 | |
Total Purchased Options (Cost $116,525) | | | | | 113,147 | |
| | | | | | | |
Total Long Positions (63.7%) (Cost $22,337,811) | | | | | 22,428,461 | ## |
| | | | | | | |
Cash, receivables and other assets, less liabilties (56.8%) | | | | | 20,008,644 | ±Ø |
| | | | | | | |
Short Positions (see summary below) ((20.5)%) | | | | | (7,227,032 | ) |
| | | | | | | |
| Total Net Assets (100.0%) | | | | | $35,210,073 | |
| | | Number of Shares | | | Value† | |
| Short Positions ((20.5)%) |
| |
Common Stocks Sold Short (16.8%)ØØ |
| |
| Aerospace & Defense (0.1%) |
General Dynamics Corp. | | | (335 | ) | | $ | (22,807 | ) |
| |
| Air Freight & Logistics (0.3%) |
Expeditors International of Washington, Inc. | | | (2,650 | ) | | | (97,017 | ) |
| |
| Beverages (0.3%) |
The Boston Beer Co., Inc. Class A | | | (850 | ) | | | (91,443 | )* |
| |
| Biotechnology (0.2%) |
Arena Pharmaceuticals, Inc. | | | (1,270 | ) | | | (10,046 | )* |
Infinity Pharmaceuticals, Inc. | | | (630 | ) | | | (14,099 | )* |
Myriad Genetics, Inc. | | | (1,550 | ) | | | (40,564 | )* |
| | | | (64,709 | ) |
| Capital Markets (0.2%) |
Stifel Financial Corp. | | | (2,130 | ) | | | (67,521 | )* |
| |
| Chemicals (0.9%) |
Air Products & Chemicals, Inc. | | | (500 | ) | | | (38,765 | ) |
| Chemtura Corp. | | | (1,300 | ) | | | (20,709 | )* |
EI du Pont de Nemours & Co. | | | (1,400 | ) | | | (62,328 | ) |
Kronos Worldwide, Inc. | | | (2,800 | ) | | | (37,380 | ) |
The Scotts Miracle-Gro Co. Class A | | | (1,055 | ) | | | (45,165 | ) |
The Sherwin- Williams Co. | | | (716 | ) | | | (102,087 | ) |
| | | | (306,434 | ) |
| Commercial Banks (0.9%) |
Bank of Hawaii Corp. | | | (1,520 | ) | | | (67,123 | ) |
| M&T Bank Corp. | | | (2,254 | ) | | | (234,642 | ) |
| | | | (301,765 | ) |
| Commercial Services & Supplies (0.7%) |
Avery Dennison Corp. | | | (800 | ) | | | (25,904 | ) |
Healthcare Services Group, Inc. | | | (3,980 | ) | | | (95,122 | ) |
| Rollins, Inc. | | | (2,970 | ) | | | (67,330 | ) |
Waste Management, Inc. | | | (1,387 | ) | | | (45,410 | ) |
| | | | (233,766 | ) |
| Communications Equipment (0.2%) |
| Finisar Corp. | | | (5,010 | ) | | $ | (57,715 | )* |
| Consumer Finance (0.2%) |
American Express Co. | | | (630 | ) | | | (35,261 | ) |
Green Dot Corp. Class A | | | (3,100 | ) | | | (31,589 | )* |
| | | | (66,850 | ) |
| Diversified Consumer Services (0.2%) |
| H&R Block, Inc. | | | (4,867 | ) | | | (86,146 | ) |
| Diversified Financial Services (0.1%) |
| NYSE Euronext | | | (900 | ) | | | (22,284 | ) |
| Electrical Equipment (0.3%) |
Emerson Electric Co. | | | (475 | ) | | | (23,004 | ) |
Rockwell Automation, Inc. | | | (500 | ) | | | (35,530 | ) |
Sensata Technologies Holding NV | | | (1,400 | ) | | | (39,438 | )* |
| | | | (97,972 | ) |
Electronic Equipment, Instruments & Components (0.9%) |
| Cognex Corp. | | | (1,960 | ) | | | (71,462 | ) |
| Coherent, Inc. | | | (900 | ) | | | (41,085 | )* |
| Littelfuse, Inc. | | | (820 | ) | | | (43,952 | ) |
Rofin-Sinar Technologies, Inc. | | | (3,150 | ) | | | (57,361 | )* |
| Rogers Corp. | | | (1,600 | ) | | | (63,056 | )* |
TE Connectivity Ltd. | | | (1,400 | ) | | | (45,052 | ) |
| | | | (321,968 | ) |
| Energy Equipment & Services (0.5%) |
Core Laboratories NV | | | (370 | ) | | | (38,354 | ) |
Newpark Resources, Inc. | | | (13,120 | ) | | | (89,085 | )* |
| Tenaris SA ADR | | | (1,000 | ) | | | (37,620 | ) |
| | | | (165,059 | ) |
| Food & Staples Retailing (0.1%) |
United Natural Foods, Inc. | | | (450 | ) | | | (23,958 | )* |
| Food Products (0.5%) |
| Annie's, Inc. | | | (1,000 | ) | | | (39,500 | )* |
DE Master Blenders 1753 NV | | | (3,700 | ) | | | (45,219 | )* |
Hormel Foods Corp. | | | (2,720 | ) | | | (80,322 | ) |
McCormick & Co, Inc. | | | (400 | ) | | | (24,648 | ) |
| | | | (189,689 | ) |
| See Notes to Schedule of Investments | 15 | |
| | | Number of Shares | | Value† |
| Health Care Equipment & Supplies (1.5%) |
Baxter International, Inc. | | | (420 | ) | | $ | (26,305 | ) |
Becton Dickinson and Co. | | | (570 | ) | | | (43,138 | ) |
DENTSPLY International, Inc. | | | (2,380 | ) | | | (87,679 | ) |
Edwards Lifesciences Corp. | | | (485 | ) | | | (42,112 | )* |
| Hologic, Inc. | | | (3,140 | ) | | | (64,747 | )* |
IDEXX Laboratories, Inc. | | | (700 | ) | | | (67,340 | )* |
| Medtronic, Inc. | | | (1,480 | ) | | | (61,538 | ) |
West Pharmaceutical Services, Inc. | | | (1,670 | ) | | | (89,963 | ) |
Zimmer Holdings, Inc. | | | (690 | ) | | | (44,305 | ) |
| | | | (527,127 | ) |
| Health Care Providers & Services (0.6%) |
| Aetna, Inc. | | | (960 | ) | | | (41,952 | ) |
Amerisource Bergen Corp. | | | (1,620 | ) | | | (63,893 | ) |
Henry Schein, Inc. | | | (990 | ) | | | (73,042 | )* |
Kindred Healthcare, Inc. | | | (2,500 | ) | | | (24,500 | )* |
| | | | (203,387 | ) |
| Health Care Technology (0.1%) |
Athenahealth, Inc. | | | (530 | ) | | | (34,073 | )* |
Greenway Medical Technologies | | | (930 | ) | | | (15,429 | )* |
| | | | (49,502 | ) |
| Hotels, Restaurants & Leisure (0.5%) |
Chuy's Holdings, Inc. | | | (1,840 | ) | | | (44,951 | )* |
Dunkin' Brands Group, Inc. | | | (1,410 | ) | | | (43,710 | ) |
Marriott International, Inc. | | | (606 | ) | | | (22,107 | ) |
Red Robin Gourmet Burgers, Inc. | | | (1,460 | ) | | | (48,764 | )* |
The Cheesecake Factory, Inc. | | | (780 | ) | | | (25,787 | ) |
| | | | (185,319 | ) |
| Household Durables (0.2%) |
| Garmin Ltd. | | | (1,200 | ) | | | (45,588 | ) |
| iRobot Corp. | | | (2,460 | ) | | | (44,206 | )* |
| | | | (89,794 | ) |
| Household Products (0.2%) |
Church & Dwight Co., Inc. | | | (1,260 | ) | | $ | (63,958 | ) |
| |
| Industrial Conglomerates (0.1%) |
Raven Industries, Inc. | | | (1,675 | ) | | | (45,711 | ) |
| |
| Insurance (0.2%) |
| Assurant, Inc. | | | (2,160 | ) | | | (81,670 | ) |
| |
| Internet Software & Services (0.1%) |
Facebook, Inc. Class A | | | (2,300 | ) | | | (48,565 | )* |
| |
| IT Services (0.1%) |
Computer Sciences Corp. | | | (1,400 | ) | | | (42,630 | ) |
| |
| Life Sciences Tools & Services (0.3%) |
Life Technologies Corp. | | | (900 | ) | | | (44,019 | )* |
Mettler-Toledo International, Inc. | | | (320 | ) | | | (54,198 | )* |
| | | | (98,217 | ) |
| Machinery (1.7%) |
Donaldson Co., Inc. | | | (2,070 | ) | | | (66,799 | ) |
| Eaton Corp. | | | (3,457 | ) | | | (163,240 | ) |
| Graco, Inc. | | | (1,030 | ) | | | (49,502 | ) |
| Rexnord Corp. | | | (3,990 | ) | | | (72,299 | )* |
Robbins & Myers, Inc. | | | (2,380 | ) | | | (141,086 | ) |
Sauer-Danfoss, Inc. | | | (1,140 | ) | | | (45,668 | ) |
| Xylem, Inc. | | | (2,790 | ) | | | (67,685 | ) |
| | | | (606,279 | ) |
| Media (0.3%) |
Comcast Corp. Class A | | | (2,216 | ) | | | (83,122 | ) |
Omnicom Group, Inc. | | | (730 | ) | | | (34,974 | ) |
| | | | (118,096 | ) |
| Metals & Mining (0.7%) |
AMCOL International Corp. | | | (3,290 | ) | | | (103,898 | ) |
Metals USA Holdings Corp. | | | (5,110 | ) | | | (74,504 | )* |
US Silica Holdings, Inc. | | | (4,850 | ) | | | (62,080 | )* |
| | | | (240,482 | ) |
| Oil, Gas & Consumable Fuels (0.0%) |
Kinder Morgan, Inc. | | | (464 | ) | | | (16,105 | ) |
| |
| Pharmaceuticals (0.3%) |
Nektar Therapeutics | | | (2,050 | ) | | | (18,450 | )* |
Takeda Pharmaceutical Co. Ltd. | | | (1,420 | ) | | $ | (65,993 | ) |
The Medicines Co. | | | (720 | ) | | | (15,782 | )* |
| Vivus, Inc. | | | (1,230 | ) | | | (18,327 | )* |
| | | | (118,552 | ) |
| Professional Services (0.1%) |
Randstad Holding NV | | | (700 | ) | | | (22,850 | ) |
| |
| Real Estate Investment Trusts (0.7%) |
Realty Income Corp. | | | (6,034 | ) | | | (236,955 | ) |
| |
Semiconductors & Semiconductor Equipment (0.3%) |
Advanced Energy Industries, Inc. | | | (3,970 | ) | | | (46,886 | )* |
EZchip SemiConductor Ltd. | | | (1,390 | ) | | | (43,090 | )* |
| | | | (89,976 | ) |
| Software (0.8%) |
Adobe Systems, Inc. | | | (1,410 | ) | | | (47,940 | )* |
| CA, Inc. | | | (1,790 | ) | | | (40,311 | ) |
FactSet Research Systems, Inc. | | | (710 | ) | | | (64,290 | ) |
MICROS Systems, Inc. | | | (610 | ) | | | (27,688 | )* |
MicroStrategy, Inc. Class A | | | (400 | ) | | | (37,788 | )* |
Opnet Technologies, Inc. | | | (1,547 | ) | | | (65,639 | ) |
| | | | (283,656 | ) |
| Specialty Retail (0.3%) |
| Aeropostale, Inc. | | | (3,500 | ) | | | (41,825 | )* |
| Chico's FAS, Inc. | | | (1,705 | ) | | | (31,713 | ) |
| Tiffany & Co. | | | (780 | ) | | | (49,312 | ) |
| | | | (122,850 | ) |
Textiles, Apparel & Luxury Goods (0.5%) |
Columbia Sportswear Co. | | | (1,450 | ) | | | (81,780 | ) |
| Hugo Boss AG | | | (400 | ) | | | (40,040 | ) |
| PVH Corp. | | | (113 | ) | | | (12,429 | ) |
| VF Corp. | | | (310 | ) | | | (48,509 | ) |
| | | | (182,758 | ) |
| Thrifts & Mortgage Finance (0.2%) |
People's United Financial, Inc. | | | (5,620 | ) | | | (67,609 | ) |
| |
Trading Companies & Distributors (0.2%) |
| Kaman Corp. | | | (1,260 | ) | | | (46,872 | ) |
| See Notes to Schedule of Investments | 16 | |
| | | Number of Shares | | Value† |
Rush Enterprises, Inc. Class A | | | (1,200 | ) | | $ | (22,800 | )* |
| | | | (69,672 | ) |
| Transportation Infrastructure (0.2%) |
Wesco Aircraft Holdings, Inc. | | | (5,920 | ) | | | (79,032 | )* |
| | | | | | | |
Total Common Stocks Sold Short (Proceeds $(5,959,631)) | | | | | (5,907,855 | ) |
| |
Exchange Traded Funds Sold Short (2.7%)ØØ |
Health Care Select Sector SPDR Fund | | | (3,220 | ) | | | (128,800 | ) |
iShares Dow Jones U.S. Real Estate Index Fund | | | (343 | ) | | | (21,962 | ) |
iShares Nasdaq Biotechnology Index Fund | | | (1,190 | ) | | | (156,854 | ) |
iShares Russell 2000 Index Fund | | | (2,590 | ) | | | (210,412 | ) |
SPDR S&P 500 ETF Trust | | | (1,595 | ) | | | (225,182 | ) |
SPDR S&P MidCap 400 ETF Trust | | | (1,190 | ) | | | (212,117 | ) |
| | | | | | | |
Total Exchange Traded Funds Sold Short (Proceeds $(966,807)) | | | | | (955,327 | ) |
| | | Principal Amount | | |
Corporate Debt Securities Sold Short (1.0%) |
| |
| Food & Staples Retailing (0.8%) |
SUPERVALU, Inc., 8.00%, due 5/1/16 | | $ | (300,000 | ) | | | (285,750 | ) |
| |
| Oil, Gas & Consumable Fuels (0.2%) |
Arch Coal, Inc., 7.00%, due 6/15/19 | | | (88,000 | ) | | | (78,100 | ) |
| | | | | | | |
Total Corporate Debt Securities Sold Short (Cost $(345,813)) | | | | | (363,850 | ) |
| | | | | | | |
Total Short Positions (Proceeds $(7,272,251)) | | | | | (7,227,032 | ) |
| See Notes to Schedule of Investments | 17 | |
Notes to Schedule of Investments
| † | In accordance with Accounting Standards Codification ("ASC") 820 "Fair Value Measurements and Disclosures" ("ASC 820"), all investments held by Neuberger Berman Absolute Return Multi-Manager Fund (the "Fund") are carried at the value that Neuberger Berman Management LLC ("Management") believes the Fund would receive upon selling an investment in an orderly transaction to an independent buyer in the principal or most advantageous market for the investment under current market conditions. Various inputs, including the volume and level of activity for the asset or liability in the market, are considered in valuing the Fund's investments, some of which are discussed below. Significant management judgment may be necessary to value investments in accordance with ASC 820. |
ASC 820 established a three-tier hierarchy of inputs to create a classification of value measurements for disclosure purposes. The three-tier hierarchy of inputs is summarized in the three broad Levels listed below
| ● | Level 1 – quoted prices in active markets for identical investments |
| ● | Level 2 – other significant observable inputs (including quoted prices for similar investments, interest rates, prepayment speeds, credit risk, amortized cost, etc.) |
| ● | Level 3 – significant unobservable inputs (including the Fund's own assumptions in determining the fair value of investments) |
The inputs or methodology used for valuing an investment are not necessarily an indication of the risk associated with investing in those securities.
The value of the Fund's investments in equity securities (long and short positions), exchange traded funds, purchased option contracts and written option contracts, for which market quotations are readily available, is generally determined by Management by obtaining valuations from an independent pricing service based on the latest sale price quoted on a principal exchange or market for that security (Level 1 inputs). Securities traded primarily on the NASDAQ Stock Market are normally valued by a Fund at the NASDAQ Official Closing Price ("NOCP") provided by NASDAQ each business day. The NOCP is the most recently reported price as of 4:00:02 p.m., Eastern time, unless that price is outside the range of the "inside" bid and asked prices (i.e., the bid and asked prices that dealers quote to each other when trading for their own accounts); in that case, NASDAQ will adjust the price to equal the inside bid or asked price, whichever is closer. Because of delays in reporting trades, the NOCP may not be based on the price of the last trade to occur before the market closes. If there is no reported sale of a security on a particular day, the independent pricing service may value the security based on reported market quotations.
The value of the Fund's investments in debt securities is determined by Management primarily by obtaining valuations from independent pricing services based on readily available bid quotations, or if quotations are not available, by methods which include various considerations based on security type (generally Level 2 inputs). In addition to the consideration of yields or prices of securities of comparable quality, coupon, maturity and type; indications as to values from dealers; and general market conditions, the following is a description of other Level 2 inputs and related valuation techniques used by an independent pricing service to value certain types of debt securities of the Fund:
Corporate Debt Securities. Inputs used to value corporate debt securities generally include relative credit information, observed market movements, sector news, spread to the U.S. Treasury market, and other market information which may include benchmark yields, reported trades, broker-dealer quotes, issuer spreads, benchmark securities, bids, offers, and reference data, such as market research publications, when available.
Bank Loans. The value of bank loan securities is determined by obtaining broker quotes from independent pricing services (generally Level 2 or Level 3 inputs depending on the number of quotes available).
See Notes to Financial Statements
Notes to Schedule of Investments (cont'd)
The value of financial futures contracts is determined by obtaining valuations from independent pricing services at the settlement price at the market close (Level 1 inputs).
Management has developed a process to periodically review information provided by independent pricing services for all types of securities.
If a valuation is not available from an independent pricing service, or if Management has reason to believe that the valuation received does not represent the amount the Fund might reasonably expect to receive on a current sale in an orderly transaction, the applicable Fund seeks to obtain quotations from principal market makers (generally considered Level 3 inputs). If such quotations are not readily available, the security is valued using methods the Neuberger Berman Alternative Funds' Board of Trustees (the "Board") has approved on the belief that they reflect fair value. Numerous factors may be considered when determining the fair value of a security based on Level 2 or 3 inputs, including available analyst, media or other reports, trading in futures or ADRs and whether the issuer of the security being fair valued has other securities outstanding.
The value of the Fund's investments in foreign securities is generally determined using the same valuation methods and inputs as other Fund investments, as discussed above. Foreign security prices expressed in local currency values are translated from the local currency into U.S. dollars using the exchange rate as of 4:00 p.m., Eastern time. The Board has approved the use of Interactive Data Pricing and Reference Data, Inc. ("Interactive") to assist in determining the fair value of foreign equity securities when changes in the value of a certain index suggest that the closing prices on the foreign exchanges may no longer represent the amount that the Fund could expect to receive for those securities or on days when foreign markets are closed and U.S. markets are open. In each of these events, Interactive will provide adjusted prices for certain foreign equity securities using a statistical analysis of historical correlations of multiple factors (Level 2 inputs). In the absence of precise information about the market values of these foreign securities as of the close of the New York Stock Exchange, the Board has determined on the basis of available data that prices adjusted in this way are likely to be closer to the prices the Fund could realize on a current sale than are the prices of those securities established at the close of the foreign markets in which the securities primarily trade.
Fair value prices are necessarily estimates, and there is no assurance that such a price will be at or close to the price at which the security is next quoted or next trades.
The following is a summary, categorized by Level, of inputs used to value the Fund's investments as of October 31, 2012:
| Asset Valuation Inputs |
| | | Level 1 | | Level 2 | | Level 3§ | | Total |
| Investments: |
| Common Stocks |
| Aerospace & Defense | | $ | 250,773 | | | $ | — | | | $ | — | | | $ | 250,773 | |
| Air Freight & Logistics | | | 94,032 | | | | 21,065 | | | | — | | | | 115,097 | |
| Automobiles | | | 74,816 | | | | — | | | | — | | | | 74,816 | |
| Beverages | | | 114,572 | | | | — | | | | — | | | | 114,572 | |
| Biotechnology | | | 704,503 | | | | 102,979 | | | | — | | | | 807,482 | |
| Building Products | | | 46,073 | | | | — | | | | — | | | | 46,073 | |
| Chemicals | | | 317,610 | | | | — | | | | — | | | | 317,610 | |
| Commercial Banks | | | 241,862 | | | | — | | | | — | | | | 241,862 | |
| Commercial Services & Supplies | | | 544,805 | | | | — | | | | — | | | | 544,805 | |
| Communications Equipment | | | 442,159 | | | | — | | | | — | | | | 442,159 | |
| Computers & Peripherals | | | 306,689 | | | | — | | | | — | | | | 306,689 | |
See Notes to Financial Statements
Notes to Schedule of Investments (cont'd)
| Construction & Engineering | | $ | 396,379 | | | $ | — | | | $ | — | | | $ | 396,379 | |
| Diversified Consumer Services | | | 109,241 | | | | — | | | | — | | | | 109,241 | |
| Diversified Financial Services | | | 111,286 | | | | — | | | | — | | | | 111,286 | |
| Diversified Telecommunication Services | | | 123,655 | | | | 91,702 | | | | — | | | | 215,357 | |
| Electric Utilities | | | 55,352 | | | | — | | | | — | | | | 55,352 | |
| Electrical Equipment | | | 576,872 | | | | — | | | | — | | | | 576,872 | |
| Electronic Equipment, Instruments & Components | | | 108,916 | | | | — | | | | — | | | | 108,916 | |
| Energy Equipment & Services | | | 151,379 | | | | — | | | | — | | | | 151,379 | |
| Food & Staples Retailing | | | 229,036 | | | | — | | | | — | | | | 229,036 | |
| Food Products | | | 141,518 | | | | 75,037 | | | | — | | | | 216,555 | |
| Health Care Equipment & Supplies | | | 868,067 | | | | — | | | | — | | | | 868,067 | |
| Health Care Providers & Services | | | 1,940,522 | | | | 31,272 | | | | — | | | | 1,971,794 | |
| Health Care Technology | | | 68,571 | | | | — | | | | — | | | | 68,571 | |
| Hotels, Restaurants & Leisure | | | 384,163 | | | | — | | | | — | | | | 384,163 | |
| Household Durables | | | 97,170 | | | | — | | | | — | | | | 97,170 | |
| Insurance | | | 395,283 | | | | — | | | | — | | | | 395,283 | |
| Internet & Catalog Retail | | | 81,995 | | | | — | | | | — | | | | 81,995 | |
| Internet Software & Services | | | 689,817 | | | | — | | | | — | | | | 689,817 | |
| IT Services | | | 144,462 | | | | — | | | | — | | | | 144,462 | |
| Life Sciences Tools & Services | | | 61,667 | | | | — | | | | — | | | | 61,667 | |
| Machinery | | | 584,940 | | | | — | | | | — | | | | 584,940 | |
| Media | | | 669,912 | | | | — | | | | — | | | | 669,912 | |
| Metals & Mining | | | 133,903 | | | | — | | | | — | | | | 133,903 | |
| Multiline Retail | | | 102,186 | | | | — | | | | — | | | | 102,186 | |
| Multi-Utilities | | | 57,231 | | | | — | | | | — | | | | 57,231 | |
| Oil, Gas & Consumable Fuels | | | 828,043 | | | | — | | | | — | | | | 828,043 | |
| Personal Products | | | 85,803 | | | | — | | | | — | | | | 85,803 | |
| Pharmaceuticals | | | 1,634,622 | | | | 52,798 | | | | — | | | | 1,687,420 | |
| Professional Services | | | 73,335 | | | | — | | | | — | | | | 73,335 | |
| Real Estate Investment Trusts | | | 417,658 | | | | — | | | | — | | | | 417,658 | |
| Real Estate Management & Development | | | 45,579 | | | | — | | | | — | | | | 45,579 | |
| Road & Rail | | | 315,700 | | | | — | | | | — | | | | 315,700 | |
| Semiconductors & Semiconductor Equipment | | | 145,553 | | | | — | | | | — | | | | 145,553 | |
| Software | | | 888,282 | | | | — | | | | — | | | | 888,282 | |
| Specialty Retail | | | 267,761 | | | | 24,413 | | | | — | | | | 292,174 | |
| Textiles, Apparel & Luxury Goods | | | 260,993 | | | | — | | | | — | | | | 260,993 | |
| Thrifts & Mortgage Finance | | | 405,276 | | | | — | | | | — | | | | 405,276 | |
| Trading Companies & Distributors | | | 45,966 | | | | — | | | | — | | | | 45,966 | |
| Transportation Infrastructure | | | 40,356 | | | | — | | | | — | | | | 40,356 | |
| Wireless Telecommunication Services | | | 208,367 | | | | — | | | | — | | | | 208,367 | |
| Total Common Stocks | | | 17,084,711 | | | | 399,266 | | | | — | | | | 17,483,977 | |
See Notes to Financial Statements
Notes to Schedule of Investments (cont'd)
| Exchange Traded Funds | | $ | 193,179 | | | $ | — | | | $ | — | | | $ | 193,179 | |
| Warrants^ | | | 2,511 | | | | — | | | | — | | | | 2,511 | |
| Corporate Debt Securities^ | | | — | | | | 1,494,045 | | | | — | | | | 1,494,045 | |
| Bank Loan Obligations^ | | | — | | | | 2,440,602 | | | | 701,000 | | | | 3,141,602 | |
| Purchased Options | | | 113,042 | | | | 105 | | | | — | | | | 113,147 | |
Total Investments | | | 17,393,443 | | | | 4,334,018 | | | | 701,000 | | | | 22,428,461 | |
| |
| Liability Valuation Inputs |
| | | Level 1 | | Level 2 | | Level 3 | | Total |
| Investments: |
| Common Stocks Sold Short |
| Aerospace & Defense | | $ | (22,807 | ) | | $ | — | | | $ | — | | | $ | (22,807 | ) |
| Air Freight & Logistics | | | (97,017 | ) | | | — | | | | — | | | | (97,017 | ) |
| Beverages | | | (91,443 | ) | | | — | | | | — | | | | (91,443 | ) |
| Biotechnology | | | (64,709 | ) | | | — | | | | — | | | | (64,709 | ) |
| Capital Markets | | | (67,521 | ) | | | — | | | | — | | | | (67,521 | ) |
| Chemicals | | | (306,434 | ) | | | — | | | | — | | | | (306,434 | ) |
| Commercial Banks | | | (301,765 | ) | | | — | | | | — | | | | (301,765 | ) |
| Commercial Services & Supplies | | | (233,766 | ) | | | — | | | | — | | | | (233,766 | ) |
| Communications Equipment | | | (57,715 | ) | | | — | | | | — | | | | (57,715 | ) |
| Consumer Finance | | | (66,850 | ) | | | — | | | | — | | | | (66,850 | ) |
| Diversified Consumer Services | | | (86,146 | ) | | | — | | | | — | | | | (86,146 | ) |
| Diversified Financial Services | | | (22,284 | ) | | | — | | | | — | | | | (22,284 | ) |
| Electrical Equipment | | | (97,972 | ) | | | — | | | | — | | | | (97,972 | ) |
| Electronic Equipment, Instruments & Components | | | (321,968 | ) | | | — | | | | — | | | | (321,968 | ) |
| Energy Equipment & Services | | | (165,059 | ) | | | — | | | | — | | | | (165,059 | ) |
| Food & Staples Retailing | | | (23,958 | ) | | | — | | | | — | | | | (23,958 | ) |
| Food Products | | | (144,470 | ) | | | (45,219 | ) | | | — | | | | (189,689 | ) |
| Health Care Equipment & Supplies | | | (527,127 | ) | | | — | | | | — | | | | (527,127 | ) |
| Health Care Providers & Services | | | (203,387 | ) | | | — | | | | — | | | | (203,387 | ) |
| Health Care Technology | | | (49,502 | ) | | | — | | | | — | | | | (49,502 | ) |
| Hotels, Restaurants & Leisure | | | (185,319 | ) | | | — | | | | — | | | | (185,319 | ) |
| Household Durables | | | (89,794 | ) | | | — | | | | — | | | | (89,794 | ) |
| Household Products | | | (63,958 | ) | | | — | | | | — | | | | (63,958 | ) |
| Industrial Conglomerates | | | (45,711 | ) | | | — | | | | — | | | | (45,711 | ) |
| Insurance | | | (81,670 | ) | | | — | | | | — | | | | (81,670 | ) |
| Internet Software & Services | | | (48,565 | ) | | | — | | | | — | | | | (48,565 | ) |
| IT Services | | | (42,630 | ) | | | — | | | | — | | | | (42,630 | ) |
| Life Sciences Tools & Services | | | (98,217 | ) | | | — | | | | — | | | | (98,217 | ) |
| Machinery | | | (606,279 | ) | | | — | | | | — | | | | (606,279 | ) |
| Media | | | (118,096 | ) | | | — | | | | — | | | | (118,096 | ) |
| Metals & Mining | | | (240,482 | ) | | | — | | | | — | | | | (240,482 | ) |
See Notes to Financial Statements
Notes to Schedule of Investments (cont'd)
| Oil, Gas & Consumable Fuels | | $ | (16,105 | ) | | $ | — | | | $ | — | | | $ | (16,105 | ) |
| Pharmaceuticals | | | (52,559 | ) | | | (65,993 | ) | | | — | | | | (118,552 | ) |
| Professional Services | | | — | | | | (22,850 | ) | | | — | | | | (22,850 | ) |
| Real Estate Investment Trusts | | | (236,955 | ) | | | — | | | | — | | | | (236,955 | ) |
| Semiconductors & Semiconductor Equipment | | | (89,976 | ) | | | — | | | | — | | | | (89,976 | ) |
| Software | | | (283,656 | ) | | | — | | | | — | | | | (283,656 | ) |
| Specialty Retail | | | (122,850 | ) | | | — | | | | — | | | | (122,850 | ) |
| Textiles, Apparel & Luxury Goods | | | (142,718 | ) | | | (40,040 | ) | | | — | | | | (182,758 | ) |
| Thrifts & Mortgage Finance | | | (67,609 | ) | | | — | | | | — | | | | (67,609 | ) |
| Trading Companies & Distributors | | | (69,672 | ) | | | — | | | | — | | | | (69,672 | ) |
| Transportation Infrastructure | | | (79,032 | ) | | | — | | | | — | | | | (79,032 | ) |
| Total Common Stocks Sold Short | | | (5,733,753 | ) | | | (174,102 | ) | | | — | | | | (5,907,855 | ) |
| Exchange Traded Funds Sold Short | | | (955,327 | ) | | | — | | | | — | | | | (955,327 | ) |
| Corporate Debt Securities Sold Short^ | | | — | | | | (363,850 | ) | | | — | | | | (363,850 | ) |
Total Investments | | | (6,689,080 | ) | | | (537,952 | ) | | | — | | | | (7,227,032 | ) |
^ The Schedule of Investments provides information on the industry categorization for the portfolio.
The following is a summary, categorized by Level, of inputs used to value the Fund's derivatives as of October 31, 2012:
| | | Level 1 | | Level 2 | | Level 3 | | Total |
| Futures | | $ | 2,795 | | | $ | — | | | $ | — | | | $ | 2,795 | |
| Written Options | | | (21,841 | ) | | | (186 | ) | | | — | | | | (22,027 | ) |
Total | | $ | (19,046 | ) | | $ | (186 | ) | | $ | — | | | $ | (19,232 | ) |
§ The following is a reconciliation between the beginning and ending balances of investments in which significant unobservable inputs (Level 3) were used in determining value:
| | | Beginning balance, as of 5/15/12 | | Accrued discounts/ (premiums) | | Realized gain/loss and change in unrealized appreciation/ (depreciation) | | Purchases | | Sales | | Transfers in to Level 3 | | Transfers out of Level 3 | | Balance, as of 10/31/12 | | Net change in unrealized appreciation/ (depreciation) from investments still held as of 10/31/12 |
| Investments in Securities: |
Bank Loan Obligations |
Insurance | | $ | — | | | $ | — | | | $ | 6,000 | | | $ | 594,000 | | | $ | — | | | $ | — | | | $ | — | | | $ | 600,000 | | | $ | 6,000 | |
| Machinery | | | — | | | | 26 | | | | 2,974 | | | | 98,000 | | | | — | | | | — | | | | — | | | | 101,000 | | | | 2,974 | |
Total | | $ | — | | | $ | 26 | | | $ | 8,974 | | | $ | 692,000 | | | $ | — | | | $ | — | | | $ | — | | | $ | 701,000 | | | $ | 8,974 | |
## At October 31, 2012, selected fund information on a U.S. federal income tax basis was as follows:
| | | Cost | | Gross Unrealized Appreciation | | Gross Unrealized Depreciation | | Net Unrealized Appreciation (Depreciation) |
| Absolute Return Multi-Manager | | $ | 22,429,532 | | | $ | 618,928 | | | $ | 619,999 | | | $ | (1,071 | ) |
See Notes to Financial Statements
Notes to Schedule of Investments (cont'd)
* Security did not produce income during the last twelve months.
± At October 31, 2012, the Fund had outstanding call and put options written as follows:
| Name of Issuer | | Contracts | | Exercise Price | | Expiration Date | | Market Value of Options |
Allscripts Healthcare Solutions, Inc., Call | | | 31 | | | | $ 16 | | | March 2013 | | $ | (155 | ) |
| Best Buy Co., Inc., Call | | | 28 | | | | 24 | | | March 2013 | | | (588 | ) |
| Cliffs Natural Resources, Inc., Call | | | 15 | | | | 34 | | | November 2012 | | | (4,470 | ) |
| Corrections Corp. of America, Call | | | 15 | | | | 34 | | | November 2012 | | | (1,200 | ) |
| Corrections Corp. of America, Put | | | 15 | | | | 34 | | | November 2012 | | | (1,800 | ) |
| Dun & Bradstreet Corp., Call | | | 19 | | | | 95 | | | November 2012 | | | (190 | ) |
| LyondellBasell Industries NV, Put | | | 9 | | | | 48 | | | December 2012 | | | (855 | ) |
| Mondelez International, Inc., Put | | | 21 | | | | 33 | | | December 2012 | | | (126 | ) |
| Mondelez International, Inc., Put | | | 10 | | | | 34 | | | December 2012 | | | (60 | ) |
| Mondelez International, Inc., Put | | | 2 | | | | 35 | | | December 2012 | | | (2 | ) |
| Murphy Oil Corp., Call | | | 12 | | | | 60 | | | November 2012 | | | (2,040 | ) |
| Nexen Inc., Put | | | 31 | | | | 18 | | | March 2013 | | | (2,635 | ) |
| Oshkosh Corp., Call | | | 19 | | | | 28 | | | November 2012 | | | (4,180 | ) |
| SPDR S&P 500 ETF Trust, Put | | | 27 | | | | 133 | | | December 2012 | | | (3,726 | ) |
Total | | | | | | | | $ | (22,027 | ) |
See Note A-13 in the Notes to Financial Statements for the Fund's open positions in derivatives at October 31, 2012.
| ñ | Securities were purchased under Rule 144A of the Securities Act of 1933 or are private placements and, unless registered under the Act or exempted from registration, may only be sold to qualified institutional investors. These securities have been deemed by the investment manager to be liquid. At October 31, 2012, these securities amounted to approximately $500,013 or 1.42% of net assets for the Fund. |
| Ø | All or a portion of this security or cash is segregated in connection with obligations for securities sold short and/or delayed delivery purchase commitments and/or call and put options written and/or futures. |
| ØØ | At October 31, 2012, the Fund had deposited $7,571,080 in one or more accounts to satisfy collateral requirements for borrowing in connection with securities sold short. At October 31, 2012, the Fund had pledged securities in the amount of $941,939 to cover collateral requirements for borrowing in connection with securities sold short. |
| ≠ | Security had an event of default. |
| c | Payment-in-kind security for which part of the income earned may be paid as additional principal. |
| µ | Floating rate securities are securities whose yields vary with a designated market index or market rate. These securities are shown at their current rates as of October 31, 2012 and their final maturities. |
| ¢ | All or a portion of this security was purchased on a delayed delivery basis. |
| ^^ | All or a portion of this security has not settled as of October 31, 2012 and thus does not have an interest rate in effect. Interest rates do not take effect until settlement. |
| Ñ | These securities have been deemed by Management to be illiquid. At October 31, 2012, these securities amounted to approximately $701,000 or 1.99% of net assets for the Fund. |
See Notes to Financial Statements
Statement of Assets and Liabilities
| Neuberger Berman Alternative Funds |
| | ABSOLUTE RETURN MULTI-MANAGER FUND |
| | October 31, 2012 |
Assets | | | | |
| Investments in securities, at value* (Note A)—see Schedule of Investments: |
| Unaffiliated issuers | | $ | 22,428,461 | |
| Cash | | | 13,062,615 | |
| Foreign currency* | | | 115,234 | |
| Deposits with broker for short sales (Note A-11) | | | 7,571,080 | |
| Deposit with broker for futures contracts (Note A-13) | | | 8,000 | |
| Dividends and interest receivable | | | 29,260 | |
| Foreign tax reclaims | | | 175 | |
| Receivable for securities sold | | | 2,422,414 | |
| Receivable for Fund shares sold | | | 89,725 | |
| Receivable from administrator—net (Note B) | | | 24,109 | |
| Prepaid expenses and other assets | | | 41,740 | |
Total Assets | | | 45,792,813 | |
Liabilities | | | | |
Investments sold short, at value (Note A) (proceeds $7,272,251) | | | 7,227,032 | |
| Written Options, at value (Note A) (proceeds $31,242) | | | 22,027 | |
| Dividends and interest payable for short sales | | | 18,924 | |
| Payable for Fund shares redeemed | | | 12,172 | |
| Payable for securities purchased | | | 3,111,425 | |
| Payable for variation margin (Note A-13) | | | 1,020 | |
| Payable to investment manager—net (Note B) | | | 59,044 | |
| Accrued expenses and other payables | | | 131,096 | |
Total Liabilities | | | 10,582,740 | |
Net Assets | | $ | 35,210,073 | |
Net Assets consist of: |
| Paid-in capital | | $ | 35,276,444 | |
| Undistributed net investment income (loss) | | | (136,050 | ) |
| Accumulated net realized gains (losses) on investments | | | (79,625 | ) |
| Net unrealized appreciation (depreciation) in value of investments | | | 149,304 | |
Net Assets | | $ | 35,210,073 | |
Net Assets | | | | |
| Institutional Class | | $ | 33,230,152 | |
| Class A | | | 1,751,630 | |
| Class C | | | 228,291 | |
See Notes to Financial Statements
Statement of Assets and Liabilities (cont'd)
| Neuberger Berman Alternative Funds (cont'd) |
| | | ABSOLUTE RETURN MULTI-MANAGER FUND |
| | | October 31, 2012 |
| Shares Outstanding ($.001 par value; unlimited shares authorized) | | | | |
| Institutional Class | | | 3,322,090 | |
| Class A | | | 175,413 | |
| Class C | | | 22,937 | |
Net Asset Value, offering and redemption price per share | | | | |
| Institutional Class | | $ | 10.00 | |
Net Asset Value and redemption price per share | | | | |
| Class A | | $ | 9.99 | |
Offering Price per share | | | | |
| Class A‡ | | $ | 10.60 | |
Net Asset Value and offering price per share | | | | |
| Class C^ | | $ | 9.95 | |
*Cost of Investments: | | | | |
| Unaffiliated issuers | | $ | 22,337,811 | |
Total cost of foreign currency | | $ | 113,829 | |
‡ On single retail sales of less than $50,000. On sales of $50,000 or more or in certain other circumstances described in the Fund's prospectus, offering price is reduced.
^ Redemption price per share is equal to net asset value less any applicable contingent deferred sales charge.
See Notes to Financial Statements
Statement of Operations
| Neuberger Berman Alternative Funds |
| | ABSOLUTE RETURN MULTI-MANAGER FUND |
| | Period from May 15, 2012 (Commencement of Operations) to October 31, 2012 |
| Investment Income: | | | | |
| Income (Note A): |
| Dividend income—unaffiliated issuers | | $ | 63,674 | |
| Interest income—unaffiliated issuers | | | 44,498 | |
| Foreign taxes withheld | | | (352 | ) |
| Total income | | $ | 107,820 | |
Expenses: | | | | |
| Investment management fees (Note B) | | | 213,343 | |
| Administration fees (Note B) | | | 6,400 | |
| Administration fees (Note B): |
| Institutional Class | | | 9,295 | |
| Class A | | | 602 | |
| Class C | | | 76 | |
| Distribution fees (Note B): | | | | |
| Class A | | | 753 | |
| Class C | | | 381 | |
| Shareholder servicing agent fees: |
| Institutional Class | | | 2,416 | |
| Class A | | | 1,653 | |
| Class C | | | 1,565 | |
| Organization expense (Note A-8) | | | 568,024 | |
| Audit fees | | | 42,000 | |
| Custodian fees (Note A) | | | 70,344 | |
| Legal fees | | | 123,367 | |
| Registration and filing fees | | | 22,745 | |
| Shareholder reports | | | 15,001 | |
| Trustees' fees and expenses | | | 12,000 | |
| Short sales expense (Note A-11) | | | 56,153 | |
| Miscellaneous | | | 1,187 | |
| Total expenses | | | 1,147,305 | |
| Expenses reimbursed by Management (Note B) | | | (845,835 | ) |
| Total net expenses | | | 301,470 | |
| Net investment income (loss) | | $ | (193,650 | ) |
Realized and Unrealized Gain (Loss) on Investments (Note A): |
Net realized gain (loss) on: |
| Sales of investment securities of unaffiliated issuers | | | 250,002 | |
| Sales of investment securities of unaffiliated issuers sold short | | | (302,580 | ) |
| Foreign currency | | | (979 | ) |
| Options written | | | 31,353 | |
Change in net unrealized appreciation (depreciation) in value of: |
| Unaffiliated investment securities | | | 90,650 | |
| Unaffiliated investment securities sold short | | | 45,219 | |
| Foreign currency | | | 1,425 | |
| Financial futures contracts | | | 2,795 | |
| Options written | | | 9,215 | |
| Net gain (loss) on investments | | | 127,100 | |
| Net increase (decrease) in net assets resulting from operations | | $ | (66,550 | ) |
See Notes to Financial Statements
Statement of Changes in Net Assets
| Neuberger Berman Alternative Funds |
| | | ABSOLUTE RETURN MULTI-MANAGER FUND |
| | | Period from May 15, 2012 (Commencement of Operations) to October 31, 2012 |
| Increase (Decrease) in Net Assets: | | | | |
From Operations (Note A): | | | | |
| Net investment income (loss) | | $ | (193,650 | ) |
| Net realized gain (loss) on investments | | | (22,204 | ) |
| Change in net unrealized appreciation (depreciation) of investments | | | 149,304 | |
| Net increase (decrease) in net assets resulting from operations | | | (66,550 | ) |
From Fund Share Transactions (Note D): | | | | |
| Proceeds from shares sold: | | | | |
| Institutional Class | | | 33,591,736 | |
| Class A | | | 1,760,497 | |
| Class C | | | 230,214 | |
| Payments for shares redeemed: | | | | |
| Institutional Class | | | (305,020 | ) |
| Class A | | | (804 | ) |
Net increase (decrease) from Fund share transactions | | | 35,276,623 | |
Net Increase (Decrease) in Net Assets | | | 35,210,073 | |
Net Assets: |
| Beginning of period | | | — | |
| End of period | | $ | 35,210,073 | |
| Undistributed net investment income (loss) at end of period | | | (136,050 | ) |
See Notes to Financial Statements
Notes to Financial Statements Absolute Return
Multi-Manager Fund
Note A—Summary of Significant Accounting Policies:
| 1 | General: Neuberger Berman Alternative Funds (the "Trust") is a Delaware statutory trust organized pursuant to an Amended and Restated Trust Instrument dated October 14, 2010. The Trust is registered as an open-end management investment company under the Investment Company Act of 1940, as amended (the "1940 Act"), and its shares are registered under the Securities Act of 1933, as amended (the "1933 Act"). Absolute Return Multi-Manager Fund (the "Fund") had no operations until May 15, 2012, other than matters relating to its organization and registration of shares under the 1933 Act. The Fund is a separate operating series of the Trust and is non-diversified. The Fund offers Institutional Class shares, Class A shares and Class C shares. The Board may establish additional series or classes of shares without the approval of shareholders. The assets of the Fund belong only to the Fund, and the liabilities of the Fund are borne solely by the Fund and no other. The preparation of financial statements in accordance with U.S. generally accepted accounting principles ("GAAP") requires Management to make estimates and assumptions at the date of the financial statements. Actual results could differ from those estimates. |
| 2 | Portfolio valuation: Investment securities are valued as indicated in the notes following the Fund's Schedule of Investments. |
| 3 | Foreign currency translation:The accounting records of the Fund are maintained in U.S. dollars. Foreign currency amounts are translated into U.S. dollars using the exchange rate as of 4:00 p.m., Eastern time, to determine the value of investments, other assets and liabilities. Purchase and sale prices of securities, and income and expenses, are translated into U.S. dollars at the prevailing rate of exchange on the respective dates of such transactions. Net unrealized foreign currency gain (loss), if any, arises from changes in the value of assets and liabilities, other than investments in securities, as a result of changes in exchange rates and is stated separately in the Statement of Operations. |
| 4 | Securities transactions and investment income: Securities transactions are recorded on trade date for financial reporting purposes. Dividend income is recorded on the ex-dividend date or, for certain foreign dividends, as soon as the Fund becomes aware of the dividends. Non-cash dividends included in dividend income, if any, are recorded at the fair market value of the securities received. Interest income, including accretion of discount (adjusted for original issue discount, where applicable) and amortization of premium, where applicable, is recorded on the accrual basis. Realized gains and losses from securities transactions and foreign currency transactions, if any, are recorded on the basis of identified cost and stated separately in the Statement of Operations. |
| 5 | Income tax information: The Fund is treated as a separate entity for U.S. federal income tax purposes. It is the intention of the Fund to qualify for treatment as a regulated investment company by complying with the requirements of the U.S. Internal Revenue Code applicable to regulated investment companies and to distribute substantially all of its net investment income and net realized capital gains to its shareholders. To the extent the Fund distributes substantially all of its net investment income and net realized capital gains to shareholders, no federal income or excise tax provision is required. The Fund has adopted the provisions of ASC 740 "Income Taxes" ("ASC 740"). ASC 740 sets forth a minimum threshold for financial statement recognition of a tax position taken, or expected to be taken, in a tax return. The Fund recognizes interest and penalties, if any, related to unrecognized tax positions as an income tax expense in the Statement of Operations. As of October 31, 2012, the Fund did not have any unrecognized tax positions. Income distributions and capital gain distributions are determined in accordance with income tax regulations, which may differ from GAAP. These differences are primarily due to differing treatments of income and gains on |
| | various investment securities held by the Fund, timing differences and differing characterization of distributions made by the Fund. As determined on October 31, 2012, permanent differences resulting primarily from different book and tax accounting were reclassified at fiscal period-end. Such differences may be attributed to one or more of the following: netting of net ordinary losses with short-term capital gains, non-deductible stock issuance costs, the tax treatment of foreign currency gains and losses, payments in lieu of dividends on short sales and gains from passive foreign investment companies. These reclassifications had no effect on net income, net asset value ("NAV") or NAV per share of the Fund. For the year ended October 31, 2012, the Fund recorded the following permanent reclassifications: |
| Paid-in Capital | | Undistributed Net Investment Income (Loss) | | Accumulated Net Realized Gains (Losses) on Investments |
| $ | (179 | ) | | $ | 57,600 | | | $ | (57,421 | ) |
| | For tax purposes, distributions of short-term gains are taxable to shareholders as ordinary income. As of October 31, 2012, the components of distributable earnings (accumulated losses) on a U.S. federal income tax basis were as follows: |
Undistributed Ordinary Income | | Undistributed Long-Term Gain | | Unrealized Appreciation (Depreciation) | | Loss Carryforwards and Deferrals | | Total |
| $ | 131,611 | | | $ | 2,402 | | | $ | (47,468 | ) | | $ | — | | | $ | 86,545 | |
The difference between book basis and tax basis distributable earnings is attributable primarily to wash sale loss deferrals, amortization of organizational costs, unsettled wash sale loss deferrals, straddle loss deferrals, mark-to-market adjustments on passive foreign investment companies, constructive sales gains and delayed settlement compensation on bank loans.
To the extent the Fund's net realized capital gains, if any, can be offset by capital loss carryforwards, if any, it is the policy of the Fund not to distribute such gains.
| 6 | Foreign taxes: Foreign taxes withheld represent amounts withheld by foreign tax authorities, net of refunds recoverable. |
| 7 | Distributions to shareholders: The Fund may earn income, net of expenses, daily on its investments. Distributions from net investment income and net realized capital gains, if any, generally are distributed once a year (usually in December) and are recorded on the ex-date. |
| 8 | Organization expenses: Costs incurred by the Fund in connection with its organization, which amounted to $568,024, have been expensed as incurred. |
| 9 | Expense allocation: Certain expenses are applicable to multiple funds. Expenses directly attributable to the Fund are charged to the Fund. Expenses of the Trust that are not directly attributable to a particular series of the Trust (e.g., a Fund) are allocated among the series of the Trust, on the basis of relative net assets, except where a more appropriate allocation of expenses to each of the series can otherwise be made fairly. Expenses borne by the complex of related investment companies, which includes open-end and closed-end investment companies for which Management serves as investment manager, that are not directly attributable to a particular investment company in the complex (e.g., the Trust) or series thereof are allocated among the investment companies in the complex or series thereof, on the basis of relative net assets, except where a more appropriate allocation of expenses to each of the investment companies in the complex or series thereof can otherwise be made fairly. The Fund's expenses (other than those specific to each class) are allocated proportionally each day among the classes based upon the relative net assets of each class. |
| 10 | Investments in foreign securities: Investing in foreign securities may involve certain sovereign and other risks, in addition to the credit and market risks normally associated with domestic securities. These additional risks include the possibility of adverse political and economic developments (including political instability, nationalization, expropriation, or confiscatory taxation) and the potentially adverse effects of unavailability of public information regarding issuers, less governmental supervision and regulation of financial markets, reduced liquidity of certain financial markets, and the lack of uniform accounting, auditing, and financial reporting standards or the application of standards that are different or less stringent than those applied in the United States. Foreign securities also may experience greater price volatility, higher rates of inflation, and delays in settlement. |
| 11 | Securities sold short:The Fund may engage in short sales, which are sales of securities which have been borrowed from a third party on the expectation that the market price will decline. If the price of the securities decreases, the Fund will make a profit by purchasing the securities in the open market at a price lower than the one at which it sold the securities. If the price of the securities increases, the Fund may have to cover its short positions at a price higher than the short sale price, resulting in a loss. Gains are limited to the price at which the Fund sold the security short, while losses are potentially unlimited in size. The Fund pledges securities and/or other assets, to the lender as collateral. Proceeds received from short sales may be maintained by the lender as collateral. Proceeds maintained by the lender are included in the "Deposit with brokers for short sales" on the Statement of Assets and Liabilities. The Fund is required to segregate an amount of cash, cash equivalents or other appropriate liquid marketable securities with the custodian in at least an amount equal to the current market value of the securities sold short (less any additional collateral held by the lender). The Fund is contractually responsible to the lender for any dividends payable and interest accrued on securities while those securities are in a short position. These dividends and interest are recorded as an expense of the Fund. As of October 31, 2012, the Fund had pledged cash in the amount of $7,571,080 to JP Morgan Chase Bank, N.A. ("JPM"), as collateral for short sales. At October 31, 2012, the Fund had pledged securities in the amount of $941,939 to cover collateral requirements for borrowing in connection with securities sold short. |
| 12 | Investment company securities and exchange-traded funds:The Fund may invest in shares of other registered investment companies, including exchange-traded funds ("ETFs"), within the limitations prescribed by the 1940 Act. Some ETFs seek to track the performance of a particular market index. These indices include both broad-based market indices and more narrowly-based indices, including those relating to particular sectors, markets, regions or industries. However, some ETFs have actively-managed investment objectives. ETF shares are traded like traditional equity securities on a national securities exchange or NASDAQ. The Fund will indirectly bear its proportionate share of any management fees and other expenses paid by such other investment companies, which will decrease returns. |
| 13 | Derivative instruments: During the period ended October 31, 2012, the Fund's use of derivatives, as described below, was limited to financial futures contracts, written option transactions and purchased option transactions. The Fund has adopted the provisions of ASC 815 "Derivatives and Hedging" ("ASC 815"). The disclosure requirements of ASC 815 distinguish between derivatives that qualify for hedge accounting and those that do not. Because investment companies value their derivatives at fair value and recognize changes in fair value through the Statement of Operations, they do not qualify for hedge accounting. Accordingly, even though the Fund's investments in derivatives may represent economic hedges, they are considered non-hedge transactions for purposes of this disclosure. Financial futures contracts: During the period ended October 31, 2012, the Fund entered into financial futures contracts in an effort to enhance returns and to manage or adjust the risk profile and the investment exposure of the Fund to certain asset classes, countries and regions. The Fund also utilized financial futures contracts to provide investment exposure to certain indices other than the benchmarks. At the time the Fund enters into a financial futures contract, it is required to deposit with the futures commission merchant a specified amount of cash or liquid securities, known as "initial margin," which is a percentage of the value of the financial futures contract being traded that is set by the exchange upon which the futures contract is traded. Each day, the futures contract is valued at the official settlement price of the board of trade or U.S. |
commodity exchange on which such futures contract is traded. Subsequent payments, known as "variation margin," to and from the broker are made on a daily basis as the market price of the financial futures contract fluctuates. Daily variation margin adjustments, arising from this "mark to market," are recorded by the Fund as unrealized gains or losses.
Although some financial futures contracts by their terms call for actual delivery or acquisition of the underlying securities or currency, in most cases the contracts are closed out prior to delivery by offsetting purchases or sales of matching financial futures contracts. When the contracts are closed, the Fund recognizes a gain or loss. Risks of entering into futures contracts include the possibility there may be an illiquid market, possibly at a time of rapidly declining prices, and/or a change in the value of the contract may not correlate with changes in the value of the underlying securities. Futures executed on regulated futures exchanges have minimal counterparty risk to a fund because the exchange's clearinghouse assumes the position of the counterparty in each transaction. Thus, the Fund is exposed to risk only in connection with the clearinghouse and not in connection with the original counterparty to the transaction.
For U.S. federal income tax purposes, the futures transactions undertaken by the Fund may cause the Fund to recognize gains or losses from marking contracts to market even though its positions have not been sold or terminated, may affect the character of the gains or losses recognized as long-term or short-term, and may affect the timing of some capital gains and losses realized by the Fund. Also, the Fund's losses on transactions involving futures contracts may be deferred rather than being taken into account currently in calculating the Fund's taxable income.
At October 31, 2012, open positions in financial futures contracts were:
| Expiration | Open Contracts | Position | | Unrealized Appreciation (Depreciation) |
| December 2012 | 2 S&P Mid 400 EMini Index | Short | | $ | 2,795 | |
During the period ended October 31, 2012, the average notional value of financial futures contracts was $195,620 for short positions.
At October 31, 2012, the Fund had deposited $6,980 in a segregated account to cover margin requirements on open futures contracts.
Options: Premiums received by the Fund upon writing a covered call option or a put option are recorded in the liability section of the Statement of Assets and Liabilities and are subsequently adjusted to the current market value. When an option is exercised, closed, or expired, the Fund realizes a gain or loss and the liability is eliminated.
When writing a covered call option, the Fund, in return for the premium, gives up the opportunity for profit from a price increase in the underlying security above the exercise price, but conversely retains the risk of loss should the price of the security decline. When writing a put option, the Fund, in return for the premium, takes the risk that it must purchase the underlying security at a price that may be higher than the current market price of the security. If a put option that the Fund has written expires unexercised, the Fund will realize a gain in the amount of the premium. All securities covering outstanding options are held in escrow by the custodian bank.
Written option transactions were used in an attempt to generate incremental returns for the Fund for the period ended October 31, 2012. Written option transactions for the Fund for the period ended October 31, 2012 were:
| | | Number of Contracts | | Premiums |
| Outstanding at May 15, 2012 | | | — | | | $ | — | |
| Options written | | | 949 | | | | 101,224 | |
Options terminated in closing purchase transactions | | | (569 | ) | | | (40,143 | ) |
| Options exercised | | | (76 | ) | | | (8,090 | ) |
| Options expired | | | (50 | ) | | | (21,749 | ) |
| Outstanding at October 31, 2012 | | | 254 | | | $ | 31,242 | |
Premiums paid by the Fund upon purchasing a covered call option are recorded in the asset section of the Fund's Statement of Assets and Liabilities and are subsequently adjusted to the current market value. When an option is exercised, closed, or expired, the Fund realizes a gain or loss and the asset is eliminated.
For purchased call options, the Fund's loss is limited to the amount of the option premium paid.
Purchased option transactions were used in an attempt to manage or adjust the risk profile and the investment exposure of the Fund to certain securities for the Fund and enhance returns for the period ended October 31, 2012. Purchased option transactions for the Fund for the period ended October 31, 2012 were:
| | | Number of Contracts | | Premiums |
| Outstanding at May 15, 2012 | | | — | | | $ | — | |
| Options purchased | | | 1,838 | | | | 273,646 | |
Options terminated in closing sale transactions | | | (650 | ) | | | (97,283 | ) |
| Options exercised | | | (90 | ) | | | (36,466 | ) |
| Options expired | | | (304 | ) | | | (23,372 | ) |
| Outstanding at October 31, 2012 | | | 794 | | | $ | 116,525 | |
For the period ended October 31, 2012, the Fund had an average market value of $79,336 and $11,918 in purchased options and written options, respectively.
At October 31, 2012, the Fund had the following derivatives (which did not qualify as hedging instruments under ASC 815), grouped by primary risk exposure:
| Derivative Type | | Statement of Assets and Liabilities Location | | Equity Risk | | Total |
| Futures contracts | | Receivable/Payable for variation margin(1) | | $ | 2,795 | | | $ | 2,795 | |
| Purchased options | | Investments in securities, at value | | | 113,147 | | | | 113,147 | |
Total Value—Assets | | | | $ | 115,942 | | | $ | 115,942 | |
| Derivative Type | | Statement of Assets and Liabilities Location | | Equity Risk | | Total |
| Option contracts written | | Option contracts written, at value | | $ | (22,027 | ) | | $ | (22,027 | ) |
Total Value—Assets | | | | $ | (22,027 | ) | | $ | (22,027 | ) |
| (1) | "Futures contracts" reflects the cumulative appreciation (depreciation) of futures contracts as of October 31, 2012, which is reflected in the Statement of Assets and Liabilities under the caption "Net unrealized appreciation (depreciation) in value of investments." The outstanding variation margin as of October 31, 2012, if any, is reflected in the Statement of Assets and Liabilities under the caption "Receivable/Payable for variation margin." The impact of the use of these derivative instruments on the Statement of Operations during the period ended October 31, 2012, was as follows: |
| Derivative Type | | Statement of Operations Location | | Equity Risk | | Total |
| Option contracts written | | Net realized gain (loss) on: options written | | $ | 31,353 | | | $ | 31,353 | |
| Option contracts purchased | | Net realized gain (loss) on: sales of investment securities of unaffiliated issuers | | | (96,128 | ) | | | (96,128 | ) |
Total Realized Gain (Loss) | | | | $ | (64,775 | ) | | $ | (64,775 | ) |
| Change in Appreciation (Depreciation) | |
| Derivative Type | | Statement of Operations Location | | Equity Risk | | Total |
| Futures contracts | | Net realized gain (loss) on: financial futures contracts | | $ | 2,795 | | | $ | 2,795 | |
| Option contracts written | | Change in net unrealized appreciation (depreciation) in value of: options written | | | 9,215 | | | | 9,215 | |
| Option contracts purchased | | Change in net unrealized appreciation (depreciation) in value of: unaffiliated investment securities | | | (3,378 | ) | | | (3,378 | ) |
Total Change in Appreciation (Depreciation) | | | | $ | 8,632 | | | $ | 8,632 | |
| 14 | Indemnifications: Like many other companies, the Trust's organizational documents provide that its officers and trustees are indemnified against certain liabilities arising out of the performance of their duties to the Trust. In addition, both in some of its principal service contracts and in the normal course of its business, the Trust enters into contracts that provide indemnifications to other parties for certain types of losses or liabilities. The Trust's maximum exposure under these arrangements is unknown as this could involve future claims against the Trust. |
| 15 | Expense offset arrangement: The Fund has an expense offset arrangement in connection with its custodian contract. For the period ended October 31, 2012, the Fund had no impact from this arrangement. |
| 16 | Other: All net investment income and realized and unrealized capital gains and losses of the Fund are allocated, on the basis of relative net assets, pro rata among its respective classes. |
Note B—Management Fees, Administration Fees, Distribution Arrangements, and Other Transactions with Affiliates:
The Fund retains Management as its investment manager under a Management Agreement. For such investment management services, the Fund pays Management a fee at the annual rate of 2.000% of the first $250 million of the Fund's average daily net assets, 1.975% of the next $250 million, 1.950% of the next $250 million, 1.925% of the next $250 million, 1.900% of the next $500 million, 1.875% of the next $2.5 billion, and 1.850% of average daily net assets in excess of $4 billion. Accordingly, for the period ended October 31, 2012, the fee pursuant to the Management Agreement was equivalent to an annual effective rate of 2.00% of the Fund's average daily net assets.
The Fund retains Management as its administrator under an Administration Agreement. The Fund pays Management an administration fee at the annual rate of 0.06% of its average daily net assets under this agreement. In addition, the Fund's Institutional Class pays Management an administration fee at the annual rate of 0.09% of its average daily net assets under this agreement and the Fund's Class A and Class C pays Management an administration fee at the annual rate of 0.20% of its average daily net assets under this agreement. Additionally, Management retains JPM as its sub-administrator under a Sub-Administration Agreement. Management pays JPM a fee for all services received under the agreement.
Management has contractually agreed to waive current payment of fees and/or reimburse certain expenses of the Institutional Class, Class A and Class C of the Fund so that the total annual operating expenses of those classes do not exceed the expense limitations as detailed in the following table. These undertakings apply to the Fund's direct expenses and exclude interest, taxes, brokerage commissions, acquired fund fees and expenses, extraordinary expenses, and dividend and interest expense on short sales, if any; consequently, net expenses may exceed the contractual expense limitations. The Fund has agreed that each of its respective classes will repay Management for fees and expenses waived or reimbursed for that class provided that repayment does not cause that class' annual operating expenses to exceed its contractual expense limitation in place at the time the fees and expenses were forgone or reimbursed. Any such repayment must be made within three years after the year in which Management incurred the expense.
During the period ended October 31, 2012, there was no reimbursement to Management under this agreement.
At October 31, 2012, contingent liabilities to Management under the contractual expense limitation were as follows:
| | | | | | Expenses Reimbursed In the Period Ending, October 31, 2012 |
| | | | | | Subject to Repayment until October 31, |
| Class | | Contractual Expense Limitation(1) | | Expiration | | 2015 |
Institutional Class | | | 2.45 | % | | 10/31/15 | | $ | 816,372 | (2) |
Class A | | | 2.81 | % | | 10/31/15 | | | 24,960 | |
Class C | | | 3.56 | % | | 10/31/15 | | | 4,503 | (2) |
(1) Expense limitation per annum of the respective class' average daily net assets.
(2) Period from May 15, 2012 (Commencement of Operations) to October 31, 2012.
NB Alternative Investment Management LLC ("NBAIM"), as the sub-adviser to the Fund, is retained by Management to provide day-to-day investment management services and receives a monthly fee paid by Management. As investment manager, Management is responsible for overseeing the investment activities of NBAIM. Several individuals who are officers and/or Trustees of the Trust are also employees of NBAIM and/or Management.
Management and NB Alternative Investment Management LLC are indirect subsidiaries of Neuberger Berman Group LLC (("NBG") and together with its consolidated subsidiaries ("NB Group")). NBSH Acquisition, LLC ("NBSH"), which is owned by portfolio managers, members of the NB Group management team and certain of NB Group's key employees and senior professionals, owns, as of September 30, 2012 approximately 57% of NBG's common units, and Lehman Brothers Holdings Inc. ("LBHI") and certain of its subsidiaries (collectively the "LBHI Parties") own the remaining 43% of such common units. Pursuant to agreements among NBG, NBSH and the LBHI Parties, NBG is entitled to acquire the remaining Class A common units through a process that is expected to end in 2017. In April 2012, NBG exercised its option (the "Redemption Agreement Option") to redeem during 2012 certain of its Class A common units held by the LBHI Parties equal to 10% of NBG's aggregate common units issued and outstanding as of March 16, 2012. The final payment for such Class A common units is due within thirty (30) days of December 31, 2012.
Management and NBAIM engage The Boston Company Asset Management, LLC, Cramer Rosenthal McGlynn, LLC, GAMCO Asset Management, Inc., Levin Capital Strategies, L.P., MacKay Shields LLC, Sound Point Capital Management, L.P., Turner Investments, L.P., and Visium Asset Management, L.P. as subadvisers to provide investment management services. Management compensates the subadvisers out of the investment advisory fees it receives from the Fund. During the period, MacKay Shields LLC did not provide investment management services to the Fund.
The Fund also has a distribution agreement with Management with respect to each class of shares. Management acts as agent in arranging for the sale of class shares without sales commission or other compensation, except as described below for Class A and Class C shares, and bears advertising and promotion expenses.
However, Management receives fees from Class A and Class C under their distribution plans (each a "Plan", collectively, the "Plans") pursuant to Rule 12b-1 under the 1940 Act. The Plans provide that, as compensation for administrative and other services provided to these classes, Management's activities and expenses related to the sale and distribution of these classes, and ongoing services provided to investors in these classes, Management receives from each of these respective classes a fee at the annual rate of 0.25% of Class A's and 1.00% of Class C's average daily net assets. Management receives this amount to provide distribution and shareholder servicing for these classes and pays a portion of it to institutions that provide such services. Those institutions may use the payments for, among other purposes, compensating employees engaged in sales and/or shareholder servicing. The amount of fees paid by each class during any year may be more or less than the cost of distribution and other services provided to that class. FINRA rules limit the amount of annual distribution fees that may be paid by a mutual fund and impose a ceiling on the cumulative distribution fees paid. The Trust's Plans comply with those rules.
Class A shares of the Fund are generally sold with an initial sales charge of up to 5.75% and no contingent deferred sales charge ("CDSC"), except that a CDSC of 1.00% applies to certain redemptions made within 18 months following purchases of $1 million or more without an initial sales charge. Class C shares of the Fund are sold with no initial sales charge and a 1.00% CDSC if shares are sold within one year after purchase.
For the period ended October 31, 2012, Management, acting as underwriter and broker-dealer, received net initial sales charges from the purchase of Class A shares and CDSCs from the redemption of Class A and Class C shares as follows:
| | | Underwriter | | Broker-Dealer |
| | | Net Initial Sales Charges | | CDSC | | Net Initial Sales Charges | | CDSC |
| Class A | | $ | 1,976 | | | $ | — | | | $ | — | | | $ | 7,979 | |
Class C | | | — | | | | — | | | | — | | | | — | |
Note C—Securities Transactions:
During the period ended October 31, 2012, there were purchase and sale transactions of long-term securities (excluding financial futures contracts and option contracts) as follows:
| Purchases | | Securities Sold Short | | Sales | | Covers on Securities Sold Short |
| $ | 50,901,151 | | | $ | 19,708,352 | | | $ | 29,231,802 | | | $ | 12,740,301 | |
During the period ended October 31, 2012, no brokerage commissions on securities transactions were paid to affiliated brokers.
Note D—Fund Share Transactions:
Share activity for the period ended October 31, 2012 was as follows:
| | | For the Period Ended October 31, 2012 | |
| | | Shares Sold | | Shares Issued on Reinvestment of Dividends and Distributions | | Shares Redeemed | | Total | |
Institutional Class(1) | | | 3,352,383 | | | | — | | | | (30,293 | ) | | | 3,322,090 | | |
Class A(1) | | | 175,493 | | | | — | | | | (80 | ) | | | 175,413 | | |
Class C(1) | | | 22,937 | | | | — | | | | — | | | | 22,937 | | |
(1) Period from May 15, 2012 (Commencement of Operations) to October 31, 2012.
Note E—Recent Accounting Pronouncement:
In December 2011, the Financial Accounting Standards Board issued Accounting Standards Update 2011-11 Disclosures about Offsetting Assets and Liabilities ("ASU 2011-11"). Effective for annual reporting periods beginning on or after January 1, 2013 and interim periods within those annual periods, ASU 2011-11 is intended to enhance disclosure requirements on the offsetting of financial assets and liabilities. At this time, Management is evaluating the implications of ASU 2011-11 and its impact on the financial statements.
Financial Highlights
The following table includes selected data for a share outstanding throughout the period and other performance information derived from the Financial Statements. Per share amounts that round to less than $0.01 or $(0.01) per share are presented as $0.00 or $(0.00), respectively. Net Asset amounts with a zero balance may reflect actual amounts rounding to less than $0.1 million.
| | | Net Asset Value, Beginning of Period | | Net Investment Income (Loss)@ | | Net Gains or Losses on Securities (both realized and unrealized) | | Total From Investment Operations | | Dividends from Net Investment Income | | Distributions from Net Realized Capital Gains | | Tax Return of Capital | | Total Distributions | | Net Asset Value, End of Period |
Absolute Return Multi-Manager Fund |
Institutional Class |
Period from 5/15/2012^ to 10/31/2012 | | $ | 10.00 | | | $ | (0.08 | ) | | $ | 0.08 | | | $ | — | | | $ | — | | | $ | — | | | $ | — | | | $ | — | | | $ | 10.00 | |
Class A |
Period from 5/15/2012^ to 10/31/2012 | | $ | 10.00 | | | $ | (0.09 | ) | | $ | 0.08 | | | $ | (0.01 | ) | | $ | — | | | $ | — | | | $ | — | | | $ | — | | | $ | 9.99 | |
Class C |
Period from 5/15/2012^ to 10/31/2012 | | $ | 10.00 | | | $ | (0.13 | ) | | $ | 0.08 | | | $ | (0.05 | ) | | $ | — | | | $ | — | | | $ | — | | | $ | — | | | $ | 9.95 | |
See Notes to Financial Highlights
| | | Total Return†† | | Net Assets, End of Period (in millions) | | Ratio of Gross Expenses to Average Net Assets‡# | | Ratio of Gross Expenses to Average Net Assets (excluding expenses on securities sold short)‡ | | Ratio of Net Expenses to Average Net Assets‡ | | Ratio of Net Expenses to Average Net Assets (excluding expenses on securities sold short)‡ | | Ratio of Net Investment Income/ (Loss) to Average Net Assets‡ | | Portfolio Turnover Rate (including securities sold short)** | | Portfolio Turnover Rate (excluding securities sold short)** |
Absolute Return Multi-Manager Fund |
Institutional Class |
Period from 5/15/2012^ to 10/31/2012 | | 0.00 | %** | $ | 33.2 | | | | 7.86 | %* | | | 7.50 | %* | | | 2.81 | %* | | | 2.45 | %* | | | (1.81 | %)* | | | 270 | % | | | 213 | % |
Class A |
Period from 5/15/2012^ to 10/31/2012 | | (0.10 | %)** | $ | 1.8 | | | | 8.67 | %* | | | 8.26 | %* | | | 3.22 | %* | | | 2.81 | %* | | | (2.02 | %)* | | | 270 | % | | | 213 | % |
Class C |
Period from 5/15/2012^ to 10/31/2012 | | (0.50 | %)** | $ | 0.2 | | | | 13.12 | %* | | | 12.74 | %* | | | 3.94 | %* | | | 3.56 | %* | | | (2.86 | %)* | | | 270 | % | | | 213 | % |
Notes to Financial Highlights
| @ | Calculated based on the average number of shares outstanding during the fiscal period. |
| †† | Total return based on per share NAV reflects the effects of changes in NAV on the performance of the Fund during the fiscal period and assumes income dividends and other distributions, if any, were reinvested but does not reflect the effect of sales charges. Results represent past performance and do not indicate future results. Current returns may be lower or higher than the performance data quoted. Investment returns and principal may fluctuate and shares when redeemed may be worth more or less than original cost. Total return would have been lower if Management had not reimbursed and/or waived certain expenses. |
| # | Represents the annualized ratios of net expenses to average daily net assets if Management had not reimbursed certain expenses and/or waived a portion of the investment management fee. |
| ‡ | Organization expense, which is a non-recurring expense, is included in these ratios on a non-annualized basis. |
| ^ | The date investment operations commenced. |
Report of Independent Registered Public Accounting Firm
To the Board of Trustees of Neuberger Berman Alternative Funds and Shareholders of
Neuberger Berman Absolute Return Multi-Manager Fund
We have audited the accompanying statement of assets and liabilities of Neuberger Berman Absolute Return Multi-Manager Fund (the "Fund"), including the schedule of investments, as of October 31, 2012, the related statement of operations, the statement of changes in net assets, and the financial highlights for the period from May 15, 2012 (commencement of operations) through October 31, 2012. These financial statements and financial highlights are the responsibility of the Fund's management. Our responsibility is to express an opinion on these financial statements and financial highlights based on our audit.
We conducted our audit in accordance with the standards of the Public Company Accounting Oversight Board (United States). Those standards require that we plan and perform the audit to obtain reasonable assurance about whether the financial statements and financial highlights are free of material misstatement. We were not engaged to perform an audit of the Fund's internal control over financial reporting. Our audit included consideration of internal control over financial reporting as a basis for designing audit procedures that are appropriate in the circumstances, but not for the purpose of expressing an opinion on the effectiveness of the Fund's internal control over financial reporting. Accordingly, we express no such opinion. An audit also includes examining, on a test basis, evidence supporting the amounts and disclosures in the financial statements and financial highlights, assessing the accounting principles used and significant estimates made by management, and evaluating the overall financial statement presentation. Our procedures included confirmation of securities owned as of October 31, 2012 by correspondence with the custodian and brokers or by other appropriate auditing procedures where replies from brokers were not received. We believe that our audit provides a reasonable basis for our opinion.
In our opinion, the financial statements and financial highlights referred to above present fairly, in all material respects, the financial position of Neuberger Berman Absolute Return Multi-Manager Fund as of October 31, 2012, and the results of its operations, the changes in its net assets, and the financial highlights for the period from May 15, 2012 (commencement of operations) through October 31, 2012, in conformity with U.S. generally accepted accounting principles.
Boston, Massachusetts
December 21, 2012
Directory
| Investment Manager, Administrator and Distributor Neuberger Berman Management LLC 605 Third Avenue, 2nd Floor New York, NY 10158-0180 800.877.9700 or 212.476.8800 Intermediary Support Services 800.366.6264 Sub-Advisers NB Alternative Investment Management LLC 605 Third Avenue, 22nd Floor New York, NY 10158 The Boston Company Asset Management, LLC One Boston Place, 14th Floor Boston, MA 02108 Cramer Rosenthal McGlynn, LLC 520 Madison Avenue, 20th Floor New York, NY 10022 GAMCO Asset Management, Inc. One Corporate Center Rye, NY 10580 Levin Capital Strategies, LP 595 Madison Avenue, 17th Floor New York, NY 10022 MacKay Shields, LLC 9 West 57th Street, 33rd Floor New York, NY 10019 Sound Point Capital Management, L.P. 1185 Avenue of the Americas, 36th Floor New York, NY 10036 Turner Investments, L.P. 1205 Westlakes Drive Suite 100 Berwyn, PA 19312 Visium Asset Management, L.P. 888 Seventh Avenue, 22nd Floor New York, NY 10019 | Custodian JPMorgan Chase & Co. 14201 Dallas Parkway Dallas, TX 75254 Shareholder Servicing Agent State Street Bank and Trust Company 2 Avenue de Lafayette Boston, MA 02111 For Institutional Class Shareholders Address correspondence to: Neuberger Berman Management LLC 605 Third Avenue, Mail Drop 2-7 New York, NY 10158-0180 Attn: Intermediary Support Services 800.366.6264 For Class A and Class C Shareholders: Please contact your investment provider Legal Counsel K&L Gates LLP 1601 K Street, NW Washington, DC 20006 Independent Registered Public Accounting Firm Ernst & Young LLP 200 Clarendon Street Boston, MA 02116 |
Trustees and Officers
The following tables set forth information concerning the trustees ("Trustees") and officers ("Officers") of the Fund. All persons named as Trustees and Officers also serve in similar capacities for other funds administered or managed by Management and NBAIM. The Fund's Statement of Additional Information includes additional information about the Trustees as of the time of the Fund's most recent public offering and is available upon request, without charge, by calling (800) 877-9700.
Information about the Board of Trustees
Name, (Year of Birth), and Address(1) | | Position(s) and Length of Time Served(2) | | Principal Occupation(s)(3) | | Number of Funds in Fund Complex Overseen by Fund Trustee | | Other Directorships Held Outside Fund Complex by Fund Trustee(3) | |
Independent Fund Trustees | |
| Faith Colish (1935) | | Trustee since inception | | Counsel, Carter Ledyard & Milburn LLP (law firm) since October 2002; formerly, Attorney-at-Law and President, Faith Colish, A Professional Corporation, 1980 to 2002. | | | 50 | | | Formerly, Director, 1997 to 2003, and Advisory Director, 2003 to 2006, ABA Retirement Funds (formerly, American Bar Retirement Association) (not-for-profit membership corporation). | |
| Martha C. Goss (1949) | | Trustee since 2007 | | President, Woodhill Enterprises Inc./Chase Hollow Associates LLC (personal investment vehicle), since 2006; Chief Operating and Financial Officer, Hopewell Holdings LLC/ Amwell Holdings, LLC (a holding company for investments in the healthcare sector), since 2003; formerly, Consultant, Resources Connection (temporary staffing), 2002 to 2006. | | | 50 | | | Director, American Water (water utility), since 2003; Director, Channel Reinsurance (financial guaranty reinsurance), 2006 to 2010; Director, Allianz Life of New York (insurance), since 2005; Director, Financial Women's Association of New York (not-for-profit association), since 2003; Trustee Emerita, Brown University, since 1998; formerly, Director, Ocwen Financial Corporation (mortgage servicing), 2005 to 2010; formerly, Advisory Board Member, Attensity (software developer), 2005 to 2007; formerly, Director, Bank Leumi (commercial bank), 2005 to 2007; formerly, Director, Claire's Stores, Inc. (retailer), 2005 to 2007. | |
Name, (Year of Birth), and Address(1) | | Position(s) and Length of Time Served(2) | | Principal Occupation(s)(3) | | Number of Funds in Fund Complex Overseen by Fund Trustee | | Other Directorships Held Outside Fund Complex by Fund Trustee(3) | |
| | | | | | | | | | | | |
| Michael M. Knetter (1960) | | Trustee since 2007 | | President and Chief Executive Officer, University of Wisconsin Foundation, since October 2010; formerly, Dean, School of Business, University of Wisconsin—Madison; formerly, Professor of International Economics and Associate Dean, Amos Tuck School of Business—Dartmouth College, 1998 to 2002. | | | 50 | | | Director, American Family Insurance (a mutual company, not publicly traded), since March 2009; formerly, Trustee, Northwestern Mutual Series Fund, Inc., 2007 to 2010; formerly, Director, Wausau Paper, 2005 to 2011; formerly, Director, Great Wolf Resorts, 2004 to 2009. | |
| Howard A. Mileaf (1937) | | Trustee since inception | | Retired; formerly, Vice President and General Counsel, WHX Corporation (holding company), 1993 to 2001. | | | 50 | | | Formerly, Director, Webfinancial Corporation (holding company), 2002 to 2008; formerly, Director, WHX Corporation (holding company), 2002 to 2005; formerly, Director, State Theatre of New Jersey (not-for-profit theatre), 2000 to 2005. | |
| George W. Morriss (1947) | | Trustee since 2007 | | Adjunct Faculty Member, Columbia University School of International Policy and Administration, since October 2012; formerly, Executive Vice President and Chief Financial Officer, People's Bank, Connecticut (a financial services company), 1991 to 2001. | | | 50 | | | Formerly, Manager, Larch Lane Multi-Strategy Fund complex (which consisted of three funds), 2006 to 2011; formerly, Member, NASDAQ Issuers' Affairs Committee, 1995 to 2003. | |
Name, (Year of Birth), and Address(1) | | Position(s) and Length of Time Served(2) | | Principal Occupation(s)(3) | | Number of Funds in Fund Complex Overseen by Fund Trustee | | Other Directorships Held Outside Fund Complex by Fund Trustee(3) | |
| | | | | | | | | | | | |
| Jack L. Rivkin (1940) | | Trustee since inception; President from inception to 2008 | | Formerly, Executive Vice President and Chief Investment Officer, Neuberger Berman Holdings LLC (holding company), 2002 to August 2008 and 2003 to August 2008, respectively; formerly, Managing Director and Chief Investment Officer, Neuberger Berman LLC ("Neuberger") December 2005 to August 2008 and 2003 to August 2008, respectively; formerly, Executive Vice President, Neuberger, December 2002 to 2005; formerly, Director and Chairman, Management, December 2002 to August 2008; formerly, Executive Vice President, Citigroup Investments, Inc., September 1995 to February 2002; formerly, Executive Vice President, Citigroup Inc., September 1995 to February 2002. | | | 50 | | | Director, Idealab (private company), since 2009; Director, Distributed World Power (private company), since 2009; Director, Dale Carnegie and Associates, Inc. (private company), since 1999; Director, Solbright, Inc. (private company), since 1998; Director, SA Agricultural Fund, since 2009; Chairman and Director, Essential Brands (consumer products) since 2008; formerly, Director, New York Society of Security Analysts, 2006 to 2008. | |
| Tom D. Seip (1950) | | Trustee since inception; Chairman of the Board since 2008; Lead Independent Trustee from 2006 to 2008 | | General Partner, Ridgefield Farm LLC (a private investment vehicle); formerly, President and CEO, Westaff, Inc. (temporary staffing), May 2001 to January 2002; formerly, Senior Executive, The Charles Schwab Corporation, 1983 to 1998, including Chief Executive Officer, Charles Schwab Investment Management, Inc.; Trustee, Schwab Family of Funds and Schwab Investments, 1997 to 1998; and Executive Vice President-Retail Brokerage, Charles Schwab & Co., Inc., 1994 to 1997. | | | 50 | | | Director, H&R Block, Inc. (financial services company), since May 2001; Chairman, Governance and Nominating Committee, H&R Block, Inc., since 2011; formerly, Chairman, Compensation Committee, H&R Block, Inc., 2006 to 2010; formerly, Director, Forward Management, Inc. (asset management company), 1999 to 2006. | |
Name, (Year of Birth), and Address(1) | | Position(s) and Length of Time Served(2) | | Principal Occupation(s)(3) | | Number of Funds in Fund Complex Overseen by Fund Trustee | | Other Directorships Held Outside Fund Complex by Fund Trustee(3) | |
| | | | | | | | | | | | |
| Candace L. Straight (1947) | | Trustee since inception | | Private investor and consultant specializing in the insurance industry; formerly, Advisory Director, Securitas Capital LLC (a global private equity investment firm dedicated to making investments in the insurance sector), 1998 to December 2003. | | | 50 | | | Public Member, Board of Governors and Board of Trustees, Rutgers University, since 2011; Director, Montpelier Re Holdings Ltd. (reinsurance company), since 2006; formerly, Director, National Atlantic Holdings Corporation (property and casualty insurance company), 2004 to 2008; formerly, Director, The Proformance Insurance Company (property and casualty insurance company), 2004 to 2008; formerly, Director, Providence Washington Insurance Company (property and casualty insurance company), 1998 to 2006; formerly, Director, Summit Global Partners (insurance brokerage firm), 2000 to 2005. | |
| Peter P. Trapp (1944) | | Trustee since inception | | Retired; formerly, Regional Manager for Mid-Southern Region, Ford Motor Credit Company, September 1997 to 2007; formerly, President, Ford Life Insurance Company, April 1995 to August 1997. | | | 50 | | | None. | |
Name, (Year of Birth), and Address(1) | | Position(s) and Length of Time Served(2) | | Principal Occupation(s)(3) | | Number of Funds in Fund Complex Overseen by Fund Trustee | | Other Directorships Held Outside Fund Complex by Fund Trustee(3) | |
| | |
| Fund Trustees who are "Interested Persons" | |
| Joseph V. Amato* (1962) | | Trustee since 2009 | | President and Director, NBG, since 2009; President and Chief Executive Officer, Neuberger and Neuberger Berman Holdings LLC (including its predecessor, Neuberger Berman Inc.), since 2007; Chief Investment Officer, Neuberger, since 2009; Chief Investment Officer (Equities) and Managing Director, Management, since 2009; Managing Director, Neuberger Berman Fixed Income LLC ("NBFI"), since 2007; Board member of NBFI since 2006; formerly, Global Head of Asset Management of Lehman Brothers Holdings Inc.'s ("LBHI") Investment Management Division, 2006 to 2009; formerly, member of LBHI's Investment Management Division's Executive Management Committee, 2006 to 2009; formerly, Managing Director, Lehman Brothers Inc. ("LBI"), 2006 to 2008; formerly, Chief Recruiting and Development Officer, LBI, 2005 to 2006; formerly, Global Head of LBI's Equity Sales and a Member of its Equities Division Executive Committee, 2003 to 2005. | | | 50 | | | Member of Board of Advisors, McDonough School of Business, Georgetown University, since 2001; Member of New York City Board of Advisors, Teach for America, since 2005; Trustee, Montclair Kimberley Academy (private school), since 2007. | |
Name, (Year of Birth), and Address(1) | | Position(s) and Length of Time Served(2) | | Principal Occupation(s)(3) | | Number of Funds in Fund Complex Overseen by Fund Trustee | | Other Directorships Held Outside Fund Complex by Fund Trustee(3) | |
| | | | | | | | | | | | |
| Robert Conti* (1956) | | Chief Executive Officer, President and Trustee since 2008; prior thereto, Executive Vice President in 2008 and Vice President from inception to 2008 | | Managing Director, Neuberger, since 2007; formerly, Senior Vice President, Neuberger, 2003 to 2006; formerly, Vice President, Neuberger, 1999 to 2003; President and Chief Executive Officer, Management, since 2008; formerly, Senior Vice President, Management, 2000 to 2008; Managing Director, NBFI, since 2009. | | | 50 | | | Director, Staten Island Mental Health Society, since 2008; formerly, Chairman of the Board, Staten Island Mental Health Society, 2008 to 2011. | |
| (1) | The business address of each listed person is 605 Third Avenue, New York, New York 10158. |
| (2) | Pursuant to the Trust's Trust Instrument, each of these Fund Trustees shall hold office for life or until his or her successor is elected or the Trust terminates; except that (a) any Fund Trustee may resign by delivering a written resignation; (b) any Fund Trustee may be removed with or without cause at any time by a written instrument signed by at least two-thirds of the other Fund Trustees; (c) any Fund Trustee who requests to be retired, or who has become unable to serve, may be retired by a written instrument signed by a majority of the other Fund Trustees; and (d) any Fund Trustee may be removed at any shareholder meeting by a vote of at least two-thirds of the outstanding shares. |
| (3) | Except as otherwise indicated, each individual has held the positions shown for at least the last five years. |
| * | Indicates a Fund Trustee who is an "interested person" within the meaning of the 1940 Act. Mr. Amato and Mr. Conti are interested persons of the Trust by virtue of the fact that each is an officer of Management, Neuberger and/or their affiliates. |
Information about the Officers of the Trust
Name, (Year of Birth), and Address(1) | | Position(s) and Length of Time Served(2) | | Principal Occupation(s)(3) | |
| | | | | | |
| Andrew B. Allard (1961) | | Anti-Money Laundering Compliance Officer since inception | | Senior Vice President, Neuberger, since 2006 and Employee since 1999; Deputy General Counsel, Neuberger, since 2004; formerly, Vice President, Neuberger, 2000 to 2005; formerly, Employee, Management, 1994 to 1999; Anti-Money Laundering Compliance Officer, nine registered investment companies for which Management acts as investment manager and administrator (six since 2002, one since 2003, one since 2005 and one since 2006). | |
| Claudia A. Brandon (1956) | | Executive Vice President since 2008 and Secretary since inception | | Senior Vice President, Neuberger, since 2007 and Employee since 1999; Senior Vice President, Management, since 2008 and Assistant Secretary since 2004; formerly, Vice President, Neuberger, 2002 to 2006; formerly, Vice President-Mutual Fund Board Relations, Management, 2000 to 2008; formerly, Vice President, Management, 1986 to 1999 and Employee 1984 to 1999; Executive Vice President, nine registered investment companies for which Management acts as investment manager and administrator (nine since 2008); Secretary, nine registered investment companies for which Management acts as investment manager and administrator (three since 1985, three since 2002, one since 2003, one since 2005 and one since 2006). | |
| Anthony DiBernardo (1979) | | Assistant Treasurer since 2011 | | Vice President, Neuberger, since 2009; Employee, Management, since 2003; Assistant Treasurer, nine registered investment companies for which Management acts as investment manager and administrator (nine since 2011). | |
| Maxine L. Gerson (1950) | | Executive Vice President since 2008 and Chief Legal Officer since inception (only for purposes of sections 307 and 406 of the Sarbanes-Oxley Act of 2002) | | Managing Director, Neuberger, since 2009, and Deputy General Counsel and Assistant Secretary, Neuberger, since 2001; Managing Director, Management, since 2009, and Secretary and General Counsel, Management, since 2004; formerly, Senior Vice President, Neuberger, 2002 to 2009; formerly, Senior Vice President, Management, 2006 to 2009; Executive Vice President, nine registered investment companies for which Management acts as investment manager and administrator (nine since 2008); Chief Legal Officer (only for purposes of sections 307 and 406 of the Sarbanes-Oxley Act of 2002), nine registered investment companies for which Management acts as investment manager and administrator (eight since 2005 and one since 2006). | |
| Sheila R. James (1965) | | Assistant Secretary since inception | | Vice President, Neuberger, since 2008 and Employee since 1999; formerly, Assistant Vice President, Neuberger, 2007; formerly, Employee, Management, 1991 to 1999; Assistant Secretary, nine registered investment companies for which Management acts as investment manager and administrator (six since 2002, one since 2003, one since 2005 and one since 2006). | |
Name, (Year of Birth), and Address(1) | | Position(s) and Length of Time Served(2) | | Principal Occupation(s)(3) | |
| | | | | | |
| Brian Kerrane (1969) | | Vice President since 2008 | | Senior Vice President, Neuberger, since 2006; formerly, Vice President, Neuberger, 2002 to 2006; Vice President, Management, since 2008 and Employee since 1991; Vice President, nine registered investment companies for which Management acts as investment manager and administrator (nine since 2008). | |
| Kevin Lyons (1955) | | Assistant Secretary since inception | | Assistant Vice President, Neuberger, since 2008 and Employee since 1999; formerly, Employee, Management, 1993 to 1999; Assistant Secretary, nine registered investment companies for which Management acts as investment manager and administrator (seven since 2003, one since 2005 and one since 2006). | |
| Owen F. McEntee, Jr. (1961) | | Vice President since 2008 | | Vice President, Neuberger, since 2006; Employee, Management, since 1992; Vice President, nine registered investment companies for which Management acts as investment manager and administrator (nine since 2008). | |
| John M. McGovern (1970) | | Treasurer and Principal Financial and Accounting Officer since inception | | Senior Vice President, Neuberger, since 2007; formerly, Vice President, Neuberger, 2004 to 2006; Employee, Management, since 1993; Treasurer and Principal Financial and Accounting Officer, nine registered investment companies for which Management acts as investment manager and administrator (eight since 2005 and one since 2006); formerly, Assistant Treasurer, eight registered investment companies for which Management acts as investment manager and administrator, 2002 to 2005. | |
| Frank Rosato (1971) | | Assistant Treasurer since inception | | Vice President, Neuberger, since 2006; Employee, Management, since 1995; Assistant Treasurer, nine registered investment companies for which Management acts as investment manager and administrator (eight since 2005 and one since 2006). | |
| Neil S. Siegel (1967) | | Vice President since 2008 | | Managing Director, Management, since 2008; Managing Director, Neuberger, since 2006; formerly, Senior Vice President, Neuberger, 2004 to 2006; Vice President, nine registered investment companies for which Management acts as investment manager and administrator (nine since 2008). | |
| Chamaine Williams (1971) | | Chief Compliance Officer since inception | | Senior Vice President, Neuberger, since 2007; Chief Compliance Officer, Management, since 2006; Chief Compliance Officer, nine registered investment companies for which Management acts as investment manager and administrator (eight since 2005 and one since 2006); formerly, Senior Vice President, LBI, 2007 to 2008; formerly, Vice President, LBI, 2003 to 2006; formerly, Chief Compliance Officer, Lehman Brothers Asset Management Inc., 2003 to 2007; formerly, Chief Compliance Officer, Lehman Brothers Alternative Investment Management LLC, 2003 to 2007. | |
| (1) | The business address of each listed person is 605 Third Avenue, New York, New York 10158. |
| (2) | Pursuant to the By-Laws of the Trust, each officer elected by the Fund Trustees shall hold office until his or her successor shall have been elected and qualified or until his or her earlier death, inability to serve, or resignation. Officers serve at the pleasure of the Fund Trustees and may be removed at any time with or without cause. |
| (3) | Except as otherwise indicated, each individual has held the positions shown for at least the last five years. |
Proxy Voting Policies and Procedures
A description of the policies and procedures that the Trust uses to determine how to vote proxies relating to portfolio securities is available, without charge, by calling 1-800-877-9700 (toll-free) and on the website of the Securities and Exchange Commission, at www.sec.gov. Information regarding how the Trust voted proxies relating to portfolio securities from its inception through June 30, 2012 is also available, without charge, by calling 1-800-877-9700 (toll-free), on the website of the Securities and Exchange Commission at www.sec.gov, and on Management's website at www.nb.com.
Quarterly Portfolio Schedule
The Trust files a complete schedule of portfolio holdings for the Fund with the Securities and Exchange Commission for the first and third quarters of the fiscal year on Form N-Q. The Trust's Forms N-Q are available on the Securities and Exchange Commission's website at www.sec.gov and may be reviewed and copied at the Securities and Exchange Commission's Public Reference Room in Washington, DC. Information on the operation of the Public Reference Room may be obtained by calling 1-800-SEC-0330. The information on Form N-Q is available upon request, without charge, by calling 1-800-877-9700 (toll-free).
Notice to Shareholders
In early 2012 you will receive information to be used in filing your 2012 tax returns, which will include a notice of the exact tax status of all distributions paid to you by the Fund during calendar year 2012. Please consult your own tax advisor for details as to how this information should be reflected on your tax returns.
For the fiscal period ended October 31, 2012, the Fund designates $57,862, or up to the maximum amount of such dividends allowable pursuant to the Internal Revenue Code, as qualified dividend income eligible for reduced tax rates. These lower rates range from 5% to 15% depending upon an individual's tax bracket. Complete information regarding the Fund's distributions during the calendar year 2012 will be reported in conjunction with Form 1099DIV.
Board Consideration of the Management and Sub-Advisory Agreements
At meetings held on December 14, 2011 and February 21, 2012, the Board of Trustees of Neuberger Berman Alternative Funds ("Board"), including the Trustees who are not "interested persons" of Neuberger Berman Management LLC ("Management") (including its affiliates) or Neuberger Berman Alternative Funds ("Independent Fund Trustees"), considered and approved the management agreement with Management ("Management Agreement") and the advisory agreement between NB Alternative Investment Management LLC ("NBAIM") and Management ("Advisory Agreement") for Neuberger Berman Absolute Return Multi-Manager Fund ("Fund").
In addition, at meetings held on December 14, 2011, February 21, 2012 and April 19, 2012, the Board, including the Independent Fund Trustees, considered and approved separate sub-advisory agreements among Management, NBAIM and each of the following subadvisers (each a "Subadviser"): The Boston Company Asset Management, LLC, Cramer Rosenthal McGlynn, LLC, GAMCO Asset Management, Inc., Levin Capital Strategies, L.P., MacKay Shields LLC, Sound Point Capital Management, L.P., Turner Investments, L.P., and Visium Asset Management, LP (each, a "Sub-Advisory Agreement"; collectively with the Management Agreement and Advisory Agreement, the "Agreements").
In evaluating the Agreements, the Board, including the Independent Fund Trustees, reviewed materials furnished by Management, NBAIM, and each Subadviser. In addition, the Board, including the Independent Fund Trustees, met with senior representatives of Management, NBAIM, and each Subadviser regarding their personnel and operations. The Independent Fund Trustees were advised by counsel that is experienced in Investment Company Act of 1940 ("1940 Act") matters and that is independent of Management and NBAIM.
The Board evaluated the terms of the Agreements, the overall fairness of the Agreements to the Fund and whether the Agreements were in the best interests of the Fund and its shareholders. The Board considered the following factors, among others, in connection with its approval of the Agreements: (1) the nature, extent, and quality of the services to be provided by Management, NBAIM and the Subadvisers; (2) the expected costs of the services to be provided; (3) the extent to which economies of scale might be realized as the Fund grows; and (4) whether fee levels reflect any such potential economies of scale for the benefit of investors in the Fund. In their deliberations, the Board members did not identify any particular information that was all-important or controlling, and each Trustee may have attributed different weights to the various factors.
The Board received and considered information regarding the nature, extent and quality of services provided to the Fund by Management, NBAIM and each Subadviser under the Agreements. The Board noted that Management and NBAIM, together with the Fund, had applied to the Securities and Exchange Commission ("SEC") for an exemptive order that would permit Management to add or replace subadvisers to the Fund without a shareholder vote, provided the Independent Fund Trustees of the Board approve the new subadviser and certain other steps are taken. In this context, the Board considered Management's and NBAIM's responsibilities for designing an overall investment program for the Fund and then identifying the Subadvisers who will carry out the different portions of that program based on NBAIM's due diligence of those Subadvisers. The Board noted the likelihood that under the multi-manager arrangement, Management would in the future have to due diligence additional subadvisers. The Board noted that NBAIM is responsible for allocating the Fund's portfolio among the various Subadvisers and determining when and how to rebalance the allocations among the Subadvisers in the wake of disparate growth and changes in the markets and the broader economy, subject to Management's general oversight.
The Board further noted that Management and NBAIM are responsible for overseeing the Subadvisers pursuant to the Agreements and related subadviser oversight policies and procedures approved by the Board. Under these procedures, NBAIM is responsible for overseeing the investment performance of the Subadvisers and evaluating the risk and return of each Subadviser's sleeve and the Fund as a whole, in addition to other significant oversight responsibilities, subject to Management's general oversight. The Board noted that Management also provides certain administrative services, including fund accounting and compliance oversight. The Board considered the size and scope of the activities necessary to periodically evaluate the compliance programs and other operational aspects of each Subadviser. The Board also considered the manner in which Management addressed various non-routine matters that have arisen from time to time, some of them a result of developments in the broader fund industry or the regulations governing it.
The Board also considered the experience and staffing of the portfolio management and investment research personnel of NBAIM and each Subadviser who would perform services for the Fund. With respect to NBAIM, the Board reviewed the performance of its fund of hedge funds product as an indication of its ability to allocate assets among different hedge fund managers, although it noted that the fund of hedge funds' strategy was not identical in that it was not subject to the liquidity or other requirements under the 1940 Act. With respect to each Subadviser, the Board reviewed performance information for any funds managed by each Subadviser that were substantially similar in strategy to the strategy the Subadviser will use for the Fund, again noting that the fund may not be subject to the same 1940 Act restrictions as the Fund. The Board considered the policies and practices regarding brokerage and allocation of portfolio transactions of each of the Subadvisers and noted that Management and NBAIM would monitor the quality of the execution services provided by each Subadviser.
The Board also reviewed whether the Subadvisers would use brokers to execute Fund transactions that provide research and other services to the Subadviser, and the types of benefits potentially derived from such services by the Subadviser, the funds and other clients of the Subadviser. In addition, the Board considered the compliance programs and compliance history of Management, NBAIM and each Subadviser, including the Fund's Chief Compliance Officer's and NBAIM's assessment of the compliance programs of the Subadvisers. The Board also considered whether there were any pending lawsuits, enforcement proceedings or regulatory investigations involving NBAIM or any Subadviser, and reviewed information regarding their financial condition, history of operations and any conflicts of interests in managing the Fund.
With respect to the overall fairness of the agreements, the Board considered the fee structure of the agreements as compared to a peer group of comparable funds and any fall-out benefits likely to accrue to Management or its affiliates. Management indicated that similar comparative information was not available with respect to the amount paid to NBAIM or to each Subadviser. The Board did, however, consider the allocation of duties and responsibilities among Management, NBAIM, and the Subadvisers and, in light of that, the amount of fees retained by each. The Board noted, however, that Management, and not the Fund, pays the fee to NBAIM and the Subadvisers. In this connection, the Board considered whether there are other business arrangements between Management or NBAIM and any Subadviser that could give rise to potential conflicts. The Board considered the fees the Subadvisers charge for similar products, if any. The Board also considered fees charged to an unregistered fund of funds managed by NBAIM that uses some of the same strategies used by the Fund and determined it was not an appropriate point of comparison because it is not subject to the 1940 Act limitations or the same liquidity constraints as the Fund. It considered whether any of the Sub-Advisory Agreements will provide for breakpoints in the fees. The Board also discussed whether to anticipate economies of scale in relation to the services Management provides to the Fund, noting that it was too soon to have a sense about economies at the start-up phase of a fund. The Board reviewed an estimate of the costs of the services to be provided and estimated profits or losses that would be realized by NBAIM and the Subadvisers.
Conclusions
In approving the Agreements, the Board concluded that the terms of each Agreement are fair and reasonable and that approval of the Agreements is in the best interests of the Fund and its shareholders. In reaching this determination, the Board considered that Management, NBAIM, and each Subadviser could be expected to provide a high level of service to the Fund; that the Fund's fee structure appeared to the Board to be reasonable given the nature and quality of services expected to be provided; and that the expected benefits accruing to Management and its affiliates by virtue of their relationship to the Fund were reasonable in comparison with the expected costs of providing the investment advisory services and the expected benefits accruing to the Fund.
| | Neuberger Berman Management LLC 605 Third Avenue 2nd Floor New York, NY 10158–0180 Shareholder Services 800.877.9700 Institutional Services 800.366.6264 www.nb.com Statistics and projections in this report are derived from sources deemed to be reliable but cannot be regarded as a representation of future results of the Fund. This report is prepared for the general information of shareholders and is not an offer of shares of the Fund. Shares are sold only through the currently effective prospectus, which must precede or accompany this report. M0257 12/12 |

Item 2. Code of Ethics.
The Board of Trustees (“Board”) of Neuberger Berman Alternative Funds (“Registrant”) adopted a code of ethics that applies to the Registrant’s principal executive officer, principal financial officer, principal accounting officer or controller, or persons performing similar functions (“Code of Ethics”). For the period covered by this Form N-CSR, there were no amendments to the Code of Ethics and there were no waivers from the Code of Ethics granted to the Registrant’s principal executive officer, principal financial officer, principal accounting officer or controller, or persons performing similar functions.
A copy of the Code of Ethics is incorporated by reference to Neuberger Berman Equity Funds’ Form N-CSR, Investment Company Act file number 811-00582 (filed on May 4, 2012). The Code of Ethics is also available, without charge, by calling 1-800-877-9700 (toll-free).
Item 3. Audit Committee Financial Expert.
The Board has determined that the Registrant has three audit committee financial experts serving on its audit committee. The Registrant’s audit committee financial experts are Martha Goss, George Morriss and Candace Straight. Ms. Goss, Mr. Morriss and Ms. Straight are independent trustees as defined by Form N-CSR.
Item 4. Principal Accountant Fees and Services.
Ernst & Young LLP (“E&Y”) serves as independent registered public accounting firm to Neuberger Berman Absolute Return Multi-Manager Fund, Neuberger Berman Global Allocation and Neuberger Berman Risk Balanced Commodity Strategy Fund. Neuberger Berman Absolute Return Multi-Manager Fund, Neuberger Berman Global Allocation and Neuberger Berman Risk Balanced Commodity Strategy Fund commenced operations on May 15, 2012, December 29, 2010, and August 27, 2012, respectively.
Tait, Weller & Baker LLP (“Tait Weller”) serves as independent registered public accounting firm to Neuberger Berman Long Short Fund. Neuberger Berman Long Short Fund commenced operations on December 29, 2011.
The aggregate fees billed for professional services rendered by E&Y for the audit of the annual financial statements or services that are normally provided by E&Y in connection with statutory and regulatory filings or engagements were $53,000 and $149,500 for the fiscal years ended 2011 and 2012, respectively.
The aggregate fees billed for professional services rendered by Tait Weller for the audit of the annual financial statements or services that are normally provided by Tait Weller in connection with statutory and regulatory filings or engagements were $25,000 for the fiscal period ended 2012.
The fees billed to other entities in the investment company complex for assurance and related services by E&Y that are reasonably related to the performance of the audit that the Audit Committee was required to approve because the engagement related directly to the operations and financial reporting of the Registrant were $0 and $0 for the fiscal period ended 2011 and 2012, respectively. The Audit Committee approved 0% and 0% of these services provided by E&Y for the fiscal period ended 2011 and 2012, respectively, pursuant to the waiver provisions of Rule 2-01(c)(7)(i)(C) of Regulation S-X.
The fees billed to other entities in the investment company complex for assurance and related services by Tait Weller that are reasonably related to the performance of the audit that the Audit Committee was required to approve because the engagement related directly to the operations and financial reporting of the Registrant were $0 for the fiscal period ended 2012. The Audit Committee approved 0% of these services provided by Tait Weller for the fiscal period ended 2012, respectively, pursuant to the waiver provisions of Rule 2-01(c)(7)(i)(C) of Regulation S-X.
The aggregate fees billed to the Registrant for professional services rendered by E&Y for tax compliance, tax advice, and tax planning were $11,500 and $38,600 for the fiscal years ended 2011 and 2012, respectively. The nature of the services provided includes preparation of the Federal and State tax extensions and tax returns, review of annual excise tax calculations, and preparation of form 8613, in addition to guidance with the identification of Passive Foreign Investment Companies ("PFICS"), assistance with determination of various foreign withholding taxes, and assistance with Internal Revenue Code and tax regulation requirements for fund investments. The Audit Committee approved 0% and 0% of these services provided by E&Y for the fiscal years ended 2011 and 2012, respectively, pursuant to the waiver provisions of Rule 2-01(c)(7)(i)(C) of Regulation S-X.
The fees billed to other entities in the investment company complex for professional services rendered by E&Y for tax compliance, tax advice, and tax planning that the Audit Committee was required to approve because the engagement related directly to the operations and financial
reporting of the Registrant were $0 and $0 for the fiscal years ended 2011 and 2012, respectively. The Audit Committee approved 0% and 0% of these services provided by E&Y for the fiscal years ended 2011 and 2012, respectively, pursuant to the waiver provisions of Rule 2-01(c)(7)(i)(C) of Regulation S-X.
The aggregate fees billed to the Registrant for professional services rendered by Tait Weller for tax compliance, tax advice, and tax planning were $4,000 for the fiscal period ended 2012. The nature of the services provided includes preparation of the Federal and State tax extensions and tax returns, review of annual excise tax calculations, and preparation of form 8613, in addition to guidance with the identification of Passive Foreign Investment Companies ("PFICS"), assistance with determination of various foreign withholding taxes, and assistance with Internal Revenue Code and tax regulation requirements for fund investments. The Audit Committee approved 0% of these services provided by Tait Weller for the fiscal period ended 2012, pursuant to the waiver provisions of Rule 2-01(c)(7)(i)(C) of Regulation S-X.
The fees billed to other entities in the investment company complex for professional services rendered by Tait Weller for tax compliance, tax advice, and tax planning that the Audit Committee was required to approve because the engagement related directly to the operations and financial reporting of the Registrant were $0 for the fiscal period ended 2012. The Audit Committee approved 0% of these services provided by Tait Weller for the fiscal period ended 2012, pursuant to the waiver provisions of Rule 2-01(c)(7)(i)(C) of Regulation S-X.
to the operations and financial reporting of the Registrant were $0 for the fiscal period ended 2012. The Audit Committee approved 0% of these services provided by E&Y for the fiscal period ended 2012, pursuant to the waiver provisions of Rule 2-01(c)(7)(i)(C) of Regulation S-X.
(1) The Audit Committee’s pre-approval policies and procedures for the Registrant to engage an accountant to render audit and non-audit services delegate to each member of the Committee the power to pre-approve services between meetings of the Committee.
(2) None of the services described in paragraphs (b) through (d) above were approved by the Audit Committee pursuant to paragraph (c)(7)(i)(C) of Rule 2-01 of Regulation S-X.
Not applicable.
Non-audit fees billed by E&Y for services rendered to the Registrant were $11,500 and $38,600 for the fiscal years ended 2011 and 2012, respectively.
Non-audit fees billed by E&Y for services rendered to the Registrant’s investment adviser and any entity controlling, controlled by, or under common control with the adviser that provides ongoing services to the Registrant were $0 and $0 for the fiscal years ended 2011 and 2012, respectively.
Non-audit fees billed by Tait Weller for services rendered to the Registrant were $4,000 for the fiscal period ended 2012.
Non-audit fees billed by Tait Weller for services rendered to the Registrant’s investment adviser and any entity controlling, controlled by, or under common control with the adviser that provides ongoing services to the Registrant were $0 for the fiscal period ended 2012.
(h) The Audit Committee of the Board considered whether the provision of non-audit services rendered to the Registrant’s investment adviser and any entity controlling, controlled by, or under common control with the adviser that provides ongoing services to the Registrant that were not pre-approved by the Audit Committee because the engagement did not relate directly to the operations and financial reporting of the Registrant is compatible with maintaining E&Y’s and Tait Weller’s independence.
Item 5. Audit Committee of Listed Registrants.
Not applicable to the Registrant.
Item 6. Schedule of Investments.
The complete schedule of investments for each series is disclosed in the Registrant’s Annual Report, which is included as Item 1 of this Form N-CSR.
Item 7. Disclosure of Proxy Voting Policies and Procedures for Closed-End Management Investment Companies.
Not applicable to the Registrant.
Item 8. Portfolio Managers of Closed-End Management Investment Companies.
Not applicable to the Registrant.
Item 9. Purchases of Equity Securities by Closed-End Management Investment Company and Affiliated Purchasers.
Not applicable to the Registrant.
Item 10. Submission of Matters to a Vote of Security Holders.
There were no changes to the procedures by which shareholders may recommend nominees to the Board.
Item 11. Controls and Procedures.
Item 12. Exhibits.
The certifications provided pursuant to Rule 30a-2(b) of the Act and Section 906 of the Sarbanes-Oxley Act are not deemed “filed” for purposes of Section 18 of the Securities Exchange Act of 1934, as amended (“Exchange Act”), or otherwise subject to the liability of that section. Such certifications will not be deemed to be incorporated by reference into any filing under the Securities Act of 1933, as amended, or the Exchange Act, except to the extent that the Registrant specifically incorporates them by reference.
Pursuant to the requirements of the Securities Exchange Act of 1934 and the Investment Company Act of 1940, the Registrant has duly caused this report to be signed on its behalf by the undersigned, thereunto duly authorized.
Pursuant to the requirements of the Securities Exchange Act of 1934 and the Investment Company Act of 1940, this report has been signed below by the following persons on behalf of the Registrant and in the capacities and on the dates indicated.
John M. McGovern