As filed with the Securities and Exchange Commission on January 6, 2014
UNITED STATES
SECURITIES AND EXCHANGE COMMISSION
Washington, D.C. 20549
FORM N-CSR
CERTIFIED SHAREHOLDER REPORT OF
REGISTERED MANAGEMENT INVESTMENT COMPANIES
Investment Company Act file number: 811- 21715
NEUBERGER BERMAN ALTERNATIVE FUNDS
(Exact Name of the Registrant as Specified in Charter)
c/o Neuberger Berman Management LLC
605 Third Avenue, 2nd Floor
New York, New York 10158-0180
(Address of Principal Executive Offices – Zip Code)
Registrant’s telephone number, including area code: (212) 476-8800
Robert Conti
Chief Executive Officer and President
Neuberger Berman Alternative Funds
c/o Neuberger Berman Management LLC
605 Third Avenue, 2nd Floor
New York, New York 10158-0180
Arthur C. Delibert, Esq.
K&L Gates LLP
1601 K Street, N.W.
Washington, D.C. 20006-1600
(Names and Addresses of agents for service)
Date of fiscal year end: October 31, 2013
Date of reporting period: October 31, 2013
Form N-CSR is to be used by management investment companies to file reports with the Commission not later than 10 days after the transmission to stockholders of any report that is required to be transmitted to stockholders under Rule 30e-1 under the Investment Company Act of 1940 (17 CFR 270.30e-1). The Commission may use the information provided on Form N-CSR in its regulatory, disclosure review, inspection and policymaking roles.
A registrant is required to disclose the information specified by Form N-CSR, and the Commission will make this information public. A registrant is not required to respond to the collection of information contained in Form N-CSR unless the Form displays a currently valid Office of Management and Budget (“OMB”) control number. Please direct comments concerning the accuracy of the information collection burden estimate and any suggestions for reducing the burden to the Secretary, Securities and Exchange Commission, 100 F Street, NE, Washington, DC 20549-0609. The OMB has reviewed this collection of information under the clearance requirements of 44 U.S.C. § 3507.
Item 1. Report to Shareholders.

Neuberger Berman
Alternative and Multi-Asset Class Funds
Institutional Class Shares
Class A Shares
Class C Shares
Dynamic Real Return Fund
Flexible Select Fund
Global Allocation Fund
Long Short Fund
Annual Report
October 31, 2013
Contents
THE FUNDS | |
President's Letter | | | 1 | | |
PORTFOLIO COMMENTARY | |
Dynamic Real Return Fund | | | 2 | | |
Flexible Select Fund | | | 5 | | |
Global Allocation Fund | | | 9 | | |
Long Short Fund | | | 13 | | |
FUND EXPENSE INFORMATION | | | 19 | | |
SCHEDULE OF INVESTMENTS/TOP TEN
EQUITY HOLDINGS | |
Dynamic Real Return Fund | | | 21 | | |
Flexible Select Fund | | | 24 | | |
Global Allocation Fund | | | 29 | | |
Positions by Industry | | | 32 | | |
Long Short Fund | | | 34 | | |
FINANCIAL STATEMENTS | | | 45 | | |
FINANCIAL HIGHLIGHTS (ALL CLASSES)/
PER SHARE DATA | |
Dynamic Real Return Fund | | | 75 | | |
Flexible Select Fund | | | 75 | | |
Global Allocation Fund | | | 77 | | |
Long Short Fund | | | 77 | | |
Reports of Independent Registered Public Accounting Firms | | | 80 | | |
Directory | | | 82 | | |
Trustees and Officers | | | 83 | | |
Proxy Voting Policies and Procedures | | | 91 | | |
Quarterly Portfolio Schedule | | | 91 | | |
Notice to Shareholders | | | 92 | | |
Board Consideration of the Management and
Sub-Advisory Agreements | | | 93 | | |
The "Neuberger Berman" name and logo are registered service marks of Neuberger Berman Group LLC. "Neuberger Berman Management LLC" and the individual Fund names in this piece are either service marks or registered service marks of Neuberger Berman Management LLC. ©2013 Neuberger Berman Management LLC. All rights reserved.
Dear Fellow Shareholder,
I am pleased to present this annual shareholder report for the following Neuberger Berman Alternative and Multi-Asset Class Funds: Neuberger Berman Global Allocation Fund, Neuberger Berman Long Short Fund and Neuberger Berman Dynamic Real Return Fund. This report also includes the new Neuberger Berman Flexible Select Fund, which was launched on May 31, 2013. The Fund seeks long-term growth of capital, while working to minimize downside volatility. The Fund is a long-only, actively managed diversified mutual fund that seeks to replicate the largest positions held by the multiple higher tracking error, absolute-return oriented equity teams at the firm. The Fund tracks the positions of approximately 17 distinct portfolio management teams at Neuberger Berman that currently manage assets primarily for high net worth clients. The Fund also has the ability to invest in cash and bonds as necessary, based on the underlying asset allocations of the various portfolio management teams.
Shifting gears to the global financial markets, they were volatile at times and generated mixed results during the reporting period. Volatility was triggered by a number of factors, including incoming global economic data, expectations for future central bank monetary policy, geopolitical issues, uncertainties regarding the U.S. fiscal cliff and sequestration, and the partial government shutdown. Despite elevated volatility at times, risk assets generated strong results during the reporting period. U.S. equities were highly resilient and generated strong results over the 12 months ended October 31, 2013. In contrast, fixed income securities were generally weak amid a rising interest rate environment.
Looking ahead, while October's government shutdown is behind us, another round of budget and debt ceiling negotiations is slated for early 2014. This could result in another bout of market volatility. Also impacting investor sentiment could be uncertainties related to the Federal Reserve's asset purchase tapering, geopolitical events and global economic data. Still, as we've seen in the past, we believe market volatility can lead to mispriced securities and compelling opportunities for long-term investors.
Thank you for your continued support and trust. We look forward to continue serving your investment needs in the years to come.
Sincerely,

ROBERT CONTI
PRESIDENT AND CEO
NEUBERGER BERMAN MUTUAL FUNDS
1
Dynamic Real Return Fund Commentary (Unaudited)
Neuberger Berman Dynamic Real Return Fund Institutional Class generated a 3.80% total return from its inception on December 19, 2012 through October 31, 2013. During this same time period, the Barclays 1-10 Year U.S. TIPS Index provided a -3.79% return while the U.S. Consumer Price Index was 1.7%.1 (Performance for all share classes is provided in the table immediately following this letter.)
The global financial markets were volatile at times and generated mixed results during the reporting period. Volatility was triggered by a number of factors, including incoming global economic data, expectations for future central bank monetary policy, geopolitical issues, uncertainties regarding the U.S. fiscal cliff and sequestration, as well as the partial government shutdown. Developed global equities were highly resilient and generated strong results; master limited partnerships (MLPs) also rallied sharply. In contrast, fixed income securities were weak amid a rising interest rate environment, in particular global Treasury Inflation-Protected Securities (TIPS) as expectations for future inflation were relatively muted.
The Fund benefited from its diversified investment approach, which helped it to outperform its benchmark. Among the sectors in which the Fund invests, its allocations to equities within the Energy and Materials sectors and to MLPs added the most value. Other contributors to absolute performance included the Fund's exposures to real estate investment trusts (REITs), high yield securities and emerging market securities. On the downside, the Fund's allocations to global TIPS and commodities were the largest detractors from results. In aggregate, the Fund's dynamic overlay (flexible use of strategies to add or remove certain exposures without disrupting the portfolio underlying structure) did not meaningfully impact its performance during the reporting period.
Looking ahead, higher inflation does not appear to us to be a near-term concern. That being said, economic data in the U.S. has generally improved in recent months, although the timing and magnitude of the Federal Reserve's asset purchase tapering remains uncertain. Outside the U.S., Europe's economy appears to us to have bottomed and aggressive monetary policy in Japan has had positive early results in terms of stimulating its economy and potentially ending its deflationary cycle. Elsewhere, recent manufacturing data in China has lessened concerns regarding a hard landing for its economy. Against this backdrop, we feel that current inflation expectations are not reflective of the global economic environment. While breakeven inflation has fallen in recent months, the overall trend has been upward over the last two years as a whole.
We believe that the Fund is well positioned, as we have the flexibility to allocate its portfolio in a diversified array of inflation-sensitive asset classes. In addition, with its dynamic overlay, we believe the Fund has the potential to provide attractive real returns in a variety of inflationary environments.
Sincerely,


THANOS BARDAS, ANDREW JOHNSON AND THOMAS J. MARTHALER
PORTFOLIO CO-MANAGERS
Information about the principal risks of investing in the Fund is set forth in the prospectus and statement of additional information.
The portfolio composition, industries and holdings of the Fund are subject to change.
The opinions expressed are those of the Fund's portfolio managers. The opinions are as of the date of this report and are subject to change without notice.
1 Consumer Price Index (CPI) is a measure that examines the weighted average of prices of a basket of consumer goods and services, such as transportation, food and medical care. The CPI is one of the most frequently used statistics for identifying periods of inflation or deflation. The CPI is available monthly, so the value shown is from December 31, 2012 through October 31, 2013, not seasonally adjusted.
2
Dynamic Real Return Fund (Unaudited)
TICKER SYMBOLS
Institutional Class | | NDRIX | |
Class A | | NDRAX | |
Class C | | NDRCX | |
PORTFOLIO BY TYPE OF
INVESTMENT STRATEGY
(as a % of Total Investment Strategies)
Commodities | | | 9.2 | % | |
Emerging Markets | | | 8.9 | | |
Global Treasury Inflation Protected Securities | | | 24.4 | | |
High Yield Securities | | | 9.6 | | |
Loans | | | 5.7 | | |
Master Limited Partnerships | | | 10.2 | | |
Real Estate Investment Trusts | | | 10.5 | | |
S&P Energy | | | 10.8 | | |
S&P Materials | | | 10.7 | | |
Total | | | 100.0 | % | |
PORTFOLIO BY TYPE OF SECURITY
(as a % of Total Net Assets)
Common Stocks | | | 40.4 | % | |
Government Securities | | | 13.5 | | |
U.S. Treasury Securities | | | 10.6 | | |
Mutual Funds | | | 33.0 | | |
Exchange Traded Funds | | | 1.5 | | |
Short-Term Investments | | | 0.8 | | |
Cash, receivables and other assets,
less liabilities | | | 0.2 | | |
Total | | | 100.0 | % | |
PERFORMANCE HIGHLIGHTS
| | | Inception
Date | | Cumulative
Total Return
Ended 10/31/2013
Life of Fund | |
At NAV | | | | | |
Institutional Class | | 12/19/2012 | | | 3.80 | % | |
Class A | | 12/19/2012 | | | 3.50 | % | |
Class C | | 12/19/2012 | | | 2.80 | % | |
With Sales Charge | | | | | |
Class A | | | | | -2.45 | % | |
Class C | | | | | 1.80 | % | |
Index | |
| Barclays U.S. 1-10 Year Treasury TIPS Index1,2 | | | | | -3.79 | % | |
The performance data quoted represent past performance and do not indicate future results. Current performance may be lower or higher than the performance data quoted. For more current performance data, please visit www.nb.com/performance.
The results shown in the table reflect the reinvestment of income dividends and other distributions, if any. The results do not reflect the effect of taxes a shareholder would pay on Fund distributions or on the redemption of Fund shares.
The investment return and principal value of an investment will fluctuate and shares, when redeemed, may be worth more or less than their original cost.
Returns would have been lower if Neuberger Berman Management LLC ("Management") had not reimbursed certain expenses and/or waived a portion of the investment management fees during certain of the periods shown. Repayment by a class (of expenses previously reimbursed and/or fees previously waived by Management) will decrease the class's returns. Please see Note B in the Notes to Financial Statements for specific information regarding expense reimbursement and/or fee waiver arrangements.
As stated in the Fund's most recent prospectus, the estimated total annual operating expense ratios for fiscal year 2013 were 1.69%, 2.05% and 2.80% for Institutional Class, Class A and Class C shares, respectively (before expense reimbursements and/or fee waivers, if any). The expense ratios were 1.01%, 1.37% and 2.12% for Institutional Class, Class A and Class C shares, respectively, after expense reimbursements and/or fee waivers.
Returns shown with a sales charge reflect the deduction of the current maximum initial sales charge of 5.75% for Class A shares and the applicable contingent deferred sales charges (CDSC) for Class C shares. The maximum CDSC for Class C shares is 1%, which is reduced to 0% after 1 year. The performance of the Fund's share classes will differ primarily due to different sales charge structures and class expenses. Please see the prospectus for more information about sales charge structures, if any, and class expenses for your share class.
3
Dynamic Real Return Fund (Unaudited)
COMPARISON OF A $1,000,000 INVESTMENT
(000s omitted)
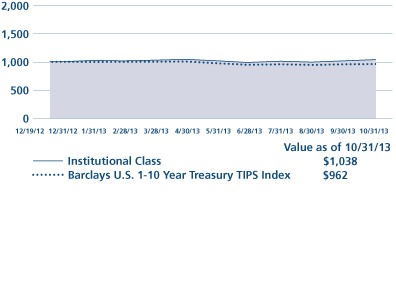
This graph shows the change in value of a hypothetical $1,000,000 investment in the Fund over the past 10 fiscal years, or since the Fund's inception if it has not operated for 10 years. The graph is based on the Institutional Class shares only; the performance of the Fund's share classes will differ primarily due to different sales charge structures and class expenses (see Performance Highlights chart on previous page). The result is compared with benchmarks, which include a broad-based market index and may include a more narrowly based index. Market indices have not been reduced to reflect any of the fees and costs of investing. The results shown in the graph reflect the reinvestment of income dividends and other distributions, if any. The results do not reflect the effect of taxes a shareholder would pay on Fund distributions or on the redemption of Fund shares. Results represent past performance and do not indicate future results.
4
Flexible Select Fund Commentary (Unaudited)
We are pleased to provide the first annual report for Neuberger Berman Flexible Select Fund, which was launched on May 31, 2013. The Fund seeks to provide long-term capital appreciation with lower volatility than the broader equity market, with a focus on mitigating downside risk. To pursue this objective, the Fund seeks to replicate the core securities selected by a diversified group of experienced Neuberger Berman portfolio managers, who have the flexibility to use an all-cap, all style equity approach in addition to the incidental use of cash and bonds in an attempt to decrease risk. Equities typically comprise the largest portion of the portfolio. As of October 31, 2013, the allocation was 86.2% equity, 7.0% fixed income and 6.8% cash and cash equivalents.
Since inception through October 31, 2013, Neuberger Berman Flexible Select Fund Institutional Class generated an 8.00% total return, compared to the 7.96% return of its benchmark, the Russell 3000® Index. The Fund provided its return with 15% lower volatility than the overall equity market, as defined by the Russell 3000 Index. (Performance for all share classes is provided in the table immediately following this letter.)
A broad range of macroeconomic indicators over the last five months pointed to a steady recovery in the U.S. These included a strengthening housing market, increasing consumer confidence and spending, generally declining unemployment, and a benign inflationary backdrop. Job growth strengthened over the summer, weakened in September, but picked up again later in the fall. This pattern helped buoy the equity markets. Geopolitical factors, including the situation in Syria and the government gridlock and eventual shutdown in October, added volatility to the markets.
In the equity portion of the portfolio, industry sector allocation had a positive contribution to relative performance during the reporting period. An underweight position in Financials had the largest positive impact, in addition to overweights in Energy and Industrials and an underweight in Information Technology (IT). Security selection also contributed positively to relative performance. The largest positive security selection contribution came from the Energy sector, where being overweighted in the smaller, U.S.-focused exploration and production companies and energy services, as well as being underweight the major integrated players, added significant value. The largest negative security selection contribution came from IT.
From a sector perspective, the portfolio's largest overweight was Energy. Many of our portfolio managers believe that despite new discoveries in the U.S., energy is a resource with increasing demand and depleting reserves. In addition, they generally believe that "easy" energy has already been discovered, and what is being discovered today is harder, i.e. more expensive, to extract. They favor exploration and production oil and natural gas companies that they believe can take advantage of unconventional drilling technology, and are optimistic about the U.S.'s prospects for energy independence. The portfolio's second-largest overweight is Health Care. The portfolio is also overweighted in Industrials, Materials and Utilities.
The portfolio's largest underweight is Financials, a sector the portfolio managers see as "under-earning and over-regulated." Within the sector, the portfolio managers generally are underweighted in banks and diversified financial companies. The portfolio is also underweighted in IT, while having high conviction in select names (four of the top 10 holdings are IT names). Other underweight sectors include Consumer Discretionary, Consumer Staples and Telecommunication Services.
We are constructive on equities over the next 12 months, with a positive outlook for further gains. Economic data has been solid, and we anticipate that the U.S. recovery will continue. We believe we will see improved U.S. earnings growth, continued multiple expansion and strong margins. We also think the Federal Reserve will continue to be supportive. Stock return correlations, which rose meaningfully in the wake of the global financial crisis, have started to decline, a trend that we believe may continue in the next 12 months. This could provide a tailwind to equity managers who focus on
5
fundamental security selection, as performance dispersion among stocks increases and company fundamentals take on greater importance in driving returns.
Sincerely,

JOSEPH V. AMATO
PORTFOLIO MANAGER
Information about the principal risks of investing in the Fund is set forth in the prospectus and statement of additional information.
The portfolio composition, industries and holdings of the Fund are subject to change.
The opinions expressed are those of the Fund's portfolio manager. The opinions are as of the date of this report and are subject to change without notice.
6
Flexible Select Fund (Unaudited)
TICKER SYMBOLS
Institutional Class | | NFLIX | |
Class A | | NFLAX | |
Class C | | NFLCX | |
SECTOR ALLOCATION
(as a % of Total Investments)
Consumer Discretionary | | | 9.8 | % | |
Consumer Staples | | | 7.4 | | |
Energy | | | 11.9 | | |
Financials | | | 11.4 | | |
Health Care | | | 12.9 | | |
Industrials | | | 11.8 | | |
Information Technology | | | 12.2 | | |
Materials | | | 4.5 | | |
Telecommunication Services | | | 0.7 | | |
Utilities | | | 3.8 | | |
Other | | | 6.9 | | |
Short-Term Investments | | | 6.7 | | |
Total | | | 100.0 | % | |
PERFORMANCE HIGHLIGHTS
| | | Inception
Date | | Cumulative
Total Return
Ended 10/31/2013
Life of Fund | |
At NAV | | | | | |
Institutional Class | | 05/31/2013 | | | 8.00 | % | |
Class A | | 05/31/2013 | | | 7.80 | % | |
Class C | | 05/31/2013 | | | 7.50 | % | |
With Sales Charge | | | | | |
Class A | | | | | 1.60 | % | |
Class C | | | | | 6.50 | % | |
Index | |
| Russell 3000® Index1,2 | | | | | 7.96 | % | |
The performance data quoted represent past performance and do not indicate future results. Current performance may be lower or higher than the performance data quoted. For more current performance data, please visit www.nb.com/performance.
The results shown in the table reflect the reinvestment of income dividends and other distributions, if any. The results do not reflect the effect of taxes a shareholder would pay on Fund distributions or on the redemption of Fund shares.
The investment return and principal value of an investment will fluctuate and shares, when redeemed, may be worth more or less than their original cost.
Returns would have been lower if Neuberger Berman Management LLC ("Management") had not reimbursed certain expenses and/or waived a portion of the investment management fees during certain of the periods shown. Repayment by a class (of expenses previously reimbursed and/or fees previously waived by Management) will decrease the class's returns. Please see Note B in the Notes to Financial Statements for specific information regarding expense reimbursement and/or fee waiver arrangements.
As stated in the Fund's most recent prospectus, the estimated total annual operating expense ratios for fiscal year 2013 were 1.33%, 1.69% and 2.44% for Institutional Class, Class A and Class C shares, respectively (before expense reimbursements and/or fee waivers, if any). The expense ratios were 0.88%, 1.24% and 1.99% for Institutional Class, Class A and Class C shares, respectively, after expense reimbursements and/or fee waivers.
Returns shown with a sales charge reflect the deduction of the current maximum initial sales charge of 5.75% for Class A shares and the applicable contingent deferred sales charges (CDSC) for Class C shares. The maximum CDSC for Class C shares is 1%, which is reduced to 0% after 1 year. The performance of the Fund's share classes will differ primarily due to different sales charge structures and class expenses. Please see the prospectus for more information about sales charge structures, if any, and class expenses for your share class.
7
Flexible Select Fund (Unaudited)
COMPARISON OF A $1,000,000 INVESTMENT
(000s omitted)

This graph shows the change in value of a hypothetical $1,000,000 investment in the Fund over the past 10 fiscal years, or since the Fund's inception if it has not operated for 10 years. The graph is based on the Institutional Class shares only; the performance of the Fund's share classes will differ primarily due to different sales charge structures and class expenses (see Performance Highlights chart on previous page). The result is compared with benchmarks, which include a broad-based market index and may include a more narrowly based index. Market indices have not been reduced to reflect any of the fees and costs of investing. The results shown in the graph reflect the reinvestment of income dividends and other distributions, if any. The results do not reflect the effect of taxes a shareholder would pay on Fund distributions or on the redemption of Fund shares. Results represent past performance and do not indicate future results.
8
Global Allocation Fund Commentary (Unaudited)
Neuberger Berman Global Allocation Fund Institutional Class generated a 14.56% total return for the 12 months ended October 31, 2013 and outperformed its custom benchmark, a 50/50 combination of the MSCI World Index and the JP Morgan Global Government Bond Index, which provided a 10.61% return for the period. (Performance for all share classes is provided in the table immediately following this letter.)
The global financial markets were volatile at times and generated mixed results during the reporting period. Volatility was triggered by a number of factors, including global economic data, expectations for future central bank monetary policy, geopolitical issues, uncertainties regarding the U.S. fiscal cliff and sequestration, as well as the partial government shutdown. Developed global equities were highly resilient and generated strong results during the period. Relative to equity markets, global fixed income securities generally exhibited weaker performance, partly in response to the prospect of a rising interest rate environment. Elsewhere, the currency markets fluctuated at times, partially driven by expectations for shifting central bank monetary policy.
One of the main drivers of the Fund's outperformance was security selection. From a sector perspective, almost all sectors contributed positively, particularly securities within the Financial and Industrial sectors. Positioning in Health Care companies marginally detracted from performance over the 12-month period. On a regional basis, security selection added value almost across the board, particularly within the U.S. and Europe ex-UK. Security selection within Canada was the only area to detract value.
Our asset allocation strategy generated mixed results during the period. Tactical positioning within equity added value to the Fund's performance, whereas fixed income and currency positioning detracted from results. The Fund's macro positioning in fixed income securities was implemented primarily through derivatives, such as futures contracts on government bonds and derivatives on a broad-based fixed income index. The Fund's positioning in equity markets and its currency exposure were obtained through a combination of exchange traded funds (ETFs) and derivatives such as futures and forwards.
In equities, our positioning in Japan was the largest contributor, as its market rallied sharply given highly accommodative monetary and fiscal policy. Tactically adjusting the Fund's UK equity exposure was also beneficial. In fixed income markets, our overall positioning was a positive for results. Our overweight positioning in UK gilts and U.S. Treasuries were detractors, while the Fund's tactical positioning in Australian bonds generated a gain. In terms of the Fund's currency exposure, positioning in the Australian dollar and, to a lesser extent the Japanese yen, detracted from performance. These negatives were partially offset by the positive impact of our positioning in the UK pound.
Much of the Fund's investment exposure is accomplished through the use of derivatives, including total return swaps, futures and forwards, which may not require the Fund to deposit the full notional amount of its investments with counterparties. The Fund's resulting cash balances are invested in money market mutual funds.
Despite the political uncertainty in the U.S., global markets have shown resilience, evidenced by the highs we have witnessed from some assets in the Fund's universe and slightly stronger corporate and consumer confidence. Against this backdrop, as we move into the last portion of the year, we are cautiously optimistic about the Fund's equity positioning. In fixed income, the Fund's positioning is fairly tactical, whereas our view on the U.S. dollar is slightly positive. Overall, while we have found that macro views have been challenged, the opportunity set for individual stock picking has
9
increased, in our view. With a dynamic risk taking capability, the Fund has the ability to be flexible and go anywhere, allowing it to potentially take advantage of these opportunities.
Sincerely,


WAI LEE, ALEXANDRE DA SILVA, PING ZHOU, JOSEPH V. AMATO AND BRADLEY TANK
PORTFOLIO CO-MANAGERS
Information about the principal risks of investing in the Fund is set forth in the prospectus and statement of additional information.
The portfolio composition, industries and holdings of the Fund are subject to change.
The opinions expressed are those of the Fund's portfolio managers. The opinions are as of the date of this report and are subject to change without notice.
10
Global Allocation Fund (Unaudited)
TICKER SYMBOLS
Institutional Class | | NGLIX | |
Class A | | NGLAX | |
Class C | | NGLCX | |
PERFORMANCE HIGHLIGHTS3
| | | Average Annual Total
Return Ended 10/31/2013 | |
| | | Inception
Date | | 1 Year | | Life of
Fund | |
At NAV | |
Institutional Class | | 12/29/2010 | | | 14.56 | % | | | 9.46 | % | |
Class A | | 12/29/2010 | | | 14.15 | % | | | 9.09 | % | |
Class C | | 12/29/2010 | | | 13.30 | % | | | 8.26 | % | |
With Sales Charge | |
Class A | | | | | | | 7.54 | % | | | 6.84 | % | |
Class C | | | | | | | 12.30 | % | | | 8.26 | % | |
Index | |
50% MSCI World Index and 50% J.P. Morgan
Global Government Bond Index1,2 | | | | | | | 10.61 | % | | | 7.21 | % | |
| MSCI World Index1,2 | | | | | | | 26.48 | % | | | 11.43 | % | |
The performance data quoted represent past performance and do not indicate future results. Current performance may be lower or higher than the performance data quoted. For more current performance data, please visit www.nb.com/performance.
The results shown in the table reflect the reinvestment of income dividends and other distributions, if any. The results do not reflect the effect of taxes a shareholder would pay on Fund distributions or on the redemption of Fund shares.
The investment return and principal value of an investment will fluctuate and shares, when redeemed, may be worth more or less than their original cost.
Returns would have been lower if Neuberger Berman Management LLC ("Management") had not reimbursed certain expenses and/or waived a portion of the investment management fees during certain of the periods shown. Repayment by a class (of expenses previously reimbursed and/or fees previously waived by Management) will decrease the class's returns. Please see Note B in the Notes to Financial Statements for specific information regarding expense reimbursement and/or fee waiver arrangements.
As stated in the Fund's most recent prospectus, the total annual operating expense ratios for fiscal year 2012 were 4.87%, 5.27% and 6.33% for Institutional Class, Class A and Class C shares, respectively (before expense reimbursements and/or fee waivers, if any). The expense ratios were 1.49%, 1.88% and 2.58% for Institutional Class, Class A and Class C shares, respectively, after expense reimbursements and/or fee waivers.
Returns shown with a sales charge reflect the deduction of the current maximum initial sales charge of 5.75% for Class A shares and the applicable contingent deferred sales charges (CDSC) for Class C shares. The maximum CDSC for Class C shares is 1%, which is reduced to 0% after 1 year. The performance of the Fund's share classes will differ primarily due to different sales charge structures and class expenses. Please see the prospectus for more information about sales charge structures, if any, and class expenses for your share class.
11
Global Allocation Fund (Unaudited)
COMPARISON OF A $1,000,000 INVESTMENT
(000s omitted)
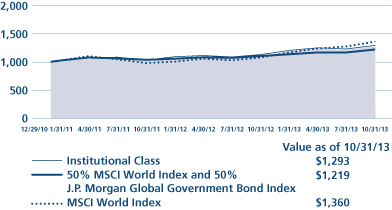
This graph shows the change in value of a hypothetical $1,000,000 investment in the Fund over the past 10 fiscal years, or since the Fund's inception if it has not operated for 10 years. The graph is based on the Institutional Class shares only; the performance of the Fund's share classes will differ primarily due to different sales charge structures and class expenses (see Performance Highlights chart on previous page). The result is compared with benchmarks, which include a broad-based market index and may include a more narrowly based index. Market indices have not been reduced to reflect any of the fees and costs of investing. The results shown in the graph reflect the reinvestment of income dividends and other distributions, if any. The results do not reflect the effect of taxes a shareholder would pay on Fund distributions or on the redemption of Fund shares. Results represent past performance and do not indicate future results.
12
Long Short Fund Commentary (Unaudited)
Neuberger Berman Long Short Fund Institutional Class generated a 13.47% total return for the 12 months ended October 31, 2013, but underperformed its primary benchmark, the S&P 500 Index, which provided a 27.18% return for the period. (Performance for all share classes is provided in the table immediately following this letter.) However, the Fund outperformed the HFRX Equity Hedge Index, which returned 9.74% for the period. (The index tracks the performance of strategies that maintain positions both long and short in primarily equity and equity derivative securities.)
The financial markets were volatile during the reporting period. However, the U.S. equity market was highly resilient, with the S&P 500 Index rising sharply and reaching all-time highs on several occasions. In contrast, the overall fixed income market generated weak results. Interest rates moved higher given expectations that the U.S. Federal Reserve (the Fed) would start tapering its asset purchases sooner than previously expected. Rates declined somewhat over the last two months of the period as the Fed chose to delay the taper, but it was not enough to offset earlier losses. One notable bright spot within the fixed income market were high yield bonds, as they benefited from overall robust demand and low defaults.
We maintained a positive outlook on risk assets such as equities and high yield bonds, which was reflected in the long side of the portfolio. Within our equity holdings, which represented the bulk of our long exposure, the Fund remained most exposed to more cyclical industries, including the Consumer Discretionary sector. Elsewhere, we increased our allocation to the Information Technology (IT) sector.
We categorize our investments on the long side into three groups: Capital Growth, Total Return and Opportunistic. Capital Growth investments demonstrate what we believe are attractive industry fundamentals, strong competitive positions, growing revenues and attractive re-investment opportunities. Total Return investments demonstrate what we believe are sustainable and/or growing streams of income that are underpinned by asset value and which can result in growing cash returns to shareholders. The Total Return category includes our fixed income holdings, which consisted mainly of high yield securities during the reporting period. Opportunistic investments are those where we find what we believe are identifiable catalysts. This may include companies with management changes, company reorganizations, merger and acquisition activity and other market dislocations that have the potential to unlock intrinsic value.1
In favorable macro environments, the exposure to Capital Growth and Opportunistic fundamental longs historically tended to increase relative to the Total Return category. During the reporting period, the Capital Growth category represented the largest exposure in our long portfolio and was the largest contributor to the Fund's performance.
The short exposure within the portfolio is broken into "Fundamental" shorts and "Market" shorts. During the reporting period, our Market shorts consisted primarily of exchange traded funds and short futures positions on the S&P 500 Index. Given increased market volatility during the second half of the period, we increased our weighting to Fundamental shorts versus Market shorts. Due to the market's strong rally, our Market shorts detracted the most from the Fund's performance. The majority of our derivatives exposure fell under our aforementioned Market short categorization.
Looking ahead, we continue to have a positive outlook on risk assets such as equities and high yield bonds. This is based on two fundamental beliefs. First, the U.S. economy, although growing at a modest pace, is structurally more resilient than generally believed, in our opinion. Second, equities and high yield bonds are more attractive than traditional "safe" asset classes such as Treasury and investment grade bonds, in our view. Our positive view on risk assets is not without potential risks. We have been consistent in our belief that the massive global liquidity measures by the Fed, European Central Bank and Japan's central bank, while positive for risk assets globally, may have severe unintended consequences over the long term. We believe ongoing fiscal policy uncertainties are also likely to weigh on investment sentiment at
13
times. We highlight these different risks because the current environment necessitates a flexible approach. However, we believe the greatest risks to the global economy are still those that are unknown today, whether they are financial or geopolitical in nature.
Sincerely,

CHARLES KANTOR
PORTFOLIO MANAGER
Information about the principal risks of investing in the Fund is set forth in the prospectus and statement of additional information.
The portfolio composition, industries and holdings of the Fund are subject to change.
The opinions expressed are those of the Fund's portfolio manager. The opinions are as of the date of this report and are subject to change without notice.
1 Intrinsic value reflects the portfolio manager's analysis and estimates of a company's value. There is no guarantee that any intrinsic values will be realized; security prices may decrease regardless of intrinsic value.
14
Long Short Fund (Unaudited)
TICKER SYMBOLS
Institutional Class | | NLSIX | |
Class A | | NLSAX | |
Class C | | NLSCX | |
PORTFOLIO BY TYPE OF SECURITY
(as a % of Total Investments)
| | | Long | | Short | |
Common Stocks | | | 87.0 | % | | | (10.3 | )% | |
Corporate Debt Securities | | | 19.2 | | | | — | | |
Exchange Traded Funds | | | — | | | | (8.9 | ) | |
Preferred Stocks | | | 0.1 | | | | — | | |
Purchased Options | | | 0.3 | | | | — | | |
Short-Term Investments | | | 12.6 | | | | — | | |
Total | | | 119.2 | % | | | (19.2 | )% | |
PERFORMANCE HIGHLIGHTS
| | | Average Annual Total
Return Ended 10/31/2013 | |
| | | Inception
Date | | 1 Year | | Life of
Fund | |
At NAV | | | | | |
Institutional Class | | 12/29/2011 | | | 13.47 | % | | | 13.28 | % | |
Class A | | 12/29/2011 | | | 13.08 | % | | | 12.90 | % | |
Class C | | 12/29/2011 | | | 12.23 | % | | | 12.05 | % | |
With Sales Charge | |
Class A | | | | | 6.62 | % | | | 9.33 | % | |
Class C | | | | | 11.23 | % | | | 12.05 | % | |
Index | |
| S&P 500 Index1,2 | | | | | 27.18 | % | | | 22.92 | % | |
| HFRX Equity Hedge Index1,2 | | | | | 9.74 | % | | | 7.49 | % | |
The performance data quoted represent past performance and do not indicate future results. Current performance may be lower or higher than the performance data quoted. For more current performance data, please visit www.nb.com/performance.
The results shown in the table reflect the reinvestment of income dividends and other distributions, if any. The results do not reflect the effect of taxes a shareholder would pay on Fund distributions or on the redemption of Fund shares.
The investment return and principal value of an investment will fluctuate and shares, when redeemed, may be worth more or less than their original cost.
Returns would have been lower if Neuberger Berman Management LLC ("Management") had not reimbursed certain expenses and/or waived a portion of the investment management fees during certain of the periods shown. Repayment by a class (of expenses previously reimbursed and/or fees previously waived by Management) will decrease the class's returns. Please see Note B in the Notes to Financial Statements for specific information regarding expense reimbursement and/or fee waiver arrangements.
As stated in the Fund's most recent prospectus, the total annual operating expense ratios for fiscal year 2012 were 2.59%, 3.03% and 4.14% for Institutional Class, Class A and Class C shares, respectively (before expense reimbursements and/or fee waivers, if any). The expense ratios were 1.86%, 2.20% and 2.98% for Institutional Class, Class A and Class C shares, respectively, after expense reimbursements and/or fee waivers.
Returns shown with a sales charge reflect the deduction of the current maximum initial sales charge of 5.75% for Class A shares and the applicable contingent deferred sales charges (CDSC) for Class C shares. The maximum CDSC for Class C shares is 1%, which is reduced to 0% after 1 year. The performance of the Fund's share classes will differ primarily due to different sales charge structures and class expenses. Please see the prospectus for more information about sales charge structures, if any, and class expenses for your share class.
15
Long Short Fund (Unaudited)
COMPARISON OF A $1,000,000 INVESTMENT
(000s omitted)
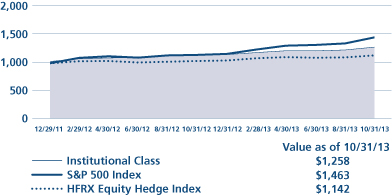
This graph shows the change in value of a hypothetical $1,000,000 investment in the Fund over the past 10 fiscal years, or since the Fund's inception if it has not operated for 10 years. The graph is based on the Institutional Class shares only; the performance of the Fund's share classes will differ primarily due to different sales charge structures and class expenses (see Performance Highlights chart on previous page). The result is compared with benchmarks, which include a broad-based market index and may include a more narrowly based index. Market indices have not been reduced to reflect any of the fees and costs of investing. The results shown in the graph reflect the reinvestment of income dividends and other distributions, if any. The results do not reflect the effect of taxes a shareholder would pay on Fund distributions or on the redemption of Fund shares. Results represent past performance and do not indicate future results.
16
1 Please see "Glossary of Indices" on page 18 for a description of indices. The HFRX Index does take into account fees and expenses of investing since it is based on the underlying hedge funds' net returns. Please note that all other indices listed in this report do not take into account any fees, expenses or tax consequences of investing in the individual securities that they track, and that individuals cannot invest directly in any index. Data about the performance of an index is prepared or obtained by Neuberger Berman Management LLC ("Management") and reflects the reinvestment of income dividends and other distributions, if any. The Fund may invest in securities not included in a described index and may not invest in all securities included in a described index.
2 The date used to calculate Life of Fund performance for the index is the inception date of the oldest share class.
3 During the period from December 29, 2010 through April 30, 2011, the Fund had only one shareholder and the Fund was relatively small, which could have impacted Fund performance. The same techniques used to produce returns in a small fund may not work to produce similar returns in a larger fund.
For more complete information on any of the Neuberger Berman Alternative and Multi-Asset Class Funds, call Management at (800) 877-9700, or visit our website at www.nb.com.
17
MSCI World Index: | | A free float-adjusted market capitalization weighted index that is designed to measure the equity market performance of developed markets. The MSCI World Index consists of the following 24 developed market country indices: Australia, Austria, Belgium, Canada, Denmark, Finland, France, Germany, Greece, Hong Kong, Ireland, Israel, Italy, Japan, Netherlands, New Zealand, Norway, Portugal, Singapore, Spain, Sweden, Switzerland, the United Kingdom, and the United States. | |
50% MSCI World Index and 50% J.P. Morgan Global Government Bond Index: | | A blended index combining the performance of two separate indexes, the MSCI World Index and the J.P. Morgan Global Government Bond Index. The blended index tracks the performance of the two indexes at a 50%/50% weight, and is rebalanced monthly. The J.P. Morgan Global Government Bond Index (GBI) provides a comprehensive measure for the performance of market-weighted local currency denominated fixed rate government debt of large developed government bond markets. This index covers 13 countries: Australia, Belgium, Canada, Denmark, France, Germany, Italy, Japan, the Netherlands, Spain, Sweden, the United Kingdom, and the United States. The index measures returns in USD terms with no currency hedging and is rebalanced monthly. All government debt issues with at least 13 months remaining to maturity and meeting liquidity requirements are included in the index. | |
S&P 500 Index: | | Widely regarded as the standard for measuring the performance of large-cap stocks traded on U.S. markets and includes a representative sample of leading companies in leading industries. | |
Barclays 1-10 Year U.S. TIPS Index: | | An unmanaged index market comprised of U.S. Treasury Inflation Protected securities having a maturity of at least 1 year and less than 10 years. | |
HFRX Equity Hedge Index: | | The HFRX Equity Hedge Index is designed to reflect the performance of strategies that maintain positions both long and short in primarily equity and equity derivative securities. A wide variety of investment processes can be employed to arrive at an investment decision, including both quantitative and fundamental techniques; strategies can be broadly diversified or narrowly focused on specific sectors and can range broadly in terms of levels of net exposure, leverage employed, holding period, concentrations of market capitalizations and valuation ranges of typical portfolios. Equity Hedge managers would typically maintain at least 50%, and may in some cases be substantially entirely invested in equities, both long and short. Fund weights are determined by the optimization process. Constituent funds are selected from an eligible pool of the more than 6,800 funds that report performance to the Hedge Fund Research (HFR) database on a voluntary basis, and rebalanced quarterly. Funds included in the index must meet all of the following criteria: report monthly returns net of all fees; be denominated in USD; be active and accepting new investments; have a minimum 24 months track record; and the Fund's manager must have at least $50 million in assets under management. The index is available daily, with finalized month-end performance available two to three business days after the last business day of the month. | |
Russell 3000® Index: | | Measures the performance of the largest 3,000 U.S. companies, representing approximately 98% of the investable U.S. equity market. | |
18
Information About Your Fund's Expenses (Unaudited)
As a Fund shareholder, you incur two types of costs: (1) transaction costs, including sales charges (loads) on purchase payments or redemption proceeds (if applicable); and (2) ongoing costs, including management fees, distribution and/or service (12b-1) fees (if applicable), and other Fund expenses. This example is intended to help you understand your ongoing costs (in dollars) of investing in a Fund and compare these costs with the ongoing costs of investing in other mutual funds.
This table is designed to provide information regarding costs related to your investments. The following examples are based on an investment of $1,000 made at the beginning of the six month period ended October 31, 2013 and held for the entire period. The table illustrates each Fund's costs in two ways:
Actual Expenses and Performance: | | The first section of the table provides information about actual account values and actual expenses in dollars, based on the Fund's actual performance during the period when the Fund was operational. You may use the information in this line, together with the amount you invested, to estimate the expenses you paid over the period. Simply divide your account value by $1,000 (for example, an $8,600 account value divided by $1,000 = 8.6), then multiply the result by the number in the first section of the table under the heading entitled "Expenses Paid During the Period" to estimate the expenses you paid over the period. | |
Hypothetical Example for Comparison Purposes: | | The second section of the table provides information about hypothetical account values and hypothetical expenses based on the Fund's actual expense ratio and an assumed rate of return at 5% per year before expenses. This return is not the Fund's actual return. The hypothetical account values and expenses may not be used to estimate the actual ending account balance or expenses you paid for the period. You may use this information to compare the ongoing costs of investing in a Fund versus other funds. To do so, compare the expenses shown in this 5% hypothetical example with the 5% hypothetical examples that appear in the shareholder reports of other funds. | |
Please note that the expenses in the table are meant to highlight your ongoing costs only and do not include any transaction costs, such as sales charges (loads)(if applicable). Therefore, the information under the heading "Hypothetical (5% annual return before expenses)" is useful in comparing ongoing costs only, and will not help you determine the relative total costs of owning different funds. In addition, if these transaction costs were included, your costs would have been higher.
19
Expense Information as of 10/31/13 (Unaudited)
Neuberger Berman Alternative Funds | |
| | | ACTUAL | | HYPOTHETICAL (5% ANNUAL RETURN BEFORE EXPENSES)(3) | |
| | | Beginning
Account
Value
5/1/13 | | Ending
Account
Value
10/31/13 | | Expenses Paid
During the
Period(1)
5/1/13 - 10/31/13 | | Expense
Ratio | | Beginning
Account
Value
5/1/13 | | Ending
Account
Value
10/31/13 | | Expenses Paid
During the
Period(1)
5/1/13 - 10/31/13 | | Expense
Ratio | |
Dynamic Real Return Fund | |
Institutional Class | | $ | 1,000.00 | | | $ | 996.20 | | | $ | 3.47 | | | | 0.69 | % | | $ | 1,000.00 | | | $ | 1,021.73 | | | $ | 3.52 | | | | 0.69 | % | |
Class A | | $ | 1,000.00 | | | $ | 994.20 | | | $ | 5.28 | | | | 1.05 | % | | $ | 1,000.00 | | | $ | 1,019.91 | | | $ | 5.35 | | | | 1.05 | % | |
Class C | | $ | 1,000.00 | | | $ | 990.40 | | | $ | 9.03 | | | | 1.80 | % | | $ | 1,000.00 | | | $ | 1,016.13 | | | $ | 9.15 | | | | 1.80 | % | |
Flexible Select Fund | |
Institutional Class | | $ | 1,000.00 | | | $ | 1,080.00 | | | $ | 3.64 | (2) | | | 0.83 | % | | $ | 1,000.00 | | | $ | 1,021.02 | | | $ | 4.23 | | | | 0.83 | % | |
Class A | | $ | 1,000.00 | | | $ | 1,078.00 | | | $ | 5.22 | (2) | | | 1.19 | % | | $ | 1,000.00 | | | $ | 1,019.21 | | | $ | 6.06 | | | | 1.19 | % | |
Class C | | $ | 1,000.00 | | | $ | 1,075.00 | | | $ | 8.49 | (2) | | | 1.94 | % | | $ | 1,000.00 | | | $ | 1,015.43 | | | $ | 9.86 | | | | 1.94 | % | |
Global Allocation Fund | |
Institutional Class | | $ | 1,000.00 | | | $ | 1,036.50 | | | $ | 7.19 | | | | 1.40 | % | | $ | 1,000.00 | | | $ | 1,018.15 | | | $ | 7.12 | | | | 1.40 | % | |
Class A | | $ | 1,000.00 | | | $ | 1,034.90 | | | $ | 9.08 | | | | 1.77 | % | | $ | 1,000.00 | | | $ | 1,016.28 | | | $ | 9.00 | | | | 1.77 | % | |
Class C | | $ | 1,000.00 | | | $ | 1,030.70 | | | $ | 12.90 | | | | 2.52 | % | | $ | 1,000.00 | | | $ | 1,012.50 | | | $ | 12.78 | | | | 2.52 | % | |
Long Short Fund | |
Institutional Class | | $ | 1,000.00 | | | $ | 1,054.90 | | | $ | 8.96 | | | | 1.73 | % | | $ | 1,000.00 | | | $ | 1,016.48 | | | $ | 8.79 | | | | 1.73 | % | |
Class A | | $ | 1,000.00 | | | $ | 1,053.50 | | | $ | 10.66 | | | | 2.06 | % | | $ | 1,000.00 | | | $ | 1,014.82 | | | $ | 10.46 | | | | 2.06 | % | |
Class C | | $ | 1,000.00 | | | $ | 1,049.70 | | | $ | 14.52 | | | | 2.81 | % | | $ | 1,000.00 | | | $ | 1,011.04 | | | $ | 14.24 | | | | 2.81 | % | |
(1) For each class, expenses are equal to the annualized expense ratio for the class, multiplied by the average account value over the period, multiplied by 184/365 (to reflect the one-half year period shown), unless otherwise indicated.
(2) For each class, expenses are equal to the annualized expense ratio for the class, multiplied by the average account value over the period, multiplied by 154/365 (to reflect the period shown of May 31, 2013 (Commencement of Operations) to October 31, 2013).
(3) Hypothetical 5% annual return before expenses is calculated by multiplying the number of days in the most recent period divided by 365.
20
Schedule of Investments Dynamic Real Return Fund
TOP TEN HOLDINGS
| | 1 | | | Neuberger Berman High Income Bond Fund Institutional Class | | | 9.5 | % | |
| | 2 | | | Neuberger Berman Risk Balanced Commodity Strategy Fund Institutional Class | | | 9.0 | % | |
| | 3 | | | Neuberger Berman Emerging Markets Equity Fund Institutional Class | | | 8.8 | % | |
| | 4 | | | Neuberger Berman Floating Rate Income Fund Institutional Class | | | 5.6 | % | |
| | 5 | | | Italy Buoni Poliennali Del Tesoro, Senior Unsecured Notes, 2.60%, due 9/15/23 | | | 2.7 | % | |
| | 6 | | | Exxon Mobil Corp. | | | 2.4 | % | |
| | 7 | | | United Kingdom Gilt Inflation Linked Bonds, 0.13%, due 3/22/29 | | | 2.3 | % | |
| | 8 | | | France Government Bond OAT, Bonds, 0.25%, due 7/25/24 | | | 2.1 | % | |
| | 9 | | | U.S. Treasury Inflation Indexed Notes, 1.13%, due 1/15/21 | | | 1.7 | % | |
| | 10 | | | U.S. Treasury Inflation Indexed Notes, 0.13%, due 1/15/23 | | | 1.7 | % | |
| | |
Number
of Shares | |
Value† | |
Common Stocks (40.4%) | |
Chemicals (7.6%) | |
Air Products &
Chemicals, Inc. | | | 660
| | | $ | 71,946
| | |
Airgas, Inc. | | | 217 | | | | 23,668 | | |
CF Industries
Holdings, Inc. | | | 205
| | | | 44,198
| | |
Dow Chemical
Co. | | | 3,738
| | | | 147,539
| | |
E. I. du Pont
de Nemours &
Co. | | | 2,914
| | | | 178,337
| | |
Eastman
Chemical Co. | | | 475
| | | | 37,425
| | |
Ecolab, Inc. | | | 827 | | | | 87,662 | | |
FMC Corp. | | | 435 | | | | 31,651 | | |
International
Flavors &
Fragrances, Inc. | | | 255
| | | | 21,076
| | |
LyondellBasell
Industries NV
Class A | | | 1,154
| | | | 86,088
| | |
Monsanto Co. | | | 1,694 | | | | 177,667 | | |
Mosaic Co. | | | 872 | | | | 39,981 | | |
PPG Industries,
Inc. | | | 446
| | | | 81,431
| | |
Praxair, Inc. | | | 944 | | | | 117,726 | | |
Sherwin-Williams
Co. | | | 268
| | | | 50,384
| | |
Sigma-Aldrich
Corp. | | | 381
| | | | 32,930
| | |
| | | | 1,229,709 | | |
Construction Materials (0.1%) | |
Vulcan Materials
Co. | | | 414
| | | | 22,170
| | |
Containers & Packaging (0.6%) | |
Ball Corp. | | | 481 | | | | 23,516 | | |
Bemis Co., Inc. | | | 323 | | | | 12,888 | | |
MeadWestvaco
Corp. | | | 547
| | | | 19,063
| | |
Owens-Illinois,
Inc. | | | 513
| | | | 16,308
| * | |
Sealed Air Corp. | | | 616 | | | | 18,591 | | |
| | | | 90,366 | | |
| | |
Number
of Shares | |
Value† | |
Energy Equipment & Services (1.8%) | |
Baker Hughes,
Inc. | | | 412
| | | $ | 23,933
| | |
Cameron
International
Corp. | | | 230
| | | | 12,618
| * | |
Diamond
Offshore
Drilling, Inc. | | | 65
| | | | 4,026
| | |
Ensco PLC
Class A | | | 222
| | | | 12,798
| | |
FMC
Technologies,
Inc. | | | 219
| | | | 11,071
| * | |
Halliburton Co. | | | 865 | | | | 45,871 | | |
Helmerich &
Payne, Inc. | | | 97
| | | | 7,522
| | |
Nabors
Industries Ltd. | | | 278
| | | | 4,859
| | |
National Oilwell
Varco, Inc. | | | 408
| | | | 33,122
| | |
Noble Corp. | | | 236 | | | | 8,897 | | |
Rowan Cos. PLC
Class A | | | 115
| | | | 4,149
| * | |
Schlumberger
Ltd. | | | 1,245
| | | | 116,681
| | |
| | | | 285,547 | | |
Gas Utilities (1.1%) | |
ONEOK, Inc. | | | 1,600 | | | | 90,400 | | |
Suburban
Propane
Partners LP | | | 2,000
| | | | 95,360
| | |
| | | | 185,760 | | |
Hotels, Restaurants & Leisure (0.5%) | |
Cedar Fair LP | | | 1,700 | | | | 77,945 | | |
Household Durables (0.2%) | |
TRI Pointe
Homes, Inc. | | | 1,630
| | | | 25,950
| * | |
Metals & Mining (1.7%) | |
Alcoa, Inc. | | | 3,366 | | | | 31,203 | | |
Allegheny
Technologies,
Inc. | | | 330
| | | | 10,923
| | |
Cliffs Natural
Resources, Inc. | | | 495
| | | | 12,712
| | |
| | |
Number
of Shares | |
Value† | |
Freeport-
McMoRan
Copper & Gold,
Inc. | | | 3,152
| | | $ | 115,868
| | |
Newmont
Mining Corp. | | | 1,671
| | | | 45,551
| | |
Nucor Corp. | | | 998 | | | | 51,666 | | |
United States
Steel Corp. | | | 467
| | | | 11,624
| | |
| | | | 279,547 | | |
Multi-Utilities (0.2%) | |
CenterPoint
Energy, Inc. | | | 1,600
| | | | 39,360
| | |
Oil, Gas & Consumable Fuels (15.9%) | |
Alliance
Holdings GP LP | | | 1,800
| | | | 107,352
| | |
Anadarko
Petroleum Corp. | | | 458
| | | | 43,643
| | |
Apache Corp. | | | 371 | | | | 32,945 | | |
Boardwalk
Pipeline
Partners LP | | | 2,400
| | | | 71,880
| | |
Cabot Oil &
Gas Corp. | | | 376
| | | | 13,280
| | |
Chesapeake
Energy Corp. | | | 483
| | | | 13,505
| | |
Chevron Corp. | | | 1,790 | | | | 214,728 | | |
ConocoPhillips | | | 1,120 | | | | 82,096 | | |
CONSOL Energy,
Inc. | | | 203
| | | | 7,410
| | |
Crestwood
Equity
Partners LP | | | 5,500
| | | | 83,050
| | |
Crestwood
Midstream
Partners LP | | | 4,176
| | | | 91,454
| | |
Denbury
Resources, Inc. | | | 358
| | | | 6,798
| * | |
Devon Energy
Corp. | | | 348
| | | | 22,001
| | |
Energy Transfer
Equity LP | | | 2,050
| | | | 138,559
| | |
Enterprise
Products
Partners | | | 2,100
| | | | 132,888
| | |
EOG Resources,
Inc. | | | 252
| | | | 44,957
| | |
See Notes to Schedule of Investments
21
| | |
Number
of Shares | |
Value† | |
EQT Corp. | | | 139 | | | $ | 11,900 | | |
Exxon Mobil
Corp. | | | 4,233
| | | | 379,361
| | |
Hess Corp. | | | 268 | | | | 21,762 | | |
Kinder Morgan,
Inc. | | | 581
| | | | 20,515
| | |
Marathon Oil
Corp. | | | 662
| | | | 23,342
| | |
Marathon
Petroleum Corp. | | | 306
| | | | 21,928
| | |
Murphy Oil Corp. | | | 166 | | | | 10,013 | | |
Newfield
Exploration Co. | | | 129
| | | | 3,928
| * | |
NGL Energy
Partners LP | | | 1,500
| | | | 47,190
| | |
Noble Energy,
Inc. | | | 332
| | | | 24,877
| | |
NuStar GP
Holdings LLC | | | 1,700
| | | | 41,735
| | |
Occidental
Petroleum Corp. | | | 747
| | | | 71,772
| | |
Peabody Energy
Corp. | | | 255
| | | | 4,967
| | |
Phillips 66 | | | 591 | | | | 38,078 | | |
Pioneer Natural
Resources Co. | | | 119
| | | | 24,369
| | |
PVR Partners LP | | | 4,200 | | | | 109,998 | | |
QEP Resources,
Inc. | | | 164
| | | | 5,422
| | |
Range Resources
Corp. | | | 150
| | | | 11,356
| | |
Regency Energy
Partners LP | | | 5,800
| | | | 147,842
| | |
Southcross
Energy Partners
LP | | | 1,600
| | | | 32,320
| | |
Southwestern
Energy Co. | | | 323
| | | | 12,022
| * | |
Spectra Energy
Corp. | | | 2,407
| | | | 85,617
| | |
Spectra Energy
Partners LP | | | 900
| | | | 39,348
| | |
Teekay LNG
Partners LP | | | 850
| | | | 35,275
| | |
Teekay Offshore
Partners LP | | | 1,700
| | | | 57,137
| | |
Tesoro Corp. | | | 130 | | | | 6,356 | | |
Valero Energy
Corp. | | | 521
| | | | 21,450
| | |
Western Gas
Partners LP | | | 600
| | | | 36,066
| | |
Williams Cos.,
Inc. | | | 3,017
| | | | 107,737
| | |
WPX Energy, Inc. | | | 181 | | | | 4,007 | * | |
| | | | 2,564,236 | | |
Paper & Forest Products (0.4%) | |
International
Paper Co. | | | 1,364
| | | | 60,848
| | |
Real Estate Investment Trusts (9.8%) | |
American
Campus
Communities,
Inc. | | | 475
| | | | 16,416
| | |
| | |
Number
of Shares | |
Value† | |
American
Homes 4 Rent
Class A | | | 800
| | | $ | 12,384
| ñ* | |
American
Homes 4 Rent
Class A | | | 1,345
| | | | 20,821
| * | |
American
Residential
Properties, Inc. | | | 1,570
| | | | 27,051
| * | |
American Tower
Corp. | | | 1,330
| | | | 105,535
| | |
AvalonBay
Communities,
Inc. | | | 580
| | | | 72,529
| | |
Boston
Properties, Inc. | | | 550
| | | | 56,925
| | |
Brixmor
Property
Group, Inc. | | | 600
| | | | 12,390
| * | |
Camden
Property Trust | | | 510
| | | | 32,742
| | |
CBL &
Associates
Properties, Inc. | | | 820
| | | | 16,244
| | |
Corporate
Office
Properties Trust | | | 885
| | | | 21,771
| | |
Cousins
Properties, Inc. | | | 1,565
| | | | 17,731
| | |
DDR Corp. | | | 2,020 | | | | 34,239 | | |
Digital Realty
Trust, Inc. | | | 610
| | | | 29,073
| | |
Douglas
Emmett, Inc. | | | 1,160
| | | | 28,919
| | |
EastGroup
Properties, Inc. | | | 480
| | | | 30,557
| | |
Equity
Residential | | | 1,375
| | | | 71,995
| | |
Federal Realty
Investment Trust | | | 325
| | | | 33,670
| | |
General Growth
Properties, Inc. | | | 2,110
| | | | 44,795
| | |
HCP, Inc. | | | 1,237 | | | | 51,336 | | |
Health Care
REIT, Inc. | | | 525
| | | | 34,046
| | |
Highwoods
Properties, Inc. | | | 530
| | | | 20,458
| | |
Host Hotels &
Resorts, Inc. | | | 2,375
| | | | 44,056
| | |
LaSalle Hotel
Properties | | | 950
| | | | 29,498
| | |
OMEGA
Healthcare
Investors, Inc. | | | 750
| | | | 24,930
| | |
Post Properties,
Inc. | | | 565
| | | | 25,843
| | |
Prologis, Inc. | | | 1,785 | | | | 71,311 | | |
Public Storage | | | 520 | | | | 86,824 | | |
QTS Realty
Trust, Inc.
Class A | | | 800
| | | | 17,184
| * | |
Rayonier, Inc. | | | 490 | | | | 23,040 | | |
Simon Property
Group, Inc. | | | 985
| | | | 152,232
| | |
| | |
Number
of Shares | |
Value† | |
SL Green Realty
Corp. | | | 325
| | | $ | 30,735
| | |
Sovran Self
Storage, Inc. | | | 220
| | | | 16,828
| | |
Taubman
Centers, Inc. | | | 385
| | | | 25,329
| | |
Terreno Realty
Corp. | | | 960
| | | | 17,069
| | |
Urstadt Biddle
Properties, Inc.
Class A | | | 985
| | | | 19,444
| | |
Ventas, Inc. | | | 960 | | | | 62,630 | | |
Vornado Realty
Trust | | | 825
| | | | 73,474
| | |
Weyerhaeuser
Co. | | | 2,055
| | | | 62,472
| | |
| | | | 1,574,526 | | |
Real Estate Management & Development (0.5%) | |
Altisource
Residential
Corp. | | | 925
| | | | 24,577
| | |
Brookfield Asset
Management,
Inc. Class A | | | 595
| | | | 23,550
| | |
Forest City
Enterprises,
Inc. Class A | | | 1,365
| | | | 27,655
| * | |
| | | | 75,782 | | |
Specialty Retail (0.0%) | |
CST Brands, Inc. | | | 57 | | | | 1,837 | | |
Murphy USA, Inc. | | | 41 | | | | 1,664 | * | |
| | | | 3,501 | | |
Total Common Stocks
(Cost $5,984,071) | | | | | | | 6,515,247
| | |
| | | Principal
Amount | | | |
Government Securities (13.5%) | |
Sovereign (13.5%) | |
Australia
Government
Bond, Senior
Unsecured
Notes,
1.25%, due
2/21/22 | | AUD | 44,952
| a | | | 43,217
| | |
Australia
Government
Bond, Senior
Unsecured
Notes,
2.50%, due
9/20/30 | | AUD | 160,000
| a | | | 178,773
| | |
Canadian
Government
Bond, Bonds,
4.25%, due
12/1/21 | | CAD | 148,176
| a | | | 186,745
| | |
See Notes to Schedule of Investments
22
| | |
Principal
Amount | |
Value† | |
France
Government
Bond OAT,
Bonds,
0.25%, due
7/25/24 | | EUR | 257,440
| a | | $ | 337,120
| | |
Italy Buoni
Poliennali Del
Tesoro, Bonds,
2.55%, due
9/15/41 | | EUR | 37,793
| a | | | 43,667
| | |
Italy Buoni
Poliennali Del
Tesoro, Senior
Unsecured
Notes,
2.35%, due
9/15/35 | | EUR | 118,807
| a | | | 144,056
| | |
Italy Buoni
Poliennali Del
Tesoro, Senior
Unsecured
Notes,
2.60%, due
9/15/23 | | EUR | 323,372
| a | | | 434,169
| | |
New
Zealand
Government
Bond, Senior
Unsecured
Notes,
2.00%, due
9/20/25 | | NZD | 180,000
| a | | | 141,700
| | |
Sweden
Government
Bond, Bonds,
0.25%, due
6/1/22 | | SEK | 1,185,000
| a | | | 177,783
| | |
United
Kingdom Gilt
Inflation
Linked Bonds,
0.13%, due
3/22/24 | | GBP | 41,409
| a | | | 69,595
| | |
United
Kingdom Gilt
Inflation
Linked Bonds,
0.13%, due
3/22/29 | | GBP | 221,974
| a | | | 367,117
| | |
United
Kingdom Gilt
Inflation
Linked Bonds,
1.88%, due
11/22/22 | | GBP | 30,507
| a | | | 60,344
| | |
Total Government
Securities
(Cost $2,201,381) | |
| | | 2,184,286
| | |
| | |
Principal
Amount | |
Value† | |
U.S. Treasury Securities-Backed by the Full Faith and Credit of the U.S. Government (10.6%) | |
U.S.
Treasury
Inflation
Indexed Bonds,
0.63%, due
2/15/43 | | $ | 86,463
| | | $ | 71,440
| | |
U.S. Treasury
Inflation
Indexed Bonds,
1.75%, due
1/15/28 | | | 217,684
| | | | 244,368
| | |
U.S. Treasury
Inflation
Indexed Bonds,
2.13%, due
1/15/19 | | | 196,070
| | | | 223,260
| | |
U.S. Treasury
Inflation
Indexed Bonds,
2.13%, due
2/15/40 | | | 91,972
| | | | 109,468
| | |
U.S. Treasury
Inflation
Indexed Bonds,
2.38%, due
1/15/25 | | | 55,832
| | | | 66,727
| | |
U.S. Treasury
Inflation
Indexed Bonds,
3.88%, due
4/15/29 | | | 135,148
| | | | 194,053
| | |
U.S. Treasury
Inflation
Indexed Notes,
0.13%, due
1/15/22 | | | 258,320
| | | | 255,979
| | |
U.S. Treasury
Inflation
Indexed Notes,
0.13%, due
1/15/23 | | | 278,630
| | | | 272,078
| | |
U.S. Treasury
Inflation
Indexed Notes,
1.13%, due
1/15/21 | | | 256,584
| | | | 276,990
| | |
Total U.S. Treasury
Securities-Backed by the
Full Faith and Credit of the
U.S. Government
(Cost $1,819,620) | | | | | | | 1,714,363
| | |
| | |
Number
of Shares | |
Value† | |
Mutual Funds (33.0%) | |
Neuberger
Berman
Emerging
Markets Equity
Fund
Institutional
Class | | | 84,322
| | | $ | 1,426,337
| § | |
Neuberger
Berman
Floating Rate
Income Fund
Institutional
Class | | | 88,308
| | | | 908,393
| § | |
Neuberger
Berman
High Income
Bond Fund
Institutional
Class | | | 159,659
| | | | 1,539,701
| § | |
Neuberger
Berman
Risk Balanced
Commodity
Strategy Fund
Institutional
Class | | | 161,988
| | | | 1,458,878
| *§ | |
Total Mutual Funds
(Cost $5,369,977) | | | | | 5,333,309
| | |
Exchange Traded Funds (1.5%) | |
Energy Select
Sector SPDR
Fund | | | 2,300
| | | | 198,697
| | |
Materials Select
Sector SPDR
Trust | | | 800
| | | | 35,016
| | |
Total Exchange
Traded Funds
(Cost $225,192) | |
| | | 233,713
| | |
Short-Term Investments (0.8%) | |
State Street
Institutional
Liquid Reserves
Fund
Institutional
Class (Cost
$127,327) | | | 127,327
| | | | 127,327
| | |
Total Investments (99.8%)
(Cost $15,727,568) | | | | | | | 16,108,245
| ## | |
Cash, receivables
and other assets,
less liabilities (0.2%) | | | | | 34,075
| ± | |
Total Net Assets (100.0%) | | | | $ | 16,142,320 | | |
See Notes to Schedule of Investments
23
Schedule of Investments Flexible Select Fund
TOP TEN HOLDINGS
| | 1 | | | Neuberger Berman Core Bond Fund Insitutional Class | | | 6.8 | % | |
| | 2 | | | Microsoft Corp. | | | 1.7 | % | |
| | 3 | | | Bristol-Myers Squibb Co. | | | 1.6 | % | |
| | 4 | | | Occidental Petroleum Corp. | | | 1.5 | % | |
| | 5 | | | Schlumberger Ltd. | | | 1.5 | % | |
| | 6 | | | Pfizer, Inc. | | | 1.4 | % | |
| | 7 | | | IBM Corp. | | | 1.4 | % | |
| | 8 | | | Apple, Inc. | | | 1.3 | % | |
| | 9 | | | Google, Inc. Class A | | | 1.3 | % | |
| | 10 | | | Johnson & Johnson | | | 1.3 | % | |
| | |
Number
of Shares | |
Value† | |
Common Stocks (86.1%) | |
Aerospace & Defense (3.0%) | |
Boeing Co. | | | 8,562 | | | $ | 1,117,341 | | |
General
Dynamics
Corp. | | | 7,642
| | | | 662,026
| | |
Honeywell
International,
Inc. | | | 5,874
| | | | 509,452
| | |
Lockheed
Martin Corp. | | | 78
| | | | 10,401
| | |
Precision
Castparts Corp. | | | 629
| | | | 159,420
| | |
Raytheon Co. | | | 929 | | | | 76,522 | | |
United
Technologies
Corp. | | | 1,053
| | | | 111,881
| | |
| | | | 2,647,043 | | |
Air Freight & Logistics (0.6%) | |
FedEx Corp. | | | 1,192 | | | | 156,152 | | |
United Parcel
Service, Inc.
Class B | | | 3,736
| | | | 367,025
| | |
| | | | 523,177 | | |
Airlines (0.4%) | |
Delta Air Lines,
Inc. | | | 12,292
| | | | 324,263
| | |
Auto Components (0.2%) | |
BorgWarner,
Inc. | | | 1,482
| | | | 152,839
| | |
Delphi
Automotive
PLC | | | 1,015
| | | | 58,058
| | |
| | | | 210,897 | | |
Beverages (1.6%) | |
Anheuser-Busch
InBev NV ADR | | | 2,655
| | | | 275,403
| | |
Beam, Inc. | | | 1,564 | | | | 105,257 | | |
Coca-Cola Co. | | | 14,186 | | | | 561,340 | | |
Dr Pepper
Snapple
Group, Inc. | | | 2,968
| | | | 140,535
| | |
PepsiCo, Inc. | | | 3,683 | | | | 309,704 | | |
| | | | 1,392,239 | | |
| | |
Number
of Shares | |
Value† | |
Biotechnology (1.3%) | |
Amgen, Inc. | | | 3,808 | | | $ | 441,728 | | |
Celgene Corp. | | | 1,177 | | | | 174,773 | * | |
Regeneron
Pharmaceuticals,
Inc. | | | 1,703
| | | | 489,783
| * | |
Vertex
Pharmaceuticals,
Inc. | | | 351
| | | | 25,040
| * | |
| | | | 1,131,324 | | |
Capital Markets (1.1%) | |
BlackRock, Inc. | | | 1,170 | | | | 351,948 | | |
Franklin
Resources, Inc. | | | 2,141
| | | | 115,314
| | |
Goldman
Sachs Group,
Inc. | | | 1,590
| | | | 255,767
| | |
Golub Capital
BDC, Inc. | | | 1,226
| | | | 21,577
| | |
Hannon
Armstrong
Sustainable
Infrastructure
Capital, Inc. | | | 1,187
| | | | 14,541
| | |
Invesco Ltd. | | | 1,713 | | | | 57,814 | | |
T. Rowe Price
Group, Inc. | | | 1,141
| | | | 88,325
| | |
UBS AG | | | 4,050 | | | | 78,408 | * | |
| | | | 983,694 | | |
Chemicals (2.9%) | |
Air Products &
Chemicals, Inc. | | | 463
| | | | 50,472
| | |
Ashland, Inc. | | | 3,744 | | | | 346,507 | | |
E. I. du Pont
de Nemours &
Co. | | | 1,993
| | | | 121,972
| | |
Ecolab, Inc. | | | 3,760 | | | | 398,560 | | |
International
Flavors &
Fragrances, Inc. | | | 903
| | | | 74,633
| | |
Methanex Corp. | | | 1,038 | | | | 60,370 | | |
Minerals
Technologies,
Inc. | | | 2,941
| | | | 166,549
| | |
Monsanto Co. | | | 3,499 | | | | 366,975 | | |
Mosaic Co. | | | 1,542 | | | | 70,701 | | |
Praxair, Inc. | | | 2,050 | | | | 255,655 | | |
| | |
Number
of Shares | |
Value† | |
Scotts
Miracle-Gro
Co. Class A | | | 1,292
| | | $ | 75,866
| | |
Sensient
Technologies
Corp. | | | 3,616
| | | | 188,502
| | |
WR Grace & Co. | | | 3,420 | | | | 313,477 | * | |
| | | | 2,490,239 | | |
Commercial Banks (1.2%) | |
BankUnited, Inc. | | | 1,585 | | | | 48,770 | | |
First Republic
Bank | | | 1,048
| | | | 53,521
| | |
Itau Unibanco
Holding SA
ADR,
Preference
Shares | | | 7,987
| | | | 123,080
| | |
M&T Bank
Corp. | | | 1,121
| | | | 126,146
| | |
PNC Financial
Services
Group, Inc. | | | 535
| | | | 39,339
| | |
U.S. Bancorp | | | 4,411 | | | | 164,795 | | |
Wells Fargo &
Co. | | | 11,839
| | | | 505,407
| | |
| | | | 1,061,058 | | |
Commercial Services & Supplies (1.3%) | |
Covanta
Holding Corp. | | | 13,218
| | | | 226,953
| | |
Healthcare
Services
Group, Inc. | | | 4,829
| | | | 132,266
| | |
Knoll, Inc. | | | 496 | | | | 8,144 | | |
Pitney Bowes,
Inc. | | | 13,183
| | | | 281,325
| | |
Stericycle, Inc. | | | 1,851 | | | | 215,086 | * | |
Tetra Tech, Inc. | | | 4,660 | | | | 121,766 | * | |
Tyco
International
Ltd. | | | 4,290
| | | | 156,800
| | |
| | | | 1,142,340 | | |
Communications Equipment (0.5%) | |
Arris Group, Inc. | | | 3,676 | | | | 65,653 | * | |
Cisco Systems,
Inc. | | | 14,413
| | | | 324,293
| | |
| | | | 389,946 | | |
See Notes to Schedule of Investments
24
| | |
Number
of Shares | |
Value† | |
Computers & Peripherals (2.3%) | |
Apple, Inc. | | | 2,228 | | | $ | 1,163,796 | | |
EMC Corp. | | | 26,185 | | | | 630,273 | | |
SanDisk Corp. | | | 2,772 | | | | 192,654 | | |
| | | | 1,986,723 | | |
Construction & Engineering (0.2%) | |
Chicago
Bridge & Iron
Co. NV | | | 1,064
| | | | 78,832
| | |
Quanta
Services, Inc. | | | 4,169
| | | | 125,945
| * | |
| | | | 204,777 | | |
Consumer Finance (0.8%) | |
American
Express Co. | | | 8,846
| | | | 723,603
| | |
Containers & Packaging (0.8%) | |
Avery Dennison
Corp. | | | 1,554
| | | | 73,225
| | |
Packaging
Corp. of
America | | | 1,594
| | | | 99,274
| | |
Sealed Air
Corp. | | | 16,796
| | | | 506,903
| | |
| | | | 679,402 | | |
Diversified Consumer Services (0.1%) | |
Sotheby's | | | 1,463 | | | | 75,930 | | |
Diversified Financial Services (2.6%) | |
Berkshire
Hathaway, Inc.
Class B | | | 5,040
| | | | 580,003
| * | |
Citigroup, Inc. | | | 2,623 | | | | 127,950 | | |
CME Group,
Inc. | | | 3,607
| | | | 267,675
| | |
Intercontinental
Exchange, Inc. | | | 838
| | | | 161,508
| * | |
JPMorgan
Chase & Co. | | | 21,800
| | | | 1,123,572
| | |
| | | | 2,260,708 | | |
Diversified Telecommunication Services (0.5%) | |
AT&T, Inc. | | | 2,749 | | | | 99,514 | | |
BCE Inc. | | | 3,925 | | | | 170,855 | | |
Singapore
Telecommunications
Ltd. | | | 48,568
| | | | 147,792
| | |
tw telecom, Inc. | | | 1,456 | | | | 45,893 | * | |
| | | | 464,054 | | |
Electric Utilities (1.6%) | |
El Paso
Electric Co. | | | 393
| | | | 13,822
| | |
Great Plains
Energy, Inc. | | | 11,107
| | | | 260,348
| | |
ITC Holdings
Corp. | | | 2,661
| | | | 267,670
| | |
NextEra
Energy, Inc. | | | 6,392
| | | | 541,722
| | |
| | |
Number
of Shares | |
Value† | |
Northeast
Utilities | | | 3,160
| | | $ | 135,533
| | |
NRG Yield, Inc.
Class A | | | 1,220
| | | | 43,212
| * | |
OGE Energy
Corp. | | | 1,438
| | | | 53,062
| | |
Pinnacle West
Capital Corp. | | | 1,068
| | | | 59,840
| | |
| | | | 1,375,209 | | |
Electrical Equipment (0.5%) | |
ABB Ltd. ADR | | | 3,833 | | | | 97,626 | * | |
Eaton Corp.
PLC | | | 2,144
| | | | 151,281
| | |
Rockwell
Automation,
Inc. | | | 1,217
| | | | 134,369
| | |
Roper
Industries, Inc. | | | 512
| | | | 64,927
| | |
| | | | 448,203 | | |
Electronic Equipment, Instruments & Components (0.5%) | |
Corning, Inc. | | | 12,540 | | | | 214,308 | | |
Dolby
Laboratories,
Inc. Class A | | | 1,483
| | | | 53,002
| | |
National
Instruments
Corp. | | | 2,452
| | | | 71,231
| | |
Universal
Display Corp. | | | 1,844
| | | | 58,824
| * | |
| | | | 397,365 | | |
Energy Equipment & Services (2.3%) | |
Dresser-Rand
Group, Inc. | | | 1,464
| | | | 88,967
| * | |
Ensco PLC
Class A | | | 2,658
| | | | 153,234
| | |
FMC
Technologies,
Inc. | | | 1,827
| | | | 92,355
| * | |
Rowan Cos.
PLC Class A | | | 3,621
| | | | 130,646
| * | |
Schlumberger
Ltd. | | | 13,676
| | | | 1,281,715
| | |
SEACOR
Holdings, Inc. | | | 256
| | | | 25,037
| | |
Seadrill Ltd. | | | 4,746 | | | | 221,258 | | |
| | | | 1,993,212 | | |
Food & Staples Retailing (1.1%) | |
Costco
Wholesale
Corp. | | | 2,163
| | | | 255,234
| | |
CVS Caremark
Corp. | | | 2,994
| | | | 186,406
| | |
Safeway, Inc. | | | 4,120 | | | | 143,788 | | |
Walgreen Co. | | | 6,762 | | | | 400,581 | | |
| | | | 986,009 | | |
| | |
Number
of Shares | |
Value† | |
Food Products (2.7%) | |
Bunge Ltd. | | | 2,084 | | | $ | 171,159 | | |
ConAgra
Foods, Inc. | | | 10,826
| | | | 344,375
| | |
Kraft Foods
Group, Inc. | | | 7,538
| | | | 409,916
| | |
McCormick &
Co., Inc. | | | 822
| | | | 56,841
| | |
Mead Johnson
Nutrition Co. | | | 1,542
| | | | 125,920
| | |
Mondelez
International,
Inc. Class A | | | 10,855
| | | | 365,162
| | |
Nestle SA ADR | | | 2,526 | | | | 182,908 | | |
Unilever NV | | | 9,992 | | | | 396,882 | | |
WhiteWave
Foods Co.
Class A | | | 12,998
| | | | 260,090
| * | |
| | | | 2,313,253 | | |
Gas Utilities (0.1%) | |
National Fuel
Gas Co. | | | 1,761
| | | | 126,000
| | |
Health Care Equipment &
Supplies (2.5%) | |
Abbott
Laboratories | | | 2,129
| | | | 77,815
| | |
Baxter
International,
Inc. | | | 809
| | | | 53,289
| | |
Becton,
Dickinson &
Co. | | | 678
| | | | 71,278
| | |
C.R. Bard, Inc. | | | 3,671 | | | | 500,064 | | |
Cooper Cos.,
Inc. | | | 504
| | | | 65,122
| | |
Covidien PLC | | | 4,319 | | | | 276,891 | | |
Edwards
Lifesciences
Corp. | | | 1,820
| | | | 118,646
| * | |
Hill-Rom
Holdings, Inc. | | | 2,650
| | | | 109,418
| | |
IDEXX
Laboratories,
Inc. | | | 2,789
| | | | 300,821
| * | |
Medtronic, Inc. | | | 4,337 | | | | 248,944 | | |
Sirona Dental
Systems, Inc. | | | 3,327
| | | | 240,376
| * | |
West
Pharmaceutical
Services, Inc. | | | 667
| | | | 32,249
| | |
Zimmer
Holdings, Inc. | | | 662
| | | | 57,905
| | |
| | | | 2,152,818 | | |
Health Care Providers & Services (2.2%) | |
Cardinal
Health, Inc. | | | 6,083
| | | | 356,829
| | |
DaVita
HealthCare
Partners, Inc. | | | 2,022
| | | | 113,657
| * | |
Express Scripts
Holding Co. | | | 9,045
| | | | 565,493
| * | |
See Notes to Schedule of Investments
25
| | |
Number
of Shares | |
Value† | |
HCA Holdings,
Inc. | | | 3,321
| | | $ | 156,552
| | |
Henry Schein,
Inc. | | | 1,745
| | | | 196,190
| * | |
McKesson Corp. | | | 1,645 | | | | 257,179 | | |
VCA Antech,
Inc. | | | 5,195
| | | | 147,798
| * | |
WellPoint Inc. | | | 1,081 | | | | 91,669 | | |
| | | | 1,885,367 | | |
Hotels, Restaurants & Leisure (1.8%) | |
Arcos Dorados
Holdings, Inc.
Class A | | | 6,030
| | | | 72,601
| | |
Darden
Restaurants,
Inc. | | | 1,992
| | | | 102,648
| | |
Dunkin' Brands
Group, Inc. | | | 5,606
| | | | 267,294
| | |
Hyatt Hotels
Corp. Class A | | | 2,952
| | | | 140,515
| * | |
Las Vegas
Sands Corp. | | | 2,588
| | | | 181,730
| | |
McDonald's
Corp. | | | 5,756
| | | | 555,569
| | |
Starbucks Corp. | | | 1,787 | | | | 144,836 | | |
Wendy's Co. | | | 12,753 | | | | 110,824 | | |
| | | | 1,576,017 | | |
Household Durables (0.7%) | |
Jarden Corp. | | | 1,969 | | | | 109,004 | * | |
Lennar Corp.
Class A | | | 4,447
| | | | 158,091
| | |
Newell
Rubbermaid,
Inc. | | | 7,475
| | | | 221,484
| | |
Toll Brothers,
Inc. | | | 3,071
| | | | 100,975
| * | |
Tupperware
Brands Corp. | | | 679
| | | | 60,872
| | |
| | | | 650,426 | | |
Household Products (1.3%) | |
Church &
Dwight Co.,
Inc. | | | 2,877
| | | | 187,437
| | |
Procter &
Gamble Co. | | | 11,871
| | | | 958,583
| | |
| | | | 1,146,020 | | |
Independent Power Producers & Energy Traders (0.3%) | |
AES Corp. | | | 9,073 | | | | 127,839 | | |
Calpine Corp. | | | 8,409 | | | | 169,609 | * | |
| | | | 297,448 | | |
Industrial Conglomerates (1.8%) | |
3M Co. | | | 4,140 | | | | 521,019 | | |
Danaher Corp. | | | 5,872 | | | | 423,313 | | |
General
Electric Co. | | | 17,093
| | | | 446,811
| | |
Koninklijke
Philips NV | | | 5,951
| | | | 210,725
| | |
| | | | 1,601,868 | | |
| | |
Number
of Shares | |
Value† | |
Insurance (2.4%) | |
Allstate Corp. | | | 2,745 | | | $ | 145,650 | | |
American
International
Group, Inc. | | | 5,723
| | | | 295,593
| | |
Aon PLC | | | 4,260 | | | | 336,923 | | |
Assurant, Inc. | | | 654 | | | | 38,246 | | |
Enstar Group
Ltd. | | | 220
| | | | 29,905
| * | |
Lincoln
National Corp. | | | 1,262
| | | | 57,307
| | |
Loews Corp. | | | 976 | | | | 47,150 | | |
Marsh &
McLennan
Cos., Inc. | | | 3,326
| | | | 152,331
| | |
MetLife, Inc. | | | 4,418 | | | | 209,016 | | |
Progressive
Corp. | | | 5,598
| | | | 145,380
| | |
Reinsurance
Group of
America, Inc. | | | 2,709
| | | | 192,827
| | |
Torchmark
Corp. | | | 657
| | | | 47,869
| | |
Travelers Cos.,
Inc. | | | 3,893
| | | | 335,966
| | |
Unum Group | | | 2,572 | | | | 81,635 | | |
| | | | 2,115,798 | | |
Internet & Catalog Retail (0.4%) | |
Amazon.com,
Inc. | | | 896
| | | | 326,171
| * | |
Internet Software & Services (1.9%) | |
eBay, Inc. | | | 8,068 | | | | 425,264 | * | |
Facebook, Inc.
Class A | | | 2,268
| | | | 113,990
| * | |
Google, Inc.
Class A | | | 1,111
| | | | 1,144,974
| * | |
| | | | 1,684,228 | | |
IT Services (2.8%) | |
Accenture PLC
Class A | | | 955
| | | | 70,192
| | |
Amdocs Ltd. | | | 6,677 | | | | 256,731 | | |
Automatic
Data
Processing, Inc. | | | 2,077
| | | | 155,713
| | |
Fiserv, Inc. | | | 906 | | | | 94,885 | * | |
Genpact Ltd. | | | 7,044 | | | | 139,683 | * | |
IBM Corp. | | | 6,644 | | | | 1,190,671 | | |
MasterCard,
Inc. Class A | | | 207
| | | | 148,440
| | |
VeriFone
Systems, Inc. | | | 2,818
| | | | 63,856
| * | |
Visa, Inc. Class A | | | 1,631 | | | | 320,769 | | |
Western
Union Co. | | | 2,460
| | | | 41,869
| | |
| | | | 2,482,809 | | |
Leisure Equipment & Products (0.4%) | |
Mattel, Inc. | | | 5,302 | | | | 235,250 | | |
Polaris
Industries, Inc. | | | 1,009
| | | | 132,128
| | |
| | | | 367,378 | | |
| | |
Number
of Shares | |
Value† | |
Life Sciences Tools & Services (0.1%) | |
Charles River
Laboratories
International,
Inc. | | | 1,331
| | | $ | 65,499
| * | |
Thermo Fisher
Scientific, Inc. | | | 331
| | | | 32,365
| | |
| | | | 97,864 | | |
Machinery (1.0%) | |
Deere & Co. | | | 2,065 | | | | 169,000 | | |
Dover Corp. | | | 865 | | | | 79,398 | | |
Ingersoll-Rand
PLC | | | 1,277
| | | | 86,236
| | |
Mueller
Industries, Inc. | | | 1,499
| | | | 90,375
| | |
Pall Corp. | | | 1,014 | | | | 81,647 | | |
Pentair Ltd. | | | 4,257 | | | | 285,602 | | |
Valmont
Industries, Inc. | | | 311
| | | | 43,695
| | |
| | | | 835,953 | | |
Media (3.2%) | |
Comcast Corp.
Class A | | | 5,513
| | | | 262,309
| | |
Comcast Corp.
Class A Special | | | 4,592
| | | | 212,610
| | |
Discovery
Communications,
Inc. Class C | | | 1,235
| | | | 102,147
| * | |
Gannett Co.,
Inc. | | | 3,979
| | | | 110,099
| | |
Lions Gate
Entertainment
Corp. | | | 1,809
| | | | 62,555
| * | |
News Corp.
Class A | | | 8,868
| | | | 156,077
| * | |
Omnicom
Group, Inc. | | | 2,126
| | | | 144,802
| | |
Pearson PLC | | | 8,167 | | | | 170,758 | | |
Pearson PLC
ADR | | | 4,641
| | | | 97,461
| | |
Regal
Entertainment
Group Class A | | | 9,602
| | | | 182,534
| | |
Scripps
Networks
Interactive,
Inc. Class A | | | 1,127
| | | | 90,724
| | |
Thomson
Reuters Corp. | | | 1,232
| | | | 46,286
| | |
Time Warner,
Inc. | | | 1,102
| | | | 75,751
| | |
Twenty-First
Century Fox,
Inc. Class A | | | 5,766
| | | | 196,505
| | |
Viacom, Inc.
Class B | | | 5,809
| | | | 483,832
| | |
Walt Disney Co. | | | 6,250 | | | | 428,687 | | |
| | | | 2,823,137 | | |
See Notes to Schedule of Investments
26
| | |
Number
of Shares | |
Value† | |
Metals & Mining (0.7%) | |
Allegheny
Technologies,
Inc. | | | 1,938
| | | $ | 64,148
| | |
BHP Billiton
Ltd. ADR | | | 1,205
| | | | 85,181
| | |
Carpenter
Technology
Corp. | | | 3,134
| | | | 185,940
| | |
Freeport-
McMoRan
Copper &
Gold, Inc. | | | 1,765
| | | | 64,881
| | |
Goldcorp, Inc. | | | 5,213 | | | | 132,567 | | |
Nucor Corp. | | | 1,836 | | | | 95,050 | | |
| | | | 627,767 | | |
Multi-Utilities (1.6%) | |
Alliant Energy
Corp. | | | 4,361
| | | | 227,732
| | |
Ameren Corp. | | | 7,279 | | | | 263,354 | | |
CenterPoint
Energy, Inc. | | | 11,517
| | | | 283,318
| | |
Dominion
Resources, Inc. | | | 2,085
| | | | 132,919
| | |
NiSource, Inc. | | | 2,112 | | | | 66,570 | | |
Sempra Energy | | | 2,072 | | | | 188,842 | | |
Wisconsin
Energy Corp. | | | 4,621
| | | | 194,590
| | |
| | | | 1,357,325 | | |
Multiline Retail (0.3%) | |
Kohl's Corp. | | | 1,617 | | | | 91,846 | | |
Macy's, Inc. | | | 2,623 | | | | 120,946 | | |
Nordstrom, Inc. | | | 1,474 | | | | 89,133 | | |
| | | | 301,925 | | |
Office Electronics (0.0%) | |
Xerox Corp. | | | 3,646 | | | | 36,241 | | |
Oil, Gas & Consumable Fuels (9.6%) | |
Anadarko
Petroleum
Corp. | | | 6,590
| | | | 627,961
| | |
Apache Corp. | | | 402 | | | | 35,698 | | |
ARC Resources
Ltd. | | | 3,152
| | | | 84,921
| | |
BG Group PLC | | | 6,283 | | | | 128,294 | | |
BG Group PLC
ADR | | | 1,110
| | | | 22,711
| | |
Cabot Oil &
Gas Corp. | | | 16,214
| | | | 572,678
| | |
Cenovus
Energy, Inc. | | | 11,072
| | | | 329,060
| | |
Cheniere
Energy, Inc. | | | 607
| | | | 24,159
| * | |
Chevron Corp. | | | 1,718 | | | | 206,091 | | |
ConocoPhillips | | | 2,449 | | | | 179,512 | | |
Continental
Resources, Inc. | | | 530
| | | | 60,367
| * | |
Denbury
Resources, Inc. | | | 7,533
| | | | 143,052
| * | |
Devon Energy
Corp. | | | 1,149
| | | | 72,640
| | |
| | |
Number
of Shares | |
Value† | |
Enbridge Inc. | | | 6,951 | | | $ | 301,604 | | |
EOG Resources,
Inc. | | | 5,041
| | | | 899,314
| | |
Exxon Mobil
Corp. | | | 5,010
| | | | 448,996
| | |
GasLog Ltd. | | | 1,198 | | | | 17,826 | | |
Kinder Morgan,
Inc. | | | 6,302
| | | | 222,524
| | |
Occidental
Petroleum
Corp. | | | 13,720
| | | | 1,318,218
| | |
Pioneer Natural
Resources Co. | | | 3,280
| | | | 671,678
| | |
QEP Resources,
Inc. | | | 2,181
| | | | 72,104
| | |
Range
Resources
Corp. | | | 14,603
| | | | 1,105,593
| | |
Southwestern
Energy Co. | | | 3,783
| | | | 140,803
| * | |
Spectra Energy
Corp. | | | 2,298
| | | | 81,740
| | |
Targa
Resources
Corp. | | | 1,247
| | | | 96,717
| | |
Teekay Corp. | | | 7,810 | | | | 339,188 | | |
Whiting
Petroleum
Corp. | | | 1,951
| | | | 130,502
| * | |
Williams Cos.,
Inc. | | | 2,084
| | | | 74,420
| | |
| | | | 8,408,371 | | |
Paper & Forest Products (0.1%) | |
International
Paper Co. | | | 2,387
| | | | 106,484
| | |
Personal Products (0.5%) | |
Estee Lauder
Cos., Inc.
Class A | | | 4,047
| | | | 287,175
| | |
Nu Skin
Enterprises,
Inc. Class A | | | 994
| | | | 116,229
| | |
| | | | 403,404 | | |
Pharmaceuticals (6.8%) | |
AbbVie, Inc. | | | 4,092 | | | | 198,257 | | |
Allergan, Inc. | | | 1,281 | | | | 116,071 | | |
AstraZeneca
PLC ADR | | | 4,593
| | | | 242,786
| | |
Bristol-Myers
Squibb Co. | | | 26,514
| | | | 1,392,515
| | |
Johnson &
Johnson | | | 12,174
| | | | 1,127,434
| | |
Merck & Co.,
Inc. | | | 1,780
| | | | 80,260
| | |
Novartis
AG ADR | | | 8,312
| | | | 644,596
| | |
Pfizer, Inc. | | | 40,997 | | | | 1,257,788 | | |
Roche Holding
AG | | | 410
| | | | 113,509
| | |
Roche Holding
AG ADR | | | 3,543
| | | | 245,672
| | |
| | |
Number
of Shares | |
Value† | |
Sanofi ADR | | | 5,388 | | | $ | 288,150 | | |
Teva
Pharmaceutical
Industries Ltd.
ADR | | | 1,939
| | | | 71,917
| | |
Zoetis, Inc. | | | 6,263 | | | | 198,287 | | |
| | | | 5,977,242 | | |
Professional Services (0.9%) | |
IHS Inc. Class A | | | 1,157 | | | | 126,171 | * | |
Nielsen
Holdings NV | | | 11,571
| | | | 456,360
| | |
Verisk Analytics,
Inc. Class A | | | 3,451
| | | | 236,463
| * | |
| | | | 818,994 | | |
Real Estate Investment Trusts (2.9%) | |
American
Campus
Communities,
Inc. | | | 2,501
| | | | 86,435
| | |
American
Tower Corp. | | | 6,224
| | | | 493,874
| | |
Ares
Commercial
Real Estate
Corp. | | | 3,907
| | | | 48,564
| | |
Corrections
Corporation
of America | | | 2,465
| | | | 91,205
| | |
Equity
Residential | | | 1,962
| | | | 102,730
| | |
HCP, Inc. | | | 3,547 | | | | 147,201 | | |
Plum Creek
Timber Co.,
Inc. | | | 5,118
| | | | 232,357
| | |
Prologis, Inc. | | | 3,484 | | | | 139,186 | | |
Public Storage | | | 992 | | | | 165,634 | | |
Simon Property
Group, Inc. | | | 613
| | | | 94,739
| | |
Starwood
Property Trust,
Inc. | | | 14,726
| | | | 378,311
| | |
Ventas, Inc. | | | 2,414 | | | | 157,489 | | |
Vornado Realty
Trust | | | 1,475
| | | | 131,364
| | |
Weyerhaeuser
Co. | | | 8,104
| | | | 246,362
| | |
| | | | 2,515,451 | | |
Real Estate Management & Development (0.2%) | |
Brookfield
Asset
Management,
Inc. Class A | | | 3,559
| | | | 140,865
| | |
Road & Rail (1.7%) | |
Avis Budget
Group, Inc. | | | 1,944
| | | | 60,905
| * | |
Canadian
National
Railway Co. | | | 136
| | | | 14,950
| | |
See Notes to Schedule of Investments
27
| | |
Number
of Shares | |
Value† | |
Canadian
Pacific
Railway Ltd. | | | 1,738
| | | $ | 248,656
| | |
CSX Corp. | | | 7,548 | | | | 196,701 | | |
Hertz Global
Holdings, Inc. | | | 12,030
| | | | 276,209
| * | |
J.B. Hunt
Transport
Services, Inc. | | | 1,859
| | | | 139,481
| | |
Kansas City
Southern | | | 554
| | | | 67,322
| | |
Norfolk
Southern
Corp. | | | 3,679
| | | | 316,467
| | |
Union Pacific
Corp. | | | 959
| | | | 145,193
| | |
| | | | 1,465,884 | | |
Semiconductors & Semiconductor Equipment (1.1%) | |
Altera Corp. | | | 8,872 | | | | 298,099 | | |
ASML Holding
NV | | | 988
| | | | 93,504
| | |
Intel Corp. | | | 6,141 | | | | 150,025 | | |
Texas
Instruments,
Inc. | | | 9,577
| | | | 403,000
| | |
| | | | 944,628 | | |
Software (3.1%) | |
Activision
Blizzard, Inc. | | | 7,650
| | | | 127,296
| | |
ANSYS, Inc. | | | 853 | | | | 74,595 | * | |
Check Point
Software
Technologies
Ltd. | | | 820
| | | | 47,576
| * | |
Intuit, Inc. | | | 5,824 | | | | 415,892 | | |
Microsoft Corp. | | | 42,962 | | | | 1,518,707 | | |
NICE-Systems
Ltd. ADR | | | 3,895
| | | | 152,606
| | |
Nuance
Communications,
Inc. | | | 4,525
| | | | 70,409
| * | |
Oracle Corp. | | | 8,089 | | | | 270,981 | | |
| | | | 2,678,062 | | |
Specialty Retail (2.0%) | |
Bed Bath &
Beyond, Inc. | | | 4,794
| | | | 370,672
| * | |
Best Buy Co.,
Inc. | | | 2,438
| | | | 104,346
| | |
Foot Locker, Inc. | | | 1,323 | | | | 45,908 | | |
Gap Inc. | | | 1,184 | | | | 43,796 | | |
Home Depot,
Inc. | | | 4,995
| | | | 389,061
| | |
L Brands, Inc. | | | 1,357 | | | | 84,962 | | |
PetSmart, Inc. | | | 2,138 | | | | 155,561 | | |
Staples, Inc. | | | 4,952 | | | | 79,826 | | |
Tiffany & Co. | | | 2,620 | | | | 207,425 | | |
Tile Shop
Holdings, Inc. | | | 5,054
| | | | 112,856
| * | |
| | |
Number
of Shares | |
Value† | |
TJX Cos., Inc. | | | 2,752 | | | $ | 167,294 | | |
Zale Corp. | | | 661 | | | | 10,332 | * | |
| | | | 1,772,039 | | |
Textiles, Apparel & Luxury Goods (0.6%) | |
Deckers
Outdoor Corp. | | | 81
| | | | 5,575
| * | |
Hanesbrands,
Inc. | | | 1,827
| | | | 124,455
| | |
Luxottica
Group SpA
ADR | | | 1,473
| | | | 79,351
| | |
NIKE, Inc.
Class B | | | 1,076
| | | | 81,518
| | |
PVH Corp. | | | 1,295 | | | | 161,318 | | |
Wolverine
World Wide,
Inc. | | | 1,195
| | | | 68,999
| | |
| | | | 521,216 | | |
Thrifts & Mortgage Finance (0.1%) | |
People's United
Financial, Inc. | | | 5,239
| | | | 75,599
| | |
Tobacco (0.3%) | |
Altria Group,
Inc. | | | 1,414
| | | | 52,643
| | |
Philip Morris
International,
Inc. | | | 2,347
| | | | 209,165
| | |
| | | | 261,808 | | |
Trading Companies & Distributors (0.2%) | |
United Rentals,
Inc. | | | 1,012
| | | | 65,365
| * | |
W.W. Grainger,
Inc. | | | 287
| | | | 77,194
| | |
| | | | 142,559 | | |
Transportation Infrastructure (0.1%) | |
Wesco Aircraft
Holdings, Inc. | | | 3,863
| | | | 70,770
| * | |
Water Utilities (0.2%) | |
American
Water Works
Co., Inc. | | | 3,394
| | | | 145,501
| | |
Wireless Telecommunication
Services (0.1%) | |
SBA
Communications
Corp. Class A | | | 1,363
| | | | 119,222
| * | |
Total Common Stocks
(Cost $71,390,504) | | | | | 75,265,327
| | |
Preferred Stocks (0.2%) | |
Commercial Banks (0.1%) | |
U.S. Bancorp,
Ser. G, 6.00% | | | 1,882
| | | | 51,134
| | |
U.S. Bancorp,
Ser. F, 6.50% | | | 2,842
| | | | 76,222
| | |
| | | | 127,356 | | |
| | |
Number
of Shares | |
Value† | |
Marine (0.1%) | |
Seaspan Corp.,
Ser. C, 9.50% | | | 1,883
| | | $ | 50,220
| | |
Total Preferred Stocks
(Cost $178,249) | | | | | 177,576
| | |
Exchange Traded Funds (0.1%) | |
ProShares
UltraShort
20+ Year
Treasury | | | 162
| | | | 11,819
| * | |
SPDR Gold
Shares | | | 369
| | | | 47,136
| * | |
Total Exchange Traded Funds
(Cost $59,999) | | | | | 58,955
| | |
Mutual Funds (6.8%) | |
Central Fund
of Canada
Ltd. Class A | | | 751
| | | | 11,167
| | |
Neuberger
Berman Core
Bond Fund
Institutional
Class | | | 576,112
| | | | 5,975,624
| § | |
Total Mutual Funds
(Cost $5,979,550) | | | | | 5,986,791
| | |
Short-Term Investments (6.7%) | |
State Street
Institutional
Treasury
Money Market
Fund
Institutional
Class (Cost
$5,875,649) | | | 5,875,649
| | | | 5,875,649
| | |
Total Investments (99.9%)
(Cost $83,483,951) | | | | | 87,364,298
| ## | |
Cash, receivables
and other assets,
less liabilities (0.1%) | | | | | 76,766
| | |
Total Net Assets (100.0%) | | | | $ | 87,441,064 | | |
See Notes to Schedule of Investments
28
Schedule of Investments Global Allocation Fund
TOP TEN EQUITY HOLDINGS LONG POSITIONS
| | 1 | | | Delta Air Lines, Inc. | | United States | | Airlines | | | 2.0 | % | |
| | 2 | | | Keller Group PLC | | United Kingdom | | Construction & Engineering | | | 1.5 | % | |
| | 3 | | | Lincoln National Corp. | | United States | | Insurance | | | 1.5 | % | |
| | 4 | | | American Equity Investment Life Holding Co. | | United States | | Insurance | | | 1.5 | % | |
| | 5 | | | Argo Group International Holdings Ltd. | | Bermuda | | Insurance | | | 1.3 | % | |
| | 6 | | | Public Power Corp. SA | | Greece | | Electric Utilities | | | 1.3 | % | |
| | 7 | | | OPAP SA | | Greece | | Hotels, Restaurants & Leisure | | | 1.3 | % | |
| | 8 | | | American National Insurance Co. | | United States | | Insurance | | | 1.2 | % | |
| | 9 | | | Symetra Financial Corp. | | United States | | Insurance | | | 1.2 | % | |
| | 10 | | | Genworth Financial, Inc. Class A | | United States | | Insurance | | | 1.1 | % | |
TOP TEN EQUITY HOLDINGS SHORT POSITIONS
| | 1 | | | Southern Copper Corp. | | United States | | Metals & Mining | | | (1.9 | )% | |
| | 2 | | | American Tower Corp. | | United States | | Real Estate Investment Trusts | | | (1.9 | )% | |
| | 3 | | | Simon Property Group, Inc. | | United States | | Real Estate Investment Trusts | | | (1.7 | )% | |
| | 4 | | | Federal Realty Investment Trust | | United States | | Real Estate Investment Trusts | | | (1.6 | )% | |
| | 5 | | | CONSOL Energy, Inc. | | United States | | Oil, Gas & Consumable Fuels | | | (1.6 | )% | |
| | 6 | | | Boston Properties, Inc. | | United States | | Real Estate Investment Trusts | | | (1.2 | )% | |
| | 7 | | | Groupe Eurotunnel SA | | France | | Transportation Infrastructure | | | (1.0 | )% | |
| | 8 | | | Glencore Xstrata PLC | | Switzerland | | Metals & Mining | | | (0.9 | )% | |
| | 9 | | | Macerich Co. | | United States | | Real Estate Investment Trusts | | | (0.9 | )% | |
| | 10 | | | Fresnillo PLC | | Mexico | | Metals & Mining | | | (0.9 | )% | |
| | |
Number
of Shares | |
Value† | |
Long Positions (93.6%) | |
Common Stocks (36.2%) | |
Australia (0.2%) | |
BlueScope
Steel Ltd. | | | 10,321 | | | $ | 48,677 | * | |
Bermuda (3.0%) | |
Argo Group
International
Holdings Ltd. | | | 9,449
| | | | 396,669
| | |
Assured
Guaranty Ltd. | | | 10,463
| | | | 214,491
| | |
Vostok Nafta
Investment Ltd. | | | 36,515
| | | | 297,246
| * | |
| | | | 908,406 | | |
Canada (0.2%) | |
BlackBerry Ltd. | | | 8,255 | | | | 65,160 | * | |
Denmark (0.3%) | |
Dfds A/S | | | 1,322 | | | | 96,143 | | |
Greece (3.9%) | |
Hellenic
Telecommunications
Organization
SA | | | 13,805
| | | | 174,129
| * | |
JUMBO SA | | | 15,591 | | | | 209,570 | * | |
OPAP SA | | | 30,993 | | | | 385,038 | | |
Public Power
Corp. SA | | | 26,609
| | | | 395,967 | | |
| | | | 1,164,704 | | |
| | |
Number
of Shares | |
Value† | |
Guernsey (0.6%) | |
Tetragon
Financial
Group Ltd. | | | 16,864
| | | $ | 166,785
| | |
Hong Kong (0.2%) | |
Truly
International
Holdings | | | 104,000
| | | | 66,400
| | |
Italy (1.0%) | |
| ASTM SpA | | | 5,794 | | | | 87,479 | | |
Safilo Group
SpA | | | 10,093
| | | | 206,927
| * | |
| | | | 294,406 | | |
Japan (2.1%) | |
ADEKA Corp. | | | 14,000 | | | | 163,877 | | |
Nippon
Synthetic
Chemical
Industry
Co. Ltd. | | | 28,000
| | | | 269,379
| | |
Temp Holdings
Co. Ltd. | | | 2,900
| | | | 84,201
| | |
Tosoh Corp. | | | 17,000 | | | | 64,660 | | |
Toyo Tire &
Rubber Co. Ltd. | | | 8,000
| | | | 46,537
| | |
| | | | 628,654 | | |
Jersey (0.7%) | |
Beazley PLC | | | 54,036 | | | | 198,235 | | |
| | |
Number
of Shares | |
Value† | |
Netherlands (0.3%) | |
AVG
Technologies NV | | | 4,785
| | | $ | 96,178
| *È | |
United Kingdom (4.3%) | |
| 3i Group PLC | | | 27,369 | | | | 163,729 | | |
easyJet PLC | | | 14,922 | | | | 313,190 | | |
Enterprise
Inns PLC | | | 23,307
| | | | 56,616
| * | |
Keller
Group PLC | | | 26,811
| | | | 451,812
| | |
Pace PLC | | | 50,152 | | | | 244,940 | | |
PayPoint PLC | | | 2,930 | | | | 48,906 | | |
| | | | 1,279,193 | | |
United States (19.4%) | |
Alaska Air
Group, Inc. | | | 838
| | | | 59,213
| | |
Allegiant
Travel Co. | | | 1,210
| | | | 126,167
| È | |
American Equity
Investment Life
Holding Co. | | | 21,014
| | | | 437,932
| È | |
American
National
Insurance Co. | | | 3,625
| | | | 366,379
| | |
Brown Shoe
Co, Inc. | | | 5,861
| | | | 131,521
| | |
CNO Financial
Group, Inc. | | | 6,029
| | | | 93,932
| | |
See Notes to Schedule of Investments
29
| | |
Number
of Shares | |
Value† | |
Community
Health
Systems, Inc. | | | 2,630
| | | $ | 114,747
| | |
CVR Energy, Inc. | | | 5,165 | | | | 205,154 | | |
Delek US
Holdings, Inc. | | | 1,963
| | | | 50,155
| | |
Delta Air Lines,
Inc. | | | 22,408
| | | | 591,123
| | |
GameStop
Corp. Class A | | | 3,603
| | | | 197,516
| È | |
Genworth
Financial, Inc.
Class A | | | 23,563
| | | | 342,370
| * | |
Health
Management
Associates, Inc. | | | 12,573
| | | | 161,186
| *È | |
Hercules
Offshore, Inc. | | | 7,286
| | | | 49,545
| * | |
Horace Mann
Educators Corp. | | | 6,785
| | | | 187,944
| È | |
JetBlue Airways
Corp. | | | 7,983
| | | | 56,599
| *È | |
KapStone Paper
and Packaging
Corp. | | | 5,630
| | | | 292,535
| | |
Lincoln National
Corp. | | | 9,825
| | | | 446,153
| | |
MetLife, Inc. | | | 1,028 | | | | 48,635 | | |
Nelnet, Inc. | | | 1,331 | | | | 56,741 | | |
Pilgrim's Pride
Corp. | | | 11,593
| | | | 164,273
| * | |
Proofpoint, Inc. | | | 2,183 | | | | 69,070 | * | |
Protective Life
Corp. | | | 2,942
| | | | 135,567
| | |
Resolute Forest
Products, Inc. | | | 13,415
| | | | 214,506
| * | |
Rite Aid Corp. | | | 39,476 | | | | 210,407 | * | |
Sanmina Corp. | | | 11,758 | | | | 171,196 | * | |
Schweitzer-
Mauduit
International,
Inc. | | | 2,220
| | | | 137,374
| | |
Symetra
Financial Corp. | | | 19,093
| | | | 357,612
| | |
Tesoro Corp. | | | 940 | | | | 45,957 | È | |
Unisys Corp. | | | 2,771 | | | | 73,016 | *È | |
US Airways
Group, Inc. | | | 2,692
| | | | 59,143
| *È | |
VCA Antech, Inc. | | | 2,025 | | | | 57,611 | * | |
Western
Refining, Inc. | | | 3,609
| | | | 116,462
| È | |
| | | | 5,827,741 | | |
Total Common Stocks
(Cost $9,478,742) | | | | | 10,840,682 | | |
| | |
Number
of Shares | |
Value† | |
Short-Term Investments (57.4%) | |
State Street
Institutional
Government
Money Market
Fund
Institutional
Class (Cost
$17,208,391) | | | 17,208,391
| | | $ | 17,208,391
| ØØ | |
Total Long
Positions (93.6%)
(Cost $26,687,133) | | | | | 28,049,073
| ## | |
Cash, receivables
and other assets,
less liabilities (40.0%) | | | | | 12,000,445 | ± | |
Short Positions
(see summary
below) ((33.6)%) | | | | | (10,084,725 | ) | |
Total Net Assets (100.0%) | | | | $ | 29,964,793 | | |
Short Positions ((33.6)%) | |
| Common Stocks Sold Short (33.6%)‡ | |
Australia (0.2%) | |
Newcrest
Mining Ltd. | | | (5,177
| ) | | | (50,398
| ) | |
Austria (0.9%) | |
Andritz AG | | | (2,254 | ) | | | (138,849 | ) | |
Telekom
Austria AG | | | (14,754
| ) | | | (121,535
| ) | |
| | | | (260,384 | ) | |
Canada (1.1%) | |
Franco-Nevada
Corp. | | | (2,138
| ) | | | (96,191
| ) | |
Tahoe
Resources, Inc. | | | (12,545
| ) | | | (240,237
| )* | |
| | | | (336,428 | ) | |
China (0.1%) | |
ASM Pacific
Technology Ltd. | | | (4,700
| ) | | | (45,375
| ) | |
Denmark (0.4%) | |
Vestas Wind
Systems A/S | | | (4,635
| ) | | | (124,455
| )* | |
Finland (0.8%) | |
Cargotec Oyj | | | (2,166 | ) | | | (79,228 | ) | |
Kone Oyj
Class B | | | (1,862
| ) | | | (164,202
| ) | |
| | | | (243,430 | ) | |
France (1.2%) | |
Groupe
Eurotunnel SA | | | (31,246
| ) | | | (302,994
| ) | |
Peugeot SA | | | (3,904 | ) | | | (51,448 | )* | |
| | | | (354,442 | ) | |
Germany (1.3%) | |
Aixtron SE | | | (7,103 | ) | | | (102,565 | )* | |
| | |
Number
of Shares | |
Value† | |
Deutsche
Wohnen AG | | | (11,881
| ) | | $ | (223,581
| ) | |
MAN SE | | | (445 | ) | | | (53,623 | ) | |
| | | | (379,769 | ) | |
Japan (1.8%) | |
Hokkaido
Electric Power
Co., Inc. | | | (5,800
| ) | | | (74,439
| )* | |
Japan Steel
Works Ltd. | | | (18,000
| ) | | | (100,132
| ) | |
Kansai Electric
Power Co., Inc. | | | (8,800
| ) | | | (110,973
| )* | |
Kyushu Electric
Power Co., Inc. | | | (7,500
| ) | | | (105,182
| )* | |
Mitsubishi
Motors Corp. | | | (3,800
| ) | | | (42,433
| )* | |
Sharp Corp. | | | (38,000 | ) | | | (111,685 | )* | |
| | | | (544,844 | ) | |
Mexico (0.9%) | |
Fresnillo PLC | | | (16,565 | ) | | | (259,096 | ) | |
Spain (0.7%) | |
Banco Popular
Espanol SA | | | (29,251
| ) | | | (166,487
| )* | |
Prosegur Cia de
Seguridad SA | | | (9,711
| ) | | | (57,751
| ) | |
| | | | (224,238 | ) | |
Sweden (0.6%) | |
Lundin
Petroleum AB | | | (5,610
| ) | | | (115,835
| )* | |
Sandvik AB | | | (5,938 | ) | | | (80,364 | ) | |
| | | | (196,199 | ) | |
Switzerland (0.9%) | |
Glencore
Xstrata PLC | | | (49,980
| ) | | | (272,469
| )* | |
United Kingdom (2.7%) | |
Aggreko PLC | | | (9,586 | ) | | | (247,460 | ) | |
G4S PLC | | | (42,685 | ) | | | (178,973 | ) | |
Intu Properties
PLC | | | (26,453
| ) | | | (145,992
| ) | |
Invensys PLC | | | (6,554 | ) | | | (52,859 | ) | |
Telecity Group
PLC | | | (14,811
| ) | | | (181,078
| ) | |
| | | | (806,362 | ) | |
United States (20.0%) | |
American
Campus
Communities,
Inc. | | | (2,251
| ) | | | (77,795
| ) | |
American Realty
Capital
Properties, Inc. | | | (3,711
| ) | | | (49,245
| ) | |
American
Tower Corp. | | | (7,184
| ) | | | (570,050
| ) | |
Apartment
Investment &
Management
Co. Class A | | | (3,116
| ) | | | (87,186
| ) | |
See Notes to Schedule of Investments
30
| | |
Number
of Shares | |
Value† | |
Ariad
Pharmaceuticals,
Inc. | | | (4,391
| ) | | $ | (9,660
| )* | |
Boston
Properties, Inc. | | | (3,612
| ) | | | (373,842
| ) | |
Cobalt
International
Energy, Inc. | | | (4,190
| ) | | | (97,250
| )* | |
CONSOL
Energy, Inc. | | | (13,047
| ) | | | (476,215
| ) | |
Digital Realty
Trust, Inc. | | | (3,766
| ) | | | (179,488
| ) | |
Duke Realty
Corp. | | | (5,970
| ) | | | (98,923
| ) | |
Equinix, Inc. | | | (615 | ) | | | (99,310 | )* | |
F5 Networks,
Inc. | | | (746
| ) | | | (60,806
| )* | |
Facebook, Inc.
Class A | | | (1,971
| ) | | | (99,062
| )* | |
Federal Realty
Investment
Trust | | | (4,752
| ) | | | (492,307
| ) | |
Five Below, Inc. | | | (2,516 | ) | | | (121,422 | )* | |
Highwoods
Properties, Inc. | | | (1,756
| ) | | | (67,782
| ) | |
Incyte Corp. Ltd. | | | (2,722 | ) | | | (106,158 | )* | |
Infinity
Pharmaceuticals,
Inc. | | | (2,258
| ) | | | (30,596
| )* | |
InterMune, Inc. | | | (3,963 | ) | | | (55,839 | )* | |
JC Penney
Co., Inc. | | | (19,801
| ) | | | (148,507
| )* | |
Macerich Co. | | | (4,579 | ) | | | (271,123 | ) | |
Navistar
International
Corp. | | | (1,486
| ) | | | (53,734
| )* | |
Netflix, Inc. | | | (200 | ) | | | (64,496 | )* | |
ONEOK, Inc. | | | (968 | ) | | | (54,692 | ) | |
Palo Alto
Networks, Inc. | | | (1,031
| ) | | | (43,467
| )* | |
Peabody Energy
Corp. | | | (12,938
| ) | | | (252,032
| ) | |
Regency
Centers Corp. | | | (982
| ) | | | (50,730
| ) | |
Royal Gold, Inc. | | | (3,317 | ) | | | (159,349 | ) | |
Simon Property
Group, Inc. | | | (3,229
| ) | | | (499,042
| ) | |
Southern
Copper Corp. | | | (20,789
| ) | | | (581,052
| ) | |
Tanger Factory
Outlet Centers | | | (4,529
| ) | | | (157,836
| ) | |
Tempur Sealy
International,
Inc. | | | (1,576
| ) | | | (60,440
| )* | |
Theravance, Inc. | | | (3,914 | ) | | | (143,409 | )* | |
Universal
Display Corp. | | | (5,370
| ) | | | (171,303
| )* | |
Volcano Corp. | | | (6,400 | ) | | | (122,688 | )* | |
| | | | (5,986,836 | ) | |
Total Short Positions
(Proceeds $(9,984,602)) | | | | | (10,084,725 | ) | |
See Notes to Schedule of Investments
31
LONG POSITIONS BY INDUSTRY GLOBAL ALLOCATION FUND (UNAUDITED)
| Industry | | Investments at
Value† �� | | Percentage of
Net Assets | |
Insurance | | $ | 3,225,919 | | | | 10.7 | % | |
Airlines | | | 1,205,435 | | | | 4.0 | % | |
Paper & Forest Products | | | 644,415 | | | | 2.2 | % | |
Capital Markets | | | 627,760 | | | �� | 2.1 | % | |
Specialty Retail | | | 538,607 | | | | 1.8 | % | |
Chemicals | | | 497,916 | | | | 1.7 | % | |
Construction & Engineering | | | 451,812 | | | | 1.5 | % | |
Hotels, Restaurants & Leisure | | | 441,654 | | | | 1.5 | % | |
Oil, Gas & Consumable Fuels | | | 417,728 | | | | 1.4 | % | |
Electric Utilities | | | 395,967 | | | | 1.3 | % | |
Health Care Providers & Services | | | 333,544 | | | | 1.1 | % | |
Communications Equipment | | | 310,100 | | | | 1.0 | % | |
Electronic Equipment, Instruments & Components | | | 237,596 | | | | 0.8 | % | |
Food & Staples Retailing | | | 210,407 | | | | 0.7 | % | |
Textiles, Apparel & Luxury Goods | | | 206,927 | | | | 0.7 | % | |
Diversified Telecommunication Services | | | 174,129 | | | | 0.6 | % | |
Software | | | 165,248 | | | | 0.6 | % | |
Food Products | | | 164,273 | | | | 0.5 | % | |
Marine | | | 96,143 | | | | 0.3 | % | |
Transportation Infrastructure | | | 87,479 | | | | 0.3 | % | |
Professional Services | | | 84,201 | | | | 0.3 | % | |
IT Services | | | 73,016 | | | | 0.2 | % | |
Consumer Finance | | | 56,741 | | | | 0.2 | % | |
Energy Equipment & Services | | | 49,545 | | | | 0.2 | % | |
Commercial Services & Supplies | | | 48,906 | | | | 0.2 | % | |
Metals & Mining | | | 48,677 | | | | 0.2 | % | |
Auto Components | | | 46,537 | | | | 0.1 | % | |
Short-Term Investments and Other Assets-Net | | | 29,208,836 | | | | 97.4 | % | |
Short Positions (see summary below) | | | (10,084,725 | ) | | | (33.6 | )% | |
| | $ | 29,964,793 | | | | 100.0 | % | |
See Notes to Schedule of Investments
32
SHORT POSITIONS BY INDUSTRY GLOBAL ALLOCATION FUND (UNAUDITED)
| Industry | | Investments at
Value† | | Percentage of
Net Assets | |
Real Estate Investment Trusts | | $ | (3,121,341 | ) | | | (10.4 | )% | |
Metals & Mining | | | (1,658,792 | ) | | | (5.5 | )% | |
Oil, Gas & Consumable Fuels | | | (941,332 | ) | | | (3.1 | )% | |
Machinery | | | (722,991 | ) | | | (2.4 | )% | |
Commercial Services & Supplies | | | (484,184 | ) | | | (1.6 | )% | |
Internet Software & Services | | | (379,450 | ) | | | (1.3 | )% | |
Biotechnology | | | (345,662 | ) | | | (1.2 | )% | |
Transportation Infrastructure | | | (302,994 | ) | | | (1.0 | )% | |
Electric Utilities | | | (290,594 | ) | | | (1.0 | )% | |
Real Estate Management & Development | | | (223,581 | ) | | | (0.7 | )% | |
Household Durables | | | (172,125 | ) | | | (0.6 | )% | |
Electronic Equipment, Instruments & Components | | | (171,303 | ) | | | (0.6 | )% | |
Commercial Banks | | | (166,487 | ) | | | (0.6 | )% | |
Multiline Retail | | | (148,507 | ) | | | (0.5 | )% | |
Semiconductors & Semiconductor Equipment | | | (147,940 | ) | | | (0.5 | )% | |
Electrical Equipment | | | (124,455 | ) | | | (0.4 | )% | |
Health Care Equipment & Supplies | | | (122,688 | ) | | | (0.4 | )% | |
Diversified Telecommunication Services | | | (121,535 | ) | | | (0.4 | )% | |
Specialty Retail | | | (121,422 | ) | | | (0.4 | )% | |
Communications Equipment | | | (104,273 | ) | | | (0.3 | )% | |
Automobiles | | | (93,881 | ) | | | (0.3 | )% | |
Internet & Catalog Retail | | | (64,496 | ) | | | (0.2 | )% | |
Gas Utilities | | | (54,692 | ) | | | (0.2 | )% | |
Total Common Stocks Sold Short | | $ | (10,084,725 | ) | | | (33.6 | )% | |
See Notes to Schedule of Investments
33
Schedule of Investments Long Short Fund
TOP TEN EQUITY HOLDINGS LONG POSITIONS
| | 1 | | | PVH Corp. | | | 2.5 | % | |
| | 2 | | | Brookfield Infrastructure Partners LP | | | 2.0 | % | |
| | 3 | | | PetSmart, Inc. | | | 1.8 | % | |
| | 4 | | | Enbridge, Inc. | | | 1.8 | % | |
| | 5 | | | Delta Air Lines, Inc. | | | 1.6 | % | |
| | 6 | | | DaVita HealthCare Partners, Inc. | | | 1.5 | % | |
| | 7 | | | Weyerhaeuser Co. | | | 1.4 | % | |
| | 8 | | | Genpact Ltd. | | | 1.4 | % | |
| | 9 | | | Dunkin' Brands Group, Inc. | | | 1.4 | % | |
| | 10 | | | Visa, Inc. Class A | | | 1.3 | % | |
TOP TEN EQUITY HOLDINGS SHORT POSITIONS (as a % of Net Assets)
| | 1 | | | IShares Russell Midcap Index Fund | | | (1.9 | )% | |
| | 2 | | | iShares Core S&P Small-Cap ETF | | | (0.9 | )% | |
| | 3 | | | Kohl's Corp. | | | (0.6 | )% | |
| | 4 | | | Sysco Corp. | | | (0.6 | )% | |
| | 5 | | | Marathon Petroleum Corp. | | | (0.5 | )% | |
| | 6 | | | iShares Russell 2000 Fund | | | (0.5 | )% | |
| | 7 | | | PG&E Corp. | | | (0.5 | )% | |
| | 8 | | | Consumer Discretionary Select Sector SPDR Fund | | | (0.5 | )% | |
| | 9 | | | SPDR S&P Retail ETF | | | (0.4 | )% | |
| | 10 | | | Motorola Solutions, Inc. | | | (0.4 | )% | |
| | |
Number
of Shares | |
Value† | |
Long Positions (84.7%) | |
Common Stocks (61.8%) | |
Aerospace & Defense (1.4%) | |
Boeing Co. | | | 55,500 | | | $ | 7,242,750 | | |
Precision
Castparts
Corp. | | | 65,000
| | | | 16,474,250
| | |
| | | | 23,717,000 | | |
Air Freight & Logistics (0.5%) | |
United
Parcel
Service, Inc.
Class B | | | 76,300
| | | | 7,495,712
| | |
Airlines (1.6%) | |
Delta Air
Lines, Inc. | | | 1,020,000
| | | | 26,907,600
| ØØ | |
Automobiles (0.7%) | |
General
Motors Co. | | | 327,500
| | | | 12,101,125
| * | |
Biotechnology (0.4%) | |
Vertex
Pharmaceuticals,
Inc. | | | 95,400
| | | | 6,805,836
| * | |
Building Products (0.2%) | |
Ply Gem
Holdings, Inc. | | | 208,600
| | | | 3,108,140
| * | |
Capital Markets (0.9%) | |
BlackRock, Inc. | | | 21,800 | | | | 6,557,658 | | |
UBS AG | | | 400,000 | | | | 7,744,000 | * | |
| | | | 14,301,658 | | |
| | |
Number
of Shares | |
Value† | |
Chemicals (0.5%) | |
Ashland, Inc. | | | 84,200 | | | $ | 7,792,710 | | |
Commercial Banks (1.2%) | |
Fifth Third
Bancorp | | | 254,000
| | | | 4,833,620
| | |
U.S. Bancorp | | | 160,900 | | | | 6,011,224 | | |
Wells Fargo &
Co. | | | 201,000
| | | | 8,580,690
| | |
| | | | 19,425,534 | | |
Commercial Services & Supplies (0.9%) | |
Copart, Inc. | | | 440,000 | | | | 14,181,200 | * | |
Communications Equipment (0.4%) | |
Cisco
Systems,
Inc. | | | 231,500
| | | | 5,208,750
| | |
Juniper
Networks,
Inc. | | | 69,000
| | | | 1,286,160
| * | |
| | | | 6,494,910 | | |
Computers & Peripherals (1.4%) | |
Apple, Inc. | | | 19,700 | | | | 10,290,295 | | |
SanDisk
Corp. | | | 184,400
| | | | 12,815,800
| | |
| | | | 23,106,095 | | |
Consumer Finance (0.1%) | |
SLM Corp. | | | 62,000 | | | | 1,572,940 | | |
Containers & Packaging (0.5%) | |
Mead
Westvaco
Corp. | | | 239,400
| | | | 8,343,090
| | |
| | |
Number
of Shares | |
Value† | |
Diversified Consumer Services (0.2%) | |
K12, Inc. | | | 160,450 | | | $ | 2,933,026 | * | |
Diversified Financial Services (1.8%) | |
Citigroup,
Inc. | | | 192,800
| | | | 9,404,784
| | |
CME
Group, Inc. | | | 135,000
| | | | 10,018,350
| | |
JPMorgan
Chase &
Co. | | | 200,000
| | | | 10,308,000
| | |
| | | | 29,731,134 | | |
Electric Utilities (2.8%) | |
Brookfield
Infrastructure
Partners LP | | | 839,577
| | | | 33,054,146
| ØØ | |
Northeast
Utilities | | | 220,000
| | | | 9,435,800
| | |
NRG Yield,
Inc. Class A | | | 130,000
| | | | 4,604,600
| * | |
| | | | 47,094,546 | | |
Electronic Equipment, Instruments & Components (0.2%) | |
Amphenol
Corp.
Class A | | | 51,000
| | | | 4,094,790
| | |
Health Care Equipment &
Supplies (1.9%) | |
C.R. Bard,
Inc. | | | 140,000
| | | | 19,070,800
| | |
MAKO
Surgical
Corp. | | | 75,000
| | | | 2,235,750
| * | |
See Notes to Schedule of Investments
34
| | |
Number
of Shares | |
Value† | |
Sirona
Dental
Systems,
Inc. | | | 148,000
| | | $ | 10,693,000
| * | |
| | | | 31,999,550 | | |
Health Care Providers &
Services (1.9%) | |
Accretive
Health, Inc. | | | 906,000
| | | | 7,483,560
| * | |
DaVita
HealthCare
Partners, Inc. | | | 439,500
| | | | 24,704,295
| *ØØ | |
| | | | 32,187,855 | | |
Hotels, Restaurants & Leisure (2.6%) | |
Arcos
Dorados
Holdings,
Inc. Class A | | | 560,000
| | | | 6,742,400
| | |
Dunkin'
Brands
Group, Inc. | | | 475,800
| | | | 22,686,144
| | |
McDonald's
Corp. | | | 103,000
| | | | 9,941,560
| | |
Wyndham
Worldwide
Corp. | | | 43,700
| | | | 2,901,680
| | |
| | | | 42,271,784 | | |
Household Durables (1.3%) | |
Lennar Corp.
Class A | | | 495,000
| | | | 17,597,250
| | |
Newell
Rubbermaid,
Inc. | | | 140,000
| | | | 4,148,200
| | |
| | | | 21,745,450 | | |
Household Products (0.3%) | |
Procter &
Gamble Co. | | | 68,200
| | | | 5,507,150
| | |
Independent Power Producers & Energy Traders (0.1%) | |
Brookfield
Renewable
Energy
Partners LP | | | 35,700
| | | | 980,322
| | |
Internet & Catalog Retail (1.1%) | |
Vipshop
Holdings
Ltd. ADS‡‡ | | | 273,800
| | | | 18,873,034
| *ØØ | |
Internet Software & Services (2.1%) | |
eBay, Inc. | | | 310,000 | | | | 16,340,100 | * | |
Facebook,
Inc.
Class A | | | 127,500
| | | | 6,408,150
| * | |
Google, Inc.
Class A | | | 12,000
| | | | 12,366,960
| * | |
| | | | 35,115,210 | | |
| | |
Number
of Shares | |
Value† | |
IT Services (2.7%) | |
Genpact
Ltd. | | | 1,190,189
| | | $ | 23,601,448
| *ØØ | |
Visa, Inc.
Class A | | | 111,600
| | | | 21,948,372
| | |
| | | | 45,549,820 | | |
Machinery (0.5%) | |
Ingersoll-
Rand PLC | | | 125,000
| | | | 8,441,250
| | |
Metals & Mining (1.7%) | |
ArcelorMittal | | | 497,500 | | | | 7,840,600 | | |
Steel
Dynamics,
Inc. | | | 650,000
| | | | 11,680,500
| | |
United
States Steel
Corp. | | | 333,300
| | | | 8,295,837
| | |
| | | | 27,816,937 | | |
Multi-Utilities (0.7%) | |
NiSource, Inc. | | | 114,200 | | | | 3,599,584 | | |
Wisconsin
Energy
Corp. | | | 183,000
| | | | 7,706,130
| | |
| | | | 11,305,714 | | |
Multiline Retail (0.4%) | |
Target Corp. | | | 92,000 | | | | 5,960,680 | | |
Oil, Gas & Consumable Fuels (7.1%) | |
Alpha
Natural
Resources,
Inc. | | | 1,230,000
| | | | 8,610,000
| * | |
Antero
Resources
Corp. | | | 254,000
| | | | 14,348,460
| * | |
Athlon
Energy, Inc. | | | 466,000
| | | | 15,331,400
| * | |
Cabot Oil &
Gas Corp. | | | 334,400
| | | | 11,811,008
| | |
Enbridge,
Inc. | | | 669,700
| | | | 29,058,283
| ØØ | |
Forest Oil
Corp. | | | 1,897,100
| | | | 8,992,254
| * | |
MarkWest
Energy
Partners LP | | | 90,000
| | | | 6,685,200
| | |
Peabody
Energy
Corp. | | | 417,700
| | | | 8,136,796
| | |
Pioneer
Natural
Resources
Co. | | | 24,000
| | | | 4,914,720
| | |
Teekay Corp. | | | 231,461 | | | | 10,052,351 | | |
| | | | 117,940,472 | | |
Paper & Forest Products (0.5%) | |
International
Paper Co. | | | 180,800
| | | | 8,065,488
| | |
| | |
Number
of Shares | |
Value† | |
Personal Products (0.6%) | |
Estee Lauder
Cos., Inc.
Class A
| | | 129,900
| | | $ | 9,217,704
| | |
Pharmaceuticals (1.4%) | |
Bristol-Myers
Squibb Co. | | | 360,000
| | | | 18,907,200
| | |
Pfizer, Inc. | | | 136,500 | | | | 4,187,820 | | |
| | | | 23,095,020 | | |
Professional Services (1.4%) | |
Nielsen
Holdings NV | | | 345,000
| | | | 13,606,800
| | |
Verisk
Analytics, Inc.
Class A | | | 131,242
| | | | 8,992,702
| * | |
| | | | 22,599,502 | | |
Real Estate Investment Trusts (1.7%) | |
General
Growth
Properties,
Inc. | | | 215,000
| | | | 4,564,450
| | |
Weyerhaeuser
Co. | | | 780,000
| | | | 23,712,000
| ØØ | |
| | | | 28,276,450 | | |
Real Estate Management & Development (0.9%) | |
Brookfield
Asset
Management,
Inc. Class A | | | 354,000
| | | | 14,011,320
| | |
Brookfield
Property
Partners LP | | | 74,214
| | | | 1,429,362
| | |
| | | | 15,440,682 | | |
Road & Rail (1.1%) | |
Canadian
Pacific
Railway
Ltd. | | | 129,000
| | | | 18,456,030
| | |
Semiconductors & Semiconductor Equipment (0.9%) | |
Altera Corp. | | | 440,000 | | | | 14,784,000 | | |
Software (1.1%) | |
Activision
Blizzard,
Inc. | | | 651,000
| | | | 10,832,640
| | |
MICROS
Systems,
Inc. | | | 135,000
| | | | 7,323,750
| * | |
| | | | 18,156,390 | | |
Specialty Retail (4.9%) | |
Asbury
Automotive
Group, Inc. | | | 268,860
| | | | 12,918,723
| * | |
Home Depot,
Inc. | | | 260,000
| | | | 20,251,400
| | |
See Notes to Schedule of Investments
35
| | |
Number
of Shares | |
Value† | |
Monro
Muffler
Brake, Inc. | | | 166,500
| | | $ | 7,659,000
| | |
PetSmart,
Inc. | | | 404,239
| | | | 29,412,430
| ØØ | |
Sally Beauty
Holdings,
Inc. | | | 188,100
| | | | 4,950,792
| * | |
Tractor
Supply Co. | | | 89,000
| | | | 6,350,150
| | |
| | | | 81,542,495 | | |
Textiles, Apparel & Luxury Goods (3.7%) | |
Lululemon
Athetica,
Inc. | | | 65,700
| | | | 4,536,585
| * | |
Michael
Kors
Holdings
Ltd. | | | 160,000
| | | | 12,312,000
| * | |
PVH Corp. | | | 329,000 | | | | 40,983,530 | ØØ | |
Wolverine
World Wide,
Inc. | | | 54,700
| | | | 3,158,378
| | |
| | | | 60,990,493 | | |
Thrifts & Mortgage Finance (0.0%) | |
Essent
Group Ltd. | | | 37,500
| | | | 637,500
| * | |
Tobacco (0.5%) | |
Philip
Morris
International,
Inc. | | | 96,700
| | | | 8,617,904
| | |
Transportation Infrastructure (1.1%) | |
Wesco
Aircraft
Holdings,
Inc. | | | 956,801
| | | | 17,528,594
| * | |
Water Utilities (1.2%) | |
American
Water
Works Co.,
Inc. | | | 470,000
| | | | 20,148,900
| | |
Wireless Telecommunication Services (0.7%) | |
SBA
Communications
Corp.
Class A | | | 131,300
| | | | 11,484,811
| * | |
Total Common
Stocks
(Cost $922,544,155) | |
| | | 1,023,944,237
| | |
Preferred Stocks (0.1%) | |
Automobiles (0.1%) | |
General
Motors Co.,
Ser. B, 4.75% | | | 16,200
| | | | 831,384
| | |
| | |
Number
of Shares | |
Value† | |
Diversified Financial Services (0.0%) | |
Citigroup
Capital XIII,
7.88% | | | 2,600
| | | $ | 71,500
| | |
Total Preferred Stocks
(Cost $667,279) | | | | | 902,884 | | |
| | | Principal
Amount | | | |
Corporate Debt Securities (13.7%) | |
Airlines (0.7%) | |
United
Continental
Holdings,
Inc.,
Guaranteed
Notes, 6.38%,
due
6/1/2018 | | $ | 11,685,000
| | | | 12,123,188
| | |
Auto Manufacturers (0.5%) | |
Chrysler
Group
LLC/CG
Co-Issuer,
Inc.,
Secured
Notes,
8.25%,
due
6/15/21 | | | 6,620,000
| | | | 7,488,875
| | |
Auto Parts & Equipment (0.8%) | |
American
Axle &
Manufacturing,
Inc.,
Guaranteed
Notes, 6.63%,
due
10/15/22 | | | 5,080,000
| | | | 5,359,400
| | |
The
Goodyear
Tire &
Rubber Co.,
Guaranteed
Notes,
6.50%,
due
3/1/21 | | | 1,600,000
| | | | 1,692,000
| | |
The
Goodyear
Tire &
Rubber Co.,
Guaranteed
Notes,
7.00%,
due
5/15/22 | | | 5,730,000
| | | | 6,159,750
| | |
| | | | 13,211,150 | | |
Building Materials (0.0%) | |
Masco | | $ | 100,000 | | | $ | 106,000 | | |
| | |
Principal
Amount | |
Value† | |
Corp.,
Senior
Unsecured
Notes, 5.95%,
due
3/15/22 | | | | | |
Coal (1.4%) | |
Alpha
Natural
Resources,
Inc.,
Guaranteed
Notes, 9.75%,
due
4/15/18 | | | 9,511,000
| | | | 9,796,330
| | |
Arch Coal,
Inc.,
Guaranteed
Notes, 7.00%,
due
6/15/19 | | | 16,581,000
| | | | 12,850,275
| | |
Arch Coal,
Inc.,
Guaranteed
Notes, 7.25%,
due
10/1/20 | | | 650,000
| | | | 494,812
| | |
| | | | 23,141,417 | | |
Computers (0.2%) | |
Apple, Inc.,
Senior
Unsecured
Notes, 3.85%,
due
5/4/43 | | | 4,925,000
| | | | 4,170,155
| | |
Diversified Financial Services (0.3%) | |
E*TRADE
Financial
Corp.,
Senior
Unsecured
Notes, 6.38%,
due
11/15/19 | | | 1,490,000
| | | | 1,594,300
| | |
E*TRADE
Financial
Corp., Senior
Unsecured
Notes, 6.75%,
due
6/1/16 | | | 705,000
| | | | 760,519
| | |
SLM Corp.,
Senior
Unsecured
Medium
Term
Notes, 6.00%,
due, 1/25/17 | | | 100,000
| | | | 108,750
| | |
See Notes to Schedule of Investments
36
| | |
Principal
Amount | |
Value† | |
SLM
Corp.,
Senior
Unsecured
Notes, 5.50%,
due 1/25/23 | | $ | 3,050,000
| | | $ | 2,911,624
| | |
| | | | 5,375,193 | | |
Electric (0.8%) | |
DPL, Inc.,
Senior
Unsecured
Notes, 7.25%,
due
10/15/21 | | | 12,335,000
| | | | 12,828,400
| | |
Entertainment (0.0%) | |
Regal
Entertainment
Group,
Guaranteed
Notes, 9.13%,
due 8/15/18 | | | 175,000
| | | | 192,500
| | |
Food (0.0%) | |
Smithfield
Foods, Inc.,
Senior
Unsecured
Notes, 6.63%,
due 8/15/22 | | | 260,000
| | | | 273,650
| | |
Healthcare-Services (0.9%) | |
CHS/
Community
Health
Systems, Inc.,
Guaranteed
Notes, 7.13%,
due 7/15/20 | | | 13,731,000
| | | | 14,451,878
| | |
Iron—Steel (0.9%) | |
AK Steel
Corp.,
Guaranteed
Notes, 7.63%,
due
5/15/20 | | | 9,657,000
| | | | 8,643,015
| | |
United
States
Steel Corp.,
Senior
Unsecured
Notes, 7.38%,
due
4/1/20 | | | 5,940,000
| | | | 6,266,700
| | |
United States
Steel Corp.,
Senior
Unsecured
Notes, 7.50%,
due 3/15/22 | | | 175,000
| | | | 183,313
| | |
| | | | 15,093,028 | | |
| | |
Principal
Amount | |
Value† | |
Media (1.4%) | |
Cable-
vision
Systems
Corp.,
Senior
Unsecured
Notes, 5.88%,
due 9/15/22 | | $ | 10,159,000
| | | $ | 10,171,699
| | |
Cablevision
Systems
Corp.,
Senior
Unsecured
Notes, 7.75%,
due 4/15/18 | | | 915,000
| | | | 1,038,525
| | |
CCO
Holdings
LLC,
Guaranteed
Notes, 5.25%,
due 9/30/22 | | | 7,305,000
| | | | 6,866,700
| | |
CCO
Holdings
LLC,
Guaranteed
Notes, 6.63%,
due 1/31/22 | | | 225,000
| | | | 232,875
| | |
Clear
Channel
Worldwide
Holdings, Inc.,
Guaranteed
Notes,
Ser. B, 7.63%,
due 3/15/20 | | | 5,245,000
| | | | 5,599,037
| | |
| | | | 23,908,836 | | |
Oil & Gas (2.2%) | |
Chesapeake
Energy Corp.,
Guaranteed
Notes, 6.13%,
due
2/15/21 | | | 690,000
| | | | 753,825
| | |
EXCO
Resources,
Inc.,
Guaranteed
Notes, 7.50%,
due 9/15/18 | | | 10,710,000
| | | | 10,361,925
| | |
Forest Oil
Corp.,
Guaranteed
Notes, 7.25%,
due
6/15/19 | | | 14,375,000
| | | | 14,518,750
| | |
Plains
Exploration &
Production Co.,
Guaranteed
Notes, 6.88%,
due 2/15/23 | | | 200,000
| | | | 221,500
| | |
| | |
Principal
Amount | |
Value† | |
Sand-
Ridge
Energy, Inc.,
Guaranteed
Notes, 7.50%,
due 3/15/21 | | $ | 9,135,000
| | | $ | 9,683,100
| | |
SandRidge
Energy, Inc.,
Guaranteed
Notes, 8.75%,
due
1/15/20 | | | 125,000
| | | | 135,000
| | |
| | | | 35,674,100 | | |
Pipelines (0.8%) | |
KB Home,
Guaranteed
Notes, 7.00%,
due
12/15/21 | | | 12,640,000
| | | | 13,019,200
| | |
Retail (1.0%) | |
Best
Buy Co.,
Inc., Senior
Unsecured
Notes, 5.50%,
due 3/15/21 | | | 9,975,000
| | | | 10,099,687
| | |
JC Penney
Corp., Inc.,
Guaranteed
Notes, 5.65%,
due
6/1/20 | | | 8,386,000
| | | | 6,258,052
| | |
JC Penney
Corp., Inc.,
Guaranteed
Notes, 5.75%,
due
2/15/18 | | | 735,000
| | | | 560,438
| | |
| | | | 16,918,177 | | |
Semiconductors (0.3%) | |
Advanced
Micro
Devices, Inc.,
Senior
Unsecured
Notes, 8.13%,
due
12/15/17 | | | 4,405,000
| | | | 4,614,238
| | |
Telecommunications (1.2%) | |
Frontier
Communications
Corp., Senior
Unsecured
Notes, 7.63%,
due
4/15/24 | | | 1,700,000
| | | | 1,793,500
| | |
See Notes to Schedule of Investments
37
| | |
Principal
Amount | |
Value† | |
Metro-
PCS
Wireless,
Inc.,
Guaranteed
Notes, 6.63%,
due 11/15/20 | | $ | 4,910,000
| | | $ | 5,192,325
| | |
Sprint
Nextel
Corp.,
Senior
Unsecured
Notes, 6.00%,
due
11/15/22 | | | 12,655,000
| | | | 12,465,175
| | |
| | | | 19,451,000 | | |
Transportation (0.3%) | |
Swift
Services
Holdings, Inc.,
Secured
Notes, 10.00%,
due 11/15/18 | | | 4,355,000
| | | | 4,877,600
| | |
Total Corporate
Debt Securities
(Cost $224,819,699) | |
| | | 226,918,585
| | |
| | | Contracts | | | |
Purchased Options (0.2%) | |
SPDR S&P 500
ETF Trust,
Put, November
2013 @ 153 | | | 3,700
| | | | 18,500
| | |
SPDR S&P 500
ETF Trust,
Put, December
2013 @ 164 | | | 3,750
| | | | 303,750
| | |
SPDR S&P 500
ETF Trust,
Put, December
2013 @ 165 | | | 2,500
| | | | 250,000
| | |
SPDR S&P 500
ETF Trust,
Put, January
2014 @ 168 | | | 12,000
| | | | 2,388,000
| | |
Total Options
(Cost $6,027,325) | | | | | 2,960,250 | | |
| | | Number
of Shares | | | |
Short-Term Investments (8.9%) | |
State
Street
Institutional
Government
Money Market
Fund Institutional
Class (Cost
$147,978,056)
| | | 147,978,056
| | | | 147,978,056
| ØØ | |
| | |
Number
of Shares | |
Value† | |
Total Long
Positions (84.7%)
(Cost $1,302,036,514) | | | | $ | 1,402,704,012
| ## | |
Cash, receivables
and other assets,
less liabilities (28.9%) | | | | | 478,624,251
| ‡‡± | |
Short Positions
(see summary
below) ((13.6)%) | |
| | | (225,881,158
| ) | |
Total Net Assets
(100.0%) | | | | $ | 1,655,447,105
| | |
Short Positions ((13.6)%) | |
| Common Stocks Sold Short (7.3%)‡ | |
Auto Components (0.4%) | |
Standard
Motor
Products,
Inc. | | | (178,415
| ) | | | (6,451,486
| ) | |
Capital Markets (0.3%) | |
Cohen &
Steers, Inc. | | | (86,101
| ) | | | (3,302,834
| ) | |
Franklin
Resources,
Inc. | | | (45,900
| ) | | | (2,472,174
| ) | |
| | | | (5,775,008 | ) | |
Commercial Banks (0.3%) | |
First Horizon
National
Corp. | | | (419,900
| ) | | | (4,471,935
| ) | |
Communications Equipment (0.4%) | |
Motorola
Solutions,
Inc. | | | (111,100
| ) | | | (6,945,972
| ) | |
Electric Utilities (0.3%) | |
Southern
Co. | | | (131,000
| ) | | | (5,359,210
| ) | |
Food & Staples Retailing (0.6%) | |
Sysco Corp. | | | (300,000 | ) | | | (9,702,000 | ) | |
Health Care Equipment & Supplies (0.0%) | |
ResMed, Inc. | | | (36 | ) | | | (1,863 | ) | |
Hotels, Restaurants & Leisure (0.6%) | |
Bloomin'
Brands,
Inc. | | | (232,900
| ) | | | (5,829,487
| )* | |
Chuy's
Holdings,
Inc. | | | (93,593
| ) | | | (3,519,097
| )* | |
| | | | (9,348,584 | ) | |
Internet Software & Services (0.4%) | |
ValueClick,
Inc. | | | (338,600
| ) | | | (6,504,506
| )* | |
Multi-Utilities (0.5%) | |
PG&E Corp. | | | (196,500 | ) | | | (8,223,525 | ) | |
| | |
Number
of Shares | |
Value† | |
Multiline Retail (0.7%) | |
Family Dollar
Stores, Inc. | | | (30,000
| ) | | $ | (2,066,400
| ) | |
Kohl's Corp. | | | (172,100 | ) | | | (9,775,280 | ) | |
| | | | (11,841,680 | ) | |
Oil, Gas & Consumable Fuels (0.8%) | |
HollyFrontier
Corp. | | | (91,500
| ) | | | (4,214,490
| ) | |
Marathon
Petroleum
Corp. | | | (124,000
| ) | | | (8,885,840
| ) | |
| | | | (13,100,330 | ) | |
Professional Services (0.3%) | |
Dun &
Bradstreet
Corp. | | | (49,000
| ) | | | (5,330,710
| ) | |
Semiconductors & Semiconductor Equipment (0.8%) | |
Freescale
Semiconductor
Ltd. | | | (172,700
| ) | | | (2,666,488
| )* | |
Lam Research
Corp. | | | (79,000
| ) | | | (4,284,170
| )* | |
Taiwan
Semiconductor
Manufacturing
Co. Ltd.
ADR | | | (80,900
| ) | | | (1,489,369
| ) | |
Xilinx, Inc. | | | (105,000 | ) | | | (4,769,100 | ) | |
| | | | (13,209,127 | ) | |
Specialty Retail (0.9%) | |
Conn's, Inc. | | | (107,000 | ) | | | (6,467,080 | )* | |
Sonic
Automotive,
Inc. Class A | | | (180,000
| ) | | | (4,010,400
| ) | |
Staples, Inc. | | | (265,000 | ) | | | (4,271,800 | ) | |
| | | | (14,749,280 | ) | |
Total Common
Stocks Sold Short
(Proceeds
$(117,133,171)) | |
| | | (121,015,216
| ) | |
Exchange Traded Funds Sold Short (6.3%) | |
Consumer
Discretionary
Select Sector
SPDR Fund | | | (118,800
| ) | | | (7,533,108
| ) | |
Consumer
Staples
Select
Sector
SPDR Fund | | | (142,600
| ) | | | (6,039,110
| ) | |
Financial
Select
Sector
SPDR Fund | | | (228,300
| ) | | | (4,693,848
| ) | |
See Notes to Schedule of Investments
38
| | |
Number
of Shares | |
Value† | |
iShares
Core S&P
Small-Cap
ETF | | | (137,000
| ) | | $ | (14,167,170
| ) | |
iShares
MSCI
Australia
ETF | | | (101,000
| ) | | | (2,693,670
| ) | |
iShares
MSCI
Brazil
Capped
ETF | | | (71,900
| ) | | | (3,605,785
| ) | |
iShares
MSCI
Emerging
Markets
ETF | | | (102,800
| ) | | | (4,364,888
| ) | |
iShares
Russell 2000
ETF | | | (78,500
| ) | | | (8,574,555
| ) | |
iShares
Russell
Mid-Cap
ETF | | | (220,000
| ) | | | (31,673,400
| ) | |
iShares
U.S. Real
Estate ETF | | | (66,700
| ) | | | (4,413,539
| ) | |
Market
Vectors
Semiconductor
ETF | | | (95,700
| ) | | | (3,939,969
| ) | |
SPDR S&P
Retail ETF | | | (85,000
| ) | | | (7,154,450
| ) | |
Utilities
Select
Sector
SPDR Fund | | | (155,000
| ) | | | (6,012,450
| ) | |
Total Exchange
Traded Funds Sold
Short (Proceeds
$(94,574,512)) | |
| | | (104,865,942
| ) | |
Total Short
Positions (Proceeds
$(211,707,683)) | |
| | | (225,881,158
| ) | |
See Notes to Schedule of Investments
39
Notes to Schedule of Investments
† In accordance with Accounting Standards Codification ("ASC") 820 "Fair Value Measurements and Disclosures" ("ASC 820"), all investments held by each of Neuberger Berman Dynamic Real Return Fund ("Dynamic Real Return"), Neuberger Berman Flexible Select Fund ("Flexible Select"), Neuberger Berman Global Allocation Fund ("Global Allocation") and Neuberger Berman Long Short Fund ("Long Short") (each individually a "Fund," and collectively, the "Funds") are carried at the value that Neuberger Berman Management LLC ("Management") believes a Fund would receive upon selling an investment in an orderly transaction to an independent buyer in the principal or most advantageous market for the investment under current market conditions. Various inputs, including the volume and level of activity for the asset or liability in the market, are considered in valuing the Funds' investments, some of which are discussed below. Significant management judgment may be necessary to value investments in accordance with ASC 820.
ASC 820 established a three-tier hierarchy of inputs to create a classification of value measurements for disclosure purposes. The three-tier hierarchy of inputs is summarized in the three broad Levels listed below.
• Level 1 – quoted prices in active markets for identical investments
• Level 2 – other significant observable inputs (including quoted prices for similar investments, interest rates, prepayment speeds, credit risk, amortized cost, etc.)
• Level 3 – significant unobservable inputs (including a Fund's own assumptions in determining the fair value of investments)
The inputs or methodology used for valuing an investment are not necessarily an indication of the risk associated with investing in those securities.
The value of the Funds' investments (long and short positions) in equity securities, exchange traded funds, purchased option contracts, written option contracts and closed-end funds, for which market quotations are readily available, is generally determined by Management by obtaining valuations from an independent pricing service based on the latest sale price quoted on a principal exchange or market for that security (Level 1 inputs). Securities traded primarily on the NASDAQ Stock Market are normally valued by a Fund at the NASDAQ Official Closing Price ("NOCP") provided by NASDAQ each business day. The NOCP is the most recently reported price as of 4:00:02 p.m., Eastern time, unless that price is outside the range of the "inside" bid and asked prices (i.e., the bid and asked prices that dealers quote to each other when trading for their own accounts); in that case, NASDAQ will adjust the price to equal the inside bid or asked price, whichever is closer. Because of delays in reporting trades, the NOCP may not be based on the price of the last trade to occur before the market closes. If there is no reported sale of a security on a particular day, the independent pricing service may value the security based on reported market quotations.
The value of the Funds' investments in debt securities is determined by Management primarily by obtaining valuations from independent pricing services based on readily available bid quotations, or if quotations are not available, by methods which include various considerations based on security type (generally Level 2 inputs). In addition to the consideration of yields or prices of securities of comparable quality, coupon, maturity and type; indications as to values from dealers; and general market conditions, the following is a description of other Level 2 inputs and related valuation techniques used by an independent pricing service to value certain types of debt securities of the Funds:
Corporate Debt Securities. Inputs used to value corporate debt securities generally include relative credit information, observed market movements, sector news, spread to the U.S. Treasury market, and other market information which may include benchmark yields, reported trades, broker-dealer quotes, issuer spreads, benchmark securities, bids, offers, and reference data, such as market research publications, when available ("Other Market Information").
See Notes to Financial Statements
40
Notes to Schedule of Investments (cont'd)
U.S. Treasury Securities. Inputs used to value U.S. Treasury securities generally include quotes from several inter-dealer brokers and Other Market Information.
Sovereign Debt. Inputs used to value sovereign debt generally include dealer quotes, bond market activity, discounted cash flow models, and other relevant information such as credit spreads, benchmark curves and Other Market Information.
The value of financial futures contracts is determined by obtaining valuations from independent pricing services at the settlement price at the market close (Level 1 inputs).
The value of forward foreign currency contracts is determined by obtaining valuations from an independent pricing service based on actual traded currency rates on an independent pricing service's network, along with other traded and quoted currency rates provided to the pricing service by leading market participants (Level 2 inputs).
The value of total return swaps is determined by obtaining valuations from an independent pricing service using the underlying index and stated LIBOR ("London Interbank Offered Rate") rate (Level 2 inputs).
Management has developed a process to periodically review information provided by independent pricing services for all types of securities.
Investments in investment companies, with the exception of closed-end funds, are valued using the respective fund's daily calculated net asset value per share (Level 2 inputs).
If a valuation is not available from an independent pricing service, or if Management has reason to believe that the valuation received does not represent the amount a Fund might reasonably expect to receive on a current sale in an orderly transaction, the applicable Fund seeks to obtain quotations from principal market makers (generally considered Level 3 inputs). If such quotations are not readily available, the security is valued using methods the Neuberger Berman Alternative Funds' Board of Trustees (the "Board") has approved on the belief that they reflect fair value. Numerous factors may be considered when determining the fair value of a security based on Level 2 or 3 inputs, including available analyst, media or other reports, trading in futures or American Depositary Receipts ("ADRs") and whether the issuer of the security being fair valued has other securities outstanding.
The value of the Funds' investments in foreign securities is generally determined using the same valuation methods and inputs as other Fund investments, as discussed above. Foreign security prices expressed in local currency values are translated from the local currency into U.S. dollars using the exchange rate as of 4:00 p.m., Eastern time. The Board has approved the use of Interactive Data Pricing and Reference Data, Inc. ("Interactive") to evaluate the prices of foreign income securities as of the close of the New York Stock Exchange (the "NYSE"). Interactive utilizes benchmark spread and yield curves and evaluates available market activity from the local close to the close of the NYSE (Level 2 inputs) to assist in determining prices for certain foreign income securities. In the absence of precise information about the market values of these foreign securities as of the close of the NYSE, the Board has determined on the basis of available data that prices evaluated in this way are likely to be closer to the prices the Fund could realize on a current sale than are the prices of those securities established at the close of the foreign markets in which the securities primarily trade. The Board has also approved the use of Interactive to assist in determining the fair value of foreign equity securities when changes in the value of a certain index suggest that the closing prices on the foreign exchanges may no longer represent the amount that a Fund could expect to receive for those securities or on days when foreign markets are closed and U.S. markets are open. In each of these events, Interactive will provide adjusted prices for certain foreign equity securities using a statistical analysis of historical correlations of multiple factors (Level 2 inputs). In the absence of precise information about the market values of these foreign securities as of the close of the New York Stock Exchange, the Board has determined on the basis of available data that prices adjusted in this way are likely to be closer to the prices a fund could realize on a current sale than are the prices of those securities established at the close of the foreign markets in which the securities primarily trade.
See Notes to Financial Statements
41
Notes to Schedule of Investments (cont'd)
Fair value prices are necessarily estimates, and there is no assurance that such a price will be at or close to the price at which the security is next quoted or next trades.
The following is a summary, categorized by Level, of inputs used to value the Funds' investments as of October 31, 2013:
Asset Valuation Inputs | |
| | | Level 1 | | Level 2 | | Level 3 | | Total | |
Dynamic Real Return | |
Investments: | |
Common Stocks^ | | $ | 6,515,247 | | | $ | — | | | $ | — | | | $ | 6,515,247 | | |
Government Securities^ | | | — | | | | 2,184,286 | | | | — | | | | 2,184,286 | | |
U.S. Treasury Securities-Backed by the Full Faith and
Credit of the U.S. Government | | | — | | | | 1,714,363 | | | | — | | | | 1,714,363 | | |
Mutual Funds | | | — | | | | 5,333,309 | | | | — | | | | 5,333,309 | | |
Exchange Traded Funds | | | 233,713 | | | | — | | | | — | | | | 233,713 | | |
Short-Term Investments | | | — | | | | 127,327 | | | | — | | | | 127,327 | | |
Total Investments | | | 6,748,960 | | | | 9,359,285 | | | | — | | | | 16,108,245 | | |
Flexible Select | |
Investments: | |
Common Stocks^ | | | 75,265,327 | | | | — | | | | — | | | | 75,265,327 | | |
Preferred Stocks^ | | | 177,576 | | | | — | | | | — | | | | 177,576 | | |
Exchange Traded Funds | | | 58,955 | | | | — | | | | — | | | | 58,955 | | |
Mutual Funds | | | 11,167 | | | | 5,975,624 | | | | — | | | | 5,986,791 | | |
Short-Term Investments | | | — | | | | 5,875,649 | | | | — | | | | 5,875,649 | | |
Total Investments | | | 75,513,025 | | | | 11,851,273 | | | | — | | | | 87,364,298 | | |
Global Allocation | |
Investments: | |
Common Stocks^ | | | 10,840,682 | | | | — | | | | — | | | | 10,840,682 | | |
Short-Term Investments | | | — | | | | 17,208,391 | | | | — | | | | 17,208,391 | | |
Total Long Positions | | | 10,840,682 | | | | 17,208,391 | | | | — | | | | 28,049,073 | | |
Long Short | |
Investments: | |
Common Stocks^ | | | 1,023,944,237 | | | | — | | | | — | | | | 1,023,944,237 | | |
Preferred Stocks^ | | | 902,884 | | | | — | | | | — | | | | 902,884 | | |
Corporate Debt Securities^ | | | — | | | | 226,918,585 | | | | — | | | | 226,918,585 | | |
Purchased Options | | | 2,960,250 | | | | — | | | | — | | | | 2,960,250 | | |
Short-Term Investments | | | — | | | | 147,978,056 | | | | — | | | | 147,978,056 | | |
Total Long Positions | | | 1,027,807,371 | | | | 374,896,641 | | | | — | | | | 1,402,704,012 | | |
^ The Schedule of Investments provides information on the industry and/or country categorization for the portfolio.
See Notes to Financial Statements
42
Notes to Schedule of Investments (cont'd)
The following is a summary, categorized by Level, of inputs used to value the Funds' derivatives as of October 31, 2013:
Asset Valuation Inputs | | Level 1 | | Level 2 | | Level 3 | | Total | |
Dynamic Real Return | |
Futures contracts (unrealized appreciation) | | $ | 9,763 | | | $ | — | | | $ | — | | | $ | 9,763 | | |
Total | | $ | 9,763 | | | $ | — | | | $ | — | | | $ | 9,763 | | |
Global Allocation | |
Forward contracts (unrealized appreciation) | | $ | — | | | $ | 8,225 | | | $ | — | | | $ | 8,225 | | |
Futures contracts (unrealized appreciation) | | | 724,490 | | | | — | | | | — | | | | 724,490 | | |
Total return swaps | | | — | | | | 527,596 | | | | — | | | | 527,596 | | |
Total | | $ | 724,490 | | | $ | 535,821 | | | $ | — | | | $ | 1,260,311 | | |
The following is a summary, categorized by Level, of inputs used to value the Funds' investments as of October 31, 2013:
Liability Valuation Inputs | |
| | | Level 1 | | Level 2 | | Level 3 | | Total | |
Global Allocation | |
Common Stocks Sold Short^ | | $ | (10,084,725) | | | $ | — | | | $ | — | | | $ | (10,084,725) | | |
Total | | $ | (10,084,725) | | | $ | — | | | $ | — | | | $ | (10,084,725) | | |
Long Short | |
Common Stocks Sold Short^ | | $ | (121,015,216) | | | $ | — | | | $ | — | | | $ | (121,015,216) | | |
Exchange Traded Funds Sold Short | | | (104,865,942) | | | | — | | | | — | | | | (104,865,942) | | |
Total | | $ | (225,881,158) | | | $ | — | | | $ | — | | | $ | (225,881,158) | | |
^ The Schedule of Investments provides information on the industry and/or country categorization for the portfolio.
| | | Level 1 | | Level 2 | | Level 3 | | Total | |
Dynamic Real Return | |
Futures contracts (unrealized depreciation) | | $ | (23,941 | ) | | $ | — | | | $ | — | | | $ | (23,941 | ) | |
Total | | $ | (23,941 | ) | | $ | — | | | $ | — | | | $ | (23,941 | ) | |
Global Allocation | |
Forward contracts (unrealized depreciation) | | $ | — | | | $ | (3,565 | ) | | $ | — | | | $ | (3,565 | ) | |
Futures contracts (unrealized depreciation) | | | (188,440 | ) | | | — | | | | — | | | | (188,440 | ) | |
Total | | $ | (188,440 | ) | | $ | (3,565 | ) | | $ | — | | | $ | (192,005 | ) | |
Long Short | |
Futures contracts (unrealized depreciation) | | $ | (2,957,330 | ) | | $ | — | | | $ | — | | | $ | (2,957,330 | ) | |
Option contracts | | | (2,306,000 | ) | | | — | | | | — | | | | (2,306,000 | ) | |
Total | | $ | (5,263,330 | ) | | $ | — | | | $ | — | | | $ | (5,263,330 | ) | |
See Notes to Financial Statements
43
Notes to Schedule of Investments (cont'd)
The Funds had no transfers between Levels 1 and 2 during the period ended October 31, 2013.
## At October 31, 2013, selected fund information on a U.S. federal income tax basis was as follows:
| | | Cost | | Gross
Unrealized
Appreciation | | Gross
Unrealized
Depreciation | | Net Unrealized
Appreciation
(Depreciation) | |
Dynamic Real Return | | $ | 15,670,978 | | | $ | 813,641 | | | $ | 376,374 | | | $ | 437,267 | | |
Flexible Select | | | 83,586,313 | | | | 4,367,149 | | | | 589,164 | | | | 3,777,985 | | |
Global Allocation | | | 26,778,337 | | | | 1,609,293 | | | | 338,557 | | | | 1,270,736 | | |
Long Short | | | 1,303,568,469 | | | | 119,893,097 | | | | 20,757,554 | | | | 99,135,543 | | |
* Security did not produce income during the last twelve months.
‡‡ At October 31, 2013, Long Short had outstanding call and put options written as follows:
| Name of Issuer | | Contracts | | Exercise
Price | | Expiration Date | | Market Value
of Options | |
SPDR S&P 500 ETF Trust, Put | | | 2,000 | | | | 155 | | | December 2013 | | $ | (80,000 | ) | |
SPDR S&P 500 ETF Trust, Put | | | 12,000 | | | | 160 | | | January 2014 | | | (1,116,000 | ) | |
Vipshop Holdings Ltd. ADS, Call@ | | | 1,000 | | | | 60 | | | November 2013 | | | (1,110,000 | ) | |
| | | | | | | | $ | (2,306,000 | ) | |
@ This security is held in escrow by the custodian bank.
ñ Securities were purchased under Rule 144A of the Securities Act of 1933, as amended (the "1933 Act"), or are private placements and, unless registered under the 1933 Act or exempted from registration, may only be sold to qualified institutional investors. These securities have been deemed by the investment manager to be liquid. At October 31, 2013, these securities amounted to $12,384 or 0.1% of net assets for Dynamic Real Return.
È All or a portion of this security is on loan.
ØØ All or a portion of this security is segregated in connection with obligations for common stocks sold short and/or forward foreign currency contracts and/or total return swap contracts and/or financial futures contracts.
‡ At October 31, 2013, Global Allocation had deposited $10,321,344 in a segregated account to cover collateral requirements for borrowing in connection with securities sold short. This collateral is made up of the proceeds from the securities sold short and collateral received from security lending activities. At October 31, 2013, Long Short had deposited $249,155,574 in a segregated account to cover collateral requirements for borrowing in connection with securities sold short.
§ Affiliated issuer (see Note F of Notes to Financial Statements).
a Principal amount is stated in the currency in which security is denominated.
AUD = Australian Dollar
CAD = Canadian Dollar
EUR = Euro
GBP = Pound Sterling
NZD = New Zealand Dollar
SEK = Swedish Krona
± See Note A-14 in the Notes to Financial Statements for the Funds' open positions in derivatives at October 31, 2013.
See Notes to Financial Statements
44
Statements of Assets and Liabilities
Neuberger Berman Alternative Funds
| | | DYNAMIC
REAL RETURN
FUND | | FLEXIBLE
SELECT FUND | | GLOBAL
ALLOCATION
FUND | |
| | | October 31, 2013 | | October 31, 2013 | | October 31, 2013 | |
Assets | |
Investments in securities, at value*† (Notes A and F)—
see Schedule of Investments: | |
Unaffiliated issuers | | $ | 10,774,936 | | | $ | 81,388,674 | | | $ | 28,049,073 | | |
Affiliated issuers | | | 5,333,309 | | | | 5,975,624 | | | | — | | |
| | | | 16,108,245 | | | | 87,364,298 | | | | 28,049,073 | | |
Cash | | | — | | | | 270 | | | | — | | |
Foreign currency | | | 18,064 | | | | 38 | | | | 174,969 | | |
Deposits with brokers for short sales (Note A-11) | | | — | | | | — | | | | 10,321,344 | | |
Deposits with brokers for futures contracts (Note A-14) | | | 31,076 | | | | — | | | | 1,153,918 | | |
Deposits with brokers for options purchased (Note A-14) | | | — | | | | — | | | | — | | |
Dividends and interest receivable | | | 36,100 | | | | 74,879 | | | | 12,799 | | |
Receivable for securities sold | | | — | | | | 161,955 | | | | — | | |
Receivable for Fund shares sold | | | — | | | | — | | | | 55,710 | | |
Receivable from Management—net (Note B) | | | — | | | | 14,425 | | | | 6,786 | | |
Total return swaps, at value (Note A-14) | | | — | | | | — | | | | 527,596 | | |
Cash collateral for securities loaned (Note A-12) | | | — | | | | — | | | | 208,167 | | |
Receivable for variation margin (Note A-14) | | | 2,182 | | | | — | | | | — | | |
Receivable for open forward foreign currency contracts (Note A-14) | | | — | | | | — | | | | 8,225 | | |
Prepaid expenses and other assets | | | 51,079 | | | | 34,609 | | | | 15,035 | | |
Total Assets | | | 16,246,746 | | | | 87,650,474 | | | | 40,533,622 | | |
Liabilities | |
Investments sold short, at value (Note A) (proceeds $9,984,602
and $211,707,683, respectively) | | | — | | | | — | | | | 10,084,725 | | |
Interest payable for short sales | | | — | | | | — | | | | 11,661 | | |
Payable for collateral on securities loaned (Note A-12) | | | — | | | | — | | | | 208,167 | | |
Payable to investment manager—net (Notes A & B) | | | 5,949 | | | | 42,615 | | | | 16,930 | | |
Options contracts written, at value** (Note A-14) | | | — | | | | — | | | | — | | |
Payable for securities purchased | | | 22,727 | | | | 104,768 | | | | — | | |
Payable for Fund shares redeemed | | | — | | | | — | | | | 55,423 | | |
Payable to administrator—net (Note B) | | | 565 | | | | — | | | | — | | |
Payable to trustees | | | 2,525 | | | | 2,525 | | | | 2,525 | | |
Payable for variation margin (Note A-14) | | | — | | | | — | | | | 83,200 | | |
Payable for open forward foreign currency contracts (Note A-14) | | | — | | | | — | | | | 3,565 | | |
Accrued expenses and other payables | | | 72,660 | | | | 59,502 | | | | 102,633 | | |
Total Liabilities | | | 104,426 | | | | 209,410 | | | | 10,568,829 | | |
Net Assets | | $ | 16,142,320 | | | $ | 87,441,064 | | | $ | 29,964,793 | | |
Net Assets consist of: | |
Paid-in capital | | $ | 15,742,141 | | | $ | 83,583,731 | | | $ | 27,143,469 | | |
Undistributed net investment income (loss) | | | 157,407 | | | | 134,668 | | | | 1,798,541 | | |
Distributions in excess of net investment income | | | — | | | | — | | | | — | | |
Accumulated net realized gains (losses) on investments | | | (123,556 | ) | | | (157,684 | ) | | | (1,308,159 | ) | |
Net unrealized appreciation (depreciation) in value of investments | | | 366,328 | | | | 3,880,349 | | | | 2,330,942 | | |
Net Assets | | $ | 16,142,320 | | | $ | 87,441,064 | | | $ | 29,964,793 | | |
Net Assets | |
Institutional Class | | | 15,933,412 | | | | 87,187,689 | | | | 17,234,003 | | |
Class A | | | 106,060 | | | | 145,920 | | | | 7,863,644 | | |
Class C | | | 102,848 | | | | 107,455 | | | | 4,867,146 | | |
See Notes to Financial Statements
45
Statements of Assets and Liabilities (cont'd)
Neuberger Berman Alternative Funds (cont'd)
| | | DYNAMIC
REAL RETURN
FUND | | FLEXIBLE
SELECT FUND | | GLOBAL
ALLOCATION
FUND | |
| | | October 31, 2013 | | October 31, 2013 | | October 31, 2013 | |
Shares Outstanding ($.001 par value; unlimited
shares authorized) | |
Institutional Class | | | 1,534,272 | | | | 8,076,561 | | | | 1,482,214 | | |
Class A | | | 10,246 | | | | 13,536 | | | | 679,907 | | |
Class C | | | 10,000 | | | | 10,000 | | | | 425,782 | | |
Net Asset Value, offering and redemption price per share | |
Institutional Class | | $ | 10.38 | | | $ | 10.80 | | | $ | 11.63 | | |
Net Asset Value and redemption price per share | |
Class A | | $ | 10.35 | | | $ | 10.78 | | | $ | 11.57 | | |
Offering Price per share | |
Class A‡ | | $ | 10.98 | | | $ | 11.44 | | | $ | 12.28 | | |
Net Asset Value and offering price per share | |
Class C^ | | $ | 10.28 | | | $ | 10.75 | | | $ | 11.43 | | |
†Securities on loan, at value: | |
Unaffiliated issuers | | $ | — | | | $ | — | | | $ | 199,214 | | |
*Cost of Investments | |
Unaffiliated issuers | | $ | 10,357,591 | | | $ | 77,515,700 | | | $ | 26,687,133 | | |
Affiliated issuers | | | 5,369,977 | | | | 5,968,251 | | | | — | | |
Total cost of investments | | $ | 15,727,568 | | | $ | 83,483,951 | | | $ | 26,687,133 | | |
Total cost of foreign currency | | $ | 18,225 | | | $ | 39 | | | $ | 174,192 | | |
**Premium received from options written | | $ | — | | | $ | — | | | $ | — | | |
‡ On single retail sales of less than $50,000. On sales of $50,000 or more or in certain other circumstances described in the Fund's prospectus, offering price is reduced.
^ Redemption price per share is equal to net asset value less any applicable contingent deferred sales charge.
See Notes to Financial Statements
46
Statements of Assets and Liabilities (cont'd)
Neuberger Berman Alternative Funds
| | | LONG SHORT
FUND | |
| | | October 31, 2013 | |
Assets | |
Investments in securities, at value*† (Note A & F)—see Schedule of Investments: | |
Unaffiliated issuers | | $ | 1,402,704,012 | | |
Affiliated issuers | | | — | | |
| | | | 1,402,704,012 | | |
Cash | | | 109,740 | | |
Foreign currency | | | — | | |
Deposits with brokers for short sales (Note A-11) | | | 249,155,574 | | |
Deposits with brokers for futures contracts (Note A-14) | | | 5,430,040 | | |
Deposits with brokers for open option contracts (Note A-14) | | | 234,150,000 | | |
Dividends and interest receivable | | | 4,692,851 | | |
Receivable for securities sold | | | 14,173,941 | | |
Receivable for Fund shares sold | | | 13,326,830 | | |
Receivable from Management—net (Note B) | | | — | | |
Total return swaps, at value (Note A-14) | | | — | | |
Cash collateral for securities loaned (Note A-12) | | | — | | |
Receivable for variation margin (Note A-14) | | | 697,115 | | |
Receivable for open forward foreign currency contracts (Note A-14) | | | — | | |
Prepaid expenses and other assets | | | 53,494 | | |
Total Assets | | | 1,924,493,597 | | |
Liabilities | |
Investments sold short, at value (Note A) (proceeds $9,984,602 and $211,707,683, respectively) | | | 225,881,158 | | |
Interest payable for short sales | | | 41,227 | | |
Payable for collateral on securities loaned (Note A-12) | | | — | | |
Payable to investment manager—net (Notes A & B) | | | 1,510,611 | | |
Options contracts written, at value** (Note A-14) | | | 2,306,000 | | |
Payable for securities purchased | | | 36,658,520 | | |
Payable for Fund shares redeemed | | | 1,890,918 | | |
Payable to administrator—net (Note B) | | | 444,539 | | |
Payable to trustees | | | 2,525 | | |
Payable for variation margin (Note A-14) | | | — | | |
Payable for open forward foreign currency contracts (Note A-14) | | | — | | |
Accrued expenses and other payables | | | 310,994 | | |
Total Liabilities | | | 269,046,492 | | |
Net Assets | | $ | 1,655,447,105 | | |
Net Assets consist of: | |
Paid-in capital | | $ | 1,562,566,858 | | |
Undistributed net investment income (loss) | | | — | | |
Distributions in excess of net investment income | | | (42,614 | ) | |
Accumulated net realized gains (losses) on investments | | | 9,440,708 | | |
Net unrealized appreciation (depreciation) in value of investments | | | 83,482,153 | | |
Net Assets | | $ | 1,655,447,105 | | |
Net Assets | |
Institutional Class | | | 1,038,235,934 | | |
Class A | | | 502,063,979 | | |
Class C | | | 115,147,192 | | |
See Notes to Financial Statements
47
Statements of Assets and Liabilities (cont'd)
Neuberger Berman Alternative Funds (cont'd)
| | | LONG SHORT
FUND | |
| | | October 31, 2013 | |
Shares Outstanding ($.001 par value; unlimited shares authorized) | |
Institutional Class | | | 83,212,733 | | |
Class A | | | 40,470,562 | | |
Class C | | | 9,394,834 | | |
Net Asset Value, offering and redemption price per share | |
Institutional Class | | $ | 12.48 | | |
Net Asset Value and redemption price per share | |
Class A | | $ | 12.41 | | |
Offering Price per share | |
Class A‡ | | $ | 13.17 | | |
Net Asset Value and offering price per share | |
Class C^ | | $ | 12.26 | | |
†Securities on loan, at value: | |
Unaffiliated issuers | | $ | — | | |
*Cost of Investments | |
Unaffiliated issuers | | $ | 1,302,036,514 | | |
Affiliated issuers | | | — | | |
Total cost of investments | | $ | 1,302,036,514 | | |
Total cost of foreign currency | | $ | — | | |
**Premium received from options written | | $ | 2,251,460 | | |
‡ On single retail sales of less than $50,000. On sales of $50,000 or more or in certain other circumstances described in the Fund's prospectus, offering price is reduced.
^ Redemption price per share is equal to net asset value less any applicable contingent deferred sales charge.
See Notes to Financial Statements
48
Neuberger Berman Alternative Funds
| | | DYNAMIC
REAL RETURN
FUND | | FLEXIBLE
SELECT FUND | | GLOBAL
ALLOCATION
FUND | |
| | | Period from
December 19, 2012
(Commencement
of Operations) to
October 31, 2013 | | Period from
May 31, 2013
(Commencement
of Operations) to
October 31, 2013 | | For the
Year Ended
October 31,
2013 | |
Investment Income: | |
Income (Note A): | |
Dividend income—unaffiliated issuers | | $ | 134,141 | | | $ | 232,083 | | | $ | 163,053 | | |
Dividend income—affiliated issuers (Note F) | | | 112,148 | | | | 35,807 | | | | — | | |
Interest and other income—unaffiliated issuers | | | 52,598 | | | | — | | | | 2,101 | | |
Income from securities loaned—net (Note A-12) | | | — | | | | — | | | | 1,484 | | |
Foreign taxes withheld | | | (347 | ) | | | (1,885 | ) | | | (4,493 | ) | |
Total income | | $ | 298,540 | | | $ | 266,005 | | | $ | 162,145 | | |
Expenses: | |
Investment management fees (Note B) | | | 74,446 | | | | 89,570 | | | | 188,319 | | |
Administration fees (Note B) | | | 6,872 | | | | 8,957 | | | | 15,983 | | |
Administration fees (Note B): | |
Institutional Class | | | 10,147 | | | | 13,345 | | | | 13,014 | | |
Class A | | | 179 | | | | 114 | | | | 16,242 | | |
Class C | | | 179 | | | | 86 | | | | 8,114 | | |
Distribution fees (Note B): | |
Class A | | | 224 | | | | 143 | | | | 20,303 | | |
Class C | | | 893 | | | | 431 | | | | 40,572 | | |
Shareholder servicing agent fees: | |
Institutional Class | | | 2,514 | | | | 2,637 | | | | 1,445 | | |
Class A | | | 1,653 | | | | 1,568 | | | | 2,531 | | |
Class C | | | 1,644 | | | | 1,555 | | | | 1,234 | | |
Organization expense (Note A-8) | | | 212,980 | | | | 87,078 | | | | — | | |
Audit fees | | | 43,800 | | | | 25,500 | | | | 64,200 | | |
Custodian and accounting fees | | | 50,056 | | | | 35,933 | | | | 119,334 | | |
Insurance expense | | | 312 | | | | — | | | | 1,437 | | |
Legal fees | | | 64,382 | | | | 37,994 | | | | 115,779 | | |
Registration and filing fees | | | 33,373 | | | | 20,775 | | | | 65,615 | | |
Shareholder reports | | | 12,000 | | | | 10,000 | | | | 5,004 | | |
Repayment to Management of expenses previously assumed by
Management (Note B) | | | — | | | | — | | | | — | | |
Trustees' fees and expenses | | | 34,504 | | | | 12,003 | | | | 45,241 | | |
Short sales expense (Note A-11) | | | — | | | | — | | | | 200,841 | | |
Miscellaneous | | | 3,907 | | | | 1,244 | | | | 9,207 | | |
Total expenses | | | 554,065 | | | | 348,933 | | | | 934,415 | | |
Expenses reimbursed by Management (Note B) | | | (448,882 | ) | | | (221,357 | ) | | | (465,982 | ) | |
Investment management fees waived (Note A) | | | (25,313 | ) | | | (2,692 | ) | | | — | | |
Expenses reduced by custodian fee expense offset
arrangement (Note A-17) | | | — | | | | — | | | | (16 | ) | |
Total net expenses | | | 79,870 | | | | 124,884 | | | | 468,417 | | |
Net investment income (loss) | | $ | 218,670 | | | $ | 141,121 | | | $ | (306,272 | ) | |
See Notes to Financial Statements
49
Statements of Operations (cont'd)
Neuberger Berman Alternative Funds (cont'd)
| | | DYNAMIC
REAL RETURN
FUND | | FLEXIBLE
SELECT FUND | | GLOBAL
ALLOCATION
FUND | |
| | | Period from
December 19, 2012
(Commencement
of Operations) to
October 31, 2013 | | Period from
May 31, 2013
(Commencement
of Operations) to
October 31, 2013 | | For the
Year Ended
October 31,
2013 | |
Realized and Unrealized Gain (Loss) on Investments (Note A): | |
Net realized gain (loss) on: | |
Sales of investment securities of unaffiliated issuers | | | (155,806 | ) | | | (154,702 | ) | | | 1,113,331 | | |
Sales of investment securities of affiliated issuers | | | (32,681 | ) | | | (8,784 | ) | | | — | | |
Sales of investment securities of unaffiliated issuers sold short | | | — | | | | — | | | | (294,133 | ) | |
Forward foreign currency contracts | | | — | | | | — | | | | (122,198 | ) | |
Foreign currency | | | (5,244 | ) | | | (982 | ) | | | 9,256 | | |
Financial futures contracts | | | 9,340 | | | | — | | | | (1,343,311 | ) | |
Options written | | | — | | | | — | | | | — | | |
Total return swap contracts | | | — | | | | — | | | | 2,067,585 | | |
Change in net unrealized appreciation (depreciation)
in value of: | |
Unaffiliated investment securities | | | 417,345 | | | | 3,872,974 | | | | 1,323,211 | | |
Affiliated investment securities | | | (36,668 | ) | | | 7,373 | | | | — | | |
Unaffiliated investment securities sold short | | | — | | | | — | | | | (283,278 | ) | |
Forward foreign currency contracts | | | — | | | | — | | | | 8,376 | | |
Foreign currency | | | (171 | ) | | | 2 | | | | 1,494 | | |
Financial futures contracts | | | (14,178 | ) | | | — | | | | 523,340 | | |
Options written | | | — | | | | — | | | | — | | |
Total return swap contracts | | | — | | | | — | | | | 612,628 | | |
Net gain (loss) on investments | | | 181,937 | | | | 3,715,881 | | | | 3,616,301 | | |
Net increase (decrease) in net assets resulting from operations | | $ | 400,607 | | | $ | 3,857,002 | | | $ | 3,310,029 | | |
See Notes to Financial Statements
50
Statements of Operations (cont'd)
Neuberger Berman Alternative Funds
| | | LONG SHORT
FUND | |
| | | For the
Year Ended
October 31,
2013 | |
Investment Income: | |
Income (Note A): | |
Dividend income—unaffiliated issuers | | $ | 6,592,257 | | |
Dividend income—affiliated issuers (Note F) | | | — | | |
Interest and other income—unaffiliated issuers | | | 6,973,680 | | |
Income from securities loaned—net (Note A-12) | | | — | | |
Foreign taxes withheld | | | (187,767 | ) | |
Total income | | $ | 13,378,170 | | |
Expenses: | |
Investment management fees (Note B) | | | 8,404,225 | | |
Administration fees (Note B) | | | 434,354 | | |
Administration fees (Note B): | |
Institutional Class | | | 411,790 | | |
Class A | | | 437,817 | | |
Class C | | | 94,940 | | |
Distribution fees (Note B): | |
Class A | | | 547,271 | | |
Class C | | | 474,700 | | |
Shareholder servicing agent fees: | |
Institutional Class | | | 52,087 | | |
Class A | | | 59,325 | | |
Class C | | | 12,718 | | |
Organization expense (Note A-8) | | | — | | |
Audit fees | | | 29,750 | | |
Custodian and accounting fees | | | 189,211 | | |
Insurance expense | | | 12,866 | | |
Legal fees | | | 109,036 | | |
Registration and filing fees | | | 138,991 | | |
Shareholder reports | | | 36,733 | | |
Repayment to Management of expenses previously assumed by Management (Note B) | | | 323,680 | | |
Trustees' fees and expenses | | | 45,241 | | |
Short sales expense (Note A-11) | | | 2,048,013 | | |
Miscellaneous | | | 25,550 | | |
Total expenses | | | 13,888,298 | | |
Expenses reimbursed by Management (Note B) | | | — | | |
Investment management fees waived (Note A) | | | — | | |
Expenses reduced by custodian fee expense offset arrangement (Note A-17) | | | (48 | ) | |
Total net expenses | | | 13,888,250 | | |
Net investment income (loss) | | $ | (510,080 | ) | |
See Notes to Financial Statements
51
Statements of Operations (cont'd)
Neuberger Berman Alternative Funds (cont'd)
| | | LONG SHORT
FUND | |
| | | For the
Year Ended
October 31,
2013 | |
Realized and Unrealized Gain (Loss) on Investments (Note A): | |
Net realized gain (loss) on: | |
Sales of investment securities of unaffiliated issuers | | | 24,803,790 | | |
Sales of investment securities of affiliated issuers | | | — | | |
Sales of investment securities of unaffiliated issuers sold short | | | (7,248,697 | ) | |
Forward foreign currency contracts | | | — | | |
Foreign currency | | | (8,122 | ) | |
Financial futures contracts | | | (7,281,053 | ) | |
Options written | | | 162,542 | | |
Total return swap contracts | | | — | | |
Change in net unrealized appreciation (depreciation) in value of: | |
Unaffiliated investment securities | | | 98,899,998 | | |
Affiliated investment securities | | | — | | |
Unaffiliated investment securities sold short | | | (14,191,064 | ) | |
Forward foreign currency contracts | | | — | | |
Foreign currency | | | (14 | ) | |
Financial futures contracts | | | (3,136,527 | ) | |
Options written | | | (54,540 | ) | |
Total return swap contracts | | | — | | |
Net gain (loss) on investments | | | 91,946,313 | | |
Net increase (decrease) in net assets resulting from operations | | $ | 91,436,233 | | |
See Notes to Financial Statements
52
Statements of Changes in Net Assets
Neuberger Berman Alternative Funds
| | | DYNAMIC
REAL RETURN
FUND | | FLEXIBLE
SELECT FUND | | GLOBAL ALLOCATION FUND | |
| | | Period from
December 19, 2012
(Commencement
of Operations)
to October 31,
2013 | | Period from
May 31, 2013
(Commencement
of Operations)
to October 31,
2013 | | Year Ended
October 31,
2013 | | Year Ended
October 31,
2012 | |
Increase (Decrease) in Net Assets: | |
From Operations (Note A): | |
Net investment income (loss) | | $ | 218,670 | | | $ | 141,121 | | | $ | (306,272 | ) | | $ | (189,871 | ) | |
Net realized gain (loss) on investments | | | (184,391 | ) | | | (164,468 | ) | | | 1,430,530 | | | | 530,075 | | |
Change in net unrealized appreciation (depreciation) of investments | | | 366,328 | | | | 3,880,349 | | | | 2,185,771 | | | | (189,034 | ) | |
Net increase (decrease) in net assets resulting from operations | | | 400,607 | | | | 3,857,002 | | | | 3,310,029 | | | | 151,170 | | |
Distributions to Shareholders From (Note A): | |
Net investment income: | |
Institutional Class | | | — | | | | — | | | | (158,784 | ) | | | (126,485 | ) | |
Class A | | | — | | | | — | | | | (62,020 | ) | | | (3,706 | ) | |
Class C | | | — | | | | — | | | | (11,158 | ) | | | (1,337 | ) | |
Net realized gain on investments: | |
Institutional Class | | | — | | | | — | | | | — | | | | (426,028 | ) | |
Class A | | | — | | | | — | | | | — | | | | (13,551 | ) | |
Class C | | | — | | | | — | | | | — | | | | (5,721 | ) | |
Total distributions to shareholders | | | — | | | | — | | | | (231,962 | ) | | | (576,828 | ) | |
From Fund Share Transactions (Note D): | |
Proceeds from shares sold: | |
Institutional Class | | | 17,050,189 | | | | 85,284,877 | | | | 10,290,119 | | | | 15,325,607 | | |
Class A | | | 102,500 | | | | 135,504 | | | | 8,890,938 | | | | 9,666,922 | | |
Class C | | | 103,500 | | | | 100,000 | | | | 2,951,761 | | | | 2,100,306 | | |
Proceeds from reinvestment of dividends and distributions: | |
Institutional Class | | | — | | | | — | | | | 157,181 | | | | 552,345 | | |
Class A | | | — | | | | — | | | | 51,292 | | | | 17,256 | | |
Class C | | | — | | | | — | | | | 10,926 | | | | 7,058 | | |
Payments for shares redeemed: | |
Institutional Class | | | (1,511,161 | ) | | | (1,936,319 | ) | | | (3,857,972 | ) | | | (12,348,482 | ) | |
Class A | | | — | | | | — | | | | (5,368,301 | ) | | | (6,391,944 | ) | |
Class C | | | (3,315 | ) | | | — | | | | (726,293 | ) | | | (9,541 | ) | |
Net increase (decrease) from Fund share transactions | | | 15,741,713 | | | | 83,584,062 | | | | 12,399,651 | | | | 8,919,527 | | |
Net Increase (Decrease) in Net Assets | | | 16,142,320 | | | | 87,441,064 | | | | 15,477,718 | | | | 8,493,869 | | |
Net Assets: | |
Beginning of year | | | — | | | | — | | | | 14,487,075 | | | | 5,993,206 | | |
End of year | | $ | 16,142,320 | | | $ | 87,441,064 | | | $ | 29,964,793 | | | $ | 14,487,075 | | |
Undistributed net investment income (loss) at end of year | | $ | 157,407 | | | $ | 134,668 | | | $ | 1,798,541 | | | $ | 307,037 | | |
Distributions in excess of net investment income at end of year | | $ | — | | | $ | — | | | $ | — | | | $ | — | | |
See Notes to Financial Statements
53
| | LONG SHORT FUND | |
| | | Year Ended
October 31,
2013 | | Period from
December 29, 2011
(Commencement
of Operations)
to October 31,
2012 | |
Increase (Decrease) in Net Assets: | |
From Operations (Note A): | |
Net investment income (loss) | | $ | (510,080 | ) | | $ | 105,627 | | |
Net realized gain (loss) on investments | | | 10,428,460 | | | | 659,165 | | |
Change in net unrealized appreciation (depreciation) of investments | | | 81,517,853 | | | | 1,964,300 | | |
Net increase (decrease) in net assets resulting from operations | | | 91,436,233 | | | | 2,729,092 | | |
Distributions to Shareholders From (Note A): | |
Net investment income: | |
Institutional Class | | | (107,714 | ) | | | — | | |
Class A | | | (36,085 | ) | | | — | | |
Class C | | | (1,288 | ) | | | — | | |
Net realized gain on investments: | |
Institutional Class | | | (787,269 | ) | | | — | | |
Class A | | | (315,555 | ) | | | — | | |
Class C | | | (37,516 | ) | | | — | | |
Total distributions to shareholders | | | (1,285,427 | ) | | | — | | |
From Fund Share Transactions (Note D): | |
Proceeds from shares sold: | |
Institutional Class | | | 993,039,563 | | | | 92,669,640 | | |
Class A | | | 508,140,690 | | | | 26,973,514 | | |
Class C | | | 110,775,702 | | | | 3,294,397 | | |
Proceeds from reinvestment of dividends and distributions: | |
Institutional Class | | | 853,873 | | | | — | | |
Class A | | | 293,006 | | | | — | | |
Class C | | | 17,797 | | | | — | | |
Payments for shares redeemed: | |
Institutional Class | | | (105,947,534 | ) | | | (2,540,314 | ) | |
Class A | | | (60,519,912 | ) | | | (161,483 | ) | |
Class C | | | (4,321,732 | ) | | | — | | |
Net increase (decrease) from Fund share transactions | | | 1,442,331,453 | | | | 120,235,754 | | |
Net Increase (Decrease) in Net Assets | | | 1,532,482,259 | | | | 122,964,846 | | |
Net Assets: | |
Beginning of year | | | 122,964,846 | | | | — | | |
End of year | | $ | 1,655,447,105 | | | $ | 122,964,846 | | |
Undistributed net investment income (loss) at end of year | | $ | — | | | $ | 106,349 | | |
Distributions in excess of net investment income at end of year | | $ | (42,614 | ) | | $ | — | | |
54
Notes to Financial Statements Alternative Funds
Note A—Summary of Significant Accounting Policies:
1 General: Neuberger Berman Alternative Funds (the "Trust") is a Delaware statutory trust organized pursuant to an Amended and Restated Trust Instrument dated October 14, 2010. The Trust is registered as an open-end management investment company under the Investment Company Act of 1940, as amended (the "1940 Act"), and its shares are registered under the Securities Act of 1933, as amended (the "1933 Act"). Each Fund is a separate operating series of the Trust. Global Allocation and Long Short are each non-diversified. Dynamic Real Return and Flexible Select are each diversified. Long Short had no operations until December 29, 2011, other than matters relating to its organization and its registration of shares under the 1933 Act. Dynamic Real Return had no operations until December 19, 2012, other than matters relating to its organization and its registration of shares under the 1933 Act. Flexible Select had no operations until May 31, 2013, other than matters relating to its organization and its registration of shares under the 1933 Act. Each Fund offers Institutional Class shares, Class A shares and Class C shares. The Board may establish additional series or classes of shares without the approval of shareholders.
The assets of each Fund belong only to that Fund, and the liabilities of each Fund are borne solely by that Fund and no other.
The preparation of financial statements in accordance with U.S. generally accepted accounting principles ("GAAP") requires Management to make estimates and assumptions at the date of the financial statements. Actual results could differ from those estimates.
2 Portfolio valuation: Investment securities are valued as indicated in the notes following the Funds' Schedule of Investments.
3 Foreign currency translation: The accounting records of the Funds are maintained in U.S. dollars. Foreign currency amounts are translated into U.S. dollars using the exchange rate as of 4:00 p.m., Eastern time, to determine the value of investments, other assets and liabilities. Purchase and sale prices of securities, and income and expenses, are translated into U.S. dollars at the prevailing rate of exchange on the respective dates of such transactions. Net unrealized foreign currency gain (loss), if any, arises from changes in the value of assets and liabilities, other than investments in securities, as a result of changes in exchange rates and is stated separately in the Statements of Operations.
4 Securities transactions and investment income: Securities transactions are recorded on trade date for financial reporting purposes. Dividend income is recorded on the ex-dividend date or, for certain foreign dividends, as soon as the Fund becomes aware of the dividends. Non-cash dividends included in dividend income, if any, are recorded at the fair market value of the securities received. Interest income, including accretion of discount on securities, accretion of original issue discount, where applicable, and accretion of discount on short-term investments, if any, is recorded on the accrual basis. Realized gains and losses from securities transactions and foreign currency transactions, if any, are recorded on the basis of identified cost and stated separately in the Statements of Operations.
5 Income tax information: Each Fund is treated as a separate entity for U.S. federal income tax purposes. It is the policy of each of Global Allocation and Long Short to continue to, and the intention of each of Dynamic Real Return and Flexible Select to, qualify for treatment as a regulated investment company by complying with the requirements of the U.S. Internal Revenue Code applicable to regulated investment companies and to distribute substantially all of its net investment income and net realized capital gains to its shareholders. To the extent a Fund distributes substantially all of its net investment income and net realized capital gains to shareholders, no federal income or excise tax provision is required.
55
The Funds have adopted the provisions of ASC 740 "Income Taxes" ("ASC 740"). ASC 740 sets forth a minimum threshold for financial statement recognition of a tax position taken, or expected to be taken, in a tax return. The Funds recognize interest and penalties, if any, related to unrecognized tax positions as an income tax expense in the Statements of Operations. As of October 31, 2013, the Funds did not have any unrecognized tax positions.
Income distributions and capital gain distributions are determined in accordance with income tax regulations, which may differ from GAAP. These differences are primarily due to differing treatments of income and gains on various investment securities held by each Fund, timing differences and differing characterization of distributions made by each Fund.
As determined on October 31, 2013, permanent differences resulting primarily from different book and tax accounting were reclassified at year end. Such differences may be attributed to one or more of the following: accounting for passive foreign investment company gains and losses, reclassification of gain or loss from certain closed futures contracts under IRC §988, foreign currency gains and losses, partnership basis adjustment, reclassification of partnership capital, non-deductible Rule 12b-1 fees, ordinary loss netting to reduce short term capital gains, return of capital distributions and the characterization of distributions from real estate investment trusts ("REITs"), rollforward of swap true-up from prior years, reclassification of short sale dividend expense, non-deductible excise taxes, tax treatment of deflation adjustments on U.S. Treasury Inflation Protected Bonds and income recognized on total return swaps. These reclassifications had no effect on net income, net asset value ("NAV") or NAV per share of each Fund. For the year ended October 31, 2013, the Funds recorded the following permanent reclassifications:
| | | Paid-in Capital | | Undistributed
Net Investment
Income (Loss) | | Accumulated Net
Realized Gains
(Losses) on
Investments | |
Dynamic Real Return | | $ | 428 | | | $ | (61,263 | ) | | $ | 60,835 | | |
Flexible Select | | | (331 | ) | | | (6,453 | ) | | | 6,784 | | |
Global Allocation | | | — | | | | 2,029,738 | | | | (2,029,738 | ) | |
Long Short | | | — | | | | 506,204 | | | | (506,204 | ) | |
For tax purposes, distributions of short-term gains are taxable to shareholders as ordinary income.
The tax character of distributions paid during the years ended October 31, 2013 and October 31, 2012 was as follows:
| | | Distributions Paid From: | |
| | | Ordinary Income | | Tax-Exempt
Income | | Long-Term
Capital Gain | | Return of
Capital | | Total | |
| | 2013 | | 2012 | | 2013 | | 2012 | | 2013 | | 2012 | | 2013 | | 2012 | | 2013 | | 2012 | |
Dynamic Real Return | | $ | — | (2) | | $ | — | | | $ | — | (2) | | $ | — | | | $ | — | (2) | | $ | — | | | $ | — | (2) | | $ | — | | | $ | — | (2) | | $ | — | | |
Flexible Select | | | — | (3) | | | — | | | | — | (3) | | | — | | | | — | (3) | | | — | | | | — | (3) | | | — | | | | — | (3) | | | — | | |
Global Allocation | | | 231,962 | | | | 561,328 | | | | — | | | | — | | | | — | | | | 15,500 | | | | — | | | | — | | | | 231,962 | | | | 576,828 | | |
Long Short | | | 1,285,427 | | | | — | (1) | | | — | | | | — | (1) | | | — | | | | — | (1) | | | — | | | | — | (1) | | | 1,285,427 | | | | — | (1) | |
(1) Period from December 29, 2011 (Commencement of Operations) to October 31, 2012.
(2) Period from December 19, 2012 (Commencement of Operations) to October 31, 2013.
(3) Period from May 31, 2013 (Commencement of Operations) to October 31, 2013.
56
As of October 31, 2013, the components of distributable earnings (accumulated losses) on a U.S. federal income tax basis were as follows:
| | | Undistributed
Ordinary
Income | | Undistributed
Long-Term
Gain | | Unrealized
Appreciation
(Depreciation) | | Loss
Carryforwards
and Deferrals | | Other
Temporary
Differences | | Total | |
Dynamic Real Return | | $ | 158,581 | | | $ | — | | | $ | 416,627 | | | $ | (175,029 | ) | | $ | — | | | $ | 400,179 | | |
Flexible Select | | | 160,825 | | | | — | | | | 3,777,987 | | | | (55,388 | ) | | | (26,091 | ) | | | 3,857,333 | | |
Global Allocation | | | 2,427,035 | | | | — | | | | 1,671,533 | | | | (738,607 | ) | | | (538,637 | ) | | | 2,821,324 | | |
Long Short | | | 8,015,333 | | | | — | | | | 84,907,528 | | | | — | | | | (42,614 | ) | | | 92,880,247 | | |
The differences between book basis and tax basis distributable earnings are primarily due to: timing differences of wash sales, organizational expenses, open return of capital basis adjustments, partnership basis adjustments, REIT basis adjustments, passive losses from partnership investments, mark to market on certain forward contracts and futures contract transactions, mark to market on certain swap contract transactions, short sales settlement date loss deferral, deferral of current and prior year IRC §1092 straddle losses, tax treatment of deflation adjustments on U.S. Treasury Inflation Protected Bonds and accrued but unrecognized income on total return swaps.
To the extent the Funds' net realized capital gains, if any, can be offset by capital loss carryforwards, it is the policy of the Fund not to distribute such gains. For taxable years beginning after December 22, 2010, the capital loss carryforward rules allow for regulated investment companies to carry forward capital losses indefinitely and to retain the character of capital loss carryforwards as short-term or long-term. As determined at October 31, 2013, the Funds had unused capital loss carryforwards available for federal income tax purposes to offset net realized capital gains, if any, as follows:
| | | Post-Enactment (No Expiration Date) | |
| | | Long-Term | | Short-Term | |
Dynamic Real Return | | $ | — | | | $ | 175,029 | | |
Flexible Select | | | — | | | | 55,388 | | |
Global Allocation | | | 104,885 | | | | 633,722 | | |
6 Foreign taxes: Foreign taxes, if any, withheld represent amounts withheld by foreign tax authorities, net of refunds recoverable.
7 Distributions to shareholders: Each Fund may earn income, net of expenses, daily on its investments. Distributions from net investment income and net realized capital gains, if any, generally are distributed once a year (usually in December) and are recorded on the ex-date.
8 Organization expenses: Costs incurred by each of Dynamic Real Return and Flexible Select in connection with its organization, which amounted to $212,980 and $87,078, respectively, which is reflected in Organization expense in the Statements of Operations, have been expensed as incurred.
9 Expense allocation: Certain expenses are applicable to multiple funds. Expenses directly attributable to a Fund are charged to that Fund. Expenses of the Trust that are not directly attributable to a particular series of the Trust (e.g., a Fund) are allocated among the series of the Trust, on the basis of relative net assets, except where a more appropriate allocation of expenses to each of the series can otherwise be made fairly. Expenses borne by the complex of related investment companies, which includes open-end and closed-end investment companies for which Management serves as investment manager, that are not directly attributable to a particular investment company in the complex (e.g., the Trust) or series thereof are allocated among the investment companies in the complex or series thereof, on the basis of relative net assets, except where a more appropriate allocation of expenses to each of the investment companies in the complex or series thereof can otherwise be made fairly. Each Fund's expenses (other than those specific to each class) are allocated proportionally each day among the classes based upon the relative net assets of each class.
57
10 Investments in foreign securities: Investing in foreign securities may involve certain sovereign and other risks, in addition to the credit and market risks normally associated with domestic securities. These additional risks include the possibility of adverse political and economic developments (including political instability, nationalization, expropriation, or confiscatory taxation) and the potentially adverse effects of unavailability of public information regarding issuers, less governmental supervision and regulation of financial markets, reduced liquidity of certain financial markets, and the lack of uniform accounting, auditing, and financial reporting standards or the application of standards that are different or less stringent than those applied in the United States. Foreign securities also may experience greater price volatility, higher rates of inflation, and delays in settlement.
11 Securities sold short: Each Fund may engage in short sales, which are sales of securities which have been borrowed from a third party on the expectation that the market price will decline. If the price of the securities decreases, a Fund will make a profit by purchasing the securities in the open market at a price lower than the one at which it sold the securities. If the price of the securities increases, a Fund may have to cover its short positions at a price higher than the short sale price, resulting in a loss. Gains are limited to the price at which a Fund sold the security short, while losses are potentially unlimited in size. The Funds pledge securities and/or other assets, which may include cash collateral from securities lending activities, to the lender as collateral. Proceeds received from short sales may be maintained by the lender as collateral or may be released to the Funds and used to purchase additional securities or for any other purpose. Proceeds maintained by the lender are included in the "Deposit with brokers for short sales" on the Statements of Assets and Liabilities. The Funds are required to segregate an amount of cash, cash equivalents or other appropriate liquid marketable securities with the custodian in at least an amount equal to the current market value of the securities sold short (less any additional collateral held by the lender) and, for Global Allocation, the amount of any securities lending cash collateral used to finance short sales until the Fund replaces a borrowed security. The Funds are contractually responsible to the lender for any dividends payable on securities while those securities are in a short position. These dividends are recorded as an expense of the Funds and are excluded from the contractual expense limitation. As of October 31, 2013, Global Allocation had pledged cash in the amount of $10,321,344 to State Street Bank and Trust Company ("State Street"), as collateral for short sales, in addition to cash collateral received from securities lending activities for the Fund. In addition, State Street has a perfected security interest in these Global Allocation assets. At October 31, 2013, Long Short had pledged cash in the amount of $249,155,574 to State Street to cover collateral requirements for borrowing in connection with securities sold short.
12 Security lending: Each of Global Allocation and Long Short, using State Street as its lending agent, may loan securities to qualified brokers and dealers in exchange for negotiated lender's fees. These fees disclosed within the Statements of Operations under the caption, "Income from securities loaned-net" are net of expenses retained by State Street as compensation for its services as lending agent. For the year ended October 31, 2013, Global Allocation received net income under the securities lending arrangement of $1,484. The Funds receive cash collateral at the beginning of each transaction equal to at least 102% of the prior day's market value of the loaned securities (105% in the case of international securities). Some or all of the cash collateral may be used to finance short sales. As of October 31, 2013, approximately 100% of the cash collateral received by Global Allocation was used to finance short sales.
As of October 31, 2013, Global Allocation had outstanding loans of securities to certain approved brokers for which it received collateral as follows:
| | | Value of Loaned
Securities | | Value of
Collateral | |
Global Allocation | | $ | 199,214 | | | $ | 208,167 | | |
13 Investment company securities and exchange-traded funds: The Funds invest in shares of other registered investment companies, including exchange-traded funds ("ETFs"), within the limitations prescribed by the 1940 Act or pursuant to an exemptive order from the Securities and Exchange Commission ("SEC") that permits the Funds to invest in both affiliated and unaffiliated investment companies, including exchange-traded funds, in excess of the limits in Section 12(d)(1)(A) of the 1940 Act, as amended, subject to the terms and conditions of such
58
order (see Note A-16 for more information about the exemptive order). Some ETFs seek to track the performance of a particular market index. These indices include both broad-based market indices and more narrowly-based indices, including those relating to particular sectors, markets, regions or industries. However, some ETFs have an actively-managed investment objective. ETF shares are traded like traditional equity securities on a national securities exchange or NASDAQ. A Fund will indirectly bear its proportionate share of any management fees and other expenses paid by such other investment companies, which will increase expenses and decrease returns.
14 Derivative instruments: During the year ended October 31, 2013, the Funds' use of derivatives, as described below for each Fund, except for Flexible Select, was limited to total return swaps, financial futures contracts, forward foreign currency contracts, and written and purchased option transactions. The Funds have adopted the provisions of ASC 815 "Derivatives and Hedging" ("ASC 815"). The disclosure requirements of ASC 815 distinguish between derivatives that qualify for hedge accounting and those that do not. Because investment companies value their derivatives at fair value and recognize changes in fair value through the Statements of Operations, they do not qualify for hedge accounting. Accordingly, even though a Fund's investments in derivatives may represent economic hedges, they are considered non-hedge transactions for purposes of this disclosure.
Total return swap contracts: During the year ended October 31, 2013, Global Allocation used total return swaps to provide investment exposure to the benchmark indices. Total return swaps involve commitments to pay fixed or floating rate interest in exchange for a market-linked return based on a notional amount. To the extent the total return of the reference security or index underlying the total return swap exceeds or falls short of the offsetting interest rate obligation, a Fund will receive a payment or make a payment to the counterparty, respectively. Certain risks may arise when entering into swap transactions, including counterparty default, liquidity or unfavorable changes in the value of the underlying reference security or index. The value of the swap is adjusted daily and the change in value, if any, is recorded as unrealized appreciation or depreciation in the Statements of Assets and Liabilities. Payments received or made at the end of each measurement period are recorded as realized gain or loss in the Statements of Operations.
At October 31, 2013, the outstanding total return swap contracts for Global Allocation were as follows:
| | | | | | | Rate Type | | | | | | | |
Swap
Counterparty | | Notional
Amount(1) | | Termination
Date | | Variable-rate
Payments
Made/
(Received)
by the Fund | | Reference Entity | | Accrued Net
Interest
Receivable
(Payable) | | Unrealized
Appreciation
(Depreciation) | | Total Fair
Value | |
| J.P. Morgan | | $ | 7,840,514 | | | January 7, 2014 | | | .763 | %(2) | | J.P. Morgan Global
Government Bond
Total Return
Index Unhedged | | $ | (3,826 | ) | | $ | 32,235 | | | $ | 28,409 | | |
| J.P. Morgan | | | 13,415,831 | | | January 15, 2014 | | | (0.015 | %)(3) | | MSCI Daily Total
Return Net World
Index | | | 87 | | | | 499,100 | | | | 499,187 | | |
| Total | | | | | | | | | | | | | | | | | | $ | (3,739 | ) | | $ | 531,335 | | | $ | 527,596 | | |
(1) The notional amount at period end is indicative of the volume throughout the period.
(2) 1 month LIBOR plus .59% at October 7, 2013.
(3) 1 month LIBOR minus .19% at October 14, 2013.
Financial futures contracts: During the period ended October 31, 2013, Dynamic Real Return entered into financial futures contracts for economic hedging purposes, including as a maturity or duration management device. During the year ended October 31, 2013, Global Allocation entered into financial futures contracts in an effort to enhance returns and to manage or adjust the risk profile and the investment exposure of the Fund to certain asset classes, countries and regions, including adjusting the investment exposures provided by the Fund's
59
total return swaps, described above, to the benchmark indices. In addition, the Fund also utilized financial futures contracts to provide investment exposure to certain indices and markets other than the benchmark indices. In addition, Global Allocation utilized financial futures contracts to provide investment exposure to certain indices and markets other than the benchmark indices. During the year ended October 31, 2013, Long Short entered into financial futures contracts on the broader market index and U.S. Treasuries in an effort either to enhance returns or to manage or adjust the risk profile and the investment exposure of the Fund.
At the time a Fund enters into a financial futures contract, it is required to deposit with the futures commission merchant a specified amount of cash or liquid securities, known as "initial margin," which is a percentage of the value of the financial futures contract being traded that is set by the exchange upon which the futures contract is traded. Each day, the futures contract is valued at the official settlement price of the board of trade or U.S. commodity exchange on which such futures contract is traded. Subsequent payments, known as "variation margin," to and from the broker are made on a daily basis as the market price of the financial futures contract fluctuates. Daily variation margin adjustments, arising from this "mark to market," are recorded by a Fund as unrealized gains or losses.
Although some financial futures contracts by their terms call for actual delivery or acquisition of the underlying securities or currency, in most cases the contracts are closed out prior to delivery by offsetting purchases or sales of matching financial futures contracts. When the contracts are closed, a Fund recognizes a gain or loss. Risks of entering into futures contracts include the possibility there may be an illiquid market, possibly at a time of rapidly declining prices, and/or a change in the value of the contract may not correlate with changes in the value of the underlying securities. Futures executed on regulated futures exchanges have minimal counterparty risk to a fund because the exchange's clearinghouse assumes the position of the counterparty in each transaction. Thus, a Fund is exposed to risk only in connection with the clearinghouse and not in connection with the original counterparty to the transaction.
For U.S. federal income tax purposes, the futures transactions undertaken by a Fund may cause that Fund to recognize gains or losses from marking contracts to market even though its positions have not been sold or terminated, may affect the character of the gains or losses recognized as long-term or short-term, and may affect the timing of some capital gains and losses realized by the Fund. Also, a Fund's losses on transactions involving futures contracts may be deferred rather than being taken into account currently in calculating such Fund's taxable income.
At October 31, 2013, open positions in financial futures contracts were:
Fund | | Expiration | | Open Contracts | | Position | | Unrealized
Appreciation
(Depreciation) | |
Dynamic Real Return | | December 2013 | | 2 Australian Dollar/US Dollar Currency | | Short | | $ | (3,086 | ) | |
Dynamic Real Return | | December 2013 | | 1 Euro Currency | | Short | | | (3,828 | ) | |
Dynamic Real Return | | December 2013 | | 1 German Euro Bond | | Short | | | (6,030 | ) | |
Dynamic Real Return | | December 2013 | | 2 New Zealand Dollar | | Short | | | (2,723 | ) | |
Dynamic Real Return | | December 2013 | | 3 Ultra Long US Treasury Bond | | Short | | | (6,195 | ) | |
Dynamic Real Return | | December 2013 | | 1 US Treasury Note, 2 Year | | Short | | | (806 | ) | |
Dynamic Real Return | | December 2013 | | 2 Canadian Currency | | Long | | | (1,131 | ) | |
Dynamic Real Return | | December 2013 | | 4 GBP Currency | | Long | | | 8,163 | | |
Dynamic Real Return | | September 2015 | | 1 Canada Bankers Acceptance, 3 Month | | Long | | | 550 | | |
Dynamic Real Return | | December 2016 | | 1Eurodollar, 90 Day | | Long | | | 1,050 | | |
Dynamic Real Return | | December 2016 | | 2 Sterling Interest Rate, 3 Month | | Long | | | (142 | ) | |
Total | | | | | | | | $ | (14,178 | ) | |
60
Fund | | Expiration | | Open Contracts | | Position | | Unrealized
Appreciation
(Depreciation) | |
Global Allocation | | December 2013 | | 1 Australian Treasury Bond, 10 Year | | Short | | $ | (1,268 | ) | |
Global Allocation | | December 2013 | | 19 Mini Japanese Government Bond, 10 Year | | Short | | | (39,312 | ) | |
Global Allocation | | December 2013 | | 9 Australian Dollar/US Dollar Currency | | Short | | | (14,102 | ) | |
Global Allocation | | December 2013 | | 8 Canadian Currency | | Short | | | 6,699 | | |
Global Allocation | | December 2013 | | 21 Euro STOXX 50 Index | | Short | | | (40,597 | ) | |
Global Allocation | | December 2013 | | 6 German Euro-Bond | | Short | | | (24,194 | ) | |
Global Allocation | | December 2013 | | 8 Japanese Yen | | Short | | | (16,221 | ) | |
Global Allocation | | December 2013 | | 27 Mini MSCI Emerging Markets Index | | Short | | | (27,219 | ) | |
Global Allocation | | December 2013 | | 3 S&P TSX 60 Index | | Short | | | (22,136 | ) | |
Global Allocation | | November 2013 | | 4 Hang Seng Index Future | | Long | | | 8,645 | | |
Global Allocation | | December 2013 | | 21 Government of Canada Bond, 10 Year | | Long | | | 33,950 | | |
Global Allocation | | December 2013 | | 9 Mini Japanese Government Bond, 10 Year | | Long | | | 18,539 | | |
Global Allocation | | December 2013 | | 3 Australian Dollar | | Long | | | 4,672 | | |
Global Allocation | | December 2013 | | 11 GBP Currency | | Long | | | 13,536 | | |
Global Allocation | | December 2013 | | 4 Canadian Dollar | | Long | | | (3,391 | ) | |
Global Allocation | | December 2013 | | 1 CHF Currency | | Long | | | 3,597 | | |
Global Allocation | | December 2013 | | 17 Euro Currency | | Long | | | 58,937 | | |
Global Allocation | | December 2013 | | 23 Euro STOXX 50 Index | | Long | | | 56,782 | | |
Global Allocation | | December 2013 | | 17 FTSE 100 Index | | Long | | | 31,584 | | |
Global Allocation | | December 2013 | | 6 German Euro Bond | | Long | | | 33,551 | | |
Global Allocation | | December 2013 | | 15 Japanese Yen | | Long | | | 30,242 | | |
Global Allocation | | December 2013 | | 14 UK Long Gilt Bond | | Long | | | 59,639 | | |
Global Allocation | | December 2013 | | 2 S&P TSX 60 Index | | Long | | | 14,744 | | |
Global Allocation | | December 2013 | | 65 S&P 500 E-Mini Index | | Long | | | 223,524 | | |
Global Allocation | | December 2013 | | 3 SPI 200 Index | | Long | | | 12,041 | | |
Global Allocation | | December 2013 | | 11 Topix Index | | Long | | | 6,161 | | |
Global Allocation | | December 2013 | | 29 US Treasury Note, 10 Year | | Long | | | 107,647 | | |
Total | | | | | | | | $ | 536,050 | | |
Long Short | | December 2013 | | 1,204 S&P 500 E-Mini Index | | Short | | $ | (2,947,094 | ) | |
Long Short | | December 2013 | | 160 US Treasury Note, 10 Year | | Short | | | (10,236 | ) | |
Total | | | | | | | | $ | (2,957,330 | ) | |
During the period ended October 31, 2013, the average notional value of financial futures contracts was:
| | | Long positions | | Short positions | |
Dynamic Real Return | | $ | 746,989 | | | $ | (570,858 | ) | |
Global Allocation | | $ | 34,885,536 | | | $ | (20,519,704 | ) | |
Long Short | | $ | 2,425,370 | | | $ | (66,479,586 | ) | |
At October 31, 2013, the notional value of financial futures contracts was:
| | | Long positions | | Short positions | |
Dynamic Real Return | | $ | 1,465,706 | | | $ | (1,368,804 | ) | |
Global Allocation | | $ | 29,117,732 | | | $ | (9,397,235 | ) | |
Long Short | | $ | — | | | $ | (125,787,700 | ) | |
61
At October 31, 2013, the Funds had deposited the following in segregated accounts to cover margin requirements on open futures contracts:
Dynamic Real Return | | $ | 31,076 | | |
Global Allocation | | $ | 1,153,918 | | |
Long Short | | $ | 5,430,040 | | |
Forward foreign currency contracts: During the year ended October 31, 2013, Global Allocation entered into forward foreign currency contracts to manage or adjust the risk profile and investment exposure of the Fund, including altering investment exposures to certain currencies provided by the Fund's total return swaps, described above.
A forward contract is an agreement between two parties to buy or sell a specific currency for another at a set price on a future date, which is individually negotiated and privately traded by currency traders and their customers in the interbank market. The market value of a forward contract fluctuates with changes in forward currency exchange rates. Forward contracts are marked to market daily, and the change in value is recorded by the Fund as an unrealized gain or loss. At the consummation of a forward contract to purchase or sell currency, a Fund may either exchange the currencies specified at the maturity of a forward contract or enter into a closing transaction involving the purchase or sale of an offsetting forward contract. Closing transactions with respect to forward contracts are usually performed with the counterparty to the original forward contract. The gain or loss arising from the difference between the US dollar cost of the original contract and the value of the foreign currency in US dollars upon closing a contract is included in "Net realized gain (loss) from forward foreign currency contracts" in the Statements of Operations. These contracts may involve market risk in excess of the unrealized gain or loss reflected in a Fund's Statement of Assets and Liabilities. In addition, a Fund could be exposed to risk if the counterparties are unable to meet the terms of the contracts or if the value of the currency changes unfavorably to the US dollar.
At October 31, 2013, open forward contracts for Global Allocation were as follows:
| Contracts to Receive | | In Exchange For | | Counterparty | | Settlement
Date | | Value | | Net Unrealized
Appreciation
(Depreciation) | |
| | 1,218,073,869 | | | Indonesian Rupiah | | $ | 106,317 | | | J.P. Morgan | | 11/14/13 | | $ | 107,877 | | | $ | 1,560 | | |
| | 110,433,513 | | | South Korean Won | | | 102,662 | | | J.P. Morgan | | 11/14/13 | | | 104,032 | | | | 1,370 | | |
| | 590,899 | | | Polish Zloty | | | 190,042 | | | J.P. Morgan | | 11/14/13 | | | 191,720 | | | | 1,678 | | |
| | 10,441,965 | | | New Taiwan Dollar | | | 354,169 | | | J.P. Morgan | | 11/14/13 | | | 355,493 | | | | 1,324 | | |
| Contracts to Deliver | | In Exchange For | | Counterparty | | Settlement
Date | | Value | | Net Unrealized
Appreciation
(Depreciation) | |
| | 322,741 | | | Brazilian Real | | $ | 145,189 | | | J.P. Morgan | | 11/14/13 | | $ | 143,719 | | | $ | 1,470 | | |
| | 23,280,304 | | | Chilean Peso | | | 46,181 | | | J.P. Morgan | | 11/14/13 | | | 45,383 | | | | 798 | | |
| | 56,337 | | | Czech Koruna | | | 2,990 | | | J.P. Morgan | | 11/14/13 | | | 2,965 | | | | 25 | | |
| | 35,330,208 | | | Hungarian Forint | | | 161,469 | | | J.P. Morgan | | 11/14/13 | | | 162,176 | | | | (707 | ) | |
| | 1,643,674 | | | Mexican Peso | | | 124,590 | | | J.P. Morgan | | 11/14/13 | | | 125,879 | | | | (1,289 | ) | |
| | 290,653 | | | Singapore Dollar | | | 232,569 | | | J.P. Morgan | | 11/14/13 | | | 233,984 | | | | (1,415 | ) | |
| | 405,689 | | | South African Rand | | | 40,201 | | | J.P. Morgan | | 11/14/13 | | | 40,355 | | | | (154 | ) | |
For the year ended October 31, 2013, Global Allocation's investment in forward contracts had an average value of $3,638,216.
Options: Premiums received by a Fund upon writing a covered call option or a put option are recorded in the liability section of the Fund's Statement of Assets and Liabilities and are subsequently adjusted to the current market value. When an option is exercised, closed, or expired, the Fund realizes a gain or loss and the liability is eliminated.
62
When writing a covered call option, a Fund, in return for the premium, gives up the opportunity for profit from a price increase in the underlying security above the exercise price, but conversely retains the risk of loss should the price of the security decline. When writing a put option, the Fund, in return for the premium, takes the risk that it must purchase the underlying security at a price that may be higher than the current market price of the security. If a covered call or a put option that the Fund has written expires unexercised, the Fund will realize a gain in the amount of the premium. All securities covering outstanding written options are held in escrow by the custodian bank.
Written option transactions were used in an attempt to generate incremental returns for Long Short for the year ended October 31, 2013. Written options transactions for the year ended October 31, 2013 were:
Long Short
| | Number | | Value When
Written | |
Contracts outstanding 10/31/2012 | | | — | | | $ | — | | |
Contracts written | | | 17,750 | | | | 2,733,377 | | |
Contracts expired | | | — | | | | — | | |
Contracts exercised | | | — | | | | — | | |
Contracts closed | | | (2,750 | ) | | | (481,917 | ) | |
Contracts outstanding 10/31/2013 | | | 15,000 | | | $ | 2,251,460 | | |
Premiums paid by a Fund upon purchasing a call or put option are recorded in the asset section of the Fund's Statement of Assets and Liabilities and are subsequently adjusted to the current market value. When an option is exercised, closed, or expired, the Fund realizes a gain or loss and the asset is eliminated.
For purchased call options, a Fund's loss is limited to the amount of the option premium paid.
Purchased option transactions were used either for hedging purposes or in an attempt to generate incremental returns for Long Short for the year ended October 31, 2013. Purchased option transactions for Long Short for the year ended October 31, 2013 were:
Long Short
| | | Number | | Value When
Purchased | |
Contracts outstanding 10/31/2012 | | | 100 | | | $ | 21,650 | | |
Contracts purchased | | | 35,505 | | | | 7,651,849 | | |
Contracts expired | | | (12,680 | ) | | | (1,584,201 | ) | |
Contracts exercised | | | (250 | ) | | | (15,606 | ) | |
Contracts closed | | | (725 | ) | | | (46,367 | ) | |
Contracts outstanding 10/31/2013 | | | 21,950 | | | $ | 6,027,325 | | |
For the year ended October 31, 2013, Long Short had an average market value of $661,177 in purchased options and $(277,692) in written options.
63
At October 31, 2013, the Funds (except Flexible Select) had the following derivatives (which did not qualify as hedging instruments under ASC 815), grouped by primary risk exposure:
| | | Asset Derivatives | |
Derivative Type | | Statements of
Assets and
Liabilities Location | | Interest
Rate Risk | | Currency Risk | | Equity Risk | | Total | |
Dynamic Real Return | |
Futures contracts | | Receivable/Payable for
variation margin(2) | | $ | 1,600
| | | $ | 8,163
| | | $ | —
| | | $ | 9,763
| | |
Total Value—Assets | | | | $ | 1,600 | | | $ | 8,163 | | | $ | — | | | $ | 9,763 | | |
Global Allocation | |
Swap contracts | | Total return swaps,
at value(1) | | $ | —
| | | $ | —
| | | $ | 527,596 | | | $ | 527,596 | | |
Futures contracts | | Receivable/Payable for
variation margin(2) | | | 253,326 | | | | 117,682 | | | | 353,482 | | | | 724,490 | | |
| Forward contracts | | Receivable for open
forward foreign
currency contracts | | | —
| | | | 8,225 | | | | —
| | | | 8,225 | | |
Total Value—Assets | | | | $ | 253,326 | | | $ | 125,907 | | | $ | 881,078 | | | $ | 1,260,311 | | |
Long Short | |
| Option contracts purchased | | Investments in
securities, at value | | $ | —
| | | $ | —
| | | $ | 2,960,250 | | | $ | 2,960,250 | | |
Total Value—Assets | | | | $ | — | | | $ | — | | | $ | 2,960,250 | | | $ | 2,960,250 | | |
| | | Liability Derivatives | |
Derivative Type | | Statements of
Assets and
Liabilities Location | | Interest
Rate Risk | | Currency Risk | | Equity Risk | | Total | |
Dynamic Real Return | |
Futures contracts | | Receivable/Payable for
variation margin(2) | | $ | (13,173 | ) | | $ | (10,768 | ) | | $ | — | | | $ | (23,941 | ) | |
Total Value—Liabilities | | | | $ | (13,173 | ) | | $ | (10,768 | ) | | $ | — | | | $ | (23,941 | ) | |
Global Allocation | |
Swap contracts | | Total return swaps,
at value(1) | | $ | — | | | $ | — | | | $ | | | | $ | — | | |
Futures contracts | | Receivable/Payable for
variation margin(2) | | | (64,773 | ) | | | (33,714 | ) | | | (89,953 | ) | | | (188,440 | ) | |
Forward contracts | | Payable for open
forward foreign
currency contracts | | | — | | | | (3,565 | ) | | | — | | | | (3,565 | ) | |
Total Value—Liabilities | | | | $ | (64,773 | ) | | $ | (37,279 | ) | | $ | (89,953 | ) | | $ | (192,005 | ) | |
64
Derivative Type | | Statements of
Assets and
Liabilities Location | | Interest
Rate Risk | | Currency Risk | | Equity Risk | | Total | |
Long Short | |
Futures contracts | | Receivable/Payable for
variation margin(2) | | $ | (10,236 | ) | | $ | — | | | $ | (2,947,094 | ) | | $ | (2,957,330 | ) | |
Option contracts written | | Option contracts written,
at value | | | — | | | | — | | | | (2,306,000 | ) | | | (2,306,000 | ) | |
Total Value—Liabilities | | | | $ | (10,236 | ) | | $ | — | | | $ | (5,253,094 | ) | | $ | (5,263,330 | ) | |
(1) "Swap contracts" reflects the appreciation (depreciation) of the total return swap contracts plus accrued interest as of October 31, 2013, which is reflected in the Statements of Assets and Liabilities under the caption "Total return swaps, at value."
(2) "Futures contracts" reflects the cumulative appreciation (depreciation) of futures contracts as of October 31, 2013, which is reflected in the Statements of Assets and Liabilities under the caption "Net unrealized appreciation (depreciation) in value of investments." The outstanding variation margin as of October 31, 2013, if any, is reflected in the Statements of Assets and Liabilities under the caption "Receivable/Payable for variation margin."
The impact of the use of these derivative instruments on the Statements of Operations during the year ended October 31, 2013, was as follows:
Realized Gain (Loss) | |
Derivative Type | | Statements of
Operations
Location | | Rate Risk | | Currency Risk | | Equity Risk | | Total | |
Dynamic Real Return | |
Futures contracts | | Net realized gain (loss) on:
financial futures contracts | | $ | (7,474 | ) | | $ | 16,814 | | | $ | — | | | $ | 9,340 | | |
Total Realized Gain (Loss) | | | | $ | (7,474 | ) | | $ | 16,814 | | | $ | — | | | $ | 9,340 | | |
Global Allocation | |
Swap contracts | | Net realized gain (loss) on:
total return swap contracts | | $ | — | | | $ | — | | | $ | 2,067,585 | | | $ | 2,067,585 | | |
Futures contracts | | Net realized gain (loss) on:
financial futures contracts | | | (1,207,525 | ) | | | (439,240 | ) | | | 303,454 | | | | (1,343,311 | ) | |
Forward contracts | | Net realized gain (loss) on:
forward foreign currency
contracts | | | — | | | | (122,198 | ) | | | — | | | | (122,198 | ) | |
Total Realized Gain (Loss) | | | | $ | (1,207,525 | ) | | $ | (561,438 | ) | | $ | 2,371,039 | | | $ | 602,076 | | |
Long Short | |
Futures contracts | | Net realized gain (loss) on:
financial futures contracts | | $ | 1,265,212 | | | $ | — | | | $ | (8,546,265 | ) | | $ | (7,281,053 | ) | |
Option contracts purchased | | Net realized gain (loss) on:
sales of investment securities
of unaffiliated issuers | | | — | | | | — | | | | (1,537,532 | ) | | | (1,537,532 | ) | |
| Option contracts written | | Net realized gain (loss) on:
options written | | | — | | | | — | | | | 162,542 | | | | 162,542 | | |
Total Realized Gain (Loss) | | | | $ | 1,265,212 | | | $ | — | | | $ | (9,921,255 | ) | | $ | (8,656,043 | ) | |
65
Change in Appreciation (Depreciation) | |
Derivative Type | | Statements of
Operations
Location | | Interest
Rate Risk | | Currency Risk | | Equity Risk | | Total | |
Dynamic Real Return | |
Futures contracts | | Change in net unrealized
appreciation (depreciation)
in value of: financial
futures contracts | | $ | (11,574 | ) | | $ | (2,604 | ) | | $ | — | | | $ | (14,178 | ) | |
Total Change in Appreciation
(Depreciation) | | | | $ | (11,574 | ) | | $ | (2,604 | ) | | $ | — | | | $ | (14,178 | ) | |
Global Allocation | |
Swap contracts | | Change in net unrealized
appreciation (depreciation)
in value of: total return
swap contracts | | $ | — | | | $ | — | | | $ | 612,628 | | | $ | 612,628 | | |
Futures contracts | | Change in net unrealized
appreciation (depreciation)
in value of: financial
futures contracts | | | 201,150 | | | | 47,955 | | | | 274,235 | | | | 523,340 | | |
Forward contracts | | Change in net unrealized
appreciation (depreciation)
in value of: forward foreign
currency contracts | | | 8,376 | | | | — | | | | — | | | | 8,376 | | |
Total Change in Appreciation
(Depreciation) | | | | $ | 209,526 | | | $ | 47,955 | | | $ | 886,863 | | | $ | 1,144,344 | | |
Long Short | |
Futures contracts | | Change in net unrealized
appreciation (depreciation)
in value of: financial
futures contracts | | $ | (10,236 | ) | | $ | — | | | $ | (3,126,291 | ) | | $ | (3,136,527 | ) | |
Option contracts purchased | | Change in net unrealized
appreciation (depreciation)
in value of: unaffiliated
investment securities | | | — | | | | — | | | | (3,069,975 | ) | | | (3,069,975 | ) | |
Option contracts written | | Change in net unrealized
appreciation (depreciation)
in value of: options written | | | — | | | | — | | | | (54,540 | ) | | | (54,540 | ) | |
Total Change in Appreciation
(Depreciation) | | | | $ | (10,236 | ) | | $ | — | | | $ | (6,250,806 | ) | | $ | (6,261,042 | ) | |
66
15 Indemnifications: Like many other companies, the Trust's organizational documents provide that its officers and trustees are indemnified against certain liabilities arising out of the performance of their duties to the Trust. In addition, both in some of its principal service contracts and in the normal course of its business, the Trust enters into contracts that provide indemnifications to other parties for certain types of losses or liabilities. The Trust's maximum exposure under these arrangements is unknown as this could involve future claims against the Trust.
16 Transactions with other funds managed by Neuberger Berman Management LLC: Neuberger Berman Alternative Funds and Management have obtained an exemptive order from the Securities and Exchange Commission ("SEC") that permits the Funds to invest in both affiliated and unaffiliated investment companies, including exchange-traded funds, in excess of the limits in Section 12(d)(1)(A) of the 1940 Act, as amended, subject to the terms and conditions of such order. Through October 31, 2013, Dynamic Real Return invested in the Neuberger Berman Emerging Markets Equity Fund, Neuberger Berman High Income Bond Fund, Neuberger Berman Floating Rate Income Fund and Neuberger Berman Risk Balanced Commodity Strategy Fund (collectively the "Underlying Funds"). Through October 31, 2013, Flexible Select invested in the Neuberger Berman Core Bond Fund (an "Underlying Fund") (See Note F).
For the Funds' investments in the Underlying Funds, Management waived a portion of its management fee equal to the management fee it received from the Underlying Funds on those assets (the "Arrangement"). For the fiscal period ended October 31, 2013, management fees waived under this Arrangement are reflected in the Statements of Operations under the caption "Investment management fees waived." For the fiscal period ended October 31, 2013, income earned under this Arrangement on Dynamic Real Return's and Flexible Select's investments is reflected in the Statements of Operations under the caption "Dividend income-affiliated issuers." For the fiscal period ended October 31, 2013, management fees waived and income earned under this Arrangement on Dynamic Real Return's and Flexible Select's investments in the Underlying Funds were as follows:
| | | Management fee waived | | Income earned | |
Dynamic Real Return | | $ | 25,313 | | | $ | 112,148 | | |
Flexible Select | | | 2,692 | | | | 35,807 | | |
17 Expense offset arrangement: Prior to January 1, 2013, each Fund had an expense offset arrangement in connection with its custodian contract. For the year ended October 31, 2013, the impact of this arrangement was a reduction of expenses of $0, $16 and $48 for Dynamic Real Return, Global Allocation and Long Short, respectively.
18 Other: All net investment income and realized and unrealized capital gains and losses of each Fund are allocated, on the basis of relative net assets, pro rata among its respective classes.
Note B—Management Fees, Administration Fees, Distribution Arrangements, and Other Transactions with Affiliates:
Each Fund retains Management as its investment manager under a Management Agreement. For such investment management services, Dynamic Real Return pays Management a fee at the annual rate of 0.650% of the first $250 million of the Fund's average daily net assets, 0.625% of the next $250 million, 0.600% of the next $250 million, 0.575% of the next $250 million, 0.550% of the next $500 million, 0.525% of the next $2.5 billion, and 0.500% of the average daily net assets in excess of $4 billion. Flexible Select pays Management a fee at the annual rate of 0.600% of the first $250 million of the Fund's average daily net assets, 0.575% of the next $250 million, 0.550% of the next $250 million, 0.525% of the next $250 million, 0.500% of the next $500 million, 0.475% of the next $2.5 billion, and 0.450% of the average daily net assets in excess of $4 billion. As of February 28, 2013, Global Allocation pays Management a fee at the annual rate of 0.650% of the first $1 billion of the Fund's average daily net assets, 0.625% of the next $1 billion and 0.600% of average daily net assets in excess of $2 billion. Prior to February 28, 2013 Global Allocation paid Management a fee at the annual rate of 0.900% of the first $1 billion of the Fund's average daily net assets, 0.875% of the next $1 billion and 0.850% of average daily net assets in excess of $2 billion. Long Short pays Management a fee at the annual rate of 1.200% of the first $250 million of the Fund's
67
average daily net assets, 1.175% of the next $250 million, 1.150% of the next $250 million, 1.125% of the next $250 million, 1.100% of the next $500 million, 1.075% of the next $2.5 billion, and 1.050% of average daily net assets in excess of $4 billion. Accordingly, for the period ended October 31, 2013, the fee pursuant to the Management Agreement was equivalent to an annual effective rate of 0.65% (0.43% after management fee waiver (See Note A-16)), 0.60% (0.58% after management fee waiver (See Note A-16), 0.71% and 1.16% of Dynamic Real Return's, Flexible Select's, Global Allocation's and Long Short's average daily net assets, respectively.
Each Fund retains Management as its administrator under an Administration Agreement. Each Fund pays Management an administration fee at the annual rate of 0.06% of its average daily net assets under this agreement. In addition, each Fund's Institutional Class pays Management an administration fee at the annual rate of 0.09% of its average daily net assets under this agreement and each Fund's Class A and Class C pays Management an administration fee at the annual rate of 0.20% of its average daily net assets under this agreement. Additionally, Management retains State Street as its sub-administrator under a Sub-Administration Agreement. Management pays State Street a fee for all services received under the agreement.
Management has contractually agreed to waive current payment of fees and/or reimburse certain expenses of the Institutional Class, Class A and Class C of each Fund so that the total annual operating expenses of those classes do not exceed the expense limitations as detailed in the following table. These undertakings apply to a Fund's direct expenses and exclude interest, taxes, brokerage commissions, acquired fund fees and expenses, and extraordinary expenses, and, as of June 22, 2011 for Global Allocation and as of the commencement of operations for Dynamic Real Return, Flexible Select and Long Short, exclude dividend expenses relating to short sales as well as interest expenses relating to short sales for Dynamic Real Return and Flexible Select, if any; consequently, net expenses may exceed the contractual expense limitations. Each Fund has agreed that each of its respective classes will repay Management for fees and expenses waived or reimbursed for that class provided that repayment does not cause that class' annual operating expenses to exceed its contractual expense limitation in place at the time the fees and expenses were waived or reimbursed. Any such repayment must be made within three years after the year in which Management incurred the expense.
During the year ended October 31, 2013, repayments to Management under their contractual expense limitation agreements were as follows:
Long Short Institutional Class | | $ | 269,112 | | |
Long Short Class A | | | 43,517 | | |
Long Short Class C | | | 11,051 | | |
At October 31, 2013, contingent liabilities to Management under the agreements were as follows:
| | | | | | | Expenses Reimbursed In
Fiscal Period Ending, October 31, | |
| | | | | | | 2011 | | 2012 | | 2013 | |
| | | | | | | Subject to Repayment Until October 31, | |
Class | | Contractual
Expense
Limitation(1) | | Expiration | | 2014 | | 2015 | | 2016 | |
Dynamic Real Return Institutional Class | | | 0.90 | % | | 10/31/15 | | $ | — | | | $ | — | | | $ | 438,126 | (4) | |
Dynamic Real Return Class A | | | 1.26 | % | | 10/31/15 | | | — | | | | — | | | | 5,378 | (4) | |
Dynamic Real Return Class C | | | 2.01 | % | | 10/31/15 | | | — | | | | — | | | | 5,378 | (4) | |
Flexible Select Institutional Class | | | 0.85 | % | | 10/31/16 | | | — | | | | — | | | | 216,729 | (6) | |
Flexible Select Class A | | | 1.21 | % | | 10/31/16 | | | — | | | | — | | | | 2,426 | (6) | |
68
| | | | | | | Expenses Reimbursed In
Fiscal Period Ending, October 31, | |
| | | | | | 2011 | | 2012 | | 2013 | |
| | | | | | Subject to Repayment Until October 31, | |
| Class | | Contractual
Expense
Limitation(1) | | Expiration | | 2014 | | 2015 | | 2016 | |
Flexible Select Class C | | | 1.96 | % | | 10/31/16 | | $ | — | | | $ | — | | | $ | 2,202 | (6) | |
Global Allocation Institutional Class | | | 0.90 | %(5) | | 10/31/16 | | | 894,111 | (2) | | | 342,304 | | | | 253,136 | | |
Global Allocation Class A | | | 1.26 | %(5) | | 10/31/16 | | | 11,162 | (2) | | | 125,936 | | | | 141,365 | | |
Global Allocation Class C | | | 2.01 | %(5) | | 10/31/16 | | | 6,919 | (2) | | | 19,134 | | | | 71,481 | | |
Long Short Institutional Class | | | 1.70 | % | | 10/31/16 | | | — | | | | — | (3) | | | — | | |
Long Short Class A | | | 2.06 | % | | 10/31/16 | | | — | | | | — | (3) | | | — | | |
Long Short Class C | | | 2.81 | % | | 10/31/16 | | | — | | | | — | (3) | | | — | | |
(1) Expense limitation per annum of the respective class' average daily net assets.
(2) Period from December 29, 2010 (Commencement of Operations) to October 31, 2011.
(3) Period from December 29, 2011 (Commencement of Operations) to October 31, 2012.
(4) Period from December 19, 2012 (Commencement of Operations) to October 31, 2013.
(5) Prior to February 28, 2013, the contractual expense limitation was 1.20% for Institutional Class, 1.56% for Class A and 2.31% for Class C.
(6) Period from May 31, 2013 (Commencement of Operations) to October 31, 2013.
Neuberger Berman Fixed Income LLC ("NBFI"), as the sub-adviser to Dynamic Real Return and Global Allocation, is retained by Management to provide day-to-day investment management services and receives a monthly fee paid by Management. As investment manager, Management is responsible for overseeing the investment activities of NBFI. Neuberger Berman LLC ("Neuberger"), as the sub-adviser to Flexible Select and Long Short, is retained by Management to furnish it with investment recommendations and research information without added cost to the Fund. Several individuals who are officers and/or Trustees of the Trust are also employees of NBFI, Neuberger and/or Management.
Management, NBFI, and Neuberger are indirect subsidiaries of Neuberger Berman Group LLC (("NBG") and together with its consolidated subsidiaries ("NB Group")). NBSH Acquisition, LLC ("NBSH" and together with NBG, the "NB Parties"), which is owned by portfolio managers, members of the NB Group management team and certain of NB Group's key employees, senior professionals, and certain of their permitted transferees, owns, as of September 30, 2013, approximately 76% of NBG's equity, and Lehman Brothers Holdings Inc. ("LBHI") and certain of its subsidiaries (collectively the "LBHI Parties") own the remaining 24% of such equity. Pursuant to agreements among the NB Parties and the LBHI Parties, as well as the issuance of NBSH equity to employees with respect to their previously made equity elections relating to 2013 compensation, it is expected that NBSH will own 81% of NBG's equity as of January 1, 2014. NBG has the opportunity to continue to redeem the remaining NBG equity held by the LBHI Parties through a process that is expected to end in 2016.
Each Fund also has a distribution agreement with Management with respect to each class of shares. Management acts as agent in arranging for the sale of class shares without sales commission or other compensation, except as described below for Class A and Class C shares, and bears advertising and promotion expenses.
However, Management receives fees from Class A and Class C under their distribution plans (each a "Plan", collectively the "Plans") pursuant to Rule 12b-1 under the 1940 Act. The Plans provide that, as compensation for
69
administrative and other services provided to these classes, Management's activities and expenses related to the sale and distribution of these classes of shares, and ongoing services provided to investors in these classes, Management receives from each of these classes a fee at the annual rate of 0.25% of Class A's and 1.00% of Class C's average daily net assets. Management receives this amount to provide distribution and shareholder servicing for these classes and pays a portion of it to institutions that provide such services. Those institutions may use the payments for, among other purposes, compensating employees engaged in sales and/or shareholder servicing. The amount of fees paid by each class during any year may be more or less than the cost of distribution and other services provided to that class. FINRA rules limit the amount of annual distribution fees that may be paid by a mutual fund and impose a ceiling on the cumulative distribution fees paid. The Trust's Plans comply with those rules.
Class A shares of each Fund are generally sold with an initial sales charge of up to 5.75% and no contingent deferred sales charge ("CDSC"), except that a CDSC of 1.00% will apply to certain redemptions made within 18 months following purchases of $1 million or more without an initial sales charge. Class C shares of each Fund are sold with no initial sales charge and a 1.00% CDSC if shares are sold within one year after purchase.
For the year ended October 31, 2013, Management, acting as underwriter and broker-dealer, received net initial sales charges from the purchase of Class A shares and CDSCs from the redemption of Class A and Class C shares as follows:
| | | Underwriter | | Broker-Dealer | |
| | | Net Initial
Sales Charge | | CDSC | | Net Initial
Sales Charge | | CDSC | |
Dynamic Real Return Class A | | $ | — | | | $ | — | | | $ | — | | | $ | — | | |
Dynamic Real Return Class C | | | — | | | | 33 | | | | — | | | | — | | |
Flexible Select Class A | | | — | | | | — | | | | — | | | | — | | |
Flexible Select Class C | | | — | | | | — | | | | — | | | | — | | |
Global Allocation Class A | | | 11,227 | | | | — | | | | — | | | | — | | |
Global Allocation Class C | | | — | | | | 860 | | | | — | | | | — | | |
Long Short Class A | | | 145,995 | | | | — | | | | — | | | | — | | |
Long Short Class C | | | — | | | | 28,940 | | | | — | | | | — | | |
Note C—Securities Transactions:
During the year ended October 31, 2013, there were purchase and sale transactions of long-term securities (excluding total return swaps, financial futures contracts, forward foreign currency contracts and option contracts) as follows:
| | | Purchases | | Securities Sold
Short | | Sales | | Covers on Securities
Sold Short | |
Dynamic Real Return | | $ | 21,418,281 | | | $ | — | | | $ | 5,832,904 | | | $ | — | | |
Flexible Select | | | 28,397,170 | | | | — | | | | 9,083,557 | | | | — | | |
Global Allocation | | | 15,696,029 | | | | 16,270,881 | | | | 11,138,661 | | | | 10,169,985 | | |
Long Short | | | 1,328,268,636 | | | | 380,991,235 | | | | 288,263,894 | | | | 187,405,359 | | |
During the year ended October 31, 2013, no brokerage commissions on securities transactions were paid to affiliated brokers.
70
Note D—Fund Share Transactions:
Share activity for the years ended October 31, 2013 and October 31, 2012 was as follows:
| | | For the Year Ended October 31, 2013 | | For the Year Ended October 31, 2012 | |
| | | Shares
Sold | | Shares Issued on
Reinvestment of
Dividends and
Distributions | | Shares
Redeemed | | Total | | Shares
Sold | | Shares Issued on
Reinvestment of
Dividends and
Distributions | | Shares
Redeemed | | Total | |
Dynamic Real Return | |
Institutional
Class(2) | | | 1,682,682 | | | | — | | | | (148,410 | ) | | | 1,534,272 | | | | — | | | | — | | | | — | | | | — | | |
| Class A(2) | | | 10,246 | | | | — | | | | — | | | | 10,246 | | | | — | | | | — | | | | — | | | | — | | |
| Class C(2) | | | 10,343 | | | | — | | | | (343 | ) | | | 10,000 | | | | — | | | | — | | | | — | | | | — | | |
Flexible Select | |
Institutional
Class(3) | | | 8,265,459 | | | | — | | | | (188,898 | ) | | | 8,076,561 | | | | — | | | | — | | | | — | | | | — | | |
| Class A(3) | | | 13,536 | | | | — | | | | — | | | | 13,536 | | | | — | | | | — | | | | — | | | | — | | |
| Class C(3) | | | 10,000 | | | | — | | | | — | | | | 10,000 | | | | — | | | | — | | | | — | | | | — | | |
Global Allocation | |
Institutional Class | | | 951,702 | | | | 14,913 | | | | (349,004 | ) | | | 617,611 | | | | 1,526,708 | | | | 58,760 | | | | (1,285,156 | ) | | | 300,312 | | |
Class A | | | 832,046 | | | | 4,880 | | | | (490,611 | ) | | | 346,315 | | | | 962,595 | | | | 1,841 | | | | (643,796 | ) | | | 320,640 | | |
Class C | | | 278,048 | | | | 1,044 | | | | (66,913 | ) | | | 212,179 | | | | 209,308 | | | | 756 | | | | (939 | ) | | | 209,125 | | |
Long Short | |
Institutional Class | | | 83,663,403 | | | | 76,375 | | | | (8,872,962 | ) | | | 74,866,816 | | | | 8,577,855 | | | | — | | | | (231,938 | ) | | | 8,345,917 | (1) | |
Class A | | | 43,047,040 | | | | 26,279 | | | | (5,046,542 | ) | | | 38,026,777 | | | | 2,458,443 | | | | — | | | | (14,658 | ) | | | 2,443,785 | (1) | |
Class C | | | 9,454,741 | | | | 1,606 | | | | (366,848 | ) | | | 9,089,499 | | | | 305,335 | | | | — | | | | — | | | | 305,335 | (1) | |
(1) Period from December 29, 2011 (Commencement of Operations) to October 31, 2012.
(2) Period from December 19, 2012 (Commencement of Operations) to October 31, 2013.
(3) Period from May 31, 2013 (Commencement of Operations) to October 31, 2013.
Note E—Line of Credit:
At October 31, 2013, each Fund was a participant in a single committed, unsecured $300,000,000 ($200,000,000 prior to September 2013) line of credit with State Street, to be used only for temporary or emergency purposes. Other investment companies managed by Management also participate in this line of credit on the same terms. Interest is charged on borrowings under this line of credit at the higher of (a) the Federal Funds Rate plus 1.25% per annum or (b) the overnight LIBOR Rate plus 1.25% per annum. A commitment fee of 0.10% per annum of the available line of credit is charged, of which each participating Fund has agreed to pay its pro rata share, based on the ratio of its individual net assets to the net assets of all participants at the time the fee is due and payable. The fee is paid quarterly in arrears. Because several mutual funds participate, there is no assurance that an individual Fund will have access to all or any part of the $300,000,000 at any particular time. There were no loans outstanding pursuant to this line of credit at October 31, 2013. During the year ended October 31, 2013, none of the Funds utilized this line of credit.
71
At October 31, 2013, the Funds were participants in a single uncommitted, unsecured $100,000,000 line of credit with State Street, to be used only for temporary or emergency purposes. Other investment companies managed by Management also participate in this line of credit on the same terms. Interest is charged on borrowings under this line of credit at a variable rate per annum as determined and quoted by State Street at the time a Fund requests a loan. Because several mutual funds participate, there is no assurance that an individual Fund will have access to all or any part of the $100,000,000 at any particular time. There were no loans outstanding pursuant to this line of credit at October 31, 2013. During September (inception of line of credit) and October 2013, none of the Funds utilized this line of credit.
Note F—Investments in Affiliates(1):
| | Balance of
Shares Held
October 31,
2012 | | Gross
Purchases
and
Additions | | Gross
Sales
and
Reductions | | Balance of
Shares Held
October 31,
2013 | | Value
October 31,
2013 | | Income from
Investments
in Affiliated
Issuers | | Net Realized
Gain (Loss)
from
Investments
in Affiliated
Issuers | |
| Dynamic Real Return(2) | |
Neuberger Berman
Emerging Markets
Equity Fund
Institutional Class | | | — | | | | 84,322 | | | | — | | | | 84,322 | | | $ | 1,426,337 | | | $ | — | | | $ | — | | |
Neuberger Berman
Floating Rate Income
Fund Institutional Class | | | — | | | | 150,631 | | | | 62,323 | | | | 88,308 | | | | 908,393 | | | | 40,357 | | | | (11 | ) | |
Neuberger Berman
High Income Bond
Fund Institutional Class | | | — | | | | 159,659 | | | | — | | | | 159,659 | | | | 1,539,701 | | | | 71,791 | | | | — | | |
Neuberger Berman Risk
Balanced Commodity
Strategy Fund
Institutional Class | | | — | | | | 214,416 | | | | 52,428 | | | | 161,988 | | | | 1,458,878 | | | | — | * | | | (32,670 | ) | |
Total | | | | | | | | | | $ | 5,333,309 | | | $ | 112,148 | | | $ | (32,681 | ) | |
| Flexible Select(3) | |
Neuberger Berman Core
Bond Fund Institutional
Class | | | — | | | | 609,160 | | | | 33,048 | | | | 576,112 | | | $ | 5,975,624 | | | $ | 35,807 | | | $ | (8,784 | ) | |
(1) Affiliated issuers, as defined in the 1940 Act.
(2) Period from December 19, 2012 (Commencement of Operations) to October 31, 2013.
(3) Period from May 31, 2013 (Commencement of Operations) to October 31, 2013.
* Security did not produce income during the last twelve months.
72
Note G—Recent Accounting Pronouncements:
In December 2011, the Financial Accounting Standards Board ("FASB") issued Accounting Standards Update 2011-11 Disclosures about Offsetting Assets and Liabilities ("ASU 2011-11"). Effective for annual reporting periods beginning on or after January 1, 2013 and interim periods within those annual periods, ASU 2011-11 is intended to enhance disclosure requirements on the offsetting of financial assets and liabilities. At this time, Management is evaluating the implications of ASU 2011-11 and its impact on the Funds' financial statements. ASU 2011-11 is effective for Flexible Select as of October 31, 2013, however no additional disclosure was necessary.
In June 2013, FASB issued Accounting Standards Update 2013-08 Financial Services—Investment Companies (Topic 946)—Amendments to the Scope, Measurement, and Disclosure Requirements ("ASU 2013-08"). Effective for interim and annual reporting periods in fiscal years that begin after December 15, 2013, ASU 2013-08 sets forth a methodology for determining whether an entity should be characterized as an investment company and prescribes fair value accounting for an investment company's non-controlling ownership interest in another investment company. FASB has determined that a fund registered under the 1940 Act automatically meets ASU 2013-08's criteria for an investment company. Although still evaluating the potential impact of ASU 2013-08 on the Funds' financial statements, Management expects that the impact will be limited to additional financial statement disclosures.
73
This page has been left blank intentionally
74
The following tables include selected data for a share outstanding throughout each period and other performance information derived from the Financial Statements. Per share amounts that round to less than $.01 or $(0.01) per share are presented as $0.00 or $(0.00), respectively. Ratios that round to less than 0.00% or (0.00%) per share are presented as 0.00% or (0.00%), respectively. Net Asset amounts with a zero balance may reflect actual amounts rounding to less than $0.1 million. A "—" indicates that the line item was not applicable in the corresponding period.
| �� | Net Asset
Value,
Beginning
of Year | | Net
Investment
Income
(Loss)@ | | Net Gains or
Losses on
Securities
(both realized
and
unrealized) | | Total From
Investment
Operations | | Dividends
from Net
Investment
Income | | Distributions
from Net
Realized
Capital
Gains | | Total
Distributions | | Net Asset
Value,
End
of Year | | Total
Return†† | |
Dynamic Real Return Fund | |
Institutional Class | |
Period from 12/19/2012^
to 10/31/2013 | | $ | 10.00 | | | $ | 0.17 | | | $ | 0.21 | | | $ | 0.38 | | | $ | — | | | $ | — | | | $ | — | | | $ | 10.38 | | | | 3.80 | %** | |
Class A | |
Period from 12/19/2012^
to 10/31/2013 | | $ | 10.00 | | | $ | 0.14 | | | $ | 0.21 | | | $ | 0.35 | | | $ | — | | | $ | — | | | $ | — | | | $ | 10.35 | | | | 3.50 | %** | |
Class C | |
Period from 12/19/2012^
to 10/31/2013 | | $ | 10.00 | | | $ | 0.07 | | | $ | 0.21 | | | $ | 0.28 | | | $ | — | | | $ | — | | | $ | — | | | $ | 10.28 | | | | 2.80 | %** | |
Flexible Select Fund | |
Institutional Class | |
Period from 5/31/12013^
to 10/31/2013 | | $ | 10.00 | | | $ | 0.04 | | | $ | 0.76 | | | $ | 0.80 | | | $ | — | | | $ | — | | | $ | — | | | $ | 10.80 | | | | 8.00 | %** | |
Class A | |
Period from 5/31/12013^
to 10/31/2013 | | $ | 10.00 | | | $ | 0.02 | | | $ | 0.76 | | | $ | 0.78 | | | $ | — | | | $ | — | | | $ | — | | | $ | 10.78 | | | | 7.80 | %** | |
Class C | |
Period from 5/31/12013^
to 10/31/2013 | | $ | 10.00 | | | $ | (0.01 | ) | | $ | 0.76 | | | $ | 0.75 | | | $ | — | | | $ | — | | | $ | — | | | $ | 10.75 | | | | 7.50 | %** | |
See Notes to Financial Highlights
75
| | | Net Assets,
End of
Year
(in millions) | | Ratio
of Gross
Expenses to
Average
Net
Assets# | | Ratio
of Gross
Expenses to
Average Net
Assets
(excluding
dividend
expenses on
securities
sold
short) | | Ratio
of Net
Expenses to
Average
Net
Assets | | Ratio
of Net
Expenses to
Average Net
Assets
(excluding
dividend
expenses on
securities
sold
short) | | Ratio
of Net
Investment
Income/
(Loss) to
Average
Net
Assets | | Portfolio
Turnover
Rate
(including
securities
sold
short) | | Portfolio
Turnover
Rate
(excluding
securities
sold
short) | |
Dynamic Real Return Fund | |
Institutional Class | |
Period from 12/19/2012^
to 10/31/2013 | | $ | 15.9 | | | | 4.55 | %‡* | | | 4.55 | %‡Ø* | | | .69 | %‡* | | | .69 | %‡Ø* | | | 1.92 | %‡* | | | 45 | %** | | | 45 | %Ø** | |
Class A | |
Period from 12/19/2012^
to 10/31/2013 | | $ | 0.1 | | | | 6.99 | %‡* | | | 6.99 | %‡Ø* | | | 1.04 | %‡* | | | 1.04 | %‡Ø* | | | 1.59 | %‡* | | | 45 | %** | | | 45 | %Ø** | |
Class C | |
Period from 12/19/2012^
to 10/31/2013 | | $ | 0.1 | | | | 7.76 | %‡* | | | 7.76 | %‡Ø* | | | 1.79 | %‡* | | | 1.79 | %‡Ø* | | | .84 | %‡* | | | 45 | %** | | | 45 | %Ø** | |
Flexible Select Fund | |
Institutional Class | |
Period from 5/31/12013^
to 10/31/2013 | | $ | 87.2 | | | | 1.97 | %‡* | | | 1.97 | %‡Ø* | | | .83 | %‡* | | | .83 | %‡Ø* | | | .95 | %‡* | | | 20 | %** | | | 20 | %Ø** | |
Class A | |
Period from 5/31/12013^
to 10/31/2013 | | $ | 0.1 | | | | 5.09 | %‡* | | | 5.09 | %‡Ø* | | | 1.19 | %‡* | | | 1.19 | %‡Ø* | | | .57 | %‡* | | | 20 | %** | | | 20 | %Ø** | |
Class C | |
Period from 5/31/12013^
to 10/31/2013 | | $ | 0.1 | | | | 6.71 | %‡* | | | 6.71 | %‡Ø* | | | 1.94 | %‡* | | | 1.94 | %‡Ø* | | | (.18 | %)‡* | | | 20 | %** | | | 20 | %Ø** | |
76
Financial Highlights (cont'd)
| | Net Asset
Value,
Beginning
of Year | | Net
Investment
Income
(Loss)@ | | Net Gains or
Losses on
Securities
(both realized
and
unrealized) | | Total From
Investment
Operations | | Dividends
from Net
Investment
Income | | Distributions
from Net
Realized
Capital
Gains | | Total
Distributions | | Net Asset
Value,
End
of Year | | Total
Return†† | |
Global Allocation Fund | |
Institutional Class | |
10/31/2013 | | $ | 10.30 | | | $ | (0.09 | ) | | $ | 1.57 | | | $ | 1.48 | | | $ | (0.15 | ) | | $ | — | | | $ | (0.15 | ) | | $ | 11.63 | | | | 14.56 | % | |
10/31/2012 | | $ | 10.30 | | | $ | (0.12 | ) | | $ | 1.02 | | | $ | 0.90 | | | $ | (0.21 | ) | | $ | (0.69 | ) | | $ | (0.90 | ) | | $ | 10.30 | | | | 9.60 | % | |
Period from 12/29/2010^
to 10/31/2011 | | $ | 10.00 | | | $ | (0.08 | ) | | $ | 0.38 | | | $ | 0.30 | | | $ | — | | | $ | — | | | $ | — | | | $ | 10.30 | | | | 3.00 | %** | |
Class A | |
10/31/2013 | | $ | 10.25 | | | $ | (0.14 | ) | | $ | 1.58 | | | $ | 1.44 | | | $ | (0.12 | ) | | $ | — | | | $ | (0.12 | ) | | $ | 11.57 | | | | 14.15 | % | |
10/31/2012 | | $ | 10.27 | | | $ | (0.15 | ) | | $ | 1.01 | | | $ | 0.86 | | | $ | (0.19 | ) | | $ | (0.69 | ) | | $ | (0.88 | ) | | $ | 10.25 | | | | 9.24 | % | |
Period from 12/29/2010^
to 10/31/2011 | | $ | 10.00 | | | $ | (0.14 | ) | | $ | 0.41 | | | $ | 0.27 | | | $ | — | | | $ | — | | | $ | — | | | $ | 10.27 | | | | 2.70 | %** | |
Class C | |
10/31/2013 | | $ | 10.13 | | | $ | (0.21 | ) | | $ | 1.55 | | | $ | 1.34 | | | $ | (0.04 | ) | | $ | — | | | $ | (0.04 | ) | | $ | 11.43 | | | | 13.30 | % | |
10/31/2012 | | $ | 10.21 | | | $ | (0.23 | ) | | $ | 1.00 | | | $ | 0.77 | | | $ | (0.16 | ) | | $ | (0.69 | ) | | $ | (0.85 | ) | | $ | 10.13 | | | | 8.34 | % | |
Period from 12/29/2010^
to 10/31/2011 | | $ | 10.00 | | | $ | (0.18 | ) | | $ | 0.39 | | | $ | 0.21 | | | $ | — | | | $ | — | | | $ | — | | | $ | 10.21 | | | | 2.10 | %** | |
Long Short Fund | |
Institutional Class | |
10/31/2013 | | $ | 11.09 | | | $ | 0.01 | | | $ | 1.47 | | | $ | 1.48 | | | $ | (0.01 | ) | | $ | (0.08 | ) | | $ | (0.09 | ) | | $ | 12.48 | | | | 13.47 | % | |
Period from 12/29/2011^
to 10/31/2012 | | $ | 10.00 | | | $ | 0.04 | | | $ | 1.05 | | | $ | 1.09 | | | $ | — | | | $ | — | | | $ | — | | | $ | 11.09 | | | | 10.90 | %** | |
Class A | |
10/31/2013 | | $ | 11.06 | | | $ | (0.03 | ) | | $ | 1.47 | | | $ | 1.44 | | | $ | (0.01 | ) | | $ | (0.08 | ) | | $ | (0.09 | ) | | $ | 12.41 | | | | 13.08 | % | |
Period from 12/29/2011^
to 10/31/2012 | | $ | 10.00 | | | $ | 0.00 | | | $ | 1.06 | | | $ | 1.06 | | | $ | — | | | $ | — | | | $ | — | | | $ | 11.06 | | | | 10.60 | %** | |
Class C | |
10/31/2013 | | $ | 10.99 | | | $ | (0.12 | ) | | $ | 1.46 | | | $ | 1.34 | | | $ | (0.00 | ) | | $ | (0.07 | ) | | $ | (0.07 | ) | | $ | 12.26 | | | | 12.23 | % | |
Period from 12/29/2011^
to 10/31/2012 | | $ | 10.00 | | | $ | (0.06 | ) | | $ | 1.05 | | | $ | 0.99 | | | $ | — | | | $ | — | | | $ | — | | | $ | 10.99 | | | | 9.90 | %** | |
See Notes to Financial Highlights
77
| | | Net Assets,
End of
Year
(in millions) | | Ratio
of Gross
Expenses to
Average
Net
Assets# | | Ratio
of Gross
Expenses to
Average Net
Assets
(excluding
dividend
expenses on
securities
sold
short) | | Ratio
of Net
Expenses to
Average
Net
Assets | | Ratio
of Net
Expenses to
Average Net
Assets
(excluding
dividend
expenses on
securities
sold
short) | | Ratio
of Net
Investment
Income/
(Loss) to
Average
Net
Assets | | Portfolio
Turnover
Rate
(including
securities
sold
short) | | Portfolio
Turnover
Rate
(excluding
securities
sold
short) | |
Global Allocation Fund | |
Institutional Class | |
10/31/2013 | | $ | 17.2 | | | | 3.23 | % | | | 2.73 | % | | | 1.48 | % | | | 0.98 | % | | | (.85 | %) | | | 187 | % | | | 158 | % | |
10/31/2012 | | $ | 8.9 | | | | 5.01 | % | | | 4.55 | % | | | 1.68 | % | | | 1.22 | % | | | (1.19 | %) | | | 446 | % | | | 423 | % | |
Period from 12/29/2010^
to 10/31/2011 | | $ | 5.8 | | | | 18.45 | %‡* | | | 18.31 | %‡*^^ | | | 1.36 | %‡* | | | 1.21 | %‡*^^ | | | (.95 | %)‡* | | | 268 | %** | | | 216 | %** | |
Class A | |
10/31/2013 | | $ | 7.9 | | | | 3.58 | % | | | 3.07 | % | | | 1.84 | % | | | 1.33 | % | | | (1.25 | %) | | | 187 | % | | | 158 | % | |
10/31/2012 | | $ | 3.4 | | | | 5.41 | % | | | 4.93 | % | | | 2.07 | % | | | 1.59 | % | | | (1.48 | %) | | | 446 | % | | | 423 | % | |
Period from 12/29/2010^
to 10/31/2011 | | $ | 0.1 | | | | 22.01 | %‡* | | | 21.63 | %‡*^^ | | | 1.96 | %‡* | | | 1.58 | %‡*^^ | | | (1.64 | %)‡* | | | 268 | %** | | | 216 | %** | |
Class C | |
10/31/2013 | | $ | 4.9 | | | | 4.35 | % | | | 3.85 | % | | | 2.59 | % | | | 2.09 | % | | | (1.99 | %) | | | 187 | % | | | 158 | % | |
10/31/2012 | | $ | 2.2 | | | | 6.47 | % | | | 6.03 | % | | | 2.78 | % | | | 2.34 | % | | | (2.26 | %) | | | 446 | % | | | 423 | % | |
Period from 12/29/2010^
to 10/31/2011 | | $ | 0.0 | | | | 25.07 | %‡* | | | 24.87 | %‡*^^ | | | 2.52 | %‡* | | | 2.33 | %‡*^^ | | | (2.12 | %)‡* | | | 268 | %** | | | 216 | %** | |
Long Short Fund | |
Institutional Class | |
10/31/2013 | | $ | 1,038.2 | | | | 1.75 | % | | | 1.60 | % | | | 1.75 | %§ | | | 1.60 | %§ | | | .10 | % | | | 103 | % | | | 52 | % | |
Period from 12/29/2011^
to 10/31/2012 | | $ | 92.6 | | | | 2.78 | %‡* | | | 2.65 | %‡* | | | 1.83 | %‡* | | | 1.70 | %‡* | | | .40 | %‡* | | | 93 | %** | | | 56 | %** | |
Class A | |
10/31/2013 | | $ | 502.1 | | | | 2.08 | % | | | 1.94 | % | | | 2.08 | %§ | | | 1.94 | %§ | | | (.23 | %) | | | 103 | % | | | 52 | % | |
Period from 12/29/2011^
to 10/31/2012 | | $ | 27.0 | | | | 3.21 | %‡* | | | 3.11 | %‡* | | | 2.17 | %‡* | | | 2.06 | %‡* | | | .05 | %‡* | | | 93 | %** | | | 56 | %** | |
Class C | |
10/31/2013 | | $ | 115.1 | | | | 2.83 | % | | | 2.68 | % | | | 2.83 | %§ | | | 2.68 | %§ | | | (1.00 | %) | | | 103 | % | | | 52 | % | |
Period from 12/29/2011^
to 10/31/2012 | | $ | 3.4 | | | | 4.34 | %‡* | | | 4.20 | %‡* | | | 2.95 | %‡* | | | 2.81 | %‡* | | | (.69 | %)‡* | | | 93 | %** | | | 56 | %** | |
78
Notes to Financial Highlights
†† Total return based on per share NAV reflects the effects of changes in NAV on the performance of each Fund during each fiscal period. Returns assume income dividends and other distributions, if any, were reinvested, but do not reflect the effect of sales charges. Results represent past performance and do not indicate future results. Current returns may be lower or higher than the performance data quoted. Investment returns and principal may fluctuate and shares when redeemed may be worth more or less than original cost. Total return would have been lower if Management had not reimbursed and/or waived certain expenses. Total return would have been higher if Management had not recouped previously reimbursed and/or waived expenses.
^ The date investment operations commenced.
‡ Organization expense, which is a non-recurring expense, is included in these ratios on a non-annualized basis.
@ Calculated based on the average number of shares outstanding during each fiscal period.
§ After repayment of expenses previously reimbursed and/or fees previously waived by Management, as applicable. Had the Fund not made such repayments, the annualized ratios of net expenses to average daily net assets would have been:
| | | Including
Dividend
Expenses on
Securities Sold
Short | | Excluding
Dividend
Expenses on
Securities Sold
Short | |
| | | Year Ended October 31, 2013 | |
Long Short Fund Institutional Class | | | 1.69 | % | | | 1.54 | % | |
Long Short Fund Class A | | | 2.06 | % | | | 1.92 | % | |
Long Short Fund Class C | | | 2.81 | % | | | 2.66 | % | |
* Annualized.
** Not annualized.
^^ As of June 22, 2011, Global Allocation's Institutional Class, Class A and Class C contractual expense limitations exclude dividend expenses relating to short sales, if any; consequently, net expenses may exceed the contractual expense limitations (See Note B of Notes to Financial Statements).
# Represents the annualized ratios of net expenses to average daily net assets if Management had not reimbursed certain expenses and/or waived a portion of the investment management fee.
Ø Dynamic Real Return and Flexible Select did not engage in short sales.
79
Report of Independent Registered Public Accounting Firm
To the Board of Trustees of
Neuberger Berman Alternative Funds and Shareholders of:
Neuberger Berman Dynamic Real Return Fund
Neuberger Berman Flexible Select Fund
Neuberger Berman Global Allocation Fund
We have audited the accompanying statements of assets and liabilities of Neuberger Berman Dynamic Real Return Fund, Neuberger Berman Flexible Select Fund and Neuberger Berman Global Allocation Fund, three of the series constituting the Neuberger Berman Alternative Funds (the "Funds"), including the schedules of investments, as of October 31, 2013, and the related statements of operations, the statements of changes in net assets, and the financial highlights for each of the periods indicated therein. These financial statements and financial highlights are the responsibility of the Funds' management. Our responsibility is to express an opinion on these financial statements and financial highlights based on our audit.
We conducted our audits in accordance with the standards of the Public Company Accounting Oversight Board (United States). Those standards require that we plan and perform the audit to obtain reasonable assurance about whether the financial statements and financial highlights are free of material misstatement. We were not engaged to perform an audit of the Funds' internal control over financial reporting. Our audits included consideration of internal control over financial reporting as a basis for designing audit procedures that are appropriate in the circumstances, but not for the purpose of expressing an opinion on the effectiveness of the Funds' internal control over financial reporting. Accordingly, we express no such opinion. An audit also includes examining, on a test basis, evidence supporting the amounts and disclosures in the financial statements and financial highlights, assessing the accounting principles used and significant estimates made by management, and evaluating the overall financial statement presentation. Our procedures included confirmation of securities owned as of October 31, 2013, by correspondence with the custodian, and others or by other appropriate auditing procedures where replies from others were not received. We believe that our audits provide a reasonable basis for our opinion.
In our opinion, the financial statements and financial highlights referred to above present fairly, in all material respects, the financial position of Neuberger Berman Dynamic Real Return Fund, Neuberger Berman Flexible Select Fund and Neuberger Berman Global Allocation Fund at October 31, 2013, the results of their operations, the changes in their net assets, and the financial highlights for each of the periods indicated therein, in conformity with U.S. generally accepted accounting principles.

Boston, Massachusetts
December 20, 2013
80
Report of Independent Registered Public Accounting Firm
To the Board of Trustees and Shareholders
Neuberger Berman Alternative Funds
We have audited the accompanying statement of assets and liabilities of the Neuberger Berman Long Short Fund, a series of the Neuberger Berman Alternative Funds (the "Trust"), including the schedule of investments, as of October 31, 2013, and the related statement of operations for the year then ended, and the statements of changes in net assets and the financial highlights for the year then ended and for the period December 29, 2011 (commencement of operations) to October 31, 2012. These financial statements and financial highlights are the responsibility of the Trust's management. Our responsibility is to express an opinion on these financial statements and financial highlights based on our audit.
We conducted our audits in accordance with the standards of the Public Company Accounting Oversight Board (United States). Those standards require that we plan and perform the audit to obtain reasonable assurance about whether the financial statements and financial highlights are free of material misstatement. The Trust is not required to have, nor were we engaged to perform, an audit of its internal control over financial reporting. Our audits included consideration of internal control over financial reporting as a basis for designing audit procedures that are appropriate in the circumstances, but not for the purpose of expressing an opinion on the effectiveness of the Trust's internal control over financial reporting. Accordingly, we express no such opinion. An audit also includes examining, on a test basis, evidence supporting the amounts and disclosures in the financial statements, assessing the accounting principles used and significant estimates made by management, as well as evaluating the overall financial statement presentation. Our procedures included confirmation of securities owned as of October 31, 2013, by correspondence with the custodian and brokers or by other appropriate auditing procedures where replies from brokers were not received. We believe that our audits provide a reasonable basis for our opinion.
In our opinion, the financial statements and financial highlights referred to above present fairly, in all material respects, the financial position of the Neuberger Berman Long Short Fund, as of October 31, 2013, and the results of its operations for the year then ended, and the changes in its net assets and the financial highlights for the year then ended and for the period December 29, 2011 (commencement of operations) to October 31, 2012, in conformity with accounting principles generally accepted in the United States of America.

Philadelphia, Pennsylvania
December 17, 2013
81
Investment Manager, Administrator and Distributor
Neuberger Berman Management LLC
605 Third Avenue, 2nd Floor
New York, NY 10158-0180
800.877.9700 or 212.476.8800
Intermediary Client Services 800.366.6264
Sub-Advisers
Neuberger Berman Fixed Income LLC
190 South LaSalle Street
Chicago, IL 60603
Neuberger Berman LLC
605 Third Avenue
New York, NY 10158-3698
Custodian and Shareholder Servicing Agent
State Street Bank and Trust Company
2 Avenue de Lafayette
Boston, MA 02111
For Institutional Class Shareholders
Address correspondence to:
Neuberger Berman Management LLC
605 Third Avenue, Mail Drop 2-7
New York, NY 10158-0180
Attn: Intermediary Client Services
800.366.6264
For Class A and Class C Shareholders:
Please contact your investment provider
Legal Counsel
K&L Gates LLP
1601 K Street, NW
Washington, DC 20006
Independent Registered Public Accounting Firms
Ernst & Young LLP
200 Clarendon Street
Boston, MA 02116
Tait, Weller & Baker LLP
1818 Market Street
Suite 2400
Philadelphia, PA 19103
82
The following tables set forth information concerning the trustees ("Trustees") and officers ("Officers") of each of the Funds. All persons named as Trustees and Officers also serve in similar capacities for other funds administered or managed by Management, NBFI and/or Neuberger. Each Fund's Statement of Additional Information includes additional information about the Trustees as of the date of the Fund's most recent public offering documents and is available upon request, without charge, by calling (800) 877-9700.
Information about the Board of Trustees
Name, (Year of Birth),
and Address(1) | | Position(s)
and Length of
Time Served(2) | | Principal Occupation(s)(3) | | Number of
Funds in
Fund Complex
Overseen by
Trustee | | Other Directorships Held
Outside Fund Complex by
Trustee(3) | |
Independent Trustees | |
Faith Colish (1935) | | Trustee since inception | | Counsel, Carter Ledyard & Milburn LLP (law firm) since October 2002; formerly, Attorney-at-Law and President, Faith Colish, A Professional Corporation, 1980 to 2002. | | | 54 | | | Formerly, Director, 1997 to 2003, and Advisory Director, 2003 to 2006, ABA Retirement Funds (formerly, American Bar Retirement Association) (not-for-profit membership corporation). | |
83
Name, (Year of Birth),
and Address(1) | | Position(s)
and Length of
Time Served(2) | | Principal Occupation(s)(3) | | Number of
Funds in
Fund Complex
Overseen by
Trustee | | Other Directorships Held
Outside Fund Complex by
Trustee(3) | |
Martha C. Goss (1949) | | Trustee since 2007 | | President, Woodhill Enterprises Inc./Chase Hollow Associates LLC (personal investment vehicle), since 2006; formerly, Consultant, Resources Global Professionals (temporary staffing), 2002 to 2006. | | | 54 | | | Director, American Water (water utility), since 2003; Director, Allianz Life of New York (insurance), since 2005; Director, Berger Group Holdings, Inc. (engineering consulting firm), since 2013; Director, Financial Women's Association of New York (not-for-profit association), since 2003; Trustee Emerita, Brown University, since 1998; Director, Museum of American Finance (not-for-profit), since 2013; formerly, Non-Executive Chair and Director, Channel Reinsurance (financial guaranty reinsurance), 2006 to 2010; formerly, Director, Ocwen Financial Corporation (mortgage servicing), 2005 to 2010; formerly, Director, Claire's Stores, Inc. (retailer), 2005 to 2007; formerly, Director, Parsons Brinckerhoff Inc. (engineering consulting firm), 2007 to 2010; formerly Director, Bank Leumi (commercial bank), 2005 to 2007; formerly Advisory Board Member, Attensity (software developer), 2005 to 2007. | |
Michael M. Knetter (1960) | | Trustee since 2007 | | President and Chief Executive Officer, University of Wisconsin Foundation, since October 2010; formerly, Dean, School of Business, University of Wisconsin—Madison; formerly, Professor of International Economics and Associate Dean, Amos Tuck School of Business—Dartmouth College, 1998 to 2002. | | | 54 | | | Director, American Family Insurance (a mutual company, not publicly traded), since March 2009; formerly, Trustee, Northwestern Mutual Series Fund, Inc., 2007 to 2010; formerly, Director, Wausau Paper, 2005 to 2011; formerly, Director, Great Wolf Resorts, 2004 to 2009. | |
84
Name, (Year of Birth),
and Address(1) | | Position(s)
and Length of
Time Served(2) | | Principal Occupation(s)(3) | | Number of
Funds in
Fund Complex
Overseen by
Trustee | | Other Directorships Held
Outside Fund Complex by
Trustee(3) | |
Howard A. Mileaf (1937) | | Trustee since inception | | Retired; formerly, Vice President and General Counsel, WHX Corporation (holding company), 1993 to 2001. | | | 54 | | | Formerly, Director, Webfinancial Corporation (holding company), 2002 to 2008; formerly, Director, WHX Corporation (holding company), 2002 to 2005; formerly, Director, State Theatre of New Jersey (not-for-profit theatre), 2000 to 2005. | |
George W. Morriss (1947) | | Trustee since 2007 | | Adjunct Professor, Columbia University School of International and Public Affairs, since October 2012; formerly, Executive Vice President and Chief Financial Officer, People's Bank, Connecticut (a financial services company), 1991 to 2001. | | | 54 | | | Director and Treasurer, National Association of Corporate Directors, Connecticut Chapter, since 2013; Trustee, Steben Alternative Investment Funds, Steben Select Multi-Strategy Fund, and Steben Select Multi-Strategy Master Fund, since 2013; formerly, Manager, Larch Lane Multi-Strategy Fund complex (which consisted of three funds), 2006 to 2011; formerly, Member, NASDAQ Issuers' Affairs Committee, 1995 to 2003. | |
Tom D. Seip (1950) | | Trustee since inception; Chairman of the Board since 2008; Lead Independent Trustee from 2006 to 2008 | | General Partner, Ridgefield Farm LLC (a private investment vehicle); formerly, President and CEO, Westaff, Inc. (temporary staffing), May 2001 to January 2002; formerly, Senior Executive, The Charles Schwab Corporation, 1983 to 1998, including Chief Executive Officer, Charles Schwab Investment Management, Inc.; Trustee, Schwab Family of Funds and Schwab Investments, 1997 to 1998; and Executive Vice President-Retail Brokerage, Charles Schwab & Co., Inc., 1994 to 1997. | | | 54 | | | Director, H&R Block, Inc. (financial services company), since May 2001; Chairman, Governance and Nominating Committee, H&R Block, Inc., since 2011; formerly, Chairman, Compensation Committee, H&R Block, Inc., 2006 to 2010; formerly, Director, Forward Management, Inc. (asset management company), 1999 to 2006. | |
85
Name, (Year of Birth),
and Address(1) | | Position(s)
and Length of
Time Served(2) | | Principal Occupation(s)(3) | | Number of
Funds in
Fund Complex
Overseen by
Trustee | | Other Directorships Held
Outside Fund Complex by
Trustee(3) | |
Candace L. Straight (1947) | | Trustee since inception | | Private investor and consultant specializing in the insurance industry; formerly, Advisory Director, Securitas Capital LLC (a global private equity investment firm dedicated to making investments in the insurance sector), 1998 to December 2003. | | | 54 | | | Public Member, Board of Governors and Board of Trustees, Rutgers University, since 2011; Director, Montpelier Re Holdings Ltd. (reinsurance company), since 2006; formerly, Director, National Atlantic Holdings Corporation (property and casualty insurance company), 2004 to 2008; formerly, Director, The Proformance Insurance Company (property and casualty insurance company), 2004 to 2008; formerly, Director, Providence Washington Insurance Company (property and casualty insurance company), 1998 to 2006; formerly, Director, Summit Global Partners (insurance brokerage firm), 2000 to 2005. | |
Peter P. Trapp (1944) | | Trustee since inception | | Retired; formerly, Regional Manager for Mid-Southern Region, Ford Motor Credit Company, September 1997 to 2007; formerly, President, Ford Life Insurance Company, April 1995 to August 1997. | | | 54 | | | None. | |
86
Name, (Year of Birth),
and Address(1) | | Position(s)
and Length of
Time Served(2) | | Principal Occupation(s)(3) | | Number of
Funds in
Fund Complex
Overseen by
Trustee | | Other Directorships Held
Outside Fund Complex by
Trustee(3) | |
Trustees who are "Interested Persons" | |
Joseph V. Amato* (1962) | | Trustee since 2009 | | President and Director, Neuberger Berman Group LLC, since 2009; President and Chief Executive Officer, Neuberger and Neuberger Berman Holdings LLC (including its predecessor, Neuberger Berman Inc.), since 2007; Chief Investment Officer (Equities) and Managing Director, Management, since 2009; Managing Director, NBFI, since 2007; Board member of NBFI since 2006; formerly, Global Head of Asset Management of Lehman Brothers Holdings Inc.'s ("LBHI") Investment Management Division, 2006 to 2009; formerly, member of LBHI's Investment Management Division's Executive Management Committee, 2006 to 2009; formerly, Managing Director, Lehman Brothers Inc. ("LBI"), 2006 to 2008; formerly, Chief Recruiting and Development Officer, LBI, 2005 to 2006; formerly, Global Head of LBI's Equity Sales and a Member of its Equities Division Executive Committee, 2003 to 2005. | | | 54 | | | Member of Board of Advisors, McDonough School of Business, Georgetown University, since 2001; Member of New York City Board of Advisors, Teach for America, since 2005; Trustee, Montclair Kimberley Academy (private school), since 2007; Member of Board of Regents, Georgetown University, since 2013. | |
Robert Conti* (1956) | | Chief Executive Officer, President and Trustee since 2008; prior thereto, Executive Vice President in 2008 and Vice President from inception to 2008 | | Managing Director, Neuberger, since 2007; Managing Director, NBFI, since 2009; formerly, Senior Vice President, Neuberger, 2003 to 2006; formerly, Vice President, Neuberger, 1999 to 2003; President and Chief Executive Officer, Management, since 2008; formerly, Senior Vice President, Management, 2000 to 2008. | | | 54 | | | Director, Staten Island Mental Health Society, since 1994; formerly, Chairman of the Board, Staten Island Mental Health Society, 2008 to 2011. | |
(1) The business address of each listed person is 605 Third Avenue, New York, New York 10158.
87
(2) Pursuant to the Trust's Trust Instrument, each of these Fund Trustees shall hold office for life or until his or her successor is elected or the Trust terminates; except that (a) any Fund Trustee may resign by delivering a written resignation; (b) any Fund Trustee may be removed with or without cause at any time by a written instrument signed by at least two-thirds of the other Fund Trustees; (c) any Fund Trustee who requests to be retired, or who has become unable to serve, may be retired by a written instrument signed by a majority of the other Fund Trustees; and (d) any Fund Trustee may be removed at any shareholder meeting by a vote of at least two-thirds of the outstanding shares.
(3) Except as otherwise indicated, each individual has held the positions shown for at least the last five years.
* Indicates a Fund Trustee who is an "interested person" within the meaning of the 1940 Act. Mr. Amato and Mr. Conti are interested persons of the Trust because each is an officer of Management, Neuberger, NBFI and/or their affiliates.
88
Information about the Officers of the Trust
Name, (Year of Birth),
and Address(1) | | Position(s)
and Length of
Time Served(2) | | Principal Occupation(s)(3) | |
Andrew B. Allard (1961) | | Chief Legal Officer since 2013 (only for purposes of sections 307 and 406 of the Sarbanes-Oxley Act of 2002) and Anti-Money Laundering Compliance Officer since 2002 | | General Counsel and Senior Vice President, Management, since 2013; Senior Vice President, Neuberger, since 2006 and Employee since 1999; Deputy General Counsel, Neuberger, since 2004; formerly, Vice President, Neuberger, 2000 to 2005; formerly, Employee, Management, 1994 to 1999; Chief Legal Officer since 2013 (only for purposes of sections 307 and 406 of the Sarbanes-Oxley Act of 2002) ten registered investment companies for which Management acts as investment manager and administrator (ten since 2013); Anti-Money Laundering Compliance Officer, ten registered investment companies for which Management acts as investment manager and administrator (six since 2002, one since 2003, one since 2005, one since 2006 and one since 2013). | |
Claudia A. Brandon (1956) | | Executive Vice President since 2008 and Secretary since inception | | Senior Vice President, Neuberger, since 2007 and Employee since 1999; Senior Vice President, Management, since 2008 and Assistant Secretary since 2004; formerly, Vice President, Neuberger, 2002 to 2006; formerly, Vice President-Mutual Fund Board Relations, Management, 2000 to 2008; formerly, Vice President, Management, 1986 to 1999 and Employee 1984 to 1999; Executive Vice President, ten registered investment companies for which Management acts as investment manager and administrator (nine since 2008 and one since 2013); Secretary, ten registered investment companies for which Management acts as investment manager and administrator (three since 1985, three since 2002, one since 2003, one since 2005, one since 2006 and one since 2013). | |
Agnes Diaz (1971) | | Vice President since 2013 | | Vice President, ten registered investment companies for which Management acts as investment manager and administrator (ten since 2013). | |
Anthony DiBernardo (1979) | | Assistant Treasurer since 2011 | | Vice President, Neuberger, since 2009; Employee, Management, since 2003; Assistant Treasurer, ten registered investment companies for which Management acts as investment manager and administrator (nine since 2011 and one since 2013). | |
Sheila R. James (1965) | | Assistant Secretary since inception | | Vice President, Neuberger, since 2008 and Employee since 1999; formerly, Assistant Vice President, Neuberger, 2007; formerly, Employee, Management, 1991 to 1999; Assistant Secretary, ten registered investment companies for which Management acts as investment manager and administrator (six since 2002, one since 2003, one since 2005, one since 2006 and one since 2013). | |
Brian Kerrane (1969) | | Vice President since 2008 | | Senior Vice President, Neuberger, since 2008 and Employee since 1991; formerly, Vice President, Neuberger, 2002 to 2008; Vice President, ten registered investment companies for which Management acts as investment manager and administrator (nine since 2008 and one since 2013). | |
89
Name, (Year of Birth),
and Address(1) | | Position(s)
and Length of
Time Served(2) | | Principal Occupation(s)(3) | |
Kevin Lyons (1955) | | Assistant Secretary since inception | | Assistant Vice President, Neuberger, since 2008 and Employee since 1999; formerly, Employee, Management, 1993 to 1999; Assistant Secretary, ten registered investment companies for which Management acts as investment manager and administrator (seven since 2003, one since 2005, one since 2006 and one since 2013). | |
Owen F. McEntee, Jr. (1961) | | Vice President since 2008 | | Vice President, Neuberger, since 2006; Employee, Management, since 1992; Vice President, ten registered investment companies for which Management acts as investment manager and administrator (nine since 2008 and one since 2013). | |
John M. McGovern (1970) | | Treasurer and Principal Financial and Accounting Officer since inception | | Senior Vice President, Neuberger, since 2007; formerly, Vice President, Neuberger, 2004 to 2006; Employee, Management, since 1993; Treasurer and Principal Financial and Accounting Officer, ten registered investment companies for which Management acts as investment manager and administrator (eight since 2005, one since 2006 and one since 2013); formerly, Assistant Treasurer, eight registered investment companies for which Management acts as investment manager and administrator, 2002 to 2005. | |
Frank Rosato (1971) | | Assistant Treasurer since inception | | Vice President, Neuberger, since 2006; Employee, Management, since 1995; Assistant Treasurer, ten registered investment companies for which Management acts as investment manager and administrator (eight since 2005, one since 2006 and one since 2013). | |
Neil S. Siegel (1967) | | Vice President since 2008 | | Managing Director, Management, since 2008; Managing Director, Neuberger, since 2006; Managing Director, NBFI, since 2011; formerly, Senior Vice President, Neuberger, 2004 to 2006; Vice President, ten registered investment companies for which Management acts as investment manager and administrator (nine since 2008 and one since 2013). | |
Chamaine Williams (1971) | | Chief Compliance Officer since inception | | Senior Vice President, Neuberger Berman, since 2007; Chief Compliance Officer, NB Management, since 2006; Chief Compliance Officer, ten registered investment companies for which NB Management acts as investment manager and administrator (eight since 2005, one since 2006 and one since 2013); formerly, Senior Vice President, LBI, 2007 to 2008; formerly, Vice President, LBI, 2003 to 2006; formerly, Chief Compliance Officer, Lehman Brothers Asset Management Inc., 2003 to 2007; formerly, Chief Compliance Officer, Lehman Brothers Alternative Investment Management LLC, 2003 to 2007. | |
(1) The business address of each listed person is 605 Third Avenue, New York, New York 10158.
(2) Pursuant to the By-Laws of the Trust, each officer elected by the Fund Trustees shall hold office until his or her successor shall have been elected and qualified or until his or her earlier death, inability to serve, or resignation. Officers serve at the pleasure of the Fund Trustees and may be removed at any time with or without cause.
(3) Except as otherwise indicated, each individual has held the positions shown for at least the last five years.
90
Proxy Voting Policies and Procedures
A description of the policies and procedures that the Trust uses to determine how to vote proxies relating to portfolio securities is available, without charge, by calling 800-877-9700 (toll-free) and on the website of the Securities and Exchange Commission at www.sec.gov. Information regarding how the Trust voted proxies relating to portfolio securities during the most recent 12-month period ended June 30 is also available, without charge, by calling 800-877-9700 (toll-free), on the website of the Securities and Exchange Commission at www.sec.gov, and on Management's website at www.nb.com.
Quarterly Portfolio Schedule
The Trust files a complete schedule of portfolio holdings for each Fund with the Securities and Exchange Commission for the first and third quarters of the fiscal year on Form N-Q. The Trust's Forms N-Q are available on the Securities and Exchange Commission's website at www.sec.gov and may be reviewed and copied at the Securities and Exchange Commission's Public Reference Room in Washington, DC. Information on the operation of the Public Reference Room may be obtained by calling 800-SEC-0330. The information on Form N-Q is available upon request, without charge, by calling 800-877-9700 (toll-free).
91
Notice to Shareholders
In early 2014 you will receive information to be used in filing your 2013 tax returns, which will include a notice of the exact tax status of all distributions paid to you by the Fund during calendar year 2013. Please consult your own tax advisor for details as to how this information should be reflected on your tax returns.
For the fiscal year ended October 31, 2013, each Fund makes the following designation, or up to the maximum amount of such dividends allowable pursuant to the Internal Revenue Code, as qualified dividend income eligible for reduced tax rates. Complete information regarding each Funds distributions during the calendar year 2013 will be reported in conjunction with Form 1099-DIV.
Fund | | Qualified
Dividend Income | |
Dynamic Real Return | | $ | 246,164 | | |
Flexible Select | | | 243,762 | | |
Global Allocation | | | 163,053 | | |
Long Short | | | 6,397,989 | | |
92
Board Consideration of the Management and Sub-Advisory Agreements
On an annual basis, the Board of Trustees ("Board") of Neuberger Berman Alternative Funds ("Trust"), including the Trustees who are not "interested persons" of Neuberger Berman Management LLC ("Management") (including its affiliates) or the Trust ("Independent Fund Trustees"), considers whether to continue the Management and Sub-Advisory Agreements ("Agreements") with respect to Neuberger Berman Global Allocation Fund and Neuberger Berman Long Short Fund (each, a "Fund"). At a meeting held on October 22-23, 2013, the Board, including the Independent Fund Trustees, approved the continuation of the Agreements for each Fund.
In evaluating the Agreements, the Board, including the Independent Fund Trustees, reviewed extensive materials provided by Management in response to questions submitted by the Board and counsel for the Independent Fund Trustees, and met with senior representatives of Management regarding their personnel, operations and financial conditions as they relate to the Funds. The annual contract review extends over at least two regular meetings of the Board to ensure that Management, Neuberger Berman LLC ("Neuberger") and Neuberger Berman Fixed Income LLC ("NBFI") have time to respond to any questions the Independent Fund Trustees may have on their initial review of the materials and that the Independent Fund Trustees have time to consider those responses. (Neuberger serves as sub-adviser for Neuberger Berman Long Short Fund, and NBFI serves as sub-adviser for Neuberger Berman Global Allocation Fund.)
In connection with its deliberations, the Board also considered the broad range of information relevant to the annual contract review that is provided to the Board (including its various standing committees) at meetings throughout the year, including investment performance reports and related portfolio information for each Fund, as well as periodic reports on, among other matters, pricing and valuation; brokerage and execution; and compliance, shareholder and other services provided by Management, Neuberger, NBFI and their affiliates. To assist the Board in its deliberations regarding the annual contract review, the Board has established a Contract Review Committee comprised of Independent Fund Trustees, as well as other committees that focus throughout the year on specific areas relevant to the annual contract review, such as Fund performance or compliance matters.
Throughout the process, the Independent Fund Trustees were advised by counsel that is experienced in Investment Company Act of 1940 matters and that is independent of Management. The Independent Fund Trustees received from independent counsel a memorandum discussing the legal standards for their consideration of the proposed continuation of the Agreements. During the course of the year and during their deliberations regarding the annual contract review, the Independent Fund Trustees met with such counsel separately from representatives of Management, Neuberger, and NBFI.
In connection with its approval of the continuation of the Agreements, the Board evaluated the terms of the Agreements, the overall fairness of the Agreements to each Fund and whether the Agreements were in the best interests of each Fund and its shareholders. The Board considered all factors it deemed relevant with respect to each Fund, including the following factors: (1) the nature, extent, and quality of the services provided by Management and Neuberger or NBFI, as applicable; (2) the investment performance of the Fund compared to a relevant market index and/or a peer group of investment companies; (3) the costs of the services provided and profit or loss realized by Management and its affiliates from their relationship with the Fund; (4) the extent to which economies of scale might be realized as the Fund grows; and (5) whether fee levels reflect any such potential economies of scale for the benefit of investors in the Fund. While each Trustee may have attributed different weights to the various factors, the Board's determination to approve the continuation of the Agreements was based on a comprehensive consideration of all information provided to the Board throughout the year and specifically in connection with the annual contract review. The Board members did not identify any particular information or factor that was all-important or controlling. The Board focused on the overall costs and benefits of the Agreements relating to each Fund and, through the Funds, their shareholders.
With respect to the nature, extent and quality of the services provided, the Board considered the investment philosophy and decision-making processes of Management, Neuberger, and NBFI, and the qualifications, experience and capabilities of and the resources available to the portfolio management personnel of Management, Neuberger or NBFI, as applicable, who perform services for the Funds. The Board noted that Management also provides certain administrative services, including fund accounting and compliance oversight. The Board also considered Management's, Neuberger's and NBFI's policies and practices regarding brokerage and allocation of portfolio transactions and reviewed the quality of the
93
execution services that Management had provided. The Board also reviewed whether Management, Neuberger, or NBFI used brokers to execute Fund transactions that provide research and other services to Management, Neuberger, or NBFI and the types of benefits potentially derived from such services by Management, Neuberger, NBFI, the Funds and other clients of Management, Neuberger and NBFI. The Board also considered that Management's responsibilities include daily management of investment, operational, enterprise, legal, regulatory and compliance risks as they relate to the Funds, and considered information regarding Management's processes for managing risk. In addition, the Board noted the positive compliance history of Management, Neuberger, and NBFI, as each firm has been free of significant reported compliance problems. The Board also considered the general structure of the portfolio manager compensation program and whether this structure provides appropriate incentives to act in the best interest of the Funds. Because the Neuberger Berman Global Allocation Fund makes significant use of investment techniques that are not widely used by other funds in the NB fund family, the Board, prior to initially approving the Fund, received additional reports from Management regarding Management's programs for compliance and oversight of investment and operational risk, as well as other elements of the operational infrastructure, which the Board has continued to monitor.
As in past years, the Board also considered the manner in which Management addressed various non-routine matters that arose during the year, some of them a result of developments in the broader fund industry or the regulations governing it. In addition, the Board considered actions taken by Management, Neuberger and NBFI in response to recent market conditions, including actions taken in response to changes in market volatility, and considered the overall performance of Management, Neuberger and NBFI in this context.
With respect to investment performance, the Board considered information regarding each Fund's performance on both an absolute basis and relative to a relevant market index (or benchmark) and/or the average performance of its composite peer group of investment companies pursuing broadly similar strategies. The Board also reviewed performance in relation to certain measures of the degree of investment risk undertaken by the portfolio managers. The Board factored into its evaluation of each Fund's performance the limitations inherent in the methodology for constructing peer groups and determining which investment companies should be included in which peer groups. The Board noted that performance, especially short-term performance, is only one of the factors that it deems relevant to its consideration of a Fund's Agreements and that, after considering all relevant factors, it may be appropriate to approve the continuation of the Agreements notwithstanding a Fund's recent performance.
With respect to the overall fairness of the Agreements, the Board considered the fee structure for each Fund under the Agreements as compared to a peer group of comparable funds and any fall-out benefits likely to accrue to Management or NBFI or their affiliates from their relationship with each Fund. The Board also considered the profitability of Management and its affiliates from their association with the Funds. The Board reviewed a comparison of each Fund's management fee and overall expense ratio to a peer group of broadly comparable funds. The Board noted that the comparative management fee analysis includes, in each Fund's management fee, the separate administrative fee paid to Management, but it was not clear whether this was the case for all funds in the peer group. The Board considered the mean and median of the management fees and expense ratios for each Fund's peer group. In addition, the Board considered the contractual limit on expenses of certain classes of each Fund. The Board noted that Management incurred a loss on the Funds during the review period. The Board also considered whether there were other funds that were advised or sub-advised by Management or its affiliates or separate accounts managed by Management or its affiliates with investment objectives, policies and strategies that were similar to those of the Funds. The Board compared the fees charged to each Fund to the fees charged to any such funds and/or separate accounts. The Board considered the appropriateness and reasonableness of any differences between the fees charged to each Fund and any such funds and/or separate accounts, including any breakpoints, and determined that any differences in fees and fee structures were consistent with the management and other services provided. With respect to Neuberger Berman Global Allocation Fund, the fee and expense comparisons discussed above were performed when the Fund was first considered by the Board.
The Board also evaluated any apparent or anticipated economies of scale in relation to the services Management provides to the Funds. The Board considered whether each Fund's fee structure provides for a reduction of payments resulting from the use of breakpoints and whether any such breakpoints are set at appropriate asset levels.
94
In concluding that the benefits accruing to Management and its affiliates by virtue of their relationship to the Funds were reasonable in light of the costs of providing the investment advisory and other services and the benefits accruing to the Funds, the Board reviewed specific data as to Management's profit or loss on each Fund for a recent period. The Board also carefully examined Management's cost allocation methodology. The Board recognized that Management should be entitled to earn a reasonable level of profits for services it provides to the Funds and, based on its review, concluded that Management's reported level of profitability was reasonable.
Conclusions
In approving the Agreements, the Board concluded that the terms of each Agreement are fair and reasonable to each Fund and that approval of the Agreements is in the best interests of each Fund and its shareholders. In reaching this determination, the Board considered that Management and Neuberger or NBFI, as applicable, could be expected to provide a high level of service to each Fund; that the performance of the each Fund was satisfactory; that each Fund's fee structure appeared to the Board to be reasonable given the nature, extent and quality of services provided; and that the benefits accruing to Management and its affiliates by virtue of their relationship to the Funds were reasonable in light of the benefits accruing to the Funds. The Board's conclusions may be based in part on its consideration of materials prepared in connection with the Agreements in prior years and on the Board's ongoing regular review of the Funds' performance and operations throughout the year, in addition to material prepared specifically for the most recent annual review of the Agreements.
Board Consideration of the Management and Sub-Advisory Agreements (Neuberger Berman Flexible Select Fund)
At a meeting held on February 26-27, 2013, the Board of Trustees ("Board") of Neuberger Berman Alternative Funds ("Trust"), including the Trustees who are not "interested persons" of Neuberger Berman Management LLC ("Management") (including its affiliates) or the Trust ("Independent Fund Trustees"), approved the Management and Sub-Advisory Agreements ("Agreements") for Neuberger Berman Flexible Select Fund (the "Fund").
In evaluating the Agreements, the Board, including the Independent Fund Trustees, reviewed extensive materials provided by Management and Neuberger Berman LLC ("Neuberger Berman"), and met with senior representatives of Management regarding their personnel, operations and financial conditions as they relate to the Fund.
To assist the Board in its deliberations regarding the contract review, the Board has established a Contract Review Committee comprised of Independent Fund Trustees, as well as other committees that focus on specific areas relevant to the contract review.
The Independent Fund Trustees were advised by counsel that is experienced in Investment Company Act of 1940 matters and that is independent of Management. The Independent Trustees received from independent counsel a memorandum discussing the legal standards for their consideration of the Agreements. During the course of their deliberations regarding the contract review, the Independent Fund Trustees met with such counsel separately from representatives of Management and Neuberger Berman.
In connection with its approval of the Agreements, the Board evaluated the terms of the Agreements, the overall fairness of the Agreements to the Fund and whether the Agreements were in the best interests of the Fund and its shareholders. The Board considered all factors it deemed relevant with respect to the Fund, including the following factors: (1) the nature, extent, and quality of the services to be provided by Management and Neuberger Berman; (2) the expected costs of the services to be provided; (3) the extent to which economies of scale might be realized as the Fund grows; and (4) whether proposed fee levels reflect any such potential economies of scale for the benefit of investors in the Fund. While each Trustee may have attributed different weights to the various factors, the Board's determination to approve the Agreements was based on a comprehensive consideration of all information provided to the Board, and the Board members did not identify any particular information or factor that was all-important or controlling. The Board focused on the overall costs and benefits of the Agreements relating to the Fund and, through the Fund, its shareholders.
95
With respect to the nature, extent and quality of the services to be provided, the Board considered the investment philosophy and decision-making processes of Management and Neuberger Berman, and the qualifications, experience and capabilities of and the resources available to the portfolio management personnel of Management and Neuberger Berman who would perform services for the Fund. The Board noted that Management also would provide certain administrative services, including fund accounting and compliance oversight. The Board also considered Management's policies and practices regarding brokerage and allocation of portfolio transactions. The Board also considered that Management's responsibilities include daily management of investment, operational, enterprise, legal, regulatory and compliance risks as they relate to the Fund, and considered information regarding Management's process for managing risk. In addition, the Board considered the scope and depth of the compliance programs of Management and Neuberger Berman. The Board also considered the manner in which Management addressed various non-routine matters that have arisen from time to time, some of them a result of developments in the broader fund industry or the regulations governing it.
The Board also noted the performance, over various periods, of a separate account that was managed by Management or its affiliates with investment objectives, policies and strategies that were similar to those of the Fund.
With respect to the overall fairness of the Agreements, the Board considered the fee structure proposed for the Fund under the Agreements as compared to a peer group of comparable funds and any fall-out benefits likely to accrue to Management or Neuberger Berman or their affiliates from their relationship with the Fund. The Board reviewed a comparison of the Fund's proposed management fee and overall expense ratio to a peer group of broadly comparable funds. The Board noted that the comparative management fee analysis includes, in the Fund's management fee, the separate administrative fee proposed to be paid to Management, but it was not clear whether this was the case for all funds in the peer group. The Board considered the mean and median of the management fees and overall expense ratios of the peer group. Where the Fund's proposed management fee was higher than the peer group mean and/or median for some classes, the Board considered whether specific portfolio management or administration needs contributed to the management fee. In addition, the Board considered the proposed contractual limit on expenses of each class of the Fund. The Board also considered whether there were other accounts that were managed by Management or its affiliates with investment objectives, policies and strategies that were similar to those of the Fund. The Board compared the fees proposed to be charged to the Fund to the fees charged to any such accounts. The Board considered the appropriateness and reasonableness of any differences between the fees proposed to be charged to the Fund and any such accounts, including any breakpoints, and determined that any differences in fees and fee structures were consistent with the management and other services provided. The Board considered that the Fund's fee structure provides for a reduction of payments resulting from the use of breakpoints. The Board also considered whether it would be appropriate to evaluate any anticipated economies of scale in relation to the services Management would provide to the Fund, noting that it may be too soon to anticipate the economies at the start-up phase of a fund. The Board concluded that the benefits expected to accrue to Management and its affiliates by virtue of their relationship to the Fund were reasonable in light of the costs of providing the investment advisory and other services and the benefits expected to accrue to the Fund.
Conclusions
In approving the Agreements, the Board concluded that the terms of each Agreement are fair and reasonable to the Fund and that approval of the Agreements is in the best interests of the Fund and its shareholders. In reaching this determination, the Board considered that Management and Neuberger Berman could be expected to provide a high level of service to the Fund; that the Fund's proposed fee structure appeared to the Board to be reasonable given the nature, extent and quality of services expected to be provided; and that the benefits expected to accrue to Management and its affiliates by virtue of their relationship to the Fund were reasonable in light of the costs of providing the investment advisory and other services and the benefits expected to accrue to the Fund.
96

Neuberger Berman Management LLC
605 Third Avenue 2nd Floor
New York, NY 10158–0180
Shareholder Services
800.877.9700
Institutional Services
800.366.6264
www.nb.com
Statistics and projections in this report are derived from sources deemed to be reliable but cannot be regarded as a representation of future results of the Funds. This report is prepared for the general information of shareholders and is not an offer of shares of the Funds. Shares are sold only through the currently effective prospectus, which must precede or accompany this report.
 L0265 12/13

Neuberger Berman
Alternative Funds
Institutional Class Shares
Class A Shares
Class C Shares
Risk Balanced Commodity Strategy Fund
Annual Report
October 31, 2013
Contents
PRESIDENT'S LETTER | | | 1 | | |
PORTFOLIO COMMENTARY | | | 2 | | |
FUND EXPENSE INFORMATION | | | 7 | | |
CONSOLIDATED SCHEDULE OF INVESTMENTS | | | 9 | | |
CONSOLIDATED FINANCIAL STATEMENTS | | | 14 | | |
CONSOLIDATED FINANCIAL HIGHLIGHTS/
PER SHARE DATA | | | 27 | | |
Report of Independent Registered Public Accounting Firm | | | 30 | | |
Directory | | | 31 | | |
Trustees and Officers | | | 32 | | |
Proxy Voting Policies and Procedures | | | 40 | | |
Quarterly Portfolio Schedule | | | 40 | | |
Board Consideration of the Management and
Sub-Advisory Agreements | | | 41 | | |
The "Neuberger Berman" name and logo are registered service marks of Neuberger Berman Group LLC. "Neuberger Berman Management LLC" and the individual Fund name in this piece are either service marks or registered service marks of Neuberger Berman Management LLC. ©2013 Neuberger Berman Management LLC. All rights reserved.
Dear Shareholder,
I am pleased to present this annual shareholder report for Neuberger Berman Risk Balanced Commodity Strategy Fund. The report includes a portfolio commentary, a listing of the Fund's investments and its audited financial statements for the 12 months ended October 31, 2013. The Fund seeks to generate returns that are not highly correlated with other major asset classes and that may improve the overall risk-reward profile of an investment portfolio.
Overall, the commodity markets were weak during the reporting period. This was driven by a number of factors, including signs of moderating growth in China and certain other parts of the world, concerns regarding the U.S. fiscal cliff, sequestration and the debt ceiling, generally favorable weather conditions as well as geopolitical events. Precious metals and agricultural commodities posted the weakest results during the reporting period, whereas the energy sector (ex-natural gas) generated a positive return.
Our short- to medium-term outlook for commodities is somewhat mixed. Over the coming months, precious metals may become more attractively valued given their sharp decline over the last year. Still, a rebound will likely be driven by expectations for global growth and inflation, in our view. Our short-term forecast for the energy sector is somewhat more restrained given current supply/demand trends. That being said, we believe that commodities remain an important long-term investment opportunity and a way for investors to more thoroughly diversify their portfolios.
Thank you for your continued support and trust. We look forward to continue serving your investment needs in the years to come.
Sincerely,

ROBERT CONTI
PRESIDENT AND CEO
NEUBERGER BERMAN MUTUAL FUNDS
1
Risk Balanced Commodity Strategy Fund Commentary (Unaudited)
Neuberger Berman Risk Balanced Commodity Strategy Fund1Institutional Class generated a -8.43% total return for the 12 months ended October 31, 2013 and outperformed its benchmark, the Dow Jones-UBS Commodity Index, which posted a -12.21% return for the period. (Performance for all share classes is provided in the table immediately following this letter.)
Most segments of the commodity market produced negative results during the reporting period. This was triggered by a number of factors, including concerns regarding global growth—especially in China—generally weak supply/demand trends, favorable weather conditions and shifting central bank monetary policy. Investor sentiment was also negatively impacted by a number of geopolitical issues. Against this backdrop, precious metals and agricultural commodities posted the weakest results. Energy (ex-natural gas) was the only major commodity sector to generate a positive return during the period—crude oil rose but natural gas declined.
The Fund's core strategy uses a systematic investment process to select portfolio weights that are projected to balance risk among each of the underlying individual commodities which aggregate into six major commodity sectors: energy, industrial metals, precious metals, agriculture, livestock and softs. Relative to the DJ-UBS Commodity Index, the Fund's overweight positions in Brent crude oil, gasoline, cocoa and lean hogs were beneficial to performance. The Fund's relative underweights in gold, corn, silver and natural gas were also beneficial.
The Fund's tactical strategy seeks to enhance performance by having tactical tilts toward or away from certain sectors. These tactical tilts are based on short- to medium-term factors including macroeconomics, supply/demand, the pricing relationships among commodities and the shape of the futures curve. The Fund's tactical positioning added value during the reporting period.1
As we look ahead to the end of the year and into 2014, we anticipate there will be limited upside to the energy complex as the recently built-in Syria premium appears to have faded and a pick-up in Libyan production is likely to balance the market. In our opinion precious metals may be in the best position for a rebound given their declines, but this is partially contingent on inflation expectations and economic growth.
Aside from mildly reducing our exposure to precious metals over the last few months, sector weights in the Fund have largely remained consistent. In the very near term, our tactical views reflect a cautious approach to agricultural commodities, which in the U.S. are generally in their harvesting period, and also to gold and silver within the precious metals sector. Meanwhile, the Fund is tactically positioned with a more favorable outlook toward other sectors, but positions may change during the coming months as market conditions evolve.
Sincerely,


WAI LEE, HAKAN KAYA, THOMAS SONTAG AND RICHARD GRAU
PORTFOLIO CO-MANAGERS
Information about the principal risks of investing in the Fund is set forth in the prospectus and statement of additional information.
The portfolio composition, industries and holdings of the Fund are subject to change.
The opinions expressed are those of the Fund's portfolio managers. The opinions are as of the date of this report and are subject to change without notice.
1 Much of the Fund's investment exposure is accomplished through the use of derivatives which may not require the Fund to deposit the full notional amount of the investment with its counterparties, such as a futures commission merchant. The Fund's resulting cash balances are invested in money market mutual funds.
2
Risk Balanced Commodity Strategy Fund (Unaudited)
TICKER SYMBOLS
Institutional Class | | NRBIX | |
Class A | | NRBAX | |
Class C | | NRBCX | |
PORTFOLIO BY TYPE OF SECURITY
(as a % of Total Investments) | |
Asset-Backed Securities | | | 4.9 | % | |
Corporate Debt Securities | | | 46.6 | | |
U.S. Government Agency Securities | | | 1.1 | | |
U.S. Treasury Securities | | | 15.1 | | |
Short-Term Investments | | | 32.3 | | |
Total | | | 100.0 | % | |
PORTFOLIO BY INVESTMENT EXPOSURE
TO COMMODITY DERIVATIVES
(as a % of Total Notional Value) | |
Commodity Futures: | | | |
Agriculture | | | 18.1 | % | |
Energy | | | 32.2 | | |
Industrial Metals | | | 19.9 | | |
Livestock | | | 11.8 | | |
Precious Metals | | | 11.1 | | |
Softs | | | 6.9 | | |
Total | | | 100.0 | % | |
PERFORMANCE HIGHLIGHTS2
| | | | | Average Annual Total Return | |
| | | Inception | | Ended 10/31/2013 | |
| | | Date | | 1 Year | | Life of Fund | |
At NAV | | | | | | | | | | | | | |
Institutional Class | | 08/27/2012 | | | -8.43 | % | | | -8.45 | % | |
Class A | | 08/27/2012 | | | -8.84 | % | | | -8.79 | % | |
Class C | | 08/27/2012 | | | -9.66 | % | | | -9.57 | % | |
With Sales Charge | |
Class A | | | | | -14.08 | % | | | -13.26 | % | |
Class C | | | | | -10.57 | % | | | -9.57 | % | |
Index | | | | | | | | | | | | | |
| Dow Jones-UBS Commodity Index1,3 | | | | | -12.21 | % | | | -11.80 | % | |
The performance data quoted represent past performance and do not indicate future results. Current performance may be lower or higher than the performance data quoted. For more current performance data, please visit www.nb.com/performance.
The results shown in the table reflect the reinvestment of income dividends and other distributions, if any. The results do not reflect the effect of taxes a shareholder would pay on Fund distributions or on the redemption of Fund shares.
The investment return and principal value of an investment will fluctuate and shares, when redeemed, may be worth more or less than their original cost.
Returns would have been lower if Neuberger Berman Management LLC ("Management") had not reimbursed certain expenses and/or waived a portion of the investment management fees during certain of the periods shown. Repayment by a class (of expenses previously reimbursed and/or fees previously waived by Management) will decrease the class's returns. Please see Note B in the Notes to Financial Statements for specific information regarding expense reimbursement and/or fee waiver arrangements.
As stated in the Fund's most recent prospectus, the estimated total annual operating expense ratios for fiscal year 2013 were 1.59%, 1.95% and 2.70% for Institutional Class, Class A and Class C shares, respectively (before expense reimbursements and/or fee waivers, if any). The expense ratios were 1.12%, 1.48% and 2.23% for Institutional Class, Class A and Class C shares, respectively, after expense reimbursements and/or fee waivers.
Returns shown with a sales charge reflect the deduction of the current maximum initial sales charge of 5.75% for Class A shares and the applicable contingent deferred sales charges (CDSC) for Class C shares. The maximum CDSC for Class C shares is 1%, which is reduced to 0% after 1 year. The performance of the Fund's share classes will differ primarily due to different sales charge structures and class expenses. Please see the prospectus for more information about sales charge structures, if any, and class expenses for your share class.
3
Risk Balanced Commodity Strategy Fund (Unaudited)
COMPARISON OF A $1,000,000 INVESTMENT
(000's omitted)

This graph shows the change in value of a hypothetical $1,000,000 investment in the Fund over the past 10 fiscal years, or since the Fund's inception if it has not operated for 10 years. The graph is based on the Institutional Class shares only; the performance of the Fund's share classes will differ primarily due to different sales charge structures and class expenses (see Performance Highlights chart on previous page). The result is compared with benchmarks, which include a broad-based market index and may include a more narrowly based index. Market indices have not been reduced to reflect any of the fees and costs of investing. The results shown in the graph reflect the reinvestment of income dividends and other distributions, if any. The results do not reflect the effect of taxes a shareholder would pay on Fund distributions or on the redemption of Fund shares. Results represent past performance and do not indicate future results.
4
1 Please see "Description of Index" on page 6 for a description of the index. Please note that the index does not take into account any fees, expenses or tax consequences of investing in the individual securities that it tracks, and that individuals cannot invest directly in any index. Data about the performance of an index is prepared or obtained by Neuberger Berman Management LLC ("Management") and reflects the reinvestment of income dividends and other distributions, if any. The Fund may invest in securities not included in a described index and may not invest in all securities included in a described index.
2 During the period from August 2012 through January 2013, the Fund was relatively small, which could have impacted performance. The same techniques used to produce returns in a small fund may not work to produce similar returns in a larger fund.
3 The date used to calculate Life of Fund performance for the index is the inception date of the oldest share class.
For more complete information on any of the Neuberger Berman Alternative and Multi-Asset Class Funds, call Management at (800) 877-9700, or visit our website at www.nb.com.
5
Dow Jones-UBS Commodity Index: | | A rolling index composed of futures contracts on 19 physical commodities traded on U.S. exchanges, with the exception of aluminum, nickel and zinc, which are traded on the London Metal Exchange (LME). Weighting is based on liquidity, or the relative amount of trading activity of a particular commodity; dollar-adjusted production data are secondary. All data used are averaged over a five-year period. The DJ-UBSCI is calculated on an excess return basis, reflecting only the return of its underlying commodity price movement. A total return index reflects the return on a fully collateralized investment of the index. | |
6
Information About Your Fund's Expenses (Unaudited)
As a Fund shareholder, you incur two types of costs: (1) transaction costs, including sales charges (loads) on purchase payments or redemption proceeds (if applicable); and (2) ongoing costs, including management fees, distribution and/or service (12b-1) fees (if applicable), and other Fund expenses. This example is intended to help you understand your ongoing costs (in dollars) of investing in a Fund and compare these costs with the ongoing costs of investing in other mutual funds.
This table is designed to provide information regarding costs related to your investments. The following examples are based on an investment of $1,000 made at the beginning of the six month period ended October 31, 2013 and held for the entire period. The table illustrates the Fund's costs in two ways:
Actual Expenses and Performance: | | The first section of the table provides information about actual account values and actual expenses in dollars, based on the Fund's actual performance during the period. You may use the information in this line, together with the amount you invested, to estimate the expenses you paid over the period. Simply divide your account value by $1,000 (for example, an $8,600 account value divided by $1,000 = 8.6), then multiply the result by the number in the first section of the table under the heading entitled "Expenses Paid During the Period" to estimate the expenses you paid over the period. | |
Hypothetical Example for Comparison Purposes: | | The second section of the table provides information about hypothetical account values and hypothetical expenses based on the Fund's actual expense ratio and an assumed rate of return at 5% per year before expenses. This return is not the Fund's actual return. The hypothetical account values and expenses may not be used to estimate the actual ending account balance or expenses you paid for the period. You may use this information to compare the ongoing costs of investing in this Fund versus other funds. To do so, compare the expenses shown in this 5% hypothetical example with the 5% hypothetical examples that appear in the shareholder reports of other funds. | |
Please note that the expenses in the table are meant to highlight your ongoing costs only and do not include any transaction costs, such as sales charges (loads) (if applicable). Therefore, the information under the heading "Hypothetical (5% annual return before expenses)" is useful in comparing ongoing costs only, and will not help you determine the relative total costs of owning different funds. In addition, if these transaction costs were included, your costs would have been higher.
7
Expense Information as of 10/31/13 (Unaudited)
Neuberger Berman Alternative Funds | |
| | | ACTUAL | | HYPOTHETICAL (5% ANNUAL RETURN BEFORE EXPENSES)(2) | |
| | Beginning
Account
Value
5/1/13 | | Ending
Account
Value
10/31/13 | | Expenses Paid
During the
Period(1)
5/1/13 - 10/31/13 | | Expense
Ratio | | Beginning
Account
Value
5/1/13 | | Ending
Account
Value
10/31/13 | | Expenses Paid
During the
Period(1)
5/1/13 - 10/31/13 | | Expense
Ratio | |
Neuberger Risk Balanced Commodity Strategy Fund | |
Institutional Class | | $ | 1,000.00 | | | $ | 978.30 | | | $ | 5.49 | | | | 1.10 | % | | $ | 1,000.00 | | | $ | 1,019.66 | | | $ | 5.60 | | | | 1.10 | % | |
Class A | | $ | 1,000.00 | | | $ | 976.10 | | | $ | 7.27 | | | | 1.46 | % | | $ | 1,000.00 | | | $ | 1,017.85 | | | $ | 7.43 | | | | 1.46 | % | |
Class C | | $ | 1,000.00 | | | $ | 971.60 | | | $ | 10.98 | | | | 2.21 | % | | $ | 1,000.00 | | | $ | 1,014.06 | | | $ | 11.22 | | | | 2.21 | % | |
(1) For each class, expenses are equal to the annualized expense ratio for the class, including expenses of the Fund's subsidiary (See Note A-1 of Notes to Consolidated Financial Statements) multiplied by the average account value over the period, multiplied by 184/365 (to reflect the one-half year period shown).
(2) Hypothetical 5% annual return before expenses is calculated by multiplying the number of days in the most recent period divided by 365.
8
Consolidated Schedule of Investments Risk Balanced Commodity Strategy Fund
PRINCIPAL AMOUNT | | | | VALUE† | |
U.S. Treasury Securities-Backed by the Full Faith and Credit of the U.S. Government (14.1%) | | | |
$ | 500,000 | | | U.S. Treasury Notes, 4.25%, due 11/15/13 | | $ | 500,762 | | |
| | 250,000 | | | U.S. Treasury Notes, 1.00%, due 5/15/14 | | | 251,192 | | |
| | 1,500,000 | | | U.S. Treasury Notes, 1.75%, due 3/31/14 | | | 1,510,078 | | |
| | 4,500,000 | | | U.S. Treasury Notes, 1.25%, due 3/15/14 | | | 4,518,985 | | |
| | | | | Total U.S. Treasury Securities-Backed by the Full Faith and Credit of the
U.S. Government (Cost $6,781,792) | | | 6,781,017 | | |
U.S. Government Agency Securities (1.0%) | | | |
| | 250,000 | | | Federal National Mortgage Association, Notes, 0.15%, due 6/20/14 | | | 250,078 | µ | |
| | 250,000 | | | Federal Farm Credit Banks, Bonds, 0.20%, due 3/13/15 | | | 250,001 | µ | |
| | | | | Total U.S. Government Agency Securities (Cost $500,131) | | | 500,079 | | |
Asset-Backed Securities (4.6%) | | | |
| | 275,000 | | | Honda Auto Receivables Owner Trust, Ser. 2013-3, Class A2, 0.54%, due 1/15/16 | | | 275,424 | | |
| | 665,000 | | | Hyundai Auto Receivables Trust, Ser. 2013-C, Class A2, 0.57%, due 6/15/16 | | | 665,547 | | |
| | 480,253 | | | Nelnet Student Loan Trust, Ser. 2006-1, Class A4, 0.35%, due 11/23/22 | | | 478,548 | µ | |
| | 800,000 | | | World Omni Auto Receivables Trust, Ser. 2013-B, Class A2, 0.48%, due 11/15/16 | | | 800,097 | | |
| | | | | Total Asset-Backed Securities (Cost $2,218,220) | | | 2,219,616 | | |
Corporate Debt Securities (43.5%) | | | |
Aerospace & Defense (0.8%) | | | |
| | 375,000 | | | United Technologies Corp., Senior Unsecured Notes, 0.53%, due 12/2/13 | | | 375,098 | µ | |
Auto Manufacturers (2.3%) | | | |
| | 520,000 | | | Daimler Finance N.A. LLC, Guaranteed Notes, 6.50%, due 11/15/13 | | | 520,883 | | |
| | 540,000 | | | Toyota Motor Credit Corp., Senior Unsecured Medium-Term Notes, 0.64%, due 1/17/14 | | | 540,700 | µ | |
| | 45,000 | | | Toyota Motor Credit Corp., Senior Unsecured Notes, 0.55%, due 5/17/16 | | | 45,102 | µ | |
| | | | 1,106,685 | | |
Banks (14.8%) | | | |
| | 190,000 | | | Bank of Montreal, Senior Unsecured Medium-Term Notes, 0.76%, due 7/15/16 | | | 190,975 | µ | |
| | 700,000 | | | Bank of Nova Scotia, Senior Unsecured Notes, 1.28%, due 1/12/15 | | | 708,229 | µ | |
| | 300,000 | | | Barclays Bank PLC, Senior Unsecured Notes, 1.28%, due 1/13/14 | | | 300,584 | µ | |
| | 400,000 | | | Credit Suisse New York, Senior Unsecured Notes, 1.20%, due 1/14/14 | | | 400,710 | µ | |
| | 350,000 | | | Goldman Sachs Group, Inc., Senior Unsecured Notes, 1.27%, due 2/7/14 | | | 350,676 | µ | |
| | 865,000 | | | JPMorgan Chase & Co., Senior Unsecured Medium-Term Notes, 0.69%, due 4/23/15 | | | 866,714 | µ | |
| | 500,000 | | | Mellon Funding Corp., Guaranteed Notes, 0.41%, due 5/15/14 | | | 500,213 | µ | |
| | 395,000 | | | National Australia Bank Ltd., Senior Unsecured Notes, 0.79%, due 7/25/16 | | | 396,081 | µ | |
| | 100,000 | | | Rabobank Nederland, Bank Guaranteed Notes, 1.85%, due 1/10/14 | | | 100,319 | | |
| | 750,000 | | | Rabobank Nederland, Bank Guaranteed Medium-Term Notes, 0.59%, due 4/14/14 | | | 751,145 | µ | |
| | 600,000 | | | Royal Bank of Canada, Senior Unsecured Global Medium-Term Notes, 0.94%, due 10/30/14 | | | 604,076 | µ | |
| | 50,000 | | | Royal Bank of Canada, Senior Unsecured Medium-Term Notes, Ser. 1, 0.54%, due 4/17/14 | | | 50,068 | µ | |
| | 450,000 | | | Svenska Handelsbanken AB, Senior Unsecured Notes, 0.72%, due 9/23/16 | | | 450,905 | µ | |
| | 575,000 | | | Wells Fargo & Co., Senior Unsecured Notes, 1.17%, due 6/26/15 | | | 581,674 | µ | |
| | 850,000 | | | Westpac Banking Corp., Senior Unsecured Notes, 1.01%, due 9/25/15 | | | 859,262 | µ | |
| | | | 7,111,631 | | |
See Notes to Schedule of Investments
9
Consolidated Schedule of Investments Risk Balanced Commodity Strategy Fund (cont'd)
PRINCIPAL AMOUNT | | | | VALUE† | |
Beverages (1.9%) | | | |
$ | 550,000 | | | Anheuser-Busch InBev Worldwide, Inc., Guaranteed Notes, 0.79%, due 1/27/14 | | $ | 550,708 | µ | |
| | 35,000 | | | Anheuser-Busch InBev Worldwide, Inc., Guaranteed Notes, 0.60%, due 7/14/14 | | | 35,076 | µ | |
| | 330,000 | | | Coca-Cola Co., Senior Unsecured Notes, 0.24%, due 3/5/15 | | | 329,747 | µ | |
| | | | 915,531 | | |
Computers (3.0%) | | | |
| | 455,000 | | | Apple, Inc., Senior Unsecured Notes, 0.29%, due 5/3/16 | | | 454,436 | µ | |
| | 985,000 | | | International Business Machines Corp., Senior Unsecured Notes, 0.27%, due 7/29/15 | | | 984,659 | µ | |
| | | | 1,439,095 | | |
Cosmetics—Personal Care (0.3%) | | | |
| | 154,000 | | | Procter & Gamble Co., Senior Unsecured Notes, 0.19%, due 2/6/14 | | | 153,970 | µ | |
Diversified Financial Services (5.9%) | | | |
| | 425,000 | | | American Express Credit Corp., Senior Unsecured Medium-Term Notes, 1.36%, due 6/12/15 | | | 431,341 | µ | |
| | 84,000 | | | American Express Credit Corp., Senior Unsecured Notes, 1.10%, due 6/24/14 | | | 84,401 | µ | |
| | 215,000 | | | American Honda Finance Corp., Senior Unsecured Notes, 0.74%, due 10/7/16 | | | 215,809 | µ | |
| | 1,060,000 | | | General Electric Capital Corp., Senior Unsecured Global Medium-Term Notes, 0.89%, due 7/12/16 | | | 1,065,694 | µ | |
| | 200,000 | | | General Electric Capital Corp., Senior Unsecured Medium-Term Notes, Ser. A, 0.37%, due 12/20/13 | | | 200,042 | µ | |
| | 100,000 | | | John Deere Capital Corp., Senior Unsecured Notes, 0.39%, due 4/25/14 | | | 100,091 | µ | |
| | 510,000 | | | John Deere Capital Corp., Senior Unsecured Notes, 0.37%, due 6/15/15 | | | 510,514 | µ | |
| | 210,000 | | | John Deere Capital Corp., Senior Unsecured Notes, 0.54%, due 10/11/16 | | | 210,248 | µ | |
| | | | 2,818,140 | | |
Insurance (0.9%) | | | |
| | 50,000 | | | Berkshire Hathaway Finance Corp., Guaranteed Notes, 0.57%, due 1/10/14 | | | 50,038 | µ | |
| | 400,000 | | | Berkshire Hathaway, Inc., Senior Unsecured Notes, 0.96%, due 8/15/14 | | | 402,335 | µ | |
| | | | 452,373 | | |
Machinery—Construction & Mining (0.9%) | | | |
| | 50,000 | | | Caterpillar Financial Services Corp., Senior Unsecured Medium-Term Notes, 0.41%, due 8/27/14 | | | 50,071 | µ | |
| | 400,000 | | | Caterpillar Financial Services Corp., Senior Unsecured Medium-Term Notes, 0.50%, due 2/26/16 | | | 400,288 | µ | |
| | | | 450,359 | | |
Media (0.1%) | | | |
| | 65,000 | | | Walt Disney Co., Senior Unsecured Medium-Term Notes, 0.25%, due 2/11/15 | | | 65,001 | µ | |
Mining (0.9%) | | | |
| | 440,000 | | | BHP Billiton Finance USA Ltd., Guaranteed Notes, 0.50%, due 9/30/16 | | | 440,513 | µ | |
Oil & Gas (2.2%) | | | |
| | 565,000 | | | BP Capital Markets PLC, Guaranteed Notes, 0.88%, due 12/6/13 | | | 565,359 | µ | |
| | 50,000 | | | BP Capital Markets PLC, Guaranteed Notes, 0.86%, due 3/11/14 | | | 50,102 | µ | |
| | 425,000 | | | Occidental Petroleum Corp., Senior Unsecured Notes, 1.45%, due 12/13/13 | | | 425,516 | | |
| | | | 1,040,977 | | |
See Notes to Schedule of Investments
10
Consolidated Schedule of Investments Risk Balanced Commodity Strategy Fund (cont'd)
PRINCIPAL AMOUNT | | | | VALUE† | |
Pharmaceuticals (4.7%) | | | |
$ | 645,000 | | | GlaxoSmithKline Capital, Inc., Guaranteed Notes, 4.38%, due 4/15/14 | | $ | 656,380 | | |
| | 105,000 | | | Johnson & Johnson, Senior Unsecured Notes, 0.35%, due 5/15/14 | | | 105,101 | µ | |
| | 150,000 | | | Johnson & Johnson, Senior Unsecured Notes, 1.20%, due 5/15/14 | | | 150,674 | | |
| | 290,000 | | | Merck & Co., Inc., Senior Unsecured Notes, 0.45%, due 5/18/16 | | | 290,870 | µ | |
| | 1,065,000 | | | Sanofi, Senior Unsecured Notes, 0.56%, due 3/28/14 | | | 1,066,507 | µ | |
| | | | 2,269,532 | | |
Retail (2.6%) | | | |
| | 378,000 | | | Home Depot, Inc., Senior Unsecured Notes, 5.25%, due 12/16/13 | | | 380,111 | | |
| | 450,000 | | | Target Corp., Senior Unsecured Notes, 0.42%, due 7/18/14 | | | 450,837 | µ | |
| | 425,000 | | | Wal-Mart Stores, Inc., Senior Unsecured Notes, 1.63%, due 4/15/14 | | | 427,847 | | |
| | | | 1,258,795 | | |
Telecommunications (2.1%) | | | |
| | 550,000 | | | Cisco Systems, Inc., Senior Unsecured Notes, 0.50%, due 3/14/14 | | | 550,638 | µ | |
| | 455,000 | | | Verizon Communications, Inc., Senior Unsecured Notes, 0.86%, due 3/28/14 | | | 455,785 | µ | |
| | | | 1,006,423 | | |
Transportation (0.1%) | | | |
| | 45,000 | | | Canadian National Railway Co., Senior Unsecured Notes, 0.44%, due 11/6/15 | | | 44,982 | µØ | |
| | | | | Total Corporate Debt Securities (Cost $20,934,451) | | | 20,949,105 | | |
Short-Term Investments (30.1%) | | | |
| U.S. Treasury Securities-Backed by the Full Faith and Credit of the U.S. Government(a)(19.5%) | | | |
| | 450,000 | | | U.S. Treasury Bills, Disc. Notes, 0.00%, due 11/7/13 | | | 449,999 | | |
| | 750,000 | | | U.S. Treasury Bills, Disc. Notes, 0.01%, due 11/21/13 | | | 749,989 | | |
| | 400,000 | | | U.S. Treasury Bills, Disc. Notes, 0.01%, due 12/5/13 | | | 399,986 | | |
| | 250,000 | | | U.S. Treasury Bills, Disc. Notes, 0.02%, due 12/19/13 | | | 249,988 | | |
| | 1,250,000 | | | U.S. Treasury Bills, Disc. Notes, 0.02%, due 12/26/13 | | | 1,249,924 | | |
| | 4,525,000 | | | U.S. Treasury Bills, Disc. Notes, 0.02%-0.03%, due 1/9/14 | | | 4,524,737 | | |
| | 1,750,000 | | | U.S. Treasury Bills, Disc. Notes, 0.03%, due 1/30/14 | | | 1,749,835 | | |
| | | | 9,374,458 | | |
NUMBER OF SHARES | | | | | |
Money Market Fund (10.6%) | | | |
| | 5,130,595 | | | State Street Institutional Government Money Market Fund Institutional Class | | | 5,130,595 | Ø؆† | |
| | | | | Total Short-Term Investments (Cost $14,504,850) | | | 14,505,053 | | |
| | | | | Total Investments (93.3%) (Cost $44,939,444) | | | 44,954,870 | ## | |
| | | | | Cash, receivables and other assets, less liabilities (6.7%) | | | 3,225,923 | ± | |
| | | | | Total Net Assets (100.0%) | | $ | 48,180,793 | | |
See Notes to Schedule of Investments
11
Notes to Consolidated Schedule of Investments
† In accordance with Accounting Standards Codification ("ASC") 820 "Fair Value Measurements and Disclosures" ("ASC 820"), all investments held by Neuberger Berman Risk Balanced Commodity Strategy Fund (the "Fund") are carried at the value that Neuberger Berman Management LLC ("Management") believes the Fund would receive upon selling an investment in an orderly transaction to an independent buyer in the principal or most advantageous market for the investment under current market conditions. Various inputs, including the volume and level of activity for the asset or liability in the market, are considered in valuing the Fund's investments, some of which are discussed below. Significant management judgment may be necessary to value investments in accordance with ASC 820.
ASC 820 established a three-tier hierarchy of inputs to create a classification of value measurements for disclosure purposes. The three-tier hierarchy of inputs is summarized in the three broad Levels listed below.
• Level 1 – quoted prices in active markets for identical investments
• Level 2 – other significant observable inputs (including quoted prices for similar investments, interest rates, prepayment speeds, credit risk, amortized cost, etc.)
• Level 3 – significant unobservable inputs (including the Fund's own assumptions in determining the fair value of investments)
The inputs or methodology used for valuing an investment are not necessarily an indication of the risk associated with investing in those securities.
The value of the Fund's investments in debt securities is determined by Management primarily by obtaining valuations from independent pricing services based on readily available bid quotations, or if quotations are not available, by methods which include various considerations based on security type (generally Level 2 inputs). In addition to the consideration of yields or prices of securities of comparable quality, coupon, maturity and type; indications as to values from dealers; and general market conditions, the following is a description of other Level 2 inputs and related valuation techniques used by an independent pricing service to value certain types of debt securities of the Fund:
Corporate Debt Securities. Inputs used to value corporate debt securities generally include relative credit information, observed market movements, sector news, spread to the U.S. Treasury market, and other market information which may include benchmark yields, reported trades, broker-dealer quotes, issuer spreads, benchmark securities, bids, offers, and reference data, such as market research publications, when available ("Other Market Information").
Asset-Backed Securities. Inputs used to value asset-backed securities generally include models that consider a number of factors, which may include the following: prepayment speeds, cash flows, spread adjustments and Other Market Information.
U.S. Treasury Securities. Inputs used to value U.S. Treasury securities generally include quotes from several inter-dealer brokers and Other Market Information.
U.S. Government Agency Securities. Inputs used to value U.S. Government Agency securities generally include obtaining benchmark quotes and Other Market Information.
The value of commodity futures contracts is determined by obtaining valuations from independent pricing services at the settlement price at the market close (Level 1 inputs).
Management has developed a process to periodically review information provided by independent pricing services for all types of securities.
Investments in money market funds are valued using the fund's daily calculated net asset value per share (Level 2 inputs).
See Notes to Financial Statements
12
Notes to Consolidated Schedule of Investments (cont'd)
If a valuation is not available from an independent pricing service, or if Management has reason to believe that the valuation received does not represent the amount the Fund might reasonably expect to receive on a current sale in an orderly transaction, the Fund seeks to obtain quotations from principal market makers (generally considered Level 3 inputs). If such quotations are not readily available, the security is valued using methods the Neuberger Berman Alternative Funds' Board of Trustees (the "Board") has approved on the belief that they reflect fair value. Numerous factors may be considered when determining the fair value of a security based on Level 2 or 3 inputs, including available analyst, media or other reports, trading in futures or American Depositary Receipts ("ADRs") and whether the issuer of the security being fair valued has other securities outstanding.
Fair value prices are necessarily estimates, and there is no assurance that such a price will be at or close to the price at which the security is next quoted or next trades.
The following is a summary, categorized by Level, of inputs used to value the Fund's investments as of October 31, 2013:
Asset Valuation Inputs | |
| | | Level 1 | | Level 2 | | Level 3 | | Total | |
Investments: | |
U.S. Treasury Securities-Backed by the Full Faith and
Credit of the U.S. Government | | $ | — | | | $ | 6,781,017 | | | $ | — | | | $ | 6,781,017 | | |
U.S. Government Agency Securities | | | — | | | | 500,079 | | | | — | | | | 500,079 | | |
Asset-Backed Securities | | | — | | | | 2,219,616 | | | | — | | | | 2,219,616 | | |
Corporate Debt Securities^ | | | — | | | | 20,949,105 | | | | — | | | | 20,949,105 | | |
Short-Term Investments^ | | | — | | | | 14,505,053 | | | | — | | | | 14,505,053 | | |
Total Investments | | $ | — | | | $ | 44,954,870 | | | $ | — | | | $ | 44,954,870 | | |
^ The Consolidated Schedule of Investments provides information on the industry categorization for the portfolio.
The following is a summary, categorized by Level, of inputs used to value the Fund's derivatives as of October 31, 2013:
| | | Level 1 | | Level 2 | | Level 3 | | Total | |
Futures Contracts (unrealized appreciation) | | $ | 639,652 | | | $ | — | | | $ | — | | | $ | 639,652 | | |
Liability Valuation Inputs | |
| | | Level 1 | | Level 2 | | Level 3 | | Total | |
Futures Contracts (unrealized depreciation) | | $ | (878,082 | ) | | $ | — | | | $ | — | | | $ | (878,082 | ) | |
## At October 31, 2013, the cost of investments for U.S. federal income tax purposes was $44,939,444. Gross unrealized appreciation of investments was $18,749 and gross unrealized depreciation of investments was $3,323, resulting in net unrealized appreciation of $15,426 based on cost for U.S. federal income tax purposes.
Ø All or a portion of this security was purchased on a when-issued basis. At October 31, 2013, these securities amounted to $44,982.
ØØ All or a portion of this security is segregated in connection with obligations for commodity futures contracts and when-issued security purchase commitments.
†† A portion of this security is held by Neuberger Berman Cayman Commodity Fund I Ltd., (the "Subsidiary") a wholly-owned subsidiary of the Fund. See Note A-1 of the Notes to Consolidated Financial Statements.
(a) Interest rate represents discount rate at time of purchase, not a coupon rate.
µ Floating rate securities are securities whose yields vary with a designated index or market rate. These securities are shown at their current rates as of October 31, 2013, and their final maturity dates.
± See Note A-11 in the Notes to Consolidated Financial Statements for the Fund's or Subsidiary's open positions in derivatives at October 31, 2013.
See Notes to Financial Statements
13
Consolidated Statement of Assets and Liabilities*
Neuberger Berman Alternative Funds | |
| | | RISK BALANCED
COMMODITY
STRATEGY FUND | |
| | | October 31, 2013 | |
Assets | |
Investments in securities, at value** (Notes A)—see Schedule of Investments: | |
Unaffiliated issuers | | $ | 44,954,870 | | |
Cash | | | 1,000,000 | | |
Deposits with brokers for futures contracts (Note A-11) | | | 2,825,540 | | |
Dividends and interest receivable | | | 61,385 | | |
Receivable for Fund shares sold | | | 60,511 | | |
Receivable from Management—net (Note B) | | | 7,349 | | |
Prepaid expenses and other assets | | | 26,643 | | |
Total Assets | | | 48,936,298 | | |
Liabilities | |
Payable for securities purchased | | | 45,000 | | |
Payable for Fund shares redeemed | | | 13,386 | | |
Payable for variation margin (Note A-11) | | | 536,621 | | |
Payable to investment manager—net (Note B) | | | 28,719 | | |
Payable to trustees | | | 2,525 | | |
Accrued expenses and other payables | | | 129,254 | | |
Total Liabilities | | | 755,505 | | |
Net Assets | | $ | 48,180,793 | | |
Net Assets consist of: | |
Paid-in capital | | $ | 48,579,787 | | |
Undistributed net investment income (loss) | | | (175,990 | ) | |
Net unrealized appreciation (depreciation) in value of investments | | | (223,004 | ) | |
Net Assets | | $ | 48,180,793 | | |
Net Assets | |
Institutional Class | | $ | 9,563,396 | | |
Class A | | | 35,036,791 | | |
Class C | | | 3,580,606 | | |
Shares Outstanding ($.001 par value; unlimited shares authorized) | |
Institutional Class | | | 1,061,917 | | |
Class A | | | 3,907,913 | | |
Class C | | | 403,030 | | |
Net Asset Value, offering and redemption price per share | |
Institutional Class | | $ | 9.01 | | |
Net Asset Value and redemption price per share | |
Class A | | $ | 8.97 | | |
Offering Price per share | |
Class A‡ | | $ | 9.52 | | |
Net Asset Value and offering price per share | |
Class C^ | | $ | 8.88 | | |
**Cost of Investments | | $ | 44,939,444 | | |
‡ On single retail sales of less than $50,000. On sales of $50,000 or more or in certain other circumstances described in the Fund's prospectus, offering price is reduced.
^ Redemption price per share is equal to net asset value less any applicable contingent deferred sales charge.
* See Notes A-1 and A-2 of the Notes to Consolidated Financial Statements.
See Notes to Financial Statements
14
Consolidated Statement of Operations*
Neuberger Berman Alternative Funds | |
| | | RISK BALANCED
COMMODITY
STRATEGY FUND | |
| | | For the
Year Ended
October 31,
2013 | |
Investment Income: | |
Income (Note A): | |
Interest income—unaffiliated issuers | | $ | 33,095 | | |
Foreign taxes withheld | | | (26 | ) | |
Total income | | $ | 33,069 | | |
Expenses: | |
Investment management fees (Note B) | | | 130,544 | | |
Administration fees (Note B) | | | 11,189 | | |
Administration fees (Note B): | |
Institutional Class | | | 6,616 | | |
Class A | | | 20,187 | | |
Class C | | | 2,411 | | |
Distribution fees (Note B): | |
Class A | | | 25,233 | | |
Class C | | | 12,055 | | |
Shareholder servicing agent fees: | |
Institutional Class | | | 748 | | |
Class A | | | 1,959 | | |
Class C | | | 1,468 | | |
Subsidiary administration fees (Note B) | | | 50,034 | | |
Audit fees | | | 85,600 | | |
Custodian and accounting fees | | | 51,302 | | |
Insurance expense | | | 142 | | |
Legal fees | | | 177,764 | | |
Registration and filing fees | | | 76,029 | | |
Shareholder reports | | | 8,990 | | |
Trustees' fees and expenses | | | 45,241 | | |
Miscellaneous | | | 4,904 | | |
Total expenses | | | 712,416 | | |
Expenses reimbursed by Management (Note B) | | | (457,456 | ) | |
Expenses reduced by custodian fee expense offset arrangement (Note A-13) | | | (2 | ) | |
Total net expenses | | | 254,958 | | |
Net investment income (loss) | | $ | (221,889 | ) | |
Realized and Unrealized Gain (Loss) on Investments (Note A): | |
Net realized gain (loss) on: | |
Sales of investment securities of unaffiliated issuers | | | 1,726 | | |
Commodity futures contracts | | | 26,297 | | |
Change in net unrealized appreciation (depreciation) in value of: | |
Unaffiliated investment securities | | | 15,341 | | |
Commodity futures contracts | | | (202,854 | ) | |
Net gain (loss) on investments | | | (159,490 | ) | |
Net increase (decrease) in net assets resulting from operations | | $ | (381,379 | ) | |
* See Notes A-1 and A-2 of the Notes to Consolidated Financial Statements.
See Notes to Financial Statements
15
Consolidated Statements of Changes in Net Assets*
Neuberger Berman Alternative Funds
| | | RISK BALANCED COMMODITY
STRATEGY FUND | |
| | | Year Ended
October 31,
2013 | | Period from
August 27, 2012
(Commencement
of Operations) to
October 31,
2012 | |
Increase (Decrease) in Net Assets: | |
From Operations (Note A): | |
Net investment income (loss) | | $ | (221,889 | ) | | $ | (9,258 | ) | |
Net realized gain (loss) on investments | | | 28,023 | | | | (52,003 | ) | |
Change in net unrealized appreciation (depreciation) of investments | | | (187,513 | ) | | | (35,491 | ) | |
Net increase (decrease) in net assets resulting from operations | | | (381,379 | ) | | | (96,752 | ) | |
From Fund Share Transactions (Note D): | |
Proceeds from shares sold: | |
Institutional Class | | | 11,363,372 | | | | 5,069,219 | | |
Class A | | | 38,040,599 | | | | 129,263 | | |
Class C | | | 3,611,986 | | | | 100,000 | | |
Payments for shares redeemed: | |
Institutional Class | | | (6,261,561 | ) | | | — | | |
Class A | | | (3,247,163 | ) | | | — | | |
Class C | | | (146,791 | ) | | | — | | |
Net increase (decrease) from Fund share transactions | | | 43,360,442 | | | | 5,298,482 | | |
Net Increase (Decrease) in Net Assets | | | 42,979,063 | | | | 5,201,730 | | |
Net Assets: | |
Beginning of year | | | 5,201,730 | | | | — | | |
End of year | | $ | 48,180,793 | | | $ | 5,201,730 | | |
Undistributed net investment income (loss) at end of year | | $ | (175,990 | ) | | $ | (775 | ) | |
* See Notes A-1 and A-2 of the Notes to Consolidated Financial Statements.
See Notes to Financial Statements
16
Notes to Consolidated Financial Statements Risk Balanced Commodity Strategy Fund
Note A—Summary of Significant Accounting Policies:
1 General: Neuberger Berman Alternative Funds (the "Trust") is a Delaware statutory trust organized pursuant to an Amended and Restated Trust Instrument dated October 14, 2010. The Trust is registered as an open-end management investment company under the Investment Company Act of 1940, as amended (the "1940 Act"), and its shares are registered under the Securities Act of 1933, as amended (the "1933 Act"). The Fund is a separate operating series of the Trust and is non-diversified. The Fund had no operations until August 27, 2012, other than matters relating to its organization and registration of its shares under the 1933 Act. The Fund offers Institutional Class shares, Class A shares and Class C shares. The Board may establish additional series or classes of shares without the approval of shareholders.
The assets of the Fund belong only to the Fund, and the liabilities of the Fund are borne solely by the Fund and no other.
The Fund invests in commodity-related instruments through the Subsidiary, which is organized under the laws of the Cayman Islands. Subscription agreements were entered into between the Fund and the Subsidiary with the intent that the Fund will remain the sole shareholder of the Subsidiary. The Subsidiary is governed by its own Board of Directors.
As of October 31, 2013, the value of the Fund's investment in the Subsidiary was as follows:
Investment in
Subsidiary | | Percentage of
Net Assets | |
| $ | 7,833,888 | | | | 16.3 | % | |
The preparation of financial statements in accordance with U.S. generally accepted accounting principles ("GAAP") requires Management to make estimates and assumptions at the date of the financial statements. Actual results could differ from those estimates.
2 Consolidation: The accompanying financial statements of the Fund present the consolidated accounts of the Fund and the Subsidiary. All intercompany accounts and transactions have been eliminated in consolidation.
3 Portfolio valuation: Investment securities are valued as indicated in the notes following the Schedule of Investments.
4 Foreign currency translation: The accounting records of the Fund and Subsidiary are maintained in U.S. dollars. Foreign currency amounts are translated into U.S. dollars using the exchange rate as of 4:00 p.m., Eastern time, to determine the value of investments, other assets and liabilities. Purchase and sale prices of securities, and income and expenses, are translated into U.S. dollars at the prevailing rate of exchange on the respective dates of such transactions. Net unrealized foreign currency gain (loss), if any, arises from changes in the value of assets and liabilities, other than investments in securities, as a result of changes in exchange rates and is stated separately in the Consolidated Statement of Operations.
5 Securities transactions and investment income: Securities transactions are recorded on trade date for financial reporting purposes. Dividend income is recorded on the ex-dividend date or, for certain foreign dividends, as soon as the Fund becomes aware of the dividends. Non-cash dividends included in dividend income, if any, are recorded at the fair market value of the securities received. Interest income, including accretion of discount (adjusted for original issue discount, where applicable) and amortization of premium, where applicable, is recorded on the accrual basis. Realized gains and losses from securities transactions and foreign currency transactions, if any, are recorded on the basis of identified cost and stated separately in the Consolidated Statement of Operations.
17
6 Income tax information: It is the policy of the Fund to continue to qualify for treatment as a regulated investment company by complying with the requirements of the U.S. Internal Revenue Code applicable to regulated investment companies and to distribute substantially all of its net investment income and net realized capital gains to its shareholders. To the extent the Fund distributes substantially all of its net investment income and net realized capital gains to shareholders, no federal income or excise tax provision is required.
The Fund has adopted the provisions of ASC 740 "Income Taxes" ("ASC 740"). ASC 740 sets forth a minimum threshold for financial statement recognition of a tax position taken, or expected to be taken, in a tax return. The Fund recognizes interest and penalties, if any, related to unrecognized tax positions as an income tax expense in the Consolidated Statement of Operations. The Fund is subject to examination by U.S. federal and state tax authorities for returns filed for the prior fiscal period. As of October 31, 2013, the Fund did not have any unrecognized tax positions.
The Subsidiary is a controlled foreign corporation under the U.S. Internal Revenue Code. As a U.S. shareholder of a controlled foreign corporation, the Fund will include in its gross income its share of the Subsidiary's current earnings and profits (including net realized gains). Any deficit generated by the Subsidiary will be disregarded for purposes of computing the Fund's gross income in the current period and also disregarded for all future periods.
Income distributions and capital gain distributions are determined in accordance with income tax regulations, which may differ from GAAP. These differences are primarily due to differing treatments of income and gains on various investment securities held by the Fund, timing differences and differing characterization of distributions made by the Fund. The Fund may also utilize earnings and profits distributed to shareholders on redemption of shares as a part of the dividends-paid deduction for income tax purposes.
As determined on October 31, 2013, permanent differences resulting primarily from different book and tax accounting were reclassified at year end. Such differences may be attributed to one or more of the following: net operating losses, non-deductible Rule 12b-1 fees, ordinary loss netting to reduce short term capital gains and Subsidiary income, gain (loss) and expense adjustments. These reclassifications had no effect on net income, net asset value ("NAV") or NAV per share of the Fund. For the year ended October 31, 2013, the Fund recorded the following permanent reclassifications:
| Paid-in Capital | | Undistributed
Net Investment
Income (Loss) | | Accumulated
Net Realized
Gains (Losses)
on Investments | |
| $ | (18,651 | ) | | $ | 46,674 | | | $ | (28,023 | ) | |
For tax purposes, distributions of short-term gains are taxable to shareholders as ordinary income.
As of October 31, 2013, the components of distributable earnings (accumulated losses) on a U.S. federal income tax basis were as follows:
Undistributed
Ordinary
Income | | Unrealized
Appreciation
(Depreciation) | | Loss
Carryforwards
and Deferrals | | Other Temporary
Differences | | Total | |
| $ | — | | | $ | 15,426 | | | $ | (175,267 | ) | | $ | (239,153 | ) | | $ | (398,994 | ) | |
The difference between book basis and tax basis distributable earnings is primarily due to organizational expenses.
To the extent the Fund's net realized capital gains, if any, can be offset by capital loss carryforwards, it is the policy of the Fund not to distribute such gains. For taxable years beginning after December 22, 2010, the capital loss carryforward rules allow for regulated investment companies to carry forward capital losses indefinitely and to retain the character of capital loss carryforwards as short-term or long-term. As determined at October 31, 2013,
18
the Fund had unused capital loss carryforwards available for federal income tax purposes to offset net realized capital gains, if any, as follows:
Late-Year
Ordinary
Loss Deferral | |
| $ | 175,267 | | |
7 Distributions to shareholders: The Fund may earn income, net of expenses, daily on its investments. Distributions from net investment income and net realized capital gains, if any, generally are distributed once a year (usually in December) and are recorded on the ex-date.
8 Foreign taxes: Foreign taxes, if any, withheld, if any, represent amounts withheld by foreign tax authorities, net of refunds recoverable.
9 Expense allocation: Certain expenses are applicable to multiple funds. Expenses directly attributable to the Fund are charged to the Fund. Expenses of the Trust that are not directly attributable to a particular series of the Trust (e.g., the Fund) are allocated among the series of the Trust, on the basis of relative net assets, except where a more appropriate allocation of expenses to each of the series can otherwise be made fairly. Expenses borne by the complex of related investment companies, which includes open-end and closed-end investment companies for which Management serves as investment manager, that are not directly attributable to a particular investment company in the complex (e.g., the Trust) or series thereof are allocated among the investment companies in the complex or series thereof, on the basis of relative net assets, except where a more appropriate allocation of expenses to each of the investment companies in the complex or series thereof can otherwise be made fairly. The Fund's expenses (other than those specific to each class) are allocated proportionally each day among the classes based upon the relative net assets of each class.
10 Investments in foreign securities: Investing in foreign securities may involve certain sovereign and other risks, in addition to the credit and market risks normally associated with domestic securities. These additional risks include the possibility of adverse political and economic developments (including political instability, nationalization, expropriation, or confiscatory taxation) and the potentially adverse effects of unavailability of public information regarding issuers, less governmental supervision and regulation of financial markets, reduced liquidity of certain financial markets, and the lack of uniform accounting, auditing, and financial reporting standards or the application of standards that are different or less stringent than those applied in the United States. Foreign securities also may experience greater price volatility, higher rates of inflation, and delays in settlement.
11 Derivative instruments: During the year ended October 31, 2013, the Fund's use of derivatives was limited to commodity futures contracts. The Fund has adopted the provisions of ASC 815 "Derivatives and Hedging" ("ASC 815"). The disclosure requirements of ASC 815 distinguish between derivatives that qualify for hedge accounting and those that do not. Because investment companies value their derivatives at fair value and recognize changes in fair value through the Consolidated Statement of Operations, they do not qualify for hedge accounting. Accordingly, even though the Fund's investments in derivatives may represent economic hedges, they are considered non-hedge transactions for purposes of this disclosure.
Commodity futures contracts: During the year ended October 31, 2013, the Fund entered into commodity futures contracts (through investments in the Subsidiary) to provide investment exposure to individual commodities, as well as to manage and/or adjust the risk profile of the Fund.
At the time the Fund or Subsidiary enters into a commodity futures contract, it is required to deposit with the futures commission merchant a specified amount of cash or liquid securities, known as "initial margin," which is a percentage of the value of the commodity futures contract being traded that is set by the exchange upon which the futures contract is traded. Each day, the futures contract is valued at the official settlement price of the board of trade or U.S. commodity exchange on which such futures contract is traded. Subsequent payments, known as "variation margin," to and from the broker are made on a daily basis as the market price of the commodity futures
19
contract fluctuates. Daily variation margin adjustments, arising from this "mark to market," are recorded by the Fund or Subsidiary as unrealized gains or losses.
Although some commodity futures contracts by their terms call for actual delivery or acquisition of the underlying securities or currency, in most cases the contracts are closed out prior to delivery by offsetting purchases or sales of matching commodity futures contracts. When the contracts are closed, the Fund or Subsidiary recognizes a gain or loss. Risks of entering into futures contracts include the possibility there may be an illiquid market, possibly at a time of rapidly declining prices, and/or a change in the value of the contract may not correlate with changes in the value of the underlying securities. Futures executed on regulated futures exchanges have minimal counterparty risk to a fund because the exchange's clearinghouse assumes the position of the counterpary in each transaction. Thus, the Fund is exposed to risk only in connection with the clearinghouse and not in connection with the original counterpary to the transaction.
For U.S. federal income tax purposes, the futures transactions undertaken by the Fund or Subsidiary may cause the Fund or Subsidiary to recognize gains or losses from marking contracts to market even though its positions have not been sold or terminated, may affect the character of the gains or losses recognized as long-term or short-term, and may affect the timing of some capital gains and losses realized by the Fund or Subsidiary. Also, the Fund's or Subsidiary's losses on transactions involving futures contracts may be deferred rather than being taken into account currently in calculating the Fund's or Subsidiary's taxable income.
At October 31, 2013, open positions in commodity futures contracts(1) were:
Expiration | | Open Contracts | | Position | | Unrealized
Appreciation
(Depreciation) | |
November 2013 | | 35 Lead | | Long | | $ | 76,800 | | |
November 2013 | | 16 Nickel | | Long | | | 53,836 | | |
November 2013 | | 42 Premium High Grade Aluminum | | Long | | | (28,848 | ) | |
November 2013 | | 46 Zinc | | Long | | | 28,420 | | |
December 2013 | | 38 Lead | | Long | | | (561 | ) | |
December 2013 | | 20 Nickel | | Long | | | 83,608 | | |
December 2013 | | 43 Premium High Grade Aluminum | | Long | | | 7,569 | | |
December 2013 | | 40 Zinc | | Long | | | 22,199 | | |
January 2014 | | 29 Cattle Feeder | | Long | | | (3,475 | ) | |
January 2014 | | 37 Lead | | Long | | | 66,028 | | |
January 2014 | | 20 Nickel | | Long | | | 72,868 | | |
January 2014 | | 11 Platinum | | Long | | | (42,435 | ) | |
January 2014 | | 46 Premium High Grade Aluminum | | Long | | | 2,889 | | |
January 2014 | | 46 Zinc | | Long | | | 28,695 | | |
February 2014 | | 32 Gas Oil | | Long | | | (21,031 | ) | |
February 2014 | | 22 Gasoline RBOB | | Long | | | (20,683 | ) | |
February 2014 | | 23 Gold 100 Oz. | | Long | | | (42,163 | ) | |
February 2014 | | 37 Lead | | Long | | | (6,478 | ) | |
February 2014 | | 38 Lean Hogs | | Long | | | 35,169 | | |
February 2014 | | 36 Live Cattle | | Long | | | 10,717 | | |
February 2014 | | 36 Natural Gas | | Long | | | (22,795 | ) | |
February 2014 | | 20 New York Harbor ULSD | | Long | | | (19,207 | ) | |
February 2014 | | 17 Nickel | | Long | | | 381 | | |
20
Expiration | | Open Contracts | | Position | | Unrealized
Appreciation
(Depreciation) | |
February 2014 | | 41 Premium High Grade Aluminum | | Long | | $ | (19,028 | ) | |
February 2014 | | 31 WTI Crude | | Long | | | 4,083 | | |
February 2014 | | 42 Zinc | | Long | | | (5,842 | ) | |
March 2014 | | 32 Brent Crude Oil | | Long | | | (18,832 | ) | |
March 2014 | | 25 Cocoa | | Long | | | 15,164 | | |
March 2014 | | 15 Coffee 'C' | | Long | | | (43,093 | ) | |
March 2014 | | 26 Copper | | Long | | | (16,571 | ) | |
March 2014 | | 25 Cotton No. 2 | | Long | | | (81,570 | ) | |
March 2014 | | 109 Corn | | Long | | | (149,850 | ) | |
March 2014 | | 14 Silver | | Long | | | 2,887 | | |
March 2014 | | 36 Soybean | | Long | | | (18,350 | ) | |
March 2014 | | 17 Soybean Meal | | Long | | | (7,200 | ) | |
March 2014 | | 19 Soybean Oil | | Long | | | (3,032 | ) | |
March 2014 | | 51 Sugar 11 | | Long | | | 78,633 | | |
March 2014 | | 40 Wheat | | Long | | | (14,634 | ) | |
March 2014 | | 44 Wheat | | Long | | | 25,860 | | |
November 2013 | | 35 Lead | | Short | | | (493 | ) | |
November 2013 | | 16 Nickel | | Short | | | (67,802 | ) | |
November 2013 | | 425 Premium High Grade Aluminum | | Short | | | (12,373 | ) | |
November 2013 | | 46 Zinc | | Short | | | (31,074 | ) | |
December 2013 | | 38 Lead | | Short | | | (68,842 | ) | |
December 2013 | | 20 Nickel | | Short | | | (73,352 | ) | |
December 2013 | | 43 Premium High Grade Aluminum | | Short | | | (4,975 | ) | |
December 2013 | | 40 Zinc | | Short | | | (27,689 | ) | |
January 2014 | | 37 Lead | | Short | | | 1,196 | | |
January 2014 | | 20 Nickel | | Short | | | (5,804 | ) | |
January 2014 | | 46 Premium High Grade Aluminum | | Short | | | 21,006 | | |
January 2014 | | 46 Zinc | | Short | | | 1,644 | | |
| | | | | | | $ | (238,430 | ) | |
(1) Commodity futures are held by the Subsidiary. See Note A-1 of the Notes to Financial Statements.
During the year ended October 31, 2013, the average notional value of commodity futures contracts was $25,691,142 for long positions and $(6,874,528) for short positions.
The notional value of commodity futures contracts at October 31, 2013 was $71,705,900 for long positions and $(23,305,339) for short positions.
At October 31, 2013, the Fund had deposited $2,825,540 in a segregated account to cover margin requirements on open futures contracts.
21
At October 31, 2013, the Fund had the following derivatives (which did not qualify as hedging instruments under ASC 815), grouped by primary risk exposure:
Asset Derivatives
| | | Commodity Risk | | Consolidated
Statement of
Assets and
Liabilities Location | |
Futures Contracts | | $ | 639,652 | | | Receivable/Payable for | |
Total Value | | $ | 639,652 | | | variation margin(1) | |
Liability Derivatives
| | | Commodity Risk | | Consolidated
Statement of
Assets and
Liabilities Location | |
Futures Contracts | | $ | (878,082 | ) | | Receivable/Payable for | |
Total Value | | $ | (878,082 | ) | | variation margin(1) | |
(1) "Futures Contracts" reflects the cumulative appreciation (depreciation) of futures contracts as of October 31, 2013, which is reflected in the Consolidated Statement of Assets and Liabilities under the caption "Net unrealized appreciation (depreciation) in value of investments." The outstanding variation margin as of October 31, 2013, if any, is reflected in the Consolidated Statement of Assets and Liabilities under the caption "Receivable/Payable for variation margin."
The impact of the use of these derivative instruments on the Consolidated Statement of Operations during the year ended October 31, 2013, was as follows:
Realized Gain (Loss) | |
| | | Commodity Risk | | Consolidated
Statement of
Operations Location | |
Futures Contracts | | $ | 26,297 | | | Net realized gain
(loss) on: commodity | |
Total Realized Gain (Loss) | | $ | 26,297 | | | futures contracts | |
Change in Appreciation (Depreciation)
| | | Commodity Risk | | | |
Futures Contracts | | $ | (202,854 | ) | | Change in net
unrealized appreciation
(depreciation) in value of: | |
Total Change in Appreciation (Depreciation) | | $ | (202,854 | ) | | commodity futures contracts | |
12 Indemnifications: Like many other companies, the Trust's organizational documents provide that its officers and trustees are indemnified against certain liabilities arising out of the performance of their duties to the Trust. In addition, both in some of its principal service contracts and in the normal course of its business, the Trust enters into contracts that provide indemnifications to other parties for certain types of losses or liabilities. The Trust's maximum exposure under these arrangements is unknown as this could involve future claims against the Trust.
13 Expense offset arrangement: Prior to January 1, 2013, the Fund had an expense offset arrangement in connection with its custodian contract. For the year ended October 31, 2013, the impact of this arrangement was a reduction of expenses of $2.
22
14 Other: All net investment income and realized and unrealized capital gains and losses of the Fund are allocated, on the basis of relative net assets, pro rata among its respective classes.
Note B—Management Fees, Administration Fees, Distribution Arrangements, and Other Transactions with Affiliates:
The Fund retains Management as its investment manager under a Management Agreement. For such investment management services, the Fund pays Management a fee at the annual rate of 0.70% of the first $250 million of the Fund's average daily net assets, 0.675% of the next $250 million, 0.65% of the next $250 million, 0.625% of the next $250 million, 0.60% of the next $500 million, 0.575% of the next $2.5 billion and 0.55% of average daily net assets in excess of $4 billion, less the net asset value of the Subsidiary. Accordingly, for the year ended October 31, 2013, the management fee pursuant to the Management Agreement was equivalent to an annual effective rate of 0.70% of the Fund's average daily net assets.
Management also serves as investment adviser to the Subsidiary. For such investment management services, the Subsidiary pays Management a fee at the annual rate of 0.70% of the first $250 million of the Subsidiary's average daily net assets, 0.675% of the next $250 million, 0.65% of the next $250 million, 0.625% of the next $250 million, 0.60% of the next $500 million, 0.575% of the next $2.5 billion and 0.55% of average daily net assets in excess of $4 billion. Accordingly, for the year ended October 31, 2013, the management fee pursuant to the Management Agreement was equivalent to an annual effective rate of 0.70% of the Subsidiary's average daily net assets.
The Fund retains Management as its administrator under an Administration Agreement. The Fund pays Management an administration fee at the annual rate of 0.06% of its average daily net assets under this agreement. In addition, the Fund's Institutional Class pays Management an administration fee at the annual rate of 0.09% of its average daily net assets under this agreement and the Fund's Class A and Class C pays Management an administration fee at the annual rate of 0.20% of its average daily net assets under this agreement. Additionally, Management retains State Street Bank and Trust Company ("State Street") as its sub-administrator under a Sub-Administration Agreement. Management pays State Street a fee for all services received under this agreement. The Subsidiary also retains Management as its administrator, and State Street as its sub-administrator.
Management has contractually agreed to waive current payment of fees and/or reimburse certain expenses of the Institutional Class, Class A and Class C of the Fund so that the total annual operating expenses of those classes do not exceed the expense limitations as detailed in the following table. These undertakings apply to the Fund's direct expenses and exclude interest, taxes, brokerage commissions, acquired fund fees and expenses, extraordinary expenses, and dividend and interest expenses relating to short sales, if any; consequently, net expenses may exceed the contractual expense limitations. The Fund has agreed that each of its respective classes will repay Management for fees and expenses waived or reimbursed for that class provided that repayment does not cause that class' annual operating expenses to exceed its contractual expense limitation at the time the fees and expenses were waived or reimbursed. Any such repayment must be made within three years after the year in which Management incurred the expense. The expenses of the Subsidiary are included in the total expenses used to calculate the reimbursement, which the Fund has agreed to share with the Subsidiary. For the year ended October 31, 2013, these Subsidiary expenses amounted to $122,786.
During the year ended October 31, 2013, there was no repayment to Management under this agreement.
23
At October 31, 2013, contingent liabilities to Management under the agreement were as follows:
| | | | | | | Expenses Reimbursed In
Fiscal Period Ending, October 31, | |
| | | | | | | 2012 | | 2013 | |
| | | | | | | Subject to Repayment until
October 31, | |
| | | Contractual
Expense
Limitation(1) | | Expiration | | 2015 | | 2016 | |
Institutional Class | | | 1.10 | % | | 10/31/16 | | $ | 518,969 | (2) | | $ | 190,694 | | |
Class A | | | 1.46 | % | | 10/31/16 | | | 13,769 | (2) | | | 236,827 | | |
Class C | | | 2.21 | % | | 10/31/16 | | | 12,521 | (2) | | | 29,935 | | |
(1) Expense limitation per annum of the respective class's average daily net assets.
(2) Period from August 27, 2012 (Commencement of Operations) to October 31, 2012.
Neuberger Berman Fixed Income LLC ("NBFI"), as the sub-adviser to the Fund and the Subsidiary, is retained by Management to provide day-to-day investment management services and receives a monthly fee paid by Management. As investment manager, Management is responsible for overseeing the investment activities of NBFI. Several individuals who are officers and/or Trustees of the Trust are also employees of NBFI, Neuberger Berman LLC ("Neuberger") and/or Management.
Management and NBFI are indirect subsidiaries of Neuberger Berman Group LLC (("NBG") and together with its consolidated subsidiaries ("NB Group")). NBSH Acquisition, LLC ("NBSH" and together with NBG, the "NB Parties"), which is owned by portfolio managers, members of the NB Group management team and certain of NB Group's key employees, senior professionals, and certain of their permitted transferees, owns, as of September 30, 2013, approximately 76% of NBG's equity, and Lehman Brothers Holdings Inc. ("LBHI") and certain of its subsidiaries (collectively the "LBHI Parties") own the remaining 24% of such equity. Pursuant to agreements among the NB Parties and the LBHI Parties, as well as the issuance of NBSH equity to employees with respect to their previously made equity elections relating to 2013 compensation, it is expected that NBSH will own 81% of NBG's equity as of January 1, 2014. NBG has the opportunity to continue to redeem the remaining NBG equity held by the LBHI Parties through a process that is expected to end in 2016.
The Fund also has a distribution agreement with Management with respect to each class of shares. Management acts as agent in arranging for the sale of class shares without sales commission or other compensation, except as described below for Class A and Class C shares, and bears advertising and promotion expenses.
However, Management receives fees from Class A and Class C under their distribution plans (each a "Plan", collectively the "Plans") pursuant to Rule 12b-1 under the 1940 Act. The Plans provide that, as compensation for administrative and other services provided to these classes, Management's activities and expenses related to the sale and distribution of these classes of shares, and ongoing services provided to investors in these classes, Management receives from each of these classes a fee at the annual rate of 0.25% of Class A's and 1.00% of Class C's average daily net assets. Management receives this amount to provide distribution and shareholder servicing for these classes and pays a portion of it to institutions that provide such services. Those institutions may use the payments for, among other purposes, compensating employees engaged in sales and/or shareholder servicing. The amount of fees paid by each class during any year may be more or less than the cost of distribution and other services provided to that class. FINRA rules limit the amount of annual distribution fees that may be paid by a mutual fund and impose a ceiling on the cumulative distribution fees paid. The Trust's Plans comply with those rules.
Class A shares are generally sold with an initial sales charge of up to 5.75% and no contingent deferred sales charge ("CDSC"), except that a CDSC of 1.00% applies to certain redemptions made within 18 months following purchases of $1 million or more without an initial sales charge. Class C shares are sold with no initial sales charge and a 1.00% CDSC if shares are sold within one year after purchase.
24
For the year ended October 31, 2013, Management, acting as underwriter and broker-dealer, received net initial sales charges from the purchase of Class A shares and CDSCs from the redemption of Class A and Class C shares as follows:
| | | Underwriter | | Broker-Dealer | |
| | | Net Initial Sales
Charges | | CDSC | | Net Initial Sales
Charges | | CDSC | |
Class A | | $ | 248 | | | $ | — | | | $ | — | | | $ | — | | |
Class C | | | — | | | | 548 | | | | — | | | | — | | |
Note C—Securities Transactions:
During the year ended October 31, 2013, there were purchase and sale transactions (excluding commodity futures contracts and short-term investments) of $14,477,065 and $195,345, respectively.
Note D—Fund Share Transactions:
Share activity for the year ended October 31, 2013 and for the period ended October 31, 2012 was as follows:
| | | For the Year Ended
October 31, 2013 | | For the Period Ended
October 31, 2012(1) | |
| | | Shares Sold | | Shares
Redeemed | | Total | | Shares Sold | | Total | |
Institutional Class | | | 1,230,011 | | | | (673,603 | ) | | | 556,408 | | | | 505,509 | | | | 505,509 | | |
Class A | | | 4,253,041 | | | | (358,029 | ) | | | 3,895,012 | | | | 12,901 | | | | 12,901 | | |
Class C | | | 409,240 | | | | (16,210 | ) | | | 393,030 | | | | 10,000 | | | | 10,000 | | |
(1) Period from August 27, 2012 (Commencement of Operations) to October 31, 2012.
At October 31, 2013, the Neuberger Dynamic Real Return Fund, which is also managed by Management, held 7.7% of the outstanding shares of the Fund.
Note E—Line of Credit:
At October 31, 2013, the Fund was a participant in a single committed, unsecured $300,000,000 line of credit with State Street, to be used only for temporary or emergency purposes. Other investment companies managed by Management also participate in this line of credit on the same terms. Interest is charged on borrowings under this line of credit at the higher of (a) the Federal Funds Rate plus 1.25% per annum or (b) the Overnight LIBOR Rate plus 1.25% per annum. A commitment fee of 0.10% per annum of the unused portion of the available line of credit is charged, of which each participating Fund has agreed to pay its pro rata share, based on the ratio of its individual net assets to the net assets of all participants at the time the fee is due and payable. The fee is paid quarterly in arrears. Because several mutual funds participate, there is no assurance that an individual Fund will have access to all or any part of the $300,000,000 at any particular time. There were no loans outstanding pursuant to this line of credit at October 31, 2013. During the year ended October 31, 2013, the Fund did not utilize this line of credit.
At October 31, 2013, the Fund was a participant in a single uncommitted, unsecured $100,000,000 line of credit with State Street, to be used only for temporary or emergency purposes. Other investment companies managed by Management also participate in this line of credit on the same terms. Interest is charged on borrowings under this line of credit at a variable rate per annum as determined and quoted by State Street at the time a Fund requests a loan. Because several mutual funds participate, there is no assurance that an individual Fund will have access to all or any part of the $100,000,000 at any particular time. There were no loans outstanding pursuant to this line of
25
credit at October 31, 2013. During September (inception of line of credit) and October 2013, the Fund did not utilize this line of credit.
Note F—Recent Accounting Pronouncements:
In December 2011, the Financial Accounting Standards Board ("FASB") issued Accounting Standards Update 2011-11 Disclosures about Offsetting Assets and Liabilities ("ASU 2011-11"). Effective for annual reporting periods beginning on or after January 1, 2013 and interim periods within those annual periods, ASU 2011-11 is intended to enhance disclosure requirements on the offsetting of financial assets and liabilities. At this time, Management is evaluating the implications of ASU 2011-11 and its impact on the Fund's financial statements.
In June 2013, FASB issued Accounting Standards Update 2013-08 Financial Services—Investment Companies (Topic 946)—Amendments to the Scope, Measurement, and Disclosure Requirements ("ASU 2013-08"). Effective for interim and annual reporting period in fiscal years that begin after December 15, 2013, ASU 2013-08 sets forth a methodology for determining whether an entity should be characterized as an investment company and prescribes fair value accounting for an investment company's non-controlling ownership interest in another investment company. FASB has determined that a fund registered under the 1940 Act automatically meets ASU 2013-08's criteria for an investment company. Although still evaluating the potential impact of ASU 2013-08 on the Fund's financial statements, Management expects that the impact will be limited to additional financial statement disclosures.
26
Consolidated Financial Highlights
The following table includes selected data for a share outstanding throughout each period and other performance information derived from the Consolidated Financial Statements. Per share amounts that round to less than $0.01 or $(0.01) per share are presented as $0.00 or $(0.00) respectively. Net Asset amounts with a zero balance may reflect actual amounts rounding to less than $0.1 million. A "—" indicates that the line item was not applicable in the corresponding period.
| | Net Asset
Value,
Beginning
of Year | | Net
Investment
Income (Loss)@ | | Net Gains or
Losses on
Securities
(both realized
and
unrealized) | | Total From
Investment
Operations | | Dividends
from Net
Investment
Income | | Distributions
from Net
Realized
Capital Gains | | Total
Distributions | |
Risk Balanced Commodity Strategy Fund | |
Institutional Class | |
10/31/2013 | | $ | 9.84 | | | $ | (0.09 | ) | | $ | (0.74 | ) | | $ | (0.83 | ) | | $ | — | | | $ | — | | | $ | — | | |
Period from 8/27/2012^
to 10/31/2012 | | $ | 10.00 | | | $ | (0.02 | ) | | $ | (0.14 | ) | | $ | (0.16 | ) | | $ | — | | | $ | — | | | $ | — | | |
Class A | |
10/31/2013 | | $ | 9.84 | | | $ | (0.12 | ) | | $ | (0.75 | ) | | $ | (0.87 | ) | | $ | — | | | $ | — | | | $ | — | | |
Period from 8/27/2012^
to 10/31/2012 | | $ | 10.00 | | | $ | (0.03 | ) | | $ | (0.13 | ) | | $ | (0.16 | ) | | $ | — | | | $ | — | | | $ | — | | |
Class C | |
10/31/2013 | | $ | 9.83 | | | $ | (0.18 | ) | | $ | (0.77 | ) | | $ | (0.95 | ) | | $ | — | | | $ | — | | | $ | — | | |
Period from 8/27/2012^
to 10/31/2012 | | $ | 10.00 | | | $ | (0.04 | ) | | $ | (0.13 | ) | | $ | (0.17 | ) | | $ | — | | | $ | — | | | $ | — | | |
See Notes to Financial Highlights
27
| | | Net Asset
Value, End of
Year | | Total Return†† | | Net Assets,
End of Year
(in millions) | | Ratio of Gross
Expenses to
Average Net
Assets# | | Ratio of Net
Expenses to
Average Net
Assets | | Ratio of Net
Investment
Income/
(Loss) to
Average Net
Assets | | Portfolio
Turnover
Rate | |
Risk Balanced Commodity Strategy Fund | |
Institutional Class | |
10/31/2013 | | $ | 9.01 | | | | (8.43 | )% | | $ | 9.6 | | | | 3.69 | % | | | 1.10 | % | | | (.94 | )% | | | 5 | % | |
Period from 8/27/2012^
to 10/31/2012 | | $ | 9.84 | | | | (1.60 | )%** | | $ | 5.0 | | | | 25.60 | %*‡ | | | 1.10 | %*‡ | | | (.99 | )%*‡ | | | 0 | %** | |
Class A | |
10/31/2013 | | $ | 8.97 | | | | (8.84 | )% | | $ | 35.0 | | | | 3.81 | % | | | 1.46 | % | | | (1.27 | )% | | | 5 | % | |
Period from 8/27/2012^
to 10/31/2012 | | $ | 9.84 | | | | (1.60 | )%** | | $ | 0.1 | | | | 33.04 | %*‡ | | | 1.46 | %*‡ | | | (1.36 | )%*‡ | | | 0 | %** | |
Class C | |
10/31/2013 | | $ | 8.88 | | | | (9.66 | )% | | $ | 3.6 | | | | 4.69 | % | | | 2.21 | % | | | (2.03 | )% | | | 5 | % | |
Period from 8/27/2012^
to 10/31/2012 | | $ | 9.83 | | | | (1.70 | )%** | | $ | 0.1 | | | | 35.12 | %*‡ | | | 2.21 | %*‡ | | | (2.11 | )%*‡ | | | 0 | %** | |
28
Notes to Consolidated Financial Highlights
†† Total return based on per share NAV reflects the effects of changes in NAV on the performance of the Fund during each fiscal period. Returns assume income dividends and other distributions, if any, were reinvested, but do not reflect the effect of sales charges. Results represent past performance and do not indicate future results. Current returns may be lower or higher than the performance data quoted. Investment returns and principal may fluctuate and shares when redeemed may be worth more or less than original cost. Total return would have been lower if Management had not reimbursed and/or waived certain expenses.
# Represents the annualized ratios of net expenses to average daily net assets if Management had not reimbursed certain expenses and/or waived a portion of the investment management fee.
@ Calculated based on the average number of shares outstanding during each fiscal period.
^ The date investment operations commenced.
‡ Organization expense, which is a non-recurring expense, is included in these ratios on a non-annualized basis.
* Annualized.
** Not annualized.
29
Report of Independent Registered Public Accounting Firm
To the Board of Trustees Neuberger Berman Alternative Funds
and Shareholders of Neuberger Berman Risk Balanced Commodity Strategy Fund
We have audited the accompanying consolidated statements of assets and liabilities of Neuberger Berman Risk Balanced Commodity Strategy Fund, one of the series constituting the Neuberger Berman Alternative Funds, (the "Fund"), including the consolidated schedules of investments, as of October 31, 2013, and the related consolidated statements of operations for the year then ended, the consolidated statements of changes in net assets, and the consolidated financial highlights for each of the periods indicated therein. These consolidated financial statements and consolidated financial highlights are the responsibility of the Fund's management. Our responsibility is to express an opinion on these consolidated financial statements and consolidated financial highlights based on our audits.
We conducted our audits in accordance with the standards of the Public Company Accounting Oversight Board (United States). Those standards require that we plan and perform the audit to obtain reasonable assurance about whether the consolidated financial statements and consolidated financial highlights are free of material misstatement. We were not engaged to perform an audit of the Fund's internal control over financial reporting. Our audits included consideration of internal control over financial reporting as a basis for designing audit procedures that are appropriate in the circumstances, but not for the purpose of expressing an opinion on the effectiveness of the Fund's internal control over financial reporting. Accordingly, we express no such opinion. An audit also includes examining, on a test basis, evidence supporting the amounts and disclosures in the consolidated financial statements and consolidated financial highlights, assessing the accounting principles used and significant estimates made by management, and evaluating the overall financial statement presentation. Our procedures included confirmation of securities owned as of October 31, 2013, by correspondence with the custodian and others or by other appropriate auditing procedures where replies from others were not received. We believe that our audits provide a reasonable basis for our opinion.
In our opinion, the consolidated financial statements and consolidated financial highlights referred to above present fairly, in all material respects, the consolidated financial position of Neuberger Berman Risk Balanced Commodity Strategy Fund, a series of Neuberger Berman Alternative Funds, at October 31, 2013, and the consolidated results of its operations for the year then ended, the consolidated changes in its net assets, and the financial highlights for each of the periods indicated therein, in conformity with U.S. generally accepted accounting principles.

Boston, Massachusetts
December 20, 2013
30
Investment Manager, Administrator and Distributor
Neuberger Berman Management LLC
605 Third Avenue, 2nd Floor
New York, NY 10158-0180
800.877.9700 or 212.476.8800
Intermediary Client Services 800.366.6264
Sub-Adviser
Neuberger Berman Fixed Income LLC
190 South LaSalle Street
Chicago, IL 60603
Custodian and Shareholder Servicing Agent
State Street Bank and Trust Company
2 Avenue de Lafayette
Boston, MA 02111
For Institutional Class Shareholders
Address correspondence to:
Neuberger Berman Management LLC
605 Third Avenue, Mail Drop 2-7
New York, NY 10158-0180
Attn: Intermediary Client Services
800.366.6264
For Class A and Class C Shareholders:
Please contact your investment provider
Legal Counsel
K&L Gates LLP
1601 K Street, NW
Washington, DC 20006
Independent Registered Public Accounting Firms
Ernst & Young LLP
200 Clarendon Street
Boston, MA 02116
31
The following tables set forth information concerning the trustees ("Trustees") and officers ("Officers") of the Fund. All persons named as Trustees and Officers also serve in similar capacities for other funds administered or managed by Management and NBFI. The Fund's Statement of Additional Information includes additional information about the Trustees as of the date of the Fund's most recent public offering documents and is available upon request, without charge, by calling (800) 877-9700.
Information about the Board of Trustees
Name, (Year of Birth),
and Address(1) | | Position(s)
and Length of
Time Served(2) | | Principal Occupation(s)(3) | | Number of
Funds in
Fund Complex
Overseen by
Trustee | | Other Directorships Held
Outside Fund Complex by
Trustee(3) | |
Independent Trustees | |
Faith Colish (1935) | | Trustee since inception | | Counsel, Carter Ledyard & Milburn LLP (law firm) since October 2002; formerly, Attorney-at-Law and President, Faith Colish, A Professional Corporation, 1980 to 2002. | | | 54 | | | Formerly, Director, 1997 to 2003, and Advisory Director, 2003 to 2006, ABA Retirement Funds (formerly, American Bar Retirement Association) (not-for-profit membership corporation). | |
32
Name, (Year of Birth),
and Address(1) | | Position(s)
and Length of
Time Served(2) | | Principal Occupation(s)(3) | | Number of
Funds in
Fund Complex
Overseen by
Trustee | | Other Directorships Held
Outside Fund Complex by
Trustee(3) | |
Martha C. Goss (1949) | | Trustee since 2007 | | President, Woodhill Enterprises Inc./Chase Hollow Associates LLC (personal investment vehicle), since 2006; formerly, Consultant, Resources Global Professionals (temporary staffing), 2002 to 2006. | | | 54 | | | Director, American Water (water utility), since 2003; Director, Allianz Life of New York (insurance), since 2005; Director, Berger Group Holdings, Inc. (engineering consulting firm), since 2013; Director, Financial Women's Association of New York (not-for-profit association), since 2003; Trustee Emerita, Brown University, since 1998; Director, Museum of American Finance (not-for-profit), since 2013; formerly, Non-Executive Chair and Director, Channel Reinsurance (financial guaranty reinsurance), 2006 to 2010; formerly, Director, Ocwen Financial Corporation (mortgage servicing), 2005 to 2010; formerly, Director, Claire's Stores, Inc. (retailer), 2005 to 2007; formerly, Director, Parsons Brinckerhoff Inc. (engineering consulting firm), 2007 to 2010; formerly, Director, Bank Leumi (commercial bank), 2005 to 2007; formerly, Advisory Board Member, Attensity (software developer), 2005 to 2007. | |
Michael M. Knetter (1960) | | Trustee since 2007 | | President and Chief Executive Officer, University of Wisconsin Foundation, since October 2010; formerly, Dean, School of Business, University of Wisconsin—Madison; formerly, Professor of International Economics and Associate Dean, Amos Tuck School of Business—Dartmouth College, 1998 to 2002. | | | 54 | | | Director, American Family Insurance (a mutual company, not publicly traded), since March 2009; formerly, Trustee, Northwestern Mutual Series Fund, Inc., 2007 to 2010; formerly, Director, Wausau Paper, 2005 to 2011; formerly, Director, Great Wolf Resorts, 2004 to 2009. | |
33
Name, (Year of Birth),
and Address(1) | | Position(s)
and Length of
Time Served(2) | | Principal Occupation(s)(3) | | Number of
Funds in
Fund Complex
Overseen by
Trustee | | Other Directorships Held
Outside Fund Complex by
Trustee(3) | |
Howard A. Mileaf (1937) | | Trustee since inception | | Retired; formerly, Vice President and General Counsel, WHX Corporation (holding company), 1993 to 2001. | | | 54 | | | Formerly, Director, Webfinancial Corporation (holding company), 2002 to 2008; formerly, Director, WHX Corporation (holding company), 2002 to 2005; formerly, Director, State Theatre of New Jersey (not-for-profit theatre), 2000 to 2005. | |
George W. Morriss (1947) | | Trustee since 2007 | | Adjunct Professor, Columbia University School of International and Public Affairs, since October 2012; formerly, Executive Vice President and Chief Financial Officer, People's Bank, Connecticut (a financial services company), 1991 to 2001. | | | 54 | | | Director and Treasurer, National Association of Corporate Directors, Connecticut Chapter, since 2013; Trustee, Steben Alternative Investment Funds, Steben Select Multi-Strategy Fund, and Steben Select Multi-Strategy Master Fund, since 2013; formerly, Manager, Larch Lane Multi-Strategy Fund complex (which consisted of three funds), 2006 to 2011; formerly, Member, NASDAQ Issuers' Affairs Committee, 1995 to 2003. | |
Tom D. Seip (1950) | | Trustee since inception; Chairman of the Board since 2008; Lead Independent Trustee from 2006 to 2008 | | General Partner, Ridgefield Farm LLC (a private investment vehicle); formerly, President and CEO, Westaff, Inc. (temporary staffing), May 2001 to January 2002; formerly, Senior Executive, The Charles Schwab Corporation, 1983 to 1998, including Chief Executive Officer, Charles Schwab Investment Management, Inc.; Trustee, Schwab Family of Funds and Schwab Investments, 1997 to 1998; and Executive Vice President-Retail Brokerage, Charles Schwab & Co., Inc., 1994 to 1997. | | | 54 | | | Director, H&R Block, Inc. (financial services company), since May 2001; Chairman, Governance and Nominating Committee, H&R Block, Inc., since 2011; formerly, Chairman, Compensation Committee, H&R Block, Inc., 2006 to 2010; formerly, Director, Forward Management, Inc. (asset management company), 1999 to 2006. | |
34
Name, (Year of Birth),
and Address(1) | | Position(s)
and Length of
Time Served(2) | | Principal Occupation(s)(3) | | Number of
Funds in
Fund Complex
Overseen by
Trustee | | Other Directorships Held
Outside Fund Complex by
Trustee(3) | |
Candace L. Straight (1947) | | Trustee since inception | | Private investor and consultant specializing in the insurance industry; formerly, Advisory Director, Securitas Capital LLC (a global private equity investment firm dedicated to making investments in the insurance sector), 1998 to December 2003. | | | 54 | | | Public Member, Board of Governors and Board of Trustees, Rutgers University, since 2011; Director, Montpelier Re Holdings Ltd. (reinsurance company), since 2006; formerly, Director, National Atlantic Holdings Corporation (property and casualty insurance company), 2004 to 2008; formerly, Director, The Proformance Insurance Company (property and casualty insurance company), 2004 to 2008; formerly, Director, Providence Washington Insurance Company (property and casualty insurance company), 1998 to 2006; formerly, Director, Summit Global Partners (insurance brokerage firm), 2000 to 2005. | |
Peter P. Trapp (1944) | | Trustee since inception | | Retired; formerly, Regional Manager for Mid-Southern Region, Ford Motor Credit Company, September 1997 to 2007; formerly, President, Ford Life Insurance Company, April 1995 to August 1997. | | | 54 | | | None. | |
35
Name, (Year of Birth),
and Address(1) | | Position(s)
and Length of
Time Served(2) | | Principal Occupation(s)(3) | | Number of
Funds in
Fund Complex
Overseen by
Trustee | | Other Directorships Held
Outside Fund Complex by
Trustee(3) | |
Trustees who are "Interested Persons" | |
Joseph V. Amato* (1962) | | Trustee since 2009 | | President and Director, Neuberger Berman Group LLC, since 2009; President and Chief Executive Officer, Neuberger and Neuberger Berman Holdings LLC (including its predecessor, Neuberger Berman Inc.), since 2007; Chief Investment Officer (Equities) and Managing Director, Management, since 2009; Managing Director, NBFI, since 2007; Board member of NBFI since 2006; formerly, Global Head of Asset Management of Lehman Brothers Holdings Inc.'s ("LBHI") Investment Management Division, 2006 to 2009; formerly, member of LBHI's Investment Management Division's Executive Management Committee, 2006 to 2009; formerly, Managing Director, Lehman Brothers Inc. ("LBI"), 2006 to 2008; formerly, Chief Recruiting and Development Officer, LBI, 2005 to 2006; formerly, Global Head of LBI's Equity Sales and a Member of its Equities Division Executive Committee, 2003 to 2005. | | | 54 | | | Member of Board of Advisors, McDonough School of Business, Georgetown University, since 2001; Member of New York City Board of Advisors, Teach for America, since 2005; Trustee, Montclair Kimberley Academy (private school), since 2007; Member of Board of Regents, Georgetown University, since 2013. | |
36
Name, (Year of Birth),
and Address(1) | | Position(s)
and Length of
Time Served(2) | | Principal Occupation(s)(3) | | Number of
Funds in
Fund Complex
Overseen by
Trustee | | Other Directorships Held
Outside Fund Complex by
Trustee(3) | |
Robert Conti* (1956) | | Chief Executive Officer, President and Trustee since 2008; prior thereto, Executive Vice President in 2008 and Vice President from inception to 2008 | | Managing Director, Neuberger, since 2007; Managing Director, NBFI, since 2009; formerly, Senior Vice President, Neuberger, 2003 to 2006; formerly, Vice President, Neuberger, 1999 to 2003; President and Chief Executive Officer, Management, since 2008; formerly, Senior Vice President, Management, 2000 to 2008. | | | 54 | | | Director, Staten Island Mental Health Society, since 1994; formerly, Chairman of the Board, Staten Island Mental Health Society, 2008 to 2011. | |
(1) The business address of each listed person is 605 Third Avenue, New York, New York 10158.
(2) Pursuant to the Trust's Trust Instrument, each of these Fund Trustees shall hold office for life or until his or her successor is elected or the Trust terminates; except that (a) any Fund Trustee may resign by delivering a written resignation; (b) any Fund Trustee may be removed with or without cause at any time by a written instrument signed by at least two-thirds of the other Fund Trustees; (c) any Fund Trustee who requests to be retired, or who has become unable to serve, may be retired by a written instrument signed by a majority of the other Fund Trustees; and (d) any Fund Trustee may be removed at any shareholder meeting by a vote of at least two-thirds of the outstanding shares.
(3) Except as otherwise indicated, each individual has held the positions shown for at least the last five years.
* Indicates a Trustee who is an "interested person" within the meaning of the 1940 Act. Mr. Amato and Mr. Conti are interested persons of the Trust because each is an officer of Management, Neuberger and/or their affiliates.
37
Information about the Officers of the Trust
Name, (Year of Birth),
and Address(1) | | Position(s)
and Length of
Time Served(2) | | Principal Occupation(s)(3) | |
Andrew B. Allard (1961) | | Chief Legal Officer since 2013 (only for purposes of sections 307 and 406 of the Sarbanes-Oxley Act of 2002) and Anti-Money Laundering Compliance Officer since 2002 | | General Counsel and Senior Vice President, Management, since 2013; Senior Vice President, Neuberger, since 2006 and Employee since 1999; Deputy General Counsel, Neuberger, since 2004; formerly, Vice President, Neuberger, 2000 to 2005; formerly, Employee, Management, 1994 to 1999; Chief Legal Officer since 2013 (only for purposes of sections 307 and 406 of the Sarbanes-Oxley Act of 2002) ten registered investment companies for which Management acts as investment manager and administrator (ten since 2013); Anti-Money Laundering Compliance Officer, ten registered investment companies for which Management acts as investment manager and administrator (six since 2002, one since 2003, one since 2005, one since 2006 and one since 2013). | |
Claudia A. Brandon (1956) | | Executive Vice President since 2008 and Secretary since inception | | Senior Vice President, Neuberger, since 2007 and Employee since 1999; Senior Vice President, Management, since 2008 and Assistant Secretary since 2004; formerly, Vice President, Neuberger, 2002 to 2006; formerly, Vice President-Mutual Fund Board Relations, Management, 2000 to 2008; formerly, Vice President, Management, 1986 to 1999 and Employee 1984 to 1999; Executive Vice President, ten registered investment companies for which Management acts as investment manager and administrator (nine since 2008 and one since 2013); Secretary, ten registered investment companies for which Management acts as investment manager and administrator (three since 1985, three since 2002, one since 2003, one since 2005, one since 2006 and one since 2013). | |
Agnes Diaz (1971) | | Vice President since 2013 | | Vice President, ten registered investment companies for which Management acts as investment manager and administrator (ten since 2013). | |
Anthony DiBernardo (1979) | | Assistant Treasurer since 2011 | | Vice President, Neuberger, since 2009; Employee, Management, since 2003; Assistant Treasurer, ten registered investment companies for which Management acts as investment manager and administrator (nine since 2011 and one since 2013). | |
Sheila R. James (1965) | | Assistant Secretary since inception | | Vice President, Neuberger, since 2008 and Employee since 1999; formerly, Assistant Vice President, Neuberger, 2007; formerly, Employee, Management, 1991 to 1999; Assistant Secretary, ten registered investment companies for which Management acts as investment manager and administrator (six since 2002, one since 2003, one since 2005, one since 2006 and one since 2013). | |
Brian Kerrane (1969) | | Vice President since 2008 | | Senior Vice President, Neuberger, since 2008 and Employee since 1991; formerly, Vice President, Neuberger, 2002 to 2008; Vice President, ten registered investment companies for which Management acts as investment manager and administrator (nine since 2008 and one since 2013). | |
38
Name, (Year of Birth),
and Address(1) | | Position(s)
Time Served(2) | | Principal Occupation(s)(3)
and Length of | |
Kevin Lyons (1955) | | Assistant Secretary since inception | | Assistant Vice President, Neuberger, since 2008 and Employee since 1999; formerly, Employee, Management, 1993 to 1999; Assistant Secretary, ten registered investment companies for which Management acts as investment manager and administrator (seven since 2003, one since 2005, one since 2006 and one since 2013). | |
Owen F. McEntee, Jr. (1961) | | Vice President since 2008 | | Vice President, Neuberger, since 2006; Employee, Management, since 1992; Vice President, ten registered investment companies for which Management acts as investment manager and administrator (nine since 2008 and one since 2013). | |
John M. McGovern (1970) | | Treasurer and Principal Financial and Accounting Officer since inception | | Senior Vice President, Neuberger, since 2007; formerly, Vice President, Neuberger, 2004 to 2006; Employee, Management, since 1993; Treasurer and Principal Financial and Accounting Officer, ten registered investment companies for which Management acts as investment manager and administrator (eight since 2005, one since 2006 and one since 2013); formerly, Assistant Treasurer, eight registered investment companies for which Management acts as investment manager and administrator, 2002 to 2005. | |
Frank Rosato (1971) | | Assistant Treasurer since inception | | Vice President, Neuberger, since 2006; Employee, Management, since 1995; Assistant Treasurer, ten registered investment companies for which Management acts as investment manager and administrator (eight since 2005, one since 2006 and one since 2013). | |
Neil S. Siegel (1967) | | Vice President since 2008 | | Managing Director, Management, since 2008; Managing Director, Neuberger, since 2006; Managing Director, NBFI, since 2011; formerly, Senior Vice President, Neuberger, 2004 to 2006; Vice President, ten registered investment companies for which Management acts as investment manager and administrator (nine since 2008 and one since 2013). | |
Chamaine Williams (1971) | | Chief Compliance Officer since inception | | Senior Vice President, Neuberger, since 2007; Chief Compliance Officer, Management, since 2006; Chief Compliance Officer, ten registered investment companies for which Management acts as investment manager and administrator (eight since 2005, one since 2006 and one since 2013); formerly, Senior Vice President, LBI, 2007 to 2008; formerly, Vice President, LBI, 2003 to 2006; formerly, Chief Compliance Officer, Lehman Brothers Asset Management Inc., 2003 to 2007; formerly, Chief Compliance Officer, Lehman Brothers Alternative Investment Management LLC, 2003 to 2007. | |
(1) The business address of each listed person is 605 Third Avenue, New York, New York 10158.
(2) Pursuant to the By-Laws of the Trust, each officer elected by the Fund Trustees shall hold office until his or her successor shall have been elected and qualified or until his or her earlier death, inability to serve, or resignation. Officers serve at the pleasure of the Fund Trustees and may be removed at any time with or without cause.
(3) Except as otherwise indicated, each individual has held the positions shown for at least the last five years.
39
Proxy Voting Policies and Procedures
A description of the policies and procedures that the Trust uses to determine how to vote proxies relating to portfolio securities is available, without charge, by calling 800-877-9700 (toll-free) and on the website of the Securities and Exchange Commission at www.sec.gov. Information regarding how the Trust voted proxies relating to portfolio securities during the most recent 12-month period ended June 30 is also available, without charge, by calling 800-877-9700 (toll-free), on the website of the Securities and Exchange Commission at www.sec.gov, and on Management's website at www.nb.com.
Quarterly Portfolio Schedule
The Trust files a complete schedule of portfolio holdings for the Fund with the Securities and Exchange Commission for the first and third quarters of the fiscal year on Form N-Q. The Trust's Forms N-Q are available on the Securities and Exchange Commission's website at www.sec.gov and may be reviewed and copied at the Securities and Exchange Commission's Public Reference Room in Washington, DC. Information on the operation of the Public Reference Room may be obtained by calling 800-SEC-0330. The information on Form N-Q is available upon request, without charge, by calling 800-877-9700 (toll-free).
40
Board Consideration of the Management and Sub-Advisory Agreements
On an annual basis, the Board of Trustees ("Board") of Neuberger Berman Alternative Funds ("Trust"), including the Trustees who are not "interested persons" of Neuberger Berman Management LLC ("Management") (including its affiliates) or the Trust ("Independent Fund Trustees"), considers whether to continue the Management and Sub- Advisory Agreements ("Agreements") with respect to Neuberger Berman Risk Balanced Commodity Strategy Fund (the "Fund"). At a meeting held on October 22-23, 2013, the Board, including the Independent Fund Trustees, approved the continuation of the Agreements for the Fund.
In evaluating the Agreements, the Board, including the Independent Fund Trustees, reviewed extensive materials provided by Management in response to questions submitted by the Board and counsel for the Independent Fund Trustees, and met with senior representatives of Management regarding their personnel, operations and financial conditions as they relate to the Fund. The annual contract review extends over at least two regular meetings of the Board to ensure that Management and Neuberger Berman Fixed Income LLC ("NBFI") have time to respond to any questions the Independent Fund Trustees may have on their initial review of the materials and that the Independent Fund Trustees have time to consider those responses.
In connection with its deliberations, the Board also considered the broad range of information relevant to the annual contract review that is provided to the Board (including its various standing committees) at meetings throughout the year, including investment performance reports and related portfolio information for the Fund, as well as periodic reports on, among other matters, pricing and valuation; brokerage and execution; and compliance, shareholder and other services provided by Management, NBFI and their affiliates. To assist the Board in its deliberations regarding the annual contract review, the Board has established a Contract Review Committee comprised of Independent Fund Trustees, as well as other committees that focus throughout the year on specific areas relevant to the annual contract review, such as Fund performance or compliance matters.
Throughout the process, the Independent Fund Trustees were advised by counsel that is experienced in Investment Company Act of 1940 matters and that is independent of Management. The Independent Fund Trustees received from independent counsel a memorandum discussing the legal standards for their consideration of the proposed continuation of the Agreements. During the course of the year and during their deliberations regarding the annual contract review, the Independent Fund Trustees met with such counsel separately from representatives of Management and NBFI.
In connection with its approval of the continuation of the Agreements, the Board evaluated the terms of the Agreements, the overall fairness of the Agreements to the Fund and whether the Agreements were in the best interests of the Fund and its shareholders. The Board considered all factors it deemed relevant with respect to the Fund, including the following factors: (1) the nature, extent, and quality of the services to be provided by Management and NBFI; (2) the investment performance of the Fund compared to a relevant market index and a peer group of investment companies; (3) the costs of the services provided; (4) the extent to which economies of scale might be realized as the Fund grows; and (5) whether fee levels reflect any such potential economies of scale for the benefit of investors in the Fund. While each Trustee may have attributed different weights to the various factors, the Board's determination to approve the continuation of the Agreements was based on a comprehensive consideration of all information provided to the Board throughout the year and specifically in connection with the annual contract review. The Board members did not identify any particular information or factor that was all-important or controlling. The Board focused on the overall costs and benefits of the Agreements relating to the Fund and, through the Fund, its shareholders.
With respect to the nature, extent and quality of the services provided, the Board considered the investment philosophy and decision-making processes of Management and NBFI, and the qualifications, experience and capabilities of and the resources available to the portfolio management personnel of Management and NBFI who perform services for the Fund. The Board noted that Management also provides certain administrative services, including fund accounting and compliance oversight. The Board also considered Management's and NBFI's policies and practices regarding brokerage and allocation of portfolio transactions and reviewed the quality of the execution services that Management had provided. The Board also reviewed whether Management or NBFI used brokers to execute Fund transactions that provide research and other services to Management or NBFI and the types of benefits potentially derived from such services by Management, NBFI, the Fund and other clients of Management and NBFI. The Board also considered that Management's responsibilities include daily management of investment, operational, enterprise, legal, regulatory and compliance risks as they relate to the
41
Fund, and considered information regarding Management's process for managing risk. In addition, the Board noted the positive compliance history of Management and NBFI, as each firm has been free of significant reported compliance problems. The Board also considered the general structure of the portfolio manager compensation program and whether this structure provides appropriate incentives to act in the best interest of the Fund. The Board also considered the manner in which Management addressed various non-routine matters that arose during the year, some of them a result of developments in the broader fund industry or the regulations governing it. In addition, the Board considered actions taken by Management and NBFI in response to recent market conditions, including actions taken in response to changes in market volatility, and considered the overall performance of Management and NBFI in this context.
With respect to investment performance, when the Board first approved the Fund it considered information regarding the performance of a separate account managed by a Management affiliate with similar investment objectives, policies and strategies as the Fund relative to a relevant market index (or benchmark). In addition, throughout the period the Board considered information regarding the Fund's recent performance. The Board also reviewed performance in relation to certain measures of the degree of investment risk undertaken by the portfolio managers. The Board noted that performance, especially short-term performance, is only one of the factors that it deems relevant to its consideration of the Fund's Agreements and that, after considering all relevant factors, it may be appropriate to approve the continuation of the Agreements notwithstanding the Fund's recent performance.
With respect to the overall fairness of the Agreements, when the Board first approved the Fund the Board considered the fee structure for the Fund under the Agreements as compared to a peer group of comparable funds, and any fall-out benefits likely to accrue to Management or NBFI or their affiliates from their relationship with the Fund. The Board also considered the profitability of Management and its affiliates from their association with the Fund; however, because the Fund has been in operation for a relatively short period of time, there was no useful information available regarding Management's profitability.
Prior to the Fund's inception, the Board reviewed a comparison of the Fund's management fee and overall expense ratio to a peer group of broadly comparable funds. The Board noted that the comparative management fee analysis includes in the Fund's management fee the separate administrative fee paid to Management, but it was not clear whether this was the case for all funds in the peer group. The Board considered the mean and median of management fees and expense ratios of the peer group. The Board also considered whether there were other funds that were advised or sub-advised by Management or its affiliates or separate accounts managed by Management or its affiliates with investment objectives, policies and strategies that were similar to the Fund. The Board compared the fees charged to the Fund to the fees charged to any such funds and/or separate accounts. The Board considered the appropriateness and reasonableness of any differences between the fees charged to the Fund and any such funds and/or separate accounts, including any breakpoints, and determined that any differences in fees and fee structures were consistent with the management and other services provided. The Board considered Management's willingness to waive advisory fees to the extent that other entities provide services that overlap with those called for under the Agreement. In addition, the Board considered the contractual limits on the expenses undertaken by Management for the Fund. The Board also evaluated any apparent or anticipated economies of scale in relation to the services Management provides to the Fund. The Board considered whether the Fund's fee structure provides for a reduction of payments resulting from the use of breakpoints and whether those breakpoints are set at appropriate asset levels.
Conclusions
In approving the Agreements, the Board concluded that the terms of each Agreement are fair and reasonable to the Fund and that approval of the Agreements is in the best interests of the Fund and its shareholders. In reaching this determination, the Board considered that Management and NBFI could be expected to provide a high level of service to the Fund; that the Fund's fee structure appeared to the Board to be reasonable given the nature, extent and quality of services provided; and that the benefits accruing to Management and its affiliates by virtue of their relationship to the Fund were reasonable in light of the benefits accruing to the Fund. The Board's conclusions may be based in part on its consideration of materials prepared in connection with the Agreements in prior years and on the Board's ongoing regular review of Fund performance and operations throughout the year, in addition to material prepared specifically for the most recent annual review of the Agreements.
42
This page has been left blank intentionally
43

Neuberger Berman Management LLC
605 Third Avenue 2nd Floor
New York, NY 10158–0180
Shareholder Services
800.877.9700
Institutional Services
800.366.6264
www.nb.com
Statistics and projections in this report are derived from sources deemed to be reliable but cannot be regarded as a representation of future results of the Fund. This report is prepared for the general information of shareholders and is not an offer of shares of the Fund. Shares are sold only through the currently effective prospectus, which must precede or accompany this report.
 M0258 12/13

Neuberger Berman
Alternative and Multi-Asset Class Funds
Institutional Class Shares
Class A Shares
Class C Shares
Absolute Return Multi-Manager Fund
Annual Report
October 31, 2013
Contents
PRESIDENT'S LETTER | | | 1 | | |
PORTFOLIO COMMENTARY | | | 2 | | |
FUND EXPENSE INFORMATION | | | 8 | | |
SCHEDULE OF INVESTMENTS/TOP TEN
EQUITY HOLDINGS | | | 10 | | |
FINANCIAL STATEMENTS | | | 32 | | |
FINANCIAL HIGHLIGHTS/PER SHARE DATA | | | 53 | | |
Report of Independent Registered Public Accounting Firm | | | 56 | | |
Directory | | | 57 | | |
Trustees and Officers | | | 58 | | |
Proxy Voting Policies and Procedures | | | 66 | | |
Quarterly Portfolio Schedule | | | 66 | | |
Notice to Shareholders | | | 66 | | |
Board Consideration of the Management and
Sub-Advisory Agreements | | | 67 | | |
The "Neuberger Berman" name and logo are registered service marks of Neuberger Berman Group LLC. "Neuberger Berman Management LLC" and the individual Fund name in this piece are either service marks or registered service marks of Neuberger Berman Management LLC. ©2013 Neuberger Berman Management LLC. All rights reserved.
Dear Shareholder,
I am pleased to present this annual shareholder report for Neuberger Berman Absolute Return Multi-Manager Fund. The report includes a portfolio commentary, a listing of the Fund's investments and its audited financial statements for the 12 months ended October 31, 2013. The Fund seeks long-term capital appreciation with an emphasis on absolute returns by investing in a diversified portfolio of assets subadvised by seasoned hedge fund managers across multiple strategies that target low volatility and low beta to broader markets.
The global financial markets generated mixed results during the period. The markets were volatile at times due to a number of factors, including global economic data, expectations regarding future central bank monetary policy, geopolitical issues, uncertainties surrounding the U.S. fiscal cliff and sequestration, and the partial government shutdown. Despite several flights to quality, risk assets generated strong results, with U.S. equities reaching several new record highs during the period. In contrast, fixed income securities were generally weak amid a rising interest rate environment. Hedge fund managers, as reflected by the HFRX Absolute Return Index, returned 3.99% during the reporting period.
Looking ahead, we anticipate the Fund's subadvisers will continue to actively manage their respective portfolios and identify what they believe to be attractive investment opportunities. In particular, generally low stock correlations could be a positive environment for our long/short equity subadvisers. Still, given the market's strong returns since the credit crisis, the subadvisers remain defensively positioned to hedge against a potential market correction. We see a positive backdrop for our event driven subadvisers, given what we feel will be continued robust merger and acquisition, spinoff, divestiture and share buyback activity. Finally, our credit long/short subadviser continues to emphasize bank loans and refinancing opportunities, while our asset-backed security subadviser is identifying what it believes are attractive opportunities in both residential and commercial mortgage-backed securities.
Thank you for your continued support and trust. We look forward to continue serving your investment needs in the years to come.
Sincerely,

ROBERT CONTI
PRESIDENT AND CEO
NEUBERGER BERMAN MUTUAL FUNDS
1
Absolute Return Multi-Manager Fund Commentary (Unaudited)
Neuberger Berman Absolute Return Multi-Manager Fund Institutional Class generated a 9.19% total return for the 12 months ended October 31, 2013. During the period, the Fund outperformed its benchmark, the HFRX Absolute Return Index, which posted a 3.99% return. (Performance for all share classes is provided in the table following this letter.)
The financial markets were volatile at times during the reporting period. However, the equity markets were highly resilient, with the S&P 500 and other broad indices reaching all-time highs. In contrast, the overall fixed income market generated weak results. Interest rates moved higher given expectations that the Federal Reserve (the Fed) would start tapering its asset purchases sooner than previously expected. Two notable bright spots within the fixed income market were high yield bonds and floating rate bank loans, as they benefited from overall robust demand and low defaults. All told, the S&P 500 Index returned 27.18% and the Barclays U.S. Aggregate Bond Index returned –1.08% during the 12-month reporting period.
All of the portfolio's subadvisers generated positive absolute returns for the period. Long/short equity was the most material positive contributor, with all of the Fund's subadvisers in the space posting positive performance. In particular, long and short positions in the Health Care sector were beneficial, as the subadvisers took long positions in companies that they felt would benefit from the Affordable Care Act, while shorting companies that they believed would be negatively impacted. On the downside, a number of short positions across sectors detracted from performance amid the market's sharp rally.
Event driven equity strategies were the next most material positive contributor for the period, with all of the portfolio's subadvisers in this category generating positive performance. They continued to benefit from a robust environment for spinoffs, divestitures and share buybacks. On the downside, short positions that were part of spread trades and shorts that acted as broader market/sector hedges drove the majority of event driven losses as markets rallied. One new event driven subadviser was added during the reporting period. We feel this will enhance the portfolio's array of investment as, unlike the other event driven subadvisers, the new subadviser emphasizes small- and mid-cap companies.
The Fund's credit long/short subadviser performed well during the period, benefiting from refinancing opportunities. The subadviser also emphasized more senior parts of the capitalization structure, such as floating rate bank loans, which act as a partial hedge against interest rate volatility. The Fund's asset-backed security subadviser generated positive results as well by favoring residential mortgage-backed securities over commercial mortgage-backed securities.
During the reporting period, the subadvisers' use of futures, forward foreign currency contracts options and equity and total return swaps did not meaningfully impact the Fund's performance.
With the U.S. government shutdown and debt ceiling debate behind us and no material geopolitical or economic events anticipated for the near term, at least in our view, we think correlations between stocks will remain low. This, in turn, could present a favorable environment for fundamental stock pickers in our view. That being said, with equity markets at historic highs, we believe our subadvisers remain defensively positioned, with relatively low gross and net exposures and robust short books.
The increase of deal announcements on a year-over-year basis during the reporting period was encouraging for event driven strategies. Corporate cash balances remain high and the market continues to reward companies involved in corporate activity. Against this backdrop, we anticipate seeing a robust environment of mergers and acquisitions, spinoffs, divestitures and share buybacks.
2
As the eventual Fed tapering continues to loom, our credit long/short subadviser remains overweighted in shorter duration securities, including floating rate bank loans. The subadviser also continues to focus on refinancing opportunities. Since the Fed's latest decision to delay tapering, our asset-backed security subadviser believes it is seeing more positive market dynamics for both residential and commercial mortgage-backed securities.
Sincerely,


ERIC WEINSTEIN, JEFF MAJIT, FRED INGHAM, DAVID KUPPERMAN AND IAN HAAS
PORTFOLIO CO-MANAGERS
Information about the principal risks of investing in the Fund is set forth in the prospectus and statement of additional information.
The portfolio composition, industries and holdings of the Fund are subject to change.
The opinions expressed are those of the Fund's portfolio managers. The opinions are as of the date of this report and are subject to change without notice.
3
Absolute Return Multi-Manager Fund (Unaudited)
TICKER SYMBOLS
Institutional Class | | NABIX | |
Class A | | NABAX | |
Class C | | NABCX | |
PORTFOLIO BY TYPE OF SECURITY
(as a % of Total Net Assets)
| | | Long | | Short | |
Asset-Backed Securities | | | 0.4 | % | | | — | % | |
Bank Loan Obligations | | | 8.1 | | | | — | | |
Common Stocks | | | 47.9 | | | | (10.7 | ) | |
Convertible Bonds | | | 0.0 | | | | — | | |
Corporate Debt Securities | | | 1.1 | | | | (0.3 | ) | |
Exchange Traded Funds | | | 0.5 | | | | (8.7 | ) | |
Investment Companies | | | 0.0 | | | | — | | |
Mortgage-Backed Securities | | | 2.4 | | | | — | | |
Preferred Stocks | | | 0.5 | | | | — | | |
Purchased Options | | | 0.4 | | | | — | | |
Rights | | | 0.0 | | | | — | | |
U.S. Treasury Securities | | | 0.0 | | | | (0.1 | ) | |
Warrants | | | 0.0 | | | | — | | |
Short-Term Investments | | | 39.9 | | | | — | | |
Cash, receivables and other
assets, less liabilities | | | 18.6 | | | | — | | |
Total | | | 119.8 | % | | | (19.8 | )% | |
PERFORMANCE HIGHLIGHTS
| | | Inception | | Average Annual Total Return
Ended 10/31/2013 | |
| | | Date | | 1 Year | | Life of Fund | |
At NAV | |
Institutional Class | | 05/15/2012 | | | 9.19 | % | | | 6.18 | % | |
Class A | | 05/15/2012 | | | 8.70 | % | | | 5.79 | % | |
Class C | | 05/15/2012 | | | 8.03 | % | | | 5.05 | % | |
With Sales Charge | |
Class A | | | | | 2.45 | % | | | 1.60 | % | |
Class C | | | | | 7.03 | % | | | 5.05 | % | |
Index | |
| HFRX Absolute Return Index1,2 | | | | | 3.99 | % | | | 2.47 | % | |
| S&P 500 Index1,2 | | | | | 27.18 | % | | | 23.05 | % | |
| Barclays U.S. Aggregate Bond Index1,2 | | | | | –1.08 | % | | | 0.80 | % | |
The performance data quoted represent past performance and do not indicate future results. Current performance may be lower or higher than the performance data quoted. For more current performance data, please visit www.nb.com/performance.
The results shown in the table reflect the reinvestment of income dividends and other distributions, if any. The results do not reflect the effect of taxes a shareholder would pay on Fund distributions or on the redemption of Fund shares.
The investment return and principal value of an investment will fluctuate and shares, when redeemed, may be worth more or less than their original cost.
Returns would have been lower if Neuberger Berman Management LLC ("Management") had not reimbursed certain expenses and/or waived a portion of the investment management fees during certain of the periods shown. Repayment by a class (of expenses previously reimbursed and/or fees previously waived by Management) will decrease the class's returns. Please see Note B in the Notes to Financial Statements for specific information regarding expense reimbursement and/or fee waiver arrangements.
As stated in the Fund's most recent prospectus, the total annual operating expense ratios for fiscal year 2012 were 5.10%, 5.90% and 10.51% for Institutional Class, Class A and Class C shares, respectively (before expense reimbursements and/or fee waivers, if any). The expense ratios were 2.34%, 2.74% and 3.46% for Institutional Class, Class A and Class C shares, respectively, after expense reimbursements and/or fee waivers.
Returns shown with a sales charge reflect the deduction of the current maximum initial sales charge of 5.75% for Class A shares and the applicable contingent deferred sales charges (CDSC) for Class C shares. The maximum CDSC for Class C shares is 1%, which is reduced to 0% after 1 year. The performance of the Fund's share classes will differ primarily due to different sales charge structures and class expenses. Please see the prospectus for more information about sales charge structures, if any, and class expenses for your share class.
4
Absolute Return Multi-Manager Fund (Unaudited)
COMPARISON OF A $1,000,000 INVESTMENT
(000's omitted)
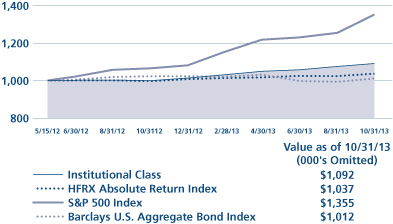
This graph shows the change in value of a hypothetical $1,000,000 investment in the Fund over the past 10 fiscal years, or since the Fund's inception if it has not operated for 10 years. The graph is based on the Institutional Class shares only; the performance of the Fund's share classes will differ primarily due to different sales charge structures and class expenses (see Performance Highlights chart on previous page). The result is compared with benchmarks, which include a broad-based market index and may include a more narrowly based index. Market indices have not been reduced to reflect any of the fees and costs of investing. The results shown in the graph reflect the reinvestment of income dividends and other distributions, if any. The results do not reflect the effect of taxes a shareholder would pay on Fund distributions or on the redemption of Fund shares. Results represent past performance and do not indicate future results.
5
1 Please see "Glossary of Indices" on page 7 for a description of indices. Please note that the S&P 500 and the Barclays U.S. Aggregate Bond indices do not take into account any fees, expenses or tax consequences of investing in the individual securities that they track, and that individuals cannot invest directly in any index. The HFRX Index does take into account fees and expenses of investing since it is based on the underlying hedge funds' net returns. Data about the performance of an index is prepared or obtained by Neuberger Berman Management LLC ("Management") and reflects the reinvestment of income dividends and other distributions, if any. The Fund may invest in securities not included in a described index and may not invest in all securities included in a described index.
2 The date used to calculate Life of Fund performance for the index is the inception date of the oldest share class.
For more complete information on any of the Neuberger Berman Alternative and Multi-Asset Class Funds, call Management at (800) 877-9700, or visit our website at www.nb.com.
6
HFRX Absolute Return Index: | | Designed to be representative of the overall composition of the hedge fund universe. It is comprised of all eligible hedge fund strategies; including but not limited to convertible arbitrage, distressed securities, equity hedge, equity market neutral, event driven, macro, merger arbitrage, and relative value arbitrage. As a component of the optimization process, the index selects constituents which characteristically exhibit lower volatilities and lower correlations to standard directional benchmarks of equity market and hedge fund industry performance. Fund weights are determined by the optimization process. Constituent funds are selected from an eligible pool of the more than 6,800 funds that report performance to the Hedge Fund Research (HFR) database on a voluntary basis, and rebalanced quarterly. Funds included in the index must meet all of the following criteria: report monthly returns net of all fees; be denominated in USD; be active and accepting new investments; have a minimum 24 months track record; and the Fund's manager must have at least $50 million in assets under management. The index is available daily, with finalized month-end performance available two to three business days after the last business day of the month. | |
S&P 500 Index: | | Widely regarded as the standard for measuring the performance of large-cap stocks traded on U.S. markets and includes a representative sample of leading companies in leading industries. | |
Barclays U.S. Aggregate Bond Index: | | An unmanaged index that represents the U.S. domestic investment grade bond market. It is comprised of the Barclays Government/Corporate Bond Index, Mortgage-Backed Securities Index, and Asset-Backed Securities Index, including securities that are of investment-grade quality or better, have at least one year to maturity, and have an outstanding par value of at least $250 million. Asset backed securities must have at least $500 million deal size and $25 million tranche size. For commercial mortgage-backed securities, the original transaction must have a minimum deal size of $500 million, and a minimum tranche size of $25 million; the current outstanding transaction size must be at least $300 million to remain in the index. | |
7
Information About Your Fund's Expenses (Unaudited)
As a Fund shareholder, you incur two types of costs: (1) transaction costs, including sales charges (loads) on purchase payments or redemption proceeds (if applicable); and (2) ongoing costs, including management fees; distribution and/or service (12b-1) fees (if applicable); and other Fund expenses. This example is intended to help you understand your ongoing costs (in dollars) of investing in the Fund and compare these costs with the ongoing costs of investing in other mutual funds.
This table is designed to provide information regarding costs related to your investments. The following examples are based on an investment of $1,000 made at the beginning of the six months ended October 31, 2013 and held for the entire period. The table illustrates the Fund's costs in two ways:
Actual Expenses and Performance: | | The first section of the table provides information about actual account values and actual expenses in dollars, based on the Fund's actual performance during the period. You may use the information in this line, together with the amount you invested, to estimate the expenses you paid over the period. Simply divide your account value by $1,000 (for example, an $8,600 account value divided by $1,000 = 8.6), then multiply the result by the number in the first section of the table under the heading entitled "Expenses Paid During the Period" to estimate the expenses you paid over the period. | |
Hypothetical Example for
Comparison Purposes: | | The second section of the table provides information about hypothetical account values and hypothetical expenses based on the Fund's actual expense ratio and an assumed rate of return at 5% per year before expenses. This return is not the Fund's actual return. The hypothetical account values and expenses may not be used to estimate the actual ending account balance or expenses you paid for the period. You may use this information to compare the ongoing costs of investing in this Fund versus other funds. To do so, compare the expenses shown in this 5% hypothetical example with the 5% hypothetical examples that appear in the shareholder reports of other funds. | |
Please note that the expenses in the table are meant to highlight your ongoing costs only and do not include any transaction costs, such as sales charges (loads) (if applicable). Therefore, the information under the heading "Hypothetical (5% annual return before expenses)" is useful in comparing ongoing costs only, and will not help you determine the relative total costs of owning different funds. In addition, if these transaction costs were included, your costs would have been higher.
8
Expense Information as of 10/31/13 (Unaudited)
Neuberger Berman Alternative Funds | |
| | | ACTUAL | | HYPOTHETICAL(5% ANNUAL RETURN BEFORE EXPENSES)(2) | |
| | | Beginning
Account
Value
5/1/13 | | Ending
Account
Value
10/31/13 | | Expenses Paid
During the
Period(1)
5/1/13 -
10/31/13 | | Expense
Ratio | | Beginning
Account
Value
5/1/13 | | Ending
Account
Value
10/31/13 | | Expenses Paid
During the
Period(1)
5/1/13 -
10/31/13 | | Expense
Ratio | |
Neuberger Berman Absolute Return Multi-Manager Fund | |
Institutional Class | | $ | 1,000.00 | | | $ | 1,040.20 | | | $ | 11.52 | | | | 2.24 | % | | $ | 1,000.00 | | | $ | 1,013.91 | | | $ | 11.37 | | | | 2.24 | % | |
Class A | | $ | 1,000.00 | | | $ | 1,038.40 | | | $ | 13.41 | | | | 2.61 | % | | $ | 1,000.00 | | | $ | 1,012.05 | | | $ | 13.24 | | | | 2.61 | % | |
Class C | | $ | 1,000.00 | | | $ | 1,034.80 | | | $ | 17.28 | | | | 3.37 | % | | $ | 1,000.00 | | | $ | 1,008.22 | | | $ | 17.06 | | | | 3.37 | % | |
(1) For each class, expenses are equal to the annualized expense ratio for the class, multiplied by the average account value over the period, multiplied by 184/365 (to reflect the one-half year period shown).
(2) Hypothetical 5% annual return before expenses is calculated by multiplying the number of days in the most recent period divided by 365.
9
Schedule of Investments Absolute Return Multi-Manager Fund
TOP TEN EQUITY HOLDINGS LONG POSITIONS (as a % of Net Assets)
| | | | | Country | | Industry | | | |
| | 1 | | | Life Technologies Corp. | | United States | | Life Sciences Tools & Services | | | 1.3 | % | |
| | 2 | | | NYSE Euronext | | United States | | Diversified Financial Services | | | 1.1 | % | |
| | 3 | | | CBS Corp. Class B | | United States | | Media | | | 1.1 | % | |
| | 4 | | | Liberty Global PLC Series C | | United Kingdom | | Media | | | 0.9 | % | |
| | 5 | | | Teradata Corp. | | United States | | IT Services | | | 0.8 | % | |
| | 6 | | | Vodafone Group PLC ADR | | United Kingdom | | Wireless Telecommunication Services | | | 0.7 | % | |
| | 7 | | | Lender Processing Services, Inc. | | United States | | IT Services | | | 0.7 | % | |
| | 8 | | | Air Products & Chemicals, Inc. | | United States | | Chemicals | | | 0.7 | % | |
| | 9 | | | The Dun & Bradstreet Corp. | | United States | | Professional Services | | | 0.7 | % | |
| | 10 | | | Hartford Financial Services Group, Inc. | | United States | | Insurance | | | 0.7 | % | |
TOP TEN EQUITY HOLDINGS SHORT POSITIONS (as a % of Net Assets)
| | | | | Country | | Industry | | | |
| | 1 | | | IntercontinentalExchange, Inc. | | United States | | Diversified Financial Services | | | (0.9 | )% | |
| | 2 | | | M&T Bank Corp. | | United States | | Commercial Banks | | | (0.6 | )% | |
| | 3 | | | Liberty Global PLC Class A | | United Kingdom | | Media | | | (0.4 | )% | |
| | 4 | | | Perrigo Co. | | United States | | Pharmaceuticals | | | (0.3 | )% | |
| | 5 | | | Time Warner, Inc. | | United States | | Media | | | (0.3 | )% | |
| | 6 | | | Pacira Pharmaceuticals, Inc. | | United States | | Pharmaceuticals | | | (0.2 | )% | |
| | 7 | | | Marine Harvest ASA | | Norway | | Food Products | | | (0.2 | )% | |
| | 8 | | | Lennar Corp. Class A | | United States | | Household Durables | | | (0.2 | )% | |
| | 9 | | | HSN, Inc. | | United States | | Internet & Catalog Retail | | | (0.2 | )% | |
| | 10 | | | Verizon Communications, Inc. | | United States | | Diversified Telecommunication Services | | | (0.2 | )% | |
| | | Number
of Shares | | Value† | |
Long Positions (101.2%) | |
Common Stocks (47.9%) | |
Aerospace & Defense (0.1%) | |
DigitalGlobe, Inc. | | | 12,950 | | | $ | 412,069 | * | |
Airlines (0.1%) | |
AMR Corp. | | | 2,011 | | | | 14,781 | * | |
JetBlue
Airways Corp. | | | 51,810 | | | | 367,333 | *Ø | |
United
Continental
Holdings, Inc. | | | 4 | | | | 136 | * | |
US Airways
Group, Inc. | | | 9,362 | | | | 205,683 | *Ø | |
| | | | 587,933 | | |
Auto Components (0.1%) | |
Cooper Tire &
Rubber Co. | | | 19,800 | | | | 514,998 | ±Ø | |
Automobiles (0.1%) | |
Daimler AG | | | 3,482 | | | | 285,741 | Ø | |
Fiat SpA | | | 15,136 | | | | 118,990 | *Ø | |
Motors
Liquidation
Co. GUC Trust | | | 2,954 | | | | 107,230 | * | |
| | | | 511,961 | | |
Beverages (0.8%) | |
Anheuser-Busch
InBev NV | | | 15,646 | | | | 1,627,241 | Ø | |
Asahi Group
Holdings Ltd. | | | 17,600 | | | | 474,321 | Ø | |
| | | Number
of Shares | | Value† | |
Constellation
Brands, Inc.
Class A | | | 903 | | | $ | 58,966 | * | |
Molson Coors
Brewing Co.
Class B | | | 33,196 | | | | 1,792,584 | | |
| | | | 3,953,112 | | |
Biotechnology (2.4%) | |
Ablynx NV | | | 2,188 | | | | 21,479 | * | |
Aegerion
Pharmaceuticals,
Inc. | | | 16,610 | | | | 1,375,640 | *Ø | |
Agios
Pharmaceuticals,
Inc. | | | 2,970 | | | | 68,785 | *Ø | |
Alexion
Pharmaceuticals,
Inc. | | | 229 | | | | 28,156 | * | |
Algeta ASA | | | 582 | | | | 23,122 | * | |
Amgen, Inc. | | | 382 | | | | 44,312 | Ø | |
Basilea
Pharmaceutica | | | 4,719 | | | | 514,885 | *Ø | |
Biogen Idec, Inc. | | | 1,412 | | | | 344,796 | *Ø | |
BioMarin
Pharmaceutical,
Inc. | | | 467 | | | | 29,337 | *Ø | |
Celgene Corp. | | | 265 | | | | 39,350 | *Ø | |
Cepheid, Inc. | | | 6,610 | | | | 269,159 | * | |
Coronado
Biosciences, Inc. | | | 8,370 | | | | 13,978 | *Ø | |
Cubist
Pharmaceuticals,
Inc. | | | 12,900 | | | | 799,800 | *Ø | |
| | | Number
of Shares | | Value† | |
Durata
Therapeutics,
Inc. | | | 1,070 | | | $ | 10,358 | * | |
Elan Corp. PLC
ADR | | | 188,535 | | | | 3,140,993 | *Ø | |
Enanta
Pharmaceuticals,
Inc. | | | 3,832 | | | | 76,487 | *Ø | |
Galapagos NV | | | 1,094 | | | | 21,196 | * | |
Geron Corp. | | | 55,160 | | | | 217,882 | * | |
Gilead Sciences,
Inc. | | | 2,836 | | | | 201,328 | *Ø | |
Grifols SA ADR | | | 815 | | | | 24,580 | Ø | |
Kamada Ltd. | | | 1,042 | | | | 14,984 | * | |
Keryx
Biopharmaceuticals,
Inc. | | | 31,104 | | | | 321,926 | *Ø | |
MacroGenics, Inc. | | | 2,830 | | | | 76,240 | * | |
Medivation, Inc. | | | 570 | | | | 34,120 | * | |
Neurocrine
Biosciences, Inc. | | | 58,634 | | | | 553,505 | *Ø | |
NPS
Pharmaceuticals,
Inc. | | | 17,309 | | | | 498,153 | *Ø | |
OvaScience, Inc. | | | 264 | | | | 2,553 | *Ø | |
Pharmacyclics,
Inc. | | | 264 | | | | 31,321 | * | |
QLT, Inc. | | | 4,348 | | | | 18,914 | Ø | |
Receptos, Inc. | | | 11,654 | | | | 297,876 | *Ø | |
Regeneron
Pharmaceuticals,
Inc. | | | 86 | | | | 24,734 | * | |
Rigel
Pharmaceuticals,
Inc. | | | 49,700 | | | | 153,573 | * | |
See Notes to Schedule of Investments
10
| | | Number
of Shares | | Value† | |
Sarepta
Therapeutics,
Inc. | | | 433 | | | $ | 16,861 | * | |
Swedish Orphan
Biovitrum AB | | | 50,681 | | | | 484,907 | *Ø | |
Theravance, Inc. | | | 33,838 | | | | 1,239,824 | *± | |
Trius
Therapeutics Inc. | | | 24,000 | | | | 3,120 | *fØ | |
| | | | 11,038,234 | | |
Capital Markets (0.5%) | |
Evercore Partners,
Inc. Class A | | | 24,250 | | | | 1,223,897 | Ø | |
GAM Holding
AG | | | 49,520 | | | | 927,801 | * | |
Medallion
Financial Corp. | | | 1,075 | | | | 16,318 | | |
Mediobanca SpA | | | 28,942 | | | | 264,266 | Ø | |
| | | | 2,432,282 | | |
Chemicals (2.4%) | |
Air Products &
Chemicals, Inc. | | | 29,824 | | | | 3,251,114 | Ø | |
Ashland, Inc. | | | 14,421 | | | | 1,334,664 | | |
FMC Corp. | | | 40,925 | | | | 2,977,703 | Ø | |
Huntsman Corp. | | | 43,000 | | | | 998,460 | Ø | |
LANXESS AG | | | 3,761 | | | | 264,721 | Ø | |
LyondellBasell
Industries NV
Class A | | | 4,100 | | | | 305,860 | Ø | |
Monsanto Co. | | | 8,020 | | | | 841,138 | Ø | |
Rockwood
Holdings, Inc. | | | 954 | | | | 60,340 | Ø | |
Syngenta AG | | | 61 | | | | 24,639 | | |
The Sherwin-
Williams Co. | | | 1,200 | | | | 225,600 | Ø | |
Tredegar Corp. | | | 8,160 | | | | 238,435 | | |
Yongye
International,
Inc. | | | 17,904 | | | | 112,795 | * | |
Zoltek Cos., Inc. | | | 39,000 | | | | 651,300 | *Ø | |
| | | | 11,286,769 | | |
Commercial Banks (0.9%) | |
Aozora Bank
Ltd. | | | 232,441 | | | | 673,708 | Ø | |
CapitalSource,
Inc. | | | 34,156 | | | | 446,760 | Ø | |
Chong Hing
Bank Ltd. | | | 89,490 | | | | 404,569 | | |
CIT Group, Inc. | | | 5,718 | | | | 275,379 | *Ø | |
Commerzbank
AG | | | 7,261 | | | | 93,351 | *Ø | |
Kasikornbank
PCL | | | 134,700 | | | | 822,265 | Ø | |
MetroCorp
Bancshares, Inc. | | | 14,814 | | | | 212,285 | Ø | |
StellarOne Corp. | | | 624 | | | | 14,527 | | |
Sterling Bancorp. | | | 16,769 | | �� | | 247,343 | Ø | |
Sterling
Financial Corp. | | | 6,750 | | | | 195,480 | Ø | |
Synovus
Financial Corp. | | | 66,739 | | | | 216,902 | Ø | |
| | | Number
of Shares | | Value† | |
Valley National
Bancorp. | | | 25,607 | | | $ | 249,668 | Ø | |
Virginia
Commerce
Bancorp., Inc. | | | 12,784 | | | | 204,927 | *Ø | |
| | | | 4,057,164 | | |
Commercial Services & Supplies (0.7%) | |
Iron Mountain,
Inc. | | | 42,601 | | | | 1,130,630 | ±Ø | |
Pitney Bowes,
Inc. | | | 11,055 | | | | 235,914 | Ø | |
Tyco
International
Ltd. | | | 50,325 | | | | 1,839,379 | Ø | |
| | | | 3,205,923 | | |
Communications Equipment (0.6%) | |
Anaren, Inc. | | | 9,332 | | | | 233,113 | *Ø | |
BlackBerry Ltd. | | | 5,000 | | | | 39,550 | * | |
Cisco Systems,
Inc. | | | 36,600 | | | | 823,500 | Ø | |
Globecomm
Systems, Inc. | | | 12,080 | | | | 169,482 | *Ø | |
Nokia OYJ ADR | | | 68,893 | | | | 525,654 | *Ø | |
Polycom, Inc. | | | 1,253 | | | | 13,031 | * | |
Symmetricom,
Inc. | | | 12,186 | | | | 87,374 | * | |
Tellabs, Inc. | | | 335,933 | | | | 819,677 | Ø | |
| | | | 2,711,381 | | |
Computers & Peripherals (0.2%) | |
Diebold, Inc. | | | 19,021 | | | | 569,869 | Ø | |
EMC Corp. | | | 13,424 | | | | 323,116 | | |
Quantum Corp. | | | 52,961 | | | | 65,672 | * | |
| | | | 958,657 | | |
Construction & Engineering (0.0%) | |
KHD Humboldt
Wedag
International AG | | | 2,778 | | | | 24,045 | | |
Containers & Packaging (0.5%) | |
MeadWestvaco
Corp. | | | 24,800 | | | | 864,280 | | |
Nampak Ltd. | | | 447,170 | | | | 1,478,874 | Ø | |
| | | | 2,343,154 | | |
Diversified Consumer Services (0.7%) | |
Estacio
Participacoes SA | | | 71,200 | | | | 549,844 | Ø | |
H&R Block, Inc. | | | 3,046 | | | | 86,628 | Ø | |
Mac-Gray Corp. | | | 40,000 | | | | 843,200 | Ø | |
Regis Corp. | | | 86,250 | | | | 1,250,625 | Ø | |
Stewart
Enterprises, Inc.
Class A | | | 35,000 | | | | 462,350 | Ø | |
Weight
Watchers
International,
Inc. | | | 5,780 | | | | 185,596 | ± | |
| | | 3,378,243 | | |
| | | Number
of Shares | | Value† | |
Diversified Financial Services (1.6%) | |
Capmark
Financial
Group, Inc. | | | 5,677 | | | $ | 33,154 | Ø | |
Citigroup, Inc. | | | 28,300 | | | | 1,380,474 | Ø | |
GT Capital
Holdings, Inc. | | | 22,120 | | | | 438,202 | Ø | |
MPHB Capital
Bhd | | | 219,721 | | | | 118,371 | *Ø | |
NYSE Euronext | | | 122,571 | | | | 5,395,576 | Ø | |
PHH Corp. | | | 5,484 | | | | 131,890 | * | |
| | | | 7,497,667 | | |
Diversified Telecommunication
Services (0.2%) | |
Fairpoint
Communications,
Inc. | | | 13,897 | | | | 129,798 | *Ø | |
Globalstar, Inc. | | | 50,812 | | | | 70,629 | *Ø | |
Intelsat SA | | | 3,466 | | | | 70,672 | *Ø | |
Koninklijke
KPN NV | | | 147,531 | | | | 471,530 | *Ø | |
Oi SA ADR | | | 25,569 | | | | 44,234 | | |
Ziggo NV | | | 2,875 | | | | 123,371 | | |
| | | | 910,234 | | |
Electric Utilities (0.3%) | |
FirstEnergy Corp. | | | 5,900 | | | | 223,433 | Ø | |
NV Energy, Inc. | | | 48,117 | | | | 1,142,298 | Ø | |
| | | | 1,365,731 | | |
Electrical Equipment (0.5%) | |
Capstone
Turbine Corp. | | | 418,485 | | | | 531,476 | * | |
Coleman Cable,
Inc. | | | 2,059 | | | | 50,651 | | |
Eaton Corp. PLC | | | 21,950 | | | | 1,548,792 | Ø | |
| | | | 2,130,919 | | |
Electronic Equipment, Instruments & Components (0.1%) | |
Molex, Inc. | | | 5,345 | | | | 206,317 | Ø | |
Molex, Inc.
Class A | | | 9,528 | | | | 366,828 | Ø | |
| | | | 573,145 | | |
Energy Equipment & Services (0.8%) | |
Cameron
International
Corp. | | | 31,600 | | | | 1,733,576 | *Ø | |
McDermott
International,
Inc. | | | 65,295 | | | | 461,636 | * | |
Noble Corp. | | | 38,122 | | | | 1,437,199 | Ø | |
Weatherford
International
Ltd. | | | 10,131 | | | | 166,554 | * | |
| | | | 3,798,965 | | |
See Notes to Schedule of Investments
11
| | | Number
of Shares | | Value† | |
Food & Staples Retailing (0.8%) | |
CVS Caremark
Corp. | | | 369 | | | $ | 22,974 | | |
Harris Teeter
Supermarkets,
Inc. | | | 29,432 | | | | 1,451,586 | Ø | |
Nash Finch Co. | | | 2,630 | | | | 73,798 | Ø | |
Safeway, Inc. | | | 17,610 | | | | 614,589 | ±Ø | |
Shoppers Drug
Mart Corp. | | | 23,308 | | | | 1,361,841 | Ø | |
Valor Co. Ltd. | | | 31,400 | | | | 451,856 | | |
| | | | 3,976,644 | | |
Food Products (0.6%) | |
Dole Food Co.,
Inc. | | | 50,000 | | | | 677,500 | *Ø | |
GrainCorp. Ltd.
Class A | | | 10,000 | | | | 116,632 | Ø | |
Maple Leaf
Foods, Inc. | | | 17,005 | | | | 250,349 | | |
Pinnacle Foods,
Inc. | | | 24,266 | | | | 657,366 | | |
Warrnambool
Cheese & Butter
Factory Co.
Holding Ltd. | | | 10,000 | | | | 78,447 | | |
WhiteWave
Foods Co.
Class A | | | 61,277 | | | | 1,226,153 | * | |
| | | | 3,006,447 | | |
Health Care Equipment & Supplies (1.7%) | |
Align
Technology, Inc. | | | 12,150 | | | | 693,279 | * | |
Baxter
International, Inc. | | | 448 | | | | 29,510 | | |
Covidien PLC | | | 22,469 | | | | 1,440,488 | Ø | |
Cyberonics, Inc. | | | 5,110 | | | | 295,154 | *Ø | |
DexCom, Inc. | | | 4,590 | | | | 131,871 | * | |
HeartWare
International,
Inc. | | | 392 | | | | 28,443 | * | |
Hologic, Inc. | | | 28,886 | | | | 646,757 | *Ø | |
ICU Medical, Inc. | | | 20,490 | | | | 1,266,282 | *Ø | |
MAKO Surgical
Corp. | | | 36,094 | | | | 1,075,962 | *Ø | |
Rochester
Medical Corp. | | | 39,722 | | | | 793,646 | *Ø | |
Teleflex, Inc. | | | 6,090 | | | | 561,376 | Ø | |
Trinity Biotech
PLC ADR | | | 1,114 | | | | 27,850 | Ø | |
William Demant
Holding A/S | | | 8,830 | | | | 873,637 | *Ø | |
Wright Medical
Group, Inc. | | | 708 | | | | 19,236 | * | |
Zimmer Holdings,
Inc. | | | 235 | | | | 20,555 | | |
| | | | 7,904,046 | | |
Health Care Providers & Services (2.0%) | |
Aetna, Inc. | | | 942 | | | | 59,063 | Ø | |
BioScrip, Inc. | | | 20,800 | | | | 145,808 | * | |
BioTelemetry, Inc. | | | 22,230 | | | | 203,182 | *Ø | |
| | | Number
of Shares | | Value† | |
Brookdale Senior
Living, Inc. | | | 1,127 | | | $ | 30,519 | * | |
Capital Senior
Living Corp. | | | 6,556 | | | | 145,412 | * | |
Cardinal Health,
Inc. | | | 573 | | | | 33,612 | | |
Catamaran Corp. | | | 319 | | | | 14,980 | * | |
Cigna Corp. | | | 515 | | | | 39,645 | | |
DaVita
HealthCare
Partners, Inc. | | | 373 | | | | 20,966 | *Ø | |
Express Scripts
Holding Co. | | | 653 | | | | 40,825 | *Ø | |
Extendicare, Inc. | | | 57,087 | | | | 366,290 | Ø | |
Fresenius SE &
Co. KGaA | | | 143 | | | | 18,587 | | |
HCA Holdings,
Inc. | | | 785 | | | | 37,005 | Ø | |
Health
Management
Associates, Inc.
Class A | | | 167,870 | | | | 2,152,093 | *Ø | |
Life Healthcare
Group Holdings
Ltd. | | | 364,241 | | | | 1,487,624 | Ø | |
McKesson Corp. | | | 15,898 | | | | 2,485,493 | Ø | |
Omnicare, Inc. | | | 5,744 | | | | 316,782 | Ø | |
Team Health
Holdings, Inc. | | | 17,750 | | | | 771,060 | *Ø | |
Tenet Healthcare
Corp. | | | 846 | | | | 39,923 | * | |
UnitedHealth
Group, Inc. | | | 607 | | | | 41,434 | Ø | |
Universal Health
Services, Inc.
Class B | | | 10,578 | | | | 852,164 | | |
| | | | 9,302,467 | | |
Health Care Technology (0.4%) | |
Allscripts
Healthcare
Solutions, Inc. | | | 11,610 | | | | 160,566 | * | |
Cerner Corp. | | | 19,280 | | | | 1,080,259 | *Ø | |
Greenway
Medical
Technologies | | | 32,100 | | | | 653,235 | *Ø | |
Merge
Healthcare, Inc. | | | 6,984 | | | | 17,739 | *Ø | |
| | | | 1,911,799 | | |
Hotels, Restaurants & Leisure (0.7%) | |
Darden
Restaurants, Inc. | | | 2,239 | | | | 115,376 | | |
McDonald's
Corp. | | | 14,871 | | | | 1,435,349 | Ø | |
Morgans Hotel
Group Co. | | | 16,811 | | | | 120,367 | *Ø | |
Orient-Express
Hotels Ltd.
Class A | | | 3,000 | | | | 39,930 | *Ø | |
Penn National
Gaming, Inc. | | | 10,000 | | | | 585,100 | * | |
| | | Number
of Shares | | Value† | |
Pinnacle
Entertainment,
Inc. | | | 3,673 | | | $ | 85,948 | * | |
SHFL
Entertainment,
Inc. | | | 32,894 | | | | 762,483 | *Ø | |
| | | | 3,144,553 | | |
Household Durables (0.2%) | |
Blyth, Inc. | | | 4,261 | | | | 58,844 | | |
Lennar Corp.
Class B | | | 30,442 | | | | 897,126 | Ø | |
UCP, Inc. Class A | | | 7,969 | | | | 112,363 | * | |
| | | | 1,068,333 | | |
Household Products (0.1%) | |
Vinda
International
Holdings Ltd. | | | 266,802 | | | | 378,540 | Ø | |
Industrial Conglomerates (0.3%) | |
Alliance Global
Group, Inc. | | | 2,115,600 | | | | 1,290,119 | Ø | |
Siemens AG | | | 394 | | | | 50,382 | Ø | |
| | | | 1,340,501 | | |
Insurance (1.0%) | |
Ambac Financial
Group, Inc. | | | 5,332 | | | | 107,653 | * | |
American
International
Group, Inc. | | | 3,222 | | | | 166,416 | | |
Donegal Group,
Inc. Class A | | | 10,121 | | | | 160,418 | Ø | |
eHealth, Inc. | | | 3,720 | | | | 158,547 | * | |
Hartford
Financial
Services Group,
Inc. | | | 95,135 | | | | 3,206,050 | Ø | |
MetLife, Inc. | | | 3,514 | | | | 166,247 | ± | |
Syncora
Holdings Ltd. | | | 1,709 | | | | 752 | * | |
Tower Group
International
Ltd. | | | 953 | | | | 3,459 | | |
UNIQA Insurance
Group AG | | | 68,764 | | | | 842,146 | Ø | |
| | | | 4,811,688 | | |
Internet & Catalog Retail (0.2%) | |
Liberty Ventures
Series A | | | 8,000 | | | | 858,960 | *Ø | |
Internet Software & Services (0.4%) | |
The Active
Network, Inc. | | | 79,290 | | | | 1,144,948 | *Ø | |
Trulia, Inc. | | | 1,088 | | | | 43,487 | * | |
Web.com
Group, Inc. | | | 1,789 | | | | 48,214 | * | |
Yahoo Japan
Corp. | | | 181,800 | | | | 844,936 | Ø | |
| | | | 2,081,585 | | |
See Notes to Schedule of Investments
12
| | | Number
of Shares | | Value† | |
IT Services (1.6%) | |
iSoftStone
Holdings Ltd.
ADR | | | 5,001 | | | $ | 24,805 | *Ø | |
Leidos Holdings,
Inc. | | | 2,864 | | | | 134,866 | | |
Lender
Processing
Services, Inc. | | | 96,225 | | | | 3,321,687 | Ø | |
Teradata Corp. | | | 81,600 | | | | 3,596,112 | *Ø | |
Verifone
Systems, Inc. | | | 12,493 | | | | 283,091 | *Ø | |
| | | | 7,360,561 | | |
Leisure Equipment & Products (0.2%) | |
Hasbro, Inc. | | | 19,139 | | | | 988,529 | Ø | |
Life Sciences Tools & Services (1.7%) | |
Agilent
Technologies,
Inc. | | | 24,600 | | | | 1,248,696 | Ø | |
Furiex
Pharmaceuticals,
Inc. | | | 12,220 | | | | 477,802 | *Ø | |
Life Technologies
Corp. | | | 83,684 | | | | 6,302,242 | *Ø | |
Morphosys AG | | | 333 | | | | 25,821 | *Ø | |
| | | | 8,054,561 | | |
Machinery (1.2%) | |
Dover Corp. | | | 15,160 | | | | 1,391,536 | Ø | |
Edwards Group
Ltd. ADR | | | 16,660 | | | | 166,600 | *Ø | |
Ingersoll-Rand
PLC | | | 11,480 | | | | 775,244 | Ø | |
Invensys PLC | | | 40,000 | | | | 322,604 | Ø | |
Joy Global, Inc. | | | 21,530 | | | | 1,221,828 | Ø | |
Navistar
International
Corp. | | | 2,139 | | | | 77,346 | *± | |
Pentair Ltd. | | | 17,789 | | | | 1,193,464 | Ø | |
Timken Co. | | | 8,706 | | | | 459,764 | | |
Titan
International,
Inc. | | | 7,788 | | | | 112,926 | Ø | |
Xerium
Technologies,
Inc. | | | 2,858 | | | | 34,268 | *Ø | |
| | | | 5,755,580 | | |
Media (4.9%) | |
Belo Corp.
Class A | | | 35,000 | | | | 480,550 | Ø | |
Cablevision
Systems Corp.
Class A | | | 8,950 | | | | 139,172 | | |
CBS Corp.
Class B | | | 87,400 | | | | 5,168,836 | Ø | |
Clear Channel
Outdoor
Holdings, Inc.
Class A | | | 2,170 | | | | 18,445 | *Ø | |
CTS Eventim AG | | | 1,835 | | | | 89,568 | | |
| | | Number
of Shares | | Value† | |
Digital
Generation, Inc. | | | 4,127 | | | $ | 52,207 | * | |
DISH Network
Corp. Class A | | | 27,525 | | | | 1,326,705 | Ø | |
Gannett Co., Inc. | | | 3,800 | | | | 105,146 | Ø | |
Gray Television,
Inc. | | | 40,920 | | | | 345,774 | *Ø | |
Hakuhodo DY
Holdings, Inc. | | | 84,100 | | | | 648,305 | Ø | |
Journal
Communications,
Inc. Class A | | | 6,768 | | | | 56,513 | *Ø | |
Lamar
Advertising Co.
Class A | | | 13,500 | | | | 617,085 | *±Ø | |
Liberty Global
PLC Class A | | | 1,846 | | | | 144,671 | *Ø | |
Liberty Global
PLC Series C | | | 58,562 | | | | 4,383,951 | *Ø | |
Liberty Media
Corp. Class A | | | 8,142 | | | | 1,244,993 | *Ø | |
LIN Media LLC
Class A | | | 32 | | | | 786 | *Ø | |
Loral Space &
Communications,
Inc. | | | 3,315 | | | | 236,592 | Ø | |
News Corp.
Class A | | | 135,689 | | | | 2,388,126 | *Ø | |
Nexstar
Broadcasting
Group, Inc.
Class A | | | 456 | | | | 20,242 | Ø | |
Omnicom
Group, Inc. | | | 12,471 | | | | 849,400 | Ø | |
Sinclair
Broadcast
Group, Inc.
Class A | | | 1,271 | | | | 40,748 | Ø | |
Sky Deutschland
AG | | | 85,225 | | | | 841,243 | *Ø | |
Tribune Co. | | | 39,093 | | | | 2,617,276 | * | |
Tribune Co.
Class 1C
Litigation | | | 300,000 | | | | 750 | *Ø | |
Viacom, Inc.
Class B | | | 16,551 | | | | 1,378,533 | Ø | |
| | | | 23,195,617 | | |
Metals & Mining (0.6%) | |
AuRico Gold, Inc. | | | 3,000 | | | | 12,330 | Ø | |
Cia de Minas
Buenaventura
SAA ADR | | | 9,632 | | | | 139,664 | Ø | |
Gold Fields Ltd.
ADR | | | 126,612 | | | | 582,415 | Ø | |
Gold Reserve,
Inc. | | | 8,791 | | | | 30,383 | *Ø | |
International
Minerals Corp. | | | 1,000 | | | | 2,714 | | |
Sibanye Gold
Ltd. ADR | | | 27,896 | | | | 156,776 | | |
SunCoke Energy,
Inc. | | | 82,241 | | | | 1,644,820 | * | |
| | | | 2,569,102 | | |
| | | Number
of Shares | | Value† | |
Multiline Retail (0.6%) | |
Canadian Tire
Corp. Ltd.
Class A | | | 4,327 | | | $ | 401,637 | Ø | |
Family Dollar
Stores, Inc. | | | 17,198 | | | | 1,184,598 | Ø | |
JC Penney Co.,
Inc. | | | 42,695 | | | | 320,213 | *Ø | |
Saks, Inc. | | | 46,716 | | | | 746,989 | *Ø | |
| | | | 2,653,437 | | |
Multi-Utilities (0.2%) | |
E.ON SE | | | 62,280 | | | | 1,137,764 | Ø | |
Oil, Gas & Consumable Fuels (2.4%) | |
Anadarko
Petroleum Corp. | | | 13,180 | | | | 1,255,922 | Ø | |
Angle Energy,
Inc. | | | 35,827 | | | | 128,856 | *Ø | |
Berry Petroleum
Co. Class A | | | 600 | | | | 28,650 | Ø | |
| BP PLC ADR | | | 16,714 | | | | 777,201 | Ø | |
Cameco Corp. | | | 93,970 | | | | 1,785,430 | Ø | |
Gulf Coast Ultra
Deep Royalty
Trust | | | 17,250 | | | | 41,745 | *Ø | |
Harvest Natural
Resources, Inc. | | | 21,496 | | | | 107,480 | *Ø | |
Hess Corp. | | | 30,712 | | | | 2,493,814 | Ø | |
Novus Energy,
Inc. | | | 179,093 | | | | 195,814 | *Ø | |
Occidental
Petroleum Corp. | | | 32,174 | | | | 3,091,278 | Ø | |
Penn West
Petroleum Ltd. | | | 17,850 | | | | 199,741 | | |
Petrominerales
Ltd. | | | 14,000 | | | | 160,994 | Ø | |
Renegade
Petroleum Ltd. | | | 31,418 | | | | 33,447 | | |
Royal Dutch
Shell PLC ADR | | | 1,630 | | | | 108,656 | Ø | |
Talisman Energy,
Inc. | | | 32,060 | | | | 400,033 | | |
Trilogy Energy
Corp. | | | 1,342 | | | | 39,373 | | |
Western
Refining, Inc. | | | 3,895 | | | | 125,692 | | |
Z Energy Ltd. | | | 76,609 | | | | 244,890 | *Ø | |
| | | | 11,219,016 | | |
Paper & Forest Products (0.1%) | |
Ainsworth
Lumber Co. Ltd. | | | 100,834 | | | | 381,035 | *Ø | |
Personal Products (0.5%) | |
Elizabeth Arden,
Inc. | | | 12,706 | | | | 459,830 | *Ø | |
Prestige Brands
Holdings, Inc. | | | 12,450 | | | | 388,814 | *Ø | |
The Estee Lauder
Cos., Inc.
Class A | | | 18,500 | | | | 1,312,760 | Ø | |
| | | | 2,161,404 | | |
See Notes to Schedule of Investments
13
| | | Number
of Shares | | Value† | |
Pharmaceuticals (4.1%) | |
AbbVie, Inc. | | | 2,252 | | | $ | 109,109 | | |
Acino Holding
AG | | | 500 | | | | 63,316 | *Ø | |
Actavis PLC | | | 7,299 | | | | 1,128,280 | *Ø | |
Allergan, Inc. | | | 293 | | | | 26,549 | Ø | |
AstraZeneca
PLC ADR | | | 25,420 | | | | 1,343,701 | Ø | |
Bayer AG | | | 190 | | | | 23,615 | Ø | |
Bristol-Myers
Squibb Co. | | | 28,887 | | | | 1,517,145 | Ø | |
Cadence
Pharmaceuticals,
Inc. | | | 4,910 | | | | 24,206 | *Ø | |
Cempra, Inc. | | | 1,477 | | | | 16,779 | *Ø | |
Cornerstone
Therapeutics,
Inc. | | | 21,977 | | | | 208,122 | *Ø | |
DepoMed, Inc. | | | 85,526 | | | | 615,787 | *Ø | |
Forest
Laboratories,
Inc. | | | 447 | | | | 21,023 | * | |
Hi-Tech
Pharmacal Co.,
Inc. | | | 14,000 | | | | 603,260 | Ø | |
Impax
Laboratories,
Inc. | | | 36,440 | | | | 738,274 | *Ø | |
Jazz
Pharmaceuticals
PLC | | | 286 | | | | 25,952 | *Ø | |
Johnson &
Johnson | | | 15,800 | | | | 1,463,238 | Ø | |
Lannett Co., Inc. | | | 75,120 | | | | 1,773,583 | *Ø | |
Meda AB
Class A | | | 1,690 | | | | 18,986 | | |
Merck & Co.,
Inc. | | | 805 | | | | 36,298 | | |
Mylan, Inc. | | | 739 | | | | 27,986 | *Ø | |
Novartis AG | | | 302 | | | | 23,448 | Ø | |
Omthera
Pharmaceuticals,
Inc. | | | 100 | | | | — | *f | |
Pfizer, Inc. | | | 100,554 | | | | 3,084,997 | Ø | |
Roche Holding
AG | | | 118 | | | | 32,668 | Ø | |
Roche Holding
AG ADR | | | 26,290 | | | | 1,822,949 | Ø | |
Salix
Pharmaceuticals
Ltd. | | | 4,756 | | | | 341,243 | *Ø | |
SHIRE PLC ADR | | | 4,410 | | | | 586,971 | Ø | |
Sucampo
Pharmaceuticals,
Inc. Class A | | | 2,187 | | | | 13,559 | * | |
Taro
Pharmaceutical
Industries Ltd. | | | 500 | | | | 39,175 | *Ø | |
ViroPharma, Inc. | | | 59,536 | | | | 2,311,188 | *± | |
Zoetis, Inc. | | | 35,858 | | | | 1,135,264 | | |
| | | | 19,176,671 | | |
| | | Number
of Shares | | Value† | |
Professional Services (1.1%) | |
National
Technical
Systems, Inc. | | | 9,077 | | | $ | 207,773 | *Ø | |
Nielsen Holdings
NV | | | 11,795 | | | | 465,195 | Ø | |
The Dun &
Bradstreet Corp. | | | 29,825 | | | | 3,244,662 | Ø | |
Towers
Watson & Co.
Class A | | | 9,350 | | | | 1,073,473 | Ø | |
| | | | 4,991,103 | | |
Real Estate Investment Trusts (1.2%) | |
American Realty
Capital
Properties, Inc. | | | 81,890 | | | | 1,086,680 | Ø | |
BRE Properties,
Inc. | | | 42,655 | | | | 2,329,390 | Ø | |
CapLease, Inc. | | | 28,530 | | | | 242,505 | Ø | |
Chatham
Lodging Trust | | | 16,525 | | | | 311,662 | Ø | |
Cole Real Estate
Investment, Inc. | | | 24,176 | | | | 343,299 | | |
Columbia
Property Trust,
Inc. | | | 3,579 | | | | 80,706 | * | |
CommonWealth
REIT | | | 4,613 | | | | 112,419 | Ø | |
Gramercy
Property Trust,
Inc. | | | 6,728 | | | | 30,747 | * | |
Mid-America
Apartment
Communities,
Inc. | | | 4,871 | | | | 323,434 | Ø | |
Newcastle
Investment
Corp. | | | 57,051 | | | | 327,473 | Ø | |
Ryman
Hospitality
Properties | | | 18,026 | | | | 665,340 | | |
| | | | 5,853,655 | | |
Real Estate Management &
Development (0.6%) | |
Brookfield Office
Properties, Inc. | | | 13,555 | | | | 253,614 | Ø | |
Daiwa House
Industry Co. Ltd. | | | 59,000 | | | | 1,176,640 | Ø | |
DIC Asset AG | | | 18,153 | | | | 200,875 | Ø | |
GSW Immobilien
AG | | | 692 | | | | 32,119 | Ø | |
Pruksa Real
Estate PCL | | | 1,324,200 | | | | 948,744 | fØ | |
| | | | 2,611,992 | | |
Road & Rail (0.2%) | |
Hertz Global
Holdings, Inc. | | | 40,967 | | | | 940,602 | *Ø | |
| | | Number
of Shares | | Value† | |
Semiconductors & Semiconductor Equipment (0.2%) | |
Kulicke & Soffa
Industries, Inc. | | | 22,556 | | | $ | 290,972 | *± | |
LSI Corp. | | | 22,459 | | | | 190,452 | Ø | |
Microsemi Corp. | | | 2,237 | | | | 56,216 | * | |
NXP
Semiconductor
NV | | | 3,535 | | | | 148,894 | * | |
Spreadtrum
Communications,
Inc. ADR | | | 5,128 | | | | 155,943 | Ø | |
| | | | 842,477 | | |
Software (0.7%) | |
AsiaInfo-Linkage,
Inc. | | | 21,158 | | | | 245,433 | *Ø | |
Check Point
Software
Technologies
Ltd. | | | 5,879 | | | | 341,099 | *Ø | |
Compuware
Corp. | | | 140,047 | | | | 1,495,702 | Ø | |
Ebix, Inc. | | | 2,000 | | | | 22,760 | Ø | |
Ellie Mae, Inc. | | | 2,554 | | | | 73,810 | *Ø | |
Nuance
Communications,
Inc. | | | 47,530 | | | | 739,567 | * | |
Stonesoft OYJ | | | 5,000 | | | | 30,210 | *Ø | |
Symantec Corp. | | | 15,874 | | | | 360,975 | | |
Zynga, Inc.
Class A | | | 17,898 | | | | 64,254 | * | |
| | | | 3,373,810 | | |
Specialty Retail (0.5%) | |
American Eagle
Outfitters, Inc. | | | 5,823 | | | | 90,198 | | |
CST Brands, Inc. | | | 2,823 | | | | 91,013 | Ø | |
Emperor
Watch &
Jewellery Ltd. | | | 4,240,000 | | | | 339,069 | Ø | |
Fielmann AG | | | 481 | | | | 53,814 | | |
Office Depot,
Inc. | | | 51,298 | | | | 286,756 | *Ø | |
The Men's
Wearhouse, Inc. | | | 9,116 | | | | 385,607 | ±Ø | |
Vitamin Shoppe,
Inc. | | | 27,230 | | | | 1,277,359 | * | |
| | | | 2,523,816 | | |
Textiles, Apparel & Luxury Goods (1.0%) | |
Fifth & Pacific
Cos., Inc. | | | 8,961 | | | | 237,377 | *Ø | |
PVH Corp. | | | 20,675 | | | | 2,575,485 | Ø | |
RG Barry Corp. | | | 3,284 | | | | 62,659 | | |
The Jones
Group, Inc. | | | 12,419 | | | | 192,991 | ±Ø | |
Vera Bradley, Inc. | | | 68,600 | | | | 1,519,490 | * | |
| | | | 4,588,002 | | |
See Notes to Schedule of Investments
14
| | | Number
of Shares | | Value† | |
Thrifts & Mortgage Finance (0.8%) | |
Aareal Bank AG | | | 2,618 | | | $ | 100,684 | *Ø | |
Astoria Financial
Corp. | | | 31,568 | | | | 417,013 | Ø | |
Fox Chase
Bancorp., Inc. | | | 6,675 | | | | 115,277 | | |
Hudson City
Bancorp., Inc. | | | 322,523 | | | | 2,896,256 | Ø | |
Ocwen Financial
Corp. | | | 4,707 | | | | 264,675 | *Ø | |
| | | | 3,793,905 | | |
Tobacco (0.2%) | |
Swedish Match
AB | | | 30,047 | | | | 991,358 | Ø | |
Trading Companies & Distributors (0.1%) | |
Edgen Group,
Inc. | | | 20,000 | | | | 239,400 | * | |
Kloeckner & Co.
SE | | | 5,817 | | | | 82,258 | * | |
United Rentals,
Inc. | | | 2,200 | | | | 142,098 | *± | |
| | | | 463,756 | | |
Transportation Infrastructure (0.0%) | |
Macquarie
Infrastructure
Co., LLC | | | 3,331 | | | | 182,905 | Ø | |
Wireless Telecommunication
Services (1.2%) | |
Leap Wireless
International,
Inc. | | | 77,572 | | | | 1,248,909 | *Ø | |
Sprint Corp. | | | 84,837 | | | | 570,953 | * | |
Telephone &
Data Systems,
Inc. | | | 11,498 | | | | 358,508 | Ø | |
T-Mobile US, Inc. | | | 9,137 | | | | 253,369 | *Ø | |
Vodafone Group
PLC ADR | | | 91,638 | | | | 3,374,111 | | |
| | | | 5,805,850 | | |
Total Common Stocks
(Cost $216,883,853) | | 225,094,657 | |
Preferred Stocks (0.5%) | |
Automobiles (0.0%) | |
Volkswagen AG,
3.56% | | | 304 | | | | 77,268 | | |
Beverages (0.3%) | |
Cia de Bebidas
das Americas | | | 34,800 | | | | 1,298,204 | Ø | |
Commercial Banks (0.1%) | |
Synovus
Financial Corp.,
Ser. C, 7.88% | | | 2,061 | | | | 57,007 | *Ø? | |
Wells Fargo &
Co., Ser. L,
7.50% | | | 100 | | | | 113,900 | | |
| | | | 170,907 | | |
| | | Number
of Shares | | Value† | |
Consumer Finance (0.0%) | |
Ally Financial,
Inc., 7.00% | | | 134 | | | $ | 128,661 | *ñØ | |
Diversified Financial Services (0.1%) | |
Bank of America
Corp., Ser. L,
7.25% | | | 161 | | | | 173,477 | * | |
Real Estate Investment Trusts (0.0%) | |
Gramercy
Property Trust,
Inc., Ser. A,
8.13% | | | 869 | | | | 29,937 | * | |
Strategic
Hotels &
Resorts, Inc.,
Ser. B, 8.25% | | | 1,038 | | | | 23,770 | Ø | |
Strategic
Hotels &
Resorts, Inc.,
Ser. C, 8.25% | | | 891 | | | | 20,493 | *Ø | |
| | | | 74,200 | | |
Thrifts & Mortgage Finance (0.0%) | |
Astoria Financial
Corp., Ser. C,
6.50% | | | 2,029 | | | | 44,293 | * | |
Federal National
Mortgage
Association,
Ser. S, 8.25% | | | 4,827 | | | | 34,320 | *Ø? | |
| | | | 78,613 | | |
Total Preferred Stocks
(Cost $1,983,421) | | | | | 2,001,330 | | |
Exchange Traded Funds (0.5%) | |
db x-trackers
ShortDAX Daily
UCITS ETF | | | 2,045 | | | | 100,124 | *Ø | |
PowerShares DB
U.S. Dollar
Index Bullish
Fund | | | 105,400 | | | | 2,278,748 | *Ø | |
ProShares Short
20+ Year
Treasury | | | 3,565 | | | | 112,476 | *Ø | |
Total Exchange Traded Funds
(Cost $2,537,129) | | | | | 2,491,348 | | |
Investment Companies (0.0%) | |
Mutual Funds (0.0%) | |
Nuveen Ohio
Quality Income
Municipal Fund
(Cost $29,377) | | | 2,102 | | | | 30,016 | | |
| | | Number
of Rights | | Value† | |
Rights (0.0%) | |
Biotechnology (0.0%) | |
Cubist
Pharmaceuticals,
Inc. | | | 5,000 | | | $ | 9,650 | * | |
Pharmaceuticals (0.0%) | |
Sanofi | | | 48,123 | | | | 91,434 | *Ø | |
Total Rights
(Cost $92,055) | | | | | 101,084 | | |
| | | Number
of Warrants | | | |
Warrants (0.0%) | |
Insurance (0.0%) | |
American
International
Group, Inc. | | | 2,577 | | | | 54,968 | * | |
Machinery (0.0%) | |
Xerium
Technologies,
Inc. | | | 8,437 | | | | 2,109 | *Ø | |
Media (0.0%) | |
Tribune Co. | | | 1,877 | | | | 125,571 | * | |
Total Warrants
(Cost $142,001) | | | | | 182,648 | | |
| | | Principal
Amount | | | |
U.S. Treasury Securities-Backed by the Full Faith and Credit of the U.S. Government (0.0%) | |
U.S. Treasury
Bonds, 3.13%,
due 2/15/43
(Cost
$32,103) | | $ | 32,000 | | | | 28,960 | Ø | |
Mortgage-Backed Securities (2.4%) | |
Collateralized Mortgage
Obligations (1.5%) | |
Bear Stearns
Asset Backed
Securities Trust,
Ser. 2004-AC4,
Class A1, 5.83%,
due 8/25/34 | | | 462,768 | | | | 473,457 | aØ | |
Citicorp
Mortgage
Securities REMIC
Pass-Through
Certificates Trust,
Ser. 2005-7,
Class 1A4,
5.50%, due
10/25/35 | | | 398,822 | | | | 391,659 | Ø | |
See Notes to Schedule of Investments
15
| | | Principal
Amount | | Value† | |
Citicorp
Mortgage
Securities, Inc.,
Ser. 2006-4,
Class 1A2,
6.00%, due
8/25/36 | | $ | 682,006 | | | $ | 690,189 | Ø | |
Citicorp
Mortgage
Securities, Inc.,
Ser. 2007-8,
Class 1A4,
6.00%, due
9/25/37 | | | 245,972 | | | | 239,936 | Ø | |
First Horizon
Mortgage
Pass-Through
Trust,
Ser. 2005-5,
Class 1A3,
5.50%, due
10/25/35 | | | 336,822 | | | | 336,442 | Ø | |
GSR Mortgage
Loan Trust,
Ser. 2005-AR6,
Class 3A2,
2.66%, due
9/25/35 707,986 656,921?
JP Morgan
Mortgage Trust,
Ser. 2007-A1,
Class 4A1,
2.74%, due
7/25/35 | | | 383,338 | | | | 380,653 | Ø? | |
MASTR
Alternative
Loans Trust,
Ser. 2004-10,
Class 4A1,
6.00%, due
9/25/19 | | | 199,887 | | | | 207,293 | Ø | |
PHH Mortgage
Trust,
Ser. 2008-CIM1,
Class 21A2,
6.00%, due
5/25/38 | | | 291,949 | | | | 293,315 | Ø | |
RFMSI Trust,
Ser. 2005-SA3,
Class 1A,
2.86%, due
8/25/35 | | | 437,030 | | | | 348,054 | Ø? | |
Structured
Asset Securities
Corp. Trust,
Ser. 2005-6,
Class 2A1,
5.50%, due
5/25/35 | | | 363,925 | | | | 370,910 | Ø | |
| | | Principal
Amount | | Value† | |
WaMu
Mortgage
Pass-Through
Certificates,
Ser. 2004-S1,
Class 1A11,
5.50%, due
3/25/34 | | $ | 265,781 | | | $ | 273,812 | Ø | |
Wells Fargo
Mortgage
Backed
Securities Trust,
Ser. 2005-AR9,
Class 3A2,
2.66%, due
6/25/34 | | | 470,324 | | | | 447,569 | Ø? | |
Wells Fargo
Mortgage
Backed
Securities Trust,
Ser. 2006-13,
Class A5,
6.00%, due
10/25/36 | | | 410,110 | | | | 414,348 | Ø | |
Wells Fargo
Mortgage
Backed
Securities Trust,
Ser. 2007-14,
Class 1A1,
6.00%, due
10/25/37 | | | 896,117 | | | | 891,391 | | |
Wells Fargo
Mortgage
Backed
Securities Trust,
Ser. 2007-16,
Class 1A7,
6.00%, due
12/28/37 | | | 463,979 | | | | 476,374 | Ø | |
| | | | 6,892,323 | | |
Commercial Mortgage-Backed (0.9%) | |
Boca Hotel
Portfolio Trust,
Ser. 2013-BOCA,
Class E, 3.92%,
due 8/15/26 | | | 700,000 | | | | 700,463 | ñ? | |
COMM
Mortgage Trust,
Ser. 2006-FL12,
Class F, 0.51%,
due 12/15/20 | | | 454,987 | | | | 438,676 | ñ? | |
Credit Suisse
First Boston
Commercial
Mortgage Trust,
Ser. 2003-C3,
Class H, 5.16%,
due 5/15/38 | | | 600,000 | | | | 594,191 | ñ? | |
| | | Principal
Amount | | Value† | |
Credit Suisse
Mortgage
Capital
Certificates,
Ser. 2006-TF2A,
Class KERE,
0.77%, due
9/15/21 | | $ | 170,781 | | | $ | 165,221 | ñØ? | |
LB-UBS
Commercial
Mortgage Trust,
Ser. 2006-C4,
Class AJ, 5.88%,
due 6/15/38 | | | 500,000 | | | | 517,480 | Ø? | |
LB-UBS
Commercial
Mortgage Trust,
Ser. 2007-C1,
Class AJ,
5.48%, due
2/15/40 | | | 900,000 | | | | 919,163 | Ø | |
NorthStar,
Ser. 2013-1A,
Class B, 5.17%,
due 8/25/29 | | | 500,000 | | | | 496,719 | ñØ? | |
UBS Commercial
Mortgage Trust,
Ser. 2007-FL1,
Class F, 0.75%,
due 7/15/24 | | | 475,000 | | | | 426,597 | ñØ? | |
| | | 4,258,510 | | |
Total Mortgage-Backed Securities
(Cost $11,172,903) | | | | | 11,150,833 | | |
Asset-Backed Securities (0.4%) | |
Countrywide
Asset-Backed
Certificates,
Ser. 2005-7,
Class AF4,
4.87%, due
10/25/35 | | | 520,813 | | | | 522,074 | Ø? | |
JP Morgan
Mortgage
Acquisition
Corp.,
Ser. 2007-CH1,
Class AF3,
5.50%, due
11/25/36 | | | 789,961 | | | | 801,357 | aØ | |
Structured Asset
Securities Corp.
Mortgage Loan
Trust,
Ser. 2005-4XS,
Class 1A3,
5.00%,
due 3/25/35 | | | 594,087 | | | | 609,836 | aØ | |
Total Asset-Backed Securities
(Cost $1,941,161) | | | | | 1,933,267 | | |
See Notes to Schedule of Investments
16
| | | Principal
Amount | | Value† | |
Corporate Debt Securities (1.1%) | |
Aerospace & Defense (0.0%) | |
Alliant
Techsystems,
Inc., 5.25%,
due 10/1/21 | | $ | 15,000 | | | $ | 15,094 | ñ | |
Building Products (0.0%) | |
USG Corp.,
5.88%, due
11/1/21 | | | 154,000 | | | | 157,080 | ñ | |
Chemicals (0.1%) | |
Montell Finance
Co. BV, 8.10%,
due 3/15/27 | | | 127,000 | | | | 165,773 | ñØ | |
Commercial Services & Supplies (0.0%) | |
Harland Clarke
Holdings Corp.,
9.50%, due
5/15/15 | | | 36,000 | | | | 36,090 | Ø | |
Communications Equipment (0.0%) | |
Avaya, Inc.,
10.50%, due
3/1/21 | | | 109,000 | | | | 94,830 | ñ | |
Computers & Peripherals (0.1%) | |
Seagate HDD
Cayman, 3.75%,
due 11/15/18 | | | 310,000 | | | | 310,000 | ñ | |
Diversified Financial Services (0.1%) | |
Lehman Brothers
Holdings, Inc.,
6.88%, due
5/2/18 | | | 1,000,000 | | | | 217,500 | ≠Ø | |
Diversified Telecommunication
Services (0.2%) | |
Intelsat Jackson
Holdings SA,
5.50%, due
8/1/23 | | | 863,000 | | | | 832,795 | ñØ | |
Level 3
Financing, Inc.,
6.13%, due
1/15/21 | | | 154,000 | | | | 156,695 | ñ | |
| | | | 989,490 | | |
Electric Utilities (0.1%) | |
Energy Future
Intermediate
Holding Co.
LLC, 11.00%,
due 10/1/21 | | | 50,000 | | | | 54,875 | Ø | |
Energy Future
Intermediate
Holding Co.
LLC, 12.25%,
due 3/1/22 | | | 428,000 | | | | 492,200 | ñ | |
| | | | 547,075 | | |
| | | Principal
Amount | | Value† | |
Energy Equipment & Services (0.0%) | |
Pacific Drilling
SA, 8.25%,
due 2/23/15 | | $ | 100,000 | | | $ | 105,250 | Ø | |
Hotels, Restaurants & Leisure (0.1%) | |
Caesars
Entertainment
Operating Co.,
Inc., 11.25%,
due 6/1/17 | | | 165,000 | | | | 164,587 | Ø | |
Caesars
Entertainment
Resort
Properties LLC,
8.00%, due
10/1/20 | | | 253,000 | | | | 253,633 | ñØ | |
Mohegan Tribal
Gaming
Authority,
9.75%, due
9/1/21 | | | 167,000 | | | | 179,943 | ñØ | |
| | | | 598,163 | | |
Independent Power Producers & Energy Traders (0.0%) | |
Edison Mission
Energy, 7.00%,
due 5/15/17 | | | 168,000 | | | | 122,640 | ≠ | |
Insurance (0.1%) | |
Ambac
Assurance
Corp., 5.10%,
due 6/7/20 | | | 363,000 | | | | 323,070 | ≠ñØ | |
Internet Software & Services (0.1%) | |
Ancestry.com,
Inc., 9.63%,
due 10/15/18 | | | 217,000 | | | | 221,882 | cñ | |
Media (0.0%) | |
Gray Television,
Inc., 7.50%,
due 10/1/20 | | | 71,000 | | | | 74,373 | ñ | |
Oil, Gas & Consumable Fuels (0.0%) | |
Kinder Morgan,
Inc., 5.00%,
due 2/15/21 | | | 31,000 | | | | 31,000 | ñ | |
Kinder Morgan,
Inc., 5.63%,
due 11/15/23 | | | 38,000 | | | | 38,000 | ñ | |
| | | | 69,000 | | |
Pharmaceuticals (0.0%) | |
Capsugel SA,
7.00%, due
5/15/19 | | | 155,000 | | | | 155,000 | cñ | |
Semiconductors & Semiconductor Equipment (0.0%) | |
Freescale
Semiconductor,
Inc., 6.00%,
due 1/15/22 | | | 39,000 | | | | 39,439 | ñ | |
| | | Principal
Amount | | Value† | |
Software (0.1%) | |
Audatex North
America, Inc.,
6.13%, due
11/1/23 | | $ | 284,000 | | | $ | 288,260 | ñ | |
Specialty Retail (0.0%) | |
Chinos
Intermediate
Holdings A,
Inc., 7.75%,
due 5/1/19 | | | 154,000 | | | | 154,962 | cñ | |
Transportation Infrastructure (0.1%) | |
Navios Maritime
Acquisition
Corp. / Navios
Acquisition
Finance US,
Inc., 8.13%,
due 11/15/21 | | | 308,000 | | | | 311,080 | ñ | |
Wireless Telecommunication
Services (0.0%) | |
Clearwire
Communications
LLC / Clearwire
Finance, Inc.,
12.00%, due
12/1/15 | | | 92,000 | | | | 95,404 | ñØ | |
Total Corporate Debt Securities
(Cost $4,900,456) | | | | | 5,091,455 | | |
Convertible Corporate Debt
Securities (0.0%) | |
Communications Equipment (0.0%) | |
Nortel Networks
Corp., 1.75%,
due 4/15/12
(Cost $81,340) | | | 83,000 | | | | 81,962 | Ø≠ | |
| Bank Loan Obligations?(8.1%) | |
Aerospace & Defense (0.1%) | |
Consolidated
Precision
Products Corp.,
2nd Lien Term
Loan, due
4/21/23 | | | 500,000 | | | | 503,750 | ¢^^Ñ | |
Auto Parts & Equipment (0.1%) | |
Metaldyne LLC,
Term Loan B,
due 12/18/18 | | | 450,000 | | | | 452,812 | ¢^^ | |
Building Products (0.4%) | |
Continental
Building
Products LLC,
8.50%, due
2/15/21 | | | 500,000 | | | | 500,000 | Ø | |
See Notes to Schedule of Investments
17
| | | Principal
Amount | | Value† | |
Quikrete
Holdings, Inc.,
1st Lien Term
Loan, 4.00%,
due 9/18/20 | | $ | 500,000 | | | $ | 501,875 | Ø | |
Quikrete
Holdings, Inc.,
2nd Lien Term
Loan, 7.00%,
due 3/19/21 | | | 60,000 | | | | 61,350 | Ø | |
Tomkins Air
Distribution
Technologies,
2nd Lien Term
Loan, 9.25%,
due 10/31/20 | | | 600,000 | | | | 608,250 | Ø | |
| | | | 1,671,475 | | |
Chemicals (0.1%) | |
Ascend
Performance
Materials LLC,
Term Loan B,
6.75%, due
4/4/18 | | | 205,000 | | | | 194,238 | | |
OXEA, 2nd Lien
Term Loan,
8.25%, due
6/5/20 | | | 49,000 | | | | 49,582 | Ø | |
Royal
Adhesives &
Sealants LLC,
2nd Lien Term
Loan, 9.75%,
due 12/31/20 | | | 87,000 | | | | 87,000 | ØÑ | |
| | | | 330,820 | | |
Commercial Services & Supplies (0.6%) | |
Eastman Kodak
Co., 2nd Lien
Term Loan,
10.75%, due
7/31/20 | | | 250,000 | | | | 250,938 | Ø | |
Eastman Kodak
Co., Term Loan,
7.25%, due
7/31/19 | | | 498,750 | | | | 496,047 | Ø | |
GCA Services
Group, Inc.,
2nd Lien Term
Loan, 9.25%,
due 12/31/19 | | | 77,000 | | | | 77,770 | Ø | |
Insight Global,
Inc., due
10/31/19 | | | 500,000 | | | | 500,000 | ¢^^ | |
Sedgwick Claims
Management
Services, Inc.,
1st Lien Term
Loan, 4.25%,
due 6/7/18 | | | 179,550 | | | | 180,561 | Ø | |
| | | Principal
Amount | | Value† | |
Sedgwick Claims
Management
Services, Inc.,
2nd Lien Term
Loan, 8.00%,
due 12/7/18 | | $ | 330,000 | | | $ | 335,362 | Ø | |
TriNET HR Corp.,
1st Lien Term
Loan B2,
5.00%, due
8/30/19 | | | 500,000 | | | | 495,625 | Ø | |
TriNET HR Corp.,
2nd Lien Term
Loan, 8.75%,
due 12/30/19 | | | 500,000 | | | | 492,190 | Ø | |
| | | | 2,828,493 | | |
Communications Equipment (0.2%) | |
Sorenson
Communications,
Inc., Term Loan,
9.50%, due
10/31/14 | | | 1,103,169 | | | | 1,115,579 | آ^^ | |
Computers & Peripherals (0.3%) | |
Dell, Inc., Term
Loan B1, due
3/11/20 | | | 1,334,000 | | | | 1,325,796 | آ^^ | |
Diversified Consumer Services (0.0%) | |
Coinmach
Service Corp.,
Term Loan,
5.50%, due
11/15/19 | | | 250,000 | | | | 249,375 | Ø | |
Diversified Financial Services (0.3%) | |
Duff & Phelps
Corp., Term
Loan B, due
4/23/20 | | | 950,000 | | | | 949,411 | ¢^^ | |
Guggenheim
Partners LLC,
Term Loan B,
4.25%, due
12/31/18 | | | 206,000 | | | | 206,944 | Ø | |
Walter
Investment
Management
Corp., Term
Loan, 5.75%,
due 11/15/17 | | | 237,500 | | | | 239,528 | Ø | |
| | | | 1,395,883 | | |
Diversified Telecommunication
Services (0.2%) | |
Fairpoint
Communications,
Inc., Term
Loan B, 7.50%,
due 2/14/19 | | | 528,839 | | | | 538,606 | آ | |
| | | Principal
Amount | | Value† | |
Global Telecom
Link Corp.,
2nd Lien Term
Loan, 9.00%,
due 5/21/20 | | $ | 325,000 | | | $ | 314,438 | Ø | |
Securus
Technologies
Holdings, Inc.,
2nd Lien Term
Loan, 9.00%,
due 4/2/21 | | | 59,000 | | | | 58,361 | Ø | |
| | | | 911,405 | | |
Electronic Equipment, Instruments & Components (0.2%) | |
Excelitas
Technologies
Corp., 1st Lien
Term Loan, due
10/23/20 | | | 935,000 | | | | 935,000 | ¢^^ | |
Excelitas
Technologies
Corp., Term
Loan, due
10/23/20 | | | 65,000 | | | | 65,000 | ¢^^ | |
| | | | 1,000,000 | | |
Energy Equipment & Services (0.1%) | |
Alinta Energy
Holdings Pty.
Ltd., due
12/31/20 | | | 25,789 | | | | 25,435 | Ø¢†† | |
Alinta Energy
Holdings Pty.
Ltd., 6.37%,
due 12/31/20 | | | 394,211 | | | | 388,790 | آ | |
Stallion Oilfield
Holdings, Inc.,
Term Loan,
8.00%, due
6/3/18 | | | 148,628 | | | | 151,414 | ØÑ | |
Texas
Competitive
Holdings LLC,
Extended Term
Loan, 4.67%,
due 10/10/17 | | | 106,000 | | | | 70,593 | Ø | |
| | | | 636,232 | | |
Food Products (0.2%) | |
CTI Foods
Holding Co.,
LLC, 2nd Lien
Term Loan,
8.25%, due
6/30/19 | | | 65,000 | | | | 64,675 | Ø | |
H.J. Heinz
Holding Corp.,
due 6/7/19 | | | 254,363 | | | | 255,660 | آ | |
See Notes to Schedule of Investments
18
| | | Principal
Amount | | Value† | |
Performance
Food Group,
Inc., 2nd Lien
Term Loan,
6.25%, due
10/29/19 | | $ | 498,750 | | | $ | 497,089 | Ø | |
| | | | 817,424 | | |
Health Care Equipment & Supplies (0.0%) | |
Carestream
Health, Inc.,
2nd Lien Term
Loan, 9.50%,
due 12/5/19 | | | 93,000 | | | | 93,077 | Ø | |
Health Care Providers & Services (0.4%) | |
Genesis
HealthCare
LLC, Term Loan,
10.00%, due
10/2/17 | | | 183,494 | | | | 187,164 | Ø | |
Gentiva Health
Services, Inc.,
Term Loan B,
due 10/16/19 | | | 1,500,000 | | | | 1,491,090 | آ^^ | |
| | | | 1,678,254 | | |
Health Care Technology (0.1%) | |
The TriZetto
Group Inc.,
4.75%, due
4/26/18 | | | 104,732 | | | | 97,401 | Ø | |
The TriZetto
Group Inc.,
2nd Lien Term
Loan, 8.50%,
due 3/27/19 | | | 500,000 | | | | 435,000 | ÑØ | |
| | | | 532,401 | | |
Hotels, Restaurants & Leisure (1.0%) | |
Bally
Technologies,
Inc., 1st Lien
Term Loan B,
due 8/21/20 | | | 500,000 | | | | 501,250 | آ^^ | |
Caesars
Entertainment
Corp., 1st Lien
Term Loan,
7.00%, due
10/9/20 | | | 600,000 | | | | 591,096 | آ | |
Harrah's
Entertainment,
Inc., Term
Loan B4,
9.50%, due
10/31/16 | | | 106,447 | | | | 106,269 | آ | |
Harrah's
Entertainment,
Inc., Term
Loan B5,
4.49%, due
1/28/18 | | | 2,000,000 | | | | 1,833,880 | آ^^ | |
| | | Principal
Amount | | Value† | |
Harrah's
Entertainment,
Inc., Term
Loan B6,
5.49%, due
1/28/18 | | $ | 1,100,000 | | | $ | 1,030,931 | Ø | |
Hilton Hotels
Holdings Corp.,
Term Loan B2,
4.00%, due
9/23/20 | | | 750,000 | | | | 754,140 | Ø | |
| | | | 4,817,566 | | |
Independent Power Producers & Energy Traders (0.2%) | |
Calpine Corp.,
Term Loan, due
10/30/20 | | | 1,000,000 | | | | 1,006,250 | ¢^^ | |
Insurance (0.2%) | |
Asurion LLC,
Term Loan B2,
3.50%, due
6/19/20 | | | 778,050 | | | | 762,979 | Ø | |
Internet Software & Services (0.5%) | |
Digital Insight
Corp., 1st Lien
Term Loan,
4.75%, due
8/1/19 | | | 500,000 | | | | 499,790 | آ | |
Digital Insight
Corp., 2nd Lien
Term Loan,
8.75%, due
8/1/20 | | | 500,000 | | | | 501,665 | Ø | |
Manwin
Licensing
International,
1st Lien Term
Loan, 14.00%,
due 10/4/18 | | | 1,482,000 | | | | 1,467,180 | Ñ | |
Travelport Ltd.,
due 1/31/16 | | | 157,000 | | | | 162,495 | آ | |
| | | 2,631,130 | | |
IT Services (0.1%) | |
Virtu Financial
LLC, Term Loan,
5.75%, due
7/1/16 | | | 498,230 | | | | 500,876 | Ø | |
Media (0.3%) | |
Advanstar, Inc.,
2nd Lien Term
Loan, 9.50%,
due 5/14/20 | | | 62,000 | | | | 61,896 | Ø | |
Clear Channel
Capital I LLC,
due 1/30/19 | | | 310,000 | | | | 294,540 | آ | |
| | | Principal
Amount | | Value† | |
Gatehouse
Media
Operating Inc.,
Term Loan C,
2.52%, due
8/24/14 | | $ | 503 | | | $ | 197 | ¢^^ | |
Lee Enterprises,
Inc., due
12/31/15 | | | 231,000 | | | | 228,459 | ¢ | |
Penton Media,
Inc., 2nd Lien
Term Loan,
9.00%, due
10/1/20 | | | 136,000 | | | | 134,556 | Ø | |
Springer
Science+Business
Media, Term
Loan B2,
5.00%, due
7/23/20 | | | 750,000 | | | | 749,768 | Ø | |
| | | | 1,469,416 | | |
Metals & Mining (0.1%) | |
Fairmount
Minerals Ltd.,
Term Loan B,
5.00%, due
9/3/19 | | | 500,000 | | | | 504,645 | Ø | |
Tube City IMS
LLC, Term
Loan B, due
10/2/20 | | | 204,000 | | | | 204,384 | آ^^ | |
| | | | 709,029 | | |
Multiline Retail (0.1%) | |
Hudson's Bay
Co., 2nd Lien
Term Loan, due
10/8/21 | | | 300,000 | | | | 307,875 | ¢^^ | |
Oil, Gas & Consumable Fuels (0.2%) | |
Bowie Resources
LLC, 1st Lien
Term Loan,
6.75%, due
8/7/20 | | | 203,000 | | | | 204,015 | Ø | |
Bowie Resources
LLC, 2nd Lien
Term Loan,
11.75%, due
12/31/20 | | | 45,000 | | | | 44,100 | ØÑ | |
NFR Energy LLC,
2nd Lien Term
Loan, 8.75%,
due 12/31/18 | | | 500,000 | | | | 501,875 | Ø | |
Oxbow
Carbon &
Minerals LLC,
2nd Lien Term
Loan, 8.00%,
due 1/18/20 | | | 52,000 | | | | 52,910 | Ø | |
See Notes to Schedule of Investments
19
| | | Principal
Amount | | Value† | |
PowerTeam
Services LLC,
2nd Lien Term
Loan, 8.25%,
due
11/15/20 | | $ | 52,000 | | | $ | 51,588 | آ | |
Samson
Resources Co.,
due 9/25/18 | | | 250,000 | | | | 251,798 | آ | |
| | | | 1,106,286 | | |
Pharmaceuticals (0.2%) | |
Amneal
Pharmaceuticals
LLC, Term
Loan B, due
10/30/20 | | | 556,000 | | | | 556,000 | ¢^^ | |
PRA Holdings,
Inc., Term
Loan, 5.00%,
due 12/31/20 | | | 500,000 | | | | 500,000 | Ø | |
| | | | 1,056,000 | | |
Software (1.6%) | |
Ascend Learning
LLC, Term
Loan B, 7.00%,
due 12/31/20 | | | 997,455 | | | | 994,962 | Ø | |
Avaya Holdings
Corp., due
10/26/17 | | | 196,675 | | | | 181,643 | آ | |
Mitchell
International,
Inc., 2nd Lien
Term Loan, due
10/1/21 | | | 197,000 | | | | 199,709 | آ^^ | |
Mitchell
International,
Inc., Term
Loan B1,
4.50%, due
10/1/20 | | | 170,000 | | | | 171,063 | Ø | |
P2 Energy
Solutions, Inc.,
1st Lien Term
Loan, due
10/22/20 | | | 637,000 | | | | 637,000 | ¢^^Ñ | |
P2 Energy
Solutions, Inc.,
2nd Lien Term
Loan, due
4/30/21 | | | 605,000 | | | | 605,000 | ¢^^Ñ | |
Progressive
Solutions, Inc.,
1st Lien Term
Loan, due
10/16/20 | | | 1,000,000 | | | | 1,002,500 | ¢^^Ñ | |
RedPrairie
Corp., 1st Lien
Term Loan,
6.75%, due
12/14/18 | | | 340,642 | | | | 343,793 | آ | |
| | | Principal
Amount | | Value† | |
Renaissance
Learning, Inc.,
1st Lien Term
Loan, due
10/16/20 | | $ | 1,500,000 | | | $ | 1,498,755 | آ^^ | |
Renaissance
Learning, Inc.,
2nd Lien Term
Loan, due
4/16/19 | | | 1,000,000 | | | | 1,007,500 | آ^^ | |
StoneRiver
Holdings, Inc.,
1st Lien Term
Loan, 4.50%,
due 11/29/19 | | | 61,731 | | | | 61,396 | Ø | |
StoneRiver
Holdings, Inc.,
2nd Lien Term
Loan, 8.50%,
due 5/14/20 | | | 592,353 | | | | 596,428 | Ø | |
Websense, Inc.,
2nd Lien Term
Loan, 8.25%,
due 12/18/20 | | | 54,000 | | | | 53,932 | Ø | |
| | | | 7,353,681 | | |
Trading Companies & Distributors (0.1%) | |
HD Supply, Inc.,
1st Lien Term
Loan, due
10/12/17 | | | 349,000 | | | | 351,181 | �� | |
Transportation Infrastructure (0.2%) | |
Livingston
International,
Inc., 2nd Lien
Term Loan,
9.00%, due
3/27/20 | | | 128,038 | | | | 128,358 | Ø | |
Navios Maritime
Partners LP, Term
Loan, due
6/18/30 | | | 750,000 | | | | 759,375 | ¢^^ | |
| | | | 887,733 | | |
Total Bank Loan Obligations
(Cost $38,163,134) | | | | | 38,502,778 | | |
| | | Number
of Contracts | | | |
Purchased Options (0.4%) | |
Call Options (0.0%) | |
Astoria Financial
Corp., Call,
Jan 2014
@ 12.5 | | | 45 | | | | 4,050 | | |
Astoria Financial
Corp., Call,
Jan 2014
@ 15 | | | 65 | | | | 325 | | |
BlackBerry Ltd.,
Call, Nov 2013
@ 15 | | | 27 | | | | — | | |
| | | Number
of Contracts | | Value† | |
BlackBerry Ltd.,
Call, Dec 2013
@ 9 | | | 22 | | | $ | 660 | | |
BlackBerry Ltd.,
Call, Dec 2013
@ 10 | | | 63 | | | | 819 | | |
BlackBerry Ltd.,
Call, Dec 2013
@ 11 | | | 58 | | | | 406 | | |
Cablevision
Systems Corp.,
Call, Dec 2013
@ 20 | | | 82 | | | | 820 | | |
Campbell Soup
Co., Call,
Nov 2013 @ 45 | | | 22 | | | | — | | |
Cia de Minas
Buenaventura
SAA, Call,
Dec 2013 @ 16 | | | 55 | | | | 1,925 | | |
Fusion-io, Inc.,
Call, Dec 2013
@ 19 | | | 44 | | | | 176 | | |
General Motors
Co., Call,
Nov 2013 @ 35 | | | 13 | | | | 2,873 | ± | |
Iron Mountain,
Inc., Call,
Nov 2013
@ 32.5 | | | 45 | | | | 450 | ± | |
NII Holdings,
Inc., Call,
Dec 2013 @ 9 | | | 80 | | | | 160 | | |
NII Holdings,
Inc., Call,
Dec 2013 @ 10 | | | 54 | | | | 108 | | |
Penn West
Petroleum Ltd.,
Call, Nov 2013
@ 12 | | | 75 | | | | 750 | | |
Penn West
Petroleum Ltd.,
Call, Dec 2013
@ 15 | | | 138 | | | | — | | |
Synovus
Financial Corp.,
Call, Jan 2014
@ 3.5 | | | 54 | | | | 540 | | |
Synovus
Financial Corp.,
Call, Jan 2014
@ 4 | | | 37 | | | | — | | |
The Active
Network, Inc.,
Call, Jan 2014
@ 15 | | | 27 | | | | — | | |
US Airways
Group, Inc.,
Call, Jan 2014
@ 20 | | | 39 | | | | 11,661 | | |
Valley National
Bancorp., Call,
Dec 2013 @ 11 | | | 12 | | | | 48 | | |
See Notes to Schedule of Investments
20
| | | Number
of Contracts | | Value† | |
Valley National
Bancorp., Call,
Dec 2013 @ 12 | | | 71 | | | $ | — | | |
Weatherford
International
Ltd., Call,
Jan 2014 @ 18 | | | 60 | | | | 2,640 | | |
Zynga, Inc., Call,
Dec 2013 @ 5 | | | 56 | | | | 112 | | |
| | | | 28,523 | | |
Put Options (0.4%) | |
American
Capital Agency
Corp., Put,
Dec 2013 @ 15 | | | 8 | | | | — | | |
American
Capital Agency
Corp., Put,
Dec 2013 @ 20 | | | 18 | | | | 378 | | |
American
Capital Agency
Corp., Put,
Jan 2014 @ 17 | | | 116 | | | | 812 | | |
Annaly Capital
Management,
Inc., Put,
Dec 2013 @ 10 | | | 36 | | | | 180 | | |
AsiaInfo-Linkage,
Inc., Put,
Jan 2014 @ 11 | | | 26 | | | | 260 | | |
BMC Software,
Inc., Put,
Nov 2013 @ 45 | | | 22 | | | | — | | |
ICU Medical,
Inc., Put,
Nov 2013 @ 70 | | | 20 | | | | 14,200 | | |
Iron Mountain,
Inc., Put,
Nov 2013
@ 22.5 | | | 71 | | | | 355 | | |
iShares
Russell 2000
ETF, Put,
Dec 2013
@ 110 | | | 12 | | | | 3,528 | ± | |
iShares
Russell 2000
ETF, Put,
Jun 2014 @ 96 | | | 284 | | | | 83,212 | ± | |
iShares
Russell 2000
Index Fund,
Put, Nov 2013
@ 90 | | | 59 | | | | — | ± | |
Lamar
Advertising Co.,
Put, Nov 2013
@ 40 | | | 135 | | | | 3,375 | | |
Leap Wireless
International,
Inc., Put,
Apr 2014 @ 13 | | | 73 | | | | 1,460 | | |
| | | Number
of Contracts | | Value† | |
Lender
Processing
Services, Inc.,
Put, Dec 2013
@ 29 | | | 22 | | | $ | — | | |
MAKO Surgical
Corp., Put,
Jan 2014 @ 20 | | | 13 | | | | 130 | | |
MAKO Surgical
Corp., Put,
Jan 2014
@ 27.5 | | | 64 | | | | 640 | | |
Netflix, Inc., Put,
Dec 2013
@ 310 | | | 1 | | | | 1,445 | | |
Russell 2000
Index, Put,
Nov 2013
@ 1070 | | | 8 | | | | 3,560 | | |
Russell 2000
Index, Put,
Dec 2013
@ 1080 | | | 5 | | | | 9,560 | | |
Russell 2000
Index, Put,
Dec 2013
@ 1100 | | | 3 | | | | 7,950 | | |
Russell 2000
Index, Put,
Dec 2013
@ 1110 | | | 5 | | | | 15,555 | | |
Russell 2000
Index, Put,
Jan 2014
@ 1100 | | | 4 | | | | 14,100 | | |
S&P 500 Index,
Put, Dec 2013
@ 1680 | | | 2 | | | | 1,990 | | |
S&P 500 Index,
Put, Dec 2013
@ 1705 | | | 1 | | | | 1,385 | | |
S&P 500 Index,
Put, Dec 2013
@ 1720 | | | 2 | | | | 3,508 | | |
S&P 500 Index,
Put, Dec 2013
@ 1750 | | | 2 | | | | 6,000 | | |
S&P 500 Index,
Put, Dec 2013
@ 1760 | | | 3 | | | | 9,570 | | |
S&P 500 Index,
Put, Dec 2013
@ 1770 | | | 5 | | | | 16,500 | | |
S&P 500 Index,
Put, Jan 2014
@ 1730 | | | 3 | | | | 9,915 | | |
S&P 500 Index,
Put, Jan 2014
@ 1770 | | | 2 | | | | 9,980 | | |
Safeway, Inc.,
Put, Dec 2013
@ 33 | | | 27 | | | | 2,565 | | |
| | | Number
of Contracts | | Value† | |
SPDR S&P 500
ETF Trust, Put,
Nov 2013
@ 169 | | | 4 | | | $ | 100 | | |
SPDR S&P 500
ETF Trust, Put,
Dec 2013
@ 164 | | | 1,200 | | | | 97,200 | ± | |
SPDR S&P 500
ETF Trust, Put,
Dec 2013
@ 166 | | | 2,000 | | | | 228,000 | ± | |
SPDR S&P 500
ETF Trust, Put,
Dec 2013
@ 167 | | | 4 | | | | 424 | ± | |
SPDR S&P 500
ETF Trust, Put,
Dec 2013
@ 168 | | | 1,300 | | | | 169,000 | ± | |
SPDR S&P 500
ETF Trust, Put,
Dec 2013
@ 172 | | | 5 | | | | 1,035 | ± | |
SPDR S&P 500
ETF Trust, Put,
Dec 2013
@ 173 | | | 13 | | | | 3,081 | ± | |
SPDR S&P 500
ETF Trust, Put,
Mar 2014
@ 171 | | | 2,000 | | | | 880,000 | ± | |
Spreadtrum
Communications,
Inc., Put,
Nov 2013 @ 23 | | | 14 | | | | — | | |
Tesla Motors,
Inc., Put,
Dec 2013
@ 165 | | | 2 | | | | 3,576 | | |
The Active
Network, Inc.,
Put, Jan 2014
@ 12.5 | | | 27 | | | | — | | |
Theravance, Inc.,
Put, Jan 2014
@ 39 | | | 235 | | | | 110,450 | ± | |
Tower Group
International
Ltd., Put,
Nov 2013 @ 6 | | | 10 | | | | 2,300 | | |
ViroPharma,
Inc., Put,
Nov 2013 @ 35 | | | 33 | | | | 2,145 | ± | |
ViroPharma,
Inc., Put,
Jan 2014 @ 35 | | | 319 | | | | 95,700 | | |
WisdomTree
Japan Hedged
Equity Fund,
Put, Nov 2013
@ 45 | | | 24 | | | | 360 | | |
See Notes to Schedule of Investments
21
| | | Number
of Contracts | | Value† | |
WisdomTree
Japan Hedged
Equity Fund,
Put, Nov 2013
@ 46 | | | 30 | | | $ | 750 | | |
WisdomTree
Japan Hedged
Equity Fund,
Put, Nov 2013
@ 47 | | | 12 | | | | 540 | | |
| | | | 1,816,774 | | |
Total Purchased Options
(Cost $3,995,043) | | | | | 1,845,297 | | |
| | | Principal
Amount | | | |
Short-Term Investments (39.9%) | |
U.S. Treasury Securities-Backed by the Full Faith and Credit of the U.S. Government (0.0%) | |
U.S. Treasury
Bills, 0.21%,
due 11/7/13 | | $ | 120,000 | | | | 120,000 | | |
| | | Number
of Shares | | | |
Money Market Fund (39.9%) | |
Dreyfus Treasury
Prime Cash
Management | | | 187,447,683 | | | | 187,447,681 | Ø | |
Total Short-Term Investments
(Cost $187,567,677) | | | | | 187,567,681 | | |
Total Long Positions (101.2%)
(Cost $469,521,653) | | | | | 476,103,316 | ## | |
Cash, receivables
and other assets,
less liabilities (18.6%) | | | | | 87,006,561 | ±Ø††† | |
Short Positions
(see summary
below) ((19.8)%) | | | | | (92,813,549 | ) | |
Total Net Assets (100.0%) | | $470,296,328 | |
Short Positions ((19.8)%) | |
| Common Stocks Sold Short (10.7%)£ØØ | |
Aerospace & Defense (0.3%) | |
AAR Corp. | | | (21,650 | ) | | | (633,912 | ) | |
Rockwell
Collins, Inc. | | | (8,050 | ) | | | (562,131 | ) | |
| | | | (1,196,043 | ) | |
Air Freight & Logistics (0.2%) | |
bpost SA | | | (29,679 | ) | | | (624,195 | )* | |
Expeditors
International
of Washington,
Inc. | | | (8,000 | ) | | | (362,320 | ) | |
| | | | (986,515 | ) | |
| | | Number
of Shares | | Value† | |
Airlines (0.0%) | |
United
Continental
Holdings, Inc. | | | (4 | ) | | $ | (136 | )* | |
US Airways
Group, Inc. | | | (2,279 | ) | | | (50,069 | )* | |
| | | | (50,205 | ) | |
Automobiles (0.1%) | |
Daihatsu Motor
Co. Ltd. | | | (29,100 | ) | | | (562,882 | ) | |
General Motors
Co. | | | (1,417 | ) | | | (52,358 | )*± | |
| | | | (615,240 | ) | |
Biotechnology (0.5%) | |
Acorda
Therapeutics,
Inc. | | | (448 | ) | | | (13,713 | )* | |
Agios
Pharmaceuticals,
Inc. | | | (11,237 | ) | | | (260,249 | )* | |
Alnylam
Pharmaceuticals,
Inc. | | | (269 | ) | | | (15,497 | )* | |
Arena
Pharmaceuticals,
Inc. | | | (72,000 | ) | | | (316,080 | )* | |
BioCryst
Pharmaceuticals,
Inc. | | | (1,443 | ) | | | (8,304 | )* | |
Bluebird Bio, Inc. | | | (8,500 | ) | | | (180,625 | )* | |
Cellular
Dynamics
International,
Inc. | | | (448 | ) | | | (6,321 | )* | |
Foundation
Medicine, Inc. | | | (4,092 | ) | | | (130,453 | )* | |
Halozyme
Therapeutics,
Inc. | | | (23,480 | ) | | | (273,542 | )* | |
ImmunoGen,
Inc. | | | (16,460 | ) | | | (270,932 | )* | |
Insmed, Inc. | | | (896 | ) | | | (12,759 | )* | |
Intrexon Corp. | | | (6,600 | ) | | | (139,920 | )* | |
Medivation, Inc. | | | (3,570 | ) | | | (213,700 | )* | |
Myriad Genetics,
Inc. | | | (431 | ) | | | (10,508 | )* | |
Tetraphase
Pharmaceuticals,
Inc. | | | (1,343 | ) | | | (16,828 | )* | |
ThromboGenics
NV | | | (2,855 | ) | | | (78,846 | )* | |
United
Therapeutics
Corp. | | | (5,063 | ) | | | (448,177 | )* | |
| | | | (2,396,454 | ) | |
Capital Markets (0.1%) | |
Greenhill & Co.,
Inc. | | | (11,275 | ) | | | (578,407 | ) | |
| | | Number
of Shares | | Value† | |
Chemicals (0.9%) | |
BASF SE | | | (6,019 | ) | | $ | (626,243 | ) | |
Innophos
Holdings, Inc. | | | (11,850 | ) | | | (593,922 | ) | |
Koninklijke
DSM NV | | | (7,261 | ) | | | (550,012 | ) | |
Koppers
Holdings, Inc. | | | (15,000 | ) | | | (667,650 | ) | |
Potash Corp of
Saskatchewan,
Inc. | | | (13,400 | ) | | | (416,740 | ) | |
Rockwood
Holdings, Inc. | | | (10,900 | ) | | | (689,425 | ) | |
The
Sherwin-Williams
Co. | | | (1,200 | ) | | | (225,600 | ) | |
Umicore SA | | | (11,800 | ) | | | (562,914 | ) | |
| | | | (4,332,506 | ) | |
Commercial Banks (0.8%) | |
M&T Bank
Corp. | | | (26,292 | ) | | | (2,958,639 | ) | |
PacWest
Bancorp. | | | (9,688 | ) | | | (368,628 | ) | |
Umpqua
Holdings Corp. | | | (10,875 | ) | | | (178,024 | ) | |
Union First
Market
Bankshares
Corp. | | | (625 | ) | | | (15,075 | ) | |
United
Bankshares,
Inc. | | | (8,339 | ) | | | (246,668 | ) | |
| | | | (3,767,034 | ) | |
Communications Equipment (0.0%) | |
BlackBerry Ltd. | | | (4,479 | ) | | | (35,429 | )* | |
Computers & Peripherals (0.1%) | |
NCR Corp. | | | (7,200 | ) | | | (263,160 | )* | |
Construction & Engineering (0.2%) | |
Layne
Christensen Co. | | | (38,350 | ) | | | (741,689 | )* | |
Containers & Packaging (0.2%) | |
Bemis Co., Inc. | | | (11,150 | ) | | | (444,885 | ) | |
Rock Tenn Co.
Class A | | | (5,700 | ) | | | (609,957 | ) | |
| | | | (1,054,842 | ) | |
Diversified Consumer Services (0.0%) | |
H&R Block, Inc. | | | (3,046 | ) | | | (86,628 | ) | |
Diversified Financial Services (0.9%) | |
Intercontinental
Exchange, Inc. | | | (20,789 | ) | | | (4,006,664 | )* | |
Diversified Telecommunication
Services (0.2%) | |
Verizon
Communications,
Inc. | | | (16,782 | ) | | | (847,659 | ) | |
See Notes to Schedule of Investments
22
| | | Number
of Shares | | Value† | |
Food & Staples Retailing (0.4%) | |
George Weston
Ltd. | | | (2,221 | ) | | $ | (180,935 | ) | |
Loblaw Cos. Ltd. | | | (3,715 | ) | | | (169,921 | ) | |
Shoprite
Holdings Ltd. | | | (28,925 | ) | | | (529,589 | ) | |
Spartan Stores,
Inc. | | | (760 | ) | | | (17,883 | ) | |
Sysco Corp. | | | (17,500 | ) | | | (565,950 | ) | |
The Kroger Co. | | | (400 | ) | | | (17,136 | ) | |
The Spar Group
Ltd. | | | (42,853 | ) | | | (548,536 | ) | |
| | | | (2,029,950 | ) | |
Food Products (0.4%) | |
Campbell Soup
Co. | | | (13,950 | ) | | | (593,851 | ) | |
Marine Harvest
ASA | | | (805,821 | ) | | | (944,832 | ) | |
WhiteWave
Foods Co.
Class A | | | (13,751 | ) | | | (275,158 | )* | |
| | | | (1,813,841 | ) | |
Health Care Equipment & Supplies (0.4%) | |
Abaxis, Inc. | | | (2,350 | ) | | | (83,966 | ) | |
Cynosure, Inc.
Class A | | | (11,780 | ) | | | (254,566 | )* | |
Edwards
Lifesciences
Corp. | | | (3,870 | ) | | | (252,285 | )* | |
Mazor Robotics
Ltd. ADR | | | (9,400 | ) | | | (169,623 | )* | |
Neogen Corp. | | | (6,360 | ) | | | (293,959 | )* | |
Sirona Dental
Systems, Inc. | | | (10,340 | ) | | | (747,065 | )* | |
| | | | (1,801,464 | ) | |
Health Care Providers & Services (0.9%) | |
Aetna, Inc. | | | (273 | ) | | | (17,117 | ) | |
Catamaran
Corp. | | | (11,500 | ) | | | (540,040 | )* | |
Community
Health Systems,
Inc. | | | (11,628 | ) | | | (507,330 | ) | |
Express Scripts
Holding Co. | | | (7,880 | ) | | | (492,657 | )* | |
Fresenius
Medical Care
AG & Co.
KGaA ADR | | | (8,010 | ) | | | (263,689 | ) | |
Health
Management
Associates, Inc.
Class A | | | (19,634 | ) | | | (251,708 | )* | |
Laboratory Corp.
of America
Holdings | | | (2,630 | ) | | | (265,367 | )* | |
LifePoint
Hospitals, Inc. | | | (8,230 | ) | | | (424,997 | )* | |
Owens & Minor,
Inc. | | | (8,550 | ) | | | (319,941 | ) | |
| | | Number
of Shares | | Value† | |
Quest
Diagnostics, Inc. | | | (4,270 | ) | | $ | (255,816 | ) | |
WellPoint, Inc. | | | (8,910 | ) | | | (755,568 | ) | |
| | | | (4,094,230 | ) | |
Health Care Technology (0.1%) | |
athenahealth,
Inc. | | | (1,980 | ) | | | (264,350 | )* | |
HMS Holdings
Corp. | | | (6,310 | ) | | | (133,330 | )* | |
Vocera
Communications,
Inc. | | | (7,990 | ) | | | (134,472 | )* | |
| | | | (532,152 | ) | |
Hotels, Restaurants & Leisure (0.1%) | |
Panera Bread Co.
Class A | | | (3,050 | ) | | | (481,656 | )* | |
Household Durables (0.2%) | |
Lennar Corp.
Class A | | | (30,442 | ) | | | (1,082,213 | ) | |
Household Products (0.1%) | |
Church &
Dwight Co., Inc. | | | (9,425 | ) | | | (614,039 | ) | |
Insurance (0.5%) | |
ACE Ltd. | | | (4,500 | ) | | | (429,480 | ) | |
Aspen Insurance
Holdings Ltd. | | | (15,700 | ) | | | (612,457 | ) | |
Axis Capital
Holdings Ltd. | | | (13,550 | ) | | | (642,541 | ) | |
Fidelity National
Financial, Inc.
Class A | | | (25,308 | ) | | | (712,420 | ) | |
| | | | (2,396,898 | ) | |
Internet & Catalog Retail (0.2%) | |
HSN, Inc. | | | (16,550 | ) | | | (867,220 | ) | |
Netflix, Inc. | | | (45 | ) | | | (14,512 | )* | |
TripAdvisor, Inc. | | | (2,000 | ) | | | (165,420 | )* | |
| | | | (1,047,152 | ) | |
Internet Software & Services (0.0%) | |
Trulia, Inc. | | | (1,088 | ) | | | (43,487 | )* | |
Machinery (0.4%) | |
Deere & Co. | | | (10,220 | ) | | | (836,405 | ) | |
Illinois Tool
Works, Inc. | | | (7,850 | ) | | | (618,501 | ) | |
Kennametal, Inc. | | | (12,450 | ) | | | (572,700 | ) | |
| | | | (2,027,606 | ) | |
Media (0.9%) | |
Comcast Corp.
Class A | | | (318 | ) | | | (15,130 | ) | |
Liberty Global
PLC Class A | | | (26,540 | ) | | | (2,079,940 | )* | |
Sirius XM Radio,
Inc. | | | (157,858 | ) | | | (595,125 | ) | |
Time Warner,
Inc. | | | (18,800 | ) | | | (1,292,312 | ) | |
| | | | (3,982,507 | ) | |
| | | Number
of Shares | | Value† | |
Multiline Retail (0.0%) | |
JC Penney Co.,
Inc. | | | (19,914 | ) | | $ | (149,355 | )* | |
Oil, Gas & Consumable Fuels (0.0%) | |
Royal Dutch
Shell PLC ADR | | | (1,629 | ) | | | (113,248 | ) | |
Paper & Forest Products (0.0%) | |
Louisiana-Pacific
Corp. | | | (6,540 | ) | | | (111,245 | )* | |
Pharmaceuticals (0.6%) | |
Ampio
Pharmaceuticals,
Inc. | | | (1,789 | ) | | | (15,815 | )* | |
Aratana
Therapeutics,
Inc. | | | (537 | ) | | | (10,718 | )* | |
Hospira, Inc. | | | (5,040 | ) | | | (204,221 | )* | |
Pacira
Pharmaceuticals,
Inc. | | | (21,225 | ) | | | (1,072,075 | )* | |
Perrigo Co. | | | (10,775 | ) | | | (1,485,765 | ) | |
| | | | (2,788,594 | ) | |
Real Estate Investment Trusts (0.6%) | |
American Realty
Capital
Properties, Inc. | | | (18,110 | ) | | | (240,320 | ) | |
Annaly Capital
Management,
Inc. | | | (2,282 | ) | | | (26,905 | ) | |
AvalonBay
Communities,
Inc. | | | (893 | ) | | | (111,669 | ) | |
Equity
Residential | | | (1,980 | ) | | | (103,673 | ) | |
Essex Property
Trust, Inc. | | | (3,447 | ) | | | (554,967 | ) | |
Host Hotels &
Resorts, Inc. | | | (7,918 | ) | | | (146,879 | ) | |
Mid-America
Apartment
Communities,
Inc. | | | (4,871 | ) | | | (323,434 | ) | |
National Retail
Properties, Inc. | | | (9,262 | ) | | | (318,613 | ) | |
Realty Income
Corp. | | | (17,317 | ) | | | (721,253 | ) | |
| | | | (2,547,713 | ) | |
Semiconductors & Semiconductor Equipment (0.1%) | |
Marvell
Technology
Group Ltd. | | | (24,400 | ) | | | (292,800 | ) | |
Software (0.2%) | |
SAP AG ADR | | | (8,000 | ) | | | (626,800 | ) | |
VMware, Inc.
Class A | | | (2,148 | ) | | | (174,589 | )* | |
| | | | (801,389 | ) | |
See Notes to Schedule of Investments
23
| | | Number
of Shares | | Value† | |
Specialty Retail (0.0%) | |
Williams-Sonoma,
Inc. | | | (1,247 | ) | | $ | (65,393 | ) | |
Textiles, Apparel & Luxury Goods (0.0%) | |
Michael Kors
Holdings Ltd. | | | (1,140 | ) | | | (87,723 | )* | |
Thrifts & Mortgage Finance (0.0%) | |
Provident
New York
Bancorp. | | | (6,312 | ) | | | (73,977 | ) | |
Trading Companies & Distributors (0.1%) | |
HD Supply
Holdings, Inc. | | | (19,650 | ) | | | (396,734 | )* | |
Wireless Telecommunication
Services (0.0%) | |
NII Holdings, Inc. | | | (5,434 | ) | | | (18,693 | )* | |
Total Common Stocks Sold Short (Proceeds $(49,090,308)) | | | | | (50,352,534 | ) | |
Exchange Traded Funds Sold
Short (8.7%)£ØØ | |
CurrencyShares
Euro Trust | | | (5,700 | ) | | | (765,453 | )* | |
Energy Select
Sector SPDR
Fund | | | (52,045 | ) | | | (4,496,167 | ) | |
First Trust
ISE-Revere
Natural Gas
Index Fund | | | (1,871 | ) | | | (36,597 | ) | |
Health Care
Select Sector
SPDR Fund | | | (68,080 | ) | | | (3,590,539 | ) | |
iShares iBoxx $
High Yield
Corporate
Bond ETF | | | (7,129 | ) | | | (665,849 | ) | |
iShares MSCI
Emerging
Markets ETF | | | (71,368 | ) | | | (3,030,285 | ) | |
iShares MSCI
Germany ETF | | | (2,894 | ) | | | (84,939 | ) | |
iShares MSCI
Malaysia ETF | | | (7,950 | ) | | | (126,087 | ) | |
iShares MSCI
United Kingdom
ETF | | | (6,133 | ) | | | (124,806 | ) | |
iShares Nasdaq
Biotechnology
ETF | | | (12,870 | ) | | | (2,639,894 | ) | |
iShares
Russell 2000
Fund | | | (8,521 | ) | | | (930,749 | ) | |
iShares U.S.
Real Estate ETF | | | (12,107 | ) | | | (801,120 | ) | |
Market Vectors
Biotech ETF | | | (20,290 | ) | | | (1,663,780 | ) | |
Market Vectors
Gold Miners
ETF | | | (2,012 | ) | | | (50,521 | ) | |
| | | Number
of Shares | | Value† | |
Market Vectors
Oil Service ETF | | | (61,385 | ) | | $ | (3,045,924 | ) | |
Market Vectors
Semiconductor
ETF | | | (6,320 | ) | | | (260,194 | ) | |
Nomura TOPIX
Exchange
Traded Fund | | | (19,864 | ) | | | (245,851 | ) | |
SPDR Barclays
High Yield
Bond ETF | | | (5,019 | ) | | | (203,922 | ) | |
SPDR S&P 500
ETF Trust | | | (78,800 | ) | | | (13,847,524 | )± | |
SPDR S&P
Biotech ETF | | | (16,228 | ) | | | (1,930,970 | ) | |
SPDR S&P
Homebuilders
ETF | | | (2,782 | ) | | | (84,907 | ) | |
SPDR S&P
Regional
Banking ETF | | | (12,358 | ) | | | (461,571 | ) | |
Utilities Select
Sector SPDR
Fund | | | (1,445 | ) | | | (56,052 | ) | |
Vanguard REIT
ETF | | | (19,017 | ) | | | (1,314,455 | ) | |
Total Exchange Traded Funds Sold Short (Proceeds $(39,225,490)) | | | | | (40,458,156 | ) | |
| | | Principal
Amount | | | |
U.S. Treasury Securities-Backed by
the Full Faith and Credit of the
U.S. Government Sold Short (0.1%)£ØØ | |
U.S. Treasury
Bonds, 2.88%,
due 5/15/43 | | $ | (403,000 | ) | | | (345,510 | ) | |
U.S. Treasury
Notes, 1.75%,
due 5/15/23 | | | (183,000 | ) | | | (170,833 | ) | |
Total U.S. Treasury Securities-Backed
by the Full Faith and Credit of the
U.S. Government Sold Short
(Proceeds $(512,911)) | | | | | (516,343 | ) | |
Corporate Debt Securities
Sold Short (0.3%)£ØØ | |
Auto Parts & Equipment (0.0%) | |
Delphi Corp.,
5.00%, due
2/15/23 | | | (179,000 | ) | | | (187,950 | ) | |
Beverages (0.0%) | |
Constellation
Brands, Inc.,
4.25%, due
5/1/23 | | | (50,000 | ) | | | (47,937 | ) | |
Diversified Telecommunication
Services (0.0%) | |
CenturyLink, Inc.,
Ser. V, 5.63%,
due 4/1/20 | | | (59,000 | ) | | | (59,959 | ) | |
| | | Principal
Amount | | Value† | |
Verizon
Communications,
Inc., 6.55%,
due 9/15/43 | | $ | (71,000 | ) | | $ | (82,330 | ) | |
| | | | (142,289 | ) | |
Food Products (0.0%) | |
HJ Heinz
Finance Co.,
7.13%, due
8/1/39 | | | (123,000 | ) | | | (128,228 | )ñ | |
Household Products (0.1%) | |
Reynolds Group
Issuer, Inc.,
9.00%, due
4/15/19 | | | (123,000 | ) | | | (131,610 | ) | |
Reynolds Group
Issuer, Inc.,
9.88%, due
8/15/19 | | | (92,000 | ) | | | (101,775 | ) | |
| | | | (233,385 | ) | |
Media (0.0%) | |
Cumulus Media
Holdings, Inc.,
7.75%, due
5/1/19 | | | (70,000 | ) | | | (73,850 | ) | |
Metals & Mining (0.0%) | |
Cliffs Natural
Resources, Inc.,
6.25%, due
10/1/40 | | | (48,000 | ) | | | (42,762 | ) | |
Oil, Gas & Consumable Fuels (0.0%) | |
Samson
Investment Co.,
10.25%, due
2/15/20 | | | (119,000 | ) | | | (128,520 | )ñ | |
Pharmaceuticals (0.1%) | |
Valeant
Pharmaceuticals
International,
6.75%, due
8/15/18 | | | (116,000 | ) | | | (127,020 | )ñ | |
Valeant
Pharmaceuticals
International,
7.50%, due
7/15/21 | | | (116,000 | ) | | | (128,760 | )ñ | |
| | | | (255,780 | ) | |
Trading Companies & Distributors (0.1%) | |
HD Supply, Inc.,
7.50%, due
7/15/20 | | | (233,000 | ) | | | (245,815 | )ñ | |
Total Corporate Debt Securities Sold Short (Proceeds $(1,466,008)) | | | | | (1,486,516 | ) | |
Total Short Positions
(Proceeds $(90,294,717)) | | | | | (92,813,549 | ) | |
See Notes to Schedule of Investments
24
Notes to Schedule of Investments
† In accordance with Accounting Standards Codification ("ASC") 820 "Fair Value Measurements and Disclosures" ("ASC 820"), all investments held by Neuberger Berman Absolute Return Multi-Manager Fund (the "Fund") are carried at the value that Neuberger Berman Management LLC ("Management") believes the Fund would receive upon selling an investment in an orderly transaction to an independent buyer in the principal or most advantageous market for the investment under current market conditions. Various inputs, including the volume and level of activity for the asset or liability in the market, are considered in valuing the Fund's investments, some of which are discussed below. Significant management judgment may be necessary to value investments in accordance with ASC 820.
ASC 820 established a three-tier hierarchy of inputs to create a classification of value measurements for disclosure purposes. The three-tier hierarchy of inputs is summarized in the three broad Levels listed below.
• Level 1 – quoted prices in active markets for identical investments
• Level 2 – other significant observable inputs (including quoted prices for similar investments, interest rates, prepayment speeds, credit risk, amortized cost, etc.)
• Level 3 – significant unobservable inputs (including the Fund's own assumptions in determining the fair value of investments)
The inputs or methodology used for valuing an investment are not necessarily an indication of the risk associated with investing in those securities.
The value of the Fund's investments (long and short positions) in equity securities, exchange traded funds, purchased option contracts, written option contracts, rights and warrants, for which market quotations are readily available, is generally determined by Management by obtaining valuations from an independent pricing service based on the latest sale price quoted on a principal exchange or market for that security (Level 1 inputs). Securities traded primarily on the NASDAQ Stock Market are normally valued by a Fund at the NASDAQ Official Closing Price ("NOCP") provided by NASDAQ each business day. The NOCP is the most recently reported price as of 4:00:02 p.m., Eastern time, unless that price is outside the range of the "inside" bid and asked prices (i.e., the bid and asked prices that dealers quote to each other when trading for their own accounts); in that case, NASDAQ will adjust the price to equal the inside bid or asked price, whichever is closer. Because of delays in reporting trades, the NOCP may not be based on the price of the last trade to occur before the market closes. If there is no reported sale of a security on a particular day, the independent pricing service may value the security based on reported market quotations.
The value of the Fund's investments in debt securities (long and short positions) is determined by Management primarily by obtaining valuations from independent pricing services based on readily available bid quotations, or if quotations are not available, by methods which include various considerations based on security type (generally Level 2 inputs). In addition to the consideration of yields or prices of securities of comparable quality, coupon, maturity and type; indications as to values from dealers; and general market conditions, the following is a description of other Level 2 inputs and related valuation techniques used by an independent pricing service to value certain types of debt securities of the Fund:
U.S. Treasury Securities. Inputs used to value U.S. Treasury securities generally include quotes from several inter-dealer brokers and Other Market Information.
Corporate Debt Securities. Inputs used to value corporate debt securities generally include relative credit information, observed market movements, sector news, spread to the U.S. Treasury market, and other market information which may include benchmark yields, reported trades, broker-dealer quotes, issuer spreads, benchmark securities, bids, offers, and reference data, such as market research publications, when available.
See Notes to Financial Statements
25
Notes to Schedule of Investments (cont'd)
Asset-Backed Securities and Mortgage-Backed Securities. Inputs used to value asset-backed securities and mortgage-backed securities generally include models that consider a number of factors, which may include the following: prepayment speeds, cash flows, spread adjustments and Other Market Information.
Bank Loans. The value of bank loan securities is determined by Management primarily by obtaining valuations from independent pricing services based on broker quotes (generally Level 2 or Level 3 inputs depending on the number of quotes available).
The value of financial futures contracts is determined by obtaining valuations from independent pricing services at the settlement price at the market close (Level 1 inputs).
The value of forward foreign currency contracts is determined by obtaining valuations from an independent pricing service based on actual traded currency rates on an independent pricing service's network, along with other traded and quoted currency rates provided to the pricing service by leading market participants (Level 2 inputs).
The value of total return swaps is determined by obtaining valuations from an independent pricing service using the underlying index and stated LIBOR ("London Interbank Offered Rate") rate (Level 2 inputs).
The value of equity swaps is determined by obtaining valuations from an independent pricing service using the underlying security and stated LIBOR rate or Federal Funds floating rate (Level 2 inputs).
Management has developed a process to periodically review information provided by independent pricing services for all types of securities.
Investments in investment companies are valued using the respective fund's daily calculated net asset value per share (Level 2 inputs).
If a valuation is not available from an independent pricing service, or if Management has reason to believe that the valuation received does not represent the amount the Fund might reasonably expect to receive on a current sale in an orderly transaction, the Fund seeks to obtain quotations from principal market makers (generally considered Level 3 inputs). If such quotations are not readily available, the security is valued using methods the Neuberger Berman Alternative Funds' Board of Trustees (the "Board") has approved on the belief that they reflect fair value. Numerous factors may be considered when determining the fair value of a security based on Level 2 or 3 inputs, including available analyst, media or other reports, trading in futures or ADRs and whether the issuer of the security being fair valued has other securities outstanding.
The value of the Fund's investments in foreign securities is generally determined using the same valuation methods and inputs as other Fund investments, as discussed above. Foreign security prices expressed in local currency values are translated from the local currency into U.S. dollars using the exchange rate as of 4:00 p.m., Eastern time. The Board has approved the use of Interactive Data Pricing and Reference Data, Inc. ("Interactive") to assist in determining the fair value of foreign equity securities when changes in the value of a certain index suggest that the closing prices on the foreign exchanges may no longer represent the amount that the Fund could expect to receive for those securities or on days when foreign markets are closed and U.S. markets are open. In each of these events, Interactive will provide adjusted prices for certain foreign equity securities using a statistical analysis of historical correlations of multiple factors (Level 2 inputs). In the absence of precise information about the market values of these foreign securities as of the close of the New York Stock Exchange, the Board has determined on the basis of available data that prices adjusted in this way are likely to be closer to the prices the Fund could realize on a current sale than are the prices of those securities established at the close of the foreign markets in which the securities primarily trade.
Fair value prices are necessarily estimates, and there is no assurance that such a price will be at or close to the price at which the security is next quoted or next trades.
See Notes to Financial Statements
26
Notes to Schedule of Investments (cont'd)
The following is a summary, categorized by Level, of inputs used to value the Fund's investments as of October 31, 2013:
Asset Valuation Inputs | |
| | | Level 1 | | Level 2 | | Level 3§ | | Total | |
Investments: | |
Common Stocks | |
Biotechnology | | $ | 11,035,114 | | | $ | 3,120 | | | $ | — | | | $ | 11,038,234 | | |
Media | | | 23,194,867 | | | | — | | | | 750 | | | | 23,195,617 | | |
Other Common Stocks^ | | | 190,860,806 | | | | — | | | | — | | | | 190,860,806 | | |
Total Common Stocks | | | 225,090,787 | | | | 3,120 | | | | 750 | | | | 225,094,657 | | |
Preferred Stocks^ | | | 2,001,330 | | | | — | | | | — | | | | 2,001,330 | | |
Exchange Traded Funds | | | 2,491,348 | | | | — | | | | — | | | | 2,491,348 | | |
Investment Companies | | | — | | | | 30,016 | | | | — | | | | 30,016 | | |
Rights^ | | | 101,084 | | | | — | | | | — | | | | 101,084 | | |
Warrants^ | | | 182,648 | | | | — | | | | — | | | | 182,648 | | |
U.S. Treasury Securities-Backed by the Full Faith and
Credit of the U.S. Government | | | — | | | | 28,960 | | | | — | | | | 28,960 | | |
Collateralized Mortgage Obligations | | | — | | | | 6,892,323 | | | | — | | | | 6,892,323 | | |
Commercial Mortgage-Backed Securities | | | — | | | | 3,761,791 | | | | 496,719 | | | | 4,258,510 | | |
Asset-Backed Securities | | | — | | | | 1,933,267 | | | | — | | | | 1,933,267 | | |
Corporate Debt Securities^ | | | — | | | | 5,091,455 | | | | — | | | | 5,091,455 | | |
Convertible Corporate Debt^ | | | — | | | | 81,962 | | | | — | | | | 81,962 | | |
Bank Loan Obligations | |
Aerospace & Defense | | | — | | | | — | | | | 503,750 | | | | 503,750 | | |
Auto Parts & Equipment | | | — | | | | 452,812 | | | | — | | | | 452,812 | | |
Building Products | | | — | | | | 1,671,475 | | | | — | | | | 1,671,475 | | |
Chemicals | | | — | | | | 243,820 | | | | 87,000 | | | | 330,820 | | |
Commercial Services & Supplies | | | — | | | | 2,328,493 | | | | 500,000 | | | | 2,828,493 | | |
Communications Equipment | | | — | | | | 1,115,579 | | | | — | | | | 1,115,579 | | |
Computers & Peripherals | | | — | | | | 1,325,796 | | | | — | | | | 1,325,796 | | |
Diversified Consumer Services | | | — | | | | 249,375 | | | | — | | | | 249,375 | | |
Diversified Financial Services | | | — | | | | 1,395,883 | | | | — | | | | 1,395,883 | | |
Diversified Telecommunication Services | | | — | | | | 911,405 | | | | — | | | | 911,405 | | |
Electronic Equipment, Instruments & Components | | | — | | | | 1,000,000 | | | | — | | | | 1,000,000 | | |
Energy Equipment & Services | | | — | | | | 484,818 | | | | 151,414 | | | | 636,232 | | |
Food Products | | | — | | | | 817,424 | | | | — | | | | 817,424 | | |
Health Care Equipment & Supplies | | | — | | | | 93,077 | | | | — | | | | 93,077 | | |
Health Care Providers & Services | | | — | | | | 1,678,254 | | | | — | | | | 1,678,254 | | |
Health Care Technology | | | — | | | | 97,401 | | | | 435,000 | | | | 532,401 | | |
Hotels, Restaurants & Leisure | | | — | | | | 4,817,566 | | | | — | | | | 4,817,566 | | |
Independent Power Producers & Energy Traders | | | — | | | | 1,006,250 | | | | — | | | | 1,006,250 | | |
See Notes to Financial Statements
27
Notes to Schedule of Investments (cont'd)
Insurance | | $ | — | | | $ | 762,979 | | | $ | — | | | $ | 762,979 | | |
Internet Software & Services | | | — | | | | 1,163,950 | | | | 1,467,180 | | | | 2,631,130 | | |
IT Services | | | — | | | | 500,876 | | | | — | | | | 500,876 | | |
Media | | | — | | | | 1,469,416 | | | | — | | | | 1,469,416 | | |
Metals & Mining | | | — | | | | 709,029 | | | | — | | | | 709,029 | | |
Multiline Retail | | | — | | | | 307,875 | | | | — | | | | 307,875 | | |
Oil, Gas & Consumable Fuels | | | — | | | | 1,062,186 | | | | 44,100 | | | | 1,106,286 | | |
Pharmaceuticals | | | — | | | | 1,056,000 | | | | — | | | | 1,056,000 | | |
Software | | | — | | | | 5,109,181 | | | | 2,244,500 | | | | 7,353,681 | | |
Trading Companies & Distributors | | | — | | | | 351,181 | | | | — | | | | 351,181 | | |
Transportation Infrastructure | | | — | | | | 887,733 | | | | — | | | | 887,733 | | |
Total Bank Loan Obligations | | | — | | | | 33,069,834 | | | | 5,128,024 | | | | 38,197,858 | | |
Purchased Options | | | 1,843,483 | | | | 1,814 | | | | — | | | | 1,845,297 | | |
Short-Term Investments | | | — | | | | 187,567,681 | | | | — | | | | 187,567,681 | | |
| Total Investments | | | 231,710,680 | | | | 238,462,223 | | | | 5,930,413 | | | | 476,103,316 | | |
Liability Valuation Inputs | |
| | | Level 1 | | Level 2 | | Level 3§ | | Total | |
Investments: | |
Common Stocks Sold Short^ | | $ | (50,352,534 | ) | | $ | — | | | $ | — | | | $ | (50,352,534 | ) | |
Exchange Traded Funds Sold Short | | | (40,458,156 | ) | | | — | | | | — | | | | (40,458,156 | ) | |
U.S. Treasury Securities-Backed by the Full Faith and Credit
of the U.S. Government Sold Short | | | — | | | | (516,343 | ) | | | — | | | | (516,343 | ) | |
Corporate Debt Securities Sold Short^ | | | — | | | | (1,486,516 | ) | | | — | | | | (1,486,516 | ) | |
Total Investments | | | (90,810,690 | ) | | | (2,002,859 | ) | | | — | | | | (92,813,549 | ) | |
^ The Schedule of Investments provides information on the industry categorization for the portfolio.
See Notes to Financial Statements
28
Notes to Schedule of Investments (cont'd)
§ The following is a reconciliation between the beginning and ending balances of investments in which significant unobservable inputs (Level 3) were used in determining value:
| | | Beginning
balance as
of 11/01/12 | | Accrued
discounts/
(premiums) | | Realized
gain/loss
and change
in unrealized
appreciation/
(depreciation) | | Purchases | | Sales | | Transfers
in to
Level 3 | | Transfers
out of
Level 3 | | Balance
as of
10/31/13 | | Net change
in unrealized
appreciation/
(depreciation)
from
investments
still held as of
10/31/13 | |
Investments in Securities: | |
Common Stocks | |
Media | | $ | — | | | $ | — | | | $ | 750 | | | $ | — | | | $ | — | | | $ | — | | | $ | — | | | $ | 750 | | | $ | 750 | | |
Commercial
Mortgage-Backed
Securities | | | — | | | | 37 | | | | (78 | ) | | | 496,760 | | | | — | | | | — | | | | — | | | | 496,719 | | | | (78 | ) | |
Bank Loan Obligations | |
Aerospace &
Defense | | | — | | | | — | | | | 6,250 | | | | 497,500 | | | | — | | | | — | | | | — | | | | 503,750 | | | | 6,250 | | |
Chemicals | | | — | | | | 43 | | | | 1,697 | | | | 85,260 | | | | — | | | | — | | | | — | | | | 87,000 | | | | 1,697 | | |
Commercial
Services & Supplies | | | — | | | | — | | | | (3,750 | ) | | | 503,750 | | | | — | | | | — | | | | — | | | | 500,000 | | | | (3,750 | ) | |
Energy Equipment &
Services | | | — | | | | 65 | | | | 4,208 | | | | 147,141 | | | | — | | | | — | | | | — | | | | 151,414 | | | | 4,208 | | |
Health Care
Technology | | | — | | | | 1,161 | | | | (62,201 | ) | | | — | | | | — | | | | 496,040 | | | | — | | | | 435,000 | | | | (62,201 | ) | |
Insurance | | | 600,000 | | | | 7 | | | | 2,243 | | �� | | — | | | | (602,250 | ) | | | — | | | | — | | | | — | | | | — | | |
Internet Software &
Services | | | — | | | | 176 | | | | 14,644 | | | | 1,452,360 | | | | — | | | | — | | | | — | | | | 1,467,180 | | | | 14,644 | | |
Machinery | | | 101,000 | | | | — | | | | 2,000 | | | | — | | | | (103,000 | ) | | | — | | | | — | | | | — | | | | — | | |
Oil, Gas &
Consumable Fuels | | | — | | | | 43 | | | | 857 | | | | 43,200 | | | | — | | | | — | | | | — | | | | 44,100 | | | | 857 | | |
Software | | | — | | | | — | | | | 21,735 | | | | 2,222,765 | | | | — | | | | — | | | | — | | | | 2,244,500 | | | | 21,735 | | |
Total | | $ | 701,000 | | | $ | 1,532 | | | $ | (11,645 | ) | | $ | 5,448,736 | | | $ | (705,250 | ) | | $ | 496,040 | | | $ | — | | | $ | 5,930,413 | | | $ | (15,888 | ) | |
As of October 31, 2013, one security in the Fund transferred from Level 2 to Level 3 as a result of a decrease in the number of observable quotations that were readily available to the independent pricing service. In addition, one security transferred from Level 2 to Level 1 due to active market activity on recognized exchanges, as of October 31, 2013.
The following is a summary, categorized by Level, of inputs used to value the Fund's derivatives as of October 31, 2013:
Asset Valuation Inputs | |
| | | Level 1 | | Level 2 | | Level 3 | | Total | |
Forward contracts (unrealized appreciation) | | $ | — | | | $ | 39,118 | | | $ | — | | | $ | 39,118 | | |
Equity swaps | | | — | | | | 440,123 | | | | — | | | | 440,123 | | |
Total | | $ | — | | | $ | 479,241 | | | $ | — | | | $ | 479,241 | | |
See Notes to Financial Statements
29
Notes to Schedule of Investments (cont'd)
Liability Valuation Inputs | |
| | | Level 1 | | Level 2 | | Level 3 | | Total | |
Forward contracts (unrealized depreciation) | | $ | — | | | $ | (194,143 | ) | | $ | — | | | $ | (194,143 | ) | |
Total return swaps | | | — | | | | (409,350 | ) | | | — | | | | (409,350 | ) | |
Options written | | | (925,318 | ) | | | — | | | | — | | | | (925,318 | ) | |
Total | | $ | (925,318 | ) | | $ | (603,493 | ) | | $ | — | | | $ | (1,528,811 | ) | |
## At October 31, 2013, selected fund information on a U.S. federal income tax basis was as follows:
| | | Cost | | Gross
Unrealized
Appreciation | | Gross
Unrealized
Depreciation | | Net Unrealized
Appreciation
(Depreciation) | |
Absolute Return Multi-Manager | | $ | 470,423,287 | | | $ | 11,659,707 | | | $ | (5,979,678 | ) | | $ | 5,680,029 | | |
* Security did not produce income during the last twelve months.
^^ All or a portion of this security has not settled as of October 31, 2013 and thus does not have an interest rate in effect. Interest rates do not take effect until settlement.
± At October 31, 2013, the Fund had outstanding call and put options written as follows:
Name of Issuer | | Contracts | | Exercise
Price | | Expiration
Date | | Market Value
of Options | |
Cooper Tire & Rubber Co., Call | | | 109 | | | $ | 25 | | | November 2013 | | $ | (27,250 | ) | |
Cooper Tire & Rubber Co., Call | | | 11 | | | | 22.5 | | | January 2014 | | | (4,840 | ) | |
Cooper Tire & Rubber Co., Call | | | 18 | | | | 26 | | | November 2013 | | | (3,402 | ) | |
General Motors Co., Call | | | 13 | | | | 37 | | | November 2013 | | | (1,014 | ) | |
Iron Mountain, Inc., Call | | | 51 | | | | 25 | | | November 2013 | | | (9,690 | ) | |
iShares Russell 2000 ETF, Put | | | 284 | | | | 80 | | | June 2014 | | | (35,784 | ) | |
iShares Russell 2000 Index Fund, Put | | | 59 | | | | 75 | | | November 2013 | | | — | | |
Kulicke & Soffa Industries, Inc., Call | | | 22 | | | | 13 | | | November 2013 | | | (990 | ) | |
Kulicke & Soffa Industries, Inc., Call | | | 22 | | | | 12 | | | November 2013 | | | (2,420 | ) | |
Lamar Advertising Co., Call | | | 135 | | | | 46 | | | November 2013 | | | (21,600 | ) | |
MetLife, Inc., Call | | | 7 | | | | 47 | | | November 2013 | | | (791 | ) | |
Navistar International Corp., Call | | | 4 | | | | 35 | | | November 2013 | | | (460 | ) | |
Safeway, Inc., Call | | | 24 | | | | 36 | | | November 2013 | | | (1,440 | ) | |
SPDR S&P 500 ETF Trust, Put | | | 1,200 | | | | 157 | | | December 2013 | | | (52,800 | ) | |
SPDR S&P 500 ETF Trust, Put | | | 1,300 | | | | 161 | | | December 2013 | | | (89,700 | ) | |
SPDR S&P 500 ETF Trust, Put | | | 2,000 | | | | 159 | | | December 2013 | | | (102,000 | ) | |
SPDR S&P 500 ETF Trust, Put | | | 2,000 | | | | 163 | | | March 2014 | | | (524,000 | ) | |
The Jones Group, Inc., Call | | | 16 | | | | 16 | | | November 2013 | | | (720 | ) | |
The Men's Wearhouse, Inc., Call | | | 27 | | | | 45 | | | November 2013 | | | (3,510 | ) | |
The Men's Wearhouse, Inc., Call | | | 27 | | | | 46 | | | November 2013 | | | (2,700 | ) | |
The Men's Wearhouse, Inc., Call | | | 33 | | | | 44 | | | November 2013 | | | (5,940 | ) | |
Theravance, Inc., Call | | | 235 | | | | 47 | | | January 2014 | | | (7,050 | ) | |
Theravance, Inc., Put | | | 235 | | | | 32 | | | January 2014 | | | (15,275 | ) | |
United Rentals, Inc., Call | | | 22 | | | | 62.5 | | | November 2013 | | | (6,974 | ) | |
ViroPharma, Inc., Call | | | 33 | | | | 40 | | | November 2013 | | | (4,950 | ) | |
Weight Watchers International, Inc., Call | | | 9 | | | | 42.5 | | | November 2013 | | | (18 | ) | |
Total | | | | | | | | $ | (925,318 | ) | |
See Notes to Financial Statements
30
Notes to Schedule of Investments (cont'd)
≠ Security had an event of default.
¢ All or a portion of this security was purchased on a delayed delivery basis.
£ At October 31, 2013, the Fund had pledged securities in the amount of $24,111,158 to cover collateral requirements for borrowing in connection with securities sold short and option contracts written.
a Step Bond: Coupon rate is a fixed rate for an initial period then resets at a specified date and rate.
c Payment-in-kind security for which part of the income earned may be paid as additional principal.
f Value of the security was determined using methods the Board has approved on the belief they reflect fair value.
ñ Securities were purchased under Rule 144A of the Securities Act of 1933 or are private placements and, unless registered under the Act or exempted from registration, may only be sold to qualified institutional investors. These securities have been deemed by the investment manager to be liquid. At October 31, 2013, these securities amounted to approximately $8,099,384 or 1.72% of net assets for the Fund.
Ñ These securities have been deemed by the investment manager to be illiquid. At October 31, 2013, these securities amounted to approximately $4,932,944 or 1.05% of net assets for the Fund.
Ø All or a portion of this security or cash is segregated in connection with obligations for securities sold short and/or delayed delivery purchase commitments and/or call and put options written and/or forward foreign currency contracts and/or swaps.
ØØ At October 31, 2013, the Fund had deposited $89,465,765 in one or more accounts to satisfy collateral requirements for borrowing in connection with securities sold short.
µ Floating rate securities are securities whose yields vary with a designated market index or market rate. These securities are shown at their current rates as of October 31, 2013 and their final maturities.
†† As of October 31, 2013, the value of unfunded loan commitments was approximately $25,435 pursuant to the following loan agreement:
| Borrower | | Principal
Amount | | Value | |
Alinta Energy, due 12/31/20 | | $ | 25,789 | | | $ | 25,435 | | |
††† See Note A-12 in the Notes to Financial Statements for the Fund's open positions in derivatives at October 31, 2013.
See Notes to Financial Statements
31
Statement of Assets and Liabilities
Neuberger Berman Alternative Funds | |
| | | ABSOLUTE RETURN
MULTI-MANAGER
FUND | |
| | | October 31, 2013 | |
Assets | | | | | |
Investments in securities, at value* (Note A)—see Schedule of Investments: | |
Unaffiliated issuers | | $ | 476,103,316 | | |
Deposits with broker for short sales (Note A-10) | | | 89,465,765 | | |
Deposits with broker for swaps (Note A-12) | | | 14,300,000 | | |
Dividends and interest receivable | | | 290,589 | | |
Foreign tax reclaims | | | 3,361 | | |
Receivable for securities sold | | | 24,442,517 | | |
Receivable for Fund shares sold | | | 14,825,407 | | |
Equity Swaps, at value (Note A-12) | | | 440,123 | | |
Receivable for open forward foreign currency contracts (Note A-12) | | | 39,118 | | |
Prepaid expenses and other assets | | | 46,277 | | |
Total Assets | | | 619,956,473 | | |
Liabilities | | | | | |
Investments sold short, at value (Note A) (proceeds $90,294,717) | | | 92,813,549 | | |
Written Options, at value (Note A) (proceeds $2,236,061) | | | 925,318 | | |
Due to Custodian | | | 5,051,026 | | |
Foreign currency—due to custodian* | | | 4,214,645 | | |
Dividends and interest payable for short sales | | | 53,080 | | |
Payable to investment manager—net (Note B) | | | 565,547 | | |
Payable to administrator—net (Note B) | | | 19,140 | | |
Payable for securities purchased | | | 36,754,438 | | |
Payable for Fund shares redeemed | | | 8,483,468 | | |
Total return Swaps, at value (Note A-12) | | | 409,350 | | |
Payable for open forward foreign currency contracts (Note A-12) | | | 194,143 | | |
Accrued expenses and other payables | | | 176,441 | | |
Total Liabilities | | | 149,660,145 | | |
Net Assets | | $ | 470,296,328 | | |
Net Assets consist of: | |
Paid-in capital | | $ | 462,630,337 | | |
Undistributed net investment income (loss) | | | 25,564 | | |
Accumulated net realized gains (losses) on investments | | | 2,391,217 | | |
Net unrealized appreciation (depreciation) in value of investments | | | 5,249,210 | | |
Net Assets | | $ | 470,296,328 | | |
Net Assets | | | | | |
Institutional Class | | $ | 324,323,789 | | |
Class A | | | 124,715,152 | | |
Class C | | | 21,257,387 | | |
See Notes to Financial Statements
32
Statement of Assets and Liabilities (cont'd)
| |
| | | ABSOLUTE RETURN
MULTI-MANAGER
FUND | |
| | | October 31, 2013 | |
Shares Outstanding ($.001 par value; unlimited shares authorized) | | | | | |
Institutional Class | | | 29,860,600 | | |
Class A | | | 11,522,771 | | |
Class C | | | 1,985,698 | | |
Net Asset Value, offering and redemption price per share | | | | | |
Institutional Class | | $ | 10.86 | | |
Net Asset Value and redemption price per share | | | | | |
Class A | | $ | 10.82 | | |
Offering Price per share | | | | | |
Class A‡ | | $ | 11.48 | | |
Net Asset Value and offering price per share | | | | | |
Class C^ | | $ | 10.71 | | |
*Cost of Investments: | | | |
Unaffiliated issuers | | $ | 469,521,653 | | |
Total cost of foreign currency | | $ | (4,218,102 | ) | |
‡ On single retail sales of less than $50,000. On sales of $50,000 or more or in certain other circumstances described in the Fund's prospectus, offering price is reduced.
^ Redemption price per share is equal to net asset value less any applicable contingent deferred sales charge.
See Notes to Financial Statements
33
Neuberger Berman Alternative Funds | |
| | | ABSOLUTE RETURN
MULTI-MANAGER
FUND | |
| | | For the
Year Ended
October 31, 2013 | |
Investment Income: | | | | | |
Income (Note A): | | | | | |
Dividend income—unaffiliated issuers | | $ | 877,084 | | |
Interest income—unaffiliated issuers | | | 825,914 | | |
Foreign taxes withheld | | | (15,405 | ) | |
Total income | | $ | 1,687,593 | | |
Expenses: | | | | | |
Investment management fees (Note B) | | | 1,917,384 | | |
Administration fees (Note B) | | | 66,416 | | |
Administration fees (Note B): | | | | | |
Institutional Class | | | 72,229 | | |
Class A | | | 53,079 | | |
Class C | | | 7,805 | | |
Distribution fees (Note B): | | | | | |
Class A | | | 66,348 | | |
Class C | | | 39,025 | | |
Shareholder servicing agent fees: | | | | | |
Institutional Class | | | 11,749 | | |
Class A | | | 12,648 | | |
Class C | | | 1,959 | | |
Audit fees | | | 57,900 | | |
Custodian fees (Note A) | | | 205,364 | | |
Legal fees | | | 241,761 | | |
Registration and filing fees | | | 81,451 | | |
Shareholder reports | | | 35,000 | | |
Trustees' fees and expenses | | | 47,999 | | |
Short sales expense (Note A-10) | | | 417,466 | | |
Miscellaneous | | | 11,111 | | |
Total expenses | | | 3,346,694 | | |
Expenses reimbursed by Management (Note B) | | | (669,435 | ) | |
Expenses reduced by custodian fee expense offset arrangement (Note A) | | | (6,322 | ) | |
Total net expenses | | | 2,670,937 | | |
Net investment income (loss) | | $ | (983,344 | ) | |
Realized and Unrealized Gain (Loss) on Investments (Note A): | | | | | |
Net realized gain (loss) on: | | | | | |
Sales of investment securities of unaffiliated issuers | | | 5,831,916 | | |
Sales of investment securities of unaffiliated issuers sold short | | | (2,760,593 | ) | |
Forward foreign currency contracts | | | 27,633 | | |
Foreign currency | | | (96,972 | ) | |
Financial futures contracts | | | (58,511 | ) | |
Options written | | | 275,033 | | |
Swap contracts | | | 505,524 | | |
Change in net unrealized appreciation (depreciation) in value of: | | | | | |
Unaffiliated investment securities | | | 6,491,013 | | |
Unaffiliated investment securities sold short | | | (2,564,051 | ) | |
Forward foreign currency contracts | | | (155,025 | ) | |
Foreign currency | | | (1,537 | ) | |
Financial futures contracts | | | (2,795 | ) | |
Options written | | | 1,301,528 | | |
Swap contracts | | | 30,773 | | |
Net gain (loss) on investments | | | 8,823,936 | | |
Net increase (decrease) in net assets resulting from operations | | $ | 7,840,592 | | |
See Notes to Financial Statements
34
Statements of Changes in Net Assets
Neuberger Berman Alternative Funds | |
| | | ABSOLUTE RETURN
MULTI-MANAGER FUND | |
| | | Year Ended
October 31, 2013 | | Period from
May 15, 2012
(Commencement
of Operations) to
October 31, 2012 | |
Increase (Decrease) in Net Assets: | | | | | | | | | |
From Operations (Note A): | | | | | | | | | |
Net investment income (loss) | | $ | (983,344 | ) | | $ | (193,650 | ) | |
Net realized gain (loss) on investments | | | 3,724,030 | | | | (22,204 | ) | |
Change in net unrealized appreciation (depreciation) of investments | | | 5,099,906 | | | | 149,304 | | |
Net increase (decrease) in net assets resulting from operations | | | 7,840,592 | | | | (66,550 | ) | |
Distributions to Shareholders From (Note A): | | | | | | | | | |
Net investment income: | | | | | | | | | |
Institutional Class | | | (58,599 | ) | | | — | | |
Net realized gain on investments: | | | | | | | | | |
Institutional Class | | | (119,803 | ) | | | — | | |
Class A | | | (12,381 | ) | | | — | | |
Class C | | | (2,073 | ) | | | — | | |
Total distributions to shareholders | | | (192,856 | ) | | | — | | |
From Fund Share Transactions (Note D): | | | | | | | | | |
Proceeds from shares sold: | | | | | | | | | |
Institutional Class | | | 308,138,341 | | | | 33,591,736 | | |
Class A | | | 124,995,179 | | | | 1,760,497 | | |
Class C | | | 21,030,909 | | | | 230,214 | | |
Proceeds from reinvestment of dividends and distributions: | | | | | | | | | |
Institutional Class | | | 172,922 | | | | — | | |
Class A | | | 9,064 | | | | — | | |
Class C | | | 1,988 | | | | — | | |
Payments for shares redeemed: | | | | | | | | | |
Institutional Class | | | (22,848,165 | ) | | | (305,020 | ) | |
Class A | | | (3,847,011 | ) | | | (804 | ) | |
Class C | | | (214,708 | ) | | | — | | |
Net increase (decrease) from Fund share transactions | | | 427,438,519 | | | | 35,276,623 | | |
Net Increase (Decrease) in Net Assets | | | 435,086,255 | | | | 35,210,073 | | |
Net Assets: | | | | | | | | | |
Beginning of period | | | 35,210,073 | | | | — | | |
End of year | | $ | 470,296,328 | | | $ | 35,210,073 | | |
Undistributed net investment income (loss) at end of period | | | 25,564 | | | | (136,050 | ) | |
See Notes to Financial Statements
35
Notes to Financial Statements Absolute Return
Multi-Manager Fund
Note A—Summary of Significant Accounting Policies:
1 General: Neuberger Berman Alternative Funds (the "Trust") is a Delaware statutory trust organized pursuant to an Amended and Restated Trust Instrument dated October 14, 2010. The Trust is registered as an open-end management investment company under the Investment Company Act of 1940, as amended (the "1940 Act"), and its shares are registered under the Securities Act of 1933, as amended (the "1933 Act"). The Fund had no operations until May 15, 2012, other than matters relating to its organization and its registration of shares under the 1933 Act. The Fund is a separate operating series of the Trust and is non-diversified. The Fund offers Institutional Class shares, Class A shares and Class C shares. The Board may establish additional series or classes of shares without the approval of shareholders.
The assets of the Fund belong only to the Fund, and the liabilities of the Fund are borne solely by the Fund and no other.
The preparation of financial statements in accordance with U.S. generally accepted accounting principles ("GAAP") requires Management to make estimates and assumptions at the date of the financial statements. Actual results could differ from those estimates.
2 Portfolio valuation: Investment securities are valued as indicated in the notes following the Fund's Schedule of Investments.
3 Foreign currency translation: The accounting records of the Fund are maintained in U.S. dollars. Foreign currency amounts are translated into U.S. dollars using the exchange rate as of 4:00 p.m., Eastern time, to determine the value of investments, other assets and liabilities. Purchase and sale prices of securities, and income and expenses, are translated into U.S. dollars at the prevailing rate of exchange on the respective dates of such transactions. Net unrealized foreign currency gain (loss), if any, arises from changes in the value of assets and liabilities, other than investments in securities, as a result of changes in exchange rates and is stated separately in the Statement of Operations.
4 Securities transactions and investment income: Securities transactions are recorded on trade date for financial reporting purposes. Dividend income is recorded on the ex-dividend date or, for certain foreign dividends, as soon as the Fund becomes aware of the dividends. Non-cash dividends included in dividend income, if any, are recorded at the fair market value of the securities received. Interest income, including accretion of discount (adjusted for original issue discount, where applicable) and amortization of premium, where applicable, is recorded on the accrual basis. Realized gains and losses from securities transactions and foreign currency transactions, if any, are recorded on the basis of identified cost and stated separately in the Statement of Operations.
5 Income tax information: The Fund is treated as a separate entity for U.S. federal income tax purposes. It is the policy of the Fund to continue to qualify for treatment as a regulated investment company by complying with the requirements of the U.S. Internal Revenue Code applicable to regulated investment companies and to distribute substantially all of its net investment income and net realized capital gains to its shareholders. To the extent the Fund distributes substantially all of its net investment income and net realized capital gains to shareholders, no federal income or excise tax provision is required.
The Fund has adopted the provisions of ASC 740 "Income Taxes" ("ASC 740"). ASC 740 sets forth a minimum threshold for financial statement recognition of a tax position taken, or expected to be taken, in a tax return. The Fund recognizes interest and penalties, if any, related to unrecognized tax positions as an income tax expense in the Statement of Operations. As of October 31, 2013, the Fund did not have any unrecognized tax positions.
36
Income distributions and capital gain distributions are determined in accordance with income tax regulations, which may differ from GAAP. These differences are primarily due to differing treatments of income and gains on various investment securities held by the Fund, timing differences and differing characterization of distributions made by the Fund.
As determined on October 31, 2013, permanent differences resulting primarily from different book and tax accounting were reclassified at year end. Such differences may be attributed to one or more of the following: netting of net ordinary losses with short-term capital gains, income recognized on swap transactions, non-deductible stock issuance costs, the tax treatment of foreign currency gains and losses, payments in lieu of dividends on short sales and gains from passive foreign investment companies. These reclassifications had no effect on net income, net asset value ("NAV") or NAV per share of the Fund. For the year ended October 31, 2013, the Fund recorded the following permanent reclassifications:
| Paid-In Capital | | Undistributed
Net Investment
Income (Loss) | | Accumulated
Net Realized
Gains (Losses)
on Investments | |
| $ | (84,626 | ) | | $ | 1,203,557 | | | $ | (1,118,931 | ) | |
For tax purposes, distributions of short-term gains are taxable to shareholders as ordinary income.
The tax character of distributions paid during the years ended October 31, 2013 and October 31, 2012 was as follows:
| | | | | Distributions Paid From: | | | | | |
Ordinary Income | | Tax-Exempt
Income | | Long-Term
Capital Gain | | Return of
Capital | | Total | |
| 2013 | | 2012 | | 2013 | | 2012 | | 2013 | | 2012 | | 2013 | | 2012 | | 2013 | | 2012 | |
| $ | 190,445 | | | $ | — | (1) | | $ | — | | | $ | — | (1) | | $ | 2,411 | | | $ | — | (1) | | $ | — | | | $ | — | (1) | | $ | 192,856 | | | $ | — | (1) | |
(1) Period from May 15, 2012 (Commencement of Operations) to October 31, 2012.
As of October 31, 2013, the components of distributable earnings (accumulated losses) on a U.S. federal income tax basis were as follows:
Undistributed
Ordinary
Income | | Undistributed
Long-Term
Gain | | Unrealized
Appreciation
(Depreciation) | | Loss
Carryforwards
and Deferrals | | Other Temporary
Differences | | Total | |
$ | 4,424,384 | | | $ | — | | | $ | 3,673,124 | | | $ | — | | | $ | (431,517 | ) | | $ | 7,665,991 | | |
The difference between book basis and tax basis distributable earnings is attributable primarily to wash sale loss deferrals, amortization of organizational costs, mark to market on certain swap contract transactions, unsettled wash sale loss deferrals, straddle loss deferrals, mark-to-market adjustments on passive foreign investment companies, constructive sales gains and delayed settlement compensation on bank loans.
To the extent the Fund's net realized capital gains, if any, can be offset by capital loss carryforwards, if any, it is the policy of the Fund not to distribute such gains.
6 Foreign taxes: Foreign taxes withheld represent amounts withheld, if any, by foreign tax authorities, net of refunds recoverable.
7 Distributions to shareholders: The Fund may earn income, net of expenses, daily on its investments. Distributions from net investment income and net realized capital gains, if any, generally are distributed once a year (usually in December) and are recorded on the ex-date.
37
8 Expense allocation: Certain expenses are applicable to multiple funds. Expenses directly attributable to the Fund are charged to the Fund. Expenses of the Trust that are not directly attributable to a particular series of the Trust (e.g., a Fund) are allocated among the series of the Trust, on the basis of relative net assets, except where a more appropriate allocation of expenses to each of the series can otherwise be made fairly. Expenses borne by the complex of related investment companies, which includes open-end and closed-end investment companies for which Management serves as investment manager, that are not directly attributable to a particular investment company in the complex (e.g., the Trust) or series thereof are allocated among the investment companies in the complex or series thereof, on the basis of relative net assets, except where a more appropriate allocation of expenses to each of the investment companies in the complex or series thereof can otherwise be made fairly. The Fund's expenses (other than those specific to each class) are allocated proportionally each day among the classes based upon the relative net assets of each class.
9 Investments in foreign securities: Investing in foreign securities may involve certain sovereign and other risks, in addition to the credit and market risks normally associated with domestic securities. These additional risks include the possibility of adverse political and economic developments (including political instability, nationalization, expropriation, or confiscatory taxation) and the potentially adverse effects of unavailability of public information regarding issuers, less governmental supervision and regulation of financial markets, reduced liquidity of certain financial markets, and the lack of uniform accounting, auditing, and financial reporting standards or the application of standards that are different or less stringent than those applied in the United States. Foreign securities also may experience greater price volatility, higher rates of inflation, and delays in settlement.
10 Securities sold short: The Fund may engage in short sales, which are sales of securities which have been borrowed from a third party on the expectation that the market price will decline. If the price of the securities decreases, the Fund will make a profit by purchasing the securities in the open market at a price lower than the one at which it sold the securities. If the price of the securities increases, the Fund may have to cover its short positions at a price higher than the short sale price, resulting in a loss. Gains are limited to the price at which the Fund sold the security short, while losses are potentially unlimited in size. The Fund pledges securities and/or other assets, to the lender as collateral. Proceeds received from short sales may be maintained by the lender as collateral. Proceeds maintained by the lender are included in the "Deposit with brokers for short sales" on the Statement of Assets and Liabilities. The Fund is required to segregate an amount of cash, cash equivalents or other appropriate liquid marketable securities with the custodian in at least an amount equal to the current market value of the securities sold short (less any additional collateral held by the lender). The Fund is contractually responsible to the lender for any dividends payable and interest accrued on securities while those securities are in a short position. These dividends and interest are recorded as an expense of the Fund and are excluded from the contractual expense limitation. As of October 31, 2013, the Fund had pledged cash in the amount of $89,465,765 to JP Morgan Chase Bank, N.A. ("JPM"), as collateral for short sales. At October 31, 2013, the Fund had pledged securities in the amount of $24,083,373 to cover collateral requirements for borrowing in connection with securities sold short.
11 Investment company securities and exchange-traded funds: The Fund may invest in shares of other registered investment companies, including exchange-traded funds ("ETFs"), within the limitations prescribed by the 1940 Act. Some ETFs seek to track the performance of a particular market index. These indices include both broad-based market indices and more narrowly-based indices, including those relating to particular sectors, markets, regions or industries. However, some ETFs have actively-managed investment objectives. ETF shares are traded like traditional equity securities on a national securities exchange or NASDAQ. The Fund will indirectly bear its proportionate share of any management fees and other expenses paid by such other investment companies, which will decrease returns.
12 Derivative instruments: During the year ended October 31, 2013, the Fund's use of derivatives, as described below, was limited to equity swaps, total return swaps, financial futures contracts, forward foreign currency contracts, written option transactions and purchased option transactions. The Fund has adopted the provisions of ASC 815 "Derivatives and Hedging" ("ASC 815"). The disclosure requirements of ASC 815 distinguish between derivatives that qualify for hedge accounting and those that do not. Because investment companies value their derivatives at
38
fair value and recognize changes in fair value through the Statement of Operations, they do not qualify for hedge accounting. Accordingly, even though the Fund's investments in derivatives may represent economic hedges, they are considered non-hedge transactions for purposes of this disclosure.
Equity swap contracts: During the year ended October 31, 2013, the Fund used equity swaps to provide investment exposure to certain foreign investments. Equity swaps are two-party contracts that generally obligate one party to pay the positive return and the other party to pay the negative return on a specified reference security, basket of securities, security index or index component during the period of the swap. Equity swap contracts are marked to market daily based on the value of the underlying reference entity and the change, if any, is recorded as an unrealized gain or loss. Equity swaps normally do not involve the delivery of securities or other underlying assets. If the other party to an equity swap defaults, a Fund's risk of loss consists of the net amount of payments that such Fund is contractually entitled to receive, if any. Equity swaps are derivatives and their value can be very volatile. To the extent that the Adviser or Sub-Adviser, as applicable, do not accurately analyze and predict future market trends, the values of assets or economic factors, a Fund may suffer a loss, which may exceed the related amounts shown in the Statement of Assets and Liabilities. Periodic payments received or paid by the Fund is recorded as realized gains or losses.
At October 31, 2013, the outstanding equity swaps* for the Fund were as follows:
Counterparty | | Description | | Value† | |
JPMorgan Chase Bank, N.A.
| | The Fund receives or pays the total return on a portfolio of long and short
positions and pays or receives a specified LIBOR or Federal Funds floating rate,
which is denominated in various foreign currencies based on the local currencies
of the positions within the portfolio. | | $ | 440,123 | | |
* The following table represents the individual long and short positions and related values within the equity swaps as of October 31, 2013.
Reference Entity | | Shares | | Notional
Value(a) | | Net Unrealized
Appreciation
(Depreciation) | |
Long Positions | |
Australia | |
GrainCorp Ltd. | | | 54,143 | | | $ | 632,372 | | | $ | (894 | ) | |
Belgium | |
Henex | | | 1,867 | | | | 158,477 | | | | 513 | | |
Brazil | |
MMX Mineracao e Metalicos SA | | | 901,417 | | | | 1,218,568 | | | | (224,683 | ) | |
Canada | |
Extendicare Inc. | | | 92,694 | | | | 586,990 | | | | 7,766 | | |
Petrominerales Ltd. | | | 54,459 | | | | 617,746 | | | | 8,508 | | |
Shoppers Drug Mart Corp. | | | 51,789 | | | | 2,969,987 | | | | 55,943 | | |
| | | | | | | | 72,217 | | |
Denmark | |
Bavarian Nordic A/S | | | 950 | | | | 11,483 | | | | 104 | | |
Coloplast A/S | | | 254 | | | | 14,592 | | | | 1,970 | | |
Genmab A/S | | | 273 | | | | 11,219 | | | | 634 | | |
H. Lundbeck A/S | | | 1,079 | | | | 22,595 | | | | 603 | | |
| | | | | | | | 3,311 | | |
39
Reference Entity | | Shares | | Notional
Value(a) | | Net Unrealized
Appreciation
(Depreciation) | |
France | |
BNP Paribas SA | | | 1,400 | | | $ | 97,786 | | | $ | 5,887 | | |
Caisse Regionale Credit Agricole Mutuel d'Ille et Vilaine | | | 298 | | | | 19,557 | | | | 418 | | |
Caisse Regionale de Credit Agricole Mutuel Alpes Provence | | | 116 | | | | 9,113 | | | | 495 | | |
Credit Agricole Atlantique Vendee CCI | | | 343 | | | | 37,330 | | | | (115 | ) | |
Credit Agricole de la Touraine et du Poitou | | | 219 | | | | 16,019 | | | | 38 | | |
Credit Agricole de Normandie-Seine | | | 450 | | | | 49,852 | | | | 1,105 | | |
Credit Agricole Loire Haute-Loire | | | 177 | | | | 11,038 | | | | 810 | | |
Credit Agricole Nord de France CCI | | | 1,460 | | | | 30,384 | | | | 1,076 | | |
Orange | | | 13,278 | | | | 184,383 | | | | (2,118 | ) | |
Sanofi | | | 244 | | | | 24,839 | | | | 1,181 | | |
Vivendi | | | 5,112 | | | | 125,974 | | | | 3,784 | | |
| | | | | | | | 12,561 | | |
Germany | |
Celesio AG | | | 14,329 | | | | 397,069 | | | | 49,136 | | |
GSW Immobilien AG | | | 3,532 | | | | 158,552 | | | | 5,385 | | |
KHD Humboldt Wedag International AG | | | 2,455 | | | | 21,196 | | | | 53 | | |
MAN SE | | | 5,092 | | | | 604,135 | | | | 9,453 | | |
| | | | | | | | 64,027 | | |
Ireland | |
Shire PLC | | | 8,389 | | | | 331,421 | | | | 38,614 | | |
Isle of Man | |
GVC Holdings PLC | | | 38,793 | | | | 199,861 | | | | 18,854 | | |
Italy | |
Telecom Italia SpA | | | 144,737 | | | | 99,139 | | | | 13,956 | | |
Netherlands | |
Unit4 NV | | | 6,717 | | | | 309,055 | | | | 7,591 | | |
Ziggo NV | | | 11,146 | | | | 477,399 | | | | 895 | | |
| | | | | | | | 8,486 | | |
South Africa | |
Adcock Ingram Holdings Ltd. | | | 30,768 | | | | 211,018 | | | | 9,963 | | |
Spain | |
Almirall SA | | | 2,148 | | | | 31,520 | | | | 590 | | |
Banco Santander SA | | | 9,104 | | | | 76,340 | | | | 4,488 | | |
Distribuidora Internacional de Alimentacion SA | | | 2,567 | | | | 23,479 | | | | (12 | ) | |
| | | | | | | | 5,066 | | |
Sweden | |
Elekta AB | | | 1,090 | | | | 17,438 | | | | (1,357 | ) | |
Meda AB | | | 4,214 | | | | 45,886 | | | | 1,456 | | |
Medivir AB | | | 1,074 | | | | 13,813 | | | | 275 | | |
Swedish Orphan Biovitrum AB | | | 2,434 | | | | 20,309 | | | | 2,979 | | |
| | | | | | | | 3,353 | | |
40
Reference Entity | | Shares | | Notional
Value(a) | | Net Unrealized
Appreciation
(Depreciation) | |
United Kingdom | |
Abcam PLC | | | 1,658 | | | $ | 12,937 | | | $ | 475 | | |
Aberdeen Asset Management PLC | | | 137,957 | | | | 874,740 | | | | 104,956 | | |
Amerisur Resources PLC | | | 379,019 | | | | 276,797 | | | | (9,400 | ) | |
Associated British Foods PLC | | | 41,681 | | | | 1,268,322 | | | | 246,743 | | |
Fiberweb PLC | | | 34,938 | | | | 52,621 | | | | 4,982 | | |
Galliford Try PLC | | | 51,750 | | | | 903,911 | | | | 46,994 | | |
GlaxoSmithKline PLC | | | 1,043 | | | | 26,899 | | | | 586 | | |
Inmarsat PLC | | | 12,693 | | | | 146,815 | | | | (179 | ) | |
Invensys PLC | | | 72,994 | | | | 583,258 | | | | 5,446 | | |
Ladbrokes PLC | | | 252,870 | | | | 713,846 | | | | 60,972 | | |
Rexam PLC | | | 107,920 | | | | 869,490 | | | | 29,447 | | |
SABMiller PLC | | | 8,726 | | | | 457,604 | | | | (2,328 | ) | |
Tate & Lyle PLC | | | 112,229 | | | | 1,412,971 | | | | 11,317 | | |
Taylor Wimpey PLC | | | 513,450 | | | | 880,088 | | | | 27,151 | | |
Vodafone Group PLC | | | 365,052 | | | | 1,260,021 | | | | 54,032 | | |
| | | | | | | | 581,194 | | |
United States | |
Brookfield Office Properties, Inc. | | | 65,538 | | | | 1,242,658 | | | | (16,442 | ) | |
PAA Natural Gas Storage, L.P. | | | 80,646 | | | | 1,844,758 | | | | (7,643 | ) | |
Pioneer Southwest Energy Partners, L.P. | | | 72,249 | | | | 3,179,657 | | | | 237,721 | | |
| | | | | | | | 213,636 | | |
Total Long Positions of Portfolio Swap | | | | | | | 820,174 | | |
Short Positions | |
Belgium | |
Anheuser-Busch InBev NV | | | (4,475 | ) | | | (462,019 | ) | | | (3,397 | ) | |
Bermuda | |
Catlin Group Ltd. | | | (21,590 | ) | | | (171,917 | ) | | | (5,324 | ) | |
Hiscox Ltd. | | | (16,350 | ) | | | (172,434 | ) | | | (982 | ) | |
| | | | | | | | (6,306 | ) | |
Canada | |
Loblaw Cos. Ltd. | | | (19,138 | ) | | | (842,124 | ) | | | (33,233 | ) | |
France | |
Bureau Veritas SA | | | (18,160 | ) | | | (551,657 | ) | | | 3,291 | | |
LVMH Moet Hennessy Louis Vuitton SA | | | (3,177 | ) | | | (600,215 | ) | | | (11,449 | ) | |
Lyxor ETF CAC 40 | | | (7,704 | ) | | | (211,212 | ) | | | (5,155 | ) | |
Lyxor ETF STOXX Europe 600 Banks | | | (4,339 | ) | | | (247,791 | ) | | | (4,680 | ) | |
Publicis Groupe | | | (10,102 | ) | | | (791,345 | ) | | | (51,231 | ) | |
Schneider Electric SA | | | (1,901 | ) | | | (158,662 | ) | | | (1,494 | ) | |
| | | | | | | | (70,718 | ) | |
41
Reference Entity | | Shares | | Notional
Value(a) | | Net Unrealized
Appreciation
(Depreciation) | |
Germany | |
Deutsche Wohnen AG | | | (6,712 | ) | | $ | (125,329 | ) | | $ | (980 | ) | |
Ireland | |
iShares FTSE 100 UCITS ETF Inc. | | | (25,899 | ) | | | (270,314 | ) | | | (8,578 | ) | |
Italy | |
Assicurazioni Generali SpA | | | (2,428 | ) | | | (51,546 | ) | | | (5,222 | ) | |
Telecom Italia SpA | | | (116,724 | ) | | | (100,042 | ) | | | (13,669 | ) | |
| | | | | | | | (18,891 | ) | |
Portugal | |
Jeronimo Martins, SGPS, SA | | | (14,470 | ) | | | (279,166 | ) | | | 11,775 | | |
United Kingdom | |
Amlin PLC | | | (26,150 | ) | | | (170,589 | ) | | | (8,070 | ) | |
BTG PLC | | | (28,700 | ) | | | (170,882 | ) | | | (22,208 | ) | |
Bunzl PLC | | | (8,060 | ) | | | (169,820 | ) | | | (8,135 | ) | |
Capita PLC | | | (11,050 | ) | | | (169,335 | ) | | | (5,360 | ) | |
Drax Group PLC | | | (16,780 | ) | | | (171,253 | ) | | | 136 | | |
G4S PLC | | | (44,330 | ) | | | (170,282 | ) | | | (15,589 | ) | |
Imperial Tobacco Group PLC | | | (23,050 | ) | | | (860,466 | ) | | | (295 | ) | |
Provident Financial PLC | | | (6,480 | ) | | | (169,602 | ) | | | 5,440 | | |
Schroders PLC | | | (20,671 | ) | | | (868,463 | ) | | | 13,682 | | |
Serco Group PLC | | | (20,760 | ) | | | (172,611 | ) | | | (12,796 | ) | |
| | | | | | | | (53,195 | ) | |
United States | |
Pioneer Natural Resources Co. | | | (16,801 | ) | | | (3,156,956 | ) | | | (283,553 | ) | |
Plains All American Pipeline, L.P. | | | (35,079 | ) | | | (1,811,245 | ) | | | 14,499 | | |
| | | | | | | | (269,054 | ) | |
Total Short Positions of Portfolio Swap | | | | | | | (452,577 | ) | |
Total Long and Short Positions of Portfolio Swap | | | | | | | 367,597 | | |
Financing Costs and Other Receivables | | | | | | | 72,526 | | |
Swap, at Value | | | | | | $ | 440,123 | | |
(a) Notional value represents the market value (including any fees or commissions) of the long and short positions when they are established.
Total return swap contracts: During the year ended October 31, 2013, the Fund used total return swaps to hedge certain indices and provide investment exposure to certain foreign investments. Total return swaps involve commitments to pay fixed or floating rate interest in exchange for a market-linked return based on a notional amount. To the extent the total return of the reference security or index underlying the total return swap exceeds or falls short of the offsetting interest rate obligation, a Fund will receive a payment or make a payment to the counterparty, respectively. Certain risks may arise when entering into swap transactions, including counterparty default, liquidity or unfavorable changes in the value of the underlying reference security or index. The value of the swap is adjusted daily and the change in value, if any, is recorded as unrealized appreciation or depreciation in the Statement of Assets and Liabilities. Payments received or made at the end of each measurement period are recorded as realized gain or loss in the Statement of Operations.
42
At October 31, 2013, the outstanding total return swap contracts were as follows:
| | | | | | | Rate Type | | | | | | | |
Swap
Counterparty | | Notional
Amount(1) | | Termination
Date | | Variable-rate
Payments
Made/
(Received)
by the Fund | | Reference Entity | | Accrued Net
Interest
Receivable
(Payable) | | Unrealized
Appreciation
(Depreciation) | | Total Fair
Value | |
J.P. Morgan
| | $ | 1,199,127
| | | Various (June 30,
2014 to August 21,
2014) | | Various
(0.174 to
0.176)%(2) | | Banco do Brasil S.A.
| | $ | (163
| ) | | $ | (256,295
| ) | | $ | (256,458
| ) | |
J.P. Morgan
| | | 2,087,113
| | | November 6, 2014
| | | 0.129
| (3) | | The EURO STOXX 50
Index | | | —
| | | | (27,927
| ) | | | (27,927
| ) | |
J.P. Morgan
| | | 2,052,756
| | | July 31, 2014
| | | 0.127
| (4) | | The STOXX 600
Automobiles & Parts
(Price) Index | | | (217
| ) | | | (124,748
| ) | | | (124,965
| ) | |
| Totals | | | | | | | | | | | | | | | | | | $ | (380 | ) | | $ | (408,970 | ) | | $ | (409,350 | ) | |
(1) The notional amount at period end is indicative of the volume throughout the period.
(2) 1 month LIBOR minus 0.50%-0.80% at October 15, 2013.
(3) 1 month EURIBOR minus 0.65% at October 15, 2013.
(4) 1 month EURIBOR minus 0.45% at October 15, 2013.
Financial futures contracts: During the year ended October 31, 2013, the Fund entered into financial futures contracts in an effort to enhance returns and to manage or adjust the risk profile and the investment exposure of the Fund to certain asset classes, countries and regions. The Fund also utilized financial futures contracts to provide investment exposure to certain indices other than the benchmarks.
At the time the Fund enters into a financial futures contract, it is required to deposit with the futures commission merchant a specified amount of cash or liquid securities, known as "initial margin," which is a percentage of the value of the financial futures contract being traded that is set by the exchange upon which the futures contract is traded. Each day, the futures contract is valued at the official settlement price of the board of trade or U.S. commodity exchange on which such futures contract is traded. Subsequent payments, known as "variation margin," to and from the broker are made on a daily basis as the market price of the financial futures contract fluctuates. Daily variation margin adjustments, arising from this "mark to market," are recorded by the Fund as unrealized gains or losses.
Although some financial futures contracts by their terms call for actual delivery or acquisition of the underlying securities or currency, in most cases the contracts are closed out prior to delivery by offsetting purchases or sales of matching financial futures contracts. When the contracts are closed, the Fund recognizes a gain or loss. Risks of entering into futures contracts include the possibility there may be an illiquid market, possibly at a time of rapidly declining prices, and/or a change in the value of the contract may not correlate with changes in the value of the underlying securities. Futures executed on regulated futures exchanges have minimal counterparty risk to a fund because the exchange's clearinghouse assumes the position of the counterparty in each transaction. Thus, the Fund is exposed to risk only in connection with the clearinghouse and not in connection with the original counterparty to the transaction.
For U.S. federal income tax purposes, the futures transactions undertaken by the Fund may cause the Fund to recognize gains or losses from marking contracts to market even though its positions have not been sold or terminated, may affect the character of the gains or losses recognized as long-term or short-term, and may affect the timing of some capital gains and losses realized by the Fund. Also, the Fund's losses on transactions involving
43
futures contracts may be deferred rather than being taken into account currently in calculating the Fund's taxable income. At October 31, 2013 there were no open positions in financial futures contracts.
During the year ended October 31, 2013, the average notional value of financial futures contracts was $239,691 for short positions.
Forward foreign currency contracts: During the year ended October 31, 2013, the Fund entered into forward foreign currency contracts ("forward contracts") to hedge foreign currency.
A forward contract is an agreement between two parties to buy or sell a specific currency for another at a set price on a future date, which is individually negotiated and privately traded by currency traders and their customers in the interbank market. The market value of a forward contract fluctuates with changes in forward currency exchange rates. Forward contracts are marked to market daily, and the change in value is recorded by the Fund as an unrealized gain or loss. At the consummation of a forward contract to purchase or sell currency, a Fund may either exchange the currencies specified at the maturity of a forward contract or enter into a closing transaction involving the purchase or sale of an offsetting forward contract. Closing transactions with respect to forward contracts are usually performed with the counterparty to the original forward contract. The gain or loss arising from the difference between the US dollar cost of the original contract and the value of the foreign currency in US dollars upon closing a contract is included in "Net realized gain (loss) from forward foreign currency contracts" in the Statement of Operations. These contracts may involve market risk in excess of the unrealized gain or loss reflected in a Fund's Statement of Assets and Liabilities. In addition, a Fund could be exposed to risk if the counterparties are unable to meet the terms of the contracts or if the value of the currency changes unfavorably to the US dollar.
At October 31, 2013, open forward contracts for the Fund were as follows:
Buy | | Counterparty | | Contracts to
Receive | | In Exchange
For | | Settlement
Date | | Value | | Net Unrealized
Appreciation
(Depreciation) | |
Australian Dollar | | J.P. Morgan | | | 148,423 | | | $ | 133,195 | | | 11/20/13 | | $ | 140,130 | | | $ | 6,935 | | |
Brazilian Real | | J.P. Morgan | | | 649,545 | | | | 289,598 | | | 11/20/13 | | | 288,815 | | | | (783 | ) | |
Canadian Dollar | | J.P. Morgan | | | 715,394 | | | | 694,413 | | | 11/20/13 | | | 685,844 | | | | (8,569 | ) | |
Danish Krone | | J.P. Morgan | | | 48,159 | | | | 8,889 | | | 11/20/13 | | | 8,768 | | | | (121 | ) | |
Euro | | J.P. Morgan | | | 2,191,809 | | | | 2,977,449 | | | 11/20/13 | | | 2,976,046 | | | | (1,403 | ) | |
Hong Kong Dollar | | J.P. Morgan | | | 1,783,884 | | | | 230,077 | | | 11/20/13 | | | 230,100 | | | | 23 | | |
Japanese Yen | | J.P. Morgan | | | 44,419,424 | | | | 453,512 | | | 11/20/13 | | | 451,773 | | | | (1,739 | ) | |
New Zealand Dollar | | J.P. Morgan | | | 6,278 | | | | 5,179 | | | 11/20/13 | | | 5,180 | | | | 1 | | |
Norwegian Krone | | J.P. Morgan | | | 8,585,192 | | | | 1,433,392 | | | 11/20/13 | | | 1,441,293 | | | | 7,901 | | |
Philippine Peso | | J.P. Morgan | | | 27,363,394 | | | | 633,091 | | | 11/20/13 | | | 633,513 | | | | 422 | | |
Pound Sterling | | J.P. Morgan | | | 243,996 | | | | 388,080 | | | 11/20/13 | | | 391,176 | | | | 3,096 | | |
South African Rand | | J.P. Morgan | | | 4,164,451 | | | | 410,388 | | | 11/20/13 | | | 413,877 | | | | 3,489 | | |
Swedish Krona | | J.P. Morgan | | | 14,216,794 | | | | 2,222,191 | | | 11/20/13 | | | 2,193,055 | | | | (29,136 | ) | |
Swiss Franc | | J.P. Morgan | | | 811,964 | | | | 890,986 | | | 11/20/13 | | | 894,990 | | | | 4,004 | | |
Thai Baht | | J.P. Morgan | | | 4,136,130 | | | | 130,782 | | | 11/20/13 | | | 132,749 | | | | 1,967 | | |
Total | | | | | | | | | | | | $ | (13,913 | ) | |
44
Sell | | Counterparty | | Contracts to
Deliver | | In Exchange
For | | Settlement
Date | | Value | | Net Unrealized
Appreciation
(Depreciation) | |
Australian Dollar | | J.P. Morgan | | | 148,423 | | | $ | 133,992 | | | 11/20/13 | | $ | (140,130 | ) | | $ | (6,138 | ) | |
Brazilian Real | | J.P. Morgan | | | 4,856,051 | | | | 2,130,180 | | | 11/20/13 | | | (2,159,207 | ) | | | (29,027 | ) | |
Canadian Dollar | | J.P. Morgan | | | 715,394 | | | | 687,365 | | | 11/20/13 | | | (685,845 | ) | | | 1,520 | | |
Danish Krone | | J.P. Morgan | | | 4,722,685 | | | | 861,321 | | | 11/20/13 | | | (859,839 | ) | | | 1,482 | | |
Euro | | J.P. Morgan | | | 4,284,830 | | | | 5,789,199 | | | 11/20/13 | | | (5,817,957 | ) | | | (28,758 | ) | |
Hong Kong Dollar | | J.P. Morgan | | | 4,412,427 | | | | 569,113 | | | 11/20/13 | | | (569,150 | ) | | | (37 | ) | |
Japanese Yen | | J.P. Morgan | | | 348,639,081 | | | | 3,543,447 | | | 11/20/13 | | | (3,545,874 | ) | | | (2,427 | ) | |
New Zealand Dollar | | J.P. Morgan | | | 304,019 | | | | 246,338 | | | 11/20/13 | | | (250,847 | ) | | | (4,509 | ) | |
Norwegian Krone | | J.P. Morgan | | | 2,996,451 | | | | 496,702 | | | 11/20/13 | | | (503,048 | ) | | | (6,346 | ) | |
Philippine Peso | | J.P. Morgan | | | 103,381,217 | | | | 2,378,657 | | | 11/20/13 | | | (2,393,467 | ) | | | (14,810 | ) | |
Pound Sterling | | J.P. Morgan | | | 520,765 | | | | 827,951 | | | 11/20/13 | | | (834,894 | ) | | | (6,943 | ) | |
South African Rand | | J.P. Morgan | | | 23,993,318 | | | | 2,392,815 | | | 11/20/13 | | | (2,384,537 | ) | | | 8,278 | | |
Swedish Krona | | J.P. Morgan | | | 20,545,654 | | | | 3,162,572 | | | 11/20/13 | | | (3,169,332 | ) | | | (6,760 | ) | |
Swiss Franc | | J.P. Morgan | | | 1,668,480 | | | | 1,818,030 | | | 11/20/13 | | | (1,839,088 | ) | | | (21,058 | ) | |
Thai Baht | | J.P. Morgan | | | 58,800,297 | | | | 1,861,615 | | | 11/20/13 | | | (1,887,194 | ) | | | (25,579 | ) | |
Total | | | | | | | | | | | | $ | (141,112 | ) | |
For the year ended October 31, 2013, the Fund's investment in forward contracts had an average value of $3,174,249.
Options: Premiums received by the Fund upon writing a covered call option or a put option are recorded in the liability section of the Statement of Assets and Liabilities and are subsequently adjusted to the current market value. When an option is exercised, closed, or expired, the Fund realizes a gain or loss and the liability is eliminated.
When writing a covered call option, the Fund, in return for the premium, gives up the opportunity for profit from a price increase in the underlying security above the exercise price, but conversely retains the risk of loss should the price of the security decline. When writing a put option, the Fund, in return for the premium, takes the risk that it must purchase the underlying security at a price that may be higher than the current market price of the security. If a put option that the Fund has written expires unexercised, the Fund will realize a gain in the amount of the premium. All securities covering outstanding options are held in escrow by the custodian bank.
Written option transactions were used in an attempt to generate incremental returns for the Fund for the year ended October 31, 2013. Written option transactions for the Fund for the year ended October 31, 2013 were:
| | | Number of
Contracts | | Premiums | |
Outstanding at October 31, 2012 | | | 254 | | | $ | 31,242 | | |
Options written | | | 11,857 | | | | 3,098,876 | | |
Options terminated in closing
purchase transactions | | | (3,000 | ) | | | (521,712 | ) | |
Options exercised | | | (93 | ) | | | (26,270 | ) | |
Options expired | | | (1,122 | ) | | | (346,075 | ) | |
Outstanding at October 31, 2013 | | | 7,896 | | | $ | 2,236,061 | | |
Premiums paid by the Fund upon purchasing a covered call option are recorded in the asset section of the Fund's Statement of Assets and Liabilities and are subsequently adjusted to the current market value. When an option is exercised, closed, or expired, the Fund realizes a gain or loss and the asset is eliminated.
For purchased call options, the Fund's loss is limited to the amount of the option premium paid.
45
Purchased option transactions were used in an attempt to manage or adjust the risk profile and the investment exposure of the Fund to certain securities for the Fund and enhance returns for the year ended October 31, 2013. Purchased option transactions for the Fund for the year ended October 31, 2013 were:
| | | Number of
Contracts | | Premiums | |
Outstanding at October 31, 2012 | | | 794 | | | $ | 116,525 | | |
Options purchased | | | 18,624 | | | | 5,813,818 | | |
Options terminated in closing
sale transactions | | | (4,285 | ) | | | (950,206 | ) | |
Options exercised | | | (334 | ) | | | (57,109 | ) | |
Options expired | | | (5,271 | ) | | | (927,985 | ) | |
Outstanding at October 31, 2013 | | | 9,528 | | | $ | 3,995,043 | | |
For the year ended October 31, 2013, the Fund had an average market value of $317,649 and $636,100 in purchased options and written options, respectively.
At October 31, 2013, the Fund had the following derivatives (which did not qualify as hedging instruments under ASC 815), grouped by primary risk exposure:
Asset Derivatives
Derivative Type | | Statement of
Assets and
Liabilities Location | | Currency Risk | | Equity Risk | | Total | |
Equity swaps | | Swaps, at value | | $ | — | | | $ | 440,123 | | | $ | 440,123 | | |
| Forward contracts | | Receivable for open forward
foreign currency
contracts | | | 39,118 | | | | — | | | | 39,118 | | |
Purchased options | | Investments in securities,
at value | | | — | | | | 1,845,297 | | | | 1,845,297 | | |
Total Value—Assets | | | | $ | 39,118 | | | $ | 2,285,420 | | | $ | 2,324,538 | | |
Liability Derivatives
Derivative Type | | Statement of
Assets and
Liabilities Location | | Currency Risk | | Equity Risk | | Total | |
Total return swaps | | Swaps, at value | | $ | — | | | $ | (409,350 | ) | | $ | (409,350 | ) | |
| Forward contracts | | Payable for open forward
foreign currency
contracts | | | (194,143 | ) | | | — | | | | (194,143 | ) | |
Option contracts written | | Written options, at value | | | — | | | | (925,318 | ) | | | (925,318 | ) | |
Total Value—Liabilities | | | | $ | (194,143 | ) | | $ | (1,334,668 | ) | | $ | (1,528,811 | ) | |
46
The impact of the use of these derivative instruments on the Statement of Operations during the year ended October 31, 2013, was as follows:
Realized Gain (Loss)
Derivative Type | | Statement of
Operations Location | | Currency Risk | | Equity Risk | | Total | |
| Forward contracts | | Net realized gain
(loss) on: forward
foreign currency
contracts | | $ | 27,633 | | | $ | — | | | $ | 27,633 | | |
Futures contracts | | Net realized gain
(loss) on: financial
futures contracts | | | — | | | | (58,511 | ) | | | (58,511 | ) | |
Option contracts written | | Net realized gain
(loss) on: options written | | | — | | | | 275,033 | | | | 275,033 | | |
Option contracts purchased | | Net realized gain
(loss) on: sales of
investment securities
of unaffiliated issuers | | | — | | | | (1,065,160 | ) | | | (1,065,160 | ) | |
Swap contracts | | Net realized gain
(loss) on: swap contracts | | | — | | | | 505,524 | | | | 505,524 | | |
Total Realized Gain (Loss) | | | | $ | 27,633 | | | $ | (343,114 | ) | | $ | (315,481 | ) | |
Change in Appreciation (Depreciation)
Derivative Type | | Statement of
Operations Location | | Currency Risk | | Equity Risk | | Total | |
Forward contracts | | Change in net unrealized
appreciation (depreciation)
in value of: forward
foreign currency contracts | | $ | (155,025 | ) | | $ | — | | | $ | (155,025 | ) | |
Futures contracts | | Change in net unrealized
appreciation (depreciation)
in value of: financial
futures contracts | | | — | | | | (2,795 | ) | | | (2,795 | ) | |
Option contracts written | | Change in net unrealized
appreciation (depreciation)
in value of: options written | | | — | | | | 1,301,528 | | | | 1,301,528 | | |
Option contracts purchased | | Change in net unrealized
appreciation (depreciation)
in value of: unaffiliated
investment securities | | | — | | | | (2,146,368 | ) | | | (2,146,368 | ) | |
Swap contracts | | Change in net unrealized
appreciation (depreciation)
in value of: swap contracts | | | — | | | | 30,773 | | | | 30,773 | | |
Total Change in Appreciation
(Depreciation) | | | | $ | (155,025 | ) | | $ | (816,862 | ) | | $ | (971,887 | ) | |
47
13 Indemnifications: Like many other companies, the Trust's organizational documents provide that its officers and trustees are indemnified against certain liabilities arising out of the performance of their duties to the Trust. In addition, both in some of its principal service contracts and in the normal course of its business, the Trust enters into contracts that provide indemnifications to other parties for certain types of losses or liabilities. The Trust's maximum exposure under these arrangements is unknown as this could involve future claims against the Trust.
14 Expense offset arrangement: The Fund has an expense offset arrangement in connection with its custodian contract. For the year ended October 31, 2013, the impact of this arrangement was a reduction of expenses of $6,322.
15 Other: All net investment income and realized and unrealized capital gains and losses of the Fund are allocated, on the basis of relative net assets, pro rata among its respective classes.
Note B—Management Fees, Administration Fees, Distribution Arrangements, and Other Transactions with Affiliates:
The Fund retains Management as its investment manager under a Management Agreement. For such investment management services, the Fund pays Management a fee at the annual rate of 1.700% of the first $250 million of the Fund's average daily net assets, 1.675% of the next $250 million, 1.650% of the next $250 million, 1.625% of the next $250 million, 1.600% of the next $500 million, 1.575% of the next $2.5 billion, and 1.550% of average daily net assets in excess of $4 billion. Prior to February 28, 2013, the Fund paid Management a fee at the annual rate of 2.000% of the first $250 million of the Fund's average daily net assets, 1.975% of the next $250 million, 1.950% of the next $250 million, 1.925% of the next $250 million, 1.900% of the next $500 million, 1.875% of the next $2.5 billion, and 1.850% of average daily net assets in excess of $4 billion. Accordingly, for the year ended October 31, 2013, the fee pursuant to the Management Agreement was equivalent to an annual effective rate of 1.732% of the Fund's average daily net assets.
The Fund retains Management as its administrator under an Administration Agreement. The Fund pays Management an administration fee at the annual rate of 0.06% of its average daily net assets under this agreement. In addition, the Fund's Institutional Class pays Management an administration fee at the annual rate of 0.09% of its average daily net assets under this agreement and the Fund's Class A and Class C pays Management an administration fee at the annual rate of 0.20% of its average daily net assets under this agreement. Additionally, Management retains JPM as its sub-administrator under a Sub-Administration Agreement. Management pays JPM a fee for all services received under the agreement.
Management has contractually agreed to waive current payment of fees and/or reimburse certain expenses of the Institutional Class, Class A and Class C of the Fund so that the total annual operating expenses of those classes do not exceed the expense limitations as detailed in the following table. These undertakings apply to the Fund's direct expenses and exclude interest, taxes, brokerage commissions, acquired fund fees and expenses, extraordinary expenses, and dividend and interest expenses on short sales, if any; consequently, net expenses may exceed the contractual expense limitations. The Fund has agreed that each of its respective classes will repay Management for fees and expenses waived or reimbursed for that class provided that repayment does not cause that class' annual operating expenses to exceed its contractual expense limitation in place at the time the fees and expenses were forgone or reimbursed. Any such repayment must be made within three years after the year in which Management incurred the expense.
During the year ended October 31, 2013, there was no repayment to Management under this agreement.
48
At October 31, 2013, contingent liabilities to Management under the contractual expense limitation were as follows:
| | | | | | | Expenses Reimbursed in
Fiscal Period Ending, October 31, 2013 | |
| | | | | | 2012 | | 2013 | |
| | | Contractual Expense | | | | Subject to Repayment until October 31, | |
Class | | Limitation(1)(2) | | Expiration | | 2015 | | 2016 | |
Institutional Class | | | 1.97 | % | | 10/31/16 | | $ | 816,372 | | | $ | 447,655 | | |
Class A | | | 2.33 | % | | 10/31/16 | | | 24,960 | | | | 165,195 | | |
Class C | | | 3.08 | % | | 10/31/16 | | | 4,503 | | | | 23,788 | | |
(1) Expense limitation per annum of the respective class' average daily net assets.
(2) Prior to February 28, 2013, the contractual expense limitations were 2.45%, 2.81% and 3.56% for the Institutional Class, Class A and Class C shares, respectively. In addition, from January 2, 2013 to February 28, 2013, Management had voluntarily undertaken to waive current payment of fees and/or reimburse certain expenses of Institutional Class, Class A and Class C shares so that their Operating Expenses were limited to 1.97%, 2.33% and 3.08%, respectively, per annum of their average daily net assets. For the year ended October 31, 2013, voluntary reimbursements for Institutional Class, Class A and Class C amounted to $27,734, $4,524 and $539, respectively. These amounts are not subject to recovery by Management.
NB Alternative Investment Management LLC ("NBAIM"), as the sub-adviser to the Fund, is retained by Management to provide day-to-day investment management services and receives a monthly fee paid by Management. As investment manager, Management is responsible for overseeing the investment activities of NBAIM. Several individuals who are officers and/or Trustees of the Trust are also employees of NBAIM and/or Management.
Management and NBAIM are indirect subsidiaries of Neuberger Berman Group LLC (("NBG") and together with its consolidated subsidiaries ("NB Group")). NBSH Acquisition, LLC ("NBSH" and together with NBG, the "NB Parties"), which is owned by portfolio managers, members of the NB Group management team and certain of NB Group's key employees, senior professionals, and certain of their permitted transferees, owns, as of September 30, 2013, approximately 76% of NBG's equity, and Lehman Brothers Holdings Inc. ("LBHI") and certain of its subsidiaries (collectively the "LBHI Parties") own the remaining 24% of such equity. Pursuant to agreements among the NB Parties and the LBHI Parties, as well as the issuance of NBSH equity to employees with respect to their previously made equity elections relating to 2013 compensation, it is expected that NBSH will own 81% of NBG's equity as of January 1, 2014. NBG has the opportunity to continue to redeem the remaining NBG equity held by the LBHI Parties through a process that is expected to end in 2016 (and if necessary, 2017).
Management and NBAIM engage Cramer Rosenthal McGlynn, LLC, GAMCO Asset Management, Inc., Good Hill Partners LP, Lazard Asset Management LLC, Levin Capital Strategies, L.P., Loeb Arbitrage Management LP, MacKay Shields LLC, Sound Point Capital Management, L.P., Turner Investments, L.P., and Visium Asset Management, LP as subadvisers to provide investment management services. Management and NBAIM are not currently allocating the Fund's assets to Mackay Shields. Management compensates the subadvisers out of the investment advisory fees it receives from the Fund.
The Fund also has a distribution agreement with Management with respect to each class of shares. Management acts as agent in arranging for the sale of class shares without sales commission or other compensation, except as described below for Class A and Class C shares, and bears advertising and promotion expenses.
However, Management receives fees from Class A and Class C under their distribution plans (each a "Plan", collectively, the "Plans") pursuant to Rule 12b-1 under the 1940 Act. The Plans provide that, as compensation for administrative and other services provided to these classes, Management's activities and expenses related to the sale and distribution of these classes, and ongoing services provided to investors in these classes, Management receives from each of these respective classes a fee at the annual rate of 0.25% of Class A's and 1.00% of Class C's average daily net assets. Management receives this amount to provide distribution and shareholder servicing for these
49
classes and pays a portion of it to institutions that provide such services. Those institutions may use the payments for, among other purposes, compensating employees engaged in sales and/or shareholder servicing. The amount of fees paid by each class during any year may be more or less than the cost of distribution and other services provided to that class. FINRA rules limit the amount of annual distribution fees that may be paid by a mutual fund and impose a ceiling on the cumulative distribution fees paid. The Trust's Plans comply with those rules.
Class A shares of the Fund are generally sold with an initial sales charge of up to 5.75% and no contingent deferred sales charge ("CDSC"), except that a CDSC of 1.00% applies to certain redemptions made within 18 months following purchases of $1 million or more without an initial sales charge. Class C shares of the Fund are sold with no initial sales charge and a 1.00% CDSC if shares are sold within one year after purchase.
For the year ended October 31, 2013, Management, acting as underwriter and broker-dealer, received net initial sales charges from the purchase of Class A shares and CDSCs from the redemption of Class A and Class C shares as follows:
| | | Underwriter | | Broker-Dealer | |
| | | Net Initial Sales
Charges | | CDSC | | Net Initial Sales
Charges | | CDSC | |
Class A | | $ | 18,423 | | | $ | — | | | $ | — | | | $ | — | | |
Class C | | | — | | | | 1,342 | | | | — | | | | — | | |
Note C—Securities Transactions:
During the year ended October 31, 2013, there were purchase and sale transactions of long-term securities (excluding swap contracts, financial futures contracts and option contracts) as follows:
| Purchases | | Securities Sold
Short | | Sales | | Covers on Securities
Sold Short | |
| $ | 511,945,770 | | | $ | 171,539,832 | | | $ | 262,888,542 | | | $ | 91,250,930 | | |
During the year ended October 31, 2013, no brokerage commissions on securities transactions were paid to affiliated brokers.
Note D—Fund Share Transactions:
Share activity for the year ended October 31, 2013 and for the period ended October 31, 2012 was as follows:
| | | For the Year Ended October 31, 2013 | | For the Period Ended October 31, 2012 | |
| | | Shares
Sold | | Shares Issued on
Reinvestment of
Dividends and
Distributions | | Shares
Redeemed | | Total | | Shares
Sold | | Shares Issued on
Reinvestment of
Dividends and
Distributions | | Shares
Redeemed | | Total | |
Institutional Class | | | 28,662,260 | | | | 17,121 | | | | (2,140,871 | ) | | | 26,538,510 | | | | 3,352,383 | | | | — | | | | (30,293 | ) | | | 3,322,090 | (1) | |
Class A | | | 11,706,206 | | | | 898 | | | | (359,746 | ) | | | 11,347,358 | | | | 175,493 | | | | — | | | | (80 | ) | | | 175,413 | (1) | |
Class C | | | 1,982,903 | | | | 198 | | | | (20,340 | ) | | | 1,962,761 | | | | 22,937 | | | | — | | | | — | | | | 22,937 | (1) | |
(1) Period from May 15, 2012 (Commencement of Operations) to October 31, 2012.
Note E—Recent Accounting Pronouncement:
In December 2011, the Financial Accounting Standards Board issued Accounting Standards Update 2011-11 Disclosures about Offsetting Assets and Liabilities ("ASU 2011-11"). Effective for annual reporting periods beginning on or after January 1, 2013 and interim periods within those annual periods, ASU 2011-11 is intended to
50
enhance disclosure requirements on the offsetting of financial assets and liabilities. At this time, Management is evaluating the implications of ASU 2011-11 and its impact on the financial statements.
In June 2013, FASB issued Accounting Standards Update 2013-08 Financial Services—Investment Companies (Topic 946)—Amendments to the Scope, Measurement, and Disclosure Requirements ("ASU 2013-08"). Effective for interim and annual reporting periods in fiscal years that begin after December 15, 2013, ASU 2013-08 sets forth a methodology for determining whether an entity should be characterized as an investment company and prescribes fair value accounting for an investment company's non-controlling ownership interest in another investment company. FASB has determined that a fund registered under the 1940 Act automatically meets ASU 2013-08's criteria for an investment company. Although still evaluating the potential impact of ASU 2013-08 on the Funds' financial statements, Management expects that the impact will be limited to additional financial statement disclosures.
Note F—Subsequent Event:
Effective November 1, 2013, NB Management engaged SLS Capital Management, LLC ("SLS") as a new subadviser for the Fund. In connection with the addition of SLS, a portion of the Fund's assets may be allocated to an investment strategy that focuses on long and short equity.
51
This page has been left blank intentionally
52
The following table includes selected data for a share outstanding throughout each period and other performance information derived from the Financial Statements. Per share amounts that round to less than $0.01 or $(0.01) per share are presented as $0.00 or $(0.00), respectively. Net Asset amounts with a zero balance may reflect actual amounts rounding to less than $0.1 million. A "—" indicates that the line item was not applicable in the corresponding period.
| | | Net Asset
Value,
Beginning
of Year | | Net
Investment
Income
(Loss)@ | | Net Gains or
Losses on
Securities
(both realized
and
unrealized) | | Total From
Investment
Operations | | Dividends
from Net
Investment
Income | | Distributions
from Net
Realized
Capital
Gains | | Tax
Return of
Capital | | Total
Distributions | | Net Asset
Value,
End of
Year | |
Absolute Return Multi-Manager Fund | |
Institutional Class | |
10/31/2013 | | $ | 10.00 | | | $ | (0.08 | ) | | $ | 1.00 | | | $ | 0.92 | | | $ | (0.02 | ) | | $ | (0.04 | ) | | $ | — | | | $ | (0.06 | ) | | $ | 10.86 | | |
Period from 5/15/2012^
to 10/31/2012 | | $ | 10.00 | | | $ | (0.08 | ) | | $ | 0.08 | | | $ | — | | | $ | — | | | $ | — | | | $ | — | | | $ | — | | | $ | 10.00 | | |
Class A | |
10/31/2013 | | $ | 9.99 | | | $ | (0.12 | ) | | $ | 0.99 | | | $ | 0.87 | | | $ | — | | | $ | (0.04 | ) | | $ | — | | | $ | (0.04 | ) | | $ | 10.82 | | |
Period from 5/15/2012^
to 10/31/2012 | | $ | 10.00 | | | $ | (0.09 | ) | | $ | 0.08 | | | $ | (0.01 | ) | | $ | — | | | $ | — | | | $ | — | | | $ | — | | | $ | 9.99 | | |
Class C | |
10/31/2013 | | $ | 9.95 | | | $ | (0.21 | ) | | $ | 1.01 | | | $ | 0.80 | | | $ | — | | | $ | (0.04 | ) | | $ | — | | | $ | (0.04 | ) | | $ | 10.71 | | |
Period from 5/15/2012^
to 10/31/2012 | | $ | 10.00 | | | $ | (0.13 | ) | | $ | 0.08 | | | $ | (0.05 | ) | | $ | — | | | $ | — | | | $ | — | | | $ | — | | | $ | 9.95 | | |
See Notes to Financial Highlights
53
| | | Total
Return†† | | Net Assets,
End of
Year
(in millions) | | Ratio
of Gross
Expenses to
Average
Net
Assets# | | Ratio
of Gross
Expenses
to Average
Net Assets
(excluding
Dividend
expenses on
securities
sold short) | | Ratio
of Net
Expenses to
Average
Net
Assets | | Ratio
of Net
Expenses
to Average
Net Assets
(excluding
Dividend
expenses on
securities
sold short) | | Ratio
of Net
Investment
Income/
(Loss) to
Average
Net
Assets | | Portfolio
Turnover
Rate
(including
securities
sold
short)** | | Portfolio
Turnover
Rate
(excluding
securities
sold
short)** | |
Absolute Return Multi-Manager Fund | |
Institutional Class | |
10/31/2013 | | | 9.19 | % | | $ | 324.3 | | | | 2.89 | % | | | 2.60 | % | | | 2.30 | %‡‡ | | | 2.01 | %‡‡ | | | (0.74 | %) | | | 421 | % | | | 330 | % | |
Period from 5/15/2012^
to 10/31/2012 | | | 0.00 | %** | | $ | 33.2 | | | | 7.86 | %*‡ | | | 7.50 | %*‡ | | | 2.81 | %*‡ | | | 2.45 | %*‡ | | | (1.81 | %)*‡ | | | 270 | % | | | 213 | % | |
Class A | |
10/31/2013 | | | 8.70 | % | | $ | 124.7 | | | | 3.27 | % | | | 2.99 | % | | | 2.62 | %‡‡ | | | 2.34 | %‡‡ | | | (1.17 | %) | | | 421 | % | | | 330 | % | |
Period from 5/15/2012^
to 10/31/2012 | | | (0.10 | %)** | | $ | 1.8 | | | | 8.67 | %*‡ | | | 8.26 | %*‡ | | | 3.22 | %*‡ | | | 2.81 | %*‡ | | | (2.02 | %)*‡ | | | 270 | % | | | 213 | % | |
Class C | |
10/31/2013 | | | 8.03 | % | | $ | 21.3 | | | | 4.01 | % | | | 3.72 | % | | | 3.38 | %‡‡ | | | 3.09 | %‡‡ | | | (1.94 | %) | | | 421 | % | | | 330 | % | |
Period from 5/15/2012^
to 10/31/2012 | | | (0.50 | %)** | | $ | 0.2 | | | | 13.12 | %*‡ | | | 12.74 | %*‡ | | | 3.94 | %*‡ | | | 3.56 | %*‡ | | | (2.86 | %)*‡ | | | 270 | % | | | 213 | % | |
54
Notes to Financial Highlights
†† Total return based on per share NAV reflects the effects of changes in NAV on the performance of the Fund during the fiscal period and assumes income dividends and other distributions, if any, were reinvested but does not reflect the effect of sales charges. Results represent past performance and do not indicate future results. Current returns may be lower or higher than the performance data quoted. Investment returns and principal may fluctuate and shares when redeemed may be worth more or less than original cost. Total return would have been lower if Management had not reimbursed and/or waived certain expenses.
# Represents the annualized ratios of net expenses to average daily net assets if Management had not reimbursed certain expenses and/or waived a portion of the investment management fee.
‡ Organization expense, which is a non-recurring expense, is included in these ratios on a non-annualized basis.
@ Calculated based on the average number of shares outstanding during the fiscal period.
^ The date investment operations commenced.
** Not annualized.
* Annualized.
‡‡ After reimbursement of expenses and/or waiver of a portion of the investment management fee by Management. The Fund is required to calculate an expense ratio without taking into consideration any expense reductions related to expense offset arrangements. Had the Fund not received expense reductions related to expense offset arrangements, the annualized ratios of net expenses to average daily net assets would have been:
| | | Including
Expenses on
Securities
Sold Short | | Excluding
Expenses on
Securities
Sold Short | |
| | | Year Ended October 31, 2013 | |
Absolute Return Multi-Manager Fund Institutional Class | | | 2.30 | % | | | 2.01 | % | |
Absolute Return Multi-Manager Fund Class A | | | 2.63 | % | | | 2.35 | % | |
Absolute Return Multi-Manager Fund Class C | | | 3.39 | % | | | 3.10 | % | |
55
Report of Independent Registered Public Accounting Firm
To the Board of Trustees of Neuberger Berman Alternative Funds and Shareholders of
Neuberger Berman Absolute Return Multi-Manager Fund
We have audited the accompanying statement of assets and liabilities of Neuberger Berman Absolute Return Multi-Manager Fund, one of the series constituting the Neuberger Berman Alternative Funds, (the "Fund"), including the schedule of investments, as of October 31, 2013, and the related statement of operations for the year then ended, the statement of changes in net assets, and the financial highlights for each of the years or periods indicated therein. These financial statement and financial highlights are the responsibility of the Fund's management. Our responsibility is to express an opinion on these financial statement and financial highlights based on our audits.
We conducted our audits in accordance with the standards of the Public Company Accounting Oversight Board (United States). Those standards require that we plan and perform the audit to obtain reasonable assurance about whether the financial statement and financial highlights are free of material misstatement. We were not engaged to perform an audit of the Fund's internal control over financial reporting. Our audits included consideration of internal control over financial reporting as a basis for designing audit procedures that are appropriate in the circumstances, but not for the purpose of expressing an opinion on the effectiveness of the Fund's internal control over financial reporting. Accordingly, we express no such opinion. An audit also includes examining, on a test basis, evidence supporting the amounts and disclosures in the financial statements and financial highlights, assessing the accounting principles used and significant estimates made by management, and evaluating the overall financial statement presentation. Our procedures included confirmation of securities owned as of October 31, 2013, by correspondence with the custodian, and others or by other appropriate auditing procedures where replies from others were not received. We believe that our audits provide a reasonable basis for our opinion.
In our opinion, the financial statements and financial highlights referred to above present fairly, in all material respects, the financial position of Neuberger Berman Absolute Return Multi-Manager Fund, a series of Neuberger Berman Alternative Funds, at October 31, 2013, the results of its operations for the year then ended, the changes in its net assets, and the financial highlights for each of the periods indicated therein, in conformity with U.S. generally accepted accounting principles.

Boston, Massachusetts
December 24, 2013
56
Investment Manager, Administrator and Distributor
Neuberger Berman Management LLC
605 Third Avenue, 2nd Floor
New York, NY 10158-0180
800.877.9700 or 212.476.8800
Intermediary Client Services 800.366.6264
Sub-Advisers
NB Alternative Investment Management LLC
605 Third Avenue, 22nd Floor
New York, NY 10158
Cramer Rosenthal McGlynn, LLC
520 Madison Avenue, 20th Floor
New York, NY 10022
GAMCO Asset Management Inc.
One Corporate Center
Rye, NY 10580
Good Hill Partners LP
1599 Post Road East
Westport, CT 06880
Lazard Asset Management LLC
30 Rockefeller Plaza
New York, NY 10112
Levin Capital Strategies, L.P.
595 Madison Avenue, 17th Floor
New York, NY 10022
Loeb Arbitrage Management LP
61 Broadway
New York, NY 10006
MacKay Shields LLC
1345 Avenue of the Americas, 43rd Floor
New York, NY 10105
SLS Management, LLC
140 West 57th Street, 7th Floor
New York, New York 10019
Sound Point Capital Management, L.P.
1185 Avenue of the Americas, 36th Floor
New York, NY 10036
Turner Investments, L.P.
1205 Westlakes Drive, Suite 100
Berwyn, PA 19312
Visium Asset Management, LP
888 Seventh Avenue, 22nd Floor
New York, NY 10019
Custodian
JPMorgan Chase & Co.
14201 Dallas Parkway
Dallas, TX 75254
Shareholder Servicing Agent
State Street Bank and Trust Company
2 Avenue de Lafayette
Boston, MA 02111
For Institutional Class Shareholders
Address correspondence to:
Neuberger Berman Management LLC
605 Third Avenue, Mail Drop 2-7
New York, NY 10158-0180
Attn: Intermediary Client Services
800.366.6264
For Class A and Class C Shareholders:
Please contact your investment provider
Legal Counsel
K&L Gates LLP
1601 K Street, NW
Washington, DC 20006
Independent Registered Public Accounting Firm
Ernst & Young LLP
200 Clarendon Street
Boston, MA 02116
57
The following tables set forth information concerning the trustees ("Trustees") and officers ("Officers") of the Fund. All persons named as Trustees and Officers also serve in similar capacities for other funds administered or managed by Management and NBAIM. The Fund's Statement of Additional Information includes additional information about the Trustees as of the date of the Fund's most recent public offering documents and is available upon request, without charge, by calling (800) 877-9700.
Information about the Board of Trustees
Name, (Year of Birth),
and Address(1) | | Position(s)
and Length of
Time Served(2) | | Principal Occupation(s)(3) | | Number of
Funds in
Fund Complex
Overseen by
Trustee | | Other Directorships Held
Outside Fund Complex by
Trustee(3) | |
Independent Trustees | |
Faith Colish (1935) | | Trustee since inception | | Counsel, Carter Ledyard & Milburn LLP (law firm) since October 2002; formerly, Attorney-at-Law and President, Faith Colish, A Professional Corporation, 1980 to 2002. | | | 54 | | | Formerly, Director, 1997 to 2003, and Advisory Director, 2003 to 2006, ABA Retirement Funds (formerly, American Bar Retirement Association) (not-for-profit membership corporation). | |
58
Name, (Year of Birth),
and Address(1) | | Position(s)
and Length of
Time Served(2) | | Principal Occupation(s)(3) | | Number of
Funds in
Fund Complex
Overseen by
Trustee | | Other Directorships Held
Outside Fund Complex by
Trustee(3) | |
Martha C. Goss (1949) | | Trustee since 2007 | | President, Woodhill Enterprises Inc./Chase Hollow Associates LLC (personal investment vehicle), since 2006; formerly, Consultant, Resources Global Professionals (temporary staffing), 2002 to 2006. | | | 54 | | | Director, American Water (water utility), since 2003; Director, Allianz Life of New York (insurance), since 2005; Director, Berger Group Holdings, Inc. (engineering consulting firm), since 2013; Director, Financial Women's Association of New York (not-for-profit association), since 2003; Trustee Emerita, Brown University, since 1998; Director, Museum of American Finance (not-for-profit), since 2013; formerly, Non-Executive Chair and Director, Channel Reinsurance (financial guaranty reinsurance), 2006 to 2010; formerly, Director, Ocwen Financial Corporation (mortgage servicing), 2005 to 2010; formerly, Director, Claire's Stores, Inc. (retailer), 2005 to 2007; formerly, Director, Parsons Brinckerhoff Inc. (engineering consulting firm), 2007 to 2010; formerly, Director, Bank Leumi (commercial bank), 2005 to 2007; formerly, Advisory Board Member, Attensity (software developer), 2005 to 2007. | |
59
Name, (Year of Birth),
and Address(1) | | Position(s)
and Length of
Time Served(2) | | Principal Occupation(s)(3) | | Number of
Funds in
Fund Complex
Overseen by
Trustee | | Other Directorships Held
Outside Fund Complex by
Trustee(3) | |
Michael M. Knetter (1960) | | Trustee since 2007 | | President and Chief Executive Officer, University of Wisconsin Foundation, since October 2010; formerly, Dean, School of Business, University of Wisconsin—Madison; formerly, Professor of International Economics and Associate Dean, Amos Tuck School of Business—Dartmouth College, 1998 to 2002. | | | 54 | | | Director, American Family Insurance (a mutual company, not publicly traded), since March 2009; formerly, Trustee, Northwestern Mutual Series Fund, Inc., 2007 to 2010; formerly, Director, Wausau Paper, 2005 to 2011; formerly, Director, Great Wolf Resorts, 2004 to 2009. | |
Howard A. Mileaf (1937) | | Trustee since inception | | Retired; formerly, Vice President and General Counsel, WHX Corporation (holding company), 1993 to 2001. | | | 54 | | | Formerly, Director, Webfinancial Corporation (holding company), 2002 to 2008; formerly, Director, WHX Corporation (holding company), 2002 to 2005; formerly, Director, State Theatre of New Jersey (not-for-profit theatre), 2000 to 2005. | |
George W. Morriss (1947) | | Trustee since 2007 | | Adjunct Professor, Columbia University School of International and Public Affairs, since October 2012; formerly, Executive Vice President and Chief Financial Officer, People's Bank, Connecticut (a financial services company), 1991 to 2001. | | | 54 | | | Director and Treasurer, National Association of Corporate Directors, Connecticut Chapter, since 2013; Trustee, Steben Alternative Investment Funds, Steben Select Multi-Strategy Fund, and Steben Select Multi-Strategy Master Fund, since 2013; formerly, Manager, Larch Lane Multi-Strategy Fund complex (which consisted of three funds), 2006 to 2011; formerly, Member, NASDAQ Issuers' Affairs Committee, 1995 to 2003. | |
60
Name, (Year of Birth),
and Address(1) | | Position(s)
and Length of
Time Served(2) | | Principal Occupation(s)(3) | | Number of
Funds in
Fund Complex
Overseen by
Trustee | | Other Directorships Held
Outside Fund Complex by
Trustee(3) | |
Tom D. Seip (1950) | | Trustee since inception; Chairman of the Board since 2008; Lead Independent Trustee from 2006 to 2008 | | General Partner, Ridgefield Farm LLC (a private investment vehicle); formerly, President and CEO, Westaff, Inc. (temporary staffing), May 2001 to January 2002; formerly, Senior Executive, The Charles Schwab Corporation, 1983 to 1998, including Chief Executive Officer, Charles Schwab Investment Management, Inc.; Trustee, Schwab Family of Funds and Schwab Investments, 1997 to 1998; and Executive Vice President-Retail Brokerage, Charles Schwab & Co., Inc., 1994 to 1997. | | | 54 | | | Director, H&R Block, Inc. (financial services company), since May 2001; Chairman, Governance and Nominating Committee, H&R Block, Inc., since 2011; formerly, Chairman, Compensation Committee, H&R Block, Inc., 2006 to 2010; formerly, Director, Forward Management, Inc. (asset management company), 1999 to 2006. | |
Candace L. Straight (1947) | | Trustee since inception | | Private investor and consultant specializing in the insurance industry; formerly, Advisory Director, Securitas Capital LLC (a global private equity investment firm dedicated to making investments in the insurance sector), 1998 to December 2003. | | | 54 | | | Public Member, Board of Governors and Board of Trustees, Rutgers University, since 2011; Director, Montpelier Re Holdings Ltd. (reinsurance company), since 2006; formerly, Director, National Atlantic Holdings Corporation (property and casualty insurance company), 2004 to 2008; formerly, Director, The Proformance Insurance Company (property and casualty insurance company), 2004 to 2008; formerly, Director, Providence Washington Insurance Company (property and casualty insurance company), 1998 to 2006; formerly, Director, Summit Global Partners (insurance brokerage firm), 2000 to 2005. | |
61
Name, (Year of Birth),
and Address(1) | | Position(s)
and Length of
Time Served(2) | | Principal Occupation(s)(3) | | Number of
Funds in
Fund Complex
Overseen by
Trustee | | Other Directorships Held
Outside Fund Complex by
Trustee(3) | |
Peter P. Trapp (1944) | | Trustee since inception | | Retired; formerly, Regional Manager for Mid-Southern Region, Ford Motor Credit Company, September 1997 to 2007; formerly, President, Ford Life Insurance Company, April 1995 to August 1997. | | | 54 | | | None. | |
Trustees who are "Interested Persons" | |
Joseph V. Amato* (1962) | | Trustee since 2009 | | President and Director, Neuberger Berman Group LLC, since 2009; President and Chief Executive Officer, Neuberger and Neuberger Berman Holdings LLC (including its predecessor, Neuberger Berman Inc.), since 2007; Chief Investment Officer (Equities) and Managing Director, Management, since 2009; Managing Director, NBFI, since 2007; Board member of NBFI since 2006; formerly, Global Head of Asset Management of Lehman Brothers Holdings Inc.'s ("LBHI") Investment Management Division, 2006 to 2009; formerly, member of LBHI's Investment Management Division's Executive Management Committee, 2006 to 2009; formerly, Managing Director, Lehman Brothers Inc. ("LBI"), 2006 to 2008; formerly, Chief Recruiting and Development Officer, LBI, 2005 to 2006; formerly, Global Head of LBI's Equity Sales and a Member of its Equities Division Executive Committee, 2003 to 2005. | | | 54 | | | Member of Board of Advisors, McDonough School of Business, Georgetown University, since 2001; Member of New York City Board of Advisors, Teach for America, since 2005; Trustee, Montclair Kimberley Academy (private school), since 2007; Member of Board of Regents, Georgetown University, since 2013. | |
62
Name, (Year of Birth),
and Address(1) | | Position(s)
and Length of
Time Served(2) | | Principal Occupation(s)(3) | | Number of
Funds in
Fund Complex
Overseen by
Trustee | | Other Directorships Held
Outside Fund Complex by
Trustee(3) | |
Robert Conti* (1956) | | Chief Executive Officer, President and Trustee since 2008; prior thereto, Executive Vice President in 2008 and Vice President from inception to 2008 | | Managing Director, Neuberger, since 2007; Managing Director, NBFI, since 2009; formerly, Senior Vice President, Neuberger, 2003 to 2006; formerly, Vice President, Neuberger, 1999 to 2003; President and Chief Executive Officer, Management, since 2008; formerly, Senior Vice President, Management, 2000 to 2008. | | | 54 | | | Director, Staten Island Mental Health Society, since 1994; formerly, Chairman of the Board, Staten Island Mental Health Society, 2008 to 2011. | |
(1) The business address of each listed person is 605 Third Avenue, New York, New York 10158.
(2) Pursuant to the Trust's Trust Instrument, each of these Fund Trustees shall hold office for life or until his or her successor is elected or the Trust terminates; except that (a) any Fund Trustee may resign by delivering a written resignation; (b) any Fund Trustee may be removed with or without cause at any time by a written instrument signed by at least two-thirds of the other Fund Trustees; (c) any Fund Trustee who requests to be retired, or who has become unable to serve, may be retired by a written instrument signed by a majority of the other Fund Trustees; and (d) any Fund Trustee may be removed at any shareholder meeting by a vote of at least two-thirds of the outstanding shares.
(3) Except as otherwise indicated, each individual has held the positions shown for at least the last five years.
* Indicates a Trustee who is an "interested person" within the meaning of the 1940 Act. Mr. Amato and Mr. Conti are interested persons of the Trust because each is an officer of Management, Neuberger and/or their affiliates.
63
Information about the Officers of the Trust
Name, (Year of Birth),
and Address(1) | | Position(s)
and Length of
Time Served(2) | | Principal Occupation(s)(3) | |
Andrew B. Allard (1961) | | Chief Legal Officer since 2013 (only for purposes of sections 307 and 406 of the Sarbanes-Oxley Act of 2002) and Anti-Money Laundering Compliance Officer since 2002 | | General Counsel and Senior Vice President, Management, since 2013; Senior Vice President, Neuberger, since 2006 and Employee since 1999; Deputy General Counsel, Neuberger, since 2004; formerly, Vice President, Neuberger, 2000 to 2005; formerly, Employee, Management, 1994 to 1999; Chief Legal Officer since 2013 (only for purposes of sections 307 and 406 of the Sarbanes-Oxley Act of 2002) ten registered investment companies for which Management acts as investment manager and administrator (ten since 2013); Anti-Money Laundering Compliance Officer, ten registered investment companies for which Management acts as investment manager and administrator (six since 2002, one since 2003, one since 2005, one since 2006 and one since 2013). | |
Claudia A. Brandon (1956) | | Executive Vice President since 2008 and Secretary since inception | | Senior Vice President, Neuberger, since 2007 and Employee since 1999; Senior Vice President, Management, since 2008 and Assistant Secretary since 2004; formerly, Vice President, Neuberger, 2002 to 2006; formerly, Vice President-Mutual Fund Board Relations, Management, 2000 to 2008; formerly, Vice President, Management, 1986 to 1999 and Employee 1984 to 1999; Executive Vice President, ten registered investment companies for which Management acts as investment manager and administrator (nine since 2008 and one since 2013); Secretary, ten registered investment companies for which Management acts as investment manager and administrator (three since 1985, three since 2002, one since 2003, one since 2005, one since 2006 and one since 2013). | |
Agnes Diaz (1971) | | Vice President since 2013 | | Vice President, ten registered investment companies for which Management acts as investment manager and administrator (ten since 2013). | |
Anthony DiBernardo (1979) | | Assistant Treasurer since 2011 | | Vice President, Neuberger, since 2009; Employee, Management, since 2003; Assistant Treasurer, ten registered investment companies for which Management acts as investment manager and administrator (nine since 2011 and one since 2013). | |
Sheila R. James (1965) | | Assistant Secretary since inception | | Vice President, Neuberger, since 2008 and Employee since 1999; formerly, Assistant Vice President, Neuberger, 2007; formerly, Employee, Management, 1991 to 1999; Assistant Secretary, ten registered investment companies for which Management acts as investment manager and administrator (six since 2002, one since 2003, one since 2005, one since 2006 and one since 2013). | |
Brian Kerrane (1969) | | Vice President since 2008 | | Senior Vice President, Neuberger, since 2008 and Employee since 1991; formerly, Vice President, Neuberger, 2002 to 2008; Vice President, ten registered investment companies for which Management acts as investment manager and administrator (nine since 2008 and one since 2013). | |
64
Name, (Year of Birth),
and Address(1) | | Position(s)
and Length of
Time Served(2) | | Principal Occupation(s)(3) | |
Kevin Lyons (1955) | | Assistant Secretary since inception | | Assistant Vice President, Neuberger, since 2008 and Employee since 1999; formerly, Employee, Management, 1993 to 1999; Assistant Secretary, ten registered investment companies for which Management acts as investment manager and administrator (seven since 2003, one since 2005, one since 2006 and one since 2013). | |
Owen F. McEntee, Jr. (1961) | | Vice President since 2008 | | Vice President, Neuberger, since 2006; Employee, Management, since 1992; Vice President, ten registered investment companies for which Management acts as investment manager and administrator (nine since 2008 and one since 2013). | |
John M. McGovern (1970) | | Treasurer and Principal Financial and Accounting Officer since inception | | Senior Vice President, Neuberger, since 2007; formerly, Vice President, Neuberger, 2004 to 2006; Employee, Management, since 1993; Treasurer and Principal Financial and Accounting Officer, ten registered investment companies for which Management acts as investment manager and administrator (eight since 2005, one since 2006 and one since 2013); formerly, Assistant Treasurer, eight registered investment companies for which Management acts as investment manager and administrator, 2002 to 2005. | |
Frank Rosato (1971) | | Assistant Treasurer since inception | | Vice President, Neuberger, since 2006; Employee, Management, since 1995; Assistant Treasurer, ten registered investment companies for which Management acts as investment manager and administrator (eight since 2005, one since 2006 and one since 2013). | |
Neil S. Siegel (1967) | | Vice President since 2008 | | Managing Director, Management, since 2008; Managing Director, Neuberger, since 2006; Managing Director, NBFI, since 2011; formerly, Senior Vice President, Neuberger, 2004 to 2006; Vice President, ten registered investment companies for which Management acts as investment manager and administrator (nine since 2008 and one since 2013). | |
Chamaine Williams (1971) | | Chief Compliance Officer since inception | | Senior Vice President, Neuberger, since 2007; Chief Compliance Officer, Management, since 2006; Chief Compliance Officer, ten registered investment companies for which Management acts as investment manager and administrator (eight since 2005, one since 2006 and one since 2013); formerly, Senior Vice President, LBI, 2007 to 2008; formerly, Vice President, LBI, 2003 to 2006; formerly, Chief Compliance Officer, Lehman Brothers Asset Management Inc., 2003 to 2007; formerly, Chief Compliance Officer, Lehman Brothers Alternative Investment Management LLC, 2003 to 2007. | |
(1) The business address of each listed person is 605 Third Avenue, New York, New York 10158.
(2) Pursuant to the By-Laws of the Trust, each officer elected by the Fund Trustees shall hold office until his or her successor shall have been elected and qualified or until his or her earlier death, inability to serve, or resignation. Officers serve at the pleasure of the Fund Trustees and may be removed at any time with or without cause.
(3) Except as otherwise indicated, each individual has held the positions shown for at least the last five years.
65
Proxy Voting Policies and Procedures
A description of the policies and procedures that the Trust uses to determine how to vote proxies relating to portfolio securities is available, without charge, by calling 800-877-9700 (toll-free) and on the website of the Securities and Exchange Commission at www.sec.gov. Information regarding how the Trust voted proxies relating to portfolio securities during the most recent 12-month period ended June 30 is also available, without charge, by calling 800-877-9700 (toll-free), on the website of the Securities and Exchange Commission at www.sec.gov, and on Management's website at www.nb.com.
Quarterly Portfolio Schedule
The Trust files a complete schedule of portfolio holdings for the Fund with the Securities and Exchange Commission for the first and third quarters of the fiscal year on Form N-Q. The Trust's Forms N-Q are available on the Securities and Exchange Commission's website at www.sec.gov and may be reviewed and copied at the Securities and Exchange Commission's Public Reference Room in Washington, DC. Information on the operation of the Public Reference Room may be obtained by calling 800-SEC-0330. The information on Form N-Q is available upon request, without charge, by calling 800-877-9700 (toll-free).
Notice to Shareholders
In early 2014 you will receive information to be used in filing your 2013 tax returns, which will include a notice of the exact tax status of all distributions paid to you by the Fund during calendar year 2013. Please consult your own tax advisor for details as to how this information should be reflected on your tax returns.
The Fund designates $2,411, as a capital gain distribution.
For the year ended October 31, 2013, the Fund designates $600,183, or up to the maximum amount of such dividends allowable pursuant to the Internal Revenue Code, as qualified dividend income eligible for reduced tax rates. These lower rates range from 5% to 15% depending upon an individual's tax bracket. Complete information regarding the Fund's distributions during the calendar year 2013 will be reported in conjunction with Form 1099-DIV.
66
Board Consideration of the Management and Sub-Advisory Agreements
On an annual basis, the Board of Trustees ("Board") of Neuberger Berman Alternative Funds ("Trust"), including the Trustees who are not "interested persons" of Neuberger Berman Management LLC ("Management") (including its affiliates) or the Trust ("Independent Fund Trustees"), considers whether to continue the management agreement with Management ("Management Agreement"), the advisory agreement between NB Alternative Investment Management LLC ("NBAIM") and Management ("Advisory Agreement") and separate sub-advisory agreements among Management, NBAIM and each of the following subadvisers (each a "Subadviser"): Cramer Rosenthal McGlynn, LLC, GAMCO Asset Management, Inc., Levin Capital Strategies, L.P., MacKay Shields LLC, Sound Point Capital Management, L.P., Turner Investments, L.P., and Visium Asset Management, LP (each, a "Sub-Advisory Agreement"; collectively with the Management Agreement and Advisory Agreement, the "Agreements") with respect to Neuberger Berman Absolute Return Multi-Manager Fund ("Fund"). At a meeting held on October 22-23, 2013, the Board, including the Independent Fund Trustees, approved the continuation of the Agreements for the Fund.
In evaluating the Agreements, the Board, including the Independent Fund Trustees, reviewed extensive materials provided by Management, NBAIM, and each Subadviser in response to questions submitted by the Board and counsel for the Independent Fund Trustees and met with senior representatives of Management regarding their personnel, operations and financial conditions as they relate to the Fund. The annual contract review extends over at least two regular meetings of the Board to ensure that Management and NBAIM have time to respond to any questions the Independent Fund Trustees may have on their initial review of the materials and that the Independent Fund Trustees have time to consider those responses.
In connection with its deliberations, the Board also considered the broad range of information relevant to the annual contract review that is provided to the Board (including its various standing committees) at meetings throughout the year, including investment performance reports and related portfolio information for each Fund, as well as periodic reports on, among other matters, pricing and valuation; brokerage and execution; and compliance, shareholder and other services provided by Management, NBAIM and their affiliates. To assist the Board in its deliberations regarding the annual contract review, the Board has established a Contract Review Committee comprised of Independent Fund Trustees, as well as other committees that focus throughout the year on specific areas relevant to the annual contract review, such as Fund performance or compliance matters.
Throughout the process, the Independent Fund Trustees were advised by counsel that is experienced in Investment Company Act of 1940, as amended ("1940 Act") matters and that is independent of Management. The Independent Fund Trustees received from independent counsel a memorandum discussing the legal standards for their consideration of the proposed continuation of the Agreements. During the course of the year and during their deliberations regarding the annual contract review, the Independent Fund Trustees met with such counsel separately from representatives of Management and NBAIM.
In connection with its approval of the continuation of the Agreements, the Board evaluated the overall fairness of the Agreements to the Fund and whether the Agreements were in the best interests of the Fund and its shareholders. The Board considered all factors it deemed relevant with respect to the Fund, including the following factors: (1) the nature, extent, and quality of the services to be provided by Management, NBAIM and the Subadvisers; (2) the investment performance of the Fund compared to a relevant market index and a peer group of investment companies, and the contribution of each sleeve to the Fund's overall performance; (3) the costs of the services provided and the profit or loss realized by Management, its affiliates and each Subadviser from their relationships with the Fund; (4) the extent to which economies of scale might be realized as the Fund grows; and (5) whether fee levels reflect any such potential economies of scale for the benefit of investors in the Fund.
While each Trustee may have attributed different weights to the various factors, the Board's determination to approve the continuation of the Agreements was based on a comprehensive consideration of all information provided to the Board throughout the year and specifically in connection with the annual contract review. The Board members did not identify any particular information or factor that was all-important or controlling. The Board focused on the overall costs and benefits of the Agreements relating to the Fund and, through the Fund, its shareholders.
67
With respect to the nature, extent and quality of the services provided, the Board considered the investment philosophy and decision-making processes of Management, NBAIM and each Subadviser, and the qualifications, experience and capabilities of and the resources available to the portfolio management personnel of Management, NBAIM and each Subadviser who performs services for the Fund. The Board noted that Management also provides certain administrative services, including fund accounting and compliance oversight. The Board noted that Management and NBAIM, together with the Fund, had obtained from the Securities and Exchange Commission an exemptive order that permitted Management to add or replace subadvisers to the Fund without a shareholder vote, provided the Independent Fund Trustees of the Board approve the new subadviser and certain other steps are taken. In this context, the Board considered Management's and NBAIM's responsibilities for designing an overall investment program for the Fund and then identifying the Subadvisers who will carry out the different portions of that program based on NBAIM's due diligence of those Subadvisers. The Board noted that under the multi-manager arrangement, NBAIM is continually assessing the need for new subadvisers and the appropriateness of potential candidates, and noted the likelihood Management and/or NBAIM would in the future have to due diligence additional subadvisers. The Board noted that NBAIM is responsible for allocating the Fund's portfolio among the various Subadvisers and determining when and how to rebalance the allocations among the Subadvisers in the wake of disparate growth and changes in the markets and the broader economy, subject to Management's general oversight.
The Board further noted that Management and NBAIM are responsible for overseeing the Subadvisers pursuant to the Agreements and related subadviser oversight policies and procedures approved by the Board. Under these procedures, NBAIM is responsible for overseeing the investment performance of the Subadvisers and evaluating the risk and return of each Subadviser and the Fund as a whole, in addition to other significant oversight responsibilities, subject to Management's general oversight. The Board also considered that Management's responsibilities include daily monitoring of investment, operational, enterprise, legal, regulatory and compliance risks as they relate to the Fund, and considered information regarding Management's process for managing risk. In addition, the Board noted the positive compliance history of Management and NBAIM, as each firm has been free of significant reported compliance problems. The Board also considered the experience and staffing of the portfolio management and investment research personnel of NBAIM, and the general structure of the portfolio manager compensation program and whether this structure provides appropriate incentives to act in the best interests of the Fund. The Board also considered the size and scope of the activities necessary to periodically evaluate the compliance programs and other operational aspects of each Subadviser. In addition, the Board considered the scope and compliance history of the compliance programs of Management, NBAIM and each Subadviser, including the Fund's Chief Compliance Officer's and NBAIM's assessment of the compliance programs of the Subadvisers. The Board also considered whether there were any pending lawsuits, enforcement proceedings or regulatory investigations involving Management, NBAIM or any Subadviser, and reviewed information regarding their financial condition, history of operations and any conflicts of interests in managing the Fund. The Board also considered the manner in which Management addressed various non-routine matters that arose during the year, some of them a result of developments in the broader fund industry or the regulations governing it. In addition, the Board considered actions taken by Management, NBAIM and the Subadvisers in response to recent market conditions, including actions taken in response to changes in market volatility, and considered the overall performance of Management, NBAIM and the Subadvisers in this context.
The Board considered the policies and practices regarding brokerage and allocation of portfolio transactions of each of the Subadvisers and noted that Management and NBAIM monitored the quality of the execution services provided by each Subadviser. The Board also reviewed whether the Subadvisers would use brokers to execute Fund transactions that provide research and other services to the Subadviser, and the types of benefits potentially derived from such services by the Subadviser, the Fund and other clients of the Subadviser.
With respect to investment performance, the Board considered information regarding the Fund's performance on both an absolute basis and relative to a relevant benchmark and, prior to the Fund's inception, the Fund's hypothetical performance against the performance of a composite peer group of investment companies pursuing broadly similar strategies. The Board also considered information regarding each Subadviser's performance, as applicable. The Board also reviewed the Fund's performance in relation to certain measures of the degree of investment risk undertaken by the Subadvisers. The Board factored into its evaluation of the Fund's performance the limitations inherent in the
68
methodology for constructing peer groups and determining which investment companies should be included in which peer groups. In this regard, the Board noted that performance, especially short-term performance, is only one of the factors that it deems relevant to its consideration of the Fund's Agreements and that, after considering all relevant factors, it may be appropriate to approve the continuation of the Agreements notwithstanding the Fund's or a Subadviser's underperformance.
With respect to the overall fairness of the Agreements, the Board considered the fee structure of the Fund under the Agreements and any fall-out benefits likely to accrue to Management and NBAIM or their affiliates from their relationship with the Fund. The Board also considered the profitability of Management and its affiliates from their association with the Fund.
Prior to the Fund's inception in 2012, the Board reviewed a comparison of the Fund's management fee and overall expense ratio to a peer group of broadly comparable funds. The Board noted that the comparative management fee analysis includes in the Fund's management fee the separate administrative fee paid to Management, but it was not clear whether this was the case for all funds in the peer group. The Board considered the mean and median of the management fees and expense ratios of the peer group. Noting that the Fund's management fee was higher than the peer group mean and median, the Board considered whether specific portfolio management, administration or oversight needs contributed to the management fee. In addition, the Board considered the contractual limit on expenses for each class of the Fund. Management indicated that similar comparative information was not available with respect to the amount paid to NBAIM or to each Subadviser. The Board did, however, consider the allocation of duties and responsibilities among Management, NBAIM, and the Subadvisers and, in light of that, the amount of fees retained by each. The Board noted, however, that Management, and not the Fund, pays the fee to NBAIM and the Subadvisers. In this connection, the Board considered whether there are other business arrangements between Management or NBAIM and any Subadviser that could give rise to potential conflicts in the selection of subadvisers. The Board considered the fees the Subadvisers charge for similar products, if any. The Board also considered fees charged to an unregistered fund of funds managed by NBAIM that uses some of the same strategies used by the Fund and noted differences that reduced the usefulness of the comparison. The Board also evaluated any apparent or anticipated economies of scale in relation to the services Management provides to the Fund. The Board considered whether the Fund's fee structure provides for a reduction of payments resulting from the use of breakpoints. It also considered whether any of the Sub-Advisory Agreements will provide for breakpoints in the fees and, as a general matter, the way in which such breakpoints should factor into the fees paid by the Fund. In addition, the Board, at its February 27, 2013 meeting, considered and approved a reduction in the Fund's management and administration fees. In concluding that the benefits accruing to Management and its affiliates by virtue of their relationship to the Fund were reasonable in light of the costs of providing the investment advisory and other services and the benefits accruing to the Fund, the Board reviewed the costs of the services to be provided and profits or losses realized by Management, NBAIM and the Subadvisers. The Board recognized that Management, NBAIM, and the Subadvisers should each be entitled to earn a reasonable level of profits for services they provide to the Fund, and, based on its review, concluded that the reported level of profitability of Management, NBAIM, and the Subadvisers, if any, was reasonable.
Conclusions as to existing Agreements
In approving the Agreements, the Board concluded that each Agreement is fair and reasonable to the Fund and that approval of the Agreements is in the best interests of the Fund and its shareholders. In reaching this determination, the Board considered that Management, NBAIM, and each Subadviser could be expected to provide a high level of service to the Fund; that the performance of the Fund was satisfactory over time; that the Fund's fee structure appeared to the Board to be reasonable given the nature, extent and quality of services provided; and that the benefits accruing to Management and its affiliates by virtue of their relationship to the Fund were reasonable in light of the costs of providing the investment advisory and other services and the benefits accruing to the Fund. The Board's conclusions may be based in part on its consideration of materials prepared in connection with the Agreements in prior years and on the Board's ongoing regular review of Fund performance and operations throughout the year, in addition to material prepared specifically for the most recent annual review of the Agreements.
69
Board Consideration of Additional Sub-Advisory Agreements
At meetings held on June 26-27, 2013, and October 22-23, 2013, respectively, the Board of Trustees ("Board") of Neuberger Berman Alternative Funds ("Trust"), including the Trustees who are not "interested persons" of Neuberger Berman Management LLC ("Management") (including its affiliates) or the Trust ("Independent Fund Trustees"), considered and approved the separate sub-advisory agreements ("Sub-Advisory Agreements") among Management, NB Alternative Investment Management LLC ("NBAIM") and each of Loeb Arbitrage Management LP and SLS Management, LLC (each an "Additional Subadviser"), each of which would be responsible for managing a portion of the assets of the Fund.
In evaluating the Sub-Advisory Agreements, the Board, including the Independent Trustees, reviewed materials furnished by each Additional Subadviser. In addition, the Board, including the Independent Trustees, met with senior representatives of each Additional Subadviser regarding their personnel and operations. The Independent Trustees were advised by counsel that is experienced in 1940 Act matters and that is independent of Management and NBAIM.
The Board noted that Management and NBAIM, together with the Fund, had received an order from the SEC that permits Management to add or replace subadvisers to the Fund without a shareholder vote, provided the Independent Trustees approve the new subadviser and certain other steps are taken. In this context, the Board considered Management's and NBAIM's responsibilities for designing an overall investment program for the Fund and then identifying the Additional Subadvisers who will carry out the different portions of that program based on the NBAIM's due diligence of those Additional Subadvisers. The Board further noted that Management and NBAIM, pursuant to their agreements with the Fund and related subadviser oversight policies and procedures approved by the Board, are responsible for overseeing the Additional Subadvisers.
The Board evaluated the overall fairness of the Agreements to the Fund and whether the Agreements were in the best interests of the Fund and its shareholders. The Board considered the following factors, among others, in connection with its approval of the Sub-Advisory Agreements: (1) the nature, extent, and quality of the services to be provided by each Additional Subadviser; and (2) the expected costs of the services to be provided. In their deliberations, the Board members did not identify any particular information that was all-important or controlling, and each Trustee may have attributed different weights to the various factors.
The Board received and considered information regarding the nature, extent and quality of services to be provided to the Fund by each Additional Subadviser under the Sub-Advisory Agreements. The Board considered the experience and staffing of the portfolio management and investment research personnel of each Additional Subadviser who would perform services for the Fund, as well as the resources available to each. With respect to each Additional Subadviser, the Board reviewed the performance for accounts managed by the Additional Subadviser that were substantially similar in strategy to the strategy the Additional Subadviser will use for the Fund, noting that the accounts may not be subject to the same 1940 Act restrictions as the Fund. The Board considered the policies and practices regarding brokerage and allocation of portfolio transactions of each of the Additional Subadvisers and noted that Management and NBAIM would monitor the quality of the execution services provided by each Additional Subadviser.
The Board also reviewed whether the Additional Subadvisers would use brokers to execute Fund transactions that provide research and other services to the Additional Subadviser, and the types of benefits potentially derived from such services by the Additional Subadviser, the Fund and other clients of the Additional Subadviser. The Board also considered the compliance programs and compliance history of each Additional Subadviser, including the Fund's Chief Compliance Officer's and NBAIM's assessment of the compliance programs of the Additional Subadvisers. The Board also considered whether there were any pending lawsuits, enforcement proceedings or regulatory investigations involving an Additional Subadviser, and reviewed information regarding their financial condition, history of operations and any conflicts of interests in managing the Fund.
With respect to the overall fairness of the Sub-Advisory Agreements, the Board had previously considered the Fund's fee structure as compared to a peer group of comparable funds and any fall-out benefits likely to accrue to Management or its affiliates. Management indicated that similar comparative information was not available with respect to the amount paid
70
to each Additional Subadviser. The Board did, however, consider an estimate of the costs of the services to be provided and estimated profits or losses that would be realized by each Additional Subadviser, as well as the fees each Additional Subadviser charges for similar products. The Board noted, however, that Management, and not the Fund, pays the fee to the Additional Subadvisers and therefore the fees charged by the Additional Subadvisers will not change the overall expenses of the Fund. The Board also considered whether there are other business arrangements between Management or NBAIM and any Additional Subadviser that could give rise to potential conflicts. It considered whether the Sub-Advisory Agreements will or should provide for breakpoints in the fees and, as a general matter, the way in which any such breakpoints should factor into the fees paid by the Fund.
Conclusions as to Additional Subadvisory Agreements
In approving the Sub-Advisory Agreements, the Board concluded that each Sub-Advisory Agreement is fair and reasonable and that approval of the Agreements is in the best interests of the Fund and its shareholders. In reaching this determination, the Board considered that each Additional Subadviser could be expected to provide a high level of service to the Fund; that each Additional Subadviser's fees appeared to the Board to be reasonable given the nature and quality of services expected to be provided; and that the expected benefits accruing to each Additional Subadviser and its affiliates and Management and its affiliates by virtue of their relationship to the Fund were reasonable in light of the expected costs of providing the sub-advisory services and the expected benefits accruing to the Fund.
71

Neuberger Berman Management LLC
605 Third Avenue 2nd Floor
New York, NY 10158–0180
Shareholder Services
800.877.9700
Institutional Services
800.366.6264
www.nb.com
Statistics and projections in this report are derived from sources deemed to be reliable but cannot be regarded as a representation of future results of the Fund. This report is prepared for the general information of shareholders and is not an offer of shares of the Fund. Shares are sold only through the currently effective prospectus, which must precede or accompany this report.
 M0257 12/13
Item 2. Code of Ethics.
The Board of Trustees (“Board”) of Neuberger Berman Alternative Funds (“Registrant”) adopted a code of ethics that applies to the Registrant’s principal executive officer, principal financial officer, principal accounting officer or controller, or persons performing similar functions (“Code of Ethics”). For the period covered by this Form N-CSR, there were no amendments to the Code of Ethics and there were no waivers from the Code of Ethics granted to the Registrant’s principal executive officer, principal financial officer, principal accounting officer or controller, or persons performing similar functions.
A copy of the Code of Ethics is incorporated by reference to Neuberger Berman Equity Funds’ Form N-CSRS Investment Company Act file number 811-00582 (filed May 6, 2013). The Code of Ethics is also available, without charge, by calling 1-800-877-9700 (toll-free).
Item 3. Audit Committee Financial Expert.
The Board has determined that the Registrant has three audit committee financial experts serving on its audit committee. The Registrant’s audit committee financial experts are Martha C. Goss, George W. Morriss and Candace L. Straight. Ms. Goss, Mr. Morriss and Ms. Straight are independent trustees as defined by Form N-CSR.
Item 4. Principal Accountant Fees and Services.
Ernst & Young LLP (“E&Y”) serves as independent registered public accounting firm to Neuberger Berman Absolute Return Multi-Manager Fund, Neuberger Berman Dynamic Real Return Fund, Neuberger Berman Global Allocation Fund and Neuberger Berman Risk Balanced Commodity Strategy Fund. Neuberger Berman Absolute Return Multi-Manager Fund, Neuberger Berman Dynamic Real Return Fund, Neuberger Berman Flexible Select Fund, Neuberger Berman Global Allocation Fund and Neuberger Berman Risk Balanced Commodity Strategy Fund commenced operations on May 15, 2013, December 19, 2012, May 31, 2013, December 29, 2010, and August 27, 2012, respectively.
Tait, Weller & Baker LLP (“Tait Weller”) serves as independent registered public accounting firm to Neuberger Berman Long Short Fund. Neuberger Berman Long Short Fund commenced operations on December 29, 2011.
(a) Audit Fees
The aggregate fees billed for professional services rendered by E&Y for the audit of the annual financial statements or services that are normally provided by E&Y in connection with statutory and regulatory filings or engagements were $149,500 and $214,000 for the fiscal years ended 2012 and 2013, respectively.
The aggregate fees billed for professional services rendered by Tait Weller for the audit of the annual financial statements or services that are normally provided by Tait Weller in connection with statutory and regulatory filings or engagements were $25,000 and $25,500 for the fiscal years ended 2012 and 2013, respectively.
(b) Audit-Related Fees
The aggregate fees billed to the Registrant for assurance and related services by E&Y that are reasonably related to the performance of the audit of the Registrant’s financial statements and are not reported above in Audit Fees were $0 and $0 for the fiscal years ended 2012 and 2013, respectively. The Audit Committee approved 0% and 0% of these services provided by E&Y for the fiscal years ended 2012 and 2013, respectively, pursuant to the waiver provisions of Rule 2-01(c)(7)(i)(C) of Regulation S-X.
The fees billed to other entities in the investment company complex for assurance and related services by E&Y that are reasonably related to the performance of the audit that the Audit Committee was required to approve because the engagement related directly to the operations and financial reporting of the Registrant were $0 and $0 for the fiscal years ended 2012 and 2013, respectively. The Audit Committee approved 0% and 0% of these services provided by E&Y for the fiscal years ended 2012 and 2013, respectively, pursuant to the waiver provisions of Rule 2-01(c)(7)(i)(C) of Regulation S-X.
The aggregate fees billed to the Registrant for assurance and related services by Tait Weller that are reasonably related to the performance of the audit of the Registrant’s financial statements and are not reported above in Audit Fees were $0 and $0 for the fiscal years ended 2012 and 2013, respectively. The Audit Committee approved 0% and 0% of these services provided by Tait Weller for the fiscal years ended 2012 and 2013, respectively, pursuant to the waiver provisions of Rule 2-01(c)(7)(i)(C) of Regulation S-X.
The fees billed to other entities in the investment company complex for assurance and related services by Tait Weller that are reasonably related to the performance of the audit that the Audit Committee was required to approve because the engagement related directly to the operations and financial reporting of the Registrant were $0 and $0 for the fiscal years ended 2012 and 2013, respectively. The Audit Committee approved 0% and 0% of these services provided by Tait Weller for the fiscal years ended 2012 and 2013, respectively, pursuant to the waiver provisions of Rule 2-01(c)(7)(i)(C) of Regulation S-X.
(c) Tax Fees
The aggregate fees billed to the Registrant for professional services rendered by E&Y for tax compliance, tax advice, and tax planning were $38,600 and $63,000 for the fiscal years ended 2012 and 2013, respectively. The nature of the services provided includes preparation of the Federal and State tax extensions and tax returns, review of annual excise tax calculations, and preparation of form 8613, in addition to guidance with the identification of Passive Foreign Investment Companies ("PFICS"), assistance with determination of various foreign withholding taxes, and assistance with Internal Revenue Code and tax regulation requirements for fund investments. The Audit Committee approved 0% and 0% of these services provided by E&Y for the fiscal years ended 2012 and 2013, respectively, pursuant to the waiver provisions of Rule 2-01(c)(7)(i)(C) of Regulation S-X.
The fees billed to other entities in the investment company complex for professional services rendered by E&Y for tax compliance, tax advice, and tax planning that the Audit Committee was
required to approve because the engagement related directly to the operations and financial reporting of the Registrant were $0 and $0 for the fiscal years ended 2012 and 2013, respectively. The Audit Committee approved 0% and 0% of these services provided by E&Y for the fiscal years ended 2012 and 2013, respectively, pursuant to the waiver provisions of Rule 2-01(c)(7)(i)(C) of Regulation S-X.
The aggregate fees billed to the Registrant for professional services rendered by Tait Weller for tax compliance, tax advice, and tax planning were $4,000 and $4,250 for the fiscal years ended 2012 and 2013, respectively. The nature of the services provided includes preparation of the Federal and State tax extensions and tax returns, review of annual excise tax calculations, and preparation of form 8613, in addition to guidance with the identification of Passive Foreign Investment Companies ("PFICS"), assistance with determination of various foreign withholding taxes, and assistance with Internal Revenue Code and tax regulation requirements for fund investments. The Audit Committee approved 0% and 0% of these services provided by Tait Weller for the fiscal years ended 2012 and 2013, respectively, pursuant to the waiver provisions of Rule 2-01(c)(7)(i)(C) of Regulation S-X.
The fees billed to other entities in the investment company complex for professional services rendered by Tait Weller for tax compliance, tax advice, and tax planning that the Audit Committee was required to approve because the engagement related directly to the operations and financial reporting of the Registrant were $0 and $0 for the fiscal years ended 2012 and 2013, respectively. The Audit Committee approved 0% and 0% of these services provided by Tait Weller for the fiscal years ended 2012 and 2013, respectively, pursuant to the waiver provisions of Rule 2-01(c)(7)(i)(C) of Regulation S-X.
(d) All Other Fees
The aggregate fees billed to the Registrant for products and services provided by E&Y, other than services reported in Audit Fees, Audit-Related Fees, and Tax Fees were $0 and $0 for the fiscal years ended 2012 and 2013, respectively. The Audit Committee approved 0% and 0% of these services provided by E&Y for the fiscal years ended 2012 and 2013, respectively, pursuant to the waiver provisions of Rule 2-01(c)(7)(i)(C) of Regulation S-X.
The fees billed to other entities in the investment company complex for products and services provided by E&Y, other than services reported in Audit Fees, Audit-Related Fees, and Tax Fees, that the Audit Committee was required to approve because the engagement related directly to the operations and financial reporting of the Registrant were $0 and $0 for the fiscal years ended 2012 and 2013, respectively. The Audit Committee approved 0% and 0% of these services provided by E&Y for the fiscal years ended 2012 and 2013, respectively, pursuant to the waiver provisions of Rule 2-01(c)(7)(i)(C) of Regulation S-X.
The aggregate fees billed to the Registrant for products and services provided by Tait Weller, other than services reported in Audit Fees, Audit-Related Fees, and Tax Fees were $0 and $0 for the fiscal years ended 2012 and 2013, respectively. The Audit Committee approved 0% and 0% of these services provided by Tait Weller for the fiscal years ended 2012 and 2013, respectively, pursuant to the waiver provisions of Rule 2-01(c)(7)(i)(C) of Regulation S-X.
The fees billed to other entities in the investment company complex for products and services provided by Tait Weller, other than services reported in Audit Fees, Audit-Related Fees, and Tax Fees, that the Audit Committee was required to approve because the engagement related directly to the operations and financial reporting of the Registrant were $0 and $0 for the fiscal years ended 2012 and 2013, respectively. The Audit Committee approved 0% and 0% of these services provided by Tait Weller for the fiscal years ended 2012 and 2013, respectively, pursuant to the waiver provisions of Rule 2-01(c)(7)(i)(C) of Regulation S-X.
(e) Audit Committee’s Pre-Approval Policies and Procedures
(1) The Audit Committee’s pre-approval policies and procedures for the Registrant to engage an accountant to render audit and non-audit services delegate to each member of the Committee the power to pre-approve services between meetings of the Committee.
(2) None of the services described in paragraphs (b) through (d) above were approved by the Audit Committee pursuant to paragraph (c)(7)(i)(C) of Rule 2-01 of Regulation S-X.
(f) Hours Attributed to Other Persons
Not applicable.
(g) Non-Audit Fees
Non-audit fees billed by E&Y for services rendered to the Registrant were $ 38,600 and $63,000 for the fiscal years ended 2012 and 2013, respectively.
Non-audit fees billed by E&Y for services rendered to the Registrant’s investment adviser and any entity controlling, controlled by, or under common control with the adviser that provides ongoing services to the Registrant were $0 and $0 for the fiscal years ended 2012 and 2013, respectively.
Non-audit fees billed by Tait Weller for services rendered to the Registrant were $4,000 and $4,250 for the fiscal years ended 2012 and 2013, respectively.
Non-audit fees billed by Tait Weller for services rendered to the Registrant’s investment adviser and any entity controlling, controlled by, or under common control with the adviser that provides ongoing services to the Registrant were $0 and $0 for the fiscal years ended 2012 and 2013, respectively.
(h) The Audit Committee of the Board considered whether the provision of non-audit services rendered to the Registrant’s investment adviser and any entity controlling, controlled by, or under common control with the adviser that provides ongoing services to the Registrant that were not pre-approved by the Audit Committee because the engagement did not relate directly to the operations and financial reporting of the Registrant is compatible with maintaining E&Y’s and Tait Weller’s independence.
Item 5. Audit Committee of Listed Registrants.
Not applicable to the Registrant.
Item 6. Schedule of Investments.
The complete schedule of investments for each series is disclosed in the Registrant’s Annual Report, which is included as Item 1 of this Form N-CSR.
Item 7. Disclosure of Proxy Voting Policies and Procedures for Closed-End Management Investment Companies.
Not applicable to the Registrant.
Item 8. Portfolio Managers of Closed-End Management Investment Companies.
Not applicable to the Registrant.
Item 9. Purchases of Equity Securities by Closed-End Management Investment Company and Affiliated Purchasers.
Not applicable to the Registrant.
Item 10. Submission of Matters to a Vote of Security Holders.
There were no changes to the procedures by which shareholders may recommend nominees to the Board.
Item 11. Controls and Procedures.
| (a) | Based on an evaluation of the disclosure controls and procedures (as defined in Rule 30a-3(c) under the Investment Company Act of 1940, as amended (the “Act”)) as of a date within 90 days of the filing date of this document, the Chief Executive Officer and Treasurer and Principal Financial and Accounting Officer of the Registrant have concluded that such disclosure controls and procedures are effectively designed to ensure that information required to be disclosed by the Registrant on Form N-CSR and Form N-Q is accumulated and communicated to the Registrant’s management to allow timely decisions regarding required disclosure. |
| | |
| (b) | There were no significant changes in the Registrant’s internal controls over financial reporting (as defined in Rule 30a-3(d) under the Act) that occurred during the Registrant’s second fiscal quarter of the period covered by this report that have materially affected, or are reasonably likely to materially affect, the Registrant’s internal control over financial reporting. |
Item 12. Exhibits.
| (a)(1) | A copy of the Code of Ethics is incorporated by reference to Neuberger Berman Equity Funds’ Form N-CSRS, Investment Company Act file number 811-00582 (filed May 6, 2013). |
| (a)(2) | The certifications required by Rule 30a-2(a) of the Act and Section 302 of the Sarbanes-Oxley Act of 2002 (“Sarbanes-Oxley Act”) are filed herewith. |
| | |
| (a)(3) | Not applicable to the Registrant. |
| | |
| (b) | The certifications required by Rule 30a-2(b) of the Act and Section 906 of the Sarbanes-Oxley Act are filed herewith. |
The certifications provided pursuant to Rule 30a-2(b) of the Act and Section 906 of the Sarbanes-Oxley Act are not deemed “filed” for purposes of Section 18 of the Securities Exchange Act of 1934, as amended (“Exchange Act”), or otherwise subject to the liability of that section. Such certifications will not be deemed to be incorporated by reference into any filing under the Securities Act of 1933, as amended, or the Exchange Act, except to the extent that the Registrant specifically incorporates them by reference.
SIGNATURES
Pursuant to the requirements of the Securities Exchange Act of 1934 and the Investment Company Act of 1940, the Registrant has duly caused this report to be signed on its behalf by the undersigned, thereunto duly authorized.
NEUBERGER BERMAN ALTERNATIVE FUNDS
By: /s/ Robert Conti |
| | Robert Conti |
| | Chief Executive Officer |
Date: January 6, 2014
Pursuant to the requirements of the Securities Exchange Act of 1934 and the Investment Company Act of 1940, this report has been signed below by the following persons on behalf of the Registrant and in the capacities and on the dates indicated.
By: /s/ Robert Conti |
| | Robert Conti |
| | Chief Executive Officer |
Date: January 6, 2014
By: /s/ John M. McGovern |
| | John M. McGovern |
| | Treasurer and Principal Financial |
| | and Accounting Officer |
Date: January 6, 2014