Washington, D.C. 20549
Arthur C. Delibert, Esq.
1601 K Street, N.W.
Washington, D.C. 20006-1600
Form N-CSR is to be used by management investment companies to file reports with the Commission not later than 10 days after the transmission to stockholders of any report that is required to be transmitted to stockholders under Rule 30e-1 under the Investment Company Act of 1940 (17 CFR 270.30e-1). The Commission may use the information provided on Form N-CSR in its regulatory, disclosure review, inspection and policymaking roles.
A registrant is required to disclose the information specified by Form N-CSR, and the Commission will make this information public. A registrant is not required to respond to the collection of information contained in Form N-CSR unless the Form displays a currently valid Office of Management and Budget (“OMB”) control number. Please direct comments concerning the accuracy of the information collection burden estimate and any suggestions for reducing the burden to the Secretary, Securities and Exchange Commission, 100 F Street, NE, Washington, DC 20549-0609. The OMB has reviewed this collection of information under the clearance requirements of 44 U.S.C. § 3507.
Item 1. Report to Shareholders.

Neuberger Berman
Alternative and Multi-Asset Class Funds
Institutional Class Shares
Class A Shares
Class C Shares
Class R6 Shares
Absolute Return Multi-Manager Fund
Long Short Multi-Manager Fund
Annual Report
October 31, 2014
Contents
THE FUNDS | |
President's Letter | | | 1 | | |
PORTFOLIO COMMENTARY | |
Absolute Return Multi-Manager Fund | | | 2 | | |
Long Short Multi-Manager Fund | | | 5 | | |
FUND EXPENSE INFORMATION | | | 10 | | |
SCHEDULE OF INVESTMENTS/TOP TEN EQUITY HOLDINGS | |
Absolute Return Multi-Manager Fund | | | 12 | | |
Long Short Multi-Manager Fund | | | 36 | | |
FINANCIAL STATEMENTS | | | 52 | | |
FINANCIAL HIGHLIGHTS (ALL CLASSES)/
PER SHARE DATA | | | 81 | | |
Report of Independent Registered Public Accounting Firm | | | 86 | | |
Directory | | | 87 | | |
Trustees and Officers | | | 88 | | |
Proxy Voting Policies and Procedures | | | 95 | | |
Quarterly Portfolio Schedule | | | 95 | | |
Notice to Shareholders | | | 95 | | |
Board Consideration of the Management and
Sub-Advisory Agreements | | | 96 | | |
The "Neuberger Berman" name and logo are registered service marks of Neuberger Berman Group LLC. "Neuberger Berman Management LLC" and the individual Fund names in this piece are either service marks or registered service marks of Neuberger Berman Management LLC. ©2014 Neuberger Berman Management LLC. All rights reserved.
Dear Shareholder,
I am pleased to present this annual shareholder report for Neuberger Berman Absolute Return Multi-Manager Fund and Neuberger Berman Long Short Multi-Manager Fund.
The global financial markets faced a number of challenges during the reporting period, but generally produced positive results. After a lengthy period of relatively low volatility, the markets experienced sharp fluctuations at times over the 12 months ended October 31, 2014. This was triggered by a number of factors, including signs of moderating global growth, uncertainness regarding future central bank monetary policy and several geopolitical issues. While U.S. equities largely overcame these challenges and posted strong returns, emerging market equities produced only a modest gain and international developed market equities were largely flat. After a difficult start, the fixed income market rallied and generated a positive return for the period. Among the best performers were emerging market debt, high yield and investment grade corporate bonds.
Looking ahead, while growth in many developed countries—including those in the eurozone and Japan—are facing stiff challenges, the U.S. economy appears to be on relatively solid footing. Against this backdrop, the U.S. Federal Reserve concluded its third round of quantitative easing in October 2014 and all eyes are on when the central bank will begin raising interest rates. In contrast, the European Central Bank and Bank of Japan are expected to remain highly accommodative. Elsewhere, growth in China has moderated, which could impact growth in many developing countries. While the markets could remain volatile in the coming year, we believe this could lead to attractive opportunities for long-term investors.
Thank you for your continued support and trust. We look forward to continue serving your investment needs in the years to come.
Sincerely,

ROBERT CONTI
PRESIDENT AND CEO
NEUBERGER BERMAN MUTUAL FUNDS
Absolute Return Multi-Manager Fund Commentary (Unaudited)
Neuberger Berman Absolute Return Multi-Manager Fund Institutional Class generated a 1.96% total return for the 12 months ended October 31, 2014. During the period, the Fund underperformed its primary benchmark, the HFRX Absolute Return Index, which posted a 2.19% return. (Performance for all share classes is provided in the table following this letter.)
Despite periods of heightened volatility, the global financial markets largely generated positive results during the reporting period. Investor sentiment was challenged at times given concerns over global growth, uncertainties regarding future monetary policy and a host of geopolitical issues. Regardless of these headwinds, U.S. equities rallied sharply during the reporting period, whereas international developed equities were largely flat and emerging market equities posted a modest gain. Within the fixed income market, most non-Treasury securities produced positive returns and outperformed equal-duration Treasuries.
All of the portfolio's strategies generated positive absolute returns for the period. Long/short equity was the largest positive contributor, as gains from long positions offset losses from short positions. But short positions were profitable for several months in 2014 due to decreasing correlations between stocks. As a result, the general tilt toward being long mid- and small-cap equities versus short large-cap equities was a detractor from performance.
Event-driven strategies were the next most material positive contributors for the period. Gains for the strategy were driven by positive developments for several ongoing situations in the cable TV, pharmaceutical and food industries. The strategy did, however, face several headwinds. For example, the broad selloff in growth sectors in March and April led to losses for many event-driven managers that had exposure to growth sectors where there was a large amount of corporate activity. Additionally, the negative press about tax inversion mergers beginning in July and culminating in the Shire/AbbVie agreement being terminated in October led to a broad selloff in event-driven trades.
The Fund's credit strategies also generated positive performance. Although the corporate credit long/short allocation was positioned to benefit from rising interest rates during the period when rates actually declined, our subadvisers generated modest gains as they profited from company-specific developments and broad spread tightening (the difference in interest rates between Treasury securities and non-Treasury securities that have a different quality rating). The asset-backed securities allocation was a positive contributor, with gains spread across sectors and led by commercial mortgage-backed securities.
Looking ahead, we believe the dynamics for equity long/short strategies have continued to improve, with decreasing correlations between stocks and the approach of rising interest rates, which could help expose companies that have been able to offset poor operating numbers with cheap financing over the past several years. We continue to see what we believe are the underlying dynamics for a healthy opportunity set for event-driven managers, namely, a continued low growth environment, large amounts of cash on corporate balance sheets and the potential onset of rising interest rates. We are, therefore, positive on the strategy heading into 2015. After reaching one year lows in mid-October 2014, due to the recent flight to quality, Treasury yields have since begun to rise. We anticipate this trend will continue now that quantitative easing has ended and economic data have recently been better than expected. While our credit long/short subadvisers' positioning to benefit from a rising interest rate environment has been a headwind thus far in 2014, we anticipate it to be a tailwind heading into 2015.
Sincerely,
DAVID KUPPERMAN, JEFF MAJIT, FRED INGHAM, IAN HAAS AND ERIC WEINSTEIN
PORTFOLIO CO-MANAGERS
Information about principal risks of investing in the Fund is set forth in the prospectus and statement of additional information.
The portfolio composition, industries and holdings of the Fund are subject to change.
The opinions expressed are those of the Fund's portfolio managers. The opinions are as of the date of this report and are subject to change without notice.
Absolute Return Multi-Manager Fund (Unaudited)
TICKER SYMBOLS
Institutional Class | | NABIX | |
Class A | | NABAX | |
Class C | | NABCX | |
Class R6 | | NRABX | |
PORTFOLIO BY TYPE OF SECURITY
(as a % of Total Net Assets)
| | | Long | | Short | |
Asset-Backed Securities | | | 2.6 | % | | | — | % | |
Bank Loan Obligations | | | 10.3 | | | | — | | |
Common Stocks | | | 58.8 | | | | (11.0 | ) | |
Corporate Debt Securities | | | 4.0 | | | | (0.4 | ) | |
Exchange Traded Funds | | | 0.7 | | | | (10.8 | ) | |
Mortgage-Backed Securities | | | 4.8 | | | | — | | |
Municipal Notes | | | 1.0 | | | | — | | |
Preferred Stocks | | | 0.4 | | | | — | | |
Purchased Options | | | 0.4 | | | | — | | |
Rights | | | 0.0 | | | | — | | |
Warrants | | | 0.0 | | | | — | | |
Short-Term Investments | | | 17.7 | | | | — | | |
Cash, receivables and other
assets, less liabilities | | | 21.5 | | | | — | | |
Total | | | 122.2 | % | | | (22.2 | )% | |
PERFORMANCE HIGHLIGHTS3
| | | Inception | | Average Annual Total Return
Ended 10/31/2014 | |
| | | Date | | 1 Year | | Life of Fund | |
At NAV | |
Institutional Class | | 05/15/2012 | | | 1.96 | % | | | 4.45 | % | |
Class A | | 05/15/2012 | | | 1.60 | % | | | 4.07 | % | |
Class C | | 05/15/2012 | | | 0.77 | % | | | 3.29 | % | |
| Class R64 | | 12/31/2013 | | | 2.05 | % | | | 4.49 | % | |
With Sales Charge | | | | | | | | | | | | | |
Class A | | | | | –4.25 | % | | | 1.60 | % | |
Class C | | | | | –0.23 | % | | | 3.29 | % | |
Index | | | | | | | | | | | | | |
| HFRX Absolute Return Index1,2 | | | | | | | 2.19 | % | | | 2.36 | % | |
| S&P 500® Index1,2 | | | | | | | 17.27 | % | | | 20.67 | % | |
| Barclays U.S. Aggregate Bond Index1,2 | | | | | | | 4.14 | % | | | 2.14 | % | |
The performance data quoted represent past performance and do not indicate future results. Current performance may be lower or higher than the performance data quoted. For performance data current to the most recent month-end, please visit www.nb.com/performance.
The results shown in the table reflect the reinvestment of income dividends and other distributions, if any. The results do not reflect the effect of taxes a shareholder would pay on Fund distributions or on the redemption of Fund shares.
The investment return and principal value of an investment will fluctuate and shares, when redeemed, may be worth more or less than their original cost.
Returns would have been lower if Neuberger Berman Management LLC (Management) had not reimbursed certain expenses and/or waived a portion of the investment management fees during certain of the periods shown. Repayment by a class (of expenses previously reimbursed and/or fees previously waived by Management) will decrease the class's returns. Please see Note B in the Notes to Financial Statements for specific information regarding expense reimbursement and/or fee waiver arrangements.
As stated in the Fund's most recent prospectus, the total annual operating expense ratios for fiscal year 2013 (estimated for 2014 for Class R6) were 2.89%, 3.29%, 4.03% and 2.71% for Institutional Class, Class A, Class C and Class R6 shares, respectively (before expense reimbursements and/or fee waivers, if any). The expense ratios were 2.30%, 2.65%, 3.41% and 2.23% for Institutional Class, Class A, Class C and Class R6 shares, respectively, after expense reimbursements and/or fee waivers. The expense ratios for fiscal year 2014 can be found in the Financial Highlights section of this report.
Returns shown with a sales charge reflect the deduction of the current maximum initial sales charge of 5.75% for Class A shares and the contingent deferred sales charge (CDSC) for Class C shares. The CDSC for Class C shares is 1%, which is reduced to 0% after 1 year. The performance of the Fund's share classes will differ primarily due to different sales charge structures and class expenses. Please see the prospectus for more information about sales charge structures, if any, and class expenses for your share class.
Absolute Return Multi-Manager Fund (Unaudited)
COMPARISON OF A $1,000,000 INVESTMENT
(000's omitted)
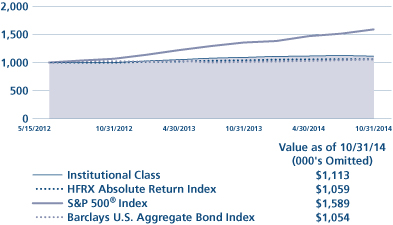
This graph shows the change in value of a hypothetical $1,000,000 investment in the Fund over the past 10 fiscal years, or since the Fund's inception if it has not operated for 10 years. The graph is based on the Institutional Class shares only; the performance of the Fund's share classes will differ primarily due to different sales charge structures and class expenses (see Performance Highlights chart on previous page). The result is compared with benchmarks, which include a broad-based market index and may include a more narrowly based index. Market indices have not been reduced to reflect any of the fees and costs of investing. The results shown in the graph reflect the reinvestment of income dividends and other distributions, if any. The results do not reflect the effect of taxes a shareholder would pay on Fund distributions or on the redemption of Fund shares. Results represent past performance and do not indicate future results.
Long Short Multi-Manager Fund Commentary (Unaudited)
Neuberger Berman Long Short Multi-Manager Fund Institutional Class generated a 3.90% total return from its inception on December 19, 2013 through October 31, 2014. During this same time period, its benchmarks, the HFRX Equity Hedge Index and the S&P 500® Index returned 2.41% and 13.38%, respectively. (Performance for all share classes is provided in the table immediately following this letter.)
Despite periods of heightened volatility, the global financial markets largely generated positive results during the reporting period. Investor sentiment was challenged at times given concerns over global growth, uncertainties regarding future monetary policy and a host of geopolitical issues. Regardless of these headwinds, U.S. equities rallied sharply during the reporting period, whereas international developed equities were largely flat and emerging market equities posted a modest gain.
During the period, gains from our subadvisers' long positions outweighed losses from their short positions. From a sector perspective, most areas of the portfolio were profitable. In particular, Health Care, Information Technology (IT) and Consumer Discretionary were the largest contributing sectors to performance. The only notable sector detractor was Financials.
Within Health Care, the portfolio experienced several sources of gains. The largest of these gains came from a long position in a provider of development solutions and delivery technologies for drugs, biologics and consumer health products. The Fund participated in the company's initial public offering (IPO) in late July and its shares rallied after reporting solid results for its first quarter as a public company. In the IT sector, a long position in a company that develops software and hardware for the security, surveillance and business intelligence markets was materially additive to performance. The growth in big data has been a tailwind for the company and its earnings have accelerated as a result of its new focus on security software for government agencies and corporations. Within Consumer Discretionary, a long position in a major fast food company was beneficial to returns as it made a surprise announcement to take over another firm. The subadviser who held the position captured the gain and exited the position. The Fund also benefitted from a short position in a media and entertainment company that is facing higher programming costs and getting squeezed on retransmission fees. Within Financials, the Fund had modest losses from both long and short positions. The top detractor on the short side was an asset manager whose shares rallied sharply on the announcement that a chief investment officer from a competitor would be joining the company. On the long side, the Fund lost money in the preferred securities of a government-sponsored enterprise as a result of adverse litigation.
During the reporting period, the subadvisers' aggregate use of forwards, options and swap contracts contributed to the Fund's performance.
The dynamics for equity long/short strategies have continued to improve with decreasing correlations between stocks and the potential approach of rising interest rates, which we believe should help expose companies that have been able to offset poor operating numbers with cheap financing over the past several years. We therefore maintain our positive view on the strategy.
Sincerely,
DAVID KUPPERMAN, JEFF MAJIT, IAN HAAS, FRED INGHAM AND ERIC WEINSTEIN
PORTFOLIO CO-MANAGERS
Information about principal risks of investing in the Fund is set forth in the prospectus and statement of additional information.
The portfolio composition, industries and holdings of the Fund are subject to change.
The opinions expressed are those of the Fund's portfolio managers. The opinions are as of the date of this report and are subject to change without notice.
Long Short Multi-Manager Fund (Unaudited)
TICKER SYMBOLS
Institutional Class | | NLMIX | |
Class A | | NLMAX | |
Class C | | NLMCX | |
PORTFOLIO BY TYPE OF SECURITY
(as a % of Total Net Assets)
| | | Long | | Short | |
Common Stocks | | | 68.3 | % | | | (22.4 | )% | |
Exchange Traded Funds | | | 1.7 | | | | (6.8 | ) | |
Preferred Stocks | | | 0.9 | | | | — | | |
Short-Term Investments | | | 27.8 | | | | — | | |
Cash, receivables and other
assets, less liabilities | | | 30.5 | | | | — | | |
Total | | | 129.2 | % | | | (29.2 | )% | |
PERFORMANCE HIGHLIGHTS
| | | Inception
Date | | Cumulative Total Return
Ended 10/31/2014
Life of Fund | |
At NAV | |
Institutional Class | | 12/19/2013 | | | 3.90 | % | |
Class A | | 12/19/2013 | | | 3.60 | % | |
Class C | | 12/19/2013 | | | 2.90 | % | |
With Sales Charge | |
Class A | | | | | | | –2.36 | % | |
Class C | | | | | | | 1.90 | % | |
Index | |
| HFRX Equity Hedge Index1,2 | | | | | | | 2.41 | % | |
| S&P 500® Index1,2 | | | | | | | 13.38 | % | |
The performance data quoted represent past performance and do not indicate future results. Current performance may be lower or higher than the performance data quoted. For performance data current to the most recent month-end, please visit www.nb.com/performance.
The results shown in the table reflect the reinvestment of income dividends and other distributions, if any. The results do not reflect the effect of taxes a shareholder would pay on Fund distributions or on the redemption of Fund shares.
The investment return and principal value of an investment will fluctuate and shares, when redeemed, may be worth more or less than their original cost.
Returns would have been lower if Neuberger Berman Management LLC (Management) had not reimbursed certain expenses and/or waived a portion of the investment management fees during certain of the periods shown. Repayment by a class (of expenses previously reimbursed and/or fees previously waived by Management) will decrease the class's returns. Please see Note B in the Notes to Financial Statements for specific information regarding expense reimbursement and/or fee waiver arrangements.
As stated in the Fund's most recent prospectus, the estimated total annual operating expense ratios for fiscal year 2014 were 3.26%, 3.62% and 4.37% for Institutional Class, Class A and Class C shares, respectively (before expense reimbursements and/or fee waivers, if any). The expense ratios were 2.51%, 2.87% and 3.62% for Institutional Class, Class A and Class C shares, respectively, after expense reimbursements and/or fee waivers. The expense ratios for fiscal year 2014 can be found in the Financial Highlights section of this report.
Returns shown with a sales charge reflect the deduction of the current maximum initial sales charge of 5.75% for Class A shares and the contingent deferred sales charge (CDSC) for Class C shares. The CDSC for Class C shares is 1%, which is reduced to 0% after 1 year. The performance of the Fund's share classes will differ primarily due to different sales charge structures and class expenses. Please see the prospectus for more information about sales charge structures, if any, and class expenses for your share class.
Long Short Multi-Manager Fund (Unaudited)
COMPARISON OF A $1,000,000 INVESTMENT
(000's omitted)
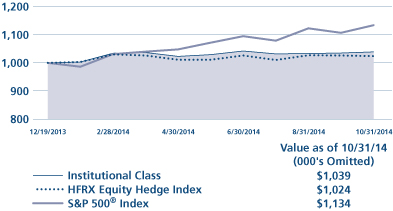
This graph shows the change in value of a hypothetical $1,000,000 investment in the Fund over the past 10 fiscal years, or since the Fund's inception if it has not operated for 10 years. The graph is based on the Institutional Class shares only; the performance of the Fund's share classes will differ primarily due to different sales charge structures and class expenses (see Performance Highlights chart on previous page). The result is compared with benchmarks, which include a broad-based market index and may include a more narrowly based index. Market indices have not been reduced to reflect any of the fees and costs of investing. The results shown in the graph reflect the reinvestment of income dividends and other distributions, if any. The results do not reflect the effect of taxes a shareholder would pay on Fund distributions or on the redemption of Fund shares. Results represent past performance and do not indicate future results.
1 Please see "Glossary of Indices" on page 9 for a description of indices. Please note that individuals cannot invest directly in any index. The S&P 500® and the Barclays U.S. Aggregate Bond indices do not take into account any fees, expenses or tax consequences of investing in the individual securities that they track. The HFRX Absolute Return and HFRX Equity Hedge indices do take into account fees and expenses of investing since they are based on the underlying hedge funds' net returns. Data about the performance of an index are prepared or obtained by Neuberger Berman Management LLC ("Management") and reflect the reinvestment of income dividends and other distributions, if any. The Fund may invest in securities not included in a described index and generally does not invest in all securities included in a described index.
2 The date used to calculate Life of Fund performance for the index is the inception date of the oldest share class.
3 The investments for the Fund are managed by the same portfolio manager(s) who manage(s) one or more other registered funds that have names, investment objectives and investment styles that are similar to those of the Fund. You should be aware that the Fund is likely to differ from the other mutual fund(s) in size, cash flow pattern and tax matters. Accordingly, the holdings and performance of the Fund can be expected to vary from those of the other mutual fund(s).
4 The performance information for Class R6 prior to the class' inception date is that of the Institutional Class of Neuberger Berman Absolute Return Multi-Manager Fund. The Institutional Class has higher expenses and typically lower returns than Class R6.
For more complete information on any of the Neuberger Berman Alternative and Multi-Asset Class Funds, call Management at (800) 877-9700, or visit our website at www.nb.com.
HFRX Absolute Return Index: | | The index is designed to be representative of the overall composition of the hedge fund universe. The index comprises all eligible hedge fund strategies including, but not limited to, convertible arbitrage, distressed securities, equity hedge, equity market neutral, event driven, macro, merger arbitrage, and relative value arbitrage. The index employs a constituent weighting methodology that selects constituent funds which characteristically exhibit lower volatilities and lower correlations to standard directional benchmarks of equity market and hedge fund industry performance. Constituent funds are selected from an eligible pool of the more than 7,500 funds worldwide that report to the Hedge Fund Research (HFR) Database. Constituent funds must meet all of the following criteria: report monthly; report performance net of all fees; be U.S. dollar-denominated; be active and accepting new investments; have a minimum 24 months track record; and the fund's manager must have at least $50 million in assets under management. The index is rebalanced quarterly. | |
HFRX Equity Hedge Index: | | The index comprises equity hedge strategies. Equity hedge strategies maintain positions both long and short in primarily equity and equity derivative securities. A wide variety of investment processes can be employed to arrive at an investment decision, including both quantitative and fundamental techniques; strategies can be broadly diversified or narrowly focused on specific sectors and can range broadly in terms of levels of net exposure, leverage employed, holding period, concentrations of market capitalizations and valuation ranges of typical portfolios. Equity hedge managers would typically maintain at least 50%, and may in some cases be substantially entirely invested, in equities, both long and short. Constituent funds are selected from an eligible pool of the more than 7,500 funds worldwide that report to the Hedge Fund Research (HFR) Database. Constituent funds must meet all of the following criteria: report monthly; report performance net of all fees; be U.S. dollar-denominated; be active and accepting new investments; have a minimum 24 months track record; and the fund's manager must have at least $50 million in assets under management. The index is rebalanced quarterly. | |
| S&P 500® Index: | | The index is a float-adjusted market capitalization-weighted index that focuses on the large-cap segment of the U.S. equity market, and includes a significant portion of the total value of the market. | |
Barclays U.S. Aggregate Bond Index: | | The index measures the investment grade, U.S. dollar-denominated, fixed-rate, taxable bond market and includes Treasuries, government-related and corporate securities, mortgage-backed securities (MBS) (agency fixed-rate and hybrid adjustable rate mortgage (ARM) pass-throughs), asset-backed securities (ABS), and commercial mortgage-backed securities (CMBS) (agency and non-agency). | |
Information About Your Fund's Expenses (Unaudited)
As a Fund shareholder, you incur two types of costs: (1) transaction costs, including sales charges (loads) on purchase payments or redemption proceeds (if applicable); and (2) ongoing costs, including management fees, distribution and/or service (12b-1) fees (if applicable), and other Fund expenses. This example is intended to help you understand your ongoing costs (in U.S. dollars) of investing in a Fund and compare these costs with the ongoing costs of investing in other mutual funds.
This table is designed to provide information regarding costs related to your investments. The following examples are based on an investment of $1,000 made at the beginning of the six month period ended October 31, 2014 and held for the entire period. The table illustrates each Fund's costs in two ways:
Actual Expenses and Performance: | | The first section of the table provides information about actual account values and actual expenses in dollars, based on the Fund's actual performance during the period indicated. You may use the information in this line, together with the amount you invested, to estimate the expenses you paid over the period. Simply divide your account value by $1,000 (for example, an $8,600 account value divided by $1,000 = 8.6), then multiply the result by the number in the first section of the table under the heading entitled "Expenses Paid During the Period" to estimate the expenses you paid over the period. | |
Hypothetical Example for
Comparison Purposes: | | The second section of the table provides information about hypothetical account values and hypothetical expenses based on the Fund's actual expense ratio and an assumed rate of return at 5% per year before expenses. This return is not the Fund's actual return. The hypothetical account values and expenses may not be used to estimate the actual ending account balance or expenses you paid for the period. You may use this information to compare the ongoing costs of investing in a Fund versus other funds. To do so, compare the expenses shown in this 5% hypothetical example with the 5% hypothetical examples that appear in the shareholder reports of other funds. | |
Please note that the expenses in the table are meant to highlight your ongoing costs only and do not include any transaction costs, such as sales charges (loads) (if applicable). Therefore, the information under the heading "Hypothetical (5% annual return before expenses)" is useful in comparing ongoing costs only, and will not help you determine the relative total costs of owning different funds. In addition, if these transaction costs were included, your costs would have been higher.
Expense Information as of 10/31/14 (Unaudited)
Neuberger Berman Alternative Funds | |
| | | ACTUAL | | HYPOTHETICAL (5% ANNUAL RETURN BEFORE EXPENSES)(2) | |
| | | Beginning
Account
Value
5/1/14 | | Ending
Account
Value
10/31/14 | | Expenses Paid
During the
Period(1)
5/1/14 - 10/31/14 | | Expense
Ratio | | Beginning
Account
Value
5/1/14 | | Ending
Account
Value
10/31/14 | | Expenses Paid
During the
Period(1)
5/1/14 - 10/31/14 | | Expense
Ratio | |
Absolute Return Multi-Manager Fund | |
Institutional Class | | $ | 1,000.00 | | | $ | 997.30 | | | $ | 13.04 | | | | 2.59 | % | | $ | 1,000.00 | | | $ | 1,012.15 | | | $ | 13.14 | | | | 2.59 | % | |
Class A | | $ | 1,000.00 | | | $ | 995.40 | | | $ | 14.89 | | | | 2.96 | % | | $ | 1,000.00 | | | $ | 1,010.28 | | | $ | 15.00 | | | | 2.96 | % | |
Class C | | $ | 1,000.00 | | | $ | 991.70 | | | $ | 18.57 | | | | 3.70 | % | | $ | 1,000.00 | | | $ | 1,006.55 | | | $ | 18.71 | | | | 3.70 | % | |
Class R6 | | $ | 1,000.00 | | | $ | 997.30 | | | $ | 12.49 | | | | 2.48 | % | | $ | 1,000.00 | | | $ | 1,012.70 | | | $ | 12.58 | | | | 2.48 | % | |
Long Short Multi-Manager Fund | |
Institutional Class | | $ | 1,000.00 | | | $ | 1,015.60 | | | $ | 13.56 | | | | 2.67 | % | | $ | 1,000.00 | | | $ | 1,011.75 | | | $ | 13.54 | | | | 2.67 | % | |
Class A | | $ | 1,000.00 | | | $ | 1,013.70 | | | $ | 15.28 | | | | 3.01 | % | | $ | 1,000.00 | | | $ | 1,010.03 | | | $ | 15.25 | | | | 3.01 | % | |
Class C | | $ | 1,000.00 | | | $ | 1,009.80 | | | $ | 19.15 | | | | 3.78 | % | | $ | 1,000.00 | | | $ | 1,006.15 | | | $ | 19.11 | | | | 3.78 | % | |
(1) For each class, expenses are equal to the annualized expense ratio for the class, multiplied by the average account value over the period, multiplied by 184/365 (to reflect the one-half year period shown).
(2) Hypothetical 5% annual return before expenses is calculated by multiplying the number of days in the most recent period divided by 365.
Schedule of Investments Neuberger Berman Absolute Return Multi-Manager Fund
TOP TEN EQUITY HOLDINGS LONG POSITIONS (as a % of Net Assets)
| | | | | Country | | Industry | | | |
| | 1 | | | DIRECTV | | United States | | Media | | | 2.7 | % | |
| | 2 | | | TRW Automotive Holdings Corp. | | United States | | Auto Components | | | 2.0 | % | |
| | 3 | | | Allergan, Inc. | | United States | | Pharmaceuticals | | | 1.9 | % | |
| | 4 | | | Time Warner Cable, Inc. | | United States | | Media | | | 1.2 | % | |
| | 5 | | | Rockwood Holdings, Inc. | | United States | | Chemicals | | | 1.0 | % | |
| | 6 | | | CareFusion Corp. | | United States | | Health Care Equipment & Supplies | | | 0.9 | % | |
| | 7 | | | Ashland, Inc. | | United States | | Chemicals | | | 0.7 | % | |
| | 8 | | | Verint Systems, Inc. | | United States | | Software | | | 0.7 | % | |
| | 9 | | | Nomad Holdings Ltd. | | United States | | Diversified Financial Services | | | 0.7 | % | |
| | 10 | | | CBS Corp. Class B | | United States | | Media | | | 0.7 | % | |
TOP TEN EQUITY HOLDINGS SHORT POSITIONS (as a % of Net Assets)
| | | | | Country | | Industry | | | |
| | 1 | | | Level 3 Communications, Inc. | | United States | | Diversified Telecommunication Services | | | (0.5 | )% | |
| | 2 | | | Lennar Corp. Class A | | United States | | Household Durables | | | (0.4 | )% | |
| | 3 | | | Comcast Corp. Class A | | United States | | Media | | | (0.3 | )% | |
| | 4 | | | Chico's FAS, Inc. | | United States | | Specialty Retail | | | (0.3 | )% | |
| | 5 | | | Deere & Co. | | United States | | Machinery | | | (0.2 | )% | |
| | 6 | | | Telecom Italia SpA | | Italy | | Diversified Telecommunication Services | | | (0.2 | )% | |
| | 7 | | | Praxair, Inc. | | United States | | Chemicals | | | (0.2 | )% | |
| | 8 | | | The Dow Chemical Co. | | United States | | Chemicals | | | (0.2 | )% | |
| | 9 | | | AT&T, Inc. | | United States | | Diversifed Telecommunications Services | | | (0.2 | )% | |
| | 10 | | | Kinder Morgan, Inc. | | United States | | Oil, Gas & Consumable Fuels | | | (0.2 | )% | |
| | | Number
of Shares | | Value† | |
Long Positions (100.7%) | |
Common Stocks (58.8%) | |
Aerospace & Defense (0.7%) | |
B/E
Aerospace,
Inc. | | | 69,696 | | | $ | 5,188,867 | *£Ø | |
Exelis, Inc. | | | 294,030 | | | | 5,248,436 | Ø | |
MacDonald
Dettwiler &
Associates Ltd. | | | 15,680 | | | | 1,195,634 | Ø | |
| | | 11,632,937 | | |
Airlines (0.1%) | |
American
Airlines
Group, Inc. | | | 12,700 | | | | 525,145 | ±Ø | |
AMR Corp. | | | 14,383 | | | | 35,814 | *fNØ | |
JetBlue
Airways Corp. | | | 24,856 | | | | 286,838 | *£Ø | |
Republic
Airways
Holdings, Inc. | | | 8,295 | | | | 103,853 | * | |
| | | 951,650 | | |
Auto Components (2.8%) | |
Continental AG | | | 3,283 | | | | 644,472 | Ø | |
Cooper
Tire &
Rubber Co. | | | 102,800 | | | | 3,311,188 | Ø | |
TRW
Automotive
Holdings
Corp. | | | 319,211 | | | | 32,352,035 | *Ø | |
| | | Number
of Shares | | Value† | |
Visteon Corp. | | | 110,481 | | | $ | 10,374,166 | *£Ø | |
| | | 46,681,861 | | |
Automobiles (0.4%) | |
Fiat Chrysler
Automobiles
NV | | | 299,053 | | | | 3,427,147 | *Ø | |
General
Motors Co. | | | 10,200 | | | | 320,280 | ± | |
Honda
Motor Co.
Ltd. | | | 56,200 | | | | 1,740,661 | Ø | |
Kia Motors
Corp. | | | 16,705 | | | | 814,360 | Ø | |
Motors
Liquidation
Co. GUC Trust | | | 34,607 | | | | 799,422 | *Ø | |
| | | | 7,101,870 | | |
Banks (2.8%) | |
1st United
Bancorp, Inc. | | | 175,332 | | | | 1,551,688 | Ø | |
Aozora Bank
Ltd. | | | 308,291 | | | | 1,073,152 | Ø | |
Bank of
America
Corp. | | | 301,525 | | | | 5,174,169 | Ø | |
BOC
Hong Kong
Holdings Ltd. | | | 375,000 | | | | 1,247,558 | Ø | |
Cascade
Bancorp | | | 52,519 | | | | 268,372 | *£ | |
| | | Number
of Shares | | Value† | |
China
Construction
Bank Corp.
Class H | | | 1,480,000 | | | $ | 1,103,060 | Ø | |
Chongqing
Rural
Commercial
Bank
Class H | | | 2,198,000 | | | | 1,057,174 | Ø | |
CIT
Group, Inc. | | | 27,018 | | | | 1,321,991 | Ø | |
City National
Corp. | | | 54,150 | | | | 4,262,146 | Ø | |
Dah Sing
Banking
Group Ltd. | | | 168,795 | | | | 306,459 | Ø | |
Dah Sing
Financial
Holdings Ltd. | | | 55,323 | | | | 344,558 | Ø | |
Erste Group
Bank AG | | | 66,962 | | | | 1,704,282 | Ø | |
Intervest
Bancshares
Corp. | | | 62,789 | | | | 612,193 | Ø | |
Mitsubishi
UFJ Financial
Group, Inc. | | | 402,100 | | | | 2,263,144 | Ø | |
Mizuho
Financial
Group,
Inc. | | | 2,321,100 | | | | 4,132,829 | Ø | |
OmniAmerican
Bancorp, Inc. | | | 139,868 | | | | 3,782,031 | Ø | |
See Notes to Schedule of Investments
12
| | | Number
of Shares | | Value† | |
Piraeus
Bank SA | | | 894,349 | | | $ | 1,300,074 | *Ø | |
Regions
Financial
Corp. | | | 638,600 | | | | 6,341,298 | Ø | |
Sberbank
of Russia
ADR | | | 145,187 | | | | 1,101,969 | | |
Sumitomo
Mitsui
Financial
Group, Inc. | | | 51,700 | | | | 2,024,965 | Ø | |
Sumitomo
Mitsui
Trust
Holdings,
Inc. | | | 501,000 | | | | 1,980,360 | Ø | |
The Bank
of Kentucky
Financial
Corp. | | | 50,784 | | | | 2,382,277 | Ø | |
| | | 45,335,749 | | |
Beverages (0.8%) | |
AMBEV SA | | | 533,700 | | | | 3,532,297 | Ø | |
Cott Corp. | | | 678,587 | | | | 4,119,023 | £ | |
PepsiCo, Inc. | | | 51,986 | | | | 4,999,494 | Ø | |
| | | | 12,650,814 | | |
Biotechnology (0.2%) | |
Ambit
Biosciences
Corp. | | | 70,000 | | | | 1,093,400 | *Ø | |
ARIAD
Pharmaceuticals,
Inc. | | | 16,600 | | | | 98,936 | *£ | |
Chelsea
Therapeutics
International
Ltd. | | | 3,500 | | | | 385 | *fNØ | |
Durata
Therapeutics,
Inc. | | | 36,904 | | | | 886,803 | *Ø | |
QLT, Inc. | | | 176,117 | | | | 700,946 | *£Ø | |
Trius
Therapeutics
Inc. | | | 24,000 | | | | 3,120 | *fNØ | |
United
Therapeutics
Corp. | | | 8,204 | | | | 1,074,478 | *Ø | |
| | | | 3,858,068 | | |
Building Products (0.1%) | |
LIXIL
Group
Corp. | | | 40,600 | | | | 867,483 | Ø | |
Sanitec
Corp. | | | 4,000 | | | | 51,326 | * | |
| | | | 918,809 | | |
| | | Number
of Shares | | Value† | |
Capital Markets (0.5%) | |
BGC
Partners,
Inc. Class A | | | 7,374 | | | $ | 62,531 | £ | |
DAB
Bank AG | | | 42,677 | | | | 255,638 | Ø | |
GFI Group,
Inc. | | | 19,175 | | | | 105,462 | | |
Jafco Co.
Ltd. | | | 46,800 | | | | 1,760,338 | Ø | |
Nomura
Holdings,
Inc. | | | 325,600 | | | | 1,956,354 | Ø | |
NorthStar
Asset
Management
Group, Inc. | | | 65,440 | | | | 1,185,773 | *£ | |
RCS Capital
Corp.
Class A | | | 138,739 | | | | 2,276,707 | Ø | |
SWS Group,
Inc. | | | 31,484 | | | | 232,667 | *£ | |
| | | | 7,835,470 | | |
Chemicals (3.9%) | |
Air Products &
Chemicals,
Inc. | | | 72,500 | | | | 9,762,850 | Ø | |
Asahi Kasei
Corp. | | | 93,000 | | | | 746,732 | Ø | |
Ashland,
Inc. | | | 110,640 | | | | 11,956,865 | £Ø | |
Auriga
Industries
A/S Class B | | | 10,000 | | | | 516,037 | *Ø | |
FMC Corp. | | | 73,538 | | | | 4,217,404 | Ø | |
Huntsman
Corp. | | | 69,000 | | | | 1,683,600 | Ø | |
Monsanto
Co. | | | 14,490 | | | | 1,666,929 | Ø | |
Nissan
Chemical
Industries
Ltd. | | | 91,900 | | | | 1,663,322 | Ø | |
Nitto
Denko
Corp. | | | 28,400 | | | | 1,505,143 | Ø | |
Penford Corp. | | | 300 | | | | 5,655 | * | |
Rockwood
Holdings,
Inc. | | | 208,968 | | | | 16,071,729 | Ø | |
Shin-Etsu
Chemical
Co. Ltd. | | | 31,500 | | | | 1,975,393 | Ø | |
Sigma-Aldrich
Corp. | | | 44,082 | | | | 5,991,185 | Ø | |
Taminco
Corp. | | | 26,638 | | | | 689,658 | *Ø | |
Tronox
Ltd.
Class A | | | 35,522 | | | | 858,922 | Ø | |
| | | Number
of Shares | | Value† | |
Ube
Industries
Ltd. | | | 453,000 | | | $ | 685,600 | Ø | |
WR Grace &
Co. | | | 49,258 | | | | 4,659,807 | *Ø | |
| | | 64,656,831 | | |
Commercial Services & Supplies (0.3%) | |
RR Donnelley &
Sons Co. | | | 8,900 | | | | 155,305 | ±Ø | |
The Brink's
Co. | | | 14,573 | | | | 306,033 | ±£ | |
Tyco
International
Ltd. | | | 91,975 | | | | 3,948,487 | Ø | |
| | | 4,409,825 | | |
Communications Equipment (0.2%) | |
Juniper
Networks,
Inc. | | | 31,800 | | | | 670,026 | | |
Motorola
Solutions,
Inc. | | | 32,500 | | | | 2,096,250 | | |
Nokia OYJ
ADR | | | 44,260 | | | | 366,030 | Ø | |
ParkerVision,
Inc. | | | 110,421 | | | | 144,651 | *Ø | |
Riverbed
Technology,
Inc. | | | 29,794 | | | | 565,788 | *Ø | |
ShoreTel, Inc. | | | 13,729 | | | | 111,068 | *£ | |
| | | 3,953,813 | | |
Construction & Engineering (0.3%) | |
Balfour
Beatty PLC | | | 500 | | | | 1,229 | | |
Foster
Wheeler AG | | | 46,265 | | | | 1,435,603 | Ø | |
Pike Corp. | | | 130,500 | | | | 1,558,170 | *Ø | |
Taisei Corp. | | | 313,000 | | | | 1,713,733 | Ø | |
| | | 4,708,735 | | |
Consumer Finance (0.1%) | |
Ally Financial,
Inc. | | | 27,931 | | | | 634,034 | *±£ | |
Carfinco
Financial
Group, Inc. | | | 71,153 | | | | 700,134 | Ø | |
| | | | 1,334,168 | | |
Containers & Packaging (0.4%) | |
Nampak Ltd. | | | 441,793 | | | | 1,801,259 | Ø | |
Orora Ltd. | | | 2,343,712 | | | | 3,578,379 | Ø | |
Pact Group
Holdings
Ltd. | | | 346,768 | | | | 1,165,695 | Ø | |
| | | | 6,545,333 | | |
See Notes to Schedule of Investments
13
| | | Number
of Shares | | Value† | |
Diversified Consumer Services (0.5%) | |
Cengage
Learning
Holdings II LP | | | 1,481 | | | $ | 41,468 | *Ø | |
Regis Corp. | | | 202,600 | | | | 3,440,148 | Ø | |
Sotheby's | | | 96,754 | | | | 3,837,264 | Ø | |
| | | 7,318,880 | | |
Diversified Financial Services (0.9%) | |
Capmark
Financial
Group, Inc. | | | 26,469 | | | | 132,345 | £ | |
EME
Reorganization
Trust | | | 7,488,000 | | | | 973,440 | Ø | |
Nomad
Holdings
Ltd. | | | 1,025,652 | | | | 11,820,639 | *Ø | |
ORIX Corp. | | | 159,600 | | | | 2,143,393 | Ø | |
Rescap
Liquidating
Trust | | | 17,071 | | | | 271,429 | *Ø | |
| | | | 15,341,246 | | |
Diversified Telecommunication
Services (1.6%) | |
BCE, Inc. | | | 15,437 | | | | 685,526 | | |
Consolidated
Communications
Holdings,
Inc. | | | 25,385 | | | | 657,476 | £ | |
Fairpoint
Communications,
Inc. | | | 49,501 | | | | 821,717 | *Ø | |
Globalstar,
Inc. | | | 708,435 | | | | 1,678,991 | *±Ø | |
Intelsat SA | | | 45,903 | | | | 893,272 | *Ø | |
Jazztel PLC | | | 119,098 | | | | 1,901,415 | *Ø | |
Koninklijke
KPN NV | | | 35,000 | | | | 114,782 | Ø | |
Telecom
Italia SpA | | | 3,684,395 | | | | 3,291,992 | Ø | |
tw telecom,
inc. | | | 244,570 | | | | 10,462,705 | *Ø | |
Vivendi SA | | | 156,133 | | | | 3,810,441 | *Ø | |
Ziggo NV | | | 26,335 | | | | 1,286,571 | *Ø | |
| | | 25,604,888 | | |
Electric Utilities (0.2%) | |
Cleco Corp. | | | 52,889 | | | | 2,843,313 | Ø | |
Pepco
Holdings,
Inc. | | | 40,000 | | | | 1,093,600 | Ø | |
| | | | 3,936,913 | | |
Electrical Equipment (0.2%) | |
Nidec Corp. | | | 22,300 | | | | 1,433,791 | Ø | |
Vacon OYJ | | | 26,000 | | | | 1,100,943 | Ø | |
| | | | 2,534,734 | | |
| | | Number
of Shares | | Value† | |
Electronic Equipment, Instruments & Components (0.2%) | |
Hitachi Ltd. | | | 97,000 | | | $ | 741,889 | Ø | |
Keyence Corp. | | | 2,100 | | | | 981,153 | Ø | |
Nichicon Corp. | | | 73,503 | | | | 484,894 | Ø | |
RealD, Inc. | | | 59,707 | | | | 675,883 | *±£ | |
Viasystems
Group, Inc. | | | 4,682 | | | | 74,304 | * | |
| | | | 2,958,123 | | |
Energy Equipment & Services (0.9%) | |
Calfrac Well
Services Ltd. | | | 88,600 | | | | 1,061,266 | Ø | |
Dresser-Rand
Group, Inc. | | | 123,114 | | | | 10,058,414 | *±Ø | |
Noble
Corp. PLC | | | 101,993 | | | | 2,133,694 | Ø | |
Paragon
Offshore
PLC | | | 282,519 | | | | 1,375,867 | *Ø | |
| | | | 14,629,241 | | |
Food & Staples Retailing (0.7%) | |
Rite Aid Corp. | | | 81,169 | | | | 426,137 | * | |
Safeway, Inc. | | | 85,041 | | | | 2,964,529 | Ø | |
Sysco Corp. | | | 65,400 | | | | 2,520,516 | Ø | |
Walgreen Co. | | | 91,475 | | | | 5,874,525 | Ø | |
| | | 11,785,707 | | |
Food Products (0.6%) | |
Boulder
Brands, Inc. | | | 9,777 | | | | 86,820 | *± | |
Cermaq ASA | | | 79,200 | | | | 1,124,308 | Ø | |
Chiquita
Brands
International,
Inc. | | | 139,979 | | | | 2,019,897 | *Ø | |
GrainCorp.
Ltd. Class A | | | 18,000 | | | | 138,758 | Ø | |
Kellogg Co. | | | 35,210 | | | | 2,252,032 | Ø | |
Maple
Leaf Foods,
Inc. | | | 29,036 | | | | 502,375 | Ø | |
Mead
Johnson
Nutrition
Co. | | | 8,415 | | | | 835,694 | ±Ø | |
Nutreco NV | | | 2,000 | | | | 100,139 | | |
Oceana
Group Ltd. | | | 115,067 | | | | 790,777 | Ø | |
Unilever
NV CVA | | | 46,783 | | | | 1,814,185 | Ø | |
Warrnamboo
Cheese &
Butter
Factory Co.
Holding Ltd. | | | 10,000 | | | | 70,928 | *Ø | |
| | | 9,735,913 | | |
Health Care Equipment & Supplies (1.9%) | |
Alere, Inc. | | | 98,620 | | | | 3,941,841 | *Ø | |
| | | Number
of Shares | | Value† | |
ArthroCare
Corp. | | | 46,000 | | | $ | 16,100 | *fN | |
Baxter
International,
Inc. | | | 7,132 | | | | 500,239 | £ | |
CareFusion
Corp. | | | 271,208 | | | | 15,559,203 | *Ø | |
Covidien PLC | | | 46,225 | | | | 4,273,039 | ±Ø | |
Nobel
Biocare
Holding AG | | | 100,000 | | | | 1,766,876 | *Ø | |
Smith &
Nephew
PLC ADR | | | 62,056 | | | | 2,113,007 | ±£Ø | |
Symmetry
Medical, Inc. | | | 38,288 | | | | 379,051 | *£ | |
The Cooper
Cos., Inc. | | | 15,300 | | | | 2,507,670 | £Ø | |
Tornier NV | | | 25 | | | | 699 | *£ | |
Wright
Medical
Group, Inc. | | | 21,148 | | | | 668,700 | *£Ø | |
| | | 31,726,425 | | |
Health Care Providers & Services (1.1%) | |
Accretive
Health, Inc. | | | 522,873 | | | | 3,764,686 | *£Ø | |
Brookdale
Senior Living,
Inc. | | | 108,702 | | | | 3,664,344 | *£Ø | |
Extendicare,
Inc. | | | 346,257 | | | | 2,506,949 | Ø | |
Fresenius
SE & Co.
KGaA | | | 36,030 | | | | 1,853,448 | Ø | |
Gentiva
Health
Services,
Inc. | | | 141,025 | | | | 2,778,193 | *£Ø | |
Kindred
Healthcare,
Inc. | | | 68,979 | | | | 1,500,293 | £ | |
Mediclinic
International
Ltd. | | | 208,891 | | | | 1,865,479 | Ø | |
| | | 17,933,392 | | |
Hotels, Restaurants & Leisure (2.9%) | |
Accor SA | | | 149,084 | | | | 6,260,493 | Ø | |
Bally
Technologies,
Inc. | | | 57,746 | | | | 4,642,778 | *Ø | |
Belmond
Ltd. Class A | | | 3,000 | | | | 34,380 | *Ø | |
Bob Evans
Farms, Inc. | | | 165,323 | | | | 8,076,029 | £Ø | |
Einstein Noah
Restaurant
Group, Inc. | | | 94,453 | | | | 1,912,673 | Ø | |
GTECH SpA | | | 23,242 | | | | 540,864 | Ø | |
See Notes to Schedule of Investments
14
| | | Number
of Shares | | Value† | |
International
Game
Technology | | | 227,112 | | | $ | 3,722,366 | ±£Ø | |
Isle of Capri
Casinos, Inc. | | | 199,741 | | | | 1,484,076 | *Ø | |
McDonald's
Corp. | | | 13,151 | | | | 1,232,643 | Ø | |
Morgans
Hotel Group
Co. | | | 116,316 | | | | 929,365 | *£ | |
Multimedia
Games
Holding Co.,
Inc. | | | 40,839 | | | | 1,425,281 | *Ø | |
Starbucks
Coffee
Japan Ltd. | | | 55,000 | | | | 714,890 | Ø | |
Tim Hortons,
Inc. | | | 196,624 | | | | 15,930,830 | Ø | |
Vail Resorts,
Inc. | | | 2,781 | | | | 240,167 | £ | |
| | | 47,146,835 | | |
Household Durables (0.6%) | |
Blyth, Inc. | | | 4,000 | | | | 33,560 | Ø | |
Brookfield
Residential
Properties,
Inc. | | | 4,015 | | | | 93,349 | * | |
Indesit Co.
SpA | | | 50,000 | | | | 687,353 | *Ø | |
Lennar Corp.
Class B | | | 160,345 | | | | 5,629,713 | Ø | |
Rinnai Corp. | | | 22,600 | | | | 1,973,790 | Ø | |
Sony Corp. | | | 101,030 | | | | 1,863,647 | Ø | |
| | | 10,281,412 | | |
Independent Power & Renewable Electricity Producers (0.0%) | |
Primary
Energy
Recycling
Corp. | | | 29,606 | | | | 153,063 | * | |
Industrial Conglomerates (0.2%) | |
Alliance
Global
Group, Inc. | | | 3,984,500 | | | | 2,246,415 | Ø | |
Toshiba
Corp. | | | 408,000 | | | | 1,756,588 | Ø | |
| | | | 4,003,003 | | |
Insurance (2.1%) | |
Ambac
Financial
Group, Inc. | | | 28,958 | | | | 662,559 | *Ø | |
Aspen
Insurance
Holdings
Ltd. | | | 1,600 | | | | 69,808 | Ø | |
Assured
Guaranty
Ltd. | | | 282,233 | | | | 6,513,938 | Ø | |
| | | Number
of Shares | | Value† | |
FNFV Group | | | 37,066 | | | $ | 498,167 | *£ | |
Hartford
Financial
Services
Group, Inc. | | | 263,661 | | | | 10,435,702 | Ø | |
Insurance
Australia
Group Ltd. | | | 316,970 | | | | 1,818,647 | Ø | |
Meadowbrook
Insurance
Group, Inc. | | | 137,992 | | | | 879,009 | Ø | |
National
Interstate
Corp. | | | 176,689 | | | | 5,025,035 | NØ | |
Protective
Life Corp. | | | 119,118 | | | | 8,300,142 | Ø | |
Schweizerische
National-
Versicherungs-
Gesellschaft
AG | | | 500 | | | | 41,600 | Ø | |
Syncora
Holdings
Ltd. | | | 22,879 | | | | 45,758 | *Ø | |
| | | 34,290,365 | | |
Internet & Catalog Retail (0.2%) | |
Groupon, Inc. | | | 54,976 | | | | 401,875 | *± | |
Overstock.com,
Inc. | | | 6,292 | | | | 145,471 | * | |
Shutterfly,
Inc. | | | 82,785 | | | | 3,462,896 | *±£ | |
| | | | 4,010,242 | | |
Internet Software & Services (1.8%) | |
AOL, Inc. | | | 83,650 | | | | 3,641,285 | *Ø | |
Conversant,
Inc. | | | 101,389 | | | | 3,573,962 | *±£Ø | |
Digital
River, Inc. | | | 13,000 | | | | 332,410 | * | |
eBay, Inc. | | | 104,765 | | | | 5,500,162 | *±£Ø | |
Equinix, Inc. | | | 14,350 | | | | 2,997,715 | Ø | |
Google,
Inc. Class A | | | 11,340 | | | | 6,439,646 | *Ø | |
Move, Inc. | | | 253,497 | | | | 5,310,762 | *Ø | |
Rackspace
Hosting,
Inc. | | | 3,214 | | | | 123,289 | *Ø | |
Travelport
LLC | | | 90,896 | | | | 1,251,638 | *fNØ | |
Zillow,
Inc. Class A | | | 4,689 | | | | 509,835 | *Ø | |
| | | 29,680,704 | | |
IT Services (0.0%) | |
Blackhawk
Network
Holdings, Inc.
Class B | | | 5,000 | | | | 167,000 | * | |
Bull | | | 500 | | | | 3,070 | * | |
| | | | 170,070 | | |
| | | Number
of Shares | | Value† | |
Leisure Products (0.2%) | |
Hasbro, Inc. | | | 57,800 | | | $ | 3,325,234 | Ø | |
Smith &
Wesson
Holding
Corp. | | | 18,610 | | | | 189,078 | * | |
| | | | 3,514,312 | | |
Life Sciences Tools & Services (0.1%) | |
Affymetrix,
Inc. | | | 147,392 | | | | 1,328,002 | *£ | |
Machinery (0.7%) | |
Amada Co.
Ltd. | | | 176,100 | | | | 1,494,087 | Ø | |
Crane Co. | | | 73,648 | | | | 4,591,953 | Ø | |
Komatsu
Ltd. | | | 40,600 | | | | 943,207 | Ø | |
Makita
Corp. | | | 29,300 | | | | 1,614,663 | Ø | |
Parker
Hannifin
Corp. | | | 20,800 | | | | 2,642,224 | Ø | |
Xerium
Technologies,
Inc. | | | 33,956 | | | | 506,623 | *Ø | |
| | | 11,792,757 | | |
Marine (0.0%) | |
Nippon
Yusen KK | | | 262,000 | | | | 667,100 | Ø | |
Media (8.0%) | |
AMC
Networks,
Inc. Class A | | | 11,100 | | | | 673,215 | *±Ø | |
Cablevision
Systems
Corp.
Class A | | | 28,532 | | | | 531,266 | Ø | |
CBS Corp.
Class B | | | 208,425 | | | | 11,300,803 | Ø | |
Cineplex,
Inc. | | | 33,800 | | | | 1,273,367 | Ø | |
DIRECTV | | | 519,629 | | | | 45,098,601 | *Ø | |
DISH
Network
Corp.
Class A | | | 149,448 | | | | 9,512,365 | *±£Ø | |
Gannett
Co., Inc. | | | 139,548 | | | | 4,395,762 | Ø | |
Gray
Television,
Inc. | | | 207,667 | | | | 1,918,843 | *Ø | |
Journal
Communications,
Inc. Class A | | | 131,800 | | | | 1,292,958 | *£Ø | |
Lamar
Advertising
Co. Class A | | | 153,089 | | | | 7,907,047 | Ø | |
Liberty
Global PLC
Class A | | | 224 | | | | 10,185 | *Ø | |
See Notes to Schedule of Investments
15
| | | Number
of Shares | | Value† | |
Liberty
Global
PLC
Series C | | | 114,691 | | | $ | 5,100,309 | *Ø | |
Liberty
Media
Corp.
Class A | | | 4,125 | | | | 198,082 | *Ø | |
Liberty
Media
Corp.
Class C | | | 4,203 | | | | 201,450 | *Ø | |
LIN Media
LLC
Class A | | | 111,332 | | | | 2,664,175 | *Ø | |
Loral Space &
Communications,
Inc. | | | 64,039 | | | | 4,898,983 | *Ø | |
Mediaset
SpA | | | 239,709 | | | | 800,242 | *Ø | |
Nexstar
Broadcasting
Group, Inc.
Class A | | | 9,386 | | | | 423,496 | Ø | |
PubliGroupe
AG | | | 500 | | | | 108,871 | Ø | |
Sinclair
Broadcast
Group, Inc.
Class A | | | 13,293 | | | | 386,162 | Ø | |
Sirius XM
Holdings,
Inc. | | | 410,974 | | | | 1,409,641 | *Ø | |
Sky
Deutschland
AG | | | 201,547 | | | | 1,700,568 | *Ø | |
Starz
Class A | | | 22,200 | | | | 685,980 | *£ | |
Time
Warner
Cable, Inc. | | | 135,352 | | | | 19,925,168 | Ø | |
Time Warner,
Inc. | | | 54,450 | | | | 4,327,141 | Ø | |
Tribune Co.
Class 1C
Litigation | | | 300,000 | | | | 750 | *Ø | |
Tribune
Media Co.
Class A | | | 72,862 | | | | 4,881,754 | *Ø | |
| | | 131,627,184 | | |
Metals & Mining (0.9%) | |
B2Gold Corp. | | | 331 | | | | 551 | * | |
Barrick
Gold Corp. | | | 21,790 | | | | 258,647 | £Ø | |
Gold Fields
Ltd. ADR | | | 639,614 | | | | 2,040,369 | Ø | |
Newmont
Mining
Corp. | | | 24,417 | | | | 458,063 | Ø | |
Nippon
Steel &
Sumitomo
Metal Corp. | | | 376,000 | | | | 970,754 | Ø | |
| | | Number
of Shares | | Value† | |
Nyrstar NV | | | 43,387 | | | $ | 146,256 | *Ø | |
SunCoke
Energy, Inc. | | | 421,850 | | | | 10,082,215 | *Ø | |
| | | 13,956,855 | | |
Multiline Retail (1.3%) | |
Dollar
General
Corp. | | | 43,240 | | | | 2,709,851 | *Ø | |
Dollar Tree,
Inc. | | | 74,850 | | | | 4,533,664 | *Ø | |
Family Dollar
Stores, Inc. | | | 139,818 | | | | 10,946,351 | Ø | |
Macy's, Inc. | | | 43,800 | | | | 2,532,516 | Ø | |
Takashimaya
Co. Ltd. | | | 130,000 | | | | 1,082,128 | Ø | |
| | | 21,804,510 | | |
Multi-Utilities (0.1%) | |
Integrys
Energy
Group, Inc. | | | 16,200 | | | | 1,177,416 | Ø | |
Oil, Gas & Consumable Fuels (2.4%) | |
Alvopetro
Energy Ltd. | | | 50,000 | | | | 21,295 | * | |
Anadarko
Petroleum
Corp. | | | 67,459 | | | | 6,191,387 | £Ø | |
Apco Oil
and Gas
International,
Inc. | | | 22,240 | | | | 318,699 | *£ | |
Athlon
Energy, Inc. | | | 59,857 | | | | 3,489,663 | *Ø | |
| BP PLC ADR | | | 5,830 | | | | 253,372 | | |
Cameco
Corp. | | | 187,220 | | | | 3,253,884 | Ø | |
Cheniere
Energy, Inc. | | | 65,607 | | | | 4,920,525 | *£ | |
CONSOL
Energy, Inc. | | | 85,528 | | | | 3,147,430 | Ø | |
Eni SpA | | | 97,655 | | | | 2,080,398 | Ø | |
Hess Corp. | | | 49,046 | | | | 4,159,591 | £Ø | |
JX Holdings,
Inc. | | | 109,200 | | | | 461,979 | Ø | |
Kinder
Morgan
Management
LLC | | | 26,891 | | | | 2,558,413 | | |
Kodiak
Oil & Gas
Corp. | | | 118,905 | | | | 1,282,985 | *Ø | |
Occidental
Petroleum
Corp. | | | 65,962 | | | | 5,866,001 | £Ø | |
Talisman
Energy, Inc. | | | 170,376 | | | | 1,086,999 | Ø | |
| | | 39,092,621 | | |
Paper & Forest Products (0.0%) | |
Ainsworth
Lumber
Co. Ltd. | | | 110,000 | | | | 253,760 | *Ø | |
| | | Number
of Shares | | Value† | |
Pharmaceuticals (4.5%) | |
AbbVie, Inc. | | | 21,600 | | | $ | 1,370,736 | Ø | |
Actavis PLC | | | 46,107 | | | | 11,192,013 | *£Ø | |
Allergan,
Inc. | | | 165,870 | | | | 31,525,252 | ±Ø | |
AstraZeneca
PLC ADR | | | 6,800 | | | | 495,992 | ±Ø | |
Auxilium
Pharmaceuticals,
Inc. | | | 15,927 | | | | 512,372 | * | |
Bayer AG | | | 17,130 | | | | 2,435,370 | Ø | |
Catalent,
Inc. | | | 98,500 | | | | 2,563,955 | *Ø | |
Endo
International
PLC | | | 5,691 | | | | 380,841 | * | |
Furiex
Pharmaceuticals,
Inc. | | | 1,500 | | | | 14,655 | *fNØ | |
Johnson &
Johnson | | | 33,350 | | | | 3,594,463 | Ø | |
Omthera
Pharmaceuticals,
Inc. | | | 100 | | | | — | *fN | |
Pfizer, Inc. | | | 138,704 | | | | 4,154,185 | ±Ø | |
Revance
Therapeutics,
Inc. | | | 31,043 | | | | 625,827 | *£ | |
Salix
Pharmaceuticals
Ltd. | | | 10,850 | | | | 1,560,772 | *±Ø | |
Shire PLC
ADR | | | 43,374 | | | | 8,666,125 | £Ø | |
Teva
Pharmaceutical
Industries
Ltd. ADR | | | 44,400 | | | | 2,507,269 | Ø | |
Theravance,
Inc. | | | 105,983 | | | | 1,697,848 | Ø | |
Zoetis, Inc. | | | 39,336 | | | | 1,461,726 | Ø | |
| | | 74,759,401 | | |
Real Estate Investment Trusts (2.5%) | |
American
Realty
Capital
Healthcare
Trust, Inc. | | | 382,278 | | | | 4,319,741 | Ø | |
American
Realty
Capital
Properties,
Inc. | | | 314,455 | | | | 2,789,216 | £Ø | |
Aviv REIT, Inc. | | | 12,791 | | | | 431,440 | | |
Gaming and
Leisure
Properties,
Inc. | | | 97,406 | | | | 3,043,937 | Ø | |
Glimcher
Realty Trust | | | 170,369 | | | | 2,339,166 | Ø | |
HealthLease
Properties
Real Estate
Investment
Trust | | | 3,000 | | | | 37,585 | Ø | |
See Notes to Schedule of Investments
16
| | | Number
of Shares | | Value† | |
Iron
Mountain,
Inc. | | | 109,714 | | | $ | 3,957,384 | Ø | |
Japan
Retail
Fund
Investment
Corp. | | | 855 | | | | 1,702,769 | Ø | |
New Senior
Investment
Group, Inc. | | | 39,037 | | | | 745,607 | *Ø | |
Newcastle
Investment
Corp. | | | 484,158 | | | | 11,319,343 | *Ø | |
NorthStar
Realty
Finance
Corp. | | | 550,363 | | | | 10,225,745 | £Ø | |
| | | 40,911,933 | | |
Real Estate Management &
Development (0.5%) | |
Daiwa
House
Industry
Co. Ltd. | | | 213,900 | | | | 3,967,600 | Ø | |
Mitsubishi
Estate Co.
Ltd. | | | 76,000 | | | | 1,891,458 | Ø | |
Tokyo
Tatemono
Co. Ltd. | | | 183,000 | | | | 1,539,595 | Ø | |
Tokyu
Fudosan
Holdings
Corp. | | | 187,700 | | | | 1,295,059 | Ø | |
| | | | 8,693,712 | | |
Road & Rail (0.4%) | |
Contrans
Group, Inc.
Class A | | | 25,000 | | | | 331,174 | Ø | |
Hertz Global
Holdings,
Inc. | | | 154,327 | | | | 3,382,848 | *£Ø | |
Union
Pacific
Corp. | | | 28,750 | | | | 3,347,938 | Ø | |
| | | | 7,061,960 | | |
Semiconductors & Semiconductor Equipment (1.1%) | |
Broadcom
Corp.
Class A | | | 55,700 | | | | 2,332,717 | Ø | |
Cree, Inc. | | | 16,686 | | | | 525,275 | *Ø | |
International
Rectifier
Corp. | | | 88,165 | | | | 3,506,322 | *Ø | |
Marvell
Technology
Group Ltd. | | | 34,930 | | | | 469,459 | | |
| | | Number
of Shares | | Value† | |
Micron
Technology,
Inc. | | | 109,549 | | | $ | 3,624,976 | *Ø | |
Montage
Technology
Group Ltd. | | | 4,649 | | | | 102,743 | * | |
NVIDIA Corp. | | | 38,933 | | | | 760,751 | Ø | |
NXP
Semiconductor
NV | | | 17,100 | | | | 1,174,086 | *Ø | |
OmniVision
Technologies,
Inc. | | | 1,000 | | | | 26,780 | * | |
Peregrine
Semiconductor
Corp. | | | 85,000 | | | | 1,056,550 | *Ø | |
RF Micro
Devices,
Inc. | | | 61,955 | | | | 806,035 | *Ø | |
SCREEN
Holdings
Co. Ltd. | | | 272,000 | | | | 1,438,398 | Ø | |
SunEdison,
Inc. | | | 69,055 | | | | 1,347,263 | *Ø | |
TriQuint
Semiconductor,
Inc. | | | 5,630 | | | | 121,777 | *Ø | |
| | | 17,293,132 | | |
Software (2.6%) | |
Compuware
Corp. | | | 285,756 | | | | 2,900,423 | ±Ø | |
Comverse,
Inc. | | | 61,938 | | | | 1,350,248 | *Ø | |
Concur
Technologies,
Inc. | | | 54,485 | | | | 6,991,515 | *Ø | |
Covisint
Corp. | | | 57,544 | | | | 166,303 | * | |
Ebix, Inc. | | | 2,000 | | | | 29,500 | Ø | |
Exact
Holding
NV | | | 3,023 | | | | 118,781 | | |
Nintendo
Co. Ltd. | | | 4,700 | | | | 498,349 | Ø | |
Nuance
Communications,
Inc. | | | 273,018 | | | | 4,212,668 | *Ø | |
PTC, Inc. | | | 144,550 | | | | 5,514,583 | *Ø | |
Shanda
Games
Ltd. ADR | | | 14,368 | | | | 92,889 | *Ø | |
TIBCO
Software,
Inc. | | | 395,294 | | | | 9,238,021 | *Ø | |
Verint
Systems,
Inc. | | | 207,704 | | | | 11,940,903 | *£Ø | |
| | | 43,054,183 | | |
| | | Number
of Shares | | Value† | |
Specialty Retail (1.1%) | |
ANN, Inc. | | | 125,100 | | | $ | 4,802,589 | *Ø | |
Dick's
Sporting
Goods, Inc. | | | 24,000 | | | | 1,088,880 | Ø | |
Express, Inc. | | | 11,965 | | | | 179,116 | *Ø | |
GNC
Holdings,
Inc. Class A | | | 50,797 | | | | 2,111,631 | Ø | |
New York &
Co., Inc. | | | 9,309 | | | | 30,441 | * | |
Office
Depot,
Inc. | | | 109,500 | | | | 571,590 | *Ø | |
Sanrio
Co. Ltd. | | | 29,000 | | | | 830,047 | Ø | |
Tiffany & Co. | | | 39,639 | | | | 3,810,101 | £Ø | |
United
Arrows Ltd. | | | 62,100 | | | | 2,288,840 | Ø | |
Vitamin
Shoppe,
Inc. | | | 44,568 | | | | 2,091,576 | *£ | |
| | | 17,804,811 | | |
Technology Hardware, Storage & Peripherals (0.6%) | |
Apple, Inc. | | | 24,285 | | | | 2,622,780 | Ø | |
BlackBerry
Ltd. | | | 42,974 | | | | 451,227 | *£Ø | |
EMC Corp. | | | 14,194 | | | | 407,794 | | |
Quantum
Corp. | | | 21,144 | | | | 27,064 | *Ø | |
Ricoh
Co. Ltd. | | | 68,500 | | | | 700,094 | Ø | |
Western
Digital
Corp. | | | 48,336 | | | | 4,754,812 | Ø | |
| | | | 8,963,771 | | |
Textiles, Apparel & Luxury Goods (0.5%) | |
PVH Corp. | | | 27,875 | | | | 3,187,506 | Ø | |
Vera
Bradley, Inc. | | | 206,425 | | | | 4,706,490 | *£ | |
| | | 7,893,996 | | |
Thrifts & Mortgage Finance (0.2%) | |
Dime
Community
Bancshares,
Inc. | | | 17,656 | | | | 278,082 | £ | |
Federal
Home
Loan
Mortgage
Corp. | | | 42,631 | | | | 87,820 | *£ | |
Federal
National
Mortgage
Association | | | 204,222 | | | | 441,119 | * | |
Franklin
Financial
Corp. | | | 21,128 | | | | 438,617 | *Ø | |
See Notes to Schedule of Investments
17
| | | Number
of Shares | | Value† | |
Hudson
City
Bancorp,
Inc. | | | 220,620 | | | $ | 2,128,983 | Ø | |
| | | 3,374,621 | | |
Tobacco (0.1%) | |
Lorillard, Inc. | | | 25,202 | | | | 1,549,923 | Ø | |
Trading Companies & Distributors (0.0%) | |
Mitsubishi
Corp. | | | 34,000 | | | | 654,876 | Ø | |
Transportation Infrastructure (0.3%) | |
Macquarie
Infrastructure
Co. LLC | | | 67,128 | | | | 4,809,050 | Ø | |
Water Utilities (0.1%) | |
Cia de
Saneamento
Basico do
Estado de
Sao Paulo | | | 175,000 | | | | 1,369,406 | Ø | |
Wireless Telecommunication
Services (0.4%) | |
Leap Wireless
International,
Inc. | | | 60,000 | | | | 151,200 | *fNØ | |
SoftBank
Corp. | | | 43,500 | | | | 3,074,529 | Ø | |
Sprint Corp. | | | 18,933 | | | | 112,273 | *£ | |
T-Mobile
US, Inc. | | | 121,375 | | | | 3,542,936 | *±£Ø | |
| | | 6,880,938 | | |
Total Common Stocks
(Cost $957,161,225) | | | | | 966,107,319 | | |
Preferred Stocks (0.4%) | |
Automobiles (0.1%) | |
Volkswagen
AG, 4.06% | | | 4,597 | | | | 979,612 | Ø | |
Banks (0.2%) | |
National
Bank of
Greece SA,
Ser. A,
9.00% | | | 222,541 | | | | 3,932,299 | *Ø | |
Consumer Finance (0.1%) | |
Ally Financial,
Inc., Ser. G,
7.00% | | | 625 | | | | 625,937 | ñ | |
Real Estate Investment Trusts (0.0%) | |
Strategic
Hotels &
Resorts,
Inc., Ser. B,
8.25% | | | 5,145 | | | | 131,197 | £ | |
| | | Number
of Shares | | Value† | |
Thrifts & Mortgage Finance (0.0%) | |
Federal
Home
Loan
Mortgage
Corp.,
Ser. V,
5.57% | | | 11,077 | | | $ | 35,003 | *£ | |
Federal
Home
Loan
Mortgage
Corp.,
Ser. W,
5.66% | | | 5,370 | | | | 16,969 | *£ | |
Federal
Home
Loan
Mortgage
Corp., Ser. Z,
8.38% | | | 70,341 | | | | 298,949 | *ص | |
| | | | 350,921 | | |
Total Preferred Stocks
(Cost $6,341,650) | | | | | 6,019,966 | | |
Exchange Traded Funds (0.7%) | |
iShares
20+ Year
Treasury
Bond ETF | | | 43,800 | | | | 5,223,150 | | |
PowerShares
DB U.S. Dollar
Index Bullish
Fund | | | 252,900 | | | | 5,839,461 | *Ø | |
Total Exchange
Traded Funds
(Cost $10,503,868) | | | | | 11,062,611 | | |
| | | Number
of Rights | | | |
Rights (0.0%) | |
Biotechnology (0.0%) | |
Cubist
Pharmaceuticals,
Inc., due
12/31/49 | | | 5,000 | | | | 377 | * | |
Health Care Providers & Services (0.0%) | |
Community
Health
Systems,
Inc., due
1/4/16 | | | 19,880 | | | | 594 | *£ | |
Total Rights
(Cost $438) | | | | | 971 | | |
| | | Number
of Warrants | | Value† | |
Warrants (0.0%) | |
Diversified Financial Services (0.0%) | |
Nomad
Holdings
Ltd., due
4/10/17 | | | 1,025,486 | | | $ | 548,635 | *Ø | |
Media (0.0%) | |
Tribune
Media Co.,
due 12/31/32 | | | 1,877 | | | | 125,759 | *f | |
Metals & Mining (0.0%) | |
HudBay
Minerals,
Inc., due
7/20/18 | | | 1,360 | | | | 953 | * | |
Total Warrants
(Cost $157,365) | | | | | 675,347 | | |
| | | Principal
Amount | | | |
Mortgage-Backed Securities (4.8%) | |
Collateralized Mortgage
Obligations (1.2%) | |
Alternative Loan Trust,
Ser. 2005-J2,
Class 1A5,
0.65%, due
4/25/35 | | $ | 3,185,301 | | | | 2,860,320 | µ | |
Banc of America
Alternative
Loan Trust,
Ser. 2005-6,
Class 2CB2,
6.00%,
due 7/25/35 | | | 806,430 | | | | 755,954 | | |
Bear Stearns
Asset Backed
Securities Trust,
Ser. 2004-AC4,
Class A1, 5.83%,
due 8/25/34 | | | 403,878 | | | | 414,663 | a | |
CHL Mortgage
Pass-Through
Trust,
Ser. 2005-19,
Class 1A1,
5.50%, due
8/25/35 | | | 427,278 | | | | 420,580 | | |
See Notes to Schedule of Investments
18
| | | Principal
Amount | | Value† | |
Citicorp
Mortgage
Securities
REMIC
Pass-Through
Certificates
Trust,
Ser. 2005-7,
Class 1A4,
5.50%, due
10/25/35 | | $ | 331,919 | | | $ | 334,062 | | |
Citicorp
Mortgage
Securities,
Inc.,
Ser. 2006-3,
Class 1A10,
6.25%, due
6/25/36 | | | 3,389,201 | | | | 3,546,494 | | |
Citicorp
Mortgage
Securities,
Inc.,
Ser. 2006-3,
Class 1A9,
5.75%, due
6/25/36 | | | 691,674 | | | | 711,652 | | |
Citicorp
Mortgage
Securities,
Inc.,
Ser. 2006-4,
Class 1A2,
6.00%, due
8/25/36 | | | 933,330 | | | | 954,627 | | |
Citicorp
Mortgage
Securities,
Inc.,
Ser. 2007-8,
Class 1A4,
6.00%, due
9/25/37 | | | 194,640 | | | | 194,612 | | |
GSR
Mortgage
Loan Trust,
Ser. 2005-AR6,
Class 3A2,
2.64%, due
9/25/35 | | | 569,351 | | | | 537,894 | µ | |
JP Morgan
Alternative
Loan Trust,
Ser. 2006-S4,
Class A3A,
5.78%, due
12/25/36 | | | 802,425 | | | | 738,012 | a | |
JP Morgan
Alternative
Loan Trust,
Ser. 2006-S4,
Class A6,
5.71%, due
12/25/36 | | | 815,309 | | | | 765,368 | a | |
| | | Principal
Amount | | Value† | |
JP Morgan
Mortgage
Trust,
Ser. 2007-A1,
Class 4A1,
2.49%, due
7/25/35 | | $ | 298,724 | | | $ | 301,319 | µ | |
JP Morgan
Mortgage
Trust,
Ser. 2007-A1,
Class 5A6,
2.59%, due
7/25/35 | | | 356,856 | | | | 325,486 | µ | |
MASTR
Alternative
Loans Trust,
Ser. 2004-10,
Class 4A1,
6.00%, due
9/25/19 | | | 140,474 | | | | 145,129 | | |
PHH
Mortgage
Trust,
Ser. 2008-CIM1,
Class 21A2,
6.00%, due
5/25/38 | | | 217,718 | | | | 223,723 | | |
RFMSI
Trust,
Ser. 2005-SA3,
Class 1A,
2.72%, due
8/25/35 | | | 399,028 | | | | 320,055 | µ | |
Structured Asset
Securities
Corp. Trust,
Ser. 2005-6,
Class 2A1,
5.50%, due
5/25/35 | | | 276,433 | | | | 284,892 | | |
WaMu
Mortgage
Pass-Through
Certificates,
Ser. 2004-S1,
Class 1A11,
5.50%, due
3/25/34 | | | 209,133 | | | | 220,329 | | |
Wells Fargo
Mortgage
Backed
Securities Trust,
Ser. 2005-9,
Class 1A12,
5.50%, due
10/25/35 | | | 1,318,712 | | | | 1,324,930 | | |
| | | Principal
Amount | | Value† | |
Wells Fargo
Mortgage
Backed
Securities Trust,
Ser. 2005-AR9,
Class 3A2,
2.61%, due
6/25/34 | | $ | 375,542 | | | $ | 363,272 | µ | |
Wells Fargo
Mortgage
Backed
Securities Trust,
Ser. 2006-13,
Class A5,
6.00%, due
10/25/36 | | | 356,073 | | | | 367,727 | | |
Wells Fargo
Mortgage
Backed
Securities Trust,
Ser. 2007-10,
Class 2A5,
6.25%, due
7/25/37 | | | 1,247,009 | | | | 1,257,035 | | |
Wells Fargo
Mortgage
Backed
Securities Trust,
Ser. 2007-12,
Class A6,
5.50%, due
9/25/37 | | | 912,478 | | | | 929,762 | | |
Wells Fargo
Mortgage
Backed
Securities Trust,
Ser. 2007-14,
Class 1A1,
6.00%, due
10/25/37 | | | 999,945 | | | | 1,013,472 | | |
Wells Fargo
Mortgage
Backed
Securities Trust,
Ser. 2007-16,
Class 1A7,
6.00%, due
12/28/37 | | | 307,875 | | | | 317,711 | | |
| | | | 19,629,080 | | |
Commercial Mortgage-Backed (3.6%) | |
BAMLL
Commercial
Mortgage
Securities Trust,
Ser. 2013-DSNY,
Class F, 3.65%,
due
9/15/26 | | | 4,200,000 | | | | 4,218,686 | ñص | |
See Notes to Schedule of Investments
19
| | | Principal
Amount | | Value† | |
BAMLL
Commercial
Mortgage
Securities Trust,
Ser. 2014-ICTS,
Class E, 3.10%,
due
6/15/28 | | $ | 3,450,000 | | | $ | 3,432,829 | ñµ | |
Boca Hotel
Portfolio Trust,
Ser. 2013-BOCA,
Class E,
3.90%, due
8/15/26 | | | 700,000 | | | | 700,874 | ñص | |
COMM
Mortgage
Trust,
Ser. 2014-PAT,
Class E,
3.30%, due
8/13/27 | | | 1,700,000 | | | | 1,683,372 | ñµ | |
Commercial
Mortgage Trust,
Ser. 2007-GG11,
Class AJ,
6.05%, due
12/10/49 | | | 5,940,000 | | | | 6,209,670 | ص | |
Credit
Suisse
Commercial
Mortgage Trust,
Ser. 2006-C4,
Class AJ,
5.54%, due
9/15/39 | | | 3,500,000 | | | | 3,531,861 | µ | |
Credit
Suisse
First Boston
Commercial
Mortgage Trust,
Ser. 2003-C3,
Class H,
5.16%, due
5/15/38 | | | 382,254 | | | | 382,269 | ñµ | |
GE Capital
Commercial
Mortgage Corp.,
Ser. 2005-C3,
Class G,
5.16%, due
7/10/45 | | | 3,000,000 | | | | 3,021,720 | ñµ | |
JP Morgan
Chase
Commercial
Mortgage
Securities Trust,
Ser. 2006-CB15,
Class AM,
5.86%, due
6/12/43 | | | 4,800,000 | | | | 4,909,973 | ص | |
| | | Principal
Amount | | Value† | |
JP Morgan
Chase
Commercial
Mortgage
Securities Trust,
Ser. 2006-LDP8,
Class C,
5.55%, due
5/15/45 | | $ | 1,200,000 | | | $ | 1,204,918 | ص | |
JP Morgan
Chase
Commercial
Mortgage
Securities Trust,
Ser. 2013-JWRZ,
Class E,
3.89%, due
4/15/30 | | | 4,330,000 | | | | 4,338,734 | ñµ | |
JP Morgan
Chase
Commercial
Mortgage
Securities Trust,
Ser. 2014-FL5,
Class D,
3.65%, due
7/15/31 | | | 1,150,000 | | | | 1,154,730 | ñµ | |
LB-UBS
Commercial
Mortgage Trust,
Ser. 2007-C1,
Class AJ,
5.48%, due
2/15/40 | | | 2,500,000 | | | | 2,602,200 | Ø | |
LB-UBS
Commercial
Mortgage Trust,
Ser. 2007-C7,
Class AJ,
6.25%, due
9/15/45 | | | 4,000,000 | | | | 4,230,816 | ص | |
Morgan
Stanley
Capital I Trust,
Ser. 2007-T25,
Class AJ,
5.57%, due
11/12/49 | | | 7,725,000 | | | | 7,924,475 | ص | |
NorthStar,
Ser. 2013-1A,
Class B,
5.15%, due
8/25/29 | | | 500,000 | | | | 512,500 | ñص | |
PFP III Ltd.,
Ser. 2014-1,
Class D,
4.25%, due
6/14/31 | | | 3,300,000 | | | | 3,306,036 | ñص | |
Wachovia
Bank
Commercial
Mortgage Trust,
Ser. 2007-C31,
Class AJ,
5.66%, due
4/15/47 | | | 4,450,000 | | | | 4,621,881 | ص | |
| | | Principal
Amount | | Value† | |
Wells
Fargo
Commercial
Mortgage Trust,
Ser. 2014-TISH,
Class WTS2,
3.40%, due
2/15/27 | | $ | 1,700,000 | | | $ | 1,698,256 | ñص | |
| | | | 59,685,800 | | |
Total Mortgage-Backed
Securities
(Cost $79,235,019) | | | | | 79,314,880 | | |
Asset-Backed Securities (2.6%) | |
AmeriCredit
Automobile
Receivables
Trust, Ser. 2012-4,
Class E,
3.82%, due
2/10/20 | | | 400,000 | | | | 412,708 | ñ | |
Ameri-
Credit
Automobile
Receivables
Trust, Ser. 2014-1,
Class E,
3.58%, due
8/9/21 | | | 3,500,000 | | | | 3,509,058 | | |
AmeriCredit
Automobile
Receivables
Trust, Ser. 2014-2,
Class E,
3.37%, due
11/8/21 | | | 3,500,000 | | | | 3,491,611 | | |
Atlas Senior
Loan Fund II Ltd.,
Ser. 2012-2A,
Class D,
4.48%, due
1/30/24 | | | 2,200,000 | | | | 2,152,275 | ñµ | |
Babson
CLO Ltd.,
Ser. 2006-2A,
Class D,
1.63%, due
10/16/20 | | | 5,000,000 | | | | 4,781,277 | ñµ | |
Babson
CLO Ltd.,
Ser. 2013-IA,
Class D,
3.73%, due
4/20/25 | | | 1,450,000 | | | | 1,367,684 | ñµ | |
Callidus
Debt Partners
CLO Fund V Ltd.,
Ser. 5A, Class C,
1.68%, due
11/20/20 | | | 2,000,000 | | | | 1,924,453 | ñµ | |
See Notes to Schedule of Investments
20
| | | Principal
Amount | | Value† | |
CIFC
Funding Ltd.,
Ser. 2006-1BA,
Class B2L,
4.23%, due
12/22/20 | | $ | 1,900,000 | | | $ | 1,843,235 | ñµ | |
ColumbusNova
CLO IV Ltd.,
Ser. 2007-2A,
Class D,
4.73%, due
10/15/21 | | | 900,000 | | | | 912,550 | ñµ | |
Countrywide
Asset-Backed
Certificates,
Ser. 2005-7,
Class AF4,
4.87%, due
10/25/35 | | | 475,697 | | | | 479,818 | µ | |
Country
wide
Asset-Backed
Certificates,
Ser. 2005-15,
Class 1AF6,
4.57%, due
4/25/36 | | | 1,100,608 | | | | 1,116,888 | µ | |
Exeter
Automobile
Receivables
Trust,
Ser. 2014-3A,
Class C,
4.17%, due
6/15/20 | | | 300,000 | | | | 300,020 | ñ | |
Fairway
Loan
Funding Co.,
Ser. 2006-1A,
Class B2L,
4.03%, due
10/17/18 | | | 200,000 | | | | 198,646 | ñµ | |
Gale
Force 4 CLO
Ltd.,
Ser. 2007-4A,
Class E,
6.63%, due
8/20/21 | | | 1,300,000 | | | | 1,298,048 | µ | |
Golub
Capital
Partners
CLO Ltd.,
Ser. 2011-10AR,
Class DR,
4.08%, due
10/20/21 | | | 750,000 | | | | 737,435 | ñµ | |
Greens
Creek
Funding Ltd.,
Ser. 2007-1A,
Class C,
2.48%, due
4/18/21 | | | 4,000,000 | | | | 3,909,936 | ñµ | |
| | | Principal
Amount | | Value† | |
Halcyon
Loan Advisors
Funding Ltd.,
Ser. 2012-2A,
Class E,
5.63%, due
12/20/24 | | $ | 300,000 | | | $ | 279,969 | ñµ | |
JP Morgan
Mortgage
Acquisition
Corp.,
Ser. 2007-CH1,
Class AF3,
5.43%, due
11/25/36 | | | 783,894 | | | | 802,599 | a | |
JP Morgan
Mortgage
Acquisition
Corp.,
Ser. 2007-CH1,
Class AF6,
5.43%, due
11/25/36 | | | 877,114 | | | | 884,737 | a | |
LCM XI LP,
Ser. 11A,
Class D2,
4.18%, due
4/19/22 | | | 2,600,000 | | | | 2,519,160 | ñµ | |
Morgan
Stanley ABS
Capital I, Inc.
Trust,
Ser. 2006-HE3,
Class A2C,
0.31%, due
4/25/36 | | | 1,708,114 | | | | 1,664,687 | µ | |
Structured
Asset
Securities Corp.
Mortgage
Loan Trust,
Ser. 2005-4XS,
Class 1A3,
5.00%, due
3/25/35 | | | 403,482 | | | | 408,132 | a | |
Symphony
CLO XII Ltd.,
Ser. 2013-12A,
Class D,
3.73%, due
10/15/25 | | | 750,000 | | | | 704,903 | ñµ | |
Venture IX
CDO Ltd.,
Ser. 2007-9A,
Class D,
4.38%, due
10/12/21 | | | 2,500,000 | | | | 2,528,553 | ñµ | |
Venture
XIV CLO Ltd.,
Ser. 2013-14A,
Class D,
3.99%, due
8/28/25 | | | 2,400,000 | | | | 2,278,480 | ñµ | |
| | | Principal
Amount | | Value† | |
Vitesse
CLO Ltd.,
Ser. 2006-1A,
Class B1L,
2.03%, due
8/17/20 | | $ | 3,000,000 | | | $ | 2,947,439 | ñµ | |
Total Asset-Backed
Securities
(Cost $43,409,843) | | | | | 43,454,301 | | |
Corporate Debt Securities (4.0%) | |
Aerospace & Defense (0.1%) | |
Bombardier,
Inc., 7.50%,
due 3/15/18 | | | 645,000 | | | | 715,950 | ñØ | |
Trans
Digm,
Inc., 6.00%,
due 7/15/22 | | | 330,000 | | | | 333,712 | | |
| | | | 1,049,662 | | |
Auto Components (0.1%) | |
American
Axle &
Manufacturing,
Inc., 5.13%,
due 2/15/19 | | | 650,000 | | | | 659,750 | Ø | |
Gajah
Tunggal
Tbk PT,
7.75%, due
2/6/18 | | | 250,000 | | | | 251,250 | ñØ | |
Icahn
Enterprises
LP, 4.88%,
due 3/15/19 | | | 725,000 | | | | 737,687 | Ø | |
Schaeffler
Holding
Finance BV,
6.88%, due
8/15/18 | | | 695,000 | | | | 728,013 | cñ | |
| | | | 2,376,700 | | |
Banks (0.2%) | |
Bancolombia
SA, 5.13%,
due 9/11/22 | | | 245,000 | | | | 249,900 | Ø | |
CIT Group,
Inc., 5.25%,
due 3/15/18 | | | 650,000 | | | | 685,750 | Ø | |
Citigroup,
Inc., Ser. M,
6.30%, due
5/15/24 | | | 375,000 | | | | 372,656 | ص | |
ICICI Bank
Ltd., 6.37%,
due 4/30/22 | | | 350,000 | | | | 361,830 | ص | |
Industrial
Senior
Trust, 5.50%,
due 11/1/22 | | | 245,000 | | | | 243,163 | ñØ | |
See Notes to Schedule of Investments
21
| | | Principal
Amount | | Value† | |
Lloyds
Banking
Group PLC,
7.50%, due
6/27/24 | | $ | 500,000 | | | $ | 520,000 | ص | |
VTB Bank
OJSC
Via VTB
Capital SA,
6.95%, due
10/17/22 | | | 250,000 | | | | 238,006 | Ø | |
Wells
Fargo & Co.,
Ser. S, 5.90%,
due 6/15/24 | | | 350,000 | | | | 359,835 | ص | |
| | | | 3,031,140 | | |
Building Products (0.0%) | |
Associated
Materials
LLC, 9.13%,
due 11/1/17 | | | 175,000 | | | | 171,062 | Ø | |
Building
Materials
Corp. of
America,
5.38%, due
11/15/24 | | | 333,000 | | | | 333,833 | ñ | |
| | | | 504,895 | | |
Chemicals (0.0%) | |
Braskem
Finance Ltd.,
6.45%, due
2/3/24 | | | 250,000 | | | | 265,187 | Ø | |
Momentive
Performance
Materials, Inc.,
10.00%, due
10/15/20 | | | 613,000 | | | | 16,858 | ≠ | |
Momentive
Performance
Materials, Inc.,
4.69%, due
4/24/22 | | | 613,000 | | | | 499,595 | ≠ | |
| | | | 781,640 | | |
Communications Equipment (0.0%) | |
Avaya, Inc.,
10.50%, due
3/1/21 | | | 445,000 | | | | 389,931 | £ñ | |
Construction & Engineering (0.0%) | |
Michael
Baker
Holdings LLC,
8.88%,
due 4/15/19 | | | 304,000 | | | | 300,960 | cñØ | |
Consumer Finance (0.1%) | |
SLM Corp.,
8.45%, due
6/15/18 | | | 700,000 | | | | 800,800 | Ø | |
| | | Principal
Amount | | Value† | |
Containers & Packaging (0.1%) | |
Ardagh
Holdings
USA, Inc.,
3.23%, due
12/15/19 | | $ | 325,000 | | | $ | 318,094 | ñص | |
Sealed
Air Corp.,
8.13%,
due 9/15/19 | | | 500,000 | | | | 541,875 | ñØ | |
| | | | 859,969 | | |
Diversified Consumer Services (0.0%) | |
Service Corp.
International,
7.63%, due
10/1/18 | | | 575,000 | | | | 644,000 | Ø | |
Diversified Financial Services (0.2%) | |
Comcel
Trust, 6.88%,
due 2/6/24 | | | 270,000 | | | | 288,900 | ñØ | |
Corolla
Trust, 0.00%,
due 8/28/39 | | | 2,954,000 | | | | 2,304,120 | ñص | |
Enova
International,
Inc., 9.75%,
due 6/1/21 | | | 450,000 | | | | 456,750 | £ñ | |
Lehman
Brothers
Holdings, Inc.,
6.88%, due
5/2/18 | | | 1,000,000 | | | | 152,500 | ≠Ø | |
Opal
Acquisition,
Inc., 8.88%,
due 12/15/21 | | | 215,000 | | | | 224,406 | £ñ | |
| | | | 3,426,676 | | |
Diversified Telecommunication
Services (0.3%) | |
Fairpoint
Communications,
Inc., 8.75%,
due 8/15/19 | | | 1,115,000 | | | | 1,176,325 | ñØ | |
Intelsat
Jackson
Holdings SA,
5.50%, due
8/1/23 | | | 2,750,000 | | | | 2,756,875 | Ø | |
Intelsat
Luxembourg SA,
6.75%,
due 6/1/18 | | | 575,000 | | | | 595,125 | Ø | |
Sprint
Capital
Corp., 8.75%,
due 3/15/32 | | | 600,000 | | | | 670,500 | Ø | |
| | | | 5,198,825 | | |
| | | Principal
Amount | | Value† | |
Electric Utilities (0.1%) | |
Energy
Future
Intermediate
Holding Co.
LLC, 11.75%,
due 3/1/22 | | $ | 1,671,000 | | | $ | 1,988,490 | ≠ñØ | |
Energy Equipment & Services (0.0%) | |
CHC
Helicopter SA,
9.25%, due
10/15/20 | | | 270,000 | | | | 288,900 | Ø | |
PHI, Inc.,
5.25%, due
3/15/19 | | | 415,000 | | | | 409,962 | | |
| | | | 698,862 | | |
Food Products (0.1%) | |
ESAL
GmbH,
6.25%, due
2/5/23 | | | 250,000 | | | | 255,000 | ñØ | |
Minerva
Luxembourg SA,
7.75%, due
1/31/23 | | | 240,000 | | | | 250,800 | ñØ | |
Premier
Foods
Finance PLC,
6.50%, due
3/15/21 | | | 400,000 | | | | 574,894 | ñØ | |
Virgolino
de Oliveira
Finance Ltd.,
10.50%, due
1/28/18 | | | 400,000 | | | | 98,000 | ñØ | |
Virgolino de
Oliveira
Finance Ltd.,
10.88%, due
1/13/20 | | | 200,000 | | | | 121,940 | ñØ | |
| | | | 1,300,634 | | |
Health Care Equipment & Supplies (0.1%) | |
Biomet,
Inc., 6.50%,
due 10/1/20 | | | 895,000 | | | | 946,462 | £ | |
Health Care Providers & Services (0.3%) | |
21st Century
Oncology, Inc.,
8.88%, due
1/15/17 | | | 1,336,000 | | | | 1,359,380 | | |
Community
Health
Systems, Inc.,
5.13%, due
8/15/18 | | | 350,000 | | | | 364,000 | Ø | |
Community
Health
Systems, Inc.,
6.88%, due
2/1/22 | | | 500,000 | | | | 538,750 | ñØ | |
See Notes to Schedule of Investments
22
| | | Principal
Amount | | Value† | |
HCA,
Inc.,
7.25%, due
9/15/20 | | $ | 1,600,000 | | | $ | 1,696,000 | Ø | |
HCA, Inc.,
5.00%, due
3/15/24 | | | 715,000 | | | | 737,351 | Ø | |
Tenet
Healthcare
Corp., 8.13%,
due 4/1/22 | | | 400,000 | | | | 458,500 | Ø | |
| | | | 5,153,981 | | |
Healthcare—Products (0.0%) | |
Kinetic
Concepts, Inc.,
10.50%, due
11/1/18 | | | 135,000 | | | | 148,838 | | |
Hotels, Restaurants & Leisure (0.2%) | |
Caesars
Entertainment
Resort
Properties LLC,
8.00%, due
10/1/20 | | | 753,000 | | | | 730,410 | ñØ | |
Isle of
Capri
Casinos, Inc.,
7.75%, due
3/15/19 | | | 275,000 | | | | 288,750 | | |
MGM
Resorts
International,
7.63%, due
1/15/17 | | | 725,000 | | | | 791,156 | Ø | |
MTR
Gaming
Group, Inc.,
11.50%, due
8/1/19 | | | 749,000 | | | | 822,028 | Ø | |
Royal
Caribbean
Cruises Ltd.,
7.25%, due
3/15/18 | | | 320,000 | | | | 359,200 | Ø | |
| | | | 2,991,544 | | |
Household Durables (0.1%) | |
KB Home,
7.50%, due
9/15/22 | | | 350,000 | | | | 377,125 | Ø | |
Lennar
Corp., 6.95%,
due 6/1/18 | | | 575,000 | | | | 639,688 | Ø | |
Standard
Pacific Corp.,
8.38%, due
5/15/18 | | | 460,000 | | | | 532,450 | Ø | |
| | | | 1,549,263 | | |
| | | Principal
Amount | | Value† | |
Household Products (0.1%) | |
Reynolds
Group
Issuer, Inc.,
7.13%, due
4/15/19 | | $ | 750,000 | | | $ | 779,063 | Ø | |
Reynolds
Group
Issuer, Inc.,
5.75%, due
10/15/20 | | | 525,000 | | | | 546,000 | Ø | |
| | | | 1,325,063 | | |
Independent Power & Renewable Electricity Producers (0.0%) | |
Calpine
Corp., 5.75%,
due 1/15/25 | | | 325,000 | | | | 329,062 | Ø | |
Insurance (0.3%) | |
Ambac
Assurance
Corp., 5.10%,
due 6/7/20 | | | 3,299,000 | | | | 3,793,850 | ≠ñØ | |
Liberty
Mutual
Group, Inc.,
7.00%, due
3/15/37 | | | 550,000 | | | | 572,000 | ñص | |
Pearl
Group
Holdings No. 1
Ltd., 6.59%,
due 4/25/16 | | | 153,000 | | | | 238,488 | ص | |
| | | | 4,604,338 | | |
Machinery (0.1%) | |
CNH
Industrial
Capital LLC,
3.63%, due
4/15/18 | | | 725,000 | | | | 725,000 | Ø | |
Navistar
International
Corp., 8.25%,
due 11/1/21 | | | 275,000 | | | | 282,700 | Ø | |
SPX Corp.,
6.88%, due
9/1/17 | | | 490,000 | | | | 535,325 | Ø | |
| | | | 1,543,025 | | |
Marine (0.1%) | |
Hapag-Lloyd
AG, 9.75%,
due 10/15/17 | | | 800,000 | | | | 824,000 | ñØ | |
Stena AB,
7.00%, due
2/1/24 | | | 280,000 | | | | 279,300 | ñ | |
| | | | 1,103,300 | | |
Media (0.2%) | |
Cenveo
Corp., 11.50%,
due 5/15/17 | | | 1,862,000 | | | | 1,889,930 | Ø | |
| | | Principal
Amount | | Value† | |
DISH
DBS
Corp., 5.88%,
due 7/15/22 | | $ | 650,000 | | | $ | 689,000 | Ø | |
iHeart
Communications,
Inc., 10.00%,
due 1/15/18 | | | 600,000 | | | | 501,375 | Ø | |
iHeart
Communications,
Inc., 9.00%,
due 3/1/21 | | | 360,000 | | | | 360,000 | Ø | |
Media
General
Financing
Sub, Inc.,
5.88%, due
11/15/22 | | | 333,000 | | | | 335,497 | ñ | |
| | | | 3,775,802 | | |
Metals & Mining (0.2%) | |
AK Steel
Corp., 8.75%,
due 12/1/18 | | | 575,000 | | | | 628,187 | Ø | |
APERAM,
7.75%, due
4/1/18 | | | 650,000 | | | | 672,750 | ñØ | |
ArcelorMittal,
6.75%, due
2/25/22 | | | 725,000 | | | | 804,823 | Ø | |
Ryerson,
Inc./Joseph T.
Ryerson & Son,
Inc., 9.00%,
due 10/15/17 | | | 500,000 | | | | 526,250 | Ø | |
Severstal
OAO Via
Steel
Capital SA,
5.90%, due
10/17/22 | | | 250,000 | | | | 237,750 | ñ | |
United
States
Steel Corp.,
7.00%, due
2/1/18 | | | 600,000 | | | | 661,500 | Ø | |
Vedanta
Resources
PLC, 8.25%,
due 6/7/21 | | | 500,000 | | | | 545,000 | ñØ | |
| | | | 4,076,260 | | |
Oil, Gas & Consumable Fuels (0.5%) | |
Alpha
Natural
Resources,
Inc., 6.00%,
due 6/1/19 | | | 600,000 | | | | 300,000 | Ø | |
Arch
Coal, Inc.,
8.00%, due
1/15/19 | | | 645,000 | | | | 419,250 | ñØ | |
See Notes to Schedule of Investments
23
| | | Principal
Amount | | Value† | |
Atlas
Pipeline
Partners LP,
5.88%, due
8/1/23 | | $ | 345,000 | | | $ | 357,937 | Ø | |
Chesapeake
Energy Corp.,
7.25%, due
12/15/18 | | | 550,000 | | | | 630,438 | Ø | |
CITGO
Petroleum
Corp., 6.25%,
due 8/15/22 | | | 215,000 | | | | 218,763 | ñØ | |
EP Energy
LLC, 6.88%,
due 5/1/19 | | | 600,000 | | | | 624,000 | Ø | |
Kinder
Morgan
Finance Co.
LLC, 6.00%,
due 1/15/18 | | | 600,000 | | | | 657,750 | ñØ | |
Linn
Energy
LLC, 6.25%,
due 11/1/19 | | | 500,000 | | | | 460,000 | Ø | |
Overseas
Shipholding
Group, Inc.,
8.13%, due
3/30/18 | | | 1,565,000 | | | | 1,576,737 | ≠Ø | |
Pacific
Rubiales
Energy Corp.,
5.13%, due
3/28/23 | | | 400,000 | | | | 383,000 | ñØ | |
Regency
Energy
Partners LP,
8.38%, due
6/1/19 | | | 495,000 | | | | 527,175 | ñ | |
Tesoro
Corp.,
5.38%, due
10/1/22 | | | 625,000 | | | | 643,750 | Ø | |
Tesoro
Logistics LP,
5.50%, due
10/15/19 | | | 275,000 | | | | 282,563 | ñ | |
The Williams
Cos., Inc.,
4.55%, due
6/24/24 | | | 470,000 | | | | 460,274 | Ø | |
| | | | 7,541,637 | | |
Paper & Forest Products (0.0%) | |
Verso
Paper
Holdings
LLC/Verso
Paper, Inc.,
11.75%, due
1/15/19 | | | 646,000 | | | | 553,945 | | |
| | | Principal
Amount | | Value† | |
Pharmaceuticals (0.0%) | |
Valeant
Pharmaceuticals
International,
Inc., 5.63%,
due 12/1/21 | | $ | 725,000 | | | $ | 717,750 | ñØ | |
Real Estate Management &
Development (0.0%) | |
TRI Pointe
Holdings,
Inc., 4.38%,
due 6/15/19 | | | 280,000 | | | | 278,600 | ñØ | |
Retail (0.1%) | |
Petco
Holdings,
Inc., 8.50%,
due 10/15/17 | | | 944,000 | | | | 948,720 | cñØ | |
Road & Rail (0.1%) | |
Avis
Budget
Car Rental
LLC, 4.88%,
due 11/15/17 | | | 345,000 | | | | 355,781 | Ø | |
The Hertz
Corp., 6.75%,
due 4/15/19 | | | 650,000 | | | | 677,625 | Ø | |
Ukraine
Railways
via Shortline
PLC, 9.50%,
due 5/21/18 | | | 250,000 | | | | 180,050 | ñØ | |
| | | | 1,213,456 | | |
Software (0.1%) | |
First Data
Holdings,
Inc., 14.50%,
due 9/24/19 | | | 1,218,000 | | | | 1,288,644 | cñ | |
Wireless Telecommunication
Services (0.2%) | |
Eileme 2 AB,
11.75%, due
1/31/20 | | | 400,000 | | | | 577,076 | Ø | |
Hughes
Satellite
Systems Corp.,
7.63%, due
6/15/21 | | | 450,000 | | | | 500,625 | Ø | |
NII
International
Telecom SCA,
7.88%, due
8/15/19 | | | 1,040,000 | | | | 665,600 | ≠ñØ | |
T-Mobile
USA, Inc.,
5.25%, due
9/1/18 | | | 650,000 | | | | 674,375 | Ø | |
| | | Principal
Amount | | Value† | |
Vimpel
Communications
Via VIP
Finance
Ireland Ltd.
OJSC, 7.75%,
due 2/2/21 | | $ | 250,000 | | | $ | 254,375 | ñ | |
| | | | 2,672,051 | | |
Total Corporate Debt
Securities
(Cost $67,322,326) | | | | | 66,114,925 | | |
| Bank Loan Obligationsµ (10.3%) | |
Advertising (0.7%) | |
Affinion
Group, Inc.,
1st Lien Term
Loan B, 6.75%,
due 4/30/18 | | | 3,256,825 | | | | 3,148,274 | | |
Authentic
Brands,
1st Lien Term
Loan, 5.50%,
due 5/22/21 | | | 1,990,000 | | | | 1,975,075 | | |
Catalina
Marketing
Corp.,
1st Lien Term
Loan, 4.50%,
due 4/2/21 | | | 679,298 | | | | 661,045 | | |
CBS
Outdoor
Americas
Capital LLC,
3.00%, due
1/31/21 | | | 750,000 | | | | 736,125 | Ø | |
Extreme
Reach, Inc.,
1st Lien Term
Loan, 6.75%,
due 12/31/25 | | | 1,003,437 | | | | 1,003,437 | | |
Extreme
Reach, Inc.,
2nd Lien Term
Loan, 10.50%,
due 12/31/25 | | | 1,593,000 | | | | 1,593,000 | | |
VFH
Parent LLC,
1st Lien Term
Loan, 5.75%,
due 11/5/19 | | | 2,731,351 | | | | 2,731,351 | | |
| | | | 11,848,307 | | |
Aerospace & Defense (0.1%) | |
The SI
Organization,
Inc., 1st Lien
Term Loan,
5.75%, due
10/24/19 | | | 1,433,623 | | | | 1,431,387 | Ø | |
See Notes to Schedule of Investments
24
| | | Principal
Amount | | Value† | |
The SI
Organization,
Inc., Delayed
Draw 1st Lien
Term Loan,
due 11/23/19 | | $ | 190,108 | | | $ | 189,811 | ؆† | |
| | | | 1,621,198 | | |
Auto Components (0.1%) | |
TI Group
Automotive
Systems LLC,
4.25%, due
7/2/21 | | | 498,750 | | | | 493,763 | | |
Visteon
Corp., Initial
Term Loan,
3.50%, due
4/9/21 | | | 598,500 | | | | 589,522 | Ø | |
| | | | 1,083,285 | | |
Building Materials (0.0%) | |
Quikrete
Holdings,
Inc., 1st Lien
Term Loan,
4.00%, due
9/18/20 | | | 719,282 | | | | 711,729 | Ø | |
Chemicals (0.1%) | |
Arizona
Chemicals
Ltd., 1st Lien
Term Loan,
4.50%, due
6/9/21 | | | 710,490 | | | | 709,048 | Ø | |
Axalta
Coating
Systems US
Holdings,
Inc., 4.00%,
due 2/1/20 | | | 713,967 | | | | 701,923 | Ø | |
| | | | 1,410,971 | | |
Commercial Services & Supplies (0.8%) | |
Aramark
Services,
Inc., 1st Lien
Term Loan F,
3.25%, due
2/21/21 | | | 746,873 | | | | 735,439 | Ø | |
CA
Acquisition
Holdings, Inc.,
6.00%, due
8/17/19 | | | 382,687 | | | | 383,483 | | |
Indiana
Toll Road
Concession
Co. LLC,
Term Loan,
due 6/30/14 | | | 2,322,432 | | | | 1,730,212 | Ø | |
| | | Principal
Amount | | Value† | |
Indiana
Toll Road
Concession
Co. LLC,
Term Loan A,
due 6/28/15 | | $ | 6,178,342 | | | $ | 4,595,142 | ^^≠ | |
Indiana
Toll Road
Concession
Co. LLC,
Term Loan B,
due 6/28/15 | | | 285,664 | | | | 212,462 | ^^≠ | |
Indiana
Toll Road
Concession
Co. LLC,
Term Loan C,
due 6/28/15 | | | 872,515 | | | | 648,933 | ^^≠ | |
Insight
Global, Inc.,
5.25%, due
12/31/19 | | | 494,962 | | | | 493,725 | | |
iQor
US, Inc.,
2nd Lien
Term Loan,
9.75%, due
2/18/22 | | | 293,667 | | | | 256,224 | Ø | |
Millennium
Laboratories
LLC, 5.25%,
due 3/28/21 | | | 415,958 | | | | 415,700 | | |
PHS Group
PLC, 1st Lien
Term Loan B,
due 8/2/15 | | | 347,000 | | | | 385,331 | ^^ | |
PHS Group
PLC, 1st Lien
Term Loan C,
due 7/4/16 | | | 347,000 | | | | 388,106 | ^^ | |
Sedgwick,
Inc., 2nd Lien
Term Loan,
6.75%, due
2/11/22 | | | 1,252,000 | | | | 1,214,440 | Ø | |
The Brickman
Group Ltd.
LLC, 2nd Lien
Term Loan,
7.50%, due
12/17/21 | | | 1,788,000 | | | | 1,756,156 | Ø | |
| | | | 13,215,353 | | |
Computers & Peripherals (0.0%) | |
Peak 10,
Inc., 2nd Lien
Term Loan,
8.25%, due
6/10/22 | | | 655,000 | | | | 645,994 | | |
| | | Principal
Amount | | Value† | |
Diversified Financial Services (0.5%) | |
| 4
Technologies,
Inc., Term Loan B,
5.50%, due
4/3/20 | L | | $ | 1,824,000 | | | $ | 1,811,469 | Ø | |
Connolly
Corp., 1st Lien
Term Loan,
5.00%, due
5/9/21 | | | 1,361,588 | | | | 1,353,078 | Ø | |
Environmental
Resources
Management,
1st Lien
Term Loan,
due 5/9/21 | | | 2,881,000 | | | | 2,826,981 | ^^ | |
Twin River
Management
Group, Inc.,
1st Lien
Term Loan,
5.25%, due
4/10/20 | | | 1,380,540 | | | | 1,373,637 | Ø | |
| | | | 7,365,165 | | |
Diversified Telecommunication
Services (0.4%) | |
Fairpoint
Communications,
Inc., Term Loan B,
7.50%, due
2/14/19 | | | 2,890,064 | | | | 2,909,948 | Ø | |
Global
Telcom Link
Corp., 2nd Lien
Term Loan,
9.00%, due
5/21/20 | | | 2,825,000 | | | | 2,799,095 | Ø | |
Level 3
Communications,
Inc., Term Loan,
due 1/31/22 | | | 200,000 | | | | 200,812 | | |
| | | | 5,909,855 | | |
Electric Utilities (0.4%) | |
Texas
Competitive
Electric
Holdings
Co. LLC,
Extended
Term Loan,
due 10/10/17 | | | 2,380,000 | | | | 1,730,593 | ^^≠Ø | |
Texas
Competitive
Electric
Holdings
Co., DIP
Term Loan,
due 5/5/16 | | | 235,901 | | | | 237,081 | ≠Ø | |
See Notes to Schedule of Investments
25
| | | Principal
Amount | | Value† | |
Texas
Competitive
Electric
Holdings Co.,
Term Loan,
due 6/6/16 | | $ | 4,680,000 | | | $ | 4,668,300 | ≠Ø | |
| | | | 6,635,974 | | |
Electrical Components & Equipment (0.0%) | |
Pelican
Products,
Inc., 2nd Lien
Term Loan,
9.25%, due
4/8/21 | | | 670,000 | | | | 663,300 | | |
Food Products (0.3%) | |
Albertson's
Holdings LLC,
Term Loan B3,
4.00%, due
8/8/19 | | | 1,708,000 | | | | 1,703,115 | Ø | |
Del Monte
Corp.,
2nd Lien
Term Loan,
8.25%, due
7/26/21 | | | 1,917,000 | | | | 1,706,130 | Ø | |
Ferrara
Candy Co.,
7.50%, due
6/8/17 | | | 1,885,533 | | | | 1,800,684 | | |
H.J. Heinz
Holding
Corp.,
3.25%,
due 6/7/19 | | | 5 | | | | 5 | | |
Shearer's
Foods LLC,
Term Loan,
7.75%, due
6/19/22 | | | 208,000 | | | | 203,840 | Ø | |
| | | | 5,413,774 | | |
Health Care Equipment & Supplies (0.1%) | |
Carestream
Health, Inc.,
2nd Lien
Term Loan,
9.50%, due
12/5/19 | | | 1,063,099 | | | | 1,052,734 | Ø | |
Hologic, Inc.,
Refinanced
Term Loan,
3.25%, due
8/1/19 | | | 745,103 | | | | 740,633 | | |
US Renal
Care, Inc.,
1st Lien
Term Loan,
4.25%, due
7/3/19 | | | 497,487 | | | | 493,756 | Ø | |
| | | | 2,287,123 | | |
| | | Principal
Amount | | Value† | |
Health Care Providers & Services (0.4%) | |
Correct
Care
Solutions LLC,
1st Lien
Term Loan,
5.00%, due
7/22/21 | | $ | 494,000 | | | $ | 485,355 | Ø | |
CRC
Health Corp.,
Term Loan,
9.00%, due
9/28/21 | | | 808,000 | | | | 825,170 | Ø | |
Genesis
HealthCare
DE LLC,
Term Loan,
10.00%, due
10/2/17 | | | 173,926 | | | | 179,144 | Ø | |
Gentiva
Health
Services, Inc.,
Term Loan B,
6.50%, due
10/16/19 | | | 2,481,250 | | | | 2,483,309 | Ø | |
HCA,
Inc.,
Term Loan B5,
2.90%, due
3/31/17 | | | 1,175,000 | | | | 1,170,230 | | |
MPH
Acquisition
Holdings LLC,
Initial
Term Loan,
4.00%, due
3/31/21 | | | 715,718 | | | | 703,959 | | |
| | | | 5,847,167 | | |
Healthcare—Products (0.0%) | |
Ortho-Clinical
Diagnostics,
Inc., Term Loan B,
4.75%, due
6/30/21 | | | 448,875 | | | | 443,937 | | |
Hotels, Restaurants & Leisure (1.5%) | |
Amaya BV,
1st Lien
Term Loan,
5.00%, due
7/29/21 | | | 3,035,000 | | | | 3,009,081 | Ø | |
Amaya BV,
2nd Lien
Term Loan,
8.00%, due
7/29/22 | | | 1,777,000 | | | | 1,793,295 | ^^Ø | |
AMF
Bowling
Centers, Inc.,
Term Loan B,
7.25%, due
8/12/21 | | | 1,205,000 | | | | 1,192,950 | | |
| | | Principal
Amount | | Value† | |
Aristocrat
Leisure,
Term Loan B,
due 9/29/21 | | $ | 4,851,000 | | | $ | 4,813,114 | | |
Caesars
Entertainment
Corp., 1st Lien
Term Loan,
7.00%, due
10/9/20 | | | 1,488,750 | | | | 1,417,692 | | |
Caesars
Entertainment
Operating
Co., Inc.,
Term Loan B,
9.75%, due
3/1/17 | | | 3,628,905 | | | | 3,347,665 | Ø | |
Caesars
Growth
Properties
Holdings LLC,
1st Lien
Term Loan,
6.25%, due
4/9/21 | | | 248,378 | | | | 234,096 | | |
ClubCorp
Club
Operations,
Inc., Term
Loan B,
4.50%, due
7/24/20 | | | 500,000 | | | | 494,790 | Ø | |
Diamond
Resorts
Corp., Term
Loan, 5.50%,
due 4/23/21 | | | 495,758 | | | | 494,518 | | |
Fitness
International
LLC, 1st Lien
Term Loan B,
5.50%, due
6/10/20 | | | 1,843,380 | | | | 1,826,863 | Ø | |
Harrah's
Entertainment,
Inc., Term
Loan B5,
5.19%, due
1/28/18 | | | 1,835,830 | | | | 1,635,266 | Ø | |
Harrah's
Entertainment,
Inc., Term
Loan B6,
6.99%, due
1/28/18 | | | 1,039,804 | | | | 930,521 | Ø | |
Hilton
Worldwide
Finance LLC,
Term Loan B2,
3.50%, due
9/23/20 | | | 674,912 | | | | 667,826 | | |
See Notes to Schedule of Investments
26
| | | Principal
Amount | | Value† | |
Mohegan
Tribal Gaming
Authority,
1st Lien
Term Loan B,
5.50%, due
11/19/19 | | $ | 1,468,900 | | | $ | 1,424,833 | | |
Scientific
Games
International,
Inc., Initial
Term Loan,
4.25%, due
10/18/20 | | | 497,494 | | | | 486,454 | | |
SeaWorld
Parks &
Entertainment,
Inc., Term
Loan B2, 3.00%,
due 5/14/20 | | | 487,419 | | | | 466,401 | Ø | |
| | | | 24,235,365 | | |
Household Products (0.2%) | |
Huish
Detergent,
Inc., 1st Lien
Term Loan,
5.50%, due
3/23/20 | | | 2,030,556 | | | | 1,827,500 | ^^Ø | |
KIK Custom
Products, Inc.,
1st Lien
Term Loan,
5.50%, due
4/29/19 | | | 496,238 | | | | 492,268 | | |
Prestige
Brands, Inc.,
Term Loan,
4.50%, due
4/28/21 | | | 550,000 | | | | 550,170 | | |
| | | | 2,869,938 | | |
Independent Power & Renewable Electricity Producers (0.1%) | |
NRG Energy,
Inc., 4.50%,
due 2/4/21 | | | 1,990,000 | | | | 1,897,963 | | |
Insurance (0.5%) | |
Asurion LLC,
1st Lien Term
Loan, 5.00%,
due 12/31/20 | | | 861,312 | | | | 861,553 | | |
Asurion LLC,
2nd Lien
Term Loan,
8.50%, due
2/19/21 | | | 5,232,000 | | | | 5,311,788 | ^^Ø | |
Cunningham | | | 1,000,000 | | | | 1,000,000 | Ø | |
Lindsey U.S.,
Inc., 2nd Initial
Loan, 9.25%,
due 6/10/20 | |
| | | Principal
Amount | | Value† | |
York
Risk Services
Group, Inc.,
Delayed Draw
Term Loan,
due 10/1/21 | | $ | 61,854 | | | $ | 61,429 | †† | |
York Risk
Services
Group, Inc.,
Term Loan,
4.75%, due
9/18/21 | | | 572,146 | | | | 568,216 | | |
| | | | 7,802,986 | | |
Internet Software & Services (0.4%) | |
Answers
Corp.,
Term Loan,
6.25%, due
10/3/21 | | | 649,000 | | | | 626,285 | | |
Manwin
Licensing
International,
Term Loan,
14.00%, due
10/4/18 | | | 1,385,179 | | | | 1,501,188 | ^^N | |
ProQuest
LLC, Term
Loan B, due
9/23/21 | | | 2,321,000 | | | | 2,318,818 | ^^ | |
The Active
Network, Inc.,
Term Loan,
5.50%, due
11/15/20 | | | 457,695 | | | | 452,926 | Ø | |
Travelclick,
1st Lien
Term Loan,
5.50%, due
5/8/21 | | | 460,874 | | | | 455,113 | Ø | |
Travelport
LLC, Term
Loan B,
6.00%, due
8/15/21 | | | 1,832,000 | | | | 1,829,710 | Ø | |
| | | | 7,184,040 | | |
Machinery (0.1%) | |
Husky
Injection
Molding
Systems Ltd.,
1st Lien Term
Loan, 4.25%,
due 6/30/21 | | | 747,148 | | | | 734,387 | Ø | |
Milacron
LLC, Term
Loan B, 4.00%,
due 3/28/20 | | | 597,000 | | | | 581,329 | | |
| | | | 1,315,716 | | |
| | | Principal
Amount | | Value† | |
Media (1.1%) | |
Charter
Communications
Operating LLC,
Term Loan F,
3.00%, due
1/31/21 | | $ | 748,106 | | | $ | 734,782 | Ø | |
Endemol,
1st Lien
Term Loan,
6.75%, due
8/6/21 | | | 1,519,000 | | | | 1,474,691 | Ø | |
IMG
Worldwide,
Inc., 1st Lien
Term Loan,
5.25%, due
3/19/21 | | | 2,329,163 | | | | 2,288,984 | Ø | |
IMG
Worldwide,
Inc., 2nd Lien
Term Loan,
8.25%, due
3/21/22 | | | 1,262,000 | | | | 1,230,450 | Ø | |
NEP/NCP
Holdco, Inc.,
4.25%, due
1/22/20 | | | 2,519,685 | | | | 2,456,693 | | |
Orion
Cable GmbH,
Senior Lien
Term Loan,
due 12/31/14 | | | 295,959 | | | | 363,000 | ^^ | |
Orion
Cable GmbH,
Senior Lien
Term Loan,
7.91%, due
12/31/14 | | | 3,037,725 | | | | 3,725,832 | ^^ | |
Rentpath,
Inc., Term
Loan, 6.25%,
due 5/29/20 | | | 1,982,437 | | | | 1,977,481 | | |
Springer
Science+Business
Media GmbH,
5.00%, due
8/15/20 | | | 2,231,263 | | | | 2,211,740 | | |
Thomson
Learning,
1st Lien
Term Loan,
7.00%, due
3/6/21 | | | 2,142,741 | | | | 2,143,813 | Ø | |
| | | | 18,607,466 | | |
Metals & Mining (0.0%) | |
FMG
Resources
August 2006
Pty Ltd.,
Term Loan B,
3.75%, due
6/30/19 | | | 746,858 | | | | 727,932 | Ø | |
See Notes to Schedule of Investments
27
| | | Principal
Amount | | Value† | |
Miscellaneous Manufacturing (0.1%) | |
Filtration
Group, Inc.,
2nd Lien
Term Loan,
8.25%, due
11/15/21 | | $ | 400,000 | | | $ | 398,000 | Ø | |
Gates Global
LLC, 4.25%,
due 6/12/21 | | | 725,000 | | | | 715,937 | Ø | |
| | | | 1,113,937 | | |
Multiline Retail (0.1%) | |
JC
Penny Co.,
Inc., 1st Lien
Term Loan,
5.00%, due
6/13/19 | | | 973,560 | | | | 950,847 | Ø | |
Oil & Gas Services (0.2%) | |
Brand
Energy, Inc.,
1st Lien
Term Loan B,
4.75%, due
11/20/20 | | | 1,336 | | | | 1,327 | | |
Expro
Oilfield
Services PLC,
Term Loan B,
5.75%, due
8/12/21 | | | 1,797,000 | | | | 1,758,059 | Ø | |
Preferred
Proppants LLC,
Term Loan B,
6.75%, due
8/12/20 | | | 1,022,000 | | | | 970,900 | | |
Stallion
Oilfield
Holdings, Inc.,
Term Loan,
8.00%, due
6/3/18 | | | 143,723 | | | | 137,256 | Ø | |
| | | | 2,867,542 | | |
Oil, Gas & Consumable Fuels (0.1%) | |
Bowie
Resources
Holdings LLC,
2nd Lien
Term Loan,
11.75%, due
12/31/20 | | | 35,100 | | | | 35,276 | | |
Energy
Transfer
Equity LP,
Term Loan,
3.25%, due
12/2/19 | | | 750,000 | | | | 734,197 | Ø | |
| | | Principal
Amount | | Value† | |
Fieldwood
Energy LLC,
1st Lien
Term Loan,
3.88%, due
9/28/18 | | $ | 596,987 | | | $ | 583,107 | Ø | |
| | | | 1,352,580 | | |
Packaging & Containers (0.2%) | |
Ardagh
Holdings
USA, Inc.,
1st Lien
Term Loan B,
4.00%, due
12/17/19 | | | 497,500 | | | | 492,112 | Ø | |
Berlin
Packaging
LLC, 1st Lien
Term Loan,
4.50%, due
9/24/21 | | | 434,000 | | | | 431,288 | | |
Beverage
Packaging
Holdings SA,
4.00%, due
12/1/18 | | | 1,739 | | | | 1,728 | | |
Goodpack
Ltd., 1st Lien
Term Loan,
due 8/5/21 | | | 957,000 | | | | 949,823 | Ø | |
Goodpack
Ltd., 2nd
Lien Term
Loan, 8.00%,
due 8/5/22 | | | 1,053,000 | | | | 1,049,051 | Ø | |
| | | | 2,924,002 | | |
Paper & Forest Products (0.0%) | |
NewPage
Corp., 1st Lien
Term Loan,
9.50%, due
2/5/21 | | | 494,000 | | | | 478,686 | Ø | |
Personal Products (0.1%) | |
Vogue
International
LLC, Term Loan,
5.25%, due
2/7/20 | | | 940,275 | | | | 940,275 | | |
Pharmaceuticals (0.2%) | |
Amneal
Pharmaceuticals
LLC, Term Loan B,
4.75%, due
10/30/20 | | | 340,142 | | | | 336,741 | Ø | |
Atrium
Innovations,
Inc., 1st Lien
Term Loan,
4.25%, due
1/29/21 | | | 1,760,898 | | | | 1,659,646 | Ø | |
| | | Principal
Amount | | Value† | |
Packaging
Coordinators,
Inc. Term Loan,
5.25%, due
8/12/21 | | $ | 1,838,000 | | | $ | 1,824,215 | Ø | |
| | | | 3,820,602 | | |
Real Estate Management & Development (0.2%) | |
DTZ US
Borrower LLC,
1st Lien Term
Loan, due
10/28/21 | | | 1,034,627 | | | | 1,033,768 | ^^ | |
DTZ US
Borrower LLC,
Delayed Draw
Term Loan B,
due 10/28/22 | | | 616,373 | | | | 615,862 | ^^ | |
Realogy
Group LLC,
New Term
Loan B, 3.75%,
due 3/5/20 | | | 748,116 | | | | 741,569 | | |
| | | | 2,391,199 | | |
Software (0.7%) | |
Ascend
Learning LLC,
2nd Lien
Term Loan,
9.50%, due
11/28/20 | | | 2,000,000 | | | | 1,990,000 | Ø | |
Ascend
Learning LLC,
Term Loan B,
6.00%, due
12/31/20 | | | 1,162,218 | | | | 1,163,670 | | |
First Data
Corp., Extended
Term Loan,
4.15%, due
3/24/21 | | | 500,000 | | | | 496,565 | Ø | |
First Data
Corp.,
Term Loan C1,
3.65%, due
3/24/18 | | | 250,000 | | | | 247,500 | | |
Novell, Inc.,
2nd Lien
Term Loan,
11.00%, due
10/31/18 | | | 2,626,000 | | | | 2,662,107 | Ø | |
P2 Energy
Solutions, Inc.,
2nd Lien
Term Loan,
9.00%, due
4/30/21 | | | 605,000 | | | | 598,950 | Ø | |
See Notes to Schedule of Investments
28
| | | Principal
Amount | | Value† | |
Progres-
sive Solutions,
Inc., 1st Lien
Term Loan,
5.50%, due
10/16/20 | | $ | 1,413,519 | | | $ | 1,404,685 | | |
Progressive
Solutions, Inc.,
2nd Lien
Term Loan,
9.50%, due
10/22/21 | | | 2,073,000 | | | | 2,031,540 | Ø | |
Renaissance
Learning, Inc.,
2nd Lien
Term Loan,
8.00%, due
4/1/22 | | | 427,000 | | | | 415,258 | Ø | |
Team
Viewer
US LCC,
1st Lien
Term Loan,
6.00%, due
12/11/20 | | | 937,000 | | | | 915,524 | Ø | |
| | | | 11,925,799 | | |
Specialty Retail (0.2%) | |
National
Vision, Inc.,
2nd Lien
Term Loan,
6.75%, due
7/1/18 | | | 302,930 | | | | 286,648 | Ø | |
Payless, Inc.,
1st Lien
Term Loan,
5.00%, due
3/5/21 | | | 1,523,345 | | | | 1,470,668 | | |
Payless, Inc.,
2nd Lien
Term Loan,
8.50%, due
3/4/22 | | | 766,000 | | | | 726,742 | Ø | |
| | | | 2,484,058 | | |
Steel—Specialty (0.0%) | |
Signode
Industrial
Group US,
Inc., 1st Lien
Term Loan,
4.00%, due
4/8/21 | | | 644,444 | | | | 631,962 | | |
Technology Hardware, Storage & Peripherals (0.1%) | |
Eastman
Kodak Co.,
Term Loan,
7.25%, due
7/31/19 | | | 1,981,200 | | | | 1,982,844 | | |
| | | Principal
Amount | | Value† | |
Telecommunications (0.3%) | |
Converge
One
Holdings Corp.,
1st Lien
Term Loan,
6.00%, due
6/16/20 | | $ | 2,493,750 | | | $ | 2,471,929 | | |
NTELOS,
Inc., Term
Loan B, 5.75%,
due 11/9/19 | | | 2,782,802 | | | | 2,778,155 | Ø | |
| | | | 5,250,084 | | |
Wireless Telecommunication
Services (0.0%) | |
SBA
Senior Finance II
LLC, Term
Loan B-1A,
3.25%, due
3/24/21 | | | 748,125 | | | | 734,434 | Ø | |
Total Bank Loan
Obligations
(Cost $171,856,658) | | | | | 169,593,389 | | |
Municipal Notes (1.0%) | |
Puerto Rico (1.0%) | |
Puerto
Rico
Commonwealth
Development
Bank Senior
Notes, Ser. B-1A,
7.75%, due
6/30/15 | | | 6,015,000 | | | | 6,013,917 | | |
Puerto
Rico
Commonwealth
GO Bonds,
Ser. A, 8.00%,
due 7/1/35 | | | 12,361,000 | | | | 10,785,714 | Ø | |
Puerto
Rico
Commonwealth
GO Bonds
Refunding for
Public
Improvement,
Ser. B, 6.00%,
due 7/1/39 | | | 315,000 | | | | 232,174 | Ø | |
Total Municipal Notes
(Cost $17,509,972) | | | | | 17,031,805 | | |
| | | Number
of Contracts | | | |
Purchased Options (0.4%) | |
Call Options (0.1%) | |
AMC Networks,
Inc., Call,
Dec 2014 @ 65 | | | 111 | | | | 12,765 | ± | |
| | | Number
of Contracts | | Value† | |
Applied
Materials,
Inc., Call,
Jan 2015 @ 21 | | | 265 | | | $ | 52,735 | | |
Applied
Materials,
Inc., Call,
Apr 2015 @ 20 | | | 3,843 | | | | 1,210,545 | | |
Applied
Materials,
Inc., Call,
Apr 2015 @ 21 | | | 338 | | | | 85,852 | | |
Applied
Materials,
Inc., Call,
Apr 2015 @ 23 | | | 336 | | | | 52,080 | | |
AstraZeneca
PLC, Call,
Jan 2015 @ 80 | | | 315 | | | | 43,785 | ± | |
AT&T,
Inc., Call,
Jun 2015 @ 46 | | | 1,342 | | | | 2,684 | ±f | |
AT&T,
Inc., Call,
Jun 2015 @ 47 | | | 4,610 | | | | 9,220 | ± | |
BGC Partners,
Inc., Call,
Nov 2014 @ 10 | | | 724 | | | | — | f | |
CME Group,
Inc., Call,
Nov 2014 @ 85 | | | 53 | | | | 4,611 | | |
Conn's,
Inc., Call,
Nov 2014 @ 34 | | | 32 | | | | 2,240 | | |
Conn's,
Inc., Call,
Nov 2014 @ 37 | | | 116 | | | | 580 | f | |
Digital River,
Inc., Call,
Dec 2014 @ 27 | | | 85 | | | | 425 | | |
Dollar Tree,
Inc., Call,
Jan 2015 @ 70 | | | 22 | | | | 220 | | |
Joy Global,
Inc., Call,
Jan 2015 @ 65 | | | 30 | | | | 390 | | |
Nuance
Communications,
Inc., Call,
Jan 2015 @ 18 | | | 101 | | | | 3,535 | | |
Office Depot,
Inc., Call,
Jan 2015 @ 7 | | | 210 | | | | — | f | |
Perrigo Co.
PLC, Call,
Nov 2014 @ 160 | | | 39 | | | | 21,060 | | |
Rite Aid
Corp., Call,
Nov 2014 @ 5.5 | | | 178 | | | | 2,492 | | |
S&P 500 Index,
Call,
Nov 2014 @ 1910 | | | 23 | | | | 247,595 | ± | |
See Notes to Schedule of Investments
29
| | | Number
of Contracts | | Value† | |
Salix
Pharmaceuticals
Ltd., Call,
Nov 2014 @ 150 | | | 84 | | | $ | 43,680 | ± | |
Smith &
Nephew
PLC, Call,
Dec 2014 @ 40 | | | 12 | | | | — | ±f | |
Vodafone
Group
PLC, Call,
Apr 2015 @ 38 | | | 409 | | | | 12,270 | | |
| | | | 1,808,764 | | |
Put Options (0.3%) | |
Actavis
PLC, Put,
Dec 2014 @ 235 | | | 56 | | | | 38,080 | | |
Actavis
PLC, Put,
Dec 2014 @ 240 | | | 59 | | | | 52,510 | | |
Actavis
PLC, Put,
Jan 2015 @ 215 | | | 16 | | | | 6,016 | | |
Allergan,
Inc., Put,
Nov 2014 @ 165 | | | 21 | | | | 210 | ± | |
Allergan,
Inc., Put,
Nov 2014 @ 170 | | | 64 | | | | 6,912 | ± | |
Allergan,
Inc., Put,
Nov 2014 @ 175 | | | 21 | | | | 2,415 | ± | |
Allergan,
Inc., Put,
Jan 2015 @ 175 | | | 81 | | | | 52,650 | ± | |
American
Airlines
Group,
Inc., Put,
Dec 2014 @ 38 | | | 127 | | | | 15,240 | ± | |
Annaly
Capital
Management,
Inc., Put,
Jan 2015 @ 8 | | | 52 | | | | 156 | | |
ARIAD
Pharmaceuticals,
Inc., Put,
Nov 2014 @ 6 | | | 166 | | | | 7,470 | | |
AT&T,
Inc., Put,
Jun 2015 @ 30 | | | 2,165 | | | | 142,890 | ± | |
AT&T,
Inc., Put,
Jun 2015 @ 33 | | | 4,414 | | | | 635,616 | ± | |
Athlon
Energy,
Inc., Put,
Nov 2014 @ 55 | | | 41 | | | | 615 | | |
Auxilium
Pharmaceuticals,
Inc., Put,
Jan 2015 @ 25 | | | 87 | | | | 2,610 | | |
| | | Number
of Contracts | | Value† | |
B/E Aerospace,
Inc., Put,
Jan 2015 @ 85 | | | 111 | | | $ | 130,980 | | |
B/E Aerospace,
Inc., Put,
Jan 2015 @ 95 | | | 37 | | | | 76,220 | | |
Bally
Technologies,
Inc., Put,
Jan 2015 @ 75 | | | 13 | | | | 2,288 | | |
Burger King
Worldwide,
Inc., Put,
Jan 2015 @ 40 | | | 178 | | | | 167,320 | | |
Chiquita
Brands
International,
Inc., Put,
Nov 2014 @ 12 | | | 78 | | | | 390 | f | |
CME Group,
Inc., Put,
Nov 2014 @ 82.5 | | | 54 | | | | 6,534 | | |
Comcast
Corp., Put,
Apr 2015 @ 50 | | | 213 | | | | 30,672 | | |
Compuware
Corp., Put,
Nov 2014 @ 9 | | | 746 | | | | — | ±f | |
Compuware
Corp., Put,
Feb 2015 @ 10 | | | 214 | | | | 2,140 | ± | |
Covidien
PLC, Put,
Dec 2014 @ 70 | | | 106 | | | | 4,770 | ± | |
Covidien
PLC, Put,
Jan 2015 @ 90 | | | 196 | | | | 113,680 | ± | |
Digital River,
Inc., Put,
Dec 2014 @ 24 | | | 46 | | | | 1,380 | f | |
DIRECTV,
Put,
Jun 2015 @ 85 | | | 182 | | | | 74,620 | | |
eBay,
Inc., Put,
Nov 2014 @ 49 | | | 43 | | | | 860 | ± | |
eBay,
Inc., Put,
Dec 2014 @ 45 | | | 106 | | | | 1,802 | ± | |
EMC
Corp., Put,
Jan 2015 @ 28 | | | 164 | | | | 14,596 | | |
Endo
International
PLC, Put,
Nov 2014 @ 55 | | | 21 | | | | 105 | f | |
Express,
Inc., Put,
Jan 2015 @ 15 | | | 130 | | | | 23,400 | | |
Family
Dollar Stores,
Inc., Put,
Jan 2015 @ 75 | | | 82 | | | | 2,050 | | |
| | | Number
of Contracts | | Value† | |
Globalstar,
Inc., Put,
Apr 2015 @ 3 | | | 2,291 | | | $ | 240,555 | ± | |
Groupon,
Inc., Put,
Nov 2014 @ 5.5 | | | 291 | | | | 582 | ± | |
International
Game
Technology, Put,
Jan 2015 @ 16 | | | 73 | | | | 4,380 | ± | |
iShares
Russell 2000
ETF, Put,
Nov 2014 @ 105 | | | 55 | | | | 770 | ± | |
iShares
Russell 2000
ETF, Put,
Nov 2014 @ 107 | | | 111 | | | | 1,998 | ± | |
iShares
Russell 2000
ETF, Put,
Nov 2014 @ 109.5 | | | 55 | | | | 1,925 | ± | |
iShares
Russell 2000
ETF, Put,
Nov 2014 @ 111 | | | 83 | | | | 4,482 | ± | |
iShares
Russell 2000
ETF, Put,
Nov 2014 @ 111.5 | | | 7 | | | | 413 | ± | |
iShares
Russell 2000
ETF, Put,
Mar 2015 @ 105 | | | 1,325 | | | | 336,550 | ± | |
Isle of Capri
Casinos,
Inc., Put,
Jan 2015 @ 8 | | | 113 | | | | 11,865 | | |
JetBlue
Airways
Corp., Put,
Jan 2015 @ 10 | | | 436 | | | | 15,260 | | |
Juniper
Networks,
Inc., Put,
Nov 2014 @ 19 | | | 178 | | | | 712 | | |
Juniper
Networks,
Inc., Put,
Nov 2014 @ 20 | | | 89 | | | | 1,246 | | |
Juniper
Networks,
Inc., Put,
Dec 2014 @ 20 | | | 49 | | | | 1,911 | | |
Lorillard,
Inc., Put,
Mar 2015 @ 57.5 | | | 171 | | | | 25,650 | | |
M&T Bank
Corp., Put,
Jan 2015 @ 125 | | | 25 | | | | 15,500 | | |
M&T Bank
Corp., Put,
Jan 2015 @ 130 | | | 54 | | | | 46,980 | | |
See Notes to Schedule of Investments
30
| | | Number
of Contracts | | Value† | |
M&T Bank
Corp., Put,
Jan 2015 @ 135 | | | 28 | | | $ | 37,520 | | |
Mead
Johnson
Nutrition
Co., Put,
Dec 2014 @ 90 | | | 31 | | | | 3,627 | ± | |
Medtronic,
Inc., Put,
Jan 2015 @ 60 | | | 66 | | | | 3,300 | | |
Multimedia
Games
Holding Co.,
Inc., Put,
Jan 2015 @ 30 | | | 101 | | | | 2,020 | | |
Nuance
Communications,
Inc., Put,
Nov 2014 @ 14 | | | 172 | | | | 860 | | |
Office Depot,
Inc., Put,
Nov 2014 @ 5 | | | 1,095 | | | | 16,425 | | |
Rackspace
Hosting,
Inc., Put,
Jan 2015 @ 30 | | | 97 | | | | 3,880 | | |
Riverbed
Technology,
Inc., Put,
Dec 2014 @ 18 | | | 203 | | | | 3,451 | | |
Rockwood
Holdings,
Inc., Put,
Nov 2014 @ 70 | | | 164 | | | | 80,360 | f | |
Ruti-Sweetwater,
Inc., Put,
Nov 2014 @ 1100 | | | 8 | | | | 2,600 | | |
Ruti-Sweetwater,
Inc., Put,
Nov 2014 @ 1120 | | | 10 | | | | 6,000 | | |
Ruti-Sweetwater,
Inc., Put,
Dec 2014 @ 1140 | | | 7 | | | | 14,140 | | |
Ruti-Sweetwater,
Inc., Put,
Dec 2014 @ 1150 | | | 3 | | | | 6,882 | | |
Salix
Pharmaceuticals
Ltd., Put,
Nov 2014 @ 135 | | | 24 | | | | 9,240 | ± | |
Shire
PLC, Put,
Jan 2015 @ 175 | | | 34 | | | | 11,560 | | |
Shire
PLC, Put,
Apr 2015 @ 220 | | | 65 | | | | 187,850 | | |
Southside
Bancshares,
Inc., Put,
Jan 2015 @ 40 | | | 52 | | | | 41,080 | | |
SPDR S&P 500
ETF Trust, Put,
Nov 2014 @ 185 | | | 55 | | | | 935 | ± | |
| | | Number
of Contracts | | Value† | |
SPDR S&P 500
ETF Trust, Put,
Nov 2014 @ 190 | | | 110 | | | $ | 3,850 | ± | |
SPDR S&P 500
ETF Trust, Put,
Nov 2014 @ 192 | | | 10 | | | | 470 | ± | |
SPDR S&P 500
ETF Trust, Put,
Nov 2014 @ 196 | | | 13 | | | | 1,170 | ± | |
SPDR S&P 500
ETF Trust, Put,
Nov 2014 @ 200 | | | 9 | | | | 1,638 | ± | |
SPDR S&P 500
ETF Trust, Put,
Dec 2014 @ 190 | | | 5,000 | | | | 830,000 | ± | |
SPDR S&P 500
ETF Trust, Put,
Dec 2014 @ 193 | | | 18 | | | | 3,258 | ± | |
SPDR S&P 500
ETF Trust, Put,
Dec 2014 @ 198 | | | 14 | | | | 4,172 | ± | |
SPDR S&P 500
ETF Trust, Put,
Feb 2015 @ 190 | | | 2,000 | | | | 672,000 | ± | |
SPDR S&P 500
ETF Trust, Put,
Mar 2015 @ 181 | | | 708 | | | | 205,320 | ± | |
Sprint
Corp., Put,
Jan 2015 @ 5 | | | 409 | | | | 4,908 | | |
Star Buffet,
Inc., Put,
Dec 2014 @ 25 | | | 222 | | | | 8,880 | ±f | |
Talisman Energy,
Inc., Put,
Apr 2015 @ 8 | | | 245 | | | | 51,450 | | |
Tesla Motors,
Inc., Put,
Jan 2015 @ 190 | | | 9 | | | | 3,960 | | |
Tesla Motors,
Inc., Put,
Mar 2015 @ 190 | | | 10 | | | | 8,550 | | |
TIBCO Software,
Inc., Put,
Jan 2015 @ 21 | | | 284 | | | | 12,780 | | |
Tim Hortons,
Inc., Put,
Jan 2015 @ 70 | | | 102 | | | | 4,998 | | |
Time Warner
Cable,
Inc., Put,
Jan 2015 @ 140 | | | 113 | | | | 64,410 | | |
T-Mobile US,
Inc., Put,
Feb 2015 @ 27 | | | 319 | | | | 14,674 | ± | |
TriQuint
Semiconductor,
Inc., Put,
Nov 2014 @ 18 | | | 88 | | | | 440 | | |
Weight
Watchers
International,
Inc., Put,
Jan 2015 @ 15 | | | 139 | | | | 3,197 | | |
| | | Number
of Contracts | | Value† | |
Weight
Watchers
International,
Inc., Put,
Jan 2015 @ 16 | | | 14 | | | $ | 280 | | |
| | | | 4,660,111 | | |
Total Purchased
Options
(Cost $9,259,660) | | | | | 6,468,875 | | |
| | | Number
of Shares | | | |
Short-Term Investment (17.7%) | |
Money Market Fund (17.7%) | |
Dreyfus
Treasury
Prime Cash
Management
(Cost $290,553,880) | | | 290,553,885 | | | | 290,553,880 | Ø | |
Total Long
Positions (100.7%)
(Cost $1,653,311,904) | | | | | 1,656,398,269 | ## | |
Cash, receivable
and other assets,
less liabilities (21.5%) | | | | | 354,425,988 | ±Ø††† | |
Short Positions
(see summary
below) ((22.2)%) | | | | | (365,511,610 | ) | |
Total Net
Assets (100.0%) | | | | $ | 1,645,312,647 | | |
Short Positions ((22.2)%) | |
| Common Stocks Sold Short (11.0%)£ØØ | |
Aerospace & Defense (0.1%) | |
Esterline
Technologies
Corp. | | | (19,700 | ) | | | (2,307,067 | )* | |
Airlines (0.0%) | |
American
Airlines
Group, Inc. | | | (1,204 | ) | | | (49,785 | ) | |
Automobiles (0.3%) | |
General
Motors Co. | | | (27,733 | ) | | | (870,816 | ) | |
Honda
Motor
Co. Ltd. | | | (31,700 | ) | | | (981,832 | ) | |
Nissan
Motor
Co. Ltd. | | | (244,000 | ) | | | (2,167,706 | ) | |
Tesla
Motors, Inc. | | | (827 | ) | | | (199,886 | )* | |
Toyota
Motor Corp. | | | (20,800 | ) | | | (1,203,280 | ) | |
| | | | (5,423,520 | ) | |
See Notes to Schedule of Investments
31
| | | Number
of Shares | | Value† | |
Banks (0.4%) | |
Bank of
the Ozarks,
Inc. | | | (2,532 | ) | | $ | (89,228 | ) | |
BB&T
Corp. | | | (37,218 | ) | | | (1,409,818 | ) | |
M&T Bank
Corp. | | | (5,174 | ) | | | (632,159 | ) | |
Southside
Bancshares,
Inc. | | | (60,319 | ) | | | (2,025,512 | ) | |
Towne Bank | | | (29,579 | ) | | | (448,418 | ) | |
Valley
National
Bancorp | | | (156,393 | ) | | | (1,560,802 | ) | |
| | | (6,165,937 | ) | |
Beverages (0.0%) | |
Dr. Pepper
Snapple
Group, Inc. | | | (10,100 | ) | | | (699,425 | ) | |
Biotechnology (0.0%) | |
Gilead
Sciences, Inc. | | | (7,064 | ) | | | (791,168 | )* | |
Capital Markets (0.5%) | |
LPL Financial
Holdings,
Inc. | | | (19,900 | ) | | | (823,661 | ) | |
Prospect
Capital
Corp. | | | (89,082 | ) | | | (853,406 | ) | |
RCS Capital
Corp.
Class A | | | (49,125 | ) | | | (806,141 | ) | |
T. Rowe
Price Group,
Inc. | | | (32,800 | ) | | | (2,692,552 | ) | |
The Goldman
Sachs Group,
Inc. | | | (13,950 | ) | | | (2,650,360 | ) | |
| | | | (7,826,120 | ) | |
Chemicals (0.8%) | |
Air Products &
Chemicals,
Inc. | | | (1,127 | ) | | | (151,762 | ) | |
Albemarle
Corp. | | | (33,384 | ) | | | (1,948,958 | ) | |
Celanese
Corp.
Series A | | | (20,750 | ) | | | (1,218,647 | ) | |
Ecolab, Inc. | | | (7,400 | ) | | | (823,102 | ) | |
Kaneka
Corp. | | | (171,000 | ) | | | (921,033 | ) | |
Kuraray
Co. Ltd. | | | (40,600 | ) | | | (461,935 | ) | |
Methanex
Corp. | | | (14,200 | ) | | | (842,628 | ) | |
Platform
Specialty
Products
Corp. | | | (5,062 | ) | | | (131,612 | )* | |
| | | Number
of Shares | | Value† | |
Praxair, Inc. | | | (26,100 | ) | | $ | (3,288,339 | ) | |
The Dow
Chemical
Co. | | | (62,550 | ) | | | (3,089,970 | ) | |
Toray
Industries,
Inc. | | | (142,000 | ) | | | (933,856 | ) | |
| | | (13,811,842 | ) | |
Commercial Services & Supplies (0.1%) | |
Clean
Harbors,
Inc. | | | (32,300 | ) | | | (1,603,049 | )* | |
The Brink's
Co. | | | (1,941 | ) | | | (40,761 | ) | |
| | | (1,643,810 | ) | |
Communications Equipment (0.0%) | |
QUALCOMM,
Inc. | | | (3,834 | ) | | | (301,008 | ) | |
Construction & Engineering (0.0%) | |
Pike Corp. | | | (25,340 | ) | | | (302,559 | )* | |
Diversified Consumer Services (0.0%) | |
Weight
Watchers
International,
Inc. | | | (18,552 | ) | | | (483,280 | )* | |
Diversified Financial Services (0.0%) | |
CME Group,
Inc. | | | (5,300 | ) | | | (444,193 | ) | |
Diversified Telecommunication
Services (1.0%) | |
AT&T, Inc. | | | (86,027 | ) | | | (2,997,181 | ) | |
BCE, Inc. | | | (15,446 | ) | | | (685,925 | ) | |
Consolidated
Communications
Holdings,
Inc. | | | (25,389 | ) | | | (657,575 | ) | |
Level 3
Communications,
Inc. | | | (171,172 | ) | | | (8,029,679 | )* | |
Telecom
Italia SpA | | | (2,907,961 | ) | | | (3,288,810 | )* | |
Verizon
Communications,
Inc. | | | (27,346 | ) | | | (1,374,137 | ) | |
| | | (17,033,307 | ) | |
Electrical Equipment (0.2%) | |
Emerson
Electric Co. | | | (40,100 | ) | | | (2,568,806 | ) | |
Electronic Equipment, Instruments & Components (0.2%) | |
Hirose Electric
Co. Ltd. | | | (4,400 | ) | | | (529,214 | ) | |
Japan
Display, Inc. | | | (89,900 | ) | | | (254,513 | )* | |
Kyocera
Corp. | | | (16,400 | ) | | | (736,595 | ) | |
Ryosan
Co. Ltd. | | | (6,600 | ) | | | (136,554 | ) | |
| | | Number
of Shares | | Value† | |
Taiyo Yuden
Co. Ltd. | | | (66,400 | ) | | $ | (660,305 | ) | |
TTM
Technologies,
Inc. | | | (493 | ) | | | (3,407 | )* | |
Yaskawa
Electric
Corp. | | | (50,200 | ) | | | (627,472 | ) | |
| | | | (2,948,060 | ) | |
Energy Equipment & Services (0.1%) | |
Dresser-Rand
Group, Inc. | | | (11,000 | ) | | | (898,700 | )* | |
Food & Staples Retailing (0.2%) | |
The SPAR
Group Ltd. | | | (73,762 | ) | | | (862,627 | ) | |
United
Natural Foods,
Inc. | | | (27,900 | ) | | | (1,897,758 | )* | |
Whole
Foods
Market, Inc. | | | (21,600 | ) | | | (849,528 | ) | |
| | | (3,609,913 | ) | |
Food Products (0.2%) | |
Danone
SA ADR | | | (4,120 | ) | | | (56,320 | ) | |
Darling
Ingredients,
Inc. | | | (7,774 | ) | | | (136,822 | )* | |
Ezaki
Glico
Co. Ltd. | | | (6,700 | ) | | | (212,945 | ) | |
House
Foods
Group, Inc. | | | (14,700 | ) | | | (250,224 | ) | |
Ingredion,
Inc. | | | (18,500 | ) | | | (1,429,125 | ) | |
Kewpie
Corp. | | | (22,700 | ) | | | (387,815 | ) | |
Tiger
Brands Ltd. | | | (31,337 | ) | | | (942,149 | ) | |
| | | (3,415,400 | ) | |
Health Care Equipment & Supplies (0.6%) | |
Becton
Dickinson
and Co. | | | (18,493 | ) | | | (2,380,049 | ) | |
Haemonetics
Corp. | | | (47,300 | ) | | | (1,784,156 | )* | |
Halyard
Health, Inc. | | | (54,800 | ) | | | (2,080,756 | )* | |
Medtronic,
Inc. | | | (24,647 | ) | | | (1,679,940 | ) | |
STERIS Corp. | | | (8,202 | ) | | | (506,884 | ) | |
Stryker Corp. | | | (1,285 | ) | | | (112,476 | ) | |
Sysmex Corp. | | | (18,000 | ) | | | (755,575 | ) | |
Zimmer
Holdings,
Inc. | | | (2,910 | ) | | | (323,708 | ) | |
| | | (9,623,544 | ) | |
See Notes to Schedule of Investments
32
| | | Number
of Shares | | Value† | |
Health Care Providers & Services (0.0%) | |
Kindred
Healthcare,
Inc. | | | (10,004 | ) | | $ | (217,587 | ) | |
Hotels, Restaurants & Leisure (0.3%) | |
Burger King
Worldwide,
Inc. | | | (25,476 | ) | | | (832,556 | ) | |
Hilton
Worldwide
Holdings,
Inc. | | | (38,365 | ) | | | (968,332 | )* | |
Marriott
International,
Inc.
Class A | | | (27,827 | ) | | | (2,107,895 | ) | |
Scientific
Games
Corp. Class A | | | (4,410 | ) | | | (51,906 | )* | |
Starwood
Hotels &
Resorts
Worldwide,
Inc. | | | (11,610 | ) | | | (890,023 | ) | |
| | | (4,850,712 | ) | |
Household Durables (0.5%) | |
Lennar Corp.
Class A | | | (160,345 | ) | | | (6,907,662 | ) | |
Nikon Corp. | | | (51,100 | ) | | | (683,305 | ) | |
| | | (7,590,967 | ) | |
Household Products (0.1%) | |
The Clorox
Co. | | | (21,800 | ) | | | (2,169,100 | ) | |
Industrial Conglomerates (0.0%) | |
Koninklijke
Philips NV | | | (4,795 | ) | | | (133,972 | ) | |
Insurance (0.1%) | |
Hilltop
Holdings,
Inc. | | | (7,998 | ) | | | (176,196 | )* | |
Montpelier
Re Holdings
Ltd. | | | (27,100 | ) | | | (898,094 | ) | |
| | | (1,074,290 | ) | |
Internet & Catalog Retail (0.0%) | |
Amazon.com,
Inc. | | | (646 | ) | | | (197,327 | )* | |
Internet Software & Services (0.1%) | |
Alibaba
Group
Holding
Ltd. ADR | | | (1,157 | ) | | | (114,080 | )* | |
Digital
River, Inc. | | | (10,600 | ) | | | (271,042 | )* | |
Trulia, Inc. | | | (10,561 | ) | | | (492,671 | )* | |
| | | (877,793 | ) | |
| | | Number
of Shares | | Value† | |
IT Services (0.3%) | |
Alliance
Data Systems
Corp. | | | (4,242 | ) | | $ | (1,201,971 | )* | |
International
Business
Machines
Corp. | | | (12,460 | ) | | | (2,048,424 | ) | |
Unisys Corp. | | | (34,900 | ) | | | (894,836 | )* | |
| | | | (4,145,231 | ) | |
Machinery (1.0%) | |
AGCO Corp. | | | (30,700 | ) | | | (1,360,317 | ) | |
Caterpillar,
Inc. | | | (8,700 | ) | | | (882,267 | ) | |
Colfax Corp. | | | (37,450 | ) | | | (2,036,531 | )* | |
Deere & Co. | | | (40,280 | ) | | | (3,445,551 | ) | |
Hitachi
Construction
Machinery
Co. Ltd. | | | (52,300 | ) | | | (1,040,645 | ) | |
Joy Global,
Inc. | | | (24,050 | ) | | | (1,265,752 | ) | |
Kone OYJ
Class B | | | (59,932 | ) | | | (2,576,060 | ) | |
Kubota
Corp. | | | (41,000 | ) | | | (634,209 | ) | |
Parker
Hannifin
Corp. | | | (13,600 | ) | | | (1,727,608 | ) | |
SPX Corp. | | | (21,400 | ) | | | (2,028,506 | ) | |
| | | (16,997,446 | ) | |
Media (1.3%) | |
Cengage
Learning
Acquisitions,
Inc. | | | (1,440 | ) | | (40,320)*fN | |
Charter
Communications,
Inc. Class A | | | (2,864 | ) | | | (453,629 | )* | |
Comcast Corp.
Class A | | | (98,799 | ) | | | (5,468,525 | ) | |
Dex Media,
Inc. | | | (189,074 | ) | | | (1,472,886 | )* | |
DIRECTV | | | (2,500 | ) | | | (216,975 | )* | |
Discovery
Communications,
Inc. Class A | | | (64,625 | ) | | | (2,284,494 | )* | |
Hakuhodo
DY Holdings,
Inc. | | | (123,700 | ) | | | (1,201,484 | ) | |
Liberty
Global PLC
Class A | | | (18,549 | ) | | | (843,423 | )* | |
Liberty
Global PLC
Series C | | | (25,778 | ) | | | (1,146,348 | )* | |
Live Nation
Entertainment,
Inc. | | | (1,160 | ) | | | (30,160 | )* | |
Media
General,
Inc. | | | (12,016 | ) | | | (179,519 | )* | |
| | | Number
of Shares | | Value† | |
Sirius
XM Holdings,
Inc. | | | (68,550 | ) | | $ | (235,126 | )* | |
The Walt
Disney Co. | | | (18,243 | ) | | | (1,667,045 | ) | |
Tribune
Media Co.
Class A | | | (37,000 | ) | | | (2,479,000 | )* | |
Twenty-First
Century Fox,
Inc. Class A | | | (70,100 | ) | | | (2,417,048 | ) | |
Viacom, Inc.
Class B | | | (12,620 | ) | | | (917,222 | ) | |
| | | (21,053,204 | ) | |
Metals & Mining (0.1%) | |
ArcelorMittal | | | (131,400 | ) | | | (1,729,224 | ) | |
B2Gold
Corp. | | | (115,871 | ) | | | (193,281 | )* | |
Cliffs Natural
Resources,
Inc. | | | (7,357 | ) | | | (82,619 | ) | |
| | | (2,005,124 | ) | |
Multiline Retail (0.2%) | |
Dollar
General Corp. | | | (6,336 | ) | | | (397,077 | )* | |
JC Penney
Co., Inc. | | | (230,957 | ) | | | (1,757,583 | )* | |
Kohl's Corp. | | | (28,100 | ) | | | (1,523,582 | ) | |
| | | (3,678,242 | ) | |
Oil, Gas & Consumable Fuels (0.2%) | |
Kinder
Morgan,
Inc. | | | (72,787 | ) | | | (2,816,857 | ) | |
Penn
Virginia
Corp. | | | (4,505 | ) | | | (38,608 | )* | |
Whiting
Petroleum
Corp. | | | (9,011 | ) | | | (551,834 | )* | |
WPX Energy,
Inc. | | | (1,776 | ) | | | (33,957 | )* | |
| | | (3,441,256 | ) | |
Personal Products (0.1%) | |
The Estee
Lauder Cos.,
Inc. Class A | | | (16,200 | ) | | | (1,217,916 | ) | |
Pharmaceuticals (0.1%) | |
Auxilium
Pharmaceuticals,
Inc. | | | (15,907 | ) | | | (511,728 | )* | |
Endo
International
PLC | | | (1,964 | ) | | | (131,431 | )* | |
Johnson &
Johnson | | | (2,086 | ) | | | (224,829 | ) | |
| | | (867,988 | ) | |
See Notes to Schedule of Investments
33
| | | Number
of Shares | | Value† | |
Real Estate Investment Trusts (0.4%) | |
National
Retail
Properties,
Inc. | | | (24,143 | ) | | $ | (920,331 | ) | |
Omega
Healthcare
Investors,
Inc. | | | (11,512 | ) | | | (439,298 | ) | |
Realty
Income
Corp. | | | (50,249 | ) | | | (2,312,961 | ) | |
Ventas, Inc. | | | (36,043 | ) | | | (2,469,306 | ) | |
Washington
Prime
Group, Inc. | | | (33,055 | ) | | | (582,760 | ) | |
| | | (6,724,656 | ) | |
Real Estate Management &
Development (0.1%) | |
Altisource
Portfolio
Solutions SA | | | (10,632 | ) | | | (793,785 | )* | |
Road & Rail (0.2%) | |
Canadian
National
Railway Co. | | | (24,000 | ) | | | (1,693,920 | ) | |
Union
Pacific
Corp. | | | (11,400 | ) | | | (1,327,530 | ) | |
| | | | (3,021,450 | ) | |
Semiconductors & Semiconductor
Equipment (0.5%) | |
Analog
Devices, Inc. | | | (12,600 | ) | | | (625,212 | ) | |
ASM
International
NV | | | (26,710 | ) | | | (1,068,415 | ) | |
Avago
Technologies
Ltd. | | | (9,190 | ) | | | (792,637 | ) | |
Marvell
Technology
Group Ltd. | | | (45,800 | ) | | | (615,552 | ) | |
NVIDIA Corp. | | | (50,300 | ) | | | (982,862 | ) | |
Peregrine
Semiconductor
Corp. | | | (26,816 | ) | | | (333,323 | )* | |
PMC-Sierra,
Inc. | | | (225,600 | ) | | | (1,757,424 | )* | |
RF Micro
Devices, Inc. | | | (9,431 | ) | | | (122,697 | )* | |
Rohm
Co. Ltd. | | | (4,700 | ) | | | (279,092 | ) | |
Tokyo
Electron
Ltd. ADR | | | (7,085 | ) | | | (114,069 | ) | |
TriQuint
Semiconductor,
Inc. | | | (36,988 | ) | | | (800,050 | )* | |
| | | (7,491,333 | ) | |
| | | Number
of Shares | | Value† | |
Software (0.0%) | |
Concur
Technologies,
Inc. | | | (3,400 | ) | | $ | (436,288 | )* | |
Splunk, Inc. | | | (888 | ) | | | (58,679 | )* | |
| | | (494,967 | ) | |
Specialty Retail (0.4%) | |
Cabela's, Inc. | | | (1,457 | ) | | | (69,965 | )* | |
Chico's FAS,
Inc. | | | (275,100 | ) | | | (4,148,508 | ) | |
Conn's,
Inc. | | | (14,800 | ) | | | (460,428 | )* | |
Dick's
Sporting
Goods, Inc. | | | (1,984 | ) | | | (90,014 | ) | |
Hennes &
Mauritz AB
Class B | | | (52,561 | ) | | | (2,090,581 | ) | |
Sally Beauty
Holdings,
Inc. | | | (3,025 | ) | | | (88,663 | )* | |
| | | (6,948,159 | ) | |
Technology Hardware, Storage & Peripherals (0.2%) | |
Canon, Inc. | | | (37,500 | ) | | | (1,131,427 | ) | |
Seagate
Technology PLC | | | (39,729 | ) | | | (2,496,173 | ) | |
| | | | (3,627,600 | ) | |
Textiles, Apparel & Luxury Goods (0.1%) | |
Kate
Spade & Co. | | | (62,100 | ) | | | (1,684,773 | )* | |
Tobacco (0.0%) | |
Reynolds
American,
Inc. | | | (3,321 | ) | | | (208,924 | ) | |
Trading Companies & Distributors (0.0%) | |
United
Rentals, Inc. | | | (3,337 | ) | | | (367,270 | )* | |
Wireless Telecommunication
Services (0.0%) | |
NII
Holdings,
Inc. | | | (106,795 | ) | | | (4,379 | )* | |
Vodafone
Group PLC ADR | | | (41 | ) | | | (1,362 | ) | |
| | | (5,741 | ) | |
Total Common Stocks
Sold Short (Proceeds
$(178,858,201)) | | | | | | | (182,234,257 | ) | |
Exchange Traded Funds Sold
Short (10.8%)£ØØ | |
Energy
Select
Sector SPDR
Fund | | | (161,536 | ) | | | (14,121,477 | ) | |
| | | Number
of Shares | | Value† | |
Hang
Seng
Investment
Index Funds
Series—H-Share
Index ETF | | | (12,146 | ) | | $ | (172,280 | ) | |
Health Care
Select
Sector SPDR
Fund | | | (158,423 | ) | | | (10,657,115 | ) | |
iShares FTSE
A50 China
Index ETF | | | (200,958 | ) | | | (243,840 | ) | |
iShares
iBoxx $ High
Yield Corporate
Bond ETF | | | (19,711 | ) | | | (1,823,859 | ) | |
iShares
Nasdaq
Biotechnology
ETF | | | (14,335 | ) | | | (4,252,048 | ) | |
iShares
Russell 2000
Fund | | | (193,365 | ) | | | (22,538,624 | ) | |
iShares
U.S. Real
Estate ETF | | | (171,919 | ) | | | (12,890,487 | ) | |
Market
Vectors Gold
Miners ETF | | | (23,319 | ) | | | (401,320 | ) | |
Market
Vectors
Pharmaceutical
ETF | | | (15,387 | ) | | | (975,228 | ) | |
Market
Vectors
Semiconductor
ETF | | | (9,571 | ) | | | (492,141 | ) | |
Materials
Select Sector
SPDR Fund | | | (156,861 | ) | | | (7,592,072 | ) | |
Nomura
ETF—Nikkei 225
Exchange
Traded Fund | | | (4,102 | ) | | | (610,963 | ) | |
Nomura
TOPIX
Exchange
Traded Fund | | | (48,551 | ) | | | (589,139 | ) | |
Powershares
QQQ Trust
Series 1 | | | (9,443 | ) | | | (957,520 | ) | |
SPDR
S&P 500
ETF Trust | | | (347,750 | ) | | | (70,127,265 | ) | |
SPDR
S&P Biotech
ETF | | | (1,331 | ) | | | (228,120 | ) | |
SPDR
S&P MidCap 400
ETF Trust | | | (93,514 | ) | | | (24,137,834 | ) | |
See Notes to Schedule of Investments
34
| | | Number
of Shares | | Value† | |
SPDR
S&P Regional
Banking ETF | | | (6,349 | ) | | $ | (254,468 | ) | |
SPDR
S&P Retail ETF | | | (1,043 | ) | | | (92,253 | ) | |
Vanguard
REIT ETF | | | (48,713 | ) | | | (3,847,840 | ) | |
WisdomTree
Japan
Hedged
Equity Fund | | | (6,600 | ) | | | (355,212 | ) | |
Total Exchange Traded
Funds Sold Short
(Proceeds $(169,443,474)) | | | | | (177,361,105 | ) | |
| | | Principal
Amount | | | |
| Corporate Debt Securities Sold Short (0.4%)£ØØ | |
Commercial Services & Supplies (0.0%) | |
ACCO
Brands
Corp., 6.75%,
due 4/30/20 | | $ | (275,000 | ) | | | (292,188 | ) | |
Health Care Providers & Services (0.1%) | |
HCA,
Inc., 5.88%,
due 5/1/23 | | | (650,000 | ) | | | (698,750 | ) | |
Hotels, Restaurants & Leisure (0.0%) | |
Caesars
Entertainment
Operating
Co., Inc.,
10.00%,
due 12/15/18 | | | (1,598,000 | ) | | | (231,710 | ) | |
IT Services (0.0%) | |
iPayment,
Inc., 10.25%,
due
5/15/18 | | | (606,000 | ) | | | (509,040 | ) | |
Metals & Mining (0.0%) | |
Cliffs
Natural
Resources,
Inc., 6.25%,
due 10/1/40 | | | (48,000 | ) | | | (35,520 | ) | |
Oil, Gas & Consumable Fuels (0.1%) | |
Access
Midstream
Partners
LP, 4.88%,
due 5/15/23 | | | (450,000 | ) | | | (470,250 | ) | |
Rice Energy,
Inc., 6.25%,
due 5/1/22 | | | (365,000 | ) | | | (352,909 | )≠ ñ | |
| | | | (823,159 | ) | |
| | | Principal
Amount | | Value† | |
Specialty Retail (0.2%) | |
Staples,
Inc., 4.38%,
due 1/12/23 | | $ | (3,000,000 | ) | | $ | (3,006,891 | ) | |
Telecommunications (0.0%) | |
NII
Capital
Corp., 10.00%,
due 8/15/16 | | | (1,029,000 | ) | | | (318,990 | )≠ | |
Total Corporate Debt
Securities Sold Short
(Proceeds $(6,644,632)) | | | | | (5,916,248 | ) | |
Total Short Positions
(Proceeds $(354,946,307)) | | | | | (365,511,610 | ) | |
See Notes to Schedule of Investments
Schedule of Investments Neuberger Berman Long Short Multi-Manager Fund
TOP TEN EQUITY HOLDINGS LONG POSITIONS (as a % of Net Assets)
| | | | | Country | | Industry | | | |
| | 1 | | | Verint Systems, Inc. | | United States | | Software | | | 2.1 | % | |
| | 2 | | | The Williams Cos., Inc. | | United States | | Oil, Gas & Consumable Fuels | | | 1.8 | % | |
| | 3 | | | Covanta Holding Corp. | | United States | | Commercial Services & Supplies | | | 1.8 | % | |
| | 4 | | | CBS Corp. Class B | | United States | | Media | | | 1.8 | % | |
| | 5 | | | Air Products & Chemicals, Inc. | | United States | | Chemicals | | | 1.6 | % | |
| | 6 | | | American Electric Power Co., Inc. | | United States | | Electric Utilities | | | 1.6 | % | |
| | 7 | | | Allergan, Inc. | | United States | | Pharmaceuticals | | | 1.3 | % | |
| | 8 | | | Assured Guaranty Ltd. | | Bermuda | | Insurance | | | 1.2 | % | |
| | 9 | | | Accor SA | | France | | Hotels, Restaurants & Leisure | | | 1.2 | % | |
| | 10 | | | NorthStar Realty Finance Corp. | | United States | | Real Estate Investment Trusts | | | 1.2 | % | |
TOP TEN EQUITY HOLDINGS SHORT POSITIONS (as a % of Net Assets)
| | | | | Country | | Industry | | | |
| | 1 | | | Chico's FAS, Inc. | | United States | | Specialty Retail | | | (0.7 | )% | |
| | 2 | | | Consolidated Edison, Inc. | | United States | | Multi-Utilities | | | (0.6 | )% | |
| | 3 | | | Spectra Energy Corp. | | United States | | Oil, Gas & Consumable Fuels | | | (0.6 | )% | |
| | 4 | | | Telecom Italia SpA | | Italy | | Diversified Telecommunication Services | | | (0.6 | )% | |
| | 5 | | | Praxair, Inc. | | United States | | Chemicals | | | (0.5 | )% | |
| | 6 | | | Deere & Co. | | United States | | Machinery | | | (0.5 | )% | |
| | 7 | | | The Dow Chemical Co. | | United States | | Chemicals | | | (0.5 | )% | |
| | 8 | | | Kone OYJ Class B | | Finland | | Machinery | | | (0.5 | )% | |
| | 9 | | | Seagate Technology PLC | | Ireland
| | Technology Hardware, Storage &
Peripherals | | | (0.5
| )% | |
| | 10 | | | T. Rowe Price Group, Inc. | | United States | | Capital Markets | | | (0.4 | )% | |
| | | Number
of Shares | |
Value† | |
Long Positions (98.7%) | |
Common Stocks (68.3%) | |
Aerospace & Defense (1.0%) | |
Exelis, Inc. | | | 14,990 | | | $ | 267,572 | Ø | |
MacDonald
Dettwiler &
Associates Ltd. | | | 640 | | | | 48,801 | Ø | |
| | | | 316,373 | | |
Auto Components (1.4%) | |
Continental AG | | | 136 | | | | 26,698 | Ø | |
Cooper Tire &
Rubber Co. | | | 3,425 | | | | 110,319 | £Ø | |
Visteon Corp. | | | 3,315 | | | | 311,278 | *£Ø | |
| | | | 448,295 | | |
Automobiles (0.9%) | |
Fiat Chrysler
Automobiles
NV | | | 17,826 | | | | 204,286 | *Ø | |
Honda Motor
Co. Ltd. | | | 2,300 | | | | 71,237 | Ø | |
| | | | 275,523 | | |
Banks (4.5%) | |
Bank of
America
Corp. | | | 15,425 | | | | 264,693 | Ø | |
BOC Hong
Kong
Holdings
Ltd. | | | 15,500 | | | | 51,566 | Ø | |
| | | Number
of Shares | |
Value† | |
China
Construction
Bank Corp.
Class H | | | 63,000 | | | $ | 46,954 | Ø | |
Chongqing
Rural
Commercial
Bank
Class H | | | 93,000 | | | | 44,730 | Ø | |
City
National
Corp. | | | 2,775 | | | | 218,420 | Ø | |
Erste
Group
Bank AG | | | 2,835 | | | | 72,155 | Ø | |
Mitsubishi
UFJ
Financial
Group, Inc. | | | 13,000 | | | | 73,168 | Ø | |
Mizuho
Financial
Group, Inc. | | | 87,000 | | | | 154,908 | Ø | |
Regions
Financial
Corp. | | | 32,575 | | | | 323,470 | Ø | |
Sberbank
of Russia
ADR | | | 6,485 | | | | 49,221 | | |
Sumitomo
Mitsui
Financial
Group, Inc. | | | 1,700 | | | | 66,585 | Ø | |
| | | Number
of Shares | |
Value† | |
Sumitomo
Mitsui Trust
Holdings, Inc. | | | 16,000 | | | $ | 63,245 | Ø | |
| | | | 1,429,115 | | |
Beverages (0.9%) | |
PepsiCo, Inc. | | | 3,099 | | | | 298,031 | Ø | |
Biotechnology (0.1%) | |
United
Therapeutics
Corp. | | | 366 | | | | 47,935 | *Ø | |
Building Products (0.1%) | |
LIXIL Group
Corp. | | | 1,300 | | | | 27,777 | Ø | |
Capital Markets (0.4%) | |
Jafco Co. Ltd. | | | 1,500 | | | | 56,421 | Ø | |
Nomura
Holdings,
Inc. | | | 10,500 | | | | 63,089 | Ø | |
| | | | 119,510 | | |
Chemicals (2.9%) | |
Air Products &
Chemicals,
Inc. | | | 3,725 | | | | 501,609 | Ø | |
Asahi Kasei
Corp. | | | 3,000 | | | | 24,088 | Ø | |
Huntsman
Corp. | | | 3,550 | | | | 86,620 | Ø | |
Monsanto
Co. | | | 662 | | | | 76,156 | £Ø | |
See Notes to Schedule of Investments
36
| | | Number
of Shares | |
Value† | |
Nissan Chemical
Industries
Ltd. | | | 3,000 | | | $ | 54,298 | Ø | |
Nitto Denko
Corp. | | | 900 | | | | 47,698 | Ø | |
Shin-Etsu
Chemical
Co. Ltd. | | | 1,000 | | | | 62,711 | Ø | |
Tronox Ltd.
Class A | | | 1,586 | | | | 38,349 | Ø | |
Ube
Industries Ltd. | | | 15,000 | | | | 22,702 | Ø | |
| | | | 914,231 | | |
Commercial Services & Supplies (2.4%) | |
Covanta
Holding
Corp. | | | 26,201 | | | | 578,256 | Ø | |
Tyco
International
Ltd. | | | 4,700 | | | | 201,771 | Ø | |
| | | 780,027 | | |
Communications Equipment (0.4%) | |
Motorola
Solutions,
Inc. | | | 1,700 | | | | 109,650 | | |
ParkerVision,
Inc. | | | 6,219 | | | | 8,147 | *£Ø | |
| | | | 117,797 | | |
Construction & Engineering (0.2%) | |
Taisei Corp. | | | 10,000 | | | | 54,752 | Ø | |
Containers & Packaging (1.0%) | |
Nampak Ltd. | | | 18,034 | | | | 73,527 | Ø | |
Orora Ltd. | | | 139,038 | | | | 212,283 | Ø | |
Pact Group
Holdings Ltd. | | | 14,120 | | | | 47,466 | Ø | |
| | | | 333,276 | | |
Diversified Consumer Services (1.3%) | |
Regis Corp. | | | 10,350 | | | | 175,743 | Ø | |
Sotheby's | | | 5,760 | | | | 228,442 | Ø | |
| | | | 404,185 | | |
Diversified Financial Services (0.2%) | |
ORIX Corp. | | | 5,200 | | | | 69,835 | Ø | |
Diversified Telecommunication Services (1.3%) | |
Telecom
Italia SpA | | | 218,611 | | | | 195,328 | Ø | |
Vivendi SA | | | 9,217 | | | | 224,942 | *Ø | |
| | | | 420,270 | | |
Electric Utilities (4.4%) | |
ALLETE, Inc. | | | 2,991 | | | | 156,250 | Ø | |
American
Electric
Power Co.,
Inc. | | | 8,502 | | | | 496,006 | Ø | |
| | | Number
of Shares | |
Value† | |
Edison
International | | | 733 | | | $ | 45,871 | Ø | |
Enel SpA | | | 7,413 | | | | 37,809 | Ø | |
Northeast
Utilities | | | 791 | | | | 39,036 | Ø | |
OGE Energy
Corp. | | | 3,303 | | | | 123,169 | Ø | |
Pinnacle
West
Capital
Corp. | | | 1,798 | | | | 110,523 | Ø | |
Portland
General
Electric Co. | | | 2,995 | | | | 109,048 | Ø | |
PPL Corp. | | | 7,298 | | | | 255,357 | Ø | |
Xcel Energy,
Inc. | | | 1,308 | | | | 43,779 | Ø | |
| | | | 1,416,848 | | |
Electrical Equipment (0.1%) | |
Nidec Corp. | | | 700 | | | | 45,007 | Ø | |
Electronic Equipment, Instruments & Components (0.3%) | |
Hitachi Ltd. | | | 3,000 | | | | 22,945 | Ø | |
Keyence Corp. | | | 100 | | | | 46,721 | Ø | |
Nichicon Corp. | | | 2,400 | | | | 15,833 | Ø | |
| | | | 85,499 | | |
Energy Equipment & Services (0.2%) | |
Calfrac
Well
Services Ltd. | | | 4,000 | | | | 47,913 | Ø | |
Paragon
Offshore
PLC | | | 281 | | | | 1,368 | *Ø | |
| | | | 49,281 | | |
Food & Staples Retailing (1.3%) | |
Sysco Corp. | | | 2,765 | | | | 106,563 | £Ø | |
Walgreen Co. | | | 4,675 | | | | 300,229 | Ø | |
| | | | 406,792 | | |
Food Products (0.6%) | |
Kellogg Co. | | | 1,580 | | | | 101,057 | £Ø | |
Oceana
Group Ltd. | | | 4,871 | | | | 33,475 | Ø | |
Unilever NV
CVA | | | 1,903 | | | | 73,796 | Ø | |
| | | | 208,328 | | |
Health Care Equipment & Supplies (1.1%) | |
Alere, Inc. | | | 5,692 | | | | 227,509 | *£Ø | |
The Cooper
Cos., Inc. | | | 800 | | | | 131,120 | Ø | |
| | | | 358,629 | | |
Health Care Providers & Services (1.2%) | |
Accretive
Health, Inc. | | | 30,007 | | | | 216,050 | *Ø | |
| | | Number
of Shares | |
Value† | |
Fresenius SE &
Co. KGaA | | | 1,521 | | | $ | 78,243 | Ø | |
Mediclinic
International
Ltd. | | | 8,527 | | | | 76,150 | Ø | |
| | | | 370,443 | | |
Hotels, Restaurants & Leisure (1.3%) | |
Accor SA | | | 8,882 | | | | 372,982 | Ø | |
McDonald's
Corp. | | | 522 | | | | 48,927 | £Ø | |
| | | | 421,909 | | |
Household Durables (0.3%) | |
Rinnai Corp. | | | 700 | | | | 61,135 | Ø | |
Sony Corp. | | | 2,100 | | | | 38,738 | Ø | |
| | | | 99,873 | | |
Independent Power & Renewable Electricity Producers (2.0%) | |
AES Corp. | | | 22,697 | | | | 319,347 | Ø | |
EDP
Renovaveis SA | | | 5,675 | | | | 36,867 | Ø | |
NRG Energy,
Inc. | | | 9,596 | | | | 287,688 | Ø | |
| | | | 643,902 | | |
Industrial Conglomerates (0.5%) | |
Alliance
Global
Group, Inc. | | | 177,890 | | | | 100,292 | Ø | |
Toshiba Corp. | | | 13,000 | | | | 55,970 | Ø | |
| | | | 156,262 | | |
Insurance (1.4%) | |
Assured
Guaranty
Ltd. | | | 16,763 | | | | 386,890 | Ø | |
Insurance
Australia
Group Ltd. | | | 12,970 | | | | 74,417 | Ø | |
| | | | 461,307 | | |
Internet Software & Services (2.2%) | |
AOL, Inc. | | | 4,300 | | | | 187,179 | *Ø | |
Equinix, Inc. | | | 775 | | | | 161,898 | Ø | |
Google, Inc.
Class A | | | 620 | | | | 352,079 | *Ø | |
| | | | 701,156 | | |
Leisure Products (0.5%) | |
Hasbro, Inc. | | | 2,600 | | | | 149,578 | £Ø | |
Machinery (1.5%) | |
Amada Co. Ltd. | | | 5,700 | | | | 48,361 | Ø | |
Crane Co. | | | 3,750 | | | | 233,812 | Ø | |
Komatsu Ltd. | | | 1,300 | | | | 30,201 | Ø | |
Makita Corp. | | | 900 | | | | 49,597 | Ø | |
Parker Hannifin
Corp. | | | 821 | | | | 104,292 | £Ø | |
| | | | 466,263 | | |
See Notes to Schedule of Investments
37
| | | Number
of Shares | |
Value† | |
Marine (0.1%) | |
Nippon
Yusen KK | | | 8,000 | | | $ | 20,369 | Ø | |
Media (4.2%) | |
CBS Corp.
Class B | | | 10,650 | | | | 577,443 | Ø | |
Cineplex, Inc. | | | 1,410 | | | | 53,120 | Ø | |
DISH
Network
Corp. Class A | | | 3,350 | | | | 213,228 | *£Ø | |
Liberty
Global
PLC
Series C | | | 5,401 | | | | 240,182 | *Ø | |
Mediaset
SpA | | | 9,821 | | | | 32,786 | *Ø | |
Time
Warner, Inc. | | | 3,006 | | | | 238,887 | Ø | |
| | | | 1,355,646 | | |
Metals & Mining (0.1%) | |
Nippon
Steel &
Sumitomo
Metal Corp. | | | 12,000 | | | | 30,981 | Ø | |
Nyrstar NV | | | 1,759 | | | | 5,930 | *Ø | |
| | | | 36,911 | | |
Multiline Retail (1.6%) | |
Dollar
General
Corp. | | | 2,150 | | | | 134,741 | *Ø | |
Dollar
Tree,
Inc. | | | 3,800 | | | | 230,166 | *Ø | |
Macy's,
Inc. | | | 2,200 | | | | 127,204 | Ø | |
Takashimaya
Co. Ltd. | | | 4,000 | | | | 33,296 | Ø | |
| | | | 525,407 | | |
Multi-Utilities (0.9%) | |
CenterPoint
Energy,
Inc. | | | 2,914 | | | | 71,539 | Ø | |
CMS
Energy
Corp. | | | 1,516 | | | | 49,528 | Ø | |
Dominion
Resources,
Inc. | | | 1,829 | | | | 130,408 | Ø | |
PG&E Corp. | | | 655 | | | | 32,959 | Ø | |
| | | | 284,434 | | |
Oil, Gas & Consumable Fuels (5.8%) | |
Cameco
Corp. | | | 9,550 | | | | 165,979 | Ø | |
CONSOL
Energy, Inc. | | | 5,107 | | | | 187,938 | Ø | |
Eni SpA | | | 3,984 | | | | 84,873 | Ø | |
GasLog Ltd. | | | 3,163 | | | | 65,854 | Ø | |
Golar LNG
Ltd. | | | 4,872 | | | | 273,368 | Ø | |
| | | Number
of Shares | |
Value† | |
JX Holdings,
Inc. | | | 3,500 | | | $ | 14,807 | Ø | |
Kinder
Morgan,
Inc. | | | 8,120 | | | | 314,244 | Ø | |
SemGroup
Corp.
Class A | | | 2,220 | | | | 170,385 | £Ø | |
The
Williams
Cos., Inc. | | | 10,603 | | | | 588,572 | £Ø | |
| | | | 1,866,020 | | |
Pharmaceuticals (3.7%) | |
AbbVie,
Inc. | | | 900 | | | | 57,114 | Ø | |
Allergan,
Inc. | | | 2,125 | | | | 403,877 | Ø | |
Bayer AG | | | 701 | | | | 99,661 | Ø | |
Catalent,
Inc. | | | 5,000 | | | | 130,150 | *Ø | |
Johnson &
Johnson | | | 1,725 | | | | 185,921 | Ø | |
Pfizer, Inc. | | | 4,400 | | | | 131,780 | Ø | |
Teva
Pharmaceutical
Industries Ltd.
ADR | | | 1,988
| | | | 112,262
| £Ø | |
Zoetis, Inc. | | | 1,618 | | | | 60,125 | £Ø | |
| | | | 1,180,890 | | |
Real Estate Investment Trusts (1.9%) | |
Gaming
and Leisure
Properties, Inc. | | | 5,809 | | | | 181,531 | Ø | |
Japan
Retail
Fund
Investment
Corp. | | | 28 | | | | 55,763 | Ø | |
NorthStar
Realty
Finance
Corp. | | | 19,986 | | | | 371,340 | Ø | |
| | | | 608,634 | | |
Real Estate Management & Development (1.0%) | |
Daiwa
House
Industry
Co. Ltd. | | | 7,900 | | | | 146,536 | Ø | |
Mitsubishi
Estate
Co. Ltd. | | | 3,000 | | | | 74,663 | Ø | |
Tokyo
Tatemono
Co. Ltd. | | | 6,000 | | | | 50,478 | Ø | |
Tokyu
Fudosan
Holdings
Corp. | | | 6,100 | | | | 42,088 | Ø | |
| | | | 313,765 | | |
| | | Number
of Shares | |
Value† | |
Road & Rail (0.5%) | |
Union
Pacific Corp. | | | 1,500 | | | $ | 174,675 | Ø | |
Semiconductors & Semiconductor Equipment (1.4%) | |
Broadcom
Corp.
Class A | | | 2,800 | | | | 117,264 | Ø | |
Micron
Technology,
Inc. | | | 6,535 | | | | 216,243 | *Ø | |
NXP
Semiconductor
NV | | | 760 | | | | 52,182 | *£Ø | |
SCREEN
Holdings
Co. Ltd. | | | 9,000 | | | | 47,594 | Ø | |
| | | | 433,283 | | |
Software (3.2%) | |
Comverse,
Inc. | | | 2,343 | | | | 51,077 | *£Ø | |
Nintendo
Co. Ltd. | | | 200 | | | | 21,206 | Ø | |
PTC, Inc. | | | 7,425 | | | | 283,264 | *Ø | |
Verint
Systems, Inc. | | | 11,642 | | | | 669,299 | *£Ø | |
| | | | 1,024,846 | | |
Specialty Retail (2.6%) | |
ANN, Inc. | | | 6,425 | | | | 246,656 | *Ø | |
Dick's
Sporting
Goods, Inc. | | | 951 | | | | 43,147 | £Ø | |
GNC
Holdings,
Inc. Class A | | | 2,100 | | | | 87,297 | Ø | |
Sanrio
Co. Ltd. | | | 1,300 | | | | 37,209 | Ø | |
Tiffany & Co. | | | 2,362 | | | | 227,035 | Ø | |
United
Arrows Ltd. | | | 2,600 | | | | 95,829 | Ø | |
Vitamin
Shoppe, Inc. | | | 1,900 | | | | 89,167 | *Ø | |
| | | | 826,340 | | |
Technology Hardware, Storage & Peripherals (1.4%) | |
Apple, Inc. | | | 1,220 | | | | 131,760 | Ø | |
Ricoh Co.
Ltd. | | | 2,200 | | | | 22,485 | Ø | |
Western
Digital
Corp. | | | 2,883 | | | | 283,600 | Ø | |
| | | | 437,845 | | |
Textiles, Apparel & Luxury Goods (1.2%) | |
PVH Corp. | | | 1,375 | | | | 157,231 | Ø | |
Vera Bradley,
Inc. | | | 10,525 | | | | 239,970 | *Ø | |
| | | 397,201 | | |
See Notes to Schedule of Investments
38
| | | Number
of Shares | |
Value† | |
Thrifts & Mortgage Finance (0.1%) | |
Federal
National
Mortgage
Association | | | 9,601 | | | $ | 20,738 | *Ø | |
Trading Companies & Distributors (0.1%) | |
Mitsubishi Corp. | | | 1,100 | | | | 21,187 | Ø | |
Water Utilities (0.2%) | |
Cia de
Saneamento
Basico do
Estado de
Sao Paulo
ADR | | | 7,400 | | | | 57,424 | £Ø | |
Wireless Telecommunication Services (0.4%) | |
SoftBank Corp. | | | 1,900 | | | | 134,290 | Ø | |
Total Common
Stocks
(Cost $21,178,386) | | | | | 21,817,914 | | |
Preferred Stocks (0.9%) | |
Automobiles (0.1%) | |
Volkswagen
AG, 4.06% | | | 187 | | | | 39,849 | Ø | |
Banks (0.7%) | |
National
Bank of
Greece SA,
Ser. A,
9.00% | | | 11,804 | | | | 208,577 | *£Ø | |
Thrifts & Mortgage Finance (0.1%) | |
Federal
Home
Loan
Mortgage
Corp.,
Ser. Z, 8.38% | | | 4,202 | | | | 17,859 | *ص | |
Total Preferred
Stocks
(Cost $296,306) | | | | | 266,285 | | |
Exchange Traded Funds (1.7%) | |
iShares
20+ Year
Treasury
Bond ETF | | | 2,200 | | | | 262,350 | Ø | |
PowerShares
DB U.S.
Dollar Index
Bullish Fund | | | 12,950 | | | | 299,015 | *Ø | |
Total Exchange
Traded Funds
(Cost $533,485) | | | | | 561,365 | | |
| | | Number
of Shares | |
Value† | |
Short-Term Investment (27.8%) | |
Money Market Fund (27.8%) | |
Dreyfus
Treasury
Prime Cash
Management
(Cost $8,883,656) | | | 8,883,656 | | | $ | 8,883,656 | Ø | |
Total Long
Positions (98.7%)
(Cost $30,891,833) | | | | | 31,529,220 | ## | |
Cash, receivable
and other assets,
less liabilities (30.5%) | | | | | | | 9,755,516 | ؆†† | |
Short Positions
(see summary
below) ((29.2)%) | | | | | | | (9,347,745 | ) | |
Total Net Assets (100.0%) | | | | $ | 31,936,991 | | |
Short Positions ((29.2)%) | |
| Common Stocks Sold Short (22.4%)£ØØ | |
Aerospace & Defense (0.4%) | |
Esterline
Technologies
Corp. | | | (1,000 | ) | | | (117,110 | )* | |
Automobiles (0.5%) | |
Honda
Motor
Co. Ltd. | | | (1,000 | ) | | | (30,973 | ) | |
Nissan
Motor
Co. Ltd. | | | (9,000 | ) | | | (79,956 | ) | |
Toyota
Motor
Corp. | | | (800 | ) | | | (46,280 | ) | |
| | | | (157,209 | ) | |
Beverages (0.1%) | |
Dr. Pepper
Snapple
Group, Inc. | | | (550 | ) | | | (38,088 | ) | |
Biotechnology (0.1%) | |
Gilead
Sciences, Inc. | | | (346 | ) | | | (38,752 | )* | |
Capital Markets (1.1%) | |
LPL
Financial
Holdings,
Inc. | | | (1,025 | ) | | | (42,425 | ) | |
RCS
Capital
Corp.
Class A | | | (2,500 | ) | | | (41,025 | ) | |
T. Rowe
Price
Group,
Inc. | | | (1,700 | ) | | | (139,553 | ) | |
| | | Number
of Shares | |
Value† | |
The Goldman
Sachs
Group, Inc. | | | (725 | ) | | $ | (137,743 | ) | |
| | | | (360,746 | ) | |
Chemicals (1.7%) | |
Celanese
Corp.
Series A | | | (1,050 | ) | | | (61,666 | ) | |
Ecolab, Inc. | | | (350 | ) | | | (38,931 | ) | |
Kaneka Corp. | | | (6,000 | ) | | | (32,317 | ) | |
Kuraray Co.
Ltd. | | | (1,300 | ) | | | (14,791 | ) | |
Methanex Corp. | | | (750 | ) | | | (44,505 | ) | |
Praxair, Inc. | | | (1,300 | ) | | | (163,787 | ) | |
The Dow
Chemical
Co. | | | (3,150 | ) | | | (155,610 | ) | |
Toray
Industries,
Inc. | | | (5,000 | ) | | | (32,882 | ) | |
| | | | (544,489 | ) | |
Commercial Services & Supplies (0.2%) | |
Clean Harbors,
Inc. | | | (1,675 | ) | | | (83,130 | )* | |
Diversified Telecommunication Services (1.1%) | |
AT&T, Inc. | | | (2,141 | ) | | | (74,593 | ) | |
Telecom
Italia
SpA | | | (173,037 | ) | | | (195,699 | )* | |
Verizon
Communications,
Inc. | | | (1,613 | ) | | | (81,053 | ) | |
| | | | (351,345 | ) | |
Electric Utilities (0.8%) | |
Iberdrola SA | | | (2,724 | ) | | | (19,256 | ) | |
IDACORP, Inc. | | | (537 | ) | | | (33,954 | ) | |
Otter Tail
Corp. | | | (3,062 | ) | | | (94,922 | ) | |
The Southern
Co. | | | (2,158 | ) | | | (100,045 | ) | |
| | | | (248,177 | ) | |
Electrical Equipment (0.4%) | |
Emerson
Electric Co. | | | (2,050 | ) | | | (131,323 | ) | |
Electronic Equipment, Instruments & Components (0.3%) | |
Hirose
Electric Co.
Ltd. | | | (100 | ) | | | (12,028 | ) | |
Japan
Display,
Inc. | | | (2,900 | ) | | | (8,210 | )* | |
Kyocera Corp. | | | (500 | ) | | | (22,457 | ) | |
See Notes to Schedule of Investments
39
| | | Number
of Shares | |
Value† | |
Ryosan Co.
Ltd. | | | (200 | ) | | $ | (4,138 | ) | |
Taiyo
Yuden
Co. Ltd. | | | (2,100 | ) | | | (20,883 | ) | |
Yaskawa
Electric
Corp. | | | (1,600 | ) | | | (19,999 | ) | |
| | | | (87,715 | ) | |
Food & Staples Retailing (0.6%) | |
The
SPAR
Group Ltd. | | | (3,011 | ) | | | (35,213 | ) | |
United
Natural
Foods, Inc. | | | (1,475 | ) | | | (100,329 | )* | |
Whole
Foods
Market, Inc. | | | (1,100 | ) | | | (43,263 | ) | |
| | | | (178,805 | ) | |
Food Products (0.4%) | |
Ezaki
Glico
Co. Ltd. | | | (200 | ) | | | (6,357 | ) | |
House
Foods
Group,
Inc. | | | (500 | ) | | | (8,511 | ) | |
Ingredion, Inc. | | | (900 | ) | | | (69,525 | ) | |
Kewpie Corp. | | | (700 | ) | | | (11,959 | ) | |
Tiger Brands
Ltd. | | | (1,279 | ) | | | (38,453 | ) | |
| | | | (134,805 | ) | |
Gas Utilities (0.4%) | |
AGL Resources,
Inc. | | | (505 | ) | | | (27,224 | ) | |
Northwest
Natural Gas
Co. | | | (1,411 | ) | | | (66,218 | ) | |
Piedmont
Natural Gas
Co., Inc. | | | (693 | ) | | | (26,341 | ) | |
Southwest
Gas
Corp. | | | (375 | ) | | | (21,784 | ) | |
| | | | (141,567 | ) | |
Health Care Equipment & Supplies (0.7%) | |
Haemonetics
Corp. | | | (2,450 | ) | | | (92,414 | )* | |
Halyard
Health,
Inc. | | | (2,800 | ) | | | (106,316 | )* | |
Sysmex Corp. | | | (600 | ) | | | (25,186 | ) | |
| | | | (223,916 | ) | |
| | | Number
of Shares | |
Value† | |
Hotels, Restaurants & Leisure (0.7%) | |
Hilton
Worldwide
Holdings,
Inc. | | | (2,291 | ) | | $ | (57,825 | )* | |
Marriott
International,
Inc.
Class A | | | (1,658 | ) | | | (125,594 | ) | |
Starwood
Hotels &
Resorts
Worldwide,
Inc. | | | (693 | ) | | | (53,125 | ) | |
| | | | (236,544 | ) | |
Household Durables (0.1%) | |
Nikon Corp. | | | (1,700 | ) | | | (22,732 | ) | |
Household Products (0.3%) | |
The Clorox Co. | | | (1,100 | ) | | | (109,450 | ) | |
Insurance (0.1%) | |
Montpelier
Re Holdings
Ltd. | | | (1,350 | ) | | | (44,739 | ) | |
IT Services (0.5%) | |
International
Business
Machines
Corp. | | | (670 | ) | | | (110,148 | ) | |
Unisys Corp. | | | (1,800 | ) | | | (46,152 | )* | |
| | | | (156,300 | ) | |
Machinery (2.6%) | |
AGCO Corp. | | | (1,600 | ) | | | (70,896 | ) | |
Caterpillar, Inc. | | | (400 | ) | | | (40,564 | ) | |
Colfax Corp. | | | (1,950 | ) | | | (106,041 | )* | |
Deere & Co. | | | (1,861 | ) | | | (159,190 | ) | |
Hitachi
Construction
Machinery
Co. Ltd. | | | (1,700 | ) | | | (33,826 | ) | |
Joy Global,
Inc. | | | (1,200 | ) | | | (63,156 | ) | |
Kone OYJ
Class B | | | (3,538 | ) | | | (152,074 | ) | |
Kubota Corp. | | | (1,000 | ) | | | (15,469 | ) | |
Parker
Hannifin
Corp. | | | (700 | ) | | | (88,921 | ) | |
SPX Corp. | | | (1,075 | ) | | | (101,899 | ) | |
| | | | (832,036 | ) | |
Media (1.7%) | |
Discovery
Communications,
Inc.
Class A | | | (3,350 | ) | | | (118,423 | )* | |
Hakuhodo
DY
Holdings,
Inc. | | | (5,000 | ) | | | (48,564 | ) | |
| | | Number
of Shares | |
Value† | |
The Walt
Disney Co. | | | (800 | ) | | $ | (73,104 | ) | |
Tribune
Media Co.
Class A | | | (1,900 | ) | | | (127,300 | )* | |
Twenty-First
Century Fox,
Inc. Class A | | | (3,600 | ) | | | (124,128 | ) | |
Viacom, Inc.
Class B | | | (550 | ) | | | (39,974 | ) | |
| | | | (531,493 | ) | |
Metals & Mining (0.3%) | |
ArcelorMittal | | | (6,700 | ) | | | (88,172 | ) | |
Multiline Retail (0.2%) | |
Kohl's Corp. | | | (1,450 | ) | | | (78,619 | ) | |
Multi-Utilities (3.0%) | |
Alliant Energy
Corp. | | | (804 | ) | | | (49,776 | ) | |
Ameren Corp. | | | (992 | ) | | | (42,001 | ) | |
Avista Corp. | | | (3,652 | ) | | | (129,463 | ) | |
Consolidated
Edison, Inc. | | | (3,273 | ) | | | (207,377 | ) | |
DTE Energy
Co. | | | (1,368 | ) | | | (112,395 | ) | |
NorthWestern
Corp. | | | (748 | ) | | | (39,524 | ) | |
PG&E Corp. | | | (955 | ) | | | (48,056 | ) | |
Public Service
Enterprise
Group, Inc. | | | (2,680 | ) | | | (110,711 | ) | |
SCANA Corp. | | | (1,691 | ) | | | (92,819 | ) | |
Wisconsin
Energy
Corp. | | | (2,284 | ) | | | (113,424 | ) | |
| | | | (945,546 | ) | |
Oil, Gas & Consumable Fuels (0.7%) | |
ONEOK, Inc. | | | (517 | ) | | | (30,472 | ) | |
Spectra Energy
Corp. | | | (5,050 | ) | | | (197,606 | ) | |
| | | | (228,078 | ) | |
Personal Products (0.2%) | |
The Estee
Lauder Cos.,
Inc. Class A | | | (660 | ) | | | (49,619 | ) | |
Road & Rail (0.5%) | |
Canadian
National
Railway Co. | | | (1,225 | ) | | | (86,460 | ) | |
Union Pacific
Corp. | | | (500 | ) | | | (58,225 | ) | |
| | | | (144,685 | ) | |
Semiconductors & Semiconductor Equipment (0.8%) | |
Analog
Devices,
Inc. | | | (500 | ) | | | (24,810 | ) | |
ASM
International
NV | | | (1,086 | ) | | | (43,441 | ) | |
See Notes to Schedule of Investments
40
| | | Number
of Shares | |
Value† | |
Avago
Technologies
Ltd. | | | (300 | ) | | $ | (25,875 | ) | |
Marvell
Technology
Group Ltd. | | | (1,900 | ) | | | (25,536 | ) | |
NVIDIA Corp. | | | (2,000 | ) | | | (39,080 | ) | |
PMC-Sierra,
Inc. | | | (11,500 | ) | | | (89,585 | )* | |
Rohm Co. Ltd. | | | (200 | ) | | | (11,876 | ) | |
| | | | (260,203 | ) | |
Specialty Retail (1.1%) | |
Chico's
FAS, Inc. | | | (14,100 | ) | | | (212,627 | ) | |
Hennes &
Mauritz AB
Class B | | | (3,119 | ) | | | (124,056 | ) | |
| | | | (336,683 | ) | |
Technology Hardware, Storage & Peripherals (0.6%) | |
Canon, Inc. | | | (1,500 | ) | | | (45,257 | ) | |
Seagate
Technology
PLC | | | (2,372 | ) | | | (149,033 | ) | |
| | | | (194,290 | ) | |
Textiles, Apparel & Luxury Goods (0.2%) | |
Kate Spade &
Co. | | | (3,200 | ) | | | (86,816 | )* | |
Total Common
Stocks Sold Short
(Proceeds
$(7,021,994)) | | | | | (7,183,182 | ) | |
| Exchange Traded Funds Sold Short (6.8%)£ØØ | |
iShares
Nasdaq
Biotechnology
ETF | | | (587 | ) | | | (174,116 | ) | |
SPDR
S&P 500
ETF Trust | | | (5,337 | ) | | | (1,076,260 | ) | |
Utilities
Select
Sector
SPDR Fund | | | (15,057 | ) | | | (684,642 | ) | |
Vanguard
REIT ETF | | | (2,906 | ) | | | (229,545 | ) | |
Total Exchange
Traded Funds Sold
Short (Proceeds
$(2,012,107)) | | | | | (2,164,563 | ) | |
Total Short
Positions (Proceeds
$(9,034,101)) | | | | | (9,347,745 | ) | |
See Notes to Schedule of Investments
Notes to Schedule of Investments
† In accordance with Accounting Standards Codification ("ASC") 820 "Fair Value Measurement" ("ASC 820"), all investments held by each of Neuberger Berman Absolute Return Multi-Manager Fund ("Absolute Return Multi-Manager") and Neuberger Berman Long Short Multi-Manager ("Long Short Multi-Manager") (each individually a "Fund," and collectively, the "Funds") are carried at the value that Neuberger Berman Management LLC ("Management") believes a Fund would receive upon selling an investment in an orderly transaction to an independent buyer in the principal or most advantageous market for the investment under current market conditions. Various inputs, including the volume and level of activity for the asset or liability in the market, are considered in valuing the Funds' investments, some of which are discussed below. Significant management judgment may be necessary to value investments in accordance with ASC 820.
ASC 820 established a three-tier hierarchy of inputs to create a classification of value measurements for disclosure purposes. The three-tier hierarchy of inputs is summarized in the three broad Levels listed below.
• Level 1 – quoted prices in active markets for identical investments
• Level 2 – other observable inputs (including quoted prices for similar investments, interest rates, prepayment speeds, credit risk, amortized cost, etc.)
• Level 3 – unobservable inputs (including a Fund's own assumptions in determining the fair value of investments)
The inputs or methodology used for valuing an investment are not necessarily an indication of the risk associated with investing in those securities.
The value of the Funds' investments (long and short positions) in equity securities, exchange traded funds, preferred stocks, convertible preferred stocks, purchased option contracts, written option contracts, rights and warrants, for which market quotations are readily available, is generally determined by Management by obtaining valuations from independent pricing services based on the latest sale price quoted on a principal exchange or market for that security (Level 1 inputs). Securities traded primarily on the NASDAQ Stock Market are normally valued at the NASDAQ Official Closing Price ("NOCP") provided by NASDAQ each business day. The NOCP is the most recently reported price as of 4:00:02 p.m., Eastern time, unless that price is outside the range of the "inside" bid and asked prices (i.e., the bid and asked prices that dealers quote to each other when trading for their own accounts); in that case, NASDAQ will adjust the price to equal the inside bid or asked price, whichever is closer. Because of delays in reporting trades, the NOCP may not be based on the price of the last trade to occur before the market closes. If there is no reported sale of a security on a particular day, the independent pricing service may value the security based on reported market quotations.
The value of the Funds' investments (long and short positions) in debt securities is determined by Management primarily by obtaining valuations from independent pricing services based on readily available bid quotations or, if quotations are not available, by methods which include various considerations based on security type (generally Level 2 inputs). In addition to the consideration of yields or prices of securities of comparable quality, coupon, maturity and type; indications as to values from dealers; and general market conditions, the following is a description of other Level 2 inputs and related valuation techniques used by an independent pricing service to value certain types of debt securities of the Funds:
Corporate Debt Securities. Inputs used to value corporate debt securities generally include relative credit information, observed market movements, sector news, spread to the U.S. Treasury market, and other market information, which may include benchmark yields, reported trades, broker-dealer quotes, issuer spreads, benchmark securities, bids, offers, and reference data, such as market research publications, when available ("Other Market Information").
See Notes to Financial Statements
Notes to Schedule of Investments (cont'd)
Convertible Bonds. Inputs used to value convertible bonds generally include underlying stock data, dealer quotes, conversion premiums, listed bond and preferred stock prices and other market information, which may include benchmark curves, trade execution data, and sensitivity analysis, when available.
U.S. Treasury Securities. Inputs used to value U.S. Treasury securities generally include quotes from several inter-dealer brokers and Other Market Information.
Asset-Backed Securities and Mortgage-Backed Securities. Inputs used to value asset-backed securities and mortgage-backed securities generally include models that consider a number of factors, which may include the following: prepayment speeds, cash flows, spread adjustments and Other Market Information.
Municipal Debt Securities. Inputs used to value municipal debt securities include current trades, bid-wanted lists (which inform the market that a holder is interested in selling a position and that offers will be considered), offerings, general information on market movement, direction, trends, and specific data on specialty issues.
The value of bank loan obligations is determined by Management primarily by obtaining valuations from independent pricing services based on broker quotes (generally Level 2 or Level 3 inputs depending on the number of quotes available).
The value of financial futures contracts is determined by Management by obtaining valuations from independent pricing services at the settlement price at the market close (Level 1 inputs).
The value of forward foreign currency contracts ("forward contracts") is determined by Management by obtaining valuations from an independent pricing service based on actual traded currency rates on an independent pricing service's network, along with other traded and quoted currency rates provided to the pricing service by leading market participants (Level 2 inputs).
The value of total return swaps is determined by Management by obtaining valuations from an independent pricing service using the underlying index and stated London Interbank Offered Rate ("LIBOR") (Level 2 inputs).
The value of equity swaps is determined by Management by obtaining valuations from an independent pricing service using the underlying security and stated LIBOR rate or Federal Funds floating rate (Level 2 inputs).
The value of credit default swap contracts is determined by Management by obtaining valuations from an independent pricing service using a model that considers a number of factors, which may include default probabilities, credit curves, recovery rates and cash flows (Level 2 inputs).
Management has developed a process to periodically review information provided by independent pricing services for all types of securities.
Investments in investment companies are valued using the respective fund's daily calculated net asset value per share (Level 2 inputs).
If a valuation is not available from an independent pricing service, or if Management has reason to believe that the valuation received does not represent the amount a Fund might reasonably expect to receive on a current sale in an orderly transaction, Management seeks to obtain quotations from brokers or dealers (generally considered Level 2 or Level 3 inputs depending on the number of quotes available). If such quotations are not readily available, the security is valued using methods the Neuberger Berman Alternative Funds' Board of Trustees (the "Board") has approved in the good faith belief that the resulting valuation will reflect the fair value of the security. Numerous factors may be considered when determining the fair value of a security based on Level 2 or Level 3 inputs, including available analyst, media or other reports, trading in futures or American Depositary Receipts ("ADRs") and whether the issuer of the security being fair valued has other securities outstanding.
See Notes to Financial Statements
Notes to Schedule of Investments (cont'd)
The value of the Funds' investments in foreign securities is generally determined using the same valuation methods and inputs as other Fund investments, as discussed above. Foreign security prices expressed in local currency values are translated from the local currency into U.S. dollars using the exchange rates as of the end of regular trading on the New York Stock Exchange ("NYSE") on business days, usually 4:00 p.m. Eastern time. The Board has approved the use of Interactive Data Pricing and Reference Data, Inc. ("Interactive") to assist in determining the fair value of foreign equity securities when changes in the value of a certain index suggest that the closing prices on the foreign exchanges may no longer represent the amount that a Fund could expect to receive for those securities or on days when foreign markets are closed and U.S. markets are open. In each of these events, Interactive will provide adjusted prices for certain foreign equity securities using a statistical analysis of historical correlations of multiple factors (Level 2 inputs). The Board has also approved the use of Interactive to evaluate the prices of foreign income securities as of the close of the NYSE. Interactive utilizes benchmark spread and yield curves and evaluates available market activity from the local close to the close of the NYSE (Level 2 inputs) to assist in determining prices for certain foreign income securities. In the case of both foreign equity and foreign income securities, in the absence of precise information about the market values of these foreign securities as of the close of the NYSE, the Board has determined on the basis of available data that prices adjusted or evaluated in this way are likely to be closer to the prices a Fund could realize on a current sale than are the prices of those securities established at the close of the foreign markets in which the securities primarily trade.
Fair value prices are necessarily estimates, and there is no assurance that such a price will be at or close to the price at which the security is next quoted or next trades.
The following is a summary, categorized by Level, of inputs used to value the Funds' investments as of October 31, 2014:
Asset Valuation Inputs | |
| | | Level 1 | | Level 2 | | Level 3§ | | Total | |
Absolute Return Multi-Manager | |
Investments: | |
Common Stocks | |
Airlines | | $ | 915,836 | | | $ | 35,814 | | | $ | — | | | $ | 951,650 | | |
Biotechnology | | | 3,854,563 | | | | 3,505 | | | | — | | | | 3,858,068 | | |
Health Care Equipment & Supplies | | | 31,710,325 | | | | 16,100 | | | | — | | | | 31,726,425 | | |
Internet Software & Services | | | 28,429,066 | | | | 1,251,638 | | | | — | | | | 29,680,704 | | |
Media | | | 131,626,434 | | | | — | | | | 750 | | | | 131,627,184 | | |
Pharmaceuticals | | | 74,744,746 | | | | 14,655 | | | | — | | | | 74,759,401 | | |
Wireless Telecommunication Services | | | 6,729,738 | | | | 151,200 | | | | — | | | | 6,880,938 | | |
Other Common Stocks^ | | | 686,622,949 | | | | — | | | | — | | | | 686,622,949 | | |
Total Common Stocks | | | 964,633,657 | | | | 1,472,912 | | | | 750 | | | | 966,107,319 | | |
Preferred Stocks^ | | | 6,019,966 | | | | — | | | | — | | | | 6,019,966 | | |
Exchange Traded Funds | | | 11,062,611 | | | | — | | | | — | | | | 11,062,611 | | |
Rights^ | | | 971 | | | | — | | | | — | | | | 971 | | |
Warrants | |
Media | | | — | | | | 125,759 | | | | — | | | | 125,759 | | |
Other Warrants^ | | | 549,588 | | | | — | | | | — | | | | 549,588 | | |
Total Warrants | | | 549,588 | | | | 125,759 | | | | — | | | | 675,347 | | |
See Notes to Financial Statements
Notes to Schedule of Investments (cont'd)
Asset Valuation Inputs | |
| | | Level 1 | | Level 2 | | Level 3§ | | Total | |
Mortgage-Backed Securities^ | | $ | — | | | $ | 79,314,880 | | | $ | — | | | $ | 79,314,880 | | |
Asset-Backed Securities | | | — | | | | 43,454,301 | | | | — | | | | 43,454,301 | | |
Corporate Debt Securities | |
Diversified Financial Services | | | — | | | | 1,122,556 | | | | 2,304,120 | | | | 3,426,676 | | |
Other Corporate Debt Securities^ | | | — | | | | 62,688,249 | | | | — | | | | 62,688,249 | | |
Total Corporate Debt Securities | | | — | | | | 63,810,805 | | | | 2,304,120 | | | | 66,114,925 | | |
Bank Loan Obligations | |
Advertising | | | — | | | | 4,545,444 | | | | 7,302,863 | | | | 11,848,307 | | |
Commercial Services & Supplies | | | — | | | | 11,485,141 | | | | 1,730,212 | | | | 13,215,353 | | |
Electrical Components & Equipment | | | — | | | | — | | | | 663,300 | | | | 663,300 | | |
Health Care Providers & Services | | | — | | | | 5,668,023 | | | | 179,144 | | | | 5,847,167 | | |
Hotels, Restaurants & Leisure | | | — | | | | 23,740,847 | | | | 494,518 | | | | 24,235,365 | | |
Insurance | | | — | | | | 6,802,986 | | | | 1,000,000 | | | | 7,802,986 | | |
Media | | | — | | | | 15,399,535 | | | | 3,207,931 | | | | 18,607,466 | | |
Oil & Gas Services | | | — | | | | 1,896,642 | | | | 970,900 | | | | 2,867,542 | | |
Oil, Gas & Consumable Fuels | | | — | | | | 1,317,304 | | | | 35,276 | | | | 1,352,580 | | |
Personal Products | | | — | | | | — | | | | 940,275 | | | | 940,275 | | |
Pharmaceuticals | | | — | | | | 1,659,646 | | | | 2,160,956 | | | | 3,820,602 | | |
Software | | | — | | | | 7,305,309 | | | | 4,620,490 | | | | 11,925,799 | | |
Other Bank Loan Obligations^ | | | — | | | | 66,466,647 | | | | — | | | | 66,466,647 | | |
Total Bank Loan Obligations | | | — | | | | 146,287,524 | | | | 23,305,865 | | | | 169,593,389 | | |
Municipal Notes | | | — | | | | 17,031,805 | | | | — | | | | 17,031,805 | | |
Purchased Options | | | 6,374,496 | | | | 94,379 | | | | — | | | | 6,468,875 | | |
Short-Term Investments | | | — | | | | 290,553,880 | | | | — | | | | 290,553,880 | | |
Total Long Positions | | $ | 988,641,289 | | | $ | 642,146,245 | | | $ | 25,610,735 | | | $ | 1,656,398,269 | | |
Long Short Multi-Manager | |
Investments: | |
Common Stocks^ | | | 21,817,914 | | | | — | | | | — | | | | 21,817,914 | | |
Preferred Stocks^ | | | 266,285 | | | | — | | | | — | | | | 266,285 | | |
Exchange Traded Funds | | | 561,365 | | | | — | | | | — | | | | 561,365 | | |
Short-Term Investments | | | — | | | | 8,883,656 | | | | — | | | | 8,883,656 | | |
Total Long Positions | | $ | 22,645,564 | | | $ | 8,883,656 | | | $ | — | | | $ | 31,529,220 | | |
^ The Schedule of Investments provides information on the industry categorization for the portfolio.
§ The following is a reconciliation between the beginning and ending balances of investments in which unobservable inputs (Level 3) were used in determining value:
See Notes to Financial Statements
Notes to Schedule of Investments (cont'd)
| | | Beginning
balance as
of 11/1/13 | | Accrued
discounts/
(premiums) | | Realized
gain/loss
and change
in unrealized
appreciation/
(depreciation) | | Purchases | | Sales | | Transfers
in to
Level 3 | | Transfers
out of
Level 3 | | Balance as
of 10/31/14 | | Net change in
unrealized
appreciation/
(depreciation)
from
investments
still held as of
10/31/14 | |
Investments in Securities: | |
Common Stock | |
Media | | $ | 750 | | | $ | — | | | $ | — | | | $ | — | | | $ | — | | | $ | — | | | $ | — | | | $ | 750 | | | $ | — | | |
Commercial
Mortgage-Backed
Securities | | | 496,719 | | | | — | | | | — | | | | — | | | | — | | | | — | | | | (496,719 | ) | | | — | | | | — | | |
Corporate
Debt Security | | | — | | | | 4,669 | | | | 10,101 | | | | 2,289,350 | | | | — | | | | — | | | | — | | | | 2,304,120 | | | | 10,101 | | |
Bank Loan Obligation | |
Advertising | | | — | | | | 1,242 | | | | 29,500 | | | | 7,968,313 | | | | (696,192 | ) | | | — | | | | — | | | | 7,302,863 | | | | 11,160 | | |
Aerospace &
Defense | | | 503,750 | | | | 155 | | | | 2,326 | | | | — | | | | (506,231 | ) | | | — | | | | — | | | | — | | | | — | | |
Chemicals | | | 87,000 | | | | 179 | | | | 1,542 | | | | — | | | | (88,721 | ) | | | — | | | | — | | | | — | | | | — | | |
Commercial
Services &
Supplies | | | 500,000 | | | | (2 | ) | | | 50,172 | | | | 1,683,763 | | | | (503,721 | ) | | | — | | | | — | | | | 1,730,212 | | | | 46,449 | | |
Electrical
Components &
Equipment | | | — | | | | 262 | | | | (1,949 | ) | | | 664,987 | | | | — | | | | — | | | | — | | | | 663,300 | | | | (1,949 | ) | |
Energy
Equipment &
Services | | | 151,414 | | | | — | | | | — | | | | — | | | | — | | | | — | | | | (151,414 | ) | | | — | | | | — | | |
Health Care
Providers &
Services | | | — | | | | 1,971 | | | | (423 | ) | | | — | | | | (9,568 | ) | | | 187,164 | | | | — | | | | 179,144 | | | | (864 | ) | |
Health Care
Technology | | | 435,000 | | | | 992 | | | | 67,739 | | | | — | | | | (503,731 | ) | | | — | | | | — | | | | — | | | | — | | |
Hotels,
Restaurants &
Leisure | | | — | | | | 133 | | | | 1,104 | | | | 494,524 | | | | (1,243 | ) | | | — | | | | — | | | | 494,518 | | | | 1,098 | | |
Insurance | | | — | | | | (348 | ) | | | (2,152 | ) | | | 1,002,500 | | | | — | | | | — | | | | — | | | | 1,000,000 | | | | (2,152 | ) | |
Internet
Software &
Services | | | 1,467,180 | | | | — | | | | — | | | | — | | | | — | | | | — | | | | (1,467,180 | ) | | | — | | | | — | | |
Media | | | — | | | | 4,950 | | | | 8,653 | | | | 3,211,891 | | | | (17,563 | ) | | | — | | | | — | | | | 3,207,931 | | | | 8,347 | | |
Oil & Gas
Services | | | — | | | | 206 | | | | (41,096 | ) | | | 1,011,790 | | | | — | | | | — | | | | — | | | | 970,900 | | | | (41,096 | ) | |
See Notes to Financial Statements
Notes to Schedule of Investments (cont'd)
| | | Beginning
balance as
of 11/1/13 | | Accrued
discounts/
(premiums) | | Realized
gain/loss
and change
in unrealized
appreciation/
(depreciation) | | Purchases | | Sales | | Transfers
in to
Level 3 | | Transfers
out of
Level 3 | | Balance as
of 10/31/14 | | Net change in
unrealized
appreciation/
(depreciation)
from
investments
still held as of
10/31/14 | |
Oil, Gas &
Consumable
Fuels | | $ | 44,100 | | | $ | 241 | | | $ | 1,033 | | | $ | — | | | $ | (10,098 | ) | | $ | — | | | $ | — | | | $ | 35,276 | | | $ | 501 | | |
Personal
Products | | | — | | | | 987 | | | | 8,463 | | | | 935,550 | | | | (4,725 | ) | | | — | | | | — | | | | 940,275 | | | | 8,419 | | |
Pharmaceuticals | | | — | | | | 1,958 | | | | 4,761 | | | | 2,160,641 | | | | (562,404 | ) | | | 556,000 | | | | — | | | | 2,160,956 | | | | (4,667 | ) | |
Software | | | 2,244,500 | | | | 2,370 | | | | (35,885 | ) | | | 4,042,665 | | | | (630,660 | ) | | | — | | | | (1,002,500 | ) | | | 4,620,490 | | | | (29,105 | ) | |
Total | | $ | 5,930,413 | | | $ | 19,965 | | | $ | 103,889 | | | $ | 25,465,974 | | | $ | (3,534,857 | ) | | $ | 743,164 | | | $ | (3,117,813 | ) | | $ | 25,610,735 | | | $ | 6,242 | | |
As of the year ended October 31, 2014, certain securities were transferred from one level to another based on beginning of period market values as of November 1, 2013. $743,164 was transferred from Level 2 to Level 3 for Absolute Return Multi-Manager as a result of a decrease in the number of observable quotations that were readily available to the independent pricing service. In addition, $3,117,813 was transferred from Level 3 to Level 2 for Absolute Return Multi-Manager as a result of an increase in the number of observable inputs that were readily available to the independent pricing service.
The following is a summary, categorized by Level, of inputs used to value the Funds' derivatives as of October 31, 2014:
Asset Valuation Inputs | |
| | | Level 1 | | Level 2 | | Level 3 | | Total | |
Absolute Return Multi-Manager | |
Forward contracts (unrealized appreciation) | | $ | — | | | $ | 11,190,816 | | | $ | — | | | $ | 11,190,816 | | |
Credit default swaps | | | — | | | | 1,576,132 | | | | — | | | | 1,576,132 | | |
Total | | $ | — | | | $ | 12,766,948 | | | $ | — | | | $ | 12,766,948 | | |
Long Short Multi-Manager | |
Forward contracts (unrealized appreciation) | | $ | — | | | $ | 448,447 | | | $ | — | | | $ | 448,447 | | |
Equity swaps | | | — | | | | 43,238 | | | | — | | | | 43,238 | | |
Total | | $ | — | | | $ | 491,685 | | | $ | — | | | $ | 491,685 | | |
See Notes to Financial Statements
Notes to Schedule of Investments (cont'd)
The following is a summary, categorized by Level, of inputs used to value the Funds' investments as of October 31, 2014:
Liability Valuation Inputs | |
| | | Level 1 | | Level 2 | | Level 3 | | Total | |
Absolute Return Multi-Manager | |
Investments: | |
Common Stocks Sold Short | |
Media | | $ | (21,012,884 | ) | | $ | (40,320 | ) | | $ | — | | | $ | (21,053,204 | ) | |
Other Common Stocks Sold Short^ | | | (161,181,053 | ) | | | — | | | | — | | | | (161,181,053 | ) | |
Total Common Stocks Sold Short | | | (182,193,937 | ) | | | (40,320 | ) | | | — | | | | (182,234,257 | ) | |
Exchange Traded Funds Sold Short | | | (177,361,105 | ) | | | — | | | | — | | | | (177,361,105 | ) | |
Corporate Debt Securities Sold Short^ | | | — | | | | (5,916,248 | ) | | | — | | | | (5,916,248 | ) | |
Total Short Positions | | $ | (359,555,042 | ) | | $ | (5,956,568 | ) | | $ | — | | | $ | (365,511,610 | ) | |
Long Short Multi-Manager | |
Investments: | |
Common Stocks Sold Short^ | | $ | (7,183,182 | ) | | $ | — | | | $ | — | | | $ | (7,183,182 | ) | |
Exchange Traded Funds Sold Short | | | (2,164,563 | ) | | | — | | | | — | | | | (2,164,563 | ) | |
Total Short Positions | | $ | (9,347,745 | ) | | $ | — | | | $ | — | | | $ | (9,347,745 | ) | |
^ The Schedule of Investments provides information on the industry categorization for the portfolio.
The following is a summary, categorized by Level, of inputs used to value the Funds' derivatives as of October 31, 2014:
Liability Valuation Inputs | |
| | | Level 1 | | Level 2 | | Level 3 | | Total | |
Absolute Return Multi-Manager | |
Forward contracts (unrealized depreciation) | | $ | — | | | $ | (2,237,230 | ) | | $ | — | | | $ | (2,237,230 | ) | |
Equity swaps | | | — | | | | (4,771,290 | ) | | | — | | | | (4,771,290 | ) | |
Futures contracts (unrealized depreciation) | | | (38,769 | ) | | | — | | | | — | | | | (38,769 | ) | |
Credit default swaps | | | — | | | | (338,661 | ) | | | — | | | | (338,661 | ) | |
Total return swaps | | | — | | | | (170,159 | ) | | | — | | | | (170,159 | ) | |
Options written | | | (2,212,746 | ) | | | (26,930 | ) | | | — | | | | (2,239,676 | ) | |
Total | | $ | (2,251,515 | ) | | $ | (7,544,270 | ) | | $ | — | | | $ | (9,795,785 | ) | |
Long Short Multi-Manager | |
Forward contracts (unrealized depreciation) | | $ | — | | | $ | (114,315 | ) | | $ | — | | | $ | (114,315 | ) | |
Total return swaps | | | — | | | | (58,528 | ) | | | — | | | | (58,528 | ) | |
Total | | $ | — | | | $ | (172,843 | ) | | $ | — | | | $ | (172,843 | ) | |
See Notes to Financial Statements
Notes to Schedule of Investments (cont'd)
## At October 31, 2014, selected fund information on a U.S. federal income tax basis was as follows:
| | | Cost | | Gross
Unrealized
Appreciation | | Gross
Unrealized
Depreciation | | Net Unrealized
Appreciation
(Depreciation) | |
Absolute Return Multi-Manager | | $ | 1,665,844,398 | | | $ | 40,599,408 | | | $ | 50,045,537 | | | $ | (9,446,129 | ) | |
| Long Short Multi-Manager | | | 30,945,209 | | | | 1,245,438 | | | | 661,427 | | | | 584,011 | | |
* Security did not produce income during the last twelve months.
^^ All or a portion of this security has not settled as of October 31, 2014 and thus may not have an interest rate in effect. Interest rates do not take effect until settlement.
± At October 31, 2014, Absolute Return Multi-Manager had outstanding call and put options written as follows:
Name of Issuer | | Contracts | | Exercise
Price | | Expiration
Date | | Market Value
of Options | |
Allergan, Inc., Call | | | 87 | | | $ | 180 | | | November 2014 | | $ | (114,840 | ) | |
Allergan, Inc., Call | | | 42 | | | | 190 | | | November 2014 | | | (25,368 | ) | |
Allergan, Inc., Call | | | 43 | | | | 175 | | | December 2014 | | | (84,710 | ) | |
Allergan, Inc., Call | | | 21 | | | | 180 | | | December 2014 | | | (32,130 | ) | |
Ally Financial, Inc., Call | | | 44 | | | | 22 | | | November 2014 | | | (4,928 | ) | |
Ally Financial, Inc., Call | | | 45 | | | | 22 | | | December 2014 | | | (5,400 | ) | |
Ally Financial, Inc., Call | | | 49 | | | | 22.5 | | | December 2014 | | | (4,410 | ) | |
AMC Networks, Inc., Call | | | 111 | | | | 55 | | | December 2014 | | | (66,600 | ) | |
AMC Networks, Inc., Call | | | 111 | | | | 70 | | | December 2014 | | | (5,550 | )f | |
American Airlines Group, Inc., Call | | | 127 | | | | 40 | | | December 2014 | | | (41,910 | ) | |
AstraZeneca PLC, Call | | | 315 | | | | 90 | | | January 2015 | | | (11,025 | ) | |
AstraZeneca PLC, Put | | | 315 | | | | 65 | | | January 2015 | | | (23,625 | ) | |
AT&T, Inc., Call | | | 5,952 | | | | 40 | | | June 2015 | | | (59,520 | ) | |
AT&T, Inc., Put | | | 6,180 | | | | 25 | | | June 2015 | | | (123,600 | ) | |
Boulder Brands, Inc., Put | | | 89 | | | | 7.5 | | | December 2014 | | | (1,780 | ) | |
Compuware Corp., Call | | | 765 | | | | 11 | | | February 2015 | | | (11,475 | )f | |
Conversant, Inc., Call | | | 54 | | | | 35 | | | November 2014 | | | (3,240 | ) | |
Conversant, Inc., Call | | | 273 | | | | 35 | | | December 2014 | | | (19,110 | ) | |
Covidien PLC, Put | | | 196 | | | | 72.5 | | | January 2015 | | | (24,500 | ) | |
DISH Network Corp., Call | | | 53 | | | | 60 | | | November 2014 | | | (27,560 | ) | |
Dresser-Rand Group, Inc., Call | | | 205 | | | | 85 | | | November 2014 | | | (1,025 | )f | |
eBay, Inc., Call | | | 106 | | | | 52.5 | | | December 2014 | | | (18,974 | ) | |
General Motors Co., Call | | | 102 | | | | 30 | | | November 2014 | | | (15,912 | ) | |
Globalstar, Inc., Call | | | 2,132 | | | | 5 | | | April 2015 | | | (21,320 | ) | |
Globalstar, Inc., Call | | | 159 | | | | 6 | | | April 2015 | | | (795 | ) | |
Groupon, Inc., Call | | | 133 | | | | 6 | | | November 2014 | | | (18,221 | ) | |
Groupon, Inc., Call | | | 133 | | | | 6.5 | | | November 2014 | | | (12,236 | ) | |
International Game Technology, Call | | | 82 | | | | 17 | | | November 2014 | | | (1,230 | ) | |
International Game Technology, Call | | | 73 | | | | 18 | | | January 2015 | | | (1,825 | ) | |
iShares Russell 2000 ETF, Put | | | 1,325 | | | | 85 | | | March 2015 | | | (62,275 | ) | |
Mead Johnson Nutrition Co., Call | | | 32 | | | | 95 | | | December 2014 | | | (20,960 | ) | |
Mead Johnson Nutrition Co., Call | | | 31 | | | | 105 | | | December 2014 | | | (8,215 | ) | |
See Notes to Financial Statements
Notes to Schedule of Investments (cont'd)
Name of Issuer | | Contracts | | Exercise
Price | | Expiration
Date | | Market Value
of Options | |
Pfizer, Inc., Call | | | 53 | | | $ | 30 | | | December 2014 | | $ | (2,385 | ) | |
RealD, Inc., Call | | | 597 | | | | 10 | | | November 2014 | | | (65,670 | ) | |
RR Donnelley & Sons Co., Call | | | 89 | | | | 17 | | | December 2014 | | | (8,010 | ) | |
S&P 500 Index, Call | | | 23 | | | | 1,900 | | | November 2014 | | | (266,110 | ) | |
Salix Pharmaceuticals Ltd., Call | | | 53 | | | | 120 | | | November 2014 | | | (124,020 | ) | |
Salix Pharmaceuticals Ltd., Call | | | 31 | | | | 125 | | | November 2014 | | | (60,450 | ) | |
Salix Pharmaceuticals Ltd., Call | | | 84 | | | | 175 | | | November 2014 | | | (11,340 | ) | |
Shutterfly, Inc., Call | | | 341 | | | | 45 | | | November 2014 | | | (17,050 | ) | |
Smith & Nephew PLC, Call | | | 22 | | | | 32 | | | November 2014 | | | (10,450 | ) | |
SPDR S&P 500 ETF Trust, Put | | | 5,000 | | | | 180 | | | December 2014 | | | (350,000 | ) | |
SPDR S&P 500 ETF Trust, Put | | | 2,000 | | | | 178 | | | February 2015 | | | (304,000 | ) | |
SPDR S&P 500 ETF Trust, Put | | | 708 | | | | 160 | | | March 2015 | | | (70,800 | ) | |
Star Buffet, Inc., Call | | | 222 | | | | 35 | | | December 2014 | | | (8,880 | )f | |
The Brink's Co., Call | | | 115 | | | | 22.5 | | | December 2014 | | | (575 | ) | |
T-Mobile US, Inc., Call | | | 413 | | | | 28 | | | November 2014 | | | (65,667 | ) | |
Total | | | | | | | | $ | (2,239,676 | ) | |
≠ Security had an event of default.
¢ All or a portion of this security was purchased on a delayed delivery basis.
£ At October 31, 2014, Absolute Return Multi-Manager had pledged securities in the amount of $76,493,351 to cover collateral requirements for borrowing in connection with securities sold short and option contracts written. At October 31, 2014, Long Short Multi-Manager had pledged securities in the amount of $1,630,442 to cover collateral requirements for borrowing in connection with securities sold short.
a Step Bond: Coupon rate is a fixed rate for an initial period then resets at a specified date and rate.
c Payment-in-kind security for which part of the income earned may be paid as additional principal.
f Value of the security was determined using methods the Board has approved in the good faith belief that the resulting valuation will reflect the fair value of security.
ñ Securities were purchased or sold short under Rule 144A of the Securities Act of 1933, as amended (the "1933 Act"), or are private placements and, unless registered under the 1933 Act or exempted from registration, may only be sold to qualified institutional investors. These securities have been deemed by the investment manager to be liquid. At October 31, 2014, these securities amounted to $81,788,907 of long positions and $(352,909) of short positions, or 5.0% and (0.0%), respectively, of net assets for Absolute Return Multi-Manager.
N These securities have been deemed by the investment manager to be illiquid. At October 31, 2014, these securities amounted to $8,092,067 or 0.5% of net assets for Absolute Return Multi-Manager.
Ø All or a portion of this security or cash is segregated in connection with obligations for securities sold short and/or delayed delivery purchase commitments and/or call and put options written and/or forward foreign currency contracts and/or swaps and/or futures contracts.
ØØ At October 31, 2014, Absolute Return Multi-Manager had deposited $362,825,084 in one or more accounts to satisfy collateral requirements for borrowing in connection with securities sold short. At October 31, 2014, Long Short Multi-Manager had deposited $9,080,875 in one or more accounts to satisfy collateral requirements for
See Notes to Financial Statements
Notes to Schedule of Investments (cont'd)
borrowing in connection with securities sold short. In addition, Absolute Return Multi-Manager had deposited $23,994,162 in a segregated account for forward foreign currency contracts, futures and/or swaps.
µ Floating rate securities are securities whose yields vary with a designated market index or market rate. These securities are shown at their current rates as of October 31, 2014 and their final maturities.
†† As of October 31, 2014, Absolute Return Multi-Manager's value of unfunded loan commitments was $251,240 pursuant to the following loan agreement:
Borrower | | Principal
Amount | | Value | |
The SI Organization, Inc., Delayed Draw 1st Lien Term Loan, due 11/23/19 | | $ | 190,108 | | | $ | 189,811 | | |
York Risk Services Group, Inc., Delayed Draw Term Loan, Due 10/1/21 | | | 61,854 | | | | 61,429 | | |
††† See Note A-13 in the Notes to Financial Statements for the Funds' open positions in derivatives at October 31, 2014.
See Notes to Financial Statements
Statements of Assets and Liabilities
Neuberger Berman Alternative Funds
| | ABSOLUTE RETURN
MULTI-MANAGER
FUND | | LONG SHORT
MULTI-MANAGER
FUND | |
| | October 31, 2014 | | October 31, 2014 | |
Assets | |
Investments in securities, at value* (Note A)—see Schedule of Investments: | |
Unaffiliated issuers | | $ | 1,656,398,269 | | | $ | 31,529,220 | | |
Due from Custodian | | | 1,441,901 | | | | — | | |
Foreign currency* | | | 7,837,859 | | | | 692,457 | | |
Deposit with broker for short sales (Note A-11) | | | 362,825,084 | | | | 9,080,875 | | |
Deposits with broker for swaps, futures and forward foreign currency contracts
(Note A-13) | | | 23,994,162 | | | | — | | |
Dividends and interest receivable | | | 3,955,897 | | | | 37,307 | | |
Foreign tax reclaims | | | 58,305 | | | | 1,230 | | |
Receivable for securities sold | | | 77,994,160 | | | | 1,811,540 | | |
Receivable for Fund shares sold | | | 5,515,682 | | | | — | | |
Receivable from administrator—net (Note B) | | | — | | | | 1,824 | | |
Swaps, at value (Note A-13) | | | 1,576,132 | | | | 43,238 | | |
Receivable for variation margin (Note A-13) | | | 1,916 | | | | — | | |
Receivable for open forward foreign currency contracts (Note A-13) | | | 11,190,816 | | | | 448,447 | | |
Prepaid expenses and other assets | | | 79,899 | | | | 30,610 | | |
Total Assets | | | 2,152,870,082 | | | | 43,676,748 | | |
Liabilities | |
Investments sold short, at value** (Note A) | | | 365,511,610 | | | | 9,347,745 | | |
Option contracts written, at value*** (Note A) | | | 2,239,676 | | | | — | | |
Due to Custodian | | | 23,292,234 | | | | 285,813 | | |
Dividends and interest payable for short sales | | | 852,777 | | | | 16,055 | | |
Swaps, at value (Note A-13) | | | 5,280,110 | | | | 58,528 | | |
Payable to administrator—net (Note B) | | | 249,088 | | | | — | | |
Payable to investment manager—net (Note B) | | | 2,282,433 | | | | 44,623 | | |
Payable for securities purchased | | | 98,518,512 | | | | 1,704,332 | | |
Payable for Fund shares redeemed | | | 6,558,464 | | | | 25,938 | | |
Payable for open forward foreign currency contracts (Note A-13) | | | 2,237,230 | | | | 114,315 | | |
Accrued expenses and other payables | | | 535,301 | | | | 142,408 | | |
Total Liabilities | | | 507,557,435 | | | | 11,739,757 | | |
Net Assets | | $ | 1,645,312,647 | | | $ | 31,936,991 | | |
Net Assets consist of: | |
Paid-in capital | | $ | 1,639,244,821 | | | $ | 31,503,986 | | |
Undistributed net investment income (loss) | | | (3,573,831 | ) | | | (266,354 | ) | |
Accumulated net realized gains (losses) on investments | | | 13,252,375 | | | | 94,609 | | |
Net unrealized appreciation (depreciation) in value of investments | | | (3,610,718 | ) | | | 604,750 | | |
Net Assets | | $ | 1,645,312,647 | | | $ | 31,936,991 | | |
Net Assets | |
Institutional Class | | $ | 1,275,342,746 | | | $ | 30,819,967 | | |
Class A | | | 242,240,138 | | | | 866,869 | | |
Class C | | | 95,270,772 | | | | 250,155 | | |
Class R6 | | | 32,458,991 | | | | — | | |
See Notes to Financial Statements
Statements of Assets and Liabilities (cont'd)
Neuberger Berman Alternative Funds (cont'd)
| | ABSOLUTE RETURN
MULTI-MANAGER
FUND | | LONG SHORT
MULTI-MANAGER
FUND | |
| | October 31, 2014 | | October 31, 2014 | |
Shares Outstanding ($.001 par value; unlimited shares authorized) | |
Institutional Class | | | 115,917,241 | | | | 2,966,503 | | |
Class A | | | 22,178,025 | | | | 83,686 | | |
Class C | | | 8,884,244 | | | | 24,307 | | |
Class R6 | | | 2,947,803 | | | | — | | |
Net Asset Value, offering and redemption price per share | |
Institutional Class | | $ | 11.00 | | | $ | 10.39 | | |
Class R6 | | $ | 11.01 | | | $ | — | | |
Net Asset Value and redemption price per share | |
Class A | | $ | 10.92 | | | $ | 10.36 | | |
Offering Price per share | |
Class A‡ | | $ | 11.59 | | | $ | 10.99 | | |
Net Asset Value and offering price per share | |
Class C^ | | $ | 10.72 | | | $ | 10.29 | | |
*Cost of Investments: | |
Unaffiliated issuers | | $ | 1,653,311,904 | | | $ | 30,891,833 | | |
Total cost of foreign currency | | $ | 8,895,035 | | | $ | 729,543 | | |
**Proceeds from investments sold short | | $ | 354,946,307 | | | $ | 9,034,101 | | |
***Premium received from option contracts written | | $ | 3,120,532 | | | $ | — | | |
‡ On single retail sales of less than $50,000. On sales of $50,000 or more or in certain other circumstances described in the Fund's prospectus, offering price is reduced.
^ Redemption price per share is equal to net asset value less any applicable contingent deferred sales charge.
See Notes to Financial Statements
Neuberger Berman Alternative Funds
| | ABSOLUTE RETURN
MULTI-MANAGER
FUND | | LONG SHORT
MULTI-MANAGER
FUND | |
| | October 31, 2014 | | For the
Period from
December 19, 2013
(Commencement
of Operations) to
October 31, 2014 | |
Investment Income: | |
Income (Note A): | |
Dividend income—unaffiliated issuers | | $ | 18,656,034 | | | $ | 266,549 | | |
Interest income—unaffiliated issuers | | | 12,116,288 | | | | — | | |
Foreign taxes withheld (Note A-6) | | | (365,472 | ) | | | (9,025 | ) | |
Total income | | $ | 30,406,850 | | | $ | 257,524 | | |
Expenses: | |
Investment management fees (Note B) | | | 20,310,374 | | | | 318,620 | | |
Administration fees (Note B) | | | 739,587 | | | | 11,245 | | |
Administration fees (Note B): | |
Institutional Class | | | 774,350 | | | | 16,324 | | |
Class A | | | 571,172 | | | | 928 | | |
Class C | | | 135,431 | | | | 281 | | |
Class R6 | | | 3,800 | | | | — | | |
Distribution fees (Note B): | |
Class A | | | 713,957 | | | | 1,160 | | |
Class C | | | 677,153 | | | | 1,405 | | |
Shareholder servicing agent fees: | |
Institutional Class | | | 74,502 | | | | 2,974 | | |
Class A | | | 72,171 | | | | 1,809 | | |
Class C | | | 16,858 | | | | 1,623 | | |
Class R6 | | | 2,775 | | | | — | | |
Organization expense (Note A-8) | | | — | | | | 108,561 | | |
Audit fees | | | 124,457 | | | | 40,000 | | |
Custodian and accounting fees (Note A) | | | 752,447 | | | | 104,095 | | |
Legal fees | | | 267,616 | | | | 122,902 | | |
Registration and filing fees | | | 182,091 | | | | 39,158 | | |
Shareholder reports | | | 177,093 | | | | 20,000 | | |
Trustees' fees and expenses | | | 31,361 | | | | 33,000 | | |
Short sales expense (Note A-11) | | | 2,319,454 | | | | 39,561 | | |
Dividend expense on securities sold short (Note A-11) | | | 6,267,661 | | | | 110,913 | | |
Miscellaneous | | | 104,595 | | | | 2,572 | | |
Total expenses | | | 34,318,905 | | | | 977,131 | | |
Expenses reimbursed by Management (Note B) | | | (1,165,578 | ) | | | (479,386 | ) | |
Expenses reduced by custodian fee expense offset arrangement (Note A-15) | | | (438 | ) | | | — | | |
Total net expenses | | | 33,152,889 | | | | 497,745 | | |
Net investment income (loss) | | $ | (2,746,039 | ) | | $ | (240,221 | ) | |
See Notes to Financial Statements
Statements of Operations (cont'd)
Neuberger Berman Alternative Funds (cont'd)
| | ABSOLUTE RETURN
MULTI-MANAGER
FUND | | LONG SHORT
MULTI-MANAGER
FUND | |
| | October 31, 2014 | | For the
Period from
December 19, 2013
(Commencement
of Operations) to
October 31, 2014 | |
Realized and Unrealized Gain (Loss) on Investments (Note A): | |
Net realized gain (loss) on: | |
Sales of investment securities of unaffiliated issuers | | | 12,384,419 | | | | 153,958 | | |
Sales of investment securities of unaffiliated issuers sold short | | | (9,453,567 | ) | | | (13,868 | ) | |
Forward foreign currency contracts | | | 380,626 | | | | 62,647 | | |
Foreign currency | | | (1,705,901 | ) | | | (126,820 | ) | |
Option contracts written | | | 11,490,422 | | | | 1,219 | | |
Swap contracts | | | 1,424,980 | | | | (9,077 | ) | |
Change in net unrealized appreciation (depreciation) in value of: | |
Unaffiliated investment securities | | | (3,495,298 | ) | | | 637,387 | | |
Unaffiliated investment securities sold short | | | (8,046,471 | ) | | | (313,644 | ) | |
Forward foreign currency contracts | | | 9,108,611 | | | | 334,132 | | |
Foreign currency | | | (907,777 | ) | | | (38,600 | ) | |
Financial futures contracts | | | (38,769 | ) | | | — | | |
Option contracts written | | | (429,887 | ) | | | — | | |
Swap contracts | | | (5,050,337 | ) | | | (14,525 | ) | |
Net gain (loss) on investments | | | 5,661,051 | | | | 672,809 | | |
Net increase (decrease) in net assets resulting from operations | | $ | 2,915,012 | | | $ | 432,588 | | |
See Notes to Financial Statements
Statements of Changes in Net Assets
Neuberger Berman Alternative Funds
| | ABSOLUTE RETURN
MULTI-MANAGER FUND | | LONG SHORT
MULTI-MANAGER
FUND | |
| | For the
Year Ended
October 31, 2014 | | For the
Year Ended
October 31, 2013 | | Period from
December 19, 2013
(Commencement
of Operations) to
October 31, 2014 | |
Increase (Decrease) in Net Assets: | |
From Operations (Note A): | |
Net investment income (loss) | | $ | (2,746,039 | ) | | $ | (983,344 | ) | | $ | (240,221 | ) | |
Net realized gain (loss) on investments | | | 14,520,979 | | | | 3,724,030 | | | | 68,059 | | |
Change in net unrealized appreciation (depreciation) of investments | | | (8,859,928 | ) | | | 5,099,906 | | | | 604,750 | | |
Net increase (decrease) in net assets resulting from operations | | | 2,915,012 | | | | 7,840,592 | | | | 432,588 | | |
Distributions to shareholders from (Note A): | |
Net investment income | |
Institutional Class | | | — | | | | (58,599 | ) | | | — | | |
Net realized gain on investments: | |
Institutional Class | | | (2,978,909 | ) | | | (119,803 | ) | | | — | | |
Class A | | | (1,210,727 | ) | | | (12,381 | ) | | | — | | |
Class C | | | (239,295 | ) | | | (2,073 | ) | | | — | | |
Total distributions to shareholders | | | (4,428,931 | ) | | | (192,856 | ) | | | — | | |
From Fund Share Transactions (Note D): | |
Proceeds from shares sold: | |
Institutional Class | | | 1,255,772,758 | | | | 308,138,341 | | | | 31,805,466 | | |
Class A | | | 410,998,109 | | | | 124,995,179 | | | | 1,304,866 | | |
Class C | | | 82,073,906 | | | | 21,030,909 | | | | 263,695 | | |
Class R6 | | | 39,264,828 | | | | — | | | | — | | |
Proceeds from reinvestment of dividends and distributions: | |
Institutional Class | | | 2,604,571 | | | | 172,922 | | | | — | | |
Class A | | | 1,098,266 | | | | 9,064 | | | | — | | |
Class C | | | 179,005 | | | | 1,988 | | | | — | | |
Payments for shares redeemed: | |
Institutional Class | | | (305,059,216 | ) | | | (22,848,165 | ) | | | (1,405,540 | ) | |
Class A | | | (296,348,593 | ) | | | (3,847,011 | ) | | | (445,888 | ) | |
Class C | | | (7,428,396 | ) | | | (214,708 | ) | | | (18,196 | ) | |
Class R6 | | | (6,625,000 | ) | | | — | | | | — | | |
Net increase (decrease) from Fund share transactions | | | 1,176,530,238 | | | | 427,438,519 | | | | 31,504,403 | | |
Net Increase (Decrease) in Net Assets | | | 1,175,016,319 | | | | 435,086,255 | | | | 31,936,991 | | |
Net Assets: | |
Beginning of period | | | 470,296,328 | | | | 35,210,073 | | | | — | | |
End of period | | $ | 1,645,312,647 | | | $ | 470,296,328 | | | $ | 31,936,991 | | |
Undistributed net investment income (loss) at end of period | | | (3,573,831 | ) | | | 25,564 | | | | (266,354 | ) | |
See Notes to Financial Statements
Notes to Financial Statements Alternative and
Multi-Asset Class Funds
Note A—Summary of Significant Accounting Policies:
1 General: Neuberger Berman Alternative Funds (the "Trust") is a Delaware statutory trust organized pursuant to an Amended and Restated Trust Instrument dated March 27, 2014. The Trust is registered as an open-end management investment company under the Investment Company Act of 1940, as amended (the "1940 Act"), and its shares are registered under the 1933 Act. Each Fund is a separate operating series of the Trust, and is diversified. Each Fund offers Institutional Class shares, Class A shares and Class C shares; and Absolute Return Multi-Manager offers Class R6 shares. Long Short Multi-Manager had no operations until December 19, 2013, other than matters relating to its organization and registration of shares under the 1933 Act. The Board may establish additional series or classes of shares without the approval of shareholders.
The assets of each Fund belong only to that Fund, and the liabilities of each Fund are borne solely by that Fund and no other.
Each Fund is an investment company and accordingly follows the investment company accounting and reporting guidance of the Financial Accounting Standards Board (FASB) Accounting Standard Codification Topic 946 Financial Services—Investment Companies.
The preparation of financial statements in accordance with U.S. generally accepted accounting principles ("GAAP") requires Management to make estimates and assumptions at the date of the financial statements. Actual results could differ from those estimates.
2 Portfolio valuation: Investment securities are valued as indicated in the notes following the Funds' Schedule of Investments.
3 Foreign currency translation: The accounting records of the Funds are maintained in U.S. dollars. Foreign currency amounts are translated into U.S. dollars using the exchange rate as of the end of regular trading on the NYSE on business days, usually 4:00 p.m. Eastern time, to determine the value of investments, other assets and liabilities. Purchase and sale prices of securities, and income and expenses, are translated into U.S. dollars at the prevailing rate of exchange on the respective dates of such transactions. Net unrealized foreign currency gain (loss), if any, arises from changes in the value of assets and liabilities, other than investments in securities, as a result of changes in exchange rates and is stated separately in the Statements of Operations.
4 Securities transactions and investment income: Securities transactions are recorded on trade date for financial reporting purposes. Dividend income is recorded on the ex-dividend date or, for certain foreign dividends, as soon as the Funds become aware of the dividends. Non-cash dividends included in dividend income, if any, are recorded at the fair market value of the securities received. Interest income, including accretion of discount (adjusted for original issue discount, where applicable) and amortization of premium, where applicable, and accretion of discount on short-term investments, if any, is recorded on the accrual basis. Realized gains and losses from securities transactions and foreign currency transactions, if any, are recorded on the basis of identified cost and stated separately in the Statements of Operations.
5 Income tax information: Each Fund is treated as a separate entity for U.S. federal income tax purposes. It is the policy of Absolute Return Multi-Manager to continue to, and the intention of Long Short Multi-Manager to, qualify for treatment as regulated investment companies by complying with the requirements of the U.S. Internal Revenue Code applicable to regulated investment companies and to distribute substantially all of its net investment income and net realized capital gains to its shareholders. To the extent a Fund distributes substantially all of its net investment income and net realized capital gains to shareholders, no federal income or excise tax provision is required.
The Funds have adopted the provisions of ASC 740 "Income Taxes" ("ASC 740"). ASC 740 sets forth a minimum threshold for financial statement recognition of a tax position taken, or expected to be taken, in a tax return. The Funds recognize interest and penalties, if any, related to unrecognized tax positions as an income tax expense in the Statements of Operations. The Funds are subject to examination by U.S. federal and state tax authorities for returns filed for the tax years for which the applicable statutes of limitations have not yet expired. As of October 31, 2014, the Funds did not have any unrecognized tax positions.
Income distributions and capital gain distributions are determined in accordance with income tax regulations, which may differ from GAAP. These differences are primarily due to differing treatments of income and gains on various investment securities held by each Fund, timing differences and differing characterization of distributions made by each Fund.
As determined on October 31, 2014, permanent differences resulting primarily from different book and tax accounting were reclassified at year end. Such differences may be attributed to the tax treatment of one or more of the following: netting of net ordinary losses with short-term capital gains, income recognized on swap transactions, non-deductible stock issuance costs, the tax treatment of foreign currency gains and losses, payments in lieu of dividends on short sales and gains from passive foreign investment companies. These reclassifications had no effect on net income, net asset value ("NAV") or NAV per share of each Fund. For the year ended October 31, 2014, the Funds recorded the following permanent reclassifications:
| | Paid-in Capital | | Undistributed
Net Investment
Income (Loss) | | Accumulated Net
Realized Gains
(Losses) on
Investments | |
Absolute Return Multi-Manager | | $ | 84,246 | | | $ | (853,356 | ) | | $ | 769,110 | | |
Long Short Multi-Manager | | | (417 | ) | | | (26,133 | ) | | | 26,550 | | |
For tax purposes, distributions of short-term gains are taxable to shareholders as ordinary income.
The tax character of distributions paid during the period ended October 31, 2014 and the year ended October 31, 2013 was as follows:
| | Distributions Paid From: | |
| | | Ordinary Income | | Tax-Exempt
Income | | Long-Term
Capital Gain | | Return of
Capital | | Total | |
| | 2014 | | 2013 | | 2014 | | 2013 | | 2014 | | 2013 | | 2014 | | 2013 | | 2014 | | 2013 | |
Absolute Return
Multi-Manager | | $ | 4,428,931 | | | $ | 190,445 | | | $ | — | | | $ | — | | | $ | — | | | $ | 2,411 | | | $ | — | | | $ | — | | | $ | 4,428,931 | | | $ | 192,856 | | |
Long Short
Multi-Manager | | | — | (1) | | | — | | | | — | (1) | | | — | | | | — | (1) | | | — | | | | — | (1) | | | — | | | | — | (1) | | | — | | |
(1) Period from December 19, 2013 (commencement of operations) to October 31, 2014.
As of October 31, 2014, the components of distributable earnings (accumulated losses) on a U.S. federal income tax basis were as follows:
| | | Undistributed
Ordinary
Income | | Undistributed
Long-Term
Gain | | Unrealized
Appreciation
(Depreciation) | | Loss
Carryforwards
and Deferrals | | Other
Temporary
Differences | | Total | |
Absolute Return
Multi-Manager | | $ | 37,448,192 | | | $ | — | | | $ | (26,844,450 | ) | | $ | — | | | $ | (4,535,916 | ) | | $ | 6,067,826 | | |
Long Short
Multi-Manager | | | 281,920 | | | | — | | | | 224,305 | | | | — | | | | (73,220 | ) | | | 433,005 | | |
The differences between book basis and tax basis distributable earnings are primarily due to: wash sale loss deferrals, amortization of organizational costs, mark to market on certain swap contract transactions, unsettled wash sale loss deferrals, straddle loss deferrals, mark-to-market adjustments on passive foreign investment companies, constructive sales gains and delayed settlement compensation on bank loans.
To the extent each Fund's net realized capital gains, if any, can be offset by capital loss carryforwards, if any, it is the policy of each Fund not to distribute such gains.
6 Foreign taxes: Foreign taxes withheld, if any, represent amounts withheld by foreign tax authorities, net of refunds recoverable.
7 Distributions to shareholders: Each Fund may earn income, net of expenses, daily on its investments. Distributions from net investment income and net realized capital gains, if any, generally are distributed once a year (usually in December) and are recorded on the ex-date.
8 Organization expenses: Costs incurred by Long Short Multi-Manager in connection with its organization, which amounted to $108,561, and are reflected in Organization expense in the Statements of Operations, have been expensed as incurred.
9 Expense allocation: Certain expenses are applicable to multiple funds. Expenses directly attributable to a Fund are charged to that Fund. Expenses of the Trust that are not directly attributable to a particular series of the Trust (e.g., a Fund) are allocated among the series of the Trust, on the basis of relative net assets, except where a more appropriate allocation of expenses to each of the series can otherwise be made fairly. Expenses borne by the complex of related investment companies, which includes open-end and closed-end investment companies for which Management serves as investment manager, that are not directly attributable to a particular investment company in the complex (e.g., the Trust) or series thereof are allocated among the investment companies in the complex or series thereof, on the basis of relative net assets, except where a more appropriate allocation of expenses to each of the investment companies in the complex or series thereof can otherwise be made fairly. Each Fund's expenses (other than those specific to each class) are allocated proportionally each day among the classes based upon the relative net assets of each class.
10 Investments in foreign securities: Investing in foreign securities may involve certain sovereign and other risks, in addition to the credit and market risks normally associated with domestic securities. These additional risks include the possibility of adverse political and economic developments (including political instability, nationalization, expropriation, or confiscatory taxation) and the potentially adverse effects of unavailability of public information regarding issuers, less governmental supervision and regulation of financial markets, reduced liquidity of certain financial markets, and the lack of uniform accounting, auditing, and financial reporting standards or the application of standards that are different or less stringent than those applied in the United States. Foreign securities also may experience greater price volatility, higher rates of inflation, and delays in settlement.
11 Securities sold short: Each Fund may engage in short sales, which are sales of securities which have been borrowed from a third party on the expectation that the market price will decline. If the price of the securities decreases, a Fund will make a profit by purchasing the securities in the open market at a price lower than the one at which it sold the securities. If the price of the securities increases, a Fund may have to cover its short positions at a price higher than the short sale price, resulting in a loss. Gains are limited to the price at which a Fund sold the security short, while losses are potentially unlimited in size. The Funds pledge securities and/or other assets to the lender as collateral. Proceeds received from short sales may be maintained by the lender as collateral. Proceeds maintained by the lender are included in the "Deposits with brokers for short sales" on the Statements of Assets and Liabilities. The Funds are required to segregate an amount of cash, cash equivalents or other appropriate liquid marketable securities with the custodian in an amount at least equal to the current market value of the securities sold short (less any additional collateral held by the lender). The Funds are contractually responsible to the lender for any dividends payable and interest accrued on securities while those securities are in a short position. These dividends and interest are recorded as an expense of the Funds and are excluded from the contractual expense limitation. As of October 31, 2014, Absolute Return Multi-Manager and Long Short Multi-Manager had pledged
cash in the amount of $362,825,084 and $9,080,875, respectively, to J.P. Morgan Chase Bank, N.A. ("JPM"), as collateral for short sales. At October 31, 2014, Absolute Return Multi-Manager and Long Short Multi-Manager had pledged securities in the amount of $76,493,351 and $1,630,442, respectively, to cover collateral requirements for borrowing in connection with securities sold short.
12 Investment company securities and exchange-traded funds: The Funds may invest in shares of other registered investment companies, including exchange-traded funds ("ETFs"), within the limitations prescribed by the 1940 Act. Some ETFs seek to track the performance of a particular market index. These indices include both broad-based market indices and more narrowly-based indices, including those relating to particular sectors, markets, regions or industries. However, some ETFs have actively-managed investment objectives. ETF shares are traded like traditional equity securities on a national securities exchange or NASDAQ. A Fund will indirectly bear its proportionate share of any management fees and other expenses paid by such other investment companies, which will increase expenses and decrease returns.
13 Derivative instruments: During the year ended October 31, 2014, the Funds' use of derivatives, as described below, was limited to credit default swap contracts, financial futures contracts, equity swaps, total return swaps, forward foreign currency contracts, written option transactions and purchased option transactions. The Funds have adopted the provisions of ASC 815 "Derivatives and Hedging" ("ASC 815"). The disclosure requirements of ASC 815 distinguish between derivatives that qualify for hedge accounting and those that do not. Because investment companies value their derivatives at fair value and recognize changes in fair value through the Statements of Operations, they do not qualify for hedge accounting. Accordingly, even though a Fund's investments in derivatives may represent economic hedges, they are considered non-hedge transactions for purposes of this disclosure.
Credit default swap contracts: During the year ended October 31, 2014, Absolute Return Multi-Manager entered into credit default swaps as part of its investment strategies, to hedge against unfavorable changes in the value of investments and to protect against adverse movements in interest rates or credit performance with counterparties. When a Fund is the buyer of a credit default swap contract, it is entitled to receive the par (or other agreed-upon) value of a referenced debt obligation (or basket of debt obligations) from the counterparty if a credit event occurs. In return, the Fund pays the counterparty a periodic stream of payments over the term of the contract provided that no credit event has occurred. If no credit event occurs, the Fund would have spent the stream of payments and received no proceeds from the contract. When a Fund is the seller of a credit default swap contract, it receives the stream of payments, but is obligated to pay to the buyer of the protection an amount up to the notional amount of the swap and in certain instances take delivery of securities of the reference entity upon the occurrence of a credit event, as defined under the terms of that particular swap agreement. Credit events are contract specific but may include bankruptcy, failure to pay, restructuring, obligation acceleration and repudiation/moratorium. If a Fund is a seller of protection and a credit event occurs, the maximum potential amount of future payments that the Fund could be required to make (or the risk of loss) would be an amount equal to the notional amount of the agreement. This potential amount would be partially offset by any recovery value of the respective referenced obligation, or net amount received from the settlement of a buy protection credit default swap agreement entered into by the Fund for the same referenced obligation. As the seller, the Fund may add economic leverage to its portfolio because, in addition to its total net assets, the Fund is subject to investment exposure on the notional amount of the swap. The net periodic payments paid or received on the swap contract are accrued daily as a component of unrealized appreciation (depreciation) and are recorded as realized gain upon receipt or realized loss upon payment. The Fund also records an increase or decrease to unrealized appreciation (depreciation) in an amount equal to the daily valuation of the swap. For financial reporting purposes, unamortized upfront payments, if any, are netted with unrealized appreciation or depreciation on swap contracts to determine the market value of swaps as presented in the table below.
At October 31, 2014, the outstanding credit default swap contracts were as follows:
Absolute Return Multi-Manager: | |
Credit Default Swap Contracts—Buy Protection
Swap
Counterparty | | Reference
Entity | | Notional
Amount(1) | | Contract
Annual
Fixed
Rate* | | Termination
Date | | Credit
Spread at
October 31,
2014 | | Market
Value | | Unamortized
Upfront
Payments
Received
(Paid) | | Unrealized
Appreciation
(Depreciation) | | Accrued
Net
Interest
Receivable/
(Payable) | | Total
Fair Value | |
J.P. Morgan
Chase
Bank N.A. | | Best Buy Co.,
Inc., 5.500%,
03/15/21 | | $ | 3,000,000 | | | | 5.000
| % | | December 20,
2019 | | | 2.737 | % | | $ | (322,411 | ) | | $ | 325,679 | | | $ | 3,268 | | | $ | (16,250 | ) | | $ | (12,982 | ) | |
J.P. Morgan
Chase
Bank N.A. | | Darden
Restaurants,
Inc., 6.200%,
10/15/17 | | | 5,000,000 | | | | 1.000 | | | December 20,
2019 | | | 1.858 | | | | 214,928 | | | | (249,374 | ) | | | (34,446 | ) | | | (5,417 | ) | | | (39,863 | ) | |
J.P. Morgan
Chase
Bank N.A. | | JC Penney
Corp., Inc.,
6.375%,
10/15/17 | | | 1,000,000 | | | | 5.000 | | | September 20,
2019 | | | 8.388 | | | | 126,952 | | | | (69,650 | ) | | | 57,302 | | | | (5,417 | ) | | | 51,885 | | |
J.P. Morgan
Chase
Bank N.A. | | JC Penney
Corp., Inc.,
6.375%,
10/15/17 | | | 1,000,000 | | | | 5.000 | | | December 20,
2019 | | | 8.529 | | | | 136,490 | | | | (137,280 | ) | | | (790 | ) | | | (5,417 | ) | | | (6,207 | ) | |
J.P. Morgan
Chase
Bank N.A. | | RadioShack
Corp.,
6.750%,
05/15/19 | | | 1,000,000 | | | | 5.000 | | | June 20, 2016 | | | 61.266 | | | | 467,484 | | | | (467,650 | ) | | | (166 | ) | | | (5,417 | ) | | | (5,583 | ) | |
J.P. Morgan
Chase
Bank N.A. | | RadioShack
Corp.,
6.750%,
05/15/19 | | | 1,000,000 | | | | 5.000 | | | June 20, 2016 | | | 0.000 | | | | 492,778 | | | | (491,954 | ) | | | 824 | | | | 11,667 | | | | 12,491 | | |
J.P. Morgan
Chase
Bank N.A. | | Staples, Inc.,
4.375%,
01/12/23 | | | 1,000,000 | | | | 1.000 | | | September 20,
2019 | | | 1.778 | | | | 36,257 | | | | (49,629 | ) | | | (13,372 | ) | | | (1,083 | ) | | | (14,455 | ) | |
J.P. Morgan
Bank N.A. | | Staples, Inc.,
01/12/18 | | | 2,000,000 | | | | 1.000 | | | September 20, | | | 1.778 | | | | 72,515
Chase | | | | (111,936
2.750%, | ) | | | (39,421 | ) | | | (2,167 | ) | | | (41,588
2019 | ) | |
J.P. Morgan
Chase
Bank N.A. | | Staples, Inc.,
2.750%,
01/12/18 | | | 1,000,000 | | | | 1.000 | | | December 20,
2019 | | | 1.888 | | | | 43,062 | | | | (63,792 | ) | | | (20,730 | ) | | | (1,083 | ) | | | (21,813 | ) | |
Total | | | | | | | | | | | | | | | | | | | | $ | 1,268,055 | | | $ | (1,315,586 | ) | | $ | (47,531 | ) | | $ | (30,584 | ) | | $ | (78,115 | ) | |
* The contract annual fixed rate represents the annual fixed rate of interest paid by the Fund (as a buyer of protection) on the notional amount of the credit default swap contract.
(1) For the fiscal year ended October 31, 2014, the average notional value of credit default swap contracts for Absolute Return Multi-Manager was $1,846,154.
Financial futures contracts: During the year ended October 31, 2014, Absolute Return Multi-Manager entered into financial futures contracts for economic hedging purposes. At the time the Fund enters into a financial futures contract, it is required to deposit with the futures commission merchant a specified amount of cash or liquid securities, known as "initial margin," which is a percentage of the value of the financial futures contract being traded that is set by the exchange upon which the futures contract is traded. Each day, the futures contract is valued at the official settlement price of the board of trade or U.S. commodity exchange on which such futures contract is traded. Subsequent payments, known as "variation margin," to and from the broker are made on a daily basis as the market price of the financial futures contract fluctuates. Daily variation margin adjustments, arising from this "mark to market," are recorded by the Fund as unrealized gains or losses.
Although some financial futures contracts by their terms call for actual delivery or acquisition of the underlying securities or currency, in most cases the contracts are closed out prior to delivery by offsetting purchases or sales of matching financial futures contracts. When the contracts are closed, the Fund recognizes a gain or loss. Risks of entering into futures contracts include the possibility there may be an illiquid market, possibly at a time of rapidly declining prices, and/or a change in the value of the contract may not correlate with changes in the value of the underlying securities. Futures executed on regulated futures exchanges have minimal counterparty risk to a fund because the exchange's clearinghouse assumes the position of the counterparty in each transaction. Thus, the Fund is exposed to risk only in connection with the clearinghouse and not in connection with the original counterparty to the transaction.
For U.S. federal income tax purposes, the futures transactions undertaken by the Fund may cause the Fund to recognize gains or losses from marking contracts to market even though its positions have not been sold or terminated, may affect the character of the gains or losses recognized as long-term or short-term, and may affect the timing of some capital gains and losses realized by the Fund. Also, the Fund's losses on transactions involving futures contracts may be deferred rather than being taken into account currently in calculating the Fund's taxable income.
At October 31, 2014, open positions in financial futures contracts were:
Absolute Return Multi-Manager | |
| Expiration | | Open Contracts | | Position | | Unrealized
Appreciation
(Depreciation) | |
December 2014 | | 45 U.S. 2 Year Note | | Short | | $ | (38,769 | ) | |
During the year ended October 31, 2014, the average notional value of financial futures contracts was $(9,864,141) for short positions.
Equity swap contracts: During the year ended October 31, 2014, Absolute Return Multi-Manager used equity swaps to provide investment exposure to certain investments, primarily foreign securities. During the period ended October 31, 2014 Long Short Multi-Manager used equity swaps to provide investment exposure to certain foreign investments. Equity swaps are two-party contracts in which counterparties exchange the return on a specified reference security, basket of securities, security index or index component for the return based on a fixed or floating interest rate on another equity security or basket of securities during the period of the swap. Equity swap contracts are marked to market daily based on the value of the underlying reference entity and the change, if any, is recorded as an unrealized gain or loss. Equity swaps normally do not involve the delivery of securities or other underlying assets. If the other party to an equity swap defaults, a Fund's risk of loss consists of the net amount of payments that such Fund is contractually entitled to receive, if any. Equity swaps are derivatives and their value can be very volatile. To the extent that the Adviser or Sub-Adviser, as applicable, does not accurately analyze and predict future market trends, the values of assets or economic factors, a Fund may suffer a loss, which may exceed the related amounts shown in the Statements of Assets and Liabilities. Periodic payments received or paid by a Fund are recorded as realized gains or losses.
At October 31, 2014, the outstanding equity swaps* for the Funds were as follows:
Absolute Return Multi-Manager | |
Counterparty | | Description | | Value | |
J.P. Morgan
Chase Bank N.A.
| | The Fund receives or pays the total return on long and short positions and
pays or receives a specified LIBOR or Federal Funds floating rate, which is
denominated in various foreign currencies based on the local currencies
of the positions. | | $ | (4,771,290 | ) | |
* The following table represents the individual long and short positions and related values of the equity swaps as of October 31, 2014.
| Reference Entity | | Shares | | Notional
Value(a)(b) | | Net Unrealized
Appreciation
(Depreciation) | |
Long Positions | |
Australia | |
Roc Oil Co. Ltd. | | | 414,429 | | | $ | 248,469 | | | $ | 3,172 | | |
Brazil | |
MMX Mineracao e Metalicos SA | | | 4,091,973 | | | | 4,952,972 | | | | 281,926 | | |
Canada | |
Athabasca Oil Corp. | | | 1,919,712 | | | | 11,078,411 | | | | (4,861,341 | ) | |
B2Gold Corp. | | | 115,384 | | | | 299,907 | | | | (107,439 | ) | |
| | | | | | | | (4,968,780 | ) | |
Finland | |
Sanitec Corp. | | | 63,975 | | | | 820,584 | | | | 314 | | |
Vacon OYJ | | | 13,766 | | | | 580,141 | | | | 2,765 | | |
| | | | | | | | 3,079 | | |
France | |
Alstom SA | | | 57,781 | | | | 1,944,744 | | | | 65,310 | | |
Lafarge SA | | | 13,718 | | | | 951,689 | | | | (871 | ) | |
Plastic Omnium SA | | | 59,268 | | | | 1,324,014 | | | | 23,275 | | |
Publicis Groupe SA | | | 35,250 | | | | 2,333,198 | | | | 108,273 | | |
Total SA | | | 37,991 | | | | 2,389,225 | | | | (131,633 | ) | |
| | | | | | | | 64,354 | | |
Ireland | |
C&C Group PLC | | | 84,582 | | | | 432,439 | | | | (55,313 | ) | |
Shire PLC | | | 67,231 | | | | 5,046,401 | | | | (569,118 | ) | |
| | | | | | | | (624,431 | ) | |
Netherlands | |
Corio NV | | | 31,311 | | | | 1,515,631 | | | | 7,172 | | |
Exact Holding NV | | | 17,575 | | | | 685,661 | | | | 4,906 | | |
Nutreco NV | | | 14,616 | | | | 719,563 | | | | 12,255 | | |
Royal Dutch Shell PLC | | | 45,910 | | | | 1,746,118 | | | | (104,317 | ) | |
Ziggo NV | | | 408,374 | | | | 17,312,557 | | | | 2,638,168 | | |
| | | | | | | | 2,558,184 | | |
Reference Entity | | Shares | | Notional
Value(a)(b) | | Net Unrealized
Appreciation
(Depreciation) | |
Norway | |
Hurtigruten ASA | | | 190,257 | | | $ | 192,927 | | | $ | 575 | | |
Papua New Guinea | |
New Britain Palm Oil Ltd. | | | 50,201 | | | | 539,166 | | | | 6,918 | | |
Spain | |
Cia de Distribucion Integral Logista Holdings SAU | | | 28,456 | | | | 496,083 | | | | 17,772 | | |
Switzerland | |
Nobel Biocare Holding AG | | | 78,176 | | | | 1,382,567 | | | | (1,294 | ) | |
Swisslog Holding AG | | | 184,660 | | | | 257,408 | | | | (230 | ) | |
| | | | | | | | (1,524 | ) | |
United Kingdom | |
Anglo American PLC | | | 107,380 | | | | 2,428,873 | | | | (167,445 | ) | |
Associated British Foods PLC | | | 24,802 | | | | 1,056,810 | | | | 35,860 | | |
AstraZeneca PLC | | | 6,476 | | | | 450,802 | | | | 19,889 | | |
Daisy Group PLC | | | 3,730 | | | | 10,941 | | | | 8 | | |
Diageo PLC | | | 61,710 | | | | 1,788,973 | | | | 25,454 | | |
Infinis Energy PLC | | | 444,762 | | | | 1,836,255 | | | | (300,869 | ) | |
International Consolidated Airlines Group SA | | | 120,515 | | | | 710,978 | | | | 77,910 | | |
Jazztel plc | | | 124,651 | | | | 1,993,132 | | | | (3,063 | ) | |
Mecom Group PLC | | | 41,141 | | | | 99,725 | | | | (14,167 | ) | |
Smith & Nephew PLC | | | 19,637 | | | | 321,513 | | | | 10,526 | | |
Spirit Pub Co. PLC | | | 237,063 | | | | 389,915 | | | | 13,017 | | |
St. James's Place PLC | | | 98,980 | | | | 1,124,584 | | | | 55,036 | | |
Synergy Health PLC | | | 17,692 | | | | 513,252 | | | | 15,427 | | |
TUI Travel PLC | | | 155,515 | | | | 931,677 | | | | 59,949 | | |
William Hill PLC | | | 198,751 | | | | 1,090,951 | | | | 55,230 | | |
| | | | | | | | (117,238 | ) | |
United States | |
Glimcher Realty Trust | | | 245,850 | | | | 3,331,674 | | | | 43,847 | | |
Kinder Morgan Energy Partners LP | | | 139,242 | | | | 12,502,411 | | | | 558,489 | | |
Safeway, Inc. | | | 258,548 | | | | 8,854,130 | | | | 158,853 | | |
| | | | | | | | 761,189 | | |
Total Long Positions of Equity Swap Contracts | | | | | | | (2,014,804 | ) | |
Short Positions | |
France | |
Klepierre | | | (35,694 | ) | | | (1,536,344 | ) | | | (6,839 | ) | |
Danone SA | | | (3,225 | ) | | | (208,376 | ) | | | (10,749 | ) | |
| | | | | | | | (17,588 | ) | |
Germany | |
TUI AG | | | (62,051 | ) | | | (866,334 | ) | | | (80,773 | ) | |
Reference Entity | | Shares | | Notional
Value(a)(b) | | Net Unrealized
Appreciation
(Depreciation) | |
South Korea | |
Halla Visteon Climate Control Corp. | | | (32,517 | ) | | $ | (1,247,922 | ) | | $ | (204,912 | ) | |
Switzerland | |
Holcim Ltd. | | | (13,718 | ) | | | (986,914 | ) | | | 15,255 | | |
United Kingdom | |
AMEC PLC | | | (37,075 | ) | | | (642,496 | ) | | | 25,684 | | |
Liberty Global PLC Series A | | | (82,961 | ) | | | (3,267,528 | ) | | | (504,708 | ) | |
Liberty Global PLC Series C | | | (145,949 | ) | | | (5,647,929 | ) | | | (842,422 | ) | |
Greene King PLC | | | (31,340 | ) | | | (386,462 | ) | | | (15,618 | ) | |
| | | | | | | | (1,337,064 | ) | |
United States | |
Albemarle Corp. | | | (23 | ) | | | (1,222 | ) | | | (120 | ) | |
Kinder Morgan, Inc. | | | (305,371 | ) | | | (11,181,557 | ) | | | (636,301 | ) | |
Washington Prime Group, Inc. | | | (48,899 | ) | | | (834,861 | ) | | | (27,229 | ) | |
| | | | | | | | (663,650 | ) | |
Total Short Positions of Equity Swap Contracts | | | | | | | (2,288,732 | ) | |
Total Long and Short Positions of Equity Swap Contracts | | | | | | | (4,303,536 | ) | |
Financing Costs and Other Payables | | | | | | | (467,754 | ) | |
Equity Swap Contracts, at Value | | | | | | $ | (4,771,290 | ) | |
(a) Notional value represents the market value (including any fees or commissions) of the long and short positions when they are established.
(b) For the fiscal year ended October 31, 2014, the average notional value of equity swap contracts was $61,977,230 for long positions and $(23,620,544) for short positions, respectively, for Absolute Return Multi-Manager.
Long Short Multi-Manager
Counterparty | | Description | | Value | |
J.P. Morgan
Chase Bank N.A.
| | The Fund receives or pays the total return on long and short positions and
pays or receives a specified LIBOR or Federal Funds floating rate, which is
denominated in various foreign currencies based on the local currencies
of the positions. | | $ | 43,238 | | |
* The following table represents the individual long and short positions and related values of the equity swaps as of October 31, 2014.
Reference Entity | | Shares | | Notional
Value(a)(b) | | Net Unrealized
Appreciation
(Depreciation) | |
Long Positions | |
France | |
Alstom SA | | | 2,350 | | | $ | 79,100 | | | $ | 2,650 | | |
Plastic Omnium SA | | | 2,650 | | | | 59,200 | | | | 1,040 | | |
Publicis Groupe SA | | | 1,430 | | | | 94,652 | | | | 4,392 | | |
Total SA | | | 1,547 | | | | 97,306 | | | | (5,377 | ) | |
| | | | | | | | 2,705 | | |
Reference Entity | | Shares | | Notional
Value(a)(b) | | Net Unrealized
Appreciation
(Depreciation) | |
Ireland | |
Shire PLC | | | 1,170 | | | $ | 71,983 | | | $ | 5,934 | | |
Netherlands | |
Royal Dutch Shell PLC | | | 1,882 | | | | 71,610 | | | | (4,307 | ) | |
United Kingdom | |
Anglo American PLC | | | 4,370 | | | | 98,847 | | | | (6,815 | ) | |
Associated British Foods PLC | | | 1,107 | | | | 47,399 | | | | 1,371 | | |
Diageo PLC | | | 2,510 | | | | 72,765 | | | | 1,035 | | |
Infinis Energy PLC | | | 18,828 | | | | 70,298 | | | | (5,300 | ) | |
International Consolidated Airlines Group SA | | | 5,383 | | | | 31,662 | | | | 3,575 | | |
St. James's Place PLC | | | 4,420 | | | | 50,219 | | | | 2,458 | | |
William Hill PLC | | | 8,133 | | | | 44,642 | | | | 2,260 | | |
| | | | | | | | (1,416 | ) | |
Total Long Positions of Equity Swap Contracts | | | | | | | 2,916 | | |
Short Positions | |
Halla Visteon Climate Control Corp. | | | (1,913 | ) | | | (76,973 | ) | | | (8,498 | ) | |
Total Short Positions of Equity Swap Contracts | | | | | | | (8,498 | ) | |
Total Long and Short Positions of Equity Swap Contracts | | | | | | | (5,582 | ) | |
Financing Costs and Other Receivables | | | | | | | 48,820 | | |
Equity Swap Contracts, at Value | | | | | | $ | 43,238 | | |
(a) Notional value represents the market value (including any fees or commissions) of the long and short positions when they are established.
(b) For the period ended October 31, 2014, the average notional value of equity swap contracts was $443,577 for long positions and $(193,021) for short positions, respectively, for Long Short Multi-Manager.
Total return swap contracts: During the year ended October 31, 2014, Absolute Return Multi-Manager used total return swaps to hedge certain indices and provide investment exposure to certain investments, primarily foreign securities. During the period ended October 31, 2014, Long Short Multi-Manager used total return swaps to hedge certain indices and provide investment exposure to certain foreign investments. Total return swaps involve commitments to pay fixed or floating rate interest in exchange for a market-linked return based on a notional amount. To the extent the total return of the reference security or index underlying the total return swap exceeds or falls short of the offsetting interest rate obligation, a Fund will receive a payment or make a payment to the counterparty, respectively. Certain risks may arise when entering into total return swap transactions, including counterparty default, liquidity or unfavorable changes in the value of the underlying reference security or index. The value of the swap is adjusted daily and the change in value, if any, is recorded as unrealized appreciation or depreciation in the Statements of Assets and Liabilities. Payments received or made at the end of each measurement period are recorded as realized gain or loss in the Statements of Operations.
At October 31, 2014, the outstanding total return swap contracts were as follows:
Absolute Return Multi-Manager Fund
| | | | | | | Rate Type | | | | | | | |
Swap
Counterparty | | Notional
Amount(2) | | Termination
Date | | Variable-rate
Payments
Made/
(Received)
by the Fund | | Reference Entity | | Accrued Net
Interest
Receivable
(Payable) | | Unrealized
Appreciation
(Depreciation) | | Total Fair
Value | |
J.P. Morgan
Chase
Bank N.A. | | EUR | (1
| ) 4,282,016 | | May 14,
2015
| | | 0.010
| %(3) | | The EURO STOXX 50
Index
| | $ | —
| | | $ | (170,159
| ) | | $ | (170,159
| ) | |
(1) EUR Euro
(2) For the fiscal year ended October 31, 2014, the average notional value of total return swap contracts for Absolute Return Multi-Manager was $6,443,346.
(3) 1 month EURIBOR minus 0.40% at October 15, 2015.
Long Short Multi-Manager
| | | | | | | Rate Type | | | | | | | | | |
Swap
Counterparty | | Notional
Amount(1) | | Termination
Date | | Variable-rate
Payments
Made/
(Received)
by the Fund | | Reference
Entity | | Accrued Net
Interest
Receivable
(Payable) | | Unrealized
Appreciation
(Depreciation) | | Upfront
Payments
Made
(Received) | | Total
Fair
Value | |
J.P. Morgan
Chase
Bank N.A. | | $ | 159,205
| | | April 2,
2015
| | Various
0.156 to
0.157%(2) | | AMBEV SA
| | $ | (141
| ) | | $ | (13,191
| ) | | $ | (194
| ) | | $ | (13,526
| ) | |
J.P. Morgan
Chase
Bank N.A. | | | 34,522
| | | April 10,
2015
| | | 0.154
| (3) | | Kia Motors
Corp.
| | | (15
| ) | | | (2,497
| ) | | | —
| | | | (2,512
| ) | |
J.P. Morgan
Chase
Bank N.A. | | | 83,309
| | | February 23,
2015
| | Various
0.156 to
0.157(4) | | Piraeus
Bank SA
| | | (208
| ) | | | (34,156
| ) | | | (571
| ) | | | (34,935
| ) | |
J.P. Morgan
Chase
Bank N.A. | | EUR | (5
| ) 190,111 | | April 7,
2015
| | | (0.010
| )(6) | | The EURO
STOXX 50
Index | | | —
| | | | (7,555
| ) | | | —
| | | | (7,555
| ) | |
Totals | | | | | | | | | | $ | (364 | ) | | $ | (57,399 | ) | | $ | (765 | ) | | $ | (58,528 | ) | |
(1) For the period ended October 31, 2014, the average notional value of total return swap contracts for Long Short Multi-Manager was $180,876
(2) 1 month LIBOR plus 0.60% at October 15, 2014.
(3) 1 month LIBOR plus 0.75% at October 15, 2014.
(4) 1 month LIBOR plus 1.75% at October 15, 2014.
(5) EUR Euro
(6) 1 month EURIBOR minus 0.40% at October 15, 2014.
Forward foreign currency contracts: During the period ended October 31, 2014, each Fund entered into forward foreign currency contracts ("forward contracts") to hedge foreign currency.
A forward contract is an agreement between two parties to buy or sell a specific currency for another at a set price on a future date, and is individually negotiated and privately traded by currency traders and their customers in the interbank market. The market value of a forward contract fluctuates with changes in forward currency exchange rates. Forward contracts are marked to market daily, and the change in value is recorded by a Fund as an unrealized gain or loss. At the consummation of a forward contract to purchase or sell currency, a Fund may either exchange the currencies specified at the maturity of the forward contract or enter into a closing transaction involving the purchase or sale of an offsetting forward contract. Closing transactions with respect to forward contracts are usually performed with the counterparty to the original forward contract. The gain or loss arising from the difference between the U.S. dollar cost of the original contract and the value of the foreign currency in U.S. dollars upon closing a contract is included in "Net realized gain (loss) from forward foreign currency contracts" in the Statements of Operations. These contracts may involve market risk in excess of the unrealized gain or loss reflected in a Fund's Statements of Assets and Liabilities. In addition, a Fund could be exposed to risk if the counterparties are unable to meet the terms of the contracts or if the value of the currency changes unfavorably to the U.S. dollar.
At October 31, 2014, open forward contracts for each Fund were as follows:
Absolute Return Multi-Manager
Buy | | Counterparty | | Contracts to
Receive | | In Exchange
For | | Settlement
Date | | Net Unrealized
Appreciation
(Depreciation) | |
Australian Dollar | | J.P. Morgan Chase Bank N.A. | | | 8,507,725 | �� | | $ | 7,600,895 | | | 11/20/14 | | $ | (122,632 | ) | |
Czech Koruna | | J.P. Morgan Chase Bank N.A. | | | 41,918,999 | | | | 1,931,286 | | | 11/20/14 | | | (42,698 | ) | |
Euro | | J.P. Morgan Chase Bank N.A. | | | 10,701,426 | | | | 13,606,141 | | | 11/20/14 | | | (194,221 | ) | |
Japanese Yen | | J.P. Morgan Chase Bank N.A. | | | 3,390,015,151 | | | | 31,876,283 | | | 11/20/14 | | | (1,692,374 | ) | |
Norwegian Krone | | J.P. Morgan Chase Bank N.A. | | | 8,623,346 | | | | 1,318,066 | | | 11/20/14 | | | (40,307 | ) | |
Pound Sterling | | J.P. Morgan Chase Bank N.A. | | | 658,950 | | | | 1,059,945 | | | 11/20/14 | | | (5,965 | ) | |
Pound Sterling | | J.P. Morgan Chase Bank N.A. | | | 19,000 | | | | 30,862 | | | 12/03/14 | | | (475 | ) | |
South African Rand | | J.P. Morgan Chase Bank N.A. | | | 57,799,100 | | | | 5,318,049 | | | 11/20/14 | | | (91,948 | ) | |
Swedish Krona | | J.P. Morgan Chase Bank N.A. | | | 15,220,000 | | | | 2,086,678 | | | 11/28/14 | | | (25,404 | ) | |
Swiss Franc | | J.P. Morgan Chase Bank N.A. | | | 1,732,302 | | | | 1,806,140 | | | 11/20/14 | | | (5,472 | ) | |
Total | | | | | | | | | | $ | (2,221,496 | ) | |
Sell | | Counterparty | | Contracts to
Deliver | | In Exchange
For | | Settlement
Date | | Net Unrealized
Appreciation
(Depreciation) | |
Australian Dollar | | J.P. Morgan Chase Bank N.A. | | | 11,752,125 | | | $ | 10,701,398 | | | 11/20/14 | | $ | 371,318 | | |
Australian Dollar | | J.P. Morgan Chase Bank N.A. | | | 3,960,000 | | | | 3,515,353 | | | 11/28/14 | | | 36,386 | | |
Brazilian Real | | J.P. Morgan Chase Bank N.A. | | | 11,872,700 | | | | 4,759,551 | | | 11/20/14 | | | (7,283 | ) | |
Canadian Dollar | | J.P. Morgan Chase Bank N.A. | | | 3,944,095 | | | | 3,559,639 | | | 11/20/14 | | | 61,520 | | |
Czech Koruna | | J.P. Morgan Chase Bank N.A. | | | 41,918,999 | | | | 1,918,737 | | | 11/20/14 | | | 30,150 | | |
Euro | | J.P. Morgan Chase Bank N.A. | | | 20,536,167 | | | | 27,187,946 | | | 11/20/14 | | | 1,450,308 | | |
Euro | | J.P. Morgan Chase Bank N.A. | | | 8,340,000 | | | | 10,637,671 | | | 11/28/14 | | | 184,779 | | |
Euro | | J.P. Morgan Chase Bank N.A. | | | 502,000 | | | | 650,472 | | | 12/03/14 | | | 21,273 | | |
Hong Kong Dollar | | J.P. Morgan Chase Bank N.A. | | | 26,891,204 | | | | 3,470,020 | | | 11/20/14 | | | 2,429 | | |
Japanese Yen | | J.P. Morgan Chase Bank N.A. | | | 10,685,946,456 | | | | 103,904,638 | | | 11/20/14 | | | 8,759,450 | | |
Korean Won | | J.P. Morgan Chase Bank N.A. | | | 937,150,500 | | | | 867,844 | | | 11/20/14 | | | (8,451 | ) | |
Norwegian Krone | | J.P. Morgan Chase Bank N.A. | | | 8,623,346 | | | | 1,302,256 | | | 11/20/14 | | | 24,497 | | |
Pound Sterling | | J.P. Morgan Chase Bank N.A. | | | 470,011 | | | | 762,593 | | | 11/20/14 | | | 10,819 | | |
Pound Sterling | | J.P. Morgan Chase Bank N.A. | | | 556,000 | | | | 898,807 | | | 12/03/14 | | | 9,584 | | |
Sell | | Counterparty | | Contracts to
Deliver | | In Exchange
For | | Settlement
Date | | Net Unrealized
Appreciation
(Depreciation) | |
South African Rand | | J.P. Morgan Chase Bank N.A. | | | 85,276,368 | | | $ | 7,855,577 | | | 11/20/14 | | $ | 145,025 | | |
Swiss Franc | | J.P. Morgan Chase Bank N.A. | | | 1,732,302 | | | | 1,883,946 | | | 11/20/14 | | | 83,278 | | |
Total | | | | | | | | | | $ | 11,175,082 | | |
Long Short Multi-Manager
Buy | | Counterparty | | Contracts to
Receive | | In Exchange
For | | Settlement
Date | | Net Unrealized
Appreciation
(Depreciation) | |
Australian Dollar | | J.P. Morgan Chase Bank N.A. | | | 356,500 | | | $ | 318,534 | | | 11/20/14 | | $ | (5,172 | ) | |
Czech Koruna | | J.P. Morgan Chase Bank N.A. | | | 1,701,021 | | | | 78,369 | | | 11/20/14 | | | (1,733 | ) | |
Euro | | J.P. Morgan Chase Bank N.A. | | | 438,938 | | | | 558,257 | | | 11/20/14 | | | (8,143 | ) | |
Japanese Yen | | J.P. Morgan Chase Bank N.A. | | | 178,616,607 | | | | 1,681,913 | | | 11/20/14 | | | (91,552 | ) | |
Norwegian Krone | | J.P. Morgan Chase Bank N.A. | | | 350,217 | | | | 53,535 | | | 11/20/14 | | | (1,642 | ) | |
Pound Sterling | | J.P. Morgan Chase Bank N.A. | | | 33,024 | | | | 53,363 | | | 11/20/14 | | | (541 | ) | |
South African Rand | | J.P. Morgan Chase Bank N.A. | | | 2,390,400 | | | | 219,939 | | | 11/20/14 | | | (3,803 | ) | |
Swedish Krona | | J.P. Morgan Chase Bank N.A. | | | 903,000 | | | | 123,802 | | | 11/28/14 | | | (1,507 | ) | |
Swiss Franc | | J.P. Morgan Chase Bank N.A. | | | 70,424 | | | | 73,426 | | | 11/20/14 | | | (222 | ) | |
Total | | | | | | | | | | $ | (114,315 | ) | |
| | | | | | | | | | | | | | |
Sell | | Counterparty | | Contracts to
Deliver | | In Exchange
For | | Settlement
Date | | Net Unrealized
Appreciation
(Depreciation) | |
Australian Dollar | | J.P. Morgan Chase Bank N.A. | | | 489,000 | | | $ | 445,420 | | | 11/20/14 | | $ | 15,590 | | |
Australian Dollar | | J.P. Morgan Chase Bank N.A. | | | 235,000 | | | | 208,613 | | | 11/28/14 | | | 2,159 | | |
Canadian Dollar | | J.P. Morgan Chase Bank N.A. | | | 152,210 | | | | 137,274 | | | 11/20/14 | | | 2,275 | | |
Czech Koruna | | J.P. Morgan Chase Bank N.A. | | | 1,701,021 | | | | 77,859 | | | 11/20/14 | | | 1,223 | | |
Euro | | J.P. Morgan Chase Bank N.A. | | | 806,478 | | | | 1,066,879 | | | 11/20/14 | | | 56,133 | | |
Euro | | J.P. Morgan Chase Bank N.A. | | | 495,000 | | | | 631,373 | | | 11/28/14 | | | 10,967 | | |
Hong Kong Dollar | | J.P. Morgan Chase Bank N.A. | | | 1,130,900 | | | | 145,930 | | | 11/20/14 | | | 102 | | |
Japanese Yen | | J.P. Morgan Chase Bank N.A. | | | 423,614,662 | | | | 4,120,418 | | | 11/20/14 | | | 348,651 | | |
Norwegian Krone | | J.P. Morgan Chase Bank N.A. | | | 350,217 | | | | 52,888 | | | 11/20/14 | | | 995 | | |
Pound Sterling | | J.P. Morgan Chase Bank N.A. | | | 26,100 | | | | 42,667 | | | 11/20/14 | | | 921 | | |
South African Rand | | J.P. Morgan Chase Bank N.A. | | | 3,525,664 | | | | 324,829 | | | 11/20/14 | | | 6,045 | | |
Swiss Franc | | J.P. Morgan Chase Bank N.A. | | | 70,424 | | | | 76,590 | | | 11/20/14 | | | 3,386 | | |
Total | | | | | | | | | | $ | 448,447 | | |
For the period ended October 31, 2014, Absolute Return Multi-Manager's and Long Short Multi-Manager's investments in forward contracts had an average value of $85,830,160 and $3,323,374, respectively.
Options: Premiums received by a Fund upon writing a covered call option or a put option are recorded in the liability section of the Statement of Assets and Liabilities and are subsequently adjusted to the current market value. When an option is exercised, closed, or expired, a Fund realizes a gain or loss and the liability is eliminated.
When writing a covered call option, a Fund, in return for the premium, gives up the opportunity for profit from a price increase in the underlying security above the exercise price, but conversely retains the risk of loss should the price of the security decline. When writing a put option, a Fund, in return for the premium, takes the risk that it must purchase the underlying security at a price that may be higher than the current market price of the security. If
a covered call or put option that a Fund has written expires unexercised, the Fund will realize a gain in the amount of the premium. All securities covering outstanding options are held in escrow by the custodian bank.
Written option transactions were used in an attempt to generate incremental returns for Absolute Return Multi-Manager and Long Short Multi-Manager for the period ended October 31, 2014. Written option transactions for Absolute Return Multi-Manager and Long Short Multi-Manager for the period ended October 31, 2014 were:
Absolute Return Multi-Manager
| | | Number of
Contracts | | Value when
written | |
Outstanding at October 31, 2013 | | | 7,896 | | | $ | 2,236,061 | | |
Options written | | | 125,132 | | | | 16,706,115 | | |
Options terminated in closing
purchase transactions | | | (46,641 | ) | | | (7,417,673 | ) | |
Options exercised | | | (788 | ) | | | (99,968 | ) | |
Options expired | | | (56,463 | ) | | | (8,304,003 | ) | |
Outstanding at October 31, 2014 | | | 29,136 | | | $ | 3,120,532 | | |
Long Short Multi-Manager
| | | Number of
Contracts | | Value when
written | |
Outstanding at October 31, 2013 | | | — | | | $ | — | | |
Options written | | | 12 | | | | 1,219 | | |
Options terminated in closing
purchase transactions | | | (12 | ) | | | (1,219 | ) | |
Options exercised | | | — | | | | — | | |
Options expired | | | — | | | | — | | |
Outstanding at October 31, 2014 | | | — | | | $ | — | | |
For the period ended October 31, 2014, Absolute Return Multi-Manager and Long Short Multi-Manager had an average market value of $(1,523,666) and $0, respectively, in written options.
Premiums paid by a Fund upon purchasing a covered call or put option are recorded in the assets section of the Statement of Assets and Liabilities and are subsequently adjusted to the current market value. When an option is exercised, closed, or expired, a Fund realizes a gain or loss and the asset is eliminated.
For purchased call options, a Fund's loss is limited to the amount of the option premium paid.
Purchased option transactions were used in an attempt to manage or adjust the risk profile and the investment exposure of each Fund to certain securities and enhance returns for the period ended October 31, 2014. Purchased option transactions for each Fund for the period ended October 31, 2014 were:
Absolute Return Multi-Manager
| | | Number of
Contracts | | Value when
Purchased | |
Outstanding at October 31, 2013 | | | 9,528 | | | $ | 3,995,043 | | |
Options purchased | | | 158,490 | | | | 38,561,584 | | |
Options terminated in closing
sale transactions | | | (53,093 | ) | | | (17,241,992 | ) | |
Options exercised | | | (217 | ) | | | (189,090 | ) | |
Options expired | | | (73,883 | ) | | | (15,865,885 | ) | |
Outstanding at October 31, 2014 | | | 40,825 | | | $ | 9,259,660 | | |
Long Short Multi-Manager
| | | Number of
Contracts | | Value when
Purchased | |
Outstanding at October 31, 2013 | | | — | | | $ | — | | |
Options purchased | | | 45 | | | | 21,318 | | |
Options terminated in closing
sale transactions | | | (5 | ) | | | (4,873 | ) | |
Options exercised | | | — | | | | — | | |
Options expired | | | (40 | ) | | | (16,445 | ) | |
Outstanding at October 31, 2014 | | | — | | | $ | — | | |
For the period ended October 31, 2014, Absolute Return Multi-Manager and Long Short Multi-Manager had an average market value of $4,213,985 and $644 in purchased options, respectively.
At October 31, 2014, the Funds had the following derivatives (which did not qualify as hedging instruments under ASC 815), grouped by primary risk exposure:
Absolute Return Multi-Manager
Asset Derivatives
Derivative Type | | Statement of
Assets and
Liabilities Location | | Credit Risk | | Currency Risk | | Equity Risk | | Total | |
Swap contracts | | Swaps, at value | | $ | 1,576,132 | | | $ | — | | | $ | — | | | $ | 1,576,132 | | |
| Forward contracts | | Receivable for open forward
foreign currency
contracts | | | | | 11,190,816 | | | | — | | | | 11,190,816 | | |
Option contracts purchased | | Investments in securities,
at value | | | — | | | | — | | | | 6,468,875 | | | | 6,468,875 | | |
Total Value—Assets | | | | $ | 1,576,132 | | | $ | 11,190,816 | | | $ | 6,468,875 | | | $ | 19,235,823 | | |
Liability Derivatives
Derivative Type | | Statement of
Assets and
Liabilities Location | | Credit Risk | | Currency Risk | | Equity Risk | | Total | |
Swap contracts | | Swaps, at value | | $ | (338,661 | ) | | $ | — | | | $ | (4,941,449 | ) | | $ | (5,280,110 | ) | |
| Forward contracts | | Payable for open forward
foreign currency
contracts | | | | | (2,237,230 | ) | | | — | | | | (2,237,230 | ) | |
Option contracts written | | Written options, | | | — | | | | — | | | | (2,239,676 | ) | | | (2,239,676
at value | ) | |
Total Value—Liabilities | | | | $ | (338,661 | ) | | $ | (2,237,230 | ) | | $ | (7,181,125 | ) | | $ | (9,757,016 | ) | |
Long Short Multi-Manager
Asset Derivatives
| Derivative Type | | Statement of
Assets and
Liabilities Location | | Foreign
Currency Risk | | Equity Risk | | Total | |
Swap contracts | | Swaps, at value | | $ | — | | | $ | 43,238 | | | $ | 43,238 | | |
| Forward contracts | | Receivable for open forward
foreign currency
contracts | | | 448,447 | | | | — | | | | 448,447 | | |
Total Value—Assets | | | | $ | 448,447 | | | $ | 43,238 | | | $ | 491,685 | | |
Liability Derivatives
| Derivative Type | | Statement of
Liabilities Location | | Currency Risk | | Assets and
Equity Risk | | Foreign
Total | |
Swap contracts | | Swaps, at value | | $ | — | | | $ | (58,528 | ) | | $ | (58,528 | ) | |
| Forward contracts | | Payable for open forward
foreign currency
contracts | | | (114,315 | ) | | | — | | | | (114,315 | ) | |
Total Value—Liabilities | | | | $ | (114,315 | ) | | $ | (58,528 | ) | | $ | (172,843 | ) | |
The impact of the use of these derivative instruments on the Statements of Operations during the period ended October 31, 2014, was as follows:
Absolute Return Multi-Manager
Realized Gain (Loss)
| Derivative Type | | Statement of
Operations Location | | Credit Risk | | Currency Risk | | Equity Risk | | Total | |
Forward contracts | | Net realized gain (loss) on:
forward foreign
currency contracts | | $ | — | | | $ | 380,626 | | | $ | — | | | $ | 380,626 | | |
Futures contracts | | Net realized gain (loss) on:
financial futures contracts | | | — | | | | — | | | | — | | | | — | | |
Option contracts written | | Net realized gain (loss)
on: options contracts written | | | — | | | | — | | | | 11,490,422 | | | | 11,490,422 | | |
Option contracts purchased | | Net realized gain
(loss) on: sales of
investment securities
of unaffiliated issuers | | | — | | | | — | | | | (21,564,232 | ) | | | (21,564,232 | ) | |
Swap contracts | | Net realized gain (loss)
on: swaps contracts | | | 6,168 | | | | — | | | | 1,418,812 | | | | 1,424,980 | | |
Total Realized Gain (Loss) | | | | $ | 6,168 | | | $ | 380,626 | | | $ | (8,654,998 | ) | | $ | (8,268,204 | ) | |
Change in Appreciation (Depreciation)
| Derivative Type | | Statement of
Operations Location | | Credit Risk | | Currency Risk | | Equity Risk | | Total | |
Forward contracts | | Change in net unrealized
appreciation (depreciation)
in value of: forward
foreign currency contracts | | $ | — | | | $ | 9,108,611 | | | $ | — | | | $ | 9,108,611 | | |
Futures contracts | | Change in net unrealized
appreciation (depreciation)
in value of: financial
futures contracts | | | — | | | | — | | | | (38,769 | ) | | | (38,769 | ) | |
Option contracts written | | Change in net unrealized
appreciation (depreciation)
in value of: options
contracts written | | | — | | | | — | | | | (429,887 | ) | | | (429,887 | ) | |
Option contracts purchased | | Change in net unrealized
appreciation (depreciation)
in value of: unaffiliated
investment securities | | | — | | | | — | | | | (641,039 | ) | | | (641,039 | ) | |
Swap contracts | | Change in net unrealized
appreciation (depreciation)
in value of: swap contracts | | | (78,115 | ) | | | — | | | | (4,972,221 | ) | | | (5,050,336 | ) | |
Total Change in Appreciation
(Depreciation) | | | | $ | (78,115 | ) | | $ | 9,108,611 | | | $ | (6,081,916 | ) | | $ | 2,948,580 | | |
Long Short Multi-Manager
Realized Gain (Loss)
| Derivative Type | | Statement of
Operations Location | | Currency Risk | | Equity Risk | | Total | |
Forward contracts | | Net realized gain (loss) on:
forward foreign
currency contracts | | $ | 62,647 | | | $ | — | | | $ | 62,647 | | |
Option contracts written | | Net realized gain (loss)
on: options
contracts written | | | — | | | | 1,219 | | | | 1,219 | | |
Option contracts purchased | | Net realized gain
(loss) on: sales of
investment securities
of unaffiliated issuers | | | — | | | | (18,057 | ) | | | (18,057 | ) | |
Swap contracts | | Net realized gain (loss)
on: swap contracts | | | — | | | | (9,077 | ) | | | (9,077 | ) | |
Total Realized Gain (Loss) | | | | $ | 62,647 | | | $ | (25,915 | ) | | $ | 36,732 | | |
Change in Appreciation (Depreciation) | |
| Derivative Type | | Statement of
Operations Location | | Currency Risk | | Equity Risk | | Total | |
Forward contracts | | Change in net unrealized
appreciation (depreciation)
in value of: forward
foreign currency contracts | | $ | 334,132 | | | $ | — | | | $ | 334,132 | | |
Swap contracts | | Change in net unrealized
appreciation (depreciation)
in value of: swap contracts | | | — | | | | (14,525 | ) | | | (14,525 | ) | |
Total Change in Appreciation (Depreciation) | | | | $ | 334,132 | | | $ | (14,525 | ) | | $ | 319,607 | | |
During the current reporting period, the Funds adopted the provisions of Accounting Standards Update 2011-11 Disclosures about Offsetting Assets and Liabilities ("ASU 2011-11"). ASU 2011-11 is intended to enhance disclosure requirements on the offsetting of financial assets and liabilities. Pursuant to ASU 2011-11, an entity is required to disclose both gross and net information for assets and liabilities related to derivatives, repurchase and reverse repurchase agreements, and securities lending and securities borrowing transactions that are eligible for offset or subject to an enforceable master netting or similar agreement. The Funds' derivative assets and liabilities at fair value by type are reported gross in the Statements of Assets and Liabilities. The following tables present the Funds' derivative assets and liabilities by counterparty, net of amounts available for offset under a master netting agreement and net of the related collateral received by the Funds for assets and pledged by the Funds for liabilities as of October 31, 2014.
Absolute Return Multi-Manager
Description | | Gross Amounts of
Recognized Assets | | Gross Amounts
Offset in the
Statement of
Assets and
Liabilities | | Net Amounts of Assets Presented in the
Statements of Assets and Liabilities | |
Credit default swap contracts | | $ | 1,576,132 | | | $ | — | | | $ | 1,576,132 | | |
Forward contracts | | | 11,190,816 | | | | — | | | | 11,190,816 | | |
Total | | $ | 12,766,948 | | | $ | — | | | $ | 12,766,948 | | |
| | | Gross Amounts Not Offset in the Statements of Assets and Liabilities | |
Counterparty | | Net Amounts of
Assets Presented in
the Statements of
Assets and Liabilities | | Financial
Instruments | | Cash Collateral
Received(a) | | Net Amount(b) | |
J.P. Morgan Chase Bank N.A. | | $ | 12,766,948 | | | $ | (2,237,230 | ) | | $ | — | | | $ | 10,529,718 | | |
Description | | Gross Amounts of
Recognized Liabilities | | Gross Amounts
Offset in the
Statement of
Assets and
Liabilities | | Net Amounts of Assets Presented in the
Statements of Assets and Liabilities | |
Credit default swap contracts | | $ | (338,661 | ) | | $ | — | | | $ | (338,661 | ) | |
Equity swap contracts | | | (4,771,290 | ) | | | — | | | | (4,771,290 | ) | |
Total return swap contracts | | | (170,159 | ) | | | — | | | | (170,159 | ) | |
Forward contracts | | | (2,237,230 | ) | | | — | | | | (2,237,230 | ) | |
Total | | $ | (7,517,340 | ) | | $ | — | | | $ | (7,517,340 | ) | |
| | | Gross Amounts Not Offset in the Statements of Assets and Liabilities | |
Counterparty | | Net Amounts of
Liabilities Presented in
the Statements of
Assets and Liabilities | | Financial
Instruments | | Cash Collateral
Pledged(a) | | Net Amount(c) | |
J.P. Morgan Chase Bank N.A. | | $ | (7,517,340 | ) | | $ | 2,237,230 | | | $ | 5,280,110 | | | $ | — | | |
(a) Collateral received (or pledged) is limited to an amount not to exceed 100% of the net amount of assets (or liabilities) in the tables presented above, for each respective counterparty.
(b) Net Amount represents amounts subject to loss as of October 31,2014, in the event of a counterparty failure.
(c) Net Amount represents amounts under-collateralized by the Fund to each counterparty as of October 31, 2014.
Long Short Multi-Manager
Description | | Gross Amounts of
Recognized Assets | | Gross Amounts
Offset in the
Statement of
Assets and
Liabilities | | Net Amounts of Assets Presented in the
Statements of Assets and Liabilities | |
Equity swap contracts | | $ | 43,238 | | | $ | — | | | $ | 43,238 | | |
Forward contracts | | | 448,447 | | | | — | | | | 448,447 | | |
Total | | $ | 491,685 | | | $ | — | | | $ | 491,685 | | |
| | | Gross Amounts Not Offset in the Statements of Assets and Liabilities | |
Counterparty | | Net Amounts of
Assets Presented in
the Statements of
Assets and Liabilities | | Financial
Instruments | | Cash Collateral
Received(a) | | Net Amount(b) | |
J.P. Morgan Chase Bank N.A. | | $ | 491,685 | | | $ | (114,315 | ) | | $ | — | | | $ | 377,370 | | |
Description | | Gross Amounts of
Recognized Liabilities | | Gross Amounts
Offset in the
Statement of
Assets and
Liabilities | | Net Amounts of Assets Presented in the
Statements of Assets and Liabilities | |
Total return swap contracts | | $ | (58,528 | ) | | $ | — | | | $ | (58,528 | ) | |
Forward contracts | | | (114,315 | ) | | | — | | | | (114,315 | ) | |
Total | | $ | (172,843 | ) | | $ | — | | | $ | (172,843 | ) | |
| | | Gross Amounts Not Offset in the Statements of Assets and Liabilities | |
Counterparty | | Net Amounts of
Liabilities Presented in
the Statements of
Assets and Liabilities | | Financial
Instruments | | Cash Collateral
Pledged(a) | | Net Amount(c) | |
J.P. Morgan Chase Bank N.A. | | $ | (172,843 | ) | | $ | 114,315 | | | $ | 58,528 | | | $ | — | | |
(a) Collateral received (or pledged) is limited to an amount not to exceed 100% of the net amount of assets (or liabilities) in the tables presented above, for each respective counterparty.
(b) Net Amount represents amounts subject to loss as of October 31,2014, in the event of a counterparty failure.
(c) Net Amount represents amounts under-collateralized by the Fund to each counterparty as of October 31, 2014.
14 Indemnifications: Like many other companies, the Trust's organizational documents provide that its officers and trustees are indemnified against certain liabilities arising out of the performance of their duties to the Trust. In addition, both in some of its principal service contracts and in the normal course of its business, the Trust enters into contracts that provide indemnifications to other parties for certain types of losses or liabilities. The Trust's maximum exposure under these arrangements is unknown as this could involve future claims against the Trust.
15 Expense offset arrangement: Absolute Return Multi-Manager has an expense offset arrangement in connection with its custodian contract. For the year ended October 31, 2014, the impact of this arrangement was a reduction of expenses of $438.
16 Other: All net investment income and realized and unrealized capital gains and losses of each Fund are allocated, on the basis of relative net assets, pro rata among its respective classes.
Note B—Management Fees, Administration Fees, Distribution Arrangements, and Other Transactions with Affiliates:
Each Fund retains Management as its investment manager under a Management Agreement. For such investment management services, each Fund pays Management a fee at the annual rate of 1.700% of the first $250 million of the Fund's average daily net assets, 1.675% of the next $250 million, 1.650% of the next $250 million, 1.625% of the next $250 million, 1.600% of the next $500 million, 1.575% of the next $2.5 billion, and 1.550% of average daily net assets in excess of $4 billion. Accordingly, for the period ended October 31, 2014, the fee pursuant to the Management Agreement was equivalent to an annual effective rate of 1.65% and 1.70% of Absolute Return Multi-Manager's and Long Short Multi- Manager's average daily net assets, respectively.
Each Fund retains Management as its administrator under an Administration Agreement. Each Fund pays Management an administration fee at the annual rate of 0.06% of its average daily net assets under this agreement. In addition, Institutional Class of each Fund pays Management an administration fee at the annual rate of 0.09% of its average daily net assets, Class A and Class C of each Fund pays Management an administration fee at the annual rate of 0.20% of its average daily net assets and Class R6 of Absolute Return Multi-Manager pays Management an administration fee at the annual rate of 0.02% of its average daily net assets under this agreement. Additionally, Management retains JPM as its sub-administrator under a Sub-Administration Agreement. Management pays JPM a fee for all services received under the agreement.
Management has contractually agreed to waive current payment of fees and/or reimburse certain expenses of the Institutional Class, Class A, Class C and Class R6 of each Fund that offers those classes so that the total annual operating expenses of those classes do not exceed the expense limitations as detailed in the following table. These undertakings apply to each Fund's direct expenses and exclude interest, taxes, brokerage commissions, acquired fund fees and expenses, extraordinary expenses, as of August 12, 2014, fees related to short sales and dividend and interest expenses relating to short sales, if any; consequently, net expenses may exceed the contractual expense limitations. Each Fund has agreed that each of its respective classes will repay Management for fees and expenses waived or reimbursed for that class provided that repayment does not cause that class' annual operating expenses to exceed its contractual expense limitation in place at the time the fees and expenses were waived or reimbursed. Any such repayment must be made within three years after the year in which Management incurred the expense.
During the period ended October 31, 2014, there was no repayment to Management under these agreements.
At October 31, 2014, contingent liabilities to Management under the agreements were as follows:
| | | | | | | Expenses Reimbursed in
Fiscal Period Ending,
October 31, | |
| | | | | | | 2012 | | 2013 | | 2014 | |
| | | Contractual
Expense | | | | Subject to Repayment until
October 31, | |
Class | | Limitation(1) | | Expiration | | 2015 | | 2016 | | 2017 | |
| Absolute Return Multi-Manager Institutional Class(2) | | | 1.97 | % | | 10/31/17 | | $ | 816,372 | | | $ | 447,655 | | | $ | 759,554 | | |
| Absolute Return Multi-Manager Class A(2) | | | 2.33 | % | | 10/31/17 | | | 24,960 | | | | 165,195 | | | | 316,015 | | |
| Absolute Return Multi-Manager Class C(2) | | | 3.08 | % | | 10/31/17 | | | 4,503 | | | | 23,788 | | | | 71,856 | | |
| Absolute Return Multi-Manager Class R6(2) | | | 1.90 | % | | 10/31/17 | | | — | | | | — | | | | 18,153 | (4) | |
Long Short Multi-Manager Institutional Class | | | 1.97 | % | | 10/31/17 | | | — | | | | — | | | | 459,171 | (3) | |
Long Short Multi-Manager Class A | | | 2.33 | % | | 10/31/17 | | | — | | | | — | | | | 13,772 | (3) | |
Long Short Multi-Manager Class C | | | 3.08 | % | | 10/31/17 | | | — | | | | — | | | | 6,443 | (3) | |
(1) Expense limitation per annum of the respective class' average daily net assets.
(2) Prior to February 28, 2013, the contractual expense limitations were 2.45%, 2.81% and 3.56% for the Institutional Class, Class A and Class C shares, respectively. In addition, from January 2, 2013 to February 28, 2013, Management had voluntarily undertaken to waive current payment of fees and/or reimburse certain expenses of Institutional Class, Class A and Class C shares so that their Operating Expenses were limited to 1.97%, 2.33% and 3.08%, respectively, per annum of their average daily net assets. These voluntarily waived fees are not subject to recovery by Management.
(3) Period from December 19, 2013 (Commencement of Operations) to October 31, 2014.
(4) Period from December 31, 2013 (Commencement of Operations) to October 31, 2014.
NB Alternative Investment Management LLC ("NBAIM"), as the investment adviser to the Funds, is retained by Management to provide day-to-day investment management services, including oversight of each Fund's investments and handling its day-to-day business, including the oversight of the subadvisers' investment activities, and receives a monthly fee paid by Management. As investment manager, Management is responsible for overseeing the investment activities of NBAIM. Several individuals who are officers and/or Trustees of the Trust are also employees of NBAIM and/or Management.
Management and NBAIM engage Blue Jay Capital Management, LLC, Cloud Gate Capital LLC, Cramer Rosenthal McGlynn, LLC, GAMCO Asset Management Inc., Good Hill Partners LP, Lazard Asset Management LLC, Levin Capital Strategies, L.P., Loeb Arbitrage Management LP, MacKay Shields LLC, SLS Management, LLC, Sound Point Capital Management, L.P., and Visium Asset Management, LP as subadvisers of Absolute Return Multi-Manager to provide investment management services. Management and NBAIM engage Blue Jay Capital Management, LLC, Cloud Gate Capital LLC, Cramer Rosenthal McGlynn, LLC, Lazard Asset Management LLC, Levin Capital Strategies, L.P. and SLS Management, LLC as subadvisers of Long Short Multi-Manager to provide investment management services. Management compensates the subadvisers out of the investment advisory fees it receives from each Fund.
Each Fund also has a distribution agreement with Management with respect to each class of shares. Management acts as agent in arranging for the sale of class shares without sales commission or other compensation, except as described below for Class A and Class C shares, and bears advertising and promotion expenses.
However, Management receives fees from Class A and Class C under their distribution plans (each a "Plan", collectively, the "Plans") pursuant to Rule 12b-1 under the 1940 Act. The Plans provide that, as compensation for administrative and other services provided to these classes, Management's activities and expenses related to the sale
and distribution of these classes, and ongoing services provided to investors in these classes, Management receives from each of these respective classes a fee at the annual rate of 0.25% of Class A's and 1.00% of Class C's average daily net assets. Management receives this amount to provide distribution and shareholder servicing for these classes and pays a portion of it to institutions that provide such services. Those institutions may use the payments for, among other purposes, compensating employees engaged in sales and/or shareholder servicing. The amount of fees paid by each class during any year may be more or less than the cost of distribution and other services provided to that class. FINRA rules limit the amount of annual distribution fees that may be paid by a mutual fund and impose a ceiling on the cumulative distribution fees paid. The Trust's Plans comply with those rules.
Class A shares of each Fund are generally sold with an initial sales charge of up to 5.75% and no contingent deferred sales charge ("CDSC"), except that a CDSC of 1.00% applies to certain redemptions made within 18 months following purchases of $1 million or more without an initial sales charge. Class C shares of each Fund are sold with no initial sales charge and a 1.00% CDSC if shares are sold within one year after purchase.
For the period ended October 31, 2014, Management, acting as underwriter and broker-dealer, received net initial sales charges from the purchase of Class A shares and CDSCs from the redemption of Class A and Class C shares as follows:
| | | Underwriter | | Broker-Dealer | |
| | | Net Initial Sales Charges | | CDSC | | Net Initial Sales Charges | | CDSC | |
Absolute Return Multi-Manager Class A | | $ | 83,937 | | | $ | — | | | $ | — | | | $ | — | | |
Absolute Return Multi-Manager Class C | | | — | | | | 27,654 | | | | — | | | | — | | |
Long Short Multi-Manager Class A | | | 285 | | | | — | | | | — | | | | — | | |
Long Short Multi-Manager Class C | | | — | | | | 172 | | | | — | | | | — | | |
Note C—Securities Transactions:
During the period ended October 31, 2014, there were purchase and sale transactions of long-term securities (excluding swap contracts, forward foreign currency contracts, futures contracts and option contracts) as follows:
| | | Purchases | | Securities Sold
Short | | Sales | | Covers on
Securities Sold
Short | |
Absolute Return Multi-Manager | | $ | 3,407,773,151 | | | $ | 1,647,946,099 | | | $ | 2,379,985,171 | | | $ | 1,391,402,032 | | |
Long Short Multi-Manager | | | 45,460,541 | | | | 34,689,747 | | | | 23,623,498 | | | | 25,668,684 | | |
During the period ended October 31, 2014, no brokerage commissions on securities transactions were paid to affiliated brokers.
Note D—Fund Share Transactions:
Share activity for the period ended October 31, 2014 and for the year ended October 31, 2013 was as follows:
| | For the Period Ended October 31, 2014 | | For the Year Ended October 31, 2013 | |
| | | Shares
Sold | | Shares Issued
on Reinvestment
of Dividends
and Distributions | | Shares
Redeemed | | Total | | Shares
Sold | | Shares Issued
on Reinvestment
of Dividends
and Distributions | | Shares
Redeemed | | Total | |
Absolute Return
Multi-Manager | |
Institutional
Class | | | 113,457,577 | | | | 238,078 | | | | (27,639,014 | ) | | | 86,056,641 | | | | 28,662,260 | | | | 17,121 | | | | (2,140,871 | ) | | | 26,538,510 | | |
Class A | | | 37,374,025 | | | | 100,758 | | | | (26,819,529 | ) | | | 10,655,254 | | | | 11,706,206 | | | | 898 | | | | (359,746 | ) | | | 11,347,358 | | |
Class C | | | 7,568,959 | | | | 16,621 | | | | (687,034 | ) | | | 6,898,546 | | | | 1,982,903 | | | | 198 | | | | (20,340 | ) | | | 1,962,761 | | |
Class R6 | | | 3,539,971 | | | | — | | | | (592,168 | ) | | | 2,947,803 | | | | — | | | | — | | | | — | | | | — | | |
Long Short
Multi-Manager | |
Institutional
Class(1) | | | 3,102,815 | | | | — | | | | (136,312 | ) | | | 2,966,503 | | | | — | | | | — | | | | — | | | | — | | |
| Class A(1) | | | 126,914 | | | | — | | | | (43,228 | ) | | | 83,686 | | | | — | | | | — | | | | — | | | | — | | |
| Class C(1) | | | 26,084 | | | | — | | | | (1,777 | ) | | | 24,307 | | | | — | | | | — | | | | — | | | | — | | |
(1) Period from December 19, 2013 (Commencement of Operation) to October 31, 2014.
This page has been left blank intentionally
The following tables include selected data for a share outstanding throughout each period and other performance information derived from the Financial Statements. Per share amounts that round to less than $0.01 or $(0.01) per share are presented as $0.00 or $(0.00), respectively. Ratios that round to less than 0.00% or (0.00%) per share are presented as 0.00% ot (0.00%) respectively. Net Asset amounts with a zero balance may reflect actual amounts rounding to less than $0.1 million. A "—" indicates that the line item was not applicable in the corresponding period.
| | | Net Asset
Value,
Beginning
of Period | | Net
Investment
Income
(Loss)@ | | Net Gains or
Losses on
Securities
(both realized
and
unrealized) | | Total From
Investment
Operations | | Dividends
from Net
Investment
Income | | Distributions
from Net
Realized
Capital
Gains | | Tax
Return of
Capital | | Total
Distributions | | Net Asset
Value,
End of
Period | | Total
Return†† | | Net Assets,
End of
Period
(in millions) | | Ratio
of Gross
Expenses to
Average
Net
Assets# | | Ratio
of Gross
Expenses
to Average
Net Assets
(excluding
dividend
and interest
expenses on
securities
sold short) | | Ratio
of Net
Expenses to
Average
Net
Assets | | Ratio
of Net
Expenses
to Average
Net Assets
(excluding
dividend
and interest
expenses on
securities
sold short) | | Ratio
of Net
Investment
Income/
(Loss) to
Average
Net
Assets | | Portfolio
Turnover
Rate
(including
securities
sold
short) | | Portfolio
Turnover
Rate
(excluding
securities
sold
short) | |
Absolute Return Multi-Manager Fund | |
Institutional Class | |
10/31/14 | | $ | 10.86 | | | $ | (0.01 | ) | | $ | 0.22 | | | $ | 0.21 | | | $ | — | | | $ | (0.07 | ) | | $ | — | | | $ | (0.07 | ) | | $ | 11.00 | | | | 1.96 | % | | $ | 1,275.3 | | | | 2.64 | % | | | 2.13 | % | | | 2.55 | %Ø | | | 2.04 | %Ø | | | (0.10 | %) | | | 329 | % | | | 257 | % | |
10/31/13 | | $ | 10.00 | | | $ | (0.08 | ) | | $ | 1.00 | | | $ | 0.92 | | | $ | (0.02 | ) | | $ | (0.04 | ) | | $ | — | | | $ | (0.06 | ) | | $ | 10.86 | | | | 9.19 | % | | $ | 324.3 | | | | 2.89 | % | | | 2.60 | % | | | 2.30 | %Ø | | | 2.01 | %Ø | | | (0.74 | %) | | | 421 | % | | | 330 | % | |
Period from 5/15/2012^
to 10/31/2012 | | $ | 10.00 | | | $ | (0.08 | ) | | $ | 0.08 | | | $ | — | | | $ | — | | | $ | — | | | $ | — | | | $ | — | | | $ | 10.00 | | | | 0.00 | %** | | $ | 33.2 | | | | 7.86 | %*‡ | | | 7.50 | %*‡ | | | 2.81 | %*‡ | | | 2.45 | %*‡ | | | (1.81 | %)*‡ | | | 270 | %** | | | 213 | %** | |
Class A | |
10/31/14 | | $ | 10.82 | | | $ | (0.04 | ) | | $ | 0.21 | | | $ | 0.17 | | | $ | — | | | $ | (0.07 | ) | | $ | — | | | $ | (0.07 | ) | | $ | 10.92 | | | | 1.60 | % | | $ | 242.2 | | | | 3.02 | % | | | 2.49 | % | | | 2.90 | %Ø | | | 2.38 | %Ø | | | (0.40 | %) | | | 329 | % | | | 257 | % | |
10/31/13 | | $ | 9.99 | | | $ | (0.12 | ) | | $ | 0.99 | | | $ | 0.87 | | | $ | — | | | $ | (0.04 | ) | | $ | — | | | $ | (0.04 | ) | | $ | 10.82 | | | | 8.70 | % | | $ | 124.7 | | | | 3.27 | % | | | 2.99 | % | | | 2.62 | %Ø | | | 2.34 | %Ø | | | (1.17 | %) | | | 421 | % | | | 330 | % | |
Period from 5/15/2012^
to 10/31/2012 | | $ | 10.00 | | | $ | (0.09 | ) | | $ | 0.08 | | | $ | (0.01 | ) | | $ | — | | | $ | — | | | $ | — | | | $ | — | | | $ | 9.99 | | | | (0.10 | %)** | | $ | 1.8 | | | | 8.67 | %*‡ | | | 8.26 | %*‡ | | | 3.22 | %*‡ | | | 2.81 | %*‡ | | | (2.02 | %)*‡ | | | 270 | %** | | | 213 | %** | |
Class C | |
10/31/14 | | $ | 10.71 | | | $ | (0.13 | ) | | $ | 0.21 | | | $ | 0.08 | | | $ | — | | | $ | (0.07 | ) | | $ | — | | | $ | (0.07 | ) | | $ | 10.72 | | | | 0.77 | % | | $ | 95.3 | | | | 3.77 | % | | | 3.26 | % | | | 3.66 | %Ø | | | 3.15 | %Ø | | | (1.18 | %) | | | 329 | % | | | 257 | % | |
10/31/13 | | $ | 9.95 | | | $ | (0.21 | ) | | $ | 1.01 | | | $ | 0.80 | | | $ | — | | | $ | (0.04 | ) | | $ | — | | | $ | (0.04 | ) | | $ | 10.71 | | | | 8.03 | % | | $ | 21.3 | | | | 4.01 | % | | | 3.72 | % | | | 3.38 | %Ø | | | 3.09 | %Ø | | | (1.94 | %) | | | 421 | % | | | 330 | % | |
Period from 5/15/2012^
to 10/31/2012 | | $ | 10.00 | | | $ | (0.13 | ) | | $ | 0.08 | | | $ | (0.05 | ) | | $ | — | | | $ | — | | | $ | — | | | $ | — | | | $ | 9.95 | | | | (0.50 | %)** | | $ | 0.2 | | | | 13.12 | %*‡ | | | 12.74 | %*‡ | | | 3.94 | %*‡ | | | 3.56 | %*‡ | | | (2.86 | %)*‡ | | | 270 | %** | | | 213 | %** | |
See Notes to Financial Highlights
Financial Highlights (cont'd)
| | | Net Asset
Value,
Beginning
of Period | | Net
Investment
Income
(Loss)@ | | Net Gains or
Losses on
Securities
(both realized
and
unrealized) | | Total From
Investment
Operations | | Dividends
from Net
Investment
Income | | Distributions
from Net
Realized
Capital
Gains | | Tax
Return of
Capital | | Total
Distributions | | Net Asset
Value,
End of
Period | | Total
Return†† | | Net Assets,
End of
Period
(in millions) | | Ratio
of Gross
Expenses to
Average
Net
Assets# | | Ratio
of Gross
Expenses
to Average
Net Assets
(excluding
dividend
and interest
expenses on
securities
sold short) | | Ratio
of Net
Expenses to
Average
Net
Assets | | Ratio
of Net
Expenses
to Average
Net Assets
(excluding
dividend
and interest
expenses on
securities
sold short) | | Ratio
of Net
Investment
Income/
(Loss) to
Average
Net
Assets | | Portfolio
Turnover
Rate
(including
securities
sold
short) | | Portfolio
Turnover
Rate
(excluding
securities
sold
short) | |
Absolute Return Multi-Manager (cont'd) | |
Class R6 | |
Period from 12/31/2013^
to 10/31/2014 | | $ | 10.99 | | | $ | 0.01 | | | $ | 0.01 | | | $ | 0.02 | | | $ | — | | | $ | — | | | $ | — | | | $ | — | | | $ | 11.01 | | | | 0.18 | %** | | $ | 32.5 | | | | 2.56 | %* | | | 2.08 | %* | | | 2.46 | %*Ø | | | 1.98 | %*Ø | | | 0.10 | %* | | | 329 | % | | | 257 | % | |
Long Short Multi-Manager | |
Institutional Class | |
Period from 12/19/2013^
to 10/31/2014 | | $ | 10.00 | | | $ | (0.11 | ) | | $ | 0.50 | | | $ | 0.39 | | | $ | — | | | $ | — | | | $ | — | | | $ | — | | | $ | 10.39 | | | | 3.90 | %** | | $ | 30.8 | | | | 5.09 | %*‡ | | | 4.50 | %*‡ | | | 2.64 | %*‡ | | | 2.05 | %*‡ | | | (1.26 | %)*‡ | | | 293 | %** | | | 168 | %** | |
Class A | |
Period from 12/19/2013^
to 10/31/2014 | | $ | 10.00 | | | $ | (0.15 | ) | | $ | 0.51 | | | $ | 0.36 | | | $ | — | | | $ | — | | | $ | — | | | $ | — | | | $ | 10.36 | | | | 3.60 | %** | | $ | 0.9 | | | | 5.87 | %*‡ | | | 5.30 | %*‡ | | | 2.99 | %*‡ | | | 2.42 | %*‡ | | | (1.66 | %)*‡ | | | 293 | %** | | | 168 | %** | |
Class C | |
Period from 12/19/2013^
to 10/31/2014 | | $ | 10.00 | | | $ | (0.21 | ) | | $ | 0.50 | | | $ | 0.29 | | | $ | — | | | $ | — | | | $ | — | | | $ | — | | | $ | 10.29 | | | | 2.90 | %** | | $ | 0.3 | | | | 8.18 | %*‡ | | | 7.59 | %*‡ | | | 3.73 | %*‡ | | | 3.15 | %*‡ | | | (2.34 | %)*‡ | | | 293 | %** | | | 168 | %** | |
See Notes to Financial Highlights
Notes to Financial Highlights
@ Calculated based on the average number of shares outstanding during the fiscal period.
†† Total return based on per share NAV reflects the effects of changes in NAV on the performance of each Fund during the fiscal period. Returns assume income dividends and other distributions, if any, were reinvested, but do not reflect the effect of sales charges. Results represent past performance and do not indicate future results. Current returns may be lower or higher than the performance data quoted. Investment returns and principal may fluctuate and shares when redeemed may be worth more or less than original cost. Total return would have been lower if Management had not reimbursed certain expenses.
# Represents the annualized ratios of net expenses to average daily net assets if Management had not reimbursed certain expenses and/or waived a portion of the investment management fee.
‡ Organization expense, which is a non-recurring expense, is included in these ratios on a non-annualized basis.
** Not annualized.
* Annualized.
^ The date investment operations commenced.
Ø After reimbursement of expenses and/or waiver of a portion of the investment management fee by Management. The Fund is required to calculate an expense ratio without taking into consideration any expense reductions related to expense offset arrangements. Had the Fund not received expense reductions related to expense offset arrangements, the annualized ratios of net expenses to average daily net assets would have been:
| | | Including
Expenses on
Securities
Sold Short | | Excluding
Expenses on
Securities
Sold Short | | Including
Expenses on
Securities
Sold Short | | Excluding
Expenses on
Securities
Sold Short | |
| | | Year Ended
October 31, 2014 | | Year Ended
October 31, 2013 | |
Absolute Return Multi-Manager Fund Institutional Class | | | 2.55 | % | | | 2.04 | % | | | 2.30 | % | | | 2.01 | % | |
Absolute Return Multi-Manager Fund Class A | | | 2.90 | % | | | 2.38 | % | | | 2.63 | % | | | 2.35 | % | |
Absolute Return Multi-Manager Fund Class C | | | 3.66 | % | | | 3.15 | % | | | 3.39 | % | | | 3.10 | % | |
Absolute Return Multi-Manager Fund Class R6 | | | 2.46 | % | | | 1.98 | % | | | — | | | | — | | |
Report of Independent Registered Public Accounting Firm
To the Board of Trustees of Neuberger Berman Alternative Funds and Shareholders of
Neuberger Berman Absolute Return Multi-Manager Fund
Neuberger Berman Long Short Multi-Manager Fund
We have audited the accompanying statements of assets and liabilities of Neuberger Berman Absolute Return Multi-Manager Fund and Neuberger Berman Long Short Multi-Manager Fund (the "Funds"), two of the series constituting the Neuberger Berman Alternative Funds, (the "Funds"), including the schedules of investments, as of October 31, 2014, and the related statement of operations, the statements of changes in net assets, and the financial highlights for each of the periods indicated therein. These financial statements and financial highlights are the responsibility of the Funds' management. Our responsibility is to express an opinion on these financial statements and financial highlights based on our audits.
We conducted our audits in accordance with the standards of the Public Company Accounting Oversight Board (United States). Those standards require that we plan and perform the audit to obtain reasonable assurance about whether the financial statements and financial highlights are free of material misstatement. We were not engaged to perform an audit of the Funds' internal control over financial reporting. Our audits included consideration of internal control over financial reporting as a basis for designing audit procedures that are appropriate in the circumstances, but not for the purpose of expressing an opinion on the effectiveness of the Funds' internal control over financial reporting. Accordingly, we express no such opinion. An audit also includes examining, on a test basis, evidence supporting the amounts and disclosures in the financial statements and financial highlights, assessing the accounting principles used and significant estimates made by management, and evaluating the overall financial statement presentation. Our procedures included confirmation of securities owned as of October 31, 2014 by correspondence with the custodian and others or by other appropriate auditing procedures where replies from others were not received. We believe that our audits provide a reasonable basis for our opinion.
In our opinion, the financial statements and financial highlights referred to above present fairly, in all material respects, the financial position of Neuberger Berman Absolute Return Multi-Manager Fund and Neuberger Berman Long Short Multi-Manager Fund, at October 31, 2014, the results of their operations, the changes in their net assets, and the financial highlights for each of the periods indicated therein, in conformity with U.S. generally accepted accounting principles.

Boston, Massachusetts
December 29, 2014
Investment Manager, Administrator and Distributor
Neuberger Berman Management LLC
605 Third Avenue, 2nd Floor
New York, NY 10158-0180
800.877.9700 or 212.476.8800
Intermediary Client Services 800.366.6264
Sub-Advisers
NB Alternative Investment Management LLC
605 Third Avenue, 22nd Floor
New York, NY 10158
Blue Jay Capital Management, LLC
2121 Avenue of the Stars, Suite 2420
Los Angeles, CA 90067
Cloud Gate Capital LLC
900 North Michigan Avenue, Suite 1600
Chicago, IL 60611
Cramer Rosenthal McGlynn, LLC
520 Madison Avenue, 20th Floor
New York, NY 10022
GAMCO Asset Management Inc.
One Corporate Center
Rye, NY 10580
Good Hill Partners LP
1599 Post Road East
Westport, CT 06880
Lazard Asset Management LLC
30 Rockefeller Plaza
New York, NY 10112
Levin Capital Strategies, L.P.
595 Madison Avenue, 17th Floor
New York, NY 10022
Loeb Arbitrage Management LP
125 Broad
New York, NY 10006
MacKay Shields LLC
1345 Avenue of the Americas, 43rd Floor
New York, NY 10105
SLS Management, LLC
140 West 57th Street, 7th Floor
New York, New York 10019
Sound Point Capital Management, L.P.
375 Park Avenue
New York, NY 10152
Visium Asset Management, LP
888 Seventh Avenue, 22nd Floor
New York, NY 10019
Custodian
J.P. Morgan Chase Bank, N.A.
14201 Dallas Parkway
Dallas, TX 75254
Shareholder Servicing Agent
State Street Bank and Trust Company
2 Avenue de Lafayette
Boston, MA 02111
For Institutional Class Shareholders
Address correspondence to:
Neuberger Berman Management LLC
605 Third Avenue, Mail Drop 2-7
New York, NY 10158-0180
Attn: Intermediary Client Services
800.366.6264
For Class A, Class C and Class R6 Shareholders:
Please contact your investment provider
Legal Counsel
K&L Gates LLP
1601 K Street, NW
Washington, DC 20006-1600
Independent Registered Public Accounting Firm
Ernst & Young LLP
200 Clarendon Street
Boston, MA 02116
The following tables set forth information concerning the trustees ("Trustees") and officers ("Officers") of each of the Funds. All persons named as Trustees and Officers also serve in similar capacities for other funds administered or managed by Management and NBAIM. Each Fund's Statement of Additional Information includes additional information about the Trustees as of the time of the Fund's most recent public offering and is available upon request, without charge, by calling (800) 877-9700.
Information about the Board of Trustees
Name, (Year of Birth),
and Address(1) | | Position(s)
and Length of
Time Served(2) | | Principal Occupation(s)(3) | | Number of
Funds in
Fund Complex
Overseen by
Fund Trustee | | Other Directorships Held
Outside Fund Complex by
Fund Trustee(3) | |
Independent Trustees | |
Faith Colish (1935) | | Trustee since inception | | Counsel, Carter Ledyard & Milburn LLP (law firm) since October 2002; formerly, Attorney-at-Law and President, Faith Colish, A Professional Corporation, 1980 to 2002. | | | 59 | | | Formerly, Director, 1997 to 2003, and Advisory Director, 2003 to 2006, ABA Retirement Funds (formerly, American Bar Retirement Association) (not-for-profit membership corporation). | |
Martha C. Goss (1949) | | Trustee since 2007 | | President, Woodhill Enterprises Inc./Chase Hollow Associates LLC (personal investment vehicle), since 2006; formerly, Consultant, Resources Global Professionals (temporary staffing), 2002 to 2006. | | | 59 | | | Director, American Water (water utility), since 2003; Director, Allianz Life of New York (insurance), since 2005; Director, Berger Group Holdings, Inc. (engineering consulting firm), since 2013; Director, Financial Women's Association of New York (not-for-profit association), since 2003; Trustee Emerita, Brown University, since 1998; Director, Museum of American Finance (not-for-profit), since 2013; formerly, Non-Executive Chair and Director, Channel Reinsurance (financial guaranty reinsurance), 2006 to 2010; formerly, Director, Ocwen Financial Corporation (mortgage servicing), 2005 to 2010; formerly, Director, Claire's Stores, Inc. (retailer), 2005 to 2007; formerly, Director, Parsons Brinckerhoff Inc. (engineering consulting firm), 2007 to 2010; formerly, Director, Bank Leumi (commercial bank), 2005 to 2007; formerly, Advisory Board Member, Attensity (software developer), 2005 to 2007. | |
Name, (Year of Birth),
and Address(1) | | Position(s)
and Length of
Time Served(2) | | Principal Occupation(s)(3) | | Number of
Funds in
Fund Complex
Overseen by
Fund Trustee
| | Other Directorships Held
Outside Fund Complex by
Fund Trustee(3) | |
Michael M. Knetter (1960) | | Trustee since 2007 | | President and Chief Executive Officer, University of Wisconsin Foundation, since October 2010; formerly, Dean, School of Business, University of Wisconsin—Madison; formerly, Professor of International Economics and Associate Dean, Amos Tuck School of Business—Dartmouth College, 1998 to 2002. | | | 59 | | | Board Member, American Family Insurance (a mutual company, not publicly traded), since March 2009; formerly, Trustee, Northwestern Mutual Series Fund, Inc., 2007 to 2011; formerly, Director, Wausau Paper, 2005 to 2011; formerly, Director, Great Wolf Resorts, 2004 to 2009. | |
Howard A. Mileaf (1937) | | Trustee since 1984 | | Retired; formerly, Vice President and General Counsel, WHX Corporation (holding company), 1993 to 2001. | | | 59 | | | Formerly, Director, Webfinancial Corporation (holding company), 2002 to 2008; formerly, Director, WHX Corporation (holding company), 2002 to 2005; formerly, Director, State Theatre of New Jersey (not-for-profit theatre), 2000 to 2005. | |
George W. Morriss (1947) | | Trustee since 2007 | | Adjunct Professor, Columbia University School of International and Public Affairs, since October 2012; formerly, Executive Vice President and Chief Financial Officer, People's Bank, Connecticut (a financial services company), 1991 to 2001. | | | 59 | | | Director and Treasurer, National Association of Corporate Directors, Connecticut Chapter, since 2011; Trustee, Steben Alternative Investment Funds, Steben Select Multi-Strategy Fund and Steben Select Multi-Strategy Master Fund, since 2013; formerly, Manager, Larch Lane Multi-Strategy Fund complex (which consisted of three funds), 2006 to 2011; formerly, Member, NASDAQ Issuers' Affairs Committee, 1995 to 2003. | |
Name, (Year of Birth),
and Address(1) | | Position(s)
and Length of
Time Served(2) | | Principal Occupation(s)(3) | | Number of
Funds in
Fund Complex
Overseen by
Fund Trustee | | Other Directorships Held
Outside Fund Complex by
Fund Trustee(3) | |
Tom D. Seip (1950) | | Trustee since inception; Chairman of the Board since 2008; formerly, Lead Independent Trustee from 2006 to 2008 | | General Partner, Ridgefield Farm LLC (a private investment vehicle); formerly, President and CEO, Westaff, Inc. (temporary staffing), May 2001 to January 2002; formerly, Senior Executive, The Charles Schwab Corporation, 1983 to 1998, including Chief Executive Officer, Charles Schwab Investment Management, Inc.; Trustee, Schwab Family of Funds and Schwab Investments, 1997 to 1998; and Executive Vice President-Retail Brokerage, Charles Schwab & Co., Inc., 1994 to 1997. | | | 59 | | | Director, H&R Block, Inc. (financial services company), since May 2001; Chairman, Governance and Nominating Committee, H&R Block, Inc., since 2011; formerly, Chairman, Compensation Committee, H&R Block, Inc., 2006 to 2010; formerly, Director, Forward Management, Inc. (asset management company), 1999 to 2006. | |
Candace L. Straight (1947) | | Trustee since inception | | Private investor and consultant specializing in the insurance industry; formerly, Advisory Director, Securitas Capital LLC (a global private equity investment firm dedicated to making investments in the insurance sector), 1998 to 2003. | | | 59 | | | Public Member, Board of Governors and Board of Trustees, Rutgers University, since 2011; Director, Montpelier Re Holdings Ltd. (reinsurance company), since 2006; formerly, Director, National Atlantic Holdings Corporation (property and casualty insurance company), 2004 to 2008; formerly, Director, The Proformance Insurance Company (property and casualty insurance company), 2004 to 2008; formerly, Director, Providence Washington Insurance Company (property and casualty insurance company), 1998 to 2006; formerly, Director, Summit Global Partners (insurance brokerage firm), 2000 to 2005. | |
Peter P. Trapp (1944) | | Trustee since inception | | Retired; formerly, Regional Manager for Mid-Southern Region, Ford Motor Credit Company, September 1997 to 2007; formerly, President, Ford Life Insurance Company, April 1995 to August 1997. | | | 59 | | | None. | |
Name, (Year of Birth),
and Address(1) | | Position(s)
and Length of
Time Served(2) | | Principal Occupation(s)(3) | | Number of
Funds in
Fund Complex
Overseen by
Fund Trustee | | Other Directorships Held
Outside Fund Complex by
Fund Trustee(3) | |
Trustees who are "Interested Persons" | |
Joseph V. Amato* (1962) | | Trustee since 2009 | | President and Director, Neuberger Berman Group LLC, since 2009; President and Chief Executive Officer, Neuberger and Neuberger Berman Holdings LLC (including its predecessor, Neuberger Berman Inc.), since 2007; Chief Investment Officer (Equities) and Managing Director, Management, since 2009; Managing Director, Neuberger Berman Fixed Income LLC ("NBFI"), since 2007; Board member of NBFI since 2006; formerly, Global Head of Asset Management of Lehman Brothers Holdings Inc.'s ("LBHI") Investment Management Division, 2006 to 2009; formerly, member of LBHI's Investment Management Division's Executive Management Committee, 2006 to 2009; formerly, Managing Director, Lehman Brothers Inc. ("LBI"), 2006 to 2008; formerly, Chief Recruiting and Development Officer, LBI, 2005 to 2006; formerly, Global Head of LBI's Equity Sales and a Member of its Equities Division Executive Committee, 2003 to 2005. | | | 59 | | | Member of Board of Advisors, McDonough School of Business, Georgetown University, since 2001; Member of New York City Board of Advisors, Teach for America, since 2005; Trustee, Montclair Kimberley Academy (private school), since 2007; Member of Board of Regents, Georgetown University, since 2013. | |
Robert Conti* (1956) | | Chief Executive Officer, President and Trustee since 2008; prior thereto, Executive Vice President in 2008 and Vice President from inception to 2008 | | Managing Director, Neuberger, since 2007; Managing Director, NBFI, since 2009; formerly, Senior Vice President, Neuberger, 2003 to 2006; formerly, Vice President, Neuberger, 1999 to 2003; President and Chief Executive Officer, Management, since 2008; formerly, Senior Vice President, Management, 2000 to 2008. | | | 59 | | | Director, Staten Island Mental Health Society, since 1994; formerly, Chairman of the Board, Staten Island Mental Health Society, 2008 to 2011. | |
(1) The business address of each listed person is 605 Third Avenue, New York, New York 10158.
(2) Pursuant to the Trust's Trust Instrument, each of these Trustees shall hold office for life or until his or her successor is elected or the Trust terminates; except that (a) any Trustee may resign by delivering a written resignation; (b) any Trustee may be removed with or without cause at any time by a written instrument signed by at least two-thirds of the other Trustees; (c) any Trustee who requests to be retired, or who has become unable to serve, may be retired by a written instrument signed by a majority of the other Trustees; and (d) any Trustee may be removed at any shareholder meeting by a vote of at least two-thirds of the outstanding shares.
(3) Except as otherwise indicated, each individual has held the positions shown for at least the last five years.
* Indicates a Trustee who is an "interested person" within the meaning of the 1940 Act. Mr. Amato and Mr. Conti are interested persons of the Trust by virtue of the fact that each is an officer of Management, Neuberger and/or their affiliates.
Information about the Officers of the Trust
Name, (Year of Birth),
and Address(1) | | Position(s)
and Length of
Time Served(2) | | Principal Occupation(s)(3) | |
Andrew B. Allard (1961) | | Chief Legal Officer since 2013 (only for purposes of sections 307 and 406 of the Sarbanes-Oxley Act of 2002) and Anti-Money Laundering Compliance Officer since 2002 | | General Counsel and Senior Vice President, Management, since 2013; Senior Vice President, Neuberger, since 2006 and Employee since 1999; Deputy General Counsel, Neuberger, since 2004; formerly, Vice President, Neuberger, 2000 to 2005; formerly, Employee, Management, 1994 to 1999; Chief Legal Officer since 2013 (only for purposes of sections 307 and 406 of the Sarbanes-Oxley Act of 2002), ten registered investment companies for which Management acts as investment manager and administrator (ten since 2013); Anti-Money Laundering Compliance Officer, ten registered investment companies for which Management acts as investment manager and administrator (six since 2002, one since 2003, one since 2005, one since 2006 and one since 2013). | |
Claudia A. Brandon (1956) | | Executive Vice President since 2008 and Secretary since inception | | Senior Vice President, Neuberger, since 2007 and Employee since 1999; Senior Vice President, Management, since 2008 and Assistant Secretary since 2004; formerly, Vice President, Neuberger, 2002 to 2006; formerly, Vice President-Mutual Fund Board Relations, Management, 2000 to 2008; formerly, Vice President, Management, 1986 to 1999 and Employee 1984 to 1999; Executive Vice President, ten registered investment companies for which Management acts as investment manager and administrator (nine since 2008 and one since 2013); Secretary, ten registered investment companies for which Management acts as investment manager and administrator (three since 1985, three since 2002, one since 2003, one since 2005, one since 2006 and one since 2013). | |
Agnes Diaz (1971) | | Vice President since 2013 | | Senior Vice President, Neuberger, since 2012; Employee, Management, since 1996; formerly, Vice President, Neuberger, 2007 to 2012; Vice President, ten registered investment companies for which Management acts as investment manager and administrator (ten since 2013). | |
Anthony DiBernardo (1979) | | Assistant Treasurer since 2011 | | Senior Vice President, Neuberger, since 2014; Employee, Management, since 2003; formerly, Vice President, Neuberger, 2009 to 2014; Assistant Treasurer, ten registered investment companies for which Management acts as investment manager and administrator (nine since 2011 and one since 2013). | |
Sheila R. James (1965) | | Assistant Secretary since inception | | Vice President, Neuberger, since 2008 and Employee since 1999; formerly, Assistant Vice President, Neuberger, 2007; formerly, Employee, Management, 1991 to 1999; Assistant Secretary, ten registered investment companies for which Management acts as investment manager and administrator (six since 2002, one since 2003, one since 2005, one since 2006 and one since 2013). | |
Brian Kerrane (1969) | | Vice President since 2008 | | Managing Director, Neuberger, since 2014; Vice President, Management, since 2008 and Employee since 1991; formerly, Senior Vice President, Neuberger, 2006 to 2014; Vice President, ten registered investment companies for which Management acts as investment manager and administrator (nine since 2008 and one since 2013). | |
Name, (Year of Birth),
and Address(1) | | Position(s)
and Length of
Time Served(2) | | Principal Occupation(s)(3) | |
Kevin Lyons (1955) | | Assistant Secretary since inception | | Assistant Vice President, Neuberger, since 2008 and Employee since 1999; formerly, Employee, Management, 1993 to 1999; Assistant Secretary, ten registered investment companies for which Management acts as investment manager and administrator (seven since 2003, one since 2005, one since 2006 and one since 2013). | |
Owen F. McEntee, Jr. (1961) | | Vice President since 2008 | | Vice President, Neuberger, since 2006; Employee, Management, since 1992; Vice President, ten registered investment companies for which Management acts as investment manager and administrator (nine since 2008 and one since 2013). | |
John M. McGovern (1970) | | Treasurer and Principal Financial and Accounting Officer since inception | | Senior Vice President, Neuberger, since 2007; Employee, Management, since 1993; Treasurer and Principal Financial and Accounting Officer, ten registered investment companies for which Management acts as investment manager and administrator (eight since 2005, one since 2006 and one since 2013); formerly, Vice President, Neuberger, 2004 to 2006; formerly, Assistant Treasurer, eight registered investment companies for which Management acts as investment manager and administrator, 2002 to 2005. | |
Frank Rosato (1971) | | Assistant Treasurer since inception | | Vice President, Neuberger, since 2006; Employee, Management, since 1995; Assistant Treasurer, ten registered investment companies for which Management acts as investment manager and administrator (eight since 2005, one since 2006 and one since 2013). | |
Neil S. Siegel (1967) | | Vice President since 2008 | | Managing Director, Management, since 2008; Managing Director, Neuberger, since 2006; Managing Director, NBFI, since 2011; formerly, Senior Vice President, Neuberger, 2004 to 2006; Vice President, ten registered investment companies for which Management acts as investment manager and administrator (nine since 2008 and one since 2013). | |
Chamaine Williams (1971) | | Chief Compliance Officer since inception | | Senior Vice President, Neuberger, since 2007; Chief Compliance Officer, Management, since 2006; Chief Compliance Officer, ten registered investment companies for which Management acts as investment manager and administrator (eight since 2005, one since 2006 and one since 2013); formerly, Senior Vice President, LBI, 2007 to 2008; formerly, Vice President, LBI, 2003 to 2006; formerly, Chief Compliance Officer, Lehman Brothers Asset Management Inc., 2003 to 2007; formerly, Chief Compliance Officer, Lehman Brothers Alternative Investment Management LLC, 2003 to 2007. | |
(1) The business address of each listed person is 605 Third Avenue, New York, New York 10158.
(2) Pursuant to the By-Laws of the Trust, each officer elected by the Trustees shall hold office until his or her successor shall have been elected and qualified or until his or her earlier death, inability to serve, or resignation. Officers serve at the pleasure of the Trustees and may be removed at any time with or without cause.
(3) Except as otherwise indicated, each individual has held the positions shown for at least the last five years.
Proxy Voting Policies and Procedures
A description of the policies and procedures that the Trust uses to determine how to vote proxies relating to portfolio securities is available, without charge, by calling 800-877-9700 (toll-free) and on the Securities and Exchange Commission's website, at www.sec.gov. Information regarding how the Trust voted proxies relating to portfolio securities during the most recent 12-month period ended June 30 is also available upon request, without charge, by calling 800-877-9700 (toll-free), on the Securities and Exchange Commission's website at www.sec.gov, and on Management's website at www.nb.com.
Quarterly Portfolio Schedule
The Trust files a complete schedule of portfolio holdings for each Fund with the Securities and Exchange Commission for the first and third quarters of each fiscal year on Form N-Q. The Trust's Forms N-Q are available on the Securities and Exchange Commission's website at www.sec.gov and may be reviewed and copied at the Securities and Exchange Commission's Public Reference Room in Washington, DC. Information on the operation of the Public Reference Room may be obtained by calling 800-SEC-0330. The information on Form N-Q is available upon request, without charge, by calling 800-877-9700 (toll-free).
Notice to Shareholders
In early 2015 you will receive information to be used in filing your 2014 tax returns, which will include a notice of the exact tax status of all distributions paid to you by a Fund during calendar year 2014. Please consult your own tax advisor for details as to how this information should be reflected on your tax returns.
For the period ended October 31, 2014, Absolute Return Multi-Manager designates $4,428,931, or up to the maximum amount of such dividends allowable pursuant to the Internal Revenue Code, as qualified dividend income eligible for reduced tax rates. These lower rates range from 5% to 15% depending upon an individual's tax bracket. Complete information regarding the Fund's distributions during the calendar year 2014 will be reported in conjunction with Form 1099-DIV.
Board Consideration of the Existing Management and Sub-Advisory Agreements
On an annual basis, the Board of Trustees ("Board") of Neuberger Berman Alternative Funds ("Trust"), including the Trustees who are not "interested persons" of Neuberger Berman Management LLC ("Management") (including its affiliates) or the Trust ("Independent Fund Trustees"), considers whether to continue the management agreement with Management ("Management Agreement"), the advisory agreement between NB Alternative Investment Management LLC ("NBAIM") and Management ("Advisory Agreement") and separate sub-advisory agreements among Management, NBAIM and each of the following subadvisers (each a "Subadviser"): Cramer Rosenthal McGlynn, LLC, GAMCO Asset Management, Inc., Good Hill Partners LP, Lazard Asset Management LLC, Levin Capital Strategies, L.P., Loeb Arbitrage Management LP, MacKay Shields LLC, SLS Management, LLC, Sound Point Capital Management, L.P., and Visium Asset Management, LP (each, a "Sub-Advisory Agreement"; collectively with the Management Agreement and Advisory Agreement, the "Agreements") with respect to Neuberger Berman Absolute Return Multi-Manager Fund ("Fund"). At a meeting held on October 6-7, 2014, the Board, including the Independent Fund Trustees, approved the continuation of the Agreements for the Fund.
In evaluating the Agreements, the Board, including the Independent Fund Trustees, reviewed extensive materials provided by Management, NBAIM, and each Subadviser in response to questions submitted by the Board and counsel for the Independent Fund Trustees and met with senior representatives of Management regarding its personnel, operations and financial condition as they relate to the Fund. The annual contract review extends over at least two regular meetings of the Board to ensure that Management and NBAIM have time to respond to any questions the Independent Fund Trustees may have on their initial review of the materials and that the Independent Fund Trustees have time to consider those responses.
In connection with its deliberations, the Board also considered the broad range of information relevant to the annual contract review that is provided to the Board (including its various standing committees) at meetings throughout the year, including investment performance reports and related portfolio information for the Fund, as well as periodic reports on, among other matters, pricing and valuation; brokerage and execution; and compliance, shareholder and other services provided by Management, NBAIM and their affiliates. To assist the Board in its deliberations regarding the annual contract review, the Board has established a Contract Review Committee comprised of Independent Fund Trustees, as well as other committees that focus throughout the year on specific areas relevant to the annual contract review, such as Fund performance or compliance matters.
Throughout the process, the Independent Fund Trustees were advised by counsel that is experienced in Investment Company Act of 1940 matters and that is independent of Management. The Independent Fund Trustees received from independent counsel a memorandum discussing the legal standards for their consideration of the proposed continuation of the Agreements. During the course of the year and during their deliberations regarding the annual contract review, the Contract Review Committee and the Independent Fund Trustees met with such counsel separately from representatives of Management and NBAIM.
In connection with its approval of the continuation of the Agreements, the Board evaluated the overall fairness of the Agreements to the Fund and whether the Agreements were in the best interests of the Fund and its shareholders. The Board considered all factors it deemed relevant with respect to the Fund, including the following factors: (1) the nature, extent, and quality of the services provided by Management, NBAIM and the Subadvisers; (2) the investment performance of the Fund compared to an appropriate market index and a peer group of investment companies, and the contribution of each sleeve to the Fund's overall performance; (3) the costs of the services provided and the loss realized by Management, its affiliates and each Subadviser from their relationship with the Fund; (4) the extent to which economies of scale might be realized as the Fund grows; and (5) whether fee levels reflect any such potential economies of scale for the benefit of investors in the Fund.
While each Trustee may have attributed different weights to the various factors, the Board's determination to approve the continuation of the Agreements was based on a comprehensive consideration of all information provided to the Board throughout the year and specifically in connection with the annual contract review. The Board members did not identify
any particular information or factor that was all-important or controlling. The Board focused on the overall costs and benefits of the Agreements relating to the Fund and, through the Fund, its shareholders.
With respect to the nature, extent and quality of the services provided, the Board considered the investment philosophy and decision-making processes of Management, NBAIM and each Subadviser, and the qualifications, experience and capabilities of and the resources available to the portfolio management personnel of Management, NBAIM and each Subadviser who performs services for the Fund. The Board noted that Management also provides certain administrative services, including fund accounting and compliance oversight. The Board noted that Management and NBAIM, together with the Fund, had obtained from the Securities and Exchange Commission an exemptive order that permitted Management to add or replace subadvisers to the Fund without a shareholder vote, provided the Independent Fund Trustees of the Board approve the new subadviser and certain other steps are taken. In this context, the Board considered Management's and NBAIM's responsibilities for designing an overall investment program for the Fund and then identifying the Subadvisers who will carry out the different portions of that program based on NBAIM's due diligence of those Subadvisers. The Board noted that under the multi-manager arrangement, NBAIM is continually assessing the need for new subadvisers and the appropriateness of potential candidates, and noted the likelihood Management and/or NBAIM would in the future have to due diligence additional subadvisers. The Board noted that NBAIM is responsible for allocating the Fund's portfolio among the various Subadvisers and determining when and how to rebalance the allocations among the Subadvisers in the wake of disparate growth and changes in the markets and the broader economy, subject to Management's general oversight.
The Board further noted that Management and NBAIM are responsible for overseeing the Subadvisers pursuant to the Agreements and related subadviser oversight policies and procedures approved by the Board. Under these procedures, NBAIM is responsible for overseeing the investment performance of the Subadvisers and evaluating the risk and return of each Subadviser and the Fund as a whole, in addition to other significant oversight responsibilities, subject to Management's general oversight. The Board also considered that Management's responsibilities include daily monitoring of investment, operational, enterprise, legal, regulatory and compliance risks as they relate to the Fund, and considered information regarding Management's process for managing risk. In addition, the Board noted the positive compliance history of Management and NBAIM, as no significant compliance problems were reported to the Board with respect to either firm. The Board also considered the experience and staffing of the portfolio management and investment research personnel of NBAIM, and the general structure of the portfolio manager compensation program and whether this structure provides appropriate incentives to act in the best interests of the Fund. The Board also considered the size and scope of the activities necessary to periodically evaluate the compliance programs and other operational aspects of each Subadviser. In addition, the Board considered the scope and compliance history of the compliance programs of Management, NBAIM and each Subadviser, including the Fund's Chief Compliance Officer's and NBAIM's assessment of the compliance programs of the Subadvisers. The Board also considered whether there were any pending lawsuits, enforcement proceedings or regulatory investigations involving Management, NBAIM or any Subadviser, and reviewed information regarding their financial condition, history of operations and any conflicts of interests in managing the Fund. As in past years, the Board also considered the manner in which Management addressed various non-routine matters that arose during the year, some of them a result of developments in the broader fund industry or the regulations governing it. In addition, the Board considered actions taken by Management, NBAIM and the Subadvisers in response to recent market conditions, including actions taken in response to regulatory concerns about changes in fixed-income market liquidity and potential volatility, and considered the overall performance of Management, NBAIM and the Subadvisers in this context.
The Board considered the policies and practices regarding brokerage and allocation of portfolio transactions of each of the Subadvisers and noted that Management and NBAIM monitored the quality of the execution services provided by each Subadviser. The Board also reviewed whether the Subadvisers would use brokers to execute Fund transactions that provide research and other services to the Subadviser, and the types of benefits potentially derived from such services by the Subadviser, the Fund and other clients of the Subadviser.
With respect to investment performance, the Board considered information regarding the Fund's performance on both an absolute basis and relative to an appropriate market index and the average performance of a composite peer group (as
constructed by an independent organization) of investment companies pursuing broadly similar strategies. The Board also considered information regarding each Subadviser's performance. The Board also reviewed the Fund's performance in relation to certain measures of the degree of investment risk undertaken by the Subadvisers. The Board factored into its evaluation of the Fund's performance the limitations inherent in the methodology for constructing peer groups and determining which investment companies should be included in which peer groups. In this regard, the Board noted that performance, especially short-term performance, is only one of the factors that it deems relevant to its consideration of the Fund's Agreements and that, after considering all relevant factors, it may be appropriate to approve the continuation of the Agreements notwithstanding a Subadviser's underperformance.
With respect to the overall fairness of the Agreements, the Board considered the fee structure for the Fund under the Agreements as compared to a peer group of comparable funds and any fall-out benefits likely to accrue to Management and NBAIM or their affiliates from their relationship with the Fund. The Board also considered the profitability of Management and its affiliates from their association with the Fund, profitability broken out between the investment management and administrative portions of the services provided, and year-over-year changes in each of Management's reported expense categories.
The Board reviewed a comparison of the Fund's management fee and overall expense ratio to a peer group of broadly comparable funds. The Board noted that the comparative management fee analysis includes, in the Fund's management fee, the separate administrative fee paid to Management, but it was not clear whether this was the case for all funds in the peer group. The Board considered the mean and median of the management fees and expense ratios of the peer group. Noting that the Fund's management fee was higher than the peer group mean and median, the Board considered whether specific portfolio management, administration or oversight needs contributed to the management fee. The Board noted that Management incurred a loss on the Fund during the review period. In addition, the Board considered the contractual limit on expenses for each class of the Fund. Management indicated that similar comparative information was not available with respect to the amount paid to NBAIM or to each Subadviser. The Board did, however, consider the allocation of duties and responsibilities among Management, NBAIM, and the Subadvisers and, in light of that, the amount of fees retained by each. The Board noted, however, that Management, and not the Fund, pays the fee to NBAIM and the Subadvisers. In this connection, the Board considered whether there are other business arrangements between Management or NBAIM and any Subadviser that could give rise to potential conflicts in the selection of subadvisers. The Board considered the fees the Subadvisers charge for similar products, if any. The Board also considered fees charged to an unregistered fund of funds managed by NBAIM that uses some of the same strategies used by the Fund and noted differences that reduced the usefulness of the comparison. The Board also evaluated any apparent or anticipated economies of scale in relation to the services Management provides to the Fund. The Board considered that the Fund's fee structure provides for a reduction of payments resulting from the use of breakpoints and whether those breakpoints are set at appropriate asset levels. It also considered whether the fee was set at an appropriate level and compared the fee structure to that of the peer group. In concluding that the benefits accruing to Management and its affiliates by virtue of their relationship with the Fund were reasonable in light of the costs of providing the investment advisory and other services and the benefits accruing to the Fund, the Board reviewed specific data as to Management's loss on the Fund for a recent period. The Board also carefully examined Management's cost allocation methodology. It also considered whether any of the Sub-Advisory Agreements will provide for breakpoints in the fees and, as a general matter, the way in which such breakpoints should factor into the fees paid by the Fund. The Board recognized that Management, NBAIM, and the Subadvisers should each be entitled to earn a reasonable level of profits for services they provide to the Fund, and, based on its review, concluded that the reported level of profitability of Management, NBAIM, and the Subadvisers, if any, was reasonable.
Conclusions as to Existing Agreements
In approving the Agreements, the Board concluded that each Agreement is fair and reasonable to the Fund and that approval of the Agreements is in the best interests of the Fund and its shareholders. In reaching this determination, the Board considered that Management, NBAIM, and each Subadviser could be expected to provide a high level of service to the Fund; that the performance of the Fund was satisfactory over time, or, in the case of an underperforming Subadviser,
that it retained confidence in the Subadviser's capabilities to manage the Fund; that the Fund's fee structure appeared to the Board to be reasonable given the nature, extent and quality of services provided; and that the benefits accruing to Management and its affiliates by virtue of their relationship with the Fund were reasonable in light of the costs of providing the investment advisory and other services and the benefits accruing to the Fund. The Board's conclusions may be based in part on its consideration of materials prepared in connection with the approval or continuance of the Agreements in prior years and on the Board's ongoing regular review of Fund performance and operations throughout the year, in addition to material prepared specifically for the most recent annual review of the Agreements.
Board Consideration of Additional Sub-Advisory Agreements
At meetings held on October 6-7, the Board of Trustees ("Board") of Neuberger Berman Alternative Funds ("Trust"), including the Trustees who are not "interested persons" of Neuberger Berman Management LLC ("Management") (including its affiliates) or the Trust ("Independent Fund Trustees"), considered and approved the separate sub-advisory agreements ("Sub-Advisory Agreements") among Management, NB Alternative Investment Management LLC ("NBAIM") and each of Blue Jay Capital Management, LLC and Cloud Gate Capital LLC (each an "Additional Subadviser"), each of which would be responsible for managing a portion of the assets of Neuberger Berman Absolute Return Multi-Manager Fund and Neuberger Berman Long Short Multi-Manager Fund (each a "Fund").
In evaluating the Sub-Advisory Agreements, the Board, including the Independent Trustees, reviewed materials furnished by each Additional Subadviser. In addition, the Board, including the Independent Trustees, met with senior representatives of each Additional Subadviser regarding its personnel and operations. The Independent Trustees were advised by counsel that is experienced in 1940 Act matters and that is independent of Management and NBAIM.
The Board noted that Management and NBAIM, together with the Funds, had received an order from the SEC that permits Management to add or replace subadvisers to the Funds without a shareholder vote, provided the Independent Trustees approve the new subadviser and certain other steps are taken. In this context, the Board considered Management's and NBAIM's responsibilities for designing an overall investment program for each Fund and then identifying the subadvisers who will carry out the different portions of that program based on the NBAIM's due diligence of those subadvisers. The Board further noted that Management and NBAIM, pursuant to their agreements with each Fund and related subadviser oversight policies and procedures approved by the Board, are responsible for overseeing the subadvisers.
The Board evaluated the overall fairness of the Agreements to each Fund and whether the Agreements were in the best interests of each Fund and its shareholders. The Board considered the following factors with respect to each Fund, among others, in connection with its approval of the Sub-Advisory Agreements: (1) the nature, extent, and quality of the services to be provided by each Additional Subadviser; and (2) the expected costs of the services to be provided. In their deliberations, the Board members did not identify any particular information that was all-important or controlling, and each Trustee may have attributed different weights to the various factors.
The Board received and considered information regarding the nature, extent and quality of services to be provided to each Fund by each Additional Subadviser under the Sub-Advisory Agreements. The Board considered the experience and staffing of the portfolio management and investment research personnel of each Additional Subadviser who would perform services for the Funds, as well as the resources available to each. With respect to each Additional Subadviser, the Board reviewed the performance for accounts managed by the Additional Subadviser that were substantially similar in strategy to the strategy the Additional Subadviser will use for the Funds, noting that the accounts may not be subject to the same 1940 Act restrictions as the Funds. The Board considered the policies and practices regarding brokerage and allocation of portfolio transactions of each of the Additional Subadvisers and noted that Management and NBAIM would monitor the quality of the execution services provided by each Additional Subadviser.
The Board also reviewed whether the Additional Subadvisers would use brokers to execute transactions for each Fund that provide research and other services to the Additional Subadviser, and the types of benefits potentially derived from such services by the Additional Subadviser, the Funds and other clients of the Additional Subadviser. The Board also considered the compliance programs and compliance history of each Additional Subadviser, including the Fund's Chief
Compliance Officer's and NBAIM's assessment of the compliance programs of the Additional Subadvisers. The Board also considered whether there were any pending lawsuits, enforcement proceedings or regulatory investigations involving an Additional Subadviser, and reviewed information regarding their financial condition, history of operations and any conflicts of interests in managing the Funds.
With respect to the overall fairness of the Sub-Advisory Agreements, the Board had previously considered each Fund's fee structure as compared to a peer group of comparable funds and any fall-out benefits likely to accrue to Management or its affiliates. Management indicated that similar comparative information was not available with respect to the amount paid to each Additional Subadviser. The Board did, however, consider an estimate of the costs of the services to be provided and estimated profits or losses that would be realized by each Additional Subadviser, as well as the fees each Additional Subadviser charges for similar products. The Board noted, however, that Management, and not the Funds, pays the fee to the Additional Subadvisers and therefore the fees charged by the Additional Subadvisers will not change the overall expenses of each Fund. The Board also considered whether there are other business arrangements between Management or NBAIM and any Additional Subadviser that could give rise to potential conflicts. It considered whether the Sub-Advisory Agreements will or should provide for breakpoints in the fees and, as a general matter, the way in which any such breakpoints should factor into the fees paid by each Fund.
Conclusions as to Additional Sub-Advisory Agreements
In approving the Sub-Advisory Agreements, the Board concluded that each Sub-Advisory Agreement is fair and reasonable and that approval of the Agreements is in the best interests of each Fund and its shareholders. In reaching this determination, the Board considered that each Additional Subadviser could be expected to provide a high level of service to each Fund; that each Additional Subadviser's fees appeared to the Board to be reasonable given the nature and quality of services expected to be provided; and that the expected benefits accruing to each Additional Subadviser and its affiliates and Management and its affiliates by virtue of their relationship with the Funds were reasonable in light of the expected costs of providing the sub-advisory services and the expected benefits accruing to each Fund.
Investment manager: Neuberger Berman Management LLC
Investment adviser: NB Alternative Investment Management LLC
Neuberger Berman Management LLC
605 Third Avenue 2nd Floor
New York, NY 10158–0180
Shareholder Services
800.877.9700
Institutional Services
800.366.6264
www.nb.com
Statistics and projections in this report are derived from sources deemed to be reliable but cannot be regarded as a representation of future results of the Funds. This report is prepared for the general information of shareholders and is not an offer of shares of the Funds. Shares are sold only through the currently effective prospectus, which must precede or accompany this report.
 M0257 12/14
Neuberger Berman
Alternative and Multi-Asset Class Funds
Institutional Class Shares
Class A Shares
Class C Shares
Flexible Select Fund
Global Allocation Fund
Inflation Navigator Fund
(Formerly Dynamic Real Return Fund)
Long Short Fund
Annual Report
October 31, 2014
Contents
THE FUNDS | |
President's Letter | | | 1 | | |
PORTFOLIO COMMENTARY | |
Flexible Select Fund | | | 2 | | |
Global Allocation Fund | | | 6 | | |
Inflation Navigator Fund (Formerly Dynamic Real Return Fund) | | | 9 | | |
Long Short Fund | | | 12 | | |
FUND EXPENSE INFORMATION | | | 18 | | |
SCHEDULE OF INVESTMENTS/TOP TEN
HOLDINGS | |
Flexible Select Fund | | | 20 | | |
Global Allocation Fund | | | 25 | | |
Positions by Industry | | | 29 | | |
Inflation Navigator Fund (Formerly Dynamic Real Return Fund) | | | 31 | | |
Long Short Fund | | | 35 | | |
FINANCIAL STATEMENTS | | | 47 | | |
FINANCIAL HIGHLIGHTS (ALL CLASSES)/
PER SHARE DATA | |
Flexible Select Fund | | | 79 | | |
Global Allocation Fund | | | 79 | | |
Inflation Navigator Fund (Formerly Dynamic Real Return Fund) | | | 81 | | |
Long Short Fund | | | 81 | | |
Reports of Independent Registered Public Accounting Firms | | | 86 | | |
Directory | | | 88 | | |
Trustees and Officers | | | 89 | | |
Proxy Voting Policies and Procedures | | | 96 | | |
Quarterly Portfolio Schedule | | | 96 | | |
Notice to Shareholders | | | 97 | | |
Board Consideration of the Management and
Sub-Advisory Agreements | | | 98 | | |
The "Neuberger Berman" name and logo are registered service marks of Neuberger Berman Group LLC. "Neuberger Berman Management LLC" and the individual Fund names in this piece are either service marks or registered service marks of Neuberger Berman Management LLC. ©2014 Neuberger Berman Management LLC. All rights reserved.
Dear Shareholder,
I am pleased to present this annual shareholder report for Neuberger Berman Flexible Select Fund, Neuberger Berman Global Allocation Fund, Neuberger Berman Inflation Navigator Fund and Neuberger Berman Long Short Fund.
The global financial markets faced a number of challenges during the reporting period, but generally produced positive results. After a lengthy period of relatively low volatility, the markets experienced sharp fluctuations at times over the 12 months ended October 31, 2014. This was triggered by a number of factors, including signs of moderating global growth, uncertainty regarding future central bank monetary policy and several geopolitical issues. While U.S. equities largely overcame these challenges and posted strong returns during the period, emerging market equities produced only a modest gain and international developed market equities were largely flat. After a difficult start, the fixed income market rallied and generated a positive return for the period. Among the best performers were emerging market debt, high yield and investment grade corporate bonds.
Looking ahead, while growth in many other developed countries—including those in the eurozone and Japan—are facing stiff challenges, the U.S. economy appears to be on relatively solid footing. Against this backdrop, the U.S. Federal Reserve concluded its third round of quantitative easing in October 2014 and all eyes are on when the central bank will begin raising interest rates. In contrast, the European Central Bank and Bank of Japan are anticipated to remain highly accommodative. Elsewhere, growth in China has moderated, which could impact growth in many developing countries. While the markets could remain volatile in the coming year, we believe this could lead to attractive opportunities for long-term investors.
Thank you for your continued support and trust. We look forward to continue serving your investment needs in the years to come.
Sincerely,
ROBERT CONTI
PRESIDENT AND CEO
NEUBERGER BERMAN MUTUAL FUNDS
Flexible Select Fund Commentary (Unaudited)
Neuberger Berman Flexible Select Fund Institutional Class generated an 11.16% total return for the 12 months ended October 31, 2014, but underperformed its benchmark, the Russell 3000® Index, which provided a 16.07% return. (Performance for all share classes is provided in the table immediately following this letter.)
The Fund seeks to provide long-term capital appreciation with lower volatility than the broader equity market, with a focus on mitigating downside risk. To pursue this objective, the Fund combines the core securities selected by a diversified group of experienced Neuberger Berman portfolio managers, who have the flexibility to use an all-cap, all style equity approach in addition to the incidental use of cash and bonds in an attempt to decrease risk. As of October 31, 2014, the allocation was 86.3% equity, 6.5% fixed income and 7.2% cash and cash equivalents.
While volatility in the equity markets has picked up in recent months, a number of macroeconomic factors have served as a reminder to us that growth in the United States has been moving in the right direction. Solid GDP growth (3.5% initial reading for the third quarter of 2014, following a 4.6% increase in the second quarter), an improving job market, and positive indicators in housing, earnings, and factory activity have all generally continued to point to a strengthening U.S. economy. The U.S. Federal Reserve (Fed) ended its bond buying program in October, as was widely expected. Growth in other regions of the world—particularly China and Europe—has meanwhile slowed down in recent months, and global central bank policy has started to diverge. The dollar has gained strength in anticipation of continuing divergence among global central bank policies.
The presence of cash and fixed income in the portfolio detracted from returns relative to the benchmark over the course of the fiscal year. However, cash and bonds have helped keep the portfolio's volatility at roughly 85% that of the benchmark.
In the equity portion of the portfolio, the Energy sector had the largest negative contribution to relative performance during the 12-month period. The overweight to oil-price-sensitive sectors (energy producers and oil services companies) detracted from performance during a period of declining oil prices. The second-largest negative contribution came from the Information Technology sector—in particular, underweights to select social media names and a large device manufacturer. Security selection had a negative contribution to relative performance in six of the 10 GICS (Global Industry Classification Standard) sectors. The largest positive security selection contribution came from Industrials, including contributions from two holdings in the transportation and aerospace industries.
From a sector perspective, the Industrials sector has been the portfolio's largest overweight versus the benchmark. Our portfolio managers are optimistic about the momentum of the U.S. economy and believe there is a trend towards re-industrialization in the U.S. Within the sector, they are overweighted in the theme of transportation. The portfolio managers' second largest overweight during the fiscal year period was to the Energy sector. They continue to find this sector attractive for the longer term and favor exploration and production oil companies, as well as natural gas companies that can take advantage of unconventional drilling technology. We are optimistic about the prospects for energy independence in the U.S. in light of the new technologies. The portfolio is also overweighted to Materials and Utilities.
The portfolio's largest underweight continues to be Financials, a sector the portfolio managers see as "under-earning and over-regulated." Within the sector, the portfolio managers continue to be generally negative on banks but are overweighted to exchanges and select specialty real estate investment trusts. The portfolio's second-largest underweight is Consumer Staples, which many of the portfolio managers currently find expensive. Other underweight sectors include Information Technology, Telecommunication Services and Consumer Discretionary.
Overall, we are optimistic on the equity markets. In our view, low commodity prices, a stronger dollar, improving earnings expectations and solid leading economic indicators are contributing to a relatively benign backdrop for equities. While the Fed looks likely to start raising interest rates next year, we generally believe that central bank policy will continue to be supportive and that any policy normalization would be accompanied by stronger economic conditions.
However, with the Russell 3000 up 9.9% year to date (through October 31, 2014), slowing growth in Europe and China, and continuing geopolitical uncertainties, the path forward may be a bit uneven.
Sincerely,
JOSEPH V. AMATO
PORTFOLIO MANAGER
Information about principal risks of investing in the Fund is set forth in the prospectus and statement of additional information.
The portfolio composition, industries and holdings of the Fund are subject to change.
The opinions expressed are those of the Fund's portfolio manager. The opinions are as of the date of this report and are subject to change without notice.
Flexible Select Fund (Unaudited)
TICKER SYMBOLS
Institutional Class | | NFLIX | |
Class A | | NFLAX | |
Class C | | NFLCX | |
SECTOR ALLOCATION
(as a % of Total Investments) | |
Consumer Discretionary | | | 10.3 | % | |
Consumer Staples | | | 5.2 | | |
Energy | | | 9.3 | | |
Financials | | | 12.7 | | |
Health Care | | | 12.8 | | |
Industrials | | | 12.4 | | |
Information Technology | | | 15.0 | | |
Materials | | | 4.6 | | |
Telecommunication Services | | | 0.8 | | |
Utilities | | | 3.4 | | |
Mutual Funds | | | 6.3 | | |
Other | | | 0.0 | | |
Short-Term Investments | | | 7.2 | | |
Total | | | 100.0 | % | |
PERFORMANCE HIGHLIGHTS
| | | | | Average Annual Total
Return Ended 10/31/2014 | |
| | | Inception
Date | | 1 Year | | Life of
Fund | |
At NAV | |
Institutional Class | | 05/31/2013 | | | 11.16 | % | | | 13.71 | % | |
Class A | | 05/31/2013 | | | 10.80 | % | | | 13.31 | % | |
Class C | | 05/31/2013 | | | 9.88 | % | | | 12.42 | % | |
With Sales Charge | |
Class A | | | | | 4.41 | % | | | 8.69 | % | |
Class C | | | | | 8.88 | % | | | 12.42 | % | |
Index | |
| Russell 3000® Index1,2 | | | | | 16.07 | % | | | 17.19 | % | |
The performance data quoted represent past performance and do not indicate future results. Current performance may be lower or higher than the performance data quoted. For performance data current to the most recent month-end, please visit www.nb.com/performance.
The results shown in the table reflect the reinvestment of income dividends and other distributions, if any. The results do not reflect the effect of taxes a shareholder would pay on Fund distributions or on the redemption of Fund shares.
The investment return and principal value of an investment will fluctuate and shares, when redeemed, may be worth more or less than their original cost.
Returns would have been lower if Neuberger Berman Management LLC (Management) had not reimbursed certain expenses and/or waived a portion of the investment management fees during certain of the periods shown. Repayment by a class (of expenses previously reimbursed and/or fees previously waived by Management) will decrease the class's returns. Please see Note B in the Notes to Financial Statements for specific information regarding expense reimbursement and/or fee waiver arrangements.
As stated in the Fund's most recent prospectus, the total annual operating expense ratios for fiscal year 2013 were 1.75%, 4.85% and 6.46% for Institutional Class, Class A and Class C shares, respectively (before expense reimbursements and/or fee waivers, if any). The expense ratios were 0.85%, 1.21% and 1.96% for Institutional Class, Class A and Class C shares, respectively, after expense reimbursements and/or fee waivers. The expense ratios for fiscal year 2014 can be found in the Financial Highlights section of this report.
Returns shown with a sales charge reflect the deduction of the current maximum initial sales charge of 5.75% for Class A shares and the contingent deferred sales charge (CDSC) for Class C shares. The CDSC for Class C shares is 1%, which is reduced to 0% after 1 year. The performance of the Fund's share classes will differ primarily due to different sales charge structures and class expenses. Please see the prospectus for more information about sales charge structures, if any, and class expenses for your share class.
Flexible Select Fund (Unaudited)
COMPARISON OF A $1,000,000 INVESTMENT
(000's omitted)
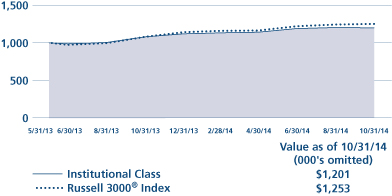
This graph shows the change in value of a hypothetical $1,000,000 investment in the Fund over the past 10 fiscal years, or since the Fund's inception if it has not operated for 10 years. The graph is based on the Institutional Class shares only; the performance of the Fund's share classes will differ primarily due to different sales charge structures and class expenses (see Performance Highlights chart on previous page). The result is compared with benchmarks, which include a broad-based market index and may include a more narrowly based index. Market indices have not been reduced to reflect any of the fees and costs of investing. The results shown in the graph reflect the reinvestment of income dividends and other distributions, if any. The results do not reflect the effect of taxes a shareholder would pay on Fund distributions or on the redemption of Fund shares. Results represent past performance and do not indicate future results.
Global Allocation Fund Commentary (Unaudited)
Neuberger Berman Global Allocation Fund1 Institutional Class generated a 1.37% total return for the 12 months ended October 31, 2014 but underperformed its custom benchmark, a 50/50 combination of the MSCI World Index and the J.P. Morgan Global Government Bond Index, which provided a 4.26% return for the period. (Performance for all share classes is provided in the table immediately following this letter.)
Despite periods of heightened volatility, the global financial markets largely generated positive results during the reporting period. Investor sentiment was challenged at times over concerns about global growth, uncertainties regarding future monetary policy and a host of geopolitical issues. Regardless of these headwinds, U.S. equities rallied sharply during the period, whereas international developed equities were largely flat and emerging market equities posted a modest gain. Within the fixed income market, most non-Treasury securities produced positive returns and outperformed equal-duration Treasuries. Elsewhere, the currency markets fluctuated, partially driven by diverging central bank monetary policy, which prompted a sharp rally for the U.S. dollar toward the end of the reporting period.
Equity security selection strategy detracted from the Fund's performance during the period. In particular, holdings in the Information Technology and Consumer Discretionary sectors, along with some short positions in real estate investment trusts, were negative for results. On the other hand, security selection in the Industrials and Materials sectors added the most value. On a regional basis, equity holdings in the U.S. were a drag on performance, whereas security selection in the UK and Japan enhanced the Fund's returns.
Overall, our asset allocation strategy contributed to results. Equity positioning added the most value, while fixed income and currency positioning were modestly additive. From an equity perspective, positioning in the U.S. and Australia benefited performance, whereas positioning in Hong Kong detracted from results. Within the fixed income market, the positive impact from U.S. Treasuries and UK gilts was partially offset by an underweight to Canadian bonds. Finally, looking at the Fund's currency exposures, negative views on the Japanese yen as well as euro positioning were beneficial for results, whereas a generally bearish view on the Canadian dollar was a drag on performance. The Fund's macro positioning in fixed income securities was implemented primarily through derivatives, such as futures contracts on government bonds and derivatives on broad-based fixed income indices. The Fund's positioning in equity markets and its currency exposure were obtained through the use of derivatives such as futures, swap contracts and forwards. The Fund's use of derivatives contributed to performance.
Looking ahead, we anticipate a number of potential headwinds for the short-term performance in the global equity market. These include signs of moderating global growth, our expectations for shifting monetary policy in the U.S., and geopolitical issues. There are also questions regarding reforms in China, the eurozone and Japan. Against this backdrop, we may move to increase our allocations to U.S. Treasuries and UK gilts. Within the currency market, we maintain our bearish views on the euro and yen, whereas we have an overall positive outlook for the U.S. dollar.
Sincerely,
WAI LEE, ALEXANDRE DA SILVA, PING ZHOU, JOSEPH V. AMATO AND BRADLEY TANK
PORTFOLIO CO-MANAGERS
Information about principal risks of investing in the Fund is set forth in the prospectus and statement of additional information.
The portfolio composition, industries and holdings of the Fund are subject to change.
The opinions expressed are those of the Fund's portfolio managers. The opinions are as of the date of this report and are subject to change without notice.
1 Much of the Fund's investment exposure is accomplished through the use of derivatives, including total return swaps, futures and forwards, which may not require the Fund to deposit the full notional amount of its investments with counterparties. The Fund's resulting cash balances are invested in money market mutual funds.
Global Allocation Fund (Unaudited)
TICKER SYMBOLS
Institutional Class | | NGLIX | |
Class A | | NGLAX | |
Class C | | NGLCX | |
PERFORMANCE HIGHLIGHTS3
| | | | | Average Annual Total
Return Ended 10/31/2014 | |
| | | Inception
Date | | 1 Year | | Life of
Fund | |
At NAV | |
Institutional Class | | 12/29/2010 | | | 1.37 | % | | | 7.30 | % | |
Class A | | 12/29/2010 | | | 1.03 | % | | | 6.93 | % | |
Class C | | 12/29/2010 | | | 0.30 | % | | | 6.13 | % | |
With Sales Charge | |
Class A | | | | | –4.82 | % | | | 5.30 | % | |
Class C | | | | | –0.63 | % | | | 6.13 | % | |
Index | | | | | | | |
50% MSCI World Index and 50% J.P. Morgan
Global Government Bond Index1,2 | | | | | 4.26 | % | | | 6.44 | % | |
| MSCI World Index1,2 | | | | | 9.25 | % | | | 10.86 | % | |
The performance data quoted represent past performance and do not indicate future results. Current performance may be lower or higher than the performance data quoted. For performance data current to the most recent month-end, please visit www.nb.com/performance.
The results shown in the table reflect the reinvestment of income dividends and other distributions, if any. The results do not reflect the effect of taxes a shareholder would pay on Fund distributions or on the redemption of Fund shares.
The investment return and principal value of an investment will fluctuate and shares, when redeemed, may be worth more or less than their original cost.
Returns would have been lower if Neuberger Berman Management LLC (Management) had not reimbursed certain expenses and/or waived a portion of the investment management fees during certain of the periods shown. Repayment by a class (of expenses previously reimbursed and/or fees previously waived by Management) will decrease the class's returns. Please see Note B in the Notes to Financial Statements for specific information regarding expense reimbursement and/or fee waiver arrangements.
As stated in the Fund's most recent prospectus, the total annual operating expense ratios for fiscal year 2013 were 3.24%, 3.60% and 4.37% for Institutional Class, Class A and Class C shares, respectively (before expense reimbursements and/or fee waivers, if any). The expense ratios were 1.48%, 1.85% and 2.59% for Institutional Class, Class A and Class C shares, respectively, after expense reimbursements and/or fee waivers. The expense ratios for fiscal year 2014 can be found in the Financial Highlights section of this report.
Returns shown with a sales charge reflect the deduction of the current maximum initial sales charge of 5.75% for Class A shares and the contingent deferred sales charge (CDSC) for Class C shares. The CDSC for Class C shares is 1%, which is reduced to 0% after 1 year. The performance of the Fund's share classes will differ primarily due to different sales charge structures and class expenses. Please see the prospectus for more information about sales charge structures, if any, and class expenses for your share class.
Global Allocation Fund (Unaudited)
COMPARISON OF A $1,000,000 INVESTMENT
(000's omitted)
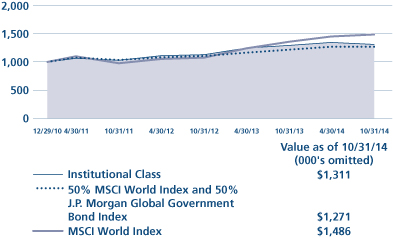
This graph shows the change in value of a hypothetical $1,000,000 investment in the Fund over the past 10 fiscal years, or since the Fund's inception if it has not operated for 10 years. The graph is based on the Institutional Class shares only; the performance of the Fund's share classes will differ primarily due to different sales charge structures and class expenses (see Performance Highlights chart on previous page). The result is compared with benchmarks, which include a broad-based market index and may include a more narrowly based index. Market indices have not been reduced to reflect any of the fees and costs of investing. The results shown in the graph reflect the reinvestment of income dividends and other distributions, if any. The results do not reflect the effect of taxes a shareholder would pay on Fund distributions or on the redemption of Fund shares. Results represent past performance and do not indicate future results.
Inflation Navigator Fund Commentary* (Unaudited)
Neuberger Berman Inflation Navigator Fund Institutional Class generated a 5.73% total return for the 12 months ended October 31, 2014. During this same time period, the Barclays U.S. 1-10 Year Treasury Inflation-Protected Securities (TIPS) Index provided a 0.60% return while the U.S. Consumer Price Index (CPI) was up 1.7%.1 (Performance for all share classes is provided in the table immediately following this letter.)
Despite periods of heightened volatility, the global financial markets largely generated positive results during the reporting period. Investor sentiment was challenged at times over concerns about global growth, uncertainties regarding future monetary policy and a host of geopolitical issues. Regardless of these headwinds, U.S. equities rallied sharply during the period, whereas international developed equities were largely flat and emerging market equities posted a modest gain. Short-term U.S. Treasury yields moved higher and longer-term rates declined. Most non-Treasury securities produced positive returns and outperformed equal-duration Treasuries. Finally, inflation expectations remained muted during the period.
The Fund's diversified investment approach helped it to outperform its benchmark. Among the sectors in which the Fund invests, its allocations to equities within real estate investment trusts (REITs) added the most value, as did investments in Materials and master limited partnerships (MLPs). On the downside, the Fund's allocations to commodities, emerging market equities and Energy equities detracted the most from results. In addition, the Fund's dynamic overlay (flexible use of strategies in an attempt to capitalize on short-term changes in inflation expectations) was a modest drag on performance during the reporting period as it was positioned for higher inflation. The Fund's use of futures detracted from the Fund's performance.
Several adjustments were made to the portfolio during the reporting period. We increased the Fund's exposures to equities in the Materials and REITs sectors, while reducing its allocation to fixed income.
Growth in the U.S. continues to show signs of diverging with other developed economies. In addition, monetary policy in the U.S. is clearly on a different path than that of the European Central Bank and Bank of Japan. While the U.S. Federal Reserve (Fed) ended its monthly asset purchases in October 2014, we anticipate that the Fed will be true to its word and let the data determine when it will begin raising interest rates. We believe the Fed will take a cautious and measured approach given continued slack in the economy, as well as the potential headwinds from weaker growth in Europe, Japan and China. In the U.S., we forecast real GDP growth of 2.6% +/– 0.3% in 2015. We anticipate relatively stable inflation in 2015 as the housing component of CPI continues to strengthen along with improvement in the labor markets, while weakness in energy prices is feeding through to consumer prices.
Sincerely,
THANOS BARDAS, ANDREW JOHNSON AND THOMAS J. MARTHALER
PORTFOLIO CO-MANAGERS
Information about principal risks of investing in the Fund is set forth in the prospectus and statement of additional information.
The portfolio composition, industries and holdings of the Fund are subject to change.
The opinions expressed are those of the Fund's portfolio managers. The opinions are as of the date of this report and are subject to change without notice.
* Effective June 2, 2014, Neuberger Berman Dynamic Real Return Fund changed its name to Neuberger Berman Inflation Navigator Fund.
1 Consumer Price Index (CPI) is a measure that examines the weighted average of prices of a basket of consumer goods and services, such as transportation, food and medical care. The CPI is one of the most frequently used statistics for identifying periods of inflation or deflation. The CPI is available monthly, so the value shown is from October 31, 2013 to October 31, 2014, and is not seasonally adjusted.
Inflation Navigator Fund (Unaudited)
TICKER SYMBOLS
Institutional Class | | NDRIX | |
Class A | | NDRAX | |
Class C | | NDRCX | |
PORTFOLIO BY TYPE OF
INVESTMENT STRATEGY
(as a % of Total Investment Strategies)
Commodities | | | 10.3 | % | |
Emerging Markets | | | 9.1 | | |
Global Treasury Inflation Protected Securities | | | 26.2 | | |
High Yield Securities | | | 4.9 | | |
Loans | | | 4.7 | | |
Master Limited Partnerships | | | 10.2 | | |
Real Estate Investment Trusts | | | 13.2 | | |
S&P Energy | | | 10.5 | | |
S&P Materials | | | 10.9 | | |
Total | | | 100.0 | % | |
PORTFOLIO BY TYPE OF SECURITY
(as a % of Total Net Assets)
Common Stocks | | | 45.0 | % | |
Government Securities | | | 13.3 | | |
U.S. Treasury Securities | | | 11.4 | | |
Mutual Funds | | | 29.1 | | |
Short-Term Investments | | | 1.6 | | |
Cash, receivables and other assets,
less liabilities | | | (0.4 | ) | |
Total | | | 100.0 | % | |
PERFORMANCE HIGHLIGHTS4
| | | | | Average Annual Total
Return Ended 10/31/2014 | |
| | | Inception
Date | | 1 Year | | Life of
Fund | |
At NAV | |
Institutional Class | | 12/19/2012 | | | 5.73 | % | | | 5.10 | % | |
Class A | | 12/19/2012 | | | 5.39 | % | | | 4.76 | % | |
Class C | | 12/19/2012 | | | 4.60 | % | | | 3.96 | % | |
With Sales Charge | |
Class A | | | | | –0.65 | % | | | 1.49 | % | |
Class C | | | | | 3.60 | % | | | 3.96 | % | |
Index | |
Barclays U.S. 1-10 Year Treasury
Inflation-Protected Securities (TIPS) Index1,2 | | | | | 0.60 | % | | | –1.73 | % | |
The performance data quoted represent past performance and do not indicate future results. Current performance may be lower or higher than the performance data quoted. For performance data current to the most recent month-end, please visit www.nb.com/performance.
The results shown in the table reflect the reinvestment of income dividends and other distributions, if any. The results do not reflect the effect of taxes a shareholder would pay on Fund distributions or on the redemption of Fund shares.
The investment return and principal value of an investment will fluctuate and shares, when redeemed, may be worth more or less than their original cost.
Returns would have been lower if Neuberger Berman Management LLC (Management) had not reimbursed certain expenses and/or waived a portion of the investment management fees during certain of the periods shown. Repayment by a class (of expenses previously reimbursed and/or fees previously waived by Management) will decrease the class's returns. Please see Note B in the Notes to Financial Statements for specific information regarding expense reimbursement and/or fee waiver arrangements.
As stated in the Fund's most recent prospectus, the total annual operating expense ratios for fiscal year 2013 were 3.20%, 5.45% and 6.20% for Institutional Class, Class A and Class C shares, respectively (before expense reimbursements and/or fee waivers, if any). The expense ratios were 0.95%, 1.31% and 2.06% for Institutional Class, Class A and Class C shares, respectively, after expense reimbursements and/or fee waivers. The expense ratios for fiscal year 2014 can be found in the Financial Highlights section of this report.
Returns shown with a sales charge reflect the deduction of the current maximum initial sales charge of 5.75% for Class A shares and the contingent deferred sales charge (CDSC) for Class C shares. The CDSC for Class C shares is 1%, which is reduced to 0% after 1 year. The performance of the Fund's share classes will differ primarily due to different sales charge structures and class expenses. Please see the prospectus for more information about sales charge structures, if any, and class expenses for your share class.
Inflation Navigator Fund (Unaudited)
COMPARISON OF A $1,000,000 INVESTMENT
(000's omitted)

This graph shows the change in value of a hypothetical $1,000,000 investment in the Fund over the past 10 fiscal years, or since the Fund's inception if it has not operated for 10 years. The graph is based on the Institutional Class shares only; the performance of the Fund's share classes will differ primarily due to different sales charge structures and class expenses (see Performance Highlights chart on previous page). The result is compared with benchmarks, which include a broad-based market index and may include a more narrowly based index. Market indices have not been reduced to reflect any of the fees and costs of investing. The results shown in the graph reflect the reinvestment of income dividends and other distributions, if any. The results do not reflect the effect of taxes a shareholder would pay on Fund distributions or on the redemption of Fund shares. Results represent past performance and do not indicate future results.
Long Short Fund Commentary (Unaudited)
Neuberger Berman Long Short Fund Institutional Class generated a 4.83% total return for the 12 months ended October 31, 2014 but underperformed its primary benchmark, the S&P 500® Index, which provided a 17.27% return for the period. However, the Fund outperformed the HFRX Equity Hedge Index, which returned 3.33% for the period. (Performance for all share classes is provided in the table immediately following this letter.)
Despite periods of heightened volatility, the global financial markets largely generated positive results during the reporting period. Investor sentiment was challenged at times over concerns about global growth, uncertainties regarding future monetary policy and a host of geopolitical issues. The U.S. continued to show resilience as earnings growth remained healthy and the economy expanded during the period. Additionally, merger and acquisition activity in the U.S. increased as companies turned to acquisitions to fuel growth. Conversely, global growth remained strained as Europe and Japan faced structural challenges. In the U.S., large-cap stocks outperformed their small-cap counterparts, while growth stocks outperformed value stocks.
We had a positive outlook on risk assets, such as equities and high yield bonds, during the fiscal year. This was reflected in the Fund's net notional long exposure, which began the period at approximately 50% net long, then moved to a high of about 60%, before closing at roughly 55%. The long side of the portfolio also expressed an outlook for continued economic growth in the U.S. As such, we maintained a bias for equities in more cyclical industries, including those within the Consumer Discretionary and Industrials sectors.
The Fund's use of futures and options detracted from the Fund's performance.
We categorize our long investment exposure into three groups: Capital Growth, Total Return and Opportunistic. Capital Growth investments demonstrate what we believe are attractive industry fundamentals, strong competitive positions, growing revenues and attractive re-investment opportunities. Total Return investments demonstrate what we believe are sustainable and/or growing streams of income that are underpinned by asset value and which can result in growing cash returns to shareholders. The Total Return category includes our fixed income holdings, which consisted mainly of high yield securities during the reporting period. Opportunistic investments are those where we find what we believe are identifiable catalysts. This may include companies with management changes, company reorganizations, merger and acquisition activity and other market dislocations that have the potential to unlock intrinsic value.1
During the period, we pared our allocation to Total Return in favor of Capital Growth. We have found what we think are more compelling opportunities in Capital Growth relative to Total Return, as the prospect of higher interest rates could adversely impact longer duration assets and cash flows. The portfolio's short exposure includes "Fundamental" shorts and "Market" shorts. During the reporting period, our Market shorts consisted primarily of sector-based exchange traded funds, coupled with short futures positions on broad-based U.S. equity indices and U.S. Treasuries. Our mix between Fundamental shorts and Market shorts remained fairly consistent over the reporting period.
We continue to believe that the current economic expansion in the U.S. could last longer than expected when compared to previous cycles. We also believe that corporate earnings could continue improving and be a source of equity market returns going forward. Our positive view on risk assets is not without potential risks. Global central bank policy is driving short-term market behavior. Even as the U.S. Federal Reserve winds down the support program and markets assess the possibility of a first rate hike, the European Central Bank and the Bank of Japan appear committed to further stimulus. We believe an extended period of ultralow interest rates—while positive for an extended business cycle and risk
assets—has the potential to exacerbate key risks over the long term. Furthermore, ongoing geopolitical issues remind us that the current environment may necessitate a flexible, long-bias, equity-bias approach.
Sincerely,
CHARLES KANTOR
PORTFOLIO MANAGER
Information about principal risks of investing in the Fund is set forth in the prospectus and statement of additional information.
The portfolio composition, industries and holdings of the Fund are subject to change.
The opinions expressed are those of the Fund's portfolio manager. The opinions are as of the date of this report and are subject to change without notice.
1 Intrinsic value reflects the portfolio manager's analysis and estimates of a company's value. There is no guarantee that any intrinsic values will be realized; security prices may decrease regardless of intrinsic value.
Long Short Fund (Unaudited)
TICKER SYMBOLS
Institutional Class | | NLSIX | |
Class A | | NLSAX | |
Class C | | NLSCX | |
PORTFOLIO BY TYPE OF SECURITY
(as a % of Total Investments)
| | | Long | | Short | |
Common Stocks | | | 76.7 | % | | | (8.0 | )% | |
Corporate Debt Securities | | | 19.2 | | | | — | | |
Exchange Traded Funds | | | — | | | | (6.6 | ) | |
Purchased Options | | | 0.0 | | | | — | | |
Short-Term Investments | | | 18.7 | | | | — | | |
Total | | | 114.6 | % | | | (14.6 | )% | |
PERFORMANCE HIGHLIGHTS
| | | | | Average Annual Total
Return Ended 10/31/2014 | |
| | | Inception
Date | | 1 Year | | Life of
Fund | |
At NAV | |
Institutional Class | | 12/29/2011 | | | 4.83 | % | | | 10.23 | % | |
Class A | | 12/29/2011 | | | 4.47 | % | | | 9.86 | % | |
Class C | | 12/29/2011 | | | 3.71 | % | | | 9.04 | % | |
With Sales Charge | |
Class A | | | | | –1.56 | % | | | 7.60 | % | |
Class C | | | | | 2.71 | % | | | 9.04 | % | |
Index | |
| S&P 500® Index1,2 | | | | | 17.27 | % | | | 20.90 | % | |
| HFRX Equity Hedge Index1,2 | | | | | 3.33 | % | | | 6.01 | % | |
The performance data quoted represent past performance and do not indicate future results. Current performance may be lower or higher than the performance data quoted. For performance data current to the most recent month-end, please visit www.nb.com/performance.
The results shown in the table reflect the reinvestment of income dividends and other distributions, if any. The results do not reflect the effect of taxes a shareholder would pay on Fund distributions or on the redemption of Fund shares.
The investment return and principal value of an investment will fluctuate and shares, when redeemed, may be worth more or less than their original cost.
Returns would have been lower if Neuberger Berman Management LLC (Management) had not reimbursed certain expenses and/or waived a portion of the investment management fees during certain of the periods shown. Repayment by a class (of expenses previously reimbursed and/or fees previously waived by Management) will decrease the class's returns. Please see Note B in the Notes to Financial Statements for specific information regarding expense reimbursement and/or fee waiver arrangements.
As stated in the Fund's most recent prospectus, the total annual operating expense ratios for fiscal year 2013 were 1.77%, 2.11% and 2.85% for Institutional Class, Class A and Class C shares, respectively (before expense reimbursements and/or fee waivers, if any). The total annual operating expense ratio for each of Institutional Class, Class A and Class C includes the class's repayment of expenses previously reimbursed and/or fees previously waived by Management. The expense ratios for fiscal year 2014 can be found in the Financial Highlights section of this report.
Returns shown with a sales charge reflect the deduction of the current maximum initial sales charge of 5.75% for Class A shares and the contingent deferred sales charge (CDSC) for Class C shares. The CDSC for Class C shares is 1%, which is reduced to 0% after 1 year. The performance of the Fund's share classes will differ primarily due to different sales charge structures and class expenses. Please see the prospectus for more information about sales charge structures, if any, and class expenses for your share class.
Long Short Fund (Unaudited)
COMPARISON OF A $1,000,000 INVESTMENT
(000's omitted)
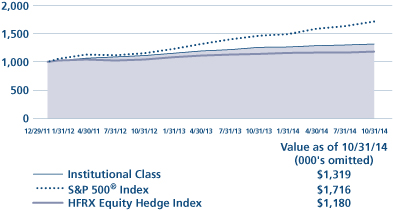
This graph shows the change in value of a hypothetical $1,000,000 investment in the Fund over the past 10 fiscal years, or since the Fund's inception if it has not operated for 10 years. The graph is based on the Institutional Class shares only; the performance of the Fund's share classes will differ primarily due to different sales charge structures and class expenses (see Performance Highlights chart on previous page). The result is compared with benchmarks, which include a broad-based market index and may include a more narrowly based index. Market indices have not been reduced to reflect any of the fees and costs of investing. The results shown in the graph reflect the reinvestment of income dividends and other distributions, if any. The results do not reflect the effect of taxes a shareholder would pay on Fund distributions or on the redemption of Fund shares. Results represent past performance and do not indicate future results.
1 Please see "Glossary of Indices" on page 17 for a description of indices. Please note that individuals cannot invest directly in any index. The HFRX Equity Hedge Index takes into account fees and expenses of investing since it is based on the underlying hedge funds' net returns. The other indices described in this report do not take into account any fees, expenses or tax consequences of investing in the individual securities that they track. Data about the performance of an index are prepared or obtained by Neuberger Berman Management LLC ("Management") and reflect the reinvestment of income dividends and other distributions, if any. The Fund may invest in securities not included in a described index and generally does not invest in all securities included in a described index.
2 The date used to calculate Life of Fund performance for the index is the inception date of the oldest share class.
3 During the period from December 29, 2010 through April 30, 2011, the Fund had only one shareholder and the Fund was relatively small, which could have impacted Fund performance. The same techniques used to produce returns in a small fund may not work to produce similar returns in a larger fund.
4 Effective June 2, 2014, Neuberger Berman Dynamic Real Return Fund changed its name to Neuberger Berman Inflation Navigator Fund.
For more complete information on any of the Neuberger Berman Alternative and Multi-Asset Class Funds, call Management at (800) 877-9700, or visit our website at www.nb.com.
MSCI World Index: | | The index is a free float-adjusted market capitalization-weighted index that is designed to measure the equity market performance of developed markets. The index consists of the following 23 developed market country indexes: Australia, Austria, Belgium, Canada, Denmark, Finland, France, Germany, Hong Kong, Ireland, Israel, Italy, Japan, the Netherlands, New Zealand, Norway, Portugal, Singapore, Spain, Sweden, Switzerland, the United Kingdom, and the United States. | |
50% MSCI World Index and 50% J.P. Morgan Global Government Bond Index: | | The blended index is composed of 50% MSCI World Index (described above) and 50% J.P. Morgan Global Government Bond Index, and is rebalanced monthly. The J.P. Morgan Global Government Bond Index tracks the performance of local currency denominated bonds issued by developed market governments. The index consists of issues from the following 13 developed international bond markets: Australia, Belgium, Canada, Denmark, France, Germany, Italy, Japan, Netherlands, Spain, Sweden, United Kingdom and United States. | |
| S&P 500® Index: | | The index is a float-adjusted market capitalization-weighted index that focuses on the large-cap segment of the U.S. equity market, and includes a significant portion of the total value of the market. | |
Barclays U.S. 1-10 Year Treasury Inflation-Protected Securities (TIPS) Index: | | The index is the 1-10 year component of the Barclays U.S. TIPS Index (Series-L). The Barclays U.S. TIPS Index (Series-L) tracks the performance of inflation-protection securities issued by the U.S. Treasury. | |
HFRX Equity Hedge Index: | | The index comprises equity hedge strategies. Equity hedge strategies maintain positions both long and short in primarily equity and equity derivative securities. A wide variety of investment processes can be employed to arrive at an investment decision, including both quantitative and fundamental techniques; strategies can be broadly diversified or narrowly focused on specific sectors and can range broadly in terms of levels of net exposure, leverage employed, holding period, concentrations of market capitalizations and valuation ranges of typical portfolios. Equity hedge managers would typically maintain at least 50%, and may in some cases be substantially entirely invested, in equities, both long and short. Constituent funds are selected from an eligible pool of the more than 7,500 funds worldwide that report to the Hedge Fund Research (HFR) Database. Constituent funds must meet all of the following criteria: report monthly; report performance net of all fees; be U.S. dollar-denominated; be active and accepting new investments; have a minimum 24 months track record; and the fund's manager must have at least $50 million in assets under management. The index is rebalanced quarterly. | |
| Russell 3000® Index: | | The index is a float-adjusted market capitalization-weighted index that measures the performance of the 3,000 largest U.S. public companies based on total market capitalization. The index is rebalanced annually in June. | |
Information About Your Fund's Expenses (Unaudited)
As a Fund shareholder, you incur two types of costs: (1) transaction costs, including sales charges (loads) on purchase payments or redemption proceeds (if applicable); and (2) ongoing costs, including management fees, distribution and/or service (12b-1) fees (if applicable), and other Fund expenses. This example is intended to help you understand your ongoing costs (in U.S. dollars) of investing in a Fund and compare these costs with the ongoing costs of investing in other mutual funds.
This table is designed to provide information regarding costs related to your investments. The following examples are based on an investment of $1,000 made at the beginning of the six month period ended October 31, 2014 and held for the entire period. The table illustrates each Fund's costs in two ways:
Actual Expenses and Performance: | | The first section of the table provides information about actual account values and actual expenses in dollars, based on the Fund's actual performance during the period indicated. You may use the information in this line, together with the amount you invested, to estimate the expenses you paid over the period. Simply divide your account value by $1,000 (for example, an $8,600 account value divided by $1,000 = 8.6), then multiply the result by the number in the first section of the table under the heading entitled "Expenses Paid During the Period" to estimate the expenses you paid over the period. | |
Hypothetical Example for Comparison Purposes: | | The second section of the table provides information about hypothetical account values and hypothetical expenses based on the Fund's actual expense ratio and an assumed rate of return at 5% per year before expenses. This return is not the Fund's actual return. The hypothetical account values and expenses may not be used to estimate the actual ending account balance or expenses you paid for the period. You may use this information to compare the ongoing costs of investing in a Fund versus other funds. To do so, compare the expenses shown in this 5% hypothetical example with the 5% hypothetical examples that appear in the shareholder reports of other funds. | |
Please note that the expenses in the table are meant to highlight your ongoing costs only and do not include any transaction costs, such as sales charges (loads) (if applicable). Therefore, the information under the heading "Hypothetical (5% annual return before expenses)" is useful in comparing ongoing costs only, and will not help you determine the relative total costs of owning different funds. In addition, if these transaction costs were included, your costs would have been higher.
Expense Information as of 10/31/14 (Unaudited)
Neuberger Berman Alternative Funds | |
| | | ACTUAL | | HYPOTHETICAL (5% ANNUAL RETURN BEFORE EXPENSES)(3) | |
| | | Beginning
Account
Value
5/1/14 | | Ending
Account
Value
10/31/14 | | Expenses Paid
During the
Period(1)
5/1/14 - 10/31/14 | | Expense
Ratio | | Beginning
Account
Value
5/1/14 | | Ending
Account
Value
10/31/14 | | Expenses Paid
During the
Period(1)
5/1/14 - 10/31/14 | | Expense
Ratio | |
Flexible Select Fund | |
Institutional Class | | $ | 1,000.00 | | | $ | 1,051.00 | | | $ | 4.29 | | | | 0.83 | % | | $ | 1,000.00 | | | $ | 1,021.02 | | | $ | 4.23 | | | | 0.83 | % | |
Class A | | $ | 1,000.00 | | | $ | 1,049.30 | | | $ | 6.15 | | | | 1.19 | % | | $ | 1,000.00 | | | $ | 1,019.21 | | | $ | 6.06 | | | | 1.19 | % | |
Class C | | $ | 1,000.00 | | | $ | 1,044.20 | | | $ | 10.00 | | | | 1.94 | % | | $ | 1,000.00 | | | $ | 1,015.43 | | | $ | 9.86 | | | | 1.94 | % | |
Global Allocation Fund | |
Institutional Class | | $ | 1,000.00 | | | $ | 973.00 | | | $ | 7.71 | | | | 1.55 | % | | $ | 1,000.00 | | | $ | 1,017.39 | | | $ | 7.88 | | | | 1.55 | % | |
Class A | | $ | 1,000.00 | | | $ | 972.00 | | | $ | 9.49 | | | | 1.91 | % | | $ | 1,000.00 | | | $ | 1,015.58 | | | $ | 9.70 | | | | 1.91 | % | |
Class C | | $ | 1,000.00 | | | $ | 968.00 | | | $ | 13.24 | | | | 2.67 | % | | $ | 1,000.00 | | | $ | 1,011.75 | | | $ | 13.54 | | | | 2.67 | % | |
| Inflation Navigator Fund(2) | |
Institutional Class | | $ | 1,000.00 | | | $ | 1,000.90 | | | $ | 3.48 | | | | 0.69 | % | | $ | 1,000.00 | | | $ | 1,021.73 | | | $ | 3.52 | | | | 0.69 | % | |
Class A | | $ | 1,000.00 | | | $ | 999.10 | | | $ | 5.29 | | | | 1.05 | % | | $ | 1,000.00 | | | $ | 1,019.91 | | | $ | 5.35 | | | | 1.05 | % | |
Class C | | $ | 1,000.00 | | | $ | 995.30 | | | $ | 9.05 | | | | 1.80 | % | | $ | 1,000.00 | | | $ | 1,016.13 | | | $ | 9.15 | | | | 1.80 | % | |
Long Short Fund | |
Institutional Class | | $ | 1,000.00 | | | $ | 1,026.80 | | | $ | 8.79 | | | | 1.72 | % | | $ | 1,000.00 | | | $ | 1,016.53 | | | $ | 8.74 | | | | 1.72 | % | |
Class A | | $ | 1,000.00 | | | $ | 1,025.40 | | | $ | 10.67 | | | | 2.09 | % | | $ | 1,000.00 | | | $ | 1,014.67 | | | $ | 10.61 | | | | 2.09 | % | |
Class C | | $ | 1,000.00 | | | $ | 1,021.00 | | | $ | 14.47 | | | | 2.84 | % | | $ | 1,000.00 | | | $ | 1,010.89 | | | $ | 14.39 | | | | 2.84 | % | |
(1) For each class, expenses are equal to the annualized expense ratio for the class, multiplied by the average account value over the period, multiplied by 184/365 (to reflect the one-half year period shown), unless otherwise indicated.
(2) Effective June 2, 2014. Formerly, Dynamic Real Return Fund through June 1, 2014.
(3) Hypothetical 5% annual return before expenses is calculated by multiplying the number of days in the most recent period divided by 365.
Schedule of Investments Flexible Select Fund
TOP TEN EQUITY HOLDINGS
| 1
| | | Neuberger Berman Core Bond Fund
Institutional Class | | | 6.3
| % | |
| | 2 | | | Apple, Inc. | | | 1.6 | % | |
| | 3 | | | Microsoft Corp. | | | 1.5 | % | |
| | 4 | | | Bristol-Myers Squibb Co. | | | 1.5 | % | |
| | 5 | | | Johnson & Johnson | | | 1.4 | % | |
| | 6 | | | Schlumberger Ltd. | | | 1.4 | % | |
| | 7 | | | JPMorgan Chase & Co. | | | 1.4 | % | |
| | 8 | | | Pfizer, Inc. | | | 1.2 | % | |
| | 9 | | | Boeing Co. | | | 1.2 | % | |
| | 10 | | | eBay, Inc. | | | 1.1 | % | |
| | | Number
of Shares | |
Value† | |
Common Stocks (86.1%) | |
Aerospace & Defense (2.9%) | |
BE Aerospace,
Inc. | | | 1,216 | | | $ | 90,531 | * | |
Boeing Co. | | | 9,071 | | | | 1,133,059 | | |
General
Dynamics Corp. | | | 4,227 | | | | 590,765 | | |
Honeywell
International,
Inc. | | | 5,900 | | | | 567,108 | | |
L-3
Communications
Holdings, Inc. | | | 80 | | | | 9,717 | | |
Lockheed
Martin Corp. | | | 64 | | | | 12,196 | | |
Precision
Castparts Corp. | | | 997 | | | | 220,038 | | |
Raytheon Co. | | | 729 | | | | 75,729 | | |
United
Technologies
Corp. | | | 1,239 | | | | 132,573 | | |
| | | | 2,831,716 | | |
Air Freight & Logistics (0.6%) | |
FedEx Corp. | | | 1,198 | | | | 200,545 | | |
United Parcel
Service, Inc.
Class B | | | 3,761 | | | | 394,567 | | |
| | | | 595,112 | | |
Airlines (0.8%) | |
American
Airlines Group,
Inc. | | | 4,028 | | | | 166,558 | | |
Delta Air Lines,
Inc. | | | 11,964 | | | | 481,312 | | |
United
Continental
Holdings, Inc. | | | 2,241 | | | | 118,347 | * | |
| | | | 766,217 | | |
Auto Components (0.3%) | |
BorgWarner,
Inc. | | | 3,212 | | | | 183,148 | | |
Delphi
Automotive
PLC | | | 1,907 | | | | 131,545 | | |
| | | | 314,693 | | |
Automobiles (0.1%) | |
General Motors
Co. | | | 2,158 | | | | 67,761 | | |
| | | Number
of Shares | |
Value† | |
Banks (3.2%) | |
BankUnited, Inc. | | | 1,645 | | | $ | 49,186 | | |
First Republic
Bank | | | 1,350 | | | | 68,756 | | |
Itau Unibanco
Holding
SA ADR,
Preference
Shares | | | 10,359 | | | | 152,899 | | |
JPMorgan
Chase & Co. | | | 21,788 | | | | 1,317,738 | | |
M&T Bank Corp. | | | 1,395 | | | | 170,441 | | |
PNC Financial
Services Group,
Inc. | | | 701 | | | | 60,559 | | |
SVB Financial
Group | | | 2,956 | | | | 331,042 | * | |
U.S. Bancorp | | | 8,333 | | | | 354,986 | | |
Wells Fargo &
Co. | | | 11,148 | | | | 591,847 | | |
| | | | 3,097,454 | | |
Beverages (1.1%) | |
Anheuser-Busch
InBev NV ADR | | | 1,852 | | | | 205,535 | | |
Coca-Cola Co. | | | 7,960 | | | | 333,365 | | |
Dr Pepper
Snapple Group,
Inc. | | | 3,018 | | | | 208,996 | | |
PepsiCo, Inc. | | | 2,930 | | | | 281,778 | | |
| | | | 1,029,674 | | |
Biotechnology (1.5%) | |
Amgen, Inc. | | | 3,239 | | | | 525,301 | | |
Celgene Corp. | | | 3,364 | | | | 360,251 | * | |
Regeneron
Pharmaceuticals,
Inc. | | | 1,364 | | | | 537,034 | * | |
Vertex
Pharmaceuticals,
Inc. | | | 368 | | | | 41,451 | * | |
| | | | 1,464,037 | | |
Capital Markets (1.3%) | |
BlackRock, Inc. | | | 1,018 | | | | 347,250 | | |
Franklin
Resources, Inc. | | | 2,448 | | | | 136,133 | | |
Goldman Sachs
Group, Inc. | | | 2,687 | | | | 510,503 | | |
Golub Capital
BDC, Inc. | | | 1,097 | | | | 19,011 | | |
Invesco Ltd. | | | 3,690 | | | | 149,335 | | |
| | | Number
of Shares | |
Value† | |
T. Rowe Price
Group, Inc. | | | 1,098 | | | $ | 90,135 | | |
| | | | 1,252,367 | | |
Chemicals (3.3%) | |
Ashland, Inc. | | | 2,642 | | | | 285,521 | | |
Chemtura Corp. | | | 5,183 | | | | 120,712 | * | |
Dow Chemical
Co. | | | 4,906 | | | | 242,356 | | |
E.I. du Pont de
Nemours & Co. | | | 3,759 | | | | 259,935 | | |
Eastman
Chemical Co. | | | 671 | | | | 54,203 | | |
Ecolab, Inc. | | | 2,204 | | | | 245,151 | | |
FMC Corp. | | | 1,509 | | | | 86,541 | | |
International
Flavors &
Fragrances, Inc. | | | 950 | | | | 94,193 | | |
LyondellBasell
Industries NV
Class A | | | 487 | | | | 44,624 | | |
Minerals
Technologies,
Inc. | | | 7,040 | | | | 540,039 | | |
Monsanto Co. | | | 1,574 | | | | 181,073 | | |
Mosaic Co. | | | 2,572 | | | | 113,965 | | |
PolyOne Corp. | | | 2,154 | | | | 79,720 | | |
Praxair, Inc. | | | 1,408 | | | | 177,394 | | |
RPM
International,
Inc. | | | 2,238 | | | | 101,381 | | |
Scotts
Miracle-Gro Co.
Class A | | | 1,193 | | | | 70,673 | | |
Sensient
Technologies
Corp. | | | 5,028 | | | | 297,557 | | |
Sigma-Aldrich
Corp. | | | 7 | | | | 951 | | |
WR Grace & Co. | | | 2,901 | | | | 274,435 | * | |
| | | | 3,270,424 | | |
Commercial Services & Supplies (1.9%) | |
ADT Corp. | | | 9,568 | | | | 342,917 | | |
Covanta
Holding Corp. | | | 13,039 | | | | 287,771 | | |
Healthcare
Services Group,
Inc. | | | 5,508 | | | | 164,028 | | |
Pitney Bowes,
Inc. | | | 19,384 | | | | 479,560 | | |
Stericycle, Inc. | | | 1,901 | | | | 239,526 | * | |
See Notes to Schedule of Investments
20
| | | Number
of Shares | |
Value† | |
Tetra Tech, Inc. | | | 6,138 | | | $ | 164,560 | | |
Tyco
International
Ltd. | | | 4,296 | | | | 184,427 | | |
| | | | 1,862,789 | | |
Communications Equipment (0.2%) | |
Cisco Systems,
Inc. | | | 9,955 | | | | 243,599 | | |
Construction & Engineering (0.1%) | |
Quanta Services,
Inc. | | | 2,990 | | | | 101,899 | * | |
Consumer Finance (0.9%) | |
American
Express Co. | | | 9,411 | | | | 846,520 | | |
Discover
Financial
Services | | | 58 | | | | 3,699 | | |
| | | | 850,219 | | |
Containers & Packaging (0.6%) | |
Packaging Corp.
of America | | | 1,715 | | | | 123,617 | | |
Sealed Air Corp. | | | 13,154 | | | | 476,833 | | |
| | | | 600,450 | | |
Diversified Consumer Services (0.2%) | |
H&R Block, Inc. | | | 5,584 | | | | 180,419 | | |
Diversified Financial Services (2.6%) | |
Berkshire
Hathaway, Inc.
Class B | | | 5,418 | | | | 759,387 | * | |
CME Group, Inc. | | | 8,067 | | | | 676,095 | | |
Intercontinental
Exchange, Inc. | | | 1,783 | | | | 371,381 | | |
McGraw-Hill
Financial, Inc. | | | 12 | | | | 1,086 | | |
Moody's Corp. | | | 4,794 | | | | 475,709 | | |
MSCI, Inc. | | | 5,006 | | | | 233,580 | | |
| | | | 2,517,238 | | |
Diversified Telecommunication Services (0.7%) | |
BCE, Inc. | | | 6,252 | | | | 278,026 | | |
tw telecom, inc. | | | 1,796 | | | | 76,833 | * | |
Verizon
Communications,
Inc. | | | 5,779 | | | | 290,395 | | |
| | | | 645,254 | | |
Electric Utilities (1.7%) | |
ALLETE, Inc. | | | 3,162 | | | | 165,183 | | |
Edison
International | | | 888 | | | | 55,571 | | |
El Paso Electric
Co. | | | 386 | | | | 14,606 | | |
Great Plains
Energy, Inc. | | | 10,552 | | | | 284,165 | | |
ITC Holdings
Corp. | | | 8,874 | | | | 351,499 | | |
NextEra Energy,
Inc. | | | 4,165 | | | | 417,416 | | |
| | | Number
of Shares | |
Value† | |
Northeast
Utilities | | | 3,131 | | | $ | 154,515 | | |
NRG Yield, Inc.
Class A | | | 1,065 | | | | 53,218 | | |
OGE Energy
Corp. | | | 2,191 | | | | 81,703 | | |
Pinnacle West
Capital Corp. | | | 1,046 | | | | 64,298 | | |
| | | | 1,642,174 | | |
Electrical Equipment (0.3%) | |
ABB Ltd. ADR | | | 3,532 | | | | 77,492 | * | |
Eaton Corp. PLC | | | 745 | | | | 50,951 | | |
Rockwell
Automation,
Inc. | | | 635 | | | | 71,342 | | |
Sensata
Technologies
Holding NV | | | 1,937 | | | | 94,545 | * | |
| | | | 294,330 | | |
Electronic Equipment, Instruments & Components (1.0%) | |
Amphenol Corp.
Class A | | | 6,749 | | | | 341,364 | | |
Corning, Inc. | | | 14,119 | | | | 288,451 | | |
IPG Photonics
Corp. | | | 1,117 | | | | 81,999 | * | |
TE Connectivity
Ltd. | | | 3,046 | | | | 186,202 | | |
Universal Display
Corp. | | | 1,753 | | | | 54,834 | * | |
| | | | 952,850 | | |
Energy Equipment & Services (1.6%) | |
Dresser-Rand
Group, Inc. | | | 1,017 | | | | 83,089 | * | |
FMC
Technologies,
Inc. | | | 2,152 | | | | 120,598 | * | |
National Oilwell
Varco, Inc. | | | 6 | | | | 436 | | |
Schlumberger
Ltd. | | | 13,377 | | | | 1,319,775 | | |
| | | | 1,523,898 | | |
Food & Staples Retailing (1.3%) | |
Costco | | | 5,698 | | | | 759,942 | | |
Wholesale
Corp. | |
CVS Health
Corp. | | | 3,487 | | | | 299,219 | | |
Smart & Final
Stores, Inc. | | | 6,657 | | | | 98,191 | * | |
Walgreen Co. | | | 1,308 | | | | 84,000 | | |
| | | | 1,241,352 | | |
Food Products (1.4%) | |
ConAgra Foods,
Inc. | | | 4,120 | | | | 141,522 | | |
Kraft Foods
Group, Inc. | | | 2,343 | | | | 132,028 | | |
| | | Number
of Shares | |
Value† | |
Mead Johnson
Nutrition Co. | | | 1,622 | | | $ | 161,081 | | |
Mondelez
International,
Inc. Class A | | | 9,427 | | | | 332,396 | | |
Nestle SA ADR | | | 1,182 | | | | 86,676 | | |
Unilever NV | | | 3,105 | | | | 120,257 | | |
WhiteWave
Foods Co. | | | 11,280 | | | | 419,954 | * | |
| | | | 1,393,914 | | |
Gas Utilities (0.1%) | |
National Fuel
Gas Co. | | | 1,221 | | | | 84,530 | | |
Health Care Equipment & Supplies (1.8%) | |
Abbott
Laboratories | | | 2,653 | | | | 115,644 | | |
Becton,
Dickinson & Co. | | | 737 | | | | 94,852 | | |
C.R. Bard, Inc. | | | 374 | | | | 61,325 | | |
Cooper Cos.,
Inc. | | | 1,669 | | | | 273,549 | | |
Covidien PLC | | | 1,750 | | | | 161,770 | | |
Hill-Rom
Holdings, Inc. | | | 1,992 | | | | 88,604 | | |
IDEXX
Laboratories,
Inc. | | | 2,726 | | | | 386,193 | * | |
Medtronic, Inc. | | | 1,508 | | | | 102,785 | | |
Sirona Dental
Systems, Inc. | | | 2,308 | | | | 181,293 | * | |
West
Pharmaceutical
Services, Inc. | | | 1,349 | | | | 69,136 | | |
Zimmer
Holdings, Inc. | | | 1,824 | | | | 202,902 | | |
| | | | 1,738,053 | | |
Health Care Providers &
Services (2.3%) | |
Aetna, Inc. | | | 2,417 | | | | 199,427 | | |
Cardinal Health,
Inc. | | | 2,297 | | | | 180,268 | | |
DaVita
HealthCare
Partners, Inc. | | | 2,579 | | | | 201,342 | * | |
Express Scripts
Holding Co. | | | 7,164 | | | | 550,338 | * | |
HCA Holdings,
Inc. | | | 2,843 | | | | 199,152 | * | |
Henry Schein,
Inc. | | | 1,725 | | | | 207,052 | * | |
Laboratory
Corporation of
America
Holdings | | | 1,264 | | | | 138,143 | * | |
McKesson Corp. | | | 1,198 | | | | 243,685 | | |
VCA, Inc. | | | 4,380 | | | | 199,597 | * | |
WellPoint, Inc. | | | 1,069 | | | | 135,432 | | |
| | | | 2,254,436 | | |
See Notes to Schedule of Investments
21
| | | Number
of Shares | |
Value† | |
Health Care Technology (0.1%) | |
IMS Health
Holdings, Inc. | | | 3,878 | | | $ | 94,042 | * | |
Hotels, Restaurants & Leisure (1.3%) | |
Aramark | | | 3,665 | | | | 102,290 | | |
Darden
Restaurants,
Inc. | | | 1,966 | | | | 101,799 | | |
Dunkin' Brands
Group, Inc. | | | 4,018 | | | | 182,739 | | |
Hilton
Worldwide
Holdings, Inc. | | | 6,017 | | | | 151,869 | * | |
Hyatt Hotels
Corp. Class A | | | 1,734 | | | | 102,687 | * | |
McDonald's
Corp. | | | 2,184 | | | | 204,706 | | |
Starbucks Corp. | | | 1,737 | | | | 131,248 | | |
Wendy's Co. | | | 14,474 | | | | 116,082 | | |
Wynn Resorts
Ltd. | | | 862 | | | | 163,789 | | |
| | | | 1,257,209 | | |
Household Durables (0.9%) | |
Jarden Corp. | | | 1,910 | | | | 124,322 | * | |
Lennar Corp.
Class A | | | 6,416 | | | | 276,401 | | |
Newell
Rubbermaid,
Inc. | | | 9,706 | | | | 323,501 | | |
Toll Brothers,
Inc. | | | 3,008 | | | | 96,106 | * | |
Tupperware
Brands Corp. | | | 687 | | | | 43,796 | | |
| | | | 864,126 | | |
Household Products (1.0%) | |
Church &
Dwight Co., Inc. | | | 2,457 | | | | 177,911 | | |
Colgate-
Palmolive Co. | | | 732 | | | | 48,956 | | |
Energizer
Holdings, Inc. | | | 1,075 | | | | 131,849 | | |
Kimberly-Clark
Corp. | | | 488 | | | | 55,764 | | |
Procter &
Gamble Co. | | | 6,742 | | | | 588,374 | | |
| | | | 1,002,854 | | |
Independent Power and Renewable Electricity Producers (0.5%) | |
AES Corp. | | | 7,431 | | | | 104,554 | | |
Calpine Corp. | | | 15,433 | | | | 352,181 | * | |
TransAlta
Renewables,
Inc. | | | 1,255 | | | | 13,542 | | |
| | | | 470,277 | | |
Industrial Conglomerates (1.4%) | |
3M Co. | | | 3,649 | | | | 561,107 | | |
Danaher Corp. | | | 4,959 | | | | 398,703 | | |
General Electric
Co. | | | 6,478 | | | | 167,197 | | |
| | | Number
of Shares | |
Value† | |
Koninklijke
Philips NV | | | 5,882 | | | $ | 164,343 | | |
Roper Industries,
Inc. | | | 639 | | | | 101,154 | | |
| | | | 1,392,504 | | |
Insurance (2.3%) | |
Allstate Corp. | | | 2,732 | | | | 177,170 | | |
American
International
Group, Inc. | | | 1,827 | | | | 97,873 | | |
Aon PLC | | | 6,077 | | | | 522,622 | | |
Lincoln National
Corp. | | | 3,782 | | | | 207,102 | | |
Marsh &
McLennan
Cos., Inc. | | | 3,257 | | | | 177,083 | | |
MetLife, Inc. | | | 4,092 | | | | 221,950 | | |
Progressive Corp. | | | 9,882 | | | | 260,984 | | |
Prudential PLC | | | 4,283 | | | | 98,833 | | |
Reinsurance
Group of
America, Inc. | | | 1,704 | | | | 143,562 | | |
Travelers Cos.,
Inc. | | | 2,754 | | | | 277,603 | | |
Unum Group | | | 2,433 | | | | 81,408 | | |
| | | | 2,266,190 | | |
Internet & Catalog Retail (0.3%) | |
Amazon.com,
Inc. | | | 1,091 | | | | 333,257 | * | |
Internet Software & Services (2.4%) | |
eBay, Inc. | | | 20,216 | | | | 1,061,340 | * | |
Facebook, Inc.
Class A | | | 411 | | | | 30,821 | * | |
Google, Inc.
Class A | | | 972 | | | | 551,969 | * | |
Google, Inc.
Class C | | | 921 | | | | 514,913 | * | |
IAC/
InterActiveCorp | | | 2,277 | | | | 154,130 | | |
Twitter, Inc. | | | 383 | | | | 15,883 | * | |
| | | | 2,329,056 | | |
IT Services (3.8%) | |
Accenture PLC
Class A | | | 1,047 | | | | 84,933 | | |
Alliance Data
Systems Corp. | | | 382 | | | | 108,240 | * | |
Amdocs Ltd. | | | 7,455 | | | | 354,411 | | |
Automatic Data
Processing, Inc. | | | 1,772 | | | | 144,914 | | |
Computer
Sciences Corp. | | | 2,243 | | | | 135,477 | | |
Fiserv, Inc. | | | 1,758 | | | | 122,146 | * | |
IBM Corp. | | | 5,618 | | | | 923,599 | | |
Leidos Holdings,
Inc. | | | 8,151 | | | | 298,082 | | |
MasterCard, Inc.
Class A | | | 2,075 | | | | 173,781 | | |
NeuStar, Inc.
Class A | | | 8,169 | | | | 215,743 | * | |
Teradata Corp. | | | 1,834 | | | | 77,615 | * | |
| | | Number
of Shares | |
Value† | |
VeriFone
Systems, Inc. | | | 6,174 | | | $ | 230,043 | * | |
Visa, Inc. Class A | | | 1,632 | | | | 394,014 | | |
WEX, Inc. | | | 4,308 | | | | 489,216 | * | |
| | | | 3,752,214 | | |
Leisure Products (0.2%) | |
Mattel, Inc. | | | 1,835 | | | | 57,014 | | |
Polaris
Industries, Inc. | | | 969 | | | | 146,183 | | |
| | | | 203,197 | | |
Life Sciences Tools & Services (0.1%) | |
Charles River
Laboratories
International,
Inc. | | | 1,319 | | | | 83,308 | * | |
Thermo Fisher
Scientific, Inc. | | | 344 | | | | 40,444 | | |
| | | | 123,752 | | |
Machinery (1.1%) | |
Deere & Co. | | | 2,256 | | | | 192,978 | | |
Dover Corp. | | | 1,427 | | | | 113,361 | | |
Ingersoll-Rand
PLC | | | 1,518 | | | | 95,057 | | |
Joy Global, Inc. | | | 3,556 | | | | 187,152 | | |
Lincoln Electric
Holdings, Inc. | | | 1,806 | | | | 130,899 | | |
Mueller
Industries, Inc. | | | 2,746 | | | | 89,135 | | |
Pentair PLC | | | 1,689 | | | | 113,248 | | |
Stanley Black &
Decker, Inc. | | | 1,463 | | | | 136,995 | | |
Valmont
Industries, Inc. | | | 399 | | | | 54,332 | | |
| | | | 1,113,157 | | |
Media (3.9%) | |
Comcast Corp.
Class A | | | 5,426 | | | | 300,329 | | |
Comcast Corp.
Class A Special | | | 6,554 | | | | 361,388 | | |
Cumulus Media,
Inc. Class A | | | 42,235 | | | | 163,027 | * | |
Discovery
Communications,
Inc. Class C | | | 1,963 | | | | 68,685 | * | |
Lions Gate
Entertainment
Corp. | | | 2,107 | | | | 69,805 | | |
Markit Ltd. | | | 6,699 | | | | 171,092 | * | |
Omnicom
Group, Inc. | | | 1,972 | | | | 141,708 | | |
Pearson PLC | | | 9,489 | | | | 177,601 | | |
Pearson PLC
ADR | | | 10,281 | | | | 192,769 | | |
Regal
Entertainment
Group Class A | | | 11,576 | | | | 256,408 | | |
Scholastic Corp. | | | 3,576 | | | | 124,481 | | |
Time Warner,
Inc. | | | 2,386 | | | | 189,615 | | |
See Notes to Schedule of Investments
22
| | | Number
of Shares | |
Value† | |
Tribune Media
Co. Class A | | | 2,266 | | | $ | 151,822 | * | |
Twenty-First
Century Fox,
Inc. Class A | | | 11,310 | | | | 389,969 | | |
Viacom, Inc.
Class B | | | 6,179 | | | | 449,090 | | |
Walt Disney Co. | | | 7,066 | | | | 645,691 | | |
| | | | 3,853,480 | | |
Metals & Mining (0.6%) | |
Allegheny
Technologies,
Inc. | | | 2,124 | | | | 69,773 | | |
Carpenter
Technology
Corp. | | | 3,815 | | | | 190,941 | | |
Dominion
Diamond Corp. | | | 7,950 | | | | 111,380 | * | |
Goldcorp, Inc. | | | 9,153 | | | | 171,893 | | |
| | | | 543,987 | | |
Multi-Utilities (0.9%) | |
Alliant Energy
Corp. | | | 2,310 | | | | 143,012 | | |
Ameren Corp. | | | 6,393 | | | | 270,680 | | |
CenterPoint
Energy, Inc. | | | 6,726 | | | | 165,123 | | |
NiSource, Inc. | | | 1,860 | | | | 78,231 | | |
TECO Energy,
Inc. | | | 462 | | | | 9,060 | | |
Wisconsin
Energy Corp. | | | 5,227 | | | | 259,573 | | |
| | | | 925,679 | | |
Multiline Retail (0.3%) | |
Kohl's Corp. | | | 1,712 | | | | 92,825 | | |
Macy's, Inc. | | | 1,459 | | | | 84,359 | | |
Nordstrom, Inc. | | | 1,165 | | | | 84,591 | | |
Target Corp. | | | 14 | | | | 865 | | |
| | | | 262,640 | | |
Oil, Gas & Consumable Fuels (7.7%) | |
Anadarko
Petroleum Corp. | | | 5,326 | | | | 488,820 | | |
Antero
Resources Corp. | | | 8,209 | | | | 430,480 | * | |
Apache Corp. | | | 2,228 | | | | 172,002 | | |
Athlon Energy,
Inc. | | | 2,240 | | | | 130,592 | * | |
Cabot Oil &
Gas Corp. | | | 14,227 | | | | 442,460 | | |
Canadian
Natural
Resources Ltd. | | | 235 | | | | 8,197 | | |
Cenovus
Energy, Inc. | | | 9,222 | | | | 228,337 | | |
Cheniere
Energy, Inc. | | | 295 | | | | 22,125 | * | |
Chevron Corp. | | | 713 | | | | 85,524 | | |
ConocoPhillips | | | 2,489 | | | | 179,581 | | |
Continental
Resources, Inc. | | | 927 | | | | 52,255 | * | |
| | | Number
of Shares | |
Value† | |
Devon Energy
Corp. | | | 1,239 | | | $ | 74,340 | | |
Enbridge, Inc. | | | 4,501 | | | | 213,167 | | |
EOG Resources,
Inc. | | | 9,385 | | | | 892,044 | | |
Exxon Mobil
Corp. | | | 4,205 | | | | 406,666 | | |
Laredo
Petroleum, Inc. | | | 2,183 | | | | 41,390 | * | |
Memorial
Resource
Development
Corp. | | | 7,067 | | | | 191,445 | * | |
Noble Energy,
Inc. | | | 2,121 | | | | 122,233 | | |
Occidental
Petroleum
Corp. | | | 10,433 | | | | 927,807 | | |
Pioneer Natural
Resources Co. | | | 2,361 | | | | 446,371 | | |
QEP Resources,
Inc. | | | 5,754 | | | | 144,253 | | |
Range
Resources
Corp. | | | 10,810 | | | | 739,404 | | |
Rice Energy,
Inc. | | | 3,600 | | | | 95,148 | * | |
Royal Dutch
Shell PLC ADR
Class A | | | 3,414 | | | | 245,091 | | |
Spectra Energy
Corp. | | | 211 | | | | 8,256 | | |
Targa Resources
Corp. | | | 839 | | | | 107,921 | | |
Teekay Corp. | | | 6,765 | | | | 395,482 | | |
Veresen, Inc. | | | 7,934 | | | | 124,818 | | |
Whiting
Petroleum
Corp. | | | 1,747 | | | | 106,986 | * | |
| | | | 7,523,195 | | |
Paper & Forest Products (0.1%) | |
International
Paper Co. | | | 1,847 | | | | 93,495 | | |
Personal Products (0.3%) | |
Estee Lauder
Cos., Inc.
Class A | | | 4,456 | | | | 335,002 | | |
Pharmaceuticals (7.0%) | |
AbbVie, Inc. | | | 2,892 | | | | 183,526 | | |
Actavis PLC | | | 1,618 | | | | 392,753 | * | |
Allergan, Inc. | | | 1,004 | | | | 190,820 | | |
Bristol-Myers
Squibb Co. | | | 24,685 | | | | 1,436,420 | | |
Eli Lilly & Co. | | | 1,481 | | | | 98,235 | | |
Johnson &
Johnson | | | 12,829 | | | | 1,382,710 | | |
Merck & Co.,
Inc. | | | 2,039 | | | | 118,140 | | |
Novartis AG
ADR | | | 5,523 | | | | 511,927 | | |
| | | Number
of Shares | |
Value† | |
Pacira
Pharmaceuticals,
Inc. | | | 1,129 | | | $ | 104,794 | * | |
Pfizer, Inc. | | | 40,515 | | | | 1,213,424 | | |
Roche Holding
AG | | | 404 | | | | 119,124 | | |
Roche Holding
AG ADR | | | 3,769 | | | | 138,737 | | |
Sanofi ADR | | | 6,532 | | | | 302,040 | | |
Teva
Pharmaceutical
Industries Ltd.
ADR | | | 2,558 | | | | 144,450 | | |
Zoetis, Inc. | | | 12,834 | | | | 476,911 | | |
| | | | 6,814,011 | | |
Professional Services (1.0%) | |
IHS, Inc. Class A | | | 1,741 | | | | 228,123 | * | |
Nielsen NV | | | 5,797 | | | | 246,315 | | |
Verisk Analytics,
Inc. Class A | | | 8,478 | | | | 528,603 | * | |
| | | | 1,003,041 | | |
Real Estate Investment Trusts (1.9%) | |
American Tower
Corp. | | | 4,442 | | | | 433,095 | | |
CBS Outdoor
Americas, Inc. | | | 4,171 | | | | 126,924 | | |
Corrections
Corporation of
America | | | 3,348 | | | | 123,139 | | |
Hannon
Armstrong
Sustainable
Infrastructure
Capital, Inc. | | | 1,338 | | | | 18,705 | | |
Iron Mountain,
Inc. | | | 2,879 | | | | 103,846 | | |
NorthStar Realty
Finance Corp. | | | 3,089 | | | | 57,394 | | |
Plum Creek | | | 3,235 | | | | 132,667 | | |
Timber Co., Inc. | |
Starwood
Property
Trust, Inc. | | | 19,683 | | | | 444,048 | | |
Ventas, Inc. | | | 668 | | | | 45,765 | | |
Vornado Realty
Trust | | | 1,056 | | | | 115,611 | | |
Weyerhaeuser
Co. | | | 7,232 | | | | 244,875 | | |
| | | | 1,846,069 | | |
Real Estate Management & Development (0.3%) | |
Brookfield Asset
Management,
Inc. Class A | | | 5,133 | | | | 251,363 | | |
Road & Rail (1.4%) | |
Avis Budget
Group, Inc. | | | 3,381 | | | | 188,491 | * | |
Canadian
National
Railway Co. | | | 294 | | | | 20,751 | | |
See Notes to Schedule of Investments
23
| | | Number
of Shares | |
Value† | |
Canadian Pacific
Railway Ltd. | | | 885 | | | $ | 183,797 | | |
CSX Corp. | | | 4,366 | | | | 155,561 | | |
Hertz Global
Holdings, Inc. | | | 8,394 | | | | 183,996 | * | |
J.B. Hunt
Transport
Services, Inc. | | | 434 | | | | 34,620 | | |
Kansas City
Southern | | | 731 | | | | 89,759 | | |
Norfolk
Southern Corp. | | | 1,893 | | | | 209,442 | | |
Union Pacific
Corp. | | | 2,865 | | | | 333,629 | | |
| | | | 1,400,046 | | |
Semiconductors & Semiconductor Equipment (1.4%) | |
Altera Corp. | | | 5,606 | | | | 192,678 | | |
Analog Devices,
Inc. | | | 1,767 | | | | 87,679 | | |
ASML Holding
NV | | | 2,961 | | | | 295,153 | | |
Intel Corp. | | | 8,525 | | | | 289,935 | | |
Linear
Technology
Corp. | | | 33 | | | | 1,414 | | |
Skyworks
Solutions, Inc. | | | 1,756 | | | | 102,269 | | |
Texas
Instruments,
Inc. | | | 8,594 | | | | 426,778 | | |
| | | | 1,395,906 | | |
Software (3.2%) | |
Activision
Blizzard, Inc. | | | 4,690 | | | | 93,566 | | |
ANSYS, Inc. | | | 1,253 | | | | 98,436 | * | |
Check Point
Software
Technologies
Ltd. | | | 2,108 | | | | 156,519 | * | |
FireEye, Inc. | | | 1,902 | | | | 64,649 | * | |
Intuit, Inc. | | | 5,154 | | | | 453,604 | | |
Microsoft Corp. | | | 32,090 | | | | 1,506,625 | | |
NICE-Systems
Ltd. ADR | | | 4,162 | | | | 169,310 | | |
Nuance
Communications,
Inc. | | | 6,838 | | | | 105,510 | * | |
Oracle Corp. | | | 9,450 | | | | 369,022 | | |
VMware, Inc.
Class A | | | 1,614 | | | | 134,882 | * | |
| | | | 3,152,123 | | |
Specialty Retail (2.4%) | |
Asbury
Automotive
Group, Inc. | | | 1,213 | | | | 84,959 | * | |
Bed Bath &
Beyond, Inc. | | | 2,768 | | | | 186,397 | * | |
Best Buy Co.,
Inc. | | | 3,961 | | | | 135,229 | | |
| | | Number
of Shares | |
Value† | |
DSW, Inc.
Class A | | | 3,210 | | | $ | 95,176 | | |
Foot Locker, Inc. | | | 1,233 | | | | 69,060 | | |
Gap, Inc. | | | 1,593 | | | | 60,359 | | |
GNC Holdings,
Inc. Class A | | | 5,176 | | | | 215,166 | | |
Home Depot,
Inc. | | | 4,969 | | | | 484,577 | | |
Office Depot,
Inc. | | | 16,866 | | | | 88,040 | * | |
PetSmart, Inc. | | | 3,054 | | | | 220,957 | | |
Tiffany & Co. | | | 2,615 | | | | 251,354 | | |
TJX Cos., Inc. | | | 6,387 | | | | 404,425 | | |
| | | | 2,295,699 | | |
Technology Hardware, Storage & Peripherals (2.8%) | |
Apple, Inc. | | | 14,223 | | | | 1,536,084 | | |
EMC Corp. | | | 19,300 | | | | 554,489 | | |
SanDisk Corp. | | | 7,281 | | | | 685,433 | | |
| | | | 2,776,006 | | |
Textiles, Apparel & Luxury Goods (0.4%) | |
Coach, Inc. | | | 56 | | | | 1,926 | | |
Columbia
Sportswear Co. | | | 102 | | | | 3,931 | | |
NIKE, Inc.
Class B | | | 1,039 | | | | 96,596 | | |
PVH Corp. | | | 1,295 | | | | 148,083 | | |
Ralph Lauren
Corp. | | | 662 | | | | 109,124 | | |
| | | | 359,660 | | |
Thrifts & Mortgage Finance (0.1%) | |
People's United
Financial, Inc. | | | 5,548 | | | | 81,112 | | |
Tobacco (0.1%) | |
Philip Morris
International, Inc. | | | 1,088 | | | | 96,843 | | |
Trading Companies &
Distributors (0.3%) | |
NOW, Inc. | | | 3,234 | | | | 97,214 | * | |
United Rentals,
Inc. | | | 786 | | | | 86,507 | * | |
W.W. Grainger,
Inc. | | | 585 | | | | 144,378 | | |
| | | | 328,099 | | |
Transportation Infrastructure (0.4%) | |
Macquarie
Infrastructure
Co. LLC | | | 3,579 | | | | 256,400 | | |
Wesco Aircraft
Holdings, Inc. | | | 6,954 | | | | 123,433 | * | |
| | | | 379,833 | | |
Water Utilities (0.2%) | |
American Water
Works Co., Inc. | | | 2,810 | | | | 149,970 | | |
| | | Number
of Shares | |
Value† | |
Wireless Telecommunication
Services (0.2%) | |
SBA
Communications
Corp. Class A | | | 1,330 | | | $ | 149,399 | * | |
Total Common Stocks
(Cost $73,154,082) | | | | | 84,035,352 | | |
Preferred Stocks (0.3%) | |
Banks (0.2%) | |
HSBC Holdings
PLC, Ser. 2,
8.00% | | | 4,427 | | | | 118,644 | | |
JPMorgan
Chase & Co.,
Ser. O 5.50% | | | 22 | | | | 508 | | |
U.S. Bancorp,
Ser. F, 6.50% | | | 2,839 | | | | 83,211 | | |
Wells Fargo &
Co., Ser. N,
5.20% | | | 22 | | | | 511 | | |
| | | | 202,874 | | |
Marine (0.1%) | |
Seaspan Corp.,
Ser. C, 9.50% | | | 2,001 | | | | 53,067 | | |
Total Preferred Stocks
(Cost $250,667) | | | | | 255,941 | | |
Exchange Traded Funds (0.0%) | |
SPDR S&P 500
ETF Trust
(Cost $14,370) | | | 78 | | | | 15,729 | | |
Mutual Funds (6.3%) | |
Neuberger
Berman Core
Bond Fund
Institutional
Class (Cost
$6,031,189) | | | 582,729 | | | | 6,133,003 | § | |
Short-Term Investments (7.2%) | |
State Street
Institutional
Treasury Money
Market Fund
Premier Class
(Cost
$6,983,117) | | | 6,983,117 | | | | 6,983,117 | | |
Total Investments (99.9%)
(Cost $86,433,425) | | | | | | | 97,423,142
| ## | |
Cash, receivables
and other assets,
less liabilities (0.1%) | | | | | 115,977 | | |
Total Net Assets (100.0%) | | | | | | $ | 97,539,119 | | |
See Notes to Schedule of Investments
Schedule of Investments Global Allocation Fund
TOP TEN EQUITY HOLDINGS LONG POSITIONS
| | | | | Country | | Industry | | | |
| | 1 | | | VCA, Inc. | | United States | | Health Care Providers & Services | | | 1.9 | % | |
| | 2 | | | Micron Technology, Inc.
| | United States
| | Semiconductors & Semiconductor
Equipment | | | 1.2
| % | |
| | 3 | | | Symetra Financial Corp. | | United States | | Insurance | | | 1.2 | % | |
| | 4 | | | Porsche Automobil Holding SE
(Preference Shares) | | Germany
| | Automobiles
| | | 1.1
| % | |
| | 5 | | | Bellway PLC | | United Kingdom | | Household Durables | | | 1.1 | % | |
| | 6 | | | 3i Group PLC | | United Kingdom | | Capital Markets | | | 1.0 | % | |
| | 7 | | | Amkor Technology, Inc.
| | United States
| | Semiconductors & Semiconductor
Equipment | | | 0.9
| % | |
| | 8 | | | Tosoh Corp. | | Japan | | Chemicals | | | 0.9 | % | |
| | 9 | | | Pace PLC | | United Kingdom | | Communications Equipment | | | 0.7 | % | |
| | 10 | | | OmniVision Technologies, Inc.
| | United States
| | Semiconductors & Semiconductor
Equipment | | | 0.7
| % | |
TOP TEN EQUITY HOLDINGS SHORT POSITIONS
| | | | | Country | | Industry | | | |
| | 1 | | | Auxilium Pharmaceuticals, Inc. | | United States | | Pharmaceuticals | | | (0.8 | )% | |
| | 2 | | | Concur Technologies, Inc. | | United States | | Software | | | (0.7 | )% | |
| | 3 | | | NetSuite, Inc. | | United States | | Software | | | (0.6 | )% | |
| | 4 | | | LinkedIn Corp. Class A | | United States | | Internet Software & Services | | | (0.6 | )% | |
| | 5 | | | Scientific Games Corp. Class A | | United States | | Hotels, Restaurants & Leisure | | | (0.6 | )% | |
| | 6 | | | Dealertrack Technologies, Inc. | | United States | | Internet Software & Services | | | (0.6 | )% | |
| | 7 | | | Amaya Gaming Group, Inc. | | Canada | | Hotels, Restaurants & Leisure | | | (0.5 | )% | |
| | 8 | | | Sumitomo Realty &
Development Co. Ltd. | | Japan
| | Real Estate Management &
Development | | | (0.5
| )% | |
| | 9 | | | Kinder Morgan, Inc. | | United States | | Oil, Gas & Consumable Fuels | | | (0.5 | )% | |
| | 10 | | | Receptos, Inc. | | United States | | Biotechnology | | | (0.5 | )% | |
| | | Number
of Shares | |
Value† | |
Long Positions (92.2%) | |
Common Stocks (33.3%) | |
Australia (0.8%) | |
Beach Energy
Ltd. | | | 82,395 | | | $ | 84,471 | | |
Challenger Ltd. | | | 8,342 | | | | 50,873 | | |
Fairfax Media
Ltd. | | | 74,636 | | | | 53,529 | | |
Sims Metal
Management
Ltd. | | | 4,955 | | | | 48,575 | | |
| | | | 237,448 | | |
Austria (0.5%) | |
C.A.T. Oil AG | | | 8,282 | | | | 157,755 | ØØ | |
Canada (1.7%) | |
Advantage
Oil & Gas Ltd. | | | 9,577 | | | | 41,042 | * | |
BlackBerry Ltd. | | | 5,098 | | | | 53,556 | * | |
Canaccord
Genuity
Group, Inc. | | | 4,453 | | | | 37,693 | | |
Centerra Gold,
Inc. | | | 8,970 | | | | 35,019 | | |
Genworth MI
Canada, Inc. | | | 1,522 | | | | 53,207 | | |
Linamar Corp. | | | 2,691 | | | | 137,457 | | |
| | | Number
of Shares | |
Value† | |
Lundin Mining
Corp. | | | 31,169 | | | $ | 139,107 | * | |
| | | | 497,081 | | |
China (0.3%) | |
Yangzijiang
Shipbuilding
Holdings Ltd. | | | 83,000 | | | | 73,005 | | |
France (0.8%) | |
Groupe Fnac | | | 3,205 | | | | 134,347 | * | |
Montupet | | | 1,180 | | | | 91,488 | | |
| | | | 225,835 | | |
Germany (2.2%) | |
Nordex SE | | | 6,435 | | | | 108,703 | * | |
Porsche
Automobil
Holding SE
(Preference
Shares) | | | 3,959 | | | | 324,117 | ØØ | |
Wacker
Neuson SE | | | 10,269 | | | | 199,399 | ØØ | |
| | | | 632,219 | | |
Italy (0.5%) | |
Cementir
Holding SpA | | | 16,103 | | | | 96,458 | | |
Enel SpA | | | 9,151 | | | | 46,673 | | |
| | | | 143,131 | | |
| | | Number
of Shares | |
Value† | |
Japan (3.8%) | |
Hazama Ando
Corp. | | | 8,400 | | | $ | 55,040 | | |
HI-LEX Corp. | | | 3,700 | | | | 94,044 | | |
Minebea Co.
Ltd. | | | 4,000 | | | | 52,633 | | |
Nippon Paint
Holdings Co.
Ltd. | | | 4,000 | | | | 87,852 | | |
Nippon Paper
Industries Co.
Ltd. | | | 2,900 | | | | 41,980 | | |
Nohmi Bosai
Ltd. | | | 3,000 | | | | 42,386 | | |
NOK Corp. | | | 4,300 | | | | 106,844 | | |
Obara Group,
Inc. | | | 1,300 | | | | 46,641 | | |
Seiko Epson
Corp. | | | 2,700 | | | | 122,350 | | |
Tokyo Electric
Power Co.,
Inc. | | | 13,100 | | | | 46,301 | * | |
Tosoh Corp. | | | 61,000 | | | | 257,414 | ØØ | |
Toyo Tire &
Rubber Co.
Ltd. | | | 7,500 | | | | 119,987 | | |
Ulvac, Inc. | | | 3,400 | | | | 41,106 | * | |
| | | | 1,114,578 | | |
See Notes to Schedule of Investments
25
| | | Number
of Shares | |
Value† | |
Luxembourg (0.5%) | |
APERAM | | | 4,598 | | | $ | 132,093 | * | |
Netherlands (0.1%) | |
PostNL NV | | | 10,042 | | | | 42,572 | * | |
Puerto Rico (0.2%) | |
Popular, Inc. | | | 1,599 | | | | 50,976 | * | |
Sweden (0.4%) | |
Haldex AB | | | 5,873 | | | | 71,979 | | |
Investment AB
Kinnevik,
B Shares | | | 1,244 | | | | 39,405 | | |
| | | | 111,384 | | |
Switzerland (0.2%) | |
Autoneum
Holding AG | | | 361 | | | | 60,032 | * | |
United Arab Emirates (0.3%) | |
Lamprell PLC | | | 37,450 | | | | 87,916 | * | |
United Kingdom (5.5%) | |
| 3i Group PLC | | | 46,380 | | | | 294,476 | ØØ | |
African Barrick
Gold PLC | | | 35,829 | | | | 118,070 | | |
Al Noor
Hospitals
Group PLC | | | 5,421 | | | | 88,368 | | |
Beazley PLC | | | 11,638 | | | | 48,777 | | |
Bellway PLC | | | 11,522 | | | | 322,371 | ØØ | |
easyJet PLC | | | 7,055 | | | | 169,288 | | |
Greggs PLC | | | 14,429 | | | | 139,647 | | |
Hikma
Pharmaceuticals
PLC | | | 1,704 | | | | 51,656 | | |
Pace PLC | | | 36,256 | | | | 200,966 | ØØ | |
Taylor Wimpey
PLC | | | 39,991 | | | | 75,745 | | |
Trinity Mirror
PLC | | | 36,065 | | | | 94,617 | * | |
| | | | 1,603,981 | | |
United States (15.5%) | |
Amkor
Technology,
Inc. | | | 39,568 | | | | 268,271 | *ØØ | |
ArcBest Corp. | | | 1,452 | | | | 56,192 | È | |
Best Buy Co.,
Inc. | | | 2,928 | | | | 99,962 | | |
BioCryst
Pharmaceuticals,
Inc. | | | 11,521 | | | | 135,026 | * | |
Broadcom
Corp. Class A | | | 1,402 | | | | 58,716 | | |
Clayton
Williams
Energy, Inc. | | | 770 | | | | 64,018 | *ØØ | |
Delta Air Lines,
Inc. | | | 2,416 | | | | 97,196 | ØØ | |
Dynegy, Inc. | | | 1,963 | | | | 59,871 | *ÈØØ | |
Federal-Mogul
Holdings Corp. | | | 3,126 | | | | 48,797 | *È | |
First Solar, Inc. | | | 1,131 | | | | 66,616 | *ÈØØ | |
| | | Number
of Shares | |
Value† | |
Freescale
Semiconductor
Ltd. | | | 6,395 | | | $ | 127,196 | *È | |
Genworth
Financial, Inc.
Class A | | | 4,616 | | | | 64,578 | *ØØ | |
Globalstar, Inc. | | | 35,590 | | | | 84,348 | *È | |
Greenbrier
Cos., Inc. | | | 1,857 | | | | 116,137 | ÈØØ | |
Ingram Micro,
Inc. Class A | | | 2,020 | | | | 54,217 | * | |
Inovio
Pharmaceuticals,
Inc. | | | 6,396 | | | | 72,659 | *È | |
Insys
Therapeutics,
Inc. | | | 1,796 | | | | 73,052 | *ØØ | |
Integrated
Device
Technology,
Inc. | | | 3,927 | | | | 64,442 | *ØØ | |
JetBlue
Airways Corp. | | | 7,309 | | | | 84,346 | *È | |
Key Energy
Services, Inc. | | | 7,802 | | | | 23,718 | *È | |
Lexmark
International,
Inc. Class A | | | 1,791 | | | | 77,299 | È | |
Lincoln
National Corp. | | | 1,531 | | | | 83,837 | ØØ | |
Micron
Technology,
Inc. | | | 10,777 | | | | 356,611 | *ØØ | |
Nabors
Industries Ltd. | | | 3,148 | | | | 56,192 | | |
National
Western Life
Insurance Co.,
Class A | | | 621 | | | | 168,291 | ÈØØ | |
OmniVision
Technologies,
Inc. | | | 7,483 | | | | 200,395 | *ØØ | |
Pilgrim's Pride
Corp. | | | 5,517 | | | | 156,738 | *ÈØØ | |
Pioneer Energy
Services Corp. | | | 2,971 | | | | 27,274 | * | |
Piper Jaffray
Cos. | | | 2,583 | | | | 145,836 | *ÈØØ | |
RF Micro
Devices, Inc. | | | 15,360 | | | | 199,834 | *ÈØØ | |
Rite Aid Corp. | | | 7,426 | | | | 38,986 | * | |
Sanderson
Farms, Inc. | | | 515 | | | | 43,250 | È | |
Symetra
Financial
Corp. | | | 15,038 | | | | 356,401 | ØØ | |
Tech Data
Corp. | | | 1,010 | | | | 60,317 | *ØØ | |
Trinity
Industries, Inc. | | | 3,376 | | | | 120,557 | ÈØØ | |
TriQuint
Semiconductor,
Inc. | | | 7,129 | | | | 154,200 | *È | |
| | | Number
of Shares | |
Value† | |
VCA, Inc. | | | 11,917 | | | $ | 543,058 | *ØØ | |
| | | | 4,508,434 | | |
Total Common Stocks
(Cost $10,302,205) | | | | | 9,678,440 | | |
Short-Term Investments (58.9%) | |
State Street
Institutional
Government
Money Market
Fund Premier
Class (Cost
$17,091,904) | | | 17,091,904 | | | | 17,091,904 | ØØ | |
Total Long
Positions (92.2%)
(Cost $27,394,109) | | | | | 26,770,344 | ## | |
Cash, receivables
and other assets,
less liabilities (41.3%) | | | | | 11,988,482 | ± | |
Short Positions
(see summary
below) ((33.5)%) | | | | | (9,735,766 | ) | |
Total Net Assets (100.0%) | | | | $ | 29,023,060 | | |
Short Positions ((33.5)%) | |
| Common Stocks Sold Short (33.5%)‡ | |
Australia (0.9%) | |
Coca-Cola
Amatil Ltd. | | | (6,399 | ) | | | (51,524 | ) | |
Iluka Resources
Ltd. | | | (10,035 | ) | | | (63,582 | ) | |
Newcrest
Mining Ltd. | | | (7,614 | ) | | | (62,447 | )* | |
Whitehaven
Coal Ltd. | | | (63,571 | ) | | | (84,753 | )* | |
| | | | (262,306 | ) | |
Austria (0.5%) | |
Andritz AG | | | (1,210 | ) | | | (58,408 | ) | |
Conwert
Immobilien
Invest SE | | | (8,850 | ) | | | (98,028 | )* | |
| | | | (156,436 | ) | |
Belgium (0.3%) | |
Telenet Group
Holding NV | | | (1,385 | ) | | | (78,319 | )* | |
Canada (1.6%) | |
Alamos Gold,
Inc. | | | (10,459 | ) | | | (78,045 | ) | |
Amaya
Gaming
Group, Inc. | | | (4,924 | ) | | | (149,636 | )* | |
Avigilon Corp. | | | (2,507 | ) | | | (34,678 | )* | |
B2Gold Corp. | | | (24,364 | ) | | | (40,641 | )* | |
Detour Gold
Corp. | | | (6,555 | ) | | | (38,386 | )* | |
See Notes to Schedule of Investments
26
| | | Number
of Shares | |
Value† | |
First Majestic
Silver Corp. | | | (6,687 | ) | | $ | (34,294 | )* | |
Turquoise Hill
Resources Ltd. | | | (17,004 | ) | | | (57,029 | )* | |
Yamana Gold,
Inc. | | | (7,253 | ) | | | (28,895 | ) | |
| | | | (461,604 | ) | |
Finland (0.4%) | |
Metso OYJ | | | (2,802 | ) | | | (91,400 | ) | |
Outokumpu
OYJ | | | (5,930 | ) | | | (33,485 | )* | |
| | | | (124,885 | ) | |
France (1.4%) | |
Alcatel-Lucent | | | (27,755 | ) | | | (85,144 | )* | |
Bureau Veritas
SA | | | (5,093 | ) | | | (125,923 | ) | |
Edenred | | | (2,768 | ) | | | (76,659 | ) | |
Remy
Cointreau SA | | | (1,581 | ) | | | (112,474 | ) | |
| | | | (400,200 | ) | |
Italy (1.0%) | |
Brunello
Cucinelli SpA | | | (5,560 | ) | | | (112,456 | ) | |
Geox SpA | | | (13,578 | ) | | | (41,483 | )* | |
Salvatore
Ferragamo
SpA | | | (2,076 | ) | | | (49,013 | ) | |
Yoox SpA | | | (4,313 | ) | | | (79,613 | )* | |
| | | | (282,565 | ) | |
Japan (3.8%) | |
Daibiru Corp. | | | (5,900 | ) | | | (64,502 | ) | |
GMO Internet,
Inc. | | | (4,500 | ) | | | (36,617 | ) | |
Hokkaido
Electric Power
Co., Inc. | | | (14,900 | ) | | | (122,702 | )* | |
Hulic Co. Ltd. | | | (10,500 | ) | | | (112,735 | ) | |
Kakaku.com,
Inc. | | | (3,100 | ) | | | (41,039 | ) | |
Mitsubishi
Estate Co. Ltd. | | | (4,000 | ) | | | (99,550 | ) | |
Mitsui
Fudosan Co.
Ltd. | | | (3,000 | ) | | | (93,679 | ) | |
NTT Urban
Development
Corp. | | | (11,700 | ) | | | (129,265 | ) | |
Sony Corp. | | | (3,000 | ) | | | (55,339 | ) | |
Sumitomo
Realty &
Development
Co. Ltd. | | | (4,000 | ) | | | (145,809 | ) | |
Tokyotokeiba
Co. Ltd. | | | (23,000 | ) | | | (64,296 | ) | |
TonenGeneral
Sekiyu KK | | | (5,000 | ) | | | (43,312 | ) | |
Yahoo Japan
Corp. | | | (23,600 | ) | | | (83,412 | ) | |
| | | | (1,092,257 | ) | |
| | | Number
of Shares | |
Value† | |
Mexico (0.3%) | |
Fresnillo PLC | | | (7,147 | ) | | $ | (79,746 | ) | |
Netherlands (1.0%) | |
Koninklijke
Vopak NV | | | (2,359 | ) | | | (118,129 | ) | |
OCI | | | (3,595 | ) | | | (125,196 | )* | |
Ziggo NV | | | (1,140 | ) | | | (55,694 | )* | |
| | | | (299,019 | ) | |
Peru (0.2%) | |
Hochschild
Mining PLC | | | (47,634 | ) | | | (75,400 | )* | |
Russia (0.4%) | |
Polymetal
International
PLC | | | (12,897 | ) | | | (106,251 | ) | |
Singapore (0.2%) | |
Global Logistic
Properties Ltd. | | | (34,000 | ) | | | (72,780 | ) | |
Spain (0.2%) | |
Atresmedia
Corp.
de Medios de
Comunicacion
SA | | | (3,388 | ) | | | (49,632 | ) | |
Sweden (0.4%) | |
Lundin
Petroleum AB | | | (7,452 | ) | | | (105,662 | )* | |
Switzerland (0.1%) | |
Meyer Burger
Technology
AG | | | (5,160 | ) | | | (43,387 | )* | |
United Kingdom (4.0%) | |
AVEVA Group
PLC | | | (1,518 | ) | | | (37,299 | ) | |
Balfour Beatty
PLC | | | (12,185 | ) | | | (29,960 | ) | |
Diageo PLC | | | (4,231 | ) | | | (124,402 | ) | |
Drax Group
PLC | | | (10,456 | ) | | | (99,439 | ) | |
Experian PLC | | | (7,776 | ) | | | (116,743 | ) | |
GlaxoSmithKline
PLC | | | (2,396 | ) | | | (54,331 | ) | |
Intertek
Group PLC | | | (2,756 | ) | | | (120,007 | ) | |
Kazakhmys
PLC | | | (22,778 | ) | | | (83,880 | )* | |
Ladbrokes PLC | | | (52,993 | ) | | | (100,117 | ) | |
Oxford
Instruments
PLC | | | (4,926 | ) | | | (85,105 | ) | |
Perform
Group PLC | | | (17,816 | ) | | | (74,386 | )* | |
Serco Group
PLC | | | (8,528 | ) | | | (40,613 | ) | |
Telecity Group
PLC | | | (8,984 | ) | | | (110,734 | ) | |
Tullow Oil PLC | | | (10,494 | ) | | | (81,552 | ) | |
| | | | (1,158,568 | ) | |
| | | Number
of Shares | |
Value† | |
United States (16.8%) | |
Alexander &
Baldwin, Inc. | | | (1,672 | ) | | $ | (66,930 | ) | |
Altisource
Portfolio
Solutions SA | | | (872 | ) | | | (65,103 | )* | |
Amazon.com,
Inc. | | | (421 | ) | | | (128,599 | )* | |
American
Realty Capital
Properties, Inc. | | | (6,794 | ) | | | (60,263 | ) | |
Ascent Capital
Group, Inc.
Class A | | | (1,578 | ) | | | (101,465 | )* | |
athenahealth,
Inc. | | | (648 | ) | | | (79,380 | )* | |
Auxilium
Pharmaceuticals,
Inc. | | | (7,193 | ) | | | (231,399 | )* | |
Chimerix, Inc. | | | (2,330 | ) | | | (72,323 | )* | |
Clovis
Oncology, Inc. | | | (2,033 | ) | | | (121,289 | )* | |
Coach, Inc. | | | (3,728 | ) | | | (128,169 | ) | |
Coeur Mining,
Inc. | | | (12,568 | ) | | | (46,502 | )* | |
CommVault
Systems, Inc. | | | (1,089 | ) | | | (48,286 | )* | |
Concur
Technologies,
Inc. | | | (1,532 | ) | | | (196,586 | )* | |
Contra Furiex
Pharmaceuticals | | | (1,793 | ) | | | (17,518 | )^^ | |
Cornerstone
OnDemand,
Inc. | | | (3,025 | ) | | | (109,717 | )* | |
CoStar Group,
Inc. | | | (392 | ) | | | (63,147 | )* | |
Dealertrack
Technologies,
Inc. | | | (3,448 | ) | | | (162,228 | )* | |
Equinix, Inc. | | | (240 | ) | | | (50,136 | ) | |
Forest City
Enterprises,
Inc. Class A | | | (5,203 | ) | | | (108,691 | )* | |
Groupon, Inc. | | | (11,166 | ) | | | (81,623 | )* | |
HeartWare
International,
Inc. | | | (1,172 | ) | | | (90,385 | )* | |
HomeAway,
Inc. | | | (3,924 | ) | | | (136,948 | )* | |
Iron Mountain,
Inc. | | | (2,714 | ) | | | (97,894 | ) | |
Kinder
Morgan, Inc. | | | (3,591 | ) | | | (138,972 | ) | |
LinkedIn Corp.
Class A | | | (747 | ) | | | (171,033 | )* | |
Michael Kors
Holdings Ltd. | | | (645 | ) | | | (50,690 | )* | |
Navistar
International
Corp. | | | (1,966 | ) | | | (69,537 | )* | |
Nektar
Therapeutics | | | (4,767 | ) | | | (65,737 | )* | |
See Notes to Schedule of Investments
27
| | | Number
of Shares | |
Value† | |
NetSuite, Inc. | | | (1,718 | ) | | $ | (186,678 | )* | |
Novavax, Inc. | | | (11,896 | ) | | | (66,618 | )* | |
Philip Morris
International,
Inc. | | | (1,435 | ) | | | (127,729 | ) | |
QLIK
Technologies,
Inc. | | | (4,416 | ) | | | (125,194 | )* | |
Rackspace
Hosting, Inc. | | | (1,682 | ) | | | (64,521 | )* | |
Realogy
Holdings
Corp. | | | (2,476 | ) | | | (101,541 | )* | |
Receptos, Inc. | | | (1,339 | ) | | | (138,787 | )* | |
Sarepta
Therapeutics,
Inc. | | | (3,394 | ) | | | (54,881 | )* | |
Scientific
Games Corp.
Class A | | | (14,299 | ) | | | (168,299 | )* | |
Shutterfly, Inc. | | | (2,963 | ) | | | (123,942 | )* | |
Sinclair
Broadcast
Group, Inc.
Class A | | | (2,258 | ) | | | (65,595 | ) | |
SolarCity Corp. | | | (1,875 | ) | | | (110,962 | )* | |
Sprint Corp. | | | (17,629 | ) | | | (104,540 | )* | |
TESARO, Inc. | | | (1,852 | ) | | | (51,523 | )* | |
Tesla Motors,
Inc. | | | (454 | ) | | | (109,732 | )* | |
Trulia, Inc. | | | (1,162 | ) | | | (54,207 | )* | |
UTi
Worldwide,
Inc. | | | (5,246 | ) | | | (57,339 | )* | |
VeriSign, Inc. | | | (2,260 | ) | | | (135,058 | )* | |
WebMD
Health Corp. | | | (874 | ) | | | (37,302 | )* | |
Whole Foods
Market, Inc. | | | (1,419 | ) | | | (55,809 | ) | |
Xoom Corp. | | | (3,848 | ) | | | (58,105 | )* | |
Zillow, Inc.
Class A | | | (330 | ) | | | (35,881 | )* | |
Zynga, Inc.
Class A | | | (36,061 | ) | | | (91,956 | )* | |
| | | | (4,886,749 | ) | |
Total Short Positions
(Proceeds $(10,342,182)) | | | | | (9,735,766 | ) | |
See Notes to Schedule of Investments
LONG POSITIONS BY INDUSTRY GLOBAL ALLOCATION FUND (UNAUDITED)
Industry | | Investments at
Value† | | Percentage of
Net Assets | |
Semiconductors & Semiconductor Equipment | | $ | 1,537,387 | | | | 5.3 | % | |
Insurance | | | 721,884 | | | | 2.5 | % | |
Machinery | | | 680,351 | | | | 2.3 | % | |
Auto Components | | | 658,649 | | | | 2.3 | % | |
Health Care Providers & Services | | | 631,426 | | | | 2.2 | % | |
Capital Markets | | | 478,005 | | | | 1.6 | % | |
Metals & Mining | | | 472,864 | | | | 1.6 | % | |
Household Durables | | | 398,116 | | | | 1.4 | % | |
Energy Equipment & Services | | | 352,855 | | | | 1.2 | % | |
Airlines | | | 350,830 | | | | 1.2 | % | |
Chemicals | | | 345,266 | | | | 1.2 | % | |
Automobiles | | | 324,117 | | | | 1.1 | % | |
Biotechnology | | | 280,737 | | | | 1.0 | % | |
Technology Hardware, Storage & Peripherals | | | 253,205 | | | | 0.9 | % | |
Specialty Retail | | | 234,309 | | | | 0.8 | % | |
Communications Equipment | | | 200,966 | | | | 0.7 | % | |
Food Products | | | 199,988 | | | | 0.7 | % | |
Oil, Gas & Consumable Fuels | | | 189,531 | | | | 0.7 | % | |
Food & Staples Retailing | | | 178,633 | | | | 0.6 | % | |
Electronic Equipment, Instruments & Components | | | 156,920 | | | | 0.5 | % | |
Media | | | 148,146 | | | | 0.5 | % | |
Electrical Equipment | | | 108,703 | | | | 0.4 | % | |
Construction Materials | | | 96,458 | | | | 0.3 | % | |
Electric Utilities | | | 92,974 | | | | 0.3 | % | |
Diversified Financial Services | | | 90,278 | | | | 0.3 | % | |
Diversified Telecommunication Services | | | 84,348 | | | | 0.3 | % | |
Independent Power and Renewable Electricity Producers | | | 59,871 | | | | 0.2 | % | |
Road & Rail | | | 56,192 | | | | 0.2 | % | |
Construction & Engineering | | | 55,040 | | | | 0.2 | % | |
Thrifts & Mortgage Finance | | | 53,207 | | | | 0.2 | % | |
Pharmaceuticals | | | 51,656 | | | | 0.2 | % | |
Banks | | | 50,976 | | | | 0.2 | % | |
Air Freight & Logistics | | | 42,572 | | | | 0.1 | % | |
Paper & Forest Products | | | 41,980 | | | | 0.1 | % | |
Short-Term Investments and Other Assets—Net | | | 29,080,386 | | | | 100.2 | % | |
Short Positions (see summary on next page) | | | (9,735,766 | ) | | | (33.5 | )% | |
| | | $ | 29,023,060 | | | | 100.0 | % | |
See Notes to Schedule of Investments
SHORT POSITIONS BY INDUSTRY GLOBAL ALLOCATION FUND (UNAUDITED)
Industry | | Investments at
Value† | | Percentage of
Net Assets | |
Internet Software & Services | | $ | (1,350,085 | ) | | | (4.7 | )% | |
Real Estate Management & Development | | | (1,158,613 | ) | | | (4.0 | )% | |
Metals & Mining | | | (828,583 | ) | | | (2.9 | )% | |
Software | | | (685,999 | ) | | | (2.4 | )% | |
Oil, Gas & Consumable Fuels | | | (572,380 | ) | | | (2.0 | )% | |
Biotechnology | | | (505,421 | ) | | | (1.7 | )% | |
Hotels, Restaurants & Leisure | | | (482,348 | ) | | | (1.7 | )% | |
Internet & Catalog Retail | | | (413,777 | ) | | | (1.4 | )% | |
Textiles, Apparel & Luxury Goods | | | (381,811 | ) | | | (1.3 | )% | |
Pharmaceuticals | | | (368,985 | ) | | | (1.3 | )% | |
Professional Services | | | (362,673 | ) | | | (1.2 | )% | |
Beverages | | | (288,400 | ) | | | (1.0 | )% | |
Media | | | (267,932 | ) | | | (0.9 | )% | |
Machinery | | | (262,732 | ) | | | (0.9 | )% | |
Real Estate Investment Trusts | | | (158,157 | ) | | | (0.5 | )% | |
Construction & Engineering | | | (155,156 | ) | | | (0.5 | )% | |
Tobacco | | | (127,729 | ) | | | (0.4 | )% | |
Electric Utilities | | | (122,702 | ) | | | (0.4 | )% | |
Electronic Equipment, Instruments & Components | | | (119,783 | ) | | | (0.4 | )% | |
Commercial Services & Supplies | | | (117,272 | ) | | | (0.4 | )% | |
Electrical Equipment | | | (110,962 | ) | | | (0.4 | )% | |
Automobiles | | | (109,732 | ) | | | (0.4 | )% | |
Wireless Telecommunication Services | | | (104,540 | ) | | | (0.4 | )% | |
Diversified Consumer Services | | | (101,465 | ) | | | (0.3 | )% | |
Independent Power and Renewable Electricity Producers | | | (99,439 | ) | | | (0.3 | )% | |
Health Care Equipment & Supplies | | | (90,385 | ) | | | (0.3 | )% | |
Communications Equipment | | | (85,144 | ) | | | (0.3 | )% | |
Health Care Technology | | | (79,380 | ) | | | (0.3 | )% | |
Air Freight & Logistics | | | (57,339 | ) | | | (0.2 | )% | |
Food & Staples Retailing | | | (55,809 | ) | | | (0.2 | )% | |
Diversified Telecommunication Services | | | (55,694 | ) | | | (0.2 | )% | |
Household Durables | | | (55,339 | ) | | | (0.2 | )% | |
Total Common Stocks Sold Short | | $ | (9,735,766 | ) | | | (33.5 | )% | |
See Notes to Schedule of Investments
Schedule of Investments Inflation Navigator Fundb
TOP TEN HOLDINGS
| | 1 | | | Neuberger Berman Risk Balanced Commodity Strategy Fund Institutional Class | | | 10.3 | % | |
| | 2 | | | Neuberger Berman Emerging Markets Equity Fund Institutional Class | | | 9.1 | % | |
| | 3 | | | Neuberger Berman High Income Bond Fund Institutional Class | | | 4.9 | % | |
| | 4 | | | Neuberger Berman Floating Rate Income Fund Institutional Class | | | 4.8 | % | |
| | 5 | | | U.S. Treasury Inflation Indexed Bonds, 0.63%, due 1/15/24 | | | 2.6 | % | |
| | 6 | | | Exxon Mobil Corp. | | | 2.5 | % | |
| | 7 | | | United Kingdom Gilt Inflation Linked Bonds, Bonds, 0.13%, due 3/22/44 | | | 2.3 | % | |
| | 8 | | | Italy Buoni Poliennali Del Tesoro, Bonds, 2.35%, due 9/15/35 | | | 2.0 | % | |
| | 9 | | | U.S. Treasury Inflation Indexed Bonds, 1.75%, due 1/15/28 | | | 1.7 | % | |
| | 10 | | | Italy Buoni Poliennali Del Tesoro, Senior Unsecured Notes, 2.60%, due 9/15/23 | | | 1.7 | % | |
| | | Number
of Shares | |
Value† | |
Common Stocks (45.0%) | |
Chemicals (8.2%) | |
A. Schulman,
Inc. | | | 49 | | | $ | 1,735 | | |
Air Products &
Chemicals, Inc. | | | 670 | | | | 90,222 | | |
Airgas, Inc. | | | 205 | | | | 22,866 | | |
Ashland, Inc. | | | 21 | | | | 2,269 | | |
Axiall Corp. | | | 20 | | | | 806 | | |
Cabot Corp. | | | 46 | | | | 2,136 | | |
Celanese Corp.
Class A | | | 36 | | | | 2,114 | | |
CF Industries
Holdings, Inc. | | | 182 | | | | 47,320 | | |
Chase Corp. | | | 10 | | | | 359 | | |
Dow Chemical
Co. | | | 4,309 | | | | 212,864 | | |
E.I. du Pont de
Nemours & Co. | | | 3,360 | | | | 232,344 | | |
Eastman
Chemical Co. | | | 579 | | | | 46,772 | | |
Ecolab, Inc. | | | 946 | | | | 105,223 | | |
Ferro Corp. | | | 61 | | | | 800 | * | |
FMC Corp. | | | 336 | | | | 19,270 | | |
Huntsman Corp. | | | 137 | | | | 3,343 | | |
International
Flavors &
Fragrances, Inc. | | | 267 | | | | 26,473 | | |
Kraton
Performance
Polymers, Inc. | | | 71 | | | | 1,270 | * | |
LyondellBasell
Industries NV
Class A | | | 1,824 | | | | 167,133 | | |
Monsanto Co. | | | 1,802 | | | | 207,302 | | |
Mosaic Co. | | | 1,100 | | | | 48,741 | | |
OM Group, Inc. | | | 38 | | | | 989 | | |
OMNOVA
Solutions, Inc. | | | 195 | | | | 1,371 | * | |
PPG Industries,
Inc. | | | 488 | | | | 99,401 | | |
Praxair, Inc. | | | 1,010 | | | | 127,250 | | |
RPM
International,
Inc. | | | 70 | | | | 3,171 | | |
Sherwin-Williams
Co. | | | 253 | | | | 58,079 | | |
| | | Number
of Shares | |
Value† | |
Sigma-Aldrich
Corp. | | | 368 | | | $ | 50,015 | | |
Taminco Corp. | | | 51 | | | | 1,320 | * | |
Westlake
Chemical
Corp. | | | 34 | | | | 2,399 | | |
Zep, Inc. | | | 62 | | | | 996 | | |
| | | | 1,586,353 | | |
Construction Materials (0.3%) | |
Eagle
Materials, Inc. | | | 26 | | | | 2,273 | | |
Martin Marietta
Materials, Inc. | | | 206 | | | | 24,086 | | |
Vulcan
Materials Co. | | | 413 | | | | 25,486 | | |
| | | | 51,845 | | |
Containers & Packaging (0.6%) | |
Avery Dennison
Corp. | | | 310 | | | | 14,524 | | |
Ball Corp. | | | 463 | | | | 29,831 | | |
Bemis Co., Inc. | | | 192 | | | | 7,386 | | |
MeadWestvaco
Corp. | | | 563 | | | | 24,868 | | |
Owens-Illinois,
Inc. | | | 716 | | | | 18,451 | * | |
Rock-Tenn Co.
Class A | | | 29 | | | | 1,483 | | |
Sealed Air Corp. | | | 779 | | | | 28,239 | | |
| | | | 124,782 | | |
Electric Utilities (0.3%) | |
NRG Yield,
Inc. Class A | | | 1,300 | | | | 64,961 | | |
Energy Equipment & Services (1.9%) | |
Atwood
Oceanics, Inc. | | | 47 | | | | 1,911 | * | |
Baker Hughes,
Inc. | | | 652 | | | | 34,530 | | |
Cameron
International
Corp. | | | 259 | | | | 15,423 | * | |
CARBO Ceramics,
Inc. | | | 1 | | | | 52 | | |
Diamond Offshore
Drilling, Inc. | | | 112 | | | | 4,223 | | |
| | | Number
of Shares | |
Value† | |
FMC
Technologies,
Inc. | | | 256 | | | $ | 14,346 | * | |
Gulfmark
Offshore,
Inc. Class A | | | 25 | | | | 754 | | |
Halliburton Co. | | | 1,211 | | | | 66,775 | | |
Helmerich &
Payne, Inc. | | | 165 | | | | 14,325 | | |
Nabors
Industries Ltd. | | | 505 | | | | 9,014 | | |
National Oilwell
Varco, Inc. | | | 537 | | | | 39,008 | | |
Parker Drilling Co. | | | 130 | | | | 577 | * | |
Patterson-UTI
Energy, Inc. | | | 25 | | | | 576 | | |
Rowan Cos. PLC
Class A | | | 176 | | | | 4,271 | | |
Schlumberger
Ltd. | | | 1,613 | | | | 159,139 | | |
Tidewater, Inc. | | | 30 | | | | 1,106 | | |
| | | | 366,030 | | |
Gas Utilities (0.5%) | |
Suburban
Propane
Partners LP | | | 2,000 | | | | 90,100 | | |
Hotels, Restaurants & Leisure (0.5%) | |
Cedar Fair LP | | | 1,700 | | | | 80,342 | | |
Starwood
Hotels &
Resorts
Worldwide, Inc. | | | 300 | | | | 22,998 | | |
| | | | 103,340 | | |
Household Durables (0.2%) | |
TRI Pointe
Homes, Inc. | | | 2,265 | | | | 31,008 | * | |
Metals & Mining (1.5%) | |
Alcoa, Inc. | | | 4,037 | | | | 67,660 | | |
Allegheny
Technologies,
Inc. | | | 432 | | | | 14,191 | | |
Ampco-
Pittsburgh
Corp. | | | 65 | | | | 1,416 | | |
See Notes to Schedule of Investments
31
| | | Number
of Shares | |
Value† | |
Century
Aluminum
Co. | | | 49 | | | $ | 1,435 | * | |
Commercial
Metals Co. | | | 108 | | | | 1,867 | | |
Freeport-
McMoRan,
Inc. | | | 3,888 | | | | 110,808 | | |
Newmont
Mining Corp. | | | 1,767 | | | | 33,149 | ØØ | |
Nucor Corp. | | | 1,048 | | | | 56,655 | | |
Reliance Steel &
Aluminum Co. | | | 34 | | | | 2,294 | | |
Steel Dynamics,
Inc. | | | 83 | | | | 1,910 | | |
Stillwater
Mining Co. | | | 105 | | | | 1,379 | * | |
United States
Steel Corp. | | | 64 | | | | 2,563 | | |
| | | | 295,327 | | |
Multi-Utilities (0.5%) | |
CenterPoint
Energy, Inc. | | | 2,400 | | | | 58,920 | | |
Sempra Energy | | | 300 | | | | 33,000 | | |
| | | | 91,920 | | |
Oil, Gas & Consumable Fuels (17.2%) | |
Alliance
Holdings GP LP | | | 1,800 | | | | 123,588 | | |
Anadarko
Petroleum Corp. | | | 671 | | | | 61,584 | | |
Apache Corp. | | | 571 | | | | 44,081 | | |
Bill Barrett Corp. | | | 25 | | | | 380 | * | |
Cabot Oil &
Gas Corp. | | | 511 | | | | 15,892 | | |
Chesapeake
Energy Corp. | | | 683 | | | | 15,149 | | |
Chevron Corp. | | | 2,335 | | | | 280,083 | | |
Cimarex
Energy Co. | | | 115 | | | | 13,072 | | |
Comstock
Resources, Inc. | | | 34 | | | | 403 | | |
ConocoPhillips | | | 1,592 | | | | 114,863 | | |
CONSOL
Energy, Inc. | | | 280 | | | | 10,304 | | |
Crestwood
Equity
Partners LP | | | 5,500 | | | | 47,905 | | |
Crestwood
Midstream
Partners LP | | | 3,426 | | | | 68,143 | | |
Denbury
Resources, Inc. | | | 577 | | | | 7,155 | | |
Devon Energy
Corp. | | | 526 | | | | 31,560 | | |
Energy Transfer
Equity LP | | | 4,100 | | | | 239,276 | | |
Energy XXI
Bermuda Ltd. | | | 100 | | | | 769 | | |
Enterprise
Products
Partners LP | | | 4,200 | | | | 154,980 | | |
| | | Number
of Shares | |
Value† | |
EOG Resources,
Inc. | | | 692 | | | $ | 65,775 | | |
EQT Corp. | | | 181 | | | | 17,021 | | |
EXCO
Resources,
Inc. | | | 120 | | | | 366 | | |
Exxon Mobil
Corp. | | | 5,018 | | | | 485,291 | | |
Halcon
Resources
Corp. | | | 103 | | | | 320 | * | |
Hess Corp. | | | 352 | | | | 29,853 | | |
Kinder
Morgan, Inc. | | | 765 | | | | 29,606 | | |
Marathon
Oil Corp. | | | 875 | | | | 30,975 | | |
Marathon
Petroleum
Corp. | | | 337 | | | | 30,633 | | |
Murphy
Oil Corp. | | | 215 | | | | 11,479 | | |
Newfield
Exploration
Co. | | | 211 | | | | 6,881 | * | |
NGL Energy
Partners LP | | | 2,100 | | | | 72,156 | | |
Noble
Energy, Inc. | | | 492 | | | | 28,354 | | |
NuStar GP
Holdings LLC | | | 1,700 | | | | 66,572 | | |
Oasis
Petroleum, Inc. | | | 17 | | | | 509 | * | |
Occidental
Petroleum Corp. | | | 975 | | | | 86,707 | | |
ONEOK, Inc. | | | 2,038 | | | | 120,120 | | |
PBF Energy,
Inc. Class A | | | 18 | | | | 469 | | |
Peabody
Energy Corp. | | | 41 | | | | 428 | | |
Phillips 66 | | | 708 | | | | 55,578 | | |
Pioneer
Natural
Resources Co. | | | 181 | | | | 34,220 | | |
QEP Resources,
Inc. | | | 256 | | | | 6,418 | | |
Range Resources
Corp. | | | 193 | | | | 13,201 | | |
Regency Energy
Partners LP | | | 10,084 | | | | 302,520 | | |
Rosetta
Resources, Inc. | | | 16 | | | | 608 | * | |
Sanchez
Energy Corp. | | | 22 | | | | 376 | * | |
Southcross
Energy
Partners LP | | | 1,600 | | | | 31,792 | | |
Southwestern
Energy Co. | | | 426 | | | | 13,849 | * | |
Spectra
Energy Corp. | | | 2,579 | | | | 100,916 | | |
Spectra
Energy
Partners LP | | | 900 | | | | 48,600 | | |
| | | Number
of Shares | |
Value† | |
Stone Energy
Corp. | | | 19 | | | $ | 466 | * | |
Summit
Midstream
Partners LP | | | 850 | | | | 39,941 | | |
Teekay LNG
Partners LP | | | 1,250 | | | | 49,125 | | |
Teekay
Offshore
Partners LP | | | 1,700 | | | | 50,881 | | |
Tesoro Corp. | | | 132 | | | | 9,426 | | |
Valero Energy
Corp. | | | 610 | | | | 30,555 | | |
W&T Offshore,
Inc. | | | 62 | | | | 564 | | |
Western Gas
Partners LP | | | 800 | | | | 55,920 | | |
Whiting
Petroleum Corp. | | | 8 | | | | 490 | * | |
Williams Cos.,
Inc. | | | 3,210 | | | | 178,187 | | |
| | | | 3,336,335 | | |
Paper & Forest Products (0.4%) | |
International
Paper Co. | | | 1,381 | | | | 69,906 | | |
Resolute Forest
Products, Inc. | | | 25 | | | | 464 | * | |
| | | | 70,370 | | |
Real Estate Investment Trusts (12.3%) | |
Alexandria Real
Estate Equities,
Inc. | | | 645 | | | | 53,535 | | |
Altisource
Residential Corp. | | | 1,500 | | | | 34,830 | | |
American
Homes 4 Rent
Class A | | | 4,000 | | | | 70,120 | | |
American
Residential
Properties, Inc. | | | 1,765 | | | | 33,535 | * | |
American
Tower Corp. | | | 1,645 | | | | 160,387 | | |
AvalonBay
Communities,
Inc. | | | 750 | | | | 116,880 | | |
Boston
Properties, Inc. | | | 1,055 | | | | 133,721 | | |
Camden
Property Trust | | | 660 | | | | 50,602 | | |
CBL & Associates
Properties, Inc. | | | 1,750 | | | | 33,478 | | |
Crown Castle
International
Corp. | | | 870 | | | | 67,964 | | |
DDR Corp. | | | 2,965 | | | | 53,785 | | |
Douglas
Emmett, Inc. | | | 1,405 | | | | 39,523 | | |
EastGroup
Properties, Inc. | | | 645 | | | | 44,415 | | |
Equity
Residential | | | 1,915 | | | | 133,207 | | |
See Notes to Schedule of Investments
32
| | | Number
of Shares | |
Value† | |
Federal Realty
Investment
Trust | | | 435 | | | $ | 57,333 | | |
General Growth
Properties, Inc. | | | 1,755 | | | | 45,472 | | |
HCP, Inc. | | | 1,027 | | | | 45,157 | ØØ | |
Health Care
REIT, Inc. | | | 750 | | | | 53,332 | | |
Host Hotels &
Resorts, Inc. | | | 3,335 | | | | 77,739 | | |
LaSalle Hotel
Properties | | | 1,045 | | | | 40,974 | | |
National Retail
Properties, Inc. | | | 875 | | | | 33,355 | | |
OMEGA
Healthcare
Investors, Inc. | | | 680 | | | | 25,949 | | |
Parkway
Properties, Inc. | | | 1,810 | | | | 36,291 | | |
Plum Creek
Timber Co.,
Inc. | | | 805 | | | | 33,013 | | |
Prologis, Inc. | | | 2,195 | | | | 91,422 | | |
Public Storage | | | 500 | | | | 92,170 | | |
Regency
Centers Corp. | | | 775 | | | | 47,043 | | |
Simon Property
Group, Inc. | | | 1,405 | | | | 251,790 | | |
SL Green
Realty Corp. | | | 600 | | | | 69,420 | | |
Sunstone Hotel
Investors, Inc. | | | 3,025 | | | | 46,313 | | |
Urstadt Biddle
Properties, Inc.
Class A | | | 1,155 | | | | 24,983 | | |
Ventas, Inc. | | | 1,545 | | | | 105,848 | | |
Vornado
Realty Trust | | | 830 | | | | 90,868 | | |
Washington
Prime Group,
Inc. | | | 1,282 | | | | 22,602 | | |
Weyerhaeuser
Co. | | | 2,050 | | | | 69,413 | | |
| | | | 2,386,469 | | |
Real Estate Management & Development (0.6%) | |
Brookfield
Asset
Management,
Inc. Class A | | | 975 | | | | 47,746 | | |
Brookfield
Property
Partners LP | | | 995 | | | | 22,636 | | |
Forest City
Enterprises, Inc.
Class A | | | 2,490 | | | | 52,016 | * | |
| | | | 122,398 | | |
Total Common Stocks
(Cost $7,448,194) | | | | | 8,721,238 | | |
| | | Principal
Amounta | |
Value† | |
Government Securities (13.3%) | |
Sovereign (13.3%) | |
Australia
Government
Bond, Senior
Unsecured
Notes,
2.50%, due
9/20/30 | | AUD | 30,000 | | | $ | 34,323 | | |
Canadian
Government
Bond, Bonds,
1.50%, due
12/1/44 | | CAD | 48,932 | | | | 52,487 | | |
Deutsche
Bundesrepublik
Inflation
Linked
Bond, Bonds,
0.50%, due
4/15/30 | | EUR | 65,488 | | | | 89,946 | | |
France
Government
Bond OAT,
Unsecured
Notes,
0.70%, due
7/25/30 | | EUR | 129,981 | | | | 172,943 | | |
Ireland
Government
Bond,
Unsecured
Notes,
3.40%, due
3/18/24 | | EUR | 95,000 | | | | 136,189 | | |
Italy
Buoni
Poliennali
Del Tesoro,
Bonds,
2.35%, due
9/15/35 | | EUR | 286,068 | | | | 383,354 | | |
Italy
Buoni
Poliennali
Del Tesoro,
Bonds,
2.55%, due
9/15/41 | | EUR | 146,265 | | | | 193,537 | | |
Italy
Buoni
Poliennali
Del Tesoro,
Senior
Unsecured
Notes,
2.60%, due
9/15/23 | | EUR | 227,668 | | | | 320,046 | | |
Mexican
Bonos,
Bonds,
7.75%, due
11/13/42 | | MXN | 190,000 | | | | 15,777 | | |
| | | Principal
Amounta | |
Value† | |
New
Zealand
Government
Bond,
Senior
Unsecured
Notes,
2.00%, due
9/20/25 | | NZD | 240,000 | | | $ | 186,203 | | |
South
Africa
Government
Bond,
Bonds,
6.50%, due
2/28/41 | | ZAR | 255,000 | | | | 17,991 | | |
Spain
Government
Bond,
Bonds,
5.15%, due
10/31/44 | | EUR | 105,000 | | | | 171,956 | ñ | |
Sweden
Government
Bond,
Bonds,
0.25%, due
6/1/22 | | SEK | 345,000 | | | | 49,220 | | |
United
Kingdom
Gilt
Inflation
Linked
Bonds,
Bonds,
0.13%, due
3/22/24 | | GBP | 26,500 | | | | 45,269 | | |
United
Kingdom
Gilt
Inflation
Linked
Bonds,
Bonds,
0.13%, due
3/22/44 | | GBP | 238,500 | | | | 440,061 | | |
United
Kingdom
Gilt
Inflation
Linked
Bonds,
Senior
Unsecured
Notes, 0.13%,
due 3/22/29 | | GBP | 156,938 | | | | 271,522 | | |
Total Government
Securities
(Cost $2,589,458) | | | | | 2,580,824 | | |
See Notes to Schedule of Investments
33
| | | Principal
Amounta | |
Value† | |
U.S. Treasury Securities-Backed by the Full Faith and Credit of the U.S. Government (11.4%) | |
U.S.
Treasury
Inflation
Indexed
Bonds,
0.13%, due
4/15/18 | | $ | 20,580 | | | $ | 20,826 | | |
U.S.
Treasury
Inflation
Indexed
Bonds,
0.13%, due
4/15/19 | | | 65,983 | | | | 66,422 | | |
U.S.
Treasury
Inflation
Indexed
Bonds,
0.13%, due
7/15/22 | | | 51,718 | | | | 50,950 | | |
U.S.
Treasury
Inflation
Indexed
Bonds,
0.63%, due
1/15/24 | | | 489,326 | | | | 496,819 | | |
U.S.
Treasury
Inflation
Indexed
Bonds,
0.75%, due
2/15/42 | | | 63,161 | | | | 59,578 | | |
U.S.
Treasury
Inflation
Indexed
Bonds,
1.75%, due
1/15/28 | | | 283,853 | | | | 321,951 | | |
U.S.
Treasury
Inflation
Indexed
Bonds,
1.88%, due
7/15/19 | | | 83,552 | | | | 91,464 | | |
U.S.
Treasury
Inflation
Indexed
Bonds,
2.00%, due
1/15/26 | | | 137,822 | | | | 159,130 | | |
| | | Principal
Amounta | |
Value† | |
U.S.
Treasury
Inflation
Indexed
Bonds,
2.13%, due
2/15/40 | | $ | 66,031 | | | $ | 83,704 | | |
U.S.
Treasury
Inflation
Indexed
Bonds,
2.38%, due
1/15/27 | | | 70,771 | | | | 85,129 | | |
U.S.
Treasury
Inflation
Indexed
Bonds,
2.50%, due
1/15/29 | | | 193,883 | | | | 241,005 | | |
U.S.
Treasury
Inflation
Indexed
Bonds,
3.38%, due
4/15/32 | | | 80,405 | | | | 114,012 | | |
U.S.
Treasury
Inflation
Indexed
Bonds,
3.88%, due
4/15/29 | | | 115,754 | | | | 166,135 | | |
U.S.
Treasury
Inflation
Indexed
Notes,
0.13%, due
1/15/22 | | | 78,821 | | | | 77,626 | | |
U.S.
Treasury
Inflation
Indexed
Notes,
1.13%, due
1/15/21 | | | 152,232 | | | | 160,640 | | |
Total U.S. Treasury
Securities-Backed by the
Full Faith and Credit of the
U.S. Government
(Cost $2,227,040) | | | | | | | 2,195,391 | | |
| | | Number
of Shares | |
Value† | |
Mutual Funds (29.1%) | |
Neuberger
Berman
Emerging
Markets
Equity Fund
Institutional
Class | | | 103,341 | | | $ | 1,764,005 | § | |
Neuberger
Berman
Floating Rate
Income Fund
Institutional
Class | | | 91,688 | | | | 927,348 | § | |
Neuberger
Berman High
Income Bond
Fund
Institutional
Class | | | 102,045 | | | | 948,255 | § | |
Neuberger
Berman Risk
Balanced
Commodity
Strategy Fund
Institutional
Class | | | 238,082 | | | | 1,998,032 | *§ | |
Total Mutual Funds
(Cost $5,867,864) | | | | | 5,637,640 | | |
Short-Term Investments (1.6%) | |
State Street
Institutional
Liquid Reserves
Fund
Premier Class
(Cost $314,775) | | | 314,775 | | | | 314,775 | ØØ | |
Total Investments (100.4%)
(Cost $18,447,331) | | | | | | | 19,449,868 | ## | |
Liabilities, less
cash,
receivables and
other assets [(0.4%)] | | | | | (68,475 | )± | |
Total Net Assets (100.0%) | | | | $ | 19,381,393 | | |
See Notes to Schedule of Investments
Schedule of Investments Long Short Fund
TOP TEN EQUITY HOLDINGS LONG POSITIONS
| | 1 | | | PetSmart, Inc. | | | 2.8 | % | |
| | 2 | | | Zimmer Holdings, Inc. | | | 2.6 | % | |
| | 3 | | | Brookfield Infrastructure Partners LP | | | 2.2 | % | |
| | 4 | | | PVH Corp. | | | 2.0 | % | |
| | 5 | | | Delta Air Lines, Inc. | | | 1.7 | % | |
| | 6 | | | Home Depot, Inc. | | | 1.7 | % | |
| | 7 | | | DaVita HealthCare Partners, Inc. | | | 1.7 | % | |
| | 8 | | | Markit Ltd. | | | 1.5 | % | |
| | 9 | | | Enbridge, Inc. | | | 1.4 | % | |
| | 10 | | | Wesco-Aircraft Holdings, Inc. | | | 1.3 | % | |
TOP TEN EQUITY HOLDINGS SHORT POSITIONS
| | 1 | | | iShares Russell Mid-Cap ETF | | | (1.1 | )% | |
| | 2 | | | iShares Russell 2000 ETF | | | (1.0 | )% | |
| | 3 | | | Utilities Select Sector SPDR Fund | | | (0.9 | )% | |
| | 4 | | | Vipshop Holdings Ltd. ADS | | | (0.6 | )% | |
| | 5 | | | Vanguard REIT ETF | | | (0.6 | )% | |
| | 6 | | | Bed Bath & Beyond, Inc. | | | (0.6 | )% | |
| | 7 | | | Consolidated Edison, Inc. | | | (0.5 | )% | |
| | 8 | | | CGI Group, Inc. Class A | | | (0.5 | )% | |
| | 9 | | | iShares MSCI Emerging Markets ETF | | | (0.5 | )% | |
| | 10 | | | Consumer Discretionary Select Sector SPDR Fund | | | (0.5 | )% | |
| | | Number
of Shares | |
Value† | |
Long Positions (98.2%) | |
Common Stocks (65.8%) | |
Aerospace & Defense (0.8%) | |
Precision
Castparts
Corp. | | | 113,700 | | | $ | 25,093,590 | | |
Airlines (1.7%) | |
Delta Air
Lines, Inc. | | | 1,395,966 | | | | 56,159,712 | | |
Automobiles (1.1%) | |
General
Motors Co. | | | 1,179,220 | | | | 37,027,508 | | |
Banks (2.6%) | |
Citigroup,
Inc. | | | 444,000 | | | | 23,767,320 | ØØ | |
Fifth Third
Bancorp | | | 330,000 | | | | 6,596,700 | | |
JPMorgan
Chase & Co. | | | 450,000 | | | | 27,216,000 | | |
U.S. Bancorp | | | 198,300 | | | | 8,447,580 | | |
Wells Fargo &
Co. | | | 355,000 | | | | 18,846,950 | | |
| | | | 84,874,550 | | |
Building Products (0.7%) | |
Armstrong
World
Industries, Inc. | | | 491,900 | | | | 23,817,798 | * | |
Capital Markets (0.5%) | |
BlackRock, Inc. | | | 29,000 | | | | 9,892,190 | | |
Moelis & Co.
Class A | | | 146,400 | | | | 5,001,024 | | |
| | | | 14,893,214 | | |
Chemicals (0.6%) | |
Ashland, Inc. | | | 192,500 | | | | 20,803,475 | | |
Communications Equipment (0.4%) | |
Motorola
Solutions, Inc. | | | 180,500 | | | | 11,642,250 | | |
Consumer Finance (0.8%) | |
Synchrony
Financial | | | 955,000 | | | | 25,804,100 | *ØØ | |
| | | Number
of Shares | |
Value† | |
Diversified Financial Services (0.8%) | |
CME
Group, Inc. | | | 310,000 | | | $ | 25,981,100 | | |
Electric Utilities (3.0%) | |
Brookfield
Infrastructure
Partners LP | | | 1,720,400 | | | | 69,831,036 | ØØ | |
Northeast
Utilities | | | 293,900 | | | | 14,503,965 | | |
NRG Yield,
Inc. Class A | | | 280,000 | | | | 13,991,600 | | |
| | | | 98,326,601 | | |
Electrical Equipment (0.3%) | |
Sensata
Technologies
Holding NV | | | 202,000 | | | | 9,859,620 | * | |
Electronic Equipment, Instruments & Components (0.4%) | |
Amphenol
Corp.
Class A | | | 240,000 | | | | 12,139,200 | | |
Food & Staples Retailing (0.9%) | |
Costco
Wholesale
Corp. | | | 202,000 | | | | 26,940,740 | | |
Walgreen Co. | | | 51,000 | | | | 3,275,220 | | |
| | | | 30,215,960 | | |
Food Products (0.4%) | |
Pinnacle
Foods,
Inc. | | | 332,200 | | | | 11,228,360 | ØØ | |
Health Care Equipment & Supplies (3.5%) | |
Sirona
Dental
Systems,
Inc. | | | 352,900 | | | | 27,720,295 | *ØØ | |
Zimmer
Holdings,
Inc. | | | 764,200 | | | | 85,009,608 | ØØ | |
| | | | 112,729,903 | | |
| | | Number
of Shares | |
Value† | |
Health Care Providers & Services (2.9%) | |
Accretive
Health,
Inc. | | | 1,090,875 | | | $ | 7,854,300 | * | |
DaVita
HealthCare
Partners, Inc. | | | 692,000 | | | | 54,024,440 | * | |
HCA
Holdings,
Inc. | | | 162,300 | | | | 11,369,115 | * | |
HealthSouth
Corp. | | | 196,932 | | | | 7,942,267 | | |
Tenet | | | 198,900 | | | | 11,148,345 | * | |
Healthcare
Corp. | |
| | | | 92,338,467 | | |
Hotels, Restaurants & Leisure (3.1%) | |
Darden
Restaurants,
Inc. | | | 340,000 | | | | 17,605,200 | | |
Dunkin'
Brands
Group, Inc. | | | 790,000 | | | | 35,929,200 | | |
Hilton
Worldwide
Holdings,
Inc. | | | 712,800 | | | | 17,991,072 | * | |
McDonald's
Corp. | | | 120,000 | | | | 11,247,600 | | |
Wyndham
Worldwide
Corp. | | | 228,500 | | | | 17,747,595 | | |
| | | | 100,520,667 | | |
Household Durables (1.0%) | |
Lennar Corp.
Class A | | | 570,000 | | | | 24,555,600 | | |
Newell
Rubbermaid,
Inc. | | | 270,000 | | | | 8,999,100 | | |
| | | | 33,554,700 | | |
See Notes to Schedule of Investments
35
| | | Number
of Shares | |
Value† | |
Independent Power and Renewable Electricity Producers (0.5%) | |
Calpine
Corp. | | | 750,000 | | | $ | 17,115,000 | *ØØ | |
Internet & Catalog Retail (0.5%) | |
Amazon.com,
Inc. | | | 48,900 | | | | 14,936,994 | * | |
Internet Software & Services (1.9%) | |
Alibaba
Group
Holding Ltd.
ADR | | | 121,100 | | | | 11,940,460 | * | |
eBay, Inc. | | | 490,000 | | | | 25,725,000 | * | |
Google, Inc.
Class A | | | 23,000 | | | | 13,061,010 | * | |
Google, Inc.
Class C | | | 19,400 | | | | 10,846,152 | * | |
| | | | 61,572,622 | | |
IT Services (2.0%) | |
Genpact
Ltd. | | | 1,197,505 | | | | 21,016,213 | * | |
Visa, Inc.
Class A | | | 159,000 | | | | 38,387,370 | | |
WEX, Inc. | | | 40,000 | | | | 4,542,400 | * | |
| | | | 63,945,983 | | |
Machinery (0.7%) | |
Ingersoll-
Rand
PLC | | | 345,000 | | | | 21,603,900 | | |
Media (1.5%) | |
Markit Ltd. | | | 1,880,100 | | | | 48,017,754 | * | |
Metals & Mining (0.9%) | |
Steel
Dynamics,
Inc. | | | 660,000 | | | | 15,186,600 | | |
United
States Steel
Corp. | | | 310,000 | | | | 12,412,400 | | |
| | | | 27,599,000 | | |
Multi-Utilities (1.6%) | |
NiSource, Inc. | | | 609,500 | | | | 25,635,570 | | |
Wisconsin
Energy
Corp. | | | 491,000 | | | | 24,383,060 | ØØ | |
| | | | 50,018,630 | | |
Oil, Gas & Consumable Fuels (5.9%) | |
Antero
Resources
Corp. | | | 437,500 | | | | 22,942,500 | * | |
Athlon
Energy, Inc. | | | 513,700 | | | | 29,948,710 | * | |
Cabot Oil &
Gas Corp. | | | 400,400 | | | | 12,452,440 | | |
Enbridge,
Inc. | | | 975,000 | | | | 46,176,000 | | |
| | | Number
of Shares | |
Value† | |
Peabody
Energy
Corp. | | | 856,300 | | | $ | 8,931,209 | | |
Rice
Energy,
Inc. | | | 1,293,200 | | | | 34,179,276 | *ØØ | |
Southwestern
Energy Co. | | | 380,000 | | | | 12,353,800 | * | |
Teekay Corp. | | | 386,320 | | | | 22,584,267 | ØØ | |
| | | | 189,568,202 | | |
Pharmaceuticals (2.1%) | |
Bristol-Myers
Squibb Co. | | | 634,900 | | | | 36,944,831 | | |
Eli Lilly & Co. | | | 205,000 | | | | 13,597,650 | | |
Pfizer, Inc. | | | 545,600 | | | | 16,340,720 | | |
| | | | 66,883,201 | | |
Professional Services (2.1%) | |
Nielsen NV | | | 620,300 | | | | 26,356,547 | | |
Verisk
Analytics, Inc.
Class A | | | 640,642 | | | | 39,944,029 | * | |
| | | | 66,300,576 | | |
Real Estate Investment Trusts (1.6%) | |
CBS Outdoor
Americas,
Inc. | | | 398,300 | | | | 12,120,269 | | |
General
Growth
Properties,
Inc. | | | 450,000 | | | | 11,659,500 | | |
Weyerhaeuser
Co. | | | 850,000 | | | | 28,781,000 | ØØ | |
| | | | 52,560,769 | | |
Real Estate Management & Development (1.3%) | |
Brookfield
Asset
Management,
Inc. Class A | | | 850,000 | | | | 41,624,500 | | |
Road & Rail (1.0%) | |
Canadian
Pacific
Railway
Ltd. | | | 162,100 | | | | 33,664,928 | | |
Semiconductors & Semiconductor Equipment (1.3%) | |
Altera Corp. | | | 673,097 | | | | 23,134,344 | ØØ | |
ASML
Holding
NV | | | 200,000 | | | | 19,936,000 | ØØ | |
| | | | 43,070,344 | | |
Software (0.4%) | |
Activision
Blizzard,
Inc. | | | 681,000 | | | | 13,585,950 | ØØ | |
| | | Number
of Shares | |
Value† | |
Specialty Retail (6.3%) | |
Asbury
Automotive
Group, Inc. | | | 330,000 | | | $ | 23,113,200 | * | |
Home Depot,
Inc. | | | 570,000 | | | | 55,586,400 | | |
PetSmart,
Inc. | | | 1,270,858 | | | | 91,946,576 | ØØ | |
Tractor
Supply Co. | | | 463,000 | | | | 33,900,860 | ØØ | |
| | | | 204,547,036 | | |
Technology Hardware, Storage & Peripherals (1.8%) | |
Apple, Inc. | | | 216,300 | | | | 23,360,400 | ØØ | |
SanDisk
Corp. | | | 364,000 | | | | 34,266,960 | ØØ | |
| | | | 57,627,360 | | |
Textiles, Apparel & Luxury Goods (2.5%) | |
lululemon
athletica,
Inc. | | | 201,518 | | | | 8,393,225 | * | |
PVH Corp. | | | 555,000 | | | | 63,464,250 | ØØ | |
Wolverine
World Wide,
Inc. | | | 275,000 | | | | 7,463,500 | | |
| | | | 79,320,975 | | |
Tobacco (1.6%) | |
Lorillard, Inc. | | | 530,000 | | | | 32,595,000 | | |
Philip
Morris
International,
Inc. | | | 208,100 | | | | 18,522,981 | | |
| | | | 51,117,981 | | |
Transportation Infrastructure (1.3%) | |
Wesco
Aircraft
Holdings,
Inc. | | | 2,420,000 | | | | 42,955,000 | * | |
Water Utilities (0.9%) | |
American
Water
Works
Co., Inc. | | | 564,000 | | | | 30,100,680 | | |
Wireless Telecommunication Services (0.6%) | |
SBA
Communications
Corp.
Class A | | | 160,000 | | | | 17,972,800 | *ØØ | |
Total Common
Stocks
(Cost $1,886,035,460) | | | | | 2,122,720,960 | | |
See Notes to Schedule of Investments
36
| | | Principal
Amount | |
Value† | |
Corporate Debt Securities (16.4%) | |
Airlines (0.8%) | |
UAL
Corp.,
Guaranteed
Notes,
6.00%,
due
12/1/20 | | $ | 6,970,000 | | | $ | 7,170,388 | | |
UAL Corp.,
Guaranteed
Notes, 6.38%,
due 6/1/18 | | | 4,385,000 | | | | 4,582,325 | | |
UAL Corp.,
Guaranteed
Notes,
Ser. A, 6.00%,
due
7/15/26 | | | 4,030,000 | | | | 3,899,025 | | |
UAL Corp.,
Guaranteed
Notes,
Ser. B, 6.00%,
due
7/15/28 | | | 10,970,000 | | | | 10,448,925 | | |
| | | | 26,100,663 | | |
Auto Manufacturers (0.1%) | |
Chrysler
Group
LLC/CG
Co-Issuer,
Inc.,
Secured
Notes,
8.25%,
due
6/15/21 | | | 4,120,000 | | | | 4,604,100 | | |
Auto Parts & Equipment (0.3%) | |
Goodyear
Tire &
Rubber
Co.,
Guaranteed
Notes,
6.50%,
due 3/1/21 | | | 6,425,000 | | | | 6,874,750 | | |
Goodyear
Tire &
Rubber Co.,
Guaranteed
Notes,
7.00%,
due 5/15/22 | | | 1,460,000 | | | | 1,587,750 | | |
| | | | 8,462,500 | | |
Beverages (0.0%) | |
Constellation
Brands, Inc.,
Guaranteed
Notes, 4.75%,
due
11/15/24 | | | 190,000 | | | | 194,275 | Ø | |
| | | Principal
Amount | |
Value† | |
Coal (0.9%) | |
Alpha
Natural
Resources,
Inc.,
Guaranteed
Notes, 6.00%,
due
6/1/19 | | $ | 15,860,000 | | | $ | 7,930,000 | | |
Alpha
Natural
Resources,
Inc.,
Guaranteed
Notes, 6.25%,
due
6/1/21 | | | 2,705,000 | | | | 1,244,300 | | |
Alpha
Natural
Resources,
Inc.,
Guaranteed
Notes, 9.75%,
due
4/15/18 | | | 9,511,000 | | | | 6,205,928 | | |
Arch
Coal, Inc.,
Guaranteed
Notes, 7.00%,
due
6/15/19 | | | 28,456,000 | | | | 11,240,120 | | |
Arch
Coal, Inc.,
Guaranteed
Notes, 7.25%,
due
10/1/20 | | | 2,333,000 | | | | 1,119,840 | | |
| | | | 27,740,188 | | |
Computers (0.1%) | |
Dell, Inc.,
Senior
Unsecured
Notes, 5.88%,
due
6/15/19 | | | 3,817,000 | | | | 4,046,020 | | |
Diversified Financial Services (0.1%) | |
SLM Corp.,
Senior
Unsecured
Notes, 5.50%,
due
1/25/23 | | | 3,050,000 | | | | 3,050,000 | | |
Electric (1.6%) | |
Calpine
Corp.,
Senior
Unsecured
Notes, 5.75%,
due
1/15/25 | | | 19,225,000 | | | | 19,465,313 | | |
| | | Principal
Amount | |
Value† | |
DPL,
Inc.,
Senior
Unsecured
Notes, 7.25%,
due
10/15/21 | | $ | 28,571,000 | | | $ | 30,356,687 | | |
| | | | 49,822,000 | | |
Entertainment (0.1%) | |
Regal
Entertainment
Group,
Senior
Unsecured
Notes, 5.75%,
due
3/15/22 | | | 2,595,000 | | | | 2,536,613 | | |
Food (0.6%) | |
SUPER-
VALU,
Inc.,
Senior
Unsecured
Notes, 6.75%,
due
6/1/21 | | | 19,440,000 | | | | 19,051,200 | | |
Healthcare-Services (1.2%) | |
CHS/
Community
Health
Systems, Inc.,
Guaranteed
Notes, 7.13%,
due
7/15/20 | | | 14,746,000 | | | | 15,962,545 | | |
DaVita
HealthCare
Partners, Inc.,
Guaranteed
Notes, 5.13%,
due
7/15/24 | | | 9,650,000 | | | | 9,843,000 | | |
HCA, Inc.,
Guaranteed
Notes, 5.88%,
due
5/1/23 | | | 2,070,000 | | | | 2,225,250 | | |
Select
Medical
Corp.,
Guaranteed
Notes, 6.38%,
due
6/1/21 | | | 10,908,000 | | | | 11,153,430 | | |
| | | | 39,184,225 | | |
Home Builders (0.8%) | |
KB Home,
Guaranteed
Notes, 7.00%,
due
12/15/21 | | | 14,960,000 | | | | 16,007,200 | | |
See Notes to Schedule of Investments
37
| | | Principal
Amount | |
Value† | |
KB
Home,
Guaranteed
Notes, 7.50%,
due 9/15/22 | | $ | 9,067,000 | | | $ | 9,769,693 | | |
| | | | 25,776,893 | | |
Iron—Steel (1.0%) | |
AK Steel
Corp.,
Guaranteed
Notes, 7.63%,
due
5/15/20 | | | 21,675,000 | | | | 21,837,562 | | |
AK Steel
Corp.,
Guaranteed
Notes, 7.63%,
due
10/1/21 | | | 1,770,000 | | | | 1,774,425 | | |
United
States Steel
Corp.,
Senior
Unsecured
Notes, 7.38%,
due
4/1/20 | | | 5,940,000 | | | | 6,652,800 | | |
United
States Steel
Corp.,
Senior
Unsecured
Notes, 7.50%,
due
3/15/22 | | | 2,086,000 | | | | 2,284,170 | | |
| | | | 32,548,957 | | |
Media (2.1%) | |
Cable-
vision
Systems
Corp.,
Senior
Unsecured
Notes, 5.88%,
due
9/15/22 | | | 25,778,000 | | | | 26,229,115 | | |
CCO
Holdings
LLC,
Guaranteed
Notes, 5.25%,
due
9/30/22 | | | 6,545,000 | | | | 6,585,906 | | |
CCOH
Safari LLC,
Guaranteed
Notes,
5.75%,
due
12/1/24 | | | 8,340,000 | | | | 8,402,550 | Ø | |
| | | Principal
Amount | |
Value† | |
Clear
Channel
Worldwide
Holdings, Inc.,
Guaranteed
Notes,
Ser. B, 7.63%,
due
3/15/20 | | $ | 11,735,000 | | | $ | 12,483,106 | | |
Sinclair
Television
Group, Inc.,
Guaranteed
Notes, 5.38%,
due
4/1/21 | | | 1,000,000 | | | | 1,002,500 | | |
Sinclair
Television
Group, Inc.,
Senior
Unsecured
Notes, 6.13%,
10/1/22 | | | 12,563,000 | | | | 13,002,705 | | |
| | | | 67,705,882 | | |
Oil & Gas (2.1%) | |
EXCO
Resources,
Inc.,
Guaranteed
Notes, 7.50%,
due
9/15/18 | | | 27,290,000 | | | | 24,083,425 | | |
Forest
Oil Corp.,
Guaranteed
Notes, 7.25%,
due 6/15/19 | | | 20,104,000 | | | | 19,400,360 | | |
SandRidge
Energy, Inc.,
Guaranteed
Notes,
7.50%,
due
2/15/23 | | | 18,175,000 | | | | 16,221,187 | | |
SandRidge
Energy, Inc.,
Guaranteed
Notes, 7.50%,
due
3/15/21 | | | 9,835,000 | | | | 8,753,150 | | |
| | | | 68,458,122 | | |
Oil & Gas Services (0.5%) | |
Key
Energy
Services, Inc.,
Guaranteed
Notes, 6.75%,
due
3/1/21 | | | 17,450,000 | | | | 15,530,500 | | |
| | | Principal
Amount | |
Value† | |
Retail (1.3%) | |
BC
ULC/
New Red
Finance,
Inc.,
Secured
Notes, 6.00%,
due
4/1/22 | | $ | 250,000 | | | $ | 253,437 | ñ | |
Best Buy
Co., Inc.,
Senior
Unsecured
Notes, 5.50%,
due 3/15/21 | | | 20,042,000 | | | | 20,593,155 | | |
Bon-Ton
Department
Stores, Inc.,
Secured
Notes, 8.00%,
due
6/15/21 | | | 14,984,000 | | | | 13,036,080 | | |
JC Penney
Corp., Inc.,
Guaranteed
Notes, 5.65%,
due 6/1/20 | | | 9,236,000 | | | | 7,596,610 | | |
JC Penney
Corp., Inc.,
Guaranteed
Notes, 5.75%,
due
2/15/18 | | | 735,000 | | | | 687,225 | | |
JC Penney
Corp., Inc.,
Guaranteed
Notes, 8.13%,
due
10/1/19 | | | 250,000 | | | | 240,000 | | |
| | | | 42,406,507 | | |
Telecommunications (2.5%) | |
CenturyLink,
Inc.,
Senior
Unsecured
Notes, Ser. T,
5.80%,
due
3/15/22 | | | 500,000 | | | | 530,000 | | |
CenturyLink,
Inc.,
Senior
Unsecured
Notes,
Ser. W, 6.75%,
due
12/1/23 | | | 3,392,000 | | | | 3,765,120 | | |
See Notes to Schedule of Investments
38
| | | Principal
Amount | |
Value† | |
Frontier
Communications
Corp.,
Senior
Unsecured
Notes, 6.88%,
due
1/15/25 | | $ | 7,020,000 | | | $ | 7,107,750 | | |
Frontier
Communications
Corp.,
Senior
Unsecured
Notes, 7.63%,
due
4/15/24 | | | 20,927,000 | | | | 22,496,525 | | |
MetroPCS
Wireless, Inc.,
Guaranteed
Notes, 6.63%,
due
11/15/20 | | | 4,910,000 | | | | 5,173,912 | | |
Sprint
Capital Corp.,
Guaranteed
Notes, 6.88%,
11/15/28 | | | 17,456,000 | | | | 16,975,960 | | |
Sprint
Nextel Corp.,
Senior
Unsecured
Notes, 6.00%,
due
11/15/22 | | | 15,425,000 | | | | 15,386,437 | | |
T-Mobile
USA, Inc.,
Guaranteed
Notes, 6.13%,
due
1/15/22 | | | 4,090,000 | | | | 4,238,263 | | |
T-Mobile
USA, Inc.,
Guaranteed
Notes, 6.38%,
due 3/1/25 | | | 465,000 | | | | 477,788 | | |
T-Mobile
USA, Inc.,
Guaranteed
Notes, 6.50%,
due
1/15/24 | | | 5,475,000 | | | | 5,735,062 | | |
| | | | 81,886,817 | | |
Transportation (0.3%) | |
Teekay
Offshore
Partners
LP, Senior
Unsecured
Notes, 6.00%,
due
7/30/19 | | | 10,820,000 | | | | 10,454,825 | | |
Total Corporate
Debt Securities
(Cost $554,149,059) | | | | | | | 529,560,287 | | |
| | |
Contracts | |
Value† | |
Purchased Options (0.0%) | |
PetSmart,
Inc., Call
January
2015 @ 75
(Cost
$420,633) | | | 1,760 | | | $ | 369,600 | | |
| | | Number
of Shares | | | |
Short-Term Investments (16.0%) | |
State
Street
Institutional
Government
Money Market
Fund Premier
Class (Cost
$517,723,917) | | | 517,723,917 | | | | 517,723,917 | ØØ | |
Total Long
Positions (98.2%)
(Cost $2,958,329,069) | | | | | 3,170,374,764 | ## | |
Cash, receivables
and other assets,
less liabilities (14.3%) | | | | | 460,471,184 | ‡‡± | |
Short Positions
(see summary
below) ((12.5)%) | | | | | | | (403,450,020 | ) | |
Total
Net Assets (100.0%) | | | | | | $ | 3,227,395,928 | | |
Short Positions ((12.5)%) | |
| Common Stocks Sold Short (6.8%)‡ | |
Airlines (0.2%) | |
American
Airlines
Group, Inc. | | | (140,000 | ) | | | (5,789,000 | ) | |
Auto Components (0.4%) | |
Lear Corp. | | | (142,000 | ) | | | (13,135,000 | ) | |
Banks (0.1%) | |
First
Horizon
National
Corp. | | | (352,300 | ) | | | (4,530,578 | ) | |
Capital Markets (0.2%) | |
Cohen & | | | (96,101 | ) | | | (4,118,889 | ) | |
Steers,
Inc. | |
Franklin
Resources,
Inc. | | | (45,900 | ) | | | (2,552,499 | ) | |
| | | | (6,671,388 | ) | |
Containers & Packaging (0.1%) | |
Bemis Co.,
Inc. | | | (88,000 | ) | | | (3,385,360 | ) | |
Electric Utilities (0.3%) | |
Southern
Co. | | | (230,000 | ) | | | (10,662,800 | ) | |
| | | Number
of Shares | |
Value† | |
Electronic Equipment, Instruments & Components (0.2%) | |
Avnet, Inc. | | | (119,600 | ) | | $ | (5,172,700 | ) | |
Energy Equipment & Services (0.3%) | |
Baker
Hughes,
Inc. | | | (52,900 | ) | | | (2,801,584 | ) | |
Transocean
Partners
LLC | | | (216,000 | ) | | | (5,428,080 | )* | |
Weatherford
International
PLC | | | (75,000 | ) | | | (1,231,500 | )* | |
| | | | (9,461,164 | ) | |
Hotels, Restaurants & Leisure (0.2%) | |
Carnival
Corp. | | | (75,000 | ) | | | (3,011,250 | ) | |
Chuy's
Holdings,
Inc. | | | (85,100 | ) | | | (2,545,341 | )* | |
| | | | (5,556,591 | ) | |
Internet & Catalog Retail (0.8%) | |
Jumei
International
Holding Ltd.
ADR | | | (258,700 | ) | | | (6,964,204 | )* | |
Vipshop
Holdings Ltd.
ADS | | | (87,700 | ) | | | (20,108,733 | )* | |
| | | | (27,072,937 | ) | |
IT Services (0.6%) | |
CGI Group,
Inc.
Class A | | | (463,362 | ) | | | (15,916,485 | )* | |
NeuStar,
Inc.
Class A | | | (100,000 | ) | | | (2,641,000 | )* | |
| | | | (18,557,485 | ) | |
Multi-Utilities (0.7%) | |
Consolidated
Edison,
Inc. | | | (260,000 | ) | | | (16,473,600 | ) | |
PG&E Corp. | | | (100,000 | ) | | | (5,032,000 | ) | |
| | | | (21,505,600 | ) | |
Multiline Retail (0.1%) | |
Kohl's Corp. | | | (60,000 | ) | | | (3,253,200 | ) | |
Oil, Gas & Consumable Fuels (0.7%) | |
Cheniere
Energy,
Inc. | | | (83,400 | ) | | | (6,255,000 | )* | |
Energy
Transfer
Partners LP | | | (140,200 | ) | | | (9,033,086 | ) | |
Kinder
Morgan,
Inc. | | | (200,000 | ) | | | (7,740,000 | ) | |
| | | | (23,028,086 | ) | |
See Notes to Schedule of Investments
39
| | | Number
of Shares | |
Value† | |
Professional Services (0.1%) | |
Dun &
Bradstreet
Corp. | | | (35,000 | ) | | $ | (4,298,350 | ) | |
Semiconductors & Semiconductor Equipment (0.4%) | |
Applied
Materials,
Inc. | | | (370,000 | ) | | | (8,173,300 | ) | |
Xilinx, Inc. | | | (97,000 | ) | | | (4,314,560 | ) | |
| | | | (12,487,860 | ) | |
Software (0.1%) | |
Rovi Corp. | | | (168,404 | ) | | | (3,516,275 | )* | |
Specialty Retail (1.1%) | |
Bed Bath &
Beyond,
Inc. | | | (270,000 | ) | | | (18,181,800 | )* | |
Sally
Beauty
Holdings,
Inc. | | | (320,000 | ) | | | (9,379,200 | )* | |
Sonic
Automotive,
Inc.
Class A | | | (332,900 | ) | | | (8,285,881 | ) | |
| | | | (35,846,881 | ) | |
Textiles, Apparel & Luxury Goods (0.2%) | |
Coach, Inc. | | | (180,000 | ) | | | (6,188,400 | ) | |
Total Common
Stocks Sold Short
(Proceeds
$(205,987,040)) | | | | | (220,119,655 | ) | |
Exchange Traded Funds Sold Short (5.7%) | |
Consumer
Discretionary
Select
Sector
SPDR Fund | | | (227,000 | ) | | | (15,458,700 | ) | |
Industrial
Select
Sector
SPDR Fund | | | (270,000 | ) | | | (14,909,400 | ) | |
iShares
Core S&P
Small-Cap
ETF | | | (77,000 | ) | | | (8,586,270 | ) | |
iShares
MSCI
Australia
ETF | | | (101,000 | ) | | | (2,568,430 | ) | |
iShares
MSCI
Emerging
Markets
ETF | | | (370,000 | ) | | | (15,595,500 | ) | |
| | | Number
of Shares | |
Value† | |
iShares
Russell
2000 ETF | | | (273,500 | ) | | $ | (31,879,160 | ) | |
iShares
Russell
Mid-Cap
ETF | | | (220,000 | ) | | | (35,932,600 | ) | |
SPDR
S&P
Retail
ETF | | | (126,500 | ) | | | (11,188,925 | ) | |
Utilities
Select
Sector
SPDR
Fund | | | (604,000 | ) | | | (27,463,880 | ) | |
Vanguard
REIT
ETF | | | (250,000 | ) | | | (19,747,500 | ) | |
Total Exchange
Traded Funds Sold
Short (Proceeds
$(165,847,760)) | | | | | (183,330,365 | ) | |
Total Short
Positions (Proceeds
$(371,834,800)) | | | | | (403,450,020 | ) | |
See Notes to Schedule of Investments
Notes to Schedule of Investments
† In accordance with Accounting Standards Codification ("ASC") 820 "Fair Value Measurement" ("ASC 820"), all investments held by each of Neuberger Berman Flexible Select Fund ("Flexible Select"), Neuberger Berman Global Allocation Fund ("Global Allocation"), Neuberger Berman Inflation Navigator Fund ("Inflation Navigator") (formerly, Neuberger Berman Dynamic Real Return Fund) and Neuberger Berman Long Short Fund ("Long Short") (each individually a "Fund," and collectively, the "Funds") are carried at the value that Neuberger Berman Management LLC ("Management") believes a Fund would receive upon selling an investment in an orderly transaction to an independent buyer in the principal or most advantageous market for the investment under current market conditions. Various inputs, including the volume and level of activity for the asset or liability in the market, are considered in valuing the Funds' investments, some of which are discussed below. Significant management judgment may be necessary to value investments in accordance with ASC 820.
ASC 820 established a three-tier hierarchy of inputs to create a classification of value measurements for disclosure purposes. The three-tier hierarchy of inputs is summarized in the three broad Levels listed below.
• Level 1 – quoted prices in active markets for identical investments
• Level 2 – other observable inputs (including quoted prices for similar investments, interest rates, prepayment speeds, credit risk, amortized cost, etc.)
• Level 3 – unobservable inputs (including a Fund's own assumptions in determining the fair value of investments)
The inputs or methodology used for valuing an investment are not necessarily an indication of the risk associated with investing in those securities.
The value of the Funds' investments (long and short positions) in equity securities, exchange traded funds, preferred stock, purchased option contracts and written option contracts, for which market quotations are readily available, is generally determined by Management by obtaining valuations from an independent pricing service based on the latest sale price quoted on a principal exchange or market for that security (Level 1 inputs). Securities traded primarily on the NASDAQ Stock Market are normally valued at the NASDAQ Official Closing Price ("NOCP") provided by NASDAQ each business day. The NOCP is the most recently reported price as of 4:00:02 p.m., Eastern time, unless that price is outside the range of the "inside" bid and asked prices (i.e., the bid and asked prices that dealers quote to each other when trading for their own accounts); in that case, NASDAQ will adjust the price to equal the inside bid or asked price, whichever is closer. Because of delays in reporting trades, the NOCP may not be based on the price of the last trade to occur before the market closes. If there is no reported sale of a security on a particular day, the independent pricing service may value the security based on reported market quotations.
The value of the Funds' investments in debt securities is determined by Management primarily by obtaining valuations from independent pricing services based on readily available bid quotations, or if quotations are not available, by methods which include various considerations based on security type (generally Level 2 inputs). In addition to the consideration of yields or prices of securities of comparable quality, coupon, maturity and type; indications as to values from dealers; and general market conditions, the following is a description of other Level 2 inputs and related valuation techniques used by independent pricing services to value certain types of debt securities of the Funds:
Corporate Debt Securities. Inputs used to value corporate debt securities generally include relative credit information, observed market movements, sector news, spread to the U.S. Treasury market, and other market information, which may include benchmark yields, reported trades, broker-dealer quotes, issuer spreads, benchmark securities, bids, offers, and reference data, such as market research publications, when available ("Other Market Information").
See Notes to Financial Statements
Notes to Schedule of Investments (cont'd)
U.S. Treasury Securities. Inputs used to value U.S. Treasury securities generally include quotes from several inter-dealer brokers and Other Market Information.
Sovereign Debt. Inputs used to value sovereign debt generally include dealer quotes, bond market activity, discounted cash flow models, and other relevant information such as credit spreads, benchmark curves and Other Market Information.
The value of financial futures contracts is determined by Management by obtaining valuations from independent pricing services at the settlement price at the market close (Level 1 inputs).
The value of forward foreign currency contracts ("forward contracts") is determined by Management by obtaining valuations from an independent pricing service based on actual traded currency rates on an independent pricing service's network, along with other traded and quoted currency rates provided to the pricing service by leading market participants (Level 2 inputs).
The value of total return swaps is determined by Management by obtaining valuations from an independent pricing service using the underlying index and stated London Interbank Offered Rate ("LIBOR") rate (Level 2 inputs).
Management has developed a process to periodically review information provided by independent pricing services for all types of securities.
Investments in investment companies are valued using the respective fund's daily calculated net asset value per share (Level 2 inputs).
If a valuation is not available from an independent pricing service, or if Management has reason to believe that the valuation received does not represent the amount a Fund might reasonably expect to receive on a current sale in an orderly transaction, Management seeks to obtain quotations from brokers or dealers (generally considered Level 2 or Level 3 inputs depending on the number of quotes available). If such quotations are not readily available, the security is valued using methods the Neuberger Berman Alternative Funds' Board of Trustees (the "Board") has approved in the good-faith belief that the resulting valuation will reflect the fair value of the security. Numerous factors may be considered when determining the fair value of a security based on Level 2 or Level 3 inputs, including available analyst, media or other reports, trading in futures or American Depositary Receipts ("ADRs") and whether the issuer of the security being fair valued has other securities outstanding.
The value of the Funds' investments in foreign securities is generally determined using the same valuation methods and inputs as other Fund investments, as discussed above. Foreign security prices expressed in local currency values are translated from the local currency into U.S. dollars using the exchange rates as of the end of regular trading on the New York Stock Exchange ("NYSE") on business days, usually 4:00 p.m., Eastern time. The Board has approved the use of Interactive Data Pricing and Reference Data, Inc. ("Interactive") to assist in determining the fair value of foreign equity securities when changes in the value of a certain index suggest that the closing prices on the foreign exchanges may no longer represent the amount that a Fund could expect to receive for those securities or on days when foreign markets are closed and U.S. markets are open. In each of these events, Interactive will provide adjusted prices for certain foreign equity securities using a statistical analysis of historical correlations of multiple factors (Level 2 inputs). The Board has also approved the use of Interactive to evaluate the prices of foreign income securities as of the close of the NYSE. Interactive utilizes benchmark spread and yield curves and evaluates available market activity from the local close to the close of the NYSE (Level 2 inputs) to assist in determining prices for certain foreign income securities. In the case of both foreign equity and foreign income securities, in the absence of precise information about the market values of these foreign securities as of the close of the NYSE, the Board has determined on the basis of available data that prices adjusted or evaluated in this way are likely to be closer to the prices a Fund could realize on a current sale than are the prices of those securities established at the close of the foreign markets in which the securities primarily trade.
See Notes to Financial Statements
Notes to Schedule of Investments (cont'd)
Fair value prices are necessarily estimates, and there is no assurance that such a price will be at or close to the price at which the security is next quoted or next trades.
The following is a summary, categorized by Level, of inputs used to value the Funds' investments as of October 31, 2014:
Asset Valuation Inputs | |
| | | Level 1 | | Level 2 | | Level 3 | | Total | |
Flexible Select | |
Investments: | |
Common Stocks^ | | $ | 84,035,352 | | | $ | — | | | $ | — | | | $ | 84,035,352 | | |
Preferred Stocks^ | | | 255,941 | | | | — | | | | — | | | | 255,941 | | |
Exchange Traded Funds | | | 15,729 | | | | — | | | | — | | | | 15,729 | | |
Mutual Funds | | | — | | | | 6,133,003 | | | | — | | | | 6,133,003 | | |
Short-Term Investments | | | — | | | | 6,983,117 | | | | — | | | | 6,983,117 | | |
Total Investments | | | 84,307,022 | | | | 13,116,120 | | | | — | | | | 97,423,142 | | |
Global Allocation | |
Investments: | |
Common Stocks^ | | | 9,678,440 | | | | — | | | | — | | | | 9,678,440 | | |
Short-Term Investments | | | — | | | | 17,091,904 | | | | — | | | | 17,091,904 | | |
Total Long Positions | | | 9,678,440 | | | | 17,091,904 | | | | — | | | | 26,770,344 | | |
Inflation Navigator | |
Investments: | |
Common Stocks^ | | | 8,721,238 | | | | — | | | | — | | | | 8,721,238 | | |
Government Securities^ | | | — | | | | 2,580,824 | | | | — | | | | 2,580,824 | | |
U.S. Treasury Securities-Backed by the Full Faith and
Credit of the U.S. Government | | | — | | | | 2,195,391 | | | | — | | | | 2,195,391 | | |
Mutual Funds | | | — | | | | 5,637,640 | | | | — | | | | 5,637,640 | | |
Short-Term Investments | | | — | | | | 314,775 | | | | — | | | | 314,775 | | |
Total Investments | | | 8,721,238 | | | | 10,728,630 | | | | — | | | | 19,449,868 | | |
Long Short | |
Investments: | |
Common Stocks^ | | | 2,122,720,960 | | | | — | | | | — | | | | 2,122,720,960 | | |
Corporate Debt Securities^ | | | — | | | | 529,560,287 | | | | — | | | | 529,560,287 | | |
Purchased Options | | | 369,600 | | | | — | | | | — | | | | 369,600 | | |
Short-Term Investments | | | — | | | | 517,723,917 | | | | — | | | | 517,723,917 | | |
Total Long Positions | | $ | 2,123,090,560 | | | $ | 1,047,284,204 | | | $ | — | | | $ | 3,170,374,764 | | |
^ The Schedule of Investments (or Long Positions by Industry and Short Positions by Industry for Global Allocation) provides information on the industry categorization for the portfolio.
See Notes to Financial Statements
Notes to Schedule of Investments (cont'd)
The following is a summary, categorized by Level, of inputs used to value the Funds' derivatives as of October 31, 2014:
Asset Valuation Inputs | | Level 1 | | Level 2 | | Level 3 | | Total | |
Global Allocation | |
Forward contracts (unrealized appreciation) | | $ | — | | | $ | 27,652 | | | $ | — | | | $ | 27,652 | | |
Futures contracts (unrealized appreciation) | | | 353,804 | | | | — | | | | — | | | | 353,804 | | |
Total return swaps (unrealized appreciation) | | | — | | | | 571,855 | | | | — | | | | 571,855 | | |
Total | | $ | 353,804 | | | $ | 599,507 | | | $ | — | | | $ | 953,311 | | |
Inflation Navigator | |
Futures contracts (unrealized appreciation) | | $ | 39,355 | | | $ | — | | | $ | — | | | $ | 39,355 | | |
Total | | $ | 39,355 | | | $ | — | | | $ | — | | | $ | 39,355 | | |
The following is a summary, categorized by Level, of inputs used to value the Funds' investments as of October 31, 2014:
Liability Valuation Inputs | | Level 1 | | Level 2 | | Level 3 | | Total | |
Global Allocation | |
Common Stocks Sold Short^ | |
United States | | $ | (4,869,231 | ) | | $ | (17,518 | ) | | $ | — | | | $ | (4,886,749 | ) | |
Other Common Stock Sold Shortß | | | (4,849,017 | ) | | | — | | | | — | | | | (4,849,017 | ) | |
Total Common Stocks Sold Short | | | (9,718,248 | ) | | | (17,518 | ) | | | — | | | | (9,735,766 | ) | |
Total Short Positions | | $ | (9,718,248 | ) | | $ | (17,518 | ) | | $ | — | | | $ | (9,735,766 | ) | |
Long Short | |
Common Stocks Sold Short^ | | $ | (220,119,655 | ) | | $ | — | | | $ | — | | | $ | (220,119,655 | ) | |
Exchange Traded Funds Sold Short | | | (183,330,365 | ) | | | — | | | | — | | | | (183,330,365 | ) | |
Total Short Positions | | $ | (403,450,020 | ) | | $ | — | | | $ | — | | | $ | (403,450,020 | ) | |
^ The Schedule of Investments (or Summary Schedule of Investments by Industry for Global Allocation) provides information on the industry for the portfolio.
ß Represents a geographic location and/or industry where all securities were Level 1 securities. Please refer to the Schedule of Investments for additional information.
The following is a summary, categorized by Level, of inputs used to value the Funds' derivatives as of October 31, 2014:
Liability Valuation Inputs | | Level 1 | | Level 2 | | Level 3 | | Total | |
Global Allocation | |
Forward contracts (unrealized depreciation) | | $ | — | | | $ | (24,692 | ) | | $ | — | | | $ | (24,692 | ) | |
Futures contracts (unrealized depreciation) | | | (141,128 | ) | | | — | | | | — | | | | (141,128 | ) | |
Total return swaps (unrealized depreciation) | | | — | | | | (115,060 | ) | | | — | | | | (115,060 | ) | |
Total | | $ | (141,128 | ) | | $ | (139,752 | ) | | $ | — | | | $ | (280,880 | ) | |
Inflation Navigator | |
Futures contracts (unrealized depreciation) | | $ | (54,036 | ) | | $ | — | | | $ | — | | | $ | (54,036 | ) | |
Total | | $ | (54,036 | ) | | $ | — | | | $ | — | | | $ | (54,036 | ) | |
See Notes to Financial Statements
Notes to Schedule of Investments (cont'd)
Liability Valuation Inputs | | Level 1 | | Level 2 | | Level 3 | | Total | |
Long Short | |
Futures contracts (unrealized depreciation) | | $ | (8,995,636 | ) | | $ | — | | | $ | — | | | $ | (8,995,636 | ) | |
Option contracts | | | (147,840 | ) | | | — | | | | — | | | | (147,840 | ) | |
Total | | $ | (9,143,476 | ) | | $ | — | | | $ | — | | | $ | (9,143,476 | ) | |
As of the year ending October 31, 2014, the Funds had no transfers between levels 1, 2 or 3 based on the beginning of period market values as of October 31, 2013.
## At October 31, 2014, selected fund information on a U.S. federal income tax basis was as follows:
| | | Cost | | Gross
Unrealized
Appreciation | | Gross
Unrealized
Depreciation | | Net Unrealized
Appreciation
(Depreciation) | |
Flexible Select | | $ | 86,665,275 | | | $ | 11,881,007 | | | $ | 1,123,140 | | | $ | 10,757,867 | | |
Global Allocation | | | 27,394,110 | | | | 500,769 | | | | 1,124,535 | | | | (623,766 | ) | |
Inflation Navigator | | | 18,307,054 | | | | 1,599,832 | | | | 457,018 | | | | 1,142,814 | | |
Long Short | | | 2,956,634,338 | | | | 294,636,538 | | | | 80,896,112 | | | | 213,740,426 | | |
* Security did not produce income during the last twelve months.
‡‡ At October 31, 2014, Long Short had outstanding put options written as follows:
Name of Issuer | | Contracts | | Exercise
Price | | Expiration Date | | Market Value
of Options | |
PetSmart, Inc., Put | | | 1,760 | | | | 65 | | | January 2015 | | $ | (147,840 | ) | |
| | | | | | | | | $ | (147,840 | ) | |
At October 31, 2014, Long Short had deposited $12,012,000 in a segregated account to cover requirements on put options written.
@ All or a portion of this security is pledged in connection with outstanding call options written.
ñ Securities were purchased under Rule 144A of the Securities Act of 1933, as amended (the "1933 Act"), or are private placements and, unless registered under the 1933 Act or exempted from registration, may only be sold to qualified institutional investors. These securities have been deemed by the investment manager to be liquid. At October 31, 2014, these securities amounted to $171,956 or 0.9% of net assets for Inflation Navigator and $253,437 or 0.0% of net assets for Long Short.
Ø All or a portion of this security was purchased on a when-issued basis. At October 31, 2014, these securities amounted to $8,596,825 for Long Short.
È All or a portion of this security is on loan.
ØØ All or a portion of this security is segregated in connection with obligations for common stocks sold short and/or forward foreign currency contracts and/or total return swap contracts and/or financial futures contracts and/or when-issued security purchase commitments.
‡ At October 31, 2014, Global Allocation had deposited $10,286,452 in a segregated account to cover collateral requirements for borrowing in connection with securities sold short. For Global Allocation, this collateral is made up of the proceeds from the securities sold short and collateral received from security lending activities. At October 31, 2014, Long Short had deposited $406,375,507 in a segregated account to cover collateral requirements for borrowing in connection with securities sold short.
See Notes to Financial Statements
Notes to Schedule of Investments (cont'd)
§ Affiliated issuer (see Note F of Notes to Financial Statements).
a Principal amount is stated in the currency in which security is denominated.
AUD = Australian Dollar
CAD = Canadian Dollar
EUR = Euro
GBP = Pound Sterling
MXN = Mexican Peso
NZD = New Zealand Dollar
SEK = Swedish Krona
ZAR = South African Rand
b Effective June 2, 2014. Formerly, Neuberger Berman Dynamic Real Return Fund through June 1, 2014.
± See Note A-13 in the Notes to Financial Statements for the Funds' open positions in derivatives at October 31, 2014.
^^ Value of the security was determined using methods the Board has approved in the good-faith belief that the resulting valuation will reflect the fair value of the security.
See Notes to Financial Statements
Statements of Asset and Liabilities
Neuberger Berman Alternative Funds
| | | FLEXIBLE
SELECT FUND | | | GLOBAL
ALLOCATION
FUND | | | INFLATION
NAVIGATOR
FUNDa | |
| | | October 31, 2014 | | | October 31, 2014 | | | October 31, 2014 | |
Assets | |
Investments in securities, at value*† (Notes A & F)—
see Schedule of Investments: | |
Unaffiliated issuers | | $ | 91,290,139 | | | $ | 26,770,344 | | | $ | 13,812,228 | |
Affiliated issuers | | | 6,133,003 | | | | — | | | | 5,637,640 | |
| | | | 97,423,142 | | | | 26,770,344 | | | | 19,449,868 | |
Foreign currency* | | | — | | | | 3,930 | | | | 8,025 | |
Deposits with brokers for short sales (Note A-10) | | | — | | | | 10,053,738 | | | | — | |
Deposits with brokers for futures contracts (Note A-13) | | | — | | | | 679,709 | | | | 43,262 | |
Deposits with brokers for option contracts (Note A-13) | | | — | | | | — | | | | — | |
Deposits with brokers for open swap contracts (Note A-13) | | | — | | | | 460,000 | | | | — | |
Deposits with brokers for forward foreign currency contracts (Note A-13) | | | — | | | | 420,000 | | | | — | |
Dividends and interest receivable | | | 81,038 | | | | 8,477 | | | | 34,924 | |
Receivable for securities sold | | | 273,678 | | | | — | | | | 49,246 | |
Receivable for Fund shares sold | | | — | | | | 18,202 | | | | — | |
Receivable from Management—net (Note B) | | | 37,295 | | | | 60,567 | | | | 57,081 | |
Open swap contracts, at value (Note A-13) | | | — | | | | 571,855 | | | | — | |
Cash collateral for securities loaned (Note A-11) | | | — | | | | 243,916 | | | | — | |
Receivable for variation margin (Note A-13) | | | — | | | | 45,674 | | | | 10,479 | |
Receivable for open forward foreign currency contracts (Note A-13) | | | — | | | | 27,652 | | | | — | |
Prepaid expenses and other assets | | | 15,681 | | | | 13,908 | | | | 24,125 | |
Total Assets | | | 97,830,834 | | | | 39,377,972 | | | | 19,677,010 | |
Liabilities | |
Investments sold short, at value** (Note A) | | | — | | | | 9,735,766 | | | | — | |
Interest payable for short sales | | | — | | | | 21,177 | | | | — | |
Payable for collateral on securities loaned (Note A-11) | | | — | | | | 243,916 | | | | — | |
Payable to investment manager—net (Notes A & B) | | | 46,544 | | | | 16,056 | | | | 6,662 | |
Options contracts written, at value*** (Note A-13) | | | — | | | | — | | | | — | |
Payable for securities purchased | | | 161,752 | | | | — | | | | 166,959 | |
Payable for Fund shares redeemed | | | — | | | | 34,820 | | | | — | |
Payable to administrator—net (Note B) | | | — | | | | — | | | | — | |
Payable to trustees | | | 1,881 | | | | 1,881 | | | | 1,881 | |
Open swap contracts, at value (Note A-13) | | | — | | | | 115,060 | | | | — | |
Payable for variation margin (Note A) | | | — | | | | — | | | | — | |
Payable for open forward foreign currency contracts (Note A-13) | | | — | | | | 24,692 | | | | — | |
Accrued expenses and other payables | | | 81,538 | | | | 161,544 | | | | 120,115 | |
Total Liabilities | | | 291,715 | | | | 10,354,912 | | | | 295,617 | |
Net Assets | �� | $ | 97,539,119 | | | $ | 29,023,060 | | | $ | 19,381,393 | |
Net Assets consist of: | |
Paid-in capital | | $ | 84,248,054 | | | $ | 28,452,911 | | | $ | 18,466,551 | |
Undistributed net investment income (loss) | | | 704,109 | | | | 148,162 | | | | 3,028 | |
Distributions in excess of net investment income | | | — | | | | — | | | | — | |
Accumulated net realized gains (losses) on investments | | | 1,597,358 | | | | (219,215 | ) | | | (76,667 | ) |
Net unrealized appreciation (depreciation) in value of investments | | | 10,989,598 | | | | 641,202 | | | | 988,481 | |
Net Assets | | $ | 97,539,119 | | | $ | 29,023,060 | | | $ | 19,381,393 | |
Net Assets | |
Institutional Class | | | 96,765,995 | | | | 12,452,132 | | | | 16,887,069 | |
Class A | | | 636,543 | | | | 9,569,462 | | | | 2,192,530 | |
Class C | | | 136,581 | | | | 7,001,466 | | | | 301,794 | |
See Notes to Financial Statements
Statements of Asset and Liabilities (cont'd)
Neuberger Berman Alternative Funds (cont'd)
| | | FLEXIBLE
SELECT FUND | | | GLOBAL
ALLOCATION
FUND | | | INFLATION
NAVIGATOR
FUNDa | |
| | | October 31, 2014 | | | October 31, 2014 | | | October 31, 2014 | |
Shares Outstanding ($.001 par value; unlimited
shares authorized) | |
Institutional Class | | | 8,093,058 | | | | 1,151,488 | | | | 1,572,028 | |
Class A | | | 53,407 | | | | 889,354 | | | | 204,734 | |
Class C | | | 11,561 | | | | 660,334 | | | | 28,394 | |
Net Asset Value, offering and redemption price per share | |
Institutional Class | | $ | 11.96 | | | $ | 10.81 | | | $ | 10.74 | |
Net Asset Value and redemption price per share | |
Class A | | $ | 11.92 | | | $ | 10.76 | | | $ | 10.71 | |
Offering Price per share | |
Class A‡ | | $ | 12.65 | | | $ | 11.42 | | | $ | 11.36 | |
Net Asset Value and offering price per share | |
Class C^ | | $ | 11.81 | | | $ | 10.60 | | | $ | 10.63 | |
†Securities on loan, at value: | |
Unaffiliated issuers | | $ | — | | | $ | 236,221 | | | $ | — | |
*Cost of Investments: | |
Unaffiliated issuers | | $ | 80,402,236 | | | $ | 27,394,109 | | | $ | 12,579,467 | |
Affiliated issuers | | | 6,031,189 | | | | — | | | | 5,867,864 | |
Total cost of investments | | $ | 86,433,425 | | | $ | 27,394,109 | | | $ | 18,447,331 | |
Total cost of foreign currency | | $ | — | | | $ | 3,182 | | | $ | 7,388 | |
**Proceeds from investments sold short | | $ | — | | | $ | 10,342,182 | | | $ | — | |
***Premium received from options written | | $ | — | | | $ | — | | | $ | — | |
‡ On single retail sales of less than $50,000. On sales of $50,000 or more or in certain other circumstances described in the Fund's prospectus, offering price is reduced.
^ Redemption price per share is equal to net asset value less any applicable contingent deferred sales charge.
a Formerly Dynamic Real Return Fund. See Note A of Notes to Financial Statements.
See Notes to Financial Statements
Statements of Asset and Liabilities (cont'd)
Neuberger Berman Alternative Funds
| | | LONG SHORT
FUND | |
| | | October 31, 2014 | |
Assets | |
Investments in securities, at value*† (Notes A & F)—see Schedule of Investments: | |
Unaffiliated issuers | | $ | 3,170,374,764 | |
Affiliated issuers | | | — | |
| | | | 3,170,374,764 | |
Foreign currency* | | | — | |
Deposits with brokers for short sales (Note A-10) | | | 406,375,507 | |
Deposits with brokers for futures contracts (Note A-13) | | | 18,476,370 | |
Deposits with brokers for option contracts (Note A-13) | | | 12,012,000 | |
Deposits with brokers for open swap contracts (Note A-13) | | | — | |
Deposits with brokers for forward foreign currency contracts (Note A-13) | | | — | |
Dividends and interest receivable | | | 10,721,909 | |
Receivable for securities sold | | | 42,538,195 | |
Receivable for Fund shares sold | | | 7,919,320 | |
Receivable from Management—net (Note B) | | | — | |
Open swap contracts, at value (Note A-13) | | | — | |
Cash collateral for securities loaned (Note A-11) | | | — | |
Receivable for variation margin (Note A) | | | — | |
Receivable for open forward foreign currency contracts (Note A-13) | | | — | |
Prepaid expenses and other assets | | | 89,956 | |
Total Assets | | | 3,668,508,021 | |
Liabilities | |
Investments sold short, at value** (Note A) | | | 403,450,020 | |
Dividends payable for short sales | | | 368,438 | |
Payable for collateral on securities loaned (Note A-11) | | | — | |
Payable to investment manager—net (Notes A & B) | | | 2,977,309 | |
Options contracts written, at value*** (Note A-13) | | | 147,840 | |
Payable for securities purchased | | | 21,812,901 | |
Payable for Fund shares redeemed | | | 6,466,590 | |
Payable to administrator—net (Note B) | | | 714,563 | |
Payable to trustees | | | 1,881 | |
Open swap contracts, at value (Note A-13) | | | — | |
Payable for variation margin (Note A) | | | 4,416,113 | |
Payable for open forward foreign currency contracts (Note A-13) | | | — | |
Accrued expenses and other payables | | | 756,438 | |
Total Liabilities | | | 441,112,093 | |
Net Assets | | $ | 3,227,395,928 | |
Net Assets consist of: | |
Paid-in capital | | $ | 3,034,472,230 | |
Undistributed net investment income (loss) | | | — | |
Distributions in excess of net investment income | | | (2,109,958 | ) |
Accumulated net realized gains (losses) on investments | | | 23,438,928 | |
Net unrealized appreciation (depreciation) in value of investments | | | 171,594,728 | |
Net Assets | | $ | 3,227,395,928 | |
Net Assets | |
Institutional Class | | | 2,627,830,743 | |
Class A | | | 388,555,093 | |
Class C | | | 211,010,092 | |
See Notes to Financial Statements
Statements of Asset and Liabilities (cont'd)
Neuberger Berman Alternative Funds (cont'd)
| | | LONG SHORT
FUND | |
| | | October 31, 2014 | |
Shares Outstanding ($.001 par value; unlimited shares authorized) | |
Institutional Class | | | 201,769,229 | |
Class A | | | 30,097,519 | |
Class C | | | 16,670,725 | |
Net Asset Value, offering and redemption price per share | |
Institutional Class | | $ | 13.02 | |
Net Asset Value and redemption price per share | |
Class A | | $ | 12.91 | |
Offering Price per share | |
Class A‡ | | $ | 13.70 | |
Net Asset Value and offering price per share | |
Class C^ | | $ | 12.66 | |
†Securities on loan, at value: | |
Unaffiliated issuers | | $ | — | |
*Cost of Investments: | |
Unaffiliated issuers | | $ | 2,958,329,069 | |
Affiliated issuers | | | — | |
Total cost of investments | | $ | 2,958,329,069 | |
Total cost of foreign currency | | $ | — | |
**Proceeds from investments sold short | | $ | 371,834,800 | |
***Premium received from options written | | $ | 307,729 | |
‡ On single retail sales of less than $50,000. On sales of $50,000 or more or in certain other circumstances described in the Fund's prospectus, offering price is reduced.
^ Redemption price per share is equal to net asset value less any applicable contingent deferred sales charge.
See Notes to Financial Statements
Neuberger Berman Alternative Funds
| | | FLEXIBLE
SELECT FUND | | | GLOBAL
ALLOCATION
FUND | | | INFLATION
NAVIGATOR
FUNDa | |
| | | For the
Year Ended
October 31,
2014 | | | For the
Year Ended
October 31,
2014 | | | For the
Year Ended
October 31,
2014 | |
Investment Income: | |
Income (Note A): | |
Dividend income—unaffiliated issuers | | $ | 1,533,716 | | | $ | 127,498 | | | $ | 217,806 | |
Dividend income—affiliated issuers (Notes A-15 & F) | | | 160,279 | | | | — | | | | 94,099 | |
Interest and other income—unaffiliated issuers | | | 99 | | | | — | | | | 71,432 | |
Income from securities loaned—net (Note A-11) | | | — | | | | 1,837 | | | | — | |
Foreign taxes withheld (Note A-6) | | | (19,353 | ) | | | (9,007 | ) | | | (224 | ) |
Total income | | $ | 1,674,741 | | | $ | 120,328 | | | $ | 383,113 | |
Expenses: | |
Investment management fees (Note B) | | | 555,535 | | | | 208,713 | | | | 108,535 | |
Administration fees (Note B) | | | 55,554 | | | | 19,266 | | | | 10,018 | |
Administration fees (Note B): | |
Institutional Class | | | 82,953 | | | | 15,348 | | | | 14,550 | |
Class A | | | 609 | | | | 18,631 | | | | 796 | |
Class C | | | 230 | | | | 11,482 | | | | 267 | |
Distribution fees (Note B): | |
Class A | | | 762 | | | | 23,289 | | | | 994 | |
Class C | | | 1,150 | | | | 57,411 | | | | 1,334 | |
Shareholder servicing agent fees: | |
Institutional Class | | | 6,421 | | | | 1,663 | | | | 1,267 | |
Class A | | | 263 | | | | 3,245 | | | | 260 | |
Class C | | | 130 | | | | 1,841 | | | | 143 | |
Audit fees | | | 41,000 | | | | 64,700 | | | | 59,300 | |
Custodian and accounting fees | | | 93,463 | | | | 191,221 | | | | 64,604 | |
Insurance expense | | | 1,419 | | | | 1,123 | | | | 560 | |
Legal fees | | | 109,334 | | | | 114,657 | | | | 126,649 | |
Registration and filing fees | | | 79,003 | | | | 49,047 | | | | 79,321 | |
Shareholder reports | | | 2,131 | | | | 7,574 | | | | 6,382 | |
Trustees' fees and expenses | | | 37,055 | | | | 37,095 | | | | 37,095 | |
Short sales expense (Note A-10) | | | — | | | | 112,873 | | | | — | |
Dividend expense on securities sold short (Note A-10) | | | — | | | | 166,721 | | | | — | |
Miscellaneous | | | 6,085 | | | | 46,473 | | | | 28,573 | |
Total expenses | | | 1,073,097 | | | | 1,152,373 | | | | 540,648 | |
Expenses reimbursed by Management (Note B) | | | (283,525 | ) | | | (571,747 | ) | | | (386,994 | ) |
Investment management fees waived (Note A) | | | (15,167 | ) | | | — | | | | (36,050 | ) |
Total net expenses | | | 774,405 | | | | 580,626 | | | | 117,604 | |
Net investment income (loss) | | $ | 900,336 | | | $ | (460,298 | ) | | $ | 265,509 | |
See Notes to Financial Statements
Statements of Operations (cont'd)
Neuberger Berman Alternative Funds (cont'd)
| | | FLEXIBLE
SELECT FUND | | | GLOBAL
ALLOCATION
FUND | | | INFLATION
NAVIGATOR
FUNDa | |
| | | For the
Year Ended
October 31,
2014 | | | For the
Year Ended
October 31,
2014 | | | For the
Year Ended
October 31,
2014 | |
Realized and Unrealized Gain (Loss) on Investments (Note A): | |
Net realized gain (loss) on: | |
Sales of investment securities of unaffiliated issuers | | | 1,765,832 | | | | 2,048,670 | | | | 37,307 | |
Sales of investment securities of affiliated issuers | | | (5,711 | ) | | | — | | | | (4,778 | ) |
Sales of investment securities of unaffiliated issuers sold short | | | — | | | | (1,626,339 | ) | | | — | |
Realized gain distributions from affiliated issuers | | | — | | | | — | | | | 30,706 | |
Forward foreign currency contracts | | | — | | | | 38,624 | | | | — | |
Foreign currency | | | (477 | ) | | | (12,396 | ) | | | (2,536 | ) |
Financial futures contracts | | | — | | | | 556,587 | | | | (98,804 | ) |
Options written | | | — | | | | — | | | | — | |
Total return swap contracts | | | — | | | | 1,302,921 | | | | — | |
Net increase from payments by affiliates (Note B) | | | — | | | | 10,922 | | | | — | |
Change in net unrealized appreciation (depreciation)
in value of: | |
Unaffiliated investment securities | | | 7,014,929 | | | | (1,985,705 | ) | | | 815,416 | |
Affiliated investment securities | | | 94,441 | | | | — | | | | (193,556 | ) |
Unaffiliated investment securities sold short | | | — | | | | 706,539 | | | | — | |
Forward foreign currency contracts | | | — | | | | (1,700 | ) | | | — | |
Foreign currency | | | (121 | ) | | | (14,699 | ) | | | 796 | |
Financial futures contracts | | | — | | | | (323,374 | ) | | | (503 | ) |
Options written | | | — | | | | — | | | | — | |
Total return swap contracts | | | — | | | | (70,801 | ) | | | — | |
Net gain (loss) on investments | | | 8,868,893 | | | | 629,249 | | | | 584,048 | |
Net increase (decrease) in net assets resulting from operations | | $ | 9,769,229 | | | $ | 168,951 | | | $ | 849,557 | |
a Formerly Dynamic Real Return Fund. See Note A of Notes to Financial Statements.
See Notes to Financial Statements
Statements of Operations (cont'd)
Neuberger Berman Alternative Funds
| | | LONG SHORT
FUND | |
| | | For the
Year Ended
October 31,
2014 | |
Investment Income: | |
Income (Note A): | |
Dividend income—unaffiliated issuers | | $ | 21,939,246 | | |
Dividend income—affiliated issuers (Notes A-15 & F) | | | — | | |
Interest and other income—unaffiliated issuers | | | 26,321,009 | | |
Income from securities loaned—net (Note A-11) | | | — | | |
Foreign taxes withheld (Note A-6) | | | (377,566 | ) | |
Total income | | $ | 47,882,689 | | |
Expenses: | |
Investment management fees (Note B) | | | 28,173,690 | | |
Administration fees (Note B) | | | 1,516,671 | | |
Administration fees (Note B): | |
Institutional Class | | | 1,572,706 | | |
Class A | | | 1,203,776 | | |
Class C | | | 356,893 | | |
Distribution fees (Note B): | |
Class A | | | 1,504,720 | | |
Class C | | | 1,784,466 | | |
Shareholder servicing agent fees: | |
Institutional Class | | | 192,568 | | |
Class A | | | 111,138 | | |
Class C | | | 34,981 | | |
Audit fees | | | 32,800 | | |
Custodian and accounting fees | | | 420,776 | | |
Insurance expense | | | 49,357 | | |
Legal fees | | | 117,980 | | |
Registration and filing fees | | | 340,710 | | |
Shareholder reports | | | 264,658 | | |
Trustees' fees and expenses | | | 37,095 | | |
Short sales expense (Note A-10) | | | 3,822,513 | | |
Dividend expense on securities sold short (Note A-10) | | | 6,106,390 | | |
Miscellaneous | | | 108,127 | | |
Total expenses | | | 47,752,015 | | |
Expenses reimbursed by Management (Note B) | | | — | | |
Investment management fees waived (Note A) | | | — | | |
Total net expenses | | | 47,752,015 | | |
Net investment income (loss) | | $ | 130,674 | | |
See Notes to Financial Statements
Statements of Operations (cont'd)
Neuberger Berman Alternative Funds (cont'd)
| | | LONG SHORT
FUND | |
| | | For the
Year Ended
October 31,
2014 | |
Realized and Unrealized Gain (Loss) on Investments (Note A): | |
Net realized gain (loss) on: | |
Sales of investment securities of unaffiliated issuers | | | 56,869,716 | | |
Sales of investment securities of affiliated issuers | | | — | | |
Sales of investment securities of unaffiliated issuers sold short | | | (12,144,559 | ) | |
Realized gain distributions from affiliated issuers | | | — | | |
Forward foreign currency contracts | | | — | | |
Foreign currency | | | (36,413 | ) | |
Financial futures contracts | | | (29,901,918 | ) | |
Options written | | | 5,153,000 | | |
Total return swap contracts | | | — | | |
Net increase from payments by affiliates (Note B) | | | 60,836 | | |
Change in net unrealized appreciation (depreciation) in value of: | |
Unaffiliated investment securities | | | 111,378,197 | | |
Affiliated investment securities | | | — | | |
Unaffiliated investment securities sold short | | | (17,441,745 | ) | |
Forward foreign currency contracts | | | — | | |
Foreign currency | | | — | | |
Financial futures contracts | | | (6,038,306 | ) | |
Options written | | | 214,429 | | |
Total return swap contracts | | | — | | |
Net gain (loss) on investments | | | 108,113,237 | | |
Net increase (decrease) in net assets resulting from operations | | $ | 108,243,911 | | |
See Notes to Financial Statements
Statements of Changes in Net Assets
Neuberger Berman Alternative Funds
| | | FLEXIBLE SELECT FUND | | | GLOBAL ALLOCATION FUND | | | INFLATION NAVIGATOR FUNDa | | | LONG SHORT FUND | |
| | | Year Ended
October 31,
2014 | | | Period from
May 31, 2013
(Commencement
of Operations) to
October 31,
2013 | | | Year Ended
October 31,
2014 | | | Year Ended
October 31,
2013 | | | Year Ended
October 31,
2014 | | | Period from
December 19, 2012
(Commencement
of Operations) to
October 31,
2013 | | | Year Ended
October 31,
2014 | | | Year Ended
October 31,
2013 | |
Increase (Decrease) in Net Assets: | |
From Operations (Note A): | |
Net investment income (loss) | | $ | 900,336 | | | $ | 141,121 | | | $ | (460,298 | ) | | $ | (306,272 | ) | | $ | 265,509 | | | $ | 218,670 | | | $ | 130,674 | | | $ | (510,080 | ) |
Net realized gain (loss) on investments | | | 1,759,644 | | | | (164,468 | ) | | | 2,308,067 | | | | 1,430,530 | | | | (38,105 | ) | | | (184,391 | ) | | | 19,939,826 | | | | 10,428,460 | |
Net increase from payments by affiliates (Note B) | | | — | | | | — | | | | 10,922 | | | | — | | | | — | | | | — | | | | 60,836 | | | | — | |
Change in net unrealized appreciation (depreciation) of investments | | | 7,109,249 | | | | 3,880,349 | | | | (1,689,740 | ) | | | 2,185,771 | | | | 622,153 | | | | 366,328 | | | | 88,112,575 | | | | 81,517,853 | |
Net increase (decrease) in net assets resulting from operations | | | 9,769,229 | | | | 3,857,002 | | | | 168,951 | | | | 3,310,029 | | | | 849,557 | | | | 400,607 | | | | 108,243,911 | | | | 91,436,233 | |
Distributions to Shareholders From (Note A): | |
Net investment income: | |
Institutional Class | | | (335,177 | ) | | | — | | | | (1,423,702 | ) | | | (158,784 | ) | | | (332,927 | ) | | | — | | | | — | | | | (107,714 | ) |
Class A | | | (302 | ) | | | — | | | | (632,740 | ) | | | (62,020 | ) | | | (1,920 | ) | | | — | | | | — | | | | (36,085 | ) |
Class C | | | (17 | ) | | | — | | | | (373,622 | ) | | | (11,158 | ) | | | (1,167 | ) | | | — | | | | — | | | | (1,288 | ) |
Net realized gain on investments: | |
Institutional Class | | | — | | | | — | | | | — | | | | — | | | | — | | | | — | | | | (5,606,352 | ) | | | (787,269 | ) |
Class A | | | — | | | | — | | | | — | | | | — | | | | — | | | | — | | | | (2,452,314 | ) | | | (315,555 | ) |
Class C | | | — | | | | — | | | | — | | | | — | | | | — | | | | — | | | | (609,411 | ) | | | (37,516 | ) |
Total distributions to shareholders | | | (335,496 | ) | | | — | | | | (2,430,064 | ) | | | (231,962 | ) | | | (336,014 | ) | | | — | | | | (8,668,077 | ) | | | (1,285,427 | ) |
From Fund Share Transactions (Note D): | |
Proceeds from shares sold: | |
Institutional Class | | | 8,535 | | | | 85,284,877 | | | | 3,525,689 | | | | 10,290,119 | | | | 1,024,850 | | | | 17,050,189 | | | | 2,043,724,867 | | | | 993,039,563 | |
Class A | | | 540,373 | | | | 135,504 | | | | 7,858,510 | | | | 8,890,938 | | | | 2,379,608 | | | | 102,500 | | | | 405,081,481 | | | | 508,140,690 | |
Class C | | | 18,500 | | | | 100,000 | | | | 4,320,936 | | | | 2,951,761 | | | | 199,190 | | | | 103,500 | | | | 112,535,003 | | | | 110,775,702 | |
Proceeds from reinvestment of dividends and distributions: | |
Institutional Class | | | 335,177 | | | | — | | | | 1,413,385 | | | | 157,181 | | | | 332,927 | | | | — | | | | 4,822,872 | | | | 853,873 | |
Class A | | | 302 | | | | — | | | | 502,685 | | | | 51,292 | | | | 1,920 | | | | — | | | | 2,249,144 | | | | 293,006 | |
Class C | | | 17 | | | | — | | | | 359,737 | | | | 10,926 | | | | 1,167 | | | | — | | | | 466,547 | | | | 17,797 | |
Payments for shares redeemed: | |
Institutional Class | | | (162,561 | ) | | | (1,936,319 | ) | | | (8,502,926 | ) | | | (3,857,972 | ) | | | (932,595 | ) | | | (1,511,161 | ) | | | (526,844,014 | ) | | | (105,947,534 | ) |
Class A | | | (76,021 | ) | | | — | | | | (6,038,449 | ) | | | (5,368,301 | ) | | | (281,537 | ) | | | — | | | | (546,927,034 | ) | | | (60,519,912 | ) |
Class C | | | — | | | | — | | | | (2,120,187 | ) | | | (726,293 | ) | | | — | | | | (3,315 | ) | | | (22,735,877 | ) | | | (4,321,732 | ) |
Net increase (decrease) from Fund share transactions | | | 664,322 | | | | 83,584,062 | | | | 1,319,380 | | | | 12,399,651 | | | | 2,725,530 | | | | 15,741,713 | | | | 1,472,372,989 | | | | 1,442,331,453 | |
Net Increase (Decrease) in Net Assets | | | 10,098,055 | | | | 87,441,064 | | | | (941,733 | ) | | | 15,477,718 | | | | 3,239,073 | | | | 16,142,320 | | | | 1,571,948,823 | | | | 1,532,482,259 | |
Net Assets: | |
Beginning of year | | | 87,441,064 | | | | — | | | | 29,964,793 | | | | 14,487,075 | | | | 16,142,320 | | | | — | | | | 1,655,447,105 | | | | 122,964,846 | |
End of year | | $ | 97,539,119 | | | $ | 87,441,064 | | | $ | 29,023,060 | | | $ | 29,964,793 | | | $ | 19,381,393 | | | $ | 16,142,320 | | | $ | 3,227,395,928 | | | $ | 1,655,447,105 | |
Undistributed net investment income (loss) at end of year | | $ | 704,109 | | | $ | 134,668 | | | $ | 148,162 | | | $ | 1,798,541 | | | $ | 3,028 | | | $ | 157,407 | | | $ | — | | | $ | — | |
Distributions in excess of net investment income at end of year | | $ | — | | | $ | — | | | $ | — | | | $ | — | | | $ | — | | | $ | — | | | $ | (2,109,958 | ) | | $ | (42,614 | ) |
a Formerly Dynamic Real Return Fund. See Note A of Notes to Financial Statements.
See Notes to Financial Statements
Notes to Financial Statements Alternative Funds
Note A—Summary of Significant Accounting Policies:
1 General: Neuberger Berman Alternative Funds (the "Trust") is a Delaware statutory trust organized pursuant to an Amended and Restated Trust Instrument dated March 27, 2014. The Trust is registered as an open-end management investment company under the Investment Company Act of 1940, as amended (the "1940 Act"), and its shares are registered under the Securities Act of 1933, as amended (the "1933 Act"). Each Fund is a separate operating series of the Trust. Long Short is non-diversified. Under the 1940 Act, the status of a Fund that was registered as non-diversified may, under certain circumstances, change to that of a diversified Fund (Global Allocation became diversified in December 2013). Flexible Select, and Inflation Navigator are each diversified. Inflation Navigator had no operations until December 19, 2012, other than matters relating to its organization and its registration of shares under the 1933 Act. Flexible Select had no operations until May 31, 2013, other than matters relating to its organization and its registration of shares under the 1933 Act. Each Fund offers Institutional Class shares, Class A shares and Class C shares. The Board may establish additional series or classes of shares without the approval of shareholders. Effective June 2, 2014, Neuberger Berman Dynamic Real Return Fund changed its name to Neuberger Berman Inflation Navigator Fund.
The assets of each Fund belong only to that Fund, and the liabilities of each Fund are borne solely by that Fund and no other.
Each Fund is an investment company and accordingly follows the investment company accounting and reporting guidance of the Financial Accounting Standards Board (FASB) Accounting Standard Codification Topic 946 "Financial Services—Investment Companies".
The preparation of financial statements in accordance with U.S. generally accepted accounting principles ("GAAP") requires Management to make estimates and assumptions at the date of the financial statements. Actual results could differ from those estimates.
2 Portfolio valuation: Investment securities are valued as indicated in the notes following the Funds' Schedule of Investments.
3 Foreign currency translation: The accounting records of the Funds are maintained in U.S. dollars. Foreign currency amounts are translated into U.S. dollars using the exchange rate as of the end of regular trading on the NYSE on business days, usually 4:00 p.m. Eastern time, to determine the value of investments, other assets and liabilities. Purchase and sale prices of securities, and income and expenses, are translated into U.S. dollars at the prevailing rate of exchange on the respective dates of such transactions. Net unrealized foreign currency gain (loss), if any, arises from changes in the value of assets and liabilities, other than investments in securities, as a result of changes in exchange rates and is stated separately in the Statements of Operations.
4 Securities transactions and investment income: Securities transactions are recorded on trade date for financial reporting purposes. Dividend income is recorded on the ex-dividend date or, for certain foreign dividends, as soon as the Fund becomes aware of the dividends. Non-cash dividends included in dividend income, if any, are recorded at the fair market value of the securities received. Interest income, including accretion of discount on securities, accretion of original issue discount, where applicable, and accretion of discount on short-term investments, if any, is recorded on the accrual basis. Realized gains and losses from securities transactions and foreign currency transactions, if any, are recorded on the basis of identified cost and stated separately in the Statements of Operations.
5 Income tax information: Each Fund is treated as a separate entity for U.S. federal income tax purposes. It is the policy of each Fund to continue to qualify for treatment as a regulated investment company by complying with the requirements of the U.S. Internal Revenue Code applicable to regulated investment companies and to distribute substantially all of its net investment income and net realized capital gains to its shareholders. To the extent a Fund
distributes substantially all of its net investment income and net realized capital gains to shareholders, no federal income or excise tax provision is required.
The Funds have adopted the provisions of ASC 740 "Income Taxes" ("ASC 740"). ASC 740 sets forth a minimum threshold for financial statement recognition of a tax position taken, or expected to be taken, in a tax return. The Funds recognize interest and penalties, if any, related to unrecognized tax positions as an income tax expense in the Statements of Operations. The Funds are subject to examination by U.S. federal and state tax authorities for returns filed for the tax years for which the applicable statutes of limitations have not yet expired. As of October 31, 2014, the Funds did not have any unrecognized tax positions.
Income distributions and capital gain distributions are determined in accordance with income tax regulations, which may differ from GAAP. These differences are primarily due to differing treatments of income and gains on various investment securities held by each Fund, timing differences and differing characterization of distributions made by each Fund.
As determined on October 31, 2014, permanent differences resulting primarily from different book and tax accounting were reclassified at year end. Such differences may be attributed to the tax treatment of one or more of the following: gains and losses from passive foreign investment companies (PFICs), swaps, foreign currencies, foreign futures and partnerships; net operating losses written off or netted against short term gains; non-deductible stock issuance costs and excise taxes; distributions from real estate investment trusts (REITs); capitalized dividends on short sales; and deflation adjustments on U.S. Treasury inflation protected bonds (TIPs). These reclassifications had no effect on net income, net asset value ("NAV") or NAV per share of each Fund. For the year ended October 31, 2014, the Funds recorded the following permanent reclassifications:
| | | Paid-in Capital | | Undistributed
Net Investment
Income (Loss) | | Accumulated
Net Realized
Gains (Losses)
on Investments | |
Flexible Select | | $ | 1 | | | $ | 4,601 | | | $ | (4,602 | ) | |
Global Allocation | | | (9,938 | ) | | | 1,239,983 | | | | (1,230,045 | ) | |
Inflation Navigator | | | (1,120 | ) | | | (83,874 | ) | | | 84,994 | | |
Long Short | | | (467,617 | ) | | | (2,198,018 | ) | | | 2,665,635 | | |
For tax purposes, distributions of short-term capital gains are taxable to shareholders as ordinary income.
The tax character of distributions paid during the years ended October 31, 2014 and October 31, 2013 was as follows:
| | | Distributions Paid From: | |
| | | Ordinary Income | | Tax-Exempt
Income | | Long-Term
Capital Gain | | Return of
Capital | | Total | |
| | | 2014 | | 2013 | | 2014 | | 2013 | | 2014 | | 2013 | | 2014 | | 2013 | | 2014 | | 2013 | |
Flexible Select | | $ | 335,496 | | | $ | — | (2) | | $ | — | | | $ | — | (2) | | $ | — | | | $ | — | (2) | | $ | — | | | $ | — | (2) | | $ | 335,496 | | | $ | — | (2) | |
Global Allocation | | | 2,430,064 | | | | 231,962 | | | | — | | | | — | | | | — | | | | — | | | | — | | | | — | | | | 2,430,064 | | | | 231,962 | | |
Inflation Navigator | | | 336,014 | | | | — | (1) | | | — | | | | — | (1) | | | — | | | | — | (1) | | | — | | | | — | (1) | | | 336,014 | | | | — | (1) | |
Long Short | | | 7,970,437 | | | | 1,285,427 | | | | — | | | | — | | | | 697,640 | | | | — | | | | — | | | | — | | | | 8,668,077 | | | | 1,285,427 | | |
(1) Period from December 19, 2012 (Commencement of Operations) to October 31, 2013.
(2) Period from May 31, 2013 (Commencement of Operations) to October 31, 2013.
As of October 31, 2014, the components of distributable earnings (accumulated losses) on a U.S. federal income tax basis were as follows:
| | | Undistributed
Ordinary
Income | | Undistributed
Long-Term
Capital Gain | | Unrealized
Appreciation
(Depreciation) | | Loss
Carryforwards
and Deferrals | | Other
Temporary
Differences | | Total | |
Flexible Select | | $ | 1,367,185 | | | $ | 1,190,435 | | | $ | 10,757,748 | | | $ | — | | | $ | (24,303 | ) | | $ | 13,291,065 | | |
Global Allocation | | | 624,099 | | | | — | | | | 27,489 | | | | (68,747 | ) | | | (12,692 | ) | | | 570,149 | | |
Inflation Navigator | | | 4,215 | | | | — | | | | 1,142,120 | | | | (204,754 | ) | | | (26,739 | ) | | | 914,842 | | |
Long Short | | | — | | | | 12,748,561 | | | | 182,285,095 | | | | (2,070,580 | ) | | | (39,378 | ) | | | 192,923,698 | | |
The differences between book basis and tax basis distributable earnings are primarily due to: losses disallowed or recognized on wash sales, straddles and unsettled short sales; mark-to-market adjustments on PFICs, swaps, futures contracts and forward contracts; adjustments related to partnerships, REITs and TIPs; deferral of "late year ordinary loss" (as defined in the Internal Revenue Code of 1986, as amended); and amortization of organizational costs.
To the extent each Fund's net realized capital gains, if any, can be offset by capital loss carryforwards, it is the policy of each Fund not to distribute such gains. For taxable years beginning after December 22, 2010, the capital loss carryforward rules allow for regulated investment companies to carry forward capital losses indefinitely and to retain the character of capital loss carryforwards as short-term or long-term. As determined at October 31, 2014, the Funds had unused capital loss carryforwards available for federal income tax purposes to offset net realized capital gains, if any, as follows:
| | | Capital Loss Carryforwards (No Expiration Date) | |
| | | Long-Term | | Short-Term | |
Global Allocation | | $ | — | | | $ | 68,747 | | |
Inflation Navigator | | | — | | | | 204,754 | | |
During the year ended October 31, 2014, Flexible Select and Global Allocation utilized capital loss carryforwards of $54,983 and $669,860, respectively.
Under current tax regulations, capital losses realized on investment transactions after October 31 may be deferred and treated as occurring on the first day of the following fiscal year. Under the Act, the Funds may also defer any realized late-year ordinary losses as occurring on the first day of the following fiscal year. Late-year ordinary losses represent ordinary losses realized on investment transactions after December 31 and specified losses (ordinary losses from the sale, exchange, or other disposition of property, net foreign currency losses and net passive foreign investment company mark to market losses) realized on investment transactions after October 31. For the year ended October 31, 2014, Long Short elected to defer the following late-year ordinary losses:
| | | Late-Year
Ordinary Loss | |
| | | Deferral | |
Long Short | | $ | 2,070,580 | | |
6 Foreign taxes: Foreign taxes withheld, if any, represent amounts withheld by foreign tax authorities, net of refunds recoverable.
7 Distributions to shareholders: Each Fund may earn income, net of expenses, daily on its investments. Distributions from net investment income and net realized capital gains, if any, generally are distributed once a year (usually in December) and are recorded on the ex-date.
8 Expense allocation: Certain expenses are applicable to multiple funds. Expenses directly attributable to a Fund are charged to that Fund. Expenses of the Trust that are not directly attributable to a particular series of the Trust
(e.g., a Fund) are allocated among the series of the Trust, on the basis of relative net assets, except where a more appropriate allocation of expenses to each of the series can otherwise be made fairly. Expenses borne by the complex of related investment companies, which includes open-end and closed-end investment companies for which Management serves as investment manager, that are not directly attributable to a particular investment company in the complex (e.g., the Trust) or series thereof are allocated among the investment companies in the complex or series thereof, on the basis of relative net assets, except where a more appropriate allocation of expenses to each of the investment companies in the complex or series thereof can otherwise be made fairly. Each Fund's expenses (other than those specific to each class) are allocated proportionally each day among the classes based upon the relative net assets of each class.
9 Investments in foreign securities: Investing in foreign securities may involve certain sovereign and other risks, in addition to the credit and market risks normally associated with domestic securities. These additional risks include the possibility of adverse political and economic developments (including political instability, nationalization, expropriation, or confiscatory taxation) and the potentially adverse effects of unavailability of public information regarding issuers, less governmental supervision and regulation of financial markets, reduced liquidity of certain financial markets, and the lack of uniform accounting, auditing, and financial reporting standards or the application of standards that are different or less stringent than those applied in the United States. Foreign securities also may experience greater price volatility, higher rates of inflation, and delays in settlement.
10 Securities sold short: Each Fund may engage in short sales, which are sales of securities which have been borrowed from a third party on the expectation that the market price will decline. If the price of the securities decreases, a Fund will make a profit by purchasing the securities in the open market at a price lower than the one at which it sold the securities. If the price of the securities increases, a Fund may have to cover its short positions at a price higher than the short sale price, resulting in a loss. Gains are limited to the price at which a Fund sold the security short, while losses are potentially unlimited in size. The Funds pledge securities and/or other assets, which may include cash collateral from securities lending activities, to the lender as collateral. Proceeds received from short sales may be maintained by the lender as collateral or may be released to the Funds and used to purchase additional securities or for any other purpose. Proceeds maintained by the lender are included in the "Deposits with brokers for short sales" on the Statements of Assets and Liabilities. The Funds are required to segregate an amount of cash, cash equivalents or other appropriate liquid marketable securities with the custodian in an amount at least equal to the current market value of the securities sold short (less any additional collateral held by the lender) and, for Global Allocation, the amount of any securities lending cash collateral used to finance short sales until the Fund replaces a borrowed security. The Funds are contractually responsible to the lender for any dividends and interest payable on securities while those securities are in a short position. These dividends and interest are recorded as an expense of the Funds and are excluded from the contractual expense limitation. At October 31, 2014, Global Allocation had pledged cash in the amount of $10,053,738 to State Street Bank and Trust Company ("State Street"), as collateral for short sales, in addition to cash collateral received from securities lending activities for the Fund. In addition, State Street has a perfected security interest in these Global Allocation assets. At October 31, 2014, Long Short had pledged cash in the amount of $406,375,507 to State Street to cover collateral requirements for borrowing in connection with securities sold short.
11 Security lending: Each of Global Allocation and Long Short, using State Street as its lending agent, may loan securities to qualified brokers and dealers in exchange for negotiated lender's fees. These fees disclosed within the Statements of Operations under the caption, "Income from securities loaned-net" are net of expenses retained by State Street as compensation for its services as lending agent. For the year ended October 31, 2014, Global Allocation received net income under the securities lending arrangement of $1,837. The Funds receive cash collateral at the beginning of each transaction equal to at least 102% of the prior day's market value of the loaned securities (105% in the case of international securities). Some or all of the cash collateral may be used to finance short sales. As of October 31, 2014, approximately 100% of the cash collateral received by Global Allocation was used to finance short sales.
As of October 31, 2014, Global Allocation had outstanding loans of securities to certain approved brokers for which it received collateral as follows:
| | | Value of Loaned
Securities | | Value of
Collateral | |
Global Allocation | | $ | 236,221 | | | $ | 243,916 | | |
12 Investment company securities and exchange-traded funds: The Funds may invest in shares of other registered investment companies, including exchange-traded funds ("ETFs"), within the limitations prescribed by the 1940 Act or pursuant to an exemptive order from the Securities and Exchange Commission ("SEC") that permits the Funds to invest in both affiliated and unaffiliated investment companies, including exchange-traded funds, in excess of the limits in Section 12(d)(1)(A) of the 1940 Act, as amended, subject to the terms and conditions of such order (see Note A-15 for more information about the exemptive order). Some ETFs seek to track the performance of a particular market index. These indices include both broad-based market indices and more narrowly-based indices, including those relating to particular sectors, markets, regions or industries. However, some ETFs have an actively-managed investment objective. ETF shares are traded like traditional equity securities on a national securities exchange or NASDAQ. A Fund will indirectly bear its proportionate share of any management fees and other expenses paid by such other investment companies, which will increase expenses and decrease returns.
13 Derivative instruments: During the year ended October 31, 2014, the Funds' use of derivatives, as described below for each Fund, except for Flexible Select, was limited to total return swaps, financial futures contracts, forward foreign currency contracts, and purchased and written option transactions. The Funds have adopted the provisions of ASC 815 "Derivatives and Hedging" ("ASC 815"). The disclosure requirements of ASC 815 distinguish between derivatives that qualify for hedge accounting and those that do not. Because investment companies value their derivatives at fair value and recognize changes in fair value through the Statements of Operations, they do not qualify for hedge accounting. Accordingly, even though a Fund's investments in derivatives may represent economic hedges, they are considered non-hedge transactions for purposes of this disclosure.
Total return swap contracts: During the year ended October 31, 2014, Global Allocation used total return swaps to provide investment exposure to the benchmark indices. Total return swaps involve commitments to pay fixed or floating rate interest in exchange for a market-linked return based on a notional amount. To the extent the total return of the reference security or index underlying the total return swap exceeds or falls short of the offsetting interest rate obligation, a Fund will receive a payment or make a payment to the counterparty, respectively. Certain risks may arise when entering into total return swap transactions, including counterparty default, liquidity or unfavorable changes in the value of the underlying reference security or index. The value of the swap is adjusted daily and the change in value, if any, is recorded as unrealized appreciation or depreciation in the Statements of Assets and Liabilities. Payments received or made at the end of each measurement period are recorded as realized gain or loss in the Statements of Operations.
At October 31, 2014, the outstanding total return swap contracts for Global Allocation were as follows:
| | | | | | | Rate Type | | | | | | | |
Swap
Counterparty | | Notional
Amount | | Termination
Date | | Variable-rate
Payments
Made/
(Received)
by the Fund | | Reference Entity | | Accrued Net
Interest
Receivable
(Payable) | | Unrealized
Appreciation
(Depreciation) | | Total Fair
Value | |
J.P. Morgan
Chase
Bank N.A. | | $ | 13,668,117 | | | January 7, 2015 | | | 0.743 | %(1) | | J.P. Morgan Global
Government Bond
Total Return
Index Unhedged | | $ | (6,484 | ) | | $ | (108,576 | ) | | $ | (115,060 | ) | |
| | | | | | | Rate Type | | | | | | | |
Swap
Counterparty | | Notional
Amount | | Termination
Date | | Variable-rate
Payments
Made/
(Received)
by the Fund | | Reference Entity | | Accrued Net
Interest
Receivable
(Payable) | | Unrealized
Appreciation
(Depreciation) | | Total Fair
Value | |
J.P. Morgan
Chase
Bank N.A. | | $ | 16,952,854 | | | January 14, 2015 | | | 0.203 | %(2) | | MSCI Daily Total
Return Net World
Index | | $ | (1,627 | ) | | $ | 573,482 | | | $ | 571,855 | | |
| Total | | | | | | | | | | | | | | | | | | $ | (8,111 | ) | | $ | 464,906 | | | $ | 456,795 | | |
(1) 1 month LIBOR plus 0.59% at October 7, 2014.
(2) 1 month LIBOR plus 0.05% at October 13, 2014.
For the year ended October 31, 2014, the average notional value of total return swap contracts for Global Allocation was $28,884,550.
At October 31, 2014, Global Allocation had deposited $460,000 in a segregated account to cover margin requirements for total return swap contracts.
Financial futures contracts: During the year ended October 31, 2014, Global Allocation entered into financial futures contracts in an effort to enhance returns and to manage or adjust the risk profile and the investment exposure of the Fund to certain asset classes, countries and regions, including adjusting the investment exposures provided by the Fund's total return swaps, described above, to the benchmark indices. In addition, the Fund also utilized financial futures contracts to provide investment exposure to certain indices and markets other than the benchmark indices. During the year ended October 31, 2014, Inflation Navigator entered into financial futures contracts for economic hedging purposes, including as a maturity or duration management device. During the year ended October 31, 2014, Long Short entered into financial futures contracts on the broader market index and U.S. Treasuries in an effort either to enhance returns or to manage or adjust the risk profile and the investment exposure of the Fund.
At the time a Fund enters into a financial futures contract, it is required to deposit with the futures commission merchant a specified amount of cash or liquid securities, known as "initial margin," which is a percentage of the value of the financial futures contract being traded that is set by the exchange upon which the futures contract is traded. Each day, the futures contract is valued at the official settlement price of the board of trade or U.S. commodity exchange on which such futures contract is traded. Subsequent payments, known as "variation margin," to and from the broker are made on a daily basis, or as needed, as the market price of the financial futures contract fluctuates. Daily variation margin adjustments, arising from this "mark to market," are recorded by a Fund as unrealized gains or losses.
Although some financial futures contracts by their terms call for actual delivery or acquisition of the underlying securities or currency, in most cases the contracts are closed out prior to delivery by offsetting purchases or sales of matching financial futures contracts. When the contracts are closed, a Fund recognizes a gain or loss. Risks of entering into futures contracts include the possibility there may be an illiquid market, possibly at a time of rapidly declining prices, and/or a change in the value of the contract may not correlate with changes in the value of the underlying securities. Futures executed on regulated futures exchanges have minimal counterparty risk to a Fund because the exchange's clearinghouse assumes the position of the counterparty in each transaction. Thus, a Fund is exposed to risk only in connection with the clearinghouse and not in connection with the original counterparty to the transaction.
For U.S. federal income tax purposes, the futures transactions undertaken by a Fund may cause that Fund to recognize gains or losses from marking contracts to market even though its positions have not been sold or terminated, may affect the character of the gains or losses recognized as long-term or short-term, and may affect
the timing of some capital gains and losses realized by the Fund. Also, a Fund's losses on transactions involving futures contracts may be deferred rather than being taken into account currently in calculating such Fund's taxable income.
At October 31, 2014, open positions in financial futures contracts were as follows:
Fund | | Expiration | | Open Contracts | | Position | | Unrealized
Appreciation
(Depreciation) | |
Global Allocation | | November 2014 | | 3 Hang Seng Index Future | | Short | | $ | (14,891 | ) | |
Global Allocation | | December 2014 | | 21 Mini Japanese Government Bond, 10 Year | | Short | | | (16,457 | ) | |
Global Allocation | | December 2014 | | 1 Australian Dollar/U.S. Dollar Currency | | Short | | | (832 | ) | |
Global Allocation | | December 2014 | | 8 Canadian Currency | | Short | | | 14,995 | | |
Global Allocation | | December 2014 | | 11 Euro Currency | | Short | | | 38,847 | | |
Global Allocation | | December 2014 | | 14 Euro STOXX 50 Index | | Short | | | 12,404 | | |
Global Allocation | | December 2014 | | 1 Euro-Bund | | Short | | | 111 | | |
Global Allocation | | December 2014 | | 14 FTSE 100 Index | | Short | | | 3,547 | | |
Global Allocation | | December 2014 | | 2 GBP Currency | | Short | | | 895 | | |
Global Allocation | | December 2014 | | 12 Japanese Yen | | Short | | | 65,701 | | |
Global Allocation | | December 2014 | | 9 Mini MSCI Emerging Markets Index | | Short | | | (13,566 | ) | |
Global Allocation | | December 2014 | | 12 S&P TSX 60 Index | | Short | | | 18,484 | | |
Global Allocation | | December 2014 | | 14 S&P 500 E-Mini Index | | Short | | | (53,329 | ) | |
Global Allocation | | December 2014 | | 2 Topix Index | | Short | | | (11,769 | ) | |
Global Allocation | | December 2014 | | 1 U.S. Treasury Note, 10 Year | | Short | | | 952 | | |
Global Allocation | | December 2014 | | 3 Australian Dollar/U.S. Dollar Currency | | Long | | | (9,788 | ) | |
Global Allocation | | December 2014 | | 11 Australian Treasury Bond, 10 Year | | Long | | | 14,732 | | |
Global Allocation | | December 2014 | | 9 Canadian Treasury Bond, 10 Year | | Long | | | 5,706 | | |
Global Allocation | | December 2014 | | 4 CHF Currency | | Long | | | (9,110 | ) | |
Global Allocation | | December 2014 | | 5 Euro-Bund | | Long | | | 11,958 | | |
Global Allocation | | December 2014 | | 9 GBP Currency | | Long | | | (11,386 | ) | |
Global Allocation | | December 2014 | | 14 UK Long Gilt Bond | | Long | | | 53,726 | | |
Global Allocation | | December 2014 | | 12 S&P 500 E-Mini Index | | Long | | | 20,858 | | |
Global Allocation | | December 2014 | | 4 SPI 200 Index | | Long | | | 21,108 | | |
Global Allocation | | December 2014 | | 14 Topix Index | | Long | | | 51,286 | | |
Global Allocation | | December 2014 | | 17 U.S. Treasury Note, 10 Year | | Long | | | 18,494 | | |
Total | | | | | | | | $ | 212,676 | | |
Inflation Navigator | | December 2014 | | 1 Mini Japanese Government Bond, 10 Year | | Short | | $ | (654 | ) | |
Inflation Navigator | | December 2014 | | 2 Government of Canada Bond, 10 Year | | Short | | | (1,159 | ) | |
Inflation Navigator | | December 2014 | | 4 Euro Currency | | Short | | | 17,176 | | |
Inflation Navigator | | December 2014 | | 2 Euro-Bund | | Short | | | (4,991 | ) | |
Inflation Navigator | | December 2014 | | 1 New Zealand Dollar | | Short | | | 5,457 | | |
Inflation Navigator | | December 2014 | | 1 Swedish Krona | | Short | | | 4,439 | | |
Fund | | Expiration | | Open Contracts | | Position | | Unrealized
Appreciation
(Depreciation) | |
Inflation Navigator | | December 2014 | | 1 U.S. Treasury Note, 2 Year | | Short | | $ | (674 | ) | |
Inflation Navigator | | December 2014 | | 7 U.S. Treasury Bond, Ultra Long | | Short | | | (19,094 | ) | |
Inflation Navigator | | December 2014 | | 11 GBP Currency | | Long | | | (24,961 | ) | |
Inflation Navigator | | December 2014 | | 4 U.S. Treasury Note, 10 Year | | Long | | | 3,174 | | |
Inflation Navigator | | December 2014 | | 4 Long U.S. Treasury Bond | | Long | | | 7,253 | | |
Inflation Navigator | | December 2014 | | 1 Euribor, 3 Month | | Long | | | 626 | | |
Inflation Navigator | | December 2014 | | 1 Australian Dollar | | Long | | | 737 | | |
Inflation Navigator | | December 2014 | | 1 Canadian Dollar | | Long | | | (2,503 | ) | |
Inflation Navigator | | December 2015 | | 1 Canadian Banker's Acceptance | | Long | | | 330 | | |
Inflation Navigator | | December 2015 | | 1 New Zealand Bank Bill, 3 Month | | Long | | | 91 | | |
Inflation Navigator | | March 2015 | | 1 EuroYen, 3Month | | Long | | | 72 | | |
Total | | | | | | | | $ | (14,681 | ) | |
Long Short | | December 2014 | | 110 S&P MidCap 400 E-Mini Index | | Short | | $ | (465,072 | ) | |
Long Short | | December 2014 | | 2,887 S&P 500 E-Mini Index | | Short | | | (5,011,788 | ) | |
Long Short | | December 2014 | | 595 Russell 2000 Mini Index | | Short | | | (3,518,776 | ) | |
Total | | | | | | | | $ | (8,995,636 | ) | |
During the year ended October 31, 2014, the average notional value of financial futures contracts was:
| | | Long positions | | Short positions | |
Global Allocation | | $ | 20,003,980 | | | $ | (10,450,985 | ) | |
Inflation Navigator | | $ | 2,249,495 | | | $ | (2,399,996 | ) | |
Long Short | | $ | — | | | $ | (257,086,736 | ) | |
At October 31, 2014, the notional value of financial futures contracts was:
| | | Long Positions | | Short Positions | |
Global Allocation | | $ | 12,994,955 | | | $ | (13,484,385 | ) | |
Inflation Navigator | | $ | 3,871,046 | | | $ | (3,043,789 | ) | |
Long Short | | $ | — | | | $ | (375,589,490 | ) | |
At October 31, 2014, the Funds had deposited the following in segregated accounts to cover margin requirements on open financial futures contracts:
Global Allocation | | $ | 679,709 | | |
Inflation Navigator | | $ | 43,262 | | |
Long Short | | $ | 18,476,370 | | |
Forward foreign currency contracts: During the year ended October 31, 2014, Global Allocation entered into forward foreign currency contracts ("forward contracts") contracts to manage or adjust the risk profile and investment exposure of the Fund, including altering investment exposures to certain currencies provided by the Fund's total return swaps, described above.
A forward contract is an agreement between two parties to buy or sell a specific currency for another at a set price on a future date, and is individually negotiated and privately traded by currency traders and their customers in the
interbank market. The market value of a forward contract fluctuates with changes in forward currency exchange rates. Forward contracts are marked to market daily, and the change in value is recorded by a Fund as an unrealized gain or loss. At the consummation of a forward contract to purchase or sell currency, a Fund may either exchange the currencies specified at the maturity of the forward contract or enter into a closing transaction involving the purchase or sale of an offsetting forward contract. Closing transactions with respect to forward contracts are usually performed with the counterparty to the original forward contract. The gain or loss arising from the difference between the U.S. dollar cost of the original contract and the value of the foreign currency in U.S. dollars upon closing a contract is included in "Net realized gain (loss) from forward foreign currency contracts" in the Statements of Operations. These contracts may involve market risk in excess of the unrealized gain or loss reflected in a Fund's Statement of Assets and Liabilities. In addition, a Fund could be exposed to risk if the counterparties are unable to meet the terms of the contracts or if the value of the currency changes unfavorably to the U.S. dollar.
At October 31, 2014, open forward contracts for Global Allocation were as follows:
| | | Contracts to Receive | | In Exchange For | | Counterparty | | Settlement
Date | | Net
Unrealized
Appreciation
(Depreciation) | |
| | | | 323,216 | | | Brazilian Real | | $ | 128,597 | | | Goldman Sachs | | November 13, 2014 | | $ | 1,481 | | |
| | | | 6,796,503,829 | | | Indonesian Rupiah | | | 552,247 | | | Goldman Sachs | | November 13, 2014 | | | 9,315 | | |
| | | | 241,770,663 | | | South Korean Won | | | 225,646 | | | Goldman Sachs | | November 13, 2014 | | | 494 | | |
| | | | 23,738,034 | | | New Taiwan Dollar | | | 779,395 | | | Goldman Sachs | | November 13, 2014 | | | 1,099 | | |
| | | | 3,686,737 | | | South African Rand | | | 323,897 | | | Goldman Sachs | | November 13, 2014 | | | 9,864 | | |
Total | | | | | | | | | | | | $ | 22,253 | | |
| | | Contracts to Deliver | | In Exchange For | | Counterparty | | Settlement
Date | | Net
Unrealized
Appreciation
(Depreciation) | |
| | | | 288,408,415 | | | Chilean Peso | | $ | 479,235 | | | Goldman Sachs | | November 13, 2014 | | $ | (21,545 | ) | |
| | | | 4,217,312 | | | Czech Koruna | | | 192,295 | | | Goldman Sachs | | November 13, 2014 | | | 2,302 | | |
| | | | 140,284,007 | | | Hungarian Forint | | | 567,570 | | | Goldman Sachs | | November 13, 2014 | | | (2,865 | ) | |
| | | | 1,801,265 | | | Mexican Peso | | | 133,405 | | | Goldman Sachs | | November 13, 2014 | | | (282 | ) | |
| | | | 720,256 | | | Polish Zloty | | | 215,130 | | | Goldman Sachs | | November 13, 2014 | | | 1,446 | | |
| | | | 540,238 | | | Singapore Dollar | | | 422,147 | | | Goldman Sachs | | November 13, 2014 | | | 1,651 | | |
Total | | | | | | | | | | | | $ | (19,293 | ) | |
For the year ended October 31, 2014, Global Allocation's investment in forward contracts had an average value of $2,077,131.
At October 31, 2014, Global Allocation had deposited $420,000 in a segregated account to cover margin requirements for forward contracts.
Options: Premiums received by a Fund upon writing a covered call option or a put option are recorded in the liability section of the Fund's Statement of Assets and Liabilities and are subsequently adjusted to the current market value. When an option is exercised, closed, or expired, a Fund realizes a gain or loss and the liability is eliminated.
When writing a covered call option, a Fund, in return for the premium, gives up the opportunity for profit from a price increase in the underlying security above the exercise price, but conversely retains the risk of loss should the price of the security decline. When writing a put option, a Fund, in return for the premium, takes the risk that it must purchase the underlying security at a price that may be higher than the current market price of the security. If a covered call or a put option that a Fund has written expires unexercised, a Fund will realize a gain in the amount of the premium. All securities covering outstanding written options are held in escrow by the custodian bank.
Written option transactions were used in an attempt to generate incremental returns for Long Short for the year ended October 31, 2014. Written option transactions for Long Short for the year ended October 31, 2014 were:
Long Short
| | | Number of
Contracts | | Premium
Received | |
Outstanding 10/31/2013 | | | 15,000 | | | $ | 2,251,460 | | |
Options written | | | 32,560 | | | | 4,792,794 | | |
Options expired | | | (25,217 | ) | | | (3,885,118 | ) | |
Options exercised | | | (3,250 | ) | | | (818,281 | ) | |
Options closed | | | (17,333 | ) | | | (2,033,126 | ) | |
Outstanding 10/31/2014 | | | 1,760 | | | $ | 307,729 | | |
Premiums paid by a Fund upon purchasing a call or put option are recorded in the asset section of the Fund's Statement of Assets and Liabilities and are subsequently adjusted to the current market value. When an option is exercised, closed, or expired, a Fund realizes a gain or loss and the asset is eliminated.
For purchased call options, a Fund's loss is limited to the amount of the option premium paid.
Purchased option transactions were used either for hedging purposes or in an attempt to generate incremental returns for Long Short for the year ended October 31, 2014.
For the year ended October 31, 2014, Long Short had an average market value of $1,718,208 in purchased options and $(639,487) in written options.
At October 31, 2014, the Funds (except Flexible Select) had the following derivatives (which did not qualify as hedging instruments under ASC 815), grouped by primary risk exposure:
Asset Derivatives
Derivative Type | | Statements of
Assets and
Liabilities Location | | Interest
Rate Risk | | Currency Risk | | Equity Risk | | Total | |
Global Allocation | |
Swap contracts | | Open swap contracts,
at value(1) | | $ | — | | | $ | — | | | $ | 571,855 | | | $ | 571,855 | | |
Futures contracts | | Receivable/Payable for
variation margin(2) | | | 105,679 | | | | 120,438 | | | | 127,687 | | | | 353,804 | | |
Forward contracts | | Receivable for open
forward foreign
currency contracts | | | — | | | | 27,652 | | | | — | | | | 27,652 | | |
Total Value—Assets | | | | $ | 105,679 | | | $ | 148,090 | | | $ | 699,542 | | | $ | 953,311 | | |
Inflation Navigator | |
Futures contracts | | Receivable/Payable for
variation margin(2) | | $ | 11,546 | | | $ | 27,809 | | | $ | — | | | $ | 39,355 | | |
Total Value—Assets | | | | $ | 11,546 | | | $ | 27,809 | | | $ | — | | | $ | 39,355 | | |
Long Short | |
Option contracts purchased | | Investments in securities,
at value | | $ | — | | | $ | — | | | $ | 369,600 | | | $ | 369,600 | | |
Total Value—Assets | | | | $ | — | | | $ | — | | | $ | 369,600 | | | $ | 369,600 | | |
Liability Derivatives
Derivative Type | | Statements of
Assets and
Liabilities Location | | Interest
Rate Risk | | Currency Risk | | Equity Risk | | Total | |
Global Allocation | |
Swap contracts | | Open swap contracts,
at value(1) | | $ | — | | | $ | — | | | $ | (115,060 | ) | | $ | (115,060 | ) | |
Futures contracts | | Receivable/Payable for
variation margin(2) | | | (16,457 | ) | | | (31,116 | ) | | | (93,555 | ) | | | (141,128 | ) | |
Forward contracts | | Payable for open
forward foreign
currency contracts | | | — | | | | (24,692 | ) | | | — | | | | (24,692 | ) | |
Total Value—Liabilities | | | | $ | (16,457 | ) | | $ | (55,808 | ) | | $ | (208,615 | ) | | $ | (280,880 | ) | |
Inflation Navigator | |
Futures contracts | | Receivable/Payable for
variation margin(2) | | $ | (26,573 | ) | | $ | (27,463 | ) | | $ | — | | | $ | (54,036 | ) | |
Total Value—Liabilities | | | | $ | (26,573 | ) | | $ | (27,463 | | | $ | — | | | $ | (54,036 | ) | |
Long Short | |
Futures contracts | | Receivable/Payable for
variation margin(2) | | $ | — | | | $ | — | | | $ | (8,995,636 | ) | | $ | (8,995,636 | ) | |
Option contracts written | | Option contracts
written, at value | | | — | | | | — | | | | (147,840 | ) | | | (147,840 | ) | |
Total Value—Liabilities | | | | $ | — | | | $ | — | | | $ | (9,143,476 | ) | | $ | (9,143,476 | ) | |
(1) "Swap contracts" reflects the appreciation (depreciation) of the total return swap contracts plus accrued interest as of October 31, 2014, which is reflected in the Statements of Assets and Liabilities under the caption "Open swap contracts, at value."
(2) "Futures contracts" reflects the cumulative appreciation (depreciation) of futures contracts as of October 31, 2014, which is reflected in the Statements of Assets and Liabilities under the caption "Net unrealized appreciation (depreciation) in value of investments." The outstanding variation margin as of October 31, 2014, if any, is reflected in the Statements of Assets and Liabilities under the caption "Receivable/Payable for variation margin."
The impact of the use of these derivative instruments on the Statements of Operations during the year ended October 31, 2014, was as follows:
Realized Gain (Loss)
Derivative Type | | Statements of
Operations
Location | | Interest
Rate Risk | | Currency Risk | | Equity Risk | | Total | |
Global Allocation | |
Swap contracts | | Net realized gain (loss) on:
total return swap contracts | | $ | — | | | $ | — | | | $ | 1,302,921 | | | $ | 1,302,921 | | |
Futures contracts | | Net realized gain (loss) on:
financial futures contracts | | | 109,646 | | | | (250,635 | ) | | | 697,576 | | | | 556,587 | | |
Forward contracts | | Net realized gain (loss) on:
forward foreign currency
contracts | | | — | | | | 38,624 | | | | — | | | | 38,624 | | |
Total Realized Gain (Loss) | | | | $ | 109,646 | | | $ | (212,011 | ) | | $ | 2,000,497 | | | $ | 1,898,132 | | |
Inflation Navigator | |
Futures contracts | | Net realized gain (loss) on:
financial futures contracts | | $ | (142,616 | ) | | $ | 43,812 | | | $ | — | | | $ | (98,804 | ) | |
Total Realized Gain (Loss) | | | | $ | (142,616 | ) | | $ | 43,812 | | | $ | — | | | $ | (98,804 | ) | |
Long Short | |
Futures contracts | | Net realized gain (loss) on:
financial futures contracts | | $ | (1,941,929 | ) | | $ | — | | | $ | (27,959,989 | ) | | $ | (29,901,918 | ) | |
Option contracts purchased | | Net realized gain (loss) on:
sales of investment securities
of unaffiliated issuers | | | — | | | | — | | | | (8,344,559 | ) | | | (8,344,559 | ) | |
Option contracts written | | Net realized gain (loss) on:
option contracts written | | | — | | | | — | | | | 5,153,000 | | | | 5,153,000 | | |
Total Realized Gain (Loss) | | | | $ | (1,941,929 | ) | | $ | — | | | $ | (31,151,548 | ) | | $ | (33,093,477 | ) | |
Change in Appreciation (Depreciation)
Derivative Type | | Statements of
Operations
Location | | Interest
Rate Risk | | Currency Risk | | Equity Risk | | Total | |
Global Allocation | |
Swap contracts | | Change in net unrealized
appreciation (depreciation)
in value of: total return
swap contracts | | $ | — | | | $ | — | | | $ | (70,801 | ) | | $ | (70,801 | ) | |
Futures contracts | | Change in net unrealized
appreciation (depreciation)
in value of: financial
futures contracts | | | (99,329 | ) | | | 5,352 | | | | (229,397 | ) | | | (323,374 | ) | |
Forward contracts | | Change in net unrealized
appreciation (depreciation)
in value of: forward foreign
currency contracts | | | — | | | | (1,700 | ) | | | — | | | | (1,700 | ) | |
Total Change in Appreciation
(Depreciation) | | | | $ | (99,329 | ) | | $ | 3,652 | | | $ | (300,198 | ) | | $ | (395,875 | ) | |
Inflation Navigator | |
Futures contracts | | Change in net unrealized
appreciation (depreciation)
in value of: financial
futures contracts | | $ | (3,453 | ) | | $ | 2,950 | | | $ | — | | | $ | (503 | ) | |
Total Change in Appreciation
(Depreciation) | | | | $ | (3,453 | ) | | $ | 2,950 | | | $ | — | | | $ | (503 | ) | |
Long Short | |
Futures contracts | | Change in net unrealized
appreciation (depreciation)
in value of: financial
futures contracts | | $ | 10,236 | | | $ | — | | | $ | (6,048,542 | ) | | $ | (6,038,306 | ) | |
Option contracts purchased | | Change in net unrealized
appreciation (depreciation)
in value of: unaffiliated
investment securities | | | — | | | | — | | | | 3,016,042 | | | | 3,016,042 | | |
Option contracts written | | Change in net unrealized
appreciation (depreciation)
in value of: option
contracts written | | | — | | | | — | | | | 214,429 | | | | 214,429 | | |
Total Change in Appreciation
(Depreciation) | | | | $ | 10,236 | | | $ | — | | | $ | (2,818,071 | ) | | $ | (2,807,835 | ) | |
During the current reporting period, the Funds adopted the provisions of Accounting Standards Update 2011-11 Disclosures about Offsetting Assets and Liabilities ("ASU 2011-11"). ASU 2011-11 is intended to enhance disclosure requirements on the offsetting of financial assets and liabilities. Pursuant to ASU 2011-11, an entity is required to disclose both gross and net information for assets and liabilities related to derivatives, repurchase and reverse repurchase agreements, and securities lending and securities borrowing transactions that are eligible for offset or subject to an enforceable master netting or similar agreement. ASU 2011-11 is applicable to only Global Allocation at October 31, 2014. Global Allocation's derivative assets and liabilities at fair value by type are reported gross in the Statements of Assets and Liabilities. The following tables present Global Allocation's derivative assets and liabilities by counterparty, net of amounts available for offset and net of the related collateral received by Global Allocation for assets and pledged by Global Allocation for liabilities as of October 31, 2014.
Description | | Gross Amounts of
Recognized Assets | | Gross Amounts Offset
in the Statements of
Assets and Liabilities | | Net Amounts of Assets
Presented in the Statements
of Assets and Liabilities | |
Swap contracts | | $ | 571,855 | | | $ | — | | | $ | 571,855 | | |
Forward contracts | | | 27,652 | | | | — | | | | 27,652 | | |
Securities lending | | | 236,221 | | | | — | | | | 236,221 | | |
Total | | $ | 835,728 | | | $ | — | | | $ | 835,728 | | |
Gross Amounts Not Offset in the Statements of Assets and Liabilities
Counterparty | | Net Amounts of
Assets Presented in
the Statements of Assets
and Liabilities | | Financial
Instruments | | Cash Collateral
Received(a) | | Net Amount(b) | |
Goldman Sachs | | $ | 27,652 | | | $ | (24,692 | ) | | $ | — | | | $ | 2,960 | | |
J.P. Morgan Chase Bank N.A. | | | 571,855 | | | | (115,060 | ) | | | — | | | | 456,795 | | |
State Street Bank and Trust Company | | | 236,221 | | | | — | | | | (236,221 | ) | | | — | | |
Total | | $ | 835,728 | | | $ | (139,752 | ) | | $ | (236,221 | ) | | $ | 459,755 | | |
Description | | Gross Amounts of
Recognized Liabilities | | Gross Amounts Offset
in the Statements of
Assets and Liabilities | | Net Amounts of Liabilities
Presented in the Statements
of Assets and Liabilities | |
Swap contracts | | $ | (115,060 | ) | | $ | — | | | $ | (115,060 | ) | |
Forward contracts | | | (24,692 | ) | | | — | | | | (24,692 | ) | |
Total | | $ | (139,752 | ) | | $ | — | | | $ | (139,752 | ) | |
Gross Amounts Not Offset in the Statements of Assets and Liabilities
Counterparty | | Net Amounts of
Liabilities Presented in
the Statements of Assets
and Liabilities | | Financial
Instruments | | Cash Collateral
Pledged(a) | | Net Amount(c) | |
Goldman Sachs | | $ | (24,692 | ) | | $ | 24,692 | | | $ | — | | | $ | — | | |
J.P. Morgan Chase Bank N.A. | | | (115,060 | ) | | | 115,060 | | | | — | | | | — | | |
Total | | $ | (139,752 | ) | | $ | 139,752 | | | $ | — | | | $ | — | | |
(a) Collateral received (or pledged) is limited to an amount not to exceed 100% of the net amount of assets (or liabilities) in the tables presented above, for each respective counterparty.
(b) Net Amount represents amounts subject to loss as of October 31, 2014, in the event of a counterparty failure.
(c) Net Amount represents amounts under-collateralized by Global Allocation to each counterparty as of October 31, 2014.
14 Indemnifications: Like many other companies, the Trust's organizational documents provide that its officers and trustees are indemnified against certain liabilities arising out of the performance of their duties to the Trust. In addition, both in some of its principal service contracts and in the normal course of its business, the Trust enters into contracts that provide indemnifications to other parties for certain types of losses or liabilities. The Trust's maximum exposure under these arrangements is unknown as this could involve future claims against the Trust.
15 Transactions with other funds managed by Neuberger Berman Management LLC: Neuberger Berman Alternative Funds and Management have obtained an exemptive order from the Securities and Exchange Commission ("SEC") that permits the Funds to invest in both affiliated and unaffiliated investment companies, including exchange-traded funds, in excess of the limits in Section 12(d)(1)(A) of the 1940 Act, as amended, subject to the terms and conditions of such order. Through October 31, 2014, Flexible Select invested in Neuberger Berman Core Bond Fund (an "Underlying Fund"). Through October 31, 2014, Inflation Navigator invested in Neuberger Berman Emerging Markets Equity Fund, Neuberger Berman Floating Rate Income Fund, Neuberger Berman High Income Bond Fund and Neuberger Berman Risk Balanced Commodity Strategy Fund (collectively the "Underlying Funds") (See Note F).
For the Funds' investments in the Underlying Funds, Management waived a portion of its management fee equal to the management fee it received from the Underlying Funds on those assets (the "Arrangement"). For the fiscal period ended October 31, 2014, management fees waived under this Arrangement are reflected in the Statements of Operations under the caption "Investment management fees waived." For the fiscal period ended October 31, 2014, income earned under this Arrangement on Flexible Select's and Inflation Navigator's investments is reflected in the Statements of Operations under the caption "Dividend income-affiliated issuers." For the fiscal period ended October 31, 2014, management fees waived and income earned under this Arrangement on Flexible Select's and Inflation Navigator's investments in the Underlying Funds were as follows:
| | | Management fees waived | | Income earned | |
Flexible Select | | $ | 15,167 | | | $ | 160,279 | | |
Inflation Navigator | | | 36,050 | | | | 94,099 | | |
16 Other:All net investment income and realized and unrealized capital gains and losses of each Fund are allocated, on the basis of relative net assets, pro rata among its respective classes.
Note B—Management Fees, Administration Fees, Distribution Arrangements, and Other Transactions with Affiliates:
Each Fund retains Management as its investment manager under a Management Agreement. For such investment management services, Flexible Select pays Management a fee at the annual rate of 0.600% of the first $250 million of the Fund's average daily net assets, 0.575% of the next $250 million, 0.550% of the next $250 million, 0.525% of the next $250 million, 0.500% of the next $500 million, 0.475% of the next $2.5 billion, and 0.450% of the average daily net assets in excess of $4 billion. Global Allocation pays Management a fee at the annual rate of 0.650% of the first $1 billion of the Fund's average daily net assets, 0.625% of the next $1 billion, and 0.600% of average daily net assets in excess of $2 billion. Inflation Navigator pays Management a fee at the annual rate of 0.650% of the first $250 million of the Fund's average daily net assets, 0.625% of the next $250 million, 0.600% of the next $250 million, 0.575% of the next $250 million, 0.550% of the next $500 million, 0.525% of the next $2.5 billion, and 0.500% of the average daily net assets in excess of $4 billion. Long Short pays Management a fee at the annual rate of 1.200% of the first $250 million of the Fund's average daily net assets, 1.175% of the next $250 million, 1.150% of the next $250 million, 1.125% of the next $250 million, 1.100% of the next $500 million, 1.075% of the next $2.5 billion, and 1.050% of average daily net assets in excess of $4 billion. Accordingly, for the year ended October 31, 2014, the fee pursuant to the Management Agreement was equivalent to an annual effective rate of 0.60% (0.58% after management fee waiver (See Note A-15), 0.65%, 0.65% (0.43% after management fee waiver (See Note A-15)), and
1.11% of Flexible Select's, Global Allocation's, Inflation Navigator's and Long Short's average daily net assets, respectively.
Each Fund retains Management as its administrator under an Administration Agreement. Each Fund pays Management an administration fee at the annual rate of 0.06% of its average daily net assets under this agreement. In addition, Institutional Class of each Fund pays Management an administration fee at the annual rate of 0.09% of its average daily net assets under this agreement and Class A and Class C of each Fund pays Management an administration fee at the annual rate of 0.20% of its average daily net assets under this agreement. Additionally, Management retains State Street as its sub-administrator under a Sub-Administration Agreement. Management pays State Street a fee for all services received under the agreement.
Management has contractually agreed to waive current payment of fees and/or reimburse certain expenses of the Institutional Class, Class A and Class C of each Fund so that the total annual operating expenses of those classes do not exceed the expense limitations as detailed in the following table. These undertakings apply to a Fund's direct expenses and exclude interest, taxes, brokerage commissions, acquired fund fees and expenses, extraordinary expenses, as of August 12, 2014, transaction charges related to short sales for Global Allocation and Long Short, and exclude dividend expenses relating to short sales as well as interest expenses relating to short sales for Flexible Select and Inflation Navigator, if any; consequently, net expenses may exceed the contractual expense limitations. Each Fund has agreed that each of its respective classes will repay Management for fees and expenses waived or reimbursed for that class provided that repayment does not cause that class' annual operating expenses to exceed its contractual expense limitation in place at the time the fees and expenses were waived or reimbursed. Any such repayment must be made within three years after the year in which Management incurred the expense.
During the year ended October 31, 2014, there was no repayment to Management under these agreements.
At October 31, 2014, contingent liabilities to Management under the agreements were as follows:
| | | | | | | Expenses Reimbursed in
Fiscal Period Ending October 31, | |
| | | | | | | 2012 | | 2013 | | 2014 | |
| | | | | | | Subject to Repayment Until
October 31, | |
Class | | Contractual
Expense
Limitation(1) | | Expiration | | 2015 | | 2016 | | 2017 | |
Flexible Select Institutional Class | | | 0.85 | % | | 10/31/17 | | $ | — | | | $ | 216,729 | (5) | | $ | 281,744 | | |
Flexible Select Class A | | | 1.21 | % | | 10/31/17 | | | — | | | | 2,426 | (5) | | | 1,301 | | |
Flexible Select Class C | | | 1.96 | % | | 10/31/17 | | | — | | | | 2,202 | (5) | | | 480 | | |
Global Allocation Institutional Class | | | 0.90 | %(4) | | 10/31/17 | | | 342,304 | | | | 253,136 | | | | 297,504 | | |
Global Allocation Class A | | | 1.26 | %(4) | | 10/31/17 | | | 125,936 | | | | 141,365 | | | | 168,872 | | |
Global Allocation Class C | | | 2.01 | %(4) | | 10/31/17 | | | 19,134 | | | | 71,481 | | | | 105,371 | | |
Inflation Navigator Institutional Class | | | 0.90 | % | | 10/31/17 | | | — | | | | 438,126 | (3) | | | 374,332 | | |
Inflation Navigator Class A | | | 1.26 | % | | 10/31/17 | | | — | | | | 5,378 | (3) | | | 9,441 | | |
Inflation Navigator Class C | | | 2.01 | % | | 10/31/17 | | | — | | | | 5,378 | (3) | | | 3,221 | | |
Long Short Institutional Class | | | 1.70 | % | | 10/31/17 | | | — | (2) | | | — | | | | — | | |
Long Short Class A | | | 2.06 | % | | 10/31/17 | | | — | (2) | | | — | | | | — | | |
Long Short Class C | | | 2.81 | % | | 10/31/17 | | | — | (2) | | | — | | | | — | | |
(1) Expense limitation per annum of the respective class' average daily net assets.
(2) Period from December 29, 2011 (Commencement of Operations) to October 31, 2012.
(3) Period from December 19, 2012 (Commencement of Operations) to October 31, 2013.
(4) Prior to February 28, 2013, the contractual expense limitation was 1.20% for Institutional Class, 1.56% for Class A and 2.31% for Class C.
(5) Period from May 31, 2013 (Commencement of Operations) to October 31, 2013.
Neuberger Berman Fixed Income LLC ("NBFI"), as the sub-adviser to Global Allocation and Inflation Navigator, is retained by Management to provide day-to-day investment management services and receives a monthly fee paid by Management. As investment manager, Management is responsible for overseeing the investment activities of NBFI. Neuberger Berman LLC ("Neuberger"), as the sub-adviser to Flexible Select and Long Short, is retained by Management to furnish it with investment recommendations and research information without added cost to the Fund. Several individuals who are officers and/or Trustees of the Trust are also employees of NBFI, Neuberger and/or Management.
Each Fund also has a distribution agreement with Management with respect to each class of shares. Management acts as agent in arranging for the sale of class shares without sales commission or other compensation, except as described below for Class A and Class C shares, and bears advertising and promotion expenses.
However, Management receives fees from Class A and Class C under their distribution plans (each a "Plan", collectively the "Plans") pursuant to Rule 12b-1 under the 1940 Act. The Plans provide that, as compensation for administrative and other services provided to these classes, Management's activities and expenses related to the sale and distribution of these classes, and ongoing services provided to investors in these classes, Management receives from each of these classes a fee at the annual rate of 0.25% of Class A's and 1.00% of Class C's average daily net assets. Management receives this amount to provide distribution and shareholder servicing for these classes and pays a portion of it to institutions that provide such services. Those institutions may use the payments for, among other purposes, compensating employees engaged in sales and/or shareholder servicing. The amount of fees paid by each class during any year may be more or less than the cost of distribution and other services provided to that class. FINRA rules limit the amount of annual distribution fees that may be paid by a mutual fund and impose a ceiling on the cumulative distribution fees paid. The Trust's Plans comply with those rules.
Class A shares of each Fund are generally sold with an initial sales charge of up to 5.75% and no contingent deferred sales charge ("CDSC"), except that a CDSC of 1.00% will apply to certain redemptions made within 18 months following purchases of $1 million or more without an initial sales charge. Class C shares of each Fund are sold with no initial sales charge and a 1.00% CDSC if shares are sold within one year after purchase.
For the year ended October 31, 2014, Management, acting as underwriter and broker-dealer, received net initial sales charges from the purchase of Class A shares and CDSCs from the redemption of Class A and Class C shares as follows:
| | | Underwriter | | Broker-Dealer | |
| | | Net Initial
Sales Charge | | CDSC | | Net Initial
Sales Charge | | CDSC | |
Flexible Select Class A | | $ | 2,372 | | | $ | — | | | $ | — | | | $ | — | | |
Flexible Select Class C | | | — | | | | — | | | | — | | | | — | | |
Global Allocation Class A | | | 11,377 | | | | — | | | | — | | | | — | | |
Global Allocation Class C | | | — | | | | 13,908 | | | | — | | | | — | | |
Inflation Navigator Class A | | | 2,188 | | | | — | | | | — | | | | — | | |
Inflation Navigator Class C | | | — | | | | — | | | | — | | | | — | | |
Long Short Class A | | | 136,616 | | | | — | | | | — | | | | — | | |
Long Short Class C | | | — | | | | 67,417 | | | | — | | | | — | | |
On June 3, 2014, Management made a voluntary contribution to certain of the Funds in connection with a payment matter related to the Funds' investment in a State Street money market fund as follows:
| | | Contribution
Amount | |
Global Allocation | | $ | 10,922 | | |
Long Short | | | 60,836 | | |
Note C—Securities Transactions:
During the year ended October 31, 2014, there were purchase and sale transactions of long-term securities (excluding total return swaps, financial futures contracts, forward foreign currency contracts and option contracts) as follows:
| | | Purchases | | Securities Sold
Short | | Sales | | Covers on
Securities Sold
Short | |
Flexible Select | | $ | 43,498,512 | | | $ | — | | | $ | 43,608,543 | | | $ | — | | |
Global Allocation | | | 21,706,335 | | | | 22,882,875 | | | | 22,938,443 | | | | 23,941,209 | | |
Inflation Navigator | | | 9,230,913 | | | | — | | | | 6,854,988 | | | | — | | |
Long Short | | | 2,099,704,027 | | | | 555,075,700 | | | | 873,018,697 | | | | 407,093,142 | | |
During the year ended October 31, 2014, no brokerage commissions on securities transactions were paid to affiliated brokers.
Note D—Fund Share Transactions:
Share activity for the years ended October 31, 2014 and October 31, 2013 was as follows:
| | | For the Year Ended October 31, 2014 | | For the Year Ended October 31, 2013 | |
| | | Shares
Sold | | Shares Issued
on Reinvestment
of Dividends
and Distributions | | Shares
Redeemed | | Total | | Shares
Sold | | Shares Issued
on Reinvestment
of Dividends
and Distributions | | Shares
Redeemed | | Total | |
Flexible Select | |
Institutional
Class | | | 769 | | | | 30,471 | | | | (14,743 | ) | | | 16,497 | | | | 8,265,459 | | | | — | | | | (188,898 | ) | | | 8,076,561 | (2) | |
Class A | | | 46,439 | | | | 27 | | | | (6,595 | ) | | | 39,871 | | | | 13,536 | | | | — | | | | — | | | | 13,536 | (2) | |
Class C | | | 1,559 | | | | 2 | | | | — | | | | 1,561 | | | | 10,000 | | | | — | | | | — | | | | 10,000 | (2) | |
Global Allocation | |
Institutional
Class | | | 320,306 | | | | 129,312 | | | | (780,344 | ) | | | (330,726 | ) | | | 951,702 | | | | 14,913 | | | | (349,004 | ) | | | 617,611 | | |
Class A | | | 717,157 | | | | 46,075 | | | | (553,785 | ) | | | 209,447 | | | | 832,046 | | | | 4,880 | | | | (490,611 | ) | | | 346,315 | | |
Class C | | | 395,709 | | | | 33,247 | | | | (194,404 | ) | | | 234,552 | | | | 278,048 | | | | 1,044 | | | | (66,913 | ) | | | 212,179 | | |
Inflation Navigator | |
Institutional
Class | | | 95,566 | | | | 32,833 | | | | (90,643 | ) | | | 37,756 | | | | 1,682,682 | | | | — | | | | (148,410 | ) | | | 1,534,272 | (1) | |
Class A | | | 220,368 | | | | 189 | | | | (26,069 | ) | | | 194,488 | | | | 10,246 | | | | — | | | | — | | | | 10,246 | (1) | |
Class C | | | 18,279 | | | | 115 | | | | — | | | | 18,394 | | | | 10,343 | | | | — | | | | (343 | ) | | | 10,000 | (1) | |
Long Short | |
Institutional
Class | | | 159,546,263 | | | | 382,464 | | | | (41,372,231 | ) | | | 118,556,496 | | | | 83,663,403 | | | | 76,375 | | | | (8,872,962 | ) | | | 74,866,816 | | |
Class A | | | 32,183,453 | | | | 179,358 | | | | (42,735,854 | ) | | | (10,373,043 | ) | | | 43,047,040 | | | | 26,279 | | | | (5,046,542 | ) | | | 38,026,777 | | |
Class C | | | 9,063,806 | | | | 37,716 | | | | (1,825,631 | ) | | | 7,275,891 | | | | 9,454,741 | | | | 1,606 | | | | (366,848 | ) | | | 9,089,499 | | |
(1) Period from December 19, 2012 (Commencement of Operations) to October 31, 2013.
(2) Period from May 31, 2013 (Commencement of Operations) to October 31, 2013.
Note E—Lines of Credit:
At October 31, 2014, each Fund was a participant in a single committed, unsecured $300,000,000 line of credit with State Street, to be used only for temporary or emergency purposes. Other investment companies managed by Management also participate in this line of credit on the same terms. Interest is charged on borrowings under this line of credit at the higher of (a) the Federal Funds Rate plus 1.25% per annum or (b) the overnight LIBOR Rate plus 1.25% per annum. A commitment fee of 0.10% per annum of the available line of credit is charged, of which each participating Fund has agreed to pay its pro rata share, based on the ratio of its individual net assets to the net assets of all participants at the time the fee is due and payable. The fee is paid quarterly in arrears. Because several mutual funds participate, there is no assurance that an individual Fund will have access to all or any part of the $300,000,000 at any particular time. There were no loans outstanding pursuant to this line of credit at October 31, 2014. During the year ended October 31, 2014, none of the Funds utilized this line of credit.
At October 31, 2014, the Funds were participants in a single uncommitted, unsecured $100,000,000 line of credit with State Street, to be used only for temporary or emergency purposes. Other investment companies managed by
Management also participate in this line of credit on the same terms. Interest is charged on borrowings under this line of credit at a variable rate per annum as determined and quoted by State Street at the time a Fund requests a loan. Because several mutual funds participate, there is no assurance that an individual Fund will have access to all or any part of the $100,000,000 at any particular time. There were no loans outstanding pursuant to this line of credit at October 31, 2014. During the year ended October 31, 2014, none of the Funds utilized this line of credit.
In December 2014, a new single committed, unsecured $700,000,000 line of credit was approved for each Fund that will replace the lines of credit with State Street noted above. The new line of credit will be used only for temporary or emergency purposes.
Note F—Investments in Affiliates(1):
| | | Balance of
Shares Held
October 31,
2013 | | Gross
Purchases
and
Additions | | Gross
Sales and
Reductions | | Balance of
Shares Held
October 31,
2014 | | Value
October 31,
2014 | | Distributions
from
Investments
in Affiliated
Issuers(2) | | Net Realized
Gain (Loss)
from
Investments
in Affiliated
Issuers | |
Flexible Select | |
Neuberger Berman
Core Bond Fund
Institutional Class | | | 576,112 | | | | 51,704 | | | | 45,087 | | | | 582,729 | | | $ | 6,133,003 | | | $ | 160,279 | | | $ | (5,711 | ) | |
Inflation Navigator | |
Neuberger Berman
Emerging Markets
Equity Fund
Institutional Class | | | 84,322 | | | | 19,019 | | | | — | | | | 103,341 | | | $ | 1,764,005 | | | $ | 7,294 | | | $ | — | | |
Neuberger Berman
Floating Rate Income
Fund Institutional
Class | | | 88,308 | | | | 3,380 | | | | — | | | | 91,688 | | | | 927,348 | | | | 34,593 | | | | — | | |
Neuberger Berman
High Income Bond
Fund Institutional
Class | | | 159,659 | | | | 36,775 | | | | 94,389 | | | | 102,045 | | | | 948,255 | | | | 82,918 | | | | (2,317 | ) | |
Neuberger Berman
Risk Balanced
Commodity Strategy
Fund Institutional
Class | | | 161,988 | | | | 81,612 | | | | 5,518 | | | | 238,082 | | | | 1,998,032 | | | | — | * | | | (2,461 | ) | |
Total | | | | | | | | | | $ | 5,637,640 | | | $ | 124,805 | | | $ | (4,778 | ) | |
(1) Affiliated issuers, as defined in the 1940 Act.
(2) Distributions received include distributions from net investment income and net realized capital gains, if any, from the Underlying Fund.
* Security did not produce income during the last twelve months.
Other: At October 31, 2014, there were affiliated investors owning 2.8% and 2.4% of Flexible Select's and Inflation Navigator's outstanding shares, respectively.
Note G—Recent Accounting Pronouncement:
In June 2014, FASB issued ASU 2014-11 Transfers & Servicing (Topic 860): Repurchase-to-Maturity Transactions, Repurchase Financings, and Disclosures to improve the financial reporting of repurchase agreements and other similar transactions. The guidance includes expanded disclosure requirements for entities that enter into repurchase agreements or securities lending transactions. The guidance is effective for financial statements with fiscal years beginning on or after January 1, 2015, and interim periods within those fiscal years. Management is evaluating the impact, if any, of this guidance on the Funds' financial statement disclosures.
This page has been left blank intentionally
The following tables include selected data for a share outstanding throughout each period and other performance information derived from the Financial Statements. Per share amounts that round to less than $0.01 or $(0.01) per share are presented as $0.00 or $(0.00), respectively. Ratios that round to less than 0.00% or (0.00%) per share are presented as 0.00% or (0.00%), respectively. Net Asset amounts with a zero balance may reflect actual amounts rounding to less than $0.1 million. A "—" indicates that the line item was not applicable in the corresponding period.
| | | Net Asset
Value,
Beginning
of Year | | Net
Investment
Income
(Loss)@ | | Net Gains or
Losses on
Securities
(both realized
and
unrealized) | | Total From
Investment
Operations | | Dividends
from Net
Investment
Income | | Distributions
from Net
Realized
Capital
Gains | | Tax
Return of
Capital | | Total
Distributions | | Net
Asset
Value,
End of
Year | | Total
Return†† | | Voluntary
Contributions
from
Management | | Net
Assets,
End of
Year
(in millions) | | Ratio
of Gross
Expenses
to Average
Net
Assets# | | Ratio
of Gross
Expenses
to Average
Net Assets
(excluding
dividend and
interest
expenses on
securities
sold short) | | Ratio
of Net
Expenses
to Average
Net
Assets | | Ratio
of Net
Expenses to
Average
Net Assets
(excluding
dividend and
interest
expenses
on securities
sold short) | | Ratio
of Net
Investment
Income/
(Loss) to
Average
Net
Assets | | Portfolio
Turnover
Rate
(including
securities
sold
short) | | Portfolio
Turnover
Rate
(excluding
securities
sold
short) | |
Flexible Select Fund | |
Institutional Class | |
10/31/2014 | | $ | 10.80 | | | $ | 0.11 | | | $ | 1.09 | | | $ | 1.20 | | | $ | (0.04 | ) | | $ | — | | | $ | — | | | $ | (0.04 | ) | | $ | 11.96 | | | | 11.16 | % | | $ | — | | | $ | 96.8 | | | | 1.16 | % | | | 1.16 | %Ø | | | .83 | % | | | .83 | %Ø | | | .98 | % | | | 50 | % | | | 50 | %Ø | |
Period from 5/31/2013^
to 10/31/2013 | | $ | 10.00 | | | $ | 0.04 | | | $ | 0.76 | | | $ | 0.80 | | | $ | — | | | $ | — | | | $ | — | | | $ | — | | | $ | 10.80 | | | | 8.00 | %** | | $ | — | | | $ | 87.2 | | | | 1.97 | %‡* | | | 1.97 | %‡Ø* | | | .83 | %‡* | | | .83 | %‡Ø* | | | .95 | %‡* | | | 20 | %** | | | 20 | %Ø** | |
Class A | |
10/31/2014 | | $ | 10.78 | | | $ | 0.06 | | | $ | 1.10 | | | $ | 1.16 | | | $ | (0.02 | ) | | $ | — | | | $ | — | | | $ | (0.02 | ) | | $ | 11.92 | | | | 10.80 | % | | $ | — | | | $ | 0.6 | | | | 1.64 | % | | | 1.64 | %Ø | | | 1.19 | % | | | 1.19 | %Ø | | | .50 | % | | | 50 | % | | | 50 | %Ø | |
Period from 5/31/2013^
to 10/31/2013 | | $ | 10.00 | | | $ | 0.02 | | | $ | 0.76 | | | $ | 0.78 | | | $ | — | | | $ | — | | | $ | — | | | $ | — | | | $ | 10.78 | | | | 7.80 | %** | | $ | — | | | $ | 0.1 | | | | 5.09 | %‡* | | | 5.09 | %‡Ø* | | | 1.19 | %‡* | | | 1.19 | %‡Ø* | | | .57 | %‡* | | | 20 | %** | | | 20 | %Ø** | |
Class C | |
10/31/2014 | | $ | 10.75 | | | $ | (0.02 | ) | | $ | 1.08 | | | $ | 1.06 | | | $ | (0.00 | ) | | $ | — | | | $ | — | | | $ | (0.00 | ) | | $ | 11.81 | | | | 9.88 | % | | $ | — | | | $ | 0.1 | | | | 2.38 | % | | | 2.38 | %Ø | | | 1.94 | % | | | 1.94 | %Ø | | | (.14 | %) | | | 50 | % | | | 50 | %Ø | |
Period from 5/31/2013^
to 10/31/2013 | | $ | 10.00 | | | $ | (0.01 | ) | | $ | 0.76 | | | $ | 0.75 | | | $ | — | | | $ | — | | | $ | — | | | $ | — | | | $ | 10.75 | | | | 7.50 | %** | | $ | — | | | $ | 0.1 | | | | 6.71 | %‡* | | | 6.71 | %‡Ø* | | | 1.94 | %‡* | | | 1.94 | %‡Ø* | | | (.18 | %)‡* | | | 20 | %** | | | 20 | %Ø** | |
Global Allocation Fund | |
Institutional Class | |
10/31/2014 | | $ | 11.63 | | | $ | (0.12 | ) | | $ | 0.29 | | | $ | 0.17 | | | $ | (0.99 | ) | | $ | — | | | $ | — | | | $ | (0.99 | ) | | $ | 10.81 | | | | 1.37 | % | | $ | 0.00 | | | $ | 12.5 | | | | 3.25 | % | | | 2.72 | % | | | 1.50 | % | | | .98 | % | | | (1.12 | %) | | | 228 | % | | | 216 | % | |
10/31/2013 | | $ | 10.30 | | | $ | (0.09 | ) | | $ | 1.57 | | | $ | 1.48 | | | $ | (0.15 | ) | | $ | — | | | $ | — | | | $ | (0.15 | ) | | $ | 11.63 | | | | 14.56 | % | | $ | — | | | $ | 17.2 | | | | 3.23 | % | | | 2.73 | % | | | 1.48 | % | | | .98 | % | | | (.85 | %) | | | 187 | % | | | 158 | % | |
10/31/2012 | | $ | 10.30 | | | $ | (0.12 | ) | | $ | 1.02 | | | $ | 0.90 | | | $ | (0.21 | ) | | $ | (0.69 | ) | | $ | — | | | $ | (0.90 | ) | | $ | 10.30 | | | | 9.60 | % | | $ | — | | | $ | 8.9 | | | | 5.01 | % | | | 4.55 | % | | | 1.68 | % | | | 1.22 | % | | | (1.19 | %) | | | 446 | % | | | 423 | % | |
Period from 12/29/2010^
to 10/31/2011 | | $ | 10.00 | | | $ | (0.08 | ) | | $ | 0.38 | | | $ | 0.30 | | | $ | — | | | $ | — | | | $ | — | | | $ | — | | | $ | 10.30 | | | | 3.00 | %** | | $ | — | | | $ | 5.8 | | | | 18.45 | %‡* | | | 18.31 | %‡*^^ | | | 1.36 | %‡* | | | 1.21 | %‡*^^ | | | (.95 | %)‡* | | | 268 | %** | | | 216 | %** | |
Class A | |
10/31/2014 | | $ | 11.57 | | | $ | (0.16 | ) | | $ | 0.29 | | | $ | 0.13 | | | $ | (0.94 | ) | | $ | — | | | $ | — | | | $ | (0.94 | ) | | $ | 10.76 | | | | 1.03 | % | | $ | 0.00 | | | $ | 9.6 | | | | 3.68 | % | | | 3.16 | % | | | 1.86 | % | | | 1.35 | % | | | (1.49 | %) | | | 228 | % | | | 216 | % | |
10/31/2013 | | $ | 10.25 | | | $ | (0.14 | ) | | $ | 1.58 | | | $ | 1.44 | | | $ | (0.12 | ) | | $ | — | | | $ | — | | | $ | (0.12 | ) | | $ | 11.57 | | | | 14.15 | % | | $ | — | | | $ | 7.9 | | | | 3.58 | % | | | 3.07 | % | | | 1.84 | % | | | 1.33 | % | | | (1.25 | %) | | | 187 | % | | | 158 | % | |
10/31/2012 | | $ | 10.27 | | | $ | (0.15 | ) | | $ | 1.01 | | | $ | 0.86 | | | $ | (0.19 | ) | | $ | (0.69 | ) | | $ | — | | | $ | (0.88 | ) | | $ | 10.25 | | | | 9.24 | % | | $ | — | | | $ | 3.4 | | | | 5.41 | % | | | 4.93 | % | | | 2.07 | % | | | 1.59 | % | | | (1.48 | %) | | | 446 | % | | | 423 | % | |
Period from 12/29/2010^
to 10/31/2011 | | $ | 10.00 | | | $ | (0.14 | ) | | $ | 0.41 | | | $ | 0.27 | | | $ | — | | | $ | — | | | $ | — | | | $ | — | | | $ | 10.27 | | | | 2.70 | %** | | $ | — | | | $ | 0.1 | | | | 22.01 | %‡* | | | 21.63 | %‡*^^ | | | 1.96 | %‡* | | | 1.58 | %‡*^^ | | | (1.64 | %)‡* | | | 268 | %** | | | 216 | %** | |
See Notes to Financial Highlights
Financial Highlights (cont'd)
| | | Net Asset
Value,
Beginning
of Year | | Net
Investment
Income
(Loss)@ | | Net Gains or
Losses on
Securities
(both realized
and
unrealized) | | Total From
Investment
Operations | | Dividends
from Net
Investment
Income | | Distributions
from Net
Realized
Capital
Gains | | Tax
Return of
Capital | | Total
Distributions | | Net
Asset
Value,
End of
Year | | Total
Return†† | | Voluntary
Contributions
from
Management | | Net
Assets,
End of
Year
(in millions) | | Ratio
of Gross
Expenses
to Average
Net
Assets# | | Ratio
of Gross
Expenses
to Average
Net Assets
(excluding
dividend and
interest
expenses on
securities
sold short) | | Ratio
of Net
Expenses
to Average
Net
Assets | | Ratio
of Net
Expenses to
Average
Net Assets
(excluding
dividend and
interest
expenses
on securities
sold short) | | Ratio
of Net
Investment
Income/
(Loss) to
Average
Net
Assets | | Portfolio
Turnover
Rate
(including
securities
sold
short) | | Portfolio
Turnover
Rate
(excluding
securities
sold
short) | |
Global Allocation Fund (cont'd) | |
Class C | |
10/31/2014 | | $ | 11.43 | | | $ | (0.25 | ) | | $ | 0.30 | | | $ | 0.05 | | | $ | (0.88 | ) | | $ | — | | | $ | — | | | $ | (0.88 | ) | | $ | 10.60 | | | | .30 | % | | $ | 0.00 | | | $ | 7.0 | | | | 4.46 | % | | | 3.95 | % | | | 2.63 | % | | | 2.11 | % | | | (2.27 | %) | | | 228 | % | | | 216 | % | |
10/31/2013 | | $ | 10.13 | | | $ | (0.21 | ) | | $ | 1.55 | | | $ | 1.34 | | | $ | (0.04 | ) | | $ | — | | | $ | — | | | $ | (0.04 | ) | | $ | 11.43 | | | | 13.30 | % | | $ | — | | | $ | 4.9 | | | | 4.35 | % | | | 3.85 | % | | | 2.59 | % | | | 2.09 | % | | | (1.99 | %) | | | 187 | % | | | 158 | % | |
10/31/2012 | | $ | 10.21 | | | $ | (0.23 | ) | | $ | 1.00 | | | $ | 0.77 | | | $ | (0.16 | ) | | $ | (0.69 | ) | | $ | — | | | $ | (0.85 | ) | | $ | 10.13 | | | | 8.34 | % | | $ | — | | | $ | 2.2 | | | | 6.47 | % | | | 6.03 | % | | | 2.78 | % | | | 2.34 | % | | | (2.26 | %) | | | 446 | % | | | 423 | % | |
Period from 12/29/2010^
to 10/31/2011 | | $ | 10.00 | | | $ | (0.18 | ) | | $ | 0.39 | | | $ | 0.21 | | | $ | — | | | $ | — | | | $ | — | | | $ | — | | | $ | 10.21 | | | | 2.10 | %** | | $ | — | | | $ | 0.00 | | | | 25.07 | %‡* | | | 24.87 | %‡*^^ | | | 2.52 | %‡* | | | 2.33 | %‡*^^ | | | (2.12 | %)‡* | | | 268 | %** | | | 216 | %** | |
| Inflation Navigator Fund§§ | |
Institutional Class | |
10/31/2014 | | $ | 10.38 | | | $ | 0.17 | | | $ | 0.41 | | | $ | 0.58 | | | $ | (0.22 | ) | | $ | — | | | $ | — | | | $ | (0.22 | ) | | $ | 10.74 | | | | 5.73 | % | | $ | — | | | $ | 16.9 | | | | 3.22 | % | | | 3.22 | %Ø | | | .69 | % | | | .69 | %Ø | | | 1.61 | % | | | 41 | % | | | 41 | %Ø | |
Period from 12/19/2012^
to 10/31/2013 | | $ | 10.00 | | | $ | 0.17 | | | $ | 0.21 | | | $ | 0.38 | | | $ | — | | | $ | — | | | $ | — | | | $ | — | | | $ | 10.38 | | | | 3.80 | %** | | $ | — | | | $ | 15.9 | | | | 4.55 | %‡* | | | 4.55 | %‡Ø* | | | .69 | %‡* | | | .69 | %‡Ø* | | | 1.92 | %‡* | | | 45 | %** | | | 45 | %Ø** | |
Class A | |
10/31/2014 | | $ | 10.35 | | | $ | 0.11 | | | $ | 0.44 | | | $ | 0.55 | | | $ | (0.19 | ) | | $ | — | | | $ | — | | | $ | (0.19 | ) | | $ | 10.71 | | | | 5.39 | % | | $ | — | | | $ | 2.2 | | | | 3.64 | % | | | 3.64 | %Ø | | | 1.05 | % | | | 1.05 | %Ø | | | 1.01 | % | | | 41 | % | | | 41 | %Ø | |
Period from 12/19/2012^
to 10/31/2013 | | $ | 10.00 | | | $ | 0.14 | | | $ | 0.21 | | | $ | 0.35 | | | $ | — | | | $ | — | | | $ | — | | | $ | — | | | $ | 10.35 | | | | 3.50 | %** | | $ | — | | | $ | 0.1 | | | | 6.99 | %‡* | | | 6.99 | %‡Ø* | | | 1.04 | %‡* | | | 1.04 | %‡Ø* | | | 1.59 | %‡* | | | 45 | %** | | | 45 | %Ø** | |
Class C | |
10/31/2014 | | $ | 10.28 | | | $ | 0.03 | | | $ | 0.44 | | | $ | 0.47 | | | $ | (0.12 | ) | | $ | — | | | $ | — | | | $ | (0.12 | ) | | $ | 10.63 | | | | 4.60 | % | | $ | — | | | $ | 0.3 | | | | 4.43 | % | | | 4.43 | %Ø | | | 1.80 | % | | | 1.80 | %Ø | | | .33 | % | | | 41 | % | | | 41 | %Ø | |
Period from 12/19/2012^
to 10/31/2013 | | $ | 10.00 | | | $ | 0.07 | | | $ | 0.21 | | | $ | 0.28 | | | $ | — | | | $ | — | | | $ | — | | | $ | — | | | $ | 10.28 | | | | 2.80 | %** | | $ | — | | | $ | 0.1 | | | | 7.76 | %‡* | | | 7.76 | %‡Ø* | | | 1.79 | %‡* | | | 1.79 | %‡Ø* | | | .84 | %‡* | | | 45 | %** | | | 45 | %Ø** | |
Long Short Fund | |
Institutional Class | |
10/31/2014 | | $ | 12.48 | | | $ | 0.02 | | | $ | 0.58 | | | $ | 0.60 | | | $ | — | | | $ | (0.06 | ) | | $ | — | | | $ | (0.06 | ) | | $ | 13.02 | | | | 4.83 | % | | $ | 0.00 | | | $ | 2,627.8 | | | | 1.72 | % | | | 1.48 | % | | | 1.72 | % | | | 1.48 | % | | | .17 | % | | | 61 | % | | | 44 | % | |
10/31/2013 | | $ | 11.09 | | | $ | 0.01 | | | $ | 1.47 | | | $ | 1.48 | | | $ | (0.01 | ) | | $ | (0.08 | ) | | $ | — | | | $ | (0.09 | ) | | $ | 12.48 | | | | 13.47 | % | | $ | — | | | $ | 1,038.2 | | | | 1.75 | % | | | 1.60 | % | | | 1.75 | %§ | | | 1.60 | %§ | | | .10 | % | | | 103 | % | | | 52 | % | |
Period from 12/29/2011^
to 10/31/2012 | | $ | 10.00 | | | $ | 0.04 | | | $ | 1.05 | | | $ | 1.09 | | | $ | — | | | $ | — | | | $ | — | | | $ | — | | | $ | 11.09 | | | | 10.90 | %** | | $ | — | | | $ | 92.6 | | | | 2.78 | %‡* | | | 2.65 | %‡* | | | 1.83 | %‡* | | | 1.70 | %‡* | | | .40 | %‡* | | | 93 | %** | | | 56 | %** | |
See Notes to Financial Highlights
Financial Highlights (cont'd)
| | | Net Asset
Value,
Beginning
of Year | | Net
Investment
Income
(Loss)@ | | Net Gains or
Losses on
Securities
(both realized
and
unrealized) | | Total From
Investment
Operations | | Dividends
from Net
Investment
Income | | Distributions
from Net
Realized
Capital
Gains | | Tax
Return of
Capital | | Total
Distributions | | Net
Asset
Value,
End of
Year | | Total
Return†† | | Voluntary
Contributions
from
Management | | Net
Assets,
End of
Year
(in millions) | | Ratio
of Gross
Expenses
to Average
Net
Assets# | | Ratio
of Gross
Expenses
to Average
Net Assets
(excluding
dividend and
interest
expenses on
securities
sold short) | | Ratio
of Net
Expenses
to Average
Net
Assets | | Ratio
of Net
Expenses to
Average
Net Assets
(excluding
dividend and
interest
expenses
on securities
sold short) | | Ratio
of Net
Investment
Income/
(Loss) to
Average
Net
Assets | | Portfolio
Turnover
Rate
(including
securities
sold
short) | | Portfolio
Turnover
Rate
(excluding
securities
sold
short) | |
Long Short Fund (cont'd) | |
Class A | |
10/31/2014 | | $ | 12.41 | | | $ | (0.03 | ) | | $ | 0.58 | | | $ | 0.55 | | | $ | — | | | $ | (0.05 | ) | | $ | — | | | $ | (0.05 | ) | | $ | 12.91 | | | | 4.47 | % | | $ | 0.00 | | | $ | 388.6 | | | | 2.09 | % | | | 1.85 | % | | | 2.09 | % | | | 1.85 | % | | | (.20 | %) | | | 61 | % | | | 44 | % | |
10/31/2013 | | $ | 11.06 | | | $ | (0.03 | ) | | $ | 1.47 | | | $ | 1.44 | | | $ | (0.01 | ) | | $ | (0.08 | ) | | $ | — | | | $ | (0.09 | ) | | $ | 12.41 | | | | 13.08 | % | | $ | — | | | $ | 502.1 | | | | 2.08 | % | | | 1.94 | % | | | 2.08 | %§ | | | 1.94 | %§ | | | (.23 | %) | | | 103 | % | | | 52 | % | |
Period from 12/29/2011^
to 10/31/2012 | | $ | 10.00 | | | $ | 0.00 | | | $ | 1.06 | | | $ | 1.06 | | | $ | — | | | $ | — | | | $ | — | | | $ | — | | | $ | 11.06 | | | | 10.60 | %** | | $ | — | | | $ | 27.0 | | | | 3.21 | %‡* | | | 3.11 | %‡* | | | 2.17 | %‡* | | | 2.06 | %‡* | | | .05 | %‡* | | | 93 | %** | | | 56 | %** | |
Class C | |
10/31/2014 | | $ | 12.26 | | | $ | (0.12 | ) | | $ | 0.57 | | | $ | 0.45 | | | $ | — | | | $ | (0.05 | ) | | $ | — | | | $ | (0.05 | ) | | $ | 12.66 | | | | 3.71 | % | | $ | 0.00 | | | $ | 211.0 | | | | 2.84 | % | | | 2.60 | % | | | 2.84 | % | | | 2.60 | % | | | (.94 | %) | | | 61 | % | | | 44 | % | |
10/31/2013 | | $ | 10.99 | | | $ | (0.12 | ) | | $ | 1.46 | | | $ | 1.34 | | | $ | (0.00 | ) | | $ | (0.07 | ) | | $ | — | | | $ | (0.07 | ) | | $ | 12.26 | | | | 12.23 | % | | $ | — | | | $ | 115.1 | | | | 2.83 | % | | | 2.68 | % | | | 2.83 | %§ | | | 2.68 | %§ | | | (1.00 | %) | | | 103 | % | | | 52 | % | |
Period from 12/29/2011^
to 10/31/2012 | | $ | 10.00 | | | $ | (0.06 | ) | | $ | 1.05 | | | $ | 0.99 | | | $ | — | | | $ | — | | | $ | — | | | $ | — | | | $ | 10.99 | | | | 9.90 | %** | | $ | — | | | $ | 3.4 | | | | 4.34 | %‡* | | | 4.20 | %‡* | | | 2.95 | %‡* | | | 2.81 | %‡* | | | (.69 | %)‡* | | | 93 | %** | | | 56 | %** | |
See Notes to Financial Highlights
Notes to Financial Highlights
†† Total return based on per share NAV reflects the effects of changes in NAV on the performance of each Fund during each fiscal period. Returns assume income dividends and other distributions, if any, were reinvested, but do not reflect the effect of sales charges. Results represent past performance and do not indicate future results. Current returns may be lower or higher than the performance data quoted. Investment returns and principal may fluctuate and shares when redeemed may be worth more or less than original cost. Total return would have been lower if Management had not reimbursed and/or waived certain expenses. Total return would have been higher if Management had not recouped previously reimbursed and/or waived expenses. The voluntary contribution listed in Note B of the Notes to Financial Statements had no impact on the Funds' total returns for the year ended October 31, 2014.
^ The date investment operations commenced.
‡ Organization expense, which is a non-recurring expense, is included in these ratios on a non-annualized basis.
@ Calculated based on the average number of shares outstanding during each fiscal period.
§ After repayment of expenses previously reimbursed and/or fees previously waived by Management, as applicable. Had the Fund not made such repayments, the annualized ratios of net expenses to average daily net assets would have been:
| | | Including
Dividend
Expenses on
Securities Sold
Short | | Excluding
Dividend
Expenses on
Securities Sold
Short | |
| | | Year Ended October 31, 2013 | |
Long Short Fund Institutional Class | | | 1.69 | % | | | 1.54 | % | |
Long Short Fund Class A | | | 2.06 | % | | | 1.92 | % | |
Long Short Fund Class C | | | 2.81 | % | | | 2.66 | % | |
* Annualized.
** Not annualized.
^^ As of June 22, 2011, Global Allocation's Institutional Class, Class A and Class C contractual expense limitations exclude dividend expenses relating to short sales, if any; consequently, net expenses may exceed the contractual expense limitations (See Note B of Notes to Financial Statements).
# Represents the annualized ratios of net expenses to average daily net assets if Management had not reimbursed certain expenses and/or waived a portion of the investment management fee.
Ø Flexible Select and Inflation Navigator did not engage in short sales.
§§ Effective June 2, 2014, Neuberger Berman Dynamic Real Return Fund changed its name to Neuberger Berman Inflation Navigator Fund.
Report of Independent Registered Public Accounting Firm
To the Board of Trustees of
Neuberger Berman Alternative Funds and
Shareholders of:
Neuberger Berman Flexible Select Fund
Neuberger Berman Global Allocation Fund
Neuberger Berman Inflation Navigator Fund
We have audited the accompanying statements of assets and liabilities of Neuberger Berman Flexible Select Fund, Neuberger Berman Global Allocation Fund and Neuberger Berman Inflation Navigator Fund (formerly, Neuberger Berman Dynamic Real Return Fund), three of the series constituting the Neuberger Berman Alternative Funds (the "Funds"), including the schedules of investments, as of October 31, 2014, and the related statements of operations for the year then ended, and the statements of changes in net assets and the financial highlights for each of the periods indicated therein. These financial statements and financial highlights are the responsibility of the Funds' management. Our responsibility is to express an opinion on these financial statements and financial highlights based on our audits.
We conducted our audits in accordance with the standards of the Public Company Accounting Oversight Board (United States). Those standards require that we plan and perform the audit to obtain reasonable assurance about whether the financial statements and financial highlights are free of material misstatement. We were not engaged to perform an audit of the Funds' internal control over financial reporting. Our audits included consideration of internal control over financial reporting as a basis for designing audit procedures that are appropriate in the circumstances, but not for the purpose of expressing an opinion on the effectiveness of the Funds' internal control over financial reporting. Accordingly, we express no such opinion. An audit also includes examining, on a test basis, evidence supporting the amounts and disclosures in the financial statements and financial highlights, assessing the accounting principles used and significant estimates made by management, and evaluating the overall financial statement presentation. Our procedures included confirmation of securities owned as of October 31, 2014 by correspondence with the custodian and others or by other appropriate auditing procedures where replies from others were not received. We believe that our audits provide a reasonable basis for our opinion.
In our opinion, the financial statements and financial highlights referred to above present fairly, in all material respects, the financial position of Neuberger Berman Flexible Select Fund, Neuberger Berman Global Allocation Fund, and Neuberger Berman Inflation Navigator Fund (formerly, Neuberger Berman Dynamic Real Return Fund), at October 31, 2014, the results of their operations for the year then ended, and the changes in their net assets and the financial highlights for each of the periods indicated therein, in conformity with U.S. generally accepted accounting principles.
Boston, Massachusetts
December 19, 2014
Report of Independent Registered Public Accounting Firm
To the Board of Trustees and Shareholders
Neuberger Berman Alternative Funds
We have audited the accompanying statement of assets and liabilities of Neuberger Berman Long Short Fund, a series of Neuberger Berman Alternative Funds (the "Trust"), including the schedule of investments, as of October 31, 2014, and the related statement of operations for the year then ended, and the statements of changes in net assets for each of the two years in the period then ended, and the financial highlights for each of the two years in the period then ended and for the period December 29, 2011 (commencement of operations) to October 31, 2012. These financial statements and financial highlights are the responsibility of the Trust's management. Our responsibility is to express an opinion on these financial statements and financial highlights based on our audit.
We conducted our audit in accordance with the standards of the Public Company Accounting Oversight Board (United States). Those standards require that we plan and perform the audit to obtain reasonable assurance about whether the financial statements and financial highlights are free of material misstatement. The Trust is not required to have, nor were we engaged to perform, an audit of its internal control over financial reporting. Our audit included consideration of internal control over financial reporting as a basis for designing audit procedures that are appropriate in the circumstances, but not for the purpose of expressing an opinion on the effectiveness of the Trust's internal control over financial reporting. Accordingly, we express no such opinion. An audit also includes examining, on a test basis, evidence supporting the amounts and disclosures in the financial statements, assessing the accounting principles used and significant estimates made by management, as well as evaluating the overall financial statement presentation. Our procedures included confirmation of securities owned as of October 31, 2014, by correspondence with the custodian and brokers or by other appropriate auditing procedures where replies from brokers were not received. We believe that our audit provides a reasonable basis for our opinion.
In our opinion, the financial statements and financial highlights referred to above present fairly, in all material respects, the financial position of Neuberger Berman Long Short Fund, as of October 31, 2014, and the results of its operations for the year then ended, and the changes in its net assets for each of the two years in the period then ended, and the financial highlights for each of the two years in the period then ended and for the period December 29, 2011 (commencement of operations) to October 31, 2012, in conformity with accounting principles generally accepted in the United States of America.

Philadelphia, Pennsylvania
December 18, 2014
Investment Manager, Administrator and Distributor
Neuberger Berman Management LLC
605 Third Avenue, 2nd Floor
New York, NY 10158-0180
800.877.9700 or 212.476.8800
Intermediary Client Services 800.366.6264
Sub-Advisers
Neuberger Berman Fixed Income LLC
190 South LaSalle Street
Chicago, IL 60603
Neuberger Berman LLC
605 Third Avenue
New York, NY 10158-3698
Custodian and Shareholder Servicing Agent
State Street Bank and Trust Company
One Lincoln Street
Boston, MA 02111
For Institutional Class Shareholders
Address correspondence to:
Neuberger Berman Management LLC
605 Third Avenue, Mail Drop 2-7
New York, NY 10158-0180
Attn: Intermediary Client Services
800.366.6264
For Class A and Class C Shareholders:
Please contact your investment provider
Legal Counsel
K&L Gates LLP
1601 K Street, NW
Washington, DC 20006-1600
Independent Registered Public Accounting Firms
Ernst & Young LLP
200 Clarendon Street
Boston, MA 02116
Tait, Weller & Baker LLP
1818 Market Street
Suite 2400
Philadelphia, PA 19103
The following tables set forth information concerning the trustees ("Trustees") and officers ("Officers") of each of the Funds. All persons named as Trustees and Officers also serve in similar capacities for other funds administered or managed by Management, NBFI and/or Neuberger. Each Fund's Statement of Additional Information includes additional information about the Trustees as of the time of the Fund's most recent public offering and is available upon request, without charge, by calling (800) 877-9700.
Information about the Board of Trustees
Name, (Year of Birth),
and Address(1) | | Position(s)
and Length of
Time Served(2) | | Principal Occupation(s)(3) | | Number of
Funds in
Fund Complex
Overseen by
Fund Trustee | | Other Directorships Held
Outside Fund Complex by
Fund Trustee(3) | |
Independent Trustees | |
Faith Colish (1935) | | Trustee since inception | | Counsel, Carter Ledyard & Milburn LLP (law firm) since October 2002; formerly, Attorney-at-Law and President, Faith Colish, A Professional Corporation, 1980 to 2002. | | | 59 | | | Formerly, Director, 1997 to 2003, and Advisory Director, 2003 to 2006, ABA Retirement Funds (formerly, American Bar Retirement Association) (not-for-profit membership corporation). | |
Martha C. Goss (1949) | | Trustee since 2007 | | President, Woodhill Enterprises Inc./Chase Hollow Associates LLC (personal investment vehicle), since 2006; formerly, Consultant, Resources Global Professionals (temporary staffing), 2002 to 2006. | | | 59 | | | Director, American Water (water utility), since 2003; Director, Allianz Life of New York (insurance), since 2005; Director, Berger Group Holdings, Inc. (engineering consulting firm), since 2013; Director, Financial Women's Association of New York (not-for-profit association), since 2003; Trustee Emerita, Brown University, since 1998; Director, Museum of American Finance (not-for-profit), since 2013; formerly, Non-Executive Chair and Director, Channel Reinsurance (financial guaranty reinsurance), 2006 to 2010; formerly, Director, Ocwen Financial Corporation (mortgage servicing), 2005 to 2010; formerly, Director, Claire's Stores, Inc. (retailer), 2005 to 2007; formerly, Director, Parsons Brinckerhoff Inc. (engineering consulting firm), 2007 to 2010; formerly, Director, Bank Leumi (commercial bank), 2005 to 2007; formerly, Advisory Board Member, Attensity (software developer), 2005 to 2007. | |
Name, (Year of Birth),
and Address(1) | | Position(s)
and Length of
Time Served(2) | | Principal Occupation(s)(3) | | Number of
Funds in
Fund Complex
Overseen by
Fund Trustee | | Other Directorships Held
Outside Fund Complex by
Fund Trustee(3) | |
Michael M. Knetter (1960) | | Trustee since 2007 | | President and Chief Executive Officer, University of Wisconsin Foundation, since October 2010; formerly, Dean, School of Business, University of Wisconsin—Madison; formerly, Professor of International Economics and Associate Dean, Amos Tuck School of Business—Dartmouth College, 1998 to 2002. | | | 59 | | | Board Member, American Family Insurance (a mutual company, not publicly traded), since March 2009; formerly, Trustee, Northwestern Mutual Series Fund, Inc., 2007 to 2011; formerly, Director, Wausau Paper, 2005 to 2011; formerly, Director, Great Wolf Resorts, 2004 to 2009. | |
Howard A. Mileaf (1937) | | Trustee since 1984 | | Retired; formerly, Vice President and General Counsel, WHX Corporation (holding company), 1993 to 2001. | | | 59 | | | Formerly, Director, Webfinancial Corporation (holding company), 2002 to 2008; formerly, Director, WHX Corporation (holding company), 2002 to 2005; formerly, Director, State Theatre of New Jersey
(not-for-profit theatre), 2000 to 2005. | |
George W. Morriss (1947) | | Trustee since 2007 | | Adjunct Professor, Columbia University School of International and Public Affairs, since October 2012; formerly, Executive Vice President and Chief Financial Officer, People's Bank, Connecticut (a financial services company), 1991 to 2001. | | | 59 | | | Director and Treasurer, National Association of Corporate Directors, Connecticut Chapter, since 2011; Trustee, Steben Alternative Investment Funds, Steben Select Multi-Strategy Fund and Steben Select Multi-Strategy Master Fund, since 2013; formerly, Manager, Larch Lane Multi-Strategy Fund complex (which consisted of three funds), 2006 to 2011; formerly, Member, NASDAQ Issuers' Affairs Committee, 1995 to 2003. | |
Name, (Year of Birth),
and Address(1) | | Position(s)
and Length of
Time Served(2) | | Principal Occupation(s)(3) | | Number of
Funds in
Fund Complex
Overseen by
Fund Trustee | | Other Directorships Held
Outside Fund Complex by
Fund Trustee(3) | |
Tom D. Seip (1950) | | Trustee since inception; Chairman of the Board since 2008; formerly, Lead Independent Trustee from 2006 to 2008 | | General Partner, Ridgefield Farm LLC (a private investment vehicle); formerly, President and CEO, Westaff, Inc. (temporary staffing), May 2001 to January 2002; formerly, Senior Executive, The Charles Schwab Corporation, 1983 to 1998, including Chief Executive Officer, Charles Schwab Investment Management, Inc.; Trustee, Schwab Family of Funds and Schwab Investments, 1997 to 1998; and Executive Vice President-Retail Brokerage, Charles Schwab & Co., Inc., 1994 to 1997. | | | 59 | | | Director, H&R Block, Inc. (financial services company), since May 2001; Chairman, Governance and Nominating Committee, H&R Block, Inc., since 2011; formerly, Chairman, Compensation Committee, H&R Block, Inc., 2006 to 2010; formerly, Director, Forward Management, Inc. (asset management company), 1999 to 2006. | |
Candace L. Straight (1947) | | Trustee since inception | | Private investor and consultant specializing in the insurance industry; formerly, Advisory Director, Securitas Capital LLC (a global private equity investment firm dedicated to making investments in the insurance sector), 1998 to 2003. | | | 59 | | | Public Member, Board of Governors and Board of Trustees, Rutgers University, since 2011; Director, Montpelier Re Holdings Ltd. (reinsurance company), since 2006; formerly, Director, National Atlantic Holdings Corporation (property and casualty insurance company), 2004 to 2008; formerly, Director, The Proformance Insurance Company (property and casualty insurance company), 2004 to 2008; formerly, Director, Providence Washington Insurance Company (property and casualty insurance company), 1998 to 2006; formerly, Director, Summit Global Partners (insurance brokerage firm), 2000 to 2005. | |
Peter P. Trapp (1944) | | Trustee since inception | | Retired; formerly, Regional Manager for Mid-Southern Region, Ford Motor Credit Company, September 1997 to 2007; formerly, President, Ford Life Insurance Company, April 1995 to August 1997. | | | 59 | | | None. | |
Name, (Year of Birth),
and Address(1) | | Position(s)
and Length of
Time Served(2) | | Principal Occupation(s)(3) | | Number of
Funds in
Fund Complex
Overseen by
Fund Trustee | | Other Directorships Held
Outside Fund Complex by
Fund Trustee(3) | |
Trustees who are "Interested Persons" | |
Joseph V. Amato* (1962) | | Trustee since 2009 | | President and Director, Neuberger Berman Group LLC, since 2009; President and Chief Executive Officer, Neuberger and Neuberger Berman Holdings LLC (including its predecessor, Neuberger Berman Inc.), since 2007; Chief Investment Officer (Equities) and Managing Director, Management, since 2009; Managing Director, NBFI, since 2007; Board member of NBFI since 2006; formerly, Global Head of Asset Management of Lehman Brothers Holdings Inc.'s ("LBHI") Investment Management Division, 2006 to 2009; formerly, member of LBHI's Investment Management Division's Executive Management Committee, 2006 to 2009; formerly, Managing Director, Lehman Brothers Inc. ("LBI"), 2006 to 2008; formerly, Chief Recruiting and Development Officer, LBI, 2005 to 2006; formerly, Global Head of LBI's Equity Sales and a Member of its Equities Division Executive Committee, 2003 to 2005. | | | 59 | | | Member of Board of Advisors, McDonough School of Business, Georgetown University, since 2001; Member of New York City Board of Advisors, Teach for America, since 2005; Trustee, Montclair Kimberley Academy (private school), since 2007; Member of Board of Regents, Georgetown University, since 2013. | |
Robert Conti* (1956) | | Chief Executive Officer, President and Trustee since 2008; prior thereto, Executive Vice President in 2008 and Vice President from inception to 2008 | | Managing Director, Neuberger, since 2007; Managing Director, NBFI, since 2009; formerly, Senior Vice President, Neuberger, 2003 to 2006; formerly, Vice President, Neuberger, 1999 to 2003; President and Chief Executive Officer, Management, since 2008; formerly, Senior Vice President, Management, 2000 to 2008. | | | 59 | | | Director, Staten Island Mental Health Society, since 1994; formerly, Chairman of the Board, Staten Island Mental Health Society, 2008 to 2011. | |
(1) The business address of each listed person is 605 Third Avenue, New York, New York 10158.
(2) Pursuant to the Trust's Trust Instrument, each of these Trustees shall hold office for life or until his or her successor is elected or the Trust terminates; except that (a) any Trustee may resign by delivering a written resignation; (b) any Trustee may be removed with or without cause at any time by a written instrument signed by at least two-thirds of the other Trustees; (c) any Trustee who requests to be retired, or who has become unable to serve, may be retired by a written instrument signed by a majority of the other Trustees; and (d) any Trustee may be removed at any shareholder meeting by a vote of at least two-thirds of the outstanding shares.
(3) Except as otherwise indicated, each individual has held the positions shown for at least the last five years.
* Indicates a Trustee who is an "interested person" within the meaning of the 1940 Act. Mr. Amato and Mr. Conti are interested persons of the Trust by virtue of the fact that each is an officer of Management, Neuberger and/or their affiliates.
Information about the Officers of the Trust
Name, (Year of Birth),
and Address(1) | | Position(s)
and Length of
Time Served(2) | | Principal Occupation(s)(3) | |
Andrew B. Allard (1961) | | Chief Legal Officer since 2013 (only for purposes of sections 307 and 406 of the Sarbanes-Oxley Act of 2002) and Anti-Money Laundering Compliance Officer since 2002 | | General Counsel and Senior Vice President, Management, since 2013; Senior Vice President, Neuberger, since 2006 and Employee since 1999; Deputy General Counsel, Neuberger, since 2004; formerly, Vice President, Neuberger, 2000 to 2005; formerly, Employee, Management, 1994 to 1999; Chief Legal Officer since 2013 (only for purposes of sections 307 and 406 of the Sarbanes-Oxley Act of 2002), ten registered investment companies for which Management acts as investment manager and administrator (ten since 2013); Anti-Money Laundering Compliance Officer, ten registered investment companies for which Management acts as investment manager and administrator (six since 2002, one since 2003, one since 2005, one since 2006 and one since 2013). | |
Claudia A. Brandon (1956) | | Executive Vice President since 2008 and Secretary since inception | | Senior Vice President, Neuberger, since 2007 and Employee since 1999; Senior Vice President, Management, since 2008 and Assistant Secretary since 2004; formerly, Vice President, Neuberger, 2002 to 2006; formerly, Vice President-Mutual Fund Board Relations, Management, 2000 to 2008; formerly, Vice President, Management, 1986 to 1999 and Employee 1984 to 1999; Executive Vice President, ten registered investment companies for which Management acts as investment manager and administrator (nine since 2008 and one since 2013); Secretary, ten registered investment companies for which Management acts as investment manager and administrator (three since 1985, three since 2002, one since 2003, one since 2005, one since 2006 and one since 2013). | |
Agnes Diaz (1971) | | Vice President since 2013 | | Senior Vice President, Neuberger, since 2012; Employee, Management, since 1996; formerly, Vice President, Neuberger, 2007 to 2012; Vice President, ten registered investment companies for which Management acts as investment manager and administrator (ten since 2013). | |
Anthony DiBernardo (1979) | | Assistant Treasurer since 2011 | | Senior Vice President, Neuberger, since 2014; Employee, Management, since 2003; formerly, Vice President, Neuberger, 2009 to 2014; Assistant Treasurer, ten registered investment companies for which Management acts as investment manager and administrator (nine since 2011 and one since 2013). | |
Sheila R. James (1965) | | Assistant Secretary since inception | | Vice President, Neuberger, since 2008 and Employee since 1999; formerly, Assistant Vice President, Neuberger, 2007; formerly, Employee, Management, 1991 to 1999; Assistant Secretary, ten registered investment companies for which Management acts as investment manager and administrator (six since 2002, one since 2003, one since 2005, one since 2006 and one since 2013). | |
Brian Kerrane (1969) | | Vice President since 2008 | | Managing Director, Neuberger, since 2014; Vice President, Management, since 2008 and Employee since 1991; formerly, Senior Vice President, Neuberger, 2006 to 2014; Vice President, ten registered investment companies for which Management acts as investment manager and administrator (nine since 2008 and one since 2013). | |
Name, (Year of Birth),
and Address(1) | | Position(s)
and Length of
Time Served(2) | | Principal Occupation(s)(3) | |
Kevin Lyons (1955) | | Assistant Secretary since inception | | Assistant Vice President, Neuberger, since 2008 and Employee since 1999; formerly, Employee, Management, 1993 to 1999; Assistant Secretary, ten registered investment companies for which Management acts as investment manager and administrator (seven since 2003, one since 2005, one since 2006 and one since 2013). | |
Owen F. McEntee, Jr. (1961) | | Vice President since 2008 | | Vice President, Neuberger, since 2006; Employee, Management, since 1992; Vice President, ten registered investment companies for which Management acts as investment manager and administrator (nine since 2008 and one since 2013). | |
John M. McGovern (1970) | | Treasurer and Principal Financial and Accounting Officer since inception | | Senior Vice President, Neuberger, since 2007; Employee, Management, since 1993; Treasurer and Principal Financial and Accounting Officer, ten registered investment companies for which Management acts as investment manager and administrator (eight since 2005, one since 2006 and one since 2013); formerly, Vice President, Neuberger, 2004 to 2006; formerly, Assistant Treasurer, eight registered investment companies for which Management acts as investment manager and administrator, 2002 to 2005. | |
Frank Rosato (1971) | | Assistant Treasurer since inception | | Vice President, Neuberger, since 2006; Employee, Management, since 1995; Assistant Treasurer, ten registered investment companies for which Management acts as investment manager and administrator (eight since 2005, one since 2006 and one since 2013). | |
Neil S. Siegel (1967) | | Vice President since 2008 | | Managing Director, Management, since 2008; Managing Director, Neuberger, since 2006; Managing Director, NBFI, since 2011; formerly, Senior Vice President, Neuberger, 2004 to 2006; Vice President, ten registered investment companies for which Management acts as investment manager and administrator (nine since 2008 and one since 2013). | |
Chamaine Williams (1971) | | Chief Compliance Officer since inception | | Senior Vice President, Neuberger, since 2007; Chief Compliance Officer, Management, since 2006; Chief Compliance Officer, ten registered investment companies for which Management acts as investment manager and administrator (eight since 2005, one since 2006 and one since 2013); formerly, Senior Vice President, LBI, 2007 to 2008; formerly, Vice President, LBI, 2003 to 2006; formerly, Chief Compliance Officer, Lehman Brothers Asset Management Inc., 2003 to 2007; formerly, Chief Compliance Officer, Lehman Brothers Alternative Investment Management LLC, 2003 to 2007. | |
(1) The business address of each listed person is 605 Third Avenue, New York, New York 10158.
(2) Pursuant to the By-Laws of the Trust, each officer elected by the Trustees shall hold office until his or her successor shall have been elected and qualified or until his or her earlier death, inability to serve, or resignation. Officers serve at the pleasure of the Trustees and may be removed at any time with or without cause.
(3) Except as otherwise indicated, each individual has held the positions shown for at least the last five years.
Proxy Voting Policies and Procedures
A description of the policies and procedures that the Trust uses to determine how to vote proxies relating to portfolio securities is available, without charge, by calling 800-877-9700 (toll-free) and on the Securities and Exchange Commission's website at www.sec.gov. Information regarding how the Trust voted proxies relating to portfolio securities during the most recent 12-month period ended June 30 is also available, without charge upon request, by calling 800-877-9700 (toll-free), on the Securities and Exchange Commission's website at www.sec.gov, and on Management's website at www.nb.com.
Quarterly Portfolio Schedule
The Trust files a complete schedule of portfolio holdings for each Fund with the Securities and Exchange Commission for the first and third quarters of the fiscal year on Form N-Q. The Trust's Forms N-Q are available on the Securities and Exchange Commission's website at www.sec.gov and may be reviewed and copied at the Securities and Exchange Commission's Public Reference Room in Washington, DC. Information on the operation of the Public Reference Room may be obtained by calling 800-SEC-0330. The information on Form N-Q is available upon request, without charge, by calling 800-877-9700 (toll-free).
Notice to Shareholders
Under most state tax laws, mutual fund dividends which are derived from direct investments in U.S. Government obligations are not taxable, as long as a Fund meets certain requirements. Some states require that a Fund must provide shareholders with a written notice, within 60 days of the close of a Fund's taxable year, designating the portion of the dividends which represents interest which those states consider to have been earned on U.S. Government obligations. The chart below shows the percentage of income derived from such investments for the twelve months ended October 31, 2014. This information should not be used to complete your tax returns.
| | | U.S. Treasury
Obligations | | Other Direct U.S.
Government
Obligations | | Other Indirect
U.S. Government
Obligations | | Repurchase
Agreements | |
Flexible Select | | | 0.0 | % | | | 0.0 | % | | | 0.0 | % | | | 0.0 | % | |
Global Allocation | | | 0.0 | | | | 0.0 | | | | 0.0 | | | | 0.0 | | |
Inflation Navigator | | | 0.6 | | | | 0.0 | | | | 0.0 | | | | 0.0 | | |
Long Short | | | 0.0 | | | | 0.0 | | | | 0.0 | | | | 0.0 | | |
For the fiscal year ended October 31, 2014, each Fund makes the following designation, or up to the maximum amount of such dividends allowable pursuant to the U.S. Internal Revenue Code, as qualified dividend income eligible for reduced tax rates. These lower rates range from 5% to 15% depending upon an individual's tax bracket. Complete information regarding each Fund's distributions during the calendar year 2014 will be reported in conjunction with Form 1099-DIV.
Fund | | Qualified
Dividend Income | |
Flexible Select | | $ | 1,742,461 | | |
Global Allocation | | | 128,260 | | |
Inflation Navigator | | | 326,614 | | |
Long Short | | | 21,941,560 | | |
In early 2015 you will receive information to be used in filing your 2014 tax returns, which will include a notice of the exact tax status of all distributions paid to you by the Fund during calendar year 2014. Please consult your own tax advisor for details as to how this information should be reflected on your tax returns.
Neuberger Berman Long Short Fund designates $697,640 as a capital gain distribution.
Board Consideration of the Management and Sub-Advisory Agreements
On an annual basis, the Board of Trustees ("Board") of Neuberger Berman Alternative Funds ("Trust"), including the Trustees who are not "interested persons" of Neuberger Berman Management LLC ("Management") (including its affiliates) or the Trust ("Independent Fund Trustees"), considers whether to continue the Management and Sub-Advisory Agreements ("Agreements") with respect to Neuberger Berman Flexible Select Fund, Neuberger Berman Global Allocation Fund, Neuberger Berman Inflation Navigator Fund (formerly Neuberger Berman Dynamic Real Return Fund) and Neuberger Berman Long Short Fund (each, a "Fund"). At a meeting held on October 6-7, 2014, the Board, including the Independent Fund Trustees, approved the continuation of the Agreements for each Fund.
In evaluating the Agreements, the Board, including the Independent Fund Trustees, reviewed extensive materials provided by Management in response to questions submitted by the Board and counsel for the Independent Fund Trustees, and met with senior representatives of Management regarding its personnel, operations and financial condition as they relate to the Funds. The annual contract review extends over at least two regular meetings of the Board to ensure that Management, Neuberger Berman LLC ("Neuberger") and Neuberger Berman Fixed Income LLC ("NBFI") have time to respond to any questions the Independent Fund Trustees may have on their initial review of the materials and that the Independent Fund Trustees have time to consider those responses. (Neuberger serves as sub-adviser for Neuberger Berman Flexible Select Fund and Neuberger Berman Long Short Fund, and NBFI serves as sub-adviser for Neuberger Berman Global Allocation Fund and Neuberger Berman Inflation Navigator Fund.)
In connection with its deliberations, the Board also considered the broad range of information relevant to the annual contract review that is provided to the Board (including its various standing committees) at meetings throughout the year, including investment performance reports and related portfolio information for each Fund, as well as periodic reports on, among other matters, pricing and valuation; brokerage and execution; and compliance, shareholder and other services provided by Management, Neuberger, NBFI and their affiliates. To assist the Board in its deliberations regarding the annual contract review, the Board has established a Contract Review Committee comprised of Independent Fund Trustees, as well as other committees that focus throughout the year on specific areas relevant to the annual contract review, such as Fund performance or compliance matters.
Throughout the process, the Independent Fund Trustees were advised by counsel that is experienced in Investment Company Act of 1940 matters and that is independent of Management. The Independent Fund Trustees received from independent counsel a memorandum discussing the legal standards for their consideration of the proposed continuation of the Agreements. During the course of the year and during their deliberations regarding the annual contract review, the Contract Review Committee and the Independent Fund Trustees met with such counsel separately from representatives of Management, Neuberger, and NBFI.
In connection with its approval of the continuation of the Agreements, the Board evaluated the terms of the Agreements, the overall fairness of the Agreements to each Fund and whether the Agreements were in the best interests of each Fund and its shareholders. The Board considered all factors it deemed relevant with respect to each Fund, including the following factors: (1) the nature, extent, and quality of the services provided by Management and Neuberger or NBFI, as applicable; (2) the investment performance of each Fund compared to an appropriate market index and a peer group of investment companies; (3) the costs of the services provided and the profit or loss realized by Management and its affiliates from their relationship with each Fund; (4) the extent to which economies of scale might be realized as each Fund grows; and (5) whether fee levels reflect any such potential economies of scale for the benefit of investors in each Fund. While each Trustee may have attributed different weights to the various factors, the Board's determination to approve the continuation of the Agreements was based on a comprehensive consideration of all information provided to the Board throughout the year and specifically in connection with the annual contract review. The Board members did not identify any particular information or factor that was all-important or controlling. The Board focused on the overall costs and benefits of the Agreements relating to each Fund and, through the Funds, their shareholders.
With respect to the nature, extent and quality of the services provided, the Board considered the investment philosophy and decision-making processes of Management, Neuberger, and NBFI, and the qualifications, experience and capabilities of and the resources available to the portfolio management personnel of Management, Neuberger or NBFI, as applicable,
who perform services for the Funds. The Board noted that Management also provides certain administrative services, including fund accounting and compliance oversight. The Board also considered Management's, Neuberger's and NBFI's policies and practices regarding brokerage and allocation of portfolio transactions and reviewed the quality of the execution services that Management had provided. The Board also reviewed whether Management, Neuberger, or NBFI used brokers to execute Fund transactions that provide research and other services to Management, Neuberger, or NBFI and the types of benefits potentially derived from such services by Management, Neuberger, NBFI, the Funds and other clients of Management, Neuberger and NBFI. The Board also considered that Management's responsibilities include daily management of investment, operational, enterprise, legal, regulatory and compliance risks as they relate to the Funds, and considered information regarding Management's process for managing risk. In addition, the Board noted the positive compliance history of Management, Neuberger, and NBFI, as no significant compliance problems were reported to the Board with respect to any of the firms. The Board also considered the general structure of the portfolio manager compensation program and whether this structure provides appropriate incentives to act in the best interests of the Funds.
As in past years, the Board also considered the manner in which Management addressed various non-routine matters that arose during the year, some of them a result of developments in the broader fund industry or the regulations governing it. In addition, the Board considered actions taken by Management, Neuberger and NBFI in response to recent market conditions, including actions taken in response to regulatory concerns about changes in fixed-income market liquidity and potential volatility, and considered the overall performance of Management, Neuberger and NBFI in this context.
With respect to investment performance, the Board considered information regarding each Fund's performance on both an absolute basis and relative to an appropriate market index (or benchmark) and the average performance of a composite peer group (as constructed by an independent organization) of investment companies pursuing broadly similar strategies. The Board also reviewed performance in relation to certain measures of the degree of investment risk undertaken by portfolio managers. The Board factored into its evaluation of the Funds' performance the limitations inherent in the methodology for constructing peer groups and determining which investment companies should be included in which peer groups. In the case of those Funds that had underperformed their relevant market indices and/or peer groups over certain periods, the Board discussed with Management each Fund's performance and steps that Management had taken, or intended to take, to improve performance. The Board also considered Management's responsiveness with respect to the Funds that experienced lagging performance. In this regard, the Board noted that performance, especially short-term performance, is only one of the factors that it deems relevant to its consideration of a Fund's Agreements and that, after considering all relevant factors, it may be appropriate to approve the continuation of the Agreements notwithstanding a Fund's recent performance.
With respect to the overall fairness of the Agreements, the Board considered the fee structure for each Fund under the Agreements as compared to a peer group of comparable funds and any fall-out benefits likely to accrue to Management or NBFI or their affiliates from their relationship with each Fund. With respect to Neuberger Berman Flexible Select Fund and Neuberger Berman Inflation Navigator Fund, the Board considered that each Fund intended to invest in affiliated underlying funds pursuant to exemptive relief obtained from the Securities and Exchange Commission. The Board further considered, for any assets that Neuberger Berman Flexible Select Fund and Neuberger Berman Inflation Navigator Fund invest in an affiliated underlying fund, Management's undertaking to waive a portion of each Fund's advisory fee equal to the advisory fee it receives from such affiliated underlying fund. The Board also considered the profitability of Management and its affiliates from their association with the Funds, profitability broken out between the investment management and administrative portions of the services provided, and year-over-year changes in each of Management's reported expense categories. The Board reviewed a comparison of each Fund's management fee and overall expense ratio to a peer group of broadly comparable funds. The Board noted that the comparative management fee analysis includes, in each Fund's management fee, the separate administrative fee paid to Management, but it was not clear whether this was the case for all funds in the peer group. The Board considered the mean and median of the management fees and expense ratios of each peer group. In addition, the Board considered the contractual limit on expenses of certain classes of each Fund. The Board noted that Management incurred a loss on certain of the Funds during the review period. The Board also considered whether there were other funds that were advised or sub-advised by Management or its affiliates or separate accounts managed by Management or its affiliates with investment objectives, policies and strategies that were similar to those of any of the Funds. The Board compared the fees charged to each Fund to the fees charged to any such
funds and/or separate accounts. The Board considered the appropriateness and reasonableness of any differences between the fees charged to each Fund and any such funds and/or separate accounts, including any breakpoints, and determined that any differences in fees and fee structures were consistent with the management and other services provided.
The Board also evaluated any apparent or anticipated economies of scale in relation to the services Management provides to each Fund. The Board considered each Fund's fee structure and noting that each Fund's fee structure provides for a reduction of payments resulting from the use of breakpoints, the Board considered whether any such breakpoints are set at appropriate asset levels.
In concluding that the benefits accruing to Management and its affiliates by virtue of their relationship with each Fund were reasonable in light of the costs of providing the investment advisory and other services and the benefits accruing to each Fund, the Board reviewed specific data as to Management's profit or loss on each Fund for a recent period. The Board also carefully examined Management's cost allocation methodology. The Board recognized that Management should be entitled to earn a reasonable level of profits for the services it provides to the Funds and, based on its review, concluded that Management's reported level of profitability, if any, was reasonable.
Conclusions
In approving the Agreements, the Board concluded that the terms of each Agreement are fair and reasonable to each Fund and that approval of the Agreements is in the best interests of each Fund and its shareholders. In reaching this determination, the Board considered that Management and Neuberger or NBFI, as applicable, could be expected to provide a high level of service to each Fund; that the performance of each Fund was satisfactory over time, or, in the case of underperforming Funds, that it retained confidence in Management's, Neuberger's and NBFI's capabilities to manage the Funds; that each Fund's fee structure appeared to the Board to be reasonable given the nature, extent and quality of services provided; and that the benefits accruing to Management and its affiliates by virtue of their relationship with the Funds were reasonable in light of the costs of providing the investment advisory and other services and the benefits accruing to each Fund. The Board's conclusions may be based in part on its consideration of materials prepared in connection with the approval or continuance of the Agreements in prior years and on the Board's ongoing regular review of Fund performance and operations throughout the year, in addition to material prepared specifically for the most recent annual review of the Agreements.
Investment manager: Neuberger Berman Management LLC
Sub-advisers: Neuberger Berman Fixed Income LLC
Neuberger Berman LLC
Neuberger Berman Management LLC
605 Third Avenue 2nd Floor
New York, NY 10158–0180
Shareholder Services
800.877.9700
Institutional Services
800.366.6264
www.nb.com
Statistics and projections in this report are derived from sources deemed to be reliable but cannot be regarded as a representation of future results of the Funds. This report is prepared for the general information of shareholders and is not an offer of shares of the Funds. Shares are sold only through the currently effective prospectus, which must precede or accompany this report.
L0265 12/14
Neuberger Berman
Alternative and Multi-Asset Class Funds
Institutional Class Shares
Class A Shares
Class C Shares
Risk Balanced Commodity Strategy Fund
Annual Report
October 31, 2014
Contents
PRESIDENT'S LETTER | | | 1 | | |
PORTFOLIO COMMENTARY | | | 2 | | |
FUND EXPENSE INFORMATION | | | 7 | | |
CONSOLIDATED SCHEDULE OF INVESTMENTS | | | 9 | | |
CONSOLIDATED FINANCIAL STATEMENTS | | | 16 | | |
CONSOLIDATED FINANCIAL HIGHLIGHTS (ALL CLASSES)/
PER SHARE DATA | | | 29 | | |
Report of Independent Registered Public Accounting Firm | | | 32 | | |
Directory | | | 33 | | |
Trustees and Officers | | | 34 | | |
Proxy Voting Policies and Procedures | | | 42 | | |
Quarterly Portfolio Schedule | | | 42 | | |
Board Consideration of the Management and
Sub-Advisory Agreements | | | 43 | | |
The "Neuberger Berman" name and logo are registered service marks of Neuberger Berman Group LLC. "Neuberger Berman Management LLC" and the individual Fund name in this piece are either service marks or registered service marks of Neuberger Berman Management LLC. ©2014 Neuberger Berman Management LLC. All rights reserved.
Dear Shareholder,
I am pleased to present this annual shareholder report for Neuberger Berman Risk Balanced Commodity Strategy Fund. The report includes a portfolio commentary, a listing of the Fund's investments and its audited financial statements for the 12 months ended October 31, 2014. The Fund seeks to generate returns that are not highly correlated with other major asset classes and that may improve the overall risk-reward profile of an investment portfolio.
After a strong first half of the reporting period, the commodity market generated weak results. Overall, the commodity market in the aggregate posted a negative return for the 12 months ended October 31, 2014. Commodities were initially supported by several factors, including severe winter weather that propelled the price of natural gas higher and the conflict in Ukraine, which impacted wheat prices. Commodities then declined in general as the period progressed. In the energy sector, the price of oil fell sharply given challenging supply/demand dynamics. Agriculture prices were dragged down by a bumper crop and moderating demand, whereas precious metals were negatively impacted by a sharply rising U.S. dollar and expectations of tightening U.S. monetary policy. For the reporting period as a whole, livestock and certain components of the softs sectors generated positive results.
Looking ahead, in our view commodity prices could continue to fluctuate given geopolitical uncertainties and macroeconomic factors. However, over the longer-term we would anticipate that commodities would once again be driven more by their underlying fundamentals. Against this backdrop, certain commodities that either declined or rallied during the reporting period could experience a reversion to the mean. We continue to believe that commodities remain an important long-term investment opportunity and a way for investors to more thoroughly diversify their portfolios.
Thank you for your continued support and trust. We look forward to continue serving your investment needs in the years to come.
Sincerely,
ROBERT CONTI
PRESIDENT AND CEO
NEUBERGER BERMAN MUTUAL FUNDS
Risk Balanced Commodity Strategy Fund Commentary (Unaudited)
Neuberger Berman Risk Balanced Commodity Strategy Fund1 Class A generated a total return of –7.25% at NAV for the 12 months ended October 31, 2014 and underperformed its benchmark, the Bloomberg Commodity Index (formerly called the Dow Jones-UBS Commodity Index), which posted a –5.94% return for the period. (Performance for all share classes is provided in the table immediately following this letter.)
While there were pockets of strength, the overall commodity market generated weak results during the reporting period. Among the weakest performers were precious metals, energy and agriculture. The strengthening U.S. economy, the end of the U.S. Federal Reserve's (Fed) quantitative easing program and the rallying U.S. dollar were headwinds for precious metals. The energy sector was challenged by weakening global demand and increased supply, which contributed to the declining price of oil, especially toward the end of the period. Agriculture prices were driven lower by a bumper crop season. Conversely, livestock and certain parts of the softs sector posted positive results. Within the livestock sector, a deadly virus led to the death of millions of piglets, which drove up the price of lean hogs in the first quarter of 2014. Strong performers in the softs sector included coffee, due to a drought in Brazil, and cocoa, given concerns of the Ebola virus spreading into cocoa-producing African countries.
The Fund's Dynamic Core strategy selects weights by focusing on risk, liquidity and yield. The Fund's underperformance relative to the index was largely due to its overweights in some energy commodities, as well as an underweight to natural gas, which surged higher in early 2014 when frigid temperatures gripped the northeastern U.S., boosting demand for heating fuel. Elsewhere, an underweight to coffee was negative for performance. On the upside, the Fund's overweight to livestock and an underweight to agriculture were additive for results, and an underweighted precious metals exposure also added value.
The Fund's Tactical Strategy actively manages the Dynamic Core exposures by taking advantage of short- to medium-term opportunities based on factors including macroeconomics, supply/demand, the pricing relationships between commodities and the shape of the futures curve. The Fund's tactical positioning detracted from performance during the reporting period.
The Fund's use of commodity futures detracted from performance.
Looking ahead, we envision several scenarios that could impact certain commodity sectors going forward. For example, there are several factors that could result in a bottom for the price of oil. These include the potential for production cuts from OPEC, postponed or cancelled projects by Western oil companies, and a possible spike in prices should the Islamic State invade the southern parts of Iraq. In the precious metals space, if the Fed delays interest rate hikes, we think it would likely be a headwind for the U.S. dollar. This, in turn, may support the precious metals space. Lastly, in the agricultural sector, we have seen a substantial inventory build-up that dragged prices down to multi-year lows. Increased inventory was a result of an almost perfect growing and harvesting period, for grains in particular. As prices have fallen and international demand has weakened, farmers may reduce supplies to instigate a recovery in prices and balance the market. On top of this, weather-related issues could correct prices from their current lows.
Sincerely,
WAI LEE, HAKAN KAYA, THOMAS SONTAG AND RICHARD GRAU
PORTFOLIO CO-MANAGERS
Information about principal risks of investing in the Fund is set forth in the prospectus and statement of additional information.
The portfolio composition, industries and holdings of the Fund are subject to change.
The opinions expressed are those of the Fund's portfolio managers. The opinions are as of the date of this report and are subject to change without notice.
1 Much of the Fund's investment exposure is accomplished through the use of derivatives which may not require the Fund to deposit the full notional amount of the investment with its counterparties, such as a futures commission merchant. The Fund's resulting cash balances are invested in a variety of conservative fixed income securities.
Risk Balanced Commodity Strategy Fund (Unaudited)
TICKER SYMBOLS
Institutional Class | | NRBIX | |
Class A | | NRBAX | |
Class C | | NRBCX | |
PORTFOLIO BY TYPE OF SECURITY
(as a % of Total Investments) | |
Asset-Backed Securities | | | 21.2 | % | |
Certificates of Deposit | | | 2.1 | | |
Corporate Debt Securities | | | 48.4 | | |
U.S. Government Agency Securities | | | 0.3 | | |
U.S. Treasury Securities | | | 18.3 | | |
Short-Term Investments | | | 9.7 | | |
Total | | | 100.0 | % | |
PORTFOLIO BY INVESTMENT
EXPOSURE TO COMMODITY
DERIVATIVES
(as a % of Total Notional Value) | |
Commodity Futures: | | | |
Agriculture | | | 12.8 | % | |
Energy | | | 32.1 | | |
Industrial Metals | | | 19.8 | | |
Livestock | | | 11.1 | | |
Precious Metals | | | 17.6 | | |
Softs | | | 6.6 | | |
Total | | | 100.0 | % | |
PERFORMANCE HIGHLIGHTS2
| | |
Inception | | Average Annual Total Return
Ended 10/31/2014 | |
| | | Date | | 1 Year | | Life of Fund | |
At NAV | | | | | | | |
Institutional Class | | 08/27/2012 | | | –6.88 | % | | | –7.73 | % | |
Class A | | 08/27/2012 | | | –7.25 | % | | | –8.09 | % | |
Class C | | 08/27/2012 | | | –7.77 | % | | | –8.75 | % | |
With Sales Charge | | | | | | | |
Class A | | | | | –12.61 | % | | | –10.55 | % | |
Class C | | | | | –8.69 | % | | | –8.75 | % | |
Index | | | | | | | | | | | | | |
| Bloomberg Commodity Index1,3 | | | | | –5.94 | % | | | –9.16 | % | |
The performance data quoted represent past performance and do not indicate future results. Current performance may be lower or higher than the performance data quoted. For performance data current to the most recent month-end, please visit www.nb.com/performance.
The results shown in the table reflect the reinvestment of income dividends and other distributions, if any. The results do not reflect the effect of taxes a shareholder would pay on Fund distributions or on the redemption of Fund shares.
The investment return and principal value of an investment will fluctuate and shares, when redeemed, may be worth more or less than their original cost.
Returns would have been lower if Neuberger Berman Management LLC (Management) had not reimbursed certain expenses and/or waived a portion of the investment management fees during certain of the periods shown. Repayment by a class (of expenses previously reimbursed and/or fees previously waived by Management) will decrease the class's returns. Please see Note B in the Notes to Financial Statements for specific information regarding expense reimbursement and/or fee waiver arrangements.
As stated in the Fund's most recent prospectus, the total annual operating expense ratios for fiscal year 2013 were 3.70%, 3.81% and 4.70% for Institutional Class, Class A and Class C shares, respectively (before expense reimbursements and/or fee waivers, if any). The expense ratios were 1.10%, 1.46% and 2.21% for Institutional Class, Class A and Class C shares, respectively, after expense reimbursements and/or fee waivers. The expense ratios for fiscal year 2014 can be found in the Financial Highlights section of this report.
Returns shown with a sales charge reflect the deduction of the current maximum initial sales charge of 5.75% for Class A shares and the contingent deferred sales charge (CDSC) for Class C shares. The CDSC for Class C shares is 1%, which is reduced to 0% after 1 year. The performance of the Fund's share classes will differ primarily due to different sales charge structures and class expenses. Please see the prospectus for more information about sales charge structures, if any, and class expenses for your share class.
Risk Balanced Commodity Strategy Fund (Unaudited)
COMPARISON OF A $10,000 INVESTMENT
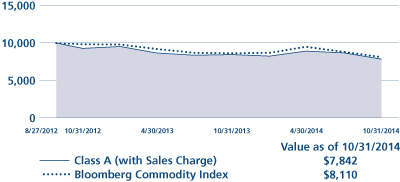
This graph shows the change in value of a hypothetical $10,000 investment in the Fund over the past 10 fiscal years, or since the Fund's inception if it has not operated for 10 years. The graph is based on the Class A shares only; the performance of the Fund's share classes will differ primarily due to different sales charge structures and class expenses (see Performance Highlights chart on previous page). The result is compared with benchmarks, which include a broad-based market index and may include a more narrowly based index. Market indices have not been reduced to reflect any of the fees and costs of investing. The results shown in the graph reflect the reinvestment of income dividends and other distributions, if any. The results do not reflect the effect of taxes a shareholder would pay on Fund distributions or on the redemption of Fund shares. Results represent past performance and do not indicate future results.
1 Please see "Description of Index" on page 6 for a description of the index. Please note that individuals cannot invest directly in any index. The index described in this report does not take into account any fees, expenses or tax consequences of investing in the individual securities that it tracks. Data about the performance of an index are prepared or obtained by Neuberger Berman Management LLC ("Management") and reflect the reinvestment of income dividends and other distributions, if any. The Fund may invest in securities not included in a described index and generally does not invest in all securities included in a described index.
2 During the period from August 2012 through January 2013, the Fund was relatively small, which could have impacted Fund performance. The same techniques used to produce returns in a small fund may not work to produce similar returns in a larger fund.
3 The date used to calculate Life of Fund performance for the index is the inception date of the oldest share class.
For more complete information on any of the Neuberger Berman Alternative and Multi-Asset Class Funds, call Management at (800) 877-9700, or visit our website at www.nb.com.
Bloomberg Commodity Index (formerly the Dow Jones-UBS Commodity Index): | | The index is a rolling index composed of exchange-traded futures contracts on physical commodities. The index relies primarily on liquidity data of futures contracts, along with U.S. dollar-adjusted production data, in determining the relative quantities of included commodities. The index is designed to be a highly liquid and diversified benchmark for commodities investments. The version of the index that is calculated on a total return basis reflects the returns on a fully collateralized investment in the underlying commodity futures contracts, combined with the returns on cash collateral invested in Treasury Bills. | |
Information About Your Fund's Expenses (Unaudited)
As a Fund shareholder, you incur two types of costs: (1) transaction costs, including sales charges (loads) on purchase payments or redemption proceeds (if applicable); and (2) ongoing costs, including management fees, distribution and/or service (12b-1) fees (if applicable), and other Fund expenses. This example is intended to help you understand your ongoing costs (in U.S. dollars) of investing in the Fund and compare these costs with the ongoing costs of investing in other mutual funds.
This table is designed to provide information regarding costs related to your investments. The following examples are based on an investment of $1,000 made at the beginning of the six month period ended October 31, 2014 and held for the entire period. The table illustrates the Fund's costs in two ways:
Actual Expenses and Performance: | | The first section of the table provides information about actual account values and actual expenses in dollars, based on the Fund's actual performance during the period indicated. You may use the information in this line, together with the amount you invested, to estimate the expenses you paid over the period. Simply divide your account value by $1,000 (for example, an $8,600 account value divided by $1,000 = 8.6), then multiply the result by the number in the first section of the table under the heading entitled "Expenses Paid During the Period" to estimate the expenses you paid over the period. | |
Hypothetical Example for Comparison Purposes: | | The second section of the table provides information about hypothetical account values and hypothetical expenses based on the Fund's actual expense ratio and an assumed rate of return at 5% per year before expenses. This return is not the Fund's actual return. The hypothetical account values and expenses may not be used to estimate the actual ending account balance or expenses you paid for the period. You may use this information to compare the ongoing costs of investing in this Fund versus other funds. To do so, compare the expenses shown in this 5% hypothetical example with the 5% hypothetical examples that appear in the shareholder reports of other funds. | |
Please note that the expenses in the table are meant to highlight your ongoing costs only and do not include any transaction costs, such as sales charges (loads) (if applicable). Therefore, the information under the heading "Hypothetical (5% annual return before expenses)" is useful in comparing ongoing costs only, and will not help you determine the relative total costs of owning different funds. In addition, if these transaction costs were included, your costs would have been higher.
Expense Information as of 10/31/14 (Unaudited)
Neuberger Berman Alternative and Multi-Asset Class Funds | |
| | | ACTUAL | | HYPOTHETICAL (5% ANNUAL RETURN BEFORE EXPENSES)(2) | |
| | Beginning
Account
Value
5/1/14 | | Ending
Account
Value
10/31/14 | | Expenses Paid
During the
Period(1)
5/1/14 - 10/31/14 | | Expense
Ratio | | Beginning
Account
Value
5/1/14 | | Ending
Account
Value
10/31/14 | | Expenses Paid
During the
Period(1)
5/1/14 - 10/31/14 | | Expense
Ratio | |
Neuberger Berman Risk Balanced Commodity Strategy Fund | |
Institutional Class | | $ | 1,000.00 | | | $ | 882.20 | | | $ | 5.22 | | | | 1.10 | % | | $ | 1,000.00 | | | $ | 1,019.66 | | | $ | 5.60 | | | | 1.10 | % | |
Class A | | $ | 1,000.00 | | | $ | 880.40 | | | $ | 6.92 | | | | 1.46 | % | | $ | 1,000.00 | | | $ | 1,017.85 | | | $ | 7.43 | | | | 1.46 | % | |
Class C | | $ | 1,000.00 | | | $ | 877.80 | | | $ | 10.46 | | | | 2.21 | % | | $ | 1,000.00 | | | $ | 1,014.06 | | | $ | 11.22 | | | | 2.21 | % | |
(1) For each class, expenses are equal to the annualized expense ratio for the class, including expenses of the Fund's subsidiary (See Note A-1 in the Notes to Consolidated Financial Statements) multiplied by the average account value over the period, multiplied by 184/365 (to reflect the one-half year period shown).
(2) Hypothetical 5% annual return before expenses is calculated by multiplying the number of days in the most recent period divided by 365.
Consolidated Schedule of Investments Risk Balanced Commodity Strategy Fund
PRINCIPAL AMOUNT | | | | VALUE† | |
U.S. Treasury Securities-Backed by the Full Faith and Credit of the U.S. Government (3.3%) | | | |
$ | 3,000,000 | | | U.S. Treasury Notes, 4.00%, due 2/15/15 (Cost $3,034,084) | | $ | 3,033,399 | | |
U.S. Government Agency Securities (0.3%) | | | |
| | 250,000 | | | Federal Farm Credit Banks, Bonds, 0.18%, due 3/13/15 (Cost $250,024) | | | 250,077 | µ | |
Asset-Backed Securities (20.3%) | | | |
| | 705,595 | | | Ally Auto Receivables Trust, Ser. 2011-5, Class A4, 1.32%, due 7/15/16 | | | 707,216 | | |
| | 335,324 | | | Ally Auto Receivables Trust, Ser. 2012-3, Class A3, 0.85%, due 8/15/16 | | | 335,708 | | |
| | 230,781 | | | Ally Auto Receivables Trust, Ser. 2013-1, Class A3, 0.63%, due 5/15/17 | | | 230,981 | | |
| | 800,000 | | | Ally Auto Receivables Trust, Ser. 2012-4, Class A4, 0.80%, due 10/16/17 | | | 800,770 | | |
| | 990,000 | | | Capital One Multi-Asset Execution Trust, Ser. 2007-A2, Class A2, 0.23%, due 12/16/19 | | | 985,415 | µ | |
| | 747,778 | | | CarMax Auto Owner Trust, Ser. 2012-3, Class A3, 0.52%, due 7/17/17 | | | 748,060 | | |
| | 1,475,000 | | | CarMax Auto Owner Trust, Ser. 2013-1, Class A3, 0.60%, due 10/16/17 | | | 1,476,062 | | |
| | 875,000 | | | Chase Issuance Trust, Ser. 2013-A5, Class A, 0.47%, due 5/15/17 | | | 875,342 | | |
| | 1,300,000 | | | Chase Issuance Trust, Ser. 2014-A4, Class A4, 0.36%, due 4/16/18 | | | 1,299,054 | µ | |
| | 1,120,000 | | | Citibank Credit Card Issuance Trust, Ser. 2008-A6, Class A6, 1.36%, due 5/22/17 | | | 1,126,372 | µ | |
| | 1,000,000 | | | Citibank Credit Card Issuance Trust, Ser. 2005-A9, Class A9, 5.10%, due 11/20/17 | | | 1,047,670 | | |
| | 416,319 | | | Ford Credit Auto Owner Trust, Ser. 2014-A, Class A2, 0.48%, due 11/15/16 | | | 416,423 | | |
| | 550,000 | | | Ford Credit Auto Owner Trust, Ser. 2013-B, Class A3, 0.57%, due 10/15/17 | | | 550,453 | | |
| | 600,000 | | | Ford Credit Auto Owner Trust, Ser. 2013-C, Class A3, 0.82%, due 12/15/17 | | | 601,657 | | |
| | 105,827 | | | Honda Auto Receivables Owner Trust, Ser. 2013-3, Class A2, 0.54%, due 1/15/16 | | | 105,860 | | |
| | 1,550,000 | | | Honda Auto Receivables Owner Trust, Ser. 2014-3, Class A2, 0.48%, due 12/15/16 | | | 1,550,391 | | |
| | 640,000 | | | Honda Auto Receivables Owner Trust, Ser. 2011-3, Class A4, 1.17%, due 12/21/17 | | | 640,840 | | |
| | 286,523 | | | Hyundai Auto Receivables Trust, Ser. 2013-C, Class A2, 0.57%, due 6/15/16 | | | 286,707 | | |
| | 298,453 | | | Nelnet Student Loan Trust, Ser. 2006-1, Class A4, 0.32%, due 11/23/22 | | | 298,008 | µ | |
| | 263,818 | | | Nissan Auto Receivables Owner Trust, Ser. 2013-A, Class A3, 0.50%, due 5/15/17 | | | 263,892 | | |
| | 994,519 | | | SLM Student Loan Trust, Ser. 2014-2, Class A1, 0.40%, due 7/25/19 | | | 994,576 | µ | |
| | 1,296,833 | | | SLM Student Loan Trust, Ser. 2005-9, Class A5, 0.35%, due 1/27/25 | | | 1,294,377 | µ | |
| | 1,500,000 | | | Toyota Auto Receivables Owner Trust, Ser. 2014-B, Class A2, 0.40%, due 12/15/16 | | | 1,498,914 | | |
| | 447,239 | | | World Omni Auto Receivables Trust, Ser. 2013-B, Class A2, 0.48%, due 11/15/16 | | | 447,241 | | |
| | | | | Total Asset-Backed Securities (Cost $18,634,002) | | | 18,581,989 | | |
Corporate Debt Securities (46.3%) | | | |
Aerospace & Defense (1.6%) | | | |
| | 805,000 | | | Rockwell Collins, Inc., Senior Unsecured Notes, 0.58%, due 12/15/16 | | | 805,852 | µ | |
| | 695,000 | | | United Technologies Corp., Senior Unsecured Notes, 0.73%, due 6/1/15 | | | 696,907 | µ | |
| | | | 1,502,759 | | |
Automobile Manufacturers (5.1%) | | | |
| | 965,000 | | | American Honda Finance Corp., Senior Unsecured Notes, 0.73%, due 10/7/16 | | | 971,664 | µ | |
| | 1,100,000 | | | Daimler Finance North America LLC, Guaranteed Notes, 0.57%, due 8/1/17 | | | 1,098,507 | ñµ | |
| | 1,120,000 | | | Toyota Motor Credit Corp., Senior Unsecured Medium-Term Notes, 0.33%, due 9/23/16 | | | 1,118,737 | µ | |
| | 445,000 | | | Toyota Motor Credit Corp., Senior Unsecured Notes, 0.52%, due 5/17/16 | | | 446,025 | µ | |
| | 410,000 | | | Volkswagen Group of America Finance LLC, Guaranteed Notes, 0.60%, due 5/23/17 | | | 410,413 | ñµ | |
| | 575,000 | | | Volkswagen Int'l Finance NV, Guaranteed Notes, 0.83%, due 11/20/14 | | | 575,139 | ñµ | |
| | | | 4,620,485 | | |
See Notes to Schedule of Investments
Consolidated Schedule of Investments Risk Balanced Commodity Strategy Fund (cont'd)
PRINCIPAL AMOUNT | | | | VALUE† | |
Banks (14.4%) | | | |
$ | 710,000 | | | Bank of America N.A., Senior Unsecured Notes, 0.70%, due 11/14/16 | | $ | 710,287 | µ | |
| | 490,000 | | | Bank of Montreal, Senior Unsecured Medium-Term Notes, 0.75%, due 7/15/16 | | | 492,765 | µ | |
| | 1,000,000 | | | Bank of New York Mellon Corp., Senior Unsecured Medium-Term Notes, 0.46%, due 3/4/16 | | | 1,000,398 | µ | |
| | 750,000 | | | Goldman Sachs Group, Inc., Senior Unsecured Medium-Term Notes, 1.23%, due 11/21/14 | | | 750,305 | µ | |
| | 965,000 | | | HSBC USA, Inc., Senior Unsecured Notes, 0.53%, due 6/23/17 | | | 965,578 | µ | |
| | 2,105,000 | | | JPMorgan Chase & Co., Senior Unsecured Notes, 0.75%, due 2/15/17 | | | 2,111,191 | µ | |
| | 230,000 | | | Mizuho Bank Ltd., Guaranteed Notes, 0.66%, due 4/16/17 | | | 230,390 | ñµ | |
| | 600,000 | | | Morgan Stanley, Senior Unsecured Global Medium-Term Notes, 1.18%, due 12/19/14 | | | 600,552 | µ | |
| | 395,000 | | | National Australia Bank Ltd., Senior Unsecured Notes, 0.78%, due 7/25/16 | | | 397,327 | µ | |
| | 476,000 | | | National City Corp., Senior Unsecured Notes, 4.90%, due 1/15/15 | | | 480,004 | | |
| | 730,000 | | | Royal Bank of Canada, Senior Unsecured Global Medium-Term Notes, 0.45%, due 12/16/15 | | | 731,142 | µ | |
| | 450,000 | | | Svenska Handelsbanken AB, Senior Unsecured Notes, 0.70%, due 9/23/16 | | | 452,202 | µ | |
| | 655,000 | | | Toronto-Dominion Bank, Senior Unsecured Medium-Term Notes, 0.44%, due 11/6/15 | | | 655,721 | µ | |
| | 920,000 | | | U.S. Bank N.A., Senior Unsecured Bank Notes, 0.46%, due 1/30/17 | | | 920,587 | µ | |
| | 1,340,000 | | | Wells Fargo & Co., Senior Unsecured Medium-Term Notes, 0.49%, due 9/8/17 | | | 1,338,487 | µ | |
| | 500,000 | | | Wells Fargo & Co., Senior Unsecured Medium-Term Notes, 0.76%, due 7/20/16 | | | 502,169 | µ | |
| | 850,000 | | | Westpac Banking Corp., Senior Unsecured Notes, 0.99%, due 9/25/15 | | | 855,526 | µ | |
| | | | 13,194,631 | | |
Beverages (0.9%) | | | |
| | 460,000 | | | Anheuser-Busch InBev Finance, Inc., Guaranteed Notes, 0.42%, due 1/27/17 | | | 459,499 | µ | |
| | 330,000 | | | Coca-Cola Co., Senior Unsecured Notes, 0.21%, due 3/5/15 | | | 330,035 | µ | |
| | | | 789,534 | | |
Computers (2.0%) | | | |
| | 455,000 | | | Apple, Inc., Senior Unsecured Notes, 0.28%, due 5/3/16 | | | 455,000 | µ | |
| | 390,000 | | | Apple, Inc., Senior Unsecured Notes, 0.31%, due 5/5/17 | | | 389,806 | µ | |
| | 985,000 | | | International Business Machines Corp., Senior Unsecured Notes, 0.26%, due 7/29/15 | | | 985,000 | µ | |
| | | | 1,829,806 | | |
Diversified Financial Services (3.8%) | | | |
| | 925,000 | | | American Express Credit Corp., Senior Unsecured Medium-Term Notes, 1.33%, due 6/12/15 | | | 930,735 | µ | |
| 1,860,000
| | | General Electric Capital Corp., Senior Unsecured Global Medium-Term Notes,
0.88%, due 7/12/16 | | | 1,875,125
| µØØ | |
| | 675,000 | | | Harley-Davidson Funding Corp., Guaranteed Notes, 5.75%, due 12/15/14 | | | 679,065 | ñ | |
| | | | 3,484,925 | | |
Electric (1.6%) | | | |
| | 1,023,000 | | | Duke Energy Ohio, Inc., 1st Mortgage Notes, 0.37%, due 3/6/15 | | | 1,023,241 | µ | |
| | 460,000 | | | Electricite de France, Senior Unsecured Notes, 0.69%, due 1/20/17 | | | 461,341 | ñµ | |
| | | | 1,484,582 | | |
Healthcare — Products (1.6%) | | | |
| | 1,470,000 | | | Medtronic, Inc., Senior Unsecured Notes, 0.33%, due 2/27/17 | | | 1,466,281 | µ | |
See Notes to Schedule of Investments
Consolidated Schedule of Investments Risk Balanced Commodity Strategy Fund (cont'd)
PRINCIPAL AMOUNT | | | | VALUE† | |
Insurance (2.2%) | | | |
$ | 210,000 | | | Berkshire Hathaway Finance Corp., Guaranteed Notes, 0.38%, due 1/10/17 | | $ | 210,003 | µ | |
| | 270,000 | | | Metropolitan Life Global Funding I, Secured Notes, 0.76%, due 7/15/16 | | | 272,073 | ñµ | |
| | 1,000,000 | | | Pricoa Global Funding I, Secured Notes, 0.50%, due 8/19/15 | | | 1,001,984 | ñµ | |
| | 495,000 | | | Principal Life Global Funding II, Senior Secured Notes, 0.61%, due 5/27/16 | | | 496,476 | ñµ | |
| | | | 1,980,536 | | |
Machinery — Construction & Mining (0.6%) | | | |
| 170,000
| | | Caterpillar Financial Services Corp., Senior Unsecured Medium-Term Notes,
0.35%, due 11/25/15 | | | 170,161
| µ | |
| | 400,000 | | | Caterpillar Financial Services Corp., Senior Unsecured Medium-Term Notes,
0.47%, due 2/26/16 | | | 400,745
| µ | |
| | | | 570,906 | | |
Machinery Diversified (0.8%) | | | |
| | 510,000 | | | John Deere Capital Corp., Senior Unsecured Medium-Term Notes, 0.35%, due 6/15/15 | | | 510,406 | µ | |
| | 210,000 | | | John Deere Capital Corp., Senior Unsecured Notes, 0.52%, due 10/11/16 | | | 210,573 | µ | |
| | | | 720,979 | | |
Media (0.9%) | | | |
| | 770,000 | | | NBCUniversal Enterprise, Inc., Guaranteed Notes, 0.77%, due 4/15/16 | | | 773,235 | ñµ | |
| | 65,000 | | | Walt Disney Co., Senior Unsecured Medium-Term Notes, 0.22%, due 2/11/15 | | | 65,004 | µ | |
| | | | 838,239 | | |
Mining (1.3%) | | | |
| | 750,000 | | | BHP Billiton Finance USA Ltd., Guaranteed Notes, 1.13%, due 11/21/14 | | | 750,224 | | |
| | 440,000 | | | BHP Billiton Finance USA Ltd., Guaranteed Notes, 0.48%, due 9/30/16 | | | 440,595 | µ | |
| | | | 1,190,819 | | |
Oil & Gas (3.5%) | | | |
| | 535,000 | | | BP Capital Markets PLC, Guaranteed Notes, 0.66%, due 11/7/16 | | | 536,707 | µ | |
| | 400,000 | | | BP Capital Markets PLC, Guaranteed Notes, 1.70%, due 12/5/14 | | | 400,445 | | |
| | 800,000 | | | Canadian Natural Resources Ltd., Senior Unsecured Notes, 4.90%, due 12/1/14 | | | 802,661 | | |
| | 400,000 | | | Devon Energy Corp., Senior Unsecured Notes, 0.68%, due 12/15/15 | | | 401,289 | µ | |
| | 1,000,000 | | | Nexen Energy ULC, Guaranteed Notes, 5.20%, due 3/10/15 | | | 1,016,532 | | |
| | | | 3,157,634 | | |
Pharmaceuticals (1.0%) | | | |
| | 335,000 | | | Bayer US Finance LLC, Guaranteed Notes, 0.48%, due 10/7/16 | | | 335,255 | ñµ | |
| | 290,000 | | | Merck & Co., Inc., Senior Unsecured Notes, 0.42%, due 5/18/16 | | | 290,615 | µ | |
| | 320,000 | | | Pfizer, Inc., Senior Unsecured Notes, 0.38%, due 5/15/17 | | | 319,677 | µ | |
| | | | 945,547 | | |
Pipelines (1.3%) | | | |
| | 1,165,000 | | | TransCanada PipeLines Ltd., Senior Unsecured Notes, 0.91%, due 6/30/16 | | | 1,171,967 | µØØ | |
See Notes to Schedule of Investments
Consolidated Schedule of Investments Risk Balanced Commodity Strategy Fund (cont'd)
PRINCIPAL AMOUNT | | | | VALUE† | |
Real Estate Investment Trusts (0.4%) | | | |
$ | 346,000 | | | Simon Property Group LP, Senior Unsecured Notes, 4.20%, due 2/1/15 | | $ | 346,000 | | |
Software (0.9%) | | | |
| | 825,000 | | | Oracle Corp., Senior Unsecured Notes, 0.43%, due 7/7/17 | | | 824,997 | µ | |
Telecommunications (1.6%) | | | |
| | 1,450,000 | | | Cisco Systems, Inc., Senior Unsecured Notes, 0.51%, due 3/3/17 | | | 1,451,675 | µ | |
Transportation (0.8%) | | | |
| | 770,000 | | | Canadian National Railway Co., Senior Unsecured Notes, 0.44%, due 11/6/15 | | | 770,386 | µ | |
| | | | | Total Corporate Debt Securities (Cost $42,326,006) | | | 42,342,688 | | |
Certificates of Deposit (2.0%) | | | |
| | 480,000 | | | Credit Suisse New York, Yankee CD, 0.64%, due 12/7/15 | | | 480,000 | µ | |
| | 950,000 | | | Nordea Bank Finland PLC, Yankee CD1, 0.41%, due 6/13/16 | | | 949,694 | µ | |
| | 450,000 | | | Sumitomo Mitsui Banking Corp., Yankee CD, 0.56%, due 3/3/16 | | | 449,884 | µ | |
| | | | | Total Certificates of Deposit (Cost $1,880,000) | | | 1,879,578 | | |
Short-Term Investments (23.5%) | | | |
| U.S. Treasury Securities-Backed by the Full Faith and Credit of the U.S. Governmenta (14.2%) | | | |
| | 5,000,000 | | | U.S. Treasury Bill, Disc. Notes, 0.00%, due 11/13/14 | | | 4,999,990 | | |
| | 7,000,000 | | | U.S. Treasury Bill, Disc. Notes, 0.01%, due 12/18/14 | | | 6,999,888 | | |
| | 1,000,000 | | | U.S. Treasury Bill, Disc. Notes, 0.01%, due 1/2/15 | | | 999,987 | | |
| | | | 12,999,865 | | |
NUMBER OF SHARES | |
Money Market Fund (9.3%) | | | |
| | 8,449,352 | | | State Street Institutional Government Money Market Fund Premier Class | | | 8,449,352 | Ø؆† | |
| | | | | Total Short-Term Investments (Cost $21,448,941) | | | 21,449,217 | | |
| | | | | Total Investments (95.7%) (Cost $87,573,057) | | | 87,536,948 | ## | |
| | | | | Cash, receivables and other assets, less liabilities (4.3%) | | | 3,945,027 | ± | |
| | | | | Total Net Assets (100.0%) | | $ | 91,481,975 | | |
See Notes to Schedule of Investments
Notes to Consolidated Schedule of Investments
† In accordance with Accounting Standards Codification ("ASC") 820 "Fair Value Measurement" ("ASC 820"), all investments held by Neuberger Berman Risk Balanced Commodity Strategy Fund (the "Fund") are carried at the value that Neuberger Berman Management LLC ("Management") believes the Fund would receive upon selling an investment in an orderly transaction to an independent buyer in the principal or most advantageous market for the investment under current market conditions. Various inputs, including the volume and level of activity for the asset or liability in the market, are considered in valuing the Fund's investments, some of which are discussed below. Significant management judgment may be necessary to value investments in accordance with ASC 820.
ASC 820 established a three-tier hierarchy of inputs to create a classification of value measurements for disclosure purposes. The three-tier hierarchy of inputs is summarized in the three broad Levels listed below.
• Level 1 – quoted prices in active markets for identical investments
• Level 2 – other observable inputs (including quoted prices for similar investments, interest rates, prepayment speeds, credit risk, amortized cost, etc.)
• Level 3 – unobservable inputs (including the Fund's own assumptions in determining the fair value of investments)
The inputs or methodology used for valuing an investment are not necessarily an indication of the risk associated with investing in those securities.
The value of the Fund's investments in debt securities is determined by Management primarily by obtaining valuations from independent pricing services based on readily available bid quotations, or if quotations are not available, by methods which include various considerations based on security type (generally Level 2 inputs). In addition to the consideration of yields or prices of securities of comparable quality, coupon, maturity and type; indications as to values from dealers; and general market conditions, the following is a description of other Level 2 inputs and related valuation techniques used by independent pricing services to value certain types of debt securities of the Fund:
Corporate Debt Securities. Inputs used to value corporate debt securities generally include relative credit information, observed market movements, sector news, spread to the U.S. Treasury market, and other market information, which may include benchmark yields, reported trades, broker-dealer quotes, issuer spreads, benchmark securities, bids, offers, and reference data, such as market research publications, when available ("Other Market Information").
Asset-Backed Securities. Inputs used to value asset-backed securities generally include models that consider a number of factors, which may include the following: prepayment speeds, cash flows, spread adjustments and Other Market Information.
U.S. Treasury Securities. Inputs used to value U.S. Treasury securities generally include quotes from several inter-dealer brokers and Other Market Information.
U.S. Government Agency Securities. Inputs used to value U.S. Government Agency securities generally include obtaining benchmark quotes and Other Market Information.
The value of commodity futures contracts is determined by Management by obtaining valuations from independent pricing services at the settlement price at the market close (Level 1 inputs).
Management has developed a process to periodically review information provided by independent pricing services for all types of securities.
Certificates of deposit are valued at amortized cost.
See Notes to Financial Statements
Notes to Consolidated Schedule of Investments (cont'd)
Investments in money market funds are valued using the fund's daily calculated net asset value per share (Level 2 inputs).
If a valuation is not available from an independent pricing service, or if Management has reason to believe that the valuation received does not represent the amount the Fund might reasonably expect to receive on a current sale in an orderly transaction, Management seeks to obtain quotations from brokers or dealers (generally considered Level 2 or Level 3 inputs depending on the number of quotes available). If such quotations are not readily available, the security is valued using methods the Neuberger Berman Alternative Funds' Board of Trustees (the "Board") has approved in the good-faith belief that the resulting valuation will reflect the fair value of the security. Numerous factors may be considered when determining the fair value of a security based on Level 2 or Level 3 inputs, including available analyst, media or other reports, trading in futures or American Depositary Receipts ("ADRs") and whether the issuer of the security being fair valued has other securities outstanding.
Fair value prices are necessarily estimates, and there is no assurance that such a price will be at or close to the price at which the security is next quoted or next trades.
The following is a summary, categorized by Level, of inputs used to value the Fund's investments as of October 31, 2014:
Asset Valuation Inputs | |
| | | Level 1 | | Level 2 | | Level 3 | | Total | |
Investments: | |
U.S. Treasury Securities-Backed by the Full Faith and Credit
of the U.S. Government | | $ | — | | | $ | 3,033,399 | | | $ | — | | | $ | 3,033,399 | | |
U.S. Government Agency Securities | | | — | | | | 250,077 | | | | — | | | | 250,077 | | |
Asset-Backed Securities | | | — | | | | 18,581,989 | | | | — | | | | 18,581,989 | | |
Corporate Debt Securities^ | | | — | | | | 42,342,688 | | | | — | | | | 42,342,688 | | |
Certificates of Deposit | | | — | | | | 1,879,578 | | | | — | | | | 1,879,578 | | |
Short-Term Investments | | | — | | | | 21,449,217 | | | | — | | | | 21,449,217 | | |
Total Investments | | $ | — | | | $ | 87,536,948 | | | $ | — | | | $ | 87,536,948 | | |
^ The Consolidated Schedule of Investments provides information on the industry categorization for the portfolio.
The Fund had no transfers between Levels 1, 2 and 3 during the year ended October 31, 2014.
The following is a summary, categorized by Level, of inputs used to value the Fund's derivatives as of October 31, 2014:
Asset Valuation Inputs | |
| | | Level 1 | | Level 2 | | Level 3 | | Total | |
Futures Contracts (unrealized appreciation) | | $ | 2,826,382 | | | $ | — | | | $ | — | | | $ | 2,826,382 | | |
Liability Valuation Inputs | |
| | | Level 1 | | Level 2 | | Level 3 | | Total | |
Futures Contracts (unrealized depreciation) | | $ | (6,952,251 | ) | | $ | — | | | $ | — | | | $ | (6,952,251 | ) | |
## At October 31, 2014, the cost of investments for U.S. federal income tax purposes was $87,573,057. Gross unrealized appreciation of investments was $35,507 and gross unrealized depreciation of investments was $71,616, resulting in net unrealized depreciation of $36,109 based on cost for U.S. federal income tax purposes.
See Notes to Financial Statements
Notes to Consolidated Schedule of Investments (cont'd)
ñ Securities were purchased under Rule 144A of the Securities Act of 1933, as amended (the "1933 Act"), or are private placements and, unless registered under the 1933 Act or exempted from registration, may only be sold to qualified institutional investors. These securities have been deemed by the investment manager to be liquid. At October 31, 2014, these securities amounted to $6,333,878 or 6.9% of net assets.
ØØ All or a portion of this security is segregated in connection with obligations for commodity futures contracts.
†† A portion of this security is held by Neuberger Berman Cayman Commodity Fund I Ltd. (the "Subsidiary"), a wholly-owned subsidiary of the Fund. See Note A-1 in the Notes to Consolidated Financial Statements.
a Interest rate represents discount rate at time of purchase, not a coupon rate.
µ Floating rate securities are securities whose yields vary with a designated index or market rate. These securities are shown at their current rates as of October 31, 2014, and their final maturities.
± See Note A-11 in the Notes to Consolidated Financial Statements for the Fund's or Subsidiary's open positions in derivatives at October 31, 2014.
See Notes to Financial Statements
Consolidated Statement of Assets and Liabilities*
Neuberger Berman Alternative Funds
| | | RISK
BALANCED
COMMODITY
STRATEGY
FUND | |
| | | October 31, 2014 | |
Assets | |
Investments in securities, at value ** (Note A)—see Schedule of Investments: | |
Unaffiliated issuers | | $ | 87,536,948 | | |
Deposits with brokers for futures contracts (Note A-11) | | | 4,342,708 | | |
Interest receivable | | | 140,488 | | |
Receivable for Fund shares sold | | | 126,987 | | |
Receivable from Management-net (Note B) | | | 5,357 | | |
Prepaid expenses and other assets | | | 29,655 | | |
Total Assets | | | 92,182,143 | | |
Liabilities | |
Payable for Fund shares redeemed | | | 61,550 | | |
Payable for variation margin (Note A-11) | | | 400,114 | | |
Payable to investment manager-net (Note B) | | | 59,830 | | |
Payable to trustees | | | 1,881 | | |
Accrued expenses and other payables | | | 176,793 | | |
Total Liabilities | | | 700,168 | | |
Net Assets | | $ | 91,481,975 | | |
Net Assets consist of: | |
Paid-in capital | | $ | 96,174,138 | | |
Undistributed net investment income (loss) | | | (531,223 | ) | |
Accumulated net realized gains (losses) on investments | | | 1,038 | | |
Net unrealized appreciation (depreciation) in value of investments | | | (4,161,978 | ) | |
Net Assets | | $ | 91,481,975 | | |
Net Assets | |
Institutional Class | | | 20,497,478 | | |
Class A | | | 66,783,527 | | |
Class C | | | 4,200,970 | | |
Shares Outstanding ($.001 par value; unlimited shares authorized) | |
Institutional Class | | | 2,443,152 | | |
Class A | | | 8,024,557 | | |
Class C | | | 513,199 | | |
Net Asset Value, offering and redemption price per share | |
Institutional Class | | $ | 8.39 | | |
Net Asset Value and redemption price per share | |
Class A | | $ | 8.32 | | |
Offering Price per share | |
Class A‡ | | $ | 8.83 | | |
Net Asset Value and offering price per share | |
Class C^ | | $ | 8.19 | | |
** Cost of Investments | | $ | 87,573,057 | | |
‡ On single retail sales of less than $50,000. On sales of $50,000 or more or in certain other circumstances described in the Fund's prospectus, offering price is reduced.
^ Redemption price per share is equal to net asset value less any applicable contingent deferred sales charge.
* See Notes A-1 and A-2 of the Notes to Consolidated Financial Statements.
See Notes to Financial Statements
Consolidated Statement of Operations*
Neuberger Berman Alternative Funds
| | | RISK
BALANCED
COMMODITY
STRATEGY
FUND | |
| | | For the
Year Ended
October 31,
2014 | |
Investment Income: | |
Income (Note A): | |
Interest income—unaffiliated issuers | | $ | 258,411 | | |
Expenses: | |
Investment management fees (Note B) | | | 486,324 | | |
Administration fees (Note B) | | | 41,685 | | |
Administration fees (Note B): | |
Institutional Class | | | 13,621 | | |
Class A | | | 99,893 | | |
Class C | | | 8,787 | | |
Distribution fees (Note B): | |
Class A | | | 124,866 | | |
Class C | | | 43,937 | | |
Shareholder servicing agent fees: | |
Institutional Class | | | 1,537 | | |
Class A | | | 9,654 | | |
Class C | | | 5,129 | | |
Subsidiary administration fees (Note B) | | | 49,966 | | |
Audit fees | | | 86,100 | | |
Custodian and accounting fees | | | 71,073 | | |
Insurance expense | | | 1,111 | | |
Legal fees | | | 141,069 | | |
Registration and filing fees | | | 61,847 | | |
Shareholder reports | | | 48,047 | | |
Trustees' fees and expenses | | | 37,095 | | |
Miscellaneous | | | 29,268 | | |
Total expenses | | | 1,361,009 | | |
Expenses reimbursed by Management (Note B) | | | (368,068 | ) | |
Total net expenses | | | 992,941 | | |
Net investment income (loss) | | $ | (734,530 | ) | |
Realized and Unrealized Gain (Loss) on Investments (Note A): | |
Net realized gain (loss) on: | |
Sales of investment securities of unaffiliated issuers | | | 6,583 | | |
Commodity futures contracts | | | (3,806,990 | ) | |
Change in net unrealized appreciation (depreciation) in value of: | |
Unaffiliated investment securities | | | (51,535 | ) | |
Commodity futures contracts | | | (3,887,439 | ) | |
Net gain (loss) on investments | | | (7,739,381 | ) | |
Net increase (decrease) in net assets resulting from operations | | $ | (8,473,911 | ) | |
* See Notes A-1 and A-2 of the Notes to Consolidated Financial Statements.
See Notes to Financial Statements
Consolidated Statements of Changes in Net Assets*
Neuberger Berman Alternative Funds | |
| | | RISK BALANCED COMMODITY
STRATEGY FUND | |
| | | Year Ended
October 31,
2014 | | Year Ended
October 31,
2013 | |
Increase (Decrease) in Net Assets: | |
From Operations (Note A): | |
Net investment income (loss) | | $ | (734,530 | ) | | $ | (221,889 | ) | |
Net realized gain (loss) on investments | | | (3,800,407 | ) | | | 28,023 | | |
Change in net unrealized appreciation (depreciation) of investments | | | (3,938,974 | ) | | | (187,513 | ) | |
Net increase (decrease) in net assets resulting from operations | | | (8,473,911 | ) | | | (381,379 | ) | |
From Fund Share Transactions (Note D): | |
Proceeds from shares sold: | |
Institutional Class | | | 13,347,175 | | | | 11,363,372 | | |
Class A | | | 50,351,242 | | | | 38,040,599 | | |
Class C | | | 1,518,489 | | | | 3,611,986 | | |
Payments for shares redeemed: | |
Institutional Class | | | (911,849 | ) | | | (6,261,561 | ) | |
Class A | | | (12,022,096 | ) | | | (3,247,163 | ) | |
Class C | | | (507,868 | ) | | | (146,791 | ) | |
Net increase (decrease) from Fund share transactions | | | 51,775,093 | | | | 43,360,442 | | |
Net Increase (Decrease) in Net Assets | | | 43,301,182 | | | | 42,979,063 | | |
Net Assets: | |
Beginning of year | | | 48,180,793 | | | | 5,201,730 | | |
End of year | | $ | 91,481,975 | | | $ | 48,180,793 | | |
Undistributed net investment income (loss) at end of year | | $ | (531,223 | ) | | $ | (175,990 | ) | |
* See Notes A-1 and A-2 of the Notes to Consolidated Financial Statements.
See Notes to Financial Statements
Notes to Consolidated Financial Statements Risk Balanced Commodity Strategy Fund
Note A—Summary of Significant Accounting Policies:
1 General: Neuberger Berman Alternative Funds (the "Trust") is a Delaware statutory trust organized pursuant to an Amended and Restated Trust Instrument dated March 27, 2014. The Trust is registered as an open-end management investment company under the Investment Company Act of 1940, as amended (the "1940 Act"), and its shares are registered under the Securities Act of 1933, as amended (the "1933 Act"). The Fund is a separate operating series of the Trust and is non-diversified. The Fund had no operations until August 27, 2012, other than matters relating to its organization and registration of shares under the 1933 Act. The Fund offers Institutional Class shares, Class A shares and Class C shares. The Board may establish additional series or classes of shares without the approval of shareholders.
The assets of the Fund belong only to the Fund, and the liabilities of the Fund are borne solely by the Fund and no other.
The Fund invests in commodity-related instruments through the Subsidiary, which is organized under the laws of the Cayman Islands. Subscription agreements were entered into between the Fund and the Subsidiary with the intent that the Fund will remain the sole shareholder of the Subsidiary. The Subsidiary is governed by its own Board of Directors.
As of October 31, 2014, the value of the Fund's investment in the Subsidiary was as follows:
Investment in
Subsidiary | | Percentage of
Net Assets | |
| $ | 11,503,695 | | | | 12.6 | % | |
The Fund is an investment company and accordingly follows the investment company accounting and reporting guidance of the Financial Accounting Standards Board (FASB) Accounting Standard Codification Topic 946 "Financial Services—Investment Companies".
The preparation of financial statements in accordance with U.S. generally accepted accounting principles ("GAAP") requires Management to make estimates and assumptions at the date of the financial statements. Actual results could differ from those estimates.
2 Consolidation: The accompanying financial statements of the Fund present the consolidated accounts of the Fund and the Subsidiary. All intercompany accounts and transactions have been eliminated in consolidation.
3 Portfolio valuation: Investment securities are valued as indicated in the notes following the Schedule of Investments.
4 Foreign currency translation: The accounting records of the Fund and Subsidiary are maintained in U.S. dollars. Foreign currency amounts are translated into U.S. dollars using the exchange rate as of the end of regular trading on the New York Stock Exchange on business days, usually 4:00 p.m. Eastern time, to determine the value of investments, other assets and liabilities. Purchase and sale prices of securities, and income and expenses, are translated into U.S. dollars at the prevailing rate of exchange on the respective dates of such transactions. Net unrealized foreign currency gain (loss), if any, arises from changes in the value of assets and liabilities, other than investments in securities, as a result of changes in exchange rates and is stated separately in the Consolidated Statement of Operations.
5 Securities transactions and investment income: Securities transactions are recorded on the trade date for financial reporting purposes. Dividend income is recorded on the ex-dividend date or, for certain foreign
dividends, as soon as the Fund becomes aware of the dividends. Non-cash dividends included in dividend income, if any, are recorded at the fair market value of the securities received. Interest income, including accretion of discount (adjusted for original issue discount, where applicable) and amortization of premium, where applicable, is recorded on the accrual basis. Realized gains and losses from securities transactions and foreign currency transactions, if any, are recorded on the basis of identified cost and stated separately in the Consolidated Statement of Operations.
6 Income tax information: It is the policy of the Fund to continue to qualify for treatment as a regulated investment company by complying with the requirements of the U.S. Internal Revenue Code applicable to regulated investment companies and to distribute substantially all of its net investment income and net realized capital gains to its shareholders. To the extent the Fund distributes substantially all of its net investment income and net realized capital gains to shareholders, no federal income or excise tax provision is required.
The Fund has adopted the provisions of ASC 740 "Income Taxes" ("ASC 740"). ASC 740 sets forth a minimum threshold for financial statement recognition of a tax position taken, or expected to be taken, in a tax return. The Fund recognizes interest and penalties, if any, related to unrecognized tax positions as an income tax expense in the Consolidated Statement of Operations. The Fund is subject to examination by U.S. federal and state tax authorities for returns filed for the tax years for which the applicable statutes of limitations have not yet expired. As of October 31, 2014, the Fund did not have any unrecognized tax positions.
The Subsidiary is a controlled foreign corporation under the U.S. Internal Revenue Code. As a U.S. shareholder of a controlled foreign corporation, the Fund will include in its taxable income its share of the Subsidiary's current earnings and profits (including net realized gains). Any deficit generated by the Subsidiary will be disregarded for purposes of computing the Fund's taxable income in the current period and also disregarded for all future periods.
Income distributions and capital gain distributions are determined in accordance with income tax regulations, which may differ from GAAP. These differences are primarily due to differing treatments of income and gains on various investment securities held by the Fund, timing differences and differing characterization of distributions made by the Fund. The Fund may also utilize earnings and profits distributed to shareholders on redemption of shares as a part of the dividends-paid deduction for income tax purposes.
As determined on October 31, 2014, permanent differences resulting primarily from different book and tax accounting were reclassified at year end. Such differences may be attributed to the tax treatment of one or more of the following: net operating losses, ordinary loss netting to reduce short term capital gains, Subsidiary income and gain (loss). These reclassifications had no effect on net income, net asset value ("NAV") or NAV per share of the Fund. For the year ended October 31, 2014, the Fund recorded the following permanent reclassifications:
| Paid-in Capital | | Undistributed
Net Investment
Income (Loss) | | Accumulated
Net Realized
Gains (Losses)
on Investments | |
| $ | (4,180,742 | ) | | $ | 379,297 | | | $ | 3,801,445 | | |
For tax purposes, distributions of short-term capital gains are taxable to shareholders as ordinary income.
As of October 31, 2014, the components of distributable earnings (accumulated losses) on a U.S. federal income tax basis were as follows:
Undistributed
Ordinary
Income | | Undistributed
Long-Term
Capital Gain | | Unrealized
Appreciation
(Depreciation) | | Loss
Carryforwards
and Deferrals | | Other Temporary
Differences | | Total | |
| $ | — | | | $ | 1,038 | | | $ | (36,109 | ) | | $ | (530,552 | ) | | $ | (4,126,540 | ) | | $ | (4,692,163 | ) | |
The difference between book basis and tax basis distributable earnings is primarily due to organization expense.
To the extent the Fund's net realized capital gains, if any, can be offset by capital loss carryforwards, it is the policy of the Fund not to distribute such gains. For taxable years beginning after December 22, 2010, the capital loss carryforward rules allow for regulated investment companies to carry forward capital losses indefinitely and to retain the character of capital loss carryforwards as short-term or long-term. As determined at October 31, 2014, the Fund had no unused capital loss carryforwards available for federal income tax purposes to offset net realized capital gains.
Under current tax regulations, capital losses realized on investment transactions after October 31 may be deferred and treated as occurring on the first day of the following fiscal year. Under the Regulated Investment Company Modernization Act of 2010, the Fund may also defer any realized late-year ordinary losses as occurring on the first day of the following fiscal year. Late-year ordinary losses represent ordinary losses realized on investment transactions after December 31 and specified losses (ordinary losses from the sale, exchange, or other disposition of property, net foreign currency losses and net passive foreign investment company mark to market losses) realized on investment transactions after October 31. For the year ended October 31, 2014, the Fund elected to defer the following late-year ordinary losses and post October capital losses:
Late-Year
Ordinary Loss
Deferral | |
| $ | (530,552 | ) | |
7 Distributions to shareholders: The Fund may earn income, net of expenses, daily on its investments. Distributions from net investment income and net realized capital gains, if any, generally are distributed once a year (usually in December) and are recorded on the ex-date.
8 Foreign taxes: Foreign taxes withheld, if any, represent amounts withheld by foreign tax authorities, net of refunds recoverable.
9 Expense allocation: Certain expenses are applicable to multiple funds. Expenses directly attributable to the Fund are charged to the Fund. Expenses of the Trust that are not directly attributable to a particular series of the Trust (e.g., the Fund) are allocated among the series of the Trust, on the basis of relative net assets, except where a more appropriate allocation of expenses to each of the series can otherwise be made fairly. Expenses borne by the complex of related investment companies, which includes open-end and closed-end investment companies for which Management serves as investment manager, that are not directly attributable to a particular investment company in the complex (e.g., the Trust) or series thereof are allocated among the investment companies in the complex or series thereof, on the basis of relative net assets, except where a more appropriate allocation of expenses to each of the investment companies in the complex or series thereof can otherwise be made fairly. The Fund's expenses (other than those specific to each class) are allocated proportionally each day among the classes based upon the relative net assets of each class.
10 Investments in foreign securities: Investing in foreign securities may involve certain sovereign and other risks, in addition to the credit and market risks normally associated with domestic securities. These additional risks include the possibility of adverse political and economic developments (including political instability, nationalization, expropriation, or confiscatory taxation) and the potentially adverse effects of unavailability of public information regarding issuers, less governmental supervision and regulation of financial markets, reduced liquidity of certain financial markets, and the lack of uniform accounting, auditing, and financial reporting standards or the application of standards that are different or less stringent than those applied in the United States. Foreign securities also may experience greater price volatility, higher rates of inflation, and delays in settlement.
11 Derivative instruments: During the year ended October 31, 2014, the Fund's use of derivatives was limited to commodity futures contracts. The Fund has adopted the provisions of ASC 815 "Derivatives and Hedging" ("ASC 815"). The disclosure requirements of ASC 815 distinguish between derivatives that qualify for hedge accounting and those that do not. Because investment companies value their derivatives at fair value and recognize changes in fair value through the Consolidated Statement of Operations, they do not qualify for hedge accounting.
Accordingly, even though the Fund's investments in derivatives may represent economic hedges, they are considered non-hedge transactions for purposes of this disclosure.
Commodity futures contracts: During the year ended October 31, 2014, the Fund entered into commodity futures contracts (through investments in the Subsidiary) to provide investment exposure to individual commodities, as well as to manage and/or adjust the risk profile of the Fund.
At the time the Fund or Subsidiary enters into a commodity futures contract, it is required to deposit with the futures commission merchant a specified amount of cash or liquid securities, known as "initial margin," which is a percentage of the value of the commodity futures contract being traded that is set by the exchange upon which the futures contract is traded. Each day, the futures contract is valued at the official settlement price of the board of trade or U.S. commodity exchange on which such futures contract is traded. Subsequent payments, known as "variation margin," to and from the broker are made on a daily basis or as needed as the market price of the commodity futures contract fluctuates. Daily variation margin adjustments, arising from this "mark to market," are recorded by the Fund or Subsidiary as unrealized gains or losses.
Although some commodity futures contracts by their terms call for actual delivery or acquisition of the underlying securities or currency, in most cases the contracts are closed out prior to delivery by offsetting purchases or sales of matching commodity futures contracts. When the contracts are closed, the Fund or Subsidiary recognizes a gain or loss. Risks of entering into futures contracts include the possibility there may be an illiquid market, possibly at a time of rapidly declining prices, and/or a change in the value of the contract may not correlate with changes in the value of the underlying securities. Futures executed on regulated futures exchanges have minimal counterparty risk to the Fund because the exchange's clearinghouse assumes the position of the counterparty in each transaction. Thus, the Fund is exposed to risk only in connection with the clearinghouse and not in connection with the original counterparty to the transaction.
For U.S. federal income tax purposes, the futures transactions undertaken by the Fund or Subsidiary may cause the Fund or Subsidiary to recognize gains or losses from marking contracts to market even though its positions have not been sold or terminated, may affect the character of the gains or losses recognized as long-term or short-term, and may affect the timing of some capital gains and losses realized by the Fund or Subsidiary. Also, the Fund's or Subsidiary's losses on transactions involving futures contracts may be deferred rather than being taken into account currently in calculating the Fund's or Subsidiary's taxable income.
At October 31, 2014, open positions in commodity futures contracts(1) were:
Expiration | | Open Contracts | | Position | | Unrealized
Appreciation
(Depreciation) | |
November 2014 | | 63 Lead | | Long | | $ | (387,720 | ) | |
November 2014 | | 30 Nickel | | Long | | | (559,538 | ) | |
November 2014 | | 60 Premium High Grade Aluminum | | Long | | | 63,829 | | |
November 2014 | | 68 Zinc | | Long | | | (105,971 | ) | |
December 2014 | | 61 Lead | | Long | | | (381,655 | ) | |
December 2014 | | 33 Nickel | | Long | | | (557,459 | ) | |
December 2014 | | 59 Premium High Grade Aluminum | | Long | | | (82,916 | ) | |
December 2014 | | 70 Zinc | | Long | | | (86,009 | ) | |
January 2015 | | 24 Cattle Feeder | | Long | | | (9,297 | ) | |
January 2015 | | 76 Gas Oil | | Long | | | (536,515 | ) | |
January 2015 | | 49 Gasoline RBOB | | Long | | | (582,511 | ) | |
January 2015 | | 73 Lead | | Long | | | (141,528 | ) | |
January 2015 | | 34 Nickel | | Long | | | (98,208 | ) | |
January 2015 | | 68 Platinum | | Long | | | (548,523 | ) | |
Expiration | | Open Contracts | | Position | | Unrealized
Appreciation
(Depreciation) | |
January 2015 | | 57 Premium High Grade Aluminum | | Long | | $ | 96,003 | | |
January 2015 | | 26 Soybean Meal | | Long | | | 54,909 | | |
January 2015 | | 52 Soybean Oil | | Long | | | 39,056 | | |
January 2015 | | 69 WTI Crude | | Long | | | (756,844 | ) | |
January 2015 | | 63 Zinc | | Long | | | 16,068 | | |
February 2015 | | 61 Brent Crude Oil | | Long | | | (719,345 | ) | |
February 2015 | | 70 Gold 100 Oz. | | Long | | | (314,355 | ) | |
February 2015 | | 70 Lead | | Long | | | (19,361 | ) | |
February 2015 | | 97 Lean Hogs | | Long | | | (85,904 | ) | |
February 2015 | | 60 Live Cattle | | Long | | | 37,286 | | |
February 2015 | | 30 Nickel | | Long | | | 63,672 | | |
February 2015 | | 65 Premium High Grade Aluminum | | Long | | | 44,547 | | |
February 2015 | | 76 Zinc | | Long | | | 46,892 | | |
March 2015 | | 65 Cocoa | | Long | | | (248,362 | ) | |
March 2015 | | 11 Coffee 'C' | | Long | | | (25,613 | ) | |
March 2015 | | 53 Copper | | Long | | | 12,651 | | |
March 2015 | | 175 Corn | | Long | | | 443,479 | | |
March 2015 | | 68 Cotton No. 2 | | Long | | | 49,105 | | |
March 2015 | | 70 Natural Gas | | Long | | | 40,060 | | |
March 2015 | | 54 New York Harbor ULSD | | Long | | | (3,862 | ) | |
March 2015 | | 77 Hard Red Winter Wheat | | Long | | | 109,378 | | |
March 2015 | | 45 Silver | | Long | | | (242,498 | ) | |
March 2015 | | 40 Soybean | | Long | | | 224,850 | | |
March 2015 | | 66 Sugar 11 | | Long | | | (133,461 | ) | |
March 2015 | | 71 Wheat | | Long | | | 180,285 | | |
November 2014 | | 63 Lead | | Short | | | 396,499 | | |
November 2014 | | 30 Nickel | | Short | | | 505,572 | | |
November 2014 | | 60 Premium High Grade Aluminum | | Short | | | 78,648 | | |
November 2014 | | 68 Zinc | | Short | | | 78,941 | | |
December 2014 | | 61 Lead | | Short | | | 119,251 | | |
December 2014 | | 33 Nickel | | Short | | | 107,311 | | |
December 2014 | | 59 Premium High Grade Aluminum | | Short | | | (138,644 | ) | |
December 2014 | | 70 Zinc | | Short | | | (21,612 | ) | |
January 2015 | | 73 Lead | | Short | | | 18,090 | | |
January 2015 | | 34 Nickel | | Short | | | (74,874 | ) | |
January 2015 | | 57 Premium High Grade Aluminum | | Short | | | (47,828 | ) | |
January 2015 | | 63 Zinc | | Short | | | (41,838 | ) | |
| | | | | | | $ | (4,125,869 | ) | |
(1) Commodity futures are held by the Subsidiary. See Note A-1 in the Notes to Consolidated Financial Statements.
During the year ended October 31, 2014, the average notional value of commodity futures contracts was $95,377,433 for long positions and $(25,807,913) for short positions.
At October 31, 2014, the notional value of commodity futures contracts was $131,079,647 for long positions and $(39,717,747) for short positions.
At October 31, 2014, the Fund had deposited $4,342,708 in a segregated account to cover margin requirements on open commodity futures contracts.
At October 31, 2014, the Fund had the following derivatives (which did not qualify as hedging instruments under ASC 815), grouped by primary risk exposure:
Asset Derivatives
| | | Commodity Risk | | Consolidated
Statement of
Assets and
Liabilities Location | |
Futures Contracts | | $ | 2,826,382 | | | Receivable/Payable for | |
Total Value | | $ | 2,826,382 | | | variation margin(1) | |
Liability Derivatives
| | | Commodity Risk | | Consolidated
Statement of
Assets and
Liabilities Location | |
Futures Contracts | | $ | (6,952,251 | ) | | Receivable/Payable for | |
Total Value | | $ | (6,952,251 | ) | | variation margin(1) | |
(1) "Futures Contracts" reflects the cumulative appreciation (depreciation) of futures contracts as of October 31, 2014, which is reflected in the Consolidated Statement of Assets and Liabilities under the caption "Net unrealized appreciation (depreciation) in value of investments." The outstanding variation margin as of October 31, 2014, if any, is reflected in the Consolidated Statement of Assets and Liabilities under the caption "Receivable/Payable for variation margin."
The impact of the use of these derivative instruments on the Consolidated Statement of Operations during the year ended October 31, 2014, was as follows:
Realized Gain (Loss) | |
| | | Commodity Risk | | Consolidated
Statement of
Operations Location | |
| | | | | Net realized gain | |
Futures Contracts | | $ | (3,806,990 | ) | | (loss) on: commodity | |
Total Realized Gain (Loss) | | $ | (3,806,990 | ) | | futures contracts | |
Change in Appreciation (Depreciation)
| | | Commodity Risk | | | |
Futures Contracts | | $ | (3,887,439 | ) | | Change in net
unrealized appreciation
(depreciation) in value of: | |
Total Change in Appreciation (Depreciation) | | $ | (3,887,439 | ) | | commodity futures contracts | |
12 Indemnifications: Like many other companies, the Trust's organizational documents provide that its officers and trustees are indemnified against certain liabilities arising out of the performance of their duties to the Trust. In addition, both in some of its principal service contracts and in the normal course of its business, the Trust enters into contracts that provide indemnifications to other parties for certain types of losses or liabilities. The Trust's maximum exposure under these arrangements is unknown as this could involve future claims against the Trust.
13 Other: All net investment income and realized and unrealized capital gains and losses of the Fund are allocated, on the basis of relative net assets, pro rata among its respective classes.
Note B—Management Fees, Administration Fees, Distribution Arrangements, and Other Transactions with Affiliates:
The Fund retains Management as its investment manager under a Management Agreement. For such investment management services, the Fund pays Management a fee at the annual rate of 0.70% of the first $250 million of the Fund's average daily net assets, 0.675% of the next $250 million, 0.65% of the next $250 million, 0.625% of the next $250 million, 0.60% of the next $500 million, 0.575% of the next $2.5 billion and 0.55% of average daily net assets in excess of $4 billion, less the net asset value of the Subsidiary. Accordingly, for the year ended October 31, 2014, the management fee pursuant to the Management Agreement was equivalent to an annual effective rate of 0.70% of the Fund's average daily net assets.
Management also serves as investment adviser to the Subsidiary. For such investment management services, the Subsidiary pays Management a fee at the annual rate of 0.70% of the first $250 million of the Subsidiary's average daily net assets, 0.675% of the next $250 million, 0.65% of the next $250 million, 0.625% of the next $250 million, 0.60% of the next $500 million, 0.575% of the next $2.5 billion and 0.55% of average daily net assets in excess of $4 billion. Accordingly, for the year ended October 31, 2014, the management fee pursuant to the Management Agreement was equivalent to an annual effective rate of 0.70% of the Subsidiary's average daily net assets.
The Fund retains Management as its administrator under an Administration Agreement. The Fund pays Management an administration fee at the annual rate of 0.06% of its average daily net assets under this agreement. In addition, the Fund's Institutional Class pays Management an administration fee at the annual rate of 0.09% of its average daily net assets under this agreement and the Fund's Class A and Class C pays Management an administration fee at the annual rate of 0.20% of its average daily net assets under this agreement. Additionally, Management retains State Street Bank and Trust Company ("State Street") as its sub-administrator under a Sub-Administration Agreement. Management pays State Street a fee for all services received under this agreement. The Subsidiary also retains Management as its administrator, and State Street as its sub-administrator.
Management has contractually agreed to waive current payment of fees and/or reimburse certain expenses of the Institutional Class, Class A and Class C of the Fund so that the total annual operating expenses of those classes do not exceed the expense limitations as detailed in the following table. These undertakings apply to the Fund's direct expenses and exclude interest, taxes, brokerage commissions, acquired fund fees and expenses, extraordinary expenses, and dividend and interest expenses relating to short sales, if any; consequently, net expenses may exceed the contractual expense limitations. The Fund has agreed that each of its respective classes will repay Management for fees and expenses waived or reimbursed for that class provided that repayment does not cause that class' annual operating expenses to exceed its contractual expense limitation at the time the fees and expenses were waived or reimbursed. Any such repayment must be made within three years after the year in which Management incurred the expense. The expenses of the Subsidiary are included in the total expenses used to calculate the reimbursement, which the Fund has agreed to share with the Subsidiary. For the year ended October 31, 2014, these Subsidiary expenses amounted to $185,567.
During the year ended October 31, 2014, there was no repayment to Management under this agreement.
At October 31, 2014, contingent liabilities to Management under the agreement were as follows:
| | | | | | | Expenses Reimbursed in
Fiscal Period Ending October 31, | |
| | | | | | | 2012(2) | | 2013 | | 2014 | |
| | | | | | | Subject to Repayment Until
October 31, | |
| | | Contractual
Expense
Limitation(1) | | Expiration | | 2015 | | 2016 | | 2017 | |
Institutional Class | | | 1.10 | % | | 10/31/17 | | $ | 518,969 | | | $ | 190,694 | | | $ | 79,267 | | |
Class A | | | 1.46 | % | | 10/31/17 | | | 13,769 | | | | 236,827 | | | | 260,968 | | |
Class C | | | 2.21 | % | | 10/31/17 | | | 12,521 | | | | 29,935 | | | | 27,833 | | |
(1) Expense limitation per annum of the respective class's average daily net assets.
(2) Period from August 27, 2012 (Commencement of Operations) to October 31, 2012.
Neuberger Berman Fixed Income LLC ("NBFI"), as the sub-adviser to the Fund and the Subsidiary, is retained by Management to provide day-to-day investment management services and receives a monthly fee paid by Management. As investment manager, Management is responsible for overseeing the investment activities of NBFI. Several individuals who are officers and/or Trustees of the Trust are also employees of NBFI and/or Management.
The Fund also has a distribution agreement with Management with respect to each class of shares. Management acts as agent in arranging for the sale of class shares without sales commission or other compensation, except as described below for Class A and Class C shares, and bears advertising and promotion expenses.
However, Management receives fees from Class A and Class C under their distribution plans (each a "Plan", collectively the "Plans") pursuant to Rule 12b-1 under the 1940 Act. The Plans provide that, as compensation for administrative and other services provided to these classes, Management's activities and expenses related to the sale and distribution of these classes, and ongoing services provided to investors in these classes, Management receives from each of these classes a fee at the annual rate of 0.25% of Class A's and 1.00% of Class C's average daily net assets. Management receives this amount to provide distribution and shareholder servicing for these classes and pays a portion of it to institutions that provide such services. Those institutions may use the payments for, among other purposes, compensating employees engaged in sales and/or shareholder servicing. The amount of fees paid by each class during any year may be more or less than the cost of distribution and other services provided to that class. FINRA rules limit the amount of annual distribution fees that may be paid by a mutual fund and impose a ceiling on the cumulative distribution fees paid. The Trust's Plans comply with those rules.
Class A shares are generally sold with an initial sales charge of up to 5.75% and no contingent deferred sales charge ("CDSC"), except that a CDSC of 1.00% applies to certain redemptions made within 18 months following purchases of $1 million or more without an initial sales charge. Class C shares are sold with no initial sales charge and a 1.00% CDSC if shares are sold within one year after purchase.
For the year ended October 31, 2014, Management, acting as underwriter and broker-dealer, received net initial sales charges from the purchase of Class A shares and CDSCs from the redemption of Class A and Class C shares as follows:
| | | Underwriter | | Broker-Dealer | |
| | | Net Initial Sales
Charges | |
CDSC | | Net Initial Sales
Charges | |
CDSC | |
Class A | | $ | — | | | $ | — | | | $ | — | | | $ | — | | |
Class C | | | — | | | | 649 | | | | — | | | | — | | |
Note C—Securities Transactions:
During the year ended October 31, 2014, there were purchase and sale transactions (excluding commodity futures contracts and short-term investments) of $47,564,827 and $7,540,272, respectively.
Note D—Fund Share Transactions:
Share activity for the years ended October 31, 2014 and October 31, 2013 was as follows:
| | | For the Year Ended
October 31, 2014 | | For the Year Ended
October 31, 2013 | |
| | | Shares Sold | | Shares
Redeemed | | Total | | Shares Sold | | Shares
Redeemed | | Total | |
Institutional Class | | | 1,480,892 | | | | (99,657 | ) | | | 1,381,235 | | | | 1,230,011 | | | | (673,603 | ) | | | 556,408 | | |
Class A | | | 5,460,429 | | | | (1,343,785 | ) | | | 4,116,644 | | | | 4,253,041 | | | | (358,029 | ) | | | 3,895,012 | | |
Class C | | | 169,965 | | | | (59,796 | ) | | | 110,169 | | | | 409,240 | | | | (16,210 | ) | | | 393,030 | | |
Other: At October 31, 2014, Neuberger Berman Inflation Navigator Fund (formerly, Neuberger Berman Dynamic Real Return Fund), which is also managed by Management, held 2.2% of the outstanding shares of the Fund.
Note E—Lines of Credit:
At October 31, 2014, the Fund was a participant in a single committed, unsecured $300,000,000 line of credit with State Street, to be used only for temporary or emergency purposes. Other investment companies managed by Management also participate in this line of credit on the same terms. Interest is charged on borrowings under this line of credit at the higher of (a) the Federal Funds Rate plus 1.25% per annum or (b) the overnight LIBOR Rate plus 1.25% per annum. A commitment fee of 0.10% per annum of the unused portion of the available line of credit is charged, of which each participating fund has agreed to pay its pro rata share, based on the ratio of its individual net assets to the net assets of all participants at the time the fee is due and payable. The fee is paid quarterly in arrears. Because several mutual funds participate, there is no assurance that an individual Fund will have access to all or any part of the $300,000,000 at any particular time. There were no loans outstanding pursuant to this line of credit at October 31, 2014. During the year ended October 31, 2014, the Fund did not utilize this line of credit.
At October 31, 2014, the Fund was a participant in a single uncommitted, unsecured $100,000,000 line of credit with State Street, to be used only for temporary or emergency purposes. Other investment companies managed by Management also participate in this line of credit on the same terms. Interest is charged on borrowings under this line of credit at a variable rate per annum as determined and quoted by State Street at the time a fund requests a loan. Because several mutual funds participate, there is no assurance that an individual Fund will have access to all or any part of the $100,000,000 at any particular time. There were no loans outstanding pursuant to this line of credit at October 31, 2014. During the year ended October 31, 2014, the Fund did not utilize this line of credit.
In December 2014, a new single committed, unsecured $700,000,000 line of credit was approved for the Fund that will replace the lines of credit with State Street noted above. The new line of credit will be used only for temporary or emergency purposes.
This page has been left blank intentionally
Consolidated Financial Highlights
The following table includes selected data for a share outstanding throughout each period and other performance information derived from the Consolidated Financial Statements. Per share amounts that round to less than $0.01 or $(0.01) per share are presented as $0.00 or $(0.00), respectively. Ratios that round to less than 0.00% or (0.00%) per share are presented as 0.00% or (0.00%), respectively. Net Asset amounts with a zero balance may reflect actual amounts rounding to less than $0.1 million. A "—" indicates that the line item was not applicable in the corresponding period.
| | | Net Asset
Value,
Beginning
of Year | | Net
Investment
Income (Loss)@ | | Net Gains or
Losses on
Securities
(both realized
and
unrealized) | | Total From
Investment
Operations | | Dividends
from Net
Investment
Income | | Distributions
from Net
Realized
Capital Gains | | Total
Distributions | |
Risk Balanced Commodity Strategy Fund | |
Institutional Class | |
10/31/2014 | | $ | 9.01 | | | $ | (0.07 | ) | | $ | (0.55 | ) | | $ | (0.62 | ) | | $ | — | | | $ | — | | | $ | — | | |
10/31/2013 | | $ | 9.84 | | | $ | (0.09 | ) | | $ | (0.74 | ) | | $ | (0.83 | ) | | $ | — | | | $ | — | | | $ | — | | |
Period from 8/27/2012^
to 10/31/2012 | | $ | 10.00 | | | $ | (0.02 | ) | | $ | (0.14 | ) | | $ | (0.16 | ) | | $ | — | | | $ | — | | | $ | — | | |
Class A | |
10/31/2014 | | $ | 8.97 | | | $ | (0.10 | ) | | $ | (0.55 | ) | | $ | (0.65 | ) | | $ | — | | | $ | — | | | $ | — | | |
10/31/2013 | | $ | 9.84 | | | $ | (0.12 | ) | | $ | (0.75 | ) | | $ | (0.87 | ) | | $ | — | | | $ | — | | | $ | — | | |
Period from 8/27/2012^
to 10/31/2012 | | $ | 10.00 | | | $ | (0.03 | ) | | $ | (0.13 | ) | | $ | (0.16 | ) | | $ | — | | | $ | — | | | $ | — | | |
Class C | |
10/31/2014 | | $ | 8.88 | | | $ | (0.16 | ) | | $ | (0.53 | ) | | $ | (0.69 | ) | | $ | — | | | $ | — | | | $ | — | | |
10/31/2013 | | $ | 9.83 | | | $ | (0.18 | ) | | $ | (0.77 | ) | | $ | (0.95 | ) | | $ | — | | | $ | — | | | $ | — | | |
Period from 8/27/2012^
to 10/31/2012 | | $ | 10.00 | | | $ | (0.04 | ) | | $ | (0.13 | ) | | $ | (0.17 | ) | | $ | — | | | $ | — | | | $ | — | | |
See Notes to Financial Highlights
| | | Net Asset
Value, End of
Year | | Total Return†† | | Net Assets,
End of Year
(in millions) | | Ratio of Gross
Expenses to
Average Net
Assets# | | Ratio of Net
Expenses to
Average Net
Assets | | Ratio of Net
Investment
Income/
(Loss) to
Average Net
Assets | | Portfolio
Turnover
Rate | |
Risk Balanced Commodity Strategy Fund | |
Institutional Class | |
10/31/2014 | | $ | 8.39 | | | | (6.88 | %) | | $ | 20.5 | | | | 1.62 | % | | | 1.10 | % | | | (0.73 | %) | | | 21 | % | |
10/31/2013 | | $ | 9.01 | | | | (8.43 | %) | | $ | 9.6 | | | | 3.69 | % | | | 1.10 | % | | | (0.94 | %) | | | 5 | % | |
Period from 8/27/2012^
to 10/31/2012 | | $ | 9.84 | | | | (1.60 | %)** | | $ | 5.0 | | | | 25.60 | %*‡ | | | 1.10 | %*‡ | | | (0.99 | %)*‡ | | | 0 | %** | |
Class A | |
10/31/2014 | | $ | 8.32 | | | | (7.25 | %) | | $ | 66.8 | | | | 1.98 | % | | | 1.46 | % | | | (1.09 | %) | | | 21 | % | |
10/31/2013 | | $ | 8.97 | | | | (8.84 | %) | | $ | 35.0 | | | | 3.81 | % | | | 1.46 | % | | | (1.27 | %) | | | 5 | % | |
Period from 8/27/2012^
to 10/31/2012 | | $ | 9.84 | | | | (1.60 | %)** | | $ | 0.1 | | | | 33.04 | %*‡ | | | 1.46 | %*‡ | | | (1.36 | %)*‡ | | | 0 | %** | |
Class C | |
10/31/2014 | | $ | 8.19 | | | | (7.77 | %) | | $ | 4.2 | | | | 2.84 | % | | | 2.21 | % | | | (1.84 | %) | | | 21 | % | |
10/31/2013 | | $ | 8.88 | | | | (9.66 | %) | | $ | 3.6 | | | | 4.69 | % | | | 2.21 | % | | | (2.03 | %) | | | 5 | % | |
Period from 8/27/2012^
to 10/31/2012 | | $ | 9.83 | | | | (1.70 | %)** | | $ | 0.1 | | | | 35.12 | %*‡ | | | 2.21 | %*‡ | | | (2.11 | %)*‡ | | | 0 | %** | |
Notes to Consolidated Financial Highlights
†† Total return based on per share NAV reflects the effects of changes in NAV on the performance of the Fund during each fiscal period. Returns assume income dividends and other distributions, if any, were reinvested, but do not reflect the effect of sales charges. Results represent past performance and do not indicate future results. Current returns may be lower or higher than the performance data quoted. Investment returns and principal may fluctuate and shares when redeemed may be worth more or less than original cost. Total return would have been lower if Management had not reimbursed and/or waived certain expenses.
# Represents the annualized ratios of net expenses to average daily net assets if Management had not reimbursed certain expenses and/or waived a portion of the investment management fee.
@ Calculated based on the average number of shares outstanding during each fiscal period.
^ The date investment operations commenced.
‡ Organization expense, which is a non-recurring expense, is included in these ratios on a non-annualized basis.
* Annualized.
** Not annualized.
Report of Independent Registered Public Accounting Firm
To the Board of Trustees Neuberger Berman Alternative Funds
and Shareholders of Neuberger Berman Risk Balanced Commodity Strategy Fund
We have audited the accompanying consolidated statements of assets and liabilities of Neuberger Berman Risk Balanced Commodity Strategy Fund, one of the series constituting the Neuberger Berman Alternative Funds, (the "Fund"), including the consolidated schedule of investments, as of October 31, 2014, and the related consolidated statements of operations for the year ended, the consolidated statements of changes in net assets for each of the two years in the period then ended and the consolidated financial highlights for each of the periods indicated therein. These consolidated financial statements and consolidated financial highlights are the responsibility of the Fund's management. Our responsibility is to express an opinion on these consolidated financial statements and consolidated financial highlights based on our audits.
We conducted our audits in accordance with the standards of the Public Company Accounting Oversight Board (United States). Those standards require that we plan and perform the audit to obtain reasonable assurance about whether the consolidated financial statements and consolidated financial highlights are free of material misstatement. We were not engaged to perform an audit of the Fund's internal control over financial reporting. Our audits included consideration of internal control over financial reporting as a basis for designing audit procedures that are appropriate in the circumstances, but not for the purpose of expressing an opinion on the effectiveness of the Fund's internal control over financial reporting. Accordingly, we express no such opinion. An audit also includes examining, on a test basis, evidence supporting the amounts and disclosures in the consolidated financial statements and consolidated financial highlights, assessing the accounting principles used and significant estimates made by management, and evaluating the overall financial statement presentation. Our procedures included confirmation of securities owned as of October 31, 2014 by correspondence with the custodian and others or by other appropriate auditing procedures where replies from others were not received. We believe that our audits provide a reasonable basis for our opinion.
In our opinion, the consolidated financial statements and consolidated financial highlights referred to above present fairly, in all material respects, the consolidated financial position of Neuberger Berman Risk Balanced Commodity Strategy Fund, a series of Neuberger Berman Alternative Funds, at October 31, 2014, and the consolidated results of its operations for the year ended, the consolidated changes in its net assets for each of the two years in the period then ended and the consolidated financial highlights for each of the periods indicated therein, in conformity with U.S. generally accepted accounting principles.
Boston, Massachusetts
December 19, 2014
Investment Manager, Administrator and Distributor
Neuberger Berman Management LLC
605 Third Avenue, 2nd Floor
New York, NY 10158-0180
800.877.9700 or 212.476.8800
Intermediary Client Services 800.366.6264
Sub-Adviser
Neuberger Berman Fixed Income LLC
190 South LaSalle Street
Chicago, IL 60603
Custodian and Shareholder Servicing Agent
State Street Bank and Trust Company
One Lincoln Street
Boston, MA 02111
For Institutional Class Shareholders
Address correspondence to:
Neuberger Berman Management LLC
605 Third Avenue, Mail Drop 2-7
New York, NY 10158-0180
Attn: Intermediary Client Services
800.366.6264
For Class A and Class C Shareholders:
Please contact your investment provider
Legal Counsel
K&L Gates LLP
1601 K Street, NW
Washington, DC 20006-1600
Independent Registered Public Accounting Firm
Ernst & Young LLP
200 Clarendon Street
Boston, MA 02116
The following tables set forth information concerning the trustees ("Trustees") and officers ("Officers") of the Fund. All persons named as Trustees and Officers also serve in similar capacities for other funds administered or managed by Management and NBFI. The Fund's Statement of Additional Information includes additional information about the Trustees as of the time of the Fund's most recent public offering and is available upon request, without charge, by calling (800) 877-9700.
Information about the Board of Trustees
Name, (Year of Birth),
and Address(1) | | Position(s)
and Length of
Time Served(2) | | Principal Occupation(s)(3) | | Number of
Funds in
Fund Complex
Overseen by
Fund Trustee | | Other Directorships Held
Outside Fund Complex by
Fund Trustee(3) | |
Independent Trustees | |
Faith Colish (1935) | | Trustee since inception | | Counsel, Carter Ledyard & Milburn LLP (law firm) since October 2002; formerly, Attorney-at-Law and President, Faith Colish, A Professional Corporation, 1980 to 2002. | | | 59 | | | Formerly, Director, 1997 to 2003, and Advisory Director, 2003 to 2006, ABA Retirement Funds (formerly, American Bar Retirement Association) (not-for-profit membership corporation). | |
Name, (Year of Birth),
and Address(1) | | Position(s)
and Length of
Time Served(2) | | Principal Occupation(s)(3) | | Number of
Funds in
Fund Complex
Overseen by
Fund Trustee | | Other Directorships Held
Outside Fund Complex by
Fund Trustee(3) | |
Martha C. Goss (1949) | | Trustee since 2007 | | President, Woodhill Enterprises Inc./Chase Hollow Associates LLC (personal investment vehicle), since 2006; formerly, Consultant, Resources Global Professionals (temporary staffing), 2002 to 2006. | | | 59 | | | Director, American Water (water utility), since 2003; Director, Allianz Life of New York (insurance), since 2005; Director, Berger Group Holdings, Inc. (engineering consulting firm), since 2013; Director, Financial Women's Association of New York (not-for-profit association), since 2003; Trustee Emerita, Brown University, since 1998; Director, Museum of American Finance (not-for-profit), since 2013; formerly, Non-Executive Chair and Director, Channel Reinsurance (financial guaranty reinsurance), 2006 to 2010; formerly, Director, Ocwen Financial Corporation (mortgage servicing), 2005 to 2010; formerly, Director, Claire's Stores, Inc. (retailer), 2005 to 2007; formerly, Director, Parsons Brinckerhoff Inc. (engineering consulting firm), 2007 to 2010; formerly, Director, Bank Leumi (commercial bank), 2005 to 2007; formerly, Advisory Board Member, Attensity (software developer), 2005 to 2007. | |
Name, (Year of Birth),
and Address(1) | | Position(s)
and Length of
Time Served(2) | | Principal Occupation(s)(3) | | Number of
Funds in
Fund Complex
Overseen by
Fund Trustee | | Other Directorships Held
Outside Fund Complex by
Fund Trustee(3) | |
Michael M. Knetter (1960) | | Trustee since 2007 | | President and Chief Executive Officer, University of Wisconsin Foundation, since October 2010; formerly, Dean, School of Business, University of Wisconsin—Madison; formerly, Professor of International Economics and Associate Dean, Amos Tuck School of Business—Dartmouth College, 1998 to 2002. | | | 59 | | | Board Member, American Family Insurance (a mutual company, not publicly traded), since March 2009; formerly, Trustee, Northwestern Mutual Series Fund, Inc., 2007 to 2011; formerly, Director, Wausau Paper, 2005 to 2011; formerly, Director, Great Wolf Resorts, 2004 to 2009. | |
Howard A. Mileaf (1937) | | Trustee since 1984 | | Retired; formerly, Vice President and General Counsel, WHX Corporation (holding company), 1993 to 2001. | | | 59 | | | Formerly, Director, Webfinancial Corporation (holding company), 2002 to 2008; formerly, Director, WHX Corporation (holding company), 2002 to 2005; formerly, Director, State Theatre of New Jersey (not-for-profit theatre), 2000 to 2005. | |
George W. Morriss (1947) | | Trustee since 2007 | | Adjunct Professor, Columbia University School of International and Public Affairs, since October 2012; formerly, Executive Vice President and Chief Financial Officer, People's Bank, Connecticut (a financial services company), 1991 to 2001. | | | 59 | | | Director and Treasurer, National Association of Corporate Directors, Connecticut Chapter, since 2011; Trustee, Steben Alternative Investment Funds, Steben Select Multi-Strategy Fund and Steben Select Multi-Strategy Master Fund, since 2013; formerly, Manager, Larch Lane Multi-Strategy Fund complex (which consisted of three funds), 2006 to 2011; formerly, Member, NASDAQ Issuers' Affairs Committee, 1995 to 2003. | |
Name, (Year of Birth),
and Address(1) | | Position(s)
and Length of
Time Served(2) | | Principal Occupation(s)(3) | | Number of
Funds in
Fund Complex
Overseen by
Fund Trustee | | Other Directorships Held
Outside Fund Complex by
Fund Trustee(3) | |
Tom D. Seip (1950) | | Trustee since inception; Chairman of the Board since 2008; formerly, Lead Independent Trustee from 2006 to 2008 | | General Partner, Ridgefield Farm LLC (a private investment vehicle); formerly, President and CEO, Westaff, Inc. (temporary staffing), May 2001 to January 2002; formerly, Senior Executive, The Charles Schwab Corporation, 1983 to 1998, including Chief Executive Officer, Charles Schwab Investment Management, Inc.; Trustee, Schwab Family of Funds and Schwab Investments, 1997 to 1998; and Executive Vice President-Retail Brokerage, Charles Schwab & Co., Inc., 1994 to 1997. | | | 59 | | | Director, H&R Block, Inc. (financial services company), since May 2001; Chairman, Governance and Nominating Committee, H&R Block, Inc., since 2011; formerly, Chairman, Compensation Committee, H&R Block, Inc., 2006 to 2010; formerly, Director, Forward Management, Inc. (asset management company), 1999 to 2006. | |
Candace L. Straight (1947) | | Trustee since inception | | Private investor and consultant specializing in the insurance industry; formerly, Advisory Director, Securitas Capital LLC (a global private equity investment firm dedicated to making investments in the insurance sector), 1998 to 2003. | | | 59 | | | Public Member, Board of Governors and Board of Trustees, Rutgers University, since 2011; Director, Montpelier Re Holdings Ltd. (reinsurance company), since 2006; formerly, Director, National Atlantic Holdings Corporation (property and casualty insurance company), 2004 to 2008; formerly, Director, The Proformance Insurance Company (property and casualty insurance company), 2004 to 2008; formerly, Director, Providence Washington Insurance Company (property and casualty insurance company), 1998 to 2006; formerly, Director, Summit Global Partners (insurance brokerage firm), 2000 to 2005. | |
Peter P. Trapp (1944) | | Trustee since inception | | Retired; formerly, Regional Manager for Mid-Southern Region, Ford Motor Credit Company, September 1997 to 2007; formerly, President, Ford Life Insurance Company, April 1995 to August 1997. | | | 59 | | | None. | |
Name, (Year of Birth),
and Address(1) | | Position(s)
and Length of
Time Served(2) | | Principal Occupation(s)(3) | | Number of
Funds in
Fund Complex
Overseen by
Fund Trustee | | Other Directorships Held
Outside Fund Complex by
Fund Trustee(3) | |
Trustees who are "Interested Persons" | |
Joseph V. Amato* (1962) | | Trustee since 2009 | | President and Director, Neuberger Berman Group LLC, since 2009; President and Chief Executive Officer, Neuberger and Neuberger Berman Holdings LLC (including its predecessor, Neuberger Berman Inc.), since 2007; Chief Investment Officer (Equities) and Managing Director, Management, since 2009; Managing Director, NBFI, since 2007; Board member of NBFI since 2006; formerly, Global Head of Asset Management of Lehman Brothers Holdings Inc.'s ("LBHI") Investment Management Division, 2006 to 2009; formerly, member of LBHI's Investment Management Division's Executive Management Committee, 2006 to 2009; formerly, Managing Director, Lehman Brothers Inc. ("LBI"), 2006 to 2008; formerly, Chief Recruiting and Development Officer, LBI, 2005 to 2006; formerly, Global Head of LBI's Equity Sales and a Member of its Equities Division Executive Committee, 2003 to 2005. | | | 59 | | | Member of Board of Advisors, McDonough School of Business, Georgetown University, since 2001; Member of New York City Board of Advisors, Teach for America, since 2005; Trustee, Montclair Kimberley Academy (private school), since 2007; Member of Board of Regents, Georgetown University, since 2013. | |
Name, (Year of Birth),
and Address(1) | | Position(s)
and Length of
Time Served(2) | | Principal Occupation(s)(3) | | Number of
Funds in
Fund Complex
Overseen by
Fund Trustee | | Other Directorships Held
Outside Fund Complex by
Fund Trustee(3) | |
Robert Conti* (1956) | | Chief Executive Officer, President and Trustee since 2008; prior thereto, Executive Vice President in 2008 and Vice President from inception to 2008 | | Managing Director, Neuberger, since 2007; Managing Director, NBFI, since 2009; formerly, Senior Vice President, Neuberger, 2003 to 2006; formerly, Vice President, Neuberger, 1999 to 2003; President and Chief Executive Officer, Management, since 2008; formerly, Senior Vice President, Management, 2000 to 2008. | | | 59 | | | Director, Staten Island Mental Health Society, since 1994; formerly, Chairman of the Board, Staten Island Mental Health Society, 2008 to 2011. | |
(1) The business address of each listed person is 605 Third Avenue, New York, New York 10158.
(2) Pursuant to the Trust's Trust Instrument, each of these Trustees shall hold office for life or until his or her successor is elected or the Trust terminates; except that (a) any Trustee may resign by delivering a written resignation; (b) any Trustee may be removed with or without cause at any time by a written instrument signed by at least two-thirds of the other Trustees; (c) any Trustee who requests to be retired, or who has become unable to serve, may be retired by a written instrument signed by a majority of the other Trustees; and (d) any Trustee may be removed at any shareholder meeting by a vote of at least two-thirds of the outstanding shares.
(3) Except as otherwise indicated, each individual has held the positions shown for at least the last five years.
* Indicates a Trustee who is an "interested person" within the meaning of the 1940 Act. Mr. Amato and Mr. Conti are interested persons of the Trust by virtue of the fact that each is an officer of Management, Neuberger and/or their affiliates.
Information about the Officers of the Trust
Name, (Year of Birth),
and Address(1) | | Position(s)
and Length of
Time Served(2) | | Principal Occupation(s)(3) | |
Andrew B. Allard (1961) | | Chief Legal Officer since 2013 (only for purposes of sections 307 and 406 of the Sarbanes-Oxley Act of 2002) and Anti-Money Laundering Compliance Officer since 2002 | | General Counsel and Senior Vice President, Management, since 2013; Senior Vice President, Neuberger, since 2006 and Employee since 1999; Deputy General Counsel, Neuberger, since 2004; formerly, Vice President, Neuberger, 2000 to 2005; formerly, Employee, Management, 1994 to 1999; Chief Legal Officer since 2013 (only for purposes of sections 307 and 406 of the Sarbanes-Oxley Act of 2002), ten registered investment companies for which Management acts as investment manager and administrator (ten since 2013); Anti-Money Laundering Compliance Officer, ten registered investment companies for which Management acts as investment manager and administrator (six since 2002, one since 2003, one since 2005, one since 2006 and one since 2013). | |
Claudia A. Brandon (1956) | | Executive Vice President since 2008 and Secretary since inception | | Senior Vice President, Neuberger, since 2007 and Employee since 1999; Senior Vice President, Management, since 2008 and Assistant Secretary since 2004; formerly, Vice President, Neuberger, 2002 to 2006; formerly, Vice President-Mutual Fund Board Relations, Management, 2000 to 2008; formerly, Vice President, Management, 1986 to 1999 and Employee 1984 to 1999; Executive Vice President, ten registered investment companies for which Management acts as investment manager and administrator (nine since 2008 and one since 2013); Secretary, ten registered investment companies for which Management acts as investment manager and administrator (three since 1985, three since 2002, one since 2003, one since 2005, one since 2006 and one since 2013). | |
Agnes Diaz (1971) | | Vice President since 2013 | | Senior Vice President, Neuberger, since 2012; Employee, Management, since 1996; formerly, Vice President, Neuberger, 2007 to 2012; Vice President, ten registered investment companies for which Management acts as investment manager and administrator (ten since 2013). | |
Anthony DiBernardo (1979) | | Assistant Treasurer since 2011 | | Senior Vice President, Neuberger, since 2014; Employee, Management, since 2003; formerly, Vice President, Neuberger, 2009 to 2014; Assistant Treasurer, ten registered investment companies for which Management acts as investment manager and administrator (nine since 2011 and one since 2013). | |
Sheila R. James (1965) | | Assistant Secretary since inception | | Vice President, Neuberger, since 2008 and Employee since 1999; formerly, Assistant Vice President, Neuberger, 2007; formerly, Employee, Management, 1991 to 1999; Assistant Secretary, ten registered investment companies for which Management acts as investment manager and administrator (six since 2002, one since 2003, one since 2005, one since 2006 and one since 2013). | |
Name, (Year of Birth),
and Address(1) | | Position(s)
and Length of
Time Served(2) | | Principal Occupation(s)(3) | |
Brian Kerrane (1969) | | Vice President since 2008 | | Managing Director, Neuberger, since 2014; Vice President, Management, since 2008 and Employee since 1991; formerly, Senior Vice President, Neuberger, 2006 to 2014; Vice President, ten registered investment companies for which Management acts as investment manager and administrator (nine since 2008 and one since 2013). | |
Kevin Lyons (1955) | | Assistant Secretary since inception | | Assistant Vice President, Neuberger, since 2008 and Employee since 1999; formerly, Employee, Management, 1993 to 1999; Assistant Secretary, ten registered investment companies for which Management acts as investment manager and administrator (seven since 2003, one since 2005, one since 2006 and one since 2013). | |
Owen F. McEntee, Jr. (1961) | | Vice President since 2008 | | Vice President, Neuberger, since 2006; Employee, Management, since 1992; Vice President, ten registered investment companies for which Management acts as investment manager and administrator (nine since 2008 and one since 2013). | |
John M. McGovern (1970) | | Treasurer and Principal Financial and Accounting Officer since inception | | Senior Vice President, Neuberger, since 2007; Employee, Management, since 1993; Treasurer and Principal Financial and Accounting Officer, ten registered investment companies for which Management acts as investment manager and administrator (eight since 2005, one since 2006 and one since 2013); formerly, Vice President, Neuberger, 2004 to 2006; formerly, Assistant Treasurer, eight registered investment companies for which Management acts as investment manager and administrator, 2002 to 2005. | |
Frank Rosato (1971) | | Assistant Treasurer since inception | | Vice President, Neuberger, since 2006; Employee, Management, since 1995; Assistant Treasurer, ten registered investment companies for which Management acts as investment manager and administrator (eight since 2005, one since 2006 and one since 2013). | |
Neil S. Siegel (1967) | | Vice President since 2008 | | Managing Director, Management, since 2008; Managing Director, Neuberger, since 2006; Managing Director, NBFI, since 2011; formerly, Senior Vice President, Neuberger, 2004 to 2006; Vice President, ten registered investment companies for which Management acts as investment manager and administrator (nine since 2008 and one since 2013). | |
Chamaine Williams (1971) | | Chief Compliance Officer since inception | | Senior Vice President, Neuberger, since 2007; Chief Compliance Officer, Management, since 2006; Chief Compliance Officer, ten registered investment companies for which Management acts as investment manager and administrator (eight since 2005, one since 2006 and one since 2013); formerly, Senior Vice President, LBI, 2007 to 2008; formerly, Vice President, LBI, 2003 to 2006; formerly, Chief Compliance Officer, Lehman Brothers Asset Management Inc., 2003 to 2007; formerly, Chief Compliance Officer, Lehman Brothers Alternative Investment Management LLC, 2003 to 2007. | |
(1) The business address of each listed person is 605 Third Avenue, New York, New York 10158.
(2) Pursuant to the By-Laws of the Trust, each officer elected by the Trustees shall hold office until his or her successor shall have been elected and qualified or until his or her earlier death, inability to serve, or resignation. Officers serve at the pleasure of the Trustees and may be removed at any time with or without cause.
(3) Except as otherwise indicated, each individual has held the positions shown for at least the last five years.
Proxy Voting Policies and Procedures
A description of the policies and procedures that the Trust uses to determine how to vote proxies relating to portfolio securities is available, without charge, by calling 800-877-9700 (toll-free) and on the Securities and Exchange Commission's website, at www.sec.gov. Information regarding how the Trust voted proxies relating to portfolio securities during the most recent 12-month period ended June 30 is also available upon request, without charge, by calling 800-877-9700 (toll-free), on the Securities and Exchange Commission's website at www.sec.gov, and on Management's website at www.nb.com.
Quarterly Portfolio Schedule
The Trust files a complete schedule of portfolio holdings for the Fund with the Securities and Exchange Commission for the first and third quarters of the fiscal year on Form N-Q. The Trust's Forms N-Q are available on the Securities and Exchange Commission's website at www.sec.gov and may be reviewed and copied at the Securities and Exchange Commission's Public Reference Room in Washington, DC. Information on the operation of the Public Reference Room may be obtained by calling 800-SEC-0330. The information on Form N-Q is available upon request, without charge, by calling 800-877-9700 (toll-free).
Board Consideration of the Management and Sub-Advisory Agreements
On an annual basis, the Board of Trustees ("Board") of Neuberger Berman Alternative Funds ("Trust"), including the Trustees who are not "interested persons" of Neuberger Berman Management LLC ("Management") (including its affiliates) or the Trust ("Independent Fund Trustees"), considers whether to continue the Management and Sub-Advisory Agreements ("Agreements") with respect to Neuberger Berman Risk Balanced Commodity Strategy Fund (the "Fund"). At a meeting held on October 6-7, 2014, the Board, including the Independent Fund Trustees, approved the continuation of the Agreements for the Fund.
In evaluating the Agreements, the Board, including the Independent Fund Trustees, reviewed extensive materials provided by Management in response to questions submitted by the Board and counsel for the Independent Fund Trustees, and met with senior representatives of Management regarding its personnel, operations and financial condition as they relate to the Fund. The annual contract review extends over at least two regular meetings of the Board to ensure that Management and Neuberger Berman Fixed Income LLC ("NBFI") have time to respond to any questions the Independent Fund Trustees may have on their initial review of the materials and that the Independent Fund Trustees have time to consider those responses.
In connection with its deliberations, the Board also considered the broad range of information relevant to the annual contract review that is provided to the Board (including its various standing committees) at meetings throughout the year, including investment performance reports and related portfolio information for the Fund, as well as periodic reports on, among other matters, pricing and valuation; brokerage and execution; and compliance, shareholder and other services provided by Management, NBFI and their affiliates. To assist the Board in its deliberations regarding the annual contract review, the Board has established a Contract Review Committee comprised of Independent Fund Trustees, as well as other committees that focus throughout the year on specific areas relevant to the annual contract review, such as Fund performance or compliance matters.
Throughout the process, the Independent Fund Trustees were advised by counsel that is experienced in Investment Company Act of 1940 matters and that is independent of Management. The Independent Fund Trustees received from independent counsel a memorandum discussing the legal standards for their consideration of the proposed continuation of the Agreements. During the course of the year and during their deliberations regarding the annual contract review, the Contract Review Committee and the Independent Fund Trustees met with such counsel separately from representatives of Management and NBFI.
In connection with its approval of the continuation of the Agreements, the Board evaluated the terms of the Agreements, the overall fairness of the Agreements to the Fund and whether the Agreements were in the best interests of the Fund and its shareholders. The Board considered all factors it deemed relevant with respect to the Fund, including the following factors: (1) the nature, extent, and quality of the services provided by Management and NBFI; (2) the investment performance of the Fund compared to an appropriate market index and a peer group of investment companies; (3) the costs of the services provided and the loss realized by Management and its affiliates from their relationship with the Fund; (4) the extent to which economies of scale might be realized as the Fund grows; and (5) whether fee levels reflect any such potential economies of scale for the benefit of investors in the Fund. While each Trustee may have attributed different weights to the various factors, the Board's determination to approve the continuation of the Agreements was based on a comprehensive consideration of all information provided to the Board throughout the year and specifically in connection with the annual contract review. The Board members did not identify any particular information or factor that was all-important or controlling. The Board focused on the overall costs and benefits of the Agreements relating to the Fund and, through the Fund, its shareholders.
With respect to the nature, extent and quality of the services provided, the Board considered the investment philosophy and decision-making processes of Management and NBFI, and the qualifications, experience and capabilities of and the resources available to the portfolio management personnel of Management and NBFI who perform services for the Fund. The Board noted that Management also provides certain administrative services, including fund accounting and compliance oversight. The Board also considered Management's and NBFI's policies and practices regarding brokerage and allocation of portfolio transactions and reviewed the quality of the execution services that Management had
provided. The Board also considered that Management's responsibilities include daily management of investment, operational, enterprise, legal, regulatory and compliance risks as they relate to the Fund, and considered information regarding Management's process for managing risk. In addition, the Board noted the positive compliance history of Management and NBFI, as no significant compliance problems were reported to the Board with respect to either firm. The Board also considered the general structure of the portfolio manager compensation program and whether this structure provides appropriate incentives to act in the best interests of the Fund. As in past years, the Board also considered the manner in which Management addressed various non-routine matters that arose during the year, some of them a result of developments in the broader fund industry or the regulations governing it. In addition, the Board considered actions taken by Management and NBFI in response to recent market conditions, including actions taken in response to regulatory concerns about changes in fixed-income market liquidity and potential volatility, and considered the overall performance of Management and NBFI in this context.
With respect to investment performance, the Board considered information regarding the Fund's performance both on an absolute basis and relative to an appropriate market index and the average performance of a composite peer group (as constructed by an independent organization) of investment companies pursuing broadly similar strategies. The Board also reviewed performance in relation to certain measures of the degree of investment risk undertaken by portfolio managers. The Board factored into its evaluation of the Fund's performance the limitations inherent in the methodology for constructing the peer group and determining which investment companies should be included in the peer group. The Board noted that performance, especially short-term performance, is only one of the factors that it deems relevant to its consideration of the Fund's Agreements.
With respect to the overall fairness of the Agreements, the Board considered the fee structure for the Fund under the Agreements as compared to a peer group of comparable funds, and any fall-out benefits likely to accrue to Management or NBFI or their affiliates from their relationship with the Fund. The Board also considered the profitability of Management and its affiliates from their association with the Fund, profitability broken out between the investment management and administrative portions of the services provided, and year-over-year changes in each of Management's reported expense categories; however, because the Fund has been in operation for a relatively short period of time and remains small, there was no useful information available regarding Management's potential long-term profitability.
The Board reviewed a comparison of the Fund's management fee and overall expense ratio to a peer group of broadly comparable funds. The Board noted that the comparative management fee analysis includes, in the Fund's management fee, the separate administrative fee paid to Management, but it was not clear whether this was the case for all funds in the peer group. The Board considered the mean and median of the management fees and expense ratios of the peer group. The Board noted that the Fund's management fee was lower than the peer group mean and median. In addition, the Board considered the contractual limit on expenses of each class of the Fund. The Board noted that Management incurred a loss on the Fund during the review period. The Board also considered whether there were other funds that were advised or sub-advised by Management or its affiliates or separate accounts managed by Management or its affiliates with investment objectives, policies and strategies that were similar to those of the Fund. The Board compared the fees charged to the Fund to the fees charged to any such funds and/or separate accounts. The Board considered the appropriateness and reasonableness of any differences between the fees charged to the Fund and any such funds and/or separate accounts, including any breakpoints, and determined that any differences in fees and fee structures were consistent with the management and other services provided. The Board also evaluated any apparent or anticipated economies of scale in relation to the services Management provides to the Fund. The Board considered that the Fund's fee structure provides for a reduction of payments resulting from the use of breakpoints and whether those breakpoints are set at appropriate asset levels. In concluding that the benefits accruing to Management and its affiliates by virtue of their relationship with the Fund were reasonable in light of the costs of providing the investment advisory and other services and the benefits accruing to the Fund, the Board reviewed specific data as to Management's loss on the Fund for a recent period. The Board also carefully examined Management's cost allocation methodology.
Conclusions
In approving the Agreements, the Board concluded that the terms of each Agreement are fair and reasonable to the Fund and that approval of the Agreements is in the best interests of the Fund and its shareholders. In reaching this determination, the Board considered that Management and NBFI could be expected to provide a high level of service to the Fund; that the performance of the Fund was satisfactory over time; that the Fund's fee structure appeared to the Board to be reasonable given the nature, extent and quality of services provided; and that the benefits accruing to Management and its affiliates by virtue of their relationship with the Fund were reasonable in light of the costs of providing the investment advisory and other services and benefits accruing to the Fund. The Board's conclusions may be based in part on its consideration of materials prepared in connection with the approval or continuance of the Agreements in prior years and on the Board's ongoing regular review of Fund performance and operations throughout the year, in addition to material prepared specifically for the most recent annual review of the Agreements.
This page has been left blank intentionally
This page has been left blank intentionally
Investment manager: Neuberger Berman Management LLC
Sub-adviser: Neuberger Berman Fixed Income LLC
Neuberger Berman Management LLC
605 Third Avenue, 2nd Floor
New York, NY 10158–0180
Shareholder Services
800.877.9700
Institutional Services
800.366.6264
www.nb.com
Statistics and projections in this report are derived from sources deemed to be reliable but cannot be regarded as a representation of future results of the Fund. This report is prepared for the general information of shareholders and is not an offer of shares of the Fund. Shares are sold only through the currently effective prospectus, which must precede or accompany this report.
M0258 12/14
Item 2. Code of Ethics.
The Board of Trustees (“Board”) of Neuberger Berman Alternative Funds (“Registrant”) adopted a code of ethics that applies to the Registrant’s principal executive officer, principal financial officer, principal accounting officer or controller, or persons performing similar functions (“Code of Ethics”). For the period covered by this Form N-CSR, there were no amendments to the Code of Ethics and there were no waivers from the Code of Ethics granted to the Registrant’s principal executive officer, principal financial officer, principal accounting officer or controller, or persons performing similar functions.
A copy of the Code of Ethics is incorporated by reference to Neuberger Berman Equity Funds’ Form N-CSRS Investment Company Act file number 811-00582 (filed May 6, 2013). The Code of Ethics is also available, without charge, by calling 1-800-877-9700 (toll-free).
Item 3. Audit Committee Financial Expert.
The Board has determined that the Registrant has two audit committee financial experts serving on its audit committee. The Registrant’s audit committee financial experts are George W. Morriss and Candace L. Straight. Mr. Morriss and Ms. Straight are independent trustees as defined by Form N-CSR.
Item 4. Principal Accountant Fees and Services.
Ernst & Young LLP (“E&Y”) serves as independent registered public accounting firm to Neuberger Berman Absolute Return Multi-Manager Fund, Neuberger Berman Flexible Select Fund, Neuberger Berman Global Allocation Fund, Neuberger Berman Inflation Navigator Fund, Neuberger Berman Long Short Multi-Manager Fund and Neuberger Berman Risk Balanced Commodity Strategy Fund. Neuberger Berman Absolute Return Multi-Manager Fund, Neuberger Berman Flexible Select Fund, Neuberger Berman Global Allocation Fund, Neuberger Berman Inflation Navigator Fund, Neuberger Berman Long Short Multi-Manager Fund and Neuberger Berman Risk Balanced Commodity Strategy Fund commenced operations on May 15, 2013, May 31, 2013, December 29, 2010, December 19, 2012, December 19, 2013 and August 27, 2012, respectively.
Tait, Weller & Baker LLP (“Tait Weller”) serves as independent registered public accounting firm to Neuberger Berman Long Short Fund. Neuberger Berman Long Short Fund commenced operations on December 29, 2011.
(a) Audit Fees
The aggregate fees billed for professional services rendered by E&Y for the audit of the annual financial statements or services that are normally provided by E&Y in connection with statutory and regulatory filings or engagements were $209,000 and $300,000 for the fiscal years ended 2013 and 2014, respectively.
The aggregate fees billed for professional services rendered by Tait Weller for the audit of the annual financial statements or services that are normally provided by Tait Weller in connection
with statutory and regulatory filings or engagements were $25,500 and $27,200 for the fiscal years ended 2013 and 2014, respectively.
(b) Audit-Related Fees
The aggregate fees billed to the Registrant for assurance and related services by E&Y that are reasonably related to the performance of the audit of the Registrant’s financial statements and are not reported above in Audit Fees were $0 and $0 for the fiscal years ended 2013 and 2014, respectively. The Audit Committee approved 0% and 0% of these services provided by E&Y for the fiscal years ended 2013 and 2014, respectively, pursuant to the waiver provisions of Rule 2-01(c)(7)(i)(C) of Regulation S-X.
The fees billed to other entities in the investment company complex for assurance and related services by E&Y that are reasonably related to the performance of the audit that the Audit Committee was required to approve because the engagement related directly to the operations and financial reporting of the Registrant were $0 and $0 for the fiscal years ended 2013 and 2014, respectively. The Audit Committee approved 0% and 0% of these services provided by E&Y for the fiscal years ended 2013 and 2014, respectively, pursuant to the waiver provisions of Rule 2-01(c)(7)(i)(C) of Regulation S-X.
The aggregate fees billed to the Registrant for assurance and related services by Tait Weller that are reasonably related to the performance of the audit of the Registrant’s financial statements and are not reported above in Audit Fees were $0 and $0 for the fiscal years ended 2013 and 2014, respectively. The Audit Committee approved 0% and 0% of these services provided by Tait Weller for the fiscal years ended 2013 and 2014, respectively, pursuant to the waiver provisions of Rule 2-01(c)(7)(i)(C) of Regulation S-X.
The fees billed to other entities in the investment company complex for assurance and related services by Tait Weller that are reasonably related to the performance of the audit that the Audit Committee was required to approve because the engagement related directly to the operations and financial reporting of the Registrant were $0 and $0 for the fiscal years ended 2013 and 2014, respectively. The Audit Committee approved 0% and 0% of these services provided by Tait Weller for the fiscal years ended 2013 and 2014, respectively, pursuant to the waiver provisions of Rule 2-01(c)(7)(i)(C) of Regulation S-X.
(c) Tax Fees
The aggregate fees billed to the Registrant for professional services rendered by E&Y for tax compliance, tax advice, and tax planning were $63,000 and $78,500 for the fiscal years ended 2013 and 2014, respectively. The nature of the services provided includes preparation of the Federal and State tax extensions and tax returns, review of annual excise tax calculations, and preparation of form 8613, in addition to guidance with the identification of Passive Foreign Investment Companies ("PFICS"), assistance with determination of various foreign withholding taxes, and assistance with Internal Revenue Code and tax regulation requirements for fund investments. The Audit Committee approved 0% and 0% of these services provided by E&Y for the fiscal years ended 2013 and 2014, respectively, pursuant to the waiver provisions of Rule 2-01(c)(7)(i)(C) of Regulation S-X.
The fees billed to other entities in the investment company complex for professional services rendered by E&Y for tax compliance, tax advice, and tax planning that the Audit Committee was required to approve because the engagement related directly to the operations and financial reporting of the Registrant were $0 and $0 for the fiscal years ended 2013 and 2014, respectively. The Audit Committee approved 0% and 0% of these services provided by E&Y for the fiscal years ended 2013 and 2014, respectively, pursuant to the waiver provisions of Rule 2-01(c)(7)(i)(C) of Regulation S-X.
The aggregate fees billed to the Registrant for professional services rendered by Tait Weller for tax compliance, tax advice, and tax planning were $4,250 and $5,600 for the fiscal years ended 2013 and 2014, respectively. The nature of the services provided includes preparation of the Federal and State tax extensions and tax returns, review of annual excise tax calculations, and preparation of form 8613, in addition to guidance with the identification of Passive Foreign Investment Companies ("PFICS"), assistance with determination of various foreign withholding taxes, and assistance with Internal Revenue Code and tax regulation requirements for fund investments. The Audit Committee approved 0% and 0% of these services provided by Tait Weller for the fiscal years ended 2013 and 2014, respectively, pursuant to the waiver provisions of Rule 2-01(c)(7)(i)(C) of Regulation S-X.
The fees billed to other entities in the investment company complex for professional services rendered by Tait Weller for tax compliance, tax advice, and tax planning that the Audit Committee was required to approve because the engagement related directly to the operations and financial reporting of the Registrant were $0 and $0 for the fiscal years ended 2013 and 2014, respectively. The Audit Committee approved 0% and 0% of these services provided by Tait Weller for the fiscal years ended 2013 and 2014, respectively, pursuant to the waiver provisions of Rule 2-01(c)(7)(i)(C) of Regulation S-X.
(d) All Other Fees
The aggregate fees billed to the Registrant for products and services provided by E&Y, other than services reported in Audit Fees, Audit-Related Fees, and Tax Fees were $0 and $0 for the fiscal years ended 2013 and 2014, respectively. The Audit Committee approved 0% and 0% of these services provided by E&Y for the fiscal years ended 2013 and 2014, respectively, pursuant to the waiver provisions of Rule 2-01(c)(7)(i)(C) of Regulation S-X.
The fees billed to other entities in the investment company complex for products and services provided by E&Y, other than services reported in Audit Fees, Audit-Related Fees, and Tax Fees, that the Audit Committee was required to approve because the engagement related directly to the operations and financial reporting of the Registrant were $0 and $0 for the fiscal years ended 2013 and 2014, respectively. The Audit Committee approved 0% and 0% of these services provided by E&Y for the fiscal years ended 2013 and 2014, respectively, pursuant to the waiver provisions of Rule 2-01(c)(7)(i)(C) of Regulation S-X.
The aggregate fees billed to the Registrant for products and services provided by Tait Weller, other than services reported in Audit Fees, Audit-Related Fees, and Tax Fees were $0 and $0 for the fiscal years ended 2013 and 2014, respectively. The Audit Committee approved 0% and 0%
of these services provided by Tait Weller for the fiscal years ended 2013 and 2014, respectively, pursuant to the waiver provisions of Rule 2-01(c)(7)(i)(C) of Regulation S-X.
The fees billed to other entities in the investment company complex for products and services provided by Tait Weller, other than services reported in Audit Fees, Audit-Related Fees, and Tax Fees, that the Audit Committee was required to approve because the engagement related directly to the operations and financial reporting of the Registrant were $0 and $0 for the fiscal years ended 2013 and 2014, respectively. The Audit Committee approved 0% and 0% of these services provided by Tait Weller for the fiscal years ended 2013 and 2014, respectively, pursuant to the waiver provisions of Rule 2-01(c)(7)(i)(C) of Regulation S-X.
(e) Audit Committee’s Pre-Approval Policies and Procedures
(1) The Audit Committee’s pre-approval policies and procedures for the Registrant to engage an accountant to render audit and non-audit services delegate to each member of the Committee the power to pre-approve services between meetings of the Committee.
(2) None of the services described in paragraphs (b) through (d) above were approved by the Audit Committee pursuant to paragraph (c)(7)(i)(C) of Rule 2-01 of Regulation S-X.
(f) Hours Attributed to Other Persons
Not applicable.
(g) Non-Audit Fees
Non-audit fees billed by E&Y for services rendered to the Registrant were $63,000 and $78,500 for the fiscal years ended 2013 and 2014, respectively.
Non-audit fees billed by E&Y for services rendered to the Registrant’s investment adviser and any entity controlling, controlled by, or under common control with the adviser that provides ongoing services to the Registrant were $0 and $0 for the fiscal years ended 2013 and 2014, respectively.
Non-audit fees billed by Tait Weller for services rendered to the Registrant were $4,250 and $5,600 for the fiscal years ended 2013 and 2014, respectively.
Non-audit fees billed by Tait Weller for services rendered to the Registrant’s investment adviser and any entity controlling, controlled by, or under common control with the adviser that provides ongoing services to the Registrant were $0 and $0 for the fiscal years ended 2013 and 2014, respectively.
(h) The Audit Committee of the Board considered whether the provision of non-audit services rendered to the Registrant’s investment adviser and any entity controlling, controlled by, or under common control with the adviser that provides ongoing services to the Registrant that were not pre-approved by the Audit Committee because the engagement did not relate directly to the operations and financial reporting of the Registrant is compatible with maintaining E&Y’s and Tait Weller’s independence.
Item 5. Audit Committee of Listed Registrants.
Not applicable to the Registrant.
Item 6. Schedule of Investments.
The complete schedule of investments for each series is disclosed in the Registrant’s Annual Report, which is included as Item 1 of this Form N-CSR.
Item 7. Disclosure of Proxy Voting Policies and Procedures for Closed-End Management Investment Companies.
Not applicable to the Registrant.
Item 8. Portfolio Managers of Closed-End Management Investment Companies.
Not applicable to the Registrant.
Item 9. Purchases of Equity Securities by Closed-End Management Investment Company and Affiliated Purchasers.
Not applicable to the Registrant.
Item 10. Submission of Matters to a Vote of Security Holders.
There were no changes to the procedures by which shareholders may recommend nominees to the Board.
Item 11. Controls and Procedures.
| (a) | Based on an evaluation of the disclosure controls and procedures (as defined in Rule 30a-3(c) under the Investment Company Act of 1940, as amended (the “Act”)) as of a date within 90 days of the filing date of this document, the Chief Executive Officer and Treasurer and Principal Financial and Accounting Officer of the Registrant have concluded that such disclosure controls and procedures are effectively designed to ensure that information required to be disclosed by the Registrant on Form N-CSR and Form N-Q is accumulated and communicated to the Registrant’s management to allow timely decisions regarding required disclosure. |
| | |
| (b) | There were no significant changes in the Registrant’s internal controls over financial reporting (as defined in Rule 30a-3(d) under the Act) that occurred during the Registrant’s second fiscal quarter of the period covered by this report that have materially affected, or are reasonably likely to materially affect, the Registrant’s internal control over financial reporting. |
Item 12. Exhibits.
| (a)(1) | A copy of the Code of Ethics is incorporated by reference to Neuberger Berman Equity Funds’ Form N-CSRS, Investment Company Act file number 811-00582 (filed May 6, 2013). |
| | |
| (a)(2) | The certifications required by Rule 30a-2(a) of the Act and Section 302 of the Sarbanes-Oxley Act of 2002 (“Sarbanes-Oxley Act”) are filed herewith. |
| | |
| (a)(3) | Not applicable to the Registrant. |
| | |
| (b) | The certifications required by Rule 30a-2(b) of the Act and Section 906 of the Sarbanes-Oxley Act are filed herewith. |
The certifications provided pursuant to Rule 30a-2(b) of the Act and Section 906 of the Sarbanes-Oxley Act are not deemed “filed” for purposes of Section 18 of the Securities Exchange Act of 1934, as amended (“Exchange Act”), or otherwise subject to the liability of that section. Such certifications will not be deemed to be incorporated by reference into any filing under the Securities Act of 1933, as amended, or the Exchange Act, except to the extent that the Registrant specifically incorporates them by reference.
SIGNATURES
Pursuant to the requirements of the Securities Exchange Act of 1934 and the Investment Company Act of 1940, the Registrant has duly caused this report to be signed on its behalf by the undersigned, thereunto duly authorized.
NEUBERGER BERMAN ALTERNATIVE FUNDS
| By: | /s/ Robert Conti | |
| | Robert Conti |
| | Chief Executive Officer |
| | |
| Date: January 7, 2015 |
| |
| | |
| Pursuant to the requirements of the Securities Exchange Act of 1934 and the Investment Company Act of 1940, this report has been signed below by the following persons on behalf of the Registrant and in the capacities and on the dates indicated. |
| | |
| | |
| | |
| By | /s/ Robert Conti | |
| | Robert Conti |
| | Chief Executive Officer |
| | |
| Date: January 7, 2015 |
| | |
| | |
| | |
| By: | /s/ Robert Conti | |
| | John M. McGovern |
| | Treasurer and Principal Financial |
| | and Accounting Officer |
| | |
| Date: January 7, 2015 |