Washington, D.C. 20549
Arthur C. Delibert, Esq.
1601 K Street, N.W.
Washington, D.C. 20006-1600
Form N-CSR is to be used by management investment companies to file reports with the Commission not later than 10 days after the transmission to stockholders of any report that is required to be transmitted to stockholders under Rule 30e-1 under the Investment Company Act of 1940as amended (“Act”) (17 CFR 270.30e-1). The Commission may use the information provided on Form N-CSR in its regulatory, disclosure review, inspection, and policymaking roles.
A registrant is required to disclose the information specified by Form N-CSR, and the Commission will make this information public. A registrant is not required to respond to the collection of information contained in Form N-CSR unless the Form displays a currently valid Office of Management and Budget (“OMB”) control number. Please direct comments concerning the accuracy of the information collection burden estimate and any suggestions for reducing the burden to Secretary, Securities and Exchange Commission, 100 F Street, NE, Washington, DC 20549-0609. The OMB has reviewed this collection of information under the clearance requirements of 44 U.S.C. § 3507.
Item 1. Report to Shareholders.
Following are copies of the annual reports transmitted to shareholders pursuant to Rule 30e-1 under the Act.

Neuberger Berman
Alternative and Multi-Asset Class Funds
Institutional Class Shares
Class A Shares
Class C Shares
Class R6 Shares
Global Allocation Fund
Hedged Option Premium Strategy Fund
Long Short Fund
Long Short Credit Fund
Multi-Asset Income Fund
Risk Balanced Commodity Strategy Fund
U.S. Equity Index PutWrite Strategy Fund
Annual Report
October 31, 2017
Contents
THE FUNDS | |
President's Letter | | | | 1 | |
PORTFOLIO COMMENTARY | |
Global Allocation Fund | | | | 2 | |
Hedged Option Premium Strategy Fund | | | | 5 | |
Long Short Fund | | | | 8 | |
Long Short Credit Fund | | | | 11 | |
Multi-Asset Income Fund | | | | 14 | |
Risk Balanced Commodity Strategy Fund | | | | 17 | |
U.S. Equity Index PutWrite Strategy Fund | | | | 20 | |
FUND EXPENSE INFORMATION | | | | 27 | |
SCHEDULE OF INVESTMENTS | |
Global Allocation Fund | | | | 29 | |
Positions by Industry | | | | 37 | |
Hedged Option Premium Strategy Fund | | | | 48 | |
Long Short Fund | | | | 52 | |
Long Short Credit Fund | | | | 64 | |
Multi-Asset Income Fund | | | | 75 | |
Risk Balanced Commodity Strategy Fund | | | | 93 | |
U.S. Equity Index PutWrite Strategy Fund | | | | 100 | |
FINANCIAL STATEMENTS | | | | 104 | |
FINANCIAL HIGHLIGHTS (ALL CLASSES)/
PER SHARE DATA | |
Global Allocation Fund | | | | 154 | |
Hedged Option Premium Strategy Fund | | | | 156 | |
Long Short Fund | | | | 156 | |
Long Short Credit Fund | | | | 158 | |
Multi-Asset Income Fund | | | | 160 | |
Risk Balanced Commodity Strategy Fund | | | | 162 | |
U.S. Equity Index PutWrite Strategy Fund | | | | 164 | |
Reports of Independent Registered Public Accounting Firms | | | | 168 | |
Directory | | | | 170 | |
Trustees and Officers | | | | 171 | |
Proxy Voting Policies and Procedures | | | | 181 | |
Quarterly Portfolio Schedule | | | | 181 | |
Board of Consideration of the Management Agreement | | | | 182 | |
Notice to Shareholders | | | | 188 | |
The "Neuberger Berman" name and logo and "Neuberger Berman Investment Advisers LLC" name are registered service marks of Neuberger Berman Group LLC. The individual Fund names in this piece are either service marks or registered service marks of Neuberger Berman Investment Advisers LLC, an affiliate of Neuberger Berman BD LLC, distributor, member FINRA. @2017 Neuberger Berman BD LLC, distributor. All rights reserved.
Dear Shareholder,
I am pleased to present this annual shareholder report for Neuberger Berman Alternative and Multi-Asset Class Funds.
The global financial market generated varying results over the 12-months ended October 31, 2017. Global equities generated strong results, supported by corporate profits that often exceeded expectations, strengthening global growth and overall robust demand. Meanwhile, the global fixed income markets posted a modest gain. In the U.S., yields moved higher as the U.S. Federal Reserve (Fed) raised interest rates on three occasions during the period, with another interest rate hike in December 2017. Additionally, in a well telegraphed move, the Fed began reducing its balance sheet in October 2017.
All told, the U.S. equity market, as measured by the S&P 500® Index, gained 23.63% over the reporting period. International developed and emerging market equities also posted strong results. Meanwhile, the overall U.S. bond market, as measured by the Bloomberg Barclays U.S. Aggregate Bond Index, gained 0.90% during the period. Finally, inflation was generally well contained over the period.
Looking ahead, against a background of synchronous global growth, low and falling unemployment and U.S. corporate margins at record highs, we believe the current softness in inflation could be a lagged effect of weak growth and low energy prices during 2015-16. As such, in a scenario of a return to a moderate rise in inflation, we believe the Fed's forecast for interest rate hikes in 2018 would be closer to reality than the market currently anticipates. From an investment perspective, we continue to have high conviction with our portfolio managers and believe their portfolios are well positioned for the current and coming environment.
Thank you for your continued support and trust. We look forward to continue serving your investment needs in the years to come.
Sincerely,

ROBERT CONTI
PRESIDENT AND CEO
NEUBERGER BERMAN MUTUAL FUNDS
1
Global Allocation Fund Commentary (Unaudited)
Neuberger Berman Global Allocation Fund Institutional Class generated a 16.24% total return for the 12 months ended October 31, 2017, and outperformed its custom benchmark, a custom blend consisting of 60% MSCI All Country World Index (Net) and 40% Bloomberg Barclays Global Aggregate Index, which provided a 13.94% return for the same period. (Performance for all share classes is provided in the table immediately following this letter.)
Global equity markets, as measured by the MSCI All Country World Index (Net), generated positive returns during this reporting period as momentum continued to build across the global economy. European stocks in particular benefitted from the rebound in economic growth and rising corporate earnings. U.S. stocks performed well fueled by elevated consumer confidence, strong earnings growth, and renewed talks of tax reform, despite natural disasters and rising geopolitical tensions. In fixed income markets, U.S. and non-U.S. developed regions were broadly positive. Treasury yields were boosted following the November 2016 U.S. election but suffered a setback in the first quarter when the healthcare bill was pulled. Despite a stronger Euro, the European Central Bank announced that it plans to reduce its quantitative easing program while the Bank of Japan maintained its accommodative monetary policy stance. Commodities were strengthened by a weaker U.S. dollar and more balanced supply/demand dynamics. Energy markets performed well over the reporting period given hurricane-driven supply disruptions in the third quarter of 2017 and supply reductions from OPEC countries. The industrial metals sector was supported by robust demand from China, which particularly boosted copper, zinc and aluminum prices.
During the reporting period, equities, fixed income and opportunistic allocations all added value. The largest positive contributors to the Fund's performance were equities, in particular non-US equities. Within fixed income, allocations to high yield and investment grade corporate bonds contributed to results amid solid investor risk appetite and supportive fundamentals. Opportunistic investments provided uncorrelated returns and diversification benefits to the Fund. The allocation to Global TIPS modestly detracted from Fund performance.
The Fund's aggregate use of futures, forward foreign currency, swap and option contracts contributed positively to performance during the reporting period.
The global economy has continued to improve as both hard and soft data have trended higher and consequently, has reignited investor optimism. In particular, corporate earnings growth across key regions such as Europe, Japan, and the U.S. provided further tailwinds. As a whole, we see global markets currently in the midst of an environment characterized by moderate growth, muted inflation, and a still-accommodative monetary policy, but within a more fragile overall economic regime. We believe this favors equity and credit over government bonds although valuations suggest subdued forward-looking returns for most markets.
Sincerely,
ERIK KNUTZEN, BRADLEY TANK, WAI LEE* AND AJAY JAIN
PORTFOLIO MANAGERS
* Wai Lee, a portfolio manager of the Fund during the reporting period, ceased his portfolio management responsibilities on or about December 1, 2017.
Information about principal risks of investing in the Fund is set forth in the prospectus and statement of additional information.
The portfolio composition, industries and holdings of the Fund are subject to change without notice.
The opinions expressed are those of the Fund's portfolio managers. The opinions are as of the date of this report and are subject to change without notice.
2
Global Allocation Fund (Unaudited)
TICKER SYMBOLS
Institutional Class | | NGLIX | |
Class A | | NGLAX | |
Class C | | NGLCX | |
PERFORMANCE HIGHLIGHTS3
| | | Inception | | Average Annual Total Return
Ended 10/31/2017 | |
| | | Date | | 1 Year | | 5 Year | | Life of Fund | |
At NAV | | | | | | | | | |
Institutional Class | | 12/29/2010 | | | 16.24 | % | | | 6.13 | % | | | 6.31 | % | |
Class A | | 12/29/2010 | | | 15.77 | % | | | 5.75 | % | | | 5.93 | % | |
Class C | | 12/29/2010 | | | 14.99 | % | | | 4.97 | % | | | 5.14 | % | |
With Sales Charge | | | | | | | | | |
Class A | | | | | 9.16 | % | | | 4.49 | % | | | 5.02 | % | |
Class C | | | | | 13.99 | % | | | 4.97 | % | | | 5.14 | % | |
Index | | | | | | | | | |
60% MSCI All Country World Index (Net)
and 40% Bloomberg Barclays
Global Aggregate Index1,2 | | | | | 13.94 | % | | | 6.66 | % | | | 6.01 | % | |
MSCI All Country World
Index (Net)1,2 | | | | | 23.20 | % | | | 10.80 | % | | | 8.48 | % | |
The performance data quoted represent past performance and do not indicate future results. Current performance may be lower or higher than the performance data quoted. For performance data current to the most recent month-end, please visit www.nb.com/performance.
The results shown in the table reflect the reinvestment of income dividends and other distributions, if any. The results do not reflect the effect of taxes a shareholder would pay on Fund distributions or on the redemption of Fund shares.
The investment return and principal value of an investment will fluctuate and shares, when redeemed, may be worth more or less than their original cost.
Returns would have been lower if Neuberger Berman Investment Advisers LLC ("Management") had not reimbursed certain expenses and/or waived a portion of the investment management fees during certain of the periods shown. Repayment by a class (of expenses previously reimbursed and/or fees previously waived by Management) will decrease the class's returns. Please see Note B in the Notes to Financial Statements for specific information regarding expense reimbursement and/or fee waiver arrangements.
As stated in the Fund's most recent prospectus, the total annual operating expense ratios for fiscal year 2016 were 4.39%, 4.78% and 5.53% for Institutional Class, Class A and Class C shares, respectively (before expense reimbursements and/or fee waivers, if any). The total annual operating expense ratios were 0.90%, 1.26% and 2.01% for Institutional Class, Class A and Class C shares, respectively, after expense reimbursements and/or fee waivers. The expense ratios for the annual period ended October 31, 2017 can be found in the Financial Highlights section of this report.
Returns shown with a sales charge reflect the deduction of the current maximum initial sales charge of 5.75% for Class A shares and the contingent deferred sales charge (CDSC) for Class C shares. The CDSC for Class C shares is 1%, which is reduced to 0% after 1 year. The performance of the Fund's share classes will differ primarily due to different sales charge structures and class expenses. Please see the prospectus for more information about sales charge structures, if any, and class expenses for your share class.
3
Global Allocation Fund (Unaudited)
COMPARISON OF A $1,000,000 INVESTMENT
(000's omitted)
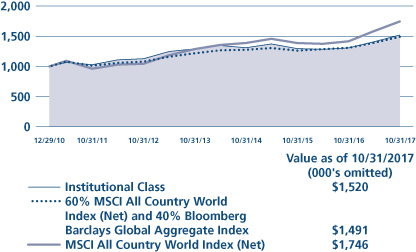
This graph shows the change in value of a hypothetical $1,000,000 investment in the Fund over the past 10 fiscal years, or since the Fund's inception if it has not operated for 10 years. The graph is based on the Institutional Class shares only; the performance of the Fund's share classes will differ primarily due to different sales charge structures and class expenses (see Performance Highlights chart on previous page). The result is compared with benchmarks, which include a broad-based market index and may include a more narrowly based index. Market indices have not been reduced to reflect any of the fees and costs of investing. The results shown in the graph reflect the reinvestment of income dividends and other distributions, if any. The results do not reflect the effect of taxes a shareholder would pay on Fund distributions or on the redemption of Fund shares. Results represent past performance and do not indicate future results.
4
Hedged Option Premium Strategy Fund Commentary (Unaudited)
Since inception on April 12, 2017, the Neuberger Berman Hedged Option Premium Fund Institutional Class generated a total return of 1.92% for the period ended October 31, 2017, outperforming its primary benchmark, the CBOE S&P 500 Iron Condor Index, which generated a total return of 0.68% for the same period. (Performance for all share classes is provided in the table immediately following this letter.)
The Fund's fixed income collateral holdings of short-term U.S. Treasuries contributed marginally to returns as short-term U.S. Treasury bond yields increased over the period with the 2-Year U.S. Treasury yield increasing roughly 36 basis points to 1.60%. Over time, we anticipate short-term interest rates to rise, and believe the strategy will benefit from that as the shorter duration exposures of the Fund's collateral portfolio allow the Fund to capture higher yields without experiencing significant duration risk. The CBOE S&P 500 Volatility Index ("VIX") and CBOE Russell 2000 Volatility Index ("RVX"), two popular measures of index option implied volatility levels, remained near historically low levels, averaging 10.9 and 15.3, respectively, over the reporting period.
The Fund pursues an absolute return objective and is intended to experience limited correlation to broader equity markets. The Fund seeks to achieve its goal primarily through a strategy of selling (writing) put and call option spreads on U.S. indices, including the S&P 500® Index and the Russell 2000® Index, exchange traded funds ("ETFs") and equity securities, and through investments in fixed income instruments. The Fund attempts to generate returns through the receipt of premiums from selling put and call option spreads, as well as through investments in fixed income instruments, which collectively are intended to reduce volatility relative to what it would be if the Fund held the underlying reference asset (e.g., the underlying index, ETF or security) on which the options are written. In an effort to diversify exposures and limit volatility, the Fund will sell put and call option spreads at varying strike prices and with varying expiration dates on various reference assets.
As we look towards 2018, we anticipate equity market return dispersion to continue to increase across various regions, sectors and industries due to a combination of diverse interest rate politics, increased global competition, geopolitics (e.g., U.S. tax reform and Brexit). As a result, index returns are likely to be at or below longer-term averages, which may lead to higher relative returns versus the Fund's benchmark and related U.S. equity market indices such as the S&P 500 Index and Russell 2000 Index.
Sincerely,
DEREK DEVENS
PORTFOLIO MANAGER
Information about principal risks of investing in the Fund is set forth in the prospectus and statement of additional information.
The portfolio composition, industries and holdings of the Fund are subject to change without notice.
The opinions expressed are those of the Fund's portfolio manager. The opinions are as of the date of this report and are subject to change without notice.
5
Hedged Option Premium Strategy Fund (Unaudited)
TICKER SYMBOLS
Institutional Class | | NHOIX | |
Class A | | NHOAX | |
Class C | | NHOCX | |
Class R6 | | NHORX | |
PORTFOLIO BY TYPE OF SECURITY
(as a % of Total Net Assets) | |
U.S. Treasury Obligations | | | 88.6 | % | |
Options Purchased | | | 0.0 | | |
Options Written | | | (0.3 | ) | |
Short-Term Investment | | | 29.4 | | |
Liabilities Less Other Assets | | | (17.7 | ) | |
Total | | | 100.0 | % | |
PERFORMANCE HIGHLIGHTS4
| | | Inception
Date | | Cumulative Total Return
Ended 10/31/2017
Life of Fund | |
At NAV | | | | | |
Institutional Class | | 04/12/2017 | | | 1.92 | % | |
Class A | | 04/12/2017 | | | 1.74 | % | |
Class C | | 04/12/2017 | | | 1.32 | % | |
Class R6 | | 04/12/2017 | | | 1.95 | % | |
With Sales Charge | | | | | |
Class A | | | | | –4.13 | % | |
Class C | | | | | 0.32 | % | |
Index | | | | | |
| CBOE S&P 500 Iron Condor Index1,2 | | | | | 0.68 | % | |
| S&P 500® Index1,2 | | | | | 10.55 | % | |
The performance data quoted represent past performance and do not indicate future results. Current performance may be lower or higher than the performance data quoted. For performance data current to the most recent month-end, please visit www.nb.com/performance.
The results shown in the table reflect the reinvestment of income dividends and other distributions, if any. The results do not reflect the effect of taxes a shareholder would pay on Fund distributions or on the redemption of Fund shares.
The investment return and principal value of an investment will fluctuate and shares, when redeemed, may be worth more or less than their original cost.
Returns would have been lower if Neuberger Berman Investment Advisers LLC ("Management") had not reimbursed certain expenses and/or waived a portion of the investment management fees during certain of the periods shown. Repayment by a class (of expenses previously reimbursed and/or fees previously waived by Management) will decrease the class's returns. Please see Note B in the Notes to Financial Statements for specific information regarding expense reimbursement and/or fee waiver arrangements.
As stated in the Fund's most recent prospectus, the estimated total annual operating expense ratios for fiscal year 2017 are 1.42%, 1.78%, 2.53% and 1.35% for Institutional Class, Class A, Class C and Class R6 shares, respectively (before expense reimbursements and/or fee waivers, if any). The estimated total annual operating expense ratios for the current fiscal year are 0.65%, 1.01%, 1.76% and 0.58% for Institutional Class, Class A, Class C and Class R6 shares, respectively, after expense reimbursements and/or fee waivers. The expense ratios for the annual period ended October 31, 2017 can be found in the Financial Highlights section of this report.
Returns shown with a sales charge reflect the deduction of the current maximum initial sales charge of 5.75% for Class A shares and the contingent deferred sales charge (CDSC) for Class C shares. The CDSC for Class C shares is 1%, which is reduced to 0% after 1 year. The performance of the Fund's share classes will differ primarily due to different sales charge structures and class expenses. Please see the prospectus for more information about sales charge structures, if any, and class expenses for your share class.
6
Hedged Option Premium Strategy Fund (Unaudited)
COMPARISON OF A $1,000,000 INVESTMENT
(000's omitted)
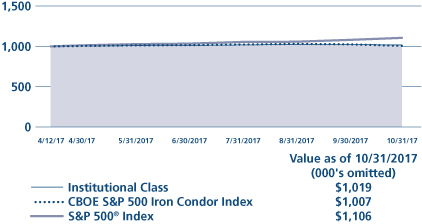
This graph shows the change in value of a hypothetical $1,000,000 investment in the Fund over the past 10 fiscal years, or since the Fund's inception if it has not operated for 10 years. The graph is based on the Institutional Class shares only; the performance of the Fund's share classes will differ primarily due to different sales charge structures and class expenses (see Performance Highlights chart on previous page). The result is compared with benchmarks, which include a broad-based market index and may include a more narrowly based index. Market indices have not been reduced to reflect any of the fees and costs of investing. The results shown in the graph reflect the reinvestment of income dividends and other distributions, if any. The results do not reflect the effect of taxes a shareholder would pay on Fund distributions or on the redemption of Fund shares. Results represent past performance and do not indicate future results.
7
Long Short Fund Commentary (Unaudited)
Neuberger Berman Long Short Fund Institutional Class generated an 11.54% total return for the 12 months ended October 31, 2017, outperforming its primary benchmark, the HFRX Equity Hedge Index, which returned 9.69% for the same period. The Fund, however, underperformed the S&P 500® Index which provided a 23.63% return for the period. (Performance for all share classes is provided in the table immediately following this letter.)
The U.S. stock market generated very strong results during the reporting period. Supporting the market were corporate profits that generally exceeded expectations, strengthening global growth and overall robust demand. These factors more than offset the potential headwinds from the U.S. Federal Reserve tightening monetary policy, stalled fiscal policy initiatives and several geopolitical issues. The overall U.S. stock market, as measured by the S&P 500 Index, reached numerous all-time record highs.
We maintained our constructive, albeit highly selective outlook during the reporting period. This was reflected in the Fund's net long exposure during the period. The Fund remained constructively positioned during the period for an ongoing economic recovery in the U.S. Against this backdrop, the Fund's largest sector weights were in Information Technology and Industrials.
We categorize our long investment exposure into three groups: Capital Growth, Total Return and Opportunistic. Capital Growth continues to represent our largest allocation followed by Total Return and Opportunistic. We continued to identify more compelling opportunities in Capital Growth relative to Total Return, as higher interest rates could negatively impact longer duration assets and cash flows. The portfolio's short exposure includes both single name "Fundamental" shorts and "Market" shorts. During the period, Fundamental shorts exposure increased against the backdrop of heightened market volatility and greater sector dispersion. As fundamentals came back into focus, Market shorts consisted primarily of sector and market cap-specific indices to help manage broader portfolio exposures, which also increased during the period.
Equity and credit long exposure added to Fund performance, while Fundamental shorts and the Fund's aggregate use of futures, option and swap contracts related to hedging activity detracted from performance during the period given the overall positive move in markets.
We continue to hold a fairly constructive, albeit highly selective, outlook driven by solid recent economic data and the emergence of a seemingly more pro-business environment in the U.S. Looking ahead, we believe the critical market dynamic will be the ongoing shift from monetary policy to fiscal policy and its effects on growth, earnings, interest rates, confidence and the federal deficit. We believe there could be periods of heightened volatility going forward, particularly if fiscal action differs from expectations in both magnitude and timing. We are very mindful of the complex world in which we live and invest. The risks of the long-term inflationary effects of continued government intervention, coupled with a myriad of ongoing geopolitical issues, remain top of our mind. As always, we remain dedicated to thinking deeply and creatively and strive to deliver attractive risk-adjusted returns. Given the vicissitudes of an increasingly global economy, we will also remain flexible in our decisions and open-minded to new ideas across different sectors, asset classes and geographies.
Sincerely,
CHARLES KANTOR AND MARC REGENBAUM
PORTFOLIO MANAGERS
Information about principal risks of investing in the Fund is set forth in the prospectus and statement of additional information.
The portfolio composition, industries and holdings of the Fund are subject to change without notice.
The opinions expressed are those of the Fund's portfolio manager. The opinions are as of the date of this report and are subject to change without notice.
8
Long Short Fund (Unaudited)
TICKER SYMBOLS
Institutional Class | | NLSIX | |
Class A | | NLSAX | |
Class C | | NLSCX | |
PORTFOLIO BY TYPE OF SECURITY
(as a % of Total Net Assets)
| | | Long | | Short | |
Common Stocks | | | 74.7 | % | | | (12.6 | )% | |
Convertible Bonds | | | 0.4 | | | | — | | |
Corporate Bonds | | | 5.6 | | | | (1.6 | ) | |
Exchange Traded Funds | | | — | | | | (2.1 | ) | |
Master Limited Partnerships | | | — | | | | (0.3 | ) | |
Options Purchased | | | 0.1 | | | | — | | |
Preferred Stock | | | 0.4 | | | | — | | |
Short-Term Investment | | | 17.6 | | | | — | | |
Other Assets Less Liabilities | | | 17.8 | * | | | — | | |
Total | | | 116.6 | % | | | (16.6 | )% | |
* Includes the impact of the Fund's open positions in derivatives (other than Options Purchased), if any.
PERFORMANCE HIGHLIGHTS
| | | Inception | | Average Annual Total Return
Ended 10/31/2017 | |
| | | Date | | 1 Year | | 5 Year | | Life of Fund | |
At NAV | | | | | | | | | |
Institutional Class | | 12/29/2011 | | | 11.54 | % | | | 5.48 | % | | | 6.54 | % | |
Class A | | 12/29/2011 | | | 11.15 | % | | | 5.09 | % | | | 6.15 | % | |
Class C | | 12/29/2011 | | | 10.31 | % | | | 4.31 | % | | | 5.36 | % | |
With Sales Charge | | | | | | | | | |
Class A | | | | | 4.73 | % | | | 3.87 | % | | | 5.08 | % | |
Class C | | | | | 9.31 | % | | | 4.31 | % | | | 5.36 | % | |
Index | | | | | | | | | |
| HFRX Equity Hedge Index1,2 | | | | | 9.69 | % | | | 3.72 | % | | | 3.88 | % | |
| S&P 500® Index1,2 | | | | | 23.63 | % | | | 15.18 | % | | | 15.58 | % | |
The performance data quoted represent past performance and do not indicate future results. Current performance may be lower or higher than the performance data quoted. For performance data current to the most recent month-end, please visit www.nb.com/performance.
The results shown in the table reflect the reinvestment of income dividends and other distributions, if any. The results do not reflect the effect of taxes a shareholder would pay on Fund distributions or on the redemption of Fund shares.
The investment return and principal value of an investment will fluctuate and shares, when redeemed, may be worth more or less than their original cost.
Returns would have been lower if Neuberger Berman Investment Advisers LLC ("Management") had not reimbursed certain expenses and/or waived a portion of the investment management fees during certain of the periods shown. Repayment by a class (of expenses previously reimbursed and/or fees previously waived by Management) will decrease the class's returns. Please see Note B in the Notes to Financial Statements for specific information regarding expense reimbursement and/or fee waiver arrangements.
As stated in the Fund's most recent prospectus, the total annual operating expense ratios for fiscal year 2016 were 1.94%, 2.30% and 3.04% for Institutional Class, Class A and Class C shares, respectively (before expense reimbursements and/or fee waivers, if any). The expense ratios for the annual period ended October 31, 2017 can be found in the Financial Highlights section of this report.
Returns shown with a sales charge reflect the deduction of the current maximum initial sales charge of 5.75% for Class A shares and the contingent deferred sales charge (CDSC) for Class C shares. The CDSC for Class C shares is 1%, which is reduced to 0% after 1 year. The performance of the Fund's share classes will differ primarily due to different sales charge structures and class expenses. Please see the prospectus for more information about sales charge structures, if any, and class expenses for your share class.
9
Long Short Fund (Unaudited)
COMPARISON OF A $1,000,000 INVESTMENT
(000's omitted)
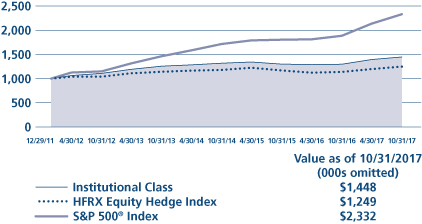
This graph shows the change in value of a hypothetical $1,000,000 investment in the Fund over the past 10 fiscal years, or since the Fund's inception if it has not operated for 10 years. The graph is based on the Institutional Class shares only; the performance of the Fund's share classes will differ primarily due to different sales charge structures and class expenses (see Performance Highlights chart on previous page). The result is compared with benchmarks, which include a broad-based market index and may include a more narrowly based index. Market indices have not been reduced to reflect any of the fees and costs of investing. The results shown in the graph reflect the reinvestment of income dividends and other distributions, if any. The results do not reflect the effect of taxes a shareholder would pay on Fund distributions or on the redemption of Fund shares. Results represent past performance and do not indicate future results.
10
Long Short Credit Fund Commentary (Unaudited)
Neuberger Berman Long Short Credit Fund Institutional Class returned 5.36% for the 12 months ended October 31, 2017, and outperformed its primary benchmark, the HRFX Fixed Income—Credit Index, which returned 4.79% for the same period. (Performance for all share classes is provided in the table immediately following this letter.)
Credit markets globally performed well for the period, supported mainly by dovish global central bank policies and synchronous global growth. This period has witnessed a historically low volatility regime, which has also supported investor risk appetites and encouraged investors to continue to invest in credit. The search for yield in a low rate environment clearly persisted during the period.
The modest upward move in U.S. Treasury yields played a significant role in credit market performance. The 10 year U.S. Treasury started the period at 1.84% and ended at 2.38%. This move was driven by a number of factors, the most significant of which were: the election of a new U.S. President; strengthening global growth; a resurgence of reflation; and finally U.S. Federal Reserve (Fed) interest rate hikes. The total number of Fed interest hikes during the period was three with a further hike in December 2017. The upward move in interest rates appears to have been absorbed by the credit markets.
We anticipate many of these drivers to continue to be the dominant themes in the upcoming year. While the Fed has been hiking interest rates and curtailing asset purchases, both the Bank of Japan and the European Central Bank appear committed to their dovish path and asset purchase programs. We believe that is the good news for credit markets. The increase in global growth and the resurgence of some inflation measures that have started to appear may begin to weigh on the interest rates markets. These opposing forces should drive most of the price action in the rates market with their unavoidable spillover to credit. We continue to believe in the attractiveness of credit, from the standpoint of fundamentals. We do, however, worry about the valuation levels and question whether investors are being paid appropriately for the risks. Our perspective should be viewed more so, as to risk vs. reward, as opposed to absolute, outright directional reward.
We have run what we believe is a conservative portfolio. The portfolio has comprised a mix of long positions and short positions both outright and on a relative value basis. We have not excessively levered up the portfolio, nor have we grossed up the exposures. Over the period, the largest contributors to performance were our positions in the communications, financial and basic materials sectors, while our losses stemmed principally from our short positioning in the consumer non-cyclical and healthcare sectors.
The Fund's aggregate use of futures, forward foreign currency, swap and option contracts contributed positively to performance during the reporting period.
In our view, the market does offer pockets of value, but we intend to remain invested conservatively. We believe that we are entering an interesting time in credit. Much of the adrenalin from central banks, delivered over the last nine years, may be coming to an end. As global growth resurfaces and inflation measures pick up, we believe the markets will have to adjust. We do not believe that the transition will be as smooth as is currently predicted; rather, we think volatility in credit will increase. We have constructed a portfolio of single name long and short positions based on fundamental analysis. We hope to be able to capture the idiosyncratic opportunities that we believe are mispriced. This continues to be expressed through relative value trades, capital structure arbitrage trades and directional long and short positions.
We do not believe that investors need to be exposed to the full credit market; but rather, that a balanced book of longs and shorts may perhaps be a better solution for the upcoming changes we are anticipating. Our intention is to deliver a stable series of returns that are not correlated to either the volatility or general return of the broad credit markets. We believe that a portfolio of fundamental long and short positions in credit, with less interest rate risk, should be able to help accomplish this in the upcoming year.
Sincerely,
RICK DOWDLE AND NORMAN MILNER
PORTFOLIO MANAGERS
Information about principal risks of investing in the Fund is set forth in the prospectus and statement of additional information.
The portfolio composition, industries and holdings of the Fund are subject to change without notice.
The opinions expressed are those of the Fund's portfolio managers. The opinions are as of the date of this report and are subject to change without notice.
11
Long Short Credit Fund (Unaudited)
TICKER SYMBOLS
Institutional Class | | NLNIX | |
Class A | | NLNAX | |
Class C | | NLNCX | |
Class R6 | | NRLNX | |
PORTFOLIO BY TYPE OF SECURITY
(as a % of Total Net Assets) | |
Common Stocks | | | 1.1 | % | |
Convertible Bonds | | | 1.0 | | |
Corporate Bonds | | | 84.4 | | |
Foreign Government Security | | | 0.6 | | |
Loan Assignments | | | 13.9 | | |
Preferred Stock | | | 3.1 | | |
Short Term Investment | | | 0.0 | | |
Liabilities Less Other Assets | | | (4.1 | )* | |
Total | | | 100.0 | % | |
* Includes the impact of the Fund's open positions in derivatives (other than Options Purchased), if any.
PERFORMANCE HIGHLIGHTS
| | | | | Average Annual Total
Return Ended 10/31/2017 | |
| | | Inception
Date | | 1 Year | | Life of
Fund | |
At NAV | |
Institutional Class | | 06/29/2015 | | | 5.36 | % | | | 1.23 | % | |
Class A | | 06/29/2015 | | | 4.98 | % | | | 0.90 | % | |
Class C | | 06/29/2015 | | | 4.10 | % | | | 0.20 | % | |
Class R6 | | 06/29/2015 | | | 5.33 | % | | | 1.30 | % | |
With Sales Charge | |
Class A | | | | | 0.55 | % | | | –0.93 | % | |
Class C | | | | | 3.10 | % | | | 0.20 | % | |
Index | |
| HFRX Fixed Income - Credit Index1,2 | | | | | 4.79 | % | | | 0.87 | % | |
| Bloomberg Barclays U.S. Aggregate Bond Index1,2 | | | | | 0.90 | % | | | 3.05 | % | |
The performance data quoted represent past performance and do not indicate future results. Current performance may be lower or higher than the performance data quoted. For performance data current to the most recent month-end, please visit www.nb.com/performance.
The results shown in the table reflect the reinvestment of income dividends and other distributions, if any. The results do not reflect the effect of taxes a shareholder would pay on Fund distributions or on the redemption of Fund shares.
The investment return and principal value of an investment will fluctuate and shares, when redeemed, may be worth more or less than their original cost.
Returns would have been lower if Neuberger Berman Investment Advisers LLC ("Management") had not reimbursed certain expenses and/or waived a portion of the investment management fees during certain of the periods shown. Repayment by a class (of expenses previously reimbursed and/or fees previously waived by Management) will decrease the class's returns. Please see Note B in the Notes to Financial Statements for specific information regarding expense reimbursement and/or fee waiver arrangements.
As stated in the Fund's most recent prospectus, the total annual operating expense ratios for fiscal year 2016 were 3.23%, 3.73%, 4.31% and 3.06% for Institutional Class, Class A, Class C and Class R6 shares, respectively (before expense reimbursements and/or fee waivers, if any). The total annual operating expense ratios were 2.08%, 2.48%, 3.16% and 1.93% for Institutional Class, Class A, Class C and Class R6 shares, respectively, after expense reimbursements and/or fee waivers. The expense ratios for the annual period ended October 31, 2017 can be found in the Financial Highlights section of this report.
Returns shown with a sales charge reflect the deduction of the current maximum initial sales charge of 4.25% for Class A shares and the contingent deferred sales charge (CDSC) for Class C shares. The CDSC for Class C shares is 1%, which is reduced to 0% after 1 year. The performance of the Fund's share classes will differ primarily due to different sales charge structures and class expenses. Please see the prospectus for more information about sales charge structures, if any, and class expenses for your share class.
12
Long Short Credit Fund (Unaudited)
COMPARISON OF A $1,000,000 INVESTMENT
(000's omitted)
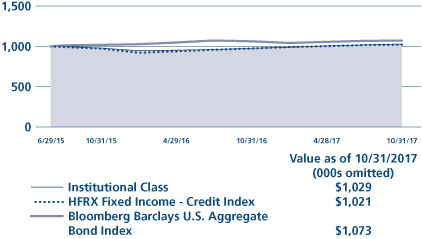
This graph shows the change in value of a hypothetical $1,000,000 investment in the Fund over the past 10 fiscal years, or since the Fund's inception if it has not operated for 10 years. The graph is based on the Institutional Class shares only; the performance of the Fund's share classes will differ primarily due to different sales charge structures and class expenses (see Performance Highlights chart on previous page). The result is compared with benchmarks, which include a broad-based market index and may include a more narrowly based index. Market indices have not been reduced to reflect any of the fees and costs of investing. The results shown in the graph reflect the reinvestment of income dividends and other distributions, if any. The results do not reflect the effect of taxes a shareholder would pay on Fund distributions or on the redemption of Fund shares. Results represent past performance and do not indicate future results.
13
Multi-Asset Income Fund Commentary (Unaudited)
Neuberger Berman Multi-Asset Income Fund Institutional Class generated a 9.93% total return for the 12 month period ended October 31, 2017, and outperformed its custom benchmark, a custom blend consisting of 60% Bloomberg Barclays U.S. Aggregate Bond Index and 40% S&P 500® Index (the benchmark), which provided a 9.53% return for the same period. (Performance for all share classes is provided in the table immediately following this letter.)
Global equity markets, as measured by the MSCI All Country World Index (Net), generated positive returns during this reporting period, as momentum continued to build across the global economy. European stocks in particular benefitted from the rebound in economic growth and rising corporate earnings. U.S. stocks performed well fueled by elevated consumer confidence, strong earnings growth, and renewed talks of tax reform, despite natural disasters and rising geopolitical tensions. Over the period, "growth" stocks generally outperformed "value" stocks, pushing the equity market to new highs. Emerging market (EM) equities posted strong positive performance over the period. An uptick in EM earnings expectations and positive gross domestic product revisions provided investor confidence despite losses immediately following the U.S. election.
Fixed income securities were broadly positive, particularly EM debt and high yield securities. Treasury yields were boosted following the 2016 U.S. election but suffered a setback in the first quarter of 2017 when the healthcare bill was pulled. The Federal Reserve's interest rate hikes over the period also impacted fixed income markets. Despite a stronger Euro, the European Central Bank announced that it plans to reduce its quantitative easing program while the Bank of Japan maintained its accommodative monetary policy stance.
During the reporting period, equities, fixed income and opportunistic allocations all added value. The largest positive contributors to the Fund's total returns were high dividend yielding equities. Exposure to MLPs and REITS also added value. Relative to the benchmark's equity exposure however, the equity allocation slightly underperformed. The Fund's fixed income allocations added value, particularly security selection within investment grade bonds, as well as asset-backed securities and high yield securities. The Fund's opportunistic investments provided uncorrelated returns and diversification benefits to the Fund.
The Fund's aggregate use of futures, forward foreign currency, swap and option contracts contributed positively to performance during the reporting period.
The global economy has continued to improve as both hard and soft data have trended higher and consequently, has reignited investor optimism. In particular, corporate earnings growth across key regions such as Europe, Japan, and the U.S. provided further tailwinds. As a whole, we see global markets currently in the midst of an environment characterized by moderate growth, muted inflation, and a still-accommodative monetary policy, but within a more fragile overall economic regime. We believe this favors equity and credit over government bonds although valuations suggest subdued forward-looking returns for most markets.
Sincerely,
ERIK KNUTZEN, BRADLEY TANK, WAI LEE* AND AJAY JAIN
PORTFOLIO MANAGERS
* Wai Lee, a portfolio manager of the Fund during the reporting period, ceased his portfolio management responsibilities on or about December 1, 2017.
Information about principal risks of investing in the Fund is set forth in the prospectus and statement of additional information.
The portfolio composition, industries and holdings of the Fund are subject to change without notice.
The opinions expressed are those of the Fund's portfolio managers. The opinions are as of the date of this report and are subject to change without notice.
14
Multi-Asset Income Fund (Unaudited)
TICKER SYMBOLS
Institutional Class | | NANIX | |
Class A | | NANAX | |
Class C | | NANCX | |
Class R6 | | NRANX | |
PORTFOLIO BY TYPE OF SECURITY
(as a % of Total Net Assets) | |
Asset-Backed Securities | | | 3.2 | % | |
Common Stocks | | | 33.8 | | |
Convertible Bonds | | | 0.7 | | |
Convertible Preferred Stocks | | | 0.2 | | |
Corporate Bonds | | | 10.8 | | |
Exchange Traded Funds | | | 3.5 | | |
Foreign Government Security | | | 0.6 | | |
Investment Companies | | | 20.8 | | |
Mortgage-Backed Securities | | | 13.0 | | |
Master Limited Partnerships | | | 3.1 | | |
Preferred Stocks | | | 1.2 | | |
Rights | | | 0.0 | | |
U.S. Government Agency Securities | | | 0.9 | | |
U.S. Treasury Obligations | | | 12.6 | | |
Short-Term Investment | | | 4.3 | | |
Liabilities Less Other Assets | | | (8.7 | )* | |
Total | | | 100.0 | % | |
* Includes the impact of the Fund's open positions in derivatives (other than Options Purchased), if any.
PERFORMANCE HIGHLIGHTS
| | | | | Average Annual Total
Return Ended 10/31/2017 | |
| | | Inception
Date | | 1 Year | | Life of
Fund | |
At NAV | |
Institutional Class | | 03/27/2015 | | | 9.93 | % | | | 4.67 | % | |
Class A | | 03/27/2015 | | | 9.53 | % | | | 4.29 | % | |
Class C | | 03/27/2015 | | | 8.71 | % | | | 3.52 | % | |
Class R6 | | 03/27/2015 | | | 10.01 | % | | | 4.74 | % | |
With Sales Charge | |
Class A | | | | | 4.83 | % | | | 2.58 | % | |
Class C | | | | | 7.71 | % | | | 3.52 | % | |
Index | |
60% Bloomberg Barclays U.S.
Aggregrate Bond Index and 40% S&P 500® Index1,2 | | | | | 9.53 | % | | | 5.77 | % | |
| Bloomberg Barclays U.S. Aggregate Bond Index1,2 | | | | | 0.90 | % | | | 2.00 | % | |
The performance data quoted represent past performance and do not indicate future results. Current performance may be lower or higher than the performance data quoted. For performance data current to the most recent month-end, please visit www.nb.com/performance.
The results shown in the table reflect the reinvestment of income dividends and other distributions, if any. The results do not reflect the effect of taxes a shareholder would pay on Fund distributions or on the redemption of Fund shares.
The investment return and principal value of an investment will fluctuate and shares, when redeemed, may be worth more or less than their original cost.
Returns would have been lower if Neuberger Berman Investment Advisers LLC ("Management") had not reimbursed certain expenses and/or waived a portion of the investment management fees during certain of the periods shown. Repayment by a class (of expenses previously reimbursed and/or fees previously waived by Management) will decrease the class's returns. Please see Note B in the Notes to Financial Statements for specific information regarding expense reimbursement and/or fee waiver arrangements.
For the period ended October 31, 2017, the 30-day SEC yields were 3.12%, 2.75%, 2.00% and 3.19% for Institutional Class, Class A, Class C and Class R6 shares, respectively. Absent expense reimbursements and/or fee waivers, the 30-day SEC yields would have been 1.45%, 1.05%, 0.34% and 1.53% for Institutional Class, Class A, Class C and Class R6 shares, respectively.
As stated in the Fund's most recent prospectus, the total annual operating expense ratios for fiscal year 2016 were 4.20%, 4.61%, 5.33% and 4.12% for Institutional Class, Class A, Class C and Class R6 shares, respectively (before expense reimbursements and/or fee waivers, if any). The total annual operating expense ratios were 0.78%, 1.15%, 1.90% and 0.71% for Institutional Class, Class A, Class C and Class R6 shares, respectively, after expense reimbursements and/or fee waivers. The expense ratios for the annual period ended October 31, 2017 can be found in the Financial Highlights section of this report.
Returns shown with a sales charge reflect the deduction of the current maximum initial sales charge of 4.25% for Class A shares and the contingent deferred sales charge (CDSC) for Class C shares. The CDSC for Class C shares is 1%, which is reduced to 0% after 1 year. The performance of the Fund's share classes will differ primarily due to different sales charge structures and class expenses. Please see the prospectus for more information about sales charge structures, if any, and class expenses for your share class.
15
Multi-Asset Income Fund (Unaudited)
COMPARISON OF A $1,000,000 INVESTMENT
(000's omitted)
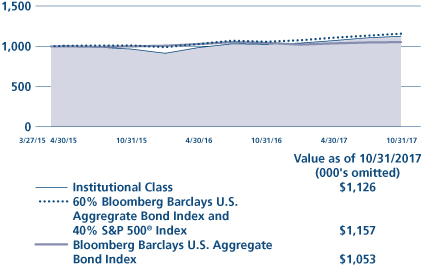
This graph shows the change in value of a hypothetical $1,000,000 investment in the Fund over the past 10 fiscal years, or since the Fund's inception if it has not operated for 10 years. The graph is based on the Institutional Class shares only; the performance of the Fund's share classes will differ primarily due to different sales charge structures and class expenses (see Performance Highlights chart on previous page). The result is compared with benchmarks, which include a broad-based market index and may include a more narrowly based index. Market indices have not been reduced to reflect any of the fees and costs of investing. The results shown in the graph reflect the reinvestment of income dividends and other distributions, if any. The results do not reflect the effect of taxes a shareholder would pay on Fund distributions or on the redemption of Fund shares. Results represent past performance and do not indicate future results.
16
Risk Balanced Commodity Strategy Fund Commentary (Unaudited)
Neuberger Berman Risk Balanced Commodity Strategy Fund1 Institutional Class generated a total return of 6.18% for the 12 months ended October 31, 2017 and outperformed its benchmark, the Bloomberg Commodity Index (the benchmark), which posted a 2.35% return for the same period. (Performance for all share classes is provided in the table immediately following this letter.)
The overall commodity market generated a positive return during the reporting period. In particular, the energy, industrial metals and livestock sectors produced the strongest returns. Energy performed well given hurricane-driven supply disruptions in the third quarter of 2017 and supply reductions from OPEC countries. The industrial metals sector was supported by robust demand from China which particularly boosted copper, zinc and aluminum prices. The livestock sector performed well, driven by supply issues in the first quarter of 2017 and solid seasonal demand. In contrast, the agriculture, softs and precious metals sectors posted the weakest results over the reporting period. Agriculture performed poorly due to strong global supply and the lack of weather-related events. Weakness in the softs sector was driven by sharply falling sugar prices amid lower consumer demand. Poor performance in the precious metals was largely due to falling prices in the immediate aftermath of the November 2016 U.S. elections.
Looking at the commodity sectors in which the Fund invests, energy was the largest contributor to outperformance relative to the benchmark. This was in part driven by an out-of-benchmark allocation to oil and natural gas. An underweight to sugar, one of the worst performing commodities during the period, was also beneficial. Elsewhere, an out-of-benchmark allocation to feeder cattle was additive to performance. Several of the Fund's tactical adjustments also contributed to results. In particular, an overweight to nickel, which appeared attractively valued relative to other metals, was rewarded. Within the industrial metals sector, the Fund's relative underweight to aluminum was additive to performance while an underweight to copper was a headwind for performance. An out-of-benchmark allocation to cocoa in the softs sector and lead in the industrial metals sector also detracted from results as they generated weak results over the period.
The Fund seeks to gain exposure to the commodity markets by investing, directly or indirectly, in futures contracts on individual commodities and other commodity-linked derivative instruments. The Fund's tactical positioning contributed positively to performance during the reporting period.
Heading into the end of the year, we are optimistic on the overall global economy, despite ongoing geopolitical tensions. We believe the tide is turning towards monetary policy tightening, not just in the U.S., but notably in Europe as well. With improving labor markets, we believe household spending should continue to drive the recovery and, in turn, push up inflation which thus far has been largely subdued. We anticipate commodities to be supported by the U.S. dollar which has been trending lower. In addition, while China's economy is slowing, we believe it will do so gradually and broad emerging market demand for raw materials should support growth oriented commodities. We continue to believe that an actively managed approach that dynamically navigates the risks of the asset class is an attractive way to gain exposure to commodities.
Sincerely,
WAI LEE*, HAKAN KAYA, THOMAS SONTAG AND DAVID YI WAN
PORTFOLIO MANAGERS
* Wai Lee, a portfolio manager of the Fund during the reporting period, ceased his portfolio management responsibilities on or about December 1, 2017.
1 Much of the Fund's investment exposure is accomplished through the use of derivatives which may not require the Fund to deposit the full notional amount of the investment with its counterparties, such as a futures commission merchant. The Fund's resulting cash balances are invested in a variety of conservative fixed income securities.
Information about principal risks of investing in the Fund is set forth in the prospectus and statement of additional information.
The portfolio composition, industries and holdings of the Fund are subject to change without notice.
The opinions expressed are those of the Fund's portfolio managers. The opinions are as of the date of this report and are subject to change without notice.
17
Risk Balanced Commodity Strategy Fund (Unaudited)
TICKER SYMBOLS
Institutional Class | | NRBIX | |
Class A | | NRBAX | |
Class C | | NRBCX | |
PORTFOLIO BY TYPE OF SECURITY
(as a % of Total Net Assets) | |
Asset-Backed Securities | | | 17.4 | % | |
Corporate Bonds | | | 54.5 | | |
U.S. Treasury Obligation | | | 7.6 | | |
Short-Term Investments | | | 14.5 | | |
Other Assets Less Liabilities | | | 6.0 | * | |
Total | | | 100.0 | % | |
* Includes the impact of the Fund's open positions in derivatives (other than Options Purchased), if any.
(as a % of Total Notional Value) | |
Commodity Futures: | |
Agriculture | | | 21.9 | % | |
Energy | | | 30.1 | | |
Industrial Metals | | | 17.0 | | |
Livestock | | | 7.1 | | |
Precious Metals | | | 17.3 | | |
Softs | | | 6.6 | | |
Total | | | 100.0 | % | |
PERFORMANCE HIGHLIGHTS3
| | | Inception | | Average Annual Total
Return Ended 10/31/2017 | |
| | | Date | | 1 Year | | 5 Years | | Life of Fund | |
At NAV | |
Institutional Class | | 08/27/2012 | | | 6.18 | % | | | –8.36 | % | | | –8.36 | % | |
Class A | | 08/27/2012 | | | 5.76 | % | | | –8.70 | % | | | –8.69 | % | |
Class C | | 08/27/2012 | | | 4.20 | % | | | –9.53 | % | | | –9.53 | % | |
With Sales Charge | |
Class A | | | | | –0.32 | % | | | –9.78 | % | | | –9.73 | % | |
Class C | | | | | 3.20 | % | | | –9.53 | % | | | –9.53 | % | |
Index | |
| Bloomberg Commodity Index1,2 | | | | | 2.35 | % | | | –9.37 | % | | | –9.37 | % | |
The performance data quoted represent past performance and do not indicate future results. Current performance may be lower or higher than the performance data quoted. For performance data current to the most recent month-end, please visit www.nb.com/performance.
The results shown in the table reflect the reinvestment of income dividends and other distributions, if any. The results do not reflect the effect of taxes a shareholder would pay on Fund distributions or on the redemption of Fund shares.
The investment return and principal value of an investment will fluctuate and shares, when redeemed, may be worth more or less than their original cost.
Returns would have been lower if Neuberger Berman Investment Advisers LLC ("Management") had not reimbursed certain expenses and/or waived a portion of the investment management fees during certain of the periods shown. Repayment by a class (of expenses previously reimbursed and/or fees previously waived by Management) will decrease the class's returns. Please see Note B in the Notes to Financial Statements for specific information regarding expense reimbursement and/or fee waiver arrangements.
As stated in the Fund's most recent prospectus, the total annual operating expense ratios for fiscal year 2016 were 1.45%,1.85% and 2.86% for Institutional Class, Class A and Class C shares, respectively (before expense reimbursements and/or fee waivers, if any). The total annual operating expense ratios were 0.74%, 1.10% and 1.85% for Institutional Class, Class A and Class C shares, respectively, after expense reimbursements and/or fee waivers. The expense ratios for the annual period ended October 31, 2017 can be found in the Financial Highlights section of this report.
Returns shown with a sales charge reflect the deduction of the current maximum initial sales charge of 5.75% for Class A shares and the contingent deferred sales charge (CDSC) for Class C shares. The CDSC for Class C shares is 1%, which is reduced to 0% after 1 year. The performance of the Fund's share classes will differ primarily due to different sales charge structures and class expenses. Please see the prospectus for more information about sales charge structures, if any, and class expenses for your share class.
18
Risk Balanced Commodity Strategy Fund (Unaudited)
COMPARISON OF A $1,000,000 INVESTMENT
(000's omitted)
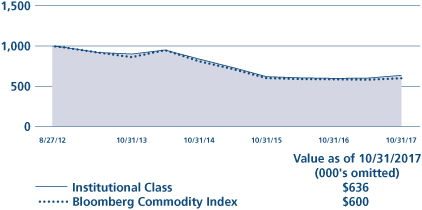
This graph shows the change in value of a hypothetical $1,000,000 investment in the Fund over the past 10 fiscal years, or since the Fund's inception if it has not operated for 10 years. The graph is based on the Institutional Class shares only; the performance of the Fund's share classes will differ primarily due to different sales charge structures and class expenses (see Performance Highlights chart on previous page). The result is compared with benchmarks, which include a broad-based market index and may include a more narrowly based index. Market indices have not been reduced to reflect any of the fees and costs of investing. The results shown in the graph reflect the reinvestment of income dividends and other distributions, if any. The results do not reflect the effect of taxes a shareholder would pay on Fund distributions or on the redemption of Fund shares. Results represent past performance and do not indicate future results.
19
U.S. Equity Index PutWrite Strategy Fund Commentary (Unaudited)
Neuberger Berman U.S. Equity Index PutWrite Fund Institutional Class generated a total return of 13.05% for the 12-month period ending October 31, 2017, outperforming its primary benchmark, a custom blend consisting of 85% CBOE S&P 500 PutWrite Index and 15% CBOE Russell 2000 PutWrite Index (the benchmark), which posted a 12.09% return for the same period. (Performance for all share classes is provided in the table immediately following this letter.)
As intended, the Fund captured a meaningful portion of the gains in the U.S. equity markets as the S&P 500® Index and the Russell 2000® Index returned 23.63% and 27.85%, respectively. The Fund's fixed income collateral holdings of short-term U.S. Treasuries contributed marginally to returns as short-term U.S. Treasury bond yields increased over the period with the 2-Year U.S. Treasury yield nearly doubling to 1.60%. While this increase limited the performance contribution from the collateral portfolio, we anticipate short-term interest rates to rise, and believe that over time, the strategy will benefit as the shorter duration exposures of the Fund's collateral portfolio allow the Fund to capture higher yields without experiencing significant duration risk. The CBOE S&P 500 Volatility Index ("VIX") and CBOE Russell 2000 Volatility Index ("RVX"), two popular measures of index option implied volatility levels, remained near historically low levels for most of the year, averaging 11.7 and 16.5, respectively, over the period. Despite this continuation of low implied volatility levels for the VIX and RVX, the Fund was able to generate a relatively high risk-adjusted rate of return of over 3.0, which was the result of a low annual daily return volatility of 4.0% for the Fund. The Fund's results over the period continue to illustrate the ability of a collateralized put write strategy to earn an attractive rate of return during periods of lower volatility levels. Shareholders should keep in mind that the Fund's upside can be limited in a strong bull market.
The Fund's investment strategy seeks to collect index put option premiums and holds a fixed income portfolio typically consisting of cash and limited duration U.S. Treasury bonds that "collateralize" the short index put option positions. The market value of the fixed income portfolio is generally equal to the short index put option portfolio's aggregate notional value. Index put option premiums tend to increase during times of greater market uncertainty, which may afford the Fund a level of protection during periods of equity market stress as well as an opportunity to improve its total return potential. The setting of option premiums is a continuous process that assimilates investor sentiments and market risk factors into explicit estimates of prospective index price distributions for specific time horizons, i.e., option implied volatilities.
As we look towards 2018, we anticipate equity market return dispersion to continue to increase across various regions, sectors and industries due to a combination of diverse interest rate politics, increased global competition, geopolitics (e.g., U.S. tax reform and Brexit). As a result, we believe index returns are likely to be at or below longer-term averages, which may lead to higher relative returns versus the Fund's benchmark and related U.S. equity market indexes such as the S&P 500 Index and Russell 2000 Index.
Sincerely,
DEREK DEVENS
PORTFOLIO MANAGER
Information about principal risks of investing in the Fund is set forth in the prospectus and statement of additional information.
The portfolio composition, industries and holdings of the Fund are subject to change without notice.
The opinions expressed are those of the Fund's portfolio manager. The opinions are as of the date of this report and are subject to change without notice.
20
U.S. Equity Index PutWrite Strategy Fund (Unaudited)
TICKER SYMBOLS
Institutional Class | | NUPIX | |
Class A | | NUPAX | |
Class C | | NUPCX | |
Class R6 | | NUPRX | |
PORTFOLIO BY TYPE OF SECURITY
(as a % of Total Net Assets) | |
U.S. Treasury Obligations | | | 97.8 | % | |
Put Options Written | | | (0.5 | ) | |
Short-Term Investment | | | 3.3 | | |
Liabilities Less Other Assets | | | (0.6 | ) | |
Total | | | 100.0 | % | |
PERFORMANCE HIGHLIGHTS5
| | | | | Average Annual Total
Return Ended 10/31/2017 | |
| | | Inception
Date | | 1 Year | | Life of
Fund | |
At NAV | |
Institutional Class | | 09/16/2016 | | | 13.05 | % | | | 12.40 | % | |
Class A | | 09/16/2016 | | | 12.70 | % | | | 12.09 | % | |
Class C | | 09/16/2016 | | | 11.81 | % | | | 11.21 | % | |
Class R6 | | 09/16/2016 | | | 13.08 | % | | | 12.53 | % | |
With Sales Charge | |
Class A | | | | | 6.18 | % | | | 6.35 | % | |
Class C | | | | | 10.81 | % | | | 11.21 | % | |
Index | |
85% CBOE S&P 500 PutWrite Index and
15% CBOE Russell 2000 PutWrite Index1,2 | | | | | 12.09 | % | | | 11.48 | % | |
The performance data quoted represent past performance and do not indicate future results. Current performance may be lower or higher than the performance data quoted. For performance data current to the most recent month-end, please visit www.nb.com/performance.
The results shown in the table reflect the reinvestment of income dividends and other distributions, if any. The results do not reflect the effect of taxes a shareholder would pay on Fund distributions or on the redemption of Fund shares.
The investment return and principal value of an investment will fluctuate and shares, when redeemed, may be worth more or less than their original cost.
Returns would have been lower if Neuberger Berman Investment Advisers LLC ("Management") had not reimbursed certain expenses and/or waived a portion of the investment management fees during certain of the periods shown. Repayment by a class (of expenses previously reimbursed and/or fees previously waived by Management) will decrease the class's returns. Please see Note B in the Notes to Financial Statements for specific information regarding expense reimbursement and/or fee waiver arrangements.
As stated in the Fund's most recent prospectus, the estimated total annual operating expense ratios for fiscal year 2017 are 1.49%, 1.85%, 2.60% and 1.42% for Institutional Class, Class A, Class C and Class R6 shares, respectively (before expense reimbursements and/or fee waivers, if any). The estimated total annual operating expense ratios for the current fiscal year are 0.65%, 1.01%, 1.76% and 0.58% for Institutional Class, Class A, Class C and Class R6 shares, respectively, after expense reimbursements and/or fee waivers. The expense ratios for the annual period ended October 31, 2017 can be found in the Financial Highlights section of this report.
Returns shown with a sales charge reflect the deduction of the current maximum initial sales charge of 5.75% for Class A shares and the contingent deferred sales charge (CDSC) for Class C shares. The CDSC for Class C shares is 1%, which is reduced to 0% after 1 year. The performance of the Fund's share classes will differ primarily due to different sales charge structures and class expenses. Please see the prospectus for more information about sales charge structures, if any, and class expenses for your share class.
21
U.S. Equity Index PutWrite Strategy Fund (Unaudited)
COMPARISON OF A $1,000,000 INVESTMENT
(000's omitted)
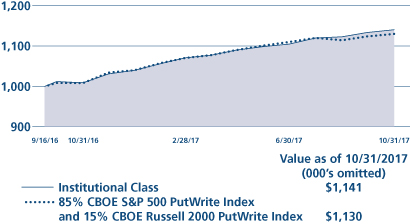
This graph shows the change in value of a hypothetical $1,000,000 investment in the Fund over the past 10 fiscal years, or since the Fund's inception if it has not operated for 10 years. The graph is based on the Institutional Class shares only; the performance of the Fund's share classes will differ primarily due to different sales charge structures and class expenses (see Performance Highlights chart on previous page). The result is compared with benchmarks, which include a broad-based market index and may include a more narrowly based index. Market indices have not been reduced to reflect any of the fees and costs of investing. The results shown in the graph reflect the reinvestment of income dividends and other distributions, if any. The results do not reflect the effect of taxes a shareholder would pay on Fund distributions or on the redemption of Fund shares. Results represent past performance and do not indicate future results.
22
1 Please see "Glossary of Indices" on page 24 for a description of indices. Please note that individuals cannot invest directly in any index. The HFRX Equity Hedge Index and HFRX Fixed Income-Credit Index do take into account fees and expenses, but not the tax consequences, of investing since they are based on the underlying hedge funds' net returns. The other indices described in this report do not take into account any fees, expenses or tax consequences of investing in the individual securities that they track. Data about the performance of an index are prepared or obtained by Neuberger Berman Investment Advisers LLC* and reflect the reinvestment of income dividends and other distributions, if any. The Fund may invest in securities not included in a described index and generally does not invest in all securities included in a described index.
2 The date used to calculate Life of Fund performance for the index is the inception date of the oldest share class.
3 During the period from December 2010 through April 2011, Neuberger Berman Global Allocation Fund had only one shareholder and the Fund was relatively small, which could have impacted Fund performance. During the period from August 2012 through January 2013, Neuberger Berman Risk Balanced Commodity Strategy Fund was relatively small, which could have impacted Fund performance. The same techniques used to produce returns in a small fund may not work to produce similar returns in a larger fund.
4 Neuberger Berman Hedged Option Premium Strategy Fund is relatively small which could have impacted Fund performance. The same techniques used to produce returns in a small fund may not work to produce similar returns in a larger fund.
5 The investments for the Fund are managed by the same portfolio manager(s) who manage(s) one or more other registered funds that have names, investment objectives and investment styles that are similar to those of the Fund. You should be aware that the Fund is likely to differ from those other mutual fund(s) in size, cash flow pattern and tax matters. Accordingly, the holdings and performance of the Fund can be expected to vary from those of the other mutual fund(s).
* On January 1, 2016, Neuberger Berman Management LLC ("NBM") and Neuberger Berman LLC ("Neuberger Berman") transferred to Neuberger Berman Fixed Income LLC ("NBFI") their rights and obligations pertaining to all services they provided to any Fund under any investment management, investment sub-advisory, and/or administration agreement, as applicable (the "Agreements"). Following such transfer, NBFI was renamed Neuberger Berman Investment Advisers LLC ("NBIA" or "Management"). In addition, since the date of the transfer, the services previously provided by NB Alternative Investment Management LLC ("NBAIM") have been provided by NBIA. Following the consolidation, the investment professionals of NBM and NBAIM who provided services to any Fund under the Agreements continue to provide the same services, except that they provide those services in their new capacities as investment professionals of NBIA. Further, the consolidation did not result in any change in the investment processes employed by any Fund, the nature or level of services provided to any Fund, or the fees any Fund pays under its Agreements.
On July 1, 2016, NBM was reorganized into Neuberger Berman (the "Reorganization"). Upon the completion of the Reorganization, Neuberger Berman assumed all rights and obligations pertaining to all services NBM provided to any Fund under any distribution agreement or distribution and services agreement (the "Agreements") or plan adopted pursuant to Rule 12b-1 under the Investment Company Act of 1940, as amended, (the "Plans"). Accordingly, after the Reorganization, Neuberger Berman became each Fund's distributor and the services previously provided by NBM under the Agreements and Plans are provided by Neuberger Berman. Following the Reorganization, the employees of NBM provide the same services to each Fund under the Agreements and Plans, except that they provide those services in their capacities as employees of Neuberger Berman. Further, the Reorganization did not result in any change in the nature or level of services provided to each Fund, or the fees, if any, each Fund pays under the Agreements or the Plans.
On January 1, 2017, the Funds' distributor, Neuberger Berman, changed its name to Neuberger Berman BD LLC.
For more complete information on any of the Neuberger Berman Alternative and Multi-Asset Class Funds, see the Fund's prospectus, which can be obtained by calling us at (800) 877-9700, or visiting our website at www.nb.com.
23
Bloomberg Barclays Global Aggregate Index: | | The index measures global investment grade debt from twenty-four different local currency markets and includes fixed-rate treasury, government-related, corporate and securitized bonds from both developed and emerging markets issuers. The index is largely comprised of three major regional aggregate components: the Bloomberg Barclays U.S. Aggregate Bond Index, the Bloomberg Barclays Pan-European Aggregate Bond Index, and the Bloomberg Barclays Asian-Pacific Aggregate Index. In addition to securities from these three indices, the Bloomberg Barclays Global Aggregate Index also includes investment grade Eurodollar, Euro-Yen, Canadian, and 144A Index-eligible securities not already in these three indices. | |
Bloomberg Barclays U.S. Aggregate Bond Index: | | The index measures the investment grade, U.S. dollar-denominated, fixed-rate, taxable bond market and includes Treasuries, government-related and corporate securities, mortgage-backed securities (MBS) (agency fixed-rate and hybrid adjustable rate mortgage (ARM) pass-throughs), asset-backed securities (ABS), and commercial mortgage-backed securities (CMBS) (agency and nonagency). | |
60% Bloomberg Barclays U.S. Aggregate Bond Index and 40% S&P 500® Index: | | The blended index is composed of 60% Bloomberg Barclays U.S. Aggregate Bond Index (described above) and 40% S&P 500® Index (described below), and is rebalanced monthly. | |
Bloomberg Commodity Index: | | The index is a rolling index composed of exchange-traded futures contracts on physical commodities. The index relies primarily on liquidity data of futures contracts, along with U.S. dollar-adjusted production data, in determining the relative quantities of included commodities. The index is designed to be a highly liquid and diversified benchmark for commodities investments. The version of the index that is calculated on a total return basis reflects the returns on a fully collateralized investment in the underlying commodity futures contracts, combined with the returns on cash collateral invested in Treasury Bills. | |
CBOE Russell 2000® PutWrite Index: | | The index tracks the value of a passive investment strategy which consists of overlaying Russell 2000 (RUT) short put options over a money market account invested in one-month Treasury bills. The RUT puts are struck at-the-money and are sold on a monthly basis. | |
CBOE S&P 500® Iron Condor Index: | | The index is designed to track the performance of a hypothetical option selling strategy that sells monthly call and put spreads and holds a money market account invested in one-month Treasury bills. The call spread consists of a short position in an out-of-the-money S&P 500 Index call option with a delta of approximately 0.20 and a long position in a further out-of-the-money S&P 500 Index call option with a delta of approximately 0.05. The put spread consists of a short position in an out-of-the-money S&P 500 Index put option with a delta of approximately –0.20 and a long position in a further out-of-the-money S&P 500 Index put option with a delta of approximately –0.05. Call and put spread positions are sized such that their notional strike differences represent 5% of the market value of the money market account. The money market account is rebalanced on option roll days and is designed to limit the downside return of the index. The delta of an option measures its price sensitivity to the price of the underlying asset. For example, if a call option has a delta of 0.20 and the price of the underlying asset increases by $1, the value of the option will increase by $0.20. | |
CBOE S&P 500® PutWrite Index: | | The index tracks the value of a passive investment strategy which consists of overlaying S&P 500 (SPX) short put options over a money market account invested in one- and three-months Treasury bills. The SPX puts are struck at-the-money and are sold on a monthly basis. | |
24
Glossary of Indices (cont'd)
85% CBOE S&P 500® PutWrite Index and 15% CBOE Russell 2000® PutWrite Index: | | The blended index is composed of 85% CBOE S&P 500 PutWrite Index (described above) and 15% CBOE Russell 2000 PutWrite Index (described above), and is rebalanced monthly. | |
HFRX Fixed Income-Credit
Index: | | The index tracks the performance of hedge fund strategies with exposure to credit across a broad continuum of credit sub-strategies, including Corporate, Sovereign, Distressed, Convertible, Asset Backed, Capital Structure Arbitrage, Multi-Strategy and other Relative Value and Event Driven sub-strategies. The investment thesis across all strategies is predicated on realization of a valuation discrepancy between the related credit instruments. Strategies may also include and utilize equity securities, credit derivatives, government fixed income, commodities, currencies or other hybrid securities. Constituent funds are selected from an eligible pool of the more than 7,500 funds worldwide that report to the Hedge Fund Research (HFR) Database. Constituent funds must meet all of the following criteria: report monthly; report performance net of all fees; be U.S. dollar-denominated; be active and accepting new investments; have a minimum 24 months track record; and the fund's manager must have at least $50 million in assets under management. Constituents are weighted by a representative optimization methodology. The index is rebalanced quarterly. | |
HFRX Equity Hedge Index: | | The index comprises equity hedge strategies. Equity hedge strategies maintain positions both long and short in primarily equity and equity derivative securities. A wide variety of investment processes can be employed to arrive at an investment decision, including both quantitative and fundamental techniques; strategies can be broadly diversified or narrowly focused on specific sectors and can range broadly in terms of levels of net exposure, leverage employed, holding period, concentrations of market capitalizations and valuation ranges of typical portfolios. Equity hedge managers would typically maintain at least 50%, and may in some cases be substantially entirely invested, in equities, both long and short. Constituent funds are selected from an eligible pool of the more than 7,500 funds worldwide that report to the Hedge Fund Research (HFR) Database. Constituent funds must meet all of the following criteria: report monthly; report performance net of all fees; be U.S. dollar-denominated; be active and accepting new investments; have a minimum 24 months track record; and the fund's manager must have at least $50 million in assets under management. The index is rebalanced quarterly. | |
MSCI All Country World Index: | | The index is a free float-adjusted market capitalization weighted index that is designed to measure the equity market performance of developed and emerging markets. The index consists of 47 country indices comprising 23 developed and 24 emerging market country indices. The developed market country indices included are: Australia, Austria, Belgium, Canada, Denmark, Finland, France, Germany, Hong Kong, Ireland, Israel, Italy, Japan, the Netherlands, New Zealand, Norway, Portugal, Singapore, Spain, Sweden, Switzerland, the United Kingdom and the United States. The emerging market country indices included are: Brazil, Chile, China, Colombia, Czech Republic, Egypt, Greece, Hungary, India, Indonesia, Korea, Malaysia, Mexico, Pakistan, Peru, the Philippines, Poland, Qatar, Russia, South Africa, Taiwan, Thailand, Turkey, and the UAE. Net total return indexes reinvest dividends after the deduction of withholding taxes, using (for international indexes) a tax rate applicable to non-resident institutional investors who do not benefit from double taxation treaties. | |
25
Glossary of Indices (cont'd)
60% MSCI All Country World Index and 40% Bloomberg Barclays Global Aggregate
Index: | | The blended index is composed of 60% MSCI All Country World Index (described above) and 40% Bloomberg Barclays Global Aggregate Index (described above), and is rebalanced monthly. Net total return indexes reinvest dividends after the deduction of withholding taxes, using (for international indexes) a tax rate applicable to non-resident institutional investors who do not benefit from double taxation treaties. | |
S&P 500® Index: | | The index is a float-adjusted market capitalization-weighted index that focuses on the large-cap segment of the U.S. equity market, and includes a significant portion of the total value of the market. | |
26
Information About Your Fund's Expenses (Unaudited)
As a Fund shareholder, you incur two types of costs: (1) transaction costs, including sales charges (loads) on purchase payments or redemption proceeds (if applicable); and (2) ongoing costs, including management fees, distribution and/or service (12b-1) fees (if applicable), and other Fund expenses. This example is intended to help you understand your ongoing costs (in U.S. dollars) of investing in a Fund and compare these costs with the ongoing costs of investing in other mutual funds.
This table is designed to provide information regarding costs related to your investments. The following examples are based on an investment of $1,000 made at the beginning of the six month period ended October 31, 2017 and held for the entire period. The table illustrates each Fund's costs in two ways:
Actual Expenses and Performance: | | The first section of the table provides information about actual account values and actual expenses in dollars, based on the Fund's actual performance during the period indicated. You may use the information in this line, together with the amount you invested, to estimate the expenses you paid over the period. Simply divide your account value by $1,000 (for example, an $8,600 account value divided by $1,000 = 8.6), then multiply the result by the number in the first section of the table under the heading entitled "Expenses Paid During the Period" to estimate the expenses you paid over the period. | |
Hypothetical Example for Comparison Purposes: | | The second section of the table provides information about hypothetical account values and hypothetical expenses based on the Fund's actual expense ratio and an assumed rate of return at 5% per year before expenses. This return is not the Fund's actual return. The hypothetical account values and expenses may not be used to estimate the actual ending account balance or expenses you paid for the period. You may use this information to compare the ongoing costs of investing in a Fund versus other funds. To do so, compare the expenses shown in this 5% hypothetical example with the 5% hypothetical examples that appear in the shareholder reports of other funds. | |
Please note that the expenses in the table are meant to highlight your ongoing costs only and do not include any transaction costs, such as sales charges (loads) (if applicable). Therefore, the information under the heading "Hypothetical (5% annual return before expenses)" is useful in comparing ongoing costs only, and will not help you determine the relative total costs of owning different funds. In addition, if these transaction costs were included, your costs would have been higher.
27
Expense Example (Unaudited)
Neuberger Berman Alternative Funds | |
| | ACTUAL | | HYPOTHETICAL (5% ANNUAL RETURN BEFORE EXPENSES) | |
| | Beginning
Account
Value
5/1/17 | | Ending
Account
Value
10/31/17 | | Expenses Paid
During the
Period(1)
5/1/17 - 10/31/17 | | Expense
Ratio | | Beginning
Account
Value
5/1/17 | | Ending
Account
Value
10/31/17 | | Expenses Paid
During the
Period(2)
5/1/17 - 10/31/17 | | Expense
Ratio | |
Global Allocation Fund | |
Institutional Class | | $ | 1,000.00 | | | $ | 1,079.10 | | | $ | 2.20 | | | | 0.42 | % | | $ | 1,000.00 | | | $ | 1,023.09 | | | $ | 2.14 | | | | 0.42 | % | |
Class A | | $ | 1,000.00 | | | $ | 1,077.90 | | | $ | 4.03 | | | | 0.77 | % | | $ | 1,000.00 | | | $ | 1,021.32 | | | $ | 3.92 | | | | 0.77 | % | |
Class C | | $ | 1,000.00 | | | $ | 1,073.70 | | | $ | 8.05 | | | | 1.54 | % | | $ | 1,000.00 | | | $ | 1,017.44 | | | $ | 7.83 | | | | 1.54 | % | |
Hedged Option Premium Strategy Fund | |
Institutional Class | | $ | 1,000.00 | | | $ | 1,016.70 | | | $ | 3.30 | (3) | | | 0.65 | % | | $ | 1,000.00 | | | $ | 1,021.93 | | | $ | 3.31 | | | | 0.65 | % | |
Class A | | $ | 1,000.00 | | | $ | 1,015.00 | | | $ | 5.13 | (3) | | | 1.01 | % | | $ | 1,000.00 | | | $ | 1,020.11 | | | $ | 5.14 | | | | 1.01 | % | |
Class C | | $ | 1,000.00 | | | $ | 1,011.20 | | | $ | 8.92 | (3) | | | 1.76 | % | | $ | 1,000.00 | | | $ | 1,016.33 | | | $ | 8.94 | | | | 1.76 | % | |
Class R6 | | $ | 1,000.00 | | | $ | 1,017.00 | | | $ | 2.95 | (3) | | | 0.58 | % | | $ | 1,000.00 | | | $ | 1,022.28 | | | $ | 2.96 | | | | 0.58 | % | |
Long Short Fund | |
Institutional Class | | $ | 1,000.00 | | | $ | 1,038.00 | | | $ | 9.20 | | | | 1.79 | %(4) | | $ | 1,000.00 | | | $ | 1,016.18 | | | $ | 9.10 | | | | 1.79 | %(4) | |
Class A | | $ | 1,000.00 | | | $ | 1,036.40 | | | $ | 10.98 | | | | 2.14 | %(4) | | $ | 1,000.00 | | | $ | 1,014.42 | | | $ | 10.87 | | | | 2.14 | %(4) | |
Class C | | $ | 1,000.00 | | | $ | 1,032.40 | | | $ | 14.75 | | | | 2.88 | %(4) | | $ | 1,000.00 | | | $ | 1,010.69 | | | $ | 14.60 | | | | 2.88 | %(4) | |
Long Short Credit Fund | |
Institutional Class | | $ | 1,000.00 | | | $ | 1,022.60 | | | $ | 6.22 | | | | 1.22 | % | | $ | 1,000.00 | | | $ | 1,019.06 | | | $ | 6.21 | | | | 1.22 | % | |
Class A | | $ | 1,000.00 | | | $ | 1,021.80 | | | $ | 8.10 | | | | 1.59 | % | | $ | 1,000.00 | | | $ | 1,017.19 | | | $ | 8.08 | | | | 1.59 | % | |
Class C | | $ | 1,000.00 | | | $ | 1,016.90 | | | $ | 11.90 | | | | 2.34 | % | | $ | 1,000.00 | | | $ | 1,013.41 | | | $ | 11.88 | | | | 2.34 | % | |
Class R6 | | $ | 1,000.00 | | | $ | 1,022.90 | | | $ | 5.86 | | | | 1.15 | % | | $ | 1,000.00 | | | $ | 1,019.41 | | | $ | 5.85 | | | | 1.15 | % | |
Multi-Asset Income Fund | |
Institutional Class | | $ | 1,000.00 | | | $ | 1,051.90 | | | $ | 2.74 | | | | 0.53 | % | | $ | 1,000.00 | | | $ | 1,022.53 | | | $ | 2.70 | | | | 0.53 | % | |
Class A | | $ | 1,000.00 | | | $ | 1,049.90 | | | $ | 4.65 | | | | 0.90 | % | | $ | 1,000.00 | | | $ | 1,020.67 | | | $ | 4.58 | | | | 0.90 | % | |
Class C | | $ | 1,000.00 | | | $ | 1,046.00 | | | $ | 8.51 | | | | 1.65 | % | | $ | 1,000.00 | | | $ | 1,016.89 | | | $ | 8.39 | | | | 1.65 | % | |
Class R6 | | $ | 1,000.00 | | | $ | 1,052.20 | | | $ | 2.38 | | | | 0.46 | % | | $ | 1,000.00 | | | $ | 1,022.89 | | | $ | 2.35 | | | | 0.46 | % | |
Risk Balanced Commodity Strategy Fund | |
Institutional Class | | $ | 1,000.00 | | | $ | 1,056.50 | | | $ | 3.84 | | | | 0.74 | % | | $ | 1,000.00 | | | $ | 1,021.48 | | | $ | 3.77 | | | | 0.74 | % | |
Class A | | $ | 1,000.00 | | | $ | 1,055.80 | | | $ | 5.70 | | | | 1.10 | % | | $ | 1,000.00 | | | $ | 1,019.66 | | | $ | 5.60 | | | | 1.10 | % | |
Class C | | $ | 1,000.00 | | | $ | 1,051.20 | | | $ | 9.41 | | | | 1.82 | % | | $ | 1,000.00 | | | $ | 1,016.03 | | | $ | 9.25 | | | | 1.82 | % | |
U.S. Equity Index PutWrite Strategy Fund | |
Institutional Class | | $ | 1,000.00 | | | $ | 1,046.70 | | | $ | 3.35 | | | | 0.65 | % | | $ | 1,000.00 | | | $ | 1,021.93 | | | $ | 3.31 | | | | 0.65 | % | |
Class A | | $ | 1,000.00 | | | $ | 1,045.90 | | | $ | 5.21 | | | | 1.01 | % | | $ | 1,000.00 | | | $ | 1,020.11 | | | $ | 5.14 | | | | 1.01 | % | |
Class C | | $ | 1,000.00 | | | $ | 1,040.70 | | | $ | 9.05 | | | | 1.76 | % | | $ | 1,000.00 | | | $ | 1,016.33 | | | $ | 8.94 | | | | 1.76 | % | |
Class R6 | | $ | 1,000.00 | | | $ | 1,046.90 | | | $ | 2.99 | | | | 0.58 | % | | $ | 1,000.00 | | | $ | 1,022.28 | | | $ | 2.96 | | | | 0.58 | % | |
(1) For each class, expenses are equal to the annualized expense ratio for the class, multiplied by the average account value over the period, multiplied by 184/365 (to reflect the one-half year period shown), unless otherwise indicated.
(2) Hypothetical expenses are equal to the annualized expense ratios for each class, multiplied by the average account value over the period (assuming a 5% annual return), multiplied by 184/365 (to reflect the one-half year period shown).
(3) For each class, expenses are equal to the annualized expense ratio for the class, multiplied by the average account value over the period, multiplied by 203/365 (to reflect the period shown of April 12, 2017 (Commencement of Operations) to October 31, 2017).
(4) Custodian Out-of-Pocket Expenses Refunded, as listed in Note G of the Notes to Financial Statements, is non-recurring. See Notes to Financial Highlights for the annualized ratio of net expenses to average daily net assets for the year ended October 31, 2107, had Long Short not received the refund as listed in Note G of the Notes to Financial Statements.
28
Schedule of Investments Global Allocation Fund October 31, 2017
| | |
Number
of Shares | | Value
(000's
omitted) | |
Common Stocks 24.8% | |
Australia 0.7% | |
Abacus Property
Group | | | 1,991 | | | $ | 6 | | |
Australia & New
Zealand Banking
Group Ltd. | | | 96 | | | | 2 | (a) | |
Caltex Australia Ltd. | | | 199 | | | | 5 | | |
CIMIC Group Ltd. | | | 525 | | | | 19 | (a) | |
Crown Resorts Ltd. | | | 379 | | | | 3 | | |
Dexus | | | 369 | | | | 3 | (a) | |
Fortescue Metals
Group Ltd. | | | 1,073 | | | | 4 | | |
Goodman Group | | | 441 | | | | 3 | (a) | |
GPT Group | | | 1,440 | | | | 6 | (a) | |
Investa Office Fund | | | 2,110 | | | | 7 | (a) | |
LendLease Group | | | 895 | | | | 11 | (a) | |
Metcash Ltd. | | | 2,563 | | | | 5 | | |
Mirvac Group | | | 10,710 | | | | 20 | (a) | |
Qantas Airways Ltd. | | | 1,256 | | | | 6 | | |
Stockland | | | 1,083 | | | | 4 | | |
Wesfarmers Ltd. | | | 462 | | | | 15 | (a) | |
Whitehaven Coal
Ltd. | | | 5,298 | | | | 15 | * | |
Woolworths Ltd. | | | 624 | | | | 12 | (a) | |
| | | | 146 | | |
Austria 0.3% | |
EVN AG | | | 127 | | | | 2 | | |
OMV AG | | | 248 | | | | 15 | | |
Telekom Austria
AG | | | 1,808 | | | | 17 | * | |
voestalpine AG | | | 472 | | | | 26 | | |
| | | | 60 | | |
| Belgium 0.0%(b) | |
Colruyt SA | | | 53 | | | | 3 | | |
Groupe Bruxelles
Lambert SA | | | 17 | | | | 2 | | |
| | | | 5 | | |
Bermuda 0.1% | |
Marvell Technology
Group Ltd. | | | 879 | | | | 16 | | |
Canada 0.5% | |
Air Canada | | | 254 | | | | 5 | * | |
Alimentation
Couche-Tard, Inc.
Class B | | | 35 | | | | 2 | (a) | |
Bank of Montreal | | | 86 | | | | 7 | (a) | |
Bank of Nova Scotia | | | 177 | | | | 11 | (a) | |
Canadian Apartment
Properties REIT | | | 98 | | | | 3 | | |
Canadian Imperial
Bank of Commerce | | | 95 | | | | 8 | | |
Dream Global Real
Estate Investment
Trust | | | 410 | | | | 4 | (a) | |
George Weston Ltd. | | | 161 | | | | 13 | (a) | |
| | |
Number
of Shares | | Value
(000's
omitted) | |
Loblaw Cos. Ltd. | | | 70 | | | $ | 4 | | |
National Bank of
Canada | | | 88 | | | | 4 | (a) | |
Rogers
Communications,
Inc. Class B | | | 126 | | | | 7 | | |
Royal Bank of
Canada | | | 163 | | | | 13 | (a) | |
Shaw Communications,
Inc. Class B | | | 48 | | | | 1 | | |
TELUS Corp. | | | 482 | | | | 17 | | |
Toronto-Dominion
Bank | | | 43 | | | | 2 | (a) | |
| | | | 101 | | |
| China 0.0%(b) | |
BOC Hong Kong
Holdings Ltd. | | | 1,500 | | | | 7 | | |
Denmark 0.1% | |
Carlsberg A/S
Class B | | | 173 | | | | 20 | | |
Danske Bank A/S | | | 63 | | | | 2 | | |
| | | | 22 | | |
Finland 0.1% | |
Outokumpu OYJ | | | 2,339 | | | | 22 | (a) | |
France 0.3% | |
Air France-KLM | | | 698 | | | | 11 | * | |
BNP Paribas SA | | | 15 | | | | 1 | (a) | |
CNP Assurances | | | 221 | | | | 5 | | |
Fonciere Des
Regions | | | 35 | | | | 4 | | |
Peugeot SA | | | 829 | | | | 20 | | |
TOTAL SA | | | 222 | | | | 12 | | |
| | | | 53 | | |
Germany 0.7% | |
Allianz SE | | | 12 | | | | 3 | | |
Bayerische Motoren
Werke AG | | | 33 | | | | 4 | | |
Bayerische Motoren
Werke AG,
Preference Shares | | | 209 | | | | 18 | (a) | |
Daimler AG | | | 94 | | | | 8 | | |
Deutsche
Lufthansa AG | | | 829 | | | | 27 | | |
Porsche Automobil
Holding SE,
Preference Shares | | | 58 | | | | 4 | | |
Salzgitter AG | | | 148 | | | | 7 | | |
Uniper SE | | | 858 | | | | 24 | | |
Volkswagen AG | | | 50 | | | | 9 | | |
Volkswagen AG,
Preference Shares | | | 99 | | | | 18 | | |
Wuestenrot &
Wuerttembergische
AG | | | 897 | | | | 24 | | |
| | | | 146 | | |
| | |
Number
of Shares | | Value
(000's
omitted) | |
Hong Kong 0.2% | |
CLP Holdings Ltd. | | | 500 | | | $ | 5 | | |
Great Eagle
Holdings Ltd. | | | 1,000 | | | | 6 | (a) | |
HK Electric
Investments & HK
Electric
Investments Ltd. | | | 5,500 | | | | 5 | (n) | |
Hongkong Land
Holdings Ltd. | | | 900 | | | | 7 | | |
Hopewell
Holdings Ltd. | | | 1,000 | | | | 4 | | |
Jardine Matheson
Holdings Ltd. | | | 100 | | | | 6 | | |
Kerry Properties Ltd. | | | 500 | | | | 2 | | |
| | | | 35 | | |
Ireland 0.1% | |
Ryanair Holdings
PLC ADR | | | 119 | | | | 13 | *(c) | |
UDG Healthcare PLC | | | 1,149 | | | | 14 | | |
| | | | 27 | | |
Israel 0.1% | |
Check Point Software
Technologies Ltd. | | | 81 | | | | 10 | *(a) | |
Italy 0.7% | |
| ASTM SpA | | | 731 | | | | 20 | | |
Autogrill SpA | | | 802 | | | | 11 | | |
Enel SpA | | | 2,903 | | | | 18 | | |
Eni SpA | | | 1,362 | | | | 22 | | |
ERG SpA | | | 1,148 | | | | 19 | | |
Ferrari NV | | | 100 | | | | 12 | | |
Moncler SpA | | | 426 | | | | 12 | | |
Prysmian SpA | | | 367 | | | | 13 | | |
Snam SpA | | | 3,955 | | | | 20 | | |
| | | | 147 | | |
Japan 1.5% | |
Bridgestone Corp. | | | 200 | | | | 9 | (a) | |
EDION Corp. | | | 1,100 | | | | 11 | (a) | |
Haseko Corp. | | | 500 | | | | 7 | | |
Hitachi Ltd. | | | 1,000 | | | | 8 | | |
Hitachi Metals Ltd. | | | 400 | | | | 5 | | |
ITOCHU Corp. | | | 1,800 | | | | 31 | (a) | |
JFE Holdings, Inc. | | | 200 | | | | 4 | | |
JXTG Holdings, Inc. | | | 2,900 | | | | 15 | (a) | |
Kajima Corp. | | | 1,000 | | | | 10 | (a) | |
Kirin Holdings Co.
Ltd. | | | 700 | | | | 17 | | |
Marubeni Corp. | | | 1,900 | | | | 13 | (a) | |
Medipal Holdings
Corp. | | | 300 | | | | 6 | | |
Mitsubishi Corp. | | | 200 | | | | 5 | (a) | |
Mitsubishi Shokuhin
Co. Ltd. | | | 100 | | | | 3 | | |
Mitsubishi Tanabe
Pharma Corp. | | | 300 | | | | 7 | (a) | |
Mitsui & Co. Ltd. | | | 1,400 | | | | 21 | | |
See Notes to Financial Statements
29
Schedule of Investments Global Allocation Fund (cont'd)
| | |
Number
of Shares | | Value
(000's
omitted) | |
NEC Corp. | | | 800 | | | $ | 22 | | |
Nippon Steel &
Sumitomo Metal
Corp. | | | 100 | | | | 2 | | |
Nippon Telegraph &
Telephone Corp. | | | 100 | | | | 5 | (a) | |
Nissan Motor Co.
Ltd. | | | 600 | | | | 6 | (a) | |
NTT DOCOMO, Inc. | | | 300 | | | | 7 | | |
Obayashi Corp. | | | 700 | | | | 9 | (a) | |
Sekisui Chemical
Co. Ltd. | | | 400 | | | | 8 | | |
Showa Sangyo Co.
Ltd. | | | 200 | | | | 5 | | |
Sojitz Corp. | | | 2,500 | | | | 8 | (a) | |
Sumitomo Corp. | | | 1,900 | | | | 27 | (a) | |
Tokyo Electric
Power Co.
Holdings, Inc. | | | 2,000 | | | | 8 | * | |
Tosoh Corp. | | | 100 | | | | 2 | | |
TS Tech Co. Ltd. | | | 400 | | | | 14 | | |
Yamada Denki
Co. Ltd. | | | 1,600 | | | | 8 | | |
Yodogawa Steel
Works Ltd. | | | 300 | | | | 9 | | |
| | | | 312 | | |
Netherlands 0.2% | |
AerCap Holdings
NV | | | 239 | | | | 13 | *(a) | |
| ASML Holding NV | | | 55 | | | | 10 | (a) | |
EXOR NV | | | 95 | | | | 6 | | |
NXP Semiconductors
NV | | | 72 | | | | 8 | * | |
Royal Dutch Shell
PLC, A Shares | | | 141 | | | | 4 | | |
Royal Dutch Shell
PLC, B Shares | | | 123 | | | | 4 | | |
Royal Dutch Shell PLC
ADR Class B | | | 196 | | | | 13 | (c) | |
| | | 58 | | |
| Norway 0.0%(b) | |
Ocean Yield ASA | | | 639 | | | | 6 | | |
| Portugal 0.0%(b) | |
Jeronimo Martins
SGPS SA | | | 56 | | | | 1 | (a) | |
| Singapore 0.0%(b) | |
Oversea-Chinese
Banking Corp. Ltd. | | | 800 | | | | 7 | (a) | |
Spain 0.1% | |
Repsol SA | | | 1,439 | | | | 27 | | |
Sweden 0.2% | |
ICA Gruppen AB | | | 629 | | | | 23 | | |
Telia Co. AB | | | 2,616 | | | | 12 | | |
| | | | 35 | | |
| | |
Number
of Shares | | Value
(000's
omitted) | |
Switzerland 0.5% | |
ABB Ltd. | | | 57 | | | $ | 1 | | |
Baloise Holding AG | | | 57 | | | | 9 | | |
Georg Fischer AG | | | 14 | | | | 17 | | |
Lonza Group AG | | | 75 | | | | 20 | * | |
Nestle SA | | | 15 | | | | 1 | | |
Pargesa Holding SA | | | 37 | | | | 3 | | |
Roche Holding AG | | | 37 | | | | 9 | | |
Swiss Life Holding AG | | | 69 | | | | 24 | * | |
Swiss Re AG | | | 229 | | | | 22 | | |
Swisscom AG | | | 5 | | | | 3 | | |
| | | | 109 | | |
United Kingdom 1.5% | |
| 3i Group PLC | | | 2,002 | | | | 26 | | |
Anglo American
PLC | | | 250 | | | | 5 | | |
Aon PLC | | | 116 | | | | 17 | (c) | |
Barratt
Developments PLC | | | 1,257 | | | | 11 | | |
| BP PLC | | | 586 | | | | 4 | | |
British American
Tobacco PLC ADR | | | 137 | | | | 9 | (a) | |
Crest Nicholson
Holdings PLC | | | 179 | | | | 1 | | |
EI Group PLC | | | 3,618 | | | | 6 | * | |
Evraz PLC | | | 5,804 | | | | 22 | (a) | |
Ferrexpo PLC | | | 6,590 | | | | 22 | | |
Fiat Chrysler
Automobiles NV | | | 1,454 | | | | 25 | * | |
Forterra PLC | | | 1,051 | | | | 4 | (n) | |
GKN PLC | | | 1,486 | | | | 6 | | |
Glencore PLC | | | 3,001 | | | | 14 | * | |
Grafton Group PLC | | | 1,516 | | | | 17 | | |
HSBC Holdings PLC | | | 1,148 | | | | 11 | (a) | |
Indivior PLC | | | 5,259 | | | | 26 | * | |
J Sainsbury PLC | | | 990 | | | | 3 | | |
John Laing Group
PLC | | | 602 | | | | 2 | (n) | |
John Menzies PLC | | | 2,570 | | | | 24 | | |
Persimmon PLC | | | 82 | | | | 3 | | |
Redrow PLC | | | 521 | | | | 5 | | |
Segro PLC | | | 760 | | | | 6 | | |
Taylor Wimpey PLC | | | 418 | | | | 1 | | |
Unilever NV | | | 232 | | | | 13 | (a) | |
WM Morrison
Supermarkets PLC | | | 7,919 | | | | 24 | | |
| | | 307 | | |
United States 16.9% | |
3M Co. | | | 58 | | | | 13 | (a) | |
AbbVie, Inc. | | | 175 | | | | 16 | (a) | |
Activision Blizzard,
Inc. | | | 223 | | | | 15 | (a) | |
Adobe Systems, Inc. | | | 91 | | | | 16 | *(a) | |
Aetna, Inc. | | | 144 | | | | 24 | (c) | |
Aflac, Inc. | | | 257 | | | | 22 | (a) | |
Agilent
Technologies, Inc. | | | 307 | | | | 21 | (a) | |
| | |
Number
of Shares | | Value
(000's
omitted) | |
AGNC Investment
Corp. | | | 1,151 | | | $ | 23 | (a) | |
Albemarle Corp. | | | 47 | | | | 7 | (a) | |
Allergan PLC | | | 26 | | | | 5 | (a) | |
Ally Financial, Inc. | | | 46 | | | | 1 | | |
Alphabet, Inc.
Class A | | | 22 | | | | 23 | *(a) | |
Alphabet, Inc.
Class C | | | 53 | | | | 54 | *(c) | |
Amazon.com, Inc. | | | 15 | | | | 17 | *(a) | |
American
International
Group, Inc. | | | 26 | | | | 2 | (a) | |
American Tower
Corp. | | | 118 | | | | 17 | (c) | |
Amgen, Inc. | | | 223 | | | | 39 | (a)(c) | |
Amkor Technology,
Inc. | | | 794 | | | | 9 | *(a) | |
Amphenol Corp.
Class A | | | 29 | | | | 3 | | |
Annaly Capital
Management, Inc. | | | 2,084 | | | | 24 | (a) | |
Anthem, Inc. | | | 35 | | | | 7 | (a) | |
Apple, Inc. | | | 620 | | | | 105 | (c) | |
Applied Materials,
Inc. | | | 103 | | | | 6 | (a) | |
Applied
Optoelectronics,
Inc. | | | 31 | | | | 1 | * | |
Aramark | | | 475 | | | | 21 | | |
Archer-Daniels-
Midland Co. | | | 609 | | | | 25 | | |
ARMOUR
Residential REIT,
Inc. | | | 463 | | | | 12 | | |
Arrow Electronics,
Inc. | | | 44 | | | | 4 | *(a) | |
Ashland Global
Holdings, Inc. | | | 100 | | | | 7 | (c) | |
Assurant, Inc. | | | 121 | | | | 12 | (a) | |
AT&T, Inc. | | | 503 | | | | 17 | (a) | |
Avangrid, Inc. | | | 188 | | | | 10 | | |
Avis Budget Group,
Inc. | | | 129 | | | | 5 | *(a) | |
Avnet, Inc. | | | 237 | | | | 9 | (a) | |
AVX Corp. | | | 954 | | | | 18 | (a) | |
Bank of America
Corp. | | | 1,340 | | | | 37 | (a) | |
BankUnited, Inc. | | | 705 | | | | 25 | (a) | |
Baxter International,
Inc. | | | 359 | | | | 23 | (a) | |
Berkshire
Hathaway, Inc.
Class B | | | 80 | | | | 15 | *(a) | |
Biogen, Inc. | | | 40 | | | | 12 | *(a) | |
Bloomin' Brands,
Inc. | | | 364 | | | | 6 | (a) | |
Blucora, Inc. | | | 236 | | | | 5 | *(a) | |
Boeing Co. | | | 27 | | | | 7 | | |
BorgWarner, Inc. | | | 22 | | | | 1 | | |
See Notes to Financial Statements
30
Schedule of Investments Global Allocation Fund (cont'd)
| | |
Number
of Shares | | Value
(000's
omitted) | |
Bristol-Myers
Squibb Co. | | | 51 | | | $ | 3 | (a) | |
Burlington Stores,
Inc. | | | 102 | | | | 10 | *(a) | |
Cabot Oil & Gas
Corp. | | | 982 | | | | 27 | (a)(c) | |
Caesars
Entertainment
Corp. | | | 222 | | | | 3 | * | |
CalAtlantic Group,
Inc. | | | 30 | | | | 1 | | |
Carnival Corp. | | | 242 | | | | 16 | (a) | |
Carnival PLC | | | 38 | | | | 2 | | |
CBS Corp. Class B | | | 322 | | | | 18 | (c) | |
CDW Corp. | | | 313 | | | | 22 | (a) | |
Celgene Corp. | | | 165 | | | | 17 | *(c) | |
Centene Corp. | | | 154 | | | | 14 | *(a) | |
CenterPoint
Energy, Inc. | | | 254 | | | | 8 | (a) | |
Charter
Communications,
Inc. Class A | | | 33 | | | | 11 | *(a) | |
Chemours Co. | | | 344 | | | | 19 | (a) | |
Chevron Corp. | | | 333 | | | | 39 | (c) | |
Chimera Investment
Corp. | | | 59 | | | | 1 | | |
Chubb Ltd. | | | 107 | | | | 16 | (c) | |
Cisco Systems, Inc. | | | 1,239 | | | | 42 | (a)(c) | |
Citigroup, Inc. | | | 581 | | | | 43 | (a) | |
CME Group, Inc. | | | 91 | | | | 12 | (a) | |
CNA Financial Corp. | | | 472 | | | | 26 | (a) | |
Coca-Cola Co. | | | 228 | | | | 10 | | |
Cognex Corp. | | | 25 | | | | 3 | | |
Comcast Corp.
Class A | | | 572 | | | | 21 | (c) | |
Comerica, Inc. | | | 232 | | | | 18 | (a) | |
Conagra Brands,
Inc. | | | 462 | | | | 16 | (c) | |
Corcept
Therapeutics,
Inc. | | | 638 | | | | 13 | *(a) | |
Corning, Inc. | | | 883 | | | | 28 | (c) | |
Costco Wholesale
Corp. | | | 110 | | | | 18 | (a) | |
CSX Corp. | | | 215 | | | | 11 | (c) | |
CVS Health Corp. | | | 99 | | | | 7 | (a) | |
Danaher Corp. | | | 415 | | | | 38 | (c) | |
Darling Ingredients,
Inc. | | | 107 | | | | 2 | * | |
DaVita, Inc. | | | 100 | | | | 6 | *(a) | |
Deckers Outdoor
Corp. | | | 62 | | | | 4 | *(a) | |
Delta Air Lines, Inc. | | | 150 | | | | 7 | (a) | |
DENTSPLY SIRONA,
Inc. | | | 269 | | | | 16 | (a) | |
Devon Energy Corp. | | | 123 | | | | 5 | (a) | |
DISH Network Corp.
Class A | | | 123 | | | | 6 | *(a) | |
Eaton Corp. PLC | | | 439 | | | | 35 | (a)(c) | |
eBay, Inc. | | | 471 | | | | 18 | *(a) | |
| | |
Number
of Shares | | Value
(000's
omitted) | |
Entegris, Inc. | | | 227 | | | $ | 7 | | |
EOG Resources, Inc. | | | 168 | | | | 17 | (a) | |
Equity
Commonwealth | | | 663 | | | | 20 | *(a) | |
Exelixis, Inc. | | | 249 | | | | 6 | *(a) | |
Exelon Corp. | | | 396 | | | | 16 | (c) | |
Exxon Mobil Corp. | | | 117 | | | | 10 | (a) | |
Facebook, Inc.
Class A | | | 185 | | | | 33 | *(c) | |
Fair Isaac Corp. | | | 57 | | | | 8 | (a) | |
FedEx Corp. | | | 53 | | | | 12 | (a) | |
Fidelity & Guaranty
Life | | | 768 | | | | 24 | | |
Fidelity National
Information
Services, Inc. | | | 13 | | | | 1 | (a) | |
Ford Motor Co. | | | 125 | | | | 2 | | |
General Dynamics
Corp. | | | 149 | | | | 30 | (a)(c) | |
General Electric Co. | | | 515 | | | | 10 | (c) | |
General Motors Co. | | | 533 | | | | 23 | (a) | |
Gilead Sciences, Inc. | | | 261 | | | | 20 | (a) | |
Goldman Sachs
Group, Inc. | | | 72 | | | | 17 | (a) | |
Goodyear Tire &
Rubber Co. | | | 166 | | | | 5 | (a) | |
Graham Holdings
Co. Class B | | | 25 | | | | 14 | (a) | |
Haemonetics Corp. | | | 97 | | | | 5 | *(a) | |
Halyard Health, Inc. | | | 168 | | | | 7 | * | |
Harris Corp. | | | 188 | | | | 26 | (c) | |
Hartford Financial
Services Group, Inc. | | | 23 | | | | 1 | (a) | |
HCA Healthcare,
Inc. | | | 140 | | | | 11 | *(a) | |
Hewlett Packard
Enterprise Co. | | | 359 | | | | 5 | (c) | |
Honeywell
International, Inc. | | | 68 | | | | 10 | (a) | |
HP, Inc. | | | 234 | | | | 5 | (a) | |
Huntsman Corp. | | | 665 | | | | 21 | (a) | |
IHS Markit Ltd. | | | 541 | | | | 23 | *(a) | |
Illinois Tool Works,
Inc. | | | 28 | | | | 4 | (a) | |
Incyte Corp. | | | 27 | | | | 3 | *(a) | |
Ingersoll-Rand PLC | | | 66 | | | | 6 | (a) | |
Ingredion, Inc. | | | 35 | | | | 4 | (a) | |
Intel Corp. | | | 1,043 | | | | 47 | (c) | |
Intercontinental
Exchange, Inc. | | | 354 | | | | 23 | (c) | |
International Game
Technology PLC | | | 204 | | | | 5 | (a) | |
Intuit, Inc. | | | 83 | | | | 13 | (a) | |
Invesco Mortgage
Capital, Inc. | | | 374 | | | | 6 | | |
Jabil, Inc. | | | 598 | | | | 17 | (a) | |
Jacobs Engineering
Group, Inc. | | | 108 | | | | 6 | (a) | |
Johnson & Johnson | | | 377 | | | | 53 | (c) | |
| | |
Number
of Shares | | Value
(000's
omitted) | |
JPMorgan Chase &
Co. | | | 1,141 | | | $ | 115 | (a)(c) | |
Kohl's Corp. | | | 26 | | | | 1 | | |
Kroger Co. | | | 219 | | | | 5 | (a) | |
Kronos Worldwide,
Inc. | | | 283 | | | | 7 | | |
L3 Technologies, Inc. | | | 59 | | | | 11 | (a) | |
Laboratory Corp. of
America Holdings | | | 141 | | | | 22 | *(a) | |
Lam Research Corp. | | | 15 | | | | 3 | (a) | |
Lear Corp. | | | 24 | | | | 4 | (a) | |
Leidos Holdings, Inc. | | | 164 | | | | 10 | (a) | |
Lennar Corp.
Class A | | | 242 | | | | 13 | (a) | |
Liberty Media
Corp-Liberty
SiriusXM Class C | | | 89 | | | | 4 | *(c) | |
Lincoln National
Corp. | | | 175 | | | | 13 | (c) | |
Live Nation
Entertainment,
Inc. | | | 27 | | | | 1 | * | |
Loews Corp. | | | 400 | | | | 20 | (a) | |
MasterCard, Inc.
Class A | | | 131 | | | | 19 | (a) | |
McDermott
International, Inc. | | | 466 | | | | 3 | *(a) | |
McDonald's Corp. | | | 47 | | | | 8 | (a) | |
MDU Resources
Group, Inc. | | | 341 | | | | 9 | (c) | |
Medpace Holdings,
Inc. | | | 301 | | | | 11 | * | |
Medtronic PLC | | | 129 | | | | 10 | (a)(c) | |
Merck & Co., Inc. | | | 260 | | | | 14 | (a) | |
Mercury Systems,
Inc. | | | 134 | | | | 7 | *(a) | |
Mettler-Toledo
International, Inc. | | | 2 | | | | 1 | *(a) | |
MFA Financial, Inc. | | | 2,341 | | | | 19 | | |
Microchip
Technology, Inc. | | | 147 | | | | 14 | | |
Micron
Technology, Inc. | | | 333 | | | | 15 | * | |
Microsoft Corp. | | | 927 | | | | 77 | (c) | |
Mohawk
Industries, Inc. | | | 55 | | | | 14 | *(c) | |
Motorola
Solutions, Inc. | | | 280 | | | | 25 | (a) | |
MTGE Investment
Corp. | | | 1,035 | | | | 19 | | |
National Beverage
Corp. | | | 48 | | | | 5 | | |
National Fuel Gas Co. | | | 75 | | | | 4 | (a) | |
National Research
Corp. Class A | | | 51 | | | | 2 | | |
NetScout Systems,
Inc. | | | 160 | | | | 5 | *(a) | |
New Residential
Investment Corp. | | | 840 | | | | 15 | (a) | |
Newell Brands, Inc. | | | 287 | | | | 12 | (a) | |
See Notes to Financial Statements
31
Schedule of Investments Global Allocation Fund (cont'd)
| | |
Number
of Shares | | Value
(000's
omitted) | |
Newmont
Mining Corp. | | | 306 | | | $ | 11 | (a) | |
Nexstar Media
Group,
Inc. Class A | | | 96 | | | | 6 | (a) | |
NIKE, Inc. Class B | | | 169 | | | | 9 | (a) | |
Northrop Grumman
Corp. | | | 15 | | | | 4 | (a) | |
NuVasive, Inc. | | | 81 | | | | 5 | *(a) | |
Office Depot, Inc. | | | 1,504 | | | | 5 | (a) | |
OGE Energy Corp. | | | 30 | | | | 1 | | |
ON Semiconductor
Corp. | | | 316 | | | | 7 | *(a) | |
Oracle Corp. | | | 333 | | | | 17 | (a) | |
Orbital ATK, Inc. | | | 124 | | | | 16 | (a) | |
Ormat
Technologies, Inc. | | | 285 | | | | 18 | (c) | |
Oshkosh Corp. | | | 51 | | | | 5 | (c) | |
Owens Corning | | | 231 | | | | 19 | (a) | |
Parker-Hannifin
Corp. | | | 12 | | | | 2 | | |
PepsiCo, Inc. | | | 68 | | | | 7 | (a) | |
PerkinElmer, Inc. | | | 112 | | | | 8 | (a) | |
Pfizer, Inc. | | | 993 | | | | 35 | (a) | |
Philip Morris
International, Inc. | | | 81 | | | | 8 | | |
Phillips 66 | | | 53 | | | | 5 | (a) | |
Pinnacle Foods, Inc. | | | 172 | | | | 9 | (a) | |
Pioneer Natural
Resources Co. | | | 42 | | | | 6 | (a) | |
PNC Financial
Services Group,
Inc. | | | 346 | | | | 47 | (c) | |
Pool Corp. | | | 67 | | | | 8 | (a) | |
Priceline Group, Inc. | | | 4 | | | | 8 | *(a) | |
Procter & Gamble
Co. | | | 448 | | | | 39 | (a) | |
Prudential Financial,
Inc. | | | 236 | | | | 26 | (a) | |
PS Business Parks,
Inc. | | | 65 | | | | 9 | (a) | |
Qorvo, Inc. | | | 15 | | | | 1 | * | |
Quad/Graphics, Inc. | | | 203 | | | | 5 | (a) | |
Quanta Services,
Inc. | | | 460 | | | | 17 | *(c) | |
Quest Diagnostics,
Inc. | | | 97 | | | | 9 | (a) | |
Reinsurance Group
of America, Inc. | | | 170 | | | | 25 | (a) | |
Reliance Steel &
Aluminum Co. | | | 31 | | | | 2 | (a) | |
Republic Services,
Inc. | | | 197 | | | | 13 | (a) | |
RH | | | 99 | | | | 9 | *(a) | |
Roper Technologies,
Inc. | | | 44 | | | | 11 | (a) | |
Sanderson Farms,
Inc. | | | 85 | | | | 13 | | |
Sanmina Corp. | | | 160 | | | | 5 | *(a) | |
Schlumberger Ltd. | | | 205 | | | | 13 | (a) | |
| | |
Number
of Shares | | Value
(000's
omitted) | |
Seaboard Corp. | | | 3 | | | $ | 13 | | |
Sealed Air Corp. | | | 216 | | | | 10 | (a) | |
Sensient
Technologies
Corp. | | | 175 | | | | 13 | (a) | |
Service Corp.
International | | | 301 | | | | 11 | (a) | |
Stanley Black &
Decker, Inc. | | | 14 | | | | 2 | (a) | |
Starbucks Corp. | | | 115 | | | | 6 | (a) | |
Starwood Waypoint
Homes | | | 240 | | | | 9 | (a) | |
STERIS PLC | | | 266 | | | | 25 | | |
Stryker Corp. | | | 32 | | | | 5 | | |
Symantec Corp. | | | 200 | | | | 6 | (a) | |
Sysco Corp. | | | 48 | | | | 3 | (a) | |
T-Mobile US, Inc. | | | 463 | | | | 28 | *(c) | |
Telephone & Data
Systems, Inc. | | | 38 | | | | 1 | (a) | |
Teradyne, Inc. | | | 622 | | | | 27 | (c) | |
Texas Capital
Bancshares, Inc. | | | 54 | | | | 5 | *(a) | |
Texas Instruments,
Inc. | | | 317 | | | | 31 | (c) | |
Thermo Fisher
Scientific, Inc. | | | 37 | | | | 7 | (a) | |
Thomson Reuters
Corp. | | | 57 | | | | 3 | (a) | |
Time Warner, Inc. | | | 251 | | | | 25 | (c) | |
TransUnion | | | 169 | | | | 9 | *(a) | |
Trimble, Inc. | | | 237 | | | | 10 | * | |
TTM Technologies,
Inc. | | | 641 | | | | 10 | * | |
Tyson Foods, Inc.
Class A | | | 64 | | | | 5 | (a) | |
U.S. Bancorp | | | 253 | | | | 14 | (a) | |
Ultra Clean
Holdings,
Inc. | | | 202 | | | | 5 | * | |
UnitedHealth
Group, Inc. | | | 257 | | | | 54 | (c) | |
Uniti Group, Inc. | | | 198 | | | | 3 | (a) | |
Unum Group | | | 213 | | | | 11 | (a) | |
Valero Energy Corp. | | | 117 | | | | 9 | | |
Valmont Industries,
Inc. | | | 48 | | | | 8 | (a) | |
Valvoline, Inc. | | | 273 | | | | 7 | | |
Vantiv, Inc. Class A | | | 107 | | | | 7 | *(a) | |
Visa, Inc. Class A | | | 106 | | | | 12 | | |
Vishay
Intertechnology,
Inc. | | | 700 | | | | 16 | (a) | |
VMware, Inc.
Class A | | | 39 | | | | 5 | *(a) | |
WageWorks, Inc. | | | 80 | | | | 5 | *(a) | |
Wal-Mart Stores,
Inc. | | | 321 | | | | 28 | (c) | |
Walgreens Boots
Alliance, Inc. | | | 123 | | | | 8 | (a) | |
| | |
Number
of Shares | | Value
(000's
omitted) | |
Waste Management,
Inc. | | | 14 | | | $ | 1 | (a) | |
Waters Corp. | | | 23 | | | | 5 | * | |
Weight Watchers
International, Inc. | | | 85 | | | | 4 | * | |
Wells Fargo & Co. | | | 315 | | | | 18 | (a) | |
West Pharmaceutical
Services, Inc. | | | 77 | | | | 8 | (c) | |
Western Digital Corp. | | | 165 | | | | 15 | (a) | |
Weyerhaeuser Co. | | | 626 | | | | 22 | (c) | |
Whirlpool Corp. | | | 59 | | | | 10 | (a) | |
Williams Cos., Inc. | | | 186 | | | | 5 | (a) | |
Wright Medical
Group NV | | | 181 | | | | 5 | *(a) | |
Xerox Corp. | | | 750 | | | | 23 | (a) | |
Zimmer Biomet
Holdings, Inc. | | | 103 | | | | 13 | (c) | |
| | | | 3,534 | | |
Total Common Stocks
(Cost $4,462) | | | 5,193 | | |
| | | Principal
Amount(d)
(000's
omitted) | | | |
U.S. Treasury Obligations 4.8% | | | |
U.S. Treasury
Bill, 0.86%,
due 5/24/18 | | $ | 100 | | | | 99 | (e)(f) | |
U.S. Treasury
Bond, 3.88%,
due 8/15/40 | | | 95 | | | | 113 | | |
U.S. Treasury
Inflation-Indexed
Bonds | |
2.00%, due
1/15/26 | | | 294 | | | | 330 | (g) | |
3.88%, due
4/15/29 | | | 158 | | | | 215 | (g) | |
0.63%, due
2/15/43 | | | 32 | | | | 30 | (g) | |
U.S. Treasury
Notes | |
1.00%, due
5/31/18 | | | 130 | | | | 130 | | |
1.50%, due
2/28/23 | | | 60 | | | | 58 | | |
1.63%, due
2/15/26 | | | 35 | | | | 33 | | |
Total U.S. Treasury
Obligations
(Cost $1,010) | | | 1,008 | | |
U.S. Government Agency Security 0.7% | | | |
Federal Home
Loan Bank,
5.50%, due
7/15/36 ($135) | | | 100 | | | | 135 | (a) | |
See Notes to Financial Statements
32
Schedule of Investments Global Allocation Fund (cont'd)
| | | Principal
Amount(d)
(000's
omitted) | | Value
(000's
omitted) | |
Mortgage-Backed Securities 7.3% | | | | | |
Collateralized Mortgage
Obligations 1.6% | | | | | |
Fannie Mae
Connecticut
Avenue
Securities | |
Ser. 2017-C02,
Class 2M2,
1 month USD
LIBOR + 3.65%,
(4.89%), due
9/25/29 | | $ | 130 | | | $ | 139 | (a)(h) | |
Ser. 2017-C03,
Class 1M2,
1 month USD
LIBOR + 3.00%,
(4.24%), due
10/25/29 | | | 25 | | | | 26 | (a)(h) | |
Ser. 2017-C04,
Class 2M2,
1 month USD
LIBOR + 2.85%,
(4.09%), due
11/25/29 | | | 70 | | | | 72 | (a)(h) | |
Ser. 2017-C05,
Class 1M2,
1 month USD
LIBOR + 2.20%,
(3.44%), due
1/25/30 | | | 75 | | | | 74 | (a)(h) | |
Ser. 2017-C06,
Class 1M2,
1 month USD
LIBOR + 2.65%,
(3.89%), due
2/25/30 | | | 15 | | | | 15 | (h) | |
Ser. 2017-C06,
Class 2M2,
1 month USD
LIBOR + 2.80%,
(4.04%), due
2/25/30 | | | 20 | | | | 20 | (h) | |
| | | | 346 | | |
Fannie Mae 3.0% | | | | | |
Pass-Through
Certificates | |
3.00%, TBA,
15 Year Maturity | | | 75 | | | | 77 | (i) | |
3.50%, TBA,
30 Year Maturity | | | 180 | | | | 185 | (i) | |
4.00%, TBA,
30 Year Maturity | | | 350 | | | | 367 | (i) | |
| | | | 629 | | |
Freddie Mac 2.7% | | | | | |
Pass-Through
Certificates | |
3.00%, TBA,
15 Year Maturity | | | 110 | | | | 113 | (i) | |
| | | Principal
Amount(d)
(000's
omitted) | | Value
(000's
omitted) | |
3.50%, TBA,
30 Year Maturity | | $ | 190 | | | $ | 195 | (i) | |
4.00%, TBA,
30 Year Maturity | | | 240 | | | | 252 | (i) | |
| | | | 560 | | |
Total Mortgage-
Backed Securities
(Cost $1,528) | | | 1,535 | | |
Corporate Bonds 6.9% | |
Australia 0.2% | |
Westpac Banking
Corp., 5 Year USD
ICE Swap
+ 2.89%,
(5.00%), due
12/31/99 | | | 35 | | | | 35 | (h) | |
Belgium 0.1% | |
Anheuser-Busch
InBev Finance, Inc.,
4.70%, due
2/1/36 | | | 10 | | | | 11 | | |
Brazil 0.2% | |
Vale Overseas Ltd.,
6.25%, due
8/10/26 | | | 45 | | | | 52 | | |
Canada 0.2% | |
Canadian Natural
Resources Ltd.,
2.95%, due
1/15/23 | | | 35 | | | | 35 | (a) | |
Mexico 0.1% | |
Petroleos
Mexicanos,
6.50%, due
3/13/27 | | | 20 | | | | 22 | (a)(j) | |
Switzerland 0.1% | |
UBS Group
Funding
Switzerland AG,
4.25%, due
3/23/28 | | | 30 | | | | 32 | (a)(j) | |
United Kingdom 0.4% | |
Barclays PLC,
4.34%, due
1/10/28 | | | 40 | | | | 41 | (a) | |
BAT Capital Corp.,
4.54%, due
8/15/47 | | | 35 | | | | 36 | (j) | |
| | | | 77 | | |
United States 5.6% | |
21st Century Fox
America, Inc.,
3.38%, due
11/15/26 | | | 10 | | | | 10 | | |
| | | Principal
Amount(d)
(000's
omitted) | | Value
(000's
omitted) | |
Abbott
Laboratories,
4.90%, due
11/30/46 | | $ | 15 | | | $ | 17 | (a) | |
AbbVie, Inc.,
4.45%, due
5/14/46 | | | 15 | | | | 16 | (a) | |
Apple, Inc. | |
2.30%, due
5/11/22 | | | 35 | | | | 35 | (a) | |
4.65%, due
2/23/46 | | | 20 | | | | 23 | (a) | |
AT&T, Inc. | |
3.90%, due
8/14/27 | | | 25 | | | | 25 | | |
4.75%, due
5/15/46 | | | 20 | | | | 19 | (a) | |
5.45%, due
3/1/47 | | | 35 | | | | 36 | (a) | |
Bank of America
Corp., Ser. L,
3.95%, due
4/21/25 | | | 25 | | | | 26 | (a) | |
Broadcom Corp./
Broadcom Cayman
Finance Ltd.,
3.88%, due
1/15/27 | | | 130 | | | | 134 | (j) | |
Capital One N.A.,
2.35%, due
1/31/20 | | | 40 | | | | 40 | (a) | |
Charter
Communications
Operating
LLC/Charter
Communications
Operating Capital | |
4.91%, due
7/23/25 | | | 40 | | | | 43 | (a) | |
6.48%, due
10/23/45 | | | 25 | | | | 29 | (a) | |
Concho
Resources, Inc.,
3.75%, due
10/1/27 | | | 25 | | | | 25 | | |
Diamond 1 Finance
Corp./Diamond 2
Finance Corp. | |
4.42%, due
6/15/21 | | | 30 | | | | 32 | (a)(j) | |
5.45%, due
6/15/23 | | | 40 | | | | 44 | (a)(j) | |
6.02%, due
6/15/26 | | | 15 | | | | 17 | (a)(j) | |
Discover Financial ,
Services
4.10%, due
2/9/27 | | | 25 | | | | 26 | (a) | |
See Notes to Financial Statements
33
Schedule of Investments Global Allocation Fund (cont'd)
| | | Principal
Amount(d)
(000's
omitted) | | Value
(000's
omitted) | |
Discovery
Communications
LLC, 5.20%, due
9/20/47 | | $ | 15 | | | $ | 15 | | |
Energy Transfer
Partners
L.P., 6.50%, due
2/1/42 | | | 20 | | | | 23 | (a) | |
General Motors
Financial Co., Inc. | |
3.20%, due
7/6/21 | | | 20 | | | | 20 | (a) | |
4.00%, due
10/6/26 | | | 25 | | | | 25 | (a) | |
Gilead
Sciences, Inc.,
4.60%, due
9/1/35 | | | 10 | | | | 11 | | |
Goldman Sachs
Group, Inc. | |
3 month USD
LIBOR + 1.51%,
(3.69%), due
6/5/28 | | | 25 | | | | 25 | (a)(h) | |
3 month USD
LIBOR + 1.37%,
(4.02%), due
10/31/38 | | | 20 | | | | 20 | (h) | |
5.15%, due
5/22/45 | | | 20 | | | | 23 | (a) | |
Hess Corp.,
4.30%, due
4/1/27 | | | 35 | | | | 35 | (a) | |
Hewlett Packard
Enterprise Co.,
4.65%, due
12/9/21 | | | 40 | | | | 43 | (a) | |
HP Enterprise Co.,
4.90%, due
10/15/25 | | | 20 | | | | 21 | (a) | |
JPMorgan
Chase & Co.,
3 month USD
LIBOR + 1.38%,
(3.54%), due
5/1/28 | | | 25 | | | | 25 | (a)(h) | |
Kinder Morgan,
Inc., 5.55%, due
6/1/45 | | | 20 | | | | 22 | (a) | |
Microsoft Corp.,
4.50%,
due 2/6/57 | | | 20 | | | | 22 | (a) | |
Morgan Stanley,
3 month USD
LIBOR + 1.34%,
(3.59%), due
7/22/28 | | | 70 | | | | 70 | (a)(h) | |
MPLX LP, 4.13%,
due 3/1/27 | | | 15 | | | | 15 | (a) | |
| | | Principal
Amount(d)
(000's
omitted) | | Value
(000's
omitted) | |
Noble Energy, Inc. | |
3.85%, due
1/15/28 | | $ | 35 | | | $ | 35 | | |
5.25%, due
11/15/43 | | | 20 | | | | 21(a) | | |
Northrop
Grumman Corp.,
2.55%, due
10/15/22 | | | 15 | | | | 15 | | |
Verizon
Communications,
Inc. | |
4.27%, due
1/15/36 | | | 15 | | | | 15 | | |
4.13%, due
8/15/46 | | | 20 | | | | 18 | (a) | |
4.67%, due
3/15/55 | | | 20 | | | | 19 | (a) | |
Viacom, Inc. | |
4.38%, due
3/15/43 | | | 35 | | | | 30 | (a) | |
3 month USD
LIBOR + 3.90%,
(5.88%), due
2/28/57 | | | 20 | | | | 20 | (a)(h) | |
| | | | 1,185 | | |
Total Corporate
Bonds
(Cost $1,425) | | | | | 1,449 | | |
Asset-Backed Securities 2.1% | | | | | |
Ally Auto
Receivables
Trust, Ser. 2017-3,
Class A2, 1.53%,
due 3/16/20 | | | 9 | | | | 9 | | |
Bear Stearns
Asset Backed
Securities Trust,
Ser. 2006-SD2,
Class M2,
1 month
USD LIBOR
+ 0.80%,
(2.03%), due
6/25/36 | | | 100 | | | | 92 | (a)(h) | |
Capital One
Multi-Asset
Execution Trust | |
Ser. 2015-A1,
Class A1,
(1.39%), due
1/15/21 | | | 20 | | | | 20 | (a) | |
| | | Principal
Amount(d)
(000's
omitted) | | Value
(000's
omitted) | |
Ser. 2016-A1,
Class A1,
1 month
USD LIBOR +
0.45%, (1.69%),
due 2/15/22 | | $ | 10 | | | $ | 10 | (a)(h) | |
Carrington
Mortgage
Loan Trust,
Ser. 2006-OPT1,
Class M1,
1 month USD
LIBOR + 0.35%,
(1.58%), due
2/25/36 | | | 100 | | | | 95 | (a)(h) | |
Citibank Credit
Card Issuance
Trust,
Ser. 2017-A3,
Class A3, 1.92%,
due 4/7/22 | | | 100 | | | | 100 | (a) | |
JP Morgan
Mortgage
Acquisition Corp.,
Ser. 2005-OPT2,
Class M3,
1 month USD
LIBOR + 0.48%,
(1.71%), due
12/25/36 | | | 80 | | | | 76 | (a)(h) | |
Toyota Auto
Receivables Owner
Trust, Ser. 2017-B,
Class A2A, 1.46%,
due 1/15/20 | | | 30 | | | | 30 | (a) | |
Total Asset-Backed
Securities
(Cost $426) | | | | | 432 | | |
Foreign Government Security 0.3% | |
South Africa
Government
Bond, Ser. R214,
6.50%, due
2/28/41
(Cost $83) | | ZAR | 1,320 | | | | 63 | (a) | |
| | | Number
of Shares | | | |
Exchange Traded Funds 2.5% | |
iShares iBoxx $
High Yield
Corporate
Bond ETF | | | 1,500 | | | | 133 | (a) | |
See Notes to Financial Statements
34
Schedule of Investments Global Allocation Fund (cont'd)
| | |
Number
of Shares | | Value
(000's
omitted) | |
PowerShares
Senior Loan
Portfolio | | | 17,000 | | | $ | 393 | (a) | |
Total Exchange
Traded Funds
(Cost $527) | | | | | 526 | | |
Investment Companies 52.6% | |
Neuberger Berman
Emerging
Markets
Debt Fund
Institutional Class | | | 56,739 | | | | 512 | (a)(k) | |
Neuberger Berman
Emerging
Markets Equity
Fund Class R6 | | | 60,542 | | | | 1,255 | (a)(k) | |
Neuberger Berman
Floating Rate
Income Fund
Institutional Class | | | 43,487 | | | | 433 | (a)(k) | |
Neuberger Berman
Genesis Fund
Class R6 | | | 21,219 | | | | 1,348 | (a)(k) | |
| | |
Number
of Shares | | Value
(000's
omitted) | |
Neuberger Berman
High Income
Bond Fund
Class R6 | | | 133,662 | | | $ | 1,177 | (a)(k) | |
Neuberger Berman
International
Select Fund
Class R6 | | | 279,073 | | | | 3,620 | (a)(k) | |
Neuberger Berman
Long Short
Credit Fund
Class R6 | | | 73,328 | | | | 708 | (a)(k) | |
Neuberger Berman
Risk Balanced
Commodity
Strategy Fund
Institutional Class | | | 144,206 | | | | 917 | *(a)(k) | |
Neuberger Berman
U.S. Equity Index
PutWrite Strategy
Fund Class R6 | | | 91,300 | | | | 1,035 | (a)(k) | |
Total Investment
Companies
(Cost $9,968) | | | | | 11,005 | | |
| | |
Number
of Shares | | Value
(000's
omitted) | |
Short-Term Investment 3.1% | |
Investment Company 3.1% | |
State Street
Institutional U.S.
Government
Money Market
Fund Premier
Class, 0.96%
(Cost $647) | | | 646,733 | | | $ | 647 | (a)(l) | |
Total Investments 105.1%
(Cost $20,211) | | | 21,993 | | |
Liabilities Less Other
Assets (5.1)% | | | | | (1,068 | )(m) | |
Net Assets 100.0% | | $ | 20,925 | | |
* Non-income producing security.
(a) All or a portion of this security is segregated in connection with obligations for to be announced securities, futures, forward foreign currency contracts, swaps and/or options written with a total value of approximately $15,846,000.
(b) Represents less than 0.05% of net assets.
(c) All or a portion of the security is pledged as collateral for options writtten.
(d) Principal amount is stated in the currency in which the security is denominated.
ZAR = South African Rand
(e) Rate shown was the discount rate at the date of purchase.
(f) All or a portion of the security is pledged as collateral for futures.
(g) Index-linked bond whose principal amount adjusts according to a government retail price index.
(h) Variable or floating rate security. The interest rate shown was the current rate as of October 31, 2017 and changes periodically.
Benchmarks for Variable/Floating Rates:
LIBOR (USD) - London Interbank Offered Rate
(i) TBA (To Be Announced) Securities are purchased/sold on a forward commitment basis with an approximate principal amount and no defined maturity date. The actual principal and maturity date will be determined upon settlement when the specific mortgage pools are assigned. Total value of all such securities (excluding forward sales contracts, if any) at October 31, 2017 amounted to approximately $1,189,000, which represents 5.7% of net assets of the Fund.
See Notes to Financial Statements
35
Schedule of Investments Global Allocation Fund (cont'd)
(j) Securities were purchased under Rule 144A of the Securities Act of 1933, as amended (the "1933 Act"), or are otherwise restricted and, unless registered under the 1933 Act or exempted from registration, may only be sold to qualified institutional investors or may have other restrictions on resale. At October 31, 2017, these securities amounted to approximately $328,000, which represents 1.6% of net assets of the Fund. These securities have been deemed by the investment manager to be liquid.
(k) Affiliated company as defined under the Investment Company Act of 1940 (see Note F of Notes to Financial Statements).
(l) Represents 7-day effective yield as of October 31, 2017.
(m) Includes the impact of the Fund's open positions in derivatives at October 31, 2017.
(n) Security exempt from registration pursuant to Regulation S under the Securities Act of 1933. Regulation S applies to securities offerings that are made outside of the United States and do not involve direct selling efforts in the United States and as such may have restrictions on resale. Total value of all such securities at October 31, 2017 amounted to approximately $11,000, which represents 0.1% of net assets of the Fund.
See Notes to Financial Statements
36
Schedule of Investments Global Allocation Fund (cont'd)
POSITIONS BY INDUSTRY
Industry | | Investments at
Value
(000's omitted) | | Percentage of
Net Assets | |
Investment Companies* | | $ | 11,005 | | | | 52.6 | % | |
Mortgage-Backed Securities | | | 1,535 | | | | 7.3 | % | |
U.S. Treasury Obligations | | | 1,008 | | | | 4.8 | % | |
Banks | | | 734 | | | | 3.5 | % | |
Exchange Traded Funds | | | 526 | | | | 2.5 | % | |
Asset-Backed Securities | | | 432 | | | | 2.1 | % | |
Insurance | | | 302 | | | | 1.4 | % | |
Oil, Gas & Consumable Fuels | | | 279 | | | | 1.3 | % | |
Media | | | 240 | | | | 1.2 | % | |
Computers | | | 215 | | | | 1.0 | % | |
Semiconductors & Semiconductor Equipment | | | 206 | | | | 1.0 | % | |
Software | | | 189 | | | | 0.9 | % | |
Pharmaceuticals | | | 181 | | | | 0.9 | % | |
Food & Staples Retailing | | | 177 | | | | 0.9 | % | |
Technology Hardware, Storage & Peripherals | | | 175 | | | | 0.8 | % | |
Oil & Gas | | | 173 | | | | 0.8 | % | |
Health Care Providers & Services | | | 169 | | | | 0.8 | % | |
Health Care Equipment & Supplies | | | 160 | | | | 0.8 | % | |
Metals & Mining | | | 155 | | | | 0.7 | % | |
Electronic Equipment, Instruments & Components | | | 153 | | | | 0.7 | % | |
Automobiles | | | 149 | | | | 0.7 | % | |
Equity Real Estate Investment Trusts | | | 146 | | | | 0.7 | % | |
Trading Companies & Distributors | | | 135 | | | | 0.7 | % | |
U.S. Government Agency Securities | | | 135 | | | | 0.7 | % | |
Semiconductors | | | 134 | | | | 0.6 | % | |
Internet Software & Services | | | 133 | | | | 0.6 | % | |
Telecommunications | | | 132 | | | | 0.6 | % | |
Biotechnology | | | 124 | | | | 0.6 | % | |
Mortgage Real Estate Investment Trusts | | | 100 | | | | 0.5 | % | |
Communications Equipment | | | 99 | | | | 0.5 | % | |
Food Products | | | 93 | | | | 0.4 | % | |
Aerospace & Defense | | | 90 | | | | 0.4 | % | |
Hotels, Restaurants & Leisure | | | 87 | | | | 0.4 | % | |
Household Durables | | | 86 | | | | 0.4 | % | |
Chemicals | | | 83 | | | | 0.4 | % | |
Capital Markets | | | 81 | | | | 0.4 | % | |
Life Sciences Tools & Services | | | 73 | | | | 0.4 | % | |
Diversified Telecommunication Services | | | 71 | | | | 0.3 | % | |
Construction & Engineering | | | 71 | | | | 0.3 | % | |
Beverages | | | 70 | | | | 0.3 | % | |
Airlines | | | 69 | | | | 0.3 | % | |
Electric Utilities | | | 65 | | | | 0.3 | % | |
Foreign Government Security** | | | 63 | | | | 0.3 | % | |
Independent Power and Renewable Electricity Producers | | | 61 | | | | 0.3 | % | |
Pipelines | | | 60 | | | | 0.3 | % | |
Industrial Conglomerates | | | 54 | | | | 0.3 | % | |
Diversified Financial Services | | | 52 | | | | 0.3 | % | |
Iron—Steel | | | 52 | | | | 0.3 | % | |
Electrical Equipment | | | 49 | | | | 0.2 | % | |
IT Services | | | 49 | | | | 0.2 | % | |
Auto Manufacturers | | | 45 | | | | 0.2 | % | |
Specialty Retail | | | 43 | | | | 0.2 | % | |
See Notes to Financial Statements
37
Schedule of Investments Global Allocation Fund (cont'd)
POSITIONS BY INDUSTRY (cont'd)
Industry | | Investments at
Value
(000's omitted) | | Percentage of
Net Assets | |
Wireless Telecommunication Services | | $ | 43 | | | | 0.2 | % | |
Auto Components | | | 39 | | | | 0.2 | % | |
Household Products | | | 39 | | | | 0.2 | % | |
Professional Services | | | 37 | | | | 0.2 | % | |
Agriculture | | | 36 | | | | 0.2 | % | |
Machinery | | | 36 | | | | 0.2 | % | |
Distributors | | | 32 | | | | 0.2 | % | |
Diversified Consumer Services | | | 29 | | | | 0.1 | % | |
Real Estate Management & Development | | | 26 | | | | 0.1 | % | |
Internet & Direct Marketing Retail | | | 25 | | | | 0.1 | % | |
Textiles, Apparel & Luxury Goods | | | 25 | | | | 0.1 | % | |
Energy Equipment & Services | | | 22 | | | | 0.1 | % | |
Transportation Infrastructure | | | 20 | | | | 0.1 | % | |
Building Products | | | 19 | | | | 0.1 | % | |
Commercial Services & Supplies | | | 19 | | | | 0.1 | % | |
Mortgage Real Estate Investment | | | 19 | | | | 0.1 | % | |
Healthcare—Products | | | 17 | | | | 0.1 | % | |
Multi-Utilities | | | 17 | | | | 0.1 | % | |
Tobacco | | | 17 | | | | 0.1 | % | |
Road & Rail | | | 16 | | | | 0.1 | % | |
Personal Products | | | 13 | | | | 0.1 | % | |
Air Freight & Logistics | | | 12 | | | | 0.1 | % | |
Containers & Packaging | | | 10 | | | | 0.0 | % | |
Construction Materials | | | 4 | | | | 0.0 | % | |
Gas Utilities | | | 4 | | | | 0.0 | % | |
Consumer Finance | | | 1 | | | | 0.0 | % | |
Multiline Retail | | | 1 | | | | 0.0 | % | |
Short-Term Investment and Other Liabilities—Net | | | (421 | ) | | | (2.0 | )% | |
| | | $ | 20,925 | | | | 100.0 | % | |
* Each position is an Investment Company under the 1940 Act and is not treated as an industry for purposes of the Fund's policy on industry concentration. This represents the aggregate of all investment companies.
** Each foreign government is deemed its own industry. This represents the aggregate of all foreign governments.
See Notes to Financial Statements
38
Schedule of Investments Global Allocation Fund (cont'd)
Derivative Instruments
Futures contracts ("futures")
At October 31, 2017, open positions in futures for the Fund were as follows:
Long Futures:
Expiration
Date | | Number of
Contracts | | Open Contracts | | Notional
Amount | | Value and
Unrealized
Appreciation/
(Depreciation) | |
12/2017 | | | 1 | | | Brazilian Real | | $ | 30,380 | | | $ | (225 | ) | |
12/2017 | | | 1 | | | Nikkei 225 Index | | | 111,125 | | | | (29 | ) | |
12/2017 | | | 1 | | | Topix Index | | | 155,050 | | | | 16,175 | | |
12/2017 | | | 3 | | | Euro STOXX 50 Index | | | 128,529 | | | | 7,051 | | |
12/2017 | | | 3 | | | FTSE 100 Index | | | 297,539 | | | | 2,018 | | |
12/2017 | | | 5 | | | MSCI EAFE Index | | | 501,850 | | | | 10,277 | | |
12/2017 | | | 20 | | | MSCI World Index | | | 1,124,200 | | | | 18,101 | | |
12/2017 | | | 3 | | | S&P 500 E-Mini Index | | | 385,905 | | | | 8,425 | | |
12/2017 | | | 3 | | | Mexican Peso | | | 77,700 | | | | (5,352 | ) | |
12/2017 | | | 1 | | | New Zealand Dollar | | | 68,360 | | | | (2,788 | ) | |
12/2017 | | | 12 | | | U.S. Treasury Note, 10 Year | | | 1,499,250 | | | | (16,766 | ) | |
12/2017 | | | 3 | | | United Kingdom Long Gilt Bond | | | 495,387 | | | | (48 | ) | |
12/2017 | | | 1 | | | U.S. Treasury Note, 5 Year | | | 117,188 | | | | (58 | ) | |
Total Long Positions | | | | | | $ | 4,992,463 | | | $ | 36,781 | | |
Short Futures:
Expiration
Date | | Number of
Contracts | | Open Contracts | | Notional
Amount | | Value and
Unrealized
Appreciation/
(Depreciation) | |
12/2017 | | | 5 | | | Euro-Bund | | $ | (947,896 | ) | | $ | (3,164 | ) | |
12/2017 | | | 1 | | | Euro-Buxl Bond, 30 Year | | | (193,505 | ) | | | (818 | ) | |
12/2017 | | | 3 | | | MSCI World Index | | | (172,200 | ) | | | (4,715 | ) | |
12/2017 | | | 4 | | | S&P 500 E-Mini Index | | | (514,540 | ) | | | (22,360 | ) | |
12/2017 | | | 1 | | | Canadian Dollar | | | (77,575 | ) | | | 2,151 | | |
12/2017 | | | 2 | | | United Kingdom Long Gilt Bond | | | (330,258 | ) | | | 100 | | |
Total Short Positions | | | | | | $ | (2,235,974 | ) | | $ | (28,806 | ) | |
Total Futures | | | | | | | | $ | 7,975 | | |
At October 31, 2017, the Fund had $157,250 deposited in a segregated account to cover margin requirements on open futures. The Fund had securities pledged in the amount of $99,290 to cover collateral requirements on open futures.
For the year ended October 31, 2017, the average notional value of futures for the Fund was $3,262,193 for long positions and $(2,544,308) for short positions.
See Notes to Financial Statements
39
Schedule of Investments Global Allocation Fund (cont'd)
Forward foreign currency contracts ("forward contracts")
At October 31, 2017, open forward contracts for the Fund were as follows:(a)
| Currency Purchased | | Currency Sold | | Counterparty | | Settlement
Date | | Net
Unrealized
Appreciation/
(Depreciation) | |
| | 307,969 | | | USD | | | | | 391,639 | | | AUD | | | | Goldman Sachs International | | 1/24/2018 | | $ | 8,451 | | |
| | 63,861 | | | USD | | | | | 83,455 | | | AUD | | | | Goldman Sachs International | | 1/24/2018 | | | 36 | | |
| | 18,252 | | | USD | | | | | 23,761 | | | AUD | | | | JPMorgan Chase Bank N.A. | | 1/24/2018 | | | 80 | | |
| | 46,062 | | | USD | | | | | 58,749 | | | AUD | | | | Royal Bank of Canada | | 1/24/2018 | | | 1,132 | | |
| | 354,807 | | | USD | | | | | 451,033 | | | AUD | | | | State Street Bank and Trust Company | | 1/24/2018 | | | 9,865 | | |
| | 96,848 | | | USD | | | | | 123,256 | | | AUD | | | | State Street Bank and Trust Company | | 1/24/2018 | | | 2,584 | | |
| | 31,068 | | | USD | | | | | 39,595 | | | AUD | | | | State Street Bank and Trust Company | | 1/24/2018 | | | 787 | | |
| | 11,489 | | | USD | | | | | 14,703 | | | AUD | | | | State Street Bank and Trust Company | | 1/24/2018 | | | 245 | | |
| | 25,709 | | | USD | | | | | 33,401 | | | AUD | | | | State Street Bank and Trust Company | | 1/24/2018 | | | 165 | | |
| | 128,532 | | | AUD | | | | | 98,197 | | | USD | | | | State Street Bank and Trust Company | | 1/24/2018 | | | 102 | | |
| | 267,145 | | | USD | | | | | 334,669 | | | CAD | | | | Citibank, N.A. | | 1/24/2018 | | | 7,502 | | |
| | 354,034 | | | USD | | | | | 443,420 | | | CAD | | | | Goldman Sachs International | | 1/24/2018 | | | 10,019 | | |
| | 68,978 | | | USD | | | | | 86,076 | | | CAD | | | | Goldman Sachs International | | 1/24/2018 | | | 2,199 | | |
| | 11,267 | | | USD | | | | | 14,439 | | | CAD | | | | JPMorgan Chase Bank N.A. | | 1/24/2018 | | | 65 | | |
| | 14,120 | | | USD | | | | | 18,125 | | | CAD | | | | JPMorgan Chase Bank N.A. | | 1/24/2018 | | | 58 | | |
| | 461,041 | | | USD | | | | | 575,397 | | | CAD | | | | Royal Bank of Canada | | 1/24/2018 | | | 14,635 | | |
| | 201,362 | | | USD | | | | | 195,100 | | | CHF | | | | Citibank, N.A. | | 1/24/2018 | | | 4,645 | | |
| | 89,532 | | | USD | | | | | 86,767 | | | CHF | | | | Goldman Sachs International | | 1/24/2018 | | | 2,045 | | |
| | 29,590 | | | USD | | | | | 29,284 | | | CHF | | | | JPMorgan Chase Bank N.A. | | 1/24/2018 | | | 63 | | |
| | 301,889 | | | USD | | | | | 294,719 | | | CHF | | | | Royal Bank of Canada | | 1/24/2018 | | | 4,727 | | |
| | 754,042 | | | USD | | | | | 730,784 | | | CHF | | | | Societe Generale | | 1/24/2018 | | | 17,200 | | |
| | 30,919 | | | USD | | | | | 30,128 | | | CHF | | | | State Street Bank and Trust Company | | 1/24/2018 | | | 541 | | |
| | 32,064 | | | USD | | | | | 31,263 | | | CHF | | | | State Street Bank and Trust Company | | 1/24/2018 | | | 541 | | |
| | 47,805 | | | EUR | | | | | 55,648 | | | USD | | | | Goldman Sachs International | | 1/24/2018 | | | 312 | | |
| | 133,741 | | | EUR | | | | | 156,400 | | | USD | | | | Goldman Sachs International | | 1/24/2018 | | | 156 | | |
| | 885,344 | | | USD | | | | | 746,593 | | | EUR | | | | State Street Bank and Trust Company | | 1/24/2018 | | | 11,387 | | |
| | 86,764 | | | USD | | | | | 73,347 | | | EUR | | | | State Street Bank and Trust Company | | 1/24/2018 | | | 904 | | |
| | 49,395 | | | USD | | | | | 41,863 | | | EUR | | | | State Street Bank and Trust Company | | 1/24/2018 | | | 390 | | |
| | 21,565 | | | USD | | | | | 18,152 | | | EUR | | | | State Street Bank and Trust Company | | 1/24/2018 | | | 317 | | |
| | 29,802 | | | USD | | | | | 25,242 | | | EUR | | | | State Street Bank and Trust Company | | 1/24/2018 | | | 254 | | |
| | 97,146 | | | GBP | | | | | 129,329 | | | USD | | | | Goldman Sachs International | | 1/24/2018 | | | 41 | | |
| | 30,590 | | | GBP | | | | | 40,266 | | | USD | | | | JPMorgan Chase Bank N.A. | | 1/24/2018 | | | 470 | | |
| | 226,633 | | | GBP | | | | | 299,394 | | | USD | | | | Royal Bank of Canada | | 1/24/2018 | | | 2,414 | | |
| | 603,280 | | | USD | | | | | 452,176 | | | GBP | | | | State Street Bank and Trust Company | | 1/24/2018 | | | 1,116 | | |
| | 55,751 | | | GBP | | | | | 73,920 | | | USD | | | | State Street Bank and Trust Company | | 1/24/2018 | | | 324 | | |
| | 17,171 | | | USD | | | | | 1,937,454 | | | JPY | | | | JPMorgan Chase Bank N.A. | | 1/24/2018 | | | 58 | | |
| | 1,206,911 | | | JPY | | | | | 10,649 | | | USD | | | | JPMorgan Chase Bank N.A. | | 1/24/2018 | | | 11 | | |
| | 140,393 | | | USD | | | | | 15,617,632 | | | JPY | | | | Societe Generale | | 1/24/2018 | | | 2,447 | | |
| | 101,561,472 | | | KRW | | | | | 90,157 | | | USD | | | | State Street Bank and Trust Company | | 1/24/2018 | | | 718 | | |
| | 61,059 | | | USD | | | | | 1,179,737 | | | MXN | | | | State Street Bank and Trust Company | | 1/24/2018 | | | 381 | | |
| | 332,156 | | | USD | | | | | 2,612,839 | | | NOK | | | | Goldman Sachs International | | 1/24/2018 | | | 11,569 | | |
See Notes to Financial Statements
40
Schedule of Investments Global Allocation Fund (cont'd)
| Currency Purchased | | Currency Sold | | Counterparty | | Settlement
Date | | Net
Unrealized
Appreciation/
(Depreciation) | |
| | 86,137 | | | USD | | | | | 687,451 | | | NOK | | | | Goldman Sachs International | | 1/24/2018 | | $ | 1,789 | | |
| | 986,928 | | | NOK | | | | | 120,901 | | | USD | | | | Goldman Sachs International | | 1/24/2018 | | | 192 | | |
| | 612,347 | | | NOK | | | | | 75,082 | | | USD | | | | Goldman Sachs International | | 1/24/2018 | | | 51 | | |
| | 139,975 | | | USD | | | | | 194,949 | | | NZD | | | | Citibank, N.A. | | 1/24/2018 | | | 6,760 | | |
| | 17,818 | | | USD | | | | | 26,059 | | | NZD | | | | Goldman Sachs International | | 1/24/2018 | | | 12 | | |
| | 556,290 | | | USD | | | | | 775,642 | | | NZD | | | | Societe Generale | | 1/24/2018 | | | 26,266 | | |
| | 147,155 | | | USD | | | | | 205,212 | | | NZD | | | | State Street Bank and Trust Company | | 1/24/2018 | | | 6,927 | | |
| | 52,200 | | | USD | | | | | 75,929 | | | NZD | | | | State Street Bank and Trust Company | | 1/24/2018 | | | 315 | | |
| | 27,321 | | | USD | | | | | 220,336 | | | SEK | | | | Goldman Sachs International | | 1/24/2018 | | | 861 | | |
| | 20,420 | | | USD | | | | | 169,374 | | | SEK | | | | Goldman Sachs International | | 1/24/2018 | | | 80 | | |
| | 61,885 | | | USD | | | | | 515,113 | | | SEK | | | | Goldman Sachs International | | 1/24/2018 | | | 26 | | |
| | 19,781 | | | USD | | | | | 161,498 | | | SEK | | | | JPMorgan Chase Bank N.A. | | 1/24/2018 | | | 387 | | |
| | 123,044 | | | USD | | | | | 993,096 | | | SEK | | | | Societe Generale | | 1/24/2018 | | | 3,785 | | |
| | 260,462 | | | USD | | | | | 2,105,376 | | | SEK | | | | State Street Bank and Trust Company | | 1/24/2018 | | | 7,631 | | |
| | 27,447 | | | USD | | | | | 223,298 | | | SEK | | | | State Street Bank and Trust Company | | 1/24/2018 | | | 632 | | |
| | 5 | | | USD | | | | | 72 | | | ZAR | | | | State Street Bank and Trust Company | | 1/24/2018 | | | 0 | | |
| | | | | | | | | | $176,670 | |
| | 95,948 | | | AUD | | | | | 75,438 | | | USD | | | | Citibank, N.A. | | 1/24/2018 | | | (2,059 | ) | |
| | 79,937 | | | AUD | | | | | 62,374 | | | USD | | | | Goldman Sachs International | | 1/24/2018 | | | (1,239 | ) | |
| | 161,797 | | | AUD | | | | | 127,157 | | | USD | | | | Societe Generale | | 1/24/2018 | | | (3,418 | ) | |
| | 29,892 | | | CAD | | | | | 23,250 | | | USD | | | | Goldman Sachs International | | 1/24/2018 | | | (59 | ) | |
| | 101,107 | | | CAD | | | | | 79,873 | | | USD | | | | Goldman Sachs International | | 1/24/2018 | | | (1,432 | ) | |
| | 980,499 | | | CAD | | | | | 782,452 | | | USD | | | | Societe Generale | | 1/24/2018 | | | (21,760 | ) | |
| | 21,718 | | | CAD | | | | | 17,354 | | | USD | | | | State Street Bank and Trust Company | | 1/24/2018 | | | (505 | ) | |
| | 125,807 | | | CAD | | | | | 100,562 | | | USD | | | | State Street Bank and Trust Company | | 1/24/2018 | | | (2,958 | ) | |
| | 705,291 | | | CAD | | | | | 564,746 | | | USD | | | | State Street Bank and Trust Company | | 1/24/2018 | | | (17,566 | ) | |
| | 66,157 | | | CHF | | | | | 66,891 | | | USD | | | | Goldman Sachs International | | 1/24/2018 | | | (186 | ) | |
| | 31,319 | | | USD | | | | | 31,089 | | | CHF | | | | JPMorgan Chase Bank N.A. | | 1/24/2018 | | | (27 | ) | |
| | 841,823 | | | CHF | | | | | 868,351 | | | USD | | | | State Street Bank and Trust Company | | 1/24/2018 | | | (19,549 | ) | |
| | 79,519 | | | EUR | | | | | 94,430 | | | USD | | | | Citibank, N.A. | | 1/24/2018 | | | (1,346 | ) | |
| | 65,997 | | | USD | | | | | 56,461 | | | EUR | | | | Goldman Sachs International | | 1/24/2018 | | | (96 | ) | |
| | 61,125 | | | USD | | | | | 52,326 | | | EUR | | | | Goldman Sachs International | | 1/24/2018 | | | (127 | ) | |
| | 25,526 | | | EUR | | | | | 30,323 | | | USD | | | | Goldman Sachs International | | 1/24/2018 | | | (443 | ) | |
| | 271,274 | | | EUR | | | | | 322,116 | | | USD | | | | Goldman Sachs International | | 1/24/2018 | | | (4,565 | ) | |
| | 13,533 | | | EUR | | | | | 15,939 | | | USD | | | | JPMorgan Chase Bank N.A. | | 1/24/2018 | | | (97 | ) | |
| | 17,765 | | | EUR | | | | | 21,010 | | | USD | | | | JPMorgan Chase Bank N.A. | | 1/24/2018 | | | (214 | ) | |
| | 821 | | | EUR | | | | | 974 | | | USD | | | | Royal Bank of Canada | | 1/24/2018 | | | (13 | ) | |
| | 9,179 | | | EUR | | | | | 10,894 | | | USD | | | | Societe Generale | | 1/24/2018 | | | (150 | ) | |
| | 88,833 | | | USD | | | | | 76,000 | | | EUR | | | | State Street Bank and Trust Company | | 1/24/2018 | | | (132 | ) | |
| | 211,432 | | | GBP | | | | | 282,029 | | | USD | | | | Citibank, N.A. | | 1/24/2018 | | | (465 | ) | |
| | 16,859 | | | GBP | | | | | 22,498 | | | USD | | | | Goldman Sachs International | | 1/24/2018 | | | (47 | ) | |
| | 13,100 | | | USD | | | | | 9,975 | | | GBP | | | | Goldman Sachs International | | 1/24/2018 | | | (184 | ) | |
| | 123,704 | | | USD | | | | | 93,687 | | | GBP | | | | Goldman Sachs International | | 1/24/2018 | | | (1,059 | ) | |
| | 107,798 | | | GBP | | | | | 143,609 | | | USD | | | | Societe Generale | | 1/24/2018 | | | (54 | ) | |
See Notes to Financial Statements
41
Schedule of Investments Global Allocation Fund (cont'd)
| | Currency Purchased | | Currency Sold | | Counterparty | | Settlement
Date | | Net
Unrealized
Appreciation/
(Depreciation) | |
| | | 14,001,839 | | | JPY | | | | | 125,893 | | | USD | | | | Citibank, N.A. | | 1/24/2018 | | $ | (2,219 | ) | |
| | | 60,088 | | | USD | | | | | 6,810,808 | | | JPY | | | | Goldman Sachs International | | 1/24/2018 | | | (70 | ) | |
| | | 5,503,868 | | | JPY | | | | | 48,840 | | | USD | | | | Goldman Sachs International | | 1/24/2018 | | | (226 | ) | |
| | | 2,672,993 | | | JPY | | | | | 24,046 | | | USD | | | | Goldman Sachs International | | 1/24/2018 | | | (436 | ) | |
| | | 16,725,517 | | | JPY | | | | | 150,373 | | | USD | | | | Goldman Sachs International | | 1/24/2018 | | | (2,641 | ) | |
| | | 35,608,211 | | | JPY | | | | | 315,747 | | | USD | | | | Royal Bank of Canada | | 1/24/2018 | | | (1,230 | ) | |
| | | 20,563 | | | USD | | | | | 2,331,024 | | | JPY | | | | State Street Bank and Trust Company | | 1/24/2018 | | | (26 | ) | |
| | | 48,315 | | | USD | | | | | 5,491,171 | | | JPY | | | | State Street Bank and Trust Company | | 1/24/2018 | | | (187 | ) | |
| | | 107,642 | | | USD | | | | | 12,221,835 | | | JPY | | | | State Street Bank and Trust Company | | 1/24/2018 | | | (310 | ) | |
| | | 3,480,576 | | | JPY | | | | | 31,054 | | | USD | | | | State Street Bank and Trust Company | | 1/24/2018 | | | (311 | ) | |
| | | 2,620,476 | | | JPY | | | | | 23,554 | | | USD | | | | State Street Bank and Trust Company | | 1/24/2018 | | | (408 | ) | |
| | | 89,949 | | | USD | | | | | 101,575,417 | | | KRW | | | | Goldman Sachs International | | 1/24/2018 | | | (939 | ) | |
| | | 39,365 | | | USD | | | | | 44,442,710 | | | KRW | | | | State Street Bank and Trust Company | | 1/24/2018 | | | (402 | ) | |
| | | 1,180,153 | | | MXN | | | | | 61,078 | | | USD | | | | Goldman Sachs International | | 1/24/2018 | | | (379 | ) | |
| | | 124,269 | | | NOK | | | | | 15,788 | | | USD | | | | Citibank, N.A. | | 1/24/2018 | | | (540 | ) | |
| | | 239,904 | | | NOK | | | | | 29,525 | | | USD | | | | Goldman Sachs International | | 1/24/2018 | | | (89 | ) | |
| | | 473,500 | | | NOK | | | | | 59,541 | | | USD | | | | Goldman Sachs International | | 1/24/2018 | | | (1,444 | ) | |
| | | 115,137 | | | NOK | | | | | 14,201 | | | USD | | | | JPMorgan Chase Bank N.A. | | 1/24/2018 | | | (74 | ) | |
| | | 1,158,786 | | | NOK | | | | | 145,610 | | | USD | | | | Royal Bank of Canada | | 1/24/2018 | | | (3,431 | ) | |
| | | 2,247,380 | | | NOK | | | | | 285,286 | | | USD | | | | Societe Generale | | 1/24/2018 | | | (9,540 | ) | |
| | | 171,535 | | | NOK | | | | | 21,751 | | | USD | | | | State Street Bank and Trust Company | | 1/24/2018 | | | (705 | ) | |
| | | 937,533 | | | NOK | | | | | 119,056 | | | USD | | | | State Street Bank and Trust Company | | 1/24/2018 | | | (4,024 | ) | |
| | | 118,858 | | | NZD | | | | | 81,885 | | | USD | | | | Goldman Sachs International | | 1/24/2018 | | | (665 | ) | |
| | | 97,092 | | | NZD | | | | | 67,507 | | | USD | | | | Goldman Sachs International | | 1/24/2018 | | | (1,161 | ) | |
| | | 184,379 | | | NZD | | | | | 131,173 | | | USD | | | | Goldman Sachs International | | 1/24/2018 | | | (5,180 | ) | |
| | | 200,561 | | | NZD | | | | | 143,995 | | | USD | | | | Goldman Sachs International | | 1/24/2018 | | | (6,944 | ) | |
| | | 286,409 | | | NZD | | | | | 199,513 | | | USD | | | | Royal Bank of Canada | | 1/24/2018 | | | (3,799 | ) | |
| | | 54,270 | | | NZD | | | | | 37,934 | | | USD | | | | State Street Bank and Trust Company | | 1/24/2018 | | | (850 | ) | |
| | | 621,705 | | | NZD | | | | | 446,241 | | | USD | | | | State Street Bank and Trust Company | | 1/24/2018 | | | (21,408 | ) | |
| | | 557,935 | | | SEK | | | | | 69,116 | | | USD | | | | Citibank, N.A. | | 1/24/2018 | | | (2,114 | ) | |
| | | 470,185 | | | SEK | | | | | 56,546 | | | USD | | | | Goldman Sachs International | | 1/24/2018 | | | (83 | ) | |
| | | 2,360,825 | | | SEK | | | | | 290,780 | | | USD | | | | Royal Bank of Canada | | 1/24/2018 | | | (7,273 | ) | |
| | | 211,602 | | | SEK | | | | | 25,934 | | | USD | | | | State Street Bank and Trust Company | | 1/24/2018 | | | (523 | ) | |
| | | 228,893 | | | SEK | | | | | 28,213 | | | USD | | | | State Street Bank and Trust Company | | 1/24/2018 | | | (726 | ) | |
| | | 829,788 | | | SEK | | | | | 101,419 | | | USD | | | | State Street Bank and Trust Company | | 1/24/2018 | | | (1,772 | ) | |
| | | | | | | | | | | | | | | | | | | | | | | | | | $ | (161,879 | ) | |
Total | | | | | | | | | | | | | | | | | | | | | | | | | | $ | 14,791 | | |
AUD = Australian Dollar
CAD = Canadian Dollar
CHF = Swiss Franc
EUR = Euro
GBP = Pound Sterling
See Notes to Financial Statements
42
Schedule of Investments Global Allocation Fund (cont'd)
JPY = Japanese Yen
KRW = South Korean Won
MXN= Mexican Peso
NOK = Norwegian Krone
NZD = New Zealand Dollar
SEK = Swedish Krona
ZAR = South African Rand
(a) Non-deliverable forward contracts.
For the year ended October 31, 2017, the Fund's investments in forward contracts had an average notional value of $21,800,965.
Total return swap contracts ("total return swaps")
At October 31, 2017, the Fund had outstanding over-the-counter ("OTC") total return swaps as follows:
Long Total Return Swaps
Swap
Counterparty | | Reference
Entity | | Notional
Amount(c) | | Maturity
Date | | Variable-
Rate(e) | | Unrealized
Appreciation/
(Depreciation) | | Accrued
Net
Interest
Receivable/
(Payable) | | Value | |
Goldman Sachs
International | | MSCI Europe ex UK
Financials Index | | EUR | 79,015 | | | 9/15/2018 | | | (0.18 | )%(d) | | $ | 348 | | | $ | (18 | ) | | $ | 330 | | |
Short Total Return Swaps
Swap
Counterparty | | Reference
Entity | | Notional
Amount(c) | | Maturity
Date | | Variable-
Rate(e) | | Unrealized
Appreciation/
(Depreciation) | | Accrued
Net
Interest
Receivable/
(Payable) | | Value | |
Goldman Sachs
International | | MSCI Daily TR Gross
Europe ex UK Index | | EUR | (78,986 | ) | | 9/15/2018 | | | (0.18 | )%(a) | | $ | (1,356 | ) | | $ | 18 | | | $ | (1,338 | )(f) | |
Goldman Sachs
International | | MSCI US REIT Index | | $ | (211,096 | ) | | 1/15/2018 | | | 1.52 | %(b) | | | 2,131 | | | | 40 | | | | 2,171 | | |
| Total | | | | | | | | | | | | | | | | | | $ | 775 | | | $ | 58 | | | $ | 833 | | |
(a) Fund receives 3-month Euribor plus 0.15%. Payment frequency—quarterly. Fund pays return on reference entity. Payment frequency—annually.
(b) Fund receives 3-month LIBOR plus 0.19%. Payment frequency—upon termination. Fund pays return on reference entity. Payment frequency—upon termination.
(c) Notional amount represents the value (including any fees or commissions) of the positions when they were established and is stated in the currency in which the contract is denominated.
EUR = Euro
See Notes to Financial Statements
43
Schedule of Investments Global Allocation Fund (cont'd)
(d) Fund pays 3-month Euribor plus 0.15%. Payment frequency—quarterly. Fund receives return on reference entity. Payment frequency—upon termination.
(e) Effective rate at October 31, 2017.
(f) As of the year ended October 31, 2017, these investments were valued using methods the Board has approved in the good-faith belief that the resulting valuation will reflect the fair value of the security.
For the year ended October 31, 2017, the average notional value of swaps was $95,623 for long positions and $(198,228) for short positions.
Written option contracts ("options written")
At October 31, 2017, the Fund had outstanding options written as follows:
| Description | | Number of
Contracts | | Notional
Amount | | Exercise
Price | | Expiration
Date | | Value | |
Calls | |
Exchange Traded Funds | |
iShares MSCI EAFE ETF | | | 28 | | | $ | (194,964 | ) | | $ | 70 | | | 11/3/2017 | | $ | (112 | ) | |
iShares MSCI EAFE ETF | | | 13 | | | | (90,519 | ) | | | 70 | | | 11/10/2017 | | | (227 | ) | |
iShares MSCI EAFE ETF | | | 13 | | | | (90,519 | ) | | | 70.5 | | | 11/10/2017 | | | (65 | ) | |
iShares MSCI EAFE ETF | | | 26 | | | | (181,038 | ) | | | 71 | | | 11/17/2017 | | | (130 | ) | |
iShares MSCI EAFE ETF | | | 25 | | | | (174,075 | ) | | | 70.5 | | | 11/24/2017 | | | (387 | ) | |
iShares MSCI EAFE ETF | | | 2 | | | | (13,926 | ) | | | 71 | | | 11/24/2017 | | | (16 | ) | |
iShares MSCI Emerging Markets ETF | | | 9 | | | | (41,652 | ) | | | 46.5 | | | 11/3/2017 | | | (149 | ) | |
iShares MSCI Emerging Markets ETF | | | 8 | | | | (37,024 | ) | | | 47 | | | 11/10/2017 | | | (116 | ) | |
iShares MSCI Emerging Markets ETF | | | 8 | | | | (37,024 | ) | | | 47.5 | | | 11/10/2017 | | | (44 | ) | |
iShares MSCI Emerging Markets ETF | | | 9 | | | | (41,652 | ) | | | 48 | | | 11/17/2017 | | | (58 | ) | |
iShares MSCI Emerging Markets ETF | | | 8 | | | | (37,024 | ) | | | 48.5 | | | 11/17/2017 | | | (24 | ) | |
iShares MSCI Emerging Markets ETF | | | 9 | | | | (41,652 | ) | | | 48 | | | 11/24/2017 | | | (86 | ) | |
iShares MSCI Emerging Markets ETF | | | 3 | | | | (13,884 | ) | | | 48.5 | | | 11/24/2017 | | | (17 | ) | |
iShares MSCI Emerging Markets ETF | | | 5 | | | | (23,140 | ) | | | 47.5 | | | 11/24/2017 | | | (92 | ) | |
iShares MSCI Emerging Markets ETF | | | 4 | | | | (18,512 | ) | | | 48 | | | 12/1/2017 | | | (56 | )(a)(b) | |
| | | | | | | | | | | (1,579 | ) | |
Index | |
S&P 500 Mini Index | | | 1 | | | | (25,753 | ) | | | 256 | | | 11/3/2017 | | | (185 | ) | |
S&P 500 Mini Index | | | 3 | | | | (77,259 | ) | | | 257.5 | | | 11/3/2017 | | | (218 | ) | |
S&P 500 Mini Index | | | 1 | | | | (25,753 | ) | | | 258 | | | 11/3/2017 | | | (48 | ) | |
S&P 500 Mini Index | | | 1 | | | | (25,753 | ) | | | 259 | | | 11/3/2017 | | | (0 | )(a)(b) | |
S&P 500 Mini Index | | | 10 | | | | (257,530 | ) | | | 260 | | | 11/10/2017 | | | (210 | ) | |
S&P 500 Mini Index | | | 10 | | | | (257,530 | ) | | | 260 | | | 11/17/2017 | | | (445 | ) | |
S&P 500 Mini Index | | | 6 | | | | (154,518 | ) | | | 260 | | | 11/24/2017 | | | (339 | ) | |
S&P 500 Mini Index | | | 1 | | | | (25,753 | ) | | | 262 | | | 11/24/2017 | | | (16 | )(a)(b) | |
S&P 500 Mini Index | | | 3 | | | | (77,259 | ) | | | 262.5 | | | 11/24/2017 | | | (69 | )(a)(b) | |
S&P 500 Mini Index | | | 4 | | | | (103,012 | ) | | | 262.5 | | | 12/1/2017 | | | (112 | ) | |
| | | | | | | | | | | (1,642 | ) | |
Total (premiums received: $3,095) | | | | | | | | | | $ | (3,221 | ) | |
See Notes to Financial Statements
44
Schedule of Investments Global Allocation Fund (cont'd)
| Description | | Number of
Contracts | | Notional
Amount | | Exercise
Price | | Expiration
Date | | Value | |
Puts | |
Exchange Traded Funds | |
iShares MSCI EAFE ETF | | | 2 | | | $ | (13,926 | ) | | $ | 67.5 | | | 11/3/2017 | | $ | (6 | ) | |
iShares MSCI EAFE ETF | | | 14 | | | | (97,482 | ) | | | 68.5 | | | 11/3/2017 | | | (70 | ) | |
iShares MSCI EAFE ETF | | | 1 | | | | (6,963 | ) | | | 66.5 | | | 11/10/2017 | | | (0 | )(a)(b)(c) | |
iShares MSCI EAFE ETF | | | 12 | | | | (83,556 | ) | | | 67 | | | 11/10/2017 | | | (30 | ) | |
iShares MSCI EAFE ETF | | | 13 | | | | (90,519 | ) | | | 67 | | | 11/17/2017 | | | (117 | ) | |
iShares MSCI EAFE ETF | | | 18 | | | | (125,334 | ) | | | 68 | | | 11/17/2017 | | | (180 | ) | |
iShares MSCI EAFE ETF | | | 21 | | | | (146,223 | ) | | | 67.5 | | | 11/24/2017 | | | (200 | ) | |
iShares MSCI EAFE ETF | | | 7 | | | | (48,741 | ) | | | 68 | | | 11/24/2017 | | | (109 | ) | |
iShares MSCI EAFE ETF | | | 9 | | | | (62,667 | ) | | | 67.5 | | | 12/1/2017 | | | (148 | ) | |
iShares MSCI EAFE ETF | | | 14 | | | | (97,482 | ) | | | 68 | | | 12/1/2017 | | | (252 | )(a)(b) | |
iShares MSCI Emerging Markets ETF | | | 9 | | | | (41,652 | ) | | | 44 | | | 11/3/2017 | | | (18 | ) | |
iShares MSCI Emerging Markets ETF | | | 4 | | | | (18,512 | ) | | | 44 | | | 11/10/2017 | | | (22 | ) | |
iShares MSCI Emerging Markets ETF | | | 12 | | | | (55,536 | ) | | | 44.5 | | | 11/10/2017 | | | (90 | ) | |
iShares MSCI Emerging Markets ETF | | | 2 | | | | (9,256 | ) | | | 45 | | | 11/10/2017 | | | (23 | ) | |
iShares MSCI Emerging Markets ETF | | | 3 | | | | (13,884 | ) | | | 44.5 | | | 11/17/2017 | | | (47 | ) | |
iShares MSCI Emerging Markets ETF | | | 18 | | | | (83,304 | ) | | | 45 | | | 11/17/2017 | | | (387 | ) | |
iShares MSCI Emerging Markets ETF | | | 1 | | | | (4,628 | ) | | | 44 | | | 11/24/2017 | | | (16 | ) | |
iShares MSCI Emerging Markets ETF | | | 8 | | | | (37,024 | ) | | | 44.5 | | | 11/24/2017 | | | (168 | ) | |
iShares MSCI Emerging Markets ETF | | | 5 | | | | (23,140 | ) | | | 45.5 | | | 11/24/2017 | | | (192 | ) | |
iShares MSCI Emerging Markets ETF | | | 10 | | | | (46,280 | ) | | | 44.5 | | | 12/1/2017 | | | (280 | ) | |
| | | | | | | | | | | (2,355 | ) | |
Index | |
S&P 500 Mini Index | | | 3 | | | | (77,259 | ) | | | 252 | | | 11/3/2017 | | | (21 | ) | |
S&P 500 Mini Index | | | 1 | | | | (25,753 | ) | | | 247.5 | | | 11/10/2017 | | | (15 | ) | |
S&P 500 Mini Index | | | 5 | | | | (128,765 | ) | | | 249 | | | 11/10/2017 | | | (85 | ) | |
S&P 500 Mini Index | | | 3 | | | | (77,259 | ) | | | 250 | | | 11/10/2017 | | | (73 | ) | |
S&P 500 Mini Index | | | 6 | | | | (154,518 | ) | | | 250 | | | 11/17/2017 | | | (270 | ) | |
S&P 500 Mini Index | | | 5 | | | | (128,765 | ) | | | 251 | | | 11/17/2017 | | | (257 | ) | |
S&P 500 Mini Index | | | 8 | | | | (206,024 | ) | | | 251 | | | 11/24/2017 | | | (540 | ) | |
S&P 500 Mini Index | | | 2 | | | | (51,506 | ) | | | 252 | | | 11/24/2017 | | | (154 | ) | |
S&P 500 Mini Index | | | 1 | | | | (25,753 | ) | | | 252.5 | | | 11/24/2017 | | | (83 | ) | |
S&P 500 Mini Index | | | 1 | | | | (25,753 | ) | | | 252 | | | 12/1/2017 | | | (108 | ) | |
S&P 500 Mini Index | | | 2 | | | | (51,506 | ) | | | 252.5 | | | 12/1/2017 | | | (232 | ) | |
S&P 500 Mini Index | | | 5 | | | | (128,765 | ) | | | 253 | | | 12/1/2017 | | | (613 | ) | |
| | | | | | | | | | | (2,451 | ) | |
Total (premiums received: $8,975) | | | | | | | | | | $ | (4,806 | ) | |
Total Options Written (premiums received: $12,070) | | | | | | | | | | $ | (8,027 | ) | |
(a) Security fair valued as of October 31, 2017 in accordance with procedures approved by the Fund's Board of Trustees (the "Board").
(b) Value determined using significant observable inputs.
See Notes to Financial Statements
45
Schedule of Investments Global Allocation Fund (cont'd)
(c) Amount less than one dollar.
For the year ended October 31, 2017, the Fund had an average market value of $(10,493) in options written. The Fund had securities pledged in the amount of $1,297,217 to cover collateral requirements for options written.
The following is a summary, categorized by Level (see Note A of Notes to Financial Statements), of inputs used to value the Fund's investments as of October 31, 2017:
Asset Valuation Inputs | |
(000's omitted) | | Level 1 | | Level 2 | | Level 3 | | Total | |
Investments: | |
Common Stocks | |
Germany | | $ | — | | | $ | 146 | | | $ | — | | | $ | 146 | | |
| Other Common Stocks(a) | | | 5,047 | | | | — | | | | — | | | | 5,047 | | |
Total Common Stocks | | | 5,047 | | | | 146 | | | | — | | | | 5,193 | | |
U.S. Treasury Obligations | | | — | | | | 1,008 | | | | — | | | | 1,008 | | |
U.S. Government Agency Security | | | — | | | | 135 | | | | — | | | | 135 | | |
| Mortgage-Backed Securities(a) | | | — | | | | 1,535 | | | | — | | | | 1,535 | | |
| Corporate Bonds(a) | | | — | | | | 1,449 | | | | — | | | | 1,449 | | |
Asset-Backed Securities | | | — | | | | 432 | | | | — | | | | 432 | | |
Foreign Government Security | | | — | | | | 63 | | | | — | | | | 63 | | |
Exchange Traded Funds | | | 526 | | | | — | | | | — | | | | 526 | | |
Investment Companies | | | — | | | | 11,005 | | | | — | | | | 11,005 | | |
Short-Term Investment | | | — | | | | 647 | | | | — | | | | 647 | | |
Total Investments | | $ | 5,573 | | | $ | 16,420 | | | $ | — | | | $ | 21,993 | | |
(a) The Schedule of Investments provides a geographic categorization as well as a Positions by Industry summary.
As of the year ended October 31, 2017, certain securities were transferred from one level (as of October 31, 2016) to another. Based on beginning of period market values as of November 1, 2016, approximately $37,064 was transferred from Level 1 to Level 2. These securities were categorized as Level 2 as of October 31, 2017, due to foreign exchanges having been closed and, therefore, no prices having been readily available for the securities as of that date.
The following is a summary, categorized by Level (see Note A of Notes to Financial Statements), of inputs used to value the Fund's derivatives as of October 31, 2017:
Other Financial Instruments | |
(000's omitted) | | Level 1 | | Level 2 | | Level 3(b) | | Total | |
| Futures(a) | |
Assets | | $ | 64 | | | $ | — | | | $ | — | | | $ | 64 | | |
Liabilities | | | (56 | ) | | | — | | | | — | | | | (56 | ) | |
| Forward Contracts(a) | |
Assets | | | — | | | | 177 | | | | — | | | | 177 | | |
Liabilities | | | — | | | | (162 | ) | | | — | | | | (162 | ) | |
See Notes to Financial Statements
46
Schedule of Investments Global Allocation Fund (cont'd)
Other Financial Instruments (cont'd) | |
(000's omitted) | | Level 1 | | Level 2 | | Level 3(b) | | Total | |
Swaps | |
Assets | | $ | — | | | $ | 2 | | | $ | — | | | $ | 2 | | |
Liabilities | | | — | | | | (1 | ) | | | — | | | | (1 | ) | |
Options Written | |
Liabilities | | | (8 | ) | | | — | | | | (0 | )(c) | | | (8 | ) | |
Total | | $ | (0 | )(c) | | $ | 16 | | | $ | (0 | )(c) | | $ | 16 | | |
(a) Futures and forward contracts are reported at the cumulative unrealized appreciation/(depreciation) of the instrument.
(b) The following is a reconciliation between the beginning and ending balances of investments in which unobservable inputs (Level 3) were used in determining value:
| | Beginning
balance, as
of 11/1/2016 | | Accrued
discounts/
(premiums) | | Realized
gain/(loss) | | Change
in unrealized
appreciation/
(depreciation) | | Purchases | | Sales | | Transfers
into
Level 3 | | Transfers
out of
Level 3 | | Balance,
as of
10/31/2017 | | Net change in
unrealized
appreciation/
(depreciation)
from
investments
still held as of
10/31/2017 | |
Other Financial
Instruments: | |
(000's omitted) | |
| Options Written(d) | | $ | 0 | | | $ | — | | | $ | 0 | (c) | | $ | (0 | )(c) | | $ | 0 | (c) | | $ | (0 | )(c) | | $ | — | | | $ | — | | | $ | (0 | )(c) | | $ | (0 | )(c) | |
Total | | $ | 0 | | | $ | — | | | $ | 0 | (c) | | $ | (0 | )(c) | | $ | 0 | (c) | | $ | (0 | )(c) | | $ | — | | | $ | — | | | $ | (0 | )(c) | | $ | (0 | )(c) | |
(c) Amount less than one thousand.
(d) As of the year ended October 31, 2017, these investments were valued using methods the Board has approved in the good-faith belief that the resulting valuation will reflect the fair value of the security. These investments did not have a material impact on the Fund's net assets and, therefore, disclosure of unobservable inputs used in formulating valuations is not presented.
See Notes to Financial Statements
47
Schedule of Investments Hedged Option Premium Strategy Fund
October 31, 2017
PRINCIPAL AMOUNT | | | | VALUE | |
(000's omitted) | | | | (000's omitted) | |
U.S. Treasury Obligations 88.6% | | | |
| | | | | U.S. Treasury Notes | | | | | |
$ | 1,000 | | | 1.25%, due 12/15/18 | | $ | 997 | | |
| | 1,000 | | | 1.00%, due 3/15/19 | | | 993 | | |
| | 2,000 | | | 0.88%, due 6/15/19—9/15/19 | | | 1,976 | | |
| | 2,500 | | | 1.38%, due 12/15/19—9/15/20 | | | 2,480 | (a) | |
| | 2,000 | | | 1.63%, due 3/15/20—6/30/20 | | | 1,997 | (a) | |
| | 950 | | | 1.50%, due 6/15/20 | | | 945 | | |
| | Total U.S. Treasury Obligations (Cost $9,416) | | | | | | 9,388 | | |
NUMBER OF SHARES | |
Short-Term Investment 29.4% | | | |
Investment Company 29.4% | | | |
| | 3,118,614 | | | State Street Institutional U.S. Government Money Market Fund Premier Class, 0.96% | | | 3,119 | (b)(c) | |
| | | | | (Cost $3,119) | | | |
| Total Options Purchased 0.0%(d)(e) (Cost $6) | | 2 | |
| | | | | Total Investments 118.0% (Cost $12,541) | | | 12,509 | | |
| | | | | Liabilities Less Other Assets (18.0)% | | | (1,905 | )(f) | |
| | | | | Net Assets 100.0% | | $ | 10,604 | | |
(a) All or a portion of the security is pledged as collateral for options written.
(b) All or a portion of this security is segregated in connection with obligations for options written with a total value of approximately $3,119,000.
(c) Represents 7-day effective yield as of October 31, 2017.
(d) Represents less than 0.05% of net assets.
(e) See "Purchased option contracts" under Derivative Instruments.
(f) Includes the impact of the Fund's open positions in derivatives at October 31, 2017.
See Notes to Financial Statements
48
Schedule of Investments Hedged Option Premium Strategy Fund (cont'd)
Derivative Instruments
Purchased option contracts ("options purchased")
At October 31, 2017, the Fund had outstanding options purchased as follows:
Description | | Number of
Contracts | | Notional
Amount | | Exercise
Price | | Expiration
Date | | Value | |
Calls | |
Index | |
Russell 2000 Index | | | 1 | | | $ | 150,277 | | | $ | 1,650 | | | 11/3/2017 | | $ | 0 | (a)(b) | |
Russell 2000 Index | | | 2 | | | | 300,555 | | | | 1,660 | | | 11/3/2017 | | | 0 | (a)(b) | |
Russell 2000 Index | | | 1 | | | | 150,277 | | | | 1,645 | | | 11/10/2017 | | | 0 | (a)(b) | |
Russell 2000 Index | | | 1 | | | | 150,277 | | | | 1,650 | | | 11/10/2017 | | | 10 | | |
Russell 2000 Index | | | 1 | | | | 150,277 | | | | 1,660 | | | 11/10/2017 | | | 0 | (a)(b) | |
Russell 2000 Index | | | 2 | | | | 300,555 | | | | 1,660 | | | 11/17/2017 | | | 0 | (a)(b) | |
Russell 2000 Index | | | 1 | | | | 150,277 | | | | 1,645 | | | 11/24/2017 | | | 30 | (a)(b) | |
S&P 500 Index | | | 10 | | | | 2,575,260 | | | | 2,800 | | | 11/3/2017 | | | 0 | (a)(b) | |
S&P 500 Index | | | 7 | | | | 1,802,682 | | | | 2,800 | | | 11/10/2017 | | | 0 | (a)(b) | |
S&P 500 Index | | | 4 | | | | 1,030,104 | | | | 2,825 | | | 11/10/2017 | | | 0 | (a)(b) | |
S&P 500 Index | | | 5 | | | | 1,287,630 | | | | 2,820 | | | 11/17/2017 | | | 0 | (a)(b) | |
S&P 500 Index | | | 4 | | | | 1,030,104 | | | | 2,800 | | | 11/17/2017 | | | 0 | (a)(b) | |
S&P 500 Index | | | 6 | | | | 1,545,156 | | | | 2,825 | | | 11/24/2017 | | | 60 | (a)(b) | |
Total Calls (cost: $630) | | | | | | | | | | $ | 100 | | |
Puts | |
Index | |
Russell 2000 Index | | | 2 | | | $ | 300,555 | | | $ | 1,355 | | | 11/3/2017 | | $ | 10 | | |
Russell 2000 Index | | | 1 | | | | 150,277 | | | | 1,360 | | | 11/3/2017 | | | 5 | | |
Russell 2000 Index | | | 1 | | | | 150,277 | | | | 1,355 | | | 11/10/2017 | | | 55 | | |
Russell 2000 Index | | | 1 | | | | 150,277 | | | | 1,360 | | | 11/10/2017 | | | 63 | | |
Russell 2000 Index | | | 1 | | | | 150,277 | | | | 1,345 | | | 11/10/2017 | | | 50 | | |
Russell 2000 Index | | | 2 | | | | 300,555 | | | | 1,360 | | | 11/17/2017 | | | 230 | | |
Russell 2000 Index | | | 1 | | | | 150,277 | | | | 1,345 | | | 11/24/2017 | | | 147 | | |
S&P 500 Index | | | 3 | | | | 772,578 | | | | 2,290 | | | 11/3/2017 | | | 22 | | |
S&P 500 Index | | | 1 | | | | 257,526 | | | | 2,295 | | | 11/3/2017 | | | 8 | | |
S&P 500 Index | | | 2 | | | | 515,052 | | | | 2,300 | | | 11/3/2017 | | | 15 | | |
S&P 500 Index | | | 4 | | | | 1,030,104 | | | | 2,315 | | | 11/3/2017 | | | 30 | | |
S&P 500 Index | | | 5 | | | | 1,287,630 | | | | 2,300 | | | 11/10/2017 | | | 125 | | |
S&P 500 Index | | | 5 | | | | 1,287,630 | | | | 2,315 | | | 11/10/2017 | | | 138 | | |
S&P 500 Index | | | 8 | | | | 2,060,208 | | | | 2,315 | | | 11/17/2017 | | | 560 | | |
S&P 500 Index | | | 6 | | | | 1,545,156 | | | | 2,315 | | | 11/24/2017 | | | 660 | | |
Total Puts (cost: $5,488) | | | | | | | | | | $ | 2,118 | | |
Total Options Purchased (cost: $6,118) | | | | | | | | | | $ | 2,218 | | |
(a) Security fair valued as of October 31, 2017 in accordance with procedures approved by the Board of Trustees (the "Board").
(b) Value determined using significant unobservable inputs.
See Notes to Financial Statements
49
Schedule of Investments Hedged Option Premium Strategy Fund (cont'd)
Written option contracts ("options written")
At October 31, 2017, the Fund had outstanding options written as follows:
Description | | Number of
Contracts | | Notional
Amount | | Exercise
Price | | Expiration
Date | | Value | |
Calls | |
Index | |
Russell 2000 Index | | | 2 | | | $ | (300,555 | ) | | $ | 1,525 | | | 11/3/2017 | | $ | (285 | ) | |
Russell 2000 Index | | | 1 | | | | (150,277 | ) | | | 1,540 | | | 11/3/2017 | | | (55 | ) | |
Russell 2000 Index | | | 1 | | | | (150,277 | ) | | | 1,510 | | | 11/10/2017 | | | (990 | ) | |
Russell 2000 Index | | | 2 | | | | (300,555 | ) | | | 1,535 | | | 11/10/2017 | | | (520 | ) | |
Russell 2000 Index | | | 2 | | | | (300,555 | ) | | | 1,540 | | | 11/17/2017 | | | (700 | ) | |
Russell 2000 Index | | | 1 | | | | (150,277 | ) | | | 1,525 | | | 11/24/2017 | | | (955 | ) | |
S&P 500 Index | | | 5 | | | | (1,287,630 | ) | | | 2,595 | | | 11/3/2017 | | | (425 | ) | |
S&P 500 Index | | | 5 | | | | (1,287,630 | ) | | | 2,600 | | | 11/3/2017 | | | (225 | ) | |
S&P 500 Index | | | 4 | | | | (1,030,104 | ) | | | 2,600 | | | 11/10/2017 | | | (830 | ) | |
S&P 500 Index | | | 5 | | | | (1,287,630 | ) | | | 2,605 | | | 11/10/2017 | | | (700 | ) | |
S&P 500 Index | | | 2 | | | | (515,052 | ) | | | 2,615 | | | 11/10/2017 | | | (130 | ) | |
S&P 500 Index | | | 5 | | | | (1,287,630 | ) | | | 2,610 | | | 11/17/2017 | | | (1,125 | ) | |
S&P 500 Index | | | 4 | | | | (1,030,104 | ) | | | 2,625 | | | 11/17/2017 | | | (420 | ) | |
S&P 500 Index | | | 6 | | | | (1,545,156 | ) | | | 2,625 | | | 11/24/2017 | | | (900 | ) | |
Total Calls (premiums received: $14,847) | | | | | | | | | | $ | (8,260 | ) | |
Puts | |
Index | |
Russell 2000 Index | | | 2 | | | $ | (300,555 | ) | | $ | 1,480 | | | 11/3/2017 | | $ | (455 | ) | |
Russell 2000 Index | | | 1 | | | | (150,277 | ) | | | 1,495 | | | 11/3/2017 | | | (545 | ) | |
Russell 2000 Index | | | 1 | | | | (150,277 | ) | | | 1,475 | | | 11/10/2017 | | | (560 | ) | |
Russell 2000 Index | | | 1 | | | | (150,277 | ) | | | 1,490 | | | 11/10/2017 | | | (905 | ) | |
Russell 2000 Index | | | 1 | | | | (150,277 | ) | | | 1,480 | | | 11/10/2017 | | | (655 | ) | |
Russell 2000 Index | | | 2 | | | | (300,555 | ) | | | 1,480 | | | 11/17/2017 | | | (1,950 | ) | |
Russell 2000 Index | | | 1 | | | | (150,277 | ) | | | 1,465 | | | 11/24/2017 | | | (870 | ) | |
S&P 500 Index | | | 2 | | | | (515,052 | ) | | | 2,515 | | | 11/3/2017 | | | (120 | ) | |
S&P 500 Index | | | 1 | | | | (257,526 | ) | | | 2,500 | | | 11/3/2017 | | | (45 | ) | |
S&P 500 Index | | | 4 | | | | (1,030,104 | ) | | | 2,550 | | | 11/3/2017 | | | (750 | ) | |
S&P 500 Index | | | 3 | | | | (772,578 | ) | | | 2,495 | | | 11/3/2017 | | | (120 | ) | |
S&P 500 Index | | | 3 | | | | (772,578 | ) | | | 2,550 | | | 11/10/2017 | | | (1,755 | ) | |
S&P 500 Index | | | 5 | | | | (1,287,630 | ) | | | 2,505 | | | 11/10/2017 | | | (1,113 | ) | |
S&P 500 Index | | | 2 | | | | (515,052 | ) | | | 2,535 | | | 11/10/2017 | | | (820 | ) | |
S&P 500 Index | | | 3 | | | | (772,578 | ) | | | 2,525 | | | 11/17/2017 | | | (1,905 | ) | |
S&P 500 Index | | | 5 | | | | (1,287,630 | ) | | | 2,535 | | | 11/17/2017 | | | (3,750 | ) | |
S&P 500 Index | | | 6 | | | | (1,545,156 | ) | | | 2,520 | | | 11/24/2017 | | | (4,650 | ) | |
Total Puts (premiums received: $35,697) | | | | | | | | | | $ | (20,968 | ) | |
Total Options Written (premiums received: $50,544) | | | | | | | | | | $ | (29,228 | ) | |
See Notes to Financial Statements
50
Schedule of Investments Hedged Option Premium Strategy Fund (cont'd)
For the period ended October 31, 2017, the Fund had an average market value of $1,384 in options purchased and $(21,107) in options written, respectively. The Fund had securities pledged in the amount of $1,494,258 to cover collateral requirements for options written.
The following is a summary, categorized by Level (see Note A of Notes to Financial Statements), of inputs used to value the Fund's investments as of October 31, 2017:
Asset Valuation Inputs | |
(000's omitted) | | Level 1 | | Level 2 | | Level 3(b) | | Total | |
Investments: | |
U.S. Treasury Obligations | | $ | — | | | $ | 9,388 | | | $ | — | | | $ | 9,388 | | |
| Options Purchased(a) | | | 2 | | | | — | | | | 0 | (c) | | | 2 | | |
Short-Term Investment | | | — | | | | 3,119 | | | | — | | | | 3,119 | | |
Total Investments | | $ | 2 | | | $ | 12,507 | | | $ | 0 | (c) | | $ | 12,509 | | |
(a) The Schedule of Investments provides information on the industry or sector categorization for the portfolio.
(b) The following is a reconciliation between the beginning and ending balances of investments in which unobservable inputs (Level 3) were used in determining value:
| | | Beginning
balance, as
of 4/12/2017 | | Accrued
discounts/
(premiums) | | Realized
gain/(loss) | | Change
in unrealized
appreciation/
(depreciation) | | Purchases | | Sales | | Transfers
into
Level 3 | | Transfers
out of
Level 3 | | Balance,
as of
10/31/2017 | | Net change in
unrealized
appreciation/
(depreciation)
from
investments
still held as of
10/31/2017 | |
Investments in
Securities: | |
(000's omitted) | |
Options
Purchased(d) | |
Call Options
Index | | $ | — | | | $ | — | | | $ | — | | | $ | (1 | ) | | $ | 1 | | | $ | — | | | $ | — | | | $ | — | | | $ | 0 | (c) | | $ | (1 | ) | |
Total | | $ | — | | | $ | — | | | $ | — | | | $ | (1 | ) | | $ | 1 | | | $ | — | | | $ | — | | | $ | — | | | $ | 0 | (c) | | $ | (1 | ) | |
(c) Amount less than one thousand.
(d) As of the period ended October 31, 2017, these investments were valued based on using methods the Board has approved in the good-faith belief that the resulting valuation will reflect the fair value of the security. These investments did not have a material impact on the Fund's net assets and, therefore, disclosure of unobservable inputs used in formulating valuations is not presented.
As of the period ended October 31, 2017, no securities were transferred from one level (as of April 12, 2017 (Commencement of Operations)) to another.
The following is a summary, categorized by Level (see Note A of Notes to Financial Statements), of inputs used to value the Fund's derivatives as of October 31, 2017:
Other Financial Instruments | |
(000's omitted) | | Level 1 | | Level 2 | | Level 3 | | Total | |
Options Written | |
Liabilities | | $ | (29 | ) | | $ | — | | | $ | — | | | $ | (29 | ) | |
Total | | $ | (29 | ) | | $ | — | | | $ | — | | | $ | (29 | ) | |
See Notes to Financial Statements
51
Schedule of Investments Long Short Fund October 31, 2017
| | | Number
of Shares | | Value
(000's
omitted) | |
Long Positions 98.8% | |
Common Stocks 74.7% | |
Aerospace & Defense 2.8% | |
General
Dynamics
Corp. | | | 184,000 | | | $ | 37,348 | | |
Raytheon Co. | | | 183,900 | | | | 33,139 | | |
Wesco
Aircraft
Holdings,
Inc. | | | 1,910,826 | | | | 17,293 | *(a) | |
| | | | 87,780 | | |
Air Freight & Logistics 0.3% | |
Expeditors
International
of Washington,
Inc. | | | 170,000 | | | | 9,925 | | |
Airlines 1.3% | |
Delta
Air Lines, Inc. | | | 796,000 | | | | 39,824 | | |
Banks 3.3% | |
JPMorgan
Chase & Co. | | | 693,300 | | | | 69,753 | | |
U.S. Bancorp | | | 615,800 | | | | 33,487 | | |
| | | | 103,240 | | |
Beverages 0.7% | |
PepsiCo, Inc. | | | 198,000 | | | | 21,826 | | |
Biotechnology 1.7% | |
Celgene Corp. | | | 177,100 | | | | 17,882 | * | |
Gilead
Sciences, Inc. | | | 452,600 | | | | 33,927 | | |
| | | | 51,809 | | |
Capital Markets 4.5% | |
BlackRock, Inc. | | | 68,787 | | | | 32,387 | | |
Brookfield
Asset
Management,
Inc. Class A | | | 1,052,898 | | | | 44,158 | | |
CME Group, Inc. | | | 280,100 | | | | 38,421 | | |
Goldman Sachs
Group, Inc. | | | 95,400 | | | | 23,133 | | |
| | | | 138,099 | | |
Chemicals 2.2% | |
Ashland
Global
Holdings, Inc. | | | 383,000 | | | | 26,036 | | |
PPG Industries,
Inc. | | | 195,900 | | | | 22,771 | | |
Valvoline, Inc. | | | 785,000 | | | | 18,856 | | |
| | | | 67,663 | | |
Construction & Engineering 0.7% | |
Valmont
Industries,
Inc. | | | 127,500 | | | | 20,260 | | |
| | | Number
of Shares | | Value
(000's
omitted) | |
Consumer Finance 0.6% | |
Synchrony
Financial | | | 597,228 | | | $ | 19,482 | | |
Diversified Financial Services 1.3% | |
CF Corp. | | | 927,700 | | | | 10,938 | * | |
CF Corp.
Class A | | | 2,789,918 | | | | 30,410 | * | |
| | | | 41,348 | | |
Electric Utilities 2.5% | |
Brookfield
Infrastructure
Partners LP | | | 1,373,796 | | | | 58,208 | | |
NextEra
Energy, Inc. | | | 128,500 | | | | 19,926 | | |
| | | | 78,134 | | |
Electronic Equipment, Instruments & Components 2.4% | |
Amphenol
Corp.
Class A | | | 317,200 | | | | 27,596 | | |
CDW Corp. | | | 668,900 | | | | 46,823 | | |
| | | | 74,419 | | |
Energy Equipment & Services 1.0% | |
Schlumberger
Ltd. | | | 474,300 | | | | 30,355 | | |
Equity Real Estate Investment
Trusts 1.0% | �� |
SBA
Communications
Corp. | | | 95,900 | | | | 15,073 | * | |
Weyerhaeuser
Co. | | | 418,400 | | | | 15,025 | | |
| | | | 30,098 | | |
Food & Staples Retailing 2.2% | |
Costco
Wholesale
Corp. | | | 152,800 | | | | 24,613 | | |
CVS Health
Corp. | | | 409,700 | | | | 28,077 | | |
Sprouts
Farmers
Market, Inc. | | | 880,000 | | | | 16,271 | * | |
| | | | 68,961 | | |
Food Products 2.9% | |
Conagra
Brands, Inc. | | | 1,700,000 | | | | 58,072 | | |
Hain
Celestial
Group, Inc. | | | 569,300 | | | | 20,506 | * | |
Pinnacle
Foods, Inc. | | | 203,744 | | | | 11,088 | | |
| | | | 89,666 | | |
| | | Number
of Shares | | Value
(000's
omitted) | |
Health Care Equipment & Supplies 2.3% | |
DENTSPLY
SIRONA, Inc. | | | 1,170,000 | | | $ | 71,452 | (a) | |
Health Care Providers & Services 3.3% | |
DaVita, Inc. | | | 1,095,900 | | | | 66,565 | *(a) | |
UnitedHealth
Group, Inc. | | | 169,000 | | | | 35,527 | (a) | |
| | | | 102,092 | | |
Hotels, Restaurants & Leisure 2.4% | |
Marriott
International,
Inc. Class A | | | 156,400 | | | | 18,687 | | |
McDonald's
Corp. | | | 183,000 | | | | 30,544 | | |
Starbucks
Corp. | | | 321,000 | | | | 17,604 | | |
Wyndham
Worldwide
Corp. | | | 55,400 | | | | 5,919 | | |
| | | | 72,754 | | |
Household Durables 0.3% | |
Lennar Corp.
Class A | | | 160,100 | | | | 8,913 | | |
Independent Power and Renewable Electricity Producers 1.1% | |
Calpine Corp. | | | 621,600 | | | | 9,287 | * | |
NRG Energy,
Inc. | | | 1,005,000 | | | | 25,125 | | |
| | | | 34,412 | | |
Internet & Direct Marketing
Retail 1.9% | |
Amazon.com,
Inc. | | | 25,200 | | | | 27,853 | * | |
Expedia, Inc. | | | 115,697 | | | | 14,423 | | |
Priceline
Group, Inc. | | | 8,200 | | | | 15,678 | * | |
| | | | 57,954 | | |
Internet Software & Services 4.5% | |
Alphabet, Inc.
Class A | | | 54,100 | | | | 55,888 | * | |
Alphabet, Inc.
Class C | | | 10,353 | | | | 10,525 | * | |
eBay, Inc. | | | 838,500 | | | | 31,561 | * | |
Facebook, Inc.
Class A | | | 228,000 | | | | 41,054 | * | |
| | | | 139,028 | | |
IT Services 3.7% | |
PayPal
Holdings, Inc. | | | 321,100 | | | | 23,299 | *(a) | |
Visa, Inc.
Class A | | | 531,000 | | | | 58,399 | | |
WEX, Inc. | | | 269,900 | | | | 33,357 | *(a) | |
| | | | 115,055 | | |
See Notes to Financial Statements
52
Schedule of Investments Long Short Fund (cont'd)
| | | Number
of Shares | | Value
(000's
omitted) | |
Machinery 0.9% | |
Allison
Transmission
Holdings, Inc. | | | 651,003 | | | $ | 27,661 | | |
Mortgage Real Estate Investment
Trust 0.5% | |
Starwood
Property
Trust, Inc. | | | 777,400 | | | | 16,722 | | |
Multi-Utilities 0.5% | |
WEC Energy
Group, Inc. | | | 220,000 | | | | 14,826 | | |
Oil, Gas & Consumable Fuels 3.8% | |
Cabot Oil &
Gas Corp. | | | 1,092,901 | | | | 30,273 | (a) | |
Cheniere
Energy, Inc. | | | 392,700 | | | | 18,355 | * | |
Enbridge, Inc. | | | 1,768,300 | | | | 68,009 | | |
| | | | 116,637 | | |
Pharmaceuticals 0.6% | |
Bristol-Myers
Squibb Co. | | | 275,100 | | | | 16,963 | | |
Professional Services 3.5% | |
Advisory Board
Co. | | | 265,000 | | | | 14,290 | *(a) | |
IHS Markit Ltd. | | | 1,510,000 | | | | 64,341 | *(a) | |
Verisk
Analytics, Inc. | | | 342,868 | | | | 29,161 | *(a) | |
| | | | 107,792 | | |
Real Estate Management & Development 0.2% | |
Five Point
Holdings LLC
Class A | | | 528,900 | | | | 6,796 | * | |
Road & Rail 0.9% | |
Norfolk
Southern Corp. | | | 212,800 | | | | 27,966 | (a) | |
Semiconductors & Semiconductor Equipment 1.4% | |
Analog
Devices, Inc. | | | 35,600 | | | | 3,250 | | |
ASML
Holding NV | | | 150,000 | | | | 27,113 | | |
NXP
Semiconductors
NV | | | 100,000 | | | | 11,705 | * | |
| | | | 42,068 | | |
Software 0.6% | |
Microsoft Corp. | | | 229,600 | | | | 19,098 | | |
Specialty Retail 4.3% | |
Asbury
Automotive
Group, Inc. | | | 155,000 | | | | 9,517 | * | |
| | | Number
of Shares | | Value
(000's
omitted) | |
Home Depot, Inc. | | | 404,000 | | | $ | 66,975 | | |
National
Vision
Holdings, Inc. | | | 607,200 | | | | 17,488 | * | |
Party City
Holdco, Inc. | | | 1,585,115 | | | | 17,674 | * | |
Tractor
Supply Co. | | | 366,100 | | | | 22,061 | | |
| | | | 133,715 | | |
Technology Hardware, Storage & Peripherals 1.8% | |
Apple, Inc. | | | 227,800 | | | | 38,507 | | |
Western
Digital Corp. | | | 188,400 | | | | 16,819 | | |
| | | | 55,326 | | |
Textiles, Apparel & Luxury Goods 2.3% | |
lululemon
Athletica, Inc. | | | 207,500 | | | | 12,764 | * | |
PVH Corp. | | | 457,553 | | | | 58,022 | (a) | |
| | | | 70,786 | | |
Tobacco 0.4% | |
Philip Morris
International,
Inc. | | | 118,000 | | | | 12,347 | | |
Trading Companies & Distributors 1.4% | |
HD Supply
Holdings, Inc. | | | 1,208,800 | | | | 42,779 | * | |
Water Utilities 0.7% | |
American
Water Works
Co., Inc. | | | 257,000 | | | | 22,554 | | |
Total Common Stocks
(Cost $1,832,997) | | | 2,308,585 | | |
Preferred Stock 0.4% | |
Health Care 0.4% | |
Moderna
Therapeutics
Ser. F
(Cost $11,550) | | | 1,315,490 | | | | 11,550 | *(b)(i) | |
| | | Principal
Amount
(000's
omitted) | | | |
Corporate Bonds 5.6% | |
Commercial Services 0.7% | |
APX Group,
Inc., 8.75%,
due 12/1/20 | | $ | 10,152 | | | | 10,406 | | |
Prime Security
Services
Borrower
LLC/Prime
Finance, Inc.,
9.25%, due
5/15/23 | | | 9,990 | | | | 11,071 | (c) | |
| | | | 21,477 | | |
| | | Principal
Amount
(000's
omitted) | | Value
(000's
omitted) | |
Healthcare-Services 0.7% | | | |
DaVita, Inc.,
5.75%, due
8/15/22 | | $ | 8,740 | | | $ | 9,013 | | |
HCA, Inc.,
5.88%, due
3/15/22 | | | 10,285 | | | | 11,262 | | |
| | | | 20,275 | | |
Household Products—Wares 0.2% | | | |
Kronos
Acquisition
Holdings, Inc.,
9.00%, due
8/15/23 | | | 5,293 | | | | 5,100 | (c) | |
Oil & Gas 0.4% | | | |
Endeavor
Energy
Resources
LP/EER
Finance, Inc.,
8.13%, due
9/15/23 | | | 12,295 | | | | 13,217 | (c) | |
Pipelines 0.6% | | | |
NGPL PipeCo
LLC | |
4.38%, due
8/15/22 | | | 945 | | | | 972 | (c) | |
7.77%, due
12/15/37 | | | 10,284 | | | | 12,829 | (c) | |
Niska Gas
Storage
Canada
ULC/Niska
Gas Storage
Canada
Finance
Corp., 6.50%,
due 4/1/19 | | | 5,262 | | | | 5,348 | | |
| | | | 19,149 | | |
Retail 2.7% | | | |
Argos Merger
Sub, Inc.,
7.13%, due
3/15/23 | | | 18,185 | | | | 13,866 | (c) | |
PetSmart, Inc. | |
5.88%, due
6/1/25 | | | 18,210 | | | | 15,843 | (c) | |
8.88%, due
6/1/25 | | | 47,159 | | | | 37,138 | (c) | |
Rite Aid Corp. | |
9.25%, due
3/15/20 | | | 8,592 | | | | 8,742 | | |
6.75%, due
6/15/21 | | | 7,625 | | | | 7,577 | | |
| | | | 83,166 | | |
See Notes to Financial Statements
53
Schedule of Investments Long Short Fund (cont'd)
| | | Principal
Amount
(000's
omitted) | | Value
(000's
omitted) | |
Semiconductors 0.3% | |
MagnaChip
Semiconductor
Corp., 6.63%,
due 7/15/21 | | $ | 10,902 | | | $ | 10,520 | | |
Total Corporate Bonds
(Cost $181,711) | | | 172,904 | | |
Convertible Bonds 0.4% | |
Health Care Equipment & Supplies 0.3% | |
DexCom, Inc.,
0.75%, due
5/15/22 | | | 10,060 | | | | 8,897 | (c) | |
Semiconductors 0.1% | |
MagnaChip
Semiconductor
SA, 5.00%,
due 3/1/21 | | | 3,090 | | | | 4,337 | (c) | |
Total Convertible Bonds
(Cost $12,415) | | | 13,234 | | |
| | | Number
of Shares | | | |
Total Options
Purchased(f)0.1%
(Cost $4,372) | | | 3,992 | | |
Short-Term Investment 17.6% | |
Investment Company 17.6% | |
State Street
Institutional
U.S.
Government
Money
Market
Fund Premier
Class, 0.96%
(Cost $544,666) | | | 544,665,777 | | | | 544,666 | (d)(e) | |
Total Long
Positions (98.8%)
(Cost $2,587,711) | | | 3,054,931 | | |
| Short Positions ((16.6)%)(g) | |
Common Stocks Sold Short (12.6)% | |
Auto Components (0.2)% | |
BorgWarner,
Inc. | | | (108,000 | ) | | | (5,694 | ) | |
Automobiles (0.1)% | |
Harley-
Davidson,
Inc. | | | (76,756 | ) | | | (3,634 | ) | |
Banks (0.5)% | |
CIT Group, Inc. | | | (338,409 | ) | | | (15,777 | ) | |
| | | Number
of Shares | | Value
(000's
omitted) | |
Capital Markets (0.4)% | |
Federated
Investors,
Inc. Class B | | | (396,300 | ) | | $ | (12,313 | ) | |
Commercial Services & Supplies (0.4)% | |
Ritchie Bros
Auctioneers,
Inc. | | | (436,000 | ) | | | (12,221 | ) | |
Consumer Finance (0.4)% | |
Discover
Financial
Services | | | (163,500 | ) | | | (10,878 | ) | |
Distributors (0.1)% | |
Pool Corp. | | | (14,000 | ) | | | (1,691 | ) | |
Diversified Consumer Services (0.2)% | |
H&R Block, Inc. | | | (296,900 | ) | | | (7,345 | ) | |
Diversified Telecommunication
Services (0.2)% | |
AT&T, Inc. | | | (219,000 | ) | | | (7,369 | ) | |
Electric Utilities (0.5)% | |
PG&E Corp. | | | (39,203 | ) | | | (2,265 | ) | |
Southern Co. | | | (239,500 | ) | | | (12,502 | ) | |
| | | | (14,767 | ) | |
Energy Equipment & Services (0.4)% | |
Core
Laboratories
NV | | | (127,000 | ) | | | (12,687 | ) | |
Equity Real Estate Investment
Trust (0.4)% | |
Lamar
Advertising
Co. Class A | | | (170,000 | ) | | | (11,975 | ) | |
Food & Staples Retailing (0.4)% | |
Kroger Co. | | | (339,800 | ) | | | (7,034 | ) | |
United
Natural
Foods, Inc. | | | (162,000 | ) | | | (6,280 | )* | |
| | | | (13,314 | ) | |
Food Products (0.4)% | |
General
Mills, Inc. | | | (122,000 | ) | | | (6,334 | ) | |
Kellogg Co. | | | (105,000 | ) | | | (6,566 | ) | |
| | | | (12,900 | ) | |
Health Care Equipment &
Supplies (1.1)% | |
Align
Technology,
Inc. | | | (23,000 | ) | | | (5,496 | )* | |
Becton
Dickinson
and Co. | | | (78,500 | ) | | | (16,381 | ) | |
Straumann
Holding AG | | | (16,900 | ) | | | (11,799 | ) | |
| | | | (33,676 | ) | |
| | | Number
of Shares | | Value
(000's
omitted) | |
Health Care Providers & Services (0.2)% | |
HCA
Healthcare,
Inc. | | | (71,700 | ) | | $ | (5,424 | )* | |
Hotels, Restaurants & Leisure (0.3)% | |
Chipotle
Mexican
Grill, Inc. | | | (19,553 | ) | | | (5,316 | )* | |
DineEquity,
Inc. | | | (93,000 | ) | | | (4,428 | ) | |
| | | | (9,744 | ) | |
Household Durables (0.5)% | |
Newell
Brands, Inc. | | | (99,000 | ) | | | (4,037 | ) | |
Tempur Sealy
International,
Inc. | | | (189,600 | ) | | | (12,394 | )* | |
| | | | (16,431 | ) | |
Insurance (0.3)% | |
Fidelity &
Guaranty
Life | | | (338,605 | ) | | | (10,531 | ) | |
IT Services (1.4)% | |
Automatic
Data
Processing,
Inc. | | | (80,200 | ) | | | (9,324 | ) | |
CGI Group,
Inc.
Class A | | | (183,597 | ) | | | (9,756 | )* | |
Paychex, Inc. | | | (123,700 | ) | | | (7,891 | ) | |
Western
Union Co. | | | (826,323 | ) | | | (16,411 | ) | |
| | | | (43,382 | ) | |
Life Sciences Tools & Services (0.4)% | |
Agilent
Technologies,
Inc. | | | (96,000 | ) | | | (6,531 | ) | |
Thermo
Fisher
Scientific,
Inc. | | | (30,600 | ) | | | (5,931 | ) | |
| | | | (12,462 | ) | |
Media (0.3)% | |
CBS Corp.
Class B | | | (125,000 | ) | | | (7,015 | ) | |
Discovery
Communications,
Inc. Class A | | | (50,000 | ) | | | (944 | )* | |
New Media
Investment
Group, Inc. | | | (144,200 | ) | | | (2,303 | ) | |
| | | | (10,262 | ) | |
See Notes to Financial Statements
54
Schedule of Investments Long Short Fund (cont'd)
| | | Number
of Shares | | Value
(000's
omitted) | |
Multi-Utilities (0.6)% | |
Consolidated
Edison, Inc. | | | (150,000 | ) | | $ | (12,907 | ) | |
SCANA Corp. | | | (115,000 | ) | | | (4,961 | ) | |
| | | | (17,868 | ) | |
Multiline Retail (0.7)% | |
Dollar
General Corp. | | | (165,000 | ) | | | (13,339 | ) | |
Ollie's
Bargain
Outlet
Holdings, Inc. | | | (160,000 | ) | | | (7,144 | )* | |
| | | | (20,483 | ) | |
Oil, Gas & Consumable Fuel (0.3)% | |
BP Midstream
Partners LP | | | (500,000 | ) | | | (9,000 | )* | |
Paper & Forest Products (0.1)% | |
Louisiana-Pacific
Corp. | | | (161,332 | ) | | | (4,385 | )* | |
Road & Rail (0.3)% | |
CSX Corp. | | | (150,000 | ) | | | (7,564 | ) | |
Semiconductors & Semiconductor Equipment (0.4)% | |
NVIDIA Corp. | | | (59,900 | ) | | | (12,388 | ) | |
Specialty Retail (0.1)% | |
Sonic
Automotive,
Inc. Class A | | | (222,760 | ) | | | (4,422 | ) | |
Technology Hardware, Storage & Peripherals (0.3)% | |
Seagate
Technology
PLC | | | (218,000 | ) | | | (8,059 | ) | |
Textiles, Apparel & Luxury Goods (0.7)% | |
Ralph
Lauren
Corp. | | | (180,000 | ) | | | (16,097 | ) | |
VF Corp. | | | (78,484 | ) | | | (5,467 | ) | |
| | | | (21,564 | ) | |
Total Common Stocks
Sold Short
(Proceeds $(374,728)) | | | (390,210 | ) | |
| | | Principal
Amount
(000's
omitted) | | | |
Corporate Bonds Sold Short (1.6)% | |
Diversified Financial Services (0.3)% | |
Air Lease
Corp.,
3.00%, due
9/15/23 | | $ | (9,000 | ) | | | (9,087 | ) | |
| | | Principal
Amount
(000's
omitted) | | Value
(000's
omitted) | |
Entertainment (0.1)% | |
AMC
Entertainment
Holdings, Inc.,
5.75%, due
6/15/25 | | $ | (4,000 | ) | | $ | (3,930 | ) | |
| | | | (3,930 | ) | |
Lodging (0.1)% | |
Wynn
Las Vegas
LLC/Wynn
Las Vegas
Capital
Corp.,
5.50%, due
3/1/25 | | | (4,000 | ) | | | (4,220 | )(c) | |
Media (0.4)% | |
CBS Radio,
Inc.,
7.25%, due
11/1/24 | | | (7,000 | ) | | | (7,393 | )(c) | |
Gray
Television,
Inc., 5.13%,
due 10/15/24 | | | (4,000 | ) | | | (4,009 | )(c) | |
| | | | (11,402 | ) | |
Oil & Gas (0.1)% | |
Apache
Corp.,
4.25%, due
1/15/44 | | | (4,000 | ) | | | (3,844 | ) | |
Packaging & Containers (0.2)% | |
Reynolds
Group
Issuer, Inc.,
7.00%, due
7/15/24 | | | (4,000 | ) | | | (4,285 | )(c) | |
Retail (0.4)% | |
Arch Merger
Sub, Inc.,
8.50%, due
9/15/25 | | | (14,000 | ) | | | (12,425 | )(c) | |
Total Corporate
Bonds Sold Short
(Proceeds $(49,753)) | | | (49,193 | ) | |
| | | Number
of Shares | | | |
Exchange Traded Funds Sold
Short (2.1)% | |
Consumer | | | (373,000 | ) | | | (34,312 | ) | |
Discretionary
Select Sector
SPDR Fund | |
| | | Number
of Shares | | Value
(000's
omitted) | |
iShares Core
S&P Small-
Cap ETF | | | (154,000 | ) | | $ | (11,529 | ) | |
SPDR S&P
Retail ETF | | | (34,500 | ) | | | (1,362 | ) | |
Vanguard
REIT ETF | | | (231,600 | ) | | | (19,038 | ) | |
Total Exchange
Traded Funds
Sold Short
(Proceeds $(52,106)) | | | (66,241 | ) | |
Master Limited Partnership Sold
Short (0.3)% | |
Tallgrass
Energy
Partners LP
(Proceeds
$(9,083)) | | | (192,800 | ) | | | (8,414 | ) | |
Total Short Positions
(Proceeds $(485,670)) | | | (514,058 | ) | |
Total Investments 82.2%
(Cost $2,102,041) | | | 2,540,873 | | |
Other Assets
Less Liabilities 17.8% | | | | | 550,437 | (h) | |
Net Assets 100.0% | | $ | 3,091,310 | | |
See Notes to Financial Statements
55
Schedule of Investments Long Short Fund (cont'd)
* Non-income producing security.
(a) All or a portion of the security is pledged as collateral for futures and/or options written.
(b) Value determined using significant unobservable inputs.
(c) Securities were purchased or sold short under Rule 144A of the Securities Act of 1933, as amended (the "1933 Act"), or are otherwise restricted and, unless registered under the 1933 Act or exempted from registration, may only be sold to qualified institutional investors or may have other restrictions on resale. At October 31, 2017, these securities amounted to approximately $123,270,000 of long positions and $(32,332,000) of short positions, which represents 4.0% and (1.0)%, respectively, of net assets of the Fund. Securities denoted with a (c) but without a (i) have been deemed by the investment manager to be liquid.
(d) All or a portion of this security is segregated in connection with obligations for securities sold short, options written, swaps and/or futures with a total value of approximately $544,666,000.
(e) Represents 7-day effective yield as of October 31, 2017.
(f) See "Purchased option contracts" under Derivative Instruments.
(g) At October 31, 2017 the Fund had approximately $521,682,000 deposited, in one or more accounts to satisfy collateral requirements for borrowing in connection with securities sold short.
(h) Includes the impact of the Fund's open positions in derivatives at October 31, 2017.
(i) This security has been deemed by the investment manager to be illiquid, and is subject to restrictions on resale.
At October 31, 2017, this security amounted to approximately $11,550,000, which represents 0.4% of net assets of the Fund.
(000's omitted) | | Acquisition
Date | | Acquisition
Cost | | Acquisition
Cost
Percentage
of Net Assets | | Value as of
10/31/2017 | | Fair Value
Percentage
of Net Assets
as of
10/31/2017 | |
Moderna Therapeutics
(Ser. F Preferred Shares) | | 8/10/2016 | | $ | 11,550 | | | | 0.5 | % | | $ | 11,550 | | | | 0.4 | % | |
Derivative Instruments
Futures contracts ("futures")
At October 31, 2017, open positions in futures for the Fund were as follows:
Short Futures
Expiration Date | | Number of
Contracts | | Open Contracts | | Notional
Amount | | Value and
Unrealized
Appreciation/
(Depreciation) | |
12/2017 | | | 131 | | | NASDAQ 100 E-Mini Index | | $ | (16,374,345 | ) | | $ | (662,727 | ) | |
12/2017 | | | 1,562 | | | Russell 2000 Mini Index | | | (117,360,870 | ) | | | (6,365,853 | ) | |
12/2017 | | | 2,572 | | | S&P 500 E-Mini Index | | | (330,849,220 | ) | | | (11,176,498 | ) | |
12/2017 | | | 244 | | | S&P MidCap 400 E-Mini Index | | | (44,747,160 | ) | | | (2,330,273 | ) | |
12/2017 | | | 50 | | | US. Treasury Long Bond | | | (7,623,438 | ) | | | 175,760 | | |
Total Futures | | | | | | $ | (516,955,033 | ) | | $ | (20,359,591 | ) | |
See Notes to Financial Statements
56
Schedule of Investments Long Short Fund (cont'd)
At October 31, 2017, the Fund had $17,951,687 deposited in a segregated account to cover margin requirements on open futures.
For the year October 31, 2017, the average notional value of futures for the Fund was $(496,334,371) for short positions.
Total return basket swap contracts ("total return basket swaps")
At October 31, 2017, the Fund had outstanding total return basket swaps(a) as follows:
Counterparty | | Description | | Maturity
Date(s) | | Value | |
Goldman Sachs International
| | The Fund pays the total return, and receives floating rate
plus or minus a spread on a portfolio of short positions.
The receipts, based on the specified benchmark floating
rates*, are denominated in various foreign currencies based
on the local currencies of the positions within the swaps. | | 3/14/2018 | | $ | 789,885 | | |
(a) The following table represents required component disclosures associated with the total return basket swaps with Goldman Sachs International as of October 31, 2017.
Reference Entity | | Shares | | Notional
Amount(c) | | Unrealized
Appreciation/
(Depreciation) | | Percentage
of Net
Assets | |
Short Positions | |
| GSCBNML3(b) | |
Tallgrass Energy Partners LP | | | (19,758 | ) | | $ | (1,927,082 | ) | | $ | 183,671 | | | | 0.0 | % | |
Summit Midstream Partners LP | | | (18,431 | ) | | | (1,797,701 | ) | | | 171,339 | | | | 0.0 | % | |
Enable Midstream Partners LP | | | (12,082 | ) | | | (1,178,424 | ) | | | 112,316 | | | | 0.0 | % | |
Andeavor Logistics LP | | | (11,909 | ) | | | (1,161,549 | ) | | | 110,707 | | | | 0.0 | % | |
NuStar GP Holdings LLC | | | (8,759 | ) | | | (854,321 | ) | | | 81,425 | | | | 0.0 | % | |
| MPLX LP | | | (4,394 | ) | | | (428,618 | ) | | | 40,852 | | | | 0.0 | % | |
| | | (75,333 | ) | | | (7,347,695 | ) | | | 700,310 | | | | 0.0 | % | |
Accrued Net Interest Receivable/(Payable) | | | | | | | (1,667 | ) | | | |
Value | | | | | | | 698,643 | | | | |
| GSCBNML3(b) | |
Tallgrass Energy Partners LP | | | (2,718 | ) | | | (263,846 | ) | | | 24,018 | | | | 0.0 | % | |
Summit Midstream Partners LP | | | (2,535 | ) | | | (246,132 | ) | | | 22,405 | | | | 0.0 | % | |
Enable Midstream Partners LP | | | (1,662 | ) | | | (161,344 | ) | | | 14,687 | | | | 0.0 | % | |
Andeavor Logistics LP | | | (1,638 | ) | | | (159,033 | ) | | | 14,477 | | | | 0.0 | % | |
NuStar GP Holdings LLC | | | (1,205 | ) | | | (116,969 | ) | | | 10,648 | | | | 0.0 | % | |
| MPLX LP | | | (605 | ) | | | (58,684 | ) | | | 5,342 | | | | 0.0 | % | |
| | | (10,363 | ) | | | (1,006,008 | ) | | | 91,577 | | | | 0.0 | % | |
Accrued Net Interest Receivable/(Payable) | | | | | | | (335 | ) | | | |
Value | | | | | | | 91,242 | | | | |
Total Return Basket Swaps, at Value | | | | | | $ | 789,885 | | | | 0.0 | % | |
(b) The Fund receives monthly 1 month LIBOR (USD) minus 1.70%; The Fund pays the return on investment upon termination.
See Notes to Financial Statements
57
Schedule of Investments Long Short Fund (cont'd)
(c) Notional Amount represents the value (including any fees or commissions) of the positions when they were established. At October 31, 2017, the absolute notional value for total return basket swaps was $7,561,816 for Goldman Sachs International.
*Benchmark Floating Rates | | Value at Period End | |
1-Month LIBOR (USD) - London Interbank Offered Rate | | | 1.24 | % | |
Total return swap contracts ("total return swaps")
At October 31, 2017, the Fund had outstanding over-the-counter ("OTC") total return swaps as follows:
Short Total Return Swaps
Counterparty | | Reference Entity | | Notional
Amount(a) | | Maturity
Date | | Variable-Rate(k) | | Unrealized
Appreciation/
(Depreciation) | | Accrued
Net
Interest
Receivable/
(Payable) | | Value | |
| Citibank N.A. | | Consumer Staples
S&P US Select
Sector Index | | $ | (13,271,835 | ) | | 11/15/2017 | | | 0.96 | %(b) | | $ | 359,767 | | | $ | 8,800 | | | $ | 368,567 | | |
Goldman Sachs
International | | Prospect
Capital Corp. | | | (1,925,082 | ) | | 4/1/2019 | | | (0.86 | )%(c) | | | 191,061 | | | | (3,369 | ) | | | 187,692 | | |
Citibank N.A. | | Prospect
Capital Corp. | | | (1,891,703 | ) | | 3/28/2019 | | | (0.76 | )%(d) | | | 195,933 | | | | (2,943 | ) | | | 192,990 | | |
Citibank N.A. | | Prospect
Capital Corp. | | | (1,879,245 | ) | | 3/28/2019 | | | (0.76 | )%(d) | | | 183,656 | | | | — | | | | 183,656 | | |
Citibank N.A. | | Prospect
Capital Corp. | | | (1,887,879 | ) | | 3/28/2019 | | | (0.76 | )%(d) | | | 192,289 | | | | (3,042 | ) | | | 189,247 | | |
Goldman Sachs
International | | Russell Mid-Cap
Index | | | (71,130,597 | ) | | 1/31/2019 | | | 0.69 | %(e) | | | (2,456,828 | ) | | | 45,943 | | | | (2,410,885 | )(j) | |
Citibank N.A. | | SPDR S&P 500
Growth Index | | | (7,555,442 | ) | | 11/15/2017 | | | 1.06 | %(f) | | | (90,177 | ) | | | 13,029 | | | | (77,148 | )(j) | |
Citibank N.A. | | SPDR S&P 500
Growth Index | | | (4,421,009 | ) | | 11/15/2017 | | | 0.97 | %(b) | | | (52,767 | ) | | | 5,226 | | | | (47,541 | ) | |
Citibank N.A. | | SPDR S&P 500
Growth Index | | | (59,772,916 | ) | | 11/15/2017 | | | 1.01 | %(b) | | | (713,416 | ) | | | 21,136 | | | | (692,280 | ) | |
Citibank N.A. | | SPDR S&P 500
Growth Index | | | (30,050,469 | ) | | 11/15/2017 | | | 1.00 | %(b) | | | (358,666 | ) | | | 10,375 | | | | (348,291 | ) | |
Citibank N.A. | | SPDR S&P Retail ETF | | | (16,090,650 | ) | | 1/24/2018 | | | 0.54 | %(g) | | | 97,200 | | | | 2,247 | | | | 99,447 | | |
Citibank N.A. | | United Natural
Foods, Inc. | | | (2,436,571 | ) | | 11/22/2019 | | | 0.89 | %(h) | | | (178,039 | ) | | | 900 | | | | (177,139 | ) | |
Citibank N.A. | | Utilities Select
Sector SPDR Fund | | | (23,795,200 | ) | | 9/19/2017 | | | 1.24 | %(i) | | | (457,600 | ) | | | 8,995 | | | | (448,605 | ) | |
Total | | | | | | | | | | $ | (3,087,587 | ) | | $ | 107,297 | | | $ | (2,980,290 | ) | |
(a) Notional amount represents the value (including any fees or commissions) of the positions when they were established.
(b) Fund receives 3-month LIBOR minus 0.35%. Payment frequency-quarterly. Fund pays return on reference entity. Payment frequency-quarterly.
See Notes to Financial Statements
58
Schedule of Investments Long Short Fund (cont'd)
(c) Fund receives 1-month LIBOR minus 2.10%. Payment frequency-monthly. Fund pays return on reference entity. Payment frequency-upon termination.
(d) Fund receives 1-month LIBOR minus 2.00%. Payment frequency-monthly. Fund pays return on reference entity. Payment frequency-upon termination.
(e) Fund receives 1-month LIBOR minus 0.55%. Payment frequency-monthly. Fund pays return on reference entity. Payment frequency-upon termination.
(f) Fund receives 3-month LIBOR minus 0.25%. Payment frequency-quarterly. Fund pays return on reference entity. Payment frequency-quarterly.
(g) Fund receives 1-month LIBOR minus 0.70%. Payment frequency-monthly. Fund pays return on reference entity. Payment frequency-monthly.
(h) Fund receives 1-month LIBOR minus 0.35%. Payment frequency-monthly. Fund pays return on reference entity. Payment frequency-upon termination.
(i) Fund receives 1-month LIBOR. Payment frequency-monthly. Fund pays return on reference entity. Payment frequency-upon termination.
(j) Security fair valued as of October 31, 2017 in accordance with procedures approved by the Board.
(k) Effective rate at October 31, 2017.
At October 31, 2017, the Fund had cash collateral of $6,970,000 and $1,330,000 deposited in segregated accounts for Citibank, N.A and Goldman Sachs International, respectively, to cover collateral requirements on OTC derivatives.
For the year ended October 31, 2017, the average notional value of total return basket swaps and total return swaps for the Fund was $(148,078,442) for short positions.
Purchased option contracts ("options purchased")
At October 31, 2017, the Fund had outstanding options purchased as follows:
| Description | | Number of
Contracts | | Notional
Amount | | Exercise
Price | | Expiration
Date | | Value | |
| Calls | |
Food & Staples Retailing | |
Sprouts Farmers Market, Inc. | | | 6,470 | | | $ | 11,963,030 | | | $ | 20 | | | 11/17/2017 | | $ | 372,025 | | |
Sprouts Farmers Market, Inc. | | | 6,600 | | | | 12,203,400 | | | | 25 | | | 12/15/2017 | | | 99,000 | | |
| | | | | | | | | | | 471,025 | | |
Food Products | |
Conagra Brands, Inc. | | | 1,477 | | | | 5,045,432 | | | | 37 | | | 12/15/2017 | | | 25,848 | | |
Hain Celestial Group, Inc. | | | 2,770 | | | | 9,977,540 | | | | 48 | | | 2/16/2018 | | | 83,100 | | |
| | | | | | | | | | | 108,948 | | |
| Index | |
S&P 500 Index | | | 260 | | | | 66,956,760 | | | | 2,550 | | | 12/29/2017 | | | 1,315,600 | | |
S&P 500 Index | | | 573 | | | | 147,562,398 | | | | 2,600 | | | 12/29/2017 | | | 1,123,080 | | |
| | | | | | | | | | | 2,438,680 | | |
See Notes to Financial Statements
59
Schedule of Investments Long Short Fund (cont'd)
| Description | | Number of
Contracts | | Notional
Amount | | Exercise
Price | | Expiration
Date | | Value | |
Oil, Gas & Consumable Fuels | |
Enbridge, Inc. | | | 2,460 | | | $ | 9,461,160 | | | $ | 40 | | | 4/20/2018 | | $ | 258,300 | | |
Trading Companies & Distributors | |
HD Supply Holdings, Inc. | | | 1,960 | | | | 6,936,440 | | | | 32.5 | | | 12/15/2017 | | | 705,600 | | |
Total Calls (cost: $4,057,321) | | | | | | | | | | $ | 3,982,553 | | |
| Puts | |
| Household Durables | |
Tempur Sealy International, Inc. | | | 730 | | | $ | 4,772,010 | | | $ | 40 | | | 1/19/2018 | | $ | 9,125 | | |
Total Puts (cost: $315,027) | | | | | | | | | | $ | 9,125 | | |
Total Options Purchased (cost: $4,372,348) | | | | | | | | | | $ | 3,991,678 | | |
Written option contracts ("options written")
At October 31, 2017, the Fund had outstanding options written as follows:
Description | | Number of
Contracts | | Notional
Amount | | Exercise
Price | | Expiration
Date | | Value | |
Calls | |
Construction & Engineering | |
Valmont Industries, Inc. | | | 350 | | | $ | (5,561,500 | ) | | $ | 165 | | | 12/15/2017 | | $ | (54,250 | ) | |
Hotels, Restaurants & Leisure | |
Marriott International, Inc. | | | 372 | | | | (4,444,656 | ) | | | 115 | | | 11/17/2017 | | | (228,780 | ) | |
Household Durables | |
Tempur Sealy International, Inc. | | | 730 | | | | (4,772,010 | ) | | | 55 | | | 1/19/2018 | | | (861,400 | ) | |
Machinery | |
Allison Transmission Holdings, Inc. | | | 1,392 | | | | (5,914,608 | ) | | | 40 | | | 11/17/2017 | | | (375,840 | ) | |
Road & Rail | |
Norfolk Southern Corp. | | | 600 | | | | (7,885,200 | ) | | | 125 | | | 12/15/2017 | | | (477,000 | ) | |
Textiles, Apparel & Luxury Goods | |
lululemon Athletica, Inc. | | | 740 | | | | (4,551,740 | ) | | | 75 | | | 12/15/2017 | | | (28,120 | ) | |
PVH Corp. | | | 600 | | | | (7,608,600 | ) | | | 140 | | | 12/15/2017 | | | (55,500 | ) | |
| | | | | | | | | | | | (83,620 | ) | |
Total Calls (premiums received: $1,181,335) | | | | | | | | | | $ | (2,080,890 | ) | |
Puts | |
Capital Markets | |
Goldman Sachs Group, Inc. | | | 138 | | | $ | (3,346,224 | ) | | $ | 200 | | | 1/19/2018 | | $ | (11,799 | ) | |
Construction & Engineering | |
Valmont Industries, Inc. | | | 415 | | | | (6,594,350 | ) | | | 140 | | | 12/15/2017 | | | (16,600 | ) | |
Food & Staples Retailing | |
Costco Wholesale Corp. | | | 390 | | | | (6,282,120 | ) | | | 150 | | | 11/17/2017 | | | (9,750 | ) | |
Sprouts Farmers Market, Inc. | | | 9,240 | | | | (17,084,760 | ) | | | 17.5 | | | 3/16/2018 | | | (1,455,300 | ) | |
| | | | | | | | | | | | (1,465,050 | ) | |
Food Products | |
Conagra Brands, Inc. | | | 1,850 | | | | (6,319,600 | ) | | | 30 | | | 12/15/2017 | | | (18,500 | ) | |
Hain Celestial Group, Inc. | | | 4,620 | | | | (16,641,240 | ) | | | 38 | | | 2/16/2018 | | | (1,755,600 | ) | |
| | | | | | | | | | | | (1,774,100 | ) | |
See Notes to Financial Statements
60
Schedule of Investments Long Short Fund (cont'd)
Description | | Number of
Contracts | | Notional
Amount | | Exercise
Price | | Expiration
Date | | Value | |
Health Care Equipment & Supplies | |
DexCom, Inc. | | | 2,000 | | | $ | (8,994,000 | ) | | $ | 40 | | | 12/15/2017 | | $ | (180,000 | ) | |
Independent Power and Renewable Electricity Producers | |
Calpine Corp. | | | 5,540 | | | | (8,276,760 | ) | | | 13 | | | 12/15/2017 | | | (27,700 | ) | |
NRG Energy, Inc. | | | 3,700 | | | | (9,250,000 | ) | | | 21 | | | 1/19/2018 | | | (222,000 | ) | |
| | | | | | | | | | | | (249,700 | ) | |
IT Services | |
PayPal Holdings, Inc. | | | 1,820 | | | | (13,205,920 | ) | | | 50 | | | 1/15/2018 | | | (93,730 | ) | |
Visa, Inc. | | | 743 | | | | (8,171,514 | ) | | | 97.5 | | | 12/15/2017 | | | (15,975 | ) | |
Wex, Inc. | | | 558 | | | | (6,896,322 | ) | | | 110 | | | 2/16/2018 | | | (124,155 | ) | |
| | | | | | | | | | | | (233,860 | ) | |
Oil, Gas & Consumable Fuels | |
Cheniere Energy, Inc. | | | 650 | | | | (3,038,100 | ) | | | 45 | | | 1/18/2018 | | | (331,500 | ) | |
Cheniere Energy, Inc. | | | 2,310 | | | | (10,796,940 | ) | | | 42.5 | | | 3/16/2018 | | | (362,670 | ) | |
Enbridge Energy Partners L.P. | | | 4,620 | | | | (6,966,960 | ) | | | 15 | | | 1/19/2018 | | | (346,500 | ) | |
Enbridge Energy Partners L.P. | | | 2,460 | | | | (3,709,680 | ) | | | 35 | | | 4/20/2018 | | | (221,400 | ) | |
| | | | | | | | | | | | (1,262,070 | ) | |
Professional Services | |
Equifax, Inc. | | | 560 | | | | (6,077,680 | ) | | | 105 | | | 1/19/2018 | | | (243,600 | ) | |
Specialty Retail | |
Party City Holdco, Inc. | | | 4,640 | | | | (5,173,600 | ) | | | 12.5 | | | 1/19/2018 | | | (823,600 | ) | |
Total Puts (premiums received: $6,920,004) | | | | | | | | | | $ | (6,260,379 | ) | |
Total Options Written
(premiums received: $8,101,339) | | | | | | | | | | $ | (8,341,269 | ) | |
For the year ended October 31, 2017, the Fund had an average market value of $3,775,248 in options purchased and $(5,156,558) in options written, respectively. The Fund had securities pledged in the amount of $60,402,185 to cover collateral requirements for options written.
The following is a summary, categorized by Level (see Note A of Notes to Financial Statements), of inputs used to value the Fund's investments as of October 31, 2017:
Asset Valuation Inputs | |
(000's omitted) | | Level 1 | | Level 2 | | Level 3(b) | | Total | |
Investments: | |
| Common Stocks(a) | | $ | 2,308,585 | | | $ | — | | | $ | — | | | $ | 2,308,585 | | |
| Preferred Stock(a) | | | — | | | | — | | | | 11,550 | | | | 11,550 | | |
| Corporate Bonds(a) | | | — | | | | 172,904 | | | | — | | | | 172,904 | | |
| Convertible Bonds(a) | | | — | | | | 13,234 | | | | — | | | | 13,234 | | |
| Options Purchased(a) | | | 3,992 | | | | — | | | | — | | | | 3,992 | | |
Short-Term Investment | | | — | | | | 544,666 | | | | — | | | | 544,666 | | |
Total Long Positions | | $ | 2,312,577 | | | $ | 730,804 | | | $ | 11,550 | | | $ | 3,054,931 | | |
(a) The Schedule of Investments provides information on the industry or sector categorization for the portfolio.
See Notes to Financial Statements
61
Schedule of Investments Long Short Fund (cont'd)
(b) The following is a reconciliation between the beginning and ending balances of investments in which unobservable inputs (Level 3) were used in determining value:
| | | Beginning
balance, as
of 11/1/2016 | | Accrued
discounts/
(premiums) | | Realized
gain/(loss) | | Change
in unrealized
appreciation/
(depreciation) | | Purchases | | Sales | | Transfers
into
Level 3 | | Transfers
out of
Level 3 | | Balance,
as of
10/31/2017 | | Net change in
unrealized
appreciation/
(depreciation)
from
investments
still held as of
10/31/2017 | |
Investments in Securities: | |
(000's omitted) | |
Preferred Stock | |
Health Care | | $ | 11,550 | | | $ | — | | | $ | — | | | $ | — | | | $ | — | | | $ | — | | | $ | — | | | $ | — | | | $ | 11,550 | | | $ | — | | |
Total | | $ | 11,550 | | | $ | — | | | $ | — | | | $ | — | | | $ | — | | | $ | — | | | $ | — | | | $ | — | | | $ | 11,550 | | | $ | — | | |
The following table presents additional information about valuation techniques and inputs used for investments that are measured at fair value and categorized within Level 3 as of October 31, 2017.
Asset class | | Fair value
at 10/31/2017 | | Valuation techniques | | Unobservable
input | | Amount or
range
per unit | | Input value
per unit | | Impact to
valuation
from
decrease
in input(c) | |
Preferred Stock | | $ | 11,550,002 | | | Market Transaction Method | | Transaction Price | | $ | 8.78 | | | $ | 8.78 | | | Decrease | |
(c) Represents the expected directional change in the fair value of the Level 3 investments that would result from a decrease in the corresponding input. An increase to the unobservable input would have the opposite effect. Significant changes in these inputs could result in significantly higher or lower fair value measurements.
The following is a summary, categorized by Level (see Note A of Notes to Financial Statements), of inputs used to value the Fund's investments as of October 31, 2017:
Liabilities Valuation Inputs | |
(000's omitted) | | Level 1 | | Level 2 | | Level 3 | | Total | |
Investments: | |
| Common Stocks Sold Short(a) | | $ | (390,210 | ) | | $ | — | | | $ | — | | | $ | (390,210 | ) | |
| Corporate Bonds Sold Short(a) | | | — | | | | (49,193 | ) | | | — | | | | (49,193 | ) | |
Exchange Traded Funds Sold Short | | | (66,241 | ) | | | — | | | | — | | | | (66,241 | ) | |
| Master Limited Partnership Sold Short(a) | | | (8,414 | ) | | | — | | | | — | | | | (8,414 | ) | |
Total Short Positions | | $ | (464,865 | ) | | $ | (49,193 | ) | | $ | — | | | $ | (514,058 | ) | |
(a) The Schedule of Investments provides information on the industry or sector categorization for the portfolio.
As of the year ended October 31, 2017, no securities were transferred from one level (as of October 31, 2016) to another.
See Notes to Financial Statements
62
Schedule of Investments Long Short Fund (cont'd)
The following is a summary, categorized by Level (see Note A of Notes to Financial Statements), of inputs used to value the Fund's derivatives as of October 31, 2017:
Other Financial Instruments | |
(000's omitted) | | Level 1 | | Level 2 | | Level 3(b) | | Total | |
| Futures(a) | |
Assets | | $ | 176 | | | $ | — | | | $ | — | | | $ | 176 | | |
Liabilities | | | (20,536 | ) | | | — | | | | — | | | | (20,536 | ) | |
Swaps | |
Assets | | | — | | | | 2,012 | | | | — | | | | 2,012 | | |
Liabilities | | | — | | | | (4,202 | ) | | | — | | | | (4,202 | ) | |
Options Written | |
Liabilities | | | (8,341 | ) | | | — | | | | — | | | | (8,341 | ) | |
Total | | $ | (28,701 | ) | | $ | (2,190 | ) | | $ | — | | | $ | (30,891 | ) | |
(a) Futures are reported at the cumulative unrealized appreciation/(depreciation) of the instrument.
(b) The following is a reconciliation between the beginning and ending balances of investments in which unobservable inputs (Level 3) were used in determining value:
| | | Beginning
balance, as
of 11/1/2016 | | Accrued
discounts/
(premiums) | | Realized
gain/(loss) | | Change
in unrealized
appreciation/
(depreciation) | | Purchases | | Sales | | Transfers
into
Level 3 | | Transfers
out of
Level 3 | | Balance,
as of
10/31/2017 | | Net change in
unrealized
appreciation/
(depreciation)
from
investments
still held as of
10/31/2017 | |
Other Financial Instruments: | |
(000's omitted) | |
| Options Written(c) | | $ | (7 | ) | | $ | — | | | $ | 394 | | | $ | (414 | ) | | $ | 27 | | | $ | — | | | $ | — | | | $ | — | | | $ | — | | | $ | — | | |
Total | | $ | (7 | ) | | $ | — | | | $ | 394 | | | $ | (414 | ) | | $ | 27 | | | $ | — | | | $ | — | | | $ | — | | | $ | — | | | $ | — | | |
(c) At the beginning of the year, the Fund's Level 3 investments were valued based on using methods the Fund's Board has approved in the good-faith belief that the resulting valuation will reflect the fair value of the security. The Fund held no Level 3 investments at October 31, 2017.
See Notes to Financial Statements
63
Schedule of Investments Long Short Credit Fund October 31, 2017
NUMBER OF SHARES | | | | VALUE | |
| | | | | (000's omitted) | |
Common Stocks 1.1% | | | |
Airlines 0.8% | | | |
| | 25,000 | | | B2Gold Corp. | | $ | 63 | * | |
| | 6,500 | | | Liberty Global PLC LiLAC | | | 143 | * | |
| | | | 206 | | |
Hotels, Restaurants & Leisure 0.3% | | | |
| | 5,000 | | | Caesars Entertainment Corp. | | | 65 | * | |
| | | | | Total Common Stocks (Cost $288) | | | 271 | | |
PRINCIPAL AMOUNT | | | | | |
(000's omitted) | | | | | |
| Loan Assignments(a) 13.9% | |
All Telecom 3.1% | | | |
$ | 800 | | | Intelsat Jackson HLDG, First Lien Term Loan B2, 3 month USD LIBOR + 2.75%, (4.07%), | | | 797 | | |
| | | | | due 6/30/19 | | | | | |
Business Equipment & Services 4.7% | | | |
| | | | | Digicert Holdings | | | | | |
| | 800 | | | First Lien Term Loan B2, 3 month USD LIBOR + 4.75%, due 9/15/24 | | | 809 | (b)(c) | |
| | 400 | | | Second Lien Term Loan, 3 month USD LIBOR + 8.00%, due 9/15/25 | | | 402 | (b)(c) | |
| | | | 1,211 | | |
Health Care 0.9% | | | |
| | 234 | | | Grifols SA, First Lien Term Loan B, 3 month USD LIBOR + 2.25%, (3.45%), due 1/19/25 | | | 235 | | |
Nonferrous Metals/Minerals 1.9% | | | |
| | 500 | | | Consol Mining, First Lien Term Loan B, 3 month USD LIBOR + 6.00%, (7.00%), due 10/30/22 | | | 497 | | |
Oil & Gas 2.5% | | | |
| | 600 | | | Chesapeake Energy Corp., First Lien Term Loan, 3 month USD LIBOR + 7.50%, (8.81%), due 8/23/21 | | | 643 | | |
Steel 0.8% | | | |
| | 200 | | | Big River Steel, First Lien Term Loan B, 3 month USD LIBOR + 5.00%, (6.33%), due 8/15/23 | | | 204 | (d) | |
| | | | | Total Loan Assignments (Cost $3,531) | | | 3,587 | | |
NUMBER OF SHARES | | | | | |
Preferred Stock 3.1% | |
Banks 3.1% | | | |
| | 30 | | | GMAC Capital Trust I, Ser. 2, 3 month USD LIBOR +5.79%, (7.10%) (Cost $752) | | | 788 | (a) | |
See Notes to Financial Statements
64
Schedule of Investments Long Short Credit Fund (cont'd)
PRINCIPAL AMOUNT | | | | VALUE | |
(000's omitted) | | | | (000's omitted) | |
Convertible Bond 1.0% | | | |
Electrical Equipment 1.0% | | | |
$ | 250 | | | SolarCity Corp., 2.75%, due 11/1/18 (Cost $249) | | $ | 250 | | |
Corporate Bonds 84.4% | | | |
Auto Manufacturers 0.8% | | | |
| | 200 | | | American Honda Finance Corp., 3 month USD LIBOR + 0.31%, (1.63%), due 12/11/17 | | | 200 | (a) | |
Banks 11.9% | | | |
| | 500 | | | Barclays Bank PLC, 7.63%, due 11/21/22 | | | 574 | | |
| | 400 | | | Capital One N.A., 3 month USD LIBOR + 0.68%, (1.99%), due 2/5/18 | | | 400 | (a) | |
| | 550 | | | HSBC Holdings PLC, 5 year USD ICE Swap + 5.51% (6.88%), due 12/29/49 | | | 606 | (a)(m) | |
| | 800 | | | JPMorgan Chase & Co., 3 month USD LIBOR + 3.47%, (7.90%), due 12/29/49 | | | 820 | (a) | |
| | 300 | | | Royal Bank of Scotland Group PLC, 5 year USD Swap + 7.60%, (8.63%), due 12/29/49 | | | 340 | (a)(m) | |
| | 300 | | | Societe Generale SA, 5 year USD Swap + 6.24%, (7.38%), due 12/29/49 | | | 332 | (a)(m) | |
| | | | 3,072 | | |
Chemicals 2.9% | | | |
| | 700 | | | Braskem Finance Ltd., 5.75%, due 4/15/21 | | | 757 | (f) | |
Coal 0.8% | | | |
| | 200 | | | Consol Mining Corp., 11.00%, due 11/15/25 | | | 206 | (f) | |
Commercial Services 0.9% | | | |
| | 200 | | | Prime Security Services Borrower LLC/Prime Finance, Inc., 9.25%, due 5/15/23 | | | 222 | (f) | |
Computers 0.8% | | | |
| | 200 | | | Dell International LLC/EMC Corp., 5.88%, due 6/15/21 | | | 209 | (f) | |
Diversified Financial Services 6.8% | | | |
| | 300 | | | Jefferies Finance LLC/JFIN Co-Issuer Corp., 7.38%, due 4/1/20 | | | 310 | (f) | |
| | 900 | | | Nationstar Mortgage LLC/Nationstar Capital Corp., 9.63%, due 5/1/19 | | | 928 | (g) | |
| | 500 | | | OneMain Financial Holdings LLC, 7.25%, due 12/15/21 | | | 520 | (f) | |
| | | | 1,758 | | |
Electric 1.6% | | | |
| | 400 | | | Duke Energy Progress LLC, 3 month USD LIBOR + 0.20%, (1.52%), due 11/20/17 | | | 400 | (a) | |
Food 2.2% | | | |
| | 100 | | | JBS USA LUX SA/JBS USA Finance, Inc., 8.25%, due 2/1/20 | | | 101 | (f) | |
| | 500 | | | SUPERVALU, Inc., 6.75%, due 6/1/21 | | | 474 | | |
| | | | 575 | | |
Forest Products & Paper 1.7% | | | |
| | 398 | | | Suzano Trading Ltd., 5.88%, due 1/23/21 | | | 428 | (f) | |
See Notes to Financial Statements
65
Schedule of Investments Long Short Credit Fund (cont'd)
PRINCIPAL AMOUNT | | | | VALUE | |
(000's omitted) | | | | (000's omitted) | |
Healthcare—Services 3.5% | | | |
$ | 600 | | | CHS/Community Health Systems, Inc., 5.13%, due 8/1/21 | | $ | 582 | | |
| | 300 | | | HCA, Inc., 5.25%, due 6/15/26 | | | 319 | | |
| | | | 901 | | |
Iron/Steel 4.3% | | | |
| | 300 | | | Allegheny Technologies, Inc., 7.88%, due 8/15/23 | | | 329 | | |
| | 500 | | | BlueScope Steel Finance Ltd./BlueScope Steel Finance USA LLC, 6.50%, due 5/15/21 | | | 522 | (f) | |
| | 250 | | | Steel Dynamics, Inc., 5.13%, due 10/1/21 | | | 257 | | |
| | | | 1,108 | | |
Media 15.8% | | | |
| | 250 | | | Altice Financing SA, 7.50%, due 5/15/26 | | | 275 | (f) | |
| | 700 | | | Altice Luxembourg SA, 7.75%, due 5/15/22 | | | 741 | (f) | |
| | 1,000 | | | CCO Holdings LLC/CCO Holdings Capital Corp., 5.13%, due 5/1/23 | | | 1,043 | (f) | |
| | 419 | | | CSC Holdings LLC, 10.88%, due 10/15/25 | | | 513 | (f) | |
| | 684 | | | NBCUniversal Enterprise, Inc., 3 month USD LIBOR + 0.69%, (2.04%), due 4/15/18 | | | 686 | (a)(f) | |
| | 200 | | | Numericable-SFR SA, 7.38%, due 5/1/26 | | | 215 | (f) | |
| | 350 | | | Sinclair Television Group, Inc., 5.13%, due 2/15/27 | | | 333 | (f) | |
| | 250 | | | Univision Communications, Inc., 5.13%, due 2/15/25 | | | 248 | (f) | |
| | | | 4,054 | | |
Mining 4.6% | | | |
| | 200 | | | First Quantum Minerals Ltd., 7.00%, due 2/15/21 | | | 208 | (f) | |
| | | | | Hudbay Minerals, Inc. | | | | | |
| | 290 | | | 7.25%, due 1/15/23 | | | 312 | (f) | |
| | 310 | | | 7.63%, due 1/15/25 | | | 342 | (f) | |
| | 300 | | | Lundin Mining Corp., 7.50%, due 11/1/20 | | | 312 | (f) | |
| | | | 1,174 | | |
Oil & Gas 8.2% | | | |
| | 500 | | | Chevron Corp., 3 month USD LIBOR + 0.36%, (1.67%), due 11/9/17 | | | 500 | (a) | |
| | 400 | | | PBF Holding Co. LLC/PBF Finance Corp., 7.25%, due 6/15/25 | | | 414 | (f) | |
| | 450 | | | Petrobras Global Finance BV, 6.13%, due 1/17/22 | | | 486 | | |
| | 250 | | | Seadrill Ltd., 6.13%, due 9/15/17 | | | 43 | (f)(h) | |
| | 600 | | | YPF SA, 8.50%, due 3/23/21 | | | 679 | (f) | |
| | | | 2,122 | | |
Pipelines 1.0% | | | |
| | 250 | | | DCP Midstream Operating L.P., 2.50%, due 12/1/17 | | | 250 | | |
Semiconductors 0.8% | | | |
| | 200 | | | NXP BV/NXP Funding LLC, 4.63%, due 6/1/23 | | | 215 | (f) | |
Software 2.6% | | | |
| | 400 | | | Infor Software Parent LLC/Infor Software Parent, Inc., 7.13% Cash/7.88% PIK, due 5/1/21 | | | 411 | (f)(i) | |
| | 250 | | | Rackspace Hosting, Inc., 8.63%, due 11/15/24 | | | 263 | (f) | |
| | | | 674 | | |
See Notes to Financial Statements
66
Schedule of Investments Long Short Credit Fund (cont'd)
PRINCIPAL AMOUNT | | | | VALUE | |
(000's omitted) | | | | (000's omitted) | |
Telecommunications 13.2% | | | |
$ | 500 | | | C&W Senior Financing Designated Activity Co., 6.88%, due 9/15/27 | | $ | 522 | (f) | |
| | 250 | | | Frontier Communications Corp., 11.00%, due 9/15/25 | | | 211 | | |
| | | | | Intelsat Jackson Holdings SA | | | | | |
| | 200 | | | 5.50%, due 8/1/23 | | | 170 | | |
| | 100 | | | 9.75%, due 7/15/25 | | | 101 | (f) | |
| | 700 | | | Sprint Capital Corp., 8.75%, due 3/15/32 | | | 849 | (g) | |
| | 300 | | | Telesat Canada/Telesat LLC, 8.88%, due 11/15/24 | | | 336 | (f) | |
| | | | | Wind Acquisition Finance SA | | | | | |
| | 575 | | | 4.75%, due 7/15/20 | | | 582 | (f) | |
| | 600 | | | 7.38%, due 4/23/21 | | | 623 | (f) | |
| | | | 3,394 | | |
| | | | | Total Corporate Bonds (Cost $21,711) | | | 21,719 | | |
Foreign Government Security 0.6% | | | |
| | 220 | | | Argentine Republic Government International Bond, 2.50%, due 12/31/38 (Cost $160) | | | 158 | (h) | |
NUMBER OF SHARES | | | | | |
| Short-Term Investment 0.0%(j) | |
| Investment Company 0.0%(j) | | | |
| | 1,971 | | | State Street Institutional U.S. Government Money Market Fund Premier Class, 0.96% (Cost $2) | | | 2 | (g)(k) | |
| | | | | Total Investments 104.1% (Cost $26,693) | | | 26,775 | | |
| | | | | Liabilities Less Other Assets (4.1)% | | | (1,060 | )(I) | |
| | | | | Net Assets 100.0% | | $ | 25,715 | | |
* Non-income producing security.
(a) Variable or floating rate security. The interest rate shown was the current rate as of October 31, 2017 and changes periodically.
Benchmarks for Variable/Floating Rates:
LIBOR (USD) - London Interbank Offered Rate
(b) All or a portion of this security was purchased on a delayed delivery basis.
(c) All or a portion of this security has not settled as of October 31, 2017 and thus may not have an interest rate in effect. Interest rates do not take effect until settlement.
(d) Value determined using significant unobservable inputs.
(e) Weighted average coupon that changes/updates periodically. Rate shown is the rate at October 31, 2017.
(f) Securities were purchased under Rule 144A of the Securities Act of 1933, as amended (the "1933 Act"), or are otherwise restricted and, unless registered under the 1933 Act or exempted from registration, may only be sold to qualified institutional investors or may have other restrictions on resale. At October 31, 2017, these securities amounted to approximately $13,024,000, which represents 50.6% of net assets of the Fund. These securities have been deemed by the investment manager to be liquid.
See Notes to Financial Statements
67
Schedule of Investments Long Short Credit Fund (cont'd)
(g) All or a portion of this security is segregated in connection with obligations for delayed delivery securities, forward foreign currency contracts, futures and/or swaps with a total value of approximately $1,777,000.
(h) Defaulted security.
(i) Payment-in-kind (PIK) security.
(j) Represents less than 0.05% of net assets.
(k) Represents 7-day effective yield as of October 31, 2017.
(l) Includes the impact of the Fund's open positions in derivatives at October 31, 2017.
(m) Perpetual Bond Security. The rate reflected was the rate in effect on October 31, 2017. The maturity date reflects the next call date.
Reverse Repurchase Agreements
There were no open reverse repurchase agreements outstanding as of October 31, 2017. For the year ended October 31, 2017, the average borrowings under settled reverse repurchase agreements and the average interest rate were approximately $1,012,148 and 1.69%, respectively.
Derivative Instruments
Futures contracts ("futures")
At October 31, 2017, open positions in futures for the Fund were as follows:
Long Futures:
Expiration Date | | Number of
Contracts | | Open Contracts | | Notional
Amount | | Value and
Unrealized
Appreciation/
(Depreciation) | |
12/2017 | | | 1 | | | E-Mini Russell 2000 Index | | $ | 75,135 | | | $ | 3,943 | | |
12/2017 | | | 3 | | | MSCI World Index | | | 168,630 | | | | 3,564 | | |
12/2017 | | | 11 | | | Stoxx 600 Banks Index | | | 119,292 | | | | 1,964 | | |
Total Long Positions | | | | | | $ | 363,057 | | | $ | 9,471 | | |
Short Futures:
Expiration Date | | Number of
Contracts | | Open Contracts | | Notional
Amount | | Value and
Unrealized
Appreciation/
(Depreciation) | |
12/2017 | | | 7 | | | Euro-Bund | | $ | (1,327,055 | ) | | $ | (15,228 | ) | |
12/2017 | | | 10 | | | U.S. Treasury Note, 10 Year | | | (1,249,375 | ) | | | (5,177 | ) | |
Total Short Positions | | | | | | $ | (2,576,430 | ) | | $ | (20,405 | ) | |
Total Futures | | | | | | | | $ | (10,934 | ) | |
At October 31, 2017, the Fund had $53,859 deposited in a segregated account to cover margin requirements on open futures. For the year ended October 31, 2017, the average notional value of futures for the Fund was $1,844,931 for long positions and $(2,771,933) for short positions.
See Notes to Financial Statements
68
Schedule of Investments Long Short Credit Fund (cont'd)
Forward foreign currency contracts ("forward contracts")
At October 31, 2017, open forward contracts for the Fund were as follows:
| Currency Purchased | | Currency Sold | | Counterparty | | Settlement
Date | | Net
Unrealized
Appreciation/
(Depreciation) | |
| $ | 89,192 | | | | 74,913 | | | Euro | | Goldman Sachs International | | 1/24/2018 | | $ | 1,500 | | |
Total | | | | | | | | | | $ | 1,500 | | |
For the year ended October 31, 2017, the Fund's investments in forward contracts had an average notional value of $580,868.
Credit default swap contracts ("credit default swaps")
At October 31, 2017, the Fund had outstanding credit default swaps as follows:
OTC Credit Default Swaps — Buy Protection
| | | Swap
Counterparty | | Reference
Entity | | Notional
Amount(a) | | Financing
Rate
Paid by
the Fund | | Maturity
Date | | Upfront
Payments
(Receipts)
Paid | | Unrealized
Appreciation/
(Depreciation) | | Accrued
Net
Interest
Receivable/
(Payable) | | Value | |
| | Bank of
America, N.A. | | AK Steel Corp.,
Senior Securities | | $ | 250,000 | | | | 5.00 | %(b) | | 6/20/2020 | | $ | (20,636 | ) | | $ | (585 | ) | | $ | (1,458 | ) | | $ | (22,679 | ) | |
| | Bank of
America, N.A | | United States Steel
Corp., Senior
Securities | | | 250,000 | | | | 5.00 | %(b) | | 6/20/2020 | | | (18,262 | ) | | | (5,952 | ) | | | (1,458 | ) | | | (25,672 | ) | |
| | BNP Paribas SA | | Natixis, Senior
Securities | | EUR | 250,000 | | | | 1.00 | %(b) | | 6/20/2020 | | | (5,735 | ) | | | (672 | ) | | | (344 | ) | | | (6,751 | ) | |
| | Goldman Sachs
International | | KB Home, Senior
Securities | | $ | 250,000 | | | | 5.00 | %(b) | | 12/20/2022 | | | (38,217 | ) | | | (6,111 | ) | | | (1,458 | ) | | | (45,786 | ) | |
| | Goldman Sachs
International | | SuperValue, Inc.,
Senior Securities | | | 500,000 | | | | 5.00 | %(b) | | 6/20/2021 | | | 3,108 | | | | 6,047 | | | | (2,917 | ) | | | 6,238 | | |
Total | | | | | | | | | | | | $ | (79,742 | ) | | $ | (7,273 | ) | | $ | (7,635 | ) | | $ | (94,650 | ) | |
(a) Notional amount represents the value (including any fees or commissions) of the positions when they were established and is stated in the currency in which the contract is denominated.
EUR = Euro
(b) Payment frequency-quarterly.
OTC Credit Default Swaps — Sell Protection
Swap
Counterparty | | Reference
Entity | | Notional
Amount | | Financing
Rate
Received by
the Fund | | Maturity
Date | | Upfront
Payments
(Receipts)
Paid | | Unrealized
Appreciation/
(Depreciation) | | Accrued
Net
Interest
Receivable/
(Payable) | | Value | |
Citibank N.A. | | Petrobas Global Finance,
Senior Securities | | $ | 300,000 | | | | 1.00 | %(a) | | 12/20/2022 | | $ | (20,477 | ) | | $ | 5,229 | | | $ | 350 | | | $ | (14,898 | ) | |
Goldman Sachs
International | | Republic of Argentina,
Senior Securities | | | 650,000 | | | | 5.00 | %(a) | | 12/20/2022 | | | 62,680 | | | | 14,541 | | | | 3,792 | | | | 81,013 | | |
Total | | | | | | | | | | $ | 42,203 | | | $ | 19,770 | | | $ | 4,142 | | | $ | 66,115 | | |
(a) Payment frequency-quarterly.
See Notes to Financial Statements
69
Schedule of Investments Long Short Credit Fund (cont'd)
Centrally Cleared Credit Default Swaps — Buy Protection
Clearinghouse | | Reference
Entity | | Notional
Amount | | Financing
Rate
Paid by
the Fund | | Maturity
Date | | Upfront
Payments
(Receipts) | | Unrealized
Appreciation/
(Depreciation) | | Accrued
Net
Interest
Receivable/
(Payable) | | Value | |
ICE Clear Credit LLC | | CDX North American
Investment Grade
Index, Ser. 28 V.1 | | $ | 10,000,000 | | | | 1.00 | %(a) | | 6/20/2022 | | $ | (204,827 | ) | | $ | (15,613 | ) | | $ | (11,667 | ) | | $ | (232,107 | ) | |
Total | | | | | | | | | | $ | (204,827 | ) | | $ | (15,613 | ) | | $ | (11,667 | ) | | $ | (232,107 | ) | |
(a) Payment frequency-quarterly.
Centrally Cleared Credit Default Swaps — Sell Protection
| Clearinghouse | | | | Reference
Entity | | Notional
Amount | | Financing
Rate
Received by
the Fund | | Maturity
Date | | Upfront
Payments
(Receipts) | | Unrealized
Appreciation/
(Depreciation) | | Accrued
Net
Interest
Receivable/
(Payable) | | Value | |
| | ICE Clear Credit LLC | | CDX Emerging
Markets
Index, Ser. 27 V.1 | | $ | 1,500,000 | | | | 1.00 | %(a) | | 12/20/2022 | | $ | (59,737 | ) | | $ | 7,582 | | | $ | 1,750 | | | $ | (50,405 | ) | |
Total | | | | | | | | | | $(59,737) | | $7,582 | | $1,750 | | $(50,405) | |
(a) Payment frequency-quarterly.
For the year ended October 31, 2017, the average notional value of credit default swaps for the Fund was $3,194,503 for buy protection and $(6,395,799) for sell protection.
At October 31, 2017, the Fund had $306,988 deposited in a segregated account to cover margin requirements for centrally cleared credit default swaps.
Total return swap contracts ("total return swaps")
At October 31, 2017, the Fund had outstanding OTC total return swaps as follows:
Long Total Return Swaps
Counterparty | | Reference
Entity | | Notional
Amount(a) | | Maturity
Date | | Variable-
Rate | | Upfront
Payments
(Receipts) | | Unrealized
Appreciation/
(Depreciation) | | Accrued
Net
Interest
Receivable/
(Payable) | | Value | |
Goldman Sachs
International | | iBoxx USD Liquid
investment Grade
Index | | $ | 2,000,000 | | | 12/20/2017 | | | 1.325 | %(b) | | $ | (736 | ) | | $ | 2,021 | | | $ | 2,152 | | | $ | 3,437 | | |
Goldman Sachs
International | | iBoxx USD Liquid
investment Grade
Index | | | 3,000,000 | | | 12/20/2017 | | | 1.325 | %(b) | | | (1,104 | ) | | | 2,556 | | | | 3,030 | | | | 4,482 | | |
Goldman Sachs
International | | T Mobile US,
Inc. Equity | | | 65,459 | | | 11/17/2018 | | | 1.64 | %(c) | | | — | | | | (5,689 | ) | | | (182 | ) | | | (5,871 | ) | |
Goldman Sachs
International | | NXP Semiconductors NV
US Equity | | | 314,564 | | | 3/23/2018 | | | 1.64 | %(c) | | | — | | | | 36,586 | | | | (726 | ) | | | 35,860 | | |
Total | | | | | | | | | | $ | (1,840 | ) | | $ | 35,474 | | | $ | 4,274 | | | $ | 37,908 | | |
See Notes to Financial Statements
70
Schedule of Investments Long Short Credit Fund (cont'd)
(a) Notional amount represents the value (including any fees or commissions) of the positions when they were established.
(b) Fund pays 3-month USD LIBOR. Payment frequency-upon termination. Fund receives return on reference entity. Pays upon termination.
(c) Fund pays 1-month USD LIBOR plus 0.40%. Payment frequency-monthly. Fund receives return on reference entity. Pays upon termination.
(d) Fund pays 1-month USD LIBOR plus 0.50%. Payment frequency-monthly. Fund receives return on reference entity. Pays upon termination.
(e) Effective rate at October 31, 2017.
Total return basket swap contracts ("total return basket swaps")
At October 31, 2017, the Fund had outstanding total return basket swap(a) as follows:
Counterparty | | Description | | Maturity Date(s) | | Value | |
Goldman Sachs
International
| | The Fund receives the total return, and pays floating rate
plus or minus a spread on a portfolio of long positions.
The receipts, based on the specified benchmark floating rates*,
are denominated in various foreign
currencies based on the local currencies of the positions
within the swaps. | | 3/14/2019 | | $ | 10,268 | | |
(a) The following table represents required component disclosures associated with the total return basket swaps with Goldman Sachs International as of October 31, 2017.
| Reference Entity | | Shares | | Notional
Amount(c) | | Unrealized
Appreciation/
(Depreciation) | | Percentage of
Net Assets | |
Long Positions | |
GSCBEN12(b) | |
| BP PLC | | | 263 | | | $ | 26,454 | | | $ | 1,777 | | | | 0.0 | % | |
ConocoPhillips | | | 261 | | | | 26,281 | | | | 1,765 | | | | 0.0 | % | |
Royal Dutch Shell PLC | | | 255 | | | | 25,687 | | | | 1,726 | | | | 0.0 | % | |
TOTAL SA | | | 243 | | | | 24,476 | | | | 1,644 | | | | 0.0 | % | |
Exxon Mobil Corp. | | | 243 | | | | 24,459 | | | | 1,643 | | | | 0.0 | % | |
Chevron Corp. | | | 235 | | | | 23,760 | | | | 1,596 | | | | 0.0 | % | |
| | | | | 151,117 | | | | 10,151 | | | | 0.0 | % | |
Accrued Net Interest Receivable/(Payable) | | | | | | | 117 | | | | |
Total Return Basket Swaps, at Value | | | | | | $ | 10,268 | | | | |
(b) The Fund pays monthly 1-month LIBOR (USD) plus 0.50%; the Fund receives the return on investment monthly.
(c) Notional amount represents the value (including any fees or commissions) of the positions when they were established. At October 31, 2017, the absolute notional value for total return basket swaps was $161,268 for Goldman Sachs International.
*Benchmark Floating Rates | | Value at
Period End | |
1-Month LIBOR (USD)—London Interbank Offered Rate | | | 1.24 | % | |
See Notes to Financial Statements
71
Schedule of Investments Long Short Credit Fund (cont'd)
Short Total Return Swaps
| | | Counterparty | | Reference
Entity | | Notional
Amount(a) | | Maturity
Date | | Variable-
Rate(g) | | Upfront
Payments
(Receipts) | | Unrealized
Appreciation/
(Depreciation) | | Accrued
Net
Interest
Receivable/
(Payable) | | Value | |
| | BNP Paribas SA | | HCA, Inc., Senior
Unsecured Notes,
5.88%, due 2/15/2026 | | $ | 160,000 | | | 3/22/2018 | | | 0.74 | %(b) | | $ | — | | | $ | (482 | ) | | $ | 30 | | | $ | (452 | ) | |
| | BNP Paribas SA | | HCA, Inc., Senior
Unsecured Notes,
5.88%, due 2/15/2026 | | | 300,000 | | | 8/20/2018 | | | 0.74 | %(b) | | | — | | | | 12,029 | | | | 98 | | | | 12,127 | | |
| | BNP Paribas SA | | GRIFLS SA, Senior
Unsecured Notes,
3.20%, due 5/1/2025 | | EUR | 225,000 | | | 9/18/2018 | | | (1.37 | %)(c) | | | — | | | | (3,291 | ) | | | (137 | ) | | | (3,428 | ) | |
| | BNP Paribas SA | | Care Capital Properties LP,
5.125%, due 9/26/2018 | | $ | 200,000 | | | 9/26/2018 | | | 0.74 | %(b) | | | — | | | | 353 | | | | 65 | | | | 418 | | |
| | BNP Paribas SA | | HCA, Inc., Senior
Unsecured Notes,
5.88%, due 2/15/2026 | | | 90,000 | | | 11/15/2018 | | | 0.74 | %(b) | | | — | | | | 601 | | | | 34 | | | | 635 | | |
| | BNP Paribas SA | | Macy's Retail Holdings, Inc.,
Senior Unsecured Notes,
3.875%, due 1/15/2022 | | | 500,000 | | | 11/15/2018 | | | 1.74 | %(d) | | | — | | | | 8,102 | | | | 386 | | | | 8,488 | | |
| | BNP Paribas SA | | Michael's Stores, Inc.,
Senior Subordinated Notes,
5.875%, due 12/15/2020 | | | 500,000 | | | 11/15/2018 | | | 0.74 | %(b) | | | — | | | | (3,869 | ) | | | 164 | | | | (3,705 | ) | |
| | BNP Paribas SA | | SBA Communications Corp.,
Senior Unsecured Notes,
4.875%, due 7/15/2022 | | | 250,000 | | | 11/15/2018 | | | 0.74 | %(b) | | | — | | | | (2,025 | ) | | | 108 | | | | (1,917 | ) | |
| | BNP Paribas SA | | CHS/Community Health
Systems, Inc, Senior
Unsecured Notes,
8.00%, due 11/15/2019 | | | 200,000 | | | 12/15/2018 | | | 1.49 | %(e) | | | — | | | | 3,480 | | | | 108 | | | | 3,588 | | |
| | BNP Paribas SA | | CHS/Community Health
Systems, Inc, Senior
Unsecured Notes,
8.00%, due 11/15/2019 | | | 400,000 | | | 12/15/2018 | | | 1.49 | %(e) | | | — | | | | 7,228 | | | | 199 | | | | 7,427 | | |
| | BNP Paribas SA | | SFR/Numericable Group SA,
5.375%, due 5/15/2022 | | EUR | 500,000 | | | 12/17/2018 | | | (1.91 | )%(f) | | | — | | | | (3,518 | ) | | | (401 | ) | | | (3,919 | ) | |
Total | | | | | | | | | | | | $ | — | | | $ | 18,608 | | | $ | 654 | | | $ | 19,262 | | |
(a) Notional amount represents the value (including any fees or commissions) of the positions when they were established and is stated in the currency in which the contract is denominated.
EUR = Euro
(b) Fund receives 1-month USD LIBOR minus 0.50%. Payment frequency-monthly. Fund pays return on reference entity. Pays upon termination.
(c) Fund receives 1-month EUR LIBOR minus 1.00%. Payment frequency-monthly. Fund pays return on reference entity. Pays upon termination.
(d) Fund receives 1-month USD LIBOR plus 0.50%. Payment frequency-monthly. Fund pays return on reference entity. Pays upon termination.
See Notes to Financial Statements
72
Schedule of Investments Long Short Credit Fund (cont'd)
(e) Fund receives 1-month USD LIBOR plus 0.25%. Payment frequency-monthly. Fund pays return on reference entity. Pays upon termination.
(f) Fund receives 1-month EUR LIBOR minus 0.75%. Payment frequency-monthly. Fund pays return on reference entity. Pays upon termination.
(g) Effective rate at October 31, 2017.
Benchmark Floating Rates | | Value at
Period End | |
LIBOR (USD)—London Interbank Offered Rate (1-month) | | | 1.24 | % | |
LIBOR (USD)—London Interbank Offered Rate (3-month) | | | 1.38 | | |
LIBOR (EUR)—London Interbank Offered Rate denominated in Euros | | | (0.40 | ) | |
For the year ended October 31, 2017, the average notional value of total return swaps was $2,504,964 for long positions and $(2,458,952) for short positions.
At October 31, 2017, the Fund had cash collateral of $520,000 deposited in a segregated account for BNP Paribas SA to cover collateral requirements on OTC derivatives.
The following is a summary, categorized by Level (see Note A of Notes to Financial Statements), of inputs used to value the Fund's investments as of October 31, 2017:
Asset Valuation Inputs | |
(000's omitted) | | Level 1 | | Level 2 | | Level 3(b) | | Total | |
Investments: | |
| Common Stocks(a) | | $ | 271 | | | $ | — | | | $ | — | | | $ | 271 | | |
Loan Assignments | |
Steel | | | — | | | | — | | | | 204 | | | | 204 | | |
| Other Loan Assignments(a) | | | — | | | | 3,383 | | | | — | | | | 3,383 | | |
Total Loan Assignments | | | — | | | | 3,383 | | | | 204 | | | | 3,587 | | |
| Convertible Bond(a) | | | — | | | | 250 | | | | — | | | | 250 | | |
| Preferred Stock(a) | | | 788 | | | | — | | | | — | | | | 788 | | |
| Corporate Bonds(a) | | | — | | | | 21,719 | | | | — | | | | 21,719 | | |
Foreign Government Security | | | — | | | | 158 | | | | — | | | | 158 | | |
Short-Term Investment | | | — | | | | 2 | | | | — | | | | 2 | | |
Total Investments | | $ | 1,059 | | | $ | 25,512 | | | $ | 204 | | | $ | 26,775 | | |
(a) The Schedule of Investments provides information on the industry or sector categorization for the portfolio.
(b) The following is a reconciliation between the beginning and ending balances of investments in which unobservable inputs (Level 3) were used in determining value:
See Notes to Financial Statements
73
Schedule of Investments Long Short Credit Fund (cont'd)
(000's omitted) | | Beginning
balance, as
of 11/1/2016 | | Accrued
discounts/
(premiums) | | Realized
gain/(loss) | |
Change
in unrealized
appreciation/
(depreciation) | | Purchases | | Sales | | Transfers
into
Level 3 | | Transfers
out of
Level 3 | | Balance,
as of
10/31/2017 | | Net change in
unrealized
appreciation/
(depreciation)
from
investments
still held as of
10/31/2017 | |
Investments in
Securities: | |
| Loan Assignments(c) | |
Steel | | $ | — | | | $ | — | | | $ | — | | | $ | 6 | | | $ | 198 | | | $ | — | | | $ | — | | | $ | — | | | $ | 204 | | | $ | 6 | | |
Total | | $ | — | | | $ | — | | | $ | — | | | $ | 6 | | | $ | 198 | | | $ | — | | | $ | — | | | $ | — | | | $ | 204 | | | $ | 6 | | |
(c) Securities categorized as Level 3 are valued based on a single quotation obtained from a dealer. The Fund does not have access to unobservable inputs and therefore cannot disclose such inputs used in formulating such quotation.
As of the year ended October 31, 2017, no securities were transferred from one level (as of October 31, 2016) to another.
The following is a summary, categorized by Level (see Note A of Notes to Financial Statements), of inputs used to value the Fund's derivatives as of October 31, 2017:
Other Financial Instruments | |
(000's omitted) | | Level 1 | | Level 2 | | Level 3 | | Total | |
| Futures(a) | |
Assets | | $ | 9 | | | $ | — | | | $ | — | | | $ | 9 | | |
Liabilities | | | (20 | ) | | | — | | | | — | | | | (20 | ) | |
| Forward Contracts(a) | | | — | | | | 2 | | | | — | | | | 2 | | |
Swaps | |
Assets | | | — | | | | 175 | | | | — | | | | 175 | | |
Liabilities | | | — | | | | (418 | ) | | | — | | | | (418 | ) | |
Total | | $ | (11 | ) | | $ | (241 | ) | | $ | — | | | $ | (252 | ) | |
(a) Futures and forward contracts are reported at the cumulative unrealized appreciation/(depreciation) of the instrument.
See Notes to Financial Statements
74
Schedule of Investments Multi-Asset Income Fund October 31, 2017
| | |
Number
of Shares | | Value
(000's
omitted) | |
Common Stocks 33.8% | |
Aerospace & Defense 0.8% | |
Arconic, Inc. | | | 46 | | | $ | 1 | | |
BAE Systems PLC | | | 2,047 | | | | 16 | | |
Boeing Co. | | | 295 | | | | 76 | (a) | |
Huntington
Ingalls
Industries, Inc. | | | 6 | | | | 2 | | |
Lockheed Martin
Corp. | | | 290 | | | | 89 | (a) | |
Orbital ATK, Inc. | | | 14 | | | | 2 | | |
| | | | 186 | | |
Airlines 0.1% | |
Air New Zealand
Ltd. | | | 5,394 | | | | 12 | | |
Copa Holdings
SA Class A | | | 24 | | | | 3 | (a) | |
Deutsche
Lufthansa AG | | | 56 | | | | 2 | | |
| | | | 17 | | |
Auto Components 0.1% | |
Dana, Inc. | | | 223 | | | | 7 | | |
Faurecia | | | 51 | | | | 3 | | |
Gentex Corp. | | | 155 | | | | 3 | | |
GKN PLC | | | 196 | | | | 1 | | |
Goodyear Tire &
Rubber Co. | | | 125 | | | | 4 | | |
Schaeffler AG | | | 108 | | | | 2 | | |
Toyo Tire &
Rubber Co. Ltd. | | | 100 | | | | 2 | | |
Xinyi Glass
Holdings Ltd. | | | 2,000 | | | | 2 | * | |
| | | | 24 | | |
Automobiles 0.1% | |
Bayerische
Motoren Werke
AG, Preference
Shares | | | 77 | | | | 7 | | |
Ford Motor Co. | | | 591 | | | | 7 | | |
Peugeot SA | | | 378 | | | | 9 | | |
Volkswagen AG,
Preference
Shares | | | 6 | | | | 1 | | |
| | | | 24 | | |
Banks 1.6% | |
Australia & New
Zealand Banking
Group Ltd. | | | 2,168 | | | | 49 | (a) | |
Banco Santander
SA | | | 85 | | | | 1 | | |
Bank of America
Corp. | | | 304 | | | | 8 | | |
Bendigo &
Adelaide Bank
Ltd. | | | 776 | | | | 7 | | |
BNP Paribas SA | | | 46 | | | | 3 | | |
| | |
Number
of Shares | | Value
(000's
omitted) | |
BOC Hong Kong
Holdings Ltd. | | | 2,500 | | | $ | 12 | | |
CaixaBank SA | | | 124 | | | | 1 | | |
Citigroup, Inc. | | | 400 | | | | 29 | | |
Credit Agricole
SA | | | 113 | | | | 2 | | |
First Hawaiian,
Inc. | | | 1,225 | | | | 36 | (a) | |
FNB Corp. | | | 1,700 | | | | 23 | (a) | |
Hang Seng Bank
Ltd. | | | 400 | | | | 9 | | |
HSBC Holdings
PLC | | | 69 | | | | 1 | | |
JPMorgan
Chase & Co. | | | 793 | | | | 80 | (a) | |
Mediobanca SpA | | | 364 | | | | 4 | | |
National
Australia Bank
Ltd. | | | 82 | | | | 2 | | |
Nordea Bank AB | | | 48 | | | | 1 | | |
PNC Financial
Services Group,
Inc. | | | 300 | | | | 41 | (a) | |
Societe Generale
SA | | | 66 | | | | 4 | | |
Umpqua
Holdings Corp. | | | 2,425 | | | | 49 | (a) | |
| | | | 362 | | |
Beverages 0.6% | |
Coca-Cola Co. | | | 1,480 | | | | 68 | (a) | |
PepsiCo, Inc. | | | 657 | | | | 72 | (a) | |
| | | | 140 | | |
Biotechnology 0.5% | |
Amgen, Inc. | | | 337 | | | | 59 | (a) | |
Gilead Sciences,
Inc. | | | 725 | | | | 54 | (a) | |
| | | | 113 | | |
Capital Markets 0.2% | |
| 3i Group PLC | | | 230 | | | | 3 | | |
Ameriprise
Financial, Inc. | | | 34 | | | | 5 | | |
Ashmore Group
PLC | | | 150 | | | | 1 | | |
BlackRock, Inc. | | | 13 | | | | 6 | | |
BT Investment
Management
Ltd. | | | 88 | | | | 1 | | |
CME Group, Inc. | | | 26 | | | | 4 | | |
Morgan Stanley | | | 17 | | | | 1 | | |
Natixis SA | | | 267 | | | | 2 | | |
Virtu Financial,
Inc. Class A | | | 1,350 | | | | 19 | (a) | |
| | | | 42 | | |
Chemicals 0.8% | |
Agrium, Inc. | | | 275 | | | | 30 | (a) | |
Air Products &
Chemicals, Inc. | | | 58 | | | | 9 | | |
| | |
Number
of Shares | | Value
(000's
omitted) | |
Albemarle Corp. | | | 15 | | | $ | 2 | | |
BASF SE | | | 645 | | | | 71 | (a) | |
Cabot Corp. | | | 26 | | | | 2 | | |
Covestro AG | | | 32 | | | | 3 | (0) | |
DowDuPont, Inc. | | | 510 | | | | 37 | | |
Huntsman Corp. | | | 453 | | | | 14 | | |
Kronos
Worldwide, Inc. | | | 243 | | | | 6 | | |
Lenzing AG | | | 14 | | | | 2 | | |
Olin Corp. | | | 127 | | | | 5 | | |
Orica Ltd. | | | 183 | | | | 3 | | |
Trinseo SA | | | 106 | | | | 7 | (a) | |
| | | | 191 | | |
Commercial Services & Supplies 0.1% | |
Downer EDI Ltd. | | | 943 | | | | 5 | | |
Quad/Graphics,
Inc. | | | 134 | | | | 3 | | |
Republic Services,
Inc. | | | 109 | | | | 7 | | |
| | | | 15 | | |
Communications Equipment 0.5% | |
Cisco Systems,
Inc. | | | 3,140 | | | | 107 | (a) | |
InterDigital, Inc. | | | 9 | | | | 1 | | |
| | | | 108 | | |
Construction & Engineering 0.2% | |
Bouygues SA | | | 118 | | | | 6 | | |
CIMIC Group
Ltd. | | | 81 | | | | 3 | | |
FLSmidth & Co.
A/S | | | 39 | | | | 3 | * | |
Galliford Try PLC | | | 59 | | | | 1 | | |
Peab AB | | | 243 | | | | 2 | | |
Skanska AB, B
Shares | | | 155 | | | | 3 | | |
Vinci SA | | | 243 | | | | 24 | (a) | |
| | | | 42 | | |
Containers & Packaging 0.3% | |
Greif, Inc.
Class A | | | 88 | | | | 5 | | |
Greif, Inc. Class B | | | 30 | | | | 2 | | |
International
Paper Co. | | | 867 | | | | 50 | (a) | |
WestRock Co. | | | 25 | | | | 1 | | |
| | | | 58 | | |
| Distributors 0.0%(c) | |
Genuine Parts
Co. | | | 9 | | | | 1 | | |
| Diversified Consumer Services 0.0%(c) | |
Adtalem Global
Education, Inc. | | | 40 | | | | 1 | * | |
Capella
Education Co. | | | 8 | | | | 1 | | |
| | | | 2 | | |
See Notes to Financial Statements
75
Schedule of Investments Multi-Asset Income Fund (cont'd)
| | |
Number
of Shares | | Value
(000's
omitted) | |
Diversified Financial Services 0.1% | |
Banca IFIS SpA | | | 25 | | | $ | 2 | | |
Leucadia
National Corp. | | | 79 | | | | 2 | | |
Standard Life
Aberdeen PLC | | | 1,247 | | | | 7 | | |
| | | | 11 | | |
Diversified Telecommunication
Services 0.7% | |
AT&T, Inc. | | | 2,722 | | | | 91 | (a) | |
HKT Trust & HKT
Ltd. | | | 3,000 | | | | 4 | | |
Inmarsat PLC | | | 53 | | | | 0 | (d) | |
PCCW Ltd. | | | 4,003 | | | | 2 | | |
Singapore
Telecommunications
Ltd. | | | 6,500 | | | | 18 | | |
TDC A/S | | | 328 | | | | 2 | | |
Telefonica
Deutschland
Holding AG | | | 782 | | | | 4 | | |
Telefonica SA | | | 483 | | | | 5 | | |
Telenor ASA | | | 690 | | | | 15 | | |
Telia Co. AB | | | 2,099 | | | | 10 | | |
Telstra Corp. Ltd. | | | 3,680 | | | | 10 | | |
| | | | 161 | | |
Electric Utilities 1.5% | |
ALLETE, Inc. | | | 85 | | | | 7 | | |
American Electric
Power Co., Inc. | | | 247 | | | | 18 | | |
AusNet Services | | | 2,974 | | | | 4 | | |
BKW AG | | | 68 | | | | 4 | | |
CLP Holdings Ltd. | | | 2,000 | | | | 20 | (a) | |
Duke Energy
Corp. | | | 323 | | | | 29 | (a) | |
Edison
International | | | 201 | | | | 16 | (a) | |
EDP—Energias
de Portugal SA | | | 2,517 | | | | 9 | | |
Electricite de
France SA | | | 325 | | | | 4 | | |
Enel SpA | | | 1,590 | | | | 10 | | |
Entergy Corp. | | | 44 | | | | 4 | (a) | |
Eversource
Energy | | | 60 | | | | 4 | | |
Exelon Corp. | | | 1,126 | | | | 45 | (a) | |
FirstEnergy Corp. | | | 25 | | | | 1 | | |
Fortum OYJ | | | 231 | | | | 5 | | |
HK Electric
Investments &
HK Electric
Investments Ltd. | | | 4,407 | | | | 4 | (o) | |
Kansai Electric
Power Co., Inc. | | | 100 | | | | 1 | | |
NextEra Energy,
Inc. | | | 523 | | | | 81 | (a) | |
OGE Energy
Corp. | | | 179 | | | | 7 | | |
PG&E Corp. | | | 319 | | | | 18 | (a) | |
| | |
Number
of Shares | | Value
(000's
omitted) | |
Pinnacle West
Capital Corp. | | | 33 | | | $ | 3 | | |
Power Assets
Holdings Ltd. | | | 1,000 | | | | 9 | | |
PPL Corp. | | | 500 | | | | 19 | (a) | |
Southern Co. | | | 147 | | | | 8 | (a) | |
SSE PLC | | | 353 | | | | 6 | | |
Terna Rete
Elettrica
Nazionale SpA | | | 110 | | | | 1 | | |
Xcel Energy, Inc. | | | 232 | | | | 11 | | |
| | | | 348 | | |
Electrical Equipment 0.1% | |
Eaton Corp. PLC | | | 205 | | | | 16 | (a) | |
Emerson Electric
Co. | | | 209 | | | | 13 | | |
General Cable
Corp. | | | 76 | | | | 2 | | |
Regal Beloit
Corp. | | | 20 | | | | 2 | | |
| | | | 33 | | |
Electronic Equipment, Instruments & Components 0.1% | |
AVX Corp. | | | 45 | | | | 1 | | |
Corning, Inc. | | | 249 | | | | 8 | | |
Jabil, Inc. | | | 151 | | | | 4 | | |
Venture Corp.
Ltd. | | | 400 | | | | 6 | | |
Vishay
Intertechnology,
Inc. | | | 100 | | | | 2 | | |
| | | | 21 | | |
Energy Equipment & Services 0.2% | |
Archrock, Inc. | | | 501 | | | | 6 | | |
Baker Hughes a
GE Co. | | | 100 | | | | 3 | (a) | |
Helmerich &
Payne, Inc. | | | 575 | | | | 31 | | |
John Wood
Group PLC | | | 790 | | | | 8 | | |
National Oilwell
Varco, Inc. | | | 34 | | | | 1 | | |
Petrofac Ltd. | | | 714 | | | | 4 | | |
TGS NOPEC
Geophysical Co.
ASA | | | 26 | | | | 1 | | |
| | | | 54 | | |
Equity Real Estate Investment Trusts 3.4% | |
Alexandria Real
Estate Equities,
Inc. | | | 337 | | | | 42 | (a) | |
American
Campus
Communities,
Inc. | | | 257 | | | | 11 | | |
| | |
Number
of Shares | | Value
(000's
omitted) | |
American Tower
Corp. | | | 147 | | | $ | 21 | | |
CBL & Associates
Properties, Inc. | | | 543 | | | | 4 | | |
Colony
NorthStar, Inc.
Class A | | | 520 | | | | 6 | | |
CoreSite Realty
Corp. | | | 370 | | | | 41 | (a) | |
Crown Castle
International
Corp. | | | 552 | | | | 59 | (a) | |
CyrusOne, Inc. | | | 227 | | | | 14 | | |
DCT Industrial
Trust, Inc. | | | 900 | | | | 52 | (a) | |
Douglas Emmett,
Inc. | | | 1,050 | | | | 42 | (a) | |
Easterly
Government
Properties, Inc. | | | 300 | | | | 6 | | |
EPR Properties | | | 123 | | | | 9 | (a) | |
Equinix, Inc. | | | 60 | | | | 28 | (a) | |
Extra Space
Storage, Inc. | | | 159 | | | | 13 | | |
Highwoods
Properties, Inc. | | | 273 | | | | 14 | | |
Host Hotels &
Resorts, Inc. | | | 2,800 | | | | 55 | (a) | |
Iron Mountain,
Inc. | | | 1,541 | | | | 62 | (a) | |
Kimco Realty
Corp. | | | 707 | | | | 13 | | |
LaSalle Hotel
Properties | | | 234 | | | | 7 | | |
Medical
Properties Trust,
Inc. | | | 645 | | | | 9 | | |
Mid-America
Apartment
Communities,
Inc. | | | 123 | | | | 13 | | |
OMEGA
Healthcare
Investors, Inc. | | | 574 | | | | 17 | (a) | |
Outfront Media,
Inc. | | | 1,100 | | | | 26 | | |
Park Hotels &
Resorts, Inc. | | | 241 | | | | 7 | | |
Physicians Realty
Trust | | | 1,525 | | | | 26 | (a) | |
Prologis, Inc. | | | 870 | | | | 56 | (a) | |
Public Storage | | | 59 | | | | 12 | | |
Simon Property
Group, Inc. | | | 59 | | | | 9 | (a) | |
STAG Industrial,
Inc. | | | 526 | | | | 14 | | |
Sun
Communities,
Inc. | | | 92 | | | | 8 | | |
Ventas, Inc. | | | 152 | | | | 10 | | |
See Notes to Financial Statements
76
Schedule of Investments Multi-Asset Income Fund (cont'd)
| | |
Number
of Shares | | Value
(000's
omitted) | |
Vornado Realty
Trust | | | 86 | | | $ | 6 | | |
Washington
Prime Group,
Inc. | | | 804 | | | | 6 | | |
Welltower, Inc. | | | 142 | | | | 9 | | |
Weyerhaeuser
Co. | | | 1,432 | | | | 51 | (a) | |
| | | | 778 | | |
Food & Staples Retailing 0.9% | |
Andersons, Inc. | | | 22 | | | | 1 | | |
Casino Guichard
Perrachon SA | | | 117 | | | | 6 | | |
Costco
Wholesale Corp. | | | 5 | | | | 1 | | |
CVS Health Corp. | | | 175 | | | | 12 | | |
J Sainsbury PLC | | | 1,520 | | | | 5 | | |
SpartanNash Co. | | | 46 | | | | 1 | | |
Wal-Mart Stores,
Inc. | | | 1,388 | | | | 121 | (a) | |
Walgreens Boots
Alliance, Inc. | | | 94 | | | | 6 | | |
Wesfarmers Ltd. | | | 902 | | | | 29 | (a) | |
WM Morrison
Supermarkets
PLC | | | 580 | | | | 2 | | |
Woolworths Ltd. | | | 1,014 | | | | 20 | (a) | |
| | | | 204 | | |
Food Products 0.4% | |
Archer-Daniels-
Midland Co. | | | 294 | | | | 12 | | |
Bunge Ltd. | | | 561 | | | | 39 | (a) | |
Campbell Soup
Co. | | | 25 | | | | 1 | | |
Conagra Brands,
Inc. | | | 60 | | | | 2 | (a) | |
Flowers Foods,
Inc. | | | 100 | | | | 2 | | |
General Mills, Inc. | | | 49 | | | | 3 | | |
Hershey Co. | | | 31 | | | | 3 | | |
Ingredion, Inc. | | | 26 | | | | 3 | | |
J & J Snack Foods
Corp. | | | 11 | | | | 1 | | |
J.M. Smucker Co. | | | 14 | | | | 1 | | |
Schouw & Co.
AB | | | 24 | | | | 3 | | |
Tyson Foods, Inc.
Class A | | | 132 | | | | 10 | | |
| | | | 80 | | |
Gas Utilities 0.1% | |
Gas Natural SDG
SA | | | 324 | | | | 7 | | |
National Fuel Gas
Co. | | | 65 | | | | 4 | | |
Southwest Gas
Holdings Inc. | | | 101 | | | | 8 | | |
UGI Corp. | | | 115 | | | | 6 | | |
| | | | 25 | | |
| | |
Number
of Shares | | Value
(000's
omitted) | |
| Health Care Equipment & Supplies 0.0%(c) | |
Ansell Ltd. | | | 128 | | | $ | 2 | | |
Health Care Providers & Services 0.1% | |
Anthem, Inc. | | | 5 | | | | 1 | | |
Quest
Diagnostics, Inc. | | | 84 | | | | 8 | | |
Sonic Healthcare
Ltd. | | | 102 | | | | 1 | | |
UDG Healthcare
PLC | | | 59 | | | | 1 | | |
UnitedHealth
Group, Inc. | | | 47 | | | | 10 | | |
| | | | 21 | | |
Hotels, Restaurants & Leisure 0.6% | |
bet-at-home.com
AG | | | 5 | | | | 1 | | |
Carnival Corp. | | | 1,222 | | | | 81 | (a) | |
Crown Resorts
Ltd. | | | 207 | | | | 2 | | |
International
Game
Technology PLC | | | 254 | | | | 6 | (a) | |
McDonald's
Corp. | | | 256 | | | | 42 | (a) | |
Royal Caribbean
Cruises Ltd. | | | 14 | | | | 1 | (a) | |
Tabcorp Holdings
Ltd. | | | 155 | | | | 1 | | |
TUI AG | | | 39 | | | | 1 | | |
Wyndham
Worldwide
Corp. | | | 7 | | | | 1 | | |
| | | | 136 | | |
Household Durables 0.2% | |
Barratt
Developments
PLC | | | 511 | | | | 5 | | |
Bellway PLC | | | 107 | | | | 5 | | |
Berkeley Group
Holdings PLC | | | 49 | | | | 2 | | |
Crest Nicholson
Holdings PLC | | | 166 | | | | 1 | | |
D.R. Horton, Inc. | | | 129 | | | | 6 | | |
Man Wah
Holdings Ltd. | | | 2,400 | | | | 2 | | |
MDC Holdings,
Inc. | | | 215 | | | | 8 | | |
Persimmon PLC | | | 388 | | | | 15 | | |
PulteGroup, Inc. | | | 235 | | | | 7 | | |
Redrow PLC | | | 432 | | | | 4 | | |
Taylor Wimpey
PLC | | | 492 | | | | 1 | | |
| | | | 56 | | |
Household Products 0.8% | |
Colgate-
Palmolive Co. | | | 307 | | | | 22 | (a) | |
| | |
Number
of Shares | | Value
(000's
omitted) | |
Kimberly-Clark
Corp. | | | 164 | | | $ | 18 | (a) | |
Procter &
Gamble Co. | | | 1,694 | | | | 146 | (a) | |
Spectrum Brands
Holdings, Inc. | | | 17 | | | | 2 | | |
| | | | 188 | | |
Independent Power and Renewable Electricity Producers 0.3% | |
NextEra Energy
Partners LP | | | 1,725 | | | | 68 | (a) | |
NRG Energy, Inc. | | | 285 | | | | 7 | | |
| | | | 75 | | |
Industrial Conglomerates 0.2% | |
Hopewell
Holdings Ltd. | | | 1,500 | | | | 6 | | |
Keppel Corp. Ltd. | | | 500 | | | | 3 | | |
NWS Holdings
Ltd. | | | 2,000 | | | | 4 | | |
Raven Industries,
Inc. | | | 24 | | | | 1 | | |
Siemens AG ADR | | | 480 | | | | 34 | (a) | |
| | | | 48 | | |
Insurance 1.7% | |
Aegon NV | | | 108 | | | | 1 | | |
Aflac, Inc. | | | 118 | | | | 10 | | |
Allianz SE | | | 392 | | | | 92 | (a) | |
American Equity
Investment Life
Holding Co. | | | 44 | | | | 1 | | |
Assicurazioni
Generali SpA | | | 223 | | | | 4 | | |
Aviva PLC | | | 558 | | | | 4 | | |
AXA SA | | | 1,698 | | | | 51 | (a) | |
Chubb Ltd. | | | 29 | | | | 4 | (a) | |
CNA Financial
Corp. | | | 209 | | | | 11 | | |
CNP Assurances | | | 210 | | | | 5 | | |
Gjensidige
Forsikring ASA | | | 42 | | | | 1 | | |
Hannover Rueck
SE | | | 28 | | | | 4 | | |
Insurance
Australia Group
Ltd. | | | 1,017 | | | | 5 | | |
Legal & General
Group PLC | | | 5,182 | | | | 18 | | |
Mapfre SA | | | 1,383 | | | | 5 | | |
Muenchener
Rueckversicherungs-
Gesellschaft
AG in
Muenchen | | | 117 | | | | 26 | (a) | |
Old Mutual PLC | | | 3,614 | | | | 9 | | |
Phoenix Group
Holdings | | | 58 | | | | 1 | | |
Principal Financial
Group, Inc. | | | 52 | | | | 3 | | |
See Notes to Financial Statements
77
Schedule of Investments Multi-Asset Income Fund (cont'd)
| | |
Number
of Shares | | Value
(000's
omitted) | |
Progressive Corp. | | | 151 | | | $ | 7 | | |
Prudential
Financial, Inc. | | | 74 | | | | 8 | | |
QBE Insurance
Group Ltd. | | | 59 | | | | 1 | | |
Sampo OYJ, A
Shares | | | 139 | | | | 7 | | |
SCOR SE | | | 123 | | | | 5 | | |
Storebrand ASA | | | 674 | | | | 6 | * | |
Swiss Life
Holding AG | | | 24 | | | | 8 | * | |
Swiss Re AG | | | 261 | | | | 25 | (a) | |
Travelers Cos.,
Inc. | | | 86 | | | | 11 | | |
Unipol Gruppo
SpA | | | 966 | | | | 4 | | |
UNIQA Insurance
Group AG | | | 144 | | | | 2 | | |
Unum Group | | | 82 | | | | 4 | | |
Zurich Insurance
Group AG | | | 126 | | | | 39 | (a) | |
| | | | 382 | | |
IT Services 0.4% | |
Atea ASA | | | 75 | | | | 1 | * | |
Automatic Data
Processing, Inc. | | | 268 | | | | 31 | (a) | |
IBM Corp. | | | 382 | | | | 59 | (a) | |
| | | | 91 | | |
Machinery 0.2% | |
Cummins, Inc. | | | 82 | | | | 14 | | |
IHI Corp. | | | 100 | | | | 4 | | |
Metso OYJ | | | 103 | | | | 4 | | |
Sandvik AB | | | 129 | | | | 2 | | |
VAT Group AG | | | 46 | | | | 6 | *(o) | |
Volvo AB, B
Shares | | | 34 | | | | 1 | | |
Yangzijiang
Shipbuilding
Holdings Ltd. | | | 6,100 | | | | 7 | | |
| | | | 38 | | |
Media 0.4% | |
CBS Corp.
Class B | | | 32 | | | | 2 | | |
I-CABLE
Communications
Ltd. | | | 799 | | | | 0 | *(d) | |
Interpublic Group
of Cos., Inc. | | | 1,950 | | | | 37 | | |
Meredith Corp. | | | 92 | | | | 5 | | |
Modern Times
Group MTG AB,
B Shares | | | 57 | | | | 2 | | |
Pearson PLC | | | 1,155 | | | | 11 | | |
ProSiebenSat.1
Media SE | | | 16 | | | | 1 | | |
Regal
Entertainment
Group Class A | | | 1,625 | | | | 26 | (a) | |
| | |
Number
of Shares | | Value
(000's
omitted) | |
Scripps Networks
Interactive, Inc.
Class A | | | 36 | | | $ | 3 | | |
Sinclair Broadcast
Group, Inc.
Class A | | | 85 | | | | 3 | | |
Time Warner, Inc. | | | 20 | | | | 2 | | |
Time, Inc. | | | 41 | | | | 0 | (d) | |
Tribune Media
Co. Class A | | | 49 | | | | 2 | | |
Twenty-First
Century Fox, Inc.
Class B | | | 25 | | | | 1 | | |
Viacom, Inc.
Class A | | | 29 | | | | 1 | | |
Viacom, Inc.
Class B | | | 217 | | | | 5 | | |
| | | | 101 | | |
Metals & Mining 1.6% | |
Anglo American
PLC | | | 1,237 | | | | 23 | (a) | |
Bekaert SA | | | 15 | | | | 1 | | |
BHP Billiton Ltd. | | | 2,368 | | | | 48 | (a) | |
BHP Billiton PLC | | | 1,476 | | | | 27 | (a) | |
Carpenter
Technology
Corp. | | | 23 | | | | 1 | | |
Commercial
Metals Co. | | | 209 | | | | 4 | | |
Ferrexpo PLC | | | 2,145 | | | | 7 | | |
Fortescue Metals
Group Ltd. | | | 1,435 | | | | 5 | | |
Franco-Nevada
Corp. | | | 385 | | | | 31 | (a) | |
Glencore PLC | | | 1,056 | | | | 5 | * | |
Hitachi Metals
Ltd. | | | 200 | | | | 3 | | |
Nucor Corp. | | | 69 | | | | 4 | | |
Outokumpu OYJ | | | 556 | | | | 5 | | |
Reliance Steel &
Aluminum Co. | | | 19 | | | | 1 | | |
Rio Tinto Ltd. | | | 309 | | | | 16 | | |
Rio Tinto PLC | | | 1,149 | | | | 54 | (a) | |
Rio Tinto PLC
ADR | | | 1,500 | | | | 72 | (a) | |
Southern Copper
Corp. | | | 925 | | | | 40 | (a) | |
Steel Dynamics,
Inc. | | | 390 | | | | 15 | | |
Vedanta
Resources PLC | | | 586 | | | | 7 | | |
| | | | 369 | | |
Mortgage Real Estate Investment Trusts 0.6% | |
AGNC
Investment
Corp. | | | 276 | | | | 6 | | |
Annaly Capital
Management,
Inc. | | | 2,234 | | | | 26 | (a) | |
| | |
Number
of Shares | | Value
(000's
omitted) | |
ARMOUR
Residential REIT,
Inc. | | | 52 | | | $ | 1 | | |
Blackstone
Mortgage Trust,
Inc. Class A | | | 626 | | | | 20 | (a) | |
Chimera
Investment
Corp. | | | 805 | | | | 15 | | |
CYS Investments,
Inc. | | | 91 | | | | 1 | | |
Invesco
Mortgage
Capital, Inc. | | | 194 | | | | 3 | | |
Ladder Capital
Corp. | | | 73 | | | | 1 | | |
MFA Financial,
Inc. | | | 361 | | | | 3 | | |
New Residential
Investment
Corp. | | | 622 | | | | 11 | | |
PennyMac
Mortgage
Investment Trust | | | 138 | | | | 2 | | |
Starwood
Property Trust,
Inc. | | | 1,862 | | | | 40 | (a) | |
Two Harbors
Investment
Corp. | | | 541 | | | | 5 | | |
| | | | 134 | | |
Multi-Utilities 1.0% | |
ACEA SpA | | | 180 | | | | 3 | | |
AGL Energy Ltd. | | | 208 | | | | 4 | | |
Ameren Corp. | | | 787 | | | | 49 | (a) | |
CenterPoint
Energy, Inc. | | | 586 | | | | 17 | | |
Centrica PLC | | | 3,358 | | | | 8 | | |
Consolidated
Edison, Inc. | | | 74 | | | | 6 | | |
DTE Energy Co. | | | 284 | | | | 31 | | |
Engie SA | | | 286 | | | | 5 | | |
MDU Resources
Group, Inc. | | | 139 | | | | 4 | | |
National Grid
PLC | | | 1,896 | | | | 23 | | |
NiSource, Inc. | | | 1,000 | | | | 26 | | |
Sempra Energy | | | 350 | | | | 41 | (a) | |
WEC Energy
Group, Inc. | | | 59 | | | | 4 | (a) | |
| | | | 221 | | |
Multiline Retail 0.1% | |
Harvey Norman
Holdings Ltd. | | | 179 | | | | 1 | | |
Kohl's Corp. | | | 149 | | | | 6 | | |
Macy's, Inc. | | | 25 | | | | 0 | (d) | |
Marks & Spencer
Group PLC | | | 660 | | | | 3 | | |
Target Corp. | | | 147 | | | | 9 | (a) | |
| | | | 19 | | |
See Notes to Financial Statements
78
Schedule of Investments Multi-Asset Income Fund (cont'd)
| | |
Number
of Shares | | Value
(000's
omitted) | |
Oil, Gas & Consumable Fuels 3.0% | |
Eni SpA | | | 107 | | | $ | 2 | | |
Exxon Mobil
Corp. | | | 1,239 | | | | 103 | (a) | |
Idemitsu Kosan
Co. Ltd. | | | 100 | | | | 3 | | |
JXTG Holdings,
Inc. | | | 100 | | | | 1 | | |
Marathon
Petroleum Corp. | | | 318 | | | | 19 | | |
OMV AG | | | 165 | | | | 10 | | |
ONEOK, Inc. | | | 2,713 | | | | 147 | (a) | |
Pembina Pipeline
Corp. | | | 800 | | | | 26 | | |
Repsol SA | | | 1,077 | | | | 20 | | |
Royal Dutch Shell
PLC, A Shares | | | 2,023 | | | | 64 | (a) | |
Royal Dutch Shell
PLC, B Shares | | | 1,395 | | | | 45 | (a) | |
Snam SpA | | | 431 | | | | 2 | | |
Statoil ASA | | | 672 | | | | 14 | | |
Suncor Energy,
Inc. | | | 2,025 | | | | 69 | (a) | |
Targa Resources
Corp. | | | 675 | | | | 28 | (a) | |
TOTAL SA | | | 1,550 | | | | 86 | (a) | |
Total SA ADR | | | 500 | | | | 28 | | |
Valero Energy
Corp. | | | 209 | | | | 16 | | |
Woodside
Petroleum Ltd. | | | 387 | | | | 9 | | |
| | | | 692 | | |
Paper & Forest Products 0.1% | |
Stora Enso OYJ,
R Shares | | | 52 | | | | 1 | | |
UPM-Kymmene
OYJ | | | 520 | | | | 15 | | |
| | | | 16 | | |
| Personal Products 0.0%(c) | |
Nu Skin
Enterprises, Inc.
Class A | | | 21 | | | | 1 | | |
Pharmaceuticals 3.0% | |
AstraZeneca PLC | | | 1,075 | | | | 72 | (a) | |
Eli Lilly & Co. | | | 763 | | | | 63 | (a) | |
GlaxoSmithKline
PLC | | | 4,027 | | | | 73 | (a) | |
GlaxoSmithKline
PLC ADR | | | 200 | | | | 7 | (a) | |
Johnson &
Johnson | | | 1,343 | | | | 187 | (a) | |
Merck & Co., Inc. | | | 1,228 | | | | 68 | (a) | |
Orion OYJ
Class B | | | 123 | | | | 5 | | |
Pfizer, Inc. | | | 2,833 | | | | 99 | (a) | |
Sanofi | | | 916 | | | | 87 | (a) | |
| | |
Number
of Shares | | Value
(000's
omitted) | |
Takeda
Pharmaceutical
Co. Ltd. | | | 400 | | | $ | 22 | (a) | |
| | | | 683 | | |
Real Estate Management & Development 0.2% | |
Brookfield
Property
Partners LP | | | 748 | | | | 17 | (a) | |
Kerry Properties
Ltd. | | | 1,000 | | | | 4 | | |
LendLease Group | | | 368 | | | | 5 | | |
New World
Development
Co. Ltd. | | | 3,000 | | | | 4 | | |
Wharf Holdings
Ltd. | | | 1,000 | | | | 9 | | |
Yanlord Land
Group Ltd. | | | 1,300 | | | | 2 | | |
| | | 41 | | |
Road & Rail 0.3% | |
CSX Corp. | | | 150 | | | | 8 | (a) | |
Norfolk Southern
Corp. | | | 312 | | | | 41 | (a) | |
Union Pacific
Corp. | | | 250 | | | | 29 | (a) | |
| | | | 78 | | |
Semiconductors & Semiconductor Equipment 1.7% | |
Analog Devices,
Inc. | | | 105 | | | | 10 | | |
Applied
Materials, Inc. | | | 295 | | | | 17 | | |
BE
Semiconductor
Industries NV | | | 33 | | | | 3 | | |
Brooks
Automation, Inc. | | | 218 | | | | 7 | | |
Cypress
Semiconductor
Corp. | | | 107 | | | | 2 | | |
Intel Corp. | | | 2,144 | | | | 97 | (a) | |
KLA-Tencor Corp. | | | 119 | | | | 13 | | |
Lam Research
Corp. | | | 63 | | | | 13 | | |
Maxim
Integrated
Products, Inc. | | | 1,000 | | | | 53 | (a) | |
QUALCOMM,
Inc. | | | 1,025 | | | | 52 | (a) | |
STMicroelectronics NV | | | 177 | | | | 4 | | |
Taiwan
Semiconductor
Manufacturing
Co. Ltd. ADR | | | 1,625 | | | | 69 | (a) | |
Texas
Instruments, Inc. | | | 553 | | | | 53 | (a) | |
| | | | 393 | | |
| | |
Number
of Shares | | Value
(000's
omitted) | |
Software 0.9% | |
Microsoft Corp. | | | 2,447 | | | $ | 204 | (a) | |
Specialty Retail 0.3% | |
Best Buy Co., Inc. | | | 161 | | | | 9 | (a) | |
Gap, Inc. | | | 236 | | | | 6 | | |
Hennes &
Mauritz AB, B
Shares | | | 282 | | | | 7 | | |
Office Depot, Inc. | | | 481 | | | | 2 | | |
Williams-Sonoma, Inc. | | | 700 | | | | 36 | (a) | |
| | | | 60 | | |
Technology Hardware, Storage & Peripherals 0.8% | |
Apple, Inc. | | | 513 | | | | 87 | (a) | |
Canon, Inc. | | | 600 | | | | 22 | (a) | |
HP, Inc. | | | 1,098 | | | | 24 | (a) | |
Logitech
International SA | | | 33 | | | | 1 | | |
Western Digital
Corp. | | | 625 | | | | 56 | (a) | |
Xerox Corp. | | | 80 | | | | 2 | | |
| | | | 192 | | |
| Textiles, Apparel & Luxury Goods 0.0%(c) | |
Yue Yuen
Industrial
Holdings Ltd. | | | 1,000 | | | | 4 | | |
| Thrifts & Mortgage Finance 0.0%(c) | |
OneSavings Bank
PLC | | | 183 | | | | 1 | | |
Tobacco 1.4% | |
Altria Group, Inc. | | | 899 | | | | 57 | (a) | |
British American
Tobacco PLC | | | 1,418 | | | | 92 | (a) | |
British American
Tobacco PLC
ADR | | | 261 | | | | 17 | | |
Imperial Brands
PLC | | | 683 | | | | 28 | (a) | |
Philip Morris
International,
Inc. | | | 1,171 | | | | 122 | (a) | |
Universal Corp. | | | 49 | | | | 3 | | |
| | | | 319 | | |
Trading Companies & Distributors 0.1% | |
Aircastle Ltd. | | | 111 | | | | 2 | | |
GATX Corp. | | | 40 | | | | 2 | | |
Grafton Group
PLC | | | 177 | | | | 2 | | |
Rexel SA | | | 100 | | | | 2 | | |
Seven Group
Holdings Ltd. | | | 180 | | | | 2 | | |
Sumitomo Corp. | | | 400 | | | | 6 | | |
| | | | 16 | | |
See Notes to Financial Statements
79
Schedule of Investments Multi-Asset Income Fund (cont'd)
| | |
Number
of Shares | | Value
(000's
omitted) | |
Transportation Infrastructure 0.1% | |
Hutchison Port
Holdings Trust | | | 2,600 | | | $ | 1 | | |
Sydney Airport | | | 4,700 | | | | 26 | | |
| | | | 27 | | |
Wireless Telecommunication Services 0.3% | |
Freenet AG | | | 28 | | | | 1 | | |
Millicom
International
Cellular SA ADR | | | 31 | | | | 2 | | |
Vodafone Group
PLC | | | 18,986 | | | | 54 | (a) | |
| | | | 57 | | |
Total Common Stocks
(Cost $6,870) | | | 7,705 | | |
Convertible Preferred Stocks 0.2% | |
| Oil, Gas & Consumable Fuel 0.0%(c) | |
El Paso
Energy Capital
Trust I, 4.75%,
due 3/31/28 | | | 100 | | | | 5 | | |
Pharmaceuticals 0.2% | |
Allergan PLC,
Ser. A, 5.50%,
due 3/1/18 | | | 60 | | | | 39 | (a) | |
Total Convertible
Preferred Stocks
(Cost $53) | | | 44 | | |
Preferred Stocks 1.2% | |
Equity Real Estate Investment Trusts 1.2% | |
American Homes
4 Rent, Ser. D,
6.50% | | | 746 | | | | 20 | (a) | |
Ashford
Hospitality Trust,
Inc., Ser. F,
7.38% | | | 200 | | | | 5 | | |
Ashford
Hospitality Trust,
Inc., Ser. H,
7.50% | | | 529 | | | | 13 | | |
Cedar Realty
Trust, Inc.,
Ser.B, 7.25% | | | 370 | | | | 10 | | |
Colony
NorthStar, Inc.,
Ser. J, 7.13% | | | 793 | | | | 20 | | |
Digital Realty
Trust, Inc.,
Ser.C, 6.63% | | | 648 | | | | 18 | | |
Farmland
Partners, Inc.,
Ser. B, 6.00% | | | 400 | | | | 11 | (e) | |
| | |
Number
of Shares | | Value
(000's
omitted) | |
GGP, Inc., Ser. A,
6.38% | | | 1,226 | | | $ | 31 | (a) | |
Hersha
Hospitality Trust,
Ser. C, 6.88% | | | 764 | | | | 19 | | |
National Retail
Properties, Inc.,
Ser. F, 5.20% | | | 675 | | | | 17 | | |
Pebblebrook
Hotel Trust,
Ser. D, 6.38% | | | 746 | | | | 19 | | |
Public Storage,
Ser. E, 4.90% | | | 575 | | | | 14 | | |
Retail Properties
of America, Inc.,
Ser. A, 7.00% | | | 764 | | | | 19 | | |
Rexford Industrial
Realty, Inc.,
Ser. A, 5.88% | | | 533 | | | | 14 | | |
Sabra Health
Care REIT, Inc.,
Ser. A, 7.13% | | | 986 | | | | 25 | (a) | |
VEREIT, Inc.,
Ser. F, 6.70% | | | 764 | | | | 20(a) | | |
Total Preferred Stocks
(Cost $271) | | | 275 | | |
| | | Principal
Amount(f)
(000's
omitted) | | | |
Convertible Bonds 0.7% | |
| Communications Equipment 0.0%(c) | |
Finisar Corp.,
0.50%, due
12/15/36 | | $ | 5 | | | | 5 | (a)(b) | |
Equity Real Estate Investment Trusts 0.3% | |
Colony
Starwood
Homes, 3.50%,
due 1/15/22 | | | 10 | | | | 11 | (a)(b) | |
Extra Space
Storage LP,
3.13%, due
10/1/35 | | | 50 | | | | 55 | (a)(b) | |
| | | | 66 | | |
| Health Care Providers & Services 0.0%(c) | |
Teladoc, Inc.,
3.00%, due
12/15/22 | | | 10 | | | | 11 | (b) | |
| | | Principal
Amount(f)
(000's
omitted) | | Value
(000's
omitted) | |
Independent Power and Renewable Electricity Producers 0.1% | |
NextEra Energy
Partners L.P.,
1.50%, due
9/15/20 | | $ | 15 | | | $ | 14 | (b) | |
| Internet & Direct Marketing Retail 0.0%(c) | |
Liberty Expedia
Holdings, Inc.,
1.00%, due
6/30/47 | | | 10 | | | | 10 | (b) | |
| Internet Software & Services 0.0%(c) | |
Zillow Group,
Inc., 2.00%,
due 12/1/21 | | | 10 | | | | 11 | (a)(b) | |
Media 0.1% | |
World
Wrestling
Entertainment,
Inc., 3.38%,
due 12/15/23 | | | 10 | | | | 12 | (a)(b) | |
Oil Field Equipment & Services 0.1% | |
Ensco Jersey
Finance Ltd.,
3.00%, due
1/31/24 | | | 20 | | | | 17 | (a)(b) | |
Oil, Gas & Consumable Fuel 0.1% | |
Golar LNG Ltd.,
2.75%, due
2/15/22 | | | 15 | | | | 14 | (a)(b) | |
| Software 0.0%(c) | |
Nice Systems,
Inc., 1.25%,
due 1/15/24 | | | 10 | | | | 11 | (a)(b) | |
Total Convertible Bonds
(Cost $165) | | | 171 | | |
Corporate Bonds 10.8% | |
Aerospace & Defense 0.1% | |
Northrop
Grumman
Corp., 2.55%,
due 10/15/22 | | | 35 | | | | 35 | | |
Agriculture 0.3% | |
BAT Capital
Corp., 4.54%,
due 8/15/47 | | | 65 | | | | 66 | (b) | |
Auto Manufacturers 0.4% | |
General Motors
Financial Co., Inc.
3.20%, due
7/6/21 | | | 40 | | | | 41 | (a) | |
4.00%, due
10/6/26 | | | 45 | | | | 45 | (a) | |
| | | | 86 | | |
See Notes to Financial Statements
80
Schedule of Investments Multi-Asset Income Fund (cont'd)
| | | Principal
Amount(f)
(000's
omitted) | | Value
(000's
omitted) | |
Banks 2.3% | | | | | |
Bank of America
Corp., Ser. L,
3.95%,
due 4/21/25 | | $ | 45 | | | $ | 46 | (a) | |
Capital One
N.A., 2.35%,
due 1/31/20 | | | 80 | | | | 80 | (a) | |
Goldman Sachs
Group, Inc.
3 month USD
LIBOR + 1.51%,
(3.69%), due
6/5/28 | | | 45 | | | | 46 | (a)(g) | |
3 month USD
LIBOR + 1.37%,
(4.02%), due
10/31/38 | | | 35 | | | | 35 | (g) | |
5.15%, due
5/22/45 | | | 50 | | | | 57 | (a) | |
JPMorgan
Chase & Co.,
3 month USD
LIBOR + 1.38%,
(3.54%), due
5/1/28 | | | 50 | | | | 51 | (a)(g) | |
Morgan Stanley,
3 month USD
LIBOR + 1.34%,
(3.59%), due
7/22/28 | | | 120 | | | | 121 | (a)(g) | |
SunTrust Banks,
Inc., Ser. G,
3 month USD
LIBOR + 3.10%,
(5.05%), due
12/31/99 | | | 15 | | | | 15 | (a)(g) | |
Westpac Banking
Corp., 1 month
USD LIBOR +
2.89%, (5.00%),
due 12/31/99 | | | 65 | | | | 65 | (g) | |
| | | | 516 | | |
Beverages 0.1% | | | | | |
Anheuser-Busch
InBev Finance,
Inc., 4.70%,
due 2/1/36 | | | 20 | | | | 22 | | |
Biotechnology 0.1% | | | | | |
Gilead Sciences,
Inc., 4.60%,
due 9/1/35 | | | 20 | | | | 22 | | |
Computers 1.8% | | | | | |
Apple, Inc.
2.30%, due
5/11/22 | | | 65 | | | | 65 | (a) | |
4.65%, due
2/23/46 | | | 40 | | | | 45 | (a) | |
| | | Principal
Amount(f)
(000's
omitted) | | Value
(000's
omitted) | |
Diamond 1
Finance Corp./
Diamond 2
Finance Corp.
4.42%, due
6/15/21 | | $ | 50 | | | $ | 53 | (a)(b) | |
5.45%, due
6/15/23 | | | 80 | | | | 88 | (a)(b) | |
6.02%, due
6/15/26 | | | 25 | | | | 28 | (b) | |
Hewlett
Packard
Enterprise Co.,
4.65%, due
12/9/21 | | | 80 | | | | 86 | (a) | |
HP Enterprise
Co., 4.90%,
due 10/15/25 | | | 35 | | | | 37 | (a) | |
| | | | 402 | | |
Diversified Financial Services 0.2% | | | | | |
Discover
Financial
Services, 4.10%,
due 2/9/27 | | | 45 | | | | 46 | (a) | |
Healthcare—Products 0.1% | | | | | |
Abbott
Laboratories,
4.90%, due
11/30/46 | | | 30 | | | | 34 | (a) | |
Iron—Steel 0.4% | | | | | |
Vale Overseas
Ltd., 6.25%,
due 8/10/26 | | | 85 | | | | 98 | | |
Media 1.1% | | | | | |
21st Century
Fox America,
Inc., 3.38%,
due 11/15/26 | | | 20 | | | | 20 | | |
Charter
Communications
Operating
LLC/Charter
Communications
Operating Capital
4.91%, due
7/23/25 | | | 65 | | | | 69 | (a) | |
6.48%, due
10/23/45 | | | 50 | | | | 58 | (a) | |
Discovery
Communications
LLC, 5.20%,
due 9/20/47 | | | 25 | | | | 25 | | |
Viacom, Inc.
4.38%, due
3/15/43 | | | 65 | | | | 55 | (a) | |
3 month USD
LIBOR + 3.90%,
(5.88%), due
2/28/57 | | | 35 | | | | 35 | (a)(g) | |
| | | | 262 | | |
| | | Principal
Amount(f)
(000's
omitted) | | Value
(000's
omitted) | |
Oil & Gas 1.4% | | | | | |
Canadian
Natural
Resources
Ltd., 2.95%,
due 1/15/23 | | $ | 60 | | | $ | 60 | (a) | |
Concho
Resources,
Inc., 3.75%,
due 10/1/27 | | | 45 | | | | 46 | | |
Hess Corp., 4.30%,
due 4/1/27 | | | 65 | | | | 66 | (a) | |
Noble Energy, Inc.
3.85%, due
1/15/28 | | | 70 | | | | 70 | | |
5.25%, due
11/15/43 | | | 35 | | | | 37 | (a) | |
Petroleos
Mexicanos,
6.50%, due
3/13/27 | | | 40 | | | | 44 | (b) | |
| | | | 323 | | |
Pharmaceuticals 0.2% | | | | | |
AbbVie, Inc.,
4.45%, due
5/14/46 | | | 40 | | | | 42 | (a) | |
Pipelines 0.5% | | | | | |
Energy Transfer
Partners L.P.,
6.50%, due
2/1/42 | | | 30 | | | | 34 | (a) | |
Kinder Morgan,
Inc., 5.55%,
due 6/1/45 | | | 40 | | | | 43 | (a) | |
MPLX LP, 4.13%,
due 3/1/27 | | | 25 | | | | 26 | | |
| | | | 103 | | |
Semiconductors 0.6% | | | | | |
Broadcom
Corp./Broadcom
Cayman Finance
Ltd., 3.88%,
due 1/15/27 | | | 130 | | | | 134 | (b) | |
Software 0.2% | | | | | |
Microsoft Corp.,
4.50%, due
2/6/57 | | | 40 | | | | 45 | (a) | |
Telecommunications 1.0% | | | | | |
AT&T, Inc.
3.90%, due
8/14/27 | | | 40 | | | | 40 | | |
4.75%, due
5/15/46 | | | 35 | | | | 33 | (a) | |
5.45%, due
3/1/47 | | | 65 | | | | 68 | (a) | |
See Notes to Financial Statements
81
Schedule of Investments Multi-Asset Income Fund (cont'd)
| | | Principal
Amount(f)
(000's
omitted) | | Value
(000's
omitted) | |
Verizon
Communications,
Inc.
4.13%, due
8/15/46 | | $ | 30 | | | $ | 27 | (a) | |
4.27%, due
1/15/36 | | | 30 | | | | 30 | | |
4.67%, due
3/15/55 | | | 35 | | | | 33 | (a) | |
| | | | 231 | | |
Total Corporate Bonds
(Cost $2,338) | | | 2,467 | | |
Mortgage-Backed Securities 13.0% | | | | | |
Collateralized Mortgage Obligations 3.1% | | | | | |
Fannie Mae
Connecticut
Avenue Securities
Ser. 2017-C02,
Class 2M2,
1 month USD
LIBOR + 3.65%,
(4.89%), due
9/25/29 | | | 230 | | | | 245 | (a)(g) | |
Ser. 2017-C03,
Class 1M2,
1 month USD
LIBOR + 3.00%,
(4.24%), due
10/25/29 | | | 45 | | | | 46 | (g) | |
Ser. 2017-C04,
Class 2M2,
1 month USD
LIBOR + 2.85%,
(4.09%), due
11/25/29 | | | 120 | | | | 123 | (g) | |
Ser. 2017-C05,
Class 1M2,
1 month USD
LIBOR + 2.20%,
(3.44%), due
1/25/30 | | | 35 | | | | 35 | (g) | |
Freddie Mac
Structured
Agency Credit
Risk Debt Notes,
Ser. 2017-DNA2,
Class M2,
1 month USD
LIBOR + 3.45%,
(4.69%), due
10/25/29 | | | 250 | | | | 266 | (a)(g) | |
| | | | 715 | | |
| | | Principal
Amount(f)
(000's
omitted) | | Value
(000's
omitted) | |
Fannie Mae 5.3% | | | | | |
Pass-Through
Certificates
3.00%, TBA,
15 Year Maturity | | $ | 160 | | | $ | 164 | (h) | |
3.50%, TBA,
30 Year Maturity | | | 340 | | | | 349 | (h) | |
4.00%, TBA,
30 Year Maturity | | | 665 | | | | 698 | (h) | |
| | | | 1,211 | | |
Freddie Mac 4.6% | | | | | |
Pass-Through
Certificates
3.00%, TBA,
15 Year Maturity | | | 185 | | | | 189 | (h) | |
3.50%, TBA,
30 Year Maturity | | | 365 | | | | 375 | (h) | |
4.00%, TBA,
30 Year Maturity | | | 460 | | | | 483 | (h) | |
| | | | 1,047 | | |
Total Mortgage-Backed
Securities
(Cost $2,947) | | | 2,973 | | |
U.S. Treasury Obligations 12.6% | | | | | |
U.S. Treasury
Bill, 0.89%,
due 5/24/18 | | | 100 | | | | 99 | (i)(j) | |
U.S. Treasury
Bonds
4.50%, due
2/15/36 | | | 231 | | | | 296 | | |
3.88%, due
8/15/40 | | | 436 | | | | 517 | (j) | |
U.S. Treasury
Inflation-Indexed
Bonds
2.00%, due
1/15/26 | | | 604 | | | | 677 | (j)(k) | |
1.75%, due
1/15/28 | | | 12 | | | | 13 | (k) | |
2.50%, due
1/15/29 | | | 69 | | | | 83 | (k) | |
3.88%, due
4/15/29 | | | 223 | | | | 302 | (j)(k) | |
0.63%, due
2/15/43 | | | 21 | | | | 20 | (k) | |
U.S. Treasury
Notes
2.63%, due
4/30/18 | | | 310 | | | | 312 | | |
1.00%, due
5/31/18 | | | 180 | | | | 180 | | |
1.50%, due
8/31/18-2/28/23 | | | 325 | | | | 322 | | |
1.63%, due
2/15/26 | | | 45 | | | | 43 | | |
Total U.S. Treasury
Obligations
(Cost $2,895) | | | 2,864 | | |
| | | Principal
Amount(f)
(000's
omitted) | | Value
(000's
omitted) | |
U.S. Government Agency Securities 0.9% | |
Federal Home
Loan Bank,
5.50%,
due 7/15/36 | | $ | 120 | | | $ | 162 | | |
Tennessee Valley
Authority,
5.38%, due
4/1/56 | | | 30 | | | | 41 | | |
Total U.S. Government
Agency Securities
(Cost $209) | | | 203 | | |
Asset-Backed Securities 3.2% | |
Ally Auto
Receivables
Trust,
Ser. 2017-3,
Class A2,
1.53%,
due 3/16/20 | | | 19 | | | | 19 | | |
Bear Stearns
Asset Backed
Securities
Trust,
Ser. 2006-SD2,
Class M2, 2.03%,
due 6/25/36,
1 month USD
LIBOR + 0.80%,
(2.04%), due
6/25/36 | | | 170 | | | | 157 | (a)(g) | |
Capital One
Multi-Asset
Execution Trust
Ser. 2015-A1,
Class A1,
1.39%, due
1/15/21 | | | 30 | | | | 30 | | |
Ser. 2016-A1,
Class A1, 1
month USD
LIBOR + 0.45%,
(1.69%), due
2/15/22 | | | 20 | | | | 20 | (g) | |
Carrington
Mortgage
Loan Trust,
Ser. 2006-OPT1,
Class M1,
1 month USD
LIBOR + 0.35%,
(1.58%), due
2/25/36, 1 month
USD LIBOR
+0.35%,
(1.59%), due
2/25/36 | | | 168 | | | | 159 | (a)(g) | |
See Notes to Financial Statements
82
Schedule of Investments Multi-Asset Income Fund (cont'd)
| | | Principal
Amount(f)
(000's
omitted) | | Value
(000's
omitted) | |
Citibank Credit
Card Issuance
Trust,
Ser. 2017-A3,
Class A3,
1.92%,
due 4/7/22 | | $ | 170 | | | $ | 170 | (a) | |
JP Morgan
Mortgage
Acquisition
Corp.,
Ser. 2005-OPT2,
Class M3,
1 month USD
LIBOR + 0.48%,
(1.71%), due
12/25/36,
1 month USD
LIBOR + 0.48%,
(1.72%), due
12/25/35 | | | 135 | | | | 128 | (a)(g) | |
Toyota Auto
Receivables
Owner Trust,
Ser. 2017-B,
Class A2A,
1.46% due
1/15/20 | | | 50 | | | | 50 | | |
Total Asset-Backed
Securities
(Cost $723) | | | 733 | | |
Foreign Government Security 0.6% | |
South Africa
Government
International
Bond,
Ser. R214,
6.50%, due
2/28/41
(Cost $141) | | ZAR | 2,695 | | | | 130 | | |
| | | Number
of Shares | | | |
Exchange Traded Funds 3.5% | |
iShares iBoxx
High Yield
Corporate
Bond ETF | | | 1,300 | | | | 115 | | |
PowerShares
Senior Loan
Portfolio | | | 29,700 | | | | 687 | (a) | |
Total Exchange
Traded Funds
(Cost $806) | | | 802 | | |
| | |
Number
of Shares | | Value
(000's
omitted) | |
Master Limited Partnerships 3.1% | |
Hotels, Restaurants & Leisure 0.3% | |
Cedar Fair LP | | | 1,000 | | | $ | 63 | (a) | |
Oil, Gas & Consumable Fuels 2.8% | |
Alliance Holdings
GP LP | | | 1,325 | | | | 37 | (a) | |
Antero
Midstream
Partners LP | | | 1,300 | | | | 37 | (a) | |
DCP Midstream
LP | | | 500 | | | | 17 | (a) | |
Dominion Energy
Midstream
Partners LP | | | 1,400 | | | | 45 | (a) | |
Energy Transfer
Equity LP | | | 7,000 | | | | 124 | (a) | |
Energy Transfer
Partners LP | | | 1,500 | | | | 26 | (a) | |
Enterprise
Products
Partners LP | | | 2,700 | | | | 66 | (a) | |
EQT GP Holdings
LP | | | 2,000 | | | | 55 | (a) | |
EQT Midstream
Partners LP | | | 575 | | | | 42 | (a) | |
| MPLX LP | | | 1,400 | | | | 49 | (a) | |
NuStar Energy LP | | | 900 | | | | 30 | (a) | |
Western Gas
Equity Partners
LP | | | 2,800 | | | | 111 | (a) | |
| | | | 639 | | |
Total Master Limited
Partnerships
(Cost $740) | | | 702 | | |
Investment Companies 20.8% | |
Neuberger
Berman
Emerging
Markets Debt
Fund
Institutional
Class | | | 114,486 | | | | 1,033 | (a)(l) | |
Neuberger
Berman Floating
Rate Income
Fund
Institutional
Class | | | 106,866 | | | | 1,063 | (a)(l) | |
Neuberger
Berman High
Income Bond
Fund Class R6 | | | 245,375 | | | | 2,162 | (a)(l) | |
| | |
Number
of Shares | | Value
(000's
omitted) | |
Neuberger
Berman Long
Short Credit
Fund Class R6 | | | 48,970 | | | $ | 472 | (a)(l) | |
Total Investment
Companies
(Cost $4,657) | | | 4,730 | | |
| Rights 0.0%(c) | |
| Banks 0.0%(c) | |
Banco Santander
SA
(Cost $0)(d) | | | 87 | | | | 0 | *(d) | |
Short-Term Investment 4.3% | |
Investment Company 4.3% | |
State Street
Institutional U.S.
Government
Money Market
Fund Premier
Class, 0.96%
(Cost $969) | | | 969,402 | | | | 969 | (a)(m) | |
Total
Investments 108.7%
(Cost $23,784) | | | 24,768 | | |
Liabilities Less
Other Assets (8.7)% | | | | | (1,988 | )(n) | |
Net Assets 100.0% | | $ | 22,780 | | |
See Notes to Financial Statements
83
Schedule of Investments Multi-Asset Income Fund (cont'd)
* Non-income producing security.
(a) All or a portion of this security is segregated in connection with obligations for to be announced securities, futures, forward foreign currency contracts, options written and/or swaps with a total value of approximately $15,395,000.
(b) Securities were purchased under Rule 144A of the Securities Act of 1933 Act, as amended (the "1933 Act"), or are otherwise restricted and, unless registered under the 1933 Act or exempted from registration, may only be sold to qualified institutional investors or may have other restrictions on resale. At October 31, 2017, these securities amounted to approximately $584,000, which represents 2.6% of the net assets of the Fund. These securities have been deemed by the investment manager to be liquid.
(c) Represents less than 0.05% of net assets.
(d) Amount less than one thousand.
(e) Step Bond. Coupon rate is a fixed rate for an initial period that either resets at a specific date or may reset in the future contingent upon a predetermined trigger. The interest rate shown was the current rate as of October 31, 2017.
(f) Principal amount is stated in the currency in which the security is denominated.
ZAR = South African Rand
(g) Variable or floating rate security. The interest rate shown was the current rate as of October 31, 2017 and changes periodically.
Benchmarks for Variable/Floating Rates:
LIBOR (USD) - London Interbank Offered Rate
(h) TBA (To Be Announced) Securities are purchased/sold on a forward commitment basis with an approximate principal amount and no defined maturity date. The actual principal and maturity date will be determined upon settlement when the specific mortgage pools are assigned. Total value of all such securities (excluding forward sales contracts, if any) at October 31, 2017 amounted to approximately $2,258,000, which represents 9.9% of net assets of the Fund.
(i) Rate shown was the discount rate at the date of purchase.
(j) All or a portion of the security is pledged as collateral for futures and/or options written.
(k) Index-linked bond whose principal amount adjusts according to a government retail price index.
(l) Affiliated company as defined under the Investment Company Act of 1940. (see Note F of Notes to Financial Statements).
(m) Represents 7-day effective yield as of October 31, 2017.
(n) Includes the impact of the Fund's open positions in derivatives at October 31, 2017.
(o) Security exempt from registration pursuant to Regulation S under the Securities Act of 1933. Regulation S applies to securities offerings that are made outside of the United States and do not involve direct selling efforts in the United States and as such may have restrictions on resale. Total value of all such securities at October 31, 2017 amounted to approximately $13,000, which represents 0.1% of net assets of the Fund.
See Notes to Financial Statements
84
Schedule of Investments Multi-Asset Income Fund (cont'd)
Derivative Instruments
Futures contracts ("futures")
At October 31, 2017, open positions in futures for the Fund were as follows:
Long Futures: | |
Expiration
Date | | Number of
Contracts | | Open Contracts | | Notional
Amount | | Value and
Unrealized
Appreciation/
(Depreciation) | |
12/2017 | | | 2 | | | Brazilian Real | | $ | 60,760 | | | $ | (450 | ) | |
12/2017 | | | 1 | | | Nikkei 225 Index | | | 111,125 | | | | (29 | ) | |
12/2017 | | | 1 | | | Topix Index | | | 155,050 | | | | 16,175 | | |
12/2017 | | | 4 | | | Euro STOXX 50 Index | | | 171,373 | | | | 9,390 | | |
12/2017 | | | 4 | | | FTSE 100 Index | | | 396,718 | | | | 1,970 | | |
12/2017 | | | 5 | | | MSCI EAFE Index | | | 501,850 | | | | 10,282 | | |
12/2017 | | | 29 | | | MSCI World Index | | | 1,630,090 | | | | 25,353 | | |
12/2017 | | | 3 | | | S&P 500 E-Mini Index | | | 385,905 | | | | 8,424 | | |
12/2017 | | | 5 | | | Mexican Peso | | | 129,500 | | | | (8,920 | ) | |
12/2017 | | | 2 | | | New Zealand Dollar | | | 136,720 | | | | (5,576 | ) | |
12/2017 | | | 15 | | | U.S. Treasury Note, 10 Year | | | 1,874,063 | | | | (17,590 | ) | |
12/2017 | | | 2 | | | U.S. Treasury Ultra Long Bond | | | 267,844 | | | | 1,251 | | |
12/2017 | | | 3 | | | United Kingdom Long Gilt Bond | | | 495,387 | | | | (49 | ) | |
Total Long Positions | | | | | | $ | 6,316,385 | | | $ | 40,231 | | |
Short Futures: | |
Expiration
Date | | Number of
Contracts | | Open Contracts | | Notional
Amount | | Value and
Unrealized
Appreciation/
(Depreciation) | |
12/2017 | | | 7 | | | Euro-Bund | | $ | (1,327,055 | ) | | $ | (6,027 | ) | |
12/2017 | | | 2 | | | Euro-Buxl Bond, 30 Year | | | (387,010 | ) | | | (1,636 | ) | |
12/2017 | | | 3 | | | MSCI World Index | | | (172,200 | ) | | | (4,717 | ) | |
12/2017 | | | 4 | | | S&P 500 E-Mini Index | | | (514,540 | ) | | | (22,362 | ) | |
12/2017 | | | 1 | | | Euro | | | (146,013 | ) | | | 3,590 | | |
12/2017 | | | 2 | | | Canadian Dollar | | | (155,150 | ) | | | 4,303 | | |
12/2017 | | | 3 | | | U.S. Treasury Ultra Long Bond | | | (457,406 | ) | | | 7,377 | | |
12/2017 | | | 3 | | | United Kingdom Long Gilt Bond | | | (495,387 | ) | | | 3,153 | | |
Total Short Positions | | | | | | $ | (3,654,761 | ) | | $ | (16,319 | ) | |
Total Futures | | | | | | | | $ | 23,912 | | |
See Notes to Financial Statements
85
Schedule of Investments Multi-Asset Income Fund (cont'd)
At October 31, 2017, the Fund had $183,899 deposited in a segregated account to cover margin requirements on open futures. The Fund had securities pledged in the amount of $99,290 to cover collateral requirements on open futures.
For the year ended October 31, 2017, the average notional value of futures for the Fund was $3,513,202 for long positions and $(2,994,908) for short positions.
Forward foreign currency contracts ("forward contracts")
At October 31, 2017, open forward contracts for the Fund were as follows:(a)
| Currency Purchased | | Currency Sold | | Counterparty | | Settlement
Date | | Net
Unrealized
Appreciation/
(Depreciation) | |
| | 346,004 | | | USD | | | | | 440,007 | | | AUD | | | | Goldman Sachs International | | 1/24/2018 | | $ | 9,494 | | |
| | 71,986 | | | USD | | | | | 94,073 | | | AUD | | | | Goldman Sachs International | | 1/24/2018 | | | 41 | | |
| | 19,926 | | | USD | | | | | 25,940 | | | AUD | | | | JPMorgan Chase Bank N.A. | | 1/24/2018 | | | 87 | | |
| | 67,931 | | | USD | | | | | 86,641 | | | AUD | | | | Royal Bank of Canada | | 1/24/2018 | | | 1,670 | | |
| | 325,689 | | | USD | | | | | 414,017 | | | AUD | | | | State Street Bank and Trust Company | | 1/24/2018 | | | 9,056 | | |
| | 110,955 | | | USD | | | | | 141,209 | | | AUD | | | | State Street Bank and Trust Company | | 1/24/2018 | | | 2,961 | | |
| | 18,406 | | | USD | | | | | 23,555 | | | AUD | | | | State Street Bank and Trust Company | | 1/24/2018 | | | 392 | | |
| | 30,905 | | | USD | | | | | 40,151 | | | AUD | | | | State Street Bank and Trust Company | | 1/24/2018 | | | 198 | | |
| | 138,276 | | | AUD | | | | | 105,641 | | | USD | | | | State Street Bank and Trust Company | | 1/24/2018 | | | 110 | | |
| | 265,318 | | | USD | | | | | 332,380 | | | CAD | | | | Citibank, N.A. | | 1/24/2018 | | | 7,451 | | |
| | 269,511 | | | USD | | | | | 337,557 | | | CAD | | | | Goldman Sachs International | | 1/24/2018 | | | 7,628 | | |
| | 93,880 | | | USD | | | | | 117,150 | | | CAD | | | | Goldman Sachs International | | 1/24/2018 | | | 2,992 | | |
| | 11,947 | | | USD | | | | | 15,311 | | | CAD | | | | JPMorgan Chase Bank N.A. | | 1/24/2018 | | | 69 | | |
| | 12,968 | | | USD | | | | | 16,646 | | | CAD | | | | JPMorgan Chase Bank N.A. | | 1/24/2018 | | | 53 | | |
| | 201,700 | | | USD | | | | | 251,730 | | | CAD | | | | Royal Bank of Canada | | 1/24/2018 | | | 6,403 | | |
| | 202,237 | | | USD | | | | | 195,947 | | | CHF | | | | Citibank, N.A. | | 1/24/2018 | | | 4,665 | | |
| | 119,941 | | | USD | | | | | 116,237 | | | CHF | | | | Goldman Sachs International | | 1/24/2018 | | | 2,740 | | |
| | 31,836 | | | USD | | | | | 31,506 | | | CHF | | | | JPMorgan Chase Bank N.A. | | 1/24/2018 | | | 68 | | |
| | 348,042 | | | USD | | | | | 339,776 | | | CHF | | | | Royal Bank of Canada | | 1/24/2018 | | | 5,449 | | |
| | 519,273 | | | USD | | | | | 503,256 | | | CHF | | | | Societe Generale | | 1/24/2018 | | | 11,845 | | |
| | 42,095 | | | USD | | | | | 41,018 | | | CHF | | | | State Street Bank and Trust Company | | 1/24/2018 | | | 737 | | |
| | 51,398 | | | EUR | | | | | 59,831 | | | USD | | | | Goldman Sachs International | | 1/24/2018 | | | 336 | | |
| | 140,605 | | | EUR | | | | | 164,427 | | | USD | | | | Goldman Sachs International | | 1/24/2018 | | | 164 | | |
| | 10,711 | | | USD | | | | | 9,024 | | | EUR | | | | Societe Generale | | 1/24/2018 | | | 147 | | |
| | 808,364 | | | USD | | | | | 681,678 | | | EUR | | | | State Street Bank and Trust Company | | 1/24/2018 | | | 10,397 | | |
| | 93,213 | | | USD | | | | | 78,799 | | | EUR | | | | State Street Bank and Trust Company | | 1/24/2018 | | | 971 | | |
| | 59,333 | | | USD | | | | | 50,286 | | | EUR | | | | State Street Bank and Trust Company | | 1/24/2018 | | | 469 | | |
| | 29,616 | | | USD | | | | | 25,084 | | | EUR | | | | State Street Bank and Trust Company | | 1/24/2018 | | | 253 | | |
| | 95,785 | | | GBP | | | | | 127,517 | | | USD | | | | Goldman Sachs International | | 1/24/2018 | | | 40 | | |
| | 38,066 | | | GBP | | | | | 50,107 | | | USD | | | | JPMorgan Chase Bank N.A. | | 1/24/2018 | | | 585 | | |
| | 237,880 | | | GBP | | | | | 314,251 | | | USD | | | | Royal Bank of Canada | | 1/24/2018 | | | 2,534 | | |
| | 589,931 | | | USD | | | | | 442,171 | | | GBP | | | | State Street Bank and Trust Company | | 1/24/2018 | | | 1,092 | | |
| | 59,909 | | | GBP | | | | | 79,433 | | | USD | | | | State Street Bank and Trust Company | | 1/24/2018 | | | 348 | | |
| | 16,548 | | | USD | | | | | 1,867,136 | | | JPY | | | | JPMorgan Chase Bank N.A. | | 1/24/2018 | | | 56 | | |
| | 1,297,682 | | | JPY | | | | | 11,450 | | | USD | | | | JPMorgan Chase Bank N.A. | | 1/24/2018 | | | 12 | | |
See Notes to Financial Statements
86
Schedule of Investments Multi-Asset Income Fund (cont'd)
| Currency Purchased | | Currency Sold | | Counterparty | | Settlement
Date | | Net
Unrealized
Appreciation/
(Depreciation) | |
| | 132,580 | | | USD | | | | | 14,748,487 | | | JPY | | | | Societe Generale | | 1/24/2018 | | $ | 2,311 | | |
| | 100,173,046 | | | KRW | | | | | 88,925 | | | USD | | | | State Street Bank and Trust Company | | 1/24/2018 | | | 708 | | |
| | 51,731 | | | USD | | | | | 999,514 | | | MXN | | | | State Street Bank and Trust Company | | 1/24/2018 | | | 323 | | |
| | 323,725 | | | USD | | | | | 2,546,519 | | | NOK | | | | Goldman Sachs International | | 1/24/2018 | | | 11,275 | | |
| | 91,009 | | | USD | | | | | 726,335 | | | NOK | | | | Goldman Sachs International | | 1/24/2018 | | | 1,890 | | |
| | 1,084,392 | | | NOK | | | | | 132,841 | | | USD | | | | Goldman Sachs International | | 1/24/2018 | | | 211 | | |
| | 658,149 | | | NOK | | | | | 80,698 | | | USD | | | | Goldman Sachs International | | 1/24/2018 | | | 55 | | |
| | 144,078 | | | USD | | | | | 200,663 | | | NZD | | | | Citibank, N.A. | | 1/24/2018 | | | 6,958 | | |
| | 19,073 | | | USD | | | | | 27,894 | | | NZD | | | | Goldman Sachs International | | 1/24/2018 | | | 12 | | |
| | 406,283 | | | USD | | | | | 566,486 | | | NZD | | | | Societe Generale | | 1/24/2018 | | | 19,183 | | |
| | 163,127 | | | USD | | | | | 227,485 | | | NZD | | | | State Street Bank and Trust Company | | 1/24/2018 | | | 7,679 | | |
| | 56,121 | | | USD | | | | | 81,633 | | | NZD | | | | State Street Bank and Trust Company | | 1/24/2018 | | | 338 | | |
| | 64,715 | | | USD | | | | | 521,913 | | | SEK | | | | Goldman Sachs International | | 1/24/2018 | | | 2,039 | | |
| | 22,008 | | | USD | | | | | 182,543 | | | SEK | | | | Goldman Sachs International | | 1/24/2018 | | | 86 | | |
| | 66,293 | | | USD | | | | | 551,810 | | | SEK | | | | Goldman Sachs International | | 1/24/2018 | | | 28 | | |
| | 21,391 | | | USD | | | | | 174,643 | | | SEK | | | | JPMorgan Chase Bank N.A. | | 1/24/2018 | | | 419 | | |
| | 110,188 | | | USD | | | | | 889,331 | | | SEK | | | | Societe Generale | | 1/24/2018 | | | 3,390 | | |
| | 233,854 | | | USD | | | | | 1,890,301 | | | SEK | | | | State Street Bank and Trust Company | | 1/24/2018 | | | 6,852 | | |
| | 31,556 | | | USD | | | | | 256,724 | | | SEK | | | | State Street Bank and Trust Company | | 1/24/2018 | | | 726 | | |
| | 5 | | | USD | | | | | 73 | | | ZAR | | | | State Street Bank and Trust Company | | 1/24/2018 | | | 0 | | |
| | | | | | | | | | $155,994 | |
| | 113,421 | | | AUD | | | | | 89,176 | | | USD | | | | Citibank, N.A. | | 1/24/2018 | | | (2,434 | ) | |
| | 84,534 | | | AUD | | | | | 65,961 | | | USD | | | | Goldman Sachs International | | 1/24/2018 | | | (1,311 | ) | |
| | 115,029 | | | AUD | | | | | 90,402 | | | USD | | | | Societe Generale | | 1/24/2018 | | | (2,430 | ) | |
| | 32,086 | | | CAD | | | | | 24,956 | | | USD | | | | Goldman Sachs International | | 1/24/2018 | | | (63 | ) | |
| | 110,648 | | | CAD | | | | | 87,411 | | | USD | | | | Goldman Sachs International | | 1/24/2018 | | | (1,567 | ) | |
| | 688,453 | | | CAD | | | | | 549,396 | | | USD | | | | Societe Generale | | 1/24/2018 | | | (15,279 | ) | |
| | 28,609 | | | CAD | | | | | 22,861 | | | USD | | | | State Street Bank and Trust Company | | 1/24/2018 | | | (665 | ) | |
| | 155,813 | | | CAD | | | | | 124,547 | | | USD | | | | State Street Bank and Trust Company | | 1/24/2018 | | | (3,664 | ) | |
| | 587,176 | | | CAD | | | | | 470,168 | | | USD | | | | State Street Bank and Trust Company | | 1/24/2018 | | | (14,624 | ) | |
| | 60,685 | | | CHF | | | | | 61,359 | | | USD | | | | Goldman Sachs International | | 1/24/2018 | | | (171 | ) | |
| | 36,631 | | | USD | | | | | 36,362 | | | CHF | | | | JPMorgan Chase Bank N.A. | | 1/24/2018 | | | (32 | ) | |
| | 640,097 | | | CHF | | | | | 660,268 | | | USD | | | | State Street Bank and Trust Company | | 1/24/2018 | | | (14,865 | ) | |
| | 82,395 | | | EUR | | | | | 97,846 | | | USD | | | | Citibank, N.A. | | 1/24/2018 | | | (1,395 | ) | |
| | 70,545 | | | USD | | | | | 60,352 | | | EUR | | | | Goldman Sachs International | | 1/24/2018 | | | (103 | ) | |
| | 65,655 | | | USD | | | | | 56,204 | | | EUR | | | | Goldman Sachs International | | 1/24/2018 | | | (137 | ) | |
| | 25,976 | | | EUR | | | | | 30,858 | | | USD | | | | Goldman Sachs International | | 1/24/2018 | | | (451 | ) | |
| | 171,039 | | | EUR | | | | | 203,095 | | | USD | | | | Goldman Sachs International | | 1/24/2018 | | | (2,878 | ) | |
| | 14,298 | | | EUR | | | | | 16,840 | | | USD | | | | JPMorgan Chase Bank N.A. | | 1/24/2018 | | | (103 | ) | |
| | 16,506 | | | EUR | | | | | 19,521 | | | USD | | | | JPMorgan Chase Bank N.A. | | 1/24/2018 | | | (199 | ) | |
| | 10,388 | | | EUR | | | | | 12,327 | | | USD | | | | Royal Bank of Canada | | 1/24/2018 | | | (167 | ) | |
| | 95,509 | | | USD | | | | | 81,711 | | | EUR | | | | State Street Bank and Trust Company | | 1/24/2018 | | | (142 | ) | |
| | 215,722 | | | GBP | | | | | 287,752 | | | USD | | | | Citibank, N.A. | | 1/24/2018 | | | (474 | ) | |
| | 19,961 | | | GBP | | | | | 26,638 | | | USD | | | | Goldman Sachs International | | 1/24/2018 | | | (56 | ) | |
See Notes to Financial Statements
87
Schedule of Investments Multi-Asset Income Fund (cont'd)
| | | Currency Purchased | | Currency Sold | | Counterparty | | Settlement
Date | | Net
Unrealized
Appreciation/
(Depreciation) | |
| | | 13,981 | | | USD | | | | | 10,646 | | | GBP | | | | Goldman Sachs International | | 1/24/2018 | | $ | (196 | ) | |
| | | 136,269 | | | USD | | | | | 103,203 | | | GBP | | | | Goldman Sachs International | | 1/24/2018 | | | (1,167 | ) | |
| | | 103,937 | | | GBP | | | | | 138,465 | | | USD | | | | Societe Generale | | 1/24/2018 | | | (52 | ) | |
| | | 13,960 | | | USD | | | | | 10,565 | | | GBP | | | | State Street Bank and Trust Company | | 1/24/2018 | | | (109 | ) | |
| | | 13,812,322 | | | JPY | | | | | 124,189 | | | USD | | | | Citibank, N.A. | | 1/24/2018 | | | (2,189 | ) | |
| | | 64,355 | | | USD | | | | | 7,294,396 | | | JPY | | | | Goldman Sachs International | | 1/24/2018 | | | (75 | ) | |
| | | 2,782,795 | | | JPY | | | | | 24,694 | | | USD | | | | Goldman Sachs International | | 1/24/2018 | | | (114 | ) | |
| | | 3,310,243 | | | JPY | | | | | 29,778 | | | USD | | | | Goldman Sachs International | | 1/24/2018 | | | (540 | ) | |
| | | 21,899,297 | | | JPY | | | | | 196,888 | | | USD | | | | Goldman Sachs International | | 1/24/2018 | | | (3,458 | ) | |
| | | 28,017,660 | | | JPY | | | | | 248,440 | | | USD | | | | Royal Bank of Canada | | 1/24/2018 | | | (968 | ) | |
| | | 22,439 | | | USD | | | | | 2,543,663 | | | JPY | | | | State Street Bank and Trust Company | | 1/24/2018 | | | (29 | ) | |
| | | 48,763 | | | USD | | | | | 5,542,041 | | | JPY | | | | State Street Bank and Trust Company | | 1/24/2018 | | | (188 | ) | |
| | | 115,778 | | | USD | | | | | 13,145,707 | | | JPY | | | | State Street Bank and Trust Company | | 1/24/2018 | | | (334 | ) | |
| | | 4,421,645 | | | JPY | | | | | 39,450 | | | USD | | | | State Street Bank and Trust Company | | 1/24/2018 | | | (395 | ) | |
| | | 10,037,094 | | | JPY | | | | | 90,216 | | | USD | | | | State Street Bank and Trust Company | | 1/24/2018 | | | (1,561 | ) | |
| | | 88,720 | | | USD | | | | | 100,187,520 | | | KRW | | | | Goldman Sachs International | | 1/24/2018 | | | (926 | ) | |
| | | 42,323 | | | USD | | | | | 47,782,563 | | | KRW | | | | State Street Bank and Trust Company | | 1/24/2018 | | | (432 | ) | |
| | | 999,944 | | | MXN | | | | | 51,752 | | | USD | | | | Goldman Sachs International | | 1/24/2018 | | | (321 | ) | |
| | | 49,247 | | | NOK | | | | | 6,257 | | | USD | | | | Citibank, N.A. | | 1/24/2018 | | | (214 | ) | |
| | | 256,361 | | | NOK | | | | | 31,550 | | | USD | | | | Goldman Sachs International | | 1/24/2018 | | | (95 | ) | |
| | | 419,439 | | | NOK | | | | | 52,743 | | | USD | | | | Goldman Sachs International | | 1/24/2018 | | | (1,279 | ) | |
| | | 124,586 | | | NOK | | | | | 15,367 | | | USD | | | | JPMorgan Chase Bank N.A. | | 1/24/2018 | | | (81 | ) | |
| | | 1,286,296 | | | NOK | | | | | 161,633 | | | USD | | | | Royal Bank of Canada | | 1/24/2018 | | | (3,808 | ) | |
| | | 2,030,667 | | | NOK | | | | | 257,777 | | | USD | | | | Societe Generale | | 1/24/2018 | | | (8,620 | ) | |
| | | 385,410 | | | NOK | | | | | 48,872 | | | USD | | | | State Street Bank and Trust Company | | 1/24/2018 | | | (1,583 | ) | |
| | | 1,050,123 | | | NOK | | | | | 133,354 | | | USD | | | | State Street Bank and Trust Company | | 1/24/2018 | | | (4,507 | ) | |
| | | 129,247 | | | NZD | | | | | 89,043 | | | USD | | | | Goldman Sachs International | | 1/24/2018 | | | (724 | ) | |
| | | 103,722 | | | NZD | | | | | 72,117 | | | USD | | | | Goldman Sachs International | | 1/24/2018 | | | (1,240 | ) | |
| | | 206,261 | | | NZD | | | | | 146,740 | | | USD | | | | Goldman Sachs International | | 1/24/2018 | | | (5,794 | ) | |
| | | 239,012 | | | NZD | | | | | 171,601 | | | USD | | | | Goldman Sachs International | | 1/24/2018 | | | (8,275 | ) | |
| | | 82,343 | | | NZD | | | | | 57,360 | | | USD | | | | Royal Bank of Canada | | 1/24/2018 | | | (1,092 | ) | |
| | | 51,928 | | | NZD | | | | | 36,297 | | | USD | | | | State Street Bank and Trust Company | | 1/24/2018 | | | (813 | ) | |
| | | 598,581 | | | NZD | | | | | 429,643 | | | USD | | | | State Street Bank and Trust Company | | 1/24/2018 | | | (20,611 | ) | |
| | | 569,520 | | | SEK | | | | | 70,551 | | | USD | | | | Citibank, N.A. | | 1/24/2018 | | | (2,158 | ) | |
| | | 505,705 | | | SEK | | | | | 60,818 | | | USD | | | | Goldman Sachs International | | 1/24/2018 | | | (89 | ) | |
| | | 2,289,380 | | | SEK | | | | | 281,980 | | | USD | | | | Royal Bank of Canada | | 1/24/2018 | | | (7,053 | ) | |
| | | 226,521 | | | SEK | | | | | 27,762 | | | USD | | | | State Street Bank and Trust Company | | 1/24/2018 | | | (560 | ) | |
| | | 277,380 | | | SEK | | | | | 34,190 | | | USD | | | | State Street Bank and Trust Company | | 1/24/2018 | | | (880 | ) | |
| | | 891,833 | | | SEK | | | | | 109,003 | | | USD | | | | State Street Bank and Trust Company | | 1/24/2018 | | | (1,904 | ) | |
| | | | | | | | | | | | | | | | | | | | | | | | | | $ | (147,644 | ) | |
Total | | | | | | | | | | | | | | | | | | | | | | | | | | $ | 8,350 | | |
AUD = Australian Dollar
CAD = Canadian Dollar
See Notes to Financial Statements
88
Schedule of Investments Multi-Asset Income Fund (cont'd)
CHF = Swiss Franc
EUR = Euro
GBP = Pound Sterling
JPY = Japanese Yen
KRW = South Korean Won
MXN= Mexican Peso
NOK = Norwegian Krone
NZD = New Zealand Dollar
SEK = Swedish Krona
ZAR = South African Rand
(a) Non-deliverable forward contracts.
For the year ended October 31, 2017, the Fund's investments in forward contracts had an average notional value of $19,054,652.
Total return swap contracts ("total return swaps")
At October 31, 2017, the Fund had outstanding over-the-counter ("OTC") total return swaps as follows:
Long Total Return Swaps
Swap
Counterparty | | Reference Entity | | Notional
Amount(d) | | Maturity
Date | | Variable-Rate(e) | | Unrealized
Appreciation/
(Depreciation) | | Accrued
Net
Interest
Receivable/
(Payable) | | Value | |
Goldman
Sachs
International | | MSCI Europe ex UK
Financials Index | | EUR | 84,006 | | | 9/15/2018 | | | (0.18 | )%(f) | | $ | 370 | | | $ | (19 | ) | | $ | 351 | | |
Short Total Return Swaps
| | | Swap
Counterparty | | Reference Entity | | Notional
Amount(d) | | Maturity
Date | | Variable-Rate(e) | | Unrealized
Appreciation/
(Depreciation) | | Accrued
Net
Interest
Receivable/
(Payable) | | Value | |
| | Goldman
Sachs
International | | MSCI Daily TR Gross
Europe ex UK Index | | EUR | (83,987 | ) | | 9/15/2018 | | | (0.18 | )%(a) | | $ | (1,442 | ) | | $ | (43 | ) | | $ | (1,485 | )(c) | |
| | Citibank, N.A. | | MSCI U.S. REIT
Gross TR Index | | $ | (232,048 | ) | | 1/15/2018 | | | 1.51 | %(b) | | | 3,555 | | | | 22 | | | | 3,577 | (c) | |
Total | | | | | | | | | | | | $ | 2,113 | | | $ | (21 | ) | | $ | 2,092 | | |
(a) Fund receives 3-month Euribor plus 0.15% upon termination. Payment frequency—upon termination. Fund pays return on reference entity. Payment frequency—upon termination.
(b) Fund receives 3-month LIBOR plus 0.15% upon termination. Payment frequency—upon termination. Fund pays return on reference entity. Payment frequency—upon termination.
See Notes to Financial Statements
89
Schedule of Investments Multi-Asset Income Fund (cont'd)
(c) Security fair valued as of October 31, 2017 in accordance with procedures approved by the Board of Trustees (the "Board").
(d) Notional amount represents the value (including any fees or commissions) of the positions when they were established and is stated in the currency in which the contract is denominated.
EUR = Euro
(e) Effective rate at October 31, 2017.
(f) Fund pays 3-month Euribor plus 0.15%. Payment frequency—quarterly. Fund receives return on reference entity. Payment frequency—upon termination.
For the year ended October 31, 2017, the average notional value of total return swaps was $50,831 for long positions and $(163,324) for short positions.
Written option contracts ("options written")
At October 31, 2017, the Fund had outstanding options written as follows:
Description | | Number of
Contracts | | Notional
Amount | | Exercise
Price | | Expiration
Date | | Value | |
Calls | |
Index | |
S&P 500 Mini Index | | | 2 | | | $ | (51,506 | ) | | $ | 256 | | | 11/3/2017 | | $ | (369 | ) | |
S&P 500 Mini Index | | | 6 | | | | (154,518 | ) | | | 257.5 | | | 11/3/2017 | | | (435 | ) | |
S&P 500 Mini Index | | | 3 | | | | (77,259 | ) | | | 258 | | | 11/3/2017 | | | (142 | ) | |
S&P 500 Mini Index | | | 1 | | | | (25,753 | ) | | | 259 | | | 11/3/2017 | | | (0 | )(a)(b) | |
S&P 500 Mini Index | | | 21 | | | | (540,813 | ) | | | 260 | | | 11/10/2017 | | | (441 | ) | |
S&P 500 Mini Index | | | 21 | | | | (540,813 | ) | | | 260 | | | 11/17/2017 | | | (935 | ) | |
S&P 500 Mini Index | | | 14 | | | | (360,542 | ) | | | 260 | | | 11/24/2017 | | | (791 | ) | |
S&P 500 Mini Index | | | 5 | | | | (128,765 | ) | | | 262.5 | | | 11/24/2017 | | | (115 | ) | |
S&P 500 Mini Index | | | 2 | | | | (51,506 | ) | | | 262 | | | 11/24/2017 | | | (34 | )(a)(b) | |
S&P 500 Mini Index | | | 9 | | | | (231,777 | ) | | | 262.5 | | | 12/1/2017 | | | (252 | )(a)(b) | |
Total (premiums received: $2,909) | | | | | | | | $(3,514) | |
Puts | |
Index | |
S&P 500 Mini Index | | | 5 | | | $ | (128,765 | ) | | $ | 252 | | | 11/3/2017 | | $ | (35 | ) | |
S&P 500 Mini Index | | | 1 | | | | (25,753 | ) | | | 247.5 | | | 11/10/2017 | | | (15 | ) | |
S&P 500 Mini Index | | | 14 | | | | (360,542 | ) | | | 249 | | | 11/10/2017 | | | (238 | ) | |
S&P 500 Mini Index | | | 6 | | | | (154,518 | ) | | | 250 | | | 11/10/2017 | | | (147 | ) | |
S&P 500 Mini Index | | | 10 | | | | (257,530 | ) | | | 250 | | | 11/17/2017 | | | (450 | ) | |
S&P 500 Mini Index | | | 14 | | | | (360,542 | ) | | | 251 | | | 11/17/2017 | | | (721 | ) | |
S&P 500 Mini Index | | | 16 | | | | (412,048 | ) | | | 251 | | | 11/24/2017 | | | (1,080 | ) | |
S&P 500 Mini Index | | | 3 | | | | (77,259 | ) | | | 252 | | | 11/24/2017 | | | (231 | ) | |
S&P 500 Mini Index | | | 3 | | | | (77,259 | ) | | | 252.5 | | | 11/24/2017 | | | (248 | ) | |
S&P 500 Mini Index | | | 5 | | | | (128,765 | ) | | | 252.5 | | | 12/1/2017 | | | (580 | ) | |
S&P 500 Mini Index | | | 10 | | | | (257,530 | ) | | | 253 | | | 12/1/2017 | | | (1,225 | ) | |
Total (premiums received: $9,924) | | | | | | | | $(4,970) | |
Total Options Written (premiums received: $12,833) | | | | | | | | $(8,484) | |
See Notes to Financial Statements
90
Schedule of Investments Multi-Asset Income Fund (cont'd)
(a) Security fair valued as of October 31, 2017 in accordance with procedures approved by the Board.
(b) Value determined using significant unobservable inputs.
For the year ended October 31, 2017, the Fund had an average market value of $(10,099) in options written. The Fund had securities pledged in the amount of $661,968 to cover collateral requirements for options written.
The following is a summary, categorized by Level (see Note A of Notes to Financial Statements), of inputs used to value the Fund's investments as of October 31, 2017:
Asset Valuation Inputs | |
(000's omitted) | | Level 1 | | Level 2 | | Level 3 | | Total | |
Investments: | |
Common Stocks | |
Airlines | | $ | 15 | | | $ | 2 | | | $ | — | | | $ | 17 | | |
Auto Components | | | 22 | | | | 2 | | | | — | | | | 24 | | |
Automobiles | | | 16 | | | | 8 | | | | — | | | | 24 | | |
Chemicals | | | 117 | | | | 74 | | | | — | | | | 191 | | |
Diversified Telecommunication Services | | | 157 | | | | 4 | | | | — | | | | 161 | | |
Hotels, Restaurants & Leisure | | | 135 | | | | 1 | | | | — | | | | 136 | | |
Insurance | | | 260 | | | | 122 | | | | — | | | | 382 | | |
Media | | | 100 | | | | 1 | | | | — | | | | 101 | | |
Wireless Telecommunication Services | | | 56 | | | | 1 | | | | — | | | | 57 | | |
| Other Common Stocks(a) | | | 6,612 | | | | — | | | | — | | | | 6,612 | | |
Total Common Stocks | | | 7,490 | | | | 215 | | | | — | | | | 7,705 | | |
| Convertible Preferred Stocks(a) | | | 44 | | | | — | | | | — | | | | 44 | | |
| Preferred Stocks(a) | | | 275 | | | | — | | | | — | | | | 275 | | |
| Convertible Bonds(a) | | | — | | | | 171 | | | | — | | | | 171 | | |
| Corporate Bonds(a) | | | — | | | | 2,467 | | | | — | | | | 2,467 | | |
| Mortgage-Backed Securities(a) | | | — | | | | 2,973 | | | | — | | | | 2,973 | | |
U.S. Treasury Obligations | | | — | | | | 2,864 | | | | — | | | | 2,864 | | |
U.S. Government Agency Securities | | | — | | | | 203 | | | | — | | | | 203 | | |
Asset-Backed Securities | | | — | | | | 733 | | | | — | | | | 733 | | |
Foreign Government Security | | | — | | | | 130 | | | | — | | | | 130 | | |
Exchange Traded Funds | | | 802 | | | | — | | | | — | | | | 802 | | |
| Master Limited Partnerships(a) | | | 702 | | | | — | | | | — | | | | 702 | | |
Investment Companies | | | — | | | | 4,730 | | | | — | | | | 4,730 | | |
| Rights(a) | | | 0 | (b) | | | — | | | | — | | | | 0 | (b) | |
Short-Term Investment | | | — | | | | 969 | | | | — | | | | 969 | | |
Total Investments | | $ | 9,313 | | | $ | 15,455 | | | $ | — | | | $ | 24,768 | | |
(a) The Schedule of Investments provides information on the industry categorization for the portfolio.
(b) Amount less than one thousand.
See Notes to Financial Statements
91
Schedule of Investments Multi-Asset Income Fund (cont'd)
As of the year ended October 31, 2017, certain securities were transferred from one level (as of October 31, 2016) to another. Based on beginning of period market values as of November 1, 2016, approximately $152,410 was transferred from Level 1 to Level 2. These securities were categorized as Level 2 as of October 31, 2017, due to foreign exchanges having been closed and, therefore, no prices having been readily available for the securities as of that date.
The following is a summary, categorized by Level (see Note A of Notes to Financial Statements), of inputs used to value the Fund's derivatives as of October 31, 2017:
Other Financial Instruments | |
(000's omitted) | | Level 1 | | Level 2 | | Level 3(c) | | Total | |
| Futures(a) | |
Assets | | $ | 91 | | | $ | — | | | $ | — | | | $ | 91 | | |
Liabilities | | | (67 | ) | | | — | | | | — | | | | (67 | ) | |
| Forward Contracts(a) | |
Assets | | | — | | | | 156 | | | | — | | | | 156 | | |
Liabilities | | | — | | | | (148 | ) | | | — | | | | (148 | ) | |
Swaps | |
Assets | | | — | | | | 4 | | | | — | | | | 4 | | |
Liabilities | | | — | | | | (2 | ) | | | — | | | | (2 | ) | |
Options Written | |
Liabilities | | | (8 | ) | | | — | | | | (0 | )(b) | | | (8 | ) | |
Total | | $ | 16 | | | $ | 10 | | | $ | (0 | )(b) | | $ | 26 | | |
(a) Futures and forward contracts are reported at the cumulative unrealized appreciation/(depreciation) of the instrument.
(b) Amount less than one thousand.
(c) The following is a reconciliation between the beginning and ending balances of investments in which unobservable inputs (Level 3) were used in determining value:
| | | Beginning
balance, as
of 11/1/2016 | | Accrued
discounts/
(premiums) | | Realized
gain/(loss) | | Change
in unrealized
appreciation/
(depreciation) | | Purchases | | Sales | | Transfers
into
Level 3 | | Transfers
out of
Level 3 | | Balance,
as of
10/31/2017 | | Net change in
unrealized
appreciation/
(depreciation)
from
investments
still held as of
10/31/2017 | |
Other Financial
Instruments: | |
(000's omitted) | |
| Options Written(d) | | $ | (0 | )(e) | | $ | — | | | $ | 1 | | | $ | (1 | ) | | $ | 0 | (e) | | $ | (0 | )(e) | | $ | — | | | $ | — | | | $ | (0 | )(e) | | $ | 0 | (e) | |
Total | | $ | (0 | )(e) | | $ | — | | | $ | 1 | | | $ | (1 | ) | | $ | 0 | (e) | | $ | (0 | )(e) | | $ | — | | | $ | — | | | $ | (0 | )(e) | | $ | 0 | (e) | |
(d) As of the year ended October 31, 2017, these investments were valued using methods the Board has approved in the good-faith belief that the resulting valuation will reflect the fair value of the security. These investments did not have a material impact on the Fund's net assets and, therefore, disclosure of unobservable inputs used in formulating valuations is not presented.
(e) Amount less than one thousand.
See Notes to Financial Statements
92
Consolidated Schedule of Investments Risk Balanced Commodity Strategy Fund October 31, 2017
PRINCIPAL AMOUNT | | | | VALUE | |
(000's omitted) | | | | (000's omitted) | |
U.S. Treasury Obligation 7.6% | | | |
$ | 9,500 | | | U.S.Treasury Bill, 0.85%, due 1/11/18 (Cost $9,480) | | $ | 9,480 | (a) | |
Asset-Backed Securities 17.4% | | | |
| | | | | Ally Auto Receivables Trust | | | | | |
| | 49 | | | Ser. 2016-3, Class A2, 1.19%, due 12/17/18 | | | 49 | | |
| | 2,230 | | | Ser. 2017-3, Class A2, 1.53%, due 3/16/20 | | | 2,229 | | |
| | 691 | | | Ser. 2016-1, Class A3, 1.47%, due 4/15/20 | | | 691 | | |
| | 1,160 | | | American Express Credit Account Master Trust, Ser. 2013-1, Class A,
1 month USD LIBOR + 0.42%, (1.66%), due 2/16/21 | | | 1,163
| (b) | |
| | 1,434 | | | BMW Vehicle Lease Trust, Ser. 2017-1, Class A2, 1.64%, due 7/22/19 | | | 1,434 | | |
| | 498 | | | BMW Vehicle Owner Trust, Ser. 2016-A, Class A2A, 0.99%, due 5/28/19 | | | 497 | | |
| | 600 | | | Canadian Pacer Auto Receivables Trust, Ser. 2017-1A, Class A2A, 1.77%, due 12/19/19 | | | 600 | (c) | |
| | 2,100 | | | Chase Issuance Trust, Ser. 2015-A1, Class A1, 1 month USD LIBOR + 0.32%, (1.56%), due 2/18/20 | | | 2,102 | (b) | |
| | | | | Citibank Credit Card Issuance Trust | | | | | |
| | 445 | | | Ser. 2013-A2, Class A2, 1 month USD LIBOR + 0.28%, (1.52%), due 5/26/20 | | | 446 | (b) | |
| | 1,125 | | | Ser. 2017-A1, Class A1, 1 month USD LIBOR + 0.25%, (1.49%), due 1/19/21 | | | 1,127 | (b) | |
| | | | | Ford Credit Auto Owner Trust | | | | | |
| | 363 | | | Ser. 2016-C, Class A2A, 1.04%, due 9/15/19 | | | 362 | | |
| | 575 | | | Ser. 2017-A, Class A2A, 1.33%, due 12/15/19 | | | 574 | | |
| | 1,310 | | | GM Financial Consumer Automobile Receivables Trust, Ser. 2017-3A, Class A2A,
1.71%, due 9/16/20 | | | 1,309
| (c) | |
| | | | | Honda Auto Receivables Owner Trust | | | | | |
| | 103 | | | Ser. 2016-2, Class A2, 1.13%, due 9/17/18 | | | 103 | | |
| | 1,100 | | | Ser. 2017-3, Class A2, 1.57%, due 1/21/20 | | | 1,099 | | |
| | 516 | | | Huntington Auto Trust, Ser. 2016-1, Class A2, 1.29%, due 5/15/19 | | | 516 | | |
| | 120 | | | Hyundai Auto Receivables Trust, Ser. 2016-A, Class A2A, 1.21%, due 6/17/19 | | | 120 | | |
| | 596 | | | Mercedes-Benz Auto Receivables Trust, Ser. 2016-1, Class A2A, 1.11%, due 3/15/19 | | | 596 | | |
| | 519 | | | Navient Student Loan Trust, Ser. 2016-3A, Class A1, 1 month USD LIBOR + 0.60%,
(1.84%), due 6/25/65 | | | 520
| (b)(c) | |
| | | | | Nissan Auto Receivables Owner Trust | | | | | |
| | 98 | | | Ser. 2016-B, Class A2A, 1.05%, due 4/15/19 | | | 98 | | |
| | 489 | | | Ser. 2016-C, Class A2A, 1.07%, due 5/15/19 | | | 489 | | |
| | 1,350 | | | Ser. 2017-B, Class A2A, 1.56%, due 5/15/20 | | | 1,349 | | |
| | | | | Securitized Term Auto Receivables Trust | | | | | |
| | 407 | | | Ser. 2017-1A, Class A2A, 1.51%, due 4/25/19 | | | 407 | (c) | |
| | 480 | | | Ser. 2017-2A, Class A2A, 1.78%, due 1/27/20 | | | 480 | (c)(d) | |
| | | | | Toyota Auto Receivables Owner Trust | | | | | |
| | 135 | | | Ser. 2016-C, Class A2A, 1.00%, due 1/15/19 | | | 135 | | |
| | 82 | | | Ser. 2015-A, Class A3, 1.12%, due 2/15/19 | | | 82 | | |
| | 1,850 | | | Ser. 2017-C, Class A2A, 1.58%, due 7/15/20 | | | 1,848 | | |
| | 1,480 | | | World Omni Auto Receivables Trust, Ser.2017-B, Class A2A, 1.61%, due 2/16/21 | | | 1,478 | | |
| | | | | Total Asset-Backed Securities (Cost $21,914) | | | 21,903 | | |
Corporate Bonds 54.5% | | | |
Agriculture 1.6% | | | |
| | 1,980 | | | BAT Capital Corp., 3 month USD LIBOR + 0.59%, (1.91%), due 8/14/20 | | | 1,990 | (b)(c) | |
See Notes to Financial Statements
93
Consolidated Schedule of Investments Risk Balanced Commodity Strategy Fund (cont'd)
PRINCIPAL AMOUNT | | | | VALUE | |
(000's omitted) | | | | (000's omitted) | |
Auto Manufacturers 4.1% | | | |
| | | | | American Honda Finance Corp. | | | | | |
$ | 785 | | | 3 month USD LIBOR + 0.34%, (1.65%), due 2/14/20 | | $ | 788 | (b) | |
| | 520 | | | 3 month USD LIBOR + 0.27%, (1.63%), due 7/20/20 | | | 522 | (b) | |
| | 520 | | | Daimler Finance N.A. LLC, 3 month USD LIBOR + 0.25%, (1.56%), due 11/5/18 | | | 520 | (b)(c) | |
| | 2,165 | | | Ford Motor Credit Co. LLC, 3 month USD LIBOR + 0.94%, (2.29%), due 1/9/18 | | | 2,168 | (b) | |
| | | | | Toyota Motor Credit Corp. | | | | | |
| | 335 | | | 3 month USD LIBOR + 0.82%, (2.14%), due 2/19/19 | | | 338 | (b) | |
| | 880 | | | 3 month USD LIBOR + 0.26%, (1.61%), due 4/17/20 | | | 882 | (b) | |
| | | | 5,218 | | |
Banks 16.2% | | | |
| | 2,735 | | | Bank of America Corp., 3 month USD LIBOR + 0.87%, (2.21%), due 4/1/19 | | | 2,759 | (b) | |
| | 1,945 | | | Capital One Financial Corp., 3 month USD LIBOR + 0.76%, (2.07%), due 5/12/20 | | | 1,961 | (b) | |
| | 2,060 | | | Citigroup, Inc., 3 month USD LIBOR + 0.79%, (2.14%), due 1/10/20 | | | 2,077 | (b) | |
| | 2,775 | | | Goldman Sachs Group, Inc., 3 month USD LIBOR + 1.16%, (2.52%), due 4/23/20 | | | 2,823 | (b) | |
| | 2,740 | | | JPMorgan Chase & Co., 3 month USD LIBOR + 0.96%, (2.32%), due 1/23/20 | | | 2,781 | (b) | |
| | 2,855 | | | Morgan Stanley, 3 month USD LIBOR + 0.80%, (2.11%), due 2/14/20 | | | 2,869 | (b) | |
| | 675 | | | U.S. Bank N.A., 3 month USD LIBOR + 0.32%, (1.68%), due 1/24/20 | | | 677 | (b) | |
| | 2,635 | | | Wells Fargo & Co., Ser. N, 3 month USD LIBOR + 0.68%, (2.06%), due 1/30/20 | | | 2,662 | (b) | |
| | 1,705 | | | Westpac Banking Corp., 3 month USD LIBOR + 0.43%, (1.75%), due 3/6/20 | | | 1,711 | (b) | |
| | | | 20,320 | | |
Beverages 2.0% | | | |
| | 2,555 | | | Anheuser-Busch InBev Worldwide, Inc., 3 month USD LIBOR + 0.69%, (2.07%), due 8/1/18 | | | 2,568 | (b) | |
Biotechnology 1.2% | | | |
| | 1,480 | | | Gilead Sciences, Inc., 3 month USD LIBOR + 0.17%, (1.50%), due 9/20/18 | | | 1,481 | (b) | |
Commercial Services 0.7% | | | |
| | 940 | | | Moody's Corp., 3 month USD LIBOR + 0.35%, (1.67%), due 9/4/18 | | | 942 | (b) | |
Computers 0.4% | | | |
| | 450 | | | Apple, Inc., 3 month USD LIBOR + 0.82%, (2.13%), due 2/22/19 | | | 455 | (b) | |
Diversified Financial Services 1.7% | | | |
| | 835 | | | AIG Global Funding, 3 month USD LIBOR + 0.48%, (1.82%), due 7/2/20 | | | 837 | (b)(c) | |
| | 1,330 | | | American Express Co., 3 month USD LIBOR + 0.33%, (1.71%), due 10/30/20 | | | 1,329 | (b) | |
| | | | 2,166 | | |
Electric 2.9% | | | |
| | 1,890 | | | Dominion Energy, Inc., 3 month USD LIBOR + 0.55%, (1.87%), due 6/1/19 | | | 1,896 | (b)(c) | |
| | 1,250 | | | Duke Energy Progress LLC, 3 month USD LIBOR + 0.20%, (1.52%), due 11/20/17 | | | 1,250 | (b) | |
| | 500 | | | Southern Power Co., 1.85%, due 12/1/17 | | | 500 | | |
| | | | 3,646 | | |
See Notes to Financial Statements
94
Consolidated Schedule of Investments Risk Balanced Commodity Strategy Fund (cont'd)
PRINCIPAL AMOUNT | | | | VALUE | |
(000's omitted) | | | | (000's omitted) | |
Insurance 1.1% | | | |
$ | 470 | | | Berkshire Hathaway Finance Corp., 3 month USD LIBOR + 0.69%, (2.01%), due 3/15/19 | | $ | 475 | (b) | |
| | 870 | | | Principal Life Global Funding II, 3 month USD LIBOR + 0.30%, (1.62%), due 5/21/18 | | | 871 | (b)(c) | |
| | | | 1,346 | | |
Machinery—Construction & Mining 1.9% | | | |
| | | | | Caterpillar Financial Services Corp. | | | | | |
| | 1,100 | | | 3 month USD LIBOR + 0.25%, (1.57%), due 11/20/17 | | | 1,100 | (b) | |
| | 1,250 | | | 3 month USD LIBOR + 0.70%, (2.01%), due 2/23/18 | | | 1,253 | (b) | |
| | | | 2,353 | | |
Machinery-Diversified 1.8% | | | |
| | 2,230 | | | John Deere Capital Corp., 3 month USD LIBOR + 0.29%, (1.61%), due 6/22/20 | | | 2,233 | (b) | |
Media 2.0% | | | |
| | 2,560 | | | NBCUniversal Enterprise, Inc., 3 month USD LIBOR + 0.69%, (2.04%), due 4/15/18 | | | 2,568 | (b)(c) | |
Miscellaneous Manufacturer 3.5% | | | |
| | 2,370 | | | General Electric Co., 3 month USD LIBOR + 0.27%, (1.58%), due 8/7/18 | | | 2,373 | (b) | |
| | 1,965 | | | Siemens Financieringsmaatschappij NV, 3 month USD LIBOR + 0.34%, (1.66%), due 3/16/20 | | | 1,972 | (b)(c) | |
| | | | 4,345 | | |
Oil & Gas 6.3% | | | |
| | 2,355 | | | BP Capital Markets PLC, 3 month USD LIBOR + 0.35%, (1.66%), due 8/14/18 | | | 2,361 | (b) | |
| | 1,350 | | | Chevron Corp., 3 month USD LIBOR + 0.17%, (1.49%), due 3/2/18 | | | 1,351 | (b) | |
| | 1,525 | | | Exxon Mobil Corp., 3 month USD LIBOR + 0.60%, (1.92%), due 2/28/18 | | | 1,528 | (b) | |
| | | | | Total Capital Int'l SA | | | | | |
| | 2,075 | | | 3 month USD LIBOR + 0.57%, (1.88%), due 8/10/18 | | | 2,083 | (b) | |
| | 620 | | | 3 month USD LIBOR + 0.35%, (1.67%), due 6/19/19 | | | 622 | (b) | |
| | | | 7,945 | | |
Real Estate Investment Trusts 2.2% | | | |
| | 2,710 | | | Simon Property Group L.P., 1.50%, due 2/1/18 | | | 2,710 | (c) | |
Semiconductors 0.8% | | | |
| | 1,000 | | | QUALCOMM, Inc., 3 month USD LIBOR + 0.36%, (1.68%), due 5/20/19 | | | 1,004 | (b) | |
Telecommunications 4.1% | | | |
| | 2,500 | | | AT&T, Inc., 3 month USD LIBOR + 0.93%, (2.26%), due 6/30/20 | | | 2,536 | (b) | |
| | 2,575 | | | Verizon Communications, Inc., 3 month USD LIBOR + 0.55%, (1.86%), due 5/22/20 | | | 2,591 | (b) | |
| | | | 5,127 | | |
| | | | | Total Corporate Bonds (Cost $68,304) | | | 68,417 | | |
See Notes to Financial Statements
95
Consolidated Schedule of Investments Risk Balanced Commodity Strategy Fund (cont'd)
NUMBER OF SHARES | | | | VALUE | |
| | | | | (000's omitted) | |
Short-Term Investments 14.5% | | | |
Investment Companies 14.5% | | | |
| | 5,100,140 | | | State Street Institutional Treasury Money Market Fund Premier Class, 0.94% | | $ | 5,100 | (e)(f) | |
| | 13,072,129 | | | State Street Institutional U.S. Government Money Market Fund Premier Class, 0.96% | | | 13,072 | (e)(f)(g) | |
| | | | | Total Short-Term Investments (Cost $18,172) | | | 18,172 | | |
| | | | | Total Investments 94.0% (Cost $117,870) | | | 117,972 | | |
| | | | | Other Assets Less Liabilities 6.0% | | | 7,525 | (h) | |
| | | | | Net Assets 100.0% | | $ | 125,497 | | |
(a) Rate shown was the discount rate at the date of purchase.
(b) Variable or floating rate security. The interest rate shown was the current rate as of October 31, 2017 and changes periodically.
Benchmarks for Variable/Floating Rates:
LIBOR (USD) - London Interbank Offered Rate
(c) Securities were purchased under Rule 144A of the Securities Act of 1933, as amended (the "1933 Act"), or are otherwise restricted and, unless registered under the 1933 Act or exempted from registration, may only be sold to qualified institutional investors or may have other restrictions on resale. At October 31, 2017, these securities amounted to approximately $16,680,000, which represents 13.3% of net assets of the Fund. These securities have been deemed by the investment manager to be liquid.
(d) Value determined using significant unobservable inputs.
(e) Represents 7-day effective yield as of October 31, 2017.
(f) All or a portion of this security is segregated in connection with obligations for futures with a total value of approximately $18,172,000.
(g) All or a portion represents positions held by the Neuberger Berman Cayman Commodity Fund I Ltd., a wholly owned subsidiary (the "RBCS Subsidiary").
(h) Includes the impact of the Fund's open positions in derivatives at October 31, 2017.
See Notes to Financial Statements
96
Consolidated Schedule of Investments Risk Balanced Commodity Strategy Fund (cont'd)
Derivative Instruments
Futures contracts ("futures")
At October 31, 2017, open positions in futures(a) for the Fund were as follows:
Long Futures:
Expiration
Date | | Number of
Contracts | | Open Contracts | | Notional
Amount | | Value and
Unrealized
Appreciation/
(Depreciation) | |
12/2017 | | | 33 | | | Feeder Cattle | | $ | 2,630,513 | | | $ | 194,980 | | |
12/2017 | | | 151 | | | WTI Crude Oil | | | 8,211,380 | | | | 486,949 | | |
12/2017 | | | 101 | | | Natural Gas | | | 2,924,960 | | | | (289,318 | ) | |
12/2017 | | | 107 | | | New York Harbor ULSD | | | 8,450,967 | | | | 1,182,020 | | |
12/2017 | | | 108 | | | RBOB Gasoline | | | 7,858,620 | | | | 1,282,139 | | |
12/2017 | | | 86 | | | Cotton No.2 | | | 2,940,340 | | | | (139,405 | ) | |
12/2017 | | | 79 | | | Low Sulphur Gasoil | | | 4,327,225 | | | | 555,978 | | |
12/2017 | | | 82 | | | Cocoa | | | 1,717,080 | | | | 52,072 | | |
12/2017 | | | 510 | | | Corn | | | 8,816,625 | | | | (931,910 | ) | |
12/2017 | | | 172 | | | Hard Red Winter Wheat | | | 3,581,900 | | | | (635,778 | ) | |
12/2017 | | | 126 | | | Lean Hogs | | | 3,427,200 | | | | 485,128 | | |
12/2017 | | | 152 | | | Soybean Meal | | | 4,739,360 | | | | (164,981 | ) | |
12/2017 | | | 100 | | | Soybean Oil | | | 2,085,000 | | | | 60,354 | | |
12/2017 | | | 141 | | | Wheat | | | 2,950,425 | | | | (577,503 | ) | |
12/2017 | | | 26 | | | Coffee 'C' | | | 1,219,725 | | | | (141,015 | ) | |
12/2017 | | | 72 | | | Lead | | | 4,336,200 | | | | 162,823 | | |
12/2017 | | | 67 | | | Nickel | | | 4,935,555 | | | | 136,886 | | |
12/2017 | | | 45 | | | Primary Aluminum | | | 2,421,562 | | | | 51,396 | | |
12/2017 | | | 58 | | | Zinc | | | 4,770,500 | | | | 293,876 | | |
12/2017 | | | 68 | | | High Grade Copper | | | 5,271,700 | | | | 329,133 | | |
12/2017 | | | 83 | | | Gold 100 Oz. | | | 10,545,150 | | | | (22,553 | ) | |
12/2017 | | | 58 | | | Silver | | | 4,840,970 | | | | (168,409 | ) | |
12/2017 | | | 67 | | | Live Cattle | | | 3,366,750 | | | | 332,076 | | |
1/2018 | | | 140 | | | Platinum | | | 6,437,200 | | | | (648,789 | ) | |
2/2018 | | | 138 | | | Brent Crude Oil | | | 8,371,080 | | | | 381,817 | | |
2/2018 | | | 81 | | | Sugar 11 | | | 1,337,213 | | | | 15,246 | | |
3/2018 | | | 74 | | | Soybean | | | 3,681,500 | | | | (24,456 | ) | |
Total Long Positions | | | | | | $ | 126,196,700 | | | $ | 2,258,756 | | |
See Notes to Financial Statements
97
Consolidated Schedule of Investments Risk Balanced Commodity Strategy Fund (cont'd)
Short Futures:
Expiration
Date | | Number of
Contracts | | Open Contracts | | Notional
Amount | | Value and
Unrealized
Appreciation/
(Depreciation) | |
12/2017 | | | 1 | | | Lead | | $ | (60,225 | ) | | $ | 869 | | |
12/2017 | | | 1 | | | Nickel | | | (73,665 | ) | | | (5,091 | ) | |
12/2017 | | | 7 | | | Primary Aluminum | | | (376,687 | ) | | | (392 | ) | |
12/2017 | | | 3 | | | Zinc | | | (246,750 | ) | | | (8,194 | ) | |
Total Short Positions | | | | | | $ | (757,327 | ) | | $ | (12,808 | ) | |
Total Futures | | | | | | | | $ | 2,245,948 | | |
(a) Commodity futures are held by the RBCS Subsidiary, a wholly-owned subsidiary of the Fund. See Note A in the Notes to Financial Statements.
At October 31, 2017, the Fund had $5,532,178 deposited in a segregated account to cover margin requirements on open futures.
For the year ended October 31, 2017, the average notional value of futures for the Fund was $110,096,585 for long positions and $(7,443,781) for short positions.
The following is a summary, categorized by Level (see Note A of Notes to Financial Statements), of inputs used to value the Fund's investments as of October 31, 2017:
Asset Valuation Inputs | |
(000's omitted) | | Level 1 | | Level 2 | | Level 3(b) | | Total | |
Investments: | |
U.S. Treasury Obligation | | $ | — | | | $ | 9,480 | | | $ | — | | | $ | 9,480 | | |
Asset-Backed Securities | | | — | | | | 21,423 | | | | 480 | | | | 21,903 | | |
| Corporate Bonds(a) | | | — | | | | 68,417 | | | | — | | | | 68,417 | | |
Short-Term Investments | | | — | | | | 18,172 | | | | — | | | | 18,172 | | |
Total Investments | | $ | — | | | $ | 117,492 | | | $ | 480 | | | $ | 117,972 | | |
(a) The Consolidated Schedule of Investments provides information on the industry or sector categorization for the portfolio.
See Notes to Financial Statements
98
Consolidated Schedule of Investments Risk Balanced Commodity Strategy Fund (cont'd)
(b) The following is a reconciliation between the beginning and ending balances of investments in which unobservable inputs (Level 3) were used in determining value:
| | | Beginning
balance, as
of 11/1/2016 | | Accrued
discounts/
(premiums) | | Realized
gain/(loss) | | Change
in unrealized
appreciation/
(depreciation) | | Purchases | | Sales | | Transfers
into
Level 3 | | Transfers
out of
Level 3 | | Balance,
as of
10/31/2017 | | Net change in
unrealized
appreciation/
(depreciation)
from
investments
still held as of
10/31/2017 | |
Investments in Securities: | |
(000's omitted) | |
Asset-Backed
Securities(c) | | $ | — | | | $ | — | | | $ | — | | | $ | — | | | $ | 480 | | | $ | — | | | $ | — | | | $ | — | | | $ | 480 | | | $ | — | | |
Total | | $ | — | | | $ | — | | | $ | — | | | $ | — | | | $ | 480 | | | $ | — | | | $ | — | | | $ | — | | | $ | 480 | | | $ | — | | |
(c) Securities categorized as Level 3 are valued based on a single quotation obtained from a dealer. The Fund does not have access to unobservable inputs and therefore cannot disclose such inputs used in formulating such quotation.
As of the year ended October 31, 2017, no securities were transferred from one level (as of October 31, 2016) to another.
The following is a summary, categorized by Level (see Note A of Notes to Financial Statements), of inputs used to value the Fund's derivatives as of October 31, 2017:
Other Financial Instruments | |
(000's omitted) | | Level 1 | | Level 2 | | Level 3 | | Total | |
| Futures(a) | |
Assets | | $ | 6,004 | | | $ | — | | | $ | — | | | $ | 6,004 | | |
Liabilities | | | (3,758 | ) | | | — | | | | — | | | | (3,758 | ) | |
Total | | $ | 2,246 | | | $ | — | | | $ | — | | | $ | 2,246 | | |
(a) Futures are reported at the cumulative unrealized appreciation/(depreciation) of the instrument.
See Notes to Financial Statements
99
Schedule of Investments U.S. Equity Index PutWrite Strategy Fund October 31, 2017
PRINCIPAL AMOUNT | | | | VALUE | |
(000's omitted) | | | | (000's omitted) | |
U.S. Treasury Obligations 97.8% | | | |
| | | | | U.S. Treasury Notes | | | | | |
$ | 200 | | | 0.63%, due 11/30/17 | | $ | 200 | | |
| | 29,300 | | | 0.88%, due 6/15/19—9/15/19 | | | 28,942 | (a) | |
| | 51,700 | | | 1.00%, due 12/15/17—3/15/19 | | | 51,488 | (a) | |
| | 10,500 | | | 1.13%, due 6/15/18 | | | 10,485 | | |
| | 11,400 | | | 1.25%, due 12/15/18 | | | 11,367 | (a) | |
| | 22,700 | | | 1.38%, due 12/15/19—9/15/20 | | | 22,545 | | |
| | 9,000 | | | 1.50%, due 6/15/20 | | | 8,954 | | |
| | 31,200 | | | 1.63%, due 3/15/20—6/30/20 | | | 31,152 | | |
| | | | | Total U.S. Treasury Obligations (Cost $165,719) | | | 165,133 | | |
NUMBER OF SHARES | | | | | |
Short-Term Investment 3.3% | | | |
Investment Company 3.3% | | | |
| 5,531,761
| | | State Street Institutional U.S. Government Money Market Fund Premier Class, 0.96%
(Cost $5,532) | | | 5,532
| (b)(c) | |
| | | | | Total Investments 101.1% (Cost $171,251) | | | 170,665 | | |
| | | | | Liabilities Less Other Assets (1.1)% | | | (1,837 | )(d) | |
| | | | | Net Assets 100.0% | | $ | 168,828 | | |
(a) All or a portion of the security is pledged as collateral for options written.
(b) All or a portion of this security is segregated in connection with obligations for options written with a total value of approximately $5,532,000.
(c) Represents 7-day effective yield as of October 31, 2017.
(d) Includes the impact of the Fund's open positions in derivatives at October 31, 2017.
See Notes to Financial Statements
100
Schedule of Investments U.S. Equity Index PutWrite Strategy Fund (cont'd)
Derivative Instruments
Written option contracts ("options written")
At October 31, 2017, the Fund had outstanding options written as follows:
Description | | Number of
Contracts | | Notional
Amount | | Exercise
Price | | Expiration
Date | | Value | |
Puts | |
Index | |
Russell 2000 Index | | | 4 | | | $ | (601,109 | ) | | $ | 1,490 | | | 11/3/2017 | | $ | (1,620 | ) | |
Russell 2000 Index | | | 21 | | | | (3,155,823 | ) | | | 1,500 | | | 11/3/2017 | | | (15,330 | ) | |
Russell 2000 Index | | | 11 | | | | (1,653,050 | ) | | | 1,510 | | | 11/3/2017 | | | (13,750 | ) | |
Russell 2000 Index | | | 3 | | | | (450,832 | ) | | | 1,505 | | | 11/3/2017 | | | (2,895 | ) | |
Russell 2000 Index | | | 36 | | | | (5,409,983 | ) | | | 1,500 | | | 11/10/2017 | | | (45,540 | ) | |
Russell 2000 Index | | | 5 | | | | (751,387 | ) | | | 1,510 | | | 11/10/2017 | | | (8,725 | ) | |
Russell 2000 Index | | | 2 | | | | (300,555 | ) | | | 1,500 | | | 11/17/2017 | | | (3,240 | ) | |
Russell 2000 Index | | | 4 | | | | (601,109 | ) | | | 1,495 | | | 11/17/2017 | | | (5,700 | ) | |
Russell 2000 Index | | | 20 | | | | (3,005,546 | ) | | | 1,490 | | | 11/17/2017 | | | (24,900 | ) | |
Russell 2000 Index | | | 19 | | | | (2,855,269 | ) | | | 1,505 | | | 11/24/2017 | | | (39,710 | ) | |
Russell 2000 Index | | | 15 | | | | (2,254,160 | ) | | | 1,500 | | | 11/24/2017 | | | (28,125 | ) | |
Russell 2000 Index | | | 1 | | | | (150,277 | ) | | | 1,490 | | | 11/24/2017 | | | (1,505 | ) | |
Russell 2000 Index | | | 7 | | | | (1,051,941 | ) | | | 1,495 | | | 11/24/2017 | | | (11,725 | ) | |
Russell 2000 Index | | | 1 | | | | (150,277 | ) | | | 1,490 | | | 12/1/2017 | | | (1,790 | ) | |
Russell 2000 Index | | | 18 | | | | (2,704,991 | ) | | | 1,500 | | | 12/1/2017 | | | (39,150 | ) | |
S&P 500 Index | | | 11 | | | | (2,832,786 | ) | | | 2,530 | | | 11/3/2017 | | | (990 | ) | |
S&P 500 Index | | | 24 | | | | (6,180,624 | ) | | | 2,540 | | | 11/3/2017 | | | (3,000 | ) | |
S&P 500 Index | | | 16 | | | | (4,120,416 | ) | | | 2,550 | | | 11/3/2017 | | | (3,000 | ) | |
S&P 500 Index | | | 1 | | | | (257,526 | ) | | | 2,545 | | | 11/3/2017 | | | (153 | ) | |
S&P 500 Index | | | 46 | | | | (11,846,196 | ) | | | 2,570 | | | 11/3/2017 | | | (23,690 | ) | |
S&P 500 Index | | | 38 | | | | (9,785,988 | ) | | | 2,545 | | | 11/10/2017 | | | (19,570 | ) | |
S&P 500 Index | | | 44 | | | | (11,331,144 | ) | | | 2,550 | | | 11/10/2017 | | | (25,740 | ) | |
S&P 500 Index | | | 53 | | | | (13,648,878 | ) | | | 2,555 | | | 11/10/2017 | | | (35,775 | ) | |
S&P 500 Index | | | 45 | | | | (11,588,670 | ) | | | 2,555 | | | 11/17/2017 | | | (48,375 | ) | |
S&P 500 Index | | | 17 | | | | (4,377,942 | ) | | | 2,550 | | | 11/17/2017 | | | (16,660 | ) | |
S&P 500 Index | | | 18 | | | | (4,635,468 | ) | | | 2,560 | | | 11/17/2017 | | | (21,420 | ) | |
S&P 500 Index | | | 56 | | | | (14,421,456 | ) | | | 2,565 | | | 11/17/2017 | | | (74,200 | ) | |
S&P 500 Index | | | 10 | | | | (2,575,260 | ) | | | 2,565 | | | 11/24/2017 | | | (15,750 | ) | |
S&P 500 Index | | | 31 | | | | (7,983,306 | ) | | | 2,570 | | | 11/24/2017 | | | (53,475 | ) | |
S&P 500 Index | | | 7 | | | | (1,802,682 | ) | | | 2,550 | | | 11/24/2017 | | | (8,505 | ) | |
S&P 500 Index | | | 29 | | | | (7,468,254 | ) | | | 2,560 | | | 11/24/2017 | | | (41,615 | ) | |
S&P 500 Index | | | 61 | | | | (15,709,086 | ) | | | 2,575 | | | 11/24/2017 | | | (116,205 | ) | |
S&P 500 Index | | | 46 | | | | (11,846,196 | ) | | | 2,575 | | | 12/1/2017 | | | (107,180 | ) | |
S&P 500 Index | | | 3 | | | | (772,578 | ) | | | 2,570 | | | 12/1/2017 | | | (6,450 | ) | |
Total Options Written (premiums received: $1,328,909) | | | | | | | | | | $ | (865,458 | ) | |
See Notes to Financial Statements
101
Schedule of Investments U.S. Equity Index PutWrite Strategy Fund (cont'd)
For the year ended October 31, 2017, the Fund had an average market value of $(651,302) in options written. The Fund had securities pledged in the amount of $27,632,440 to cover collateral requirements for options written.
The following is a summary, categorized by Level (see Note A of Notes to Financial Statements), of inputs used to value the Fund's investments as of October 31, 2017:
Asset Valuation Inputs | |
(000's omitted) | | Level 1 | | Level 2 | | Level 3 | | Total | |
Investments: | |
U.S. Treasury Obligations | | $ | — | | | $ | 165,133 | | | $ | — | | | $ | 165,133 | | |
Short-Term Investment | | | — | | | | 5,532 | | | | — | | | | 5,532 | | |
Total Investments | | $ | — | | | $ | 170,665 | | | $ | — | | | $ | 170,665 | | |
As of the year ended October 31, 2017, no securities were transferred from one level (as of October 31, 2016) to another.
The following is a summary, categorized by Level (see Note A of Notes to Financial Statements), of inputs used to value the Fund's derivatives as of October 31, 2017:
Other Financial Instruments | |
(000's omitted) | | Level 1 | | Level 2 | | Level 3 | | Total | |
Options Written | |
Liabilities | | $ | (865 | ) | | $ | — | | | $ | — | | | $ | (865 | ) | |
Total | | $ | (865 | ) | | $ | — | | | $ | — | | | $ | (865 | ) | |
See Notes to Financial Statements
102
This page has been left blank intentionally
103
Statements of Assets and Liabilities
Neuberger Berman Alternative Funds
(000's omitted except per share amounts)
| | | GLOBAL
ALLOCATION
FUND | | HEDGED
OPTION
PREMIUM
STRATEGY
FUND | | LONG SHORT
FUND | | LONG SHORT
CREDIT FUND | | MULTI-ASSET
INCOME FUND | | RISK
BALANCED
COMMODITY
STRATEGY
FUND** | | U.S. EQUITY
INDEX
PUTWRITE
STRATEGY
FUND | |
| | | October 31,
2017 | | October 31,
2017 | | October 31,
2017 | | October 31,
2017 | | October 31,
2017 | | October 31,
2017 | | October 31,
2017 | |
Assets | |
Investments in securities, at value* (Notes A & F)—see Schedule of Investments: | |
| Unaffiliated issuers(a) | | $ | 10,988 | | | $ | 12,509 | | | $ | 3,054,931 | | | $ | 26,775 | | | $ | 20,038 | | | $ | 117,972 | | | $ | 170,665 | | |
| Affiliated issuers(b) | | | 11,005 | | | | — | | | | — | | | | — | | | | 4,730 | | | | — | | | | — | | |
| | | | 21,993 | | | | 12,509 | | | | 3,054,931 | | | | 26,775 | | | | 24,768 | | | | 117,972 | | | | 170,665 | | |
Cash | | | 1 | | | | 2 | | | | 1,468 | | | | — | | | | 1 | | | | 600 | | | | — | | |
| Foreign currency(c) | | | 1 | | | | — | | | | — | | | | 152 | | | | 3 | | | | — | | | | — | | |
Cash collateral segregated for short sales (Note A) | | | — | | | | — | | | | 521,682 | | | | — | | | | — | | | | — | | | | — | | |
Cash collateral segregated for futures contracts (Note A) | | | 157 | | | | — | | | | 17,952 | | | | 54 | | | | 184 | | | | 5,532 | | | | — | | |
Cash collateral segregated for swap contracts (Note A) | | | — | | | | — | | | | 8,300 | | | | 790 | | | | — | | | | — | | | | — | | |
Receivable from broker | | | — | | | | — | | | | — | | | | 65 | | | | — | | | | — | | | | — | | |
Dividends and interest receivable | | | 46 | | | | 33 | | | | 5,822 | | | | 394 | | | | 80 | | | | 210 | | | | 522 | | |
Receivable for securities sold | | | 189 | | | | — | | | | 17,320 | | | | 741 | | | | 191 | | | | 3,330 | | | | 77 | | |
Receivable for Fund shares sold | | | 45 | | | | 119 | | | | 10,366 | | | | — | | | | 125 | | | | 127 | | | | 2,098 | | |
Receivable from Management—net (Note B) | | | 6 | | | | — | | | | — | | | | 32 | | | | 29 | | | | 47 | | | | — | | |
Receivable for variation margin on futures contracts (Note A) | | | 37 | | | | — | | | | — | | | | 78 | | | | 76 | | | | 1,697 | | | | — | | |
| Receivable for variation margin on centrally cleared swap contracts(f) | | | — | | | | — | | | | — | | | | 33 | | | | — | | | | — | | | | — | | |
| OTC swap contracts, at value (Note A)(g) | | | 2 | | | | — | | | | 2,012 | | | | 175 | | | | 4 | | | | — | | | | — | | |
Receivable for forward foreign currency contracts (Note A) | | | 177 | | | | — | | | | — | | | | 2 | | | | 156 | | | | — | | | | — | | |
Prepaid expenses and other assets | | | 21 | | | | 51 | | | | 165 | | | | 17 | | | | 17 | | | | 32 | | | | 42 | | |
Total Assets | | | 22,675 | | | | 12,714 | | | | 3,640,018 | | | | 29,308 | | | | 25,634 | | | | 129,547 | | | | 173,404 | | |
Liabilities | |
| Investments sold short, at value(d) (Note A) | | | — | | | | — | | | | 514,058 | | | | — | | | | — | | | | — | | | | — | | |
| OTC swap contracts, at value(g) (Note A) | | | 1 | | | | — | | | | 4,202 | | | | 135 | | | | 2 | | | | — | | | | — | | |
Dividends and interest payable for short sales and reverse repurchase agreements | | | — | | | | — | | | | 1,281 | | | | — | | | | — | | | | — | | | | — | | |
Payable to investment manager—net (Notes A & B) | | | — | | | | 3 | | | | 2,815 | | | | 18 | | | | 7 | | | | 52 | | | | 62 | | |
| Option contracts written, at value(e) (Note A) | | | 8 | | | | 29 | | | | 8,341 | | | | — | | | | 8 | | | | — | | | | 865 | | |
Due to custodian | | | — | | | | — | | | | — | | | | 1,433 | | | | — | | | | — | | | | — | | |
Payable for securities purchased | | | 1,296 | | | | 1,987 | | | | 13,355 | | | | 1,884 | | | | 2,458 | | | | 3,744 | | | | 3,484 | | |
Payable for Fund shares redeemed | | | 26 | | | | — | | | | 2,393 | | | | 6 | | | | 23 | | | | 68 | | | | — | | |
Payable to administrator—net (Note B) | | | 36 | | | | 11 | | | | 514 | | | | — | | | | — | | | | — | | | | 60 | | |
Payable to trustees | | | 2 | | | | 2 | | | | 2 | | | | 2 | | | | 2 | | | | 2 | | | | 2 | | |
Payable for variation margin on futures contracts (Note A) | | | — | | | | — | | | | 1,609 | | | | — | | | | — | | | | — | | | | — | | |
Payable for forward foreign currency contracts (Note A) | | | 162 | | | | — | | | | — | | | | — | | | | 148 | | | | — | | | | — | | |
Distributions payable | | | — | | | | — | | | | — | | | | — | | | | 10 | | | | — | | | | — | | |
Accrued expenses and other payables | | | 219 | | | | 78 | | | | 138 | | | | 115 | | | | 196 | | | | 184 | | | | 103 | | |
Total Liabilities | | | 1,750 | | | | 2,110 | | | | 548,708 | | | | 3,593 | | | | 2,854 | | | | 4,050 | | | | 4,576 | | |
Net Assets | | $ | 20,925 | | | $ | 10,604 | | | $ | 3,091,310 | | | $ | 25,715 | | | $ | 22,780 | | | $ | 125,497 | | | $ | 168,828 | | |
See Notes to Financial Statements
104
105
Statements of Assets and Liabilities (cont'd)
Neuberger Berman Alternative Funds (cont'd)
(000's omitted except per share amounts)
| | | GLOBAL
ALLOCATION
FUND | | HEDGED
OPTION
PREMIUM
STRATEGY
FUND | | LONG SHORT
FUND | | LONG SHORT
CREDIT FUND | | MULTI-ASSET
INCOME FUND | | RISK
BALANCED
COMMODITY
STRATEGY
FUND** | | U.S. EQUITY
INDEX
PUTWRITE
STRATEGY
FUND | |
| | | October 31,
2017 | | October 31,
2017 | | October 31,
2017 | | October 31,
2017 | | October 31,
2017 | | October 31,
2017 | | October 31,
2017 | |
Net Assets consist of: | |
Paid-in capital | | $ | 18,297 | | | $ | 10,509 | | | $ | 2,712,962 | | | $ | 26,615 | | | $ | 21,999 | | | $ | 123,204 | | | $ | 159,242 | | |
Undistributed net investment income (loss) | | | 176 | | | | 6 | | | | (6,496 | ) | | | — | | | | — | | | | 29 | | | | 73 | | |
Distributions in excess of net investment income | | | — | | | | — | | | | — | | | | (94 | ) | | | (88 | ) | | | — | | | | — | | |
Accumulated net realized gains (losses) on investments | | | 642 | | | | 100 | | | | (31,198 | ) | | | (941 | ) | | | (154 | ) | | | (84 | ) | | | 9,635 | | |
Net unrealized appreciation (depreciation) in value of investments | | | 1,810 | | | | (11 | ) | | | 416,042 | | | | 135 | | | | 1,023 | | | | 2,348 | | | | (122 | ) | |
Net Assets | | $ | 20,925 | | | $ | 10,604 | | | $ | 3,091,310 | | | $ | 25,715 | | | $ | 22,780 | | | $ | 125,497 | | | $ | 168,828 | | |
Net Assets | |
Institutional Class | | $ | 13,869 | | | $ | 8,561 | | | $ | 2,853,025 | | | $ | 15,654 | | | $ | 17,348 | | | $ | 83,095 | | | $ | 152,006 | | |
Class A | | | 3,880 | | | | 26 | | | | 145,556 | | | | 3,028 | | | | 600 | | | | 42,373 | | | | 4,075 | | |
Class C | | | 3,176 | | | | 35 | | | | 92,729 | | | | 1,006 | | | | 733 | | | | 29 | | | | 522 | | |
Class R6 | | | — | | | | 1,982 | | | | — | | | | 6,027 | | | | 4,099 | | | | — | | | | 12,225 | | |
Shares Outstanding ($.001 par value; unlimited shares authorized) | |
Institutional Class | | | 1,142 | | | | 337 | | | | 200,833 | | | | 1,622 | | | | 1,704 | | | | 13,071 | | | | 13,413 | | |
Class A | | | 323 | | | | 1 | | | | 10,428 | | | | 314 | | | | 59 | | | | 6,794 | | | | 360 | | |
Class C | | | 272 | | | | 1 | | | | 6,929 | | | | 104 | | | | 72 | | | | 5 | | | | 46 | | |
Class R6 | | | — | | | | 78 | | | | — | | | | 624 | | | | 403 | | | | — | | | | 1,078 | | |
Net Asset Value, offering and redemption price per share | |
Institutional Class | | $ | 12.14 | | | $ | 25.41 | | | $ | 14.21 | | | $ | 9.65 | | | $ | 10.18 | | | $ | 6.36 | | | $ | 11.33 | | |
Class R6 | | | — | | | $ | 25.41 | | | | — | | | | 9.65 | | | | 10.18 | | | | — | | | | 11.34 | | |
Net Asset Value and redemption price per share | |
Class A | | $ | 12.04 | | | $ | 25.41 | | | $ | 13.96 | | | $ | 9.65 | | | $ | 10.18 | | | $ | 6.24 | | | $ | 11.33 | | |
Offering Price per share | |
Class A‡ | | $ | 12.77 | | | $ | 26.96 | | | $ | 14.81 | | | $ | 10.08 | | | $ | 10.63 | | | $ | 6.62 | | | $ | 12.02 | | |
Net Asset Value and offering price per share | |
Class C^ | | $ | 11.66 | | | $ | 25.33 | | | $ | 13.38 | | | $ | 9.64 | | | $ | 10.18 | | | $ | 5.95 | | | $ | 11.24 | | |
*Cost of Investments: | |
(a) Unaffiliated issuers | | $ | 10,243 | | | $ | 12,541 | | | $ | 2,587,711 | | | $ | 26,693 | | | $ | 19,127 | | | $ | 117,870 | | | $ | 171,251 | | |
(b) Affiliated issuers | | | 9,968 | | | | — | | | | — | | | | — | | | | 4,657 | | | | — | | | | — | | |
Total cost of investments | | $ | 20,211 | | | $ | 12,541 | | | $ | 2,587,711 | | | $ | 26,693 | | | $ | 23,784 | | | $ | 117,870 | | | $ | 171,251 | | |
(c) Total cost of foreign currency | | $ | — | | | $ | — | | | $ | — | | | $ | 154 | | | $ | 3 | | | $ | — | | | $ | — | | |
(d) Proceeds from investments sold short | | $ | — | | | $ | — | | | $ | 485,670 | | | $ | — | | | $ | — | | | $ | — | | | $ | — | | |
(e) Premium received from option contracts written | | $ | 12 | | | $ | 50 | | | $ | 8,101 | | | $ | — | | | $ | 13 | | | $ | — | | | $ | 1,329 | | |
(f) Unamortized upfront receipts on centrally cleared swap contracts | | $ | — | | | $ | — | | | $ | — | | | $ | (265 | ) | | $ | — | | | $ | — | | | $ | — | | |
(g) Unamortized upfront receipts on OTC swap contracts | | $ | — | | | $ | — | | | $ | — | | | $ | (39 | ) | | $ | — | | | $ | — | | | $ | — | | |
** Consolidated financial statement, see Note A of the Notes to Financial Statements for additional information.
‡ On single retail sales of less than $50,000. On sales of $50,000 or more or in certain other circumstances described in the Fund's prospectus, offering price is reduced.
^ Redemption price per share is equal to net asset value less any applicable contingent deferred sales charge.
See Notes to Financial Statements
106
107
Neuberger Berman Alternative Funds
(000's omitted)
| | | GLOBAL
ALLOCATION
FUND | | HEDGED
OPTION
PREMIUM
STRATEGY
FUND | | LONG SHORT
FUND | | LONG SHORT
CREDIT FUND | | MULTI-ASSET
INCOME FUND | | RISK
BALANCED
COMMODITY
STRATEGY
FUNDa | | U.S. EQUITY
INDEX
PUTWRITE
STRATEGY
FUND | |
| | | For the
Year Ended
October 31,
2017 | | Period from
April 12, 2017
(Commencement
of Operations) to
October 31,
2017 | | For the
Year Ended
October 31,
2017 | | For the
Year Ended
October 31,
2017 | | For the
Year Ended
October 31,
2017 | | For the
Year Ended
October 31,
2017 | | For the
Year Ended
October 31,
2017 | |
Investment Income: | |
Income (Note A): | |
Dividend income—unaffiliated issuers | | $ | 153 | | | $ | — | | | $ | 32,231 | | | $ | 53 | | | $ | 356 | | | $ | — | | | $ | — | | |
Dividend income—affiliated issuers (Note F) | | | 210 | | | | — | | | | — | | | | — | | | | 285 | | | | — | | | | — | | |
Interest income—unaffiliated issuers | | | 89 | | | | 43 | | | | 17,903 | | | | 1,379 | | | | 156 | | | | 1,232 | | | | 1,160 | | |
Foreign taxes withheld (Note A) | | | (6 | ) | | | — | | | | (472 | ) | | | — | | | | (7 | ) | | | — | | | | — | | |
Total income | | $ | 446 | | | $ | 43 | | | $ | 49,662 | | | $ | 1,432 | | | $ | 790 | | | $ | 1,232 | | | $ | 1,160 | | |
Expenses: | |
Investment management fees (Note B) | | | 122 | | | | 15 | | | | 28,670 | | | | 225 | | | | 94 | | | | 572 | | | | 456 | | |
Administration fees (Note B) | | | 8 | | | | 1 | | | | 960 | | | | 12 | | | | 8 | | | | 38 | | | | 31 | | |
Administration fees (Note B): | |
Institutional Class | | | 14 | | | | 3 | | | | 2,615 | | | | 20 | | | | 18 | | | | 73 | | | | 108 | | |
Class A | | | 10 | | | | — | | | | 351 | | | | 6 | | | | 1 | | | | 85 | | | | 5 | | |
Class C | | | 8 | | | | — | | | | 225 | | | | 2 | | | | 1 | | | | — | | | | — | | |
Class R6 | | | — | | | | 1 | | | | — | | | | 2 | | | | 2 | | | | — | | | | 4 | | |
Distribution fees (Note B): | |
Class A | | | 11 | | | | — | | | | 402 | | | | 7 | | | | 1 | | | | 95 | | | | 5 | | |
Class C | | | 39 | | | | — | | | | 1,030 | | | | 10 | | | | 7 | | | | 1 | | | | 2 | | |
Shareholder servicing agent fees: | |
Institutional Class | | | — | | | | — | | | | 207 | | | | — | | | | — | | | | 1 | | | | 1 | | |
Class A | | | 1 | | | | — | | | | 11 | | | | — | | | | 1 | | | | 6 | | | | — | | |
Class C | | | 1 | | | | — | | | | 3 | | | | — | | | | — | | | | 1 | | | | — | | |
Organization expense (Note A) | | | — | | | | 92 | | | | — | | | | — | | | | — | | | | — | | | | — | | |
RBCS Subsidiary Administration Fees | | — | | — | | — | | — | | — | | 50 | |
Audit fees | | | 70 | | | | 25 | | | | 36 | | | | 58 | | | | 71 | | | | 81 | | | | 45 | | |
Custodian and accounting fees | | | 284 | | | | 34 | | | | 409 | | | | 81 | | | | 249 | | | | 81 | | | | 78 | | |
Insurance expense | | | 1 | | | | — | | | | 89 | | | | 1 | | | | 1 | | | | 3 | | | | — | | |
Legal fees | | | 98 | | | | 32 | | | | 125 | | | | 108 | | | | 97 | | | | 110 | | | | 82 | | |
Registration and filing fees | | | 64 | | | | 31 | | | | 213 | | | | 59 | | | | 46 | | | | 62 | | | | 120 | | |
Shareholder reports | | | 4 | | | | 5 | | | | 216 | | | | — | | | | — | | | | 6 | | | | 10 | | |
Trustees' fees and expenses | | | 44 | | | | 23 | | | | 54 | | | | 44 | | | | 44 | | | | 44 | | | | 40 | | |
Dividend and interest expense on securities sold short and reverse
repurchase agreements (Note A) | | | 8 | | | | — | | | | 12,284 | | | | 11 | | | | — | | | | — | | | | — | | |
Interest expense | | | — | | | | — | | | | 2 | | | | 1 | | | | — | | | | 1 | | | | — | | |
Miscellaneous | | | 37 | | | | 6 | | | | 201 | | | | 1 | | | | 2 | | | | 43 | | | | 7 | | |
Total expenses | | | 824 | | | | 268 | | | | 48,103 | | | | 648 | | | | 643 | | | | 1,353 | | | | 994 | | |
See Notes to Financial Statements
108
109
Statements of Operations (cont'd)
Neuberger Berman Alternative Funds (cont'd)
(000's omitted)
| | | GLOBAL
ALLOCATION
FUND | | HEDGED
OPTION
PREMIUM
STRATEGY
FUND | | LONG SHORT
FUND | | LONG SHORT
CREDIT FUND | | MULTI-ASSET
INCOME FUND | | RISK
BALANCED
COMMODITY
STRATEGY
FUNDa | | U.S. EQUITY
INDEX
PUTWRITE
STRATEGY
FUND | |
| | | For the
Year Ended
October 31,
2017 | | Period from
April 12, 2017
(Commencement
of Operations) to
October 31,
2017 | | For the
Year Ended
October 31,
2017 | | For the
Year Ended
October 31,
2017 | | For the
Year Ended
October 31,
2017 | | For the
Year Ended
October 31,
2017 | | For the
Year Ended
October 31,
2017 | |
Expenses reimbursed by Management (Note B) | | | (588 | ) | | | (246 | ) | | | — | | | | (281 | ) | | | (497 | ) | | | (343 | ) | | | (330 | ) | |
Investment management fees waived (Note A) | | | (71 | ) | | | — | | | | — | | | | — | | | | (33 | ) | | | — | | | | — | | |
Custodian out-of-pocket expenses refunded (Note G) | | | — | | | | — | | | | (5 | ) | | | — | | | | — | | | | — | | | | — | | |
Total net expenses | | | 165 | | | | 22 | | | | 48,098 | | | | 367 | | | | 113 | | | | 1,010 | | | | 664 | | |
Net investment income (loss) | | $ | 281 | | | $ | 21 | | | $ | 1,564 | | | $ | 1,065 | | | $ | 677 | | | $ | 222 | | | $ | 496 | | |
Realized and Unrealized Gain (Loss) on Investments (Note A): | |
Net realized gain (loss) on: | |
Transactions in investment securities of unaffiliated issuers | | | 640 | | | | (27 | ) | | | 146,844 | | | | 289 | | | | 75 | | | | 14 | | | | (13 | ) | |
Transactions in investment securities of affiliated issuers | | | 279 | | | | — | | | | — | | | | — | | | | 24 | | | | — | | | | — | | |
Realized gain distributions from affiliated issuers | | | 83 | | | | — | | | | — | | | | — | | | | — | | | | — | | | | — | | |
Closed short positions of unaffiliated issuers | | | (134 | ) | | | — | | | | (15,828 | ) | | | — | | | | — | | | | — | | | | — | | |
Settlement of forward foreign currency contracts | | | (5 | ) | | | — | | | | — | | | | (21 | ) | | | 5 | | | | — | | | | — | | |
Settlement of foreign currency transactions | | | 42 | | | | — | | | | 13 | | | | 3 | | | | 34 | | | | — | | | | — | | |
Expiration or closing of futures contracts | | | 83 | | | | — | | | | (62,300 | ) | | | 23 | | | | 90 | | | | 4,073 | | | | — | | |
Expiration or closing of option contracts written and swaptions written | | | 87 | | | | 127 | | | | 11,532 | | | | 14 | | | | 109 | | | | — | | | | 10,210 | | |
Expiration or closing of swap contracts | | | 1 | | | | — | | | | (19,599 | ) | | | 22 | | | | (6 | ) | | | — | | | | — | | |
Net increase from payments by affiliates (Note B) | | | — | | | | — | | | | 37 | | | | — | | | | — | | | | — | | | | — | | |
Change in net unrealized appreciation (depreciation) in value of: | |
Investment securities of unaffiliated issuers | | | 597 | | | | (32 | ) | | | 262,312 | | | | 70 | | | | 867 | | | | 49 | | | | (569 | ) | |
Investment securities of affiliated issuers | | | 1,135 | | | | — | | | | — | | | | — | | | | 50 | | | | — | | | | — | | |
Short positions of unaffiliated issuers | | | (51 | ) | | | — | | | | (22,962 | ) | | | — | | | | — | | | | — | | | | — | | |
Forward foreign currency contracts | | | 40 | | | | — | | | | — | | | | (5 | ) | | | 30 | | | | — | | | | — | | |
Foreign currency translations | | | — | | | | — | | | | — | | | | — | | | | 1 | | | | — | | | | — | | |
Futures contracts | | | 19 | | | | — | | | | (33,546 | ) | | | (66 | ) | | | 43 | | | | 1,581 | | | | — | | |
Option contracts and swaptions written | | | 2 | | | | 21 | | | | (2,147 | ) | | | — | | | | 1 | | | | — | | | | 522 | | |
Swap contracts | | | 1 | | | | — | | | | 3,023 | | | | 40 | | | | 2 | | | | — | | | | — | | |
Net gain (loss) on investments | | | 2,819 | | | | 89 | | | | 267,379 | | | | 369 | | | | 1,325 | | | | 5,717 | | | | 10,150 | | |
Net increase (decrease) in net assets resulting from operations | | $ | 3,100 | | | $ | 110 | | | $ | 268,943 | | | $ | 1,434 | | | $ | 2,002 | | | $ | 5,939 | | | $ | 10,646 | | |
a Consolidated financial statement, see Note A of the Notes to Financial Statements for additional information.
See Notes to Financial Statements
110
111
Statements of Changes in Net Assets
Neuberger Berman Alternative Funds
(000's omitted)
| | | GLOBAL ALLOCATION FUND | | HEDGED OPTION PREMIUM
STRATEGY FUND | | LONG SHORT FUND | | LONG SHORT CREDIT FUND | | MULTI-ASSET INCOME FUND | | RISK BALANCED COMMODITY
STRATEGY FUNDa | |
| | | Year Ended
October 31,
2017 | | Year Ended
October 31,
2016 | | Period from
April 12, 2017
(Commencement
of Operations) to
October 31,
2017 | | Year Ended
October 31,
2017 | | Year Ended
October 31,
2016 | | Year Ended
October 31,
2017 | | Year Ended
October 31,
2016 | | Year Ended
October 31,
2017 | | Year Ended
October 31,
2016 | | Year Ended
October 31,
2017 | | Year Ended
October 31,
2016 | |
Increase (Decrease) in Net Assets: | |
From Operations: | |
Net investment income (loss) (Note A) | | $ | 281 | | | $ | 125 | | | $ | 21 | | | $ | 1,564 | | | $ | (8,766 | ) | | $ | 1,065 | | | $ | 486 | | | $ | 677 | | | $ | 518 | | | $ | 222 | | | $ | (463 | ) | |
Net realized gain (loss) on investments (Note A) | | | 1,076 | | | | (149 | ) | | | 100 | | | | 60,662 | | | | (94,760 | ) | | | 330 | | | | (926 | ) | | | 331 | | | | (383 | ) | | | 4,087 | | | | (1,428 | ) | |
Net increase from payments by affiliates (Note B) | | | — | | | | — | | | | — | | | | 37 | | | | — | | | | — | | | | — | | | | — | | | | — | | | | — | | | | — | | |
Change in net unrealized appreciation (depreciation) of
investments (Note A) | | | 1,743 | | | | 35 | | | | (11 | ) | | | 206,680 | | | | 80,504 | | | | 39 | | | | 432 | | | | 994 | | | | 778 | | | | 1,630 | | | | 201 | | |
Net increase (decrease) in net assets resulting from operations | | | 3,100 | | | | 11 | | | | 110 | | | | 268,943 | | | | (23,022 | ) | | | 1,434 | | | | (8 | ) | | | 2,002 | | | | 913 | | | | 5,939 | | | | (1,690 | ) | |
Distributions to Shareholders From (Note A): | |
Net investment income: | |
Institutional Class | | | (44 | ) | | | — | | | | (11 | ) | | | — | | | | (361 | ) | | | (659 | ) | | | (499 | ) | | | (548 | ) | | | (344 | ) | | | — | | | | — | | |
Class A | | | — | | | | — | | | | (0 | ) | | | — | | | | — | | | | (100 | ) | | | (21 | ) | | | (18 | ) | | | (14 | ) | | | — | | | | — | | |
Class C | | | — | | | | — | | | | — | | | | — | | | | — | | | | (28 | ) | | | (11 | ) | | | (16 | ) | | | (10 | ) | | | — | | | | — | | |
Class R6 | | | — | | | | — | | | | (6 | ) | | | — | | | | — | | | | (251 | ) | | | (102 | ) | | | (142 | ) | | | (122 | ) | | | — | | | | — | | |
Net realized gain on investments: | |
Institutional Class | | | — | | | | (16 | ) | | | — | | | | — | | | | — | | | | — | | | | — | | | | — | | | | — | | | | — | | | | — | | |
Class A | | | — | | | | (14 | ) | | | — | | | | — | | | | — | | | | — | | | | — | | | | — | | | | — | | | | — | | | | — | | |
Class C | | | — | | | | (13 | ) | | | — | | | | — | | | | — | | | | — | | | | — | | | | — | | | | — | | | | — | | | | — | | |
Class R6 | | | — | | | | — | | | | — | | | | — | | | | — | | | | — | | | | — | | | | — | | | | — | | | | — | | | | — | | |
Tax return of capital: | |
Institutional Class | | | — | | | | — | | | | — | | | | — | | | | — | | | | — | | | | — | | | | (16 | ) | | | (104 | ) | | | — | | | | — | | |
Class A | | | — | | | | — | | | | — | | | | — | | | | — | | | | — | | | | — | | | | (1 | ) | | | (5 | ) | | | — | | | | — | | |
Class C | | | — | | | | — | | | | — | | | | — | | | | — | | | | — | | | | — | | | | (1 | ) | | | (4 | ) | | | — | | | | — | | |
Class R6 | | | — | | | | — | | | | — | | | | — | | | | — | | | | — | | | | — | | | | (4 | ) | | | (36 | ) | | | — | | | | — | | |
Total distributions to shareholders | | | (44 | ) | | | (43 | ) | | | (17 | ) | | | — | | | | (361 | ) | | | (1,038 | ) | | | (633 | ) | | | (746 | ) | | | (639 | ) | | | — | | | | — | | |
From Fund Share Transactions (Note D): | |
Proceeds from shares sold: | |
Institutional Class | | | 6,799 | | | | 3,603 | | | | 8,498 | | | | 1,209,220 | | | | 858,721 | | | | 5,003 | | | | 7,628 | | | | 5,407 | | | | 1,594 | | | | 45,513 | | | | 27,038 | | |
Class A | | | 1,344 | | | | 1,982 | | | | 25 | | | | 46,543 | | | | 45,394 | | | | 2,136 | | | | 135 | | | | 11 | | | | 122 | | | | 16,494 | | | | 16,243 | | |
Class C | | | 215 | | | | 826 | | | | 35 | | | | 8,792 | | | | 9,572 | | | | 25 | | | | 25 | | | | 59 | | | | 206 | | | | — | | | | 135 | | |
Class R6 | | | — | | | | — | | | | 1,950 | | | | — | | | | — | | | | 220 | | | | 1,353 | | | | — | | | | — | | | | — | | | | — | | |
Proceeds from reinvestment of dividends and distributions: | |
Institutional Class | | | 44 | | | | 16 | | | | 11 | | | | — | | | | 185 | | | | 660 | | | | 399 | | | | 564 | | | | 306 | | | | — | | | | — | | |
Class A | | | — | | | | 14 | | | | — | | | | — | | | | — | | | | 65 | | | | 7 | | | | 3 | | | | 5 | | | | — | | | | — | | |
Class C | | | — | | | | 12 | | | | — | | | | — | | | | — | | | | 1 | | | | 3 | | | | 5 | | | | 4 | | | | — | | | | — | | |
Class R6 | | | — | | | | — | | | | — | | | | — | | | | — | | | | 56 | | | | 29 | | | | — | | | | 44 | | | | — | | | | — | | |
Payments for shares redeemed: | |
Institutional Class | | | (4,963 | ) | | | (2,526 | ) | | | (8 | ) | | | (672,348 | ) | | | (1,488,015 | ) | | | (12,619 | ) | | | (7,971 | ) | | | (1,978 | ) | | | (279 | ) | | | (15,387 | ) | | | (9,690 | ) | |
Class A | | | (4,053 | ) | | | (4,077 | ) | | | — | | | | (124,652 | ) | | | (196,288 | ) | | | (207 | ) | | | (423 | ) | | | (11 | ) | | | (51 | ) | | | (9,373 | ) | | | (17,175 | ) | |
Class C | | | (2,268 | ) | | | (2,625 | ) | | | — | | | | (43,665 | ) | | | (79,785 | ) | | | (11 | ) | | | (33 | ) | | | (13 | ) | | | (47 | ) | | | (57 | ) | | | (2,899 | ) | |
Class R6 | | | — | | | | — | | | | — | | | | — | | | | — | | | | (473 | ) | | | (14 | ) | | | — | | | | (32 | ) | | | — | | | | — | | |
Net increase (decrease) from Fund share transactions | | | (2,882 | ) | | | (2,775 | ) | | | 10,511 | | | | 423,890 | | | | (850,216 | ) | | | (5,144 | ) | | | 1,138 | | | | 4,047 | | | | 1,872 | | | | 37,190 | | | | 13,652 | | |
Net Increase (Decrease) in Net Assets | | | 174 | | | | (2,807 | ) | | | 10,604 | | | | 692,833 | | | | (873,599 | ) | | | (4,748 | ) | | | 497 | | | | 5,303 | | | | 2,146 | | | | 43,129 | | | | 11,962 | | |
See Notes to Financial Statements
112
113
Statements of Changes in Net Assets (cont'd)
Neuberger Berman Alternative Funds (cont'd)
(000's omitted)
| | | GLOBAL ALLOCATION FUND | | HEDGED OPTION PREMIUM
STRATEGY FUND | | LONG SHORT FUND | | LONG SHORT CREDIT FUND | | MULTI-ASSET INCOME FUND | | RISK BALANCED COMMODITY
STRATEGY FUNDa | |
| | | Year Ended
October 31,
2017 | | Year Ended
October 31,
2016 | | Period from
April 12, 2017
(Commencement
of Operations) to
October 31,
2017 | | Year Ended
October 31,
2017 | | Year Ended
October 31,
2016 | | Year Ended
October 31,
2017 | | Year Ended
October 31,
2016 | | Year Ended
October 31,
2017 | | Year Ended
October 31,
2016 | | Year Ended
October 31,
2017 | | Year Ended
October 31,
2016 | |
Net Assets: | |
Beginning of year | | | 20,751 | | | | 23,558 | | | | — | | | | 2,398,477 | | | | 3,272,076 | | | | 30,463 | | | | 29,966 | | | | 17,477 | | | | 15,331 | | | | 82,368 | | | | 70,406 | | |
End of year | | $ | 20,925 | | | $ | 20,751 | | | $ | 10,604 | | | $ | 3,091,310 | | | $ | 2,398,477 | | | $ | 25,715 | | | $ | 30,463 | | | $ | 22,780 | | | $ | 17,477 | | | $ | 125,497 | | | $ | 82,368 | | |
Undistributed net investment income (loss) at end of year | | $ | 176 | | | $ | 15 | | | $ | 6 | | | $ | — | | | $ | — | | | $ | — | | | $ | — | | | $ | — | | | $ | 6 | | | $ | 29 | | | $ | (268 | ) | |
Distributions in excess of net investment income at end of year | | $ | — | | | $ | — | | | $ | — | | | $ | (6,496 | ) | | $ | (9,127 | ) | | $ | (94 | ) | | $ | (63 | ) | | $ | (88 | ) | | $ | — | | | $ | — | | | $ | — | | |
a Consolidated financial statement, see Note A of the Notes to Financial Statements for additional information.
See Notes to Financial Statements
114
115
Statements of Changes in Net Assets (cont'd)
Neuberger Berman Alternative Funds
(000's omitted)
| | | U.S. EQUITY INDEX PUTWRITE
STRATEGY FUND | |
| | | Year Ended
October 31,
2017 | | Period from
September 16, 2016
(Commencement
of Operations) to
October 31,
2016 | |
Increase (Decrease) in Net Assets: | |
From Operations: | |
Net investment income (loss) (Note A) | | $ | 496 | | | $ | 6 | | |
Net realized gain (loss) on investments (Note A) | | | 10,197 | | | | 161 | | |
Net increase from payments by affiliates (Note B) | | | — | | | | — | | |
Change in net unrealized appreciation (depreciation) of investments (Note A) | | | (47 | ) | | | (75 | ) | |
Net increase (decrease) in net assets resulting from operations | | | 10,646 | | | | 92 | | |
Distributions to Shareholders From (Note A): | |
Net investment income: | |
Institutional Class | | | (385 | ) | | | — | | |
Class A | | | (2 | ) | | | — | | |
Class C | | | — | | | | — | | |
Class R6 | | | (45 | ) | | | — | | |
Net realized gain on investments: | |
Institutional Class | | | (87 | ) | | | — | | |
Class A | | | (2 | ) | | | — | | |
Class C | | | (0 | ) | | | — | | |
Class R6 | | | (14 | ) | | | — | | |
Tax return of capital | |
Institutional Class | | | — | | | | — | | |
Class A | | | — | | | | — | | |
Class C | | | — | | | | — | | |
Class R6 | | | — | | | | — | | |
Total distributions to shareholders | | | (535 | ) | | | — | | |
From Fund Share Transactions (Note D): | |
Proceeds from shares sold: | |
Institutional Class | | | 137,312 | | | | 21,148 | | |
Class A | | | 3,952 | | | | 422 | | |
Class C | | | 403 | | | | 102 | | |
Class R6 | | | 10,681 | | | | 4,770 | | |
Proceeds from reinvestment of dividends and distributions: | |
Institutional Class | | | 471 | | | | — | | |
Class A | | | 3 | | | | — | | |
Class C | | | — | | | | — | | |
Class R6 | | | 54 | | | | — | | |
Payments for shares redeemed: | |
Institutional Class | | | (15,953 | ) | | | — | | |
Class A | | | (503 | ) | | | — | | |
Class C | | | (2 | ) | | | — | | |
Class R6 | | | (4,235 | ) | | | — | | |
Net increase (decrease) from Fund share transactions | | | 132,183 | | | | 26,442 | | |
Net Increase (Decrease) in Net Assets | | | 142,294 | | | | 26,534 | | |
See Notes to Financial Statements
116
Statements of Changes in Net Assets (cont'd)
Neuberger Berman Alternative Funds (cont'd)
(000's omitted)
| | | U.S. EQUITY INDEX PUTWRITE
STRATEGY FUND | |
| | | Year Ended
October 31,
2017 | | Period from
September 16, 2016
(Commencement
of Operations) to
October 31,
2016 | |
Net Assets: | |
Beginning of year | | | 26,534 | | | | — | | |
End of year | | $ | 168,828 | | | $ | 26,534 | | |
Undistributed net investment income (loss) at end of year | | $ | 73 | | | $ | 8 | | |
Distributions in excess of net investment income at end of year | | $ | — | | | $ | — | | |
a Consolidated financial statement, see Note A of the Notes to Financial Statements for additional information.
See Notes to Financial Statements
117
Notes to Financial Statements Alternative Fundsß
Note A—Summary of Significant Accounting Policies:
1 General: Neuberger Berman Alternative Funds (the "Trust") is a Delaware statutory trust organized pursuant to an Amended and Restated Trust Instrument dated March 27, 2014. The Trust is registered as an open-end management investment company under the Investment Company Act of 1940, as amended (the "1940 Act"), and its shares are registered under the Securities Act of 1933, as amended (the "1933 Act"). Each of Neuberger Berman Global Allocation Fund ("Global Allocation"), Neuberger Berman Hedged Option Premium Strategy Fund ("Hedged Option Premium Strategy"), Neuberger Berman Long Short Fund ("Long Short"), Neuberger Berman Long Short Credit Fund ("Long Short Credit"), Neuberger Berman Multi-Asset Income Fund ("Multi-Asset Income"), Neuberger Berman Risk Balanced Commodity Strategy Fund ("Risk Balanced Commodity Strategy") and Neuberger Berman U.S. Equity Index PutWrite Strategy Fund ("U.S. Equity Index PutWrite Strategy"), (each individually a "Fund," and collectively, the "Funds") is a separate operating series of the Trust. Under the 1940 Act, the status of a Fund that was registered as non-diversified may, under certain circumstances, change to that of a diversified Fund (Global Allocation, Long Short and Risk Balanced Commodity Strategy became diversified in December 2013, December 2014 and August 2015, respectively). Hedged Option Premium Strategy, Long Short Credit, Multi-Asset Income and U.S. Equity Index PutWrite Strategy are each diversified. U.S. Equity Index PutWrite Strategy had no operations until September 16, 2016, other than matters relating to its organization and its registration of shares under the 1933 Act. Hedged Option Premium Strategy had no operations until April 12, 2017, other than matters relating to its organization and its registration of shares under the 1933 Act. Each Fund offers Institutional Class shares, Class A shares and Class C shares. Hedged Option Premium Strategy, Long Short Credit, Multi-Asset Income and U.S. Equity Index PutWrite Strategy also offer Class R6 shares. The Trust's Board of Trustees (the "Board") may establish additional series or classes of shares without the approval of shareholders.
A zero balance, if any, reflects an actual amount rounding to less than $1,000.
The assets of each Fund belong only to that Fund, and the liabilities of each Fund are borne solely by that Fund and no other.
Each Fund is an investment company and accordingly follows the investment company accounting and reporting guidance of the Financial Accounting Standards Board ("FASB") Accounting Standard Codification Topic 946 "Financial Services—Investment Companies."
The preparation of financial statements in accordance with U.S. generally accepted accounting principles ("GAAP") requires Neuberger Berman Investment Advisers LLC ("NBIA" or "Management") to make estimates and assumptions at the date of the financial statements. Actual results could differ from those estimates.
Risk Balanced Commodity Strategy invests in commodity-related instruments through Neuberger Berman Cayman Commodity Fund I Ltd. (the "RBCS Subsidiary"), which is organized under the laws of the Cayman Islands. Subscription agreements were entered into between the Fund and the RBCS Subsidiary with the intent that Risk Balanced Commodity Strategy will remain the sole shareholder of the RBCS Subsidiary. The RBCS Subsidiary is governed by its own Board of Directors.
As of October 31, 2017, the value of Risk Balanced Commodity Strategy's investment in the RBCS Subsidiary was as follows:
Investment in
RBCS Subsidiary | | Percentage of
Net Assets | |
| $ | 19,533,243 | | | | 15.6 | % | |
ß Consolidated Notes to Financial Statements for Risk Balanced Commodity Strategy
118
The Consolidated Financial Statements include all investments and other accounts of the RBCS Subsidiary as if held directly by Risk Balanced Commodity Strategy. A summary of the RBCS Subsidiary's financial information is presented below:
RBCS Subsidiary Financial Statement Information
(000's omitted) | | Amount | |
Total Assets | | $ | 19,623 | | |
Total Liabilities | | | 90 | | |
Net Assets | | | 19,533 | | |
Net investment income (loss) | | | (76 | ) | |
Net realized gain (loss) | | | 4,073 | | |
Change in net unrealized appreciation\(depreciation) | | | 1,581 | | |
Net increase/(decrease) in net assets resulting from operations | | | 5,578 | | |
2 Consolidation: The accompanying financial statements of Risk Balanced Commodity Strategy present the consolidated accounts of Risk Balanced Commodity Strategy and the RBCS Subsidiary. All intercompany accounts and transactions have been eliminated in consolidation.
3 Portfolio valuation: In accordance with Accounting Standards Codification ("ASC") 820 "Fair Value Measurement" ("ASC 820"), all investments held by each of the Funds are carried at the value that Management believes a Fund would receive upon selling an investment in an orderly transaction to an independent buyer in the principal or most advantageous market for the investment under current market conditions. Various inputs, including the volume and level of activity for the asset or liability in the market, are considered in valuing the Funds' investments, some of which are discussed below. Significant Management judgment may be necessary to value investments in accordance with ASC 820.
ASC 820 established a three-tier hierarchy of inputs to create a classification of value measurements for disclosure purposes. The three-tier hierarchy of inputs is summarized in the three broad Levels listed below.
• Level 1 – quoted prices in active markets for identical investments
• Level 2 – other observable inputs (including quoted prices for similar investments, interest rates, prepayment speeds, credit risk, amortized cost, etc.)
• Level 3 – unobservable inputs (including a Fund's own assumptions in determining the fair value of investments)
The inputs or methodology used for valuing an investment are not necessarily an indication of the risk associated with investing in those securities.
The value of the Funds' investments (long and short positions) in equity securities, convertible preferred stocks, exchange-traded funds, preferred stock, master limited partnerships, exchange-traded options purchased and options written, for which market quotations are readily available, is generally determined by Management by obtaining valuations from independent pricing services based on the latest sale price quoted on a principal exchange or market for that security (Level 1 inputs). Securities traded primarily on the NASDAQ Stock Market are normally valued at the NASDAQ Official Closing Price ("NOCP") provided by NASDAQ each business day. The NOCP is the most recently reported price as of 4:00:02 p.m., Eastern Time, unless that price is outside the range of the "inside" bid and asked prices (i.e., the bid and asked prices that dealers quote to each other when trading for their own accounts); in that case, NASDAQ will adjust the price to equal the inside bid or asked price, whichever is closer. Because of delays in reporting trades, the NOCP may not be based on the price of the last trade to occur before the market closes. If there is no sale of a security on a particular day, the independent pricing services may value the security based on market quotations.
119
The value of the Funds' investments for long and short positions in debt securities is determined by Management primarily by obtaining valuations from independent pricing services based on readily available bid or offer quotations, respectively, or if quotations are not available, by methods which include various considerations based on security type (generally Level 2 inputs). In addition to the consideration of yields or prices of securities of comparable quality, coupon, maturity and type, indications as to values from dealers, and general market conditions, the following is a description of other Level 2 inputs and related valuation techniques used by independent pricing services to value certain types of debt securities held by the Funds:
Corporate Bonds. Inputs used to value corporate debt securities generally include relative credit information, observed market movements, sector news, U.S. Treasury yield curve or relevant benchmark curve, and other market information, which may include benchmark yields, reported trades, broker-dealer quotes, issuer spreads, benchmark securities, bids, offers, and reference data, such as market research publications, when available ("Other Market Information").
Convertible Bonds. Inputs used to value convertible bonds generally include underlying stock data, dealer quotes, conversion premiums, listed bond and preferred stock prices and other market information, which may include benchmark curves, trade execution data, and sensitivity analysis, when available.
U.S. Treasury Obligations. Inputs used to value U.S. Treasury securities generally include quotes from several inter-dealer brokers and Other Market Information.
U.S. Government Agency Securities. Inputs used to value U.S. Government Agency securities generally include obtaining benchmark quotes and Other Market Information.
Asset-Backed Securities and Mortgage-Backed Securities. Inputs used to value asset-backed securities and mortgage-backed securities generally include models that consider a number of factors, which may include the following: prepayment speeds, cash flows, spread adjustments and Other Market Information.
Emerging Markets Debt, Sovereign Debt, and Quasi-Sovereign Debt. Inputs used to value emerging markets debt, sovereign debt and quasi-sovereign debt generally include dealer quotes, bond market activity, discounted cash flow models, and other relevant information such as credit spreads, benchmark curves and Other Market Information.
The value of loan assignments is determined by Management primarily by obtaining valuations from independent pricing services based on broker quotes (generally Level 2 or Level 3 inputs depending on the number of quotes available).
The value of futures is determined by Management by obtaining valuations from independent pricing services at the settlement price at the market close (Level 1 inputs).
The value of forward contracts is determined by Management by obtaining valuations from independent pricing services based on actual traded currency rates on independent pricing services' networks, along with other traded and quoted currency rates provided to the pricing services by leading market participants (Level 2 inputs).
The value of credit default swaps is determined by Management by obtaining valuations from independent pricing services using a model that considers a number of factors, which may include default probabilities, credit curves, recovery rates and cash flows (Level 2 inputs).
The value of total return swaps and total return basket swaps is determined by Management by obtaining valuations from independent pricing services using the underlying asset and stated London Interbank Offered Rate ("LIBOR") or Federal Funds floating rate (Level 2 inputs).
Management has developed a process to periodically review information provided by independent pricing services for all types of securities.
120
Investments in non-exchange traded investment companies are valued using the respective fund's daily calculated net asset value per share (Level 2 inputs).
If a valuation is not available from an independent pricing service, or if Management has reason to believe that the valuation received does not represent the amount a Fund might reasonably expect to receive on a current sale in an orderly transaction, Management seeks to obtain quotations from brokers or dealers (generally considered Level 2 or Level 3 inputs depending on the number of quotes available). If such quotations are not readily available, the security is valued using methods the Board has approved in the good-faith belief that the resulting valuation will reflect the fair value of the security. Numerous factors may be considered when determining the fair value of a security based on Level 2 or Level 3 inputs, including available analyst, media or other reports, securities within the same industry with recent highly correlated performance, trading in futures or American Depositary Receipts and whether the issuer of the security being fair valued has other securities outstanding.
The value of the Funds' investments in foreign securities is generally determined using the same valuation methods and inputs as other Fund investments, as discussed above. Foreign security prices expressed in local currency values are normally translated from the local currency into U.S. dollars using the exchange rates as of 4:00 p.m., Eastern Time on days the New York Stock Exchange ("NYSE") is open for business. The Board has approved the use of Interactive Data Pricing and Reference Data LLC ("Interactive") to assist in determining the fair value of foreign equity securities when changes in the value of a certain index suggest that the closing prices on the foreign exchanges may no longer represent the amount that a Fund could expect to receive for those securities or on days when foreign markets are closed and U.S. markets are open. In each of these events, Interactive will provide adjusted prices for certain foreign equity securities using a statistical analysis of historical correlations of multiple factors (Level 2 inputs). The Board has also approved the use of Interactive to evaluate the prices of foreign debt securities as of the time as of which a Fund's share price is calculated. Interactive utilizes benchmark spread and yield curves and evaluates available market activity from the local close to the time as of which a Fund's share price is calculated (Level 2 inputs) to assist in determining prices for certain foreign debt securities. In the case of both foreign equity and foreign income securities, in the absence of precise information about the market values of these foreign securities as of the time as of which a Fund's share price is calculated, the Board has determined on the basis of available data that prices adjusted or evaluated in this way are likely to be closer to the prices a Fund could realize on a current sale than are the prices of those securities established at the close of the foreign markets in which the securities primarily trade.
Fair value prices are necessarily estimates, and there is no assurance that such a price will be at or close to the price at which the security is next quoted or next trades.
4 Foreign currency translation: The accounting records of the Funds and RBCS Subsidiary are maintained in U.S. dollars. Foreign currency amounts are normally translated into U.S. dollars using the exchange rate as of 4:00 p.m. Eastern Time, on days the NYSE is open for business, to determine the value of investments, other assets and liabilities. Purchase and sale prices of securities, and income and expenses, are translated into U.S. dollars at the prevailing rate of exchange on the respective dates of such transactions. Net unrealized foreign currency gain/(loss), if any, arises from changes in the value of assets and liabilities, other than investments in securities, as a result of changes in exchange rates and is stated separately in the Statements of Operations.
5 Securities transactions and investment income: Securities transactions are recorded on trade date for financial reporting purposes. Dividend income is recorded on the ex-dividend date or, for certain foreign dividends, as soon as a Fund becomes aware of the dividends. Non-cash dividends included in dividend income, if any, are recorded at the fair market value of the securities received. Interest income, including accretion of discount on securities, accretion of original issue discount, where applicable, and accretion of discount on short-term investments, if any, is recorded on the accrual basis. Realized gains and losses from securities transactions and foreign currency transactions, if any, are recorded on the basis of identified cost and stated separately in the Statements of Operations.
121
6 Income tax information: Each Fund is treated as a separate entity for U.S. federal income tax purposes. It is the policy of each Fund, except Hedged Option Premium Strategy, to continue to, and the intention of Hedged Option Premium Strategy to, qualify for treatment as a regulated investment company ("RIC") by complying with the requirements of the U.S. Internal Revenue Code applicable to RICs and to distribute substantially all of its net investment income and net realized capital gains to its shareholders. To the extent a Fund distributes substantially all of its net investment income and net realized capital gains to shareholders, no federal income or excise tax provision is required.
The Funds have adopted the provisions of ASC 740 "Income Taxes" ("ASC 740"). ASC 740 sets forth a minimum threshold for financial statement recognition of a tax position taken, or expected to be taken, in a tax return. The Funds recognize interest and penalties, if any, related to unrecognized tax positions as an income tax expense in the Statements of Operations. The Funds are subject to examination by U.S. federal and state tax authorities for returns filed for the tax years for which the applicable statutes of limitations have not yet expired. As of October 31, 2017, the Funds did not have any unrecognized tax positions.
The RBCS Subsidiary is a controlled foreign corporation under the U.S. Internal Revenue Code. As a U.S. shareholder of a controlled foreign corporation, Risk Balanced Commodity Strategy will include in its taxable income its share of the RBCS Subsidiary's current earnings and profits (including net realized gains). Any deficit generated by the RBCS Subsidiary will be disregarded for purposes of computing Risk Balanced Commodity Strategy's taxable income in the current period and also disregarded for all future periods.
At October 31, 2017, selected Fund information for all long security positions, short security positions and derivative instruments (if any) for U.S. federal income tax purposes was as follows:
| (000's omitted) | | Cost | | Gross
Unrealized
Appreciation | | Gross
Unrealized
Depreciation | | Net Unrealized
Appreciation/
(Depreciation) | |
Global Allocation | | $ | 20,264 | | | $ | 2,189 | | | $ | 441 | | | $ | 1,748 | | |
Hedged Option Premium Strategy | | | 12,541 | | | | 21 | | | | 50 | | | | (29 | ) | |
Long Short | | | 2,603,110 | | | | 510,788 | | | | 89,089 | | | | 421,699 | | |
Long Short Credit | | | 26,715 | | | | 500 | | | | 440 | | | | 60 | | |
Multi-Asset Income | | | 23,775 | | | | 1,573 | | | | 564 | | | | 1,009 | | |
Risk Balanced Commodity Strategy | | | 122,356 | | | | 750 | | | | 4,502 | | | | (3,752 | ) | |
U.S. Equity Index PutWrite Strategy | | | 171,251 | | | | — | | | | 587 | | | | (587 | ) | |
Income distributions and capital gain distributions are determined in accordance with income tax regulations, which may differ from GAAP. These differences are primarily due to differing treatments of income and gains on various investment securities held by each Fund, timing differences and differing characterization of distributions made by each Fund.
As determined on October 31, 2017, permanent differences resulting primarily from different book and tax accounting were reclassified at year end. Such differences may be attributed to the tax treatment of one or more of the following: net operating loss netted against short term capital gains or written-off, current and prior year partnership basis adjustments, net operating losses, return of capital distributions, non-taxable distributions from real estate investment trusts ("REITs") and other underlying investments, paydown losses on mortgage-backed and asset-backed securities, RBCS Subsidiary income and gain (loss), gains and losses on swap contracts and futures, foreign currency gains and losses, tax adjustments related to short sales gains and losses from forwards, gains and losses from passive foreign investment companies ("PFICs"), non-deductible stock issuance fees, affiliated capital gain reclass to ordinary income, distributions in excess and re-designated, deemed distributions on shareholder redemptions and deflation adjustments on U.S. Treasury inflation-indexed bonds ("TIPs"). These reclassifications
122
had no effect on net income, net asset value ("NAV") or NAV per share of each Fund. For the year ended October 31, 2017, the Funds recorded the following permanent reclassifications:
| | Paid-in Capital | | Undistributed
Net Investment
Income/(Loss) | | Accumulated
Net Realized
Gains/(Losses)
on Investments | |
Global Allocation | | $ | 111,919 | | | $ | (75,855 | ) | | $ | (36,064 | ) | |
Hedged Option Premium Strategy | | | (2,276 | ) | | | 2,402 | | | | (126 | ) | |
Long Short | | | (7,821,026 | ) | | | 1,066,836 | | | | 6,754,190 | | |
Long Short Credit | | | (1,621 | ) | | | (58,456 | ) | | | 60,077 | | |
Multi-Asset Income | | | 1,624 | | | | (47,087 | ) | | | 45,463 | | |
Risk Balanced Commodity Strategy | | | 3,997,848 | | | | 75,694 | | | | (4,073,542 | ) | |
U.S. Equity Index PutWrite Strategy | | | 618,692 | | | | 1,364 | | | | (620,056 | ) | |
The tax character of distributions paid during the years ended October 31, 2017 and October 31, 2016 was as follows:
| | Distributions Paid From: | |
| | Taxable
Income | | Long-Term
Capital Gain | | Return of
Capital | | Total | |
| | 2017 | | 2016 | | 2017 | | 2016 | | 2017 | | 2016 | | 2017 | | 2016 | |
Global Allocation | | $ | 44,404 | | | $ | — | | | $ | — | | | $ | 43,247 | | | $ | — | | | $ | — | | | $ | 44,404 | | | $ | 43,247 | | |
Hedged Option
Premium Strategy | | | 16,672 | (a) | | | — | | | | — | (a) | | | — | | | | — | (a) | | | — | | | | 16,672 | (a) | | | — | | |
Long Short | | | — | | | | 361,261 | | | | — | | | | — | | | | — | | | | — | | | | — | | | | 361,261 | | |
Long Short Credit | | | 1,038,403 | | | | 633,046 | | | | — | | | | — | | | | — | | | | — | | | | 1,038,403 | | | | 633,046 | | |
Multi-Asset Income | | | 723,961 | | | | 489,748 | | | | — | | | | — | | | | 22,515 | | | | 149,478 | | | | 746,476 | | | | 639,226 | | |
Risk Balanced
Commodity
Strategy | | | — | | | | — | | | | — | | | | — | | | | — | | | | — | | | | — | | | | — | | |
U.S. Equity Index
PutWrite Strategy | | | 473,142 | | | | — | (b) | | | 61,645 | | | | — | (b) | | | — | | | | — | (b) | | | 534,787 | | | | — | (b) | |
(a) Period from April 12, 2017 (Commencement of Operations) to October 31, 2017.
(b) Period from September 16, 2016 (Commencement of Operations) to October 31, 2016.
As of October 31, 2017, the components of distributable earnings (accumulated losses) on a U.S. federal income tax basis were as follows:
| | Undistributed
Ordinary
Income | | Undistributed
Long-Term
Capital Gain | | Unrealized
Appreciation/
(Depreciation) | | Loss
Carryforwards
and Deferrals | | Other
Temporary
Differences | | Total | |
Global Allocation | | $ | 532,799 | | | $ | 368,318 | | | $ | 1,747,666 | | | $ | — | | | $ | (20,347 | ) | | $ | 2,628,436 | | |
Hedged Option Premium Strategy | | | 55,980 | | | | 70,070 | | | | (28,684 | ) | | | — | | | | (2,284 | ) | | | 95,082 | | |
Long Short | | | — | | | | — | | | | 421,699,487 | | | | (42,465,021 | ) | | | (886,714 | ) | | | 378,347,752 | | |
Long Short Credit | | | 10,119 | | | | — | | | | 59,112 | | | | (950,543 | ) | | | (19,126 | ) | | | (900,438 | ) | |
Multi-Asset Income | | | — | | | | — | | | | 1,009,372 | | | | (206,079 | ) | | | (22,599 | ) | | | 780,694 | | |
Risk Balanced Commodity Strategy | | | 4,516,268 | | | | — | | | | (3,751,983 | ) | | | (84,076 | ) | | | 1,613,259 | | | | 2,293,468 | | |
U.S. Equity Index PutWrite Strategy | | | 4,357,866 | | | | 5,819,643 | | | | (586,289 | ) | | | — | | | | (4,821 | ) | | | 9,586,399 | | |
123
The temporary differences between book basis and tax basis distributable earnings are primarily due to: losses disallowed and recognized on wash sales, straddles and unsettled short sales; timing differences of distribution payments, swaps, futures contracts and forward contracts; adjustments related to post-October capital loss and late-year ordinary loss deferrals, unamortized organization expenses, mark-to-market adjustments on option contracts and tax adjustments related to REITs, TIPs, PFICs, short sales, partnerships, futures, swap contracts and other investments.
To the extent each Fund's net realized capital gains, if any, can be offset by capital loss carryforwards, it is the policy of each Fund not to distribute such gains. Capital loss carryforward rules allow for regulated investment companies to carry forward capital losses indefinitely and to retain the character of capital loss carryforwards as short-term or long-term. As determined at October 31, 2017, the Funds had unused capital loss carryforwards available for federal income tax purposes to offset net realized capital gains, if any, as follows:
| | | Capital Loss Carryforwards | |
| | | Long-Term | | Short-Term | |
Long Short | | $ | — | | | $ | 35,496,428 | | |
Long Short Credit | | | — | | | | 950,543 | | |
Multi-Asset Income | | | — | | | | 206,079 | | |
Risk Balanced Commodity Strategy | | | 74,165 | | | | 9,911 | | |
Under current tax regulations, capital losses realized on investment transactions after October 31 may be deferred and treated as occurring on the first day of the following fiscal year. Under the Regulated Investment Company Modernization Act of 2010, the Funds may also defer any realized late-year ordinary losses as occurring on the first day of the following fiscal year. Late-year ordinary losses represent ordinary losses realized on investment transactions after December 31 and specified losses (ordinary losses from the sale, exchange, or other disposition of property, net foreign currency losses and net passive foreign investment company mark to market losses) realized on investment transactions after October 31. For the year ended October 31, 2017, Long Short and elected to defer the following late-year ordinary losses:
| | | Late-Year
Ordinary Loss
Deferral | |
Long Short | | $ | 6,968,593 | | |
During the year ended October 31, 2017, Global Allocation, Long Short, Long Short Credit, Multi-Asset Income and Risk Balanced Commodity Strategy had utilized capital loss carryforwards of $264,367, $26,401,425, $314,125, $361,065 and $14,268, respectively.
7 Foreign taxes: Foreign taxes withheld, if any, represent amounts withheld by foreign tax authorities, net of refunds recoverable.
Foreign capital gains on certain foreign securities may be subject to foreign taxes, which are accrued as applicable. At October 31, 2017, there were no outstanding balances of accrued capital gains taxes for any Fund.
8 Distributions to shareholders: Each Fund may earn income, net of expenses, daily on its investments. Distributions from net investment income, if any, are recorded on the ex-date and generally distributed once a year (usually in December) for Global Allocation, Long Short and Risk Balanced Commodity Strategy, monthly for Multi-Asset Income and quarterly for Hedged Option Premium Strategy, Long Short Credit (monthly prior to October 1, 2016) and U.S. Equity Index PutWrite Strategy. Distributions from net realized capital gains, if any, generally are distributed once a year (usually in December) and are recorded on the ex-date.
It is the policy of each of Global Allocation, Long Short and Multi-Asset Income to pass through to its shareholders substantially all REIT distributions and other income it receives, less operating expenses. The distributions received from REITs are generally composed of income, capital gains, and/or return of REIT capital, but the REITs do not report this information to these Funds until the following calendar year. At October 31, 2017, Long Short and
124
Multi-Asset Income estimated these amounts for the period January 1, 2017 to October 31, 2017 within the financial statements because the 2017 information is not available from the REITs until after each Fund's fiscal period. All estimates are based upon REIT information sources available to these Funds together with actual IRS Forms 1099-DIV received to date. For the year ended October 31, 2017, the character of distributions paid to shareholders of Global Allocation, Long Short and Multi-Asset Income disclosed within the Statements of Changes in Net Assets is based on estimates made at that time. Based on past experience it is possible that a portion of these Funds' distributions during the current fiscal year, if any, will be considered tax return of capital, but the actual amount of the tax return of capital, if any, is not determinable until after each Fund's fiscal year-end. After calendar year-end, when these Funds learn the nature of the distributions paid by REITs during that year, distributions previously identified as income are often recharacterized as return of capital and/or capital gain. After all applicable REITs have informed these Funds of the actual breakdown of distributions paid to these Funds during their fiscal year, estimates previously recorded are adjusted on the books of these Funds to reflect actual results. As a result, the composition of these Funds' distributions as reported herein may differ from the final composition determined after calendar year-end and reported to these Funds shareholders on IRS Form 1099-DIV.
9 Expense allocation: Certain expenses are applicable to multiple funds within the complex of related investment companies. Expenses directly attributable to a Fund are charged to that Fund. Expenses of the Trust that are not directly attributable to a particular series of the Trust (e.g., a Fund) are allocated among the series of the Trust, on the basis of relative net assets, except where a more appropriate allocation of expenses to each of the series can otherwise be made fairly. Expenses borne by the complex of related investment companies, which includes open-end and closed-end investment companies for which Management serves as investment manager, that are not directly attributable to a particular investment company in the complex (e.g., the Trust) or series thereof are allocated among the investment companies in the complex or series thereof on the basis of relative net assets, except where a more appropriate allocation of expenses to each of the investment companies in the complex or series thereof can otherwise be made fairly. Each Fund's expenses (other than those specific to each class) are allocated proportionally each day among the classes based upon the relative net assets of each class.
10 Investments in foreign securities: Investing in foreign securities may involve sovereign and other risks, in addition to the credit and market risks normally associated with domestic securities. These additional risks include the possibility of adverse political and economic developments (including political instability, nationalization, expropriation, or confiscatory taxation) and the potentially adverse effects of unavailability of public information regarding issuers, less governmental supervision and regulation of financial markets, reduced liquidity of certain financial markets, and the lack of uniform accounting, auditing, and financial reporting standards or the application of standards that are different or less stringent than those applied in the United States. Foreign securities also may experience greater price volatility, higher rates of inflation, and delays in settlement.
11 Dollar rolls: The Funds may enter into dollar roll transactions. In a dollar roll transaction, a Fund sells securities for delivery in the current month and simultaneously agrees to repurchase substantially similar (i.e., same type and coupon) securities on a specified future date from the same party. During the period before this repurchase, a Fund forgoes principal and interest payments on the securities. A Fund is compensated by the difference between the current sales price and the forward price for the future purchase (often referred to as the "drop"), as well as by the interest earned on the cash proceeds of the initial sale. Dollar rolls may increase fluctuations in a Fund's NAV and may be viewed as a form of leverage. There is a risk that the counterparty will be unable or unwilling to complete the transaction as scheduled, which may result in losses to a Fund.
12 Reverse repurchase agreements: In a reverse repurchase agreement, a Fund sells portfolio securities to another party and agrees to repurchase the securities at an agreed-upon price and date, which reflects an interest payment. In periods of increased demand for a security, the Fund may receive a payment from the counterparty for the use of the security, which is recorded as interest income. Reverse repurchase agreements involve the risk that the other party will fail to return the securities in a timely manner, or at all, which may result in losses to a Fund. A Fund could lose money if it is unable to recover the securities and the value of the collateral held by the Fund is less than the value of the securities. Reverse repurchase agreements also involve the risk that the market value of the
125
securities sold will decline below the price at which a Fund is obligated to repurchase them. Reverse repurchase agreements may be viewed as a form of borrowing by a Fund. When the Fund enters into a reverse repurchase agreement, any fluctuations in the market value of either the securities transferred to another party or the securities in which the proceeds may be invested would affect the market value of the Fund's assets. During the term of the agreement, the Fund may also be obligated to pledge additional cash and/or securities in the event of a decline in the fair value of the transferred security.
13 Securities sold short: Each Fund may engage in short sales, which are sales of securities which have been borrowed from a third party on the expectation that the market price will decline. If the price of the securities decreases, a Fund will make a profit by purchasing the securities in the open market at a price lower than the one at which it sold the securities. If the price of the securities increases, a Fund may have to cover its short positions at a price higher than the short sale price, resulting in a loss. Gains are limited to the price at which a Fund sold the security short, while losses are potentially unlimited in size. The Funds pledge securities and/or other assets, which may include cash collateral from securities lending activities, to the lender as collateral. Proceeds received from short sales may be maintained by the lender as collateral or may be released to the Funds and used to purchase additional securities or for any other purpose. Proceeds maintained by the lender are included in the "Cash collateral segregated for short sales" on the Statements of Assets and Liabilities. The Funds are required to segregate an amount of cash or liquid securities in an amount at least equal to the current market value of the securities sold short (less any additional collateral pledged to the lender). The Funds are contractually responsible to remit to the lender any dividends and interest payable on securities while those securities are being borrowed by the Fund. The Funds may receive or pay the net of the interest charged by the prime broker on the borrowed securities and a financing charge for the difference in the market value of the short position and the cash collateral deposited with the broker. This income or fee is calculated daily based upon the market value of each borrowed security and a variable rate that is dependent on the availability of the security. These costs related to short sales (i.e., dividend and interest remitted to the lender and interest charged by the prime broker) are recorded as an expense of the Funds and are excluded from the contractual expense limitation. A net negative expense, if any, represents a gain to the Fund as the total cash rebates received exceeded the other costs related to short sales. The net amount of fees incurred during the year ended October 31, 2017, are included in the "Dividend and interest expense on securities sold short and reverse repurchase agreements" on the Statements of Operations and are as follows:
Global Allocation | | $ | 2,518 | | |
Long Short | | | (1,236,598 | ) | |
At October 31, 2017, Long Short had cash pledged in the amount of $521,681,907 to State Street to cover collateral requirements for borrowing in connection with securities sold short.
14 Security lending: Each Fund using State Street as its lending agent, may loan securities to qualified brokers and dealers in exchange for negotiated lender's fees. These fees disclosed within the Statements of Operations under the caption, "Income from securities loaned-net" are net of expenses retained by State Street as compensation for its services as lending agent. For the year ended October 31, 2017, Global Allocation received net income under the securities lending arrangement of $56. The Funds receive cash collateral at the beginning of each transaction equal to at least 102% of the prior day's market value of the loaned securities (105% in the case of international securities). Some or all of the cash collateral may be used to finance short sales.
As of October 31, 2017, Global Allocation had no outstanding loans of securities.
15 Investment company securities and exchange-traded funds: The Funds may invest in shares of other registered investment companies, including exchange-traded funds ("ETFs"), within the limitations prescribed by the 1940 Act or pursuant to an exemptive order from the U.S. Securities and Exchange Commission ("SEC") that permits the Funds to invest in both affiliated and unaffiliated investment companies, including ETFs, in excess of the limits in Section 12(d)(1)(A) of the 1940 Act, as amended, subject to the terms and conditions of such order. Some ETFs seek to track the performance of a particular market index. These indices include both broad-based market indices and more narrowly-based indices, including those relating to particular sectors, markets, regions or
126
industries. However, some ETFs have an actively-managed investment objective. ETF shares are traded like traditional equity securities on a national securities exchange or NASDAQ. A Fund will indirectly bear its proportionate share of any management fees and other expenses paid by such other investment companies, which will increase expenses and decrease returns.
16 Derivative instruments: Certain of the Funds' use of derivatives during the year ended October 31, 2017, is described below. Please see the Schedule of Investments for each Fund's open positions in derivatives, if any, at October 31, 2017. The Funds have adopted the provisions of ASC 815 "Derivatives and Hedging" ("ASC 815"). The disclosure requirements of ASC 815 distinguish between derivatives that qualify for hedge accounting and those that do not. Because investment companies value their derivatives at fair value and recognize changes in fair value through the Statements of Operations, they do not qualify for hedge accounting. Accordingly, even though a Fund's investments in derivatives may represent economic hedges, they are considered non-hedge transactions for purposes of this disclosure.
Futures contracts: During the year ended October 31, 2017, Global Allocation used futures to enhance total return and to manage or adjust the risk profile and the investment exposure of the Fund to certain asset classes, countries and regions. In addition, Global Allocation also utilized futures to provide investment exposure to certain indices and markets other than the benchmark indices. During the year ended October 31, 2017, Long Short used futures on broader market indices and U.S. Treasuries either to enhance returns or to manage or adjust the risk profile and the investment exposure of the Fund. During the year ended October 31, 2017, Long Short Credit used futures to manage or adjust the risk profile of the Fund or the risk of individual positions, to adjust the duration of the Fund's portfolio, to hedge risk and to alter the Fund's exposure to currencies, interest rates, sectors and individual issuers. During the year ended October 31, 2017, Multi-Asset Income used futures to enhance total return and to manage or adjust the risk profile and the investment exposure of the Fund to certain asset classes, countries and regions. In addition, Multi-Asset Income also utilized futures to provide investment exposure to certain indices and markets other than the benchmark indices. During the year ended October 31, 2017, Risk Balanced Commodity Strategy used commodity futures contracts (through investments in the RBCS Subsidiary) to provide investment exposure to individual commodities, as well as to manage and/or adjust the risk profile of the Fund.
At the time a Fund or RBCS Subsidiary enters into a futures contract, it is required to deposit with the futures commission merchant a specified amount of cash or liquid securities, known as "initial margin," which is a percentage of the value of the futures contract being traded that is set by the exchange upon which the futures contract is traded. Each day, the futures contract is valued at the official settlement price of the board of trade or U.S. commodity exchange on which such futures contract is traded. Subsequent payments, known as "variation margin," to and from the broker are made on a daily basis, or as needed, as the market price of the futures contract fluctuates. Daily variation margin adjustments, arising from this "mark to market," are recorded by a Fund or RBCS Subsidiary as unrealized gains or losses.
Although some futures by their terms call for actual delivery or acquisition of the underlying securities or currency, in most cases the contracts are closed out prior to delivery by offsetting purchases or sales of matching futures. When the contracts are closed, a Fund recognizes a gain or loss. Risks of entering into futures contracts include the possibility there may be an illiquid market, possibly at a time of rapidly declining prices, and/or a change in the value of the contract may not correlate with changes in the value of the underlying securities. Futures executed on regulated futures exchanges have minimal counterparty risk to a Fund because the exchange's clearinghouse assumes the position of the counterparty in each transaction. Thus, a Fund is exposed to risk only in connection with the clearinghouse and not in connection with the original counterparty to the transaction.
For U.S. federal income tax purposes, the futures transactions undertaken by a Fund or RBCS Subsidiary may cause the Fund or RBCS Subsidiary to recognize gains or losses from marking contracts to market even though its positions have not been sold or terminated, may affect the character of the gains or losses recognized as long-term or short-term, and may affect the timing of some capital gains and losses realized by the Fund or RBCS Subsidiary . Also, a Fund's or RBCS Subsidiary's losses on transactions involving futures contracts may be deferred rather than being taken into account currently in calculating such Fund's or RBCS Subsidiary's taxable income.
127
Forward foreign currency contracts: During the year ended October 31, 2017, Global Allocation used forward contracts to obtain or reduce exposure to certain markets, establish net short or long positions for currencies and alter the Fund's exposure to markets and currencies. During the year ended October 31, 2017, Long Short Credit used forward contracts to alter the Fund's exposure to currencies, interest rates, sectors and individual issuers. During the year ended October 31, 2017, Multi-Asset Income used forward contracts to obtain or reduce exposure to certain markets, establish net short or long positions for currencies and alter the Fund's exposure to markets and currencies.
A forward contract is an agreement between two parties to buy or sell a specific currency for another at a set price on a future date, and is individually negotiated and privately traded by currency traders and their customers in the interbank market. The market value of a forward contract fluctuates with changes in forward currency exchange rates. Forward contracts are marked to market daily, and the change in value is recorded by a Fund as an unrealized gain or loss. At the consummation of a forward contract to purchase or sell currency, a Fund may either exchange the currencies specified at the maturity of the forward contract or enter into a closing transaction involving the purchase or sale of an offsetting forward contract. Closing transactions with respect to forward contracts are usually performed with the counterparty to the original forward contract. The gain or loss arising from the difference between the U.S. dollar cost of the original contract and the value of the foreign currency in U.S. dollars upon closing a contract is included in "Net realized gain (loss) on forward foreign currency contracts" in the Statements of Operations. These contracts may involve market risk in excess of the unrealized gain or loss reflected in a Fund's Statement of Assets and Liabilities. In addition, a Fund could be exposed to risks associated with fluctuations in foreign currency and the risk the counterparty will fail to fulfill its obligation.
Credit default swap contracts: During the year ended October 31, 2017, Long Short Credit used credit default swaps to replace more traditional direct investments, to establish net short or long positions for individual markets, currencies or securities and to hedge risk. When a Fund is the buyer of an OTC credit default swap contract, it is entitled to receive the notional amount of the swap from the counterparty if a credit event occurs. In return, the Fund pays the counterparty a periodic stream of payments over the term of the contract provided that no credit event has occurred. If no credit event occurs, the Fund would have spent the stream of payments and received no proceeds from the contract. When a Fund is the seller of an OTC credit default swap contract, it receives the stream of payments, but is obligated to pay to the buyer of the protection an amount up to the notional amount of the swap and in certain instances take delivery of securities of the reference entity upon the occurrence of a credit event, as defined under the terms of that particular swap agreement. Credit events are contract specific but may include bankruptcy, failure to pay, restructuring, obligation acceleration and repudiation/moratorium. If a Fund is a seller of protection and a credit event occurs, the maximum potential amount of future payments that the Fund could be required to make (or the risk of loss) would be an amount equal to the notional amount of the agreement. This potential amount would be partially offset by any recovery value of the respective referenced obligation, or net amount received from the settlement of a buy protection credit default swap agreement entered into by the Fund for the same referenced obligation. As the seller, the Fund may add economic leverage to its portfolio because, in addition to its total net assets, the Fund is subject to investment exposure on the notional amount of the swap. The net periodic payments paid or received on the swap contract are accrued daily as a component of unrealized appreciation/(depreciation) and are recorded as realized gain upon receipt or realized loss upon payment. The Fund also records an increase or decrease to unrealized appreciation/(depreciation) in an amount equal to the daily valuation of swaps. For financial reporting purposes, unamortized upfront payments/(receipts), if any, are netted with unrealized appreciation or (depreciation) and net interest received or paid on swap contracts to determine the fair value of swaps.
Centrally cleared swap contracts: Certain clearinghouses currently offer clearing for limited types of derivative transactions, including certain credit default swaps. In a cleared derivative transaction, a Fund typically enters into the transaction with a financial institution counterparty that is then cleared through a central clearinghouse. Upon acceptance of a swap by a central clearinghouse, the original swap is extinguished and replaced with a swap with the clearinghouse, thereby reducing or eliminating the Fund's exposure to the credit risk of the original
128
counterparty. A Fund typically will be required to post specified levels of both initial and variation margin with the clearinghouse or at the instruction of the clearinghouse. The daily change in valuation is recorded as a receivable or payable for variation margin and settled in cash with the centrally clearing party. For financial reporting purposes, unamortized upfront/(receipts) payments, if any, are netted with unrealized appreciation or (depreciation) and net interest received or paid on swap contracts to determine the fair value of swaps.
Equity swap contracts: During the year ended October 31, 2017, Long Short Credit used equity swap contracts ("equity swaps") to replace traditional direct investments and to hedge risk.
Equity swaps are two-party contracts in which counterparties exchange the return on a specified reference security, basket of securities, security index or index component for the return based on a fixed or floating interest rate during the period of the swap. Equity swaps are marked to market daily based on the value of the underlying reference entity and the change, if any, is recorded as an unrealized gain or loss. Equity swaps normally do not involve the delivery of securities or other underlying assets. If the other party to an equity swap defaults, the Fund's risk of loss consists of the net amount of payments that the Fund is contractually entitled to receive, if any. Equity swaps are derivatives and their value can be very volatile. To the extent that future market trends, the values of assets or economic factors are not accurately analyzed and predicted, the Fund may suffer a loss, which may exceed the related amounts shown in the Statements of Assets and Liabilities. Periodic payments received or paid by the Fund are recorded as realized gains or losses.
Total return basket swap contracts: During the year ended October 31, 2017, Long Short used total return basket swaps to increase returns, reduce risks and for hedging purposes. During the year ended October 31, 2017, Long Short Credit used total return basket swaps to replace more traditional direct investments and to hedge risk. Certain Funds may enter into a total return basket swap agreement to obtain exposure to a portfolio of long and short securities. Under the terms of the agreement, the swap is designed to function as a portfolio of direct investments in long and short equity or fixed income positions. The Funds have the ability to trade in and out of long and short positions within the swap and will receive all of the economic benefits and risks equivalent to direct investments in these positions such as: capital appreciation/(depreciation), corporate actions, and dividends and interest received and paid, all of which are reflected in the swap value. The swap value also includes interest charges and credits related to the notional values of the long and short positions and cash balances within the swap. These interest charges and credits are based on defined market rates plus or minus a specified spread and are referred to herein as "financing costs". Positions within the swap are reset periodically, and financing costs are reset monthly. During a reset, any unrealized gains (losses) on positions and accrued financing costs become available for cash settlement between the Funds and the swap counterparty. Cash settlement in and out of the swap may occur at a reset date or any other date, at the discretion of the Funds and the counterparty, over the life of the agreement, and is generally determined based on limits and thresholds established as part of an International Swaps and Derivatives Association (ISDA) agreement between the Funds and the counterparty. A change in the market value of a total return basket swap contract is recognized as a change in unrealized appreciation/(depreciation) on swap contracts in the Statements of Operations. Cash settlements between a Fund and the counterparty are recognized as realized gains (losses) on swap contracts in the Statements of Operations.
Total return swap contracts: During the year ended October 31, 2017, Global Allocation used total return swaps to enhance total return and obtain or reduce exposure to certain markets. During the year ended October 31, 2017, Long Short used total return swaps to increase returns, reduce risks and for hedging purposes. During the year ended October 31, 2017, Long Short Credit used total return swaps to replace more traditional direct investments and to hedge risk. During the year ended October 31, 2017, Multi-Asset Income used total return swaps to enhance total return and obtain or reduce exposure to certain markets. Total return swaps involve commitments to pay fixed or floating rate interest in exchange for a market-linked return based on a notional amount. To the extent the total return of the reference security or index underlying the total return swap exceeds or falls short of the offsetting interest rate obligation, a Fund will receive a payment or make a payment to the counterparty, respectively. For financial reporting purposes, unamortized upfront payments/(receipts), if any, are netted with unrealized appreciation or (depreciation) and net interest received or paid on swap contracts to determine the fair value of
129
swaps. respectively. Certain risks may arise when entering into total return swap transactions, including counterparty default, liquidity or unfavorable changes in the value of the underlying reference security or index. The value of the swap is adjusted daily and the change in value, if any, is recorded as unrealized appreciation or (depreciation) in the Statements of Assets and Liabilities. Payments received or made at the end of each measurement period are recorded as realized gain or loss in the Statements of Operations.
Options: During the year ended October 31, 2017, Global Allocation used options written to enhance total return, manage or adjust the risk profile of the Fund or the risk of individual positions, replace more traditional direct investments and obtain exposure to certain markets. During the period ended October 31, 2017, Hedged Option Premium Strategy used options written primarily to gain exposure to securities, markets, sectors or geographical areas and also to enhance total return and gain exposure more efficiently than through a direct purchase of the underlying security. During the period ended October 31, 2017, Hedged Option Premium Strategy used options purchased primarily to hedge exposures to securities, markets, sectors or geographical areas while attempting to limit risk. During the year ended October 31, 2017, Long Short used options written to generate incremental returns. During the year ended October 31, 2017, Long Short used options purchased either for hedging purposes or to generate incremental returns. During the year ended October 31, 2017, Long Short Credit used options purchased (including swaptions and options on futures) either for either for hedging purposes or to generate incremental returns. During the year ended October 31, 2017, Long Short Credit used options written (including swaptions and options on futures) to establish net short or long positions for individual markets, currencies or securities, hedge risk and alter the Fund's exposure to currencies, interest rates, sectors and individual issuers. During the year ended October 31, 2017, Multi-Asset Income used options written to enhance total return, manage or adjust the risk profile of the Fund or the risk of individual positions replace more traditional direct investments and obtain exposure to certain markets. During the year ended October 31, 2017, U.S. Equity Index PutWrite Strategy used options written primarily to gain exposure to securities, markets, sectors or geographical areas and also to enhance income and gain exposure more efficiently than through a direct purchase of the underlying security.
Premiums received by a Fund upon writing a call option or a put option are recorded in the liability section of the Fund's Statement of Assets and Liabilities and are subsequently adjusted to the current market value. When an option is exercised, closed, or expired, a Fund realizes a gain or loss and the liability is eliminated.
When a Fund writes a call option on an underlying asset it does not own, its exposure on such an option is theoretically unlimited. When writing a covered call option, a Fund, in return for the premium, gives up the opportunity for profit from a price increase in the underlying security above the exercise price, but conversely retains the risk of loss should the price of the security decline. When writing a put option, a Fund, in return for the premium, takes the risk that it must purchase the underlying security at a price that may be higher than the current market price of the security. If a covered call or put option that a Fund has written expires unexercised, a Fund will realize a gain in the amount of the premium. All securities covering outstanding written options are held in escrow by the custodian bank.
Premiums paid by a Fund upon purchasing a call or put option are recorded in the asset section of the Fund's Statement of Assets and Liabilities and are subsequently adjusted to the current market value. When an option is exercised, closed, or expired, a Fund realizes a gain or loss and the asset is eliminated.
For purchased call options, a Fund's loss is limited to the amount of the option premium paid.
Swaptions are similar to options on securities except that instead of selling or purchasing the right to buy or sell a security, the writer or purchaser of the swaptions is granting or buying the right to enter into a previously agreed upon interest rate or credit default swap agreement at any time before the expiration of the option.
A Fund may write or purchase options on exchange-traded futures contracts ("futures option") to hedge an existing position or future investment, for speculative purposes or to manage exposure to market movements. A futures option is an option contract in which the underlying instrument is a specific futures contract.
130
At October 31, 2017, the Funds had the following derivatives (which did not qualify as hedging instruments under ASC 815), grouped by primary risk exposure:
Asset Derivatives
(000's omitted) | |
Derivative
Type | | Statements of
Assets and
Liabilities Location | | Interest
Rate Risk | | Currency
Risk | | Equity Risk | | Credit Risk | | Commodity
Risk | | Total | |
Global Allocation | |
Futures
| | Receivable/Payable
for variation margin
on futures contracts(a) | | $ | 0
| (d) | | $ | 2
| | | $ | 62
| | | $ | —
| | | $ | —
| | | $ | 64
| | |
Forward
contracts
| | Receivable for
forward foreign
currency contracts | | | —
| | | | 177
| | | | —
| | | | —
| | | | —
| | | | 177
| | |
OTC swaps
| | OTC swap
contracts, at value(b) | | | —
| | | | —
| | | | 2
| | | | —
| | | | —
| | | | 2
| | |
Total Value—Assets | | | | $ | 0 | (d) | | $ | 179 | | | $ | 64 | | | $ | — | | | $ | — | | | $ | 243 | | |
Hedged Option Premium Strategy | |
Options
purchased | | Investments in
securities, at value | | $ | —
| | | $ | —
| | | $ | 2
| | | $ | —
| | | $ | —
| | | $ | 2
| | |
Total Value—Assets | | | | $ | — | | | $ | — | | | $ | 2 | | | $ | — | | | $ | — | | | $ | 2 | | |
Long Short | |
Futures
| | Receivable/Payable
for variation margin
on futures contracts(a) | | $ | 176
| | | $ | —
| | | $ | —
| | | $ | —
| | | $ | —
| | | $ | 176
| | |
OTC swaps
| | OTC swap contracts,
at value(b) | | | —
| | | | —
| | | | 2,012
| | | | —
| | | | —
| | | | 2,012
| | |
Options
purchased | | Investments in
securities, at value | | | —
| | | | —
| | | | 3,992
| | | | —
| | | | —
| | | | 3,992
| | |
Total Value—Assets | | | | $ | 176 | | | $ | — | | | $ | 6,004 | | | $ | — | | | $ | — | | | $ | 6,180 | | |
Long Short Credit | |
Futures
| | Receivable/Payable
for variation margin
on futures contracts(a) | | $ | —
| | | $ | —
| | | $ | 9
| | | $ | —
| | | $ | —
| | | $ | 9
| | |
Forward
contracts
| | Receivable for
forward foreign
currency contracts | | | —
| | | | 2
| | | | —
| | | | —
| | | | —
| | | | 2
| | |
OTC swaps
| | OTC swap contracts,
at value(b) | | | —
| | | | —
| | | | 86
| | | | 89
| | | | —
| | | | 175
| | |
Total Value—Assets | | | | $ | — | | | $ | 2 | | | $ | 95 | | | $ | 89 | | | $ | — | | | $ | 186 | | |
131
Derivative
Type | | Statements of
Assets and
Liabilities Location | | Interest
Rate Risk | | Currency
Risk | | Equity Risk | | Credit Risk | | Commodity
Risk | | Total | |
Multi-Asset Income | |
Futures
| | Receivable/Payable
for variation margin
on futures contracts(a) | | $ | 12
| | | $ | 8
| | | $ | 71
| | | $ | —
| | | $ | —
| | | $ | 91
| | |
Forward
contracts
| | Receivable for
forward foreign
currency contracts | | | —
| | | | 156
| | | | —
| | | | —
| | | | —
| | | | 156
| | |
OTC swaps
| | OTC swap contracts,
at value(b) | | | —
| | | | —
| | | | 4
| | | | —
| | | | —
| | | | 4
| | |
Total Value—Assets | | | | $ | 12 | | | $ | 164 | | | $ | 75 | | | $ | — | | | $ | — | | | $ | 251 | | |
Risk Balanced Commodity Strategy | |
Futures
| | Receivable/Payable
for variation margin
on futures contracts(a) | | $ | —
| | | $ | —
| | | $ | —
| | | $ | —
| | | $ | 6,004
| | | $ | 6,004
| | |
Total Value—Assets | | | | $ | — | | | $ | — | | | $ | — | | | $ | — | | | $ | 6,004 | | | $ | 6,004 | | |
Liability Derivatives
(000's omitted) | |
Global Allocation | |
Futures
| | Receivable/Payable
for variation margin
on futures contracts(a) | | $ | (21
| ) | | $ | (8
| ) | | $ | (27
| ) | | $ | —
| | | $ | —
| | | $ | (56
| ) | |
Forward
contracts
| | Payable for
forward foreign
currency contracts | | | —
| | | | (162
| ) | | | —
| | | | —
| | | | —
| | | | (162
| ) | |
OTC swaps
| | OTC swap contracts,
at value(b) | | | —
| | | | —
| | | | (1
| ) | | | —
| | | | —
| | | | (1
| ) | |
Options
written | | Option contracts
written, at value | | | —
| | | | —
| | | | (8
| ) | | | —
| | | | —
| | | | (8
| ) | |
Total Value—Liabilities | | | | $ | (21 | ) | | $ | (170 | ) | | $ | (36 | ) | | $ | — | | | $ | — | | | $ | (227 | ) | |
Hedged Option Premium Strategy | |
Options
written | | Option contracts
written, at value | | $ | —
| | | $ | —
| | | $ | (29
| ) | | $ | —
| | | $ | —
| | | $ | (29
| ) | |
Total Value—Liabilities | | | | $ | — | | | $ | — | | | $ | (29 | ) | | $ | — | | | $ | — | | | $ | (29 | ) | |
Long Short | |
Futures
| | Receivable/Payable
for variation margin
on futures contracts(a) | | $ | —
| | | $ | —
| | | $ | (20,536
| ) | | $ | —
| | | $ | —
| | | $ | (20,536
| ) | |
OTC swaps
| | OTC swap contracts,
at value(b) | | | —
| | | | —
| | | | (4,202
| ) | | | —
| | | | —
| | | | (4,202
| ) | |
Options
written | | Option contracts
written, at value | | | —
| | | | —
| | | | (8,341
| ) | | | —
| | | | —
| | | | (8,341
| ) | |
Total Value—Liabilities | | | | $ | — | | | $ | — | | | $ | (33,079 | ) | | $ | — | | | $ | — | | | $ | (33,079 | ) | |
132
Derivative
Type | | Statements of
Assets and
Liabilities Location | | Interest
Rate Risk | | Currency
Risk | | Equity Risk | | Credit Risk | | Commodity
Risk | | Total | |
Long Short Credit | |
Futures
| | Receivable/Payable
for variation margin
on futures contracts(a) | | $ | (20
| ) | | $ | —
| | | $ | —
| | | $ | —
| | | $ | —
| | | $ | (20
| ) | |
Centrally
cleared
swaps
| | Receivable/Payable
for variation margin
on centrally cleared
swap contracts(c) | | | —
| | | | —
| | | | —
| | | | (283
| ) | | | —
| | | | (283
| ) | |
OTC swaps
| | OTC swap contracts,
at value(b) | | | —
| | | | —
| | | | (19
| ) | | | (116
| ) | | | —
| | | | (135
| ) | |
Total Value—Liabilities | | | | $ | (20 | ) | | $ | — | | | $ | (19 | ) | | $ | (399 | ) | | $ | — | | | $ | (438 | ) | |
Multi-Asset Income | |
Futures
| | Receivable/Payable
for variation margin
on futures contracts(a) | | $ | (25
| ) | | $ | (15
| ) | | $ | (27
| ) | | $ | —
| | | $ | —
| | | $ | (67
| ) | |
Forward
contracts
| | Payable for
forward foreign
currency contracts | | | —
| | | | (148
| ) | | | —
| | | | —
| | | | —
| | | | (148
| ) | |
OTC swaps
| | OTC swap contracts,
at value(b) | | | —
| | | | —
| | | | (2
| ) | | | —
| | | | —
| | | | (2
| ) | |
Options
written | | Option contracts
written, at value | | | —
| | | | —
| | | | (8
| ) | | | —
| | | | —
| | | | (8
| ) | |
Total Value—Liabilities | | | | $ | (25 | ) | | $ | (163 | ) | | $ | (37 | ) | | $ | — | | | $ | — | | | $ | (225 | ) | |
Risk Balanced Commodity Strategy | |
Futures
| | Receivable/Payable
for variation margin
on futures contracts(a) | | $ | —
| | | $ | —
| | | $ | —
| | | $ | —
| | | $ | (3,758
| ) | | $ | (3,758
| ) | |
Total Value—Liabilities | | | | $ | — | | | $ | — | | | $ | — | | | $ | — | | | $ | (3,758 | ) | | $ | (3,758 | ) | |
U.S. Equity Index PutWrite Strategy | |
Options
written | | Option contracts
written, at value | | $ | —
| | | $ | —
| | | $ | (865
| ) | | $ | —
| | | $ | —
| | | $ | (865
| ) | |
Total Value—Liabilities | | | | $ | — | | | $ | — | | | $ | (865 | ) | | $ | — | | | $ | — | | | $ | (865 | ) | |
(a) "Futures" reflects the cumulative unrealized appreciation/(depreciation) of futures contracts as of October 31, 2017, which is reflected in the Statements of Assets and Liabilities under the caption "Net unrealized appreciation (depreciation) in value of investments." The current day's variation margin as of October 31, 2017, if any, is reflected in the Statements of Assets and Liabilities under the caption "Receivable/Payable for variation margin on futures contracts."
(b) "OTC swaps" reflects the cumulative unrealized appreciation/(depreciation) of the OTC swap contracts plus accrued interest as of October 31, 2017 which is reflected in the Statements of Assets and Liabilities under the caption "OTC swap contracts, at value."
133
(c) "Centrally cleared swaps" reflects cumulative unrealized appreciation/(depreciation) of centrally cleared credit default swaps as of October 31, 2017, which is reflected in the Statements of Assets and Liabilities under the caption "Net unrealized appreciation/(depreciation) in value of investments." Variation margin on centrally cleared credit default swaps is reported within the Statements of Assets and Liabilities under the caption "Receivable/Payable for variation margin on centrally cleared swap contracts."
(d) Amount less than one thousand.
The impact of the use of these derivative instruments on the Statements of Operations during the year ended October 31, 2017, was as follows:
Realized Gain/(Loss)
(000's omitted) | |
Derivative
Type | | Statements of
Operations Location | | Interest
Rate Risk | | Currency
Risk | | Equity
Risk | | Credit
Risk | | Commodity
Risk | | Total | |
Global Allocation | |
Futures
| | Net realized gain/(loss) on:
expiration or closing
of futures contracts | | $ | 12
| | | $ | (22
| ) | | $ | 93
| | | $ | —
| | | $ | —
| | | $ | 83
| | |
Forward
contracts
| | Net realized gain/(loss) on:
settlement of forward
foreign currency contracts | | | —
| | | | (5
| ) | | | —
| | | | —
| | | | —
| | | | (5
| ) | |
Swaps
| | Net realized gain/(loss) on:
expiration or closing of
swap contracts | | | —
| | | | —
| | | | 1
| | | | —
| | | | —
| | | | 1
| | |
Options
written
| | Net realized gain/(loss) on:
expiration or closing of
option contracts and
swaptions written | | | —
| | | | —
| | | | 87
| | | | —
| | | | —
| | | | 87
| | |
Total Realized
Gain/(Loss) | | | | $ | 12 | | | $ | (27 | ) | | $ | 181 | | | $ | — | | | $ | — | | | $ | 166 | | |
Hedged Option Premium Strategy | |
Options
purchased
| | Net realized gain/(loss) on:
sales of investment securities
of unaffiliated issuers | | $ | —
| | | $ | —
| | | $ | (27
| ) | | $ | —
| | | $ | —
| | | $ | (27
| ) | |
Options
written
| | Net realized gain/(loss) on:
expiration or closing of
option contracts and
swaptions written | | | —
| | | | —
| | | | 127
| | | | —
| | | | —
| | | | 127
| | |
Total Realized
Gain/(Loss) | | | | $ | — | | | $ | — | | | $ | 100 | | | $ | — | | | $ | — | | | $ | 100 | | |
134
Derivative
Type | | Statements of
Operations Location | | Interest
Rate Risk | | Currency
Risk | | Equity
Risk | | Credit
Risk | | Commodity
Risk | | Total | |
Long Short | |
Futures
| | Net realized gain/(loss) on:
expiration or closing of
futures contracts | | $ | 498
| | | $ | —
| | | $ | (62,798
| ) | | $ | —
| | | $ | —
| | | $ | (62,300
| ) | |
Options
purchased
| | Net realized gain/(loss) on:
sales of investment securities
of unaffiliated issuers | | | —
| | | | —
| | | | 2,974
| | | | —
| | | | —
| | | | 2,974
| | |
Swaps
| | Net realized gain/(loss) on:
expiration or closing of
swap contracts | | | —
| | | | —
| | | | (19,599
| ) | | | —
| | | | —
| | | | (19,599
| ) | |
Options
written
| | Net realized gain/(loss) on:
expiration or closing of
option contracts and
swaptions written | | | —
| | | | —
| | | | 11,532
| | | | —
| | | | —
| | | | 11,532
| | |
Total Realized
Gain/(Loss) | | | | $ | 498 | | | $ | — | | | $ | (67,891 | ) | | $ | — | | | $ | — | | | $ | (67,393 | ) | |
Long Short Credit | |
Futures
| | Net realized gain/(loss) on:
expiration or closing of
futures contracts | | $ | (36
| ) | | $ | —
| | | $ | 59
| | | $ | —
| | | $ | —
| | | $ | 23
| | |
Forward
contracts
| | Net realized gain/(loss) on:
settlement of forward
foreign currency contracts | | | —
| | | | (21
| ) | | | —
| | | | —
| | | | —
| | | | (21
| ) | |
Swaps
| | Net realized gain/(loss) on:
expiration or closing of
swap contracts | | | —
| | | | —
| | | | 28
| | | | (6
| ) | | | —
| | | | 22
| | |
Options
purchased
| | Net realized gain/(loss) on:
transactions in investment
securities of
unaffiliated issuers | | | 12
| | | | —
| | | | (13
| ) | | | —
| | | | —
| | | | (1
| ) | |
Options and
swaptions
written
| | Net realized gain/(loss) on:
expiration or closing of
option contracts and
swaptions written | | | 6
| | | | —
| | | | 8
| | | | —
| | | | —
| | | | 14
| | |
Total Realized
Gain/(Loss) | | | | $ | (18 | ) | | $ | (21 | ) | | $ | 82 | | | $ | (6 | ) | | $ | — | | | $ | 37 | | |
135
Derivative
Type | | Statements of
Operations Location | | Interest
Rate Risk | | Currency
Risk | | Equity
Risk | | Credit
Risk | | Commodity
Risk | | Total | |
Multi-Asset Income | |
Futures
| | Net realized gain/(loss) on
expiration or closing of
futures contracts: | | $ | (21
| ) | | $ | 1
| | | $ | 110
| | | $ | —
| | | $ | —
| | | $ | 90
| | |
Forward
contracts
| | Net realized gain/(loss) on:
settlement of forward
foreign currency contracts | | | —
| | | | 5
| | | | —
| | | | —
| | | | —
| | | | 5
| | |
Swaps
| | Net realized gain/(loss) on:
expiration or closing of
swap contracts | | | —
| | | | —
| | | | (6
| ) | | | —
| | | | —
| | | | (6
| ) | |
Options
written
| | Net realized gain/(loss) on:
expiration or closing of
option contracts and
swaptions written | | | —
| | | | —
| | | | 109
| | | | —
| | | | —
| | | | 109
| | |
Total Realized
Gain/(Loss) | | | | $ | (21 | ) | | $ | 6 | | | $ | 213 | | | $ | — | | | $ | — | | | $ | 198 | | |
Risk Balanced Commodity Strategy | |
Futures
| | Net realized gain/(loss) on:
expiration or closing of
futures contracts | | $ | —
| | | $ | —
| | | $ | —
| | | $ | —
| | | $ | 4,073
| | | $ | 4,073
| | |
Total Realized
Gain/(Loss) | | | | $ | — | | | $ | — | | | $ | — | | | $ | — | | | $ | 4,073 | | | $ | 4,073 | | |
U.S. Equity Index PutWrite Strategy | |
Options
written
| | Net realized gain/(loss) on:
expiration or closing of
option contracts and
swaptions written | | $ | —
| | | $ | —
| | | $ | 10,212
| | | $ | —
| | | $ | —
| | | $ | 10,212
| | |
Total Realized
Gain/(Loss) | | | | $ | — | | | $ | — | | | $ | 10,212 | | | $ | — | | | $ | — | | | $ | 10,212 | | |
136
Change in Appreciation/(Depreciation) | |
(000's omitted) | |
Derivative
Type | | Statements of
Operations Location | | Interest
Rate Risk | | Currency
Risk | | Equity
Risk | | Credit
Risk | | Commodity
Risk | | Total | |
Global Allocation | |
Futures
| | Change in net unrealized
appreciation/ (depreciation)
in value of: futures contracts | | $ | (5
| ) | | $ | (10
| ) | | $ | 34
| | | $ | —
| | | $ | —
| | | $ | 19
| | |
Forward
contracts
| | Change in net unrealized
appreciation/ (depreciation)
in value of: forward foreign
currency contracts | | | —
| | | | 40
| | | | —
| | | | —
| | | | —
| | | | 40
| | |
Swaps
| | Change in net unrealized
appreciation/ (depreciation)
in value of: swap contracts | | | —
| | | | —
| | | | 1
| | | | —
| | | | —
| | | | 1
| | |
Options
written
| | Change in net unrealized
appreciation/ (depreciation)
in value of: option contracts
and swaptions written | | | —
| | | | —
| | | | 2
| | | | —
| | | | —
| | | | 2
| | |
Total Change in
Appreciation/
(Depreciation) | | | | $ | (5 | ) | | $ | 30 | | | $ | 37 | | | $ | — | | | $ | — | | | $ | 62 | | |
Hedged Option Premium Strategy | |
Options
purchased
| | Change in net unrealized
appreciation/(depreciation)
in value of: investment
securities of unaffiliated
issuers | | $ | —
| | | $ | —
| | | $ | (4
| ) | | $ | —
| | | $ | —
| | | $ | (4
| ) | |
Options
written
| | Change in net unrealized
appreciation/(depreciation)
in value of: option contracts
and swaptions written | | | —
| | | | —
| | | | 21
| | | | —
| | | | —
| | | | 21
| | |
Total Change in
Appreciation/
(Depreciation) | | | | $ | — | | | $ | — | | | $ | 17 | | | $ | — | | | $ | — | | | $ | 17 | | |
137
Derivative
Type | | Statements of
Operations Location | | Interest
Rate Risk | | Currency
Risk | | Equity
Risk | | Credit
Risk | | Commodity
Risk | | Total | |
Long Short | |
Futures
| | Change in net unrealized
appreciation/(depreciation)
in value of: futures contracts | | $ | 23
| | | $ | —
| | | $ | (33,569
| ) | | $ | —
| | | $ | —
| | | $ | (33,546
| ) | |
Options
purchased
| | Change in net unrealized
appreciation/(depreciation)
in value of: investment
securities of unaffiliated
issuers | | | —
| | | | —
| | | | 1,524
| | | | —
| | | | —
| | | | 1,524
| | |
Swaps
| | Change in net unrealized
appreciation/(depreciation)
in value of: swap contracts | | | —
| | | | —
| | | | 3,023
| | | | —
| | | | —
| | | | 3,023
| | |
Options
written
| | Change in net unrealized
appreciation/(depreciation)
in value of: option contracts
and swaptions written | | | —
| | | | —
| | | | (2,147
| ) | | | —
| | | | —
| | | | (2,147
| ) | |
Total Change in
Appreciation/
(Depreciation) | | | | $ | 23 | | | $ | — | | | $ | (31,169 | ) | | $ | — | | | $ | — | | | $ | (31,146 | ) | |
Long Short Credit | |
Futures
| | Change in net unrealized
appreciation/(depreciation)
in value of: futures contracts | | $ | (75
| ) | | $ | —
| | | $ | 9
| | | $ | —
| | | $ | —
| | | $ | (66
| ) | |
Forward
contracts
| | Change in net unrealized
appreciation/(depreciation)
in value of: forward foreign
currency contracts | | | —
| | | | (5
| ) | | | —
| | | | —
| | | | —
| | | | (5
| ) | |
Swaps
| | Change in net unrealized
appreciation/(depreciation)
in value of: swap contracts | | | —
| | | | —
| | | | (203
| ) | | | 243
| | | | —
| | | | 40
| | |
Total Change in
Appreciation/
(Depreciation) | | | | $ | (75 | ) | | $ | (5 | ) | | $ | (194 | ) | | $ | 243 | | | $ | — | | | $ | (31 | ) | |
138
Derivative
Type | | Statements of
Operations Location | | Interest
Rate Risk | | Currency
Risk | | Equity
Risk | | Credit
Risk | | Commodity
Risk | | Total | |
Multi-Asset Income | |
Futures
| | Change in net unrealized
appreciation/(depreciation)
in value of: futures contracts | | $ | 9
| | | $ | (7
| ) | | $ | 41
| | | $ | —
| | | $ | —
| | | $ | 43
| | |
Forward
contracts
| | Change in net unrealized
appreciation/(depreciation)
in value of: forward
foreign currency contracts | | | —
| | | | 30
| | | | —
| | | | —
| | | | —
| | | | 30
| | |
Swaps
| | Change in net unrealized
appreciation/(depreciation)
in value of: swap contracts | | | —
| | | | —
| | | | 2
| | | | —
| | | | —
| | | | 2
| | |
Options
written
| | Change in net unrealized
appreciation/(depreciation)
in value of: option contracts
and swaptions written | | | —
| | | | —
| | | | 1
| | | | —
| | | | —
| | | | 1
| | |
Total Change in
Appreciation/
(Depreciation) | | | | $ | 9 | | | $ | 23 | | | $ | 44 | | | $ | — | | | $ | — | | | $ | 76 | | |
Risk Balanced Commodity Strategy | |
Futures
| | Change in net unrealized
appreciation/(depreciation)
in value of: futures contracts | | $ | —
| | | $ | —
| | | $ | —
| | | $ | —
| | | $ | 1,581
| | | $ | 1,581
| | |
Total Change in
Appreciation/
(Depreciation) | | | | $ | — | | | $ | — | | | $ | — | | | $ | — | | | $ | 1,581 | | | $ | 1,581 | | |
U.S. Equity Index PutWrite Strategy | |
Options
written
| | Change in net unrealized
appreciation/(depreciation)
in value of: option contracts
and swaptions written | | $ | —
| | | $ | —
| | | $ | 522
| | | $ | —
| | | $ | —
| | | $ | 522
| | |
Total Change in
Appreciation/
(Depreciation) | | | | $ | — | | | $ | — | | | $ | 522 | | | $ | — | | | $ | — | | | $ | 522 | | |
While the Funds may receive redeemable preference shares, rights and warrants in connection with their investments in securities, these rights and warrants are not considered "derivative instruments" under ASC 815.
The Funds adopted the provisions of Accounting Standards Update ("ASU") 2011-11 Disclosures about Offsetting Assets and Liabilities ("ASU 2011-11"). ASU 2011-11 is intended to enhance disclosure requirements on the offsetting of financial assets and liabilities. Pursuant to ASU 2011-11, an entity is required to disclose both gross and net information for assets and liabilities related to derivatives, repurchase and reverse repurchase agreements, and securities lending and securities borrowing transactions that are eligible for offset or subject to an enforceable master netting or similar agreement. ASU 2011-11 is applicable to the Funds, except Hedged Option Premium Strategy, Risk Balanced Commodity Strategy and U.S. Equity Index PutWrite Strategy, at October 31, 2017. The
139
Funds' derivative assets and liabilities at fair value by type are reported gross in the Statements of Assets and Liabilities. The following tables present derivative assets and liabilities by counterparty, net of amounts available for offset under a master netting agreement and net of the related collateral received by a Fund for assets and pledged by a Fund for liabilities as of October 31, 2017.
Description
(000's omitted) | | Gross Amounts of
Recognized Assets | | Gross Amounts Offset
in the Statements of
Assets and Liabilities | | Net Amounts of Assets
Presented in the Statements
of Assets and Liabilities | |
Global Allocation | |
Forward contracts | | $ | 177 | | | $ | — | | | $ | 177 | | |
OTC Swaps | | | 2 | | | | — | | | | 2 | | |
Total | | $ | 179 | | | $ | — | | | $ | 179 | | |
Long Short | |
Swap contracts | | $ | 2,012 | | | $ | — | | | $ | 2,012 | | |
Total | | $ | 2,012 | | | $ | — | | | $ | 2,012 | | |
Long Short Credit | |
OTC swaps | | $ | 175 | | | $ | — | | | $ | 175 | | |
Forward contracts | | | 2 | | | | — | | | | 2 | | |
Total | | $ | 177 | | | $ | — | | | $ | 177 | | |
Multi-Asset Income | |
Forward contracts | | $ | 156 | | | $ | — | | | $ | 156 | | |
OTC Swaps | | | 4 | | | | — | | | | 4 | | |
Total | | $ | 160 | | | $ | — | | | $ | 160 | | |
Gross Amounts Not Offset in the Statements of Assets and Liabilities
Counterparty
(000's omitted) | | Net Amounts of
Assets Presented in
the Statements of Assets
and Liabilities | | Liabilities
Available
for Offset | | Cash Collateral
Received(a) | | Net Amount(b) | |
Global Allocation | |
Citibank N.A. | | $ | 19 | | | $ | (9 | ) | | $ | — | | | $ | 10 | | |
Goldman Sachs International | | | 40 | | | | (31 | ) | | | — | | | | 9 | | |
JPMorgan Chase Bank N.A. | | | 1 | | | | (0 | )(d) | | | — | | | | 1 | | |
Royal Bank of Canada | | | 23 | | | | (16 | ) | | | — | | | | 7 | | |
Societe Generale | | | 50 | | | | (35 | ) | | | — | | | | 15 | | |
State Street Bank and Trust Company | | | 46 | | | | (46 | ) | | | — | | | | — | | |
Total | | $ | 179 | | | $ | (137 | ) | | $ | — | | | $ | 42 | | |
Long Short | |
Citibank N.A. | | $ | 1,034 | | | $ | (1,034 | ) | | $ | — | | | $ | — | | |
Goldman Sachs International | | | 978 | | | | (978 | ) | | | — | | | $ | — | | |
Total | | $ | 2,012 | | | $ | (2,012 | ) | | $ | — | | | $ | — | | |
Long Short Credit | |
BNP Paribas SA | | $ | 33 | | | $ | (20 | ) | | $ | — | | | $ | 13 | | |
Goldman Sachs International | | | 144 | | | | (52 | ) | | | — | | | | 92 | | |
Total | | $ | 177 | | | $ | (72 | ) | | $ | — | | | $ | 105 | | |
140
Gross Amounts Not Offset in the Statements of Assets and Liabilities
Counterparty
(000's omitted) | | Net Amounts of
Assets Presented in
the Statements of Assets
and Liabilities | | Liabilities
Available
for Offset | | Cash Collateral
Received(a) | | Net Amount(b) | |
Multi-Asset Income | |
Citibank N.A. | | $ | 23 | | | $ | (9 | ) | | $ | — | | | $ | 14 | | |
Goldman Sachs International | | | 39 | | | | (33 | ) | | | — | | | | 6 | | |
JPMorgan Chase Bank N.A. | | | 1 | | | | (1 | ) | | | — | | | | — | | |
Royal Bank of Canada | | | 16 | | | | (13 | ) | | | — | | | | 3 | | |
Societe Generale | | | 37 | | | | (26 | ) | | | — | | | | 11 | | |
State Street Bank and Trust Company | | | 44 | | | | (44 | ) | | | — | | | | — | | |
Total | | $ | 160 | | | $ | (126 | ) | | $ | — | | | $ | 34 | | |
Description
(000's omitted) | | Gross Amounts of
Recognized Liabilities | | Gross Amounts Offset
in the Statements of
Assets and Liabilities | | Net Amounts of Liabilities
Presented in the Statements
of Assets and Liabilities | |
Global Allocation | |
Forward contracts | | $ | (162 | ) | | $ | — | | | $ | (162 | ) | |
OTC Swaps | | | (1 | ) | | | — | | | | (1 | ) | |
Total | | $ | (163 | ) | | $ | — | | | $ | (163 | ) | |
Long Short | |
OTC swaps | | $ | (4,202 | ) | | $ | — | | | $ | (4,202 | ) | |
Total | | $ | (4,202 | ) | | $ | — | | | $ | (4,202 | ) | |
Long Short Credit | |
OTC swaps | | $ | (135 | ) | | $ | — | | | $ | (135 | ) | |
Total | | $ | (135 | ) | | $ | — | | | $ | (135 | ) | |
Multi-Asset Income | |
Forward contracts | | $ | (148 | ) | | $ | — | | | $ | (148 | ) | |
OTC Swaps | | | (2 | ) | | | — | | | | (2 | ) | |
Total | | $ | (150 | ) | | $ | — | | | $ | (150 | ) | |
141
Gross Amounts Not Offset in the Statements of Assets and Liabilities
Counterparty
(000's omitted) | | Net Amounts of
Liabilities Presented in
the Statements of Assets
and Liabilities | | Assets
Available
for Offset | | Cash Collateral
Pledged(a) | | Net Amount(c) | |
Global Allocation | |
Citibank N.A. | | $ | (9 | ) | | $ | 9 | | | $ | — | | | $ | — | | |
Goldman Sachs International | | | (31 | ) | | | 31 | | | | — | | | | — | | |
JPMorgan Chase Bank N.A. | | | (0 | )(d) | | | 0 | (d) | | | — | | | | — | | |
Royal Bank of Canada | | | (16 | ) | | | 16 | | | | — | | | | — | | |
Societe Generale | | | (35 | ) | | | 35 | | | | — | | | | — | | |
State Street Bank and Trust Company | | | (72 | ) | | | 46 | | | | — | | | | (26 | ) | |
Total | | $ | (163 | ) | | $ | 137 | | | $ | — | | | $ | (26 | ) | |
Long Short | |
Citibank N.A. | | $ | (1,791 | ) | | $ | 1,034 | | | $ | 757 | | | $ | — | | |
Goldman Sachs International | | | (2,411 | ) | | | 978 | | | | 1,330 | | | | (103 | ) | |
Total | | $ | (4,202 | ) | | $ | 2,012 | | | $ | 2,087 | | | $ | (103 | ) | |
Long Short Credit | |
Bank of America, N.A. | | $ | (48 | ) | | $ | — | | | $ | — | | | $ | (48 | ) | |
BNP Paribas SA | | $ | (20 | ) | | $ | 20 | | | $ | — | | | $ | — | | |
Citibank N.A. | | | (15 | ) | | | — | | | | — | | | | (15 | ) | |
Goldman Sachs International | | | (52 | ) | | | 52 | | | | — | | | | — | | |
Total | | $ | (135 | ) | | $ | 72 | | | $ | — | | | $ | (63 | ) | |
Multi-Asset Income | |
Citibank N.A. | | $ | (9 | ) | | $ | 9 | | | $ | — | | | $ | — | | |
Goldman Sachs International | | | (33 | ) | | | 33 | | | | — | | | | — | | |
JPMorgan Chase Bank N.A. | | | (1 | ) | | | 1 | | | | — | | | | — | | |
Royal Bank of Canada | | | (13 | ) | | | 13 | | | | — | | | | — | | |
Societe Generale | | | (26 | ) | | | 26 | | | | — | | | | — | | |
State Street Bank and Trust Company | | | (68 | ) | | | 44 | | | | — | | | | (24 | ) | |
Total | | $ | (150 | ) | | $ | 126 | | | $ | — | | | $ | (24 | ) | |
(a) Collateral received (or pledged) is limited to an amount not to exceed 100% of the net amount of assets (or liabilities) in the tables presented above, for each respective counterparty.
(b) Net Amount represents amounts subject to loss as of October 31, 2017, in the event of a counterparty failure.
(c) Net Amount represents amounts under-collateralized to each counterparty as of October 31, 2017.
(d) Amount less than one thousand.
While the Funds may receive redeemable preference shares, rights and warrants in connection with their investments in securities, these rights and warrants are not considered "derivative instruments" under ASC 815.
17 Indemnifications: Like many other companies, the Trust's organizational documents provide that its officers ("Officers") and trustees ("Trustees") are indemnified against certain liabilities arising out of the performance of their duties to the Trust. In addition, both in some of its principal service contracts and in the normal course of its business, the Trust enters into contracts that provide indemnifications to other parties for certain types of losses or liabilities. The Trust's maximum exposure under these arrangements is unknown as this could involve future claims against the Trust.
142
18 Transactions with other funds managed by Neuberger Berman Investment Advisers LLC: Neuberger Berman Alternative Funds and Management have obtained an exemptive order from the SEC that permits the Funds to invest in both affiliated and unaffiliated investment companies, including exchange-traded funds, in excess of the limits in Section 12(d)(1)(A) of the 1940 Act, subject to the terms and conditions of such order. Through October 31, 2017, Global Allocation invested in Neuberger Berman Emerging Markets Debt Fund, Neuberger Berman Emerging Markets Equity Fund, Neuberger Berman Floating Rate Income Fund, Neuberger Berman Genesis Fund, Neuberger Berman High Income Bond Fund, Neuberger Berman International Select Fund, Long Short Credit, Risk Balanced Commodity Strategy and U.S. Equity Index PutWrite Strategy (collectively the "Underlying Funds"). Through October 31, 2017, Multi-Asset Income invested in Neuberger Berman Emerging Markets Debt Fund, Neuberger Berman Floating Rate Income Fund, Neuberger Berman High Income Bond Fund and Long Short Credit (collectively the "Underlying Funds") (See Note F).
For the Funds' investments in the Underlying Funds, Management waived a portion of its management fee equal to the management fee it received from the Underlying Funds on those assets (the "Arrangement"). For the year ended October 31, 2017, management fees waived under this Arrangement are reflected in the Statements of Operations under the caption "Investment management fees waived." For the year ended October 31, 2017, income earned under this Arrangement on Global Allocation's and Multi-Asset Income's investments is reflected in the Statements of Operations under the caption "Dividend income-affiliated issuers." For the year ended October 31, 2017, management fees waived and income earned under this Arrangement on Global Allocation's and Multi-Asset Income's investments in the Underlying Funds were as follows:
| | | Management fees waived | | Income earned | |
Global Allocation | | $ | 70,855 | | | $ | 292,942 | | |
Multi-Asset Income | | | 33,151 | | | | 290,247 | | |
19 Organization expenses: Costs incurred by Hedged Option Premium Strategy in connection with its organization, which amounted to $92,069 and are reflected in Organization expense in the Statements of Operations, have been expensed as incurred.
20 Other: All net investment income and realized and unrealized capital gains and losses of each Fund are allocated, on the basis of relative net assets, pro rata among its respective classes.
Note B—Investment Management Fees, Administration Fees, Distribution Arrangements, and Other Transactions With Affiliates:
Each Fund retains Management as its investment manager under a Management Agreement. For such investment management services, each Fund pays Management a fee according to the following table:
Investment Management Fee as a Percentage of Average Daily Net Assets(a):
| | | First
$250
million | | Next
$250
million | | Next
$250
million | | Next
$250
million | | Next
$500
million | | Next
$500
million | | Next
$2
billion | | Thereafter | |
| For Global Allocation:(b) | | | |
| | | | | | 0.55 | % | | | 0.55 | % | | | 0.55 | % | | | 0.55 | % | | | 0.525 | % | | | 0.525 | % | | | 0.50 | % | | | 0.50 | % | |
For Long Short: | | | |
| | | | | | 1.20 | % | | | 1.175 | % | | | 1.15 | % | | | 1.125 | % | | | 1.10 | % | | | 1.075 | % | | | 1.075 | % | | | 1.05 | % | |
For Long Short Credit: | | | |
| | | | | | 0.80 | % | | | 0.80 | % | | | 0.80 | % | | | 0.80 | % | | | 0.80 | % | | | 0.80 | % | | | 0.80 | % | | | 0.80 | % | |
143
| | | First
$250
million | | Next
$250
million | | Next
$250
million | | Next
$250
million | | Next
$500
million | | Next
$500
million | | Next
$2
billion | | Thereafter | |
For Multi-Asset Income: | | | |
| | | | | | 0.45 | % | | | 0.425 | % | | | 0.40 | % | | | 0.375 | % | | | 0.35 | % | | | 0.325 | % | | | 0.325 | % | | | 0.30 | % | |
| For Risk Balanced Commodity Strategy and RBCS Subsidiary:(c) | | | |
| | | | | | 0.50 | % | | | 0.475 | % | | | 0.45 | % | | | 0.425 | % | | | 0.40 | % | | | 0.375 | % | | | 0.375 | % | | | 0.35 | % | |
For Hedged Option Premium Strategy: | | | |
| | | | | | 0.45 | % | | | 0.45 | % | | | 0.45 | % | | | 0.45 | % | | | 0.45 | % | | | 0.45 | % | | | 0.45 | % | | | 0.45 | % | |
For U.S. Equity Index PutWrite Strategy: | | | |
| | | | | | 0.45 | % | | | 0.45 | % | | | 0.45 | % | | | 0.45 | % | | | 0.45 | % | | | 0.45 | % | | | 0.45 | % | | | 0.45 | % | |
(a) Less the net asset value of the RBCS Subsidiary for Risk Balanced Commodity Strategy.
(b) 0.65% of the first $1 billion of the Fund's average daily net assets, 0.625% of the next $1 billion and 0.600% of average daily net assets in excess of $2 billion prior to February 28, 2017.
(c) 0.70% of the first $250 million of the Fund's average daily net assets, 0.675% of the next $250 million, 0.65% of the next $250 million, 0.625% of the next $250 million, 0.60% of the next $500 million, 0.575% of the next $2.5 billion, and 0.55% of average daily net assets in excess of $4 billion prior to February 28, 2017.
Accordingly, for the year ended October 31, 2017, the investment management fee pursuant to the Management Agreement was equivalent to an annual effective rate of each Fund's average daily net assets(a), as follows:
| | | Effective Rate | |
Global Allocation | | | 0.24 | % | |
Long Short | | | 1.11 | % | |
Multi-Asset Income | | | 0.29 | % | |
Risk Balanced Commodity Strategy | | | 0.56 | % | |
RBCS Subsidiary | | | 0.56 | % | |
(a) Less the net asset value of the RBCS Subsidiary for Risk Balanced Commodity Strategy.
Each Fund retains Management as its administrator under an Administration Agreement. Prior to July 1, 2017, each Fund paid Management an administration fee at the annual rate of 0.06% of its average daily net assets under this agreement in addition to an annual fee for certain class level services (specifically, 0.20% for each of Class A and Class C of each of Global Allocation, Hedged Option Premium Strategy, Long Short, Risk Balanced Commodity Strategy and U.S. Equity Index PutWrite Strategy; 0.21% for each of Class A and Class C of each of Long Short Credit and Multi-Asset Income; 0.09% for Institutional Class and 0.02% for Class R6, each as a percentage of average daily net assets). Effective July 1, 2017, the administration fee will only be assessed at the Class level and as such each share class of a Fund, as applicable, pays Management an annual administration fee equal to the following: 0.26% for each of Class A and Class C of each of Global Allocation, Hedged Option Premium Strategy, Long Short, Risk Balanced Commodity Strategy and U.S. Equity Index PutWrite Strategy; 0.27% for each of Class A and Class C of each of Long Short Credit and Multi-Asset Income; 0.15% for Institutional Class; and 0.08% for Class R6, each as a percentage of its average daily net assets. This will not result in an increase in any administration expense for any Fund or share class. Additionally, Management retains State Street Bank and Trust Company ("State Street") as its sub-administrator under a Sub-Administration Agreement. Management pays State Street a fee for all services received under the agreement.
Management has contractually agreed to waive fees and/or reimburse certain expenses of the Institutional Class, Class A, Class C and Class R6 of each Fund so that the total annual operating expenses of those classes do not exceed the expense limitations as detailed in the following table. These undertakings exclude interest, taxes, brokerage commissions, acquired fund fees and expenses, extraordinary expenses, and dividend and interest expenses relating to short sales, if any (commitment fees relating to borrowings are treated as interest for purposes
144
of this exclusion); consequently, net expenses may exceed the contractual expense limitations. Each Fund has agreed that each of its respective classes will repay Management for fees and expenses waived or reimbursed for that class provided that repayment does not cause that class' annual operating expenses to exceed its contractual expense limitation in place at the time the fees and expenses were waived or reimbursed, or the expense limitation in place at the time the Fund repays Management, whichever is lower. Any such repayment must be made within three years after the year in which Management incurred the expense. The expenses of the RBCS Subsidiary are included in the total expenses used to calculate the reimbursement, which Risk Balanced Commodity Strategy has agreed to share with the RBCS Subsidiary. For the year ended October 31, 2017, these RBCS Subsidiary expenses amounted to $155,720.
During the year ended October 31, 2017, there was no repayment to Management under these agreements.
At October 31, 2017, contingent liabilities to Management under the agreements were as follows:
| | | | | | | Expenses Reimbursed In
Year Ending October 31, | |
| | | | | | | 2015 | | 2016 | | 2017 | |
| | | | | | | Subject to Repayment until
October 31, | |
Class | | Contractual
Expense
Limitation(a) | | Expiration | | 2018 | | 2019 | | 2020 | |
Global Allocation Institutional Class | | | 0.75 | %(b) | | 10/31/20 | | $ | 218,863 | | | $ | 249,350 | | | $ | 346,296 | | |
Global Allocation Class A | | | 1.11 | %(b) | | 10/31/20 | | | 186,931 | | | | 182,783 | | | | 131,054 | | |
Global Allocation Class C | | | 1.86 | %(b) | | 10/31/20 | | | 141,948 | | | | 149,577 | | | | 110,994 | | |
Hedged Option Premium Strategy
Institutional Class | | | 0.65 | % | | 10/31/20 | | | — | | | | — | | | | 163,736 | (c) | |
Hedged Option Premium Strategy Class A | | | 1.01 | % | | 10/31/20 | | | — | | | | — | | | | 1,070 | (c) | |
Hedged Option Premium Strategy Class C | | | 1.76 | % | | 10/31/20 | | | — | | | | — | | | | 1,213 | (c) | |
Hedged Option Premium Strategy Class R6 | | | 0.58 | % | | 10/31/20 | | | — | | | | — | | | | 80,469 | (c) | |
Long Short Institutional Class | | | 1.70 | % | | 10/31/20 | | | — | | | | — | | | | — | | |
Long Short Class A | | | 2.06 | % | | 10/31/20 | | | — | | | | — | | | | — | | |
Long Short Class C | | | 2.81 | % | | 10/31/20 | | | — | | | | — | | | | — | | |
Long Short Credit Institutional Class | | | 1.20 | %(d) | | 10/31/20 | | | 189,647 | (e) | | | 283,260 | | | | 178,900 | | |
Long Short Credit Class A | | | 1.57 | %(d) | | 10/31/20 | | | 11,941 | (e) | | | 14,957 | | | | 28,780 | | |
Long Short Credit Class C | | | 2.32 | %(d) | | 10/31/20 | | | 11,651 | (e) | | | 10,932 | | | | 10,218 | | |
Long Short Credit Class R6 | | | 1.13 | %(d) | | 10/31/20 | | | 51,813 | (e) | | | 56,434 | | | | 63,573 | | |
Multi-Asset Income Institutional Class | | | 0.65 | %(f) | | 10/31/20 | | | 211,942 | (g) | | | 349,252 | | | | 372,208 | | |
Multi-Asset Income Class A | | | 1.02 | %(f) | | 10/31/20 | | | 11,183 | (g) | | | 16,514 | | | | 14,267 | | |
Multi-Asset Income Class C | | | 1.77 | %(f) | | 10/31/20 | | | 11,072 | (g) | | | 15,614 | | | | 16,358 | | |
Multi-Asset Income Class R6 | | | 0.58 | %(f) | | 10/31/20 | | | 77,569 | (g) | | | 119,681 | | | | 94,517 | | |
Risk Balanced Commodity Strategy
Institutional Class | | | 0.73 | %(h) | | 10/31/20 | | | 93,942 | | | | 171,296 | | | | 211,468 | | |
Risk Balanced Commodity Strategy Class A | | | 1.09 | %(h) | | 10/31/20 | | | 209,027 | | | | 150,132 | | | | 131,093 | | |
Risk Balanced Commodity Strategy Class C | | | 1.84 | %(h) | | 10/31/20 | | | 17,483 | | | | 7,166 | | | | 545 | | |
U.S. Equity Index PutWrite Strategy
Institutional Class | | | 0.65 | % | | 10/31/20 | | | — | | | | 154,906 | (i) | | | 290,602 | | |
U.S. Equity Index PutWrite Strategy Class A | | | 1.01 | % | | 10/31/20 | | | — | | | | 2,299 | (i) | | | 6,844 | | |
U.S. Equity Index PutWrite Strategy Class C | | | 1.76 | % | | 10/31/20 | | | — | | | | 912 | (i) | | | 628 | | |
U.S. Equity Index PutWrite Strategy Class R6 | | | 0.58 | % | | 10/31/20 | | | — | | | | 46,827 | (i) | | | 31,856 | | |
145
(a) Expense limitation per annum of the respective class' average daily net assets.
(b) Prior to February 28, 2017, the contractual expense limitation was 0.90% for Institutional Class, 1.26% for Class A and 2.01% for Class C.
(c) Period from April 12, 2017 (Commencement of Operations) to October 31, 2017.
(d) In addition, Management voluntarily waived its fees as necessary to maintain a minimum yield for Long Short Credit from June 29, 2015 to July 2, 2015, for Institutional Class, Class A, Class C and Class R6. For the period ended October 31, 2015, voluntary reimbursements for Institutional Class, Class A, Class C and Class R6 of Long Short Credit amounted to $3,229, $257, $394 and $830, respectively. In addition, Management voluntarily waived its fees as necessary to maintain a minimum yield for Long Short Credit on several days in 2016, for Institutional Class, Class A, Class C and Class R6. For the year ended October 31, 2016, voluntary reimbursements for Institutional Class, Class A, Class C and Class R6 of Long Short Credit amounted to $26,236, $2,133, $2,908 and $4,880, respectively.
(e) Period from June 29, 2015 (Commencement of Operations) to October 31, 2015.
(f) In addition, Management voluntarily waived its fees as necessary to maintain a minimum yield for Multi-Asset Income on March 27, 2015, for Institutional Class, Class A, Class C and Class R6 and March 30, 2015, for Class A and Class C. For the period ended October 31, 2015, voluntary reimbursements for Institutional Class, Class A, Class C and Class R6 of Multi-Asset Income amounted to $456, $43, $84 and $159, respectively.
(g) Period from March 27, 2015 (Commencement of Operations) to October 31, 2015.
(h) Prior to February 28, 2017, the contractual expense limitation was 1.10% for Institutional Class, 1.46% for Class A and 2.21% for Class C.
(i) Period from September 16, 2016 (Commencement of Operations) to October 31, 2016.
Until December 31, 2015, Neuberger Berman Fixed Income LLC ("NBFI"), as the sub-adviser to Global Allocation, Long Short Credit, Multi-Asset Income and Risk Balanced Commodity Strategy, was retained by Neuberger Berman Management LLC ("NBM") to provide day-to-day investment management services and received a monthly fee paid by NBM. As investment manager, NBM was responsible for overseeing the investment activities of NBFI. Until December 31, 2015, Neuberger Berman LLC ("Neuberger Berman"), was the sub-adviser to Long Short and was retained by NBM to furnish it with investment recommendations and research information without added cost to the Funds. Several individuals who are Officers and/or Trustees of the Trust are also employees of NBFI, Neuberger Berman and/or NBM. As a result of the entity consolidation described on page 23 of this Annual Report, the services previously provided by NBFI and Neuberger Berman under the respective sub-advisory agreements are now provided by NBIA as of January 1, 2016.
Each Fund also has a distribution agreement with Neuberger Berman BD LLC (the "Distributor") with respect to each class of shares. The Distributor acts as agent in arranging for the sale of class shares without sales commission or other compensation, except as described below for Class A and Class C shares, and bears the advertising and promotion expenses.
However, the Distributor receives fees from Class A and Class C under their distribution plans (each a "Plan", collectively the "Plans") pursuant to Rule 12b-1 under the 1940 Act. The Plans provide that, as compensation for administrative and other services provided to these classes, the Distributor's activities and expenses related to the sale and distribution of these classes, and ongoing services provided to investors in these classes, the Distributor receives from each of these classes a fee at the annual rate of 0.25% of Class A's and 1.00% of Class C's average daily net assets. The Distributor receives this amount to provide distribution and shareholder servicing for these classes and pays a portion of it to institutions that provide such services. Those institutions may use the payments for,
146
among other purposes, compensating employees engaged in sales and/or shareholder servicing. The amount of fees paid by each class during any year may be more or less than the cost of distribution and other services provided to that class. FINRA rules limit the amount of annual distribution fees that may be paid by a mutual fund and impose a ceiling on the cumulative distribution fees paid. The Trust's Plans comply with those rules.
Class A shares of each Fund (except Long Short Credit and Multi-Asset Income) are generally sold with an initial sales charge of up to 5.75%. Class A shares of Long Short Credit and Multi-Asset Income are generally sold with an initial sales charge of up to 4.25%. Class A shares of each Fund are generally sold with no contingent deferred sales charge ("CDSC"), except that a CDSC of 1.00% will apply to certain redemptions made within 18 months following purchases of $1 million or more without an initial sales charge. Class C shares of each Fund are sold with no initial sales charge and a 1.00% CDSC if shares are sold within one year after purchase.
For the year ended October 31, 2017, Neuberger Berman, acting as underwriter and broker-dealer, received net initial sales charges from the purchase of Class A shares and CDSCs from the redemption of Class A and Class C shares as follows:
| | | Underwriter | | Broker-Dealer | |
| | | Net Initial
Sales Charge | | CDSC | | Net Initial
Sales Charge | | CDSC | |
Global Allocation Class A | | $ | 3,816 | | | $ | — | | | $ | — | | | $ | — | | |
Global Allocation Class C | | | — | | | | 1,595 | | | | — | | | | — | | |
| Hedged Option Premium Strategy Class A(a) | | | — | | | | — | | | | — | | | | — | | |
| Hedged Option Premium Strategy Class C(a) | | | — | | | | — | | | | — | | | | — | | |
Long Short Class A | | | 23,948 | | | | — | | | | — | | | | — | | |
Long Short Class C | | | — | | | | 10,222 | | | | — | | | | — | | |
Long Short Credit Class A | | | — | | | | — | | | | — | | | | — | | |
Long Short Credit Class C | | | — | | | | 50 | | | | — | | | | — | | |
Multi-Asset Income Class A | | | — | | | | — | | | | — | | | | — | | |
Multi-Asset Income Class C | | | — | | | | — | | | | — | | | | — | | |
Risk Balanced Commodity Strategy Class A | | | — | | | | — | | | | — | | | | — | | |
Risk Balanced Commodity Strategy Class C | | | — | | | | — | | | | — | | | | — | | |
U.S. Equity Index PutWrite Strategy Class A | | | 3,412 | | | | — | | | | — | | | | — | | |
U.S. Equity Index PutWrite Strategy Class C | | | — | | | | 25 | | | | — | | | | — | | |
(a) Period from April 12, 2017 (Commencement of Operations) to October 31, 2017.
For the year ended October 31, 2017, Long Short recorded a capital contribution from Management in the amount of $37,124. This amount was paid in connection with losses incurred in the execution of trades.
147
Note C—Securities Transactions:
During the year ended October 31, 2017, there were purchase and sale transactions of long-term securities (excluding swaps, futures, forward contracts, swaptions and option contracts) as follows:
(000's omitted) | | Purchases of
U.S. Government
and Agency
Obligations | | Purchases
excluding
U.S. Government
and
Agency
Obligations | | Securities
Sold
Short | | Sales and
Maturities
of
U.S. Government
and
Agency
Obligations | | Sales and
Maturities
excluding
U.S. Government
and
Agency
Obligations | | Covers on
Securities
Sold
Short | |
Global Allocation | | $ | 15,172 | | | $ | 17,467 | | | $ | 724 | | | $ | 14,227 | | | $ | 21,114 | | | $ | 3,121 | | |
Hedged Option
Premium Strategy(a) | | | 9,417 | | | | — | | | | — | | | | — | | | | — | | | | — | | |
Long Short | | | — | | | | 1,513,575 | | | | 745,169 | | | | — | | | | 1,453,942 | | | | 643,999 | | |
Long Short Credit | | | — | | | | 31,583 | | | | — | | | | — | | | | 32,981 | | | | — | | |
Multi-Asset Income | | | 25,062 | | | | 14,219 | | | | — | | | | 22,670 | | | | 11,741 | | | | — | | |
Risk Balanced
Commodity Strategy | | | — | | | | 98,603 | | | | — | | | | — | | | | 60,052 | | | | — | | |
U.S. Equity Index
PutWrite Strategy | | | 140,741 | | | | — | | | | — | | | | — | | | | — | | | | — | | |
(a) Period from April 12, 2017 (Commencement of Operations) to October 31, 2017.
During the year ended October 31, 2017, no brokerage commissions on securities transactions were paid to affiliated brokers.
Note D—Fund Share Transactions:
Share activity for the years ended October 31, 2017 and October 31, 2016 was as follows:
| | | For the Year Ended October 31, 2017 | | For the Year Ended October 31, 2016 | |
(000's omitted) | | Shares
Sold | | Shares
Issued on
Reinvestment
of Dividends
and
Distributions | | Shares
Redeemed | | Total | | Shares
Sold | | Shares
Issued on
Reinvestment
of Dividends
and
Distributions | | Shares
Redeemed | | Total | |
Global Allocation | |
Institutional Class | | | 615 | | | | 4 | | | | (441 | ) | | | 178 | | | | 350 | | | | 2 | | | | (244 | ) | | | 108 | | |
Class A | | | 123 | | | | — | | | | (373 | ) | | | (250 | ) | | | 194 | | | | 2 | | | | (404 | ) | | | (208 | ) | |
Class C | | | 20 | | | | — | | | | (211 | ) | | | (191 | ) | | | 83 | | | | 1 | | | | (266 | ) | | | (182 | ) | |
Hedged Option Premium Strategy | |
| Institutional Class(a) | | | 337 | | | | 0 | (c) | | | (0 | )(c) | | | 337 | | | | — | | | | — | | | | — | | | | — | | |
| Class A(a) | | | 1 | | | | — | | | | — | | | | 1 | | | | — | | | | — | | | | — | | | | — | | |
| Class C(a) | | | 1 | | | | — | | | | — | | | | 1 | | | | — | | | | — | | | | — | | | | — | | |
| Class R6(a) | | | 78 | | | | — | | | | — | | | | 78 | | | | — | | | | — | | | | — | | | | — | | |
148
| | | For the Year Ended October 31, 2017 | | For the Year Ended October 31, 2016 | |
(000's omitted) | | Shares
Sold | | Shares
Issued on
Reinvestment
of Dividends
and
Distributions | | Shares
Redeemed | | Total | | Shares
Sold | | Shares
Issued on
Reinvestment
of Dividends
and
Distributions | | Shares
Redeemed | | Total | |
Long Short | |
Institutional Class | | | 88,065 | | | | — | | | | (50,080 | ) | | | 37,985 | | | | 68,394 | | | | 15 | | | | (118,738 | ) | | | (50,329 | ) | |
Class A | | | 3,529 | | | | — | | | | (9,532 | ) | | | (6,003 | ) | | | 3,664 | | | | — | | | | (15,880 | ) | | | (12,216 | ) | |
Class C | | | 688 | | | | — | | | | (3,428 | ) | | | (2,740 | ) | | | 795 | | | | — | | | | (6,641 | ) | | | (5,846 | ) | |
Long Short Credit | |
Institutional Class | | | 522 | | | | 69 | | | | (1,312 | ) | | | (721 | ) | | | 811 | | | | 42 | | | | (847 | ) | | | 6 | | |
Class A | | | 224 | | | | 7 | | | | (22 | ) | | | 209 | | | | 14 | | | | 1 | | | | (45 | ) | | | (30 | ) | |
Class C | | | 2 | | | | 0 | (c) | | | (1 | ) | | | 1 | | | | 3 | | | | — | | | | (3 | ) | | | — | | |
Class R6 | | | 23 | | | | 6 | | | | (49 | ) | | | (20 | ) | | | 143 | | | | 3 | | | | (2 | ) | | | 144 | | |
Multi-Asset Income | |
Institutional Class | | | 553 | | | | 57 | | | | (198 | ) | | | 412 | | | | 166 | | | | 32 | | | | (29 | ) | | | 169 | | |
Class A | | | 1 | | | | 0 | (c) | | | (1 | ) | | | 0 | (c) | | | 13 | | | | 1 | | | | (6 | ) | | | 8 | | |
Class C | | | 6 | | | | 0 | (c) | | | (1 | ) | | | 5 | | | | 22 | | | | 0 | (c) | | | (5 | ) | | | 17 | | |
Class R6 | | | — | | | | — | | | | — | | | | — | | | | — | | | | 5 | | | | (3 | ) | | | 2 | | |
Risk Balanced Commodity Strategy | |
Institutional Class | | | 7,424 | | | | — | | | | (2,530 | ) | | | 4,894 | | | | 4,718 | | | | — | | | | (1,667 | ) | | | 3,051 | | |
Class A | | | 2,710 | | | | — | | | | (1,568 | ) | | | 1,142 | | | | 2,943 | | | | — | | | | (3,090 | ) | | | (147 | ) | |
Class C | | | — | | | | — | | | | (10 | ) | | | (10 | ) | | | 25 | | | | — | | | | (534 | ) | | | (509 | ) | |
U.S. Equity Index PutWrite Strategy | |
Institutional Class | | | 12,745 | | | | 43 | | | | (1,475 | ) | | | 11,313 | | | | 2,100 | | | | — | | | | — | | | | 2,100 | (b) | |
Class A | | | 364 | | | | 0 | (c) | | | (46 | ) | | | 318 | | | | 42 | | | | — | | | | — | | | | 42 | (b) | |
Class C | | | 36 | | | | 0 | (c) | | | (0 | )(c) | | | 36 | | | | 10 | | | | — | | | | — | | | | 10 | (b) | |
Class R6 | | | 998 | | | | 5 | | | | (401 | ) | | | 602 | | | | 476 | | | | — | | | | — | | | | 476 | (b) | |
(a) Period from April 12, 2017 (Commencement of Operations) to October 31, 2017.
(b) Period from September 16, 2016 (Commencement of Operations) to October 31, 2016.
(c) A zero balance reflects actual amounts rounding to less than one thousand.
Note E—Line of Credit:
At October 31, 2017, each Fund was a participant in a syndicated committed, unsecured $700,000,000 line of credit (the "Credit Facility"), to be used only for temporary or emergency purposes. Series of other investment companies managed by Management also participate in this line of credit on substantially the same terms except that some do not have access to the full amount of the Credit Facility. Interest is charged on borrowings under this Credit Facility at the highest of (a) a federal funds effective rate plus 1.00% per annum, (b) a Eurodollar rate for a one-month period plus 1.00% per annum, and (c) an overnight bank funding rate plus 1.00% per annum. The Credit Facility has an annual commitment fee of 0.15% per annum of the available line of credit, which is paid quarterly. Each Fund has agreed to pay its pro rata share of the annual commitment fee, based on the ratio of its individual net assets to the net assets of all participants at the time the fee is due and payable and the level of its access to the Credit Facility, and interest charged on any borrowing made by such Fund and other costs incurred by such Fund.
149
Because several mutual funds participate in the Credit Facility, there is no assurance that an individual Fund will have access to all or any part of the $700,000,000 at any particular time. There were no loans outstanding under the Credit Facility at October 31, 2017. During the period ended October 31, 2017, none of the Funds utilized the Credit Facility.
Note F—Investments In Affiliates(a):
| | | Balance of
Shares Held
October 31,
2016 | | Gross
Purchases
and
Additions | | Gross
Sales
and
Reductions | | Balance of
Shares Held
October 31,
2017 | | Value
October 31,
2017 | | Distributions
from
Investments
in Affiliated
Issuers(b) | | Net Realized
Gain/(Loss)
from
Investments
in Affiliated
Issuers | | Change in
Net Unrealized
Appreciation/
(Depreciation)
from
Investments
in Affiliated
Issuers | |
Global Allocation | |
Neuberger Berman
Emerging Markets
Debt Fund
Institutional Class | | | 122,360 | | | | 3,982 | | | | 69,603 | | | | 56,739 | | | $ | 511,788 | | | $ | 34,246 | | | $ | (6,505 | ) | | $ | 7,518 | | |
Neuberger Berman
Emerging
Markets Equity
Fund Class R6 | | | 83,409 | | | | 5,380 | | | | 28,247 | | | | 60,542 | | | | 1,255,041 | | | | 7,540 | | | | 68,316 | | | | 257,611 | | |
Neuberger Berman
Floating Rate
Income Fund
Institutional Class | | | 155,344 | | | | 3,062 | | | | 114,919 | | | | 43,487 | | | | 432,692 | | | | 31,850 | | | | 1,743 | | | | 2,973 | | |
Neuberger Berman
Genesis Fund
Class R6 | | | 19,987 | | | | 5,149 | | | | 3,917 | | | | 21,219 | | | | 1,347,802 | | | | 87,223 | | | | 14,794 | | | | 168,578 | | |
Neuberger Berman
High Income
Bond Fund Class R6 | | | 48,844 | | | | 113,666 | | | | 28,848 | | | | 133,662 | | | | 1,177,560 | | | | 43,397 | | | | (981 | ) | | | 5,539 | | |
Neuberger Berman
International Select
Fund Class R6 | | | — | | | | 341,351 | | | | 62,278 | | | | 279,073 | | | | 3,619,573 | | | | — | | | | 57,917 | | | | 493,959 | | |
Long Short Credit
Class R6 | | | 82,815 | | | | 4,311 | | | | 13,798 | | | | 73,328 | | | | 707,617 | | | | 31,254 | | | | 2,200 | | | | 7,411 | | |
Risk Balanced
Commodity
Strategy
Institutional Class | | | 97,139 | | | | 72,293 | | | | 25,226 | | | | 144,206 | | | | 917,149 | | | | — | * | | | (29,636 | ) | | | 78,181 | | |
U.S. Equity Index
PutWrite Strategy
Class R6 | | | 86,224 | | | | 16,701 | | | | 11,625 | | | | 91,300 | | | | 1,035,340 | | | | 7,339 | | | | 7,471 | | | | 109,330 | | |
150
| | | Balance of
Shares Held
October 31,
2016 | | Gross
Purchases
and
Additions | | Gross
Sales
and
Reductions | | Balance of
Shares Held
October 31,
2017 | | Value
October 31,
2017 | | Distributions
from
Investments
in Affiliated
Issuers(b) | | Net Realized
Gain (Loss)
from
Investments
in Affiliated
Issuers | | Change in
Net Unrealized
Appreciation/
(Depreciation)
from
Investments
in Affiliated
Issuers | |
Sub-total for
affiliates held
as of 10/31/17(c) | | | | | | | | | | $ | 11,004,562 | | | $ | 242,849 | | | $ | 115,319 | | | $ | 1,131,100 | | |
Neuberger Berman
International Select
Fund Institutional
Class | | | 344,206 | | | | 26,400 | | | | 370,606 | | | | — | | | | — | | | | 50,093 | | | | 163,248 | | | | 4,130 | | |
Sub-total for
affiliates not held
as of 10/31/17(d) | | | | | | | | | | | | $ | 50,093 | | | $ | 163,248 | | | $ | 4,130 | | |
Total | | | | | | | | | | | | $ | 292,942 | | | $ | 278,567 | | | $ | 1,135,230 | | |
Multi-Asset Income | |
Neuberger Berman
Emerging Markets
Debt Fund
Institutional Class | | | 156,831 | | | | 29,925 | | | | 72,270 | | | | 114,486 | | | | 1,032,663 | | | | 57,977 | | | | 15,606 | | | | 8,267 | | |
Neuberger Berman
Floating Rate Income
Fund Institutional
Class | | | 322,521 | | | | 47,395 | | | | 263,050 | | | | 106,866 | | | | 1,063,317 | | | | 74,797 | | | | (2,364 | ) | | | 12,174 | | |
Neuberger Berman
High Income Bond
Fund Class R6 | | | 276,284 | | | | 30,595 | | | | 61,504 | | | | 245,375 | | | | 2,161,754 | | | | 127,464 | | | | 4,776 | | | | 25,650 | | |
Long Short Credit
Class R6 | | | 59,625 | | | | 24,578 | | | | 35,233 | | | | 48,970 | | | | 472,565 | | | | 24,476 | | | | 5,646 | | | | 3,838 | | |
Total | | | | | | | | | | $ | 4,730,299 | | | $ | 284,714 | | | $ | 23,664 | | | $ | 49,929 | | |
(a) Affiliated issuers, as defined in the 1940 Act.
(b) Distributions received include distributions from net investment income and net realized capital gains, if any, from the Underlying Fund.
(c) At October 31, 2017, these securities amounted to approximately 52.6% and 20.1% of net assets of Global Allocation and Multi-Asset Income, respectively.
(d) At October 31, 2017, the issuers of these companies were no longer held by Global Allocation.
* Security did not produce income during the period.
151
Other: At October 31, 2017, Global Allocation, which is also managed by Management, held 0.73% of the outstanding shares of Risk Balanced Commodity Strategy. Global Allocation and Multi-Asset Income, which are also managed by Management, held 2.75% and 1.84% , respectively, of the outstanding shares of Long Short Credit. At October 31, 2017, Global Allocation, which is also managed by Management, held 0.61% of the outstanding shares of U.S. Equity Index PutWrite Strategy.
In addition, at October 31, 2017, there were affiliated investors owning 8.67%, 47.94%, 39.07%, 67.45% and 0.07% of Global Allocation's, Hedged Option Premium Strategy's, Long Short Credit's, Multi-Asset Income's and U.S. Equity Index PutWrite Strategy's outstanding shares, respectively.
Note G—Custodian Out-of-Pocket Expenses Refunded:
In May 2016, the Funds' custodian, State Street, announced that it had identified inconsistencies in the way in which Long Short was invoiced for categories of expenses, particularly those deemed "out-of-pocket" costs, from 1998 through November 2015. The amounts in the table below represent the refunded expenses and interest determined to be payable to Long Short for the period in question. These amounts were refunded to Long Short by State Street during the year ended October 31, 2017.
| | | Expenses
Refunded | | Interest Paid
to the Funds | |
Long Short | | $ | 5,171 | | | $ | 32 | | |
Note H—Recent Accounting Pronouncement:
In December 2016, FASB issued ASU No. 2016-19, "Technical Corrections and Improvements" ("ASU 2016-19"). The guidance includes an amendment to Topic 820, Fair Value Measurement, which clarifies the difference between a valuation approach and a valuation technique. The amendments also require an entity to disclose when it has changed either a valuation approach and/or a valuation technique. The guidance is effective for interim and annual reporting periods beginning after December 15, 2016. Management is currently evaluating the impact, if any, of applying this guidance.
152
This page has been left blank intentionally
153
The following tables include selected data for a share outstanding throughout each year and other performance information derived from the Financial Statements. Amounts that do not round to $0.01 or $(0.01) per share are presented as $0.00 or $(0.00), respectively. Ratios that do not round to 0.01% or (0.01)% are presented as 0.00% or (0.00)%, respectively. Net Asset amounts with a zero balance, if any, may reflect actual amounts rounding to less than $0.1 million. A "—" indicates that the line item was not applicable in the corresponding period.
| | | Net Asset
Value,
Beginning
of Year | | Net
Investment
Income
(Loss)@ | | Net Gains
or
Losses on
Securities
(both
realized
and
unrealized) | | Total From
Investment
Operations | | Dividends
from Net
Investment
Income | | Distributions
from Net
Realized
Capital
Gains | | Tax
Return
of
Capital | | Total
Distributions | | Voluntary
Contribution
from
Management | | Net Asset
Value,
End of
Year | | Total
Returna | | Net Assets,
End of
Year
(in millions) | | Ratio
of Gross
Expenses to
Average
Net
Assets# | | Ratio
of Gross
Expenses
to Average
Net Assets
(excluding
dividend
and interest
expense
relating to
short sales
and reverse
repurchase
agreements)# | | Ratio
of Net
Expenses to
Average
Net
Assets | | Ratio
of Net
Expenses
to Average
Net Assets
(excluding
dividend
and interest
expense
relating to
short sales
and reverse
repurchase
agreements) | | Ratio
of Net
Investment
Income/
(Loss)
to
Average
Net
Assets | | Portfolio
Turnover
Rate
(including
securities
sold
short) | | Portfolio
Turnover
Rate
(excluding
securities
sold
short) | |
Global Allocation Fund | |
Institutional Class | |
10/31/2017 | | $ | 10.49 | | | $ | 0.18 | | | $ | 1.52 | | | $ | 1.70 | | | $ | (0.05 | ) | | $ | — | | | $ | — | | | $ | (0.05 | ) | | $ | — | | | $ | 12.14 | | | | 16.24 | % | | $ | 13.9 | | | | 3.59 | %h | | | 3.56 | % | | | 0.49 | %h | | | 0.46 | % | | | 1.63 | %h | | | 113 | % | | | 101 | % | |
10/31/2016 | | $ | 10.42 | | | $ | 0.10 | | | $ | (0.01 | ) | | $ | 0.09 | | | $ | (0.00 | ) | | $ | (0.02 | ) | | $ | — | | | $ | (0.02 | ) | | $ | — | | | $ | 10.49 | | | | 0.87 | % | | $ | 10.1 | | | | 4.17 | % | | | 3.66 | % | | | 1.11 | % | | | 0.60 | % | | | 0.97 | % | | | 176 | %b | | | 174 | %b | |
10/31/2015 | | $ | 10.81 | | | $ | 0.06 | | | $ | (0.17 | ) | | $ | (0.11 | ) | | $ | (0.28 | ) | | $ | (0.00 | ) | | $ | — | | | $ | (0.28 | ) | | $ | — | | | $ | 10.42 | | | | (1.12 | )% | | $ | 8.9 | | | | 3.29 | % | | | 2.94 | % | | | 1.03 | % | | | 0.69 | % | | | 0.51 | % | | | 195 | %b | | | 185 | %b | |
10/31/2014 | | $ | 11.63 | | | $ | (0.12 | ) | | $ | 0.29 | | | $ | 0.17 | | | $ | (0.99 | ) | | $ | — | | | $ | — | | | $ | (0.99 | ) | | $ | 0.00 | | | $ | 10.81 | | | | 1.37 | %c | | $ | 12.5 | | | | 3.25 | % | | | 2.72 | % | | | 1.50 | % | | | 0.98 | % | | | (1.12 | )% | | | 228 | % | | | 216 | % | |
10/31/2013 | | $ | 10.30 | | | $ | (0.09 | ) | | $ | 1.57 | | | $ | 1.48 | | | $ | (0.15 | ) | | $ | — | | | $ | — | | | $ | (0.15 | ) | | $ | — | | | $ | 11.63 | | | | 14.56 | % | | $ | 17.2 | | | | 3.23 | % | | | 2.73 | % | | | 1.48 | % | | | 0.98 | % | | | (0.85 | )% | | | 187 | % | | | 158 | % | |
Class A | |
10/31/2017 | | $ | 10.40 | | | $ | 0.14 | | | $ | 1.50 | | | $ | 1.64 | | | $ | — | | | $ | — | | | $ | — | | | $ | — | | | $ | — | | | $ | 12.04 | | | | 15.77 | % | | $ | 3.9 | | | | 4.10 | %h | | | 4.05 | % | | | 0.89 | %h | | | 0.84 | % | | | 1.27 | %h | | | 113 | % | | | 101 | % | |
10/31/2016 | | $ | 10.36 | | | $ | 0.06 | | | $ | (0.00 | ) | | $ | 0.06 | | | $ | — | | | $ | (0.02 | ) | | $ | — | | | $ | (0.02 | ) | | $ | — | | | $ | 10.40 | | | | 0.59 | % | | $ | 5.9 | | | | 4.53 | % | | | 4.01 | % | | | 1.49 | % | | | 0.96 | % | | | 0.64 | % | | | 176 | %b | | | 174 | %b | |
10/31/2015 | | $ | 10.76 | | | $ | 0.02 | | | $ | (0.18 | ) | | $ | (0.16 | ) | | $ | (0.24 | ) | | $ | (0.00 | ) | | $ | — | | | $ | (0.24 | ) | | $ | — | | | $ | 10.36 | | | | (1.52 | )% | | $ | 8.1 | | | | 3.69 | % | | | 3.34 | % | | | 1.39 | % | | | 1.04 | % | | | 0.16 | % | | | 195 | %b | | | 185 | %b | |
10/31/2014 | | $ | 11.57 | | | $ | (0.16 | ) | | $ | 0.29 | | | $ | 0.13 | | | $ | (0.94 | ) | | $ | — | | | $ | — | | | $ | (0.94 | ) | | $ | 0.00 | | | $ | 10.76 | | | | 1.03 | %c | | $ | 9.6 | | | | 3.68 | % | | | 3.16 | % | | | 1.86 | % | | | 1.35 | % | | | (1.49 | )% | | | 228 | % | | | 216 | % | |
10/31/2013 | | $ | 10.25 | | | $ | (0.14 | ) | | $ | 1.58 | | | $ | 1.44 | | | $ | (0.12 | ) | | $ | — | | | $ | — | | | $ | (0.12 | ) | | $ | — | | | $ | 11.57 | | | | 14.15 | % | | $ | 7.9 | | | | 3.58 | % | | | 3.07 | % | | | 1.84 | % | | | 1.33 | % | | | (1.25 | )% | | | 187 | % | | | 158 | % | |
Class C | |
10/31/2017 | | $ | 10.14 | | | $ | 0.05 | | | $ | 1.47 | | | $ | 1.52 | | | $ | — | | | $ | — | | | $ | — | | | $ | — | | | $ | — | | | $ | 11.66 | | | | 14.99 | % | | $ | 3.2 | | | | 4.84 | %h | | | 4.79 | % | | | 1.63 | %h | | | 1.59 | % | | | 0.50 | %h | | | 113 | % | | | 101 | % | |
10/31/2016 | | $ | 10.18 | | | $ | (0.01 | ) | | $ | (0.01 | ) | | $ | (0.02 | ) | | $ | — | | | $ | (0.02 | ) | | $ | — | | | $ | (0.02 | ) | | $ | — | | | $ | 10.14 | | | | (0.19 | )% | | $ | 4.7 | | | | 5.26 | % | | | 4.74 | % | | | 2.24 | % | | | 1.71 | % | | | (0.10 | )% | | | 176 | %b | | | 174 | %b | |
10/31/2015 | | $ | 10.60 | | | $ | (0.06 | ) | | $ | (0.18 | ) | | $ | (0.24 | ) | | $ | (0.18 | ) | | $ | (0.00 | ) | | $ | — | | | $ | (0.18 | ) | | $ | — | | | $ | 10.18 | | | | (2.29 | )% | | $ | 6.6 | | | | 4.45 | % | | | 4.10 | % | | | 2.14 | % | | | 1.79 | % | | | (0.57 | )% | | | 195 | %b | | | 185 | %b | |
10/31/2014 | | $ | 11.43 | | | $ | (0.25 | ) | | $ | 0.30 | | | $ | 0.05 | | | $ | (0.88 | ) | | $ | — | | | $ | — | | | $ | (0.88 | ) | | $ | 0.00 | | | $ | 10.60 | | | | 0.30 | %c | | $ | 7.0 | | | | 4.46 | % | | | 3.95 | % | | | 2.63 | % | | | 2.11 | % | | | (2.27 | )% | | | 228 | % | | | 216 | % | |
10/31/2013 | | $ | 10.13 | | | $ | (0.21 | ) | | $ | 1.55 | | | $ | 1.34 | | | $ | (0.04 | ) | | $ | — | | | $ | — | | | $ | (0.04 | ) | | $ | — | | | $ | 11.43 | | | | 13.30 | % | | $ | 4.9 | | | | 4.35 | % | | | 3.85 | % | | | 2.59 | % | | | 2.09 | % | | | (1.99 | )% | | | 187 | % | | | 158 | % | |
See Notes to Financial Highlights
154
155
Financial Highlights (cont'd)
| | | Net Asset
Value,
Beginning
of Year | | Net
Investment
Income
(Loss)@ | | Net Gains
or
Losses on
Securities
(both
realized
and
unrealized) | | Total From
Investment
Operations | | Dividends
from Net
Investment
Income | | Distributions
from Net
Realized
Capital
Gains | | Tax
Return
of
Capital | | Total
Distributions | | Voluntary
Contribution
from
Management | | Net Asset
Value,
End of
Year | | Total
Returna | | Net Assets,
End of
Year
(in millions) | | Ratio
of Gross
Expenses to
Average
Net
Assets# | | Ratio
of Gross
Expenses
to Average
Net Assets
(excluding
dividend
and interest
expense
relating to
short sales
and reverse
repurchase
agreements)# | | Ratio
of Net
Expenses to
Average
Net
Assets | | Ratio
of Net
Expenses
to Average
Net Assets
(excluding
dividend
and interest
expense
relating to
short sales
and reverse
repurchase
agreements) | | Ratio
of Net
Investment
Income/
(Loss)
to
Average
Net
Assets | | Portfolio
Turnover
Rate
(including
securities
sold
short) | | Portfolio
Turnover
Rate
(excluding
securities
sold
short) | |
Hedged Option Premium Strategy Fund | |
Institutional Class | |
Period from
4/12/2017^
to 10/31/2017 | | $ | 25.00 | | | $ | 0.09 | | | $ | 0.39 | | | $ | 0.48 | | | $ | (0.07 | ) | | $ | — | | | $ | — | | | $ | (0.07 | ) | | $ | — | | | $ | 25.41 | | | | 1.92 | %* | | $ | 8.6 | | | | 6.75 | %‡** | | | 6.75 | %؇** | | | 0.65 | %‡** | | | 0.65 | %؇** | | | 0.62 | %‡** | | | 0 | %* | | | 0 | %Ø* | |
Class A | |
Period from
4/12/2017^
to 10/31/2017 | | $ | 25.00 | | | $ | 0.03 | | | $ | 0.41 | | | $ | 0.44 | | | $ | (0.03 | ) | | $ | — | | | $ | — | | | $ | (0.03 | ) | | $ | — | | | $ | 25.41 | | | | 1.74 | %* | | $ | 0.0 | | | | 7.39 | %‡** | | | 7.39 | %؇** | | | 1.01 | %‡** | | | 1.01 | %؇** | | | 0.24 | %‡** | | | 0 | %* | | | 0 | %Ø* | |
Class C | |
Period from
4/12/2017^
to 10/31/2017 | | $ | 25.00 | | | $ | (0.07 | ) | | $ | 0.40 | | | $ | 0.33 | | | $ | — | | | $ | — | | | $ | — | | | $ | — | | | $ | — | | | $ | 25.33 | | | | 1.32 | %* | | $ | 0.0 | | | | 8.10 | %‡** | | | 8.10 | %؇** | | | 1.76 | %‡** | | | 1.76 | %؇** | | | (0.50 | )%‡** | | | 0 | %* | | | 0 | %Ø* | |
Class R6 | |
Period from
4/12/2017^
to 10/31/2017 | | $ | 25.00 | | | $ | 0.09 | | | $ | 0.40 | | | $ | 0.49 | | | $ | (0.08 | ) | | $ | — | | | $ | — | | | $ | (0.08 | ) | | $ | — | | | $ | 25.41 | | | | 1.95 | %* | | $ | 2.0 | | | | 6.69 | %‡** | | | 6.69 | %؇** | | | 0.58 | %‡** | | | 0.58 | %؇** | | | 0.67 | %‡** | | | 0 | % | | | 0 | %Ø* | |
Long Short Fund | |
Institutional Class | |
10/31/2017 | | $ | 12.74 | | | $ | 0.02 | | | $ | 1.45 | | | $ | 1.47 | | | $ | — | | | $ | — | | | $ | — | | | $ | — | | | $ | 0.00 | | | $ | 14.21 | | | | 11.54 | %dg | | $ | 2,853.0 | | | | 1.80 | % | | | 1.33 | % | | | 1.80 | %e | | | 1.32 | %e | | | 0.12 | %e | | | 80 | % | | | 64 | % | |
10/31/2016 | | $ | 12.76 | | | $ | (0.03 | ) | | $ | 0.01 | | | $ | (0.02 | ) | | $ | (0.00 | ) | | $ | — | | | $ | — | | | $ | (0.00 | ) | | $ | — | | | $ | 12.74 | | | | (0.14 | )% | | $ | 2,074.7 | | | | 1.91 | % | | | 1.33 | % | | | 1.91 | % | | | 1.33 | % | | | (0.22 | )% | | | 86 | % | | | 72 | % | |
10/31/2015 | | $ | 13.02 | | | $ | 0.02 | | | $ | (0.21 | ) | | $ | (0.19 | ) | | $ | (0.02 | ) | | $ | (0.05 | ) | | $ | — | | | $ | (0.07 | ) | | $ | — | | | $ | 12.76 | | | | (1.45 | )% | | $ | 2,719.8 | | | | 1.66 | % | | | 1.31 | % | | | 1.66 | % | | | 1.31 | % | | | 0.16 | % | | | 91 | % | | | 69 | % | |
10/31/2014 | | $ | 12.48 | | | $ | 0.02 | | | $ | 0.58 | | | $ | 0.60 | | | $ | — | | | $ | (0.06 | ) | | $ | — | | | $ | (0.06 | ) | | $ | 0.00 | | | $ | 13.02 | | | | 4.83 | %c | | $ | 2,627.8 | | | | 1.72 | % | | | 1.48 | % | | | 1.72 | % | | | 1.48 | % | | | 0.17 | % | | | 61 | % | | | 44 | % | |
10/31/2013 | | $ | 11.09 | | | $ | 0.01 | | | $ | 1.47 | | | $ | 1.48 | | | $ | (0.01 | ) | | $ | (0.08 | ) | | $ | — | | | $ | (0.09 | ) | | $ | — | | | $ | 12.48 | | | | 13.47 | % | | $ | 1,038.2 | | | | 1.75 | % | | | 1.60 | % | | | 1.75 | %§ | | | 1.60 | %§ | | | 0.10 | % | | | 103 | % | | | 52 | % | |
See Notes to Financial Highlights
156
157
Financial Highlights (cont'd)
| | | Net Asset
Value,
Beginning
of Year | | Net
Investment
Income
(Loss)@ | | Net Gains
or
Losses on
Securities
(both
realized
and
unrealized) | | Total From
Investment
Operations | | Dividends
from Net
Investment
Income | | Distributions
from Net
Realized
Capital
Gains | | Tax
Return
of
Capital | | Total
Distributions | | Voluntary
Contribution
from
Management | | Net Asset
Value,
End of
Year | | Total
Returna | | Net Assets,
End of
Year
(in millions) | | Ratio
of Gross
Expenses to
Average
Net
Assets# | | Ratio
of Gross
Expenses
to Average
Net Assets
(excluding
dividend
and interest
expense
relating to
short sales
and reverse
repurchase
agreements)# | | Ratio
of Net
Expenses to
Average
Net
Assets | | Ratio
of Net
Expenses
to Average
Net Assets
(excluding
dividend
and interest
expense
relating to
short sales
and reverse
repurchase
agreements) | | Ratio
of Net
Investment
Income/
(Loss)
to
Average
Net
Assets | | Portfolio
Turnover
Rate
(including
securities
sold
short) | | Portfolio
Turnover
Rate
(excluding
securities
sold
short) | |
Long Short Fund (cont'd) | |
Class A | |
10/31/2017 | | $ | 12.56 | | | $ | (0.02 | ) | | $ | 1.42 | | | $ | 1.40 | | | $ | — | | | $ | — | | | $ | — | | | $ | — | | | $ | 0.00 | | | $ | 13.96 | | | | 11.15 | %dg | | $ | 145.6 | | | | 2.16 | % | | | 1.68 | % | | | 2.16 | %e | | | 1.68 | %e | | | (0.18 | )%e | | | 80 | % | | | 64 | % | |
10/31/2016 | | $ | 12.62 | | | $ | (0.07 | ) | | $ | 0.01 | | | $ | (0.06 | ) | | $ | — | | | $ | — | | | $ | — | | | $ | — | | | $ | — | | | $ | 12.56 | | | | (0.48 | )% | | $ | 206.4 | | | | 2.28 | % | | | 1.69 | % | | | 2.28 | % | | | 1.69 | % | | | (0.59 | )% | | | 86 | % | | | 72 | % | |
10/31/2015 | | $ | 12.91 | | | $ | (0.03 | ) | | $ | (0.21 | ) | | $ | (0.24 | ) | | $ | — | | | $ | (0.05 | ) | | $ | — | | | $ | (0.05 | ) | | $ | — | | | $ | 12.62 | | | | (1.89 | )% | | $ | 361.7 | | | | 2.03 | % | | | 1.68 | % | | | 2.03 | % | | | 1.68 | % | | | (0.20 | )% | | | 91 | % | | | 69 | % | |
10/31/2014 | | $ | 12.41 | | | $ | (0.03 | ) | | $ | 0.58 | | | $ | 0.55 | | | $ | — | | | $ | (0.05 | ) | | $ | — | | | $ | (0.05 | ) | | $ | 0.00 | | | $ | 12.91 | | | | 4.47 | %c | | $ | 388.6 | | | | 2.09 | % | | | 1.85 | % | | | 2.09 | % | | | 1.85 | % | | | (0.20 | )% | | | 61 | % | | | 44 | % | |
10/31/2013 | | $ | 11.06 | | | $ | (0.03 | ) | | $ | 1.47 | | | $ | 1.44 | | | $ | (0.01 | ) | | $ | (0.08 | ) | | $ | — | | | $ | (0.09 | ) | | $ | — | | | $ | 12.41 | | | | 13.08 | % | | $ | 502.1 | | | | 2.08 | % | | | 1.94 | % | | | 2.08 | %§ | | | 1.94 | %§ | | | (0.23 | )% | | | 103 | % | | | 52 | % | |
Class C | |
10/31/2017 | | $ | 12.13 | | | $ | (0.12 | ) | | $ | 1.37 | | | $ | 1.25 | | | $ | — | | | $ | — | | | $ | — | | | $ | — | | | $ | 0.00 | | | $ | 13.38 | | | | 10.31 | %dg | | $ | 92.7 | | | | 2.90 | % | | | 2.43 | % | | | 2.90 | %e | | | 2.43 | %e | | | (0.94 | )%e | | | 80 | % | | | 64 | % | |
10/31/2016 | | $ | 12.29 | | | $ | (0.16 | ) | | $ | 0.00 | | | $ | (0.16 | ) | | $ | — | | | $ | — | | | $ | — | | | $ | — | | | $ | — | | | $ | 12.13 | | | | (1.30 | )% | | $ | 117.3 | | | | 3.02 | % | | | 2.44 | % | | | 3.02 | % | | | 2.44 | % | | | (1.33 | )% | | | 86 | % | | | 72 | % | |
10/31/2015 | | $ | 12.66 | | | $ | (0.12 | ) | | $ | (0.20 | ) | | $ | (0.32 | ) | | $ | — | | | $ | (0.05 | ) | | $ | — | | | $ | (0.05 | ) | | $ | — | | | $ | 12.29 | | | | (2.56 | )% | | $ | 190.6 | | | | 2.77 | % | | | 2.42 | % | | | 2.77 | % | | | 2.42 | % | | | (0.94 | )% | | | 91 | % | | | 69 | % | |
10/31/2014 | | $ | 12.26 | | | $ | (0.12 | ) | | $ | 0.57 | | | $ | 0.45 | | | $ | — | | | $ | (0.05 | ) | | $ | — | | | $ | (0.05 | ) | | $ | 0.00 | | | $ | 12.66 | | | | 3.71 | %c | | $ | 211.0 | | | | 2.84 | % | | | 2.60 | % | | | 2.84 | % | | | 2.60 | % | | | (0.94 | )% | | | 61 | % | | | 44 | % | |
10/31/2013 | | $ | 10.99 | | | $ | (0.12 | ) | | $ | 1.46 | | | $ | 1.34 | | | $ | (0.00 | ) | | $ | (0.07 | ) | | $ | — | | | $ | (0.07 | ) | | $ | — | | | $ | 12.26 | | | | 12.23 | % | | $ | 115.1 | | | | 2.83 | % | | | 2.68 | % | | | 2.83 | %§ | | | 2.68 | %§ | | | (1.00 | )% | | | 103 | % | | | 52 | % | |
Long Short Credit Fund | |
Institutional Class | |
10/31/2017 | | $ | 9.53 | | | $ | 0.37 | | | $ | 0.13 | | | $ | 0.50 | | | $ | (0.38 | ) | | $ | — | | | $ | — | | | $ | (0.38 | ) | | $ | — | | | $ | 9.65 | | | | 5.36 | % | | $ | 15.7 | | | | 2.23 | % | | | 2.19 | %Ø | | | 1.24 | % | | | 1.21 | %Ø | | | 3.84 | % | | | 123 | % | | | 123 | %Ø | |
10/31/2016 | | $ | 9.75 | | | $ | 0.15 | | | $ | (0.18 | ) | | $ | (0.03 | ) | | $ | (0.19 | ) | | $ | — | | | $ | — | | | $ | (0.19 | ) | | $ | — | | | $ | 9.53 | | | | (0.28 | )% | | $ | 22.3 | | | | 3.22 | % | | | 2.36 | % | | | 1.97 | % | | | 1.10 | % | | | 1.54 | % | | | 190 | % | | | 197 | % | |
Period from
6/29/2015^
to 10/31/2015 | | $ | 10.00 | | | $ | 0.02 | | | $ | (0.23 | ) | | $ | (0.21 | ) | | $ | (0.04 | ) | | $ | — | | | $ | — | | | $ | (0.04 | ) | | $ | — | | | $ | 9.75 | | | | (2.06 | )%* | | $ | 22.8 | | | | 3.50 | %‡** | | | 3.45 | % | | | 1.21 | %‡** | | | 1.15 | % | | | 0.64 | %‡** | | | 32 | %* | | | 18 | %* | |
Class A | |
10/31/2017 | | $ | 9.53 | | | $ | 0.34 | | | $ | 0.13 | | | $ | 0.47 | | | $ | (0.35 | ) | | $ | — | | | $ | — | | | $ | (0.35 | ) | | $ | — | | | $ | 9.65 | | | | 4.98 | % | | $ | 3.0 | | | | 2.68 | % | | | 2.63 | %Ø | | | 1.62 | % | | | 1.58 | %Ø | | | 3.52 | % | | | 123 | % | | | 123 | %Ø | |
10/31/2016 | | $ | 9.75 | | | $ | 0.11 | | | $ | (0.17 | ) | | $ | (0.06 | ) | | $ | (0.16 | ) | | $ | — | | | $ | — | | | $ | (0.16 | ) | | $ | — | | | $ | 9.53 | | | | (0.55 | )% | | $ | 1.0 | | | | 3.72 | % | | | 2.82 | % | | | 2.29 | % | | | 1.40 | % | | | 1.16 | % | | | 190 | % | | | 197 | % | |
Period from
6/29/2015^
to 10/31/2015 | | $ | 10.00 | | | $ | 0.01 | | | $ | (0.23 | ) | | $ | (0.22 | ) | | $ | (0.03 | ) | | $ | — | | | $ | — | | | $ | (0.03 | ) | | $ | — | | | $ | 9.75 | | | | (2.17 | )%* | | $ | 1.3 | | | | 4.28 | %‡** | | | 4.23 | % | | | 1.55 | %‡** | | | 1.50 | % | | | 0.28 | %‡** | | | 32 | %* | | | 18 | %* | |
See Notes to Financial Highlights
158
159
Financial Highlights (cont'd)
| | | Net Asset
Value,
Beginning
of Year | | Net
Investment
Income
(Loss)@ | | Net Gains
or
Losses on
Securities
(both
realized
and
unrealized) | | Total From
Investment
Operations | | Dividends
from Net
Investment
Income | | Distributions
from Net
Realized
Capital
Gains | | Tax
Return
of
Capital | | Total
Distributions | | Voluntary
Contribution
from
Management | | Net Asset
Value,
End of
Year | | Total
Returna | | Net Assets,
End of
Year
(in millions) | | Ratio
of Gross
Expenses to
Average
Net
Assets# | | Ratio
of Gross
Expenses
to Average
Net Assets
(excluding
dividend
and interest
expense
relating to
short sales
and reverse
repurchase
agreements)# | | Ratio
of Net
Expenses to
Average
Net
Assets | | Ratio
of Net
Expenses
to Average
Net Assets
(excluding
dividend
and interest
expense
relating to
short sales
and reverse
repurchase
agreements) | | Ratio
of Net
Investment
Income/
(Loss)
to
Average
Net
Assets | | Portfolio
Turnover
Rate
(including
securities
sold
short) | | Portfolio
Turnover
Rate
(excluding
securities
sold
short) | |
Long Short Credit Fund (cont'd) | |
Class C | |
10/31/2017 | | $ | 9.53 | | | $ | 0.26 | | | $ | 0.12 | | | $ | 0.38 | | | $ | (0.27 | ) | | $ | — | | | $ | — | | | $ | (0.27 | ) | | $ | — | | | $ | 9.64 | | | | 4.10 | % | | $ | 1.0 | | | | 3.40 | % | | | 3.36 | %Ø | | | 2.37 | % | | | 2.33 | %Ø | | | 2.74 | % | | | 123 | % | | | 123 | %Ø | |
10/31/2016 | | $ | 9.75 | | | $ | 0.06 | | | $ | (0.17 | ) | | $ | (0.11 | ) | | $ | (0.11 | ) | | $ | — | | | $ | — | | | $ | (0.11 | ) | | $ | — | | | $ | 9.53 | | | | (1.10 | )% | | $ | 1.0 | | | | 4.30 | % | | | 3.47 | % | | | 2.85 | % | | | 2.02 | % | | | 0.64 | % | | | 190 | % | | | 197 | % | |
Period from
6/29/2015^
to 10/31/2015 | | $ | 10.00 | | | $ | (0.01 | ) | | $ | (0.23 | ) | | $ | (0.24 | ) | | $ | (0.01 | ) | | $ | — | | | $ | — | | | $ | (0.01 | ) | | $ | — | | | $ | 9.75 | | | | (2.41 | )%* | | $ | 1.0 | | | | 5.04 | %‡** | | | 4.98 | % | | | 2.26 | %‡** | | | 2.20 | % | | | (0.43 | )%‡** | | | 32 | % | | | 18 | %* | |
Class R6 | |
10/31/2017 | | $ | 9.54 | | | $ | 0.38 | | | $ | 0.12 | | | $ | 0.50 | | | $ | (0.39 | ) | | $ | — | | | $ | — | | | $ | (0.39 | ) | | $ | — | | | $ | 9.65 | | | | 5.33 | % | | $ | 6.0 | | | | 2.20 | % | | | 2.16 | %Ø | | | 1.18 | % | | | 1.14 | %Ø | | | 3.93 | % | | | 123 | % | | | 123 | %Ø | |
10/31/2016 | | $ | 9.75 | | | $ | 0.16 | | | $ | (0.18 | ) | | $ | (0.02 | ) | | $ | (0.19 | ) | | $ | — | | | $ | — | | | $ | (0.19 | ) | | $ | — | | | $ | 9.54 | | | | (0.12 | )% | | $ | 6.1 | | | | 3.05 | % | | | 2.26 | % | | | 1.83 | % | | | 1.04 | % | | | 1.71 | % | | | 190 | % | | | 197 | % | |
Period from
6/29/2015^
to 10/31/2015 | | $ | 10.00 | | | $ | 0.02 | | | $ | (0.22 | ) | | $ | (0.20 | ) | | $ | (0.05 | ) | | $ | — | | | $ | — | | | $ | (0.05 | ) | | $ | — | | | $ | 9.75 | | | | (2.03 | )%* | | $ | 4.9 | | | | 3.49 | %‡** | | | 3.44 | % | | | 1.14 | %‡** | | | 1.08 | % | | | 0.69 | %‡** | | | 32 | %* | | | 18 | %* | |
Multi-Asset Income Fund | |
Institutional Class | |
10/31/2017 | | $ | 9.60 | | | $ | 0.32 | | | $ | 0.62 | | | $ | 0.94 | | | $ | (0.35 | ) | | $ | — | | | $ | (0.01 | ) | | $ | (0.36 | ) | | $ | — | | | $ | 10.18 | | | | 9.93 | % | | $ | 17.3 | | | | 3.03 | % | | | 3.03 | %Ø | | | 0.50 | % | | | 0.50 | %Ø | | | 3.28 | % | | | 84 | % | | | 84 | %bØ | |
10/31/2016 | | $ | 9.43 | | | $ | 0.31 | | | $ | 0.25 | | | $ | 0.56 | | | $ | (0.30 | ) | | $ | — | | | $ | (0.09 | ) | | $ | (0.39 | ) | | $ | — | | | $ | 9.60 | | | | 6.09 | % | | $ | 12.4 | | | | 3.86 | % | | | 3.86 | %Ø | | | 0.44 | % | | | 0.44 | %Ø | | | 3.33 | % | | | 94 | % | | | 94 | %Ø | |
Period from
3/27/2015^
to 10/31/2015 | | $ | 10.00 | | | $ | 0.23 | | | $ | (0.57 | ) | | $ | (0.34 | ) | | $ | (0.23 | ) | | $ | — | | | $ | — | | | $ | (0.23 | ) | | $ | — | | | $ | 9.43 | | | | (3.43 | )%* | | $ | 10.6 | | | | 3.66 | %‡** | | | 3.66 | %؇** | | | 0.43 | %‡** | | | 0.43 | %؇** | | | 3.87 | %‡** | | | 33 | %* | | | 33 | %Ø* | |
Class A | |
10/31/2017 | | $ | 9.60 | | | $ | 0.29 | | | $ | 0.61 | | | $ | 0.90 | | | $ | (0.31 | ) | | $ | — | | | $ | (0.01 | ) | | $ | (0.32 | ) | | $ | — | | | $ | 10.18 | | | | 9.53 | % | | $ | 0.6 | | | | 3.47 | % | | | 3.47 | %Ø | | | 0.86 | % | | | 0.86 | %Ø | | | 2.90 | % | | | 84 | % | | | 84 | %bØ | |
10/31/2016 | | $ | 9.43 | | | $ | 0.28 | | | $ | 0.24 | | | $ | 0.52 | | | $ | (0.26 | ) | | $ | — | | | $ | (0.09 | ) | | $ | (0.35 | ) | | $ | — | | | $ | 9.60 | | | | 5.70 | % | | $ | 0.6 | | | | 4.27 | % | | | 4.27 | %Ø | | | 0.81 | % | | | 0.81 | %Ø | | | 2.98 | % | | | 94 | % | | | 94 | %Ø | |
Period from
3/27/2015^
to 10/31/2015 | | $ | 10.00 | | | $ | 0.20 | | | $ | (0.56 | ) | | $ | (0.36 | ) | | $ | (0.21 | ) | | $ | — | | | $ | — | | | $ | (0.21 | ) | | $ | — | | | $ | 9.43 | | | | (3.64 | )%* | | $ | 0.5 | | | | 4.55 | %‡** | | | 4.55 | %؇** | | | 0.79 | %‡** | | | 0.79 | %؇** | | | 3.50 | %‡** | | | 33 | %* | | | 33 | %Ø* | |
See Notes to Financial Highlights
160
161
Financial Highlights (cont'd)
| | | Net Asset
Value,
Beginning
of Year | | Net
Investment
Income
(Loss)@ | | Net Gains
or
Losses on
Securities
(both
realized
and
unrealized) | | Total From
Investment
Operations | | Dividends
from Net
Investment
Income | | Distributions
from Net
Realized
Capital
Gains | | Tax
Return
of
Capital | | Total
Distributions | | Voluntary
Contribution
from
Management | | Net Asset
Value,
End of
Year | | Total
Returna | | Net Assets,
End of
Year
(in millions) | | Ratio
of Gross
Expenses to
Average
Net
Assets# | | Ratio
of Gross
Expenses
to Average
Net Assets
(excluding
dividend
and interest
expense
relating to
short sales
and reverse
repurchase
agreements)# | | Ratio
of Net
Expenses to
Average
Net
Assets | | Ratio
of Net
Expenses
to Average
Net Assets
(excluding
dividend
and interest
expense
relating to
short sales
and reverse
repurchase
agreements) | | Ratio
of Net
Investment
Income/
(Loss)
to
Average
Net
Assets | | Portfolio
Turnover
Rate
(including
securities
sold
short) | | Portfolio
Turnover
Rate
(excluding
securities
sold
short) | |
Multi-Asset Income Fund (cont'd) | |
Class C | |
10/31/2017 | | $ | 9.60 | | | $ | 0.21 | | | $ | 0.62 | | | $ | 0.83 | | | $ | (0.24 | ) | | $ | — | | | $ | (0.01 | ) | | $ | (0.25 | ) | | $ | — | | | $ | 10.18 | | | | 8.71 | % | | $ | 0.7 | | | | 4.16 | % | | | 4.16 | %Ø | | | 1.62 | % | | | 1.62 | %Ø | | | 2.15 | % | | | 84 | % | | | 84 | %bØ | |
10/31/2016 | | $ | 9.43 | | | $ | 0.20 | | | $ | 0.25 | | | $ | 0.45 | | | $ | (0.19 | ) | | $ | — | | | $ | (0.09 | ) | | $ | (0.28 | ) | | $ | — | | | $ | 9.60 | | | | 4.91 | % | | $ | 0.6 | | | | 4.99 | % | | | 4.99 | %Ø | | | 1.56 | % | | | 1.56 | %Ø | | | 2.20 | % | | | 94 | % | | | 94 | %Ø | |
Period from
3/27/2015^
to 10/31/2015 | | $ | 10.00 | | | $ | 0.16 | | | $ | (0.56 | ) | | $ | (0.40 | ) | | $ | (0.17 | ) | | $ | — | | | $ | — | | | $ | (0.17 | ) | | $ | — | | | $ | 9.43 | | | | (4.07 | )%* | | $ | 0.5 | | | | 5.29 | %‡** | | | 5.29 | %؇** | | | 1.53 | %‡** | | | 1.53 | %؇** | | | 2.76 | %‡** | | | 33 | %* | | | 33 | %Ø* | |
Class R6 | |
10/31/2017 | | $ | 9.60 | | | $ | 0.33 | | | $ | 0.61 | | | $ | 0.94 | | | $ | (0.35 | ) | | $ | — | | | $ | (0.01 | ) | | $ | (0.36 | ) | | $ | — | | | $ | 10.18 | | | | 10.01 | % | | $ | 4.1 | | | | 2.97 | % | | | 2.97 | %Ø | | | 0.42 | % | | | 0.42 | %Ø | | | 3.34 | % | | | 84 | % | | | 84 | %bØ | |
10/31/2016 | | $ | 9.43 | | | $ | 0.32 | | | $ | 0.24 | | | $ | 0.56 | | | $ | (0.30 | ) | | $ | — | | | $ | (0.09 | ) | | $ | (0.39 | ) | | $ | — | | | $ | 9.60 | | | | 6.16 | % | | $ | 3.9 | | | | 3.78 | % | | | 3.78 | %Ø | | | 0.37 | % | | | 0.37 | %Ø | | | 3.42 | % | | | 94 | % | | | 94 | %Ø | |
Period from
3/27/2015^
to 10/31/2015 | | $ | 10.00 | | | $ | 0.23 | | | $ | (0.57 | ) | | $ | (0.34 | ) | | $ | (0.23 | ) | | $ | — | | | $ | — | | | $ | (0.23 | ) | | $ | — | | | $ | 9.43 | | | | (3.39 | )%* | | $ | 3.8 | | | | 3.63 | %‡** | | | 3.63 | %؇** | | | 0.36 | %‡** | | | 0.36 | %؇** | | | 3.93 | %‡** | | | 33 | %* | | | 33 | %Ø* | |
| Risk Balanced Commodity Strategy Fundf | |
Institutional Class | |
10/31/2017 | | $ | 5.99 | | | $ | 0.02 | | | $ | 0.35 | | | $ | 0.37 | | | $ | — | | | $ | — | | | $ | — | | | $ | — | | | $ | — | | | $ | 6.36 | | | | 6.18 | % | | $ | 83.1 | | | | 1.18 | % | | | 1.18 | %Ø | | | 0.85 | % | | | 0.85 | %Ø | | | 0.36 | % | | | 105 | % | | | 105 | %Ø | |
10/31/2016 | | $ | 6.20 | | | $ | (0.03 | ) | | $ | (0.18 | ) | | $ | (0.21 | ) | | $ | — | | | $ | — | | | $ | — | | | $ | — | | | $ | — | | | $ | 5.99 | | | | (3.39 | )% | | $ | 49.0 | | | | 1.65 | % | | | 1.65 | %Ø | | | 1.10 | % | | | 1.10 | %Ø | | | (0.44 | )% | | | 58 | % | | | 58 | %Ø | |
10/31/2015 | | $ | 8.39 | | | $ | (0.05 | ) | | $ | (2.14 | ) | | $ | (2.19 | ) | | $ | — | | | $ | (0.00 | ) | | $ | — | | | $ | (0.00 | ) | | $ | — | | | $ | 6.20 | | | | (26.09 | )% | | $ | 31.8 | | | | 1.47 | % | | | 1.47 | %Ø | | | 1.10 | % | | | 1.10 | %Ø | | | (0.67 | )% | | | 35 | % | | | 35 | %Ø | |
10/31/2014 | | $ | 9.01 | | | $ | (0.07 | ) | | $ | (0.55 | ) | | $ | (0.62 | ) | | $ | — | | | $ | — | | | $ | — | | | $ | — | | | $ | — | | | $ | 8.39 | | | | (6.88 | )% | | $ | 20.5 | | | | 1.62 | % | | | 1.62 | %Ø | | | 1.10 | % | | | 1.10 | %Ø | | | (0.73 | )% | | | 21 | % | | | 21 | %Ø | |
10/31/2013 | | $ | 9.84 | | | $ | (0.09 | ) | | $ | (0.74 | ) | | $ | (0.83 | ) | | $ | — | | | $ | — | | | $ | — | | | $ | — | | | $ | — | | | $ | 9.01 | | | | (8.43 | )% | | $ | 9.6 | | | | 3.69 | % | | | 3.69 | %Ø | | | 1.10 | % | | | 1.10 | %Ø | | | (0.94 | )% | | | 5 | % | | | 5 | %Ø | |
Class A | |
10/31/2017 | | $ | 5.90 | | | $ | (0.00 | ) | | $ | 0.34 | | | $ | 0.34 | | | $ | — | | | $ | — | | | $ | — | | | $ | — | | | $ | — | | | $ | 6.24 | | | | 5.76 | % | | $ | 42.4 | | | | 1.56 | % | | | 1.56 | %Ø | | | 1.21 | % | | | 1.21 | %Ø | | | (0.02 | )% | | | 105 | % | | | 105 | %Ø | |
10/31/2016 | | $ | 6.12 | | | $ | (0.05 | ) | | $ | (0.17 | ) | | $ | (0.22 | ) | | $ | — | | | $ | — | | | $ | — | | | $ | — | | | $ | — | | | $ | 5.90 | | | | (3.59 | )% | | $ | 33.3 | | | | 2.04 | % | | | 2.04 | %Ø | | | 1.46 | % | | | 1.46 | %Ø | | | (0.82 | )% | | | 58 | % | | | 58 | %Ø | |
10/31/2015 | | $ | 8.32 | | | $ | (0.07 | ) | | $ | (2.13 | ) | | $ | (2.20 | ) | | $ | — | | | $ | (0.00 | ) | | $ | — | | | $ | (0.00 | ) | | $ | — | | | $ | 6.12 | | | | (26.43 | )% | | $ | 35.5 | | | | 1.84 | % | | | 1.84 | %Ø | | | 1.46 | % | | | 1.46 | %Ø | | | (1.05 | )% | | | 35 | % | | | 35 | %Ø | |
10/31/2014 | | $ | 8.97 | | | $ | (0.10 | ) | | $ | (0.55 | ) | | $ | (0.65 | ) | | $ | — | | | $ | — | | | $ | — | | | $ | — | | | $ | — | | | $ | 8.32 | | | | (7.25 | )% | | $ | 66.8 | | | | 1.98 | % | | | 1.98 | %Ø | | | 1.46 | % | | | 1.46 | %Ø | | | (1.09 | )% | | | 21 | % | | | 21 | %Ø | |
10/31/2013 | | $ | 9.84 | | | $ | (0.12 | ) | | $ | (0.75 | ) | | $ | (0.87 | ) | | $ | — | | | $ | — | | | $ | — | | | $ | — | | | $ | — | | | $ | 8.97 | | | | (8.84 | )% | | $ | 35.0 | | | | 3.81 | % | | | 3.81 | %Ø | | | 1.46 | % | | | 1.46 | %Ø | | | (1.27 | )% | | | 5 | % | | | 5 | %Ø | |
See Notes to Financial Highlights
162
163
Financial Highlights (cont'd)
| | | Net Asset
Value,
Beginning
of Year | | Net
Investment
Income
(Loss)@ | | Net Gains
or
Losses on
Securities
(both
realized
and
unrealized) | | Total From
Investment
Operations | | Dividends
from Net
Investment
Income | | Distributions
from Net
Realized
Capital
Gains | | Tax
Return
of
Capital | | Total
Distributions | | Voluntary
Contribution
from
Management | | Net Asset
Value,
End of
Year | | Total
Returna | | Net Assets,
End of
Year
(in millions) | | Ratio
of Gross
Expenses to
Average
Net
Assets# | | Ratio
of Gross
Expenses
to Average
Net Assets
(excluding
dividend
and interest
expense
relating to
short sales
and reverse
repurchase
agreements)# | | Ratio
of Net
Expenses to
Average
Net
Assets | | Ratio
of Net
Expenses
to Average
Net Assets
(excluding
dividend
and interest
expense
relating to
short sales
and reverse
repurchase
agreements) | | Ratio
of Net
Investment
Income/
(Loss)
to
Average
Net
Assets | | Portfolio
Turnover
Rate
(including
securities
sold
short) | | Portfolio
Turnover
Rate
(excluding
securities
sold
short) | |
| Risk Balanced Commodity Strategy Fundf (cont'd) | |
Class C | |
10/31/2017 | | $ | 5.71 | | | $ | (0.05 | ) | | $ | 0.29 | | | $ | 0.24 | | | $ | — | | | $ | — | | | $ | — | | | $ | — | | | $ | — | | | $ | 5.95 | | | | 4.20 | % | | $ | 0.0 | | | | 3.20 | % | | | 3.20 | %Ø | | | 2.03 | % | | | 2.03 | %Ø | | | (0.92 | )% | | | 105 | % | | | 105 | %Ø | |
10/31/2016 | | $ | 5.98 | | | $ | (0.09 | ) | | $ | (0.18 | ) | | $ | (0.27 | ) | | $ | — | | | $ | — | | | $ | — | | | $ | — | | | $ | — | | | $ | 5.71 | | | | (4.52 | )% | | $ | 0.1 | | | | 3.06 | % | | | 3.06 | %Ø | | | 2.21 | % | | | 2.21 | %Ø | | | (1.65 | )% | | | 58 | % | | | 58 | %Ø | |
10/31/2015 | | $ | 8.19 | | | $ | (0.12 | ) | | $ | (2.09 | ) | | $ | (2.21 | ) | | $ | — | | | $ | (0.00 | ) | | $ | — | | | $ | (0.00 | ) | | $ | — | | | $ | 5.98 | | | | (26.98 | )% | | $ | 3.1 | | | | 2.70 | % | | | 2.70 | %Ø | | | 2.21 | % | | | 2.21 | %Ø | | | (1.79 | )% | | | 35 | % | | | 35 | %Ø | |
10/31/2014 | | $ | 8.88 | | | $ | (0.16 | ) | | $ | (0.53 | ) | | $ | (0.69 | ) | | $ | — | | | $ | — | | | $ | — | | | $ | — | | | $ | — | | | $ | 8.19 | | | | (7.77 | )% | | $ | 4.2 | | | | 2.84 | % | | | 2.84 | %Ø | | | 2.21 | % | | | 2.21 | %Ø | | | (1.84 | )% | | | 21 | % | | | 21 | %Ø | |
10/31/2013 | | $ | 9.83 | | | $ | (0.18 | ) | | $ | (0.77 | ) | | $ | (0.95 | ) | | $ | — | | | $ | — | | | $ | — | | | $ | — | | | $ | — | | | $ | 8.88 | | | | (9.66 | )% | | $ | 3.6 | | | | 4.69 | % | | | 4.69 | %Ø | | | 2.21 | % | | | 2.21 | %Ø | | | (2.03 | )% | | | 5 | % | | | 5 | %Ø | |
U.S. Equity Index PutWrite Strategy Fund | |
Institutional Class | |
10/31/2017 | | $ | 10.09 | | | $ | 0.05 | | | $ | 1.26 | | | $ | 1.31 | | | $ | (0.04 | ) | | $ | (0.03 | ) | | $ | — | | | $ | (0.07 | ) | | $ | — | | | $ | 11.33 | | | | 13.05 | % | | $ | 152.0 | | | | 0.98 | % | | | 0.98 | %Ø | | | 0.65 | % | | | 0.65 | %Ø | | | 0.49 | % | | | 0 | % | | | 0 | %Ø | |
Period from
9/16/2016^
to 10/31/2016 | | $ | 10.00 | | | $ | 0.00 | | | $ | 0.09 | | | $ | 0.09 | | | $ | — | | | $ | — | | | $ | — | | | $ | — | | | $ | — | | | $ | 10.09 | | | | 0.90 | %* | | $ | 21.2 | | | | 3.84 | %‡** | | | 3.84 | %Ø | | | 0.65 | %‡** | | | 0.65 | %Ø | | | 0.26 | %‡** | | | 0 | %* | | | 0 | %Ø* | |
Class A | |
10/31/2017 | | $ | 10.09 | | | $ | 0.01 | | | $ | 1.27 | | | $ | 1.28 | | | $ | (0.01 | ) | | $ | (0.03 | ) | | $ | — | | | $ | (0.04 | ) | | $ | — | | | $ | 11.33 | | | | 12.70 | % | | $ | 4.1 | | | | 1.35 | % | | | 1.35 | %Ø | | | 1.01 | % | | | 1.01 | %Ø | | | 0.13 | % | | | 0 | % | | | 0 | %Ø | |
Period from
9/16/2016^
to 10/31/2016 | | $ | 10.00 | | | $ | (0.00 | ) | | $ | 0.09 | | | $ | 0.09 | | | $ | — | | | $ | — | | | $ | — | | | $ | — | | | $ | — | | | $ | 10.09 | | | | 0.90 | %* | | $ | 0.4 | | | | 4.26 | %‡** | | | 4.26 | %Ø | | | 1.01 | %‡** | | | 1.01 | %Ø | | | (0.05 | )%‡** | | | 0 | %* | | | 0 | %Ø* | |
Class C | |
10/31/2017 | | $ | 10.08 | | | $ | (0.07 | ) | | $ | 1.26 | | | $ | 1.19 | | | $ | — | | | $ | (0.03 | ) | | $ | — | | | $ | (0.03 | ) | | $ | — | | | $ | 11.24 | | | | 11.81 | % | | $ | 0.5 | | | | 2.12 | % | | | 2.12 | %Ø | | | 1.76 | % | | | 1.76 | %Ø | | | (0.63 | )% | | | 0 | % | | | 0 | %Ø | |
Period from
9/16/2016^
to 10/31/2016 | | $ | 10.00 | | | $ | (0.01 | ) | | $ | 0.09 | | | $ | 0.08 | | | $ | — | | | $ | — | | | $ | — | | | $ | — | | | $ | — | | | $ | 10.08 | | | | 0.80 | %* | | $ | 0.1 | | | | 5.10 | %‡** | | | 5.10 | %Ø | | | 1.76 | %‡** | | | 1.76 | %Ø | | | (0.86 | )%‡** | | | 0 | %* | | | 0 | %Ø* | |
Class R6 | |
10/31/2017 | | $ | 10.10 | | | $ | 0.06 | | | $ | 1.26 | | | $ | 1.32 | | | $ | (0.05 | ) | | $ | (0.03 | ) | | $ | — | | | $ | (0.08 | ) | | $ | — | | | $ | 11.34 | | | | 13.08 | % | | $ | 12.2 | | | | 0.93 | % | | | 0.93 | %Ø | | | 0.58 | % | | | 0.58 | %Ø | | | 0.55 | % | | | 0 | % | | | 0 | %Ø | |
Period from
9/16/2016^
to 10/31/2016 | | $ | 10.00 | | | $ | 0.00 | | | $ | 0.10 | | | $ | 0.10 | | | $ | — | | | $ | — | | | $ | — | | | $ | — | | | $ | — | | | $ | 10.10 | | | | 1.00 | %* | | $ | 4.8 | | | | 3.77 | %‡** | | | 3.77 | %Ø | | | 0.58 | %‡** | | | 0.58 | %Ø | | | 0.26 | %‡** | | | 0 | %* | | | 0 | %Ø* | |
See Notes to Financial Highlights
164
165
Notes to Financial Highlights
@ Calculated based on the average number of shares outstanding during each fiscal period.
# Represents the annualized ratios of net expenses to average daily net assets if Management had not reimbursed certain expenses and/or waived a portion of the investment management fee and/or if certain Funds did not receive the Custodian Out-of-Pocket Expenses Refunded, as listed in Note G of Notes to Financial Statements.
** Annualized.
^ The date investment operations commenced.
* Not annualized.
‡ Organization expense, which is a non-recurring expense, is included in these ratios on a non-annualized basis.
Ø Hedged Option Premium Strategy, Multi-Asset Income, Risk Balanced Commodity Strategy and U.S. Equity Index PutWrite Strategy did not engage in short sales. For the year ended October 31, 2017, Long Short Credit did not engage in short sales.
§ After repayment of expenses previously reimbursed and/or fees previously waived by Management, as applicable. Had the Fund not made such repayments, the annualized ratios of net expenses to average net assets would have been:
| | | Including
Dividend
and Interest
Expense
Relating to
Short Sales
and Reverse
Repurchase
Agreements | | Excluding
Dividend
and Interest
Expense
Relating to
Short Sales
and Reverse
Repurchase
Agreements | |
| | | Year Ended October 31, 2013 | |
Long Short Institutional Class | | | 1.69 | % | | | 1.54 | % | |
Long Short Class A | | | 2.06 | % | | | 1.92 | % | |
Long Short Class C | | | 2.81 | % | | | 2.66 | % | |
a Total return based on per share NAV reflects the effects of changes in NAV on the performance of each Fund during each fiscal period. Returns assume income dividends and other distributions, if any, were reinvested, but do not reflect the effect of sales charges. Results represent past performance and do not indicate future results. Current returns may be lower or higher than the performance data quoted. Investment returns and principal may fluctuate and shares when redeemed may be worth more or less than original cost. Total return would have been lower if Management had not reimbursed and/or waived certain expenses. Total return would have been higher if Management had not recouped previously reimbursed and/or waived expenses.
b The portfolio turnover rates including mortgage dollar roll transactions, including and excluding securities sold short, were 165% and 154%, respectively, for the year ended October 31 2017 and 182% and 183%, respectively, for the year ended October 31, 2016 and 198% and 189%, respectively, for the year ended October 31, 2015, for Global Allocation. The portfolio turnover rate including mortgage dollar roll transactions was 165% for the year ended October 31, 2017, for Multi-Asset Income.
c The voluntary contribution received in 2014 had no impact on the Funds' total returns for the year ended October 31, 2014.
d The voluntary contribution listed in Note B of the Notes to Financial Statements had no impact on the Fund's total returns for the year ended October 31, 2017.
166
Notes to Financial Highlights (cont'd)
e Custodian Out-of-Pocket Expenses Refunded, as listed in Note G of the Notes to Financial Statements, is non-recurring, and is included in these ratios. Had Long Short not received the refund the annualized ratios of net expenses to average net assets and net investment income/(loss) to average net assets would have been:
| | | Ratio of Net
Expenses to
Average Net
Assets | | Ratio of Net
Expenses to
Average
Net Assets
(excluding
dividend and
interest
expense
relating to
short sales
and reverse
repurchase
agreements) | | Ratio of Net
Investment
Income/
(Loss) to
Average
Net Assets | |
Long Short Institutional Class | | | 1.80 | % | | | 1.32 | % | | | 0.12 | % | |
Long Short Class A | | | 2.16 | % | | | 1.68 | % | | | (0.18 | )% | |
Long Short Class C | | | 2.90 | % | | | 2.43 | % | | | (0.94 | )% | |
f Consolidated financial highlights, see Note A in the Notes to Financial Statements.
g The Custodian Out-of-Pocket Expenses Refunded listed in Note G of the Notes to Financial Statements had no impact on the Long Short's total returns for the year ended October 31, 2017.
h Dividend and interest expense relating to short sales, which is a non-recurring expense for Global Allocation, is included in these ratios on a non-annualized basis.
167
Report of Independent Registered Public Accounting Firm
To the Board of Trustees of Neuberger Berman Alternative Funds and Shareholders of:
Neuberger Berman Global Allocation Fund
Neuberger Berman Long Short Credit Fund
Neuberger Berman Hedged Option Premium Strategy Fund
Neuberger Berman Multi-Asset Income Fund
Neuberger Berman Risk Balanced Commodity Strategy Fund
Neuberger Berman U.S. Equity Index PutWrite Strategy Fund
We have audited the accompanying statements of assets and liabilities, including the schedules of investments, of Neuberger Berman Global Allocation Fund, Neuberger Berman Long Short Credit Fund, Neuberger Berman Hedged Option Premium Strategy Fund, Neuberger Berman Multi-Asset Income Fund, Neuberger Berman Risk Balanced Commodity Strategy Fund, and Neuberger Berman U.S. Equity Index PutWrite Strategy Fund, six of the series constituting the Neuberger Berman Alternative Funds (the "Trust") as of October 31, 2017, and the related statements of operations for the period then ended, and the statements of changes in net assets and the financial highlights for each of the periods indicated therein. These financial statements and financial highlights are the responsibility of the Trust's management. Our responsibility is to express an opinion on these financial statements and financial highlights based on our audits.
We conducted our audits in accordance with the standards of the Public Company Accounting Oversight Board (United States). Those standards require that we plan and perform the audit to obtain reasonable assurance about whether the financial statements and financial highlights are free of material misstatement. We were not engaged to perform an audit of the Trust's internal control over financial reporting. Our audits included consideration of internal control over financial reporting as a basis for designing audit procedures that are appropriate in the circumstances, but not for the purpose of expressing an opinion on the effectiveness of the Trust's internal control over financial reporting. Accordingly, we express no such opinion. An audit also includes examining, on a test basis, evidence supporting the amounts and disclosures in the financial statements and financial highlights, assessing the accounting principles used and significant estimates made by management, and evaluating the overall financial statement presentation. Our procedures included confirmation of securities owned as of October 31, 2017, by correspondence with the custodian and others or by other appropriate auditing procedures where replies from others were not received. We believe that our audits provide a reasonable basis for our opinion.
In our opinion, the financial statements and financial highlights referred to above present fairly, in all material respects, the financial position of the above-mentioned series of the Neuberger Berman Alternative Funds, at October 31, 2017, the results of their operations for the period then ended, and the changes in their net assets and the financial highlights for each of the periods indicated therein in conformity with U.S. generally accepted accounting principles.

Boston, Massachusetts
December 22, 2017
168
Report of Independent Registered Public Accounting Firm
To the Board of Trustees and Shareholders
Neuberger Berman Alternative Funds
We have audited the accompanying statement of assets and liabilities of the Neuberger Berman Long Short Fund, a series of the Neuberger Berman Alternative Funds (the "Trust"), including the schedule of investments, as of October 31, 2017, and the related statement of operations for the year then ended, and the statements of changes in net assets for each of the two years in the period then ended, and the financial highlights for each of the five years in the period then ended. These financial statements and financial highlights are the responsibility of the Trust's management. Our responsibility is to express an opinion on these financial statements and financial highlights based on our audit.
We conducted our audit in accordance with the standards of the Public Company Accounting Oversight Board (United States). Those standards require that we plan and perform the audit to obtain reasonable assurance about whether the financial statements and financial highlights are free of material misstatement. The Trust is not required to have, nor were we engaged to perform, an audit of its internal control over financial reporting. Our audit included consideration of internal control over financial reporting as a basis for designing audit procedures that are appropriate in the circumstances, but not for the purpose of expressing an opinion on the effectiveness of the Trust's internal control over financial reporting. Accordingly, we express no such opinion. An audit also includes examining, on a test basis, evidence supporting the amounts and disclosures in the financial statements, assessing the accounting principles used and significant estimates made by management, as well as evaluating the overall financial statement presentation. Our procedures included confirmation of securities owned as of October 31, 2017, by correspondence with the custodian and brokers or by other appropriate auditing procedures where replies from brokers were not received. We believe that our audit provides a reasonable basis for our opinion.
In our opinion, the financial statements and financial highlights referred to above present fairly, in all material respects, the financial position of the Neuberger Berman Long Short Fund, as of October 31, 2017, and the results of its operations for the year then ended, and the changes in its net assets for each of the two years in the period then ended, and the financial highlights for each of the five years in the period then ended, in conformity with accounting principles generally accepted in the United States of America.

Philadelphia, Pennsylvania
December 22, 2017
169
Investment Manager and Administrator
Neuberger Berman Investment Advisers LLC
1290 Avenue of the Americas
New York, NY 10104-0002
800.877.9700 or 212.476.8800
Intermediary Client Services 800.366.6264
Distributor
Neuberger Berman BD LLC
1290 Avenue of the Americas
New York, NY 10104-0002
800.877.9700 or 212.476.8800
Intermediary Client Services 800.366.6264
Custodian and Shareholder Servicing Agent
State Street Bank and Trust Company
One Lincoln Street
Boston, MA 02111
For Institutional Class Shareholders
Address correspondence to:
Neuberger Berman Investment Advisers LLC
1290 Avenue of the Americas, 22nd Floor
New York, NY 10104-0002
Intermediary Client Services 800.366.6264
For Class A, Class C and Class R6 Shareholders:
Please contact your investment provider
Legal Counsel
K&L Gates LLP
1601 K Street, NW
Washington, DC 20006-1600
Independent Registered Public Accounting Firms
Ernst & Young LLP
200 Clarendon Street
Boston, MA 02116
Tait, Weller & Baker LLP
1818 Market Street
Suite 2400
Philadelphia, PA 19103
170
The following tables set forth information concerning the Trustees and Officers of each of the Funds. All persons named as Trustees and Officers also serve in similar capacities for other funds administered or managed by NBIA (formerly, Neuberger Berman Fixed Income LLC ("NBFI") and including predecessor entities). Each Fund's Statement of Additional Information includes additional information about the Trustees as of the time of the Fund's most recent public offering and is available upon request, without charge, by calling (800) 877-9700.
Information about the Board of Trustees
Name, (Year of Birth),
and Address(1) | | Position(s)
and Length of
Time Served(2) | | Principal Occupation(s)(3) | | Number of
Funds in
Fund Complex | | Other Directorships Held
Outside Fund Complex by
Fund Trustee(3) Overseen
by Fund Trustee | |
Independent Fund Trustees | | | | | | | | | |
Michael J. Cosgrove (1949) | | Trustee since 2015 | | President, Carragh Consulting USA, since 2014; formerly, Executive, General Electric Company, 1970 to 2014, including President, Mutual Funds and Global Investment Programs, GE Asset Management, 2011 to 2014, President and Chief Executive Officer, Mutual Funds and Intermediary Business, GE Asset Management, 2007 to 2011, President, Institutional Sales and Marketing, GE Asset Management, 1998 to 2007, and Chief Financial Officer, GE Asset Management, and Deputy Treasurer, GE Company, 1988 to 1993. | | | 56 | | | Director, America Press, Inc. (not-for-profit Jesuit publisher), since 2015; Director, Fordham University, since 2001; formerly, Director, The Gabelli Go Anywhere Trust, June 2015 to June 2016; Director, Skin Cancer Foundation (not-for-profit), 2006 to 2015; Director, GE Investments Funds, Inc., 1997 to 2014; Trustee, GE Institutional Funds, 1997 to 2014; Director, GE Asset Management, 1988 to 2014; Director, Elfun Trusts, 1988 to 2014; Trustee, GE Pension & Benefit Plans, 1988 to 2014. | |
171
Name, (Year of Birth),
and Address(1) | | Position(s)
and Length of
Time Served(2) | | Principal Occupation(s)(3) | | Number of
Funds in
Fund Complex | | Other Directorships Held
Outside Fund Complex by
Fund Trustee(3) Overseen
by Fund Trustee | |
Marc Gary (1952) | | Trustee since 2015 | | Executive Vice Chancellor and Chief Operating Officer, Jewish Theological Seminary, since 2012; formerly, Executive Vice President and General Counsel, Fidelity Investments, 2007 to 2012; Executive Vice President and General Counsel, BellSouth Corporation, 2004 to 2007; Vice President and Associate General Counsel, BellSouth Corporation, 2000 to 2004; Associate, Partner, and National Litigation Practice Co-Chair, Mayer, Brown LLP, 1981 to 2000; Associate Independent Counsel, Office of Independent Counsel, 1990 to 1992. | | | 56 | | | Trustee, Jewish Theological Seminary, since 2015; Director, Counsel on Call (privately held for-profit company), since 2012; Director, Lawyers Committee for Civil Rights Under Law (not-for-profit), since 2005; formerly, Director, Equal Justice Works (not-for-profit), 2005 to 2014; Director, Corporate Counsel Institute, Georgetown University Law Center, 2007 to 2012; Director, Greater Boston Legal Services (not-for-profit), 2007 to 2012. | |
172
Name, (Year of Birth),
and Address(1) | | Position(s)
and Length of
Time Served(2) | | Principal Occupation(s)(3) | | Number of
Funds in
Fund Complex | | Other Directorships Held
Outside Fund Complex by
Fund Trustee(3) Overseen
by Fund Trustee | |
Martha C. Goss (1949) | | Trustee since 2007 | | President, Woodhill Enterprises Inc./Chase Hollow Associates LLC (personal investment vehicle), since 2006; formerly, Consultant, Resources Global Professionals (temporary staffing), 2002 to 2006. | | | 56 | | | Director, American Water (water utility), since 2003; Director, Allianz Life of New York (insurance), since 2005; Director, Berger Group Holdings, Inc. (engineering consulting firm), since 2013; Director, Financial Women's Association of New York (not-for-profit association), since 2003; Trustee Emerita, Brown University, since 1998; Director, Museum of American Finance (not-for-profit), since 2013; formerly, Non-Executive Chair and Director, Channel Reinsurance (financial guaranty reinsurance), 2006 to 2010; formerly, Director, Ocwen Financial Corporation (mortgage servicing), 2005 to 2010; formerly, Director, Claire's Stores, Inc. (retailer), 2005 to 2007; formerly, Director, Parsons Brinckerhoff Inc. (engineering consulting firm), 2007 to 2010; formerly, Director, Bank Leumi (commercial bank), 2005 to 2007; formerly, Advisory Board Member, Attensity (software developer), 2005 to 2007. | |
173
Name, (Year of Birth),
and Address(1) | | Position(s)
and Length of
Time Served(2) | | Principal Occupation(s)(3) | | Number of
Funds in
Fund Complex | | Other Directorships Held
Outside Fund Complex by
Fund Trustee(3) Overseen
by Fund Trustee | |
Michael M. Knetter (1960) | | Trustee since 2007 | | President and Chief Executive Officer, University of Wisconsin Foundation, since October 2010; formerly, Dean, School of Business, University of Wisconsin—Madison; formerly, Professor of International Economics and Associate Dean, Amos Tuck School of Business—Dartmouth College, 1998 to 2002. | | | 56 | | | Board Member, American Family Insurance (a mutual company, not publicly traded), since March 2009; formerly, Trustee, Northwestern Mutual Series Fund, Inc., 2007 to 2011; formerly, Director, Wausau Paper, 2005 to 2011; formerly, Director, Great Wolf Resorts, 2004 to 2009. | |
Deborah C. McLean (1954) | | Trustee since 2015 | | Member, Circle Financial Group (private wealth management membership practice), since 2011; Managing Director, Golden Seeds LLC (an angel investing group), since 2009; Adjunct Professor, Columbia University School of International and Public Affairs, since 2008; formerly, Visiting Assistant Professor, Fairfield University, Dolan School of Business, Fall 2007; formerly, Adjunct Associate Professor of Finance, Richmond, The American International University in London, 1999 to 2007. | | | 56 | | | Board member, Norwalk Community College Foundation, since 2014; Dean's Advisory Council, Radcliffe Institute for Advanced Study, since 2014; formerly, Director and Treasurer, At Home in Darien (not-for-profit), 2012 to 2014; Director, National Executive Service Corps (not-for-profit), 2012 to 2013; Trustee, Richmond, The American International University in London, 1999 to 2013. | |
174
Name, (Year of Birth),
and Address(1) | | Position(s)
and Length of
Time Served(2) | | Principal Occupation(s)(3) | | Number of
Funds in
Fund Complex | | Other Directorships Held
Outside Fund Complex by
Fund Trustee(3) Overseen
by Fund Trustee | |
George W. Morriss (1947) | | Trustee since 2007 | | Adjunct Professor, Columbia University School of International and Public Affairs, since October 2012; formerly, Executive Vice President and Chief Financial Officer, People's United Bank, Connecticut (a financial services company), 1991 to 2001. | | | 56 | | | Director, National Association of Corporate Directors, Connecticut Chapter, since 2011; Trustee, Steben Alternative Investment Funds, Steben Select Multi-Strategy Fund, and Steben Select Multi-Strategy Master Fund, since 2013; formerly, Treasurer, National Association of Corporate Directors, Connecticut Chapter, 2011 to 2015; formerly, Manager, Larch Lane Multi-Strategy Fund complex (which consisted of three funds), 2006 to 2011; formerly, Member, NASDAQ Issuers' Affairs Committee, 1995 to 2003. | |
Tom D. Seip (1950) | | Trustee since inception; Chairman of the Board since 2008; formerly Lead Independent Trustee from 2006 to 2008 | | General Partner, Ridgefield Farm LLC (a private investment vehicle); formerly, President and CEO, Westaff, Inc. (temporary staffing), May 2001 to January 2002; formerly, Senior Executive, The Charles Schwab Corporation, 1983 to 1998, including Chief Executive Officer, Charles Schwab Investment Management, Inc.; Trustee, Schwab Family of Funds and Schwab Investments, 1997 to 1998; and Executive Vice President-Retail Brokerage, Charles Schwab & Co., Inc., 1994 to 1997. | | | 56 | | | Director, H&R Block, Inc. (financial services company), since May 2001; Chairman, Governance and Nominating Committee, H&R Block, Inc., since 2011; formerly, Chairman, Compensation Committee, H&R Block, Inc., 2006 to 2010; formerly, Director, Forward Management, Inc. (asset management company), 1999 to 2006. | |
175
Name, (Year of Birth),
and Address(1) | | Position(s)
and Length of
Time Served(2) | | Principal Occupation(s)(3) | | Number of
Funds in
Fund Complex | | Other Directorships Held
Outside Fund Complex by
Fund Trustee(3) Overseen
by Fund Trustee | |
James G. Stavridis (1955) | | Trustee since 2015 | | Dean, Fletcher School of Law and Diplomacy, Tufts University since 2013; formerly, Admiral, United States Navy, 2006 to 2013, including Supreme Allied Commander, NATO and Commander, European Command, 2009 to 2013, and Commander, United States Southern Command, 2006 to 2009. | | | 56 | | | Director, Utilidata Inc., since 2015; Director, BMC Software Federal, LLC, since 2014; Director, Vertical Knowledge, LLC, since 2013; formerly, Director, Navy Federal Credit Union, 2000-2002. | |
Candace L. Straight (1947) | | Trustee since inception | | Private investor and consultant specializing in the insurance industry; formerly, Advisory Director, Securitas Capital LLC (a global private equity investment firm dedicated to making investments in the insurance sector), 1998 to 2003. | | | 56 | | | Formerly, Public Member, Board of Governors and Board of Trustees, Rutgers University, 2011 to 2016; formerly, Director, Montpelier Re Holdings Ltd. (reinsurance company), 2006 to 2015; formerly, Director, National Atlantic Holdings Corporation (property and casualty insurance company), 2004 to 2008; formerly, Director, The Proformance Insurance Company (property and casualty insurance company), 2004 to 2008; formerly, Director, Providence Washington Insurance Company (property and casualty insurance company), 1998 to 2006; formerly, Director, Summit Global Partners (insurance brokerage firm), 2000 to 2005. | |
Peter P. Trapp (1944) | | Trustee since inception | | Retired; formerly, Regional Manager for Mid-Southern Region, Ford Motor Credit Company, September 1997 to 2007; formerly, President, Ford Life Insurance Company, April 1995 to August 1997. | | | 56 | | | None. | |
176
Name, (Year of Birth),
and Address(1) | | Position(s)
and Length of
Time Served(2) | | Principal Occupation(s)(3) | | Number of
Funds in
Fund Complex | | Other Directorships Held
Outside Fund Complex by
Fund Trustee(3) Overseen
by Fund Trustee | |
Fund Trustees who are "Interested Persons" | | | | | | | | | |
Joseph V. Amato* (1962) | | Trustee since 2009 | | President and Director, Neuberger Berman Group LLC, since 2009; President and Chief Executive Officer, Neuberger Berman BD LLC ("Neuberger Berman") and Neuberger Berman Holdings LLC (including its predecessor, Neuberger Berman Inc.), since 2007; Chief Investment Officer (Equities) and President (Equities), NBIA, since 2007, and Board Member of NBIA since 2006; formerly, Global Head of Asset Management of Lehman Brothers Holdings Inc.'s ("LBHI") Investment Management Division, 2006 to 2009; formerly, member of LBHI's Investment Management Division's Executive Management Committee, 2006 to 2009; formerly, Managing Director, Lehman Brothers Inc. ("LBI"), 2006 to 2008; formerly, Chief Recruiting and Development Officer, LBI, 2005 to 2006; formerly, Global Head of LBI's Equity Sales and a Member of its Equities Division Executive Committee, 2003 to 2005. | | | 56 | | | Member of Board of Advisors, McDonough School of Business, Georgetown University, since 2001; Member of New York City Board of Advisors, Teach for America, since 2005; Trustee, Montclair Kimberley Academy (private school), since 2007; Member of Board of Regents, Georgetown University, since 2013. | |
177
Name, (Year of Birth),
and Address(1) | | Position(s)
and Length of
Time Served(2) | | Principal Occupation(s)(3) | | Number of
Funds in
Fund Complex | | Other Directorships Held
Outside Fund Complex by
Fund Trustee(3) Overseen
by Fund Trustee | |
Robert Conti* (1956) | | Chief Executive Officer, President and Trustee since 2008; prior thereto, Executive Vice President in 2008 and Vice President from inception to 2008 | | Managing Director, Neuberger Berman, since 2007; President—Mutual Funds, NBIA, since 2008; formerly, Senior Vice President, Neuberger Berman, 2003 to 2006; formerly, Vice President, Neuberger Berman, 1999 to 2003; President and Chief Executive Officer, twenty-six registered investment companies for which NBIA acts as investment manager and/or administrator. | | | 56 | | | Director, Staten Island Mental Health Society, since 1994; formerly, Chairman of the Board, Staten Island Mental Health Society, 2008 to 2011. | |
(1) The business address of each listed person is 1290 Avenue of the Americas, New York, NY 10104
(2) Pursuant to the Trust's Trust Instrument, subject to any limitations on the term of service imposed by the By-Laws or any retirement policy adopted by the Trustees, each of these Trustees shall hold office for life or until his or her successor is elected or the Trust terminates; except that (a) any Trustee may resign by delivering a written resignation; (b) any Trustee may be removed with or without cause at any time by a written instrument signed by at least two-thirds of the other Trustees; (c) any Trustee who requests to be retired, or who has become unable to serve, may be retired by a written instrument signed by a majority of the other Trustees; and (d) any Trustee may be removed at any shareholder meeting by a vote of at least two-thirds of the outstanding shares.
(3) Except as otherwise indicated, each individual has held the positions shown during at least the last five years.
* Indicates a Trustee who is an "interested person" within the meaning of the 1940 Act. Mr. Amato and Mr. Conti are interested persons of the Trust by virtue of the fact that each is an officer of NBIA and/or its affiliates.
178
Information about the Officers of the Trust
Name, (Year of Birth),
and Address(1) | | Position(s)
and Length of
Time Served(2) | | Principal Occupation(s)(3) | |
Claudia A. Brandon (1956) | | Executive Vice President since 2008 and Secretary since inception | | Senior Vice President, Neuberger Berman, since 2007 and Employee since 1999; Senior Vice President, NBIA, since 2008 and Assistant Secretary since 2004; formerly, Vice President, Neuberger Berman, 2002 to 2006; formerly, Vice President—Mutual Fund Board Relations, NBIA, 2000 to 2008; formerly, Vice President, NBIA, 1986 to 1999 and Employee, 1984 to 1999; Executive Vice President and Secretary, twenty-six registered investment companies for which NBIA acts as investment manager and/or administrator. | |
Agnes Diaz (1971) | | Vice President since 2013 | | Senior Vice President, Neuberger Berman, since 2012; Senior Vice President, NBIA, since 2012 and Employee since 1996; formerly, Vice President, Neuberger Berman, 2007 to 2012; Vice President, ten registered investment companies for which NBIA acts as investment manager and/or administrator. | |
Anthony DiBernardo (1979) | | Assistant Treasurer since 2011 | | Senior Vice President, Neuberger Berman, since 2014; Senior Vice President, NBIA, since 2014, and Employee since 2003; formerly, Vice President, Neuberger Berman, 2009 to 2014; Assistant Treasurer, ten registered investment companies for which NBIA acts as investment manager and/or administrator. | |
Corey A. Issing (1978) | | Chief Legal Officer since 2016 (only for purposes of sections 307 and 406 of the Sarbanes-Oxley Act of 2002) and Anti-Money Laundering Compliance Officer since 2016 | | General Counsel and Head of Compliance—Mutual Funds since 2016 and Managing Director, NBIA, since 2017; formerly, Associate General Counsel (2015 to 2016), Counsel (2007 to 2015), Senior Vice President (2013-2016), Vice President (2009-2013); Chief Legal Officer (only for purposes of sections 307 and 406 of the Sarbanes-Oxley Act of 2002), twenty-six registered investment companies for which NBIA acts as investment manager and/or administrator; Anti-Money Laundering Compliance Officer, twenty-six registered investment companies for which NBIA acts as investment manager and/or administrator. | |
Sheila R. James (1965) | | Assistant Secretary since inception | | Vice President, Neuberger Berman, since 2008 and Employee since 1999; Vice President, NBIA, since 2008; formerly, Assistant Vice President, Neuberger Berman, 2007; Employee, NBIA, 1991 to 1999; Assistant Secretary, twenty-six registered investment companies for which NBIA acts as investment manager and/or administrator. | |
179
Name, (Year of Birth),
and Address(1) | | Position(s)
and Length of
Time Served(2) | | Principal Occupation(s)(3) | |
Brian Kerrane (1969) | | Chief Operating Officer since 2015 and Vice President since 2008 | | Managing Director, Neuberger Berman, since 2013; Chief Operating Officer—Mutual Funds and Managing Director, NBIA, since 2015; formerly, Senior Vice President, Neuberger Berman, 2006 to 2014; Vice President, NBIA, 2008 to 2015 and Employee since 1991; Chief Operating Officer, ten registered investment companies for which NBIA acts as investment manager and/or administrator; Vice President, twenty-six registered investment companies for which NBIA acts as investment manager and/or administrator. | |
Josephine Marone (1963) | | Assistant Secretary since 2017 | | Senior Paralegal, Neuberger Berman, since 2007 and Employee since 2007; Assistant Secretary, twenty-six registered investment companies for which NBIA acts as investment manager and/or administrator. | |
Anthony Maltese (1959) | | Vice President since 2015 | | Senior Vice President, Neuberger Berman, since 2014 and Employee since 2000; Senior Vice President, NBIA, since 2014; Vice President, ten registered investment companies for which NBIA acts as investment manager and/or administrator. | |
Owen F. McEntee, Jr. (1961) | | Vice President since 2008 | | Vice President, Neuberger Berman, since 2006; Vice President, NBIA, since 2006 and Employee since 1992; Vice President, ten registered investment companies for which NBIA acts as investment manager and/or administrator. | |
John M. McGovern (1970) | | Treasurer and Principal Financial and Accounting Officer since inception | | Senior Vice President, Neuberger Berman, since 2007; Senior Vice President, NBIA, since 2007 and Employee since 1993; formerly, Vice President, Neuberger Berman, 2004 to 2006; formerly, Assistant Treasurer, 2002 to 2005; Treasurer and Principal Financial and Accounting Officer, twenty-six registered investment companies for which NBIA acts as investment manager and/or administrator. | |
Frank Rosato (1971) | | Assistant Treasurer since inception | | Vice President, Neuberger Berman, since 2006; Vice President, NBIA, since 2006 and Employee since 1995; Assistant Treasurer, ten registered investment companies for which NBIA acts as investment manager and/or administrator. | |
Chamaine Williams (1971) | | Chief Compliance Officer since inception | | Chief Compliance Officer—Mutual Funds and Senior Vice President, NBIA, since 2006; formerly, Senior Vice President, LBI, 2007 to 2008; formerly, Vice President, LBI, 2003 to 2006; formerly, Chief Compliance Officer, Lehman Brothers Asset Management Inc., 2003 to 2007; formerly, Chief Compliance Officer, Lehman Brothers Alternative Investment Management LLC, 2003 to 2007; Chief Compliance Officer, twenty-six registered investment companies for which NBIA acts as investment manager and/or administrator. | |
(1) The business address of each listed person is 1290 Avenue of the Americas, New York, NY 10104.
(2) Pursuant to the By-Laws of the Trust, each officer elected by the Trustees shall hold office until his or her successor shall have been elected and qualified or until his or her earlier death, inability to serve, or resignation. Officers serve at the pleasure of the Trustees and may be removed at any time with or without cause.
(3) Except as otherwise indicated, each individual has held the positions shown during at least the last five years.
180
Proxy Voting Policies and Procedures
A description of the policies and procedures that the Trust uses to determine how to vote proxies relating to portfolio securities is available, without charge, by calling 800-877-9700 (toll-free) and on the Securities and Exchange Commission's website at www.sec.gov. Information regarding how the Trust voted proxies relating to portfolio securities during the most recent 12-month period ended June 30 is also available, without charge upon request, by calling 800-877-9700 (toll-free), on the Securities and Exchange Commission's website at www.sec.gov, and on Management's website at www.nb.com.
Quarterly Portfolio Schedule
The Trust files a complete schedule of portfolio holdings for each Fund with the Securities and Exchange Commission for the first and third quarters of each fiscal year on Form N-Q. The Trust's Forms N-Q are available on the Securities and Exchange Commission's website at www.sec.gov and may be reviewed and copied at the Securities and Exchange Commission's Public Reference Room in Washington, DC. Information on the operation of the Public Reference Room may be obtained by calling 800-SEC-0330. The information on Form N-Q is available upon request, without charge, by calling 800-877-9700 (toll-free).
181
Board Consideration of the Management Agreement
On an annual basis, the Board of Trustees (the "Board") of Neuberger Berman Alternative Funds (the "Trust"), including the Trustees who are not "interested persons" of the Trust or of Neuberger Berman Investment Advisers LLC ("NBIA" or "Management") (including its affiliates) ("Independent Fund Trustees"), considers whether to continue the management agreement with Management (the "Agreement") with respect to each series except Neuberger Berman Absolute Return Multi-Manager Fund and Neuberger Berman Hedged Option Premium Strategy Fund (each a "Fund"). Throughout the process, the Independent Fund Trustees are advised by counsel that is experienced in Investment Company Act of 1940 matters and that is independent of Management ("Independent Counsel"). At a meeting held on September 28, 2017, the Board, including the Independent Fund Trustees, approved the continuation of the Agreement for each Fund.
In evaluating the Agreement with respect to each Fund, the Board, including the Independent Fund Trustees, reviewed extensive materials provided by Management in response to questions submitted by the Independent Fund Trustees and Independent Counsel, and met with senior representatives of Management regarding its personnel, operations and financial condition as they relate to the Funds. The annual contract review extends over at least two regular meetings of the Board to ensure that Management has time to respond to any questions the Independent Fund Trustees may have on their initial review of the materials and that the Independent Fund Trustees have time to consider those responses.
In connection with its deliberations, the Board also considered the broad range of information relevant to the annual contract review that is provided to the Board (including its various standing committees) at meetings throughout the year, including reports on investment performance, portfolio risk and other portfolio information for each Fund, including the use of derivatives if used as part of the Fund's strategy, as well as periodic reports on, among other matters, pricing and valuation; brokerage and execution; compliance; and shareholder and other services provided by Management and its affiliates. The Contract Review Committee, which is comprised of Independent Fund Trustees, was established by the Board to assist in its deliberations regarding the annual contract review. The Board has also established other committees that focus throughout the year on specific areas relevant to the annual contract review, such as Fund performance or compliance matters, and that are charged with specific responsibilities regarding the annual contract review. Those committees provide reports to the Contract Review Committee and the full Board, which consider that information as part of the annual contract review process. The Board's Contract Review Committee annually considers and updates the questions it asks of Management in light of developments in the industry, in the markets, in mutual fund regulation and litigation, and in Management's business model.
The Independent Fund Trustees received from Independent Counsel a memorandum discussing the legal standards for their consideration of the proposed continuation of the Agreement. During the course of the year and during their deliberations regarding the annual contract review, the Contract Review Committee and the Independent Fund Trustees met with Independent Counsel separately from representatives of Management.
Provided below is a description of the Board's contract approval process and the material factors that the Board considered at its meetings regarding the renewal of the Agreement and the compensation to be paid thereunder. In connection with its approval of the continuation of the Agreement, the Board evaluated the terms of the Agreement, the overall fairness of the Agreement to each Fund and whether the Agreement was in the best interests of each Fund and Fund shareholders. The Board's determination to approve the continuation of the Agreement was based on a comprehensive consideration of all information provided to the Board throughout the year and specifically in connection with the annual contract review.
This description is not intended to include all of the factors considered by the Board. The Board members did not identify any particular information or factor that was all-important or controlling, and each Trustee may have attributed different weights to the various factors. The Board focused on the costs and benefits of the Agreement to each Fund and, through the Fund, its shareholders.
182
Nature, Extent and Quality of Services
With respect to the nature, extent and quality of the services provided, the Board considered the investment philosophy and decision-making processes of, and the qualifications, experience, and capabilities of, and the resources available to, the portfolio management personnel of Management who perform services for the Funds. The Board noted that Management also provides certain administrative services, including fund accounting and compliance services. The Board also considered Management's policies and practices regarding brokerage and allocation of portfolio transactions and reviewed the quality of the execution services that Management had provided. Moreover, the Board considered Management's approach to potential conflicts of interest between the Funds' investments and those of other funds or accounts managed by Management.
The Board noted the extensive range of services that Management provides to the Funds beyond the investment management services. The Board considered that Management's responsibilities include continual management of investment, operational, enterprise, legal, regulatory and compliance risks as they relate to the Funds, and considered information regarding Management's processes for managing risk. It also noted Management's activities under its contractual obligation to oversee the Funds' various outside service providers, including its renegotiation of certain service providers' fees and its evaluation of service providers' infrastructure, cybersecurity programs and business continuity programs, among other matters. The Board also considered Management's ongoing development of its own infrastructure and information technology to support the Funds through, among other things, cybersecurity, business continuity planning, and risk management. In addition, the Board noted the positive compliance history of Management, as no significant compliance problems were reported to the Board with respect to the firm. The Board also considered the general structure of the portfolio managers' compensation and whether this structure provides appropriate incentives to act in the best interests of the Funds. The Board also considered the ability of Management to attract and retain qualified personnel to service the Funds.
The Board noted that Management assumes significant ongoing risks with respect to each Fund, including investment, operational, enterprise, litigation, regulatory and compliance risks, for which Management is entitled to compensation. The Board also noted that when Management launches a new fund or share class, it assumes entrepreneurial risk with respect to that fund or share class, and that some new funds and share classes have been liquidated without ever having been profitable to Management.
As in past years, the Board also considered the manner in which Management addressed various matters that arose during the year, some of them a result of developments in the broader fund industry or the regulations governing it, including the Department of Labor Fiduciary Rule. In addition, the Board considered actions taken by Management in response to recent market conditions and considered the overall performance of Management in this context.
Fund Performance
The Board requested a report from an outside consulting firm that specializes in the analysis of fund industry data that compared each Fund's performance (except Neuberger Berman U.S. Equity Index PutWrite Strategy Fund due to its very short-term performance), along with its fees and other expenses, to a group of industry peers and a broad universe of similar funds. The Board considered each Fund's performance and fees in light of the limitations inherent in the methodology for constructing such peer groups and determining which investment companies should be included in the peer groups.
With respect to investment performance, the Board considered information regarding each Fund's short-, intermediate- and long-term performance, as applicable, both on an absolute basis and relative to an appropriate benchmark index and the median performance of the composite peer group (constructed by the consulting firm) of investment companies pursuing broadly similar strategies. The Board also reviewed performance in relation to certain measures of the degree of investment risk undertaken by the portfolio managers.
In the case of those Funds that had underperformed their benchmark indices and/or peer groups to an extent, or over a period of time, that the Board found to raise concerns, the Board discussed the Funds with Management, each such
183
Fund's performance, and evaluated steps that Management had taken, or intended to take, to improve performance. The Board also met with the portfolio managers of certain Funds during the period since the last contract renewal to discuss the Fund's performance. The Board also considered Management's responsiveness with respect to the Funds that experienced lagging performance. In this regard, the Board noted that performance, especially short-term performance, is only one of the factors that it deems relevant to its consideration of a Fund's Agreement and that, after considering all relevant factors, it may be appropriate to approve the continuation of the Agreement notwithstanding a Fund's underperformance.
Fee Rates, Profitability, and Fall-out Benefits
With respect to the overall fairness of the Agreement, the Board considered the fee structure for each Fund under the Agreement as compared to the peer group provided by the consulting firm. With respect to Neuberger Berman Global Allocation Fund and Neuberger Berman Multi-Asset Income Fund, the Board considered that each Fund invests in affiliated underlying funds and considered the fee structure for that arrangement. The Board reviewed a comparison of each Fund's management fee and total expense ratio to a peer group of comparable funds. The Board noted that the comparative management fee analysis includes, in each Fund's management fee, the separate administrative fees paid to Management, but it was not clear whether this was the case for all funds in the peer group. Accordingly, the Board also considered each Fund's total expense ratio.
The Board compared each Fund's contractual and actual management fees to the mean and median of the contractual and actual management fees, respectively, of that Fund's peer group. (The actual management fees are the contractual management fees reduced by any fee waivers or other adjustments.) Where a Fund's management fee was higher than the peer group mean and/or median, the Board considered whether specific portfolio management, administration or oversight needs contributed to the management fee. The Board also noted that for some classes of certain Funds, the overall expense ratio is maintained through a contractual or voluntary fee cap and/or expense reimbursements by Management.
In concluding that the benefits accruing to Management and its affiliates by virtue of their relationship with each Fund were reasonable in light of the costs of providing the investment advisory and other services and the benefits accruing to that Fund, the Board reviewed specific data as to Management's profit or loss on each Fund for a recent period on a pre-tax basis without regard to distribution expenses, including year-over-year changes in each of Management's reported expense categories. (The Board also reviewed data on Management's profit or loss on each Fund after distribution expenses and taxes were factored in, as indicators of the health of the business and the extent to which Management is directing its profits into the growth of the business.) The Board considered the cost allocation methodology that Management used in developing its profitability figures. The Board engaged an independent forensic accountant to review the profitability methodology utilized by Management when preparing this information and discussed with the consultant its conclusion that Management's process for calculating and reporting its profit or loss was not unreasonable. Recognizing that there is no uniform methodology within the asset management industry for determining profitability for this purpose and that the use of different reasonable methodologies can give rise to different profit and loss results, the Board requested from Management examples of profitability calculated by different methods. In addition, the Board recognized that Management's calculations regarding its costs may not reflect all risks, including regulatory, legal, operational, reputational, and, where appropriate, entrepreneurial risks, associated with offering and managing a mutual fund in the current regulatory and market environment. The Board also considered any fall-out benefits likely to accrue to Management or its affiliates from their relationship with each Fund. The Board recognized that Management and its affiliates should be entitled to earn a reasonable level of profits for services they provide to each Fund and, based on its review, concluded that Management's reported level of profitability, if any, on each Fund was reasonable.
Information Regarding Services to Other Clients
The Board also considered whether there were other funds or separate accounts that were advised or sub-advised by Management or its affiliates with investment objectives, policies and strategies that were similar to those of any of the
184
Funds. In the cases where such funds or separate accounts exist, the Board compared the fees charged to the Fund to the fees charged to such comparable funds and/or separate accounts. The Board considered the appropriateness and reasonableness of any differences between the fees charged to a Fund and such comparable funds and/or separate accounts, and determined that differences in fees and fee structures were consistent with the differences in the management and other services provided. The Board explored with Management its assertion that although, generally, the rates of fees paid by such accounts were lower than the fee rates paid by the corresponding Funds, the differences reflected Management's greater level of responsibilities and significantly broader scope of services regarding the Funds, the more extensive regulatory obligations and risks associated with managing the Funds, and other financial considerations with respect to creation and sponsorship of the Funds.
Economies of Scale
The Board also evaluated apparent or anticipated economies of scale in relation to the services Management provides to each Fund. The Board considered whether each Fund's fee structure provides for a reduction of payments resulting from the use of breakpoints and whether any such breakpoints are set at appropriate asset levels. The Board gave careful thought to the size of any breakpoints in each Fund's advisory fees and the asset levels at which they are set. It also considered whether the breakpoints were set at an appropriate level and compared the breakpoint structure to that of the peer group. The Board also considered that Management has provided, at no added cost to the Funds, certain additional services that were required by new regulations or regulatory interpretations, impelled by changes in the securities markets or the business landscape, and/or requested by the Board, and that this is a way of sharing economies of scale with the Funds and their shareholders.
Fund-by-Fund Analysis
With regard to the investment performance of each Fund and the fees charged to each Fund, the Board considered the following information. The peer groups and broad universes of similar funds referenced in this section are those identified by the consultant, as discussed above; the risk/return ratios referenced are the Sharpe ratios. The data used to provide the benchmark comparison was provided by Management. Where a Fund has more than one class of shares outstanding, information for a single class has been provided as identified below. For each Fund, the Board looked at the Institutional Class as a proxy for all of the Fund's classes. In the case of underperformance for the periods reflected, the Board considered the magnitude of that underperformance relative to the peer group median and the benchmark (i.e., the amount by which a Fund underperformed, including, for example, whether the Fund slightly underperformed or significantly underperformed the peer group median or benchmark).
• Neuberger Berman Global Allocation Fund (Institutional Class)—The Board considered that, as compared to its peer group, the Fund's contractual management fee and the actual management fee net of fees waived by Management were both lower than the respective medians. The Board also noted that Management, in response to Board requests and/or market pressures, had recently lowered its contractual management fee and fee caps for the Fund. The Board considered that, as compared to its peer group, the Fund's performance was higher than the median for the 1 and 5-year periods but lower than the median for the 3-year period. The Board also considered that, as compared to its benchmark, the Fund's performance was lower for the 1, 3 and 5-year periods. The Fund was launched in 2010 and therefore does not have 10-year performance. The Board met with the Portfolio Managers prior to renewing the contract. In determining to renew the Management Agreement, the Board considered that the Fund has performed well compared to its peer group median for the most recent 1-year period, and that for the 5-year period, the Fund significantly out-performed the average of the broad universe of alternative, global macro funds. The Board also considered that the Fund showed very good year-to-date performance through August 31, placing it in the top quartile of its Lipper and Morningstar peer groups for that period.
• Neuberger Berman Long Short Fund (Institutional Class)—The Board considered that, as compared to its peer group, the Fund's contractual management fee and the actual management fee were both lower than
185
the respective medians. The Board considered that, as compared to its peer group, the Fund's performance was higher than the median for the 1-year period, lower than the median for the 3-year period, and equal to the median for the 5-year period. The Board also considered that, as compared to its benchmark, the Fund's performance was higher for the 1, 3 and 5-year period. The Fund was launched in 2011 and therefore does not have 10-year performance. In determining to renew the Management Agreement, the Board considered the Fund's history of delivering performance above its benchmark, that the Fund showed strong year-to-date performance through August 31, and that its risk/return ratio was better than the median of the broad universe of alternative, long short equity funds for the five-year period ended December 31, 2016.
• Neuberger Berman Long Short Credit Fund (Institutional Class)—The Board considered that, as compared to its peer group, the Fund's contractual management fee was higher than the median, but the actual management fee net of fees waived by Management was lower than the median. The Board considered that, as compared to its peer group, the Fund's performance was lower than the median for the 1-year period. The Board also considered that, as compared to its benchmark, the Fund's performance was lower for the 1-year period. The Fund was launched in 2015 and therefore does not have 3, 5 or 10-year performance. In determining to renew the Management Agreement, the Board considered the Fund's short performance history and that the Fund performed well versus its benchmark for the year-to-date period through August 31.
• Neuberger Berman Multi-Asset Income Fund (Institutional Class)—The Board considered that, as compared to its peer group, the Fund's contractual management fee and the actual management fee net of fees waived by Management were both lower than the respective medians. The Board considered that, as compared to its peer group, the Fund's performance was higher than the median for the 1-year period. The Board also considered that, as compared to its benchmark, the Fund's performance was higher for the 1-year period. The Fund was launched in 2015 and therefore does not have 3, 5 or 10-year performance. In determining to renew the Management Agreement, the Board considered that the Fund has performed well compared to its peer group and its benchmark, and that the Fund out-performed the average of the broad universe of alternative global macro funds. The Board also considered that the Fund's risk/return ratio for the 1-year period was better than the median for the peer group.
• Neuberger Berman Risk Balanced Commodity Strategy Fund (Institutional Class)—The Board considered that, as compared to its peer group, the Fund's contractual management fee and the actual management fee net of fees waived by Management were both lower than the respective medians. The Board also noted that Management, in response to Board requests and/or market pressures, had recently lowered its contractual management fee and fee caps for the Fund. The Board considered that, as compared to its peer group, the Fund's performance was higher than the median for the 1-year period, but lower than the median for the 3-year period. The Board also considered that, as compared to its benchmark, the Fund's performance was lower for the 1 and 3-year periods. The Fund was launched in 2012 and therefore does not have 5 or 10-year performance. The Board met with the Portfolio Managers prior to renewing the contract. In determining to renew the Management Agreement, the Board considered that the Fund has performed well compared to its peer group for the 1-year period, and that the Fund showed strong year-to-date performance through August 31.
• Neuberger Berman U.S. Equity Index PutWrite Strategy Fund (Institutional Class)—The Board considered that, as compared to its peer group, the Fund's contractual management fee and the actual management fee net of fees waived by Management were both lower than the respective medians. The Board did not consider the Fund's performance relative to its peer group because the Fund has been in operation for less than one year and, as such, does not have comparable peer group performance. The Board also considered that, as compared to its benchmark, the Fund's performance was lower for the period since the Fund's inception. The Fund was launched in 2016 and while the Board reviewed its performance as compared to its benchmark, the Board recognizes the limitations of relying on very short-term performance. In determining to renew the Management Agreement, the Board considered the Fund's short performance history and that the Fund showed strong year-to-date performance through August 31.
186
Conclusions
In approving the continuation of the Agreement, the Board concluded that, in its business judgment, the terms of the Agreement are fair and reasonable to each Fund and that approval of the continuation of the Agreement is in the best interests of each Fund and its shareholders. In reaching this determination, the Board considered that Management could be expected to continue to provide a high level of service to each Fund; that the performance of each Fund was satisfactory over time, or, in the case of an underperforming Fund, that the Board retained confidence in Management's capabilities to manage the Fund; that each Fund's fee structure appeared to the Board to be reasonable given the nature, extent and quality of services provided; and that the benefits accruing to Management and its affiliates by virtue of their relationship with each Fund were reasonable in light of the costs of providing the investment advisory and other services and the benefits accruing to each Fund. The Board's conclusions may be based in part on its consideration of materials prepared in connection with the approval or continuance of the Agreement in prior years and on the Board's ongoing regular review of Fund performance and operations throughout the year, in addition to material prepared specifically for the most recent annual review of the Agreement.
187
Notice to Shareholders
In early 2018 you will receive information to be used in filing your 2017 tax returns, which will include a notice of the exact tax status of all distributions paid to you by the Fund during calendar year 2017. Please consult your own tax advisor for details as to how this information should be reflected on your tax returns.
For the fiscal year ended October 31, 2017, each Fund makes the following designation, or up to the maximum amount of such dividends allowable pursuant to the Internal Revenue Code, as qualified dividend income eligible for reduced tax rates. These lower rates range from 5% to 15% depending upon an individual's tax bracket. Complete information regarding each Funds distributions during the calendar year 2017 will be reported in conjunction with Form 1099-DIV.
Fund | | Qualified
Dividend Income | |
Global Allocation | | $ | 365,825 | | |
Long Short | | | 32,124,005 | | |
Long Short Credit | | | 53,839 | | |
Multi-Asset Income | | | 639,941 | | |
Global Allocation, Hedged Option Premium Strategy and U.S. Equity Index PutWrite Strategy hereby designate $113,732, $126 and $681,701, respectively, as a capital gain distribution.
188
This page has been left blank intentionally
189
This page has been left blank intentionally
190
This page has been left blank intentionally
189
This page has been left blank intentionally
190
Neuberger Berman Investment Advisers LLC
1290 Avenue of the Americas
New York, NY 10104-0002
Retail Services: 800.877.9700
Broker-Dealer and Institutional Services: 800.366.6264/888.556.9030
Web site: www.nb.com
Statistics and projections in this report are derived from sources deemed to be reliable but cannot be regarded as a representation of future results of the Funds. This report is prepared for the general information of shareholders and is not an offer of shares of the Funds. Shares are sold only through the currently effective prospectus which you can obtain by calling 877.628.2583. An investor should consider carefully a Fund's investment objectives, risks and fees and expenses, which are described in its prospectus, before investing.
 L0265 12/17
Neuberger Berman
Alternative and Multi-Asset Class Funds
Institutional Class Shares
Class A Shares
Class C Shares
Class R6 Shares
Absolute Return Multi-Manager Fund
Annual Report
October 31, 2017
Contents
PRESIDENT'S LETTER | | | 1 | | |
PORTFOLIO COMMENTARY | |
Absolute Return Multi-Manager Fund | | | 2 | | |
FUND EXPENSE INFORMATION | | | 7 | | |
CONSOLIDATED SCHEDULE OF INVESTMENTS | | | 8 | | |
CONSOLIDATED FINANCIAL STATEMENTS | | | 42 | | |
FINANCIAL HIGHLIGHTS (ALL CLASSES)/
PER SHARE DATA | | | 65 | | |
Report of Independent Registered Public Accounting Firm | | | 69 | | |
Directory | | | 70 | | |
Trustees and Officers | | | 71 | | |
Proxy Voting Policies and Procedures | | | 80 | | |
Quarterly Portfolio Schedule | | | 80 | | |
Notice to Shareholders | | | 80 | | |
Board Consideration of the Management and
Sub-Advisory Agreements | | | 81 | | |
The "Neuberger Berman" name and logo and "Neuberger Berman Investment Advisers LLC" name are registered service marks of Neuberger Berman Group LLC. The individual Fund name in this piece is either a service mark or registered service mark of Neuberger Berman Investment Advisers LLC, an affiliate of Neuberger Berman BD LLC, distributor, member FINRA. ©2017 Neuberger Berman BD LLC, distributor. All rights reserved.
Dear Shareholder,
I am pleased to present this annual shareholder report for Neuberger Berman Absolute Return Multi-Manager Fund.
Global equities moved higher during the reporting period while market volatility was generally muted. U.S. Treasury yields increased across the curve, especially early in the period. The overall bond market produced a modest gain, with lower quality securities, including high yield bonds, generating the strongest results. The U.S. dollar initially strengthened and then weakened as the period progressed. Meanwhile, commodity prices were mixed and oil rallied later in the period.
We continue to anticipate further interest rate hikes in the U.S. following another quarter of stronger than expected gross domestic product, earnings and job growth. We believe there will be a gradual movement to reduce quantitative easing in Europe next year and the potential for tax reform in the U.S., which should allow government debt yields generally to move higher. We therefore continue to favor strategies that can perform in line with the Fund's goals in an environment of stable or declining interest rates, while also having the potential to outperform if interest rates continue to rise.
The Fund's credit strategies, which includes corporate credit long/short and asset-backed securities, were its largest strategy allocation during the reporting period. We remain positive on this portion of the portfolio against a backdrop of relatively high current yields and the potential for event driven price appreciation for certain positions. In addition, a focus on low duration via long positions in floating rate debt and short positions in longer duration fixed rate bonds could help these strategies perform relatively well in a rising interest rate environment. Long/short equity strategies have benefited from the low correlation between stocks. In our view, interest rates, coupled with potential tax cuts and/or reform legislation, if they occur, would have the potential to extend this trend of high stock dispersion. Elsewhere, we pared the Fund's allocation to merger arbitrage late in the period amid recent spreads tightening. That being said, spreads may appear more attractive if there is greater certainty regarding tax reform in the U.S., or if interest rates rise. Finally, the Fund maintained its allocation to global macro and managed futures. In our opinion, rising interest rates could lead to higher volatility, which has historically been beneficial for these strategies.
Thank you for your continued support and trust. We look forward to continue serving your investment needs in the years to come.
Sincerely,
ROBERT CONTI
PRESIDENT AND CEO
NEUBERGER BERMAN MUTUAL FUNDS
1
Absolute Return Multi-Manager Fund Commentary (Unaudited)
Neuberger Berman Absolute Return Multi-Manager Fund Institutional Class generated a 5.80% total return for the 12 months ended October 31, 2017 and underperformed its primary benchmark, the HFRX Global Hedge Fund Index, which posted a 6.98% return for the same period. (Performance for all share classes is provided in the table following this letter.)
Global equities rallied during the period as volatility was abnormally low. U.S. Treasury yields moved higher with the majority of the move occurring early in the period. Broader bond markets were slightly higher overall, led by high yield bonds. The U.S. dollar strengthened early in the period and then weakened for the majority of the second half. Commodity pricing was mixed and oil prices rallied later in the period.
Overall, we are pleased with the Fund's risk adjusted performance for the period as the return, volatility and beta to the S&P 500® Index and Bloomberg Barclays U.S. Aggregate Bond Index were all in line with our expectations.
The Fund's allocation to credit strategies was the largest positive contributor to performance. The asset-backed securities strategy was responsible for the majority of these gains, with positive performance spread across sectors. The corporate credit long/short strategy was positive as well, with gains from bank loans, bonds and equities outpacing losses from some shorts via credit default swaps.
The allocation to long/short equity strategies was the next largest contributor. Gains from longs outpaced losses from shorts and we were happy to see that the managers, in aggregate, generated positive long/short spread (i.e. longs were up on average more than shorts). The merger arbitrage/event driven allocation contributed positively as well, as the subadvisers were able to capitalize on a relatively fertile environment.
Lastly, the allocation to global macro/managed futures strategy was slightly positive, driven primarily by the U.S. dollar strengthening earlier in the period.
The Fund's aggregate use of futures, forward foreign currency, swap and option contracts detracted from performance during the reporting period.
Over the reporting period, we removed one long/short equity sector specialist, Blue Jay Capital Management, LLC (health care), and added another long/short equity strategy managed by Neuberger Berman Investment Advisers LLC (financials concentration). We also replaced one managed futures subadviser, GSA Capital Partners LLP, with another, BH-DG Systematic Trading LLP.
We continue to anticipate further interest rate hikes in the U.S. following another quarter of stronger than expected gross domestic product, earnings and job growth. We believe gradual movement to reduce quantitative easing in Europe next year and the potential for tax reform in the U.S., if they occur, should allow government debt yields to move higher. We therefore continue to favor strategies that can perform in line with the Fund's goals in an environment of stable or declining interest rates, while also having the potential to outperform if interest rates continue to rise.
The Fund's largest strategy allocation continues to be credit strategies, which includes corporate credit long/short and asset-backed securities. Within this part of the portfolio, we believe the relatively high current yield, combined with the potential for event driven price appreciation for certain positions, has allowed the strategy to perform well in various interest rate environments. Importantly, the focus on low duration via long positions in floating rate debt and short positions in longer duration fixed rate bonds affords these strategies the potential to outperform if interest rates rise. Long/short equity strategies have continued to benefit from low correlation between stocks. We believe higher interest rates, as well as potential tax cuts and/or reform legislation, if they occur, have the potential to extend this trend of high stock dispersion. We decided to trim the allocation to merger arbitrage in October 2017, as spreads have tightened recently. We will continue to monitor the space and believe that spreads can become more interesting if (1) there is more certainty regarding tax reform in the U.S., at which point M&A activity may pick up or (2) interest rates rise. Finally, we maintained global macro and managed futures as we believe that rising interest rates have the potential to push volatility higher, and that has historically been a tailwind for these strategies.
Sincerely,
DAVID KUPPERMAN, JEFF MAJIT AND FRED INGHAM
PORTFOLIO MANAGERS
Information about principal risks of investing in the Fund is set forth in the prospectus and statement of additional information.
The portfolio composition, industries and holdings of the Fund are subject to change without notice.
The opinions expressed are those of the Fund's portfolio managers and subadvisers. The opinions are as of the date of this report and are subject to change without notice.
2
Absolute Return Multi-Manager Fund (Unaudited)
TICKER SYMBOLS
Institutional Class | | NABIX | |
Class A | | NABAX | |
Class C | | NABCX | |
Class R6 | | NRABX | |
PORTFOLIO BY TYPE OF SECURITY
(as a % of Total Net Assets)
| | Long | | Short | |
Asset-Backed Securities | | | 4.0 | % | | | — | % | |
Closed End Funds | | | 0.6 | | | | — | | |
Collateralized Mortgage
Obligations | | | 2.1 | | | | — | | |
Commercial Mortgage-Backed
Securities | | | 8.0 | | | | — | | |
Common Stocks | | | 42.6 | | | | (16.0 | ) | |
Convertible Bonds | | | 0.5 | | | | — | | |
Convertible Preferred Stocks | | | 0.0 | | | | — | | |
Corporate Bonds | | | 8.6 | | | | (0.4 | ) | |
Exchange Traded Funds | | | — | | | | (1.0 | ) | |
Exchange Traded Notes | | | — | | | | (0.1 | ) | |
Loan Assignments | | | 6.7 | | | | — | | |
Master Limited Partnerships | | | 2.1 | | | | (0.7 | ) | |
Options Purchased | | | 0.1 | | | | — | | |
Preferred Stocks | | | 0.1 | | | | (0.0 | ) | |
Rights | | | 0.0 | | | | — | | |
U.S. Treasury Obligations | | | 0.1 | | | | — | | |
Warrants | | | 0.0 | | | | — | | |
Short-Term Investments | | | 22.9 | | | | — | | |
Other Assets Less Liabilities | | | 19.8 | * | | | — | | |
Total | | | 118.2 | % | | | (18.2 | )% | |
* Includes the impact of the Fund's open positions in derivatives (other than Options Purchased), if any.
PERFORMANCE HIGHLIGHTS
| | Average Annual Total Return
Ended 10/31/2017 | |
| | Inception
Date | | 1 Year | | 5 Years | | Life of
Fund | |
At NAV | | | | | | | | | |
Institutional Class | | 05/15/2012 | | | 5.80 | % | | | 2.57 | % | | | 2.34 | % | |
Class A | | 05/15/2012 | | | 5.45 | % | | | 2.18 | % | | | 1.97 | % | |
Class C | | 05/15/2012 | | | 4.70 | % | | | 1.44 | % | | | 1.22 | % | |
Class R63 | | 12/31/2013 | | | 5.90 | % | | | 2.59 | % | | | 2.37 | % | |
With Sales Charge | | | | | | | | | |
Class A | | | | | –0.65 | % | | | 0.98 | % | | | 0.88 | % | |
Class C | | | | | 3.70 | % | | | 1.44 | % | | | 1.22 | % | |
Index | |
HFRX Global Hedge Fund Index1,2 | | | | | 6.98 | % | | | 2.23 | % | | | 2.04 | % | |
S&P 500® Index1,2 | | | | | 23.63 | % | | | 15.18 | % | | | 15.13 | % | |
Bloomberg Barclays U.S. Aggregate
Bond Index1,2 | | | | | 0.90 | % | | | 2.04 | % | | | 2.28 | % | |
The performance data quoted represent past performance and do not indicate future results. Current performance may be lower or higher than the performance data quoted. For performance data current to the most recent month-end, please visit www.nb.com/performance.
The results shown in the table reflect the reinvestment of income dividends and other distributions, if any. The results do not reflect the effect of taxes a shareholder would pay on Fund distributions or on the redemption of Fund shares.
The investment return and principal value of an investment will fluctuate and shares, when redeemed, may be worth more or less than their original cost.
Returns would have been lower if Neuberger Berman Investment Advisers LLC ("Management") had not reimbursed certain expenses and/or waived a portion of the investment management fees during certain of the periods shown. Repayment by a class (of expenses previously reimbursed and/or fees previously waived by Management) will decrease the class's returns. Please see Note B in the Consolidated Notes to Financial Statements for specific information regarding expense reimbursement and/or fee waiver arrangements.
As stated in the Fund's most recent prospectus, the total annual operating expense ratios for fiscal year 2016 were 2.88%, 3.25%, 4.01% and 2.76% for Institutional Class, Class A, Class C and Class R6 shares, respectively (before expense reimbursements and/or fee waivers, if any). The total annual operating expense ratios were 2.83%, 3.18%, 3.94% and 2.74% for Institutional Class, Class A, Class C and Class R6 shares, respectively, after expense reimbursements and/or fee waivers. The expense ratios for the annual period ended October 31, 2017 can be found in the Financial Highlights section of this report.
Returns shown with a sales charge reflect the deduction of the current maximum initial sales charge of 5.75% for Class A shares and the contingent deferred sales charge (CDSC) for Class C shares. The CDSC for Class C shares is 1%, which is reduced to 0% after 1 year. The performance of the Fund's share classes will differ primarily due to different sales charge structures and class expenses. Please see the prospectus for more information about sales charge structures, if any, and class expenses for your share class.
3
Absolute Return Multi-Manager Fund (Unaudited)
COMPARISON OF A $1,000,000 INVESTMENT
(000's omitted)
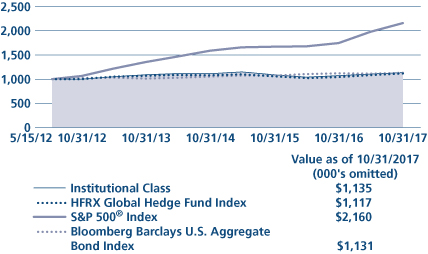
This graph shows the change in value of a hypothetical $1,000,000 investment in the Fund over the past 10 fiscal years, or since the Fund's inception if it has not operated for 10 years. The graph is based on the Institutional Class shares only; the performance of the Fund's share classes will differ primarily due to different sales charge structures and class expenses (see Performance Highlights chart on previous page). The result is compared with benchmarks, which include a broad-based market index and may include a more narrowly based index. Market indices have not been reduced to reflect any of the fees and costs of investing. The results shown in the graph reflect the reinvestment of income dividends and other distributions, if any. The results do not reflect the effect of taxes a shareholder would pay on Fund distributions or on the redemption of Fund shares. Results represent past performance and do not indicate future results.
4
1 Please see "Glossary of Indices" on page 6 for a description of indices. Please note that individuals cannot invest directly in any index. The S&P 500® and the Bloomberg Barclays U.S. Aggregate Bond indices do not take into account any fees, expenses or tax consequences of investing in the individual securities that they track. The HFRX Global Hedge Fund index does take into account fees and expenses, but not tax consequences, of investing since it is based on the underlying hedge funds' net returns. Data about the performance of an index are prepared or obtained by Neuberger Berman Investment Advisers LLC* and reflect the reinvestment of income dividends and other distributions, if any. The Fund may invest in securities not included in a described index and generally does not invest in all securities included in a described index.
2 The date used to calculate Life of Fund performance for the index is the inception date of the oldest share class.
3 The performance information for Class R6 prior to the class's inception date is that of the Institutional Class of Neuberger Berman Absolute Return Multi-Manager Fund. The performance information for the Institutional Class has not been adjusted to take into account differences in class specific operating expenses. The Institutional Class has higher expenses and typically lower returns than Class R6.
* On January 1, 2016, Neuberger Berman Management LLC ("NBM") and Neuberger Berman LLC ("Neuberger Berman") transferred to Neuberger Berman Fixed Income LLC ("NBFI") their rights and obligations pertaining to all services they provided to any Fund under any investment management, investment sub-advisory, and/or administration agreement, as applicable (the "Agreements"). Following such transfer, NBFI was renamed Neuberger Berman Investment Advisers LLC ("NBIA" or "Management"). In addition, since the date of the transfer, the services previously provided by NB Alternative Investment Management LLC ("NBAIM") have been provided by NBIA.
Following the consolidation, the investment professionals of NBM and NBAIM who provided services to the Fund under the Agreements continue to provide the same services, except that they provide those services in their new capacities as investment professionals of NBIA. Further, the consolidation did not result in any change in the investment processes employed by the Fund, the nature or level of services provided to the Fund, or the fees any Fund pays under its Agreements.
On July 1, 2016, NBM was reorganized into Neuberger Berman (the "Reorganization"). Upon the completion of the Reorganization, Neuberger Berman assumed all rights and obligations pertaining to all services NBM provided to the Fund under any distribution agreement or distribution and services agreement (the "Agreements") or plan adopted pursuant to Rule 12b-1 under the Investment Company Act of 1940, as amended, (the "Plans"). Accordingly, after the Reorganization, Neuberger Berman became the Fund's distributor and the services previously provided by NBM under the Agreements and Plans are provided by Neuberger Berman. Following the Reorganization, the employees of NBM provide the same services to the Fund under the Agreements and Plans, except that they provide those services in their capacities as employees of Neuberger Berman. Further, the Reorganization did not result in any change in the nature or level of services provided to the Fund, or the fees, if any, the Fund pays under the Agreements or the Plans.
On January 1, 2017, the Fund's distributor, Neuberger Berman, changed its name to Neuberger Berman BD LLC.
For more complete information on any of the Neuberger Berman Alternative and Multi-Asset Class Funds, see the Fund's prospectus, which can be obtained by calling us at (800) 877-9700, or visiting our website at www.nb.com.
5
Bloomberg Barclays U.S. Aggregate Bond Index: | | The index measures the investment grade, U.S. dollar-denominated, fixed-rate, taxable bond market and includes Treasuries, government-related and corporate securities, mortgage-backed securities (MBS) (agency fixed-rate and hybrid adjustable rate mortgage (ARM) pass-throughs), asset-backed securities (ABS), and commercial mortgage-backed securities (CMBS) (agency and nonagency). | |
HFRX Global Hedge Fund Index: | | The index is designed to be representative of the overall composition of the hedge fund universe. It is comprised of all eligible hedge fund strategies; including but not limited to convertible arbitrage, distressed securities, equity hedge, equity market neutral, event driven, macro, merger arbitrage, and relative value arbitrage. The strategies are asset weighted based on the distribution of assets in the hedge fund industry. Constituent funds are selected from an eligible pool of the more than 7,500 funds worldwide that report to the Hedge Fund Research (HFR) Database. Constituent funds must meet all of the following criteria: report monthly; report performance net of all fees; be U.S. dollar-denominated; be active and accepting new investments; have a minimum 24 months track record; and the fund's manager must have at least $50 million in assets under management. The index is rebalanced quarterly. | |
| S&P 500® Index: | | The index is a float-adjusted market capitalization-weighted index that focuses on the large-cap segment of the U.S. equity market, and includes a significant portion of the total value of the market. | |
6
Neuberger Berman Alternative Funds | |
| | | ACTUAL | | HYPOTHETICAL (5% ANNUAL RETURN BEFORE EXPENSES) | |
| | Beginning
Account
Value
5/1/2017 | | Ending
Account
Value
10/31/2017 | | Expenses Paid
During the
Period(1)
5/1/2017 -
10/31/2017 | | Expense
Ratio | | Beginning
Account
Value
5/1/2017 | | Ending
Account
Value
10/31/2017 | | Expenses Paid
During the
Period(2)
5/1/2017 -
10/31/2017 | | Expense
Ratio | |
Absolute Return Multi-Manager Fund | |
Institutional Class | | $ | 1,000.00 | | | $ | 1,026.70 | | | $ | 12.77 | (3) | | | 2.50 | % | | $ | 1,000.00 | | | $ | 1,012.60 | | | $ | 12.68 | (3) | | | 2.50 | % | |
Class A | | $ | 1,000.00 | | | $ | 1,025.00 | | | $ | 15.16 | (3) | | | 2.97 | % | | $ | 1,000.00 | | | $ | 1,010.23 | | | $ | 15.05 | (3) | | | 2.97 | % | |
Class C | | $ | 1,000.00 | | | $ | 1,020.90 | | | $ | 18.34 | (3) | | | 3.60 | % | | $ | 1,000.00 | | | $ | 1,007.06 | | | $ | 18.21 | (3) | | | 3.60 | % | |
Class R6 | | $ | 1,000.00 | | | $ | 1,026.70 | | | $ | 11.60 | (3) | | | 2.27 | % | | $ | 1,000.00 | | | $ | 1,013.76 | | | $ | 11.52 | (3) | | | 2.27 | % | |
(1) For each class, expenses are equal to the annualized expense ratio for the class, multiplied by the average account value over the period, multiplied by 184/365 (to reflect the one-half year period shown), unless otherwise indicated.
(2) Hypothetical expenses are equal to the annualized expense ratios for each class, multiplied by the average account value over the period (assuming 5% annual return), multiplied by 184/365 (to reflect the one-half year period shown).
(3) Includes expenses of the Fund's subsidiary (See Note A of the Notes to Consolidated Financial Statements).
7
Consolidated Schedule of Investments Neuberger Berman Absolute Return Multi-Manager Fund October 31, 2017
Investments | | Shares | | Value
(000) | |
Long Positions 98.4% | |
Common Stocks 42.6% | |
Aerospace & Defense 0.6% | |
General
Dynamics Corp.(a) | | | 2,080 | | | $ | 422 | | |
| Orbital ATK, Inc.(b) | | | 3,900 | | | | 518 | | |
| Raytheon Co.(a) | | | 2,780 | | | | 501 | | |
Rockwell
Collins, Inc.(b) | | | 1,200 | | | | 163 | | |
| Sparton Corp.*(b) | | | 4,300 | | | | 100 | | |
Ste Industrielle
d'Aviation
Latecoere SA
(France)* | | | 28,679 | | | | 182 | | |
| | | | 1,886 | | |
Air Freight & Logistics 0.9% | |
| FedEx Corp.(a) | | | 11,235 | | | | 2,537 | | |
XPO Logistics
Europe SADIR
(France)(a) | | | 2,000 | | | | 545 | | |
| | | | 3,082 | | |
| Airlines 0.0%(c) | |
AMR Corp.
Escrow *(d)(e) | | | 14,383 | | | | 19 | | |
Auto Components 0.6% | |
Delphi Automotive
plc(a) | | | 22,295 | | | | 2,216 | | |
Banks 2.0% | |
Bank of America
Corp.(a) | | | 23,250 | | | | 637 | | |
Barclays plc
(United Kingdom)(a) | | | 98,208 | | | | 242 | | |
Capital Bank
Financial Corp.,
Class A | | | 19,054 | | | | 774 | | |
| Citigroup, Inc.(a) | | | 11,065 | | | | 813 | | |
Citizens Financial
Group, Inc. | | | 13,650 | | | | 519 | | |
| Comerica, Inc.(a) | | | 7,890 | | | | 620 | | |
JPMorgan
Chase & Co.(a) | | | 6,410 | | | | 645 | | |
Pacific Continental
Corp.(b) | | | 13,500 | | | | 378 | | |
Societe Generale
SA (France) | | | 11,061 | | | | 616 | | |
UniCredit SpA
(Italy)*(a) | | | 29,250 | | | | 560 | | |
Wells Fargo &
Co.(a)(b) | | | 18,990 | | | | 1,066 | | |
| | | | 6,870 | | |
| Beverages 0.0%(c) | |
Cott Corp.
(Canada)(b) | | | 9,264 | | | | 139 | | |
Investments | | Shares | | Value
(000) | |
Biotechnology 0.2% | |
Advanced
Accelerator
Applications SA,
ADR (France)* | | | 1,200 | | | $ | 97 | | |
BioMarin
Pharmaceutical,
Inc.* | | | 4,375 | | | | 359 | | |
Enzymotec Ltd.
(Israel)* | | | 4,000 | | | | 47 | | |
Grifols SA, ADR
(Spain)(b) | | | 10,900 | | | | 258 | | |
Novelion
Therapeutics, Inc.
(Canada)*(b) | | | 4,732 | | | | 22 | | |
| | | | 783 | | |
Building Products 0.5% | |
Johnson Controls
International plc(a) | | | 44,012 | | | | 1,822 | | |
Capital Markets 1.2% | |
| Actua Corp.*(b) | | | 2,500 | | | | 39 | | |
Amundi SA
(France)(f) | | | 6,500 | | | | 551 | | |
Aretec Group, Inc.,
Class A*(d)(e)(g)(h) | | | 183,806 | | | | — | | |
Avista Healthcare
Public Acquisition
Corp., Class A* | | | 200 | | | | 2 | | |
Charles Schwab
Corp. (The) | | | 17,625 | | | | 790 | | |
Electrum Special
Acquisition Corp.* | | | 4,024 | | | | 41 | | |
Evercore, Inc.,
Class A | | | 16,550 | | | | 1,326 | | |
Goldman Sachs
Group, Inc. (The)(a) | | | 2,920 | | | | 708 | | |
J2 Acquisition Ltd.
(United Kingdom)*(f) | | | 6,800 | | | | 68 | | |
Matlin and Partners
Acquisition Corp.,
Class A*(b) | | | 13,210 | | | | 129 | | |
Modern Media
Acquisition Corp.*(b) | | | 11,900 | | | | 116 | | |
National Energy
Services Reunited
Corp.*(b) | | | 23,900 | | | | 232 | | |
Osprey Energy
Acquisition Corp.*(b) | | | 5,800 | | | | 55 | | |
Osprey Energy
Acquisition Corp.*(b) | | | 2,400 | | | | 24 | | |
| | | | 4,081 | | |
Chemicals 2.1% | |
Air Products &
Chemicals, Inc.(a) | | | 7,210 | | | | 1,149 | | |
Calgon Carbon Corp. | | | 8,900 | | | | 193 | | |
Croda International
plc (United
Kingdom) | | | 7,606 | | | | 423 | | |
Investments | | Shares | | Value
(000) | |
DowDuPont, Inc. | | | 31,580 | | | $ | 2,284 | | |
Monsanto Co. | | | 7,555 | | | | 915 | | |
| PPG Industries, Inc.(a) | | | 9,255 | | | | 1,076 | | |
Rayonier Advanced
Materials, Inc.(b) | | | 1,712 | | | | 25 | | |
| WR Grace & Co.(a) | | | 14,440 | | | | 1,104 | | |
| | | | 7,169 | | |
Communications Equipment 0.7% | |
Brocade
Communications
Systems, Inc.(b) | | | 34,595 | | | | 403 | | |
Lumentum
Holdings, Inc.* | | | 20,750 | | | | 1,310 | | |
Motorola Solutions,
Inc.(a) | | | 6,250 | | | | 566 | | |
Nokia OYJ, ADR
(Finland) | | | 10,557 | | | | 52 | | |
| | | | 2,331 | | |
Construction Materials 0.6% | |
HeidelbergCement
AG (Germany)(a) | | | 11,968 | | | | 1,225 | | |
Vulcan Materials Co. | | | 7,630 | | | | 929 | | |
| | | | 2,154 | | |
Containers & Packaging 0.1% | |
Ball Corp. | | | 8,758 | | | | 376 | | |
Diversified Telecommunication Services 0.4% | |
| CenturyLink, Inc.(b) | | | 1,906 | | | | 36 | | |
General
Communication, Inc.,
Class A*(b) | | | 9,300 | | | | 381 | | |
Level 3
Communications,
Inc.*(b) | | | 15,200 | | | | 815 | | |
Straight Path
Communications,
Inc., Class B*(b) | | | 1,500 | | | | 272 | | |
| | | | 1,504 | | |
Electric Utilities 0.6% | |
ALLETE, Inc. | | | 3,953 | | | | 310 | | |
American Electric
Power Co., Inc. | | | 1,257 | | | | 93 | | |
Exelon Corp. | | | 8,808 | | | | 354 | | |
Great Plains
Energy, Inc.(a) | | | 14,626 | | | | 480 | | |
NextEra Energy, Inc. | | | 1,919 | | | | 298 | | |
PG&E Corp. | | | 3,219 | | | | 186 | | |
| Westar Energy, Inc.(b) | | | 7,000 | | | | 374 | | |
| | | | 2,095 | | |
Electronic Equipment, Instruments & Components 0.5% | |
Axis
Communications
AB (Sweden)(a) | | | 16,400 | | | | 718 | | |
| FLIR Systems, Inc.(a) | | | 22,900 | | | | 1,072 | | |
| | | | 1,790 | | |
See Notes to Consolidated Financial Statements
8
Consolidated Schedule of Investments Neuberger Berman Absolute Return Multi-Manager Fund (cont'd)
Investments | | Shares | | Value
(000) | |
Energy Equipment & Services 0.3% | |
C&J Energy
Services, Inc.*(a) | | | 23,141 | | | $ | 660 | | |
Fairmount Santrol
Holdings, Inc.* | | | 42,727 | | | | 184 | | |
US Silica Holdings,
Inc.(a) | | | 10,459 | | | | 319 | | |
| | | | 1,163 | | |
Equity Real Estate Investment Trusts (REITs) 0.3% | |
Colony NorthStar,
Inc., Class A(b) | | | 4,787 | | | | 59 | | |
Macerich
Co. (The)(b) | | | 1,127 | | | | 61 | | |
New Senior
Investment Group,
Inc.(b) | | | 9,039 | | | | 81 | | |
New York REIT,
Inc.*(b) | | | 124,722 | | | | 942 | | |
| | | | 1,143 | | |
Food & Staples Retailing 0.6% | |
Cia Brasileira de
Distribuicao, ADR
(Brazil)*(a) | | | 9,229 | | | | 214 | | |
Magnit PJSC, GDR
(Russia)(f) | | | 7,182 | | | | 203 | | |
| Rite Aid Corp.*(b) | | | 64,425 | | | | 106 | | |
Wal-Mart de
Mexico SAB de
CV (Mexico)(a) | | | 87,901 | | | | 197 | | |
Wal-Mart Stores,
Inc.(a) | | | 6,250 | | | | 546 | | |
X5 Retail Group NV,
GDR (Russia)*(f) | | | 15,107 | | | | 621 | | |
| | | | 1,887 | | |
Food Products 0.8% | |
Blue Buffalo Pet
Products, Inc.* | | | 14,700 | | | | 425 | | |
Bob Evans
Farms, Inc. | | | 1,300 | | | | 100 | | |
| Bunge Ltd.(b) | | | 700 | | | | 48 | | |
Danone SA, ADR
(France)(b) | | | 1,653 | | | | 27 | | |
Hain Celestial
Group, Inc. (The)* | | | 13,400 | | | | 483 | | |
Mondelez
International, Inc.,
Class A(a) | | | 29,270 | | | | 1,213 | | |
Nomad Foods Ltd.
(United
Kingdom)*(b) | | | 7,138 | | | | 108 | | |
Omega Protein
Corp.(b) | | | 5,000 | | | | 110 | | |
Pinnacle Foods,
Inc.(b) | | | 1,594 | | | | 87 | | |
TreeHouse
Foods, Inc.*(b) | | | 1,134 | | | | 75 | | |
| | | | 2,676 | | |
Investments | | Shares | | Value
(000) | |
Gas Utilities 0.1% | |
Atmos Energy
Corp. | | | 2,584 | | | $ | 226 | | |
WGL Holdings,
Inc.(b) | | | 2,000 | | | | 171 | | |
| | | | 397 | | |
Health Care Equipment & Supplies 1.4% | |
| CR Bard, Inc.(a) | | | 5,653 | | | | 1,849 | | |
| Danaher Corp.(a) | | | 17,925 | | | | 1,654 | | |
Exactech, Inc.* | | | 2,800 | | | | 117 | | |
NxStage Medical,
Inc.*(b) | | | 10,900 | | | | 294 | | |
Smith & Nephew
plc (United
Kingdom)(a) | | | 7,345 | | | | 139 | | |
Zimmer Biomet
Holdings, Inc.(b) | | | 6,515 | | | | 792 | | |
| | | | 4,845 | | |
Health Care Providers & Services 0.5% | |
Aetna, Inc. | | | 7,950 | | | | 1,352 | | |
Brookdale Senior
Living, Inc.* | | | 4,826 | | | | 49 | | |
Kindred
Healthcare, Inc.(b) | | | 2,200 | | | | 13 | | |
PharMerica
Corp.*(b) | | | 4,400 | | | | 129 | | |
Shanghai
Pharmaceuticals
Holding Co. Ltd.,
Class H (China) | | | 57,371 | | | | 148 | | |
Sinopharm Group
Co. Ltd., Class H
(China) | | | 32,206 | | | | 144 | | |
| | | | 1,835 | | |
Hotels, Restaurants & Leisure 1.6% | |
Belmond Ltd.,
Class A (United
Kingdom)*(b) | | | 3,000 | | | | 39 | | |
Caesars
Entertainment
Corp.* | | | 47,100 | | | | 610 | | |
Carnival Corp. | | | 8,585 | | | | 570 | | |
| Drive Shack, Inc.(b) | | | 7,352 | | | | 27 | | |
| ILG, Inc.(b) | | | 3,063 | | | | 91 | | |
Jack in the Box,
Inc.(b) | | | 270 | | | | 28 | | |
Pinnacle
Entertainment,
Inc.*(b) | | | 33,002 | | | | 854 | | |
Playa Hotels &
Resorts NV*(b) | | | 87,119 | | | | 900 | | |
Six Flags
Entertainment
Corp.(a) | | | 26,900 | | | | 1,689 | | |
Tropicana
Entertainment,
Inc.*(b) | | | 12,249 | | | | 602 | | |
| | | | 5,410 | | |
Investments | | Shares | | Value
(000) | |
Household Durables 0.2% | |
CalAtlantic
Group, Inc. | | | 1,900 | | | $ | 94 | | |
Lennar Corp.,
Class A | | | 8,500 | | | | 473 | | |
Lennar Corp.,
Class B(b) | | | 4,400 | | | | 211 | | |
| | | | 778 | | |
| Household Products 0.0%(c) | |
HRG Group, Inc.* | | | 1,067 | | | | 17 | | |
Procter & Gamble
Co. (The) | | | 389 | | | | 34 | | |
| | | | 51 | | |
Independent Power and Renewable Electricity Producers 0.6% | |
8Point3 Energy
Partners LP | | | 14,897 | | | | 225 | | |
Atlantica Yield plc
(Spain) | | | 25,226 | | | | 564 | | |
| Calpine Corp.*(b) | | | 23,600 | | | | 353 | | |
NextEra Energy
Partners LP | | | 5,940 | | | | 234 | | |
Pattern Energy
Group, Inc. | | | 11,230 | | | | 259 | | |
TerraForm Global,
Inc., Class A*(b) | | | 110,700 | | | | 540 | | |
| | | | 2,175 | | |
Industrial Conglomerates 0.1% | |
Smiths Group plc
(United Kingdom)(a) | | | 9,113 | | | | 190 | | |
Insurance 1.5% | |
Admiral Group plc
(United Kingdom)(a) | | | 9,710 | | | | 248 | | |
AIA Group Ltd.
(Hong Kong) | | | 136,406 | | | | 1,027 | | |
American
International
Group, Inc. | | | 20,010 | | | | 1,293 | | |
| Aon plc(a) | | | 4,760 | | | | 683 | | |
Athene Holding
Ltd., Class A*(a) | | | 10,000 | | | | 521 | | |
| Chubb Ltd.(a) | | | 3,960 | | | | 597 | | |
Fidelity &
Guaranty Life | | | 1,162 | | | | 36 | | |
Genworth
Financial, Inc.,
Class A*(b) | | | 2,200 | | | | 7 | | |
RSA Insurance
Group plc
(United Kingdom)(a) | | | 69,411 | | | | 580 | | |
State National
Cos., Inc.(b) | | | 4,200 | | | | 88 | | |
Syncora Holdings
Ltd.*(b) | | | 81,817 | | | | 152 | | |
| WMIH Corp.*(b) | | | 60,581 | | | | 50 | | |
| | | | 5,282 | | |
See Notes to Consolidated Financial Statements
9
Consolidated Schedule of Investments Neuberger Berman Absolute Return Multi-Manager Fund (cont'd)
Investments | | Shares | | Value
(000) | |
Internet & Direct Marketing Retail 0.9% | |
Amazon.com,
Inc.*(a) | | | 736 | | | $ | 814 | | |
ASOS plc
(United Kingdom)* | | | 2,023 | | | | 153 | | |
China Literature
Ltd. (China)*(e)(f)(g) | | | 13 | | | | — | (i) | |
Expedia, Inc. | | | 4,230 | | | | 527 | | |
| HSN, Inc.(a) | | | 10,100 | | | | 381 | | |
Netflix, Inc.* | | | 2,690 | | | | 528 | | |
Priceline Group,
Inc. (The)* | | | 295 | | | | 564 | | |
zooplus AG
(Germany)* | | | 1,343 | | | | 222 | | |
| | | | 3,189 | | |
Internet Software & Services 2.1% | |
Alibaba Group
Holding Ltd.,
ADR (China)* | | | 7,368 | | | | 1,362 | | |
Alphabet, Inc.,
Class A*(a) | | | 1,651 | | | | 1,706 | | |
Baidu, Inc.,
ADR (China)* | | | 1,743 | | | | 425 | | |
Bankrate, Inc.* | | | 10,600 | | | | 147 | | |
eBay, Inc.* | | | 7,687 | | | | 289 | | |
Facebook, Inc.,
Class A*(a) | | | 9,742 | | | | 1,754 | | |
Mail.Ru Group Ltd.,
GDR (Russia)*(a)(f) | | | 7,718 | | | | 251 | | |
MercadoLibre, Inc.
(Argentina) | | | 1,692 | | | | 407 | | |
Pandora Media,
Inc.*(b) | | | 6,900 | | | | 50 | | |
Tencent Holdings
Ltd. (China) | | | 16,785 | | | | 753 | | |
Yandex NV,
Class A (Russia)* | | | 6,261 | | | | 212 | | |
| | | | 7,356 | | |
IT Services 0.9% | |
Accenture plc,
Class A | | | 3,300 | | | | 470 | | |
Everi
Holdings, Inc.* | | | 95,236 | | | | 789 | | |
Fidelity National
Information
Services, Inc.(a) | | | 5,635 | | | | 523 | | |
MoneyGram
International, Inc.* | | | 4,600 | | | | 72 | | |
PayPal
Holdings, Inc.* | | | 7,938 | | | | 576 | | |
Planet Payment,
Inc.* | | | 16,200 | | | | 72 | | |
Visa, Inc.,
Class A(a) | | | 4,680 | | | | 515 | | |
| | | | 3,017 | | |
Investments | | Shares | | Value
(000) | |
Life Sciences Tools & Services 1.0% | |
Bio-Rad
Laboratories, Inc.,
Class A*(a) | | | 5,975 | | | $ | 1,313 | | |
Gerresheimer
AG (Germany)(a) | | | 16,668 | | | | 1,333 | | |
| VWR Corp.*(b) | | | 20,800 | | | | 689 | | |
| | | | 3,335 | | |
Machinery 0.9% | |
| Dover Corp.(a) | | | 23,760 | | | | 2,269 | | |
EnPro Industries, Inc. | | | 8,915 | | | | 746 | | |
| | | | 3,015 | | |
Media 3.1% | |
Charter
Communications,
Inc., Class A*(a) | | | 1,390 | | | | 464 | | |
DISH Network
Corp., Class A*(a) | | | 8,914 | | | | 433 | | |
Gray Television,
Inc.*(a) | | | 53,279 | | | | 830 | | |
ITV plc
(United Kingdom)(a) | | | 369,442 | | | | 807 | | |
Liberty Global plc,
Class C
(United Kingdom)* | | | 8,040 | | | | 240 | | |
Liberty Global plc
LiLAC, Class C
(United Kingdom)*(a) | | | 1,668 | | | | 37 | | |
Liberty Media
Corp.-Liberty
SiriusXM, Class A*(b) | | | 1,822 | | | | 76 | | |
Loral Space &
Communications,
Inc.*(b) | | | 8,157 | | | | 385 | | |
New Media
Investment Group,
Inc.(b) | | | 2,900 | | | | 46 | | |
Nexstar Media
Group, Inc.,
Class A(b) | | | 16,264 | | | | 1,038 | | |
Scripps Networks
Interactive, Inc.,
Class A(b) | | | 3,200 | | | | 266 | | |
Sinclair Broadcast
Group, Inc.,
Class A(b) | | | 19,516 | | | | 619 | | |
Sirius XM
Holdings, Inc.(b) | | | 32,693 | | | | 178 | | |
Stroeer SE & Co.
KGaA (Germany) | | | 42,073 | | | | 2,691 | | |
| TEGNA, Inc.(b) | | | 1,196 | | | | 15 | | |
| Time Warner, Inc.(b) | | | 19,191 | | | | 1,886 | | |
| Time, Inc.(b) | | | 2,274 | | | | 26 | | |
Tribune Co.
Litigation,
Class 1C*(d)(e) | | | 300,000 | | | | 1 | | |
Tribune Media Co.,
Class A(b) | | | 6,900 | | | | 282 | | |
Investments | | Shares | | Value
(000) | |
Twenty-First
Century Fox, Inc.,
Class B(b) | | | 5,200 | | | $ | 132 | | |
Walt Disney Co.
(The)(b) | | | 948 | | | | 93 | | |
| | | | 10,545 | | |
Metals & Mining 0.1% | |
Dominion Diamond
Corp. (Canada)(b) | | | 33,000 | | | | 470 | | |
Multi-Utilities 0.2% | |
Black Hills Corp. | | | 1,529 | | | | 100 | | |
SCANA Corp. | | | 6,867 | | | | 296 | | |
Sempra Energy | | | 1,962 | | | | 231 | | |
| | | | 627 | | |
Oil, Gas & Consumable Fuels 2.5% | |
Antero Midstream
GP LP(a) | | | 40,172 | | | | 752 | | |
Cabot Oil & Gas
Corp. | | | 13,650 | | | | 378 | | |
Cheniere Energy,
Inc.*(a) | | | 16,439 | | | | 768 | | |
Enbridge Energy
Management
LLC*(d)(e)(g) | | | 2,249 | | | | — | (i) | |
EOG
Resources, Inc.(a) | | | 3,220 | | | | 322 | | |
EQT Corp. | | | 18,525 | | | | 1,158 | | |
Golar LNG Ltd. | | | 8,878 | | | | 188 | | |
Halcon Resources
Corp.* | | | 100,067 | | | | 658 | | |
Kinder Morgan, Inc. | | | 31,984 | | | | 579 | | |
Midstates
Petroleum
Co., Inc.*(b) | | | 56,524 | | | | 862 | | |
NextDecade Corp.* | | | 5,425 | | | | 55 | | |
ONEOK, Inc. | | | 3,990 | | | | 216 | | |
Pioneer Natural
Resources Co.(a) | | | 1,595 | | | | 239 | | |
| Rice Energy, Inc.*(b) | | | 29,700 | | | | 842 | | |
| SM Energy Co.(b) | | | 22,974 | | | | 490 | | |
Targa Resources
Corp. | | | 11,544 | | | | 479 | | |
TransCanada Corp.
(Canada)(a) | | | 10,277 | | | | 488 | | |
Williams Cos.,
Inc. (The) | | | 4,869 | | | | 139 | | |
| | | | 8,613 | | |
Personal Products 0.4% | |
Edgewell Personal
Care Co.*(a) | | | 21,438 | | | | 1,392 | | |
Pharmaceuticals 1.4% | |
| Akorn, Inc.*(a) | | | 20,600 | | | | 671 | | |
| Allergan plc(b) | | | 18,479 | | | | 3,275 | | |
Aralez
Pharmaceuticals,
Inc. (Canada)*(b) | | | 345 | | | | — | (i) | |
See Notes to Consolidated Financial Statements
10
Consolidated Schedule of Investments Neuberger Berman Absolute Return Multi-Manager Fund (cont'd)
Investments | | Shares | | Value
(000) | |
Bristol-Myers
Squibb Co. | | | 7,450 | | | $ | 459 | | |
Dr Reddy's
Laboratories Ltd.,
ADR (India) | | | 5,797 | | | | 211 | | |
Hikma
Pharmaceuticals
plc (Jordan)(a) | | | 17,797 | | | | 275 | | |
Teva Pharmaceutical
Industries Ltd.,
ADR (Israel) | | | 3,167 | | | | 44 | | |
| | | | 4,935 | | |
Professional Services 1.0% | |
Advisory Board
Co. (The)* | | | 400 | | | | 22 | | |
Dun & Bradstreet
Corp. (The)(a) | | | 17,685 | | | | 2,066 | | |
Intertrust NV
(Netherlands)(a)(f) | | | 1,072 | | | | 16 | | |
Verisk Analytics, Inc.* | | | 16,375 | | | | 1,393 | | |
| | | | 3,497 | | |
Real Estate Management & Development 0.4% | |
Forestar Group, Inc.* | | | — | (i) | | | — | (i) | |
VICI Properties, Inc.* | | | 72,840 | | | | 1,347 | | |
| | | | 1,347 | | |
Road & Rail 1.1% | |
| CSX Corp.(a) | | | 39,475 | | | | 1,991 | | |
Norfolk Southern
Corp.(a) | | | 12,597 | | | | 1,655 | | |
| | | | 3,646 | | |
Semiconductors & Semiconductor Equipment 2.0% | |
Analog Devices, Inc. | | | 6,410 | | | | 585 | | |
| Broadcom Ltd.(a) | | | 6,805 | | | | 1,796 | | |
Intel Corp. | | | 10,950 | | | | 498 | | |
IXYS Corp.* | | | 11,900 | | | | 294 | | |
Lattice
Semiconductor
Corp.*(b) | | | 11,600 | | | | 68 | | |
Microchip
Technology, Inc.(a) | | | 14,240 | | | | 1,350 | | |
NXP Semiconductors
NV (Netherlands)*(b) | | | 18,154 | | | | 2,125 | | |
| Xcerra Corp.*(b) | | | 9,900 | | | | 97 | | |
| | | | 6,813 | | |
Software 0.5% | |
Activision
Blizzard, Inc.(a) | | | 6,250 | | | | 409 | | |
BroadSoft, Inc.* | | | 1,200 | | | | 66 | | |
| Exa Corp.*(b) | | | 8,500 | | | | 206 | | |
| Gigamon, Inc.*(b) | | | 2,142 | | | | 83 | | |
Micro Focus
International plc,
ADR (United
Kingdom)*(b) | | | 1,413 | | | | 49 | | |
Investments | | Shares | | Value
(000) | |
salesforce.com,
Inc.*(a) | | | 3,550 | | | $ | 363 | | |
Silver Spring
Networks, Inc.*(b) | | | 2,600 | | | | 42 | | |
| Symantec Corp.(a) | | | 17,200 | | | | 559 | | |
| | | | 1,777 | | |
Specialty Retail 2.3% | |
| AutoZone, Inc.*(a) | | | 4,583 | | | | 2,702 | | |
Hennes & Mauritz
AB, Class B (Sweden) | | | 19,715 | | | | 495 | | |
Pets at Home
Group plc
(United Kingdom)(a) | | | 18,604 | | | | 43 | | |
Sports Direct
International plc
(United Kingdom)*(a) | | | 426,928 | | | | 2,242 | | |
| Tiffany & Co.(a) | | | 26,650 | | | | 2,495 | | |
| | | | 7,977 | | |
Technology Hardware, Storage & Peripherals 0.7% | |
| Apple, Inc.(a) | | | 6,128 | | | | 1,036 | | |
Hewlett Packard
Enterprise Co.(b) | | | 10,089 | | | | 140 | | |
Samsung
Electronics Co. Ltd.,
GDR (South Korea)(f) | | | 579 | | | | 714 | | |
Western Digital
Corp.(a) | | | 6,250 | | | | 558 | | |
| | | | 2,448 | | |
Textiles, Apparel & Luxury Goods 0.9% | |
Burberry Group plc
(United Kingdom)(a) | | | 4,013 | | | | 101 | | |
Michael Kors
Holdings Ltd.* | | | 6,913 | | | | 337 | | |
NIKE, Inc., Class B | | | 10,201 | | | | 561 | | |
PVH Corp. | | | 13,315 | | | | 1,689 | | |
Tapestry, Inc. | | | 10,989 | | | | 450 | | |
| | | | 3,138 | | |
Thrifts & Mortgage Finance 0.1% | |
Bear State
Financial, Inc. | | | 900 | | | | 9 | | |
Ocwen Financial
Corp.*(b) | | | 111,430 | | | | 389 | | |
| | | | 398 | | |
Trading Companies & Distributors 0.4% | |
Brenntag AG
(Germany) | | | 26,556 | | | | 1,507 | | |
Transportation Infrastructure 0.4% | |
Macquarie
Infrastructure
Corp.(b) | | | 18,150 | | | | 1,262 | | |
Water Utilities 0.2% | |
American Water
Works Co., Inc. | | | 5,590 | | | | 491 | | |
Investments | | Shares | | Value
(000) | |
Aqua
America, Inc.(a) | | | 7,674 | | | $ | 272 | | |
| | | | 763 | | |
Wireless Telecommunication Services 0.1% | |
T-Mobile US,
Inc. *(a)(b) | | | 8,075 | | | | 483 | | |
Total Common Stocks
(Cost $137,949) | | | | | 147,699 | | |
| | | Principal
Amount | | | |
Corporate Bonds 8.6% | |
Banks 1.6% | |
Emigrant Capital
Trust V (ICE
LIBOR USD
3 Month +
1.55%), 2.89%,
7/1/2037(d)(e)(j)(k) | | $ | 8,000,000 | | | | 5,560 | | |
Beverages 0.3% | |
CEDC Finance
Corp.
International, Inc.
(Poland) 10.00%,
12/31/2022(b)(j) | | | 950,708 | | | | 922 | | |
Capital Markets 2.3% | |
Sterling Capital
Corp. 2.77%,
10/1/2037(d)(e)(k) | | | 11,000,000 | | | | 8,030 | | |
Chemicals 0.0% | |
Momentive
Performance
Materials, Inc.
Escrow 10.00%,
10/15/2020(d)(e)(g)(l) | | | 613,000 | | | | — | | |
Commercial Services & Supplies 0.5% | |
Brink's Co. (The)
4.63%,
10/15/2027(j) | | | 42,000 | | | | 42 | | |
Corporate Risk
Holdings LLC
9.50%,
7/1/2019(b)(j) | | | 1,579,000 | | | | 1,670 | | |
West Corp.
8.50%,
10/15/2025(j) | | | 125,000 | | | | 122 | | |
| | | | 1,834 | | |
Construction & Engineering 0.2% | |
ABG Orphan
Holdco Sarl
(Spain) 14.00%,
2/28/2021(f)(m) | | | 657,087 | | | | 674 | | |
See Notes to Consolidated Financial Statements
11
Consolidated Schedule of Investments Neuberger Berman Absolute Return Multi-Manager Fund (cont'd)
Investments | | Principal
Amount | | Value
(000) | |
Energy Equipment & Services 0.5% | |
FTS
International,
Inc. (ICE LIBOR
USD 3 Month +
7.50%, 7.50%
Floor),
8.82%,
6/15/2020(j)(k) | | | $229,000 | | | | $234 | | |
| 5/1/2022(b) 6.25%, | | | 949,000 | | | | 921 | | |
Hornbeck
Offshore
Services, Inc.
5.88%, 4/1/2020 | | | 1,055,000 | | | | 696 | | |
| | | | 1,851 | | |
Equity Real Estate Investment Trusts (REITs) 0.1% | |
VICI Properties 1
LLC (ICE LIBOR
USD 3 Month +
3.50%, 4.50%
Floor),
4.85%,
10/15/2022(k) | | | 94,708 | | | | 95 | | |
| 10/15/2023 8.00%, | | | 294,000 | | | | 327 | | |
| | | | 422 | | |
Hotels, Restaurants & Leisure 0.1% | |
Constellation
Merger Sub, Inc.
8.50%,
9/15/2025(b)(j) | | | 173,000 | | | | 172 | | |
Independent Power and Renewable Electricity Producers 0.7% | |
GenOn Energy,
Inc.
9.50%,
10/15/2018(l) | | | 1,482,000 | | | | 1,045 | | |
| 10/15/2020(l) 9.88%, | | | 1,687,000 | | | | 1,189 | | |
| | | | 2,234 | | |
Insurance 0.2% | |
Alliant Holdings
Intermediate LLC
8.25%, 8/1/2023(j) | | | 500,000 | | | | 533 | | |
Internet & Direct Marketing Retail 0.3% | |
Netflix, Inc.
4.38%,
11/15/2026(b)(j) | | | 777,000 | | | | 762 | | |
| 4/15/2028(j) 4.88%, | | | 420,000 | | | | 417 | | |
| | | | 1,179 | | |
Investments | | Principal
Amount | | Value
(000) | |
Media 0.4% | |
AMC
Networks, Inc.
4.75%, 8/1/2025(b) | | $ | 246,000 | | | $ | 246 | | |
Cenveo Corp.
6.00%,
8/1/2019(b)(j) | | | 1,671,000 | | | | 1,153 | | |
| | | | 1,399 | | |
Metals & Mining 0.3% | |
Constellium NV
(Netherlands)
6.63%,
3/1/2025(b)(j) | | | 1,032,000 | | | | 1,071 | | |
Oil, Gas & Consumable Fuels 0.8% | |
Cobalt
International
Energy, Inc.
10.75%,
12/1/2021(b)(j) | | | 1,454,000 | | | | 1,490 | | |
| 12/1/2023(b)(j) 7.75%, | | | 583,000 | | | | 362 | | |
Denbury
Resources, Inc.
9.00%,
5/15/2021(b)(j) | | | 360,000 | | | | 352 | | |
5.50%, 5/1/2022 | | | 737,000 | | | | 462 | | |
EP Energy LLC
9.38%, 5/1/2020 | | | 119,000 | | | | 100 | | |
Midstates
Petroleum Co.,
Inc. Escrow
10.00%,
6/1/2020(d)(e)(g)(l) | | | 1,848,000 | | | | — | | |
| | | | 2,766 | | |
| Specialty Retail 0.0%(c) | |
Staples, Inc.
8.50%,
9/15/2025(b)(j) | | | 79,000 | | | | 70 | | |
Technology Hardware, Storage & Peripherals 0.3% | |
Everi
Payments, Inc.
10.00%,
1/15/2022 | | | 930,000 | | | | 1,011 | | |
Total Corporate Bonds
(Cost $29,407) | | | | | 29,728 | | |
Investments | | Principal
Amount | | Value
(000) | |
Commercial Mortgage-Backed Securities 8.0% | |
BAMLL
Commercial
Mortgage
Securities Trust
Series 2016-ASMZ,
Class MZA,
(ICE LIBOR USD
1 Month +9.25),
10.49%,
12/15/2017(d)(j)(n) | | $ | 5,000,000 | | | $ | 5,001 | | |
Series
2013-DSNY,
Class F,
(ICE LIBOR USD
1 Month +3.50),
4.74%,
9/15/2026(j)(n) | | | 3,000,000 | | | | 2,997 | | |
2014-ICTS,
Class E,
(ICE LIBOR USD
1 Month +2.95),
4.19%,
6/15/2028(a)(j)(n) Series | | | 3,450,000 | | | | 3,433 | | |
COMM
Mortgage Trust
Series 2014-PAT,
Class E,
(ICE LIBOR USD
1 Month +3.15),
4.39%,
8/13/2027(a)(j)(n) | | | 4,800,000 | | | | 4,875 | | |
CSMC Trust
Series 2015-DEAL,
Class E,
(ICE LIBOR USD
1 Month +4.00),
5.24%,
4/15/2029(j)(n) | | | 1,000,000 | | | | 1,004 | | |
GS Mortgage
Securities Trust
Series 2013-GC12,
Class D, 4.45%,
6/10/2046(j)(n) | | | 2,000,000 | | | | 1,724 | | |
JP Morgan
Chase
Commercial
Mortgage
Securities Trust
Series
2014-PHH,
Class E,
(ICE LIBOR USD
1 Month +3.55),
4.79%,
8/15/2027(j)(n) | | | 1,910,000 | | | | 1,910 | | |
See Notes to Consolidated Financial Statements
12
Consolidated Schedule of Investments Neuberger Berman Absolute Return Multi-Manager Fund (cont'd)
Investments | | Principal
Amount | | Value
(000) | |
Series
2014-CBM,
Class E,
(ICE LIBOR USD
1 Month +3.85),
5.09%,
10/15/2029(j)(n) | | $ | 1,700,000 | | | $ | 1,700 | | |
2013-C10,
Class D, 4.15%,
12/15/2047(n) Series | | | 1,400,000 | | | | 1,280 | | |
Lone Star
Portfolio Trust
Series 2015-LSP,
Class E,
(ICE LIBOR USD
1 Month +5.60),
6.84%,
9/15/2028(j)(n) | | | 1,109,189 | | | | 1,129 | | |
Palisades
Center Trust
Series
2016-PLSD,
Class D, 4.74%,
4/13/2033(j) | | | 1,000,000 | | | | 1,006 | | |
Wells Fargo
Commercial
Mortgage Trust
Series 2014-TISH,
Class WTS2,
(ICE LIBOR USD
1 Month +3.25),
4.49%, 2/15/2027(j)(n) | | | 1,700,000 | | | | 1,701 | | |
Total Commercial
Mortgage-Backed
Securities
(Cost $27,700) | | | | | 27,760 | | |
Loan Assignments 6.7% | |
Air Freight & Logistics 0.1% | |
Transplace, Inc.,
1st Lien Term
Loan B
(ICE LIBOR
USD 1 Month +
4.25%), 5.49%,
9/29/2024(k) | | | 215,000 | | | | 217 | | |
Capital Markets 0.1% | |
Duff & Phelps
Corp., 1st Lien
Term Loan B
(ICE LIBOR
USD 6 Month +
3.25%), 4.61%,
10/5/2024(k) | | | 168,000 | | | | 170 | | |
Investments | | Principal
Amount | | Value
(000) | |
| Chemicals 0.0%(c) | |
HB Fuller Co.,
1st Lien Term Loan
(ICE LIBOR USD
6 Month + 2.25%),
3.49%, 10/20/2024(k) | | $ | 61,000 | | | $ | 61 | | |
Commercial Services & Supplies 0.4% | |
Harland Clarke
Holdings Corp.,
Term Loan
(ICE LIBOR USD
3 Month + 5.50%),
6.83%, 2/9/2022(k) | | | 386,082 | | | | 386 | | |
Inter Car Cleaning,
1st Lien Term Loan
(ICE LIBOR USD
1 Month + 3.50%),
4.73%, 9/25/2024(e)(k) | | | 153,000 | | | | 154 | | |
Inter Car Cleaning,
2nd Lien Term Loan
(ICE LIBOR USD
6 Month + 7.50%),
8.73%,
9/25/2025(e)(k) | | | 310,000 | | | | 310 | | |
Paradigm
Acquisition Corp.,
1st Lien Term Loan
(ICE LIBOR USD
6 Month + 4.25%),
5.61%,
10/6/2024(k) | | | 283,000 | | | | 284 | | |
Paradigm
Acquisition Corp.,
2nd Lien Term Loan
(ICE LIBOR USD
6 Month + 8.50%),
10.02%,
10/6/2025(k)(o) | | | 129,000 | | | | 129 | | |
West Corp.,
Cov-lite Term
Loan (ICE LIBOR
USD 1 Month +
4.00%), 5.24%,
10/3/2024(k) | | | 65,000 | | | | 65 | | |
| | | | 1,328 | | |
| Construction & Engineering 0.0%(c) | |
Traverse
Midstream
Partners LLC,
Term Loan
(ICE LIBOR USD
6 Month + 4.00%),
5.33%, 9/22/2024(k) | | | 59,000 | | | | 60 | | |
Investments | | Principal
Amount | | Value
(000) | |
| Containers & Packaging 0.0%(c) | |
Ring Container
Technologies, Inc.,
Term Loan
(ICE LIBOR
USD 1 Month +
2.75%),
9/27/2024(k)(o)(p) | | $ | 99,000 | | | $ | 99 | | |
Diversified Telecommunication
Services 0.1% | |
Securus Holdings,
Inc., Term Loan
(ICE LIBOR USD
3 Month + 7.75%),
9.00%, 4/30/2021(k) | | | 382,000 | | | | 383 | | |
SFR Group SA,
Term Loan
(ICE LIBOR USD
3 Month + 3.00%),
1/15/2026(k)(o) | | | 49,000 | | | | 49 | | |
| | | | 432 | | |
| Electrical Equipment 0.0%(c) | |
Corsair Electrical
Connectors, Inc.,
1st Lien Term Loan B
(ICE LIBOR USD
3 Month + 4.75%),
6.08%, 9/29/2024(k) | | | 116,000 | | | | 116 | | |
Energy Equipment & Services 0.1% | |
Seadrill Operating
LP, Term Loan
(ICE LIBOR USD
3 Month + 3.00%),
4.33%,
2/21/2021(k)(o) | | | 567,000 | | | | 430 | | |
Food Products 0.2% | |
Del Monte Foods,
Inc., 1st Lien
Term Loan
(ICE LIBOR
USD 3 Month +
2.25% - 3.25%),
4.58%, 2/18/2021(k) | | | 82,360 | | | | 70 | | |
Give & Go
Prepared Foods
Corp., 1st Lien
Term Loan
(ICE LIBOR
USD 3 Month +
4.25%), 5.56%,
7/29/2023(e)(k) | | | 483,000 | | | | 490 | | |
| | | | 560 | | |
See Notes to Consolidated Financial Statements
13
Consolidated Schedule of Investments Neuberger Berman Absolute Return Multi-Manager Fund (cont'd)
Investments | | Principal
Amount | | Value
(000) | |
Health Care Providers & Services 1.3% | |
21st Century
Oncology, Inc.,
Term Loan
(ICE LIBOR
USD 3 Month +
6.13%), 7.47%,
4/30/2022(k) | | $ | 3,315,638 | | | $ | 3,117 | | |
Air Medical
Group Holdings,
Inc., 1st Lien
Term Loan B
0.00%, 9/26/2024(k) | | | 206,000 | | | | 207 | | |
Highland
Acquisition
Holdings LLC,
Term Loan B
(ICE LIBOR USD
1 Month + 5.50%),
6.74%,
11/30/2022(k)(o) | | | 1,021,919 | | | | 1,024 | | |
| | | 4,348 | | |
Hotels, Restaurants & Leisure 0.2% | |
Caesars Resort
Collection LLC,
Term Loan,
9/30/2024(k)(o) | | | 578,000 | | | | 581 | | |
Household Durables 0.1% | |
Traeger Pellet
Grills LLC,
1st Lien Term Loan
(ICE LIBOR USD
3 Month + 5.00%),
6.33%,
9/21/2024(e)(k) | | | 59,644 | | | | 60 | | |
Traeger Pellet
Grills LLC,
2nd Lien Term Loan
(ICE LIBOR USD
3 Month + 8.50%),
9.83%, 9/21/2025(k) | | | 114,000 | | | | 114 | | |
| | | | 174 | | |
Independent Power and Renewable Electricity Producers 0.4% | |
Star West
Generation LLC,
Term Loan B
(ICE LIBOR USD
3 Month + 4.75%),
6.09%, 3/13/2020(k) | | | 1,571,304 | | | | 1,387 | | |
Insurance 0.6% | |
Confie Seguros
Holding II Co.,
2nd Lien Term Loan
(ICE LIBOR USD
1 Month + 10.00%),
11.25%,
5/8/2019(k) | | | 1,218,000 | | | | 1,190 | | |
Investments | | Principal
Amount | | Value
(000) | |
Confie Seguros
Holding II Co.,
Term Loan B
(ICE LIBOR USD
1 Month + 5.75%),
6.99%, 4/19/2022(k) | | $ | 864,468 | | | $ | 856 | | |
| | | | 2,046 | | |
Leisure Products 0.1% | |
PlayCore, Inc.,
1st Lien Term Loan
(ICE LIBOR USD
6 Month + 3.75%),
5.25%, 9/18/2024(k) | | | 131,262 | | | | 132 | | |
PlayCore, Inc.,
2nd Lien Term Loan
(ICE LIBOR USD
6 Month + 7.75%),
9.25%,
9/18/2025(e)(g)(k) | | | 238,000 | | | | 235 | | |
| | | | 367 | | |
Machinery 0.1% | |
HydroChem LLC,
2nd Lien Term Loan
(ICE LIBOR USD
6 Month + 8.50%),
9.74%, 10/5/2025(k) | | | 218,000 | | | | 214 | | |
HydroChem LLC,
Term Loan
(ICE LIBOR USD
1 Month + 4.25%),
5.49%, 10/5/2024(k) | | | 293,000 | | | | 296 | | |
| | | | 510 | | |
Media 0.2% | |
Authentic Brands
Group LLC,
1st Lien Term Loan
(ICE LIBOR USD
6 Month + 3.50%),
4.83%,
9/27/2024(e)(k) | | | 272,000 | | | | 274 | | |
Authentic
Brands Group
LLC, Term Loan
(ICE LIBOR
USD 6 Month +
7.75%), 9.08%,
9/29/2025(k) | | | 107,000 | | | | 108 | | |
Red Ventures LLC,
Term Loan B
+ 3.50%),
10/18/2024(k)(o) | | | 306,000 | | | | 304 | | |
| | | 686 | | |
Investments | | Principal
Amount | | Value
(000) | |
Multiline Retail 0.3% | |
JC Penney
Corp., Inc.,
1st Lien Term Loan
(ICE LIBOR
USD 3 Month +
4.25%),
6/23/2023(k)(o)(p) | | $ | 981,000 | | | $ | 898 | | |
Oil, Gas & Consumable Fuels 0.1% | |
BCP Renaissance
Parent LLC
(ICE LIBOR
USD 3 Month +
4.00%),
9/19/2024(k)(o) | | | 197,000 | | | | 199 | | |
Southcross Energy
Partners LP,
Term Loan
(ICE LIBOR
USD 3 Month +
4.25%), 5.58%,
8/4/2021(k) | | | 355,260 | | | | 300 | | |
| | | | 499 | | |
Pharmaceuticals 0.3% | |
Valeant
Pharmaceuticals
International, Inc.,
1st Lien Term
Loan BF1 (ICE
LIBOR USD
1 Month + 4.75%),
5.99%, 4/1/2022(k) | | | 1,110,369 | | | | 1,135 | | |
| Professional Services 0.0%(c) | |
Institutional
Shareholder
Services, Inc.,
1st Lien Term Loan
(ICE LIBOR USD
3 Month + 3.75%),
5.11%, 10/3/2024(k) | | | 99,000 | | | | 99 | | |
Real Estate Management & Development 0.2% | |
Lightstone
Holdco LLC,
Term Loan B
(ICE LIBOR USD
1 Month + 4.50%),
5.74%,
1/30/2024(k) | | | 161,455 | | | | 162 | | |
Lightstone
Holdco LLC,
Term Loan C
(ICE LIBOR USD
1 Month + 4.50%),
5.74%, 1/30/2024(k) | | | 10,060 | | | | 10 | | |
See Notes to Consolidated Financial Statements
14
Consolidated Schedule of Investments Neuberger Berman Absolute Return Multi-Manager Fund (cont'd)
Investments | | Principal
Amount | | Value
(000) | |
Ten-X LLC,
1st Lien Term Loan B
(ICE LIBOR USD
1 Month + 4.00%),
5.24%, 9/20/2024(k) | | $ | 435,000 | | | $ | 435 | | |
| | | | 607 | | |
Semiconductors & Semiconductor Equipment 1.3% | |
SunEdison, Inc.,
2nd Lien
Term Loan
(ICE LIBOR USD
1 Month +
12.00%),
13.24%,
4/28/2018(e)(k) | | | 3,512,818 | | | | 3,504 | | |
SunEdison, Inc.,
2nd Lien Term
Loan A2 0.00%,
7/2/2018(k)(l) | | | 998,607 | | | | 150 | | |
SunEdison, Inc.,
Term Loan
(ICE LIBOR USD
1 Month + 7.50%),
8.74%,
4/21/2018(k) | | | 1,011,916 | | | | 1,011 | | |
| | | | 4,665 | | |
Software 0.2% | |
Digicert Holdings,
Inc., 2nd Lien
Term Loan
(ICE LIBOR USD
3 Month + 8.00%),
9/19/2025(k)(o) | | | 137,000 | | | | 138 | | |
Mcafee LLC,
1st Lien Term Loan
(ICE LIBOR USD
6 Month + 4.50%),
5.83%, 9/27/2024(k) | | | 347,000 | | | | 349 | | |
Mcafee LLC,
Term Loan
(ICE LIBOR USD
6 Month + 8.50%),
9.83%, 9/30/2025(k) | | | 260,000 | | | | 264 | | |
| | | | 751 | | |
| Specialty Retail 0.0%(c) | |
Toys R Us -
Delaware, Inc.,
DIP Term Loan
(ICE LIBOR USD
1 Month + 6.75%),
8.00%, 1/18/2019(k) | | | 115,000 | | | | 115 | | |
Investments | | Principal
Amount | | Value
(000) | |
Thrifts & Mortgage Finance 0.3% | |
Walter Investment $
Management
Corp., Tranche B
Term Loan
(ICE LIBOR USD
1 Month + 3.75%),
4.99%,
12/18/2020(k) | | | 1,170,837 | | | $ | 1,102 | | |
Total Loan Assignments
(Cost $24,528) | | | | | 23,443 | | |
Asset-Backed Securities 4.0% | |
Babson CLO Ltd.
2013-I
Series 2013-IA,
Class D, 4.86%,
4/20/2025(j)(n) | | | 1,450,000 | | | | 1,456 | | |
Catamaran
CLO Ltd.
Series 2012-1A,
Class E, 6.58%,
12/20/2023(j)(n) | | | 1,000,000 | | | | 1,001 | | |
Class D, 5.12%,
1/27/2025(j)(n) Series 2013-1A, | | | 1,000,000 | | | | 1,002 | | |
Class D, 5.01%,
4/22/2027(j)(n) Series 2015-1A, | | | 1,000,000 | | | | 1,001 | | |
CIFC Funding Ltd.
Series 2016-1A,
Class D, 5.31%,
10/21/2028(j)(n) | | | 1,000,000 | | | | 1,020 | | |
CWABS
Asset-Backed
Certificates Trust
Series 2005-7,
Class AF4, 4.87%,
10/25/2035(n) | | | 190,326 | | | | 193 | | |
DT Auto
Owner Trust
Series 2015-1A,
Class D, 4.26%,
2/15/2022(j) | | | 1,500,000 | | | | 1,528 | | |
JP Morgan
Mortgage
Acquisition Trust
Series 2007-CH1,
Class AF6, 4.96%,
11/25/2036(q) | | | 204,059 | | | | 204 | | |
Madison Park
Funding XIV Ltd.
Series 2014-14A,
Class DR, 4.61%,
7/20/2026(j)(n) | | | 1,000,000 | | | | 1,001 | | |
Ocean Trails
CLO V
Series 2014-5A,
Class DR, 4.96%,
10/13/2026(j)(n) | | | 1,000,000 | | | | 1,001 | | |
Investments | | Principal
Amount | | Value
(000) | |
Octagon
Investment
Partners XXII Ltd.
Series 2014-1A,
Class E1, 6.56%,
11/25/2025(j)(n) | | $ | 500,000 | | | $ | 500 | | |
OFSI Fund V Ltd.
Series 2013-5A,
Class B2L, 6.60%,
4/17/2025(j)(n) | | | 1,000,000 | | | | 1,002 | | |
OHA Loan
Funding Ltd.
Series 2012-1A,
Class DR, 5.51%,
1/23/2027(j)(n) | | | 1,000,000 | | | | 1,018 | | |
OZLM XII Ltd.
Series 2015-12A,
Class C, 5.08%,
4/30/2027(j)(n) | | | 1,000,000 | | | | 1,007 | | |
Sound Harbor
Loan Fund Ltd.
Series 2014-1A,
Class CR, 5.28%,
10/30/2026(j)(n) | | | 1,000,000 | | | | 1,001 | | |
Total Asset-Backed Securities
(Cost $13,576) | | | | | 13,935 | | |
Collateralized Mortgage Obligations 2.1% | |
Alternative
Loan Trust
Series 2005-21CB,
Class A17, 6.00%,
6/25/2035 | | | 1,125,290 | | | | 1,128 | | |
Chase Mortgage
Finance Trust
Series 2007-A2,
Class 3A2, 3.66%,
7/25/2037(n) | | | 290,092 | | | | 286 | | |
Citicorp Mortgage
Securities Trust
Series 2006-3,
Class 1A10, 6.25%,
6/25/2036 | | | 1,737,598 | | | | 1,754 | | |
FNMA
Series 2016-C05,
Class 2M2,
(ICE LIBOR USD
1 Month +4.45),
5.69%,
1/25/2029(n) | | | 1,000,000 | | | | 1,101 | | |
Series 2016-C06,
Class 1M2,
(ICE LIBOR USD
1 Month +4.25),
5.49%,
4/25/2029(n) | | | 1,000,000 | | | | 1,122 | | |
See Notes to Consolidated Financial Statements
15
Consolidated Schedule of Investments Neuberger Berman Absolute Return Multi-Manager Fund (cont'd)
Investments | | Principal
Amount | | Value
(000) | |
MASTR
Alternative
Loan Trust
Series 2004-10,
Class 4A1, 6.00%,
9/25/2019 | | $ | 53,401 | | | $ | 54 | | |
Oaktown Re Ltd.
Series 2017-1A,
Class M2,
(ICE LIBOR USD
1 Month +4.00),
5.24%,
4/25/2027(d)(e)(g)(j)(n) | | | 1,000,000 | | | | 1,027 | | |
WaMu Mortgage
Pass-Through
Certificates Trust
Series 2004-S1,
Class 1A11,
5.50%, 3/25/2034 | | | 106,423 | | | | 104 | | |
Washington
Mutual Mortgage
Pass-Through
Certificates
WMALT Trust
Series 2005-1,
Class 1A1, 5.50%,
3/25/2035 | | | 456,052 | | | | 457 | | |
Wells Fargo
Mortgage Backed
Securities Trust
Series 2007-14,
Class 1A1, 6.00%,
10/25/2037(a) | | | 413,704 | | | | 410 | | |
Total Collateralized
Mortgage Obligations
(Cost $7,368) | | | | | 7,443 | | |
| | | Shares | | | |
Master Limited Partnerships 2.1% | |
Energy Equipment & Services 0.1% | |
USA Compression
Partners LP | | | 11,471 | | | | 180 | | |
Oil, Gas & Consumable Fuels 2.0% | |
Andeavor
Logistics LP | | | 3,917 | | | | 177 | | |
Antero
Midstream
Partners LP | | | 6,106 | | | | 175 | | |
Boardwalk
Pipeline
Partners LP | | | 34,836 | | | | 488 | | |
Calumet
Specialty Products
Partners LP* | | | 35,290 | | | | 316 | | |
Enable Midstream
Partners LP(a) | | | 22,770 | | | | 344 | | |
Energy Transfer
Equity LP | | | 22,691 | | | | 403 | | |
Investments | | Shares | | Value
(000) | |
Energy Transfer
Partners LP | | $ | 21,158 | | | $ | 368 | | |
Enterprise
Products
Partners LP | | | 23,489 | | | | 576 | | |
| MPLX LP(a) | | | 10,444 | | | | 368 | | |
NGL Energy
Partners LP
Noble Midstream | | | 43,011
9,148 | | | | 501
474 | | |
Partners LP
Oasis Midstream | | | 19,190 | | | | 319 | | |
Partners LP*
Plains All | | | 17,816 | | | | 356 | | |
American
Pipeline LP | |
Rice Midstream
Partners LP | | | 2,482 | | | | 52 | | |
Shell Midstream
Partners LP | | | 16,067 | | | | 408 | | |
Summit Midstream
Partners LP(a) | | | 22,220 | | | | 454 | | |
Valero Energy
Partners LP | | | 5,076 | | | | 218 | | |
Western Gas
Equity Partners LP(b) | | | 16,397 | | | | 649 | | |
| Williams Partners LP(a) | | | 11,472 | | | | 425 | | |
| | | | 7,071 | | |
Total Master Limited
Partnerships
(Cost $7,690) | | | | | 7,251 | | |
Closed End Funds 0.6% | |
Altaba, Inc.*(b)
(Cost $1,032) | | | 27,470 | | | | 1,926 | | |
| | | Principal
Amount | | | |
Convertible Bonds 0.5% | |
| Capital Markets 0.0%(c) | |
Walter Investment
Management Corp.
4.50%, 11/1/2019 | | $ | 295,000 | | | | 32 | | |
Internet Software & Services 0.2% | |
Twitter, Inc.
0.25%, 9/15/2019 | | | 743,000 | | | | 704 | | |
Media 0.3% | |
DISH Network
Corp.
2.38%,
3/15/2024(j) | | | 378,000 | | | | 363 | | |
| 8/15/2026 3.38%, | | | 522,000 | | | | 562 | | |
| | | | 925 | | |
Investments | | Shares | | Value
(000) | |
| Oil, Gas & Consumable Fuels 0.0%(c) | |
Cobalt
International
Energy, Inc.
3.13%, 5/15/2024 | | $ | 494,000 | | | $ | 64 | | |
Total Convertible Bonds
(Cost $1,989) | | | | | 1,725 | | |
| | | Principal
Amount | | | |
U.S. Treasury Obligations 0.1% | |
U.S. Treasury
Bonds
3.00%,
2/15/2047(b)
(Cost $193) | | | 185,000 | | | | 190 | | |
Preferred Stocks 0.1% | |
Thrifts & Mortgage Finance 0.1% | |
FNMA, Series S
(ICE LIBOR USD
3 Month + 4.23%),
8.25%, 12/31/2020*(k)(r)
(Cost $255) | | | 27,600 | | | | 188 | | |
| Convertible Preferred Stocks 0.0%(c) | |
| Real Estate Management & Development 0.0%(c) | |
VICI Properties,
Inc.
Series A,
11/6/2017(d)(j)(r)
(Cost $154) | | | 2,200 | | | | 175 | | |
| | | No. of
Rights | | | |
| Rights 0.0%(c) | |
| Biotechnology 0.0%(c) | |
Ambit Biosciences
Corp. (Daiichi
Sankyo Co. Ltd.),
CVR*(d)(e)(g) | | | 70,000 | | | | 42 | | |
Chelsea
Therapeutics, Inc.
Escrow
(H Lundbeck A/S),
CVR (Denmark)*(d)(e)(g) | | | 3,500 | | | | — | | |
Durata
Therapeutics, Inc.
(Actavis plc),
CVR*(d)(e)(g) | | | 40,000 | | | | — | | |
Dyax Corp.,
CVR*(d)(e)(g) | | | 40,350 | | | | 45 | | |
Tobira
Therapeutics, Inc.,
CVR*(d)(e)(g) | | | 6,900 | | | | — | (i) | |
| | | | 87 | | |
See Notes to Consolidated Financial Statements
16
Consolidated Schedule of Investments Neuberger Berman Absolute Return Multi-Manager Fund (cont'd)
Investments | | No. of
Rights | | Value
(000) | |
| Food & Staples Retailing 0.0%(c) | |
Safeway, Inc.
(Casa Ley),
CVR*(d)(e) | | | 112,000 | | | $ | 60 | | |
Safeway, Inc.
(Property
Development
Centers),
CVR*(d)(e)(g) | | | 112,000 | | | | — | | |
| | | | 60 | | |
| Health Care Providers & Services 0.0%(c) | |
Community
Health Systems,
Inc., CVR*(a) | | | 19,082 | | | | — | (i) | |
Media 0.0% | |
Media General,
Inc., CVR*(d)(e)(g) | | | 76,116 | | | | — | | |
Pharmaceuticals 0.0% | |
Omthera
Pharmaceuticals,
Inc. (AstraZeneca
plc), CVR
(United Kingdom)*(d)(e)(g) | | | 100 | | | | — | | |
Total Rights
(Cost $24) | | | | | 147 | | |
| | | No. of
Warrants | | | |
| Warrants 0.0%(c) | |
Biotechnology 0.0% | |
Novelion
Therapeutics,
Inc.*(d)(e)(g) | | | 757,716 | | | | — | | |
| Capital Markets 0.0%(c) | |
Acasta
Enterprises,
Inc., expiring
1/3/2022
(Canada)*(a) | | | 219,049 | | | | 93 | | |
Electrum Special
Acquisition Corp.,
expiring
6/11/2021*(b) | | | 3,600 | | | | 2 | | |
J2 Acquisition
Ltd., expiring
10/10/2020* | | | 5,900 | | | | 3 | | |
Matlin and
Partners
Acquisition
Corp., expiring
5/28/2021*(b) | | | 21,837 | | | | 9 | | |
Osprey Energy
Acquisition
Corp., expiring
8/15/2022*(b) | | | 2,900 | | | | 2 | | |
| | | | 109 | | |
Investments | | No. of
Warrants | | Value
(000) | |
| Software 0.0%(c) | |
Rimini Street,
Inc., expiring
5/26/2022*(b) | | | 8,180 | | | $ | 6 | | |
Total Warrants
(Cost $4) | | | | | 115 | | |
| | | Shares | | | |
Short-Term Investments 22.9% | |
Investment Companies 22.9% | |
Dreyfus Treasury
Securities Cash
Management
Institutional
Class, 0.92%(a)(s) | | | 463,301 | | | | 463 | | |
Morgan Stanley
Institutional
Liquidity Funds
Treasury Portfolio
Institutional Class,
0.88%(a)(s)(t) | | | 78,763,910 | | | | 78,764 | | |
Western Asset
Institutional US
Treasury Reserves
Ltd., 0.89%(a)(s)(t) | | | 59,735 | | | | 60 | | |
Total Investment
Companies
(Cost $79,287) | | | | | 79,287 | | |
Total Options
Purchased 0.1%(u)
(Cost $381) | | | | | 177 | | |
Total Long
Positions
(Cost $331,537) | | | | | 341,189 | | |
| Short Positions (18.2)%(v) | |
Common Stocks (16.0)% | |
| Aerospace & Defense (0.0)%(c) | |
United
Technologies
Corp. | | | (113 | ) | | | (14 | ) | |
Air Freight & Logistics (0.1)% | |
CH Robinson
Worldwide, Inc. | | | (6,510 | ) | | | (511 | ) | |
Airlines (0.3)% | |
Allegiant Travel Co. | | | (2,949 | ) | | | (402 | ) | |
Exchange Income
Corp. (Canada) | | | (17,050 | ) | | | (459 | ) | |
| | | | (861 | ) | |
Auto Components (0.1)% | |
Tenneco, Inc. | | | (8,340 | ) | | | (485 | ) | |
Investments | | Shares | | Value
(000) | |
Automobiles (0.3)% | |
Ford Motor Co. | | | (42,335 | ) | | $ | (519 | ) | |
Harley-Davidson,
Inc. | | | (11,110 | ) | | | (526 | ) | |
| | | | (1,045 | ) | |
Banks (0.9)% | |
Canadian Imperial
Bank of Commerce
(Canada) | | | (5,310 | ) | | | (468 | ) | |
Columbia Banking
System, Inc. | | | (8,682 | ) | | | (378 | ) | |
First Horizon
National Corp. | | | (33,345 | ) | | | (626 | ) | |
National Bank
of Canada
(Canada) | | | (21,765 | ) | | | (1,056 | ) | |
Wells Fargo & Co. | | | (10,230 | ) | | | (574 | ) | |
| | | | (3,102 | ) | |
Beverages (0.2)% | |
PepsiCo, Inc. | | | (4,770 | ) | | | (526 | ) | |
Biotechnology (0.1)% | |
United
Therapeutics
Corp.* | | | (3,330 | ) | | | (395 | ) | |
Capital Markets (0.3)% | |
Deutsche Bank
AG (Registered)
(Germany) | | | (24,525 | ) | | | (402 | ) | |
Federated
Investors, Inc.,
Class B | | | (17,500 | ) | | | (544 | ) | |
| | | | (946 | ) | |
Chemicals (0.5)% | |
Ecolab, Inc. | | | (3,975 | ) | | | (519 | ) | |
Praxair, Inc. | | | (3,710 | ) | | | (542 | ) | |
Scotts
Miracle-Gro
Co. (The) | | | (5,260 | ) | | | (524 | ) | |
| | | | (1,585 | ) | |
Commercial Services & Supplies (0.1)% | |
Stericycle, Inc.* | | | (6,525 | ) | | | (462 | ) | |
Construction & Engineering (0.2)% | |
Badger
Daylighting
Ltd. (Canada) | | | (25,150 | ) | | | (573 | ) | |
Distributors (0.2)% | |
Genuine Parts Co. | | | (8,825 | ) | | | (779 | ) | |
Diversified Consumer Services (0.1)% | |
H&R Block, Inc. | | | (14,640 | ) | | | (362 | ) | |
Diversified Telecommunication Services (0.2)% | |
AT&T, Inc. | | | (15,042 | ) | | | (506 | ) | |
CenturyLink, Inc. | | | (15,943 | ) | | | (303 | ) | |
| | | | (809 | ) | |
See Notes to Consolidated Financial Statements
17
Consolidated Schedule of Investments Neuberger Berman Absolute Return Multi-Manager Fund (cont'd)
Investments | | Shares | | Value
(000) | |
Electric Utilities (0.2)% | |
Avangrid, Inc. | | | (1,883 | ) | | $ | (98 | ) | |
Duke Energy Corp. | | | (2,594 | ) | | | (229 | ) | |
Eversource Energy | | | (4,950 | ) | | | (310 | ) | |
Great Plains
Energy, Inc. | | | (400 | ) | | | (13 | ) | |
Hydro One Ltd.
(Canada)(f) | | | (3,868 | ) | | | (68 | ) | |
Xcel Energy, Inc. | | | (1,480 | ) | | | (73 | ) | |
| | | | (791 | ) | |
Electrical Equipment (0.2)% | |
Eaton Corp. plc | | | (3,330 | ) | | | (266 | ) | |
Regal Beloit Corp. | | | (4,470 | ) | | | (363 | ) | |
| | | | (629 | ) | |
Electronic Equipment, Instruments & Components (0.3)% | |
Ingenico Group
SA (France) | | | (4,600 | ) | | | (446 | ) | |
Littelfuse, Inc. | | | (750 | ) | | | (157 | ) | |
Tech Data Corp.* | | | (4,200 | ) | | | (390 | ) | |
| | | | (993 | ) | |
Energy Equipment & Services (0.2)% | |
Helmerich &
Payne, Inc. | | | (955 | ) | | | (52 | ) | |
Keane Group, Inc.* | | | (6,558 | ) | | | (101 | ) | |
Patterson-UTI
Energy, Inc. | | | (2,429 | ) | | | (48 | ) | |
ProPetro
Holding Corp.* | | | (7,326 | ) | | | (111 | ) | |
RPC, Inc. | | | (6,617 | ) | | | (161 | ) | |
Superior Energy
Services, Inc.* | | | (4,862 | ) | | | (43 | ) | |
| | | | (516 | ) | |
Equity Real Estate Investment Trusts (REITs) (0.8)% | |
AvalonBay
Communities, Inc. | | | (1,260 | ) | | | (228 | ) | |
Boardwalk REIT
(Canada) | | | (12,050 | ) | | | (372 | ) | |
Equity Residential | | | (7,920 | ) | | | (533 | ) | |
Host Hotels &
Resorts, Inc. | | | (20,595 | ) | | | (403 | ) | |
Park Hotels &
Resorts, Inc. | | | (19,665 | ) | | | (566 | ) | |
Simon Property
Group, Inc. | | | (3,795 | ) | | | (589 | ) | |
| | | | (2,691 | ) | |
Food & Staples Retailing (0.5)% | |
Costco
Wholesale Corp. | | | (4,865 | ) | | | (783 | ) | |
CVS Health Corp. | | | (10,565 | ) | | | (724 | ) | |
Walgreens Boots
Alliance, Inc. | | | (5,050 | ) | | | (335 | ) | |
| | | | (1,842 | ) | |
Investments | | Shares | | Value
(000) | |
Food Products (0.4)% | |
B&G Foods, Inc. | | | (7,955 | ) | | $ | (253 | ) | |
General Mills, Inc. | | | (10,440 | ) | | | (542 | ) | |
Hormel Foods Corp. | | | (14,365 | ) | | | (448 | ) | |
| | | | (1,243 | ) | |
| Gas Utilities (0.0)%(c) | |
WGL Holdings, Inc. | | | (417 | ) | | | (36 | ) | |
Health Care Equipment & Supplies (0.5)% | |
Becton
Dickinson and Co. | | | (2,873 | ) | | | (600 | ) | |
Hologic, Inc.* | | | (13,575 | ) | | | (514 | ) | |
LivaNova plc* | | | (9,380 | ) | | | (693 | ) | |
| | | | (1,807 | ) | |
Health Care Providers & Services (0.5)% | |
Cardinal Health, Inc. | | | (7,550 | ) | | | (467 | ) | |
Express Scripts
Holding Co.* | | | (8,900 | ) | | | (546 | ) | |
McKesson Corp. | | | (3,350 | ) | | | (462 | ) | |
Patterson Cos., Inc. | | | (10,890 | ) | | | (403 | ) | |
| | | | (1,878 | ) | |
Hotels, Restaurants & Leisure (0.4)% | |
Domino's Pizza, Inc. | | | (3,425 | ) | | | (627 | ) | |
Sonic Corp. | | | (10,330 | ) | | | (262 | ) | |
Starbucks Corp. | | | (9,630 | ) | | | (528 | ) | |
| | | | (1,417 | ) | |
Household Durables (0.2)% | |
Lennar Corp., Class A | | | (5,203 | ) | | | (290 | ) | |
Whirlpool Corp. | | | (3,260 | ) | | | (534 | ) | |
| | | | (824 | ) | |
Household Products (0.4)% | |
Church & Dwight
Co., Inc. | | | (18,080 | ) | | | (817 | ) | |
Clorox Co. (The) | | | (3,130 | ) | | | (396 | ) | |
Energizer
Holdings, Inc. | | | (6,308 | ) | | | (271 | ) | |
| | | | (1,484 | ) | |
Industrial Conglomerates (0.1)% | |
General Electric Co. | | | (24,250 | ) | | | (489 | ) | |
Insurance (0.4)% | |
Athene Holding
Ltd., Class A* | | | (10,170 | ) | | | (530 | ) | |
XL Group Ltd. | | | (19,500 | ) | | | (789 | ) | |
| | | | (1,319 | ) | |
Internet & Direct Marketing Retail (0.1)% | |
Liberty Interactive
Corp. QVC Group,
Class A* | | | (10,845 | ) | | | (246 | ) | |
Investments | | Shares | | Value
(000) | |
Internet Software & Services (0.6)% | |
Alibaba Group
Holding Ltd.,
ADR (China)* | | | (9,500 | ) | | $ | (1,757 | ) | |
Zillow Group, Inc.,
Class C* | | | (9,400 | ) | | | (388 | ) | |
| | | | (2,145 | ) | |
IT Services (0.3)% | |
Alliance Data
Systems Corp. | | | (1,815 | ) | | | (406 | ) | |
iPayment
Holdings,
Inc.*(d)(e)(g) | | | (305,871 | ) | | $ | (61 | ) | |
Western Union
Co. (The) | | | (21,730 | ) | | | (432 | ) | |
| | | | (899 | ) | |
Leisure Products (0.2)% | |
Hasbro, Inc. | | | (7,125 | ) | | | (660 | ) | |
Machinery (0.4)% | |
Ingersoll-Rand plc | | | (5,575 | ) | | | (494 | ) | |
Middleby Corp.
(The)* | | | (4,280 | ) | | | (496 | ) | |
SKF AB,
Class B (Sweden) | | | (24,240 | ) | | | (564 | ) | |
| | | | (1,554 | ) | |
Media (1.2)% | |
Discovery
Communications,
Inc., Class A* | | | (700 | ) | | | (13 | ) | |
EW Scripps Co.
(The), Class A* | | | (27,429 | ) | | | (476 | ) | |
MSG Networks,
Inc., Class A* | | | (29,262 | ) | | | (508 | ) | |
New Media
Investment
Group, Inc. | | | (25,353 | ) | | | (405 | ) | |
Omnicom
Group, Inc. | | | (14,185 | ) | | | (953 | ) | |
Publicis Groupe
SA (France) | | | (5,665 | ) | | | (369 | ) | |
SES SA, FDR
(Luxembourg) | | | (15,027 | ) | | | (244 | ) | |
Sinclair
Broadcast
Group, Inc.,
Class A | | | (599 | ) | | | (19 | ) | |
Sirius XM
Holdings, Inc. | | | (16,697 | ) | | | (91 | ) | |
Twenty-First
Century Fox,
Inc., Class A | | | (5,200 | ) | | | (136 | ) | |
Walt Disney
Co. (The) | | | (7,885 | ) | | | (771 | ) | |
| | | | (3,985 | ) | |
See Notes to Consolidated Financial Statements
18
Consolidated Schedule of Investments Neuberger Berman Absolute Return Multi-Manager Fund (cont'd)
Investments | | Shares | | Value
(000) | |
Multiline Retail (0.9)% | |
Canadian Tire
Corp. Ltd.,
Class A (Canada) | | | (5,325 | ) | | $ | (653 | ) | |
Dillard's, Inc., Class A | | | (6,486 | ) | | | (329 | ) | |
Dollar General Corp. | | | (6,495 | ) | | | (525 | ) | |
JC Penney Co., Inc.* | | | (27,406 | ) | | | (77 | ) | |
Kohl's Corp. | | | (15,629 | ) | | | (653 | ) | |
Macy's, Inc. | | | (9,259 | ) | | | (174 | ) | |
Nordstrom, Inc. | | | (10,292 | ) | | | (408 | ) | |
Target Corp. | | | (5,525 | ) | | | (326 | ) | |
| | | | (3,145 | ) | |
Multi-Utilities (0.2)% | |
CenterPoint
Energy, Inc. | | | (1,599 | ) | | | (47 | ) | |
Consolidated
Edison, Inc. | | | (5,844 | ) | | | (503 | ) | |
Dominion
Energy, Inc. | | | (2,854 | ) | | | (232 | ) | |
| | | | (782 | ) | |
Oil, Gas & Consumable Fuels (0.2)% | |
Enbridge, Inc.
(Canada) | | | (4,829 | ) | | | (186 | ) | |
EQT Corp. | | | (10,689 | ) | | | (668 | ) | |
Pembina
Pipeline Corp.
(Canada) | | | (1 | ) | | | — | (i) | |
| | | | (854 | ) | |
Personal Products (0.1)% | |
Herbalife Ltd.* | | | (6,110 | ) | | | (444 | ) | |
Pharmaceuticals (0.3)% | |
Roche Holding
AG (Switzerland) | | | (3,803 | ) | | | (879 | ) | |
Professional Services (0.1)% | |
Nielsen
Holdings plc | | | (11,100 | ) | | | (411 | ) | |
Semiconductors & Semiconductor Equipment (0.1)% | |
QUALCOMM, Inc. | | | (6,840 | ) | | | (349 | ) | |
Software (0.5)% | |
ANSYS, Inc.* | | | (5,525 | ) | | | (755 | ) | |
Aspen
Technology, Inc.* | | | (11,150 | ) | | | (719 | ) | |
Micro Focus
International plc
(United Kingdom) | | | (555 | ) | | | (20 | ) | |
Symantec Corp. | | | (8,470 | ) | | | (275 | ) | |
| | | | (1,769 | ) | |
Specialty Retail (1.1)% | |
American Eagle
Outfitters, Inc. | | | (29,150 | ) | | | (380 | ) | |
Bed Bath &
Beyond, Inc. | | | (3,984 | ) | | | (79 | ) | |
Best Buy Co., Inc. | | | (1,644 | ) | | | (92 | ) | |
Investments | | Shares | | Value
(000) | |
Dick's Sporting
Goods, Inc. | | | (2,047 | ) | | $ | (50 | ) | |
Foot Locker, Inc. | | | (1,598 | ) | | | (48 | ) | |
Gap, Inc. (The) | | | (10,586 | ) | | | (275 | ) | |
GNC Holdings,
Inc., Class A | | | (6,490 | ) | | | (44 | ) | |
L Brands, Inc. | | | (2,658 | ) | | | (114 | ) | |
Michaels Cos., Inc.* | | | (5,513 | ) | | | (107 | ) | |
Ross Stores, Inc. | | | (14,065 | ) | | | (893 | ) | |
Sally Beauty
Holdings, Inc.* | | | (2,085 | ) | | | (36 | ) | |
Signet Jewelers Ltd. | | | (4,019 | ) | | | (264 | ) | |
TJX Cos., Inc. (The) | | | (6,680 | ) | | | (466 | ) | |
Tractor Supply Co. | | | (9,040 | ) | | | (545 | ) | |
Ulta Beauty, Inc.* | | | (1,480 | ) | | | (299 | ) | |
| | | | (3,692 | ) | |
Technology Hardware, Storage & Peripherals (0.2)% | |
NetApp, Inc. | | | (11,815 | ) | | | (525 | ) | |
Textiles, Apparel & Luxury Goods (0.3)% | |
Fossil Group, Inc.* | | | (111,280 | ) | | | (877 | ) | |
G-III Apparel
Group Ltd.* | | | (2,675 | ) | | | (68 | ) | |
| | | | (945 | ) | |
Thrifts & Mortgage Finance (0.5)% | |
BofI Holding, Inc.* | | | (22,089 | ) | | | (594 | ) | |
Genworth MI
Canada, Inc.
(Canada) | | | (16,400 | ) | | | (510 | ) | |
Home Capital
Group, Inc.
(Canada) | | | (49,750 | ) | | | (538 | ) | |
| | | | (1,642 | ) | |
Total Common Stocks
(Proceeds $(55,718)) | | | | | (55,340 | ) | |
Exchange Traded Funds (1.0)% | |
Alerian MLP Fund | | | (93,711 | ) | | | (1,005 | ) | |
Energy Select
Sector SPDR
Fund | | | (5,036 | ) | | | (342 | ) | |
Health Care
Select Sector
SPDR Fund | | | (1,592 | ) | | | (129 | ) | |
iShares Russell
2000 Fund | | | (1,244 | ) | | | (186 | ) | |
iShares U.S.
Real Estate Fund | | | (2,715 | ) | | | (217 | ) | |
SPDR S&P 500
Fund Trust | | | (1,149 | ) | | | (296 | ) | |
SPDR S&P MidCap
400 Fund Trust | | | (825 | ) | | | (275 | ) | |
SPDR S&P Oil &
Gas Equipment &
Services Fund | | | (8,678 | ) | | | (134 | ) | |
Utilities Select
Sector SPDR Fund | | | (12,107 | ) | | | (667 | ) | |
Investments | | Shares | | Value
(000) | |
VanEck Vectors
Oil Services Fund | | | (1,914 | ) | | $ | (46 | ) | |
Total Exchange
Traded Funds
(Proceeds $(3,202)) | | | | | (3,297 | ) | |
Master Limited Partnerships (0.7)% | |
Capital Markets (0.1)% | |
Carlyle Group
LP (The) | | | (11,650 | ) | | | (257 | ) | |
| Gas Utilities (0.0)%(c) | |
Ferrellgas Partners LP | | | (12,447 | ) | | | (60 | ) | |
Oil, Gas & Consumable Fuels (0.6)% | |
Crestwood
Equity
Partners LP | | | 894 | ) | | | (22 | ) | |
DCP Midstream LP | | | (6,659 | ) | | | (220 | ) | |
Dominion Energy
Midstream
Partners LP | | | (2,473 | ) | | | (79 | ) | |
Golar LNG
Partners LP
(United Kingdom) | | | (5,313 | ) | | | (116 | ) | |
Holly Energy
Partners LP | | | (7,036 | ) | | | (241 | ) | |
Magellan
Midstream
Partners LP | | | (7,405 | ) | | | (509 | ) | |
NuStar Energy LP | | | (815 | ) | | | (27 | ) | |
Phillips 66
Partners LP | | | (5,454 | ) | | | (275 | ) | |
Spectra Energy
Partners LP | | | (9,650 | ) | | | (416 | ) | |
Tallgrass Energy
Partners LP | | | (5,249 | ) | | | (229 | ) | |
| | | | (2,134 | ) | |
Total Master
Limited Partnerships
(Proceeds $(2,734)) | | | | | (2,451 | ) | |
| | | Principal
Amount | | | |
Corporate Bonds (0.4)% | |
| Media (0.0)%(c) | |
Cenveo Corp.
8.50%,
9/15/2022(j) | | $ | (167,000 | ) | | | (41 | ) | |
Multiline Retail (0.1)% | |
Macy's Retail
Holdings, Inc.
4.50%,
12/15/2034 | | | (406,000 | ) | | | (322 | ) | |
See Notes to Consolidated Financial Statements
19
Consolidated Schedule of Investments Neuberger Berman Absolute Return Multi-Manager Fund (cont'd)
Investments | | Principal
Amount | | Value
(000) | |
Oil, Gas & Consumable Fuels (0.2)% | |
SM Energy Co.
6.50%, 1/1/2023 | | | (268,000 | ) | | | (275) | | |
6.75%, 9/15/2026 | | | (457,000 | ) | | | (474 | ) | |
| | | | (749 | ) | |
Specialty Retail (0.1)% | |
Gap, Inc. (The)
5.95%,
4/12/2021 | | | (226,000 | ) | | | (245 | ) | |
Total Corporate
Bonds
(Proceeds $(1,390)) | | | | | (1,357 | ) | |
Investments | | Shares | | Value
(000) | |
Exchange Traded Notes (0.1)% | |
JPMorgan
Alerian
MLP Index ETN
(Proceeds$(512)) | | | (16,866 | ) | | $ | (456 | ) | |
| Preferred Stocks (0.0)%(c) | |
| IT Services (0.0)%(c) | |
iPayment
Holdings,
Inc.*(d)(e)(g)
(Proceeds$(283)) | | | (1,868 | ) | | | (121 | ) | |
Investments | | Shares | | Value
(000) | |
Total Short Positions
(Proceeds $(63,839)) | | | | | (63,022 | ) | |
Total Investments 80.2%
(Cost $267,698) | | | | | 278,167 | | |
Other Assets Less
Liabilities 19.8%(w)(x) | | | | | 68,681 | | |
Net Assets 100.0% | | | | $ | 346,848 | | |
* Non-income producing security.
(a) All or a portion of this security is segregated in connection with obligations for futures, swaps, options written, and/or forward foreign currency contracts with a total value of approximately $140,202,000.
(b) All or a portion of this security is pledged with the custodian for securities sold short and/or options written.
(c) Represents less than 0.05% of net assets.
(d) Illiquid security.
(e) Value determined using significant unobservable inputs.
(f) Security exempt from registration pursuant to Regulation S under the Securities Act of 1933. Regulation S applies to securities offerings that are made outside of the United States and do not involve direct selling efforts in the United States and as such may have restrictions on resale. At October 31, 2017, the total value of these securities amounted to approximately $3,030,000 which represents 0.9% of net assets of the Fund.
(g) Security fair valued as of October 31, 2017 in accordance with procedures approved by the Board of Trustees. Total value of all such securities at October 31, 2017 amounted to approximately $1,167,000, which represents 0.3% of net assets of the Fund.
(h) Issuer filed for bankruptcy.
(i) Amount less than one thousand.
(j) Securities were purchased or sold short under Rule 144A of the Securities Act of 1933, as amended (the "1933 Act"), or are otherwise restricted and, unless registered under the 1933 Act or exempted from registration, may only be sold to qualified institutional investors or may have other restrictions on resale. At October 31, 2017, these securities amounted to approximately $56,515,000 of long positions and $(41,000) of short positions, which represents 16.3% and (0.0%) respectively, of net assets of the Fund. Securities denoted with "(j)" but without "(d)" have been deemed by the investment manager to be liquid.
(k) Variable or floating rate security. The interest rate shown was the current rate as of October 31, 2017 and changes periodically.
(l) Defaulted security.
(m) Payment in-kind security.
See Notes to Consolidated Financial Statements
20
Consolidated Schedule of Investments Neuberger Berman Absolute Return Multi-Manager Fund (cont'd)
(n) Variable or floating rate security, the interest rate of which adjusts periodically based on changes in current interest rates and prepayments on the underlying pool of assets. See Notes to Consolidated Financial Statements for further information. The interest rate shown was the current rate as of October 31, 2017.
(o) All or a portion of this security had not settled as of October 31, 2017 and thus may not have an interest rate in effect. Interest rates do not take effect until settlement.
(p) All or a portion of this security was purchased on a delayed delivery basis.
(q) Step bond. Coupon rate is a fixed rate for an initial period that either resets at a specific date or may reset in the future at a contingent upon predetermined trigger. The interest rate shown was the current rate as of October 31, 2017.
(r) Perpetual security. The rate reflected was the rate in effect on October 31, 2017. The maturity date reflects the next call date.
(s) Represents 7-day effective yield as of October 31, 2017.
(t) All or a portion represents positions held by Neuberger Berman Cayman ARMM Fund I Ltd. (the "Subsidiary") (See Note A in Notes to Consolidated Financial Statements).
(u) See "Purchased option contracts" under Derivative Instruments.
(v) At October 31, 2017 the Fund had approximately $53,183,000 deposited in one or more accounts to satisfy collateral requirements for borrowing in connection with securities sold short.
(w) Includes the impact of the Fund's open positions in derivatives at October 31, 2017.
(x) As of October 31, 2017, the value of unfunded loan commitments was approximately $3,238,000 (See Notes to Consolidated Financial Statements).
Abbreviations
ADR American Depositary Receipt
CLO Collateralized Loan Obligations
CVR Contingent Value Rights
DIP Debtor-in-Possession
FDR Fiduciary Depositary Receipt
FNMA Federal National Mortgage Association
GDR Global Depositary Receipt
ICE Intercontinental Exchange
LIBOR London Interbank Offered Rate
OYJ Public Limited Company
PJSC Public Joint Stock Company
SA Société Anonyme
SpA Società per Azioni
SPDR Standard & Poor's Depositary Receipt
USD United States Dollar
See Notes to Consolidated Financial Statements
21
Consolidated Schedule of Investments Neuberger Berman Absolute Return Multi-Manager Fund (cont'd)
Derivative Instruments
Forward foreign currency contracts ("forward contracts")
At October 31, 2017, open forward contracts for the Fund were as follows:
Currency
Purchased | | Currency Sold | �� | Counterparty | | Settlement
Date | | Unrealized
Appreciation/
(Depreciation) | |
USD | | | | | 1,056,953 | | | CHF | | | | | 1,032,581 | | | JPMorgan Chase Bank, NA | | 11/17/2017 | | $ | 20,920 | | |
USD | | | | | 4,732,066 | | | EUR | | | | | 4,004,104 | | | JPMorgan Chase Bank, NA | | 11/17/2017 | | | 64,101 | | |
USD | | | | | 1,766,608 | | | HKD | | | | | 13,776,560 | | | JPMorgan Chase Bank, NA | | 11/17/2017 | | | 484 | | |
USD | | | | | 272,969 | | | MXN | | | | | 5,158,168 | | | JPMorgan Chase Bank, NA | | 11/17/2017 | | | 4,649 | | |
USD | | | | | 709,109 | | | SEK | | | | | 5,775,973 | | | JPMorgan Chase Bank, NA | | 11/17/2017 | | | 18,592 | | |
USD | | | | | 17,826 | | | TRY | | | | | 65,815 | | | JPMorgan Chase Bank, NA | | 11/17/2017 | | | 553 | | |
USD | | | | | 34,851 | | | CAD | | | | | 44,000 | | | JPMorgan Chase Bank, NA | | 12/11/2017 | | | 732 | | |
USD | | | | | 279,120 | | | EUR | | | | | 233,000 | | | JPMorgan Chase Bank, NA | | 12/11/2017 | | | 7,099 | | |
CHF | | | | | 20,000 | | | USD | | | | | 20,065 | | | Societe Generale(a) | | 12/20/2017 | | | 52 | | |
CLP | ** | | | | 211,860,000 | | | USD | | | | | 332,320 | | | Societe Generale(a) | | 12/20/2017 | | | 359 | | |
EUR | | | | | 25,882 | | | PLN | | | | | 110,000 | | | Societe Generale(a) | | 12/20/2017 | | | 7 | | |
EUR | | | | | 910,000 | | | TRY | | | | | 3,980,065 | | | Societe Generale(a) | | 12/20/2017 | | | 28,805 | | |
GBP | | | | | 1,270,000 | | | USD | | | | | 1,682,593 | | | Societe Generale(a) | | 12/20/2017 | | | 6,766 | | |
ILS | | | | | 1,570,000 | | | USD | | | | | 445,558 | | | Societe Generale(a) | | 12/20/2017 | | | 1,038 | | |
INR | ** | | | | 147,410,000 | | | USD | | | | | 2,255,475 | | | Societe Generale(a) | | 12/20/2017 | | | 10,946 | | |
JPY | | | | | 225,518,220 | | | AUD | | | | | 2,580,000 | | | Societe Generale(a) | | 12/20/2017 | | | 14,632 | | |
KRW | ** | | | | 1,419,090,000 | | | USD | | | | | 1,256,704 | | | Societe Generale(a) | | 12/20/2017 | | | 12,766 | | |
PLN | | | | | 3,980,000 | | | EUR | | | | | 928,869 | | | Societe Generale(a) | | 12/20/2017 | | | 8,626 | | |
PLN | | | | | 540,000 | | | USD | | | | | 147,760 | | | Societe Generale(a) | | 12/20/2017 | | | 631 | | |
SGD | | | | | 20,000 | | | USD | | | | | 14,669 | | | Societe Generale(a) | | 12/20/2017 | | | 10 | | |
THB | | | | | 22,910,000 | | | USD | | | | | 685,862 | | | Societe Generale(a) | | 12/20/2017 | | | 3,893 | | |
TRY | | | | | 271,796 | | | EUR | | | | | 60,000 | | | Societe Generale(a) | | 12/20/2017 | | | 537 | | |
TRY | | | | | 180,000 | | | USD | | | | | 46,415 | | | Societe Generale(a) | | 12/20/2017 | | | 359 | | |
TRY | | | | | 10,000 | | | ZAR | | | | | 36,665 | | | Societe Generale(a) | | 12/20/2017 | | | 27 | | |
USD | | | | | 3,090,577 | | | AUD | | | | | 3,970,000 | | | Societe Generale(a) | | 12/20/2017 | | | 53,573 | | |
USD | | | | | 2,125,298 | | | BRL | ** | | | | 6,880,000 | | | Societe Generale(a) | | 12/20/2017 | | | 34,990 | | |
USD | | | | | 1,851,668 | | | CAD | | | | | 2,350,000 | | | Societe Generale(a) | | 12/20/2017 | | | 29,206 | | |
USD | | | | | 2,346,256 | | | CHF | | | | | 2,290,000 | | | Societe Generale(a) | | 12/20/2017 | | | 42,861 | | |
USD | | | | | 285,792 | | | CLP | ** | | | | 179,310,000 | | | Societe Generale(a) | | 12/20/2017 | | | 4,228 | | |
USD | | | | | 3,632,109 | | | EUR | | | | | 3,070,000 | | | Societe Generale(a) | | 12/20/2017 | | | 45,848 | | |
USD | | | | | 229,713 | | | GBP | | | | | 170,000 | | | Societe Generale(a) | | 12/20/2017 | | | 3,579 | | |
USD | | | | | 206,002 | | | HUF | | | | | 54,060,002 | | | Societe Generale(a) | | 12/20/2017 | | | 3,306 | | |
USD | | | | | 48,593 | | | ILS | | | | | 170,000 | | | Societe Generale(a) | | 12/20/2017 | | | 236 | | |
USD | | | | | 228,634 | | | INR | ** | | | | 14,820,000 | | | Societe Generale(a) | | 12/20/2017 | | | 777 | | |
USD | | | | | 4,498,049 | | | JPY | | | | | 504,940,000 | | | Societe Generale(a) | | 12/20/2017 | | | 46,197 | | |
USD | | | | | 2,092,740 | | | MXN | | | | | 39,620,000 | | | Societe Generale(a) | | 12/20/2017 | | | 43,642 | | |
USD | | | | | 534,911 | | | NOK | | | | | 4,270,000 | | | Societe Generale(a) | | 12/20/2017 | | | 11,470 | | |
USD | | | | | 1,347,017 | | | NZD | | | | | 1,920,000 | | | Societe Generale(a) | | 12/20/2017 | | | 34,323 | | |
See Notes to Consolidated Financial Statements
22
Consolidated Schedule of Investments Neuberger Berman Absolute Return Multi-Manager Fund (cont'd)
Currency
Purchased | | Currency Sold | | Counterparty | | Settlement
Date | | Unrealized
Appreciation/
(Depreciation) | |
USD | | | | | 1,247,765 | | | PHP | ** | | | | 64,220,000 | | | Societe Generale(a) | | 12/20/2017 | | $ | 10,786 | | |
USD | | | | | 183,261 | | | PLN | | | | | 660,000 | | | Societe Generale(a) | | 12/20/2017 | | | 1,894 | | |
USD | | | | | 609,207 | | | SEK | | | | | 5,010,000 | | | Societe Generale(a) | | 12/20/2017 | | | 8,913 | | |
USD | | | | | 1,841,039 | | | SGD | | | | | 2,500,000 | | | Societe Generale(a) | | 12/20/2017 | | | 6,205 | | |
USD | | | | | 62,793 | | | THB | | | | | 2,080,000 | | | Societe Generale(a) | | 12/20/2017 | | | 169 | | |
USD | | | | | 711,012 | | | TRY | | | | | 2,650,000 | | | Societe Generale(a) | | 12/20/2017 | | | 22,407 | | |
USD | | | | | 641,849 | | | ZAR | | | | | 8,860,000 | | | Societe Generale(a) | | 12/20/2017 | | | 20,474 | | |
ZAR | | | | | 37,272 | | | TRY | | | | | 10,000 | | | Societe Generale(a) | | 12/20/2017 | | | 15 | | |
USD | | | | | 87,903 | | | CAD | | | | | 108,572 | | | JPMorgan Chase Bank, NA | | 12/28/2017 | | | 3,695 | | |
USD | | | | | 523,851 | | | EUR | | | | | 440,000 | | | JPMorgan Chase Bank, NA | | 12/28/2017 | | | 9,589 | | |
USD | | | | | 679,596 | | | SEK | | | | | 5,439,880 | | | JPMorgan Chase Bank, NA | | 12/28/2017 | | | 27,395 | | |
Total unrealized appreciation | | $ | 672,362 | | |
USD | | | | | 5,744,981 | | | GBP | | | | | 4,363,902 | | | JPMorgan Chase Bank, NA | | 11/17/2017 | | $ | (53,436 | ) | |
USD | | | | | 384,525 | | | HKD | | | | | 3,000,000 | | | JPMorgan Chase Bank, NA | | 11/17/2017 | | | (68 | ) | |
CAD | | | | | 3,727,000 | | | USD | | | | | 3,035,880 | | | JPMorgan Chase Bank, NA | | 12/11/2017 | | | (145,887 | ) | |
CHF | | | | | 100,000 | | | USD | | | | | 105,219 | | | JPMorgan Chase Bank, NA | | 12/15/2017 | | | (4,675 | ) | |
EUR | | | | | 800,000 | | | USD | | | | | 959,040 | | | JPMorgan Chase Bank, NA | | 12/15/2017 | | | (24,817 | ) | |
AUD | | | | | 3,390,000 | | | JPY | | | | | 298,287,130 | | | Societe Generale(a) | | 12/20/2017 | | | (36,565 | ) | |
AUD | | | | | 3,070,000 | | | USD | | | | | 2,429,802 | | | Societe Generale(a) | | 12/20/2017 | | | (81,286 | ) | |
BRL | ** | | | | 6,280,000 | | | USD | | | | | 1,974,425 | | | Societe Generale(a) | | 12/20/2017 | | | (66,413 | ) | |
CAD | | | | | 3,940,000 | | �� | USD | | | | | 3,169,530 | | | Societe Generale(a) | | 12/20/2017 | | | (114,001 | ) | |
CHF | | | | | 680,000 | | | USD | | | | | 705,173 | | | Societe Generale(a) | | 12/20/2017 | | | (21,196 | ) | |
CLP | ** | | | | 539,580,000 | | | USD | | | | | 860,962 | | | Societe Generale(a) | | 12/20/2017 | | | (13,674 | ) | |
EUR | | | | | 712,402 | | | PLN | | | | | 3,070,000 | | | Societe Generale(a) | | 12/20/2017 | | | (11,428 | ) | |
EUR | | | | | 5,690,000 | | | USD | | | | | 6,766,126 | | | Societe Generale(a) | | 12/20/2017 | | | (119,278 | ) | |
GBP | | | | | 1,300,000 | | | USD | | | | | 1,746,156 | | | Societe Generale(a) | | 12/20/2017 | | | (16,891 | ) | |
HUF | | | | | 193,129,997 | | | USD | | | | | 741,780 | | | Societe Generale(a) | | 12/20/2017 | | | (17,642 | ) | |
ILS | | | | | 1,750,000 | | | USD | | | | | 499,752 | | | Societe Generale(a) | | 12/20/2017 | | | (1,955 | ) | |
INR | ** | | | | 35,880,000 | | | USD | | | | | 555,358 | | | Societe Generale(a) | | 12/20/2017 | | | (3,705 | ) | |
JPY | | | | | 20,789,639 | | | AUD | | | | | 240,000 | | | Societe Generale(a) | | 12/20/2017 | | | (303 | ) | |
JPY | | | | | 210,930,000 | | | USD | | | | | 1,890,027 | | | Societe Generale(a) | | 12/20/2017 | | | (30,344 | ) | |
MXN | | | | | 30,180,000 | | | USD | | | | | 1,656,052 | | | Societe Generale(a) | | 12/20/2017 | | | (95,179 | ) | |
NOK | | | | | 10,600,000 | | | USD | | | | | 1,342,054 | | | Societe Generale(a) | | 12/20/2017 | | | (42,649 | ) | |
NZD | | | | | 760,000 | | | USD | | | | | 549,002 | | | Societe Generale(a) | | 12/20/2017 | | | (29,393 | ) | |
PHP | ** | | | | 15,910,000 | | | USD | | | | | 310,943 | | | Societe Generale(a) | | 12/20/2017 | | | (4,492 | ) | |
PLN | | | | | 2,100,000 | | | EUR | | | | | 494,497 | | | Societe Generale(a) | | 12/20/2017 | | | (577 | ) | |
PLN | | | | | 3,660,000 | | | USD | | | | | 1,017,754 | | | Societe Generale(a) | | 12/20/2017 | | | (11,992 | ) | |
SEK | | | | | 7,620,000 | | | USD | | | | | 946,658 | | | Societe Generale(a) | | 12/20/2017 | | | (33,638 | ) | |
SGD | | | | | 4,700,000 | | | USD | | | | | 3,473,402 | | | Societe Generale(a) | | 12/20/2017 | | | (23,910 | ) | |
THB | | | | | 8,810,000 | | | USD | | | | | 266,376 | | | Societe Generale(a) | | 12/20/2017 | | | (1,133 | ) | |
TRY | | | | | 1,198,876 | | | EUR | | | | | 270,000 | | | Societe Generale(a) | | 12/20/2017 | | | (3,874 | ) | |
TRY | | | | | 1,030,000 | | | USD | | | | | 288,648 | | | Societe Generale(a) | | 12/20/2017 | | | (21,003 | ) | |
TRY | | | | | 760,000 | | | ZAR | | | | | 2,855,395 | | | Societe Generale(a) | | 12/20/2017 | | | (2,770 | ) | |
USD | | | | | 213,773 | | | AUD | | | | | 280,000 | | | Societe Generale(a) | | 12/20/2017 | | | (424 | ) | |
See Notes to Consolidated Financial Statements
23
Consolidated Schedule of Investments Neuberger Berman Absolute Return Multi-Manager Fund (cont'd)
Currency
Purchased | | Currency Sold | | Counterparty | | Settlement
Date | | Unrealized
Appreciation/
(Depreciation) | |
USD | | | | | 281,383 | | | CHF | | | | | 280,000 | | | Societe Generale(a) | | 12/20/2017 | | $ | (255 | ) | |
USD | | | | | 66,340 | | | CLP | ** | | | | 42,520,000 | | | Societe Generale(a) | | 12/20/2017 | | | (428 | ) | |
USD | | | | | 2,564,874 | | | EUR | | | | | 2,200,000 | | | Societe Generale(a) | | 12/20/2017 | | | (5,085 | ) | |
USD | | | | | 1,382,321 | | | GBP | | | | | 1,050,000 | | | Societe Generale(a) | | 12/20/2017 | | | (14,392 | ) | |
USD | | | | | 295,121 | | | HUF | | | | | 78,839,999 | | | Societe Generale(a) | | 12/20/2017 | | | (488 | ) | |
USD | | | | | 19,815 | | | ILS | | | | | 70,000 | | | Societe Generale(a) | | 12/20/2017 | | | (97 | ) | |
USD | | | | | 1,266,303 | | | INR | ** | | | | 83,340,000 | | | Societe Generale(a) | | 12/20/2017 | | | (15,045 | ) | |
USD | | | | | 1,584,968 | | | JPY | | | | | 180,009,999 | | | Societe Generale(a) | | 12/20/2017 | | | (2,107 | ) | |
USD | | | | | 461,348 | | | KRW | ** | | | | 526,570,000 | | | Societe Generale(a) | | 12/20/2017 | | | (9,703 | ) | |
USD | | | | | 294,245 | | | MXN | | | | | 5,700,000 | | | Societe Generale(a) | | 12/20/2017 | | | (552 | ) | |
USD | | | | | 453,176 | | | NOK | | | | | 3,700,000 | | | Societe Generale(a) | | 12/20/2017 | | | (391 | ) | |
USD | | | | | 40,997 | | | NZD | | | | | 60,000 | | | Societe Generale(a) | | 12/20/2017 | | | (25 | ) | |
USD | | | | | 178,997 | | | PHP | ** | | | | 9,310,000 | | | Societe Generale(a) | | 12/20/2017 | | | (328 | ) | |
USD | | | | | 677,667 | | | PLN | | | | | 2,480,000 | | | Societe Generale(a) | | 12/20/2017 | | | (3,833 | ) | |
USD | | | | | 21,551 | | | SEK | | | | | 180,000 | | | Societe Generale(a) | | 12/20/2017 | | | (16 | ) | |
USD | | | | | 811,864 | | | SGD | | | | | 1,110,000 | | | Societe Generale(a) | | 12/20/2017 | | | (2,803 | ) | |
USD | | | | | 173,432 | | | THB | | | | | 5,790,000 | | | Societe Generale(a) | | 12/20/2017 | | | (889 | ) | |
USD | | | | | 35,466 | | | ZAR | | | | | 510,000 | | | Societe Generale(a) | | 12/20/2017 | | | (302 | ) | |
ZAR | | | | | 2,485,392 | | | TRY | | | | | 680,000 | | | Societe Generale(a) | | 12/20/2017 | | | (2,390 | ) | |
ZAR | | | | | 5,150,000 | | | USD | | | | | 382,628 | | | Societe Generale(a) | | 12/20/2017 | | | (21,446 | ) | |
CAD | | | | | 108,572 | | | USD | | | | | 86,857 | | | JPMorgan Chase Bank, NA | | 12/28/2017 | | | (2,649 | ) | |
GBP | | | | | 18,489 | | | USD | | | | | 24,973 | | | JPMorgan Chase Bank, NA | | 12/28/2017 | | | (371 | ) | |
Total unrealized depreciation | | $ | (1,118,193 | ) | |
Net unrealized depreciation | | $ | (445,831 | ) | |
** Non-deliverable forward.
(a) The investment is held by the Subsidiary (see Note A in Notes to Consolidated Financial Statements).
For the year ended October 31, 2017, the average notional value of forward contracts for the Fund was $12,755,084. The Fund had cash collateral of $427,609 and $1,036,174 deposited in a segregated account for JPMorgan Chase Bank, NA and Societe Generale.
Futures contracts ("futures")
At October 31, 2017, open positions in futures for the Fund were as follows:
Description | | Number of
Contracts | | Expiration
Date | | Notional Amount | | Value and
Unrealized
Appreciation/
(Depreciation) | |
Long Contracts | |
| Brent Crude Oil(a) | | | 23 | | | 11/2017 | | $ | 1,401,620 | | | $ | 51,707 | | |
| Hang Seng Index(a) | | | 1 | | | 11/2017 | | | 180,737 | | | | 369 | | |
| HSCEI(a) | | | 2 | | | 11/2017 | | | 147,563 | | | | 1,458 | | |
| NY Harbor ULSD(a) | | | 12 | | | 11/2017 | | | 947,772 | | | | 29,658 | | |
| RBOB Gasoline(a) | | | 12 | | | 11/2017 | | | 873,180 | | | | 36,735 | | |
See Notes to Consolidated Financial Statements
24
Consolidated Schedule of Investments Neuberger Berman Absolute Return Multi-Manager Fund (cont'd)
Description | | Number of
Contracts | | Expiration
Date | | Notional Amount | | Value and
Unrealized
Appreciation/
(Depreciation) | |
| SGX NIFTY 50 Index(a) | | | 12 | | | 11/2017 | | $ | 249,096 | | | $ | 4,095 | | |
| WTI Crude Oil(a) | | | 16 | | | 11/2017 | | | 870,080 | | | | 19,798 | | |
| 100 oz Gold(a) | | | 3 | | | 12/2017 | | | 381,150 | | | | (1,546 | ) | |
Canada 10 Year Bond | | | 4 | | | 12/2017 | | | 426,107 | | | | 5,839 | | |
| Cocoa(a) | | | 11 | | | 12/2017 | | | 230,340 | | | | (2,359 | ) | |
| Copper(a) | | | 4 | | | 12/2017 | | | 310,100 | | | | (5,408 | ) | |
| DAX Index(a) | | | 1 | | | 12/2017 | | | 385,041 | | | | 14,590 | | |
| EURO STOXX 50 Index(a) | | | 6 | | | 12/2017 | | | 257,059 | | | | 7,302 | | |
| Euro-Bobl(a) | | | 25 | | | 12/2017 | | | 3,837,598 | | | | 9,574 | | |
Euro-BTP | | | 3 | | | 12/2017 | | | 487,804 | | | | 3,840 | | |
| Euro-BTP(a) | | | 17 | | | 12/2017 | | | 2,764,224 | | | | 64,231 | | |
| Euro-Bund(a) | | | 23 | | | 12/2017 | | | 4,360,324 | | | | 9,772 | | |
| Euro-Buxl(a) | | | 2 | | | 12/2017 | | | 387,010 | | | | 695 | | |
Euro-OAT | | | 3 | | | 12/2017 | | | 550,252 | | | | 1,813 | | |
Foreign Exchange USD/CEK | | | 1 | | | 12/2017 | | | 99,667 | | | | 5,082 | | |
Foreign Exchange USD/NOK | | | 1 | | | 12/2017 | | | 99,926 | | | | 4,025 | | |
| FTSE 100 Index(a) | | | 3 | | | 12/2017 | | | 297,539 | | | | 269 | | |
| Live Cattle(a) | | | 7 | | | 12/2017 | | | 351,750 | | | | 11,912 | | |
| Long Gilt(a) | | | 2 | | | 12/2017 | | | 330,258 | | | | 43 | | |
| Low Sulphur Gasoil(a) | | | 14 | | | 12/2017 | | | 766,850 | | | | 22,007 | | |
| NASDAQ 100 E-Mini Index(a) | | | 9 | | | 12/2017 | | | 1,124,955 | | | | 12,855 | | |
| Nikkei 225 Index(a) | | | 37 | | | 12/2017 | | | 714,261 | | | | 33,295 | | |
| Russell 2000 E-Mini Index(a) | | | 2 | | | 12/2017 | | | 150,270 | | | | (238 | ) | |
| S&P 500 E-Mini Index(a) | | | 3 | | | 12/2017 | | | 385,905 | | | | 2,575 | | |
U.S. Treasury 10 Year Note | | | 4 | | | 12/2017 | | | 499,750 | | | | 743 | | |
| 3 Month Canadian Bank Acceptance(a) | | | 7 | | | 9/2018 | | | 1,331,728 | | | | 331 | | |
| 3 Month Euro Euribor(a) | | | 60 | | | 3/2020 | | | 17,463,139 | | | | 1,643 | | |
Total Long Contracts | | | | | | $ | 42,663,055 | | | $ | 346,705 | | |
Short Contracts | |
| Natural Gas(a) | | | (6 | ) | | 11/2017 | | $ | (173,760 | ) | | $ | 7,918 | | |
| Canada 10 Year Bond(a) | | | (1 | ) | | 12/2017 | | | (106,527 | ) | | | (40 | ) | |
| CBOE Volatility Index(a) | | | (21 | ) | | 12/2017 | | | (255,675 | ) | | | 5,165 | | |
| Coffee 'C'(a) | | | (6 | ) | | 12/2017 | | | (281,475 | ) | | | 6,868 | | |
| Corn(a) | | | (29 | ) | | 12/2017 | | | (501,338 | ) | | | 7,190 | | |
| Cotton No. 2(a) | | | (4 | ) | | 12/2017 | | | (136,760 | ) | | | 44 | | |
| EURO STOXX 50 Index | | | (215 | ) | | 12/2017 | | | (9,211,284 | ) | | | (439,187 | ) | |
Foreign Exchange AUD/USD | | | (94 | ) | | 12/2017 | | | (7,192,880 | ) | | | 252,908 | | |
Foreign Exchange CAD/USD | | | (10 | ) | | 12/2017 | | | (775,750 | ) | | | 21,459 | | |
Foreign Exchange CHF/USD | | | (11 | ) | | 12/2017 | | | (1,382,013 | ) | | | 54,034 | | |
Foreign Exchange EUR/USD | | | (174 | ) | | 12/2017 | | | (25,406,174 | ) | | | 725,684 | | |
Foreign Exchange GBP/USD | | | (7 | ) | | 12/2017 | | | (581,919 | ) | | | (5,384 | ) | |
Foreign Exchange JPY/USD | | | (36 | ) | | 12/2017 | | | (3,966,075 | ) | | | 99,316 | | |
Foreign Exchange NZD/USD | | | (2 | ) | | 12/2017 | | | (136,720 | ) | | | 8,402 | | |
See Notes to Consolidated Financial Statements
25
Consolidated Schedule of Investments Neuberger Berman Absolute Return Multi-Manager Fund (cont'd)
Description | | Number of
Contracts | | Expiration
Date | | Notional Amount | | Value and
Unrealized
Appreciation/
(Depreciation) | |
Foreign Exchange PLN/USD | | | (1 | ) | | 12/2017 | | $ | (137,370 | ) | | $ | 2,697 | | |
S&P 500 E-Mini Index | | | (28 | ) | | 12/2017 | | | (3,601,780 | ) | | | (110,109 | ) | |
| Silver(a) | | | (3 | ) | | 12/2017 | | | (250,395 | ) | | | 1,299 | | |
| U.S. Treasury 10 Year Note(a) | | | (11 | ) | | 12/2017 | | | (1,374,313 | ) | | | (1,142 | ) | |
| U.S. Treasury 5 Year Note(a) | | | (24 | ) | | 12/2017 | | | (2,812,500 | ) | | | (1,935 | ) | |
| Wheat(a) | | | (16 | ) | | 12/2017 | | | (334,800 | ) | | | 20,420 | | |
| Sugar No. 11(a) | | | (22 | ) | | 2/2018 | | | (363,194 | ) | | | (15,268 | ) | |
| 3 Month Eurodollar(a) | | | (65 | ) | | 9/2019 | | | (15,911,999 | ) | | | 5,237 | | |
| 3 Month Sterling(a) | | | (101 | ) | | 9/2019 | | | (16,593,506 | ) | | | (670 | ) | |
| 3 Month Eurodollar(a) | | | (55 | ) | | 3/2020 | | | (13,452,313 | ) | | | 980 | | |
Total Short Contracts | | | | | | $ | (104,940,520 | ) | | $ | 645,886 | | |
Total Futures | | | | | | | | $ | 992,591 | | |
(a) The investment is held by the Subsidiary (see Note A in Notes to Consolidated Financial Statements).
For the year ended October 31, 2017, the average notional value of futures for the Fund was $55,603,856 for long positions and $(99,849,175) short positions. The Fund had $2,388,303 deposited in segregated accounts to cover margin requirements on open futures.
See Notes to Consolidated Financial Statements
26
Consolidated Schedule of Investments Neuberger Berman Absolute Return Multi-Manager Fund (cont'd)
Credit default swap contracts ("credit default swaps")
At October 31, 2017, the Fund had outstanding centrally cleared credit default swaps as follows:
OTC Credit Default Swaps — Buy Protection
Reference
Entity | | Financing
Rate Paid
by the
Fund | | Payment
Frequency | | Counterparty | | Maturity
Date | | Notional
Amount | | Upfront
Payments/
(Receipts) | | Unrealized
Appreciation/
(Depreciation) | | Accrued
Net
Interest
Receivable/
(Payable) | | Value | |
Assured
Guaranty
Municipal
Corp., debt
obligations | | | 5.00 | % | | quarterly | | JPMorgan
Chase
Bank, NA | | 12/20/2021 | | $ | 2,000,000 | | | $ | (245,558 | ) | | $ | (1,233 | ) | | $ | (11,667 | ) | | $ | (258,458 | ) | |
Gap, Inc. (The),
5.95%,
04/12/2021 | | | 1.00 | | | quarterly | | JPMorgan
Chase
Bank, NA | | 12/20/2021 | | | 2,000,000 | | | | 191,279 | | | | (179,630 | ) | | | (2,333 | ) | | | 9,316 | | |
Hertz Corp.
(The), 5.88%,
10/15/2020 | | | 5.00 | | | quarterly | | JPMorgan
Chase
Bank, NA | | 6/20/2020 | | | 1,000,000 | | | | 68,653 | | | | (85,075 | ) | | | (5,833 | ) | | | (22,255 | ) | |
Hertz Corp.
(The), 5.88%,
10/15/2020 | | | 5.00 | | | quarterly | | JPMorgan
Chase
Bank, NA | | 6/20/2022 | | | 1,000,000 | | | | 180,535 | | | | (137,366 | ) | | | (5,834 | ) | | | 37,335 | | |
International
Lease Finance
Corp., 8.25%,
12/15/2020 | | | 5.00 | | | quarterly | | JPMorgan
Chase
Bank, NA | | 12/20/2021 | | | 1,000,000 | | | | (122,903 | ) | | | (49,553 | ) | | | (5,833 | ) | | | (178,289 | ) | |
JC Penney
Corp., Inc.,
6.38%,
10/15/2036 | | | 5.00 | | | quarterly | | JPMorgan
Chase
Bank, NA | | 12/20/2021 | | | 1,000,000 | | | | 23,792 | | | | 192,665 | | | | (5,833 | ) | | | 210,624 | | |
Kohl's Corp.,
4.00%,
11/01/2021 | | | 1.00 | | | quarterly | | JPMorgan
Chase
Bank, NA | | 12/20/2021 | | | 1,000,000 | | | | 52,744 | | | | (34,311 | ) | | | (1,167 | ) | | | 17,266 | | |
Nordstrom,
Inc., 6.95%,
03/15/2028 | | | 1.00 | | | quarterly | | JPMorgan
Chase
Bank, NA | | 12/20/2021 | | | 1,000,000 | | | | 22,835 | | | | 9,394 | | | | (1,167 | ) | | | 31,062 | | |
Staples, Inc.,
2.75%,
01/12/2018 | | | 1.00 | | | quarterly | | JPMorgan
Chase
Bank, NA | | 12/20/2021 | | | 2,000,000 | | | | 106,469 | | | | 211,573 | | | | (2,333 | ) | | | 315,709 | | |
Total credit default swaps | | | | | | | | | | | | $ | 277,846 | | | $ | (73,536 | ) | | $ | (42,000 | ) | | $ | 162,310 | | |
See Notes to Consolidated Financial Statements
27
Consolidated Schedule of Investments Neuberger Berman Absolute Return Multi-Manager Fund (cont'd)
At October 31, 2017, the Fund had outstanding centrally cleared credit default swaps as follows:
Centrally Cleared Credit Default Swaps — Buy Protection
Reference
Entity | | Financing
Rate Paid
by the
Fund | | Payment
Frequency | | Maturity
Date | | Notional
Amount* | | Upfront
Payments/
(Receipts) | | Unrealized
Appreciation/
(Depreciation) | | Accrued
Net
Interest
Receivable/
(Payable) | | Value | |
iTraxx Europe
Crossover
Index | | | 5.00 | % | | quarterly | | 12/20/2021 | | EUR
| 4,000,000 | | | $ | (277,226 | ) | | $ | (345,200 | ) | | $ | (27,180 | ) | | $ | (649,606 | ) | |
Total centrally cleared credit default swaps | | | | | | | | | | | | $ | (277,226 | ) | | $ | (345,200 | ) | | $ | (27,180 | ) | | $ | (649,606 | ) | |
* The notional amount is stated in the currency in which the contract is denominated.
For the year ended October 31, 2017, the average notional value of credit default swaps for the Fund was $18,305,154 for buy protection and $2,000,000 for sell protection. The Fund had $91,838 deposited in segregated accounts to cover margin requirements on centrally cleared swaps.
Currency Abbreviations
AUD Australian Dollar
BRL Brazilian Real
CAD Canadian Dollar
CHF Swiss Franc
CLP Chilean Peso
EUR Euro
GBP Pound Sterling
HKD Hong Kong Dollar
HUF Hungarian Forint
ILS Israeli New Shekel
INR Indian Rupee
JPY Japanese Yen
KRW Korean Won
MXN Mexican Peso
NOK Norwegian Krone
NZD New Zealand Dollar
PHP Philippine Peso
PLN Polish Zloty
SEK Swedish Krona
SGD Singapore Dollar
THB Thai Baht
TRY Turkish Lira
USD United States Dollar
ZAR South African Rand
See Notes to Consolidated Financial Statements
28
Consolidated Schedule of Investments Neuberger Berman Absolute Return Multi-Manager Fund (cont'd)
Equity swap contracts ("equity swaps")
At October 31, 2017, the Fund had outstanding equity swaps* as follows:
Counterparty | | Description | | Maturity
Dates | | Absolute
Notional
Value | | Net Unrealized
Appreciation/
(Depreciation) | | Financing
Costs
and Other
Receivables/
(Payables) | | Value | |
JPMorgan
Chase Bank, NA
| | The Fund receives the total return,
and pays floating rates plus or minus a
spread on a portfolio of long positions.
The Fund pays the total return, and
receives floating rates plus or minus a
spread on a portfolio of short positions.
The specified spreads range from
–0.53% to 0.65%. The payments/
receipts, based on the specified
benchmark floating rates (see table
below), are denominated in various
foreign currencies based on the local
currencies of the positions within the
swaps. Payments will be made, if any,
at maturity. | | 12/14/2017-
11/5/2018 | | | $7,057,481 | | | | $183,062 | | | | $(3,753) | | | | $179,309 | | |
* The following table represents required component disclosures associated with the equity swaps as of October 31, 2017.
Reference Entity | | Shares | | Notional
Amount(a) | | Net Unrealized
Appreciation/
(Depreciation) | |
Long Positions | |
Australia | |
Mantra Group Ltd. | | | 29,455 | | | $ | 87,919 | | | $ | 644 | | |
Canada | |
Athabasca Oil Corp. | | | 29,503 | | | | 26,528 | | | | (11,848 | ) | |
Denmark | |
Nets A/S | | | 11,500 | | | | 293,609 | | | | 1,813 | | |
France | |
Zodiac Aerospace | | | 18,244 | | | | 521,725 | | | | (2,082 | ) | |
Isle of Man | |
Paysafe Group plc | | | 33,407 | | | | 260,005 | | | | 1,069 | | |
Italy | |
Ansaldo STS SpA | | | 3,000 | | | | 41,410 | | | | 1,428 | | |
Buzzi Unicem SpA | | | 25,670 | | | | 406,962 | | | | 19,090 | | |
| | | | | | | | 20,518 | | |
Netherlands | |
Refresco Group NV | | | 750 | | | | 17,342 | | | | 933 | | |
Spain | |
Abertis Infraestructuras SA | | | 12,847 | | | | 277,897 | | | | 26,681 | | |
See Notes to Consolidated Financial Statements
29
Consolidated Schedule of Investments Neuberger Berman Absolute Return Multi-Manager Fund (cont'd)
Reference Entity | | Shares | | Notional
Amount(a) | | Net Unrealized
Appreciation/
(Depreciation) | |
United Kingdom | |
AVEVA Group plc | | | 1,000 | | | $ | 33,509 | | | $ | 1,402 | | |
Booker Group plc | | | 174,363 | | | | 465,939 | | | | 2,568 | | |
Imagination Technologies Group plc | | | 10,167 | | | | 24,373 | | | | 1,699 | | |
Jimmy Choo plc | | | 22,627 | | | | 69,120 | | | | 471 | | |
Sky plc | | | 119,145 | | | | 1,492,226 | | | | (70,689 | ) | |
Worldpay Group plc | | | 187,506 | | | | 1,011,087 | | | | 5,060 | | |
| | | | | | | | (59,489 | ) | |
United States | |
Safeway, Inc. (Casa Ley), CVR | | | 429,292 | | | | 229,671 | | | | 229,671 | (b)(c) | |
Safeway, Inc. (Property Development
Centers), CVR | | | 429,292 | | | | 0 | | | | 0(b)(c)(d)(e) | | |
| | | | | | | | 229,671 | | |
Total Long Positions of Equity Swaps | | | | | | $ | 207,910 | | |
Short Positions | |
Italy | |
Buzzi Unicem SpA | | | (13,472 | ) | | | (375,530 | ) | | | (18,364 | ) | |
Spain | |
Grifols SA | | | (7,978 | ) | | | (249,754 | ) | | | (23,317 | ) | |
United Kingdom | |
Tesco plc | | | (150,127 | ) | | | (361,696 | ) | | | 15,541 | | |
United States | |
Kennedy-Wilson Holdings, Inc. | | | (1 | ) | | | (19 | ) | | | 0 | (e) | |
Vantiv, Inc. | | | (11,588 | ) | | | (811,160 | ) | | | 1,292 | | |
| | | | | | | | 1,292 | | |
Total Short Positions of Equity Swaps | | | | | | $ | (24,848 | ) | |
Total Long and Short Positions of Equity
Swaps JPMorgan Chase Bank, NA | | | | | | $ | 183,062 | | |
See Notes to Consolidated Financial Statements
30
Consolidated Schedule of Investments Neuberger Berman Absolute Return Multi-Manager Fund (cont'd)
Counterparty | | Description | | Maturity
Dates | | Absolute
Notional
Value | | Net Unrealized
Appreciation/
(Depreciation) | | Financing
Costs
and Other
Receivables/
(Payables) | | Value | |
Morgan Stanley
Capital Services
LLC
| | The Fund receives the total return, and
pays floating rates plus or minus a
spread on a portfolio of long positions.
The Fund pays the total return, and
receives floating rates plus or minus a
spread on a portfolio of short positions.
The specified spreads range from
–0.53% to 1.40%. The payments/
receipts, based on the specified
benchmark floating rates (see table
below), are denominated in various
foreign currencies based on the local
currencies of the positions within the
swaps. Payments will be made, if any,
at maturity. | | 12/4/2017-
9/17/2018 | | | $23,854,090 | | | | $880,371 | | | | $(235,812) | | | | $644,559 | | |
* The following table represents required component disclosures associated with the equity swaps as of October 31, 2017.
Reference Entity | | Shares | | Notional
Amount(a) | | Net Unrealized
Appreciation/
(Depreciation) | |
Long Positions | |
Brazil | |
Hypermarcas SA | | | 26,463 | | | $ | 276,659 | | | $ | 109,984 | | |
Canada | |
Tembec, Inc. | | | 10,975 | | | | 39,898 | | | | 3,545 | | |
France | |
Amundi SA | | | 4,445 | | | | 376,837 | | | | 144,370 | | |
BNP Paribas SA | | | 9,132 | | | | 713,132 | | | | 174,855 | | |
Danone SA | | | 18,435 | | | | 1,506,187 | | | | 151,774 | | |
Iliad SA | | | 3,541 | | | | 884,137 | | | | (27,855 | ) | |
JCDecaux SA | | | 3,589 | | | | 137,334 | | | | (14,837 | ) | |
Publicis Groupe SA | | | 5,576 | | | | 363,472 | | | | (31,517 | ) | |
Remy Cointreau SA | | | 2,402 | | | | 311,974 | | | | 116,897 | | |
| | | | | | | | 513,687 | | |
Ireland | |
Ryanair Holdings plc | | | 62,605 | | | | 1,227,335 | | | | 161,459 | | |
Jordan | |
Hikma Pharmaceuticals plc | | | 1,440 | | | | 22,262 | | | | (21,756 | ) | |
Luxembourg | |
Eurofins Scientific SE | | | 1,098 | | | | 686,826 | | | | 270,317 | | |
See Notes to Consolidated Financial Statements
31
Consolidated Schedule of Investments Neuberger Berman Absolute Return Multi-Manager Fund (cont'd)
Reference Entity | | Shares | | Notional
Amount(a) | | Net Unrealized
Appreciation/
(Depreciation) | |
South Africa | |
Aspen Pharmacare Holdings Ltd. | | | 10,218 | | | $ | 230,865 | | | $ | 33,268 | | |
South Korea | |
NAVER Corp. | | | 407 | | | | 324,772 | | | | 104,376 | | |
Spain | |
Abertis Infraestructuras SA | | | 5,856 | | | | 126,673 | | | | 11,138 | | |
Switzerland | |
Idorsia Ltd. | | | 939 | | | | 18,495 | | | | 18,923 | | |
LafargeHolcim Ltd. (Registered) | | | 14,740 | | | | 832,555 | | | | 180,473 | | |
Nestle SA (Registered) | | | 18,210 | | | | 1,531,418 | | | | 287,629 | | |
| | | | | | | | 487,025 | | |
Turkey | |
Migros Ticaret A/S | | | 39,160 | | | | 269,425 | | | | (47,846 | ) | |
United Kingdom | |
Admiral Group plc | | | 3,056 | | | | 78,092 | | | | 256 | | |
Barclays plc | | | 47,721 | | | | 117,856 | | | | 22,274 | | |
Burberry Group plc | | | 1,264 | | | | 31,930 | | | | 8,995 | | |
Croda International plc | | | 3,368 | | | | 187,159 | | | | 46,831 | | |
ITV plc | | | 55,544 | | | | 121,353 | | | | (2,165 | ) | |
Pets at Home Group plc | | | 15,218 | | | | 35,593 | | | | (21,749 | ) | |
RSA Insurance Group plc | | | 14,130 | | | | 118,043 | | | | 28,053 | | |
Sky plc | | | 5,502 | | | | 68,910 | | | | 1,307 | | |
Smith & Nephew plc | | | 59,747 | | | | 1,127,606 | | | | 179,048 | | |
Smiths Group plc | | | 607 | | | | 12,665 | | | | 3,937 | | |
Sports Direct International plc | | | 164,470 | | | | 863,715 | | | | 156,364 | | |
| | | | | | | | 423,151 | | |
Total Long Positions of Equity Swaps | | | | | | $ | 2,048,348 | | |
Short Positions | |
France | |
Air France-KLM | | | (31,071 | ) | | | (486,797 | ) | | | (212,631 | ) | |
Electricite de France SA | | | (16,893 | ) | | | (221,179 | ) | | | (22,532 | ) | |
Kering | | | (1,549 | ) | | | (710,013 | ) | | | (408,028 | ) | |
Lagardere SCA | | | (17,739 | ) | | | (584,254 | ) | | | (38,031 | ) | |
LVMH Moet Hennessy Louis Vuitton SE | | | (3,815 | ) | | | (1,138,083 | ) | | | (353,727 | ) | |
Orange SA | | | (26,365 | ) | | | (432,568 | ) | | | 51,733 | | |
| | | | | | | | (983,216 | ) | |
See Notes to Consolidated Financial Statements
32
Consolidated Schedule of Investments Neuberger Berman Absolute Return Multi-Manager Fund (cont'd)
Reference Entity | | Shares | | Notional
Amount(a) | | Net Unrealized
Appreciation/
(Depreciation) | |
Germany | |
adidas AG | | | (3,175 | ) | | $ | (706,579 | ) | | $ | (118,600 | ) | |
Deutsche Lufthansa AG (Registered) | | | (16,865 | ) | | | (538,278 | ) | | | (261,241 | ) | |
Deutsche Telekom AG (Registered) | | | (32,761 | ) | | | (596,848 | ) | | | 31,400 | | |
| | | | | | | | (348,441 | ) | |
Italy | |
Eni SpA | | | (29,831 | ) | | | (487,871 | ) | | | 5,375 | | |
Netherlands | |
Koninklijke Ahold Delhaize NV | | | (29,607 | ) | | | (557,149 | ) | | | 169,095 | | |
Switzerland | |
Givaudan SA (Registered) | | | (286 | ) | | | (638,709 | ) | | | (102,428 | ) | |
Roche Holding AG | | | (836 | ) | | | (193,152 | ) | | | 30,662 | | |
| | | | | | | | (71,766 | ) | |
United Kingdom | |
Bunzl plc | | | (19,096 | ) | | | (594,747 | ) | | | (108,232 | ) | |
GlaxoSmithKline plc | | | (17,855 | ) | | | (321,919 | ) | | | 3,070 | | |
Marks & Spencer Group plc | | | (405,782 | ) | | | (1,854,490 | ) | | | 238,939 | | |
Unilever NV | | | (12,598 | ) | | | (732,345 | ) | | | (45,425 | ) | |
| | | | | | | | 88,352 | | |
United States | |
Merck & Co., Inc. | | | (3,610 | ) | | | (198,875 | ) | | | (6,936 | ) | |
Pfizer, Inc. | | | (6,191 | ) | | | (217,056 | ) | | | (20,440 | ) | |
| | | | | | | | (27,376 | ) | |
Total Short Positions of Equity Swaps | | | | | | $ | (1,167,977 | ) | |
Total Long and Short Positions of Equity
Swaps Morgan Stanley Capital Services LLC | | | | | | $ | 880,371 | | |
(a) For the year ended October 31, 2017, the average notional value of equity swaps for the Fund was $21,504,718 for long positions and $(15,700,799) for short positions.
(b) Illiquid security.
(c) Value determined using significant unobservable inputs.
(d) Security fair valued as of October 31, 2017 in accordance with procedures approved by the Board of Trustees.
(e) Amount less than one dollar.
At October 31, 2017, the Fund had cash collateral of $2,332,391 and $4,090,000 deposited in a segregated account for JPMorgan Chase Bank, NA and Morgan Stanley Capital Services LLC, respectively, to cover collateral requirements on OTC derivatives.
See Notes to Consolidated Financial Statements
33
Consolidated Schedule of Investments Neuberger Berman Absolute Return Multi-Manager Fund (cont'd)
Benchmark Floating Rates | | Value at
Period End | |
Australian Bank-Bill Swap Reference Rate | | | 1.55 | % | |
CAD/USD Overnight Forward FX Swap Rate | | | (0.10 | ) | |
CIBOR — Copenhagen Interbank Rate | | | (0.36 | ) | |
EONIA — Euro Overnight Index Average Rate | | | (0.35 | ) | |
EURIBOR — Euro Interbank Offered Rate | | | (0.37 | ) | |
Federal Funds floating Rate | | | 1.07 | | |
LIBOR (CHF) — London Interbank Offered Rate | | | (0.78 | ) | |
LIBOR (EUR) — London Interbank Offered Rate | | | (0.40 | ) | |
LIBOR (GBP) — London Interbank Offered Rate | | | 0.40 | | |
LIBOR (USD) — London Interbank Offered Rate | | | 1.24 | | |
SONIA — Sterling Overnight Index Average Rate | | | 0.21 | | |
TOIS — Tomorrow Next Offered Indexed Swaps Rate | | | (0.54 | ) | |
Total return swap contracts on futures ("total return swaps on futures")
At October 31, 2017, there were no outstanding total return swaps on futures for the Fund.
For the year ended October 31, 2017, the average notional value of total return swaps on futures for the Fund was $1,344,041 for long positions and $(207,283) for short positions.
Purchased option contracts ("options purchased")
At October 31, 2017, the Fund had outstanding options purchased as follows:
| Description | | Number of
Contracts | | Notional
Amount | | Exercise
Price | | Expiration
Date | | Value | |
Calls | |
Diversified Telecommunication Services | |
CenturyLink, Inc. | | | 8 | | | $ | 15,192 | | | $ | 18 | | | 12/15/2017 | | $ | 1,280 | | |
Oil, Gas & Consumable Fuels | |
Antero Midstream GP LP | | | 114 | | | | 213,294 | | | | 20 | | | 1/19/2018 | | | 3,135 | | |
Antero Midstream Partners LP | | | 88 | | | | 252,560 | | | | 30 | | | 12/15/2017 | | | 5,500 | | |
Buckeye Partners LP | | | 85 | | | | 451,435 | | | | 55 | | | 1/19/2018 | | | 6,375 | | |
Enbridge Energy Partners LP | | | 203 | | | | 306,124 | | | | 15 | | | 1/19/2018 | | | 11,165 | | |
EnLink Midstream Partners LP | | | 124 | | | | 189,844 | | | | 16 | | | 2/16/2018 | | | 6,820 | | |
NGL Energy Partners LP | | | 161 | | | | 187,565 | | | | 12.5 | | | 1/19/2018 | | | 8,453 | | |
NuStar Energy LP | | | 33 | | | | 109,890 | | | | 35 | | | 3/16/2018 | | | 2,640 | | |
Plains All American Pipeline LP | | | 56 | | | | 111,832 | | | | 21 | | | 1/19/2018 | | | 3,920 | | |
| | | | | | | | | | | 48,008 | | |
Total calls | | | | | | | | | | $ | 49,288 | | |
See Notes to Consolidated Financial Statements
34
Consolidated Schedule of Investments Neuberger Berman Absolute Return Multi-Manager Fund (cont'd)
| Description | | Number of
Contracts | | Notional
Amount | | Exercise
Price | | Expiration
Date | | Value | |
Puts | |
Building Products | |
Johnson Controls International plc | | | 280 | | | $ | 1,158,920 | | | $ | 42 | | | 11/17/2017 | | | 39,620 | | |
Exchange Traded Funds | |
iShares Russell 2000 ETF | | | 378 | | | | 5,642,028 | | | | 130 | | | 12/29/2017 | | | 13,608 | | |
iShares Russell 2000 ETF | | | 142 | | | | 2,119,492 | | | | 133 | | | 12/29/2017 | | | 6,816 | | |
| | | | | | | | | | | 20,424 | | |
Index Funds | |
S&P 500 Index | | | 7 | | | | 1,802,682 | | | | 2,150 | | | 6/15/2018 | | | 15,225 | | |
Leisure Products | |
Mattel, Inc. | | | 85 | | | | 120,020 | | | | 12 | | | 12/15/2017 | | | 2,125 | | |
Pharmaceuticals | |
Allergan plc | | | 30 | | | | 531,690 | | | | 175 | | | 11/3/2017 | | | 11,850 | | |
Allergan plc | | | 56 | | | | 992,488 | | | | 180 | | | 11/3/2017 | | | 33,740 | | |
| | | | | | | | | | | 45,590 | | |
Textiles, Apparel & Luxury Goods | |
Fossil Group, Inc. | | | 161 | | | | 126,868 | | | | 5 | | | 3/16/2018 | | | 4,427 | | |
Total puts | | | | | | | | | | $ | 127,411 | | |
Total options purchased (cost $381,133) | | | | | | | | | | $ | 176,699 | | |
Written option contracts ("options written")
At October 31, 2017, the Fund had outstanding options written as follows:
| Description | | Number of
Contracts | | Notional
Amount | | Exercise
Price | | Expiration
Date | | Value | |
Calls | |
Food Products | |
Bunge Ltd. | | | 7 | | | $ | (48,146 | ) | | $ | 75 | | | 11/17/2017 | | $ | (332 | ) | |
Health Care Equipment & Supplies | |
NxStage Medical, Inc. | | | 17 | | | | (45,815 | ) | | | 30 | | | 12/15/2017 | | | (85 | ) | |
Independent Power and Renewable Electricity Producers | |
Calpine Corp. | | | 39 | | | | (58,266 | ) | | | 15 | | | 12/15/2017 | | | (292 | ) | |
Internet Software & Services | |
Pandora Media, Inc. | | | 35 | | | | (25,585 | ) | | | 8 | | | 11/3/2017 | | | (578 | ) | |
Technology Hardware, Storage & Peripherals | |
Hewlett Packard Enterprise Co. | | | 15 | | | | (20,880 | ) | | | 14.5 | | | 11/3/2017 | | | (38 | ) | |
Hewlett Packard Enterprise Co. | | | 16 | | | | (22,272 | ) | | | 14 | | | 11/17/2017 | | | (520 | ) | |
Hewlett Packard Enterprise Co. | | | 2 | | | | (2,784 | ) | | | 14.5 | | | 11/17/2017 | | | (30 | ) | |
| | | | | | | | | | | (588 | ) | |
Total options written (premium received $3,737) | | | | | | | | | | $ | (1,875 | ) | |
For the year ended October 31, 2017, the Fund had an average notional value of $307,246 in options purchased, and $(30,335) in options written, respectively.
See Notes to Consolidated Financial Statements
35
Consolidated Schedule of Investments Neuberger Berman Absolute Return Multi-Manager Fund (cont'd)
The following is a summary, categorized by Level (see Note A of Notes to Consolidated Financial Statements), of inputs used to value the Fund's investments as of October 31, 2017:
Asset Valuation Inputs | |
(000's omitted) | | Level 1 | | Level 2 | | Level 3* | | Total | |
Investments: | |
Common Stocks | |
Airlines | | $ | — | | | $ | — | | | $ | 19 | | | $ | 19 | | |
Capital Markets | | | 4,081 | | | | — | | | | — | | | | 4,081 | | |
Construction Materials | | | 929 | | | | 1,225 | | | | — | | | | 2,154 | | |
Internet & Direct Marketing Retail | | | 2,967 | | | | 222 | | | | — | (b) | | | 3,189 | | |
Life Sciences Tools & Services | | | 2,002 | | | | 1,333 | | | | — | | | | 3,335 | | |
Media | | | 7,853 | | | | 2,691 | | | | 1 | | | | 10,545 | | |
Oil, Gas & Consumable Fuels | | | 8,613 | | | | — | | | | — | (b) | | | 8,613 | | |
Trading Companies & Distributors | | | — | | | | 1,507 | | | | — | | | | 1,507 | | |
| Other Common Stocks(a) | | | 114,256 | | | | — | | | | — | | | | 114,256 | | |
Total Common Stocks | | | 140,701 | | | | 6,978 | | | | 20 | | | | 147,699 | | |
Corporate Bonds | |
Banks | | | — | | | | — | | | | 5,560 | | | | 5,560 | | |
Capital Markets | | | — | | | | — | | | | 8,030 | | | | 8,030 | | �� |
Chemicals | | | — | | | | — | | | | — | | | | — | | |
Oil, Gas & Consumable Fuels | | | — | | | | 2,766 | | | | — | (b) | | | 2,766 | | |
| Other Corporate Bonds(a) | | | — | | | | 13,372 | | | | — | | | | 13,372 | | |
Total Corporate Bonds | | | — | | | | 16,138 | | | | 13,590 | | | | 29,728 | | |
Commercial Mortgage-Backed Securities | | | — | | | | 27,760 | | | | — | | | | 27,760 | | |
Loan Assignments | |
Commercial Services & Supplies | | | — | | | | 864 | | | | 464 | | | | 1,328 | | |
Food Products | | | — | | | | 70 | | | | 490 | | | | 560 | | |
Household Durables | | | — | | | | 114 | | | | 60 | | | | 174 | | |
Leisure Products | | | — | | | | 132 | | | | 235 | | | | 367 | | |
Media | | | — | | | | 412 | | | | 274 | | | | 686 | | |
Semiconductors & Semiconductor Equipment | | | — | | | | 1,161 | | | | 3,504 | | | | 4,665 | | |
| Other Loan Assignments(a) | | | — | | | | 15,663 | | | | — | | | | 15,663 | | |
Total Loan Assignments | | | — | | | | 18,416 | | | | 5,027 | | | | 23,443 | | |
Asset-Backed Securities | | | — | | | | 13,935 | | | | — | | | | 13,935 | | |
Collateralized Mortgage Obligations | | | — | | | | 6,416 | | | | 1,027 | | | | 7,443 | | |
| Master Limited Partnerships(a) | | | 7,251 | | | | — | | | | — | | | | 7,251 | | |
Closed End Funds | | | — | | | | 1,926 | | | | — | | | | 1,926 | | |
| Convertible Bonds(a) | | | — | | | | 1,725 | | | | — | | | | 1,725 | | |
U.S. Treasury Obligations | | | — | | | | 190 | | | | — | | | | 190 | | |
| Preferred Stocks(a) | | | 188 | | | | — | | | | — | | | | 188 | | |
| Convertible Preferred Stocks(a) | | | — | | | | 175 | | | | — | | | | 175 | | |
See Notes to Consolidated Financial Statements
36
Consolidated Schedule of Investments Neuberger Berman Absolute Return Multi-Manager Fund (cont'd)
Asset Valuation Inputs (cont'd) | |
(000's omitted) | | Level 1 | | Level 2 | | Level 3* | | Total | |
Rights | |
Biotechnology | | $ | — | | | $ | — | | | $ | 87 | | | $ | 87 | | |
Food & Staples Retailing | | | — | | | | — | | | | 60 | | | | 60 | | |
Media | | | — | | | | — | | | | — | | | | — | | |
Pharmaceuticals | | | — | | | | — | | | | — | (b) | | | — | (b) | |
| Other Rights(a) | | | — | (b) | | | — | | | | — | | | | — | (b) | |
Total Rights | | | — | (b) | | | — | | | | 147 | | | | 147 | | |
Warrants | |
Biotechnology | | | — | | | | — | | | | — | (b) | | | — | (b) | |
Capital Markets | | | 109 | | | | — | | | | — | | | | 109 | | |
Software | | | 6 | | | | — | | | | — | | | | 6 | | |
Total Warrants | | | 115 | | | | — | | | | — | (b) | | | 115 | | |
Short-Term Investments | | | — | | | | 79,287 | | | | — | | | | 79,287 | | |
Options Purchased | | | 177 | | | | — | | | | — | | | | 177 | | |
Total Long Positions | | $ | 148,432 | | | $ | 172,946 | | | $ | 19,811 | | | $ | 341,189 | | |
(a) The Consolidated Schedule of Investments provides information on the industry categorization for the portfolio.
(b) Amount less than one thousand.
* The following is a reconciliation between the beginning and ending balances of investments in which unobservable inputs (Level 3) were used in determining value:
(000's omitted) | | Beginning
balance as
of 11/1/2016 | | Accrued
discounts/
(premiums) | | Realized
gain/loss
and change
in unrealized
appreciation/
(depreciation) | | Purchases | | Sales | | Transfers
into
Level 3 | | Transfers
out of
Level 3 | | Balance
as of
10/31/2017 | | Net change in
unrealized
appreciation/
(depreciation)
from
investments
still held as of
10/31/2017 | |
Investments in Securities: | |
Common Stocks | |
| Airlines(b) | | $ | 10 | | | $ | — | | | $ | 9 | | | $ | — | | | $ | — | | | $ | — | | | $ | — | | | $ | 19 | | | $ | 9 | | |
| Capital Markets(a) | | | — | (c) | | | — | | | | — | | | | — | | | | — | | | | — | | | | — | | | | — | (c) | | | — | | |
Internet & Direct
Marketing Retail(a) | | | — | | | | — | | | | — | | | | — | (c) | | | — | | | | — | | | | — | | | | — | (c) | | | — | | |
| Media(a) | | | 1 | | | | — | | | | — | | | | — | | | | — | | | | — | | | | — | | | | 1 | | | | — | | |
Oil, Gas &
Consumable Fuels(a) | | | — | | | | — | | | | — | (c) | | | — | | | | — | | | | — | | | | — | | | | — | (c) | | | — | | |
Corporate Bonds | |
| Banks(b) | | | 12,087 | | | | 127 | | | | 2,877 | | | | — | | | | (9,531 | ) | | | — | | | | — | | | | 5,560 | | | | 1,280 | | |
| Capital Markets(b) | | | 7,402 | | | | 120 | | | | 2,578 | | | | — | | | | (2,070 | ) | | | — | | | | — | | | | 8,030 | | | | 2,422 | | |
| Chemicals(a) | | | — | | | | — | | | | — | (c) | | | — | | | | — | | | | — | (c) | | | — | | | | — | | | | — | (c) | |
Oil, Gas &
Consumable Fuels(a) | | | — | (c) | | | — | | | | — | | | | — | | | | — | | | | — | | | | — | | | | — | (c) | | | — | | |
See Notes to Consolidated Financial Statements
37
Consolidated Schedule of Investments Neuberger Berman Absolute Return Multi-Manager Fund (cont'd)
(000's omitted) | | Beginning
balance as
of 11/1/2016 | | Accrued
discounts/
(premiums) | | Realized
gain/loss
and change
in unrealized
appreciation/
(depreciation) | | Purchases | | Sales | | Transfers
into
Level 3 | | Transfers
out of
Level 3 | | Balance
as of
10/31/2017 | | Net change in
unrealized
appreciation/
(depreciation)
from
investments
still held as of
10/31/2017 | |
Investments in Securities (cont'd): | |
| Loan Assignments(b) | |
Commercial
Services & Supplies | | $ | — | | | $ | — | (c) | | $ | 6 | | | $ | 458 | | | $ | — | | | $ | — | | | $ | — | | | $ | 464 | | | $ | 6 | | |
Food Products | | | — | | | | — | | | | 8 | | | | 482 | | | | — | | | | — | | | | — | | | | 490 | | | | 8 | | |
Health Care
Equipment & Supplies | | | 522 | | | | — | (c) | | | 2 | | | | — | | | | (524 | ) | | | — | | | | — | | | | — | | | | — | | |
Household Durables | | | — | | | | — | (c) | | | 1 | | | | 59 | | | | — | | | | — | | | | — | | | | 60 | | | | 1 | | |
Independent Power
and Renewable
Electricity Producers | | | 636 | | | | (10 | ) | | | (108 | ) | | | 1,078 | | | | (1,596 | ) | | | — | | | | — | | | | — | | | | — | | |
Leisure Products | | | — | | | | — | (c) | | | — | (c) | | | 235 | | | | — | | | | — | | | | — | | | | 235 | | | | — | (c) | |
Media | | | — | | | | — | | | | 4 | | | | 270 | | | | — | | | | — | | | | — | | | | 274 | | | | 4 | | |
Professional Services | | | 1,989 | | | | (8 | ) | | | (12 | ) | | | — | | | | (1,969 | ) | | | — | | | | — | | | | — | | | | — | | |
Semiconductors &
Semiconductor
Equipment | | | — | | | | (17 | ) | | | 186 | | | | 3,889 | | | | (554 | ) | | | — | | | | — | | | | 3,504 | | | | (25 | ) | |
Collateralized
Mortgage
Obligations(a) | | | — | | | | — | | | | 27 | | | | 1,000 | | | | — | | | | — | | | | — | | | | 1,027 | | | | 27 | | |
Rights | |
| Biotechnology(a) | | | 96 | | | | — | | | | 85 | | | | — | | | | (94 | ) | | | — | | | | — | | | | 87 | | | | (6 | ) | |
Food & Staples
Retailing(b) | | | 30 | | | | — | | | | 32 | | | | — | | | | (2 | ) | | | — | | | | — | | | | 60 | | | | 30 | | |
Media | | | — | | | | — | | | | 126 | | | | 24 | | | | (150 | ) | | | — | | | | — | | | | — | | | | (24 | ) | |
| Pharmaceuticals(a) | | | — | (c) | | | — | | | | — | | | | — | | | | — | | | | — | | | | — | | | | — | (c) | | | — | | |
Wireless
Telecommunication
Services | | | 189 | | | | — | | | | 15 | | | | — | | | | (204 | ) | | | — | | | | — | | | | — | | | | — | | |
Warrants | |
| Biotechnology(a) | | | — | | | | — | | | | — | | | | — | | | | — | | | | — | | | | — | | | | — | | | | — | | |
Insurance | | | — | (c) | | | — | | | | — | (c) | | | — | | | | — | (c) | | | — | | | | — | | | | — | | | | — | | |
Total | | $ | 22,962 | | | $ | 212 | | | $ | 5,836 | | | $ | 7,495 | | | $ | (16,694 | ) | | $ | — | | | $ | — | | | $ | 19,811 | | | $ | 3,732 | | |
(a) As of the year ended October 31, 2017, these securities were valued using methods the Board has approved in the good-faith belief that the resulting valuation will reflect the fair value of the security. These investments did not have a material impact on the Fund's net assets and, therefore, disclosure of unobservable inputs used in formulating valuations is not presented.
See Notes to Consolidated Financial Statements
38
Consolidated Schedule of Investments Neuberger Berman Absolute Return Multi-Manager Fund (cont'd)
(b) As of the year ended October 31, 2017, these securities are valued based on a single quotation obtained from a dealer. The Fund does not have access to unobservable inputs and therefore cannot disclose such inputs used in formulating such quotation.
(c) Amount less than one thousand.
As of the year ended October 31, 2017, certain securities were transferred from one level (as of October 31, 2016) to another. Based on beginning of period market values as of November 1, 2016, $61 was transferred from Level 2 to Level 3. The corporate bond that transferred in or out of Level 3 was primarily due to the pricing methodology using methods the Board has approved in the good-faith belief that the resulting valuation will reflect the fair value of this security (Level 3) or a single broker quote (Level 3). In addition, $5,760,895 was transferred from Level 1 to Level 2. These securities were categorized as Level 2 as of October 31, 2017, due to foreign exchanges having been closed and, therefore, no prices having been readily available for the securities as of that date.
The following is a summary, categorized by Level (see Note A of Notes to Consolidated Financial Statements), of inputs used to value the Fund's short investments as of October 31, 2017:
Liability Valuation Inputs | |
(000's omitted) | | Level 1 | | Level 2 | | Level 3* | | Total | |
Investments: | |
Common Stocks Sold Short | |
Capital Markets | | $ | — | | | $ | (402 | ) | | $ | — | | | $ | (402 | ) | |
IT Services | | | (838 | ) | | | — | | | | (61 | ) | | | (899 | ) | |
| Other Common Stocks Sold Short(a) | | | (54,039 | ) | | | — | | | | — | | | | (54,039 | ) | |
Total Common Stocks Sold Short | | | (54,877 | ) | | | (402 | ) | | | (61 | ) | | | (55,340 | ) | |
Exchange Traded Funds Sold Short | | | (3,297 | ) | | | — | | | | — | | | | (3,297 | ) | |
| Master Limited Partnerships Sold Short(a) | | | (2,451 | ) | | | — | | | | — | | | | (2,451 | ) | |
| Corporate Bonds Sold Short(a) | | | — | | | | (1,357 | ) | | | — | | | | (1,357 | ) | |
Exchange Traded Notes Sold Short | | | (456 | ) | | | — | | | | — | | | | (456 | ) | |
| Preferred Stocks Sold Short(a) | | | — | | | | — | | | | (121 | ) | | | (121 | ) | |
Total Short Positions | | $ | (61,081 | ) | | $ | (1,759 | ) | | $ | (182 | ) | | $ | (63,022 | ) | |
(a) The Consolidated Schedule of Investments provides information on the industry categorization for the portfolio.
See Notes to Consolidated Financial Statements
39
Consolidated Schedule of Investments Neuberger Berman Absolute Return Multi-Manager Fund (cont'd)
* The following is a reconciliation between the beginning and ending balances of short investments in which unobservable inputs (Level 3) were used in determining value:
(000's omitted) | | Beginning
balance as
of 11/1/2016 | | Accrued
discounts/
(premiums) | | Realized
gain/loss
and change
in unrealized
appreciation/
(depreciation) | | Purchases | | Sales | | Transfers
into
Level 3 | | Transfers
out of
Level 3 | | Balance
as of
10/31/2017 | | Net change in
unrealized
appreciation/
(depreciation)
from
investments
still held as of
10/31/2017 | |
Investments in Securities: | |
| Common Stocks Sold Short(a) | |
IT Services | | $ | (27 | ) | | $ | — | | | $ | (54 | ) | | $ | — | | | $ | 20 | | | $ | — | | | $ | — | | | $ | (61 | ) | | $ | (54 | ) | |
| Preferred Stock Sold Short(a) | |
IT Services | | | — | | | | — | | | | 162 | | | | (283 | ) | | | — | | | | — | | | | — | | | | (121 | ) | | | 162 | | |
Total | | $ | (27 | ) | | $ | — | | | $ | 108 | | | $ | (283 | ) | | $ | 20 | | | $ | — | | | $ | — | | | $ | (182 | ) | | $ | 108 | | |
(a) As of the year ended October 31, 2017, these securities were valued either based on a single quotation obtained from a dealer or using methods the Board has approved in the good-faith belief that the resulting valuation will reflect the fair value of the security. The Fund does not have access to unobservable inputs; however, these investments did not have a material impact on the Fund's net assets and, therefore, disclosure of unobservable inputs used in formulating valuations is not presented.
The following is a summary, categorized by Level (see Note A of Notes to Consolidated Financial Statements), of inputs used to value the Fund's derivatives as of October 31, 2017:
Other Financial Instruments | |
(000's omitted) | | Level 1 | | Level 2 | | Level 3* | | Total | |
| Forward contracts(a) | |
Assets | | $ | — | | | $ | 672 | | | $ | — | | | $ | 672 | | |
Liabilities | | | — | | | | (1,118 | ) | | | — | | | | (1,118 | ) | |
| Futures(a) | |
Assets | | | 1,576 | | | | — | | | | — | | | | 1,576 | | |
Liabilities | | | (583 | ) | | | — | | | | — | | | | (583 | ) | |
| Swaps(a) | |
Assets | | | — | | | | 3,447 | | | | 230 | | | | 3,677 | | |
Liabilities | | | — | | | | (3,340 | ) | | | — | | | | (3,340 | ) | |
Options written | |
Liabilities | | | (2 | ) | | | — | | | | — | | | | (2 | ) | |
Total | | $ | 991 | | | $ | (339 | ) | | $ | 230 | | | $ | 882 | | |
(a) Forward contracts and futures are reported at the cumulative unrealized appreciation/(depreciation) of the instrument. Equity swaps are reported at the cumulative unrealized appreciation/(depreciation) including financing costs and other receivables/payables. Credit default swaps are reported in the table at value.
* The following is a reconciliation between the beginning and ending balances of derivative investments in which unobservable inputs (Level 3) were used in determining value:
See Notes to Consolidated Financial Statements
40
Consolidated Schedule of Investments Neuberger Berman Absolute Return Multi-Manager Fund (cont'd)
(000's omitted) | | Beginning
balance as
of 11/1/2016 | | Accrued
discounts/
(premiums) | | Realized
gain/loss
and change
in unrealized
appreciation/
(depreciation) | | Purchases | | Sales | | Transfers
into
Level 3 | | Transfers
out of
Level 3 | | Balance
as of
10/31/2017 | | Net change in
unrealized
appreciation/
(depreciation)
from
investments
still held as of
10/31/2017 | |
Other Financial Instruments: | |
Equity Swaps | |
Brazil | | $ | (1,124 | ) | | $ | — | | | $ | 1,124 | | | $ | — | | | $ | — | | | $ | — | | | $ | — | | | $ | — | | | $ | — | | |
| United States(a) | | | 116 | | | | — | | | | 114 | | | | — | | | | — | | | | — | | | | — | | | | 230 | | | | 114 | | |
Options written | |
United States | | | (1 | ) | | | — | | | | 1 | | | | — | | | | — | | | | — | | | | — | | | | — | | | | — | | |
Total | | $ | (1,009 | ) | | $ | — | | | $ | 1,239 | | | $ | — | | | $ | — | | | $ | — | | | $ | — | | | $ | 230 | | | $ | 114 | | |
(a) As of the year ended October 31, 2017, these investments were valued either based on a single quotation obtained from a dealer or using methods the Board has approved in the good-faith belief that the resulting valuation will reflect the fair value of the security. The Fund does not have access to unobservable inputs; however, these investments did not have a material impact on the Fund's net assets and, therefore, disclosure of unobservable inputs used in formulating valuations is not presented.
See Notes to Consolidated Financial Statements
41
Consolidated Statement of Assets and Liabilities
Neuberger Berman Alternative Funds
(000's omitted, except per share amounts)
| | | ABSOLUTE RETURN
MULTI-MANAGER
FUND | |
| | | October 31, 2017 | |
Assets | |
Investments in securities, at value* (Note A)—see Schedule of Investments: | |
| Unaffiliated issuers(a) | | $ | 341,189 | | |
Cash | | | 1,034 | | |
Due from Custodian | | | 173 | | |
Cash collateral segregated for short sales (Note A) | | | 60,652 | | |
| Cash collateral segregated for swap contracts(e) (Note A) | | | 6,514 | | |
Cash collateral segregated for forward foreign currency contracts (Note A) | | | 1,464 | | |
Dividends and interest receivable | | | 1,012 | | |
Receivable for securities sold | | | 6,357 | | |
Receivable for Fund shares sold | | | 218 | | |
Deposits with brokers for futures contracts (Note A) | | | 2,389 | | |
Receivable for variation margin on futures contracts (Note A) | | | 170 | | |
| OTC swap contracts, at value(f)(g) (Note A) | | | 3,677 | | |
Receivable for forward foreign currency contracts (Note A) | | | 672 | | |
Prepaid expenses and other assets | | | 14 | | |
Total Assets | | | 425,535 | | |
Liabilities | |
| Due to Custodian, foreign currency(b) | | | 229 | | |
| Investments sold short, at value(c) (Note A) | | | 63,022 | | |
| Options contracts written, at value(d) (Note A) | | | 2 | | |
Dividends and interest payable for short sales | | | 88 | | |
| OTC swap contracts, at value(f)(g) (Note A) | | | 2,691 | | |
Payable to administrator—net (Note B) | | | 155 | | |
Payable to investment manager (Note B) | | | 500 | | |
Payable for securities purchased | | | 9,821 | | |
Payable for variation margin on centrally cleared swap contracts | | | 21 | | |
Payable for Fund shares redeemed | | | 632 | | |
Payable for forward foreign currency contracts (Note A) | | | 1,118 | | |
Accrued expenses and other payables | | | 408 | | |
Total Liabilities | | | 78,687 | | |
Net Assets | | $ | 346,848 | | |
Net Assets consist of: | |
Paid-in capital | | $ | 456,468 | | |
Undistributed net investment income/(loss) | | | (780 | ) | |
Accumulated net realized gains/(losses) on investments | | | (120,558 | ) | |
Net unrealized appreciation/(depreciation) in value of investments | | | 11,718 | | |
Net Assets | | $ | 346,848 | | |
Net Assets | |
Institutional Class | | $ | 295,732 | | |
Class A | | | 20,589 | | |
Class C | | | 17,873 | | |
Class R6 | | | 12,654 | | |
See Notes to Consolidated Financial Statements
42
Consolidated Statement of Assets and Liabilities (cont'd)
Neuberger Berman Alternative Funds (cont'd)
(000's omitted, except per share amounts)
| | | ABSOLUTE RETURN
MULTI-MANAGER
FUND | |
| | | October 31, 2017 | |
Shares Outstanding ($.001 par value; unlimited shares authorized) | | | |
Institutional Class | | | 27,459 | | |
Class A | | | 1,933 | | |
Class C | | | 1,746 | | |
Class R6 | | | 1,175 | | |
Net Asset Value, offering and redemption price per share | | | |
Institutional Class | | $ | 10.77 | | |
Class R6 | | $ | 10.77 | | |
Net Asset Value and redemption price per share | | | |
Class A | | $ | 10.65 | | |
Offering Price per share | | | |
Class A‡ | | $ | 11.30 | | |
Net Asset Value and offering price per share | | | |
Class C^ | | $ | 10.24 | | |
*Cost of Investments: | | | |
(a) Unaffiliated issuers | | $ | 331,537 | | |
(b) Total cost of foreign currency | | $ | (688 | ) | |
(c) Proceeds from investments sold short | | $ | 63,839 | | |
(d) Premium received from option contracts written | | $ | 4 | | |
(e) Unamortized upfront receipts on centrally cleared swap contracts | | $ | 277 | | |
(f) Unamortized upfront receipts on OTC swap contracts | | $ | 368 | | |
(g) Unamortized upfront payments on OTC swap contracts | | $ | 646 | | |
‡ On single retail sales of less than $50,000. On sales of $50,000 or more or in certain other circumstances described in the Fund's prospectus, offering price is reduced.
^ Redemption price per share is equal to net asset value less any applicable contingent deferred sales charge.
See Notes to Consolidated Financial Statements
43
Consolidated Statement of Operations
Neuberger Berman Alternative Funds
(000's omitted)
| | | ABSOLUTE
RETURN MULTI-
MANAGER FUND | |
| | | For the
Year Ended
October 31, 2017 | |
Investment Income: | |
Income (Note A): | |
Dividend income—unaffiliated issuers | | $ | 3,357 | | |
Interest income—unaffiliated issuers | | | 11,032 | | |
Foreign taxes withheld (Note A) | | | (39 | ) | |
Total income | | $ | 14,350 | | |
Expenses: | |
Investment management fees (Note B) | | | 7,630 | | |
Administration fees (Note B) | | | 199 | | |
Administration fees (Note B): | |
Institutional Class | | | 411 | | |
Class A | | | 74 | | |
Class C | | | 57 | | |
Class R6 | | | 2 | | |
Distribution fees (Note B): | |
Class A | | | 87 | | |
Class C | | | 263 | | |
Shareholder servicing agent fees: | |
Institutional Class | | | 6 | | |
Class A | | | 8 | | |
Class C | | | 2 | | |
Audit fees | | | 145 | | |
Custodian and accounting fees (Note A) | | | 431 | | |
Legal fees | | | 206 | | |
Registration and filing fees | | | 106 | | |
Shareholder reports | | | 132 | | |
Trustees' fees and expenses | | | 50 | | |
Dividend and interest expense on securities sold short (Note A) | | | 2,720 | | |
Interest expense | | | 4 | | |
Miscellaneous | | | 69 | | |
Total expenses | | | 12,602 | | |
Expenses reimbursed by Management (Note B) | | | (536 | ) | |
Expenses reduced by custodian fee expense offset arrangement (Note A) | | | (1 | ) | |
Total net expenses | | | 12,065 | | |
Net investment income/(loss) | | $ | 2,285 | | |
See Notes to Consolidated Financial Statements
44
Consolidated Statement of Operations (cont'd)
Neuberger Berman Alternative Funds (cont'd)
(000's omitted)
| | | ABSOLUTE
RETURN MULTI-
MANAGER FUND | |
| | | For the
Year Ended
October 31, 2017 | |
Realized and Unrealized Gain/(Loss) on Investments (Note A): | |
Net realized gain/(loss) on: | |
Transactions in investment securities of unaffiliated issuers | | | 16,960 | | |
Closed short positions of unaffiliated issuers | | | (10,382 | ) | |
Settlement of forward foreign currency contracts | | | (426 | ) | |
Settlement of foreign currency transactions | | | (423 | ) | |
Expiration or closing of futures contracts | | | (2,603 | ) | |
Expiration or closing of option contracts written | | | 298 | | |
Expiration or closing of swap contracts | | | (1 | ) | |
Change in net unrealized appreciation/(depreciation)
in value of: | |
Investment securities of unaffiliated issuers | | | 20,870 | | |
Short positions of unaffiliated issuers | | | (1,027 | ) | |
Forward foreign currency contracts | | | (640 | ) | |
Foreign currency translations | | | 400 | | |
Futures contracts | | | 313 | | |
Option contracts written | | | (25 | ) | |
Swap contracts | | | 698 | | |
Net gain/(loss) on investments | | | 24,012 | | |
Net increase/(decrease) in net assets resulting from operations | | $ | 26,297 | | |
See Notes to Consolidated Financial Statements
45
Consolidated Statements of Changes in Net Assets
Neuberger Berman Alternative Funds
(000's omitted)
| | | ABSOLUTE RETURN
MULTI-MANAGER FUND | |
| | Year Ended
October 31, 2017 | | Year Ended
October 31, 2016 | |
Increase/(Decrease) in Net Assets: | |
From Operations (Note A): | |
Net investment income/(loss) | | $ | 2,285 | | | $ | 692 | | |
Net realized gain/(loss) on investments | | | 3,423 | | | | (94,484 | ) | |
Change in net unrealized appreciation/(depreciation) of investments | | | 20,589 | | | | 51,449 | | |
Net increase/(decrease) in net assets resulting from operations | | | 26,297 | | | | (42,343 | ) | |
Distributions to shareholders from (Note A): | |
Net investment income | | | | | |
Institutional Class | | | — | | | | (2,529 | ) | |
Class R6 | | | — | | | | (53 | ) | |
Net realized gain on investments: | |
Institutional Class | | | — | | | | (10,417 | ) | |
Class A | | | — | | | | (1,839 | ) | |
Class C | | | — | | | | (784 | ) | |
Class R6 | | | — | | | | (165 | ) | |
Total distributions to shareholders | | | — | | | | (15,787 | ) | |
From Fund Share Transactions (Note D): | |
Proceeds from shares sold: | | | | | |
Institutional Class | | | 109,581 | | | | 244,845 | | |
Class A | | | 4,382 | | | | 25,581 | | |
Class C | | | 503 | | | | 5,121 | | |
Class R6 | | | 11,240 | | | | 7,223 | | |
Proceeds from reinvestment of dividends and distributions: | | | | | |
Institutional Class | | | — | | | | 11,386 | | |
Class A | | | — | | | | 1,650 | | |
Class C | | | — | | | | 583 | | |
Class R6 | | | — | | | | 218 | | |
Payments for shares redeemed: | | | | | |
Institutional Class | | | (322,155 | ) | | | (1,067,992 | ) | |
Class A | | | (48,877 | ) | | | (166,834 | ) | |
Class C | | | (24,827 | ) | | | (48,443 | ) | |
Class R6 | | | (2,275 | ) | | | (20,564 | ) | |
Net increase/(decrease) from Fund share transactions | | | (272,428 | ) | | | (1,007,226 | ) | |
Net Increase/(Decrease) in Net Assets | | | (246,131 | ) | | | (1,065,356 | ) | |
Net Assets: | |
Beginning of year | | | 592,979 | | | | 1,658,335 | | |
End of year | | $ | 346,848 | | | $ | 592,979 | | |
Undistributed net investment income/(loss) at end of year | | | (780 | ) | | | 14 | | |
See Notes to Consolidated Financial Statements
46
Notes to Consolidated Financial Statements Absolute Return Multi-Manager Fund
Note A—Summary of Significant Accounting Policies:
1 General: Neuberger Berman Alternative Funds (the "Trust") is a Delaware statutory trust organized pursuant to an Amended and Restated Trust Instrument dated March 27, 2014. The Trust is registered as an open-end management investment company under the Investment Company Act of 1940, as amended (the "1940 Act"), and its shares are registered under the 1933 Act. Neuberger Berman Absolute Return Multi-Manager Fund ("Absolute Return Multi-Manager", or the "Fund") is a separate operating series of the Trust, and is diversified. The Fund offers Institutional Class shares, Class A shares, Class C shares and Class R6 shares. The Trust's Board of Trustees (the "Board") may establish additional series or classes of shares without the approval of shareholders.
A zero balance, if any, reflects an actual amount rounding to less than $1,000.
The assets of the Fund belong only to the Fund, and the liabilities of the Fund are borne solely by the Fund and no other.
The Fund is an investment company and accordingly follows the investment company accounting and reporting guidance of the Financial Accounting Standards Board ("FASB") Accounting Standard Codification Topic 946 "Financial Services—Investment Companies."
The preparation of financial statements in accordance with U.S. generally accepted accounting principles ("GAAP") requires Neuberger Berman Investment Advisers LLC ("NBIA" or "Management") to make estimates and assumptions at the date of the financial statements. Actual results could differ from those estimates.
The Fund invests in commodity-related instruments through the Subsidiary, which is organized under the laws of the Cayman Islands. The Fund is and expects to be the sole shareholder of the Subsidiary. The Subsidiary is governed by its own Board of Directors.
As of October 31, 2017, the value of the Fund's investment in the Subsidiary was as follows:
Investment in
Subsidiary | | Percentage of
Net Assets | |
| $ | 15,676,313 | | | | 4.5 | % | |
The Consolidated Financial Statements include all investments and other accounts of the Subsidiary as if held directly by the Fund. A summary of the Subsidiary's financial information is presented below.
Subsidiary Financial Statement Information
(000's omitted) | | Amount | |
Total Assets | | $ | 17,517 | | |
Total Liabilities | | | (1,841 | ) | |
Net Assets | | | 15,676 | | |
Net Investment Income/(Loss) | | | (67 | ) | |
Net Realized Gain/(Loss) | | | (1,779 | ) | |
Change in Net Unrealized Appreciation/(Depreciation) | | | 389 | | |
Net Increase/(Decrease) in Net Assets Resulting from Operations | | | (1,457 | ) | |
47
2 Consolidation: The accompanying financial statements of the Fund present the consolidated accounts of the Fund and the Subsidiary. All intercompany accounts and transactions have been eliminated in consolidation.
3 Portfolio valuation: In accordance with Accounting Standards Codification ("ASC") 820 "Fair Value Measurement" ("ASC 820"), all investments held by the Fund are carried at the value that Management believes the Fund would receive upon selling an investment in an orderly transaction to an independent buyer in the principal or most advantageous market for the investment under current market conditions. Various inputs, including the volume and level of activity for the asset or liability in the market, are considered in valuing the Fund's investments, some of which are discussed below. Significant Management judgment may be necessary to value investments in accordance with ASC 820.
ASC 820 established a three-tier hierarchy of inputs to create a classification of value measurements for disclosure purposes. The three-tier hierarchy of inputs is summarized in the three broad Levels listed below.
• Level 1 – quoted prices in active markets for identical investments
• Level 2 – other observable inputs (including quoted prices for similar investments, interest rates, prepayment speeds, credit risk, amortized cost, etc.)
• Level 3 – unobservable inputs (including the Fund's own assumptions in determining the fair value of investments)
The inputs or methodology used for valuing an investment are not necessarily an indication of the risk associated with investing in those securities.
The value of the Fund's investments (long and short positions) in equity securities, preferred stocks, exchange traded funds, exchange traded notes, exchange traded options purchased and options written, master limited partnerships, closed-end funds, convertible preferred stocks, rights and warrants, for which market quotations are readily available, is generally determined by Management by obtaining valuations from independent pricing services based on the latest sale price quoted on a principal exchange or market for that security (Level 1 inputs). Securities traded primarily on the NASDAQ Stock Market are normally valued at the NASDAQ Official Closing Price ("NOCP") provided by NASDAQ each business day. The NOCP is the most recently reported price as of 4:00:02 p.m., Eastern Time, unless that price is outside the range of the "inside" bid and asked prices (i.e., the bid and asked prices that dealers quote to each other when trading for their own accounts); in that case, NASDAQ will adjust the price to equal the inside bid or asked price, whichever is closer. Because of delays in reporting trades, the NOCP may not be based on the price of the last trade to occur before the market closes. If there is no sale of a security on a particular day, the independent pricing services may value the security based on market quotations.
The value of the Fund's investments for long and short positions in debt securities is determined by Management primarily by obtaining valuations from independent pricing services based on readily available bid or offer quotations, respectively, or if quotations are not available, by methods which include various considerations based on security type (generally Level 2 inputs). In addition to the consideration of yields or prices of securities of comparable quality, coupon, maturity and type, indications as to values from dealers, and general market conditions, the following is a description of other Level 2 inputs and related valuation techniques used by independent pricing services to value certain types of debt securities held by the Fund:
Corporate Bonds. Inputs used to value corporate debt securities generally include relative credit information, observed market movements, sector news, U.S. Treasury yield curve or relevant benchmark curve and other market information, which may include benchmark yields, reported trades, broker-dealer quotes, issuer spreads, benchmark securities, bids, offers, and reference data, such as market research publications, when available ("Other Market Information").
Asset-Backed Securities and Mortgage-Backed Securities. Inputs used to value asset-backed securities and mortgage-backed securities generally include models that consider a number of factors, which may include the following: prepayment speeds, cash flows, spread adjustments and Other Market Information.
48
U.S. Treasury Obligations. Inputs used to value U.S. Treasury securities generally include quotes from several inter-dealer brokers and Other Market Information.
Convertible Bonds. Inputs used to value convertible bonds generally include underlying stock data, dealer quotes, conversion premiums, listed bond and preferred stock prices and other market information, which may include benchmark curves, trade execution data, and sensitivity analysis, when available.
The value of loan assignments is determined by Management primarily by obtaining valuations from independent pricing services based on broker quotes (generally Level 2 or Level 3 inputs depending on the number of quotes available).
The value of futures is determined by Management by obtaining valuations from independent pricing services at the settlement price at the market close (Level 1 inputs).
The value of forward contracts is determined by Management by obtaining valuations from independent pricing services based on actual traded currency rates on independent pricing services' networks, along with other traded and quoted currency rates provided to the pricing services by leading market participants (Level 2 inputs).
The value of equity swaps is determined by Management by obtaining valuations from independent pricing services using the underlying asset and stated London Interbank Offered Rate ("LIBOR") or Federal Funds floating rate (generally Level 2 or Level 3 inputs).
The value of credit default swaps is determined by Management by obtaining valuations from independent pricing services using a model that considers a number of factors, which may include default probabilities, credit curves, recovery rates and cash flows (Level 2 inputs).
Management has developed a process to periodically review information provided by independent pricing services for all types of securities.
Investments in non-exchange traded investment companies are valued using the respective fund's daily calculated net asset value per share (Level 2 inputs).
If a valuation is not available from an independent pricing service, or if Management has reason to believe that the valuation received does not represent the amount the Fund might reasonably expect to receive on a current sale in an orderly transaction, Management seeks to obtain quotations from brokers or dealers (generally considered Level 2 or Level 3 inputs depending on the number of quotes available). If such quotations are not readily available, the security is valued using methods the Board has approved in the good-faith belief that the resulting valuation will reflect the fair value of the security. Numerous factors may be considered when determining the fair value of a security based on Level 2 or Level 3 inputs, including available analyst, media or other reports, securities within the same industry with recent highly correlated performance, trading in futures or American Depositary Receipts ("ADRs") and whether the issuer of the security being fair valued has other securities outstanding.
The value of the Fund's investments in foreign securities is generally determined using the same valuation methods and inputs as other Fund investments, as discussed above. Foreign security prices expressed in local currency values are normally translated from the local currency into U.S. dollars using the exchange rates as of 4:00 p.m. Eastern Time on days the New York Stock Exchange ("NYSE") is open for business. The Board has approved the use of Interactive Data Pricing and Reference Data, LLC ("Interactive") to assist in determining the fair value of foreign equity securities when changes in the value of a certain index suggest that the closing prices on the foreign exchanges may no longer represent the amount that the Fund could expect to receive for those securities or on days when foreign markets are closed and U.S. markets are open. In each of these events, Interactive will provide adjusted prices for certain foreign equity securities using a statistical analysis of historical correlations of multiple factors (Level 2 inputs). The Board has also approved the use of Interactive to evaluate the prices of foreign debt securities as of the time as of which the Fund's share price is calculated. Interactive utilizes benchmark spread and yield curves and evaluates available market activity from the local close to the time as of which the Fund's share price is calculated (Level 2 inputs) to assist in determining prices for certain foreign debt securities. In the case of both foreign equity and foreign debt securities, in the absence of precise information about the market values of
49
these foreign securities as of the time as of which the Fund's share price is calculated, the Board has determined on the basis of available data that prices adjusted or evaluated in this way are likely to be closer to the prices the Fund could realize on a current sale than are the prices of those securities established at the close of the foreign markets in which the securities primarily trade.
Fair value prices are necessarily estimates, and there is no assurance that such a price will be at or close to the price at which the security is next quoted or next trades.
4 Foreign currency translation: The accounting records of the Fund and Subsidiary are maintained in U.S. dollars. Foreign currency amounts are normally translated into U.S. dollars using the exchange rate as of 4:00 p.m. Eastern Time, on days the NYSE is open for business, to determine the value of investments, other assets and liabilities. Purchase and sale prices of securities, and income and expenses, are translated into U.S. dollars at the prevailing rate of exchange on the respective dates of such transactions. Net unrealized foreign currency gain (loss), if any, arises from changes in the value of assets and liabilities, other than investments in securities, as a result of changes in exchange rates and is stated separately in the Consolidated Statement of Operations.
5 Securities transactions and investment income: Securities transactions are recorded on trade date for financial reporting purposes. Dividend income is recorded on the ex-dividend date or, for certain foreign dividends, as soon as the Fund becomes aware of the dividends. Non-cash dividends included in dividend income, if any, are recorded at the fair market value of the securities received. Interest income, including accretion of discount (adjusted for original issue discount, where applicable) and amortization of premium, where applicable, and accretion of discount on short-term investments, if any, is recorded on the accrual basis. Realized gains and losses from securities transactions and foreign currency transactions, if any, are recorded on the basis of identified cost and stated separately in the Consolidated Statement of Operations. Included in net realized gain (loss) on investments are proceeds from the settlement of a class action litigation in which the Fund participated as a class member. The amount of such proceeds for the year ended October 31, 2017, was $13,686.
6 Income tax information: The Fund is treated as a separate entity for U.S. federal income tax purposes. It is the policy of the Fund to continue to qualify for treatment as regulated investment companies ("RIC") by complying with the requirements of the U.S. Internal Revenue Code applicable to RICs and to distribute substantially all of its net investment income and net realized capital gains to its shareholders. To the extent the Fund distributes substantially all of its net investment income and net realized capital gains to shareholders, no federal income or excise tax provision is required.
The Fund has adopted the provisions of ASC 740 "Income Taxes" ("ASC 740"). ASC 740 sets forth a minimum threshold for financial statement recognition of a tax position taken, or expected to be taken, in a tax return. The Fund recognizes interest and penalties, if any, related to unrecognized tax positions as an income tax expense in the Consolidated Statement of Operations. The Fund is subject to examination by U.S. federal and state tax authorities for returns filed for the tax years for which the applicable statutes of limitations have not yet expired. As of October 31, 2017, the Fund did not have any unrecognized tax positions.
The Subsidiary is a controlled foreign corporation under the U.S. Internal Revenue Code. As a U.S. shareholder of a controlled foreign corporation, the Fund will include in its taxable income its share of the Subsidiary's current earnings and profits (including net realized gains). Any deficit generated by the Subsidiary will be disregarded for purposes of computing the Fund's taxable income in the current period and also disregarded for all future periods.
At October 31, 2017 the cost of long security positions, short security positions and derivative instruments for U.S. federal income tax purposes was $339,674,257. Gross unrealized appreciation of long security positions, short security positions and derivative instruments was $23,105,495 and gross unrealized depreciation of long security positions, short security positions and derivative instruments was $21,505,405, resulting in net unrealized appreciation of $1,600,090 based on cost for U.S. federal income tax purposes.
Income distributions and capital gain distributions are determined in accordance with income tax regulations, which may differ from GAAP. These differences are primarily due to differing treatments of income and gains on
50
various investment securities held by the Fund, timing differences and differing characterization of distributions made by the Fund.
As determined on October 31, 2017, permanent differences resulting primarily from different book and tax accounting were reclassified at year end. Such differences may be attributed to the tax treatment of one or more of the following: paydown gains and losses, partnership basis adjustments, income recognized on swap transactions, the tax treatment of foreign currency gains and losses, payments in lieu of dividends on short sales and gains from passive foreign investment companies. These reclassifications had no effect on net income, net asset value ("NAV") or NAV per share of the Fund. For the year ended October 31, 2017, the Fund recorded the following permanent reclassifications:
| Paid-in Capital | | Undistributed
Net Investment
Income/(Loss) | | Accumulated
Net Realized
Gains/(Losses)
on Investments | |
| $ | (3,136,100 | ) | | $ | (3,078,708 | ) | | $ | 6,214,808 | | |
The tax character of distributions paid during the years ended October 31, 2017 and October 31, 2016 was as follows:
| | | Distributions Paid From: | | | | | |
Ordinary Income | | Tax-Exempt
Income | | Long-Term
Capital Gain | | Return of
Capital | | Total | |
| 2017 | | 2016 | | 2017 | | 2016 | | 2017 | | 2016 | | 2017 | | 2016 | | 2017 | | 2016 | |
| $ | — | | | $ | 15,787,471 | | | $ | — | | | $ | — | | | $ | — | | | $ | — | | | $ | — | | | $ | — | | | $ | — | | | $ | 15,787,471 | | |
As of October 31, 2017, the components of distributable earnings (accumulated losses) on a U.S. federal income tax basis were as follows:
Undistributed
Ordinary
Income/(Loss) | | Undistributed
Long-Term
Capital Gain | | Unrealized
Appreciation/
(Depreciation) | | Loss
Carryforwards
and Deferrals | | Other
Temporary
Differences | | Total | |
| $ | — | | | $ | — | | | $ | 1,583,788 | | | $ | (109,478,409 | ) | | $ | (1,724,388 | ) | | $ | (109,619,009 | ) | |
The temporary differences between book basis and tax basis distributable earnings are primarily due to: losses disallowed and recognized on wash sales, short sales and straddles, mark-to-market adjustments on swaps, futures, options and forwards, unamortized organization expenses, tax adjustments related to real estate investment trusts ("REITs"), PFICs, partnerships, swap contracts, short sales and other investments and capital loss carryforwards.
To the extent the Fund's net realized capital gains, if any, can be offset by capital loss carryforwards, if any, it is the policy of the Fund not to distribute such gains. Capital loss carryforward rules allow for regulated investment companies to carry forward capital losses indefinitely and to retain the character of capital loss carryforwards as short-term or long-term. As determined at October 31, 2017, the Fund had unused capital loss carryforwards available for federal income tax purposes to offset net realized capital gains, if any, as follows:
| Long-Term | | Short-Term | |
| $ | 42,580,623 | | | $ | 66,897,786 | | |
During the year ended October 31, 2017, the Fund utilized long-term capital loss carryforwards in the amount of $846,445.
7 Foreign taxes: Foreign taxes withheld, if any, represent amounts withheld by foreign tax authorities, net of refunds recoverable.
51
Foreign capital gains on certain foreign securities may be subject to foreign taxes, which are accrued as applicable. At October 31, 2017, there were no outstanding balances of accrued capital gains taxes for the Fund.
8 Distributions to shareholders: The Fund may earn income, net of expenses, daily on its investments. Distributions from net investment income and net realized capital gains, if any, are generally distributed once a year (usually in December) and are recorded on the ex-date.
It is the policy of the Fund to pass through to its shareholders substantially all REIT distributions and other income it receives, less operating expenses. The distributions received from REITs are generally composed of income, capital gains, and/or return of REIT capital, but the REITs do not report this information to the Fund until the following calendar year. At October 31, 2017, the Fund estimated these amounts for the period January 1, 2017 to October 31, 2017 within the financial statements because the 2017 information is not available from the REITs until after the Fund's fiscal year-end. All estimates are based upon REIT information sources available to the Fund together with actual IRS Forms 1099-DIV received to date. For the year ended October 31, 2017, the character of distributions paid to shareholders of the Fund disclosed within the Consolidated Statements of Changes in Net Assets is based on estimates made at that time. Based on past experience it is possible that a portion of the Fund's distributions during the current fiscal year, if any, will be considered tax return of capital, but the actual amount of the tax return of capital, if any, is not determinable until after the Fund's fiscal year-end. After calendar year-end, when the Fund learns the nature of the distributions paid by REITs during that year, distributions previously identified as income are often recharacterized as return of capital and/or capital gain. After all applicable REITs have informed the Fund of the actual breakdown of distributions paid to the Fund during its fiscal year, estimates previously recorded are adjusted on the books of the Fund to reflect actual results. As a result, the composition of the Fund's distributions as reported herein may differ from the final composition determined after calendar year-end and reported to the Fund shareholders on IRS Form 1099-DIV.
9 Expense allocation: Certain expenses are applicable to multiple funds within the complex of related investment companies. Expenses directly attributable to the Fund are charged to the Fund. Expenses of the Trust that are not directly attributable to a particular series of the Trust (e.g., the Fund) are allocated among the series of the Trust, on the basis of relative net assets, except where a more appropriate allocation of expenses to each of the series can otherwise be made fairly. Expenses borne by the complex of related investment companies, which includes open-end and closed-end investment companies for which Management serves as investment manager, that are not directly attributable to a particular investment company in the complex (e.g., the Trust) or series thereof are allocated among the investment companies in the complex or series thereof on the basis of relative net assets, except where a more appropriate allocation of expenses to each of the investment companies in the complex or series thereof can otherwise be made fairly. The Fund's expenses (other than those specific to each class) are allocated proportionally each day among the classes based upon the relative net assets of each class.
10 Investments in foreign securities: Investing in foreign securities may involve sovereign and other risks, in addition to the credit and market risks normally associated with domestic securities. These additional risks include the possibility of adverse political and economic developments (including political instability, nationalization, expropriation, or confiscatory taxation) and the potentially adverse effects of unavailability of public information regarding issuers, less governmental supervision and regulation of financial markets, reduced liquidity of certain financial markets, and the lack of uniform accounting, auditing, and financial reporting standards or the application of standards that are different or less stringent than those applied in the United States. Foreign securities also may experience greater price volatility, higher rates of inflation, and delays in settlement.
11 Securities sold short: The Fund may engage in short sales, which are sales of securities which have been borrowed from a third party on the expectation that the market price will decline. If the price of the securities decreases, the Fund will make a profit by purchasing the securities in the open market at a price lower than the one at which it sold the securities. If the price of the securities increases, the Fund may have to cover its short positions at a price higher than the short sale price, resulting in a loss. Gains are limited to the price at which the Fund sold the security short, while losses are potentially unlimited in size. The Fund pledges securities and/or other assets to the lender as collateral. Proceeds received from short sales may be maintained by the lender as collateral or may be
52
released to the Fund and used to purchase additional securities or for any other purpose. Proceeds maintained by the lender are included in the "Cash collateral segregated for short sales" on the Consolidated Statement of Assets and Liabilities. The Fund is required to segregate an amount of cash or liquid securities in an amount at least equal to the current market value of the securities sold short (less any additional collateral pledged to the lender). The Fund is contractually responsible to remit to the lender any dividends and interest payable on securities while those securities are being borrowed by the Fund. The Fund may receive or pay the net of the interest charged by the prime broker on the borrowed securities and a financing charge for the difference in the market value of the short position and the cash collateral deposited with the broker. This income or fee is calculated daily based upon the market value of each borrowed security and a variable rate that is dependent on the availability of the security. These costs related to short sales (i.e., dividend and interest remitted to the lender and interest charged by the prime broker) are recorded as an expense of the Fund and are excluded from the contractual expense limitation. The net amount of fees incurred are included in the "Dividend and interest expense on securities sold short" on the Consolidated Statement of Operations and were $131,211 for the year ended October 31, 2017.
At October 31, 2017, the Fund had cash pledged in the amount of $53,183,436 to JPMorgan Chase Bank, NA ("JPM"), as collateral for short sales. In addition, JPM has a perfected security interest in these assets. At October 31, 2017, the Fund had securities pledged in the amount of $33,378,173 to JPM to cover collateral requirements for borrowing in connection with securities sold short and options written.
12 Investment company securities, exchange traded funds and exchange traded notes: The Fund may invest in shares of other registered investment companies, including exchange traded funds ("ETFs"), within the limitations prescribed by the 1940 Act or pursuant to an exemptive order from the SEC that permits the Fund to invest in both affiliated and unaffiliated investment companies, including exchange traded funds, in excess of the limits in Section 12(d)(1)(A) of the 1940 Act, as amended, subject to the terms and conditions of such order. Some ETFs seek to track the performance of a particular market index. These indices include both broad-based market indices and more narrowly-based indices, including those relating to particular sectors, markets, regions or industries. However, some ETFs have actively-managed investment objectives. ETF shares are traded like traditional equity securities on a national securities exchange or NASDAQ. The Fund will indirectly bear its proportionate share of any management fees and other expenses paid by such other investment companies, which will increase expenses and decrease returns. The Fund may also invest in exchange traded notes ("ETNs"). ETNs are senior, unsecured, unsubordinated debt securities that are linked to the performance of a particular market index or strategy. The issuer of the ETN pays the Fund an amount based on the returns of the underlying index or strategy, plus principal at maturity. The Fund will bear any applicable fees to the issuer upon redemption or maturity, which will increase expenses and decrease returns.
13 Derivative instruments: The Fund's use of derivatives during the year ended October 31, 2017, is described below. Please see the Consolidated Schedule of Investments for the Fund's open positions in derivatives, if any, at October 31, 2017. The Fund has adopted the provisions of ASC 815 "Derivatives and Hedging" ("ASC 815"). The disclosure requirements of ASC 815 distinguish between derivatives that qualify for hedge accounting and those that do not. Because investment companies value their derivatives at fair value and recognize changes in fair value through the Consolidated Statement of Operations, they do not qualify for hedge accounting. Accordingly, even though the Fund's investments in derivatives may represent economic hedges, they are considered non-hedge transactions for purposes of this disclosure.
Credit default swap contracts: During the year ended October 31, 2017, the Fund used credit default swaps as part of its investment strategies, to enhance returns and to hedge against unfavorable changes in the value of investments and to protect against adverse movements in interest rates or credit performance with counterparties.
Over the counter ("OTC") credit default swap contracts: When the Fund is the buyer of an OTC credit default swap contract, it is entitled to receive the notional amount of the swap from the counterparty if a credit event occurs. In return, the Fund pays the counterparty a periodic stream of payments over the term of the contract provided that no credit event has occurred. If no credit event occurs, the Fund would have spent the stream of payments and received no proceeds from the contract. When the Fund is the seller of an OTC credit default swap
53
contract, it receives the stream of payments, but is obligated to pay to the buyer of the protection an amount up to the notional amount of the swap and in certain instances take delivery of securities of the reference entity upon the occurrence of a credit event, as defined under the terms of that particular swap agreement. Credit events are contract specific but may include bankruptcy, failure to pay, restructuring, obligation acceleration and repudiation/moratorium. If the Fund is a seller of protection and a credit event occurs, the maximum potential amount of future payments that the Fund could be required to make (or the risk of loss) would be an amount equal to the notional amount of the agreement. This potential amount would be partially offset by any recovery value of the respective referenced obligation, or net amount received from the settlement of a buy protection credit default swap agreement entered into by the Fund for the same referenced obligation. As the seller, the Fund may add economic leverage to its portfolio because, in addition to its total net assets, the Fund is subject to investment exposure on the notional amount of the swap. The net periodic payments paid or received on the swap contract are accrued daily as a component of unrealized appreciation/(depreciation) and are recorded as realized gain upon receipt or realized loss upon payment. The Fund also records an increase or decrease to unrealized appreciation/(depreciation) in an amount equal to the daily valuation of the swap. For financial reporting purposes, unamortized upfront payments/(receipts), if any, are netted with unrealized appreciation or depreciation and net interest received or paid on swap contracts to determine the fair value of swaps.
Centrally cleared swap contracts: Certain clearinghouses currently offer clearing for limited types of derivative transactions, including certain credit default swaps. In a cleared derivative transaction, the Fund typically enters into the transaction with a financial institution counterparty that is then cleared through a central clearinghouse. Upon acceptance of a swap by a central clearinghouse, the original swap is extinguished and replaced with a swap with the clearinghouse, thereby reducing or eliminating the Fund's exposure to the credit risk of the original counterparty. The Fund typically will be required to post specified levels of both initial and variation margin with the clearinghouse or at the instruction of the clearinghouse. The daily change in valuation is recorded as a receivable or payable for variation margin and settled in cash with the centrally clearing party daily. For financial reporting purposes, unamortized upfront payments/(receipts), if any, are netted with unrealized appreciation or depreciation and net interest received or paid on swap contracts to determine the fair value of swaps.
Futures contracts: During the year ended October 31, 2017, the Fund used futures for economic hedging purposes and to enhance returns.
At the time the Fund or Subsidiary enters into a futures contract, it is required to deposit with the futures commission merchant a specified amount of cash or liquid securities, known as "initial margin," which is a percentage of the value of the futures contract being traded that is set by the exchange upon which the futures contract is traded. Each day, the futures contract is valued at the official settlement price of the board of trade or U.S. commodity exchange on which such futures contract is traded. Subsequent payments, known as "variation margin," to and from the broker are made on a daily basis, or as needed, as the market price of the futures contract fluctuates. Daily variation margin adjustments, arising from this "mark to market," are recorded by the Fund or Subsidiary as unrealized gains or losses.
Although some futures by their terms call for actual delivery or acquisition of the underlying securities or currency, in most cases the contracts are closed out prior to delivery by offsetting purchases or sales of matching futures. When the contracts are closed, the Fund recognizes a gain or loss. Risks of entering into futures contracts include the possibility there may be an illiquid market, possibly at a time of rapidly declining prices, and/or a change in the value of the contract may not correlate with changes in the value of the underlying securities. Futures executed on regulated futures exchanges have minimal counterparty risk to the Fund because the exchange's clearinghouse assumes the position of the counterparty in each transaction. Thus, the Fund is exposed to risk only in connection with the clearinghouse and not in connection with the original counterparty to the transaction.
For U.S. federal income tax purposes, futures transactions undertaken by the Fund may cause the Fund to recognize gains or losses from marking contracts to market even though its positions have not been sold or terminated, may affect the character of the gains or losses recognized as long-term or short-term, and may affect the timing of some capital gains and losses realized by the Fund. Also, the Fund's losses on transactions involving
54
futures contracts may be deferred rather than being taken into account currently in calculating the Fund's taxable income.
Equity swap contracts: During the year ended October 31, 2017, the Fund used equity swaps to provide investment exposure to certain investments, primarily foreign securities.
Equity swaps are two-party contracts in which counterparties exchange the return on a specified reference security, basket of securities, security index or index component for the return based on a fixed or floating interest rate during the period of the swap. Equity swaps are marked to market daily based on the value of the underlying reference entity and the change, if any, is recorded as an unrealized gain or loss. Equity swaps normally do not involve the delivery of securities or other underlying assets. If the other party to an equity swap defaults, the Fund's risk of loss consists of the net amount of payments that the Fund is contractually entitled to receive, if any. Equity swaps are derivatives and their value can be very volatile. To the extent that future market trends, the values of assets or economic factors are not accurately analyzed and predicted, the Fund may suffer a loss, which may exceed the related amounts shown in the Consolidated Statement of Assets and Liabilities. Periodic payments received or paid by the Fund are recorded as realized gains or losses.
Total return swap contracts: During the year ended October 31, 2017, the Fund used total return swaps to hedge certain indices and provide investment exposure to certain investments, primarily foreign securities.
Total return swaps involve commitments to pay fixed or floating rate interest in exchange for a market-linked return based on a notional amount. To the extent the total return of the reference security or index underlying the total return swap exceeds or falls short of the offsetting interest rate obligation, the Fund will receive a payment or make a payment to the counterparty, respectively. Certain risks may arise when entering into total return swap transactions, including counterparty default, liquidity or unfavorable changes in the value of the underlying reference security or index. The value of a swap is adjusted daily and the change in value, if any, is recorded as unrealized appreciation or depreciation in the Consolidated Statement of Assets and Liabilities. Payments received or made at the end of each measurement period are recorded as realized gain or loss in the Consolidated Statement of Operations. For financial reporting purposes, unamortized upfront payments, if any, are netted with unrealized appreciation or depreciation and net interest received or paid on swap contracts to determine the fair value of swaps.
Forward foreign currency contracts: During the year ended October 31, 2017, the Fund used forward foreign currency contracts to hedge foreign currency and to enhance returns.
A forward contract is an agreement between two parties to buy or sell a specific currency for another at a set price on a future date, and is individually negotiated and privately traded by currency traders and their customers in the interbank market. The market value of a forward contract fluctuates with changes in forward currency exchange rates. Forward contracts are marked to market daily, and the change in value is recorded by the Fund as an unrealized gain or loss. At the consummation of a forward contract to purchase or sell currency, the Fund may either exchange the currencies specified at the maturity of the forward contract or enter into a closing transaction involving the purchase or sale of an offsetting forward contract. Closing transactions with respect to forward contracts are usually performed with the counterparty to the original forward contract. The gain or loss arising from the difference between the U.S. dollar cost of the original contract and the value of the foreign currency in U.S. dollars upon closing a contract is included in "Net realized gain (loss) on settlement of forward foreign currency contracts" in the Consolidated Statement of Operations. These contracts may involve market risk in excess of the unrealized gain or loss reflected in the Fund's Consolidated Statement of Assets and Liabilities. In addition, the Fund could be exposed to risks associated with fluctuations in foreign currency and the risk the counterparty will fail to fulfill its obligation.
Options: For the year ended October 31, 2017, the Fund used written options to generate incremental returns. The Fund used purchased option contracts ("options purchased") to manage or adjust the risk profile and the investment exposure of the Fund to certain securities and to enhance returns.
55
Premiums paid by the Fund upon purchasing a call or put option are recorded in the asset section of the Fund's Consolidated Statement of Assets and Liabilities and are subsequently adjusted to the current market value. When an option is exercised, closed, or expired, the Fund realizes a gain or loss and the asset is eliminated. For purchased call options, the Fund's loss is limited to the amount of the option premium paid.
Premiums received by the Fund upon writing a call option or a put option are recorded in the liability section of the Fund's Consolidated Statement of Assets and Liabilities and are subsequently adjusted to the current market value. When an option is exercised, closed, or expired, the Fund realizes a gain or loss and the liability is eliminated.
When the Fund writes a call option on an underlying asset it does not own, its exposure on such an option is theoretically unlimited. When writing a covered call option, the Fund, in return for the premium, gives up the opportunity for profit from a price increase in the underlying security above the exercise price, but conversely retains the risk of loss should the price of the security decline. When writing a put option, the Fund, in return for the premium, takes the risk that it must purchase the underlying security at a price that may be higher than the current market price of the security. If a covered call or put option that the Fund has written expires unexercised, the Fund will realize a gain in the amount of the premium.
The Fund may write or purchase options on exchange traded futures contracts ("futures option") to hedge an existing position or future investment, for speculative purposes or to manage exposure to market movements. A futures option is an option contract in which the underlying instrument is a specific futures contract.
At October 31, 2017, the Fund had the following derivatives (which did not qualify as hedging instruments under ASC 815), grouped by primary risk exposure:
Asset Derivatives
(000's omitted)
Derivative
Type | | Consolidated
Statement of
Assets and
Liabilities Location | | Credit Risk | | Currency Risk | | Equity Risk | | Interest
Rate Risk | | Commodity
Risk | | Total | |
OTC swaps
| | OTC swap contracts,
at value(1) | | $ | 621
| | | $ | —
| | | $ | 3,056
| | | $ | —
| | | $ | —
| | | $ | 3,677
| | |
Futures
| | Receivable/Payable
for variation margin
on futures contracts(2) | | | —
| | | | 1,174
| | | | 82
| | | | 105
| | | | 215
| | | | 1,576
| | |
Forward
contracts
| | Receivable for forward
foreign currency
contracts | | | —
| | | | 672
| | | | —
| | | | —
| | | | —
| | | | 672
| | |
Options
purchased | | Investments in
securities, at value | | | —
| | | | —
| | | | 177
| | | | —
| | | | —
| | | | 177
| | |
Total Value—Assets | | | | $ | 621 | | | $ | 1,846 | | | $ | 3,315 | | | $ | 105 | | | $ | 215 | | | $ | 6,102 | | |
56
Liability Derivatives
(000's omitted)
Derivative
Type | | Consolidated
Statement of
Assets and
Liabilities Location | | Credit Risk | | Currency Risk | | Equity Risk | | Interest
Rate Risk | | Commodity
Risk | | Total | |
OTC swaps
| | OTC swap contracts,
at value(1) | | $ | (459
| ) | | $ | —
| | | $ | (2,232
| ) | | $ | —
| | | $ | —
| | | $ | (2,691
| ) | |
Centrally
cleared
swaps
| | Receivable/Payable
for variation
margin on centrally
cleared swap
contracts(3) | | | (650
| ) | | | —
| | | | —
| | | | —
| | | | —
| | | | (650 | ) | |
Futures
| | Receivable/Payable
for variation margin
on futures contracts(2) | | | — | | | | (5 | ) | | | (549 | ) | | | (4 | ) | | | (25 | ) | | | (583 | ) | |
Forward
contracts
| | Payable for forward
foreign currency
contracts | | | —
| | | | (1,118
| ) | | | —
| | | | —
| | | | —
| | | | (1,118 | ) | |
Options
written | | Option contracts
written, at value | | | —
| | | | —
| | | | 2
| | | | —
| | | | —
| | | | 2 | | |
Total Value—Liabilities | | | | $ | (1,109 | ) | | $ | (1,123 | ) | | $ | (2,779 | ) | | $ | (4 | ) | | $ | (25 | ) | | $ | (5,040 | ) | |
(1) "OTC swap contracts" reflects the unrealized appreciation/(depreciation) of the OTC swap contracts plus accrued interest as of October 31, 2017, which is reflected in the Consolidated Statement of Assets and Liabilities under the caption "OTC swap contracts, at value."
(2) "Futures" reflects the cumulative unrealized appreciation/(depreciation) of futures as of October 31, 2017, which is reflected in the Consolidated Statement of Assets and Liabilities under the caption "Net unrealized appreciation/ (depreciation) in value of investments." The current day's variation margin as of October 31, 2017, if any, is reflected in the Consolidated Statement of Assets and Liabilities under the caption "Receivable/Payable for variation margin on futures contracts."
(3) "Centrally cleared swap contracts" reflects the cumulative unrealized appreciation/(depreciation) of centrally cleared default index swaps as of October 31, 2017, which is reflected in the Consolidated Statement of Assets and Liabilities under the caption "Net unrealized appreciation/(depreciation) in value of investments". Only the current day's variation margin on centrally cleared swap contracts is reported within the Consolidated Statement of Assets and Liabilities under the caption "Receivable/Payable for variation margin on centrally cleared swap contracts."
The impact of the use of these derivative instruments on the Consolidated Statement of Operations during the fiscal year ended October 31, 2017, was as follows:
Realized Gain/(Loss)
(000's omitted)
| Derivative Type | | Consolidated
Statement of
Operations Location | | Credit
Risk | | Currency
Risk | | Equity
Risk | | Interest
Rate Risk | | Commodity
Risk | | Total | |
Forward
contracts
| | Net realized gain/(loss) on:
Forward foreign
currency contracts | | $ | — | | | $ | (426 | ) | | $ | — | | | $ | — | | | $ | — | | | $ | (426 | ) | |
57
Derivative Type | | Consolidated
Statement of
Operations Location | | Credit
Risk | | Currency
Risk | | Equity
Risk | | Interest
Rate Risk | | Commodity
Risk | | Total | |
Futures
| | Net realized gain/(loss) on:
Futures contracts | | $ | — | | | $ | 1,640 | | | $ | (1,728 | ) | | $ | (1,129 | ) | | $ | (1,386 | ) | | $ | (2,603 | ) | |
Options
purchased
| | Net realized gain/(loss) on:
Sales of investment
securities of
unaffiliated issuers | | | — | | | | — | | | | (2,910 | ) | | | — | | | | — | | | | (2,910 | ) | |
Options written
| | Net realized gain/(loss) on:
Option contracts written | | | — | | | | — | | | | 298 | | | | — | | | | — | | | | 298 | | |
Swaps
| | Net realized gain/(loss) on:
Swaps contracts | | | (547 | ) | | | — | | | | 546 | | | | — | | | | — | | | | (1 | ) | |
Total Realized Gain/(Loss) | | | | $ | (547 | ) | | $ | 1,214 | | | $ | (3,794 | ) | | $ | (1,129 | ) | | $ | (1,386 | ) | | $ | (5,642 | ) | |
Change in Appreciation/(Depreciation)
Derivative Type | | Statement of
Operations Location | | Credit
Risk | | Currency
Risk | | Equity
Risk | | Interest
Rate Risk | | Commodity
Risk | | Total | |
Forward
contracts
| | Change in net unrealized
appreciation/(depreciation)
in value of: Forward foreign
currency contracts | | $ | — | | | $ | (640 | ) | | $ | — | | | $ | — | | | $ | — | | | $ | (640 | ) | |
Futures
| | Change in net unrealized
appreciation/(depreciation)
in value of: Futures contracts | | | — | | | | (259 | ) | | | (283 | ) | | | 495 | | | | 360 | | | | 313 | | |
Option
contracts
purchased | | Change in net unrealized
appreciation/(depreciation)
in value of: Unaffiliated
investment securities | | | — | | | | — | | | | (228 | ) | | | — | | | | — | | | | (228 | ) | |
Options written
| | Change in net unrealized
appreciation/(depreciation)
in value of: Option
contracts written | | | — | | | | — | | | | (25 | ) | | | — | | | | — | | | | (25 | ) | |
Swaps
| | Change in net unrealized
appreciation/(depreciation)
in value of: Swap contracts | | | (521 | ) | | | — | | | | 1,219 | | | | — | | | | — | | | | 698 | | |
Total Change in
Appreciation/(Depreciation) | | | | $ | (521 | ) | | $ | (899 | ) | | $ | 683 | | | $ | 495 | | | $ | 360 | | | $ | 118 | | |
58
While the Fund may receive rights and warrants in connection with their investments in securities, these rights and warrants are not considered "derivative instruments" under ASC 815.
The Fund discloses both gross and net information for assets and liabilities related to derivatives, repurchase and reverse repurchase agreements, and securities lending and securities borrowing transactions that are eligible for offset or subject to an enforceable master netting or similar agreement. The Fund's derivative assets and liabilities at fair value by type are reported gross in the Consolidated Statement of Assets and Liabilities. The following tables present the Fund's derivative assets and liabilities by counterparty, net of amounts available for offset under a master netting agreement and net of the related collateral received by the Fund for assets and pledged by the Fund for liabilities as of October 31, 2017.
Description
(000's omitted) | | Gross Amounts of
Recognized Assets | | Gross Amounts Offset
in the Consolidated
Statement of
Assets and Liabilities | | Net Amounts of Assets
Presented in the
Consolidated Statement
of Assets and Liabilities | |
OTC swap contracts | | $ | 3,677 | | | $ | — | | | $ | 3,677 | | |
Forward contracts | | | 672 | | | | — | | | | 672 | | |
Total | | $ | 4,349 | | | $ | — | | | $ | 4,349 | | |
Gross Amounts Not Offset in the Consolidated Statement of Assets and Liabilities
Counterparty
(000's omitted) | | Net Amounts of
Assets Presented in
the Consolidated
and Liabilities | | Liabilities
Statement of Assets
for Offset | | Available
Received(a) | | Cash Collateral
Net Amount(b) | |
Societe Generale | | $ | 515 | | | $ | (515 | ) | | $ | — | | | $ | — | | |
JPMorgan Chase Bank, NA | | | 1,088 | | | | (821 | ) | | | — | | | | 267 | | |
Morgan Stanley Capital Services LLC | | | 2,746 | | | | (2,102 | ) | | | — | | | | 644 | | |
| | $ | 4,349 | | | $ | (3,438 | ) | | $ | — | | | $ | 911 | | |
Description
(000's omitted) | | Gross Amounts of
Recognized Liabilites | | Gross Amounts Offset
in the Consolidated
Statement of
Assets and Liabilities | | Net Amounts of Liabilities
Presented in the
Consolidated Statement
of Assets and Liabilities | |
OTC swap contracts | | $ | (2,691 | ) | | $ | — | | | $ | (2,691 | ) | |
Forward contracts | | | (1,118 | ) | | | — | | | | (1,118 | ) | |
Total | | $ | (3,809 | ) | | $ | — | | | $ | (3,809 | ) | |
Gross Amounts Not Offset in the Consolidated Statement of Assets and Liabilities
Counterparty
(000's omitted) | | Net Amounts of
Liabilites Presented in
the Consolidated
and Liabilities | | Assets
Statement of Assets
for Offset | | Available
Pledged(a) | | Cash Collateral
Net Amount(c) | |
Societe Generale | | $ | (886 | ) | | $ | 515 | | | $ | 371 | | | $ | — | | |
JPMorgan Chase Bank, NA | | | (821 | ) | | | 821 | | | | — | | | | — | | |
Morgan Stanley Capital Services LLC | | | (2,102 | ) | | | 2,102 | | | | — | | | | — | | |
| | $ | (3,809 | ) | | $ | 3,438 | | | $ | 371 | | | $ | — | | |
(a) Collateral received (or pledged) is limited to an amount not to exceed 100% of the net amount of assets (or liabilities) in the tables presented above, for each respective counterparty.
59
(b) Net Amount represents amounts subject to loss as of October 31, 2017, in the event of a counterparty failure.
(c) Net Amount represents amounts under-collateralized by the Fund to each counterparty as of October 31, 2017.
14 Indemnifications: Like many other companies, the Trust's organizational documents provide that its officers ("Officers") and trustees ("Trustees") are indemnified against certain liabilities arising out of the performance of their duties to the Trust. In addition, both in some of its principal service contracts and in the normal course of its business, the Trust enters into contracts that provide indemnifications to other parties for certain types of losses or liabilities. The Trust's maximum exposure under these arrangements is unknown as this could involve future claims against the Trust.
15 Unfunded loan commitments: The Fund may enter into certain credit agreements all or a portion of which may be unfunded. The Fund is obligated to fund these commitments at the borrower's discretion. As of October 31, 2017, the value of unfunded loan commitments was approximately $3,238,000 pursuant to the following loan agreements.
(000's omitted)
Borrower | | Principal Amount | | Value | |
| GenOn Energy Inc., Term Loan 0.00%, 11/30/2017(a)(b)(c) | | $ | 3,202 | | | $ | 3,202 | | |
Institutional Shareholder Services, Inc., Delayed Draw Term Loan 0.00%, 10/4/2024 | | | 9 | | | | 9 | | |
PlayCore, Inc., Delayed Draw Term Loan 0.00%, 9/18/2024 | | | 18 | | | | 18 | | |
| Traeger Pellet Grills LLC, Delayed Draw Term Loan 0.00%, 9/21/2024(c) | | | 9 | | | | 9 | | |
Total | | | | $ | 3,238 | | |
(a) Illiquid security.
(b) Security fair valued as of October 31, 2017 in accordance with procedures approved by the Board of Trustees.
(c) Value determined using significant unobservable inputs.
16 Expense offset arrangement: The Fund has an expense offset arrangement in connection with its custodian contract. For the year ended October 31, 2017, the impact of this arrangement was a reduction of expenses of $1,421.
17 Other: All net investment income and realized and unrealized capital gains and losses of the Fund are allocated, on the basis of relative net assets, pro rata among its respective classes.
Note B—Investment Management Fees, Administration Fees, Distribution Arrangements, and Other Transactions with Affiliates:
The Fund retains Management as its investment manager under a Management Agreement. For such investment management services, the Fund pays Management a fee at the annual rate of 1.700% of the first $250 million of the Fund's average daily net assets, 1.675% of the next $250 million, 1.650% of the next $250 million, 1.625% of the next $250 million, 1.600% of the next $500 million, 1.575% of the next $2.5 billion, and 1.550% of average daily net assets in excess of $4 billion. Accordingly, for the year ended October 31, 2017, the Investment Management fee pursuant to the Investment Management Agreement was equivalent to an annual effective rate of 1.69% of the Fund's average daily net assets.
The Fund retains Management as its administrator under an Administration Agreement. Prior to July 1, 2017, the Fund paid Management an administration fee at the annual rate of 0.06% of its average daily net assets under this agreement. Additionally, the Institutional Class of the Fund paid Management an administration fee at the annual rate of 0.09% of its average daily net assets, Class A and Class C of the Fund paid Management an administration fee at the annual rate of 0.20% of its average daily net assets and Class R6 of the Fund paid Management an
60
administration fee at the annual rate of 0.02% of its average daily net assets under this agreement. Effective July 1, 2017, the administration fee is only assessed at the Class level and each share class of the Fund, as applicable, pays Management an annual administration fee equal to the following: 0.15% for Institutional Class; 0.26% for each of, Class A and Class C; and 0.08% for Class R6, each as a percentage of its average daily net assets. This did not result in an increase in the administration fee for any share class. Additionally, Management retains JPMorgan Chase Bank, NA ("JPM") as its sub-administrator under a Sub-Administration Agreement. Management pays JPM a fee for all services received under the agreement.
Management has contractually agreed to waive fees and/or reimburse certain expenses of the Institutional Class, Class A, Class C and Class R6 of the Fund so that the total annual operating expenses of those classes do not exceed the expense limitations as detailed in the following table. These undertakings exclude interest, taxes, brokerage commissions, acquired fund fees and expenses, extraordinary expenses, dividend and interest expenses relating to short sales, if any (commitment fees relating to borrowings are treated as interest for purposes of this exclusion); consequently, net expenses may exceed the contractual expense limitations. The Fund has agreed that each of its respective classes will repay Management for fees and expenses waived or reimbursed for that class provided that repayment does not cause that class' annual operating expenses to exceed its contractual expense limitation in place at the time the fees and expenses were waived or reimbursed. Any such repayment must be made within three years after the year in which Management incurred the expense. The expenses of the Subsidiary are included in the total expenses used to calculate the reimbursement, which the Fund has agreed to share with the Subsidiary. For the year ended October 31, 2017, these Subsidiary expenses amounted to $110,294.
During the year ended October 31, 2017, no classes repaid Management under their contractual expense limitation agreements.
At October 31, 2017, contingent liabilities to Management under the agreements were as follows:
| | | | | | | Expenses Reimbursed in
Year Ending, October 31, | |
| | | | | | | 2015 | | 2016 | | 2017 | |
| | | | | | | Subject to Repayment until
October 31, | |
| | Contractual
Expense
Limitation(1) | | Expiration | | 2018 | | 2019 | | 2020 | |
Institutional Class | | | 1.97 | % | | 10/31/20 | | $ | — | | | $ | 377,847 | | | $ | 453,077 | | |
Class A | | | 2.33 | % | | 10/31/20 | | | — | | | | 89,779 | | | | 48,418 | | |
Class C | | | 3.08 | % | | 10/31/20 | | | — | | | | 40,256 | | | | 33,125 | | |
Class R6 | | | 1.90 | % | | 10/31/20 | | | — | | | | 1,667 | | | | 1,142 | | |
(1) Expense limitation per annum of the respective class' average daily net assets.
Until December 31, 2015, NB Alternative Investment Management LLC ("NBAIM"), was the investment adviser to the Fund, and was retained by Neuberger Berman Management LLC ("NBM") to provide day-to-day investment management services, including oversight of the Fund's investments and handling its day-to-day business, including the oversight of the subadvisers' investment activities, and received a monthly fee paid by NBM. As investment manager, NBM was responsible for overseeing the investment activities of NBAIM. Several individuals who are Officers and/or Trustees of the Trust were also employees of NBAIM and/or Management. As a result of the entity consolidation described on page 5 of this Annual Report, the services previously provided by NBAIM are being provided by NBIA as of January 1, 2016.
At October 31, 2017, Management engaged BH-DG Systematic Trading LLP, Cramer Rosenthal McGlynn, LLC, GAMCO Asset Management Inc., Good Hill Partners LP, Levin Capital Strategies, LP, P/E Global, LLC, Portland Hill Asset Management Limited, Sound Point Capital Management, L.P., and TPH Asset Management, LP as
61
subadvisers of the Fund to provide investment management services. Management compensates the subadvisers out of the investment advisory fees it receives from the Fund.
The Fund also has a distribution agreement with Neuberger Berman BD LLC (the "Distributor") with respect to each class of shares. The Distributor acts as agent in arranging for the sale of class shares without sales commission or other compensation, except as described below for Class A and Class C shares, and bears advertising and promotion expenses.
However, the Distributor receives fees from Class A and Class C under their distribution plans (each a "Plan", collectively, the "Plans") pursuant to Rule 12b-1 under the 1940 Act. The Plans provide that, as compensation for administrative and other services provided to these classes, the Distributor activities and expenses related to the sale and distribution of these classes, and ongoing services provided to investors in these classes, the Distributor receives from each of these respective classes a fee at the annual rate of 0.25% of Class A's and 1.00% of Class C's average daily net assets. The Distributor receives this amount to provide distribution and shareholder servicing for these classes and pays a portion of it to institutions that provide such services. Those institutions may use the payments for, among other purposes, compensating employees engaged in sales and/or shareholder servicing. The amount of fees paid by each class during any year may be more or less than the cost of distribution and other services provided to that class. FINRA rules limit the amount of annual distribution fees that may be paid by a mutual fund and impose a ceiling on the cumulative distribution fees paid. The Trust's Plans comply with those rules.
Class A shares of the Fund are generally sold with an initial sales charge of up to 5.75% and no contingent deferred sales charge ("CDSC"), except that a CDSC of 1.00% applies to certain redemptions made within 18 months following purchases of $1 million or more without an initial sales charge. Class C shares of the Fund are sold with no initial sales charge and a 1.00% CDSC if shares are sold within one year after purchase.
For the year ended October 31, 2017, Neuberger Berman, acting as underwriter and broker-dealer, received net initial sales charges from the purchase of Class A shares and CDSCs from the redemption of Class A and Class C shares as follows:
| | | Underwriter | | Broker-Dealer | |
| | | Net Initial
Sales Charges | | CDSC | | Net Initial
Sales Charges | | CDSC | |
Class A | | $ | 3,683 | | | $ | — | | | $ | — | | | $ | — | | |
Class C | | | — | | | | 1,221 | | | | — | | | | — | | |
Note C—Securities Transactions:
During the year ended October 31, 2017, there were purchase and sale transactions of long-term securities (excluding equity swaps, total return swaps, credit default swaps, forward contracts, futures and option contracts) as follows:
(000's omitted) | | Purchases of
U.S. Government
and Agency
Obligations | | Purchases
excluding
U.S. Government
and
Agency
Obligations | | Securities
Sold Short
excluding
U.S. Government
and
Agency
Obligations | | Sales and
Maturities of
U.S. Government
and Agency
Obligations | | Sales and
Maturities
excluding
U.S. Government
and Agency
Obligations | | Covers on
Securities
Sold Short
excluding
U.S. Government
and Agency
Obligations | |
| | $ | 4,214 | | | $ | 1,496,759 | | | $ | 369,842 | | | $ | 4,893 | | | $ | 1,735,267 | | | $ | 438,833 | | |
During the year ended October 31, 2017, no brokerage commissions on securities transactions were paid to affiliated brokers.
62
Note D—Fund Share Transactions:
Share activity for the years ended October 31, 2017 and year ended October 31, 2016 was as follows:
| | | For the Year Ended October 31, 2017 | | For the Year Ended October 31, 2016 | |
(000's omitted) | | Shares
Sold | | Shares
Issued on
Reinvestment
of Dividends
and
Distributions | | Shares
Redeemed | | Total | | Shares
Sold | | Shares
Issued on
Reinvestment
of Dividends
and
Distributions | | Shares
Redeemed | | Total | |
Institutional Class | | | 10,473 | | | | — | | | | (30,747 | ) | | | (20,274 | ) | | | 24,318 | | | | 1,124 | | | | (106,001 | ) | | | (80,559 | ) | |
Class A | | | 423 | | | | — | | | | (4,717 | ) | | | (4,294 | ) | | | 2,545 | | | | 164 | | | | (16,727 | ) | | | (14,018 | ) | |
Class C | | | 50 | | | | — | | | | (2,485 | ) | | | (2,435 | ) | | | 523 | | | | 59 | | | | (4,974 | ) | | | (4,392 | ) | |
Class R6 | | | 1,058 | | | | — | | | | (217 | ) | | | 841 | | | | 710 | | | | 22 | | | | (2,059 | ) | | | (1,327 | ) | |
Other: At October 31, 2017, there were no affiliated investors owning the Fund's outstanding shares.
Note E—Line of Credit:
At October 31, 2017, the Fund was a participant in a syndicated committed, unsecured $700,000,000 line of credit (the "Credit Facility"), to be used only for temporary or emergency purposes. Absolute Return Multi-Manager Fund and another fund in the complex are subject to a separate limitation under the Credit Facility and collectively can only borrow $200,000,000 at any one time. Series of other investment companies managed by Management also participate in this line of credit on substantially the same terms except that they are not subject to that $200,000,000 limitation. Interest is charged on borrowings under this Credit Facility at the highest of (a) a federal funds effective rate plus 1.00% per annum, (b) a Eurodollar rate for a one-month period plus 1.00% per annum, and (c) an overnight bank funding rate plus 1.00% per annum. The Credit Facility has an annual commitment fee of 0.15% per annum of the available line of credit, which is paid quarterly. The Fund has agreed to pay its pro rata share of the annual commitment fee, based on the ratio of its individual net assets to the net assets of all participants at the time the fee is due and payable and the level of its access to the Credit Facility, and interest charged on any borrowing made by the Fund and other costs incurred by the Fund. Because several mutual funds participate in the Credit Facility, there is no assurance that the Fund will have access to all or any part of the $700,000,000 at any particular time. There were no loans outstanding under the Credit Facility at October 31, 2017. During the period ended October 31, 2017, the Fund did not utilize the line of credit.
Note F—Recent Accounting Pronouncements:
In December 2016, FASB issued ASU No. 2016-19, "Technical Corrections and Improvements" ("ASU 2016-19"). The guidance includes an amendment to Topic 820, Fair Value Measurement, which clarifies the difference between a valuation approach and a valuation technique. The amendments also require an entity to disclose when it has changed either a valuation approach and/or a valuation technique. The guidance is effective for interim and annual reporting periods beginning after December 15, 2016. Management is currently evaluating the impact, if any, of applying this guidance.
63
This page has been left blank intentionally
64
Absolute Return Multi-Manager Fund
The following tables include selected data for a share outstanding throughout each period and other performance information derived from the Financial Statements. Amounts that do not round to $0.01 or $(0.01) per share are presented as $0.00 or $(0.00), respectively. Ratios that do not round to 0.01% or (0.01)% per share are presented as 0.00% or (0.00)%, respectively. Net Asset amounts with a zero balance, if any, may reflect actual amounts rounding to less than $0.1 million. A "—" indicates that the line item was not applicable in the corresponding period.
| | | Net Asset
Value,
Beginning
of Year | | Net
Investment
Income/
(Loss)@ | | Net Gains or
Losses on
Securities
(both realized
and
unrealized) | | Total From
Investment
Operations | | Dividends
from Net
Investment
Income | | Distributions
from Net
Realized
Capital
Gains | |
Tax
Return of
Capital | | Total
Distributions | | Net Asset
Value,
End of
Year | |
Institutional Class | |
| 10/31/2017ß | | $ | 10.18 | | | $ | 0.06 | | | $ | 0.53 | | | $ | 0.59 | | | $ | — | | | $ | — | | | $ | — | | | $ | — | | | $ | 10.77 | | |
| 10/31/2016ß | | $ | 10.47 | | | $ | 0.02 | | | $ | (0.18 | ) | | $ | (0.16 | ) | | $ | (0.03 | ) | | $ | (0.10 | ) | | $ | — | | | $ | (0.13 | ) | | $ | 10.18 | | |
10/31/2015 | | $ | 11.00 | | | $ | (0.04 | ) | | $ | (0.19 | ) | | $ | (0.23 | ) | | $ | (0.07 | ) | | $ | (0.23 | ) | | $ | — | | | $ | (0.30 | ) | | $ | 10.47 | | |
10/31/2014 | | $ | 10.86 | | | $ | (0.01 | ) | | $ | 0.22 | | | $ | 0.21 | | | $ | — | | | $ | (0.07 | ) | | $ | — | | | $ | (0.07 | ) | | $ | 11.00 | | |
10/31/2013 | | $ | 10.00 | | | $ | (0.08 | ) | | $ | 1.00 | | | $ | 0.92 | | | $ | (0.02 | ) | | $ | (0.04 | ) | | $ | — | | | $ | (0.06 | ) | | $ | 10.86 | | |
Class A | |
| 10/31/2017ß | | $ | 10.10 | | | $ | 0.02 | | | $ | 0.53 | | | $ | 0.55 | | | $ | — | | | $ | — | | | $ | — | | | $ | — | | | $ | 10.65 | | |
| 10/31/2016ß | | $ | 10.40 | | | $ | (0.02 | ) | | $ | (0.18 | ) | | $ | (0.20 | ) | | $ | — | | | $ | (0.10 | ) | | $ | — | | | $ | (0.10 | ) | | $ | 10.10 | | |
10/31/2015 | | $ | 10.92 | | | $ | (0.08 | ) | | $ | (0.18 | ) | | $ | (0.26 | ) | | $ | (0.03 | ) | | $ | (0.23 | ) | | $ | — | | | $ | (0.26 | ) | | $ | 10.40 | | |
10/31/2014 | | $ | 10.82 | | | $ | (0.04 | ) | | $ | 0.21 | | | $ | 0.17 | | | $ | — | | | $ | (0.07 | ) | | $ | — | | | $ | (0.07 | ) | | $ | 10.92 | | |
10/31/2013 | | $ | 9.99 | | | $ | (0.12 | ) | | $ | 0.99 | | | $ | 0.87 | | | $ | — | | | $ | (0.04 | ) | | $ | — | | | $ | (0.04 | ) | | $ | 10.82 | | |
Class C | |
| 10/31/2017ß | | $ | 9.78 | | | $ | (0.05 | ) | | $ | 0.51 | | | $ | 0.46 | | | $ | — | | | $ | — | | | $ | — | | | $ | — | | | $ | 10.24 | | |
| 10/31/2016ß | | $ | 10.15 | | | $ | (0.09 | ) | | $ | (0.18 | ) | | $ | (0.27 | ) | | $ | — | | | $ | (0.10 | ) | | $ | — | | | $ | (0.10 | ) | | $ | 9.78 | | |
10/31/2015 | | $ | 10.72 | | | $ | (0.16 | ) | | $ | (0.18 | ) | | $ | (0.34 | ) | | $ | — | | | $ | (0.23 | ) | | $ | — | | | $ | (0.23 | ) | | $ | 10.15 | | |
10/31/2014 | | $ | 10.71 | | | $ | (0.13 | ) | | $ | 0.21 | | | $ | 0.08 | | | $ | — | | | $ | (0.07 | ) | | $ | — | | | $ | (0.07 | ) | | $ | 10.72 | | |
10/31/2013 | | $ | 9.95 | | | $ | (0.21 | ) | | $ | 1.01 | | | $ | 0.80 | | | $ | — | | | $ | (0.04 | ) | | $ | — | | | $ | (0.04 | ) | | $ | 10.71 | | |
Class R6 | |
| 10/31/2017ß | | $ | 10.17 | | | $ | 0.05 | | | $ | 0.55 | | | $ | 0.60 | | | $ | — | | | $ | — | | | $ | — | | | $ | — | | | $ | 10.77 | | |
| 10/31/2016ß | | $ | 10.47 | | | $ | 0.04 | | | $ | (0.21 | ) | | $ | (0.17 | ) | | $ | (0.03 | ) | | $ | (0.10 | ) | | $ | — | | | $ | (0.13 | ) | | $ | 10.17 | | |
10/31/2015 | | $ | 11.01 | | | $ | (0.01 | ) | | $ | (0.22 | ) | | $ | (0.23 | ) | | $ | (0.08 | ) | | $ | (0.23 | ) | | $ | — | | | $ | (0.31 | ) | | $ | 10.47 | | |
Period from 12/31/2013^
to 10/31/2014 | | $ | 10.99 | | | $ | 0.01 | | | $ | 0.01 | | | $ | 0.02 | | | $ | — | | | $ | — | | | $ | — | | | $ | — | | | $ | 11.01 | | |
| | | Total
Return†d | | Net Assets,
End of
Year
(in millions) | | Ratio
of Gross
Expenses to
Average
Net
Assets# | | Ratio
of Gross
Expenses
to Average
Net Assets
(excluding
dividend
and interest
expenses
relating to
short sales)# | | Ratio
of Net
Expenses to
Average
Net
Assets | | Ratio
of Net
Expenses
to Average
Net Assets
(excluding
dividend
and interest
expenses
relating to
short sales) | | Ratio
of Net
Investment
Income/
(Loss) to
Average
Net
Assets | | Portfolio
Turnover
Rate
(including
securities
sold short) | | Portfolio
Turnover
Rate
(excluding
securities
sold short) | |
Institutional Class | |
| 10/31/2017ß | | | 5.80 | % | | $ | 295.7 | | | | 2.69 | % | | | 2.09 | % | | | 2.57 | %ا | | | 1.97 | %ا | | | 0.61 | % | | | 382 | % | | | 357 | % | |
| 10/31/2016ß | | | (1.57 | )% | | $ | 485.8 | | | | 2.83 | %‡ | | | 2.02 | %‡ | | | 2.78 | %ا‡ | | | 1.97 | %ا‡ | | | 0.18 | %‡ | | | 485 | % | | | 474 | % | |
10/31/2015 | | | (2.10 | )% | | $ | 1,343.3 | | | | 2.71 | % | | | 1.97 | % | | | 2.71 | %ا | | | 1.97 | %ا | | | (0.40 | )% | | | 433 | % | | | 452 | % | |
10/31/2014 | | | 1.96 | % | | $ | 1,275.3 | | | | 2.64 | % | | | 2.13 | % | | | 2.55 | %Ø | | | 2.04 | %Ø | | | (0.10 | )% | | | 329 | % | | | 257 | % | |
10/31/2013 | | | 9.19 | % | | $ | 324.3 | | | | 2.89 | % | | | 2.60 | % | | | 2.30 | %Ø | | | 2.01 | %Ø | | | (0.74 | )% | | | 421 | % | | | 330 | % | |
Class A | |
| 10/31/2017ß | | | 5.45 | % | | $ | 20.6 | | | | 3.13 | % | | | 2.47 | % | | | 2.99 | %ا | | | 2.33 | %ا | | | 0.17 | % | | | 382 | % | | | 357 | % | |
| 10/31/2016ß | | | (1.91 | )% | | $ | 62.9 | | | | 3.20 | %‡ | | | 2.40 | %‡ | | | 3.13 | %ا‡ | | | 2.33 | %ا‡ | | | (0.16 | )%‡ | | | 485 | % | | | 474 | % | |
10/31/2015 | | | (2.47 | )% | | $ | 210.6 | | | | 3.06 | % | | | 2.33 | % | | | 3.06 | %ا | | | 2.33 | %ا | | | (0.71 | )% | | | 433 | % | | | 452 | % | |
10/31/2014 | | | 1.60 | % | | $ | 242.2 | | | | 3.02 | % | | | 2.49 | % | | | 2.90 | %Ø | | | 2.38 | %Ø | | | (0.40 | )% | | | 329 | % | | | 257 | % | |
10/31/2013 | | | 8.70 | % | | $ | 124.7 | | | | 3.27 | % | | | 2.99 | % | | | 2.62 | %Ø | | | 2.34 | %Ø | | | (1.17 | )% | | | 421 | % | | | 330 | % | |
Class C | |
| 10/31/2017ß | | | 4.70 | % | | $ | 17.9 | | | | 3.82 | % | | | 3.21 | % | | | 3.69 | %ا | | | 3.08 | %ا | | | (0.53 | )% | | | 382 | % | | | 357 | % | |
| 10/31/2016ß | | | (2.66 | )% | | $ | 40.9 | | | | 3.96 | %‡ | | | 3.15 | %‡ | | | 3.89 | %ا‡ | | | 3.08 | %ا‡ | | | (0.96 | )%‡ | | | 485 | % | | | 474 | % | |
10/31/2015 | | | (3.21 | )% | | $ | 87.1 | | | | 3.81 | % | | | 3.08 | % | | | 3.81 | %ا | | | 3.08 | %ا | | | (1.48 | )% | | | 433 | % | | | 452 | % | |
10/31/2014 | | | 0.77 | % | | $ | 95.3 | | | | 3.77 | % | | | 3.26 | % | | | 3.66 | %Ø | | | 3.15 | %Ø | | | (1.18 | )% | | | 329 | % | | | 257 | % | |
10/31/2013 | | | 8.03 | % | | $ | 21.3 | | | | 4.01 | % | | | 3.72 | % | | | 3.38 | %Ø | | | 3.09 | %Ø | | | (1.94 | )% | | | 421 | % | | | 330 | % | |
Class R6 | |
| 10/31/2017ß | | | 5.90 | % | | $ | 12.7 | | | | 2.40 | % | | | 1.93 | % | | | 2.37 | %ا | | | 1.90 | %ا | | | 0.51 | % | | | 382 | % | | | 357 | % | |
| 10/31/2016ß | | | (1.58 | )% | | $ | 3.4 | | | | 2.71 | %‡ | | | 1.92 | %‡ | | | 2.69 | %ا‡ | | | 1.90 | %ا‡ | | | 0.37 | %‡ | | | 485 | % | | | 474 | % | |
10/31/2015 | | | (2.14 | )% | | $ | 17.4 | | | | 2.66 | % | | | 1.90 | % | | | 2.66 | %ا | | | 1.90 | %ا | | | (0.08 | )% | | | 433 | % | | | 452 | % | |
Period from 12/31/2013^
to 10/31/2014 | | | 0.18 | %** | | $ | 32.5 | | | | 2.56 | %* | | | 2.08 | %* | | | 2.46 | %*Ø | | | 1.98 | %*Ø | | | 0.10 | %* | | | 329 | %ØØ | | | 257 | %ØØ | |
See Notes to Financial Highlights
65
66
Notes to Financial Highlights
@ Calculated based on the average number of shares outstanding during each fiscal period.
† Total return based on per share NAV reflects the effects of changes in NAV on the performance of the Fund during each fiscal period. Returns assume income dividends and other distributions, if any, were reinvested, but do not reflect the effect of sales charges. Results represent past performance and do not indicate future results. Current returns may be lower or higher than the performance data quoted. Investment returns and principal may fluctuate and shares when redeemed may be worth more or less than original cost. Total return would have been lower if Management had not reimbursed certain expenses. Total return would have been higher if Management had not recouped previously reimbursed and/or waived expenses.
d The class action proceeds listed in Note A of the Notes to Consolidated Financial Statements, if any, had no impact on the Fund's total returns for the year ended October 31, 2017.
# Represents the annualized ratios of net expenses to average daily net assets if Management had not reimbursed Certain expenses and/or waived a portion of the investment management fee.
‡ Organization expense, which is a non-recurring expense, is included in these ratios on a non-annualized basis.
** Not annualized.
* Annualized.
^ The date investment operations commenced.
ß Consolidated financial highlights (see Note A in the Notes to Consolidated Financial Statements).
Ø After reimbursement of expenses and/or waiver of a portion of the investment management fee by Management. The Fund is required to calculate an expense ratio without taking into consideration any expense reductions related to expense offset arrangements. Had the Fund not received expense reductions related to expense offset arrangements, the annualized ratios of net expenses to average daily net assets would have been:
| | | Including
Dividend
and
Interest
Expense
Relating to
Short Sales | | Excluding
Dividend
and
Interest
Expense
Relating to
Short Sales | | Including
Dividend
and
Interest
Expense
Relating to
Short Sales | | Excluding
Dividend
and
Interest
Expense
Relating to
Short Sales | | Including
Dividend
and
Interest
Expense
Relating to
Short Sales | | Excluding
Dividend
and
Interest
Expense
Relating to
Short Sales | | Including
Dividend
and
Interest
Expense
Relating to
Short Sales | | Excluding
Dividend
and
Interest
Expense
Relating to
Short Sales | | Including
Dividend
and
Interest
Expense
Relating to
Short Sales | | Excluding
Dividend
and
Interest
Expense
Relating to
Short Sales | |
| | | Year Ended
October 31, 2017 | | Year Ended
October 31, 2016 | | Year Ended
October 31, 2015 | | Year Ended
October 31, 2014 | | Year Ended
October 31, 2013 | |
Institutional Class | | | 2.57 | % | | | 1.97 | % | | | 2.78 | % | | | 1.97 | % | | | 2.71 | % | | | 1.97 | % | | | 2.55 | % | | | 2.04 | % | | | 2.30 | % | | | 2.01 | % | |
Class A | | | 2.99 | % | | | 2.33 | % | | | 3.13 | % | | | 2.33 | % | | | 3.06 | % | | | 2.33 | % | | | 2.90 | % | | | 2.38 | % | | | 2.63 | % | | | 2.35 | % | |
Class C | | | 3.69 | % | | | 3.08 | % | | | 3.89 | % | | | 3.08 | % | | | 3.81 | % | | | 3.08 | % | | | 3.66 | % | | | 3.15 | % | | | 3.39 | % | | | 3.10 | % | |
Class R6 | | | 2.37 | % | | | 1.90 | % | | | 2.69 | % | | | 1.90 | % | | | 2.66 | % | | | 1.90 | % | | | 2.46 | % | | | 1.98 | %(1) | | | — | | | | — | | |
(1) Period from December 31, 2013 (Commencement of Operations) to October 31, 2014.
ØØ Portfolio turnover is calculated at the Fund level. Percentage indicated was calculated for the year ended October 31, 2014 for the Fund.
67
Notes to Financial Highlights (cont'd)
§ After repayment of expenses previously reimbursed and/or fees previously waived by Management, as applicable. Had the Fund not made such repayments, the annualized ratios of net expenses to average daily net assets would have been:
| | | Including
Dividend
and
Interest
Expense
Relating to
Short Sales | | Excluding
Dividend
and
Interest
Expense
Relating to
Short Sales | | Including
Dividend
and
Interest
Expense
Relating to
Short Sales | | Excluding
Dividend
and
Interest
Expense
Relating to
Short Sales | |
| | | Year Ended
October 31, 2016 | | Year Ended
October 31, 2015 | |
Institutional Class | | | 2.77 | % | | | 1.96 | % | | | 2.64 | % | | | 1.90 | % | |
Class A | | | 3.13 | % | | | 2.33 | % | | | 3.02 | % | | | 2.29 | % | |
Class C | | | 3.88 | % | | | 3.07 | % | | | 3.75 | % | | | 3.02 | % | |
Class R6 | | | 2.68 | % | | | 1.89 | % | | | 2.59 | % | | | 1.83 | % | |
68
Report of Independent Registered Public Accounting Firm
To the Board of Trustees of Neuberger Berman Alternative Funds and Shareholders of
Neuberger Berman Absolute Return Multi-Manager Fund
We have audited the accompanying consolidated statement of assets and liabilities, including the consolidated schedule of investments, of Neuberger Berman Absolute Return Multi-Manager Fund (the "Trust"), one of the series constituting the Neuberger Berman Alternative Funds as of October 31, 2017, and the related consolidated statement of operations for the year then ended, the consolidated statements of changes in net assets for each of the two years in the period then ended and the financial highlights for each of the five years in the period then ended. These financial statements and financial highlights are the responsibility of the Trust's management. Our responsibility is to express an opinion on these financial statements and financial highlights based on our audits.
We conducted our audits in accordance with the standards of the Public Company Accounting Oversight Board (United States). Those standards require that we plan and perform the audit to obtain reasonable assurance about whether the financial statements and financial highlights are free of material misstatement. We were not engaged to perform an audit of the Trust's internal control over financial reporting. Our audits included consideration of internal control over financial reporting as a basis for designing audit procedures that are appropriate in the circumstances, but not for the purpose of expressing an opinion on the effectiveness of the Trust's internal control over financial reporting. Accordingly, we express no such opinion. An audit also includes examining, on a test basis, evidence supporting the amounts and disclosures in the financial statements and financial highlights, assessing the accounting principles used and significant estimates made by management, and evaluating the overall financial statement presentation. Our procedures included confirmation of securities owned as of October 31, 2017 by correspondence with the custodian and others or by other appropriate auditing procedures where replies from others were not received. We believe that our audits provide a reasonable basis for our opinion.
In our opinion, the financial statements and financial highlights referred to above present fairly, in all material respects, the consolidated financial position of Neuberger Berman Absolute Return Multi- Manager Fund, at October 31, 2017, and the consolidated results of its operations for the year then ended, the consolidated changes in its net assets for each of the two years in the period then ended and the financial highlights for each of the five years in the period then ended, in conformity with U.S. generally accepted accounting principles.
Boston, Massachusetts
December 26, 2017
69
Investment Manager and Administrator
Neuberger Berman Investment Advisers LLC
1290 Avenue of the Americas
New York, NY 10104-0002
800.877.9700 or 212.476.8800
Intermediary Client Services 800.366.6264
Distributor
Neuberger Berman BD LLC
1290 Avenue of the Americas
New York, NY 10104-0002
800.877.9700 or 212.476.8800
Intermediary Client Services 800.366.6264
Sub-Advisers
BH-DG Systematic Trading LLP
10 Grosvenor Street
London W1K 4QB, United Kingdom
Cramer Rosenthal McGlynn, LLC
520 Madison Avenue, 20th Floor
New York, NY 10022
GAMCO Asset Management Inc.
One Corporate Center
Rye, NY 10580
Good Hill Partners LP
One Greenwich Office Park
Greenwich, CT 06831
Levin Capital Strategies, LP
595 Madison Avenue, 17th Floor
New York, NY 10022
P/E Global, LLC
75 State Street, 31st Floor
Boston, MA 02109
Portland Hill Asset Management Limited
21 Knightsbridge
London SW1X7LY, United Kingdom
Sound Point Capital Management, L.P.
375 Park Avenue
New York, NY 10152
TPH Asset Management, LP
Heritage Plaza
1111 Bagby, Suite 4920
Houston, Texas 77002
Custodian
J.P. Morgan Chase Bank, N.A.
14201 Dallas Parkway
Dallas, TX 75254
Shareholder Servicing Agent
State Street Bank and Trust Company
One Lincoln Street
Boston, MA 02111
For Institutional Class Shareholders
Address correspondence to:
Neuberger Berman Investment Advisers LLC
1290 Avenue of the Americas 22nd Floor
New York, NY 10104-0002
Intermediary Client Services
800.366.6264
For Class A, Class C and Class R6 Shareholders:
Please contact your investment provider
Legal Counsel
K&L Gates LLP
1601 K Street, NW
Washington, DC 20006-1600
Independent Registered Public Accounting Firm
Ernst & Young LLP
200 Clarendon Street
Boston, MA 02116
70
Information about the Board of Trustees
Name, (Year of Birth),
and Address(1) | | Position(s)
and Length of
Time Served(2) | | Principal Occupation(s)(3) | | Number of
Funds in
Fund Complex | | Other Directorships Held
Outside Fund Complex by
Fund Trustee(3) Overseen
by Fund Trustee | |
Independent Fund Trustees | | | | | | | | | |
Michael J. Cosgrove (1949) | | Trustee since 2015 | | President, Carragh Consulting USA, since 2014; formerly, Executive, General Electric Company, 1970 to 2014, including President, Mutual Funds and Global Investment Programs, GE Asset Management, 2011 to 2014, President and Chief Executive Officer, Mutual Funds and Intermediary Business, GE Asset Management, 2007 to 2011, President, Institutional Sales and Marketing, GE Asset Management, 1998 to 2007, and Chief Financial Officer, GE Asset Management, and Deputy Treasurer, GE Company, 1988 to 1993. | | | 56 | | | Director, America Press, Inc. (not-for-profit Jesuit publisher), since 2015; Director, Fordham University, since 2001; formerly, Director, The Gabelli Go Anywhere Trust, June 2015 to June 2016; Director, Skin Cancer Foundation (not-for-profit), 2006 to 2015; Director, GE Investments Funds, Inc., 1997 to 2014; Trustee, GE Institutional Funds, 1997 to 2014; Director, GE Asset Management, 1988 to 2014; Director, Elfun Trusts, 1988 to 2014; Trustee, GE Pension & Benefit Plans, 1988 to 2014. | |
Marc Gary (1952) | | Trustee since 2015 | | Executive Vice Chancellor and Chief Operating Officer, Jewish Theological Seminary, since 2012; formerly, Executive Vice President and General Counsel, Fidelity Investments, 2007 to 2012; Executive Vice President and General Counsel, BellSouth Corporation, 2004 to 2007; Vice President and Associate General Counsel, BellSouth Corporation, 2000 to 2004; Associate, Partner, and National Litigation Practice Co-Chair, Mayer, Brown LLP, 1981 to 2000; Associate Independent Counsel, Office of Independent Counsel, 1990 to 1992. | | | 56 | | | Trustee, Jewish Theological Seminary, since 2015; Director, Counsel on Call (privately held for-profit company), since 2012; Director, Lawyers Committee for Civil Rights Under Law (not-for-profit), since 2005; formerly, Director, Equal Justice Works (not-for-profit), 2005 to 2014; Director, Corporate Counsel Institute, Georgetown University Law Center, 2007 to 2012; Director, Greater Boston Legal Services (not-for-profit), 2007 to 2012. | |
71
Name, (Year of Birth),
and Address(1) | | Position(s)
and Length of
Time Served(2) | | Principal Occupation(s)(3) | | Number of
Funds in
Fund Complex | | Other Directorships Held
Outside Fund Complex by
Fund Trustee(3) Overseen
by Fund Trustee | |
Martha C. Goss (1949) | | Trustee since 2007 | | President, Woodhill Enterprises Inc./Chase Hollow Associates LLC (personal investment vehicle), since 2006; formerly, Consultant, Resources Global Professionals (temporary staffing), 2002 to 2006. | | | 56 | | | Director, American Water (water utility), since 2003; Director, Allianz Life of New York (insurance), since 2005; Director, Berger Group Holdings, Inc. (engineering consulting firm), since 2013; Director, Financial Women's Association of New York (not-for-profit association), since 2003; Trustee Emerita, Brown University, since 1998; Director, Museum of American Finance (not-for-profit), since 2013; formerly, Non-Executive Chair and Director, Channel Reinsurance (financial guaranty reinsurance), 2006 to 2010; formerly, Director, Ocwen Financial Corporation (mortgage servicing), 2005 to 2010; formerly, Director, Claire's Stores, Inc. (retailer), 2005 to 2007; formerly, Director, Parsons Brinckerhoff Inc. (engineering consulting firm), 2007 to 2010; formerly, Director, Bank Leumi (commercial bank), 2005 to 2007; formerly, Advisory Board Member, Attensity (software developer), 2005 to 2007. | |
72
Name, (Year of Birth),
and Address(1) | | Position(s)
and Length of
Time Served(2) | | Principal Occupation(s)(3) | | Number of
Funds in
Fund Complex | | Other Directorships Held
Outside Fund Complex by
Fund Trustee(3) Overseen
by Fund Trustee | |
Michael M. Knetter (1960) | | Trustee since 2007 | | President and Chief Executive Officer, University of Wisconsin Foundation, since October 2010; formerly, Dean, School of Business, University of Wisconsin—Madison; formerly, Professor of International Economics and Associate Dean, Amos Tuck School of Business—Dartmouth College, 1998 to 2002. | | | 56 | | | Board Member, American Family Insurance (a mutual company, not publicly traded), since March 2009; formerly, Trustee, Northwestern Mutual Series Fund, Inc., 2007 to 2011; formerly, Director, Wausau Paper, 2005 to 2011; formerly, Director, Great Wolf Resorts, 2004 to 2009. | |
Deborah C. McLean (1954) | | Trustee since 2015 | | Member, Circle Financial Group (private wealth management membership practice), since 2011; Managing Director, Golden Seeds LLC (an angel investing group), since 2009; Adjunct Professor, Columbia University School of International and Public Affairs, since 2008; formerly, Visiting Assistant Professor, Fairfield University, Dolan School of Business, Fall 2007; formerly, Adjunct Associate Professor of Finance, Richmond, The American International University in London, 1999 to 2007. | | | 56 | | | Board member, Norwalk Community College Foundation, since 2014; Dean's Advisory Council, Radcliffe Institute for Advanced Study, since 2014; formerly, Director and Treasurer, At Home in Darien (not-for-profit), 2012 to 2014; Director, National Executive Service Corps (not-for-profit), 2012 to 2013; Trustee, Richmond, The American International University in London, 1999 to 2013. | |
73
Name, (Year of Birth),
and Address(1) | | Position(s)
and Length of
Time Served(2) | | Principal Occupation(s)(3) | | Number of
Funds in
Fund Complex | | Other Directorships Held
Outside Fund Complex by
Fund Trustee(3) Overseen
by Fund Trustee | |
George W. Morriss (1947) | | Trustee since 2007 | | Adjunct Professor, Columbia University School of International and Public Affairs, since October 2012; formerly, Executive Vice President and Chief Financial Officer, People's United Bank, Connecticut (a financial services company), 1991 to 2001. | | | 56 | | | Director, National Association of Corporate Directors, Connecticut Chapter, since 2011; Trustee, Steben Alternative Investment Funds, Steben Select Multi-Strategy Fund, and Steben Select Multi-Strategy Master Fund, since 2013; formerly, Treasurer, National Association of Corporate Directors, Connecticut Chapter, 2011 to 2015; formerly, Manager, Larch Lane Multi-Strategy Fund complex (which consisted of three funds), 2006 to 2011; formerly, Member, NASDAQ Issuers' Affairs Committee, 1995 to 2003. | |
Tom D. Seip (1950) | | Trustee since inception; Chairman of the Board since 2008; formerly Lead Independent Trustee from 2006 to 2008 | | General Partner, Ridgefield Farm LLC (a private investment vehicle); formerly, President and CEO, Westaff, Inc. (temporary staffing), May 2001 to January 2002; formerly, Senior Executive, The Charles Schwab Corporation, 1983 to 1998, including Chief Executive Officer, Charles Schwab Investment Management, Inc.; Trustee, Schwab Family of Funds and Schwab Investments, 1997 to 1998; and Executive Vice President-Retail Brokerage, Charles Schwab & Co., Inc., 1994 to 1997. | | | 56 | | | Director, H&R Block, Inc. (financial services company), since May 2001; Chairman, Governance and Nominating Committee, H&R Block, Inc., since 2011; formerly, Chairman, Compensation Committee, H&R Block, Inc., 2006 to 2010; formerly, Director, Forward Management, Inc. (asset management company), 1999 to 2006. | |
74
Name, (Year of Birth),
and Address(1) | | Position(s)
and Length of
Time Served(2) | | Principal Occupation(s)(3) | | Number of
Funds in
Fund Complex | | Other Directorships Held
Outside Fund Complex by
Fund Trustee(3) Overseen
by Fund Trustee | |
James G. Stavridis (1955) | | Trustee since 2015 | | Dean, Fletcher School of Law and Diplomacy, Tufts University since 2013; formerly, Admiral, United States Navy, 2006 to 2013, including Supreme Allied Commander, NATO and Commander, European Command, 2009 to 2013, and Commander, United States Southern Command, 2006 to 2009. | | | 56 | | | Director, Utilidata Inc., since 2015; Director, BMC Software Federal, LLC, since 2014; Director, Vertical Knowledge, LLC, since 2013; formerly, Director, Navy Federal Credit Union, 2000-2002. | |
Candace L. Straight (1947) | | Trustee since inception | | Private investor and consultant specializing in the insurance industry; formerly, Advisory Director, Securitas Capital LLC (a global private equity investment firm dedicated to making investments in the insurance sector), 1998 to 2003. | | | 56 | | | Formerly, Public Member, Board of Governors and Board of Trustees, Rutgers University, 2011 to 2016; formerly, Director, Montpelier Re Holdings Ltd. (reinsurance company), 2006 to 2015; formerly, Director, National Atlantic Holdings Corporation (property and casualty insurance company), 2004 to 2008; formerly, Director, The Proformance Insurance Company (property and casualty insurance company), 2004 to 2008; formerly, Director, Providence Washington Insurance Company (property and casualty insurance company), 1998 to 2006; formerly, Director, Summit Global Partners (insurance brokerage firm), 2000 to 2005. | |
Peter P. Trapp (1944) | | Trustee since inception | | Retired; formerly, Regional Manager for Mid-Southern Region, Ford Motor Credit Company, September 1997 to 2007; formerly, President, Ford Life Insurance Company, April 1995 to August 1997. | | | 56 | | | None. | |
75
Name, (Year of Birth),
and Address(1) | | Position(s)
and Length of
Time Served(2) | | Principal Occupation(s)(3) | | Number of
Funds in
Fund Complex | | Other Directorships Held
Outside Fund Complex by
Fund Trustee(3) Overseen
by Fund Trustee | |
Fund Trustees who are "Interested Persons" | | | | | | | | | |
Joseph V. Amato* (1962) | | Trustee since 2009 | | President and Director, Neuberger Berman Group LLC, since 2009; President and Chief Executive Officer, Neuberger Berman BD LLC ("Neuberger Berman") and Neuberger Berman Holdings LLC (including its predecessor, Neuberger Berman Inc.), since 2007; Chief Investment Officer (Equities) and President (Equities), Neuberger Berman Investment Advisers LLC ("NBIA") (formerly, Neuberger Berman Fixed Income LLC ("NBFI") and including predecessor entities), since 2007, and Board Member of NBIA since 2006; formerly, Global Head of Asset Management of Lehman Brothers Holdings Inc.'s ("LBHI") Investment Management Division, 2006 to 2009; formerly, member of LBHI's Investment Management Division's Executive Management Committee, 2006 to 2009; formerly, Managing Director, Lehman Brothers Inc. ("LBI"), 2006 to 2008; formerly, Chief Recruiting and Development Officer, LBI, 2005 to 2006; formerly, Global Head of LBI's Equity Sales and a Member of its Equities Division Executive Committee, 2003 to 2005. | | | 56 | | | Member of Board of Advisors, McDonough School of Business, Georgetown University, since 2001; Member of New York City Board of Advisors, Teach for America, since 2005; Trustee, Montclair Kimberley Academy (private school), since 2007; Member of Board of Regents, Georgetown University, since 2013. | |
76
Name, (Year of Birth),
and Address(1) | | Position(s)
and Length of
Time Served(2) | | Principal Occupation(s)(3) | | Number of
Funds in
Fund Complex | | Other Directorships Held
Outside Fund Complex by
Fund Trustee(3) Overseen
by Fund Trustee | |
Robert Conti* (1956) | | Chief Executive Officer, President and Trustee since 2008; prior thereto, Executive Vice President in 2008 and Vice President from inception to 2008 | | Managing Director, Neuberger Berman, since 2007; President—Mutual Funds, NBIA, since 2008; formerly, Senior Vice President, Neuberger Berman, 2003 to 2006; formerly, Vice President, Neuberger Berman, 1999 to 2003; President and Chief Executive Officer, twenty-six registered investment companies for which NBIA acts as investment manager and/or administrator. | | | 56 | | | Director, Staten Island Mental Health Society, since 1994; formerly, Chairman of the Board, Staten Island Mental Health Society, 2008 to 2011. | |
(1) The business address of each listed person is 1290 Avenue of the Americas, New York, NY 10104
(2) Pursuant to the Trust's Trust Instrument, subject to any limitations on the term of service imposed by the By-laws or any retirement policy adopted by the Trustees, each of these Trustees shall hold office for life or until his or her successor is elected or the Trust terminates; except that (a) any Trustee may resign by delivering a written resignation; (b) any Trustee may be removed with or without cause at any time by a written instrument signed by at least two-thirds of the other Trustees; (c) any Trustee who requests to be retired, or who has become unable to serve, may be retired by a written instrument signed by a majority of the other Trustees; and (d) any Trustee may be removed at any shareholder meeting by a vote of at least two-thirds of the outstanding shares.
(3) Except as otherwise indicated, each individual has held the positions shown during at least the last five years.
* Indicates a Trustee who is an "interested person" within the meaning of the 1940 Act. Mr. Amato and Mr. Conti are interested persons of the Trust by virtue of the fact that each is an officer of NBIA and/or its affiliates.
77
Information about the Officers of the Trust
Name, (Year of Birth),
and Address(1) | | Position(s)
and Length of
Time Served(2) | | Principal Occupation(s)(3) | |
Claudia A. Brandon (1956) | | Executive Vice President since 2008 and Secretary since inception | | Senior Vice President, Neuberger Berman, since 2007 and Employee since 1999; Senior Vice President, NBIA, since 2008 and Assistant Secretary since 2004; formerly, Vice President, Neuberger Berman, 2002 to 2006; formerly, Vice President—Mutual Fund Board Relations, NBIA, 2000 to 2008; formerly, Vice President, NBIA, 1986 to 1999 and Employee, 1984 to 1999; Executive Vice President and Secretary, twenty-six registered investment companies for which NBIA acts as investment manager and/or administrator. | |
Agnes Diaz (1971) | | Vice President since 2013 | | Senior Vice President, Neuberger Berman, since 2012; Senior Vice President, NBIA, since 2012 and Employee since 1996; formerly, Vice President, Neuberger Berman, 2007 to 2012; Vice President, ten registered investment companies for which NBIA acts as investment manager and/or administrator. | |
Anthony DiBernardo (1979) | | Assistant Treasurer since 2011 | | Senior Vice President, Neuberger Berman, since 2014; Senior Vice President, NBIA, since 2014, and Employee since 2003; formerly, Vice President, Neuberger Berman, 2009 to 2014; Assistant Treasurer, ten registered investment companies for which NBIA acts as investment manager and/or administrator. | |
Corey A. Issing (1978) | | Chief Legal Officer since 2016 (only for purposes of sections 307 and 406 of the Sarbanes-Oxley Act of 2002) and Anti-Money Laundering Compliance Officer since 2016 | | General Counsel and Head of Compliance—Mutual Funds since 2016 and Managing Director, NBIA, since 2017; formerly, Associate General Counsel (2015 to 2016), Counsel (2007 to 2015), Senior Vice President (2013-2016), Vice President (2009-2013); Chief Legal Officer (only for purposes of sections 307 and 406 of the Sarbanes-Oxley Act of 2002), twenty-six registered investment companies for which NBIA acts as investment manager and/or administrator; Anti-Money Laundering Compliance Officer, twenty-six registered investment companies for which NBIA acts as investment manager and/or administrator. | |
Sheila R. James (1965) | | Assistant Secretary since inception | | Vice President, Neuberger Berman, since 2008 and Employee since 1999; Vice President, NBIA, since 2008; formerly, Assistant Vice President, Neuberger Berman, 2007; Employee, NBIA, 1991 to 1999; Assistant Secretary, twenty-six registered investment companies for which NBIA acts as investment manager and/or administrator. | |
78
Name, (Year of Birth),
and Address(1) | | Position(s)
and Length of
Time Served(2) | | Principal Occupation(s)(3) | |
Brian Kerrane (1969) | | Chief Operating Officer since 2015 and Vice President since 2008 | | Managing Director, Neuberger Berman, since 2013; Chief Operating Officer—Mutual Funds and Managing Director, NBIA, since 2015; formerly, Senior Vice President, Neuberger Berman, 2006 to 2014; Vice President, NBIA, 2008 to 2015 and Employee since 1991; Chief Operating Officer, ten registered investment companies for which NBIA acts as investment manager and/or administrator; Vice President, twenty-six registered investment companies for which NBIA acts as investment manager and/or administrator. | |
Josephine Marone (1963) | | Assistant Secretary since 2017 | | Senior Paralegal, Neuberger Berman, since 2007 and Employee since 2007; Assistant Secretary, twenty-six registered investment companies for which NBIA acts as investment manager and/or administrator. | |
Anthony Maltese (1959) | | Vice President since 2015 | | Senior Vice President, Neuberger Berman, since 2014 and Employee since 2000; Senior Vice President, NBIA, since 2014; Vice President, ten registered investment companies for which NBIA acts as investment manager and/or administrator. | |
Owen F. McEntee, Jr. (1961) | | Vice President since 2008 | | Vice President, Neuberger Berman, since 2006; Vice President, NBIA, since 2006 and Employee since 1992; Vice President, ten registered investment companies for which NBIA acts as investment manager and/or administrator. | |
John M. McGovern (1970) | | Treasurer and Principal Financial and Accounting Officer since inception | | Senior Vice President, Neuberger Berman, since 2007; Senior Vice President, NBIA, since 2007 and Employee since 1993; formerly, Vice President, Neuberger Berman, 2004 to 2006; formerly, Assistant Treasurer, 2002 to 2005; Treasurer and Principal Financial and Accounting Officer, twenty-six registered investment companies for which NBIA acts as investment manager and/or administrator. | |
Frank Rosato (1971) | | Assistant Treasurer since inception | | Vice President, Neuberger Berman, since 2006; Vice President, NBIA, since 2006 and Employee since 1995; Assistant Treasurer, ten registered investment companies for which NBIA acts as investment manager and/or administrator. | |
Chamaine Williams (1971) | | Chief Compliance Officer since inception | | Chief Compliance Officer—Mutual Funds and Senior Vice President, NBIA, since 2006; formerly, Senior Vice President, LBI, 2007 to 2008; formerly, Vice President, LBI, 2003 to 2006; formerly, Chief Compliance Officer, Lehman Brothers Asset Management Inc., 2003 to 2007; formerly, Chief Compliance Officer, Lehman Brothers Alternative Investment Management LLC, 2003 to 2007; Chief Compliance Officer, twenty-six registered investment companies for which NBIA acts as investment manager and/or administrator. | |
(1) The business address of each listed person is 1290 Avenue of the Americas, New York, NY 10104.
(2) Pursuant to the By-Laws of the Trust, each officer elected by the Trustees shall hold office until his or her successor shall have been elected and qualified or until his or her earlier death, inability to serve, or resignation. Officers serve at the pleasure of the Trustees and may be removed at any time with or without cause.
(3) Except as otherwise indicated, each individual has held the positions shown during at least the last five years.
79
Proxy Voting Policies and Procedures
A description of the policies and procedures that the Trust uses to determine how to vote proxies relating to portfolio securities is available, without charge, by calling 800-877-9700 (toll-free) and on the Securities and Exchange Commission's website, at www.sec.gov. Information regarding how the Trust voted proxies relating to portfolio securities during the most recent 12-month period ended June 30 is also available upon request, without charge, by calling 800-877-9700 (toll-free), on the Securities and Exchange Commission's website at www.sec.gov, and on Management's website at www.nb.com.
Quarterly Portfolio Schedule
The Trust files a complete schedule of portfolio holdings for each Fund with the Securities and Exchange Commission for the first and third quarters of each fiscal year on Form N-Q. The Trust's Forms N-Q are available on the Securities and Exchange Commission's website at www.sec.gov and may be reviewed and copied at the Securities and Exchange Commission's Public Reference Room in Washington, DC. Information on the operation of the Public Reference Room may be obtained by calling 800-SEC-0330. The information on Form N-Q is available upon request, without charge, by calling 800-877-9700 (toll-free).
Notice to Shareholders
In early 2018 you will receive information to be used in filing your 2017 tax returns, which will include a notice of the exact tax status of all distributions paid to you by a Fund during calendar year 2017. Please consult your own tax advisor for details as to how this information should be reflected on your tax returns.
For the fiscal year ended October 31, 2017, each Fund makes the following designation, or up to the maximum amount of such dividends allowable pursuant to the Internal Revenue Code, as qualified dividend income eligible for reduced tax rates. These lower rates range from 5% to 15% depending upon an individual's tax bracket. Complete information regarding each Funds distributions during the calendar year 2017 will be reported in conjunction with Form 1099-DIV.
80
Board Consideration of the Management and Sub-Advisory Agreements
On an annual basis, the Board of Trustees (the "Board") of Neuberger Berman Alternative Funds (the "Trust"), including the Trustees who are not "interested persons" of the Trust or of Neuberger Berman Investment Advisers LLC ("Management") (including its affiliates) ("Independent Fund Trustees"), considers whether to continue the management agreement with Management (the "Management Agreement") and the separate sub-advisory agreements between Management and each sub-adviser (each a "Sub-Adviser") with respect to Neuberger Berman Absolute Return Multi-Manager Fund ("ARMM" or "Fund"). The Board considered the sub-advisory agreements between Management and each of the following sub-advisers: Cramer Rosenthal McGlynn, LLC, GAMCO Asset Management, Inc., Good Hill Partners LP, Levin Capital Strategies, L.P., P/E Global, LLC, Portland Hill Asset Management Limited, Sound Point Capital Management, L.P., and TPH Asset Management, LP (each a "Sub-Advisory Agreement"; collectively with the Management Agreement, the "Agreements"). Throughout the process, the Independent Fund Trustees are advised by counsel that is experienced in Investment Company Act of 1940 matters and that is independent of Management ("Independent Counsel"). At a meeting held on September 28, 2017, the Board, including the Independent Fund Trustees, approved the continuation of the Agreements for the Fund.
In evaluating the Agreements with respect to the Fund, the Board, including the Independent Fund Trustees, reviewed extensive materials provided by Management and each Sub-Adviser in response to questions submitted by the Independent Fund Trustees and Independent Counsel, and (for the Sub-Advisers), by Management, and met with senior representatives of Management regarding its personnel, operations and financial condition as they relate to the Fund. The annual contract review extends over at least two regular meetings of the Board to ensure that Management and each Sub-Adviser have time to respond to any questions the Independent Fund Trustees may have on their initial review of the materials and that the Independent Fund Trustees have time to consider those responses.
In connection with its deliberations, the Board also considered the broad range of information relevant to the annual contract review that is provided to the Board (including its various standing committees) at meetings throughout the year, including reports on investment performance, portfolio risk and other portfolio information for the Fund, including the use of derivatives if used as part of a Sub-Adviser's strategy, as well as periodic reports on, among other matters, pricing and valuation; brokerage and execution; compliance; and shareholder and other services provided by Management and its affiliates. The Contract Review Committee, which is comprised of Independent Fund Trustees, was established by the Board to assist in its deliberations regarding the annual contract review. The Board has also established other committees that focus throughout the year on specific areas relevant to the annual contract review, such as Fund performance or compliance matters, and that are charged with specific responsibilities regarding the annual contract review. The Ethics and Compliance Committee received each quarter from the Fund's Chief Compliance Officer and reviewed a summary of the quarterly compliance questionnaire completed by each Sub-Adviser in addition to any other information provided between meetings. The Board also considered the size and staffing of certain Sub-Advisers, as warranted, and particularly their staffing of the portfolio management and compliance functions. Those committees provide reports to the Contract Review Committee and the full Board, which consider that information as part of the annual contract review process. The Board's Contract Review Committee annually considers and updates the questions it asks of Management and the Sub-Advisers in light of developments in the industry, in the markets, in mutual fund regulation and litigation, and in Management's and the Sub-Advisers' business models.
The Independent Fund Trustees received from Independent Counsel memoranda discussing the legal standards for their consideration of the proposed continuation of the Agreements. During the course of the year and during their deliberations regarding the annual contract review, the Contract Review Committee and the Independent Fund Trustees met with Independent Counsel separately from representatives of Management and the Sub-Advisers.
Provided below is a description of the Board's contract approval process and the material factors that the Board considered at its meetings regarding the renewals of the Agreements and the compensation to be paid thereunder. In connection with its approval of the continuation of the Agreements, the Board evaluated the terms of the Agreements, the overall fairness of the Agreements to the Fund and whether the Agreements were in the best interests of the Fund and Fund shareholders. The Board's determination to approve the continuation of the Agreements was based on a
81
comprehensive consideration of all information provided to the Board throughout the year and specifically in connection with the annual contract review.
This description is not intended to include all of the factors considered by the Board. The Board members did not identify any particular information or factor that was all-important or controlling, and each Trustee may have attributed different weights to the various factors. The Board focused on the costs and benefits of the Agreements to the Fund and, through the Fund, its shareholders.
Nature, Extent and Quality of Services
With respect to the nature, extent and quality of the services provided, the Board considered the investment philosophy and decision-making processes of, and the qualifications, experience, and capabilities of, and the resources available to, the portfolio management personnel of Management and each Sub-Adviser who perform services for the Fund.
The Board noted that Management and the Fund had obtained from the Securities and Exchange Commission an exemptive order that permitted Management to add or replace sub-advisers to the Fund without a shareholder vote, provided the Independent Fund Trustees approve the new sub-adviser and certain other steps are taken. In this context, the Board considered Management's responsibilities for designing an overall investment program for the Fund and then identifying the Sub-Advisers who will carry out the different portions of that program based on Management's due diligence of those Sub-Advisers. The Board noted that under the multi-manager arrangement, Management is continually assessing the need for new sub-advisers and the appropriateness of potential candidates, and noted the likelihood Management would in the future have to conduct "due diligence" on additional sub-advisers. The Board noted that Management is responsible for making the investments for the portion of the portfolio that it manages, allocating the Fund's portfolio among the various Sub-Advisers and itself, and determining when and how to rebalance the allocations among the Sub-Advisers and itself in the wake of disparate growth and changes in the markets and the broader economy, and to make certain other investment decisions and to engage in transactions to hedge or balance risks in the Sub-Advisers' portfolios. The Board noted that Management is also responsible for coordinating and managing the flow of information and communications relating to the Fund among the Sub-Advisers, and coordinating responses to regulatory agency inquiries related to the operations of the Trust.
The Board further noted that Management is responsible for overseeing the Sub-Advisers pursuant to the Agreements and related sub-adviser oversight policies and procedures approved by the Board. Under these procedures, Management is responsible for overseeing the investment performance of the Sub-Advisers and evaluating the risk and return of each Sub-Adviser and the Fund as a whole, in addition to other significant oversight responsibilities. The Board noted that Management is also responsible for monitoring compliance with the Fund's investment objectives, policies and restrictions, as well as compliance with applicable law.
The Board noted that Management also provides certain administrative services, including fund accounting and compliance services. The Board considered the policies and practices regarding brokerage, commissions and other trading costs, and allocation of portfolio transactions of Management and each of the Sub-Advisers and noted that Management monitored the quality of the execution services provided by each Sub-Adviser. Moreover, the Board considered Management's approach to potential conflicts of interest between the Fund's investments and those of other funds or accounts managed by Management or the Sub-Advisers.
The Board noted the extensive range of services that Management provides to the Fund beyond the investment management and Sub-Adviser oversight services. It also noted Management's activities under its contractual obligation to oversee the Fund's various outside service providers, including its renegotiation of certain service providers' fees and its evaluation of service providers' infrastructure, cybersecurity programs and business continuity programs, among other matters. The Board noted Management's extensive activities in selecting and overseeing the Sub-Advisers, including questionnaires, site visits, analyses of performance, compliance monitoring and evaluating third party reviews of potential subadvisers, and the quarterly and annual reports that Management provides to the Board on the Sub-Advisers' performance and compliance. In addition, the Board considered the scope and compliance history of the compliance programs of Management and each Sub-Adviser, including the Fund's Chief Compliance Officer's and Management's
82
assessment of the compliance programs of the Sub-Advisers. The Board discussed that Management's Chief Information Security Officer had evaluated the Sub-Advisers' responses on questions of cybersecurity, business continuity and disaster recovery. The Board also considered Management's ongoing development of its own infrastructure and information technology to support the Fund's compliance structure through, among other things, cybersecurity, business continuity planning, and risk management.
The Board noted the positive compliance history of Management and each Sub-Adviser as no significant compliance problems were reported to the Board with respect to any of the firms. The Board also considered whether there were any pending lawsuits, enforcement proceedings or regulatory investigations involving Management or any Sub-Adviser, and reviewed information regarding their financial condition, history of operations and any conflicts of interests in managing the Fund. The Board also considered the general structure of the portfolio managers compensation program and whether this structure provides appropriate incentives to act in the best interests of the Fund. The Board also considered the ability of Management to attract and retain qualified personnel to service the Fund.
The Board noted that Management assumes significant ongoing risks with respect to the Fund, including investment, operational, enterprise, litigation, regulatory and compliance risks, for which Management is entitled to compensation. The Board also noted that when Management launches a new fund or share class, it assumes entrepreneurial risk with respect to that fund or class, and that some new funds and share classes have been liquidated without ever having been profitable to Management.
As in past years, the Board also considered the manner in which Management addressed various matters that arose during the year, some of them a result of developments in the broader fund industry or the regulations governing it, including the Department of Labor Fiduciary Rule. In addition, the Board considered actions taken by Management in response to recent market conditions, such as regulatory concerns about changes in fixed-income market liquidity and potential volatility, and considered the overall performance of Management in this context.
Fund Performance
The Board requested a report from an outside consulting firm that specializes in the analysis of fund industry data that compared the Fund's performance, along with its fees and other expenses, to a group of industry peers and a broad universe of similar funds. The Board considered the Fund's performance and fees in light of the limitations inherent in the methodology for constructing such a peer group and determining which investment companies should be included in the peer group.
With respect to investment performance, the Board considered information regarding the Fund's short-, intermediate- and long-term performance, as applicable, both on an absolute basis and relative to an appropriate benchmark index and the median performance of the composite peer group (constructed by the consulting firm) of investment companies pursuing broadly similar strategies. The Board also considered information regarding each Sub-Adviser's performance. The Board also reviewed performance in relation to certain measures of the degree of investment risk undertaken by the portfolio managers. The peer group and broad universe of similar funds referenced in this section are those identified by the consulting firm, as discussed above. The data used to provide the benchmark comparison was provided by Management. In the case of underperformance for the periods reflected, the Board considered the magnitude of that underperformance relative to the peer group median and the benchmark (i.e., the amount by which a Fund underperformed, including, for example, whether the Fund slightly underperformed or significantly underperformed the peer group median or benchmark). The information provided herein relating to the Fund's performance is for the Fund's Institutional Class. The Board also reviewed information for the other classes of shares, some of which have higher fees and expenses reflecting their separate distribution and servicing arrangements. The Board considered that, to the extent those classes have higher expenses, their performance will be lower than that of Institutional Class.
The Board considered that, as compared to its peer group, the Fund's performance was higher than the median for the 1-year period, but lower than the median for the 3-year period. The Board also considered that, as compared to its benchmark, the Fund's performance was lower for the 1 and 3-year periods. The Fund was launched in 2012 and therefore does not have 5 or 10-year performance. The Board also noted that Management recently began managing a
83
sleeve of the Fund, but determined that it was too early to meaningfully evaluate its performance. In determining to renew the Management Agreement, the Board considered that the Fund had out-performed its peer group for the 1-year period, while maintaining a volatility that was lower than the average (but slightly higher than the median) volatility (as measured by the standard deviation of returns) of the broad universe of alternative, multi-strategy funds for the three-year period ended December 31, 2016.
In the case where the Fund or a particular Sub-Adviser underperformed its benchmark index and/or peer group to an extent, or over a period of time, that the Board found to raise concerns, the Board discussed with Management the Fund's performance and steps that Management had taken, or intended to take, to improve performance, including its willingness to replace or terminate a Sub-Adviser. The Board also met with the portfolio managers of the Fund, who are employed by Management or an affiliate of Management, during the period since the last contract renewal to discuss the Fund's performance. The Board also considered Management's responsiveness with respect to the lagging performance as compared to the benchmark. In this regard, the Board noted that performance, especially short-term performance, is only one of the factors that it deems relevant to its consideration of the Fund's Agreements and that, after considering all relevant factors, it may be appropriate to approve the continuation of the Agreements notwithstanding the Fund's underperformance.
Fee Rates, Profitability, and Fall-out Benefits
With respect to the overall fairness of the Agreements, the Board considered the fee structure for the Fund under the Agreements as compared to the peer group provided by the consulting firm. The Board reviewed a comparison of the Fund's management fee and total expense ratio to a peer group of comparable funds. The Board noted that the comparative management fee analysis includes, in the Fund's management fee, the separate administrative fees paid to Management, but it was not clear whether this was the case for all funds in the peer group. Accordingly, the Board also considered the Fund's total expense ratio.
The Board compared the Fund's contractual and actual management fees to the mean and median of the contractual and actual management fees, respectively, of the Fund's peer group. (The actual management fees are the contractual management fees reduced by any fee waivers or other adjustments. The information provided herein relating to the Fund's management fees is for the Fund's Institutional Class.) The Board considered that, as compared to its peer group, the Fund's contractual management fee was lower than the median, but the actual management fee net of fees waived by Management was higher than the median. The Board considered whether specific portfolio management, administration or oversight needs contributed to the management fee. The Board also noted that the overall expense ratio of each class of the Fund is maintained through a contractual fee cap and/or expense reimbursements by Management. Management indicated that similar comparative information was not available with respect to the amount paid to each Sub-Adviser. The Board did, however, consider the allocation of duties and responsibilities among Management and the Sub-Advisers and, in light of that, the amount of fees retained by each. The Board noted, however, that Management, and not the Fund, pays the fee to the Sub-Advisers.
In concluding that the benefits accruing to Management and its affiliates by virtue of their relationship with the Fund were reasonable in light of the costs of providing the investment advisory and other services and the benefits accruing to the Fund, the Board reviewed specific data as to Management's profit or loss on the Fund for a recent period on a pre-tax basis without regard to distribution expenses, including year-over-year changes in each of Management's reported expense categories. (The Board also reviewed data on Management's profit or loss on the Fund after distribution expenses and taxes were factored in, as indicators of the health of the business and the extent to which Management is directing its profits into the growth of the business.) The Board considered the cost allocation methodology that Management used in developing its profitability figures. The Board engaged an independent forensic accountant to review the profitability methodology utilized by Management when preparing this information and discussed with the consultant its conclusion that Management's process for calculating and reporting its profit or loss was not unreasonable. Recognizing that there is no uniform methodology within the asset management industry for determining profitability for this purpose and that the use of different reasonable methodologies can give rise to different profit and loss results, the Board requested from Management examples of profitability calculated by different methods and noted that the profitability levels were still
84
reasonable when calculated by these other methods. In addition, the Board recognized that Management's calculations regarding its costs may not reflect all risks, including regulatory, legal, operational, reputational, and, where appropriate, entrepreneurial risks, associated with offering and managing a mutual fund in the current regulatory and market environment.
The Board also monitors throughout the year the potential effect on the profitability of Management resulting from changes in Sub-Advisers and/or their fees. The Board did not give substantial weight to profitability data from the Sub-Advisers because the Board did not view this data as being a key factor to its deliberations given the arm's-length nature of the relationship between Management and the Sub-Advisers with respect to the negotiation of sub-advisory fee rates. To test its assumption of an arm's-length fee rate, the Board requested from Management information about any other business relationships it has with any of the Sub-Advisers. In addition, the Board noted that the Sub-Advisers may not account for their profits on an account-by-account basis and those that do typically employ different methodologies in connection with these calculations. The Board also considered any fall-out benefits likely to accrue to Management or its affiliates from their relationship with the Fund. The Board also considered the expected effect on profitability of having Management manage a sleeve of the Fund. The Board recognized that Management and its affiliates should be entitled to earn a reasonable level of profits for services they provide to the Fund and, based on its review, concluded that Management's reported level of profitability, if any, on the Fund was reasonable.
Information Regarding Services to Other Clients
The Board considered whether there were other funds or separate accounts that were advised or sub-advised by Management or its affiliates with investment objectives, policies and strategies that were similar to those of the Fund. In this regard, in prior years, the Board considered fees charged to an unregistered fund of funds managed by Management that uses some of the same strategies used by the Funds and noted differences that reduced the usefulness of the comparison. The Board also considered the fees the Sub-advisers charge for products with investment objectives, policies and strategies that were similar to those of the Fund, if any. The Board noted that in many cases, those products were hedge funds, which typically charge fees substantially higher than mutual funds.
Economies of Scale
The Board also evaluated apparent or anticipated economies of scale in relation to the services Management provides to the Fund. The Board considered whether the Fund's fee structure provides for a reduction of payments resulting from the use of breakpoints and whether any such breakpoints are set at appropriate asset levels. The Board gave careful thought to the size of any breakpoints in the Fund's advisory fees and the asset levels at which they are set. It also considered whether the breakpoints were set at an appropriate level and compared the breakpoint structure to that of the peer group. The Board considered that breakpoints in a Sub-Adviser's fee schedule would inure to the benefit of Management, and evaluated that fact in light of Management's overall profitability on the Fund, a subject on which the Board receives quarterly reports. The Board also considered that Management has provided, at no added cost to the Fund, certain additional services that were required by new regulations or regulatory interpretations, impelled by changes in the securities markets or the business landscape, and/or requested by the Board, and that this is a way of sharing economies of scale with the Fund and its shareholders.
Conclusions
In approving the continuation of the Agreements, the Board concluded that, in its business judgment, the terms of each Agreement are fair and reasonable to the Fund and that approval of the continuation of the Agreements is in the best interests of the Fund and its shareholders. In reaching this determination, the Board considered that Management and each Sub-Adviser could be expected to continue to provide a high level of service to the Fund; that the performance of the Fund was satisfactory over time, or, in the case of underperformance by a Sub-Adviser, that the Board retained confidence in Management's and each Sub-Adviser's capabilities to manage the Fund; that the Fund's fee structure appeared to the
85
Board to be reasonable given the nature, extent and quality of services provided; and that the benefits accruing to Management and its affiliates by virtue of their relationship with the Fund were reasonable in light of the costs of providing the investment advisory and other services and the benefits accruing to the Fund. The Board's conclusions may be based in part on its consideration of materials prepared in connection with the approval or continuance of the Agreements in prior years and on the Board's ongoing regular review of Fund performance and operations throughout the year, in addition to material prepared specifically for the most recent annual review of the Agreements.
86
This page has been left blank intentionally
87
This page has been left blank intentionally
87
This page has been left blank intentionally
88
Neuberger Berman Investment Advisers LLC
1290 Avenue of the Americas
New York, NY 10104–0002
Retail Services: 800.877.9700
Broker-Dealer and Institutional Services: 800.366.6264/888.556.9030
www.nb.com
Statistics and projections in this report are derived from sources deemed to be reliable but cannot be regarded as a representation of future results of the Fund. This report is prepared for the general information of shareholders and is not an offer of shares of the Fund. Shares are sold only through the currently effective prospectus which you can obtain by calling 877.628.2583. An investor should consider carefully a Fund's investment objectives, risks and fees and expenses, which are described in its prospectus, before investing.
M0257 12/17
Item 2. Code of Ethics.
The Board of Trustees (“Board”) of Neuberger Berman Alternative Funds (“Registrant”) has adopted a code of ethics that applies to the Registrant’s principal executive officer, principal financial officer, principal accounting officer or controller, or persons performing similar functions (“Code of Ethics”). During the period covered by this Form N-CSR, there were no substantive amendments to the Code of Ethics and there were no waivers from the Code of Ethics granted to the Registrant’s principal executive officer, principal financial officer, principal accounting officer or controller, or persons performing similar functions.
A copy of the Code of Ethics is incorporated by reference to Neuberger Berman Advisers Management Trust’s Form N-CSRS, Investment Company Act file number 811-04255 (filed August 25, 2016). The Code of Ethics is also available, without charge, by calling 1-800-877-9700 (toll-free).
Item 3. Audit Committee Financial Expert.
The Board has determined that the Registrant has two audit committee financial experts serving on its audit committee. The Registrant’s audit committee financial experts are Michael J. Cosgrove and Deborah C. McLean. Mr. Cosgrove and Ms. McLean are independent trustees as defined by Form N-CSR.
Item 4. Principal Accountant Fees and Services.
Ernst & Young LLP (“E&Y”) serves as independent registered public accounting firm to Neuberger Berman Absolute Return Multi-Manager Fund, Neuberger Berman Global Allocation Fund, Neuberger Berman Hedged Option Premium Strategy Fund, Neuberger Berman Long Short Credit Fund, Neuberger Berman Multi-Asset Income Fund, Neuberger Berman Risk Balanced Commodity Strategy Fund, and Neuberger Berman U.S. Equity Index PutWrite Strategy Fund. Neuberger Berman Absolute Return Multi-Manager Fund, Neuberger Berman Global Allocation Fund, Neuberger Berman Hedged Option Premium Strategy Fund, Neuberger Berman Long Short Credit Fund, Neuberger Berman Multi-Asset Income Fund, Neuberger Berman Risk Balanced Commodity Strategy Fund and Neuberger Berman U.S. Equity Index PutWrite Strategy Fund commenced operations on May 15, 2012, December 29, 2010, April 12, 2017, June 29, 2015, March 27, 2015, August 27, 2012 and September 16, 2016, respectively.
Tait, Weller & Baker LLP (“Tait Weller”) serves as independent registered public accounting firm to Neuberger Berman Long Short Fund. Neuberger Berman Long Short Fund commenced operations on December 29, 2011.
The aggregate fees billed for professional services rendered by E&Y for the audit of the annual financial statements or services that are normally provided by E&Y in connection with statutory and regulatory filings or engagements were $389,200 and $377,700 for the fiscal years ended 2016 and 2017, respectively.
The aggregate fees billed for professional services rendered by Tait Weller for the audit of the annual financial statements or services that are normally provided by Tait Weller in connection with statutory and regulatory filings or engagements were $28,890 and $29,755 for the fiscal years ended 2016 and 2017, respectively.
The aggregate fees billed to the Registrant for assurance and related services by E&Y that are reasonably related to the performance of the audit of the Registrant’s financial statements and are not reported above in Audit Fees were $0 and $0 for the fiscal years ended 2016 and 2017, respectively. The Audit Committee approved 0% and 0% of these services provided by E&Y for the fiscal years ended 2016 and 2017,
respectively, pursuant to the waiver provisions of Rule 2-01(c)(7)(i)(C) of Regulation S-X.
The fees billed to other entities in the investment company complex for assurance and related services by E&Y that are reasonably related to the performance of the audit that the Audit Committee was required to approve because the engagement related directly to the operations and financial reporting of the Registrant were $0 and $0 for the fiscal years ended 2016 and 2017, respectively. The Audit Committee approved 0% and 0% of these services provided by E&Y for the fiscal years ended 2016 and 2017, respectively, pursuant to the waiver provisions of Rule 2-01(c)(7)(i)(C) of Regulation S-X.
The aggregate fees billed to the Registrant for assurance and related services by Tait Weller that are reasonably related to the performance of the audit of the Registrant’s financial statements and are not reported above in Audit Fees were $0 and $0 for the fiscal years ended 2016 and 2017, respectively. The Audit Committee approved 0% and 0% of these services provided by Tait Weller for the fiscal years ended 2016 and 2017, respectively, pursuant to the waiver provisions of Rule 2-01(c)(7)(i)(C) of Regulation S-X.
The fees billed to other entities in the investment company complex for assurance and related services by Tait Weller that are reasonably related to the performance of the audit that the Audit Committee was required to approve because the engagement related directly to the operations and financial reporting of the Registrant were $0 and $0 for the fiscal years ended 2016 and 2017, respectively. The Audit Committee approved 0% and 0% of these services provided by Tait Weller for the fiscal years ended 2016 and 2017, respectively, pursuant to the waiver provisions of Rule 2-01(c)(7)(i)(C) of Regulation S-X.
The aggregate fees billed to the Registrant for professional services rendered by E&Y for tax compliance, tax advice, and tax planning were $139,600 and $119,200 for the fiscal years ended 2016 and 2017, respectively. The nature of the services provided includes preparation of the Federal and State tax extensions and tax returns, review of annual excise tax calculations, and preparation of form 8613, in addition to guidance with the identification of Passive Foreign Investment Companies ("PFICs"), assistance with determination of various foreign withholding taxes, and assistance with Internal Revenue Code and tax regulation requirements for fund investments. The Audit Committee approved 0% and 0% of these services provided by E&Y for the fiscal years ended 2016 and 2017, respectively, pursuant to the waiver provisions of Rule 2-01(c)(7)(i)(C) of Regulation S-X.
The fees billed to other entities in the investment company complex for professional services rendered by E&Y for tax compliance, tax advice, and tax planning that the Audit Committee was required to approve because the engagement related directly to the operations and financial reporting of the Registrant were $0 and $0 for the fiscal years ended 2016 and 2017, respectively. The Audit Committee approved 0% and 0% of these services provided by E&Y for the fiscal years ended 2016 and 2017, respectively, pursuant to the waiver provisions of Rule 2-01(c)(7)(i)(C) of Regulation S-X.
The aggregate fees billed to the Registrant for professional services rendered by Tait Weller for tax compliance, tax advice, and tax planning were $5,920 and $6,095 for the fiscal years ended 2016 and 2017, respectively. The nature of the services provided includes preparation of the Federal and State tax extensions and tax returns, review of annual excise tax calculations, and preparation of form 8613, in addition to guidance with the identification of PFICs, assistance with determination of various foreign withholding taxes, and assistance with Internal Revenue Code and tax regulation requirements for fund investments. The Audit Committee approved 0% and 0% of these services provided by Tait Weller for the fiscal years ended 2016 and 2017, respectively, pursuant to the waiver provisions of Rule 2-01(c)(7)(i)(C) of Regulation S-X.
The fees billed to other entities in the investment company complex for professional services rendered by Tait Weller for tax compliance, tax advice, and tax planning that the Audit Committee was required to approve because the engagement related directly to the operations and financial reporting of the Registrant were $0
and $0 for the fiscal years ended 2016 and 2017, respectively. The Audit Committee approved 0% and 0% of these services provided by Tait Weller for the fiscal years ended 2016 and 2017, respectively, pursuant to the waiver provisions of Rule 2-01(c)(7)(i)(C) of Regulation S-X.
The aggregate fees billed to the Registrant for products and services provided by E&Y, other than services reported in Audit Fees, Audit-Related Fees, and Tax Fees were $0 and $0 for the fiscal years ended 2016 and 2017, respectively. The Audit Committee approved 0% and 0% of these services provided by E&Y for the fiscal years ended 2016 and 2017, respectively, pursuant to the waiver provisions of Rule 2-01(c)(7)(i)(C) of Regulation S-X.
The fees billed to other entities in the investment company complex for products and services provided by E&Y, other than services reported in Audit Fees, Audit-Related Fees, and Tax Fees that the Audit Committee was required to approve because the engagement related directly to the operations and financial reporting of the Registrant were $0 and $0 for the fiscal years ended 2016 and 2017, respectively. The Audit Committee approved 0% and 0% of these services provided by E&Y for the fiscal years ended 2016 and 2017, respectively, pursuant to the waiver provisions of Rule 2-01(c)(7)(i)(C) of Regulation S-X.
The aggregate fees billed to the Registrant for products and services provided by Tait Weller, other than services reported in Audit Fees, Audit-Related Fees, and Tax Fees were $0 and $0 for the fiscal years ended 2016 and 2017, respectively. The Audit Committee approved 0% and 0% of these services provided by Tait Weller for the fiscal years ended 2016 and 2017, respectively, pursuant to the waiver provisions of Rule 2-01(c)(7)(i)(C) of Regulation S-X.
The fees billed to other entities in the investment company complex for products and services provided by Tait Weller, other than services reported in Audit Fees, Audit-Related Fees, and Tax Fees that the Audit Committee was required to approve because the engagement related directly to the operations and financial reporting of the Registrant were $0 and $0 for the fiscal years ended 2016 and 2017, respectively. The Audit Committee approved 0% and 0% of these services provided by Tait Weller for the fiscal years ended 2016 and 2017, respectively, pursuant to the waiver provisions of Rule 2-01(c)(7)(i)(C) of Regulation S-X.
(1) The Audit Committee’s pre-approval policies and procedures for the Registrant to engage an accountant to render audit and non-audit services delegate to each member of the Committee the power to pre-approve services between meetings of the Committee.
(2) None of the services described in paragraphs (b) through (d) above were approved by the Audit Committee pursuant to paragraph (c)(7)(i)(C) of Rule 2-01 of Regulation S-X.
Not applicable.
Non-audit fees billed by E&Y for services rendered to the Registrant were $139,600 and $139,600 for the fiscal years ended 2016 and 2017, respectively.
Non-audit fees billed by E&Y for services rendered to the Registrant’s investment adviser and any entity controlling, controlled by, or under common control with the adviser that provides ongoing services to the Registrant were $0 and $0 for the fiscal years ended 2016 and 2017, respectively.
Non-audit fees billed by Tait Weller for services rendered to the Registrant were $0 and $0 for the fiscal years ended 2016 and 2017, respectively.
Non-audit fees billed by Tait Weller for services rendered to the Registrant’s investment adviser and any entity controlling, controlled by, or under common control with the adviser that provides ongoing services to the Registrant were $0 and $0 for the fiscal years ended 2016 and 2017, respectively.
(h) The Audit Committee of the Board considered whether the provision of non-audit services rendered to the Registrant’s investment adviser and any entity controlling, controlled by, or under common control with the adviser that provides ongoing services to the Registrant that were not pre-approved by the Audit Committee because the engagement did not relate directly to the operations and financial reporting of the Registrant is compatible with maintaining E&Y’s and Tait Weller’s independence.
Item 5. Audit Committee of Listed Registrants.
Not applicable to the Registrant.
Item 6. Schedule of Investments.
The complete schedule of investments for each series is disclosed in the Registrant’s applicable annual report included as Item 1 of this Form N-CSR.
Item 7. Disclosure of Proxy Voting Policies and Procedures for Closed-End Management Investment Companies.
Not applicable to the Registrant.
Item 8. Portfolio Managers of Closed-End Management Investment Companies.
Not applicable to the Registrant.
Item 9. Purchases of Equity Securities by Closed-End Management Investment Company and Affiliated Purchasers.
Not applicable to the Registrant.
Item 10. Submission of Matters to a Vote of Security Holders.
There were no changes to the procedures by which shareholders may recommend nominees to the Board.
Item 11. Controls and Procedures.
the period covered by this report that have materially affected, or are reasonably likely to materially affect, the Registrant’s internal control over financial reporting.
Item 12. Disclosure of Securities Lending Activities for Closed-End Management Investment Companies.
Not applicable to the Registrant.
Item 13. Exhibits.
The certification furnished pursuant to Rule 30a-2(b) under the Act and Section 906 of the Sarbanes-Oxley Act will not be deemed “filed” for purposes of Section 18 of the Securities Exchange Act of 1934, as amended (“Exchange Act”), or otherwise subject to the liability of that section. Such certification will not be deemed to be incorporated by reference into any filing under the Securities Act of 1933, as amended, or the Exchange Act, except to the extent that the Registrant specifically incorporates it by reference.
Pursuant to the requirements of the Securities Exchange Act of 1934 and the Investment Company Act of 1940, the Registrant has duly caused this report to be signed on its behalf by the undersigned, thereunto duly authorized.
Pursuant to the requirements of the Securities Exchange Act of 1934 and the Investment Company Act of 1940, this report has been signed below by the following persons on behalf of the Registrant and in the capacities and on the dates indicated.
John M. McGovern