As filed with the Securities and Exchange Commission on January 5, 2023
UNITED STATES
SECURITIES AND EXCHANGE COMMISSION
Washington, D.C. 20549
FORM N-CSR
CERTIFIED SHAREHOLDER REPORT OF
REGISTERED MANAGEMENT INVESTMENT COMPANIES
Investment Company Act file number: 811- 21715
NEUBERGER BERMAN ALTERNATIVE FUNDS
(Exact Name of Registrant as specified in charter)
c/o Neuberger Berman Investment Advisers LLC
1290 Avenue of the Americas
New York, New York 10104-0002
(Address of Principal Executive Offices – Zip Code)
Joseph V. Amato
Chief Executive Officer and President
Neuberger Berman Alternative Funds
c/o Neuberger Berman Investment Advisers LLC
1290 Avenue of the Americas
New York, New York 10104-0002
Lori L. Schneider, Esq.
K&L Gates LLP
1601 K Street, N.W.
Washington, D.C. 20006-1600
(Names and Addresses of agents for service)
Registrant’s telephone number, including area code: (212) 476-8800
Date of fiscal year end: October 31
Date of reporting period: October 31, 2022
Form N-CSR is to be used by management investment companies to file reports with the Commission not later than 10 days after the transmission to stockholders of any report that is required to be transmitted to stockholders under Rule 30e-1 under the Investment Company Act of 1940, as amended (“Act”) (17 CFR 270.30e-1). The Commission may use the information provided on Form N-CSR in its regulatory, disclosure review, inspection, and policymaking roles.
A registrant is required to disclose the information specified by Form N-CSR, and the Commission will make this information public. A registrant is not required to respond to the collection of information contained in Form N-CSR unless the Form displays a currently valid Office of Management and Budget (“OMB”) control number. Please direct comments concerning the accuracy of the information collection burden estimate and any suggestions for reducing the burden to the Secretary, Securities and Exchange Commission, 100 F Street, NE, Washington, DC 20549-1090. The OMB has reviewed this collection of information under the clearance requirements of 44 U.S.C. § 3507.
Item 1. Report to Shareholders.
(a) Following are copies of the annual reports transmitted to shareholders pursuant to Rule 30e-1 under the Act.

Neuberger Berman
Alternative and Multi-Asset Class Funds
Institutional Class Shares
Class A Shares
Class C Shares
Class R6 Shares
Class E Shares
Absolute Return Multi-Manager Fund
Annual Report
October 31, 2022
Contents
PRESIDENT'S LETTER | | | 1 | | |
PORTFOLIO COMMENTARY | | | 2 | | |
FUND EXPENSE INFORMATION | | | 8 | | |
CONSOLIDATED SCHEDULE OF INVESTMENTS | | | 10 | | |
CONSOLIDATED FINANCIAL STATEMENTS | | | 29 | | |
NOTES TO CONSOLIDATED FINANCIAL STATEMENTS | | | 34 | | |
CONSOLIDATED FINANCIAL HIGHLIGHTS (ALL CLASSES) | | | 51 | | |
Report of Independent Registered Public Accounting Firm | | | 54 | | |
Directory | | | 55 | | |
Trustees and Officers | | | 56 | | |
Proxy Voting Policies and Procedures | | | 66 | | |
Quarterly Portfolio Schedule | | | 66 | | |
Liquidity Risk Management Program | | | 66 | | |
Notice to Shareholders | | | 66 | | |
Report of Votes to Shareholders | | | 67 | | |
Board Consideration of the Management and
Sub-Advisory Agreements | | | 68 | | |
The "Neuberger Berman" name and logo and "Neuberger Berman Investment Advisers LLC" name are registered service marks of Neuberger Berman Group LLC. The individual Fund name in this piece is either a service mark or registered service mark of Neuberger Berman Investment Advisers LLC, an affiliate of Neuberger Berman BD LLC, distributor, member FINRA. ©2022 Neuberger Berman BD LLC, distributor. All rights reserved.
Dear Shareholder,
I am pleased to present this annual shareholder report for Neuberger Berman Absolute Return Multi-Manager Fund covering the 12-month period ended October 31, 2022 (the reporting period).
It was an extremely challenging period in the global financial markets during the reporting period. Sharply rising and persistent inflation was a major factor impacting the market. The U.S. Federal Reserve Board (Fed) initially thought rising prices were transitory and they would come down as COVID-driven supply chain bottlenecks eased. However, these issues continued, consumer demand remained strong, and the impact from the war in Ukraine created a "perfect storm," pushing inflation in the U.S. to a new 40-year high.
This caused the Fed to pivot from its highly accommodative monetary policy that was in place to support the economy during the pandemic, to an aggressively tightening policy in an attempt to rein in inflation. The Fed first raised interest rates in March 2022 from a range between 0.00% to 0.25% to a range between 0.25% to 0.50%. With inflation moving steadily higher, the central bank again raised rates at its next four meetings, and again in early November (after the reporting period ended). With the last increase, the Fed funds rate moved to a range between 3.75% and 4.00%, and the Fed expects to continue raising rates "until the job is done."
Both the global stock and bond markets generated weak results during the reporting period. In addition to high inflation and aggressive Fed tightening, there were concerns that the central bank may drive the economy into a recession and negatively impact corporate profits. All told, the S&P 500® Index returned –14.61% during the reporting period. Meanwhile, international developed and emerging market equities, as measured by the MSCI EAFE® and MSCI Emerging Market (Net) Indices, returned –23.00% and –31.03%, respectively, over the reporting period. Meanwhile, with short- and long-term Treasury yields moving sharply higher bond prices declined (yields and bond prices move in the opposite direction). For the reporting period the broad taxable investment-grade bond market, as measured by the Bloomberg U.S. Aggregate Bond Index, returned –15.68%.
Looking ahead, we believe market volatility will remain elevated, driven by challenging growth and inflation dynamics, as well as uncertainty around monetary and fiscal policy. Investors will closely watch the progression of economic data over the coming months as central bank tightening continues to work its way through the economy. We believe we are moving from the post-Global Financial Crisis/pre-COVID regime to a new environment that will continue to pose headwinds for risk assets in the near-to-medium term. We also anticipate earnings growth to slow meaningfully in the coming months, driven by declining demand, rising costs, inventory build-up, and currency headwinds weighing on margins. Against this backdrop, we believe active portfolio management can be valuable to help navigate the factors impacting the markets, and to seek out attractive opportunities during periods of heightened volatility.
Thank you for your continued support and trust. We look forward to continue serving your investment needs in the years to come.
Sincerely,

JOSEPH V. AMATO
PRESIDENT AND CEO
NEUBERGER BERMAN ALTERNATIVE FUNDS
1
Absolute Return Multi-Manager Fund Commentary (Unaudited)
Neuberger Berman Absolute Return Multi-Manager Fund Institutional Class generated a 4.30% total return for the 12 months ended October 31, 2022 (the reporting period), outperforming its primary benchmark, the HFRX® Global Hedge Fund Index (the Index), which posted a –5.28% total return for the same period. (Performance for all share classes is provided in the table following this letter.)
Global equities sold off during the reporting period after a strong run of performance due to a combination of COVID-19 vaccine dissemination and both monetary and fiscal stimulus. These factors, combined with pent up consumer demand, supply chain issues, and geopolitical conflict, drove inflation to elevated levels, with inflation remaining stubbornly high despite the U.S. Federal Reserve Board (Fed) hiking interest rates at a rapid pace. While the labor market stayed strong, markets became increasingly concerned about the impact of rising rates and inflation on the consumer, capital markets, and corporate earnings. While U.S. Treasury yields moved significantly higher, the yield curve flattened and inverted. Performance for the U.S. dollar was strong versus most major currencies. Energy commodity prices rallied for most of the reporting period, while stabilizing in recent months, and the price of gold declined.
Gains from global macro/managed futures and merger arbitrage/event driven outpaced losses from long/short equity during the reporting period. From a risk management perspective, we were pleased that the Fund's volatility and betas* (risk) relative to the S&P 500® and Bloomberg U.S. Aggregate Bond Indices were all in line with our expectations.
The allocation to global macro/managed futures strategies was the primary driver of returns for the reporting period, with gains split roughly evenly between the managed futures and systematic currency strategies. Positive performance from the managed futures allocation was driven mainly by interest rate positioning, commodities, and currencies, which outpaced small losses from equity exposure. Gains within the systematic currency strategy came primarily from long U.S. dollar positioning versus the euro and, to a lesser extent, versus the Australian dollar and Japanese yen.
The merger arbitrage/event driven allocation contributed positively as a number of deals progressed and closed during the reporting period.
The allocation to long/short equity strategies detracted from performance, as losses from longs outpaced gains from shorts, while the managers in aggregate generated negative returns from both longs and shorts.
The Fund's aggregate use of futures, forward foreign currency, swap contracts and written options contributed positively to performance during the reporting period.
We continue to position the Fund to seek to benefit from elevated volatility, with additional upside if interest rates continue to rise. The Fund's largest allocation is to global macro/managed futures strategies. We believe that increases in market volatility may be beneficial for these strategies, as has been the case historically. In addition, we believe that macroeconomic conditions across regions, as well as differences in fiscal and monetary policies, have the potential to continue driving trends across asset classes. The Fund's second largest strategy allocation is long/short equity. After a period of negative contributions to returns from the strategy, they began to inflect positively in the late third calendar quarter of 2022, and we believe this may continue to play out to the extent fundamentals become a greater driver of price movement. We continue to anticipate a high dispersion of winners and losers over the medium term, driven by a number of factors, including inflation, increasing costs of capital, currency effects, and varying levels of economic sensitivity. The Fund's third largest allocation is to merger arbitrage/event driven strategies. While merger and acquisition activity may decline from the robust levels achieved over the last several quarters, we believe that current deal volumes and spreads offer ample opportunities to put capital to work with what we believe to be fairly attractive expected returns.
Sincerely,
DAVID KUPPERMAN, JEFF MAJIT AND FRED INGHAM
PORTFOLIO MANAGERS
2
* Beta is a measure of the systematic risk of a portfolio. It is the covariance of the portfolio and a market index divided by the variance of the market index. Beta measures the historical sensitivity of a portfolio's returns to movements in the market index. The beta of the market index will always be one. A portfolio with a beta above the market index (i.e., >1) means that the portfolio has greater volatility than the market index. If the beta of the portfolio is 1.2, a market increase in return of 1% implies a 1.2% increase in the portfolio's return. If the beta of the portfolio is 0.8, a market decrease in return of 1% implies a 0.8% decrease in the portfolio's return.
Information about principal risks of investing in the Fund is set forth in the prospectus and statement of additional information.
The portfolio composition, industries and holdings of the Fund are subject to change without notice.
The opinions expressed are those of the Fund's portfolio managers and subadvisers. The opinions are as of the date of this report and are subject to change without notice.
3
Absolute Return Multi-Manager Fund (Unaudited)
TICKER SYMBOLS
Institutional Class | | NABIX | |
Class A | | NABAX | |
Class C | | NABCX | |
Class R6 | | NRABX | |
Class E | | NABEX | |
PORTFOLIO BY INVESTMENT TYPE
(as a % of Total Net Assets)
| | Long | | Short | |
Common Stocks | | | 28.8 | % | | | (6.0 | )% | |
Convertible Preferred Stocks | | | 0.1 | | | | — | | |
Corporate Bonds | | | 0.0 | | | | — | | |
Loan Assignments | | | 0.0 | | | | — | | |
Rights | | | 0.1 | | | | — | | |
Warrants | | | 0.0 | | | | — | | |
Short-Term Investments | | | 69.0 | | | | — | | |
Other Assets Less Liabilities | | | 8.0 | * | | | — | | |
Total | | | 106.0 | % | | | (6.0 | )% | |
* Includes the impact of the Fund's open positions in derivatives (other than options purchased), if any.
PERFORMANCE HIGHLIGHTS
| | | | Average Annual Total Return
Ended 10/31/2022 | |
| | Inception
Date | | 1 Year | | 5 Years | | 10 Years | | Life of
Fund | |
At NAV | |
Institutional Class | | 05/15/2012 | | | 4.30 | % | | | 3.09 | % | | | 2.83 | % | | | 2.70 | % | |
Class A | | 05/15/2012 | | | 3.84 | % | | | 2.71 | % | | | 2.45 | % | | | 2.33 | % | |
Class C | | 05/15/2012 | | | 3.02 | % | | | 1.94 | % | | | 1.69 | % | | | 1.56 | % | |
| Class R63 | | 12/31/2013 | | | 4.40 | % | | | 3.18 | % | | | 2.89 | % | | | 2.76 | % | |
| Class E3 | | 01/11/2022 | | | 5.18 | % | | | 3.27 | % | | | 2.92 | % | | | 2.78 | % | |
With Sales Charge | |
Class A | | | | | –2.11 | % | | | 1.50 | % | | | 1.84 | % | | | 1.75 | % | |
Class C | | | | | 2.02 | % | | | 1.94 | % | | | 1.69 | % | | | 1.56 | % | |
Index | |
HFRX® Global Hedge Fund
Index1,2 | | | | | –5.28 | % | | | 1.55 | % | | | 1.89 | % | | | 1.81 | % | |
| S&P 500® Index1,2 | | | | | –14.61 | % | | | 10.44 | % | | | 12.79 | % | | | 12.86 | % | |
Bloomberg U.S. Aggregate
Bond Index1,2 | | | | | –15.68 | % | | | –0.54 | % | | | 0.74 | % | | | 0.92 | % | |
The performance data quoted represent past performance and do not indicate future results. Current performance may be lower or higher than the performance data quoted. For current performance data, including current to the most recent month-end, please visit www.nb.com/performance.
The results shown in the table reflect the reinvestment of income dividends and other distributions, if any. The results do not reflect the effect of taxes a shareholder would pay on Fund distributions or on the redemption of Fund shares.
The investment return and principal value of an investment will fluctuate and shares, when redeemed, may be worth more or less than their original cost.
Returns would have been lower if Neuberger Berman Investment Advisers LLC ("NBIA") had not reimbursed certain expenses and/or waived a portion of the investment management fees during certain of the periods shown. Repayment by a class (of expenses previously reimbursed and/or fees previously waived by NBIA) will decrease the class's returns. Please see Note B in the Notes to Consolidated Financial Statements for specific information regarding expense reimbursement and/or fee waiver arrangements.
As stated in the Fund's most recent prospectus, the total annual operating expense ratios for fiscal year 2021 were 2.97%, 3.35%, 4.10% and 2.90% for Institutional Class, Class A, Class C and Class R6 shares, respectively, and the estimated total annual operating expense ratio for fiscal year 2022 is 2.84% for Class E (before expense reimbursements and/or fee waivers, if any). The expense ratios were 2.20%, 2.57%, 3.31% and 2.11% for Institutional Class, Class A, Class C and Class R6 shares, respectively, and the estimated expense ratio for fiscal year 2022 is 1.14% for Class E after expense reimbursements and/or fee waivers. The expense ratios for the annual period ended October 31, 2022, can be found in the Consolidated Financial Highlights section of this report.
Returns shown with a sales charge reflect the deduction of the current maximum initial sales charge of 5.75% for Class A shares and the contingent deferred sales charge (CDSC) for Class C shares. The CDSC for Class C shares is 1.00%, which is reduced to 0% after 1 year. The performance of the Fund's share classes will differ primarily due to different sales charge structures and class expenses. Please see the prospectus for more information about sales charge structures, if any, and class expenses for your share class.
4
Absolute Return Multi-Manager Fund (Unaudited)
COMPARISON OF A $1,000,000 INVESTMENT
(000's omitted)
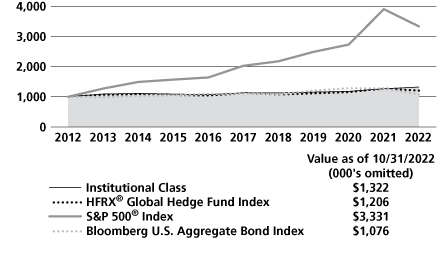
This graph shows the change in value of a hypothetical $1,000,000 investment in the Fund over the past 10 fiscal years, or since the Fund's inception if it has not operated for 10 years. The graph is based on the Institutional Class shares only; the performance of the Fund's share classes will differ primarily due to different sales charge structures and class expenses (see Performance Highlights chart on previous page). The result is compared with benchmarks, which include a broad-based market index and may include a more narrowly based index. Market indices have not been reduced to reflect any of the fees and costs of investing. The results shown in the graph reflect the reinvestment of income dividends and other distributions, if any. The results do not reflect the effect of taxes a shareholder would pay on Fund distributions or on the redemption of Fund shares. Results represent past performance and do not indicate future results.
5
1 Please see "Glossary of Indices" on page 7 for a description of indices. Please note that individuals cannot invest directly in any index. The S&P 500® and the Bloomberg U.S. Aggregate Bond Indices do not take into account any fees, expenses or tax consequences of investing in the individual securities that they track. The HFRX® Global Hedge Fund Index does take into account fees and expenses, but not tax consequences, of investing since it is based on the underlying hedge funds' net returns. Data about the performance of an index are prepared or obtained by NBIA and reflect the reinvestment of income dividends and other distributions, if any. The Fund may invest in securities not included in a described index and generally does not invest in all securities included in a described index.
2 The date used to calculate Life of Fund performance for the index is the inception date of the oldest share class.
3 The performance information for Class R6 and Class E prior to the classes' respective inception dates is that of the Institutional Class of Neuberger Berman Absolute Return Multi-Manager Fund. The performance information for the Institutional Class has not been adjusted to take into account differences in class specific operating expenses. The Institutional Class has higher expenses and typically lower returns than Class R6 and Class E.
For more complete information on any of the Neuberger Berman Alternative and Multi-Asset Class Funds, call us at (800) 877-9700, or visit our website at www.nb.com.
6
Glossary of Indices (Unaudited)
Bloomberg U.S. Aggregate
Bond Index: | | The index measures the investment grade, U.S. dollar-denominated, fixed-rate, taxable bond market and includes Treasuries, government-related and corporate securities, mortgage-backed securities (MBS) (agency fixed-rate and hybrid adjustable rate mortgage (ARM) pass-throughs), asset-backed securities (ABS), and commercial mortgage-backed securities (CMBS) (agency and nonagency). Effective August 24, 2021 all Bloomberg Barclays fixed income indices were rebranded as "Bloomberg indices". | |
HFRX® Global Hedge Fund
Index: | | The index is designed to be representative of the overall composition of the hedge fund universe. It is comprised of all eligible hedge fund strategies; including but not limited to convertible arbitrage, distressed securities, equity hedge, equity market neutral, event driven, macro, merger arbitrage, and relative value arbitrage. The strategies are asset weighted based on the distribution of assets in the hedge fund industry. Constituent funds are selected from an eligible pool of the more than 7,500 funds worldwide that report to the Hedge Fund Research (HFR) Database. Constituent funds must meet all of the following criteria: report monthly; report performance net of all fees; be U.S. dollar denominated; be active and accepting new investments; have a minimum 24 month track record; and the fund's manager must have at least $50 million in assets under management. The index is rebalanced quarterly. | |
| S&P 500® Index: | | The index is a float-adjusted market capitalization-weighted index that focuses on the large-cap segment of the U.S. equity market, and includes a significant portion of the total value of the market. | |
7
Information About Your Fund's Expenses (Unaudited)
As a Fund shareholder, you incur two types of costs: (1) transaction costs, including sales charges (loads) on purchase payments or redemption proceeds (if applicable); and (2) ongoing costs, including management fees, distribution and/or service (12b-1) fees (if applicable), and other Fund expenses. This example is intended to help you understand your ongoing costs (in U.S. dollars) of investing in the Fund and compare these costs with the ongoing costs of investing in other mutual funds.
This table is designed to provide information regarding costs related to your investments. The following examples are based on an investment of $1,000 made at the beginning of the six month period ended October 31, 2022 and held for the entire period. The table illustrates the Fund's costs in two ways:
Actual Expenses and Performance: | | The first section of the table provides information about actual account values and actual expenses in dollars, based on the Fund's actual performance during the period indicated. You may use the information in this line, together with the amount you invested, to estimate the expenses you paid over the period. Simply divide your account value by $1,000 (for example, an $8,600 account value divided by $1,000 = 8.6), then multiply the result by the number in the first section of the table under the heading entitled "Expenses Paid During the Period" to estimate the expenses you paid over the period. | |
Hypothetical Example for Comparison Purposes: | | The second section of the table provides information about hypothetical account values and hypothetical expenses based on the Fund's actual expense ratio and an assumed rate of return at 5% per year before expenses. This return is not the Fund's actual return. The hypothetical account values and expenses may not be used to estimate the actual ending account balance or expenses you paid for the period. You may use this information to compare the ongoing costs of investing in a Fund versus other funds. To do so, compare the expenses shown in this 5% hypothetical example with the 5% hypothetical examples that appear in the shareholder reports of other funds. | |
Please note that the expenses in the table are meant to highlight your ongoing costs only and do not include any transaction costs, such as sales charges (loads) (if applicable). Therefore, the information under the heading "Hypothetical (5% annual return before expenses)" is useful in comparing ongoing costs only, and will not help you determine the relative total costs of owning different funds. In addition, if these transaction costs were included, your costs would have been higher.
8
Expense Example (Unaudited)
Neuberger Berman Alternative Funds | |
| | ACTUAL | | HYPOTHETICAL (5% ANNUAL RETURN BEFORE EXPENSES) | |
| | Beginning
Account
Value
5/1/2022 | | Ending
Account
Value
10/31/2022 | | Expenses Paid
During the
Period
5/1/2022 -
10/31/2022(1)(3) | | Expense
Ratio | | Beginning
Account
Value
5/1/2022 | | Ending
Account
Value
10/31/2022 | | Expenses Paid
During the
Period
5/1/2022 -
10/31/2022(2)(3) | | Expense
Ratio | |
Absolute Return Multi-Manager Fund | |
Institutional Class | | $ | 1,000.00 | | | $ | 1,025.00 | | | $ | 11.02 | | | | 2.16 | % | | $ | 1,000.00 | | | $ | 1,014.32 | | | $ | 10.97 | | | | 2.16 | % | |
Class A | | $ | 1,000.00 | | | $ | 1,022.00 | | | $ | 12.54 | | | | 2.46 | % | | $ | 1,000.00 | | | $ | 1,012.80 | | | $ | 12.48 | | | | 2.46 | % | |
Class C | | $ | 1,000.00 | | | $ | 1,018.70 | | | $ | 16.43 | | | | 3.23 | % | | $ | 1,000.00 | | | $ | 1,008.92 | | | $ | 16.36 | | | | 3.23 | % | |
Class R6 | | $ | 1,000.00 | | | $ | 1,025.00 | | | $ | 10.36 | | | | 2.03 | % | | $ | 1,000.00 | | | $ | 1,014.97 | | | $ | 10.31 | | | | 2.03 | % | |
Class E | | $ | 1,000.00 | | | $ | 1,030.10 | | | $ | 6.50 | | | | 1.27 | % | | $ | 1,000.00 | | | $ | 1,018.80 | | | $ | 6.46 | | | | 1.27 | % | |
(1) For each class, expenses are equal to the annualized expense ratio for the class, multiplied by the average account value over the period, multiplied by 184/365 (to reflect the one-half year period shown), unless otherwise indicated.
(2) Hypothetical expenses are equal to the annualized expense ratios for each class, multiplied by the average account value over the period (assuming a 5% annual return), multiplied by 184/365 (to reflect the one-half year period shown).
(3) Includes expenses of the Fund's subsidiary (See Note A of the Notes to Consolidated Financial Statements).
9
Consolidated Schedule of Investments Absolute Return Multi-Manager Fund^ October 31, 2022
Investments | | Shares | |
Value | |
Long Positions 98.0% | |
Common Stocks 28.8% | |
Air Freight & Logistics 0.1% | |
Atlas Air
Worldwide
Holdings,
Inc.* | | | 350 | | | $ | 35,399 | | |
GXO Logistics,
Inc.* | | | 4,425 | | | | 161,689 | | |
| | | | 197,088 | | |
Airlines 0.1% | |
American
Airlines
Group, Inc.* | | | 768 | | | | 10,890 | | |
Spirit Airlines,
Inc. | | | 3,800 | | | | 83,600 | | |
| | | | 94,490 | | |
Auto Components 0.1% | |
Tenneco, Inc.,
Class A* | | | 5,901 | | | | 116,250 | | |
Automobiles 0.2% | |
General Motors
Co. | | | 7,189 | | | | 282,168 | | |
Banks 0.8% | |
Bank of America
Corp. | | | 6,582 | | | | 237,215 | | |
First Horizon
Corp. | | | 33,295 | | | | 816,061 | | |
PCSB Financial
Corp. | | | 6,500 | | | | 126,685 | | |
| | | | 1,179,961 | | |
Biotechnology 0.6% | |
Akouos, Inc.* | | | 19,900 | | | | 262,083 | | |
AVEO
Pharmaceuticals,
Inc.* | | | 4,177 | | | | 61,694 | | |
BioMarin
Pharmaceutical,
Inc.* | | | 4,552 | | | | 394,340 | | |
Grifols SA, ADR
(Spain)* | | | 3,800 | | | | 23,978 | | |
Myovant
Sciences Ltd.* | | | 2,000 | | | | 53,480 | | |
| | | | 795,575 | | |
Capital Markets 0.3% | |
BlackRock, Inc. | | | 388 | | | | 250,613 | | |
Cowen, Inc.,
Class A | | | 300 | | | | 11,586 | | |
Pegasus
Acquisition Co.
Europe BV,
Class A
(Netherlands)* | | | 12,042 | | | | 114,840 | | |
Investments | | Shares | |
Value | |
Pershing
Square,
Escrow*(a) | | | 6,100 | | | $ | 610 | | |
| | | | 377,649 | | |
Commercial Services & Supplies 0.2% | |
Rentokil
Initial plc, ADR
(United Kingdom) | | | 9,810 | | | | 303,521 | | |
Communications Equipment 0.6% | |
Cisco Systems,
Inc. | | | 4,607 | | | | 209,296 | | |
Comtech
Telecommunications
Corp. | | | 3,250 | | | | 35,913 | | |
Motorola
Solutions, Inc. | | | 1,455 | | | | 363,328 | | |
Sierra Wireless,
Inc. (Canada)* | | | 10,036 | | | | 297,868 | | |
| | | | 906,405 | | |
Construction & Engineering 0.3% | |
Quanta Services,
Inc. | | | 3,297 | | | | 468,306 | | |
Diversified Financial Services 0.6% | |
Apollo Global
Management,
Inc. | | | 7,152 | | | | 395,935 | | |
Equitable
Holdings, Inc. | | | 16,680 | | | | 510,741 | | |
| | | | 906,676 | | |
| Diversified Telecommunication Services 0.0%(b) | |
Telesat Corp.
(Canada)* | | | 2,585 | | | | 22,515 | | |
Electric Utilities 1.2% | |
Alliant Energy
Corp. | | | 6,207 | | | | 323,819 | | |
NextEra Energy,
Inc. | | | 4,231 | | | | 327,903 | | |
PG&E Corp.* | | | 27,033 | | | | 403,603 | | |
PNM Resources,
Inc. | | | 12,484 | | | | 580,131 | | |
| | | | 1,635,456 | | |
Electronic Equipment, Instruments & Components 0.5% | |
Rogers Corp.* | | | 3,000 | | | | 705,990 | | |
Entertainment 0.9% | |
Activision
Blizzard, Inc. | | | 14,599 | | | | 1,062,807 | | |
Liberty Media
Corp-Liberty
Braves, Class C* | | | 2,304 | | | | 71,793 | | |
Investments | | Shares | |
Value | |
Sciplay Corp.,
Class A* | | | 4,150 | | | $ | 58,058 | | |
| | | | 1,192,658 | | |
Equity Real Estate Investment Trusts (REITs) 0.4% | |
STORE Capital
Corp. | | | 18,105 | | | | 575,729 | | |
Food & Staples Retailing 0.3% | |
Albertsons
Cos., Inc.,
Class A | | | 2,100 | | | | 43,071 | | |
Cia Brasileira
de Distribuicao,
ADR (Brazil)* | | | 1,664 | | | | 7,005 | | |
Fresh Market,
Inc. (The)
Escrow*(a) | | | 46,500 | | | | — | | |
Magnit PJSC
(Russia)(a)(c) | | | 327 | | | | — | | |
Sendas
Distribuidora SA,
ADR (Brazil) | | | 3,520 | | | | 67,056 | | |
Wal-Mart de
Mexico SAB de
CV (Mexico) | | | 39,227 | | | | 151,519 | | |
Walmart, Inc. | | | 958 | | | | 136,352 | | |
X5 Retail
Group NV, GDR
(Russia)(a)(c)(d) | | | 4,390 | | | | — | | |
| | | | 405,003 | | |
Food Products 0.9% | |
Nestle SA
(Registered) | | | 11,391 | | | | 1,240,400 | | |
Gas Utilities 0.3% | |
South Jersey
Industries, Inc. | | | 11,550 | | | | 400,438 | | |
Southwest Gas
Holdings, Inc. | | | 650 | | | | 47,496 | | |
| | | | 447,934 | | |
Health Care Equipment & Supplies 0.1% | |
Meridian
Bioscience, Inc.* | | | 5,106 | | | | 163,239 | | |
Health Care Providers & Services 1.0% | |
1Life
Healthcare,
Inc.* | | | 9,400 | | | | 160,740 | | |
Elevance
Health, Inc. | | | 1,006 | | | | 550,051 | | |
LHC Group,
Inc.* | | | 2,190 | | | | 365,949 | | |
Shanghai
Pharmaceuticals
Holding Co. Ltd.,
Class H (China) | | | 27,684 | | | | 37,519 | | |
See Notes to Consolidated Financial Statements
10
Consolidated Schedule of Investments Absolute Return Multi-Manager Fund^ (cont'd)
Investments | | Shares | |
Value | |
Signify Health,
Inc., Class A*(e) | | | 10,412 | | | $ | 304,343 | | |
Sinopharm
Group Co. Ltd.,
Class H (China) | | | 15,345 | | | | 29,111 | | |
| | | | 1,447,713 | | |
Hotels, Restaurants & Leisure 0.4% | |
Booking
Holdings, Inc.* | | | 151 | | | | 282,292 | | |
Expedia
Group, Inc.* | | | 1,877 | | | | 175,443 | | |
Playtech plc
(United
Kingdom)* | | | 8,600 | | | | 51,186 | | |
Recipe
Unlimited Corp.
(Canada)* | | | 6,500 | | | | 98,859 | | |
| | | | 607,780 | | |
Household Durables 0.2% | |
iRobot Corp.* | | | 1,391 | | | | 78,591 | | |
Lennar Corp.,
Class B | | | 2,800 | | | | 182,616 | | |
| | | | 261,207 | | |
Household Products 0.1% | |
Spectrum
Brands
Holdings, Inc. | | | 2,086 | | | | 96,248 | | |
Insurance 0.8% | |
AIA Group Ltd.
(Hong Kong) | | | 57,852 | | | | 438,217 | | |
Aon plc, Class A | | | 1,030 | | | | 289,935 | | |
Chubb Ltd. | | | 2,097 | | | | 450,624 | | |
| | | | 1,178,776 | | |
Interactive Media & Services 1.1% | |
Alphabet, Inc.,
Class A* | | | 10,904 | | | | 1,030,537 | | |
Baidu, Inc.,
ADR (China)* | | | 636 | | | | 48,699 | | |
Baidu, Inc.,
Class A (China)* | | | 1,560 | | | | 14,956 | | |
Meta
Platforms, Inc.,
Class A* | | | 4,246 | | | | 395,557 | | |
VK Co. Ltd.,
GDR
(Russia)*(a)(c)(d) | | | 1,305 | | | | — | | |
Yandex NV,
Class A
(Russia)*(a)(c) | | | 1,428 | | | | — | | |
| | | | 1,489,749 | | |
Internet & Direct Marketing Retail 2.2% | |
Alibaba Group
Holding Ltd.,
ADR (China)* | | | 6,395 | | | | 406,594 | | |
Investments | | Shares | |
Value | |
Alibaba Group
Holding Ltd.
(China)* | | | 17,250 | | | $ | 134,117 | | |
Altaba, Inc.
Escrow*(a) | | | 63,506 | | | | 241,323 | | |
Amazon.com,
Inc.* | | | 6,058 | | | | 620,582 | | |
ASOS plc
(United
Kingdom)* | | | 1,085 | | | | 7,011 | | |
Deliveroo plc
(United
Kingdom)*(d) | | | 11,689 | | | | 11,684 | | |
eBay, Inc. | | | 4,054 | | | | 161,511 | | |
JD.com, Inc.,
Class A (China) | | | 323 | | | | 5,882 | | |
MercadoLibre,
Inc. (Brazil)* | | | 446 | | | | 402,123 | | |
Overstock.com,
Inc.* | | | 7,031 | | | | 163,471 | | |
Poshmark, Inc.,
Class A* | | | 4,700 | | | | 83,942 | | |
Prosus NV
(China)* | | | 19,289 | | | | 839,506 | | |
| | | | 3,077,746 | | |
IT Services 1.9% | |
Computer
Services, Inc. | | | 4,750 | | | | 274,313 | | |
Evo Payments,
Inc., Class A* | | | 10,061 | | | | 338,955 | | |
MoneyGram
International,
Inc.* | | | 50,400 | | | | 533,736 | | |
PayPal
Holdings, Inc.* | | | 4,054 | | | | 338,833 | | |
Switch, Inc.,
Class A | | | 20,878 | | | | 710,896 | | |
Visa, Inc.,
Class A | | | 2,437 | | | | 504,849 | | |
| | | | 2,701,582 | | |
Life Sciences Tools & Services 1.0% | |
Eurofins
Scientific SE
(Luxembourg) | | | 14,409 | | | | 922,447 | | |
Gerresheimer
AG (Germany) | | | 3,705 | | | | 212,365 | | |
Thermo Fisher
Scientific, Inc. | | | 546 | | | | 280,628 | | |
| | | | 1,415,440 | | |
| Machinery 0.0%(b) | |
Altra Industrial
Motion Corp. | | | 400 | | | | 24,056 | | |
Media 1.4% | |
Aimia, Inc.
(Canada)* | | | 5,650 | | | | 15,345 | | |
Investments | | Shares | |
Value | |
Deluxe
Television
GmbH
(Germany)*(a) | | | 16,063 | | | $ | 1,606 | | |
Shaw
Communications,
Inc., Class B
(Canada) | | | 38,371 | | | | 985,504 | | |
Stroeer SE &
Co. KGaA
(Germany) | | | 6,042 | | | | 246,364 | | |
TEGNA, Inc. | | | 35,374 | | | | 738,609 | | |
WideOpenWest,
Inc.* | | | 2,582 | | | | 35,399 | | |
| | | | 2,022,827 | | |
Metals & Mining 0.2% | |
ArcelorMittal
SA
(Luxembourg) | | | 4,589 | | | | 102,742 | | |
Artemis Gold,
Inc. (Canada)* | | | 605 | | | | 1,661 | | |
Turquoise Hill
Resources Ltd.
(Mongolia)* | | | 1,900 | | | | 53,409 | | |
Turquoise Hill
Resources Ltd.
(Mongolia)* | | | 2,500 | | | | 70,393 | | |
Vale SA,
ADR (Brazil) | | | 7,458 | | | | 96,507 | | |
Yamana Gold,
Inc. (Canada) | | | 1,905 | | | | 8,344 | | |
| | | | 333,056 | | |
Multiline Retail 0.2% | |
Fix Price
Group Ltd.,
GDR
(Russia)*(a)(c)(d) | | | 144 | | | | — | | |
Target Corp. | | | 1,503 | | | | 246,868 | | |
| | | | 246,868 | | |
Oil, Gas & Consumable Fuels 0.9% | |
Archaea
Energy, Inc.* | | | 5,524 | | | | 142,574 | | |
Cheniere
Energy, Inc. | | | 3,006 | | | | 530,288 | | |
Continental
Resources, Inc. | | | 1,400 | | | | 103,558 | | |
DT Midstream,
Inc. | | | 3,245 | | | | 193,727 | | |
Euronav NV
(Belgium) | | | 3,300 | | | | 58,839 | | |
LUKOIL PJSC
(Russia)(a)(c) | | | 661 | | | | — | | |
Petroleo
Brasileiro SA,
ADR (Brazil) | | | 4,258 | | | | 54,588 | | |
Petroleo
Brasileiro SA,
ADR (Brazil) | | | 4,209 | | | | 53,959 | | |
See Notes to Consolidated Financial Statements
11
Consolidated Schedule of Investments Absolute Return Multi-Manager Fund^ (cont'd)
Investments | | Shares | |
Value | |
Williams Cos.,
Inc. (The) | | | 5,831 | | | $ | 190,849 | | |
| | | | 1,328,382 | | |
| Paper & Forest Products 0.0%(b) | |
Resolute Forest
Products, Inc.* | | | 2,250 | | | | 46,822 | | |
Pharmaceuticals 1.6% | |
Aerie
Pharmaceuticals,
Inc.* | | | 10,794 | | | | 164,285 | | |
Aralez
Pharmaceuticals,
Inc. (Canada)*(a) | | | 345 | | | | — | | |
Bristol-Myers
Squibb Co. | | | 4,097 | | | | 317,394 | | |
Dr Reddy's
Laboratories Ltd.,
ADR (India) | | | 2,586 | | | | 140,446 | | |
Eli Lilly & Co. | | | 909 | | | | 329,140 | | |
Hikma
Pharmaceuticals
plc (Jordan) | | | 7,713 | | | | 110,477 | | |
Roche
Holding AG | | | 3,551 | | | | 1,179,293 | | |
Teva
Pharmaceutical
Industries Ltd.,
ADR (Israel)* | | | 722 | | | | 6,440 | | |
| | | | 2,247,475 | | |
Professional Services 0.5% | |
Hill International,
Inc.* | | | 39,273 | | | | 132,350 | | |
Intertrust NV
(Netherlands)*(d) | | | 12,835 | | | | 253,177 | | |
SGS SA
(Registered)
(Switzerland) | | | 145 | | | | 319,873 | | |
| | | | 705,400 | | |
Real Estate Management & Development 0.1% | |
Seritage
Growth
Properties,
Class A, REIT* | | | 12,579 | | | | 134,973 | | |
Semiconductors & Semiconductor Equipment 1.0% | |
ASML Holding
NV (Netherlands) | | | 111 | | | | 52,434 | | |
ASML Holding
NV (Registered),
NYRS
(Netherlands) | | | 302 | | | | 142,671 | | |
CyberOptics
Corp.* | | | 5,130 | | | | 276,866 | | |
Investments | | Shares | |
Value | |
Magnachip
Semiconductor
Corp.
(South Korea)* | | | 6,000 | | | $ | 59,705 | | |
MKS
Instruments, Inc. | | | 101 | | | | 8,297 | | |
NVIDIA Corp. | | | 842 | | | | 113,645 | | |
QUALCOMM,
Inc. | | | 1,794 | | | | 211,082 | | |
Silicon Motion
Technology
Corp., ADR
(Taiwan) | | | 751 | | | | 40,171 | | |
SunEdison,
Inc.*(a)(c) | | | 16,689 | | | | — | | |
Tower
Semiconductor
Ltd. (Israel)* | | | 12,650 | | | | 540,914 | | |
| | | | 1,445,785 | | |
Software 2.5% | |
Black
Knight, Inc.* | | | 1,108 | | | | 67,001 | | |
BTRS
Holdings, Inc.* | | | 13,550 | | | | 127,912 | | |
ChannelAdvisor
Corp.* | | | 5,700 | | | | 131,328 | | |
ForgeRock,
Inc., Class A* | | | 5,752 | | | | 129,765 | | |
KnowBe4, Inc.,
Class A* | | | 3,406 | | | | 83,719 | | |
Microsoft Corp. | | | 1,503 | | | | 348,891 | | |
SAP SE
(Germany) | | | 11,341 | | | | 1,094,660 | | |
UserTesting,
Inc.* | | | 14,500 | | | | 107,300 | | |
VMware, Inc.,
Class A | | | 2,750 | | | | 309,458 | | |
Zendesk, Inc.* | | | 14,288 | | | | 1,095,747 | | |
| | | | 3,495,781 | | |
Specialty Retail 0.4% | |
Sportsman's
Warehouse
Holdings, Inc.* | | | 25,845 | | | | 232,088 | | |
Toys R Us,
Inc.*(a) | | | 1,040 | | | | 5,200 | | |
Ulta Beauty, Inc.* | | | 642 | | | | 269,236 | | |
| | | | 506,524 | | |
Technology Hardware, Storage & Peripherals 1.0% | |
Apple, Inc. | | | 7,151 | | | | 1,096,534 | | |
Samsung
Electronics
Co. Ltd., GDR
(South Korea)(d) | | | 363 | | | | 375,161 | | |
| | | | 1,471,695 | | |
Investments | | Shares | |
Value | |
Textiles, Apparel & Luxury Goods 0.3% | |
Capri Holdings
Ltd.* | | | 3,529 | | | $ | 161,204 | | |
Tapestry, Inc. | | | 5,804 | | | | 183,871 | | |
| | | | 345,075 | | |
Thrifts & Mortgage Finance 0.8% | |
Flagstar
Bancorp, Inc. | | | 27,200 | | | | 1,052,640 | | |
Trading Companies & Distributors 0.3% | |
Brenntag SE
(Germany) | | | 4,377 | | | | 265,763 | | |
IMCD NV
(Netherlands) | | | 1,440 | | | | 186,850 | | |
| | | | 452,613 | | |
| Transportation Infrastructure 0.0%(b) | |
Atlas Corp. (Canada) | | | 650 | | | | 9,614 | | |
Wireless Telecommunication Services 0.4% | |
T-Mobile US, Inc.* | | | 3,467 | | | | 525,459 | | |
Total Common Stocks
(Cost $43,382,360) | |
| | | 40,688,299 | | |
Convertible Preferred Stocks 0.1% | |
Auto Components 0.1% | |
Garrett
Motion, Inc.
(Switzerland),
Series A,
11.00%,
4/30/2027(f)
(Cost $32,686) | | | 6,226 | | | | 49,248 | | |
| | | Principal
Amount | | | |
Corporate Bonds 0.0% | |
Independent Power and Renewable Electricity Producers 0.0% | |
GenOn
Energy,Inc.
Escrow,
9.50%,
10/15/2018(a)(c)(g) | | $ | 354,000 | | | | — | | |
9.88
10/15/2020(a)(c)(g)%, | | | 1,655,000 | | | | — | | |
Total Corporate Bonds
(Cost $—) | | | | | — | | |
See Notes to Consolidated Financial Statements
12
Consolidated Schedule of Investments Absolute Return Multi-Manager Fund^ (cont'd)
Investments | | Principal
Amount | |
Value | |
| Loan Assignments 0.0%(b) | |
| Media 0.0%(b) | |
Deluxe
Entertainment
Services
Group, Inc.,
1st Lien
Term Loan,
(ICE LIBOR
USD 3 Month +
5.00%), 8.67%
Cash/1.50%
PIK, due
3/25/2024(a)(c)(h)(i) | | $ | 14,429 | | | $ | 5,738 | | |
Deluxe
Entertainment
Services
Group, Inc.,
2nd Lien
Term Loan,
(ICE LIBOR
USD 3 Month +
6.00%), 9.67%
Cash/2.50%
PIK, due
9/25/2024(a)(c)(h)(i) | | | 149,698 | | | | — | | |
Total Loan Assignments
(Cost $100,773) | | | | | 5,738 | | |
| | | No. of
Rights | | | |
Rights 0.1% | |
Biotechnology 0.1% | |
Achillion
Pharmaceuticals,
Inc., CVR*(a) | | | 23,300 | | | | 11,650 | | |
Adamas
Pharmaceuticals,
Inc., CVR*(a) | | | 24,600 | | | | 1,230 | | |
Ambit
Biosciences
Corp.,
CVR*(a)(c) | | | 70,000 | | | | 118,300 | | |
Clementia
Pharmaceuticals,
Inc.,
CVR
(France)*(a)(c) | | | 3,200 | | | | — | | |
Tobira
Therapeutics,
Inc., CVR*(a)(c) | | | 6,900 | | | | — | | |
| | | | 131,180 | | |
| IT Services 0.0%(b) | |
Flexion
Therapeutics,
Inc., CVR*(a) | | | 18,500 | | | | 12,025 | | |
Investments | | No. of
Rights | |
Value | |
| Metals & Mining 0.0%(b) | |
Kinross Gold
Corp., CVR
(Canada)*(a)(c) | | | 4,800 | | | $ | 4 | | |
Pan American
Silver Corp.,
CVR, (Canada)* | | | 39,600 | | | | 23,760 | | |
| | | | 23,764 | | |
| Pharmaceuticals 0.0%(b) | |
Dova
Pharmaceuticals,
Inc., CVR
(Sweden)*(a) | | | 8,800 | | | | 1,100 | | |
Zogenix, Inc.,
CVR*(a) | | | 6,450 | | | | 4,837 | | |
| | | | 5,937 | | |
Total Rights
(Cost $29,250) | | | | | 172,906 | | |
| | | No. of
Warrants | | | |
| Warrants 0.0%(b) | |
| Capital Markets 0.0%(b) | |
FinTech
Acquisition
Corp. III,
expiring
12/1/2023*(a)(c) | | | 1,770 | | | | 8 | | |
Pegasus
Acquisition Co.
Europe BV,
expiring
4/27/2026
(Netherlands)* | | | 4,014 | | | | 51 | | |
| | | | 59 | | |
| Leisure Products 0.0%(b) | |
Tonies SE,
expiring
4/30/2026
(Germany)* | | | 4,329 | | | | 1,925 | | |
Total Warrants
(Cost $14) | | | | | 1,984 | | |
| | | Shares | | | |
Short-Term Investments 69.0% | |
Investment Companies 69.0% | |
Morgan
Stanley
Institutional
Liquidity
Funds
Treasury
Securities
Portfolio,
Institutional
Class, 3.03%(j)
(Cost $97,523,849) | | | 97,523,849 | | | | 97,523,849 | | |
Total Long Positions
(Cost $141,068,932) | |
| | | 138,442,024 | | |
Investments | | Shares | |
Value | |
| Short Positions (6.0)%(k) | |
Common Stocks Sold Short (6.0)% | |
Automobiles (0.2)% | |
Tesla, Inc. | | | (1,022 | ) | | $ | (232,546 | ) | |
Banks (0.1)% | |
Brookline
Bancorp, Inc. | | | (4,384 | ) | | | (60,280 | ) | |
Building Products (0.6)% | |
Owens Corning | | | (3,070 | ) | | | (262,823 | ) | |
Trex Co., Inc. | | | (6,847 | ) | | | (329,272 | ) | |
UFP Industries,
Inc. | | | (4,139 | ) | | | (294,821 | ) | |
| | | | (886,916 | ) | |
Capital Markets (0.5)% | |
Evercore, Inc.,
Class A | | | (2,957 | ) | | | (310,781 | ) | |
Intercontinental
Exchange, Inc. | | | (100 | ) | | | (9,557 | ) | |
Moelis & Co.,
Class A | | | (7,957 | ) | | | (337,854 | ) | |
| | | | (658,192 | ) | |
Chemicals (0.2)% | |
International
Flavors &
Fragrances, Inc. | | | (3,011 | ) | | | (293,904 | ) | |
Consumer Finance (0.3)% | |
Credit
Acceptance
Corp. | | | (960 | ) | | | (446,995 | ) | |
Entertainment (0.2)% | |
Netflix, Inc. | | | (1,043 | ) | | | (304,431 | ) | |
Equity Real Estate Investment Trusts (REITs) (0.9)% | |
Digital Realty
Trust, Inc. | | | (4,400 | ) | | | (441,100 | ) | |
Equinix, Inc. | | | (727 | ) | | | (411,802 | ) | |
SL Green Realty
Corp. | | | (5,710 | ) | | | (226,573 | ) | |
Vornado Realty
Trust | | | (9,443 | ) | | | (222,760 | ) | |
| | | | (1,302,235 | ) | |
Household Durables (0.2)% | |
Lennar Corp.,
Class A | | | (2,240 | ) | | | (180,768 | ) | |
Toll Brothers,
Inc. | | | (3,473 | ) | | | (149,617 | ) | |
| | | | (330,385 | ) | |
Household Products (0.2)% | |
Clorox Co. (The) | | | (2,100 | ) | | | (306,684 | ) | |
See Notes to Consolidated Financial Statements
13
Consolidated Schedule of Investments Absolute Return Multi-Manager Fund^ (cont'd)
Investments | | Shares | |
Value | |
Industrial Conglomerates (0.3)% | |
3M Co. | | | (3,700 | ) | | $ | (465,423 | ) | |
Insurance (0.2)% | |
Trupanion, Inc. | | | (5,952 | ) | | | (300,397 | ) | |
Internet & Direct Marketing Retail (0.3)% | |
Wayfair, Inc.,
Class A | | | (9,574 | ) | | | (363,046 | ) | |
IT Services (0.2)% | |
Western
Union Co. (The) | | | (17,311 | ) | | | (233,872 | ) | |
Media (0.2)% | |
Paramount
Global, Class B | | | (15,808 | ) | | | (289,602 | ) | |
Investments | | Shares | |
Value | |
| Oil, Gas & Consumable Fuels (0.0)%(b) | |
Frontline Ltd.
(Norway) | | | (4,214 | ) | | $ | (52,928 | ) | |
Real Estate Management & Development (0.3)% | |
eXp World
Holdings, Inc. | | | (27,062 | ) | | | (357,489 | ) | |
Semiconductors & Semiconductor Equipment (0.1)% | |
Broadcom, Inc. | | | (325 | ) | | | (152,789 | ) | |
MaxLinear, Inc. | | | (292 | ) | | | (9,017 | ) | |
| | | | (161,806 | ) | |
Thrifts & Mortgage Finance (0.8)% | |
New York
Community
Bancorp, Inc. | | | (121,563 | ) | | | (1,131,751 | ) | |
Investments | | Shares | |
Value | |
Trading Companies & Distributors (0.2)% | |
Beacon Roofing
Supply, Inc. | | | (4,512 | ) | | $ | (254,251 | ) | |
Total Common Stocks
Sold Short
(Proceeds $(9,916,109)) | |
| | | (8,433,133 | ) | |
Total Short Positions
(Proceeds $(9,916,109)) | |
| | | (8,433,133 | ) | |
Total Investments 92.0%
(Cost $131,152,823) | | | | | 130,008,891 | | |
Other Assets Less
Liabilities 8.0%(l) | | | | | 11,290,967 | | |
Net Assets 100.0% | | | | $ | 141,299,858 | | |
All bonds are denominated in US dollars, unless noted otherwise.
* Non-income producing security.
(a) Value determined using significant unobservable inputs.
(b) Represents less than 0.05% of net assets of the Fund.
(c) Security fair valued as of October 31, 2022, in accordance with procedures approved by the valuation designee. Total value of all such securities at October 31, 2022, amounted to $124,050, which represents 0.1% of net assets of the Fund.
(d) Security exempt from registration pursuant to Regulation S under the Securities Act of 1933, as amended. Regulation S applies to securities offerings that are made outside of the United States and do not involve directed selling efforts in the United States and as such may have restrictions on resale. At October 31, 2022, these securities amounted to $640,022 of long positions which represents 0.5% of net assets of the Fund.
(e) All or a portion of this security is pledged as collateral for options written.
(f) Perpetual security. Perpetual securities have no stated maturity date, but they may be called/redeemed by the issuer. The date shown reflects the next call date.
(g) Defaulted security.
(h) Payment in-kind security.
(i) Variable or floating rate security. The interest rate shown was the current rate as of October 31, 2022, and changes periodically.
(j) Represents 7-day effective yield as of October 31, 2022.
(k) At October 31, 2022, the Fund had $8,522,265 deposited in one or more accounts to satisfy collateral requirements for borrowing in connection with securities sold short.
(l) Includes the impact of the Fund's open positions in derivatives at October 31, 2022.
See Notes to Consolidated Financial Statements
14
Consolidated Schedule of Investments Absolute Return Multi-Manager Fund^ (cont'd)
Abbreviations
ADR American Depositary Receipt
CVR Contingent Value Rights
GDR Global Depositary Receipt
ICE Intercontinental Exchange
LIBOR London Interbank Offered Rate
PJSC Public Joint Stock Company
SA Société Anonyme
USD United States Dollar
Derivative Instruments
Futures contracts ("futures")
At October 31, 2022, open positions in futures for the Fund were as follows:
Description | | Number of
Contracts | | Expiration
Date | | Notional
Amount | | Value and
Unrealized
Appreciation/
(Depreciation) | |
Long Contracts | |
NY Harbor ULSD | | | 1 | | | 11/2022 | | $ | 154,312 | | | $ | 3,753 | | |
SGX NIFTY 50 Index | | | 1 | | | 11/2022 | | | 36,121 | | | | 258 | | |
Corn | | | 4 | | | 12/2022 | | | 138,300 | | | | 465 | | |
Euro-Bund | | | 3 | | | 12/2022 | | | 410,440 | | | | (12,562 | ) | |
Euro-OAT | | | 1 | | | 12/2022 | | | 131,319 | | | | 459 | | |
Foreign Exchange CAD/USD | | | 49 | | | 12/2022 | | | 3,596,845 | | | | 22,697 | | |
Foreign Exchange MXN/USD | | | 90 | | | 12/2022 | | | 2,251,800 | | | | 36,599 | | |
Foreign Exchange NZD/USD | | | 2 | | | 12/2022 | | | 116,270 | | | | 1,520 | | |
Foreign Exchange USD/NOK | | | 1 | | | 12/2022 | | | 99,750 | | | | 3,032 | | |
Foreign Exchange USD/SEK | | | 1 | | | 12/2022 | | | 99,703 | | | | 3,672 | | |
Foreign Exchange ZAR/USD | | | 9 | | | 12/2022 | | | 243,900 | | | | (6,110 | ) | |
Lean Hogs | | | 3 | | | 12/2022 | | | 101,910 | | | | (2,648 | ) | |
Live Cattle | | | 7 | | | 12/2022 | | | 426,930 | | | | 2,472 | | |
Low Sulphur Gasoil | | | 1 | | | 12/2022 | | | 101,975 | | | | 299 | | |
Milling Wheat | | | 1 | | | 12/2022 | | | 17,406 | | | | 297 | | |
Soybean Meal | | | 2 | | | 12/2022 | | | 85,620 | | | | 915 | | |
Soybean Oil | | | 2 | | | 12/2022 | | | 87,852 | | | | 5,047 | | |
Canola | | | 2 | | | 1/2023 | | | 25,808 | | | | 41 | | |
FCOJ-A | | | 1 | | | 1/2023 | | | 30,165 | | | | 207 | | |
Platinum | | | 1 | | | 1/2023 | | | 46,505 | | | | (1,453 | ) | |
Total Long Contracts | | | | | | $ | 8,202,931 | | | $ | 58,960 | | |
See Notes to Consolidated Financial Statements
15
Consolidated Schedule of Investments Absolute Return Multi-Manager Fund^ (cont'd)
Description | | Number of
Contracts | | Expiration
Date | | Notional
Amount | | Value and
Unrealized
Appreciation/
(Depreciation) | |
Short Contracts | |
Amsterdam Exchange Index | | | (2 | ) | | 11/2022 | | $ | (264,412 | ) | | $ | (10,418 | ) | |
Hang Seng Index | | | (1 | ) | | 11/2022 | | | (93,234 | ) | | | 3,839 | | |
HSCEI | | | (1 | ) | | 11/2022 | | | (31,460 | ) | | | 1,623 | | |
MSCI Singapore Index | | | (13 | ) | | 11/2022 | | | (255,298 | ) | | | (8,741 | ) | |
Natural Gas | | | (2 | ) | | 11/2022 | | | (127,100 | ) | | | (3,074 | ) | |
OMXS30 Index | | | (1 | ) | | 11/2022 | | | (17,779 | ) | | | (309 | ) | |
SGX FTSE China A50 Index | | | (6 | ) | | 11/2022 | | | (66,966 | ) | | | 4,154 | | |
SGX FTSE Taiwan Index | | | (4 | ) | | 11/2022 | | | (183,080 | ) | | | (1,213 | ) | |
| 100 oz Gold | | | (5 | ) | | 12/2022 | | | (820,350 | ) | | | 12,450 | | |
3 Month Canadian Bankers Acceptance | | | (1 | ) | | 12/2022 | | | (174,863 | ) | | | 854 | | |
Australia 10 Year Bond | | | (5 | ) | | 12/2022 | | | (378,934 | ) | | | (5,828 | ) | |
Australia 3 Year Bond | | | (12 | ) | | 12/2022 | | | (825,406 | ) | | | (8,997 | ) | |
Canada 10 Year Bond | | | (5 | ) | | 12/2022 | | | (451,536 | ) | | | (5,031 | ) | |
Canada 10 Year Bond | | | (4 | ) | | 12/2022 | | | (361,229 | ) | | | 2,398 | | |
Cocoa | | | (3 | ) | | 12/2022 | | | (70,050 | ) | | | (168 | ) | |
Coffee 'C' | | | (1 | ) | | 12/2022 | | | (66,638 | ) | | | 1,160 | | |
Copper | | | (1 | ) | | 12/2022 | | | (84,375 | ) | | | 1,673 | | |
Cotton No. 2 | | | (1 | ) | | 12/2022 | | | (36,000 | ) | | | 3,777 | | |
| EURO STOXX 50 Index | | | (1 | ) | | 12/2022 | | | (35,755 | ) | | | (1,502 | ) | |
Euro-Bobl | | | (6 | ) | | 12/2022 | | | (709,583 | ) | | | 5,790 | | |
Euro-BTP | | | (2 | ) | | 12/2022 | | | (226,606 | ) | | | (7,551 | ) | |
Euro-Bund | | | (2 | ) | | 12/2022 | | | (273,627 | ) | | | 1,128 | | |
Euro-Buxl | | | (1 | ) | | 12/2022 | | | (142,525 | ) | | | 1,048 | | |
Euro-OAT | | | (1 | ) | | 12/2022 | | | (131,319 | ) | | | (101 | ) | |
Euro-Schatz | | | (10 | ) | | 12/2022 | | | (1,056,785 | ) | | | 4,419 | | |
Foreign Exchange AUD/USD | | | (101 | ) | | 12/2022 | | | (6,465,010 | ) | | | 55,331 | | |
Foreign Exchange CHF/USD | | | (1 | ) | | 12/2022 | | | (125,506 | ) | | | 1,317 | | |
Foreign Exchange EUR/USD | | | (62 | ) | | 12/2022 | | | (7,690,713 | ) | | | 14,468 | | |
Foreign Exchange GBP/USD | | | (4 | ) | | 12/2022 | | | (287,150 | ) | | | 735 | | |
Foreign Exchange JPY/USD | | | (94 | ) | | 12/2022 | | | (7,950,050 | ) | | | 247,990 | | |
FTSE 100 Index | | | (3 | ) | | 12/2022 | | | (244,526 | ) | | | (4,121 | ) | |
FTSE/JSE Top 40 Index | | | (4 | ) | | 12/2022 | | | (131,669 | ) | | | (2,331 | ) | |
Long Gilt | | | (3 | ) | | 12/2022 | | | (351,368 | ) | | | (16,914 | ) | |
MSCI Emerging Markets E-Mini Index | | | (6 | ) | | 12/2022 | | | (256,080 | ) | | | 7,639 | | |
NASDAQ 100 E-Mini Index | | | (1 | ) | | 12/2022 | | | (228,945 | ) | | | (927 | ) | |
Russell 2000 E-Mini Index | | | (2 | ) | | 12/2022 | | | (185,300 | ) | | | (11,448 | ) | |
S&P 500 E-Mini Index | | | (8 | ) | | 12/2022 | | | (1,553,200 | ) | | | 49,800 | | |
S&P 500 E-Mini Index | | | (1 | ) | | 12/2022 | | | (194,150 | ) | | | (2,352 | ) | |
Short-Term Euro-BTP | | | (3 | ) | | 12/2022 | | | (314,441 | ) | | | (1,112 | ) | |
Silver | | | (1 | ) | | 12/2022 | | | (95,595 | ) | | | 228 | | |
U.S. Treasury 2 Year Note | | | (4 | ) | | 12/2022 | | | (817,531 | ) | | | 5,113 | | |
U.S. Treasury 5 Year Note | | | (7 | ) | | 12/2022 | | | (746,156 | ) | | | 4,812 | | |
U.S. Treasury 10 Year Note | | | (8 | ) | | 12/2022 | | | (884,750 | ) | | | 27,224 | | |
See Notes to Consolidated Financial Statements
16
Consolidated Schedule of Investments Absolute Return Multi-Manager Fund^ (cont'd)
Description | | Number of
Contracts | | Expiration
Date | | Notional
Amount | | Value and
Unrealized
Appreciation/
(Depreciation) | |
U.S. Treasury 10 Year Note | | | (5 | ) | | 12/2022 | | $ | (552,969 | ) | | $ | 5,400 | | |
U.S. Treasury Long Bond | | | (3 | ) | | 12/2022 | | | (361,500 | ) | | | 32,543 | | |
U.S. Treasury Ultra Bond | | | (1 | ) | | 12/2022 | | | (127,656 | ) | | | 11,967 | | |
Robusta Coffee | | | (5 | ) | | 1/2023 | | | (92,650 | ) | | | 3,469 | | |
Sugar No. 11 | | | (1 | ) | | 2/2023 | | | (20,126 | ) | | | (361 | ) | |
3 Month Canadian Bankers Acceptance | | | (11 | ) | | 3/2023 | | | (1,923,294 | ) | | | 14,673 | | |
Cocoa | | | (2 | ) | | 3/2023 | | | (46,860 | ) | | | (855 | ) | |
3 Month Canadian Bankers Acceptance | | | (7 | ) | | 6/2023 | | | (1,225,263 | ) | | | 10,201 | | |
| 3 Month EURIBOR | | | (13 | ) | | 9/2023 | | | (3,113,692 | ) | | | (5,318 | ) | |
| 3 Month SONIA | | | (5 | ) | | 9/2023 | | | (1,364,334 | ) | | | (10,069 | ) | |
| 3 Month SOFR | | | (10 | ) | | 12/2023 | | | (2,381,500 | ) | | | 15,270 | | |
| 3 Month SONIA | | | (5 | ) | | 12/2023 | | | (1,363,259 | ) | | | (6,304 | ) | |
| 3 Month EURIBOR | | | (10 | ) | | 3/2024 | | | (2,396,877 | ) | | | (3,737 | ) | |
| 3 Month SOFR | | | (10 | ) | | 3/2024 | | | (2,386,500 | ) | | | 4,583 | | |
| 3 Month SONIA | | | (2 | ) | | 3/2024 | | | (545,533 | ) | | | 441 | | |
| 3 Month SOFR | | | (10 | ) | | 6/2024 | | | (2,392,625 | ) | | | 14,820 | | |
| 3 Month SONIA | | | (5 | ) | | 6/2024 | | | (1,365,265 | ) | | | (4,468 | ) | |
| 3 Month SOFR | | | (3 | ) | | 9/2024 | | | (719,325 | ) | | | 2,032 | | |
| 3 Month SONIA | | | (1 | ) | | 9/2024 | | | (273,426 | ) | | | (669 | ) | |
| 3 Month SOFR | | | (9 | ) | | 12/2024 | | | (2,161,125 | ) | | | 2,785 | | |
| 3 Month SONIA | | | (4 | ) | | 12/2024 | | | (1,094,965 | ) | | | (5,677 | ) | |
| 3 Month EURIBOR | | | (5 | ) | | 3/2025 | | | (1,199,983 | ) | | | (2,617 | ) | |
| 3 Month SOFR | | | (4 | ) | | 3/2025 | | | (961,700 | ) | | | 18 | | |
| 3 Month SONIA | | | (1 | ) | | 3/2025 | | | (274,028 | ) | | | (3,176 | ) | |
| 3 Month SOFR | | | (10 | ) | | 6/2025 | | | (2,406,625 | ) | | | 883 | | |
| 3 Month SONIA | | | (4 | ) | | 6/2025 | | | (1,096,914 | ) | | | (7,318 | ) | |
| 3 Month SOFR | | | (9 | ) | | 6/2026 | | | (2,168,100 | ) | | | 3,810 | | |
Total Short Contracts | | | | | | $ | (69,423,144 | ) | | $ | 439,158 | | |
Total Futures | | | | | | | | $ | 498,118 | | |
For the year ended October 31, 2022, the average notional value for the months where the Fund had futures outstanding was $8,632,993 for long positions and $(100,184,217) for short positions. At October 31, 2022, the Fund had $1,515,453 deposited in segregated accounts to cover margin requirements on open futures.
Forward foreign currency contracts ("forward contracts")
At October 31, 2022, open forward contracts for the Fund were as follows:
Currency Purchased | | Currency Sold | | Counterparty | | Settlement
Date | | Net
Unrealized
Appreciation/
(Depreciation) | |
GBP | | | | | 5,918 | | | USD | | | | | 6,543 | | | JPM | | 11/18/2022 | | $ | 246 | | |
USD | | | | | 1,975,134 | | | CHF | | | | | 1,959,212 | | | JPM | | 11/18/2022 | | | 15,213 | | |
CHF | | | | | 100,000 | | | USD | | | | | 99,956 | | | JPM | | 12/1/2022 | | | 222 | | |
EUR | | | | | 45,000 | | | USD | | | | | 44,513 | | | JPM | | 12/1/2022 | | | 49 | | |
USD | | | | | 52,257 | | | CAD | | | | | 70,000 | | | JPM | | 12/1/2022 | | | 868 | | |
See Notes to Consolidated Financial Statements
17
Consolidated Schedule of Investments Absolute Return Multi-Manager Fund^ (cont'd)
Currency Purchased | | Currency Sold | | Counterparty | | Settlement
Date | | Net
Unrealized
Appreciation/
(Depreciation) | |
USD | | | 20,491 | | | CHF | | | | | 20,000 | | | JPM | | 12/1/2022 | | $ | 455 | | |
AUD | | | 260,000 | | | JPY | | | | | 24,373,818 | | | JPM | | 12/21/2022 | | | 1,589 | | |
AUD | | | 780,000 | | | JPY | | | | | 73,123,660 | | | SG | | 12/21/2022 | | | 4,763 | | |
AUD | | | 230,000 | | | USD | | | | | 145,176 | | | SG | | 12/21/2022 | | | 2,183 | | |
BRL** | | | 2,160,000 | | | USD | | | | | 408,850 | | | SG | | 12/21/2022 | | | 4,851 | | |
CAD | | | 650,000 | | | USD | | | | | 473,828 | | | SG | | 12/21/2022 | | | 3,571 | | |
CHF | | | 10,000 | | | USD | | | | | 10,036 | | | SG | | 12/21/2022 | | | 13 | | |
CLP** | | | 14,860,000 | | | USD | | | | | 15,328 | | | SG | | 12/21/2022 | | | 287 | | |
CZK | | | 10,790,000 | | | USD | | | | | 429,480 | | | SG | | 12/21/2022 | | | 4,770 | | |
EUR | | | 20,000 | | | TRY | | | | | 383,107 | | | SG | | 12/21/2022 | | | 51 | | |
EUR | | | 30,000 | | | USD | | | | | 29,199 | | | JPM | | 12/21/2022 | | | 574 | | |
EUR | | | 760,000 | | | USD | | | | | 745,645 | | | SG | | 12/21/2022 | | | 8,595 | | |
GBP | | | 700,000 | | | USD | | | | | 771,706 | | | SG | | 12/21/2022 | | | 32,475 | | |
HUF | | | 46,830,000 | | | USD | | | | | 108,759 | | | SG | | 12/21/2022 | | | 2,652 | | |
ILS | | | 80,000 | | | USD | | | | | 22,475 | | | SG | | 12/21/2022 | | | 260 | | |
INR** | | | 8,700,000 | | | USD | | | | | 103,914 | | | SG | | 12/21/2022 | | | 553 | | |
JPY | | | 30,480,131 | | | AUD | | | | | 320,000 | | | SG | | 12/21/2022 | | | 1,300 | | |
JPY | | | 21,220,000 | | | USD | | | | | 142,737 | | | SG | | 12/21/2022 | | | 903 | | |
KRW** | | | 118,590,000 | | | USD | | | | | 82,754 | | | SG | | 12/21/2022 | | | 412 | | |
MXN | | | 10,030,000 | | | USD | | | | | 495,900 | | | JPM | | 12/21/2022 | | | 5,806 | | |
MXN | | | 19,960,000 | | | USD | | | | | 982,739 | | | SG | | 12/21/2022 | | | 15,674 | | |
NOK | | | 300,000 | | | USD | | | | | 28,201 | | | JPM | | 12/21/2022 | | | 706 | | |
NOK | | | 1,900,000 | | | USD | | | | | 178,796 | | | SG | | 12/21/2022 | | | 4,286 | | |
NZD | | | 160,000 | | | USD | | | | | 91,196 | | | JPM | | 12/21/2022 | | | 1,900 | | |
NZD | | | 290,000 | | | USD | | | | | 164,667 | | | SG | | 12/21/2022 | | | 4,071 | | |
PHP** | | | 25,410,000 | | | USD | | | | | 428,019 | | | SG | | 12/21/2022 | | | 7,592 | | |
PLN | | | 6,370,000 | | | EUR | | | | | 1,317,858 | | | SG | | 12/21/2022 | | | 14,342 | | |
PLN | | | 1,500,000 | | | USD | | | | | 302,447 | | | SG | | 12/21/2022 | | | 8,906 | | |
SEK | | | 1,320,000 | | | USD | | | | | 117,392 | | | SG | | 12/21/2022 | | | 2,675 | | |
SGD | | | 1,960,000 | | | USD | | | | | 1,372,185 | | | SG | | 12/21/2022 | | | 12,802 | | |
THB | | | 3,230,000 | | | USD | | | | | 85,109 | | | SG | | 12/21/2022 | | | 142 | | |
TRY | | | 1,762,562 | | | EUR | | | | | 90,000 | | | JPM | | 12/21/2022 | | | 1,763 | | |
TRY | | | 8,228,416 | | | EUR | | | | | 420,000 | | | SG | | 12/21/2022 | | | 8,384 | | |
TRY | | | 960,000 | | | USD | | | | | 48,724 | | | SG | | 12/21/2022 | | | 885 | | |
USD | | | 874,556 | | | AUD | | | | | 1,290,000 | | | SG | | 12/21/2022 | | | 48,055 | | |
USD | | | 1,164,702 | | | CAD | | | | | 1,530,000 | | | SG | | 12/21/2022 | | | 40,978 | | |
USD | | | 1,161,892 | | | CHF | | | | | 1,120,000 | | | SG | | 12/21/2022 | | | 36,471 | | |
USD | | | 96,990 | | | CLP | ** | | | | 89,880,000 | | | SG | | 12/21/2022 | | | 2,542 | | |
USD | | | 299,596 | | | CZK | | | | | 7,340,000 | | | SG | | 12/21/2022 | | | 4,195 | | |
USD | | | 20,104 | | | EUR | | | | | 20,000 | | | JPM | | 12/21/2022 | | | 255 | | |
USD | | | 1,166,814 | | | EUR | | | | | 1,150,000 | | | SG | | 12/21/2022 | | | 25,531 | | |
USD | | | 996,643 | | | GBP | | | | | 850,000 | | | SG | | 12/21/2022 | | | 20,140 | | |
USD | | | 251,196 | | | HUF | | | | | 101,240,000 | | | SG | | 12/21/2022 | | | 10,341 | | |
USD | | | 34,643 | | | ILS | | | | | 120,000 | | | JPM | | 12/21/2022 | | | 541 | | |
See Notes to Consolidated Financial Statements
18
Consolidated Schedule of Investments Absolute Return Multi-Manager Fund^ (cont'd)
Currency Purchased | | Currency Sold | | Counterparty | | Settlement
Date | | Net
Unrealized
Appreciation/
(Depreciation) | |
USD | | | | | 387,627 | | | ILS | | | 1,320,000 | | | SG | | 12/21/2022 | | $ | 12,500 | | |
USD | | | | | 2,202,360 | | | INR** | | | 178,720,000 | | | SG | | 12/21/2022 | | | 56,339 | | |
USD | | | | | 980,448 | | | JPY | | | 139,060,000 | | | SG | | 12/21/2022 | | | 39,129 | | |
USD | | | | | 703,183 | | | KRW** | | | 977,430,000 | | | SG | | 12/21/2022 | | | 17,719 | | |
USD | | | | | 8,705 | | | NOK | | | 90,000 | | | JPM | | 12/21/2022 | | | 32 | | |
USD | | | | | 559,556 | | | NOK | | | 5,550,000 | | | SG | | 12/21/2022 | | | 24,767 | | |
USD | | | | | 659,804 | | | NZD | | | 1,080,000 | | | SG | | 12/21/2022 | | | 31,406 | | |
USD | | | | | 589,865 | | | PHP** | | | 33,980,000 | | | SG | | 12/21/2022 | | | 7,335 | | |
USD | | | | | 339,799 | | | PLN | | | 1,600,000 | | | SG | | 12/21/2022 | | | 7,688 | | |
USD | | | | | 558,904 | | | SEK | | | 5,840,000 | | | SG | | 12/21/2022 | | | 27,700 | | |
USD | | | | | 1,096,483 | | | SGD | | | 1,540,000 | | | SG | | 12/21/2022 | | | 8,276 | | |
USD | | | | | 48,680 | | | THB | | | 1,820,000 | | | JPM | | 12/21/2022 | | | 644 | | |
USD | | | | | 501,832 | | | THB | | | 18,360,000 | | | SG | | 12/21/2022 | | | 17,243 | | |
USD | | | | | 108,912 | | | ZAR | | | 1,960,000 | | | JPM | | 12/21/2022 | | | 2,621 | | |
USD | | | | | 399,443 | | | ZAR | | | 6,930,000 | | | SG | | 12/21/2022 | | | 23,632 | | |
CAD | | | | | 52,750 | | | USD | | | 38,344 | | | JPM | | 12/30/2022 | | | 407 | | |
USD | | | | | 317,535 | | | CAD | | | 429,168 | | | JPM | | 12/30/2022 | | | 2,264 | | |
Total unrealized appreciation | | | | | | | | | | | | $ | 645,540 | | |
Currency Purchased | | Currency Sold | | Counterparty | | Settlement
Date | | Net
Unrealized
Appreciation/
(Depreciation) | |
USD | | | 2,244,832 | | | EUR | | | | | 2,308,047 | | | JPM | | 11/18/2022 | | $ | (38,659 | ) | |
USD | | | 65,185 | | | SEK | | | | | 738,132 | | | JPM | | 11/18/2022 | | | (1,737 | ) | |
CAD | | | 1,415,754 | | | USD | | | | | 1,076,751 | | | JPM | | 12/1/2022 | | | (37,388 | ) | |
CHF | | | 345,000 | | | USD | | | | | 356,975 | | | JPM | | 12/1/2022 | | | (11,361 | ) | |
EUR | | | 292,000 | | | USD | | | | | 294,194 | | | JPM | | 12/1/2022 | | | (5,031 | ) | |
USD | | | 79,996 | | | CAD | | | | | 110,000 | | | JPM | | 12/1/2022 | | | (760 | ) | |
USD | | | 195,997 | | | EUR | | | | | 200,000 | | | JPM | | 12/1/2022 | | | (2,059 | ) | |
AUD | | | 60,000 | | | JPY | | | | | 5,693,096 | | | JPM | | 12/21/2022 | | | (95 | ) | |
AUD | | | 1,320,000 | | | JPY | | | | | 128,240,093 | | | SG | | 12/21/2022 | | | (22,356 | ) | |
AUD | | | 360,000 | | | USD | | | | | 233,926 | | | SG | | 12/21/2022 | | | (3,276 | ) | |
CAD | | | 160,000 | | | USD | | | | | 121,318 | | | SG | | 12/21/2022 | | | (3,805 | ) | |
CHF | | | 520,000 | | | USD | | | | | 531,203 | | | SG | | 12/21/2022 | | | (8,688 | ) | |
CLP** | | | 29,180,000 | | | USD | | | | | 30,931 | | | SG | | 12/21/2022 | | | (267 | ) | |
CZK | | | 4,460,000 | | | USD | | | | | 181,386 | | | SG | | 12/21/2022 | | | (1,890 | ) | |
EUR | | | 30,412 | | | PLN | | | | | 150,000 | | | JPM | | 12/21/2022 | | | (954 | ) | |
EUR | | | 994,141 | | | PLN | | | | | 4,850,000 | | | SG | | 12/21/2022 | | | (20,104 | ) | |
EUR | | | 100,000 | | | TRY | | | | | 1,989,982 | | | JPM | | 12/21/2022 | | | (3,589 | ) | |
EUR | | | 890,000 | | | TRY | | | | | 17,678,266 | | | SG | | 12/21/2022 | | | (30,266 | ) | |
EUR | | | 10,000 | | | USD | | | | | 9,977 | | | JPM | | 12/21/2022 | | | (53 | ) | |
EUR | | | 420,000 | | | USD | | | | | 421,192 | | | SG | | 12/21/2022 | | | (4,376 | ) | |
GBP | | | 90,000 | | | USD | | | | | 104,189 | | | SG | | 12/21/2022 | | | (794 | ) | |
HUF | | | 15,860,000 | | | USD | | | | | 38,162 | | | JPM | | 12/21/2022 | | | (430 | ) | |
See Notes to Consolidated Financial Statements
19
Consolidated Schedule of Investments Absolute Return Multi-Manager Fund^ (cont'd)
Currency Purchased | | Currency Sold | | Counterparty | | Settlement
Date | | Net
Unrealized
Appreciation/
(Depreciation) | |
HUF | | | | | 28,420,000 | | | USD | | | | | 68,478 | | | SG | | 12/21/2022 | | $ | (865 | ) | |
ILS | | | | | 170,000 | | | USD | | | | | 48,510 | | | SG | | 12/21/2022 | | | (198 | ) | |
INR** | | | 71,700,000 | | | USD | | | | | 871,339 | | | SG | | 12/21/2022 | | | (10,385 | ) | |
JPY | | | | | 14,897,438 | | | AUD | | | | | 160,000 | | | JPM | | 12/21/2022 | | | (1,669 | ) | |
JPY | | | | | 91,768,611 | | | AUD | | | | | 990,000 | | | SG | | 12/21/2022 | | | (13,094 | ) | |
JPY | | | | | 48,460,000 | | | USD | | | | | 335,148 | | | SG | | 12/21/2022 | | | (7,115 | ) | |
KRW** | | | 426,630,000 | | | USD | | | | | 301,509 | | | SG | | 12/21/2022 | | | (2,316 | ) | |
NOK | | | | | 780,000 | | | USD | | | | | 77,039 | | | SG | | 12/21/2022 | | | (1,879 | ) | |
NZD | | | | | 170,000 | | | USD | | | | | 102,573 | | | SG | | 12/21/2022 | | | (3,658 | ) | |
PHP** | | | 5,410,000 | | | USD | | | | | 93,244 | | | SG | | 12/21/2022 | | | (499 | ) | |
PLN | | | | | 930,000 | | | EUR | | | | | 195,107 | | | SG | | 12/21/2022 | | | (589 | ) | |
PLN | | | | | 1,020,000 | | | USD | | | | | 213,704 | | | SG | | 12/21/2022 | | | (1,984 | ) | |
SEK | | | | | 890,000 | | | USD | | | | | 81,972 | | | SG | | 12/21/2022 | | | (1,019 | ) | |
SGD | | | | | 280,000 | | | USD | | | | | 199,456 | | | SG | | 12/21/2022 | | | (1,601 | ) | |
THB | | | | | 2,170,000 | | | USD | | | | | 57,721 | | | SG | | 12/21/2022 | | | (446 | ) | |
TRY | | | | | 1,719,895 | | | EUR | | | | | 90,000 | | | SG | | 12/21/2022 | | | (443 | ) | |
USD | | | | | 82,511 | | | AUD | | | | | 130,000 | | | SG | | 12/21/2022 | | | (779 | ) | |
USD | | | | | 400,393 | | | BRL | ** | | | | 2,160,000 | | | SG | | 12/21/2022 | | | (13,306 | ) | |
USD | | | | | 7,287 | | | CAD | | | | | 10,000 | | | JPM | | 12/21/2022 | | | (58 | ) | |
USD | | | | | 422,950 | | | CAD | | | | | 580,000 | | | SG | | 12/21/2022 | | | (3,037 | ) | |
USD | | | | | 170,387 | | | CHF | | | | | 170,000 | | | SG | | 12/21/2022 | | | (435 | ) | |
USD | | | | | 62,359 | | | CLP | ** | | | | 61,290,000 | | | SG | | 12/21/2022 | | | (2,047 | ) | |
USD | | | | | 339,821 | | | CZK | | | | | 8,590,000 | | | SG | | 12/21/2022 | | | (5,889 | ) | |
USD | | | | | 9,763 | | | EUR | | | | | 10,000 | | | JPM | | 12/21/2022 | | | (161 | ) | |
USD | | | | | 638,105 | | | EUR | | | | | 650,000 | | | SG | | 12/21/2022 | | | (6,968 | ) | |
USD | | | | | 487,423 | | | GBP | | | | | 440,000 | | | SG | | 12/21/2022 | | | (18,062 | ) | |
USD | | | | | 20,662 | | | HUF | | | | | 9,110,000 | | | JPM | | 12/21/2022 | | | (1,011 | ) | |
USD | | | | | 65,767 | | | HUF | | | | | 28,590,000 | | | SG | | 12/21/2022 | | | (2,249 | ) | |
USD | | | | | 39,740 | | | ILS | | | | | 140,000 | | | JPM | | 12/21/2022 | | | (46 | ) | |
USD | | | | | 84,736 | | | ILS | | | | | 300,000 | | | SG | | 12/21/2022 | | | (521 | ) | |
USD | | | | | 35,049 | | | INR | ** | | | | 2,920,000 | | | SG | | 12/21/2022 | | | (13 | ) | |
USD | | | | | 189,880 | | | JPY | | | | | 28,130,000 | | | SG | | 12/21/2022 | | | (536 | ) | |
USD | | | | | 226,043 | | | KRW | ** | | | | 323,940,000 | | | SG | | 12/21/2022 | | | (1,135 | ) | |
USD | | | | | 102,758 | | | MXN | | | | | 2,110,000 | | | JPM | | 12/21/2022 | | | (2,786 | ) | |
USD | | | | | 385,607 | | | MXN | | | | | 7,920,000 | | | SG | | 12/21/2022 | | | (10,557 | ) | |
USD | | | | | 36,718 | | | NOK | | | | | 390,000 | | | JPM | | 12/21/2022 | | | (863 | ) | |
USD | | | | | 109,426 | | | NOK | | | | | 1,170,000 | | | SG | | 12/21/2022 | | | (3,312 | ) | |
USD | | | | | 28,382 | | | NZD | | | | | 50,000 | | | JPM | | 12/21/2022 | | | (710 | ) | |
USD | | | | | 148,240 | | | NZD | | | | | 260,000 | | | SG | | 12/21/2022 | | | (3,041 | ) | |
USD | | | | | 210,454 | | | PHP | ** | | | | 12,460,000 | | | SG | | 12/21/2022 | | | (3,151 | ) | |
USD | | | | | 38,467 | | | PLN | | | | | 190,000 | | | JPM | | 12/21/2022 | | | (972 | ) | |
USD | | | | | 206,365 | | | PLN | | | | | 1,030,000 | | | SG | | 12/21/2022 | | | (7,432 | ) | |
USD | | | | | 105,857 | | | SEK | | | | | 1,180,000 | | | SG | | 12/21/2022 | | | (1,475 | ) | |
USD | | | | | 999,428 | | | SGD | | | | | 1,430,000 | | | SG | | 12/21/2022 | | | (11,050 | ) | |
See Notes to Consolidated Financial Statements
20
Consolidated Schedule of Investments Absolute Return Multi-Manager Fund^ (cont'd)
Currency Purchased | | Currency Sold | | Counterparty | | Settlement
Date | | Net
Unrealized
Appreciation/
(Depreciation) | |
USD | | | | | 46,096 | | | TRY | | | | | 930,000 | | | JPM | | 12/21/2022 | | $ | (1,962 | ) | |
USD | | | | | 313,465 | | | TRY | | | | | 6,200,000 | | | SG | | 12/21/2022 | | | (6,919 | ) | |
USD | | | | | 5,954 | | | ZAR | | | | | 110,000 | | | SG | | 12/21/2022 | | | (11 | ) | |
ZAR | | | | | 460,000 | | | USD | | | | | 25,438 | | | JPM | | 12/21/2022 | | | (492 | ) | |
ZAR | | | | | 2,150,000 | | | USD | | | | | 118,494 | | | SG | | 12/21/2022 | | | (1,899 | ) | |
USD | | | | | 940,048 | | | CAD | | | | | 1,280,304 | | | JPM | | 12/30/2022 | | | (476 | ) | |
USD | | | | | 46,503 | | | GBP | | | | | 42,441 | | | JPM | | 12/30/2022 | | | (2,277 | ) | |
Total unrealized depreciation | | | | | | | | | | | | $ | (361,336 | ) | |
Net unrealized appreciation | | | | | | | | | | | | $ | 284,204 | | |
** Non-deliverable forward.
For the year ended October 31, 2022, the average notional value for the months where the Fund had forward contracts outstanding was $9,333,770.
Equity swap contracts ("equity swaps")
At October 31, 2022, the Fund had outstanding equity swaps as follows:
Over the counter equity swaps — Long(a)
| | | Counterparty | | Reference
Entity | | Notional
Amount | | Maturity
Date | | Variable-
Rate(b) | | Spread | | Reference
Rate | | Frequency
of Fund
Receipt/
Payment | | Value
and
Unrealized
Appreciation/
(Depreciation) | |
| | | JPM | | Aareal Bank AG | | EUR | 277,184 | | | 5/24/2023 | | | 1.30 | % | | | 0.65 | % | | | 1 | D ESTR | | T/1M | | $ | 5,007 | | |
| | | MS | | adidas AG | | EUR | 324,061 | | | 12/9/2022 | | | 1.45 | % | | | 0.60 | % | | | 1 | M EURIBOR | | T/1M | | | (252,713 | ) | |
| | JPM | | Alliance Aviation
Services Ltd. | | AUD | 37,145 |
| | 7/14/2023 | |
| 3.21 | % | |
| 0.65 | % | |
| 1 | D RBACR | | T/1M | |
| (2,119 | ) | |
| | | MS | | Amundi SA | | EUR | 718,707 | | | 12/9/2022 | | | 1.45 | % | | | 0.60 | % | | | 1 | M EURIBOR | | T/1M | | | (147,909 | ) | |
| | | MS | | Anima Holding SpA | | EUR | 287,810 | | | 12/9/2022 | | | 1.45 | % | | | 0.60 | % | | | 1 | M EURIBOR | | T/1M | | | (99,401 | ) | |
| | MS | | Aspen Pharmacare
Holdings Ltd. | | USD | 22,283 |
| | 12/15/2022 | |
| 3.98 | % | |
| 0.90 | % | |
| 1 | D FEDEF | | T/1M | |
| (14,851 | ) | |
| | | JPM | | Atlantia SpA | | EUR | 658,884 | | | 4/25/2023 | | | 1.30 | % | | | 0.65 | % | | | 1 | D ESTR | | T/1M | | | (4,519 | ) | |
| | | JPM | | Autogrill SpA | | EUR | 84,385 | | | 9/28/2023 | | | 1.30 | % | | | 0.65 | % | | | 1 | D ESTR | | T/1M | | | (332 | ) | |
| | | JPM
| | Biffa plc
| | GBP | 105,487
|
| | 7/13/2023
| |
| 2.48
2.58% | %- | |
| 0.30
0.40% | %- | |
| 1
| D SONIA | | T/1M
| |
| 1,812
|
| |
| | | MS | | Brenntag SE | | EUR | 252,334 | | | 12/9/2022 | | | 1.45 | % | | | 0.60 | % | | | 1 | M EURIBOR | | T/1M | | | 7,362 | | |
| | | MS | | Bureau Veritas SA | | EUR | 622,463 | | | 12/9/2022 | | | 1.45 | % | | | 0.60 | % | | | 1 | M EURIBOR | | T/1M | | | 77,502 | | |
| | | MS | | Croda International plc | | GBP | 59,420 | | | 12/2/2022 | | | 2.82 | % | | | 0.64 | % | | | 1 | D SONIA | | T/1M | | | 5,525 | | |
| | | MS | | Danone SA | | EUR | 702,595 | | | 12/9/2022 | | | 1.45 | % | | | 0.60 | % | | | 1 | M EURIBOR | | T/1M | | | (40,960 | ) | |
| | JPM | | Distell Group
Holdings Ltd. | | ZAR | 3,517,570 |
| | 11/18/2022 | |
| 7.21 | % | |
| 0.90 | % | |
| 1 | M JIBAR | | T/1M | |
| 5,815 |
| |
| | JPM | | Electricite de France SA | | EUR | 249,050 |
| | 6/22/2023 | |
| 1.05
1.30% | %- | |
| 0.40
0.65% | %- | |
| 1 | D ESTR | | T/1M | |
| 13,091 |
| |
| | | MS | | Elis SA | | EUR | 316,303 | | | 12/9/2022 | | | 1.45 | % | | | 0.60 | % | | | 1 | M EURIBOR | | T/1M | | | (29,100 | ) | |
See Notes to Consolidated Financial Statements
21
Consolidated Schedule of Investments Absolute Return Multi-Manager Fund^ (cont'd)
| Counterparty | | Reference
Entity | | Notional
Amount | | Maturity
Date | | Variable-
Rate(b) | | Spread | | Reference
Rate | | Frequency
of Fund
Receipt/
Payment | | Value
and
Unrealized
Appreciation/
(Depreciation) | |
| JPM | | EMIS Group plc | | GBP | 70,325 | | | 6/29/2023 | | | 2.58 | % | | | 0.40 | % | | | 1 | D SONIA | | T/1M | | $ | (751 | ) | |
| JPM | | Entain plc | | GBP | 60,182 | | | 2/8/2023 | | | 2.58 | % | | | 0.40 | % | | | 1 | D SONIA | | T/1M | | | (12,542 | ) | |
| MS | | Eurofins Scientific SE | | EUR | 87,647 | | | 12/9/2022 | | | 1.45 | % | | | 0.60 | % | | | 1 | M EURIBOR | | T/1M | | | (18,938 | ) | |
| JPM | | Euromoney Institutional
Investor plc | | GBP | 100,361 |
| | 9/6/2023 | |
| 2.58 | % | |
| 0.40 | % | |
| 1 | D SONIA | | T/1M | |
| 240 |
| |
| MS | | Gerresheimer AG | | EUR | 47,096 | | | 12/9/2022 | | | 1.45 | % | | | 0.60 | % | | | 1 | M EURIBOR | | T/1M | | | (5,733 | ) | |
| MS | | HeidelbergCement AG | | EUR | 380,244 | | | 12/9/2022 | | | 1.45 | % | | | 0.60 | % | | | 1 | M EURIBOR | | T/1M | | | (76,182 | ) | |
| MS | | Hermes International | | EUR | 169,055 | | | 12/9/2022 | | | 1.45 | % | | | 0.60 | % | | | 1 | M EURIBOR | | T/1M | | | 35,337 | | |
| MS | | Holcim AG | | CHF | 302,442 | | | 12/9/2022 | | | 1.02 | % | | | 0.57 | % | | | 1 | D SARON | | T/1M | | | (10,295 | ) | |
| JPM | | HomeServe plc | | GBP | 252,820 | | | 5/23/2023 | | | 2.58 | % | | | 0.40 | % | | | 1 | D SONIA | | T/1M | | | 3,779 | | |
| MS | | Hypera SA | | USD | 107,905 | | | 12/7/2022 | | | 3.73 | % | | | 0.65 | % | | | 1 | D FEDEF | | T/1M | | | 24,979 | | |
| JPM | | Intertrust NV | | EUR | 108,543 | | | 12/8/2022 | | | 1.30 | % | | | 0.65 | % | | | 1 | D ESTR | | T/1M | | | 1,269 | | |
| MS | | ITV plc | | GBP | 110,548 | | | 12/2/2022 | | | 2.82 | % | | | 0.64 | % | | | 1 | D SONIA | | T/1M | | | (34,953 | ) | |
| MS | | Kering SA | | EUR | 690,449 | | | 12/9/2022 | | | 1.45 | % | | | 0.60 | % | | | 1 | M EURIBOR | | T/1M | | | (39,235 | ) | |
| JPM | | Link Administration
Holdings Ltd. | | AUD | 54,942 |
| | 12/30/2022 | |
| 3.21 | % | |
| 0.65 | % | |
| 1 | D RBACR | | T/1M | |
| (23,361 | ) | |
| MS | | LVMH Moet Hennessy
Louis Vuitton SE | | EUR | 177,003 |
| | 12/9/2022 | |
| 1.45 | % | |
| 0.60 | % | |
| 1 | M EURIBOR | | T/1M | |
| 21,050 |
| |
| JPM | | MFE-MediaForEurope NV | | EUR | 9,678 | | | 7/12/2023 | | | 1.30 | % | | | 0.65 | % | | | 1 | D ESTR | | T/1M | | | (4,227 | ) | |
| JPM | | Micro Focus
International plc | | GBP | 115,058 |
| | 8/31/2023 | |
| 2.58 | % | |
| 0.40 | % | |
| 1 | D SONIA | | T/1M | |
| (62 | ) | |
| MS | | NAVER Corp. | | USD | 56,046 | | | 9/15/2023 | | | 4.58 | % | | | 1.50 | % | | | 1 | D FEDEF | | T/1M | | | (23,189 | ) | |
| JPM | | Nearmap Ltd. | | AUD | 103,000 | | | 9/1/2023 | | | 3.21 | % | | | 0.65 | % | | | 1 | D RBACR | | T/1M | | | (763 | ) | |
| JPM | | Orange Belgium SA | | EUR | 17,174 |
| | 12/9/2022 | |
| 1.05
1.15% | %- | |
| 0.40
0.50% | %- | |
| 1 | D ESTR | | T/1M | |
| (2,498 | ) | |
| MS | | Orpea SA | | EUR | 42,177 | | | 12/9/2022 | | | 1.45 | % | | | 0.60 | % | | | 1 | M EURIBOR | | T/1M | | | (104,104 | ) | |
| MS | | Publicis Groupe SA | | EUR | 49,250 | | | 12/9/2022 | | | 1.45 | % | | | 0.60 | % | | | 1 | M EURIBOR | | T/1M | | | 6,997 | | |
| JPM | | R&Q Insurance
Holdings Ltd. | | GBP | 4,489 |
| | 4/11/2023 | |
| 2.58 | % | |
| 0.40 | % | |
| 1 | D SONIA | | T/1M | |
| (5,840 | ) | |
| MS | | Ryanair Holdings plc | | EUR | 181,806 | | | 12/9/2022 | | | 1.45 | % | | | 0.60 | % | | | 1 | M EURIBOR | | T/1M | | | 6,857 | | |
| MS | | SAP SE | | EUR | 268,788 | | | 12/9/2022 | | | 1.45 | % | | | 0.60 | % | | | 1 | M EURIBOR | | T/1M | | | (80,755 | ) | |
| JPM | | Siemens Gamesa
Renewable Energy SA | | EUR | 140,501 |
| | 5/25/2023 | |
| 1.30 | % | |
| 0.65 | % | |
| 1 | D ESTR | | T/1M | |
| 802 |
| |
| JPM | | Siltronic AG | | EUR | 66,266 | | | 2/7/2023 | | | 1.30 | % | | | 0.65 | % | | | 1 | D ESTR | | T/1M | | | (77,409 | ) | |
| MS | | Smith & Nephew plc | | GBP | 447,164 | | | 12/2/2022 | | | 2.82 | % | | | 0.64 | % | | | 1 | D SONIA | | T/1M | | | (85,477 | ) | |
| JPM | | SOHO China Ltd. | | HKD | 88,455 | | | 6/23/2023 | | | 3.53 | % | | | 0.40 | % | | | 1 | D HONIA | | T/1M | | | (2,940 | ) | |
| JPM | | Spire Healthcare
Group plc | | GBP | 20,066 |
| | 6/20/2023 | |
| 2.58 | % | |
| 0.40 | % | |
| 1 | D SONIA | | T/1M | |
| 460 |
| |
| MS | | Stroeer SE & Co. KGaA | | EUR | 93,206 | | | 12/9/2022 | | | 1.45 | % | | | 0.60 | % | | | 1 | M EURIBOR | | T/1M | | | (68,933 | ) | |
| JPM | | Swedish Match AB | | SEK | 12,697,072 | | | 5/15/2023 | | | 2.05 | % | | | 0.40 | % | | | 1 | M STIBOR | | T/1M | | | 91,919 | | |
| JPM | | Telecom Italia SpA | | EUR | 10,782 | | | 11/24/2022 | | | 1.30 | % | | | 0.65 | % | | | 1 | D ESTR | | T/1M | | | (13,785 | ) | |
Total Long Positions of equity swaps | | | | | | | | | | | | | | | | $ | (974,073 | ) | |
See Notes to Consolidated Financial Statements
22
Consolidated Schedule of Investments Absolute Return Multi-Manager Fund^ (cont'd)
Over the counter equity swaps — Short(c)
| Counterparty | | Reference
Entity | | Notional
Amount | | Maturity
Date | | Variable-
Rate(b) | | Spread | | Reference
Rate | | Frequency
of Fund
Receipt/
Payment | | Value
and
Unrealized
Appreciation/
(Depreciation) | |
| MS | | Air Liquide SA | | EUR | (465,696 | ) | | 12/9/2022 | | | 0.30 | % | | | (0.35 | )% | | | 1 | D ESTR | | 1M/T | | $ | (16,783 | ) | |
| MS | | Allianz SE (Registered) | | EUR | (363,307 | ) | | 12/9/2022 | | | 0.30 | % | | | (0.35 | )% | | | 1 | D ESTR | | 1M/T | | | 10,537 | | |
| MS | | AXA SA | | EUR | (255,475 | ) | | 12/9/2022 | | | 0.30 | % | | | (0.35 | )% | | | 1 | D ESTR | | 1M/T | | | (18,181 | ) | |
| MS | | BASF SE | | EUR | (195,916 | ) | | 12/9/2022 | | | 0.30 | % | | | (0.35 | )% | | | 1 | D ESTR | | 1M/T | | | 31,331 | | |
| MS | | Bayerische Motoren
Werke AG | | EUR | (115,622 | ) | | 12/9/2022 | |
| 0.30 | % | |
| (0.35 | )% | |
| 1 | D ESTR | | 1M/T | |
| 1,149 |
| |
| MS | | Deutsche Post AG
(Registered) | | EUR | (258,157 | ) | | 12/9/2022 | |
| 0.30 | % | |
| (0.35 | )% | |
| 1 | D ESTR | | 1M/T | |
| 37,140 |
| |
| MS | | Deutsche Telekom AG
(Registered) | | EUR | (371,168 | ) | | 12/9/2022 | |
| 0.30 | % | |
| (0.35 | )% | |
| 1 | D ESTR | | 1M/T | |
| (42,613 | ) | |
| MS | | Enel SpA | | EUR | (103,612 | ) | | 12/9/2022 | | | 0.25 | % | | | (0.40 | )% | | | 1 | D ESTR | | 1M/T | | | 33,894 | | |
| MS | | Engie SA | | EUR | (243,362 | ) | | 12/9/2022 | | | 0.30 | % | | | (0.35 | )% | | | 1 | D ESTR | | 1M/T | | | (17,600 | ) | |
| JPM | | Grifols SA | | USD | (20,692 | ) | | 4/14/2023 | | | 2.66 | % | | | (0.40 | )% | | | 1 | D OBFR | | 1M/T | | | 20,047 | | |
| MS | | H & M Hennes &
Mauritz AB | | SEK | (1,215,861 | ) | | 10/19/2023 | |
| (1.45 | )% | |
| (3.13 | )% | |
| 1 | W STIBOR | | 1M/T | |
| 73,780 |
| |
| MS | | Hannover Rueck SE | | EUR | (236,818 | ) | | 12/9/2022 | | | 0.30 | % | | | (0.35 | )% | | | 1 | D ESTR | | 1M/T | | | (7,680 | ) | |
| MS | | Merck & Co., Inc. | | USD | (156,759 | ) | | 12/14/2022 | | | 2.73 | % | | | (0.35 | )% | | | 1 | D FEDEF | | 1M/T | | | (27,215 | ) | |
| MS | | Pfizer, Inc. | | USD | (129,921 | ) | | 12/14/2022 | | | 2.73 | % | | | (0.35 | )% | | | 1 | D FEDEF | | 1M/T | | | (11,348 | ) | |
| JPM | | Rentokil Initial plc | | USD | (198,521 | ) | | 4/12/2023 | | | 2.66 | % | | | (0.40 | )% | | | 1 | D OBFR | | 1M/T | | | (4,503 | ) | |
| MS | | Schneider Electric SE | | EUR | (326,678 | ) | | 12/9/2022 | | | 0.30 | % | | | (0.35 | )% | | | 1 | D ESTR | | 1M/T | | | (4,591 | ) | |
| MS | | Swisscom AG
(Registered) | | CHF | (243,690 | ) | | 12/9/2022 | |
| 0.10 | % | |
| (0.35 | )% | |
| 1 | D SARON | | 1M/T | |
| 5,923 |
| |
| MS | | Telefonica SA | | EUR | (99,072 | ) | | 12/9/2022 | | | 0.25 | % | | | (0.40 | )% | | | 1 | D ESTR | | 1M/T | | | (2,113 | ) | |
| MS | | Tencent Holdings Ltd. | | USD | (157,153 | ) | | 7/21/2023-
10/17/2023 | |
| 2.68 | % | |
| (0.40 | )% | |
| 1 | D FEDEF | | 1M/T | |
| 73,912 |
| |
| MS | | Vinci SA | | EUR | (331,255 | ) | | 12/9/2022 | | | 0.30 | % | | | (0.35 | )% | | | 1 | D ESTR | | 1M/T | | | (15,823 | ) | |
Total Short Positions of equity swaps | | | | | | | | | | | | | | | | $ | 119,263 | | |
Total Long and Short Positions of equity swaps | | | | | | | | | | | | | | | | $ | (854,810 | ) | |
Total Financing Costs and Other Receivables/(Payables) of equity swaps | | | | | | | | | | | | | | | | $ | 14,082 | | |
Total Long and Short Positions including Financing Costs and
Other Receivables/(Payables) of equity swaps | | | | | | | | | | | | | | | | $ | (840,728 | ) | |
(a) The Fund pays a specified rate based on a reference rate plus or minus a spread, and receives the total return on the reference entity.
(b) Effective rate at October 31, 2022.
(c) The Fund receives a specified rate based on a reference rate plus or minus a spread, and pays the total return on the reference entity.
See Notes to Consolidated Financial Statements
23
Consolidated Schedule of Investments Absolute Return Multi-Manager Fund^ (cont'd)
For the year ended October 31, 2022, the average notional value for the months where the Fund had equity swaps outstanding was $9,410,691 for long positions and $(4,150,288) for short positions.
At October 31, 2022, the Fund had cash collateral of $1,380,000, $2,530,000 and $157,074 deposited in a segregated account for JPMorgan Chase Bank, NA, Morgan Stanley Capital Services LLC and Societe Generale, respectively, to cover collateral requirements on over the counter derivatives.
Written option contracts ("options written")
At October 31, 2022, the Fund had outstanding options written as follows:
Description | | Number of
Contracts | | Notional
Amount | | Exercise
Price | | Expiration
Date | | Value | |
Calls | |
Health Care Providers & Services | |
Signify Health, Inc. | | | 13 | | | $ | (37,999 | ) | | $ | 30.00 | | | 11/18/2022 | | $ | (65 | ) | |
Total options written (premium received $384) | | | | | | | | | | $ | (65 | ) | |
For the year ended October 31, 2022, the average market value for the months where the Fund had options written outstanding was $(846). At October 31, 2022, the Fund had securities pledged in the amount of $238,575 to JPMorgan Chase Bank, NA to cover collateral requirements for options written.
Abbreviations
ESTR Euro Short-Term Rate
EURIBOR Euro Interbank Offered Rate
FEDEF Federal Funds Floating Rate
FTSE Financial Times Stock Exchange
JSE Johannesburg Stock Exchange
HONIA Hong Kong Overnight Index Average
HSCEI Hang Seng China Enterprises Index
JIBAR Johannesburg Interbank Agreed Rate
JPM JPMorgan Chase Bank, NA
MS Morgan Stanley Capital Services LLC
MSCI Morgan Stanley Capital International
OBFR Overnight Bank Funding Rate
OMX Stockholm Stock Exchange
RBACR Reserve Bank of Australia Cash Rate
SARON Swiss Average Overnight Rate
SG Societe Generale
SGX Singapore Exchange
SOFR Secured Overnight Financing Rate
SONIA Sterling Overnight Index Average Rate
STIBOR Stockholm Interbank Offered Rate
T Termination Date
1D One Day
1M One Month
1W One Week
See Notes to Consolidated Financial Statements
24
Consolidated Schedule of Investments Absolute Return Multi-Manager Fund^ (cont'd)
Currency Abbreviations
AUD Australian Dollar
BRL Brazilian Real
CAD Canadian Dollar
CHF Swiss Franc
CLP Chilean Peso
CZK Czech Republic Koruna
EUR Euro
GBP Pound Sterling
HKD Hong Kong Dollar
HUF Hungarian Forint
ILS Israeli New Shekel
INR Indian Rupee
JPY Japanese Yen
KRW Korean Won
MXN Mexican Peso
NOK Norwegian Krone
NZD New Zealand Dollar
PHP Philippine Peso
PLN Polish Zloty
SEK Swedish Krona
SGD Singapore Dollar
THB Thailand Baht
TRY Turkish Lira
USD United States Dollar
ZAR South African Rand
The following is a summary, categorized by Level (see Note A of the Notes to Consolidated Financial Statements), of inputs used to value the Fund's investments as of October 31, 2022:
Asset Valuation Inputs | | Level 1 | | Level 2 | | Level 3* | | Total | |
Investments: | |
Common Stocks | |
Capital Markets | | $ | 377,039 | | | $ | — | | | $ | 610 | | | $ | 377,649 | | |
Food & Staples Retailing | | | 405,003 | | | | — | | | | — | | | | 405,003 | | |
Health Care Providers & Services | | | 1,381,083 | | | | 66,630 | | | | — | | | | 1,447,713 | | |
Insurance | | | 740,559 | | | | 438,217 | | | | — | | | | 1,178,776 | | |
Interactive Media & Services | | | 1,474,793 | | | | 14,956 | | | | — | | | | 1,489,749 | | |
Internet & Direct Marketing Retail | | | 2,696,424 | | | | 139,999 | | | | 241,323 | | | | 3,077,746 | | |
Media | | | 2,021,221 | | | | — | | | | 1,606 | | | | 2,022,827 | | |
Multiline Retail | | | 246,868 | | | | — | | | | — | | | | 246,868 | | |
Oil, Gas & Consumable Fuels | | | 1,328,382 | | | | — | | | | — | | | | 1,328,382 | | |
Pharmaceuticals | | | 2,247,475 | | | | — | | | | — | | | | 2,247,475 | | |
Semiconductors & Semiconductor Equipment | | | 1,445,785 | | | | — | | | | — | | | | 1,445,785 | | |
See Notes to Consolidated Financial Statements
25
Consolidated Schedule of Investments Absolute Return Multi-Manager Fund^ (cont'd)
Asset Valuation Inputs (cont'd) | | Level 1 | | Level 2 | | Level 3* | | Total | |
Specialty Retail | | $ | 501,324 | | | $ | — | | | $ | 5,200 | | | $ | 506,524 | | |
| Other Common Stocks(a) | | | 24,913,802 | | | | — | | | | — | | | | 24,913,802 | | |
Total Common Stocks | | | 39,779,758 | | | | 659,802 | | | | 248,739 | | | | 40,688,299 | | |
| Convertible Preferred Stocks(a) | | | 49,248 | | | | — | | | | — | | | | 49,248 | | |
| Corporate Bonds(a) | | | — | | | | — | | | | — | | | | — | | |
| Loan Assignments(a) | | | — | | | | — | | | | 5,738 | | | | 5,738 | | |
Rights | |
Biotechnology | | | — | | | | — | | | | 131,180 | | | | 131,180 | | |
IT Services | | | — | | | | — | | | | 12,025 | | | | 12,025 | | |
Metals & Mining | | | 23,760 | | | | — | | | | 4 | | | | 23,764 | | |
Pharmaceuticals | | | — | | | | — | | | | 5,937 | | | | 5,937 | | |
Total Rights | | | 23,760 | | | | — | | | | 149,146 | | | | 172,906 | | |
Warrants | |
Capital Markets | | | 51 | | | | — | | | | 8 | | | | 59 | | |
Leisure Products | | | 1,925 | | | | — | | | | — | | | | 1,925 | | |
Total Warrants | | | 1,976 | | | | — | | | | 8 | | | | 1,984 | | |
Short-Term Investments | | | — | | | | 97,523,849 | | | | — | | | | 97,523,849 | | |
Total Long Positions | | $ | 39,854,742 | | | $ | 98,183,651 | | | $ | 403,631 | | | $ | 138,442,024 | | |
(a) The Consolidated Schedule of Investments provides information on the industry or sector categorization for the portfolio.
* The following is a reconciliation between the beginning and ending balances of investments in which unobservable inputs (Level 3) were used in determining value:
| | | Common
Stocks(a)(b) | | Corporate
Bonds(a)(c) | | Loan
Assignments(a) | | Rights(a)(b) | | Warrants(a) | | Total | |
Assets: | |
Investments in Securities: | |
Beginning Balance as of November 1, 2021 | | $ | 437,077 | | | $ | — | | | $ | 6,311 | | | $ | 177,026 | | | $ | 166,761 | | | $ | 787,175 | | |
Transfers into Level 3 | | | 295,686 | | | | — | | | | — | | | | — | | | | — | | | | 295,686 | | |
Transfers out of Level 3 | | | — | | | | — | | | | — | | | | — | | | | — | | | | — | | |
Accrued discounts/(premiums) | | | — | | | | — | | | | (1,321 | ) | | | — | | | | — | | | | (1,321 | ) | |
Realized gain/(loss) | | | (405,583 | ) | | | — | | | | (1,956 | ) | | | 44,863 | | | | (133,392 | ) | | | (496,068 | ) | |
Change in unrealized appreciation/
(depreciation) | | | (17,382 | ) | | | — | | | | (91,548 | ) | | | (5,329 | ) | | | (15,267 | ) | | | (129,526 | ) | |
Purchases | | | 116,372 | | | | — | | | | 110,788 | | | | 11,470 | | | | 300,108 | | | | 538,738 | | |
Sales | | | (177,431 | ) | | | — | | | | (16,536 | ) | | | (78,884 | ) | | | (318,202 | ) | | | (591,053 | ) | |
Balance as of October 31, 2022 | | $ | 248,739 | | | $ | — | | | $ | 5,738 | | | $ | 149,146 | | | $ | 8 | | | $ | 403,631 | | |
Net change in unrealized appreciation/
(depreciation) on investments still held as of
October 31, 2022 | | $ | (160,263 | ) | | $ | — | | | $ | (91,548 | ) | | $ | 6,626 | | | $ | (112 | ) | | $ | (245,297 | ) | |
See Notes to Consolidated Financial Statements
26
Consolidated Schedule of Investments Absolute Return Multi-Manager Fund^ (cont'd)
(a) As of the year ended October 31, 2022, these securities were fair valued in accordance with procedures approved by the valuation designee. These investments did not have a material impact on the Fund's net assets; therefore, disclosure of unobservable inputs used in formulating valuations is not presented.
(b) These securities were valued based on a single quotation obtained from a dealer. The Fund does not have access to unobservable inputs and therefore cannot disclose such inputs used in formulating such quotation.
(c) The reconciliation between beginning and ending balances of investments in which unobservable inputs (Level 3) were used is not presented as all values are zero.
The following is a summary, categorized by Level (see Note A of the Notes to Consolidated Financial Statements), of inputs used to value the Fund's short investments as of October 31, 2022:
Liability Valuation Inputs | | Level 1 | | Level 2 | | Level 3 | | Total | |
Investments: | |
| Common Stocks Sold Short(a) | | $ | (8,433,133 | ) | | $ | — | | | $ | — | | | $ | (8,433,133 | ) | |
Total Short Positions | | $ | (8,433,133 | ) | | $ | — | | | $ | — | | | $ | (8,433,133 | ) | |
(a) The Consolidated Schedule of Investments provides information on the industry or sector categorization for the portfolio.
The following is a summary, categorized by level (see Note A of the Notes to Consolidated Financial Statements), of inputs used to value the Fund's derivatives as of October 31, 2022:
Other Financial Instruments | | Level 1 | | Level 2 | | Level 3* | | Total | |
| Futures(a) | |
Assets | | $ | 663,598 | | | $ | — | | | $ | — | | | $ | 663,598 | | |
Liabilities | | | (165,480 | ) | | | — | | | | — | | | | (165,480 | ) | |
| Forward contracts(a) | |
Assets | | | — | | | | 645,540 | | | | — | | | | 645,540 | | |
Liabilities | | | — | | | | (361,336 | ) | | | — | | | | (361,336 | ) | |
Swaps | |
Assets | | | — | | | | 611,598 | | | | — | | | | 611,598 | | |
Liabilities | | | — | | | | (1,452,326 | ) | | | — | | | | (1,452,326 | ) | |
Options written | |
Liabilities | | | (65 | ) | | | — | | | | — | | | | (65 | ) | |
Total | | $ | 498,053 | | | $ | (556,524 | ) | | $ | — | | | $ | (58,471 | ) | |
(a) Futures and forward contracts are reported at the cumulative unrealized appreciation/(depreciation) of the instrument.
See Notes to Consolidated Financial Statements
27
Consolidated Schedule of Investments Absolute Return Multi-Manager Fund^ (cont'd)
* The following is a reconciliation between the beginning and ending balances of derivative investments in which unobservable inputs (Level 3) were used in determining value:
Other Financial Instruments: | | Equity swaps(a) | |
Beginning Balance as of November 1, 2021 | | $ | (3,127 | ) | |
Transfers into Level 3 | | | — | | |
Transfers out of Level 3 | | | — | | |
Accrued discounts/(premiums) | | | — | | |
Realized gain/(loss) | | | 3,127 | | |
Change in unrealized appreciation/(depreciation) | | | — | | |
Purchases | | | — | | |
Sales | | | — | | |
Balance as of October 31, 2022 | | $ | — | | |
Net change in unrealized appreciation/(depreciation) on investments still held as of October 31, 2022 | | $ | — | | |
(a) At the beginning of the year, certain equity swaps were valued in accordance with procedures approved by the Board of Trustees. The Fund held no Level 3 derivatives at October 31, 2022.
^ A balance indicated with a "—", reflects either a zero balance or an amount that rounds to less than 1.
See Notes to Consolidated Financial Statements
28
Consolidated Statement of Assets and Liabilities
Neuberger Berman Alternative Funds
| | | ABSOLUTE RETURN
MULTI-MANAGER
FUND | |
| | | October 31, 2022 | |
Assets | |
Investments in securities, at value* (Note A)—see Consolidated Schedule of Investments: | |
| Unaffiliated issuers(a) | | $ | 138,442,024 | | |
Cash | | | 2,102,724 | | |
Due from brokers | | | 88,267 | | |
Due from custodian | | | 201,677 | | |
Cash collateral segregated for short sales (Note A) | | | 8,522,265 | | |
Cash collateral segregated for over the counter derivatives (Note A) | | | 4,067,074 | | |
Dividends and interest receivable | | | 315,524 | | |
Receivable for securities sold | | | 903,332 | | |
Receivable for Fund shares sold | | | 172,552 | | |
Deposits with brokers for futures contracts (Note A) | | | 1,515,453 | | |
Receivable for variation margin on futures contracts (Note A) | | | 226,263 | | |
Receivable from administrator—net (Note B) | | | 34,586 | | |
Over the counter swap contracts, at value (Note A) | | | 611,598 | | |
Receivable for forward foreign currency contracts (Note A) | | | 645,540 | | |
Prepaid expenses and other assets | | | 13,544 | | |
Total Assets | | | 157,862,423 | | |
Liabilities | |
| Due to custodian, foreign currency(b) | | | 1,422,296 | | |
| Investments sold short, at value(c) (Note A) | | | 8,433,133 | | |
| Options contracts written, at value(d) (Note A) | | | 65 | | |
Over the counter swap contracts, at value (Note A) | | | 1,452,326 | | |
Payable to investment manager—net (Note B) | | | 190,365 | | |
Payable for securities purchased | | | 4,241,160 | | |
Payable for Fund shares redeemed | | | 196,419 | | |
Payable for forward foreign currency contracts (Note A) | | | 361,336 | | |
Payable to trustees | | | 16,634 | | |
Payable for audit fees | | | 129,238 | | |
Payable for custodian and accounting fees | | | 64,577 | | |
Other accrued expenses and payables | | | 55,016 | | |
Total Liabilities | | | 16,562,565 | | |
Net Assets | | $ | 141,299,858 | | |
Net Assets consist of: | |
Paid-in capital | | $ | 251,787,955 | | |
Total distributable earnings/(losses) | | | (110,488,097 | ) | |
Net Assets | | $ | 141,299,858 | | |
See Notes to Consolidated Financial Statements
29
Consolidated Statement of Assets and Liabilities (cont'd)
Neuberger Berman Alternative Funds
| | | ABSOLUTE RETURN
MULTI-MANAGER
FUND | |
| | | October 31, 2022 | |
Net Assets | | | |
Institutional Class | | $ | 123,956,363 | | |
Class A | | | 8,347,846 | | |
Class C | | | 2,807,236 | | |
Class R6 | | | 3,953,003 | | |
Class E | | | 2,235,410 | | |
Shares Outstanding ($.001 par value; unlimited shares authorized) | | | |
Institutional Class | | | 10,445,317 | | |
Class A | | | 718,175 | | |
Class C | | | 257,443 | | |
Class R6 | | | 332,844 | | |
Class E | | | 186,701 | | |
Net Asset Value, offering and redemption price per share | | | |
Institutional Class | | $ | 11.87 | | |
Class R6 | | $ | 11.88 | | |
Class E | | $ | 11.97 | | |
Net Asset Value and redemption price per share | | | |
Class A | | $ | 11.62 | | |
Offering Price per share | | | |
Class A‡ | | $ | 12.33 | | |
Net Asset Value and offering price per share | | | |
Class C^ | | $ | 10.90 | | |
*Cost of Investments: | | | |
(a) Unaffiliated issuers | | $ | 141,068,932 | | |
(b) Total cost of foreign currency | | $ | (1,548,949 | ) | |
(c) Proceeds from investments sold short | | $ | 9,916,109 | | |
(d) Premium received from option contracts written | | $ | 384 | | |
‡ On single retail sales of less than $50,000. On sales of $50,000 or more or in certain other circumstances described in the Fund's prospectus, offering price is reduced.
^ Redemption price per share is equal to net asset value less any applicable contingent deferred sales charge.
See Notes to Consolidated Financial Statements
30
Consolidated Statement of Operations
Neuberger Berman Alternative Funds
| | | ABSOLUTE RETURN
MULTI-MANAGER
FUND | |
| | | For the
Year Ended
October 31, 2022 | |
Investment Income: | |
Income (Note A): | |
Dividend income—unaffiliated issuers | | $ | 1,049,007 | | |
Interest and other income—unaffiliated issuers | | | 5,948 | | |
Foreign taxes withheld | | | (15,660 | ) | |
Total income | | $ | 1,039,295 | | |
Expenses: | |
Investment management fees (Note B) | | | 1,407,752 | | |
Administration fees (Note B): | |
Institutional Class | | | 101,211 | | |
Class A | | | 18,518 | | |
Class C | | | 6,827 | | |
Class R6 | | | 2,196 | | |
Distribution fees (Note B): | |
Class A | | | 17,806 | | |
Class C | | | 26,257 | | |
Shareholder servicing agent fees: | |
Institutional Class | | | 1,186 | | |
Class A | | | 295 | | |
Class C | | | 469 | | |
Class R6 | | | 134 | | |
Class E | | | 1,592 | | |
Audit fees | | | 129,239 | | |
Custodian and accounting fees | | | 268,657 | | |
Insurance | | | 2,057 | | |
Legal fees | | | 121,609 | | |
Registration and filing fees | | | 74,161 | | |
Shareholder reports | | | 26,181 | | |
Trustees' fees and expenses | | | 43,815 | | |
Dividend and interest expense on securities sold short (Note A) | | | 221,911 | | |
Miscellaneous and other fees | | | 10,692 | | |
Total expenses | | | 2,482,565 | | |
Expenses reimbursed by Management (Note B) | | | (568,029 | ) | |
Investment management fees waived (Note B) | | | (20,331 | ) | |
Expenses reduced by custodian fee expense offset arrangement (Note A) | | | (162 | ) | |
Total net expenses | | | 1,894,043 | | |
Net investment income/(loss) | | $ | (854,748 | ) | |
See Notes to Consolidated Financial Statements
31
Consolidated Statement of Operations (cont'd)
Neuberger Berman Alternative Funds
| | | ABSOLUTE RETURN
MULTI-MANAGER
FUND | |
| | | For the
Year Ended
October 31, 2022 | |
Realized and Unrealized Gain/(Loss) on Investments (Note A): | |
Net realized gain/(loss) on: | |
Transactions in investment securities of unaffiliated issuers | | | (200,080 | ) | |
Closed short positions of unaffiliated issuers | | | (253,490 | ) | |
Settlement of forward foreign currency contracts | | | 1,322,760 | | |
Settlement of foreign currency transactions | | | (347,644 | ) | |
Expiration or closing of futures contracts | | | 8,696,329 | | |
Expiration or closing of option contracts written | | | 4,292 | | |
Expiration or closing of swap contracts | | | (458,628 | ) | |
Change in net unrealized appreciation/(depreciation) in value of: | |
Investment securities of unaffiliated issuers | | | (6,613,556 | ) | |
Short positions of unaffiliated issuers | | | 2,126,134 | | |
Forward foreign currency contracts | | | 267,659 | | |
Foreign currency translations | | | 434,939 | | |
Futures contracts | | | (16,217 | ) | |
Option contracts written | | | 319 | | |
Swap contracts | | | (605,223 | ) | |
Net gain/(loss) on investments | | | 4,357,594 | | |
Net increase/(decrease) in net assets resulting from operations | | $ | 3,502,846 | | |
See Notes to Consolidated Financial Statements
32
Consolidated Statements of Changes in Net Assets
Neuberger Berman Alternative Funds
| | | ABSOLUTE RETURN
MULTI-MANAGER FUND | |
| | | Fiscal
Year Ended
October 31, 2022 | | Fiscal
Year Ended
October 31, 2021 | |
Increase/(Decrease) in Net Assets: | |
From Operations (Note A): | |
Net investment income/(loss) | | $ | (854,748 | ) | | $ | (1,010,777 | ) | |
Net realized gain/(loss) on investments | | | 8,763,539 | | | | 5,545,611 | | |
Change in net unrealized appreciation/(depreciation) of investments | | | (4,405,945 | ) | | | 1,638,511 | | |
Net increase/(decrease) in net assets resulting from operations | | | 3,502,846 | | | | 6,173,345 | | |
Distributions to Shareholders From (Note A): | |
Distributable earnings: | |
Institutional Class | | | (99,310 | ) | | | (1,342,136 | ) | |
Class A | | | — | | | | (89,751 | ) | |
Class C | | | — | | | | (32,769 | ) | |
Class R6 | | | (11,210 | ) | | | (27,655 | ) | |
Total distributions to shareholders | | | (110,520 | ) | | | (1,492,311 | ) | |
From Fund Share Transactions (Note D): | |
Proceeds from shares sold: | |
Institutional Class | | | 82,617,337 | | | | 13,388,746 | | |
Class A | | | 2,552,678 | | | | 1,326,832 | | |
Class C | | | 820,377 | | | | 10,526 | | |
Class R6 | | | 2,911,777 | | | | 3,434,385 | | |
Class E | | | 2,282,555 | | | | — | | |
Proceeds from reinvestment of dividends and distributions: | |
Institutional Class | | | 88,773 | | | | 1,224,720 | | |
Class A | | | — | | | | 73,520 | | |
Class C | | | — | | | | 32,275 | | |
Class R6 | | | 11,137 | | | | 27,165 | | |
Payments for shares redeemed: | |
Institutional Class | | | (22,946,066 | ) | | | (41,654,149 | ) | |
Class A | | | (1,405,508 | ) | | | (1,435,284 | ) | |
Class C | | | (1,126,611 | ) | | | (1,933,733 | ) | |
Class R6 | | | (2,690,988 | ) | | | (1,661,060 | ) | |
Class E | | | (153,393 | ) | | | — | | |
Net increase/(decrease) from Fund share transactions | | | 62,962,068 | | | | (27,166,057 | ) | |
Net Increase/(Decrease) in Net Assets | | | 66,354,394 | | | | (22,485,023 | ) | |
Net Assets: | |
Beginning of year | | | 74,945,464 | | | | 97,430,487 | | |
End of year | | $ | 141,299,858 | | | $ | 74,945,464 | | |
See Notes to Consolidated Financial Statements
33
Notes to Consolidated Financial Statements Absolute
Return Multi-Manager Fund
Note A—Summary of Significant Accounting Policies:
1 General: Neuberger Berman Alternative Funds (the "Trust") is a Delaware statutory trust organized pursuant to an Amended and Restated Trust Instrument dated March 27, 2014. The Trust is registered as an open-end management investment company under the Investment Company Act of 1940, as amended (the "1940 Act"), and its shares are registered under the Securities Act of 1933, as amended. Neuberger Berman Absolute Return Multi-Manager Fund (the "Fund") is a separate operating series of the Trust, and is diversified. The Fund offers Institutional Class shares, Class A shares, Class C shares, Class R6 shares and Class E shares. The Trust's Board of Trustees (the "Board") may establish additional series or classes of shares without the approval of shareholders.
A balance indicated with a "—", reflects either a zero balance or a balance that rounds to less than 1.
The assets of the Fund belong only to the Fund, and the liabilities of the Fund are borne solely by the Fund and no other series of the Trust.
The Fund is an investment company and accordingly follows the investment company accounting and reporting guidance of the Financial Accounting Standards Board ("FASB") Accounting Standards Codification ("ASC") Topic 946 "Financial Services—Investment Companies."
The preparation of financial statements in accordance with U.S. generally accepted accounting principles ("GAAP") requires Neuberger Berman Investment Advisers LLC ("Management" or "NBIA") to make estimates and assumptions at the date of the financial statements. Actual results could differ from those estimates.
The Fund invests in commodity-related instruments through Neuberger Berman Cayman ARMM Fund I Ltd. (the "Subsidiary"), which is organized under the laws of the Cayman Islands. The Fund is and expects to remain the sole shareholder of the Subsidiary. The Subsidiary is governed by its own Board of Directors.
As of October 31, 2022, the value of the Fund's investment in the Subsidiary was as follows:
Investment in
Subsidiary | | Percentage of
Net Assets | |
| $ | 23,460,012 | | | | 16.6 | % | |
2 Consolidation: The accompanying financial statements of the Fund present the consolidated accounts of the Fund and the Subsidiary. All intercompany accounts and transactions have been eliminated in consolidation.
3 Portfolio valuation: In accordance with ASC 820 "Fair Value Measurement" ("ASC 820"), all investments held by the Fund are carried at the value that Management believes the Fund would receive upon selling an investment in an orderly transaction to an independent buyer in the principal or most advantageous market for the investment under current market conditions. Various inputs, including the volume and level of activity for the asset or liability in the market, are considered in valuing the Fund's investments, some of which are discussed below. At times, Management may need to apply significant judgment to value investments in accordance with ASC 820.
ASC 820 established a three-tier hierarchy of inputs to create a classification of value measurements for disclosure purposes. The three-tier hierarchy of inputs is summarized in the three broad Levels listed below.
• Level 1 – unadjusted quoted prices in active markets for identical investments
• Level 2 – other observable inputs (including quoted prices for similar investments, interest rates, prepayment speeds, credit risk, amortized cost, etc.)
• Level 3 – unobservable inputs (including the Fund's own assumptions in determining the fair value of investments)
34
The inputs or methodology used for valuing an investment are not necessarily an indication of the risk associated with investing in those securities.
The value of the Fund's investments (long and short positions) in equity securities, convertible preferred stocks, rights, warrants and exchange-traded options written for which market quotations are available, is generally determined by Management by obtaining valuations from independent pricing services based on the latest sale price quoted on a principal exchange or market for that security (Level 1 inputs). Securities traded primarily on the NASDAQ Stock Market are normally valued at the NASDAQ Official Closing Price ("NOCP") provided by NASDAQ each business day. The NOCP is the most recently reported price as of 4:00:02 p.m., Eastern Time, unless that price is outside the range of the "inside" bid and asked prices (i.e., the bid and asked prices that dealers quote to each other when trading for their own accounts); in that case, NASDAQ will adjust the price to equal the inside bid or asked price, whichever is closer. Because of delays in reporting trades, the NOCP may not be based on the price of the last trade to occur before the market closes. If there is no sale of a security on a particular day, the independent pricing services may value the security based on market quotations.
The value of the Fund's investments for long positions in debt securities is determined by Management primarily by obtaining valuations from independent pricing services based on bid quotations, or if quotations are not available, by methods which include various considerations based on security type (generally Level 2 inputs). In addition to the consideration of yields or prices of securities of comparable quality, coupon, maturity and type, indications as to values from dealers, and general market conditions, the following is a description of other Level 2 inputs and related valuation techniques used by independent pricing services to value certain types of debt securities held by the Fund:
Corporate Bonds. Inputs used to value corporate debt securities generally include relevant credit information, observed market movements, sector news, U.S. Treasury yield curve or relevant benchmark curve and other market information, which may include benchmark yield curves, reported trades, broker-dealer quotes, issuer spreads, comparable securities, and reference data, such as market research publications, when available ("Other Market Information").
High Yield Securities. Inputs used to value high yield securities generally include a number of observations of equity and credit default swap curves related to the issuer and Other Market Information.
The value of loan assignments is determined by Management primarily by obtaining valuations from independent pricing services based on broker quotes (generally Level 2 or Level 3 inputs depending on the number of quotes available).
The value of futures contracts is determined by Management by obtaining valuations from independent pricing services at the settlement price at the market close (Level 1 inputs).
The value of forward foreign currency contracts is determined by Management by obtaining valuations from independent pricing services based on actual traded currency rates on independent pricing services' networks, along with other traded and quoted currency rates provided to the pricing services by leading market participants (Level 2 inputs).
The value of equity swaps is determined by Management by obtaining valuations from independent pricing services using the underlying asset and stated benchmark interest rate (Level 2 inputs).
Management has developed a process to periodically review information provided by independent pricing services for all types of securities.
Investments in non-exchange traded investment companies are valued using the respective fund's daily calculated net asset value ("NAV") per share (Level 2 inputs), when available.
35
If a valuation is not available from an independent pricing service, or if Management has reason to believe that the valuation received does not represent the amount the Fund might reasonably expect to receive on a current sale in an orderly transaction, Management seeks to obtain quotations from brokers or dealers (generally considered Level 2 or Level 3 inputs depending on the number of quotes available). If such quotations are not available, the security is valued using methods Management has approved in the good-faith belief that the resulting valuation will reflect the fair value of the security. Pursuant to Rule 2a-5 under the 1940 Act, the Board designated Management as the Fund's valuation designee. As the Fund's valuation designee, Management is responsible for determining fair value in good faith for any and all Fund investments. Inputs and assumptions considered in determining the fair value of a security based on Level 2 or Level 3 inputs may include, but are not limited to, the type of the security; the initial cost of the security; the existence of any contractual restrictions on the security's disposition; the price and extent of public trading in similar securities of the issuer or of comparable companies; quotations or evaluated prices from broker-dealers and/or pricing services; information obtained from the issuer and/or analysts; an analysis of the company's or issuer's financial statements; an evaluation of the inputs that influence the issuer and the market(s) in which the security is purchased and sold.
The value of the Fund's investments in foreign securities is generally determined using the same valuation methods and inputs as other Fund investments, as discussed above. Foreign security prices expressed in local currency values are normally translated from the local currency into U.S. dollars using the exchange rates as of 4:00 p.m. Eastern Time on days the New York Stock Exchange ("NYSE") is open for business. Management has approved the use of ICE Data Services ("ICE") to assist in determining the fair value of foreign equity securities when changes in the value of a certain index suggest that the closing prices on the foreign exchanges may no longer represent the amount that the Fund could expect to receive for those securities or on days when foreign markets are closed and U.S. markets are open. In each of these events, ICE will provide adjusted prices for certain foreign equity securities using a statistical analysis of historical correlations of multiple factors (Level 2 inputs). Management has also approved the use of ICE to evaluate the prices of foreign debt securities as of the time as of which the Fund's share price is calculated. ICE utilizes benchmark spread and yield curves and evaluates available market activity from the local close to the time as of which the Fund's share price is calculated (Level 2 inputs) to assist in determining prices for certain foreign debt securities. In the case of both foreign equity and foreign debt securities, in the absence of precise information about the market values of these foreign securities as of the time as of which the Fund's share price is calculated, Management has determined on the basis of available data that prices adjusted or evaluated in this way are likely to be closer to the prices the Fund could realize on a current sale than are the prices of those securities established at the close of the foreign markets in which the securities primarily trade.
Fair value prices are necessarily estimates, and there is no assurance that such a price will be at or close to the price at which the security is next quoted or next trades.
4 Foreign currency translations: The accounting records of the Fund and Subsidiary are maintained in U.S. dollars. Foreign currency amounts are normally translated into U.S. dollars using the exchange rate as of 4:00 p.m. Eastern Time, on days the NYSE is open for business, to determine the value of investments, other assets and liabilities. Purchase and sale prices of securities, and income and expenses, are translated into U.S. dollars at the prevailing rate of exchange on the respective dates of such transactions. Net unrealized foreign currency gain/(loss), if any, arises from changes in the value of assets and liabilities, other than investments in securities, as a result of changes in exchange rates and is stated separately in the Consolidated Statement of Operations.
5 Securities transactions and investment income: Securities transactions are recorded on trade date for financial reporting purposes. Dividend income is recorded on the ex-dividend date or, for certain foreign dividends, as soon as the Fund becomes aware of the dividends. Non-cash dividends included in dividend income, if any, are recorded at the fair market value of the securities received. Interest income, including accretion of discount (adjusted for original issue discount, where applicable) and amortization of premium, where applicable, is recorded on the accrual basis. Realized gains and losses from securities transactions and foreign currency transactions, if any, are recorded on the basis of identified cost and stated separately in the Consolidated Statement
36
of Operations. Included in net realized gain/(loss) on investments are proceeds from the settlement of class action litigation(s) in which the Fund participated as a class member. The amount of such proceeds for the year ended October 31, 2022, was $18,703.
6 Income tax information: The Fund is treated as a separate entity for U.S. federal income tax purposes. It is the policy of the Fund to continue to qualify for treatment as a regulated investment company ("RIC") by complying with the requirements of the U.S. Internal Revenue Code applicable to RICs and to distribute substantially all of its net investment income and net realized capital gains to its shareholders. To the extent the Fund distributes substantially all of its net investment income and net realized capital gains to shareholders, no federal income or excise tax provision is required.
ASC 740 "Income Taxes" sets forth a minimum threshold for financial statement recognition of a tax position taken, or expected to be taken, in a tax return. The Fund recognizes interest and penalties, if any, related to unrecognized tax positions as an income tax expense in the Consolidated Statement of Operations. The Fund is subject to examination by U.S. federal and state tax authorities for returns filed for the tax years for which the applicable statutes of limitations have not yet expired. As of October 31, 2022, the Fund did not have any unrecognized tax positions.
The Subsidiary is a controlled foreign corporation under the U.S. Internal Revenue Code. As a U.S. shareholder of a controlled foreign corporation, the Fund will include in its taxable income its share of the Subsidiary's current earnings and profits (including net realized gains). Any deficit generated by the Subsidiary will be disregarded for purposes of computing the Fund's taxable income in the current period and also disregarded for all future periods.
For federal income tax purposes, the estimated cost of investments held at October 31, 2022, was $141,527,132. The estimated gross unrealized appreciation was $1,333,649 and estimated gross unrealized depreciation was $12,655,207 resulting in net unrealized depreciation in value of investments of $11,321,558 based on cost for U.S. federal income tax purposes.
Income distributions and capital gain distributions are determined in accordance with income tax regulations, which may differ from GAAP. These differences are primarily due to differing treatments of income and gains on various investment securities held by the Fund, timing differences and differing characterization of distributions made by the Fund.
Any permanent differences resulting from different book and tax treatment are reclassified at year-end and have no impact on net income, NAV or NAV per share of the Fund. For the year ended October 31, 2022, the Fund recorded permanent reclassifications primarily related to prior year true up adjustments, prior year true up adjustments on real estate investment trust ("REIT")/non REIT return of capital adjustment, wholly owned subsidiary income and gain (loss) and amortization of bond premium. For the year ended October 31, 2022, the Fund recorded the following permanent reclassifications:
Paid-in Capital | | Total
Distributable
Earnings/(Losses) | |
| $ | 5,007,542 | | | $ | (5,007,542 | ) | |
The tax character of distributions paid during the years ended October 31, 2022, and October 31, 2021, was as follows:
Distributions Paid From: | |
Ordinary Income | | Tax-Exempt
Income | | Long-Term
Capital Gain | | Return of
Capital | | Total | |
| 2022 | | 2021 | | 2022 | | 2021 | | 2022 | | 2021 | | 2022 | | 2021 | | 2022 | | 2021 | |
| $ | 110,520 | | | $ | 1,492,311 | | | $ | — | | | $ | — | | | $ | — | | | $ | — | | | $ | — | | | $ | — | | | $ | 110,520 | | | $ | 1,492,311 | | |
37
As of October 31, 2022, the components of distributable earnings (accumulated losses) on a U.S. federal income tax basis were as follows:
Undistributed
Ordinary
Income | | Undistributed
Long-Term
Capital Gain | | Unrealized
(Depreciation) | | Loss
Carryforwards
and Deferrals | | Other
Temporary
Differences | | Total | |
| $ | 4,016,442 | | | $ | — | | | $ | (11,109,542 | ) | | $ | (103,298,422 | ) | | $ | (96,575 | ) | | $ | (110,488,097 | ) | |
The temporary differences between book basis and tax basis distributable earnings are primarily due to losses disallowed and/or recognized on wash sales and straddles, mark-to-market on adjustments on swaps, futures and forward contracts, amortization of organizational expenses, tax adjustments related to swap contracts and other investments, mark-to-market adjustments on passive foreign investment companies ("PFICs"), wholly owned subsidiary inclusions, capital loss carryforwards, amortization of bond premium and gain on constructive sale.
To the extent the Fund's net realized capital gains, if any, can be offset by capital loss carryforwards, it is the policy of the Fund not to distribute such gains. Capital loss carryforward rules allow for RICs to carry forward capital losses indefinitely and to retain the character of capital loss carryforwards as short-term or long-term. As determined at October 31, 2022, the Fund had unused capital loss carryforwards available for federal income tax purposes to offset net realized capital gains, if any, as follows:
Capital Loss Carryforwards
| Long-Term | | Short-Term | |
| $ | 35,171,011 | | | $ | 68,127,411 | | |
During the year ended October 31, 2022, the Fund utilized capital loss carryforwards of $3,647,889.
7 Foreign taxes: Foreign taxes withheld, if any, represent amounts withheld by foreign tax authorities, net of refunds recoverable.
Foreign capital gains on certain foreign securities may be subject to foreign taxes, which are accrued as applicable. At October 31, 2022, there were no outstanding balances of accrued capital gains taxes for the Fund.
As a result of several European Court of Justice ("ECJ") court cases in certain countries across the European Union ("EU"), the Fund may file tax reclaims for previously withheld taxes on dividends earned in those countries ("ECJ tax reclaims"). These additional filings are subject to various administrative proceedings by the local jurisdictions' tax authorities within the EU, as well as a number of related judicial proceedings. When the ECJ tax reclaim is "more likely than not" to not be sustained assuming examination by tax authorities due to the uncertainty that exists as to the ultimate resolution of these proceedings, the likelihood of receipt of these ECJ tax reclaims, and the potential timing of payment, no amounts are reflected in the Consolidated Statement of Assets and Liabilities. The Fund has determined that certain ECJ tax reclaims in Sweden are "more likely than not" to be sustained after examination by tax authorities. The income recognized from these ECJ tax reclaims is reflected as "Interest and other income—unaffiliated issuers" in the Consolidated Statement of Operations and the cost to file these additional ECJ tax reclaims is reflected as "Miscellaneous and other fees" in the Consolidated Statement of Operations.
8 Distributions to shareholders: The Fund may earn income, net of expenses, daily on its investments. Distributions from net investment income and net realized capital gains, if any, are generally distributed once a year (usually in December) and are recorded on the ex-date.
It is the policy of the Fund to pass through to its shareholders substantially all REIT distributions and other income it receives, less operating expenses. The distributions received from REITs are generally composed of income, capital gains, and/or return of REIT capital, but the REITs do not report this information to the Fund until the following calendar year. At October 31, 2022, the Fund estimated these amounts for the period January 1, 2022 to October 31, 2022 within the financial statements because the 2022 information is not available from the REITs until after the Fund's fiscal year-end. All estimates are based upon REIT information sources available to
38
the Fund together with actual IRS Forms 1099-DIV received to date. For the year ended October 31, 2022, the character of distributions paid to shareholders of the Fund, if any, disclosed within the Consolidated Statements of Changes in Net Assets is based on estimates made at that time. Based on past experience it is possible that a portion of the Fund's distributions during the current fiscal year, if any, will be considered tax return of capital, but the actual amount of the tax return of capital, if any, is not determinable until after the Fund's fiscal year-end. After calendar year-end, when the Fund learns the nature of the distributions paid by REITs during that year, distributions previously identified as income may be recharacterized as return of capital and/or capital gain. After all applicable REITs have informed the Fund of the actual breakdown of distributions paid to the Fund during its fiscal year, estimates previously recorded are adjusted to reflect actual results. As a result, the composition of the Fund's distributions as reported herein, may differ from the final composition determined after calendar year-end and reported to the Fund shareholders on IRS Form 1099-DIV.
9 Expense allocation: Certain expenses are applicable to multiple funds within the complex of related investment companies. Expenses directly attributable to a fund are charged to that fund. Expenses of the Trust that are not directly attributable to a particular series of the Trust (e.g., the Fund) are allocated among the series of the Trust, on the basis of relative net assets, except where a more appropriate allocation of expenses to each of the series can otherwise be made fairly. Expenses borne by the complex of related investment companies, which includes open-end and closed-end investment companies for which NBIA serves as investment manager, that are not directly attributable to a particular investment company in the complex (e.g., the Trust) or series thereof are allocated among the investment companies in the complex or series thereof on the basis of relative net assets, except where a more appropriate allocation of expenses to each of the investment companies in the complex or series thereof can otherwise be made fairly. The Fund's expenses (other than those specific to each class) are allocated proportionally each day among its classes based upon the relative net assets of each class.
10 Investments in foreign securities: Investing in foreign securities may involve sovereign and other risks, in addition to the credit and market risks normally associated with domestic securities. These additional risks include the possibility of adverse political and economic developments (including political instability, nationalization, expropriation, or confiscatory taxation) and the potentially adverse effects of unavailability of public information regarding issuers, less governmental supervision and regulation of financial markets, reduced liquidity of certain financial markets, and the lack of uniform accounting, auditing, and financial reporting standards or the application of standards that are different or less stringent than those applied in the United States. Foreign securities also may experience greater price volatility, higher rates of inflation, and delays in settlement.
11 Securities sold short: The Fund may engage in short sales, which are sales of securities which have been borrowed from a third party on the expectation that the market price will decline. If the price of the securities decreases, the Fund will make a profit by purchasing the securities in the open market at a price lower than the one at which it sold the securities. If the price of the securities increases, the Fund may have to cover its short positions at a price higher than the short sale price, resulting in a loss. Gains are limited to the price at which the Fund sold the security short, while losses are potentially unlimited in size. The Fund pledges securities and/or other assets to the lender as collateral. Proceeds received from short sales may be maintained by the lender as collateral or may be released to the Fund and used to purchase additional securities or for any other purpose. Proceeds maintained by the lender are included in the "Cash collateral segregated for short sales" on the Consolidated Statement of Assets and Liabilities. The Fund is contractually responsible to remit to the lender any dividends and interest payable on securities while those securities are being borrowed by the Fund. The Fund may receive or pay the net of the interest charged by the prime broker on the borrowed securities and a financing charge for the difference in the market value of the short position and the cash collateral deposited with the broker. This income or fee is calculated daily based upon the market value of each borrowed security and a variable rate that is dependent on the availability of the security. These costs related to short sales (i.e., dividend and interest remitted to the lender and interest charged by the prime broker) are recorded as an expense of the Fund and are excluded from the contractual expense limitation. A net negative expense, if any, represents a gain to the Fund as the total cash rebates received exceeded the other costs related to short sales. The net amount of fees incurred are included in the
39
"Dividend and interest expense on securities sold short" on the Consolidated Statement of Operations and were $(10,830) for the year ended October 31, 2022.
At October 31, 2022, the Fund had cash pledged in the amount of $8,522,265 to JPMorgan Chase Bank, NA ("JPM"), as collateral for short sales. In addition, JPM has a perfected security interest in these assets.
12 Investment company securities and exchange traded funds: The Fund may invest in shares of other registered investment companies, including exchange traded funds ("ETFs"), within the limitations prescribed by the 1940 Act, in reliance on rules adopted by the SEC, particularly Rule 12d1-4 under the 1940 Act, which the Fund was required to comply with on January 19, 2022, or any other applicable exemptive relief. Prior to the compliance date of Rule 12d1-4, a Fund was permitted to invest in both affiliated and unaffiliated investment companies, including ETFs, in excess of the limits in Section 12(d)(1)(A) of the 1940 Act, subject to the terms and conditions of exemptive orders. These exemptive orders along with Rule 12d1-2 were rescinded upon the compliance date of Rule 12d1-4. Rule 12d1-4 contains elements from the SEC's prior exemptive orders permitting fund of funds arrangements, and includes (i) limits on control and voting; (ii) required evaluations and findings; (iii) required fund of funds investment agreements; and (iv) limits on complex structures. Some ETFs seek to track the performance of a particular market index. These indices include both broad-based market indices and more narrowly-based indices, including those relating to particular sectors, markets, regions or industries. However, some ETFs have an actively-managed investment objective. ETF shares are traded like traditional equity securities on a national securities exchange or NASDAQ. The Fund will indirectly bear its proportionate share of any management fees and other expenses paid by such other investment companies, which will decrease returns.
13 When-issued/delayed delivery securities: The Fund may purchase securities with delivery or payment to occur at a later date beyond the normal settlement period. At the time the Fund enters into a commitment to purchase a security, the transaction is recorded and the value of the security is reflected in the NAV. The price of such security and the date when the security will be delivered and paid for are fixed at the time the transaction is negotiated. The value of the security may vary with market fluctuations. No interest accrues to the Fund until payment takes place. When-issued and delayed delivery transactions can have a leverage-like effect on the Fund, which can increase fluctuations in the Fund's NAV. Certain risks may arise upon entering into when-issued or delayed delivery securities transactions from the potential inability of counterparties to meet the terms of their contracts or if the issuer does not issue the securities due to political, economic, or other factors. Additionally, losses may arise due to changes in the value of the underlying securities.
14 Derivative instruments: The Fund's use of derivatives during the year ended October 31, 2022, is described below. Please see the Consolidated Schedule of Investments for the Fund's open positions in derivatives, at October 31, 2022. The disclosure requirements of ASC 815 "Derivatives and Hedging" ("ASC 815") distinguish between derivatives that qualify for hedge accounting and those that do not. Because investment companies value their derivatives at fair value and recognize changes in fair value through the Consolidated Statement of Operations, they do not qualify for hedge accounting. Accordingly, even though the Fund's investments in derivatives may represent economic hedges, they are considered non-hedge transactions for purposes of this disclosure.
The SEC adopted Rule 18f-4 under the 1940 Act which, effective August 19, 2022, regulates the use of derivatives for certain funds registered under the 1940 Act ("Rule 18f-4"). The Fund has adopted a Rule 18f-4 Policy which provides, among other things, that unless the Fund qualifies as a "limited derivatives user" as defined in Rule 18f-4, the Fund is subject to a comprehensive derivatives risk management program, is required to comply with certain value-at-risk based leverage limits and is required to provide additional disclosure both publicly and to the SEC regarding its derivatives positions. If the Fund qualifies as a limited derivatives user, Rule 18f-4 requires the Fund to have policies and procedures to manage its aggregate derivatives risk.
Futures contracts: During the year ended October 31, 2022, the Fund used futures for economic hedging purposes and to enhance returns.
At the time the Fund or Subsidiary enters into a futures contract, it is required to deposit with the futures commission merchant a specified amount of cash or liquid securities, known as "initial margin," which is a
40
percentage of the value of the futures contract being traded that is set by the exchange upon which the futures contract is traded. Each day, the futures contract is valued at the official settlement price of the board of trade or U.S. commodity exchange on which such futures contract is traded. Subsequent payments, known as "variation margin," to and from the broker are made on a daily basis, or as needed, as the market price of the futures contract fluctuates. Daily variation margin adjustments, arising from this "mark to market," are recorded by the Fund or Subsidiary as unrealized gains or losses.
Although some futures by their terms call for actual delivery or acquisition of the underlying securities or currency, in most cases the contracts are closed out prior to delivery by offsetting purchases or sales of matching futures. When the contracts are closed, the Fund or Subsidiary recognizes a gain or loss. Risks of entering into futures contracts include the possibility there may be an illiquid market, possibly at a time of rapidly declining prices, and/or a change in the value of the contract may not correlate with changes in the value of the underlying securities. Futures executed on regulated futures exchanges have minimal counterparty risk to the Fund or Subsidiary because the exchange's clearinghouse assumes the position of the counterparty in each transaction. Thus, the Fund or Subsidiary is exposed to risk only in connection with the clearinghouse and not in connection with the original counterparty to the transaction.
For U.S. federal income tax purposes, futures transactions undertaken by the Fund or Subsidiary may cause the Fund or Subsidiary to recognize gains or losses from marking contracts to market even though its positions have not been sold or terminated, may affect the character of the gains or losses recognized as long-term or short-term, and may affect the timing of some capital gains and losses realized by the Fund or Subsidiary. Also, the Fund's or Subsidiary's losses on transactions involving futures contracts may be deferred rather than being taken into account currently in calculating the Fund's or Subsidiary's taxable income.
Forward foreign currency contracts: During the year ended October 31, 2022, the Fund used forward foreign currency contracts to hedge foreign currency and to enhance returns.
A forward contract is an agreement between two parties to buy or sell a specific currency for another at a set price on a future date, and is individually negotiated and privately traded by currency traders and their customers in the interbank market. The market value of a forward contract fluctuates with changes in forward currency exchange rates. Forward contracts are marked to market daily, and the change in value is recorded by the Fund as an unrealized gain or loss. At the consummation of a forward contract to purchase or sell currency, the Fund may either exchange the currencies specified at the maturity of the forward contract or enter into a closing transaction involving the purchase or sale of an offsetting forward contract. Closing transactions with respect to forward contracts are usually performed with the counterparty to the original forward contract. The gain or loss arising from the difference between the U.S. dollar cost of the original contract and the value of the foreign currency in U.S. dollars upon closing a contract is included in "Net realized gain/(loss) on settlement of forward foreign currency contracts" in the Consolidated Statement of Operations. These contracts may involve market risk in excess of the unrealized gain or loss reflected in the Fund's Consolidated Statement of Assets and Liabilities. In addition, the Fund could be exposed to risks associated with fluctuations in foreign currency and the risk the counterparty will fail to fulfill its obligation.
Equity swap contracts: During the year ended October 31, 2022, the Fund used equity swaps to provide investment exposure to certain investments, primarily foreign securities.
Equity swaps are two-party contracts in which counterparties exchange the return on a specified reference security for the return based on a fixed or floating interest rate during the period of the swap. Upon entering an equity swap, the Fund may be required to pledge an amount of cash and/or other assets to the broker which is equal to a certain percentage of the contract amount (initial margin). Subsequent payments known as variation margins are made or received by the Fund periodically depending on the fluctuations in the value of the underlying security. Equity swaps are marked to market daily based on the value of the underlying reference entity and the change, if any, is recorded as an unrealized gain or loss. Equity swaps normally do not involve the delivery of securities or other underlying assets. Cash settlement in and out of the swap may occur at a reset date or any other date, at the
41
discretion of the Fund and the counterparty, over the life of the agreement, and is generally determined based on limits and thresholds established as part of an agreement between the Fund and the counterparty. If the other party to an equity swap defaults, the Fund's risk of loss consists of the net amount of payments that the Fund is contractually entitled to receive, if any. Equity swaps are derivatives and their value can be very volatile. To the extent that future market trends, the values of assets or economic factors are not accurately analyzed and predicted, the Fund may suffer a loss, which may exceed the related amounts shown in the Consolidated Statement of Assets and Liabilities. Periodic payments received or paid by the Fund are recorded as realized gains or losses in the Consolidated Statement of Operations.
Written options: During the year ended October 31, 2022, the Fund used options written to generate incremental returns.
Premiums paid by the Fund upon purchasing a call or put option are recorded in the asset section of the Fund's Consolidated Statement of Assets and Liabilities and are subsequently adjusted to the current market value. When an option is exercised, closed, or expired, the Fund realizes a gain or loss and the asset is eliminated. For purchased call options, the Fund's loss is limited to the amount of the option premium paid.
Premiums received by the Fund upon writing a call option or a put option are recorded in the liability section of the Fund's Consolidated Statement of Assets and Liabilities and are subsequently adjusted to the current market value. When an option is exercised, closed, or expired, the Fund realizes a gain or loss and the liability is eliminated.
When the Fund writes a call option on an underlying asset it does not own, its exposure on such an option is theoretically unlimited. When writing a covered call option, the Fund, in return for the premium, gives up the opportunity for profit from a price increase in the underlying security above the exercise price, but conversely retains the risk of loss should the price of the security decline. When writing a put option, the Fund, in return for the premium, takes the risk that it must purchase the underlying security at a price that may be higher than the current market price of the security. If a call or put option that the Fund has written expires unexercised, the Fund will realize a gain for the amount of the premium. All securities covering outstanding written options are held in escrow by the custodian bank.
At October 31, 2022, the Fund had the following derivatives (which did not qualify as hedging instruments under ASC 815), grouped by primary risk exposure:
Asset Derivatives
Derivative
Type | | Consolidated
Statement of
Assets and
Liabilities Location | | Credit Risk | | Currency Risk | | Equity Risk | | Interest
Rate Risk | | Commodity
Risk | | Total | |
Over the
counter
swaps | | Over the counter
swap contracts,
at value(1) | | $ | — |
| | $ | — |
| | $ | 611,598 |
| | $ | — |
| | $ | — |
| | $ | 611,598 |
| |
Futures | | Receivable/Payable
for variation margin
on futures contracts(2) | |
| — |
| |
| 387,361 |
| |
| 67,313 |
| |
| 172,671 |
| |
| 36,253 |
| |
| 663,598 |
| |
Forward
contracts | | Receivable for forward
foreign currency
contracts | |
| — |
| |
| 645,540 |
| |
| — |
| |
| — |
| |
| — |
| |
| 645,540 |
| |
Total Value—Assets | | | | $ | — | | | $ | 1,032,901 | | | $ | 678,911 | | | $ | 172,671 | | | $ | 36,253 | | | $ | 1,920,736 | | |
42
Liability Derivatives
Derivative
Type | | Consolidated
Statement of
Assets and
Liabilities Location | | Credit Risk | | Currency Risk | | Equity Risk | | Interest
Rate Risk | | Commodity
Risk | | Total | |
Over the
counter
swaps | | Over the counter
swap contracts,
at value(1) | | $ | — |
| | $ | — |
| | $ | (1,452,326 | ) | | $ | — |
| | $ | — |
| | $ | (1,452,326 | ) | |
Futures | | Receivable/Payable
for variation margin
on futures contracts(2) | |
| — |
| |
| (6,110 | ) | |
| (43,362 | ) | |
| (107,449 | ) | |
| (8,559 | ) | |
| (165,480 | ) | |
Forward
contracts | | Payable for forward
foreign currency
contracts | |
| — |
| |
| (361,336 | ) | |
| — |
| |
| — |
| |
| — |
| |
| (361,336 | ) | |
Options
written | | Option contracts
written, at value | |
| — |
| |
| — |
| |
| (65 | ) | |
| — |
| |
| — |
| |
| (65 | ) | |
Total Value—Liabilities | | | | $ | — | | | $ | (367,446 | ) | | $ | (1,495,753 | ) | | $ | (107,449 | ) | | $ | (8,559 | ) | | $ | (1,979,207 | ) | |
(1) "Over the counter swaps" reflects the cumulative unrealized appreciation/(depreciation) of the over the counter swap contracts plus accrued interest as of October 31, 2022.
(2) "Futures" reflects the cumulative unrealized appreciation/(depreciation) of futures as of October 31, 2022, which is reflected in the Consolidated Statement of Assets and Liabilities under the caption "Total distributable earnings/(losses)." The current day's variation margin as of October 31, 2022, if any, is reflected in the Consolidated Statement of Assets and Liabilities under the caption "Receivable/Payable for variation margin on futures contracts."
The impact of the use of these derivative instruments on the Consolidated Statement of Operations during the year ended October 31, 2022, was as follows:
Realized Gain/(Loss)
Derivative
Type | | Consolidated
Statement of
Operations Location | | Credit Risk | | Currency Risk | | Equity Risk | | Interest
Rate Risk | | Commodity
Risk | | Total | |
Forward
contracts | | Net realized gain/(loss) on:
Settlement of forward
foreign currency contracts | | $ | — |
| | $ | 1,322,760 |
| | $ | — |
| | $ | — |
| | $ | — |
| | $ | 1,322,760 |
| |
Futures | | Net realized gain/(loss) on:
Expiration or closing
of futures contracts | |
| — |
| |
| 3,660,299 |
| |
| 127,690 |
| |
| 3,758,000 |
| |
| 1,150,340 |
| |
| 8,696,329 |
| |
Options
written | | Net realized gain/(loss) on:
Expiration or closing
of option contracts written | |
| — |
| |
| — |
| |
| 4,292 |
| |
| — |
| |
| — |
| |
| 4,292 |
| |
Swaps | | Net realized gain/(loss)
on: Expiration or closing
of swaps contracts | |
| — |
| |
| ��� |
| |
| (458,628 | ) | |
| — |
| |
| — |
| |
| (458,628 | ) | |
Total Realized Gain/(Loss) | | | | $ | — | | | $ | 4,983,059 | | | $ | (326,646 | ) | | $ | 3,758,000 | | | $ | 1,150,340 | | | $ | 9,564,753 | | |
43
Change in Appreciation/(Depreciation)
Derivative
Type | | Consolidated
Statement of
Operations Location | | Credit Risk | | Currency Risk | | Equity Risk | | Interest
Rate Risk | | Commodity
Risk | | Total | |
Forward
contracts | | Change in net unrealized
appreciation/(depreciation)
in value of: Forward foreign
currency contracts | | $ | — |
| | $ | 267,659 |
| | $ | — |
| | $ | — |
| | $ | — |
| | $ | 267,659 |
| |
Futures | | Change in net unrealized
appreciation/(depreciation)
in value of: Futures contracts | |
| — |
| |
| 301,169 |
| |
| 25,513 |
| |
| (254,039 | ) | |
| (88,860 | ) | |
| (16,217 | ) | |
Options
written | | Change in net unrealized
appreciation/(depreciation)
in value of:
Option contracts written | |
| — |
| |
| — |
| |
| 319 |
| |
| — |
| |
| — |
| |
| 319 |
| |
Swaps | | Change in net unrealized
appreciation/(depreciation)
in value of: Swap contracts | |
| — |
| |
| — |
| |
| (605,223 | ) | |
| — |
| |
| — |
| |
| (605,223 | ) | |
Total Change in Appreciation/
(Depreciation) | | | | $ | — | | | $ | 568,828 | | | $ | (579,391 | ) | | $ | (254,039 | ) | | $ | (88,860 | ) | | $ | (353,462 | ) | |
While the Fund may receive rights and warrants in connection with their investments in securities, these rights and warrants are not considered "derivative instruments" under ASC 815.
The Fund is required to disclose both gross and net information for assets and liabilities related to derivatives, repurchase and reverse repurchase agreements, and securities lending and securities borrowing transactions that are eligible for offset or subject to an enforceable master netting or similar agreement. The Fund's over the counter derivative assets and liabilities at fair value by type are reported gross in the Consolidated Statement of Assets and Liabilities. The following tables present the Fund's derivative assets and liabilities by counterparty, net of amounts available for offset under a master netting or similar agreement and net of the related collateral received by the Fund for assets and pledged by the Fund for liabilities as of October 31, 2022.
Description | | Gross Amounts of
Recognized Assets | | Gross Amounts Offset
in the Consolidated
Statement of
Assets and Liabilities | | Net Amounts of Assets
Presented in the
Consolidated Statement
of Assets and Liabilities | |
Over the counter swap contracts | | $ | 611,598 | | | $ | — | | | $ | 611,598 | | |
Forward contracts | | | 645,540 | | | | — | | | | 645,540 | | |
Total | | $ | 1,257,138 | | | $ | — | | | $ | 1,257,138 | | |
Gross Amounts Not Offset in the Consolidated Statement of Assets and Liabilities
Counterparty | | Net Amounts of
Assets Presented in
the Consolidated
Statement of Assets
and Liabilities | | Liabilities
Available
for Offset | | Cash Collateral
Received(a) | | Net Amount(b) | |
Societe Generale | | $ | 609,385 | | | $ | (245,737 | ) | | $ | — | | | $ | 363,648 | | |
JPMorgan Chase Bank, NA | | | 186,729 | | | | (186,729 | ) | | | — | | | | — | | |
Morgan Stanley Capital Services LLC | | | 461,024 | | | | (461,024 | ) | | | — | | | | — | | |
| | $ | 1,257,138 | | | $ | (893,490 | ) | | $ | — | | | $ | 363,648 | | |
44
Description | | Gross Amounts of
Recognized Liabilities | | Gross Amounts Offset
in the Consolidated
Statement of
Assets and Liabilities | | Net Amounts of Liabilities
Presented in the
Consolidated Statement
of Assets and Liabilities | |
Over the counter swap contracts | | $ | (1,452,326 | ) | | $ | — | | | $ | (1,452,326 | ) | |
Forward contracts | | | (361,336 | ) | | | — | | | | (361,336 | ) | |
Total | | $ | (1,813,662 | ) | | $ | — | | | $ | (1,813,662 | ) | |
Gross Amounts Not Offset in the Consolidated Statement of Assets and Liabilities
Counterparty | | Net Amounts of
Liabilities Presented in
the Consolidated
Statement of Assets
and Liabilities | | Assets
Available
for Offset | | Cash Collateral
Pledged(a) | | Net Amount(c) | |
Societe Generale | | $ | (245,737 | ) | | $ | 245,737 | | | $ | — | | | $ | — | | |
JPMorgan Chase Bank, NA | | | (271,250 | ) | | | 186,729 | | | | (84,521 | ) | | | — | | |
Morgan Stanley Capital Services LLC | | | (1,296,675 | ) | | | 461,024 | | | | (835,651 | ) | | | — | | |
| | $ | (1,813,662 | ) | | $ | 893,490 | | | $ | (920,172 | ) | | $ | — | | |
(a) Collateral received (or pledged) is limited to an amount not to exceed 100% of the net amount of assets (or liabilities) in the tables presented above, for each respective counterparty.
(b) Net Amount represents amounts subject to loss as of October 31, 2022, in the event of a counterparty failure.
(c) Net Amount represents amounts under-collateralized by the Fund to each counterparty as of October 31, 2022.
15 Indemnifications: Like many other companies, the Trust's organizational documents provide that its officers ("Officers") and trustees ("Trustees") are indemnified against certain liabilities arising out of the performance of their duties to the Trust. In addition, both in some of its principal service contracts and in the normal course of its business, the Trust enters into contracts that provide indemnifications to other parties for certain types of losses or liabilities. The Trust's maximum exposure under these arrangements is unknown as this could involve future claims against the Trust.
16 Expense offset arrangement: The Fund has an expense offset arrangement in connection with its custodian contract. For the year ended October 31, 2022, the impact of this arrangement was a reduction in expenses of $162.
17 Other: All net investment income and realized and unrealized capital gains and losses of the Fund are allocated, on the basis of relative net assets, pro rata among its respective classes.
Note B—Investment Management Fees, Administration Fees, Distribution Arrangements, and Other Transactions with Affiliates:
The Fund retains NBIA as its investment manager under a Management Agreement. For such investment management services, the Fund pays NBIA an investment management fee at the annual rate of 1.700% of the first $250 million of the Fund's average daily net assets, 1.675% of the next $250 million, 1.650% of the next $250 million, 1.625% of the next $250 million, 1.600% of the next $500 million, 1.575% of the next $2.5 billion, and 1.550% of average daily net assets in excess of $4 billion.
NBIA has contractually agreed to waive its Class E management fee for the Fund. This undertaking lasts until October 31, 2023 and may not be terminated during its term without the consent of the Board. Management fees contractually waived pursuant to this waiver for Class E are not subject to recovery by NBIA. For the period from January 11, 2022 (commencement of operations for Class E) to October 31, 2022, the total amount of management fees waived was $20,331, which is equivalent to an annualized percentage rate of 1.70% of Class E's average daily net assets. Accordingly, for the year ended October 31, 2022, the investment management fee pursuant to the
45
Management Agreement was equivalent to an annual net effective rate of 1.69% of the Fund's average daily net assets.
The Fund retains NBIA as its administrator under an Administration Agreement. The administration fee is assessed at the Class level and each share class of the Fund, as applicable, pays NBIA an annual administration fee equal to the following: 0.15% for Institutional Class; 0.26% for each of Class A and Class C; 0.05% for Class R6, each as a percentage of its average daily net assets. Class E shares do not pay an administration fee. Additionally, NBIA retains JPM as its sub-administrator under a Sub-Administration Agreement. NBIA pays JPM a fee for all services received under the Sub-Administration Agreement.
NBIA has contractually agreed to waive fees and/or reimburse certain expenses of the Institutional Class, Class A, Class C and Class R6 so that the total annual operating expenses of those classes do not exceed the expense limitations as detailed in the following table. These undertakings exclude interest, taxes, brokerage commissions, acquired fund fees and expenses, extraordinary expenses and dividend and interest expenses relating to short sales, if any (commitment fees relating to borrowings are treated as interest for purposes of this exclusion) ("annual operating expenses"); consequently, net expenses may exceed the contractual expense limitations. The expenses of the Subsidiary are included in the total expenses used to calculate the reimbursement, which the Fund has agreed to share with the Subsidiary. For the year ended October 31, 2022, these Subsidiary expenses amounted to $131,628.
At October 31, 2022, the Fund's contingent liabilities to NBIA under the agreements were as follows:
| | | | | | | Expenses Reimbursed
in the Year Ended October 31, | |
| | | | |
| | 2020 | | 2021 | | 2022 | |
| | | | | | | Subject to Repayment until October 31, | |
| | | Contractual
Expense
Limitation(1) | | Expiration | | 2023 | | 2024 | | 2025 | |
Institutional Class | | | 1.97 | % | | 10/31/25 | | $ | 567,149 | | | $ | 522,331 | | | $ | 466,613 | | |
Class A | | | 2.33 | % | | 10/31/25 | | | 48,102 | | | | 52,624 | | | | 50,562 | | |
Class C | | | 3.08 | % | | 10/31/25 | | | 36,584 | | | | 29,872 | | | | 19,300 | | |
Class R6 | | | 1.87 | % | | 10/31/25 | | | 8,302 | | | | 20,018 | | | | 31,554 | | |
(1) Expense limitation per annum of the respective class' average daily net assets.
The Fund has agreed that each of its respective classes will repay NBIA for fees and expenses waived or reimbursed for that class provided that repayment does not cause that class's annual operating expenses to exceed its contractual expense limitation in place at the time the fees and expenses were waived or reimbursed, or the expense limitation in place at the time the Fund repays NBIA, whichever is lower. Any such repayment must be made within three years after the year in which NBIA incurred the expense.
During the year ended October 31, 2022, there was no repayment to NBIA under these agreements.
At October 31, 2022, NBIA engaged BH-DG Systematic Trading LLP, GAMCO Asset Management Inc., P/E Global, LLC and Portland Hill Asset Management Limited as subadvisers of the Fund to provide investment advisory services. NBIA compensates the subadvisers out of the investment management fees it receives from the Fund.
The Fund also has a distribution agreement with Neuberger Berman BD LLC (the "Distributor") with respect to each class of shares. The Distributor acts as agent in arranging for the sale of class shares without sales commission or other compensation, except as described below for Class A and Class C shares, and bears the advertising and promotion expenses.
46
However, the Distributor receives fees from Class A and Class C under their distribution plans (each a "Plan", collectively, the "Plans") pursuant to Rule 12b-1 under the 1940 Act. The Plans provide that, as compensation for administrative and other services provided to these classes, the Distributor's activities and expenses related to the sale and distribution of these classes, and ongoing services provided to investors in these classes, the Distributor receives from each of these classes a fee at the annual rate of 0.25% of Class A's and 1.00% of Class C's average daily net assets. The Distributor receives this amount to provide distribution and shareholder servicing for these classes and pays a portion of it to institutions that provide such services. Those institutions may use the payments for, among other purposes, compensating employees engaged in sales and/or shareholder servicing. The amount of fees paid by each class during any year may be more or less than the cost of distribution and other services provided to that class. FINRA rules limit the amount of annual distribution fees that may be paid by a mutual fund and impose a ceiling on the cumulative distribution fees paid. The Trust's Plans comply with those rules.
Class A shares of the Fund are generally sold with an initial sales charge of up to 5.75% and no contingent deferred sales charge ("CDSC"), except that a CDSC of 1.00% applies to certain redemptions made within 18 months following purchases of $1 million or more without an initial sales charge. Class C shares of the Fund are sold with no initial sales charge and a 1.00% CDSC if shares are sold within one year after purchase.
For the year ended October 31, 2022, the Distributor, acting as underwriter and broker-dealer, received net initial sales charges from the purchase of Class A shares and CDSCs from the redemption of Class A and Class C shares as follows:
| | | Underwriter | | Broker-Dealer | |
| | | Net Initial
Sales Charge | | CDSC | | Net Initial
Sales Charge | | CDSC | |
Class A | | $ | 2,112 | | | $ | — | | | $ | — | | | $ | — | | |
Class C | | | — | | | | 1,725 | | | | — | | | | — | | |
Note C—Securities Transactions:
During the year ended October 31, 2022, there were purchase and sale transactions of long-term securities (excluding swaps, forward contracts, futures and written option contracts) as follows:
Purchases of
U.S. Government
and Agency
Obligations | | Purchases
excluding
U.S. Government
and Agency
Obligations | | Securities
Sold Short
excluding
U.S. Government
and Agency
Obligations | | Sales and
Maturities of
U.S. Government
and Agency
Obligations | | Sales and
Maturities
excluding
U.S. Government
and Agency
Obligations | | Covers on
Securities
Sold Short
excluding
U.S. Government
and Agency
Obligations | |
| $ | — | | | $ | 231,534,011 | | | $ | 18,348,626 | | | $ | — | | | $ | 159,927,338 | | | $ | 18,210,256 | | |
During the year ended October 31, 2022, no brokerage commissions on securities transactions were paid to affiliated brokers.
47
Note D—Fund Share Transactions:
Share activity for the years ended October 31, 2022, and October 31, 2021, was as follows:
| | | For the Year Ended October 31, 2022 | | For the Year Ended October 31, 2021 | |
| | | Shares
Sold | | Shares
Issued on
Reinvestment
of Dividends
and
Distributions | | Shares
Redeemed | | Total | | Shares
Sold | | Shares
Issued on
Reinvestment
of Dividends
and
Distributions | | Shares
Redeemed | | Total | |
Institutional Class | | | 7,053,667 | | | | 7,933 | | | | (2,000,324 | ) | | | 5,061,276 | | | | 1,193,212 | | | | 112,670 | | | | (3,744,648 | ) | | | (2,438,766 | ) | |
Class A | | | 223,834 | | | | — | | | | (124,826 | ) | | | 99,008 | | | | 120,424 | | | | 6,871 | | | | (131,167 | ) | | | (3,872 | ) | |
Class C | | | 76,488 | | | | — | | | | (106,389 | ) | | | (29,901 | ) | | | 1,003 | | | | 3,170 | | | | (185,571 | ) | | | (181,398 | ) | |
Class R6 | | | 256,986 | | | | 996 | | | | (238,415 | ) | | | 19,567 | | | | 308,693 | | | | 2,499 | | | | (148,484 | ) | | | 162,708 | | |
| Class E(a) | | | 200,163 | | | | — | | | | (13,462 | ) | | | 186,701 | | | | — | | | | — | | | | — | | | | — | | |
(a) Period from January 11, 2022 (Commencement of Operations) to October 31, 2022.
Other: At October 31, 2022, affiliated persons, as defined in the 1940 Act, owned 0.02% of the Fund's outstanding shares.
Note E—Line of Credit:
At October 31, 2022, the Fund was a participant in a syndicated committed, unsecured $700,000,000 line of credit (the "Credit Facility"), to be used only for temporary or emergency purposes. Series of other investment companies managed by NBIA also participate in this line of credit on substantially the same terms. Interest is charged on borrowings under this Credit Facility at the highest of (a) a federal funds effective rate plus 1.00% per annum, (b) a daily simple Secured Overnight Financing Rate ("SOFR") plus 1.10% per annum, and (c) an overnight bank funding rate plus 1.00% per annum; provided that should the Administrative Agent of the Credit Facility determine that the daily simple SOFR rate is unavailable, then the interest rate option described in (b) shall be replaced with a benchmark replacement determined to be applicable by such Administrative Agent. The Credit Facility has an annual commitment fee of 0.15% per annum of the available line of credit, which is paid quarterly. The Fund has agreed to pay its pro rata share of the annual commitment fee, based on the ratio of its individual net assets to the net assets of all participants at the time the fee is due, and interest charged on any borrowing made by the Fund and other costs incurred by the Fund. Because several mutual funds participate in the Credit Facility, there is no assurance that an individual fund will have access to all or any part of the $700,000,000 at any particular time. There were no loans outstanding under the Credit Facility at October 31, 2022. During the year ended October 31, 2022, the Fund did not utilize the Credit Facility.
Note F—Recent Accounting Pronouncement:
In January 2021, the FASB issued Accounting Standards Update No. 2021-01 ("ASU 2021-01"), "Reference Rate Reform (Topic 848)". ASU 2021-01 is an update of Accounting Standards Update No. 2020-04 ("ASU 2020-04"), which is in response to concerns about structural risks of interbank offered rates, and particularly the risk of cessation of LIBOR, regulators have undertaken reference rate reform initiatives to identify alternative reference rates that are more observable or transaction based and less susceptible to manipulation. ASU 2020-04 provides optional guidance for a limited period of time to ease the potential burden in accounting for (or recognizing the effects of) reference rate reform on financial reporting. ASU 2020-04 is elective and applies to all entities, subject to meeting certain criteria, that have contracts, hedging relationships, and other transactions that reference LIBOR or another reference rate expected to be discontinued because of reference rate reform. The ASU 2021-01 update
48
clarifies that certain optional expedients and exceptions in Topic 848 for contract modifications and hedge accounting apply to derivatives that are affected by the discounting transition. The amendments in this update are effective immediately through December 31, 2022, for all entities. Management is currently evaluating the implications, if any, of the additional requirements and its impact on the Fund's consolidated financial statements.
In June 2022, FASB issued Accounting Standards Update No. 2022-03, "Fair Value Measurement of Equity Securities Subject to Contractual Sale Restrictions" ("ASU 2022-03"). ASU 2022-03 clarifies the guidance in ASC 820, related to the measurement of the fair value of an equity security subject to contractual sale restrictions, where it eliminates the ability to apply a discount to the fair value of these securities, and introduces disclosure requirements related to such equity securities. The guidance is effective for fiscal years, and interim periods within those fiscal years, beginning after December 15, 2023, and allows for early adoption. Management is currently evaluating the impact of applying this update.
Note G—Other Matters:
Coronavirus: The outbreak of the novel coronavirus in many countries has, among other things, disrupted global travel and supply chains, and adversely impacted global commercial activity, the transportation industry and commodity prices in the energy sector. The impact of this virus has negatively affected and may continue to affect the economies of many nations, individual companies and the global securities and commodities markets, including liquidity and volatility. The development and fluidity of this situation precludes any prediction as to its ultimate impact, which may have a continued adverse effect on global economic and market conditions. Such conditions (which may be across industries, sectors or geographies) have impacted and may continue to impact the issuers of the securities held by the Fund and in turn, may impact the financial performance of the Fund.
Russia's invasion of Ukraine: Russia's invasion of Ukraine, and corresponding events in late February 2022, have had, and could continue to have, severe adverse effects on regional and global economic markets for securities and commodities. Following Russia's actions, various governments, including the United States, have issued broad-ranging economic sanctions against Russia. The current events have had, and could continue to have, an adverse effect on global markets performance and liquidity, thereby negatively affecting the value of the Fund's investments beyond any direct exposure to Russian or Ukrainian issuers. The duration of ongoing hostilities and the vast array of sanctions and related events cannot be predicted. Those events present material uncertainty and risk with respect to markets globally and the performance of the Fund and its investments or operations could be negatively impacted.
49
This page has been left blank intentionally
Consolidated Financial Highlights
Absolute Return Multi-Manager Fund
The following tables include selected data for a share outstanding throughout each period and other performance information derived from the Consolidated Financial Statements. Amounts that do not round to $0.01 or $(0.01) per share are presented as $0.00 or $(0.00), respectively. Ratios that do not round to 0.01% or (0.01)% are presented as 0.00% or (0.00)%, respectively. Net Assets with a zero balance, if any, may reflect actual amounts rounding to less than $0.1 million. A "—" indicates that the line item was not applicable in the corresponding period.
| | | Net Asset
Value,
Beginning
of Period | | Net
Investment
Income/
(Loss)@ | | Net Gains or
Losses on
Securities
(both
realized
and
unrealized) | | Total From
Investment
Operations | | Dividends
from Net
Investment
Income | | Distributions
from Net
Realized
Capital
Gains | | Total
Distributions | | Net Asset
Value,
End of
Period | | Total
Return†d | | Net Assets,
End of
Period
(in millions) | | Ratio
of Gross
Expenses to
Average
Net
Assets# | | Ratio
of Gross
Expenses
to Average
Net Assets
(excluding
dividend
and interest
expense
relating to
short sales)# | | Ratio
of Net
Expenses to
Average
Net
AssetsØ | | Ratio
of Net
Expenses
to Average
Net Assets
(excluding
dividend
and interest
expense
relating to
short sales)Ø | | Ratio
of Net
Investment
Income/
(Loss) to
Average
Net
Assets | | Portfolio
Turnover
Rate
(including
securities
sold short) | | Portfolio
Turnover
Rate
(excluding
securities
sold short) | |
Institutional Class | |
10/31/2022 | | $ | 11.40 | | | $ | (0.11 | ) | | $ | 0.60 | | | $ | 0.49 | | | $ | (0.02 | ) | | $ | — | | | $ | (0.02 | ) | | $ | 11.87 | | | | 4.30 | % | | $ | 124.0 | | | | 2.93 | % | | | 2.67 | % | | | 2.24 | % | | | 1.98 | % | | | (0.97 | )% | | | 204 | % | | | 204 | % | |
10/31/2021 | | $ | 10.80 | | | $ | (0.13 | ) | | $ | 0.92 | | | $ | 0.79 | | | $ | (0.19 | ) | | $ | — | | | $ | (0.19 | ) | | $ | 11.40 | | | | 7.40 | % | | $ | 61.4 | | | | 2.94 | % | | | 2.74 | % | | | 2.17 | % | | | 1.97 | % | | | (1.16 | )% | | | 296 | % | | | 308 | % | |
10/31/2020 | | $ | 10.97 | | | $ | 0.01 | | | $ | 0.21 | | | $ | 0.22 | | | $ | (0.39 | ) | | $ | — | | | $ | (0.39 | ) | | $ | 10.80 | | | | 2.01 | % | | $ | 84.5 | | | | 2.69 | % | | | 2.54 | % | | | 2.12 | % | | | 1.97 | % | | | 0.10 | % | | | 230 | % | | | 219 | % | |
10/31/2019 | | $ | 10.71 | | | $ | 0.08 | | | $ | 0.19 | | | $ | 0.27 | | | $ | (0.01 | ) | | $ | — | | | $ | (0.01 | ) | | $ | 10.97 | | | | 2.48 | % | | $ | 157.6 | | | | 2.59 | % | | | 2.27 | % | | | 2.30 | % | | | 1.98 | % | | | 0.77 | % | | | 248 | % | | | 246 | % | |
10/31/2018 | | $ | 10.77 | | | $ | 0.09 | | | $ | (0.15 | ) | | $ | (0.06 | ) | | $ | — | | | $ | — | | | $ | — | | | $ | 10.71 | | | | (0.56 | )% | | $ | 201.1 | | | | 2.53 | % | | | 2.16 | % | | | 2.34 | % | | | 1.97 | % | | | 0.86 | % | | | 194 | % | | | 179 | % | |
Class A | |
10/31/2022 | | $ | 11.19 | | | $ | (0.15 | ) | | $ | 0.58 | | | $ | 0.43 | | | $ | — | | | $ | — | | | $ | — | | | $ | 11.62 | | | | 3.84 | % | | $ | 8.3 | | | | 3.29 | % | | | 3.02 | % | | | 2.58 | % | | | 2.31 | % | | | (1.37 | )% | | | 204 | % | | | 204 | % | |
10/31/2021 | | $ | 10.60 | | | $ | (0.18 | ) | | $ | 0.92 | | | $ | 0.74 | | | $ | (0.15 | ) | | $ | — | | | $ | (0.15 | ) | | $ | 11.19 | | | | 7.07 | % | | $ | 6.9 | | | | 3.32 | % | | | 3.11 | % | | | 2.54 | % | | | 2.33 | % | | | (1.60 | )% | | | 296 | % | | | 308 | % | |
10/31/2020 | | $ | 10.78 | | | $ | (0.03 | ) | | $ | 0.20 | | | $ | 0.17 | | | $ | (0.35 | ) | | $ | — | | | $ | (0.35 | ) | | $ | 10.60 | | | | 1.58 | % | | $ | 6.6 | | | | 3.22 | % | | | 3.08 | % | | | 2.47 | % | | | 2.33 | % | | | (0.32 | )% | | | 230 | % | | | 219 | % | |
10/31/2019 | | $ | 10.55 | | | $ | 0.04 | | | $ | 0.19 | | | $ | 0.23 | | | $ | — | | | $ | — | | | $ | — | | | $ | 10.78 | | | | 2.18 | % | | $ | 7.3 | | | | 2.98 | % | | | 2.65 | % | | | 2.67 | % | | | 2.33 | % | | | 0.40 | % | | | 248 | % | | | 246 | % | |
10/31/2018 | | $ | 10.65 | | | $ | 0.06 | | | $ | (0.16 | ) | | $ | (0.10 | ) | | $ | — | | | $ | — | | | $ | — | | | $ | 10.55 | | | | (0.94 | )% | | $ | 18.1 | | | | 2.83 | % | | | 2.55 | % | | | 2.61 | % | | | 2.33 | % | | | 0.60 | % | | | 194 | % | | | 179 | % | |
Class C | |
10/31/2022 | | $ | 10.58 | | | $ | (0.23 | ) | | $ | 0.55 | | | $ | 0.32 | | | $ | — | | | $ | — | | | $ | — | | | $ | 10.90 | | | | 3.02 | % | | $ | 2.8 | | | | 4.08 | % | | | 3.82 | % | | | 3.35 | % | | | 3.08 | % | | | (2.16 | )% | | | 204 | % | | | 204 | % | |
10/31/2021 | | $ | 10.03 | | | $ | (0.23 | ) | | $ | 0.85 | | | $ | 0.62 | | | $ | (0.07 | ) | | $ | — | | | $ | (0.07 | ) | | $ | 10.58 | | | | 6.23 | % | | $ | 3.0 | | | | 4.07 | % | | | 3.87 | % | | | 3.29 | % | | | 3.08 | % | | | (2.24 | )% | | | 296 | % | | | 308 | % | |
10/31/2020 | | $ | 10.20 | | | $ | (0.10 | ) | | $ | 0.20 | | | $ | 0.10 | | | $ | (0.27 | ) | | $ | — | | | $ | (0.27 | ) | | $ | 10.03 | | | | 0.96 | % | | $ | 4.7 | | | | 3.82 | % | | | 3.67 | % | | | 3.23 | % | | | 3.08 | % | | | (0.98 | )% | | | 230 | % | | | 219 | % | |
10/31/2019 | | $ | 10.06 | | | $ | (0.03 | ) | | $ | 0.17 | | | $ | 0.14 | | | $ | — | | | $ | — | | | $ | — | | | $ | 10.20 | | | | 1.39 | % | | $ | 7.7 | | | | 3.71 | % | | | 3.39 | % | | | 3.40 | % | | | 3.09 | % | | | (0.33 | )% | | | 248 | % | | | 246 | % | |
10/31/2018 | | $ | 10.24 | | | $ | (0.03 | ) | | $ | (0.15 | ) | | $ | (0.18 | ) | | $ | — | | | $ | — | | | $ | — | | | $ | 10.06 | | | | (1.76 | )% | | $ | 11.6 | | | | 3.65 | % | | | 3.28 | % | | | 3.45 | % | | | 3.08 | % | | | (0.24 | )% | | | 194 | % | | | 179 | % | |
Class R6 | |
10/31/2022 | | $ | 11.41 | | | $ | (0.11 | ) | | $ | 0.61 | | | $ | 0.50 | | | $ | (0.03 | ) | | $ | — | | | $ | (0.03 | ) | | $ | 11.88 | | | | 4.40 | % | | $ | 4.0 | | | | 2.86 | % | | | 2.59 | % | | | 2.14 | % | | | 1.87 | % | | | (1.00 | )% | | | 204 | % | | | 204 | % | |
10/31/2021 | | $ | 10.81 | | | $ | (0.14 | ) | | $ | 0.94 | | | $ | 0.80 | | | $ | (0.20 | ) | | $ | — | | | $ | (0.20 | ) | | $ | 11.41 | | | | 7.50 | % | | $ | 3.6 | | | | 2.87 | % | | | 2.66 | % | | | 2.07 | % | | | 1.87 | % | | | (1.27 | )% | | | 296 | % | | | 308 | % | |
10/31/2020 | | $ | 10.98 | | | $ | 0.01 | | | $ | 0.21 | | | $ | 0.22 | | | $ | (0.39 | ) | | $ | — | | | $ | (0.39 | ) | | $ | 10.81 | | | | 2.10 | % | | $ | 1.6 | | | | 2.59 | % | | | 2.45 | % | | | 2.01 | % | | | 1.87 | % | | | 0.07 | % | | | 230 | % | | | 219 | % | |
10/31/2019 | | $ | 10.71 | | | $ | 0.09 | | | $ | 0.19 | | | $ | 0.28 | | | $ | (0.01 | ) | | $ | — | | | $ | (0.01 | ) | | $ | 10.98 | | | | 2.64 | % | | $ | 1.4 | | | | 2.55 | % | | | 2.21 | % | | | 2.22 | % | | | 1.88 | % | | | 0.84 | % | | | 248 | % | | | 246 | % | |
10/31/2018 | | $ | 10.77 | | | $ | 0.10 | | | $ | (0.16 | ) | | $ | (0.06 | ) | | $ | — | | | $ | — | | | $ | — | | | $ | 10.71 | | | | (0.56 | )% | | $ | 15.3 | | | | 2.45 | % | | | 2.09 | % | | | 2.26 | % | | | 1.90 | % | | | 0.93 | % | | | 194 | % | | | 179 | % | |
Class E | |
Period from 01/11/2022^
to 10/31/2022 | | $ | 11.17 | | | $ | (0.01 | ) | | $ | 0.81 | | | $ | 0.80 | | | $ | — | | | $ | — | | | $ | — | | | $ | 11.97 | | | | 7.16 | %* | | $ | 2.2 | | | | 2.99 | %** | | | 2.66 | %** | | | 1.29 | %** | | | 0.96 | %** | | | (0.12 | )%** | | | 204 | %*ØØ | | | 204 | %*ØØ | |
See Notes to Consolidated Financial Highlights
51
52
Notes to Consolidated Financial Highlights
@ Calculated based on the average number of shares outstanding during each fiscal period.
† Total return based on per share NAV reflects the effects of changes in NAV on the performance of the Fund during each fiscal period. Returns assume income dividends and other distributions, if any, were reinvested, but do not reflect the effect of sales charges. Results represent past performance and do not indicate future results. Current returns may be lower or higher than the performance data quoted. Investment returns and principal will fluctuate and shares, when redeemed, may be worth more or less than original cost. Total return would have been lower if Management had not reimbursed and/or waived certain expenses. Total return would have been higher if Management had not recouped previously reimbursed and/or waived expenses.
d The class action proceeds listed in Note A of the Notes to Consolidated Financial Statements had no impact on the Fund's total returns for the year ended October 31, 2022. Had the Fund not received class action proceeds in 2021, the total returns based on per share NAV for the year ended October 31, 2021 would have been:
Institutional Class | | | 6.84 | % | |
Class A | | | 6.59 | % | |
Class C | | | 5.63 | % | |
Class R6 | | | 7.13 | % | |
The class action proceeds received in 2020, 2019, and 2018 had no impact on the Fund's total returns for the years ended October 31, 2020, 2019, and 2018.
# Represents the annualized ratios of net expenses to average daily net assets if Management had not reimbursed certain expenses and/or waived a portion of the investment management fee.
* Not annualized.
** Annualized.
^ The date investment operations commenced.
Ø After reimbursement of expenses and/or waiver of a portion of the investment management fee by Management. The Fund is required to calculate an expense ratio without taking into consideration any expense reductions related to expense offset arrangements (see Note A in the Notes to Consolidated Financial Statements). Had the Fund not received expense reductions related to expense offset arrangements, the annualized ratios of net expenses to average daily net assets would have been:
| | | Including
Dividend
and
Interest
Expense
Relating to
Short Sales | | Excluding
Dividend
and
Interest
Expense
Relating to
Short Sales | | Including
Dividend
and
Interest
Expense
Relating to
Short Sales | | Excluding
Dividend
and
Interest
Expense
Relating to
Short Sales | | Including
Dividend
and
Interest
Expense
Relating to
Short Sales | | Excluding
Dividend
and
Interest
Expense
Relating to
Short Sales | | Including
Dividend
and
Interest
Expense
Relating to
Short Sales | | Excluding
Dividend
and
Interest
Expense
Relating to
Short Sales | | Including
Dividend
and
Interest
Expense
Relating to
Short Sales | | Excluding
Dividend
and
Interest
Expense
Relating to
Short Sales | |
| | | Year Ended
October 31, 2022 | | Year Ended
October 31, 2021 | | Year Ended
October 31, 2020 | | Year Ended
October 31, 2019 | | Year Ended
October 31, 2018 | |
Institutional Class | | | 2.24 | % | | | 1.98 | % | | | 2.17 | % | | | 1.97 | % | | | 2.12 | % | | | 1.97 | % | | | 2.30 | % | | | 1.98 | % | | | 2.33 | % | | | 1.97 | % | |
Class A | | | 2.58 | % | | | 2.31 | % | | | 2.54 | % | | | 2.33 | % | | | 2.47 | % | | | 2.33 | % | | | 2.67 | % | | | 2.33 | % | | | 2.61 | % | | | 2.33 | % | |
Class C | | | 3.35 | % | | | 3.08 | % | | | 3.29 | % | | | 3.08 | % | | | 3.23 | % | | | 3.08 | % | | | 3.40 | % | | | 3.09 | % | | | 3.45 | % | | | 3.08 | % | |
Class R6 | | | 2.14 | % | | | 1.87 | % | | | 2.07 | % | | | 1.87 | % | | | 2.01 | % | | | 1.87 | % | | | 2.22 | % | | | 1.88 | % | | | 2.26 | % | | | 1.90 | % | |
| Class E(a) | | | 1.29 | % | | | 0.96 | % | | | — | % | | | — | % | | | — | % | | | — | % | | | — | % | | | — | % | | | — | % | | | — | % | |
(a) Period from January 11, 2022 (Commencement of Operations) to October 31, 2022.
ØØ Portfolio turnover is calculated at the Fund level. Percentage indicated was calculated for the year ended October 31, 2022 for the Fund.
53
Report of Independent Registered Public Accounting Firm
To the Shareholders and Board of Trustees of Neuberger Berman Absolute Return Multi-Manager Fund
Opinion on the Financial Statements
We have audited the accompanying consolidated statement of assets and liabilities of Neuberger Berman Absolute Return Multi-Manager Fund (the "Fund") (one of the series constituting Neuberger Berman Alternative Funds (the "Trust")), including the consolidated schedule of investments, as of October 31, 2022 and the related consolidated statement of operations for the year then ended, the consolidated statements of changes in net assets for each of the two years in the period then ended, the consolidated financial highlights for each of the five years in the period then ended and the related notes (collectively referred to as the "financial statements"). In our opinion, the financial statements present fairly, in all material respects, the consolidated financial position of the Fund (one of the series constituting Neuberger Berman Alternative Funds) at October 31, 2022, the consolidated results of its operations for the year ended, the consolidated changes in net assets for each of the two years in the period then ended and its consolidated financial highlights for each of the five years in the period then ended, in conformity with U.S. generally accepted accounting principles.
Basis for Opinion
These financial statements are the responsibility of the Trust's management. Our responsibility is to express an opinion on the Fund's financial statements based on our audits. We are a public accounting firm registered with the Public Company Accounting Oversight Board (United States) ("PCAOB") and are required to be independent with respect to the Trust in accordance with the U.S. federal securities laws and the applicable rules and regulations of the Securities and Exchange Commission and the PCAOB.
We conducted our audits in accordance with the standards of the PCAOB. Those standards require that we plan and perform the audit to obtain reasonable assurance about whether the financial statements are free of material misstatement, whether due to error or fraud. The Trust is not required to have, nor were we engaged to perform, an audit of the Trust's internal control over financial reporting. As part of our audits, we are required to obtain an understanding of internal control over financial reporting, but not for the purpose of expressing an opinion on the effectiveness of the Trust's internal control over financial reporting. Accordingly, we express no such opinion.
Our audits included performing procedures to assess the risks of material misstatement of the financial statements, whether due to error or fraud, and performing procedures that respond to those risks. Such procedures included examining, on a test basis, evidence regarding the amounts and disclosures in the financial statements. Our procedures included confirmation of securities owned as of October 31, 2022, by correspondence with the custodian, brokers and others; when replies were not received from brokers and others, we performed other auditing procedures. Our audits also included evaluating the accounting principles used and significant estimates made by management, as well as evaluating the overall presentation of the financial statements. We believe that our audits provide a reasonable basis for our opinion.

We have served as the auditor of one or more Neuberger Berman investment companies since 1954.
Boston, Massachusetts
December 23, 2022
54
Investment Manager and Administrator
Neuberger Berman Investment Advisers LLC
1290 Avenue of the Americas
New York, NY 10104-0002
Shareholder Services 800.877.9700 or 212.476.8800
Intermediary Client Services 800.366.6264
Distributor
Neuberger Berman BD LLC
1290 Avenue of the Americas
New York, NY 10104-0002
Shareholder Services 800.877.9700 or 212.476.8800
Intermediary Client Services 800.366.6264
Subadvisers
BH-DG Systematic Trading LLP
55 Baker Street
London W1U 7EU, United Kingdom
GAMCO Asset Management Inc.
One Corporate Center
Rye, NY 10580
P/E Global, LLC
75 State Street, 31st Floor
Boston, MA 02109
Portland Hill Asset Management Limited
21 Knightsbridge
London SW1X7LY, United Kingdom
Custodian
JPMorgan Chase & Co.
4 Chase Metrotech Center
Brooklyn, NY 11245
Shareholder Servicing Agent
DST Asset Manager Solutions Inc.
430 West 7th Street, Suite 219189
Kansas City, MO 64105-1407
For Institutional Class Shareholders
address correspondence to:
Neuberger Berman Funds
PO Box 219189
Kansas City, MO 64121-9189
Intermediary Client Services 800.366.6264
For Class A, Class C and Class R6 Shareholders:
Please contact your investment provider
Legal Counsel
K&L Gates LLP
1601 K Street, NW
Washington, DC 20006-1600
Independent Registered Public Accounting Firm
Ernst & Young LLP
200 Clarendon Street
Boston, MA 02116
55
The following tables set forth information concerning the Trustees and Officers of the Fund. All persons named as Trustees and Officers also serve in similar capacities for other funds administered or managed by NBIA. The Fund's Statement of Additional Information includes additional information about the Trustees as of the time of the Fund's most recent public offering and is available upon request, without charge, by calling (800) 877-9700.
Information about the Board of Trustees
Name, (Year of Birth),
and Address(1) | | Position(s)
and Length of
Time Served(2) | | Principal Occupation(s)(3) | | Number of
Funds in
Fund Complex
Overseen by
Fund Trustee | | Other Directorships Held
Outside Fund Complex by
Fund Trustee(3) | |
Independent Fund Trustees | | | | | | | | | |
Michael J. Cosgrove (1949) | | Trustee since 2015 | | President, Carragh Consulting USA, since 2014; formerly, Executive, General Electric Company, 1970 to 2014, including President, Mutual Funds and Global Investment Programs, GE Asset Management, 2011 to 2014, President and Chief Executive Officer, Mutual Funds and Intermediary Business, GE Asset Management, 2007 to 2011, President, Institutional Sales and Marketing, GE Asset Management, 1998 to 2007, and Chief Financial Officer, GE Asset Management, and Deputy Treasurer, GE Company, 1988 to 1993. | |
| 50 |
| | Director, America Press, Inc. (not-for-profit Jesuit publisher), 2015 to 2021; formerly, Director, Fordham University, 2001 to 2018; formerly, Director, The Gabelli Go Anywhere Trust, June 2015 to June 2016; formerly, Director, Skin Cancer Foundation (not-for-profit), 2006 to 2015; formerly, Director, GE Investments Funds, Inc., 1997 to 2014; formerly, Trustee, GE Institutional Funds, 1997 to 2014; formerly, Director, GE Asset Management, 1988 to 2014; formerly, Director, Elfun Trusts, 1988 to 2014; formerly, Trustee, GE Pension & Benefit Plans, 1988 to 2014; formerly, Member of Board of Governors, Investment Company Institute. | |
56
Name, (Year of Birth),
and Address(1) | | Position(s)
and Length of
Time Served(2) | | Principal Occupation(s)(3) | | Number of
Funds in
Fund Complex
Overseen by
Fund Trustee | | Other Directorships Held
Outside Fund Complex by
Fund Trustee(3) | |
Marc Gary (1952) | | Trustee since 2015 | | Executive Vice Chancellor Emeritus, The Jewish Theological Seminary, since 2020; formerly, Executive Vice Chancellor and Chief Operating Officer, The Jewish Theological Seminary, 2012 to 2020; formerly, Executive Vice President and General Counsel, Fidelity Investments, 2007 to 2012; formerly, Executive Vice President and General Counsel, BellSouth Corporation, 2004 to 2007; formerly, Vice President and Associate General Counsel, BellSouth Corporation, 2000 to 2004; formerly, Associate, Partner, and National Litigation Practice Co-Chair, Mayer, Brown LLP, 1981 to 2000; formerly, Associate Independent Counsel, Office of Independent Counsel, 1990 to 1992. | |
| 50 |
| | Chair and Director, USCJ Supporting Foundation, since 2021; Director, UJA Federation of Greater New York, since 2019; Trustee, Jewish Theological Seminary, since 2015; formerly, Director, Legility, Inc. (privately held for-profit company), 2012 to 2021; Director, Lawyers Committee for Civil Rights Under Law (not-for-profit), since 2005; formerly, Director, Equal Justice Works (not-for-profit), 2005 to 2014; formerly, Director, Corporate Counsel Institute, Georgetown University Law Center, 2007 to 2012; formerly, Director, Greater Boston Legal Services (not-for-profit), 2007 to 2012. | |
57
Name, (Year of Birth),
and Address(1) | | Position(s)
and Length of
Time Served(2) | | Principal Occupation(s)(3) | | Number of
Funds in
Fund Complex
Overseen by
Fund Trustee | | Other Directorships Held
Outside Fund Complex by
Fund Trustee(3) | |
Martha Clark Goss (1949) | | Trustee since 2007 | | Formerly, President, Woodhill Enterprises Inc./Chase Hollow Associates LLC (personal investment vehicle), 2006 to 2020; formerly, Consultant, Resources Global Professionals (temporary staffing), 2002 to 2006; formerly, Chief Financial Officer, Booz-Allen & Hamilton, Inc., 1995 to 1999; formerly, Enterprise Risk Officer, Prudential Insurance, 1994 to1995; formerly, President, Prudential Asset Management Company, 1992 to 1994; formerly, President, Prudential Power Funding (investments in electric and gas utilities and alternative energy projects), 1989 to 1992; formerly, Treasurer, Prudential Insurance Company, 1983 to 1989. | |
| 50 |
| | Director, American Water (water utility), since 2003; Director, Allianz Life of New York (insurance), since 2005; formerly, Director, Berger Group Holdings, Inc. (engineering consulting firm), from 2013 to 2018; formerly, Director, Financial Women's Association of New York (not-for-profit association), from 1987 to 1996, 2003 to 2019; Trustee Emerita, Brown University, since 1998; Director, Museum of American Finance (not-for-profit), since 2013; formerly, Non-Executive Chair and Director, Channel Reinsurance (financial guaranty reinsurance), 2006 to 2010; formerly, Director, Ocwen Financial Corporation (mortgage servicing), 2005 to 2010; formerly, Director, Claire's Stores, Inc. (retailer), 2005 to 2007; formerly, Director, Parsons Brinckerhoff Inc. (engineering consulting firm), 2007 to 2010; formerly, Director, Bank Leumi (commercial bank), 2005 to 2007; formerly, Advisory Board Member, Attensity (software developer), 2005 to 2007; formerly, Director of Foster Wheeler Manufacturing, 1994 to 2004; formerly. Director Dexter Corp., (Manufacturer of Non-Wovens, Plastics, and Medical Supplies), 1992 to 2001. | |
58
Name, (Year of Birth),
and Address(1) | | Position(s)
and Length of
Time Served(2) | | Principal Occupation(s)(3) | | Number of
Funds in
Fund Complex
Overseen by
Fund Trustee | | Other Directorships Held
Outside Fund Complex by
Fund Trustee(3) | |
Michael M. Knetter (1960) | | Trustee since 2007 | | President and Chief Executive Officer, University of Wisconsin Foundation, since 2010; formerly, Dean, School of Business, University of Wisconsin—Madison; formerly, Professor of International Economics and Associate Dean, Amos Tuck School of Business—Dartmouth College, 1998 to 2002. | |
| 50 |
| | Director, 1 William Street Credit Income Fund, since 2018; Board Member, American Family Insurance (a mutual company, not publicly traded), since March 2009; formerly, Trustee, Northwestern Mutual Series Fund, Inc., 2007 to 2011; formerly, Director, Wausau Paper, 2005 to 2011; formerly, Director, Great Wolf Resorts, 2004 to 2009. | |
Deborah C. McLean (1954) | | Trustee since 2015 | | Member, Circle Financial Group (private wealth management membership practice), since 2011; Managing Director, Golden Seeds LLC (an angel investing group), since 2009; Adjunct Professor, (Corporate Finance), Columbia University School of International and Public Affairs, since 2008; formerly, Visiting Assistant Professor, Fairfield University, Dolan School of Business, Fall 2007; formerly, Adjunct Associate Professor of Finance, Richmond, The American International University in London, 1999 to 2007. | |
| 50 |
| | Board member, The Maritime Aquarium at Norwalk, since 2020; Board member, Norwalk Community College Foundation, since 2014; Dean's Advisory Council, Radcliffe Institute for Advanced Study, since 2014; formerly, Director and Treasurer, At Home in Darien (not-for-profit), 2012 to 2014; formerly, Director, National Executive Service Corps (not-for-profit), 2012 to 2013; formerly, Trustee, Richmond, The American International University in London, 1999 to 2013. | |
59
Name, (Year of Birth),
and Address(1) | | Position(s)
and Length of
Time Served(2) | | Principal Occupation(s)(3) | | Number of
Funds in
Fund Complex
Overseen by
Fund Trustee | | Other Directorships Held
Outside Fund Complex by
Fund Trustee(3) | |
George W. Morriss (1947) | | Trustee since 2007 | | Formerly, Adjunct Professor, Columbia University School of International and Public Affairs, from 2012 to 2018; formerly, Executive Vice President and Chief Financial Officer, People's United Bank, Connecticut (a financial services company), 1991 to 2001. | |
| 50 |
| | Director, 1 WS Credit Income Fund; Chair, Audit Committee, since 2018; Director and Chair, Thrivent Church Loan and Income Fund, since 2018; formerly, Trustee, Steben Alternative Investment Funds, Steben Select Multi-Strategy Fund, and Steben Select Multi-Strategy Master Fund, 2013 to 2017; formerly, Treasurer, National Association of Corporate Directors, Connecticut Chapter, 2011 to 2015; formerly, Manager, Larch Lane Multi-Strategy Fund complex (which consisted of three funds), 2006 to 2011; formerly, Member, NASDAQ Issuers' Affairs Committee, 1995 to 2003. | |
Tom D. Seip (1950) | | Trustee since inception; Chairman of the Board since 2008; formerly Lead Independent Trustee from 2006 to 2008 | | Formerly, Managing Member, Ridgefield Farm LLC (a private investment vehicle), 2004 to 2016; formerly, President and CEO, Westaff, Inc. (temporary staffing), May 2001 to January 2002; formerly, Senior Executive, The Charles Schwab Corporation, 1983 to 1998, including Chief Executive Officer, Charles Schwab Investment Management, Inc.; Trustee, Schwab Family of Funds and Schwab Investments, 1997 to 1998; and Executive Vice President-Retail Brokerage, Charles Schwab & Co., Inc., 1994 to 1997. | |
| 50 |
| | Trustee, University of Maryland, Shore Regional Health System, since 2020; formerly, Director, H&R Block, Inc. (tax services company), 2001 to 2018; formerly, Director, Talbot Hospice Inc., 2013 to 2016; formerly, Chairman, Governance and Nominating Committee, H&R Block, Inc., 2011 to 2015; formerly, Chairman, Compensation Committee, H&R Block, Inc., 2006 to 2010; formerly, Director, Forward Management, Inc. (asset management company), 1999 to 2006. | |
60
Name, (Year of Birth),
and Address(1) | | Position(s)
and Length of
Time Served(2) | | Principal Occupation(s)(3) | | Number of
Funds in
Fund Complex
Overseen by
Fund Trustee | | Other Directorships Held
Outside Fund Complex by
Fund Trustee(3) | |
James G. Stavridis (1955) | | Trustee since 2015 | | Vice Chairman Global Affairs, The Carlyle Group, since 2018; Commentator, NBC News, since 2015; formerly, Dean, Fletcher School of Law and Diplomacy, Tufts University, 2013 to 2018; formerly, Admiral, United States Navy, 1976 to 2013, including Supreme Allied Commander, NATO and Commander, European Command, 2009 to 2013, and Commander, United States Southern Command, 2006 to 2009. | |
| 50 |
| | Director, Fortinet (cybersecurity), since 2021; Director, Ankura, since 2020; Director, Vigor Shipyard, since 2019; Director, Rockefeller Foundation, since 2018; Director, American Water (water utility), since 2018; Director, NFP Corp. (insurance broker and consultant), since 2017; Director, Onassis Foundation, since 2014; Director, Michael Baker International (construction) since 2014; Director, Vertical Knowledge, LLC, since 2013; formerly, Director, U.S. Naval Institute, 2014 to 2019; formerly, Director, Navy Federal Credit Union, 2000-2002; formerly, Director, BMC Software Federal, LLC, 2014-2019. | |
61
Name, (Year of Birth),
and Address(1) | | Position(s)
and Length of
Time Served(2) | | Principal Occupation(s)(3) | | Number of
Funds in
Fund Complex
Overseen by
Fund Trustee | | Other Directorships Held
Outside Fund Complex by
Fund Trustee(3) | |
Fund Trustees who are "Interested Persons" | | | | | | | | | |
Joseph V. Amato* (1962) | | Chief Executive Officer and President since 2018 and Trustee since 2009 | | President and Director, Neuberger Berman Group LLC, since 2009; President and Chief Executive Officer, Neuberger Berman BD LLC and Neuberger Berman Holdings LLC (including its predecessor, Neuberger Berman Inc.), since 2007; Chief Investment Officer (Equities) and President (Equities), NBIA (formerly, Neuberger Berman Fixed Income LLC and including predecessor entities), since 2007, and Board Member of NBIA since 2006; formerly, Global Head of Asset Management of Lehman Brothers Holdings Inc.'s ("LBHI") Investment Management Division, 2006 to 2009; formerly, member of LBHI's Investment Management Division's Executive Management Committee, 2006 to 2009; formerly, Managing Director, Lehman Brothers Inc. ("LBI"), 2006 to 2008; formerly, Chief Recruiting and Development Officer, LBI, 2005 to 2006; formerly, Global Head of LBI's Equity Sales and a Member of its Equities Division Executive Committee, 2003 to 2005; President and Chief Executive Officer, twelve registered investment companies for which NBIA acts as investment manager and/or administrator. | |
| 50 |
| | Member of Board of Advisors, McDonough School of Business, Georgetown University, since 2001; Member of New York City Board of Advisors, Teach for America, since 2005; Trustee, Montclair Kimberley Academy (private school), since 2007; Member of Board of Regents, Georgetown University, since 2013. | |
(1) The business address of each listed person is 1290 Avenue of the Americas, New York, NY 10104.
(2) Pursuant to the Trust's Amended and Restated Trust Instrument, subject to any limitations on the term of service imposed by the By-Laws or any retirement policy adopted by the Fund Trustees, each Fund Trustee shall hold
62
office for life or until his or her successor is elected or the Trust terminates; except that (a) any Fund Trustee may resign by delivering a written resignation; (b) any Fund Trustee may be removed with or without cause at any time by a written instrument signed by at least two-thirds of the other Fund Trustees; (c) any Fund Trustee who requests to be retired, or who has become unable to serve, may be retired by a written instrument signed by a majority of the other Fund Trustees; and (d) any Fund Trustee may be removed at any shareholder meeting by a vote of at least two-thirds of the outstanding shares.
(3) Except as otherwise indicated, each individual has held the positions shown during at least the last five years.
* Indicates a Fund Trustee who is an "interested person" within the meaning of the 1940 Act. Mr. Amato is an interested person of the Trust by virtue of the fact that he is an officer of NBIA and/or its affiliates.
63
Information about the Officers of the Trust
Name, (Year of Birth),
and Address(1) | | Position(s)
and Length of
Time Served(2) | | Principal Occupation(s)(3) | |
Claudia A. Brandon (1956) | | Executive Vice President since 2008 and Secretary since inception | | Senior Vice President, Neuberger Berman, since 2007 and Employee since 1999; Senior Vice President, NBIA, since 2008 and Assistant Secretary since 2004; formerly, Vice President, Neuberger Berman, 2002 to 2006; formerly, Vice President—Mutual Fund Board Relations, NBIA, 2000 to 2008; formerly, Vice President, NBIA, 1986 to 1999 and Employee, 1984 to 1999; Executive Vice President and Secretary, thirty-three registered investment companies for which NBIA acts as investment manager and/or administrator. | |
Agnes Diaz (1971) | | Vice President since 2013 | | Senior Vice President, Neuberger Berman, since 2012; Senior Vice President, NBIA, since 2012 and Employee since 1996; formerly, Vice President, Neuberger Berman, 2007 to 2012; Vice President, twelve registered investment companies for which NBIA acts as investment manager and/or administrator. | |
Anthony DiBernardo (1979) | | Assistant Treasurer since 2011 | | Senior Vice President, Neuberger Berman, since 2014; Senior Vice President, NBIA, since 2014, and Employee since 2003; formerly, Vice President, Neuberger Berman, 2009 to 2014; Assistant Treasurer, twelve registered investment companies for which NBIA acts as investment manager and/or administrator. | |
Savonne L. Ferguson (1973) | | Chief Compliance Officer since 2018 | | Senior Vice President, Chief Compliance Officer (Mutual Funds) and Associate General Counsel, NBIA, since November 2018; formerly, Vice President T. Rowe Price Group, Inc. (2018), Vice President and Senior Legal Counsel, T. Rowe Price Associates, Inc. (2014-2018), Vice President and Director of Regulatory Fund Administration, PNC Capital Advisors, LLC (2009-2014), Secretary, PNC Funds and PNC Advantage Funds (2010-2014); Chief Compliance Officer, thirty-three registered investment companies for which NBIA acts as investment manager and/or administrator. | |
Corey A. Issing (1978) | | Chief Legal Officer since 2016 (only for purposes of sections 307 and 406 of the Sarbanes-Oxley Act of 2002) | | General Counsel—Mutual Funds since 2016 and Managing Director, NBIA, since 2017; formerly, Associate General Counsel (2015 to 2016), Counsel (2007 to 2015), Senior Vice President (2013-2016), Vice President (2009-2013); Chief Legal Officer (only for purposes of sections 307 and 406 of the Sarbanes-Oxley Act of 2002), thirty-three registered investment companies for which NBIA acts as investment manager and/or administrator. | |
Sheila R. James (1965) | | Assistant Secretary since inception | | Vice President, Neuberger Berman, since 2008 and Employee since 1999; Vice President, NBIA, since 2008; formerly, Assistant Vice President, Neuberger Berman, 2007; Employee, NBIA, 1991 to 1999; Assistant Secretary, thirty-three registered investment companies for which NBIA acts as investment manager and/or administrator. | |
64
Name, (Year of Birth),
and Address(1) | | Position(s)
and Length of
Time Served(2) | | Principal Occupation(s)(3) | |
Brian Kerrane (1969) | | Chief Operating Officer since 2015 and Vice President since 2008 | | Managing Director, Neuberger Berman, since 2013; Chief Operating Officer—Mutual Funds and Managing Director, NBIA, since 2015; formerly, Senior Vice President, Neuberger Berman, 2006 to 2014; Vice President, NBIA, 2008 to 2015 and Employee since 1991; Chief Operating Officer, twelve registered investment companies for which NBIA acts as investment manager and/or administrator; Vice President, thirty-three registered investment companies for which NBIA acts as investment manager and/or administrator. | |
Anthony Maltese (1959) | | Vice President since 2015 | | Senior Vice President, Neuberger Berman, since 2014 and Employee since 2000; Senior Vice President, NBIA, since 2014; Vice President, twelve registered investment companies for which NBIA acts as investment manager and/or administrator. | |
Josephine Marone (1963) | | Assistant Secretary since 2017 | | Senior Paralegal, Neuberger Berman, since 2007 and Employee since 2007; Assistant Secretary, thirty-three registered investment companies for which NBIA acts as investment manager and/or administrator. | |
Owen F. McEntee, Jr. (1961) | | Vice President since 2008 | | Vice President, Neuberger Berman, since 2006; Vice President, NBIA, since 2006 and Employee since 1992; Vice President, twelve registered investment companies for which NBIA acts as investment manager and/or administrator. | |
John M. McGovern (1970) | | Treasurer and Principal Financial and Accounting Officer since inception | | Managing Director, Neuberger Berman, Since 2022; Senior Vice President, Neuberger Berman, 2007-2021; Senior Vice President, NBIA, since 2007 and Employee since 1993; formerly, Vice President, Neuberger Berman, 2004 to 2006; formerly, Assistant Treasurer, 2002 to 2005; Treasurer and Principal Financial and Accounting Officer, twelve registered investment companies for which NBIA acts as investment manager and/or administrator. | |
Frank Rosato (1971) | | Assistant Treasurer since inception | | Vice President, Neuberger Berman, since 2006; Vice President, NBIA, since 2006 and Employee since 1995; Assistant Treasurer, twelve registered investment companies for which NBIA acts as investment manager and/or administrator. | |
Niketh Velamoor (1979) | | Anti-Money Laundering Compliance Officer since 2018 | | Senior Vice President and Associate General Counsel, Neuberger Berman, since July 2018; Assistant United States Attorney, Southern District of New York, 2009 to 2018; Anti-Money Laundering Compliance Officer, five registered investment companies for which NBIA acts as investment manager and/or administrator. | |
(1) The business address of each listed person is 1290 Avenue of the Americas, New York, New York 10104.
(2) Pursuant to the By-Laws of the Trust, each officer elected by the Fund Trustees shall hold office until his or her successor shall have been elected and qualified or until his or her earlier death, inability to serve, or resignation. Officers serve at the pleasure of the Fund Trustees and may be removed at any time with or without cause.
(3) Except as otherwise indicated, each individual has held the positions shown during at least the last five years.
65
Proxy Voting Policies and Procedures
A description of the policies and procedures that the Trust uses to determine how to vote proxies relating to portfolio securities is available, without charge, by calling 800-877-9700 (toll-free) and on the SEC's website at www.sec.gov. Information regarding how the Trust voted proxies relating to portfolio securities during the most recent 12-month period ended June 30 is also available upon request, without charge, by calling 800-877-9700 (toll-free), on the SEC's website at www.sec.gov, and on Neuberger Berman's website at www.nb.com.
Quarterly Portfolio Schedule
The Trust files a complete schedule of portfolio holdings for the Fund with the SEC for the first and third quarters of each fiscal year as an exhibit to its report on Form N-PORT. The Trust's Form N-PORT is available on the SEC's website at www.sec.gov. The portfolio holdings information on Form N-PORT is available upon request, without charge, by calling 800-877-9700 (toll-free).
Liquidity Risk Management Program
Consistent with Rule 22e-4 under the Investment Company Act of 1940 (the "Liquidity Rule"), as amended, the Fund has established a liquidity risk management program (the "Program"). The Program seeks to assess and manage the Fund's liquidity risk, which is defined as the risk that a Fund is unable to meet investor redemption requests without significantly diluting the remaining investors' interests in a Fund. The Board has approved the designation of NBIA Funds' Liquidity Committee, comprised of NBIA employees, as the program administrator (the "Program Administrator"). The Program Administrator is responsible for implementing and monitoring the Program and utilizes NBIA personnel to assess and review, on an ongoing basis, the Fund's liquidity risk.
The Program includes a number of elements that support the management and assessment of liquidity risk, including an annual assessment of the Fund's liquidity risk factors and the periodic classification (or re-classification, as necessary) of the Fund's investments into buckets (highly liquid, moderately liquid, less liquid and illiquid) that reflect the Program Administrator's assessment of the investments' liquidity under current market conditions, which for the relevant period included, among other factors, market volatility as a result of geopolitical tensions (e.g., Russia's invasion of Ukraine) and the emergence of new COVID variants. The Program Administrator also utilizes information about the Fund's investment strategy, the characteristics of the Fund's shareholder base and historical redemption activity.
The Program Administrator provided the Board with a written report that addressed the operation of the Program and assessed its adequacy and effectiveness of implementation from April 1, 2021 through March 31, 2022. During the period covered by this report, the Program Administrator reported that the Program effectively assisted the Program Administrator in monitoring whether a Fund maintained a level of liquidity appropriate for its shareholder base and historical redemption activity.
Notice to Shareholders
In early 2023 you will receive information to be used in filing your 2022 tax returns, which will include a notice of the exact tax status of all distributions paid to you by the Fund during calendar year 2022. Please consult your own tax advisor for details as to how this information should be reflected on your tax returns.
For the fiscal year ended October 31, 2022, the Fund designates $110,520 or up to the maximum amount of such dividends allowable pursuant to the Internal Revenue Code, as both qualified dividend income and dividends received deduction eligible for reduced tax rates. Complete information regarding the Fund's distributions during the calendar year 2022 will be reported in conjunction with Form 1099-DIV.
66
Report of Votes of Shareholders
A Special Meeting of Shareholders was held on June 30, 2022, adjourned to August 11, 2022, and further adjourned to August 30, 2022 for certain of the Neuberger Berman Alternative Funds (the "Trust"). Shareholders voted to approve the election of four trustees to the Board of Trustees of the Trust and to approve the amendment of certain fundamental investment policies of each series of the Trust, including the Fund.
Proposal 1—To approve the election of Michael J. Cosgrove, Marc Gary, Deborah C. McLean, and James G. Stavridis as Trustees to the Board of Trustees of the Trust as follows:
Neuberger Berman Alternative Funds
| | | Number of Shares | |
| | | Votes For | | Votes Against | | Abstentions | |
Michael J. Cosgrove | | | 327,577,100 | | | | — | | | | 1,014,069 | | |
Marc Gary | | | 327,610,552 | | | | — | | | | 980,617 | | |
Deborah C. McLean | | | 328,139,995 | | | | — | | | | 451,173 | | |
James G. Stavridis | | | 325,982,569 | | | | — | | | | 2,608,599 | | |
Proposal 2—To approve the amendment of certain fundamental investment policies of the Fund as follows:
(A) To approve the amendment of the fundamental investment policy regarding borrowing;
(B) To approve the amendment of the fundamental investment policy regarding commodities;
(C) To approve the amendment of the fundamental investment policy regarding industry concentration;
(D) To approve the amendment of the fundamental investment policy regarding lending;
(E) To approve the amendment of the fundamental investment policy regarding investing in real estate;
(F) To approve the amendment of the fundamental investment policy regarding the issuance of senior securities to permit issuing senior securities; and
(G) To approve the amendment of the fundamental investment policy regarding underwriting.
| | | Number of Shares | |
Proposal | | Votes For | | Votes Against | | Abstentions | |
A | | | 2,669,519 | | | | 147,396 | | | | 71,218 | | |
B | | | 2,766,539 | | | | 49,934 | | | | 71,660 | | |
C | | | 2,797,481 | | | | 17,079 | | | | 73,574 | | |
D | | | 2,794,688 | | | | 18,383 | | | | 75,062 | | |
E | | | 2,795,835 | | | | 16,821 | | | | 75,477 | | |
F | | | 2,795,370 | | | | 17,719 | | | | 75,044 | | |
G | | | 2,766,206 | | | | 47,085 | | | | 74,843 | | |
67
Board Consideration of the Management and Sub-Advisory Agreements
On an annual basis, the Board of Trustees (the "Board or "Trustees"") of Neuberger Berman Alternative Funds (the "Trust"), including the Trustees who are not "interested persons" of the Trust or of Neuberger Berman Investment Advisers LLC ("Management") (including its affiliates), as such term is defined under the Investment Company Act of 1940, as amended ("1940 Act"), ("Independent Fund Trustees"), considers whether to continue the management agreement with Management (the "Management Agreement") and the separate sub-advisory agreements between Management and each sub-adviser (each a "Sub-Adviser") with respect to Neuberger Berman Absolute Return Multi-Manager Fund ("ARMM" or "Fund"). The Board considered the sub-advisory agreements between Management and each of the following Sub-Advisers: BH-DG Systematic Trading LLP, GAMCO Asset Management Inc., P/E Global, LLC, and Portland Hill Asset Management Limited (each a "Sub-Advisory Agreement"; collectively with the Management Agreement, the "Agreements"). Throughout the process, the Independent Fund Trustees are advised by counsel that is experienced in 1940 Act matters and that is independent of Management ("Independent Counsel"). At a meeting held on September 29, 2022 the Board, including the Independent Fund Trustees, approved the continuation of the Agreements for the Fund.
In evaluating the Agreements, the Board, including the Independent Fund Trustees, reviewed extensive materials provided by Management and each Sub-Adviser in response to questions submitted by the Independent Fund Trustees and Independent Counsel, and (for the Sub-Advisers) by Management, and met with senior representatives of Management regarding its personnel, operations, and profitability as they relate to the Fund. The annual contract review extends over at least two regular meetings of the Board to ensure that Management and each Sub-Adviser have time to respond to any questions the Independent Fund Trustees may have on their initial review of the materials and that the Independent Fund Trustees have time to consider those responses. In the limited instances where Management or Sub-Advisers may not have been able to provide information in response to certain questions, the Board conducted its evaluation based on information that was provided. In such cases, the Board determined that the omission of any such information was not material to its considerations. Additionally, the Board considered the impact of significant periods of market volatility that occurred during and after the period for which information was requested in conducting its evaluation of Management and the Sub-Adviser.
In connection with its deliberations, the Board also considered the broad range of information relevant to the annual contract review that is provided to the Board (including its various standing committees) at meetings throughout the year, including reports on investment performance, portfolio risk, liquidity management, and other portfolio information for the Fund, including the use of derivatives if used as part of a Sub-Adviser's strategy, as well as periodic reports on, among other matters, pricing and valuation; quality and cost of portfolio trade execution; compliance; and shareholder and other services provided by Management and its affiliates. The Board also considered the size and staffing of each Sub-Adviser, particularly the staffing of the portfolio management and compliance functions. The Contract Review Committee, which is comprised solely of Independent Fund Trustees, was established by the Board to assist in its evaluation and analysis of materials for the annual contract review. The Board has also established other committees that focus throughout the year on specific areas relevant to the annual contract review, such as Fund performance or compliance matters, and that are charged with specific responsibilities regarding the annual contract review. Those committees provide reports to the full Board, including the members of the Contract Review Committee, which consider that information as part of the annual contract review process. Each quarter, the Ethics and Compliance Committee received and reviewed a summary of the quarterly compliance questionnaire completed by each Sub-Adviser that was prepared by the Fund's Chief Compliance Officer. The Contract Review Committee annually considers and updates the questions it asks of Management and the Sub-Advisers in light of legal advice furnished to it by Independent Counsel; its own business judgment; and developments in the industry, in the markets, in mutual fund regulation and litigation, and in Management's and the Sub-Advisers' business models.
The Independent Fund Trustees received from Independent Counsel memoranda discussing the legal standards for their consideration of the proposed continuation of the Agreements. During the course of the year and during their deliberations regarding the annual contract review, the Contract Review Committee and the Independent Fund Trustees met with Independent Counsel separately from representatives of Management and the Sub-Advisers.
68
Provided below is a description of the Board's contract approval process and material factors that the Board considered at its meetings regarding renewals of the Agreements and the compensation to be paid thereunder. In connection with its approval of the continuation of the Agreements, the Board evaluated the terms of the Agreements, the overall fairness of the Agreements to the Fund, and whether the Agreements were in the best interests of the Fund and Fund shareholders.
The Board's determination to approve the continuation of the Agreements was based on a comprehensive consideration of all information provided to the Board throughout the year and specifically in connection with the annual contract review. The Board considered each of the Agreements separately.
This description is not intended to include all of the factors considered by the Board. The Board members did not identify any particular information or factor that was all-important or controlling, and each Trustee may have attributed different weights to the various factors. The Board focused on the costs and benefits of the Agreements to the Fund and, through the Fund, its shareholders.
Nature, Extent, and Quality of Services
With respect to the nature, extent, and quality of the services provided, the Board considered the investment philosophy and decision-making processes of, and the qualifications, experience, and capabilities of, and the resources available to, the portfolio management personnel of Management and each Sub-Adviser who perform services for the Fund.
The Board noted that Management and the Fund had obtained from the U.S. Securities and Exchange Commission an exemptive order that permitted Management to add or replace sub-advisers to the Fund without a shareholder vote, provided the Independent Fund Trustees approve the new sub-adviser and certain other steps are taken. In this context, the Board considered Management's responsibilities for designing an overall investment program for the Fund and then identifying the sub-advisers who will carry out the different portions of that program based on Management's due diligence of those sub-advisers. The Board noted that under the multi-manager arrangement, Management is continually assessing the need for new sub-advisers and the appropriateness of potential candidates or changes to current sub-advisers, and noted the possibility that Management would in the future have to conduct "due diligence" on additional sub-advisers. The Board noted that Management is responsible for making the investments for the portion of the portfolio that it manages, allocating the Fund's portfolio among the various Sub-Advisers and itself, and determining when and how to rebalance the allocations among the Sub-Advisers and itself in the wake of disparate growth and changes in the markets and the broader economy, and making certain other investment decisions and engaging in transactions to hedge or balance risks in the Sub-Advisers' portfolios. The Board noted that Management is also responsible for coordinating and managing the flow of information and communications relating to the Fund among the Sub-Advisers, and coordinating responses to regulatory agency inquiries related to the operations of the Trust.
The Board further noted that Management is responsible for overseeing the Sub-Advisers pursuant to the Agreements and related sub-adviser oversight policies and procedures approved by the Board. Under these procedures, Management is responsible for overseeing the investment performance of the Sub-Advisers and evaluating the risk and return of each Sub-Adviser's portfolio and the Fund as a whole, in addition to other significant oversight responsibilities. The Board noted that Management is also responsible for monitoring compliance with the Fund's investment objectives, policies, and restrictions, as well as compliance with applicable law, including implementing regulations adopted by the U.S. Securities and Exchange Commission.
The Board noted that Management also provides certain administrative services, including fund accounting and compliance services. The Board also considered the policies and practices regarding brokerage, commissions, other trading costs, and allocation of portfolio transactions of Management and each of the Sub-Advisers and noted that Management monitors the quality of the execution services provided by each Sub-Adviser. Moreover, the Board considered Management's approach to potential conflicts of interest both generally and between the Fund's investments and those of other funds or accounts managed by Management or the Sub-Advisers. The Board noted the additional responsibilities of Management in administering the liquidity risk management program.
69
The Board recognized the extensive range of services that Management provides to the Fund beyond the investment management services and Sub-Adviser oversight. It also noted Management's activities under its contractual obligation to oversee the Fund's various outside service providers, including its renegotiation of certain service providers' fees and its evaluation of service providers' infrastructure, cybersecurity programs, compliance programs, and business continuity programs, among other matters. The Board noted Management's extensive activities in selecting and overseeing the Sub-Advisers, including questionnaires, virtual site visits, analyses of performance, compliance monitoring, and evaluating third party reviews of potential sub-advisers, and the quarterly and annual reports that Management provides to the Board on the Sub-Advisers' performance and compliance. In addition, the Board considered the scope and compliance history of the compliance programs of Management and each Sub-Adviser, including the Fund's Chief Compliance Officer's and Management's assessment of the compliance programs of the Sub-Advisers. The Board discussed that Management's Chief Information Security Officer had evaluated the Sub-Advisers' responses on questions of cybersecurity. The Board also considered Management's ongoing development of its own infrastructure and information technology to support the Fund through, among other things, cybersecurity, business continuity planning, and risk management. The Board noted Management's and each Sub-Adviser's largely seamless implementation of their business continuity plans in response to the COVID-19 pandemic and their success in continuously providing services to the Fund not withstanding the disruptions caused by the pandemic.
In addition, the Board noted the positive compliance history of Management and each Sub-Adviser, as no significant compliance problems were reported to the Board with respect to any of the firms. The Board also considered whether there were any pending lawsuits, enforcement proceedings, or regulatory investigations involving Management or any Sub-Adviser, and reviewed information regarding their financial condition, history of operations, and any conflicts of interests in managing the Fund. The Board also considered the general structure of the portfolio managers' compensation and whether this structure provides appropriate incentives to act in the best interests of the Fund. The Board also considered the ability of Management to attract and retain qualified personnel to service the Fund.
The Board considered that Management assumes significant ongoing entrepreneurial and business risks as the investment adviser and sponsor for the Fund, for which Management is entitled to reasonable compensation. The Trustees also considered that Management's responsibilities include continual management of investment, operational, cybersecurity, enterprise, litigation, regulatory, and compliance risks as they relate to the Fund, and the Board considers on a regular basis information regarding Management's processes for monitoring and managing risk. In addition, the Board also noted that when Management launches a new fund or share class, it assumes entrepreneurial risk with respect to that fund or class, and that some new funds and share classes have been liquidated without ever having been profitable to Management.
As in past years, the Board also considered the manner in which Management addressed various matters that arose during the year, some of them a result of developments in the broader fund industry or the regulations governing it. In addition, the Board considered actions taken by Management and each Sub-Adviser in response to market conditions over the past year, such as changes in interest rates and the increase in market volatility and considered the overall performance of Management and each Sub-Adviser in this context.
Fund Performance
The Board requested a report from an outside consulting firm that specializes in the analysis of fund industry data that compared the Fund's performance, along with its fees and other expenses, to a group of industry peers ("Expense Group") and to a broader universe of funds pursuing generally similar strategies with the same investment classification and/or objective ("Performance Universe"). The Board considered the Fund's performance and fees in light of the limitations inherent in the methodology for constructing such a comparative group and determining which investment companies should be included in the comparative group, noting differences as compared to certain fund industry ranking and rating systems.
With respect to investment performance, the Board considered information regarding the Fund's short-, intermediate- and long-term performance, as applicable, net of the Fund's fees and expenses, on an absolute basis, relative to a
70
benchmark index that does not deduct the fees or expenses of investing, and compared to the performance of the Expense Group and Performance Universe, each constructed by the consulting firm. The Board also considered information regarding each Sub-Adviser's performance. The Board also reviewed performance in relation to certain measures of the degree of investment risk undertaken by Management's portfolio managers.
The Performance Universe referenced in this section are those identified by the consulting firm, as discussed above. In the case of underperformance for any of the periods reported, the Board considered the magnitude and duration of that underperformance relative to the Performance Universe and/or the benchmark (e.g., the amount by which the Fund underperformed, including, for example, whether the Fund slightly underperformed or significantly underperformed its benchmark). With respect to performance quintile rankings for the Fund compared to its Performance Universe, the first quintile represents the highest (best) performance and the fifth quintile represents the lowest performance. The Fund has more than one class of shares outstanding and information for Institutional Class has been provided as identified below. The Board reviewed the expense structures of all the other classes of shares of the Fund, some of which have higher fees and expenses that reflect their separate distribution and servicing arrangements and the differing needs of different investors. As a proxy for the class expense structure, the Board reviewed the expenses of each class for one fund in the Trust in comparison to Expense Groups for those classes. The Board noted the effect of higher expenses on the performance of the other classes of shares.
The Board considered that, based on performance data for the periods ended December 31, 2021: (1) as compared to its benchmark, the Fund's performance was lower for the 1-, 3-, and 5-year periods; and (2) as compared to its Performance Universe, the Fund's performance was in the fourth quintile for the 1-, 3-, and 5-year periods. The Fund was launched in 2012 and therefore does not have 10-year performance. The Board also considered that, based on performance data for the periods ended July 31, 2022: (1) the Fund outperformed its benchmark for the 7-month and 1-, 3-, 5-, and 10-year periods; and (2) the Fund ranked in the first quintile of both its Lipper and Morningstar peer categories for the 7-month period, the first quintile of its Lipper peer category and second quintile of its Morningstar peer category for the 1-year period, the second quintile of both its Lipper and Morningstar peer categories for the 3- and 5-year periods, and the third quintile of both its Lipper and Morningstar peer categories for the 10-year period.
The Board discussed with Management the Fund's performance, potential reasons for any underperformance, and steps that Management had taken, or intended to take, to improve performance, including its demonstrated willingness to replace or terminate a Sub-Adviser. The Board recognized that the performance data reflects a snapshot of a period as of a particular date and that selecting a different performance period could produce significantly different results. The Board further acknowledged that long-term performance could be impacted by even one period of significant outperformance or underperformance, and that a single investment theme could disproportionately affect performance. In this regard, the Board noted that performance, especially short-term performance, is only one of the factors that it deems relevant to its consideration of the Agreements and that, after considering all relevant factors, it determined to approve the continuation of the Agreements notwithstanding the Fund's relative performance.
Fee Rates, Profitability, and Fall-out Benefits
With respect to the overall fairness of the Agreements, the Board considered the fee structure for the Fund under the Agreements as compared to the Expense Group provided by the consulting firm, as discussed above. The Board reviewed a comparison of the Fund's management fee to the Expense Group. The Board noted that the comparative management fee analysis includes, in the Fund's management fee, the separate administrative fees paid to Management. However, the Board noted that some funds in the Expense Group pay directly from fund assets for certain services that Management covers out of the administration fees for the Funds. Accordingly, the Board also considered the Fund's total expense ratio as compared with its Expense Group as a way of taking account of these differences.
The Board compared the Fund's contractual and actual management fees to the median of the contractual and actual management fees, respectively, of the Fund's Expense Group. (The actual management fees are the contractual management fees reduced by any fee waivers or other adjustments. The information provided herein relating to the Fund's management fees is for the Fund's Institutional Class.) The Board also compared the Fund's total expenses to the
71
median of the total expenses of the Fund's Expense Group. With respect to the quintile rankings for fees and total expenses (net of waivers or other adjustments, if any) for the Fund compared to its Expense Group, the first quintile represents the lowest (best) fees and/or total expenses and the fifth quintile represents the highest fees and/or total expenses.
The Board considered that, as compared to its Expense Group, the Fund's contractual management fee and actual management fee net of fees waived by Management each ranked in the third quintile and total expenses ranked in the fourth quintile. The Board discussed with Management the impact of the Fund's small size on its expenses and the expenses associated with the Fund's strategy, including the selection, allocation to, and oversight of the unaffiliated subadvisers, and considered Management's representations regarding ways to manage such expenses.
In concluding that the benefits accruing to Management and its affiliates by virtue of their relationship with the Fund were reasonable in light of the costs of providing the investment advisory and other services and the benefits accruing to the Fund, the Board reviewed specific data as to Management's estimated loss on the Fund for a recent period on a pre-tax basis without regard to distribution expenses, including year-over-year changes in each of Management's reported expense categories. (The Board also reviewed data on Management's estimated loss on the Fund after distribution expenses and taxes were factored in, as indicators of the health of the business and the extent to which Management is directing its resources into the growth of the business.) The Board considered the cost allocation methodology that Management used in developing its estimated profitability figures. In recent years, the Board engaged an independent forensic accountant to review the profitability methodology utilized by Management when preparing this information and discussed with the consultant its conclusion that Management's process for calculating and reporting its estimated loss was not unreasonable.
Recognizing that there is no uniform methodology regarding the allocation of firm-wide or complex-wide expenses within the asset management industry for determining profitability for this purpose and that the use of different reasonable methodologies can give rise to different profit and loss results, the Board, in recent years, requested from Management examples of profitability calculated by different methods and noted that the estimated profitability levels were still reasonable when calculated by these other methods. The Board further noted Management's representation that its estimate of profitability is derived using methodology that is consistent with the methodology used to assess and/or report measures of profitability elsewhere at the firm. In addition, the Board recognized that Management's calculations regarding its costs may not reflect all risks, including regulatory, legal, operational, cybersecurity, reputational, and, where appropriate, entrepreneurial risks, associated with offering and managing a mutual fund in the current regulatory and market environment.
The Board also monitors throughout the year the potential effect on the profitability of Management resulting from changes in Sub-Advisers and/or their fees. The Board did not give substantial emphasis to estimated profitability data from the Sub-Advisers because the Board did not view this data as being a key factor to its deliberations given the arm's-length nature of the relationship between Management and the Sub-Advisers with respect to the negotiation of sub-advisory fee rates. To test its assumption of an arm's-length fee rate, the Board requested from Management information about any other business relationships it has with any of the Sub-Advisers beyond retaining them to advise other of Management's client accounts. In addition, the Board noted that the Sub-Advisers may not account for their profits on an account-by-account basis and those that do typically employ different methodologies in connection with these calculations. The Board also considered any fall-out (i.e., indirect) benefits likely to accrue to Management or its affiliates from their relationship with the Fund.
Information Regarding Services to Other Clients
The Board also considered whether there were other funds or separate accounts that were advised or sub-advised by Management or its affiliates with investment objectives, policies, and strategies that were similar to those of the Fund. The Board also considered the fees the Sub-Advisers charge for products with investment objectives, policies, and strategies that were similar to those of the Fund, if any. The Board noted that in many cases, those products were hedge funds, which typically charge fees substantially higher than mutual funds.
72
Economies of Scale
The Board also evaluated apparent or anticipated economies of scale in relation to the services Management provides to the Fund. The Board considered whether the Fund's fee structure provides for a reduction of payments resulting from the use of breakpoints, the size of any breakpoints in the Fund's advisory fees, and whether any such breakpoints are set at appropriate asset levels. The Board also compared the breakpoint structure to that of the Expense Group. In addition, the Board considered the expense limitation and/or fee waiver arrangement that reduce the Fund's expenses at all asset levels which can have an effect similar to breakpoints in sharing economies of scale with shareholders and provide protection from an increase in expenses if the Fund's assets decline. The Board considered that breakpoints in a Sub-Adviser's fee schedule would inure to the benefit of Management, and evaluated that fact in light of Management's profitability on the Fund, a subject on which the Board receives quarterly reports. The Board also considered that Management has provided, at no added cost to the Fund, certain additional services, including but not limited to, services required by new regulations or regulatory interpretations, services impelled by changes in the securities markets or the business landscape, and/or services requested by the Board. The Board considered that this is a way of sharing economies of scale with the Fund and its shareholders.
Conclusions
In approving the continuation of the Agreements, the Board concluded that, in its business judgment, the terms of each Agreement are fair and reasonable to the Fund and that approval of the continuation of the Agreements is in the best interests of the Fund and its shareholders. In reaching this determination, the Board considered that Management and each Sub-Adviser could be expected to continue to provide a high level of service to the Fund; that the performance of the Fund was satisfactory over time, or, in the case of underperformance by a Sub-Adviser, that the Board retained confidence in Management's and each Sub-Adviser's capabilities to manage the Fund; that the Fund's fee structure appeared to the Board to be reasonable given the nature, extent, and quality of services provided; and that the benefits accruing to Management and its affiliates by virtue of their relationship with the Fund were reasonable in light of the costs of providing the investment advisory and other services and the benefits accruing to the Fund. The Board's conclusions may be based in part on its consideration of materials prepared in connection with the approval or continuance of the Agreements in prior years and on the Board's ongoing regular review of Fund performance and operations throughout the year, in addition to material prepared specifically for the most recent annual review of the Agreements.
73
Neuberger Berman Investment Advisers LLC
1290 Avenue of the Americas
New York, NY 10104–0002
Retail Services: 800.877.9700
Broker-Dealer and Institutional Services: 800.366.6264/888.556.9030
www.nb.com
Statistics and projections in this report are derived from sources deemed to be reliable but cannot be regarded as a representation of future results of the Fund. This report is prepared for the general information of shareholders and is not an offer of shares of the Fund. Shares are sold only through the currently effective prospectus which you can obtain by calling 877.628.2583. An investor should consider carefully a Fund's investment objectives, risks and fees and expenses, which are described in its prospectus, before investing.
 M0257 12/22
Neuberger Berman
Alternative and Multi-Asset Class Funds
Institutional Class Shares |
|
|
|
|
|
U.S. Equity Index PutWrite Strategy Fund |
Annual Report
October 31, 2022
The "Neuberger Berman" name and logo and "Neuberger Berman Investment Advisers LLC" name are registered service marks of Neuberger Berman Group LLC. The individual Fund names in this piece are either service marks or registered service marks of Neuberger Berman Investment Advisers LLC, an affiliate of Neuberger Berman BD LLC, distributor, member FINRA. ©2022 Neuberger Berman BD LLC, distributor. All rights reserved.
President’s Letter
Dear Shareholder,
I am pleased to present this annual shareholder report for Neuberger Berman Alternative Funds covering the 12-month period ended October 31, 2022 (the reporting period).
It was an extremely challenging period in the global financial markets during the reporting period. Sharply rising and persistent inflation was a major factor impacting the market. The U.S. Federal Reserve Board (Fed) initially thought rising prices were transitory and that they would come down as COVID-driven supply chain bottlenecks eased. However, these issues continued, consumer demand remained strong, and the impact from the war in Ukraine created a “perfect storm,” pushing inflation in the U.S. to a new 40-year high.
This caused the Fed to pivot from its highly accommodative monetary policy that was in place to support the economy during the pandemic, to an aggressively tightening policy in an attempt to rein in inflation. The Fed first raised interest rates in March 2022 from a range between 0.00% to 0.25% to a range between 0.25% to 0.50%. With inflation moving steadily higher, the central bank again raised rates at its next four meetings, and again in early November (after the reporting period ended). With the last increase, the Fed funds rate moved to a range between 3.75% and 4.00%, and the Fed expects to continue raising rates “until the job is done.”
Both the global stock and bond markets generated weak results during the reporting period. In addition to high inflation and aggressive Fed tightening, there were concerns that the central bank may drive the economy into a recession and negatively impact corporate profits. All told, the S&P 500® Index returned -14.61% during the reporting period. Meanwhile, international developed and emerging market equities, as measured by the MSCI EAFE® and MSCI Emerging Market (Net) Indices, returned -23.00% and -31.03%, respectively, over the reporting period. Meanwhile, with short- and long-term Treasury yields moving sharply higher, bond prices declined (yields and bond prices move in the opposite direction). For the reporting period the broad taxable investment-grade bond market, as measured by the Bloomberg U.S. Aggregate Bond Index, returned -15.68%.
Looking ahead, we believe market volatility will remain elevated, driven by challenging growth and inflation dynamics, as well as uncertainty around monetary and fiscal policy. Investors will closely watch the progression of economic data over the coming months as central bank tightening continues to work its way through the economy. We believe we are moving from the post-Global Financial Crisis/pre-COVID regime to a new environment that will continue to pose headwinds for risk assets in the near-to-medium term. We also anticipate earnings growth to slow meaningfully in the coming months, driven by declining demand, rising costs, inventory build-up, and currency headwinds weighing on margins. Against this backdrop, we believe active portfolio management can be valuable to help navigate the factors impacting the markets, and to seek out attractive opportunities during periods of heightened volatility.
Thank you for your support and trust. We look forward to continue serving your investment needs in the years to come.
Sincerely,
Joseph V. Amato
President and CEO
Neuberger Berman Alternative Funds
Global Allocation Fund Commentary (Unaudited)
Neuberger Berman Global Allocation Fund Institutional Class generated a -14.88% total return for the 12 months ended October 31, 2022 (the reporting period), outperforming its blended benchmark consisting of 60% MSCI All Country World Index (Net) and 40% Bloomberg Global Aggregate Index (collectively, the Index), which provided a -20.11% total return for the same period. (Performance for all share classes is provided in the table immediately following this letter.)
The reporting period was characterized by a significant drawdown in equity and fixed income markets with elevated levels of volatility and macroeconomic risks. Inflationary pressures began mounting as supply-side dynamics lagged pent-up consumer demand following the reopening of the global economy and unprecedented fiscal and monetary stimulus. In November of 2021, U.S. Federal Reserve Board Chairman Jerome Powell abandoned the term “transitory” when referring to inflation dynamics, setting the stage for a historic policy tightening cycle amid slowing growth and geopolitical shocks. Russia’s invasion of Ukraine amplified these challenges, sending energy markets higher and accelerating inflationary pressures.
Most asset classes were negative during a challenging period for global markets. The Fund’s allocations to global equities contributed positively to excess return, while fixed income detracted slightly. Within equities, both U.S. and non-U.S., systematic strategies outperformed the equity benchmark over the period. However, the fixed income portion of the portfolio underperformed the fixed income benchmark due to negative security selection effects. Opportunistic strategies were additive to fund performance, driven by contributions from fundamental tactical asset allocation and strategic portfolio adjustments. Over the reporting period, the Fund reduced the overall portfolio risk and tilted toward defensive and lower duration positioning.
The Fund’s aggregate use of futures, forward foreign currency, swap and option contracts contributed positively to performance during the reporting period.
Over a medium-term horizon, we maintain an underweight view on global equities as we believe that the impacts of tighter financial conditions have yet to be fully reflected in the macro data and equity earnings expectations. We favor lower beta, higher quality, and value-oriented stocks. We are more constructive on exposures in Japan, where we believe low valuations and a weaker yen are favorable tailwinds for Japanese equities on a relative basis.
Within fixed income, we believe the current yields available in the credit markets are beginning to make a compelling opportunity to generate an attractive total return. However, we believe the interest rate environment will remain volatile and that there will be a two-way trading dynamic over the coming months. We prefer investment-grade credit, agency mortgage-backed securities, and select areas of the high yield market while we have downgraded our outlook on emerging market debt.
We believe a flexible, multi-dimensional approach to a diversified portfolio is prudent. Our multi-asset class approach offers a global go-anywhere strategy complemented with historically uncorrelated sources of return and a risk framework at both the security and portfolio level.
Sincerely,
Erik Knutzen, Robert Surgent and Tokufumi Kato
Portfolio Managers
Information about principal risks of investing in the Fund is set forth in the prospectus and statement of additional information.
The portfolio composition, industries and holdings of the Fund are subject to change without notice.
The opinions expressed are those of the Fund’s portfolio managers. The opinions are as of the date of this report and are subject to change without notice.
Global Allocation Fund (Unaudited)
| | | |
| | Average Annual Total Return
Ended 10/31/2022 |
| | | | |
| | | | | |
| | | | | |
| | | | | |
| | | | | |
| | | | | |
| | | | |
| | | | | |
| | | | | |
| | | | | |
| | | | |
MSCI All Country World Index (Net)2,3 | | | | |
*
Blended Benchmark is composed of 60% MSCI All Country World Index (Net) and 40% Bloomberg Global Aggregate Index, rebalanced monthly.
The performance data quoted represent past performance and do not indicate future results. Current performance may be lower or higher than the performance data quoted. For current performance data, including current to the most recent month-end, please visit www.nb.com/performance.
The results shown in the table reflect the reinvestment of income dividends and other distributions, if any. The results do not reflect the effect of taxes a shareholder would pay on Fund distributions or on the redemption of Fund shares.
The investment return and principal value of an investment will fluctuate and shares, when redeemed, may be worth more or less than their original cost.
Returns would have been lower if Neuberger Berman Investment Advisers LLC ("NBIA") had not reimbursed certain expenses and/or waived a portion of the investment management fees during certain of the periods shown. Repayment by a class (of expenses previously reimbursed and/or fees previously waived by NBIA) will decrease the class’s returns. Please see Note B in the Notes to Financial Statements for specific information regarding expense reimbursement and/or fee waiver arrangements.
As stated in the Fund’s most recent prospectus, the total annual operating expense ratios for fiscal year 2021 were 4.42%, 4.84%, 5.60% and 4.74% for Institutional Class, Class A, Class C and R6 shares, respectively (before expense reimbursements and/or fee waivers, if any, and after restatement). The expense ratios were 0.78%, 1.14%, 1.89%, and 0.68% for Institutional Class, Class A, Class C and Class R6 shares, respectively, after restatement, expense reimbursements and/or fee waivers. The expense ratios for the annual period ended October 31, 2022, can be found in the Financial Highlights section of this report.
Returns shown with a sales charge reflect the deduction of the current maximum initial sales charge of 5.75% for Class A shares and the contingent deferred sales charge (CDSC) for Class C shares. The CDSC for Class C shares is 1.00%, which is reduced to 0% after 1 year. The performance of the Fund’s share classes will differ primarily due to different sales charge structures and class expenses. Please see the prospectus for more information about sales charge structures, if any, and class expenses for your share class.
Global Allocation Fund (Unaudited)
COMPARISON OF A $1,000,000 INVESTMENT
(000's omitted)
This graph shows the change in value of a hypothetical $1,000,000 investment in the Fund over the past 10 fiscal years, or since the Fund’s inception if it has not operated for 10 years. The graph is based on the Institutional Class shares only; the performance of the Fund’s share classes will differ primarily due to different sales charge structures and class expenses (see Performance Highlights chart on previous page). The result is compared with benchmarks, which include a broad-based market index and may include a more narrowly based index. Market indices have not been reduced to reflect any of the fees and costs of investing. The results shown in the graph reflect the reinvestment of income dividends and other distributions, if any. The results do not reflect the effect of taxes a shareholder would pay on Fund distributions or on the redemption of Fund shares. Results represent past performance and do not indicate future results.
*
Blended Benchmark is composed of 60% MSCI All Country World Index (Net) and 40% Bloomberg Global Aggregate Index, rebalanced monthly.
Long Short Fund Commentary (Unaudited)
Neuberger Berman Long Short Fund Institutional Class generated a -8.63% total return for the 12 months ended October 31, 2022 (the reporting period), underperforming its primary benchmark, the HFRX® Equity Hedge Index (the Index), which returned -3.35% for the same period. (Performance for all share classes is provided in the table immediately following this letter.)
The overall equity market generated weak results during the reporting period. The U.S. Federal Reserve Board (Fed) initially characterized rising inflation as being “transitory,” but this was not the case. Robust consumer spending, supply chain bottlenecks, repercussions from the war in Ukraine, and other factors combined to push U.S. inflation to a 40-year high. Against this backdrop, the Fed began an aggressive rate hike campaign in March 2022, which is expected to continue until inflation is under control, even if it leads to a recession. This, coupled with concerns over moderating corporate profits, led to periods of elevated risk aversion. All told, the S&P 500® Index returned -14.61% during the reporting period.
With the increase in market volatility and uncertain expectations for future economic growth, we modestly reduced both the Fund’s net and gross exposures during the reporting period. On the long side, we reduced exposure to options and equities – in particular, Information Technology and Industrials. On an absolute basis, the Fund's largest sector weights were in Information Technology, Consumer Discretionary and Financials.
We categorize the Fund’s long investment exposure into three groups: Capital Growth, Total Return and Opportunistic. Capital Growth continues to represent our largest allocation, followed by Total Return and Opportunistic. We continue to take a balanced approach and, on the margin, find Total Return investments to be more attractive relative to the prior reporting period, as mid-cycle economic dynamics have emerged. The Fund’s short exposure includes both single name “Fundamental” shorts and “Market” shorts. During the reporting period, equity long exposure decreased against the backdrop of macroeconomic uncertainty, while Fundamental shorts increased. Market shorts that consist primarily of sector and market cap-specific indices to help manage broader portfolio exposures decreased during the reporting period.
The Fund’s equity long exposure detracted from performance, while its Fundamental shorts were additive to performance.
The Fund’s aggregate use of futures, swap and option contracts contributed positively to performance during the reporting period.
Looking ahead, we believe the primary debate is how much the economy will slow and how quickly inflation will reach more manageable levels. At one end, inflation peaks sooner rather than later, allowing the Fed to pivot, thus leading to a soft economic landing. On the other hand, the Fed aggressively works to tame inflation, leading to a more prolonged downturn. For now, the market seems to be indicating that the Fed will make a mistake and tighten too aggressively. The critical question is the severity of any earnings downturn. Forecasting, budgeting, and allocating scarce resources have never been more nuanced, especially given the backdrop of the unprecedented and unexpected surge in demand during 2020 and 2021. We continue our efforts to best understand company and portfolio specific factors, as we believe this environment is flush with a confluence of fiscal policy considerations, monetary policy stimulus, public health concerns, geopolitical uncertainty, commodity price volatility, inflation dynamics and sequencing question marks. As market dynamics change, this can cause company market values to dislocate from their long-term potential values, creating potential opportunities for both long and short investments.
Sincerely,
Charles Kantor and Marc Regenbaum
Portfolio Managers
Information about principal risks of investing in the Fund is set forth in the prospectus and statement of additional information.
The portfolio composition, industries and holdings of the Fund are subject to change without notice.
The opinions expressed are those of the Fund’s portfolio managers. The opinions are as of the date of this report and are subject to change without notice.
Long Short Fund (Unaudited)
PORTFOLIO BY INVESTMENT TYPE |
(as a % of Total Net Assets) |
| | |
| | |
| | |
| | |
| | |
Master Limited Partnerships and Limited Partnerships | | |
| | |
| | |
| | |
| | |
Other Assets Less Liabilities* | | |
| | |
| Includes the impact of the Fund’s open positions in derivatives (other than options purchased), if any. |
| | | |
| | Average Annual Total Return
Ended 10/31/2022 |
| | | | |
| | | | | |
| | | | | |
| | | | | |
| | | | | |
| | | | |
| | | | | |
| | | | | |
| | | | | |
| | | | |
| | | | |
The performance data quoted represent past performance and do not indicate future results. Current performance may be lower or higher than the performance data quoted. For current performance data, including current to the most recent month-end, please visit www.nb.com/performance.
The results shown in the table reflect the reinvestment of income dividends and other distributions, if any. The results do not reflect the effect of taxes a shareholder would pay on Fund distributions or on the redemption of Fund shares.
The investment return and principal value of an investment will fluctuate and shares, when redeemed, may be worth more or less than their original cost.
Returns would have been lower if Neuberger Berman Investment Advisers LLC ("NBIA") had not reimbursed certain expenses and/or waived a portion of the investment management fees during certain of the periods shown. Repayment by a class (of expenses previously reimbursed and/or fees previously waived by NBIA) will decrease the class’s returns. Please see Note B in the Notes to Financial Statements for specific information regarding expense reimbursement and/or fee waiver arrangements.
As stated in the Fund’s most recent prospectus, the total annual operating expense ratios for fiscal year 2021 were 1.60%, 1.96% and 2.71% for Institutional Class, Class A and Class C shares, respectively (before expense reimbursements and/or fee waivers, if any). The expense ratios for the annual period ended October 31, 2022, can be found in the Financial Highlights section of this report.
Returns shown with a sales charge reflect the deduction of the current maximum initial sales charge of 5.75% for Class A shares and the contingent deferred sales charge (CDSC) for Class C shares. The CDSC for Class C shares is 1.00%, which is reduced to 0% after 1 year. The performance of the Fund’s share classes will differ primarily due to different sales charge structures and class expenses. Please see the prospectus for more information about sales charge structures, if any, and class expenses for your share class.
Long Short Fund (Unaudited)
COMPARISON OF A $1,000,000 INVESTMENT
(000's omitted)
This graph shows the change in value of a hypothetical $1,000,000 investment in the Fund over the past 10 fiscal years, or since the Fund’s inception if it has not operated for 10 years. The graph is based on the Institutional Class shares only; the performance of the Fund’s share classes will differ primarily due to different sales charge structures and class expenses (see Performance Highlights chart on previous page). The result is compared with benchmarks, which include a broad-based market index and may include a more narrowly based index. Market indices have not been reduced to reflect any of the fees and costs of investing. The results shown in the graph reflect the reinvestment of income dividends and other distributions, if any. The results do not reflect the effect of taxes a shareholder would pay on Fund distributions or on the redemption of Fund shares. Results represent past performance and do not indicate future results.
U.S. Equity Index PutWrite Strategy Fund Commentary (Unaudited)
Neuberger Berman U.S. Equity Index PutWrite Strategy Fund Institutional Class generated a total return of -11.22% for the fiscal year ended October 31, 2022 (the reporting period), underperforming its benchmark, a blend consisting of 50% Cboe S&P 500 One-Week PutWrite Index and 50% Cboe S&P 500 PutWrite Index (collectively, the Index), which posted a -11.10% total return during the same period. (Performance for all share classes is provided in the table immediately following this letter.)
On February 28, 2022, the Fund began comparing its performance to the Index rather than the 42.5% Cboe S&P 500 One-Week PutWrite Index/42.5% Cboe S&P 500 PutWrite Index/7.5% Cboe Russell 2000 One-Week PutWrite Index/7.5% Cboe Russell 2000 PutWrite Index, because the Index has characteristics that are more representative of the Fund’s investment strategy than its previous index. From the close of February 28, 2022 (the effective date of the change) through the end of the reporting period, the Fund’s Institutional Class returned –4.34%, outperforming the Index, which returned –8.68%. For the entire reporting period, the Fund’s Institutional Class returned –11.22%, outperforming the previous index, which returned –11.76% for the reporting period.
Over the reporting period, the Fund’s putwrite strategy detracted from overall portfolio performance. Specifically, the Fund’s S&P 500 PutWrite sleeve underperformed the Cboe S&P 500 PutWrite Index (PUT) return of -7.59% by declining more than -10% but provided a reasonable measure of downside mitigation versus the S&P 500® Index return of -14.61%. Meanwhile, weekly putwriting, as measured by the Cboe S&P 500 One-Week PutWrite (WPUT), fell a material -14.62%. Over the reporting period, the collateral portfolio also detracted from Fund performance and underperformed the ICE BofA 0-3 Month US Treasury Bill Index return of 0.84%.
Over the reporting period, the Cboe S&P 500 Volatility Index (VIX) is up approximately 9.5 points with an average 30-day implied volatility premium of 1.4. Many have lamented that the VIX has not been higher as they have hoped hedging strategies that benefit from a higher VIX would insulate them from losses in the S&P 500 Index over the reporting period. Meanwhile, the temperature of market volatility seems to be rising at a slow but steady pace. Each incremental round of negative news seems to anchor VIX at historically elevated levels, albeit not at the ‘nosebleed’ levels many have grown to expect. Looking at the VIX trend, the Fund continues to benefit from attractive option premium levels. As we have stated throughout our history, we will trade ‘elevated for longer’ over ‘spikes of panic’ every time. We want investors to be cautious and pay for risk mitigation, but we don’t want outright panic that can result in elements of our financial system breaking down. Crises that can push VIX into the stratosphere (dot-com bubble, mortgage crisis, COVID-19, etc.) are not good for any investor except for maybe the rare ‘tail-hedger’ (i.e., strategies that seek to hedge low probability, negative outcome events such as periods of severe market drawdowns) that fights extinction daily.
During the first calendar quarter of 2022, the Fund adjusted its average option notional exposure from the strategic target of 85% S&P 500 Index and 15% Russell 2000® Index to 100% S&P 500 Index. We believe the U.S. small cap public equity universe is evolving into a less productive investment opportunity for several reasons, including:
• Private equity capital has grown to material levels over the last two decades.
• With increased demand to find investments, many private investors are holding investments until they reach larger market capitalizations than they have in the past.
• New investment vehicles such as Special Purpose Acquisition Corporations (SPACs) acquire or merge with smaller companies that results in the companies’ dropping out of small cap indexes.
• Some small cap indexes are relatively concentrated in a few names.
• Retail investors can now influence smaller company prices and create ‘meme’ stocks that may have an outsized effect on small cap index performance.
We believe the challenges facing public U.S. small cap equities have contributed to the erosion in the risk efficiency of a Russell 2000 Index putwrite strategy relative to an S&P 500 Index putwrite strategy. Hence, we have currently removed the Russell 2000 equity exposure from the Fund. We believe this adjustment has the potential to result in a reduction in strategy volatility levels and an overall increased level of risk efficiency. In addition, the team has been focused on alternatives to U.S. Treasuries for the strategy’s collateral portfolio that can assume additional exposures to focus on creating a quarterly distribution to seek to enhance distributions.
Markets are too complicated in the short-term and too efficient over the long-term for us to attempt bold predictions. However, that doesn’t prevent us from seeking simplifying explanations that help us understand what is going on or what may lay ahead. Said simply, we believe a potentially challenging environment is on the horizon for both equity and rate markets, which implies that elevated uncertainty (e.g., volatility) may be prevalent for some time to come. We like to believe that such an environment would favor our strategy. U.S. Federal Reserve Board (Fed) policy, fiscal stimulus, and the adoption of passive investing (e.g., through exchange-traded funds), transformed corporate earnings into a commodity via the S&P 500 Index. Investors simply bought the index to profit from corporate earnings and in doing so drove the multiple on those earnings, i.e., the price of the commodity, higher. The Fed essentially became the OPEC of equity markets. When we look at the Fed’s balance sheet versus the S&P 500 Index level, equity markets have retreated at the mere anticipation of a shrinking balance sheet, the Fed still must actually reduce its balance sheet. We admit that’s not a uniquely insightful conclusion. Yet, it is a simplifying framework through which to view the evaporation of active stock selection and of the remarkable risk-efficiency of the S&P 500 Index since the global financial crisis of 2008/2009. More importantly, we believe this view suggests a reasonable likelihood of a potentially challenging, multi-year process of equity markets trending back towards a ‘collectors’ market which will promote more ‘sideways’ index returns as earnings dispersion increases, paving the way for higher levels of price volatility. Moreover, it appears the pent-up savings from COVID-19 have evaporated rather quickly—back to 2010 levels—while an inflation fire has ignited. It is hard to imagine a sanguine financial/economic environment with a U.S. consumer with reduced purchasing power paying higher prices while the Fed shrinks its balance sheet. This, to us, seems like double jeopardy for the U.S. economy which has been a global outlier.
From a collateral perspective, as short-term rates continue to rise on the back of the Fed’s inflation fight, we continue to reset collateral portfolios at historically attractive short-term U.S. Treasury rates—2-Year U.S. Treasury rates pushed above 4% during the third calendar quarter of 2022 reaching levels not seen since the third calendar quarter of 2007. Higher collateral income supports our view that collateralized option writing may provide investors with a valuable alternative to the traditional 60/40 portfolio while potentially avoiding some of the non-traditional risks associated with certain other alternatives, which may include higher volatility, less liquidity, less transparency, and complicated hedges.
Sincerely,
Derek Devens and Rory Ewing
Portfolio Managers
Information about principal risks of investing in the Fund is set forth in the prospectus and statement of additional information.
The portfolio composition, industries and holdings of the Fund are subject to change without notice.
The opinions expressed are those of the Fund’s portfolio managers. The opinions are as of the date of this report and are subject to change without notice.
U.S. Equity Index PutWrite Strategy Fund (Unaudited)
PORTFOLIO BY INVESTMENT TYPE |
(as a % of Total Net Assets) |
| |
U.S. Treasury Obligations | |
| |
| |
Other Assets Less Liabilities | |
| |
| | |
| | Average Annual Total Return
Ended 10/31/2022 |
| | | |
| | | | |
| | | | |
| | | | |
| | | | |
| | | | |
| | | |
| | | | |
| | | | |
| | | | |
50% Cboe S&P 500 One-Week
PutWrite Index / 50% Cboe S&P 500
| | | |
42.5% Cboe S&P 500 One-Week
PutWrite Index / 42.5% Cboe S&P 500
PutWrite Index / 7.5% Cboe Russell 2000
One-Week PutWrite Index /
7.5% Cboe Russell 2000 PutWrite Index2,3 | | | |
| | | |
*
On February 28, 2022, the Fund began comparing its performance to the 50% Cboe S&P 500 One-Week PutWrite Index/50% Cboe S&P 500 PutWrite Index rather than the 42.5% Cboe S&P 500 One-Week PutWrite Index/42.5% Cboe S&P 500 PutWrite Index/7.5% Cboe Russell 2000 One-Week PutWrite Index/7.5% Cboe Russell 2000 PutWrite Index because the 50% Cboe S&P 500 One-Week PutWrite Index/50% Cboe S&P 500 PutWrite Index has characteristics that are more representative of the Fund’s investment strategy than its previous index.
The performance data quoted represent past performance and do not indicate future results. Current performance may be lower or higher than the performance data quoted. For current performance data, including current to the most recent month-end, please visit www.nb.com/performance.
The results shown in the table reflect the reinvestment of income dividends and other distributions, if any. The results do not reflect the effect of taxes a shareholder would pay on Fund distributions or on the redemption of Fund shares.
The investment return and principal value of an investment will fluctuate and shares, when redeemed, may be worth more or less than their original cost.
Returns would have been lower if Neuberger Berman Investment Advisers LLC ("NBIA") had not reimbursed certain expenses and/or waived a portion of the investment management fees during certain of the periods shown. Repayment by a class (of expenses previously reimbursed and/or fees previously waived by NBIA) will decrease the class’s returns. Please see Note B in the Notes to Financial Statements for specific information regarding expense reimbursement and/or fee waiver arrangements.
For the period ended October 31, 2022, the 30-day SEC yields were 10.15%, 9.78%, 9.04% and 10.24% for Institutional Class, Class A, Class C and Class R6 shares, respectively. Absent expense reimbursements and/or fee waivers, the 30-day SEC yields would have been 10.00%, 9.60%, 8.84% and 10.09% for Institutional Class, Class A, Class C and Class R6 shares, respectively.
U.S. Equity Index PutWrite Strategy Fund (Unaudited)
As stated in the Fund’s most recent prospectus, the total annual operating expense ratios for fiscal year 2021 were 0.70%, 1.07%, 1.86% and 0.60% for Institutional Class, Class A, Class C and Class R6 shares, respectively (before expense reimbursements and/or fee waivers, if any). The expense ratios were 0.66%, 1.02%, 1.77% and 0.56% for Institutional Class, Class A, Class C and Class R6 shares, respectively, after expense reimbursements and/or fee waivers. The expense ratios for the annual period ended October 31, 2022, can be found in the Financial Highlights section of this report.
Returns shown with a sales charge reflect the deduction of the current maximum initial sales charge of 5.75% for Class A shares and the contingent deferred sales charge (CDSC) for Class C shares. The CDSC for Class C shares is 1.00%, which is reduced to 0% after 1 year. The performance of the Fund’s share classes will differ primarily due to different sales charge structures and class expenses. Please see the prospectus for more information about sales charge structures, if any, and class expenses for your share class.
COMPARISON OF A $1,000,000 INVESTMENT
(000's omitted)
This graph shows the change in value of a hypothetical $1,000,000 investment in the Fund over the past 10 fiscal years, or since the Fund’s inception if it has not operated for 10 years. The graph is based on the Institutional Class shares only; the performance of the Fund’s share classes will differ primarily due to different sales charge structures and class expenses (see Performance Highlights chart on previous page). The result is compared with benchmarks, which include a broad-based market index and may include a more narrowly based index. Market indices have not been reduced to reflect any of the fees and costs of investing. The results shown in the graph reflect the reinvestment of income dividends and other distributions, if any. The results do not reflect the effect of taxes a shareholder would pay on Fund distributions or on the redemption of Fund shares. Results represent past performance and do not indicate future results.
*
On February 28, 2022, the Fund began comparing its performance to the 50% Cboe S&P 500 One-Week PutWrite Index/50% Cboe S&P 500 PutWrite Index rather than the 42.5% Cboe S&P 500 One-Week PutWrite Index/42.5% Cboe S&P 500 PutWrite Index/7.5% Cboe Russell 2000 One-Week PutWrite Index/7.5% Cboe Russell 2000 PutWrite Index because the 50% Cboe S&P 500 One-Week PutWrite Index/50% Cboe S&P 500 PutWrite Index has characteristics that are more representative of the Fund’s investment strategy than its previous index.
| The performance information for Class R6 prior to the class’s inception date is that of the Institutional Class of Neuberger Berman Global Allocation Fund. The performance information for the Institutional Class has not been adjusted to take into account differences in class specific operating expenses. The Institutional Class has higher expenses and typically lower returns than Class R6. |
| Please see "Glossary of Indices" on page 14 for a description of indices. Please note that individuals cannot invest directly in any index. The HFRX® Equity Hedge Index does take into account fees and expenses, but not the tax consequences, of investing since it is based on the underlying hedge funds’ net returns. The other indices described in this report do not take into account any fees, expenses or tax consequences of investing in the individual securities that they track. Data about the performance of an index are prepared or obtained by Neuberger Berman Investment Advisers LLC and reflect the reinvestment of income dividends and other distributions, if any. The Fund may invest in securities not included in a described index and generally does not invest in all securities included in a described index. |
| The date used to calculate Life of Fund performance for the index is the inception date of the oldest share class. |
| The investments for the Fund are managed by the same portfolio manager(s) who manage(s) one or more other registered funds that have names, investment objectives and investment styles that are similar to those of the Fund. You should be aware that the Fund is likely to differ from those other mutual fund(s) in size, cash flow pattern and tax matters. Accordingly, the holdings and performance of the Fund can be expected to vary from those of the other mutual fund(s). |
For more complete information on any of the Neuberger Berman Alternative and Multi-Asset Class Funds, call us at (800) 877-9700, or visit our website at www.nb.com.
Glossary of Indices (Unaudited)
Bloomberg Global Aggregate Index: | The index measures global investment grade debt from twenty-four different local currency markets and includes fixed-rate treasury, government-related, corporate and securitized bonds from both developed and emerging markets issuers. The index is largely comprised of three major regional aggregate components: the Bloomberg U.S. Aggregate Bond Index, the Bloomberg Pan-European Aggregate Bond Index, and the Bloomberg Asian-Pacific Aggregate Index. In addition to securities from these three indices, the Bloomberg Global Aggregate Index also includes investment grade Eurodollar, Euro-Yen, Canadian, and 144A Index-eligible securities not already in these three indices. |
Cboe Russell 2000 PutWrite Index: | The index tracks the value of a passive investment strategy, which consists of overlaying Russell 2000 (RUT) short put options over a money market account invested in one-month U.S. Treasury bills. The RUT puts are struck at-the-money and are sold on a monthly basis. |
Cboe Russell 2000 One-Week PutWrite Index: | The index is designed to track the performance of a hypothetical strategy that sells an at-the-money (ATM) Russell 2000 Index put option on a weekly basis. The maturity of the written Russell 2000 put option is one week to expiry. The written Russell 2000 put option is collateralized by a money market account invested in one-month U.S. Treasury bills. The index rolls on a weekly basis, typically every Friday. |
Cboe S&P 500 PutWrite Index: | The index tracks the value of a passive investment strategy, which consists of overlaying S&P 500 (SPX) short put options over a money market account invested in one- and three-months Treasury bills. The SPX puts are struck at-the-money and are sold on a monthly basis. |
Cboe S&P 500 One-Week PutWrite Index: | The index is designed to track the performance of a hypothetical strategy that sells an at-the- money (ATM) S&P 500 Index (SPX) put option on a weekly basis. The maturity of the written SPX put option is one week to expiry. The written SPX put option is collateralized by a money market account invested in one-month U.S. Treasury bills. The index rolls on a weekly basis, typically every Friday. |
42.5% Cboe S&P 500 One-Week PutWrite Index/42.5% Cboe S&P 500 PutWrite Index/7.5% Cboe Russell 2000 One-Week PutWrite Index/7.5% Cboe Russell 2000 PutWrite Index: | The blended index is composed of 42.5% Cboe S&P 500 One-Week PutWrite Index (described above), 42.5% Cboe S&P 500 PutWrite Index (described above), 7.5% Cboe Russell 2000 One-Week PutWrite Index (described above) and 7.5% Cboe Russell 2000 PutWrite Index (described above), and is rebalanced monthly. |
50% Cboe S&P 500 One-Week PutWrite Index/50% Cboe S&P 500 PutWrite Index: | The blended index is composed of 50% Cboe S&P 500 One-Week PutWrite Index (described above) and 50% Cboe S&P 500 PutWrite Index (described above) and is rebalanced monthly. |
HFRX® Equity Hedge Index: | The index comprises equity hedge strategies. Equity hedge strategies maintain positions both long and short in primarily equity and equity derivative securities. A wide variety of investment processes can be employed to arrive at an investment decision, including both quantitative and fundamental techniques; strategies can be broadly diversified or narrowly focused on specific sectors and can range broadly in terms of levels of net exposure, leverage employed, holding period, concentrations of market capitalizations and valuation ranges of typical portfolios. Equity hedge managers would typically maintain at least 50%, and may in some cases be substantially entirely invested, in equities, both long and short. Constituent funds are selected from an eligible pool of the more than 7,500 funds worldwide that report to the Hedge Fund Research (HFR) Database. Constituent funds must meet all of the following criteria: report monthly; report performance net of all fees; be U.S. dollar-denominated; be active and accepting new investments; have a minimum 24 months track record; and the fund’s manager must have at least $50 million in assets under management. The index is rebalanced quarterly. |
Glossary of Indices (Unaudited) (cont’d)
MSCI All Country World Index (Net): | The index is a free float-adjusted market capitalization-weighted index that is designed to measure the equity market performance of developed and emerging markets. The index consists of 47 country indexes comprising 23 developed and 24 emerging market country indexes. The developed market country indexes included are: Australia, Austria, Belgium, Canada, Denmark, Finland, France, Germany, Hong Kong, Ireland, Israel, Italy, Japan, the Netherlands, New Zealand, Norway, Portugal, Singapore, Spain, Sweden, Switzerland, the United Kingdom and the United States. The emerging market country indexes included are: Brazil, Chile, China, Colombia, the Czech Republic, Egypt, Greece, Hungary, India, Indonesia, Korea, Kuwait, Malaysia, Mexico, Peru, the Philippines, Poland, Qatar, Saudi Arabia, South Africa, Taiwan, Thailand, Turkey and the UAE. China A shares are included starting from June 1, 2018 and are partially represented at 20% of their free float-adjusted market capitalization as of November 2019. Net total return indexes reinvest dividends after the deduction of withholding taxes, using (for international indexes) a tax rate applicable to non-resident institutional investors who do not benefit from double taxation treaties. Effective after the close on March 9, 2022, MSCI reclassified MSCI Russia Indexes from Emerging Markets to Standalone Markets status. At that time, all Russian securities were removed from this index at a final price of 0.00001, including both locally traded Russian equity constituents and Russian ADRs/GDRs constituents. |
60% MSCI All Country World Index (Net) and 40% Bloomberg Global Aggregate Index: | The blended index is composed of 60% MSCI All Country World Index (Net) (described above) and 40% Bloomberg Global Aggregate Index (described above), and is rebalanced monthly. Net total return indexes reinvest dividends after the deduction of withholding taxes, using (for international indexes) a tax rate applicable to non-resident institutional investors who do not benefit from double taxation treaties. |
| The index is a float-adjusted market capitalization-weighted index that measures the performance of the small-cap segment of the U.S. equity market. It includes approximately 2,000 of the smallest securities in the Russell 3000® Index (which measures the performance of the 3,000 largest U.S. public companies based on total market capitalization). The index is rebalanced annually in June. |
| The index is a float-adjusted market capitalization-weighted index that focuses on the large-cap segment of the U.S. equity market, and includes a significant portion of the total value of the market. |
Information About Your Fund’s Expenses (Unaudited)
As a Fund shareholder, you incur two types of costs: (1) transaction costs, including sales charges (loads) on purchase payments or redemption proceeds (if applicable); and (2) ongoing costs, including management fees, distribution and/or service (12b-1) fees (if applicable), and other Fund expenses. This example is intended to help you understand your ongoing costs (in U.S. dollars) of investing in a Fund and compare these costs with the ongoing costs of investing in other mutual funds.
This table is designed to provide information regarding costs related to your investments. The following examples are based on an investment of $1,000 made at the beginning of the six month period ended October 31, 2022 and held for the entire period. The table illustrates each Fund’s costs in two ways:
Actual Expenses and Performance: | The first section of the table provides information about actual account values and actual expenses in dollars, based on the Fund’s actual performance during the period indicated. You may use the information in this line, together with the amount you invested, to estimate the expenses you paid over the period. Simply divide your account value by $1,000 (for example, an $8,600 account value divided by $1,000 = 8.6), then multiply the result by the number in the first section of the table under the heading entitled "Expenses Paid During the Period" to estimate the expenses you paid over the period. |
Hypothetical Example for Comparison Purposes: | The second section of the table provides information about hypothetical account values and hypothetical expenses based on the Fund’s actual expense ratio and an assumed rate of return at 5% per year before expenses. This return is not the Fund’s actual return. The hypothetical account values and expenses may not be used to estimate the actual ending account balance or expenses you paid for the period. You may use this information to compare the ongoing costs of investing in a Fund versus other funds. To do so, compare the expenses shown in this 5% hypothetical example with the 5% hypothetical examples that appear in the shareholder reports of other funds. |
Please note that the expenses in the table are meant to highlight your ongoing costs only and do not include any transaction costs, such as sales charges (loads) (if applicable). Therefore, the information under the heading "Hypothetical (5% annual return before expenses)" is useful in comparing ongoing costs only, and will not help you determine the relative total costs of owning different funds. In addition, if these transaction costs were included, your costs would have been higher.
Expense Example (Unaudited)
Neuberger Berman Alternative Funds
| | HYPOTHETICAL (5% ANNUAL RETURN BEFORE EXPENSES) |
| Beginning
Account
Value
5/1/22 | Ending
Account
Value
10/31/22 | Expenses Paid
During the
5/1/22 – 10/31/22 | | Beginning
Account
Value
5/1/22 | Ending
Account
Value
10/31/22 | Expenses Paid
During the
Period(2)
5/1/22 – 10/31/22 | |
|
| | | | | | | | |
| | | | | | | | |
| | | | | | | | |
| | | | | | | | |
|
| | | | | | | | |
| | | | | | | | |
| | | | | | | | |
U.S. Equity Index PutWrite Strategy |
| | | | | | | | |
| | | | | | | | |
| | | | | | | | |
| | | | | | | | |
| For each class, expenses are equal to the annualized expense ratio for the class, multiplied by the average account value over the period, multiplied by 184/365 (to reflect the one-half year period shown), unless otherwise indicated. |
| Hypothetical expenses are equal to the annualized expense ratios for each class, multiplied by the average account value over the period (assuming a 5% annual return), multiplied by 184/365 (to reflect the one-half year period shown). |
| Includes expenses of the Fund’s Blocker (See Note A of the Notes to Financial Statements). |
Legend October 31, 2022 (Unaudited)
Neuberger Berman Alternative Funds
|
| |
| = US Federal Funds Effective Rate |
| = London Interbank Offered Rate |
| = United States Overnight Bank Funding Rate |
| = Secured Overnight Financing Rate |
|
| |
| = Goldman Sachs International |
| = JPMorgan Chase Bank N.A. |
| = State Street Bank and Trust Company |
Index Periods/Payment Frequencies: |
| |
| |
| |
|
| = American Depositary Receipt |
| = Neuberger Berman Investment Advisers LLC |
|
| |
| |
| |
| |
| |
(a)
There is one official currency held in China, the Chinese Yuan Renminbi. CNY is traded onshore, in mainland China and CNH is traded offshore, mainly in the Hong Kong market, each at a different exchange rate.
Schedule of Investments Global Allocation Fund^
October 31, 2022
| |
|
| | |
| | | |
| | | |
| | Fortescue Metals Group Ltd. | |
| | | |
| | | |
| | National Australia Bank Ltd. | |
| | | |
| | | |
| | Woodside Energy Group Ltd. | |
| | | |
| | |
| | | |
| | |
| | Alimentation Couche-Tard, Inc. | |
| | | |
| | | |
| | | |
| | | |
| | | |
| | | |
| | | |
| | | |
| | Restaurant Brands International, Inc. | |
| | Rogers Communications, Inc. Class B | |
| | | |
| | | |
| | | |
| | | |
| | West Fraser Timber Co. Ltd. | |
| | | |
| | |
| | BOC Hong Kong Holdings Ltd. | |
| | | |
| | | |
| | |
| | AP Moeller - Maersk A/S Class B | |
| | | |
| | | |
| | |
| | | |
| | | |
| | | |
| | |
| | | |
| | | |
| | | |
| |
| | |
| | Cie Generale des Etablissements Michelin SCA | |
| | | |
| | | |
| | | |
| | | |
| | | |
| | | |
| | | |
| | LVMH Moet Hennessy Louis Vuitton SE | |
| | | |
| | | |
| | | |
| | | |
| | |
| | Bayerische Motoren Werke AG | |
| | | |
| | | |
| | | |
| | |
| | | |
| | | |
| | | |
| | |
| | | |
| | |
| | Assicurazioni Generali SpA | |
| | |
| | | |
| | | |
| | | |
| | Dai Nippon Printing Co. Ltd. | |
| | | |
| | | |
| | | |
| | | |
| | | |
| | | |
| | Nippon Telegraph & Telephone Corp. | |
| | | |
| | Ono Pharmaceutical Co. Ltd. | |
| | | |
| | Sekisui Chemical Co. Ltd. | |
| | | |
| | | |
| | Takeda Pharmaceutical Co. Ltd. | |
| | | |
| | Tokio Marine Holdings, Inc. | |
See Notes to Financial Statements
Schedule of Investments Global Allocation Fund^ (cont’d)
| |
| | |
| | | |
| | | |
| | | |
| | |
| | Koninklijke Ahold Delhaize NV | |
| | | |
| | | |
| | | |
| | | |
| | |
| | | |
| | |
| | | |
| | |
| | | |
| | |
| | | |
| | | |
| | | |
| | |
| | | |
| | |
| | Banco Bilbao Vizcaya Argentaria SA | |
| | | |
| | | |
| | | |
| | | |
| | | |
| | |
| | | |
| | Skandinaviska Enskilda Banken AB Class A | |
| | | |
| | |
| | | |
| | Kuehne & Nagel International AG | |
| | | |
| | | |
| | | |
| | | |
| | | |
| | | |
| | | |
| | | |
| | | |
| |
| | |
| | | |
| | | |
| | | |
| | | |
| | | |
| | Land Securities Group PLC | |
| | | |
| | | |
| | | |
| | | |
| | | |
| | | |
| | | |
| | | |
| | | |
| | | |
| | | |
| | | |
| | |
| | | |
| | | |
| | | |
| | | |
| | Agilent Technologies, Inc. | |
| | | |
| | | |
| | | |
| | Ameriprise Financial, Inc. | |
| | | |
| | | |
| | | |
| | | |
| | | |
| | Automatic Data Processing, Inc. | |
| | | |
| | | |
| | | |
| | | |
| | | |
| | Cadence Design Systems, Inc. | |
| | | |
| | | |
| | | |
| | | |
| | Chipotle Mexican Grill, Inc. | |
| | | |
| | | |
| | | |
| | | |
| | | |
| | | |
See Notes to Financial Statements
Schedule of Investments Global Allocation Fund^ (cont’d)
| |
| | |
| | Cognizant Technology Solutions Corp. Class A | |
| | | |
| | | |
| | | |
| | Consolidated Edison, Inc. | |
| | | |
| | | |
| | | |
| | | |
| | | |
| | | |
| | | |
| | | |
| | | |
| | | |
| | | |
| | Expeditors International of Washington, Inc. | |
| | Extra Space Storage, Inc. | |
| | | |
| | Fidelity National Financial, Inc. | |
| | | |
| | | |
| | | |
| | | |
| | | |
| | Goldman Sachs Group, Inc. | |
| | | |
| | Hartford Financial Services Group, Inc. | |
| | | |
| | | |
| | Interpublic Group of Cos., Inc. | |
| | | |
| | | |
| | | |
| | | |
| | | |
| | | |
| | | |
| | | |
| | | |
| | | |
| | Lululemon Athletica, Inc. | |
| | | |
| | LyondellBasell Industries NV Class A | |
| | | |
| | | |
| | Marsh & McLennan Cos., Inc. | |
| |
| | |
| | | |
| | | |
| | Meta Platforms, Inc. Class A | |
| | | |
| | | |
| | | |
| | | |
| | | |
| | | |
| | | |
| | | |
| | | |
| | | |
| | | |
| | | |
| | Pioneer Natural Resources Co. | |
| | Principal Financial Group, Inc. | |
| | | |
| | | |
| | | |
| | Raymond James Financial, Inc. | |
| | | |
| | Reliance Steel & Aluminum Co. | |
| | Robert Half International, Inc. | |
| | | |
| | | |
| | | |
| | | |
| | | |
| | | |
| | | |
| | | |
| | Thermo Fisher Scientific, Inc. | |
| | | |
| | | |
| | | |
| | | |
| | | |
| | United Parcel Service, Inc. Class B | |
| | | |
| | | |
| | | |
| | | |
| | | |
| | Zimmer Biomet Holdings, Inc. | |
| | | |
Total Common Stocks (Cost $4,702,368) | |
See Notes to Financial Statements
Schedule of Investments Global Allocation Fund^ (cont’d)
| |
|
| | |
| | Anheuser-Busch Cos., LLC/Anheuser-Busch InBev Worldwide, Inc., 4.90%, due 2/1/2046 | |
| | Anheuser-Busch InBev Worldwide, Inc., 4.60%, due 4/15/2048 | |
| | | |
| | |
| | Canadian Natural Resources Ltd., 4.95%, due 6/1/2047 | |
| | Rogers Communications, Inc. | |
| | | |
| | | |
| | | |
| | |
| | Total Capital Int'l SA, 3.13%, due 5/29/2050 | |
| | |
| | AerCap Ireland Capital Designated Activity Co./AerCap Global Aviation Trust, 3.85%, due 10/29/2041 | |
| | |
| | Grupo Bimbo SAB de CV, 4.70%, due 11/10/2047 | |
| | |
| | Shell Int'l Finance BV, 4.00%, due 5/10/2046 | |
| | |
| | Asian Development Bank, 3.13%, due 4/27/2032 | |
| | Int'l Bank for Reconstruction & Development, 3.63%, due 9/21/2029 | |
| | | |
| | |
| | AstraZeneca PLC, 2.13%, due 8/6/2050 | |
| | | |
| | | |
| | | |
| | BP Capital PLC, 4.88%, due 3/22/2030 | |
| | NatWest Group PLC, 3.03%, due 11/28/2035 | |
| | Vodafone Group PLC, 4.25%, due 9/17/2050 | |
| | | |
| | |
| | | |
| | | |
| | | |
| | Allstate Corp., 4.20%, due 12/15/2046 | |
| | Altria Group, Inc., 3.88%, due 9/16/2046 | |
| | American Int'l Group, Inc., 4.75%, due 4/1/2048 | |
| | American Water Capital Corp., 4.15%, due 6/1/2049 | |
| | Amgen, Inc., 4.40%, due 5/1/2045 | |
| | Analog Devices, Inc., 2.95%, due 10/1/2051 | |
| | Appalachian Power Co., Ser. Z, 3.70%, due 5/1/2050 | |
| | Apple, Inc., 3.75%, due 11/13/2047 | |
| | Aqua America, Inc., 4.28%, due 5/1/2049 | |
See Notes to Financial Statements
Schedule of Investments Global Allocation Fund^ (cont’d)
| |
| | |
| | | |
| | | |
| | | |
| | Baltimore Gas and Electric Co., 2.90%, due 6/15/2050 | |
| | | |
| | | |
| | | |
| | | |
| | Berkshire Hathaway Finance Corp., 4.25%, due 1/15/2049 | |
| | | |
| | | |
| | | |
| | BP Capital Markets America, Inc., 2.77%, due 11/10/2050 | |
| | Bristol-Myers Squibb Co., 4.25%, due 10/26/2049 | |
| | | |
| | | |
| | | |
| | Burlington Northern Santa Fe LLC, 4.38%, due 9/1/2042 | |
| | Capital One Financial Corp., 2.36%, due 7/29/2032 | |
| | Carrier Global Corp., 2.70%, due 2/15/2031 | |
| | CDW LLC/CDW Finance Corp., 3.57%, due 12/1/2031 | |
| | CenterPoint Energy, Inc., 3.70%, due 9/1/2049 | |
| | Charter Communications Operating LLC/Charter Communications Operating Capital, 4.80%, due 3/1/2050 | |
| | Cigna Corp., 4.80%, due 8/15/2038 | |
| | Coca-Cola Co., 2.50%, due 3/15/2051 | |
| | | |
| | | |
| | | |
| | Commonwealth Edison Co., 3.70%, due 3/1/2045 | |
| | Constellation Brands, Inc., 3.75%, due 5/1/2050 | |
| | Corebridge Financial, Inc., 3.90%, due 4/5/2032 | |
| | | |
| | | |
| | | |
| | | |
| | | |
| | | |
| | Diamondback Energy, Inc., 4.40%, due 3/24/2051 | |
| | Discovery Communications LLC | |
| | | |
| | | |
| | Dominion Energy, Inc., 4.85%, due 8/15/2052 | |
| | | |
| | | |
| | | |
| | | |
| | Duke Energy Progress LLC, 2.50%, due 8/15/2050 | |
| | Emerson Electric Co., 2.80%, due 12/21/2051 | |
| | Entergy Texas, Inc., 3.55%, due 9/30/2049 | |
| | Enterprise Products Operating LLC, 3.20%, due 2/15/2052 | |
See Notes to Financial Statements
Schedule of Investments Global Allocation Fund^ (cont’d)
| |
| | |
| | Exelon Corp., 4.70%, due 4/15/2050 | |
| | Exxon Mobil Corp., 4.23%, due 3/19/2040 | |
| | Fox Corp., 5.48%, due 1/25/2039 | |
| | Freeport-McMoRan, Inc., 5.45%, due 3/15/2043 | |
| | General Electric Capital Corp., 5.88%, due 1/14/2038 | |
| | General Motors Co., 5.00%, due 4/1/2035 | |
| | Gilead Sciences, Inc., 4.75%, due 3/1/2046 | |
| | Goldman Sachs Group, Inc., 4.02%, due 10/31/2038 | |
| | HCA, Inc., 5.25%, due 6/15/2049 | |
| | Hess Corp., 5.60%, due 2/15/2041 | |
| | Home Depot, Inc., 3.35%, due 4/15/2050 | |
| | Intel Corp., 4.90%, due 8/5/2052 | |
| | Jackson Financial, Inc., 4.00%, due 11/23/2051 | |
| | | |
| | | |
| | | |
| | | |
| | Kinder Morgan, Inc., 5.55%, due 6/1/2045 | |
| | Kraft Heinz Foods Co., 5.20%, due 7/15/2045 | |
| | | |
| | | |
| | | |
| | Lowe's Cos., Inc., 3.00%, due 10/15/2050 | |
| | LYB Int'l Finance III LLC, 4.20%, due 5/1/2050 | |
| | Magallanes, Inc., 5.39%, due 3/15/2062 | |
| | Magellan Midstream Partners L.P., 3.95%, due 3/1/2050 | |
| | Masco Corp., 4.50%, due 5/15/2047 | |
| | McDonald's Corp., 3.63%, due 9/1/2049 | |
| | Merck & Co., Inc., 2.90%, due 12/10/2061 | |
| | MetLife, Inc., 4.88%, due 11/13/2043 | |
| | Micron Technology, Inc., 3.48%, due 11/1/2051 | |
| | Microsoft Corp., 2.68%, due 6/1/2060 | |
| | MidAmerican Energy Co., 4.25%, due 5/1/2046 | |
| | | |
| | | |
| | | |
| | MPLX L.P., 5.50%, due 2/15/2049 | |
| | Nevada Power Co., Ser. EE, 3.13%, due 8/1/2050 | |
| | Norfolk Southern Corp., 3.94%, due 11/1/2047 | |
| | Oglethorpe Power Corp., 4.50%, due 4/1/2047 | |
| | | |
| | | |
| | | |
| | | |
| | Pacific Gas and Electric Co. | |
| | | |
| | | |
| | Pfizer, Inc., 2.70%, due 5/28/2050 | |
| | Public Service Co. of Colorado, 4.05%, due 9/15/2049 | |
| | Raytheon Technologies Corp., 4.35%, due 4/15/2047 | |
| | Royalty Pharma PLC, 2.20%, due 9/2/2030 | |
See Notes to Financial Statements
Schedule of Investments Global Allocation Fund^ (cont’d)
| |
| | |
| | salesforce.com, Inc., 2.70%, due 7/15/2041 | |
| | Southern California Edison Co. | |
| | Ser. B, 4.88%, due 3/1/2049 | |
| | Ser. 20A, 2.95%, due 2/1/2051 | |
| | Southwestern Public Service Co., 3.15%, due 5/1/2050 | |
| | Starbucks Corp., 3.50%, due 11/15/2050 | |
| | Sysco Corp., 6.60%, due 4/1/2050 | |
| | | |
| | | |
| | | |
| | Union Pacific Corp., 3.80%, due 10/1/2051 | |
| | United Technologies Corp., 4.50%, due 6/1/2042 | |
| | UnitedHealth Group, Inc., 4.20%, due 1/15/2047 | |
| | Upjohn, Inc., 3.85%, due 6/22/2040 | |
| | Verizon Communications, Inc. | |
| | | |
| | | |
| | | |
| | ViacomCBS, Inc., 4.20%, due 5/19/2032 | |
| | Virginia Electric and Power Co., 2.45%, due 12/15/2050 | |
| | Walmart, Inc., 2.50%, due 9/22/2041 | |
| | Walt Disney Co., 4.70%, due 3/23/2050 | |
| | | |
| | | |
| | | |
| | | |
Total Corporate Bonds (Cost $1,043,091) | |
U.S. Treasury Obligations 7.1% | |
| | | |
| | | |
| | | |
| | | |
| | | |
| | 3.13%, due 11/15/2041 - 8/15/2044 | |
| | 2.00%, due 11/15/2041 - 8/15/2051 | |
| | 2.38%, due 2/15/2042 - 5/15/2051 | |
| | 3.00%, due 5/15/2042 - 8/15/2052 | |
| | | |
| | 3.63%, due 8/15/2043 - 2/15/2044 | |
| | 2.88%, due 8/15/2045 - 5/15/2052 | |
| | | |
| | 2.75%, due 8/15/2047 - 11/15/2047 | |
| | | |
| | | |
| | | |
| | U.S. Treasury Notes, 2.75%, due 8/15/2032 | |
Total U.S. Treasury Obligations (Cost $737,080) | |
U.S. Government Agency Securities 0.3% | |
| | Fannie Mae Principal Strip, 0.00%, due 7/15/2037 | |
See Notes to Financial Statements
Schedule of Investments Global Allocation Fund^ (cont’d)
| |
U.S. Government Agency Securities – cont'd | |
| | Federal Home Loan Bank, 5.50%, due 7/15/2036 | |
Total U.S. Government Agency Securities (Cost $25,580) | |
| |
Exchange-Traded Funds 17.5% | |
| | Invesco DB Commodity Index Tracking Fund | |
| | iShares Core International Aggregate Bond ETF | |
Total Exchange-Traded Funds (Cost $1,577,192) | |
Total Purchased Options(i) 0.0%(d) (Cost $4,150) | |
|
Short-Term Investments 2.5% |
Investment Companies 2.5% | |
| | State Street Institutional U.S. Government Money Market Fund Premier Class, 3.01%(j) (Cost $201,135) | |
Total Investments 95.8% (Cost $8,290,596) | |
Other Assets Less Liabilities 4.2% | |
| |
| Non-income producing security. |
| Stapled security. A security contractually bound to one or more other securities to form a single saleable unit which cannot be sold separately. |
| Security exempt from registration pursuant to Regulation S under the Securities Act of 1933, as amended. Regulation S applies to securities offerings that are made outside of the United States and do not involve directed selling efforts in the United States and as such may have restrictions on resale. Total value of all such securities at October 31, 2022 amounted to $6,519, which represents 0.1% of net assets of the Fund. |
| Securities were purchased under Rule 144A of the Securities Act of 1933, as amended, or are otherwise restricted and, unless registered under the Securities Act of 1933 or exempted from registration, may only be sold to qualified institutional investors or may have other restrictions on resale. At October 31, 2022, these securities amounted to $26,695, which represents 0.3% of net assets of the Fund. |
| Represents less than 0.05% of net assets of the Fund. |
| Security issued at a fixed coupon rate, which converts to a variable rate at a future date. Rate shown is the rate in effect as of period end. |
| Perpetual security. Perpetual securities have no stated maturity date, but they may be called/redeemed by the issuer. The date shown reflects the next call date. |
| Step Bond. Coupon rate is a fixed rate for an initial period that either resets at a specific date or may reset in the future contingent upon a predetermined trigger. The interest rate shown was the current rate as of October 31, 2022. |
| Principal only security. This security entitles the holder to receive principal payments from an underlying pool of assets or on the security itself. |
| See "Purchased option contracts" under Derivative Instruments. |
| Represents 7-day effective yield as of October 31, 2022. |
See Notes to Financial Statements
Schedule of Investments Global Allocation Fund^ (cont’d)
| Includes the impact of the Fund's open positions in derivatives at October 31, 2022. |
See Notes to Financial Statements
Schedule of Investments Global Allocation Fund^ (cont’d)
|
| | |
| | |
U.S. Treasury Obligations | | |
| | |
| | |
| | |
Technology Hardware, Storage & Peripherals | | |
Oil, Gas & Consumable Fuels | | |
| | |
Semiconductors & Semiconductor Equipment | | |
| | |
Health Care Providers & Services | | |
| | |
| | |
Interactive Media & Services | | |
| | |
| | |
| | |
| | |
| | |
| | |
| | |
Diversified Telecommunication Services | | |
Life Sciences Tools & Services | | |
| | |
Textiles, Apparel & Luxury Goods | | |
| | |
| | |
| | |
Trading Companies & Distributors | | |
| | |
| | |
Health Care Equipment & Supplies | | |
Hotels, Restaurants & Leisure | | |
| | |
| | |
Internet & Direct Marketing Retail | | |
| | |
| | |
Commercial Services & Supplies | | |
Equity Real Estate Investment Trusts | | |
| | |
| | |
Internet & Catalog Retail | | |
Construction & Engineering | | |
| | |
| | |
See Notes to Financial Statements
Schedule of Investments Global Allocation Fund^ (cont’d)
POSITIONS BY INDUSTRY (cont’d) |
| | |
| | |
| | |
| | |
| | |
Real Estate Management & Development | | |
| | |
| | |
| | |
Diversified Financial Services | | |
Wireless Telecommunication Services | | |
| | |
| | |
U.S. Government Agency Securities | | |
| | |
| | |
| | |
| | |
| | |
| | |
| | |
| | |
| | |
| | |
| | |
| | |
| | |
Office - Business Equipment | | |
| | |
Real Estate Investment Trusts | | |
| | |
| | |
| | |
Miscellaneous Manufacturer | | |
| | |
| | |
Other industries, each representing less than 0.05% of net assets of the Fund | | |
| | |
Short-Term Investments and Other Assets—Net | | |
| | |
| Represents less than 0.05% of net assets of the Fund. |
| Each position is an Investment Company registered under the 1940 Act, as amended, and is not treated as an industry for purposes of the Fund's policy on industry concentration. This represents the aggregate of all investment companies. |
See Notes to Financial Statements
Schedule of Investments Global Allocation Fund^ (cont’d)
Derivative Instruments
Futures contracts ("futures")
At October 31, 2022, open positions in futures for the Fund were as follows:
| | | | Value and
Unrealized
Appreciation/
(Depreciation) |
| | MSCI Emerging Markets Index | | |
| | | | |
| | | | |
| | |
| | | | Value and
Unrealized
Appreciation/
(Depreciation) |
| | | | |
| | | | |
| | Japanese Government Bond, 10 Year | | |
| | | | |
| | U.S. Treasury Note, 10 Year | | |
| | |
| | |
At October 31, 2022, the Fund had $79,279 deposited in a segregated account to cover margin requirements on open futures.
For the year ended October 31, 2022, the average notional value for the months where the Fund had futures outstanding was $749,070 for long positions and $(1,968,481) for short positions.
Forward foreign currency contracts ("forward FX contracts")
At October 31, 2022, open forward FX contracts for the Fund were as follows:
| | | | Net
Unrealized
Appreciation/
(Depreciation) |
| | | | | | |
| | | | | | |
| | | | | | |
| | | | | | |
| | | | | | |
| | | | | | |
Total unrealized appreciation | | |
| | | | | | |
Total unrealized depreciation | | |
Total net unrealized appreciation | | |
See Notes to Financial Statements
Schedule of Investments Global Allocation Fund^ (cont’d)
For the year ended October 31, 2022, the average notional value for the months where the Fund had forward FX contracts outstanding was $783,605.
Total return basket swap contracts (“total return basket swaps”)
At October 31, 2022, the Fund did not have any outstanding total return basket swaps.
Total return swap contracts (“total return swaps”)
At October 31, 2022, the Fund had outstanding total return swaps as follows:
Over-the-counter total return swaps—Long(a) |
| | | | | | | Frequency
of Fund
Receipt/
Payment | Unrealized
Appreciation/
(Depreciation) | Accrued
Net
Interest
Receivable/
(Payable) | |
| Citi CUBES-D (GSCI weighted) ER Index | | | | | | | | | | |
| iShares GSCI Commodity Dynamic Roll Strategy ETF | | | | | | | | | | |
| | | | | | | | | | | |
| The Fund pays a specified rate based on a reference rate plus or minus a spread, and receives the total return on the reference entity. |
| Effective rate at October 31, 2022. |
| |
For the year ended October 31, 2022, the average notional value for the months where the Fund had total return basket swaps and total return swaps for the Fund was $122,842 for long positions and $(82,087) for short positions.
Purchased option contracts (“options purchased”)
At October 31, 2022, the Fund had outstanding options purchased as follows:
| | | | | |
|
|
iShares China Large-Cap ETF(a) | | | | | |
|
Foreign Exchange USD vs. EUR(b) | | | | | |
Total options purchased (cost $4,150) | |
| |
| Over-the-counter option. Counterparty is Goldman Sachs International. |
| Over-the-counter option. Counterparty is JPMorgan Chase Bank N.A. |
See Notes to Financial Statements
Schedule of Investments Global Allocation Fund^ (cont’d)
Written option contracts ("options written")
At October 31, 2022, the Fund did not have any open positions in options written.
For the year ended October 31, 2022, the average market value for the months where the Fund had options purchased and options written outstanding was $2,218 and $(8,797), respectively.
The following is a summary, categorized by Level (see Note A of the Notes to Financial Statements), of inputs used to value the Fund’s investments as of October 31, 2022:
| | | | |
| | | | |
| | | | |
| | | | |
| | | | |
| | | | |
| | | | |
| | | | |
| | | | |
| | | | |
| | | | |
U.S. Treasury Obligations | | | | |
U.S. Government Agency Securities | | | | |
| | | | |
| | | | |
| | | | |
| | | | |
| | | | |
| The Schedule of Investments provides a geographic categorization as well as a Positions by Industry summary. |
| The “Purchased option contracts” table under Derivative Instruments provides information on the industry or sector categorization. |
The following is a summary, categorized by Level (see Note A of the Notes to Financial Statements), of inputs used to value the Fund’s derivatives as of October 31, 2022:
Other Financial Instruments | | | | |
| | | | |
| | | | |
| | | | |
| | | | |
| | | | |
| | | | |
| | | | |
| | | | |
| | | | |
| Futures and forward FX contracts are reported at the cumulative unrealized appreciation/(depreciation) of the instrument. |
^
A balance indicated with a "—", reflects either a zero balance or an amount that rounds to less than 1.
See Notes to Financial Statements
Consolidated Schedule of Investments Long Short Fund^
October 31, 2022
| |
|
|
|
| | |
| | |
| | |
|
| | |
|
| | |
|
| | |
|
| Brookfield Asset Management, Inc. Class A | |
| | |
| | |
| | |
|
| Air Products & Chemicals, Inc. | |
| | |
| | |
Commercial Services & Supplies 1.1% |
| | |
|
| Arctic Wolf Networks, Inc. | |
Containers & Packaging 1.0% |
| | |
Diversified Consumer Services 0.2% |
| European Wax Center, Inc. Class A | |
Diversified Financial Services 2.9% |
| Apollo Global Management, Inc. | |
| | |
| Sunlight Financial Holdings, Inc. | |
| | |
|
| | |
Electrical Equipment 0.8% |
| | |
Electronic Equipment, Instruments & Components 2.2% |
| | |
| |
Electronic Equipment, Instruments & Components – cont'd |
| | |
| | |
| | |
|
| Activision Blizzard, Inc. | |
| | |
| | |
Equity Real Estate Investment Trusts 0.6% |
| | |
Food & Staples Retailing 1.7% |
| | |
| | |
| | |
|
| Mondelez International, Inc. Class A | |
Health Care Equipment & Supplies 0.9% |
| | |
| | |
| | |
Health Care Providers & Services 2.5% |
| | |
| | |
| | |
Holding Companies—Diversified 0.2% |
| Independence Holdings Corp. | |
Hotels, Restaurants & Leisure 2.9% |
| | |
| First Watch Restaurant Group, Inc. | |
| Marriott International, Inc. Class A | |
| | |
| | |
| | |
|
| | |
|
| | |
Interactive Media & Services 3.0% |
| | |
| Meta Platforms, Inc. Class A | |
| | |
See Notes to Consolidated Financial Statements
Consolidated Schedule of Investments Long Short Fund^ (cont’d)
| |
Internet & Direct Marketing Retail 2.7% |
| | |
| | |
| | |
|
| Fidelity National Information Services, Inc. | |
| | |
| | |
| | |
| | |
| | |
Life Sciences Tools & Services 0.7% |
| Thermo Fisher Scientific, Inc. | |
|
| | |
|
| | |
| | |
| | |
Oil, Gas & Consumable Fuels 2.0% |
| | |
| | |
| | |
| | |
|
| | |
Professional Services 1.1% |
| | |
|
| | |
| | |
| | |
Semiconductors & Semiconductor Equipment 1.2% |
| | |
| | |
| | |
|
| | |
| DoubleVerify Holdings, Inc. | |
| | |
| | |
| | |
| | |
| | |
| | |
| |
|
| | |
| | |
|
| Asbury Automotive Group, Inc. | |
| Fanatics Holdings, Inc. Class A | |
| Floor & Decor Holdings, Inc. Class A | |
| | |
| | |
| | |
| Warby Parker, Inc. Class A | |
| | |
Technology Hardware, Storage & Peripherals 3.0% |
| | |
Textiles, Apparel & Luxury Goods 0.9% |
| | |
|
Total Common Stocks
(Cost $3,412,772,324) | |
|
|
| | |
|
| | |
|
| | |
|
| | |
| | |
| | |
| | |
|
| | |
| | |
| | |
| | |
| | |
Total Preferred Stocks
(Cost $58,686,273) | |
See Notes to Consolidated Financial Statements
Consolidated Schedule of Investments Long Short Fund^ (cont’d)
| |
Master Limited Partnerships and Limited Partnerships 2.9% |
|
| Brookfield Infrastructure Partners L.P.
| |
| |
Oil, Gas & Consumable Fuels 1.9% |
| Enterprise Products Partners L.P.
| |
Total Master Limited Partnerships and Limited Partnerships
(Cost $134,061,146) | |
| |
|
|
| Pepsico, Inc., 2.75%, due 10/21/2051 | |
|
| Apple, Inc., 2.85%, due 8/5/2061 | |
Diversified Financial Services 0.0%(f) |
| Mastercard, Inc., 2.95%, due 3/15/2051 | |
|
| Florida Power & Light Co., 2.88%, due 12/4/2051 | |
Healthcare - Services 0.1% |
| UnitedHealth Group, Inc., 3.13%, due 5/15/2060 | |
|
| Alphabet, Inc., 2.25%, due 8/15/2060 | |
| Amazon.com, Inc., 3.25%, due 5/12/2061 | |
| Meta Platforms, Inc., 4.65%, due 8/15/2062 | |
| Uber Technologies, Inc., 8.00%, due 11/1/2026 | |
| | |
Machinery - Diversified 0.1% |
| nVent Finance Sarl, 4.55%, due 4/15/2028 | |
Miscellaneous Manufacturer 0.8% |
| Anagram International, Inc./Anagram Holdings LLC | |
| 10.00% Cash & 5.00% PIK, due 8/15/2025 | |
| 5.00% Cash & 5.00% PIK, due 8/15/2026 | |
| | |
Office - Business Equipment 0.1% |
| CDW LLC/CDW Finance Corp., 2.67%, due 12/1/2026 | |
|
| Johnson & Johnson, 2.45%, due 9/1/2060 | |
Real Estate Investment Trusts 0.1% |
| SBA Communications Corp., 3.88%, due 2/15/2027 | |
|
| Walmart, Inc., 2.65%, due 9/22/2051 | |
|
| Activision Blizzard, Inc., 2.50%, due 9/15/2050 | |
See Notes to Consolidated Financial Statements
Consolidated Schedule of Investments Long Short Fund^ (cont’d)
| |
|
| Microsoft Corp., 2.68%, due 6/1/2060 | |
| Oracle Corp., 3.85%, due 4/1/2060 | |
| | |
Total Corporate Bonds
(Cost $151,779,057) | |
|
Leisure Goods - Activities - Movies 0.4% |
| One Spa World, LLC, Second Lien Term Loan, (3M USD LIBOR + 7.50%), 11.83%, due 3/18/2027 (Cost $19,774,070) | |
|
|
|
| Arctic Wolf Networks, Inc., 0.00%, due 9/29/2027 (Cost $19,850,000) | |
| |
|
Diversified Consumer Services 0.1% |
| OneSpaWorld Holdings Ltd. Expires 3/19/2024 | |
| OneSpaWorld Holdings Ltd. Expires 6/12/2025 | |
| | |
|
| Whole Earth Brands, Inc. Expires 6/25/2025 | |
| Whole Earth Brands, Inc. Expires 6/25/2025 | |
| | |
Total Warrants
(Cost $433,413) | |
Purchased Option Contracts 0.0%(f)
(Cost $1,340,081) | |
|
Short-Term Investments 23.0% |
Investment Companies 23.0% |
| State Street Institutional U.S. Government Money Market Fund Premier Class, 3.01%(k) | |
| State Street Navigator Securities Lending Government Money Market Portfolio, 3.11%(k) | |
Total Short-Term Investments
(Cost $1,290,048,652) | |
|
See Notes to Consolidated Financial Statements
Consolidated Schedule of Investments Long Short Fund^ (cont’d)
| |
Total Long Positions (100.2%) (Cost $5,088,745,016) | |
Short Positions ((16.1)%) |
Common Stocks Sold Short (15.3)% |
Aerospace & Defense (0.4)% |
| | |
| | |
| | |
Air Freight & Logistics (0.1)% |
| Expeditors International of Washington, Inc.
| |
|
| | |
|
| | |
|
| | |
Commercial Services & Supplies (0.1)% |
| | |
Communications Equipment (0.1)% |
| | |
|
| Capital One Financial Corp. | |
| | |
| | |
| | |
Containers & Packaging (0.3)% |
| Packaging Corp. of America
| |
Diversified Consumer Services (0.3)% |
| | |
| | |
| | |
Electric Utilities (0.4)% |
| Hawaiian Electric Industries, Inc. | |
| | |
| | |
| |
Electrical Equipment (0.4)% |
| | |
| | |
| | |
|
| | |
| Warner Bros Discovery, Inc. | |
| | |
Equity Real Estate Investment Trusts (0.8)% |
| | |
| | |
| | |
Food & Staples Retailing (0.4)% |
| Grocery Outlet Holding Corp. | |
| | |
| | |
|
| Brookfield Realty Capital Corp. | |
| | |
| | |
| | |
| | |
| | |
Hotels, Restaurants & Leisure (0.6)% |
| | |
| | |
| Restaurant Brands International, Inc. | |
| | |
Household Durables (0.1)% |
| | |
| | |
| | |
Household Products (0.3)% |
| Church & Dwight Co., Inc.
| |
Industrial Conglomerates (0.3)% |
| | |
| | |
| | |
Interactive Media & Services (0.3)% |
| | |
| | |
| | |
| ZoomInfo Technologies, Inc. | |
| | |
See Notes to Consolidated Financial Statements
Consolidated Schedule of Investments Long Short Fund^ (cont’d)
| |
Internet & Direct Marketing Retail (0.0)%(f) |
| | |
|
| | |
| | |
| | |
| | |
|
| Illinois Tool Works, Inc. | |
| | |
| | |
| | |
|
| Interpublic Group of Cos., Inc. | |
| | |
| | |
| | |
| | |
| | |
|
| Consolidated Edison, Inc.
| |
|
| | |
Professional Services (0.2)% |
| | |
Real Estate Management & Development (0.2)% |
| Opendoor Technologies, Inc. | |
| | |
| | |
|
| Canadian Pacific Railway Ltd. | |
| |
|
| | |
| | |
Semiconductors & Semiconductor Equipment (0.2)% |
| | |
|
| | |
| Crowdstrike Holdings, Inc. Class A | |
| | |
| Descartes Systems Group, Inc. | |
| | |
| | |
| Palantir Technologies, Inc. | |
| | |
| | |
| | |
| | |
| SentinelOne, Inc. Class A | |
| | |
| | |
| | |
|
| | |
| | |
| | |
| | |
| | |
| Sally Beauty Holdings, Inc. | |
| | |
| | |
Textiles, Apparel & Luxury Goods (0.1)% |
| | |
Total Common Stocks Sold Short
(Proceeds $(909,766,737)) | |
| |
Corporate Bonds Sold Short (0.8)% |
Diversified Financial Services (0.2)% |
| Radian Group, Inc., 4.88%, due 3/15/2027 | |
| Rocket Mortgage LLC/Rocket Mortgage Co.-Issuer, Inc., 3.63%, due 3/1/2029 | |
| | |
|
| Hartford Financial Services Group, Inc., (3M USD LIBOR + 2.13%), 5.03%, due 2/12/2047 | |
See Notes to Consolidated Financial Statements
Consolidated Schedule of Investments Long Short Fund^ (cont’d)
| |
|
| Boyd Gaming Corp., 4.75%, due 12/1/2027 | |
|
| iHeartCommunications, Inc., 8.38%, due 5/1/2027 | |
| Sirius XM Radio, Inc., 4.00%, due 7/15/2028 | |
| | |
|
| Steelcase, Inc., 5.13%, due 1/18/2029 | |
|
| TransCanada PipeLines Ltd., (3M USD LIBOR + 2.21%), 5.12%, due 5/15/2067 | |
|
| Macy's Retail Holdings LLC, 5.88%, due 4/1/2029 | |
Total Corporate Bonds Sold Short (Proceeds $(45,302,832)) | |
Total Short Positions (Proceeds $(955,069,569)) | |
Total Investments 84.1% (Cost $4,133,675,447) | |
Other Assets Less Liabilities 15.9% | |
| |
| Non-income producing security. |
| All or a portion of this security is pledged as collateral for options written. |
| Value determined using significant unobservable inputs. |
| Security fair valued as of October 31, 2022 in accordance with procedures approved by the valuation designee. Total value of all such securities at October 31, 2022 amounted to $263,407,938, which represents 4.7% of net assets of the Fund. |
| All or a portion of this security is on loan at October 31, 2022. Total value of all such securities at October 31, 2022 amounted to $43,177,197, collateralized by cash collateral of $44,743,892 and non-cash (U.S. Treasury Securities) collateral of $207,151 for the Fund (see Note A of the Notes to Financial Statements). |
| Security represented in Units. |
| Represents less than 0.05% of net assets of the Fund. |
| Securities were purchased or sold short under Rule 144A of the Securities Act of 1933, as amended, or are otherwise restricted and, unless registered under the Securities Act of 1933 or exempted from registration, may only be sold to qualified institutional investors or may have other restrictions on resale. At October 31, 2022, these securities amounted to $54,028,111 of long positions and $(14,754,528) of short positions, which represents 1.0% and (0.3)%, respectively, of net assets of the Fund. |
| Step Bond. Coupon rate is a fixed rate for an initial period that either resets at a specific date or may reset in the future contingent upon a predetermined trigger. The interest rate shown was the current rate as of October 31, 2022. |
| Payment-in-kind (PIK) security. |
| Variable or floating rate security. The interest rate shown was the current rate as of October 31, 2022 and changes periodically. |
| Represents 7-day effective yield as of October 31, 2022. |
See Notes to Consolidated Financial Statements
Consolidated Schedule of Investments Long Short Fund^ (cont’d)
| Represents investment of cash collateral received from securities lending. |
| Includes the impact of the Fund’s open positions in derivatives at October 31, 2022. |
# These securities have been deemed by Management to be illiquid, and are subject to restrictions on resale. At October 31, 2022, these securities amounted to $260,539,802, which represents 4.6% of net assets of the Fund. Acquisition dates shown with a range, if any, represent securities that were acquired over the period shown in the table.
| | | | Fair Value
Percentage
of Net Assets
as of
10/31/2022 |
A24 Films LLC (Preferred Units) | | | | |
Arctic Wolf Networks, Inc. | | | | |
Arctic Wolf Networks, Inc. (Convertible Bonds) | | | | |
Cybereason, Inc. (Ser. F Preferred Shares) | | | | |
Druva, Inc. (Ser. 4 Preferred Shares) | | | | |
Druva, Inc. (Ser. 5 Preferred Shares) | | | | |
Fabletics, Inc. (Ser. G Preferred Shares) | | | | |
Fanatics Holdings, Inc. Class A | | | | |
| | | | |
Grammarly, Inc. (Ser. 3 Preferred Shares) | | | | |
One Spa World, LLC Second Lien Term Loan | | | | |
Savage X, Inc. (Ser. C Preferred Shares) | | | | |
Signifyd, Inc. (Ser. Seed Preferred Shares) | | | | |
Signifyd, Inc. (Ser. A Preferred Shares) | | | | |
| | | | |
Videoamp, Inc. (Ser. F1 Preferred Shares) | | | | |
| | | | |
See Notes to Consolidated Financial Statements
Consolidated Schedule of Investments Long Short Fund^ (cont’d)
Derivative Instruments
Futures contracts ("futures")
At October 31, 2022, open positions in futures for the Fund were as follows:
| | | | Value and
Unrealized
Appreciation/
(Depreciation) |
| | | | |
| | Russell 2000 E-Mini Index | | |
| | | | |
| | |
At October 31, 2022, the Fund had $23,384,552 deposited in a segregated account to cover margin requirements on open futures.
For the year ended October 31, 2022, the average notional value for the months where the Fund had futures outstanding was $(634,584,240) for short positions.
Total return basket swap contracts (“total return basket swaps”)
At October 31, 2022, the Fund had outstanding total return basket swaps(a) as follows:
Over-the-counter total return basket swaps—Short(b) |
| | | | | Frequency
of Fund
Receipt/
Payment | | |
| | | | | | | |
| | | | | | | |
| | | | | | | |
| | | | | | | |
| | | | | | | |
| | | | | | | |
| | | | | | | |
| | | | | | | |
| | | | | | | |
| | | | | | | |
| | | | | | | |
(a) The following table represents required component disclosures associated with the total return basket swaps:
| | | Unrealized
Appreciation/
(Depreciation) | |
| | | | |
| | | | |
| | | | |
Industria de Diseno Textil SA | | | | |
| | | | |
H & M Hennes & Mauritz AB | | | | |
See Notes to Consolidated Financial Statements
Consolidated Schedule of Investments Long Short Fund^ (cont’d)
| | | Unrealized Appreciation/ (Depreciation) | |
| | | | |
| | | | |
| | | | |
| | | | |
| | | | |
| | | | |
| | | | |
| | | | |
| | | | |
| | | | |
| | | | |
| | | | |
| | | | |
| | | | |
| | | | |
| | | | |
| | | | |
Watches of Switzerland Group PLC | | | | |
| | | | |
| | | | |
| | | | |
| | | | |
| | | | |
| | | | |
| | | | |
Accrued Net Interest Receivable/(Payable) | | | |
| | | | |
| | | | |
| | | | |
| | | | |
Industria de Diseno Textil SA | | | | |
| | | | |
H & M Hennes & Mauritz AB | | | | |
| | | | |
| | | | |
| | | | |
| | | | |
| | | | |
| | | | |
| | | | |
| | | | |
| | | | |
| | | | |
| | | | |
| | | | |
| | | | |
| | | | |
See Notes to Consolidated Financial Statements
Consolidated Schedule of Investments Long Short Fund^ (cont’d)
| | | Unrealized Appreciation/ (Depreciation) | |
| | | | |
| | | | |
| | | | |
Watches of Switzerland Group PLC | | | | |
| | | | |
| | | | |
| | | | |
| | | | |
| | | | |
| | | | |
| | | | |
Accrued Net Interest Receivable/(Payable) | | | |
| | | | |
| | | | |
| | | | |
| | | | |
Industria de Diseno Textil SA | | | | |
| | | | |
H & M Hennes & Mauritz AB | | | | |
| | | | |
| | | | |
| | | | |
| | | | |
| | | | |
| | | | |
| | | | |
| | | | |
| | | | |
| | | | |
| | | | |
| | | | |
| | | | |
| | | | |
| | | | |
| | | | |
Watches of Switzerland Group PLC | | | | |
| | | | |
| | | | |
| | | | |
| | | | |
| | | | |
| | | | |
| | | | |
Accrued Net Interest Receivable/(Payable) | | | |
| | | | |
| | | | |
| | | | |
See Notes to Consolidated Financial Statements
Consolidated Schedule of Investments Long Short Fund^ (cont’d)
| | | Unrealized Appreciation/ (Depreciation) | |
| | | | |
| | | | |
Industria de Diseno Textil SA | | | | |
| | | | |
H & M Hennes & Mauritz AB | | | | |
| | | | |
| | | | |
| | | | |
| | | | |
| | | | |
| | | | |
| | | | |
| | | | |
| | | | |
| | | | |
| | | | |
| | | | |
| | | | |
| | | | |
| | | | |
| | | | |
Watches of Switzerland Group PLC | | | | |
| | | | |
| | | | |
| | | | |
| | | | |
| | | | |
| | | | |
| | | | |
Accrued Net Interest Receivable/(Payable) | | | |
| | | | |
| | | | |
| | | | |
| | | | |
Industria de Diseno Textil SA | | | | |
| | | | |
H & M Hennes & Mauritz AB | | | | |
| | | | |
| | | | |
| | | | |
| | | | |
| | | | |
| | | | |
| | | | |
| | | | |
| | | | |
| | | | |
See Notes to Consolidated Financial Statements
Consolidated Schedule of Investments Long Short Fund^ (cont’d)
| | | Unrealized Appreciation/ (Depreciation) | |
| | | | |
| | | | |
| | | | |
| | | | |
| | | | |
| | | | |
| | | | |
Watches of Switzerland Group PLC | | | | |
| | | | |
| | | | |
| | | | |
| | | | |
| | | | |
| | | | |
| | | | |
Accrued Net Interest Receivable/(Payable) | | | |
| | | | |
| | | | |
| | | | |
| | | | |
| | | | |
| | | | |
| | | | |
| | | | |
| | | | |
| | | | |
| | | | |
| | | | |
| | | | |
| | | | |
| | | | |
| | | | |
| | | | |
| | | | |
| | | | |
| | | | |
| | | | |
| | | | |
| | | | |
| | | | |
| | | | |
| | | | |
Discover Financial Services | | | | |
| | | | |
Knight-Swift Transportation Holdings Inc | | | | |
| | | | |
| | | | |
See Notes to Consolidated Financial Statements
Consolidated Schedule of Investments Long Short Fund^ (cont’d)
| | | Unrealized Appreciation/ (Depreciation) | |
| | | | |
| | | | |
| | | | |
| | | | |
| | | | |
| | | | |
| | | | |
| | | | |
| | | | |
United Parcel Service Inc | | | | |
| | | | |
| | | | |
| | | | |
| | | | |
| | | | |
| | | | |
| | | | |
| | | | |
| | | | |
| | | | |
| | | | |
| | | | |
| | | | |
| | | | |
| | | | |
| | | | |
| | | | |
Accrued Net Interest Receivable/(Payable) | | | |
| | | | |
| | | | |
| | | | |
| | | | |
| | | | |
| | | | |
Hertz Global Holdings Inc | | | | |
| | | | |
| | | | |
| | | | |
| | | | |
| | | | |
| | | | |
| | | | |
| | | | |
| | | | |
| | | | |
| | | | |
| | | | |
See Notes to Consolidated Financial Statements
Consolidated Schedule of Investments Long Short Fund^ (cont’d)
| | | Unrealized Appreciation/ (Depreciation) | |
| | | | |
| | | | |
| | | | |
| | | | |
Credo Technology Group Holding Ltd | | | | |
| | | | |
NU Holdings Ltd/Cayman Islands | | | | |
| | | | |
| | | | |
Ryan Specialty Holdings Inc | | | | |
| | | | |
Full Truck Alliance Co Ltd | | | | |
| | | | |
| | | | |
| | | | |
| | | | |
| | | | |
| | | | |
| | | | |
| | | | |
| | | | |
| | | | |
| | | | |
| | | | |
Definitive Healthcare Corp | | | | |
| | | | |
| | | | |
| | | | |
| | | | |
| | | | |
| | | | |
| | | | |
| | | | |
| | | | |
| | | | |
| | | | |
Accrued Net Interest Receivable/(Payable) | | | |
| | | | |
| | | | |
| | | | |
| | | | |
| | | | |
LVMH Moet Hennessy Louis Vuitton SE | | | | |
| | | | |
| | | | |
| | | | |
| | | | |
See Notes to Consolidated Financial Statements
Consolidated Schedule of Investments Long Short Fund^ (cont’d)
| | | Unrealized Appreciation/ (Depreciation) | |
| | | | |
| | | | |
| | | | |
| | | | |
| | | | |
| | | | |
| | | | |
| | | | |
| | | | |
Cie Financiere Richemont SA | | | | |
| | | | |
| | | | |
| | | | |
Chipotle Mexican Grill Inc | | | | |
| | | | |
Marriott International Inc/MD | | | | |
Hilton Worldwide Holdings Inc | | | | |
| | | | |
| | | | |
| | | | |
| | | | |
| | | | |
| | | | |
| | | | |
| | | | |
Oriental Land Co Ltd/Japan | | | | |
| | | | |
Bayerische Motoren Werke AG | | | | |
| | | | |
| | | | |
| | | | |
| | | | |
| | | | |
Bandai Namco Holdings Inc | | | | |
| | | | |
Industria de Diseno Textil SA | | | | |
Cie Generale des Etablissements Michelin SCA | | | | |
| | | | |
MGM Resorts International | | | | |
| | | | |
| | | | |
| | | | |
| | | | |
| | | | |
| | | | |
Accrued Net Interest Receivable/(Payable) | | | |
| | | | |
See Notes to Consolidated Financial Statements
Consolidated Schedule of Investments Long Short Fund^ (cont’d)
| | | Unrealized Appreciation/ (Depreciation) | |
| | | | |
| | | | |
| | | | |
Take-Two Interactive Software Inc | | | | |
| | | | |
Performance Food Group Co | | | | |
Sprouts Farmers Market Inc | | | | |
| | | | |
| | | | |
| | | | |
| | | | |
| | | | |
| | | | |
| | | | |
| | | | |
| | | | |
| | | | |
| | | | |
| | | | |
Live Nation Entertainment Inc | | | | |
Monolithic Power Systems Inc | | | | |
| | | | |
| | | | |
| | | | |
| | | | |
| | | | |
| | | | |
| | | | |
| | | | |
| | | | |
| | | | |
| | | | |
| | | | |
| | | | |
| | | | |
| | | | |
| | | | |
AMN Healthcare Services Inc | | | | |
| | | | |
| | | | |
| | | | |
| | | | |
| | | | |
| | | | |
| | | | |
| | | | |
| | | | |
See Notes to Consolidated Financial Statements
Consolidated Schedule of Investments Long Short Fund^ (cont’d)
| | | Unrealized Appreciation/ (Depreciation) | |
| | | | |
| | | | |
| | | | |
Palantir Technologies Inc | | | | |
| | | | |
| | | | |
| | | | |
Accrued Net Interest Receivable/(Payable) | | | |
| | | | |
| | | | |
Archer-Daniels-Midland Co | | | | |
| | | | |
| | | | |
| | | | |
| | | | |
| | | | |
| | | | |
| | | | |
| | | | |
| | | | |
| | | | |
| | | | |
| | | | |
| | | | |
| | | | |
| | | | |
Keysight Technologies Inc | | | | |
| | | | |
| | | | |
| | | | |
| | | | |
| | | | |
| | | | |
| | | | |
| | | | |
| | | | |
| | | | |
Hartford Financial Services Group Inc/The | | | | |
CF Industries Holdings Inc | | | | |
| | | | |
| | | | |
Fidelity National Information Services Inc | | | | |
Principal Financial Group Inc | | | | |
| | | | |
| | | | |
Zimmer Biomet Holdings Inc | | | | |
| | | | |
See Notes to Consolidated Financial Statements
Consolidated Schedule of Investments Long Short Fund^ (cont’d)
| | | Unrealized Appreciation/ (Depreciation) | |
| | | | |
| | | | |
| | | | |
Canadian Pacific Railway Ltd | | | | |
Laboratory Corp of America Holdings | | | | |
| | | | |
| | | | |
| | | | |
| | | | |
| | | | |
Citizens Financial Group Inc | | | | |
Discover Financial Services | | | | |
| | | | |
| | | | |
| | | | |
| | | | |
Accrued Net Interest Receivable/(Payable) | | | |
| | | | |
Total Return Basket Swaps, at Value | | | |
| The Fund receives a specified rate based on a reference rate plus or minus a spread, and pays the total return on the reference entity. The cash flows may be denominated in various foreign currencies based on the local currencies of the positions within the swaps. |
| Effective rate at October 31, 2022. |
Total return swap contracts (“total return swaps”)
At October 31, 2022, the Fund had outstanding over-the-counter total return swaps as follows:
Over-the-counter total return swaps—Short(a) |
| | | | | | | Frequency
of Fund
Receipt/
Payment | Unrealized
Appreciation/
(Depreciation) | Accrued
Net
Interest
Receivable/
(Payable) | |
| S&P 500 Equal Weight Total Return Index | | | | | | | | | | |
| | | | | | | | | | | |
| The Fund receives a specified rate based on a reference rate plus or minus a spread, and pays the total return on the reference entity. |
| Effective rate at October 31, 2022. |
At October 31, 2022, the Fund had cash collateral of $3,980,000 and $3,610,000 received from Goldman Sachs International and JPMorgan Chase Bank N.A., respectively, to cover collateral requirements on over-the-counter derivatives.
For the year ended October 31, 2022, the average notional value for the months where the Fund had total return basket swaps and total return swaps for the Fund was $(704,443,870) for short positions.
See Notes to Consolidated Financial Statements
Consolidated Schedule of Investments Long Short Fund^ (cont’d)
Purchased option contracts (“options purchased”)
At October 31, 2022, the Fund had outstanding options purchased as follows:
| | | | | |
|
|
SPDR Energy Select Sector Fund ETF | | | | | |
Total options purchased (cost $1,340,081) | |
Written option contracts ("options written")
At October 31, 2022, the Fund had outstanding options written as follows:
| | | | | |
|
|
Air Products & Chemicals, Inc. | | | | | |
|
| | | | | |
| | | | | |
|
|
SPDR Energy Select Sector Fund ETF | | | | | |
Total options written (premium received $480,926) | |
For the year ended October 31, 2022, the average market value for the months where the Fund had options purchased and options written outstanding was $2,100,237 and $(1,483,156), respectively. At October 31, 2022, the Fund had securities pledged in the amount of $3,331,840 to cover collateral requirements for options written.
See Notes to Consolidated Financial Statements
Consolidated Schedule of Investments Long Short Fund^ (cont’d)
The following is a summary, categorized by Level (see Note A of the Notes to Financial Statements), of inputs used to value the Fund’s investments as of October 31, 2022:
| | | | |
| | | | |
| | | | |
| | | | |
Oil, Gas & Consumable Fuels | | | | |
| | | | |
| | | | |
| | | | |
| | | | |
| | | | |
Master Limited Partnerships and Limited Partnerships# | | | | |
| | | | |
| | | | |
| | | | |
| | | | |
Diversified Consumer Services | | | | |
| | | | |
| | | | |
| | | | |
| | | | |
| | | | |
| The Consolidated Schedule of Investments provides information on the industry or sector categorization. |
| The “Purchased option contracts” table under Derivative Instruments provides information on the industry or sector categorization. |
| The following is a reconciliation between the beginning and ending balances of investments in which unobservable inputs (Level 3) were used in determining value: |
| Beginning
balance as
of 11/1/2021 | Accrued
discounts/
(premiums) | | Change
in unrealized
appreciation/
(depreciation) | | | | | | Net change in
unrealized
appreciation/
(depreciation)
from
investments
still held as of
10/31/2022 |
Investments in Securities: |
| | | | | | | | | | |
| | | | | | | | | | |
| | | | | | | | | | |
| | | | | | | | | | |
| | | | | | | | | | |
| | | | | | | | | | |
| | | | | | | | | | |
See Notes to Consolidated Financial Statements
Consolidated Schedule of Investments Long Short Fund^ (cont’d)
(1) Quantitative Information about Level 3 Fair Value Measurements: |
| | | | | | Impact to
valuation
from
increase
in input(b) |
| | | | | | |
| | | Enterprise value
EBITDA multiple(c) (EV/EBITDA) | | | |
| | | | | | |
| | | Enterprise value
Revenue multiple(c) (EV/Revenue) | | | |
| | | | | | |
| | | | | | |
| | | | | | |
| | | Enterprise value
Revenue multiple (c) (EV/Revenue) | | | |
| | | Liquidation Preference Discount | | | |
| | | | | | |
| | | | | | |
| | | | | | |
| | | | | | |
(a) The weighted averages disclosed in the table above were weighted by relative fair value. |
(b) Represents the expected directional change in the fair value of the Level 3 investments that would result from an increase or decrease in the corresponding input. Significant changes in these inputs could result in significantly higher or lower fair value measurements. |
(c) Represents amounts used when the reporting entity has determined that market participants would use such multiples when pricing the investments. |
(2) At the beginning of the period, these investments were valued in accordance with procedures approved by the Board of Trustees. These investments did not have a material impact on the Fund's net assets and, therefore, disclosure of unobservable inputs used in formulating valuations is not presented. |
The following is a summary, categorized by Level (see Note A of the Notes to Financial Statements), of inputs used to value the Fund’s short investments as of October 31, 2022:
Liability Valuation Inputs | | | | |
| | | | |
Common Stocks Sold Short# | | | | |
Corporate Bonds Sold Short# | | | | |
| | | | |
| The Consolidated Schedule of Investments provides information on the industry or sector categorization. |
See Notes to Consolidated Financial Statements
Consolidated Schedule of Investments Long Short Fund^ (cont’d)
The following is a summary, categorized by Level (see Note A of the Notes to Financial Statements), of inputs used to value the Fund’s derivatives as of October 31, 2022:
Other Financial Instruments | | | | |
| | | | |
| | | | |
| | | | |
| | | | |
| | | | |
| | | | |
| | | | |
| | | | |
| | | | |
| Futures are reported at the cumulative unrealized appreciation/(depreciation) of the instrument. |
^
A balance indicated with a "—", reflects either a zero balance or an amount that rounds to less than 1.
See Notes to Consolidated Financial Statements
Schedule of Investments U.S. Equity Index PutWrite Strategy Fund^
October 31, 2022
| |
U.S. Treasury Obligations 79.9% |
| | |
| | |
| | |
| | |
| 0.13%, due 9/15/2023 - 12/15/2023 | |
Total U.S. Treasury Obligations (Cost $381,537,011) | |
|
|
Diversified Financial Services 15.0% |
| GS Finance Corp., 25.00%, due 2/16/2024 (Cost $92,419,987) | |
| |
|
Short-Term Investments 6.4% |
Investment Companies 6.4% |
| State Street Institutional U.S. Government Money Market Fund Premier Class, 3.01%(b) (Cost $29,617,032) | |
Total Investments 101.3% (Cost $503,574,030) | |
Liabilities Less Other Assets (1.3)% | |
| |
| All or a portion of this security is pledged as collateral for options written. |
| Represents 7-day effective yield as of October 31, 2022. |
| Includes the impact of the Fund's open positions in derivatives at October 31, 2022. |
See Notes to Financial Statements
Schedule of Investments U.S. Equity Index PutWrite Strategy Fund^ (cont’d)
Derivative Instruments
Written option contracts ("options written")
At October 31, 2022, the Fund had outstanding options written as follows:
| | | | | |
|
|
| | | | | |
| | | | | |
| | | | | |
| | | | | |
| | | | | |
| | | | | |
| | | | | |
| | | | | |
| | | | | |
| | | | | |
| | | | | |
| | | | | |
| | | | | |
| | | | | |
| | | | | |
| | | | | |
| | | | | |
| | | | | |
| | | | | |
Total options written (premium received $12,717,788) | |
For the year ended October 31, 2022, the average market value for the months where the Fund had options written outstanding was $(11,590,967). At October 31, 2022, the Fund had securities pledged in the amount of $132,775,768 to cover collateral requirements for options written.
The following is a summary, categorized by Level (see Note A of the Notes to Financial Statements), of inputs used to value the Fund’s investments as of October 31, 2022:
| | | | |
| | | | |
U.S. Treasury Obligations | | | | |
| | | | |
| | | | |
| | | | |
See Notes to Financial Statements
Schedule of Investments U.S. Equity Index PutWrite Strategy Fund^ (cont’d)
The following is a summary, categorized by Level (see Note A of the Notes to Financial Statements), of inputs used to value the Fund’s derivatives as of October 31, 2022:
Other Financial Instruments | | | | |
| | | | |
| | | | |
| | | | |
^
A balance indicated with a "—", reflects either a zero balance or an amount that rounds to less than 1.
See Notes to Financial Statements
Statements of Assets and Liabilities
Neuberger Berman Alternative Funds
| | | U.S. Equity
Index
PutWrite
Strategy Fund |
| | | |
| | | |
Investments in securities, at value*† (Note A)—
see Schedule of Investments: | | | |
| | | |
| | | |
| | | |
Cash collateral segregated for short sales (Note A) | | | |
Cash collateral segregated for futures contracts (Note A) | | | |
Dividends and interest receivable | | | |
Receivable for securities sold | | | |
Receivable for accumulated variation margin on futures contracts (Note A) | | | |
Receivable from Management—net (Note B) | | | |
Receivable for Fund shares sold | | | |
Receivable for securities lending income (Note A) | | | |
Receivable for forward foreign currency contracts (Note A) | | | |
Over-the-counter swap contracts, at value (Note A) | | | |
Prepaid expenses and other assets | | | |
| | | |
| | | |
Investments sold short, at value(d) (Note A) | | | |
Over-the-counter swap contracts, at value (Note A) | | | |
Dividends and interest payable for short sales | | | |
Cash collateral segregated for over-the-counter derivatives due to broker (Note A) | | | |
Payable to investment manager (Note B) | | | |
Option contracts written, at value(e) (Note A) | | | |
Payable for securities purchased | | | |
Payable for Fund shares redeemed | | | |
Payable for forward foreign currency contracts (Note A) | | | |
Payable to administrator—net (Note B) | | | |
| | | |
| | | |
Payable for custodian and accounting fees | | | |
| | | |
Payable for cash collateral on loaned securities (Note A) | | | |
Other accrued expenses and payables | | | |
| | | |
| | | |
| | | |
See Notes to Financial Statements
Statements of Assets and Liabilities (cont’d)
Neuberger Berman Alternative Funds (cont’d)
| | | U.S. Equity Index PutWrite Strategy Fund |
| | | |
| | | |
| | | |
Total distributable earnings/(losses) | | | |
| | | |
| | | |
| | | |
| | | |
| | | |
| | | |
Shares Outstanding ($.001 par value; unlimited shares authorized) | | | |
| | | |
| | | |
| | | |
| | | |
Net Asset Value, offering and redemption price per share | | | |
| | | |
| | | |
Net Asset Value and redemption price per share | | | |
| | | |
| | | |
| | | |
Net Asset Value and offering price per share | | | |
| | | |
†Securities on loan, at value: | | | |
| | | |
| | | |
| | | |
(c) Total cost of foreign currency | | | |
(d) Proceeds from investments sold short | | | |
(e) Premium received from option contracts written | | | |
| |
| Consolidated financial statement, see Note A of the Notes to Financial Statements for additional information. |
| On single retail sales of less than $50,000. On sales of $50,000 or more or in certain other circumstances described in the Fund's prospectus, offering price is reduced. |
| Redemption price per share is equal to net asset value less any applicable contingent deferred sales charge. |
See Notes to Financial Statements
Neuberger Berman Alternative Funds
| | | U.S. Equity
Index
PutWrite
Strategy Fund |
| For the Fiscal
Year Ended
October 31, 2022 | For the Fiscal
Year Ended
October 31, 2022 | For the Fiscal
Year Ended
October 31, 2022 |
| | | |
| | | |
Dividend income—unaffiliated issuers | | | |
Interest and other income—unaffiliated issuers | | | |
Income from securities loaned—net | | | |
| | | |
| | | |
| | | |
Investment management fees (Note B) | | | |
Administration fees (Note B): | | | |
| | | |
| | | |
| | | |
| | | |
Distribution fees (Note B): | | | |
| | | |
| | | |
Shareholder servicing agent fees: | | | |
| | | |
| | | |
| | | |
| | | |
| | | |
Subsidiary Administration Fees | | | |
Custodian and accounting fees | | | |
| | | |
| | | |
Registration and filing fees | | | |
| | | |
Trustees' fees and expenses | | | |
Dividend and interest expense on securities sold short (Note A) | | | |
| | | |
Miscellaneous and other fees (Note A) | | | |
| | | |
Expenses reimbursed by Management (Note B) | | | |
| | | |
Net investment income/(loss) | | | |
| | | |
See Notes to Financial Statements
Statements of Operations (cont’d)
Neuberger Berman Alternative Funds (cont’d)
| | | U.S. Equity Index PutWrite Strategy Fund |
| For the Fiscal Year Ended October 31, 2022 | For the Fiscal Year Ended October 31, 2022 | For the Fiscal Year Ended October 31, 2022 |
Realized and Unrealized Gain/(Loss) on Investments (Note A): | | | |
Net realized gain/(loss) on: | | | |
Transactions in investment securities of unaffiliated issuers | | | |
Closed short positions of unaffiliated issuers | | | |
Settlement of forward foreign currency contracts | | | |
Settlement of foreign currency transactions | | | |
Expiration or closing of futures contracts | | | |
Expiration or closing of option contracts written | | | |
Expiration or closing of swap contracts | | | |
Change in net unrealized appreciation/(depreciation) in value of: | | | |
Investment securities of unaffiliated issuers | | | |
Short positions of unaffiliated issuers | | | |
Forward foreign currency contracts | | | |
Foreign currency translations | | | |
| | | |
| | | |
| | | |
Net gain/(loss) on investments | | | |
Net increase/(decrease) in net assets resulting from operations | | | |
| |
| Consolidated financial statement, see Note A of the Notes to Financial Statements for additional information. |
See Notes to Financial Statements
Statements of Changes in Net Assets
Neuberger Berman Alternative Funds
| | |
| | | | |
| | | | |
Increase/(Decrease) in Net Assets: | | | | |
From Operations (Note A): | | | | |
Net investment income/(loss) | | | | |
Net realized gain/(loss) on investments | | | | |
Change in net unrealized appreciation/(depreciation) of investments | | | | |
Net increase/(decrease) in net assets resulting from operations | | | | |
Distributions to Shareholders From (Note A): | | | | |
| | | | |
| | | | |
| | | | |
| | | | |
| | | | |
Total distributions to shareholders | | | | |
From Fund Share Transactions (Note D): | | | | |
Proceeds from shares sold: | | | | |
| | | | |
| | | | |
| | | | |
| | | | |
Proceeds from reinvestment of dividends and distributions: | | | | |
| | | | |
| | | | |
| | | | |
| | | | |
Payments for shares redeemed: | | | | |
| | | | |
| | | | |
| | | | |
| | | | |
Net increase/(decrease) from Fund share transactions | | | | |
Net Increase/(Decrease) in Net Assets | | | | |
| | | | |
| | | | |
| | | | |
| |
| Consolidated financial statement, see Note A of the Notes to Financial Statements for additional information. |
See Notes to Financial Statements
U.S. Equity
Index
PutWrite
Strategy Fund |
| |
| |
| |
| |
| |
| |
| |
| |
| |
| |
| |
| |
| |
| |
| |
| |
| |
| |
| |
| |
| |
| |
| |
| |
| |
| |
| |
| |
| |
| |
| |
| |
| |
| |
| |
| |
Notes to Financial Statements Alternative and Multi-Asset Class Fundsß
Note A—Summary of Significant Accounting Policies:
1
General: Neuberger Berman Alternative Funds (the "Trust") is a Delaware statutory trust organized pursuant
to an Amended and Restated Trust Instrument dated March 27, 2014. The Trust is registered as an open-end management investment company under the Investment Company Act of 1940, as amended (the
"1940 Act"), and its shares are registered under the Securities Act of 1933, as amended. Each of Neuberger Berman Global Allocation Fund ("Global Allocation"), Neuberger Berman Long Short Fund ("Long Short"), and Neuberger Berman U.S. Equity Index PutWrite Strategy Fund ("U.S. Equity Index PutWrite Strategy")
(each individually a "Fund," and collectively, the "Funds") is a separate operating series of the Trust. Under the 1940 Act, the status of a Fund that was registered as non-diversified may, under certain circumstances, change to that of a diversified Fund (Global Allocation and Long Short became diversified in December 2013 and December 2014, respectively). U.S. Equity Index PutWrite Strategy is diversified. Each Fund offers Institutional Class shares, Class A shares and Class C shares. Global Allocation and U.S. Equity Index PutWrite Strategy also offer Class R6 shares. The Trust’s Board of Trustees (the "Board") may establish additional series or classes of shares without the approval of shareholders.
A balance indicated with a "—", reflects either a zero balance or a balance that rounds to less than 1.
The assets of each Fund belong only to that Fund, and the liabilities of each Fund are borne solely by that Fund and no other series of the Trust.
Each Fund is an investment company and accordingly follows the investment company accounting and reporting guidance of the Financial Accounting Standards Board ("FASB") Accounting Standards Codification ("ASC") Topic 946 "Financial Services—Investment Companies."
The preparation of financial statements in accordance with U.S. generally accepted accounting principles ("GAAP") requires Management to make estimates and assumptions at the date of the financial statements. Actual results could differ from those estimates.
On February 25, 2022, to facilitate compliance with certain requirements necessary to maintain its regulated investment company ("RIC") status, Long Short formed NB A24 Long Short Blocker LLC (the "Blocker"), a Delaware limited liability company, to hold interests in certain private placements. The Blocker is a wholly owned subsidiary of Long Short and Long Short will remain its sole member.
As of October 31, 2022, the value of Long Short's investment in the Blocker was as follows:
2
Consolidation: The accompanying financial statements of Long Short present the consolidated accounts of Long Short and the Blocker. All intercompany accounts and transactions have been eliminated in consolidation.
3
Portfolio valuation: In accordance with ASC 820 "Fair Value Measurement" ("ASC 820"), all investments held by each of the Funds are carried at the value that Management believes each Fund would receive upon selling an investment in an orderly transaction to an independent buyer in the principal or most advantageous market for the investment under current market conditions. Various inputs, including the volume and level of activity for the asset or liability in the market, are considered in valuing the Funds' investments, some of which are discussed below. At times, Management may need to apply significant judgment to value investments in accordance with ASC 820.
ß
Notes to Consolidated Financial Statements for Long Short
ASC 820 established a three-tier hierarchy of inputs to create a classification of value measurements for disclosure purposes. The three-tier hierarchy of inputs is summarized in the three broad Levels listed below.
•
Level 1 – unadjusted quoted prices in active markets for identical investments
•
Level 2 – other observable inputs (including quoted prices for similar investments, interest rates, prepayment speeds, credit risk, amortized cost, etc.)
•
Level 3 – unobservable inputs (including a Fund's own assumptions in determining the fair value of investments)
The inputs or methodology used for valuing an investment are not necessarily an indication of the risk associated with investing in those securities.
The value of the Funds’ investments (long and short positions) in equity securities, exchange-traded funds ("ETFs"), preferred stocks, master limited partnerships and limited partnerships, warrants and exchange-traded options purchased and written, for which market quotations are available, is generally determined by Management by obtaining valuations from independent pricing services based on the latest
sale price quoted on a principal exchange or market for that security (Level 1 inputs). Securities traded primarily on the NASDAQ Stock Market are normally valued at the NASDAQ Official Closing Price ("NOCP") provided by NASDAQ each business day. The NOCP is the most recently reported price as of 4:00:02 p.m., Eastern Time, unless that price is outside the range of the "inside" bid and asked prices (i.e., the bid and asked prices that dealers quote to each other when trading for their own accounts); in that case, NASDAQ will adjust the price to equal the inside bid or asked price, whichever is closer. Because of delays in reporting trades, the NOCP may not be based on the price of the last trade to occur before the market closes. If there is no sale of a security on a particular day, the independent pricing services may value the security based on market quotations.
The value of the Funds’ investments for long and short positions in debt securities is determined by Management primarily by obtaining valuations from independent pricing services based on bid or offer quotations, respectively, or if quotations are not available, by methods which include various considerations based on security type (generally Level 2 inputs). In addition to the consideration of yields or prices of securities of comparable quality, coupon, maturity and type, indications as to values from dealers, and general market conditions, the following is a description of other Level 2 inputs and related valuation techniques used by independent pricing services to value certain types of debt securities held by the Funds:
Corporate Bonds. Inputs used to value corporate debt securities generally include relevant credit information, observed market movements, sector news, U.S. Treasury yield curve or relevant benchmark curve, and other market information, which may include benchmark yield curves, reported trades, broker-dealer quotes, issuer spreads, comparable securities, and reference data, such as market research publications, when available ("Other Market Information").
Convertible Bonds. Inputs used to value convertible bonds generally include underlying stock data, conversion rates, credit specific details, relevant listed bond and preferred stock prices and Other Market Information.
U.S. Treasury Obligations. Inputs used to value U.S. Treasury securities generally include quotes from several inter-dealer brokers and Other Market Information.
U.S. Government Agency Securities. Inputs used to value U.S. Government Agency securities generally include obtaining benchmark quotes and Other Market Information.
Asset-Backed Securities. Inputs used to value asset-backed securities generally include models that consider a number of factors, which may include the following: prepayment speeds, cash flows, spread adjustments and Other Market Information.
High Yield Securities. Inputs used to value high yield securities generally include a number of observations of equity and credit default swap curves related to the issuer and Other Market Information.
Index Linked Notes. The value of the index linked notes is determined by obtaining a valuation from a calculation agent and is primarily based on accrued interest, the underlying index change, participation rate related to the issuer and Other Market Information.
The value of loan assignments is determined by Management primarily by obtaining valuations from independent pricing services based on broker quotes (generally Level 2 or Level 3 inputs depending on the number of quotes available).
The value of futures contracts is determined by Management by obtaining valuations from independent pricing services at the settlement price at the market close (Level 1 inputs).
The value of total return swaps and total return basket swaps is determined by Management by obtaining valuations from independent pricing services using the underlying asset and stated benchmark interest rate (Level 2 inputs).
Option contracts that are traded over-the-counter are generally valued on the basis of quotations provided by broker-dealers or prices provided by independent pricing services who use a series of techniques including simulated pricing models and/or curve fitting (bootstrapping), which aids in determining the present value of the contracts. The pricing models use inputs that are observed from actively quoted markets such as issuer details, indices, spreads, interest rates, yield curves, credit curves, volatility surfaces, and exchange rates (Level 2 inputs).
Management has developed a process to periodically review information provided by independent pricing services for all types of securities.
Investments in non-exchange traded investment companies are valued using the respective fund’s daily calculated net asset value ("NAV") per share (Level 2 inputs), when available.
If a valuation is not available from an independent pricing service, or if Management has reason to believe that the valuation received does not represent the amount a Fund might reasonably expect to receive on a current sale in an orderly transaction, Management seeks to obtain quotations from brokers or dealers (generally considered Level 2 or Level 3 inputs depending on the number of quotes available). If such quotations are not available, the security is valued using methods Management has approved in the good-faith belief that the resulting valuation will reflect the fair value of the security. Pursuant to Rule 2a-5 under the 1940 Act, the Board designated Management as the Funds' valuation designee. As the Funds' valuation designee, Management is responsible for determining fair value in good faith for any and all Fund investments. Inputs and assumptions considered in determining the fair value of a security based on Level 2 or Level 3 inputs may include, but are not limited to, the type of the security; the initial cost of the security; the existence of any contractual restrictions on the security’s disposition; the price and extent of public trading in similar securities of the issuer or of comparable companies; quotations or evaluated prices from broker-dealers and/or pricing services; information obtained from the issuer and/or analysts; an analysis of the company’s or issuer’s financial statements; an evaluation of the inputs that influence the issuer and the market(s) in which the security is purchased and sold.
The value of the Funds' investments in foreign securities is generally determined using the same valuation methods and inputs as other Fund investments, as discussed above. Foreign security prices expressed in local currency values are normally translated from the local currency into U.S. dollars using the exchange rates as of 4:00 p.m., Eastern Time on days the New York Stock Exchange ("NYSE") is open for business. Management has approved the use of ICE Data Services ("ICE") to assist in determining the fair value of foreign equity securities when changes in the value of a certain index suggest that the closing prices on the foreign exchanges may no longer represent the amount that a Fund could expect to receive for those securities or on days when foreign markets are closed and U.S. markets are open. In each of these events, ICE will provide adjusted prices for certain foreign equity securities using a statistical analysis of historical correlations of multiple factors (Level 2 inputs). Management has also approved the use of ICE to evaluate the prices of foreign debt securities as of the time as of which a Fund's share price is calculated. ICE utilizes benchmark spread and yield curves and evaluates available market activity from the local close to the time as of which a Fund's share price is calculated (Level 2 inputs) to assist in determining prices for certain foreign debt securities. In the case of both foreign equity and foreign debt securities, in the absence of
precise information about the market values of these foreign securities as of the time as of which a Fund's share price is calculated, Management has determined on the basis of available data that prices adjusted or evaluated in this way are likely to be closer to the prices a Fund could realize on a current sale than are the prices of those securities established at the close of the foreign markets in which the securities primarily trade.
Fair value prices are necessarily estimates, and there is no assurance that such a price will be at or close to the price at which the security is next quoted or next trades.
4
Foreign currency translations: The accounting records of the Funds and the Blocker are maintained in U.S. dollars. Foreign currency amounts are normally translated into U.S. dollars using the exchange rate as of 4:00 p.m. Eastern Time, on days the NYSE is open for business, to determine the value of investments, other assets and liabilities. Purchase and sale prices of securities, and income and expenses, are translated into U.S. dollars at the prevailing rate of exchange on the respective dates of such transactions. Net unrealized foreign currency gain/(loss), if any, arises from changes in the value of assets and liabilities, other than investments in securities, as a result of changes in exchange rates and is stated separately in the Statements of Operations.
5
Securities transactions and investment income: Securities transactions are recorded on trade date for financial reporting purposes. Dividend income is recorded on the ex-dividend date or, for certain foreign dividends, as soon as a Fund becomes aware of the dividends. Non-cash dividends included in dividend income, if any, are recorded at the fair market value of the securities received. Interest income, including accretion of discount (adjusted for original issue discount, where applicable) and amortization of premium, where applicable, is recorded on the accrual basis. Realized gains and losses from securities transactions and foreign currency transactions, if any, are recorded on the basis of identified cost and stated separately in the Statements of Operations. Included in net realized gain/(loss) on investments are proceeds from the settlement of class action litigation(s) in which certain of the Funds participated as a class member. The amount of such proceeds for the year ended October 31, 2022, were $959 and $234,478 for Global Allocation and Long Short, respectively.
6
Income tax information: Each Fund is treated as a separate entity for U.S. federal income tax purposes. It is the policy of each Fund to continue to qualify for treatment as a RIC by complying with the requirements of the U.S. Internal Revenue Code applicable to RICs and to distribute substantially all of its net investment income and net realized capital gains to its shareholders. To the extent a Fund distributes substantially all of its net investment income and net realized capital gains to shareholders, no federal income or excise tax provision is required.
ASC 740 "Income Taxes" sets forth a minimum threshold for financial statement recognition of a tax position taken, or expected to be taken, in a tax return. The Funds recognize interest and penalties, if any, related to unrecognized tax positions as an income tax expense in the Statements of Operations. The Funds are subject to examination by U.S. federal and state tax authorities for returns filed for the tax years for which the applicable statutes of limitations have not yet expired. As of October 31, 2022, the Funds did not have any unrecognized tax positions.
For federal income tax purposes, the estimated cost and unrealized appreciation/(depreciation) in value of investments held at October 31, 2022 were as follows:
| | Gross
Unrealized
Appreciation | Gross
Unrealized
Depreciation | Net Unrealized
Appreciation/
(Depreciation) |
| | | | |
| | | | |
U.S. Equity Index PutWrite Strategy | | | | |
Income distributions and capital gain distributions are determined in accordance with income tax regulations, which may differ from GAAP. These differences are primarily due to differing treatments of income and gains on various investment securities held by each Fund, timing differences and differing
characterization of distributions made by each Fund. The Funds may also utilize earnings and profits distributed to shareholders on redemption of their shares as a part of the dividends-paid deduction for income tax purposes.
Any permanent differences resulting from different book and tax treatment are reclassified at year-end and have no impact on net income, NAV or NAV per share of the Funds. For the year ended October 31, 2022, the Funds recorded permanent reclassifications primarily related to one or more of the following: wholly owned subsidiary income, prior year true up adjustments, non-deductible stock issuance costs, and deemed distribution on shareholder redemptions. For the year ended October 31, 2022, the Funds recorded the following permanent reclassifications:
| | Total Distributable
Earnings/(Losses) |
| | |
| | |
The tax character of distributions paid during the years ended October 31, 2022, and October 31, 2021, was as follows:
| |
| | | | |
| | | | | | | | |
| | | | | | | | |
| | | | | | | | |
U.S. Equity Index PutWrite Strategy | | | | | | | | |
As of October 31, 2022, the components of distributable earnings (accumulated losses) on a U.S. federal income tax basis were as follows:
| Undistributed
Ordinary
Income | Undistributed
Long-Term
Capital Gain | Unrealized
Appreciation/
(Depreciation) | Loss
Carryforwards
and Deferrals | Other
Temporary
Differences | |
| | | | | | |
| | | | | | |
U.S. Equity Index PutWrite Strategy | | | | | | |
The temporary differences between book basis and tax basis distributable earnings are primarily due to: losses disallowed and recognized on wash sales, straddles and unsettled short sales, mark-to-market adjustments on swaps, futures, forward FX contracts, passive foreign investment companies, amortization of organizational expenses, amortization of bond premium, wholly owned subsidiary inclusions, tax adjustments related to partnerships, swap contracts and other investments.
To the extent each Fund’s net realized capital gains, if any, can be offset by capital loss carryforwards, it is the policy of each Fund not to distribute such gains. Capital loss carryforward rules allow for RICs to carry forward capital losses indefinitely and to retain the character of capital loss carryforwards as short-term or long-term. As determined at October 31, 2022, the following Funds had unused capital loss carryforwards available for federal income tax purposes to offset future net realized capital gains, if any, as follows:
| Capital Loss Carryforwards |
| | |
U.S. Equity Index PutWrite Strategy | | |
The Blocker is taxed as a corporation under the U.S. Internal Revenue Code. As of October 31, 2022, Long Short had a gross deferred tax asset of $5,182 resulting from net operating losses in the Blocker and had no
deferred tax liability. As of October 31, 2022, the Blocker anticipated that it would be unable to fully utilize the deferred tax asset, therefore, the deferred tax asset was offset by a valuation allowance of $5,182. For the year ended October 31, 2022, Long Short did not record a provision for taxes related to the Blocker.
7
Foreign taxes: Foreign taxes withheld, if any, represent amounts withheld by foreign tax authorities, net of refunds recoverable.
Foreign capital gains on certain foreign securities may be subject to foreign taxes, which are accrued as applicable. At October 31, 2022, there were no outstanding balances of accrued capital gains taxes for any Fund.
As a result of several European Court of Justice ("ECJ") court cases in certain countries across the European Union ("EU"), certain of the Funds may file tax reclaims for previously withheld taxes on dividends earned in those countries ("ECJ tax reclaims"). These additional filings are subject to various administrative proceedings by the local jurisdictions’ tax authorities within the EU, as well as a number of related judicial proceedings. Income recognized, if any, for ECJ tax reclaims would be reflected as "Interest and other income—unaffiliated issuers" in the Statements of Operations and the cost to file these additional ECJ tax reclaims, if any, would be reflected as "Miscellaneous and other fees" in the Statements of Operations. When the ECJ tax reclaim is "more likely than not" to not be sustained assuming examination by tax authorities due to the uncertainty that exists as to the ultimate resolution of these proceedings, the likelihood of receipt of these ECJ tax reclaims, and the potential timing of payment, no amounts are reflected in the Statements of Assets and Liabilities.
8
Distributions to shareholders: Each Fund may earn income, net of expenses, daily on its investments. Distributions from net investment income, if any, are recorded on the ex-date and generally distributed once a year (usually in December) for Global Allocation, Long Short and quarterly for U.S. Equity Index PutWrite Strategy. Distributions from net realized capital gains, if any, generally are distributed once a year (usually in December) and are recorded on the ex-date.
For Funds that invest in REITs, these Funds pass through to their shareholders substantially all REIT distributions and other income they receive, less operating expenses. The distributions received from REITs are generally composed of income, capital gains, and/or return of REIT capital, but the REITs do not report this information to these Funds until the following calendar year. At October 31, 2022, these Funds estimated these amounts for the period January 1, 2022 to October 31, 2022 within the financial statements because the 2022 information is not available from the REITs until after each Fund’s fiscal year-end. All estimates are based upon REIT information sources available to these Funds together with actual IRS Forms 1099-DIV received to date. For the year ended October 31, 2022, the character of distributions, if any, paid to shareholders of these Funds disclosed within the Statements of Changes in Net Assets is based on estimates made at that time. Based on past experience it is possible that a portion of these Funds' distributions during the current fiscal year, if any, will be considered tax return of capital, but the actual amount of the tax return of capital, if any, is not determinable until after each Fund’s fiscal year-end. After calendar year-end, when these Funds learn the nature of the distributions paid by REITs during that year, distributions previously identified as income may be recharacterized as return of capital and/or capital gain. After all applicable REITs have informed these Funds of the actual breakdown of distributions paid to these Funds during their fiscal year, estimates previously recorded are adjusted to reflect actual results. As a result, the composition of these Funds' distributions as reported herein may differ from the final composition determined after calendar year-end and reported to these Funds shareholders on IRS Form 1099-DIV.
9
Expense allocation: Certain expenses are applicable to multiple funds within the complex of related investment companies. Expenses directly attributable to a fund are charged to that fund. Expenses of the Trust that are not directly attributable to a particular series of the Trust (e.g., a Fund) are allocated among the series of the Trust, on the basis of relative net assets, except where a more appropriate allocation of expenses to each of the series can otherwise be made fairly. Expenses borne by the complex of related investment companies, which includes open-end and closed-end investment companies for which NBIA serves as investment manager, that are not directly attributable to a particular investment company in the complex (e.g., the Trust) or series thereof are allocated among the investment companies in the complex or
series thereof on the basis of relative net assets, except where a more appropriate allocation of expenses to each of the investment companies in the complex or series thereof can otherwise be made fairly. Each Fund’s expenses (other than those specific to each class) are allocated proportionally each day among its classes based upon the relative net assets of each class.
10
Investments in foreign securities: Investing in foreign securities may involve sovereign and other risks, in addition to the credit and market risks normally associated with domestic securities. These additional risks include the possibility of adverse political and economic developments (including political instability, nationalization, expropriation, or confiscatory taxation) and the potentially adverse effects of unavailability of public information regarding issuers, less governmental supervision and regulation of financial markets, reduced liquidity of certain financial markets, and the lack of uniform accounting, auditing, and financial reporting standards or the application of standards that are different or less stringent than those applied in the United States. Foreign securities also may experience greater price volatility, higher rates of inflation, and delays in settlement.
11
When-issued/delayed delivery securities: Each Fund may purchase securities with delivery or payment to occur at a later date beyond the normal settlement period. At the time a Fund enters into a commitment to purchase a security, the transaction is recorded and the value of the security is reflected in the NAV. The price of such security and the date when the security will be delivered and paid for are fixed at the time the transaction is negotiated. The value of the security may vary with market fluctuations. No interest accrues to a Fund until payment takes place. When-issued and delayed delivery transactions can have a leverage-like effect on a Fund, which can increase fluctuations in the Fund’s NAV. Certain risks may arise upon entering into when-issued or delayed delivery securities transactions from the potential inability of counterparties to meet the terms of their contracts or if the issuer does not issue the securities due to political, economic, or other factors. Additionally, losses may arise due to changes in the value of the underlying securities.
Each Fund may also enter into a TBA agreement and "roll over" such agreement prior to the settlement date by selling the obligation to purchase the pools set forth in the agreement and entering into a new TBA agreement for future delivery of pools of mortgage-backed securities. TBA mortgage-backed securities may increase prepayment risks because the underlying mortgages may be less favorable than anticipated by a Fund.
12
Securities sold short: Each Fund may engage in short sales, which are sales of securities which have been borrowed from a third party on the expectation that the market price will decline. If the price of the securities decreases, a Fund will make a profit by purchasing the securities in the open market at a price lower than the one at which it sold the securities. If the price of the securities increases, a Fund may have to cover its short positions at a price higher than the short sale price, resulting in a loss. Gains are limited to the price at which a Fund sold the security short, while losses are potentially unlimited in size. The Funds pledge securities and/or other assets, which may include cash collateral from securities lending activities, to the lender as collateral. Proceeds received from short sales may be maintained by the lender as collateral or may be released to the Funds and used to purchase additional securities or for any other purpose. Proceeds maintained by the lender are included in the "Cash collateral segregated for short sales" on the Statements of Assets and Liabilities. The Funds are contractually responsible to remit to the lender any dividends and interest payable on securities while those securities are being borrowed by the Fund. The Funds may receive or pay the net of the interest charged by the prime broker on the borrowed securities and a financing charge for the difference in the market value of the short position and the cash collateral deposited with the broker. This income or fee is calculated daily based upon the market value of each borrowed security and a variable rate that is dependent on the availability of the security. These costs related to short sales (i.e., dividend and interest remitted to the lender and interest charged by the prime broker) are recorded as an expense of the Funds and are excluded from the contractual expense limitation. A net negative expense, if any, represents a gain to the Fund as the total cash rebates received exceeded the other costs related to short sales. The net amount of fees incurred during the year ended October 31, 2022, are included in the "Dividend and interest expense on securities sold short" on the Statements of Operations and are as follows:
13
Investments in private companies: Investments in private companies, including companies that have not yet issued securities publicly in an initial public offering, involve greater risks than investments in securities of companies that have traded publicly on an exchange for extended periods of time. Investments in these companies are generally less liquid than investments in securities issued by public companies and may be difficult for the Fund to value. Private placements and other restricted securities may not be listed on an exchange and may have no active trading market. As a result of the absence of a public trading market, the prices of these securities may be more difficult to determine than publicly traded securities and these securities may involve heightened risk as compared to investments in securities of publicly traded companies. Private placements and other restricted securities may be illiquid, and it frequently can be difficult to sell them at a time when it may otherwise be desirable to do so or the Fund may be able to sell them only at prices that are less than what the Fund regards as their fair market value.
14
Derivative instruments: Certain Funds' use of derivatives during the year ended October 31, 2022, is described below. Please see the Schedule of Investments for each Fund's open positions in derivatives, if any, at October 31, 2022. The disclosure requirements of ASC 815 "Derivatives and Hedging" ("ASC 815") distinguish between derivatives that qualify for hedge accounting and those that do not. Because investment companies value their derivatives at fair value and recognize changes in fair value through the Statements of Operations, they do not qualify for hedge accounting. Accordingly, even though a Fund's investments in derivatives may represent economic hedges, they are considered non-hedge transactions for purposes of this disclosure.
The SEC adopted Rule 18f-4 under the 1940 Act which, effective August 19, 2022, regulates the use of derivatives for certain funds registered under the 1940 Act ("Rule 18f-4"). The Funds have adopted a Rule 18f-4 Policy which provides, among other things, that unless a Fund qualifies as a "limited derivatives user" as defined in Rule 18f-4, the Fund is subject to a comprehensive derivatives risk management program, is required to comply with certain value-at-risk based leverage limits and is required to provide additional disclosure both publicly and to the SEC regarding its derivatives positions. If a Fund qualifies as a limited derivatives user, Rule 18f-4 requires the Fund to have policies and procedures to manage its aggregate derivatives risk.
Futures contracts: During the year ended October 31, 2022, Global Allocation used futures in an effort to enhance total return and to manage or adjust the risk profile and the investment exposure of the Fund to certain asset classes, countries and regions. In addition, Global Allocation also utilized futures to provide investment exposure to certain indices and markets other than the benchmark indices. During the year ended October 31, 2022, Long Short used futures on broader market indices and U.S. Treasuries in an effort either to enhance returns or to manage or adjust the risk profile and the investment exposure of the Fund.
At the time a Fund enters into a futures contract, it is required to deposit with the futures commission merchant a specified amount of cash or liquid securities, known as "initial margin," which is a percentage of the value of the futures contract being traded that is set by the exchange upon which the futures contract is traded. Each day, the futures contract is valued at the official settlement price of the board of trade or U.S. commodity exchange on which such futures contract is traded. Subsequent payments, known as "variation margin," to and from the broker are made on a daily basis, or as needed, as the market price of the futures contract fluctuates. Daily variation margin adjustments, arising from this "mark to market," are recorded by the Fund as unrealized gains or losses.
Although some futures by their terms call for actual delivery or acquisition of the underlying securities or currency, in most cases the contracts are closed out prior to delivery by offsetting purchases or sales of matching futures. When the contracts are closed or expire, a Fund recognizes a gain or loss. Risks of entering into futures contracts include the possibility there may be an illiquid market, possibly at a time of rapidly declining prices, and/or a change in the value of the contract may not correlate with changes in the value of the underlying securities. Futures executed on regulated futures exchanges have minimal counterparty risk to the Fund because the exchange’s clearinghouse assumes the position of the counterparty in each transaction. Thus, a Fund is exposed to risk only in connection with the clearinghouse and not in connection with the original counterparty to the transaction.
For U.S. federal income tax purposes, the futures transactions undertaken by a Fund may cause the Fund to recognize gains or losses from marking contracts to market even though its positions have not been sold or terminated, may affect the character of the gains or losses recognized as long-term or short-term, and may affect the timing of some capital gains and losses realized by the Fund. Also, a Fund’s losses on transactions involving futures contracts may be deferred rather than being taken into account currently in calculating such Fund’s taxable income.
Forward foreign currency contracts: During the year ended October 31, 2022, Global Allocation used forward FX contracts to obtain or reduce exposure to certain markets, establish net short or long positions for currencies and alter the Fund’s exposure to markets and currencies.
A forward FX contract is an agreement between two parties to buy or sell a specific currency for another at a set price on a future date, and is individually negotiated and privately traded by currency traders and their customers in the interbank market. The market value of a forward FX contract fluctuates with changes in forward currency exchange rates. Forward FX contracts are marked to market daily, and the change in value is recorded by a Fund as an unrealized gain or loss. At the consummation of a forward FX contract to purchase or sell currency, a Fund may either exchange the currencies specified at the maturity of the forward FX contract or enter into a closing transaction involving the purchase or sale of an offsetting forward FX contract. Closing transactions with respect to forward FX contracts are usually performed with the counterparty to the original forward FX contract. The gain or loss arising from the difference between the U.S. dollar cost of the original contract and the value of the foreign currency in U.S. dollars upon closing a contract is included in "Net realized gain/(loss) on settlement of forward foreign currency contracts" in the Statements of Operations. These contracts may involve market risk in excess of the unrealized gain or loss reflected in a Fund’s Statement of Assets and Liabilities. In addition, a Fund could be exposed to risks associated with fluctuations in foreign currency and the risk the counterparty will fail to fulfill its obligation.
Total return basket swap contracts: During the year ended October 31, 2022, Global Allocation used total return basket swaps to provide investment exposure to certain investments, primarily equity securities. During the year ended October 31, 2022, Long Short used total return basket swaps to increase returns, reduce risks and for hedging purposes. A Fund may enter into a total return basket swap agreement to obtain exposure to a portfolio of long and short securities. Under the terms of the agreement, the swap is designed to function as a portfolio of direct investments in long and short equity or fixed income positions. The Funds have the ability to trade in and out of long and short positions within the swap and will receive all of the economic benefits and risks equivalent to direct investments in these positions such as: capital appreciation/(depreciation), corporate actions, and dividends and interest received and paid, all of which are reflected in the swap value. The swap value also includes interest charges and credits related to the notional values of the long and short positions and cash balances within the swap. These interest charges and credits are based on defined market rates plus or minus a specified spread and are referred to herein as "financing costs". Positions within the swap are reset periodically, and financing costs are reset according to the terms of the contract. During a reset, any unrealized gains (losses) on positions and accrued financing costs become available for cash settlement between the Funds and the swap counterparty. For over-the-counter ("OTC") total return basket swaps, cash settlement in and out of the swap may occur at a reset date or any other date, at the discretion of the Funds and the counterparty, over the life of the agreement, and is generally determined based on limits and thresholds established as part of an agreement between the Funds and the counterparty. A change in the market value of a total return basket swap contract is recognized as a change in unrealized appreciation/(depreciation) on swap contracts in the Statements of Operations. Cash settlements between a Fund and the counterparty are recognized as realized gains (losses) on closing of swap contracts in the Statements of Operations.
Total return swap contracts: During the year ended October 31, 2022, Global Allocation used total return swaps to enhance total return and obtain or reduce exposure to certain markets. During the year ended October 31, 2022, Long Short used total return swaps to increase returns, reduce risks and for hedging purposes. Total return swaps involve commitments to pay fixed or floating rate interest in exchange for a market-linked return based on a notional amount. To the extent the total return of the reference security or index underlying the total return swap exceeds or falls short of the offsetting interest rate obligation, a Fund will receive a payment or make a payment to the counterparty, respectively. Certain risks may arise when
entering into total return swap transactions, including counterparty default, liquidity or unfavorable changes in the value of the underlying reference security or index. The value of the swap is adjusted daily and the change in value, if any, is recorded as unrealized appreciation or (depreciation) in the Statements of Assets and Liabilities. Payments received or made at the end of each measurement period are recorded as realized gain or loss in the Statements of Operations. For OTC total return swaps, cash settlement in and out of the swaps may occur at a reset date or any other date, at the discretion of the Fund and the counterparty, over the life of the agreement, and is generally determined based on limits and thresholds established as part of an agreement between the Fund and the counterparty.
Options: During the year ended October 31, 2022, Global Allocation used options written to enhance total return, manage or adjust the risk profile of the Fund or the risk of individual positions, replace more traditional direct investments and obtain exposure to certain markets. During the year ended October 31, 2022, Global Allocation used options purchased to enhance total return, manage or adjust the risk profile of the Fund, and replace more traditional direct investments. During the year ended October 31, 2022, Long Short used options written to enhance total returns. During the year ended October 31, 2022, Long Short used options purchased either for hedging purposes or to enhance total returns. During the year ended October 31, 2022, U.S. Equity Index PutWrite Strategy used options written primarily to gain exposure to securities, markets, sectors or geographical areas and also to enhance total return and gain exposure more efficiently than through a direct purchase of the underlying security.
Premiums paid by a Fund upon purchasing a call or put option are recorded in the asset section of the Fund’s Statement of Assets and Liabilities and are subsequently adjusted to the current market value. When an option is exercised, closed, or expired, a Fund realizes a gain or loss and the asset is eliminated. For purchased call options, a Fund's loss is limited to the amount of the option premium paid.
Premiums received by a Fund upon writing a call option or a put option are recorded in the liability section of the Fund’s Statement of Assets and Liabilities and are subsequently adjusted to the current market value. When an option is exercised, closed, or expired, a Fund realizes a gain or loss and the liability is eliminated.
When a fund writes a call option on an underlying asset it does not own, its exposure on such an option is theoretically unlimited. When writing a covered call option, a Fund, in return for the premium, gives up the opportunity for profit from a price increase in the underlying security above the exercise price, but conversely retains the risk of loss should the price of the security decline. When writing a put option, a Fund, in return for the premium, takes the risk that it must purchase the underlying security at a price that may be higher than the current market price of the security. If a call or put option that a Fund has written expires unexercised, a Fund will realize a gain for the amount of the premium. All securities covering outstanding written options are held in escrow by the custodian bank.
At October 31, 2022, the Funds listed below had the following derivatives (which did not qualify as hedging instruments under ASC 815), grouped by primary risk exposure:
| | |
| Statements of
Assets and Liabilities
Location | | Statements of
Assets and Liabilities
Location | |
| | | | |
| | | | |
| Receivable/Payable for accumulated variation margin on futures contracts | | Receivable/Payable for accumulated variation margin on futures contracts | |
| Receivable/Payable for accumulated variation margin on futures contracts | | Receivable/Payable for accumulated variation margin on futures contracts | |
| | | | |
| | |
| Statements of Assets and Liabilities Location | | Statements of Assets and Liabilities Location | |
| | | | |
| Receivable for forward foreign currency contracts | | Payable for forward foreign currency contracts | |
| | | | |
| Over-the-counter swap contracts, at value(a) | | Over-the-counter swap contracts, at value(a) | |
| | | | |
| Investments in securities, at value | | | |
| Investments in securities, at value | | | |
| | | | |
| | | | |
| | | | |
| Receivable/Payable for accumulated variation margin on futures contracts | | Receivable/Payable for accumulated variation margin on futures contracts | |
| | | | |
| Over-the-counter swap contracts, at value(a) | | Over-the-counter swap contracts, at value(a) | |
| | | | |
| Investments in securities, at value | | | |
| | | | |
| | | Option contracts written, at value | |
U.S. Equity Index PutWrite Strategy | | | | |
| | | | |
| | | Option contracts written, at value | |
| "Over-the-counter swaps" reflect the cumulative unrealized appreciation/(depreciation) of the over-the-counter swap contracts plus accrued interest as of October 31, 2022. |
The impact of the use of these derivative instruments on the Statements of Operations during the year ended October 31, 2022, was as follows:
| | | Change in Net Unrealized
Appreciation/
(Depreciation) on
|
| | | |
| | | |
| | | |
| | | |
| | | |
| Net Realized Gain/ (Loss) on Derivatives(a) | | Change in Net Unrealized Appreciation/ (Depreciation) on Derivatives(b) |
| | | |
| | | |
| | | |
| | | |
| | | |
| | | |
| | | |
| | | |
| | | |
| | | |
| | | |
| | | |
| | | |
| | | |
| | | |
| | | |
| | | |
| | | |
| | | |
| | | |
| | | |
U.S. Equity Index PutWrite Strategy | | | |
| | | |
| | | |
| Net realized gains/(losses) on derivatives are located in the Statements of Operations each under the caption, "Net realized gain/(loss) on:" |
| Expiration or closing of futures contracts |
| Settlement of forward foreign currency contracts |
| Expiration or closing of swap contracts |
| Transactions in investment securities of unaffiliated issuers |
| Expiration or closing of option contracts written |
| Change in net unrealized appreciation/(depreciation) is located in the Statements of Operations each under the caption, "Change in net unrealized appreciation/(depreciation) in value of:" |
| |
| Forward foreign currency contracts |
| |
| Investment securities of unaffiliated issuers |
| |
While the Funds may receive redeemable preference shares, rights and warrants in connection with their investments in securities, these preference shares, rights and warrants are not considered "derivative instruments" under ASC 815.
15
Securities lending: Each Fund, using State Street as its lending agent, may loan securities to qualified brokers and dealers in exchange for negotiated lender’s fees. These fees, if any, would be disclosed within the Statements of Operations under the caption "Income from securities loaned-net" and are net of expenses retained by State Street as compensation for its services as lending agent.
The initial collateral received by a Fund at the beginning of each transaction shall have a value equal to at least 102% of the prior day’s market value of the loaned securities (105% in the case of international securities). Collateral in the form of cash and/or securities issued or guaranteed by the U.S. government or its agencies, equivalent to at least 100% of the market value of securities, is maintained at all times. Thereafter, the value of the collateral is monitored on a daily basis, and collateral is moved daily between a counterparty and a Fund until the close of the transaction. Cash collateral is generally invested in a money market fund registered under the 1940 Act that is managed by an affiliate of State Street and is included on the Statements of Assets and Liabilities. The total value of securities received as collateral for securities on loan is included in a footnote following the applicable Schedule of Investments, but is not included within the Statements of Assets and Liabilities because the receiving Fund does not have the right to sell or repledge the securities received as collateral. The risks associated with lending portfolio securities include, but are not limited to, possible delays in receiving additional collateral or in the recovery of the loaned securities. Any increase or decrease in the fair value of the securities loaned and any interest earned or dividends paid or owed on those securities during the term of the loan would accrue to that Fund.
As of October 31, 2022, the Fund listed below had outstanding loans of securities to certain approved brokers each with a value as follows:
| Value of Securities
Loaned |
| |
As of October 31, 2022, the Fund listed below had outstanding loans of securities to certain approved brokers for which it received collateral as follows:
| Remaining Contractual Maturity of the Agreements |
| | | | | |
Securities Lending Transactions(a) | | | | | |
| | | | | |
| | | | | |
| | | | | |
| |
| Amounts represent the payable for loaned securities collateral received. |
16
Offsetting Assets and Liabilities: The Funds are required to disclose both gross and net information for assets and liabilities related to OTC derivatives, repurchase and reverse repurchase agreements, and securities lending and securities borrowing transactions that are eligible for offset or subject to an enforceable master netting, or similar agreement. Global Allocation and Long Short held one or more of these investments at October 31, 2022. The Funds’ OTC derivative assets and liabilities at fair value by type and securities lending assets are reported gross in the Statements of Assets and Liabilities. The following tables present derivative and securities lending assets and liabilities by counterparty, net of amounts available for offset under a master netting, or similar agreement and net of the related collateral received by a Fund for assets and pledged by a Fund for liabilities as of October 31, 2022.
| Gross Amounts of Assets
Presented in the Statements
of Assets and Liabilities | Gross Amounts of Liabilities
Presented in the Statements
of Assets and Liabilities |
| | |
| | |
Over-the-counter swap contracts | | |
Over-the-counter purchased options | | |
| | |
| | |
Over-the-counter swap contracts | | |
| | |
| | |
Gross Amounts Not Offset in the Statements of Assets and Liabilities: |
| | |
| Gross Amounts
Presented in
the Statements
of Assets and
Liabilities | Liabilities
Available
for Offset | | | Gross Amounts
Presented in
the Statements
of Assets and
Liabilities | Assets
Available
for Offset | | |
| | | | | | | |
| | | | | | | | |
| | | | | | | | |
| | | | | | | | |
| | | | | | | | |
| | | | | | | |
| | | | | | | | |
| | | | | | | | |
| | | | | | | | |
| | | | | | | | |
| Collateral received (or pledged) is limited to an amount not to exceed 100% of the net amount of assets (or liabilities) in the tables presented above, for each respective counterparty. |
| A net amount greater than zero represents amounts subject to loss as of October 31, 2022, in the event of a counterparty failure. A net amount less than zero represents amounts under-collateralized to each counterparty as of October 31, 2022. |
17
Indemnifications: Like many other companies, the Trust’s organizational documents provide that its officers ("Officers") and trustees ("Trustees") are indemnified against certain liabilities arising out of the performance of their duties to the Trust. In addition, both in some of its principal service contracts and in the normal course of its business, the Trust enters into contracts that provide indemnifications to other parties for certain types of losses or liabilities. The Trust’s maximum exposure under these arrangements is unknown as this could involve future claims against the Trust.
18
Investment company securities and exchange-traded funds: The Funds may invest in shares of other registered investment companies, including ETFs, within the limitations prescribed by the 1940 Act, in reliance on rules adopted by the SEC, particularly Rule 12d1-4 under the 1940 Act, which the Funds were required to comply with on January 19, 2022, or any other applicable exemptive relief. Prior to the compliance date of Rule 12d1-4, a Fund was permitted to invest in both affiliated and unaffiliated investment companies, including ETFs, in excess of the limits in Section 12(d)(1)(A) of the 1940 Act, subject
to the terms and conditions of exemptive orders. These exemptive orders along with Rule 12d1-2 were rescinded upon the compliance date of Rule 12d1-4. Rule 12d1-4 contains elements from the SEC’s prior exemptive orders permitting fund of funds arrangements, and includes (i) limits on control and voting; (ii) required evaluations and findings; (iii) required fund of funds investment agreements; and (iv) limits on complex structures. Some ETFs seek to track the performance of a particular market index. These indices include both broad-based market indices and more narrowly-based indices, including those relating to particular sectors, markets, regions or industries. However, some ETFs have an actively-managed investment objective. ETF shares are traded like traditional equity securities on a national securities exchange or NASDAQ. A Fund will indirectly bear its proportionate share of any management fees and other expenses paid by such other investment companies, which will decrease returns.
19
Other: All net investment income and realized and unrealized capital gains and losses of each Fund are allocated, on the basis of relative net assets, pro rata among its respective classes.
Note B—Investment Management Fees, Administration Fees, Distribution Arrangements, and Other Transactions with Affiliates:
Each Fund retains NBIA as its investment manager under a Management Agreement. For such investment management services, each Fund pays NBIA an investment management fee as a percentage of average daily net assets according to the following table:
|
| | | | | | | | |
| | | | | | | | |
| | | | | | | | |
For U.S. Equity Index PutWrite Strategy: | | | | | | | | |
Accordingly, for the year ended October 31, 2022, the investment management fee pursuant to the Management Agreement was equivalent to an annual effective rate of each Fund’s average daily net assets, as follows:
Each Fund retains NBIA as its administrator under an Administration Agreement. The administration fee is assessed at the class level and each share class of a Fund, as applicable, pays NBIA an annual administration fee equal to the following: 0.26% for each of Class A and Class C; 0.15% for Institutional Class; and 0.05% for Class R6, each as a percentage of its average daily net assets. Additionally, NBIA retains State Street as its sub-administrator under a Sub-Administration Agreement. NBIA pays State Street a fee for all services received under the Sub-Administration Agreement.
NBIA has contractually agreed to waive fees and/or reimburse certain expenses of the Institutional Class, Class A, Class C and Class R6 of each Fund that offers those classes so that the total annual operating expenses of those classes do not exceed the expense limitations as detailed in the following table. These undertakings exclude interest, taxes, brokerage commissions, acquired fund fees and expenses, extraordinary expenses, and dividend and interest expenses relating to short sales, if any (commitment fees relating to borrowings are treated as interest for purposes of this exclusion) ("annual operating expenses"); consequently, net expenses may exceed the contractual expense limitations. The expenses of the Blocker are included in the total expenses used to calculate the reimbursement, if any, which Long Short has agreed to
share with the Blocker. For the year ended October 31, 2022, the expenses of the Blocker amounted to $20,728.
At October 31, 2022, contingent liabilities to NBIA under the agreements were as follows:
| | | Expenses Reimbursed in
Year Ended October 31, |
| | | | | |
| | | Subject to Repayment until
October 31, |
| | | | | |
Global Allocation Institutional Class | | | | | |
Global Allocation Class A | | | | | |
Global Allocation Class C | | | | | |
Global Allocation Class R6 | | | | | |
Long Short Institutional Class | | | | | |
| | | | | |
| | | | | |
U.S. Equity Index PutWrite Strategy Institutional Class | | | | | |
U.S. Equity Index PutWrite Strategy Class A | | | | | |
U.S. Equity Index PutWrite Strategy Class C | | | | | |
U.S. Equity Index PutWrite Strategy Class R6 | | | | | |
| Expense limitation per annum of the respective class’s average daily net assets. |
Each Fund has agreed that each of its respective classes will repay NBIA for fees and expenses waived or reimbursed for that class provided that repayment does not cause that class’s annual operating expenses to exceed its contractual expense limitation in place at the time the fees and expenses were waived or reimbursed, or the expense limitation in place at the time the Fund repays NBIA, whichever is lower. Any such repayment must be made within three years after the year in which NBIA incurred the expense.
During the year ended October 31, 2022, there was no repayment to NBIA under these agreements.
Each Fund also has a distribution agreement with Neuberger Berman BD LLC (the "Distributor") with respect to each class of shares. The Distributor acts as agent in arranging for the sale of class shares without sales commission or other compensation, except as described below for Class A and Class C shares, and bears the advertising and promotion expenses.
However, the Distributor receives fees from Class A and Class C under their distribution plans (each a "Plan", collectively the "Plans") pursuant to Rule 12b-1 under the 1940 Act. The Plans provide that, as compensation for administrative and other services provided to these classes, the Distributor’s activities and expenses related to the sale and distribution of these classes, and ongoing services provided to investors in these classes, the Distributor receives from each of these classes a fee at the annual rate of 0.25% of Class A’s and 1.00% of Class C’s average daily net assets. The Distributor receives this amount to provide distribution and shareholder servicing for these classes and pays a portion of it to institutions that provide such services. Those institutions may use the payments for, among other purposes, compensating employees engaged in sales and/or shareholder servicing. The amount of fees paid by each class during any year may be more or less than the cost of distribution and other services provided to that class. FINRA rules limit the amount of annual distribution fees that may be paid by a mutual fund and impose a ceiling on the cumulative distribution fees paid. The Trust’s Plans comply with those rules.
Class A shares of each Fund are generally sold with an initial sales charge of up to 5.75%. Class A shares of each Fund are generally sold with no contingent deferred sales charge ("CDSC"), except that a CDSC of
1.00% applies to certain redemptions made within 18 months following purchases of $1 million or more without an initial sales charge. Class C shares of each Fund are sold with no initial sales charge and a 1.00% CDSC if shares are sold within one year after purchase.
For the year ended October 31, 2022, the Distributor, acting as underwriter and broker-dealer, received net initial sales charges from the purchase of Class A shares and CDSCs from the redemption of Class A and Class C shares as follows:
| | |
| | | | |
Global Allocation Class A | | | | |
Global Allocation Class C | | | | |
| | | | |
| | | | |
U.S. Equity Index PutWrite Strategy Class A | | | | |
U.S. Equity Index PutWrite Strategy Class C | | | | |
Note C—Securities Transactions:
During the year ended October 31, 2022, there were purchase and sale transactions of long-term securities (excluding swaps, futures, forward FX contracts and written option contracts) as follows:
| Purchases of
U.S. Government
and Agency
Obligations | Purchases
excluding
U.S. Government
and Agency
Obligations | Sales and
Maturities
of
U.S. Government
and Agency
Obligations | Sales and
Maturities
excluding
U.S. Government
and Agency
Obligations | | Covers on
Securities
Sold
Short |
| | | | | | |
| | | | | | |
U.S. Equity Index PutWrite Strategy | | | | | | |
During the year ended October 31, 2022, no brokerage commissions on securities transactions were paid to affiliated brokers.
Note D—Fund Share Transactions:
Share activity for the years ended October 31, 2022, and October 31, 2021, was as follows:
| For the Year Ended October 31, 2022 | For the Year Ended October 31, 2021 |
| | Shares
Issued on
Reinvestment
of Dividends
and
Distributions | | | | Shares
Issued on
Reinvestment
of Dividends
and
Distributions | | |
|
| | | | | | | | |
| | | | | | | | |
| | | | | | | | |
| | | | | | | | |
| For the Year Ended October 31, 2022 | For the Year Ended October 31, 2021 |
| | Shares Issued on Reinvestment of Dividends and Distributions | | | | Shares Issued on Reinvestment of Dividends and Distributions | | |
|
| | | | | | | | |
| | | | | | | | |
| | | | | | | | |
U.S. Equity Index PutWrite Strategy |
| | | | | | | | |
| | | | | | | | |
| | | | | | | | |
| | | | | | | | |
Note E—Line of Credit:
At October 31, 2022, each Fund was a participant in a syndicated committed, unsecured $700,000,000 line of credit (the "Credit Facility"), to be used only for temporary or emergency purposes. Series of other investment companies managed by NBIA also participate in this line of credit on substantially the same terms. Interest is charged on borrowings under this Credit Facility at the highest of (a) a federal funds effective rate plus 1.00% per annum, (b) a daily simple Secured Overnight Financing Rate ("SOFR") plus 1.00% per annum, and (c) an overnight bank funding rate plus 1.00% per annum; provided that should the Administrative Agent of the Credit Facility determine that the daily simple SOFR rate is unavailable, then the interest rate option described in (b) shall be replaced with a benchmark replacement determined to be applicable by such Administrative Agent. The Credit Facility has an annual commitment fee of 0.15% per annum of the available line of credit, which is paid quarterly. Each Fund that is a participant has agreed to pay its pro rata share of the annual commitment fee, based on the ratio of its individual net assets to the net assets of all participants at the time the fee is due, and interest charged on any borrowing made by such Fund and other costs incurred by such Fund. Because several mutual funds participate in the Credit Facility, there is no assurance that an individual fund will have access to all or any part of the $700,000,000 at any particular time. There were no loans outstanding under the Credit Facility at October 31, 2022. During the year ended October 31, 2022, no Fund utilized the Credit Facility.
Note F—Investments in Affiliates(a):
At October 31, 2022, affiliated persons owned outstanding shares of the following Funds:
| Affiliated Person(s)
Percentage
Ownership of
Outstanding Shares |
| |
U.S. Equity Index PutWrite Strategy | |
| Affiliated persons, as defined in the 1940 Act. |
Note G—Recent Accounting Pronouncements:
In January 2021, the FASB issued Accounting Standards Update No. 2021-01 ("ASU 2021-01"), "Reference Rate Reform (Topic 848)". ASU 2021-01 is an update of ASU 2020-04, which is in response to concerns about structural risks of interbank offered rates, and particularly the risk of cessation of LIBOR, regulators have undertaken reference rate reform initiatives to identify alternative reference rates that are more observable or transaction based and less susceptible to manipulation. ASU 2020-04 provides optional guidance for a limited period of time to ease the potential burden in accounting for (or recognizing the effects of) reference rate reform on financial reporting. ASU 2020-04 is elective and applies to all entities, subject to meeting certain criteria, that have contracts, hedging relationships, and other transactions that reference LIBOR or another reference rate expected to be discontinued because of reference rate reform. The ASU 2021-01 update clarifies that certain optional expedients and exceptions in Topic 848 for contract modifications and hedge accounting apply to derivatives that are affected by the discounting transition. The amendments in this update are effective immediately through December 31, 2022, for all entities. Management is currently evaluating the implications, if any, of the additional requirements and its impact on the Funds' financial statements.
In June 2022, FASB issued Accounting Standards Update No. 2022-03, "Fair Value Measurement of Equity Securities Subject to Contractual Sale Restrictions" ("ASU 2022-03"). ASU 2022-03 clarifies the guidance in ASC 820, related to the measurement of the fair value of an equity security subject to contractual sale restrictions, where it eliminates the ability to apply a discount to the fair value of these securities, and introduces disclosure requirements related to such equity securities. The guidance is effective for fiscal years, and interim periods within those fiscal years, beginning after December 15, 2023, and allows for early adoption. Management is currently evaluating the impact of applying this update.
Note H—Other Matters:
Coronavirus: The outbreak of the novel coronavirus in many countries has, among other things, disrupted global travel and supply chains, and adversely impacted global commercial activity, the transportation industry and commodity prices in the energy sector. The impact of this virus has negatively affected and may continue to affect the economies of many nations, individual companies and the global securities and commodities markets, including liquidity and volatility. The development and fluidity of this situation precludes any prediction as to its ultimate impact, which may have a continued adverse effect on global economic and market conditions. Such conditions (which may be across industries, sectors or geographies) have impacted and may continue to impact certain issuers of the securities held by the Funds and in turn, may impact the financial performance of the Funds.
Russia's Invasion of Ukraine: Russia’s invasion of Ukraine, and corresponding events in late February 2022, have had, and could continue to have, severe adverse effects on regional and global economic markets for securities and commodities. Following Russia’s actions, various governments, including the United States, have issued broad-ranging economic sanctions against Russia. The current events have had, and could continue to have, an adverse effect on global markets performance and liquidity, thereby negatively affecting the value of a Fund's investments beyond any direct exposure to Russian or Ukrainian issuers. The duration of ongoing hostilities and the vast array of sanctions and related events cannot be predicted. Those events present material uncertainty and risk with respect to markets globally and the performance of a Fund and its investments or operations could be negatively impacted.
Note I—Subsequent Events:
On December 15, 2022, the Board approved the liquidation of Global Allocation. Accordingly, Global Allocation will cease its investment operations, liquidate its assets and make a liquidating distribution, if applicable, to shareholders of record. The date of liquidation for Global Allocation is anticipated to be on or about February 10, 2023 (the “Liquidation Date”). Shareholders of Global Allocation may continue to redeem their Fund shares through the Liquidation Date. A supplement to Global Allocation's prospectuses was mailed to shareholders of Global Allocation with additional information on the upcoming liquidation.
This page has been left blank intentionally
The following tables include selected data for a share outstanding throughout each period and other performance information derived from the Financial Statements. Amounts that do not round to $0.01 or $(0.01) per share are presented as $0.00 or $(0.00), respectively. Ratios that do not round to 0.01% or (0.01)% are presented as 0.00% or (0.00)%, respectively. Net Assets with a zero balance, if any, may reflect actual amounts rounding to less than $0.1 million. A "—" indicates that the line item was not applicable in the corresponding period.
| Net Asset
Value,
Beginning
of Year | Net
Investment
Income/
(Loss)a | Net Gains
or
(Losses) on
Securities
(both
realized
and
unrealized) | Total From
Investment
Operations | Dividends
from Net
Investment
Income | Distributions
from Net
Realized
Capital
Gains | | | Net Asset
Value,
End of
Year |
|
|
| | | | | | | | | |
| | | | | | | | | |
| | | | | | | | | |
| | | | | | | | | |
| | | | | | | | | |
|
|
| | | | | | | | | |
| | | | | | | | | |
| | | | | | | | | |
| | | | | | | | | |
| | | | | | | | | |
|
|
| | | | | | | | | |
| | | | | | | | | |
| | | | | | | | | |
| | | | | | | | | |
| | | | | | | | | |
|
|
| | | | | | | | | |
| | | | | | | | | |
| | | | | | | | | |
| | | | | | | | | |
|
|
|
| | | | | | | | | |
| | | | | | | | | |
| | | | | | | | | |
| | | | | | | | | |
| | | | | | | | | |
See Notes to Financial Highlights
| Net Assets,
End of
Year
(in millions) | Ratio
of Gross
Expenses to
Average Net
Assetsc | Ratio
of Gross
Expenses
to Average
Net Assets
(excluding
dividend
and interest
expense
relating to
short sales)c | Ratio
of Net
Expenses to
Average
Net
Assets | Ratio
of Net
Expenses
to Average
Net Assets
(excluding
dividend
and interest
expense
relating to
short sales) | Ratio
of Net
Investment
Income/
(Loss)
to
Average
Net
Assets | Portfolio
Turnover
Rate
(including
securities
sold short) | Portfolio
Turnover
Rate
(excluding
securities
sold short) |
| | | | | | | | |
| | | | | | | | |
| | | | | | | | |
| | | | | | | | |
| | | | | | | | |
| | | | | | | | |
| | | | | | | | |
|
| | | | | | | | |
| | | | | | | | |
| | | | | | | | |
| | | | | | | | |
| | | | | | | | |
| | | | | | | | |
|
| | | | | | | | |
| | | | | | | | |
| | | | | | | | |
| | | | | | | | |
| | | | | | | | |
| | | | | | | | |
|
| | | | | | | | |
| | | | | | | | |
| | | | | | | | |
| | | | | | | | |
| | | | | | | | |
|
| | | | | | | | |
| | | | | | | | |
| | | | | | | | |
| | | | | | | | |
| | | | | | | | |
| | | | | | | | |
| | | | | | | | |
Financial Highlights (cont’d)
| Net Asset
Value,
Beginning
of Year | Net
Investment
Income/
(Loss)a | Net Gains
or
(Losses) on
Securities
(both
realized
and
unrealized) | Total From
Investment
Operations | Dividends
from Net
Investment
Income | Distributions
from Net
Realized
Capital
Gains | | | Net Asset
Value,
End of
Year |
|
|
| | | | | | | | | |
| | | | | | | | | |
| | | | | | | | | |
| | | | | | | | | |
| | | | | | | | | |
|
|
| | | | | | | | | |
| | | | | | | | | |
| | | | | | | | | |
| | | | | | | | | |
| | | | | | | | | |
|
U.S. Equity Index PutWrite Strategy Fund |
|
| | | | | | | | | |
| | | | | | | | | |
| | | | | | | | | |
| | | | | | | | | |
| | | | | | | | | |
|
|
| | | | | | | | | |
| | | | | | | | | |
| | | | | | | | | |
| | | | | | | | | |
| | | | | | | | | |
|
|
| | | | | | | | | |
| | | | | | | | | |
| | | | | | | | | |
| | | | | | | | | |
| | | | | | | | | |
|
|
| | | | | | | | | |
| | | | | | | | | |
| | | | | | | | | |
| | | | | | | | | |
| | | | | | | | | |
See Notes to Financial Highlights
| Net Assets,
End of
Year
(in millions) | Ratio
of Gross
Expenses to
Average Net
Assetsc | Ratio
of Gross
Expenses
to Average
Net Assets
(excluding
dividend
and interest
expense
relating to
short sales)c | Ratio
of Net
Expenses to
Average
Net
Assets | Ratio
of Net
Expenses
to Average
Net Assets
(excluding
dividend
and interest
expense
relating to
short sales) | Ratio
of Net
Investment
Income/
(Loss)
to
Average
Net
Assets | Portfolio
Turnover
Rate
(including
securities
sold short) | Portfolio
Turnover
Rate
(excluding
securities
sold short) |
|
| | | | | | | | |
| | | | | | | | |
| | | | | | | | |
| | | | | | | | |
| | | | | | | | |
| | | | | | | | |
|
| | | | | | | | |
| | | | | | | | |
| | | | | | | | |
| | | | | | | | |
| | | | | | | | |
| | | | | | | | |
|
| | | | | | | | |
| | | | | | | | |
| | | | | | | | |
| | | | | | | | |
| | | | | | | | |
| | | | | | | | |
| | | | | | | | |
|
| | | | | | | | |
| | | | | | | | |
| | | | | | | | |
| | | | | | | | |
| | | | | | | | |
| | | | | | | | |
|
| | | | | | | | |
| | | | | | | | |
| | | | | | | | |
| | | | | | | | |
| | | | | | | | |
| | | | | | | | |
|
| | | | | | | | |
| | | | | | | | |
| | | | | | | | |
| | | | | | | | |
| | | | | | | | |
| | | | | | | | |
Notes to Financial Highlights Alternative and Multi-Asset Class Funds
| Calculated based on the average number of shares outstanding during each fiscal period. |
| Total return based on per share NAV reflects the effects of changes in NAV on the performance of each Fund during each fiscal period. Returns assume income dividends and other distributions, if any, were reinvested, but do not reflect the effect of sales charges. Results represent past performance and do not indicate future results. Current returns may be lower or higher than the performance data quoted. Investment returns and principal will fluctuate and shares, when redeemed, may be worth more or less than original cost. Total return would have been lower if Management had not reimbursed and/or waived certain expenses. Total return would have been higher if Management had not recouped previously reimbursed and/or waived expenses. |
| Represents the annualized ratios of net expenses to average daily net assets if Management had not reimbursed certain expenses and/or waived a portion of the investment management fee. |
| The class action proceeds listed in Note A of the Notes to Financial Statements, if any, had no impact on the Funds’ total returns for the year ended October 31, 2022. The class action proceeds received in 2021, 2020, 2019 and 2018 had no impact on the Funds’ total returns for the years ended October 31, 2021, 2020, 2019 and 2018. |
| Global Allocation and U.S. Equity Index PutWrite Strategy did not engage in short sales. |
| Excluding TBA roll transactions. Had TBA roll transactions been included, the portfolio turnover rate would have been: |
| The date investment operations commenced. |
| |
| |
| Consolidated financial highlights. See Note A in the Notes to Financial Statements. |
| After the close of business on December 7, 2018, Long Short's Class A and Class C shares underwent a stock split. The per share data presented here has been retroactively adjusted to reflect this split. |
Report of Independent Registered Public Accounting Firm
To the Board of Trustees of Neuberger Berman Alternative Funds and Shareholders of
Neuberger Berman Global Allocation Fund, Neuberger Berman Long Short Fund and Neuberger Berman U.S. Equity Index PutWrite Strategy Fund
Opinion on the Financial Statements
We have audited the accompanying consolidated statement of assets and liabilities of Neuberger Berman Long Short Fund (one of the series constituting the Neuberger Berman Alternatives Funds (the “Trust”)), including the consolidated schedule of investments, as of October 31, 2022, and the related consolidated statements of operations and changes in net assets, and the consolidated financial highlights for each of the periods indicated in the table below and the related notes (collectively referred to as the “consolidated financial statements”). We have audited the accompanying statements of assets and liabilities of Neuberger Berman Global Allocation Fund and Neuberger Berman U.S. Equity Index PutWrite Strategy Fund (collectively, together with Neuberger Berman Long Short Fund, referred to as the “Funds”) (two of the series constituting the Trust), including the schedules of investments, as of October 31, 2022, and the related statements of operations and changes in net assets, and the financial highlights for each of the periods indicated in the table below and the related notes (collectively, together with the consolidated financial statements, referred to as the “financial statements”). In our opinion, the financial statements present fairly, in all material respects, the financial position, or the consolidated financial positions, of each of the Funds (three of the series constituting Neuberger Berman Alternative Funds) at October 31, 2022, and the results or the consolidated results of their operations, changes in net assets and financial highlights for each of the periods indicated in the table below, in conformity with U.S. generally accepted accounting principles. The accompanying statement of changes in net assets of the Neuberger Berman Long Short Fund for the year ended October 31, 2021 and the accompanying financial highlights of the Neuberger Berman Long Short Fund for each of the periods in the four years then ended were audited by another independent registered public accounting firm whose report, dated December 21, 2021, expressed an unqualified opinion on the financial statements containing that statement of changes in net assets and financial highlights.
Individual fund constituting Neuberger Berman Alternative Funds | | Statements of changes in net assets | |
Neuberger Berman Global Allocation Fund
Neuberger Berman U.S. Equity Index
PutWrite Strategy Fund
| For the year ended October 31, 2022 | For each of the two years in the period ended October 31, 2022 | For each of the five years in the period ended October 31, 2022 |
Neuberger Berman Long Short Fund | For the year ended October 31, 2022 | For the year ended October 31, 2022 | For the year ended October 31, 2022 |
Basis for Opinion
These financial statements are the responsibility of the Trust’s management. Our responsibility is to express an opinion on each of the Funds’ financial statements based on our audits. We are a public accounting firm registered with the Public Company Accounting Oversight Board (United States) (“PCAOB”) and are required to be independent with respect to the Trust in accordance with the U.S. federal securities laws and the applicable rules and regulations of the Securities and Exchange Commission and the PCAOB.
We conducted our audits in accordance with the standards of the PCAOB. Those standards require that we plan and perform the audit to obtain reasonable assurance about whether the financial statements are free of material misstatement, whether due to error or fraud. The Trust is not required to have, nor were we engaged to perform,
an audit of the Trust’s internal control over financial reporting. As part of our audits, we are required to obtain an understanding of internal control over financial reporting, but not for the purpose of expressing an opinion on the effectiveness of the Trust’s internal control over financial reporting. Accordingly, we express no such opinion.
Our audits included performing procedures to assess the risks of material misstatement of the financial statements, whether due to error or fraud, and performing procedures that respond to those risks. Such procedures included examining, on a test basis, evidence regarding the amounts and disclosures in the financial statements. Our procedures included confirmation of securities owned as of October 31, 2022, by correspondence with the custodian, brokers and others; when replies were not received from brokers and others, we performed other auditing procedures. Our audits also included evaluating the accounting principles used and significant estimates made by management, as well as evaluating the overall presentation of the financial statements. We believe that our audits provide a reasonable basis for our opinion.
We have served as the auditor of one or more Neuberger Berman investment companies since 1954.
Boston, Massachusetts
December 23, 2022
Investment Manager and Administrator
Neuberger Berman Investment Advisers LLC
1290 Avenue of the Americas
New York, NY 10104-0002
Shareholder Services
800.877.9700 or 212.476.8800
Intermediary Client Services 800.366.6264
Distributor
Neuberger Berman BD LLC
1290 Avenue of the Americas
New York, NY 10104-0002
Shareholder Services
800.877.9700 or 212.476.8800
Intermediary Client Services 800.366.6264
Custodian
State Street Bank and Trust Company
One Lincoln Street
Boston, MA 02111
Shareholder Servicing Agent
DST Asset Manager Solutions Inc.
430 West 7th Street, Suite 219189
Kansas City, MO 64105-1407
For Institutional Class Shareholders address correspondence to:
Neuberger Berman Funds
PO Box 219189
Kansas City, MO 64121-9189
Intermediary Client Services 800.366.6264
For Class A, Class C and Class R6 Shareholders:
Please contact your investment provider
Legal Counsel
K&L Gates LLP
1601 K Street, NW
Washington, DC 20006-1600
Independent Registered Public Accounting Firm
Ernst & Young LLP
200 Clarendon Street
Boston, MA 02116
Trustees and Officers
The following tables set forth information concerning the Trustees and Officers of the Funds. All persons named as Trustees and Officers also serve in similar capacities for other funds administered or managed by NBIA. The Funds’ Statement of Additional Information includes additional information about the Trustees as of the time of the Funds’ most recent public offering and is available upon request, without charge, by calling (800) 877-9700.
Information about the Board of Trustees
| | Principal Occupation(s)(3) | Number of
Funds in
Fund Complex
Overseen by
Fund Trustee | Other Directorships Held
Outside Fund Complex by
|
Independent Fund Trustees |
Michael J. Cosgrove (1949) | | President, Carragh Consulting USA, since 2014; formerly, Executive, General Electric Company, 1970 to 2014, including President, Mutual Funds and Global Investment Programs, GE Asset Management, 2011 to 2014, President and Chief Executive Officer, Mutual Funds and Intermediary Business, GE Asset Management, 2007 to 2011, President, Institutional Sales and Marketing, GE Asset Management, 1998 to 2007, and Chief Financial Officer, GE Asset Management, and Deputy Treasurer, GE Company, 1988 to 1993. | | Director, America Press, Inc. (not-for-profit Jesuit publisher), 2015 to 2021; formerly, Director, Fordham University, 2001 to 2018; formerly, Director, The Gabelli Go Anywhere Trust, June 2015 to June 2016; formerly, Director, Skin Cancer Foundation (not-for-profit), 2006 to 2015; formerly, Director, GE Investments Funds, Inc., 1997 to 2014; formerly, Trustee, GE Institutional Funds, 1997 to 2014; formerly, Director, GE Asset Management, 1988 to 2014; formerly, Director, Elfun Trusts, 1988 to 2014; formerly, Trustee, GE Pension & Benefit Plans, 1988 to 2014; formerly, Member of Board of Governors, Investment Company Institute. |
Name, (Year of Birth), and Address(1) | Position(s) and Length of Time Served(2) | Principal Occupation(s)(3) | Number of Funds in Fund Complex Overseen by Fund Trustee | Other Directorships Held Outside Fund Complex by Fund Trustee(3) |
| | Executive Vice Chancellor Emeritus, The Jewish Theological Seminary, since 2020; formerly, Executive Vice Chancellor and Chief Operating Officer, Jewish Theological Seminary, 2012 to 2020; formerly, Executive Vice President and General Counsel, Fidelity Investments, 2007 to 2012;formerly, Executive Vice President and General Counsel, BellSouth Corporation, 2004 to 2007; formerly, Vice President and Associate General Counsel, BellSouth Corporation, 2000 to 2004; formerly, Associate, Partner, and National Litigation Practice Co-Chair, Mayer, Brown LLP, 1981 to 2000; formerly, Associate Independent Counsel, Office of Independent Counsel, 1990 to 1992. | | Chair and Director, USCJ Supporting Foundation, since 2021; Director, UJA Federation of Greater New York, since 2019; Trustee, The Jewish Theological Seminary, since 2015; formerly, Director, Legility, Inc. (privately held for-profit company), 2012 to 2021; Director, Lawyers Committee for Civil Rights Under Law (not-for-profit), since 2005; formerly, Director, Equal Justice Works (not-for-profit), 2005 to 2014; formerly, Director, Corporate Counsel Institute, Georgetown University Law Center, 2007 to 2012; formerly, Director, Greater Boston Legal Services (not-for-profit), 2007 to 2012. |
Name, (Year of Birth), and Address(1) | Position(s) and Length of Time Served(2) | Principal Occupation(s)(3) | Number of Funds in Fund Complex Overseen by Fund Trustee | Other Directorships Held Outside Fund Complex by Fund Trustee(3) |
| | Formerly, President, Woodhill Enterprises Inc./Chase Hollow Associates LLC (personal investment vehicle), 2006 to 2020; formerly, Consultant, Resources Global Professionals (temporary staffing), 2002 to 2006; formerly, Chief Financial Officer, Booz-Allen & Hamilton, Inc., 1995 to 1999; formerly, Enterprise Risk Officer, Prudential Insurance, 1994 to1995; formerly, President, Prudential Asset Management Company, 1992 to 1994; formerly, President, Prudential Power Funding (investments in electric and gas utilities and alternative energy projects), 1989 to 1992; formerly, Treasurer, Prudential Insurance Company, 1983 to 1989. | | Director, American Water (water utility), since 2003; Director, Allianz Life of New York (insurance), since 2005; formerly, Director, Berger Group Holdings, Inc. (engineering consulting firm), from 2013 to 2018; formerly, Director, Financial Women’s Association of New York (not-for-profit association), from 1987 to 1996, 2003 to 2019; ; Trustee Emerita, Brown University, since 1998; Director, Museum of American Finance (not-for-profit), since 2013; formerly, Non-Executive Chair and Director, Channel Reinsurance (financial guaranty reinsurance), 2006 to 2010; formerly, Director, Ocwen Financial Corporation (mortgage servicing), 2005 to 2010; formerly, Director, Claire’s Stores, Inc. (retailer), 2005 to 2007; formerly, Director, Parsons Brinckerhoff Inc. (engineering consulting firm), 2007 to 2010; formerly, Director, Bank Leumi (commercial bank), 2005 to 2007; formerly, Advisory Board Member, Attensity (software developer), 2005 to 2007; formerly, Director of Foster Wheeler Manufacturing, 1994 to 2004; formerly Director Dexter Corp., (Manufacturer of Non-Wovens, Plastics, and Medical Supplies), 1992 to 2001. |
Name, (Year of Birth), and Address(1) | Position(s) and Length of Time Served(2) | Principal Occupation(s)(3) | Number of Funds in Fund Complex Overseen by Fund Trustee | Other Directorships Held Outside Fund Complex by Fund Trustee(3) |
Michael M. Knetter (1960) | | President and Chief Executive Officer, University of Wisconsin Foundation, since 2010; formerly, Dean, School of Business, University of Wisconsin - Madison; formerly, Professor of International Economics and Associate Dean, Amos Tuck School of Business - Dartmouth College, 1998 to 2002. | | Director, 1 William Street Credit Income Fund, since 2018; Board Member, American Family Insurance (a mutual company, not publicly traded), since March 2009; formerly, Trustee, Northwestern Mutual Series Fund, Inc., 2007 to 2011; formerly, Director, Wausau Paper, 2005 to 2011; formerly, Director, Great Wolf Resorts, 2004 to 2009. |
| | Member, Circle Financial Group (private wealth management membership practice), since 2011; Managing Director, Golden Seeds LLC (an angel investing group), since 2009; Adjunct Professor (Corporate Finance), Columbia University School of International and Public Affairs, since 2008; formerly, Visiting Assistant Professor, Fairfield University, Dolan School of Business, Fall 2007; formerly, Adjunct Associate Professor of Finance, Richmond, The American International University in London, 1999 to 2007. | | Board member, The Maritime Aquarium at Norwalk, since 2020; Board member, Norwalk Community College Foundation, since 2014; Dean’s Advisory Council, Radcliffe Institute for Advanced Study, since 2014; formerly, Director and Treasurer, At Home in Darien (not-for-profit), 2012 to 2014; formerly, Director, National Executive Service Corps (not-for-profit), 2012 to 2013; formerly, Trustee, Richmond, The American International University in London, 1999 to 2013. |
Name, (Year of Birth), and Address(1) | Position(s) and Length of Time Served(2) | Principal Occupation(s)(3) | Number of Funds in Fund Complex Overseen by Fund Trustee | Other Directorships Held Outside Fund Complex by Fund Trustee(3) |
| | Formerly, Adjunct Professor, Columbia University School of International and Public Affairs, from 2012 to 2018; formerly, Executive Vice President and Chief Financial Officer, People's United Bank, Connecticut (a financial services company), 1991 to 2001. | | Director, 1 WS Credit Income Fund; Chair, Audit Committee, since 2018; Director and Chair, Thrivent Church Loan and Income Fund, since 2018; formerly, Trustee, Steben Alternative Investment Funds, Steben Select Multi-Strategy Fund, and Steben Select Multi-Strategy Master Fund, 2013 to 2017; formerly, Treasurer, National Association of Corporate Directors, Connecticut Chapter, 2011 to 2015; formerly, Manager, Larch Lane Multi-Strategy Fund complex (which consisted of three funds), 2006 to 2011; formerly, Member, NASDAQ Issuers’ Affairs Committee, 1995 to 2003. |
| Trustee since inception; Chairman of the Board since 2008; formerly Lead Independent Trustee from 2006 to 2008 | Formerly, Managing Member, Ridgefield Farm LLC (a private investment vehicle), 2004 to 2016; formerly, President and CEO, Westaff, Inc. (temporary staffing), May 2001 to January 2002; formerly, Senior Executive, The Charles Schwab Corporation, 1983 to 1998, including Chief Executive Officer, Charles Schwab Investment Management, Inc.; Trustee, Schwab Family of Funds and Schwab Investments, 1997 to 1998; and Executive Vice President-Retail Brokerage, Charles Schwab & Co., Inc., 1994 to 1997. | | Trustee, University of Maryland, Shore Regional Health System, since 2020; formerly, Director, H&R Block, Inc. (tax services company), 2001 to 2018; formerly, Director, Talbot Hospice Inc., 2013 to 2016; formerly, Chairman, Governance and Nominating Committee, H&R Block, Inc., 2011 to 2015; formerly, Chairman, Compensation Committee, H&R Block, Inc., 2006 to 2010; formerly, Director, Forward Management, Inc. (asset management company), 1999 to 2006. |
Name, (Year of Birth), and Address(1) | Position(s) and Length of Time Served(2) | Principal Occupation(s)(3) | Number of Funds in Fund Complex Overseen by Fund Trustee | Other Directorships Held Outside Fund Complex by Fund Trustee(3) |
James G. Stavridis (1955) | | Vice Chairman Global Affairs, The Carlyle Group, since 2018; Commentator, NBC News, since 2015; formerly, Dean, Fletcher School of Law and Diplomacy, Tufts University, 2013 to 2018; formerly, Admiral, United States Navy, 1976 to 2013, including Supreme Allied Commander, NATO and Commander, European Command, 2009 to 2013, and Commander, United States Southern Command, 2006 to 2009. | | Director, Fortinet (cybersecurity), since 2021; Director, Ankura, since 2020; Director, Vigor Shipyard, since 2019; Director, Rockefeller Foundation, since 2018; Director, American Water (water utility), since 2018; Director, NFP Corp. (insurance broker and consultant), since 2017; Director, Onassis Foundation, since 2014; Director, Michael Baker International (construction) since 2014; Director, Vertical Knowledge, LLC, since 2013; formerly, Director, U.S. Naval Institute, 2014 to 2019; formerly, Director, Navy Federal Credit Union, 2000-2002; formerly, Director, BMC Software Federal, LLC, 2014-2019. |
Name, (Year of Birth), and Address(1) | Position(s) and Length of Time Served(2) | Principal Occupation(s)(3) | Number of Funds in Fund Complex Overseen by Fund Trustee | Other Directorships Held Outside Fund Complex by Fund Trustee(3) |
Fund Trustees who are "Interested Persons" |
| Chief Executive Officer and President since 2018 and Trustee since 2009 | President and Director, Neuberger Berman Group LLC, since 2009; President and Chief Executive Officer, Neuberger Berman BD LLC and Neuberger Berman Holdings LLC (including its predecessor, Neuberger Berman Inc.), since 2007; Chief Investment Officer (Equities) and President (Equities), NBIA (formerly, Neuberger Berman Fixed Income LLC and including predecessor entities), since 2007, and Board Member of NBIA since 2006; formerly, Global Head of Asset Management of Lehman Brothers Holdings Inc.’s (“LBHI”) Investment Management Division, 2006 to 2009; formerly, member of LBHI’s Investment Management Division’s Executive Management Committee, 2006 to 2009; formerly, Managing Director, Lehman Brothers Inc. (“LBI”), 2006 to 2008; formerly, Chief Recruiting and Development Officer, LBI, 2005 to 2006; formerly, Global Head of LBI’s Equity Sales and a Member of its Equities Division Executive Committee, 2003 to 2005; President and Chief Executive Officer, twelve registered investment companies for which NBIA acts as investment manager and/or administrator. | | Member of Board of Advisors, McDonough School of Business, Georgetown University, since 2001; Member of New York City Board of Advisors, Teach for America, since 2005; Trustee, Montclair Kimberley Academy (private school), since 2007; Member of Board of Regents, Georgetown University, since 2013. |
(1)
The business address of each listed person is 1290 Avenue of the Americas, New York, New York 10104.
(2) Pursuant to the Trust's Amended and Restated Trust Instrument, subject to any limitations on the term of service imposed by the By-Laws or any retirement policy adopted by the Fund Trustees, each Fund Trustee shall hold office for life or until his or her successor is elected or the Trust terminates; except that (a) any
Fund Trustee may resign by delivering a written resignation; (b) any Fund Trustee may be removed with or without cause at any time by a written instrument signed by at least two-thirds of the other Fund Trustees; (c) any Fund Trustee who requests to be retired, or who has become unable to serve, may be retired by a written instrument signed by a majority of the other Fund Trustees; and (d) any Fund Trustee may be removed at any shareholder meeting by a vote of at least two-thirds of the outstanding shares.
(3)
Except as otherwise indicated, each individual has held the positions shown during at least the last five years.
*
Indicates a Fund Trustee who is an "interested person" within the meaning of the 1940 Act. Mr. Amato is an interested person of the Trust by virtue of the fact that he is an officer of NBIA and/or its affiliates.
Information about the Officers of the Trust
Name, (Year of Birth), and | Position(s) and Length of Time | Principal Occupation(s)(3) |
Claudia A. Brandon (1956) | Executive Vice President since 2008 and Secretary since inception | Senior Vice President, Neuberger Berman, since 2007 and Employee since 1999; Senior Vice President, NBIA, since 2008 and Assistant Secretary since 2004; formerly, Vice President, Neuberger Berman, 2002 to 2006; formerly, Vice President — Mutual Fund Board Relations, NBIA, 2000 to 2008; formerly, Vice President, NBIA, 1986 to 1999 and Employee, 1984 to 1999; Executive Vice President and Secretary, thirty-three registered investment companies for which NBIA acts as investment manager and/or administrator. |
| | Senior Vice President, Neuberger Berman, since 2012; Senior Vice President, NBIA, since 2012 and Employee since 1996; formerly, Vice President, Neuberger Berman, 2007 to 2012; Vice President, twelve registered investment companies for which NBIA acts as investment manager and/or administrator. |
Anthony DiBernardo (1979) | Assistant Treasurer since 2011 | Senior Vice President, Neuberger Berman, since 2014; Senior Vice President, NBIA, since 2014, and Employee since 2003; formerly, Vice President, Neuberger Berman, 2009 to 2014; Assistant Treasurer, twelve registered investment companies for which NBIA acts as investment manager and/or administrator. |
Savonne L. Ferguson (1973) | Chief Compliance Officer since 2018 | Senior Vice President, Chief Compliance Officer (Mutual Funds) and Associate General Counsel, NBIA, since November 2018; formerly, Vice President T. Rowe Price Group, Inc. (2018), Vice President and Senior Legal Counsel, T. Rowe Price Associates, Inc. (2014-2018), Vice President and Director of Regulatory Fund Administration, PNC Capital Advisors, LLC (2009-2014), Secretary, PNC Funds and PNC Advantage Funds (2010-2014); Chief Compliance Officer, thirty-three registered investment companies for which NBIA acts as investment manager and/or administrator. |
| Chief Legal Officer since 2016 (only for purposes of sections 307 and 406 of the Sarbanes-Oxley Act of 2002) | General Counsel— Mutual Funds since 2016 and Managing Director, NBIA, since 2017; formerly, Associate General Counsel (2015 to 2016), Counsel (2007 to 2015), Senior Vice President (2013-2016), Vice President (2009 — 2013); Chief Legal Officer (only for purposes of sections 307 and 406 of the Sarbanes-Oxley Act of 2002), thirty-three registered investment companies for which NBIA acts as investment manager and/or administrator. |
| Assistant Secretary since inception | Vice President, Neuberger Berman, since 2008 and Employee since 1999; Vice President, NBIA, since 2008; formerly, Assistant Vice President, Neuberger Berman, 2007; Employee, NBIA, 1991 to 1999; Assistant Secretary, thirty-three registered investment companies for which NBIA acts as investment manager and/or administrator. |
Name, (Year of Birth), and Address(1) | Position(s) and Length of Time Served(2) | Principal Occupation(s)(3) |
| Chief Operating Officer since 2015 and Vice President since 2008 | Managing Director, Neuberger Berman, since 2013; Chief Operating Officer — Mutual Funds and Managing Director, NBIA, since 2015; formerly, Senior Vice President, Neuberger Berman, 2006 to 2014; Vice President, NBIA, 2008 to 2015 and Employee since 1991; Chief Operating Officer, twelve registered investment companies for which NBIA acts as investment manager and/or administrator; Vice President, thirty-three registered investment companies for which NBIA acts as investment manager and/or administrator. |
| | Senior Vice President, Neuberger Berman, since 2014 and Employee since 2000; Senior Vice President, NBIA, since 2014; Vice President, twelve registered investment companies for which NBIA acts as investment manager and/or administrator. |
| Assistant Secretary since 2017 | Senior Paralegal, Neuberger Berman, since 2007 and Employee since 2007; Assistant Secretary, thirty-three registered investment companies for which NBIA acts as investment manager and/or administrator. |
Owen F. McEntee, Jr. (1961) | | Vice President, Neuberger Berman, since 2006; Vice President, NBIA, since 2006 and Employee since 1992; Vice President, twelve registered investment companies for which NBIA acts as investment manager and/or administrator. |
| Treasurer and Principal Financial and Accounting Officer since inception | Managing Director, Neuberger Berman, since 2022; Senior Vice President, Neuberger Berman, 2007 to 2021; Senior Vice President, NBIA, since 2007 and Employee since 1993; formerly, Vice President, Neuberger Berman, 2004 to 2006; formerly, Assistant Treasurer, 2002 to 2005; Treasurer and Principal Financial and Accounting Officer, twelve registered investment companies for which NBIA acts as investment manager and/or administrator. |
| Assistant Treasurer since inception | Vice President, Neuberger Berman, since 2006; Vice President, NBIA, since 2006 and Employee since 1995; Assistant Treasurer, twelve registered investment companies for which NBIA acts as investment manager and/or administrator. |
| Anti-Money Laundering Compliance Officer since 2018 | Senior Vice President and Associate General Counsel, Neuberger Berman, since July 2018; Assistant United States Attorney, Southern District of New York, 2009 to 2018; Anti-Money Laundering Compliance Officer, five registered investment companies for which NBIA acts as investment manager and/or administrator. |
(1)
The business address of each listed person is 1290 Avenue of the Americas, New York, New York 10104.
(2) Pursuant to the By-Laws of the Trust, each officer elected by the Fund Trustees shall hold office until his or her successor shall have been elected and qualified or until his or her earlier death, inability to serve, or resignation. Officers serve at the pleasure of the Fund Trustees and may be removed at any time with or without cause.
(3)
Except as otherwise indicated, each individual has held the positions shown during at least the last five years.
Proxy Voting Policies and Procedures
A description of the policies and procedures that the Trust uses to determine how to vote proxies relating to portfolio securities is available, without charge, by calling 800-877-9700 (toll-free) and on the SEC’s website at www.sec.gov. Information regarding how the Trust voted proxies relating to portfolio securities during the most recent 12-month period ended June 30 is also available upon request, without charge, by calling 800-877-9700 (toll-free), on the SEC’s website at www.sec.gov, and on Neuberger Berman’s website at www.nb.com.
Quarterly Portfolio Schedule
The Trust files a complete schedule of portfolio holdings for each Fund with the SEC for the first and third quarters of each fiscal year as an exhibit to its report on Form N-PORT. The Trust’s Form N-PORT is available on the SEC’s website at www.sec.gov. The portfolio holdings information on Form N-PORT is available upon request, without charge, by calling 800-877-9700 (toll-free).
Liquidity Risk Management Program
Consistent with Rule 22e-4 under the Investment Company Act of 1940 (the "Liquidity Rule"), as amended, the Funds have established a liquidity risk management program (the "Program"). The Program seeks to assess and manage the Funds’ liquidity risk, which is defined as the risk that a Fund is unable to meet investor redemption requests without significantly diluting the remaining investors' interests in a Fund. The Board has approved the designation of NBIA Funds' Liquidity Committee, comprised of NBIA employees, as the program administrator (the "Program Administrator"). The Program Administrator is responsible for implementing and monitoring the Program and utilizes NBIA personnel to assess and review, on an ongoing basis, the Funds' liquidity risk.
The Program includes a number of elements that support the management and assessment of liquidity risk, including an annual assessment of the Funds' liquidity risk factors and the periodic classification (or re-classification, as necessary) of the Funds’ investments into buckets (highly liquid, moderately liquid, less liquid and illiquid) that reflect the Program Administrator's assessment of the investments' liquidity under current market conditions, which for the relevant period included, among other factors, market volatility as a result of geopolitical tensions (e.g., Russia’s invasion of Ukraine) and the emergence of new COVID variants. The Program Administrator also utilizes information about the Funds’ investment strategy, the characteristics of the Funds’ shareholder base and historical redemption activity.
The Program Administrator provided the Board with a written report that addressed the operation of the Program and assessed its adequacy and effectiveness of implementation from April 1, 2021 through March 31, 2022. During the period covered by this report, the Program Administrator reported that the Program effectively assisted the Program Administrator in monitoring whether a Fund maintained a level of liquidity appropriate for its shareholder base and historical redemption activity.
Report of Votes of Stockholders
A Special Meeting of Shareholders was held on June 30, 2022, adjourned to August 11, 2022, and further adjourned to August 30, 2022 for the Neuberger Berman Alternative Funds (the "Trust"). Shareholders voted to approve the election of four trustees to the Board of Trustees of the Trust and to approve the amendment of certain fundamental investment policies of each Fund.
Proposal 1 – To approve the election of Michael J. Cosgrove, Marc Gary, Deborah C. McLean, and James G. Stavridis as Trustees to the Board of Trustees of the Trust as follows:
Neuberger Berman Alternative Funds | | | |
| |
| | | |
| | | |
| | | |
| | | |
| | | |
Proposal 2 – To approve the amendment of certain fundamental investment policies of each Fund as follows:
(A) To approve the amendment of the fundamental investment policy regarding borrowing;
(B) To approve the amendment of the fundamental investment policy regarding commodities;
(C) To approve the amendment of the fundamental investment policy regarding industry concentration;
(D) To approve the amendment of the fundamental investment policy regarding lending;
(E) To approve the amendment of the fundamental investment policy regarding investing in real estate;
(F) To approve the amendment of the fundamental investment policy regarding the issuance of senior securities to permit issuing senior securities; and
(G) To approve the amendment of the fundamental investment policy regarding underwriting.
U.S. Equity Index PutWrite Strategy: | |
| | | |
| | | |
| | | |
| | | |
| | | |
| | | |
| | | |
| | | |
Board Consideration of the Management Agreement
On an annual basis, the Board of Trustees (the "Board" or "Trustees") of Neuberger Berman Alternative Funds (the "Trust"), including the Trustees who are not "interested persons" of the Trust or of Neuberger Berman Investment Advisers LLC ("Management") (including its affiliates), as such term is defined under the Investment Company Act of 1940, as amended ("1940 Act"), ("Independent Fund Trustees"), considers whether to continue the management agreement with Management (the "Agreement") with respect to Neuberger Berman Global Allocation Fund, Neuberger Berman Long Short Fund, and Neuberger Berman U.S. Equity Index Putwrite Strategy Fund (each a "Fund"). (This report does not include Neuberger Berman Absolute Return Multi-Manager Fund, which is the subject of a separate report.) Throughout the process, the Independent Fund Trustees are advised by counsel that is experienced in 1940 Act matters and that is independent of Management ("Independent Counsel"). At a meeting held on September 29, 2022, the Board, including the Independent Fund Trustees, approved the continuation of the Agreement for each Fund.
In evaluating the Agreement with respect to each Fund, the Board, including the Independent Fund Trustees, reviewed extensive materials provided by Management in response to questions submitted by the Independent Fund Trustees and Independent Counsel, and met with senior representatives of Management regarding its personnel, operations, and profitability as they relate to the Funds. The annual contract review extends over at least two regular meetings of the Board to ensure that Management has time to respond to any questions the Independent Fund Trustees may have on their initial review of the materials and that the Independent Fund Trustees have time to consider those responses. Additionally, the Board considered the impact of significant periods of market volatility that occurred during and after the period for which information was requested in conducting its evaluation of Management.
In connection with its deliberations, the Board also considered the broad range of information relevant to the annual contract review that is provided to the Board (including its various standing committees) at meetings throughout the year, including reports on investment performance, portfolio risk, liquidity management, and other portfolio information for each Fund, including any use of derivatives, as well as periodic reports on, among other matters, pricing and valuation; quality and cost of portfolio trade execution; compliance; and shareholder and other services provided by Management and its affiliates. The Contract Review Committee, which is comprised solely of Independent Fund Trustees, was established by the Board to assist in its evaluation and analysis of materials for the annual contract review. The Board has also established other committees that focus throughout the year on specific areas relevant to the annual contract review, such as Fund performance or compliance matters, and that are charged with specific responsibilities regarding the annual contract review. Those committees provide reports to the full Board, including the members of the Contract Review Committee, which consider that information as part of the annual contract review process. The Contract Review Committee annually considers and updates the questions it asks of Management in light of legal advice furnished to it by Independent Counsel; its own business judgment; and developments in the industry, in the markets, in mutual fund regulation and litigation, and in Management’s business model.
The Independent Fund Trustees received from Independent Counsel a memorandum discussing the legal standards for their consideration of the proposed continuation of the Agreement. During the course of the year and during their deliberations regarding the annual contract review, the Contract Review Committee and the Independent Fund Trustees met with Independent Counsel separately from representatives of Management.
Provided below is a description of the Board’s contract approval process and material factors that the Board considered at its meetings regarding renewals of the Agreement and the compensation to be paid thereunder. In connection with its approval of the continuation of the Agreement, the Board evaluated the terms of the Agreement, the overall fairness of the Agreement to each Fund, and whether the Agreement was in the best interests of each respective Fund and its shareholders. The Board’s determination to approve the continuation of the Agreement was based on a comprehensive consideration of all information provided to the Board throughout
the year and specifically in connection with the annual contract review. The Board considered each Fund’s investment management agreement separately from those of the other Funds.
This description is not intended to include all of the factors considered by the Board. The Board members did not identify any particular information or factor that was all-important or controlling, and each Trustee may have attributed different weights to the various factors. The Board focused on the costs and benefits of the Agreement to each Fund and, through the Fund, its shareholders.
Nature, Extent, and Quality of Services
With respect to the nature, extent, and quality of the services provided, the Board considered the investment philosophy and decision-making processes of, and the qualifications, experience, and capabilities of, and the resources available to, the portfolio management personnel of Management who perform services for the Funds. The Board noted that Management also provides certain administrative services, including fund accounting and compliance services. The Board also considered Management’s policies and practices regarding brokerage, commissions, other trading costs, and allocation of portfolio transactions, and reviewed the quality of the execution services that Management had provided. The Board also reviewed Management's use of brokers to execute Fund transactions that provide research services to Management. Moreover, the Board considered Management’s approach to potential conflicts of interest both generally and between the Funds’ investments and those of other funds or accounts managed by Management. The Board also noted that Management had increased its capabilities with respect to environmental, social, and corporate governance matters and considered how that might impact the relevant Funds. The Board noted the additional responsibilities of Management in administering the liquidity risk management program.
The Board recognized the extensive range of services that Management provides to the Funds beyond the investment management services. The Board noted that Management is also responsible for monitoring compliance with the Fund’s investment objectives, policies, and restrictions, as well as compliance with applicable law, including implementing rulemaking initiatives of the U.S. Securities and Exchange Commission. The Board considered that Management assumes significant ongoing entrepreneurial and business risks as the investment adviser and sponsor for the Funds, for which it is entitled to reasonable compensation. The Trustees also considered that Management’s responsibilities include continual management of investment, operational, cybersecurity, enterprise, legal, regulatory, and compliance risks as they relate to the Funds, and the Board considers on a regular basis information regarding Management’s processes for monitoring and managing risk. In addition, the Board also noted that when Management launches a new fund or share class, it assumes entrepreneurial risk with respect to that fund or share class, and that some funds and share classes have been liquidated without ever having been profitable to Management.
The Board also reviewed and evaluated Management’s activities under its contractual obligation to oversee the Funds’ various outside service providers, including its renegotiation of certain service providers’ fees and its evaluation of service providers’ infrastructure, cybersecurity programs, compliance programs, and business continuity programs, among other matters. The Board also considered Management’s ongoing development of its own infrastructure and information technology to support the Funds through, among other things, cybersecurity, business continuity planning, and risk management. The Board noted Management’s largely seamless implementation of its business continuity plan in response to the COVID-19 pandemic and its success in continuously providing services to the Funds notwithstanding the disruptions caused by the pandemic. In addition, the Board noted the positive compliance history of Management, as no significant compliance problems were reported to the Board with respect to Management. The Board also considered the general structure of the portfolio managers’ compensation and whether this structure provides appropriate incentives to act in the best interests of the Funds. The Board also considered the ability of Management to attract and retain qualified personnel to service the Funds.
As in past years, the Board also considered the manner in which Management addressed various matters that arose during the year, some of them a result of developments in the broader fund industry or the regulations governing it. In addition, the Board considered actions taken by Management in response to market conditions over the past year, such as changes in interest rates and the increase in market volatility, and considered the overall performance of Management in this context.
Fund Performance
The Board requested a report from an outside consulting firm that specializes in the analysis of fund industry data that compared each Fund’s performance, along with its fees and other expenses, to a group of industry peers ("Expense Group") and to a broader universe of funds pursuing generally similar strategies with the same investment classification and/or objective ("Performance Universe"). The Board considered each Fund’s performance and fees in light of the limitations inherent in the methodology for constructing such comparative groups and determining which investment companies should be included in the comparative groups, noting differences as compared to certain fund industry ranking and rating systems. The Board also considered the impact and inherent limitation on the comparisons due to the number of funds included in the Funds’ Expense Groups.
With respect to investment performance, the Board considered information regarding each Fund’s short-, intermediate- and long-term performance, as applicable, net of the Fund’s fees and expenses, on an absolute basis, relative to a benchmark index that does not deduct the fees or expenses of investing, and compared to the performance of its Expense Group and Performance Universe, each constructed by the consulting firm. The Board also reviewed performance in relation to certain measures of the degree of investment risk undertaken by the portfolio managers.
In the case of underperformance for any of the periods reported, the Board considered the magnitude and duration of that underperformance relative to the Performance Universe and/or the benchmark (e.g., the amount by which a Fund underperformed, including, for example, whether the Fund slightly underperformed or significantly underperformed its benchmark). The Board also considered Management’s responsiveness with respect to the relative performance. The Board recognized that the performance data reflects a snapshot of a period as of a particular date and that selecting a different performance period could produce significantly different results. The Board further acknowledged that long-term performance could be impacted by even one period of significant outperformance or underperformance, and that a single investment theme could disproportionately affect performance. In this regard, the Board noted that performance, especially short-term performance, is only one of the factors that it deems relevant to its consideration of the Agreement and that, after considering all relevant factors, it determined to approve the continuation of the Agreement notwithstanding a Fund’s relative performance.
Fee Rates, Profitability, and Fall-out Benefits
With respect to the overall fairness of the Agreement, the Board considered the fee structure for each Fund under the Agreement as compared to the Expense Group provided by the consulting firm, as discussed above. The Board reviewed a comparison of each Fund’s management fee to its Expense Group. The Board noted that the comparative management fee analysis includes, in each Fund’s management fee, the separate administrative fees paid to Management. However, the Board noted that some funds in the Expense Group pay directly from fund assets for certain services that Management covers out of the administration fees for the Funds. Accordingly, the Board also considered each Fund’s total expense ratio as compared with its Expense Group as a way of taking account of these differences.
The Board compared each Fund’s contractual and actual management fees to the median of the contractual and actual management fees, respectively, of that Fund’s Expense Group. (The actual management fees are the contractual management fees reduced by any fee waivers or other adjustments.) The Board also compared each
Fund’s total expenses to the median of the total expenses of that Fund’s Expense Group. The Board also noted that for some classes of certain Funds, the overall expense ratio is maintained through a contractual or voluntary fee cap and/or expense reimbursements by Management.
In concluding that the benefits accruing to Management and its affiliates by virtue of their relationship with each Fund were reasonable in light of the costs of providing the investment advisory and other services and the benefits accruing to that Fund, the Board reviewed specific data as to Management’s estimated profit or loss on each Fund for a recent period on a pre-tax basis without regard to distribution expenses, including year-over-year changes in each of Management’s reported expense categories. (The Board also reviewed data on Management’s estimated profit or loss on each Fund after distribution expenses and taxes were factored in, as indicators of the health of the business and the extent to which Management is directing its profits into the growth of the business.) The Board considered the cost allocation methodology that Management used in developing its estimated profitability figures. In recent years, the Board engaged an independent forensic accountant to review the profitability methodology utilized by Management when preparing this information and discussed with the consultant its conclusion that Management’s process for calculating and reporting its estimated profit or loss was not unreasonable.
Recognizing that there is no uniform methodology regarding the allocation of firm-wide or complex-wide expenses within the asset management industry for determining profitability for this purpose and that the use of different reasonable methodologies can give rise to different profit and loss results, the Board, in the past, requested from Management examples of profitability calculated by different methods and noted that the estimated profitability levels were still reasonable when calculated by these other methods. The Board further noted Management’s representation that its estimate of profitability is derived using methodology that is consistent with the methodology used to assess and/or report measures of profitability elsewhere at the firm. In addition, the Board recognized that Management’s calculations regarding its costs may not reflect all risks, including regulatory, legal, operational, cybersecurity, reputational, and, where appropriate, entrepreneurial risks, associated with offering and managing a mutual fund in the current regulatory and market environment. The Board also considered any fall-out (i.e., indirect) benefits likely to accrue to Management or its affiliates from their relationship with each Fund, such as research it may receive from broker-dealers executing the Funds’ portfolio transactions on an agency basis. The Board recognized that Management and its affiliates should be entitled to earn a reasonable level of profits for services they provide to each Fund and, based on its review, concluded that Management’s reported level of estimated profitability, if any, on each Fund was reasonable.
Information Regarding Services to Other Clients
The Board also considered whether there were other funds or separate accounts that were advised or sub-advised by Management or its affiliates with investment objectives, policies, and strategies that were similar to those of any of the Funds. In the cases where such funds or separate accounts exist, the Board compared the fees charged to the respective Fund to the fees charged to such comparable funds and/or separate accounts. The Board considered the appropriateness and reasonableness of any differences between the fees charged to a Fund and such comparable funds and/or separate accounts, and determined that differences in fees and fee structures were consistent with the differences in the management and other services provided. The Board explored with Management its assertion that although, generally, the rates of fees paid by such accounts, except other Neuberger Berman mutual funds, were lower than the fee rates paid by the corresponding Funds, the differences reflected Management’s greater level of responsibilities and significantly broader scope of services to the Funds, the more extensive regulatory obligations and risks associated with managing the Funds, and other financial considerations with respect to creation and sponsorship of the Funds.
Economies of Scale
The Board also evaluated apparent or anticipated economies of scale in relation to the services Management provides to each Fund. The Board considered whether each Fund’s fee structure provides for a reduction of payments resulting from the use of breakpoints, the size of any breakpoints in each Fund’s advisory fees, and whether any such breakpoints are set at appropriate asset levels. The Board also compared the breakpoint structure to that of the Expense Group. In addition, the Board considered the expense limitation and/or fee waiver arrangements that reduce many Funds’ expenses at some or all asset levels, which can have an effect similar to breakpoints in sharing economies of scale with shareholders and provide protection from an increase in expenses if a Fund’s assets decline. The Trustees took into account that certain Funds do not have breakpoints in their fees. As to those Funds whose advisory fees do not have breakpoints, the Board discussed with Management the reasons why the Fund’s particular investment program was less likely than others to produce economies of scale. In addition, for Funds that do not have breakpoints, the Board considered that setting competitive fee rates and pricing a Fund to scale before it has actually experienced an increase in assets are other means of sharing potential economies of scale with shareholders. The Board also considered that Management has provided, at no added cost to the Funds, certain additional services, including but not limited to, services required by new regulations or regulatory interpretations, services impelled by changes in the securities markets or the business landscape, and/or services requested by the Board. The Board considered that this is a way of sharing economies of scale with the Funds and their shareholders.
Fund-by-Fund Analysis
With regard to the investment performance of each Fund and the fees charged to each Fund, the Board considered the following information. The Performance Universes referenced in this section are those identified by the consulting firm, as discussed above, and the risk/return ratios referenced are the Sharpe ratios provided by the consulting firm. With respect to performance quintile rankings for a Fund compared to its Performance Universe, the first quintile represents the highest (best) performance and the fifth quintile represents the lowest performance. With respect to the quintile rankings for fees and total expenses (net of waivers or other adjustments, if any) for a Fund compared to its Expense Group, the first quintile represents the lowest (best) fees and/or total expenses and the fifth quintile represents the highest fees and/or total expenses. Where a Fund has more than one class of shares outstanding, information for Institutional Class has been provided as identified below. The Board reviewed the expense structures of all the other classes of shares of the Funds, some of which have higher fees and expenses that reflect their separate distribution and servicing arrangements and the differing needs of different investors. As a proxy for the class expense structure, the Board reviewed the expenses of each class for at least one Fund in the Trust in comparison to Expense Groups for those classes. The Board noted the effect of higher expenses on the performance of the other classes of shares.
• Neuberger Berman Global Allocation Fund (Institutional Class)—The Board considered that, based on performance data for the periods ended December 31, 2021: (1) as compared to its benchmark, the Fund’s performance was higher for the 1- and 3-year periods and lower for the 5- and 10-year periods; and (2) as compared to its Performance Universe, the Fund’s performance was in the second quintile for the 1- and 10-year periods and the first quintile for the 3- and 5-year periods. The Board considered that, as compared to its Expense Group, the Fund’s contractual management fee, the actual management fee net of fees waived by Management, and total expenses each ranked in the first quintile.
• Neuberger Berman Long Short Fund (Institutional Class)—The Board considered that, based on performance data for the periods ended December 31, 2021: (1) as compared to its benchmark, the Fund’s performance was lower for the 1-year period and higher for the 3-, 5-, and 10-year periods; and (2) as compared to its Performance Universe, the Fund’s performance was in the fourth quintile for the 1-year period and the second quintile for the 3-, 5-, and 10-year periods. The Board considered that, as compared
to its Expense Group, the Fund’s contractual management fee, the actual management fee, and total expenses each ranked in the second quintile.
• Neuberger Berman U.S. Equity Index PutWrite Strategy Fund (Institutional Class)—The Board considered that, based on performance data for the periods ended December 31, 2021: (1) as compared to its benchmark, the Fund’s performance was higher for the 1-, 3-, and 5-year periods; and (2) as compared to its Performance Universe, the Fund’s performance was in the first quintile for the 1-year period and the second quintile for the 3- and 5-year periods. The Fund was launched in 2016 and therefore does not have 10-year performance. The Board considered that, as compared to its Expense Group, the Fund’s contractual management fee, the actual management fee net of fees waived by Management, and total expenses each ranked in the first quintile. In addition, the Board noted that in February 2022, Management added a new portfolio manager, adjusted its strategy, and changed its benchmark index to an index with characteristics that are more representative of the Fund’s investment strategy.
Conclusions
In approving the continuation of the Agreement, the Board concluded that, in its business judgment, the terms of the Agreement are fair and reasonable to each Fund and that approval of the continuation of the Agreement is in the best interests of each Fund and its shareholders. In reaching this determination, the Board considered that Management could be expected to continue to provide a high level of service to each Fund; that the performance of each Fund was satisfactory over time, or, in the case of a Fund that underperformed relative to its Expense Group or Performance Universe, that the Board retained confidence in Management’s capabilities to manage the Fund; that each Fund’s fee structure appeared to the Board to be reasonable given the nature, extent, and quality of services provided; and that the benefits accruing to Management and its affiliates by virtue of their relationship with each Fund were reasonable in light of the costs of providing the investment advisory and other services and the benefits accruing to each Fund. The Board’s conclusions may be based in part on its consideration of materials prepared in connection with the approval or continuance of the Agreement in prior years and on the Board’s ongoing regular review of Fund performance and operations throughout the year, in addition to material prepared specifically for the most recent annual review of the Agreement.
Notice to Shareholders
In early 2023, you will receive information to be used in filing your 2022 tax returns, which will include a notice of the exact tax status of all distributions paid to you by the Fund during calendar year 2022. Please consult your own tax advisor for details as to how this information should be reflected on your tax returns.
For the fiscal year ended October 31, 2022, each Fund makes the following designation, or up to the maximum amount of such dividends allowable pursuant to the Internal Revenue Code, as capital gains distributions and qualified dividend income eligible for reduced tax rates. Complete information regarding each Funds distributions during the calendar year 2022 will be reported in conjunction with Form 1099-DIV.
| Capital Gains
Distributions | |
| | |
| | |
U.S. Equity Index PutWrite Strategy | | |
This page has been left blank intentionally
This page has been left blank intentionally
This page has been left blank intentionally
Neuberger Berman Investment Advisers LLC
1290 Avenue of the Americas
New York, NY 10104-0002
Retail Services: 800.877.9700
Broker-Dealer and Institutional Services: 800.366.6264/888.556.9030
www.nb.com
Statistics and projections in this report are derived from sources deemed to be reliable but cannot be regarded as a representation of future results of the Funds. This report is prepared for the general information of shareholders and is not an offer of shares of the Funds. Shares are sold only through the currently effective prospectus which you can obtain by calling 877.628.2583. An investor should consider carefully a Fund’s investment objectives, risks and fees and expenses, which are described in its prospectus, before investing.
L0265 12/22
(b) Not applicable to the Registrant.
Item 2. Code of Ethics.
The Board of Trustees (“Board”) of Neuberger Berman Alternative Funds (“Registrant”) has adopted a code of ethics that applies to the Registrant’s principal executive officer, principal financial officer, principal accounting officer or controller, or persons performing similar functions (“Code of Ethics”). During the period covered by this Form N-CSR, there were no substantive amendments to the Code of Ethics and there were no waivers from the Code of Ethics granted to the Registrant’s principal executive officer, principal financial officer, principal accounting officer or controller, or persons performing similar functions.
Item 3. Audit Committee Financial Expert.
The Board has determined that the Registrant has three audit committee financial experts serving on its audit committee. The Registrant’s audit committee financial experts are Michael J. Cosgrove, Martha C. Goss and Deborah C. McLean. Mr. Cosgrove, Ms. Goss and Ms. McLean are independent trustees as defined by Form N-CSR.
Item 4. Principal Accountant Fees and Services.
Ernst & Young LLP (“E&Y”), serves as independent registered public accounting firm to Neuberger Berman Absolute Return Multi-Manager Fund, Neuberger Berman Global Allocation Fund, and Neuberger Berman U.S. Equity Index PutWrite Strategy Fund. Neuberger Berman Absolute Return Multi-Manager Fund, Neuberger Berman Global Allocation Fund, and Neuberger Berman U.S. Equity Index PutWrite Strategy Fund commenced operations on May 15, 2012, December 29, 2010, and September 16, 2016, respectively. Effective December 15, 2021, E&Y also serves as independent registered public accounting firm to Neuberger Berman Long Short Fund. Neuberger Berman Long Short Fund commenced operations on December 29, 2011.
Prior to December 15, 2021, Tait, Weller & Baker LLP (“Tait Weller”) served as independent registered public accounting firm to Neuberger Berman Long Short Fund.
(a) Audit Fees
The aggregate fees billed for professional services rendered by E&Y for the audit of the annual financial statements or services that are normally provided by E&Y in connection with statutory and regulatory filings or engagements were $274,190 and $254,300 for the fiscal years ended 2021 and 2022, respectively.
The aggregate fees billed for professional services rendered by Tait Weller for the audit of the annual financial statements or services that are normally provided by Tait Weller in connection with statutory and regulatory filings or engagements were $43,875 for the fiscal year ended 2021.
(b) Audit-Related Fees
The aggregate fees billed to the Registrant for assurance and related services by E&Y that are reasonably related to the performance of the audit of the Registrant’s financial statements and are not reported above in Audit Fees were $0 and $0 for the fiscal years ended 2021 and 2022, respectively. The Audit Committee approved 0% and 0% of these services provided by E&Y for the fiscal years ended 2021 and 2022, respectively, pursuant to the waiver provisions of Rule 2-01(c)(7)(i)(C) of Regulation S-X.
The fees billed to other entities in the investment company complex for assurance and related services by E&Y that are reasonably related to the performance of the audit that the Audit Committee was required to approve
because the engagement related directly to the operations and financial reporting of the Registrant were $0 and $0 for the fiscal years ended 2021 and 2022, respectively. The Audit Committee approved 0% and 0% of these services provided by E&Y for the fiscal years ended 2021 and 2022, respectively, pursuant to the waiver provisions of Rule 2-01(c)(7)(i)(C) of Regulation S-X.
The aggregate fees billed to the Registrant for assurance and related services by Tait Weller that are reasonably related to the performance of the audit of the Registrant’s financial statements and are not reported above in Audit Fees were $0 for the fiscal year ended 2021. The Audit Committee approved 0% of these services provided by Tait Weller for the fiscal year ended 2021, pursuant to the waiver provisions of Rule 2-01(c)(7)(i)(C) of Regulation S-X.
The fees billed to other entities in the investment company complex for assurance and related services by Tait Weller that are reasonably related to the performance of the audit that the Audit Committee was required to approve because the engagement related directly to the operations and financial reporting of the Registrant were $0 for the fiscal year ended 2021. The Audit Committee approved 0% of these services provided by Tait Weller for the fiscal year ended 2021, pursuant to the waiver provisions of Rule 2-01(c)(7)(i)(C) of Regulation S-X.
(c) Tax Fees
The aggregate fees billed to the Registrant for professional services rendered by E&Y for tax compliance, tax advice, and tax planning were $92,090 and $75,600 for the fiscal years ended 2021 and 2022, respectively. The nature of the services provided includes preparation of the Federal and State tax extensions and tax returns, review of annual excise tax calculations, and preparation of form 8613, in addition to assistance with the identification of Passive Foreign Investment Companies ("PFICs"), assistance with determination of various foreign withholding taxes, and assistance with Internal Revenue Code and tax regulation requirements for fund investments. The Audit Committee approved 0% and 0% of these services provided by E&Y for the fiscal years ended 2021 and 2022, respectively, pursuant to the waiver provisions of Rule 2-01(c)(7)(i)(C) of Regulation S-X.
The fees billed to other entities in the investment company complex for professional services rendered by E&Y for tax compliance, tax advice, and tax planning that the Audit Committee was required to approve because the engagement related directly to the operations and financial reporting of the Registrant were $0 and $0 for the fiscal years ended 2021 and 2022, respectively. The Audit Committee approved 0% and 0% of these services provided by E&Y for the fiscal years ended 2021 and 2022, respectively, pursuant to the waiver provisions of Rule 2-01(c)(7)(i)(C) of Regulation S-X.
The aggregate fees billed to the Registrant for professional services rendered by Tait Weller for tax compliance, tax advice, and tax planning were $0 for the fiscal year ended 2021. The nature of the services provided includes preparation of the Federal and State tax extensions and tax returns, review of annual excise tax calculations, and preparation of form 8613, in addition to assistance with the identification of PFICs, assistance with determination of various foreign withholding taxes, and assistance with Internal Revenue Code and tax regulation requirements for fund investments. The Audit Committee approved 0% of these services provided by Tait Weller for the fiscal year ended 2021, pursuant to the waiver provisions of Rule 2-01(c)(7)(i)(C) of Regulation S-X.
The fees billed to other entities in the investment company complex for professional services rendered by Tait Weller for tax compliance, tax advice, and tax planning that the Audit Committee was required to approve because the engagement related directly to the operations and financial reporting of the Registrant were $0 for the fiscal year ended 2021. The Audit Committee approved 0% of these services provided by Tait Weller for the fiscal year ended 2021, pursuant to the waiver provisions of Rule 2-01(c)(7)(i)(C) of Regulation S-X.
(d) All Other Fees
The aggregate fees billed to the Registrant for products and services provided by E&Y, other than services reported in Audit Fees, Audit-Related Fees, and Tax Fees were $0 and $0 for the fiscal years ended 2021 and 2022, respectively. The Audit Committee approved 0% and 0% of these services provided by E&Y for the fiscal years ended 2021 and 2022, respectively, pursuant to the waiver provisions of Rule 2-01(c)(7)(i)(C) of Regulation S-X.
The fees billed to other entities in the investment company complex for products and services provided by E&Y, other than services reported in Audit Fees, Audit-Related Fees, and Tax Fees that the Audit Committee was required to approve because the engagement related directly to the operations and financial reporting of the Registrant were $0 and $0 for the fiscal years ended 2021 and 2022, respectively. The Audit Committee approved 0% and 0% of these services provided by E&Y for the fiscal years ended 2021 and 2022, respectively, pursuant to the waiver provisions of Rule 2-01(c)(7)(i)(C) of Regulation S-X.
The aggregate fees billed to the Registrant for products and services provided by Tait Weller, other than services reported in Audit Fees, Audit-Related Fees, and Tax Fees were $0 for the fiscal year ended 2021. The Audit Committee approved 0% of these services provided by Tait Weller for the fiscal year ended 2021, pursuant to the waiver provisions of Rule 2-01(c)(7)(i)(C) of Regulation S-X.
The fees billed to other entities in the investment company complex for products and services provided by Tait Weller, other than services reported in Audit Fees, Audit-Related Fees, and Tax Fees that the Audit Committee was required to approve because the engagement related directly to the operations and financial reporting of the Registrant were $0 for the fiscal year ended 2021. The Audit Committee approved 0% of these services provided by Tait Weller for the fiscal year ended 2021, pursuant to the waiver provisions of Rule 2-01(c)(7)(i)(C) of Regulation S-X.
(e) Audit Committee’s Pre-Approval Policies and Procedures
(1) The Audit Committee’s pre-approval policies and procedures for the Registrant to engage an accountant to render audit and non-audit services delegate to each member of the Committee the power to pre-approve services between meetings of the Committee.
(2) None of the services described in paragraphs (b) through (d) above were approved by the Audit Committee pursuant to paragraph (c)(7)(i)(C) of Rule 2-01 of Regulation S-X.
(f) Hours Attributed to Other Persons
Not applicable.
(g) Non-Audit Fees
Non-audit fees billed by E&Y for services rendered to the Registrant were $92,090 and $75,600 for the fiscal years ended 2021 and 2022, respectively.
Non-audit fees billed by E&Y for services rendered to the Registrant’s investment adviser and any entity controlling, controlled by, or under common control with the adviser that provides ongoing services to the Registrant were $0 and $0 for the fiscal years ended 2021 and 2022, respectively.
Non-audit fees billed by Tait Weller for services rendered to the Registrant were $0 for the fiscal year ended 2021.
Non-audit fees billed by Tait Weller for services rendered to the Registrant’s investment adviser and any entity controlling, controlled by, or under common control with the adviser that provides ongoing services to the Registrant were $0 for the fiscal year ended 2021.
(h) The Audit Committee of the Board considered whether the provision of non-audit services rendered to the Registrant’s investment adviser and any entity controlling, controlled by, or under common control with the adviser that provides ongoing services to the Registrant that were not pre-approved by the Audit Committee because the engagement did not relate directly to the operations and financial reporting of the Registrant is compatible with maintaining E&Y’s and Tait Weller’s independence.
Item 5. Audit Committee of Listed Registrants.
Not applicable to the Registrant.
Item 6. Schedule of Investments.
The complete schedule of investments for each series is disclosed in the Registrant’s annual report, which is included as Item 1 of this Form N-CSR.
Item 7. Disclosure of Proxy Voting Policies and Procedures for Closed-End Management Investment Companies.
Not applicable to the Registrant.
Item 8. Portfolio Managers of Closed-End Management Investment Companies.
Not applicable to the Registrant.
Item 9. Purchases of Equity Securities by Closed-End Management Investment Company and Affiliated Purchasers.
Not applicable to the Registrant.
Item 10. Submission of Matters to a Vote of Security Holders.
There were no changes to the procedures by which shareholders may recommend nominees to the Board.
Item 11. Controls and Procedures.
| (a) | Based on an evaluation of the disclosure controls and procedures (as defined in Rule 30a-3(c) under the Act) as of a date within 90 days of the filing date of this report, the Chief Executive Officer and President and the Treasurer and Principal Financial and Accounting Officer of the Registrant have concluded that such disclosure controls and procedures are effectively designed to ensure that information required to be disclosed by the Registrant on Form N-CSR is accumulated and communicated to the Registrant’s management to allow timely decisions regarding required disclosure. |
| (b) | There were no significant changes in the Registrant’s internal controls over financial reporting (as defined in Rule 30a-3(d) under the Act) that occurred during the Registrant’s most recent fiscal half-year period covered by this report that have materially affected, or are reasonably likely to materially affect, the Registrant’s internal control over financial reporting. |
Item 12. Disclosure of Securities Lending Activities for Closed-End Management Investment Companies.
Not applicable to the Registrant.
Item 13. Exhibits.
| (a)(3) | Not applicable to the Registrant. |
The certification furnished pursuant to Rule 30a-2(b) under the Act and Section 906 of the Sarbanes-Oxley Act will not be deemed “filed” for purposes of Section 18 of the Securities Exchange Act of 1934, as amended (“Exchange Act”), or otherwise subject to the liability of that section. Such certification will not be deemed to be incorporated by reference into any filing under the Securities Act of 1933, as amended, or the Exchange Act, except to the extent that the Registrant specifically incorporates it by reference.
SIGNATURES
Pursuant to the requirements of the Securities Exchange Act of 1934 and the Investment Company Act of 1940, the Registrant has duly caused this report to be signed on its behalf by the undersigned, thereunto duly authorized.
Neuberger Berman Alternative Funds
By:
| /s/ Joseph V. Amato |
| Joseph V. Amato |
| Chief Executive Officer and President |
Date: January 5, 2023
Pursuant to the requirements of the Securities Exchange Act of 1934 and the Investment Company Act of 1940, this report has been signed below by the following persons on behalf of the Registrant and in the capacities and on the dates indicated.
By:
| /s/ Joseph V. Amato |
| Joseph V. Amato |
| Chief Executive Officer and President |
Date: January 5, 2023
By:
| /s/ John M. McGovern |
| |
| Treasurer and Principal Financial and Accounting Officer |
Date: January 5, 2023