As filed with the Securities and Exchange Commission on January 5, 2024
UNITED STATES
SECURITIES AND EXCHANGE COMMISSION
Washington, D.C. 20549
FORM N-CSR
CERTIFIED SHAREHOLDER REPORT OF
REGISTERED MANAGEMENT INVESTMENT COMPANIES
Investment Company Act file number: 811-21715
NEUBERGER BERMAN ALTERNATIVE FUNDS
(Exact Name of Registrant as specified in charter)
c/o Neuberger Berman Investment Advisers LLC
1290 Avenue of the Americas
New York, New York 10104-0002
(Address of Principal Executive Offices – Zip Code)
Joseph V. Amato
Chief Executive Officer and President
Neuberger Berman Alternative Funds
c/o Neuberger Berman Investment Advisers LLC
1290 Avenue of the Americas
New York, New York 10104-0002
Lori L. Schneider, Esq.
K&L Gates LLP
1601 K Street, N.W.
Washington, D.C. 20006-1600
(Names and Addresses of agents for service)
Registrant’s telephone number, including area code: (212) 476-8800
Date of fiscal year end: October 31
Date of reporting period: October 31, 2023
Form N-CSR is to be used by management investment companies to file reports with the Commission not later than 10 days after the transmission to stockholders of any report that is required to be transmitted to stockholders under Rule 30e-1 under the Investment Company Act of 1940, as amended (“Act”) (17 CFR 270.30e-1). The Commission may use the information provided on Form N-CSR in its regulatory, disclosure review, inspection, and policymaking roles.
A registrant is required to disclose the information specified by Form N-CSR, and the Commission will make this information public. A registrant is not required to respond to the collection of information contained in Form N-CSR unless the Form displays a currently valid Office of Management and Budget (“OMB”) control number. Please direct comments concerning the accuracy of the information collection burden estimate and any suggestions for reducing the burden to the Secretary, Securities and Exchange Commission, 450 Fifth Street, NW, Washington, DC 20549-0609. The OMB has reviewed this collection of information under the clearance requirements of 44 U.S.C. § 3507.
Item 1. Report to Shareholders.
(a) Following are copies of the annual reports transmitted to shareholders pursuant to Rule 30e-1 under the Act.
Neuberger
Berman
Alternative
Funds
Institutional
Class
Shares
Class
A
Shares
Class
C
Shares
Class
R6
Shares
Class
E
Shares
Absolute
Return
Multi-Manager
Fund
The
“Neuberger
Berman”
name
and
logo
and
“Neuberger
Berman
Investment
Advisers
LLC”
name
are
registered
service
marks
of
Neuberger
Berman
Group
LLC.
The
individual
Fund
name
in
this
piece
is
either
a
service
mark
or
registered
service
mark
of
Neuberger
Berman
Investment
Advisers
LLC,
an
affiliate
of
Neuberger
Berman
BD
LLC,
distributor,
member
FINRA.
©
2023
Neuberger
Berman
BD
LLC,
distributor.
All
rights
reserved.
PRESIDENT’S
LETTER
1
PORTFOLIO
COMMENTARY
2
FUND
EXPENSE
INFORMATION
9
CONSOLIDATED
SCHEDULE
OF
INVESTMENTS
11
CONSOLIDATED
FINANCIAL
STATEMENTS
32
NOTES
TO
CONSOLIDATED
FINANCIAL
STATEMENTS
37
CONSOLIDATED
FINANCIAL
HIGHLIGHTS
(ALL
CLASSES)
51
Report
of
Independent
Registered
Public
Accounting
Firm
55
Directory
56
Trustees
and
Officers
57
Proxy
Voting
Policies
and
Procedures
67
Quarterly
Portfolio
Schedule
67
Liquidity
Risk
Management
Program
67
Notice
to
Shareholders
67
Board
Consideration
of
the
Management
and
Sub-Advisory
Agreements
68
Dear
Shareholder,
I
am
pleased
to
present
this
annual
shareholder
report
for
Neuberger
Berman
Absolute
Return
Multi-Manager
Fund
covering
the
fiscal
year
ended
October
31,
2023
(the
reporting
period).
The
global
financial
markets
experienced
periods
of
heightened
volatility
during
the
reporting
period.
Investor
sentiment
was
impacted
by
a
number
of
factors,
including
continued
high
inflation,
aggressive
monetary
policy
tightening,
a
period
of
unrest
in
the
regional
banking
industry,
wars
in
Ukraine
and
the
Middle
East,
and
several
other
geopolitical
events.
Despite
several
headwinds,
the
U.S.
economy
was
resilient
and
continued
to
expand.
Against
this
backdrop,
equity
and
bond
markets
generated
mixed
results
during
the
reporting
period.
With
inflation
remaining
persistent
and
elevated,
the
U.S.
Federal
Reserve
Board
(Fed)
remained
steadfast
in
its
attempt
to
moderate
economic
growth
and
orchestrate
a
“soft
landing.”
The
Fed
raised
rates
at
11
meetings
from
March
2022
through
July
2023—bringing
the
federal
funds
rate
to
a
range
between
5.25%-5.50%,
the
highest
level
in
22
years.
While
the
central
bank
paused
from
raising
rates
at
its
meetings
in
September
and
November
2023
(after
the
reporting
period),
it
left
on
the
table
the
possibility
of
additional
hikes
in
the
future.
After
rising
over
the
first
nine
months
of
the
reporting
period,
a
portion
of
equity
market
gains
were
given
back
over
the
last
three
months.
This
turnaround
was
partially
triggered
by
investors
reacting
to
the
possibility
of
a
“higher
for
longer”
interest
rate
environment.
All
told,
the
S&P
500
®
Index
returned
10.14%
during
the
reporting
period.
Meanwhile,
international
developed
and
emerging
market
equities,
as
measured
by
the
MSCI
EAFE
®
and
MSCI
Emerging
Market
Indices
(Net),
returned
14.40%
and
10.80%,
respectively.
Meanwhile,
with
short-
and
long-term
Treasury
yields
moving
higher,
the
bond
market
was
challenged
(yields
and
bond
prices
generally
move
in
the
opposite
direction).
For
the
reporting
period
the
broad
taxable
investment-grade
bond
market,
as
measured
by
the
Bloomberg
U.S.
Aggregate
Bond
Index,
returned
0.36%.
Looking
ahead,
until
we
have
more
clarity
on
the
path
of
the
economy
versus
inflation,
we
anticipate
continued
market
volatility.
In
such
an
environment,
we
believe
the
divergence
in
underlying
companies’
operating
performance
will
be
ever
more
apparent
going
forward.
Our
constructive
long-term
view
for
the
market
is
not
without
challenges
as
we
move
through
2023
and
beyond.
As
always,
we
continue
our
efforts
to
best
understand
company
and
portfolio-specific
factors
as
we
believe
this
environment
is
flush
with
a
confluence
of
fiscal
policy
considerations,
monetary
policy
stimulus,
public
health
concerns,
geopolitical
uncertainty,
commodity
price
volatility,
inflation
dynamics
and
sequencing
question
marks.
As
market
dynamics
change,
this
can
cause
company
market
values
to
dislocate
from
their
long-term
potential
values,
creating
a
volatile
environment
with
potential
opportunities.
We
highlight
these
risks
because
the
current
environment,
as
always,
necessitates
a
flexible
approach
in
the
complex
global
world
in
which
we
operate.
Thank
you
for
your
support
and
trust.
We
look
forward
to
continuing
to
serve
your
investment
needs
in
the
years
to
come.
Sincerely,
J
OSEPH
V.
A
MATO
P
RESIDENT
AND
CEO
N
EUBERGER
B
ERMAN
A
LTERNATIVE
F
UNDS
Absolute
Return
Multi-Manager
Fund
Commentary
(Unaudited)
Neuberger
Berman
Absolute
Return
Multi-Manager
Fund
Institutional
Class
generated
a
1.12%
total
return
for
the
fiscal
year
ended
October
31,
2023
(the
reporting
period),
outperforming
its
primary
benchmark,
the
HFRX
®
Global
Hedge
Fund
Index
(the
Index),
which
posted
a
0.64%
total
return
for
the
same
period.
(Performance
for
all
share
classes
is
provided
in
the
table
following
this
letter.)
Global
equities
ended
the
reporting
period
higher,
with
the
bulk
of
gains
earlier
in
the
period,
while
equities
sold
off
in
the
latter
months.
After
selling
off
throughout
most
of
calendar
year
2022
due
to
a
combination
of
geopolitical
conflict,
stubbornly
high
inflation,
and
rising
interest
rates,
equities
recovered
as
inflation
moderated
and
economic
figures
were
resilient
despite
higher
costs
of
capital
permeating
through
the
economy.
However,
weaker
economic
data,
combined
with
rising
bond
yields
and
inflation
in
recent
months,
have
begun
to
concern
investors
once
again,
leading
to
a
recent
market
selloff.
Gains
from
long/short
equity,
insurance
linked,
and
merger
arbitrage/event
driven
strategies
outpaced
losses
from
global
macro/managed
futures
strategies
during
the
reporting
period.
From
a
risk
management
perspective,
we
were
pleased
that
the
Fund’s
volatility
and
betas*
(risk)
to
the
S&P
500
®
and
Bloomberg
U.S.
Aggregate
Bond
Indices
were
all
in
line
with
our
expectations.
The
allocation
to
long/short
equity
strategies
contributed
to
performance,
as
gains
from
longs
outweighed
losses
from
shorts,
with
positive
excess
returns
generated
from
longs
and
negative
excess
returns
generated
from
shorts.
The
small
allocation
to
insurance
linked
was
a
consistent
contributor,
as
catastrophe
bonds
(cat
bonds)
generated
income
and
prices
rallied
with
no
impairment
to
any
bonds.
The
merger
arbitrage/event
driven
allocation
contributed,
as
several
deals
progressed
and
closed
during
the
reporting
period.
The
allocation
to
global
macro/managed
futures
strategies
was
a
small
detractor,
as
losses
from
the
managed
futures
strategy
outweighed
gains
from
the
systematic
currency
strategy.
Within
the
managed
futures
strategy,
gains
from
cash
were
outpaced
by
losses,
driven
by
commodities
and
followed
by
currencies,
equities,
and
interest
rate
positioning.
Within
the
systematic
currency
strategy,
positive
performance
was
driven
by
cash
holdings,
short
U.S.
government
bond
exposure,
and
a
long
in
the
U.S.
dollar
versus
several
currencies.
These
gains
were
partially
offset
by
losses
from
long
positioning
in
the
U.S.
dollar
versus
the
Japanese
yen,
euro,
and
British
pound.
The
Fund’s
aggregate
use
of
futures,
forward
foreign
currency,
swap
contracts
and
purchased
and
written
option
contracts
detracted
from
performance
during
the
reporting
period.
Even
as
central
banks
globally
have
paused
on
hiking
interest
rates,
we
believe
geopolitical
tensions,
as
well
as
declining
economic
growth
and
waning
consumer
confidence,
have
the
potential
to
drive
market
volatility.
We
continue
to
position
the
Fund
defensively
and
seek
to
benefit
from
elevated
volatility,
with
the
potential
for
additional
upside
if
rates
continue
to
rise.
The
Fund’s
largest
allocation
is
to
global
macro/managed
futures
strategies.
We
believe
that
increases
in
market
volatility
may
be
beneficial
for
these
strategies
and
that
macroeconomic
conditions
across
regions,
as
well
as
differences
in
fiscal
and
monetary
policies,
have
the
potential
to
continue
to
drive
trends
across
asset
classes.
The
Fund’s
second
largest
allocation
is
to
merger
arbitrage/event
driven
strategies.
While
M&A
activity
has
slowed,
we
believe
current
deal
volumes
and
relatively
wide
spreads
offer
ample
opportunities
to
put
capital
to
work
with
the
potential
for
attractive
returns.
The
Fund’s
third
largest
allocation
is
long/short
equity.
We
anticipate
a
high
dispersion
of
winners
and
losers
over
the
medium
term,
driven
by
a
number
of
factors,
including
inflation,
increasing
costs
of
capital,
currency
effects,
and
varying
levels
of
economic
sensitivity.
The
opportunistic
allocation
to
cat
bonds
continues
to
benefit
from
the
dislocation
in
the
cat
bond
and
reinsurance
markets
created
by
Hurricane
Ian,
offering
attractive
yields
with
strong
downside
mitigation,
in
our
view.
Sincerely,
D
AVID
K
UPPERMAN,
J
EFF
M
AJIT
AND
F
RED
I
NGHAM
P
ORTFOLIO
M
ANAGERS
*
Beta
is
a
measure
of
the
systematic
risk
of
a
portfolio.
It
is
the
covariance
of
the
portfolio
and
a
market
index
divided
by
the
variance
of
the
market
index.
Beta
measures
the
historical
sensitivity
of
a
portfolio’s
returns
to
movements
in
the
market
index.
The
beta
of
the
market
index
will
always
be
one.
A
portfolio
with
a
beta
above
the
market
index
(i.e.,
>1)
means
that
the
portfolio
has
greater
volatility
than
the
market
index.
If
the
beta
of
the
portfolio
is
1.2,
a
market
increase
in
return
of
1%
implies
a
1.2%
increase
in
the
portfolio’s
return.
If
the
beta
of
the
portfolio
is
0.8,
a
market
decrease
in
return
of
1%
implies
a
0.8%
decrease
in
the
portfolio’s
return.
Information
about
principal
risks
of
investing
in
the
Fund
is
set
forth
in
the
prospectus
and
statement
of
additional
information.
The
portfolio
composition,
industries
and
holdings
of
the
Fund
are
subject
to
change
without
notice.
The
opinions
expressed
are
those
of
the
Fund’s
portfolio
managers
and
subadvisers.
The
opinions
are
as
of
the
date
of
this
report
and
are
subject
to
change
without
notice.
TICKER
SYMBOLS
Institutional
Class
NABIX
Class
A
NABAX
Class
C
NABCX
Class
R6
NRABX
Class
E
NABEX
PORTFOLIO
BY
INVESTMENT
TYPE
(as
a
%
of
Total
Net
Assets)
Long
Short
Common
Stocks
30.9
%
(3.8)
%
Corporate
Bonds
0.0
–
Insurance
Linked
Securities
6.5
–
Loan
Assignments
0.0
–
Preferred
Stocks
0.1
–
Rights
0.1
–
Warrants
0.0
–
Short-Term
Investments
53.6
–
Other
Assets
Less
Liabilities
12.6
*
–
Total
103.8%
(3.8)%
*
Includes
the
impact
of
the
Fund's
open
positions
in
derivatives
(other
than
options
purchased),
if
any.
The
performance
data
quoted
represent
past
performance
and
do
not
indicate
future
results.
Current
performance
may
be
lower
or
higher
than
the
performance
data
quoted.
For
current
performance
data,
including
current
to
the
most
recent
month-end,
please
visit
www.nb.com/performance.
The
results
shown
in
the
table
reflect
the
reinvestment
of
income
dividends
and
other
distributions,
if
any.
The
results
do
not
reflect
the
effect
of
taxes
a
shareholder
would
pay
on
Fund
distributions
or
on
the
redemption
of
Fund
shares.
The
investment
return
and
principal
value
of
an
investment
will
fluctuate
and
shares,
when
redeemed,
may
be
worth
more
or
less
than
their
original
cost.
Returns
would
have
been
lower
if
Neuberger
Berman
Investment
Advisers
LLC
(“NBIA”)
had
not
reimbursed
certain
expenses
and/or
waived
a
portion
of
the
investment
management
fees
during
certain
of
the
periods
shown.
Repayment
by
a
class
(of
expenses
previously
reimbursed
and/or
fees
previously
waived
by
NBIA)
will
decrease
the
class’s
returns.
Please
see
Note
B
in
the
Notes
to
Consolidated
Financial
Statements
for
specific
information
regarding
expense
reimbursement
and/or
fee
waiver
arrangements.
As
stated
in
the
Fund’s
most
recent
prospectus,
the
total
annual
operating
expense
ratios
for
fiscal
year
2022
were
2.98%,
3.33%,
4.13%,
2.90%
and
3.04%
for
Institutional
Class,
Class
A,
Class
C,
Class
R6
and
Class
E
shares,
respectively
(before
expense
reimbursements
and/or
fee
waivers,
if
any).
The
expense
ratios
were
2.29%,
2.62%,
3.39%,
2.18%,
and
1.34%
for
Institutional
Class,
Class
A,
Class
C,
Class
R6
and
Class
E
shares,
respectively,
after
expense
reimbursements
and/or
fee
waivers.
The
expense
ratios
for
the
annual
period
ended
October
31,
2023,
can
be
found
in
the
Consolidated
Financial
Highlights
section
of
this
report.
Returns
shown
with
a
sales
charge
reflect
the
deduction
of
the
current
maximum
initial
sales
charge
of
5.75%
for
Class
A
shares
and
the
contingent
deferred
sales
charge
(CDSC)
for
Class
C
shares.
The
CDSC
for
Class
C
shares
is
1.00%,
which
is
reduced
to
0%
after
1
year.
The
performance
of
the
Fund’s
share
classes
will
differ
primarily
due
to
different
sales
charge
structures
and
class
expenses.
Please
see
the
prospectus
for
more
information
about
sales
charge
structures,
if
any,
and
class
expenses
for
your
share
class.
PERFORMANCE
HIGHLIGHTS
Average
Annual
Total
Return
Ended
10/31/2023
Inception
Date
1
Year
5
Years
10
Years
Life
of
Fund
At
NAV
Institutional
Class
05/15/2012
1.12%
3.44%
2.04%
2.56%
Class
A
05/15/2012
0.79%
3.07%
1.68%
2.19%
Class
C
05/15/2012
0.01%
2.28%
0.90%
1.42%
Class
R6
3
12/31/2013
1.13%
3.53%
2.10%
2.61%
Class
E
3
01/11/2022
2.53%
3.90%
2.27%
2.76%
With
Sales
Charge
Class
A
-5.01%
1.86%
1.08%
1.66%
Class
C
-0.98%
2.28%
0.90%
1.42%
Index
HRFX
®
Global
Hedge
Fund
Index
1,2
0.64%
2.41%
1.27%
1.70%
S&P
500
®
Index
1,2
10.14%
11.01%
11.18%
12.62%
Bloomberg
U.S.
Aggregate
Bond
Index
1,2
0.36%
-0.06%
0.88%
0.87%
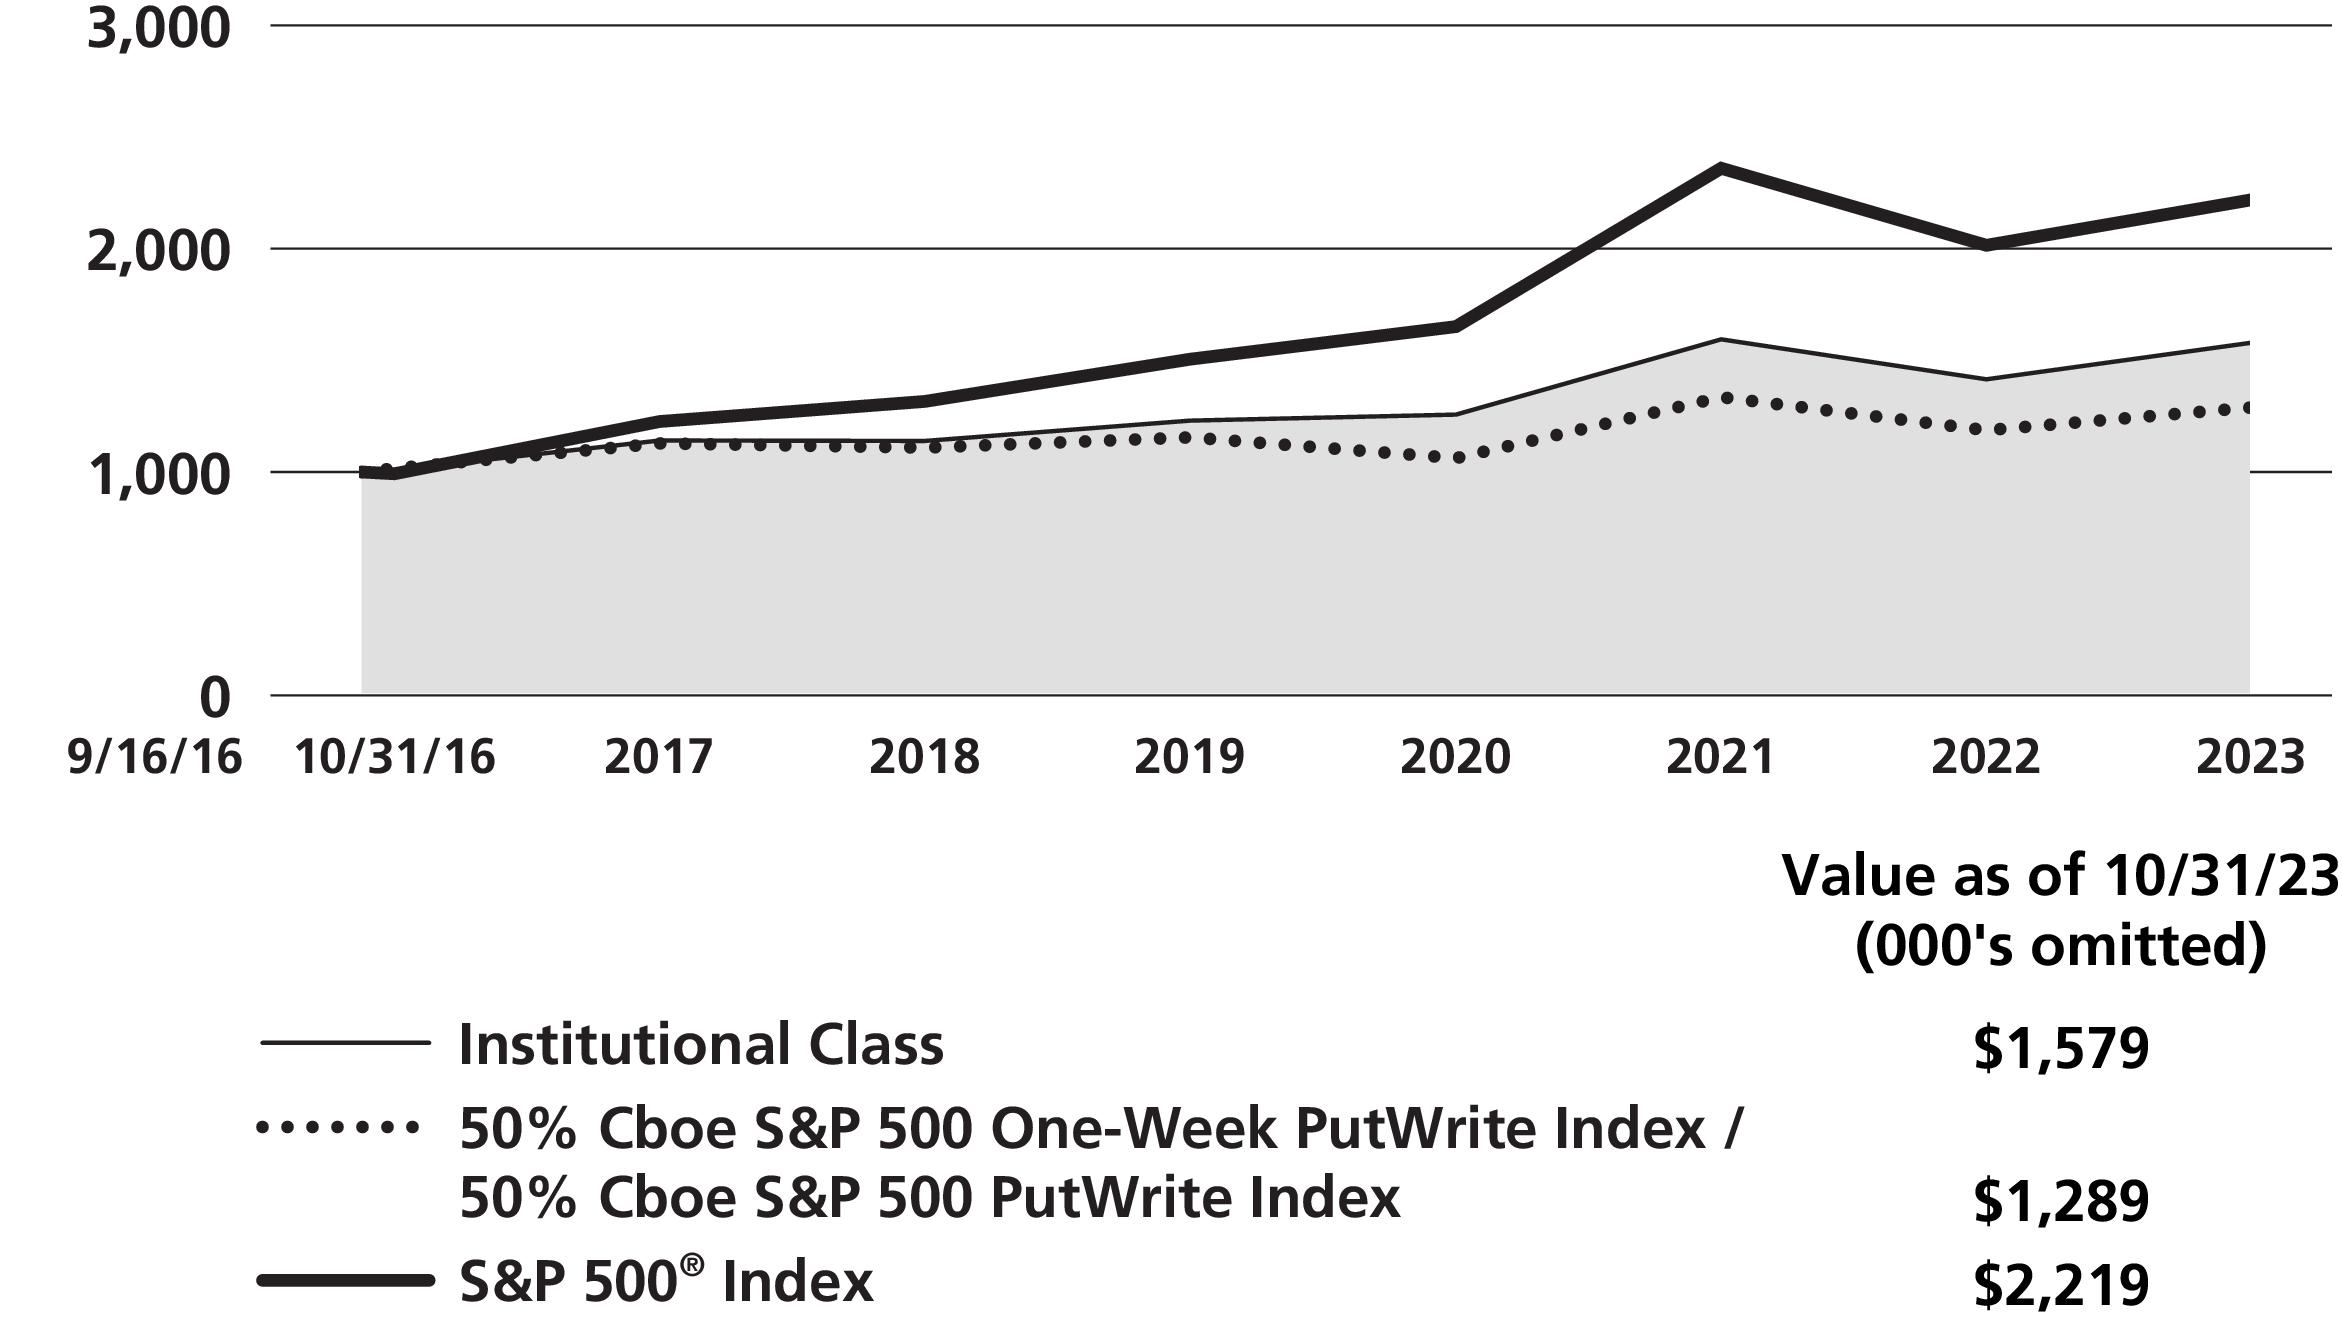
Absolute
Return
Multi-Manager
Fund
(Unaudited)
COMPARISON
OF
A
$1,000,000
INVESTMENT
(000’s
omitted)
This
graph
shows
the
change
in
value
of
a
hypothetical
$1,000,000
investment
in
the
Fund
over
the
past
10
fiscal
years,
or
since
the
Fund’s
inception
if
it
has
not
operated
for
10
years.
The
graph
is
based
on
the
Institutional
Class
shares
only;
the
performance
of
the
Fund’s
share
classes
will
differ
primarily
due
to
different
sales
charge
structures
and
class
expenses
(see
Performance
Highlights
chart
on
previous
page).
The
result
is
compared
with
benchmarks,
which
include
a
broad-based
market
index
and
may
include
a
more
narrowly
based
index.
Market
indices
have
not
been
reduced
to
reflect
any
of
the
fees
and
costs
of
investing.
The
results
shown
in
the
graph
reflect
the
reinvestment
of
income
dividends
and
other
distributions,
if
any.
The
results
do
not
reflect
the
effect
of
taxes
a
shareholder
would
pay
on
Fund
distributions
or
on
the
redemption
of
Fund
shares.
Results
represent
past
performance
and
do
not
indicate
future
results.
Absolute
Return
Multi-Manager
Fund
(Unaudited)
1
Please
see
“Glossary
of
Indices”
on
page
7
for
a
description
of
indices.
Please
note
that
individuals
cannot
invest
directly
in
any
index.
The
S&P
500
®
and
the
Bloomberg
U.S.
Aggregate
Bond
Indices
do
not
take
into
account
any
fees,
expenses
or
tax
consequences
of
investing
in
the
individual
securities
that
they
track.
The
HFRX
®
Global
Hedge
Fund
Index
does
take
into
account
fees
and
expenses,
but
not
tax
consequences,
of
investing
since
it
is
based
on
the
underlying
hedge
funds’
net
returns.
Data
about
the
performance
of
an
index
are
prepared
or
obtained
by
NBIA
and
reflect
the
reinvestment
of
income
dividends
and
other
distributions,
if
any.
The
Fund
may
invest
in
securities
not
included
in
a
described
index
and
generally
does
not
invest
in
all
securities
included
in
a
described
index.
2
The
date
used
to
calculate
Life
of
Fund
performance
for
the
index
is
the
inception
date
of
the
oldest
share
class.
3
The
performance
information
for
Class
R6
and
Class
E
prior
to
the
classes’
respective
inception
dates
is
that
of
the
Institutional
Class
of
Neuberger
Berman
Absolute
Return
Multi-Manager
Fund.
The
performance
information
for
the
Institutional
Class
has
not
been
adjusted
to
take
into
account
differences
in
class
specific
operating
expenses.
The
Institutional
Class
has
higher
expenses
and
typically
lower
returns
than
Class
R6
and
Class
E.
For
more
complete
information
on
any
of
the
Neuberger
Berman
Alternative
Funds,
call
us
at
(800)
877-9700,
or
visit
our
website
at
www.nb.com.
Glossary
of
Indices
(Unaudited)
Bloomberg
U.S.
Aggregate
Bond
Index:
The
index
measures
the
investment
grade,
U.S.
dollar-denominated,
fixed-rate,
taxable
bond
market
and
includes
Treasuries,
government-related
and
corporate
securities,
mortgage-backed
securities
(MBS)
(agency
fixed-rate
and
hybrid
adjustable
rate
mortgage
(ARM)
pass-throughs),
asset-backed
securities
(ABS),
and
commercial
mortgage-backed
securities
(CMBS)
(agency
and
nonagency).
Effective
August
24,
2021
all
Bloomberg
Barclays
fixed
income
indices
were
rebranded
as
“Bloomberg
indices”.
HFRX
®
Global
Hedge
Fund
Index:
The
index
is
designed
to
be
representative
of
the
overall
composition
of
the
hedge
fund
universe.
It
is
comprised
of
all
eligible
hedge
fund
strategies;
including
but
not
limited
to
convertible
arbitrage,
distressed
securities,
equity
hedge,
equity
market
neutral,
event
driven,
macro,
merger
arbitrage,
and
relative
value
arbitrage.
The
strategies
are
asset
weighted
based
on
the
distribution
of
assets
in
the
hedge
fund
industry.
Constituent
funds
are
selected
from
an
eligible
pool
of
the
more
than
7,500
funds
worldwide
that
report
to
the
Hedge
Fund
Research
(HFR)
Database.
Constituent
funds
must
meet
all
of
the
following
criteria:
report
monthly;
report
performance
net
of
all
fees;
be
U.S.
dollar
denominated;
be
active
and
accepting
new
investments;
have
a
minimum
24
month
track
record;
and
the
fund’s
manager
must
have
at
least
$50
million
in
assets
under
management.
The
index
is
rebalanced
quarterly.
S&P
500
®
Index:
The
index
is
a
float-adjusted
market
capitalization-weighted
index
that
focuses
on
the
large-cap
segment
of
the
U.S.
equity
market,
and
includes
a
significant
portion
of
the
total
value
of
the
market.
(This
page
intentionally
left
blank)
Information
About
Your
Fund’s
Expenses
(Unaudited)
As
a
Fund
shareholder,
you
incur
two
types
of
costs:
(1)
transaction
costs,
including
sales
charges
(loads)
on
purchase
payments
or
redemption
proceeds
(if
applicable);
and
(2)
ongoing
costs,
including
management
fees,
distribution
and/or
service
(12b-1)
fees
(if
applicable),
and
other
Fund
expenses.
This
example
is
intended
to
help
you
understand
your
ongoing
costs
(in
U.S.
dollars)
of
investing
in
the
Fund
and
compare
these
costs
with
the
ongoing
costs
of
investing
in
other
mutual
funds.
This
table
is
designed
to
provide
information
regarding
costs
related
to
your
investments.
The
following
examples
are
based
on
an
investment
of
$1,000
made
at
the
beginning
of
the
six
month
period
ended
October
31,
2023
and
held
for
the
entire
period.
The
table
illustrates
the
Fund’s
costs
in
two
ways:
Please
note
that
the
expenses
in
the
table
are
meant
to
highlight
your
ongoing
costs
only
and
do
not
include
any
transaction
costs,
such
as
sales
charges
(loads)
(if
applicable).
Therefore,
the
information
under
the
heading
“Hypothetical
(5%
annual
return
before
expenses)”
is
useful
in
comparing
ongoing
costs
only,
and
will
not
help
you
determine
the
relative
total
costs
of
owning
different
funds.
In
addition,
if
these
transaction
costs
were
included,
your
costs
would
have
been
higher.
Actual
Expenses
and
Performance:
The
first
section
of
the
table
provides
information
about
actual
account
values
and
actual
expenses
in
dollars,
based
on
the
Fund’s
actual
performance
during
the
period
indicated.
You
may
use
the
information
in
this
line,
together
with
the
amount
you
invested,
to
estimate
the
expenses
you
paid
over
the
period.
Simply
divide
your
account
value
by
$1,000
(for
example,
an
$8,600
account
value
divided
by
$1,000
=
8.6),
then
multiply
the
result
by
the
number
in
the
first
section
of
the
table
under
the
heading
entitled
“Expenses
Paid
During
the
Period”
to
estimate
the
expenses
you
paid
over
the
period.
Hypothetical
Example
for
Comparison
Purposes:
The
second
section
of
the
table
provides
information
about
hypothetical
account
values
and
hypothetical
expenses
based
on
the
Fund’s
actual
expense
ratio
and
an
assumed
rate
of
return
at
5%
per
year
before
expenses.
This
return
is
not
the
Fund’s
actual
return.
The
hypothetical
account
values
and
expenses
may
not
be
used
to
estimate
the
actual
ending
account
balance
or
expenses
you
paid
for
the
period.
You
may
use
this
information
to
compare
the
ongoing
costs
of
investing
in
the
Fund
versus
other
funds.
To
do
so,
compare
the
expenses
shown
in
this
5%
hypothetical
example
with
the
5%
hypothetical
examples
that
appear
in
the
shareholder
reports
of
other
funds.
Expense
Example
(Unaudited)
Neuberger
Berman
Alternative
Funds
ACTUAL
HYPOTHETICAL
(5%
ANNUAL
RETURN
BEFORE
EXPENSES)
Absolute
Return
Multi-Manager
Fund
Beginning
Account
Value
5/1/2023
Ending
Account
Value
10/31/2023
Expenses
Paid
During
the
Period
5/1/2023
-
10/31/2023
(1)(3)
Expense
Ratio
Beginning
Account
Value
5/1/2023
Ending
Account
Value
10/31/2023
Expenses
Paid
During
the
Period
5/1/2023
-
10/31/2023
(2)(3)
Expense
Ratio
Institutional
Class
$1,000.00
$1,020.10
$9.83
1.93%
$1,000.00
$1,015.48
$9.80
1.93%
Class
A
$1,000.00
$1,016.90
$11.64
2.29%
$1,000.00
$1,013.66
$11.62
2.29%
Class
C
$1,000.00
$1,013.20
$15.43
3.04%
$1,000.00
$1,009.88
$15.40
3.04%
Class
R6
$1,000.00
$1,019.20
$10.59
2.08%
$1,000.00
$1,014.72
$10.56
2.08%
Class
E
$1,000.00
$1,025.20
$3.32
0.65%
$1,000.00
$1,021.93
$3.31
0.65%
(1)
For
each
class,
expenses
are
equal
to
the
annualized
expense
ratio
for
the
class,
multiplied
by
the
average
account
value
over
the
period,
multiplied
by
184/365
(to
reflect
the
one-half
year
period
shown),
unless
otherwise
indicated.
(2)
Hypothetical
expenses
are
equal
to
the
annualized
expense
ratios
for
each
class,
multiplied
by
the
average
account
value
over
the
period
(assuming
a
5%
annual
return),
multiplied
by
184/365
(to
reflect
the
one-half
year
period
shown).
(3)
Includes
expenses
of
the
Fund's
subsidiary
(See
Note
A
of
the
Notes
to
Consolidated
Financial
Statements).
See
Notes
to
Consolidated
Financial
Statements
Consolidated
Schedule
of
Investments
Absolute
Return
Multi-Manager
Fund^
October
31,
2023
Investments
Shares
Value
Long
Positions
91.2%
Common
Stocks
30.9%
Automobile
Components
0.0%
(a)
Garrett
Motion,
Inc.
(Switzerland)
*
5,118
$
36,133
Banks
0.2%
American
National
Bankshares
,
Inc.
3,826
146,000
First
Horizon
Corp.
8,977
96,503
Lakeland
Bancorp,
Inc.
3,164
35,690
278,193
Biotechnology
2.5%
Abcam
plc,
ADR
(United
Kingdom)
*
43,460
996,103
Grifols
SA,
ADR
(Spain)
*
3,800
30,742
Intercept
Pharmaceuticals,
Inc.
*
3,522
66,671
Mirati
Therapeutics,
Inc.
*
10,912
605,943
Orchard
Therapeutics
plc,
ADR
(United
Kingdom)
*
9,738
154,932
Point
Biopharma
Global,
Inc.
*
10,750
136,095
Seagen
,
Inc.
*
5,360
1,140,662
3,131,148
Broadline
Retail
2.9%
Alibaba
Group
Holding
Ltd.,
ADR
(China)
*
8,000
660,320
Alibaba
Group
Holding
Ltd.
(China)
*
21,712
223,527
Amazon.com,
Inc.
*
4,531
603,031
eBay,
Inc.
5,072
198,974
JD.com,
Inc.,
Class
A
(China)
723
9,192
MercadoLibre
,
Inc.
(Brazil)
*
560
694,814
Prosus
NV
(China)
*
41,290
1,154,699
3,544,557
Capital
Markets
0.4%
Avantax
,
Inc.
*
3,500
90,335
Canaccord
Genuity
Group,
Inc.
(Canada)
26,200
135,463
Greenhill
&
Co.,
Inc.
6,308
93,421
Pegasus
Acquisition
Co.
Europe
BV,
Class
A
(Netherlands)
*(b)(c)
12,042
—
Pershing
Square,
Escrow
*(b)
6,100
915
Sculptor
Capital
Management,
Inc.
8,450
106,893
427,027
Chemicals
0.5%
Chase
Corp.
4,534
576,090
Commercial
Services
&
Supplies
0.2%
SP
Plus
Corp.
*
5,400
272,862
Investments
Shares
Value
Communications
Equipment
0.0%
(a)
Comtech
Telecommunications
Corp.
3,250
$
39,650
Consumer
Staples
Distribution
&
Retail
0.9%
Albertsons
Cos.,
Inc.,
Class
A
39,823
864,159
Almacenes
Exito
SA,
ADR
(Colombia)
*
1,925
13,398
Cia
Brasileira
de
Distribuicao
,
ADR
(Brazil)
*
1,071
707
Cia
Brasileira
de
Distribuicao
,
ADR
(Brazil)
*
2,780
1,835
Fix
Price
Group
plc,
GDR
(Russia)
*(b)(c)(d)
144
—
Sendas
Distribuidora
SA,
ADR
(Brazil)
4,023
43,529
Wal-Mart
de
Mexico
SAB
de
CV
(Mexico)
45,582
163,149
X5
Retail
Group
NV,
GDR
(Russia)
*(b)(c)(d)
4,390
—
1,086,777
Containers
&
Packaging
0.1%
Westrock
Co.
3,875
139,229
Diversified
Consumer
Services
0.1%
Arco
Platform
Ltd.,
Class
A
(Brazil)
*
12,434
172,460
Diversified
Telecommunication
Services
0.3%
Altaba
,
Inc.
Escrow
*(b)
128,456
298,660
Telesat
Corp.
(Canada)
*
4,885
49,827
348,487
Electric
Utilities
1.0%
PNM
Resources,
Inc.
28,630
1,209,904
Entertainment
0.2%
Atlanta
Braves
Holdings,
Inc.,
Class
C
*
7,104
247,077
Financial
Services
0.2%
PayPal
Holdings,
Inc.
*
5,072
262,730
Food
Products
1.8%
Hostess
Brands,
Inc.
*
17,913
598,294
Nestle
SA
(Registered)
12,689
1,368,366
Sovos
Brands,
Inc.
*(e)
13,650
296,342
2,263,002
Gas
Utilities
0.1%
Brookfield
Infrastructure
Corp.,
Class
A
(Canada)
1,145
29,495
Southwest
Gas
Holdings,
Inc.
1,200
70,332
99,827
Health
Care
Equipment
&
Supplies
0.1%
Globus
Medical,
Inc.,
Class
A
*
204
9,325
Consolidated
Schedule
of
Investments
Absolute
Return
Multi-Manager
Fund^
(cont’d)
See
Notes
to
Consolidated
Financial
Statements
Investments
Shares
Value
Opsens
,
Inc.
(Canada)
*
39,850
$
81,898
91,223
Health
Care
Providers
&
Services
0.7%
Amedisys,
Inc.
*
8,878
812,248
Shanghai
Pharmaceuticals
Holding
Co.
Ltd.,
Class
H
(China)
30,284
44,057
Sinopharm
Group
Co.
Ltd.,
Class
H
(China)
16,945
40,521
896,826
Health
Care
Technology
0.6%
NextGen
Healthcare,
Inc.
*
22,596
540,496
Tabula
Rasa
HealthCare,
Inc.
*
14,399
150,182
690,678
Hotel
&
Resort
REITs
0.1%
Hersha
Hospitality
Trust,
Class
A,
REIT
15,911
157,837
Hotels,
Restaurants
&
Leisure
1.0%
Booking
Holdings,
Inc.
*
188
524,437
Deliveroo
plc,
Class
A
(United
Kingdom)
*(d)
11,689
18,470
Expedia
Group,
Inc.
*
2,348
223,741
NEOGAMES
SA
(Israel)
*
11,611
299,564
Playtech
plc
(United
Kingdom)
*
21,590
103,024
1,169,236
Household
Durables
0.2%
iRobot
Corp.
*
825
27,167
Lennar
Corp.,
Class
B
2,800
276,108
303,275
Household
Products
0.2%
Spectrum
Brands
Holdings,
Inc.
2,736
206,076
Insurance
0.8%
AIA
Group
Ltd.
(Hong
Kong)
72,499
629,567
American
Equity
Investment
Life
Holding
Co.
2,000
105,920
Argo
Group
International
Holdings
Ltd.
8,014
239,138
974,625
Interactive
Media
&
Services
2.0%
Alphabet,
Inc.,
Class
A
*
9,090
1,127,887
Baidu,
Inc.,
ADR
(China)
*
749
78,645
Baidu,
Inc.,
Class
A
(China)
*
1,931
25,352
Meta
Platforms,
Inc.,
Class
A
*
3,979
1,198,753
VK
Co.
Ltd.,
GDR
(Russia)
*(b)(c)(d)
1,305
—
Yandex
NV,
Class
A
(Russia)
*(b)(c)
1,428
—
2,430,637
Investments
Shares
Value
IT
Services
0.0%
(a)
Chindata
Group
Holdings
Ltd.,
ADR
(China)
*
4,191
$
37,216
Life
Sciences
Tools
&
Services
0.5%
Eurofins
Scientific
SE
(Luxembourg)
11,557
586,354
Gerresheimer
AG
(Germany)
459
42,812
Olink
Holding
AB,
ADR
(Sweden)
*
1,750
43,610
672,776
Machinery
0.0%
(a)
H2O
Innovation,
Inc.
(Canada)
*
2,450
7,456
Velan,
Inc.
(Canada)
5,000
21,020
28,476
Media
1.0%
Aimia
,
Inc.
(Canada)
*
18,800
43,518
Stroeer
SE
&
Co.
KGaA
(Germany)
7,211
330,328
TEGNA,
Inc.
55,120
799,791
WideOpenWest
,
Inc.
*
2,582
18,177
1,191,814
Metals
&
Mining
0.6%
Allkem
Ltd.
(Australia)
*
15,983
97,667
ArcelorMittal
SA
(Luxembourg)
4,832
106,919
Artemis
Gold,
Inc.
(Canada)
*
605
2,221
Newcrest
Mining
Ltd.
(Australia)
(c)
27,089
406,056
United
States
Steel
Corp.
1,850
62,696
Vale
SA,
Class
B,
ADR
(Brazil)
8,667
118,825
794,384
Oil,
Gas
&
Consumable
Fuels
2.7%
Denbury,
Inc.
*
16,733
1,487,396
Earthstone
Energy,
Inc.,
Class
A
*
3,444
72,910
Euronav
NV
(Belgium)
7,821
139,448
Euronav
NV
(Belgium)
2,400
42,961
Hess
Corp.
1,342
193,785
LUKOIL
PJSC,
ADR
(Russia)
*(b)(c)
661
—
Petroleo
Brasileiro
SA,
ADR
(Brazil)
9,839
147,585
Pioneer
Natural
Resources
Co.
5,089
1,216,271
3,300,356
Passenger
Airlines
0.1%
American
Airlines
Group,
Inc.
*
768
8,563
American
Airlines
Group,
Inc.
Escrow
*(b)(c)
14,383
144
Spirit
Airlines,
Inc.
4,996
57,354
66,061
Consolidated
Schedule
of
Investments
Absolute
Return
Multi-Manager
Fund^
(cont’d)
See
Notes
to
Consolidated
Financial
Statements
Investments
Shares
Value
Pharmaceuticals
1.0%
Aralez
Pharmaceuticals,
Inc.
(Canada)
*(b)
345
$
—
Dr
Reddy's
Laboratories
Ltd.,
ADR
(India)
3,006
195,781
Hikma
Pharmaceuticals
plc
(Jordan)
7,575
175,509
Roche
Holding
AG
3,378
870,543
Teva
Pharmaceutical
Industries
Ltd.,
ADR
(Israel)
*
1,671
14,337
1,256,170
Professional
Services
0.2%
SGS
SA
(Registered)
(Switzerland)
3,576
292,054
Real
Estate
Management
&
Development
0.2%
Seritage
Growth
Properties,
Class
A,
REIT
*
33,123
239,811
Retail
REITs
0.0%
(a)
RPT
Realty,
REIT
4,889
52,752
Semiconductors
&
Semiconductor
Equipment
0.6%
ASML
Holding
NV
(Netherlands)
118
70,932
Magnachip
Semiconductor
Corp.
(South
Korea)
*
11,350
83,877
Silicon
Motion
Technology
Corp.,
ADR
(Taiwan)
*
3,262
174,778
SunEdison,
Inc.
*(b)(c)
16,689
—
Tower
Semiconductor
Ltd.
(Israel)
*
15,700
361,414
691,001
Software
3.6%
EngageSmart
,
Inc.
*
2,956
66,953
LiveVox
Holdings,
Inc.
*
21,209
76,565
New
Relic,
Inc.
*
12,263
1,062,834
SAP
SE
(Germany)
10,254
1,375,393
Splunk,
Inc.
*
4,700
691,652
VMware,
Inc.,
Class
A
*(b)(c)
7,577
1,156,250
4,429,647
Specialty
Retail
0.2%
ASOS
plc
(United
Kingdom)
*
1,085
5,242
Chico's
FAS,
Inc.
*
7,250
54,230
GNC
Holdings,
Inc.
Escrow
*(b)(c)
5,700
—
Sportsman's
Warehouse
Holdings,
Inc.
*
36,345
184,996
Toys
R
Us,
Inc.
*(b)
2,810
14,050
258,518
Technology
Hardware,
Storage
&
Peripherals
1.2%
Apple,
Inc.
4,740
809,450
Avid
Technology,
Inc.
*
7,291
197,003
Investments
Shares
Value
Samsung
Electronics
Co.
Ltd.,
GDR
(South
Korea)
(d)
357
$
446,420
Stratasys
Ltd.
*
4,644
47,229
1,500,102
Textiles,
Apparel
&
Luxury
Goods
1.1%
Capri
Holdings
Ltd.
*
23,367
1,195,923
Tapestry,
Inc.
7,262
200,141
1,396,064
Trading
Companies
&
Distributors
0.7%
Brenntag
SE
(Germany)
4,444
330,463
IMCD
NV
(Netherlands)
2,702
325,309
Textainer
Group
Holdings
Ltd.
(China)
5,230
256,897
912,669
Wireless
Telecommunication
Services
0.1%
Millicom
International
Cellular
SA
(Guatemala)
*
4,950
77,764
Total
Common
Stocks
(Cost
$39,855,031
)
38,253,201
Preferred
Stocks
0.1%
Broadline
Retail
0.0%
(a)
Qurate
Retail,
Inc.
8.00%,
3/15/2031
991
23,586
Trading
Companies
&
Distributors
0.1%
Textainer
Group
Holdings
Ltd.,
Series
B,
6.25%,
12/15/2026
(China)
(f)
1,400
33,950
Total
Preferred
Stocks
(Cost
$77,863)
57,536
Principal
Amount
Corporate
Bonds
0.0%
Independent
Power
and
Renewable
Electricity
Producers
0.0%
GenOn
Energy,
Inc.
Escrow
,
9.50%,
10/15/2018
(b)(c)(g)
$
354,000
—
9.88%,
10/15/2020
(b)(c)(g)
1,655,000
—
Total
Corporate
Bonds
(Cost
$—
)
—
Insurance
Linked
Securities
6.5%
2001
Cat
RE
Ltd.
(Bermuda)
Series
A,
(3
Month
Treasury
Bill
Rate
+
12.66%),
18.17%,
1/8/2024
(h)(i)
750,000
747,750
Consolidated
Schedule
of
Investments
Absolute
Return
Multi-Manager
Fund^
(cont’d)
See
Notes
to
Consolidated
Financial
Statements
Investments
Principal
Amount
Value
Atlas
Capital
Reinsurance
2020
DAC
(Ireland)
Series
2020,
(3
Month
Treasury
Bill
Rate
+
8.30%),
13.69%,
6/10/2024
(h)(i)
$
700,000
$
711,620
Gateway
Re
Ltd.
Series
A,
(1
Month
Treasury
Bill
Rate
+
13.00%),
18.48%,
2/24/2026
(h)(i)
250,000
263,925
Herbie
Re
Ltd.
(Bermuda)
Series
B,
(3
Month
Treasury
Bill
Rate
+
9.72%),
15.17%,
1/8/2025
(h)(i)
750,000
746,850
Series
A,
(3
Month
Treasury
Bill
Rate
+
6.73%),
12.18%,
1/8/2025
(h)(i)
250,000
245,250
Hestia
Re
Ltd.
(Bermuda)
Series
A,
(1
Month
Treasury
Bill
Rate
+
9.75%),
15.20%,
4/7/2026
(h)(i)
500,000
518,400
Kendall
Re
Ltd.
(Bermuda)
Series
B,
(3
Month
Treasury
Bill
Rate
+
6.25%),
11.65%,
5/2/2024
(h)(i)
275,000
274,175
Kilimanjaro
III
Re
Ltd.
(Bermuda)
Series
B,
(3
Month
Treasury
Bill
Rate
+
9.91%),
15.42%,
12/19/2024
(h)(i)
250,000
250,750
Lightning
Re
Series
2023-
1,
(3
Month
Treasury
Bill
Rate
+
11.00%),
16.44%,
3/31/2026
(h)(i)
500,000
524,400
Matterhorn
Re
Ltd.
(Bermuda)
(SOFR
+
7.75%),
13.09%,
3/24/2025
(h)(i)
500,000
497,000
Investments
Principal
Amount
Value
Mystic
Re
IV
Ltd.
(Bermuda)
Series
A,
(3
Month
Treasury
Bill
Rate
+
9.75%),
15.26%,
1/8/2024
(h)(i)
$
750,000
$
749,250
Northshore
Re
II
Ltd.
(Bermuda)
Series
A,
(3
Month
Treasury
Bill
Rate
+
5.75%),
11.23%,
1/8/2024
(h)(i)
500,000
499,000
Purple
Re
Ltd.
(Bermuda)
Series
A,
(1
Month
Treasury
Bill
Rate
+
10.00%),
15.47%,
6/5/2026
(h)(i)
250,000
253,175
Tailwind
RE
Ltd.
(Bermuda)
Series
B,
(3
Month
Treasury
Bill
Rate
+
8.75%),
14.19%,
1/8/2025
(h)(i)
750,000
732,375
Titania
RE
Ltd.
(Bermuda)
Series
A,
(1
Month
Treasury
Bill
Rate
+
6.50%),
11.95%,
12/27/2024
(h)(i)
250,000
242,425
Series
A,
(1
Month
Treasury
Bill
Rate
+
12.25%),
17.70%,
2/27/2026
(h)(i)
750,000
802,500
Total
Insurance
Linked
Securities
(Cost
$7,686,220)
8,058,845
Loan
Assignments
0.0%
(a)
Media
0.0%
(a)
Deluxe
Entertainment
Services
Group,
Inc.,
1st
Lien
Term
Loan
,
(ICE
LIBOR
USD
3
Month
+
5.00%),
12.50%
Cash/1.50%
PIK,
due
3/25/2024
(b)(c)(h)(j)
14,162
5,632
Deluxe
Entertainment
Services
Group,
Inc.,
2nd
Lien
Term
Loan
,
Consolidated
Schedule
of
Investments
Absolute
Return
Multi-Manager
Fund^
(cont’d)
See
Notes
to
Consolidated
Financial
Statements
All
bonds
are
denominated
in
US
dollars,
unless
noted
otherwise.
Investments
Principal
Amount
Value
(ICE
LIBOR
USD
3
Month
+
6.00%),
13.50%
Cash/2.50%
PIK,
due
9/25/2024
(b)(c)(h)(j)
$
153,519
$
—
Total
Loan
Assignments
(Cost
$104,127)
5,632
No.
of
Rights
Rights
0.1%
Biotechnology
0.1%
Achillion
Pharmaceuticals,
Inc.,
CVR
*(b)
23,300
11,650
Adamas
Pharmaceuticals,
Inc.,
CVR
*(b)
24,600
1,230
Akouos
,
Inc.,
CVR
*(b)
38,850
29,137
Ambit
Biosciences
Corp.,
CVR
*(b)(c)
70,000
—
Clementia
Pharmaceuticals,
Inc.,
CVR
(France)
*(b)(c)
3,200
—
Tobira
Therapeutics,
Inc.,
CVR
*(b)(c)
6,900
—
42,017
Financial
Services
0.0%
(a)
Resolute
Forest
Products,
Inc.
CVR
*(b)
5,750
11,500
Health
Care
Equipment
&
Supplies
0.0%
(a)
ABIOMED,
Inc.,
CVR
*(b)
3,300
5,775
IT
Services
0.0%
(a)
Flexion
Therapeutics,
Inc.,
CVR
*(b)
18,500
12,025
Metals
&
Mining
0.0%
(a)
Kinross
Gold
Corp.,
CVR
(Canada)
*(b)(c)
4,800
3
Pan
American
Silver
Corp.,
CVR
(Canada)
*
39,600
19,840
19,843
Total
Rights
(Cost
$71,472)
91,160
No.
of
Warrants
Warrants
0.0%
(a)
Leisure
Products
0.0%
(a)
Tonies
SE,
expiring
4/30/2026
(Germany)
*
(Cost
$—)
4,329
229
Investments
Shares
Value
Short-Term
Investments
53.6%
Investment
Companies
53.6%
Fidelity
Treasury
Only
Portfolio,
Institutional
Class,
5.29%
(k)
66,330,745
$
66,330,745
Morgan
Stanley
Institutional
Liquidity
Funds
Treasury
Securities
Portfolio,
Institutional
Class,
5.24%
(k)
1
1
Total
Investment
Companies
(Cost
$66,330,746)
66,330,746
Total
Long
Positions
(Cost
$114,125,459
)
112,797,349
Short
Positions
(3.8)%
(l)
Common
Stocks
Sold
Short
(3.8)%
Banks
(0.2)%
Atlantic
Union
Bankshares
Corp.
(5,169)
(148,919)
Provident
Financial
Services,
Inc.
(2,632)
(36,980)
(185,899)
Chemicals
(0.1)%
Livent
Corp.
(5,282)
(77,064)
Food
Products
(0.0)%
(a)
J
M
Smucker
Co.
(The)
(287)
(32,672)
Household
Durables
(0.2)%
Lennar
Corp.,
Class
A
(2,240)
(238,963)
Metals
&
Mining
(0.3)%
Newmont
Corp.
(10,835)
(405,987)
Oil,
Gas
&
Consumable
Fuels
(2.4)%
Chevron
Corp.
(1,376)
(200,525)
Exxon
Mobil
Corp.
(26,025)
(2,754,746)
Permian
Resources
Corp.
(4,977)
(72,515)
(3,027,786)
Retail
REITs
(0.0)%
(a)
Kimco
Realty
Corp.,
REIT
(2,957)
(53,049)
Semiconductors
&
Semiconductor
Equipment
(0.6)%
Broadcom,
Inc.
(829)
(697,496)
Total
Common
Stocks
Sold
Short
(Proceeds
$(4,653,886))
(4,718,916)
Total
Short
Positions
(Proceeds
$(4,653,886))
(4,718,916)
Total
Investments
87.4%
(Cost
$109,471,573
)
108,078,433
Other
Assets
Less
Liabilities
12.6%
(m)
15,581,268
Net
Assets
100.0%
$123,659,701
Consolidated
Schedule
of
Investments
Absolute
Return
Multi-Manager
Fund^
(cont’d)
See
Notes
to
Consolidated
Financial
Statements
*
Non-income
producing
security.
(a)
Represents
less
than
0.05%
of
net
assets
of
the
Fund.
(b)
Value
determined
using
significant
unobservable
inputs.
(c)
Security
fair
valued
as
of
October
31,
2023,
in
accordance
with
procedures
approved
by
the
valuation
designee.
Total
value
of
all
such
securities
at
October
31,
2023,
amounted
to
$1,568,085,
which
represents
1.3%
of
net
assets
of
the
Fund.
(d)
Security
exempt
from
registration
pursuant
to
Regulation
S
under
the
Securities
Act
of
1933,
as
amended.
Regulation
S
applies
to
securities
offerings
that
are
made
outside
of
the
United
States
and
do
not
involve
directed
selling
efforts
in
the
United
States
and
as
such
may
have
restrictions
on
resale.
At
October
31,
2023,
these
securities
amounted
to
$464,890
of
long
positions
which
represents
0.4%
of
net
assets
of
the
Fund.
(e)
All
or
a
portion
of
this
security
is
pledged
as
collateral
for
options
written.
(f)
Perpetual
security.
Perpetual
securities
have
no
stated
maturity
date,
but
they
may
be
called/redeemed
by
the
issuer.
The
date
shown
reflects
the
next
call
date.
(g)
Defaulted
security.
(h)
Variable
or
floating
rate
security.
The
interest
rate
shown
was
the
current
rate
as
of
October
31,
2023,
and
changes
periodically.
(i)
Securities
were
purchased
or
sold
short
under
Rule
144A
of
the
Securities
Act
of
1933,
as
amended,
or
are
otherwise
restricted
and,
unless
registered
under
the
Securities
Act
of
1933
or
exempted
from
registration,
may
only
be
sold
to
qualified
institutional
investors
or
may
have
other
restrictions
on
resale.
At
October
31,
2023,
these
securities
amounted
to
$8,058,845
of
long
positions,
which
represents
6.5%
of
net
assets
of
the
Fund.
(j)
Payment
in-kind
security.
(k)
Represents
7-day
effective
yield
as
of
October
31,
2023.
(l)
At
October
31,
2023,
the
Fund
had
approximately
$4,569,836
deposited
in
one
or
more
accounts
to
satisfy
collateral
requirements
for
borrowing
in
connection
with
securities
sold
short.
(m)
Includes
the
impact
of
the
Fund’s
open
positions
in
derivatives
at
October
31,
2023.
Abbreviations
ADR
American
Depositary
Receipt
CVR
Contingent
Value
Rights
GDR
Global
Depositary
Receipt
ICE
Intercontinental
Exchange
LIBOR
London
Interbank
Offered
Rate
PJSC
Public
Joint
Stock
Company
SA
Société
Anonyme
USD
United
States
Dollar
Consolidated
Schedule
of
Investments
Absolute
Return
Multi-Manager
Fund^
(cont’d)
See
Notes
to
Consolidated
Financial
Statements
LONG
POSITIONS
BY
COUNTRY
Country
Investments
at
Value
Percentage
of
Net
Assets
United
States
$
26,890,472
21.7%
Bermuda
6,558,900
5.3%
China
2,564,376
2.1%
Germany
2,079,225
1.7%
United
Kingdom
1,277,771
1.0%
Brazil
1,179,755
1.0%
Ireland
711,620
0.6%
Luxembourg
693,273
0.6%
Israel
675,315
0.6%
Hong
Kong
629,567
0.5%
South
Korea
530,297
0.4%
Australia
503,723
0.4%
Netherlands
396,241
0.3%
Canada
390,741
0.3%
Switzerland
328,187
0.3%
India
195,781
0.2%
Belgium
182,409
0.2%
Jordan
175,509
0.1%
Taiwan
174,778
0.1%
Mexico
163,149
0.1%
Guatemala
77,764
0.1%
Sweden
43,610
0.0%
(a)
Spain
30,742
0.0%
(a)
Colombia
13,398
0.0%
(a)
Short-Term
Investments
and
Other
Assets-Net
81,912,014
66.2%
Short
Positions
(See
summary
below)
(4,718,916)
(3.8)%
$
123,659,701
100.0%
SHORT
POSITIONS
BY
COUNTRY
Country
Investments
at
Value
Percentage
of
Net
Assets
United
States
$
(4,718,916)
(3.8)%
Total
Short
Positions
$(4,718,916)
(3.8)%
(a)
Represents
less
than
0.05%
of
net
assets
of
the
Fund.
Consolidated
Schedule
of
Investments
Absolute
Return
Multi-Manager
Fund^
(cont’d)
See
Notes
to
Consolidated
Financial
Statements
Derivative
Instruments
Futures
contracts
("futures")
At
October
31,
2023,
open
positions
in
futures
for
the
Fund
were
as
follows:
Description
Number
of
Contracts
Expiration
Date
Notional
Amount
Value
and
Unrealized
Appreciation/
(Depreciation)
Long
Contracts
Brent
Crude
Oil
1
11/2023
$
85,020
$
(4,971)
NY
Harbor
ULSD
1
11/2023
122,220
(1,405)
100
oz
Gold
6
12/2023
1,196,580
15,528
Brent
Crude
Oil
1
12/2023
84,450
(4,541)
Cocoa
14
12/2023
534,380
18,363
Euro-Bund
2
12/2023
272,969
2,247
Euro-OAT
1
12/2023
130,453
327
Foreign
Exchange
MXN/USD
2
12/2023
55,140
(2,494)
Foreign
Exchange
USD/NOK
1
12/2023
99,830
4,350
Foreign
Exchange
ZAR/USD
2
12/2023
53,425
972
Live
Cattle
1
12/2023
73,420
(1,412)
LME
Copper
Base
Metal
1
12/2023
91,225
(252)
Low
Sulphur
Gasoil
1
12/2023
85,075
(6,001)
Soybean
Meal
7
12/2023
301,700
6,242
Brent
Crude
Oil
1
1/2024
83,890
(2,611)
Fcoj
-a
1
1/2024
57,555
(610)
Robusta
Coffee
6
1/2024
141,960
(4,351)
WTI
Crude
Oil
1
1/2024
79,960
(6,592)
Sugar
No.
11
19
2/2024
576,475
(936)
Cocoa
1
3/2024
38,470
(113)
3
Month
SONIA
12
9/2024
3,460,022
2,172
WTI
Crude
Oil
1
11/2024
75,690
(1,652)
3
Month
SONIA
7
12/2024
2,022,600
841
3
Month
EURIBOR
10
3/2025
2,566,818
920
3
Month
SONIA
2
3/2025
579,132
255
3
Month
SONIA
6
6/2025
1,740,494
449
3
Month
SONIA
3
9/2025
871,295
832
3
Month
SONIA
8
12/2025
2,325,277
887
3
Month
EURIBOR
16
3/2026
4,113,681
240
3
Month
SONIA
5
3/2026
1,454,058
935
3
Month
SONIA
8
6/2026
2,327,344
751
Total
Long
Contracts
$
25,700,608
$18,370
Consolidated
Schedule
of
Investments
Absolute
Return
Multi-Manager
Fund^
(cont’d)
See
Notes
to
Consolidated
Financial
Statements
Description
Number
of
Contracts
Expiration
Date
Notional
Amount
Value
and
Unrealized
Appreciation/
(Depreciation)
Short
Contracts
CAC
40
10
Euro
Index
(2)
11/2023
$
(145,954)
$
3,377
Hang
Seng
Index
(4)
11/2023
(438,171)
1,675
HSCEI
(18)
11/2023
(677,307)
1,551
IFSC
NIFTY
50
Index
(3)
11/2023
(114,978)
2,332
MSCI
Singapore
Index
(26)
11/2023
(516,430)
786
Natural
Gas
(1)
11/2023
(35,750)
(1,282)
OMXS30
Index
(5)
11/2023
(93,091)
2,541
SGX
FTSE
China
A50
Index
(46)
11/2023
(551,862)
(6,848)
SGX
FTSE
Taiwan
Index
(2)
11/2023
(110,100)
298
Australia
10
Year
Bond
(17)
12/2023
(1,167,305)
59,421
Australia
3
Year
Bond
(58)
12/2023
(3,839,843)
45,056
Canada
10
Year
Bond
(19)
12/2023
(1,574,667)
26,821
Canada
10
Year
Bond
(5)
12/2023
(414,386)
12,473
Corn
(13)
12/2023
(311,187)
3,743
EURO
STOXX
50
Index
(4)
12/2023
(172,259)
5,142
Euro-
Bobl
(28)
12/2023
(3,445,301)
(3,675)
Euro-BTP
(2)
12/2023
(233,248)
(1,968)
Euro-BTP
(1)
12/2023
(116,624)
4,483
Euro-Bund
(13)
12/2023
(1,774,296)
12,139
Euro-
Buxl
(4)
12/2023
(509,666)
(239)
Euro-OAT
(9)
12/2023
(1,174,078)
572
Euro-Schatz
(44)
12/2023
(4,896,569)
(5,190)
Foreign
Exchange
AUD/USD
(138)
12/2023
(8,765,760)
107,364
Foreign
Exchange
CAD/USD
(5)
12/2023
(360,825)
3,276
Foreign
Exchange
CHF/USD
(8)
12/2023
(1,105,300)
22,327
Foreign
Exchange
EUR/USD
(87)
12/2023
(11,530,219)
183,812
Foreign
Exchange
GBP/USD
(37)
12/2023
(2,810,613)
71,579
Foreign
Exchange
JPY/USD
(3)
12/2023
(249,244)
9,150
Foreign
Exchange
NZD/USD
(3)
12/2023
(174,705)
2,512
FTSE
100
Index
(3)
12/2023
(267,205)
1,631
FTSE/JSE
Top
40
Index
(3)
12/2023
(103,689)
5,471
Japan
10
Year
Bond
(4)
12/2023
(3,793,502)
27,227
KC
HRW
Wheat
(9)
12/2023
(283,162)
26,940
Lean
Hogs
(1)
12/2023
(28,690)
(2,163)
Long
Gilt
(11)
12/2023
(1,245,545)
(10,378)
Long
Gilt
(2)
12/2023
(226,463)
3,292
Milling
Wheat
No.
2
(25)
12/2023
(303,542)
4,424
MSCI
Emerging
Markets
E-Mini
Index
(12)
12/2023
(551,520)
12,568
Palladium
(2)
12/2023
(225,220)
16,354
Russell
2000
E-Mini
Index
(7)
12/2023
(583,940)
24,413
Consolidated
Schedule
of
Investments
Absolute
Return
Multi-Manager
Fund^
(cont’d)
See
Notes
to
Consolidated
Financial
Statements
Description
Number
of
Contracts
Expiration
Date
Notional
Amount
Value
and
Unrealized
Appreciation/
(Depreciation)
S&P
500
E-Mini
Index
(9)
12/2023
$
(1,895,513)
$
153,838
S&P/TSX
60
Index
(2)
12/2023
(327,384)
2,686
Short-Term
Euro-BTP
(21)
12/2023
(2,321,778)
(14,227)
Soybean
Oil
(2)
12/2023
(61,704)
2,257
SPI
200
Index
(4)
12/2023
(430,280)
8,256
U.S.
Treasury
2
Year
Note
(16)
12/2023
(3,238,750)
5,919
U.S.
Treasury
5
Year
Note
(30)
12/2023
(3,134,297)
22,457
U.S.
Treasury
10
Year
Note
(21)
12/2023
(2,229,609)
51,051
U.S.
Treasury
10
Year
Note
(15)
12/2023
(1,592,578)
47,971
U.S.
Treasury
Long
Bond
(10)
12/2023
(1,094,375)
46,955
U.S.
Treasury
Ultra
Bond
(5)
12/2023
(562,812)
30,649
Wheat
(10)
12/2023
(278,125)
13,325
Canola
(24)
1/2024
(234,713)
13,880
Platinum
(2)
1/2024
(94,490)
(3,041)
Rapeseed
(9)
1/2024
(205,099)
1,684
Soybean
(1)
1/2024
(65,525)
135
3
Month
Canadian
Bankers
Acceptance
(16)
3/2024
(2,726,375)
(4,763)
Corn
(2)
3/2024
(49,300)
(5)
Wheat
(2)
3/2024
(58,525)
895
3
Month
Canadian
Bankers
Acceptance
(9)
6/2024
(1,536,101)
(4,557)
3
Month
Canadian
Bankers
Acceptance
(1)
9/2024
(171,192)
(674)
3
Month
EURIBOR
(3)
9/2024
(766,871)
(2,118)
3
Month
SOFR
(40)
12/2024
(9,508,500)
1,940
3
Month
SOFR
(38)
3/2025
(9,058,725)
4,194
3
Month
SOFR
(37)
6/2025
(8,842,537)
(853)
3
Month
SOFR
(12)
9/2025
(2,872,800)
312
3
Month
SOFR
(28)
12/2025
(6,708,800)
4,203
3
Month
SOFR
(8)
3/2026
(1,917,200)
(129)
3
Month
SOFR
(28)
6/2026
(6,709,500)
12,753
3
Month
SOFR
(31)
6/2027
(7,420,625)
7,959
Total
Short
Contracts
$
(131,036,299)
$1,075,959
Total
Futures
$1,094,329
For
the
year
ended
October
31,
2023,
the
average
notional
value
for
the
months
where
the
Fund
had
futures
outstanding
was
$13,971,708
for
long
positions
and
$(104,739,787)
for
short
positions.
At
October
31,
2023,
the
Fund
had
$2,291,856
deposited
in
segregated
accounts
to
cover
margin
requirements
on
open
futures.
Consolidated
Schedule
of
Investments
Absolute
Return
Multi-Manager
Fund^
(cont’d)
See
Notes
to
Consolidated
Financial
Statements
Forward
foreign
currency
contracts
("forward
contracts")
At
October
31,
2023,
open
forward
contracts
for
the
Fund
were
as
follows:
Currenc
y
Purchased
Currency
Sold
Counterparty
Settlement
Date
Net
Unrealized
Appreciation/
(Depreciation)
USD
2,759,867
CHF
2,485,806
JPM
11/15/2023
$
23,283
USD
11,258
SEK
123,299
JPM
11/15/2023
206
AUD
8,820,000
JPY
830,696,838
SG
12/20/2023
77,698
AUD
140,000
USD
88,691
SG
12/20/2023
265
BRL**
1,900,000
USD
371,788
SG
12/20/2023
2,936
CHF
240,000
USD
264,241
SG
12/20/2023
1,093
CLP**
250,130,000
USD
274,263
SG
12/20/2023
4,383
CZK
6,600,000
USD
282,504
SG
12/20/2023
1,444
EUR
11,221
PLN
50,000
SG
12/20/2023
48
EUR
30,000
TRY
935,610
SG
12/20/2023
33
EUR
420,000
USD
444,548
SG
12/20/2023
881
GBP
40,000
USD
48,564
SG
12/20/2023
73
HUF
196,240,000
USD
535,333
SG
12/20/2023
3,673
ILS
1,000,000
USD
246,949
SG
12/20/2023
1,149
INR**
135,790,000
USD
1,627,652
SG
12/20/2023
547
MXN
190,000
USD
10,438
SG
12/20/2023
16
PHP**
13,040,000
USD
229,565
SG
12/20/2023
66
PLN
6,500,000
EUR
1,418,854
SG
12/20/2023
35,997
PLN
3,960,000
USD
919,570
SG
12/20/2023
19,110
SGD
510,000
USD
373,164
SG
12/20/2023
142
THB
29,440,000
USD
813,868
SG
12/20/2023
8,857
TRY
2,825,026
EUR
90,000
SG
12/20/2023
521
TRY
870,000
USD
29,291
SG
12/20/2023
264
USD
3,729,643
AUD
5,800,000
SG
12/20/2023
44,303
USD
794,218
BRL**
3,980,000
SG
12/20/2023
9,271
USD
6,930,547
CAD
9,430,000
SG
12/20/2023
124,642
USD
2,356,264
CHF
2,100,000
SG
12/20/2023
34,606
USD
349,385
CLP**
313,060,000
SG
12/20/2023
633
USD
1,092,260
CZK
25,080,000
SG
12/20/2023
13,251
USD
1,578,366
EUR
1,470,000
SG
12/20/2023
19,363
USD
1,425,863
GBP
1,160,000
SG
12/20/2023
15,383
USD
2,118,568
ILS
8,110,000
SG
12/20/2023
106,496
USD
2,630,044
INR**
219,050,000
SG
12/20/2023
3,512
Consolidated
Schedule
of
Investments
Absolute
Return
Multi-Manager
Fund^
(cont’d)
See
Notes
to
Consolidated
Financial
Statements
Currency
Purchased
Currency
Sold
Counterparty
Settlement
Date
Net
Unrealized
Appreciation/
(Depreciation)
USD
5,053,757
JPY
741,570,000
SG
12/20/2023
$
120,143
USD
1,116,033
KRW**
1,482,270,000
SG
12/20/2023
17,429
USD
1,093,599
MXN
19,430,000
SG
12/20/2023
24,557
USD
2,599,537
NOK
27,990,000
SG
12/20/2023
90,249
USD
2,995,109
NZD
5,080,000
SG
12/20/2023
35,008
USD
877,528
PHP**
49,750,000
SG
12/20/2023
1,442
USD
2,991,215
SEK
33,030,000
SG
12/20/2023
24,912
USD
3,766,888
SGD
5,120,000
SG
12/20/2023
19,181
USD
1,140,518
THB
40,440,000
SG
12/20/2023
10,390
USD
332,527
TRY
9,740,000
SG
12/20/2023
1,649
ZAR
13,060,000
USD
688,578
SG
12/20/2023
9,159
GBP
13,386
USD
16,251
JPM
12/29/2023
27
USD
10,130
AUD
15,693
JPM
12/29/2023
155
USD
364,183
CAD
492,766
JPM
12/29/2023
8,459
USD
2,375
GBP
1,938
JPM
12/29/2023
18
USD
12,359
HKD
96,566
JPM
12/29/2023
8
Total
unrealized
appreciation
$
916,931
Currenc
y
Purchased
Currency
Sold
Counterparty
Settlement
Date
Net
Unrealized
Appreciation/
(Depreciation)
GBP
45,916
USD
55,822
JPM
11/15/2023
$
(8)
USD
3,739,014
EUR
3,548,799
JPM
11/15/2023
(17,991)
AUD
30,000
JPY
2,872,281
SG
12/20/2023
(47)
AUD
5,040,000
USD
3,248,390
SG
12/20/2023
(45,954)
BRL**
6,090,000
USD
1,223,955
SG
12/20/2023
(22,871)
CAD
4,180,000
USD
3,095,973
SG
12/20/2023
(79,146)
CHF
1,410,000
USD
1,581,068
SG
12/20/2023
(22,243)
CZK
28,160,000
USD
1,221,503
SG
12/20/2023
(9,985)
EUR
729,722
PLN
3,400,000
SG
12/20/2023
(32,029)
EUR
1,120,000
TRY
35,330,295
SG
12/20/2023
(12,399)
EUR
1,830,000
USD
1,947,893
SG
12/20/2023
(7,092)
GBP
490,000
USD
601,966
SG
12/20/2023
(6,160)
HUF
55,660,000
USD
153,617
SG
12/20/2023
(738)
ILS
1,980,000
USD
504,704
SG
12/20/2023
(13,470)
INR**
187,540,000
USD
2,251,184
SG
12/20/2023
(2,476)
Consolidated
Schedule
of
Investments
Absolute
Return
Multi-Manager
Fund^
(cont’d)
See
Notes
to
Consolidated
Financial
Statements
Currency
Purchased
Currency
Sold
Counterparty
Settlement
Date
Net
Unrealized
Appreciation/
(Depreciation)
JPY
567,193,685
AUD
6,060,000
SG
12/20/2023
$
(77,049)
JPY
261,030,000
USD
1,767,059
SG
12/20/2023
(30,442)
KRW**
1,118,420,000
USD
836,315
SG
12/20/2023
(7,383)
MXN
21,530,000
USD
1,236,589
SG
12/20/2023
(52,008)
NOK
9,090,000
USD
851,140
SG
12/20/2023
(36,226)
NZD
3,060,000
USD
1,824,477
SG
12/20/2023
(41,422)
PHP**
16,880,000
USD
297,478
SG
12/20/2023
(225)
PLN
3,570,000
EUR
800,444
SG
12/20/2023
(2,678)
PLN
1,570,000
USD
374,115
SG
12/20/2023
(1,964)
SEK
22,370,000
USD
2,053,451
SG
12/20/2023
(44,485)
SGD
4,130,000
USD
3,033,095
SG
12/20/2023
(10,040)
THB
420,000
USD
11,854
SG
12/20/2023
(117)
TRY
11,220,731
EUR
360,000
SG
12/20/2023
(616)
TRY
330,000
USD
11,280
SG
12/20/2023
(70)
USD
2,014,453
AUD
3,180,000
SG
12/20/2023
(6,131)
USD
846,158
BRL**
4,330,000
SG
12/20/2023
(7,817)
USD
43,261
CAD
60,000
SG
12/20/2023
(43)
USD
385,439
CHF
350,000
SG
12/20/2023
(1,505)
USD
69,435
CLP**
64,610,000
SG
12/20/2023
(2,541)
USD
575,604
CZK
13,480,000
SG
12/20/2023
(4,340)
USD
1,765,184
EUR
1,670,000
SG
12/20/2023
(5,930)
USD
861,338
GBP
710,000
SG
12/20/2023
(1,974)
USD
598,936
HUF
221,660,000
SG
12/20/2023
(9,891)
USD
12,366
ILS
50,000
SG
12/20/2023
(39)
USD
2,967,026
INR**
247,870,000
SG
12/20/2023
(5,071)
USD
364,190
KRW**
492,260,000
SG
12/20/2023
(656)
USD
259,245
MXN
4,770,000
SG
12/20/2023
(3,201)
USD
36,620
NOK
410,000
SG
12/20/2023
(136)
USD
843,499
NZD
1,450,000
SG
12/20/2023
(1,411)
USD
500,881
PHP**
28,520,000
SG
12/20/2023
(1,349)
USD
1,072,905
PLN
4,650,000
SG
12/20/2023
(29,329)
USD
544,417
SEK
6,070,000
SG
12/20/2023
(709)
USD
1,116,798
SGD
1,530,000
SG
12/20/2023
(3,123)
USD
160,193
THB
5,850,000
SG
12/20/2023
(3,291)
USD
250,210
TRY
7,430,000
SG
12/20/2023
(2,194)
Consolidated
Schedule
of
Investments
Absolute
Return
Multi-Manager
Fund^
(cont’d)
See
Notes
to
Consolidated
Financial
Statements
Currency
Purchased
Currency
Sold
Counterparty
Settlement
Date
Net
Unrealized
Appreciation/
(Depreciation)
USD
1,176,743
ZAR
22,540,000
SG
12/20/2023
$
(27,467)
AUD
365,283
USD
233,555
JPM
12/29/2023
(1,380)
CAD
109,075
USD
79,801
JPM
12/29/2023
(1,060)
GBP
1,938
USD
2,389
JPM
12/29/2023
(32)
HKD
96,566
USD
12,357
JPM
12/29/2023
(7)
USD
22,664
AUD
35,736
JPM
12/29/2023
(49)
USD
16,855
CAD
23,391
JPM
12/29/2023
(31)
USD
121,522
GBP
99,962
JPM
12/29/2023
(37)
Total
unrealized
depreciation
$
(698,078)
Net
unrealized
appreciation
$218,853
** Non-deliverable
forward.
For
the
year
ended
October
31,
2023,
the
average
notional
value
for
the
months
where
the
Fund
had
forward
contracts
outstanding
was
$3,196,804.
Equity
swap
contracts
("equity
swaps")
At
October
31,
2023,
the
Fund
had
outstanding
equity
swaps
as
follows:
Over
the
counter
equity
swaps
—
Long
(a)
Counterparty
Reference
Entity
Notional
Amount
Maturity
Date
Variable-
Rate
(b)
Spread
Reference
Rate
Frequency
of
Fund
Receipt/
Payment
Value
and
Unrealized
Appreciation/
(Depreciation)
MS
adidas
AG
EUR
537,548
2/15/2024
4.47%
0.60%
1M
EURIBOR
T/1M
$
100,630
JPM
Alliance
Aviation
Services
Ltd.
AUD
34,615
7/15/2024
4.72%
0.65%
1D
RBACR
T/1M
1,599
MS
Amundi
SA
EUR
1,397,553
2/15/2024
4.47%
0.60%
1M
EURIBOR
T/1M
(421,709)
MS
Anima
Holding
SpA
EUR
353,888
2/15/2024
4.47%
0.60%
1M
EURIBOR
T/1M
(17,158)
JPM
Applus
Services
SA
EUR
194,115
7/5/2024
4.53%
0.65%
1D
ESTR
T/1M
1,993
JPM
Ascential
plc
GBP
6,545
11/4/2024
5.59%
0.40%
1D
SONIA
T/1M
(8)
MS
Aspen
Pharmacare
Holdings
Ltd.
USD
60,786
12/15/2023
6.23%
0.90%
1D
FEDEF
T/1M
(8,338)
MS
Brenntag
SE
EUR
641,318
2/15/2024
4.47%
0.60%
1M
EURIBOR
T/1M
(2,483)
MS
Bureau
Veritas
SA
EUR
601,204
2/15/2024
4.47%
0.60%
1M
EURIBOR
T/1M
(132,254)
JPM
Chr
Hansen
Holding
A/S
DKK
1,251,222
1/2/2024
4.30%
0.40%
1M
CIBOR
T/1M
(8,445)
MS
Croda
International
plc
GBP
41,109
12/3/2024
5.83%
0.64%
1D
SONIA
T/1M
(21,897)
MS
Danone
SA
EUR
1,116,880
2/15/2024
4.47%
0.60%
1M
EURIBOR
T/1M
116,421
JPM
Dechra
Pharmaceuticals
plc
GBP
808,553
6/6/2024
5.59%
0.40%
1D
SONIA
T/1M
39,312
MS
Elis
SA
EUR
413,931
2/15/2024
4.47%
0.60%
1M
EURIBOR
T/1M
(31,641)
JPM
Entain
plc
GBP
106,475
2/8/2024
5.59%
0.40%
1D
SONIA
T/1M
(62,310)
JPM
ESI
Group
EUR
32,035
9/4/2024
4.28%
0.40%
1D
ESTR
T/1M
(373)
JPM
Estia
Health
Ltd.
AUD
158,600
8/12/2024
4.72%
0.65%
1D
RBACR
T/1M
(1,565)
MS
Eurofins
Scientific
SE
EUR
215,905
2/15/2024
4.47%
0.60%
1M
EURIBOR
T/1M
(94,376)
Consolidated
Schedule
of
Investments
Absolute
Return
Multi-Manager
Fund^
(cont’d)
See
Notes
to
Consolidated
Financial
Statements
Counterparty
Reference
Entity
Notional
Amount
Maturity
Date
Variable-
Rate
(b)
Spread
Reference
Rate
Frequency
of
Fund
Receipt/
Payment
Value
and
Unrealized
JPM
Gresham
House
plc
GBP
30,629
7/24/2024
5.59%
0.40%
1D
SONIA
T/1M
$
748
MS
Heidelberg
Materials
AG
EUR
548,182
2/15/2024
4.47%
0.60%
1M
EURIBOR
T/1M
51,256
MS
Hermes
International
SCA
EUR
223,469
2/15/2024
4.47%
0.60%
1M
EURIBOR
T/1M
7,113
MS
Holcim
AG
CHF
420,207
2/15/2024
2.28%
0.58%
1D
SARON
T/1M
2,657
MS
Hypera
SA
USD
82,446
7/15/2024
5.98%
0.65%
1D
FEDEF
T/1M
(45,542)
JPM
IMAX
China
Holding,
Inc.
HKD
654,250
7/17/2024
4.48%
0.00%
1D
HONIA
T/1M
(26,381)
MS
ITV
plc
GBP
105,367
12/3/2024
5.83%
0.64%
1D
SONIA
T/1M
(41,580)
JPM
JSR
Corp.
JPY
72,342,000
7/16/2024
0.33%
0.35%
1D
MUTSC
T/1M
(6,251)
MS
Kering
SA
EUR
560,622
2/15/2024
4.47%
0.60%
1M
EURIBOR
T/1M
(276,328)
JPM
Link
Administration
Holdings
Ltd.
AUD
10,441
12/29/2023
4.72%
0.65%
1D
RBACR
T/1M
(12,311)
MS
LVMH
Moet
Hennessy
Louis
Vuitton
SE
EUR
183,464
2/15/2024
4.47%
0.60%
1M
EURIBOR
T/1M
(39,095)
MS
NAVER
Corp.
USD
65,355
8/15/2024
6.83%
1.50%
1D
FEDEF
T/1M
(12,779)
JPM
Network
International
Holdings
plc
GBP
637,330
5/7/2024
5.59%
0.40%
1D
SONIA
T/1M
9,892
JPM
Orange
Belgium
SA
EUR
13,567
12/11/2023
4.28%
-
5.38%
0.40%
-
0.50%
1D
ESTR
T/1M
(3,931)
JPM
Origin
Energy
Ltd.
AUD
955,162
3/28/2024
4.72%
0.65%
1D
RBACR
T/1M
56,912
JPM
R&Q
Insurance
Holdings
Ltd.
GBP
689
4/11/2024
5.59%
0.40%
1D
SONIA
T/1M
(3,705)
MS
Ryanair
Holdings
plc
EUR
205,936
2/15/2024
4.47%
0.60%
1M
EURIBOR
T/1M
(12,820)
MS
SAP
SE
EUR
239,665
2/15/2024
4.47%
0.60%
1M
EURIBOR
T/1M
34,707
JPM
Siltronic
AG
EUR
74,104
2/7/2024
4.53%
0.65%
1D
ESTR
T/1M
3,830
MS
Smith
&
Nephew
plc
GBP
450,428
12/3/2024
5.83%
0.64%
1D
SONIA
T/1M
(160,044)
JPM
Spire
Healthcare
Group
plc
GBP
19,742
6/20/2024
5.59%
0.40%
1D
SONIA
T/1M
(1,130)
MS
Stroeer
SE
&
Co.
KGaA
EUR
137,633
2/15/2024
4.47%
0.60%
1M
EURIBOR
T/1M
(29,107)
JPM
Telecom
Italia
SpA
EUR
13,286
11/24/2023
4.53%
0.65%
1D
ESTR
T/1M
1,431
JPM
Vitesco
Technologies
Group
AG
EUR
69,536
10/28/2024
4.53%
0.65%
1D
ESTR
T/1M
429
Total
long
positions
of
equity
swaps
$(1,044,631)
Over
the
counter
equity
swaps
—
Short
(c)
Counterparty
Reference
Entity
Notional
Amount
Maturity
Date
Variable-
Rate
(b)
Spread
Reference
Rate
Frequency
of
Fund
Receipt/
Payment
Value
and
Unrealized
Appreciation/
(Depreciation)
MS
Air
Liquide
SA
EUR
(558,928)
2/15/2024
3.53%
(0.35)%
1D
ESTR
1M/T
$
(65,852)
MS
Allianz
SE
(Registered)
EUR
(432,522)
2/15/2024
3.53%
(0.35)%
1D
ESTR
1M/T
(3,605)
MS
AXA
SA
EUR
(280,584)
2/15/2024
3.53%
(0.35)%
1D
ESTR
1M/T
1,800
MS
BASF
SE
EUR
(184,371)
2/15/2024
3.53%
(0.35)%
1D
ESTR
1M/T
33,407
Consolidated
Schedule
of
Investments
Absolute
Return
Multi-Manager
Fund^
(cont’d)
See
Notes
to
Consolidated
Financial
Statements
Purchased
option
contracts
(“options
purchased”)
At
October
31,
2023,
the
Fund
did
not
have
any
outstanding
options
purchased.
Counterparty
Reference
Entity
Notional
Amount
Maturity
Date
Variable-
Rate
(b)
Spread
Reference
Rate
Frequency
of
Fund
Receipt/
Payment
Value
and
Unrealized
MS
Bayerische
Motoren
Werke
AG
EUR
(125,223)
2/15/2024
3.53%
(0.35)%
1D
ESTR
1M/T
$
15,253
MS
Deutsche
Post
AG
EUR
(259,562)
2/15/2024
3.53%
(0.35)%
1D
ESTR
1M/T
31,447
MS
Enel
SpA
EUR
(134,844)
2/15/2024
3.48%
(0.40)%
1D
ESTR
1M/T
(15,238)
MS
Engie
SA
EUR
(272,623)
2/15/2024
3.53%
(0.35)%
1D
ESTR
1M/T
(34,845)
JPM
Grifols
SA
USD
(27,250)
4/15/2024
4.92%
(0.40)%
1D
OBFR
1M/T
(1,982)
MS
H
&
M
Hennes
&
Mauritz
AB
SEK
(1,921,043)
10/21/2024
3.60%
(0.40)%
1W
STIBOR
1M/T
18,684
MS
Hannover
Rueck
SE
EUR
(293,911)
2/15/2024
3.53%
(0.35)%
1D
ESTR
1M/T
(45,382)
MS
Marks
&
Spencer
Group
plc
GBP
(266,085)
12/3/2024
4.89%
(0.30)%
1D
SONIA
1M/T
(83,723)
MS
Merck
&
Co.,
Inc.
USD
(199,033)
12/15/2023
4.98%
(0.35)%
1D
FEDEF
1M/T
12,026
MS
Next
plc
GBP
(199,361)
12/3/2024
4.89%
(0.30)%
1D
SONIA
1M/T
(9,563)
JPM
Novozymes
A/S
DKK
(1,263,551)
1/2/2024
3.15%
-
3.30%
(0.75)%
-
(0.60)%
1M
CIBOR
1M/T
21,066
MS
Schneider
Electric
SE
EUR
(362,740)
2/15/2024
3.53%
(0.35)%
1D
ESTR
1M/T
16,192
JPM
Smurfit
Kappa
Group
plc
USD
(121,159)
9/16/2024
4.57%
(0.75)%
1D
OBFR
1M/T
4,820
MS
Swisscom
AG
(Registered)
CHF
(263,296)
2/15/2024
1.35%
(0.35)%
1D
SARON
1M/T
14,251
MS
Telefonica
SA
EUR
(109,136)
2/15/2024
3.48%
(0.40)%
1D
ESTR
1M/T
156
MS
Tencent
Holdings
Ltd.
USD
(221,744)
7/23/2025
4.93%
(0.40)%
1D
FEDEF
1M/T
23,259
MS
Vinci
SA
EUR
(364,844)
2/15/2024
3.53%
(0.35)%
1D
ESTR
1M/T
10,809
Total
short
positions
of
equity
swaps
$(57,020)
Total
long
and
short
positions
of
equity
swaps
$(1,101,651)
Total
financing
costs
and
other
receivables/(payables)
of
equity
swaps
$9,511
Total
long
and
short
positions
including
financing
costs
and
other
receivables/(payables)
of
equity
swaps
$(1,092,140)
(a) The
Fund
pays
a
specified
rate
based
on
a
reference
rate
plus
or
minus
a
spread,
and
receives
the
total
tttttttttttt
return
on
the
reference
entity.
(b) Effective
rate
at
October
31,
2023.
(c) The
Fund
receives
a
specified
rate
based
on
a
reference
rate
plus
or
minus
a
spread,
and
pays
the
total
t
return
on
the
reference
entity.
For
the
year
ended
October
31,
2023,
the
average
notional
value
for
the
months
where
the
Fund
had
equity
swaps
outstanding
was
$14,120,293
for
long
positions
and
$(5,719,156)
for
short
positions.
At
October
31,
2023,
the
Fund
had
cash
collateral
of
$2,590,000,
$3,860,000
and
$1,063,292
deposited
in
a
segregated
account
for
JPMorgan
Chase
Bank,
NA,
Morgan
Stanley
Capital
Services
LLC
and
Societe
Generale
,
respectively,
to
cover
collateral
requirements
on
over
the
counter
derivatives.
Consolidated
Schedule
of
Investments
Absolute
Return
Multi-Manager
Fund^
(cont’d)
See
Notes
to
Consolidated
Financial
Statements
Written
option
contracts
("options
written")
At
October
31,
2023,
the
Fund
had
outstanding
options
written
as
follows:
Description
Number
of
Contracts
Notional
Amount
Exercise
Price
Expiration
Date
Value
Calls
Food
Products
Sovos
Brands,
Inc.
13
$
(28,223)
$
25.00
11/17/2023
$
—
(a)(b)
Total
options
written
(premium
received
$182)
$—
(a) Value
determined
using
significant
unobservable
inputs.
(b) Security
fair
valued
as
of
October
31,
2023,
in
accordance
with
procedures
approved
by
the
valuation
designee.
For
the
year
ended
October
31,
2023,
the
average
market
value
for
the
months
where
the
Fund
had
options
purchased
and
written
was
$18,383
for
options
purchased
and
$(662)
for
options
written.
At
October
31,
2023,
the
Fund
had
securities
pledged
in
the
amount
of
$28,223
to
JPMorgan
Chase
Bank,
NA
to
cover
collateral
requirements
for
options.
Abbreviations
CIBOR
Copenhagen
Interbank
Offered
Rate
ESTR
Euro
Short-Term
Rate
EURIBOR
Euro
Interbank
Offered
Rate
FEDEF
Federal
Funds
Floating
Rate
FTSE
Financial
Times
Stock
Exchange
HONIA
Hong
Kong
Overnight
Index
Average
HSCEI
Hang
Seng
China
Enterprises
Index
JPM
JPMorgan
Chase
Bank,
NA
JSE
Johannesburg
Stock
Exchange
MS
Morgan
Stanley
Capital
Services
LLC
MSCI
Morgan
Stanley
Capital
International
MUTSC
Bank
of
Japan
Unsecured
Overnight
Call
Rate
OBFR
Overnight
Bank
Funding
Rate
OMX
Stockholm
Stock
Exchange
RBACR
Reserve
Bank
of
Australia
Cash
Rate
SARON
Swiss
Average
Overnight
Rate
SG
Societe
Generale
SGX
Singapore
Exchange
SOFR
Secured
Overnight
Financing
Rate
SPI
Australian
Benchmark
Index
SONIA
Sterling
Overnight
Index
Average
Rate
STIBOR
Stockholm
Interbank
Offered
Rate
TSX
Toronto
Stock
Exchange
T
Termination
Date
1D
One
Day
1M
One
Month
Consolidated
Schedule
of
Investments
Absolute
Return
Multi-Manager
Fund^
(cont’d)
See
Notes
to
Consolidated
Financial
Statements
1W
One
Week
Currency
Abbreviations
AUD
Australian
Dollar
BRL
Brazilian
Real
CAD
Canadian
Dollar
CHF
Swiss
Franc
CLP
Chilean
Peso
CZK
Czech
Republic
Koruna
DKK
Danish
Krone
EUR
Euro
GBP
Pound
Sterling
HKD
Hong
Kong
Dollar
HUF
Hungarian
Forint
ILS
Israeli
New
Shekel
INR
Indian
Rupee
JPY
Japanese
Yen
KRW
Korean
Won
MXN
Mexican
Peso
NOK
Norwegian
Krone
NZD
New
Zealand
Dollar
PHP
Philippine
Peso
PLN
Polish
Zloty
SEK
Swedish
Krona
SGD
Singapore
Dollar
THB
Thailand
Baht
TRY
Turkish
Lira
USD
United
States
Dollar
ZAR
South
African
Rand
The
following
is
a
summary,
categorized
by
Level
(See
Note
A
of
the
Notes
to
Consolidated
Financial
Statements),
of
inputs
used
to
value
the
Fund's
investments
as
of
October
31,
2023:
Asset
Valuation
Inputs
Level
1
Level
2
Level
3
*
Total
Investments:
Common
Stocks
Broadline
Retail
$
3,311,838
$
232,719
$
—
$
3,544,557
Capital
Markets
426,112
—
915
427,027
Consumer
Staples
Distribution
&
Retail
1,086,777
—
—
1,086,777
Diversified
Telecommunication
Services
49,827
—
298,660
348,487
Food
Products
894,636
1,368,366
—
2,263,002
Health
Care
Providers
&
Services
812,248
84,578
—
896,826
Insurance
345,058
629,567
—
974,625
Interactive
Media
&
Services
2,405,285
25,352
—
2,430,637
Life
Sciences
Tools
&
Services
43,610
629,166
—
672,776
Media
861,486
330,328
—
1,191,814
Metals
&
Mining
183,742
610,642
—
794,384
Consolidated
Schedule
of
Investments
Absolute
Return
Multi-Manager
Fund^
(cont’d)
See
Notes
to
Consolidated
Financial
Statements
Asset
Valuation
Inputs
(cont’d)
Level
1
Level
2
Level
3
*
Total
Oil,
Gas
&
Consumable
Fuels
$
3,257,395
$
42,961
$
—
$
3,300,356
Passenger
Airlines
65,917
—
144
66,061
Pharmaceuticals
210,118
1,046,052
—
1,256,170
Professional
Services
—
292,054
—
292,054
Semiconductors
&
Semiconductor
Equipment
620,069
70,932
—
691,001
Software
1,898,004
1,375,393
1,156,250
4,429,647
Specialty
Retail
239,226
5,242
14,050
258,518
Technology
Hardware,
Storage
&
Peripherals
1,053,682
446,420
—
1,500,102
Trading
Companies
&
Distributors
256,897
655,772
—
912,669
Other
Common
Stocks
(a)
10,915,711
—
—
10,915,711
Total
Common
Stocks
28,937,638
7,845,544
1,470,019
38,253,201
Preferred
Stocks
(a)
57,536
—
—
57,536
Corporate
Bonds
(a)
—
—
—
—
Insurance
Linked
Securities
(a)
—
8,058,845
—
8,058,845
Loan
Assignments
(a)
—
—
5,632
5,632
Rights
Biotechnology
—
—
42,017
42,017
Financial
Services
—
—
11,500
11,500
Health
Care
Equipment
&
Supplies
—
—
5,775
5,775
IT
Services
—
—
12,025
12,025
Metals
&
Mining
19,840
—
3
19,843
Total
Rights
19,840
—
71,320
91,160
Warrants
(a)
229
—
—
229
Short-Term
Investments
—
66,330,746
—
66,330,746
Total
Long
Positions
$29,015,243
$82,235,135
$1,546,971
$112,797,349
(a)
The
Consolidated
Schedule
of
Investments
provides
information
on
the
industry
or
sector
categorization
as
well
as
a
Positions
by
Country
summary.
*
The
following
is
a
reconciliation
between
the
beginning
and
ending
balances
of
investments
in
which
significant
unobservable
inputs
(Level
3)
were
used
in
determining
value:
Common
Stocks
(a)(b)
Corporate
Bonds
(a)(c)
Loan
Assignments
(a)
Rights
(a)(b)
Warrants
(a)
Total
Assets:
Investments
in
Securities:
Beginning
Balance
as
of
November
1,
2022
$248,739
$–
$5,738
$149,146
$8
$403,631
Transfers
into
Level
3
424,297
–
–
–
–
424,297
Transfers
out
of
Level
3
–
–
–
–
–
–
Accrued
discounts/(premiums)
–
–
–
–
–
–
Realized
gain/(loss)
216,464
–
(199)
170,400
–
386,665
Change
in
unrealized
appreciation/
(depreciation)
84,891
–
(3,461)
(120,049)
6
(38,613)
Purchases
845,873
–
3,991
42,223
–
892,087
Sales
(350,245)
–
(437)
(170,400)
(14)
(521,096)
Balance
as
of
October
31,
2023
$1,470,019
$–
$5,632
$71,320
$–
$1,546,971
Net
change
in
unrealized
appreciation/
(depreciation)
on
investments
still
held
as
of
October
31,
2023
$(5,836)
$–
$(3,461)
$(114,110)
$–
$(123,407)
Consolidated
Schedule
of
Investments
Absolute
Return
Multi-Manager
Fund^
(cont’d)
See
Notes
to
Consolidated
Financial
Statements
(a)
As
of
the
year
ended
October
31,
2023,
these
securities
were
fair
valued
in
accordance
with
procedures
approved
by
the
valuation
designee.
These
investments
did
not
have
a
material
impact
on
the
Fund’s
net
assets;
therefore,
disclosure
of
significant
unobservable
inputs
used
in
formulating
valuations
is
not
presented.
(b)
These
securities
were
valued
based
on
a
single
quotation
obtained
from
a
dealer.
The
Fund
does
not
have
access
to
unobservable
inputs
and
therefore
cannot
disclose
such
inputs
used
in
formulating
such
quotation.
(c)
The
reconciliation
between
beginning
and
ending
balances
of
investments
in
which
significant
unobservable
inputs
(Level
3)
were
used
is
not
presented
as
all
values
are
zero.
The
following
is
a
summary,
categorized
by
Level
(see
Note
A
of
the
Notes
to
Consolidated
Financial
Statements)
,
of
inputs
used
to
value
the
Fund's
short
investments
as
of
October
31,
2023
:
Liability
Valuation
Inputs
Level
1
Level
2
Level
3
Total
Investments:
Common
Stocks
Sold
Short
(a)
$
(4,718,916)
$
—
$
—
$
(4,718,916)
Total
Short
Positions
$(4,718,916)
$—
$—
$(4,718,916)
(a)
The
Consolidated
Schedule
of
Investments
provides
information
on
the
industry
or
sector
categorization
as
well
as
a
Positions
by
Country
summary.
The
following
is
a
summary,
categorized
by
level
(see
Note
A
of
the
Notes
to
Consolidated
Financial
Statements),
of
inputs
used
to
value
the
Fund's
derivatives
as
of
October
31,
2023:
Other
Financial
Instruments
Level
1
Level
2
Level
3
*
Total
Futures
(a)
Assets
$
1,194,380
$
—
$
—
$
1,194,380
Liabilities
(100,051)
—
—
(100,051)
Forward
contracts
(a)
Assets
—
916,931
—
916,931
Liabilities
—
(698,078)
—
(698,078)
Swaps
Assets
—
645,686
—
645,686
Liabilities
—
(1,737,826)
—
(1,737,826)
Options
Written
Liabilities
—
—
—
—
Total
$
1,094,329
$
(873,287)
$
—
$
221,042
(a)
Futures
and
forward
contracts
are
reported
at
the
cumulative
unrealized
appreciation/(depreciation)
of
the
instruments.
Consolidated
Schedule
of
Investments
Absolute
Return
Multi-Manager
Fund^
(cont’d)
See
Notes
to
Consolidated
Financial
Statements
^
A
balance
indicated
with
a
“—”,
reflects
either
a
zero
balance
or
an
amount
that
rounds
to
less
than
1.
*
The
following
is
a
reconciliation
between
the
beginning
and
ending
balances
of
investments
in
which
significant
unobservable
inputs
(Level
3)
were
used
in
determining
value:
Options
Written
(a)
Other
Financial
Instruments:
Beginning
Balance
as
of
November
1,
2022
$–
Transfers
into
Level
3
–
Transfers
out
of
Level
3
–
Accrued
discounts/(premiums)
–
Realized
gain/(loss)
–
Change
in
unrealized
appreciation/(depreciation)
182
Purchases
(182)
Sales
–
Balance
as
of
October
31,
2023
$–
Net
change
in
unrealized
appreciation/(depreciation)
on
investments
still
held
as
of
October
31,
2023
$182
(a)
As
of
the
year
ended
October
31,
2023,
these
securities
were
fair
valued
in
accordance
with
procedures
approved
by
the
valuation
designee.
These
investments
did
not
have
a
material
impact
on
the
Fund’s
net
assets;
therefore,
disclosure
of
significant
unobservable
inputs
used
in
formulating
valuations
is
not
presented.
Consolidated
Statement
of
Assets
and
Liabilities
Neuberger
Berman
Alternative
Funds
See
Notes
to
Consolidated
Financial
Statements
ABSOLUTE
RETURN
MULTI-MANAGER
FUND
October
31,
2023
Assets
Investments
in
securities,
at
value*
(Note
A)—see
Consolidated
Schedule
of
Investments:
Unaffiliated
issuers
(a)
$112,797,349
Cash
1,835,315
Due
from
brokers
71,192
Foreign
currency
(b)
71,323
Cash
collateral
segregated
for
short
sales
(Note
A)
4,569,836
Cash
collateral
segregated
for
over
the
counter
derivatives
(Note
A)
7,513,292
Dividends
and
interest
receivable
512,753
Receivable
for
securities
sold
245,832
Receivable
for
Fund
shares
sold
801
Deposits
with
brokers
for
futures
contracts
(Note
A)
2,291,856
Receivable
for
variation
margin
on
futures
contracts
(Note
A)
462,858
Receivable
from
administrator—net
(Note
B)
50,106
Over
the
counter
swap
contracts,
at
value
(Note
A)
645,686
Receivable
for
forward
foreign
currency
contracts
(Note
A)
916,931
Prepaid
expenses
and
other
assets
80,484
Total
Assets
132,065,614
Liabilities
Investments
sold
short,
at
value
(Note
A)
(c)
4,718,916
Options
contracts
written,
at
value
(Note
A)
(d)
—
Over
the
counter
swap
contracts,
at
value
(Note
A)
1,737,826
Payable
to
investment
manager—net
(Note
B)
181,641
Payable
for
securities
purchased
631,944
Payable
for
Fund
shares
redeemed
135,510
Payable
for
forward
foreign
currency
contracts
(Note
A)
698,078
Payable
to
trustees
4,371
Payable
for
audit
fees
125,796
Payable
for
custodian
and
accounting
fees
114,844
Other
accrued
expenses
and
payables
56,987
Total
Liabilities
8,405,913
Net
Assets
$123,659,701
Net
Assets
consist
of:
Paid-in
capital
$235,671,901
Total
distributable
earnings/(losses)
(112,012,200)
Net
Assets
$123,659,701
Neuberger
Berman
Alternative
Funds
Consolidated
Statement
of
Assets
and
Liabilities
(cont’d)
See
Notes
to
Consolidated
Financial
Statements
ABSOLUTE
RETURN
MULTI-MANAGER
FUND
October
31,
2023
Net
Assets
Institutional
Class
$111,122,476
Class
A
7,632,993
Class
C
2,381,213
Class
R6
138,446
Class
E
2,384,573
Shares
Outstanding
($.001
par
value;
unlimited
shares
authorized)
Institutional
Class
9,517,376
Class
A
667,905
Class
C
222,274
Class
R6
11,849
Class
E
201,762
Net
Asset
Value,
offering
and
redemption
price
per
share
Institutional
Class
$11.68
Class
R6
$11.68
Class
E
$11.82
Net
Asset
Value
and
redemption
price
per
share
Class
A
$11.43
Offering
Price
per
share
Class
A‡
$12.13
Net
Asset
Value
and
offering
price
per
share
Class
C
^
$10.71
*Cost
of
Investments:
(a)
Unaffiliated
issuers
$114,125,459
(b)
Total
cost
of
foreign
currency
$71,847
(c)
Proceeds
from
investments
sold
short
$4,653,886
(d)
Premium
received
from
option
contracts
written
$182
‡
On
single
retail
sales
of
less
than
$50,000.
On
sales
of
$50,000
or
more
or
in
certain
other
circumstances
described
in
the
Fund’s
prospectus,
offering
price
is
reduced.
^
Redemption
price
per
share
is
equal
to
net
asset
value
less
any
applicable
contingent
deferred
sales
charge.
Consolidated
Statement
of
Operations
Neuberger
Berman
Alternative
Funds
See
Notes
to
Consolidated
Financial
Statements
ABSOLUTE
RETURN
MULTI-MANAGER
FUND
For
the
Fiscal
Year
Ended
October
31,
2023
Investment
Income:
Income
(Note
A):
Dividend
income—unaffiliated
issuers
$3,985,127
Interest
and
other
income—unaffiliated
issuers
990,503
Foreign
taxes
withheld
(48,785)
Total
income
$4,926,845
Expenses:
Investment
management
fees
(Note
B)
2,309,741
Administration
fees
(Note
B):
Institutional
Class
183,521
Class
A
21,013
Class
C
6,934
Class
R6
149
Distribution
fees
(Note
B):
Class
A
20,205
Class
C
26,671
Shareholder
servicing
agent
fees:
Institutional
Class
2,425
Class
A
99
Class
C
727
Class
R6
157
Class
E
111
Audit
fees
116,858
Custodian
and
accounting
fees
299,133
Insurance
2,377
Legal
fees
165,489
Registration
and
filing
fees
118,218
Shareholder
reports
49,496
Trustees'
fees
and
expenses
43,994
Dividend
and
interest
expense
on
securities
sold
short
(Note
A)
(7,607)
Miscellaneous
and
other
fees
25,452
Total
expenses
3,385,163
Expenses
reimbursed
by
Management
(Note
B)
(644,879)
Investment
management
fees
waived
(Note
B)
(42,119)
Expenses
reduced
by
custodian
fee
expense
offset
arrangement
(Note
A)
(134)
Total
net
expenses
2,698,031
Net
investment
income/(loss)
$2,228,814
Neuberger
Berman
Alternative
Funds
Consolidated
Statement
of
Operations
(cont’d)
See
Notes
to
Consolidated
Financial
Statements
ABSOLUTE
RETURN
MULTI-MANAGER
FUND
For
the
Fiscal
Year
Ended
October
31,
2023
Realized
and
Unrealized
Gain/(Loss)
on
Investments
(Note
A):
Net
realized
gain/(loss)
on:
Transactions
in
investment
securities
of
unaffiliated
issuers
2,330,028
Closed
short
positions
of
unaffiliated
issuers
(241,362)
Settlement
of
forward
foreign
currency
contracts
(759,225)
Settlement
of
foreign
currency
transactions
167,671
Expiration
or
closing
of
futures
contracts
(2,914,707)
Expiration
or
closing
of
option
contracts
written
4,942
Expiration
or
closing
of
swap
contracts
425,369
Change
in
net
unrealized
appreciation/(depreciation)
in
value
of:
Investment
securities
of
unaffiliated
issuers
1,298,798
Short
positions
of
unaffiliated
issuers
(1,548,006)
Forward
foreign
currency
contracts
(65,351)
Foreign
currency
translations
(210,271)
Futures
contracts
596,211
Option
contracts
written
(137)
Swap
contracts
(251,412)
Net
gain/(loss)
on
investments
(1,167,452)
Net
increase/(decrease)
in
net
assets
resulting
from
operations
$1,061,362
Consolidated
Statements
of
Changes
in
Net
Assets
Neuberger
Berman
Alternative
Funds
See
Notes
to
Consolidated
Financial
Statements
ABSOLUTE
RETURN
MULTI-MANAGER
FUND
Fiscal
Year
Ended
October
31,
2023
Fiscal
Year
Ended
October
31,
2022
Increase/(Decrease)
in
Net
Assets:
From
Operations
(Note
A):
Net
investment
income/(loss)
$2,228,814
$(854,748)
Net
realized
gain/(loss)
on
investments
(987,284)
8,763,539
Change
in
net
unrealized
appreciation/(depreciation)
of
investments
(180,168)
(4,405,945)
Net increase/(decrease)
in
net
assets
resulting
from
operations
1,061,362
3,502,846
Distributions
to
Shareholders
From
(Note
A):
Distributable
earnings:
Institutional
Class
(3,684,077)
(99,310)
Class
A
(201,196)
—
Class
C
(48,441)
—
Class
R6
(794)
(11,210)
Class
E
(82,978)
—
Total
distributions
to
shareholders
(4,017,486)
(110,520)
From
Fund
Share
Transactions
(Note
D):
Proceeds
from
shares
sold:
Institutional
Class
92,015,015
82,617,337
Class
A
1,776,608
2,552,678
Class
C
669,908
820,377
Class
R6
143,172
2,911,777
Class
E
948,072
2,282,555
Proceeds
from
reinvestment
of
dividends
and
distributions:
Institutional
Class
3,533,508
88,773
Class
A
171,512
—
Class
C
42,218
—
Class
R6
—
11,137
Class
E
82,978
—
Payments
for
shares
redeemed:
Institutional
Class
(105,679,313)
(22,946,066)
Class
A
(2,510,964)
(1,405,508)
Class
C
(1,084,306)
(1,126,611)
Class
R6
(3,931,595)
(2,690,988)
Class
E
(860,846)
(153,393)
Net
increase/(decrease)
from
Fund
share
transactions
(14,684,033)
62,962,068
Net
Increase/(Decrease)
in
Net
Assets
(17,640,157)
66,354,394
Net
Assets:
Beginning
of
year
141,299,858
74,945,464
End
of
year
$123,659,701
$141,299,858
Notes
to
Consolidated
Financial
Statements
Absolute
Return
Multi-Manager
Fund
Note
A—Summary
of
Significant
Accounting
Policies:
1
General:
Neuberger
Berman
Alternative
Funds
(the
“Trust”)
is
a
Delaware
statutory
trust
organized
pursuant
to
an
Amended
and
Restated
Trust
Instrument
dated
March
27,
2014.
The
Trust
is
registered
as
an
open-end
management
investment
company
under
the
Investment
Company
Act
of
1940,
as
amended
(the
“1940
Act”),
and
its
shares
are
registered
under
the
Securities
Act
of
1933,
as
amended.
Neuberger
Berman
Absolute
Return
Multi-Manager
Fund
(the
“Fund”)
is
a
separate
operating
series
of
the
Trust
and
is
diversified.
The
Fund
currently
offers
Institutional
Class
shares,
Class
A
shares,
Class
C
shares,
Class
R6
shares
and
Class
E
shares.
The
Trust’s
Board
of
Trustees
(the
“Board”)
may
establish
additional
series
or
classes
of
shares
without
the
approval
of
shareholders.
A
balance
indicated
with
a
“—”,
reflects
either
a
zero
balance
or
a
balance
that
rounds
to
less
than
1.
The
assets
of
the
Fund
belong
only
to
the
Fund,
and
the
liabilities
of
the
Fund
are
borne
solely
by
the
Fund
and
no
other
series
of
the
Trust.
The
Fund
is
an
investment
company
and
accordingly
follows
the
investment
company
accounting
and
reporting
guidance
of
the
Financial
Accounting
Standards
Board
(“FASB”)
Accounting
Standards
Codification
(“ASC”)
Topic
946
“Financial
Services—Investment
Companies.”
The
preparation
of
financial
statements
in
accordance
with
U.S.
generally
accepted
accounting
principles
(“GAAP”)
requires
Neuberger
Berman
Investment
Advisers
LLC
(“Management”
or
“NBIA”)
to
make
estimates
and
assumptions
at
the
date
of
the
financial
statements.
Actual
results
could
differ
from
those
estimates.
The
Fund
invests
in
commodity-related
instruments
through
Neuberger
Berman
Cayman
ARMM
Fund
I
Ltd.
(the
“Subsidiary”),
which
is
organized
under
the
laws
of
the
Cayman
Islands.
The
Fund
is
and
expects
to
remain
the
sole
shareholder
of
the
Subsidiary.
The
Subsidiary
is
governed
by
its
own
Board
of
Directors.
As
of
October
31,
2023,
the
value
of
the
Fund’s
investment
in
the
Subsidiary
was
as
follows:
2
Consolidation:
The
accompanying
financial
statements
of
the
Fund
present
the
consolidated
accounts
of
the
Fund
and
the
Subsidiary.
All
intercompany
accounts
and
transactions
have
been
eliminated
in
consolidation.
3
Portfolio
valuation:
In
accordance
with
ASC
820
“Fair
Value
Measurement”
(“ASC
820”),
all
investments
held
by
the
Fund
are
carried
at
the
value
that
Management
believes
the
Fund
would
receive
upon
selling
an
investment
in
an
orderly
transaction
to
an
independent
buyer
in
the
principal
or
most
advantageous
market
for
the
investment
under
current
market
conditions.
Various
inputs,
including
the
volume
and
level
of
activity
for
the
asset
or
liability
in
the
market,
are
considered
in
valuing
the
Fund’s
investments,
some
of
which
are
discussed
below.
At
times,
Management
may
need
to
apply
significant
judgment
to
value
investments
in
accordance
with
ASC
820.
ASC
820
established
a
three-tier
hierarchy
of
inputs
to
create
a
classification
of
value
measurements
for
disclosure
purposes.
The
three-tier
hierarchy
of
inputs
is
summarized
in
the
three
broad
Levels
listed
below.
Level
1
–
unadjusted
quoted
prices
in
active
markets
for
identical
investments
Level
2
–
other
observable
inputs
(including
quoted
prices
for
similar
investments,
interest
rates,
prepayment
speeds,
credit
risk,
amortized
cost,
etc.)
Level
3
–
unobservable
inputs
(including
the
Fund’s
own
assumptions
in
determining
the
fair
value
of
investments)
Investment
in
Subsidiary
Percentage
of
Net
Assets
$
24,305,403
19.7%
The
inputs
or
methodology
used
for
valuing
an
investment
are
not
necessarily
an
indication
of
the
risk
associated
with
investing
in
those
securities.
The
value
of
the
Fund’s
investments
(long
and
short
positions)
in
equity
securities,
preferred
stocks,
convertible
preferred
stocks,
rights,
warrants
and
exchange-traded
options
written
for
which
market
quotations
are
available,
is
generally
determined
by
Management
by
obtaining
valuations
from
independent
pricing
services
based
on
the
latest
sale
price
quoted
on
a
principal
exchange
or
market
for
that
security
(Level
1
inputs).
Securities
traded
primarily
on
the
NASDAQ
Stock
Market
are
normally
valued
at
the
NASDAQ
Official
Closing
Price
(“NOCP”)
provided
by
NASDAQ
each
business
day.
The
NOCP
is
the
most
recently
reported
price
as
of
4:00:02
p.m.,
Eastern
Time,
unless
that
price
is
outside
the
range
of
the
“inside”
bid
and
asked
prices
(i.e.,
the
bid
and
asked
prices
that
dealers
quote
to
each
other
when
trading
for
their
own
accounts);
in
that
case,
NASDAQ
will
adjust
the
price
to
equal
the
inside
bid
or
asked
price,
whichever
is
closer.
Because
of
delays
in
reporting
trades,
the
NOCP
may
not
be
based
on
the
price
of
the
last
trade
to
occur
before
the
market
closes.
If
there
is
no
sale
of
a
security
on
a
particular
day,
the
independent
pricing
services
may
value
the
security
based
on
market
quotations.
The
value
of
the
Fund’s
investments
for
long
positions
in
debt
securities
is
determined
by
Management
primarily
by
obtaining
valuations
from
independent
pricing
services
based
on
bid
quotations,
or
if
quotations
are
not
available,
by
methods that
include
various
considerations
based
on
security
type
(generally
Level
2
inputs).
In
addition
to
the
consideration
of
yields
or
prices
of
securities
of
comparable
quality,
coupon,
maturity
and
type,
indications
as
to
values
from
dealers,
and
general
market
conditions,
the
following
is
a
description
of
other
Level
2
inputs
and
related
valuation
techniques
used
by
independent
pricing
services
to
value
certain
types
of
debt
securities
held
by
the
Fund:
Corporate
Bonds
.
Inputs
used
to
value
corporate
debt
securities
generally
include
relevant
credit
information,
observed
market
movements,
sector
news,
U.S.
Treasury
yield
curve
or
relevant
benchmark
curve
and
other
market
information,
which
may
include
benchmark
yield
curves,
reported
trades,
broker-dealer
quotes,
issuer
spreads,
comparable
securities,
and
reference
data,
such
as
market
research
publications,
when
available
(“Other
Market
Information”).
High
Yield
Securities.
Inputs
used
to
value
high
yield
securities
generally
include
a
number
of
observations
of
equity
and
credit
default
swap
curves
related
to
the
issuer
and
Other
Market
Information.
The
value
of
insurance
linked
securities
is
determined
by
Management
primarily
by
obtaining
valuations
from
independent
third-party
pricing
services
based
on
bid
quotations
(Level
2
or
3
inputs).
The
value
of
loan
assignments
is
determined
by
Management
primarily
by
obtaining
valuations
from
independent
pricing
services
based
on
broker
quotes
(generally
Level
2
or
Level
3
inputs
depending
on
the
number
of
quotes
available).
The
value
of
futures
contracts
is
determined
by
Management
by
obtaining
valuations
from
independent
pricing
services
at
the
settlement
price
at
the
market
close
(Level
1
inputs).
The
value
of
forward
foreign
currency
contracts
is
determined
by
Management
by
obtaining
valuations
from
independent
pricing
services
based
on
actual
traded
currency
rates
on
independent
pricing
services’
networks,
along
with
other
traded
and
quoted
currency
rates
provided
to
the
pricing
services
by
leading
market
participants
(Level
2
inputs).
The
value
of
equity
swaps
is
determined
by
Management
by
obtaining
valuations
from
independent
pricing
services
using
the
underlying
asset
and
stated
benchmark
interest
rate
(Level
2
inputs).
Management
has
developed
a
process
to
periodically
review
information
provided
by
independent
pricing
services
for
all
types
of
securities.
Investments
in
non-exchange
traded
investment
companies
are
valued
using
the
respective
fund’s
daily
calculated
net
asset
value
(“NAV”)
per
share
(Level
2
inputs),
when
available.
If
a
valuation
is
not
available
from
an
independent
pricing
service,
or
if
Management
has
reason
to
believe
that
the
valuation
received
does
not
represent
the
amount
the
Fund
might
reasonably
expect
to
receive
on
a
current
sale
in
an
orderly
transaction,
Management
seeks
to
obtain
quotations
from
brokers
or
dealers
(generally
considered
Level
2
or
Level
3
inputs
depending
on
the
number
of
quotes
available).
If
such
quotations
are
not
available,
the
security
is
valued
using
methods
Management
has
approved
in
the
good-
faith
belief
that
the
resulting
valuation
will
reflect
the
fair
value
of
the
security.
Pursuant
to
Rule
2a-5
under
the
1940
Act,
the
Board
designated
Management
as
the
Fund’s
valuation
designee.
As
the
Fund’s
valuation
designee,
Management
is
responsible
for
determining
fair
value
in
good
faith
for
all
Fund
investments.
Inputs
and
assumptions
considered
in
determining
fair
value
of
a
security
based
on
Level
2
or
Level
3
inputs
may
include,
but
are
not
limited
to,
the
type
of
security;
the
initial
cost
of
the
security;
the
existence
of
any
contractual
restrictions
on
the
security’s
disposition;
the
price
and
extent
of
public
trading
in
similar
securities
of
the
issuer
or
of
comparable
companies;
quotations
or
evaluated
prices
from
broker-dealers
or
pricing
services;
information
obtained
from
the
issuer
and
analysts;
an
analysis
of
the
company’s
or
issuer’s
financial
statements;
an
evaluation
of
the
inputs
that
influence
the
issuer
and
the
market(s)
in
which
the
security
is
purchased
and
sold.
The
value
of
the
Fund’s
investments
in
foreign
securities
is
generally
determined
using
the
same
valuation
methods
and
inputs
as
other
Fund
investments,
as
discussed
above.
Foreign
security
prices
expressed
in
local
currency
values
are
normally
translated
from
the
local
currency
into
U.S.
dollars
using
the
exchange
rates
as
of
4:00
p.m.
Eastern
Time
on
days
the
New
York
Stock
Exchange
(“NYSE”)
is
open
for
business.
Management
has
approved
the
use
of
ICE
Data
Services
(“ICE”)
to
assist
in
determining
the
fair
value
of
foreign
equity
securities
when
changes
in
the
value
of
a
certain
index
suggest
that
the
closing
prices
on
the
foreign
exchanges
may
no
longer
represent
the
amount
that
the
Fund
could
expect
to
receive
for
those
securities
or
when
foreign
markets
are
closed
and
U.S.
markets
are
open.
In
each
of
these
events,
ICE
will
provide
adjusted
prices
for
certain
foreign
equity
securities
using
a
statistical
analysis
of
historical
correlations
of
multiple
factors
(Level
2
inputs).
Management
has
also
approved
the
use
of
ICE
to
evaluate
the
prices
of
foreign
debt
securities
as
of
the
time
at which
the
Fund’s
share
price
is
calculated.
ICE
utilizes
benchmark
spread
and
yield
curves
and
evaluates
available
market
activity
from
the
local
close
to
the
time
as
of
which
the
Fund’s
share
price
is
calculated
(Level
2
inputs)
to
assist
in
determining
prices
for
certain
foreign
debt
securities.
In
the
case
of
both
foreign
equity
and
foreign
debt
securities,
in
the
absence
of
precise
information
about
the
market
values
of
these
foreign
securities
as
of
the
time at
which
the
Fund’s
share
price
is
calculated,
Management
has
determined based
on available
data
that
prices
adjusted
or
evaluated
in
this
way
are
likely
to
be
closer
to
the
prices
the
Fund
could
realize
on
a
current
sale
than
the
prices
of
those
securities
established
at
the
close
of
the
foreign
markets
in
which
the
securities
primarily
trade.
Fair
value
prices
are
necessarily
estimates,
and
there
is
no
assurance
that
such
a
price
will
be
at
or
close
to
the
price
at
which
the
security
is
next
quoted
or
traded.
4
Foreign
currency
translations:
The
accounting
records
of
the
Fund
and
Subsidiary
are
maintained
in
U.S.
dollars.
Foreign
currency
amounts
are
normally
translated
into
U.S.
dollars
using
the
exchange
rate
as
of
4:00
p.m.
Eastern
Time,
on
days
the
NYSE
is
open
for
business,
to
determine
the
value
of
investments,
other
assets
and
liabilities.
Purchase
and
sale
prices
of
securities,
and
income
and
expenses,
are
translated
into
U.S.
dollars
at
the
prevailing
rate
of
exchange
on
the
respective
dates
of
such
transactions.
Net
unrealized
foreign
currency
gain/(loss),
if
any,
arises
from
changes
in
the
value
of
assets
and
liabilities,
other
than
investments
in
securities,
as
a
result
of
changes
in
exchange
rates
and
is
stated
separately
in
the
Consolidated
Statement
of
Operations.
5
Securities
transactions
and
investment
income:
Securities
transactions
are
recorded
on
trade
date
for
financial
reporting
purposes.
Dividend
income
is
recorded
on
the
ex-dividend
date
or,
for
certain
foreign
dividends,
as
soon
as
the
Fund
becomes
aware
of
the
dividends.
Non-cash
dividends
included
in
dividend
income,
if
any,
are
recorded
at
the
fair
market
value
of
the
securities
received.
Interest
income,
including
accretion
of
discount
(adjusted
for
original
issue
discount,
where
applicable)
and
amortization
of
premium,
where
applicable,
is
recorded
on
the
accrual
basis.
Realized
gains
and
losses
from
securities
transactions
and
foreign
currency
transactions,
if
any,
are
recorded
on
the
basis
of
identified
cost
and
stated
separately
in
the
Consolidated
Statement
of
Operations.
Included
in
net
realized
gain/(loss)
on
investments
are
proceeds
from
the
settlement
of
class
action
litigation(s)
in
which
the
Fund
participated
as
a
class
member.
The
amount
of
such
proceeds
for
the
year
ended
October
31,
2023,
was
$17,698.
6
Income
tax
information:
The
Fund
is
treated
as
a
separate
entity
for
U.S.
federal
income
tax
purposes.
It
is
the
policy
of
the
Fund
to
continue
to
qualify
for
treatment
as
a
regulated
investment
company
(“RIC”)
by
complying
with
the
requirements
of
the
U.S.
Internal
Revenue
Code
applicable
to
RICs
and
to
distribute
substantially
all
of
its
net
investment
income
and
net
realized
capital
gains
to
its
shareholders.
To
the
extent
the
Fund
distributes
substantially
all
of
its
net
investment
income
and
net
realized
capital
gains
to
shareholders,
no
federal
income
or
excise
tax
provision
is
required.
ASC
740
“Income
Taxes”
sets
forth
a
minimum
threshold
for
financial
statement
recognition
of
a
tax
position
taken,
or
expected
to
be
taken,
in
a
tax
return.
The
Fund
recognizes
interest
and
penalties,
if
any,
related
to
unrecognized
tax
positions
as
an
income
tax
expense
in
the
Consolidated
Statement
of
Operations.
The
Fund
is
subject
to
examination
by
U.S.
federal
and
state
tax
authorities
for
returns
filed
for
the
tax
years
for
which
the
applicable
statutes
of
limitations
have
not
yet
expired.
Management
has
analyzed
the
Fund's
tax
positions
taken
or
expected
to
be
taken
on
federal
and
state
income
tax
returns
for
all
open
tax
years
(the
current
and
the
prior
three
tax
years)
and
has
concluded
that
no
provision
for
income
tax
is
required
in
the
Fund's
financial
statements.
The
Subsidiary
is
a
controlled
foreign
corporation
under
the
U.S.
Internal
Revenue
Code.
As
a
U.S.
shareholder
of
a
controlled
foreign
corporation,
the
Fund
will
include
in
its
taxable
income
its
share
of
the
Subsidiary’s
current
earnings
and
profits
(including
net
realized
gains).
Any
deficit
generated
by
the
Subsidiary
will
be
disregarded
for
purposes
of
computing
the
Fund’s
taxable
income
in
the
current
period
and
also
disregarded
for
all
future
periods.
For
federal
income
tax
purposes,
the
estimated
cost
of
investments
held
at
October
31,
2023,
was
$120,358,805.
The
estimated
gross
unrealized
appreciation
was
$1,859,958
and
estimated
gross
unrealized
depreciation
was
$13,457,391
resulting
in
net
unrealized depreciation
in
value
of
investments
of
$11,597,433
based
on
cost
for
U.S.
federal
income
tax
purposes.
Income
distributions
and
capital
gain
distributions
are
determined
in
accordance
with
income
tax
regulations,
which
may
differ
from
GAAP.
These
differences
are
primarily
due
to
differing
treatments
of
income
and
gains
on
various
investment
securities
held
by
the
Fund,
timing
differences
and
differing
characterization
of
distributions
made
by
the
Fund.
The
Fund
may
also
utilize
earnings
and
profits
distributed
to
shareholders
on
redemption
of
their
shares
as
part
of
the
dividends-paid
deduction
for
income
tax
purposes.
Any
permanent
differences
resulting
from
different
book
and
tax
treatment
are
reclassified
at
year-end
and
have
no
impact
on
net
income,
NAV
or
NAV
per
share
of
the
Fund.
For
the
year
ended
October
31,
2023,
the
Fund
recorded
permanent
reclassifications
primarily
related
to
tax
adjustments
due
to
partnerships
and
wholly
owned
subsidiary
income
and
gain
(loss).
For
the
year
ended
October
31,
2023,
the
Fund
recorded
the
following
permanent
reclassifications:
The
tax
character
of
distributions
paid
during
the
years
ended
October
31,
2023,
and
October
31,
2022,
was
as
follows:
Paid-in
Capital
Total
Distributable
Earnings/(Losses)
(
$
1,432,021)
$1,432,021
Distributions
Paid
From:
Ordinary
Income
Tax-Exempt
Income
Long-Term
Capital
Gain
Return
of
Capital
Total
2023
2022
2023
2022
2023
2022
2023
2022
2023
2022
$4,017,486
$110,520
$–
$–
$–
$–
$–
$–
$4,017,486
$110,520
As
of
October
31,
2023,
the
components
of
distributable
earnings
(accumulated
losses)
on
a
U.S.
federal
income
tax
basis
were
as
follows:
The
temporary
differences
between
book
basis
and
tax
basis
distributable
earnings
are
primarily
due
to
losses
disallowed
and/or
recognized
on
wash
sales
and
straddles,
mark-to-market
on
adjustments
on
swaps,
futures
and
forward
contracts,
amortization
of
organizational
expenses,
tax
adjustments
related
to
swap
contracts
and
other
investments,
mark-to-market
adjustments
on
passive
foreign
investment
companies
(“PFICs”),
tax
adjustments
due
to
partnerships,
wholly
owned
subsidiary
inclusions,
and
amortization
adjustments.
To
the
extent
the
Fund’s
net
realized
capital
gains,
if
any,
can
be
offset
by
capital
loss
carryforwards,
it
is
the
policy
of
the
Fund
not
to
distribute
such
gains.
Capital
loss
carryforward
rules
allow
for
RICs
to
carry
forward
capital
losses
indefinitely
and
to
retain
the
character
of
capital
loss
carryforwards
as
short-term
or
long-term.
As
determined
at
October
31,
2023,
the
Fund
had
unused
capital
loss
carryforwards
available
for
federal
income
tax
purposes
to
offset
net
realized
capital
gains,
if
any,
as
follows:
During
the
year
ended
October
31,
2023,
the
Fund
utilized
capital
loss
carryforwards
of
$1,495,619.
7
Foreign
taxes:
Foreign
taxes
withheld,
if
any,
represent
amounts
withheld
by
foreign
tax
authorities,
net
of
refunds
recoverable.
Foreign
capital
gains
on
certain
foreign
securities
may
be
subject
to
foreign
taxes,
which
are
accrued
as
applicable.
At
October
31,
2023,
there
were
no
outstanding
balances
of
accrued
capital
gains
taxes
for
the
Fund.
As
a
result
of
several
European
Court
of
Justice
(“ECJ”)
court
cases
in
certain
countries
across
the
European
Union
(“EU”),
the
Fund
filed
tax
reclaims
for
previously
withheld
taxes
on
dividends
earned
in
those
countries
(“ECJ
tax
reclaims”).
These
additional
filings
are
subject
to
various
administrative
proceedings
by
the
local
jurisdictions’
tax
authorities
within
the
EU,
as
well
as
a
number
of
related
judicial
proceedings.
When
any
such
ECJ
tax
reclaims
are
not
"more
likely
than
not"
to
be
sustained,
no
amounts
are
included
in
the
Consolidated
Statement
of
Assets
and
Liabilities.
The
Fund
has
determined
that
certain
ECJ
tax
reclaims
are
"more
likely
than
not"
to
be
sustained
after
examination
by
tax
authorities.
The
income
recognized
from
these
ECJ
tax
reclaims
is
included
in
"Interest
and
other
income—unaffiliated
issuers"
in
the
Consolidated
Statement
of
Operations
and
the
cost
to
file
these
additional
ECJ
tax
reclaims
(which
are
excluded
from
contractual
expense
limitations)
is
included
in
"Miscellaneous
and
other
fees"
in
the
Consolidated
Statement
of
Operations.
8
Distributions
to
shareholders:
The
Fund
may
earn
income,
net
of
expenses,
daily
on
its
investments.
Distributions
from
net
investment
income
and
net
realized
capital
gains,
if
any,
are
generally
distributed
once
a
year
(usually
in December)
and
are
recorded
on
the
ex-date.
It
is
the
policy
of
the
Fund
to
pass
through
to
its
shareholders
substantially
all
REIT
distributions
and
other
income
it
receives,
less
operating
expenses.
The
distributions
received
from
REITs
are
generally
composed
of
income,
capital
gains,
and/or
return
of
REIT
capital,
but
the
REITs
do
not
report
this
information
to
the
Fund
until
the
following
calendar
year.
At
October
31,
2023,
the
Fund
estimated
these
amounts
for
the
period
January
1,
2023
to
October
31,
2023
within
the
financial
statements
because
the
2023
information
is
not
available
from
the
REITs
until
after
the
Fund’s
fiscal
year-end.
All
estimates
are
based
upon
REIT
information
sources
available
to
the
Fund
together
with
actual
IRS
Forms
1099-DIV
received
to
date. For
the
year
ended
October
31,
2023,
the
character
of
distributions
paid
to
shareholders
of
the
Fund,
if
any,
disclosed
within
Undistributed
Ordinary
Income
Undistributed
Long-Term
Capital
Gain
Unrealized
Depreciation
Loss
Carryforwards
and
Deferrals
Other
Temporary
Differences
Total
$
1,090,272
$
—
$(11,595,927)
$
(101,432,983)
$(73,562)
$
(112,012,200)
Capital
Loss
Carryforwards
Long-Term
Short-Term
$
35,326,769
$66,106,214
the
Consolidated
Statements
of
Changes
in
Net
Assets
is
based
on
estimates
made
at
that
time.
Based
on
past
experience
it
is
possible
that
a
portion
of
the
Fund’s
distributions
during
the
current
fiscal
year,
if
any,
will
be
considered
tax
return
of
capital,
but
the
actual
amount
of
the
tax
return
of
capital,
if
any,
is
not
determinable
until
after
the
Fund’s
fiscal
year-end.
After
calendar
year-end,
when
the
Fund
learns
the
nature
of
the
distributions
paid
by
REITs
during
that
year,
distributions
previously
identified
as
income
may
be
recharacterized
as
return
of
capital
and/or
capital
gain.
After
all
applicable
REITs
have
informed
the
Fund
of
the
actual
breakdown
of
distributions
paid
to
the
Fund
during
its
fiscal
year,
estimates
previously
recorded
are
adjusted
to
reflect
actual
results.
As
a
result,
the
composition
of
the
Fund’s
distributions
as
reported
herein,
may
differ
from
the
final
composition
determined
after
calendar
year-end
and
reported
to
the
Fund
shareholders
on
IRS
Form
1099-DIV.
9
Expense
allocation:
Certain
expenses
are
applicable
to
multiple
funds
within
the
complex
of
related
investment
companies.
Expenses
directly
attributable
to
a
fund
are
charged
to
that
fund.
Expenses
of
the
Trust
that
are
not
directly
attributable
to
a
particular
series
of
the
Trust
(e.g., the
Fund)
are
allocated
among
the
series
of
the
Trust,
on
the
basis
of
relative
net
assets,
except
where
a
more
appropriate
allocation
of
expenses
to
each
of
the
series
can
otherwise
be
made
fairly.
Expenses
borne
by
the
complex
of
related
investment
companies,
which
includes
open-end
and
closed-end
investment
companies
for
which
NBIA
serves
as
investment
manager,
that
are
not
directly
attributable
to
a
particular
investment
company
in
the
complex
(e.g.,
the
Trust)
or
series
thereof
are
allocated
among
the
investment
companies
in
the
complex
or
series
thereof
on
the
basis
of
relative
net
assets,
except
where
a
more
appropriate
allocation
of
expenses
to
each
of
the
investment
companies
in
the
complex
or
series
thereof
can
otherwise
be
made
fairly.
The
Fund’s
expenses
(other
than
those
specific
to
each
class)
are
allocated
proportionally
each
day
among
its
classes
based
upon
the
relative
net
assets
of
each
class.
10
Investments
in
foreign
securities:
Investing
in
foreign
securities
may
involve
sovereign
and
other
risks,
in
addition
to
the
credit
and
market
risks
normally
associated
with
domestic
securities.
These
additional
risks
include
the
possibility
of
adverse
political
and
economic
developments
(including
political
instability,
nationalization,
expropriation,
or
confiscatory
taxation)
and
the
potentially
adverse
effects
of
unavailability
of
public
information
regarding
issuers,
less
governmental
supervision
and
regulation
of
financial
markets,
reduced
liquidity
of
certain
financial
markets,
and
the
lack
of
uniform
accounting,
auditing,
and
financial
reporting
standards
or
the
application
of
standards
that
are
different
or
less
stringent
than
those
applied
in
the
United
States.
Foreign
securities
also
may
experience
greater
price
volatility,
higher
rates
of
inflation,
and
delays
in
settlement.
11
Securities
sold
short:
The
Fund
may
engage
in
short
sales,
which
are
sales
of
securities
which
have
been
borrowed
from
a
third
party
on
the
expectation
that
the
market
price
will
decline.
If
the
price
of
the
securities
decreases,
the
Fund
will
make
a
profit
by
purchasing
the
securities
in
the
open
market
at
a
price
lower
than
the
one
at
which
it
sold
the
securities.
If
the
price
of
the
securities
increases,
the
Fund
may
have
to
cover
its
short
positions
at
a
price
higher
than
the
short
sale
price,
resulting
in
a
loss.
Gains
are
limited
to
the
price
at
which
the
Fund
sold
the
security
short,
while
losses
are
potentially
unlimited
in
size.
The
Fund
pledges
securities
and/or
other
assets
to
the
lender
as
collateral.
Proceeds
received
from
short
sales
may
be
maintained
by
the
lender
as
collateral
or
may
be
released
to
the
Fund
and
used
to
purchase
additional
securities
or
for
any
other
purpose.
Proceeds
maintained
by
the
lender
are
included
in
the
“Cash
collateral
segregated
for
short
sales”
on
the
Consolidated
Statement
of
Assets
and
Liabilities.
The
Fund
is
contractually
responsible
to
remit
to
the
lender
any
dividends
and
interest
payable
on
securities
while
those
securities
are
being
borrowed
by
the
Fund.
The
Fund
may
receive
or
pay
the
net
of
the
interest
charged
by
the
prime
broker
on
the
borrowed
securities
and
a
financing
charge
for
the
difference
in
the
market
value
of
the
short
position
and
the
cash
collateral
deposited
with
the
broker.
This
income
or
fee
is
calculated
daily
based
upon
the
market
value
of
each
borrowed
security
and
a
variable
rate
that
is
dependent
on
the
availability
of
the
security.
These
costs
related
to
short
sales
(i.e.,
dividend
and
interest
remitted
to
the
lender
and
interest
charged
by
the
prime
broker)
are
recorded
as
an
expense
of
the
Fund
and
are
excluded
from
the
contractual
expense
limitation.
A
net
negative
expense,
if
any,
represents
a
gain
to
the
Fund
as
the
total
cash
rebates
received
exceeded
the
other
costs
related
to
short
sales.
The
net
amount
of
fees
incurred
are
included
in
the
“Dividend
and
interest
expense
on
securities
sold
short”
on
the
Consolidated
Statement
of
Operations
and were
$248,115
for
the
year
ended
October
31,
2023.
At
October
31,
2023,
the
Fund
had
cash
pledged
in
the
amount
of
$4,569,836
to
JPMorgan
Chase
Bank,
NA
(“JPM”),
as
collateral
for
short
sales.
In
addition,
JPM
has
a
perfected
security
interest
in
these
assets.
12
Investment
company
securities
and
exchange
traded
funds:
The
Fund
may
invest
in
shares
of
other
registered
investment
companies,
including
exchange
traded
funds
(“ETFs”),
within
the
limitations
prescribed
by
the
1940
Act,
in
reliance
on
rules
adopted
by
the
SEC,
particularly
Rule
12d1-4
or
any
other
applicable
exemptive
relief.
Rule
12d1-4
permits
investments
in
other
registered
investment
companies
in
excess
of
the
limitations
of
the
1940
Act
if
the
Fund
complies
with
the
conditions
of
the
Rule.
Shareholders
of
the
Fund
will
indirectly
bear
their
proportionate
share
of
any
management
fees
and
other
expenses
paid
by
such
other
investment
companies,
in
addition
to
the
management
fees
and
expenses
of
the
Fund.
13
When-issued/delayed
delivery
securities:
The
Fund
may
purchase
securities
with
delivery
or
payment
to
occur
at
a
later
date
beyond
the
normal
settlement
period.
At
the
time
the
Fund
enters
into
a
commitment
to
purchase
a
security,
the
transaction
is
recorded,
and
the
value
of
the
security
is
reflected
in
the
NAV.
The
price
of
such
security
and
the
date
when
the
security
will
be
delivered
and
paid
for
are
fixed
at
the
time
the
transaction
is
negotiated.
The
value
of
the
security
may
vary
with
market
fluctuations.
No
interest
accrues
to
the
Fund
until
payment
takes
place.
When-issued
and
delayed
delivery
transactions
can
have
a
leverage-like
effect
on
the
Fund,
which
can
increase
fluctuations
in
the
Fund’s
NAV.
Certain
risks
may
arise
upon
entering
into
when-issued
or
delayed
delivery
securities
transactions
from
the
potential
inability
of
counterparties
to
meet
the
terms
of
their
contracts
or
if
the
issuer
does
not
issue
the
securities
due
to
political,
economic,
or
other
factors.
Additionally,
losses
may
arise
due
to
changes
in
the
value
of
the
underlying
securities.
14
Derivative
instruments:
The
Fund’s
use
of
derivatives
during
the
year
ended
October
31,
2023,
is
described
below.
Please
see
the
Consolidated
Schedule
of
Investments
for
the
Fund’s
open
positions
in
derivatives
at
October
31,
2023.
The
disclosure
requirements
of
ASC
815
“Derivatives
and
Hedging”
(“ASC
815”)
distinguish
between
derivatives
that
qualify
for
hedge
accounting
and
those
that
do
not.
Because
investment
companies
value
their
derivatives
at
fair
value
and
recognize
changes
in
fair
value
through
the
Consolidated
Statement
of
Operations,
they
do
not
qualify
for
hedge
accounting.
Accordingly,
even
though
the
Fund’s
investments
in
derivatives
may
represent
economic
hedges,
they
are
considered
non-hedge
transactions
for
purposes
of
this
disclosure.
Rule
18f-4
under
the
1940
Act
regulates
the
use
of
derivatives
for
certain
funds
registered
under
the
1940
Act
(“Rule
18f-4”).
Unless
the
Fund
qualifies
as
a
“limited
derivatives
user”
as
defined
in
Rule
18f-4,
the
Fund
is
subject
to
a
comprehensive
derivatives
risk
management
program,
is
required
to
comply
with
certain
value-at-risk
based
leverage
limits
and
is
required
to
provide
additional
disclosure
both
publicly
and
to
the
SEC
regarding
its
derivatives
positions.
If the
Fund
qualifies
as
a
limited
derivatives
user,
Rule
18f-4
requires
the
Fund
to
have
policies
and
procedures
to
manage
its
aggregate
derivatives
risk.
Futures
contracts:
During
the
year
ended
October
31,
2023,
the
Fund
used
futures
for
economic
hedging
purposes
and
to
enhance
returns.
At
the
time
the
Fund
or
Subsidiary
enters
into
a
futures
contract,
it
is
required
to
deposit
with
the
futures
commission
merchant
a
specified
amount
of
cash
or
liquid
securities,
known
as
“initial
margin,”
which
is
a
percentage
of
the
value
of
the
futures
contract
being
traded
that
is
set
by
the
exchange
upon
which
the
futures
contract
is
traded.
Each
day,
the
futures
contract
is
valued
at
the
official
settlement
price
of
the
board
of
trade
or
U.S.
commodity
exchange
on
which
such
futures
contract
is
traded.
Subsequent
payments,
known
as
“variation
margin,”
to
and
from
the
broker
are
made
on
a
daily
basis,
or
as
needed,
as
the
market
price
of
the
futures
contract
fluctuates.
Daily
variation
margin
adjustments,
arising
from
this
“mark
to
market,”
are
recorded
by
the
Fund
or
Subsidiary
as
unrealized
gains
or
losses.
Although
some
futures
by
their
terms
call
for
actual
delivery
or
acquisition
of
the
underlying
securities
or
currency,
in
most
cases
the
contracts
are
closed
out
prior
to
delivery
by
offsetting
purchases
or
sales
of
matching
futures.
When
the
contracts
are
closed,
the
Fund
or
Subsidiary
recognizes
a
gain
or
loss.
Risks
of
entering
into
futures
contracts
include
the
possibility
there
may
be
an
illiquid
market,
possibly
at
a
time
of
rapidly
declining
prices,
and/or
a
change
in
the
value
of
the
contract
may
not
correlate
with
changes
in
the
value
of
the
underlying
securities.
Futures
executed
on
regulated
futures
exchanges
have
minimal
counterparty
risk
to
the
Fund
or
Subsidiary
because
the
exchange’s
clearinghouse
assumes
the
position
of
the
counterparty
in
each
transaction.
Thus,
the
Fund
or
Subsidiary
is
exposed
to
risk
only
in
connection
with
the
clearinghouse
and
not
in
connection
with
the
original
counterparty
to
the
transaction.
For
U.S.
federal
income
tax
purposes,
futures
transactions
undertaken
by
the
Fund
or
Subsidiary
may
cause
the
Fund
or
Subsidiary
to
recognize
gains
or
losses
from
marking
contracts
to
market
even
though
its
positions
have
not
been
sold
or
terminated,
may
affect
the
character
of
the
gains
or
losses
recognized
as
long-term
or
short-term,
and
may
affect
the
timing
of
some
capital
gains
and
losses
realized
by
the
Fund
or
Subsidiary.
Also,
the
Fund’s
or
Subsidiary’s
losses
on
transactions
involving
futures
contracts
may
be
deferred
rather
than
being
taken
into
account
currently
in
calculating
the
Fund’s
or
Subsidiary’s
taxable
income.
Forward
foreign
currency
contracts:
During
the
year
ended
October
31,
2023,
the
Fund
used
forward
foreign
currency
contracts
to
hedge
foreign
currency
and
to
enhance
returns.
A
forward
contract
is
an
agreement
between
two
parties
to
buy
or
sell
a
specific
currency
for
another
at
a
set
price
on
a
future
date
and
is
individually
negotiated
and
privately
traded
by
currency
traders
and
their
customers
in
the
interbank
market.
The
market
value
of
a
forward
contract
fluctuates
with
changes
in
forward
currency
exchange
rates.
Forward
contracts
are
marked
to
market
daily,
and
the
change
in
value
is
recorded
by
the
Fund
as
an
unrealized
gain
or
loss.
At
the
consummation
of
a
forward
contract
to
purchase
or
sell
currency,
the
Fund
may
either
exchange
the
currencies
specified
at
the
maturity
of
the
forward
contract
or
enter
into
a
closing
transaction
involving
the
purchase
or
sale
of
an
offsetting
forward
contract.
Closing
transactions
with
respect
to
forward
contracts
are
usually
performed
with
the
counterparty
to
the
original
forward
contract.
The
gain
or
loss
arising
from
the
difference
between
the
U.S.
dollar
cost
of
the
original
contract
and
the
value
of
the
foreign
currency
in
U.S.
dollars
upon
closing
a
contract
is
included
in
“Net
realized
gain/(loss)
on
settlement
of
forward
foreign
currency
contracts”
in
the
Consolidated
Statement
of
Operations.
These
contracts
may
involve
market
risk
in
excess
of
the
unrealized
gain
or
loss
reflected
in
the
Fund’s
Consolidated
Statement
of
Assets
and
Liabilities.
In
addition,
the
Fund
could
be
exposed
to
risks
associated
with
fluctuations
in
foreign
currency
and
the
risk
the
counterparty
will
fail
to
fulfill
its
obligation.
Equity
swap
contracts:
During
the
year
ended
October
31,
2023,
the
Fund
used
equity
swaps
to
provide
investment
exposure
to
certain
investments,
primarily
foreign
securities.
Equity
swaps
are
two-party
contracts
in
which
counterparties
exchange
the
return
on
a
specified
reference
security
for
the
return
based
on
a
fixed
or
floating
interest
rate
during
the
period
of
the
swap.
Upon
entering
an
equity
swap,
the
Fund
may
be
required
to
pledge
an
amount
of
cash
and/or
other
assets
to
the
broker
which
is
equal
to
a
certain
percentage
of
the
contract
amount
(initial
margin).
Subsequent
payments
known
as
variation
margins
are
made
or
received
by
the
Fund
periodically
depending
on
the
fluctuations
in
the
value
of
the
underlying
security.
Equity
swaps
are
marked
to
market
daily
based
on
the
value
of
the
underlying
reference
entity
and
the
change,
if
any,
is
recorded
as
an
unrealized
gain
or
loss.
Equity
swaps
normally
do
not
involve
the
delivery
of
securities
or
other
underlying
assets.
Cash
settlement
in
and
out
of
the
swap
may
occur
at
a
reset
date
or
any
other
date,
at
the
discretion
of
the
Fund
and
the
counterparty,
over
the
life
of
the
agreement,
and
is
generally
determined
based
on
limits
and
thresholds
established
as
part
of
an
agreement
between
the
Fund
and
the
counterparty.
If
the
other
party
to
an
equity
swap
defaults,
the
Fund’s
risk
of
loss
consists
of
the
net
amount
of
payments
that
the
Fund
is
contractually
entitled
to
receive,
if
any.
Equity
swaps
are
derivatives,
and
their
value
can
be
very
volatile.
To
the
extent
that
future
market
trends,
the
values
of
assets
or
economic
factors
are
not
accurately
analyzed
and
predicted,
the
Fund
may
suffer
a
loss,
which
may
exceed
the
related
amounts
shown
in
the
Consolidated
Statement
of
Assets
and
Liabilities.
Periodic
payments
received
or
paid
by
the
Fund
are
recorded
as
realized
gains
or
losses
in
the
Consolidated
Statement
of
Operations.
Options:
During
the
year
ended
October
31,
2023,
the
Fund
used
options
written
to
generate
incremental
returns.
The
Fund
used
purchased
options
for
economic
hedging
purposes,
to
manage
or
adjust
the
risk
profile
and
investment
exposure
of
the
Fund
or
individual
positions,
to
obtain
or
reduce
exposure
to
certain
markets,
to
establish
net
short
or
long
positions
for
markets
or
securities
and
to
enhance
total
return.
Premiums
paid
by
the
Fund
upon
purchasing
a
call
or
put
option
are
recorded
in
the
asset
section
of
the
Fund’s
Consolidated
Statement
of
Assets
and
Liabilities
and
are
subsequently
adjusted
to
the
current
market
value.
When
an
option
is
exercised,
closed,
or
expired,
the
Fund
realizes
a
gain
or
loss
and
the
asset
is
eliminated.
For
purchased
call
options,
the
Fund’s
loss
is
limited
to
the
amount
of
the
option
premium
paid.
Premiums
received
by
the
Fund
upon
writing
a
call
option
or
a
put
option
are
recorded
in
the
liability
section
of
the
Fund’s
Consolidated
Statement
of
Assets
and
Liabilities
and
are
subsequently
adjusted
to
the
current
market
value.
When
an
option
is
exercised,
closed,
or
expired,
the
Fund
realizes
a
gain
or
loss
and
the
liability
is
eliminated.
When
the
Fund
writes
a
call
option
on
an
underlying
asset
it
does
not
own,
its
exposure
on
such
an
option
is
theoretically
unlimited.
When
writing
a
covered
call
option,
the
Fund,
in
return
for
the
premium,
gives
up
the
opportunity
for
profit
from
a
price
increase
in
the
underlying
security
above
the
exercise
price,
but
conversely
retains
the
risk
of
loss
should
the
price
of
the
security
decline.
When
writing
a
put
option,
the
Fund,
in
return
for
the
premium,
takes
the
risk
that
it
must
purchase
the
underlying
security
at
a
price
that
may
be
higher
than
the
current
market
price
of
the
security.
If
a
call
or
put
option
that
the
Fund
has
written
expires
unexercised,
the
Fund
will
realize
a
gain
for
the
amount
of
the
premium.
All
securities
covering
outstanding
written
options
are
held
in
escrow
by
the
custodian
bank.
At
October
31,
2023,
the
Fund
had
the
following
derivatives
(which
did
not
qualify
as
hedging
instruments
under
ASC
815),
grouped
by
primary
risk
exposure:
Asset
Derivatives
Liability
Derivatives
Consolidated
Statement
of
Assets
and
Liabilities
Location
Value
Consolidated
Statement
of
Assets
and
Liabilities
Location
Value
Over
the
counter
swaps
Equity
risk
Over
the
counter
swap
contracts,
at
value
(1)
$
645,686
Over
the
counter
swap
contracts,
at
value
(1)
$
(1,737,826)
Forward
contracts
Foreign
currency
risk
Receivable
for
forward
foreign
currency
contracts
916,931
Payable
for
forward
foreign
currency
contracts
(698,078)
Futures
Interest
rate
risk
Receivable/Payable
for
variation
margin
on
futures
contracts
(2)
438,703
Receivable/Payable
for
variation
margin
on
futures
contracts
(2)
(48,771)
Foreign
currency
risk
Receivable/Payable
for
variation
margin
on
futures
contracts
(2)
405,342
Receivable/Payable
for
variation
margin
on
futures
contracts
(2)
(2,494)
Equity
risk
Receivable/Payable
for
variation
margin
on
futures
contracts
(2)
226,565
Receivable/Payable
for
variation
margin
on
futures
contracts
(2)
(6,848)
Commodity
risk
Receivable/Payable
for
variation
margin
on
futures
contracts
(2)
123,770
Receivable/Payable
for
variation
margin
on
futures
contracts
(2)
(41,938)
Total
Futures
1,194,380
(100,051)
(1)
“Over
the
counter
swaps”
reflects
the
cumulative
unrealized
appreciation/(depreciation)
of
the
over
the
counter
swap
contracts
plus
accrued
interest
as
of
October
31,
2023.
(2)
“Futures”
reflects
the
cumulative
unrealized
appreciation/(depreciation)
of
futures
as
of
October
31,
2023,
which
is
reflected
in
the
Consolidated
Statement
of
Assets
and
Liabilities
under
the
caption
“Total
distributable
earnings/(losses).”
The
current
day’s
variation
margin
as
of
October
31,
2023,
if
any,
is
reflected
in
the
Consolidated
Statement
of
Assets
and
Liabilities
under
the
caption
“Receivable/Payable
for
variation
margin
on
futures
contracts.”
The
impact
of
the
use
of
these
derivative
instruments
on
the
Consolidated
Statement
of
Operations
during
the year
ended
October
31,
2023,
was
as
follows:
While
the
Fund
may
receive
rights
and
warrants
in
connection
with
its
investments
in
securities,
these
rights
and
warrants
are
not
considered
“derivative
instruments”
under
ASC
815.
15
Offsetting
assets
and
liabilities:
The
Fund
is
required
to
disclose
both
gross
and
net
information
for
assets
and
liabilities
related
to
over
the
counter
derivatives,
repurchase
and
reverse
repurchase
agreements,
and
securities
lending
and
securities
borrowing
transactions
that
are
eligible
for
offset
or
subject
to
an
enforceable
master
netting
or
similar
agreement.
The
Fund’s
over
the
counter
derivative
assets
and
liabilities
at
fair
value
by
type
are
reported
gross
in
the
Consolidated
Statement
of
Assets
and
Liabilities.
The
following
tables
present
the
Fund’s
derivative
assets
and
liabilities
by
counterparty,
net
of
amounts
available
for
offset
under
a
master
netting
or
similar
agreement
and
net
of
the
related
collateral
received
by
the
Fund
for
assets
and
pledged
by
the
Fund
for
liabilities
as
of
October
31,
2023.
Net
Realized
Gain/
(Loss)
on
Derivatives
(1)
Change
in
Net
Unrealized
Appreciation/
(Depreciation)
on
Derivatives
(2)
Over
the
counter
swaps
Equity
risk
$
425,369
$
(251,412)
Futures
Interest
rate
risk
(571,392)
324,710
Foreign
currency
risk
(759,440)
21,597
Equity
risk
(681,206)
195,766
Commodity
risk
(902,669)
54,138
Total
Futures
(2,914,707)
596,211
Forward
contracts
Foreign
currency
risk
(759,225)
(65,351)
Options
purchased
Equity
risk
(25,286)
–
Options
written
Equity
risk
4,942
(137)
(1)
Net
realized
gain/(loss)
on
derivatives
is
located
in
the
Consolidated
Statement
of
Operations
each
under
the
caption,
"Net
realized
gain/(loss)
on:"
Forward
contracts
Settlement
of
forward
foreign
currency
contracts
Futures
r
Expiration
or
closing
of
futures
contracts
Swaps
Expiration
or
closing
of
swap
contracts
Options
purchased
Transactions
in
investment
securities
of
unaffiliated
issuers
Options
written
Expiration
or
closing
of
option
contracts
written
(2)
Change
in
net
unrealized
appreciation/(depreciation)
is
located
in
the
Consolidated
Statement
of
Operations
each
under
the
caption,
"Change
in
net
unrealized
appreciation/(depreciation)
in
value
of:"
Forward
contracts
Forward
foreign
currency
contracts
Futures
r
Futures
contracts
Swaps
r
Swap
contracts
Options
purchased
r
Investment
securities
of
unaffiliated
issuers
Options
written
r
Option
contracts
written
o
16
Indemnifications:
Like
many
other
companies,
the
Trust’s
organizational
documents
provide
that
its
officers
(“Officers”)
and
trustees
(“Trustees”)
are
indemnified
against
certain
liabilities
arising
out
of
the
performance
of
their
duties
to
the
Trust.
In
addition,
both
in
some
of
its
principal
service
contracts
and
in
the
normal
course
of
its
business,
the
Trust
enters
into
contracts
that
provide
indemnifications
to
other
parties
for
certain
types
of
losses
or
liabilities.
The
Trust’s
maximum
exposure
under
these
arrangements
is
unknown
as
this
could
involve
future
claims
against
the
Trust.
17
Expense
offset
arrangement:
The
Fund
has
an
expense
offset
arrangement
in
connection
with
its
custodian
contract.
For
the
year
ended
October
31,
2023,
the
impact
of
this
arrangement
was
a
reduction
in
expenses
of
$134.
18
Other:
All
net
investment
income
and
realized
and
unrealized
capital
gains
and
losses
of
the
Fund
are
allocated,
on
the
basis
of
relative
net
assets,
pro
rata
among
its
respective
classes.
Note
B—Investment
Management
Fees,
Administration
Fees,
Distribution
Arrangements,
and
Other
Transactions
with
Affiliates:
The
Fund
retains
NBIA
as
its
investment
manager
under
a
Management
Agreement.
For
such
investment
management
services,
the
Fund
pays
NBIA
an
investment
management
fee
at
the
annual
rate
of
1.700%
of
the
first
$250
million
of
the
Fund’s
average
daily
net
assets,
1.675%
of
the
next
$250
million,
1.650%
of
the
next
$250
million,
1.625%
of
the
next
$250
million,
1.600%
of
the
next
$500
million,
1.575%
of
the
next
$2.5
billion,
and
1.550%
of
average
daily
net
assets
in
excess
of
$4
billion.
NBIA
has
contractually
agreed
to
waive
its
Class
E
management
fee
for
the
Fund.
This
undertaking
lasts
until
October
31,
2024
and
may
not
be
terminated
during
its
term
without
the
consent
of
the
Board.
Management
fees
contractually
waived
pursuant
to
this
waiver
for
Class
E
are
not
subject
to
recovery
by
NBIA.
For
the
year
ended
October
31,
2023,
the
total
amount
of
management
fees
waived
was $42,119,
which
is
equivalent
to
an
annualized
percentage
rate
of
1.70%
of
Class
E’s
average
daily
net
assets.
Accordingly,
for
the
year
ended
October
31,
2023,
the
investment
management
fee
pursuant
to
the
Description
Gross
Amounts
of
Assets
Presented
in
the
Consolidated
Statement
of
Assets
and
Liabilities
Gross
Amounts
of
Liabilities
Presented
in
the
Consolidated
Statement
of
Assets
and
Liabilities
Over
the
counter
swap
contracts
$645,686
$(1,737,826)
Forward
contracts
916,931
(698,078)
Total
$1,562,617
$(2,435,904)
Gross
Amounts
Not
Offset
in
the
Consolidated
Statement
of
Assets
and
Liabilities:
Assets
Liabilities
Counterparty
Gross
Amounts
Presented
in
the
Consolidated
Statement
of
Assets
and
Liabilities
Liabilities
Available
for
Offset
Collateral
Received
(a)
Net
Amount
(b)
Gross
Amounts
Presented
in
the
Consolidated
Statement
of
Assets
and
Liabilities
Assets
Available
for
Offset
Collateral
Pledged
(a)
Net
Amount
(b)
SG
$884,775
$(677,483)
$–
$207,292
$(677,483)
$677,483
$–
$–
JPM
174,188
(153,062)
–
21,126
(153,062)
153,062
–
–
MS
503,654
(503,654)
–
–
(1,605,359)
503,654
1,101,705
–
Total
$1,562,617
$(1,334,199)
$–
$228,418
$(2,435,904)
$1,334,199
$1,101,705
$–
(a)
Collateral
received
(or
pledged)
is
limited
to
an
amount
not
to
exceed
100%
of
the
net
amount
of
assets
(or
liabilities)
in
the
tables
presented
above,
for
each
respective
counterparty.
(b)
A
net
amount
greater
than
zero
represents
amounts
subject
to
loss
as
of
October
31,
2023,
in
the
event
of
a
counterparty
failure.
A
net
amount
less
than
zero
represents
amounts
under-collateralized
to
each
counterparty
as
of
October
31,
2023.
Management
Agreement
was
equivalent
to
an
annual
net
effective
rate
of
1.70%
of
the
Fund’s
average
daily
net
assets.
The
Fund
retains
NBIA
as
its
administrator
under
an
Administration
Agreement.
The
administration
fee
is
assessed
at
the
Class
level
and
each
share
class
of
the
Fund,
as
applicable,
pays
NBIA
an
annual
administration
fee
equal
to
the
following:
0.15%
for
Institutional
Class;
0.26%
for
each
of
Class
A
and
Class
C;
0.05%
for
Class
R6,
each
as
a
percentage
of
its
average
daily
net
assets.
Class
E
shares
do
not
pay
an
administration
fee.
Additionally,
NBIA
retains
JPM
as
its
sub-administrator
under
a
Sub-Administration
Agreement.
NBIA
pays
JPM
a
fee
for
all
services
received
under
the
Sub-Administration
Agreement.
NBIA
has
contractually
agreed
to
waive
fees
and/or
reimburse
certain
expenses
of
the
Institutional
Class,
Class
A,
Class
C
and
Class
R6
so
that
the
total
annual
operating
expenses
of
those
classes
do
not
exceed
the
expense
limitations
as
detailed
in
the
following
table.
These
undertakings
exclude
interest,
brokerage
commissions,
acquired
fund
fees
and
expenses,
extraordinary
expenses,
taxes,
including
any
expenses
related
to
tax
reclaims
and
dividend
and
interest
expenses
relating
to
short
sales,
if
any
(commitment
fees
relating
to
borrowings
are
treated
as
interest
for
purposes
of
this
exclusion)
("annual
operating
expenses");
consequently,
net
expenses
may
exceed
the
contractual
expense
limitations.
The
expenses
of
the
Subsidiary
are
included
in
the
total
expenses
used
to
calculate
the
reimbursement,
which
the
Fund
has
agreed
to
share
with
the
Subsidiary.
For
the
year
ended
October
31,
2023,
these
Subsidiary
expenses
amounted
to
$139,987.
At
October
31,
2023,
the
Fund’s
contingent
liabilities
to
NBIA
under
the
agreements
were
as
follows:
The
Fund
has
agreed
that
each
of
its
respective
classes
will
repay
NBIA
for
fees
and
expenses
waived
or
reimbursed
for
that
class
provided
that
repayment
does
not
cause
that
class's
annual
operating
expenses
to
exceed
its
contractual
expense
limitation
in
place
at
the
time
the
fees
and
expenses
were
waived
or
reimbursed,
or
the
expense
limitation
in
place
at
the
time
the
Fund
repays
NBIA,
whichever
is
lower.
Any
such
repayment
must
be
made
within
three
years
after
the
year
in
which
NBIA
incurred
the
expense.
During
the
year
ended
October
31,
2023,
there
was
no
repayment
to
NBIA
under
these
agreements.
At
October
31,
2023,
NBIA
engaged
BH-DG
Systematic
Trading
LLP,
GAMCO
Asset
Management
Inc.,
P/E
Global,
LLC
and
Portland
Hill
Asset
Management
Limited
as
subadvisers
of
the
Fund
to
provide
investment
advisory
services.
NBIA
compensates
the
subadvisers
out
of
the
investment
management
fees
it
receives
from
the
Fund.
The
Fund
also
has
a
distribution
agreement
with
Neuberger
Berman
BD
LLC
(the
“Distributor”)
with
respect
to
each
class
of
shares.
The
Distributor
acts
as
agent
in
arranging
for
the
sale
of
class
shares
without
sales
commission
or
other
compensation,
except
as
described
below
for
Class
A
and
Class
C
shares,
and
bears
the
advertising
and
promotion
expenses.
However,
the
Distributor
receives
fees
from
Class
A
and
Class
C
under
their
distribution
plans
(each
a
“Plan”,
collectively,
the
“Plans”)
pursuant
to
Rule
12b-1
under
the
1940
Act.
The
Plans
provide
that,
as
compensation
for
administrative
and
other
services
provided
to
these
classes,
the
Distributor’s
activities
Expenses
Reimbursed
In
the
Year
Ended
October
31,
2021
2022
2023
Subject
to
Repayment
until
October
31,
Contractual
Expense
Limitation
(1)
Expiration
2024
2025
2026
Institutional
Class
1.97%
10/31/26
$
522,331
$
466,613
$
590,513
Class
A
2.33%
10/31/26
52,624
50,562
39,409
Class
C
3.08%
10/31/26
29,872
19,300
13,600
Class
R6
1.87%
10/31/26
20,018
31,554
1,357
(1)
Expense
limitation
per
annum
of
the
respective
class'
average
daily
net
assets.
and
expenses
related
to
the
sale
and
distribution
of
these
classes,
and
ongoing
services
provided
to
investors
in
these
classes,
the
Distributor
receives
from
each
of
these
classes
a
fee
at
the
annual
rate
of
0.25%
of
Class
A’s
and
1.00%
of
Class
C’s
average
daily
net
assets.
The
Distributor
receives
this
amount
to
provide
distribution
and
shareholder
servicing
for
these
classes
and
pays
a
portion
of
it
to
institutions
that
provide
such
services.
Those
institutions
may
use
the
payments
for,
among
other
purposes,
compensating
employees
engaged
in
sales
and/or
shareholder
servicing.
The
amount
of
fees
paid
by
each
class
during
any
year
may
be
more
or
less
than
the
cost
of
distribution
and
other
services
provided
to
that
class.
FINRA
rules
limit
the
amount
of
annual
distribution
fees
that
may
be
paid
by
a
mutual
fund
and
impose
a
ceiling
on
the
cumulative
distribution
fees
paid.
The
Trust’s
Plans
comply
with
those
rules.
Class
A
shares
of
the
Fund
are
generally
sold
with
an
initial
sales
charge
of
up
to
5.75%
and
no
contingent
deferred
sales
charge
(“CDSC”),
except
that
a
CDSC
of
1.00%
applies
to
certain
redemptions
made
within
18
months
following
purchases
of
$1
million
or
more
without
an
initial
sales
charge.
Class
C
shares
of
the
Fund
are
sold
with
no
initial
sales
charge
and
a
1.00%
CDSC
if
shares
are
sold
within
one
year
after
purchase.
For
the
year
ended
October
31,
2023,
the
Distributor,
acting
as
underwriter
and
broker-dealer,
received
net
initial
sales
charges
from
the
purchase
of
Class
A
shares
and
CDSCs
from
the
redemption
of
Class
A
and
Class
C
shares
as
follows:
Note
C—Securities
Transactions:
During
the
year
ended
October
31,
2023,
there
were
purchase
and
sale
transactions
of
long-term
securities
(excluding
swaps,
forward
contracts,
futures
and
written
option
contracts)
as
follows:
During
the
year
ended
October
31,
2023,
no
brokerage
commissions
on
securities
transactions
were
paid
to
affiliated
brokers.
Note
D—Fund
Share
Transactions:
Share
activity
for
the
years
ended
October
31,
2023,
and
October
31,
2022,
was
as
follows:
Underwriter
Broker-Dealer
Net
Initial
Sales
Charge
CDSC
Net
Initial
Sales
Charge
CDSC
Class
A
$3,715
$—
$—
$—
Class
C
—
250
—
—
Purchases
of
U.S.
Government
and
Agency
Obligations
Purchases
excluding
U.S.
Government
and
Agency
Obligations
Securities
Sold
Short
excluding
U.S.
Government
and
Agency
Obligations
Sales
and
Maturities
of
U.S.
Government
and
Agency
Obligations
Sales
and
Maturities
excluding
U.S.
Government
and
Agency
Obligations
Covers
on
Securities
Sold
Short
excluding
U.S.
Government
and
Agency
Obligations
–
$–
$92,717,871
$23,721,694
$–
$90,282,534
$29,258,524
For
the
Year
Ended
October
31,
2023
For
the
Year
Ended
October
31,
2022
Shares
Sold
Shares
Issued
on
Reinvestment
of
Dividends
and
Distributions
Shares
Redeemed
Total
Shares
Sold
Shares
Issued
on
Reinvestment
of
Dividends
and
Distributions
Shares
Redeemed
Total
Institutional
Class
7,940,939
310,502
(9,179,382)
(927,941)
7,053,667
7,933
(2,000,324)
5,061,276
Class
A
156,261
15,341
(221,872)
(50,270)
223,834
—
(124,826)
99,008
Class
C
62,487
4,002
(101,658)
(35,169)
76,488
—
(106,389)
(29,901)
Class
R6
12,285
—
(333,280)
(320,995)
256,986
996
(238,415)
19,567
Class
E
82,253
7,285
(74,477)
15,061
200,163
—
(13,462)
186,701
(a)
(a)
Period
from
January
11,
2022
(Commencement
of
Operations)
to
October
31,
2022.
Other:
At
October
31,
2023,
there
were
no
affiliated
persons,
as
defined
in
the
1940
Act,
owning
the
Fund’s
outstanding
shares.
Note
E—Line
of
Credit:
At
October
31,
2023,
the
Fund
was
a
participant
in
a
syndicated
committed,
unsecured
$700,000,000
line
of
credit
(the
“Credit
Facility”),
to
be
used
only
for
temporary
or
emergency
purposes.
Series
of
other
investment
companies
managed
by
NBIA
also
participate
in
this
line
of
credit
on
substantially
the
same
terms.
Interest
is
charged
on
borrowings
under
the
Credit
Facility
at
the
highest
of
(a)
a
federal
funds
effective
rate
plus
1.00%
per
annum,
(b)
a
daily
simple
Secured
Overnight
Financing
Rate
(“SOFR”)
plus
1.10%
per
annum, or
(c)
an
overnight
bank
funding
rate
plus
1.00%
per
annum.
The
Credit
Facility
has
an
annual
commitment
fee
of
0.15%
per
annum
of
the
available
line
of
credit,
which
is
paid
quarterly.
The
Fund
has
agreed
to
pay
its
pro
rata
share
of
the
annual
commitment
fee,
based
on
the
ratio
of
its
individual
net
assets
to
the
net
assets
of
all
participants
at
the
time
the
fee
is
due,
and
interest
charged
on
any
borrowing
made
by
the
Fund
and
other
costs
incurred
by
the
Fund.
Because
several
funds
participate
in
the
Credit
Facility,
there
is
no
assurance
that
the
Fund
will
have
access
to
all
or
any
part
of
the
$700,000,000
at
any
particular
time.
There
were
no
loans
outstanding
under
the
Credit
Facility
at
October
31,
2023.
During
the
year
ended
October
31,
2023,
the
Fund
did
not
utilize
the
Credit
Facility.
Note
F—Recent
Accounting
Pronouncement:
In
June
2022,
FASB
issued
Accounting
Standards
Update
No.
2022-03,
“Fair
Value
Measurement
of
Equity
Securities
Subject
to
Contractual
Sale
Restrictions”
(“ASU
2022-03”).
ASU
2022-03
clarifies
the
guidance
in
ASC
820,
related
to
the
measurement
of
the
fair
value
of
an
equity
security
subject
to
contractual
sale
restrictions,
where
it
eliminates
the
ability
to
apply
a
discount
to
the
fair
value
of
these
securities,
and
introduces
disclosure
requirements
related
to
such
equity
securities.
The
guidance
is
effective
for
fiscal
years,
and
interim
periods
within
those
fiscal
years,
beginning
after
December
15,
2023,
and
allows
for
early
adoption.
Management
is
currently
evaluating
the
impact
of
applying
this
update.
In
December
2022,
the
FASB
issued
Accounting
Standards
Update
No.
2022-06,
“Reference
Rate
Reform
(Topic
848)”
(“ASU
2022-06”),
which
is
an
update
to
Accounting
Standards
Update
No.
2021-
01,
“Reference
Rate
Reform
(Topic
848)”
(“ASU
2021-01”)
and
defers
the
sunset
date
for
applying
the
reference
rate
reform
relief
in
Topic
848.
ASU
2021-01
is
an
update
of
ASU
2020-04,
which
is
in
response
to
concerns
about
structural
risks
of
interbank
offered
rates,
and
particularly
the
risk
of
cessation
of
LIBOR.
Regulators
have
undertaken
reference
rate
reform
initiatives
to
identify
alternative
reference
rates
that
are
more
observable
or
transaction
based
and
less
susceptible
to
manipulation.
ASU
2020-04
provides
optional
guidance
for
a
limited
period
of
time
to
ease
the
potential
burden
in
accounting
for
(or
recognizing
the
effects
of)
reference
rate
reform
on
financial
reporting.
ASU
2020-04
is
elective
and
applies
to
all
entities,
subject
to
meeting
certain
criteria,
that
have
contracts,
hedging
relationships,
and
other
transactions
that
reference
LIBOR
or
another
reference
rate
expected
to
be
discontinued
because
of
reference
rate
reform.
The
ASU
2021-01
update
clarifies
that
certain
optional
expedients
and
exceptions
in
Topic
848
for
contract
modifications
and
hedge
accounting
apply
to
derivatives
that
are
affected
by
the
discounting
transition.
The
amendments
in
this
update
are
effective
immediately
through
December
31,
2024,
for
all
entities.
Management
is
currently
evaluating
the
implications,
if
any,
of
the
additional
requirements
and
its
impact
on
the
Fund’s
consolidated
financial
statements.
Note
G—Subsequent
Event:
On
December
14,
2023,
the
Board
approved
the
addition
of Crabel
Capital
Management,
LLC
(“Crabel”)
as
a
new
sub-adviser
to
the
Fund
utilizing
a
managed
futures
strategy.
Once
the
Sub-Advisory
Agreement
is
executed,
a
portion
of
the
Fund's
assets
may
be
allocated
to
Crabel.
Consolidated
Financial
Highlights
Absolute
Return
Multi-Manager
Fund
See
Notes
to
Consolidated
Financial
Highlights
The
following
tables
include
selected
data
for
a
share
outstanding
throughout
each
period
and
other
performance
information
derived
from
the
Consolidated
Financial
Statements.
Amounts
that
do
not
round
to
$0.01
or
$(0.01)
per
share
are
presented
as
$0.00
or
$(0.00),
respectively.
Ratios
that
do
not
round
to
0.01%
or
(0.01)%
are
presented
as
0.00%
or
(0.00)%,
respectively.
Net
Assets
with
a
zero
balance,
if
any,
may
reflect
actual
amounts
rounding
to
less
than
$0.1
million.
A
“—”
indicates
that
the
line
item
was
not
applicable
in
the
corresponding
period.
Net
Asset
Value,
Beginning
of
Year
Net
Investment
Income/
(Loss)
@
Net
Gains
or
Losses
on
Securities
(both
realized
and
unrealized)
Total
From
Investment
Operations
Dividends
from
Net
Investment
Income
Distributions
from
Net
Realized
Capital
Gains
Total
Distributions
Institutional
Class
10/31/2023
$11.87
$0.19
$(0.07)
$0.12
$(0.31)
$—
$(0.31)
10/31/2022
$11.40
$(0.11)
$0.60
$0.49
$(0.02)
$—
$(0.02)
10/31/2021
$10.80
$(0.13)
$0.92
$0.79
$(0.19)
$—
$(0.19)
10/31/2020
$10.97
$0.01
$0.21
$0.22
$(0.39)
$—
$(0.39)
10/31/2019
$10.71
$0.08
$0.19
$0.27
$(0.01)
$—
$(0.01)
Class
A
10/31/2023
$11.62
$0.15
$(0.07)
$0.08
$(0.27)
$—
$(0.27)
10/31/2022
$11.19
$(0.15)
$0.58
$0.43
$—
$—
$—
10/31/2021
$10.60
$(0.18)
$0.92
$0.74
$(0.15)
$—
$(0.15)
10/31/2020
$10.78
$(0.03)
$0.20
$0.17
$(0.35)
$—
$(0.35)
10/31/2019
$10.55
$0.04
$0.19
$0.23
$—
$—
$—
Class
C
10/31/2023
$10.90
$0.06
$(0.06)
$—
$(0.19)
$—
$(0.19)
10/31/2022
$10.58
$(0.23)
$0.55
$0.32
$—
$—
$—
10/31/2021
$10.03
$(0.23)
$0.85
$0.62
$(0.07)
$—
$(0.07)
10/31/2020
$10.20
$(0.10)
$0.20
$0.10
$(0.27)
$—
$(0.27)
10/31/2019
$10.06
$(0.03)
$0.17
$0.14
$—
$—
$—
Class
R6
10/31/2023
$11.88
$0.15
$(0.02)
$0.13
$(0.33)
$—
$(0.33)
10/31/2022
$11.41
$(0.11)
$0.61
$0.50
$(0.03)
$—
$(0.03)
10/31/2021
$10.81
$(0.14)
$0.94
$0.80
$(0.20)
$—
$(0.20)
10/31/2020
$10.98
$0.01
$0.21
$0.22
$(0.39)
$—
$(0.39)
10/31/2019
$10.71
$0.09
$0.19
$0.28
$(0.01)
$—
$(0.01)
Class
E
10/31/2023
$11.97
$0.36
$(0.07)
$0.29
$(0.44)
$—
$(0.44)
Period
from
01/11/2022
^
to
10/31/2022
$11.17
$(0.01)
$0.81
$0.80
$—
$—
$—
Net
Asset
Value,
End
of
Year
Total
Return
†d
Net
Assets,
End
of
Year
(in
millions)
Ratio
of
Gross
Expenses
to
Average
Net
Assets
#
Ratio
of
Gross
Expenses
to
Average
Net
Assets
(excluding
dividend
and
interest
expense
relating
to
short
sales)
#
Ratio
of
Net
Expenses
to
Average
Net
Assets
Ø
Ratio
of
Net
Expenses
to
Average
Net
Assets
(excluding
dividend
and
interest
expense
relating
to
short
sales)
Ø
Ratio
of
Net
Investment
Income/
(Loss)
to
Average
Net
Assets
Portfolio
Turnover
Rate
(including
securities
sold
short)
Portfolio
Turnover
Rate
(excluding
securities
sold
short)
$11.68
1.12%
$111.1
2.45%
2.46%
1.97%
1.97%
1.66%
201%
178%
$11.87
4.30%
$124.0
2.93%
2.67%
2.24%
1.98%
(0.97)%
204%
204%
$11.40
7.40%
$61.4
2.94%
2.74%
2.17%
1.97%
(1.16)%
296%
308%
$10.80
2.01%
$84.5
2.69%
2.54%
2.12%
1.97%
0.10%
230%
219%
$10.97
2.48%
$157.6
2.59%
2.27%
2.30%
1.98%
0.77%
248%
246%
$11.43
0.79%
$7.6
2.81%
2.82%
2.33%
2.33%
1.32%
201%
178%
$11.62
3.84%
$8.3
3.29%
3.02%
2.58%
2.31%
(1.37)%
204%
204%
$11.19
7.07%
$6.9
3.32%
3.11%
2.54%
2.33%
(1.60)%
296%
308%
$10.60
1.58%
$6.6
3.22%
3.08%
2.47%
2.33%
(0.32)%
230%
219%
$10.78
2.18%
$7.3
2.98%
2.65%
2.67%
2.33%
0.40%
248%
246%
$10.71
0.01%
$2.4
3.59%
3.59%
3.08%
3.08%
0.57%
201%
178%
$10.90
3.02%
$2.8
4.08%
3.82%
3.35%
3.08%
(2.16)%
204%
204%
$10.58
6.23%
$3.0
4.07%
3.87%
3.29%
3.08%
(2.24)%
296%
308%
$10.03
0.96%
$4.7
3.82%
3.67%
3.23%
3.08%
(0.98)%
230%
219%
$10.20
1.39%
$7.7
3.71%
3.39%
3.40%
3.09%
(0.33)%
248%
246%
$11.68
1.13%
$0.1
2.64%
2.33%
2.19%
1.87%
1.27%
201%
178%
$11.88
4.40%
$4.0
2.86%
2.59%
2.14%
1.87%
(1.00)%
204%
204%
$11.41
7.50%
$3.6
2.87%
2.66%
2.07%
1.87%
(1.27)%
296%
308%
$10.81
2.10%
$1.6
2.59%
2.45%
2.01%
1.87%
0.07%
230%
219%
$10.98
2.64%
$1.4
2.55%
2.21%
2.22%
1.88%
0.84%
248%
246%
$11.82
2.53%
$2.4
2.31%
2.31%
0.60%
0.61%
3.07%
201%
178%
$11.97
7.16%*
$2.2
2.99%**
2.66%**
1.29%**
0.96%**
(0.12)%**
204%*
ØØ
204%*
ØØ
Notes
to
Consolidated
Financial
Highlights
Absolute
Return
Multi-Manager
Fund
C
@
Calculated
based
on
the
average
number
of
shares
outstanding
during
each
fiscal
period.
†
Total
return
based
on
per
share
NAV
reflects
the
effects
of
changes
in
NAV
on
the
performance
of
the
Fund
during
each
fiscal
period.
Returns
assume
income
dividends
and
other
distributions,
if
any,
were
reinvested,
but
do
not
reflect
the
effect
of
sales
charges.
Results
represent
past
performance
and
do
not
indicate
future
results.
Current
returns
may
be
lower
or
higher
than
the
performance
data
quoted.
Investment
returns
and
principal
will
fluctuate
and
shares,
when
redeemed,
may
be
worth
more
or
less
than
original
cost.
Total
return
would
have
been
lower
if
Management
had
not
reimbursed
and/
or
waived
certain
expenses.
Total
return
would
have
been
higher
if
Management
had
not
recouped
previously
reimbursed
and/or
waived
expenses.
d
The
class
action
proceeds
listed
in
Note
A
of
the
Notes
to
Consolidated
Financial
Statements
had
no
impact
on
the
Fund's
total
return
for
the
year
ended
October
31,
2023.
Had
the
Fund
not
received
class
action
proceeds
in
2021,
the
total
returns
based
on
per
share
NAV
for
the
year
ended
October
31,
2021
would
have
been:
Institutional
Class
6.84%
Class
A
6.59%
Class
C
5.63%
Class
R6
7.13%
The
class
action
proceeds
received
in
2022,
2020,
2019,
and
2018
had
no
impact
on
the
Fund's
total
returns
for
the
years
ended
October
31,
2022,
2020,
2019,
and
2018.
#
Represents
the
annualized
ratios
of
net
expenses
to
average
daily
net
assets
if
Management
had
not
reimbursed
certain
expenses
and/or
waived
a
portion
of
the
investment
management
fee.
*
Not
annualized.
**
Annualized.
^
The
date
investment
operations
commenced.
Including
dividend
and
interest
expense
relating
to
short
sales
Excluding
dividend
and
interest
expense
relating
to
short
sales
(a)
Period
from
January
11,
2022
(Commencement
of
Operations)
to
October
31,
2022.
Ø
After
reimbursement
of
expenses
and/or
waiver
of
a
portion
of
the
investment
management
fee
by
Management.
The
Fund
is
required
to
calculate
an
expense
ratio
without
taking
into
consideration
any
expense
reductions
related
to
expense
offset
arrangements
(see
Note
A
in
the
Notes
to
Consolidated
Financial
Statements).
Had
the
Fund
not
received
expense
reductions
related
to
expense
offset
arrangements,
the
annualized
ratios
of
net
expenses
to
average
daily
net
assets
would
have
been:
ØØ
Portfolio
turnover
is
calculated
at
the
Fund
level.
Percentage
indicated
was
calculated
for
the
year
ended
October
31,
2022
for
the
Fund.
Report
of
Independent
Registered
Public
Accounting
Firm
To
the
Shareholders
and
Board
of
Trustees
of
Neuberger
Berman
Absolute
Return
Multi-Manager
Fund
Opinion
on
the
Financial
Statements
We
have
audited
the
accompanying
consolidated
statement
of
assets
and
liabilities
of
Neuberger
Berman
Absolute
Return
Multi-Manager
Fund
(the
“Fund”)
(one
of
the
series
constituting
Neuberger
Berman
Alternative
Funds
(the
“Trust”)),
including
the
consolidated
schedule
of
investments,
as
of
October
31,
2023
and
the
related
consolidated
statement
of
operations
for
the
year
then
ended,
the
consolidated
statements
of
changes
in
net
assets
for
each
of
the
two
years
in
the
period
then
ended,
the
consolidated
financial
highlights
for
each
of
the
five
years
in
the
period
then
ended
and
the
related
notes
(collectively
referred
to
as
the
“financial
statements”).
In
our
opinion,
the
financial
statements
present
fairly,
in
all
material
respects,
the
consolidated
financial
position
of
the
Fund
(one
of
the
series
constituting
Neuberger
Berman
Alternative
Funds)
at
October
31,
2023,
the
consolidated
results
of
its
operations
for
the
year
ended,
the
consolidated
changes
in
net
assets
for
each
of
the
two
years
in
the
period
then
ended
and
its
consolidated
financial
highlights
for
each
of
the
five
years
in
the
period
then
ended,
in
conformity
with
U.S.
generally
accepted
accounting
principles.
Basis
for
Opinion
These
financial
statements
are
the
responsibility
of
the
Trust’s
management.
Our
responsibility
is
to
express
an
opinion
on
the
Fund’s
financial
statements
based
on
our
audits.
We
are
a
public
accounting
firm
registered
with
the
Public
Company
Accounting
Oversight
Board
(United
States)
(“PCAOB”)
and
are
required
to
be
independent
with
respect
to
the
Trust
in
accordance
with
the
U.S.
federal
securities
laws
and
the
applicable
rules
and
regulations
of
the
Securities
and
Exchange
Commission
and
the
PCAOB.
We
conducted
our
audits
in
accordance
with
the
standards
of
the
PCAOB.
Those
standards
require
that
we
plan
and
perform
the
audit
to
obtain
reasonable
assurance
about
whether
the
financial
statements
are
free
of
material
misstatement,
whether
due
to
error
or
fraud.
The
Trust
is
not
required
to
have,
nor
were
we
engaged
to
perform,
an
audit
of
the
Trust’s
internal
control
over
financial
reporting.
As
part
of
our
audits,
we
are
required
to
obtain
an
understanding
of
internal
control
over
financial
reporting,
but
not
for
the
purpose
of
expressing
an
opinion
on
the
effectiveness
of
the
Trust’s
internal
control
over
financial
reporting.
Accordingly,
we
express
no
such
opinion.
Our
audits
included
performing
procedures
to
assess
the
risks
of
material
misstatement
of
the
financial
statements,
whether
due
to
error
or
fraud,
and
performing
procedures
that
respond
to
those
risks.
Such
procedures
included
examining,
on
a
test
basis,
evidence
regarding
the
amounts
and
disclosures
in
the
financial
statements.
Our
procedures
included
confirmation
of
securities
owned
as
of
October
31,
2023,
by
correspondence
with
the
custodian,
brokers
and
others;
when
replies
were
not
received
from
brokers
and
others,
we
performed
other
auditing
procedures.
Our
audits
also
included
evaluating
the
accounting
principles
used
and
significant
estimates
made
by
management,
as
well
as
evaluating
the
overall
presentation
of
the
financial
statements.
We
believe
that
our
audits
provide
a
reasonable
basis
for
our
opinion.
We
have
served
as
the
auditor
of
one
or
more
Neuberger
Berman
investment
companies
since
1954.
Boston,
Massachusetts
December
22,
2023
Investment
Manager
and
Administrator
Neuberger
Berman
Investment
Advisers
LLC
1290
Avenue
of
the
Americas
New
York,
NY
10104-0002
Shareholder
Services
800.877.9700
or
212.476.8800
Intermediary
Client
Services
800.366.6264
Distributor
Neuberger
Berman
BD
LLC
1290
Avenue
of
the
Americas
New
York,
NY
10104-0002
Shareholder
Services
800.877.9700
or
212.476.8800
Intermediary
Client
Services
800.366.6264
Subadvisers
BH-DG
Systematic
Trading
LLP
55
Baker
Street
London
W1U
7EU,
United
Kingdom
Crabel
Capital
Management,
LLC*
1999
Avenue
of
the
Stars
Suite
2550
Los
Angeles,
CA
90067
GAMCO
Asset
Management
Inc.
One
Corporate
Center
Rye,
NY
10580
P/E
Global,
LLC
75
State
Street,
31st
Floor
Boston,
MA
02109
Portland
Hill
Asset
Management
Limited
21
Knightsbridge
London
SW1X7LY,
United
Kingdom
Custodian
JPMorgan
Chase
&
Co.
4
Chase
Metrotech
Center
Brooklyn,
NY
11245
Shareholder
Servicing
Agent
SS&C
Global
Investor
&
Distribution
Solutions,
Inc.
430
West
7th
Street,
Suite
219189
Kansas
City,
MO
64105-1407
For
Institutional
Class
Shareholders
address
correspondence
to:
Neuberger
Berman
Funds
PO
Box
219189
Kansas
City,
MO
64121-9189
Intermediary
Client
Services
800.366.6264
For
Class
A,
Class
C
and
Class
R6
Shareholders:
Please
contact
your
investment
provider
Legal
Counsel
K&L
Gates
LLP
1601
K
Street,
NW
Washington,
DC
20006-1600
Independent
Registered
Public
Accounting
Firm
Ernst
&
Young
LLP
200
Clarendon
Street
Boston,
MA
02116
*
Please
refer
to
Note
G
-
Subsequent
Event
for
more
information
The
following
tables
set
forth
information
concerning
the
Trustees
and
Officers
of
the
Fund.
All
persons
named
as
Trustees
and
Officers
also
serve
in
similar
capacities
for
other
funds
administered
or
managed
by
NBIA.
The
Fund’s
Statement
of
Additional
Information
includes
additional
information
about
the
Trustees
as
of
the
time
of
the
Fund’s
most
recent
public
offering
and
is
available
upon
request,
without
charge,
by
calling
(800)
877-9700.
Information
about
the
Board
of
Trustees
Name,
(Year
of
Birth),
and
Address
(1)
Position(s)
and
Length
of
Time
Served
(2)
Principal
Occupation(s)
(3)
Number
of
Funds
in
Fund
Complex
Overseen
by
Fund
Trustee
Other
Directorships
Held
Outside
Fund
Complex
by
Fund
Trustee
(3)
Independent
Fund
Trustees
Michael
J.
Cosgrove
(1949)
Trustee
since
2015
President,
Carragh
Consulting
USA,
since
2014;
formerly,
Executive,
General
Electric
Company,
1970
to
2014,
including
President,
Mutual
Funds
and
Global
Investment
Programs,
GE
Asset
Management,
2011
to
2014,
President
and
Chief
Executive
Officer,
Mutual
Funds
and
Intermediary
Business,
GE
Asset
Management,
2007
to
2011,
President,
Institutional
Sales
and
Marketing,
GE
Asset
Management,
1998
to
2007,
and
Chief
Financial
Officer,
GE
Asset
Management,
and
Deputy
Treasurer,
GE
Company,
1988
to
1993.
47
Member
of
Advisory
Board,
Burke
Neurological
Institute,
since
2021;
Parish
Councilor,
St.
Pius
X,
since
2021;
formerly,
Director,
America
Press,
Inc.
(not-for-profit
Jesuit
publisher),
2015
to
2021;
formerly,
Director,
Fordham
University,
2001
to
2018;
formerly,
Director,
The
Gabelli
Go
Anywhere
Trust,
June
2015
to
June
2016;
formerly,
Director,
Skin
Cancer
Foundation
(not-
for-profit),
2006
to
2015;
formerly,
Director,
GE
Investments
Funds,
Inc.,
1997
to
2014;
formerly,
Trustee,
GE
Institutional
Funds,
1997
to
2014;
formerly,
Director,
GE
Asset
Management,
1988
to
2014;
formerly,
Director,
Elfun
Trusts,
1988
to
2014;
formerly,
Trustee,
GE
Pension
&
Benefit
Plans,
1988
to
2014;
formerly,
Member
of
Board
of
Governors,
Investment
Company
Institute.
Name,
(Year
of
Birth),
and
Address
(1)
Position(s)
and
Length
of
Time
Served
(2)
Principal
Occupation(s)
(3)
Number
of
Funds
in
Fund
Complex
Overseen
by
Fund
Trustee
Other
Directorships
Held
Outside
Fund
Complex
by
Fund
Trustee
(3)
Marc
Gary
(1952)
Trustee
since
2015
Executive
Vice
Chancellor
Emeritus,
The
Jewish
Theological
Seminary,
since
2020;
formerly,
Executive
Vice
Chancellor
and
Chief
Operating
Officer,
The
Jewish
Theological
Seminary,
2012
to
2020;
formerly,
Executive
Vice
President
and
General
Counsel,
Fidelity
Investments,
2007
to
2012;formerly,
Executive
Vice
President
and
General
Counsel,
BellSouth
Corporation,
2004
to
2007;
formerly,
Vice
President
and
Associate
General
Counsel,
BellSouth
Corporation,
2000
to
2004;
formerly,
Associate,
Partner,
and
National
Litigation
Practice
Co-Chair,
Mayer,
Brown
LLP,
1981
to
2000;
formerly,
Associate
Independent
Counsel,
Office
of
Independent
Counsel,
1990
to
1992.
47
Chair
and
Director,
USCJ
Supporting
Foundation,
since
2021;
Director,
UJA
Federation
of
Greater
New
York,
since
2019;
Trustee,
The
Jewish
Theological
Seminary,
since
2015;
Director,
Lawyers
Committee
for
Civil
Rights
Under
Law
(not-for-profit),
since
2005;
formerly,
Director,
Legility,
Inc.
(privately
held
for-profit
company),
2012
to
2021;
formerly,
Director,
Equal
Justice
Works
(not-for-profit),
2005
to
2014;
formerly,
Director,
Corporate
Counsel
Institute,
Georgetown
University
Law
Center,
2007
to
2012;
formerly,
Director,
Greater
Boston
Legal
Services
(not-for-profit),
2007
to
2012.
Name,
(Year
of
Birth),
and
Address
(1)
Position(s)
and
Length
of
Time
Served
(2)
Principal
Occupation(s)
(3)
Number
of
Funds
in
Fund
Complex
Overseen
by
Fund
Trustee
Other
Directorships
Held
Outside
Fund
Complex
by
Fund
Trustee
(3)
Martha
C.
Goss
(1949)
Trustee
since
2007
Formerly,
President,
Woodhill
Enterprises
Inc./Chase
Hollow
Associates
LLC
(personal
investment
vehicle),
2006
to
2020;
formerly,
Consultant,
Resources
Global
Professionals
(temporary
staffing),
2002
to
2006;
formerly,
Chief
Financial
Officer,
Booz-Allen
&
Hamilton,
Inc.,
1995
to
1999;
formerly,
Enterprise
Risk
Officer,
Prudential
Insurance,
1994
to
1995;
formerly,
President,
Prudential
Asset
Management
Company,
1992
to
1994;
formerly,
President,
Prudential
Power
Funding
(investments
in
electric
and
gas
utilities
and
alternative
energy
projects),
1989
to
1992;
formerly,
Treasurer,
Prudential
Insurance
Company,
1983
to
1989.
47
Director,
American
Water
(water
utility),
since
2003;
Director,
Allianz
Life
of
New
York
(insurance),
since
2005;
formerly,
Director,
Berger
Group
Holdings,
Inc.
(engineering
consulting
firm),
2013
to
2018;
formerly,
Director,
Financial
Women’s
Association
of
New
York
(not-for-profit
association),
1987
to
1996,
and
2003
to
2019;
Trustee
Emerita,
Brown
University,
since
1998;
Director,
Museum
of
American
Finance
(not-for-profit),
since
2013;
formerly,
Non-Executive
Chair
and
Director,
Channel
Reinsurance
(financial
guaranty
reinsurance),
2006
to
2010;
formerly,
Director,
Ocwen
Financial
Corporation
(mortgage
servicing),
2005
to
2010;
formerly,
Director,
Claire’s
Stores,
Inc.
(retailer),
2005
to
2007;
formerly,
Director,
Parsons
Brinckerhoff
Inc.
(engineering
consulting
firm),
2007
to
2010;
formerly,
Director,
Bank
Leumi
(commercial
bank),
2005
to
2007;
formerly,
Advisory
Board
Member,
Attensity
(software
developer),
2005
to
2007;
formerly,
Director,
Foster
Wheeler
Manufacturing,
1994
to
2004;
formerly,
Director,
Dexter
Corp.
(Manufacturer
of
Non-
Wovens,
Plastics,
and
Medical
Supplies),
1992
to
2001.
Name,
(Year
of
Birth),
and
Address
(1)
Position(s)
and
Length
of
Time
Served
(2)
Principal
Occupation(s)
(3)
Number
of
Funds
in
Fund
Complex
Overseen
by
Fund
Trustee
Other
Directorships
Held
Outside
Fund
Complex
by
Fund
Trustee
(3)
Ami
Kaplan
(1960)
Trustee
since
2023
Formerly,
Partner,
Deloitte
LLP,
1982
to
2023,
including
Vice
Chair,
2017
to
2020;
formerly,
President
and
Board
Chair,
Women’s
Forum
of
New
York,
2014
to
2016.
47
None.
Michael
M.
Knetter
(1960)
Trustee
since
2007
President
and
Chief
Executive
Officer,
University
of
Wisconsin
Foundation,
since
2010;
formerly,
Dean,
School
of
Business,
University
of
Wisconsin
-
Madison;
formerly,
Professor
of
International
Economics
and
Associate
Dean,
Amos
Tuck
School
of
Business
-
Dartmouth
College,
1998
to
2002.
47
Director,
1WS
Credit
Income
Fund,
since
2018;
Board
Member,
American
Family
Insurance
(a
mutual
company,
not
publicly
traded),
since
March
2009;
formerly,
Trustee,
Northwestern
Mutual
Series
Fund,
Inc.,
2007
to
2011;
formerly,
Director,
Wausau
Paper,
2005
to
2011;
formerly,
Director,
Great
Wolf
Resorts,
2004
to
2009.
Deborah
C.
McLean
(1954)
Trustee
since
2015
Member,
Circle
Financial
Group
(private
wealth
management
membership
practice),
since
2011;
Managing
Director,
Golden
Seeds
LLC
(an
angel
investing
group),
since
2009;
Adjunct
Professor
(Corporate
Finance),
Columbia
University
School
of
International
and
Public
Affairs,
since
2008;
formerly,
Visiting
Assistant
Professor,
Fairfield
University,
Dolan
School
of
Business,
Fall
2007;
formerly,
Adjunct
Associate
Professor
of
Finance,
Richmond,
The
American
International
University
in
London,
1999
to
2007.
47
Board
Member,
The
Maritime
Aquarium
at
Norwalk,
since
2020;
Board
Member,
Norwalk
Community
College
Foundation,
since
2014;
Dean’s
Advisory
Council,
Radcliffe
Institute
for
Advanced
Study,
since
2014;
formerly,
Director
and
Treasurer,
At
Home
in
Darien
(not-for-profit),
2012
to
2014;
formerly,
Director,
National
Executive
Service
Corps
(not-for-profit),
2012
to
2013;
formerly,
Trustee,
Richmond,
The
American
International
University
in
London,
1999
to
2013.
Name,
(Year
of
Birth),
and
Address
(1)
Position(s)
and
Length
of
Time
Served
(2)
Principal
Occupation(s)
(3)
Number
of
Funds
in
Fund
Complex
Overseen
by
Fund
Trustee
Other
Directorships
Held
Outside
Fund
Complex
by
Fund
Trustee
(3)
George
W.
Morriss
(1947)
Trustee
since
2007
Formerly,
Adjunct
Professor,
Columbia
University
School
of
International
and
Public
Affairs,
2012
to
2018;
formerly,
Executive
Vice
President
and
Chief
Financial
Officer,
People’s
United
Bank,
Connecticut
(a
financial
services
company),
1991
to
2001.
47
Director,
1WS
Credit
Income
Fund;
Chair,
Audit
Committee,
since
2018;
Director
and
Chair,
Thrivent
Church
Loan
and
Income
Fund,
since
2018;
formerly,
Trustee,
Steben
Alternative
Investment
Funds,
Steben
Select
Multi-Strategy
Fund,
and
Steben
Select
Multi-
Strategy
Master
Fund,
2013
to
2017;
formerly,
Treasurer,
National
Association
of
Corporate
Directors,
Connecticut
Chapter,
2011
to
2015;
formerly,
Manager,
Larch
Lane
Multi-Strategy
Fund
complex
(which
consisted
of
three
funds),
2006
to
2011;
formerly,
Member,
NASDAQ
Issuers’
Affairs
Committee,
1995
to
2003.
Tom
D.
Seip
(1950)
Trustee
since
2000;
Chairman
of
the
Board
since
2008;
formerly,
Lead
Independent
Trustee
from
2006
to
2008
Formerly,
Managing
Member,
Ridgefield
Farm
LLC
(a
private
investment
vehicle),
2004
to
2016;
formerly,
President
and
CEO,
Westaff,
Inc.
(temporary
staffing),
May
2001
to
January
2002;
formerly,
Senior
Executive,
The
Charles
Schwab
Corporation,
1983
to
1998,
including
Chief
Executive
Officer,
Charles
Schwab
Investment
Management,
Inc.;
Trustee,
Schwab
Family
of
Funds
and
Schwab
Investments,
1997
to
1998;
and
Executive
Vice
President-Retail
Brokerage,
Charles
Schwab
&
Co.,
Inc.,
1994
to
1997.
47
Trustee,
University
of
Maryland,
Shore
Regional
Health
System,
since
2020;
formerly,
Director,
H&R
Block,
Inc.
(tax
services
company),
2001
to
2018;
formerly,
Director,
Talbot
Hospice
Inc.,
2013
to
2016;
formerly,
Chairman,
Governance
and
Nominating
Committee,
H&R
Block,
Inc.,
2011
to
2015;
formerly,
Chairman,
Compensation
Committee,
H&R
Block,
Inc.,
2006
to
2010;
formerly,
Director,
Forward
Management,
Inc.
(asset
management
company),
1999
to
2006.
Franklyn
E.
Smith
(1961)
Trustee
since
2023
Formerly,
Partner,
PricewaterhouseCoopers
LLP,
1989
to
2021.
47
Director,
Zurich
American
Insurance
Company,
since
2023.
Name,
(Year
of
Birth),
and
Address
(1)
Position(s)
and
Length
of
Time
Served
(2)
Principal
Occupation(s)
(3)
Number
of
Funds
in
Fund
Complex
Overseen
by
Fund
Trustee
Other
Directorships
Held
Outside
Fund
Complex
by
Fund
Trustee
(3)
James
G.
Stavridis
(1955)
Trustee
since
2015
Vice
Chairman
Global
Affairs,
The
Carlyle
Group,
since
2018;
Commentator,
NBC
News,
since
2015;
formerly,
Dean,
Fletcher
School
of
Law
and
Diplomacy,
Tufts
University,
2013
to
2018;
formerly,
Admiral,
United
States
Navy,
1976
to
2013,
including
Supreme
Allied
Commander,
NATO
and
Commander,
European
Command,
2009
to
2013,
and
Commander,
United
States
Southern
Command,
2006
to
2009.
47
Director,
Fortinet
(cybersecurity),
since
2021;
Director,
Ankura,
since
2020;
Director,
Vigor
Shipyard,
since
2019;
Director,
Rockefeller
Foundation,
since
2018;
Director,
American
Water
(water
utility),
since
2018;
Director,
NFP
Corp.
(insurance
broker
and
consultant),
since
2017;
Director,
Onassis
Foundation,
since
2014;
Director,
Michael
Baker
International
(construction)
since
2014;
Director,
Vertical
Knowledge,
LLC,
since
2013;
formerly,
Director,
U.S.
Naval
Institute,
2014
to
2019;
formerly,
Director,
Navy
Federal
Credit
Union,
2000
to
2002;
formerly,
Director,
BMC
Software
Federal,
LLC,
2014
to
2019.
(1)
The
business
address
of
each
listed
person
is
1290
Avenue
of
the
Americas,
New
York,
NY
10104.
(2)
Pursuant
to
the
Trust’s
Amended
and
Restated
Trust
Instrument
(“Trust
Instrument”),
subject
to
any
limitations
on
the
term
of
service
imposed
by
the
By-Laws
or
any
retirement
policy
adopted
by
the
Fund
Trustees,
each
Fund
Trustee
shall
hold
office
for
life
or
until
his
or
her
successor
is
elected
or
the
Trust
terminates;
except
that
(a)
any
Fund
Trustee
may
resign
by
delivering
a
written
resignation;
(b)
any
Fund
Trustee
may
be
removed
with
or
without
cause
at
any
time
by
a
written
instrument
signed
by
at
least
two-thirds
of
the
other
Fund
Trustees;
(c)
any
Fund
Trustee
who
requests
to
be
retired,
or
who
has
become
Name,
(Year
of
Birth),
and
Address
(1)
Position(s)
and
Length
of
Time
Served
(2)
Principal
Occupation(s)
(3)
Number
of
Funds
in
Fund
Complex
Overseen
by
Fund
Trustee
Other
Directorships
Held
Outside
Fund
Complex
by
Fund
Trustee
(3)
Fund
Trustees
who
are
“Interested
Persons”
Joseph
V.
Amato*
(1962)
Chief
Executive
Officer
and
President
since
2018
and
Trustee
since
2009
President
and
Director,
Neuberger
Berman
Group
LLC,
since
2009;
President
and
Chief
Executive
Officer,
Neuberger
Berman
BD
LLC
and
Neuberger
Berman
Holdings
LLC
(including
its
predecessor,
Neuberger
Berman
Inc.),
since
2007;
Chief
Investment
Officer
(Equities)
and
President
(Equities),
NBIA
(formerly,
Neuberger
Berman
Fixed
Income
LLC
and
including
predecessor
entities),
since
2007,
and
Board
Member
of
NBIA
since
2006;
formerly,
Global
Head
of
Asset
Management
of
Lehman
Brothers
Holdings
Inc.’s
(“LBHI”)
Investment
Management
Division,
2006
to
2009;
formerly,
member
of
LBHI’s
Investment
Management
Division’s
Executive
Management
Committee,
2006
to
2009;
formerly,
Managing
Director,
Lehman
Brothers
Inc.
(“LBI”),
2006
to
2008;
formerly,
Chief
Recruiting
and
Development
Officer,
LBI,
2005
to
2006;
formerly,
Global
Head
of
LBI’s
Equity
Sales
and
a
Member
of
its
Equities
Division
Executive
Committee,
2003
to
2005;
President
and
Chief
Executive
Officer,
twelve
registered
investment
companies
for
which
NBIA
acts
as
investment
manager
and/or
administrator.
47
Member
of
Board
of
Advisors,
McDonough
School
of
Business,
Georgetown
University,
since
2001;
Member
of
New
York
City
Board
of
Advisors,
Teach
for
America,
since
2005;
Trustee,
Montclair
Kimberley
Academy
(private
school),
since
2007;
Member
of
Board
of
Regents,
Georgetown
University,
since
2013.
unable
to
serve,
may
be
retired
by
a
written
instrument
signed
by
a
majority
of
the
other
Fund
Trustees;
and
(d)
any
Fund
Trustee
may
be
removed
at
any
shareholder
meeting
by
a
vote
of
at
least
two-thirds
of
the
outstanding
shares.
(3)
Except
as
otherwise
indicated,
each
individual
has
held
the
positions
shown
during
at
least
the
last
five
years.
*
Indicates
a
Fund
Trustee
who
is
an
“interested
person”
within
the
meaning
of
the
1940
Act.
Mr.
Amato
is
an
interested
person
of
the
Trust
by
virtue
of
the
fact
that
he
is
an
officer
of
NBIA
and/or
its
affiliates.
Information
about
the
Officers
of
the
Trust
Name,
(Year
of
Birth),
and
Address
(1)
Position(s)
and
Length
of
Time
Served
(2)
Principal
Occupation(s)
(3)
Claudia
A.
Brandon
(1956)
Executive
Vice
President
since
2008
and
Secretary
since
inception
Senior
Vice
President,
Neuberger
Berman,
since
2007
and
Employee
since
1999;
Senior
Vice
President,
NBIA,
since
2008
and
Assistant
Secretary
since
2004;
formerly,
Vice
President,
Neuberger
Berman,
2002
to
2006;
formerly,
Vice
President,
Mutual
Fund
Board
Relations,
NBIA,
2000
to
2008;
formerly,
Vice
President,
NBIA,
1986
to
1999
and
Employee,
1984
to
1999;
Executive
Vice
President
and
Secretary,
thirty-three
registered
investment
companies
for
which
NBIA
acts
as
investment
manager
and/or
administrator.
Agnes
Diaz
(1971)
Vice
President
since
2013
Senior
Vice
President,
Neuberger
Berman,
since
2012;
Senior
Vice
President,
NBIA,
since
2012
and
Employee
since
1996;
formerly,
Vice
President,
Neuberger
Berman,
2007
to
2012;
Vice
President,
twelve
registered
investment
companies
for
which
NBIA
acts
as
investment
manager
and/or
administrator.
Anthony
DiBernardo
(1979)
Assistant
Treasurer
since
2011
Senior
Vice
President,
Neuberger
Berman,
since
2014;
Senior
Vice
President,
NBIA,
since
2014,
and
Employee
since
2003;
formerly,
Vice
President,
Neuberger
Berman,
2009
to
2014;
Assistant
Treasurer,
twelve
registered
investment
companies
for
which
NBIA
acts
as
investment
manager
and/or
administrator.
Savonne
L.
Ferguson
(1973)
Chief
Compliance
Officer
since
2018
Senior
Vice
President,
Chief
Compliance
Officer,
Mutual
Funds,
and
Associate
General
Counsel,
NBIA,
since
November
2018;
formerly,
Vice
President,
T.
Rowe
Price
Group,
Inc.,
2018;
Vice
President
and
Senior
Legal
Counsel,
T.
Rowe
Price
Associates,
Inc.,
2014
to
2018;
Vice
President
and
Director
of
Regulatory
Fund
Administration,
PNC
Capital
Advisors,
LLC,
2009
to
2014;
Secretary,
PNC
Funds
and
PNC
Advantage
Funds,
2010
to
2014;
Chief
Compliance
Officer,
thirty-three
registered
investment
companies
for
which
NBIA
acts
as
investment
manager
and/or
administrator.
Corey
A.
Issing
(1978)
Chief
Legal
Officer
since
2016
(only
for
purposes
of
sections
307
and
406
of
the
Sarbanes-Oxley
Act
of
2002)
General
Counsel,
Mutual
Funds,
since
2016
and
Managing
Director,
NBIA,
since
2017;
formerly,
Associate
General
Counsel,
2015
to
2016;
Counsel,
2007
to
2015;
Senior
Vice
President,
2013
to
2016;
Vice
President,
2009
to
2013;
Chief
Legal
Officer
(only
for
purposes
of
sections
307
and
406
of
the
Sarbanes-Oxley
Act
of
2002),
thirty-three
registered
investment
companies
for
which
NBIA
acts
as
investment
manager
and/or
administrator.
Sheila
R.
James
(1965)
Assistant
Secretary
since
inception
Senior
Vice
President,
Neuberger
Berman,
since
2023
and
Employee
since
1999;
Senior
Vice
President,
NBIA,
since
2023;
formerly,
Vice
President,
Neuberger
Berman,
2008
to
2023;
Assistant
Vice
President,
Neuberger
Berman,
2007;
Employee,
NBIA,
1991
to
1999;
Assistant
Secretary,
thirty-
three
registered
investment
companies
for
which
NBIA
acts
as
investment
manager
and/or
administrator.
Brian
Kerrane
(1969)
Chief
Operating
Officer
since
2015
and
Vice
President
since
2008
Managing
Director,
Neuberger
Berman,
since
2013;
Chief
Operating
Officer,
Mutual
Funds,
and
Managing
Director,
NBIA,
since
2015;
formerly,
Senior
Vice
President,
Neuberger
Berman,
2006
to
2014;
Vice
President,
NBIA,
2008
to
2015
and
Employee
since
1991;
Chief
Operating
Officer,
twelve
registered
investment
companies
for
which
NBIA
acts
as
investment
manager
and/or
administrator;
Vice
President,
thirty-three
registered
investment
companies
for
which
NBIA
acts
as
investment
manager
and/or
administrator.
Anthony
Maltese
(1959)
Vice
President
since
2015
Senior
Vice
President,
Neuberger
Berman,
since
2014
and
Employee
since
2000;
Senior
Vice
President,
NBIA,
since
2014;
Vice
President,
twelve
registered
investment
companies
for
which
NBIA
acts
as
investment
manager
and/or
administrator.
(1)
The
business
address
of
each
listed
person
is
1290
Avenue
of
the
Americas,
New
York,
NY
10104.
(2)
Pursuant
to
the
By-Laws
of
the
Trust,
each
officer
elected
by
the
Fund
Trustees
shall
hold
office
until
his
or
her
successor
shall
have
been
elected
and
qualified
or
until
his
or
her
earlier
death,
inability
to
serve,
or
resignation.
Officers
serve
at
the
pleasure
of
the
Fund
Trustees
and
may
be
removed
at
any
time
with
or
without
cause.
(3)
Except
as
otherwise
indicated,
each
individual
has
held
the
positions
shown
during
at
least
the
last
five
years.
Name,
(Year
of
Birth),
and
Address
(1)
Position(s)
and
Length
of
Time
Served
(2)
Principal
Occupation(s)
(3)
Josephine
Marone
(1963)
Assistant
Secretary
since
2017
Senior
Paralegal,
Neuberger
Berman,
since
2007
and
Employee
since
2007;
Assistant
Secretary,
thirty-three
registered
investment
companies
for
which
NBIA
acts
as
investment
manager
and/or
administrator.
Owen
F.
McEntee,
Jr.
(1961)
Vice
President
since
2008
Vice
President,
Neuberger
Berman,
since
2006;
Vice
President,
NBIA,
since
2006
and
Employee
since
1992;
Vice
President,
twelve
registered
investment
companies
for
which
NBIA
acts
as
investment
manager
and/or
administrator.
John
M.
McGovern
(1970)
Treasurer
and
Principal
Financial
and
Accounting
Officer
since
inception
Managing
Director,
Neuberger
Berman,
since
2022;
Senior
Vice
President,
Neuberger
Berman,
2007
to
2021;
Senior
Vice
President,
NBIA,
since
2007
and
Employee
since
1993;
formerly,
Vice
President,
Neuberger
Berman,
2004
to
2006;
formerly,
Assistant
Treasurer,
2002
to
2005;
Treasurer
and
Principal
Financial
and
Accounting
Officer,
twelve
registered
investment
companies
for
which
NBIA
acts
as
investment
manager
and/or
administrator.
Frank
Rosato
(1971)
Assistant
Treasurer
since
inception
Vice
President,
Neuberger
Berman,
since
2006;
Vice
President,
NBIA,
since
2006
and
Employee
since
1995;
Assistant
Treasurer,
twelve
registered
investment
companies
for
which
NBIA
acts
as
investment
manager
and/or
administrator.
Daniel
Tracer
(1987)
Anti-Money
Laundering
Compliance
Officer
since
2023
Senior
Vice
President
and
Head
of
Financial
Regulation,
Neuberger
Berman,
since
February
2023;
Assistant
United
States
Attorney,
Southern
District
of
New
York,
2016
to
2023;
Trial
Attorney,
Department
of
Justice
Antitrust
Division,
2012
to
2015;
Senior
Anti-Money
Laundering
Compliance
Officer,
five
registered
investment
companies
for
which
NBIA
acts
as
investment
manager
and/or
administrator.
Proxy
Voting
Policies
and
Procedures
A
description
of
the
policies
and
procedures
that
the
Trust
uses
to
determine
how
to
vote
proxies
relating
to
portfolio
securities
is
available,
without
charge,
by
calling
800-877-9700
(toll-free)
and
on
the
SEC’s
website
at
www.sec.gov.
Information
regarding
how
the
Trust
voted
proxies
relating
to
portfolio
securities
during
the
most
recent
12-month
period
ended
June
30
is
also
available
upon
request,
without
charge,
by
calling
800-877-9700
(toll-free),
on
the
SEC’s
website
at
www.sec.gov,
and
on
Neuberger
Berman’s
website
at
www.nb.com.
Quarterly
Portfolio
Schedule
The
Trust
files
a
complete
schedule
of
portfolio
holdings
for
the
Fund
with
the
SEC
for
the
first
and
third
quarters
of
each
fiscal
year
as
an
exhibit
to
its
report
on
Form
N-PORT.
The
Trust’s
Form
N-PORT
is
available
on
the
SEC’s
website
at
www.sec.gov.
The
portfolio
holdings
information
on
Form
N-PORT
is
available
upon
request,
without
charge,
by
calling
800-877-9700
(toll-free).
Liquidity
Risk
Management
Program
Consistent
with
Rule
22e-4
under
the
Investment
Company
Act
of
1940
(the
“Liquidity
Rule”),
as
amended,
the
Fund
has
established
a
liquidity
risk
management
program
(the
“Program”).
The
Program
seeks
to
assess
and
manage
the
Fund’s
liquidity
risk,
which
is
defined
as
the
risk
that
a
Fund
is
unable
to
meet
investor
redemption
requests
without
significantly
diluting
the
remaining
investors’
interests
in
a
Fund.
The
Board
has
approved
the
designation
of
NBIA
Funds’
Liquidity
Committee,
comprised
of
NBIA
employees,
as
the
program
administrator
(the
“Program
Administrator”).
The
Program
Administrator
is
responsible
for
implementing
and
monitoring
the
Program
and
utilizes
NBIA
personnel
to
assess
and
review,
on
an
ongoing
basis,
the
Fund’s
liquidity
risk.
The
Program
includes
a
number
of
elements
that
support
the
management
and
assessment
of
liquidity
risk,
including
an
annual
assessment
of
the
Fund’s
liquidity
risk
factors
and
the
periodic
classification
(or
re-
classification,
as
necessary)
of
the
Fund’s
investments
into
buckets
(highly
liquid,
moderately
liquid,
less
liquid
and
illiquid)
that
reflect
the
Program
Administrator’s
assessment
of
the
investments’
liquidity
under
current
market
conditions,
which
for
the
relevant
period
included,
among
other
factors,
market
volatility
as
a
result
of
geopolitical
tensions
(e.g.,
Russia’s
invasion
of
Ukraine)
and
rising
inflation.
The
Program
Administrator
also
utilizes
information
about
the
Fund’s
investment
strategy,
the
characteristics
of
the
Fund’s
shareholder
base
and
historical
redemption
activity.
The
Program
Administrator
provided
the
Board
with
a
written
report
that
addressed
the
operation
of
the
Program
and
assessed
its
adequacy
and
effectiveness
of
implementation
from
April
1,
2022
through
March
31,
2023.
During
the
period
covered
by
this
report,
the
Program
Administrator
reported
that
the
Program
effectively
assisted
the
Program
Administrator
in
monitoring
whether
a
Fund
maintained
a
level
of
liquidity
appropriate
for
its
shareholder
base
and
historical
redemption
activity.
Notice
to
Shareholders
In
early
2024
you
will
receive
information
to
be
used
in
filing
your
2023
tax
returns,
which
will
include
a
notice
of
the
exact
tax
status
of
all
distributions
paid
to
you
by
the
Fund
during
calendar
year
2023.
Please
consult
your
own
tax
advisor
for
details
as
to
how
this
information
should
be
reflected
on
your
tax
returns.
For
the
fiscal
year
ended
October
31,
2023,
the
Fund
designates
$697,921
and
$370,231
or
up
to
the
maximum
amount
of
such
dividends
allowable
pursuant
to
the
Internal
Revenue
Code,
for
qualified
dividend
income
and
dividends
received
deduction
eligible
for
reduced
tax
rates.
Complete
information
regarding
the
Fund’s
distributions
during
the
calendar
year
2023
will
be
reported
in
conjunction
with
Form
1099-DIV.
Board
Consideration
of
the
Management
and
Sub-Advisory
Agreements
Board
Consideration
of
the
Management
and
Sub-Advisory
Agreements
On
an
annual
basis,
the
Board
of
Trustees
(the
"Board
or
“Trustees”")
of
Neuberger
Berman
Alternative
Funds
(the
"Trust"),
including
the
Trustees
who
are
not
"interested
persons"
of
the
Trust
or
of
Neuberger
Berman
Investment
Advisers
LLC
("Management")
(including
its
affiliates),
as
such
term
is
defined
under
the
Investment
Company
Act
of
1940,
as
amended
(“1940
Act”),
("Independent
Fund
Trustees"),
considers
whether
to
continue
the
management
agreement
with
Management
(the
"Management
Agreement")
and
the
separate
sub-advisory
agreements
between
Management
and
each
sub-adviser
(each
a
"Sub-Adviser")
with
respect
to
Neuberger
Berman
Absolute
Return
Multi-Manager
Fund
("ARMM"
or
"Fund").
The
Board
considered
the
sub-advisory
agreements
between
Management
and
each
of
the
following
Sub-Advisers:
BH-DG
Systematic
Trading
LLP,
GAMCO
Asset
Management
Inc.,
P/E
Global,
LLC,
and
Portland
Hill
Asset
Management
Limited
(each
a
"Sub-
Advisory
Agreement";
collectively
with
the
Management
Agreement,
the
"Agreements").
Throughout
the
process,
the
Independent
Fund
Trustees
are
advised
by
counsel
that
is
experienced
in
1940
Act
matters
and
that
is
independent
of
Management
("Independent
Counsel").
At
a
meeting
held
on
October
5,
2023
the
Board,
including
the
Independent
Fund
Trustees,
approved
the
continuation
of
the
Agreements
for
the
Fund.
In
reaching
its
determination,
the
Board
considered
all
factors
it
believed
relevant,
including
(i)
the
nature,
extent,
and
quality
of
the
services
provided
to
each
Fund
and
its
shareholders;
(ii)
a
comparison
of
each
Fund’s
performance,
fees
and
expenses
relative
to
various
peers;
(iii)
the
costs
of
the
services
provided
by,
and
the
estimated
profit
or
loss
by
Management
from
its
relationships
with
each
Fund;
(iv)
any
apparent
or
anticipated
economies
of
scale
in
relation
to
the
services
Management
provides
to
each
Fund
and
whether
any
such
economies
of
scale
are
shared
with
Fund
shareholders;
and
(v)
any
“fall-out”
benefits
likely
to
accrue
to
Management
and
its
affiliates
from
their
relationship
with
each
Fund.
In
evaluating
the
Agreements,
the
Board,
including
the
Independent
Fund
Trustees,
reviewed
extensive
materials
provided
by
Management
and
each
Sub-Adviser
in
response
to
questions
submitted
by
the
Independent
Fund
Trustees
and
Independent
Counsel,
which
the
Contract
Review
Committee
annually
considers
and
updates,
and
(for
the
Sub-Advisers)
by
Management.
It
also
met
with
senior
representatives
of
Management
regarding
its
personnel,
operations,
and
profitability
as
they
relate
to
the
Fund.
The
annual
contract
review
extends
over
at
least
two
regular
meetings
of
the
Board
to
ensure
that
Management
and
each
Sub-Adviser
have
time
to
respond
to
any
questions
the
Independent
Fund
Trustees
may
have
on
their
initial
review
of
the
materials
and
that
the
Independent
Fund
Trustees
have
time
to
consider
those
responses.
In
the
limited
instances
where
Management
or
Sub-Advisers
may
not
have
been
able
to
provide
information
in
response
to
certain
questions,
the
Board
conducted
its
evaluation
based
on
information
that
was
provided.
In
such
cases,
the
Board
determined
that
the
omission
of
any
such
information
was
not
material
to
its
considerations.
In
connection
with
its
deliberations,
the
Board
also
considered
the
broad
range
of
information
relevant
to
the
annual
contract
review
that
is
provided
to
the
Board
(including
its
various
standing
committees)
at
meetings
throughout
the
year.
The
Board
also
considered
the
size
and
staffing
of
each
Sub-Adviser,
particularly
the
staffing
of
the
portfolio
management
and
compliance
functions.
The
Board
established
the
Contract
Review
Committee,
which
is
comprised
solely
of
Independent
Fund
Trustees,
to
assist
in
its
evaluation
and
analysis
of
materials
for
the
annual
contract
review.
The
Board
has
also
established
other
committees
that
focus
throughout
the
year
on
specific
areas
relevant
to
the
annual
contract
review,
such
as
Fund
performance
or
compliance
matters,
and
that
are
charged
with
specific
responsibilities
regarding
the
annual
contract
review.
Those
committees
provide
reports
to
the
full
Board,
including
the
members
of
the
Contract
Review
Committee,
which
consider
that
information
as
part
of
the
annual
contract
review
process.
Each
quarter,
the
Ethics
and
Compliance
Committee
received
and
reviewed
a
summary
of
the
quarterly
compliance
questionnaire
completed
by
each
Sub-Adviser
that
was
prepared
by
the
Fund's
Chief
Compliance
Officer.
The
Independent
Fund
Trustees
received
from
Independent
Counsel
memoranda
discussing
the
legal
standards
for
their
consideration
of
the
proposed
continuation
of
the
Agreements.
During
the
course
of
the
year
and
during
their
deliberations
regarding
the
annual
contract
review,
the
Contract
Review
Committee
and
the
Independent
Fund
Trustees
met
with
Independent
Counsel
separately
from
representatives
of
Management
and
the
Sub-
Advisers.
Provided
below
is
a
description
of
the
Board's
contract
approval
process
and
material
factors
that
the
Board
considered
at
its
meetings
regarding
renewals
of
the
Agreements
and
the
compensation
to
be
paid
thereunder.
In
connection
with
its
approval
of
the
continuation
of
the
Agreements,
the
Board
evaluated
the
terms
of
the
Agreements,
the
overall
fairness
of
the
Agreements
to
the
Fund,
and
whether
the
Agreements
were
in
the
best
interests
of
the
Fund
and
Fund
shareholders.
The
Board's
determination
to
approve
the
continuation
of
the
Agreements
was
based
on
a
comprehensive
consideration
of
all
information
provided
to
the
Board
throughout
the
year
and
specifically
in
connection
with
the
annual
contract
review.
The
Board
considered
each
of
the
Agreements
separately.
This
description
is
not
intended
to
include
all
of
the
factors
considered
by
the
Board.
The
Board
members
did
not
identify
any
particular
information
or
factor
that
was
all-important
or
controlling,
and
each
Trustee
may
have
attributed
different
weights
to
the
various
factors.
The
Board
focused
on
the
costs
and
benefits
of
the
Agreements
to
the
Fund
and,
through
the
Fund,
its
shareholders.
Nature,
Extent,
and
Quality
of
Services
With
respect
to
the
nature,
extent,
and
quality
of
the
services
provided,
the
Board
considered
the
investment
philosophy
and
decision-making
processes
of,
and
the
qualifications,
experience,
and
capabilities
of,
and
the
resources
available
to,
the
portfolio
management
personnel
of
Management
and
each
Sub-Adviser
who
perform
services
for
the
Fund.
The
Board
noted
that
Management
and
the
Fund
had
obtained
from
the
U.S.
Securities
and
Exchange
Commission
an
exemptive
order
that
permitted
Management
to
add
or
replace
sub-advisers
to
the
Fund
without
a
shareholder
vote,
provided
the
Independent
Fund
Trustees
approve
the
new
sub-adviser
and
certain
other
steps
are
taken.
In
this
context,
the
Board
considered
Management's
responsibilities
for
designing
an
overall
investment
program
for
the
Fund
and
then
identifying
the
sub-advisers
who
will
carry
out
the
different
portions
of
that
program
based
on
Management's
due
diligence
of
those
sub-advisers.
The
Board
noted
that
under
the
multi-manager
arrangement,
Management
is
continually
assessing
the
need
for
new
sub-advisers
and
the
appropriateness
of
potential
candidates
or
changes
to
current
sub-advisers,
and
noted
the
possibility
that
Management
would
in
the
future
have
to
conduct
"due
diligence"
on
additional
sub-advisers.
The
Board
noted
that
Management
is
responsible
for
making
the
investments
for
the
portion
of
the
portfolio
that
it
manages,
allocating
the
Fund's
portfolio
among
the
various
Sub-Advisers
and
itself,
and
determining
when
and
how
to
rebalance
the
allocations
among
the
Sub-Advisers
and
itself
in
the
wake
of
disparate
growth
and
changes
in
the
markets
and
the
broader
economy,
and
making
certain
other
investment
decisions
and
engaging
in
transactions
to
hedge
or
balance
risks
in
the
Sub-Advisers'
portfolios.
The
Board
noted
that
Management
is
also
responsible
for
coordinating
and
managing
the
flow
of
information
and
communications
relating
to
the
Fund
among
the
Sub-
Advisers,
and
coordinating
responses
to
regulatory
agency
inquiries
related
to
the
operations
of
the
Trust.
The
Board
further
noted
that
Management
is
responsible
for
overseeing
the
Sub-Advisers
pursuant
to
the
Agreements
and
related
sub-adviser
oversight
policies
and
procedures
approved
by
the
Board.
Under
these
procedures,
Management
is
responsible
for
overseeing
the
investment
performance
of
the
Sub-Advisers
and
evaluating
the
risk
and
return
of
each
Sub-Adviser’s
portfolio
and
the
Fund
as
a
whole,
in
addition
to
other
significant
oversight
responsibilities.
The
Board
noted
that
Management
is
also
responsible
for
monitoring
compliance
with
the
Fund's
investment
objectives,
policies,
and
restrictions,
as
well
as
compliance
with
applicable
law,
including
implementing
regulations
adopted
by
the
U.S.
Securities
and
Exchange
Commission.
The
Board
noted
that
Management
also
provides
certain
administrative
services,
including
fund
accounting,
compliance,
and
shareholder
support
services.
The
Board
also
considered
the
policies
and
practices
regarding
brokerage,
commissions,
other
trading
costs,
and
allocation
of
portfolio
transactions
of
Management
and
each
of
the
Sub-Advisers
and
noted
that
Management
monitors
the
quality
of
the
execution
services
provided
by
each
Sub-Adviser.
Moreover,
the
Board
considered
Management's
approach
to
potential
conflicts
of
interest
both
generally
and
between
the
Fund's
investments
and
those
of
other
funds
or
accounts
managed
by
Management
or
the
Sub-Advisers.
The
Board
recognized
the
extensive
range
of
services
that
Management
provides
to
the
Fund
beyond
the
investment
management
services
and
Sub-Adviser
oversight.
It
also
noted
Management's
activities
under
its
contractual
obligation
to
oversee
the
Fund's
various
outside
service
providers,
including
its
renegotiation
of
certain
service
providers'
fees
and
its
evaluation
of
service
providers'
infrastructure,
cybersecurity
programs,
compliance
programs,
and
business
continuity
programs,
among
other
matters.
The
Board
noted
Management's
extensive
activities
in
selecting
and
overseeing
the
Sub-Advisers,
including
questionnaires,
virtual
site
visits,
analyses
of
performance,
compliance
monitoring,
and
evaluating
third
party
reviews
of
potential
sub-advisers,
and
the
quarterly
and
annual
reports
that
Management
provides
to
the
Board
on
the
Sub-Advisers'
performance
and
compliance.
In
addition,
the
Board
considered
the
scope
and
compliance
history
of
the
compliance
programs
of
Management
and
each
Sub-Adviser,
including
the
Fund's
Chief
Compliance
Officer's
and
Management's
assessment
of
the
compliance
programs
of
the
Sub-Advisers.
The
Board
discussed
that
Management's
Chief
Information
Security
Officer
had
evaluated
the
Sub-Advisers'
responses
on
questions
of
cybersecurity.
The
Board
also
considered
Management's
ongoing
development
of
its
own
infrastructure
and
information
technology
to
support
the
Fund
through,
among
other
things,
cybersecurity,
business
continuity
planning,
and
risk
management.
In
addition,
the
Board
noted
the
positive
compliance
history
of
Management
and
each
Sub-Adviser,
as
no
significant
compliance
problems
were
reported
to
the
Board
with
respect
to
any
of
the
firms.
The
Board
also
considered
whether
there
were
any
pending
lawsuits,
enforcement
proceedings,
or
regulatory
investigations
involving
Management
or
any
Sub-Adviser,
and
reviewed
information
regarding
their
financial
condition,
history
of
operations,
and
any
conflicts
of
interests
in
managing
the
Fund.
The
Board
also
considered
the
general
structure
of
the
portfolio
managers'
compensation
and
whether
this
structure
provides
appropriate
incentives
to
act
in
the
best
interests
of
the
Fund.
The
Board
also
considered
the
ability
of
Management
to
attract
and
retain
qualified
personnel
to
service
the
Fund
and
the
plan
for
succession.
The
Board
considered
that
Management
assumes
significant
ongoing
entrepreneurial
and
business
risks
as
the
investment
adviser
and
sponsor
for
the
Fund,
for
which
Management
is
entitled
to
reasonable
compensation.
The
Trustees
also
considered
that
Management's
responsibilities
include
continual
management
of
investment,
operational,
cybersecurity,
enterprise,
valuation,
liquidity,
litigation,
regulatory,
and
compliance
risks
as
they
relate
to
the
Fund,
and
the
Board
considers
on
a
regular
basis
information
regarding
Management's
processes
for
monitoring
and
managing
risk.
In
addition,
the
Board
also
noted
that
when
Management
launches
a
new
fund
or
share
class,
it
assumes
entrepreneurial
risk
with
respect
to
that
fund
or
share
class,
until
it
maintains
a
certain
level
of
assets,
if
ever,
that
is
profitable
to
Management.
As
in
past
years,
the
Board
also
considered
the
manner
in
which
Management
addressed
various
matters
that
arose
during
the
year,
some
of
them
a
result
of
developments
in
the
broader
fund
industry
or
the
regulations
governing
it.
In
addition,
the
Board
considered
actions
taken
by
Management
and
each
Sub-Adviser
in
response
to
market
conditions
over
the
past
year,
such
as
changes
in
interest
rates
and
the
increase
in
market
volatility
and
considered
the
overall
performance
of
Management
and
each
Sub-Adviser
in
this
context.
Fund
Performance
The
Board
requested
a
report
from
an
outside
consulting
firm
that
specializes
in
the
analysis
of
fund
industry
data
that
compared
the
Fund's
performance,
along
with
its
fees
and
other
expenses,
to
various
peers,
including
a
group
of
industry
peers
(“Expense
Group”)
and
to
a
broader
universe
of
funds
pursuing
generally
similar
strategies
with
the
same
investment
classification
and/or
objective
(“Performance
Universe”).
The
Board
considered
the
Fund's
performance
and
fees
in
light
of
the
limitations
inherent
in
the
methodology
for
constructing
such
a
comparative
group
and
determining
which
investment
companies
should
be
included
in
the
comparative
group,
noting
differences
as
compared
to
certain
fund
industry
ranking
and
rating
systems.
With
respect
to
investment
performance,
the
Board
considered
information
regarding
the
Fund's
short-,
intermediate-
and
long-term
performance,
as
applicable,
net
of
the
Fund's
fees
and
expenses,
on
an
absolute
basis,
relative
to
a
benchmark
index
that
does
not
deduct
the
fees
or
expenses
of
investing,
and
compared
to
the
performance
of
the
Expense
Group
and
Performance
Universe,
each
constructed
by
the
consulting
firm.
The
Board
also
considered
information
regarding
each
Sub-Adviser's
performance.
The
Board
also
reviewed
performance
in
relation
to
certain
measures
of
the
degree
of
investment
risk
undertaken
by
Management’s
portfolio
managers.
The
Performance
Universe
referenced
in
this
section
are
those
identified
by
the
consulting
firm,
as
discussed
above.
In
the
case
of
underperformance
for
any
of
the
periods
reported,
the
Board
considered
the
magnitude
and
duration
of
that
underperformance
relative
to
the
Performance
Universe
and/or
the
benchmark
(e.g.,
the
amount
by
which
the
Fund
underperformed,
including,
for
example,
whether
the
Fund
slightly
underperformed
or
significantly
underperformed
its
benchmark).
With
respect
to
performance
quintile
rankings
for
the
Fund
compared
to
its
Performance
Universe,
the
first
quintile
represents
the
highest
(best)
performance
and
the
fifth
quintile
represents
the
lowest
performance.
The
Fund
has
more
than
one
class
of
shares
outstanding
and
information
for
Institutional
Class
has
been
provided
as
identified
below.
The
Board
reviewed
the
expense
structures
of
all
the
other
classes
of
shares
of
the
Fund,
some
of
which
have
higher
fees
and
expenses
that
reflect
their
separate
distribution
and
servicing
arrangements
and
the
differing
needs
of
different
investors.
As
a
proxy
for
the
class
expense
structure,
the
Board
reviewed
the
expenses
of
each
class
for
one
fund
in
the
Trust
in
comparison
to
Expense
Groups
for
those
classes.
The
Board
noted
the
effect
of
higher
expenses
on
the
performance
of
the
other
classes
of
shares.
The
Board
considered
that,
based
on
performance
data
for
the
periods
ended
December
31,
2022
(1)
as
compared
to
its
benchmark,
the
Fund’s
performance
was
higher
for
the
1-,
3-,
5-
and
10-year
periods;
and
(2)
as
compared
to
its
Performance
Universe,
the
Fund's
performance
was
in
the
first
quintile
for
the
1-,
3-,
and
5-year
periods,
and
the
second
quintile
for
the
10-year
period.
The
Board
also
took
into
account
that
the
Fund
showed
a
risk/return
ratio
that
was
better
than
the
median
of
its
Performance
Universe
for
the
3-
and
5-year
periods,
meaning
that
per
unit
of
risk
taken
versus
a
presumed
risk-free
investment,
the
Fund
achieved
a
higher
level
of
return
than
the
median
of
its
Performance
Universe
for
those
same
periods.
The
Board
recognized
that
the
performance
data
reflects
a
snapshot
of
a
period
as
of
a
particular
date
and
that
selecting
a
different
performance
period
could
produce
significantly
different
results.
The
Board
further
acknowledged
that
long-term
performance
could
be
impacted
by
even
one
period
of
significant
outperformance
or
underperformance.
In
this
regard,
the
Board
noted
that
performance,
especially
short-term
performance,
is
only
one
of
the
factors
that
it
deems
relevant
to
its
consideration
of
the
Agreements
and
that,
after
considering
all
relevant
factors,
it
determined
to
approve
the
continuation
of
the
Agreements
notwithstanding
the
Fund's
relative
performance.
Fee
Rates,
Profitability,
and
Fall-out
Benefits
With
respect
to
the
overall
fairness
of
the
Agreements,
the
Board
considered
the
fee
structure
for
the
Fund
under
the
Agreements
as
compared
to
the
Expense
Group
provided
by
the
consulting
firm,
as
discussed
above.
The
Board
reviewed
a
comparison
of
the
Fund's
management
fee
to
the
Expense
Group.
The
Board
noted
that
the
comparative
management
fee
analysis
includes,
in
the
Fund's
management
fee,
the
separate
administrative
fees
paid
to
Management.
However,
the
Board
noted
that
some
funds
in
the
Expense
Group
pay
directly
from
fund
assets
for
certain
services
that
Management
covers
out
of
the
administration
fees
for
the
Funds.
Accordingly,
the
Board
also
considered
the
Fund's
total
expense
ratio
as
compared
with
its
Expense
Group
as
a
way
of
taking
account
of
these
differences.
The
Board
compared
the
Fund's
contractual
and
actual
management
fees
to
the
median
of
the
contractual
and
actual
management
fees,
respectively,
of
the
Fund's
Expense
Group.
(The
actual
management
fees
are
the
contractual
management
fees
reduced
by
any
fee
waivers
or
other
adjustments.
The
information
provided
herein
relating
to
the
Fund's
management
fees
is
for
the
Fund's
Institutional
Class.)
The
Board
also
compared
the
Fund's
total
expenses
to
the
median
of
the
total
expenses
of
the
Fund's
Expense
Group.
With
respect
to
the
quintile
rankings
for
fees
and
total
expenses
(net
of
waivers
or
other
adjustments,
if
any)
for
the
Fund
compared
to
its
Expense
Group,
the
first
quintile
represents
the
lowest
(best)
fees
and/or
total
expenses
and
the
fifth
quintile
represents
the
highest
fees
and/or
total
expenses.
The
Board
also
noted
that
the
overall
expense
ratio
for
each
class
of
the
Fund
is
maintained
through
a
contractual
fee
cap
and/or
expense
reimbursements
by
Management.
The
Board
also
considered
the
extent
to
which
Management
currently
waives
management
fees
and/or
reimburses
the
Fund
for
other
Fund-level
expenses
at
different
rates
for
different
share
classes
and
the
process
for
monitoring
the
use
of
such
waivers
to
guard
against
any
such
waiver
resulting
in
any
cross-subsidization
by
one
share
class
of
another
share
class.
The
Board
considered
that,
as
compared
to
its
Expense
Group,
the
Fund's
contractual
management
fee
ranked
in
the
fourth
quintile,
the
actual
management
fee
net
of
fees
waived
by
Management
ranked
in
the
third
quintile,
and
total
expenses
ranked
in
the
fifth
quintile.
The
Board
discussed
with
Management
the
impact
of
the
Fund’s
small
size
on
its
expenses
and
the
expenses
associated
with
the
Fund’s
strategy,
including
the
selection,
allocation
to,
and
oversight
of
the
unaffiliated
subadvisers.
In
concluding
that
the
benefits
accruing
to
Management
and
its
affiliates
by
virtue
of
their
relationship
with
the
Fund
were
reasonable
in
light
of
the
costs
of
providing
the
investment
advisory
and
other
services
and
the
benefits
accruing
to
the
Fund,
the
Board
reviewed
specific
data
as
to
Management's
estimated
loss
on
the
Fund
for
a
recent
period
on
a
pre-tax
basis
without
regard
to
distribution
expenses.
(The
Board
also
reviewed
data
on
Management's
estimated
loss
on
the
Fund
after
distribution
expenses
and
taxes
were
factored
in,
as
indicators
of
the
health
of
the
business
and
the
extent
to
which
Management
is
directing
its
resources
into
the
growth
of
the
business.)
The
Board
considered
the
consistent
cost
allocation
methodology
that
Management
used
in
developing
its
estimated
profitability
figures.
In
addition,
the
Board
engaged
an
independent
forensic
accountant
to
review
the
profitability
methodology
utilized
by
Management
when
preparing
this
information
and
discussed
with
the
consultant
its
conclusion
that
Management's
process
for
calculating
and
reporting
its
estimated
loss
aligned
with
the
consultant’s
guiding
principles
and
industry
practices.
The
Board
further
noted
Management's
representation
that
its
estimate
of
profitability
is
derived
using
methodology
that
is
consistent
with
the
methodology
used
to
assess
and/or
report
measures
of
profitability
elsewhere
at
the
firm.
In
addition,
the
Board
recognized
that
Management's
calculations
regarding
its
costs
may
not
reflect
all
risks,
including
regulatory,
legal,
operational,
cybersecurity,
reputational,
and,
where
appropriate,
entrepreneurial
risks,
associated
with
offering
and
managing
a
mutual
fund
in
the
current
regulatory
and
market
environment.
The
Board
also
monitors
throughout
the
year
the
potential
effect
on
the
profitability
of
Management
resulting
from
changes
in
Sub-Advisers
and/or
their
fees.
The
Board
did
not
give
substantial
emphasis
to
estimated
profitability
data
from
the
Sub-Advisers
because
the
Board
did
not
view
this
data
as
being
a
key
factor
to
its
deliberations
given
the
arm's-length
nature
of
the
relationship
between
Management
and
the
Sub-Advisers
with
respect
to
the
negotiation
of
sub-advisory
fee
rates.
To
test
its
assumption
of
an
arm's-length
fee
rate,
the
Board
requested
from
Management
information
about
any
other
business
relationships
it
has
with
any
of
the
Sub-
Advisers
beyond
retaining
them
to
advise
other
of
Management’s
client
accounts.
In
addition,
the
Board
noted
that
the
Sub-Advisers
may
not
account
for
their
profits
on
an
account-by-account
basis
and
those
that
do
typically
employ
different
methodologies
in
connection
with
these
calculations.
The
Board
also
considered
any
fall-out
(i.e.,
indirect)
benefits
likely
to
accrue
to
Management
or
its
affiliates
from
their
relationship
with
the
Fund.
Information
Regarding
Services
to
Other
Clients
The
Board
also
considered
whether
there
were
other
funds
or
separate
accounts
that
were
advised
or
sub-advised
by
Management
or
its
affiliates
with
investment
objectives,
policies,
and
strategies
that
were
similar
to
those
of
the
Fund.
The
Board
also
considered
the
fees
the
Sub-Advisers
charge
for
products
with
investment
objectives,
policies,
and
strategies
that
were
similar
to
those
of
the
Fund,
if
any.
The
Board
noted
that
in
many
cases,
those
products
were
hedge
funds,
which
typically
charge
fees
substantially
higher
than
mutual
funds.
Economies
of
Scale
The
Board
also
evaluated
apparent
or
anticipated
economies
of
scale
in
relation
to
the
services
Management
provides
to
the
Fund.
The
Board
considered
that
the
Fund's
fee
structure
provides
for
a
reduction
of
payments
resulting
from
the
use
of
breakpoints,
the
size
of
such
breakpoints
in
the
Fund's
advisory
fees,
and
whether
such
breakpoints
are
set
at
appropriate
asset
levels.
The
Board
also
compared
the
breakpoint
structure
to
that
of
the
Expense
Group.
In
addition,
the
Board
considered
the
expense
limitation
and/or
fee
waiver
arrangement
that
reduce
the
Fund's
expenses
at
all
asset
levels
which
can
have
an
effect
similar
to
breakpoints
in
sharing
economies
of
scale
with
shareholders
and
provide
protection
from
an
increase
in
expenses
if
the
Fund's
assets
decline.
The
Board
considered
that
breakpoints
in
a
Sub-Adviser's
fee
schedule
would
inure
to
the
benefit
of
Management,
and
evaluated
that
fact
in
light
of
Management's
profitability
on
the
Fund,
a
subject
on
which
the
Board
receives
quarterly
reports.
The
Board
also
considered
that
Management
has
provided,
at
no
added
cost
to
the
Fund,
certain
additional
services,
including
but
not
limited
to,
services
required
by
new
regulations
or
regulatory
interpretations,
services
impelled
by
changes
in
the
securities
markets
or
the
business
landscape,
and/or
services
requested
by
the
Board.
The
Board
considered
that
this
is
a
way
of
sharing
economies
of
scale
with
the
Fund
and
its
shareholders.
Conclusions
In
approving
the
continuation
of
the
Agreements,
the
Board
concluded
that,
in
its
business
judgment,
the
terms
of
each
Agreement
are
fair
and
reasonable
to
the
Fund
and
that
approval
of
the
continuation
of
the
Agreements
is
in
the
best
interests
of
the
Fund
and
its
shareholders.
In
reaching
this
determination,
the
Board
considered
that
Management
and
each
Sub-Adviser
could
be
expected
to
continue
to
provide
a
high
level
of
service
to
the
Fund;
that
the
performance
of
the
Fund
was
satisfactory
over
time,
or,
in
the
case
of
underperformance
by
a
Sub-
Adviser,
that
the
Board
retained
confidence
in
Management's
and
each
Sub-Adviser's
capabilities
to
manage
the
Fund;
that
the
Fund's
fee
structure
appeared
to
the
Board
to
be
reasonable
given
the
nature,
extent,
and
quality
of
services
provided;
and
that
the
benefits
accruing
to
Management
and
its
affiliates
by
virtue
of
their
relationship
with
the
Fund
were
reasonable
in
light
of
the
costs
of
providing
the
investment
advisory
and
other
services
and
the
benefits
accruing
to
the
Fund.
The
Board's
conclusions
may
be
based
in
part
on
its
consideration
of
materials
prepared
in
connection
with
the
approval
or
continuance
of
the
Agreements
in
prior
years
and
on
the
Board's
ongoing
regular
review
of
Fund
performance
and
operations
throughout
the
year,
in
addition
to
material
prepared
specifically
for
the
most
recent
annual
review
of
the
Agreements.
(This
page
intentionally
left
blank)
(This
page
intentionally
left
blank)
Neuberger
Berman
Investment
Advisers
LLC
1290
Avenue
of
the
Americas
New
York,
NY
10104–0002
Retail
Services:
800.877.9700
Broker-Dealer
and
Institutional
Services:
800.366.6264/888.556.9030
www.nb.com
Statistics
and
projections
in
this
report
are
derived
from
sources
deemed
to
be
reliable
but
cannot
be
regarded
as
a
representation
of
future
results
of
the
Fund.
This
report
is
prepared
for
the
general
information
of
shareholders
and
is
not
an
offer
of
shares
of
the
Fund.
Shares
are
sold
only
through
the
currently
effective
prospectus
which
you
can
obtain
by
calling
877.628.2583.
An
investor
should
consider
carefully
a
Fund’s
investment
objectives,
risks
and
fees
and
expenses,
which
are
described
in
its
prospectus,
before
investing.
Neuberger Berman
Alternative Funds
Institutional Class Shares |
|
|
|
|
U.S. Equity Index PutWrite Strategy Fund |
Annual Report
October 31, 2023
The "Neuberger Berman" name and logo and "Neuberger Berman Investment Advisers LLC" name are registered service marks of Neuberger Berman Group LLC. The individual Fund names in this piece are either service marks or registered service marks of Neuberger Berman Investment Advisers LLC, an affiliate of Neuberger Berman BD LLC, distributor, member FINRA. ©2023 Neuberger Berman BD LLC, distributor. All rights reserved.
President’s Letter
Dear Shareholder,
I am pleased to present this annual shareholder report for Neuberger Berman Alternative Funds covering the fiscal year ended October 31, 2023 (the reporting period).
The global financial markets experienced periods of heightened volatility during the reporting period. Investor sentiment was impacted by a number of factors, including continued high inflation, aggressive monetary policy tightening, a period of unrest in the regional banking industry, wars in Ukraine and the Middle East, and several other geopolitical events. Despite several headwinds, the U.S. economy was resilient and continued to expand. Against this backdrop, equity and bond markets generated mixed results during the reporting period.
With inflation remaining persistent and elevated, the U.S. Federal Reserve Board (Fed) remained steadfast in its attempt to moderate economic growth and orchestrate a "soft landing." The Fed raised rates at 11 meetings from March 2022 through July 2023—bringing the federal funds rate to a range between 5.25%-5.50%, the highest level in 22 years. While the central bank paused from raising rates at its meetings in September and November 2023 (after the reporting period), it left on the table the possibility of additional hikes in the future.
After rising over the first nine months of the reporting period, a portion of equity market gains were given back over the last three months. This turnaround was partially triggered by investors reacting to the possibility of a "higher for longer" interest rate environment. All told, the S&P 500® Index returned 10.14% during the reporting period. Meanwhile, international developed and emerging market equities, as measured by the MSCI EAFE® and MSCI Emerging Markets Indices (Net), returned 14.40% and 10.80%, respectively. Meanwhile, with short- and long-term Treasury yields moving higher the bond market was challenged (yields and bond prices generally move in the opposite direction). For the reporting period, the broad taxable investment-grade bond market, as measured by the Bloomberg U.S. Aggregate Bond Index, returned 0.36%.
Looking ahead, until we have more clarity on the path of the economy versus inflation, we anticipate continued market volatility. In such an environment, we believe the divergence in underlying companies’ operating performance will be ever more apparent going forward. Our constructive long-term view for the market is not without challenges as we move through 2023 and beyond. As always, we continue our efforts to best understand company and portfolio-specific factors as we believe this environment is flush with a confluence of fiscal policy considerations, monetary policy stimulus, public health concerns, geopolitical uncertainty, commodity price volatility, inflation dynamics and sequencing question marks. As market dynamics change, this can cause company market values to dislocate from their long-term potential values, creating a volatile environment with potential opportunities. We highlight these risks because the current environment, as always, necessitates a flexible approach in the complex global world in which we operate.
Thank you for your support and trust. We look forward to continuing to serve your investment needs in the years to come.
Sincerely,
Joseph V. Amato
President and CEO
Neuberger Berman Alternative Funds
Long Short Fund Commentary (Unaudited)
Neuberger Berman Long Short Fund Institutional Class generated a 9.52% total return for the fiscal year ended October 31, 2023 (the reporting period), outperforming its primary benchmark, the HFRX® Equity Hedge Index (the Index), which returned 2.89% for the same period. (Performance for all share classes is provided in the table immediately following this letter.)
The overall U.S. equity market experienced periods of heightened volatility but generated strong results during the reporting period. A number of factors impacted the market, including elevated and persistent inflation, aggressive rate hikes by the U.S. Federal Reserve Board (Fed), unrest in the regional banking industry, and several geopolitical events. Despite several headwinds, the U.S. economy was resilient and continued to expand. All told, the S&P 500® Index returned 10.14% during the reporting period.
With the increase in market volatility and extreme positioning in the market driven by heightened uncertainty, we modestly increased the Fund’s net exposures. On an absolute basis, the Fund's largest sector weights were in Information Technology, Consumer Discretionary and Financials during the reporting period.
We categorize the Fund’s long investment exposure into three groups: Capital Growth, Total Return and Opportunistic. Capital Growth continues to represent our largest allocation, followed by Total Return and Opportunistic. We continue to take a balanced approach and, on the margin, find Total Return investments to be more attractive relative to the prior reporting period, as late-cycle economic dynamics have emerged. The Fund’s short exposure includes both single name "Fundamental" shorts and "Market" shorts. Market shorts consist primarily of sector and market cap-specific indices to help manage broader portfolio exposures. During the reporting period, total short exposure increased against the backdrop of macroeconomic uncertainty led by Market shorts.
The Fund’s equity long exposure was additive to performance, while its Fundamental shorts also contributed to performance.
The Fund’s aggregate use of futures, swap and option contracts detracted from performance during the reporting period.
We recognize that while the economy is slowing, it has largely been more resilient than many expected. At the same time, progress has been made by the Fed in the fight against inflation and company earnings on average are coming in above expectations. Yet, commentary around decelerating consumer trends, continued declines in existing home sales and heightened uncertainty around the second half of the year, offer a clear indication that the Fed’s tightening cycle is having a real impact to the broader economy. Furthermore, we enter the end of the year against a backdrop of consumer headwinds, such as slowing real wage growth, a resumption of student loan payments, and pressure from an acceleration in gas prices. Despite this, the Fed has remained steadfast in its commitment to fighting inflation and has shown no indication to date that it will pivot and cut rates this year, a notion we believe equity markets have now largely accepted, with cuts only priced in for mid-2024. As always, we continue our efforts to best understand company and portfolio-specific factors as we believe this environment is flush with a confluence of fiscal policy considerations, monetary policy stimulus, public health concerns, geopolitical uncertainty, commodity price volatility, and inflation dynamics. As market dynamics change, this can cause company market values to dislocate from their long-term potential values, creating a volatile environment with potential opportunities for both long and short investing.
Sincerely,
Charles Kantor and Marc Regenbaum
Portfolio Managers
Information about principal risks of investing in the Fund is set forth in the prospectus and statement of additional information.
The portfolio composition, industries and holdings of the Fund are subject to change without notice.
The opinions expressed are those of the Fund’s portfolio managers. The opinions are as of the date of this report and are subject to change without notice.
Long Short Fund (Unaudited)
PORTFOLIO BY INVESTMENT TYPE |
(as a % of Total Net Assets) |
| | |
| | |
| | |
| | |
Master Limited Partnerships and Limited Partnerships | | |
| | |
| | |
| | |
Other Assets Less Liabilities* | | |
| | |
| Includes the impact of the Fund’s open positions in derivatives (other than options purchased), if any. |
| | | |
| | Average Annual Total Return
Ended 10/31/2023 |
| | | | |
| | | | | |
| | | | | |
| | | | | |
| | | | | |
| | | | |
| | | | | |
| | | | | |
| | | | | |
| | | | |
| | | | |
The performance data quoted represent past performance and do not indicate future results. Current performance may be lower or higher than the performance data quoted. For current performance data, including current to the most recent month-end, please visit www.nb.com/performance.
The results shown in the table reflect the reinvestment of income dividends and other distributions, if any. The results do not reflect the effect of taxes a shareholder would pay on Fund distributions or on the redemption of Fund shares.
The investment return and principal value of an investment will fluctuate and shares, when redeemed, may be worth more or less than their original cost.
Returns would have been lower if Neuberger Berman Investment Advisers LLC ("NBIA") had not reimbursed certain expenses and/or waived a portion of the investment management fees during certain of the periods shown. Repayment by a class (of expenses previously reimbursed and/or fees previously waived by NBIA) will decrease the class’s returns. Please see Note B in the Notes to Financial Statements for specific information regarding expense reimbursement and/or fee waiver arrangements.
As stated in the Fund’s most recent prospectus, the total annual operating expense ratios for fiscal year 2022 were 1.69%, 2.06% and 2.81% for Institutional Class, Class A and Class C shares, respectively (before expense reimbursements and/or fee waivers, if any). The expense ratios for the annual period ended October 31, 2023, can be found in the Financial Highlights section of this report.
Returns shown with a sales charge reflect the deduction of the current maximum initial sales charge of 5.75% for Class A shares and the contingent deferred sales charge (CDSC) for Class C shares. The CDSC for Class C shares is 1.00%, which is reduced to 0% after 1 year. The performance of the Fund’s share classes will differ primarily due to different sales charge structures and class expenses. Please see the prospectus for more information about sales charge structures, if any, and class expenses for your share class.
Long Short Fund (Unaudited)
COMPARISON OF A $1,000,000 INVESTMENT
(000's omitted)
This graph shows the change in value of a hypothetical $1,000,000 investment in the Fund over the past 10 fiscal years, or since the Fund’s inception if it has not operated for 10 years. The graph is based on the Institutional Class shares only; the performance of the Fund’s share classes will differ primarily due to different sales charge structures and class expenses (see Performance Highlights chart on previous page). The result is compared with benchmarks, which include a broad-based market index and may include a more narrowly based index. Market indices have not been reduced to reflect any of the fees and costs of investing. The results shown in the graph reflect the reinvestment of income dividends and other distributions, if any. The results do not reflect the effect of taxes a shareholder would pay on Fund distributions or on the redemption of Fund shares. Results represent past performance and do not indicate future results.
U.S. Equity Index PutWrite Strategy Fund* Commentary (Unaudited)
Neuberger Berman U.S. Equity Index PutWrite Strategy Fund Institutional Class generated a total return of 11.53% for the fiscal year ended October 31, 2023 (the reporting period), outperforming its benchmark, a blend consisting of 50% Cboe S&P 500 One-Week PutWrite Index and 50% Cboe S&P 500 PutWrite Index (collectively, the Index), which posted a 8.62% total return during the same period. (Performance for all share classes is provided in the table immediately following this letter.)
In one of the most obvious 'not if, but when' market scenarios, U.S. economic resilience (i.e., inflation) and the U.S. Federal Reserve Board’s historic target rate increases seem to finally be taking its toll on financial market expectations. Just as the market rally to begin the year seems to have caught investors by surprise, so has the realization that a reversal of the forty-plus year downward trend in 30-year U.S. Treasury yields may stick around longer than previous periods and may ultimately dent the seemingly invincible U.S. consumer. Interest rates continued their charge higher with the 10-Year U.S. Treasury yield rising from around 4% at the start of the reporting period to roughly 5% at the end. Hence, the Bloomberg U.S. Aggregate Bond Index remained essentially flat with a return of 0.36% as eight out of 12 months during the period resulted in losses. Volatility levels remained within expectations with the Cboe S&P 500 Volatility Index (VIX®) averaging around 18.4 for the reporting period which was just shy of the historical average of 19.6. Over the reporting period, VIX is down -7.7 pts with an average 30-day implied volatility premium of 3.8. As we’ve noted in the past, while volatility levels are subdued from what we witnessed as a result of the global pandemic, they are in-line with long-term averages. Importantly, in our view implied volatility premiums are healthy and have been positive in all but one quarter since the first quarter of 2020, indicating that the market is pricing risk effectively. Moreover, coupled with the tailwind of higher rates translating to higher income in the collateral portfolio, we believe VIX in the mid to high teens is likely to result in higher premiums for the options sleeve which has the potential to aid the Fund in delivering attractive risk-adjusted returns and dampening portfolio volatility.
Over the reporting period, the Fund’s put writing strategy was additive to overall portfolio performance. Specifically, the Fund’s S&P 500 PutWrite sleeve delivered a return of roughly 10% versus the Cboe S&P 500 PutWrite Index (PUT) total return of 11.88%. Meanwhile, weekly put writing, as measured by the Cboe S&P 500 One-Week PutWrite (WPUT), rose 5.42%. During the reporting period, the collateral portfolio was also additive to performance as it returned more than 3% versus the ICE BofA 0-3 Month US Treasury Bill Index’s total return of 4.86%. The additional income from the collateral portfolio plus the Fund’s enhanced diversification and active risk management of the options sleeve resulted in outperformance during the reporting period versus the passive put write indices. Higher rates will continue to offer investors more income potential from their investment portfolios which in turn may dampen portfolio volatility levels. At current levels, we are seeing yields of 4.5% to 5.5% with little duration risk (approximately 1 year). When combined with average to above average option premium levels, we believe our strategy can offer very competitive returns versus many other asset classes over the next few years.
During the reporting period, there were no changes to the Fund’s average option notional exposure as it remained consistent with our strategic target of 100% S&P 500® Index.
Despite recent data suggesting that Americans have never been richer with federal data estimating U.S. household wealth reached $154 trillion1, it’s hard to believe that the average American would find their situation consistent with the data. We continue to believe that economic data is becoming increasingly 'skewed' by the wealth gap or obscured by shifting economic dynamics like 'work from home' and out-of-date methodologies that don’t fully account for global e-commerce trends like 'skimpflation', 'shrinkflation’ and the coming 'ai-flation’. Historically, technological advancement and innovation have been considered deflationary, providing more for the same price. However, it seems we may be approaching a period in which inflation is more difficult to fight because there are so many new 'expenses’. Older goods are shrinking while new services and products are 'must haves’ which compete for resources. Add a higher cost-capital and we believe the competition will intensify further fueling the inflationary cycle that is underway. That is not to say inflation will jump higher, but that the
U.S. Equity Index PutWrite Strategy Fund* Commentary (Unaudited)
phrase 'higher for longer’ likely applies. As consumers begin to feel the 'squeeze’ of higher rates and higher prices over time, we anticipate savings rates to continue to decline below long-term levels. In turn, we believe that there is a good chance that the U.S. economy may be headed for challenges that the market may not fully appreciate. If consumer behavior trends become reinforced by demographics and prove more persistent than temporary, then it’s difficult to predict how credit markets and private investments will respond. Of course, in our view, that spells higher V-O-L-A-T-I-L-I-T-Y. With rates and volatility levels back to longer-term averages, option strategy return prospects are trending towards historical norms, meaning we believe that hedging is expensive and option premiums and collateral rates favor the collectors.
Sincerely,
Derek Devens and Rory Ewing
Portfolio Managers
*As previously disclosed in a supplement to the Fund's Summary Prospectus, Prospectus and Statement of Additional Information dated July 7, 2023 (the "Supplement"), the Neuberger Berman U.S. Equity Index PutWrite Strategy Fund is currently expected to be reorganized into an exchange-traded fund in January 2024. Class A and C Shares of the Fund were converted into Institutional Class Shares on after the close of business on 9/14/23. Please read the Supplement and information statement on Form N-14, for important information about the expected reorganization.
1 Federal Reserve, Household Balance Sheet Data September 8, 2023.
Information about principal risks of investing in the Fund is set forth in the prospectus and statement of additional information.
The portfolio composition, industries and holdings of the Fund are subject to change without notice.
The opinions expressed are those of the Fund’s portfolio managers. The opinions are as of the date of this report and are subject to change without notice.
U.S. Equity Index PutWrite Strategy Fund (Unaudited)
PORTFOLIO BY INVESTMENT TYPE |
(as a % of Total Net Assets) |
U.S. Treasury Obligations | |
| |
| |
Other Assets Less Liabilities | |
| |
| Includes the impact of the Fund's open positions in derivatives (other than options purchased), if any. |
| | |
| | Average Annual Total Return
Ended 10/31/2023 |
| | | |
| | | | |
| | | | |
| | | | |
| | | | |
50% Cboe S&P 500 One-Week
PutWrite Index / 50% Cboe S&P 500
| | | |
| | | |
The performance data quoted represent past performance and do not indicate future results. Current performance may be lower or higher than the performance data quoted. For current performance data, including current to the most recent month-end, please visit www.nb.com/performance.
The results shown in the table reflect the reinvestment of income dividends and other distributions, if any. The results do not reflect the effect of taxes a shareholder would pay on Fund distributions or on the redemption of Fund shares.
The investment return and principal value of an investment will fluctuate and shares, when redeemed, may be worth more or less than their original cost.
Returns would have been lower if Neuberger Berman Investment Advisers LLC ("NBIA") had not reimbursed certain expenses and/or waived a portion of the investment management fees during certain of the periods shown. Repayment by a class (of expenses previously reimbursed and/or fees previously waived by NBIA) will decrease the class’s returns. Please see Note B in the Notes to Financial Statements for specific information regarding expense reimbursement and/or fee waiver arrangements.
As stated in the Fund’s most recent prospectus, the total annual operating expense ratios for fiscal year 2022 were 0.71% and 0.61% for Institutional Class and Class R6 shares, respectively (before expense reimbursements and/or fee waivers, if any). The expense ratios were 0.66% and 0.56% for Institutional Class and Class R6 shares, respectively, after expense reimbursements and/or fee waivers. The expense ratios for the annual period ended October 31, 2023, can be found in the Financial Highlights section of this report.
U.S. Equity Index PutWrite Strategy Fund (Unaudited)
COMPARISON OF A $1,000,000 INVESTMENT
(000's omitted)
This graph shows the change in value of a hypothetical $1,000,000 investment in the Fund over the past 10 fiscal years, or since the Fund’s inception if it has not operated for 10 years. The graph is based on the Institutional Class shares only; the performance of the Fund’s share classes will differ primarily due to different sales charge structures and class expenses (see Performance Highlights chart on previous page). The result is compared with benchmarks, which include a broad-based market index and may include a more narrowly based index. Market indices have not been reduced to reflect any of the fees and costs of investing. The results shown in the graph reflect the reinvestment of income dividends and other distributions, if any. The results do not reflect the effect of taxes a shareholder would pay on Fund distributions or on the redemption of Fund shares. Results represent past performance and do not indicate future results.
| Please see "Glossary of Indices" on page 10 for a description of indices. Please note that individuals cannot invest directly in any index. The HFRX® Equity Hedge Index does take into account fees and expenses, but not the tax consequences, of investing since it is based on the underlying hedge funds’ net returns. The other indices described in this report do not take into account any fees, expenses or tax consequences of investing in the individual securities that they track. Data about the performance of an index are prepared or obtained by Neuberger Berman Investment Advisers LLC and reflect the reinvestment of income dividends and other distributions, if any. The Fund may invest in securities not included in a described index and generally does not invest in all securities included in a described index. |
| The date used to calculate Life of Fund performance for the index is the inception date of the oldest share class. |
| The investments for the Fund are managed by the same portfolio manager(s) who manage(s) one or more other registered funds that have names, investment objectives and investment styles that are similar to those of the Fund. You should be aware that the Fund is likely to differ from those other mutual fund(s) in size, cash flow pattern and tax matters. Accordingly, the holdings and performance of the Fund can be expected to vary from those of the other mutual fund(s). |
For more complete information on any of the Neuberger Berman Alternative Funds, call us at (800) 877-9700, or visit our website at www.nb.com.
Glossary of Indices (Unaudited)
Cboe S&P 500 PutWrite Index: | The index tracks the value of a passive investment strategy, which consists of overlaying S&P 500 (SPX) short put options over a money market account invested in one- and three-months Treasury bills. The SPX puts are struck at-the-money and are sold on a monthly basis. |
Cboe S&P 500 One-Week PutWrite Index: | The index is designed to track the performance of a hypothetical strategy that sells an at-the- money (ATM) S&P 500 Index (SPX) put option on a weekly basis. The maturity of the written SPX put option is one week to expiry. The written SPX put option is collateralized by a money market account invested in one-month U.S. Treasury bills. The index rolls on a weekly basis, typically every Friday. |
50% Cboe S&P 500 One-Week PutWrite Index/50% Cboe S&P 500 PutWrite Index: | The blended index is composed of 50% Cboe S&P 500 One-Week PutWrite Index (described above) and 50% Cboe S&P 500 PutWrite Index (described above) and is rebalanced monthly. |
HFRX® Equity Hedge Index: | The index comprises equity hedge strategies. Equity hedge strategies maintain positions both long and short in primarily equity and equity derivative securities. A wide variety of investment processes can be employed to arrive at an investment decision, including both quantitative and fundamental techniques; strategies can be broadly diversified or narrowly focused on specific sectors and can range broadly in terms of levels of net exposure, leverage employed, holding period, concentrations of market capitalizations and valuation ranges of typical portfolios. Equity hedge managers would typically maintain at least 50%, and may in some cases be substantially entirely invested, in equities, both long and short. Constituent funds are selected from an eligible pool of the more than 7,500 funds worldwide that report to the Hedge Fund Research (HFR) Database. Constituent funds must meet all of the following criteria: report monthly; report performance net of all fees; be U.S. dollar-denominated; be active and accepting new investments; have a minimum 24 months track record; and the fund’s manager must have at least $50 million in assets under management. The index is rebalanced quarterly. |
| The index is a float-adjusted market capitalization-weighted index that focuses on the large-cap segment of the U.S. equity market, and includes a significant portion of the total value of the market. |
Information About Your Fund’s Expenses (Unaudited)
As a Fund shareholder, you incur two types of costs: (1) transaction costs, including sales charges (loads) on purchase payments or redemption proceeds (if applicable); and (2) ongoing costs, including management fees, distribution and/or service (12b-1) fees (if applicable), and other Fund expenses. This example is intended to help you understand your ongoing costs (in U.S. dollars) of investing in a Fund and compare these costs with the ongoing costs of investing in other mutual funds.
This table is designed to provide information regarding costs related to your investments. The following examples are based on an investment of $1,000 made at the beginning of the six month period ended October 31, 2023 and held for the entire period. The table illustrates each Fund’s costs in two ways:
Actual Expenses and Performance: | The first section of the table provides information about actual account values and actual expenses in dollars, based on the Fund’s actual performance during the period indicated. You may use the information in this line, together with the amount you invested, to estimate the expenses you paid over the period. Simply divide your account value by $1,000 (for example, an $8,600 account value divided by $1,000 = 8.6), then multiply the result by the number in the first section of the table under the heading entitled "Expenses Paid During the Period" to estimate the expenses you paid over the period. |
Hypothetical Example for Comparison Purposes: | The second section of the table provides information about hypothetical account values and hypothetical expenses based on the Fund’s actual expense ratio and an assumed rate of return at 5% per year before expenses. This return is not the Fund’s actual return. The hypothetical account values and expenses may not be used to estimate the actual ending account balance or expenses you paid for the period. You may use this information to compare the ongoing costs of investing in a Fund versus other funds. To do so, compare the expenses shown in this 5% hypothetical example with the 5% hypothetical examples that appear in the shareholder reports of other funds. |
Please note that the expenses in the table are meant to highlight your ongoing costs only and do not include any transaction costs, such as sales charges (loads) (if applicable). Therefore, the information under the heading "Hypothetical (5% annual return before expenses)" is useful in comparing ongoing costs only, and will not help you determine the relative total costs of owning different funds. In addition, if these transaction costs were included, your costs would have been higher.
Expense Example (Unaudited)
Neuberger Berman Alternative Funds
| | HYPOTHETICAL (5% ANNUAL RETURN BEFORE EXPENSES) |
| Beginning
Account
Value
5/1/23 | Ending
Account
Value
10/31/23 | Expenses Paid
During the
5/1/23 – 10/31/23 | | Beginning
Account
Value
5/1/23 | Ending
Account
Value
10/31/23 | Expenses Paid
During the
Period(2)
5/1/23 – 10/31/23 | |
|
| | | | | | | | |
| | | | | | | | |
| | | | | | | | |
U.S. Equity Index PutWrite Strategy |
| | | | | | | | |
| | | | | | | | |
| For each class, expenses are equal to the annualized expense ratio for the class, multiplied by the average account value over the period, multiplied by 184/365 (to reflect the one-half year period shown), unless otherwise indicated. |
| Hypothetical expenses are equal to the annualized expense ratios for each class, multiplied by the average account value over the period (assuming a 5% annual return), multiplied by 184/365 (to reflect the one-half year period shown). |
| Includes expenses of the Fund’s Blocker (See Note A of the Notes to Financial Statements). |
Legend October 31, 2023 (Unaudited)
Neuberger Berman Alternative Funds
|
| = United States Federal Funds Effective Rate |
| = London Interbank Offered Rate |
| = United States Overnight Bank Funding Rate |
| = Secured Overnight Financing Rate |
|
| |
| = Goldman Sachs International |
| = JPMorgan Chase Bank N.A. |
| = State Street Bank and Trust Company |
Index Periods/Payment Frequencies: |
| |
| |
| |
|
| = Neuberger Berman Investment Advisers LLC |
|
| |
Consolidated Schedule of Investments Long Short Fund^ October 31, 2023
| |
|
|
|
| | |
| | |
| L3Harris Technologies, Inc. | |
| | |
|
| | |
|
| | |
|
| | |
|
| | |
|
| | |
| | |
| | |
| | |
|
| | |
Commercial Services & Supplies 1.0% |
| | |
Consumer Staples Distribution & Retail 3.3% |
| | |
| | |
| | |
| | |
Containers & Packaging 0.8% |
| | |
Diversified Consumer Services 0.1% |
| European Wax Center, Inc. Class A | |
|
| | |
| | |
| | |
Electrical Equipment 0.7% |
| | |
Electronic Equipment, Instruments & Components 1.8% |
| | |
| | |
| |
Electronic Equipment, Instruments & Components – cont'd |
| | |
| | |
|
| | |
|
| | |
| | |
| | |
| | |
|
| Lamb Weston Holdings, Inc. | |
| Mondelez International, Inc. Class A | |
| | |
Ground Transportation 2.1% |
| | |
| | |
| | |
Health Care Equipment & Supplies 0.8% |
| | |
Health Care Providers & Services 2.8% |
| | |
| | |
| | |
Hotels, Restaurants & Leisure 3.1% |
| First Watch Restaurant Group, Inc. | |
| Marriott International, Inc. Class A | |
| | |
| | |
| | |
|
| | |
|
| | |
Interactive Media & Services 5.8% |
| | |
| | |
| Meta Platforms, Inc. Class A | |
| | |
|
| | |
See Notes to Consolidated Financial Statements
Consolidated Schedule of Investments Long Short Fund^ (cont’d)
| |
Life Sciences Tools & Services 0.5% |
| Thermo Fisher Scientific, Inc. | |
|
| | |
| | |
| | |
Oil, Gas & Consumable Fuels 1.8% |
| | |
| | |
| | |
Personal Care Products 0.8% |
| | |
| | |
| | |
|
| | |
Professional Services 2.7% |
| | |
| | |
| | |
| | |
Semiconductors & Semiconductor Equipment 1.8% |
| | |
| | |
| | |
| | |
|
| | |
| Arctic Wolf Networks, Inc. | |
| | |
| | |
| | |
| | |
| | |
| | |
| | |
| | |
| | |
| | |
|
| | |
| | |
| | |
|
| Asbury Automotive Group, Inc. | |
| | |
| |
Specialty Retail – cont'd |
| Fanatics Holdings, Inc. Class A | |
| | |
| | |
| | |
Technology Hardware, Storage & Peripherals 2.2% |
| | |
Textiles, Apparel & Luxury Goods 0.5% |
| | |
|
Total Common Stocks
(Cost $3,667,354,741) | |
|
|
| | |
|
| | |
| | |
| | |
|
| Cybereason, Inc. Series F | |
| | |
| | |
| | |
|
| | |
| Signifyd, Inc. Series Seed | |
| | |
| | |
| | |
|
Total Preferred Stocks
(Cost $58,686,273) | |
|
|
Master Limited Partnerships and Limited Partnerships 2.2% |
|
| Brookfield Infrastructure Partners LP
| |
See Notes to Consolidated Financial Statements
Consolidated Schedule of Investments Long Short Fund^ (cont’d)
| |
Oil, Gas & Consumable Fuels 1.6% |
| Enterprise Products Partners LP
| |
|
Total Master Limited Partnerships and Limited Partnerships
(Cost $125,075,723) | |
| |
|
|
| PepsiCo, Inc., 2.75%, due 10/21/2051 | |
|
| Apple, Inc., 2.85%, due 8/5/2061 | |
Diversified Financial Services 0.0%(f) |
| Mastercard, Inc., 2.95%, due 3/15/2051 | |
|
| Florida Power & Light Co., 2.88%, due 12/4/2051 | |
Healthcare - Services 0.2% |
| | |
| | |
| | |
| | |
|
| Alphabet, Inc., 2.25%, due 8/15/2060 | |
| Amazon.com, Inc., 3.25%, due 5/12/2061 | |
| | |
| | |
| | |
| | |
| Uber Technologies, Inc., 8.00%, due 11/1/2026 | |
| | |
Machinery - Diversified 0.1% |
| nVent Finance SARL, 4.55%, due 4/15/2028 | |
Miscellaneous Manufacturer 0.6% |
| Anagram International, Inc./Anagram Holdings LLC | |
| 10.00% Cash & 5.00% PIK, due 8/15/2025 | |
| 5.00% Cash & 5.00% PIK, due 8/15/2026 | 13,275,131 (c)(d)(g)(h)(i) |
| | |
Office - Business Equipment 0.1% |
| CDW LLC/CDW Finance Corp., 2.67%, due 12/1/2026 | |
|
| Johnson & Johnson, 2.45%, due 9/1/2060 | |
See Notes to Consolidated Financial Statements
Consolidated Schedule of Investments Long Short Fund^ (cont’d)
| |
Real Estate Investment Trusts 0.0%(f) |
| SBA Communications Corp., 3.88%, due 2/15/2027 | |
|
| | |
| | |
| | |
| | |
|
| Activision Blizzard, Inc., 2.50%, due 9/15/2050 | |
| Microsoft Corp., 2.68%, due 6/1/2060 | |
| | |
| | |
| | |
| | |
|
Total Corporate Bonds
(Cost $232,884,431) | |
|
|
| Arctic Wolf Networks, Inc., 0.00%, due 9/29/2027 (Cost $19,850,000) | |
|
|
|
Diversified Consumer Services 0.1% |
| OneSpaWorld Holdings Ltd. Expires 6/12/2025
(Cost $0) | |
|
|
Short-Term Investments 9.6% |
Investment Companies 9.6% |
| State Street Institutional U.S. Government Money Market Fund Premier Class, 5.30%(j) | |
| State Street Navigator Securities Lending Government Money Market Portfolio, 5.36%(j) | |
Total Short-Term Investments
(Cost $585,706,863) | |
Total Long Positions (92.7%)
(Cost $4,689,558,031) | |
| |
|
Short Positions ((15.3)%) |
Common Stocks Sold Short (14.6)% |
Air Freight & Logistics (0.1)% |
| Expeditors International of Washington, Inc.
| |
See Notes to Consolidated Financial Statements
Consolidated Schedule of Investments Long Short Fund^ (cont’d)
| |
|
|
| | |
|
| | |
| | |
| | |
Commercial Services & Supplies (0.2)% |
| | |
|
| | |
| | |
| | |
| | |
Consumer Staples Distribution & Retail (1.1)% |
| BJ's Wholesale Club Holdings, Inc. | |
| | |
| Grocery Outlet Holding Corp. | |
| | |
| Sprouts Farmers Market, Inc. | |
| | |
Diversified Consumer Services (0.1)% |
| | |
| | |
| | |
Electric Utilities (0.3)% |
| | |
Electrical Equipment (0.3)% |
| | |
| | |
| | |
|
| | |
| | |
| Warner Bros Discovery, Inc. | |
| | |
|
| | |
| | |
| | |
| | |
| | |
| | |
| |
|
|
| | |
| | |
Ground Transportation (0.1)% |
| | |
Health Care Providers & Services (0.5)% |
| | |
| | |
| | |
| | |
Hotels, Restaurants & Leisure (0.6)% |
| | |
| | |
| | |
| | |
Household Durables (0.1)% |
| | |
| | |
| | |
Independent Power and Renewable Electricity Producers |
| | |
|
| | |
| RenaissanceRe Holdings Ltd. | |
| Ryan Specialty Holdings, Inc. | |
| | |
Interactive Media & Services (0.2)% |
| | |
| | |
| | |
|
| International Business Machines Corp.
| |
Life Sciences Tools & Services (0.3)% |
| Agilent Technologies, Inc. | |
| Mettler-Toledo International, Inc. | |
| | |
| | |
|
| | |
| Illinois Tool Works, Inc. | |
| | |
See Notes to Consolidated Financial Statements
Consolidated Schedule of Investments Long Short Fund^ (cont’d)
| |
|
|
| | |
| | |
| | |
|
| Interpublic Group of Cos., Inc. | |
| | |
| | |
| | |
Passenger Airlines (0.1)% |
| | |
Professional Services (0.7)% |
| | |
| | |
| | |
| | |
Real Estate Management & Development (0.2)% |
| | |
| Opendoor Technologies, Inc. | |
| | |
| | |
Semiconductors & Semiconductor Equipment (0.3)% |
| | |
| | |
| | |
| | |
| |
|
|
| Descartes Systems Group, Inc. | |
| | |
| Palantir Technologies, Inc. | |
| | |
| | |
| | |
|
| | |
| | |
| | |
|
| | |
| | |
| | |
| Floor & Decor Holdings, Inc. | |
| | |
| | |
| | |
Textiles, Apparel & Luxury Goods (0.2)% |
| | |
| | |
| | |
|
Total Common Stocks Sold Short
(Proceeds $(953,512,475)) | |
|
|
Corporate Bonds Sold Short (0.7)% |
Diversified Financial Services (0.2)% |
| Radian Group, Inc., 4.88%, due 3/15/2027 | |
| Rocket Mortgage LLC/Rocket Mortgage Co.-Issuer, Inc., 3.63%, due 3/1/2029 | |
| | |
|
| Hartford Financial Services Group, Inc., 3 mo. USD Term SOFR + 2.39%, 7.75%, due 2/12/2047 | |
|
| Boyd Gaming Corp., 4.75%, due 12/1/2027 | |
|
| iHeartCommunications, Inc., 8.38%, due 5/1/2027 | |
| Sirius XM Radio, Inc., 4.00%, due 7/15/2028 | |
| | |
|
| Steelcase, Inc., 5.13%, due 1/18/2029 | |
See Notes to Consolidated Financial Statements
Consolidated Schedule of Investments Long Short Fund^ (cont’d)
| |
|
| TransCanada PipeLines Ltd., (3 mo. USD LIBOR + 2.21%), 7.84%, due 5/15/2067 | |
|
| Macy's Retail Holdings LLC, 5.88%, due 4/1/2029 | |
Total Corporate Bonds Sold Short (Proceeds $(45,670,283)) | |
Total Short Positions (Proceeds $(999,182,758)) | |
|
Total Investments 77.4% (Cost $3,690,375,273) | |
Other Assets Less Liabilities 22.6% | |
| |
| Non-income producing security. |
| All or a portion of this security is on loan at October 31, 2023. Total value of all such securities at October 31, 2023 amounted to $18,305,569, collateralized by cash collateral of $1,942,407 and non-cash (U.S. Treasury Securities) collateral of $16,842,776 for the Fund (see Note A of the Notes to Financial Statements). |
| Step Bond. Coupon rate is a fixed rate for an initial period that either resets at a specific date or may reset in the future contingent upon a predetermined trigger. The interest rate shown was the current rate as of October 31, 2023. |
| Value determined using significant unobservable inputs. |
| Security fair valued as of October 31, 2023 in accordance with procedures approved by the valuation designee. Total value of all such securities at October 31, 2023 amounted to $259,569,298, which represents 4.2% of net assets of the Fund. |
| Security represented in Units. |
| Represents less than 0.05% of net assets of the Fund. |
| Securities were purchased or sold short under Rule 144A of the Securities Act of 1933, as amended, or are otherwise restricted and, unless registered under the Securities Act of 1933 or exempted from registration, may only be sold to qualified institutional investors or may have other restrictions on resale. At October 31, 2023, these securities amounted to $48,647,296 of long positions and $(15,031,697) of short positions, which represents 0.8% and (0.2)%, respectively, of net assets of the Fund. |
| |
| Payment-in-kind (PIK) security. |
| Represents 7-day effective yield as of October 31, 2023. |
| Represents investment of cash collateral received from securities lending. |
| Variable or floating rate security. The interest rate shown was the current rate as of October 31, 2023 and changes periodically. |
| Includes the impact of the Fund’s open positions in derivatives at October 31, 2023. |
#
This security has been deemed by Management to be illiquid, and is subject to restrictions on resale. Total value of all such securities at October 31, 2023 amounted to $242,851,097, which represents 4.0% of net assets of the Fund. Acquisition dates shown with a range, if any, represent securities that were acquired over the period shown in the table.
See Notes to Consolidated Financial Statements
Consolidated Schedule of Investments Long Short Fund^ (cont’d)
| | | | Fair Value
Percentage
of Net Assets
as of
10/31/2023 |
A24 Films LLC (Preferred Units) | | | | |
Arctic Wolf Networks, Inc. | | | | |
Arctic Wolf Networks, Inc. (Convertible Bonds) | | | | |
Cybereason, Inc. (Series F Preferred Shares) | | | | |
Druva, Inc. (Series 4 Preferred Shares) | | | | |
Druva, Inc. (Series 5 Preferred Shares) | | | | |
Fabletics LLC (Series G Preferred Shares) | | | | |
Fanatics Holdings, Inc. Class A | | | | |
Grammarly, Inc. (Series 3 Preferred Shares) | | | | |
| | | | |
Savage X, Inc. (Series C Preferred Shares) | | | | |
Signifyd, Inc. (Series A Preferred Shares) | | | | |
Signifyd, Inc. (Series Seed Preferred Shares) | | | | |
Videoamp, Inc. (Series F1 Preferred Shares) | | | | |
|
| | | |
See Notes to Consolidated Financial Statements
Consolidated Schedule of Investments Long Short Fund^ (cont’d)
Derivative Instruments
Futures contracts ("futures")
At October 31, 2023, open positions in futures for the Fund were as follows:
| | | | Value and
Unrealized
Appreciation/
(Depreciation) |
| | | | |
| | | | |
| | |
For the year ended October 31, 2023, the average notional value for the months where the Fund had futures outstanding was $(763,116,711) for short positions.
Total return basket swap contracts ("total return basket swaps")
At October 31, 2023, the Fund had outstanding total return basket swaps(a) as follows:
Over-the-counter total return basket swaps—Short(b) |
| | | | | Frequency
of Fund
Receipt/
Payment | | |
| | | | | | | |
| | | | | | | |
| | | | | | | |
| | | | | | | |
| | | | | | | |
| | | | | | | |
| | | | | | | |
| | | | | | | |
|
|
|
|
|
|
| |
(a) The following table represents required component disclosures associated with the total return basket swaps:
| | | Unrealized
Appreciation/
(Depreciation) | |
| | | | |
| | | | |
| | | | |
| | | | |
| | | | |
| | | | |
| | | | |
| | | | |
| | | | |
| | | | |
See Notes to Consolidated Financial Statements
Consolidated Schedule of Investments Long Short Fund^ (cont’d)
| | | Unrealized Appreciation/ (Depreciation) | |
| | | | |
| | | | |
| | | | |
| | | | |
| | | | |
| | | | |
| | | | |
| | | | |
| | | | |
| | | | |
| | | | |
| | | | |
| | | | |
| | | | |
| | | | |
| | | | |
| | | | |
| | | | |
Knight-Swift Transportation Holdings Inc | | | | |
| | | | |
| | | | |
| | | | |
| | | | |
| | | | |
| | | | |
| | | | |
| | | | |
| | | | |
| | | | |
Discover Financial Services | | | | |
| | | | |
United Parcel Service Inc | | | | |
| | | | |
| | | | |
| | | | |
| | | | |
| | | | |
| | | | |
| | | | |
| | | | |
| | | | |
| | | | |
| | | | |
| | | | |
|
| | |
|
Accrued Net Interest Receivable/(Payable) |
| |
|
|
|
| |
|
See Notes to Consolidated Financial Statements
Consolidated Schedule of Investments Long Short Fund^ (cont’d)
| | | Unrealized Appreciation/ (Depreciation) | |
| | | | |
| | | | |
| | | | |
| | | | |
| | | | |
| | | | |
| | | | |
| | | | |
| | | | |
| | | | |
| | | | |
| | | | |
| | | | |
| | | | |
| | | | |
| | | | |
| | | | |
| | | | |
| | | | |
| | | | |
| | | | |
| | | | |
| | | | |
| | | | |
| | | | |
| | | | |
| | | | |
Knight-Swift Transportation Holdings Inc | | | | |
| | | | |
| | | | |
| | | | |
| | | | |
| | | | |
| | | | |
| | | | |
| | | | |
| | | | |
| | | | |
Discover Financial Services | | | | |
| | | | |
United Parcel Service Inc | | | | |
| | | | |
| | | | |
| | | | |
| | | | |
| | | | |
| | | | |
See Notes to Consolidated Financial Statements
Consolidated Schedule of Investments Long Short Fund^ (cont’d)
| | | Unrealized Appreciation/ (Depreciation) | |
| | | | |
| | | | |
| | | | |
| | | | |
| | | | |
| | | | |
| | | | |
|
| | |
|
Accrued Net Interest Receivable/(Payable) |
| |
|
|
|
| |
|
| | | | |
| | | | |
| | | | |
| | | | |
| | | | |
| | | | |
| | | | |
| | | | |
| | | | |
| | | | |
| | | | |
| | | | |
| | | | |
| | | | |
| | | | |
| | | | |
| | | | |
| | | | |
| | | | |
| | | | |
| | | | |
| | | | |
| | | | |
| | | | |
| | | | |
| | | | |
| | | | |
Knight-Swift Transportation Holdings Inc | | | | |
| | | | |
| | | | |
| | | | |
| | | | |
| | | | |
| | | | |
| | | | |
| | | | |
| | | | |
See Notes to Consolidated Financial Statements
Consolidated Schedule of Investments Long Short Fund^ (cont’d)
| | | Unrealized Appreciation/ (Depreciation) | |
| | | | |
| | | | |
Discover Financial Services | | | | |
| | | | |
United Parcel Service Inc | | | | |
| | | | |
| | | | |
| | | | |
| | | | |
| | | | |
| | | | |
| | | | |
| | | | |
| | | | |
| | | | |
| | | | |
| | | | |
|
| | |
|
Accrued Net Interest Receivable/(Payable) |
| |
|
|
|
| |
|
| | | | |
| | | | |
| | | | |
| | | | |
LVMH Moet Hennessy Louis Vuitton SE | | | | |
| | | | |
| | | | |
| | | | |
| | | | |
| | | | |
| | | | |
| | | | |
| | | | |
| | | | |
| | | | |
Chipotle Mexican Grill Inc | | | | |
Cie Financiere Richemont SA | | | | |
| | | | |
| | | | |
| | | | |
Marriott International Inc/MD | | | | |
| | | | |
| | | | |
Hilton Worldwide Holdings Inc | | | | |
| | | | |
| | | | |
Oriental Land Co Ltd/Japan | | | | |
See Notes to Consolidated Financial Statements
Consolidated Schedule of Investments Long Short Fund^ (cont’d)
| | | Unrealized Appreciation/ (Depreciation) | |
| | | | |
| | | | |
Industria de Diseno Textil SA | | | | |
| | | | |
| | | | |
Bayerische Motoren Werke AG | | | | |
| | | | |
| | | | |
| | | | |
| | | | |
| | | | |
Cie Generale des Etablissements Michelin SCA | | | | |
| | | | |
| | | | |
| | | | |
| | | | |
| | | | |
| | | | |
Bandai Namco Holdings Inc | | | | |
| | | | |
| | | | |
| | | | |
MGM Resorts International | | | | |
| | | | |
Restaurant Brands International Inc | | | | |
| | | | |
|
| | |
|
Accrued Net Interest Receivable/(Payable) |
| |
|
|
|
| |
|
| | | | |
| | | | |
AMC Entertainment Holdings Inc | | | | |
| | | | |
| | | | |
Maravai LifeSciences Holdings Inc | | | | |
| | | | |
| | | | |
| | | | |
| | | | |
Charter Communications Inc | | | | |
| | | | |
Frontier Communications Parent Inc | | | | |
| | | | |
| | | | |
| | | | |
| | | | |
Floor & Decor Holdings Inc | | | | |
See Notes to Consolidated Financial Statements
Consolidated Schedule of Investments Long Short Fund^ (cont’d)
| | | Unrealized Appreciation/ (Depreciation) | |
| | | | |
Spirit AeroSystems Holdings Inc | | | | |
| | | | |
Dick's Sporting Goods Inc | | | | |
GE HealthCare Technologies Inc | | | | |
| | | | |
| | | | |
| | | | |
Petco Health & Wellness Co Inc | | | | |
| | | | |
| | | | |
Integra LifeSciences Holdings Corp | | | | |
| | | | |
| | | | |
| | | | |
| | | | |
| | | | |
Performance Food Group Co | | | | |
| | | | |
| | | | |
| | | | |
| | | | |
| | | | |
Goldman Sachs Group Inc/The | | | | |
| | | | |
| | | | |
| | | | |
| | | | |
| | | | |
| | | | |
| | | | |
| | | | |
| | | | |
Liberty Media Corp-Liberty Live | | | | |
| | | | |
|
| | |
|
Accrued Net Interest Receivable/(Payable) |
| |
|
|
|
| |
|
| | | | |
| | | | |
Sprouts Farmers Market Inc | | | | |
| | | | |
Take-Two Interactive Software Inc | | | | |
Performance Food Group Co | | | | |
| | | | |
| | | | |
| | | | |
See Notes to Consolidated Financial Statements
Consolidated Schedule of Investments Long Short Fund^ (cont’d)
| | | Unrealized Appreciation/ (Depreciation) | |
| | | | |
| | | | |
| | | | |
| | | | |
Monolithic Power Systems Inc | | | | |
| | | | |
| | | | |
| | | | |
| | | | |
Palantir Technologies Inc | | | | |
| | | | |
| | | | |
| | | | |
| | | | |
| | | | |
| | | | |
| | | | |
| | | | |
Live Nation Entertainment Inc | | | | |
| | | | |
| | | | |
| | | | |
| | | | |
RenaissanceRe Holdings Ltd | | | | |
| | | | |
| | | | |
| | | | |
| | | | |
Taylor Morrison Home Corp | | | | |
| | | | |
| | | | |
| | | | |
| | | | |
| | | | |
| | | | |
| | | | |
| | | | |
| | | | |
| | | | |
| | | | |
| | | | |
| | | | |
| | | | |
| | | | |
|
| | |
|
Accrued Net Interest Receivable/(Payable) |
| |
|
|
|
| |
|
See Notes to Consolidated Financial Statements
Consolidated Schedule of Investments Long Short Fund^ (cont’d)
| | | Unrealized Appreciation/ (Depreciation) | |
| | | | |
| | | | |
Sprouts Farmers Market Inc | | | | |
| | | | |
Take-Two Interactive Software Inc | | | | |
Performance Food Group Co | | | | |
| | | | |
| | | | |
| | | | |
| | | | |
| | | | |
| | | | |
Monolithic Power Systems Inc | | | | |
| | | | |
| | | | |
| | | | |
| | | | |
Palantir Technologies Inc | | | | |
| | | | |
| | | | |
| | | | |
| | | | |
| | | | |
| | | | |
| | | | |
| | | | |
Live Nation Entertainment Inc | | | | |
| | | | |
| | | | |
| | | | |
| | | | |
RenaissanceRe Holdings Ltd | | | | |
| | | | |
| | | | |
| | | | |
| | | | |
Taylor Morrison Home Corp | | | | |
| | | | |
| | | | |
| | | | |
| | | | |
| | | | |
| | | | |
| | | | |
| | | | |
| | | | |
| | | | |
See Notes to Consolidated Financial Statements
Consolidated Schedule of Investments Long Short Fund^ (cont’d)
| | | Unrealized Appreciation/ (Depreciation) | |
| | | | |
| | | | |
| | | | |
| | | | |
| | | | |
| | | | |
|
| | |
|
Accrued Net Interest Receivable/(Payable) |
| |
|
|
|
| |
|
| | | | |
| | | | |
Sprouts Farmers Market Inc | | | | |
| | | | |
Take-Two Interactive Software Inc | | | | |
Performance Food Group Co | | | | |
| | | | |
| | | | |
| | | | |
| | | | |
| | | | |
| | | | |
Monolithic Power Systems Inc | | | | |
| | | | |
| | | | |
| | | | |
| | | | |
Palantir Technologies Inc | | | | |
| | | | |
| | | | |
| | | | |
| | | | |
| | | | |
| | | | |
| | | | |
| | | | |
Live Nation Entertainment Inc | | | | |
| | | | |
| | | | |
| | | | |
| | | | |
RenaissanceRe Holdings Ltd | | | | |
| | | | |
| | | | |
| | | | |
| | | | |
Taylor Morrison Home Corp | | | | |
| | | | |
See Notes to Consolidated Financial Statements
Consolidated Schedule of Investments Long Short Fund^ (cont’d)
| | | Unrealized Appreciation/ (Depreciation) | |
| | | | |
| | | | |
| | | | |
| | | | |
| | | | |
| | | | |
| | | | |
| | | | |
| | | | |
| | | | |
| | | | |
| | | | |
| | | | |
| | | | |
| | | | |
|
| | |
|
Accrued Net Interest Receivable/(Payable) |
| |
|
|
|
| |
|
Total Return Basket Swaps, at Value |
| |
|
| The Fund receives a specified rate based on a reference rate plus or minus a spread, and pays the total return on the reference entity. The cash flows may be denominated in various foreign currencies based on the local currencies of the positions within the swaps. |
| Effective rate at October 31, 2023. |
Total return swap contracts ("total return swaps")
At October 31, 2023, the Fund had outstanding over-the-counter total return swaps as follows:
Over-the-counter total return swaps—Short(a) |
| | | | | | | Frequency
of Fund
Receipt/
Payment | Unrealized
Appreciation/
(Depreciation) | Accrued
Net
Interest
Receivable/
(Payable) | |
| S&P 500 Equal
Weight Total
Return Index | | | | | | | | | | |
| S&P Retail
Select Industry
Index | | | | | | | | | | |
| S&P Retail
Select Industry
Index | | | | | | | | | | |
| S&P Retail
Select Industry
Index | | | | | | | | | | |
See Notes to Consolidated Financial Statements
Consolidated Schedule of Investments Long Short Fund^ (cont’d)
| | | | | | | Frequency of Fund Receipt/ Payment | Unrealized Appreciation/ (Depreciation) | Accrued Net Interest Receivable/ (Payable) | |
| S&P Retail
Select Industry
Index | | | | | | | | | | |
| |
|
|
|
|
|
|
| | | |
| The Fund receives a specified rate based on a reference rate plus or minus a spread, and pays the total return on the reference entity. |
| Effective rate at October 31, 2023. |
For the year ended October 31, 2023, the average notional value for the months where the Fund had total return basket swaps and total return swaps, including contracts for difference, for the Fund was $(627,288,714) for short positions.
At October 31, 2023, the Fund had cash collateral of $1,220,000, $17,380,000 and $70,680,000 deposited in segregated accounts for Citibank, N.A., Goldman Sachs International and JPMorgan Chase Bank N.A., respectively, to cover collateral requirements on over-the-counter derivatives.
| | | | | Frequency
of Fund
Receipt/
Payment | | Unrealized
Appreciation/
(Depreciation) | Accrued
Net
Interest
Receivable/
(Payable) | |
| | | | | | | | | |
The Fund receives a rate based on SOFR less a 10.75% spread.
Purchased option contracts ("options purchased")
At October 31, 2023, the Fund did not have any open positions in options purchased.
Written option contracts ("options written")
At October 31, 2023, the Fund did not have any open positions in options written.
For the year ended October 31, 2023, the average market value for the months where the Fund had options purchased and options written outstanding was $675,471 and $(2,652,811), respectively.
See Notes to Consolidated Financial Statements
Consolidated Schedule of Investments Long Short Fund^ (cont’d)
The following is a summary, categorized by Level (see Note A of the Notes to Financial Statements), of inputs used to value the Fund’s investments as of October 31, 2023:
| | | | |
| | | | |
|
|
|
|
|
| | | | |
| | | | |
| | | | |
| | | | |
| | | | |
Master Limited Partnerships and Limited Partnerships# | | | | |
|
|
|
|
|
Miscellaneous Manufacturer | | | | |
| | | | |
| | | | |
| | | | |
| | | | |
| | | | |
| | | | |
| The Consolidated Schedule of Investments provides information on the industry or sector categorization. |
| The following is a reconciliation between the beginning and ending balances of investments in which significant unobservable inputs (Level 3) were used in determining value: |
| Beginning
balance as
of 11/1/2022 | Accrued
discounts/
(premiums) | | Change
in unrealized
appreciation/
(depreciation) | | | | | | Net change in
unrealized
appreciation/
(depreciation)
from
investments
still held as of
10/31/2023 |
Investments in Securities: |
| | | | | | | | | | |
| | | | | | | | | | |
| | | | | | | | | | |
| | | | | | | | | | |
| | | | | | | | | | |
| | | | | | | | | | |
| | | | | | | | | | |
(1) Quantitative Information about Level 3 Fair Value Measurements: |
| | | Significant unobservable
input(s) | | | Impact to
valuation
from
increase
in input(b) |
| | | Enterprise value
Revenue multiple(c) (EV/Revenue) | | | |
See Notes to Consolidated Financial Statements
Consolidated Schedule of Investments Long Short Fund^ (cont’d)
|
| | | | | |
|
| | | | | |
|
| | | | | |
| | | | | | |
| | | Enterprise value
Revenue multiple(c) (EV/Revenue) | | | |
|
| | | | | |
|
| | | | | |
|
| | | | | |
| | | Enterprise value
Revenue multiple(c) (EV/Revenue) | | | |
|
| | | | | |
|
| | | | | |
|
| | | | | |
| | | | | | |
| | | Estimated Recovery Value
(of Par Value) | | | |
(a) The weighted averages disclosed in the table above were weighted by relative fair value. |
(b) Represents the expected directional change in the fair value of the Level 3 investments that would result from an increase or decrease in the corresponding input. Significant changes in these inputs could result in significantly higher or lower fair value measurements. |
(c) Represents amounts used when the reporting entity has determined that market participants would use such multiples when pricing the investments. |
(2) At the beginning of the period, these investments were valued in accordance with the procedures approved by the valuation designee. |
(3) At October 31, 2023, these investments were valued in accordance with procedures approved by the valuation designee. These investments did not have a material impact on the Fund’s net assets and, therefore, disclosure of significant unobservable inputs used in formulating valuations is not presented. |
The following is a summary, categorized by Level (see Note A of the Notes to Financial Statements), of inputs used to value the Fund’s short investments as of October 31, 2023:
Liability Valuation Inputs | | | | |
| | | | |
Common Stocks Sold Short# | | | | |
Corporate Bonds Sold Short# | | | | |
| | | | |
| The Consolidated Schedule of Investments provides information on the industry or sector categorization. |
See Notes to Consolidated Financial Statements
Consolidated Schedule of Investments Long Short Fund^ (cont’d)
The following is a summary, categorized by Level (see Note A of the Notes to Financial Statements), of inputs used to value the Fund’s derivatives as of October 31, 2023:
Other Financial Instruments | | | | |
|
|
|
|
|
| | | | |
|
|
|
|
|
| | | | |
| | | | |
| | | | |
| Futures are reported at the cumulative unrealized appreciation/(depreciation) of the instrument. |
^
A balance indicated with a "—", reflects either a zero balance or an amount that rounds to less than 1.
See Notes to Consolidated Financial Statements
Schedule of Investments U.S. Equity Index PutWrite Strategy Fund^ October 31, 2023
| |
U.S. Treasury Obligations 96.9% |
| | |
| | |
| 0.25%, due 3/15/2024 - 6/15/2024 | |
| | |
| | |
|
Total U.S. Treasury Obligations (Cost $451,934,989) | |
|
|
|
|
Short-Term Investments 4.5% |
Investment Companies 4.5% | |
|
| State Street Institutional U.S. Government Money Market Fund Premier Class, 5.30%(a) (Cost $20,675,270) | |
Total Investments 101.4% (Cost $472,610,259) | |
Liabilities Less Other Assets (1.4)% | |
| |
| Represents 7-day effective yield as of October 31, 2023. |
| Includes the impact of the Fund's open positions in derivatives at October 31, 2023. |
See Notes to Financial Statements
Schedule of Investments U.S. Equity Index PutWrite Strategy Fund^ (cont’d)
Derivative Instruments
Written option contracts ("options written")
At October 31, 2023, the Fund had outstanding options written as follows:
| | | | | |
|
|
| | | | | |
| | | | | |
| | | | | |
| | | | | |
| | | | | |
| | | | | |
| | | | | |
| | | | | |
| | | | | |
| | | | | |
| | | | | |
| | | | | |
| | | | | |
| | | | | |
| | | | | |
| | | | | |
| | | | | |
| | | | | |
| | | | | |
| | | | | |
| | | | | |
| | | | | |
| | | | | |
| | | | | |
Total options written (premium received $7,516,133) | |
For the year ended October 31, 2023, the average market value for the months where the Fund had options written outstanding was $(4,920,933).
The following is a summary, categorized by Level (see Note A of the Notes to Financial Statements), of inputs used to value the Fund’s investments as of October 31, 2023:
| | | | |
| | | | |
U.S. Treasury Obligations | | | | |
| | | | |
| | | | |
See Notes to Financial Statements
Schedule of Investments U.S. Equity Index PutWrite Strategy Fund^ (cont’d)
The following is a summary, categorized by Level (see Note A of the Notes to Financial Statements), of inputs used to value the Fund’s derivatives as of October 31, 2023:
Other Financial Instruments | | | | |
|
|
|
|
|
| | | | |
| | | | |
^
A balance indicated with a "—", reflects either a zero balance or an amount that rounds to less than 1.
See Notes to Financial Statements
Statements of Assets and Liabilities
Neuberger Berman Alternative Funds
| | U.S. Equity
Index
PutWrite
Strategy Fund |
| | |
|
|
|
Investments in securities, at value*† (Note A)—
see Schedule of Investments: |
|
|
| | |
| | |
Cash collateral segregated for short sales (Note A) | | |
Cash collateral segregated for over-the-counter derivatives (Note A) | | |
Dividends and interest receivable | | |
Receivable for securities sold | | |
Receivable for accumulated variation margin on futures contracts (Note A) | | |
Receivable for Fund shares sold | | |
Receivable for securities lending income (Note A) | | |
Over-the-counter swap contracts, at value (Note A) | | |
Prepaid expenses and other assets | | |
| | |
|
|
|
Investments sold short, at value(c) (Note A) | | |
Over-the-counter swap contracts, at value (Note A) | | |
Dividends and interest payable for short sales | | |
Cash collateral segregated for futures contracts due to broker (Note A) | | |
Payable to investment manager (Note B) | | |
Option contracts written, at value(d) (Note A) | | |
| | |
Payable for securities purchased | | |
Payable for Fund shares redeemed | | |
Payable to administrator—net (Note B) | | |
| | |
Payable for cash collateral on loaned securities (Note A) | | |
Other accrued expenses and payables | | |
| | |
| | |
|
|
|
See Notes to Financial Statements
Statements of Assets and Liabilities (cont’d)
Neuberger Berman Alternative Funds
| | U.S. Equity Index PutWrite Strategy Fund |
| | |
|
|
|
| | |
Total distributable earnings/(losses) | | |
| | |
|
|
|
| | |
| | |
| | |
| | |
Shares Outstanding ($.001 par value; unlimited shares authorized) |
|
|
| | |
| | |
| | |
| | |
Net Asset Value, offering and redemption price per share |
|
|
| | |
| | |
Net Asset Value and redemption price per share |
|
|
| | |
|
|
|
| | |
Net Asset Value and offering price per share |
|
|
| | |
†Securities on loan, at value: |
|
|
| | |
|
|
|
| | |
(b) Total cost of foreign currency | | |
(c) Proceeds from investments sold short | | |
(d) Premium received from option contracts written | | |
| |
| Consolidated financial statement, see Note A of the Notes to Financial Statements for additional information. |
| On single retail sales of less than $50,000. On sales of $50,000 or more or in certain other circumstances described in the Fund's prospectus, offering price is reduced. |
| Redemption price per share is equal to net asset value less any applicable contingent deferred sales charge. |
See Notes to Financial Statements
Neuberger Berman Alternative Funds
| | U.S. Equity
Index
PutWrite
Strategy Fund |
| For the Fiscal
Year Ended
October 31,
2023 | For the Fiscal
Year Ended
October 31,
2023 |
|
|
|
|
|
|
Dividend income—unaffiliated issuers | | |
Interest and other income—unaffiliated issuers | | |
Income from securities loaned—net | | |
| | |
| | |
|
|
|
Investment management fees (Note B) | | |
Administration fees (Note B): |
|
|
| | |
| | |
| | |
| | |
Distribution fees (Note B): |
|
|
| | |
| | |
Shareholder servicing agent fees: |
|
|
| | |
| | |
| | |
| | |
| | |
Subsidiary administration fees | | |
Custodian and accounting fees | | |
| | |
| | |
Registration and filing fees | | |
| | |
Trustees' fees and expenses | | |
Dividend and interest expense on securities sold short (Note A) | | |
| | |
Miscellaneous and other fees (Note A) | | |
| | |
Expenses reimbursed by Management (Note B) | | |
| | |
| | |
Net investment income/(loss) | | |
|
|
|
See Notes to Financial Statements
Statements of Operations (cont’d)
Neuberger Berman Alternative Funds
| | U.S. Equity Index PutWrite Strategy Fund |
| For the Fiscal Year Ended October 31, 2023 | For the Fiscal Year Ended October 31, 2023 |
Realized and Unrealized Gain/(Loss) on Investments (Note A): |
|
|
Net realized gain/(loss) on: |
|
|
Transactions in investment securities of unaffiliated issuers | | |
Closed short positions of unaffiliated issuers | | |
Settlement of foreign currency transactions | | |
Expiration or closing of futures contracts | | |
Expiration or closing of option contracts written | | |
Expiration or closing of swap contracts | | |
Change in net unrealized appreciation/(depreciation) in value of: |
|
|
Investment securities of unaffiliated issuers | | |
Short positions of unaffiliated issuers | | |
Foreign currency translations | | |
| | |
| | |
| | |
Net gain/(loss) on investments | | |
Net increase/(decrease) in net assets resulting from operations | | |
| |
| Consolidated financial statement, see Note A of the Notes to Financial Statements for additional information. |
See Notes to Financial Statements
Statements of Changes in Net Assets
Neuberger Berman Alternative Funds
| | U.S. Equity
Index
PutWrite
Strategy Fund |
| | | | |
| | | | |
Increase/(Decrease) in Net Assets: |
|
|
|
|
From Operations (Note A): |
|
|
|
|
Net investment income/(loss) | | | | |
Net realized gain/(loss) on investments | | | | |
Change in net unrealized appreciation/(depreciation) of investments | | | | |
Net increase/(decrease) in net assets resulting from operations | | | | |
Distributions to Shareholders From (Note A): |
|
|
|
|
|
|
|
|
|
| | | | |
| | | | |
| | | | |
| | | | |
|
|
|
|
|
| | | | |
| | | | |
Total distributions to shareholders | | | | |
From Fund Share Transactions (Note D): |
|
|
|
|
Proceeds from shares sold: |
|
|
|
|
| | | | |
| | | | |
| | | | |
| | | | |
Proceeds from reinvestment of dividends and distributions: |
|
|
|
|
| | | | |
| | | | |
| | | | |
| | | | |
Payments for shares redeemed: |
|
|
|
|
| | | | |
| | | | |
| | | | |
| | | | |
Net increase/(decrease) from Fund share transactions | | | | |
Net Increase/(Decrease) in Net Assets | | | | |
|
|
|
|
|
| | | | |
| | | | |
| |
| Consolidated financial statement, see Note A of the Notes to Financial Statements for additional information. |
See Notes to Financial Statements
Notes to Financial Statements Alternative Fundsß
Note A—Summary of Significant Accounting Policies:
1
General: Neuberger Berman Alternative Funds (the "Trust") is a Delaware statutory trust organized pursuant to an Amended and Restated Trust Instrument dated March 27, 2014. The Trust is registered as an open-end management investment company under the Investment Company Act of 1940, as amended (the "1940 Act"), and its shares are registered under the Securities Act of 1933, as amended. Each of Neuberger Berman Long Short Fund ("Long Short") and Neuberger Berman U.S. Equity Index PutWrite Strategy Fund ("U.S. Equity Index PutWrite Strategy") (each individually a "Fund," and collectively, the "Funds") is a separate operating series of the Trust. Under the 1940 Act, the status of a Fund that was registered as non-diversified may, under certain circumstances, change to that of a diversified Fund (Long Short became diversified in December 2014). U.S. Equity Index PutWrite Strategy is diversified. Each Fund offers Institutional Class shares. Long Short also offers Class A shares and Class C shares. U.S. Equity Index PutWrite Strategy also offers Class R6 shares. The Trust’s Board of Trustees (the "Board") may establish additional series or classes of shares without the approval of shareholders. As previously disclosed in a supplement to the Fund's prospectuses dated August 1, 2023, and as further described in the information statement/prospectus sent to shareholders of U.S. Equity Index PutWrite Strategy, after the close of business on September 14, 2023, Class A and Class C shares of U.S.Equity Index PutWrite Strategy converted into Institutional Class shares (without a contingent deferred sales charge or other charge). Accordingly, after that date, all Fund shareholders of Class A and Class C shares owned Institutional Class shares.
A balance indicated with a "—", reflects either a zero balance or a balance that rounds to less than 1.
The assets of each Fund belong only to that Fund, and the liabilities of each Fund are borne solely by that Fund and no other series of the Trust.
Each Fund is an investment company and accordingly follows the investment company accounting and reporting guidance of the Financial Accounting Standards Board ("FASB") Accounting Standards Codification ("ASC") Topic 946 "Financial Services—Investment Companies."
The preparation of financial statements in accordance with U.S. generally accepted accounting principles ("GAAP") requires Management to make estimates and assumptions at the date of the financial statements. Actual results could differ from those estimates.
On February 25, 2022, to facilitate compliance with certain requirements necessary to maintain its status as a regulated investment company ("RIC"), Long Short formed NB A24 Long Short Blocker LLC (the "Blocker"), a Delaware limited liability company, to hold interests in certain private placements. The Blocker is a wholly owned subsidiary of Long Short.
As of October 31, 2023, the value of Long Short's investment in the Blocker was as follows:
2
Consolidation: The accompanying financial statements of Long Short present the consolidated accounts of Long Short and the Blocker. All intercompany accounts and transactions have been eliminated in consolidation.
3
Portfolio valuation: In accordance with ASC 820 "Fair Value Measurement" ("ASC 820"), all investments held by each of the Funds are carried at the value that Management believes a Fund would receive upon selling an investment in an orderly transaction to an independent buyer in the principal or most advantageous market for the investment under current market conditions. Various inputs, including the
ß
Notes to Consolidated Financial Statements for Long Short
volume and level of activity for the asset or liability in the market, are considered in valuing the Funds' investments, some of which are discussed below. At times, Management may need to apply significant judgment to value investments in accordance with ASC 820.
ASC 820 established a three-tier hierarchy of inputs to create a classification of value measurements for disclosure purposes. The three-tier hierarchy of inputs is summarized in the three broad Levels listed below.
•
Level 1 – unadjusted quoted prices in active markets for identical investments
•
Level 2 – other observable inputs (including quoted prices for similar investments, interest rates, prepayment speeds, credit risk, amortized cost, etc.)
•
Level 3 – unobservable inputs (including a Fund's own assumptions in determining the fair value of investments)
The inputs or methodology used for valuing an investment are not necessarily an indication of the risk associated with investing in those securities.
The value of the Funds’ investments (long and short positions) in equity securities, exchange-traded funds ("ETFs"), preferred stocks, master limited partnerships and limited partnerships, warrants and exchange-traded options purchased and written, for which market quotations are available, is generally determined by Management by obtaining valuations from independent pricing services based on the latest sale price quoted on a principal exchange or market for that security (Level 1 inputs). Securities traded primarily on the NASDAQ Stock Market are normally valued at the NASDAQ Official Closing Price ("NOCP") provided by NASDAQ each business day. The NOCP is the most recently reported price as of 4:00:02 p.m., Eastern Time, unless that price is outside the range of the "inside" bid and asked prices (i.e., the bid and asked prices that dealers quote to each other when trading for their own accounts); in that case, NASDAQ will adjust the price to equal the inside bid or asked price, whichever is closer. Because of delays in reporting trades, the NOCP may not be based on the price of the last trade to occur before the market closes. If there is no sale of a security on a particular day, the independent pricing services may value the security based on market quotations.
The value of the Funds’ investments for long and short positions in debt securities is determined by Management primarily by obtaining valuations from independent pricing services based on bid or offer quotations, respectively, or if quotations are not available, by methods that include various considerations based on security type (generally Level 2 inputs). In addition to the consideration of yields or prices of securities of comparable quality, coupon, maturity and type, indications as to values from dealers, and general market conditions, the following is a description of other Level 2 inputs and related valuation techniques used by independent pricing services to value certain types of debt securities held by the Funds:
Corporate Bonds. Inputs used to value corporate debt securities generally include relevant credit information, observed market movements, sector news, U.S. Treasury yield curve or relevant benchmark curve, and other market information, which may include benchmark yield curves, reported trades, broker-dealer quotes, issuer spreads, comparable securities, and reference data, such as market research publications, when available ("Other Market Information").
Convertible Bonds. Inputs used to value convertible bonds generally include underlying stock data, conversion rates, credit-specific details, relevant listed bond and preferred stock prices and Other Market Information.
U.S. Treasury Obligations. Inputs used to value U.S. Treasury securities generally include quotes from several inter-dealer brokers and Other Market Information.
High Yield Securities. Inputs used to value high yield securities generally include a number of observations of equity and credit default swap curves related to the issuer and Other Market Information.
The value of futures contracts is determined by Management by obtaining valuations from independent pricing services at the settlement price at the market close (Level 1 inputs).
The value of total return swaps and total return basket swaps is determined by Management by obtaining valuations from independent pricing services using the underlying asset and stated benchmark interest rate (Level 2 inputs).
The value of contracts for difference ("CFD") is determined primarily by obtaining valuations from independent pricing services, which are based on references to the underlying asset and the stated reference rate (Level 2 inputs).
Management has developed a process to periodically review information provided by independent pricing services for all types of securities.
Investments in non-exchange traded investment companies are valued using the respective fund’s daily calculated net asset value ("NAV") per share (Level 2 inputs), when available.
If a valuation is not available from an independent pricing service, or if Management has reason to believe that the valuation received does not represent the amount a Fund might reasonably expect to receive on a current sale in an orderly transaction, Management seeks to obtain quotations from brokers or dealers (generally considered Level 2 or Level 3 inputs depending on the number of quotes available). If such quotations are not available, the security is valued using methods Management has approved in the good-faith belief that the resulting valuation will reflect the fair value of the security. Pursuant to Rule 2a-5 under the 1940 Act, the Board designated Management as the Funds' valuation designee. As the Funds' valuation designee, Management is responsible for determining fair value in good faith for all Fund investments. Inputs and assumptions considered in determining fair value of a security based on Level 2 or Level 3 inputs may include, but are not limited to, the type of security; the initial cost of the security; the existence of any contractual restrictions on the security’s disposition; the price and extent of public trading in similar securities of the issuer or of comparable companies; quotations or evaluated prices from broker-dealers or pricing services; information obtained from the issuer and analysts; an analysis of the company’s or issuer’s financial statements; an evaluation of the inputs that influence the issuer and the market(s) in which the security is purchased and sold.
The value of the Funds' investments in foreign securities is generally determined using the same valuation methods and inputs as other Fund investments, as discussed above. Foreign security prices expressed in local currency values are normally translated from the local currency into U.S. dollars using the exchange rates as of 4:00 p.m., Eastern Time on days the New York Stock Exchange ("NYSE") is open for business. Management has approved the use of ICE Data Services ("ICE") to assist in determining the fair value of foreign equity securities when changes in the value of a certain index suggest that the closing prices on the foreign exchanges may no longer represent the amount that a Fund could expect to receive for those securities or when foreign markets are closed and U.S. markets are open. In each of these events, ICE will provide adjusted prices for certain foreign equity securities using a statistical analysis of historical correlations of multiple factors (Level 2 inputs). Management has also approved the use of ICE to evaluate the prices of foreign debt securities as of the time at which a Fund's share price is calculated. ICE utilizes benchmark spread and yield curves and evaluates available market activity from the local close to the time as of which a Fund's share price is calculated (Level 2 inputs) to assist in determining prices for certain foreign debt securities. In the case of both foreign equity and foreign debt securities, in the absence of precise information about the market values of these foreign securities as of the time at which a Fund's share price is calculated, Management has determined based on available data that prices adjusted or evaluated in this way are likely to be closer to the prices a Fund could realize on a current sale than the prices of those securities established at the close of the foreign markets in which the securities primarily trade.
Fair value prices are necessarily estimates, and there is no assurance that such a price will be at or close to the price at which the security is next quoted or traded.
4
Foreign currency translations: The accounting records of the Funds and the Blocker are maintained in U.S. dollars. Foreign currency amounts are normally translated into U.S. dollars using the exchange rate as of 4:00 p.m. Eastern Time, on days the NYSE is open for business, to determine the value of investments, other assets and liabilities. Purchase and sale prices of securities, and income and expenses, are translated
into U.S. dollars at the prevailing rate of exchange on the respective dates of such transactions. Net unrealized foreign currency gain/(loss), if any, arises from changes in the value of assets and liabilities, other than investments in securities, as a result of changes in exchange rates and is stated separately in the Statements of Operations.
5
Securities transactions and investment income: Securities transactions are recorded on trade date for financial reporting purposes. Dividend income is recorded on the ex-dividend date or, for certain foreign dividends, as soon as a Fund becomes aware of the dividends. Non-cash dividends included in dividend income, if any, are recorded at the fair market value of the securities received. Interest income, including accretion of discount (adjusted for original issue discount, where applicable) and amortization of premium, where applicable, is recorded on the accrual basis. Realized gains and losses from securities transactions and foreign currency transactions, if any, are recorded on the basis of identified cost and stated separately in the Statements of Operations. Included in net realized gain/(loss) on investments are proceeds from the settlement of class action litigation(s) in which certain of the Funds participated as a class member. The amount of such proceeds for the year ended October 31, 2023, was $6,458 for Long Short.
6
Income tax information: Each Fund is treated as a separate entity for U.S. federal income tax purposes. It is the policy of each Fund to continue to qualify for treatment as a RIC by complying with the requirements of the U.S. Internal Revenue Code applicable to RICs and to distribute substantially all of its net investment income and net realized capital gains to its shareholders. To the extent a Fund distributes substantially all of its net investment income and net realized capital gains to shareholders, no federal income or excise tax provision is required.
ASC 740 "Income Taxes" sets forth a minimum threshold for financial statement recognition of a tax position taken, or expected to be taken, in a tax return. The Funds recognize interest and penalties, if any, related to unrecognized tax positions as an income tax expense in the Statements of Operations. The Funds are subject to examination by U.S. federal and state tax authorities for returns filed for the tax years for which the applicable statutes of limitations have not yet expired. Management has analyzed each Fund's tax positions taken or expected to be taken on federal and state income tax returns for all open tax years (the current and the prior three tax years) and has concluded that no provision for income tax is required in the Funds' financial statements.
For federal income tax purposes, the estimated cost and unrealized appreciation/(depreciation) in value of investments held at October 31, 2023 were as follows:
| | Gross
Unrealized
Appreciation | Gross
Unrealized
Depreciation | Net Unrealized
Appreciation/
(Depreciation) |
| | | | |
U.S. Equity Index PutWrite Strategy | | | | |
Income distributions and capital gain distributions are determined in accordance with income tax regulations, which may differ from GAAP. These differences are primarily due to differing treatments of income and gains on various investment securities held by each Fund, timing differences and differing characterization of distributions made by each Fund. The Funds may also utilize earnings and profits distributed to shareholders on redemption of their shares as a part of the dividends-paid deduction for income tax purposes.
Any permanent differences resulting from different book and tax treatment are reclassified at year-end and have no impact on net income, NAV or NAV per share of the Funds. For the year ended October 31, 2023, the Funds recorded permanent reclassifications primarily related to one or more of the following: wholly owned subsidiary income, prior year true up adjustments, non-deductible expenses from partnerships and
deemed distributions on shareholder redemptions. For the year ended October 31, 2023, the Funds recorded the following permanent reclassifications:
| | Total Distributable
Earnings/(Losses) |
| | |
The tax character of distributions paid during the years ended October 31, 2023, and October 31, 2022, was as follows:
| |
| | | | |
| | | | | | | | |
| | | | | | | | |
U.S. Equity Index PutWrite Strategy | | | | | | | | |
|
|
|
|
|
|
|
|
|
As of October 31, 2023, the components of distributable earnings (accumulated losses) on a U.S. federal income tax basis were as follows:
| Undistributed
Ordinary
Income | Undistributed
Long-Term
Capital Gain | Unrealized
Appreciation/
(Depreciation) | Loss
Carryforwards
and Deferrals | Other
Temporary
Differences | |
| | | | | | |
U.S. Equity Index PutWrite Strategy | | | | | | |
The temporary differences between book basis and tax basis distributable earnings are primarily due to: losses disallowed and recognized on wash sales, straddles and unsettled short sales, mark-to-market adjustments on swaps, futures, amortization of organizational expenses, tax adjustments related to partnerships, swap contracts and other investments.
To the extent each Fund’s net realized capital gains, if any, can be offset by capital loss carryforwards, it is the policy of each Fund not to distribute such gains. Capital loss carryforward rules allow for RICs to carry forward capital losses indefinitely and to retain the character of capital loss carryforwards as short-term or long-term. As determined at October 31, 2023, the following Funds had unused capital loss carryforwards available for federal income tax purposes to offset future net realized capital gains, if any, as follows:
| Capital Loss Carryforwards |
| | |
U.S. Equity Index PutWrite Strategy | | |
The Blocker is taxed as a corporation under the U.S. Internal Revenue Code. As of October 31, 2023, Long Short had a gross deferred tax asset of $63,153 resulting from deferred interest expense, capital losses and net operating losses in the Blocker and a gross deferred tax liability of $91,585 resulting from appreciation of the underlying holding. As of October 31, 2023, the Blocker has a net deferred tax liability of $28,432.
7
Foreign taxes: Foreign taxes withheld, if any, represent amounts withheld by foreign tax authorities, net of refunds recoverable.
Foreign capital gains on certain foreign securities may be subject to foreign taxes, which are accrued as applicable. At October 31, 2023, there were no outstanding balances of accrued capital gains taxes for any Fund.
As a result of several European Court of Justice ("ECJ") court cases in certain countries across the European Union ("EU"), a Fund that invests in foreign securities may file tax reclaims for previously withheld taxes on
dividends earned in those countries ("ECJ tax reclaims"). These additional filings are subject to various administrative proceedings by the local jurisdictions’ tax authorities within the EU, as well as a number of related judicial proceedings. When the ECJ tax reclaim is "more likely than not" to not be sustained assuming examination by tax authorities due to the uncertainty that exists as to the ultimate resolution of these proceedings, the likelihood of receipt of these ECJ tax reclaims, and the potential timing of payment, no amounts are included in the Statements of Assets and Liabilities. Income recognized, if any, for ECJ tax reclaims would be included in "Interest and other income—unaffiliated issuers" in the Statements of Operations and the cost to file these additional ECJ tax reclaims, if any, would be included in "Miscellaneous and other fees" in the Statement of Operations.
8
Distributions to shareholders: Each Fund may earn income, net of expenses, daily on its investments. Distributions from net investment income, if any, are recorded on the ex-date and generally distributed once a year (usually in December) for Long Short and quarterly for U.S. Equity Index PutWrite Strategy. Distributions from net realized capital gains, if any, generally are distributed once a year (usually in December) and are recorded on the ex-date.
For funds that invest in REITs, these Funds pass through to their shareholders substantially all REIT distributions and other income they receive, less operating expenses. The distributions received from REITs are generally composed of income, capital gains, and/or return of REIT capital, but the REITs do not report this information to these Funds until the following calendar year. At October 31, 2023, these Funds estimated these amounts for the period January 1, 2023 to October 31, 2023 within the financial statements because the 2023 information is not available from the REITs until after each Fund’s fiscal year-end. All estimates are based upon REIT information sources available to these Funds together with actual IRS Forms 1099-DIV received to date. For the year ended October 31, 2023, the character of distributions, if any, paid to shareholders of these Funds disclosed within the Statements of Changes in Net Assets was based on estimates made at that time. Based on past experience it is possible that a portion of these Funds' distributions during the current fiscal year, if any, will be considered tax return of capital, but the actual amount of the tax return of capital, if any, is not determinable until after each Fund’s fiscal year-end. After calendar year-end, when these Funds learn the nature of the distributions paid by REITs during that year, distributions previously identified as income may be recharacterized as return of capital and/or capital gain. After all applicable REITs have informed these Funds of the actual breakdown of distributions paid to these Funds during their fiscal year, estimates previously recorded are adjusted to reflect actual results. As a result, the composition of these Funds' distributions as reported herein may differ from the final composition determined after calendar year-end and reported to these Funds shareholders on IRS Form 1099-DIV.
9
Expense allocation: Certain expenses are applicable to multiple funds within the complex of related investment companies. Expenses directly attributable to a fund are charged to that fund. Expenses of the Trust that are not directly attributable to a particular series of the Trust (e.g., a Fund) are allocated among the series of the Trust, on the basis of relative net assets, except where a more appropriate allocation of expenses to each of the series can otherwise be made fairly. Expenses borne by the complex of related investment companies, which includes open-end and closed-end investment companies for which NBIA serves as investment manager, that are not directly attributable to a particular investment company in the complex (e.g., the Trust) or series thereof are allocated among the investment companies in the complex or series thereof on the basis of relative net assets, except where a more appropriate allocation of expenses to each of the investment companies in the complex or series thereof can otherwise be made fairly. Each Fund’s expenses (other than those specific to each class) are allocated proportionally each day among its classes based upon the relative net assets of each class.
10
Investments in foreign securities: Investing in foreign securities may involve sovereign and other risks, in addition to the credit and market risks normally associated with domestic securities. These additional risks include the possibility of adverse political and economic developments (including political instability, nationalization, expropriation, or confiscatory taxation) and the potentially adverse effects of unavailability of public information regarding issuers, less governmental supervision and regulation of financial markets, reduced liquidity of certain financial markets, and the lack of uniform accounting, auditing, and financial
reporting standards or the application of standards that are different or less stringent than those applied in the United States. Foreign securities also may experience greater price volatility, higher rates of inflation, and delays in settlement.
11
When-issued/delayed delivery securities: A Fund may purchase securities with delivery or payment to occur at a later date beyond the normal settlement period. At the time a Fund enters into a commitment to purchase a security, the transaction is recorded and the value of the security is reflected in the NAV. The price of such security and the date when the security will be delivered and paid for are fixed at the time the transaction is negotiated. The value of the security may vary with market fluctuations. No interest accrues to a Fund until payment takes place. When-issued and delayed delivery transactions can have a leverage-like effect on a Fund, which can increase fluctuations in the Fund’s NAV. Certain risks may arise upon entering into when-issued or delayed delivery securities transactions from the potential inability of counterparties to meet the terms of their contracts or if the issuer does not issue the securities due to political, economic, or other factors. Additionally, losses may arise due to changes in the value of the underlying securities.
12
Securities sold short: A Fund may engage in short sales, which are sales of securities which have been borrowed from a third party on the expectation that the market price will decline. If the price of the securities decreases, a Fund will make a profit by purchasing the securities in the open market at a price lower than the one at which it sold the securities. If the price of the securities increases, a Fund may have to cover its short positions at a price higher than the short sale price, resulting in a loss. Gains are limited to the price at which a Fund sold the security short, while losses are potentially unlimited in size. The Funds pledge securities and/or other assets, which may include cash collateral from securities lending activities, to the lender as collateral. Proceeds received from short sales may be maintained by the lender as collateral or may be released to the Funds and used to purchase additional securities or for any other purpose. Proceeds maintained by the lender are included in the "Cash collateral segregated for short sales" on the Statements of Assets and Liabilities. The Funds are contractually responsible to remit to the lender any dividends and interest payable on securities while those securities are being borrowed by the Fund. The Funds may receive or pay the net of the interest charged by the prime broker on the borrowed securities and a financing charge for the difference in the market value of the short position and the cash collateral deposited with the broker. This income or fee is calculated daily based upon the market value of each borrowed security and a variable rate that is dependent on the availability of the security. These costs related to short sales (i.e., dividend and interest remitted to the lender and interest charged by the prime broker) are recorded as an expense of the Funds and are excluded from the contractual expense limitation. A net negative expense, if any, represents a gain to the Fund as the total cash rebates received exceeded the other costs related to short sales. The net amount of fees incurred during the year ended October 31, 2023, are included in the "Dividend and interest expense on securities sold short" on the Statements of Operations and are as follows:
13
Investments in private companies: Investments in private companies, including companies that have not yet issued securities publicly in an initial public offering, involve greater risks than investments in securities of companies that have traded publicly on an exchange for extended periods of time. Investments in these companies are generally less liquid than investments in securities issued by public companies and may be difficult for the Fund to value. Private placements and other restricted securities may not be listed on an exchange and may have no active trading market. As a result of the absence of a public trading market, the prices of these securities may be more difficult to determine than publicly traded securities and these securities may involve heightened risk as compared to investments in securities of publicly traded companies. Private placements and other restricted securities may be illiquid, and it frequently can be difficult to sell them at a time when it may otherwise be desirable to do so or the Fund may be able to sell them only at prices that are less than what the Fund regards as their fair market value.
14
Derivative instruments: The Funds' use of derivatives during the year ended October 31, 2023, is described below. Please see the Schedule of Investments for each Fund's open positions in derivatives, if any, at October 31, 2023. The disclosure requirements of ASC 815 "Derivatives and Hedging" ("ASC 815") distinguish between derivatives that qualify for hedge accounting and those that do not. Because
investment companies value their derivatives at fair value and recognize changes in fair value through the Statements of Operations, they do not qualify for hedge accounting. Accordingly, even though a Fund's investments in derivatives may represent economic hedges, they are considered non-hedge transactions for purposes of this disclosure.
Rule 18f-4 under the 1940 Act, regulates the use of derivatives for certain funds registered under the 1940 Act ("Rule 18f-4"). Unless a Fund qualifies as a "limited derivatives user" as defined in Rule 18f-4, the Fund is subject to a comprehensive derivatives risk management program, is required to comply with certain value-at-risk based leverage limits and is required to provide additional disclosure both publicly and to the SEC regarding its derivatives positions. If a Fund qualifies as a limited derivatives user, Rule 18f-4 requires the Fund to have policies and procedures to manage its aggregate derivatives risk.
Futures contracts: During the year ended October 31, 2023, Long Short used futures on broader market indices and U.S. Treasuries in an effort either to enhance returns or to manage or adjust the risk profile and the investment exposure of the Fund.
At the time a Fund enters into a futures contract, it is required to deposit with the futures commission merchant a specified amount of cash or liquid securities, known as "initial margin," which is a percentage of the value of the futures contract being traded that is set by the exchange upon which the futures contract is traded. Each day, the futures contract is valued at the official settlement price of the board of trade or U.S. commodity exchange on which such futures contract is traded. Subsequent payments, known as "variation margin," to and from the broker are made on a daily basis, or as needed, as the market price of the futures contract fluctuates. Daily variation margin adjustments, arising from this "mark to market," are recorded by the Fund as unrealized gains or losses.
Although some futures by their terms call for actual delivery or acquisition of the underlying securities or currency, in most cases the contracts are closed out prior to delivery by offsetting purchases or sales of matching futures. When the contracts are closed or expire, a Fund recognizes a gain or loss. Risks of entering into futures contracts include the possibility there may be an illiquid market, possibly at a time of rapidly declining prices, and/or a change in the value of the contract may not correlate with changes in the value of the underlying securities. Futures executed on regulated futures exchanges have minimal counterparty risk to the Fund because the exchange’s clearinghouse assumes the position of the counterparty in each transaction. Thus, a Fund is exposed to risk only in connection with the clearinghouse and not in connection with the original counterparty to the transaction.
For U.S. federal income tax purposes, the futures transactions undertaken by a Fund may cause the Fund to recognize gains or losses from marking contracts to market even though its positions have not been sold or terminated, may affect the character of the gains or losses recognized as long-term or short-term, and may affect the timing of some capital gains and losses realized by the Fund. Also, a Fund’s losses on transactions involving futures contracts may be deferred rather than being taken into account currently in calculating such Fund’s taxable income.
Total return basket swap contracts: During the year ended October 31, 2023, Long Short used total return basket swaps to increase returns, reduce risks and for hedging purposes. A Fund may enter into a total return basket swap agreement to obtain exposure to a portfolio of long and short securities. Under the terms of the agreement, the swap is designed to function as a portfolio of direct investments in long and short equity or fixed income positions. The Funds have the ability to trade in and out of long and short positions within the swap and will receive all of the economic benefits and risks equivalent to direct investments in these positions such as: capital appreciation/(depreciation), corporate actions, and dividends and interest received and paid, all of which are reflected in the swap value. The swap value also includes interest charges and credits related to the notional values of the long and short positions and cash balances within the swap. These interest charges and credits are based on defined market rates plus or minus a specified spread and are referred to herein as "financing costs". Positions within the swap are reset periodically, and financing costs are reset according to the terms of the contract. During a reset, any unrealized gains (losses) on positions and accrued financing costs become available for cash settlement between the Funds and the swap counterparty. For over-the-counter ("OTC") total return basket swaps, cash settlement in and out of the swap may occur at a reset date or any other date, at the discretion of the
Funds and the counterparty, over the life of the agreement, and is generally determined based on limits and thresholds established as part of an agreement between the Funds and the counterparty. A change in the market value of a total return basket swap contract is recognized as a change in unrealized appreciation/(depreciation) on swap contracts in the Statements of Operations. Cash settlements between a Fund and the counterparty are recognized as realized gains (losses) on closing of swap contracts in the Statements of Operations.
Total return swap contracts: During the year ended October 31, 2023, Long Short used total return swaps, including CFDs, to increase returns, reduce risks and for hedging purposes. Total return swaps, including CFDs, involve commitments to pay fixed or floating rate interest in exchange for a market-linked return based on a notional amount. To the extent the total return of the reference security or index underlying the total return swap exceeds or falls short of the offsetting interest rate obligation, a Fund will receive a payment or make a payment to the counterparty, respectively. Certain risks may arise when entering into total return swap transactions, including counterparty default, liquidity or unfavorable changes in the value of the underlying reference security or index. The value of the swap is adjusted daily and the change in value, if any, is recorded as unrealized appreciation or (depreciation) in the Statements of Assets and Liabilities. Payments received or made at the end of each measurement period are recorded as realized gain or loss in the Statements of Operations. For OTC total return swaps, cash settlement in and out of the swaps may occur at a reset date or any other date, at the discretion of the Fund and the counterparty, over the life of the agreement, and is generally determined based on limits and thresholds established as part of an agreement between the Fund and the counterparty.
Options: During the year ended October 31, 2023, Long Short used options written to enhance total returns. During the year ended October 31, 2023, Long Short used options purchased either for hedging purposes or to enhance total returns. During the year ended October 31, 2023, U.S. Equity Index PutWrite Strategy used options written primarily to gain exposure to securities, markets, sectors or geographical areas and also to enhance total return and gain exposure more efficiently than through a direct purchase of the underlying security.
Premiums paid by a Fund upon purchasing a call or put option are recorded in the asset section of the Fund’s Statement of Assets and Liabilities and are subsequently adjusted to the current market value. When an option is exercised, closed, or expired, a Fund realizes a gain or loss and the asset is eliminated. For purchased call options, a Fund's loss is limited to the amount of the option premium paid.
Premiums received by a Fund upon writing a call option or a put option are recorded in the liability section of the Fund’s Statement of Assets and Liabilities and are subsequently adjusted to the current market value. When an option is exercised, closed, or expired, a Fund realizes a gain or loss and the liability is eliminated.
When a fund writes a call option on an underlying asset it does not own, its exposure on such an option is theoretically unlimited. When writing a covered call option, a Fund, in return for the premium, gives up the opportunity for profit from a price increase in the underlying security above the exercise price, but conversely retains the risk of loss should the price of the security decline. When writing a put option, a Fund, in return for the premium, takes the risk that it must purchase the underlying security at a price that may be higher than the current market price of the security. If a call or put option that a Fund has written expires unexercised, a Fund will realize a gain for the amount of the premium. All securities covering outstanding written options are held in escrow by the custodian bank.
At October 31, 2023, the Funds listed below had the following derivatives (which did not qualify as hedging instruments under ASC 815), grouped by primary risk exposure:
| | |
| Statements of
Assets and Liabilities
Location | | Statements of
Assets and Liabilities
Location | |
| |
| |
|
| |
| |
|
| Receivable/Payable for accumulated variation margin on futures contracts | | Receivable/Payable for accumulated variation margin on futures contracts | |
| |
| |
|
| Over-the-counter swap contracts, at value(a) | | Over-the-counter swap contracts, at value(a) | |
U.S. Equity Index PutWrite Strategy | |
| |
|
| |
| |
|
| | | Option contracts written, at value | |
| "Over-the-counter swaps" reflect the cumulative unrealized appreciation/(depreciation) of the over-the-counter swap contracts plus accrued interest as of October 31, 2023. |
The impact of the use of these derivative instruments on the Statements of Operations during the year ended October 31, 2023, was as follows:
| | | Change in Net Unrealized
Appreciation/
(Depreciation) on
|
|
|
|
|
|
|
|
|
| |
| |
|
|
|
|
| |
| |
|
|
|
|
| |
| |
|
|
|
|
| |
| |
U.S. Equity Index PutWrite Strategy |
|
|
|
|
|
|
|
| |
| |
| Net realized gain/(loss) on derivatives is located in the Statements of Operations each under the caption, "Net realized gain/(loss) on:" |
| Expiration or closing of futures contracts |
| Expiration or closing of swap contracts |
| Transactions in investment securities of unaffiliated issuers |
| Expiration or closing of option contracts written |
| Change in net unrealized appreciation/(depreciation) is located in the Statements of Operations each under the caption, "Change in net unrealized appreciation/(depreciation) in value of:" |
| |
| |
| Investment securities of unaffiliated issuers |
| |
While the Funds may receive redeemable preference shares, rights and warrants in connection with their investments in securities, these preference shares, rights and warrants are not considered "derivative instruments" under ASC 815.
15
Securities lending: Each Fund, using State Street as its lending agent, may loan securities to qualified brokers and dealers in exchange for negotiated lender’s fees. These fees, if any, would be disclosed within the Statements of Operations under the caption "Income from securities loaned-net" and are net of expenses retained by State Street as compensation for its services as lending agent.
The initial collateral received by a Fund at the beginning of each transaction shall have a value equal to at least 102% of the prior day’s market value of the loaned securities (105% in the case of international securities). Collateral in the form of cash and/or securities issued or guaranteed by the U.S. government or its agencies, equivalent to at least 100% of the market value of securities, is maintained at all times. Thereafter, the value of the collateral is monitored on a daily basis, and collateral is moved daily between a counterparty and a Fund until the close of the transaction. Cash collateral is generally invested in a money market fund registered under the 1940 Act that is managed by an affiliate of State Street and is included in the Statements of Assets and Liabilities under the caption "Investments in securities, at value—Unaffiliated Issuers". The total value of securities received as collateral for securities on loan is included in a footnote following the applicable Schedule of Investments, but is not included within the Statements of Assets and Liabilities because the receiving Fund does not have the right to sell or repledge the securities received as collateral. The risks associated with lending portfolio securities include, but are not limited to, possible delays in receiving additional collateral or in the recovery of the loaned securities. Any increase or decrease in the fair value of the securities loaned and any interest earned or dividends paid or owed on those securities during the term of the loan would accrue to that Fund.
As of October 31, 2023, the Fund listed below had outstanding loans of securities to certain approved brokers each with a value as follows:
| Value of Securities
Loaned |
| |
As of October 31, 2023, the Fund listed below had outstanding loans of securities to certain approved brokers for which it received collateral as follows:
| Remaining Contractual Maturity of the Agreements |
| | | | | |
Securities Lending Transactions(a) |
|
|
|
|
|
|
|
|
|
|
|
| | | | | |
| Amounts represent the payable for loaned securities collateral received. |
16
Offsetting assets and liabilities: The Funds are required to disclose both gross and net information for assets and liabilities related to OTC derivatives, and securities lending and securities borrowing transactions that are eligible for offset or subject to an enforceable master netting or similar agreement. Long Short held one or more of these investments at October 31, 2023. The Funds’ OTC derivative assets and liabilities at fair value by type and securities lending assets are reported gross in the Statements of Assets and Liabilities. The following tables present derivative and securities lending assets and liabilities by counterparty, net of amounts available for offset under a master netting or similar agreement and net of the related collateral received by a Fund for assets and pledged by a Fund for liabilities as of October 31, 2023.
| Gross Amounts of Assets
Presented in the Statements
of Assets and Liabilities | Gross Amounts of Liabilities
Presented in the Statements
of Assets and Liabilities |
|
|
|
Over-the-counter swap contracts | | |
| | |
| | |
Gross Amounts Not Offset in the Statements of Assets and Liabilities: |
| | |
| Gross Amounts
Presented in
the Statements
of Assets and
Liabilities | Liabilities
Available
for Offset | | | Gross Amounts
Presented in
the Statements
of Assets and
Liabilities | Assets
Available
for Offset | | |
|
|
|
|
|
|
|
|
| | | | | | | | |
| | | | | | | | |
| | | | | | | | |
| | | | | | | | |
| | | | | | | | |
| Collateral received (or pledged) is limited to an amount not to exceed 100% of the net amount of assets (or liabilities) in the tables presented above, for each respective counterparty. |
| A net amount greater than zero represents amounts subject to loss as of October 31, 2023, in the event of a counterparty failure. A net amount less than zero represents amounts under-collateralized to each counterparty as of October 31, 2023. |
17
Indemnifications: Like many other companies, the Trust’s organizational documents provide that its officers ("Officers") and trustees ("Trustees") are indemnified against certain liabilities arising out of the performance of their duties to the Trust. In addition, both in some of its principal service contracts and in
the normal course of its business, the Trust enters into contracts that provide indemnifications to other parties for certain types of losses or liabilities. The Trust’s maximum exposure under these arrangements is unknown as this could involve future claims against the Trust or a Fund.
18
Investment company securities and exchange-traded funds: The Funds may invest in shares of other registered investment companies, including ETFs, within the limitations prescribed by the 1940 Act, in reliance on rules adopted by the SEC, particularly Rule 12d1-4 or any other applicable exemptive relief. Rule 12d1-4 permits fund of funds arrangements, and includes (i) limits on control and voting; (ii) required evaluations and findings; (iii) required fund of funds investment agreements; and (iv) limits on complex structures. Shareholders of a Fund will indirectly bear their proportionate share of any management fees and other expenses paid by such other investment companies, in addition to the management fees and expenses of the Fund.
19
Other: All net investment income and realized and unrealized capital gains and losses of each Fund are allocated, on the basis of relative net assets, pro rata among its respective classes.
Note B—Investment Management Fees, Administration Fees, Distribution Arrangements, and Other Transactions with Affiliates:
Each Fund retains NBIA as its investment manager under a Management Agreement. For such investment management services, each Fund pays NBIA an investment management fee as a percentage of average daily net assets according to the following table:
|
| | | | | | | | |
| | | | | | | | |
U.S. Equity Index PutWrite Strategy | | | | | | | | |
Accordingly, for the year ended October 31, 2023, the investment management fee pursuant to the Management Agreement was equivalent to an annual effective rate of each Fund’s average daily net assets, as follows:
Each Fund retains NBIA as its administrator under an Administration Agreement. The administration fee is assessed at the class level and each share class of a Fund, as applicable, pays NBIA an annual administration fee equal to the following: 0.26% for each of Class A and Class C; 0.15% for Institutional Class; and 0.05% for Class R6, each as a percentage of its average daily net assets. Additionally, NBIA retains State Street as its sub-administrator under a Sub-Administration Agreement. NBIA pays State Street a fee for all services received under the Sub-Administration Agreement.
NBIA has contractually agreed to waive fees and/or reimburse certain expenses of the Institutional Class, Class A, Class C and Class R6 of each Fund that offers those classes so that the total annual operating expenses of those classes do not exceed the expense limitations as detailed in the following table. These undertakings exclude interest, taxes, brokerage commissions, acquired fund fees and expenses, extraordinary expenses, and dividend and interest expenses relating to short sales, if any (commitment fees relating to borrowings are treated as interest for purposes of this exclusion) ("annual operating expenses"); consequently, net expenses may exceed the contractual expense limitations. The expenses of the Blocker are included in the total expenses used to calculate the reimbursement, if any, which Long Short has agreed to share with the Blocker. For the year ended October 31, 2023, the expenses of the Blocker amounted to $13,339.
At October 31, 2023, the Funds' contingent liabilities to NBIA under the agreements were as follows:
| | | Expenses Reimbursed in
Year Ended October 31, |
| | | | | |
| | | Subject to Repayment until
October 31, |
| | | | | |
Long Short Institutional Class | | | | | |
| | | | | |
| | | | | |
U.S. Equity Index PutWrite Strategy Institutional Class | | | | | |
U.S. Equity Index PutWrite Strategy Class R6 | | | | | |
| Expense limitation per annum of the respective class’s average daily net assets. |
Each Fund has agreed that each of its respective classes will repay NBIA for fees and expenses waived or reimbursed for that class provided that repayment does not cause that class’s annual operating expenses to exceed its contractual expense limitation in place at the time the fees and expenses were waived or reimbursed, or the expense limitation in place at the time the Fund repays NBIA, whichever is lower. Any such repayment must be made within three years after the year in which NBIA incurred the expense.
During the year ended October 31, 2023, there was no repayment to NBIA under these agreements.
Each Fund also has a distribution agreement with Neuberger Berman BD LLC (the "Distributor") with respect to each class of shares. The Distributor acts as agent in arranging for the sale of class shares without sales commission or other compensation, except as described below for Class A and Class C shares, and bears the advertising and promotion expenses.
However, the Distributor receives fees from Class A and Class C under their distribution plans (each a "Plan", collectively the "Plans") pursuant to Rule 12b-1 under the 1940 Act. The Plans provide that, as compensation for administrative and other services provided to these classes, the Distributor’s activities and expenses related to the sale and distribution of these classes, and ongoing services provided to investors in these classes, the Distributor receives from each of these classes a fee at the annual rate of 0.25% of Class A’s and 1.00% of Class C’s average daily net assets. The Distributor receives this amount to provide distribution and shareholder servicing for these classes and pays a portion of it to institutions that provide such services. Those institutions may use the payments for, among other purposes, compensating employees engaged in sales and/or shareholder servicing. The amount of fees paid by each class during any year may be more or less than the cost of distribution and other services provided to that class. FINRA rules limit the amount of annual distribution fees that may be paid by a mutual fund and impose a ceiling on the cumulative distribution fees paid. The Trust’s Plans comply with those rules. Effective from July 1, 2023 to September 14, 2023, the 12b-1 fees for Class A and Class C of U.S. Equity Index PutWrite Strategy were voluntarily waived until Class A and Class C shares were converted into Institutional Class shares, which amounted to $6,178. These waivers are included in the Statements of Operations under the caption "Fees waived".
Class A shares of each Fund are generally sold with an initial sales charge of up to 5.75%. Class A shares of each Fund are generally sold with no contingent deferred sales charge ("CDSC"), except that a CDSC of 1.00% applies to certain redemptions made within 18 months following purchases of $1 million or more without an initial sales charge. Class C shares of each Fund are sold with no initial sales charge and a 1.00% CDSC if shares are sold within one year after purchase.
For the year ended October 31, 2023, the Distributor, acting as underwriter and broker-dealer, received net initial sales charges from the purchase of Class A shares and CDSCs from the redemption of Class A and Class C shares as follows:
Note C—Securities Transactions:
During the year ended October 31, 2023, there were purchase and sale transactions of long-term securities (excluding swaps, futures and written option contracts) as follows:
| Purchases of
U.S. Government
and Agency
Obligations | Purchases
excluding
U.S. Government
and Agency
Obligations | Sales and
Maturities
of
U.S. Government
and Agency
Obligations | Sales and
Maturities
excluding
U.S. Government
and Agency
Obligations | | Covers on
Securities
Sold
Short |
| | | | | | |
U.S. Equity Index PutWrite Strategy | | | | | | |
During the year ended October 31, 2023, no brokerage commissions on securities transactions were paid to affiliated brokers.
Note D—Fund Share Transactions:
Share activity for the years ended October 31, 2023, and October 31, 2022, was as follows:
| For the Year Ended October 31, 2023 | For the Year Ended October 31, 2022 |
| | Shares
Issued on
Reinvestment
of Dividends
and
Distributions | | | | Shares
Issued on
Reinvestment
of Dividends
and
Distributions | | |
|
| | | | | | | | |
| | | | | | | | |
| | | | | | | | |
U.S. Equity Index PutWrite Strategy |
| | | | | | | | |
| | | | | | | | |
| | | | | | | | |
| | | | | | | | |
| After the close of business on September 14, 2023, Class A shares and Class C shares converted into Institutional Class shares. See Note A of the Notes to Financial Statements. |
Note E—Line of Credit:
At October 31, 2023, each Fund was a participant in a syndicated committed, unsecured $700,000,000 line of credit (the "Credit Facility"), to be used only for temporary or emergency purposes. Series of other investment companies managed by NBIA also participate in this line of credit on substantially the same terms. Interest is charged on borrowings under the Credit Facility at the highest of (a) a federal funds effective rate plus 1.00% per annum, (b) a daily simple Secured Overnight Financing Rate ("SOFR") plus 1.10% per annum, or (c) an overnight bank funding rate plus 1.00% per annum. The Credit Facility has an annual commitment fee of 0.15% per annum of the available line of credit, which is paid quarterly. Each Fund that is a participant has agreed to pay its pro rata share of the annual commitment fee, based on the ratio of its individual net assets to the net assets of all participants at the time the fee is due, and interest charged on any borrowing made by such Fund and other costs incurred by such Fund. Because several funds participate in the Credit Facility, there is no assurance that an individual fund will have access to all or any part of the $700,000,000 at any particular time. There were no loans outstanding under the Credit Facility at October 31, 2023. During the year ended October 31, 2023, no Fund utilized the Credit Facility.
Note F—Investments in Affiliates:
At October 31, 2023, affiliated persons (as defined in the 1940 Act) owned outstanding shares of the following Fund:
| Affiliated Person(s)
Percentage
Ownership of
Outstanding Shares |
U.S. Equity Index PutWrite Strategy | |
Note G—Recent Accounting Pronouncements:
In June 2022, FASB issued Accounting Standards Update No. 2022-03, "Fair Value Measurement of Equity Securities Subject to Contractual Sale Restrictions" ("ASU 2022-03"). ASU 2022-03 clarifies the guidance in ASC 820, related to the measurement of the fair value of an equity security subject to contractual sale restrictions, where it eliminates the ability to apply a discount to the fair value of these securities, and introduces disclosure requirements related to such equity securities. The guidance is effective for fiscal years, and interim periods within those fiscal years, beginning after December 15, 2023, and allows for early adoption. Management is currently evaluating the impact of applying this update.
In December 2022, the FASB issued Accounting Standards Update No. 2022-06, "Reference Rate Reform (Topic 848)" ("ASU 2022-06"), which is an update to Accounting Standards Update No. 2021-01, "Reference Rate Reform (Topic 848)" ("ASU 2021-01") and defers the sunset date for applying the reference rate reform relief in Topic 848. ASU 2021-01 is an update of ASU 2020-04, which is in response to concerns about structural risks of interbank offered rates, and particularly the risk of cessation of LIBOR. Regulators have undertaken reference rate reform initiatives to identify alternative reference rates that are more observable or transaction based and less susceptible to manipulation. ASU 2020-04 provides optional guidance for a limited period of time to ease the potential burden in accounting for (or recognizing the effects of) reference rate reform on financial reporting. ASU 2020-04 is elective and applies to all entities, subject to meeting certain criteria, that have contracts, hedging relationships, and other transactions that reference LIBOR or another reference rate expected to be discontinued because of reference rate reform. The ASU 2021-01 update clarifies that certain optional expedients and exceptions in Topic 848 for contract modifications and hedge accounting apply to derivatives that are affected by the discounting transition. The amendments in this update are effective immediately through December 31, 2024, for all entities. Management is currently evaluating the implications, if any, of the additional requirements and its impact on the Funds' financial statements.
Note H—Subsequent Event:
As previously communicated, on June 29, 2023, the Board approved the conversion of U.S. Equity Index PutWrite Strategy (the "Fund") to a newly organized series of Neuberger Berman ETF Trust (the "Option Strategy ETF"). It is anticipated that the conversion, which is expected to take place on or about January 26, 2024, will be effected through the reorganization of the Fund into Option Strategy ETF (the "Conversion"). The Conversion is expected to be a tax-free organization under the U.S. Internal Revenue Code. After the Conversion, shareholders of the Fund will hold shares of the Option Strategy ETF instead of shares of the Fund. Existing shareholders of the Fund received a combined information statement/prospectus, dated November 3, 2023, which described in detail both the Conversion and Option Strategy ETF, which is involved in the Conversion.
As previously disclosed in a supplement to the Fund’s prospectuses dated August 1, 2023, and as further described in the information statement/prospectus, the Conversion will involve several important steps. First, on or about January 11, 2024, it is anticipated that Class R6 shares of the Fund will be converted into the Institutional Class of the Fund at which time the contractual expense cap for the Institutional Class will be reduced to 0.55% of average daily net assets to align its expense cap with Class R6. Second, on or about January 19, 2024, it is anticipated that the Fund will conduct a reverse stock split to increase the NAV per share of Institutional Class shares while decreasing the total number of the issued and outstanding Institutional Class shares.
Note I—Change in Fiscal Year End:
On June 29, 2023, the Board approved a change in fiscal year end from October 31 to August 31, to be effective as of the date of the Conversion, for U.S. Equity Index PutWrite Strategy.
This page has been left blank intentionally
The following tables include selected data for a share outstanding throughout each period and other performance information derived from the Financial Statements. Amounts that do not round to $0.01 or $(0.01) per share are presented as $0.00 or $(0.00), respectively. Ratios that do not round to 0.01% or (0.01)% are presented as 0.00% or (0.00)%, respectively. Net Assets with a zero balance, if any, may reflect actual amounts rounding to less than $0.1 million. A "—" indicates that the line item was not applicable in the corresponding period.
| Net Asset
Value,
Beginning
of Year | Net
Investment
Income/
(Loss)a | Net Gains
or
(Losses) on
Securities
(both
realized
and
unrealized) | Total From
Investment
Operations | Dividends
from Net
Investment
Income | Distributions
from Net
Realized
Capital
Gains | | |
|
|
| | | | | | | | |
| | | | | | | | |
| | | | | | | | |
| | | | | | | | |
| | | | | | | | |
|
|
| | | | | | | | |
| | | | | | | | |
| | | | | | | | |
| | | | | | | | |
| | | | | | | | |
|
|
| | | | | | | | |
| | | | | | | | |
| | | | | | | | |
| | | | | | | | |
| | | | | | | | |
|
U.S. Equity Index PutWrite Strategy Fund |
|
| | | | | | | | |
| | | | | | | | |
| | | | | | | | |
| | | | | | | | |
| | | | | | | | |
|
|
| | | | | | | | |
| | | | | | | | |
| | | | | | | | |
| | | | | | | | |
| | | | | | | | |
See Notes to Financial Highlights
Net Asset
Value,
End of
Year | | Net Assets,
End of
Year
(in millions) | Ratio
of Gross
Expenses to
Average Net
Assetsc | Ratio
of Gross
Expenses
to Average
Net Assets
(excluding
dividend
and interest
expense
relating to
short sales)c | Ratio
of Net
Expenses to
Average
Net
Assets | Ratio
of Net
Expenses
to Average
Net Assets
(excluding
dividend
and interest
expense
relating to
short sales) | Ratio
of Net
Investment
Income/
(Loss)
to
Average
Net
Assets | Portfolio
Turnover
Rate
(including
securities
sold short) | Portfolio
Turnover
Rate
(excluding
securities
sold short) |
|
|
|
|
|
|
|
|
|
|
|
|
|
|
|
|
|
|
|
|
| | | | | | | | | |
| | | | | | | | | |
| | | | | | | | | |
| | | | | | | | | |
| | | | | | | | | |
|
|
|
|
|
|
|
|
|
|
|
| | | | | | | | | |
| | | | | | | | | |
| | | | | | | | | |
| | | | | | | | | |
| | | | | | | | | |
|
|
|
|
|
|
|
|
|
|
|
| | | | | | | | | |
| | | | | | | | | |
| | | | | | | | | |
| | | | | | | | | |
| | | | | | | | | |
|
|
|
|
|
|
|
|
|
|
|
|
|
|
|
|
|
|
|
|
|
| | | | | | | | | |
| | | | | | | | | |
| | | | | | | | | |
| | | | | | | | | |
| | | | | | | | | |
|
|
|
|
|
|
|
|
|
|
|
| | | | | | | | | |
| | | | | | | | | |
| | | | | | | | | |
| | | | | | | | | |
| | | | | | | | | |
Notes to Financial Highlights Alternative Funds
| Calculated based on the average number of shares outstanding during each fiscal period. |
| Total return based on per share NAV reflects the effects of changes in NAV on the performance of each Fund during each fiscal period. Returns assume income dividends and other distributions, if any, were reinvested, but do not reflect the effect of sales charges. Results represent past performance and do not indicate future results. Current returns may be lower or higher than the performance data quoted. Investment returns and principal will fluctuate and shares, when redeemed, may be worth more or less than original cost. Total return would have been lower if Management had not reimbursed and/or waived certain expenses. Total return would have been higher if Management had not recouped previously reimbursed and/or waived expenses. |
| Represents the annualized ratios of net expenses to average daily net assets if Management had not reimbursed certain expenses and/or waived a portion of the investment management fee. |
| Consolidated financial highlights. See Note A in the Notes to Financial Statements. |
| The class action proceeds listed in Note A of the Notes to Financial Statements, if any, had no impact on the Funds’ total returns for the year ended October 31, 2023. The class action proceeds received in 2022, 2021, 2020 and 2019 had no impact on the Funds’ total returns for the years ended October 31, 2022, 2021, 2020 and 2019, respectively. |
| After the close of business on December 7, 2018, Long Short's Class A and Class C shares underwent a stock split. The per share data presented here has been retroactively adjusted to reflect this split. |
| U.S. Equity Index PutWrite Strategy did not engage in short sales. |
Report of Independent Registered Public Accounting Firm
To the Shareholders of Neuberger Berman Long Short Fund and Neuberger Berman U.S. Equity Index PutWrite Strategy Fund and the Board of Trustees of Neuberger Berman Alternative Funds
Opinion on the Financial Statements
We have audited the accompanying consolidated statement of assets and liabilities of Neuberger Berman Long Short Fund (one of the series constituting the Neuberger Berman Alternatives Funds (the "Trust")), including the consolidated schedule of investments, as of October 31, 2023, and the related consolidated statements of operations and changes in net assets, and the consolidated financial highlights for each of the periods indicated in the table below and the related notes (collectively referred to as the "consolidated financial statements"). We have audited the accompanying statement of assets and liabilities of Neuberger Berman U.S. Equity Index PutWrite Strategy Fund (together with Neuberger Berman Long Short Fund, referred to as the "Funds") (one of the series constituting the Trust), including the schedule of investments, as of October 31, 2023, and the related statements of operations and changes in net assets, and the financial highlights for each of the periods indicated in the table below and the related notes (together with the consolidated financial statements, referred to as the "financial statements"). In our opinion, the financial statements present fairly, in all material respects, the financial position, or the consolidated financial position, of each of the Funds (two of the series constituting Neuberger Berman Alternative Funds) at October 31, 2023, and the results or the consolidated results of their operations, changes in net assets and financial highlights for each of the periods indicated in the table below, in conformity with U.S. generally accepted accounting principles. The accompanying financial highlights of the Neuberger Berman Long Short Fund for each of the periods in the three years ended October 31, 2021 were audited by another independent registered public accounting firm whose report, dated December 21, 2021, expressed an unqualified opinion on the financial statements containing those financial highlights.
Individual fund constituting Neuberger Berman Alternative Funds | | Statements of changes in net assets | |
Neuberger Berman U.S. Equity Index
PutWrite Strategy Fund
| For the year ended October 31, 2023 | For each of the two years in the period ended October 31, 2023 | For each of the five years in the period ended October 31, 2023 |
Neuberger Berman Long Short Fund | For the year ended October 31, 2023 | For each of the two years in the period ended October 31, 2023 | For each of the two years in the period ended October 31, 2023 |
Basis for Opinion
These financial statements are the responsibility of the Trust’s management. Our responsibility is to express an opinion on each of the Funds’ financial statements based on our audits. We are a public accounting firm registered with the Public Company Accounting Oversight Board (United States) ("PCAOB") and are required to be independent with respect to the Trust in accordance with the U.S. federal securities laws and the applicable rules and regulations of the Securities and Exchange Commission and the PCAOB.
We conducted our audits in accordance with the standards of the PCAOB. Those standards require that we plan and perform the audit to obtain reasonable assurance about whether the financial statements are free of material misstatement, whether due to error or fraud. The Trust is not required to have, nor were we engaged to perform, an audit of the Trust’s internal control over financial reporting. As part of our audits, we are required to obtain an understanding of internal control over financial reporting, but not for the purpose of expressing an opinion on the effectiveness of the Trust’s internal control over financial reporting. Accordingly, we express no such opinion.
Our audits included performing procedures to assess the risks of material misstatement of the financial statements, whether due to error or fraud, and performing procedures that respond to those risks. Such procedures included examining, on a test basis, evidence regarding the amounts and disclosures in the financial statements. Our procedures included confirmation of securities owned as of October 31, 2023, by correspondence with the custodian, brokers and others; when replies were not received from brokers and others, we performed other auditing procedures. Our audits also included evaluating the accounting principles used and significant estimates made by management, as well as evaluating the overall presentation of the financial statements. We believe that our audits provide a reasonable basis for our opinion.
We have served as the auditor of one or more Neuberger Berman investment companies since 1954.
Boston, Massachusetts
December 22, 2023
Investment Manager and Administrator
Neuberger Berman Investment Advisers LLC
1290 Avenue of the Americas
New York, NY 10104-0002
Shareholder Services
800.877.9700 or 212.476.8800
Intermediary Client Services 800.366.6264
Distributor
Neuberger Berman BD LLC
1290 Avenue of the Americas
New York, NY 10104-0002
Shareholder Services
800.877.9700 or 212.476.8800
Intermediary Client Services 800.366.6264
Custodian
State Street Bank and Trust Company
One Congress Street, Suite 1
Boston, MA 02114-2016
Shareholder Servicing Agent
SS&C Global Investor & Distribution Solutions, Inc.
430 West 7th Street, Suite 219189
Kansas City, MO 64105-1407
For Institutional Class Shareholders address correspondence to:
Neuberger Berman Funds
PO Box 219189
Kansas City, MO 64121-9189
Intermediary Client Services 800.366.6264
For Class A, Class C and Class R6 Shareholders:
Please contact your investment provider
Legal Counsel
K&L Gates LLP
1601 K Street, NW
Washington, DC 20006-1600
Independent Registered Public Accounting Firm
Ernst & Young LLP
200 Clarendon Street
Boston, MA 02116
Trustees and Officers
The following tables set forth information concerning the Trustees and Officers of the Funds. All persons named as Trustees and Officers also serve in similar capacities for other funds administered or managed by NBIA. The Funds’ Statement of Additional Information includes additional information about the Trustees as of the time of the Funds’ most recent public offering and is available upon request, without charge, by calling (800) 877-9700.
Information about the Board of Trustees
| | Principal Occupation(s)(3) | Number of
Funds in
Fund Complex
Overseen by
Fund Trustee | Other Directorships Held
Outside Fund Complex by
|
Independent Fund Trustees |
Michael J. Cosgrove (1949) | | President, Carragh Consulting USA, since 2014; formerly, Executive, General Electric Company, 1970 to 2014, including President, Mutual Funds and Global Investment Programs, GE Asset Management, 2011 to 2014, President and Chief Executive Officer, Mutual Funds and Intermediary Business, GE Asset Management, 2007 to 2011, President, Institutional Sales and Marketing, GE Asset Management, 1998 to 2007, and Chief Financial Officer, GE Asset Management, and Deputy Treasurer, GE Company, 1988 to 1993. | | Member of Advisory Board, Burke Neurological Institute, since 2021; Parish Councilor, St. Pius X, since 2021; formerly, Director, America Press, Inc. (not-for-profit Jesuit publisher), 2015 to 2021; formerly, Director, Fordham University, 2001 to 2018; formerly, Director, The Gabelli Go Anywhere Trust, June 2015 to June 2016; formerly, Director, Skin Cancer Foundation (not-for-profit), 2006 to 2015; formerly, Director, GE Investments Funds, Inc., 1997 to 2014; formerly, Trustee, GE Institutional Funds, 1997 to 2014; formerly, Director, GE Asset Management, 1988 to 2014; formerly, Director, Elfun Trusts, 1988 to 2014; formerly, Trustee, GE Pension & Benefit Plans, 1988 to 2014; formerly, Member of Board of Governors, Investment Company Institute. |
Name, (Year of Birth), and Address(1) | Position(s) and Length of Time Served(2) | Principal Occupation(s)(3) | Number of Funds in Fund Complex Overseen by Fund Trustee | Other Directorships Held Outside Fund Complex by Fund Trustee(3) |
| | Executive Vice Chancellor Emeritus, The Jewish Theological Seminary, since 2020; formerly, Executive Vice Chancellor and Chief Operating Officer, The Jewish Theological Seminary, 2012 to 2020; formerly, Executive Vice President and General Counsel, Fidelity Investments, 2007 to 2012; formerly, Executive Vice President and General Counsel, BellSouth Corporation, 2004 to 2007; formerly, Vice President and Associate General Counsel, BellSouth Corporation, 2000 to 2004; formerly, Associate, Partner, and National Litigation Practice Co-Chair, Mayer, Brown LLP, 1981 to 2000; formerly, Associate Independent Counsel, Office of Independent Counsel, 1990 to 1992. | | Chair and Director, USCJ Supporting Foundation, since 2021; Director, UJA Federation of Greater New York, since 2019; Trustee, The Jewish Theological Seminary, since 2015; Director, Lawyers Committee for Civil Rights Under Law (not-for-profit), since 2005; formerly, Director, Legility, Inc. (privately held for-profit company), 2012 to 2021; formerly, Director, Equal Justice Works (not-for-profit), 2005 to 2014; formerly, Director, Corporate Counsel Institute, Georgetown University Law Center, 2007 to 2012; formerly, Director, Greater Boston Legal Services (not-for-profit), 2007 to 2012. |
Name, (Year of Birth), and Address(1) | Position(s) and Length of Time Served(2) | Principal Occupation(s)(3) | Number of Funds in Fund Complex Overseen by Fund Trustee | Other Directorships Held Outside Fund Complex by Fund Trustee(3) |
| | Formerly, President, Woodhill Enterprises Inc./Chase Hollow Associates LLC (personal investment vehicle), 2006 to 2020; formerly, Consultant, Resources Global Professionals (temporary staffing), 2002 to 2006; formerly, Chief Financial Officer, Booz-Allen & Hamilton, Inc., 1995 to 1999; formerly, Enterprise Risk Officer, Prudential Insurance, 1994 to 1995; formerly, President, Prudential Asset Management Company, 1992 to 1994; formerly, President, Prudential Power Funding (investments in electric and gas utilities and alternative energy projects), 1989 to 1992; formerly, Treasurer, Prudential Insurance Company, 1983 to 1989. | | Director, American Water (water utility), since 2003; Director, Allianz Life of New York (insurance), since 2005; formerly, Director, Berger Group Holdings, Inc. (engineering consulting firm), 2013 to 2018; formerly, Director, Financial Women’s Association of New York (not-for-profit association), 1987 to 1996, and 2003 to 2019; Trustee Emerita, Brown University, since 1998; Director, Museum of American Finance (not-for-profit), since 2013; formerly, Non-Executive Chair and Director, Channel Reinsurance (financial guaranty reinsurance), 2006 to 2010; formerly, Director, Ocwen Financial Corporation (mortgage servicing), 2005 to 2010; formerly, Director, Claire’s Stores, Inc. (retailer), 2005 to 2007; formerly, Director, Parsons Brinckerhoff Inc. (engineering consulting firm), 2007 to 2010; formerly, Director, Bank Leumi (commercial bank), 2005 to 2007; formerly, Advisory Board Member, Attensity (software developer), 2005 to 2007; formerly, Director, Foster Wheeler Manufacturing, 1994 to 2004; formerly, Director, Dexter Corp. (Manufacturer of Non-Wovens, Plastics, and Medical Supplies), 1992 to 2001. |
Name, (Year of Birth), and Address(1) | Position(s) and Length of Time Served(2) | Principal Occupation(s)(3) | Number of Funds in Fund Complex Overseen by Fund Trustee | Other Directorships Held Outside Fund Complex by Fund Trustee(3) |
| | Formerly, Partner, Deloitte LLP, 1982 to 2023, including Vice Chair, 2017 to 2020; formerly, President and Board Chair, Women's Forum of New York, 2014 to 2016. | | |
Michael M. Knetter (1960) | | President and Chief Executive Officer, University of Wisconsin Foundation, since 2010; formerly, Dean, School of Business, University of Wisconsin - Madison; formerly, Professor of International Economics and Associate Dean, Amos Tuck School of Business - Dartmouth College, 1998 to 2002. | | Director, 1WS Credit Income Fund, since 2018; Board Member, American Family Insurance (a mutual company, not publicly traded), since March 2009; formerly, Trustee, Northwestern Mutual Series Fund, Inc., 2007 to 2011; formerly, Director, Wausau Paper, 2005 to 2011; formerly, Director, Great Wolf Resorts, 2004 to 2009. |
| | Member, Circle Financial Group (private wealth management membership practice), since 2011; Managing Director, Golden Seeds LLC (an angel investing group), since 2009; Adjunct Professor (Corporate Finance), Columbia University School of International and Public Affairs, since 2008; formerly, Visiting Assistant Professor, Fairfield University, Dolan School of Business, Fall 2007; formerly, Adjunct Associate Professor of Finance, Richmond, The American International University in London, 1999 to 2007. | | Board Member, The Maritime Aquarium at Norwalk, since 2020; Board Member, Norwalk Community College Foundation, since 2014; Dean’s Advisory Council, Radcliffe Institute for Advanced Study, since 2014; formerly, Director and Treasurer, At Home in Darien (not-for-profit), 2012 to 2014; formerly, Director, National Executive Service Corps (not-for-profit), 2012 to 2013; formerly, Trustee, Richmond, The American International University in London, 1999 to 2013. |
Name, (Year of Birth), and Address(1) | Position(s) and Length of Time Served(2) | Principal Occupation(s)(3) | Number of Funds in Fund Complex Overseen by Fund Trustee | Other Directorships Held Outside Fund Complex by Fund Trustee(3) |
| | Formerly, Adjunct Professor, Columbia University School of International and Public Affairs, 2012 to 2018; formerly, Executive Vice President and Chief Financial Officer, People's United Bank, Connecticut (a financial services company), 1991 to 2001. | | Director, 1WS Credit Income Fund; Chair, Audit Committee, since 2018; Director and Chair, Thrivent Church Loan and Income Fund, since 2018; formerly, Trustee, Steben Alternative Investment Funds, Steben Select Multi-Strategy Fund, and Steben Select Multi-Strategy Master Fund, 2013 to 2017; formerly, Treasurer, National Association of Corporate Directors, Connecticut Chapter, 2011 to 2015; formerly, Manager, Larch Lane Multi-Strategy Fund complex (which consisted of three funds), 2006 to 2011; formerly, Member, NASDAQ Issuers’ Affairs Committee, 1995 to 2003. |
| Trustee since 2000; Chairman of the Board since 2008; formerly, Lead Independent Trustee from 2006 to 2008 | Formerly, Managing Member, Ridgefield Farm LLC (a private investment vehicle), 2004 to 2016; formerly, President and CEO, Westaff, Inc. (temporary staffing), May 2001 to January 2002; formerly, Senior Executive, The Charles Schwab Corporation, 1983 to 1998, including Chief Executive Officer, Charles Schwab Investment Management, Inc.; Trustee, Schwab Family of Funds and Schwab Investments, 1997 to 1998; and Executive Vice President-Retail Brokerage, Charles Schwab & Co., Inc., 1994 to 1997. | | Trustee, University of Maryland, Shore Regional Health System, since 2020; formerly, Director, H&R Block, Inc. (tax services company), 2001 to 2018; formerly, Director, Talbot Hospice Inc., 2013 to 2016; formerly, Chairman, Governance and Nominating Committee, H&R Block, Inc., 2011 to 2015; formerly, Chairman, Compensation Committee, H&R Block, Inc., 2006 to 2010; formerly, Director, Forward Management, Inc. (asset management company), 1999 to 2006. |
| | Formerly, Partner, PricewaterhouseCoopers LLP, 1989 to 2021. | | Director, Zurich American Insurance Company, since 2023. |
Name, (Year of Birth), and Address(1) | Position(s) and Length of Time Served(2) | Principal Occupation(s)(3) | Number of Funds in Fund Complex Overseen by Fund Trustee | Other Directorships Held Outside Fund Complex by Fund Trustee(3) |
James G. Stavridis (1955) | | Vice Chairman Global Affairs, The Carlyle Group, since 2018; Commentator, NBC News, since 2015; formerly, Dean, Fletcher School of Law and Diplomacy, Tufts University, 2013 to 2018; formerly, Admiral, United States Navy, 1976 to 2013, including Supreme Allied Commander, NATO and Commander, European Command, 2009 to 2013, and Commander, United States Southern Command, 2006 to 2009. | | Director, Fortinet (cybersecurity), since 2021; Director, Ankura, since 2020; Director, Vigor Shipyard, since 2019; Director, Rockefeller Foundation, since 2018; Director, American Water (water utility), since 2018; Director, NFP Corp. (insurance broker and consultant), since 2017; Director, Onassis Foundation, since 2014; Director, Michael Baker International (construction) since 2014; Director, Vertical Knowledge, LLC, since 2013; formerly, Director, U.S. Naval Institute, 2014 to 2019; formerly, Director, Navy Federal Credit Union, 2000 to 2002; formerly, Director, BMC Software Federal, LLC, 2014 to 2019. |
Name, (Year of Birth), and Address(1) | Position(s) and Length of Time Served(2) | Principal Occupation(s)(3) | Number of Funds in Fund Complex Overseen by Fund Trustee | Other Directorships Held Outside Fund Complex by Fund Trustee(3) |
Fund Trustees who are "Interested Persons" |
| Chief Executive Officer and President since 2018 and Trustee since 2009 | President and Director, Neuberger Berman Group LLC, since 2009; President and Chief Executive Officer, Neuberger Berman BD LLC and Neuberger Berman Holdings LLC (including its predecessor, Neuberger Berman Inc.), since 2007; Chief Investment Officer (Equities) and President (Equities), NBIA (formerly, Neuberger Berman Fixed Income LLC and including predecessor entities), since 2007, and Board Member of NBIA since 2006; formerly, Global Head of Asset Management of Lehman Brothers Holdings Inc.’s ("LBHI") Investment Management Division, 2006 to 2009; formerly, member of LBHI’s Investment Management Division’s Executive Management Committee, 2006 to 2009; formerly, Managing Director, Lehman Brothers Inc. ("LBI"), 2006 to 2008; formerly, Chief Recruiting and Development Officer, LBI, 2005 to 2006; formerly, Global Head of LBI’s Equity Sales and a Member of its Equities Division Executive Committee, 2003 to 2005; President and Chief Executive Officer, twelve registered investment companies for which NBIA acts as investment manager and/or administrator. | | Member of Board of Advisors, McDonough School of Business, Georgetown University, since 2001; Member of New York City Board of Advisors, Teach for America, since 2005; Trustee, Montclair Kimberley Academy (private school), since 2007; Member of Board of Regents, Georgetown University, since 2013. |
(1)
The business address of each listed person is 1290 Avenue of the Americas, New York, NY 10104.
(2) Pursuant to the Trust's Amended and Restated Trust Instrument ("Trust Instrument"), subject to any limitations on the term of service imposed by the By-Laws or any retirement policy adopted by the Fund Trustees, each Fund Trustee shall hold office for life or until his or her successor is elected or the Trust
terminates; except that (a) any Fund Trustee may resign by delivering a written resignation; (b) any Fund Trustee may be removed with or without cause at any time by a written instrument signed by at least two-thirds of the other Fund Trustees; (c) any Fund Trustee who requests to be retired, or who has become unable to serve, may be retired by a written instrument signed by a majority of the other Fund Trustees; and (d) any Fund Trustee may be removed at any shareholder meeting by a vote of at least two-thirds of the outstanding shares.
(3)
Except as otherwise indicated, each individual has held the positions shown during at least the last five years.
*
Indicates a Fund Trustee who is an "interested person" within the meaning of the 1940 Act. Mr. Amato is an interested person of the Trust by virtue of the fact that he is an officer of NBIA and/or its affiliates.
Information about the Officers of the Trust
Name, (Year of Birth), and | Position(s) and Length of Time | Principal Occupation(s)(3) |
Claudia A. Brandon (1956) | Executive Vice President since 2008 and Secretary since inception | Senior Vice President, Neuberger Berman, since 2007 and Employee since 1999; Senior Vice President, NBIA, since 2008 and Assistant Secretary since 2004; formerly, Vice President, Neuberger Berman, 2002 to 2006; formerly, Vice President, Mutual Fund Board Relations, NBIA, 2000 to 2008; formerly, Vice President, NBIA, 1986 to 1999 and Employee, 1984 to 1999; Executive Vice President and Secretary, thirty-three registered investment companies for which NBIA acts as investment manager and/or administrator. |
| | Senior Vice President, Neuberger Berman, since 2012; Senior Vice President, NBIA, since 2012 and Employee since 1996; formerly, Vice President, Neuberger Berman, 2007 to 2012; Vice President, twelve registered investment companies for which NBIA acts as investment manager and/or administrator. |
Anthony DiBernardo (1979) | Assistant Treasurer since 2011 | Senior Vice President, Neuberger Berman, since 2014; Senior Vice President, NBIA, since 2014, and Employee since 2003; formerly, Vice President, Neuberger Berman, 2009 to 2014; Assistant Treasurer, twelve registered investment companies for which NBIA acts as investment manager and/or administrator. |
Savonne L. Ferguson (1973) | Chief Compliance Officer since 2018 | Senior Vice President, Chief Compliance Officer, Mutual Funds, and Associate General Counsel, NBIA, since November 2018; formerly, Vice President, T. Rowe Price Group, Inc., 2018; Vice President and Senior Legal Counsel, T. Rowe Price Associates, Inc., 2014 to 2018; Vice President and Director of Regulatory Fund Administration, PNC Capital Advisors, LLC, 2009 to 2014; Secretary, PNC Funds and PNC Advantage Funds, 2010 to 2014; Chief Compliance Officer, thirty-three registered investment companies for which NBIA acts as investment manager and/or administrator. |
| Chief Legal Officer since 2016 (only for purposes of sections 307 and 406 of the Sarbanes-Oxley Act of 2002) | General Counsel, Mutual Funds, since 2016 and Managing Director, NBIA, since 2017; formerly, Associate General Counsel, 2015 to 2016; Counsel, 2007 to 2015; Senior Vice President, 2013 to 2016; Vice President, 2009 to 2013; Chief Legal Officer (only for purposes of sections 307 and 406 of the Sarbanes-Oxley Act of 2002), thirty-three registered investment companies for which NBIA acts as investment manager and/or administrator. |
| Assistant Secretary since inception | Senior Vice President, Neuberger Berman, since 2023 and Employee since 1999; Senior Vice President, NBIA, since 2023; formerly, Vice President, Neuberger Berman, 2008 to 2023; Assistant Vice President, Neuberger Berman, 2007; Employee, NBIA, 1991 to 1999; Assistant Secretary, thirty-three registered investment companies for which NBIA acts as investment manager and/or administrator. |
Name, (Year of Birth), and Address(1) | Position(s) and Length of Time Served(2) | Principal Occupation(s)(3) |
| Chief Operating Officer since 2015 and Vice President since 2008 | Managing Director, Neuberger Berman, since 2013; Chief Operating Officer, Mutual Funds, and Managing Director, NBIA, since 2015; formerly, Senior Vice President, Neuberger Berman, 2006 to 2014; Vice President, NBIA, 2008 to 2015 and Employee since 1991; Chief Operating Officer, twelve registered investment companies for which NBIA acts as investment manager and/or administrator; Vice President, thirty-three registered investment companies for which NBIA acts as investment manager and/or administrator. |
| | Senior Vice President, Neuberger Berman, since 2014 and Employee since 2000; Senior Vice President, NBIA, since 2014; Vice President, twelve registered investment companies for which NBIA acts as investment manager and/or administrator. |
| Assistant Secretary since 2017 | Senior Paralegal, Neuberger Berman, since 2007 and Employee since 2007; Assistant Secretary, thirty-three registered investment companies for which NBIA acts as investment manager and/or administrator. |
Owen F. McEntee, Jr. (1961) | | Vice President, Neuberger Berman, since 2006; Vice President, NBIA, since 2006 and Employee since 1992; Vice President, twelve registered investment companies for which NBIA acts as investment manager and/or administrator. |
| Treasurer and Principal Financial and Accounting Officer since inception | Managing Director, Neuberger Berman, since 2022; Senior Vice President, Neuberger Berman, 2007 to 2021; Senior Vice President, NBIA, since 2007 and Employee since 1993; formerly, Vice President, Neuberger Berman, 2004 to 2006; formerly, Assistant Treasurer, 2002 to 2005; Treasurer and Principal Financial and Accounting Officer, twelve registered investment companies for which NBIA acts as investment manager and/or administrator. |
| Assistant Treasurer since inception | Vice President, Neuberger Berman, since 2006; Vice President, NBIA, since 2006 and Employee since 1995; Assistant Treasurer, twelve registered investment companies for which NBIA acts as investment manager and/or administrator. |
| Anti-Money Laundering Compliance Officer since 2023 | Senior Vice President and Head of Financial Regulation, Neuberger Berman, since February 2023; Assistant United States Attorney, Southern District of New York, 2016 to 2023; Trial Attorney, Department of Justice Antitrust Division, 2012 to 2015; Senior Anti-Money Laundering Compliance Officer, five registered investment companies for which NBIA acts as investment manager and/or administrator. |
(1)
The business address of each listed person is 1290 Avenue of the Americas, New York, NY 10104.
(2) Pursuant to the By-Laws of the Trust, each officer elected by the Fund Trustees shall hold office until his or her successor shall have been elected and qualified or until his or her earlier death, inability to serve, or resignation. Officers serve at the pleasure of the Fund Trustees and may be removed at any time with or without cause.
(3)
Except as otherwise indicated, each individual has held the positions shown during at least the last five years.
Proxy Voting Policies and Procedures
A description of the policies and procedures that the Trust uses to determine how to vote proxies relating to portfolio securities is available, without charge, by calling 800-877-9700 (toll-free) and on the SEC’s website at www.sec.gov. Information regarding how the Trust voted proxies relating to portfolio securities during the most recent 12-month period ended June 30 is also available upon request, without charge, by calling 800-877-9700 (toll-free), on the SEC’s website at www.sec.gov, and on Neuberger Berman’s website at www.nb.com.
Quarterly Portfolio Schedule
The Trust files a complete schedule of portfolio holdings for each Fund with the SEC for the first and third quarters of each fiscal year as an exhibit to its report on Form N-PORT. The Trust’s Form N-PORT is available on the SEC’s website at www.sec.gov. The portfolio holdings information on Form N-PORT is available upon request, without charge, by calling 800-877-9700 (toll-free).
Liquidity Risk Management Program
Consistent with Rule 22e-4 under the Investment Company Act of 1940 (the "Liquidity Rule"), as amended, the Funds have established a liquidity risk management program (the "Program"). The Program seeks to assess and manage the Funds’ liquidity risk, which is defined as the risk that a Fund is unable to meet investor redemption requests without significantly diluting the remaining investors' interests in a Fund. The Board has approved the designation of NBIA Funds' Liquidity Committee, comprised of NBIA employees, as the program administrator (the "Program Administrator"). The Program Administrator is responsible for implementing and monitoring the Program and utilizes NBIA personnel to assess and review, on an ongoing basis, the Funds' liquidity risk.
The Program includes a number of elements that support the management and assessment of liquidity risk, including an annual assessment of the Funds' liquidity risk factors and the periodic classification (or re-classification, as necessary) of the Funds’ investments into buckets (highly liquid, moderately liquid, less liquid and illiquid) that reflect the Program Administrator's assessment of the investments' liquidity under current market conditions, which for the relevant period included, among other factors, market volatility as a result of geopolitical tensions (e.g., Russia’s invasion of Ukraine) and rising inflation. The Program Administrator also utilizes information about the Funds’ investment strategy, the characteristics of the Funds’ shareholder base and historical redemption activity.
The Program Administrator provided the Board with a written report that addressed the operation of the Program and assessed its adequacy and effectiveness of implementation from April 1, 2022 through March 31, 2023. During the period covered by this report, the Program Administrator reported that the Program effectively assisted the Program Administrator in monitoring whether a Fund maintained a level of liquidity appropriate for its shareholder base and historical redemption activity.
Board Consideration of the Management Agreement
On an annual basis, the Board of Trustees (the "Board" or "Trustees") of Neuberger Berman Alternative Funds (the "Trust"), including the Trustees who are not "interested persons" of the Trust or of Neuberger Berman Investment Advisers LLC ("Management") (including its affiliates), as such term is defined under the Investment Company Act of 1940, as amended ("1940 Act"), ("Independent Fund Trustees"), considers whether to continue the management agreement with Management (the "Agreement") with respect to Neuberger Berman Long Short Fund and Neuberger Berman U.S. Equity Index PutWrite Strategy Fund (each a "Fund"). (This report does not include Neuberger Berman Absolute Return Multi-Manager Fund, which is the subject of a separate report.) Throughout the process, the Independent Fund Trustees are advised by counsel that is experienced in 1940 Act matters and that is independent of Management ("Independent Counsel"). At a meeting held on October 5, 2023, the Board, including the Independent Fund Trustees, approved the continuation of the Agreement for each Fund. In reaching its determination, the Board considered all factors it believed relevant, including (i) the nature, extent, and quality of the services provided to each Fund and its shareholders; (ii) a comparison of each Fund’s performance, fees and expenses relative to various peers; (iii) the costs of the services provided by, and the estimated profit or loss by Management from its relationships with each Fund; (iv) any apparent or anticipated economies of scale in relation to the services Management provides to each Fund and whether any such economies of scale are shared with Fund shareholders; and (v) any "fall-out" benefits likely to accrue to Management and its affiliates from their relationship with each Fund.
In evaluating the Agreement with respect to each Fund, the Board, including the Independent Fund Trustees, reviewed extensive materials provided by Management in response to questions submitted by the Independent Fund Trustees and Independent Counsel, which the Contract Review Committee annually considers and updates. It also met with senior representatives of Management regarding its personnel, operations, and profitability as they relate to the Funds. The annual contract review extends over at least two regular meetings of the Board to ensure that Management has time to respond to any questions the Independent Fund Trustees may have on their initial review of the materials and that the Independent Fund Trustees have time to consider those responses.
In connection with its deliberations, the Board also considered the broad range of information relevant to the annual contract review that is provided to the Board (including its various standing committees) at meetings throughout the year. The Board established the Contract Review Committee, which is comprised solely of Independent Fund Trustees, to assist in its evaluation and analysis of materials for the annual contract review. The Board has also established other committees that focus throughout the year on specific areas relevant to the annual contract review, such as Fund performance or compliance matters, and that are charged with specific responsibilities regarding the annual contract review. Those committees provide reports to the full Board, including the members of the Contract Review Committee, which consider that information as part of the annual contract review process.
The Independent Fund Trustees received from Independent Counsel a memorandum discussing the legal standards for their consideration of the proposed continuation of the Agreement. During the course of the year and during their deliberations regarding the annual contract review, the Contract Review Committee and the Independent Fund Trustees met with Independent Counsel separately from representatives of Management.
Provided below is a description of the Board’s contract approval process and material factors that the Board considered at its meetings regarding renewals of the Agreement and the compensation to be paid thereunder. In connection with its approval of the continuation of the Agreement, the Board evaluated the terms of the Agreement, the overall fairness of the Agreement to each Fund, and whether the Agreement was in the best interests of each respective Fund and its shareholders. The Board’s determination to approve the continuation of the Agreement was based on a comprehensive consideration of all information provided to the Board throughout the year and specifically in connection with the annual contract review. The Board considered each Fund’s investment management agreement separately from those of the other Funds.
This description is not intended to include all of the factors considered by the Board. The Board members did not identify any particular information or factor that was all-important or controlling, and each Trustee may have attributed different weights to the various factors. The Board focused on the costs and benefits of the Agreement to each Fund and, through the Fund, its shareholders.
Nature, Extent, and Quality of Services
With respect to the nature, extent, and quality of the services provided, the Board considered the investment philosophy and decision-making processes of, and the qualifications, experience, and capabilities of, and the resources available to, the portfolio management personnel of Management who perform services for the Funds. The Board noted that Management also provides certain administrative services, including fund accounting, compliance, and shareholder support services. The Board also considered Management’s policies and practices regarding brokerage, commissions, other trading costs, and allocation of portfolio transactions, and reviewed the quality of the execution services that Management had provided. The Board also reviewed Management’s use of brokers to execute Fund transactions that provide research services to Management. Moreover, the Board considered Management’s approach to potential conflicts of interest both generally and between the Funds’ investments and those of other funds or accounts managed by Management.
The Board recognized the extensive range of services that Management provides to the Funds beyond the investment management services. The Board noted that Management is also responsible for monitoring compliance with the Fund’s investment objectives, policies, and restrictions, as well as compliance with applicable law, including implementing rulemaking initiatives of the U.S. Securities and Exchange Commission. The Board considered that Management assumes significant ongoing entrepreneurial and business risks as the investment adviser and sponsor for the Funds, for which it is entitled to reasonable compensation. The Trustees also considered that Management’s responsibilities include continual management of investment, operational, cybersecurity, enterprise, valuation, liquidity, legal, regulatory, and compliance risks as they relate to the Funds, and the Board considers on a regular basis information regarding Management’s processes for monitoring and managing risk. In addition, the Board also noted that when Management launches a new fund or share class, it assumes entrepreneurial risk with respect to that fund or share class, until it maintains a certain level of assets, if ever, that is profitable to Management.
The Board also reviewed and evaluated Management’s activities under its contractual obligation to oversee the Funds’ various outside service providers, including its renegotiation of certain service providers’ fees and its evaluation of service providers’ infrastructure, cybersecurity programs, compliance programs, and business continuity programs, among other matters. The Board also considered Management’s ongoing development of its own infrastructure and information technology to support the Funds through, among other things, cybersecurity, business continuity planning, and risk management. In addition, the Board noted the positive compliance history of Management, as no significant compliance problems were reported to the Board with respect to Management. The Board also considered the general structure of the portfolio managers’ compensation and whether this structure provides appropriate incentives to act in the best interests of the Funds. The Board also considered the ability of Management to attract and retain qualified personnel to service the Funds and the plan for succession.
As in past years, the Board also considered the manner in which Management addressed various matters that arose during the year, some of them a result of developments in the broader fund industry or the regulations governing it. In addition, the Board considered actions taken by Management in response to market conditions over the past year and considered the overall performance of Management in this context.
Fund Performance
The Board requested a report from an outside consulting firm that specializes in the analysis of fund industry data that compared each Fund’s performance, along with its fees and other expenses, to various peers, including a group of industry peers ("Expense Group") and to a broader universe of funds pursuing generally similar
strategies with the same investment classification and/or objective ("Performance Universe"). The Board considered each Fund’s performance and fees in light of the limitations inherent in the methodology for constructing such comparative groups and determining which investment companies should be included in the comparative groups, noting differences as compared to certain fund industry ranking and rating systems. The Board also considered the impact and inherent limitation on the comparisons due to the number of funds included in the Funds’ Expense Groups.
With respect to investment performance, the Board considered information regarding each Fund’s short-, intermediate- and long-term performance, as applicable, net of the Fund’s fees and expenses, on an absolute basis, relative to a benchmark index that does not deduct the fees or expenses of investing, and compared to the performance of its Expense Group and Performance Universe, each constructed by the consulting firm. The Board also reviewed performance in relation to certain measures of the degree of investment risk undertaken by the portfolio managers.
In the case of underperformance for any of the periods reported, the Board considered the magnitude and duration of that underperformance relative to the Performance Universe and/or the benchmark (e.g., the amount by which a Fund underperformed, including, for example, whether the Fund slightly underperformed or significantly underperformed its benchmark). The Board also considered Management’s responsiveness with respect to the relative performance. The Board recognized that the performance data reflects a snapshot of a period as of a particular date and that selecting a different performance period could produce significantly different results. The Board further acknowledged that long-term performance could be impacted by even one period of significant outperformance or underperformance. In this regard, the Board noted that performance, especially short-term performance, is only one of the factors that it deems relevant to its consideration of the Agreement and that, after considering all relevant factors, it determined to approve the continuation of the Agreement notwithstanding a Fund’s relative performance.
Fee Rates, Profitability, and Fall-out Benefits
With respect to the overall fairness of the Agreement, the Board considered the fee structure for each Fund under the Agreement as compared to the Expense Group provided by the consulting firm, as discussed above. The Board reviewed a comparison of each Fund’s management fee to its Expense Group. The Board noted that the comparative management fee analysis includes, in each Fund’s management fee, the separate administrative fees paid to Management. However, the Board noted that some funds in the Expense Group pay directly from fund assets for certain services that Management covers out of the administration fees for the Funds. Accordingly, the Board also considered each Fund’s total expense ratio as compared with its Expense Group as a way of taking account of these differences.
The Board compared each Fund’s contractual and actual management fees to the median of the contractual and actual management fees, respectively, of that Fund’s Expense Group. (The actual management fees are the contractual management fees reduced by any fee waivers or other adjustments.) The Board also compared each Fund’s total expenses to the median of the total expenses of that Fund’s Expense Group. The Board also noted that for each class of each of the Funds, the overall expense ratio is maintained through a contractual or voluntary fee cap and/or expense reimbursements by Management.
In concluding that the benefits accruing to Management and its affiliates by virtue of their relationship with each Fund were reasonable in light of the costs of providing the investment advisory and other services and the benefits accruing to that Fund, the Board reviewed specific data as to Management’s estimated profit or loss on each Fund for a recent period on a pre-tax basis without regard to distribution expenses. (The Board also reviewed data on Management’s estimated profit or loss on each Fund after distribution expenses and taxes were factored in, as indicators of the health of the business and the extent to which Management is directing its profits into the growth of the business.)
The Board considered the consistent cost allocation methodology that Management used in developing its estimated profitability figures. In addition, the Board engaged an independent forensic accountant to review the profitability methodology utilized by Management when preparing this information and discussed with the consultant its conclusion that Management’s process for calculating and reporting its estimated profit or loss aligned with the consultant’s guiding principles and industry practices.
The Board further noted Management’s representation that its estimate of profitability is derived using methodology that is consistent with the methodology used to assess and/or report measures of profitability elsewhere at the firm. In addition, the Board recognized that Management’s calculations regarding its costs may not reflect all risks, including regulatory, legal, operational, cybersecurity, reputational, and, where appropriate, entrepreneurial risks, associated with offering and managing a mutual fund in the current regulatory and market environment. The Board also considered any fall-out (i.e., indirect) benefits likely to accrue to Management or its affiliates from their relationship with each Fund, such as research it may receive from broker-dealers executing the Funds’ portfolio transactions on an agency basis. The Board recognized that Management and its affiliates should be entitled to earn a reasonable level of profits for services they provide to each Fund and, based on its review, concluded that Management’s reported level of estimated profitability, if any, on each Fund was reasonable.
Information Regarding Services to Other Clients
The Board also considered whether there were other funds or separate accounts that were advised or sub-advised by Management or its affiliates with investment objectives, policies, and strategies that were similar to those of any of the Funds. In the cases where such funds or separate accounts exist, the Board compared the fees charged to the respective Fund to the fees charged to such comparable funds and/or separate accounts. The Board considered the appropriateness and reasonableness of any differences between the fees charged to a Fund and such comparable funds and/or separate accounts, and determined that differences in fees and fee structures were consistent with the differences in the management and other services provided. The Board explored with Management its assertion that although, generally, the rates of fees paid by such accounts, except other Neuberger Berman mutual funds, were lower than the fee rates paid by the corresponding Funds, the differences reflected Management’s greater level of responsibilities and significantly broader scope of services to the Funds, the more extensive regulatory obligations and risks associated with managing the Funds, and other financial considerations with respect to creation and sponsorship of the Funds.
Economies of Scale
The Board also evaluated apparent or anticipated economies of scale in relation to the services Management provides to each Fund. The Board considered whether each Fund’s fee structure provides for a reduction of payments resulting from the use of breakpoints, the size of any breakpoints in each Fund’s advisory fees, and whether any such breakpoints are set at appropriate asset levels. The Board also compared the breakpoint structure to that of the Expense Group. In addition, the Board considered the expense limitation and/or fee waiver arrangements that reduce many Funds’ expenses at some or all asset levels, which can have an effect similar to breakpoints in sharing economies of scale with shareholders and provide protection from an increase in expenses if a Fund’s assets decline.
The Trustees took into account that certain Funds do not have breakpoints in their fees. As to those Funds whose advisory fees do not have breakpoints, the Board discussed with Management the reasons why the Fund’s particular investment program was less likely than others to produce economies of scale. In addition, for Funds that do not have breakpoints, the Board considered that setting competitive fee rates and pricing a Fund to scale before it has actually experienced an increase in assets are other means of sharing potential economies of scale with shareholders. The Board also considered that Management has provided, at no added cost to the Funds, certain additional services, including but not limited to, services required by new regulations or regulatory interpretations, services impelled by changes in the securities markets or the business landscape, and/or services
requested by the Board. The Board considered that this is a way of sharing economies of scale with the Funds and their shareholders.
Fund-by-Fund Analysis
With regard to the investment performance of each Fund and the fees charged to each Fund, the Board considered the following information. The Performance Universes referenced in this section are those identified by the consulting firm, as discussed above, and the risk/return ratios referenced are the Sharpe ratios provided by the consulting firm. With respect to performance quintile rankings for a Fund compared to its Performance Universe, the first quintile represents the highest (best) performance and the fifth quintile represents the lowest performance. With respect to the quintile rankings for fees and total expenses (net of waivers or other adjustments, if any) for a Fund compared to its Expense Group, the first quintile represents the lowest (best) fees and/or total expenses and the fifth quintile represents the highest fees and/or total expenses. Where a Fund has more than one class of shares outstanding, information for Institutional Class has been provided as identified below. The Board reviewed the expense structures of all the other classes of shares of the Funds, some of which have higher fees and expenses that reflect their separate distribution and servicing arrangements and the differing needs of different investors. As a proxy for the class expense structure, the Board reviewed the expenses of each class for at least one Fund in the Trust in comparison to Expense Groups for those classes. The Board noted the effect of higher expenses on the performance of the other classes of shares.
• Neuberger Berman Long Short Fund (Institutional Class)—The Board considered that, based on performance data for the periods ended December 31, 2022: (1) as compared to its benchmark, the Fund’s performance was lower for the 1-year period and higher for the 3-, 5-, and 10-year periods; and (2) as compared to its Performance Universe, the Fund’s performance was in the third quintile for the 1- and 10-year periods and the second quintile for the 3-and 5-year periods. The Board considered that, as compared to its Expense Group, the Fund’s contractual management fee and the actual management fee ranked in the third quintile, and total expenses ranked in the first quintile.
• Neuberger Berman U.S. Equity Index PutWrite Strategy Fund (Institutional Class)—The Board considered that, based on performance data for the periods ended December 31, 2022: (1) as compared to its benchmark utilized since February 2022, the Fund’s performance was lower for the 1-year period and higher for the 3-, and 5-year periods; and (2) as compared to its Performance Universe, the Fund’s performance was in the fourth quintile for the 1-year period, the second quintile for the 3-year period, and the third quintile for the 5-year period. The Fund was launched in 2016 and therefore does not have 10-year performance. In addition, the Board noted that in February 2022, Management added a new portfolio manager, adjusted its strategy, and changed its benchmark index to an index with characteristics that are more representative of the Fund’s investment strategy. The Board also noted the anticipated conversion of the Fund to a newly organized series of Neuberger Berman ETF Trust that will be effected through the reorganization of the Fund into an exchange-traded fund in December 2023 or January 2024. The Board considered that, as compared to its Expense Group, the Fund’s contractual management fee and the actual management fee net of fees waived by Management ranked in the first quintile, and total expenses ranked in the second quintile.
Conclusions
In approving the continuation of the Agreement, the Board concluded that, in its business judgment, the terms of the Agreement are fair and reasonable to each Fund and that approval of the continuation of the Agreement is in the best interests of each Fund and its shareholders. In reaching this determination, the Board considered that Management could be expected to continue to provide a high level of service to each Fund; that the performance of each Fund was satisfactory over time, or, in the case of a Fund that underperformed relative to its Expense Group or Performance Universe, that the Board retained confidence in Management’s capabilities to manage each
Fund; that each Fund’s fee structure appeared to the Board to be reasonable given the nature, extent, and quality of services provided; and that the benefits accruing to Management and its affiliates by virtue of their relationship with each Fund were reasonable in light of the costs of providing the investment advisory and other services and the benefits accruing to each Fund. The Board’s conclusions are based in part on its consideration of materials prepared in connection with the approval or continuance of the Agreement in prior years and on the Board’s ongoing regular review of Fund performance and operations throughout the year, in addition to material prepared specifically for the most recent annual review of the Agreement.
Notice to Shareholders
In early 2024, you will receive information to be used in filing your 2023 tax returns, which will include a notice of the exact tax status of all distributions paid to you by the Fund during calendar year 2023. Please consult your own tax advisor for details as to how this information should be reflected on your tax returns.
For the fiscal year ended October 31, 2023, each Fund makes the following designation, or up to the maximum amount of such dividends allowable pursuant to the Internal Revenue Code, as capital gains distributions and qualified dividend income eligible for reduced tax rates. Complete information regarding each Fund's distributions during the calendar year 2023 will be reported in conjunction with Form 1099-DIV.
| Capital Gains
Distributions | |
| | |
This page has been left blank intentionally
Neuberger Berman Investment Advisers LLC
1290 Avenue of the Americas
New York, NY 10104-0002
Retail Services: 800.877.9700
Broker-Dealer and Institutional Services: 800.366.6264/888.556.9030
www.nb.com
Statistics and projections in this report are derived from sources deemed to be reliable
but cannot be regarded as a representation of future results of the Funds. This report is prepared for the general information of shareholders and is not an offer of shares
of the Funds. Shares are sold only through the currently effective prospectus which you
can obtain by calling 877.628.2583. An investor should consider carefully a Fund’s
investment objectives, risks and fees and expenses, which are described in its prospectus, before investing.
L0265 12/23
(b) Not applicable to the Registrant.
Item 2. Code of Ethics.
The Board of Trustees (“Board”) of Neuberger Berman Alternative Funds (“Registrant”) has adopted a code of ethics that applies to the Registrant’s principal executive officer, principal financial officer, principal accounting officer or controller, or persons performing similar functions (“Code of Ethics”). During the period covered by this Form N-CSR, there were no substantive amendments to the Code of Ethics and there were no waivers from the Code of Ethics granted to the Registrant’s principal executive officer, principal financial officer, principal accounting officer or controller, or persons performing similar functions.
Item 3. Audit Committee Financial Expert.
The Board has determined that the Registrant has three audit committee financial experts serving on its audit committee. The Registrant’s audit committee financial experts are Michael J. Cosgrove, Martha C. Goss, and Deborah C. McLean. Mr. Cosgrove, Ms. Goss, and Ms. McLean are independent trustees as defined by Form N-CSR.
Item 4. Principal Accountant Fees and Services.
Ernst & Young, LLP (“E&Y”) serves as independent registered public accounting firm to each series of the Registrant.
(a) Audit Fees
The aggregate fees billed for professional services rendered by E&Y for the audit of the annual financial statements or services that are normally provided by E&Y in connection with statutory and regulatory filings or engagements were $254,300 and $206,800 for the fiscal years ended 2022 and 2023, respectively.
(b) Audit-Related Fees
The aggregate fees billed to the Registrant for assurance and related services by E&Y that are reasonably related to the performance of the audit of the Registrant’s financial statements and are not reported above in Audit Fees were $0 and $0 for the fiscal years ended 2022 and 2023, respectively. The Audit Committee approved 0% and 0% of these services provided by E&Y for the fiscal years ended 2022 and 2023, respectively, pursuant to the waiver provisions of Rule 2-01(c)(7)(i)(C) of Regulation S-X.
The fees billed to other entities in the investment company complex for assurance and related services by E&Y that are reasonably related to the performance of the audit that the Audit Committee was required to approve because the engagement related directly to the operations and financial reporting of the Registrant were $0 and $0 for the fiscal years ended 2022 and 2023, respectively. The Audit Committee approved 0% and 0% of these services provided by E&Y for the fiscal years ended 2022 and 2023, respectively, pursuant to the waiver provisions of Rule 2-01(c)(7)(i)(C) of Regulation S-X.
(c) Tax Fees
The aggregate fees billed to the Registrant for professional services rendered by E&Y for tax compliance, tax advice, and tax planning were $75,600 and $55,380 for the fiscal years ended 2022 and 2023, respectively. The nature of the services provided includes preparation of the Federal and State tax extensions and tax returns, review of annual excise tax calculations, and preparation of form 8613, in addition to assistance with the identification of Passive Foreign Investment Companies, assistance with determination of various foreign withholding taxes, and assistance with Internal Revenue Code and tax regulation requirements for fund
investments. The Audit Committee approved 0% and 0% of these services provided by E&Y for the fiscal years ended 2022 and 2023, respectively, pursuant to the waiver provisions of Rule 2-01(c)(7)(i)(C) of Regulation S-X.
The fees billed to other entities in the investment company complex for professional services rendered by E&Y for tax compliance, tax advice, and tax planning that the Audit Committee was required to approve because the engagement related directly to the operations and financial reporting of the Registrant were $0 and $0 for the fiscal years ended 2022 and 2023, respectively. The Audit Committee approved 0% and 0% of these services provided by E&Y for the fiscal years ended 2022 and 2023, respectively, pursuant to the waiver provisions of Rule 2-01(c)(7)(i)(C) of Regulation S-X.
(d) All Other Fees
The aggregate fees billed to the Registrant for products and services provided by E&Y, other than services reported in Audit Fees, Audit-Related Fees, and Tax Fees were $0 and $0 for the fiscal years ended 2022 and 2023, respectively. The Audit Committee approved 0% and 0% of these services provided by E&Y for the fiscal years ended 2022 and 2023, respectively, pursuant to the waiver provisions of Rule 2-01(c)(7)(i)(C) of Regulation S-X.
The fees billed to other entities in the investment company complex for products and services provided by E&Y, other than services reported in Audit Fees, Audit-Related Fees, and Tax Fees that the Audit Committee was required to approve because the engagement related directly to the operations and financial reporting of the Registrant were $0 and $0 for the fiscal years ended 2022 and 2023, respectively. The Audit Committee approved 0% and 0% of these services provided by E&Y for the fiscal years ended 2022 and 2023, respectively, pursuant to the waiver provisions of Rule 2-01(c)(7)(i)(C) of Regulation S-X.
(e) Audit Committee’s Pre-Approval Policies and Procedures
(1) The Audit Committee’s pre-approval policies and procedures for the Registrant to engage an accountant to render audit and non-audit services delegate to each member of the Committee the power to pre-approve services between meetings of the Committee.
(2) None of the services described in paragraphs (b) through (d) above were approved by the Audit Committee pursuant to paragraph (c)(7)(i)(C) of Rule 2-01 of Regulation S-X.
(f) Hours Attributed to Other Persons
Not applicable.
(g) Non-Audit Fees
Non-audit fees billed by E&Y for services rendered to the Registrant were $75,600 and $55,380 for the fiscal years ended 2022 and 2023, respectively.
Non-audit fees billed by E&Y for services rendered to the Registrant’s investment adviser and any entity controlling, controlled by, or under common control with the adviser that provides ongoing services to the Registrant were $0 and $0 for the fiscal years ended 2022 and 2023, respectively.
(h) The Audit Committee of the Board considered whether the provision of non-audit services rendered to the Registrant’s investment adviser and any entity controlling, controlled by, or under common control with the adviser that provides ongoing services to the Registrant that were not pre-approved by the Audit Committee because the engagement did not relate directly to the operations and financial reporting of the Registrant is compatible with maintaining E&Y’s independence.
(i) Not applicable.
(j) Not applicable.
Item 5. Audit Committee of Listed Registrants.
(a) Not applicable to the Registrant.
(b) Not applicable to the Registrant.
Item 6. Investments.
(a) The complete schedule of investments for each series is disclosed in the Registrant’s annual report, which is included in Item 1 of this Form N-CSR.
(b) Not applicable to the Registrant.
Item 7. Reserved.
Item 8. Reserved.
Item 9. Reserved.
Item 10. Reserved.
Item 11. Reserved.
Item 12. Disclosure of Proxy Voting Policies and Procedures for Closed-End Management Investment Companies.
Not applicable to the Registrant.
Item 13. Portfolio Managers of Closed-End Management Investment Companies.
Not applicable to the Registrant.
Item 14. Purchases of Equity Securities by Closed-End Management Investment Company and Affiliated Purchasers.
Not applicable to the Registrant.
Item 15. Submission of Matters to a Vote of Security Holders.
There were no changes to the procedures by which shareholders may recommend nominees to the Board.
Item 16. Controls and Procedures.
| (a) | Based on an evaluation of the disclosure controls and procedures (as defined in Rule 30a-3(c) under the Act) as of a date within 90 days of the filing date of this report, the Chief Executive Officer and President and the Treasurer and Principal Financial and Accounting Officer of the Registrant have concluded that such disclosure controls and procedures are effectively designed to ensure that information required to be disclosed by the Registrant on Form N-CSR is accumulated and communicated to the Registrant’s management to allow timely decisions regarding required disclosure. |
| (b) | There were no significant changes in the Registrant’s internal controls over financial reporting (as defined in Rule 30a-3(d) under the Act) that occurred during the period covered by this report that have materially affected, or are reasonably likely to materially affect, the Registrant’s internal control over financial reporting. |
Item 17. Disclosure of Securities Lending Activities for Closed-End Management Investment Companies.
Not applicable to the Registrant.
Item 18. Recovery of Erroneously Awarded Compensation.
Not applicable to the Registrant.
Item 19. Exhibits.
| (a)(2) | Not applicable to the Registrant.
|
| (a)(4) | Not applicable to the Registrant.
|
| (a)(5) | Not applicable to the Registrant.
|
The certification furnished pursuant to Rule 30a-2(b) under the Act and Section 906 of the Sarbanes-Oxley Act will not be deemed “filed” for purposes of Section 18 of the Securities Exchange Act of 1934, as amended (“Exchange Act”), or otherwise subject to the liability of that section. Such certification will not be deemed to be incorporated by reference into any filing under the Securities Act of 1933, as amended, or the Exchange Act, except to the extent that the Registrant specifically incorporates it by reference.
SIGNATURES
Pursuant to the requirements of the Securities Exchange Act of 1934 and the Investment Company Act of 1940, the Registrant has duly caused this report to be signed on its behalf by the undersigned, thereunto duly authorized.
Neuberger Berman Alternative Funds
By: /s/ Joseph V. Amato
Joseph V. Amato
Chief Executive Officer and President
Date: January 5, 2024
Pursuant to the requirements of the Securities Exchange Act of 1934 and the Investment Company Act of 1940, this report has been signed below by the following persons on behalf of the Registrant and in the capacities and on the dates indicated.
By: /s/ Joseph V. Amato
Joseph V. Amato
Chief Executive Officer and President
Date: January 5, 2024
By: /s/ John M. McGovern
John M. McGovern
Treasurer and Principal Financial
and Accounting Officer
Date: January 5, 2024