As filed with the Securities and Exchange Commission on January 6, 2025
UNITED STATES
SECURITIES AND EXCHANGE COMMISSION
Washington, D.C. 20549
FORM N-CSR
CERTIFIED SHAREHOLDER REPORT OF
REGISTERED MANAGEMENT INVESTMENT COMPANIES
Investment Company Act file number: 811-21715
NEUBERGER BERMAN ALTERNATIVE FUNDS
(Exact Name of Registrant as specified in charter)
c/o Neuberger Berman Investment Advisers LLC
1290 Avenue of the Americas
New York, New York 10104-0002
(Address of Principal Executive Offices – Zip Code)
Joseph V. Amato
Chief Executive Officer and President
Neuberger Berman Alternative Funds
c/o Neuberger Berman Investment Advisers LLC
1290 Avenue of the Americas
New York, New York 10104-0002
Lori L. Schneider, Esq.
K&L Gates LLP
1601 K Street, N.W.
Washington, D.C. 20006-1600
(Names and Addresses of agents for service)
Registrant’s telephone number, including area code: (212) 476-8800
Date of fiscal year end: October 31
Date of reporting period: October 31, 2024
Form N-CSR is to be used by management investment companies to file reports with the Commission not later than 10 days after the transmission to stockholders of any report that is required to be transmitted to stockholders under Rule 30e-1 under the Investment Company Act of 1940 (17 CFR 270.30e-1). The Commission may use the information provided on Form N-CSR in its regulatory, disclosure review, inspection, and policymaking roles.
A registrant is required to disclose the information specified by Form N-CSR, and the Commission will make this information public. A registrant is not required to respond to the collection of information contained in Form N-CSR unless the Form displays a currently valid Office of Management and Budget (“OMB”) control number. Please direct comments concerning the accuracy of the information collection burden estimate and any suggestions for reducing the burden to Secretary, Securities and Exchange Commission, 100 F Street, NE, Washington, DC 20549-1090. The OMB has reviewed this collection of information under the clearance requirements of 44 U.S.C. § 3507.
Item 1. Report to Shareholders.
(a) Following are copies of the annual reports transmitted to shareholders pursuant to Rule 30e-1 under the Act.
This annual shareholder report contains important information about the Fund for the period of November 1, 2023 to October 31, 2024. You can find additional information about the Fund at www.nb.com/en/us/products/mutual-funds/absolute-return-multi-manager-fund?section=documents. You can also request this information by contacting your financial intermediary or investment provider or at 800.877.9700 or fundinfo@nb.com. This report describes changes to the Fund that occurred during the reporting period.
Annual Shareholder Report
October 31, 2024
Neuberger Berman Absolute Return Multi-Manager Fund
What were the Fund's costs for the year?
(based on a hypothetical $10,000 investment)
| Class Name | Costs of a $10,000 investment | Costs paid as a percentage of a $10,000 investment |
|---|
| Class A | $219 | 2.15% |
How did the Fund perform last year?
Over the period, the Fund generated a positive absolute return at net asset value (NAV). Gains were driven by allocations to the Equity Long/Short, Merger Arbitrage/Event Driven and Insurance-Linked strategies. The Global Macro/Managed Futures strategies detracted, with positive contributions from the Systematic Currency strategy offset by the Managed Futures strategy. Within these strategies, equities, catastrophe bonds, and commodities contributed positively, while currencies and interest rate positioning weighed on overall performance.
Equity Long/Short strategies
Merger Arbitrage/Event Driven strategies
Insurance-Linked securities
Global Macro/Managed Futures strategies
How did the Fund perform over the past 10 years?
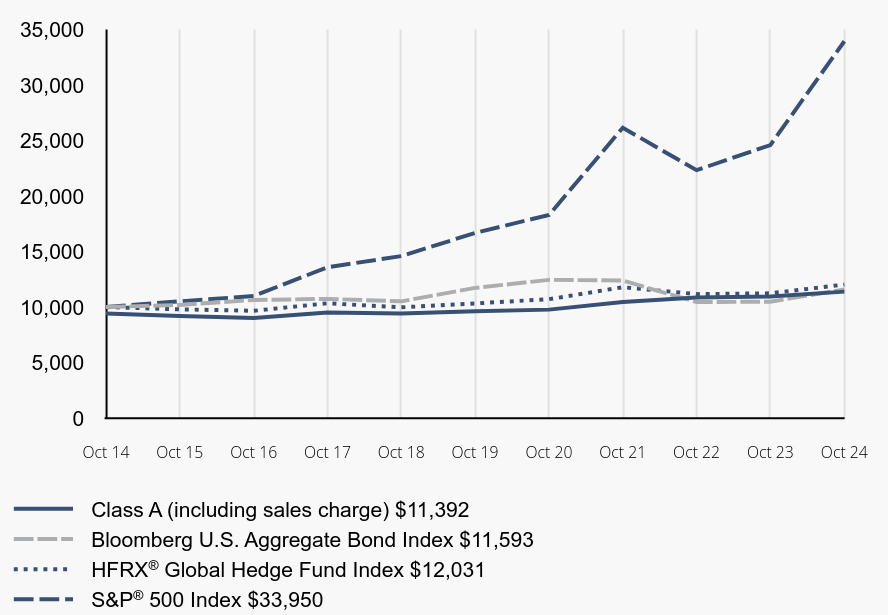
Total Return Based on a $10,000 Investment
| Class A (including sales charge) 11,392 | Bloomberg U.S. Aggregate Bond Index $11,593 | HFRX® Global Hedge Fund Index $12,031 | S&P® 500 Index $33,950 |
|---|
| Oct 14 | 9,425 | 10,000 | 10,000 | 10,000 |
| Oct 15 | 9,189 | 10,196 | 9,795 | 10,520 |
| Oct 16 | 9,013 | 10,641 | 9,668 | 10,994 |
| Oct 17 | 9,504 | 10,737 | 10,342 | 13,593 |
| Oct 18 | 9,415 | 10,517 | 9,977 | 14,591 |
| Oct 19 | 9,620 | 11,727 | 10,329 | 16,681 |
| Oct 20 | 9,772 | 12,453 | 10,711 | 18,301 |
| Oct 21 | 10,462 | 12,393 | 11,791 | 26,155 |
| Oct 22 | 10,864 | 10,450 | 11,169 | 22,334 |
| Oct 23 | 10,950 | 10,487 | 11,241 | 24,599 |
| Oct 24 | 11,392 | 11,593 | 12,031 | 33,950 |
Average Annual Total Returns
| 1 Year | 5 Years | 10 Years |
|---|
| Class A (at NAV) | 4.03% | 3.44% | 1.92% |
| Class A (including sales charge) | -1.97% | 2.22% | 1.31% |
| Bloomberg U.S. Aggregate Bond Index | 10.55% | -0.23% | 1.49% |
HFRX® Global Hedge Fund Index | 7.03% | 3.10% | 1.87% |
S&P® 500 Index | 38.02% | 15.27% | 13.00% |
The graph shows the change in value of a hypothetical $10,000 investment in the Fund inclusive of the maximum initial sales charge for the class noted over the past 10 fiscal years, including a comparison to a broad-based market index and additional indices. The graph and table do not reflect the deduction of taxes that a shareholder would pay on Fund distributions or on the redemption of Fund shares. The investment return and principal value of an investment will fluctuate so that an investor's shares, when redeemed, may be worth more or less than their original cost. Results represent the Fund's past performance, which is not a good predictor of how the Fund will perform in the future. Current performance may be lower or higher than the performance data quoted. For current performance, please visit www.nb.com/performance.
Class A: As stated in the Fund’s most recent prospectus, the total annual operating expense ratios for fiscal year 2023 were 2.88%/2.40% (before and after any expense reimbursements and/or fee waivers, respectively). Returns shown with a sales charge reflect the deduction of the current maximum initial sales charge of 5.75%. Absent any applicable expense reimbursements and/or fee waivers during certain periods, returns would have been lower.
On July 24, 2024, the Fund began comparing its performance to the Bloomberg U.S. Aggregate Bond Index in order to satisfy a change in regulatory requirements. The HFRX Global Hedge Fund Index and the S&P 500 Index will be maintained as additional indices as they show how the Fund’s performance compares to indices with characteristics that are more representative of the Fund's investment strategy than the Bloomberg U.S. Aggregate Bond Index.
Forward foreign currency contracts
| Net Assets | $90,353,718 |
| Number of Portfolio Holdings | 575 |
| Total Investment Advisory Fees Paid | $989,726 |
| Portfolio Turnover Rate | 137% |
What did the Fund invest in?
(as a % of Total InvestmentsFootnote Reference*)
| Long |
|---|
| Fidelity Treasury Only Portfolio, Institutional Class | 43.2% |
| Hess Corp. | 2.2 |
| Prosus NV (China) | 1.8 |
| HashiCorp, Inc. Class A | 1.7 |
| Kellanova | 1.6 |
| Alphabet, Inc. Class A | 1.5 |
| Meta Platforms, Inc. Class A | 1.4 |
| Herbie Re Ltd. (Bermuda) | 1.4 |
| Microsoft Corp. | 1.4 |
| Nestle SA (Registered) | 1.3 |
| Short |
|---|
| Chevron Corp. | (2.5)% |
| International Paper Co. | (1.7) |
| ConocoPhillips | (1.0) |
| Schlumberger NV | (0.5) |
| Lennar Corp. Class A | (0.4) |
| Anglogold Ashanti plc (United Kingdom) | (0.4) |
| Capital One Financial Corp. | (0.3) |
| Charter Communications, Inc. Class A | (0.3) |
| Nokia OYJ (Finland) | (0.3) |
| UMB Financial Corp. | (0.2) |
| Footnote | Description |
Footnote* | Derivatives (other than options purchased), if any, are excluded from this calculation. |
Portfolio by Investment Type
(as a % of Total Net Assets)
| Long | | Short |
| Common Stocks | 44.6% | | (6.6)% |
| Corporate Bonds | 0.0 | | - |
| Insurance Linked Securities | 8.5 | | - |
| Loan Assignments | 0.0 | | - |
| Rights | 0.1 | | - |
| Warrants | 0.0 | | - |
| Short-Term Investments | 35.4 | | - |
| Other Assets Less Liabilities | 18.0Footnote Reference** | | - |
| Total | 106.6% | | (6.6)% |
| Footnote | Description |
Footnote** | Includes the impact of the Fund's open positions in derivatives (other than options purchased), if any. |
Neuberger Berman Absolute Return Multi-Manager Fund
Annual Shareholder Report
October 31, 2024
If you wish to view additional information about the Fund, including but not limited to the Fund's prospectus, financial information, holdings, and proxy voting information, please visit www.nb.com/en/us/products/mutual-funds/absolute-return-multi-manager-fund?section=documents.
The "Neuberger Berman" name and logo and "Neuberger Berman Investment Advisers LLC" name are registered service marks of Neuberger Berman Group LLC. The individual Fund name in this piece is either a service mark or registered service mark of Neuberger Berman Investment Advisers LLC, an affiliate of Neuberger Berman BD LLC, distributor, member FINRA.© 2024 Neuberger Berman BD LLC, distributor. All rights reserved.
This is a summary of certain changes to the Fund since November 1, 2023. For more complete information, you may review the Fund's prospectus, which is available at www.nb.com/en/us/products/mutual-funds/absolute-return-multi-manager-fund?section=documents or upon request at 800.877.9700 or fundinfo@nb.com.
On December 26, 2023, Crabel Capital Management, LLC was added as a subadviser to the Fund. Effective as of June 28, 2024, BH-DG Systematic Trading LLP is no longer a subadviser to the Fund.
You may have consented to receive one shareholder report at your address if you and one or more individuals in your home have an account with the Fund (householding). If you wish to receive individual copies of your shareholder report, please contact your financial intermediary or investment provider (e.g. an insurance company, broker-dealer or bank) or if you are a direct investor with the Fund please contact 800.877.9700.
This annual shareholder report contains important information about the Fund for the period of November 1, 2023 to October 31, 2024. You can find additional information about the Fund at www.nb.com/en/us/products/mutual-funds/absolute-return-multi-manager-fund?section=documents. You can also request this information by contacting your financial intermediary or investment provider or at 800.877.9700 or fundinfo@nb.com. This report describes changes to the Fund that occurred during the reporting period.
Annual Shareholder Report
October 31, 2024
Neuberger Berman Absolute Return Multi-Manager Fund
What were the Fund's costs for the year?
(based on a hypothetical $10,000 investment)
| Class Name | Costs of a $10,000 investment | Costs paid as a percentage of a $10,000 investment |
|---|
| Class C | $295 | 2.90% |
How did the Fund perform last year?
Over the period, the Fund generated a positive absolute return at net asset value (NAV). Gains were driven by allocations to the Equity Long/Short, Merger Arbitrage/Event Driven and Insurance-Linked strategies. The Global Macro/Managed Futures strategies detracted, with positive contributions from the Systematic Currency strategy offset by the Managed Futures strategy. Within these strategies, equities, catastrophe bonds, and commodities contributed positively, while currencies and interest rate positioning weighed on overall performance.
Equity Long/Short strategies
Merger Arbitrage/Event Driven strategies
Insurance-Linked securities
Global Macro/Managed Futures strategies
How did the Fund perform over the past 10 years?
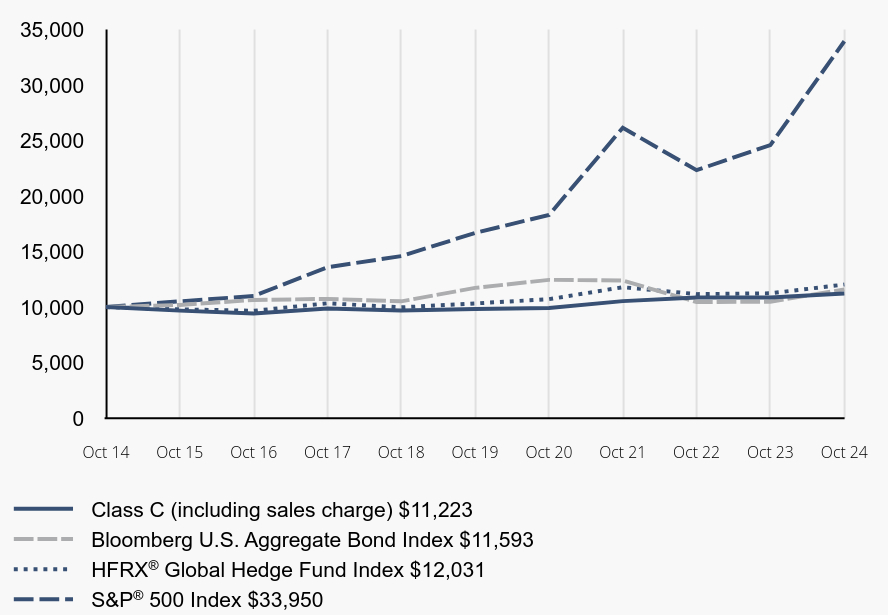
Total Return Based on a $10,000 Investment
| Class C (including sales charge) 11,223 | Bloomberg U.S. Aggregate Bond Index $11,593 | HFRX® Global Hedge Fund Index $12,031 | S&P® 500 Index $33,950 |
|---|
| Oct 14 | 10,000 | 10,000 | 10,000 | 10,000 |
| Oct 15 | 9,679 | 10,196 | 9,795 | 10,520 |
| Oct 16 | 9,422 | 10,641 | 9,668 | 10,994 |
| Oct 17 | 9,865 | 10,737 | 10,342 | 13,593 |
| Oct 18 | 9,692 | 10,517 | 9,977 | 14,591 |
| Oct 19 | 9,827 | 11,727 | 10,329 | 16,681 |
| Oct 20 | 9,921 | 12,453 | 10,711 | 18,301 |
| Oct 21 | 10,539 | 12,393 | 11,791 | 26,155 |
| Oct 22 | 10,858 | 10,450 | 11,169 | 22,334 |
| Oct 23 | 10,858 | 10,487 | 11,241 | 24,599 |
| Oct 24 | 11,223 | 11,593 | 12,031 | 33,950 |
Average Annual Total Returns
| 1 Year | 5 Years | 10 Years |
|---|
| Class C (at NAV) | 3.36% | 2.69% | 1.16% |
| Class C (including sales charge) | 2.36% | 2.69% | 1.16% |
| Bloomberg U.S. Aggregate Bond Index | 10.55% | -0.23% | 1.49% |
HFRX® Global Hedge Fund Index | 7.03% | 3.10% | 1.87% |
S&P® 500 Index | 38.02% | 15.27% | 13.00% |
The graph shows the change in value of a hypothetical $10,000 investment in the Fund for the class noted over the past 10 fiscal years, including a comparison to a broad-based market index and additional indices. The graph and table do not reflect the deduction of taxes that a shareholder would pay on Fund distributions or on the redemption of Fund shares. The investment return and principal value of an investment will fluctuate so that an investor's shares, when redeemed, may be worth more or less than their original cost. Results represent the Fund's past performance, which is not a good predictor of how the Fund will perform in the future. Current performance may be lower or higher than the performance data quoted. For current performance, please visit www.nb.com/performance.
Class C: As stated in the Fund’s most recent prospectus, the total annual operating expense ratio for fiscal year 2023 was 3.66%/3.15% before and after any expense reimbursements and/or fee waivers, respectively). Returns shown with a sales charge reflect the contingent deferred sales charge (CDSC) of 1.00%, which is reduced to 0% after 1 year. Absent any applicable expense reimbursements and/or fee waivers during certain periods, returns would have been lower.
On July 24, 2024, the Fund began comparing its performance to the Bloomberg U.S. Aggregate Bond Index in order to satisfy a change in regulatory requirements. The HFRX Global Hedge Fund Index and the S&P 500 Index will be maintained as additional indices as they show how the Fund’s performance compares to indices with characteristics that are more representative of the Fund's investment strategy than the Bloomberg U.S. Aggregate Bond Index.
Forward foreign currency contracts
| Net Assets | $90,353,718 |
| Number of Portfolio Holdings | 575 |
| Total Investment Advisory Fees Paid | $989,726 |
| Portfolio Turnover Rate | 137% |
What did the Fund invest in?
(as a % of Total InvestmentsFootnote Reference*)
| Long |
|---|
| Fidelity Treasury Only Portfolio, Institutional Class | 43.2% |
| Hess Corp. | 2.2 |
| Prosus NV (China) | 1.8 |
| HashiCorp, Inc. Class A | 1.7 |
| Kellanova | 1.6 |
| Alphabet, Inc. Class A | 1.5 |
| Meta Platforms, Inc. Class A | 1.4 |
| Herbie Re Ltd. (Bermuda) | 1.4 |
| Microsoft Corp. | 1.4 |
| Nestle SA (Registered) | 1.3 |
| Short |
|---|
| Chevron Corp. | (2.5)% |
| International Paper Co. | (1.7) |
| ConocoPhillips | (1.0) |
| Schlumberger NV | (0.5) |
| Lennar Corp. Class A | (0.4) |
| Anglogold Ashanti plc (United Kingdom) | (0.4) |
| Capital One Financial Corp. | (0.3) |
| Charter Communications, Inc. Class A | (0.3) |
| Nokia OYJ (Finland) | (0.3) |
| UMB Financial Corp. | (0.2) |
| Footnote | Description |
Footnote* | Derivatives (other than options purchased), if any, are excluded from this calculation. |
Portfolio by Investment Type
(as a % of Total Net Assets)
| Long | | Short |
| Common Stocks | 44.6% | | (6.6)% |
| Corporate Bonds | 0.0 | | - |
| Insurance Linked Securities | 8.5 | | - |
| Loan Assignments | 0.0 | | - |
| Rights | 0.1 | | - |
| Warrants | 0.0 | | - |
| Short-Term Investments | 35.4 | | - |
| Other Assets Less Liabilities | 18.0Footnote Reference** | | - |
| Total | 106.6% | | (6.6)% |
| Footnote | Description |
Footnote** | Includes the impact of the Fund's open positions in derivatives (other than options purchased), if any. |
Neuberger Berman Absolute Return Multi-Manager Fund
Annual Shareholder Report
October 31, 2024
If you wish to view additional information about the Fund, including but not limited to the Fund's prospectus, financial information, holdings, and proxy voting information, please visit www.nb.com/en/us/products/mutual-funds/absolute-return-multi-manager-fund?section=documents.
The "Neuberger Berman" name and logo and "Neuberger Berman Investment Advisers LLC" name are registered service marks of Neuberger Berman Group LLC. The individual Fund name in this piece is either a service mark or registered service mark of Neuberger Berman Investment Advisers LLC, an affiliate of Neuberger Berman BD LLC, distributor, member FINRA.© 2024 Neuberger Berman BD LLC, distributor. All rights reserved.
This is a summary of certain changes to the Fund since November 1, 2023. For more complete information, you may review the Fund's prospectus, which is available at www.nb.com/en/us/products/mutual-funds/absolute-return-multi-manager-fund?section=documents or upon request at 800.877.9700 or fundinfo@nb.com.
On December 26, 2023, Crabel Capital Management, LLC was added as a subadviser to the Fund. Effective as of June 28, 2024, BH-DG Systematic Trading LLP is no longer a subadviser to the Fund.
You may have consented to receive one shareholder report at your address if you and one or more individuals in your home have an account with the Fund (householding). If you wish to receive individual copies of your shareholder report, please contact your financial intermediary or investment provider (e.g. an insurance company, broker-dealer or bank) or if you are a direct investor with the Fund please contact 800.877.9700.
This annual shareholder report contains important information about the Fund for the period of November 1, 2023 to October 31, 2024. You can find additional information about the Fund at www.nb.com/en/us/products/mutual-funds/absolute-return-multi-manager-fund?section=documents. You can also request this information by contacting your financial intermediary or investment provider or at 800.877.9700 or fundinfo@nb.com. This report describes changes to the Fund that occurred during the reporting period.
Annual Shareholder Report
October 31, 2024
Neuberger Berman Absolute Return Multi-Manager Fund
What were the Fund's costs for the year?
(based on a hypothetical $10,000 investment)
| Class Name | Costs of a $10,000 investment | Costs paid as a percentage of a $10,000 investment |
|---|
| Class E | $67 | 0.65% |
How did the Fund perform last year?
Over the period, the Fund generated a positive absolute return at net asset value (NAV). Gains were driven by allocations to the Equity Long/Short, Merger Arbitrage/Event Driven and Insurance-Linked strategies. The Global Macro/Managed Futures strategies detracted, with positive contributions from the Systematic Currency strategy offset by the Managed Futures strategy. Within these strategies, equities, catastrophe bonds, and commodities contributed positively, while currencies and interest rate positioning weighed on overall performance.
Equity Long/Short strategies
Merger Arbitrage/Event Driven strategies
Insurance-Linked securities
Global Macro/Managed Futures strategies
How did the Fund perform over the past 10 years?
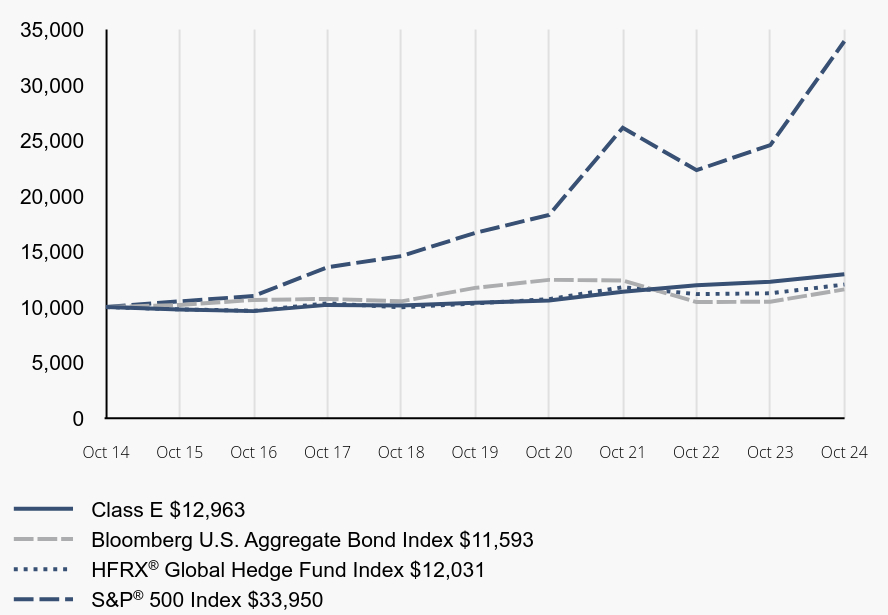
Total Return Based on a $10,000 Investment
| Class E 12,963 | Bloomberg U.S. Aggregate Bond Index $11,593 | HFRX® Global Hedge Fund Index $12,031 | S&P® 500 Index $33,950 |
|---|
| Oct 14 | 10,000 | 10,000 | 10,000 | 10,000 |
| Oct 15 | 9,790 | 10,196 | 9,795 | 10,520 |
| Oct 16 | 9,637 | 10,641 | 9,668 | 10,994 |
| Oct 17 | 10,196 | 10,737 | 10,342 | 13,593 |
| Oct 18 | 10,139 | 10,517 | 9,977 | 14,591 |
| Oct 19 | 10,390 | 11,727 | 10,329 | 16,681 |
| Oct 20 | 10,599 | 12,453 | 10,711 | 18,301 |
| Oct 21 | 11,384 | 12,393 | 11,791 | 26,155 |
| Oct 22 | 11,973 | 10,450 | 11,169 | 22,334 |
| Oct 23 | 12,275 | 10,487 | 11,241 | 24,599 |
| Oct 24 | 12,963 | 11,593 | 12,031 | 33,950 |
Average Annual Total Returns
| 1 Year | 5 Years | 10 Years |
|---|
| Class E | 5.60% | 4.52% | 2.63% |
| Bloomberg U.S. Aggregate Bond Index | 10.55% | -0.23% | 1.49% |
HFRX® Global Hedge Fund Index | 7.03% | 3.10% | 1.87% |
S&P® 500 Index | 38.02% | 15.27% | 13.00% |
The graph shows the change in value of a hypothetical $10,000 investment in the Fund for the class noted over the past 10 fiscal years, including a comparison to a broad-based market index and additional indices. The graph and table do not reflect the deduction of taxes that a shareholder would pay on Fund distributions or on the redemption of Fund shares. The performance prior to Class E's inception date of January 11, 2022 is that of the Fund's Institutional Class, which had higher expenses than Class E so its performance typically would have been lower than that of Class E. The investment return and principal value of an investment will fluctuate so that an investor's shares, when redeemed, may be worth more or less than their original cost. Results represent the Fund's past performance, which is not a good predictor of how the Fund will perform in the future. Current performance may be lower or higher than the performance data quoted. For current performance, please visit www.nb.com/performance.
Class E: As stated in the Fund’s most recent prospectus, the total annual operating expense ratios for fiscal year 2023 were 2.38%/0.68% (before and after any expense reimbursements and/or fee waivers, respectively). Absent any applicable expense reimbursements and/or fee waivers during certain periods, returns would have been lower.
On July 24, 2024, the Fund began comparing its performance to the Bloomberg U.S. Aggregate Bond Index in order to satisfy a change in regulatory requirements. The HFRX Global Hedge Fund Index and the S&P 500 Index will be maintained as additional indices as they show how the Fund’s performance compares to indices with characteristics that are more representative of the Fund's investment strategy than the Bloomberg U.S. Aggregate Bond Index.
Forward foreign currency contracts
| Net Assets | $90,353,718 |
| Number of Portfolio Holdings | 575 |
| Total Investment Advisory Fees Paid | $989,726 |
| Portfolio Turnover Rate | 137% |
What did the Fund invest in?
(as a % of Total InvestmentsFootnote Reference*)
| Long |
|---|
| Fidelity Treasury Only Portfolio, Institutional Class | 43.2% |
| Hess Corp. | 2.2 |
| Prosus NV (China) | 1.8 |
| HashiCorp, Inc. Class A | 1.7 |
| Kellanova | 1.6 |
| Alphabet, Inc. Class A | 1.5 |
| Meta Platforms, Inc. Class A | 1.4 |
| Herbie Re Ltd. (Bermuda) | 1.4 |
| Microsoft Corp. | 1.4 |
| Nestle SA (Registered) | 1.3 |
| Short |
|---|
| Chevron Corp. | (2.5)% |
| International Paper Co. | (1.7) |
| ConocoPhillips | (1.0) |
| Schlumberger NV | (0.5) |
| Lennar Corp. Class A | (0.4) |
| Anglogold Ashanti plc (United Kingdom) | (0.4) |
| Capital One Financial Corp. | (0.3) |
| Charter Communications, Inc. Class A | (0.3) |
| Nokia OYJ (Finland) | (0.3) |
| UMB Financial Corp. | (0.2) |
| Footnote | Description |
Footnote* | Derivatives (other than options purchased), if any, are excluded from this calculation. |
Portfolio by Investment Type
(as a % of Total Net Assets)
| Long | | Short |
| Common Stocks | 44.6% | | (6.6)% |
| Corporate Bonds | 0.0 | | - |
| Insurance Linked Securities | 8.5 | | - |
| Loan Assignments | 0.0 | | - |
| Rights | 0.1 | | - |
| Warrants | 0.0 | | - |
| Short-Term Investments | 35.4 | | - |
| Other Assets Less Liabilities | 18.0Footnote Reference** | | - |
| Total | 106.6% | | (6.6)% |
| Footnote | Description |
Footnote** | Includes the impact of the Fund's open positions in derivatives (other than options purchased), if any. |
Neuberger Berman Absolute Return Multi-Manager Fund
Annual Shareholder Report
October 31, 2024
If you wish to view additional information about the Fund, including but not limited to the Fund's prospectus, financial information, holdings, and proxy voting information, please visit www.nb.com/en/us/products/mutual-funds/absolute-return-multi-manager-fund?section=documents.
The "Neuberger Berman" name and logo and "Neuberger Berman Investment Advisers LLC" name are registered service marks of Neuberger Berman Group LLC. The individual Fund name in this piece is either a service mark or registered service mark of Neuberger Berman Investment Advisers LLC, an affiliate of Neuberger Berman BD LLC, distributor, member FINRA.© 2024 Neuberger Berman BD LLC, distributor. All rights reserved.
This is a summary of certain changes to the Fund since November 1, 2023. For more complete information, you may review the Fund's prospectus, which is available at www.nb.com/en/us/products/mutual-funds/absolute-return-multi-manager-fund?section=documents or upon request at 800.877.9700 or fundinfo@nb.com.
On December 26, 2023, Crabel Capital Management, LLC was added as a subadviser to the Fund. Effective as of June 28, 2024, BH-DG Systematic Trading LLP is no longer a subadviser to the Fund. The change in Fund fees for the reporting period resulted primarily from changes in dividend and interest expenses relating to short sales.
You may have consented to receive one shareholder report at your address if you and one or more individuals in your home have an account with the Fund (householding). If you wish to receive individual copies of your shareholder report, please contact your financial intermediary or investment provider (e.g. an insurance company, broker-dealer or bank) or if you are a direct investor with the Fund please contact 800.877.9700.
This annual shareholder report contains important information about the Fund for the period of November 1, 2023 to October 31, 2024. You can find additional information about the Fund at www.nb.com/en/us/products/mutual-funds/absolute-return-multi-manager-fund?section=documents. You can also request this information by contacting your financial intermediary or investment provider or at 800.366.6264 or issdl@nb.com. This report describes changes to the Fund that occurred during the reporting period.
Annual Shareholder Report
October 31, 2024
Neuberger Berman Absolute Return Multi-Manager Fund
What were the Fund's costs for the year?
(based on a hypothetical $10,000 investment)
| Class Name | Costs of a $10,000 investment | Costs paid as a percentage of a $10,000 investment |
|---|
| Class R6 | $173 | 1.69% |
How did the Fund perform last year?
Over the period, the Fund generated a positive absolute return at net asset value (NAV). Gains were driven by allocations to the Equity Long/Short, Merger Arbitrage/Event Driven and Insurance-Linked strategies. The Global Macro/Managed Futures strategies detracted, with positive contributions from the Systematic Currency strategy offset by the Managed Futures strategy. Within these strategies, equities, catastrophe bonds, and commodities contributed positively, while currencies and interest rate positioning weighed on overall performance.
Equity Long/Short strategies
Merger Arbitrage/Event Driven strategies
Insurance-Linked securities
Global Macro/Managed Futures strategies
How did the Fund perform over the past 10 years?
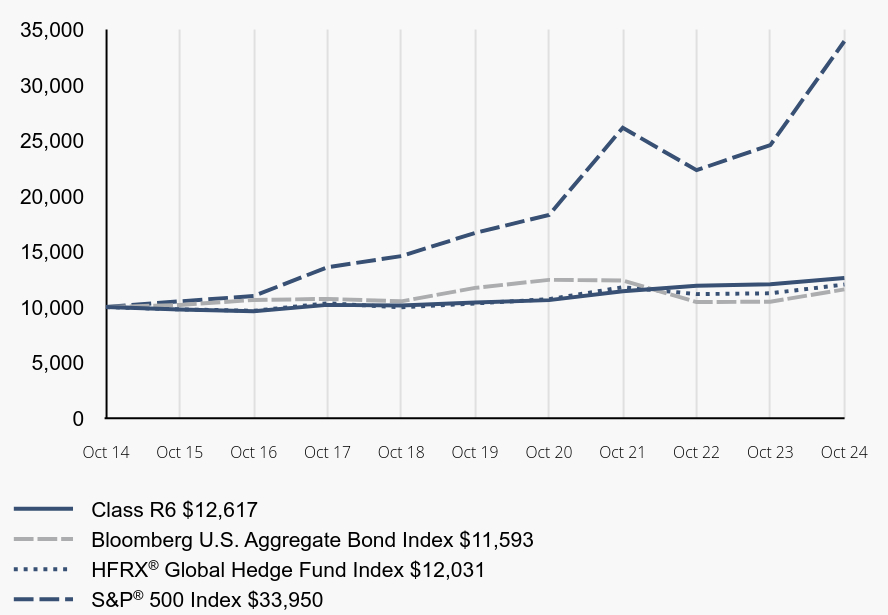
Total Return Based on a $10,000 Investment
| Class R6 12,617 | Bloomberg U.S. Aggregate Bond Index $11,593 | HFRX® Global Hedge Fund Index $12,031 | S&P® 500 Index $33,950 |
|---|
| Oct 14 | 10,000 | 10,000 | 10,000 | 10,000 |
| Oct 15 | 9,786 | 10,196 | 9,795 | 10,520 |
| Oct 16 | 9,631 | 10,641 | 9,668 | 10,994 |
| Oct 17 | 10,200 | 10,737 | 10,342 | 13,593 |
| Oct 18 | 10,143 | 10,517 | 9,977 | 14,591 |
| Oct 19 | 10,411 | 11,727 | 10,329 | 16,681 |
| Oct 20 | 10,629 | 12,453 | 10,711 | 18,301 |
| Oct 21 | 11,427 | 12,393 | 11,791 | 26,155 |
| Oct 22 | 11,930 | 10,450 | 11,169 | 22,334 |
| Oct 23 | 12,065 | 10,487 | 11,241 | 24,599 |
| Oct 24 | 12,617 | 11,593 | 12,031 | 33,950 |
Average Annual Total Returns
| 1 Year | 5 Years | 10 Years |
|---|
| Class R6 | 4.58% | 3.92% | 2.35% |
| Bloomberg U.S. Aggregate Bond Index | 10.55% | -0.23% | 1.49% |
HFRX® Global Hedge Fund Index | 7.03% | 3.10% | 1.87% |
S&P® 500 Index | 38.02% | 15.27% | 13.00% |
The graph shows the change in value of a hypothetical $10,000 investment in the Fund for the class noted over the past 10 fiscal years, including a comparison to a broad-based market index and additional indices. The graph and table do not reflect the deduction of taxes that a shareholder would pay on Fund distributions or on the redemption of Fund shares. The investment return and principal value of an investment will fluctuate so that an investor's shares, when redeemed, may be worth more or less than their original cost. Results represent the Fund's past performance, which is not a good predictor of how the Fund will perform in the future. Current performance may be lower or higher than the performance data quoted. For current performance, please visit www.nb.com/performance.
Class R6: As stated in the Fund’s most recent prospectus, the total annual operating expense ratios for fiscal year 2023 were 2.71%/2.26% (before and after any expense reimbursements and/or fee waivers, respectively). Absent any applicable expense reimbursements and/or fee waivers during certain periods, returns would have been lower.
On July 24, 2024, the Fund began comparing its performance to the Bloomberg U.S. Aggregate Bond Index in order to satisfy a change in regulatory requirements. The HFRX Global Hedge Fund Index and the S&P 500 Index will be maintained as additional indices as they show how the Fund’s performance compares to indices with characteristics that are more representative of the Fund's investment strategy than the Bloomberg U.S. Aggregate Bond Index.
Forward foreign currency contracts
| Net Assets | $90,353,718 |
| Number of Portfolio Holdings | 575 |
| Total Investment Advisory Fees Paid | $989,726 |
| Portfolio Turnover Rate | 137% |
What did the Fund invest in?
(as a % of Total InvestmentsFootnote Reference*)
| Long |
|---|
| Fidelity Treasury Only Portfolio, Institutional Class | 43.2% |
| Hess Corp. | 2.2 |
| Prosus NV (China) | 1.8 |
| HashiCorp, Inc. Class A | 1.7 |
| Kellanova | 1.6 |
| Alphabet, Inc. Class A | 1.5 |
| Meta Platforms, Inc. Class A | 1.4 |
| Herbie Re Ltd. (Bermuda) | 1.4 |
| Microsoft Corp. | 1.4 |
| Nestle SA (Registered) | 1.3 |
| Short |
|---|
| Chevron Corp. | (2.5)% |
| International Paper Co. | (1.7) |
| ConocoPhillips | (1.0) |
| Schlumberger NV | (0.5) |
| Lennar Corp. Class A | (0.4) |
| Anglogold Ashanti plc (United Kingdom) | (0.4) |
| Capital One Financial Corp. | (0.3) |
| Charter Communications, Inc. Class A | (0.3) |
| Nokia OYJ (Finland) | (0.3) |
| UMB Financial Corp. | (0.2) |
| Footnote | Description |
Footnote* | Derivatives (other than options purchased), if any, are excluded from this calculation. |
Portfolio by Investment Type
(as a % of Total Net Assets)
| Long | | Short |
| Common Stocks | 44.6% | | (6.6)% |
| Corporate Bonds | 0.0 | | - |
| Insurance Linked Securities | 8.5 | | - |
| Loan Assignments | 0.0 | | - |
| Rights | 0.1 | | - |
| Warrants | 0.0 | | - |
| Short-Term Investments | 35.4 | | - |
| Other Assets Less Liabilities | 18.0Footnote Reference** | | - |
| Total | 106.6% | | (6.6)% |
| Footnote | Description |
Footnote** | Includes the impact of the Fund's open positions in derivatives (other than options purchased), if any. |
Neuberger Berman Absolute Return Multi-Manager Fund
Annual Shareholder Report
October 31, 2024
If you wish to view additional information about the Fund, including but not limited to the Fund's prospectus, financial information, holdings, and proxy voting information, please visit www.nb.com/en/us/products/mutual-funds/absolute-return-multi-manager-fund?section=documents.
The "Neuberger Berman" name and logo and "Neuberger Berman Investment Advisers LLC" name are registered service marks of Neuberger Berman Group LLC. The individual Fund name in this piece is either a service mark or registered service mark of Neuberger Berman Investment Advisers LLC, an affiliate of Neuberger Berman BD LLC, distributor, member FINRA.© 2024 Neuberger Berman BD LLC, distributor. All rights reserved.
This is a summary of certain changes to the Fund since November 1, 2023. For more complete information, you may review the Fund's prospectus, which is available at www.nb.com/en/us/products/mutual-funds/absolute-return-multi-manager-fund?section=documents or upon request at 800.366.6264 or issdl@nb.com.
On December 26, 2023, Crabel Capital Management, LLC was added as a subadviser to the Fund. Effective as of June 28, 2024, BH-DG Systematic Trading LLP is no longer a subadviser to the Fund. The change in Fund fees for the reporting period resulted primarily from changes in dividend and interest expenses relating to short sales.
You may have consented to receive one shareholder report at your address if you and one or more individuals in your home have an account with the Fund (householding). If you wish to receive individual copies of your shareholder report, please contact your financial intermediary or investment provider (e.g. an insurance company, broker-dealer or bank) or if you are a direct investor with the Fund please contact 800.366.6264.
This annual shareholder report contains important information about the Fund for the period of November 1, 2023 to October 31, 2024. You can find additional information about the Fund at www.nb.com/en/us/products/mutual-funds/absolute-return-multi-manager-fund?section=documents. You can also request this information by contacting your financial intermediary or investment provider or at 800.366.6264 or issdl@nb.com. This report describes changes to the Fund that occurred during the reporting period.
Annual Shareholder Report
October 31, 2024
Institutional Class: NABIX
Neuberger Berman Absolute Return Multi-Manager Fund
What were the Fund's costs for the year?
(based on a hypothetical $10,000 investment)
| Class Name | Costs of a $10,000 investment | Costs paid as a percentage of a $10,000 investment |
|---|
| Institutional Class | $183 | 1.79% |
How did the Fund perform last year?
Over the period, the Fund generated a positive absolute return at net asset value (NAV). Gains were driven by allocations to the Equity Long/Short, Merger Arbitrage/Event Driven and Insurance-Linked strategies. The Global Macro/Managed Futures strategies detracted, with positive contributions from the Systematic Currency strategy offset by the Managed Futures strategy. Within these strategies, equities, catastrophe bonds, and commodities contributed positively, while currencies and interest rate positioning weighed on overall performance.
Equity Long/Short strategies
Merger Arbitrage/Event Driven strategies
Insurance-Linked securities
Global Macro/Managed Futures strategies
How did the Fund perform over the past 10 years?
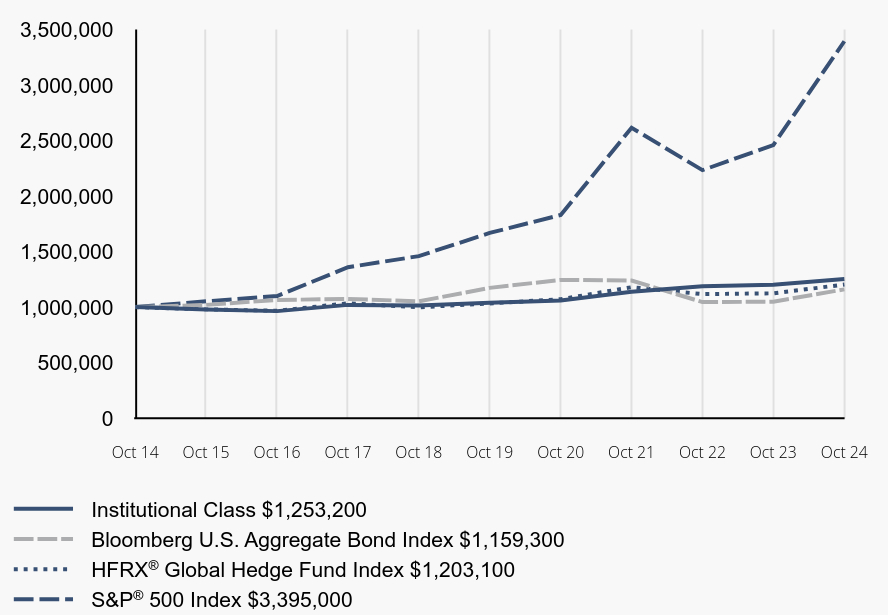
Total Return Based on a $1,000,000 Investment
| Institutional Class 1,253,200 | Bloomberg U.S. Aggregate Bond Index $1,159,300 | HFRX® Global Hedge Fund Index $1,203,100 | S&P® 500 Index $3,395,000 |
|---|
| Oct 14 | 1,000,000 | 1,000,000 | 1,000,000 | 1,000,000 |
| Oct 15 | 979,000 | 1,019,600 | 979,500 | 1,052,000 |
| Oct 16 | 963,700 | 1,064,100 | 966,800 | 1,099,400 |
| Oct 17 | 1,019,600 | 1,073,700 | 1,034,200 | 1,359,300 |
| Oct 18 | 1,013,900 | 1,051,700 | 997,700 | 1,459,100 |
| Oct 19 | 1,039,000 | 1,172,700 | 1,032,900 | 1,668,100 |
| Oct 20 | 1,059,900 | 1,245,300 | 1,071,100 | 1,830,100 |
| Oct 21 | 1,138,400 | 1,239,300 | 1,179,100 | 2,615,500 |
| Oct 22 | 1,187,300 | 1,045,000 | 1,116,900 | 2,233,400 |
| Oct 23 | 1,200,600 | 1,048,700 | 1,124,100 | 2,459,900 |
| Oct 24 | 1,253,200 | 1,159,300 | 1,203,100 | 3,395,000 |
Average Annual Total Returns
| 1 Year | 5 Years | 10 Years |
|---|
| Institutional Class | 4.39% | 3.82% | 2.28% |
| Bloomberg U.S. Aggregate Bond Index | 10.55% | -0.23% | 1.49% |
HFRX® Global Hedge Fund Index | 7.03% | 3.10% | 1.87% |
S&P® 500 Index | 38.02% | 15.27% | 13.00% |
The graph shows the change in value of a hypothetical $1,000,000 investment in the Fund for the class noted over the past 10 fiscal years, including a comparison to a broad-based market index and additional indices. The graph and table do not reflect the deduction of taxes that a shareholder would pay on Fund distributions or on the redemption of Fund shares. The investment return and principal value of an investment will fluctuate so that an investor's shares, when redeemed, may be worth more or less than their original cost. Results represent the Fund's past performance,which is not a good predictor of how the Fund will perform in the future. Current performance may be lower or higher than the performance data quoted. For current performance, please visit www.nb.com/performance.
Institutional Class: As stated in the Fund’s most recent prospectus, the total annual operating expense ratios for fiscal year 2023 were 2.52%/2.04% (before and after any expense reimbursements and/or fee waivers, respectively). Absent any applicable expense reimbursements and/or fee waivers during certain periods, returns would have been lower.
On July 24, 2024, the Fund began comparing its performance to the Bloomberg U.S. Aggregate Bond Index in order to satisfy a change in regulatory requirements. The HFRX Global Hedge Fund Index and the S&P 500 Index will be maintained as additional indices as they show how the Fund’s performance compares to indices with characteristics that are more representative of the Fund's investment strategy than the Bloomberg U.S. Aggregate Bond Index.
Forward foreign currency contracts
| Net Assets | $90,353,718 |
| Number of Portfolio Holdings | 575 |
| Total Investment Advisory Fees Paid | $989,726 |
| Portfolio Turnover Rate | 137% |
What did the Fund invest in?
(as a % of Total InvestmentsFootnote Reference*)
| Long |
|---|
| Fidelity Treasury Only Portfolio, Institutional Class | 43.2% |
| Hess Corp. | 2.2 |
| Prosus NV (China) | 1.8 |
| HashiCorp, Inc. Class A | 1.7 |
| Kellanova | 1.6 |
| Alphabet, Inc. Class A | 1.5 |
| Meta Platforms, Inc. Class A | 1.4 |
| Herbie Re Ltd. (Bermuda) | 1.4 |
| Microsoft Corp. | 1.4 |
| Nestle SA (Registered) | 1.3 |
| Short |
|---|
| Chevron Corp. | (2.5)% |
| International Paper Co. | (1.7) |
| ConocoPhillips | (1.0) |
| Schlumberger NV | (0.5) |
| Lennar Corp. Class A | (0.4) |
| Anglogold Ashanti plc (United Kingdom) | (0.4) |
| Capital One Financial Corp. | (0.3) |
| Charter Communications, Inc. Class A | (0.3) |
| Nokia OYJ (Finland) | (0.3) |
| UMB Financial Corp. | (0.2) |
| Footnote | Description |
Footnote* | Derivatives (other than options purchased), if any, are excluded from this calculation. |
Portfolio by Investment Type
(as a % of Total Net Assets)
| Long | | Short |
| Common Stocks | 44.6% | | (6.6)% |
| Corporate Bonds | 0.0 | | - |
| Insurance Linked Securities | 8.5 | | - |
| Loan Assignments | 0.0 | | - |
| Rights | 0.1 | | - |
| Warrants | 0.0 | | - |
| Short-Term Investments | 35.4 | | - |
| Other Assets Less Liabilities | 18.0Footnote Reference** | | - |
| Total | 106.6% | | (6.6)% |
| Footnote | Description |
Footnote** | Includes the impact of the Fund's open positions in derivatives (other than options purchased), if any. |
Neuberger Berman Absolute Return Multi-Manager Fund
Annual Shareholder Report
October 31, 2024
Institutional Class: NABIX
If you wish to view additional information about the Fund, including but not limited to the Fund's prospectus, financial information, holdings, and proxy voting information, please visit www.nb.com/en/us/products/mutual-funds/absolute-return-multi-manager-fund?section=documents.
The "Neuberger Berman" name and logo and "Neuberger Berman Investment Advisers LLC" name are registered service marks of Neuberger Berman Group LLC. The individual Fund name in this piece is either a service mark or registered service mark of Neuberger Berman Investment Advisers LLC, an affiliate of Neuberger Berman BD LLC, distributor, member FINRA.© 2024 Neuberger Berman BD LLC, distributor. All rights reserved.
This is a summary of certain changes to the Fund since November 1, 2023. For more complete information, you may review the Fund's prospectus, which is available at www.nb.com/en/us/products/mutual-funds/absolute-return-multi-manager-fund?section=documents or upon request at 800.366.6264 or issdl@nb.com.
On December 26, 2023, Crabel Capital Management, LLC was added as a subadviser to the Fund. Effective as of June 28, 2024, BH-DG Systematic Trading LLP is no longer a subadviser to the Fund.
You may have consented to receive one shareholder report at your address if you and one or more individuals in your home have an account with the Fund (householding). If you wish to receive individual copies of your shareholder report, please contact your financial intermediary or investment provider (e.g. an insurance company, broker-dealer or bank) or if you are a direct investor with the Fund please contact 800.366.6264.
(b) Not applicable to the Fund.
Item 2. Code of Ethics.
The Board of Trustees (“Board”) of Neuberger Berman Alternative Funds (“Registrant”) has adopted a code of ethics that applies to the Registrant’s principal executive officer, principal financial officer, principal accounting officer or controller, or persons performing similar functions (“Code of Ethics”). During the period covered by this Form N-CSR, there were no substantive amendments to the Code of Ethics and there were no waivers from the Code of Ethics granted to the Registrant’s principal executive officer, principal financial officer, principal accounting officer or controller, or persons performing similar functions.
The Code of Ethics is also available, without charge, by calling 1-800-877-9700 (toll-free).
Item 3. Audit Committee Financial Expert.
The Board has determined that the Registrant has three audit committee financial experts serving on its audit committee. The Registrant’s audit committee financial experts are Michael J. Cosgrove, Martha C. Goss, and Deborah C. McLean. Mr. Cosgrove, Ms. Goss, and Ms. McLean are independent trustees as defined by Form N-CSR.
Item 4. Principal Accountant Fees and Services.
Ernst & Young, LLP (“E&Y”) serves as independent registered public accounting firm to the Neuberger Berman Absolute Return Multi-Manager Fund (the “Fund”).
(a) Audit Fees
The aggregate fees billed for professional services rendered by E&Y for the audit of the annual financial statements or services rendered to the Fund that are normally provided by E&Y in connection with statutory and regulatory filings or engagements were $102,200 and $104,700 for the fiscal years ended 2023 and 2024, respectively.
(b) Audit-Related Fees
The aggregate fees billed to the Fund for assurance and related services by E&Y that are reasonably related to the performance of the audit of the Fund’s financial statements and are not reported above in Audit Fees were $0 and $0 for the fiscal years ended 2023 and 2024, respectively. The Audit Committee approved 0% and 0% of these services provided by E&Y for the fiscal years ended 2023 and 2024, respectively, pursuant to the waiver provisions of Rule 2-01(c)(7)(i)(C) of Regulation S-X.
The fees billed to other entities in the investment company complex for assurance and related services by E&Y that are reasonably related to the performance of the audit that the Audit Committee was required to approve because the engagement related directly to the operations and financial reporting of the Fund were $0 and $0 for the fiscal years ended 2023 and 2024, respectively. The Audit Committee approved 0% and 0% of these services provided by E&Y for the fiscal years ended 2023 and 2024, respectively, pursuant to the waiver provisions of Rule 2-01(c)(7)(i)(C) of Regulation S-X.
(c) Tax Fees
The aggregate fees billed to the Fund for professional services rendered by E&Y for tax compliance, tax advice, and tax planning were $19,040 and $19,040 for the fiscal years ended 2023 and 2024, respectively. The nature of the services provided includes preparation of the Federal and State tax extensions and tax returns, review of annual excise tax calculations, and preparation of form 8613, in addition to assistance with the identification of Passive Foreign Investment Companies, assistance with determination of various foreign withholding taxes, and assistance with Internal Revenue Code and tax regulation requirements for fund investments. The Audit Committee approved 0% and 0% of these services provided by E&Y for the fiscal years ended 2023 and 2024, respectively, pursuant to the waiver provisions of Rule 2-01(c)(7)(i)(C) of Regulation S-X.
The fees billed to other entities in the investment company complex for professional services rendered by E&Y for tax compliance, tax advice, and tax planning that the Audit Committee was required to approve because the engagement related directly to the operations and financial reporting of the Fund were $0 and $0 for the fiscal years ended 2023 and 2024, respectively. The Audit Committee approved 0% and 0% of these services provided by E&Y for the fiscal years ended 2023 and 2024, respectively, pursuant to the waiver provisions of Rule 2-01(c)(7)(i)(C) of Regulation S-X.
(d) All Other Fees
The aggregate fees billed to the Fund for products and services provided by E&Y, other than services reported in Audit Fees, Audit-Related Fees, and Tax Fees were $0 and $0 for the fiscal years ended 2023 and 2024, respectively. The Audit Committee approved 0% and 0% of these services provided by E&Y for the fiscal years ended 2023 and 2024, respectively, pursuant to the waiver provisions of Rule 2-01(c)(7)(i)(C) of Regulation S-X.
The fees billed to other entities in the investment company complex for products and services provided by E&Y, other than services reported in Audit Fees, Audit-Related Fees, and Tax Fees that the Audit Committee was required to approve because the engagement related directly to the operations and financial reporting of the Fund were $0 and $0 for the fiscal years ended 2023 and 2024, respectively. The Audit Committee approved 0% and 0% of these services provided by E&Y for the fiscal years ended 2023 and 2024, respectively, pursuant to the waiver provisions of Rule 2-01(c)(7)(i)(C) of Regulation S-X.
(e) Audit Committee’s Pre-Approval Policies and Procedures
(1) The Audit Committee’s pre-approval policies and procedures for the Registrant to engage an accountant to render audit and non-audit services delegate to each member of the Committee the power to pre-approve services between meetings of the Committee.
(2) None of the services described in paragraphs (b) through (d) above were approved by the Audit Committee pursuant to paragraph (c)(7)(i)(C) of Rule 2-01 of Regulation S-X.
(f) Hours Attributed to Other Persons
Not applicable.
(g) Non-Audit Fees
Non-audit fees billed by E&Y for services rendered to the Fund were $19,040 and $19,040 for the fiscal years ended 2023 and 2024, respectively.
Non-audit fees billed by E&Y for services rendered to the Fund’s investment adviser and any entity controlling, controlled by, or under common control with the adviser that provides ongoing services to the Fund were $0 and $0 for the fiscal years ended 2023 and 2024, respectively.
(h) The Audit Committee of the Board considered whether the provision of non-audit services rendered to the Fund’s investment adviser and any entity controlling, controlled by, or under common control with the adviser that provides ongoing services to the Fund that were not pre-approved by the Audit Committee because the engagement did not relate directly to the operations and financial reporting of the Fund is compatible with maintaining E&Y’s independence.
(i) Not applicable.
(j) Not applicable.
Item 5. Audit Committee of Listed Registrants.
(a) Not applicable to the Registrant.
(b) Not applicable to the Registrant.
Item 6. Investments.
(a) The complete schedule of investments for the Fund is disclosed in the Fund’s financial statements, which is included in Item 7 of this Form N-CSR.
(b) Not applicable to the Registrant.
Item 7. Financial Statements and Financial Highlights for Open-End Management Investment Companies.
Annual
Financial
Statements
and
Other
Information
Neuberger
Berman
Alternative
Funds
Institutional
Class
Shares
Class
A
Shares
Class
C
Shares
Class
R6
Shares
Class
E
Shares
Absolute
Return
Multi-Manager
Fund
The
“Neuberger
Berman”
name
and
logo
and
“Neuberger
Berman
Investment
Advisers
LLC”
name
are
registered
service
marks
of
Neuberger
Berman
Group
LLC.
The
individual
Fund
name
in
this
piece
is
either
a
service
mark
or
registered
service
mark
of
Neuberger
Berman
Investment
Advisers
LLC,
an
affiliate
of
Neuberger
Berman
BD
LLC,
distributor,
member
FINRA.
©
2024
Neuberger
Berman
BD
LLC,
distributor.
All
rights
reserved.
CONSOLIDATED
SCHEDULE
OF
INVESTMENTS
(Form
N-CSR
Item
7)
2
CONSOLIDATED
FINANCIAL
STATEMENTS
(Form
N-CSR
Item
7)
25
NOTES
TO
CONSOLIDATED
FINANCIAL
STATEMENTS
(Form
N-CSR
Item
7)
30
CONSOLIDATED
FINANCIAL
HIGHLIGHTS
(ALL
CLASSES)
(Form
N-CSR
Item
7)
44
Report
of
Independent
Registered
Public
Accounting
Firm
(Form
N-CSR
Item
7)
48
Directory
(Form
N-CSR
Item
7)
49
Notice
to
Shareholders
50
Other
Information
(Form
N-CSR
Items
8-11)
51
See
Notes
to
Consolidated
Financial
Statements
Consolidated
Schedule
of
Investments
Absolute
Return
Multi-Manager
Fund^
October
31,
2024
Investments
Shares
Value
Long
Positions
88.6%
Common
Stocks
44.6%
Aerospace
&
Defense
0.3%
Heroux-Devtek,
Inc.
(Canada)
*
2,450
$
56,572
Spirit
AeroSystems
Holdings,
Inc.,
Class
A
*
7,050
228,208
284,780
Automobile
Components
0.1%
Garrett
Motion,
Inc.
(Switzerland)
*
9,382
69,708
Banks
0.3%
Canadian
Western
Bank
(Canada)
1,323
54,399
First
Bancshares,
Inc.
(The)
1,496
50,071
Heartland
Financial
USA,
Inc.
2,756
163,982
Sandy
Spring
Bancorp,
Inc.
435
14,633
283,085
Beverages
0.2%
Duckhorn
Portfolio,
Inc.
(The)
*
20,118
220,493
Biotechnology
0.0%
(a)
Grifols
SA,
ADR
(Spain)
*
986
8,568
Broadline
Retail
3.6%
Alibaba
Group
Holding
Ltd.,
ADR
(China)
6,297
616,980
Alibaba
Group
Holding
Ltd.
(China)
17,285
211,436
Amazon.com,
Inc.
*
3,599
670,854
Macy's,
Inc.
2,500
38,350
MercadoLibre,
Inc.
(Brazil)
*
256
521,518
Prosus
NV
(China)
31,471
1,326,341
3,385,479
Capital
Markets
0.2%
Canaccord
Genuity
Group,
Inc.
(Canada)
21,750
156,523
Pershing
Square,
Escrow
*(b)(c)
6,100
—
156,523
Chemicals
0.7%
Aimia,
Inc.
(Canada)
*
18,800
33,891
Arcadium
Lithium
plc
(Argentina)
*
109,055
587,806
621,697
Commercial
Services
&
Supplies
1.0%
Stericycle,
Inc.
*
14,565
895,311
Communications
Equipment
1.5%
Infinera
Corp.
*(c)
78,654
547,127
Juniper
Networks,
Inc.
19,881
773,371
1,320,498
Investments
Shares
Value
Consumer
Finance
0.2%
Discover
Financial
Services
1,282
$
190,287
Consumer
Staples
Distribution
&
Retail
0.9%
Albertsons
Cos.,
Inc.,
Class
A
35,473
642,061
Fix
Price
Group
plc,
GDR
(Russia)
(b)(c)(d)
144
—
Sendas
Distribuidora
SA,
ADR
(Brazil)
*
3,297
21,430
Wal-Mart
de
Mexico
SAB
de
CV
(Mexico)
41,235
113,384
776,875
Diversified
Telecommunication
Services
0.7%
Altaba,
Inc.
Escrow
*(b)
115,604
164,736
Consolidated
Communications
Holdings,
Inc.
*
24,878
115,310
Frontier
Communications
Parent,
Inc.
*
9,154
327,072
Telesat
Corp.
(Canada)
*
4,885
61,600
668,718
Electric
Utilities
1.1%
ALLETE,
Inc.
9,028
576,979
Avangrid,
Inc.
8,060
287,823
TXNM
Energy,
Inc.
3,707
161,403
1,026,205
Electronic
Equipment,
Instruments
&
Components
0.3%
Iteris,
Inc.
*
37,700
271,063
Energy
Equipment
&
Services
0.4%
ChampionX
Corp.
12,631
356,447
Entertainment
1.0%
Atlanta
Braves
Holdings,
Inc.,
Class
C
*
6,104
241,169
Endeavor
Group
Holdings,
Inc.,
Class
A
22,647
667,860
909,029
Financial
Services
0.9%
Nuvei
Corp.
(Canada)
13,300
447,545
PayPal
Holdings,
Inc.
*
4,030
319,579
767,124
Food
Products
2.4%
Kellanova
14,457
1,165,957
Nestle
SA
(Registered)
10,570
998,553
2,164,510
Gas
Utilities
0.1%
Southwest
Gas
Holdings,
Inc.
1,450
106,213
Health
Care
Equipment
&
Supplies
1.3%
Axonics,
Inc.
*
13,834
972,530
Surmodics,
Inc.
*
5,548
208,161
1,180,691
Health
Care
Providers
&
Services
1.8%
Amedisys,
Inc.
*
9,175
867,955
Consolidated
Schedule
of
Investments
Absolute
Return
Multi-Manager
Fund^
(cont’d)
See
Notes
to
Consolidated
Financial
Statements
Investments
Shares
Value
Health
Care
Providers
&
Services
-
cont’d
R1
RCM,
Inc.
*
44,940
$
640,844
Shanghai
Pharmaceuticals
Holding
Co.
Ltd.,
Class
H
(China)
26,108
40,353
Sinopharm
Group
Co.
Ltd.,
Class
H
(China)
14,957
37,262
1,586,414
Hotels,
Restaurants
&
Leisure
2.1%
Bally's
Corp.
*
11,640
203,118
Booking
Holdings,
Inc.
150
701,438
Deliveroo
plc,
Class
A
(United
Kingdom)
*(d)
10,109
17,962
Everi
Holdings,
Inc.
*
20,650
275,265
Expedia
Group,
Inc.
*
1,865
291,518
International
Game
Technology
plc
5,400
109,728
PlayAGS,
Inc.
*
17,380
202,129
Playtech
plc
(United
Kingdom)
*
12,263
114,799
1,915,957
Household
Durables
0.9%
Lennar
Corp.,
Class
B
2,092
335,390
Vizio
Holding
Corp.,
Class
A
*
43,079
479,469
814,859
Independent
Power
and
Renewable
Electricity
Producers
0.1%
Atlantica
Sustainable
Infrastructure
plc
(Spain)
5,775
127,397
Insurance
0.7%
AIA
Group
Ltd.
(Hong
Kong)
57,907
457,020
Enstar
Group
Ltd.
*
450
145,125
602,145
Interactive
Media
&
Services
2.5%
Alphabet,
Inc.,
Class
A
6,445
1,102,804
Baidu,
Inc.,
ADR
(China)
*
608
55,468
Baidu,
Inc.,
Class
A
(China)
*
1,931
22,034
Meta
Platforms,
Inc.,
Class
A
1,836
1,042,077
Nebius
Group
NV
(Netherlands)
*(b)
1,428
30,531
PropertyGuru
Group
Ltd.
(Cayman
Islands)
*
3,600
23,868
VK
IPJSC,
GDR
(Russia)
*(b)
(c)(d)
1,305
—
2,276,782
IT
Services
0.0%
(a)
Thoughtworks
Holding,
Inc.
*
747
3,317
Leisure
Products
0.5%
Vista
Outdoor,
Inc.
*
9,534
419,210
Investments
Shares
Value
Life
Sciences
Tools
&
Services
0.8%
Eurofins
Scientific
SE
(Luxembourg)
14,650
$
719,968
Machinery
0.6%
Barnes
Group,
Inc.
10,259
479,711
Stratasys
Ltd.
*
5,394
38,567
Velan,
Inc.
(Canada)
*
2,100
17,405
535,683
Media
1.2%
Liberty
Broadband
Corp.,
Class
C
*
2,609
210,859
Paramount
Global,
Class
B
12,489
136,630
Stroeer
SE
&
Co.
KGaA
(Germany)
7,211
427,485
TEGNA,
Inc.
18,417
302,591
WideOpenWest,
Inc.
*
6,032
30,100
1,107,665
Metals
&
Mining
1.8%
ArcelorMittal
SA
(Luxembourg)
4,832
119,206
Artemis
Gold,
Inc.
(Canada)
*
605
6,092
Centamin
plc
(Egypt)
138,657
283,921
Haynes
International,
Inc.
6,009
362,703
United
States
Steel
Corp.
19,250
747,862
Universal
Stainless
&
Alloy
Products,
Inc.
*
1,050
45,906
Vale
SA,
Class
B,
ADR
(Brazil)
467
4,997
Vale
SA,
Class
B,
ADR
(Brazil)
8,200
87,740
1,658,427
Office
REITs
0.3%
Equity
Commonwealth,
REIT
*
3,700
73,223
NET
Lease
Office
Properties,
REIT
5,072
152,363
225,586
Oil,
Gas
&
Consumable
Fuels
2.8%
Hess
Corp.
12,067
1,622,770
LUKOIL
PJSC,
ADR
(Russia)
*(b)(c)
661
—
Marathon
Oil
Corp.
27,732
768,176
Petroleo
Brasileiro
SA,
ADR
(Brazil)
9,839
132,335
2,523,281
Passenger
Airlines
0.0%
(a)
American
Airlines
Group,
Inc.
*
768
10,291
Personal
Care
Products
0.0%
(a)
L'Oreal
SA
(France)
86
32,203
Pharmaceuticals
2.5%
Aralez
Pharmaceuticals,
Inc.
(Canada)
*(b)
345
—
Catalent,
Inc.
*
11,557
677,240
Consolidated
Schedule
of
Investments
Absolute
Return
Multi-Manager
Fund^
(cont’d)
See
Notes
to
Consolidated
Financial
Statements
Investments
Shares
Value
Pharmaceuticals
-
cont’d
Longboard
Pharmaceuticals,
Inc.
*
8,024
$
479,193
Revance
Therapeutics,
Inc.
*
41,886
247,127
Roche
Holding
AG
2,682
832,040
2,235,600
Professional
Services
0.7%
SGS
SA
(Registered)
(Switzerland)
3,869
409,951
Sterling
Check
Corp.
*(c)
11,436
199,155
TTEC
Holdings,
Inc.
7,148
37,170
646,276
Real
Estate
Management
&
Development
0.2%
Seritage
Growth
Properties,
Class
A
*
34,643
145,154
Semiconductors
&
Semiconductor
Equipment
0.4%
ASML
Holding
NV
(Netherlands)
319
215,552
Magnachip
Semiconductor
Corp.
(South
Korea)
*
11,350
50,053
Silicon
Motion
Technology
Corp.,
ADR
(Taiwan)
1,512
81,361
SunEdison,
Inc.
*(b)(c)
16,689
—
346,966
Software
4.9%
Altair
Engineering,
Inc.,
Class
A
*
600
62,394
ANSYS,
Inc.
*
953
305,351
Envestnet,
Inc.
*
2,500
156,950
HashiCorp,
Inc.,
Class
A
*
36,749
1,244,321
Instructure
Holdings,
Inc.
*
5,100
120,054
Matterport,
Inc.
*
24,864
113,380
Microsoft
Corp.
2,462
1,000,434
SAP
SE
(Germany)
3,446
805,153
Smartsheet,
Inc.,
Class
A
*
9,090
512,858
Zuora,
Inc.,
Class
A
*
6,250
61,875
4,382,770
Specialty
Retail
0.1%
GCI
Liberty,
Inc.
Escrow
*(b)
(c)
5,700
—
Sportsman's
Warehouse
Holdings,
Inc.
*
37,547
97,998
Toys
R
Us,
Inc.
*(b)
2,810
14,050
112,048
Technology
Hardware,
Storage
&
Peripherals
0.9%
Apple,
Inc.
2,375
536,536
Samsung
Electronics
Co.
Ltd.,
GDR
(South
Korea)
(d)
283
299,697
836,233
Textiles,
Apparel
&
Luxury
Goods
0.4%
Capri
Holdings
Ltd.
*
10,022
197,834
Hermes
International
SCA
(France)
22
49,632
Investments
Shares
Value
Textiles,
Apparel
&
Luxury
Goods
-
cont’d
NIKE,
Inc.,
Class
B
1,934
$
149,170
396,636
Trading
Companies
&
Distributors
0.9%
Brenntag
SE
(Germany)
3,324
216,362
IMCD
NV
(Netherlands)
2,741
435,452
McGrath
RentCorp
1,172
133,256
785,070
Wireless
Telecommunication
Services
0.3%
Telephone
and
Data
Systems,
Inc.
4,200
124,950
United
States
Cellular
Corp.
*
2,150
132,655
257,605
Total
Common
Stocks
(Cost
$38,739,135
)
40,366,847
Principal
Amount
Corporate
Bonds
0.0%
Independent
Power
and
Renewable
Electricity
Producers
0.0%
GenOn
Energy,
Inc.
Escrow
,
9.50%,
10/15/2018
(b)(c)(e)
$
354,000
—
9.88%,
10/15/2020
(b)(c)(e)
1,655,000
—
Total
Corporate
Bonds
(Cost
$—
)
—
Insurance
Linked
Securities
8
.5
%
Alamo
Re
Ltd.
(Bermuda)
Series
B,
(1
Month
Treasury
Bill
Rate
+
7.75%),
12.33%,
6/7/2027
(f)(g)
250,000
260,425
Cape
Lookout
Re
Ltd.
(Bermuda)
Series
A,
(1
Month
Treasury
Bill
Rate
+
8.00%),
12.58%,
4/5/2027
(f)(g)
250,000
254,875
FloodSmart
Re
Ltd.
(Bermuda)
Series
A,
(3
Month
Treasury
Bill
Rate
+
14.00%),
18.58%,
3/12/2027
(f)(g)
250,000
263,150
Gateway
Re
Ltd.
Series
A,
(1
Month
Treasury
Bill
Rate
+
13.96%),
18.54%,
2/24/2026
(f)(g)
250,000
271,225
Herbie
Re
Ltd.
(Bermuda)
Series
A,
(3
Month
Treasury
Bill
Rate
+
6.73%),
11.31%,
1/8/2025
(f)(g)
250,000
252,050
Consolidated
Schedule
of
Investments
Absolute
Return
Multi-Manager
Fund^
(cont’d)
See
Notes
to
Consolidated
Financial
Statements
Investments
Principal
Amount
Value
Insurance
Linked
Securities
-
cont’d
Series
B,
(3
Month
Treasury
Bill
Rate
+
9.72%),
14.30%,
1/8/2025
(f)(g)
$
750,000
$
755,625
Hestia
Re
Ltd.
(Bermuda)
Series
A,
(1
Month
Treasury
Bill
Rate
+
10.75%),
15.30%,
4/7/2026
(f)(g)
500,000
528,500
Kendall
Re
Ltd.
(Bermuda)
Series
B,
(3
Month
Treasury
Bill
Rate
+
7.75%),
12.33%,
4/30/2027
(f)(g)
250,000
254,000
Kilimanjaro
III
Re
Ltd.
(Bermuda)
Series
B,
(3
Month
Treasury
Bill
Rate
+
9.91%),
14.49%,
12/19/2024
(f)(g)
250,000
249,750
Series
A,
(3
Month
Treasury
Bill
Rate
+
5.85%),
10.43%,
6/25/2025
(f)(g)
650,000
665,860
Lightning
Re
Series
2023-1,
(3
Month
Treasury
Bill
Rate
+
11.00%),
15.58%,
3/31/2026
(f)(g)
500,000
532,500
Marlon
Ltd.
(Bermuda)
Series
A,
(3
Month
Treasury
Bill
Rate
+
7.00%),
11.58%,
6/7/2027
(f)(g)
250,000
251,625
Matterhorn
Re
Ltd.
(Bermuda)
(SOFR
+
7.75%),
12.58%,
3/24/2025
(f)(g)
500,000
510,250
Mona
Lisa
Re
Ltd.
(Bermuda)
Series
A,
(3
Month
Treasury
Bill
Rate
+
7.00%),
11.58%,
7/8/2025
(f)(g)
250,000
254,925
Northshore
Re
II
Ltd.
(Bermuda)
Series
A,
(3
Month
Treasury
Bill
Rate
+
8.00%),
12.58%,
7/8/2025
(f)(g)
250,000
259,300
Purple
Re
Ltd.
(Bermuda)
Series
A,
(1
Month
Treasury
Bill
Rate
+
10.50%),
15.08%,
6/5/2026
(f)(g)
250,000
264,250
Investments
Principal
Amount
Value
Insurance
Linked
Securities
-
cont’d
Tailwind
RE
Ltd.
(Bermuda)
Series
B,
(3
Month
Treasury
Bill
Rate
+
8.96%),
13.54%,
1/8/2025
(f)(g)
$
500,000
$
500,000
Titania
RE
Ltd.
(Bermuda)
Series
A,
(1
Month
Treasury
Bill
Rate
+
6.58%),
11.16%,
12/27/2024
(f)(g)
250,000
250,450
Series
A,
(1
Month
Treasury
Bill
Rate
+
12.53%),
17.11%,
2/27/2026
(f)(g)
750,000
798,525
Winston
RE
Ltd.
(Bermuda)
Series
A,
(3
Month
Treasury
Bill
Rate
+
10.25%),
14.83%,
2/26/2027
(f)(g)
250,000
262,375
Total
Insurance
Linked
Securities
(Cost
$7,366,094)
7,639,660
Loan
Assignments
0.0%
(a)
Media
0.0%
(a)
Deluxe
Entertainment
Services
Group,
Inc.,
1st
Lien
Term
Loan
,
(US
Prime
Rate
+
4.50%),
12.25%
Cash/1.50%
PIK,
due
12/31/2024
(b)
(c)(f)(h)
14,315
5,707
Deluxe
Entertainment
Services
Group,
Inc.,
2nd
Lien
Term
Loan
,
(3
Month
SOFR
+
5.00%),
13.50
due
12/31/2024
(b)(c)(f)(h)
153,519
—
Total
Loan
Assignments
(Cost
$105,973)
5,707
No.
of
Rights
Rights
0.1%
Biotechnology
0.0%
(a)
Adamas
Pharmaceuticals,
Inc.,
CVR
*(b)
24,600
1,230
Akouos,
Inc.,
CVR
*(b)
38,850
19,425
Ambit
Biosciences
Corp.,
CVR
*(b)(c)
70,000
—
Clementia
Pharmaceuticals,
Inc.,
CVR
(France)
*(b)(c)
3,200
—
Tobira
Therapeutics,
Inc.,
CVR
*(b)(c)
6,900
—
20,655
Consolidated
Schedule
of
Investments
Absolute
Return
Multi-Manager
Fund^
(cont’d)
See
Notes
to
Consolidated
Financial
Statements
Investments
No.
of
Rights
Value
Capital
Markets
0.0%
(a)
Pershing
Square
Holdings
Gp
LLC,
expiring
9/29/2033
*(b)
1,525
$
458
Health
Care
Equipment
&
Supplies
0.0%
(a)
ABIOMED,
Inc.,
CVR
*(b)
3,300
5,775
IT
Services
0.0%
(a)
Flexion
Therapeutics,
Inc.,
CVR
*(b)
18,500
3,700
Metals
&
Mining
0.1%
Kinross
Gold
Corp.,
CVR,
expiring
2/25/2032
(Canada)
*
4,800
2,677
Pan
American
Silver
Corp.,
CVR,
expiring
2/22/2029
(Canada)
*
39,600
18,612
21,289
Paper
&
Forest
Products
0.0%
(a)
Resolute
Forest
Products,
Inc.,
CVR
(Canada)
*(b)
5,750
11,500
Total
Rights
(Cost
$60,754)
63,377
No.
of
Warrants
Warrants
0.0%
(a)
Leisure
Products
0.0%
(a)
Tonies
SE,
expiring
4/30/2026
(Germany)
*
(Cost
$—)
4,329
1,177
Shares
Short-Term
Investments
35.4%
Investment
Companies
35.4%
Fidelity
Treasury
Only
Portfolio,
Institutional
Class,
4.70%
(i)
32,005,712
32,005,712
Morgan
Stanley
Institutional
Liquidity
Funds
Treasury
Securities
Portfolio,
Institutional
Class,
4.63%
(i)
60
60
Total
Investment
Companies
(Cost
$32,005,772)
32,005,772
Total
Long
Positions
(Cost
$78,277,728
)
80,082,540
Investments
Shares
Value
Short
Positions
(6.6)%
(j)
Common
Stocks
Sold
Short
(6.6)%
Banks
(0.3)%
Atlantic
Union
Bankshares
Corp.
(391)
$
(
14,780
)
National
Bank
of
Canada
(Canada)
(595)
(
56,750
)
Renasant
Corp.
(1,496)
(
51,029
)
UMB
Financial
Corp.
(1,514)
(
166,131
)
(
288,690
)
Communications
Equipment
(0.2)%
Nokia
OYJ,
ADR
(Finland)
(39,683)
(
186,907
)
Consumer
Finance
(0.3)%
Capital
One
Financial
Corp.
(1,408)
(
229,208
)
Containers
&
Packaging
(1.4)%
International
Paper
Co.
(22,854)
(
1,269,311
)
Energy
Equipment
&
Services
(0.4)%
Schlumberger
NV
(9,273)
(
371,569
)
Household
Durables
(0.3)%
Lennar
Corp.,
Class
A
(1,874)
(
319,142
)
Media
(0.2)%
Charter
Communications,
Inc.,
Class
A
(627)
(
205,412
)
Metals
&
Mining
(0.3)%
Anglogold
Ashanti
plc
(United
Kingdom)
(9,681)
(
269,132
)
Oil,
Gas
&
Consumable
Fuels
(2.9)%
Chevron
Corp.
(12,315)
(
1,832,718
)
ConocoPhillips
(6,992)
(
765,904
)
(
2,598,622
)
Professional
Services
(0.1)%
First
Advantage
Corp.
(5,103)
(
92,466
)
Software
(0.2)%
Synopsys,
Inc.
(290)
(
148,947
)
Total
Common
Stocks
Sold
Short
(Proceeds
$(5,525,802))
(
5,979,406
)
Total
Short
Positions
(Proceeds
$(5,525,802))
(5,979,406)
Total
Investments
82.0%
(Cost
$72,751,926
)
74,103,134
Other
Assets
Less
Liabilities
18.0%
(k)
16,250,584
Net
Assets
100.0%
$90,353,718
Consolidated
Schedule
of
Investments
Absolute
Return
Multi-Manager
Fund^
(cont’d)
See
Notes
to
Consolidated
Financial
Statements
All
bonds
are
denominated
in
USD,
unless
noted
otherwise.
*
Non-income
producing
security.
(a)
Represents
less
than
0.05%
of
net
assets
of
the
Fund.
(b)
Value
determined
using
significant
unobservable
inputs.
(c)
Security
fair
valued
as
of
October
31,
2024,
in
accordance
with
procedures
approved
by
the
valuation
designee.
Total
value
of
all
such
securities
at
October
31,
2024,
amounted
to
$751,989,
which
represents
0.8%
of
net
assets
of
the
Fund.
(d)
Security
exempt
from
registration
pursuant
to
Regulation
S
under
the
Securities
Act
of
1933,
as
amended.
Regulation
S
applies
to
securities
offerings
that
are
made
outside
of
the
United
States
and
do
not
involve
directed
selling
efforts
in
the
United
States
and
as
such
may
have
restrictions
on
resale.
At
October
31,
2024,
these
securities
amounted
to
$317,659
of
long
positions
which
represents
0.4%
of
net
assets
of
the
Fund.
(e)
Defaulted
security.
(f)
Variable
or
floating
rate
security.
The
interest
rate
shown
was
the
current
rate
as
of
October
31,
2024,
and
changes
periodically.
(g)
Securities
were
purchased
or
sold
short
under
Rule
144A
of
the
Securities
Act
of
1933,
as
amended,
or
are
otherwise
restricted
and,
unless
registered
under
the
Securities
Act
of
1933
or
exempted
from
registration,
may
only
be
sold
to
qualified
institutional
investors
or
may
have
other
restrictions
on
resale.
At
October
31,
2024,
these
securities
amounted
to
$7,639,660
of
long
positions,
which
represents
8.5%
of
net
assets
of
the
Fund.
(h)
Payment-in-kind
(PIK)
security.
(i)
Represents
7-day
effective
yield
as
of
October
31,
2024.
(j)
At
October
31,
2024,
the
Fund
had
approximately
$5,969,391
deposited
in
one
or
more
accounts
to
satisfy
collateral
requirements
for
borrowing
in
connection
with
securities
sold
short.
(k)
Includes
the
impact
of
the
Fund’s
open
positions
in
derivatives
at
October
31,
2024.
Abbreviations
ADR
American
Depositary
Receipt
CVR
Contingent
Value
Rights
GDR
Global
Depositary
Receipt
IPJSC
International
Public
Joint
Stock
Company
OYJ
Public
Limited
Company
SA
Société
Anonyme
SCA
Partnership
limited
by
shares
SOFR
Secured
Overnight
Financing
Rate
USD
United
States
Dollar
Consolidated
Schedule
of
Investments
Absolute
Return
Multi-Manager
Fund^
(cont’d)
See
Notes
to
Consolidated
Financial
Statements
LONG
POSITIONS
BY
COUNTRY
Country
Investments
at
Value
Percentage
of
Net
Assets
United
States
$
31,597,907
35
.0
%
Bermuda
6,835,935
7
.6
%
China
2,309,874
2
.6
%
Germany
1,450,177
1
.6
%
Canada
866,816
1
.0
%
Luxembourg
839,174
0
.9
%
Brazil
768,020
0
.9
%
Netherlands
681,535
0
.8
%
Argentina
587,806
0
.6
%
Switzerland
479,659
0
.5
%
Hong
Kong
457,020
0
.5
%
South
Korea
349,750
0
.4
%
Egypt
283,921
0
.3
%
Spain
135,965
0
.1
%
United
Kingdom
132,761
0
.1
%
Mexico
113,384
0
.1
%
France
81,835
0
.1
%
Taiwan
81,361
0
.1
%
Cayman
Islands
23,868
0
.0
%
(a)
Short-Term
Investments
and
Other
Assets-Net
48,256,356
53
.4
%
Short
Positions
(See
summary
below)
(5,979,406)
(
6
.6
)
%
$
90,353,718
100
.0
%
SHORT
POSITIONS
BY
COUNTRY
Country
Investments
at
Value
Percentage
of
Net
Assets
United
States
$
(
5,466,617
)
(
6
.0
)
%
United
Kingdom
(
269,132
)
(
0
.3
)
%
Finland
(
186,907
)
(
0
.2
)
%
Canada
(
56,750
)
(
0
.1
)
%
Total
Short
Positions
$(5,979,406)
(
6
.6
)
%
(a)
Represents
less
than
0.05%
of
net
assets
of
the
Fund.
Consolidated
Schedule
of
Investments
Absolute
Return
Multi-Manager
Fund^
(cont’d)
See
Notes
to
Consolidated
Financial
Statements
Derivative
Instruments
Futures
contracts
("futures")
At
October
31,
2024,
open
positions
in
futures
for
the
Fund
were
as
follows:
Description
Number
of
Contracts
Expiration
Date
Notional
Amount
Value
and
Unrealized
Appreciation/
(Depreciation)
Long
Contracts
Brent
Crude
Oil
1
11/2024
$
72,810
$
(
3,111
)
CAC
40
10
Euro
Index
2
11/2024
160,139
(
3,410
)
CBOE
Volatility
Index
2
11/2024
41,916
1,463
FTSE
Bursa
Malaysia
KLCI
Index
2
11/2024
36,618
(
391
)
Hang
Seng
Mini
Index
1
11/2024
26,177
(
685
)
Hang
Seng
Mini
Index
4
11/2024
37,463
(
1,055
)
IBEX
35
Index
1
11/2024
12,670
(
361
)
IBEX
35
Index
2
11/2024
253,409
(
5,638
)
IFSC
NIFTY
50
Index
9
11/2024
439,083
(
2,836
)
LME
Aluminum
Base
Metal
1
11/2024
65,029
3,076
LME
Aluminum
Base
Metal
1
11/2024
65,017
1,651
LME
Aluminum
Base
Metal
1
11/2024
64,942
7,426
LME
Aluminum
Base
Metal
2
11/2024
130,034
4,690
LME
Lead
Base
Metal
1
11/2024
49,833
(
2,495
)
LME
Nickel
Base
Metal
1
11/2024
93,028
(
5,650
)
LME
Nickel
Base
Metal
1
11/2024
92,770
(
5,034
)
LME
Zinc
Base
Metal
1
11/2024
75,829
7,576
MSCI
Singapore
Index
4
11/2024
102,688
(
2,577
)
SGX
FTSE
Taiwan
Index
1
11/2024
75,690
(
2,796
)
White
Sugar
3
11/2024
86,475
(
678
)
WTI
Crude
Oil
1
11/2024
69,260
(
881
)
100
oz
Gold
3
12/2024
824,790
55,065
Cocoa
1
12/2024
73,340
(
7,702
)
Corn
1
12/2024
27,232
3,158
Corn
2
12/2024
66,977
6,292
DAX
Index
2
12/2024
1,041,629
(
16,447
)
DJIA
CBOT
E-Mini
Index
1
12/2024
209,735
(
3,072
)
EURO
STOXX
50
Index
4
12/2024
210,327
(
7,043
)
EURO
STOXX
Bank
Index
10
12/2024
78,536
(
569
)
Euro-BTP
14
12/2024
1,820,567
(
22,112
)
Euro-Bund
2
12/2024
286,731
(
4,306
)
Euro-OAT
2
12/2024
271,198
(
3,752
)
Euro-Schatz
2
12/2024
231,778
(
1,399
)
Foreign
Exchange
AUD/USD
1
12/2024
65,775
(
177
)
Foreign
Exchange
MXN/USD
19
12/2024
471,105
1,334
Consolidated
Schedule
of
Investments
Absolute
Return
Multi-Manager
Fund^
(cont’d)
See
Notes
to
Consolidated
Financial
Statements
Description
Number
of
Contracts
Expiration
Date
Notional
Amount
Value
and
Unrealized
Appreciation/
(Depreciation)
Foreign
Exchange
USD/NOK
1
12/2024
$
100,036
$
1,926
Foreign
Exchange
ZAR/USD
1
12/2024
28,237
461
FTSE
100
Index
3
12/2024
314,381
(
8,801
)
FTSE/JSE
Top
40
Index
4
12/2024
176,926
5,501
FTSE/MIB
Index
1
12/2024
185,331
1,075
FTSE/MIB
Index
3
12/2024
111,199
438
Gold
1
12/2024
27,493
2,523
Japan
10
Year
Bond
1
12/2024
948,993
(
389
)
Japan
10
Year
Bond
1
12/2024
94,781
(
191
)
Korea
10
Year
Bond
18
12/2024
1,516,044
(
7,963
)
Korea
3
Year
Bond
49
12/2024
3,758,442
(
7,312
)
Lean
Hogs
3
12/2024
100,560
12,063
Live
Cattle
2
12/2024
149,040
5,176
LME
Aluminum
Base
Metal
1
12/2024
65,161
1,820
LME
Aluminum
Base
Metal
1
12/2024
65,157
1,729
LME
Aluminum
Base
Metal
2
12/2024
130,308
5,736
LME
Copper
Base
Metal
1
12/2024
236,390
(
7,563
)
LME
Copper
Base
Metal
1
12/2024
235,701
(
782
)
LME
Lead
Base
Metal
1
12/2024
50,170
(
3,421
)
LME
Lead
Base
Metal
1
12/2024
49,981
(
2,329
)
LME
Lead
Base
Metal
1
12/2024
49,938
432
LME
Nickel
Base
Metal
1
12/2024
93,672
(
6,741
)
LME
Nickel
Base
Metal
1
12/2024
93,651
(
624
)
LME
Nickel
Base
Metal
1
12/2024
93,420
(
640
)
LME
Tin
Base
Metal
1
12/2024
155,790
(
5,063
)
LME
Tin
Base
Metal
1
12/2024
155,600
(
9,037
)
LME
Zinc
Base
Metal
1
12/2024
75,799
4,671
LME
Zinc
Base
Metal
1
12/2024
75,737
3,814
MSCI
EAFE
Index
2
12/2024
235,020
(
10,853
)
MSCI
Emerging
Markets
Index
2
12/2024
112,650
(
3,833
)
Nikkei
225
Index
1
12/2024
257,075
3,693
Palladium
1
12/2024
111,160
7,058
Russell
2000
E-Mini
Index
1
12/2024
110,430
(
4,276
)
S&P
Midcap
400
E-Mini
Index
1
12/2024
311,360
3,208
S&P/TSX
60
Index
3
12/2024
623,679
7,569
SET50
Index
53
12/2024
294,394
3,170
Short-Term
Euro-BTP
34
12/2024
3,952,427
(
5,005
)
Silver
4
12/2024
655,920
(
16,212
)
Soybean
Oil
1
12/2024
27,084
712
SPI
200
Index
1
12/2024
134,417
(
1,150
)
STOXX
600
Banks
Index
2
12/2024
22,185
112
Consolidated
Schedule
of
Investments
Absolute
Return
Multi-Manager
Fund^
(cont’d)
See
Notes
to
Consolidated
Financial
Statements
Description
Number
of
Contracts
Expiration
Date
Notional
Amount
Value
and
Unrealized
Appreciation/
(Depreciation)
STOXX
Europe
600
Equity
Index
10
12/2024
$
275,364
$
(
8,946
)
STOXX
Europe
600
Utilities
Index
2
12/2024
43,010
(
1,560
)
TOPIX
Mini
Index
1
12/2024
17,734
(
288
)
U.S.
Dollar
Index
1
12/2024
103,878
(
58
)
XAF
Financial
Index
1
12/2024
144,210
3,971
XAP
Consumer
Staples
Index
1
12/2024
81,330
(
2,641
)
XAV
Health
Care
Index
2
12/2024
298,420
(
15,143
)
XAY
Consumer
Discretionary
Index
1
12/2024
200,140
(
5,481
)
CBOE
Volatility
Index
1
1/2025
19,742
290
Crude
Palm
Oil
4
1/2025
107,239
10,627
LME
Aluminum
Base
Metal
2
1/2025
130,808
(
3,197
)
LME
Copper
Base
Metal
1
1/2025
236,753
(
13,751
)
LME
Lead
Base
Metal
1
1/2025
50,387
400
LME
Lead
Base
Metal
1
1/2025
50,352
(
3,652
)
LME
Nickel
Base
Metal
1
1/2025
94,278
(
630
)
LME
Nickel
Base
Metal
1
1/2025
93,928
(
15,066
)
LME
Nickel
Base
Metal
1
1/2025
93,869
(
11,944
)
LME
Zinc
Base
Metal
1
1/2025
75,764
(
3,878
)
LME
Zinc
Base
Metal
1
1/2025
75,715
(
1,887
)
LME
Zinc
Base
Metal
1
1/2025
75,703
(
1,475
)
Lumber
1
1/2025
15,714
781
NY
Harbor
ULSD
1
1/2025
94,164
1,363
Rapeseed
3
1/2025
85,212
3,298
RBOB
Gasoline
1
1/2025
82,211
(
6,176
)
Crude
Palm
Oil
4
2/2025
105,823
11,630
Lean
Hogs
1
2/2025
34,080
1,968
Live
Cattle
1
2/2025
74,710
(
312
)
RBOB
Gasoline
1
2/2025
82,912
(
695
)
Sugar
No.
11
2
2/2025
50,938
(
1,102
)
White
Sugar
1
2/2025
29,260
204
Canola
2
3/2025
18,946
649
Corn
1
3/2025
11,285
(
721
)
Crude
Oil
1
3/2025
21,903
(
1,129
)
Crude
Palm
Oil
1
3/2025
26,033
1,996
Low
Sulphur
Gasoil
1
3/2025
66,700
174
Milling
Wheat
No.
2
1
3/2025
12,468
(
652
)
Robusta
Coffee
1
3/2025
42,810
(
2,661
)
Lean
Hogs
1
4/2025
35,240
588
Rapeseed
1
4/2025
28,322
1,001
Sugar
No.
11
3
4/2025
70,728
945
Milling
Wheat
No.
2
3
5/2025
38,262
(
1,589
)
Consolidated
Schedule
of
Investments
Absolute
Return
Multi-Manager
Fund^
(cont’d)
See
Notes
to
Consolidated
Financial
Statements
Description
Number
of
Contracts
Expiration
Date
Notional
Amount
Value
and
Unrealized
Appreciation/
(Depreciation)
Gold
2
6/2025
$
180,492
$
16,933
Gold
6
8/2025
541,832
35,036
Platinum
1
8/2025
16,260
(
293
)
3
Month
EURIBOR
21
9/2025
5,591,334
472
EURO
STOXX
50
Index
1
12/2025
17,208
(
217
)
3
Month
EURIBOR
1
6/2026
266,077
(
204
)
3
Month
EURIBOR
4
9/2026
1,063,983
(
88
)
3
Month
EURIBOR
4
9/2027
1,062,895
231
3
Month
EURIBOR
1
12/2027
265,683
(
560
)
Total
Long
Contracts
$
36,018,448
$(55,183)
Description
Number
of
Contracts
Expiration
Date
Notional
Amount
Value
and
Unrealized
Appreciation/
(Depreciation)
Short
Contracts
Brent
Crude
Oil
(1)
11/2024
$
(
72,810
)
$
(
241
)
E-Mini
Natural
Gas
(1)
11/2024
(
6,762
)
512
Foreign
Exchange
BRL/USD
(1)
11/2024
(
17,245
)
63
HSCEI
(1)
11/2024
(
46,829
)
1,241
LME
Aluminum
Base
Metal
(2)
11/2024
(
130,034
)
(
5,420
)
LME
Aluminum
Base
Metal
(1)
11/2024
(
64,942
)
(
2,632
)
LME
Aluminum
Base
Metal
(1)
11/2024
(
65,017
)
(
2,620
)
LME
Aluminum
Base
Metal
(1)
11/2024
(
65,030
)
(
3,208
)
LME
Lead
Base
Metal
(1)
11/2024
(
49,833
)
2,012
LME
Nickel
Base
Metal
(1)
11/2024
(
92,770
)
9,029
LME
Nickel
Base
Metal
(1)
11/2024
(
93,028
)
5,879
LME
Zinc
Base
Metal
(1)
11/2024
(
75,829
)
(
4,245
)
Natural
Gas
(1)
11/2024
(
27,070
)
1,208
NY
Harbor
ULSD
(4)
11/2024
(
375,430
)
(
4,564
)
RBOB
Gasoline
(1)
11/2024
(
82,900
)
599
SGX
FTSE
China
A50
Index
(1)
11/2024
(
13,219
)
396
WTI
Crude
Oil
(2)
11/2024
(
138,520
)
947
Australia
10
Year
Bond
(10)
12/2024
(
736,049
)
15,980
Australia
3
Year
Bond
(23)
12/2024
(
1,597,977
)
10,397
Canada
10
Year
Bond
(3)
12/2024
(
262,843
)
(
9
)
Corn
(6)
12/2024
(
123,225
)
(
2,513
)
ECX
Emission
(1)
12/2024
(
70,247
)
(
2,233
)
Euro-Bobl
(2)
12/2024
(
257,035
)
(
240
)
Euro-BTP
(2)
12/2024
(
260,081
)
(
1,345
)
Euro-Bund
(1)
12/2024
(
143,365
)
(
33
)
Euro-Buxl
(2)
12/2024
(
287,949
)
(
1,502
)
Consolidated
Schedule
of
Investments
Absolute
Return
Multi-Manager
Fund^
(cont’d)
See
Notes
to
Consolidated
Financial
Statements
Description
Number
of
Contracts
Expiration
Date
Notional
Amount
Value
and
Unrealized
Appreciation/
(Depreciation)
Foreign
Exchange
AUD/USD
(77)
12/2024
$
(
5,064,675
)
$
71,807
Foreign
Exchange
CAD/USD
(1)
12/2024
(
72,000
)
1,737
Foreign
Exchange
EUR/USD
(68)
12/2024
(
9,256,500
)
169,705
Foreign
Exchange
GBP/USD
(11)
12/2024
(
885,569
)
19,465
Foreign
Exchange
JPY/USD
(44)
12/2024
(
3,637,150
)
43,098
Foreign
Exchange
NZD/USD
(7)
12/2024
(
417,935
)
10,515
KC
HRW
Wheat
(1)
12/2024
(
28,463
)
(
502
)
KOSDAQ
150
Index
(1)
12/2024
(
9,283
)
102
LME
Aluminum
Base
Metal
(2)
12/2024
(
130,308
)
2,886
LME
Aluminum
Base
Metal
(1)
12/2024
(
65,157
)
(
1,698
)
LME
Aluminum
Base
Metal
(1)
12/2024
(
65,161
)
(
6,014
)
LME
Copper
Base
Metal
(1)
12/2024
(
235,701
)
(
11,942
)
LME
Copper
Base
Metal
(1)
12/2024
(
236,390
)
643
LME
Lead
Base
Metal
(1)
12/2024
(
49,938
)
(
1,029
)
LME
Lead
Base
Metal
(1)
12/2024
(
49,981
)
803
LME
Lead
Base
Metal
(1)
12/2024
(
50,170
)
(
452
)
LME
Nickel
Base
Metal
(1)
12/2024
(
93,420
)
1,737
LME
Nickel
Base
Metal
(1)
12/2024
(
93,651
)
5,309
LME
Nickel
Base
Metal
(1)
12/2024
(
93,672
)
569
LME
Tin
Base
Metal
(1)
12/2024
(
155,600
)
2,072
LME
Tin
Base
Metal
(1)
12/2024
(
155,790
)
8,762
LME
Zinc
Base
Metal
(1)
12/2024
(
75,737
)
1,569
LME
Zinc
Base
Metal
(1)
12/2024
(
75,799
)
2,035
Long
Gilt
(8)
12/2024
(
970,079
)
19,925
Milling
Wheat
No.
2
(4)
12/2024
(
47,426
)
63
Natural
Gas
(2)
12/2024
(
59,360
)
2,257
NY
Harbor
ULSD
(1)
12/2024
(
94,151
)
(
1,610
)
RBOB
Gasoline
(1)
12/2024
(
82,055
)
792
Red
Wheat
(2)
12/2024
(
60,425
)
1,621
S&P
500
E-Mini
Index
(7)
12/2024
(
2,008,475
)
(
13,755
)
Soybean
Meal
(5)
12/2024
(
149,750
)
6,078
U.S.
Treasury
2
Year
Note
(11)
12/2024
(
2,265,398
)
7,639
U.S.
Treasury
5
Year
Note
(10)
12/2024
(
1,072,344
)
8,007
U.S.
Treasury
10
Year
Note
(25)
12/2024
(
2,761,719
)
53,791
U.S.
Treasury
10
Year
Ultra
Note
(9)
12/2024
(
1,023,750
)
18,508
U.S.
Treasury
3
Year
Note
(1)
12/2024
(
209,672
)
319
U.S.
Treasury
Long
Bond
(1)
12/2024
(
117,969
)
(
126
)
U.S.
Treasury
Ultra
Bond
(3)
12/2024
(
376,875
)
3,309
Wheat
(2)
12/2024
(
57,050
)
408
WIG20
Index
(3)
12/2024
(
33,352
)
589
Brent
Crude
Oil
(1)
1/2025
(
72,200
)
1,859
Consolidated
Schedule
of
Investments
Absolute
Return
Multi-Manager
Fund^
(cont’d)
See
Notes
to
Consolidated
Financial
Statements
Description
Number
of
Contracts
Expiration
Date
Notional
Amount
Value
and
Unrealized
Appreciation/
(Depreciation)
Canola
(1)
1/2025
$
(
9,342
)
$
(
334
)
LME
Aluminum
Base
Metal
(1)
1/2025
(
65,423
)
948
LME
Lead
Base
Metal
(1)
1/2025
(
50,352
)
(
447
)
LME
Lead
Base
Metal
(1)
1/2025
(
50,387
)
1,347
LME
Nickel
Base
Metal
(2)
1/2025
(
188,556
)
2,447
LME
Nickel
Base
Metal
(1)
1/2025
(
93,869
)
569
LME
Nickel
Base
Metal
(1)
1/2025
(
93,928
)
566
LME
Nickel
Base
Metal
(1)
1/2025
(
94,308
)
369
LME
Zinc
Base
Metal
(1)
1/2025
(
75,703
)
2,418
Low
Sulphur
Gasoil
(1)
1/2025
(
66,700
)
(
226
)
Natural
Gas
(1)
1/2025
(
28,880
)
1,508
Robusta
Coffee
(1)
1/2025
(
43,690
)
1,229
Rough
Rice
(4)
1/2025
(
117,600
)
2,441
Soybean
(3)
1/2025
(
149,175
)
(
807
)
Soybean
Meal
(3)
1/2025
(
90,390
)
3,863
WTI
Crude
Oil
(1)
1/2025
(
68,450
)
(
1,492
)
WTI
Crude
Oil
(2)
2/2025
(
136,380
)
297
1
Month
SOFR
(1)
3/2025
(
399,178
)
144
Cocoa
(1)
3/2025
(
69,102
)
(
1,935
)
Corn
(3)
3/2025
(
63,900
)
43
Soybean
(2)
3/2025
(
100,950
)
271
Soybean
(2)
5/2025
(
102,600
)
(
954
)
3
Month
SOFR
(5)
9/2025
(
1,201,938
)
(
207
)
Brent
Crude
Oil
(1)
10/2025
(
70,940
)
(
991
)
Soybean
(3)
11/2025
(
154,950
)
(
632
)
Total
Short
Contracts
$
(
41,202,830
)
$458,744
Total
Futures
$403,561
For
the
year
ended
October
31,
2024,
the
average
notional
value
for
the
months
where
the
Fund
had
futures
outstanding
was
$44,188,544
for
long
positions
and
$(63,664,317)
for
short
positions.
At
October
31,
2024,
the
Fund
had
$1,873,100
deposited
in
segregated
accounts
to
cover
margin
requirements
on
open
futures.
Consolidated
Schedule
of
Investments
Absolute
Return
Multi-Manager
Fund^
(cont’d)
See
Notes
to
Consolidated
Financial
Statements
Forward
foreign
currency
contracts
("forward
contracts")
At
October
31,
2024,
open
forward
contracts
for
the
Fund
were
as
follows:
Currenc
y
Purchased
Currency
Sold
Counterparty
Settlement
Date
Net
Unrealized
Appreciation/
(Depreciation)
USD
100,000
KRW**
131,965,000
JPM
11/4/2024
$
4,373
INR**
62,612,154
USD
744,490
JPM
11/8/2024
58
KRW**
138,070,942
USD
100,000
JPM
11/8/2024
262
USD
744,494
INR**
62,602,094
JPM
11/8/2024
65
USD
100,000
KRW**
134,677,117
JPM
11/8/2024
2,203
TWD**
3,213,651
USD
100,000
JPM
11/15/2024
714
USD
100,000
CLP**
93,234,000
JPM
11/15/2024
3,034
USD
4,502,555
EUR
4,131,217
JPM
11/15/2024
6,600
KRW**
138,265,386
USD
100,000
JPM
11/18/2024
588
USD
100,000
KRW**
135,665,622
JPM
11/18/2024
1,303
KRW**
138,243,386
USD
100,000
JPM
11/21/2024
584
USD
100,000
KRW**
136,690,121
JPM
11/21/2024
546
CHF
500,000
JPY
86,634,250
JPM
11/22/2024
8,661
CHF
750,000
USD
869,456
JPM
11/22/2024
801
EUR
875,000
CAD
1,312,746
JPM
11/22/2024
9,133
EUR
125,000
CHF
116,906
JPM
11/22/2024
421
EUR
200,000
HUF
80,627,562
JPM
11/22/2024
3,060
EUR
100,000
JPY
16,232,190
JPM
11/22/2024
1,777
EUR
500,000
NOK
5,930,116
JPM
11/22/2024
5,132
EUR
250,000
SEK
2,856,338
JPM
11/22/2024
3,821
EUR
375,000
USD
407,619
JPM
11/22/2024
598
GBP
1,000,000
AUD
1,946,008
JPM
11/22/2024
8,489
GBP
250,000
JPY
48,626,330
JPM
11/22/2024
1,575
KRW**
276,080,758
USD
200,000
JPM
11/22/2024
881
NZD
400,000
JPY
36,186,656
JPM
11/22/2024
392
TRY
7,066,415
USD
200,000
JPM
11/22/2024
2,451
USD
796,122
CAD
1,100,000
JPM
11/22/2024
5,634
USD
600,000
HUF
222,981,429
JPM
11/22/2024
6,354
USD
83,151
JPY
12,500,000
JPM
11/22/2024
691
USD
100,000
KRW**
136,957,862
JPM
11/22/2024
348
USD
25,102
MXN
500,000
JPM
11/22/2024
194
USD
500,000
NOK
5,452,429
JPM
11/22/2024
4,272
USD
839,171
NZD
1,400,000
JPM
11/22/2024
2,291
Consolidated
Schedule
of
Investments
Absolute
Return
Multi-Manager
Fund^
(cont’d)
See
Notes
to
Consolidated
Financial
Statements
Currency
Purchased
Currency
Sold
Counterparty
Settlement
Date
Net
Unrealized
Appreciation/
(Depreciation)
ZAR
10,604,922
USD
600,000
JPM
11/22/2024
$
585
INR**
33,672,320
USD
399,999
JPM
11/25/2024
168
USD
100,000
KRW**
136,593,321
JPM
11/25/2024
601
USD
100,000
COP**
443,122,461
JPM
12/5/2024
314
GBP
2,024
USD
2,607
JPM
12/31/2024
2
USD
714,994
CAD
961,602
JPM
12/31/2024
22,945
USD
123,958
GBP
93,076
JPM
12/31/2024
3,957
Total
unrealized
appreciation
$
115,878
Currenc
y
Purchased
Currency
Sold
Counterparty
Settlement
Date
Net
Unrealized
Appreciation/
(Depreciation)
KRW**
134,701,591
USD
100,000
JPM
11/4/2024
$
(
2,390
)
GBP
383,762
USD
499,401
JPM
11/15/2024
(
4,567
)
USD
100,000
TWD**
3,213,590
JPM
11/15/2024
(
711
)
USD
1,455,508
INR**
122,559,305
JPM
11/18/2024
(
1,401
)
AUD
1,600,000
CAD
1,477,606
JPM
11/22/2024
(
8,674
)
AUD
609,238
EUR
375,000
JPM
11/22/2024
(
7,197
)
AUD
243,198
GBP
125,000
JPM
11/22/2024
(
1,096
)
AUD
200,000
JPY
19,988,396
JPM
11/22/2024
(
213
)
AUD
1,000,000
NZD
1,104,281
JPM
11/22/2024
(
1,874
)
AUD
900,000
USD
602,350
JPM
11/22/2024
(
9,940
)
CAD
400,000
JPY
43,744,116
JPM
11/22/2024
(
1,121
)
CHF
585,401
EUR
625,000
JPM
11/22/2024
(
1,096
)
CNH
6,389,421
USD
900,000
JPM
11/22/2024
(
1,673
)
EUR
125,000
CHF
117,346
JPM
11/22/2024
(
89
)
GBP
125,000
AUD
246,756
JPM
11/22/2024
(
1,246
)
GBP
834,668
EUR
1,000,000
JPM
11/22/2024
(
12,345
)
GBP
687,500
USD
895,346
JPM
11/22/2024
(
8,873
)
HUF
40,511,510
EUR
100,000
JPM
11/22/2024
(
1,004
)
JPY
21,644,780
CAD
200,000
JPM
11/22/2024
(
939
)
NZD
700,000
USD
424,153
JPM
11/22/2024
(
5,714
)
PLN
432,782
EUR
100,000
JPM
11/22/2024
(
796
)
PLN
4,379,697
USD
1,100,000
JPM
11/22/2024
(
6,429
)
SEK
4,818,650
NOK
5,000,000
JPM
11/22/2024
(
1,930
)
SEK
4,205,204
USD
400,000
JPM
11/22/2024
(
4,964
)
Consolidated
Schedule
of
Investments
Absolute
Return
Multi-Manager
Fund^
(cont’d)
See
Notes
to
Consolidated
Financial
Statements
Currency
Purchased
Currency
Sold
Counterparty
Settlement
Date
Net
Unrealized
Appreciation/
(Depreciation)
SGD
1,831,063
USD
1,400,000
JPM
11/22/2024
$
(
12,202
)
USD
289,313
CHF
250,000
JPM
11/22/2024
(
772
)
USD
700,000
CNH
4,988,267
JPM
11/22/2024
(
1,330
)
USD
406,818
EUR
375,000
JPM
11/22/2024
(
1,399
)
USD
100,000
HUF
37,737,380
JPM
11/22/2024
(
469
)
USD
100,000
ILS
374,900
JPM
11/22/2024
(
417
)
USD
82,337
JPY
12,500,000
JPM
11/22/2024
(
123
)
USD
100,000
KRW**
137,972,955
JPM
11/22/2024
(
391
)
USD
24,895
MXN
500,000
JPM
11/22/2024
(
12
)
USD
500,000
TRY
17,737,088
JPM
11/22/2024
(
8,164
)
USD
400,000
INR**
33,666,560
JPM
11/25/2024
(
99
)
USD
400,000
KRW**
552,506,000
JPM
11/25/2024
(
2,059
)
CLP**
94,334,399
USD
100,000
JPM
11/29/2024
(
1,905
)
USD
344,492
INR**
29,000,026
JPM
11/29/2024
(
95
)
CAD
196,684
USD
145,848
JPM
12/31/2024
(
4,298
)
Total
unrealized
depreciation
$
(
120,017
)
Net
unrealized
depreciation
$(4,139)
** Non-deliverable
forward.
For
the
year
ended
October
31,
2024,
the
average
notional
value
for
the
months
where
the
Fund
had
forward
contracts
outstanding
was
$5,900,309.
Equity
swap
contracts
("equity
swaps")
At
October
31,
2024,
the
Fund
had
outstanding
equity
swaps
as
follows:
Over
the
counter
equity
swaps
—
Long
(a)
Counterparty
Reference
Entity
Notional
Amount
Maturity
Date
Variable-
Rate
(b)
Spread
Reference
Rate
Frequency
of
Fund
Receipt/
Payment
Value
and
Unrealized
Appreciation/
(Depreciation)
MS
adidas
AG
EUR
420,370
2/17/2025
3.85%
0.60%
1M
EURIBOR
T/1M
$
169,414
JPM
Alliance
Aviation
Services
Ltd.
AUD
25,248
7/15/2025
4.99%
0.65%
1D
RBACR
T/1M
(
2,314
)
JPM
Aluflexpack
AG
CHF
45,000
6/6/2025
1.10%
0.15%
1D
SARON
T/1M
461
MS
Amundi
SA
EUR
1,802,615
2/17/2025
3.85%
0.60%
1M
EURIBOR
T/1M
106,853
MS
Anima
Holding
SpA
EUR
402,575
2/17/2025
3.85%
0.60%
1M
EURIBOR
T/1M
122,823
JPM
Arvida
Group
Ltd.
(d)
NZD
245,050
7/25/2025
5.28%
0.40%
1M
BKBM
T/1M
6,961
MS
Azelis
Group
NV
EUR
385,801
2/17/2025
3.85%
0.60%
1M
EURIBOR
T/1M
(
16,859
)
MS
Brenntag
SE
EUR
546,459
2/17/2025
3.85%
0.60%
1M
EURIBOR
T/1M
(
104,428
)
JPM
Britvic
plc
GBP
539,278
7/11/2025
5.35%
0.40%
1D
SONIA
T/1M
5,070
MS
Bureau
Veritas
SA
EUR
863,766
2/17/2025
3.85%
0.60%
1M
EURIBOR
T/1M
97,176
MS
Croda
International
plc
GBP
34,790
12/2/2025
5.59%
0.64%
1D
SONIA
T/1M
(
29,977
)
Consolidated
Schedule
of
Investments
Absolute
Return
Multi-Manager
Fund^
(cont’d)
See
Notes
to
Consolidated
Financial
Statements
Counterparty
Reference
Entity
Notional
Amount
Maturity
Date
Variable-
Rate
(b)
Spread
Reference
Rate
Frequency
of
Fund
Receipt/
Payment
Value
and
Unrealized
Appreciation/
(Depreciation)
MS
Danone
SA
EUR
981,689
2/17/2025
3.85%
0.60%
1M
EURIBOR
T/1M
$
243,712
JPM
DS
Smith
plc
USD
1,273,060
4/23/2025
5.23%
0.40%
1D
OBFR
T/1M
343,177
JPM
Eckoh
plc
GBP
53,188
11/3/2025
5.35%
0.40%
1D
SONIA
T/1M
(
180
)
MS
Elis
SA
EUR
747,302
2/17/2025
3.85%
0.60%
1M
EURIBOR
T/1M
134,209
JPM
Entain
plc
GBP
88,662
2/10/2025
5.35%
0.40%
1D
SONIA
T/1M
(
32,558
)
MS
Eurofins
Scientific
SE
EUR
203,943
2/17/2025
3.85%
0.60%
1M
EURIBOR
T/1M
(
105,933
)
JPM
Hargreaves
Lansdown
plc
GBP
322,081
8/28/2025
5.35%
0.40%
1D
SONIA
T/1M
(
5,045
)
MS
Heidelberg
Materials
AG
EUR
521,686
2/17/2025
3.85%
0.60%
1M
EURIBOR
T/1M
217,711
MS
Hermes
International
SCA
EUR
757,010
2/17/2025
3.85%
0.60%
1M
EURIBOR
T/1M
30,934
MS
Holcim
AG
CHF
480,362
2/17/2025
1.53%
0.58%
1D
SARON
T/1M
186,560
JPM
Hotel
Property
Investments
Ltd.
AUD
49,262
10/8/2025
4.99%
0.65%
1D
RBACR
T/1M
(
2,288
)
MS
Hypera
SA
USD
42,997
7/15/2025
5.48%
0.65%
1D
FEDEF
T/1M
(
61,899
)
JPM
IMAX
China
Holding,
Inc.
HKD
747,714
7/17/2025
4.61%
0.00%
1D
HONIA
T/1M
(
4,867
)
JPM
International
Distribution
Services
plc
GBP
354,829
5/30/2025
5.35%
0.40%
1D
SONIA
T/1M
4,093
MS
Kering
SA
EUR
265,924
2/17/2025
3.85%
0.60%
1M
EURIBOR
T/1M
(
415,215
)
MS
LVMH
Moet
Hennessy
Louis
Vuitton
SE
EUR
575,041
2/17/2025
3.85%
0.60%
1M
EURIBOR
T/1M
(
124,263
)
MS
NAVER
Corp.
USD
58,022
8/15/2025
6.33%
1.50%
1D
FEDEF
T/1M
(
20,113
)
JPM
Orange
Belgium
SA
EUR
14,830
12/11/2024
3.56%
-
3.66%
0.40%
-
0.50%
1D
ESTR
T/1M
(
2,559
)
MS
Ryanair
Holdings
plc
EUR
203,011
2/17/2025
3.85%
0.60%
1M
EURIBOR
T/1M
33,214
JPM
Shinko
Electric
Industries
Co.
Ltd.
JPY
33,224,724
1/30/2025
0.58%
0.35%
1D
MUTSC
T/1M
(
2,977
)
MS
Smith
&
Nephew
plc
GBP
403,130
12/2/2025
5.59%
0.64%
1D
SONIA
T/1M
(
103,781
)
JPM
Spirent
Communications
plc
GBP
191,557
3/7/2025
5.35%
0.40%
1D
SONIA
T/1M
(
16,682
)
MS
Stroeer
SE
&
Co.
KGaA
EUR
277,459
2/17/2025
3.85%
0.60%
1M
EURIBOR
T/1M
(
4,382
)
JPM
Telecom
Italia
SpA
EUR
12,665
11/25/2024
3.81%
0.65%
1D
ESTR
T/1M
(
1,342
)
Total
long
positions
of
equity
swaps
$644,706
Over
the
counter
equity
swaps
—
Short
(c)
Counterparty
Reference
Entity
Notional
Amount
Maturity
Date
Variable-
Rate
(b)
Spread
Reference
Rate
Frequency
of
Fund
Receipt/
Payment
Value
and
Unrealized
Appreciation/
(Depreciation)
MS
Air
Liquide
SA
EUR
(497,273)
2/17/2025
2.81%
(0.35)%
1D
ESTR
1M/T
$
(
108,852
)
MS
Allianz
SE
(Registered)
EUR
(450,306)
2/17/2025
2.81%
(0.35)%
1D
ESTR
1M/T
(
120,003
)
MS
AXA
SA
EUR
(275,262)
2/17/2025
2.81%
(0.35)%
1D
ESTR
1M/T
(
56,061
)
MS
Deutsche
Post
AG
EUR
(207,177)
2/17/2025
2.81%
(0.35)%
1D
ESTR
1M/T
23,883
Consolidated
Schedule
of
Investments
Absolute
Return
Multi-Manager
Fund^
(cont’d)
See
Notes
to
Consolidated
Financial
Statements
Purchased
option
contracts
(“options
purchased”)
At
October
31,
2024,
the
Fund
did
not
have
any
outstanding
options
purchased.
Counterparty
Reference
Entity
Notional
Amount
Maturity
Date
Variable-
Rate
(b)
Spread
Reference
Rate
Frequency
of
Fund
Receipt/
Payment
Value
and
Unrealized
Appreciation/
(Depreciation)
MS
Enel
SpA
EUR
(128,645)
2/17/2025
2.76%
(0.40)%
1D
ESTR
1M/T
$
(
32,385
)
MS
Engie
SA
EUR
(222,531)
2/17/2025
2.81%
(0.35)%
1D
ESTR
1M/T
(
34,351
)
JPM
Grifols
SA
USD
(6,664)
4/15/2025
4.43%
(0.40)%
1D
OBFR
1M/T
(
1,087
)
MS
H
&
M
Hennes
&
Mauritz
AB
SEK
(1,668,905)
10/21/2025
2.52%
(0.74)%
1W
STIBOR
1M/T
(
2,792
)
MS
Marks
&
Spencer
Group
plc
GBP
(461,231)
12/2/2025
4.65%
(0.30)%
1D
SONIA
1M/T
(
332,576
)
MS
Next
plc
GBP
(225,268)
12/2/2025
4.65%
(0.30)%
1D
SONIA
1M/T
(
90,917
)
MS
Schneider
Electric
SE
EUR
(471,316)
2/17/2025
2.81%
(0.35)%
1D
ESTR
1M/T
(
186,207
)
MS
Swisscom
AG
(Registered)
CHF
(202,510)
2/17/2025
0.60%
(0.35)%
1D
SARON
1M/T
18,675
MS
Telefonica
SA
EUR
(97,824)
2/17/2025
2.76%
(0.40)%
1D
ESTR
1M/T
(
16,604
)
MS
Tencent
Holdings
Ltd.
USD
(312,268)
7/23/2025
4.43%
(0.40)%
1D
FEDEF
1M/T
(
67,265
)
Total
short
positions
of
equity
swaps
$(1,006,542)
Total
long
and
short
positions
of
equity
swaps
$(361,836)
Total
financing
costs
and
other
receivables/(payables)
of
equity
swaps
$(6,101)
Total
long
and
short
positions
including
financing
costs
and
other
receivables/(payables)
of
equity
swaps
$(367,937)
(a) The
Fund
pays
a
specified
rate
based
on
a
reference
rate
plus
or
minus
a
spread,
and
receives
the
total
tttttttttttt
return
on
the
reference
entity.
(b) Effective
rate
at
October
31,
2024.
(c) The
Fund
receives
a
specified
rate
based
on
a
reference
rate
plus
or
minus
a
spread,
and
pays
the
total
t
return
on
the
reference
entity.
(d) Security
fair
valued
as
of
October
31,
2024,
in
accordance
with
procedures
approved
by
the
valuation
.
designee.
For
the
year
ended
October
31,
2024,
the
average
notional
value
for
the
months
where
the
Fund
had
equity
swaps
outstanding
was
$14,986,923
for
long
positions
and
$(5,433,648)
for
short
positions.
At
October
31,
2024,
the
Fund
had
cash
collateral
of
$2,460,000
and
$3,790,000
deposited
in
a
segregated
account
for
JPMorgan
Chase
Bank,
NA
and
Morgan
Stanley
Capital
Services
LLC
respectively,
to
cover
collateral
requirements
on
over
the
counter
derivatives.
Written
option
contracts
("options
written")
At
October
31,
2024,
the
Fund
had
outstanding
options
written
as
follows:
Description
Number
of
Contracts
Notional
Amount
Exercise
Price
Expiration
Date
Value
Calls
Diversified
Telecommunication
Services
Frontier
Communications
Parent,
Inc.
18
$
(
64,314
)
$
40.00
12/20/2024
$
(
855
)
Hotels,
Restaurants
&
Leisure
International
Game
Technology
plc
5
(
10,160
)
22.00
11/15/2024
(
88
)
Total
options
written
(premium
received
$852)
$(943)
Consolidated
Schedule
of
Investments
Absolute
Return
Multi-Manager
Fund^
(cont’d)
See
Notes
to
Consolidated
Financial
Statements
For
the
year
ended
October
31,
2024,
the
average
market
value
for
the
months
where
the
Fund
had
options
purchased
and
written
was
$70
for
options
purchased
and
$(864)
for
options
written.
Abbreviations
BKBM
New
Zealand's
Bank
Bill
Benchmark
Rate
CAC40
French
Stock
Market
Index
CBOE
Chicago
Board
Options
Exchange
DAX
Deutscher
Aktien
Index
ECX
European
Climate
Exchange
ESTR
Euro
Short-Term
Rate
EURIBOR
Euro
Interbank
Offered
Rate
FEDEF
Federal
Funds
Floating
Rate
FTSE
Financial
Times
Stock
Exchange
HONIA
Hong
Kong
Overnight
Index
Average
HSCEI
Hang
Seng
China
Enterprises
Index
IBEX
Iberian
Index
IFSC
International
Financial
Service
Centre
JPM
JPMorgan
Chase
Bank,
NA
JSE
Johannesburg
Stock
Exchange
KOSDAQ
Korean
Securities
Dealers
Automated
Quotations
Index
LME
London
Metal
Exchange
MS
Morgan
Stanley
Capital
Services
LLC
MSCI
Morgan
Stanley
Capital
International
MUTSC
Bank
of
Japan
Unsecured
Overnight
Call
Rate
OBFR
Overnight
Bank
Funding
Rate
RBACR
Reserve
Bank
of
Australia
Cash
Rate
SARON
Swiss
Average
Overnight
Rate
SGX
Singapore
Exchange
SOFR
Secured
Overnight
Financing
Rate
SPI
Australian
Benchmark
Index
SONIA
Sterling
Overnight
Index
Average
Rate
STIBOR
Stockholm
Interbank
Offered
Rate
TOPIX
Tokyo
Stock
Price
Index
TSX
Toronto
Stock
Exchange
T
Termination
Date
WIG
Warsaw
Stock
Exchange
Index
1D
One
Day
1M
One
Month
1W
One
Week
Consolidated
Schedule
of
Investments
Absolute
Return
Multi-Manager
Fund^
(cont’d)
See
Notes
to
Consolidated
Financial
Statements
Currency
Abbreviations
AUD
Australian
Dollar
BRL
Brazilian
Real
CAD
Canadian
Dollar
CHF
Swiss
Franc
CLP
Chilean
Peso
CNH
Chinese
Renminbi
(Offshore)
COP
Colombian
Peso
EUR
Euro
GBP
Pound
Sterling
HKD
Hong
Kong
Dollar
HUF
Hungarian
Forint
ILS
Israeli
New
Shekel
INR
Indian
Rupee
JPY
Japanese
Yen
KRW
Korean
Won
MXN
Mexican
Peso
NOK
Norwegian
Krone
NZD
New
Zealand
Dollar
PLN
Polish
Zloty
SEK
Swedish
Krona
SGD
Singapore
Dollar
TRY
Turkish
Lira
TWD
New
Taiwan
Dollar
USD
United
States
Dollar
ZAR
South
African
Rand
The
following
is
a
summary,
categorized
by
Level
(See
Note
A
of
the
Notes
to
Consolidated
Financial
Statements),
of
inputs
used
to
value
the
Fund's
long
investments
as
of
October
31,
2024:
Asset
Valuation
Inputs
Level
1
Level
2
Level
3
*
Total
Investments:
Common
Stocks
Broadline
Retail
$
3,174,043
$
211,436
$
—
$
3,385,479
Capital
Markets
156,523
—
—
156,523
Communications
Equipment
773,371
547,127
—
1,320,498
Consumer
Staples
Distribution
&
Retail
776,875
—
—
776,875
Diversified
Telecommunication
Services
503,982
—
164,736
668,718
Health
Care
Providers
&
Services
1,508,799
77,615
—
1,586,414
Insurance
145,125
457,020
—
602,145
Interactive
Media
&
Services
2,224,217
22,034
30,531
2,276,782
Oil,
Gas
&
Consumable
Fuels
2,523,281
—
—
2,523,281
Pharmaceuticals
2,235,600
—
—
2,235,600
Professional
Services
447,121
199,155
—
646,276
Semiconductors
&
Semiconductor
Equipment
346,966
—
—
346,966
Specialty
Retail
97,998
—
14,050
112,048
Other
Common
Stocks
(a)
23,729,242
—
—
23,729,242
Total
Common
Stocks
38,643,143
1,514,387
209,317
40,366,847
Consolidated
Schedule
of
Investments
Absolute
Return
Multi-Manager
Fund^
(cont’d)
See
Notes
to
Consolidated
Financial
Statements
Asset
Valuation
Inputs
(cont’d)
Level
1
Level
2
Level
3
*
Total
Corporate
Bonds
(a)
$
—
$
—
$
—
$
—
Insurance
Linked
Securities
(a)
—
7,639,660
—
7,639,660
Loan
Assignments
(a)
—
—
5,707
5,707
Rights
Biotechnology
—
—
20,655
20,655
Capital
Markets
—
—
458
458
Health
Care
Equipment
&
Supplies
—
—
5,775
5,775
IT
Services
—
—
3,700
3,700
Metals
&
Mining
18,612
2,677
—
21,289
Paper
&
Forest
Products
—
—
11,500
11,500
Total
Rights
18,612
2,677
42,088
63,377
Warrants
(a)
1,177
—
—
1,177
Short-Term
Investments
—
32,005,772
—
32,005,772
Total
Long
Positions
$38,662,932
$41,162,496
$257,112
$80,082,540
(a)
The
Consolidated
Schedule
of
Investments
provides
information
on
the
industry
or
sector
categorization
as
well
as
a
Positions
by
Country
summary.
*
The
following
is
a
reconciliation
between
the
beginning
and
ending
balances
of
investments
in
which
significant
unobservable
inputs
(Level
3)
were
used
in
determining
value:
Common
Stocks
(a)(b)
Corporate
Bonds
(a)(c)
Loan
Assignments
(a)
Rights
(a)(b)
Total
Assets:
Investments
in
Securities:
Beginning
Balance
as
of
November
1,
2023
$1,470,019
$–
$5,632
$71,320
$1,546,971
Transfers
into
Level
3
–
–
–
–
–
Transfers
out
of
Level
3
–
–
–
–
–
Accrued
discounts/(premiums)
–
–
(283)
–
(283)
Realized
gain/(loss)
337,340
–
(27)
51,432
388,745
Change
in
unrealized
appreciation/
(depreciation)
86,675
–
231
(18,514)
68,392
Purchases
58,197
–
214
–
58,411
Sales
(1,742,914)
–
(60)
(62,150)
(1,805,124)
Balance
as
of
October
31,
2024
$209,317
$–
$5,707
$42,088
$257,112
Net
change
in
unrealized
appreciation/
(depreciation)
on
investments
still
held
as
of
October
31,
2024
$(69,465)
$–
$(98,943)
$(17,580)
$(185,988)
(a)
Includes
securities
that
were
fair
valued
in
accordance
with
procedures
approved
by
the
valuation
designee.
These
investments
did
not
have
a
material
impact
on
the
Fund’s
net
assets
and
therefore,
disclosure
of
significant
unobservable
inputs
used
in
formulating
valuations
is
not
presented.
(b)
Includes
securities
that
were
valued
based
on
a
single
quotation
obtained
from
a
dealer.
(c)
The
reconciliation
between
beginning
and
ending
balances
of
investments
in
which
significant
unobservable
inputs
(Level
3)
were
used
is
not
presented
as
all
values
are
zero.
Consolidated
Schedule
of
Investments
Absolute
Return
Multi-Manager
Fund^
(cont’d)
See
Notes
to
Consolidated
Financial
Statements
The
following
is
a
summary,
categorized
by
Level
(See
Note
A
of
the
Notes
to
Consolidated
Financial
Statements)
,
of
inputs
used
to
value
the
Fund's
short
investments
as
of
October
31,
2024
:
Liability
Valuation
Inputs
Level
1
Level
2
Level
3
Total
Investments:
Common
Stocks
Sold
Short
(a)
$
(
5,979,406
)
$
—
$
—
$
(
5,979,406
)
Total
Short
Positions
$(5,979,406)
$—
$—
$(5,979,406)
(a)
The
Consolidated
Schedule
of
Investments
provides
information
on
the
industry
or
sector
categorization
as
well
as
a
Positions
by
Country
summary.
The
following
is
a
summary,
categorized
by
level
(See
Note
A
of
the
Notes
to
Consolidated
Financial
Statements),
of
inputs
used
to
value
the
Fund's
derivatives
as
of
October
31,
2024:
Other
Financial
Instruments
Level
1
Level
2
Level
3
*
Total
Futures
(a)
Assets
$
791,877
$
—
$
—
$
791,877
Liabilities
(
388,316
)
—
—
(
388,316
)
Forward
contracts
(a)
Assets
—
115,878
—
115,878
Liabilities
—
(120,017)
—
(120,017)
Swaps
Assets
—
1,772,266
—
1,772,266
Liabilities
—
(2,140,203)
—
(2,140,203)
Options
Written
Liabilities
(943)
—
—
(943)
Total
$
402,618
$
(
372,076
)
$
—
$
30,542
(a)
Futures
and
forward
contracts
are
reported
at
the
cumulative
unrealized
appreciation/(depreciation)
of
the
instruments.
Consolidated
Schedule
of
Investments
Absolute
Return
Multi-Manager
Fund^
(cont’d)
See
Notes
to
Consolidated
Financial
Statements
^
A
balance
indicated
with
a
“—”,
reflects
either
a
zero
balance
or
an
amount
that
rounds
to
less
than
1.
*
The
following
is
a
reconciliation
between
the
beginning
and
ending
balances
of
derivatives
in
which
significant
unobservable
inputs
(Level
3)
were
used
in
determining
value:
Options
Written
(a)
Other
Financial
Instruments:
Beginning
Balance
as
of
November
1,
2023
$–
Transfers
into
Level
3
–
Transfers
out
of
Level
3
–
Accrued
discounts/(premiums)
–
Realized
gain/(loss)
182
Change
in
unrealized
appreciation/(depreciation)
(182)
Purchase/Closing
of
options
–
Sales/Writing
of
options
–
Balance
as
of
October
31,
2024
$–
Net
change
in
unrealized
appreciation/(depreciation)
on
investments
still
held
as
of
October
31,
2024
$–
(a)
At
the
beginning
of
the
year,
options
written
were
valued
in
accordance
with
procedures
approved
by
the
valuation
designee.
The
Fund
held
no
Level
3
derivatives
at
October
31,
2024.
Consolidated
Statement
of
Assets
and
Liabilities
Neuberger
Berman
Alternative
Funds
See
Notes
to
Consolidated
Financial
Statements
ABSOLUTE
RETURN
MULTI-MANAGER
FUND
October
31,
2024
Assets
Investments
in
securities,
at
value*
(Note
A)—see
Consolidated
Schedule
of
Investments:
Unaffiliated
issuers
(a)
$80,082,540
Cash
2,126,388
Foreign
currency
(b)
357,849
Cash
collateral
segregated
for
short
sales
(Note
A)
5,969,391
Cash
collateral
segregated
for
over
the
counter
derivatives
(Note
A)
6,250,000
Dividends
and
interest
receivable
284,405
Receivable
for
securities
sold
422,127
Receivable
for
Fund
shares
sold
7,846
Deposits
with
brokers
for
futures
contracts
(Note
A)
1,873,100
Receivable
from
administrator—net
(Note
B)
68,675
Over
the
counter
swap
contracts,
at
value
(Note
A)
1,772,266
Receivable
for
forward
foreign
currency
contracts
(Note
A)
115,878
Prepaid
expenses
and
other
assets
73,021
Total
Assets
99,403,486
Liabilities
Investments
sold
short,
at
value
(Note
A)
(c)
5,979,406
Options
contracts
written,
at
value
(Note
A)
(d)
943
Over
the
counter
swap
contracts,
at
value
(Note
A)
2,140,203
Payable
to
investment
manager—net
(Note
B)
131,670
Payable
for
securities
purchased
149,949
Payable
for
Fund
shares
redeemed
22,802
Payable
for
variation
margin
on
futures
contracts
(Note
A)
126,830
Payable
for
forward
foreign
currency
contracts
(Note
A)
120,017
Payable
to
trustees
5,157
Payable
for
audit
fees
122,240
Payable
for
custodian
and
accounting
fees
187,955
Other
accrued
expenses
and
payables
62,596
Total
Liabilities
9,049,768
Net
Assets
$90,353,718
Net
Assets
consist
of:
Paid-in
capital
$198,403,084
Total
distributable
earnings/(losses)
(108,049,366)
Net
Assets
$90,353,718
Neuberger
Berman
Alternative
Funds
Consolidated
Statement
of
Assets
and
Liabilities
(cont’d)
See
Notes
to
Consolidated
Financial
Statements
ABSOLUTE
RETURN
MULTI-MANAGER
FUND
October
31,
2024
Net
Assets
Institutional
Class
$79,802,149
Class
A
6,336,534
Class
C
1,848,295
Class
R6
112,216
Class
E
2,254,524
Shares
Outstanding
($.001
par
value;
unlimited
shares
authorized)
Institutional
Class
6,604,775
Class
A
535,963
Class
C
167,023
Class
R6
9,283
Class
E
184,288
Net
Asset
Value,
offering
and
redemption
price
per
share
Institutional
Class
$12.08
Class
R6
$12.09
Class
E
$12.23
Net
Asset
Value
and
redemption
price
per
share
Class
A
$11.82
Offering
Price
per
share
Class
A‡
$12.54
Net
Asset
Value
and
offering
price
per
share
Class
C
^
$11.07
*Cost
of
Investments:
(a)
Unaffiliated
issuers
$78,277,728
(b)
Total
cost
of
foreign
currency
$353,034
(c)
Proceeds
from
investments
sold
short
$5,525,802
(d)
Premium
received
from
option
contracts
written
$852
‡
On
single
retail
sales
of
less
than
$50,000.
On
sales
of
$50,000
or
more
or
in
certain
other
circumstances
described
in
the
Fund’s
prospectus,
offering
price
is
reduced.
^
Redemption
price
per
share
is
equal
to
net
asset
value
less
any
applicable
contingent
deferred
sales
charge.
Consolidated
Statement
of
Operations
Neuberger
Berman
Alternative
Funds
See
Notes
to
Consolidated
Financial
Statements
ABSOLUTE
RETURN
MULTI-MANAGER
FUND
For
the
Fiscal
Year
Ended
October
31,
2024
Investment
Income:
Income
(Note
A):
Dividend
income—unaffiliated
issuers
$2,821,466
Interest
and
other
income—unaffiliated
issuers
1,333,349
Foreign
taxes
withheld
(72,136)
Total
income
$4,082,679
Expenses:
Investment
management
fees
(Note
B)
1,717,064
Administration
fees
(Note
B):
Institutional
Class
134,060
Class
A
18,003
Class
C
5,459
Class
R6
138
Distribution
fees
(Note
B):
Class
A
17,310
Class
C
20,995
Shareholder
servicing
agent
fees:
Institutional
Class
1,192
Class
C
1,037
Class
R6
162
Class
E
114
Audit
fees
117,684
Custodian
and
accounting
fees
284,994
Insurance
3,369
Legal
fees
183,063
Registration
and
filing
fees
101,307
Shareholder
reports
40,265
Trustees'
fees
and
expenses
61,982
Dividend
and
interest
expense
on
securities
sold
short
(Note
A)
(180,900)
Miscellaneous
30,694
Total
expenses
2,557,992
Expenses
reimbursed
by
Management
(Note
B)
(687,692)
Investment
management
fees
waived
(Note
B)
(39,646)
Expenses
reduced
by
custodian
fee
expense
offset
arrangement
(Note
A)
(71)
Total
net
expenses
1,830,583
Net
investment
income/(loss)
$2,252,096
Neuberger
Berman
Alternative
Funds
Consolidated
Statement
of
Operations
(cont’d)
See
Notes
to
Consolidated
Financial
Statements
ABSOLUTE
RETURN
MULTI-MANAGER
FUND
For
the
Fiscal
Year
Ended
October
31,
2024
Realized
and
Unrealized
Gain/(Loss)
on
Investments
(Note
A):
Net
realized
gain/(loss)
on:
Transactions
in
investment
securities
of
unaffiliated
issuers
2,790,633
Closed
short
positions
of
unaffiliated
issuers
(328,692)
Settlement
of
forward
foreign
currency
contracts
(1,519,412)
Settlement
of
foreign
currency
transactions
17,546
Expiration
or
closing
of
futures
contracts
(1,538,212)
Expiration
or
closing
of
option
contracts
written
7,809
Expiration
or
closing
of
swap
contracts
304,338
Change
in
net
unrealized
appreciation/(depreciation)
in
value
of:
Investment
securities
of
unaffiliated
issuers
3,132,922
Short
positions
of
unaffiliated
issuers
(388,574)
Forward
foreign
currency
contracts
(222,992)
Foreign
currency
translations
(34,405)
Futures
contracts
(690,768)
Option
contracts
written
(273)
Swap
contracts
724,203
Net
gain/(loss)
on
investments
2,254,123
Net
increase/(decrease)
in
net
assets
resulting
from
operations
$4,506,219
Consolidated
Statements
of
Changes
in
Net
Assets
Neuberger
Berman
Alternative
Funds
See
Notes
to
Consolidated
Financial
Statements
ABSOLUTE
RETURN
MULTI-MANAGER
FUND
Fiscal
Year
Ended
October
31,
2024
Fiscal
Year
Ended
October
31,
2023
Increase/(Decrease)
in
Net
Assets:
From
Operations
(Note
A):
Net
investment
income/(loss)
$2,252,096
$2,228,814
Net
realized
gain/(loss)
on
investments
(265,990)
(987,284)
Change
in
net
unrealized
appreciation/(depreciation)
of
investments
2,520,113
(180,168)
Net increase/(decrease)
in
net
assets
resulting
from
operations
4,506,219
1,061,362
Distributions
to
Shareholders
From
(Note
A):
Distributable
earnings:
Institutional
Class
(995,555)
(3,684,077)
Class
A
(44,822)
(201,196)
Class
C
—
(48,441)
Class
R6
(1,400)
(794)
Class
E
(48,897)
(82,978)
Total
distributions
to
shareholders
(1,090,674)
(4,017,486)
From
Fund
Share
Transactions
(Note
D):
Proceeds
from
shares
sold:
Institutional
Class
11,728,225
92,015,015
Class
A
431,588
1,776,608
Class
C
186,589
669,908
Class
R6
591,447
143,172
Class
E
505,793
948,072
Proceeds
from
reinvestment
of
dividends
and
distributions:
Institutional
Class
943,791
3,533,508
Class
A
38,408
171,512
Class
C
—
42,218
Class
R6
1,106
—
Class
E
48,897
82,978
Payments
for
shares
redeemed:
Institutional
Class
(46,998,175)
(105,679,313)
Class
A
(2,005,822)
(2,510,964)
Class
C
(789,583)
(1,084,306)
Class
R6
(638,901)
(3,931,595)
Class
E
(764,891)
(860,846)
Net
increase/(decrease)
from
Fund
share
transactions
(36,721,528)
(14,684,033)
Net
Increase/(Decrease)
in
Net
Assets
(33,305,983)
(17,640,157)
Net
Assets:
Beginning
of
year
123,659,701
141,299,858
End
of
year
$90,353,718
$123,659,701
Notes
to
Consolidated
Financial
Statements
Absolute
Return
Multi-Manager
Fund
Note
A—Summary
of
Significant
Accounting
Policies:
1
General:
Neuberger
Berman
Alternative
Funds
(the
“Trust”)
is
a
Delaware
statutory
trust
organized
pursuant
to
an
Amended
and
Restated
Trust
Instrument
dated
March
27,
2014.
The
Trust
is
registered
as
an
open-end
management
investment
company
under
the
Investment
Company
Act
of
1940,
as
amended
(the
“1940
Act”),
and
its
shares
are
registered
under
the
Securities
Act
of
1933,
as
amended.
Neuberger
Berman
Absolute
Return
Multi-Manager
Fund
(the
“Fund”)
is
a
separate
operating
series
of
the
Trust
and
is
diversified.
The
Fund
currently
offers
Institutional
Class
shares,
Class
A
shares,
Class
C
shares,
Class
R6
shares
and
Class
E
shares.
The
Trust’s
Board
of
Trustees
(the
“Board”)
may
establish
additional
series
or
classes
of
shares
without
the
approval
of
shareholders.
A
balance
indicated
with
a
“—”,
reflects
either
a
zero
balance
or
a
balance
that
rounds
to
less
than
1.
The
assets
of
the
Fund
belong
only
to
the
Fund,
and
the
liabilities
of
the
Fund
are
borne
solely
by
the
Fund
and
no
other
series
of
the
Trust.
The
Fund
is
an
investment
company
and
accordingly
follows
the
investment
company
accounting
and
reporting
guidance
of
the
Financial
Accounting
Standards
Board
(“FASB”)
Accounting
Standards
Codification
(“ASC”)
Topic
946
“Financial
Services—Investment
Companies.”
The
preparation
of
financial
statements
in
accordance
with
U.S.
generally
accepted
accounting
principles
(“GAAP”)
requires
Neuberger
Berman
Investment
Advisers
LLC
(“Management”
or
“NBIA”)
to
make
estimates
and
assumptions
at
the
date
of
the
financial
statements.
Actual
results
could
differ
from
those
estimates.
The
Fund
invests
in
commodity-related
instruments
through
Neuberger
Berman
Cayman
ARMM
Fund
I
Ltd.
(the
“Subsidiary”),
which
is
organized
under
the
laws
of
the
Cayman
Islands.
The
Fund
is
and
expects
to
remain
the
sole
shareholder
of
the
Subsidiary.
The
Subsidiary
is
governed
by
its
own
Board
of
Directors.
As
of
October
31,
2024,
the
value
of
the
Fund’s
investment
in
the
Subsidiary
was
as
follows:
2
Consolidation:
The
accompanying
financial
statements
of
the
Fund
present
the
consolidated
accounts
of
the
Fund
and
the
Subsidiary.
All
intercompany
accounts
and
transactions
have
been
eliminated
in
consolidation.
3
Portfolio
valuation:
In
accordance
with
ASC
820
“Fair
Value
Measurement”
(“ASC
820”),
all
investments
held
by
the
Fund
are
carried
at
the
value
that
Management
believes
the
Fund
would
receive
upon
selling
an
investment
in
an
orderly
transaction
to
an
independent
buyer
in
the
principal
or
most
advantageous
market
for
the
investment
under
current
market
conditions.
Various
inputs,
including
the
volume
and
level
of
activity
for
the
asset
or
liability
in
the
market,
are
considered
in
valuing
the
Fund’s
investments,
some
of
which
are
discussed
below.
At
times,
Management
may
need
to
apply
significant
judgment
to
value
investments
in
accordance
with
ASC
820.
ASC
820
established
a
three-tier
hierarchy
of
inputs
to
create
a
classification
of
value
measurements
for
disclosure
purposes.
The
three-tier
hierarchy
of
inputs
is
summarized
in
the
three
broad
Levels
listed
below.
Level
1
–
unadjusted
quoted
prices
in
active
markets
for
identical
investments
Level
2
–
other
observable
inputs
(including
quoted
prices
for
similar
investments,
interest
rates,
prepayment
speeds,
credit
risk,
amortized
cost,
etc.)
Level
3
–
unobservable
inputs
(including
the
Fund’s
own
assumptions
in
determining
the
fair
value
of
investments)
Investment
in
Subsidiary
Percentage
of
Net
Assets
$
2,254,708
2.5%
The
inputs
or
methodology
used
for
valuing
an
investment
are
not
necessarily
an
indication
of
the
risk
associated
with
investing
in
those
securities.
The
value
of
the
Fund’s
investments
(long
and
short
positions)
in
equity
securities,
rights,
warrants
and
exchange-traded
options
written, for
which
market
quotations
are
readily
available,
is
generally
determined
by
Management
by
obtaining
valuations
from
independent
pricing
services
based
on
the
latest
sale
price
quoted
on
a
principal
exchange
or
market
for
that
security
(Level
1
inputs).
Securities
traded
primarily
on
the
NASDAQ
Stock
Market
are
normally
valued
at
the
NASDAQ
Official
Closing
Price
(“NOCP”)
provided
by
NASDAQ
each
business
day.
The
NOCP
is
the
most
recently
reported
price
as
of
4:00:02
p.m.,
Eastern
Time,
unless
that
price
is
outside
the
range
of
the
“inside”
bid
and
asked
prices
(i.e.,
the
bid
and
asked
prices
that
dealers
quote
to
each
other
when
trading
for
their
own
accounts);
in
that
case,
NASDAQ
will
adjust
the
price
to
equal
the
inside
bid
or
asked
price,
whichever
is
closer.
Because
of
delays
in
reporting
trades,
the
NOCP
may
not
be
based
on
the
price
of
the
last
trade
to
occur
before
the
market
closes.
If
there
is
no
sale
of
a
security
on
a
particular
day,
the
independent
pricing
services
may
value
the
security
based
on
market
quotations.
The
value
of
the
Fund’s
investments
for
long
positions
in
debt
securities
is
determined
by
Management
primarily
by
obtaining
valuations
from
independent
pricing
services
based
on
bid
quotations,
or
if
quotations
are
not
available,
by
methods that
include
various
considerations
based
on
security
type
(generally
Level
2
inputs).
In
addition
to
the
consideration
of
yields
or
prices
of
securities
of
comparable
quality,
coupon,
maturity
and
type,
indications
as
to
values
from
dealers,
and
general
market
conditions,
the
following
is
a
description
of
other
Level
2
inputs
and
related
valuation
techniques
used
by
independent
pricing
services
to
value
certain
types
of
debt
securities
held
by
the
Fund:
Corporate
Bonds
.
Inputs
used
to
value
corporate
debt
securities
generally
include
relevant
credit
information,
observed
market
movements,
sector
news,
U.S.
Treasury
yield
curve
or
relevant
benchmark
curve
and
other
market
information,
which
may
include
benchmark
yield
curves,
reported
trades,
broker-dealer
quotes,
issuer
spreads,
comparable
securities,
and
reference
data,
such
as
market
research
publications,
when
available
(“Other
Market
Information”).
High
Yield
Securities.
Inputs
used
to
value
high
yield
securities
generally
include
a
number
of
observations
of
equity
and
credit
default
swap
curves
related
to
the
issuer
and
Other
Market
Information.
The
value
of
insurance
linked
securities
is
determined
by
Management
primarily
by
obtaining
valuations
from
independent
third-party
pricing
services
based
on
bid
quotations
(Level
2
or
3
inputs).
The
value
of
loan
assignments
is
determined
by
Management
primarily
by
obtaining
valuations
from
independent
pricing
services
based
on
broker
quotes
(generally
Level
2
or
Level
3
inputs
depending
on
the
number
of
quotes
available).
The
value
of
futures
contracts
is
determined
by
Management
by
obtaining
valuations
from
independent
pricing
services
at
the
settlement
price
at
the
market
close
(Level
1
inputs).
The
value
of
forward
foreign
currency
contracts
is
determined
by
Management
by
obtaining
valuations
from
independent
pricing
services
based
on
actual
traded
currency
rates
on
independent
pricing
services’
networks,
along
with
other
traded
and
quoted
currency
rates
provided
to
the
pricing
services
by
leading
market
participants
(Level
2
inputs).
The
value
of
equity
swaps
is
determined
by
Management
by
obtaining
valuations
from
independent
pricing
services
using
the
underlying
asset
and
stated
benchmark
interest
rate
(Level
2
inputs).
Management
has
developed
a
process
to
periodically
review
information
provided
by
independent
pricing
services
for
all
types
of
securities.
Investments
in
non-exchange
traded
investment
companies
are
valued
using
the
respective
fund’s
daily
calculated
net
asset
value
(“NAV”)
per
share
(Level
2
inputs),
when
available.
If
a
valuation
is
not
available
from
an
independent
pricing
service,
or
if
Management
has
reason
to
believe
that
the
valuation
received
does
not
represent
the
amount
the
Fund
might
reasonably
expect
to
receive
on
a
current
sale
in
an
orderly
transaction,
Management
seeks
to
obtain
quotations
from
brokers
or
dealers
(generally
considered
Level
2
or
Level
3
inputs
depending
on
the
number
of
quotes
available).
If
such
quotations
are
not
available,
the
security
is
valued
using
methods
Management
has
approved
in
the
good-
faith
belief
that
the
resulting
valuation
will
reflect
the
fair
value
of
the
security.
Pursuant
to
Rule
2a-5
under
the
1940
Act,
the
Board
designated
Management
as
the
Fund’s
valuation
designee.
As
the
Fund’s
valuation
designee,
Management
is
responsible
for
determining
fair
value
in
good
faith
for
all
Fund
investments.
Inputs
and
assumptions
considered
in
determining
fair
value
of
a
security
based
on
Level
2
or
Level
3
inputs
may
include,
but
are
not
limited
to,
the
type
of
security;
the
initial
cost
of
the
security;
the
existence
of
any
contractual
restrictions
on
the
security’s
disposition;
the
price
and
extent
of
public
trading
in
similar
securities
of
the
issuer
or
of
comparable
companies;
quotations
or
evaluated
prices
from
broker-dealers
or
pricing
services;
information
obtained
from
the
issuer
and
analysts;
an
analysis
of
the
company’s
or
issuer’s
financial
statements;
an
evaluation
of
the
inputs
that
influence
the
issuer
and
the
market(s)
in
which
the
security
is
purchased
and
sold.
The
value
of
the
Fund’s
investments
in
foreign
securities
is
generally
determined
using
the
same
valuation
methods
and
inputs
as
other
Fund
investments,
as
discussed
above.
Foreign
security
prices
expressed
in
local
currency
values
are
normally
translated
from
the
local
currency
into
U.S.
dollars
using
the
exchange
rates
as
of
4:00
p.m.
Eastern
Time
on
days
the
New
York
Stock
Exchange
(“NYSE”)
is
open
for
business.
Management
has
approved
the
use
of
ICE
Data
Services
(“ICE”)
to
assist
in
determining
the
fair
value
of
foreign
equity
securities
when
changes
in
the
value
of
a
certain
index
suggest
that
the
closing
prices
on
the
foreign
exchanges
may
no
longer
represent
the
amount
that
the
Fund
could
expect
to
receive
for
those
securities
or
when
foreign
markets
are
closed
and
U.S.
markets
are
open.
In
each
of
these
events,
ICE
will
provide
adjusted
prices
for
certain
foreign
equity
securities
using
a
statistical
analysis
of
historical
correlations
of
multiple
factors
(Level
2
inputs).
Management
has
also
approved
the
use
of
ICE
to
evaluate
the
prices
of
foreign
debt
securities
as
of
the
time
at which
the
Fund’s
share
price
is
calculated.
ICE
utilizes
benchmark
spread
and
yield
curves
and
evaluates
available
market
activity
from
the
local
close
to
the
time
as
of
which
the
Fund’s
share
price
is
calculated
(Level
2
inputs)
to
assist
in
determining
prices
for
certain
foreign
debt
securities.
In
the
case
of
both
foreign
equity
and
foreign
debt
securities,
in
the
absence
of
precise
information
about
the
market
values
of
these
foreign
securities
as
of
the
time at
which
the
Fund’s
share
price
is
calculated,
Management
has
determined based
on available
data
that
prices
adjusted
or
evaluated
in
this
way
are
likely
to
be
closer
to
the
prices
the
Fund
could
realize
on
a
current
sale
than
the
prices
of
those
securities
established
at
the
close
of
the
foreign
markets
in
which
the
securities
primarily
trade.
Fair
value
prices
are
necessarily
estimates,
and
there
is
no
assurance
that
such
a
price
will
be
at
or
close
to
the
price
at
which
the
security
is
next
quoted
or
traded.
4
Foreign
currency
translations:
The
accounting
records
of
the
Fund
and
Subsidiary
are
maintained
in
U.S.
dollars.
Foreign
currency
amounts
are
normally
translated
into
U.S.
dollars
using
the
exchange
rate
as
of
4:00
p.m.
Eastern
Time,
on
days
the
NYSE
is
open
for
business,
to
determine
the
value
of
investments,
other
assets
and
liabilities.
Purchase
and
sale
prices
of
securities,
and
income
and
expenses,
are
translated
into
U.S.
dollars
at
the
prevailing
rate
of
exchange
on
the
respective
dates
of
such
transactions.
Net
unrealized
foreign
currency
gain/(loss),
if
any,
arises
from
changes
in
the
value
of
assets
and
liabilities,
other
than
investments
in
securities,
as
a
result
of
changes
in
exchange
rates
and
is
stated
separately
in
the
Consolidated
Statement
of
Operations.
5
Securities
transactions
and
investment
income:
Securities
transactions
are
recorded
on
trade
date
for
financial
reporting
purposes.
Dividend
income
is
recorded
on
the
ex-dividend
date
or,
for
certain
foreign
dividends,
as
soon
as
the
Fund
becomes
aware
of
the
dividends.
Non-cash
dividends
included
in
dividend
income,
if
any,
are
recorded
at
the
fair
market
value
of
the
securities
received.
Interest
income,
including
accretion
of
discount
(adjusted
for
original
issue
discount,
where
applicable)
and
amortization
of
premium,
where
applicable,
is
recorded
on
the
accrual
basis.
Realized
gains
and
losses
from
securities
transactions
and
foreign
currency
transactions,
if
any,
are
recorded
on
the
basis
of
identified
cost
and
stated
separately
in
the
Consolidated
Statement
of
Operations.
Included
in
net
realized
gain/(loss)
on
investments
are
proceeds
from
the
settlement
of
class
action
litigation(s)
in
which
the
Fund
participated
as
a
class
member.
The
amount
of
such
proceeds
for
the
year
ended
October
31,
2024,
was
$81,759.
6
Income
tax
information:
The
Fund
is
treated
as
a
separate
entity
for
U.S.
federal
income
tax
purposes.
It
is
the
policy
of
the
Fund
to
continue
to
qualify
for
treatment
as
a
regulated
investment
company
(“RIC”)
by
complying
with
the
requirements
of
the
U.S.
Internal
Revenue
Code
applicable
to
RICs
and
to
distribute
substantially
all
of
its
net
investment
income
and
net
realized
capital
gains
to
its
shareholders.
To
the
extent
the
Fund
distributes
substantially
all
of
its
net
investment
income
and
net
realized
capital
gains
to
shareholders,
no
federal
income
or
excise
tax
provision
is
required.
ASC
740
“Income
Taxes”
sets
forth
a
minimum
threshold
for
financial
statement
recognition
of
a
tax
position
taken,
or
expected
to
be
taken,
in
a
tax
return.
The
Fund
recognizes
interest
and
penalties,
if
any,
related
to
unrecognized
tax
positions
as
an
income
tax
expense
in
the
Consolidated
Statement
of
Operations.
The
Fund
is
subject
to
examination
by
U.S.
federal
and
state
tax
authorities
for
returns
filed
for
the
tax
years
for
which
the
applicable
statutes
of
limitations
have
not
yet
expired.
Management
has
analyzed
the
Fund's
tax
positions
taken
or
expected
to
be
taken
on
federal
and
state
income
tax
returns
for
all
open
tax
years
(the
current
and
the
prior
three
tax
years)
and
has
concluded
that
no
provision
for
income
tax
is
required
in
the
Fund's
financial
statements.
The
Subsidiary
is
a
controlled
foreign
corporation
under
the
U.S.
Internal
Revenue
Code.
As
a
U.S.
shareholder
of
a
controlled
foreign
corporation,
the
Fund
will
include
in
its
taxable
income
its
share
of
the
Subsidiary’s
current
earnings
and
profits
(including
net
realized
gains).
Any
deficit
generated
by
the
Subsidiary
will
be
disregarded
for
purposes
of
computing
the
Fund’s
taxable
income
in
the
current
period
and
also
disregarded
for
all
future
periods.
For
federal
income
tax
purposes,
the
estimated
cost
of
investments
held
at
October
31,
2024,
was
$83,629,684.
The
estimated
gross
unrealized
appreciation
was
$1,970,684
and
estimated
gross
unrealized
depreciation
was
$11,484,725
resulting
in
net
unrealized depreciation
in
value
of
investments
of
$9,514,041
based
on
cost
for
U.S.
federal
income
tax
purposes.
Income
distributions
and
capital
gain
distributions
are
determined
in
accordance
with
income
tax
regulations,
which
may
differ
from
GAAP.
These
differences
are
primarily
due
to
differing
treatments
of
income
and
gains
on
various
investment
securities
held
by
the
Fund,
timing
differences
and
differing
characterization
of
distributions
made
by
the
Fund.
The
Fund
may
also
utilize
earnings
and
profits
distributed
to
shareholders
on
redemption
of
their
shares
as
part
of
the
dividends-paid
deduction
for
income
tax
purposes.
Any
permanent
differences
resulting
from
different
book
and
tax
treatment
are
reclassified
at
year-end
and
have
no
impact
on
net
income,
NAV
or
NAV
per
share
of
the
Fund.
For
the
year
ended
October
31,
2024,
the
Fund
recorded
permanent
reclassifications
primarily
related
to
tax
adjustments
due
to
wholly
owned
subsidiary
income
and
gain
(loss).
For
the
year
ended
October
31,
2024,
the
Fund
recorded
the
following
permanent
reclassifications:
The
tax
character
of
distributions
paid
during
the
years
ended
October
31,
2024,
and
October
31,
2023,
was
as
follows:
Paid-in
Capital
Total
Distributable
Earnings/(Losses)
(
$
547,289
)
$547,289
Distributions
Paid
From:
Ordinary
Income
Tax-Exempt
Income
Long-Term
Capital
Gain
Return
of
Capital
Total
2024
2023
2024
2023
2024
2023
2024
2023
2024
2023
$1,090,674
$4,017,486
$–
$–
$–
$–
$–
$–
$1,090,674
$4,017,486
As
of
October
31,
2024,
the
components
of
distributable
earnings
(accumulated
losses)
on
a
U.S.
federal
income
tax
basis
were
as
follows:
The
temporary
differences
between
book
basis
and
tax
basis
distributable
earnings
are
primarily
due
to
losses
disallowed
and/or
recognized
on
wash
sales
and
straddles,
mark-to-market
on
adjustments
on
swaps,
futures
and
forward
contracts,
amortization
of
organizational
expenses,
tax
adjustments
related
to
swap
contracts
and
other
investments,
mark-to-market
adjustments
on
passive
foreign
investment
companies
(“PFICs”),
tax
adjustments
due
to
partnerships,
wholly
owned
subsidiary
inclusions,
amortization
adjustments
and
perpetual
bond
adjustments.
To
the
extent
the
Fund’s
net
realized
capital
gains,
if
any,
can
be
offset
by
capital
loss
carryforwards,
it
is
the
policy
of
the
Fund
not
to
distribute
such
gains.
Capital
loss
carryforward
rules
allow
for
RICs
to
carry
forward
capital
losses
indefinitely
and
to
retain
the
character
of
capital
loss
carryforwards
as
short-term
or
long-term.
As
determined
at
October
31,
2024,
the
Fund
had
unused
capital
loss
carryforwards
available
for
federal
income
tax
purposes
to
offset
net
realized
capital
gains,
if
any,
as
follows:
During
the
year
ended
October
31,
2024,
the
Fund
utilized
capital
loss
carryforwards
of
$1,287,190.
7
Foreign
taxes:
Foreign
taxes
withheld,
if
any,
represent
amounts
withheld
by
foreign
tax
authorities,
net
of
refunds
recoverable.
Foreign
capital
gains
on
certain
foreign
securities
may
be
subject
to
foreign
taxes,
which
are
accrued
as
applicable.
At
October
31,
2024,
there
were
no
outstanding
balances
of
accrued
capital
gains
taxes
for
the
Fund.
As
a
result
of
several
European
Court
of
Justice
(“ECJ”)
court
cases
in
certain
countries
across
the
European
Union
(“EU”),
the
Fund
has
filed
tax
reclaims
for
previously
withheld
taxes
on
dividends
earned
in
those
countries
(“ECJ
tax
reclaims”).
These
additional
filings
are
subject
to
various
administrative
proceedings
by
the
local
jurisdictions’
tax
authorities
within
the
EU,
as
well
as
a
number
of
related
judicial
proceedings.
When
any
such
ECJ
tax
reclaims
are
"more
likely
than
not"
to
not
be
sustained
assuming
examination
by
tax
authorities
due
to
the
uncertainty
that
exists
as
to
the
ultimate
resolution
of
these
proceedings,
the
likelihood
of
receipt
of
these
ECJ
tax
reclaims,
and
the
potential
timing
of
payment,
no
amounts
are
included
in
the
Consolidated
Statement
of
Assets
and
Liabilities.
Income
recognized,
if
any,
for
ECJ
tax
reclaims
would
be
included
in
"Interest
and
other
income—unaffiliated
issuers"
in
the
Consolidated
Statement
of
Operations
and
the
cost
to
file
these
additional
ECJ
tax
reclaims,
if
any,
would
be
included
in
"Miscellaneous
and
other
fees"
in
the
Consolidated
Statement
of
Operations.
8
Distributions
to
shareholders:
The
Fund
may
earn
income,
net
of
expenses,
daily
on
its
investments.
Distributions
from
net
investment
income
and
net
realized
capital
gains,
if
any,
are
generally
distributed
once
a
year
(usually
in December)
and
are
recorded
on
the
ex-date.
It
is
the
policy
of
the
Fund
to
pass
through
to
its
shareholders
substantially
all
REIT
distributions
and
other
income
it
receives,
less
operating
expenses.
The
distributions
received
from
REITs
are
generally
composed
of
income,
capital
gains,
and/or
return
of
REIT
capital,
but
the
REITs
do
not
report
this
information
to
the
Fund
until
the
following
calendar
year.
At
October
31,
2024,
the
Fund
estimated
these
amounts
for
the
period
January
1,
2024
to
October
31,
2024
within
the
financial
statements
because
the
2024
information
is
not
available
from
the
REITs
until
after
the
Fund’s
fiscal
year-end.
All
estimates
are
based
upon
REIT
information
sources
available
to
the
Fund
together
with
actual
IRS
Forms
1099-DIV
received
to
date.
For
the
year
ended
October
31,
2024,
the
character
of
distributions
paid
to
shareholders
of
the
Fund,
if
any,
disclosed
within
Undistributed
Ordinary
Income
Undistributed
Long-Term
Capital
Gain
Unrealized
Depreciation
Loss
Carryforwards
and
Deferrals
Other
Temporary
Differences
Total
$
1,561,816
$
—
$(9,545,764)
$
(
100,121,735
)
$56,317
$
(
108,049,366
)
Capital
Loss
Carryforwards
Long-Term
Short-Term
$
(
30,563,623
)
$(69,558,112)
the
Consolidated
Statements
of
Changes
in
Net
Assets
is
based
on
estimates
made
at
that
time.
Based
on
past
experience
it
is
possible
that
a
portion
of
the
Fund’s
distributions
during
the
current
fiscal
year,
if
any,
will
be
considered
tax
return
of
capital,
but
the
actual
amount
of
the
tax
return
of
capital,
if
any,
is
not
determinable
until
after
the
Fund’s
fiscal
year-end.
After
calendar
year-end,
when
the
Fund
learns
the
nature
of
the
distributions
paid
by
REITs
during
that
year,
distributions
previously
identified
as
income
may
be
recharacterized
as
return
of
capital
and/or
capital
gain.
After
all
applicable
REITs
have
informed
the
Fund
of
the
actual
breakdown
of
distributions
paid
to
the
Fund
during
its
fiscal
year,
estimates
previously
recorded
are
adjusted
to
reflect
actual
results.
As
a
result,
the
composition
of
the
Fund’s
distributions
as
reported
herein,
may
differ
from
the
final
composition
determined
after
calendar
year-end
and
reported
to
the
Fund
shareholders
on
IRS
Form
1099-DIV.
9
Expense
allocation:
Certain
expenses
are
applicable
to
multiple
funds
within a
complex
of
related
investment
companies.
Expenses
directly
attributable
to
a
fund
are
charged
to
that
fund.
Expenses
of
the
Trust
that
are
not
directly
attributable
to
a
particular
series
of
the
Trust
(e.g., the
Fund)
are
allocated
among
the
series
of
the
Trust,
on
the
basis
of
relative
net
assets,
except
where
a
more
appropriate
allocation
of
expenses
to
each
of
the
series
can
otherwise
be
made
fairly.
Expenses
borne
by
the
complex
of
related
investment
companies,
which
includes
open-end
and
closed-end
investment
companies
for
which
NBIA
serves
as
investment
manager,
that
are
not
directly
attributable
to
a
particular
investment
company
in
the
complex
(e.g.,
the
Trust)
or
series
thereof
are
allocated
among
the
investment
companies
in
the
complex
or
series
thereof
on
the
basis
of
relative
net
assets,
except
where
a
more
appropriate
allocation
of
expenses
to
each
of
the
investment
companies
in
the
complex
or
series
thereof
can
otherwise
be
made
fairly.
The
Fund’s
expenses
(other
than
those
specific
to
each
class)
are
allocated
proportionally
each
day
among
its
classes
based
upon
the
relative
net
assets
of
each
class.
10
Investments
in
foreign
securities:
Investing
in
foreign
securities
may
involve
sovereign
and
other
risks,
in
addition
to
the
credit
and
market
risks
normally
associated
with
domestic
securities.
These
additional
risks
include
the
possibility
of
adverse
political
and
economic
developments
(including
political
instability,
nationalization,
expropriation,
or
confiscatory
taxation)
and
the
potentially
adverse
effects
of
unavailability
of
public
information
regarding
issuers,
less
governmental
supervision
and
regulation
of
financial
markets,
reduced
liquidity
of
certain
financial
markets,
and
the
lack
of
uniform
accounting,
auditing,
and
financial
reporting
standards
or
the
application
of
standards
that
are
different
or
less
stringent
than
those
applied
in
the
United
States.
Foreign
securities
also
may
experience
greater
price
volatility,
higher
rates
of
inflation,
and
delays
in
settlement.
11
Securities
sold
short:
The
Fund
may
engage
in
short
sales,
which
are
sales
of
securities
which
have
been
borrowed
from
a
third
party
on
the
expectation
that
the
market
price
will
decline.
If
the
price
of
the
securities
decreases,
the
Fund
will
make
a
profit
by
purchasing
the
securities
in
the
open
market
at
a
price
lower
than
the
one
at
which
it
sold
the
securities.
If
the
price
of
the
securities
increases,
the
Fund
may
have
to
cover
its
short
positions
at
a
price
higher
than
the
short
sale
price,
resulting
in
a
loss.
Gains
are
limited
to
the
price
at
which
the
Fund
sold
the
security
short,
while
losses
are
potentially
unlimited
in
size.
The
Fund
pledges
securities
and/or
other
assets
to
the
lender
as
collateral.
Proceeds
received
from
short
sales
may
be
maintained
by
the
lender
as
collateral
or
may
be
released
to
the
Fund
and
used
to
purchase
additional
securities
or
for
any
other
purpose.
Proceeds
maintained
by
the
lender
are
included
in
“Cash
collateral
segregated
for
short
sales”
on
the
Consolidated
Statement
of
Assets
and
Liabilities.
The
Fund
is
contractually
responsible
to
remit
to
the
lender
any
dividends
and
interest
payable
on
securities
while
those
securities
are
being
borrowed
by
the
Fund.
The
Fund
may
receive
or
pay
the
net
of
the
interest
charged
by
the
prime
broker
on
the
borrowed
securities
and
a
financing
charge
for
the
difference
in
the
market
value
of
the
short
position
and
the
cash
collateral
deposited
with
the
broker.
This
income
or
fee
is
calculated
daily
based
upon
the
market
value
of
each
borrowed
security
and
a
variable
rate
that
is
dependent
on
the
availability
of
the
security.
These
costs
related
to
short
sales
(i.e.,
dividend
and
interest
remitted
to
the
lender
and
interest
charged
by
the
prime
broker)
are
recorded
as
an
expense
of
the
Fund
and
are
excluded
from
the
contractual
expense
limitation.
A
net
negative
expense,
if
any,
represents
a
gain
to
the
Fund
as
the
total
cash
rebates
received
exceeded
the
other
costs
related
to
short
sales.
The
net
amount
of
rebates
received are
included
in
“Dividend
and
interest
expense
on
securities
sold
short”
on
the
Consolidated
Statement
of
Operations
and were
$317,600
for
the
year
ended
October
31,
2024.
At
October
31,
2024,
the
Fund
had
cash
pledged
in
the
amount
of
$5,969,391
to
JPMorgan
Chase
Bank,
NA
(“JPM”),
as
collateral
for
short
sales.
In
addition,
JPM
has
a
perfected
security
interest
in
these
assets.
12
Investment
company
securities
and
exchange
traded
funds:
The
Fund
may
invest
in
shares
of
other
registered
investment
companies,
including
exchange
traded
funds
(“ETFs”),
within
the
limitations
prescribed
by
the
1940
Act,
in
reliance
on
rules
adopted
by
the
SEC,
particularly
Rule
12d1-4
or
any
other
applicable
exemptive
relief.
Rule
12d1-4
permits
investments
in
other
registered
investment
companies
in
excess
of
the
limitations
of
the
1940
Act
if
the
Fund
complies
with
the
conditions
of
the
Rule.
Shareholders
of
the
Fund
will
indirectly
bear
their
proportionate
share
of
any
management
fees
and
other
expenses
paid
by
such
other
investment
companies,
in
addition
to
the
management
fees
and
expenses
of
the
Fund.
13
When-issued/delayed
delivery
securities:
The
Fund
may
purchase
securities
with
delivery
or
payment
to
occur
at
a
later
date
beyond
the
normal
settlement
period.
At
the
time
the
Fund
enters
into
a
commitment
to
purchase
a
security,
the
transaction
is
recorded,
and
the
value
of
the
security
is
reflected
in
the
NAV.
The
price
of
such
security
and
the
date
when
the
security
will
be
delivered
and
paid
for
are
fixed
at
the
time
the
transaction
is
negotiated.
The
value
of
the
security
may
vary
with
market
fluctuations.
No
interest
accrues
to
the
Fund
until
payment
takes
place.
When-issued
and
delayed
delivery
transactions
can
have
a
leverage-like
effect
on
the
Fund,
which
can
increase
fluctuations
in
the
Fund’s
NAV.
Certain
risks
may
arise
upon
entering
into
when-issued
or
delayed
delivery
securities
transactions
from
the
potential
inability
of
counterparties
to
meet
the
terms
of
their
contracts
or
if
the
issuer
does
not
issue
the
securities
due
to
political,
economic,
or
other
factors.
Additionally,
losses
may
arise
due
to
changes
in
the
value
of
the
underlying
securities.
14
Derivative
instruments:
The
Fund’s
use
of
derivatives
during
the
year
ended
October
31,
2024,
is
described
below.
Please
see
the
Consolidated
Schedule
of
Investments
for
the
Fund’s
open
positions
in
derivatives
at
October
31,
2024.
The
disclosure
requirements
of
ASC
815
“Derivatives
and
Hedging”
(“ASC
815”)
distinguish
between
derivatives
that
qualify
for
hedge
accounting
and
those
that
do
not.
Because
investment
companies
value
their
derivatives
at
fair
value
and
recognize
changes
in
fair
value
through
the
Consolidated
Statement
of
Operations,
they
do
not
qualify
for
hedge
accounting.
Accordingly,
even
though
the
Fund’s
investments
in
derivatives
may
represent
economic
hedges,
they
are
considered
non-hedge
transactions
for
purposes
of
this
disclosure.
Rule
18f-4
under
the
1940
Act
regulates
the
use
of
derivatives
for
certain
funds
registered
under
the
1940
Act
(“Rule
18f-4”).
Unless
the
Fund
qualifies
as
a
“limited
derivatives
user”
as
defined
in
Rule
18f-4,
the
Fund
is
subject
to
a
comprehensive
derivatives
risk
management
program,
is
required
to
comply
with
certain
value-at-risk
based
leverage
limits
and
is
required
to
provide
additional
disclosure
both
publicly
and
to
the
SEC
regarding
its
derivatives
positions.
If the
Fund
qualifies
as
a
limited
derivatives
user,
Rule
18f-4
requires
the
Fund
to
have
policies
and
procedures
to
manage
its
aggregate
derivatives
risk.
Futures
contracts:
During
the
year
ended
October
31,
2024,
the
Fund
used
futures
for
economic
hedging
purposes
and
to
enhance
returns.
At
the
time
the
Fund
or
Subsidiary
enters
into
a
futures
contract,
it
is
required
to
deposit
with
the
futures
commission
merchant
a
specified
amount
of
cash
or
liquid
securities,
known
as
“initial
margin,”
which
is
a
percentage
of
the
value
of
the
futures
contract
being
traded
that
is
set
by
the
exchange
upon
which
the
futures
contract
is
traded.
Each
day,
the
futures
contract
is
valued
at
the
official
settlement
price
of
the
board
of
trade
or
U.S.
commodity
exchange
on
which
such
futures
contract
is
traded.
Subsequent
payments,
known
as
“variation
margin,”
to
and
from
the
broker
are
made
on
a
daily
basis,
or
as
needed,
as
the
market
price
of
the
futures
contract
fluctuates.
Daily
variation
margin
adjustments,
arising
from
this
“mark
to
market,”
are
recorded
by
the
Fund
or
Subsidiary
as
unrealized
gains
or
losses.
Although
some
futures
by
their
terms
call
for
actual
delivery
or
acquisition
of
the
underlying
securities
or
currency,
in
most
cases
the
contracts
are
closed
out
prior
to
delivery
by
offsetting
purchases
or
sales
of
matching
futures.
When
the
contracts
are
closed,
the
Fund
or
Subsidiary
recognizes
a
gain
or
loss.
Risks
of
entering
into
futures
contracts
include
the
possibility
there
may
be
an
illiquid
market,
possibly
at
a
time
of
rapidly
declining
prices,
and/or
a
change
in
the
value
of
the
contract
may
not
correlate
with
changes
in
the
value
of
the
underlying
securities.
Futures
executed
on
regulated
futures
exchanges
have
minimal
counterparty
risk
to
the
Fund
or
Subsidiary
because
the
exchange’s
clearinghouse
assumes
the
position
of
the
counterparty
in
each
transaction.
Thus,
the
Fund
or
Subsidiary
is
exposed
to
risk
only
in
connection
with
the
clearinghouse
and
not
in
connection
with
the
original
counterparty
to
the
transaction.
For
U.S.
federal
income
tax
purposes,
futures
transactions
undertaken
by
the
Fund
or
Subsidiary
may
cause
the
Fund
or
Subsidiary
to
recognize
gains
or
losses
from
marking
contracts
to
market
even
though
its
positions
have
not
been
sold
or
terminated,
may
affect
the
character
of
the
gains
or
losses
recognized
as
long-term
or
short-term,
and
may
affect
the
timing
of
some
capital
gains
and
losses
realized
by
the
Fund
or
Subsidiary.
Also,
the
Fund’s
or
Subsidiary’s
losses
on
transactions
involving
futures
contracts
may
be
deferred
rather
than
being
taken
into
account
currently
in
calculating
the
Fund’s
or
Subsidiary’s
taxable
income.
Forward
foreign
currency
contracts:
During
the
year
ended
October
31,
2024,
the
Fund
used
forward
foreign
currency
contracts
to
hedge
foreign
currency
and
to
enhance
returns.
A
forward
contract
is
an
agreement
between
two
parties
to
buy
or
sell
a
specific
currency
for
another
at
a
set
price
on
a
future
date
and
is
individually
negotiated
and
privately
traded
by
currency
traders
and
their
customers
in
the
interbank
market.
The
market
value
of
a
forward
contract
fluctuates
with
changes
in
forward
currency
exchange
rates.
Forward
contracts
are
marked
to
market
daily,
and
the
change
in
value
is
recorded
by
the
Fund
as
an
unrealized
gain
or
loss.
At
the
consummation
of
a
forward
contract
to
purchase
or
sell
currency,
the
Fund
may
either
exchange
the
currencies
specified
at
the
maturity
of
the
forward
contract
or
enter
into
a
closing
transaction
involving
the
purchase
or
sale
of
an
offsetting
forward
contract.
Closing
transactions
with
respect
to
forward
contracts
are
usually
performed
with
the
counterparty
to
the
original
forward
contract.
The
gain
or
loss
arising
from
the
difference
between
the
U.S.
dollar
cost
of
the
original
contract
and
the
value
of
the
foreign
currency
in
U.S.
dollars
upon
closing
a
contract
is
included
in
“Net
realized
gain/(loss)
on
settlement
of
forward
foreign
currency
contracts”
in
the
Consolidated
Statement
of
Operations.
These
contracts
may
involve
market
risk
in
excess
of
the
unrealized
gain
or
loss
reflected
in
the
Fund’s
Consolidated
Statement
of
Assets
and
Liabilities.
In
addition,
the
Fund
could
be
exposed
to
risks
associated
with
fluctuations
in
foreign
currency
and
the
risk
the
counterparty
will
fail
to
fulfill
its
obligation.
Equity
swap
contracts:
During
the
year
ended
October
31,
2024,
the
Fund
used
equity
swaps
to
provide
investment
exposure
to
certain
investments,
primarily
foreign
securities.
Equity
swaps
are
two-party
contracts
in
which
counterparties
exchange
the
return
on
a
specified
reference
security
for
the
return
based
on
a
fixed
or
floating
interest
rate
during
the
period
of
the
swap.
Upon
entering
an
equity
swap,
the
Fund
may
be
required
to
pledge
an
amount
of
cash
and/or
other
assets
to
the
broker
which
is
equal
to
a
certain
percentage
of
the
contract
amount
(initial
margin).
Subsequent
payments
known
as
variation
margins
are
made
or
received
by
the
Fund
periodically
depending
on
the
fluctuations
in
the
value
of
the
underlying
security.
Equity
swaps
are
marked
to
market
daily
based
on
the
value
of
the
underlying
reference
entity
and
the
change,
if
any,
is
recorded
as
an
unrealized
gain
or
loss.
Equity
swaps
normally
do
not
involve
the
delivery
of
securities
or
other
underlying
assets.
Cash
settlement
in
and
out
of
the
swap
may
occur
at
a
reset
date
or
any
other
date,
at
the
discretion
of
the
Fund
and
the
counterparty,
over
the
life
of
the
agreement,
and
is
generally
determined
based
on
limits
and
thresholds
established
as
part
of
an
agreement
between
the
Fund
and
the
counterparty.
If
the
other
party
to
an
equity
swap
defaults,
the
Fund’s
risk
of
loss
consists
of
the
net
amount
of
payments
that
the
Fund
is
contractually
entitled
to
receive,
if
any.
Equity
swaps
are
derivatives,
and
their
value
can
be
very
volatile.
To
the
extent
that
future
market
trends,
the
values
of
assets
or
economic
factors
are
not
accurately
analyzed
and
predicted,
the
Fund
may
suffer
a
loss,
which
may
exceed
the
related
amounts
shown
in
the
Consolidated
Statement
of
Assets
and
Liabilities.
Periodic
payments
received
or
paid
by
the
Fund
are
recorded
as
realized
gains
or
losses
in
the
Consolidated
Statement
of
Operations.
Options:
During
the
year
ended
October
31,
2024,
the
Fund
used
options
written
to
generate
incremental
returns
and
used
options
purchased for
economic
hedging
purposes,
to
manage
or
adjust
the
risk
profile
and
investment
exposure
of
the
Fund
or
individual
positions,
to
obtain
or
reduce
exposure
to
certain
markets,
to
establish
net
short
or
long
positions
for
markets
or
securities
and
to
enhance
total
return.
Premiums
paid
by
the
Fund
upon
purchasing
a
call
or
put
option
are
recorded
in
the
asset
section
of
the
Fund’s
Consolidated
Statement
of
Assets
and
Liabilities
and
are
subsequently
adjusted
to
the
current
market
value.
When
an
option
is
exercised,
closed,
or
expired,
the
Fund
realizes
a
gain
or
loss
and
the
asset
is
eliminated.
For
purchased
call
options,
the
Fund’s
loss
is
limited
to
the
amount
of
the
option
premium
paid.
Premiums
received
by
the
Fund
upon
writing
a
call
option
or
a
put
option
are
recorded
in
the
liability
section
of
the
Fund’s
Consolidated
Statement
of
Assets
and
Liabilities
and
are
subsequently
adjusted
to
the
current
market
value.
When
an
option
is
exercised,
closed,
or
expired,
the
Fund
realizes
a
gain
or
loss
and
the
liability
is
eliminated.
When
the
Fund
writes
a
call
option
on
an
underlying
asset
it
does
not
own,
its
exposure
on
such
an
option
is
theoretically
unlimited.
When
writing
a
covered
call
option,
the
Fund,
in
return
for
the
premium,
gives
up
the
opportunity
for
profit
from
a
price
increase
in
the
underlying
security
above
the
exercise
price,
but
conversely
retains
the
risk
of
loss
should
the
price
of
the
security
decline.
When
writing
a
put
option,
the
Fund,
in
return
for
the
premium,
takes
the
risk
that
it
must
purchase
the
underlying
security
at
a
price
that
may
be
higher
than
the
current
market
price
of
the
security.
If
a
call
or
put
option
that
the
Fund
has
written
expires
unexercised,
the
Fund
will
realize
a
gain
for
the
amount
of
the
premium.
All
securities
covering
outstanding
written
options
are
held
in
escrow
by
the
custodian
bank.
At
October
31,
2024,
the
Fund
had
the
following
derivatives
(which
did
not
qualify
as
hedging
instruments
under
ASC
815),
grouped
by
primary
risk
exposure:
Asset
Derivatives
Liability
Derivatives
Consolidated
Statement
of
Assets
and
Liabilities
Location
Value
Consolidated
Statement
of
Assets
and
Liabilities
Location
Value
Over
the
counter
swaps
Equity
risk
Over
the
counter
swap
contracts,
at
value
(1)
$
1,772,266
Over
the
counter
swap
contracts,
at
value
(1)
$
(
2,140,203
)
Forward
contracts
Foreign
currency
risk
Receivable
for
forward
foreign
currency
contracts
115,878
Payable
for
forward
foreign
currency
contracts
(
120,017
)
Futures
Interest
rate
risk
Receivable/Payable
for
variation
margin
on
futures
contracts
(2)
138,724
Receivable/Payable
for
variation
margin
on
futures
contracts
(2)
(
56,742
)
Foreign
currency
risk
Receivable/Payable
for
variation
margin
on
futures
contracts
(2)
320,111
Receivable/Payable
for
variation
margin
on
futures
contracts
(2)
(
235
)
Equity
risk
Receivable/Payable
for
variation
margin
on
futures
contracts
(2)
32,818
Receivable/Payable
for
variation
margin
on
futures
contracts
(2)
(
123,824
)
Commodity
risk
Receivable/Payable
for
variation
margin
on
futures
contracts
(2)
300,225
Receivable/Payable
for
variation
margin
on
futures
contracts
(2)
(
207,516
)
Total
Futures
791,878
(
388,317
)
Options
written
Equity
risk
Options
purchased,
at
value
–
Option
contracts
written,
at
value
(
943
)
(1)
“Over
the
counter
swaps”
reflects
the
cumulative
unrealized
appreciation/(depreciation)
of
the
over
the
counter
swap
contracts
plus
accrued
interest
as
of
October
31,
2024.
(2)
“Futures”
reflects
the
cumulative
unrealized
appreciation/(depreciation)
of
futures
as
of
October
31,
2024,
which
is
reflected
in
the
Consolidated
Statement
of
Assets
and
Liabilities
under
the
caption
“Total
distributable
earnings/(losses).”
The
current
day’s
variation
margin
as
of
October
31,
2024,
if
any,
is
reflected
in
the
Consolidated
Statement
of
Assets
and
Liabilities
under
the
caption
“Receivable/Payable
for
variation
margin
on
futures
contracts.”
Settlement
of
forward
foreign
currency
contracts
Expiration
or
closing
of
futures
contracts
Expiration
or
closing
of
swap
contracts
Transactions
in
investment
securities
of
unaffiliated
issuers
Expiration
or
closing
of
option
contracts
written
Forward
foreign
currency
contracts
Investment
securities
of
unaffiliated
issuers
The
impact
of
the
use
of
these
derivative
instruments
on
the
Consolidated
Statement
of
Operations
during
the year
ended
October
31,
2024,
was
as
follows:
While
the
Fund
may
receive
rights
and
warrants
in
connection
with
its
investments
in
securities,
these
rights
and
warrants
are
not
considered
“derivative
instruments”
under
ASC
815.
15
Offsetting
assets
and
liabilities:
The
Fund
is
required
to
disclose
both
gross
and
net
information
for
assets
and
liabilities
related
to
over
the
counter
derivatives,
repurchase
and
reverse
repurchase
agreements,
and
securities
lending
and
securities
borrowing
transactions
that
are
eligible
for
offset
or
subject
to
an
enforceable
master
netting
or
similar
agreement.
The
Fund’s
over
the
counter
derivative
assets
and
liabilities
at
fair
value
by
type
are
reported
gross
in
the
Consolidated
Statement
of
Assets
and
Liabilities.
The
following
tables
present
the
Fund’s
derivative
assets
and
liabilities
by
counterparty,
net
of
amounts
available
for
offset
under
a
master
netting
or
similar
agreement
and
net
of
the
related
collateral
received
by
the
Fund
for
assets
and
pledged
by
the
Fund
for
liabilities
as
of
October
31,
2024.
Net
Realized
Gain/
(Loss)
on
Derivatives
(1)
Change
in
Net
Unrealized
Appreciation/
(Depreciation)
on
Derivatives
(2)
Over
the
counter
swaps
Equity
risk
$
304,338
$
724,203
Futures
Interest
rate
risk
(
1,499,650
)
(
307,950
)
Foreign
currency
risk
(
440,562
)
(
82,972
)
Equity
risk
(
334,640
)
(
310,723
)
Commodity
risk
736,640
10,877
Total
Futures
(
1,538,212
)
(
690,768
)
Forward
contracts
Foreign
currency
risk
(
1,519,412
)
(
222,992
)
Options
purchased
Equity
risk
(
388
)
–
Options
written
Equity
risk
7,809
(
273
)
(1)
Net
realized
gain/(loss)
on
derivatives
is
located
in
the
Consolidated
Statement
of
Operations
each
under
the
caption,
"Net
realized
gain/(loss)
on:"
(2)
Change
in
net
unrealized
appreciation/(depreciation)
is
located
in
the
Consolidated
Statement
of
Operations
each
under
the
caption,
"Change
in
net
unrealized
appreciation/(depreciation)
in
value
of:"
o
16
Indemnifications:
Like
many
other
companies,
the
Trust’s
organizational
documents
provide
that
its
officers
(“Officers”)
and
trustees
(“Trustees”)
are
indemnified
against
certain
liabilities
arising
out
of
the
performance
of
their
duties
to
the
Trust.
In
addition,
both
in
some
of
its
principal
service
contracts
and
in
the
normal
course
of
its
business,
the
Trust
enters
into
contracts
that
provide
indemnifications
to
other
parties
for
certain
types
of
losses
or
liabilities.
The
Trust’s
maximum
exposure
under
these
arrangements
is
unknown
as
this
could
involve
future
claims
against
the
Trust
or
the
Fund.
17
Expense
offset
arrangement:
The
Fund
has
an
expense
offset
arrangement
in
connection
with
its
custodian
contract.
For
the
year
ended
October
31,
2024,
the
impact
of
this
arrangement
was
a
reduction
in
expenses
of
$71.
18
Other:
All
net
investment
income
and
realized
and
unrealized
capital
gains
and
losses
of
the
Fund
are
allocated,
on
the
basis
of
relative
net
assets,
pro
rata
among
its
respective
classes.
Note
B—Investment
Management
Fees,
Administration
Fees,
Distribution
Arrangements,
and
Other
Transactions
with
Affiliates:
The
Fund
retains
NBIA
as
its
investment
manager
under
a
Management
Agreement.
For
such
investment
management
services,
the
Fund
pays
NBIA
an
investment
management
fee
at
the
annual
rate
of
1.700%
of
the
first
$250
million
of
the
Fund’s
average
daily
net
assets,
1.675%
of
the
next
$250
million,
1.650%
of
the
next
$250
million,
1.625%
of
the
next
$250
million,
1.600%
of
the
next
$500
million,
1.575%
of
the
next
$2.5
billion,
and
1.550%
of
average
daily
net
assets
in
excess
of
$4
billion.
NBIA
has
contractually
agreed
to
waive
its
Class
E
management
fee
for
the
Fund.
This
undertaking
lasts
until
October
31,
2025
and
may
not
be
terminated
during
its
term
without
the
consent
of
the
Board.
Management
fees
contractually
waived
pursuant
to
this
waiver
for
Class
E
are
not
subject
to
recovery
by
NBIA.
For
the
year
ended
October
31,
2024,
the
total
amount
of
management
fees
waived
was $39,646,
which
is
equivalent
to
an
annualized
percentage
rate
of
1.70%
of
Class
E’s
average
daily
net
assets.
Accordingly,
for
the
year
ended
October
31,
2024,
the
investment
management
fee
pursuant
to
the
Description
Gross
Amounts
of
Assets
Presented
in
the
Consolidated
Statement
of
Assets
and
Liabilities
Gross
Amounts
of
Liabilities
Presented
in
the
Consolidated
Statement
of
Assets
and
Liabilities
Over
the
counter
swap
contracts
$1,772,266
$(2,140,203)
Forward
contracts
115,878
(120,017)
Total
$1,888,144
$(2,260,220)
Gross
Amounts
Not
Offset
in
the
Consolidated
Statement
of
Assets
and
Liabilities:
Assets
Liabilities
Counterparty
Gross
Amounts
Presented
in
the
Consolidated
Statement
of
Assets
and
Liabilities
Liabilities
Available
for
Offset
Collateral
Received
(a)
Net
Amount
(b)
Gross
Amounts
Presented
in
the
Consolidated
Statement
of
Assets
and
Liabilities
Assets
Available
for
Offset
Collateral
Pledged
(a)
Net
Amount
(b)
JPM
502,980
(191,916)
–
311,064
(191,916)
191,916
–
–
MS
1,385,164
(1,385,164)
–
–
(2,068,304)
1,385,164
683,140
–
Total
$1,888,144
$(1,577,080)
$–
$311,064
$(2,260,220)
$1,577,080
$683,140
$–
(a)
Collateral
received
(or
pledged)
is
limited
to
an
amount
not
to
exceed
100%
of
the
net
amount
of
assets
(or
liabilities)
in
the
tables
presented
above,
for
each
respective
counterparty.
(b)
A
net
amount
greater
than
zero
represents
amounts
subject
to
loss
as
of
October
31,
2024,
in
the
event
of
a
counterparty
failure.
A
net
amount
less
than
zero
represents
amounts
under-collateralized
to
each
counterparty
as
of
October
31,
2024.
Management
Agreement
was
equivalent
to
an
annual
net
effective
rate
of
1.70%
of
the
Fund’s
average
daily
net
assets.
The
Fund
retains
NBIA
as
its
administrator
under
an
Administration
Agreement.
The
administration
fee
is
assessed
at
the
Class
level
and
each
share
class
of
the
Fund,
as
applicable,
pays
NBIA
an
annual
administration
fee
equal
to
the
following:
0.15%
for
Institutional
Class;
0.26%
for
each
of
Class
A
and
Class
C;
0.05%
for
Class
R6,
each
as
a
percentage
of
its
average
daily
net
assets.
Class
E
shares
do
not
pay
an
administration
fee.
Additionally,
NBIA
retains
JPM
as
its
sub-administrator
under
a
Sub-Administration
Agreement.
NBIA
pays
JPM
a
fee
for
all
services
received
under
the
Sub-Administration
Agreement.
NBIA
has
contractually
agreed
to
waive
fees
and/or
reimburse
certain
expenses
of
the
Institutional
Class,
Class
A,
Class
C
and
Class
R6
so
that
the
total
annual
operating
expenses
of
those
classes
do
not
exceed
the
expense
limitations
as
detailed
in
the
following
table.
These
undertakings
exclude
interest,
brokerage
commissions,
acquired
fund
fees
and
expenses,
extraordinary
expenses,
taxes,
including
any
expenses
related
to
tax
reclaims,
and
dividend
and
interest
expenses
relating
to
short
sales,
if
any
(commitment
fees
relating
to
borrowings
are
treated
as
interest
for
purposes
of
this
exclusion)
("annual
operating
expenses");
consequently,
net
expenses
may
exceed
the
contractual
expense
limitations.
The
expenses
of
the
Subsidiary
are
included
in
the
total
expenses
used
to
calculate
the
reimbursement,
which
the
Fund
has
agreed
to
share
with
the
Subsidiary.
For
the
year
ended
October
31,
2024,
these
Subsidiary
expenses
amounted
to
$158,042.
At
October
31,
2024,
the
Fund’s
contingent
liabilities
to
NBIA
under
the
agreements
were
as
follows:
The
Fund
has
agreed
that
each
of
its
respective
classes
will
repay
NBIA
for
fees
and
expenses
waived
or
reimbursed
for
that
class
provided
that
repayment
does
not
cause
that
class's
annual
operating
expenses
to
exceed
its
contractual
expense
limitation
in
place
at
the
time
the
fees
and
expenses
were
waived
or
reimbursed,
or
the
expense
limitation
in
place
at
the
time
the
Fund
repays
NBIA,
whichever
is
lower.
Any
such
repayment
must
be
made
within
three
years
after
the
year
in
which
NBIA
incurred
the
expense.
During
the
year
ended
October
31,
2024,
there
was
no
repayment
to
NBIA
under
these
agreements.
At
October
31,
2024,
NBIA
engaged Crabel
Capital
Management,
LLC,
GAMCO
Asset
Management
Inc.,
P/E
Global,
LLC
and
Portland
Hill
Asset
Management
Limited
as
subadvisers
of
the
Fund
to
provide
investment
advisory
services.
NBIA
compensates
the
subadvisers
out
of
the
investment
management
fees
it
receives
from
the
Fund.
The
Fund
also
has
a
distribution
agreement
with
Neuberger
Berman
BD
LLC
(the
“Distributor”)
with
respect
to
each
class
of
shares.
The
Distributor
acts
as
agent
in
arranging
for
the
sale
of
class
shares
without
sales
commission
or
other
compensation,
except
as
described
below
for
Class
A
and
Class
C
shares,
and
bears
the
advertising
and
promotion
expenses.
However,
the
Distributor
receives
fees
from
Class
A
and
Class
C
under
their
distribution
plans
(each
a
“Plan”,
collectively,
the
“Plans”)
pursuant
to
Rule
12b-1
under
the
1940
Act.
The
Plans
provide
that,
as
compensation
for
administrative
and
other
services
provided
to
these
classes,
the
Distributor’s
activities
Expenses
Reimbursed
In
the
Year
Ended
October
31,
2022
2023
2024
Subject
to
Repayment
until
October
31,
Contractual
Expense
Limitation
(1)
Expiration
2025
2026
2027
Institutional
Class
1.97%
10/31/27
$
466,613
$
590,513
$
621,726
Class
A
2.33%
10/31/27
50,562
39,409
47,929
Class
C
3.08%
10/31/27
19,300
13,600
15,662
Class
R6
1.87%
10/31/27
31,554
1,357
2,375
(1)
Expense
limitation
per
annum
of
the
respective
class'
average
daily
net
assets.
and
expenses
related
to
the
sale
and
distribution
of
these
classes,
and
ongoing
services
provided
to
investors
in
these
classes,
the
Distributor
receives
from
each
of
these
classes
a
fee
at
the
annual
rate
of
0.25%
of
Class
A’s
and
1.00%
of
Class
C’s
average
daily
net
assets.
The
Distributor
receives
this
amount
to
provide
distribution
and
shareholder
servicing
for
these
classes
and
pays
a
portion
of
it
to
institutions
that
provide
such
services.
Those
institutions
may
use
the
payments
for,
among
other
purposes,
compensating
employees
engaged
in
sales
and/or
shareholder
servicing.
The
amount
of
fees
paid
by
each
class
during
any
year
may
be
more
or
less
than
the
cost
of
distribution
and
other
services
provided
to
that
class.
FINRA
rules
limit
the
amount
of
annual
distribution
fees
that
may
be
paid
by
a
mutual
fund
and
impose
a
ceiling
on
the
cumulative
distribution
fees
paid.
The
Trust’s
Plans
comply
with
those
rules.
Class
A
shares
of
the
Fund
are
generally
sold
with
an
initial
sales
charge
of
up
to
5.75%
and
no
contingent
deferred
sales
charge
(“CDSC”),
except
that
a
CDSC
of
1.00%
applies
to
certain
redemptions
made
within
18
months
following
purchases
of
$1
million
or
more
without
an
initial
sales
charge.
Class
C
shares
of
the
Fund
are
sold
with
no
initial
sales
charge
and
a
1.00%
CDSC
if
shares
are
sold
within
one
year
after
purchase.
For
the
year
ended
October
31,
2024,
the
Distributor,
acting
as
underwriter
and
broker-dealer,
received
net
initial
sales
charges
from
the
purchase
of
Class
A
shares
and
CDSCs
from
the
redemption
of
Class
A
and
Class
C
shares
as
follows:
Note
C—Securities
Transactions:
During
the
year
ended
October
31,
2024,
there
were
purchase
and
sale
transactions
of
long-term
securities
(excluding
swaps,
forward
contracts,
futures
and
written
option
contracts)
as
follows:
During
the
year
ended
October
31,
2024,
no
brokerage
commissions
on
securities
transactions
were
paid
to
affiliated
brokers.
Note
D—Fund
Share
Transactions:
Share
activity
for
the
years
ended
October
31,
2024,
and
October
31,
2023,
was
as
follows:
Underwriter
Broker-Dealer
Net
Initial
Sales
Charge
CDSC
Net
Initial
Sales
Charge
CDSC
Class
A
$
792
$
—
$
—
$
—
Class
C
—
467
—
—
Purchases
Securities
Sold
Short
Sales
and
Maturities
Covers
on
Securities
Sold
Short
–
$61,728,180
$8,354,375
$65,926,182
$7,811,151
For
the
Year
Ended
October
31,
2024
For
the
Year
Ended
October
31,
2023
Shares
Sold
Shares
Issued
on
Reinvestment
of
Dividends
and
Distributions
Shares
Redeemed
Total
Shares
Sold
Shares
Issued
on
Reinvestment
of
Dividends
and
Distributions
Shares
Redeemed
Total
Institutional
Class
987,119
80,528
(3,980,248)
(2,912,601)
7,940,939
310,502
(9,179,382)
(927,941)
Class
A
37,447
3,340
(172,729)
(131,942)
156,261
15,341
(221,872)
(50,270)
Class
C
17,371
—
(72,622)
(55,251)
62,487
4,002
(101,658)
(35,169)
Class
R6
49,820
94
(52,480)
(2,566)
12,285
—
(333,280)
(320,995)
Class
E
42,553
4,161
(64,188)
(17,474)
82,253
7,285
(74,477)
15,061
Note
E—Line
of
Credit:
At
October
31,
2024,
the
Fund
was
a
participant
in
a
syndicated
committed,
unsecured
$700,000,000
line
of
credit
(the
“Credit
Facility”),
to
be
used
only
for
temporary
or
emergency
purposes.
Series
of
other
investment
companies
managed
by
NBIA
also
participate
in
this
line
of
credit
on
substantially
the
same
terms.
Interest
is
charged
on
borrowings
under
this
Credit
Facility
at
the
highest
of
(a)
a
federal
funds
effective
rate
plus
1.00%
per
annum,
(b)
a
daily
simple
Secured
Overnight
Financing
Rate
(“SOFR”)
plus
1.10%
per
annum, or
(c)
an
overnight
bank
funding
rate
plus
1.00%
per
annum.
The
Credit
Facility
has
an
annual
commitment
fee
of
0.15%
per
annum
of
the
available
line
of
credit,
which
is
paid
quarterly.
The
Fund
has
agreed
to
pay
its
pro
rata
share
of
the
annual
commitment
fee,
based
on
the
ratio
of
its
individual
net
assets
to
the
net
assets
of
all
participants
at
the
time
the
fee
is
due,
and
interest
charged
on
any
borrowing
made
by
the
Fund
and
other
costs
incurred
by
the
Fund.
Because
several
funds
participate
in
the
Credit
Facility,
there
is
no
assurance
that
the
Fund
will
have
access
to
all
or
any
part
of
the
$700,000,000
at
any
particular
time.
There
were
no
loans
outstanding
for
the
Fund
under
the
Credit
Facility
at
October
31,
2024.
During
the
year
ended
October
31,
2024,
the
Fund
did
not
utilize
the
Credit
Facility.
Note
F—Recent
Accounting
Pronouncement:
In
June
2022,
FASB
issued
Accounting
Standards
Update
No.
2022-03,
“Fair
Value
Measurement
of
Equity
Securities
Subject
to
Contractual
Sale
Restrictions”
(“ASU
2022-03”).
ASU
2022-03
clarifies
the
guidance
in
ASC
820,
related
to
the
measurement
of
the
fair
value
of
an
equity
security
subject
to
contractual
sale
restrictions,
where
it
eliminates
the
ability
to
apply
a
discount
to
the
fair
value
of
these
securities,
and
introduces
disclosure
requirements
related
to
such
equity
securities.
The
guidance
is
effective
for
fiscal
years,
and
interim
periods
within
those
fiscal
years,
beginning
after
December
15,
2023,
and
allows
for
early
adoption.
Management
has
elected
to
early
adopt
ASU
2022-03.
In
December
2022,
the
FASB
issued
Accounting
Standards
Update
No.
2022-06,
“Reference
Rate
Reform
(Topic
848)”
(“ASU
2022-06”),
which
is
an
update
to
Accounting
Standards
Update
No.
2021-
01,
“Reference
Rate
Reform
(Topic
848)”
(“ASU
2021-01”)
and
defers
the
sunset
date
for
applying
the
reference
rate
reform
relief
in
Topic
848.
ASU
2021-01
is
an
update
of
ASU
2020-04,
which
is
in
response
to
concerns
about
structural
risks
of
interbank
offered
rates,
and
particularly
the
risk
of
cessation
of
LIBOR.
Regulators
have
undertaken
reference
rate
reform
initiatives
to
identify
alternative
reference
rates
that
are
more
observable
or
transaction
based
and
less
susceptible
to
manipulation.
ASU
2020-04
provides
optional
guidance
for
a
limited
period
of
time
to
ease
the
potential
burden
in
accounting
for
(or
recognizing
the
effects
of)
reference
rate
reform
on
financial
reporting.
ASU
2020-04
is
elective
and
applies
to
all
entities,
subject
to
meeting
certain
criteria,
that
have
contracts,
hedging
relationships,
and
other
transactions
that
reference
LIBOR
or
another
reference
rate
expected
to
be
discontinued
because
of
reference
rate
reform.
The
ASU
2021-01
update
clarifies
that
certain
optional
expedients
and
exceptions
in
Topic
848
for
contract
modifications
and
hedge
accounting
apply
to
derivatives
that
are
affected
by
the
discounting
transition.
The
amendments
in
this
update
are
effective
immediately
through
December
31,
2024,
for
all
entities.
Management
does
not
expect
ASU
2022-06
to
have
a
material
impact on
the
Fund’s
consolidated
financial
statements.
Consolidated
Financial
Highlights
Absolute
Return
Multi-Manager
Fund
See
Notes
to
Consolidated
Financial
Highlights
The
following
tables
include
selected
data
for
a
share
outstanding
throughout
each
period
and
other
performance
information
derived
from
the
Consolidated
Financial
Statements.
Amounts
that
do
not
round
to
$0.01
or
$(0.01)
per
share
are
presented
as
$0.00
or
$(0.00),
respectively.
Ratios
that
do
not
round
to
0.01%
or
(0.01)%
are
presented
as
0.00%
or
(0.00)%,
respectively.
Net
Assets
with
a
zero
balance,
if
any,
may
reflect
actual
amounts
rounding
to
less
than
$0.1
million.
A
“—”
indicates
that
the
line
item
was
not
applicable
in
the
corresponding
period.
Net
Asset
Value,
Beginning
of
Year
Net
Investment
Income/
(Loss)
@
Net
Gains
or
Losses
on
Securities
(both
realized
and
unrealized)
Total
From
Investment
Operations
Dividends
from
Net
Investment
Income
Distributions
from
Net
Realized
Capital
Gains
Total
Distributions
Institutional
Class
10/31/2024
$11.68
$0.27
$0.24
$0.51
$(0.11)
$—
$(0.11)
10/31/2023
$11.87
$0.19
$(0.07)
$0.12
$(0.31)
$—
$(0.31)
10/31/2022
$11.40
$(0.11)
$0.60
$0.49
$(0.02)
$—
$(0.02)
10/31/2021
$10.80
$(0.13)
$0.92
$0.79
$(0.19)
$—
$(0.19)
10/31/2020
$10.97
$0.01
$0.21
$0.22
$(0.39)
$—
$(0.39)
Class
A
10/31/2024
$11.43
$0.22
$0.24
$0.46
$(0.07)
$—
$(0.07)
10/31/2023
$11.62
$0.15
$(0.07)
$0.08
$(0.27)
$—
$(0.27)
10/31/2022
$11.19
$(0.15)
$0.58
$0.43
$—
$—
$—
10/31/2021
$10.60
$(0.18)
$0.92
$0.74
$(0.15)
$—
$(0.15)
10/31/2020
$10.78
$(0.03)
$0.20
$0.17
$(0.35)
$—
$(0.35)
Class
C
10/31/2024
$10.71
$0.13
$0.23
$0.36
$—
$—
$—
10/31/2023
$10.90
$0.06
$(0.06)
$—
$(0.19)
$—
$(0.19)
10/31/2022
$10.58
$(0.23)
$0.55
$0.32
$—
$—
$—
10/31/2021
$10.03
$(0.23)
$0.85
$0.62
$(0.07)
$—
$(0.07)
10/31/2020
$10.20
$(0.10)
$0.20
$0.10
$(0.27)
$—
$(0.27)
Class
R6
10/31/2024
$11.68
$0.27
$0.26
$0.53
$(0.12)
$—
$(0.12)
10/31/2023
$11.88
$0.15
$(0.02)
$0.13
$(0.33)
$—
$(0.33)
10/31/2022
$11.41
$(0.11)
$0.61
$0.50
$(0.03)
$—
$(0.03)
10/31/2021
$10.81
$(0.14)
$0.94
$0.80
$(0.20)
$—
$(0.20)
10/31/2020
$10.98
$0.01
$0.21
$0.22
$(0.39)
$—
$(0.39)
Class
E
10/31/2024
$11.82
$0.41
$0.24
$0.65
$(0.24)
$—
$(0.24)
10/31/2023
$11.97
$0.36
$(0.07)
$0.29
$(0.44)
$—
$(0.44)
Period
from
01/11/2022
^
to
10/31/2022
$11.17
$(0.01)
$0.81
$0.80
$—
$—
$—
Net
Asset
Value,
End
of
Year
Total
Return
†d
Net
Assets,
End
of
Year
(in
millions)
Ratio
of
Gross
Expenses
to
Average
Net
Assets
#
Ratio
of
Gross
Expenses
to
Average
Net
Assets
(excluding
dividend
and
interest
expense
relating
to
short
sales)
#
Ratio
of
Net
Expenses
to
Average
Net
Assets
Ø
Ratio
of
Net
Expenses
to
Average
Net
Assets
(excluding
dividend
and
interest
expense
relating
to
short
sales)
Ø
Ratio
of
Net
Investment
Income/
(Loss)
to
Average
Net
Assets
Portfolio
Turnover
Rate
(including
securities
sold
short)
Portfolio
Turnover
Rate
(excluding
securities
sold
short)
$12.08
4.39%
$79.8
2.49%
2.67%
1.79%
1.97%
2.25%
137%
134%
$11.68
1.12%
$111.1
2.45%
2.46%
1.97%
1.97%
1.66%
201%
178%
$11.87
4.30%
$124.0
2.93%
2.67%
2.24%
1.98%
(0.97)%
204%
204%
$11.40
7.40%
$61.4
2.94%
2.74%
2.17%
1.97%
(1.16)%
296%
308%
$10.80
2.01%
$84.5
2.69%
2.54%
2.12%
1.97%
0.10%
230%
219%
$11.82
4.03%
$6.3
2.84%
3.02%
2.15%
2.33%
1.90%
137%
134%
$11.43
0.79%
$7.6
2.81%
2.82%
2.33%
2.33%
1.32%
201%
178%
$11.62
3.84%
$8.3
3.29%
3.02%
2.58%
2.31%
(1.37)%
204%
204%
$11.19
7.07%
$6.9
3.32%
3.11%
2.54%
2.33%
(1.60)%
296%
308%
$10.60
1.58%
$6.6
3.22%
3.08%
2.47%
2.33%
(0.32)%
230%
219%
$11.07
3.36%
$1.8
3.64%
3.82%
2.90%
3.08%
1.15%
137%
134%
$10.71
0.01%
$2.4
3.59%
3.59%
3.08%
3.08%
0.57%
201%
178%
$10.90
3.02%
$2.8
4.08%
3.82%
3.35%
3.08%
(2.16)%
204%
204%
$10.58
6.23%
$3.0
4.07%
3.87%
3.29%
3.08%
(2.24)%
296%
308%
$10.03
0.96%
$4.7
3.82%
3.67%
3.23%
3.08%
(0.98)%
230%
219%
$12.09
4.58%
$0.1
2.55%
2.73%
1.69%
1.87%
2.25%
137%
134%
$11.68
1.13%
$0.1
2.64%
2.33%
2.19%
1.87%
1.27%
201%
178%
$11.88
4.40%
$4.0
2.86%
2.59%
2.14%
1.87%
(1.00)%
204%
204%
$11.41
7.50%
$3.6
2.87%
2.66%
2.07%
1.87%
(1.27)%
296%
308%
$10.81
2.10%
$1.6
2.59%
2.45%
2.01%
1.87%
0.07%
230%
219%
$12.23
5.60%
$2.3
2.35%
2.53%
0.65%
0.83%
3.39%
137%
134%
$11.82
2.53%
$2.4
2.31%
2.31%
0.60%
0.61%
3.07%
201%
178%
$11.97
7.16%*
$2.2
2.99%**
2.66%**
1.29%**
0.96%**
(0.12)%**
204%*
ØØ
204%*
ØØ
Notes
to
Consolidated
Financial
Highlights
Absolute
Return
Multi-Manager
Fund
C
@
Calculated
based
on
the
average
number
of
shares
outstanding
during
each
fiscal
period.
†
Total
return
based
on
per
share
NAV
reflects
the
effects
of
changes
in
NAV
on
the
performance
of
the
Fund
during
each
fiscal
period.
Returns
assume
income
dividends
and
other
distributions,
if
any,
were
reinvested,
but
do
not
reflect
the
effect
of
sales
charges.
Results
represent
past
performance
and
do
not
indicate
future
results.
Current
returns
may
be
lower
or
higher
than
the
performance
data
quoted.
Investment
returns
and
principal
will
fluctuate
and
shares,
when
redeemed,
may
be
worth
more
or
less
than
original
cost.
Total
return
would
have
been
lower
if
Management
had
not
reimbursed
and/
or
waived
certain
expenses.
Total
return
would
have
been
higher
if
Management
had
not
recouped
previously
reimbursed
and/or
waived
expenses.
d
The
class
action
proceeds
listed
in
Note
A
of
the
Notes
to
Consolidated
Financial
Statements
had
no
impact
on
the
Fund's
total
return
for
the
year
ended
October
31,
2024.
Had
the
Fund
not
received
class
action
proceeds
in
2021,
the
total
returns
based
on
per
share
NAV
for
the
year
ended
October
31,
2021
would
have
been:
Institutional
Class
6.84%
Class
A
6.59%
Class
C
5.63%
Class
R6
7.13%
The
class
action
proceeds
received
in
2023,
2022,
and
2020
had
no
impact
on
the
Fund's
total
returns
for
the
years
ended
October
31,
2023,
2022,
and
2020.
#
Represents
the
annualized
ratios
of
net
expenses
to
average
daily
net
assets
if
Management
had
not
reimbursed
certain
expenses
and/or
waived
a
portion
of
the
investment
management
fee.
*
Not
annualized.
**
Annualized.
^
The
date
investment
operations
commenced.
Including
dividend
and
interest
expense
relating
to
short
sales
Excluding
dividend
and
interest
expense
relating
to
short
sales
Ø
After
reimbursement
of
expenses
and/or
waiver
of
a
portion
of
the
investment
management
fee
by
Management.
The
Fund
is
required
to
calculate
an
expense
ratio
without
taking
into
consideration
any
expense
reductions
related
to
expense
offset
arrangements
(see
Note
A
in
the
Notes
to
Consolidated
Financial
Statements).
Had
the
Fund
not
received
expense
reductions
related
to
expense
offset
arrangements,
the
annualized
ratios
of
net
expenses
(including
and
excluding
dividend
and
interest
expense
relating
to
short
sales),
to
average
daily
net
assets
would
have
been:
(a)
Period
from
January
11,
2022
(Commencement
of
Operations)
to
October
31,
2022.
ØØ
Portfolio
turnover
is
calculated
at
the
Fund
level.
Percentage
indicated
was
calculated
for
the
year
ended
October
31,
2022
for
the
Fund.
Report
of
Independent
Registered
Public
Accounting
Firm
To
the
Shareholders
and
Board
of
Trustees
of
Neuberger
Berman
Absolute
Return
Multi-Manager
Fund
Opinion
on
the
Financial
Statements
We
have
audited
the
accompanying
consolidated
statement
of
assets
and
liabilities
of
Neuberger
Berman
Absolute
Return
Multi-Manager
Fund
(the
“Fund”)
(one
of
the
series
constituting
Neuberger
Berman
Alternative
Funds
(the
“Trust”)),
including
the
consolidated
schedule
of
investments,
as
of
October
31,
2024
and
the
related
consolidated
statement
of
operations
for
the
year
then
ended,
the
consolidated
statements
of
changes
in
net
assets
for
each
of
the
two
years
in
the
period
then
ended,
the
consolidated
financial
highlights
for
each
of
the
five
years
in
the
period
then
ended
and
the
related
notes
(collectively
referred
to
as
the
“financial
statements”).
In
our
opinion,
the
financial
statements
present
fairly,
in
all
material
respects,
the
consolidated
financial
position
of
the
Fund
(one
of
the
series
constituting
Neuberger
Berman
Alternative
Funds)
at
October
31,
2024,
the
consolidated
results
of
its
operations
for
the
year
then
ended,
the
consolidated
changes
in
net
assets
for
each
of
the
two
years
in
the
period
then
ended
and
its
consolidated
financial
highlights
for
each
of
the
five
years
in
the
period
then
ended,
in
conformity
with
U.S.
generally
accepted
accounting
principles.
Basis
for
Opinion
These
financial
statements
are
the
responsibility
of
the
Trust’s
management.
Our
responsibility
is
to
express
an
opinion
on
the
Fund’s
financial
statements
based
on
our
audits.
We
are
a
public
accounting
firm
registered
with
the
Public
Company
Accounting
Oversight
Board
(United
States)
(“PCAOB”)
and
are
required
to
be
independent
with
respect
to
the
Trust
in
accordance
with
the
U.S.
federal
securities
laws
and
the
applicable
rules
and
regulations
of
the
Securities
and
Exchange
Commission
and
the
PCAOB.
We
conducted
our
audits
in
accordance
with
the
standards
of
the
PCAOB.
Those
standards
require
that
we
plan
and
perform
the
audit
to
obtain
reasonable
assurance
about
whether
the
financial
statements
are
free
of
material
misstatement,
whether
due
to
error
or
fraud.
The
Trust
is
not
required
to
have,
nor
were
we
engaged
to
perform,
an
audit
of
the
Trust’s
internal
control
over
financial
reporting.
As
part
of
our
audits,
we
are
required
to
obtain
an
understanding
of
internal
control
over
financial
reporting,
but
not
for
the
purpose
of
expressing
an
opinion
on
the
effectiveness
of
the
Trust’s
internal
control
over
financial
reporting.
Accordingly,
we
express
no
such
opinion.
Our
audits
included
performing
procedures
to
assess
the
risks
of
material
misstatement
of
the
financial
statements,
whether
due
to
error
or
fraud,
and
performing
procedures
that
respond
to
those
risks.
Such
procedures
included
examining,
on
a
test
basis,
evidence
regarding
the
amounts
and
disclosures
in
the
financial
statements.
Our
procedures
included
confirmation
of
securities
owned
as
of
October
31,
2024,
by
correspondence
with
the
custodian,
brokers
and
others;
when
replies
were
not
received
from
brokers
and
others,
we
performed
other
auditing
procedures.
Our
audits
also
included
evaluating
the
accounting
principles
used
and
significant
estimates
made
by
management,
as
well
as
evaluating
the
overall
presentation
of
the
financial
statements.
We
believe
that
our
audits
provide
a
reasonable
basis
for
our
opinion.
We
have
served
as
the
auditor
of
one
or
more
Neuberger
Berman
investment
companies
since
1954.
Boston,
Massachusetts
December
30,
2024
Investment
Manager
and
Administrator
Neuberger
Berman
Investment
Advisers
LLC
1290
Avenue
of
the
Americas
New
York,
NY
10104-0002
Shareholder
Services
800.877.9700
or
212.476.8800
Intermediary
Client
Services
800.366.6264
Distributor
Neuberger
Berman
BD
LLC
1290
Avenue
of
the
Americas
New
York,
NY
10104-0002
Shareholder
Services
800.877.9700
or
212.476.8800
Intermediary
Client
Services
800.366.6264
Subadvisers
Crabel
Capital
Management,
LLC
1999
Avenue
of
the
Stars
Suite
2550
Los
Angeles,
CA
90067
GAMCO
Asset
Management
Inc.
One
Corporate
Center
Rye,
NY
10580
P/E
Global,
LLC
75
State
Street,
31st
Floor
Boston,
MA
02109
Portland
Hill
Asset
Management
Limited
21
Knightsbridge
London
SW1X7LY,
United
Kingdom
Custodian
JPMorgan
Chase
&
Co.
4
Chase
Metrotech
Center
Brooklyn,
NY
11245
Shareholder
Servicing
Agent
SS&C
Global
Investor
&
Distribution
Solutions,
Inc.
430
West
7th
Street,
Suite
219189
Kansas
City,
MO
64105-1407
For
Institutional
Class
Shareholders
address
correspondence
to:
Neuberger
Berman
Funds
PO
Box
219189
Kansas
City,
MO
64121-9189
Intermediary
Client
Services
800.366.6264
For
Class
A,
Class
C
and
Class
R6
Shareholders:
Please
contact
your
investment
provider
Legal
Counsel
K&L
Gates
LLP
1601
K
Street,
NW
Washington,
DC
20006-1600
Independent
Registered
Public
Accounting
Firm
Ernst
&
Young
LLP
200
Clarendon
Street
Boston,
MA
02116
Notice
to
Shareholders
In
early
2025
you
will
receive
information
to
be
used
in
filing
your
2024
tax
returns,
which
will
include
a
notice
of
the
exact
tax
status
of
all
distributions
paid
to
you
by
the
Fund
during
calendar
year
2024.
Please
consult
your
own
tax
advisor
for
details
as
to
how
this
information
should
be
reflected
on
your
tax
returns.
For
the
fiscal
year
ended
October
31,
2024,
the
Fund
designates
$496,394
and
$302,132
or
up
to
the
maximum
amount
of
such
dividends
allowable
pursuant
to
the
Internal
Revenue
Code,
for
qualified
dividend
income
and
dividends
received
deduction
eligible
for
reduced
tax
rates.
Complete
information
regarding
the
Fund's
distributions
during
the
calendar
year
2024
will
be
reported
in
conjunction
with
Form
1099-DIV.
Other
Information
Item
8.
Changes
in
and
Disagreements
with
Accountants
for
Open-End
Manage-
ment
Investment
Companies.
There
was
nothing
to
report
with
respect
to
this
item.
Item
9.
Proxy
Disclosures
for
Open-End
Management
Investment
Companies.
There
was
nothing
to
report
with
respect
to
this
item.
Item
10.
Remuneration
Paid
to
Directors,
Officers,
and
Others
of
Open-End
Man-
agement
Investment
Companies.
The
remuneration
paid
to
trustees,
officers,
and
others
for
the
Fund
is
disclosed
in
the
Fund's
financial
statements,
which
is
included
in
Item
7
of
this
Form
N-CSR.
Item
11.
Statement
Regarding
Basis
for
Approval
of
Investment
Advisory
Con-
tracts.
On
an
annual
basis,
the
Board
of
Trustees
(the
"Board
or
"Trustees"")
of
Neuberger
Berman
Alternative
Funds
(the
"Trust"),
including
the
Trustees
who
are
not
"interested
persons"
of
the
Trust
or
of
Neuberger
Berman
Investment
Advisers
LLC
("Management")
(including
its
affiliates),
as
such
term
is
defined
under
the
Investment
Company
Act
of
1940,
as
amended
("1940
Act"),
("Independent
Fund
Trustees"),
considers
whether
to
continue
the
management
agreement
with
Management
(the
"Management
Agreement")
and
the
separate
sub-advisory
agreements
between
Management
and
each
sub-adviser
(each
a
"Sub-Adviser")
with
respect
to
Neuberger
Berman
Absolute
Return
Multi-Manager
Fund
("ARMM"
or
"Fund").
The
Board
considered
the
sub-advisory
agreements
between
Management
and
each
of
the
following
Sub-Advisers:
GAMCO
Asset
Management
Inc.,
P/E
Global,
LLC,
and
Portland
Hill
Asset
Management
Limited
(each
a
"Sub-Advisory
Agreement";
collectively
with
the
Management
Agreement,
the
"Agreements").
Throughout
the
process,
the
Independent
Fund
Trustees
are
advised
by
counsel
that
is
experienced
in
1940
Act
matters
and
that
is
independent
of
Management
("Independent
Counsel").
At
a
meeting
held
on
September
26,
2024
the
Board,
including
the
Independent
Fund
Trustees,
approved
the
continuation
of
the
Agreements
for
the
Fund.
In
reaching
its
determination,
the
Board
considered
all
factors
it
believed
relevant,
including
(i)
the
nature,
extent,
and
quality
of
the
services
provided
to
the
Fund
and
its
shareholders;
(ii)
a
comparison
of
the
Fund's
performance,
fees
and
expenses
relative
to
its
benchmark,
various
peers
or
similar
accounts;
(iii)
the
costs
of
the
services
provided
by,
and
the
estimated
profit
or
loss
by
Management
from
its
relationships
with
the
Fund;
(iv)
any
apparent
or
anticipated
economies
of
scale
in
relation
to
the
services
Management
provides
to
the
Fund
and
whether
any
such
economies
of
scale
are
shared
with
Fund
shareholders;
and
(v)
any
"fall-out"
benefits
likely
to
accrue
to
Management
and
its
affiliates
from
their
relationship
with
the
Fund.
In
evaluating
the
Agreements,
the
Board,
including
the
Independent
Fund
Trustees,
reviewed
extensive
materials
provided
by
Management
and
each
Sub-Adviser
in
response
to
questions
submitted
by
the
Independent
Fund
Trustees
and
Independent
Counsel,
which
the
Contract
Review
Committee
annually
considers
and
updates,
and
(for
the
Sub-Advisers)
by
Management.
It
also
met
with
senior
representatives
of
Management
regarding
its
personnel,
operations,
and
profitability
as
they
relate
to
the
Fund.
The
annual
contract
review
extends
over
at
least
two
regular
meetings
of
the
Board
allow
Management
and
each
Sub-Adviser
additional
time
to
respond
to
any
questions
the
Independent
Fund
Trustees
may
have
on
their
initial
review
of
the
materials
and
for
the
Independent
Fund
Trustees
to
consider
those
responses.
In
the
limited
instances
where
Management
or
Sub-
Advisers
may
not
have
been
able
to
provide
information
in
response
to
certain
questions,
the
Board
conducted
its
evaluation
based
on
information
that
was
provided.
In
such
cases,
the
Board
determined
that
the
omission
of
any
such
information
was
not
material
to
its
considerations.
In
connection
with
its
deliberations,
the
Board
also
considered
the
broad
range
of
information
relevant
to
the
annual
contract
review
that
is
provided
to
the
Board
(including
its
various
standing
committees)
at
meetings
throughout
the
year.
The
Board
also
considered
the
size
and
staffing
of
each
Sub-Adviser,
particularly
the
staffing
of
the
portfolio
management
and
compliance
functions.
The
Board
established
the
Contract
Review
Committee,
which
is
comprised
solely
of
Independent
Fund
Trustees,
to
assist
in
its
evaluation
and
analysis
of
materials
for
the
annual
contract
review.
The
Board
has
also
established
other
committees
that
focus
throughout
the
year
on
specific
areas
relevant
to
the
annual
contract
review,
such
as
Fund
performance
or
compliance
matters,
and
that
are
charged
with
specific
responsibilities
regarding
the
annual
contract
review.
Those
committees
provide
reports
to
the
full
Board,
including
the
members
of
the
Contract
Review
Committee,
which
consider
that
information
as
part
of
the
annual
contract
review
process.
Each
quarter,
the
Ethics
and
Compliance
Committee
received
and
reviewed
a
summary
of
the
quarterly
compliance
questionnaire
completed
by
each
Sub-Adviser
that
was
prepared
by
the
Fund's
Chief
Compliance
Officer.
The
Independent
Fund
Trustees
received
from
Independent
Counsel
memoranda
discussing
the
legal
standards
for
their
consideration
of
the
proposed
continuation
of
the
Agreements.
During
the
course
of
the
year
and
during
their
deliberations
regarding
the
annual
contract
review,
the
Contract
Review
Committee
and
the
Independent
Fund
Trustees
met
with
Independent
Counsel
separately
from
representatives
of
Management
and
the
Sub-
Advisers.
Provided
below
is
a
description
of
the
Board's
contract
approval
process
and
material
factors
that
the
Board
considered
at
its
meetings
regarding
renewals
of
the
Agreements
and
the
compensation
to
be
paid
thereunder.
In
connection
with
its
approval
of
the
continuation
of
the
Agreements,
the
Board
evaluated
the
terms
of
the
Agreements,
the
overall
fairness
of
the
Agreements
to
the
Fund,
and
whether
the
Agreements
were
in
the
best
interests
of
the
Fund
and
Fund
shareholders.
The
Board's
determination
to
approve
the
continuation
of
the
Agreements
was
based
on
a
comprehensive
consideration
of
all
information
provided
to
the
Board
throughout
the
year
and
in
connection
with
the
annual
contract
review.
The
Board
considered
each
of
the
Agreements
separately.
This
description
is
not
intended
to
include
all
of
the
factors
considered
by
the
Board.
The
Board
members
did
not
identify
any
particular
information
or
factor
that
was
all-important
or
controlling,
and
each
Trustee
may
have
attributed
different
weights
to
the
various
factors.
Additionally,
the
information
and
factors
considered,
and
weight
placed
on
any
particular
information
or
factor
may
change
over
time.
The
Board
focused
on
the
costs
and
benefits
of
the
Agreements
to
the
Fund
and,
through
the
Fund,
its
shareholders.
Nature,
Extent,
and
Quality
of
Services
With
respect
to
the
nature,
extent,
and
quality
of
the
services
provided,
the
Board
considered
the
investment
philosophy
and
decision-making
processes
of,
and
the
qualifications,
experience,
capabilities,
and
succession
plans
of,
and
the
resources
available
to,
the
portfolio
management
personnel
of
Management
and
each
Sub-Adviser
who
perform
services
for
the
Fund.
The
Board
noted
that
Management
and
the
Fund
had
obtained
from
the
U.S.
Securities
and
Exchange
Commission
an
exemptive
order
that
permitted
Management
to
add
or
replace
sub-advisers
to
the
Fund
without
a
shareholder
vote,
provided
the
Independent
Fund
Trustees
approve
the
new
sub-adviser
and
certain
other
steps
are
taken.
In
this
context,
the
Board
considered
Management's
responsibilities
for
designing
an
overall
investment
program
for
the
Fund
and
then
identifying
the
sub-advisers
who
will
carry
out
the
different
portions
of
that
program
based
on
Management's
due
diligence
of
those
sub-advisers.
The
Board
noted
that
under
the
multi-manager
arrangement,
Management
is
continually
assessing
the
need
for
new
sub-advisers
and
the
appropriateness
of
potential
candidates
or
changes
to
current
sub-advisers,
and
noted
the
possibility
that
Management
would
in
the
future
have
to
conduct
"due
diligence"
on
additional
sub-advisers.
The
Board
noted
that
Management
is
responsible
for
making
the
investments
for
the
portion
of
the
portfolio
that
it
manages,
allocating
the
Fund's
portfolio
among
the
various
Sub-Advisers
and
itself,
and
determining
when
and
how
to
rebalance
the
allocations
among
the
Sub-Advisers
and
itself
in
the
wake
of
disparate
growth
and
changes
in
the
markets
and
the
broader
economy,
and
making
certain
other
investment
decisions
and
engaging
in
transactions
to
hedge
or
balance
risks
in
the
Sub-Advisers'
portfolios.
The
Board
noted
that
Management
is
also
responsible
for
coordinating
and
managing
the
flow
of
information
and
communications
relating
to
the
Fund
among
the
Sub-
Advisers,
and
coordinating
responses
to
regulatory
agency
inquiries
related
to
the
operations
of
the
Trust.
The
Board
further
noted
that
Management
is
responsible
for
overseeing
the
Sub-Advisers
pursuant
to
the
Agreements
and
related
sub-adviser
oversight
policies
and
procedures
approved
by
the
Board.
Under
these
procedures,
Management
is
responsible
for
overseeing
the
investment
performance
of
the
Sub-Advisers
and
evaluating
the
risk
and
return
of
each
Sub-Adviser's
portfolio
and
the
Fund
as
a
whole,
in
addition
to
other
significant
oversight
responsibilities.
The
Board
noted
that
Management
is
also
responsible
for
monitoring
compliance
with
the
Fund's
investment
objectives,
policies,
and
restrictions,
as
well
as
compliance
with
applicable
law,
including
implementing
regulatory
initiatives
of
the
U.S.
Securities
and
Exchange
Commission
and
other
regulators.
The
Board
noted
that
Management
also
provides
certain
administrative
services,
including
fund
accounting,
compliance,
and
shareholder
support
services.
The
Board
also
considered
the
policies
and
practices
regarding
brokerage,
commissions,
other
trading
costs,
and
allocation
of
portfolio
transactions
of
Management
and
each
of
the
Sub-Advisers
and
noted
that
Management
monitors
the
quality
of
the
execution
services
provided
by
each
Sub-Adviser.
Moreover,
the
Board
considered
Management's
approach
to
potential
conflicts
of
interest
both
generally
and
between
the
Fund's
investments
and
those
of
other
funds
or
accounts
managed
by
Management
or
the
Sub-Advisers.
The
Board
recognized
the
extensive
range
of
services
that
Management
provides
to
the
Fund
beyond
the
investment
management
services
and
Sub-Adviser
oversight.
It
also
noted
Management's
activities
under
its
contractual
obligation
to
oversee
the
Fund's
various
outside
service
providers,
including
its
renegotiation
of
certain
service
providers'
fees
and
its
evaluation
of
service
providers'
infrastructure,
cybersecurity
programs,
compliance
programs,
and
business
continuity
programs,
among
other
matters.
The
Board
noted
Management's
extensive
activities
in
selecting
and
overseeing
the
Sub-Advisers,
including
questionnaires,
virtual
site
visits,
analyses
of
performance,
compliance
monitoring,
and
evaluating
third
party
reviews
of
potential
sub-advisers,
and
the
quarterly
and
annual
reports
that
Management
provides
to
the
Board
on
the
Sub-Advisers'
performance
and
compliance.
In
addition,
the
Board
considered
the
scope
and
compliance
history
of
the
compliance
programs
of
Management
and
each
Sub-Adviser,
including
the
Fund's
Chief
Compliance
Officer's
and
Management's
assessment
of
the
compliance
programs
of
the
Sub-Advisers.
The
Board
discussed
that
Management's
Chief
Information
Security
Officer
had
evaluated
the
Sub-Advisers'
responses
on
questions
of
cybersecurity.
The
Board
also
considered
Management's
ongoing
development
of
its
own
infrastructure
and
information
technology
to
support
the
Fund
through,
among
other
things,
cybersecurity,
business
continuity
planning,
and
risk
management.
In
addition,
the
Board
noted
the
positive
compliance
history
of
Management
and
each
Sub-Adviser,
as
no
significant
compliance
problems
were
reported
to
the
Board
with
respect
to
any
of
the
firms.
The
Board
also
considered
whether
there
were
any
pending
lawsuits,
enforcement
proceedings,
or
regulatory
investigations
involving
Management
or
any
Sub-Adviser,
and
reviewed
information
regarding
their
financial
condition,
history
of
operations,
and
any
conflicts
of
interests
in
managing
the
Fund.
The
Board
also
considered
the
general
structure
of
the
portfolio
managers'
compensation
and
whether
this
structure
provides
appropriate
incentives
to
act
in
the
best
interests
of
the
Fund.
The
Board
also
considered
the
ability
of
Management
to
attract
and
retain
qualified
personnel
to
service
the
Fund
and
the
plan
for
succession.
The
Board
considered
that
Management
assumes
significant
ongoing
entrepreneurial
and
business
risks
as
the
investment
adviser
and
sponsor
for
the
Fund,
for
which
Management
is
entitled
to
reasonable
compensation.
The
Trustees
also
considered
that
Management's
responsibilities
include
continual
management
of
investment,
operational,
cybersecurity,
enterprise,
valuation,
liquidity,
litigation,
regulatory,
and
compliance
risks
as
they
relate
to
the
Fund,
and
the
Board
considers
on
a
regular
basis
information
regarding
Management's
processes
for
monitoring
and
managing
risk.
In
addition,
the
Board
also
noted
that
when
Management
launches
a
new
fund
or
share
class,
it
assumes
entrepreneurial
risk
with
respect
to
that
fund
or
share
class,
until
it
maintains
a
certain
level
of
assets,
if
ever,
that
is
profitable
to
Management.
Fund
Performance
The
Board
requested
a
report
from
an
outside
consulting
firm
that
specializes
in
the
analysis
of
fund
industry
data
that
compared
the
Fund's
performance,
along
with
its
fees
and
other
expenses,
to
various
peers,
including
a
group
of
industry
peers
("Expense
Group")
and
a
broader
universe
of
funds
pursuing
generally
similar
strategies
with
the
same
investment
classification
and/or
objective
("Performance
Universe").
The
Board
considered
the
Fund's
performance
and
fees
in
light
of
the
limitations
inherent
in
the
consulting
firm's
methodology
for
constructing
such
a
comparative
group
and
determining
which
investment
companies
should
be
included
in
the
comparative
group,
noting
differences
as
compared
to
certain
fund
industry
ranking
and
rating
systems.
With
respect
to
investment
performance,
the
Board
considered
information
regarding
the
Fund's
short-,
intermediate-
and
long-term
performance,
as
applicable,
net
of
the
Fund's
fees
and
expenses,
on
an
absolute
basis,
relative
to
a
benchmark
index
that
does
not
deduct
the
fees
or
expenses
of
investing
and
compared
to
the
performance
of
the
Performance
Universe.
The
Board
also
considered
information
regarding
each
Sub-Adviser's
performance.
The
Board
also
reviewed
performance
in
relation
to
certain
measures
of
the
degree
of
investment
risk
undertaken
by
Management's
portfolio
managers.
The
Performance
Universe
referenced
in
this
section
are
those
identified
by
the
consulting
firm,
as
discussed
above.
In
the
case
of
underperformance
for
any
of
the
periods
reported,
the
Board
considered
the
magnitude
and
duration
of
that
underperformance
relative
to
the
Performance
Universe
and/or
the
benchmark
(e.g.,
the
amount
by
which
the
Fund
underperformed,
including,
for
example,
whether
the
Fund
slightly
underperformed
or
significantly
underperformed
its
benchmark).
With
respect
to
performance
quintile
rankings
for
the
Fund
compared
to
its
Performance
Universe,
the
first
quintile
represents
the
highest
(best)
performance
and
the
fifth
quintile
represents
the
lowest
performance.
The
Fund
has
more
than
one
class
of
shares
outstanding
and
information
for
Institutional
Class
has
been
provided
as
identified
below.
The
Board
reviewed
the
expense
structures
of
all
the
other
classes
of
shares
of
the
Fund,
some
of
which
have
higher
fees
and
expenses
that
reflect
their
separate
distribution
and
servicing
arrangements
and
the
differing
needs
of
different
investors.
As
a
proxy
for
the
class
expense
structure,
the
Board
reviewed
the
expenses
of
each
class
for
one
fund
in
the
Trust
in
comparison
to
Expense
Groups
for
those
classes.
The
Board
noted
the
effect
of
higher
expenses
on
the
performance
of
the
other
classes
of
shares.
The
Board
considered
that,
based
on
performance
data
for
the
periods
ended
March
31,
2024:
(1)
as
compared
to
its
benchmark,
the
Fund's
performance
was
lower
for
the
1-year
period
and
higher
for
the
3-,
5-
and
10-year
periods;
and
(2)
as
compared
to
its
Performance
Universe,
the
Fund's
performance
was
in
the
fifth
quintile
for
the
1-year
period,
the
third
quintile
for
the
3-
and
5-year
periods
and
the
fourth
quintile
for
the
10-year
period.
The
Board
also
took
into
account
that
the
Fund
showed
a
risk/return
ratio
that
was
better
than
the
median
of
its
Performance
Universe
for
the
3-
and
5-year
periods,
meaning
that
per
unit
of
risk
taken
versus
a
presumed
risk-
free
investment,
the
Fund
achieved
a
higher
level
of
return
than
the
median
of
its
Performance
Universe
for
those
same
periods.
In
addition,
the
Board
met
with
the
portfolio
management
team
in
December
2023
and
March
2024.
The
Board
recognized
that
the
performance
data
reflects
a
snapshot
of
a
period
as
of
a
particular
date
and
that
selecting
a
different
performance
period
could
produce
significantly
different
results.
The
Board
further
acknowledged
that
long-term
performance
could
be
impacted
by
even
one
period
of
significant
outperformance
or
underperformance.
In
this
regard,
the
Board
noted
that
performance
is
only
one
of
the
factors
that
it
deems
relevant
to
its
consideration
of
the
Agreements
and
that,
after
considering
all
relevant
factors,
it
can
determine
to
approve
the
continuation
of
the
Agreements
notwithstanding
the
Fund's
relative
performance.
Fee
Rates,
Profitability,
and
Fall-out
Benefits
With
respect
to
the
overall
fairness
of
the
Agreements,
the
Board
considered
the
fee
structure
for
the
Fund
under
the
Agreements
as
compared
to
the
Expense
Group
provided
by
the
consulting
firm,
as
discussed
above.
The
Board
reviewed
a
comparison
of
the
Fund's
management
fee
to
the
Expense
Group.
The
Board
noted
that
the
comparative
management
fee
analysis
includes,
in
the
Fund's
management
fee,
the
separate
administrative
fees
paid
to
Management.
However,
the
Board
noted
that
some
funds
in
the
Expense
Group
pay
directly
from
fund
assets
for
certain
services
that
Management
covers
out
of
the
administration
fees
for
the
Funds.
Accordingly,
the
Board
also
considered
the
Fund's
total
expense
ratio
as
compared
with
its
Expense
Group
as
a
way
of
taking
account
of
these
differences.
The
Board
compared
the
Fund's
contractual
and
actual
management
fees
to
the
contractual
and
actual
management
fees,
respectively,
of
the
Fund's
Expense
Group.
(The
actual
management
fees
are
the
contractual
management
fees
reduced
by
any
fee
waivers
or
other
adjustments.
The
information
provided
herein
relating
to
the
Fund's
management
fees
is
for
the
Fund's
Institutional
Class.)
The
Board
also
compared
the
Fund's
total
expenses
to
the
total
expenses
of
the
Fund's
Expense
Group.
With
respect
to
the
quintile
rankings
for
fees
and
total
expenses
(net
of
waivers
or
other
adjustments,
if
any)
for
the
Fund
compared
to
its
Expense
Group,
the
first
quintile
represents
the
lowest
(best)
fees
and/or
total
expenses
and
the
fifth
quintile
represents
the
highest
fees
and/or
total
expenses.
The
Board
also
noted
that
the
overall
expense
ratio
for
each
class
of
the
Fund
is
maintained
through
a
contractual
fee
cap
and/or
expense
reimbursements
by
Management.
The
Board
also
considered
the
extent
to
which
Management
currently
waives
management
fees
and/or
reimburses
the
Fund
for
other
Fund-level
expenses
at
different
rates
for
different
share
classes
and
the
process
for
monitoring
the
use
of
such
waivers
to
guard
against
any
such
waiver
resulting
in
any
cross-subsidization
by
one
share
class
of
another
share
class.
The
Board
considered
that,
as
compared
to
its
Expense
Group,
the
Fund's
contractual
management
fee
and
total
expenses
each
ranked
in
the
fifth
quintile
and
actual
management
fee
net
of
fees
waived
by
Management
ranked
in
the
fourth
quintile.
The
Board
discussed
with
Management
the
impact
of
the
Fund's
small
size
on
its
expenses
and
the
expenses
associated
with
the
Fund's
strategy,
including
the
selection,
allocation
to,
and
oversight
of
the
unaffiliated
subadvisers.
In
concluding
that
the
benefits
accruing
to
Management
and
its
affiliates
by
virtue
of
their
relationship
with
the
Fund
were
reasonable
in
light
of
the
costs
of
providing
the
investment
advisory
and
other
services
and
the
benefits
accruing
to
the
Fund,
the
Board
reviewed
specific
data
as
to
Management's
estimated
loss
on
the
Fund
for
a
recent
period
on
a
pre-tax
basis
without
regard
to
distribution
expenses.
(The
Board
also
reviewed
data
on
Management's
estimated
loss
on
the
Fund
after
distribution
expenses
and
taxes
were
factored
in,
as
indicators
of
the
health
of
the
business
and
the
extent
to
which
Management
is
directing
its
resources
into
the
growth
of
the
business.)
The
Board
considered
the
consistent
cost
allocation
methodology
that
Management
used
in
developing
its
estimated
profitability
figures.
In
addition,
the
Board
engaged
an
independent
forensic
accountant
to
review
the
profitability
methodology
utilized
by
Management
when
preparing
this
information
and
discussed
with
the
consultant
its
conclusion
that
Management's
process
for
calculating
and
reporting
its
estimated
loss
aligned
with
the
consultant's
guiding
principles
and
industry
practices.
The
Board
further
noted
Management's
representation
that
its
estimate
of
profitability
is
derived
using
a
methodology
that
is
consistent
with
the
methodology
used
to
assess
and/or
report
measures
of
profitability
elsewhere
at
the
firm.
In
addition,
the
Board
recognized
that
Management's
calculations
regarding
its
costs
may
not
reflect
all
risks,
including
regulatory,
legal,
operational,
cybersecurity,
reputational,
and,
where
appropriate,
entrepreneurial
risks,
associated
with
offering
and
managing
a
fund
in
the
current
regulatory
and
market
environment.
The
Board
also
monitors
throughout
the
year
the
potential
effect
on
the
profitability
of
Management
resulting
from
changes
in
Sub-Advisers
and/or
their
fees.
The
Board
did
not
give
substantial
emphasis
to
estimated
profitability
data
from
the
Sub-Advisers
because
the
Board
did
not
view
this
data
as
being
a
key
factor
to
its
deliberations
given
the
arm's-length
nature
of
the
relationship
between
Management
and
the
Sub-Advisers
with
respect
to
the
negotiation
of
sub-advisory
fee
rates.
To
test
its
assumption
of
an
arm's-length
fee
rate,
the
Board
requested
from
Management
information
about
any
other
business
relationships
it
has
with
any
of
the
Sub-
Advisers
beyond
retaining
them
to
advise
other
of
Management's
client
accounts.
In
addition,
the
Board
noted
that
the
Sub-Advisers
may
not
account
for
their
profits
on
an
account-by-account
basis
and
those
that
do
typically
employ
different
methodologies
in
connection
with
these
calculations.
The
Board
also
considered
any
fall-out
(i.e.,
indirect)
benefits
likely
to
accrue
to
Management
or
its
affiliates
from
their
relationship
with
the
Fund.
Information
Regarding
Services
to
Other
Clients
The
Board
also
considered
whether
there
were
other
funds
or
separate
accounts
that
were
advised
or
sub-advised
by
Management
or
its
affiliates
with
investment
objectives,
policies,
and
strategies
that
were
similar
to
those
of
the
Fund.
The
Board
also
considered
the
fees
the
Sub-Advisers
charge
for
products
with
investment
objectives,
policies,
and
strategies
that
were
similar
to
those
of
the
Fund,
if
any.
The
Board
noted
that
in
many
cases,
those
products
were
hedge
funds,
which
typically
charge
fees
substantially
higher
than
mutual
funds.
Economies
of
Scale
The
Board
also
evaluated
apparent
or
anticipated
economies
of
scale
in
relation
to
the
services
Management
provides
to
the
Fund.
The
Board
considered
that
the
Fund's
fee
structure
provides
for
a
reduction
of
payments
resulting
from
the
use
of
breakpoints,
the
size
of
such
breakpoints
in
the
Fund's
advisory
fees,
and
whether
such
breakpoints
are
set
at
appropriate
asset
levels.
The
Board
also
compared
the
breakpoint
structure
to
that
of
the
Expense
Group.
In
addition,
the
Board
considered
the
expense
limitation
and/or
fee
waiver
arrangement
that
reduce
the
Fund's
expenses
at
all
asset
levels
which
can
have
an
effect
similar
to
breakpoints
in
sharing
economies
of
scale
with
shareholders
and
provide
protection
from
an
increase
in
expenses
if
the
Fund's
assets
decline.
The
Board
considered
that
breakpoints
in
a
Sub-Adviser's
fee
schedule
would
inure
to
the
benefit
of
Management,
and
evaluated
that
fact
in
light
of
Management's
profitability
on
the
Fund,
a
subject
on
which
the
Board
receives
quarterly
reports.
The
Board
also
considered
that
Management
has
provided,
at
no
added
cost
to
the
Fund,
certain
additional
services,
including
but
not
limited
to,
services
required
by
new
regulations
or
regulatory
interpretations,
services
impelled
by
changes
in
the
securities
markets
or
the
business
landscape,
and/or
services
requested
by
the
Board.
The
Board
considered
that
this
is
a
way
of
sharing
economies
of
scale
with
the
Fund
and
its
shareholders.
Conclusions
In
approving
the
continuation
of
the
Agreements,
the
Board
concluded
that,
in
its
business
judgment,
the
terms
of
each
Agreement
are
fair
and
reasonable
to
the
Fund
and
that
approval
of
the
continuation
of
the
Agreements
is
in
the
best
interests
of
the
Fund
and
its
shareholders.
In
reaching
this
determination,
the
Board
considered
that
Management
and
each
Sub-Adviser
could
be
expected
to
continue
to
provide
a
high
level
of
service
to
the
Fund;
that
the
performance
of
the
Fund
was
satisfactory
over
time,
or,
in
the
case
of
underperformance
by
a
Sub-
Adviser,
that
the
Board
retained
confidence
in
Management's
and
each
Sub-Adviser's
capabilities
to
manage
the
Fund;
that
the
Fund's
fee
structure
appeared
to
the
Board
to
be
reasonable
given
the
nature,
extent,
and
quality
of
services
provided;
and
that
the
benefits
accruing
to
Management
and
its
affiliates
by
virtue
of
their
relationship
with
the
Fund
were
reasonable
in
light
of
the
costs
of
providing
the
investment
advisory
and
other
services
and
the
benefits
accruing
to
the
Fund.
The
Board's
conclusions
may
be
based
in
part
on
its
consideration
of
materials
prepared
in
connection
with
the
approval
or
continuance
of
the
Agreements
in
prior
years
and
on
the
Board's
ongoing
regular
review
of
Fund
performance
and
operations
throughout
the
year,
in
addition
to
material
prepared
specifically
for
the
most
recent
annual
review
of
the
Agreements.
Neuberger
Berman
Investment
Advisers
LLC
1290
Avenue
of
the
Americas
New
York,
NY
10104–0002
Retail
Services:
800.877.9700
Broker-Dealer
and
Institutional
Services:
800.366.6264/888.556.9030
www.nb.com
Statistics
and
projections
in
this
report
are
derived
from
sources
deemed
to
be
reliable
but
cannot
be
regarded
as
a
representation
of
future
results
of
the
Fund.
This
report
is
prepared
for
the
general
information
of
shareholders
and
is
not
an
offer
of
shares
of
the
Fund.
Shares
are
sold
only
through
the
currently
effective
prospectus
which
you
can
obtain
by
calling
877.628.2583.
An
investor
should
consider
carefully
a
Fund’s
investment
objectives,
risks
and
fees
and
expenses,
which
are
described
in
its
prospectus,
before
investing.
Item 12. Disclosure of Proxy Voting Policies and Procedures for Closed-End Management Investment Companies.
Not applicable to the Registrant.
Item 13. Portfolio Managers of Closed-End Management Investment Companies.
Not applicable to the Registrant.
Item 14. Purchases of Equity Securities by Closed-End Management Investment Company and Affiliated Purchasers.
Not applicable to the Registrant.
Item 15. Submission of Matters to a Vote of Security Holders.
There were no changes to the procedures by which shareholders may recommend nominees to the Board.
Item 16. Controls and Procedures.
(a) Based on an evaluation of the disclosure controls and procedures (as defined in Rule 30a-3(c) under the Act) as of a date within 90 days of the filing date of this report, the Chief Executive Officer and President and the Treasurer and Principal Financial and Accounting Officer of the Registrant have concluded that such disclosure controls and procedures are effectively designed to ensure that information required to be disclosed by the Registrant on Form N-CSR is accumulated and communicated to the Registrant’s management to allow timely decisions regarding required disclosure.
(b) There were no significant changes in the Registrant’s internal controls over financial reporting (as defined in Rule 30a-3(d) under the Act) that occurred during the period covered by this report that have materially affected, or are reasonably likely to materially affect, the Registrant’s internal control over financial reporting.
Item 17. Disclosure of Securities Lending Activities for Closed-End Management Investment Companies.
Not applicable to the Registrant.
Item 18. Recovery of Erroneously Awarded Compensation.
Not applicable to the Registrant.
Item 19. Exhibits.
(a)(1) A copy of the Code of Ethics is filed herewith.
(a)(2) Not applicable to the Registrant.
(a)(3) The certifications required by Rule 30a-2(a) under the Act and Section 302 of the Sarbanes-Oxley Act of 2002 (“Sarbanes-Oxley Act”) are filed herewith.
(a)(4) Not applicable to the Registrant.
(a)(5) Not applicable to the Registrant.
(b) The certification required by Rule 30a-2(b) under the Act and Section 906 of the Sarbanes-Oxley Act is furnished herewith.
The certification furnished pursuant to Rule 30a-2(b) under the Act and Section 906 of the Sarbanes-Oxley Act will not be deemed “filed” for purposes of Section 18 of the Securities Exchange Act of 1934, as amended (“Exchange Act”), or otherwise subject to the liability of that section. Such certification will not be deemed to be incorporated by reference into any filing under the Securities Act of 1933, as amended, or the Exchange Act, except to the extent that the Registrant specifically incorporates it by reference.
SIGNATURES
Pursuant to the requirements of the Securities Exchange Act of 1934 and the Investment Company Act of 1940, the Registrant has duly caused this report to be signed on its behalf by the undersigned, thereunto duly authorized.
Neuberger Berman Alternative Funds
By: /s/ Joseph V. Amato
Joseph V. Amato
Chief Executive Officer and President
Date: January 6, 2025
Pursuant to the requirements of the Securities Exchange Act of 1934 and the Investment Company Act of 1940, this report has been signed below by the following persons on behalf of the Registrant and in the capacities and on the dates indicated.
By: /s/ Joseph V. Amato
Joseph V. Amato
Chief Executive Officer and President
Date: January 6, 2025
By: /s/ John M. McGovern
John M. McGovern
Treasurer and Principal Financial
and Accounting Officer
Date: January 6, 2025