UNITED STATES
SECURITIES AND EXCHANGE COMMISSION
Washington, D.C. 20549
FORM N-CSR
CERTIFIED SHAREHOLDER REPORT OF REGISTERED MANAGEMENT INVESTMENT COMPANIES
Investment Company Act File Number 811-21726
360 Funds
(Exact name of registrant as specified in charter)
| 4300 Shawnee Mission Pkwy, Suite 100 Fairway, KS | 66205 |
| (Address of principal executive offices) | (Zip code) |
The Corporation Trust Company
Corporation Trust Center
1209 Orange St.
Wilmington, DE 19801
(Name and address of agent for service)
With Copies To:
Bo J. Howell
Strauss Troy Co., LPA
Federal Reserve Building
150 E. 4th Street, 4th Floor
Cincinnati, OH 45202-4018
Registrant’s telephone number, including area code: 800-934-5550
Date of fiscal year end: 06/30/2021
Date of reporting period: 06/30/2021
| ITEM 1. | REPORTS TO SHAREHOLDERS |
The Annual report to Shareholders of the IMS Family of Funds, series of the 360 Funds (the “registrant”) for the year ended June 30, 2021 pursuant to Rule 30e-1 under the Investment Company Act of 1940 (the “1940 Act”), as amended (17 CFR 270.30e-1) is filed herewith.
IMS Capital Value Fund
IMS Strategic Income Fund
Annual Report
June 30, 2021
Fund Adviser:
IMS Capital Management, Inc.
8995 S.E. Otty Road
Portland, OR 97086
Toll Free (800) 934-5550
IMPORTANT NOTE: Beginning on January 1, 2021, as permitted by regulations adopted by the SEC, paper copies of the IMS Family of Funds’ shareholder reports will no longer be sent by mail unless you specifically request paper copies of the reports from an IMS Fund or from your financial intermediary, such as a broker-dealer or bank. Instead, the reports will be made available on a website, and you will be notified by mail each time a report is posted and provided with a website link to access the report. If you already elected to receive shareholder reports electronically, you will not be affected by this change and you need not take any action. You may elect to receive all future reports in paper free of charge. You can inform an IMS Fund or your financial intermediary that you wish to continue receiving paper copies of your shareholder reports by calling or sending an e-mail request. Your election to receive reports in paper will apply to all funds held with the IMS Family of Funds complex/your financial intermediary.
IMS CAPITAL VALUE FUND
MANAGEMENT’S DISCUSSION AND ANALYSIS (Unaudited)
Annual Report
June 30, 2021
Dear Fellow Shareholders,
The year ended June 30, 2021 delivered mixed results for U.S. Equity markets. The returns were volatile and unevenly distributed between value, growth, large cap and small cap. In this environment, the IMS Capital Value Fund (the “Value Fund” or “Fund”) returned a solid +40.16% for the fiscal year ended June 30, 2021. The Fund’s benchmark, the S &P 500® Index (“S&P 500”) returned +40.79% over the same period. The Value Fund’s one-year return was very similar to the Fund’s benchmark primarily due to the similarity and overlap of holdings.
Investors had to navigate many obstacles over the past year. During the beginning of the period, the economic impact of the global pandemic was still devastating economies around the globe. Towards the end of the period, economies were booming, wages and inflation were on the rise, and companies were having difficulties finding enough workers. The Federal Reserve has remained committed to the support and revival of the U.S. economy and Americans, as well as U.S. Corporations, have responded with innovation and hard work.
The Value Fund’s best performers over the past year included Alphabet, Inc. - Class C (GOOG) +77.17%, United Parcel Service, Inc. (UPS) +92.69%, Charles Schwab Corp. (SCHW) +117.96% and NVIDIA Corp. (NVDA) +112.05%. All four companies were bought prior to the start of the fiscal year when their share prices were depressed and undervalued. We still see tremendous opportunities for future growth in all four of these stocks but not without short term volatility as we navigate through the remainder of 2021 and beyond.
The Value Fund’s worst performers included Vistra Energy Corp. (VST) +0.23%, Bally’s Corp. (BALY)-1.24% and Tesla (TSLA) -12.84%. Extreme and prolonged winter ice storm in Texas temporarily devasted the power generated capabilities and the earnings of Vistra Energy, as millions of its customers were without power for over two weeks. Tesla was added to portfolio February 2021 and has pulled back a bit after quite a run in 2020 but still see opportunities for future growth beyond 2021.
We seek to invest in a diversified portfolio of quality hand-picked, long term growth companies that are temporarily undervalued. Over the past 25 years, our Fund’s prudent value approach has been consistent and we have remained true to our style even as value investing went in and out of favor. We thank you for investing alongside us in the IMS Capital Value Fund as we continue to focus on building wealth wisely.
Sincerely,
Carl W. Marker
Portfolio Manager
IMS Capital Value Fund
INVESTMENT RESULTS – (Unaudited)
| | | |
| | Average Annual Total Returns
(for the years ended June 30, 2021) | |
| | One Year | | Five Years | | Ten Years | |
| IMS Capital Value Fund * | 40.16% | | 12.14% | | 8.35% | |
| S&P 500® Total Return Index ** | 40.79% | | 17.64% | | 14.83% | |
| | |
| Total annual operating expenses, as disclosed in the Value Fund’s current prospectus dated October 28, 2020, were 1.89% of average daily net assets. IMS Capital Management, Inc. (the “Adviser”) contractually agreed to waive its management fee and/or reimburse expenses so that total annual fund operating expenses (excluding interest, taxes, brokerage fees and commissions, other expenditures that are capitalized in accordance with generally accepted accounting principles, acquired fund fees and expenses, other extraordinary expenses not incurred in the ordinary course of the Value Fund’s business, interest and dividend expense on securities sold short, and amounts, if any payable pursuant to a plan adopted in accordance with Rule 12b-1 under the Investment Company Act of 1940, as amended (the “1940 Act”)) do not exceed 1.95% of the Value Fund’s average daily net assets through October 31, 2021, subject to the Adviser’s right to recoup payments on a rolling three-year basis so long as the payment would not exceed the 1.95% expense cap. This expense cap agreement may be terminated by either party upon 60 days’ written notice prior to the end of the then-current term of the agreement. |
The performance quoted represents past performance, which does not guarantee future results. The investment return and principal value of an investment will fluctuate so that an investor’s shares, when redeemed, may be worth more or less than their original cost. The returns shown do not reflect the deduction of taxes that a shareholder would pay on Fund distributions or the redemption of Fund shares. Current performance of the Fund may be lower or higher than the performance quoted. The Fund’s investment objectives, risks, charges and expenses must be considered carefully before investing. Performance data current to the most recent month end may be obtained by calling Shareholder Services at 1-800-934-5550.
| * | Return figures reflect any change in price per share and assume the reinvestment of all distributions. |
| ** | The S&P 500® Total Return Index is a widely recognized unmanaged index of equity prices and is representative of a broader market and range of securities than is found in the Fund’s portfolio. Individuals cannot invest directly in the Index; however, an individual can invest in exchange-traded funds or other investment vehicles that attempt to track the performance of a benchmark index. The annual total returns included for the above Fund are net of the total annual operating expenses for the Fund, while no annual operating expenses are deducted for the S&P 500® Total Return Index. |
Comparison of the Growth of a $10,000 Investment in the IMS Capital Value Fund and the S&P 500®
Total Return Index for the 10 Years Ended June 30, 2021 (Unaudited)
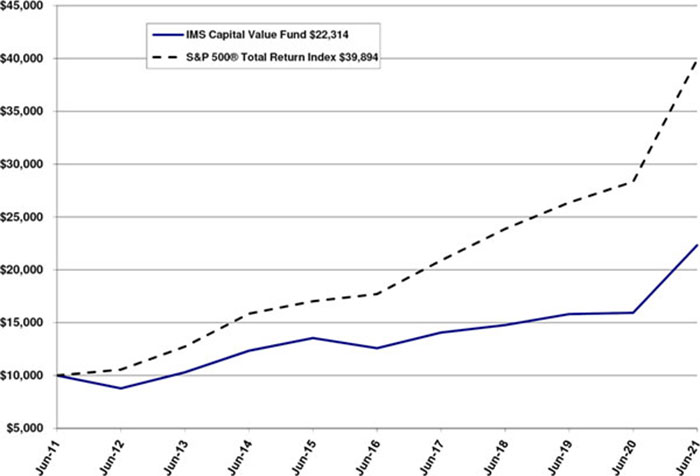
The chart above assumes an initial investment of $10,000 made on June 30, 2011 and held through June 30, 2021. The chart also assumes reinvestment of all dividends and distributions on the reinvestment dates during the period. THE FUND’S RETURN REPRESENTS PAST PERFORMANCE AND DOES NOT GUARANTEE FUTURE RESULTS. The returns shown do not reflect the deduction of taxes that a shareholder would pay on Fund distributions or the redemption of Fund shares. Investment returns and principal values will fluctuate so that your shares, when redeemed, may be worth more or less than their original purchase price.
IMS STRATEGIC INCOME FUND
MANAGEMENT’S DISCUSSION AND ANALYSIS (Unaudited)
Annual Report
June 30, 2021
Dear Fellow Shareholders,
As of June 30, 2021, the IMS Strategic Income Fund (the “Income Fund” or “Fund”) was 75% invested in bonds and 19% invested in dividend-paying stocks. High yield bonds made up 41% of the Income Fund, and investment grade bonds made up 34%. The 1-year period ending June 30, 2021 was unusual in that it began with excessive uncertainty about the course of Covid-19 and the prospects for vaccines, yet it ended with vaccines being widely available and adopted, record low interest rates, and huge fiscal and monetary stimulus. Over the 1-year period, the Income Fund’s benchmark, the Bloomberg Barclays U.S. Aggregate Bond Index (“Barclays Index”), broke even, down (0.33)% while the Income Fund posted a return of +28.53% with dividends reinvested. The Income Fund significantly outperformed its benchmark for several reasons. A percentage of the Income Fund’s assets were invested for income in dividend-paying stocks over the period, which helped the Income Fund’s returns. In addition, the types of bonds owned by the Income Fund performed significantly better that the types of bonds in the index.
For example, most of the Income Fund’s investment grade bonds are structured corporate notes, with adjustable coupon rates. When the Federal Reserve cut short-term rates to essentially zero, the steeper yield curve returned big coupons to these bonds. The Income Fund’s high yield bonds also performed well as many of the turnarounds that were in place prior to Covid-19, gained momentum as the economy reopened. Lower rates and ample liquidity also helped leveraged companies more than it helped the companies with pristine balance sheets.
The Fund had significant realized and unrealized gains in the bond prices of several leveraged companies such as American Airlines, Royal Caribbean and Ford Motor. The Fund also experienced a large realized loss on its bond holdings in Revlon as the bonds were called away at an unfavorable price. The Fund’s investment grade, structured corporate bonds issued by Morgan Stanley that mature in August of 2028, rose from $79 at the beginning of the period to $95 by the end, a 20% price increase, before factoring in the additional 5.5% coupon. Conversely, similar bonds issued by JP Morgan Chase purchased during the reporting period generated an unrealized loss of just over 9%, before accounting for the 8% coupon.
The 10-year Treasury yield started the fiscal year yielding 0.66%, and ended at 1.47%. This rising interest rate environment was not good for the performance of typical investment grade bonds. With the current strong economic growth in the U.S., and inflation above 3%, the obvious question is whether inflation will moderate to the 2% range or not. If inflation remains high for an extended period of time, some fear the Fed will be forced to buy fewer bonds and raise interest rates. We believe the current high inflation levels are transitory, meaning inflation will revert to the mean over time as our capacity to produce goods and services at normal levels returns.
The Income Fund has paid a dividend every month since its inception in November, 2002. The Income Fund will soon be entering its 20th anniversary year with an unbroken string of monthly dividends. The Income Fund’s ability to be strategic and flexible allows us the opportunity to invest in a wide range of income-producing securities as we continue to look for the best sources of current income. We believe that our Income Fund’s 75% allocation to specific and unique types of bonds provides a level of protection that is prudent in the current interest rate environment and will benefit shareholders over the long term. Going forward, we will be maintaining a strategic mix of carefully chosen bonds primarily along with a smaller percentage of income-producing stocks . We thank you for investing alongside us in the IMS Strategic Income Fund as we continue building wealth wisely.
Sincerely,
Carl W. Marker
Portfolio Manager
IMS Strategic Income Fund
INVESTMENT RESULTS - (Unaudited)
| | | |
| | Average Annual Total Returns
(for years ended June 30, 2021) | |
| | One Year | | Five Year | | Ten Year | |
| IMS Strategic Income Fund* | 28.53% | | 3.26% | | (1.13)% | |
| Bloomberg Barclays U.S. Aggregate Bond Index** | (0.33)% | | 3.02% | | 3.39% | |
| | |
| Total annual operating expenses, as disclosed in the Income Fund’s current prospectus dated October 28, 2020, were 3.64% of average daily net assets (1.98% after fee waivers/expense reimbursements by the Adviser). The Adviser contractually agreed to waive its management fee and/or reimburse expenses so that total annual fund operating expenses(excluding interest, taxes, brokerage fees and commissions, other expenditures that are capitalized in accordance with generally accepted accounting principles, acquired fund fees and expenses, other extraordinary expenses not incurred in the ordinary course of the Income Fund’s business, interest and dividend expense on securities sold short, and amounts, if any payable pursuant to a plan adopted in accordance with Rule 12b-1 under the 1940 Act) do not exceed 1.95% of the Income Fund’s average daily net assets through October 31, 2021, subject to the Adviser’s right to recoup payments on a rolling three-year basis so long as the payment would not exceed the 1.95% expense cap. This expense cap agreement may be terminated by either party upon 60 days’ written notice prior to the end of the then-current term of the agreement. |
The performance quoted represents past performance, which does not guarantee future results. The investment return and principal value of an investment will fluctuate so that an investor’s shares, when redeemed, may be worth more or less than their original cost. The returns shown do not reflect the deduction of taxes that a shareholder would pay on Fund distributions or the redemption of Fund shares. Current performance of the Fund may be lower or higher than the performance quoted. The Fund’s investment objectives, risks, charges and expenses must be considered carefully before investing. Performance data current to the most recent month end may be obtained by calling Shareholder Services at 1-800-934-5550.
| * | Return figures reflect any change in price per share and assume the reinvestment of all distributions. |
| ** | The Bloomberg Barclays U.S. Aggregate Bond Index is a widely-used indicator of the bond market. The index is market capitalization-weighted and is made up of U.S. bonds that are primarily investment grade and has a greater number of securities than is found in the Fund’s portfolio. Individuals cannot invest directly in the Index; however, an individual can invest in exchange-traded funds or other investment vehicles that attempt to track the performance of a benchmark index. The annual total returns included for the above Fund are net of the total annual operating expenses for the Fund, while no annual operating expenses are deducted for the Bloomberg Barclays U.S. Aggregate Bond Index. |
Comparison of the Growth of a $10,000 Investment in the IMS Strategic Income Fund and the
Bloomberg Barclays U.S. Aggregate Bond Index for the 10 Years Ended June 30, 2021 (Unaudited)
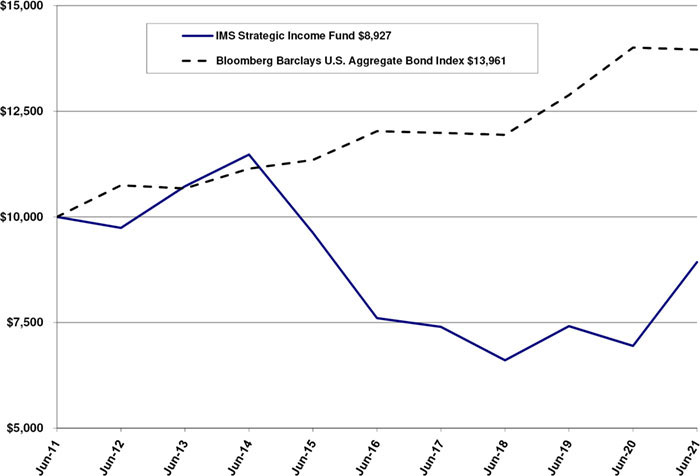
The chart above assumes an initial investment of $10,000 made on June 30, 2011 and held through June 30, 2021. The chart also assumes reinvestment of all dividends and distributions on the reinvestment dates during the period. THE FUND’S RETURN REPRESENTS PAST PERFORMANCE AND DOES NOT GUARANTEE FUTURE RESULTS. The returns shown do not reflect the deduction of taxes that a shareholder would pay on Fund distributions or the redemption of Fund shares. Investment returns and principal values will fluctuate so that your shares, when redeemed, may be worth more or less than their original purchase price.
FUND HOLDINGS – (Unaudited)
IMS Capital Value Fund Holdings as of June 30, 20211
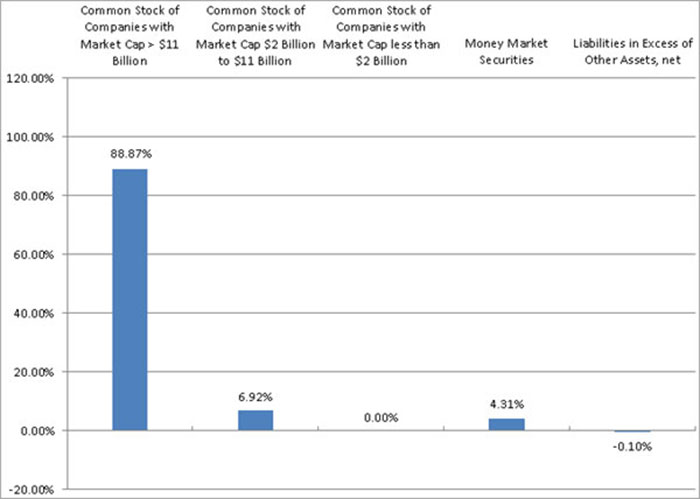
1As a percent of net assets.
The investment objective of the Value Fund is long-term growth from capital appreciation, and secondarily, income from dividends. The Value Fund typically invests in mid-cap securities, which the Adviser defines as those with a market capitalization of approximately $2 billion to $11 billion, and in large-cap securities, which the Adviser defines as those with a market capitalization of greater than $11 billion.
FUND HOLDINGS – (Unaudited) (continued)
IMS Strategic Income Fund Holdings as of June 30, 20211
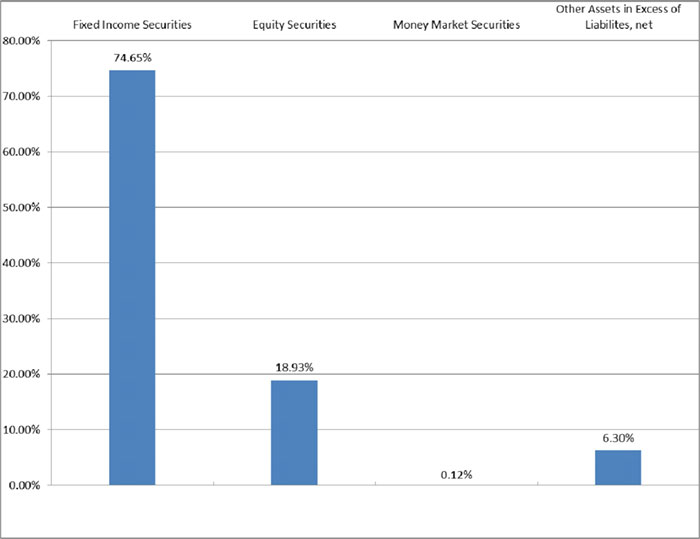
1 As a percent of net assets.
The investment objective of the Income Fund is current income, and a secondary objective of capital appreciation. In pursuing its investment objectives, the Income Fund will generally invest in corporate bonds, government bonds, dividend-paying common stocks, preferred and convertible preferred stocks, income trusts (including business trusts, oil royalty trusts and real estate investment trusts), money market instruments and cash equivalents. The Income Fund may also invest in structured products, such as reverse convertible notes, a type of structured note, and in 144A securities that are purchased in private placements and thus are subject to restrictions on resale (either as a matter of contract or under federal securities laws), but only where the Adviser has determined that a liquid trading market exists. Under normal circumstances, the Income Fund will invest at least 80% of its assets in dividend paying or other income producing securities.
Summary of Funds’ Expenses – (Unaudited)
As a shareholder of the Funds, you incur two types of costs: (1) transaction costs, such as short-term redemption fees; and (2) ongoing costs, including management fees and other Fund expenses. This Example is intended to help you understand your ongoing costs (in dollars) of investing in the Funds and to compare these costs with the ongoing costs of investing in other mutual funds.
The example is based on an investment of $1,000 invested at the beginning of the period and held for the entire period (January 1, 2021 through June 30, 2021).
Actual Expenses
The first line of the table below provides information about actual account values and actual expenses. You may use the information in this line, together with the amount you invested, to estimate the expenses that you paid over the period. Simply divide your account value by $1,000 (for example, an $8,600 account value divided by $1,000 = 8.60), then multiply the result by the number in the first line under the heading entitled “Expenses Paid During Period” to estimate the expenses you paid on your account during this period.
Hypothetical Example for Comparison Purposes
The second line of the table below provides information about hypothetical account values and hypothetical expenses based on the Funds’ actual expense ratios and an assumed rate of return of 5% per year before expenses, which are not the Funds’ actual returns. The hypothetical account values and expenses may not be used to estimate the actual ending account balance or expenses you paid for the period. You may use this information to compare the ongoing costs of investing in the Funds and other funds. To do so, compare this 5% hypothetical example with the 5% hypothetical examples that appear in the shareholder reports of other funds.
Please note that the expenses shown in the table are meant only to highlight your ongoing costs and do not reflect any transactional costs, such as short-term redemption fees. Therefore, the second line is only useful in comparing ongoing costs only and will not help you determine the relative costs of owning different funds. In addition, if these transactions costs were included, your costs would have been higher.
| IMS Funds | Beginning
Account Value
January 1, 2021 | Ending Account
Value
June 30, 2021 | Expenses Paid
During the Period*
January 1, 2021 –
June 30, 2021 |
| Capital Value Fund | | | | | | |
| Actual (+13.45%) | $ | 1,000.00 | $ | 1,134.50 | $ | 9.84 |
| Hypothetical** | $ | 1,000.00 | $ | 1,015.60 | $ | 9.30 |
| Strategic Income Fund | | | | | | |
| Actual (+13.52)% | $ | 1,000.00 | $ | 1,135.20 | $ | 10.32 |
| Hypothetical** | $ | 1,000.00 | $ | 1,015.10 | $ | 9.74 |
| | | | | | | |
| * | Expenses are equal to the Funds’ annualized expense ratios, multiplied by the average account value over the period, multiplied by 181/365 (to reflect the one-half year period). The annualized expense ratios for the Capital Value Fund and the Strategic Income Fund were 1.86% and 1.95%, respectively. |
| ** | Assumes a 5% annual return before expenses. |
IMS CAPITAL VALUE FUND
SCHEDULE OF INVESTMENTS
June 30, 2021
| COMMON STOCK - 95.79% | | Shares | | | Value | |
| | | | | | | |
| Communication Services - 14.67% | | | | | | | | |
| Alphabet, Inc. - Class C (a) | | | 900 | | | $ | 2,255,688 | |
| Facebook, Inc. - Class A (a) | | | 6,400 | | | | 2,225,344 | |
| Verizon Communications, Inc. | | | 13,400 | | | | 750,802 | |
| Walt Disney Co. (a) | | | 8,100 | | | | 1,423,737 | |
| | | | | | | | 6,655,571 | |
| Consumer Discretionary - 28.99% | | | | | | | | |
| Amazon.com, Inc. (a) | | | 590 | | | | 2,029,694 | |
| Bally’s Corp. (a) | | | 23,500 | | | | 1,271,585 | |
| Booking Holdings, Inc. (a) | | | 555 | | | | 1,214,390 | |
| Carnival Corp. (a) | | | 35,300 | | | | 930,508 | |
| Dollar Tree, Inc. (a) | | | 6,500 | | | | 646,750 | |
| Domino’s Pizza, Inc. | | | 887 | | | | 413,777 | |
| Expedia Group, Inc. (a) | | | 8,665 | | | | 1,418,547 | |
| Hilton Worldwide Holdings, Inc. (a) | | | 13,200 | | | | 1,592,184 | |
| Home Depot, Inc. | | | 2,720 | | | | 867,381 | |
| Royal Caribbean Cruises Ltd. (a) | | | 15,100 | | | | 1,287,728 | |
| Starbucks Corp. | | | 6,962 | | | | 778,421 | |
| Tesla, Inc. (a) | | | 1,025 | | | | 696,692 | |
| | | | | | | | 13,147,657 | |
| Energy - 1.92% | | | | | | | | |
| Chevron Corp. | | | 8,315 | | | | 870,913 | |
| | | | | | | | | |
| Financials - 6.23% | | | | | | | | |
| Charles Schwab Corp. | | | 11,530 | | | | 839,499 | |
| Wells Fargo & Co. | | | 43,900 | | | | 1,988,231 | |
| | | | | | | | 2,827,730 | |
| Health Care - 3.55% | | | | | | | | |
| Johnson & Johnson | | | 4,000 | | | | 658,960 | |
| UnitedHealth Group, Inc. | | | 2,379 | | | | 952,647 | |
| | | | | | | | 1,611,607 | |
| Industrials - 15.21% | | | | | | | | |
| Boeing Co. (a) | | | 6,620 | | | | 1,585,887 | |
| Delta Air Lines, Inc. (a) | | | 28,800 | | | | 1,245,888 | |
| General Electric Co. | | | 113,200 | | | | 1,523,672 | |
| Southwest Airlines Co. (a) | | | 29,840 | | | | 1,584,206 | |
| United Parcel Service, Inc. - Class B | | | 4,600 | | | | 956,662 | |
| | | | | | | | 6,896,315 | |
IMS CAPITAL VALUE FUND
SCHEDULE OF INVESTMENTS
June 30, 2021
| COMMON STOCK - 95.79% (continued) | | Shares | | | Value | |
| | | | | | | |
| Information Technology - 21.10% | | | | | | | | |
| Apple, Inc. | | | 14,600 | | | $ | 1,999,616 | |
| Broadcom, Inc. | | | 1,630 | | | | 777,249 | |
| Microsoft Corp. | | | 6,300 | | | | 1,706,670 | |
| NVIDIA Corp. | | | 1,465 | | | | 1,172,146 | |
| PayPal Holdings, Inc. (a) | | | 2,766 | | | | 806,234 | |
| QUALCOMM, Inc. | | | 5,388 | | | | 770,107 | |
| Salesforce.com, Inc. (a) | | | 3,249 | | | | 793,633 | |
| Texas Instruments, Inc. | | | 4,375 | | | | 841,313 | |
| Visa, Inc. - Class A | | | 3,000 | | | | 701,460 | |
| | | | | | | | 9,568,428 | |
| Utilities - 4.12% | | | | | | | | |
| Vistra Corp. | | | 100,620 | | | | 1,866,501 | |
| | | | | | | | | |
| TOTAL COMMON STOCK (Cost $32,618,535) | | | | | | | 43,444,722 | |
| | | | | | | | | |
| MONEY MARKET SECURITIES - 4.31% | | | | | | | | |
| Federated Hermes Government Obligations Fund - Institutional Shares, 0.01% (b) | | | 1,953,342 | | | | 1,953,342 | |
| | | | | | | | | |
| TOTAL MONEY MARKET SECURITIES (Cost $1,953,342) | | | | | | | 1,953,342 | |
| | | | | | | | | |
| TOTAL INVESTMENTS AT VALUE (Cost $34,571,877) - 100.10% | | | | | | $ | 45,398,064 | |
| LIABILITES IN EXCESS OF OTHER ASSETS, NET - (0.10%) | | | | | | | (43,594 | ) |
| NET ASSETS - 100.00% | | | | | | $ | 45,354,470 | |
| Percentages are stated as a percent of net assets. |
| |
| (a) Non-income producing security. |
| (b) Rate shown represents the 7-day yield at June 30, 2021, is subject to change and resets daily. |
| |
| The following abbreviations are used in this portfolio: |
| Ltd. - Limited |
| |
| See accompanying notes which are an integral part of these financial statements. |
IMS STRATEGIC INCOME FUND
SCHEDULE OF INVESTMENTS
June 30, 2021
| COMMON STOCK - 18.93% | | Shares | | | Value | |
| | | | | | | |
| Communication Services - 1.95% | | | | | | | | |
| Verizon Communications, Inc. | | | 5,300 | | | $ | 296,959 | |
| | | | | | | | | |
| Consumer Staples - 1.97% | | | | | | | | |
| General Mills, Inc. | | | 4,900 | | | | 298,557 | |
| | | | | | | | | |
| Financials - 5.49% | | | | | | | | |
| JPMorgan Chase & Co. | | | 2,000 | | | | 311,080 | |
| New York Community Bancorp, Inc. | | | 21,700 | | | | 239,134 | |
| Valley National Bancorp. | | | 21,100 | | | | 283,373 | |
| | | | | | | | 833,587 | |
| Health Care - 5.61% | | | | | | | | |
| AbbVie, Inc. | | | 2,600 | | | | 292,864 | |
| Bristol Myers Squibb Co. | | | 4,500 | | | | 300,690 | |
| Patterson Cos., Inc. | | | 8,500 | | | | 258,315 | |
| | | | | | | | 851,869 | |
| Industrials - 1.96% | | | | | | | | |
| General Dynamics Corp. | | | 1,580 | | | | 297,451 | |
| | | | | | | | | |
| Information Technology - 1.95% | | | | | | | | |
| Cisco Systems, Inc. | | | 5,600 | | | | 296,800 | |
| | | | | | | | | |
| TOTAL COMMON STOCK (Cost $2,961,332) | | | | | | | 2,875,223 | |
| CORPORATE BONDS - 48.36% | | Principal Amount | | | | |
| | | | | | | |
| American Airlines Group, Inc., 5.000%, due 06/01/2022 (a) | | $ | 300,000 | | | | 300,003 | |
| American Airlines Group, Inc., 3.750%, due 03/01/2025 (a) | | | 525,000 | | | | 483,656 | |
| Bombardier, Inc., 6.000%, due 10/15/2022 - Canada (b) | | | 750,000 | | | | 750,938 | |
| Enterprise Products Operating LLC, 4.875%, due 08/16/2077 | | | 650,000 | | | | 638,025 | |
| Genworth Holdings, Inc., 7.625%, due 09/24/2021 | | | 125,000 | | | | 126,925 | |
| Navient Corp., 5.625%, due 08/01/2033 | | | 600,000 | | | | 580,074 | |
| Nordstrom, Inc., 5.000%, due 01/15/2044 | | | 500,000 | | | | 500,427 | |
| Rite Aid Corp., 7.700%, due 02/15/2027 | | | 640,000 | | | | 609,126 | |
| Royal Caribbean Cruises Ltd., 3.700%, due 03/15/2028 - Liberia | | | 700,000 | | | | 668,563 | |
| Service Property Trust, 3.950%, due 01/15/2028 | | | 725,000 | | | | 683,312 | |
| Staples,Inc., 10.750%, due 04/15/2027 (a) | | | 600,000 | | | | 609,990 | |
| Tenneco, Inc., 5.000%, due 07/15/2026 | | | 750,000 | | | | 746,025 | |
| United States Steel Corp., 6.650%, due 06/01/2037 | | | 605,000 | | | | 647,350 | |
| | | | | | | | | |
| TOTAL CORPORATE BONDS (Cost $7,084,974) | | | | | | | 7,344,414 | |
| | | | | | | | | |
| STRUCTURED NOTES - 26.29% | | | | | | | | |
| | | | | | | | | |
| Bank of Montreal Autocallable Barrier Notes, 7.000%, due 01/15/2026 - Canada (c)(d) | | | 550,000 | | | | 554,620 | |
| Citigroup Global Markets Holdings, Inc. Callable Range Accrual Notes, 7.000%, due 04/16/2035 (c) (e) | | | 190,000 | | | | 182,514 | |
| Citigroup Global Markets Holdings, Inc. Callable Fixed to Float Range Accrual Notes, 7.250%, due 01/29/2041 (c) (f) | | | 600,000 | | | | 569,220 | |
| JPMorgan Chase Financial Co. LLC Callable Range Accrual Notes, 8.000%, due 01/25/2036 (c) (g) | | | 600,000 | | | | 527,340 | |
| JPMorgan Chase Financial Co. LLC Callable Range Accrual Notes, 9.000%, due 02/26/2036 (c) (h) | | | 500,000 | | | | 448,450 | |
| Morgan Stanley Fixed to Floating Rate Leveraged CMS and Index Linked Notes, 8.850%, due 08/30/2028 (c) (i) | | | 350,000 | | | | 332,500 | |
| Morgan Stanley Fixed to Floating Rate Index Linked Notes, 5.812%, due 05/30/2034 (c) (j) | | | 600,000 | | | | 516,000 | |
| Societe Generale SA Callable Fixed to Floating Rate CMS and Index Linked Note, 10.000%, 06/28/2034 - France (c) (k) | | | 325,000 | | | | 293,703 | |
| Societe Generale SA Callable Fixed to Floating Rate CMS and Index Linked Note, 9.000%, 02/19/2036 - France (c) (l) | | | 600,000 | | | | 569,040 | |
| | | | | | | | | |
| TOTAL STRUCTURED NOTES (Cost $4,235,826) | | | | | | | 3,993,387 | |
IMS STRATEGIC INCOME FUND
SCHEDULE OF INVESTMENTS
June 30, 2021
| | | Shares | | | Value | |
| MONEY MARKET SECURITIES - 0.12% | | | | | | | | |
| Federated Hermes Government Obligations Fund - Institutional Shares, 0.01% (m) | | | 18,554 | | | $ | 18,554 | |
| | | | | | | | | |
| TOTAL MONEY MARKET SECURITIES (Cost $18,554) | | | | | | | 18,554 | |
| | | | | | | | | |
| TOTAL INVESTMENTS AT VALUE (Cost $14,300,686) - 93.70% | | | | | | $ | 14,231,578 | |
| OTHER ASSETS IN EXCESS OF LIABILITIES, NET - 6.30% | | | | | | | 956,280 | |
| NET ASSETS - 100.00% | | | | | | $ | 15,187,858 | |
| Percentages are stated as a percent of net assets. |
| |
| (a) Security exempted from registration under Rule 144A of the Securities Act of 1933. The security may be resold in transactions exempt from registration, normally to qualified institutional investors. |
| (b) Security exempted from registration under Regulation S of the Securities Act of 1933. |
| (c) Variable rate security. Rate shown represents the rate in effect at June 30, 2021. |
| (d) The notes will pay a Contingent Coupon on each Contingent Coupon Payment Date at the Contingent Interest Rate of 1.750% per quarter (approximately 7.00% per annum) if the closing level of each Reference Asset on the applicable quarterly Observation Date is greater than its Coupon Barrier Level. However, if the closing level of any Reference Asset is less than or equal to its Coupon Barrier Level on an Observation Date, the notes will not pay the Contingent Coupon for that Observation Date. |
| (e) Contingent interest will accrue on the notes during each accrual period at 7.00% per annum only for each elapsed day during that accrual period on which the accrual condition is satisfied. The accrual condition will be satisfied on an elapsed day only if (i) the CMS spread is greater than the CMS spread barrier (meaning that CMS30 is greater than CMS2) on that day and (ii) the closing level of each underlying index on that day is greater than or equal to its accrual barrier level. |
| (f) The note will pay interest at a fixed rate of 7.25% per annum for the first 1.5 years following issuance. After the first 1.5 years, contingent interest will accrue on the securities during each accrual period at 7.25% only for each elapsed day during that accrual period on which the accrual condition is satisfied. The accrual condition will be satisfied on an elapsed day only if (i) the CMS spread is greater than or equal to the CMS spread barrier (meaning that CMS30 is greater than or equal to CMS2) on that day and (ii) the closing level of each underlying index on that day is greater than or equal to its accrual barrier level. |
| (g) The interest rate during the Initial Interest Periods from the Original Issue Date of the notes and ending on but excluding January 22, 2022 shall be 8.00% per annum. Thereafter, the interest rate will depend on the number of calendar days during any given interest period on which the accrual provision is satisfied. The accrual provision shall be deemed to have been satisfied on each calendar day during such interest period on which (i) the closing level of the S&P 500 Index, as determined on the accrual determination date relating to such calendar day, is greater than or equal to the minimum index level and (ii) the closing level of the EURO STOXX 50 Index, as determined on the accrual determination date relating to such calendar day, is greater than or equal to its minimum index level subject to a minimum interest rate of 0.00% per annum and a maximum interest rate of 10.00% per annum. |
| (h) The interest rate during the Initial Interest Periods from the Original Issue Date of the notes and ending on but excluding February 26, 2022 shall be 9.00% per annum. After the Initial Interest Periods, interest will accrue for each other Interest Period, at a per annum rate equal to the Spread (the 30-Year ICE Swap Rate minus the 2-Year ICE Swap Rate) on the applicable Determination Date for such Interest Period multiplied by the Multiplier, provided that the Closing Level of each Index on each Accrual Determination Date during such Interest Period is greater than or equal to its Minimum Index Level (for each Index, 70.00% of its Initial Value), and subject to the Maximum Interest Rate of 9.00% and the Minimum Interest Rate of 0.00%. |
| (i) The variable rate is equal to 5 times the difference, if any, between the 30-Year Constant Maturity Swap Rate (“30CMS”) and the 2-year Constant Maturity Swap Rate (“2CMS”) as determined on the CMS reference determination date at the start of the quarterly interest payment period; subject to a maximum interest rate of 12.00% per annum for each interest payment period during the floating rate interest period and the minimum interest rate of 0.00% per annum. |
| (j) Interest will accrue on the securities (i) in Years 1 to 3: at a rate of 10.00% per annum and (ii) in Years 4 to maturity: for each day that the closing value of the S&P 500® Index is greater than or equal to 50% of the initial index value (which we refer to as the index reference level), at a variable rate per annum equal to 4 times the difference, if any, between the 30-Year Constant Maturity Swap Rate (“30CMS”) and the 2-Year Constant Maturity Swap Rate (“2CMS”), as determined on the CMS reference determination date at the start of the related monthly interest payment period; subject to the maximum interest rate of 10.00% per annum for each interest payment period during the floating interest rate period and the minimum interest rate of 0.00% per annum. |
| (k) For each Interest Period commencing on or after the Original Issue Date through January 2021 (the “Fixed Rate Period”), the interest rate per annum will be equal to the Fixed Interest Rate of 10.000%. For each Interest Period beginning in January 2021 (the “Floating Rate Period”), the interest rate per annum will be equal to the product of (a) the 30-Year Constant Maturity Swap Rate minus the 2-Year Constant Maturity Swap Rate multiplied by the number of days the accrual condition is met divided by the number of days in the accrual period and (b) the Multiplier rate of 50, subject to the Maximum Interest Rate of 10.000% and the Minimum Interest Rate of 0.000%. The accrual condition is satisfied on days where RTY and SX7E are greater than or equal to 60% of the initial index level. |
| (l) The Notes pay interest (i) in the first two years, at a fixed rate of 9.00% per annum and (ii) after the first two years to maturity or early redemption by us, at the Variable Rate per annum described below, subject to the Maximum Coupon Rate of 10.00% per annum and the Minimum Coupon Rate of 0.00% per annum. The “Variable Rate” for each Coupon Period commencing on or after the Fixed Rate Cutoff Date will be the rate computed based on the following formula: Variable Base Rate × (Variable Days/Actual Days). The “Variable Base Rate” for each Coupon Period will be the product of (i) the 30 Year CMS Rate on the related CMS Determination Date minus the 2 Year CMS Rate on the related CMS Determination Date (the “CMS Reference Spread”) and (ii) the Multiplier, subject to the Maximum Coupon Rate and the Minimum Coupon Rate. |
| (m) Rate shown represents the 7-day effective yield at June 30, 2021, is subject to change and resets daily. |
| |
| See accompanying notes which are an integral part of these financial statements. |
| IMS FAMILY OF FUNDS |
| STATEMENTS OF ASSETS AND LIABILITIES |
| June 30, 2021 |
| | | IMS Capital
Value Fund | | | IMS Strategic
Income Fund | |
| Assets: | | | | | | |
| Investments in securities: | | | | | | | | |
| At cost | | $ | 34,571,877 | | | $ | 14,300,686 | |
| At value | | $ | 45,398,064 | | | $ | 14,231,578 | |
| Receivables: | | | | | | | | |
| Interest | | | 3 | | | | 171,044 | |
| Dividends | | | 1,366 | | | | 27,187 | |
| Fund shares sold | | | 17,009 | | | | - | |
| Investments sold | | | - | | | | 780,214 | |
| Prepaid expenses | | | 9,550 | | | | 6,568 | |
| Total assets | | | 45,425,992 | | | | 15,216,591 | |
| | | | | | | | | |
| Liabilities: | | | | | | | | |
| Payables: | | | | | | | | |
| Due to Adviser | | | 43,378 | | | | 1,748 | |
| Due to administrator, fund accountant and transfer agent | | | 4,778 | | | | 3,962 | |
| Accrued expenses | | | 23,366 | | | | 23,023 | |
| Total liabilities | | | 71,522 | | | | 28,733 | |
| Net Assets | | $ | 45,354,470 | | | $ | 15,187,858 | |
| | | | | | | | | |
| Net Assets consist of: | | | | | | | | |
| Paid-in capital | | $ | 29,231,925 | | | $ | 37,638,937 | |
| Total distributable earnings (accumulated deficit) | | | 16,122,545 | | | | (22,451,079 | ) |
| Total Net Assets | | $ | 45,354,470 | | | $ | 15,187,858 | |
| | | | | | | | | |
| Shares outstanding (unlimited number of shares authorized, no par value) | | | 1,468,747 | | | | 5,454,091 | |
| Net asset value and offering price per share | | $ | 30.88 | | | $ | 2.78 | |
| Minimum redemption price per share (a) | | $ | 30.73 | | | $ | 2.77 | |
(a) A redemption fee of 0.50% will be assessed on shares of the Fund that are redeemed within 90 days of purchase.
See accompanying notes which are an integral part of these financial statements.
IMS FAMILY OF FUNDS
STATEMENTS OF OPERATIONS
For the Year Ended June 30, 2021
| | | IMS Capital Value Fund | | | IMS Strategic Income Fund | |
| | | | | | | |
| Investment income: | | | | | | | | |
| Dividends (net of foreign withholding taxes of $0 and $1,602, respectively) | | $ | 431,931 | | | $ | 553,175 | |
| Interest | | | 50 | | | | 491,998 | |
| Total investment income | | | 431,981 | | | | 1,045,173 | |
| | | | | | | | | |
| Expenses: | | | | | | | | |
| Investment Adviser fees (a) | | | 450,449 | | | | 168,177 | |
| Accounting, administration and transfer agent fees and expenses (a) | | | 128,276 | | | | 104,779 | |
| Printing expenses | | | 18,352 | | | | 18,352 | |
| Trustee expenses | | | 17,422 | | | | 19,222 | |
| Miscellaneous expenses | | | 13,815 | | | | 12,090 | |
| Audit expenses | | | 13,000 | | | | 13,000 | |
| Legal expenses | | | 9,838 | | | | 9,479 | |
| Registration expenses | | | 9,670 | | | | 11,109 | |
| Custodian expenses | | | 9,087 | | | | 8,014 | |
| Pricing expenses | | | 6,402 | | | | 14,623 | |
| Shareholder networking fees | | | 6,070 | | | | 1,837 | |
| Interest expenses | | | 3,398 | | | | 275 | |
| Insurance expenses | | | 3,354 | | | | 1,041 | |
| Compliance fees (a) | | | 1,250 | | | | 1,250 | |
| Total expenses | | | 690,383 | | | | 383,248 | |
| Less: Fees waived and expenses reimbursed by Adviser (a) | | | — | | | | (91,367 | ) |
| Less: Fees waived by administrator (a) | | | — | | | | (31,333 | ) |
| Net expenses | | | 690,383 | | | | 260,548 | |
| | | | | | | | | |
| Net Investment Income (Loss) | | | (258,402 | ) | | | 784,625 | |
| | | | | | | | | |
| Realized and unrealized gain on investment securities: | | | | | | | | |
| Net realized gain on investment securities | | | 5,646,504 | | | | 1,194,571 | |
| Change in unrealized appreciation on investment securities | | | 6,823,187 | | | | 1,364,989 | |
| | | | | | | | | |
| Net realized and unrealized gain on investment securities | | | 12,469,691 | | | | 2,559,560 | |
| | | | | | | | | |
| Net Increase in Net Assets Resulting from Operations | | $ | 12,211,289 | | | $ | 3,344,185 | |
| (a) | See Note 4 in the Notes to Financial Statements. |
See accompanying notes which are an integral part of these financial statements.
IMS CAPITAL VALUE FUND
STATEMENTS OF CHANGES IN NET ASSETS
| | | Year Ended
June 30, 2021 | | | Year Ended
June 30, 2020 | |
| Increase (Decrease) in Net Assets due to: | | | | | | | | |
| Operations: | | | | | | | | |
| Net investment income (loss) | | $ | (258,402 | ) | | $ | 75,999 | |
| Net realized gain on investment securities | | | 5,646,504 | | | | 769,332 | |
| Change in unrealized appreciation (depreciation) on investment securities | | | 6,823,187 | | | | (630,121 | ) |
| Net increase in net assets resulting from operations | | | 12,211,289 | | | | 215,210 | |
| | | | | | | | | |
| Distributions to shareholders from: | | | | | | | | |
| Distributable earnings | | | (758,070 | ) | | | (1,530,350 | ) |
| Total Distributions | | | (758,070 | ) | | | (1,530,350 | ) |
| | | | | | | | | |
| Capital share transactions: | | | | | | | | |
| Proceeds from shares purchased | | | 5,481,414 | | | | 3,413,602 | |
| Reinvestment of distributions | | | 747,648 | | | | 1,507,069 | |
| Amount paid for shares redeemed | | | (3,570,563 | ) | | | (2,734,633 | ) |
| Proceeds from redemption fees | | | 169 | | | | 33 | |
| Net increase in net assets from share transactions | | | 2,658,668 | | | | 2,186,071 | |
| | | | | | | | | |
| Total Increase in Net Assets | | | 14,111,887 | | | | 870,931 | |
| | | | | | | | | |
| Net Assets: | | | | | | | | |
| Beginning of year | | | 31,242,583 | | | | 30,371,652 | |
| | | | | | | | | |
| End of year | | $ | 45,354,470 | | | $ | 31,242,583 | |
| | | | | | | | | |
| Capital Share Transactions | | | | | | | | |
| Shares purchased | | | 187,754 | | | | 148,369 | |
| Shares issued in reinvestment of distributions | | | 27,866 | | | | 62,199 | |
| Shares redeemed | | | (135,198 | ) | | | (116,464 | ) |
| Net increase in capital shares | | | 80,422 | | | | 94,104 | |
See accompanying notes which are an integral part of these financial statements.
IMS STRATEGIC INCOME FUND
STATEMENTS OF CHANGES IN NET ASSETS
| | | Year Ended
June 30, 2021 | | | Year Ended
June 30, 2020 | |
| Increase (Decrease) in Net Assets due to: | | | | | | | | |
| Operations: | | | | | | | | |
| Net investment income | | $ | 784,625 | | | $ | 519,999 | |
| Net realized gain (loss) on investment securities | | | 1,194,571 | | | | (1,029,136 | ) |
| Change in unrealized appreciation (depreciation) on investment securities | | | 1,364,989 | | | | (87,854 | ) |
| Net increase (decrease) in net assets resulting from operations | | | 3,344,185 | | | | (596,991 | ) |
| | | | | | | | | |
| Distributions to shareholders from: | | | | | | | | |
| Distributable earnings | | | (831,614 | ) | | | (483,725 | ) |
| Total Distributions | | | (831,614 | ) | | | (483,725 | ) |
| | | | | | | | | |
| Capital share transactions: | | | | | | | | |
| Proceeds from shares purchased | | | 1,753,728 | | | | 7,410,959 | |
| Reinvestment of distributions | | | 816,000 | | | | 464,385 | |
| Amount paid for shares redeemed | | | (1,636,908 | ) | | | (967,512 | ) |
| Proceeds from redemption fees | | | — | | | | 1,076 | |
| Net increase in net assets from share transactions | | | 932,820 | | | | 6,908,908 | |
| | | | | | | | | |
| Total Increase in Net Assets | | | 3,445,391 | | | | 5,828,192 | |
| | | | | | | | | |
| Net Assets: | | | | | | | | |
| Beginning of year | | | 11,742,467 | | | | 5,914,275 | |
| | | | | | | | | |
| End of year | | $ | 15,187,858 | | | $ | 11,742,467 | |
| | | | | | | | | |
| Capital Share Transactions | | | | | | | | |
| Shares purchased | | | 662,160 | | | | 3,047,727 | |
| Shares issued in reinvestment of distributions | | | 313,877 | | | | 193,445 | |
| Shares redeemed | | | (634,798 | ) | | | (391,184 | ) |
| Net increase in capital shares | | | 341,239 | | | | 2,849,988 | |
See accompanying notes which are an integral part of these financial statements.
IMS CAPITAL VALUE FUND
FINANCIAL HIGHLIGHTS
For a Fund share outstanding throughout each year
| | | For the Years Ended | |
| | | June 30, 2021 | | | June 30, 2020 | | | June 30, 2019 | | | June 30, 2018 | | | June 30, 2017 | |
| | | | | | | | | | | | | | | | |
| Net Asset Value, Beginning of Year | | $ | 22.50 | | | $ | 23.47 | | | | 24.75 | | | $ | 24.05 | | | $ | 21.52 | |
| | | | | | | | | | | | | | | | | | | | | |
| Investment Operations: | | | | | | | | | | | | | | | | | | | | |
| Net investment income (loss) | | | (0.18 | ) | | | 0.06 | | | | (0.02 | ) | | | (0.00 | )(a) | | | 0.02 | |
| Net realized and unrealized gain on investments | | | 9.13 | | | | 0.21 | | | | 1.27 | | | | 1.22 | | | | 2.51 | |
| Total from investment operations | | | 8.95 | | | | 0.27 | | | | 1.25 | | | | 1.22 | | | | 2.53 | |
| | | | | | | | | | | | | | | | | | | | | |
| Less Distributions to Shareholders: | | | | | | | | | | | | | | | | | | | | |
| From net investment income | | | (0.04 | ) | | | — | | | | — | | | | (0.02 | ) | | | — | |
| From net realized capital gains | | | (0.53 | ) | | | (1.24 | ) | | | (2.53 | ) | | | (0.50 | ) | | | — | |
| Total distributions | | | (0.57 | ) | | | (1.24 | ) | | | (2.53 | ) | | | (0.52 | ) | | | — | |
| | | | | | | | | | | | | | | | | | | | | |
| Paid in capital from redemption fees (a) (d) | | | 0.00 | | | | 0.00 | | | | 0.00 | | | | 0.00 | | | | 0.00 | |
| | | | | | | | | | | | | | | | | | | | | |
| Net Asset Value, End of Year | | $ | 30.88 | | | $ | 22.50 | | | | 23.47 | | | $ | 24.75 | | | $ | 24.05 | |
| | | | | | | | | | | | | | | | | | | | | |
| Total Return (b) | | | 40.16 | % | | | 0.77 | % | | | 6.99 | % | | | 5.05 | % | | | 11.76 | % |
| | | | | | | | | | | | | | | | | | | | | |
| Ratios/Supplemental Data | | | | | | | | | | | | | | | | | | | | |
| Net assets, end of year (in 000’s) | | $ | 45,354 | | | $ | 31,243 | | | | 30,372 | | | $ | 33,682 | | | $ | 40,707 | |
| | | | | | | | | | | | | | | | | | | | | |
| Ratio of expenses to average net assets: | | | 1.85 | %(c) | | | 1.88 | %(c) | | | 1.80 | %(c) | | | 1.74 | %(c) | | | 1.69 | % |
| | | | | | | | | | | | | | | | | | | | | |
| Ratio of net investment income (loss) to average net assets: | | | (0.69 | )%(c) | | | 0.26 | %(c) | | | (0.10 | )%(c) | | | (0.01 | )%(c) | | | 0.08 | % |
| | | | | | | | | | | | | | | | | | | | | |
| Portfolio turnover rate | | | 79.58 | % | | | 263.64 | % | | | 17.29 | % | | | 40.01 | % | | | 84.33 | % |
| (a) | Represents less than $0.005 per share. |
| (b) | Total return in the above table represents the rate that the investor would have earned or lost on an investment in the Fund assuming reinvestment of dividends. |
| (c) | The ratios include 0.01% of interest expense during the years ended June 30, 2018, June 30, 2019, June 30, 2020 and June 30, 2021. |
| (d) | The average shares method was used to calculate redemption fees. |
See accompanying notes which are an integral part of these financial statements.
IMS STRATEGIC INCOME FUND
FINANCIAL HIGHLIGHTS
For a Fund share outstanding throughout each year
| | | For the Years Ended | |
| | | June 30, 2021 | | | June 30, 2020 | | | June 30, 2019 | | | June 30, 2018 | | | June 30, 2017 | |
| | | | | | | | | | | | | | | | |
| Net Asset Value, Beginning of Year | | $ | 2.30 | | | $ | 2.61 | | | $ | 2.45 | | | $ | 2.93 | | | $ | 3.27 | |
| | | | | | | | | | | | | | | | | | | | | |
| Investment Operations: | | | | | | | | | | | | | | | | | | | | |
| Net investment income | | | 0.15 | | | | 0.15 | | | | 0.13 | | | | 0.19 | | | | 0.24 | |
| Net realized and unrealized gain (loss) on investments and foreign currency (a) | | | 0.49 | | | | (0.31 | ) | | | 0.16 | | | | (0.49 | ) | | | (0.32 | ) |
| Total from investment operations | | | 0.64 | | | | (0.16 | ) | | | 0.29 | | | | (0.30 | ) | | | (0.08 | ) |
| | | | | | | | | | | | | | | | | | | | | |
| Less Distributions to Shareholders: | | | | | | | | | | | | | | | | | | | | |
| From net investment income | | | (0.16 | ) | | | (0.15 | ) | | | (0.13 | ) | | | (0.18 | ) | | | (0.26 | ) |
| Total distributions | | | (0.16 | ) | | | (0.15 | ) | | | (0.13 | ) | | | (0.18 | ) | | | (0.26 | ) |
| | | | | | | | | | | | | | | | | | | | | |
| Paid in capital from redemption fees (e) | | | — | | | | 0.00 | (b) | | | 0.00 | (b) | | | 0.00 | (b) | | | 0.00 | (b) |
| | | | | | | | | | | | | | | | | | | | | |
| Net Asset Value, End of Year | | $ | 2.78 | | | $ | 2.30 | | | $ | 2.61 | | | $ | 2.45 | | | $ | 2.93 | |
| | | | | | | | | | | | | | | | | | | | | |
| Total Return (c) | | | 28.53 | % | | | (6.31 | )% | | | 12.22 | % | | | (10.71 | )% | | | (2.69 | )% |
| | | | | | | | | | | | | | | | | | | | | |
| Ratios/Supplemental Data | | | | | | | | | | | | | | | | | | | | |
| Net assets, end of year (in 000’s) | | $ | 15,188 | | | $ | 11,742 | | | $ | 5,914 | | | $ | 3,928 | | | $ | 5,580 | |
| | | | | | | | | | | | | | | | | | | | | |
| Ratio of expenses to average net assets: (d) | | | 1.95 | % | | | 1.96 | % | | | 1.98 | % | | | 2.02 | % | | | 1.98 | % |
| | | | | | | | | | | | | | | | | | | | | |
| Ratio of expenses to average net assets before waiver & reimbursement: (d) | | | 2.87 | % | | | 3.62 | % | | | 4.29 | % | | | 3.36 | % | | | 2.93 | % |
| | | | | | | | | | | | | | | | | | | | | |
| Ratio of net investment income to average net assets: (d) | | | 5.88 | % | | | 6.58 | % | | | 5.27 | % | | | 6.99 | % | | | 7.83 | % |
| | | | | | | | | | | | | | | | | | | | | |
| Ratio of net investment income to average net assets before waiver & reimbursement: (d) | | | 4.96 | % | | | 4.92 | % | | | 2.95 | % | | | 5.64 | % | | | 6.87 | % |
| | | | | | | | | | | | | | | | | | | | | |
| Portfolio turnover rate | | | 531.13 | % | | | 390.29 | % | | | 728.46 | % | | | 758.79 | % | | | 505.62 | % |
| (a) | Realized and unrealized gains and losses per share in this caption are balancing amounts necessary to reconcile the changes in net assets value per share for the period, and may not reconcile with the aggregate gains and losses in the statement of operations due to the timing of subscriptions and redemptions in relation to fluctuating market values. |
| (b) | Represents less than $0.005 per share. |
| (c) | Total return in the above table represents the rate that the investor would have earned or lost on an investment in the Fund assuming reinvestment of dividends. |
| (d) | The ratios include 0.04% of interest expense during the year ended June 30, 2017, 0.07% of interest expense during the year ended June 30, 2018, 0.03% of interest expense during the year ended June 30, 2019, 0.01% of interest expense during the year ended June 30, 2020 and 0.002% for the year ended June 30, 2021. |
| (e) | The average shares method was used to calculate redemption fees. |
See accompanying notes which are an integral part of these financial statements.
IMS FAMILY OF FUNDS
NOTES TO THE FINANCIAL STATEMENTS
June 30, 2021
NOTE 1. ORGANIZATION
The IMS Family of Funds (the “Funds”), comprising the IMS Capital Value Fund (the “Value Fund”) and the IMS Strategic Income Fund (the “Income Fund”), were each organized as a diversified series of 360 Funds (the “Trust”) on June 20, 2014. The Trust was organized on February 24, 2005, as a Delaware statutory trust. The Trust is registered as an open-end management investment company under the Investment Company Act of 1940 (the “1940 Act”). The investment objective of the Value Fund is to provide long-term growth from capital appreciation and secondarily, income from dividends. The investment objective of the Income Fund is to provide current income and secondarily, capital appreciation. The investment adviser of each Fund is IMS Capital Management, Inc. (the “Adviser”).
NOTE 2. SIGNIFICANT ACCOUNTING POLICIES
The following is a summary of significant accounting policies followed by each Fund in the preparation of its financial statements in accordance with accounting principles generally accepted in the United States of America (“GAAP”). The Funds are investment companies and accordingly follow the investment company accounting and reporting guidance of the Financial Accounting Standards Board (“FASB”) Accounting Standards Codification Topic 946 applicable to investment companies.
Securities Valuations – All investments in securities are recorded at their estimated fair value as described in Note 3.
Foreign Currency – Investment securities denominated in foreign currencies are translated into U.S. dollar amounts at the date of valuation. Purchases and sales of investment securities and income and expense items denominated in foreign currencies are translated into U.S. dollar amounts on the respective dates of such transactions. Reported net realized foreign exchange gains or losses arise from currency gains or losses realized between the trade and settlement dates on securities transactions, and the difference between the amounts of dividends, interest and foreign withholding taxes recorded on the Funds’ books and the U.S. dollar equivalent of the amounts actually received or paid. The Funds do not isolate that portion of the results of operations resulting from changes in foreign exchange rates on investments from the fluctuations arising from changes in market prices of securities. Such fluctuations are included with the net realized and unrealized gain or loss from investments.
Federal Income Taxes – The Funds intend to qualify each year as regulated investment companies (“RICs”) under subchapter M of the Internal Revenue Code of 1986, as amended, by complying with the requirements applicable to RICs and by distributing substantially all of their taxable income. The Funds also intend to distribute sufficient net investment income and net capital gains, if any, so that they will not be subject to excise tax on undistributed income and gains. If the required amount of net investment income or gains is not distributed, the Funds could incur a tax expense.
Management has evaluated the Funds’ tax positions taken on Federal income tax returns for all open tax years (tax years ended June 30, 2018, June 30, 2019 and June 30, 2020) and expected to be taken during the year ended June 30, 2021, and has concluded that no provision for income tax is required in these financial statements. As of and during the year ended June 30, 2021, the Funds did not have a liability for any unrecognized tax benefits. The Funds recognize interest and penalties, if any, related to unrecognized tax benefits as income tax expense in the statements of operations. During the year ended June 30, 2021, the Funds did not incur any interest or penalties. The Funds are not subject to examination by U.S. federal tax authorities for tax years prior to 2018.
IMS FAMILY OF FUNDS
NOTES TO THE FINANCIAL STATEMENTS – (continued)
June 30, 2021
NOTE 2. SIGNIFICANT ACCOUNTING POLICIES (continued)
Expenses – Expenses incurred by the Trust that do not relate to a specific fund of the Trust are allocated to the individual funds based on each Fund’s relative net assets or another appropriate basis (as determined by the Board of Trustees (the “Board”)).
Security Transactions and Related Income – Each Fund follows industry practice and records security transactions on the trade date for financial reporting purposes. The first in, first out method is used for determining gains or losses for financial statements and income tax purposes. Dividend income is recorded on the ex-dividend date and interest income is recorded on an accrual basis. Dividend income from real estate investment trusts (REITS) and distributions from limited partnerships are recognized on the ex-date and included in dividend income. The calendar year-end classification of distributions received from REITS during the fiscal year are reported subsequent to year end; accordingly, the Funds estimate the character of REIT distributions based on the most recent information available. Withholding taxes on foreign dividends have been provided for in accordance with each Fund’s understanding of the applicable country’s tax rules and rates. Discounts and premiums on securities purchased are amortized or accreted using the effective interest method. For bonds that miss a scheduled interest payment, after the grace period, all interest accrued on the bond is written off and no additional interest will be accrued. However, for illiquid bonds or those bonds fair valued by the Adviser, if the Adviser’s research indicates a high recovery rate in restructuring, and the Fund expects to hold the bond until the issue is restructured, past due interest may not be written off in its entirety. The ability of issuers of debt securities held by the Funds to meet their obligations may be affected by economic and political developments in a specific country or region.
Use of Estimates – The preparation of financial statements in conformity with GAAP requires management to make estimates and assumptions that affect the reported amounts of assets and liabilities and disclosure of contingent assets and liabilities at the date of the financial statements and the reported amounts of revenues and expenses during the reporting period. Actual results could differ from those estimates.
Dividends and Distributions – The Income Fund intends to distribute substantially all of its net investment income as dividends to its shareholders on a monthly basis. The Value Fund intends to distribute substantially all of its net investment income as dividends to its shareholders on at least an annual basis. Each Fund intends to distribute its net realized long-term capital gains and its net realized short-term capital gains at least once a year. Dividends to shareholders, which are determined in accordance with income tax regulations, are recorded on the ex-dividend date. The treatment for financial reporting purposes of distributions made to shareholders during the year from net investment income or net realized capital gains may differ from their ultimate treatment for federal income tax purposes. These differences are caused primarily by differences in the timing of the recognition of certain components of income, expense or realized capital gain for federal income tax purposes. Where such differences are permanent in nature, they are reclassified in the components of the net assets based on their ultimate characterization for federal income tax purposes. Any such reclassifications will have no effect on net assets, results of operations or net asset values per share of the Funds.
There were no reclassifications to the components of net assets during the year ended June 30, 2021.
IMS FAMILY OF FUNDS
NOTES TO THE FINANCIAL STATEMENTS – (continued)
June 30, 2021
NOTE 3. SECURITIES VALUATION AND FAIR VALUE MEASUREMENTS
Fair value is defined as the price that a Fund would receive upon selling an investment in an orderly transaction to an independent buyer in the principal or most advantageous market of the investment. GAAP establishes a three-tier hierarchy to maximize the use of observable market data and minimize the use of unobservable inputs and to establish classification of fair value measurements for disclosure purposes.
Inputs refer broadly to the assumptions that market participants would use in pricing the asset or liability, including assumptions about risk (the risk inherent in a particular valuation technique used to measure fair value such as a pricing model and/or the risk inherent in the inputs to the valuation technique). Inputs may be observable or unobservable. Observable inputs are inputs that reflect the assumptions market participants would use in pricing the asset or liability developed based on market data obtained from sources independent of the reporting entity. Unobservable inputs are inputs that reflect the reporting entity’s own assumptions about the assumptions market participants would use in pricing the asset or liability developed based on the best information available in the circumstances.
Various inputs are used in determining the value of each Fund’s investments. These inputs are summarized in the three broad levels listed below.
| ● | Level 1 – quoted prices in active markets for identical securities |
| ● | Level 2 – other significant observable inputs (including, but not limited to, quoted prices for an identical security in an inactive market, quoted prices for similar securities, interest rates, prepayment speeds, credit risk, etc.) |
| ● | Level 3 – significant unobservable inputs (including each Fund’s own assumptions in determining fair value of investments based on the best information available) |
The inputs used to measure fair value may fall into different levels of the fair value hierarchy. In such cases, for disclosure purposes, the level in the fair value hierarchy within which the fair value measurement falls in its entirety, is determined based on the lowest level input that is significant to the fair value measurement in its entirety.
A description of the valuation techniques applied to each Fund’s major categories of assets measured at fair value on a recurring basis follows:
Equity securities, including common stock, real estate investment trusts, and preferred securities, are generally valued by using market quotations, but may be valued on the basis of prices furnished by a pricing service when the Adviser believes such prices more accurately reflect the fair value of such securities. Securities that are traded on any stock exchange are generally valued by the pricing service at the last quoted sale price. Lacking a last sale price, an exchange traded security is generally valued by the pricing service at its last bid price.
Securities traded in the NASDAQ over-the-counter market are generally valued by the pricing service at the NASDAQ Official Closing Price. When using the market quotations or close prices provided by the pricing service and when the market is considered active, the security will be classified as a Level 1 security. Sometimes, an equity security owned by a Fund will be valued by the pricing service with factors other than market quotations or when the market is considered inactive. When this happens, the security will be classified as a Level 2 security.
IMS FAMILY OF FUNDS
NOTES TO THE FINANCIAL STATEMENTS – (continued)
June 30, 2021
NOTE 3. SECURITIES VALUATION AND FAIR VALUE MEASUREMENTS (continued)
Investments in mutual funds, including money market mutual funds, are generally priced at the ending net asset value (NAV) provided by the service agent of the mutual funds. These securities will be categorized as Level 1 securities.
Fixed income securities such as corporate bonds, municipal bonds, structured notes, and foreign bonds denominated in U.S. dollars, when valued using market quotations in an active market, will be categorized as Level 2 securities. However, they may be valued on the basis of prices furnished by a pricing service when the Adviser believes such prices more accurately reflect the fair value of such securities. A pricing service utilizes electronic data processing techniques based on yield spreads relating to securities with similar characteristics to determine prices for normal institutional-size trading units of debt securities without regard to sale or bid prices. These securities will generally be categorized as Level 2 securities. If the Adviser decides that a price provided by the pricing service does not accurately reflect the fair value of the securities, when prices are not readily available from a pricing service, or when certain restricted or illiquid securities are being valued, securities are valued at fair value as determined in good faith by the Adviser, in conformity with guidelines adopted by and subject to review of the Board and the Fair Valuation Committee. These securities will be categorized as Level 3 securities. The Adviser has used inputs such as evaluated broker quotes in inactive markets, actual trade prices in inactive markets, present value of expected future cash flows, terms of expected bond restructurings, and yields on similar securities in determining the fair value of such Level 3 securities.
Short-term investments in fixed income securities (those with maturities of less than 60 days when acquired) are valued by using the amortized cost method of valuation, which the Board has determined will represent fair value. These securities will be classified as Level 2 securities.
In accordance with the Trust’s good faith pricing guidelines, the Adviser is required to consider all appropriate factors relevant to the value of securities for which it has determined other pricing sources are not available or reliable as described above. No single standard exists for determining fair value, because fair value depends upon the circumstances of each individual case. As a general principle, the current fair value of an issue of securities being valued by the Adviser would appear to be the amount which the owner might reasonably expect to receive for them upon their current sale. Methods which are in accordance with this principle may, for example, be based on (i) a multiple of earnings; (ii) a discount from market of a similar freely traded security (including a derivative security or a basket of securities traded on other markets, exchanges or among dealers); or (iii) yield to maturity with respect to debt issues, or a combination of these and other methods. Good faith pricing is permitted if, in the Adviser’s opinion, the validity of market quotations appears to be questionable based on factors such as evidence of a thin market in the security based on a small number of quotations, a significant event occurs after the close of a market but before a Fund’s NAV calculation that may affect a security’s value, or the Adviser is aware of any other data that calls into question the reliability of market quotations. Good faith pricing may also be used in instances when the bonds in which the Funds invest may default or otherwise cease to have market quotations readily available.
The Trustees of the 360 Funds adopted the M3Sixty Consolidated Valuation Procedures on June 24, 2014, which established a Valuation Committee to work with the Adviser and report to the Board on securities being fair valued or manually priced. The Lead Chairman and Trustee for the 360 Funds, along with the Funds’ Assistant Treasurer and Acting Principal Financial Officer and Chief Compliance Officer are members of the Valuation Committee which meets at least monthly or, as required, to review the interim actions and coordination with the Adviser in pricing fair valued securities, and consideration of any unresolved valuation issue or a request to manually pricing a security. In turn, the Lead Chairman provides updates to the Board at the regularly scheduled board meetings as well as interim updates to the board members on substantive changes in a daily valuation or methodology issue.
IMS FAMILY OF FUNDS
NOTES TO THE FINANCIAL STATEMENTS – (continued)
June 30, 2021
NOTE 3. SECURITIES VALUATION AND FAIR VALUE MEASUREMENTS (continued)
The following is a summary of the inputs used to value the Value Fund’s investments as of June 30, 2021:
| | | Valuation Inputs | |
Investments at Value | | Level 1 –
Quoted Prices in
Active Markets | | | Level 2 –
Other
Significant
Observable
Inputs | | | Level 3 –
Significant
Unobservable
Inputs | | | Total | |
| Common Stock* | | $ | 43,444,722 | | | $ | — | | | $ | — | | | $ | 43,444,722 | |
| Money Market Securities | | | 1,953,342 | | | | — | | | | — | | | | 1,953,342 | |
| Total | | $ | 45,398,064 | | | $ | — | | | $ | — | | | $ | 45,398,064 | |
| * | Refer to the Schedule of Investments for industry classifications. |
The following is a summary of the inputs used to value the Income Fund’s investments as of June 30, 2021:
| | | Valuation Inputs | |
| Investments at value | | Level 1 – Quoted Prices in Active
Markets | | | Level 2 –
Other
Significant
Observable
Inputs | | | Level 3 –
Significant
Unobservable
Inputs | | | Total | |
| Common Stock* | | $ | 2,875,223 | | | $ | — | | | $ | — | | | $ | 2,875,223 | |
| Corporate Bonds | | | — | | | | 7,344,414 | | | | — | | | | 7,344,414 | |
| Structured Notes | | | — | | | | 3,993,387 | | | | — | | | | 3,993,387 | |
| Money Market Securities | | | 18,554 | | | | — | | | | — | | | | 18,554 | |
| Total | | $ | 2,893,777 | | | $ | 11,337,801 | | | $ | — | | | $ | 14,231,578 | |
The Value Fund and the Income Fund did not hold any investments at any time during the reporting period in which significant unobservable inputs were used in determining fair value; therefore, no reconciliation of Level 3 securities is included for this reporting period. The Value Fund and the Income Fund did not hold any derivative instruments during the reporting period.
| * | Refer to the Schedule of Investments for industry classifications. |
IMS FAMILY OF FUNDS
NOTES TO THE FINANCIAL STATEMENTS – (continued)
June 30, 2021
NOTE 4. FEES AND OTHER TRANSACTIONS WITH AFFILIATES
The Adviser serves as investment adviser to the Funds pursuant to an Investment Advisory Agreement (the “Advisory Agreement”) with the Trust. Pursuant to the Advisory Agreement, the Adviser manages the operations of the Funds and manages the Funds’ investments in accordance with the stated policies of the Funds, subject to approval of the Board of Trustees.
The Adviser has contractually agreed to waive its management fee and/or reimburse expenses so that total annual fund operating expenses(excluding interest, taxes, brokerage fees and commissions, other expenditures that are capitalized in accordance with generally accepted accounting principles, acquired fund fees and expenses, other extraordinary expenses not incurred in the ordinary course of the Funds’ business, interest and dividend expense on securities sold short, and amounts, if any payable pursuant to a plan adopted in accordance with Rule 12b-1 under the 1940 Act) do not exceed 1.95% of the Funds’ average daily net assets through October 31, 2021, subject to the Adviser’s right to recoup payments on a rolling three-year basis so long as the payment would not exceed the 1.95% expense cap. This expense cap agreement may be terminated by either party upon 60 days’ written notice prior to the end of the then-current term of the agreement.
Under the terms of the Advisory Agreement, the Funds are obligated to pay the Adviser a fee computed and accrued daily and paid monthly. Please see the chart below for information regarding the management fee rates, management fees earned, fee waivers and recoupments, and expenses reimbursed during the year ended June 30, 2021, as well as amounts due to the Adviser at June 30, 2021.
| | | Value Fund | | | Income Fund | |
| Management fee under Advisory Agreement (as a percentage of average net assets) | | | 1.21 | % | | | 1.26 | % |
| Expense limitation (as a percentage of average net assets) | | | 1.95 | % | | | 1.95 | % |
| Management fees earned | | $ | 450,449 | | | $ | 168,177 | |
| Fees waived and expenses reimbursed | | $ | — | | | $ | (91,367 | ) |
| Payable to Adviser | | $ | 43,378 | | | $ | 1,748 | |
The amounts subject to repayment by the Income Fund pursuant to the aforementioned conditions, are as follows:
| Fund | | | Amount | | | Expires June 30, | |
| Income Fund | | | $ | 81,754 | | | 2022 | |
| Income Fund | | | $ | 115,540 | | | 2023 | |
| Income Fund | | | $ | 91,367 | | | 2024 | |
There are no amounts subject to repayment by the Value Fund.
IMS FAMILY OF FUNDS
NOTES TO THE FINANCIAL STATEMENTS – (continued)
June 30, 2021
NOTE 4. FEES AND OTHER TRANSACTIONS WITH AFFILIATES (continued)
The Trust has entered into an Investment Company Services Agreement (the “Services Agreement”) with M3Sixty Administration, LLC (“M3Sixty”). Under the Services Agreement, M3Sixty is responsible for a wide variety of functions, including but not limited to: (a) Fund accounting services; (b) financial statement preparation; (c) valuation of the Funds’ portfolio securities; (d) pricing the Funds’ shares; (e) assistance in preparing tax returns; (f) preparation and filing of required regulatory reports; (g) communications with shareholders; (h) coordination of Board and shareholder meetings; (i) monitoring the Funds’ legal compliance; (j) maintaining shareholder account records.
For the year ended June 30, 2021, the Funds accrued servicing fees, including out of pocket expenses, as follows:
| Fund | | | Service Fees | |
| Value Fund | | | $ | 128,276 | |
| Income Fund | | | $ | 104,779 | |
M3Sixty has also agreed to voluntarily waive certain fees until certain thresholds are met by the Funds. During the year ended June 30, 2021, M3Sixty waived fees as follows:
| Fund | | | Service Fees Waived | |
| Value Fund | | | $ | — | |
| Income Fund | | | $ | 31,333 | |
Effective May 1, 2021, the Funds have also entered into a CCO Service Agreement (the “CCO Agreement”) with M3Sixty to provide Chief Compliance Officer (“CCO”) services to the Funds. For the year ended June 30, 2021, the Funds accrued CCO servicing fees as follows:
| Fund | | | CCO Service Fees | |
| Value Fund | | | $ | 1,250 | |
| Income Fund | | | $ | 1,250 | |
Certain officers and a Trustee of the Trust are also employees and/or officers of M3Sixty.
Matrix 360 Distributors, LLC (the “Distributor”) acts as the principal distributor of the Funds. There were no payments made to the Distributor by the Funds for the year ended June 30, 2021.
The Distributor is not affiliated with the Adviser. The Distributor is an affiliate of M3Sixty.
IMS FAMILY OF FUNDS
NOTES TO THE FINANCIAL STATEMENTS – (continued)
June 30, 2021
NOTE 5. LINE OF CREDIT
During the year ended June 30, 2021, the IMS Funds each respectively entered into an agreement with The Huntington National Bank, the custodian of the Funds’ investments, to open secured lines of credit secured by the Funds’ investments. Borrowings under this agreement bear interest at LIBOR plus 1.500%. Maximum borrowings for each Fund are lesser of $2,000,000 or 10.000% of the Fund’s daily investments at value. Total borrowings for the Funds cannot exceed $2,000,000 at any time. The current agreement expires on September 5, 2021.
| | | Value Fund | | | Income Fund | |
| Maximum available bank line of credit as of June 30, 2021 | | $ | 2,000,000 | | | $ | 1,423,158 | |
| Average borrowings for the year | | $ | 168,705 | | | $ | 257,342 | |
| Average interest rate for the year | | | 1.773 | % | | | 2.000 | % |
| Highest balance drawn during the year | | $ | 724,867 | | | $ | 985,359 | |
| Interest rate at June 30, 2021 | | | 2.000 | % | | | 2.000 | % |
| Line of credit borrowing at June 30, 2021 | | $ | — | | | $ | — | |
NOTE 6. INVESTMENTS
For the year ended June 30, 2021, purchases and sales of investment securities, other than short-term investments and short-term U.S. government obligations were as follows:
| | | | Value Fund | | | Income Fund | |
Purchases | | | | | | | | | |
| Other | | | $ | 29,280,905 | | | $ | 62,346,926 | |
| Sales | | | | | | | | | |
| Other | | | $ | 29,509,832 | | | $ | 62,397,744 | |
As of June 30, 2021, the net unrealized appreciation (depreciation) of investments for tax purposes was as follows:
| | | | Value Fund | | | Income Fund | |
| Gross Appreciation | | | $ | 11,026,862 | | | $ | 314,924 | |
| Gross (Depreciation) | | | | (237,228 | ) | | | (384,032 | ) |
| Net Appreciation (Depreciation) on Investments | | | $ | 10,789,634 | | | $ | (69,108 | ) |
| Tax Cost | | | $ | 34,608,430 | | | $ | 14,300,686 | |
The difference between book basis and tax basis unrealized appreciation (depreciation) of the Value Fund’s investments is primarily attributable to the tax deferral of losses on wash sales.
IMS FAMILY OF FUNDS
NOTES TO THE FINANCIAL STATEMENTS – (continued)
June 30, 2021
NOTE 7. BENEFICIAL OWNERSHIP
The beneficial ownership, either directly or indirectly, of more than 25% of the voting securities of a fund creates a presumption of control of the fund, under Section 2(a)(9) of the Investment Company Act of 1940. As of June 30, 2021, NFS LLC (“NFS”) and TD Ameritrade, Inc. (“Ameritrade”) held, for the benefit of their customers, greater than 25% of the Funds’ voting securities. As a result, both NFS and Ameritrade may be deemed to control the Funds. The percentages of voting securities of the Funds held by NFS and Ameritrade as of June 30, 2021 were as follows:
| | | | Value Fund | | | Income Fund | |
| NFS | | | | 36.42 | % | | | 34.86 | % |
| Ameritrade | | | | 38.01 | % | | | 56.43 | % |
NOTE 8. DISTRIBUTIONS TO SHAREHOLDERS
Value Fund – For the fiscal year ended June 30, 2021, the Value Fund paid distributions totaling $0.569234 per share.
The tax characterization of distributions for the fiscal year ended June 30, 2021 and for the fiscal year ended June 30, 2020 was as follows:
| Distributions paid from: | | Fiscal Year Ended June 30, 2021 | | | Fiscal Year Ended June 30, 2020 | |
| Ordinary Income | | $ | 51,454 | | | $ | 552,132 | |
| Long-term Capital Gains | | | 706,616 | | | | 978,218 | |
| Total Distributions paid | | $ | 758,070 | | | $ | 1,530,350 | |
Income Fund – For the fiscal year ended June 30, 2021, the Income Fund paid monthly distributions totaling $0.160 per share.
The tax characterization of distributions for the fiscal year ended June 30, 2021 and for the fiscal year ended June 30, 2020 was as follows:
| Distributions paid from: | | Fiscal Year Ended June 30, 2021 | | | Fiscal Year Ended June 30, 2020 | |
| Ordinary Income | | $ | 831,614 | | | $ | 483,725 | |
| Total Distributions paid | | $ | 831,614 | | | $ | 483,725 | |
As of June 30, 2021, the components of distributable earnings (accumulated deficit) on a tax basis were as follows:
| | | Value Fund | | | Income Fund | |
| Undistributed net investment income | | $ | 2,646,039 | | | $ | 1,813 | |
| Deferred capital and other losses | | | — | | | | (223,761 | ) |
| Accumulated realized capital gains (losses) | | | 2,686,872 | | | | (22,160,023 | ) |
| Net unrealized appreciation (depreciation) | | | 10,789,634 | | | | (69,108 | ) |
| | | $ | 16,122,545 | | | $ | (22,451,079 | ) |
IMS FAMILY OF FUNDS
NOTES TO THE FINANCIAL STATEMENTS – (continued)
June 30, 2021
NOTE 8. DISTRIBUTIONS TO SHAREHOLDERS (continued)
Under current law, capital losses and specified gains realized after October 31, and net investment losses realized after December 31 of a Fund’s fiscal year may be deferred and treated as occurring on the first business day of the following fiscal year for tax purposes. For disclosure purposes, these deferrals are included in “Deferred capital and other losses” above.
As of June 30, 2021, deferred capital and other losses noted above consist of:
| | | | Post-October Capital Losses | | | Late Year Ordinary Losses | |
Value Fund | | | $ | — | | | $ | — | |
| Income Fund | | | | 223,761 | | | | — | |
NOTE 9. CAPITAL LOSS CARRYFORWARDS
At June 30, 2021, for federal income tax purposes, the Funds have capital loss carryforwards, in the following amounts:
| | | Value Fund | | | Income Fund | |
| No expiration – short-term | | $ | — | | | $ | 7,115,233 | |
| No expiration – long-term | | | — | | | | 15,044,790 | |
| | | $ | — | | | $ | 22,160,023 | |
Capital loss carryforwards are available to offset future realized capital gains. To the extent that these carryforwards are used to offset future capital gains, it is probable that the amount offset will not be distributed to shareholders. During the year ended June 30, 2021, the Strategic Income Fund utilized $1,467,343 of short-term capital loss carryforwards and the Capital Value Fund did not utilize any capital loss carryforwards.
NOTE 10. STRUCTURED NOTES
The Income Fund may invest in certain structured products, including interest rate or index-linked notes. The risk of an investment in a structured product depends primarily on the type of collateral securities and the class of the structured product in which the Fund invests. In addition to the standard interest rate, default and other risks of fixed income securities, structured products carry additional risks, including the possibility that distributions from collateral securities will not be adequate to make interest or other payments, the quality of the collateral may decline in value or default, the Fund may invest in structured products that are subordinate to other classes, values may be volatile, and disputes with the issuer may produce unexpected investment results.
At June 30, 2021, the aggregate value of such securities amounted to $3,993,387 and the value amounts to 26.29% of the net assets of the Income Fund.
IMS FAMILY OF FUNDS
NOTES TO THE FINANCIAL STATEMENTS – (continued)
June 30, 2021
NOTE 11. RESTRICTED SECURITIES
Restricted securities are securities that may only be resold upon registration under federal securities laws or in transactions exempt from such registration. In some cases, the issuer of restricted securities has agreed to register such securities for resale, at the issuer’s expense, either upon demand by a fund or in connection with another registered offering of the securities. Many restricted securities may be resold in the secondary market in transactions exempt from registration. Such restricted securities may be determined to be liquid. The Funds will not incur any registration costs upon such resale. The Income Fund’s restricted securities are valued at the price provided by pricing services or dealers in the secondary market or, if no market prices are available, at the fair value price as determined by the Fund’s Adviser or pursuant to the Fund’s fair value policy, subject to oversight by the Board of Trustees. The Income Fund has acquired securities, the sale of which is restricted under Rule 144A or Regulation S the Securities Act of 1933. It is possible that the fair value price may differ significantly from the amount that may ultimately be realized in the near term, and the difference could be material.
At June 30, 2021, the aggregate value of such securities amounted to $2,144,587 and the value amounts to 14.12% of the net assets of the Income Fund.
| | | Acquisition
Date | | Principal
Amount | | | Amortized Cost | | | Value | |
| American Airlines Group, 5.00% due 06/01/2022, 144A | | 3/05/2020 | | $ | 300,000 | | | $ | 298,715 | | | $ | 300,003 | |
| American Airlines Group, 3.75% due 03/01/2025, 144A | | 2/04/2021 | | | 525,000 | | | | 442,850 | | | | 483,656 | |
| Bombardier, Inc., 6.00%, due 10/15/2022, Reg-S | | 11/12/2019 | (a) | | 750,000 | | | | 752,438 | | | | 750,938 | |
| Staples, Inc., 10.75%, due 04/15/2027, 144A | | 4/12/2021 | (b) | | 600,000 | | | | 609,043 | | | | 609,990 | |
| | | | | | | | | $ | 2,103,046 | | | $ | 2,144,587 | |
| (a) | Additional purchases were made on 4/15/2021 and 5/27/2021. |
| (b) | An Additional purchase was made on 6/3/2021. |
NOTE 12. SUBSEQUENT EVENTS
On July 15, 2021, the Income Fund declared a dividend of $54,537, which was payable on July 15, 2021.
On August 16, 2021, the Income Fund declared a dividend of $53,781, which was payable on August 16, 2021.
Management has evaluated subsequent events through the issuance of the financial statements and has noted no other such events that would require disclosure.
NOTE 13. INDEMNIFICATIONS
In the normal course of business, the Funds enter into contracts that contain general indemnifications to other parties. The Funds’ maximum exposure under these contracts is unknown as this would involve future claims that may be made against the Funds that have not yet occurred. The Funds expect the risk of loss to be remote.
NOTE 14. RECENT MARKET EVENTS
An outbreak of an infectious respiratory illness caused by a novel coronavirus known as COVID-19 began in China in December 2019 and continues today. The spread of the coronavirus resulted in travel and border restrictions, quarantines, curfews, and restrictions on large gatherings. Government measures to limit the spread of the virus include enhanced health screenings at ports of entry and elsewhere and prolonged quarantines for many people. Despite these measures, the virus’ spread resulted in a large number of deaths, disrupted global healthcare systems and supply chain chains. As a result, 2020 and early 2021 caused lower consumer demand for a wide range of products and services and general concern and uncertainty. While governments took unprecedented action to limit disruptions to the financial system, global financial markets experienced significant volatility resulting from the spread of and subsequent intervening measures intended to limit the spread of COVID-19. Since early 2021, the widespread distribution of vaccines helped stabilize some financial markets and reopen some economies, and significant government stimulus mitigated economic damages to the global economy. But the spread of COVID-19 adversely affected the economies of many nations and the entire global economy, in general. Still, global markets are concerned over the pace of economic recovery globally, the potential for inflation because of the government stimulus, and further disruption due to the emergence of highly contagious COVID-19 variants, such as the “delta” variant. At this time, the Fund cannot determine the full extent of the impact of COVID-19 and its variants on the Fund’s performance, which will depend on future developments, including the duration and the continued spread of the outbreak.

REPORT OF INDEPENDENT REGISTERED PUBLIC ACCOUNTING FIRM
To the Board of Trustees of 360 Funds
and the Shareholders of IMS Capital Value Fund and IMS Strategic Income Fund
Opinion on the Financial Statements
We have audited the accompanying statements of assets and liabilities of IMS Capital Value Fund and IMS Strategic Income Fund, each a series of shares of beneficial interest in 360 Funds (the “Funds”), including the schedules of investments, as of June 30, 2021, and the related statements of operations for the year then ended, the statements of changes in net assets for each of the years in the two-year period then ended and the financial highlights for each of the years in the three-year period then ended, and the related notes (collectively referred to as the “financial statements”). In our opinion, the financial statements present fairly, in all material respects, the financial position of the Funds as of June 30, 2021, and the results of their operations for the year then ended, the changes in their net assets for each of the years in the two-year period then ended and their financial highlights for each of the years in the three-year period then ended, in conformity with accounting principles generally accepted in the United States of America. The financial highlights for each of the years in the two-year period ended June 30, 2018, were audited by other auditors, whose report dated August 28, 2018, expressed an unqualified opinion on such financial highlights.
Basis for Opinion
These financial statements are the responsibility of the Funds’ management. Our responsibility is to express an opinion on the Funds’ financial statements based on our audits. We are a public accounting firm registered with the Public Company Accounting Oversight Board (United States) (“PCAOB”) and are required to be independent with respect to the Funds in accordance with the U.S. federal securities law and the applicable rules and regulations of the Securities and Exchange Commission and the PCAOB.
We conducted our audits in accordance with the standards of the PCAOB. Those standards require that we plan and perform the audits to obtain reasonable assurance about whether the financial statements are free of material misstatement, whether due to error or fraud. The Funds are not required to have, nor were we engaged to perform, an audit of their internal control over financial reporting. As part of our audits we are required to obtain an understanding of internal control over financial reporting but not for the purpose of expressing an opinion on the effectiveness of the Funds’ internal control over financial reporting. Accordingly, we express no such opinion.
Our audits included performing procedures to assess the risk of material misstatement of the financial statements, whether due to error or fraud, and performing procedures that respond to those risks. Such procedures included examining, on a test basis, evidence regarding the amounts and disclosures in the financial statements. Our procedures included confirmation of securities owned as of June 30, 2021 by correspondence with the custodian. Our audits also included evaluating the accounting principles used and significant estimates made by management, as well as evaluating the overall presentation of the financial statements. We believe that our audits provide a reasonable basis for our opinion.

BBD, LLP
We have served as the auditor of one or more of the Funds in the 360 Funds since 2018.
Philadelphia, Pennsylvania
August 30, 2021
TRUSTEES AND OFFICERS – (Unaudited)
The Trustees are responsible for the management and supervision of the Funds. The Trustees approve all significant agreements between the Trust, on behalf of the Funds, and those companies that furnish services to the Funds; review performance of the Funds; and oversee activities of the Funds. This section provides information about the persons who serve as Trustees and Officers to the Trust and Funds, respectively. The Statement of Additional Information for each Fund includes additional information about the Trustees and officers and is available, without charge, upon request by calling the Funds toll-free at (800) 934-5550.
Trustees and Officers. Following are the Trustees and Officers of the Trust, their age and address, their present position with the Trust or the Funds, and their principal occupation during the past five years. As described above under “Description of the Trust”, each of the Trustees of the Trust will generally hold office indefinitely. The Officers of the Trust will hold office indefinitely, except that: (1) any Officer may resign or retire and (2) any Officer may be removed any time by written instrument signed by at least two-thirds of the number of Trustees prior to such removal. In case a vacancy or an anticipated vacancy on the Board of Trustees shall for any reason exist, the vacancy shall be filled by the affirmative vote of a majority of the remaining Trustees, subject to certain restrictions under the 1940 Act. Those Trustees who are “interested persons” (as defined in the 1940 Act) by virtue of their affiliation with either the Trust or the Adviser, are indicated in the table. The address of each trustee and officer is 4300 Shawnee Mission Parkway, Suite 100, Fairway, KS 66205.
| Name, Address and Year of Birth (“YOB”) | Position(s) Held with Trust | Length of Service | Principal Occupation(s) During Past 5 Years | Number of Series Overseen | Other Directorships During Past 5 Years |
| Independent Trustees |
Arthur Q. Falk YOB : 1937 | Trustee | Since 2011 | Retired. | Six | None |
Tom M. Wirtshafter YOB : 1954 | Trustee | Since 2011 | Senior Vice President, American Portfolios Financial Services, (broker-dealer), American Portfolios Advisors (investment Advisor) (2009-Present). | Six | None |
Gary W. DiCenzo YOB: 1962 | Trustee and Independent Chairman | Since 2014 Since 2019 | Partner, Cognios Capital (investment management firm) (2015-2020) Chief Executive officer (2015-2019). | Six | None |
Steven D. Poppen YOB : 1968 | Trustee | Since 2018 | Executive Vice President and Chief Financial Officer, Minnesota Vikings (professional sports organization) (1999-present). | Six | M3Sixty Funds Trust (1 portfolio) (2015 – present) |
Thomas J. Schmidt YOB: 1963 | Trustee | Since 2018 | Principal, Tom Schmidt & Associates Consulting, LLC (2015-Present) | Six | None |
| Interested Trustee* | | | | | |
Randall K. Linscott YOB: 1971 | President | Since 2013 | Chief Executive Officer, M3Sixty Administration, LLC (2013 – present) | Six | M3Sixty Funds Trust (1 portfolio) (2015 – present) |
* The Interested Trustee is an Interested Trustee because he is Chief Executive Officer and principal owner of M3Sixty Administration, LLC, the Funds’ administrator and transfer agent.
TRUSTEES AND OFFICERS – (Unaudited) (continued)
| Name, Address and Year of Birth (“YOB”) | Position(s) Held with Trust | Length of Service | Principal Occupation(s) During Past 5 Years | Number of Series Overseen | Other Directorships During Past 5 Years |
| | | | | | |
Richard Yates YOB: 1965 | Chief Compliance Officer and Secretary | Since 2021 | Of Counsel, McElroy Deutsch (2020–present); Head of Compliance, M3Sixty Administration, LLC (2021–present); Chief Compliance Officer and Secretary, M3Sixty Funds Trust (2021–present); Founder, The Yates Law Firm (2018–2020); Chief Legal Officer, Manning & Napier, Inc. (2000–2018). | N/A | N/A |
Larry E. Beaver, Jr. YOB: 1969 | Treasurer | Since 2021 | Fund Accounting, Administration and Tax Officer, M3Sixty Administration, LLC (2017-Present); Director of Fund Accounting & Administration, M3Sixty Administration, LLC (2005-2017); Assistant Treasurer, 360 Funds Trust (2017-2021); Chief Accounting Officer, Amidex Funds, Inc. (2003-2020); Assistant Treasurer, Capital Management Investment Trust (2017-2018); Assistant Treasurer, M3Sixty Funds Trust (2017-Present; Assistant Treasurer, WP Funds Trust (2017-2021); Treasurer and Assistant Secretary, Capital Management Investment Trust (2008-2017); Treasurer, 360 Funds Trust (2007-2017); Treasurer, M3Sixty Funds Trust (2015-2017); Treasurer, WP Trust (2015-2017); Treasurer and Chief Financial Officer, Monteagle Funds (2008-2016). | N/A | N/A |
Bo J. Howell YOB: 1981 | Assistant Secretary | Since 2020 | Shareholder, Strauss Troy Co., LPA (2020-present); Partner, Practus LLP (2018-2020); CEO, Joot (2018-present); Director of Fund Administration, Ultimus Fund Services, LLC (2014-2018). | N/A | N/A |
Steve Roberts YOB: 1953 | Anti-Money Laundering Officer | Since 2021 | Chief Compliance Officer, Matrix 360 Distributors, LLC (2017-present); Chief Compliance Officer, WP Trust (2018-2021); Compliance Analyst, State Street (2016-2017). | N/A | N/A |
TRUSTEES AND OFFICERS – (Unaudited) (continued)
Remuneration Paid to Trustees and Officers - Officers of the Trust and Trustees who are “interested persons” of the Trust or the Adviser will receive no salary or fees from the Trust. Officers of the Trust and interested Trustees do receive compensation directly from certain service providers to the Trust, including Matrix 360 Distributors, LLC and M3Sixty Administration, LLC. Each Trustee who is not an “interested person” (an “Independent Trustee”) receives a $5,000 annual retainer (paid quarterly). In addition, each Independent Trustee receives, on a per fund basis: (i) a fee of $1,500 per fund each year (paid quarterly); (ii) a fee of $200 per Board meeting attended; and (iii) a fee of $200 per committee meeting attended. The Trust reimburses each Trustee for travel and other expenses incurred in connection with, and/or related to, the performance of their obligations as a Trustee. Officers of the Trust are also reimbursed for travel and other expenses relating to their attendance at Board meetings.
| Name of Trustee1 | | Aggregate Compensation From the IMS Family of Funds2 | | | Pension or Retirement Benefits Accrued As Part of Portfolio Expenses | | Estimated Annual Benefits Upon Retirement | | Total Compensation From the IMS Family of Funds Paid to Trustees2 | |
| Independent Trustees |
| Arthur Q. Falk | | $ | 7,503 | | | None | | None | | $ | 7,503 | |
| Tom M. Wirtshafter | | $ | 6,903 | | | None | | None | | $ | 6,903 | |
| Gary W. DiCenzo | | $ | 7,503 | | | None | | None | | $ | 7,503 | |
| Steven D. Poppen | | $ | 6,903 | | | None | | None | | $ | 6,903 | |
| Thomas J. Schmidt | | $ | 7,503 | | | None | | None | | $ | 7,503 | |
| | | | | | | | | | | | | |
| Interested Trustee |
| Randall K. Linscott | | | None | | | None | | None | | | None | |
1 Each of the Trustees serves as a Trustee to two IMS Family of Funds of the Trust. The Trust currently offers six series of shares.
2 Figures are for the year ended June 30, 2021.
OTHER INFORMATION – (Unaudited)
The Funds’ Statement of Additional Information (“SAI”) includes additional information about the trustees and is available without charge, upon request. You may call toll-free at (800) 934-5550 to request a copy of the SAI or to make shareholder inquiries.
The Funds file their complete schedules of portfolio holdings with the Securities and Exchange Commission (the “SEC”) for the first and third quarters of each fiscal year on Form N-PORT. The Funds’ Forms N-PORT are available on the SEC’s website at http://www.sec.gov. The Funds’ Forms N-PORT may be reviewed and copied at the SEC’s Public Reference Room in Washington, DC. Information on the operation of the SEC’s Public Reference Room may be obtained by calling 1-800-SEC-0330.
A description of the policies and procedures that the Funds use to determine how to vote proxies relating to portfolio securities is available without charge, upon request, by calling (800) 934-5550; and on the SEC’s website at http://www.sec.gov.
Information regarding how the Funds voted proxies relating to portfolio securities during the most recent 12-month period ended June 30th is available without charge, upon request, by calling (800) 934-5550; and on the SEC’s website at http://www.sec.gov.
Shareholder Tax Information - The Funds are required to advise you within 60 days of the Funds’ fiscal year end regarding the federal tax status of distributions received by shareholders during the fiscal year. For the year ended June 30, 2021, certain distributions paid by the Funds may be subject to a maximum tax rate of 20%. The Value Fund and Income Fund intend to designate up to a maximum amount of $758,070 and $831,614, respectively, as taxed at a maximum rate of 20%.
Tax information is reported from the Funds’ fiscal year and not calendar year, therefore, shareholders should refer to their Form 1099-DIV or other tax information which will be mailed in 2022 to determine the calendar year amounts to be included on their 2021 tax returns. Shareholders should consult their own tax advisors.
Approval of the Investment Advisory Agreement Renewal (Unaudited)
At a meeting held on April 21, 2021, the Board of Trustees (the “Board”) considered the approval of the Investment Advisory Agreement between the Trust, on behalf of the Funds, and IMS Capital Management, Inc. (the “Adviser”) (the “Advisory Agreement”). Legal counsel (“Counsel”) noted that the 1940 Act requires the approval of an investment advisory agreement with the Trust by a majority of the Independent Trustees.
Counsel reviewed with the Board a memorandum that summarized, among other things, the fiduciary duties and responsibilities of the Board in reviewing and approving the renewal of the Advisory Agreement between the Trust and the Adviser. Counsel discussed with the Trustees the types of information and factors that should be considered by the Board to make an informed decision regarding the approval of the continuation of the Advisory Agreement, including the following material factors: (i) the nature, extent, and quality of the services provided by the Adviser; (ii) the investment performance of the Funds; (iii) the costs of the services provided and profits realized by the Adviser from the relationship with the Funds; (iv) the extent to which economies of scale would be realized if the Funds grow and whether advisory fee levels reflect those economies of scale for the benefit of the Funds’ investors; and (v) the Adviser’s practices regarding possible conflicts of interest.
In assessing these factors and reaching its decisions, the Board took into consideration information furnished for the Board’s review and consideration throughout the year at regular Board meetings, as well as information prepared or presented in connection with the annual renewal process, including information submitted to the Board in the Adviser’s presentation earlier in the Meeting. The Board requested and was provided with information and reports relevant to the annual renewal of the Advisory Agreement, including: (i) reports regarding the services and support provided to the Funds and their shareholders by the Adviser; (ii) quarterly assessments of the investment performance of the Funds from the Adviser; (iii) periodic commentary on the reasons for the performance; (iv) presentations by the Funds’ management addressing the Adviser’s investment philosophy, investment strategy, personnel, and operations; (v) compliance and audit reports concerning the Funds and the Adviser; (vi) disclosure information contained in the registration statement of the Trust; and (vii) a memorandum from Counsel that summarized the fiduciary duties and responsibilities of the Board in reviewing and approving the Advisory Agreement, including the material factors set forth above and the types of information included in each factor that should be considered by the Board to make an informed decision.
The Board also requested and received various informational materials including, without limitation: (i) documents containing information about the Adviser, including financial information, a description of personnel and the services provided to the Funds, information on investment advice, performance, summaries of the Funds’ expenses, compliance program, current legal matters, and other general information; (ii) comparative expense and performance information for other mutual funds with strategies similar to the Funds; and (iii) benefits to be realized by the Adviser from its relationship with the Funds. The Board did not identify any information that was most relevant to its consideration to approve the Advisory Agreement, and each Trustee may have afforded different weights to the various factors.
(1) The nature, extent, and quality of the services provided by the Adviser.
The Board considered the responsibilities the Adviser has under the Advisory Agreement for the Funds. The Board reviewed the services provided by the Adviser to the Funds including, without limitation: its processes for formulating investment recommendations and assuring compliance with the Funds’ investment objectives and limitations; its coordination of services for the Funds among the Funds’ service providers; and its efforts to promote the Funds, grow assets and assist in the distribution of the Funds’ shares. The Board considered the Adviser’s staffing, personnel and methods of operating; the education and experience of the Adviser’s staff; and the Adviser’s compliance program, policies, and procedures. After reviewing the preceding and further information from the Adviser, the Board concluded that the nature, extent, and quality of the services provided by the Adviser was satisfactory and adequate for the Funds.
Approval of the Investment Advisory Agreement Renewal (Unaudited) (continued)
(2) Investment Performance of the Funds and the Adviser.
The Trustees compared the short- and long-term performance of each of the Funds with the performance of their benchmark index, or indices, as applicable, comparable funds with similar objectives and size managed by other investment advisers, and peer group indices (e.g., Morningstar category averages). The Trustees also considered the consistency of the Adviser’s management of the Funds with their investment objective and policies.
The Board considered the peer, benchmark and category performance of the Value Fund and the Income Fund over various periods. The Adviser discussed various aspects of the Funds’ under-performance, noting that its smaller size makes certain comparisons challenging. The Adviser reported its efforts to reduce the number of under-performing securities within the respective portfolios. The Board also considered the Funds’ performance during the most recent market conditions because of COVID-19.
The Board noted the Adviser’s representation that the Funds’ underperformance was largely due to the Funds’ size and expenses. Based on the preceding, the Board concluded that the investment performance information presented for the Funds was satisfactory.
| (3) | The costs of the services provided and profits realized by the Adviser from the relationship with the Funds. |
The Trustees considered the Adviser’s staffing, personnel and methods of operating; the financial condition of the Adviser and its level of commitment to the Funds; the asset levels of the Funds; and the overall expenses of the Funds. The Trustees considered the financial statements of the Adviser and the financial stability and productivity of the firm. The Board considered the Adviser’s strategic plans to manage costs related to its operations and to hire a marketing firm to assist with the Adviser’s marketing plan. The Trustees considered the fees and expenses of the Funds (including the management fee) relative to its peer group as of April 1, 2021. The Trustees noted that the management fee for each of the Funds was above the peer group median and average and towards the higher end of the category, but it was within a reasonable range for the category.
The Trustees also noted that each of the Funds’ net expense ratio was above the peer group average and median; they recognized that the Funds were substantially smaller than most of their peers, which affects the net expense ratio of the Funds. The Trustees noted that regarding the Funds, the Adviser has entered into an expense limitation agreement according to which the Adviser has agreed to waive or reduce its fees and to assume other expenses of the Funds, if necessary, to limit each Fund’s annual operating expenses (with industry-standard exceptions) through October 31, 2022. The Trustees also considered the fees assessed to the Adviser’s clients with separate accounts that were managed by the Adviser with strategies similar to the Funds and observed that the fees for such clients were generally lower than those assessed to the Funds – in this regard, the Trustees considered the Adviser’s representation that the Funds’ fees are higher, in general, due to the administrative and compliance burdens associated with the management of mutual funds. The Board also noted that the Adviser realizes a reasonable profit for its management of the Funds. Following this analysis and upon further consideration and discussion of the preceding, the Board concluded that the fees paid to the Adviser by each of the Funds were fair and reasonable.
Approval of the Investment Advisory Agreement Renewal (Unaudited) (continued)
| (4) | The extent to which economies of scale would be realized if the Funds grow and whether advisory fee levels reflect these economies of scale for the benefit of the Funds’ investors. |
The Board considered the Funds’ fee arrangements with the Adviser. The Trustees determined that although the management fee would stay the same as asset levels increased, the shareholders of the Funds would benefit from the expense limitation arrangement for each of the Funds. The Trustees noted that while a breakpoint schedule in an advisory agreement would be beneficial, such a feature only had benefits if the Funds’ assets were enough to realize the effect of the breakpoint. The Trustees noted that lower expenses for the Funds’ shareholders are realized immediately with the expense limitation arrangements with the Adviser. The Trustees noted that the Funds’ assets were at such levels that the expense limitation arrangements were providing benefits to the Funds’ shareholders currently. The Trustees also noted that the Funds would benefit from economies of scale under their agreements with some of their service providers other than the Adviser as fees that were in place with those other service providers were either fixed or essentially semi-fixed, and the Board considered the Adviser’s efforts to work with M3Sixty to secure such arrangements for the Funds. Following further discussion of the Funds’ asset levels, expectations for growth and levels of fees, the Board determined that the Funds’ fee arrangements, in light of all the facts and circumstances, were fair and reasonable and that the expense limitation arrangement provided savings and protection for the benefit of the Funds’ investors.
| (5) | Possible conflicts of interest and benefits derived by the Adviser. |
The Trustees evaluated the potential for conflicts of interest and considered such matters as: the experience and ability of the advisory and compliance personnel assigned to the Funds; the basis of decisions to buy or sell securities for the Funds; and the substance and administration of the Adviser’s code of ethics. Based on the preceding, the Board determined that the Adviser’s standards and practices relating to the identification and mitigation of possible conflicts of interest were satisfactory. It was noted that the Adviser indicated that the ability to place investors in the Funds, who did not meet the Adviser’s minimum separate account size, was an indirect benefit to the Adviser.
After additional consideration of the factors delineated in the memorandum provided by Counsel and further discussion among the Board, the Board determined that the compensation payable under the Advisory Agreement with respect to the Funds was fair, reasonable and within a range of what could have been negotiated at arms-length in light of all the surrounding circumstances, and they resolved to approve the Advisory Agreement with respect to the Funds.
Liquidity Risk Management Program (Unaudited)
In accordance with Rule 22e-4 under the Investment Company Act of 1940, as amended (the “Liquidity Rule”), the Funds have established a liquidity risk management program (the “Liquidity Program”) that is reasonably designed to assess and manage the Funds’ liquidity risk, which generally represents the risk that the Funds could not meet redemption requests without significant dilution of remaining investors’ interests. The Board has appointed M3Sixty Administration, LLC (“M3Sixty”), as the administrator of the Liquidity Program. As administrator, M3Sixty is responsible for overseeing the daily operations of the Liquidity Program, and annually assessing, managing, and reviewing with the Board the liquidity risk of each series in the Trust. M3Sixty works with the Funds’ investment adviser, as necessary, to execute the Liquidity Program and address issues as they arise.
The Liquidity Program’s principal objectives include supporting the Funds’ compliance with limits on investments in illiquid assets and mitigating the risk that the Funds cannot timely meet its redemption obligations. The Liquidity Program also includes a number of elements that support the management and assessment of liquidity risk, including an annual assessment of factors that influence each Fund’s liquidity and the periodic classification and reclassification of its investments into categories that reflect each investment adviser’s assessment of each Fund’s relative liquidity under current market conditions. Under the Liquidity Program, every investment held by the Funds is classified at least monthly into one of four liquidity categories based on estimations of the investment’s ability to be sold during designated time frames in current market conditions without significantly changing the investment’s market value.
As required by the Liquidity Rule, at a meeting held on January 27, 2021, M3Sixty presented an annual assessment to the Board that addressed the operation of the Liquidity Program and assessed its adequacy and effectiveness of implementation, including any material changes to the Liquidity Program and the determination of each Fund’s Highly Liquid Investment Minimum (“HLIM”). The annual assessment included consideration of the following factors, as applicable:
| ● | the Funds’ investment strategies and liquidity of portfolio investments during normal and reasonably foreseeable stressed conditions, including whether the investment strategies are appropriate for open-end funds; |
| ● | the extent to which the strategy involves a relatively concentrated portfolio or large positions in particular issuers; |
| ● | the use of borrowings and derivatives for investment and redemption purposes; |
| ● | short-term and long-term cash flow projections covering both normal and reasonably foreseeable stressed conditions; and |
| ● | holdings of cash and cash equivalents. |
For each series in the Trust, the annual assessment incorporated a report related to each Fund’s holdings, shareholder and portfolio concentration, any borrowings during the period, cash flow projections, and other relevant data for the period of December 1, 2019 through November 30, 2020. The report described the methodology for classifying each Fund’s investments (including derivative transactions) into one of four liquidity categories, as well as the percentage of each Fund’s investments assigned to each category. It also explained the methodology for establishing a Fund’s HLIM and noted that the investment adviser reviews the HLIM assigned to each Fund no less frequently than annually.
During the period, M3Sixty noted that the COVID-19 pandemic, especially in the March 2020 through mid-April 2020 timeframe, was the key factor and/or market event that impacted liquidity risk. Other factors included portfolio composition and client base during the period.
During the assessment period, the Board did not approve any material changes to the program.
For the Trust, certain provisions of the Liquidity Program initially became effective on June 1, 2019, and the full Liquidity Program was formally approved by the Board in December 2019. During the period covered by the annual assessment, M3Sixty concluded, and reported to the Board, that the Liquidity Program since its implementation has operated adequately and effectively and is reasonably designed to assess and manage each Fund’s liquidity risk.
360 FUNDS
4300 Shawnee Mission Parkway
Suite 100
Fairway, KS 66205
INVESTMENT ADVISER
IMS Capital Management, Inc.
8995 S.E. Otty Road,
Portland, OR 97086
ADMINISTRATOR & TRANSFER AGENT
M3Sixty Administration, LLC
4300 Shawnee Mission Parkway
Suite 100
Fairway, KS 66205
DISTRIBUTOR
Matrix 360 Distributors, LLC
4300 Shawnee Mission Parkway
Suite 100
Fairway, KS 66205
INDEPENDENT REGISTERED PUBLIC ACCOUNTING FIRM
BBD, LLP
1835 Market Street
3rd Floor
Philadelphia, PA 19103
LEGAL COUNSEL
Strauss Troy Co., LPA
Federal Reserve Building
150 E. 4th Street
4th Floor
Cincinnati, OH 45202
CUSTODIAN BANK
Huntington National Bank
41 South Street
Columbus, OH 43125
This report is intended only for the information of shareholders or those who have received the Funds’ prospectus which contains information about each Fund’s management fee and expenses. Please read the prospectus carefully before investing.
| (a) | The registrant has, as of the end of the period covered by this report, adopted a code of ethics that applies to the registrant’s principal executive officer, principal financial officer, and principal accounting officer or controller, or persons performing similar functions, regardless of whether these individuals are employed by the registrant or a third party. |
| (b) | During the period covered by this report, there were no amendments to any provision of the code of ethics. |
| (c) | During the period covered by this report, there were no waivers or implicit waivers of a provision of the code of ethics. |
| | |
| (d) | The registrant’s Code of Ethics is filed herewith. |
| ITEM 3. | AUDIT COMMITTEE FINANCIAL EXPERT. |
| | The registrant’s Board of Trustees has determined that Tom Wirtshafter serves on its audit committee as the “audit committee financial expert” as defined in Item 3. |
| ITEM 4. | PRINCIPAL ACCOUNTANT FEES AND SERVICES. |
(a) | Audit Fees. The aggregate fees billed for professional services rendered by the principal accountant for the audit of the registrant’s annual financial statements or for services that are normally provided by the accountant in connection with statutory and regulatory filings or engagements were $22,000 and $22,000 with respect to the registrant’s fiscal years ended June 30, 2021 and June 30, 2020, respectively. The June 30, 2021 and June 30, 2020 fees were paid to BBD, LLP. |
| | |
| (b) | Audit-Related Fees. There were no fees billed during the last two fiscal years for assurances and related services by the principal accountant that are reasonably related to the performance of the audit of the registrant’s financial statements and are not reported under paragraph (a) of this item. |
| (c) | Tax Fees. The aggregate fees billed in the last two fiscal years for professional services rendered by the principal accountant for tax compliance, tax advice and tax planning were $4,000 and $4,000 with respect to the registrant’s fiscal years ended June 30, 2021 and June 30, 2020, respectively. The services comprising these fees are the preparation of the registrant’s federal income and excise tax returns. The June 30, 2021 and June 30, 2020 fees were paid to BBD, LLP. |
| (d) | All Other Fees. The aggregate fees billed in last fiscal year for products and services provided by the registrant’s principal accountant, other than the services reported in paragraphs (a) through (c) of this item were $0 for the fiscal year ended June 30, 2021 and $0 for the fiscal year ended June 30, 2020 for the IMS Family of Funds. |
| (e)(1) | The audit committee does not have pre-approval policies and procedures. Instead, the audit committee or audit committee chairman approves on a case-by-case basis each audit or non-audit service before the principal accountant is engaged by the registrant. |
(e)(2) | There were no services described in each of paragraphs (b) through (d) of this Item that were approved by the audit committee pursuant to paragraph (c)(7)(i)(C) of Rule 2-01 of Regulation S-X. |
(f) | Not applicable. The percentage of hours expended on the principal accountant’s engagement to audit the registrant’s financial statements for the most recent fiscal year that were attributed to work performed by persons other than the principal accountant’s full-time permanent employees was zero percent (0%). |
| (g) | All non-audit fees billed by the registrant’s principal accountant for services rendered to the registrant for the last three fiscal years ended June 30, 2021 and June 30, 2020 are disclosed in (b)-(d) above. There were no audit or non-audit services performed by the registrant’s principal accountant for the registrant’s adviser. |
| (h) | There were no non-audit services rendered to the registrant’s investment adviser. |
| ITEM 5. | AUDIT COMMITTEE OF LISTED REGISTRANTS. |
Not applicable
| ITEM 6. | SCHEDULES OF INVESTMENTS |
Included in annual report to shareholders filed under item 1 of this form.
| ITEM 7. | DISCLOSURE OF PROXY VOTING POLICIES AND PROCEDURES FOR CLOSED-END MANAGEMENT INVESTMENT COMPANIES. |
Not applicable Fund is an open-end management investment company
| ITEM 8. | PORTFOLIO MANAGERS OF CLOSED-END MANAGEMENT INVESTMENT COMPANIES |
Not applicable Fund is an open-end management investment company
| ITEM 9. | PURCHASES OF EQUITY SECURITIES BY CLOSED-END MANAGEMENT INVESTMENT COMPANY AND AFFILIATED PURCHASERS. |
Not applicable Fund is an open-end management investment company
| ITEM 10. | SUBMISSION OF MATTERS TO A VOTE OF SECURITY HOLDERS. |
Not applicable at this time.
| ITEM 11. | CONTROLS AND PROCEDURES. |
| (a) | The registrant’s principal executive and principal financial officers, or persons performing similar functions, have concluded that the registrant’s disclosure controls and procedures (as defined in Rule 30a-3(c) under the 1940 Act, are effective, as of a date within 90 days of the filing date of this report, based on the evaluation of these controls and procedures required by Rule 30a-3(b) under the 1940 Act and Rule 15d-15(b) under the Securities Exchange Act of 1934, as amended. |
| (b) | There were no changes in the registrant’s internal control over financial reporting (as defined in Rule 30a-3(d) under the 1940 Act) that occurred during the period covered by this report that have materially affected, or are reasonably likely to materially affect, the registrant’s internal control over financial reporting. |
| ITEM 12. | DISCLOSURE OF SECURITIES LENDING ACTIVITIES FOR CLOSED-END MANAGEMENT INVESTMENT COMPANIES. |
Not applicable, Fund is an open-end management investment company
SIGNATURES
Pursuant to the requirements of the Securities Exchange Act of 1934 and the Investment Company Act of 1940, the registrant has duly caused this report to be signed on its behalf by the undersigned, thereunto duly authorized.
360 Funds
| By: Randy Linscott | /s/ Randy Linscott | |
| Principal Executive Officer, | |
| Date: September 3, 2021 | | |
Pursuant to the requirements of the Securities Exchange Act of 1934 and the Investment Company Act of 1940, this report has been signed below by the following person on behalf of the registrant and in the capacities and on the date indicated.
| By Randy Linscott | /s/ Randy Linscott | |
| Principal Executive Officer | |
| Date: September 3, 2021 | | |
Pursuant to the requirements of the Securities Exchange Act of 1934 and the Investment Company Act of 1940, this report has been signed below by the following person on behalf of the registrant and in the capacities and on the date indicated.
| By Larry E. Beaver, Jr. | /s/ Larry E. Beaver, Jr. | |
| Assistant Treasurer and Acting Principal Financial Officer | |
| Date: September 3, 2021 | | |