UNITED STATES
SECURITIES AND EXCHANGE COMMISSION
Washington, D.C. 20549
FORM N-CSR
CERTIFIED SHAREHOLDER REPORT OF REGISTERED MANAGEMENT INVESTMENT COMPANIES
Investment Company Act File Number 811-21726
360 Funds
(Exact name of registrant as specified in charter)
4300 Shawnee Mission Parkway, Suite 100, Fairway, KS | 66205 |
(Address of principal executive offices) | (Zip code) |
The Corporation Trust Company
Corporation Trust Center
1209 Orange St.
Wilmington, DE 19801
(Name and address of agent for service)
With Copies To:
Bo J. Howell
Strauss Troy Co., LPA
Federal Reserve Building
150 E. 4th Street, 4th Floor
Cincinnati, OH 45202-4018
Registrant’s telephone number, including area code: 877-244-6235
Date of fiscal year end: 09/30/2021
Date of reporting period: 09/30/2021
ITEM 1. REPORTS TO SHAREHOLDERS
The Annual report to Shareholders of the Timber Point Global Allocations Fund (the “Global Fund”) and Timber Point Alternative Income Fund (the “Income Fund”), each a series of the 360 Funds (the “registrant”), for the year ended September 30, 2021 pursuant to Rule 30e-1 under the Investment Company Act of 1940 (the “1940 Act”) (17 CFR 270.30e-1), as amended, is filed herewith.

Timber Point Global Allocations Fund Institutional Class Shares (Ticker Symbol: CGHIX) Timber Point Alternative Income Fund Institutional Class Shares (Ticker Symbol: AIIFX) Series of the 360 Funds |
ANNUAL REPORT
September 30, 2021
Investment Adviser:
Timber Point Capital Management LLC
555 Pleasantville Road, Suite N202
Briarcliff Manor, NY 10510
1-877-244-6235
www.timberpointcapital.com
Distributed by Matrix 360 Distributors, LLC
Member FINRA
This report is authorized for distribution only to shareholders and to others who have received a copy of the Funds’ prospectus.
IMPORTANT NOTE: Beginning on January 1, 2021, as permitted by regulations adopted by the SEC, paper copies of the Timber Point Funds’ shareholder reports are no longer being sent by mail unless you specifically requested paper copies of the reports from a Timber Point Fund or from your financial intermediary, such as a broker-dealer or bank. Instead, the reports are being made available on a website, and you will be notified by mail each time a report is posted and provided with a website link to access the report. If you already elected to receive shareholder reports electronically, you will not be affected by this change and you need not take any action. You may elect to receive all future reports in paper free of charge. You can inform a Timber Point Fund or your financial intermediary that you wish to continue receiving paper copies of your shareholder reports by calling or sending an e-mail request. Your election to receive reports in paper will apply to all funds held with the Timber Point Funds complex/your financial intermediary.
TABLE OF CONTENTS
Timber Point Capital Management
Letter to Shareholders
Fiscal Year Ended September 30, 2021
The fiscal year ended September 30, 2021 proved to be a period of generally strong investment returns across most risk sectors of the global investment marketplace, despite an economy which still was contending with the lingering effects of the COVID-19 crisis. Extraordinary policy stimulus, both fiscal and monetary, continued to support markets. As the economy recovered sharply from its spring 2020 COVID lows, so did corporate earnings which further buoyed equities. Fixed income markets generally underperformed for the period. An improving economy and rising inflationary pressures drove interest rates higher causing negative returns across most high-grade fixed income investments.
The Timber Point Global Allocations Fund (the “Global Fund” or “CGHIX”) and the Timber Point Alternative Income Fund (the “Income Fund” or “AIIFX”) are designed as liquid alternative investment funds with the goal of providing both diversification and return benefits relative to traditional asset classes. Both funds employ a macro-economic oriented, multi- asset investing approach as well as a risk management framework designed to provide diversification and avoid significant drawdowns and impairment.
Specifically, the Global Fund uses a directional, global multi-asset strategy investing across global equities, debt, commodities, currencies, and market hedging tools. CGHIX seeks superior risk-adjusted returns with a targeted 5-year net return of 6.00% over T-Bills while maintaining moderate levels of total portfolio volatility.
The Income Fund utilizes a fixed income diversification strategy which seeks higher yields and returns by allocating to non-traditional sectors of the bond market, particularly sectors where interest rate risk is not the primary source of return. AIIFX targets a 5-year net return of 1.50% over the Bloomberg Barclays Aggregate Bond Index while maintaining low levels of portfolio volatility.
For the one-year period ended September 30, 2021, both funds posted strong absolute results which exceeded their respective return targets. Returns were also strong on a risk adjusted basis as the portfolios did not meaningfully change their risk profiles in order to chase returns. Each Fund’s performance during the year as compared to its benchmarks was as follows:
| | 4q 2020 | | 1q 2021 | | 2q 2021 | | 3q 2021 | | Year ended 9/30/21 |
| | | | | | | | | | |
Strategies v Appropriate Benchmarks * | | | | | | | | | |
| CGHIX | 11.9 | | 3.1 | | 2.0 | | -3.8 | | 13.2 |
| S&P 500® Total Return Index | 12.2 | | 6.2 | | 8.5 | | 0.6 | | 30.0 |
| Bloomberg Barclays U.S. Aggregate Bond Index | 0.7 | | -3.4 | | 1.8 | | 0.1 | | -0.9 |
| | | | | | | | | | |
| AIIFX | 3.7 | | -0.7 | | 2.4 | | -0.1 | | 5.3 |
| Bloomberg Barclays Global Aggregate Bond Index | 3.3 | | -4.5 | | 1.3 | | -0.9 | | -0.9 |
| HFRX Absolute Return Index | 2.2 | | 0.6 | | 2.1 | | -0.7 | | 4.1 |
In as much as the CGHIX outperformed its targeted return, it did underperform pure equity benchmarks, which should be expected. The strategy is designed as multi-asset class which intends to diversify away from pure equity risk. Equity risk, however, did drive a good portion of the portfolio’s returns over the period, particularly investments in US small cap equities and other special situation companies. Specialty small caps such as FAT Brands, Tattooed Chef and Nano Dimensions provided meaningful excess returns which helped the portfolio, particularly over the first six months of the fiscal year. Over the next six months as the Delta variant of the COVID virus threatened another shock to the economy, small caps sold off which negatively impacted the Global Fund, particularly in the June to September period. Beyond a subset of individual companies, the Global Fund allocates to a wide range of exchange-traded funds (“ETFs”) to get both global broad market exposure as well as to invest in more unique sectors. The Global Fund held regional banks, insurance, water infrastructure and agribusiness ETFs, which generally helped returns. The Global Fund also held Chinese investments both in individual companies and through an ETF, both of which hurt performance.
The Global Fund generally underweighted most interest rate and fixed income exposure over the period as the return profile for fixed income was unattractive. In lieu of fixed income, the Global Fund maintained high allocations to cash to offset equity exposure and to dampen portfolio volatility.
The Global Fund did maintain modest allocations to commodities due to concerns over inflation and a generally attractive environment for hard assets.
Over the year, the Global Fund has reduced its position in private funds as returns in those investments were subpar and not worthy of reduced liquidity and transparency.
CGHIX Holdings as of September 30 2021
Asset Class | | Sector | | | | % of Portfolio |
Equity | | | | | | 60.8 |
| | Communication Services | | | 1.7 |
| | Consumer Cyclical | | | 2.0 |
| | Consumer Staples | | | 1.0 |
| | Energy | | | | 0.7 |
| | Financials | | | | 2.1 |
| | Industrials | | | | 0.8 |
| | Information Technology | | | 0.7 |
| | Equity Mutual Funds | | | 2.8 |
| | Equity ETFs | | | 49.0 |
| | | | | | |
Commodities | | | | | | 4.7 |
| | Commodity ETFs | | | 4.7 |
| | | | | | |
Fixed Income | | | | | | 10.0 |
| | Fixed Income Mutual Funds | | 10.0 |
| | | | | | |
Cash | | | | | | 24.5 |
The Income Fund performed very well over the one-year period ended September 30 2021. The Income Fund’s strategy is designed to diversify a portfolio away from pure interest rate risk and provide a differentiated return pattern from traditional fixed income. Over the period the Income Fund met its objective as traditional bonds posted negative returns and AIIFX posted a strong positive return. Given the improving economy and favorable credit conditions, the Income Fund overweighted corporate credit both in individual securities as well as through ETFs and Closed Ended Funds. All of these investments proved beneficial to portfolio returns. Despite a generally, negative environment for interest rates and government bonds, the Income Fund did own a tactical investment in a long-term treasury ETF which posted a strong return. Interest rates peaked in March 2021 and the consensus opinion was that rates would continue to rise. Yet, given concerns over the Delta variant, economic expectations diminished, and interest rates fell sharply from March through September, falling nearly 0.50%, benefiting long term bonds. The portfolio did also own a modest percentage of equities, specifically positions which both provide income and further hedge against bond market risks, such as regional banks. These investments were also additive to the Income Fund’s performance. A small allocation to commodities rounded out the portfolio.
AIIFX Holdings as of September 30 2021
Asset Class | | Sector | | % of Portfolio |
Fixed Income | | | | | | 87.9 |
| | Corporate Bond Holdings | | 46.9 |
| | Fixed Income ETFs | | | 41.0 |
| | | | | | |
Equity | | | | | | 2.9 |
| | Equity ETFs | | | 2.9 |
| | | | | | |
Commodities | | | | | | 2.9 |
| | Commodity ETFs | | | 2.9 |
| | | | | | |
Cash | | | | | | 6.3 |
Thank you for your confidence in Timber Point Capital Management and we look forward to working with you in the future.
Sincerely,
David Cleary
President and Chief Investment Officer
* The performance information quoted in this annual report assumes the reinvestment of all dividend and capital gain distributions, if any, and represents past performance, which is not a guarantee of future results. The returns shown do not reflect taxes that a shareholder would pay on Fund distributions or on the redemption of Fund shares. The investment return and principal value of an investment will fluctuate and, therefore, an investor’s shares, when redeemed, may be worth more or less than their original cost. Updated performance data current to the most recent month-end can be obtained by calling 1-877-244-6235.
| Timber Point Funds | ANNUAL REPORT |
INVESTMENT HIGHLIGHTS
Timber Point Global Allocations Fund
September 30, 2021 (Unaudited)
Returns as of September 30, 2021 | One year ended
September 30, 2021 | Five years ended
September 30, 2021 | Commencement of
Operations through
September 30, 2021* |
| Timber Point Global Allocations Fund | | | |
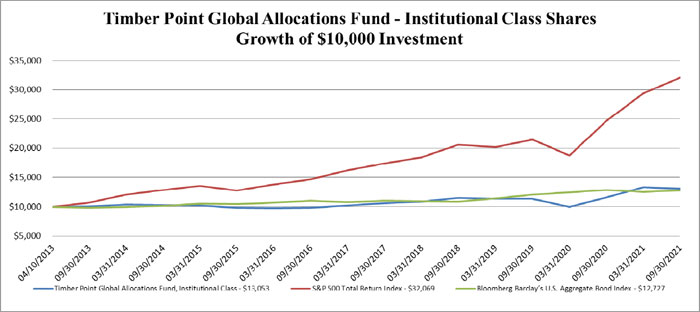
Institutional Class | 13.20% | 5.85% | 3.20% |
| S&P 500® Total Return Index | 30.00% | 16.89% | 14.73% |
| Bloomberg Barclays U.S. Aggregate Bond Index | (0.90)% | 2.94% | 2.88% |
* The Timber Point Global Allocations Fund Institutional Class shares commenced operations on April 10, 2013.
The performance information quoted in this annual report assumes the reinvestment of all dividend and capital gain distributions, if any, and represents past performance, which is not a guarantee of future results. The returns shown do not reflect taxes that a shareholder would pay on Fund distributions or on the redemption of Fund shares. The investment return and principal value of an investment will fluctuate and, therefore, an investor’s shares, when redeemed, may be worth more or less than their original cost. Updated performance data current to the most recent month-end can be obtained by calling 1-877-244-6235.
The above graphs depict the performance of the Timber Point Global Allocations Fund versus the S&P 500® Total Return Index (“S&P 500”) and the Bloomberg Barclays U.S. Aggregate Bond Index (the “Barclays Index”). The S&P 500 is a broad unmanaged index of 500 stocks, which is widely recognized as representative of the equity market in general. Index returns assume reinvestment of dividends. The Barclays Index provides a measure of the performance of the U.S. investment grade bonds market, which includes investment grade U.S. Government bonds, investment grade corporate bonds, mortgage passthrough securities, and asset-backed securities that are publicly offered for sale in the United States. The securities in the Barclays Index must have at least 1 year remaining to maturity. In addition, the securities must be denominated in U.S. dollars and must be fixed-rate, nonconvertible and taxable. Investors may not invest in any index directly; unlike the Timber Point Global Allocations Fund’s returns, an Index does not reflect any fees or expenses. The Fund will generally not invest in all the securities comprising each index.
| Timber Point Funds | ANNUAL REPORT |
INVESTMENT HIGHLIGHTS
Timber Point Global Allocations Fund
September 30, 2021 (Unaudited)
The investment objective of the Timber Point Global Allocations Fund (the “Global Fund”) is to seek income with long-term growth of capital as a secondary objective.
The Global Fund intends to achieve its investment objective by utilizing an asset allocation strategy to invest in a global portfolio of uncorrelated assets that can include exposure, through underlying vehicles, to common stocks and other investments. The Global Fund will invest primarily in common stocks of all issuers, exchange-traded funds (“ETFs”), mutual funds, closed-end funds, and private funds such as hedge funds, private equity funds, and fund-of-funds. The Global Fund, through underlying vehicles and securities in which it invests, may invest in non-U.S. companies (including those in emerging markets). The Global Fund may also invest directly in debt securities of any maturity or credit quality, including debt securities that are convertible into common or preferred stocks and high-yield bonds (commonly referred to as “junk bonds”).
The Global Fund will invest directly or indirectly in derivatives for both hedging purposes and to increase returns. The Global Fund will invest in derivatives including equity, total return, and currency swap agreements; futures contracts and options on futures contracts (including with respect to index and commodities); and forward currency contracts. Timber Point Capital Management LLC (the “Adviser”) will execute a portion of the Global Fund’s strategy by investing in a wholly owned and controlled subsidiary (the “Subsidiary”). The Subsidiary invests the majority of its assets in commodities, commodity-linked derivative investments and other futures contracts. The Subsidiary is subject to the same investment restrictions as the Global Fund, when viewed on a consolidated basis.
The Global Fund may also engage in short sales for either hedging or speculative purposes. A short sale involves the sale of a security that the Global Fund does not own in the expectation of purchasing the same security (or a security exchangeable therefor) later and at a lower price and profiting from the price decline. Similarly, when taking short positions with respect to securities through investments in derivative instruments, the Adviser is expecting the value of such securities to fall during the period of the Global Fund’s investment exposure. The Global Fund may purchase or sell options for hedging purposes. The Global Fund will not engage in naked put writing and the value of any options will be less than the Global Fund’s net assets.
Allocation of Portfolio Holdings
| Asset Class/Industry Sector | | Percentage of Net Assets* | |
| Exchange-Traded Funds | | | 51.81 | % |
| Mutual Funds | | | 12.37 | % |
| Common Stock | | | 6.67 | % |
| Preferred Stock | | | 1.09 | % |
| Warrants | | | 0.92 | % |
| Mortgage Backed Securities | | | 0.01 | % |
| Asset Backed Securities | | | 0.01 | % |
| Put Options Written | | | (0.11 | )% |
| Other, Cash and Cash Equivalents | | | 27.23 | % |
| | | | 100.00 | % |
* The percentages in the above table are based on the portfolio holdings of the Global Fund as of September 30, 2021 and are subject to change. For a detailed break-out of holdings by industry and investment type, please refer to the Consolidated Schedule of Investments.
| Timber Point Funds | ANNUAL REPORT |
INVESTMENT HIGHLIGHTS
Timber Point Alternative Income Fund
September 30, 2021 (Unaudited)
Returns as of September 30, 2021 | One year ended
September 30, 2021 | Five years ended
September 30, 2021 | Commencement of
Operations through
September 30, 2021* |
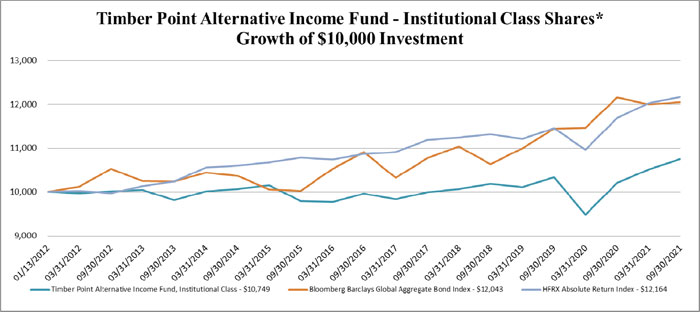
| Timber Point Alternative Income Fund Institutional Class | 5.30% | 1.54% | 0.75% |
| Bloomberg Barclays Global Aggregate Bond Index | (0.91)% | 1.99% | 1.93% |
| HFRX Absolute Return Index | 4.10% | 2.27% | 2.04% |
* Commencement of operations returns assume an inception date of January 13, 2012, the actual inception date of the Fund. The Timber Point Alternative Income Fund Institutional Class shares commenced operations on February 12, 2019. Performance information prior to February 12, 2019 represents the performance of the Crow Point Alternative Income Fund Investor Class shares. Effective May 29, 2020, Investor Class shares were exchanged for Institutional Class shares.
The performance information quoted in this annual report assumes the reinvestment of all dividend and capital gain distributions, if any, and represents past performance, which is not a guarantee of future results. The returns shown do not reflect taxes that a shareholder would pay on Fund distributions or on the redemption of Fund shares. The investment return and principal value of an investment will fluctuate and, therefore, an investor’s shares, when redeemed, may be worth more or less than their original cost. Updated performance data current to the most recent month-end can be obtained by calling 1-877-244-6235.
The above graph depicts the performance of the Timber Point Alternative Income Fund versus the Bloomberg Barclays Global Aggregate Bond Index (the “Barclays Global Index”) and the HFRX Absolute Return Index (the “HFRX Index”). The Barclays Global Index is a flagship measure of global investment grade debt from twenty-four local currency markets. This multi-currency benchmark includes treasury, government related, corporate and securitized fixed-rate bonds from both developed and emerging markets issuers. The HFRX Index is designed to be representative of the overall composition of the hedge fund universe. It is comprised of all eligible hedge fund strategies; including but not limited to convertible arbitrage, distressed securities, equity hedge, equity market neutral, event driven, macro, merger arbitrage, and relative value arbitrage. As a component of the optimization process, the index selects constituents which characteristically exhibit lower volatilities and lower correlations to standard directional benchmarks of equity market and hedge fund industry performance. Index returns assume reinvestment of dividends. Investors may not invest in any Index directly; unlike the Timber Point Alternative Income Fund’s returns, an Index does not reflect any fees or expenses.
| Timber Point Funds | ANNUAL REPORT |
INVESTMENT HIGHLIGHTS
Timber Point Alternative Income Fund
September 30, 2021 (Unaudited)
The investment objective of the Timber Point Alternative Income Fund (the “Income Fund”) is to seek to provide shareholders with above-average total returns over a complete market cycle primarily through capital appreciation and income generation. The Fund considers “above-average total returns” to be returns that are uncorrelated to, and greater than, the Fund’s primary benchmark.
The Income Fund seeks to obtain its investment objective by allocating assets among credit-related instruments such as corporate bonds, municipal bonds, mortgage and asset-backed securities, and floating-rate securities. The Income Fund is designed to generate more of its income and returns from assets with less yield-curve risk than traditional duration-sensitive bonds. The Income Fund may invest in debt securities of any maturity and any quality, including below-investment grade debt (also known as “junk bonds”).
The Income Fund may also invest in equity securities including those of private funds, such as hedge funds and private equity funds, exchange-traded-notes (ETNs”), exchange-traded funds (“ETFs”), mutual funds, and publicly traded and non-publicly traded business development companies (“BDCs”). Investments in illiquid private funds, including illiquid hedge funds and private equity funds, will be limited to no more than 15% of the Income Fund’s net assets. The Income Fund may invest in equity securities of any market capitalization. The Income Fund may invest without limitation in investments tied economically to any country in the world, including emerging market countries.
Allocation of Portfolio Holdings
| Asset Class/Industry Sector | | Percentage of Net Assets | |
| Exchange-Traded Funds | | | 46.84 | % |
| Corporate Bonds | | | 46.27 | % |
| Preferred Stock | | | 0.65 | % |
| Mortgage Backed Securities | | | 0.07 | % |
| Asset Backed Securities | | | 0.03 | % |
| Put Options Written | | | (0.03 | )% |
| Other, Cash and Cash Equivalents | | | 6.17 | % |
| | | | 100.00 | % |
The percentages in the above table are based on the portfolio holdings of the Income Fund as of September 30, 2021 and are subject to change. For a detailed break-out of holdings by industry and investment type, please refer to the Schedule of Investments.
| TIMBER POINT GLOBAL ALLOCATIONS FUND |
| CONSOLIDATED SCHEDULE OF INVESTMENTS |
| September 30, 2021 | ANNUAL REPORT |
| COMMON STOCK - 6.67% | | Shares | | | Value | |
| | | | | | | |
| Aerospace & Defense - 0.25% | | | | | | | | |
| Boeing Co. (a) | | | 400 | | | $ | 87,976 | |
| | | | | | | | | |
| Banks - 0.46% | | | | | | | | |
| JPMorgan Chase & Co. | | | 1,000 | | | | 163,690 | |
| | | | | | | | | |
| Commercial Services - 0.28% | | | | | | | | |
| PayPal Holdings, Inc. (a) | | | 380 | | | | 98,880 | |
| | | | | | | | | |
| Computers - 0.42% | | | | | | | | |
| Apple, Inc. | | | 1,050 | | | | 148,575 | |
| | | | | | | | | |
| Diversified Financial Services - 0.25% | | | | | | | | |
| Visa, Inc. - Class A | | | 400 | | | | 89,100 | |
| | | | | | | | | |
| Healthcare - Products - 0.35% | | | | | | | | |
| Medtronic PLC - Ireland | | | 975 | | | | 122,216 | |
| | | | | | | | | |
| Holding Companies - Diversified - 0.14% | | | | | | | | |
| Power & Digital Infrastructure Acquisition Corp. - Class A (a) | | | 5,000 | | | | 50,550 | |
| | | | | | | | | |
| Internet - 1.65% | | | | | | | | |
| Alibaba Group Holding Ltd. - ADR - China (a) | | | 1,800 | | | | 266,490 | |
| Baidu, Inc. - ADR - China (a) | | | 2,050 | | | | 315,187 | |
| | | | | | | | 581,677 | |
| Machinery - Diversified - 0.53% | | | | | | | | |
| Urban-Gro, Inc. (a) | | | 14,000 | | | | 186,060 | |
| | | | | | | | | |
| Oil & Gas - 0.66% | | | | | | | | |
| Pioneer Natural Resources Co. | | | 1,400 | | | | 233,114 | |
| | | | | | | | | |
| Pharmaceuticals - 0.35% | | | | | | | | |
| Inhibikase Therapeutics, Inc. (a) | | | 65,000 | | | | 123,500 | |
| | | | | | | | | |
| Real Estate - 0.67% | | | | | | | | |
| Harbor Custom Development, Inc. (a) | | | 100,000 | | | | 235,000 | |
| | | | | | | | | |
| Retail - 0.41% | | | | | | | | |
| Starbucks Corp. | | | 1,300 | | | | 143,403 | |
| | | | | | | | | |
| Software - 0.25% | | | | | | | | |
| Oracle Corp. | | | 1,000 | | | | 87,130 | |
| | | | | | | | | |
| TOTAL COMMON STOCK (Cost $2,585,216) | | | | | | | 2,350,871 | |
| TIMBER POINT GLOBAL ALLOCATIONS FUND |
| CONSOLIDATED SCHEDULE OF INVESTMENTS |
| September 30, 2021 | ANNUAL REPORT |
| PREFERRED STOCK - 1.09% | | Shares | | | Value | |
| | | | | | | |
| Real Estate - 0.42% | | | | | | | | |
| Harbor Custom Development, Inc. - Series A, 8.00% | | | 7,500 | | | $ | 147,750 | |
| | | | | | | | | |
| Retail - 0.67% | | | | | | | | |
| Fat Brands, Inc. - Series B, 8.25% | | | 10,000 | | | | 234,500 | |
| | | | | | | | | |
| TOTAL PREFERRED STOCK (Cost $436,775) | | | | | | | 382,250 | |
| | | | | | | | | |
| EXCHANGE-TRADED FUNDS - 51.81% | | | | | | | | |
| | | | | | | | | |
| Commodity Funds - 4.49% | | | | | | | | |
| iShares Gold Trust (a) | | | 16,000 | | | | 534,560 | |
| iShares Silver Trust (a) | | | 6,000 | | | | 123,120 | |
| KraneShares Global Carbon ETF (a) | | | 22,500 | | | | 924,525 | |
| | | | | | | | 1,582,205 | |
| Equity Funds - 47.32% | | | | | | | | |
| Direxion Daily S&P 500 Bull 3X | | | 5,000 | | | | 534,900 | |
| Invesco Water Resources ETF | | | 5,800 | | | | 317,376 | |
| iShares China Large-Cap ETF | | | 4,000 | | | | 155,720 | |
| iShares Core MSCI Emerging Markets ETF | | | 14,880 | | | | 918,989 | |
| iShares Core MSCI Europe ETF | | | 33,900 | | | | 1,900,434 | |
| iShares Core MSCI Pacific ETF | | | 17,600 | | | | 1,178,496 | |
| iShares Core S&P Mid-Cap ETF (b) | | | 9,100 | | | | 2,393,937 | |
| iShares Core S&P 500 ETF (b) | | | 15,000 | | | | 6,462,300 | |
| iShares Core S&P Small-Cap ETF | | | 5,480 | | | | 598,361 | |
| iShares MSCI Canada ETF | | | 10,000 | | | | 363,000 | |
| iShares MSCI Frontier and Select EM ETF | | | 15,000 | | | | 508,650 | |
| iShares Russell 2000 ETF (b) | | | 3,200 | | | | 700,000 | |
| SPDR S&P Regional Banking ETF | | | 4,000 | | | | 271,000 | |
| SPDR S&P Insurance ETF | | | 5,000 | | | | 188,900 | |
| VanEck Vectors Agribusiness ETF | | | 2,000 | | | | 182,480 | |
| | | | | | | | 16,674,543 | |
| | | | | | | | | |
| TOTAL EXCHANGE-TRADED FUNDS (Cost $18,790,260) | | | | | | | 18,256,748 | |
| | | | | | | | | |
| MUTUAL FUNDS - 12.37% | | | | | | | | |
| | | | | | | | | |
| Asset Allocation Fund - 9.63% | | | | | | | | |
| Timber Point Alternative Income Fund - Institutional Class (d) | | | 396,397 | | | | 3,393,156 | |
| | | | | | | | | |
| Equity Fund - 2.74% | | | | | | | | |
| LS Opportunity Fund - Institutional Class | | | 58,754 | | | | 967,099 | |
| | | | | | | | | |
| TOTAL MUTUAL FUNDS (Cost $4,154,044) | | | | | | | 4,360,255 | |
| | | | | | | | | |
| WARRANTS - 0.92% | | | | | | | | |
| FAT Brands, Inc., $5.00, 06/30/2025 (a) | | | 50,000 | | | | 312,500 | |
| Harbor Custom Development, Inc., $5.00, 06/10/2026 (a) | | | 22,500 | | | | 13,498 | |
| | | | | | | | | |
| TOTAL WARRANTS (Cost $725) | | | | | | | 325,998 | |
| TIMBER POINT GLOBAL ALLOCATIONS FUND |
| CONSOLIDATED SCHEDULE OF INVESTMENTS |
| September 30, 2021 | ANNUAL REPORT |
| BONDS & NOTES - 0.02% | | Principal Amount | | | Value | |
| | | | | | | |
| Asset Backed Securities - 0.01% | | | | | | | | |
| Countrywide Asset-Backed Certificates, 5.216%, 10/25/2017 (b) (e) (f) | | $ | 1,358 | | | $ | 1,401 | |
| RASC Series 2003-KS4 Trust, 3.870%, due 05/25/2033 (b) | | | 101 | | | | 108 | |
| | | | | | | | | |
| Total Asset Backed Securities (Cost $1,459) | | | | | | | 1,509 | |
| | | | | | | | | |
| Mortgage Backed Securities - 0.01% | | | | | | | | |
| Banc of America Funding 2006-2 Trust, 5.750%, due 03/25/2036 (b) | | | 1,519 | | | | 1,507 | |
| Washington Mutual Mortgage Pass-Through Certificates WMALT Series 2006-7 Trust, 4.165%, 09/25/2036 (b) (e) | | | 6,928 | | | | 2,800 | |
| | | | | | | | | |
| Total Mortgage Backed Securities (Cost $4,691) | | | | | | | 4,307 | |
| | | | | | | | | |
| TOTAL BONDS & NOTES (Cost $6,150) | | | | | | | 5,816 | |
| SHORT-TERM INVESTMENT - 23.59% | | Shares | | | | |
| | | | | | | |
| Federated Hermes Government Obligations Fund - Institutional Shares, 0.03% (c) | | | 8,312,087 | | | | 8,312,087 | |
| | | | | | | | | |
| TOTAL SHORT-TERM INVESTMENT (Cost $8,312,087) | | | | | | | 8,312,087 | |
| | | | | | | | | |
| TOTAL INVESTMENTS (Cost $34,285,257) - 96.47% | | | | | | | 33,994,025 | |
| | | | | | | | | |
| OPTIONS WRITTEN (Premiums Received $31,331) - (0.11)% | | | | | | | (38,625 | ) |
| | | | | | | | | |
| OTHER ASSETS IN EXCESS OF LIABILITIES, NET - 3.64% | | | | | | | 1,283,289 | |
| | | | | | | | | |
| NET ASSETS - 100% | | | | | | $ | 35,238,689 | |
(a) Non-income producing security.
(b) All or a portion of the security is segregated as collateral for options written.
(c) Rate shown represents the 7-day effective yield at September 30, 2021 is subject to change and resets daily.
(d) Affiliated investment company. See Note 6.
(e) Variable rate security - Interest rate shown represents the rate on September 30, 2021.
(f) Principal payments are still being received, not yet matured.
ADR - American Depositary Receipt
ETF - Exchange-Traded Fund
Ltd. - Limited
PLC - Public Limited Company
The accompanying notes are an integral part of these financial statements.
| TIMBER POINT GLOBAL ALLOCATIONS FUND |
| CONSOLIDATED SCHEDULE OF INVESTMENTS - WRITTEN OPTIONS |
| September 30, 2021 | ANNUAL REPORT |
| OPTIONS WRITTEN - (0.11%) | | | | | | | | | | | | | | | |
| | | | | | Notional | | | Exercise | | | | | | | |
| PUT OPTIONS WRITTEN - (0.11)% | | Contracts 1 | | | Amount | | | Price | | | Expiration | | | Value | |
| | | | | | | | | | | | | | | | |
| Direxion Daily S&P 500 Bull 3X | | | 75 | | | $ | 712,500 | | | $ | 95.00 | | | | 11/19/2021 | | | $ | 38,625 | |
| | | | | | | | | | | | | | | | | | | | | |
| TOTAL PUT OPTIONS WRITTEN (Premiums Received $31,331) | | | | | | | | | | | | | | | | | | | 38,625 | |
| | | | | | | | | | | | | | | | | | | | | |
| TOTAL OPTIONS WRITTEN (Premiums Received $31,331) | | | | | | | | | | | | | | | | | | $ | 38,625 | |
1 Each option contract is equivalent to 100 shares of the underlying exchange-traded fund. All options are non-income producing.
The accompanying notes are an integral part of these financial statements.
| TIMBER POINT ALTERNATIVE INCOME FUND |
| SCHEDULE OF INVESTMENTS |
| September 30, 2021 | ANNUAL REPORT |
| PREFERRED STOCK - 0.65% | | Shares | | | Value | |
| | | | | | | |
| Banks - 0.65% | | | | | |
| State Street Corp. - Series D, 5.90% | | | 2,000 | | | $ | 56,540 | |
| Truist Financial Corp. - Series O, 5.25% | | | 2,000 | | | | 55,920 | |
| | | | | | | | | |
| TOTAL PREFERRED STOCK (Cost $110,140) | | | | | | | 112,460 | |
| | | | | | | | | |
| EXCHANGE-TRADED FUNDS - 46.84% | | | | | | | | |
| | | | | | | | | |
| Commodity Funds - 2.85% | | | | | | | | |
| iShares Gold Trust (a) | | | 5,000 | | | | 167,050 | |
| iShares Silver Trust (a) | | | 3,000 | | | | 61,560 | |
| KraneShares Global Carbon ETF (a) | | | 6,500 | | | | 267,085 | |
| | | | | | | | 495,695 | |
| Debt Funds - 41.09% | | | | | | | | |
| Invesco Preferred ETF | | | 15,000 | | | | 225,450 | |
| iShares Broad USD High Yield Corporate Bond ETF (b) | | | 25,000 | | | | 1,037,500 | |
| iShares Core U.S. Aggregate Bond ETF (b) | | | 37,500 | | | | 4,306,125 | |
| SPDR Bloomberg Barclays High Yield Bond ETF (b) | | | 10,000 | | | | 1,093,600 | |
| VanEck Vectors Fallen Angel High Yield Bond ETF (b) | | | 15,000 | | | | 495,750 | |
| | | | | | | | 7,158,425 | |
| Equity Funds - 2.90% | | | | | | | | |
| Direxion Daily S&P 500 Bull 3X | | | 1,000 | | | | 106,980 | |
| iShares Select Dividend ETF | | | 2,000 | | | | 229,440 | |
| SPDR S&P Regional Banking ETF | | | 2,500 | | | | 169,375 | |
| | | | | | | | 505,795 | |
| | | | | | | | | |
| TOTAL EXCHANGE-TRADED FUNDS (Cost $7,887,168) | | | | | | | 8,159,915 | |
| BONDS & NOTES - 46.37% | Principal Amount | | | | |
| | | | | | | |
| Asset Backed Securities - 0.03% | | | | | | | | |
| Ameriquest Mortgage Securities, Inc. Asset-Backed Pass-Through Certificates Series 2003-11, 4.966%, due 12/25/2033 (d) | | $ | 387 | | | | 469 | |
| Countrywide Asset-Backed Certificates, 5.216%, due 10/25/2017 (d) (f) | | | 4,074 | | | | 4,202 | |
| GE Capital Mortgage Services, Inc. 1999-HE1 Trust, 6.265%, due 04/25/2029 | | | 158 | | | | 160 | |
| RAMP Series 2005-RS1 Trust, 4.713%, due 11/25/2034 | | | 10 | | | | 10 | |
| RASC Series 2003-KS4 Trust, 3.870%, due 05/25/2033 | | | 168 | | | | 181 | |
| | | | | | | | | |
| Total Asset Backed Securities (Cost $4,792) | | | | | | | 5,022 | |
| | | | | | | | | |
| Corporate Bonds - 46.27% | | | | | | | | |
| | | | | | | | | |
| Aerospace & Defense - 1.79% | | | | | | | | |
| Boeing Co., 2.196%, due 02/04/2026 | | | 100,000 | | | | 100,869 | |
| Embraer Netherlands Finance BV, 5.050%, due 06/15/2025 | | | 200,000 | | | | 210,500 | |
| | | | | | | | 311,369 | |
| Airlines - 3.75% | | | | | | | | |
| American Airlines 2014-1 Class B Pass Through Trust, 4.375%, due 10/01/2022 | | | 42,877 | | | | 42,933 | |
| Continental Airlines 2007-1 Class B Pass Through Trust, 6.903%, due 10/19/2023 | | | 25,063 | | | | 25,258 | |
| Delta Air Lines, Inc., 3.625%, due 03/15/2022 | | | 250,000 | | | | 252,217 | |
| United Airlines Holding, Inc., 4.875%, due 01/15/2025 | | | 325,000 | | | | 333,125 | |
| | | | | | | | 653,533 | |
| Auto Manufacturers - 1.87% | | | | | | | | |
| Ford Motor Co., 8.500%, due 04/21/2023 | | | 100,000 | | | | 109,994 | |
| Ford Motor Credit Co LLC, 4.542%, due 08/01/2026 | | | 200,000 | | | | 215,666 | |
| | | | | | | | 325,660 | |
| TIMBER POINT ALTERNATIVE INCOME FUND |
| SCHEDULE OF INVESTMENTS |
| September 30, 2021 | ANNUAL REPORT |
| BONDS & NOTES - 46.37% (continued) | | Principal Amount | | | Value | |
| | | | | | | |
| Corporate Bonds - 46.27% (continued) | | | | | | | | |
| | | | | | | | | |
| Banks - 11.13% | | | | | | | | |
| BAC Capital Trust XIV, 4.000%, due 02/16/2051 (d) | | $ | 150,000 | | | $ | 150,000 | |
| Bank of America Corp., 5.875%, due 09/15/2058 (d) | | | 139,000 | | | | 158,703 | |
| Bank of Montreal - Canada, 4.800%, due 02/25/2050 (d) | | | 150,000 | | | | 158,438 | |
| BNP Paribas SA - France, 4.625%, due 02/25/2051 (d) (e) | | | 250,000 | | | | 255,312 | |
| JPMorgan Chase & Co., 4.000%, due 10/30/2069 (d) | | | 183,000 | | | | 183,778 | |
| JPMorgan Chase & Co., 3.599%, due 04/01/2050 (d) | | | 265,000 | | | | 266,450 | |
| M&T Bank Corp., 5.125%, due 05/01/2057 (d) | | | 100,000 | | | | 110,175 | |
| Mellon Capital IV, 4.000%, due 06/19/2051 (d) | | | 250,000 | | | | 250,008 | |
| USB Capital IX, 3.500%, due 04/15/2042 (d) | | | 150,000 | | | | 147,985 | |
| Wells Fargo & Co., 3.900%, due 03/15/2051 (d) | | | 250,000 | | | | 257,812 | |
| | | | | | | | 1,938,661 | |
| Chemicals - 1.79% | | | | | | | | |
| Olin Corp., 5.500%, due 08/15/2022 | | | 200,000 | | | | 207,250 | |
| Olin Corp., 5.125%, due 09/15/2027 | | | 100,000 | | | | 103,875 | |
| | | | | | | | 311,125 | |
| Computers - 1.48% | | | | | | | | |
| EMC Corp., 3.375%, due 06/01/2023 | | | 250,000 | | | | 258,125 | |
| | | | | | | | | |
| Diversified Financial Services - 2.53% | | | | | | | | |
| Charles Schwab Corp., 4.000%, due 03/01/2051 (d) | | | 250,000 | | | | 257,115 | |
| Oppenheimer Holdings Inc., 5.500%, due 10/01/2025 | | | 176,000 | | | | 183,480 | |
| | | | | | | | 440,595 | |
| Food - 0.56% | | | | | | | | |
| TreeHouse Foods, Inc., 4.000%, due 09/01/2028 | | | 100,000 | | | | 97,867 | |
| | | | | | | | | |
| Healthcare - Products - 0.71% | | | | | | | | |
| Hill-Rom Holdings, Inc., 7.000%, due 02/25/2024 | | | 114,000 | | | | 123,071 | |
| | | | | | | | | |
| Healthcare - Services - 0.60% | | | | | | | | |
| Tenet Healthcare Corp., 4.625%, due 07/15/2024 | | | 102,000 | | | | 103,530 | |
| | | | | | | | | |
| Insurance - 1.89% | | | | | | | | |
| Radian Group, Inc., 4.500%, due 10/01/2024 | | | 50,000 | | | | 53,312 | |
| Radian Group, Inc., 6.625%, due 03/15/2025 | | | 75,000 | | | | 83,719 | |
| ProAssurance Corp., 5.300%, due 11/15/2023 | | | 80,000 | | | | 85,591 | |
| Unum Group, 4.000%, due 03/15/2024 | | | 100,000 | | | | 107,160 | |
| | | | | | | | 329,782 | |
| Investment Companies - 1.56% | | | | | | | | |
| Icahn Enterprises LP / Icahn Enterprises Finance Corp., 4.750%, due 09/15/2024 | | | 45,000 | | | | 46,800 | |
| Icahn Enterprises LP / Icahn Enterprises Finance Corp., 6.250%, due 05/15/2026 | | | 125,000 | | | | 130,625 | |
| FS KKR Capital Corp., 2.625%, due 01/15/2027 | | | 95,000 | | | | 95,187 | |
| | | | | | | | 272,612 | |
| Iron & Steel - 1.42% | | | | | | | | |
| ArcelorMittal SA - Luxembourg, 3.600%, due 07/16/2024 | | | 150,000 | | | | 159,258 | |
| United States Steel Corp., 6.250%, due 03/15/2026 | | | 86,000 | | | | 88,769 | |
| | | | | | | | 248,027 | |
| Lodging - 0.49% | | | | | | | | |
| Hyatt Hotels Corp., 1.80%, due 10/01/2024 | | | 65,000 | | | | 65,138 | |
| Marriott International, Inc., 5.750%, due 05/01/2025 | | | 18,000 | | | | 20,578 | |
| | | | | | | | 85,716 | |
| Media - 0.87% | | | | | | | | |
| AMC Networks, Inc., 5.000%, due 04/01/2024 | | | 100,000 | | | | 101,125 | |
| Univision Communications, Inc., 5.125%, due 02/15/2025 (e) | | | 50,000 | | | | 50,750 | |
| | | | | | | | 151,875 | |
| Miscellaneous Manufacturing - 1.21% | | | | | | | | |
| Hillenbrand, Inc., 5.750%, due 06/15/2025 | | | 200,000 | | | | 210,500 | |
| TIMBER POINT ALTERNATIVE INCOME FUND |
| SCHEDULE OF INVESTMENTS |
| September 30, 2021 | ANNUAL REPORT |
| BONDS & NOTES - 46.37% (continued) | | Principal Amount | | | Value | |
| | | | | | | |
| Corporate Bonds - 46.27% (continued) | | | | | | | | |
| | | | | | | | | |
| Oil & Gas - 4.98% | | | | | | | | |
| Anadarko Petroleum Corp., 5.550%, due 03/15/2026 | | $ | 100,000 | | | $ | 106,617 | |
| Antero Resources Corp., 5.000%, due 03/01/2025 | | | 100,000 | | | | 102,425 | |
| Apache Corp., 3.250%, due 04/15/2022 | | | 45,000 | | | | 45,113 | |
| Apache Corp., 5.350%, due 07/01/2049 | | | 50,000 | | | | 55,535 | |
| Apache Corp., 4.625%, due 11/15/2025 | | | 75,000 | | | | 80,916 | |
| Continental Resources, Inc., 4.500%, due 04/15/2023 | | | 150,000 | | | | 155,438 | |
| Devon Energy Corp., 5.250%, due 09/15/2024 ( e) | | | 50,000 | | | | 55,375 | |
| Murphy Oil, 6.375%, due 07/15/2028 | | | 100,000 | | | | 105,750 | |
| Ovintiv Exploration, Inc., 5.375%, due 01/01/2026 | | | 50,000 | | | | 56,513 | |
| Petroleos Mexicanos - Mexico, 4.625%, due 09/21/2023 | | | 100,000 | | | | 103,950 | |
| | | | | | | | 867,632 | |
| Packaging & Containers - 0.56% | | | | | | | | |
| Ball Corp., 2.875%, due 08/15/2030 | | | 100,000 | | | | 97,062 | |
| | | | | | | | | |
| Pipelines - 1.00% | | | | | | | | |
| EQM Midstream Partners LP, 4.750%, due 07/15/2023 | | | 68,000 | | | | 71,012 | |
| Rockies Express Pipeline LLC, 3.600%, due 05/15/2025 (e) | | | 100,000 | | | | 103,250 | |
| | | | | | | | 174,262 | |
| REITS - 3.65% | | | | | | | | |
| MGM Growth Properties Operating Partnership LP / MGP Finance Co-Issuer, Inc., 5.625%, due 05/01/2024 | | | 200,000 | | | | 217,500 | |
| iStar, Inc., 5.500%, due 02/15/2026 | | | 275,000 | | | | 287,375 | |
| Starwood Property Trust, Inc., 4.750%, due 03/15/2025 | | | 125,000 | | | | 131,562 | |
| | | | | | | | 636,437 | |
| Retail - 1.55% | | | | | | | | |
| QVC, Inc., 4.850%, due 04/01/2024 | | | 250,000 | | | | 270,000 | |
| | | | | | | | | |
| Telecommunications - 0.88% | | | | | | | | |
| Lumen Technologies, Inc., 5.800%, due 03/15/2022 | | | 100,000 | | | | 101,900 | |
| T-Mobile USA, Inc., 2.250%, due 02/15/2026 | | | 50,000 | | | | 50,563 | |
| | | | | | | | 152,463 | |
| | | | | | | | | |
| Total Corporate Bonds (Cost $7,940,779) | | | | | | | 8,059,904 | |
| | | | | | | | | |
| Mortgage Backed Securities - 0.07% | | | | | | | | |
| Banc of America Funding 2006-2 Trust, 5.750%, due 03/25/2036 | | | 4,558 | | | | 4,521 | |
| Washington Mutual Mortgage Pass-Through Certificates WMALT Series 2006-7 Trust, 4.165%, due 09/25/2036 (d) | | | 20,784 | | | | 8,399 | |
| | | | | | | | | |
| Total Mortgage Backed Securities (Cost $14,002) | | | | | | | 12,920 | |
| | | | | | | | | |
| TOTAL BONDS & NOTES (Cost $7,959,573) | | | | | | | 8,077,846 | |
| TIMBER POINT ALTERNATIVE INCOME FUND |
| SCHEDULE OF INVESTMENTS |
| September 30, 2021 | ANNUAL REPORT |
| SHORT-TERM INVESTMENT - 6.33% | | Shares | | | Value | |
| | | | | | | |
| Federated Hermes Government Obligations Fund - Institutional Shares, 0.03% (c) | | | 1,102,346 | | | $ | 1,102,346 | |
| | | | | | | | | |
| TOTAL SHORT-TERM INVESTMENT (Cost $1,102,346) | | | | | | | 1,102,346 | |
| | | | | | | | | |
| TOTAL INVESTMENTS (Cost $17,059,227) - 100.19% | | | | | | $ | 17,452,567 | |
| | | | | | | | | |
| OPTIONS WRITTEN (Proceeds $4,177) - (0.03%) | | | | | | | (5,150 | ) |
| | | | | | | | | |
| LIABILITIES IN EXCESS OF OTHER ASSETS, NET - (0.16)% | | | | | | | (28,055 | ) |
| | | | | | | | | |
| NET ASSETS - 100% | | | | | | $ | 17,419,362 | |
(a) Non-income producing security.
(b) All or a portion of the security is segregated as collateral for options written.
(c) Rate shown represents the 7-day effective yield at September 30, 2021, is subject to change and resets daily.
(d) Variable rate security - Interest rate shown represents the rate on September 30, 2021.
(e) Security exempted from registration under Rule 144A of the Securities Act of 1933. The security may be resold in transactions exempt from registration, normally to qualified institutional investors. At September 30, 2021, the aggregate value of such securities amounted to $464,687 and the value amounts to 2.67% of the net assets of the Income Fund.
(f) Principal payments are still being received, not yet matured.
BV - besloten vennootschap (Belgian equivalent of private limited company)
ETF - Exchange-Traded Fund
LLC - Limited Liability Company
LP - Limited Partnership
REITS - Real Estate Investment Trusts
SA - Société Anonyme (French equivalent of public limited company)
The accompanying notes are an integral part of these financial statements.
| TIMBER POINT ALTERNATIVE INCOME FUND |
| SCHEDULE OF INVESTMENTS - WRITTEN OPTIONS |
| September 30, 2021 | ANNUAL REPORT |
OPTIONS WRITTEN - (0.03%)
| PUT OPTIONS WRITTEN - (0.03%) | | Contracts 1 | | | Notional
Amount | | | Exercise
Price | | | Expiration | | | Value | |
| | | | | | | | | | | | | | | | |
| Direxion Daily S&P 500 Bull 3X | | | 10 | | | $ | 95,000 | | | $ | 95 | | | | 11/19/2021 | | | $ | 5,150 | |
| TOTAL PUT OPTIONS WRITTEN (Premiums Received $4,177) | | | | | | | | | | | | | | | | | | | 5,150 | |
| | | | | | | | | | | | | | | | | | | | | |
| TOTAL OPTIONS WRITTEN (Premiums Received $4,177) | | | | | | | | | | | | | | | | | | $ | 5,150 | |
1 Each option contract is equivalent to 100 shares of the underlying exchange-traded fund. All options are non-income producing.
The accompanying notes are an integral part of these financial statements.
| TIMBER POINT FUNDS | | |
| STATEMENTS OF ASSETS AND LIABILITIES | | |
| | | |
| September 30, 2021 | | ANNUAL REPORT |
| | | Timber Point Global Allocations Fund (a) | | | Timber Point Alternative Income Fund | |
| Assets: | | | | | | |
| Investment securities: | | | | | | | | |
| Unaffiliated Securities at Cost | | $ | 31,131,214 | | | $ | 17,059,227 | |
| Affiliated Securities at Cost | | | 3,154,043 | | | | — | |
| Total Securities at Cost | | | 34,285,257 | | | | 17,059,227 | |
| Unaffiliated Securities at Value | | | 30,600,869 | | | | 17,452,567 | |
| Affiliated Securities at Value | | | 3,393,156 | | | | — | |
| Cash | | | 10,126 | | | | — | |
| Deposits at broker: | | | | | | | | |
| For options written - Goldman Sachs & Co. LLC | | | 447,434 | | | | 98,081 | |
| For derivatives - Deutsche Bank AG | | | 25,000 | | | | — | |
| Due from adviser | | | — | | | | 4,695 | |
| Receivables: | | | | | | | | |
| Interest | | | 223 | | | | 77,797 | |
| Dividends | | | 2,650 | | | | — | |
| Investment securities sold | | | 1,352,577 | | | | 401,032 | |
| Fund shares sold | | | 26,527 | | | | 58 | |
| Prepaid expenses and other assets | | | 10,182 | | | | 4,600 | |
| Total assets | | | 35,868,744 | | | | 18,038,830 | |
| | | | | | | | | |
| Liabilities: | | | | | | | | |
| Options written: | | | | | | | | |
| Premiums received from options written | | | 31,331 | | | | 4,177 | |
| Total proceeds and premiums from options written | | | 31,331 | | | | 4,177 | |
| Options written at value | | | 38,625 | | | | 5,150 | |
| Total options written at value | | | 38,625 | | | | 5,150 | |
| Payables: | | | | | | | | |
| Investment securities purchased | | | 542,940 | | | | 573,584 | |
| Fund shares redeemed | | | 7,053 | | | | 18,516 | |
| Due to adviser | | | 14,788 | | | | — | |
| Due to administrator | | | 13,031 | | | | 9,050 | |
| Accrued expenses | | | 13,618 | | | | 13,168 | |
| Total liabilities | | | 630,055 | | | | 619,468 | |
| Net Assets | | $ | 35,238,689 | | | $ | 17,419,362 | |
| | | | | | | | | |
| Sources of Net Assets: | | | | | | | | |
| Paid-in capital | | $ | 37,437,936 | | | $ | 18,786,845 | |
| Total accumulated losses | | | (2,199,247 | ) | | | (1,367,483 | ) |
| Total Net Assets | | $ | 35,238,689 | | | $ | 17,419,362 | |
| | | | | | | | | |
| Institutional Class Shares: | | | | | | | | |
| Net assets | | $ | 35,238,689 | | | $ | 17,419,362 | |
| Shares Outstanding ($0 par value, Unlimited shares of beneficial interest authorized) | | | 3,436,780 | | | | 2,034,314 | |
| Net Asset Value, Offering and Redemption Price Per Share | | $ | 10.25 | | | $ | 8.56 | |
(a) Amounts for the Timber Point Global Allocations Fund are consolidated.
The accompanying notes are an integral part of these financial statements.
| TIMBER POINT FUNDS | | |
| STATEMENTS OF OPERATIONS | | |
| | | |
| September 30, 2021 | | ANNUAL REPORT |
| | | Timber Point Global Allocations Fund (a) | | | Timber Point Alternative Income Fund | |
| | | | | | | |
| | | For the | | | For the | |
| | | Year Ended | | | Year Ended | |
| | | September 30, 2021 | | | September 30, 2021 | |
| | | | | | | |
| | | | | | | |
| Investment income: | | | | | | | | |
| Dividends | | $ | 375,933 | | | $ | 318,935 | |
| Dividends from affiliated funds | | | 65,173 | | | | — | |
| Interest | | | 1,840 | | | | 352,176 | |
| Total investment income | | | 442,946 | | | | 671,111 | |
| | | | | | | | | |
| Expenses: | | | | | | | | |
| Management fees (Note 7) | | | 346,310 | | | | 144,298 | |
| Accounting and transfer agent fees and expenses | | | 150,786 | | | | 94,318 | |
| Trustee fees and expenses | | | 20,695 | | | | 20,095 | |
| Reports to shareholders | | | 18,846 | | | | 15,336 | |
| Custodian fees | | | 18,033 | | | | 9,239 | |
| Legal fees | | | 17,884 | | | | 14,887 | |
| Registration and filing fees | | | 17,510 | | | | 10,319 | |
| Non-12b-1 shareholder servicing expense | | | 16,195 | | | | 8,218 | |
| Audit fees | | | 15,700 | | | | 15,700 | |
| Interest expense | | | 15,459 | | | | 2,169 | |
| Dividends on securities sold short | | | 13,166 | | | | 3,687 | |
| Compliance officer fees | | | 12,430 | | | | 10,625 | |
| Miscellaneous | | | 11,682 | | | | 12,032 | |
| Pricing fees | | | 9,429 | | | | 32,228 | |
| Insurance | | | 4,306 | | | | 2,100 | |
| Total expenses | | | 688,431 | | | | 395,251 | |
| Less: | | | | | | | | |
| Fees waived by Adviser (Note 7) | | | (54,989 | ) | | | (86,431 | ) |
| Fees waived by Adviser for affiliated holdings (Note 7) | | | (27,176 | ) | | | — | |
| Net expenses | | | 606,266 | | | | 308,820 | |
| | | | | | | | | |
| Net investment income (loss) | | | (163,320 | ) | | | 362,291 | |
| | | | | | | | | |
| Realized and unrealized gain (loss): | | | | | | | | |
| Net realized gain (loss) on: | | | | | | | | |
| Unaffiliated Investments | | | 6,595,857 | | | | 548,484 | |
| Affiliated Investments | | | 84,531 | | | | (4,121 | ) |
| Foreign currency transactions | | | (782 | ) | | | — | |
| Options written | | | 162,528 | | | | 11,369 | |
| Securities sold short | | | (187,252 | ) | | | (105,060 | ) |
| Swaps | | | (710,107 | ) | | | — | |
| Net realized gain on investments, options written, securities sold short and swaps | | | 5,944,775 | | | | 450,672 | |
| | | | | | | | | |
| Net change in unrealized appreciation (depreciation) on: | | | | | | | | |
| Unaffiliated Investments | | | (1,727,119 | ) | | | 102,685 | |
| Affiliated Investments | | | 564,583 | | | | (7,624 | ) |
| Options written | | | (10,747 | ) | | | (973 | ) |
| Securities sold short | | | (120,865 | ) | | | (4,893 | ) |
| Swaps | | | 469,601 | | | | — | |
| Net change in unrealized appreciation (depreciation) on investments, options written, securities sold short and swaps | | | (824,547 | ) | | | 89,195 | |
| | | | | | | | | |
| Net gain on investments, options written, securities sold short and swaps | | | 5,120,228 | | | | 539,867 | |
| | | | | | | | | |
| Net increase in net assets resulting from operations | | $ | 4,956,908 | | | $ | 902,158 | |
(a) Amounts for the Timber Point Global Allocations Fund are consolidated.
The accompanying notes are an integral part of these financial statements.
| TIMBER POINT FUNDS | | |
| STATEMENTS OF CHANGES IN NET ASSETS | | |
| | | |
| | | ANNUAL REPORT |
| | | Timber Point Global Allocations Fund (a) | |
| | | | | | | |
| | | For the | | | For the | |
| | | Year Ended | | | Year Ended | |
| | | September 30, 2021 | | | September 30, 2020 | |
| | | | | | | |
| Increase (decrease) in net assets from: | | | | | | | | |
| Operations: | | | | | | | | |
| Net investment income (loss) | | $ | (163,320 | ) | | $ | 74,652 | |
| Net realized gain (loss) from investments, options written, securities sold short and swaps | | | 5,944,775 | | | | (729,633 | ) |
| Net change in unrealized appreciation (depreciation) on investments, foreign security transactions, options written, securities sold short and swaps | | | (824,547 | ) | | | 234,920 | |
| Net increase (decrease) in net assets resulting from operations | | | 4,956,908 | | | | (420,061 | ) |
| | | | | | | | | |
| Distributions to shareholders from: | | | | | | | | |
| Total distributable earnings - Investor Class | | | — | | | | (1,988 | ) |
| Total distributable earnings - Institutional Class | | | (228,929 | ) | | | (233,930 | ) |
| Total distributions | | | (228,929 | ) | | | (235,918 | ) |
| | | | | | | | | |
| From shares of beneficial interest: | | | | | | | | |
| Proceeds from shares sold: | | | | | | | | |
| Investor Class | | | — | | | | 3,000 | |
| Institutional Class | | | 15,295,970 | | | | 9,074,503 | |
| Net asset value of shares issued in exchange (b): | | | | | | | | |
| Institutional Class | | | — | | | | 318,796 | |
| Net asset value of shares issued from merger (Note 9): | | | | | | | | |
| Institutional Class | | | — | | | | 17,507,109 | |
| Net asset value of shares issued in reinvestment of distributions: | | | | | | | | |
| Investor Class | | | — | | | | 1,294 | |
| Institutional Class | | | 171,370 | | | | 81,267 | |
| Payments for shares redeemed: | | | | | | | | |
| Investor Class | | | — | | | | (222,798 | ) |
| Institutional Class | | | (23,544,713 | ) | | | (10,540,218 | ) |
| Net asset value of shares exchanged (b): | | | | | | | | |
| Investor Class | | | — | | | | (318,796 | ) |
| Increase (decrease) in net assets from transactions in shares of beneficial interest | | | (8,077,373 | ) | | | 15,904,157 | |
| | | | | | | | | |
| Increase (decrease) in net assets | | | (3,349,394 | ) | | | 15,248,178 | |
| | | | | | | | | |
| Net Assets: | | | | | | | | |
| Beginning of year | | | 38,588,083 | | | | 23,339,905 | |
| | | | | | | | | |
| End of year | | $ | 35,238,689 | | | $ | 38,588,083 | |
| | | | | | | | | |
| Capital share activity: | | | | | | | | |
| Investor Class: | | | | | | | | |
| Shares Sold | | | — | | | | 393 | |
| Shares Reinvested | | | — | | | | 137 | |
| Shares Redeemed | | | — | | | | (25,196 | ) |
| Shares Exchanged (b) | | | — | | | | (36,812 | ) |
| Net decrease in shares of beneficial interest outstanding | | | — | | | | (61,478 | ) |
| Institutional Class: | | | | | | | | |
| Shares Sold | | | 1,475,741 | | | | 1,018,730 | |
| Shares from Exchange (b) | | | — | | | | 36,601 | |
| Shares from Merger (Note 9) | | | — | | | | 1,894,709 | |
| Shares Reinvested | | | 17,001 | | | | 8,573 | |
| Shares Redeemed | | | (2,289,692 | ) | | | (1,244,968 | ) |
| Net increase (decrease) in shares of beneficial interest outstanding | | | (796,950 | ) | | | 1,713,645 | |
(a) Amounts for the Timber Point Global Allocations Fund are consolidated.
(b) Effective May 29, 2020, Investor Shares were exchanged into the Institutional Shares.
The accompanying notes are an integral part of these financial statements.
| TIMBER POINT FUNDS | | |
| STATEMENTS OF CHANGES IN NET ASSETS | | |
| | | |
| | | ANNUAL REPORT |
| | | Timber Point Alternative Income Fund | |
| | | | | | | |
| | | For the | | | For the | |
| | | Year Ended | | | Year Ended | |
| | | September 30, 2021 | | | September 30, 2020 | |
| | | | | | | |
| Increase (decrease) in net assets from: | | | | | | | | |
| Operations: | | | | | | | | |
| Net investment income | | $ | 362,291 | | | $ | 245,544 | |
| Net realized gain (loss) from investments, options written and securities sold short | | | 450,672 | | | | (822,698 | ) |
| Net change in unrealized appreciation on investments, options written and securities sold short | | | 89,195 | | | | 231,062 | |
| Net increase (decrease) in net assets resulting from operations | | | 902,158 | | | | (346,092 | ) |
| | | | | | | | | |
| Distributions to shareholders from: | | | | | | | | |
| Total distributable earnings - Investor Class | | | — | | | | (184,308 | ) |
| Total distributable earnings - Institutional Class | | | (404,052 | ) | | | (622 | ) |
| Total distributions | | | (404,052 | ) | | | (184,930 | ) |
| | | | | | | | | |
| From shares of beneficial interest: | | | | | | | | |
| Proceeds from shares sold: | | | | | | | | |
| Investor Class | | | — | | | | 11,484,070 | |
| Institutional Class | | | 3,088,467 | | | | 1,483,397 | |
| Net asset value of shares issued in exchange (a): | | | | | | | | |
| Institutional Class | | | — | | | | 16,361,514 | |
| Net asset value of shares issued in reinvestment of distributions: | | | | | | | | |
| Investor Class | | | — | | | | 74,499 | |
| Institutional Class | | | 312,593 | | | | 622 | |
| Payments for shares redeemed: | | | | | | | | |
| Investor Class | | | — | | | | (6,064,298 | ) |
| Institutional Class | | | (3,281,015 | ) | | | (1,561,659 | ) |
| Net asset value of shares exchanged (a): | | | | | | | | |
| Investor Class | | | — | | | | (16,361,514 | ) |
| Increase in net assets from transactions in shares of beneficial interest | | | 120,045 | | | | 5,416,631 | |
| | | | | | | | | |
| Increase in net assets | | | 618,151 | | | | 4,885,609 | |
| | | | | | | | | |
| Net Assets: | | | | | | | | |
| Beginning of year | | | 16,801,211 | | | | 11,915,602 | |
| End of year | | $ | 17,419,362 | | | $ | 16,801,211 | |
| | | | | | | | | |
| Capital share activity: | �� | | | | | | | |
| Investor Class: | | | | | | | | |
| Shares Sold | | | — | | | | 1,380,096 | |
| Shares Reinvested | | | — | | | | 8,693 | |
| Shares Redeemed | | | — | | | | (752,791 | ) |
| Shares Exchanged (a) | | | — | | | | (2,027,449 | ) |
| Net decrease in shares of beneficial interest outstanding | | | — | | | | (1,391,451 | ) |
| Institutional Class: | | | | | | | | |
| Shares Sold | | | 366,143 | | | | 177,437 | |
| Shares from Exchange (a) | | | — | | | | 2,022,437 | |
| Shares Reinvested | | | 37,125 | | | | 73 | |
| Shares Redeemed | | | (388,641 | ) | | | (185,296 | ) |
| Net increase in shares of beneficial interest outstanding | | | 14,627 | | | | 2,014,651 | |
(a) Effective May 29, 2020, Investor Shares were exchanged into the Institutional Shares.
The accompanying notes are an integral part of these financial statements.
| TIMBER POINT FUNDS | | |
| FINANCIAL HIGHLIGHTS | | |
| | | |
| | | ANNUAL REPORT |
The following tables set forth the per share operating performance data for a share of beneficial interest outstanding, total return, ratios to average net assets and other supplemental data for each of the years or period indicated.
| | | Timber Point Global Allocations Fund | |
| | | | |
| | | Institutional Class | |
| | | For the | | | For the | | | For the | | | For the | | | For the | | | For the | |
| | | Year Ended | | | Year Ended | | | Year Ended | | | Period Ended | | | Year Ended | | | Year Ended | |
| | | 9/30/2021 (b) | | | September 30, 2020 (b) | | | September 30, 2019 | | | September 30, 2018 (a) | | | May 31, 2018 | | | May 31, 2017 | |
| | | | | | | | | | | | | | | | | | | | | | | | | |
| Net Asset Value, Beginning of Year/Period | | $ | 9.11 | | | $ | 9.04 | | | $ | 9.28 | | | $ | 8.89 | | | $ | 8.39 | | | $ | 8.26 | |
| | | | | | | | | | | | | | | | | | | | | | | | | |
| Investment Operations: | | | | | | | | | | | | | | | | | | | | | | | | |
| Net investment income (loss) (1) | | | (0.04 | ) | | | 0.03 | | | | 0.09 | | | | 0.03 | | | | 0.10 | | | | 0.36 | |
| Net realized and unrealized gain (loss) on investments, options written, securities sold short and swaps | | | 1.24 | | | | 0.13 | (10) | | | (0.25 | ) | | | 0.36 | | | | 0.49 | | | | 0.11 | |
| Total from investment operations | | | 1.20 | | | | 0.16 | | | | (0.16 | ) | | | 0.39 | | | | 0.59 | | | | 0.47 | |
| | | | | | | | | | | | | | | | | | | | | | | | | |
| Distributions: | | | | | | | | | | | | | | | | | | | | | | | | |
| From net investment income | | | (0.06 | ) | | | (0.09 | ) | | | (0.08 | ) | | | — | | | | (0.10 | ) | | | (0.22 | ) |
| From return of capital | | | — | | | | — | | | | — | | | | — | | | | — | | | | (0.12 | ) |
| Total distributions | | | (0.06 | ) | | | (0.09 | ) | | | (0.08 | ) | | | — | | | | (0.10 | ) | | | (0.34 | ) |
| | | | | | | | | | | | | | | | | | | | | | | | | |
| Paid in capital from redemption fees | | | — | | | | — | | | | — | | | | 0.00 | (8) | | | 0.01 | | | | 0.00 | (8) |
| | | | | | | | | | | | | | | | | | | | | | | | | |
| Net Asset Value, End of Year/Period | | $ | 10.25 | | | $ | 9.11 | | | | 9.04 | | | $ | 9.28 | | | $ | 8.89 | | | $ | 8.39 | |
| | | | | | | | | | | | | | | | | | | | | | | | | |
| Total Return (2) | | | 13.20 | % | | | 1.73 | %(9) | | | (1.68 | )%(9) | | | 4.39 | %(5) | | | 7.22 | % | | | 5.82 | %(7) |
| | | | | | | | | | | | | | | | | | | | | | | | | |
| Ratios/Supplemental Data | | | | | | | | | | | | | | | | | | | | | | | | |
| Net assets, end of year/period (in 000's) | | $ | 35,239 | | | $ | 38,588 | | | | 22,789 | | | $ | 16,428 | | | $ | 9,926 | | | $ | 3,583 | |
| | | | | | | | | | | | | | | | | | | | | | | | | |
| Ratios of expenses to average net assets (3): | | | | | | | | | | | | | | | | | | | | | | | | |
| Before fees waived and expenses reimbursed | | | 1.79 | % | | | 2.23 | % | | | 2.41 | % | | | 2.69 | %(6) | | | 3.55 | % | | | 3.75 | % |
| After fees waived and expenses reimbursed | | | 1.58 | % | | | 1.46 | % | | | 1.32 | % | | | 1.07 | %(6) | | | 1.14 | % | | | 1.05 | % |
| | | | | | | | | | | | | | | | | | | | | | | | | |
| Ratios of expenses to average net assets (excluding dividends and interest on margin account) (3): | | | | | | | | | | | | | | | | | | | | | | | | |
| Before fees waived and expenses reimbursed | | | 1.72 | % | | | 2.13 | % | | | 2.32 | % | | | 2.54 | %(6) | | | 3.41 | % | | | 3.75 | % |
| After fees waived and expenses reimbursed | | | 1.50 | % | | | 1.36 | % | | | 1.23 | % | | | 0.92 | %(6) | | | 1.00 | % | | | 1.05 | % |
| | | | | | | | | | | | | | | | | | | | | | | | | |
| Ratios of net investment income (loss) to average net assets (3) (4) | | | (0.42 | )% | | | 0.31 | % | | | 1.01 | % | | | 0.96 | %(6) | | | 1.16 | % | | | 4.36 | % |
| | | | | | | | | | | | | | | | | | | | | | | | | |
| Portfolio turnover rate | | | 374 | % | | | 385 | % | | | 176 | % | | | 73 | %(5) | | | 324 | % | | | 101 | % |
| (a) | Represents the period from June 1, 2018 through September 30, 2018 |
| (b) | Amounts for the years ended September 30, 2020 and September 30, 2021 are consolidated. |
| | |
| (1) | Per share amounts calculated using the average shares method, which more appropriately presents the per share data for the period. |
| (2) | Total Return represents the rate that the investor would have earned or lost on an investment in the Fund, assuming reinvestment of dividends, if any. Total returns shown exclude the effect of applicable redemption fees. |
| (3) | The ratios of expenses and net investment income (loss) to average net assets do not reflect the Fund's proportionate share of expenses of underlying investment companies in which the Fund invests. |
| (4) | Recognition of net investment income (loss) by the Fund is affected by the timing and declaration of dividends by the underlying investment companies in which the Fund invests. |
| (5) | Not annualized. |
| (6) | Annualized. |
| (7) | As a result of a trade error, the Timber Point Global Allocation Fund (formerly the Crow Point Global Tactical Allocation Fund) experienced a loss of $10,469 for the year ended May 31, 2017, which was reimbursed by the Adviser. There was no effect on total return due to the trade error. |
| (8) | Amount represents less than $0.01 per share. |
| (9) | Includes adjustments in accordance with accounting principles generally accepted in the United States of America and, consequently, the net asset values for financial reporting purposes and the returns based upon those net asset values may differ from the net asset values and returns for shareholder transactions. |
| (10) | The amount of net realized and unrealized gain on investment per share for the year ended September 30, 2020, does not accord with the amounts in the Consolidated Statements of Operations due to the timing of purchases and sales of Fund shares in relation to fluctuating market values. |
The accompanying notes are an integral part of these financial statements.
| TIMBER POINT FUNDS | | |
| FINANCIAL HIGHLIGHTS | | |
| | | |
| | | ANNUAL REPORT |
The following tables set forth the per share operating performance data for a share of beneficial interest outstanding, total return, ratios to average net assets and other supplemental data for the years or period indicated.
| | | Timber Point Alternative Income Fund | |
| | | Institutional Class | |
| | | For the | | | For the | | | For the | |
| | | Year Ended | | | Year Ended | | | Period Ended | |
| | | September 30, 2021 | | | September 30, 2020 | | | September 30, 2019 (a) | |
| | | | | | | | | | | | | |
| Net Asset Value, Beginning of Year/Period | | $ | 8.32 | | | $ | 8.54 | | | $ | 8.30 | |
| | | | | | | | | | | | | |
| Investment Operations: | | | | | | | | | | | | |
| Net investment income (1) | | | 0.18 | | | | 0.09 | | | | 0.07 | |
| Net realized and unrealized gain (loss) on investments, options written and securities sold short | | | 0.26 | | | | (0.19 | ) | | | 0.17 | (8) |
| Total from investment operations | | | 0.44 | | | | (0.10 | ) | | | 0.24 | |
| | | | | | | | | | | | | |
| Distributions: | | | | | | | | | | | | |
| From net investment income | | | (0.20 | ) | | | (0.12 | ) | | | — | |
| Total distributions | | | (0.20 | ) | | | (0.12 | ) | | | — | |
| | | | | | | | | | | | | |
| | | | | | | | | | | | | |
| Net Asset Value, End of Year/Period | | $ | 8.56 | | | $ | 8.32 | | | $ | 8.54 | |
| | | | | | | | | | | | | |
| Total Return (2) | | | 5.30 | % | | | (1.17 | )%(7) | | | 2.89 | %(5) (7) |
| | | | | | | | | | | | | |
| Ratios/Supplemental Data | | | | | | | | | | | | |
| Net assets, end of year/period (in 000's) | | $ | 17,419 | | | $ | 16,801 | | | $ | 43 | |
| | | | | | | | | | | | | |
| Ratios of expenses to average net assets (3): | | | | | | | | | | | | |
| Before fees waived and expenses reimbursed | | | 2.28 | % | | | 2.97 | % | | | 3.29 | %(6) |
| After fees waived and expenses reimbursed | | | 1.78 | % | | | 2.04 | % | | | 2.11 | %(6) |
| | | | | | | | | | | | | |
| Ratios of expenses to average net assets (excluding dividends and interest) (3): | | | | | | | | | | | | |
| Before fees waived and expenses reimbursed | | | 2.25 | % | | | 2.79 | % | | | 3.18 | %(6) |
| After fees waived and expenses reimbursed | | | 1.75 | % | | | 1.86 | % | | | 2.00 | %(6) |
| | | | | | | | | | | | | |
| Ratios of net investment income to average net assets (3) (4) | | | 2.09 | % | | | 1.11 | % | | | 1.42 | %(6) |
| | | | | | | | | | | | | |
| Portfolio turnover rate | | | 194 | % | | | 287 | % | | | 169 | %(5) |
| (a) | The Timber Point Alternative Income Fund (formerly the Crow Point Alternative Income Fund) Institutional Shares commenced operations on February 12, 2019. |
| | |
| (1) | Per share amounts calculated using the average shares method, which more appropriately presents the per share data for the year/period. |
| (2) | Total Return represents the rate that the investor would have earned or lost on an investment in the Fund, assuming reinvestment of dividends. |
| (3) | The ratios of expenses to average net assets and net investment income to average net assets do not reflect the expenses of the underlying investment companies in which the Fund invests. |
| (4) | Recognition of net investment income by the Fund is affected by the timing and declaration of dividends by the underlying investment companies in which the Fund invests. |
| (5) | Not annualized. |
| (6) | Annualized. |
| (7) | Includes adjustments in accordance with accounting principles generally accepted in the United States of America and, consequently, the net asset values for financial reporting purposes and the returns based upon those net asset values may differ from the net asset values and returns for shareholder transactions. |
| (8) | The amount of net realized and unrealized gain on investment per share for the period, does not accord with the amounts in the Statements of Operations due to the timing of purchases and sales of Fund shares in relation to fluctuating market values. |
The accompanying notes are an integral part of these financial statements.
Timber Point Funds | ANNUAL REPORT |
NOTES TO THE FINANCIAL STATEMENTS
September 30, 2021
1. ORGANIZATION
The Timber Point Global Allocations Fund (the “Global Fund”) and the Timber Point Alternative Income Fund (the “Income Fund”) (collectively, the “Funds”) were organized on October 6, 2017 as separate diversified series of 360 Funds (the “Trust”). The Trust was organized on February 24, 2005 as a Delaware statutory trust. The Trust is registered as an open-end management investment company under the Investment Company Act of 1940, as amended (the “1940 Act”). The Global Fund’s investment objective is to seek income with long-term growth of capital as a secondary objective. The Income Fund’s investment objective is to seek to provide shareholders with above-average total returns over a complete market cycle primarily through capital appreciation and income generation.
Each Fund offers one class of shares, Institutional Class.
2. | SIGNIFICANT ACCOUNTING POLICIES |
The following is a summary of the significant accounting policies followed by the Funds in the preparation of their financial statements and are in conformity with accounting principles generally accepted in the United States of America (“GAAP”). The Funds are investment companies that follow the accounting and reporting guidance of Accounting Standards Codification Topic 946 applicable to investment companies.
a) Security Valuation – All investments in securities are recorded at their estimated fair value, as described in note 3.
b) Short Sales – The Funds may sell securities short. A short sale is a transaction in which a Fund sells a security it does not own or have the right to acquire (or that it owns but does not wish to deliver) in anticipation that the market price of that security will decline.
When Funds make a short sale, the broker-dealer through which the short sale is made must borrow the security sold short and deliver it to the party purchasing the security. Funds are required to make a margin deposit in connection with such short sales; the Funds may have to pay a fee to borrow particular securities and will often be obligated to pay over any dividends and accrued interest on borrowed securities.
If the price of the security sold short increases between the time of the short sale and the time the Funds cover their short positions, the Funds will incur a loss; conversely, if the price declines, the Funds will realize a capital gain. Any gain will be decreased, and any loss increased, by the transaction costs described above. The successful use of short selling may be adversely affected by imperfect correlation between movements in the price of the security sold short and the securities being hedged.
To the extent the Funds sell securities short, they will provide collateral to the broker-dealer and (except in the case of short sales “against the box”) will maintain additional asset coverage in the form of cash, U.S. government securities or other liquid securities with its Custodian in a segregated account in an amount at least equal to the difference between the current market value of the securities sold short and any amounts required to be deposited as collateral with the selling broker (not including the proceeds of the short sale).
c) Investment Companies – The Funds may invest in investment companies such as open-end funds (mutual funds), exchange-traded funds (“ETFs”) and closed-end funds (“CEFs”) (also referred to as “Underlying Funds”) subject to limitations as defined in the 1940 Act. Your cost of investing in the Funds will generally be higher than the cost of investing directly in the Underlying Funds. By investing in the Funds, you will indirectly bear fees and expenses charged by the Underlying Funds in which the Funds invest in addition to the Funds’ direct fees and expenses. Also, with respect to dividends paid by the Underlying Funds, it is possible for these dividends to exceed the underlying investments’ taxable earnings and profits resulting in the excess portion of such dividends being designated as a return of capital. Distributions received from investments in securities that represent a return of capital or capital gains are recorded as a reduction of the cost of investments or as a realized gain, respectively.
Timber Point Funds | ANNUAL REPORT |
NOTES TO THE FINANCIAL STATEMENTS
September 30, 2021
2. | SIGNIFICANT ACCOUNTING POLICIES (continued) |
d) Options – The Funds may purchase and write (i.e., sell) put and call options. Such options may relate to particular securities or stock indices, and may or may not be listed on a domestic or foreign securities exchange and may or may not be issued by the Options Clearing Corporation. Options trading is a highly specialized activity that entails greater than ordinary investment risk. Options may be more volatile than the underlying instruments, and therefore, on a percentage basis, an investment in options may be subject to greater fluctuation than an investment in the underlying instruments themselves.
A call option for a particular security gives the purchaser of the option the right to buy, and the writer (seller) the obligation to sell, the underlying security at the stated exercise price at any time prior to the expiration of the option, regardless of the market price of the security. The premium paid to the writer is in consideration for undertaking the obligation under the option contract. A put option for a particular security gives the purchaser the right to sell, and the writer (seller) the obligation to buy the security at the stated exercise price at any time prior to the expiration date of the option, regardless of the market price of the security. If an option purchased by the Funds expires unexercised, the Funds realize a loss equal to the premium paid. If the Funds enter into a closing sale transaction on an option purchased by it, the Funds will realize a gain if the premium received by the Funds on the closing transaction is more than the premium paid to purchase the option or a loss if it is less. If an option written by the Funds expires on the stipulated expiration date or if the Funds enter into a closing purchase transaction, they will realize a gain (or loss if the cost of a closing purchase transaction exceeds the net premium received when the option is sold). If a call option written by the Funds is exercised, the proceeds of the sale will be increased by the net premium originally received and the Funds will realize a gain or loss. If a put option written by the Funds is exercised, the cost of the purchase will be decreased by the net premium originally received.
e) Wholly Owned Subsidiary – The Global Fund may invest up to 25% of its total assets in a wholly owned and controlled Cayman Islands subsidiary (the “Subsidiary”), which is expected to invest in one or a combination of (i) options, (ii) futures, (iii) forwards, (iv) spot contracts, or (v) swap contracts, each of which may be tied to (i) commodities, (ii) financial indices and instruments, (iii) foreign currencies, or (iv) equity indices. The consolidated Schedule of Investments, Statement of Assets and Liabilities, Statement of Operations, Statements of Changes in Net Assets and Financial Highlights of the Global Fund include the accounts of the Subsidiary. All inter-company accounts and transactions have been eliminated in the consolidation for the Fund. The Subsidiary is advised by the Timber Point Capital Management LLC (the “Adviser”) and acts as an investment vehicle in order to effect certain investments consistent with the Global Fund’s investment objectives and policies specified in the Global Fund’s prospectus and statement of additional information. The inception date of the Subsidiary was December 1, 2018. As of September 30, 2021, total net assets of the Global Fund were $35,223,189 of which $165,595, or approximately 0.47%, represented the Global Fund’s ownership of the shares of the Subsidiary.
f) Swap Agreements - The Funds may enter into interest rate, index and currency exchange rate swap agreements in an attempt to obtain a particular desired return at a lower cost to the Funds than if they had invested directly in an instrument that yielded that desired return. Swap agreements are two-party contracts entered into primarily by institutional investors for periods ranging from a few weeks to more than one year. In a standard “swap” transaction, two parties agree to exchange the returns (or differentials in rates of returns) earned or realized on particular predetermined investments or instruments. The gross returns to be exchanged or “swapped” between the parties are calculated with respect to a “notional amount,” i.e., the return on or increase in value of a particular dollar amount invested at a particular interest rate, in a particular foreign currency, or in a “basket” of securities representing a particular index. The “notional amount” of the swap agreement is only a fictive basis on which to calculate the obligations the parties to a swap agreement have agreed to exchange. The Funds’ obligations (or rights) under a swap agreement will generally be equal only to the amount to be paid or received under the agreement based on the relative values of the positions held by each party to the agreement (the “net amount”). The Funds’ obligations under a swap agreement will be accrued daily (offset against any amounts owing to the Funds) and any accrued but unpaid net amounts owed to a swap counterparty will be covered by the maintenance of a segregated account consisting of cash, U.S. government securities, or other liquid securities, to avoid leveraging of the Funds’ portfolio.
Timber Point Funds | ANNUAL REPORT |
NOTES TO THE FINANCIAL STATEMENTS
September 30, 2021
2. | SIGNIFICANT ACCOUNTING POLICIES (continued) |
Whether the Funds’ use of swap agreements enhances the Funds’ total return will depend on the adviser’s ability to correctly predict whether certain types of investments are likely to produce greater returns than other investments. Because they are two-party contracts and may have terms of greater than seven days, swap agreements may be considered to be illiquid. Moreover, the Funds bear the risk of loss of the amount expected to be received under a swap agreement in the event of the default or bankruptcy of a swap agreement counterparty. The Funds’ adviser will cause the Funds to enter into swap agreements only with counterparties that would be eligible for consideration as repurchase agreement counterparties under the Funds’ repurchase agreement guidelines. The swap market is a relatively new market and is largely unregulated. It is possible that developments in the swaps market, including potential government regulation, could adversely affect the Funds’ ability to terminate existing swap agreements or to realize amounts to be received under such agreements.
g) Federal Income Taxes – The Funds have qualified and intend to continue to qualify as regulated investment companies under Subchapter M of the Internal Revenue Code of 1986, as amended (the “Code”). It is the policy of the Funds to comply with the requirements of the Code applicable to regulated investment companies and to distribute substantially all of their net investment company taxable income and net capital gains. The Funds also intend to distribute sufficient net investment income and net capital gains, if any, so that they will not be subject to excise tax on undistributed income and gains. Therefore, no federal income tax or excise tax provision is required.
As of and during the year ended September 30, 2021, the Funds did not have a liability for any unrecognized tax expenses. The Funds recognize interest and penalties, if any, related to unrecognized tax liability as income tax expense in the statements of operations. During the year ended September 30, 2021, the Funds did not incur any interest or penalties. The Funds identify their major tax jurisdictions as U.S. Federal and Delaware state.
In addition, accounting principles generally accepted in the United States of America (“GAAP”) requires management of the Funds to analyze all open tax years, as defined by IRS statute of limitations for all major jurisdictions, including federal tax jurisdictions and certain state tax jurisdictions. As of and during the period ended September 30, 2018 and the years ended September 30, 2019 through September 30, 2021 for the Global Fund; and the years ended September 30, 2019 through September 30, 2021 for the Income Fund, the Funds did not have a liability for any unrecognized tax benefits. The Funds have no examinations in progress and are not aware of any tax positions for which it is reasonably possible that the total amounts of unrecognized tax benefits will significantly change in the next twelve months.
h) Distributions to Shareholders – Dividends from net investment income and distributions of net realized capital gains, if any, will be declared and paid at least annually. Income and capital gain distributions, which are determined in accordance with income tax regulations, are recorded on the ex-dividend date. GAAP requires that permanent financial reporting differences relating to shareholder distributions be reclassified to paid-in capital or net realized gains.
i) Use of Estimates – The preparation of financial statements in conformity with GAAP requires management to make estimates and assumptions that affect the reported amounts of assets and liabilities and disclosure of contingent assets and liabilities at the date of the financial statements and the reported amounts of revenues and expenses during the reporting period. Actual results could differ from those estimates. There were no reclassifications necessary during the year ended September 30, 2021.
j) Other – Investment and shareholder transactions are recorded on trade date. The Funds determine the gain or loss realized from the investment transactions by comparing the original cost of the security lot sold with the net sales proceeds. Dividend income and expenses are recognized on the ex-dividend date or as soon as information is available to the Funds and interest income is recognized on an accrual basis. Withholding taxes on foreign dividends have been provided for in accordance with the Funds’ understanding of the applicable country’s tax rules and rates.
Processes and Structure
The Funds’ Board of Trustees (the “Board”) has adopted guidelines for valuing securities and other derivative instruments including in circumstances in which market quotes are not readily available, and has delegated authority to the Adviser to apply those guidelines in determining fair value prices, subject to review by the Board.
Timber Point Funds | ANNUAL REPORT |
NOTES TO THE FINANCIAL STATEMENTS
September 30, 2021
3. | SECURITIES VALUATIONS (continued) |
Hierarchy of Fair Value Inputs
The Funds utilize various methods to measure the fair value of their investments on a recurring basis. GAAP establishes a hierarchy that prioritizes inputs to valuation techniques used to measure fair value. The three levels of inputs are as follows:
● | Level 1 – Unadjusted quoted prices in active markets for identical assets or liabilities that the Fund has the ability to access. |
● | Level 2 – Observable inputs other than quoted prices included in level 1 that are observable for the asset or liability either directly or indirectly. These inputs may include quoted prices for the identical instrument on an inactive market, prices for similar instruments, interest rates, prepayment speeds, credit risk, yield curves, default rates, and similar data. |
● | Level 3 – Unobservable inputs for the asset or liability to the extent that relevant observable inputs are not available, representing the Fund’s own assumptions about the assumptions that a market participant would use in valuing the asset or liability, and that would be based on the best information available. |
The availability of observable inputs can vary from security to security and is affected by a wide variety of factors, including, for example, the type of security, whether the security is new and not yet established in the marketplace, the liquidity of markets, and other characteristics particular to the security. To the extent that valuation is based on models or inputs that are less observable or unobservable in the market, the determination of fair value requires more judgment. Accordingly, the degree of judgment exercised in determining fair value is greatest for instruments categorized in level 3.
The inputs used to measure fair value may fall into different levels of the fair value hierarchy. In such cases, for disclosure purposes, the level in the fair value hierarchy within which the fair value measurement falls in its entirety is determined based on the lowest level input that is significant to the fair value measurement in its entirety.
Fair Value Measurements
A description of the valuation techniques applied to the Trust’s major categories of assets and liabilities measured at fair value on a recurring basis follows.
Equity securities (common stock, ETFs, mutual funds and CEFs) – Securities traded on a national securities exchange (or reported on the NASDAQ national market) are stated at the last reported sales price on the day of valuation. To the extent these securities are actively traded, and valuation adjustments are not applied, they are categorized in level 1 of the fair value hierarchy. Certain foreign securities may be fair valued using a pricing service that considers the correlation of the trading patterns of the foreign security to the intraday trading in the U.S. markets for investments such as American Depositary Receipts, financial futures, Exchange Traded Funds, and the movement of the certain indexes of securities based on a statistical analysis of the historical relationship and are categorized in level 2. Preferred stock and other equities traded on inactive markets or valued by reference to similar instruments are also categorized in level 2.
Money market funds – Money market funds are valued at their net asset value per share and are categorized as level 1.
Derivative instruments – Listed derivatives, including options, that are actively traded, are valued based on quoted prices from the exchange and categorized in level 1 of the fair value hierarchy. Options held by the Funds for which no current quotations are readily available and which are not traded on the valuation date are valued at the mean price and are categorized within level 2 of the fair value hierarchy. Over-the-counter (OTC) derivative contracts include forward, swap, and option contracts related to interest rates; foreign currencies; credit standing of reference entities; equity prices; or commodity prices, and warrants on exchange-traded securities. Depending on the product and terms of the transaction, the fair value of the OTC derivative products can be modeled taking into account the counterparties’ creditworthiness and using a series of techniques, including simulation models. Many pricing models do not entail material subjectivity because the methodologies employed do not necessitate significant judgments, and the pricing inputs are observed from actively quoted markets, as is the case of interest rate swap and option contracts. OTC derivative products valued using pricing models are categorized within level 2 of the fair value hierarchy.
Timber Point Funds | ANNUAL REPORT |
NOTES TO THE FINANCIAL STATEMENTS
September 30, 2021
3. | SECURITIES VALUATIONS (continued) |
In accordance with the Trust’s good faith pricing guidelines, the Adviser is required to consider all appropriate factors relevant to the value of securities for which it has determined other pricing sources are not available or reliable as described above. No single standard exists for determining fair value, because fair value depends upon the circumstances of each individual case. As a general principle, the current fair value of an issue of securities being valued by the Adviser would appear to be the amount which the owner might reasonably expect to receive for them upon their current sale. Methods which are in accordance with this principle may, for example, be based on (i) a multiple of earnings; (ii) a discount from market of a similar freely traded security (including a derivative security or a basket of securities traded on other markets, exchanges or among dealers); or (iii) yield to maturity with respect to debt issues, or a combination of these and other methods. Good faith pricing is permitted if, in the Adviser’s opinion, the validity of market quotations appears to be questionable based on factors such as evidence of a thin market in the security based on a small number of quotations, a significant event occurs after the close of a market but before the Funds’ NAV calculations that may affect a security’s value, or the Adviser is aware of any other data that calls into question the reliability of market quotations. Good faith pricing may also be used in instances when the bonds in which the Funds invest may default or otherwise cease to have market quotations readily available.
The Trustees of the 360 Funds adopted the M3Sixty Consolidated Valuation Procedures, which established a Valuation Committee to work with the Adviser and report to the Board on securities being fair valued or manually priced. The Independent Chairman and Trustee of the 360 Funds, along with the Trust’s Principal Financial Officer and Chief Compliance Officer are members of the Valuation Committee which meets at least monthly or, as required, to review the interim actions and coordination with the Adviser in pricing fair valued securities, and consideration of any unresolved valuation issues or a request to change the methodology for manually pricing a security. In turn, the Independent Chairman provides updates to the Board at the regularly scheduled board meetings as well as interim updates to the board members on substantive changes in a daily valuation or methodology issue.
If the Adviser decides that a price provided by the pricing service does not accurately reflect the fair value of the securities, when prices are not readily available from a pricing service, or when certain restricted or illiquid securities are being valued, securities are valued at fair value as determined in good faith by the Adviser, in conformity with guidelines adopted by and subject to review of the Board and the Fair Valuation Committee. These securities will be categorized as level 3 securities.
The following tables summarize the inputs used to value the Funds’ assets and liabilities measured at fair value as of September 30, 2021.
Global Fund:
Financial Instruments – Assets
Classification | | Level 1 | | | Level 2 | | | Level 3 | | | Totals | |
Common Stock (1) | | $ | 2,350,871 | | | $ | — | | | $ | — | | | $ | 2,350,871 | |
Preferred Stock (1) | | | 382,250 | | | | — | | | | — | | | | 382,250 | |
Exchange-Traded Funds (1) | | | 18,256,748 | | | | — | | | | — | | | | 18,256,748 | |
Mutual Funds (1) | | | 4,360,255 | | | | — | | | | — | | | | 4,360,255 | |
Warrants | | | 325,998 | | | | — | | | | — | | | | 325,998 | |
Asset Backed Securities | | | — | | | | 1,509 | | | | — | | | | 1,509 | |
Mortgage Backed Securities | | | — | | | | 4,307 | | | | — | | | | 4,307 | |
Short-Term Investment | | | 8,312,087 | | | | — | | | | — | | | | 8,312,087 | |
Total Assets | | $ | 33,988,209 | | | $ | 5,816 | | | $ | — | | | $ | 33,994,025 | |
| | | | | | | | | | | | | | | | | |
Timber Point Funds | ANNUAL REPORT |
NOTES TO THE FINANCIAL STATEMENTS
September 30, 2021
3. | SECURITIES VALUATIONS (continued) |
Financial Instruments – Liabilities
Classification | | Level 1 | | | Level 2 | | | Level3 | | | Totals | |
Put Options Written | | $ | 38,625 | | | $ | — | | | $ | — | | | $ | 38,625 | |
Total Liabilities | | $ | 38,625 | | | $ | — | | | $ | — | | | $ | 38,625 | |
| | | | | | | | | | | | | | | | | |
(1) For a detailed break-out of common stock, preferred stock, ETFs and mutual funds by industry or asset class, please refer to the Consolidated Schedule of Investments.
Income Fund:
Financial Instruments – Assets Classification | | Level 1 | | | Level 2 | | | Level
3 | | | Totals | |
Preferred Stock (1) | | $ | 112,460 | | | $ | — | | | $ | — | | | $ | 112,460 | |
Exchange-Traded Funds (1) | | | 8,159,915 | | | | — | | | | — | | | | 8,159,915 | |
Asset Backed Securities | | | — | | | | 5,022 | | | | — | | | | 5,022 | |
Corporate Bonds (1) | | | — | | | | 8,059,904 | | | | — | | | | 8,059,904 | |
Mortgage Backed Securities | | | — | | | | 12,920 | | | | — | | | | 12,920 | |
Short-Term Investment | | | 1,102,346 | | | | — | | | | — | | | | 1,102,346 | |
Total Assets | | $ | 9,374,721 | | | $ | 8,077,846 | | | $ | — | | | $ | 17,452,567 | |
| | | | | | | | | | | | | | | | | |
Financial Instruments – Liabilities Classification | | Level 1 | | | Level 2 | | | Level 3 | | | Totals | |
Put Options Written | | $ | 5,150 | | | $ | — | | | $ | — | | | $ | 5,150 | |
Total Liabilities | | $ | 5,150 | | | $ | — | | | $ | — | | | $ | 5,150 | |
| | | | | | | | | | | | | | | | | |
(1) For a detailed break-out of common stock, preferred stock, ETFs and corporate bonds by industry or asset class, please refer to the Schedule of Investments.
The Funds did not hold any level 3 securities during the period.
4. | DERIVATIVES TRANSACTIONS |
As of September 30, 2021 portfolio securities valued at $2,743,687 and $3,279,945 were held in escrow by the custodian as collateral for options written by the Global Fund and Income Fund, respectively.
As of September 30, 2021, CPAS Fund Ltd., the wholly owned subsidiary of the Global Fund, had cash of $25,000 being held at the broker as collateral for swap investments.
Timber Point Funds | ANNUAL REPORT |
NOTES TO THE FINANCIAL STATEMENTS
September 30, 2021
4. | DERIVATIVES TRANSACTIONS (continued) |
As of September 30, 2021, the location on the Consolidated Statement of Assets and Liabilities for the Global Fund and Statement of Assets and Liabilities for the Income Fund for financial derivative instrument fair values is as follows:
Global Fund: | | | | | | |
Liabilities | | Location | | | Market Value | |
Put options written * | | Options written, at value | | | $ | 38,625 | |
Total Liabilities | | | | | | $ | 38,625 | |
Income Fund: | | | | | | |
Liabilities | | Location | | | Market Value | |
Put options written * | | Options written, at value | | | $ | 5,150 | |
Total Liabilities | | | | | | $ | 5,150 | |
* All put options written by the Funds contained equity exposure.
Realized and unrealized gains and losses on derivatives contracts entered into by the Funds during the year ended September 30, 2021 are recorded in the following locations in the Consolidated Statement of Operations for the Global Fund and the Statement of Operations for the Income Fund:
Global Fund: | | | | | | | | | |
Net change in unrealized
appreciation/(depreciation) on: | | Location | | | Equity Contracts | | | Basket ** | |
Put options written | | | Options written | | | $ | (10,747 | ) | | $ | — | |
Swaps | | | Swaps | | | | — | | | | 469,601 | |
| | | | | | $ | (10,747 | ) | | $ | 469,601 | |
Net realized gain (loss) on: | | Location | | | Equity Contracts | | | Basket ** | |
Call options purchased | | | Unaffiliated Investments | | | $ | 70,606 | | | $ | — | |
Put options purchased | | | Unaffiliated Investments | | | | (143,074 | ) | | | — | |
Call options written | | | Options written | | | | 136,056 | | | | — | |
Put options written | | | Options written | | | | 26,472 | | | | — | |
Swaps | | | Swaps | | | | — | | | | (710,107 | ) |
| | | | | | $ | 90,060 | | | $ | (710,107 | ) |
** Swaps contained investments that had “Basket” exposure. The Baskets offered exposure to over-the-counter foreign exchange and currency option transactions and to exchange-traded futures and options related to commodities, metals, financial instruments, currencies, interest rates or indices.
Income Fund: | | | | | | |
Net change in unrealized
appreciation/(depreciation) on: | | Location | | | Equity Contracts | |
Put options written | | | Options written | | | $ | (973 | ) |
| | | | | | $ | (973 | ) |
Timber Point Funds | ANNUAL REPORT |
NOTES TO THE FINANCIAL STATEMENTS
September 30, 2021
4. DERIVATIVES TRANSACTIONS (continued)
Net realized gain (loss) on: | | Location | | | Equity Contracts | |
Call options purchased | | | Unaffiliated Investments | | | $ | 7,579 | |
Put options purchased | | | Unaffiliated Investments | | | | (7,264 | ) |
Call options written | | | Options written | | | | 5,634 | |
Put options written | | | Options written | | | | 5,735 | |
| | | | | | $ | 11,684 | |
The following tables indicate the average volume for the period:
Global Fund | | Average Notional Value | |
Call Options Purchased | | $ | 600,000 | |
Put Options Purchased | | | 1,306,923 | |
Call Options Written | | | (723,615 | ) |
Put Options Written | | | (214,731 | ) |
Swaps | | | 19,230,769 | |
Income Fund | | Average Notional Value | |
Call Options Purchased | | $ | 15,385 | |
Put Options Purchased | | | 225,654 | |
Call Options Written | | | (18,846 | ) |
Put Options Written | | | (92,500 | ) |
5. | INVESTMENT TRANSACTIONS |
For the year ended September 30, 2021, aggregate purchases and sales of investment securities (excluding short-term investments) for the Fund were as follows:
| | Purchases | | | Sales | |
Global Fund | | $ | 103,243,725 | | | $ | 115,631,514 | |
Income Fund | | | 31,504,613 | | | | 32,051,785 | |
There were no U.S. Government securities purchased or sold during the year by the Global Fund. The cost of purchases and proceeds from sales of U.S. Government securities during the year ended September 30, 2021 by the Income Fund were $168,366 and $558,264, respectively.
6. | INVESTMENTS IN AFFILIATED COMPANIES |
An affiliated company is a company in which the Funds have ownership of at least 5% of the voting securities or of common management. Companies which are affiliates of the Funds at September 30, 2021, are noted in the Global Fund’s Consolidated Schedule of Investments. The Income Fund is a mutual fund which is considered affiliated because it is of common management of the Adviser. The ACA Master L.P. (“ACA”) was considered an affiliate because the Global Fund held greater than 5% of the value of ACA during the year ended September 30, 2021. The K-20 Partners Fund, LP (“K20”) was considered an affiliate because the Global Fund and Income Fund held greater than 5% of the value of K20 during the year ended September 30, 2021. As of September 30, 2021, the Income Fund is the only remaining affiliated fund of the Global Fund. The Income Fund was not invested in any affiliated funds at September 30, 2021.
| Timber Point Funds | ANNUAL REPORT |
NOTES TO THE FINANCIAL STATEMENTS
September 30, 2021
| 6. | INVESTMENTS IN AFFILIATED COMPANIES (continued) |
Transactions with affiliated companies during the year ended September 30, 2021 were as follows:
Global Fund: | | Value as of September 30,
2020 | | Realized gain
(loss) | | Change in
unrealized
appreciation
(depreciation) | | Purchases | | Sales | | Value as of
September 30,
2021 | | Income
received |
| Income Fund | | | $ | 2,737,066 | | | $ | — | | | $ | 92,585 | | | $ | 563,505 | (1) | | $ | — | | | $ | 3,393,156 | | | $ | 65,173 | |
| ACA | | | | 3,934,405 | | | | 96,519 | | | | 521,653 | | | | — | | | | (4,552,577 | ) | | | — | | | | — | |
| K20 | | | | 290,863 | | | | (11,988 | ) | | | (49,655 | ) | | | — | | | | (229,220 | ) | | | — | | | | — | |
| Total | | | $ | 6,962,334 | | | $ | 84,531 | | | $ | 564,583 | | | $ | 563,505 | | | $ | (4,781,797 | ) | | $ | 3,393,156 | | | $ | 65,173 | |
(1) Includes $38,505 of dividends reinvested.
Income Fund: | | Value as of
September 30,
2020 | | Realized gain
(loss) | | Change in
unrealized
appreciation
(depreciation) | | Purchases | | Sales | | Value as of
September 30,
2021 | | Income
received |
| K20 | | | $ | 52,525 | | | $ | (4,121 | ) | | $ | (7,624 | ) | | $ | — | | | $ | (40,780 | ) | | $ | — | | | $ | — | |
| Total | | | $ | 52,525 | | | $ | (4,121 | ) | | $ | (7,624 | ) | | $ | — | | | $ | (40,780 | ) | | $ | — | | | $ | — | |
| 7. | ADVISORY FEES AND OTHER RELATED PARTY TRANSACTIONS |
The Funds have entered into Investment Advisory Agreements (the “Advisory Agreements”) with the Adviser. Under the Advisory Agreements, the Adviser, under the supervision of the Board, agrees to invest the assets of the Funds in accordance with applicable law and the investment objectives, policies and restrictions set forth in the Funds’ current Prospectuses and Statements of Additional Information, and subject to such further limitations as the Trust may from time to time impose by written notice to the Adviser. The Adviser shall act as the investment advisor to the Funds and, as such shall (i) obtain and evaluate such information relating to the economy, industries, business, securities markets and securities as it may deem necessary or useful in discharging its responsibilities here under, (ii) formulate a continuing program for the investment of the assets of the Funds in a manner consistent with their investment objectives, policies and restrictions, and (iii) determine from time to time securities to be purchased, sold, retained or lent by the Funds, and implement those decisions, including the selection of entities with or through which such purchases, sales or loans are to be effected; provided, that the Adviser will place orders pursuant to its investment determinations either directly with the issuer or with a broker or dealer, and if with a broker or dealer, (a) will attempt to obtain the best price and execution of its orders, and (b) may nevertheless in its discretion purchase and sell portfolio securities from and to brokers who provide the Adviser with research, analysis, advice and similar services and pay such brokers in return a higher commission or spread than may be charged by other brokers.
Under the terms of the Advisory Agreements with the Funds, the Adviser receives a monthly management fee equal to annual rates of the Funds’ net assets as follows:
| | | | Management Fee Rates | |
| Global Fund | | | | 0.90 | % |
| Income Fund | | | | 0.80 | %* |
* Effective December 1, 2020, the management fee rate for the Income Fund was decreased to 0.80% from 1.00%.
For the year ended September 30, 2021, the Adviser earned management fees as follows:
| | | | Management Fees | |
| Global Fund | | | $ | 346,310 | |
| Income Fund | | | | 144,298 | |
| Timber Point Funds | ANNUAL REPORT |
NOTES TO THE FINANCIAL STATEMENTS
September 30, 2021
| 7. | ADVISORY FEES AND OTHER RELATED PARTY TRANSACTIONS (continued) |
The Adviser has contractually agreed to waive or reduce its fees and to assume other expenses of the Funds, if necessary, in an amount that limits “Total Annual Fund Operating Expenses” (exclusive of interest, expenses incurred under a plan of distribution adopted pursuant to Rule 12b-1 under the 1940 Act, taxes, acquired fund fees and expenses, brokerage commissions, dividend expenses on securities sold short and other expenditures which are capitalized in accordance with GAAP and other extraordinary expenses not incurred in the ordinary course of such Funds’ business) to not more than 1.60% of the average daily net assets of the Global Fund and 1.70% of the average daily net assets of the Income Fund through January 31, 2022. Effective December 1, 2020, the expense limit was raised from 1.43% to 1.60% for the Global Fund, and lowered from 2.00% to 1.70% for the Income Fund. These operating expense limitation agreements can be terminated only by, or with the consent of, the Board.
For the year ended September 30, 2021, the Adviser waived advisory fees and reimbursed expenses as follows:
| | | | Advisory Fees Waived | | | Expenses Reimbursed | |
| Global Fund | | | $ | 54,989 | | | $ | — | |
| Income Fund | | | | 86,431 | | | | — | |
The Global Fund invested a portion of its assets in the Income Fund, which is an affiliated Fund (Note 6). As such, the Adviser has agreed to waive its advisory fees on the portions of the Global Fund’s assets that are invested in the Income Fund.
For the year ended September 30, 2021, the Adviser waived advisory fees related to assets invested in the affiliated funds as follows:
| | | | Affiliated Funds
Advisory Fees Waived | |
| Global Fund | | | $ | 27,176 | |
These waivers are in addition to amounts waived pursuant to the contractual expense limitations detailed in the above paragraphs and are not recoupable.
Expense waivers and reimbursements are subject to possible recoupment from the Funds in future years on a rolling three year basis (within the three years after the fees have been waived or reimbursed) if such recoupment can be achieved within the expenses limits in place at the time of the waiver or reimbursement and the recoupment. Expense waivers and reimbursements made by the Former Adviser are also subject to possible recoupment by the Adviser under the same terms. As of September 30, 2021, the total amount of expenses waived/reimbursed subject to recapture and their expiration dates, pursuant to the waiver agreements, was as follows:
| | | | Amount Subject to Recoupment | | | Expiration Dates |
| Global Fund | | | | 181,052 | | | September 30, 2022 |
| Global Fund | | | | 169,994 | | | September 30, 2023 |
| Global Fund | | | | 54,989 | | | September 30, 2024 |
| Income Fund | | | | 123,012 | | | September 30, 2022 |
| Income Fund | | | | 121,629 | | | September 30, 2023 |
| Income Fund | | | | 86,431 | | | September 30, 2024 |
The Funds have entered into an Investment Company Services Agreement (“ICSA”) with M3Sixty Administration, LLC (“M3Sixty”). Pursuant to the ICSA, M3Sixty is responsible for a wide variety of functions, including but not limited to: (a) Fund accounting services; (b) financial statement preparation; (c) valuation of the Funds’ portfolio securities; (d) pricing the Funds’ shares; (e) assistance in preparing tax returns; (f) preparation and filing of required regulatory reports; (g) communications with shareholders; (h) coordination of Board and shareholder meetings; (i) monitoring the Funds’ legal compliance; and (j) maintaining shareholder account records.
For the year ended September 30, 2021, M3Sixty earned fees pursuant to the ICSA as follows:
| | | | ICSA Fees | |
| Global Fund | | | $ | 150,786 | |
| Income Fund | | | | 94,318 | |
| Timber Point Funds | ANNUAL REPORT |
NOTES TO THE FINANCIAL STATEMENTS
September 30, 2021
| 7. | ADVISORY FEES AND OTHER RELATED PARTY TRANSACTIONS (continued) |
The Funds have also entered into a Chief Compliance Officer Service Agreement (“CCO Agreement”) with M3Sixty. Pursuant to the CCO Agreement, M3Sixty agrees to provide a Chief Compliance Officer (“CCO”), as described in Rule 38a-l of the 1940 Act, to the Funds for the year and on the terms and conditions set forth in the CCO Agreement.
For the year ended September 30, 2021, M3Sixty earned fees pursuant to the CCO Agreement as follows:
| | | | CCO Agreement Fees | |
| Global Fund | | | $ | 12,430 | |
| Income Fund | | | | 10,625 | |
Certain officers of the Funds are also employees or officers of M3Sixty.
Matrix 360 Distributors, LLC (the “Distributor”) acts as the principal underwriter and distributor (the “Distributor”) of each Fund’s shares for the purpose of facilitating the registration of shares of the Funds under state securities laws and to assist in sales of the Funds’ shares pursuant to a Distribution Agreement (the “Distribution Agreement”) approved by the Trustees. The Distribution Agreement between the Funds and the Distributor requires the Distributor to use all reasonable efforts in connection with the distribution of the Funds’ shares. However, the Distributor has no obligation to sell any specific number of shares and will only sell shares for orders it receives.
The Distributor is an affiliate of M3Sixty.
| 8. | DISTRIBUTIONS TO SHAREHOLDERS AND TAX MATTERS |
The tax character of distributions during the year ended September 30, 2021, was as follows:
| | | | Ordinary Income | | | Long-Term
Capital Gains | |
| Global Fund | | | $ | 228,929 | | | $ | — | |
| Income Fund | | | | 404,052 | | | | — | |
The tax character of distributions during the year ended September 30, 2020, was as follows:
| | | | Ordinary Income | | | Long-Term
Capital Gains | |
| Global Fund | | | $ | 235,918 | | | $ | — | |
| Income Fund | | | | 184,930 | | | | — | |
The tax character of distributable earnings (deficit) at September 30, 2021, was as follows:
| | | | Undistributed Ordinary Income | | | Post-October Loss and Late Year Loss | | | Capital Loss Carry Forwards | | | Other Book/Tax Differences | | | Unrealized
Appreciation/
(Depreciation) | | | Total Accumulated Losses | |
| Global Fund | | | $ | 2 | | | $ | (211,729 | ) | | $ | (1,508,928 | ) | | $ | — | | | $ | (478,592 | ) | | $ | (2,199,247 | ) |
| Income Fund | | | | 254,588 | | | | — | | | | (1,958,171 | ) | | | (8,855 | ) | | | 344,955 | | | | (1,367,483 | ) |
The difference between book basis and tax basis undistributed net investment income (loss), accumulated net realized loss, and unrealized appreciation from investments is primarily attributable to the tax deferral of losses on wash sales and and adjustments for partnerships. In addition, the amount listed under other book/tax differences for the Income Fund is primarily attributable to unamortized organizational expense.
| Timber Point Funds | ANNUAL REPORT |
NOTES TO THE FINANCIAL STATEMENTS
September 30, 2021
| 8. | DISTRIBUTIONS TO SHAREHOLDERS AND TAX MATTERS (continued) |
Capital losses incurred after October 31 and ordinary losses incurred after December 31 within the fiscal year are deemed to arise on the first business day of the following fiscal year for tax purposes. At September 30, 2021, the Funds deferred capital and ordinary losses as follows:
| | | | Post-October Capital Losses | | | Late Year Ordinary Losses | |
| Global Fund | | | $ | — | | | $ | 211,729 | |
| Income Fund | | | | — | | | | — | |
At September 30, 2021, the Funds had capital loss carry forwards for federal income tax purposes available to offset future capital gains as follows:
| | | | Non-Expiring Short-Term | | | Non-Expiring Long-Term | | | Total | |
| Global Fund | | | $ | 1,334,584 | | | $ | 174,344 | | | $ | 1,508,928 | |
| Income Fund | | | | 1,958,171 | | | | — | | | | 1,958,171 | |
Permanent book and tax differences, primarily attributable to the book/tax basis treatment of foreign currency gains/(losses), and adjustments for paydowns and partnerships, resulted in reclassifications for the year ended September 30, 2021, as follows:
| | | | Paid-in Capital | | | Total Accumulated Losses | |
| Global Fund | | | $ | (1,093,081 | ) | | $ | 1,093,081 | |
| Income Fund | | | | — | | | | — | |
For U.S. Federal income tax purposes, the cost of securities owned, gross appreciation, gross depreciation, and net unrealized appreciation/(depreciation) of investments at September 30, 2021, were as follows:
| | | | Cost | | | Gross Appreciation | | | Gross Depreciation | | | Net Appreciation (Depreciation) | |
| Global Fund | | | $ | 34,433,992 | | | $ | 949,313 | | | $ | (1,427,905 | ) | | $ | (478,592 | ) |
| Income Fund | | | | 17,102,462 | | | | 456,090 | | | | (111,135 | ) | | | 344,955 | |
The difference between book basis and tax basis unrealized appreciation (depreciation) from investments is primarily attributable to the tax deferral of losses on wash sales.
| 9. | MERGER OF TIMBER POINT ALTERNATIVES FUND WITH THE GLOBAL FUND |
Effective as of the close of business August 21, 2020, pursuant to a Plan of Reorganization (the “Reorganization”), the Global Fund received all the assets and liabilities of the Timber Point Alternatives Fund (the “Transferring Fund”). Institutional Class shares of the Transferring Fund were exchanged for Institutional Class shares of the Global Fund. 2,334,625 shares of the Transferring Fund, valued at $7.50 per share, were exchanged for 1,894,709 Institutional Class shares of the Global Fund valued at $9.24 per share. Each Institutional Class share of the Transferring Fund was exchanged for 0.812 Institutional Class shares of the Global Fund. The Transferring Fund’s net assets on the date of the reorganization of $17,507,109, including $172,173 of unrealized depreciation, were combined with those of the Global Fund. The combined net assets immediately after the acquisition amounted to $38,928,726 with 4,211,903 shares outstanding. The Reorganization was treated as a tax-free reorganization for federal income tax purposes and, accordingly, the basis of the assets of the Global Fund reflected the historical basis of the assets of the Transferring Fund as of the date of the Reorganization. The Reorganization is also considered tax-free based on accounting principles generally accepted in the United States of America.
| 10. | COMMITMENTS AND CONTINGENCIES |
In the normal course of business, the Trust may enter into contracts that may contain a variety of representations and warranties and provide general indemnifications. The Trust’s maximum exposure under these arrangements is dependent on future claims that may be made against the Funds and, therefore, cannot be estimated; however, management considers the risk of loss from such claims to be remote.
| Timber Point Funds | ANNUAL REPORT |
NOTES TO THE FINANCIAL STATEMENTS
September 30, 2021
| 11. | RECENT AND SUBSEQUENT EVENTS |
Effective October 15, 2021, each Fund’s non-fundamental investment objective has changed. At a meeting on July 27, 2021, the Board approved the changes based on the recommendation of the Adviser. The changes better reflect each Fund’s strategy and there is no change to each Fund’s principal investment strategy as a result of the change to the Funds’ investment objectives. The new investment objective of the Global Fund is to seek superior risk adjusted total returns by investing across a wide variety of global assets. The new investment objective of the Income Fund is to seek superior risk adjusted returns by investing in income oriented securities.
In accordance with GAAP, Management has evaluated the impact of all subsequent events on the Funds through the date the financial statements were issued, and has determined that there were no other subsequent events requiring recognition or disclosure in the financial statements.
| 12. | NOVEL CORONAVIRUS PANDEMIC |
An outbreak of an infectious respiratory illness caused by a novel coronavirus known as COVID-19 began in China in December 2019 and continues today. The spread of the coronavirus resulted in travel and border restrictions, quarantines, curfews, and restrictions on large gatherings. Government measures to limit the spread of the virus include enhanced health screenings at ports of entry and elsewhere and prolonged quarantines for many people. Despite these measures, the virus’ spread resulted in a large number of deaths, disrupted global healthcare systems and supply chains. As a result, 2020 and early 2021 caused lower consumer demand for a wide range of products and services and general concern and uncertainty. While governments took unprecedented action to limit disruptions to the financial system, global financial markets experienced significant volatility resulting from the spread of and subsequent intervening measures intended to limit the spread of COVID-19. Since early 2021, the widespread distribution of vaccines helped stabilize some financial markets and reopen some economies, and significant government stimulus mitigated economic damages to the global economy. But the spread of COVID-19 adversely affected the economies of many nations and the entire global economy, in general. Still, global markets are concerned over the pace of economic recovery globally, the potential for inflation because of the government stimulus, and further disruption due to the emergence of highly contagious COVID-19 variants, such as the “delta” and other variants. At this time, the Fund cannot determine the full extent of the impact of COVID-19 and its variants on the Fund’s performance, which will depend on future developments, including the duration and the continued spread of the outbreak.

REPORT OF INDEPENDENT REGISTERED PUBLIC ACCOUNTING FIRM
To the Board of Trustees of 360 Funds
and the Shareholders of Timber Point Global Allocations Fund
and Timber Point Alternative Income Fund
Opinion on the Financial Statements
We have audited the accompanying consolidated (where noted) statements of assets and liabilities of Timber Point Global Allocations Fund and Timber Point Alternative Income Fund, each a series of shares of beneficial interest in 360 Funds (the “Funds” ), including the consolidated (where noted) schedules of investments, as of September 30, 2021, and the related consolidated (where noted) statements of operations for the year then ended, the consolidated (where noted) statements of changes in net assets for each of the years in the two-year period then ended, the consolidated (where noted) financial highlights as noted in the table below, and the related notes (collectively referred to as the “financial statements” ). In our opinion, the financial statements present fairly, in all material respects, the consolidated (where noted) financial position of the Funds as of September 30, 2021, and the results of their consolidated (where noted) operations for the year then ended, the consolidated (where noted) changes in their net assets for each of the years in the two-year period then ended and their consolidated (where noted) financial highlights for each of the periods noted in the table below, in conformity with accounting principles generally accepted in the United States of America.
Fund | Financial Highlights Presented |
| |
| |
Timber Point Global Allocations Fund | For each of the years in the three-year period ended September 30, 2021, the period from June 1, 2018 through September 30, 2018 and each of the years in the two-year period ended May 31, 2018 |
| |
Timber Point Alternative Income Fund | For each of the years in the two-year period ended September 30, 2021 and the period from February 12, 2019 (commencement of operations) through September 30, 2019 |
Basis for Opinion
These financial statements are the responsibility of the Funds’ management. Our responsibility is to express an opinion on the Funds’ financial statements based on our audits. We are a public accounting firm registered with the Public Company Accounting Oversight Board (United States) (“PCAOB” ) and are required to be independent with respect to the Funds in accordance with the U.S. federal securities law and the applicable rules and regulations of the Securities and Exchange Commission and the PCAOB.
We conducted our audits in accordance with the standards of the PCAOB. Those standards require that we plan and perform the audits to obtain reasonable assurance about whether the financial statements are free of material misstatement, whether due to error or fraud. The Funds are not required to have, nor were we engaged to perform, an audit of their internal control over financial reporting. As part of our audits we are required to obtain an understanding of internal control over financial reporting but not for the purpose of expressing an opinion on the effectiveness of the Funds’ internal control over financial reporting. Accordingly, we express no such opinion.
Our audits included performing procedures to assess the risk of material misstatement of the financial statements, whether due to error or fraud, and performing procedures that respond to those risks. Such procedures included examining, on a test basis, evidence regarding the amounts and disclosures in the financial statements. Our procedures included confirmation of securities owned as of September 30, 2021 by correspondence with the custodian, brokers, or by other appropriate auditing procedures where replies from brokers were not received. Our audits also included evaluating the accounting principles used and significant estimates made by management, as well as evaluating the overall presentation of the financial statements. We believe that our audits provide a reasonable basis for our opinion.

BBD, LLP
We have served as the auditor of one or more of the Funds in the 360 Funds since 2018.
Philadelphia, Pennsylvania
December 10, 2021
| Timber Point Funds | ANNUAL REPORT |
ADDITIONAL INFORMATION
September 30, 2021 (Unaudited)
The Trust, on behalf of the Funds, files a complete statement of investments with the U.S. Securities and Exchange Commission for the first and third quarters of each fiscal year as an exhibit to its report on Form N-PORT. Shareholders may view the filed Forms N-PORT by visiting the Commission’s website at http://www.sec.gov. The filed forms may also be viewed and copied at the Commission’s Public Reference Room in Washington, DC. Information regarding the operations of the Public Reference Room may be obtained by calling 1-800-SEC-0330.
A description of the policies and procedures that the Funds use to determine how to vote proxies relating to portfolio securities is available without charge, upon request, by calling 1-877-244-6235; and on the Commission’s website at http://www.sec.gov.
Information regarding how the Funds voted proxies relating to portfolio securities during the most recent 12-month period ended June 30th is available without charge, upon request, by calling 1-877-244-6235; and on the Commission’s website at http://www.sec.gov.
Shareholder Tax Information - The Funds are required to advise you within 60 days of the Funds’ fiscal year end regarding the federal tax status of distributions received by shareholders during the fiscal year. The Global Fund paid $228,929 of ordinary income during the year ended September 30, 2021. The Income Fund paid $404,052 of ordinary income distributions during the year ended September 30, 2021.
Tax information is reported from the Funds’ fiscal year and not calendar year, therefore, shareholders should refer to their Form 1099-DIV or other tax information which will be mailed in 2022 to determine the calendar year amounts to be included on their 2021 tax returns. Shareholders should consult their own tax advisors.
| Timber Point Funds | ANNUAL REPORT |
ADDITIONAL INFORMATION
September 30, 2021 (Unaudited)
BOARD OF TRUSTEES, OFFICERS AND PRINCIPAL SHAREHOLDERS - (Unaudited)
The Trustees are responsible for the management and supervision of the Funds. The Trustees approve all significant agreements between the Trust, on behalf of the Funds, and those companies that furnish services to the Funds; review performance of the Funds; and oversee activities of the Funds. The Statement of Additional Information of the Trust includes additional information about the Funds’ Trustees and is available upon request, without charge, by calling (877) 244-6235.
Trustees and Officers. Following are the Trustees and Officers of the Trust, their age and address, their present position with the Trust or the Funds, and their principal occupation during the past five years. Each of the Trustees of the Trust will generally hold office indefinitely. The Officers of the Trust will hold office indefinitely, except that: (1) any Officer may resign or retire and (2) any Officer may be removed any time by written instrument signed by at least two-thirds of the number of Trustees prior to such removal. In case a vacancy or an anticipated vacancy on the Board of Trustees shall for any reason exist, the vacancy shall be filled by the affirmative vote of a majority of the remaining Trustees, subject to certain restrictions under the 1940 Act. Those Trustees who are “interested persons” (as defined in the 1940 Act) by virtue of their affiliation with either the Trust or the Adviser, are indicated in the table. The address of each trustee and officer is 4300 Shawnee Mission Parkway, Suite 100, Fairway, KS 66205.
| Name, Address and Year of Birth (“YOB”) | Position(s)
Held with
Trust | Length of
Service | Principal Occupation(s) During Past 5 Years | Number
of Series
Overseen | Other Directorships
During Past 5 Years |
| Independent Trustees |
Arthur Q. Falk YOB : 1937 | Trustee | Since 2011 | Retired. | Six | None |
Tom M. Wirtshafter YOB : 1954 | Trustee | Since 2011 | Senior Vice President, American Portfolios Financial Services, (broker-dealer), American Portfolios Advisors (investment Advisor) (2009-Present). | Six | None |
Gary W. DiCenzo YOB: 1962 | Trustee and Independent Chairman | Since 2014 Since 2019 | Partner, Cognios Capital (investment management firm) (2015-2020) Chief Executive officer (2015-2019). | Six | None |
Steven D. Poppen YOB : 1968 | Trustee | Since 2018 | Executive Vice President and Chief Financial Officer, Minnesota Vikings (professional sports organization) (1999-present). | Six | M3Sixty Funds Trust (2 portfolios) (2015 – present) |
Thomas J. Schmidt YOB: 1963 | Trustee | Since 2018 | Principal, Tom Schmidt & Associates Consulting, LLC (2015-Present) | Six | None |
| Interested Trustee* | | | | | |
Randall K. Linscott YOB: 1971 | President | Since 2013 | Chief Executive Officer, M3Sixty Administration, LLC (2013 – present) | Six | M3Sixty Funds Trust (2 portfolios) (2015 – present) |
| | | | | | | | |
* The Interested Trustee is an Interested Trustee because he is an officer and principal owner of the Administrator.
| Timber Point Funds | ANNUAL REPORT |
ADDITIONAL INFORMATION
September 30, 2021 (Unaudited)
BOARD OF TRUSTEES, OFFICERS AND PRINCIPAL SHAREHOLDERS - (Unaudited) (continued)
| Name, Address and Year of Birth (“YOB”) | Position(s) Held with Trust | Length of Service | Principal Occupation(s) During Past 5 Years | Number of Series Overseen | Other Directorships During Past 5 Years |
Officers | | | | | |
Richard Yates YOB: 1965 | Chief Compliance Officer and Secretary | Since 2021 | Of Counsel, McElroy Deutsch (2020–present); Head of Compliance, M3Sixty Administration, LLC (2021–present); Chief Compliance Officer and Secretary, M3Sixty Funds Trust (2021–present); Founder, The Yates Law Firm (2018–2020); Chief Legal Officer, Manning & Napier, Inc. (2000–2018). | N/A | N/A |
Larry E. Beaver, Jr. YOB: 1969 | Treasurer | Since 2021 | Fund Accounting, Administration and Tax Officer, M3Sixty Administration, LLC (2017-Present); Director of Fund Accounting & Administration, M3Sixty Administration, LLC (2005-2017); Assistant Treasurer, 360 Funds Trust (2017-2021); Chief Accounting Officer, Amidex Funds, Inc. (2003-2020); Assistant Treasurer, Capital Management Investment Trust (2017-2018); Assistant Treasurer, M3Sixty Funds Trust (2017-Present; Assistant Treasurer, WP Funds Trust (2017-2021); Treasurer and Assistant Secretary, Capital Management Investment Trust (2008-2017); Treasurer, 360 Funds Trust (2007-2017); Treasurer, M3Sixty Funds Trust (2015-2017); Treasurer, WP Trust (2015-2017); Treasurer and Chief Financial Officer, Monteagle Funds (2008-2016). | N/A | N/A |
Bo J. Howell YOB: 1981 | Assistant Secretary | Since 2020 | Shareholder, Strauss Troy Co., LPA (2020 - present); CEO, Joot (2018 - present); Partner, Practus LLP (2018 - 2020); Director of Fund Administration, Ultimus Fund Services, LLC (2014-2018). | N/A | CCO Technology, LLC (d/b/a Joot) (since 2020) |
Steve Roberts YOB: 1953 | Anti-Money Laundering Officer | Since 2021 | Chief Compliance Officer, Matrix 360 Distributors, LLC (2017-present); Chief Compliance Officer, WP Trust (2018-2021); Compliance Analyst, State Street (2016-2017). | N/A | N/A |
| Timber Point Funds | ANNUAL REPORT |
ADDITIONAL INFORMATION
September 30, 2021 (Unaudited)
BOARD OF TRUSTEES, OFFICERS AND PRINCIPAL SHAREHOLDERS - (Unaudited) (continued)
Remuneration Paid to Trustees and Officers - Officers of the Trust and Trustees who are “interested persons” of the Trust or the Adviser will receive no salary or fees from the Trust. Officers of the Trust and interested Trustees do receive compensation directly from certain service providers to the Trust, including Matrix 360 Distributors, LLC and M3Sixty Administration LLC. Each Trustee who is not an “interested person” (an “Independent Trustee”) receives a $5,000 annual retainer (paid quarterly). In addition, each Independent Trustee receives, on a per fund basis: (i) a fee of $1,500 per fund each year (paid quarterly); (ii) a fee of $200 per Board meeting attended; and (iii) a fee of $200 per committee meeting attended. The Trust will also reimburse each Trustee for travel and other expenses incurred in connection with, and/or related to, the performance of their obligations as a Trustee. Officers of the Trust will also be reimbursed for travel and other expenses relating to their attendance at Board meetings.
| Name of Trustee1 | | Aggregate
Compensation From the Funds2 | | | Pension or Retirement
Benefits Accrued As Part
of Portfolio Expenses | | Estimated
Annual Benefits
Upon
Retirement | | Total Compensation From the Funds Paid to Trustees2 | |
| Independent Trustees |
| Arthur Q. Falk | | $ | 8,007 | | | None | | None | | $ | 8,007 | |
| Tom M. Wirtshafter | | $ | 6,607 | | | None | | None | | $ | 6,607 | |
| Gary W. DiCenzo | | $ | 8,007 | | | None | | None | | $ | 8,007 | |
| Steven D. Poppen | | $ | 6,607 | | | None | | None | | $ | 6,607 | |
| Thomas J. Schmidt | | $ | 8,007 | | | None | | None | | $ | 8,007 | |
| Interested Trustees and Officers |
| Randall K. Linscott | | | None | | | Not Applicable | | Not Applicable | | | None | |
| | | | | | | | | | | | | |
1 Each of the Trustees serves as a Trustee to each Series of the Trust. The Trust currently offers six (6) series of shares.
2 Figures are for the year ended September 30, 2021.
| Timber Point Funds | ANNUAL REPORT |
Information About Your Funds’ Expenses – (Unaudited)
As a shareholder of the Funds, you incur ongoing costs, including management fees and other Fund expenses. The example below is intended to help you understand your ongoing costs (in dollars) of investing in the Funds and to compare these costs with the ongoing costs of investing in other mutual funds.
The example is based on an investment of $1,000 invested at the beginning of the period and held for the entire period as indicated below.
Actual Expenses – The first section of the table provides information about actual account values and actual expenses (relating to the example $1,000 investment made at the beginning of the period). You may use the information in this section, together with the amount you invested, to estimate the expenses that you paid over the period. Simply divide your account value by $1,000 (for example, an $8,600 account value divided by $1,000 = 8.6), then multiply the result by the number in the first section under the heading entitled “Expenses Paid During Period” to estimate the expenses you paid on your account during this period.
Hypothetical Example for Comparison Purposes – The second section of the table provides information about the hypothetical account values and hypothetical expenses based on the Funds’ actual expense ratios and an assumed rate of return of 5% per year before expenses, which is not the Funds’ actual return. The hypothetical account values and expenses may not be used to estimate the actual ending account balance or expenses you paid for the period. You may use this information to compare the ongoing costs of investing in the Funds to other funds. To do so, compare this 5% hypothetical example with the 5% hypothetical examples that appear in the shareholder reports of the other funds.
| Expenses and Value of a $1,000 Investment for the period from 04/01/21 through 09/30/21 | |
| | | | |
| Global Fund: | | Beginning Account
Value (04/01/2021) | | | Annualized Expense
Ratio for the Period | | | Ending Account
Value (09/30/2021) | | | Expenses Paid
During Period (a) | |
| Actual Fund Return (in parentheses) | | | | | | | | | |
| Institutional Class (-1.82%) | | $ | 1,000.00 | | | | 1.56 | % | | $ | 981.80 | | | $ | 7.75 | |
| Hypothetical 5% Return | | | | | | | | | | | | | | | | |
| Institutional Class | | $ | 1,000.00 | | | | 1.56 | % | | $ | 1,017.20 | | | $ | 7.89 | |
| Expenses and Value of a $1,000 Investment for the period from 04/01/21 through 09/30/21 | |
| | |
| Income Fund: | | Beginning Account
Value (04/01/2021) | | | Annualized Expense
Ratio for the Period | | | Ending Account
Value (09/30/2021) | | | Expenses Paid
During Period (a) | |
| Actual Fund Return (in parentheses) | | | | | | | | | |
| Institutional Class (+2.27%) | | $ | 1,000.00 | | | | 1.71 | % | | $ | 1,022.70 | | | $ | 8.67 | |
| Hypothetical 5% Return | | | | | | | | | | | | | | | | |
| Institutional Class | | $ | 1,000.00 | | | | 1.71 | % | | $ | 1,016.50 | | | $ | 8.64 | |
| (a) | Expenses are equal to the Funds’ annualized expense ratios, multiplied by the average account value over the period, multiplied by 183/365 to reflect the one-half year period. |
For more information on Fund expenses, please refer to the Funds’ prospectus, which can be obtained from your investment representative or by calling 1-877-244-6235. Please read them carefully before you invest or send money.
| Timber Point Funds | ANNUAL REPORT |
Information About Your Funds’ Expenses – (Unaudited) (continued)
Total operating expense ratios as stated in the current prospectus dated January 28, 2021 were as follows: |
| Timber Point Global Allocations Fund Institutional Class, gross of fee waivers or expense reimbursements | 2.73% |
| Timber Point Global Allocations Fund Institutional Class, after waiver and reimbursement* | 2.11% |
| Timber Point Alternative Income Fund Institutional Class, gross of fee waivers or expense reimbursements | 3.01% |
| Timber Point Alternative Income Fund Institutional Class, after waiver and reimbursement* | 2.12% |
| | |
* Pursuant to an operating expense limitation agreements between the Adviser and the Funds, the Adviser has agreed to waive or reduce its fees and to assume other expenses of the Funds, if necessary, in an amount that limits “Total Annual Fund Operating Expenses” (exclusive of interest, expenses incurred under a plan of distribution adopted pursuant to Rule 12b-1 under the 1940 Act, taxes, acquired fund fees and expenses, brokerage commissions, dividend expenses on short sales and other expenditures which are capitalized in accordance with generally accepted accounting principles and other extraordinary expenses not incurred in the ordinary course of such Fund’s business) to not more than 1.60% of the average daily net assets of the Global Fund and 1.70% of the average daily net assets of the Income Fund through January 31, 2022. This operating expense limitation agreement can be terminated only by, or with the consent of, the Board of Trustees. Each waiver or reimbursement of an expense by the Adviser is subject to repayment by the Funds within three years from the date of the waiver or reimbursement, provided that the Funds are able to make the repayment without exceeding the expense limitation in place at the time of the waiver or reimbursement and at the time of the recoupment. Total Gross Operating Expenses during the year ended September 30, 2021 were 1.79% and 2.28% for the Global Fund’s and Income Fund’s Institutional Class shares, respectively. Please see the Information About Your Fund’s Expenses, the Financial Highlights and Notes to Financial Statements (Note 7) sections of this report for expense related disclosures during the year ended September 30, 2021. |
| Timber Point Funds | ANNUAL REPORT |
Liquidity Risk Management Program (Unaudited)
In accordance with Rule 22e-4 under the Investment Company Act of 1940, as amended (the “Liquidity Rule”), the Funds have established a liquidity risk management program (the “Liquidity Program”) that is reasonably designed to assess and manage the Funds’ liquidity risk, which generally represents the risk that the Funds could not meet redemption requests without significant dilution of remaining investors’ interests. The Board has appointed M3Sixty Administration, LLC (“M3Sixty”), as the administrator of the Liquidity Program. As administrator, M3Sixty is responsible for overseeing the daily operations of the Liquidity Program, and annually assessing, managing, and reviewing with the Board the liquidity risk of each series in the Trust. M3Sixty works with the Funds’ investment adviser, as necessary, to execute the Liquidity Program and address issues as they arise.
The Liquidity Program’s principal objectives include supporting the Funds’ compliance with limits on investments in illiquid assets and mitigating the risk that the Funds cannot timely meet its redemption obligations. The Liquidity Program also includes a number of elements that support the management and assessment of liquidity risk, including an annual assessment of factors that influence each Fund’s liquidity and the periodic classification and reclassification of its investments into categories that reflect each investment adviser’s assessment of each Fund’s relative liquidity under current market conditions. Under the Liquidity Program, every investment held by the Funds is classified at least monthly into one of four liquidity categories based on estimations of the investment’s ability to be sold during designated time frames in current market conditions without significantly changing the investment’s market value.
As required by the Liquidity Rule, at a meeting held on January 27, 2021, M3Sixty presented an annual assessment to the Board that addressed the operation of the Liquidity Program and assessed its adequacy and effectiveness of implementation, including any material changes to the Liquidity Program and the determination of each Fund’s Highly Liquid Investment Minimum (“HLIM”). The annual assessment included consideration of the following factors, as applicable:
| ● | the Funds’ investment strategies and liquidity of portfolio investments during normal and reasonably foreseeable stressed conditions, including whether the investment strategies are appropriate for open-end funds; |
| ● | the extent to which the strategy involves a relatively concentrated portfolio or large positions in particular issuers; |
| ● | the use of borrowings and derivatives for investment and redemption purposes; |
| ● | short-term and long-term cash flow projections covering both normal and reasonably foreseeable stressed conditions; and |
| ● | holdings of cash and cash equivalents. |
For each series in the Trust, the annual assessment incorporated a report related to each Fund’s holdings, shareholder and portfolio concentration, any borrowings during the period, cash flow projections, and other relevant data for the period of December 1, 2019 through November 30, 2020. The report described the methodology for classifying each Fund’s investments (including derivative transactions) into one of four liquidity categories, as well as the percentage of each Fund’s investments assigned to each category. It also explained the methodology for establishing a Fund’s HLIM and noted that the investment adviser reviews the HLIM assigned to each Fund no less frequently than annually.
During the period, M3Sixty noted that the COVID-19 pandemic, especially in the March 2020 through mid-April 2020 timeframe, was the key factor and/or market event that impacted liquidity risk. Other factors included portfolio composition and client base during the period.
During the assessment period, the Board did not approve any material changes to the program.
For the Trust, certain provisions of the Liquidity Program initially became effective on June 1, 2019, and the full Liquidity Program was formally approved by the Board in December 2019. During the period covered by the annual assessment, M3Sixty concluded, and reported to the Board, that the Liquidity Program since its implementation has operated adequately and effectively and is reasonably designed to assess and manage each Fund’s liquidity risk.
360 FUNDS
4300 Shawnee Mission Pkwy
Suite 100
Fairway, KS 66205
INVESTMENT ADVISER
Timber Point Capital Management LLC
555 Pleasantville Road
Suite N202
Briarcliff Manor, NY 10510
ADMINISTRATOR & TRANSFER AGENT
M3Sixty Administration, LLC
4300 Shawnee Mission Pkwy
Suite 100
Fairway, KS 66205
DISTRIBUTOR
Matrix 360 Distributors, LLC
4300 Shawnee Mission Pkwy
Suite 100
Fairway, KS 66205
INDEPENDENT REGISTERED PUBLIC ACCOUNTING FIRM
BBD, LLP
1835 Market Street
3rd Floor
Philadelphia, PA 19103
LEGAL COUNSEL
Strauss Troy Co., LPA
Federal Reserve Building
150 E. 4th Street
4th Floor
Cincinnati, OH 45202
CUSTODIAN BANK
Fifth Third Bank
Fifth Third Center
38 Fountain Square Plaza
Cincinnati, OH 45263
ITEM 2. CODE OF ETHICS.
(a) | The registrant has, as of the end of the period covered by this report, adopted a code of ethics that applies to the registrant’s principal executive officer, principal financial officer, and principal accounting officer or controller, or persons performing similar functions, regardless of whether these individuals are employed by the registrant or a third party. |
(b) | During the period covered by this report, there were no amendments to any provision of the code of ethics. |
(c) | During the period covered by this report, there were no waivers or implicit waivers of a provision of the code of ethics. |
(d) | The registrant’s Code of Ethics is filed herewith. |
ITEM 3. AUDIT COMMITTEE FINANCIAL EXPERT.
| The registrant’s Board of Trustees has determined that Tom Wirtshafter serves on its audit committee as the “audit committee financial expert” as defined in Item 3. |
ITEM 4. PRINCIPAL ACCOUNTANT FEES AND SERVICES.
(a) | Audit Fees. The aggregate fees billed for each of the last two fiscal years ended September 30, 2021 and September 30, 2020 for professional services rendered by the principal accountants for the audit of the Global Fund’s annual financial statements or for services that are normally provided by the accountant in connection with statutory and regulatory filings or engagements were $14,200 with respect to the fiscal year ended September 30, 2021 and $12,700 with respect to the registrant’s fiscal year ended September 30, 2020. |
| The aggregate fees billed for each of the last two fiscal years ended September 30, 2021 and September 30, 2020 for professional services rendered by the principal accountants for the audit of the Income Fund’s annual financial statements or for services that are normally provided by the accountant in connection with statutory and regulatory filings or engagements were $13,700 with respect to the fiscal year ended September 30, 2021 and $$12,700 with respect to the fiscal year ended September 30, 2020. |
(b) | Audit-Related Fees. There were no fees billed during the last two fiscal years for assurances and related services by the principal accountants that are reasonably related to the performance of the audit of the registrant’s financial statements and are not reported under paragraph (a) of this item. |
(c) | Tax Fees. The aggregate fees billed for each of the last two fiscal years ended September 30, 2021 and September 30, 2020 for professional services rendered by the principal accountant to the Global Fund for tax compliance, tax advice and tax planning were $4,500 with respect to the period ended September 30, 2021 and $3,000 with respect to the period ended September 30, 2020. The services comprising these fees are the preparation of the registrant’s federal and state income tax returns, review of calculations of required excise distributions and preparation of federal excise tax returns. The aggregate fees billed for each of the last two fiscal years ended September 30, 2021 and September 30, 2020 for professional services rendered by the principal accountant to the Income Fund for tax compliance, tax advice and tax planning were $3,000 with respect to the fiscal year ended September 30, 2021 and $3,000 with respect to the fiscal year ended September 30, 2020. The services comprising these fees are the preparation of the registrant’s federal and state income tax returns, review of calculations of required excise distributions and preparation of federal excise tax returns. |
(d) | All Other Fees. The aggregate fees billed in the last two fiscal years ended September 30, 2021 and September 30, 2020 for the Global Fund and the Income Fund for products and services provided by the registrant’s principal accountant, other than the services reported in paragraphs (a) through (c) of this item were $0 for all periods and fiscal years mentioned above. |
| |
(e)(1) | The audit committee does not have pre-approval policies and procedures. Instead, the audit committee or audit committee chairman approves on a case-by-case basis each audit or non-audit service before the principal accountant is engaged by the registrant. |
| |
(e)(2) | There were no services described in each of paragraphs (b) through (d) of this Item that were approved by the audit committee pursuant to paragraph (c)(7)(i)(C) of Rule 2-01 of Regulation S-X |
| |
(f) | Not applicable. The percentage of hours expended on the principal accountant’s engagement to audit the registrant’s financial statements for the most recent fiscal year that were attributed to work performed by persons other than the principal accountant’s full-time, permanent employees was zero percent (0%). |
| |
(g) | All non-audit fees billed by the registrant’s principal accountant for services rendered to the registrant for the last two fiscal years ended September 30, 2021 and September 30, 2020 for the Global Fund and the Income Fund are disclosed in (b)-(d) above. There were no audit or non-audit services performed by the registrant’s principal accountant for the registrant’s adviser during the periods and fiscal years mentioned above. |
| |
(h) | There were no non-audit services rendered to the registrant’s investment adviser. |
| ITEM 5. | AUDIT COMMITTEE OF LISTED REGISTRANTS. |
Not applicable
| ITEM 6. | SCHEDULES OF INVESTMENTS |
Included in annual report to shareholders filed under item 1 of this Form.
| ITEM 7. | DISCLOSURE OF PROXY VOTING POLICIES AND PROCEDURES FOR CLOSED-END MANAGEMENT INVESTMENT COMPANIES. |
Not applicable as the Funds are open-end management investment companies.
| ITEM 8. | PORTFOLIO MANAGERS OF CLOSED-END MANAGEMENT INVESTMENT COMPANIES |
Not applicable as the Funds are open-end management investment companies.
| ITEM 9. | PURCHASES OF EQUITY SECURITIES BY CLOSED-END MANAGEMENT INVESTMENT COMPANY AND AFFILIATED PURCHASERS. |
Not applicable as the Funds are open-end management investment companies.
| ITEM 10. | SUBMISSION OF MATTERS TO A VOTE OF SECURITY HOLDERS. |
Not applicable at this time.
| ITEM 11. | CONTROLS AND PROCEDURES. |
| (a) | The registrant’s principal executive and principal financial officers, or persons performing similar functions, have concluded that the registrant’s disclosure controls and procedures (as defined in Rule 30a-3(c) under the 1940 Act, are effective, as of a date within 90 days of the filing date of this report, based on the evaluation of these controls and procedures required by Rule 30a-3(b) under the 1940 Act and Rule 15d-15(b) under the Securities Exchange Act of 1934, as amended. |
| (b) | There were no changes in the registrant’s internal control over financial reporting (as defined in Rule 30a-3(d) under the 1940 Act) that occurred during the period covered by this report that have materially affected, or are reasonably likely to materially affect, the registrant’s internal control over financial reporting. |
| ITEM 12. | DISCLOSURE OF SECURITIES LENDING ACTIVITIES FOR CLOSED-END MANAGEMENT INVESTMENT COMPANIES. |
Not applicable as the Funds are open-end management investment companies.
(1) Code of Ethics for Principal Executive and Senior Financial Officers is attached hereto.
(2) Certifications pursuant to Section 302 of the Sarbanes-Oxley Act of 2002 are filed herewith.
(3) Certifications pursuant to Section 906 of the Sarbanes-Oxley Act of 2002 are filed herewith.
SIGNATURES
Pursuant to the requirements of the Securities Exchange Act of 1934 and the Investment Company Act of 1940, the registrant has duly caused this report to be signed on its behalf by the undersigned, thereunto duly authorized.
360 Funds
/s/ Randy Linscott | |
By Randy Linscott | |
Principal Executive Officer | |
| | |
Date: December 9, 2021 | |
Pursuant to the requirements of the Securities Exchange Act of 1934 and the Investment Company Act of 1940, this report has been signed below by the following person on behalf of the registrant and in the capacities and on the date indicated.
/s/ Larry E. Beaver, Jr. | |
By Larry E. Beaver, Jr. | |
Treasurer and Principal Financial Officer | |
| | |
Date: December 9, 2021 | |