Washington, D.C. 20549
M3Sixty Administration, LLC.
The Semi-Annual report to Shareholders of the Stringer Growth Fund and Stringer Moderate Growth Fund, each a series of the 360 Funds, for the period ended August 31, 2016 pursuant to Rule 30e-1 under the Investment Company Act of 1940 (the “1940 Act”), as amended (17 CFR 270.30e-1) is filed herewith.
Stringer Growth Fund
Class A Shares (Ticker Symbol: SRGAX)
Class C Shares (Ticker Symbol: SRGCX)
Institutional Class Shares (Ticker Symbol: SRGIX)
Stringer Moderate Growth Fund
Class A Shares (Ticker Symbol: SRQAX)
Class C Shares (Ticker Symbol: SRQCX)
Institutional Class Shares (Ticker Symbol: SRQIX)
A series of the
360 Funds
SEMI-ANNUAL REPORT
August 31, 2016
(Unaudited)
Investment Adviser
Stringer Asset Management, LLC
5050 Poplar Avenue, Suite 1103
Memphis, TN 38157
TABLE OF CONTENTS
| INVESTMENT HIGHLIGHTS | 1 |
| SCHEDULES OF INVESTMENTS | 3 |
| STATEMENTS OF ASSETS AND LIABILITIES | 5 |
| STATEMENTS OF OPERATIONS | 6 |
| STATEMENTS OF CHANGES IN NET ASSETS | 7 |
| FINANCIAL HIGHLIGHTS | 9 |
| NOTES TO FINANCIAL STATEMENTS | 15 |
| ADDITIONAL INFORMATION | 23 |
| EXPENSE EXAMPLES | 25 |
| Stringer Funds | SEMI-ANNUAL REPORT |
INVESTMENT HIGHLIGHTS
August 31, 2016 (Unaudited)
Stringer Growth Fund
The investment objective of the Stringer Growth Fund (the “Fund”) is long-term growth of capital. To meet its investment objective, the Fund will invest primarily in unaffiliated exchange-traded funds (“ETFs”). The underlying ETFs will invest in various securities including, but not limited to, domestic equity securities (including large, mid and small-cap stocks), stocks offered in international markets, including emerging markets, domestic fixed income securities, foreign debt securities, and cash or cash equivalents. The Fund may also invest in alternative sector ETFs, such as commodity and real estate ETFs, as well as exchange-traded notes (“ETNs”). ETNs are unsecured debt obligations of investment banks which are traded on exchanges and the returns of which are linked to the performance of market indices. The Fund may be appropriate for investors with long-term time horizons who are not sensitive to short-term losses and want to participate in the long-term growth of the financial markets. The Fund seeks to avoid or minimize the effects of inflation on the portfolio. The Fund may also invest directly in domestic equity securities (including large, small and mid-cap stocks), stocks offered in international markets, including emerging markets, and unaffiliated open-end investment companies. At times, the Fund may also invest directly in fixed-income securities. These fixed-income securities, either held directly or through ETFs, may be domestic or foreign, corporate or sovereign, and of any quality or duration. Notwithstanding the foregoing, under normal market conditions, the Fund will generally allocate 100% of its investments to equity securities.
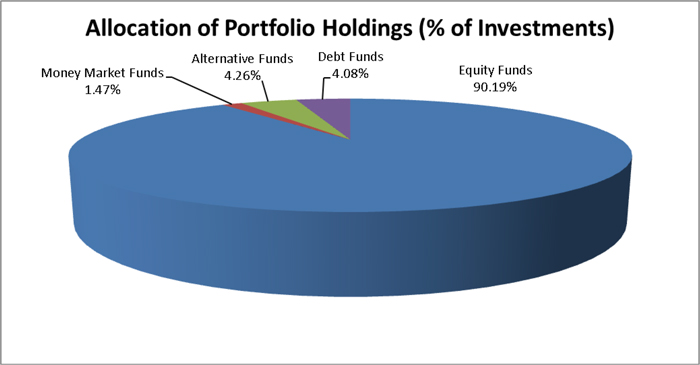
The percentages in the above graph are based on the portfolio holdings of the Fund as of August 31, 2016 and are subject to change.
| Stringer Funds | SEMI-ANNUAL REPORT |
INVESTMENT HIGHLIGHTS
August 31, 2016 (Unaudited)
Stringer Moderate Growth Fund
The investment objective of the Stringer Moderate Growth Fund (the “Fund”) is capital appreciation while also maintaining principal stability. To meet its investment objective, the Fund will invest primarily in unaffiliated exchange-traded funds (“ETFs”) that invest in equity securities. The underlying ETFs will invest in various securities including, but not limited to, domestic equity securities (including large, mid and small-cap stocks), stocks offered in international markets, including emerging markets, domestic fixed income securities, foreign debt securities, and cash or cash equivalents. The Fund may also invest in alternative sector ETFs, such as commodity and real estate ETFs, as well as exchange-traded notes (“ETNs”). ETNs are unsecured debt obligations of investment banks which are traded on exchanges and the returns of which are linked to the performance of market indices. The Fund may be appropriate for investors with long-term time horizons who are not sensitive to short-term losses and want to participate in the long-term growth of the financial markets. The Fund seeks to avoid or minimize the effects of inflation on the portfolio. The Fund may also invest directly in domestic equity securities (including large, small and mid-cap stocks), stocks offered in international markets, including emerging markets, and unaffiliated open-end investment companies. At times, the Fund may also invest directly in fixed-income securities. These fixed-income securities, either held directly or through ETFs, may be domestic or foreign, corporate or sovereign, and of any quality or duration. Notwithstanding the foregoing, under normal market conditions, the Fund will generally allocate 100% of its investments to equity securities.
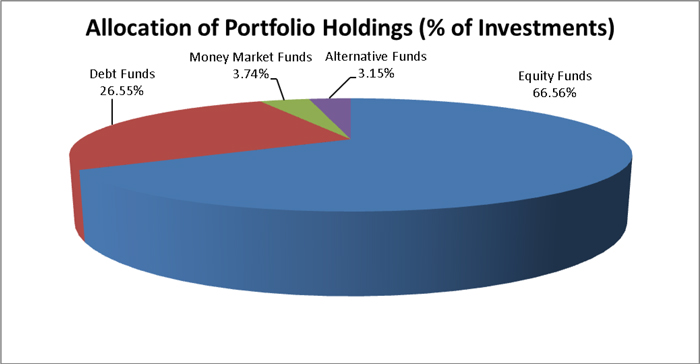
The percentages in the above graph are based on the portfolio holdings of the Fund as of August 31, 2016 and are subject to change.
| STRINGER FUNDS | SEMI-ANNUAL REPORT |
Stringer Growth Fund
SCHEDULE OF INVESTMENTS
August 31, 2016 (Unaudited)
| | | Shares | | | Fair Value | |
| | | | | | | |
| EXCHANGE-TRADED FUNDS - 98.63% | | | | | | |
| | | | | | | |
| ALTERNATIVE FUNDS - 4.26% | | | | | | |
| First Trust Exchange-Traded Fund III-First Trust Long/Short Equity ETF | | | 61,802 | | | $ | 2,028,348 | |
| | | | | | | | | |
| DEBT FUNDS - 4.09% | | | | | | | | |
| First Trust Preferred Securities and Income ETF | | | 98,954 | | | | 1,945,436 | |
| | | | | | | | | |
| EQUITY FUNDS - 90.28% | | | | | | | | |
| iShares Edge MSCI Min Vol EAFE ETF | | | 87,540 | | | | 5,824,912 | |
| iShares Edge MSCI Min Vol USA ETF | | | 105,001 | | | | 4,826,896 | |
| iShares Edge MSCI USA Momentum Factor ETF | | | 75,777 | | | | 5,856,047 | |
| iShares Emerging Markets Dividend ETF | | | 67,355 | | | | 2,398,511 | |
| iShares Global Telecom ETF | | | 39,955 | | | | 2,472,815 | |
| iShares International Select Dividend ETF | | | 85,785 | | | | 2,552,104 | |
| iShares U.S. Medical Devices ETF | | | 16,960 | | | | 2,431,216 | |
| SPDR S&P 400 Mid Cap Value ETF | | | 68,069 | | | | 5,903,624 | |
| Vanguard Value ETF | | | 56,484 | | | | 4,968,897 | |
| WisdomTree International Equity Fund ETF | | | 122,522 | | | | 5,735,255 | |
| | | | | | | | 42,970,277 | |
| | | | | | | | | |
| TOTAL EXCHANGE-TRADED FUNDS (Cost $44,147,817) | | | | | | | 46,944,061 | |
| | | | | | | | | |
| SHORT TERM INVESTMENTS - 1.47% | | | | | | | | |
Federated Government Obligations Fund - Institutional Shares, 0.24% (a) (Cost $701,338) | | | 701,338 | | | | 701,338 | |
| | | | | | | | | |
| TOTAL INVESTMENTS (Cost $44,849,155) - 100.10% | | | | | | $ | 47,645,399 | |
| LIABILITES IN EXCESS OF OTHER ASSETS, NET - (0.10%) | | | | | | | (46,827 | ) |
| NET ASSETS - 100% | | | | | | $ | 47,598,572 | |
Percentages are stated as a percent of net assets.
| (a) | Rate shown represents the rate at August 31, 2016, is subject to change and resets daily. |
The accompanying notes are an integral part of these financial statements.
| STRINGER FUNDS | SEMI-ANNUAL REPORT |
Stringer Moderate Growth Fund
SCHEDULE OF INVESTMENTS
August 31, 2016 (Unaudited)
| | | Shares | | | Fair Value | |
| | | | | | | |
| EXCHANGE-TRADED FUNDS - 96.38% | | | | | | |
| | | | | | | |
| ALTERNATIVE FUNDS - 3.15% | | | | | | |
| First Trust Exchange-Traded Fund III-First Trust Long/Short Equity ETF | | | 6,197 | | | $ | 203,386 | |
| | | | | | | | | |
| DEBT FUNDS - 26.58% | | | | | | | | |
| First Trust Preferred Securities and Income ETF | | | 13,722 | | | | 269,775 | |
| PowerShares Fundamental Investment Grade Corporate Bond Portfolio ETF | | | 10,092 | | | | 262,715 | |
| SPDR Doubleline Total Return Tactical ETF | | | 7,894 | | | | 396,279 | |
| Vanguard Total Bond Market ETF | | | 9,331 | | | | 785,763 | |
| | | | | | | | 1,714,532 | |
| | | | | | | | | |
| EQUITY FUNDS - 66.65% | | | | | | | | |
| iShares Edge MSCI Min Vol EAFE ETF | | | 8,934 | | | | 594,468 | |
| iShares Edge MSCI Min Vol USA ETF | | | 11,312 | | | | 520,013 | |
| iShares Edge MSCI USA Momentum Factor ETF | | | 6,300 | | | | 486,864 | |
| iShares Emerging Markets Dividend ETF | | | 7,186 | | | | 255,893 | |
| iShares Global Telecom ETF | | | 4,184 | | | | 258,948 | |
| iShares International Select Dividend ETF | | | 9,324 | | | | 277,389 | |
| iShares U.S. Medical Devices ETF | | | 1,896 | | | | 271,792 | |
| SPDR S&P 400 Mid Cap Value ETF | | | 7,459 | | | | 646,919 | |
| Vanguard Value ETF | | | 5,405 | | | | 475,478 | |
| WisdomTree International Equity Fund ETF | | | 10,919 | | | | 511,118 | |
| | | | | | | | 4,298,882 | |
| | | | | | | | | |
| TOTAL EXCHANGE-TRADED FUNDS (Cost $5,973,551) | | | | | | | 6,216,800 | |
| | | | | | | | | |
| SHORT TERM INVESTMENTS - 3.74% | | | | | | | | |
Federated Government Obligations Fund - Institutional Shares, 0.24% (a) (Cost $241,378) | | | 241,378 | | | | 241,378 | |
| | | | | | | | | |
| TOTAL INVESTMENTS (Cost $6,214,929) - 100.12% | | | | | | $ | 6,458,178 | |
| LIABILITES IN EXCESS OF OTHER ASSETS, NET - (0.12%) | | | | | | | (7,760 | ) |
| NET ASSETS - 100% | | | | | | $ | 6,450,418 | |
Percentages are stated as a percent of net assets.
| (a) | Rate shown represents the rate at August 31, 2016, is subject to change and resets daily. |
The accompanying notes are an integral part of these financial statements.
STRINGER FUNDS
STATEMENTS OF ASSETS AND LIABILITIES
| August 31, 2016 (Unaudited) | SEMI-ANNUAL REPORT |
| | | | | | Stringer Moderate Growth Fund | |
| Assets: | | | | | | |
| Investments, at value | | | 47,645,399 | | | | 6,458,178 | |
| Due from advisor | | | - | | | | 8,160 | |
| Receivables: | | | | | | | | |
| Interest | | | 64 | | | | 103 | |
| Fund shares sold | | | 25,000 | | | | - | |
| Prepaid expenses | | | 11,402 | | | | 1,909 | |
| Total assets | | | 47,681,865 | | | | 6,468,350 | |
| | | | | | | | | |
| Liabilities: | | | | | | | | |
| Payables: | | | | | | | | |
| Due to advisor | | | 41,280 | | | | - | |
| Accrued distribution (12b-1) fees | | | 15,782 | | | | 889 | |
| Due to administrator | | | 9,446 | | | | 3,305 | |
| Accrued Trustee fees | | | 537 | | | | 537 | |
| Accrued expenses | | | 16,248 | | | | 13,201 | |
| Total liabilities | | | 83,293 | | | | 17,932 | |
| Net Assets | | $ | 47,598,572 | | | $ | 6,450,418 | |
| | | | | | | | | |
| Sources of Net Assets: | | | | | | | | |
| Paid-in capital | | $ | 46,402,657 | | | $ | 6,560,539 | |
| Accumulated net realized loss on investments | | | (1,598,028 | ) | | | (382,817 | ) |
| Accumulated net investment income (loss) | | | (2,301 | ) | | | 29,447 | |
| Net unrealized appreciation on investments | | | 2,796,244 | | | | 243,249 | |
| Total Net Assets (Unlimited shares of beneficial interest authorized) | | $ | 47,598,572 | | | $ | 6,450,418 | |
| | | | | | | | | |
| Total Investments, at cost | | $ | 44,849,155 | | | $ | 6,214,929 | |
| | | | | | | | | |
| Class A Shares: | | | | | | | | |
| Net assets | | $ | 15,717,555 | | | $ | 1,675,792 | |
| Shares Outstanding (Unlimited shares of beneficial interest authorized) | | $ | 1,364,301 | | | $ | 172,055 | |
| Net Asset Value Per Share | | $ | 11.52 | | | $ | 9.74 | |
| | | | | | | | | |
Maximum Offering Price Per Share (a) | | $ | 12.19 | | | $ | 10.31 | |
| | | | | | | | | |
Minimum Redemption Price Per Share (b) | | $ | 11.40 | | | $ | 9.64 | |
| | | | | | | | | |
| Class C Shares: | | | | | | | | |
| Net assets | | $ | 17,255,250 | | | $ | 606,971 | |
| Shares Outstanding (Unlimited shares of beneficial interest authorized) | | $ | 1,516,352 | | | $ | 62,887 | |
| Net Asset Value and Offering Price Per Share | | $ | 11.38 | | | $ | 9.65 | |
| | | | | | | | | |
Minimum Redemption Price Per Share (c) | | $ | 11.27 | | | $ | 9.55 | |
| | | | | | | | | |
| Institutional Class Shares: | | | | | | | | |
| Net assets | | $ | 14,625,767 | | | $ | 4,167,655 | |
| Shares Outstanding (Unlimited shares of beneficial interest authorized) | | $ | 1,264,835 | | | $ | 427,078 | |
| Net Asset Value, Offering and Redemption Price Per Share | | $ | 11.56 | | | $ | 9.76 | |
| (a) | A maximum sales charge of 5.50% is imposed on Class A shares. |
| (b) | Investments in Class A shares made at or above the $1 million breakpoint are not subject to an initial sales charge and may be subject to a 1.00% contingent deferred sales charge ("CDSC") on shares redeemed within one year from the date of purchase. |
| (c) | A contingent deferred sales charge ("CDSC") of 1.00% is imposed in the event of certain redemption transactions made within one year from the date of purchase. |
The accompanying notes are an integral part of these financial statements.
STRINGER FUNDS
STATEMENTS OF OPERATIONS
| August 31, 2016 (Unaudited) | SEMI-ANNUAL REPORT |
| | | | | | Stringer Moderate Growth Fund | |
| | | | | | | |
| | | For the | | | For the | |
| | | Six Month Period Ended | | | Six Month Period Ended | |
| | | August 31, 2016 | | | August 31, 2016 | |
| | | (Unaudited) | | | (Unaudited) | |
| Investment income: | | | | | | |
| Dividends | | $ | 619,429 | | | $ | 73,460 | |
| Interest | | | 2,406 | | | | 501 | |
| Total investment income | | | 621,835 | | | | 73,961 | |
| | | | | | | | | |
| Expenses: | | | | | | | | |
| Management fees (Note 5) | | | 243,226 | | | | 23,136 | |
| Distribution (12b-1) fees - Class A | | | 20,867 | | | | 1,480 | |
| Distribution (12b-1) fees - Class C | | | 99,441 | | | | 2,526 | |
| Accounting and transfer agent fees and expenses | | | 59,536 | | | | 28,264 | |
| Audit fees | | | 6,132 | | | | 6,320 | |
| Miscellaneous | | | 8,319 | | | | 3,999 | |
| Custodian fees | | | 6,214 | | | | 4,810 | |
| Registration and filing fees | | | 6,076 | | | | 1,520 | |
| Legal fees | | | 1,999 | | | | 2,345 | |
| Trustee fees and expenses | | | 5,798 | | | | 5,798 | |
| Pricing fees | | | 744 | | | | 976 | |
| Reports to shareholders | | | 576 | | | | 463 | |
| Insurance | | | 574 | | | | 574 | |
| Total expenses | | | 459,502 | | | | 82,211 | |
| Less: fees recouped and (fees waived and expenses absorbed) | | | 2,376 | | | | (42,062 | ) |
| Net expenses | | | 461,878 | | | | 40,149 | |
| | | | | | | | | |
| Net investment income | | | 159,957 | | | | 33,812 | |
| | | | | | | | | |
| Realized and unrealized gain: | | | | | | | | |
| Net realized gain on: | | | | | | | | |
| Investments | | | 665,660 | | | | 3,282 | |
| Net realized gain on investments | | | 665,660 | | | | 3,282 | |
| | | | | | | | | |
| Net change in unrealized appreciation on: | | | | | | | | |
| Investments | | | 4,178,519 | | | | 359,642 | |
| Net change in unrealized appreciation | | | 4,178,519 | | | | 359,642 | |
| | | | | | | | | |
| Net gain on investments | | | 4,844,179 | | | | 362,924 | |
| | | | | | | | | |
| Net increase in net assets resulting from operations | | $ | 5,004,136 | | | $ | 396,736 | |
The accompanying notes are an integral part of these financial statements.
STRINGER FUNDS
STATEMENTS OF CHANGES IN NET ASSETS
| August 31, 2016 | SEMI-ANNUAL REPORT |
| | | | |
| | | | | | | |
| | | Period Ended | | | | |
| | | August 31, 2016 | | | February 29, 2016 | |
| | | (Unaudited) | | | | |
| Increase (decrease) in net assets from: | | | | | | |
| Operations: | | | | | | |
| Net investment income | | $ | 159,957 | | | $ | 191,076 | |
| Net realized gain (loss) on investments | | | 665,660 | | | | (1,483,359 | ) |
| Net unrealized appreciation (depreciation) on investments | | | 4,178,519 | | | | (4,727,214 | ) |
| Net increase (decrease) in net assets resulting from operations | | | 5,004,136 | | | | (6,019,497 | ) |
| | | | | | | | | |
| Distributions to shareholders from: | | | | | | | | |
| Net investment income - Class A | | | - | | | | (129,740 | ) |
| Net investment income - Class C | | | - | | | | - | |
| Net investment income - Institutional Class | | | - | | | | (121,789 | ) |
| Net realized capital gains - Class A | | | - | | | | (566,732 | ) |
| Net realized capital gains - Class C | | | - | | | | (604,140 | ) |
| Net realized capital gains - Institutional Class | | | - | | | | (403,919 | ) |
| Total distributions | | | - | | | | (1,826,320 | ) |
| | | | | | | | | |
| Capital share transactions (Note 3): | | | | | | | | |
| Increase (decrease) in net assets from capital share transactions | | | (10,313,761 | ) | | | 10,929,646 | |
| | | | | | | | | |
| Increase (decrease) in net assets | | | (5,309,625 | ) | | | 3,083,829 | |
| | | | | | | | | |
| Net Assets: | | | | | | | | |
| Beginning of year/period | | | 52,908,197 | | | | 49,824,368 | |
| | | | | | | | | |
| End of year/period | | $ | 47,598,572 | | | $ | 52,908,197 | |
| Accumulated net investment loss | | $ | (2,301 | ) | | $ | (162,258 | ) |
The accompanying notes are an integral part of these financial statements.
STRINGER FUNDS
STATEMENTS OF CHANGES IN NET ASSETS
| August 31, 2016 | SEMI-ANNUAL REPORT |
| | | Stringer | |
| | | Moderate Growth Fund | |
| | | | | | | |
| | | For the Six Month Period Ended | | | | |
| | | August 31, 2016 | | | February 29, 2016 (a) | |
| | | (Unaudited) | | | | |
| Increase (decrease) in net assets from: | | | | | | |
| Operations: | | | | | | |
| Net investment income | | $ | 33,812 | | | $ | 54,672 | |
| Net realized gain (loss) on investments | | | 3,282 | | | | (386,099 | ) |
| Net unrealized appreciation (depreciation) on investments | | | 359,642 | | | | (116,393 | ) |
| Net increase (decrease) in net assets resulting from operations | | | 396,736 | | | | (447,820 | ) |
| | | | | | | | | |
| Distributions to shareholders from: | | | | | | | | |
| Net investment income - Class A | | | - | | | | (6,323 | ) |
| Net investment income - Class C | | | - | | | | (5,402 | ) |
| Net investment income - Institutional Class | | | - | | | | (47,312 | ) |
| Total distributions | | | - | | | | (59,037 | ) |
| | | | | | | | | |
| Capital share transactions (Note 3): | | | | | | | | |
| Increase in net assets from capital share transactions | | | 978,345 | | | | 5,582,194 | |
| | | | | | | | | |
| Increase in net assets | | | 1,375,081 | | | | 5,075,337 | |
| | | | | | | | | |
| Net Assets: | | | | | | | | |
| Beginning of period | | | 5,075,337 | | | | - | |
| | | | | | | | | |
| End of period | | $ | 6,450,418 | | | $ | 5,075,337 | |
| Undistributed (Accumulated) net investment income (loss) | | $ | 29,447 | | | $ | (4,365 | ) |
| (a) | The Stringer Moderate Growth Fund commenced operations on March 31, 2015. |
The accompanying notes are an integral part of these financial statements.
STRINGER FUNDS
FINANCIAL HIGHLIGHTS
| August 31, 2016 | SEMI-ANNUAL REPORT |
The following tables set forth the per share operating performance data for a share of capital stock outstanding, total return ratios to average net assets and other supplemental data for the period indicated.
| | | Stringer | | |
| | | Growth Fund | | |
| | | | | | | | | | | | | | | |
| | | Class A | | |
| | | For the Six Month Period Ended | | | | | | | | | | | | |
| | | August 31, 2016 | | | | February 29, 2016 | | | February 28, 2015 | | | February 28, 2014 (a) | | |
| | | (Unaudited) | | | | | | | | | | | | |
| | | | | | | | | | | | | | | |
| Net Asset Value, Beginning of Year/Period | | $ | 10.45 | | | | $ | 12.03 | | | $ | 11.42 | | | $ | 10.00 | | |
| | | | | | | | | | | | | | | | | | | |
| Investment Operations: | | | | | | | | | | | | | | | | | | |
| Net investment income | | | 0.04 | | | | | 0.07 | | | | 0.08 | | | | 0.02 | | |
| Net realized and unrealized gain (loss) on investments | | | 1.03 | | | | | (1.27 | ) | | | 0.65 | | | | 1.46 | | |
| Total from investment operations | | | 1.07 | | | | | (1.20 | ) | | | 0.73 | | | | 1.48 | | |
| | | | | | | | | | | | | | | | | | | |
| Distributions: | | | | | | | | | | | | | | | | | | |
| From net investment income | | | - | | | | | (0.07 | ) | | | (0.08 | ) | | | (0.04 | ) | |
| From net realized capital gains | | | - | | | | | (0.31 | ) | | | (0.04 | ) | | | (0.02 | ) | |
| Total distributions | | | - | | | | | (0.38 | ) | | | (0.12 | ) | | | (0.06 | ) | |
| | | | | | | | | | | | | | | | | | | |
| Net Asset Value, End of Year/Period | | $ | 11.52 | | | | $ | 10.45 | | | $ | 12.03 | | | $ | 11.42 | | |
| | | | | | | | | | | | | | | | | | | |
Total Return (b) | | | 10.24 | % | (c) | | | (10.16 | )% | | | 6.42 | % | | | 14.82 | % | (c) |
| | | | | | | | | | | | | | | | | | | |
| Ratios/Supplemental Data | | | | | | | | | | | | | | | | | | |
| Net assets, end of year/period (in 000's) | | $ | 15,718 | | | | $ | 18,368 | | | $ | 16,633 | | | $ | 10,942 | | |
| | | | | | | | | | | | | | | | | | | |
| Ratio of expenses to average net assets: | | | | | | | | | | | | | | | | | | |
Before fees waived and expenses absorbed/recouped (e) | | | 1.58 | % | (d) | | | 1.56 | % | | | 1.68 | % | | | 2.40 | % | (d) |
After fees waived and expenses absorbed/recouped (e) | | | 1.59 | % | (d) | | | 1.65 | % | | | 1.65 | % | | | 1.65 | % | (d) |
| | | | | | | | | | | | | | | | | | | |
| Ratio of net investment income (loss): | | | | | | | | | | | | | | | | | | |
Before fees waived and expenses absorbed/recouped (e) | | | 0.86 | % | (d) | | | 0.67 | % | | | 0.72 | % | | | (0.48 | )% | (d) |
After fees waived and expenses absorbed/recouped (e) | | | 0.85 | % | (d) | | | 0.58 | % | | | 0.75 | % | | | 0.27 | % | (d) |
| | | | | | | | | | | | | | | | | | | |
| Portfolio turnover rate | | | 29 | % | (c) | | | 144 | % | | | 80 | % | | | 53 | % | (c) |
| (a) | The Stringer Growth Fund commenced operations on March 27, 2013. |
| (b) | Total Return represents the rate that the investor would have earned or lost on an investment in the Fund, assuming reinvestment of dividends. |
| (e) | These ratios exclude the impact of the expenses of the underlying investment companies in which the Fund invests. |
The accompanying notes are an integral part of these financial statements.
STRINGER FUNDS
FINANCIAL HIGHLIGHTS
| August 31, 2016 | SEMI-ANNUAL REPORT |
The following tables set forth the per share operating performance data for a share of capital stock outstanding, total return ratios to average net assets and other supplemental data for the period indicated.
| | | Stringer | | |
| | | Growth Fund | | |
| | | | | | | | | | | | | | | | |
| | | Class C | | |
| | | For the Six Month Period Ended August 31, 2016 | | | | For the Year Ended February 29, 2016 | | | For the Year Ended February 28, 2015 | | | | For the Year Ended February 28, 2014 (a) | | |
| | | (Unaudited) | | | | | | | | | | | | | |
| | | | | | | | | | | | | | | | |
| Net Asset Value, Beginning of Year/Period | | $ | 10.36 | | | | $ | 11.94 | | | $ | 11.37 | | | | $ | 10.00 | | |
| | | | | | | | | | | | | | | | | | | | |
| Investment Operations: | | | | | | | | | | | | | | | | | | | |
| Net investment income (loss) | | | - | | | | | (0.01 | ) | | | - | | (b) | | | (0.02 | ) | |
| Net realized and unrealized gain (loss) on investments | | | 1.02 | | | | | (1.26 | ) | | | 0.63 | | | | | 1.42 | | |
| Total from investment operations | | | 1.02 | | | | | (1.27 | ) | | | 0.63 | | | | | 1.40 | | |
| | | | | | | | | | | | | | | | | | | | |
| Distributions: | | | | | | | | | | | | | | | | | | | |
| From net investment income | | | - | | | | | - | | | | (0.02 | ) | | | | (0.01 | ) | |
| From net realized capital gains | | | - | | | | | (0.31 | ) | | | (0.04 | ) | | | | (0.02 | ) | |
| Total distributions | | | - | | | | | (0.31 | ) | | | (0.06 | ) | | | | (0.03 | ) | |
| | | | | | | | | | | | | | | | | | | | |
| Net Asset Value, End of Year/Period | | $ | 11.38 | | | | $ | 10.36 | | | $ | 11.94 | | | | $ | 11.37 | | |
| | | | | | | | | | | | | | | | | | | | |
Total Return (c) | | | 9.85 | % | (d) | | | (10.80 | )% | | | 5.54 | % | | | | 14.06 | % | (d) |
| | | | | | | | | | | | | | | | | | | | |
| Ratios/Supplemental Data | | | | | | | | | | | | | | | | | | | |
| Net assets, end of year/period (in 000's) | | $ | 17,255 | | | | $ | 20,373 | | | $ | 16,157 | | | | $ | 7,571 | | |
| | | | | | | | | | | | | | | | | | | | |
| Ratio of expenses to average net assets: | | | | | | | | | | | | | | | | | | | |
Before fees waived and expenses absorbed/recouped (f) | | | 2.33 | % | (e) | | | 2.31 | % | | | 2.43 | % | | | | 3.15 | % | (e) |
After fees waived and expenses absorbed/recouped (f) | | | 2.34 | % | (e) | | | 2.40 | % | | | 2.40 | % | | | | 2.40 | % | (e) |
| | | | | | | | | | | | | | | | | | | | |
| Ratio of net investment income (loss): | | | | | | | | | | | | | | | | | | | |
Before fees waived and expenses absorbed/recouped (f) | | | 0.11 | % | (e) | | | (0.08 | )% | | | (0.03 | )% | | | | (1.23 | )% | (e) |
After fees waived and expenses absorbed/recouped (f) | | | 0.10 | % | (e) | | | (0.17 | )% | | | 0.00 | % | | | | (0.48 | )% | (e) |
| | | | | | | | | | | | | | | | | | | | |
| Portfolio turnover rate | | | 29 | % | (d) | | | 144 | % | | | 80 | % | | | | 53 | % | (d) |
| (a) | The Stringer Growth Fund commenced operations on March 27, 2013. |
| (b) | Net investment income per share was less than $0.01 per share for the year ended February 28, 2015. |
| (c) | Total Return represents the rate that the investor would have earned or lost on an investment in the Fund, assuming reinvestment of dividends. |
| (f) | These ratios exclude the impact of the expenses of the underlying investment companies in which the Fund invests |
The accompanying notes are an integral part of these financial statements.
STRINGER FUNDS
FINANCIAL HIGHLIGHTS
| August 31, 2016 | SEMI-ANNUAL REPORT |
The following tables set forth the per share operating performance data for a share of capital stock outstanding, total return ratios to average net assets and other supplemental data for the period indicated.
| | | Stringer | | |
| | | Growth Fund | | |
| | | | | | | | | | | | | | | |
| | | Institutional Class | | |
| | | | | | | For the | | | For the | | | For the | | |
| | | Period Ended August 31, 2016 | | | | Year Ended February 29, 2016 | | | Year Ended February 28, 2015 | | | Period Ended February 28, 2014 (a) | | |
| | | (Unaudited) | | | | | | | | | | | | |
| | | | | | | | | | | | | | | |
| Net Asset Value, Beginning of Year/Period | | $ | 10.48 | | | | $ | 12.05 | | | $ | 11.44 | | | $ | 10.00 | | |
| | | | | | | | | | | | | | | | | | | |
| Investment Operations: | | | | | | | | | | | | | | | | | | |
| Net investment income | | | 0.06 | | | | | 0.09 | | | | 0.08 | | | | 0.04 | | |
| Net realized and unrealized gain (loss) on investments | | | 1.02 | | | | | (1.26 | ) | | | 0.67 | | | | 1.47 | | |
| Total from investment operations | | | 1.08 | | | | | (1.17 | ) | | | 0.75 | | | | 1.51 | | |
| | | | | | | | | | | | | | | | | | | |
| Distributions: | | | | | | | | | | | | | | | | | | |
| From net investment income | | | - | | | | | (0.09 | ) | | | (0.10 | ) | | | (0.05 | ) | |
| From net realized capital gains | | | - | | | | | (0.31 | ) | | | (0.04 | ) | | | (0.02 | ) | |
| Total distributions | | | - | | | | | (0.40 | ) | | | (0.14 | ) | | | (0.07 | ) | |
| | | | | | | | | | | | | | | | | | | |
| Net Asset Value, End of Year/Period | | $ | 11.56 | | | | $ | 10.48 | | | $ | 12.05 | | | $ | 11.44 | | |
| | | | | | | | | | | | | | | | | | | |
Total Return (b) | | | 10.31 | % | (c) | | | (9.88 | )% | | | 6.63 | % | | | 15.12 | % | (c) |
| | | | | | | | | | | | | | | | | | | |
| Ratios/Supplemental Data | | | | | | | | | | | | | | | | | | |
| Net assets, end of year/period (in 000's) | | $ | 14,626 | | | | $ | 14,167 | | | $ | 17,034 | | | $ | 4,400 | | |
| | | | | | | | | | | | | | | | | | | |
| Ratio of expenses to average net assets: | | | | | | | | | | | | | | | | | | |
Before fees waived and expenses absorbed/recouped (e) | | | 1.33 | % | (d) | | | 1.31 | % | | | 1.43 | % | | | 2.15 | % | (d) |
After fees waived and expenses absorbed/recouped (e) | | | 1.34 | % | (d) | | | 1.40 | % | | | 1.40 | % | | | 1.40 | % | (d) |
| | | | | | | | | | | | | | | | | | | |
| Ratio of net investment income (loss): | | | | | | | | | | | | | | | | | | |
Before fees waived and expenses absorbed/recouped (e) | | | 1.11 | % | (d) | | | 0.92 | % | | | 0.97 | % | | | (0.23 | )% | (d) |
After fees waived and expenses absorbed/recouped (e) | | | 1.10 | % | (d) | | | 0.83 | % | | | 1.00 | % | | | 0.52 | % | (d) |
| | | | | | | | | | | | | | | | | | | |
| Portfolio turnover rate | | | 29 | % | (c) | | | 144 | % | | | 80 | % | | | 53 | % | (c) |
| (a) | The Stringer Growth Fund commenced operations on March 27, 2013. |
| (b) | Total Return represents the rate that the investor would have earned or lost on an investment in the Fund, assuming reinvestment of dividends. |
| (e) | These ratios exclude the impact of the expenses of the underlying investment companies in which the Fund invests |
The accompanying notes are an integral part of these financial statements.
STRINGER FUNDS
FINANCIAL HIGHLIGHTS
| August 31, 2016 | SEMI-ANNUAL REPORT |
The following tables set forth the per share operating performance data for a share of capital stock outstanding, total return ratios to average net assets and other supplemental data for the period indicated.
| | | Stringer | | |
| | | Moderate Growth Fund | | |
| | | | | | | | | |
| | | Class A | | |
| | | August 31, 2016 | | | | 2016 (a) | | |
| | | (Unaudited) | | | | | | |
| | | | | | | | | |
| Net Asset Value, Beginning of Period | | $ | 9.07 | | | | $ | 10.00 | | |
| | | | | | | | | | | |
| Investment Operations: | | | | | | | | | | |
| Net investment income | | | 0.04 | | | | | 0.10 | | |
| Net realized and unrealized gain (loss) on investments | | | 0.63 | | | | | (0.93 | ) | |
| Total from investment operations | | | 0.67 | | | | | (0.83 | ) | |
| | | | | | | | | | | |
| Distributions: | | | | | | | | | | |
| From net investment income | | | - | | | | | (0.10 | ) | |
| From net realized capital gains | | | - | | | | | - | | |
| Total distributions | | | - | | | | | (0.10 | ) | |
| | | | | | | | | | | |
| Net Asset Value, End of Period | | $ | 9.74 | | | | $ | 9.07 | | |
| | | | | | | | | | | |
Total Return (b) | | | 7.39 | % | (c) | | | (8.38 | )% | (c) |
| | | | | | | | | | | |
| Ratios/Supplemental Data | | | | | | | | | | |
| Net assets, end of period (in 000's) | | $ | 1,676 | | | | $ | 607 | | |
| | | | | | | | | | | |
| Ratio of expenses to average net assets: | | | | | | | | | | |
Before fees waived and expenses absorbed (e) | | | 2.96 | % | (d) | | | 3.06 | % | (d) |
After fees waived and expenses absorbed (e) | | | 1.50 | % | (d) | | | 1.50 | % | (d) |
| | | | | | | | | | | |
| Ratio of net investment income (loss): | | | | | | | | | | |
Before fees waived and expenses absorbed (e) | | | (0.40 | )% | (d) | | | (0.38 | )% | (d) |
After fees waived and expenses absorbed (e) | | | 1.06 | % | (d) | | | 1.18 | % | (d) |
| | | | | | | | | | | |
| Portfolio turnover rate | | | 35 | % | (c) | | | 118 | % | (c) |
| (a) | The Stringer Moderate Growth Fund commenced operations on March 31, 2015. |
| (b) | Total Return represents the rate that the investor would have earned or lost on an investment in the Fund, assuming reinvestment of dividends. |
| (e) | These ratios exclude the impact of the expenses of the underlying investment companies in which the Fund invests |
The accompanying notes are an integral part of these financial statements.
STRINGER FUNDS
FINANCIAL HIGHLIGHTS
| August 31, 2016 | SEMI-ANNUAL REPORT |
The following tables set forth the per share operating performance data for a share of capital stock outstanding, total return ratios to average net assets and other supplemental data for the period indicated.
| | | Stringer | | |
| | | Moderate Growth Fund | | |
| | | | | | | | | |
| | | Class C | | |
| | | For the Six Month Period Ended August 31, 2016 | | | | For the Period Ended February 29, 2016 (a) | | |
| | | (Unaudited) | | | | | | |
| | | | | | | | | |
| Net Asset Value, Beginning of Period | | $ | 9.02 | | | | $ | 10.00 | | |
| | | | | | | | | | | |
| Investment Operations: | | | | | | | | | | |
| Net investment income (loss) | | | (0.06 | ) | | | | 0.02 | | |
| Net realized and unrealized gain (loss) on investments | | | 0.69 | | | | | (0.92 | ) | |
| Total from investment operations | | | 0.63 | | | | | (0.90 | ) | |
| | | | | | | | | | | |
| Distributions: | | | | | | | | | | |
| From net investment income | | | - | | | | | (0.08 | ) | |
| From net realized capital gains | | | - | | | | | - | | |
| Total distributions | | | - | | | | | (0.08 | ) | |
| | | | | | | | | | | |
| Net Asset Value, End of Period | | $ | 9.65 | | | | $ | 9.02 | | |
| | | | | | | | | | | |
Total Return (b) | | | 6.98 | % | (c) | | | (9.02 | )% | (c) |
| | | | | | | | | | | |
| Ratios/Supplemental Data | | | | | | | | | | |
| Net assets, end of period (in 000's) | | $ | 607 | | | | $ | 582 | | |
| | | | | | | | | | | |
| Ratio of expenses to average net assets: | | | | | | | | | | |
Before fees waived and expenses absorbed (e) | | | 3.71 | % | (d) | | | 3.81 | % | (d) |
After fees waived and expenses absorbed (e) | | | 2.25 | % | (d) | | | 2.25 | % | (d) |
| | | | | | | | | | | |
| Ratio of net investment income (loss): | | | | | | | | | | |
Before fees waived and expenses absorbed (e) | | | (1.15 | )% | (d) | | | (1.13 | )% | (d) |
After fees waived and expenses absorbed (e) | | | 0.31 | % | (d) | | | 0.43 | % | (d) |
| | | | | | | | | | | |
| Portfolio turnover rate | | | 35 | % | (c) | | | 118 | % | (c) |
| (a) | The Stringer Moderate Growth Fund commenced operations on March 31, 2015. |
| (b) | Total Return represents the rate that the investor would have earned or lost on an investment in the Fund, assuming reinvestment of dividends. |
| (e) | These ratios exclude the impact of the expenses of the underlying investment companies in which the Fund invests |
The accompanying notes are an integral part of these financial statements.
STRINGER FUNDS
FINANCIAL HIGHLIGHTS
| August 31, 2016 | SEMI-ANNUAL REPORT |
The following tables set forth the per share operating performance data for a share of capital stock outstanding, total return ratios to average net assets and other supplemental data for the period indicated.
| | | Stringer | | |
| | | Moderate Growth Fund | | |
| | | | | | | | | |
| | | Institutional Class | | |
| | | For the Six Month Period Ended August 31, 2016 | | | | For the Period Ended February 29, 2016 (a) | | |
| | | (Unaudited) | | | | | | |
| | | | | | | | | |
| Net Asset Value, Beginning of Period | | $ | 9.07 | | | | $ | 10.00 | | |
| | | | | | | | | | | |
| Investment Operations: | | | | | | | | | | |
| Net investment income | | | 0.06 | | | | | 0.11 | | |
| Net realized and unrealized gain (loss) on investments | | | 0.63 | | | | | (0.93 | ) | |
| Total from investment operations | | | 0.69 | | | | | (0.82 | ) | |
| | | | | | | | | | | |
| Distributions: | | | | | | | | | | |
| From net investment income | | | - | | | | | (0.11 | ) | |
| From net realized capital gains | | | - | | | | | - | | |
| Total distributions | | | - | | | | | (0.11 | ) | |
| | | | | | | | | | | |
| Net Asset Value, End of Period | | $ | 9.76 | | | | $ | 9.07 | | |
| | | | | | | | | | | |
Total Return (b) | | | 7.61 | % | (c) | | | (8.23 | )% | (c) |
| | | | | | | | | | | |
| Ratios/Supplemental Data | | | | | | | | | | |
| Net assets, end of period (in 000's) | | $ | 4,168 | | | | $ | 3,886 | | |
| | | | | | | | | | | |
| Ratio of expenses to average net assets: | | | | | | | | | | |
Before fees waived and expenses absorbed (e) | | | 2.71 | % | (d) | | | 2.81 | % | (d) |
After fees waived and expenses absorbed (e) | | | 1.25 | % | (d) | | | 1.25 | % | (d) |
| | | | | | | | | | | |
| Ratio of net investment income (loss): | | | | | | | | | | |
Before fees waived and expenses absorbed (e) | | | (0.15 | )% | (d) | | | (0.13 | )% | (d) |
After fees waived and expenses absorbed (e) | | | 1.31 | % | (d) | | | 1.43 | % | (d) |
| | | | | | | | | | | |
| Portfolio turnover rate | | | 35 | % | (c) | | | 118 | % | (c) |
| (a) | The Stringer Moderate Growth Fund commenced operations on March 31, 2015. |
| (b) | Total Return represents the rate that the investor would have earned or lost on an investment in the Fund, assuming reinvestment of dividends. |
| (e) | These ratios exclude the impact of the expenses of the underlying investment companies in which the Fund invests |
The accompanying notes are an integral part of these financial statements.
| Stringer Funds | | SEMI-ANNUAL REPORT |
NOTES TO THE FINANCIAL STATEMENTSAugust 31, 2016 (Unaudited)
| 1. | ORGANIZATION AND SIGNIFICANT ACCOUNTING POLICIES |
The Stringer Funds (the “Funds”) are series of 360 Funds (the “Trust”). The Trust was organized on February 24, 2005 as a Delaware statutory trust. The Trust is registered as an open-end management investment company under the Investment Company Act of 1940 (the “1940 Act”). The Funds are non-diversified Funds. As non-diversified Funds, they may invest a significant portion of their assets in a small number of companies. The Stringer Growth Fund’s (the “Growth Fund”) investment objective is long-term growth of capital. The Stringer Moderate Growth Fund’s (the “Moderate Growth Fund”) investment objective is capital appreciation while also maintaining principal stability. The Funds’ investment adviser is Stringer Asset Management, LLC (the “Adviser”). The Funds offers three classes of shares, Class A, Class C and Institutional Class shares. Each class of shares for the Growth Fund commenced operations on March 27, 2013. Each class of shares for the Moderate Growth Fund commenced operations on March 31, 2015. Each class differs as to sales and redemption charges and ongoing fees. Income and realized/unrealized gains or losses are allocated to each class based on relative share balances.
The following is a summary of the significant accounting policies followed by the Funds in the preparation of their financial statements. The Funds are investment companies that follow the accounting and reporting guidance of Accounting Standards Codification Topic 946 applicable to investment companies.
a) Security Valuation – All investments in securities are recorded at their estimated fair value, as described in note 2.
b) Exchange Traded Funds – The Funds may invest in Exchange Traded Funds (“ETFs”). ETFs are registered investment companies and incur fees and expenses such as operating expenses, licensing fees, registration fees, trustees fees, and marketing expenses, and ETF shareholders, such as the Funds, pay their proportionate share of these expenses. Your cost of investing in the Funds will generally be higher than the cost of investing directly in ETFs. By investing in the Funds, you will indirectly bear fees and expenses charged by the underlying ETFs in which the Funds invest in addition to the Funds’ direct fees and expenses.
c) Federal Income Taxes – The Funds have qualified and intend to continue to qualify as regulated investment companies under Subchapter M of the Internal Revenue Code of 1986, as amended (the “Code”). It is the policy of the Funds to comply with the requirements of the Code applicable to regulated investment companies and to distribute substantially all of their net investment company taxable income and net capital gains. Therefore, no provision for federal income taxes is required.
As of and during the six month period ended August 31, 2016, the Funds did not have a liability for any unrecognized tax expenses. The Funds recognizes interest and penalties, if any, related to unrecognized tax liability as income tax expense in the statements of operations. During the six month period ended August 31, 2016, the Funds did not incur any interest or penalties. The Funds identify their major tax jurisdictions as U.S. Federal and Delaware State. As required by accounting principles generally accepted in the United States of America (“GAAP”), ASC 740, management has analyzed the Funds’ tax positions taken on Federal income tax returns for all open tax years and has concluded that no provision for income tax is required in these financial statements.
d) Distributions to Shareholders – Dividends from net investment income and distributions of net realized capital gains, if any, will be declared and paid at least annually. Income and capital gain distributions, which are determined in accordance with income tax regulations, are recorded on the ex-dividend date. GAAP requires that permanent financial reporting differences relating to shareholder distributions be reclassified to paid-in capital or net realized gains. There were no reclassifications necessary for the six month period ended August 31, 2016.
e) Use of Estimates – The preparation of financial statements in conformity with GAAP requires management to make estimates and assumptions that affect the reported amounts of assets and liabilities and disclosure of contingent assets and liabilities at the date of the financial statements and the reported amounts of revenues and expenses during the reporting period. Actual results could differ from those estimates.
f) Other – Investment and shareholder transactions are recorded on trade date. The Funds determine the gain or loss realized from the investment transactions by comparing the original cost of the security lot sold with the net sales proceeds. Dividend income is recognized on the ex-dividend date or as soon as information is available to the Funds and interest income is recognized on an accrual basis. Withholding taxes on foreign dividends have been provided for in accordance with the Funds’ understanding of the applicable country’s tax rules and rates.
g) Non-Diversified Fund – The Funds are non-diversified Funds. Non-diversified Funds may or may not have a diversified portfolio of investments at any given time, and may have large amounts of assets invested in a very small number of companies, industries or securities. Such lack of diversification substantially increases market risks and the risk of loss associated with an investment in the Funds, because the value of each security will have a greater impact on the Funds’ performance and the value of each shareholder’s investment. When the value of a security in a non-diversified fund falls, it may have a greater impact on the Funds than it would have in a diversified fund.
| Stringer Funds | SEMI-ANNUAL REPORT |
NOTES TO THE FINANCIAL STATEMENTSAugust 31, 2016 (Unaudited)
| 1. | ORGANIZATION AND SIGNIFICANT ACCOUNTING POLICIES (continued) |
(h) Contingent Deferred Sales Charges – For initial purchases of Class A shares of a Fund of $1 million or more, a broker-dealer's commission (equal to 1.00% of such purchases over $1 million) may be paid by the Adviser to participating unaffiliated broker-dealers through whom such purchases are effected. A contingent deferred sales charge (“CDSC”) is imposed upon certain redemptions of Class A shares purchased at net asset value in amounts totaling $1 million if the dealer’s commission was paid by the Adviser and the shares are redeemed within one year from the date of purchase. The CDSC will be paid to the Adviser and will be equal to 0.50% of the lesser of (1) the net asset value at the time of purchase of the Class A shares being redeemed; or (2) the net asset value of such shares at the time of redemption. There were no CDSC Fees paid from Class A redemptions to the Adviser during the six month period ended August 31, 2016.
For initial purchases of Class C shares of a Fund, a broker-dealer's commission (equal to 1.00% of such purchases) may be paid by the Adviser to participating unaffiliated broker-dealers through whom such purchases are effected. A CDSC of 1.00% may be imposed on certain redemptions of Class C shares made within one year of their purchase. The CDSC will be paid to the Adviser and will be equal to 1.00% of the lesser of (1) the net asset value at the time of purchase of the Class C shares being redeemed; or (2) the net asset value of such shares at the time of redemption. During the six month period ended August 31, 2016, CDSC Fees paid from Class C redemptions of $5,221 and $3,380 were paid to the Adviser by the Growth Fund and Moderate Growth Fund, respectively.
Processes and Structure
The Funds’ Board of Trustees has adopted guidelines for valuing securities and other derivative instruments including in circumstances in which market quotes are not readily available, and has delegated authority to the Adviser to apply those guidelines in determining fair value prices, subject to review by the Board of Trustees.
Hierarchy of Fair Value Inputs
The company utilizes various methods to measure the fair value of most of its investments on a recurring basis. GAAP establishes a hierarchy that prioritizes inputs to valuation techniques used to measure fair value. The three levels of inputs are as follows:
| • | Level 1 – Unadjusted quoted prices in active markets for identical assets or liabilities that the company has the ability to access. |
| • | Level 2 – Observable inputs other than quoted prices included in level 1 that are observable for the asset or liability either directly or indirectly. These inputs may include quoted prices for the identical instrument on an inactive market, prices for similar instruments, interest rates, prepayment speeds, credit risk, yield curves, default rates, and similar data. |
| • | Level 3 – Unobservable inputs for the asset or liability to the extent that relevant observable inputs are not available, representing the company's own assumptions about the assumptions that a market participant would use in valuing the asset or liability, and that would be based on the best information available. |
The availability of observable inputs can vary from security to security and is affected by a wide variety of factors, including, for example, the type of security, whether the security is new and not yet established in the marketplace, the liquidity of markets, and other characteristics particular to the security. To the extent that valuation is based on models or inputs that are less observable or unobservable in the market, the determination of fair value requires more judgment. Accordingly, the degree of judgment exercised in determining fair value is greatest for instruments categorized in level 3.
The inputs used to measure fair value may fall into different levels of the fair value hierarchy. In such cases, for disclosure purposes, the level in the fair value hierarchy within which the fair value measurement falls in its entirety is determined based on the lowest level input that is significant to the fair value measurement in its entirety.
Fair Value Measurements
A description of the valuation techniques applied to the company's major categories of assets and liabilities measured at fair value on a recurring basis follows.
| Stringer Funds | SEMI-ANNUAL REPORT |
NOTES TO THE FINANCIAL STATEMENTSAugust 31, 2016 (Unaudited)
| 2. | SECURITIES VALUATIONS (continued) |
Equity securities (common stock and ETFs) – Securities traded on a national securities exchange (or reported on the NASDAQ national market) are stated at the last reported sales price on the day of valuation. To the extent these securities are actively traded, and valuation adjustments are not applied, they are categorized in level 1 of the fair value hierarchy. Certain foreign securities may be fair valued using a pricing service that considers the correlation of the trading patterns of the foreign security to the intraday trading in the U.S. markets for investments such as American Depositary Receipts, financial futures, Exchange Traded Funds, and the movement of the certain indexes of securities based on a statistical analysis of the historical relationship and that are categorized in level 2. Preferred stock and other equities traded on inactive markets or valued by reference to similar instruments are also categorized in level 2.
Money market funds – Money market funds are valued at their net asset value of $1.00 per share and are categorized as Level 1.
The following table summarizes the inputs used to value the Funds’ assets and liabilities measured at fair value as of August 31, 2016.
| Growth Fund | | | | | | | | | |
| Financial Instruments - Assets | | | | | Level 2 | | | | |
Security Classification (1) | | | | | (Other Significant Observable Inputs) | | | Totals | |
Exchange Traded Funds (2) | | $ | 46,944,061 | | | $ | - | | | $ | 46,944,061 | |
| Money Market Funds | | | 701,338 | | | | - | | | | 701,338 | |
| Totals | | $ | 47,645,399 | | | $ | - | | | $ | 47,645,399 | |
| Moderate Growth Fund | | | | | | | | | |
| Financial Instruments - Assets | | | | | Level 2 | | | | |
Security Classification (1) | | | | | (Other Significant Observable Inputs) | | | Totals | |
Exchange Traded Funds (2) | | $ | 6,216,800 | | | $ | - | | | $ | 6,216,800 | |
| Money Market Funds | | | 241,378 | | | | - | | | | 241,378 | |
| Totals | | $ | 6,458,178 | | | $ | - | | | $ | 6,458,178 | |
| (1) | As of and during the six month period ended August 31, 2016, the Funds held no securities that were considered to be “Level 3” securities (those valued using significant unobservable inputs). Therefore, a reconciliation of assets in which significant unobservable inputs (Level 3) were used in determining fair value is not applicable. |
| (2) | All ETFs held in the Funds are Level 1 securities. For a detailed break-out of ETFs by investment type, please refer to the Schedules of Investments. |
There were no transfers into and out of any Level during the six month period ended August 31, 2016. It is each Fund’s policy to recognize transfers between Levels at the end of the reporting period.
During the six month period ended August 31, 2016, no securities were fair valued.
| Stringer Funds | SEMI-ANNUAL REPORT |
NOTES TO THE FINANCIAL STATEMENTSAugust 31, 2016 (Unaudited)
| 3. | CAPITAL SHARE TRANSACTIONS |
Transactions in shares of capital stock for the Growth Fund for the six month period ended August 31, 2016 were as follows:
| | | Sold | | | Redeemed | | | Reinvested | | | Net Decrease | |
| Class A | | | | | | | | | | | | |
| Shares | | | 70,504 | | | | (463,789 | ) | | | - | | | | (393,285 | ) |
| Value | | $ | 774,961 | | | $ | (5,106,923 | ) | | $ | - | | | $ | (4,331,962 | ) |
| Class C | | | | | | | | | | | | | | | | |
| Shares | | | 66,803 | | | | (516,573 | ) | | | - | | | | (449,770 | ) |
| Value | | $ | 743,363 | | | $ | (5,760,434 | ) | | $ | - | | | $ | (5,017,071 | ) |
| Institutional Class | | | | | | | | | | | | | | | | |
| Shares | | | 168,084 | | | | (255,496 | ) | | | - | | | | (87,412 | ) |
| Value | | $ | 1,890,888 | | | $ | (2,855,616 | ) | | $ | - | | | $ | (964,728 | ) |
Transactions in shares of capital stock for the Moderate Growth Fund for the six month period ended August 31, 2016 were as follows:
| | | Sold | | | Redeemed | | | Reinvested | | | Net Increase (Decrease) | |
| Class A | | | | | | | | | | | | |
| Shares | | | 107,905 | | | | (2,767 | ) | | | - | | | | 105,138 | |
| Value | | $ | 1,027,034 | | | $ | (26,434 | ) | | $ | - | | | $ | 1,000,600 | |
| Class C | | | | | | | | | | | | | | | | |
| Shares | | | 34,469 | | | | (36,162 | ) | | | - | | | | (1,693 | ) |
| Value | | $ | 328,106 | | | $ | (341,731 | ) | | $ | - | | | $ | (13,625 | ) |
| Institutional Class | | | | | | | | | | | | | | | | |
| Shares | | | 59,640 | | | | (60,903 | ) | | | - | | | | (1,263 | ) |
| Value | | $ | 575,562 | | | $ | (584,192 | ) | | $ | - | | | $ | (8,630 | ) |
Transactions in shares of capital stock for the Growth Fund for the fiscal year ended February 29, 2016 were as follows:
| | | Sold | | | Redeemed | | | Reinvested | | | Net Increase (Decrease) | |
| Class A | | | | | | | | | | | | |
| Shares | | | 817,478 | | | | (503,840 | ) | | | 60,935 | | | | 374,573 | |
| Value | | $ | 9,410,625 | | | $ | (5,672,160 | ) | | $ | 674,556 | | | $ | 4,413,021 | |
| Class C | | | | | | | | | | | | | | | | |
| Shares | | | 860,773 | | | | (296,718 | ) | | | 49,176 | | | | 613,231 | |
| Value | | $ | 10,094,355 | | | $ | (3,338,621 | ) | | $ | 540,449 | | | $ | 7,296,183 | |
| Institutional Class | | | | | | | | | | | | | | | | |
| Shares | | | 375,076 | | | | (480,194 | ) | | | 43,716 | | | | (61,402 | ) |
| Value | | $ | 4,388,249 | | | $ | (5,652,609 | ) | | $ | 484,802 | | | $ | (779,558 | ) |
| Stringer Funds | SEMI-ANNUAL REPORT |
NOTES TO THE FINANCIAL STATEMENTSAugust 31, 2016 (Unaudited)
| 3. | CAPITAL SHARE TRANSACTIONS (continued) |
Transactions in shares of capital stock for the Moderate Growth Fund for the period since inception from March 31, 2015 through February 29, 2016 were as follows:
| | | Sold | | | Redeemed | | | Reinvested | | | Net Increase | |
| Class A | | | | | | | | | | | | |
| Shares | | | 94,265 | | | | (28,020 | ) | | | 672 | | | | 66,917 | |
| Value | | $ | 947,304 | | | $ | (275,904 | ) | | $ | 6,323 | | | $ | 677,723 | |
| Class C | | | | | | | | | | | | | | | | |
| Shares | | | 71,308 | | | | (7,304 | ) | | | 576 | | | | 64,580 | |
| Value | | $ | 687,637 | | | $ | (66,228 | ) | | $ | 5,402 | | | $ | 626,811 | |
| Institutional Class | | | | | | | | | | | | | | | | |
| Shares | | | 475,182 | | | | (51,583 | ) | | | 4,742 | | | | 428,341 | |
| Value | | $ | 4,725,172 | | | $ | (492,188 | ) | | $ | 44,676 | | | $ | 4,277,660 | |
| 4. | INVESTMENT TRANSACTIONS |
For the six month period ended August 31, 2016, aggregate purchases and sales of investment securities (excluding short-term investments) for the Funds were as follows:
| | | Purchases | | | Sales | |
| Growth Fund | | $ | 13,905,719 | | | $ | 18,721,425 | |
| Moderate Growth Fund | | | 2,746,937 | | | | 1,901,369 | |
There were no government securities purchased or sold during the period.
| 5. | ADVISORY FEES AND OTHER RELATED PARTY TRANSACTIONS |
The Funds have entered into an Investment Advisory Agreement (the “Advisory Agreement”) with the Adviser. Pursuant to the Advisory Agreement, the Adviser manages the operations of the Funds and manages the Funds’ investments in accordance with the stated policies of the Funds. As compensation for the investment advisory services provided to the Funds, the Adviser will receive a monthly management fee equal to an annual rate of 0.95% of the Growth Fund’s net assets and 0.80% of the Moderate Growth Fund’s net assets
The Adviser and the Funds have entered into an Expense Limitation Agreement (“Expense Agreement”) under which the Adviser has agreed to waive or reduce its fees and to assume other expenses of the Funds, if necessary, in an amount that limits annual operating expenses (exclusive of interest, taxes, brokerage fees and commissions, acquired fund fees and expenses, extraordinary expenses and payments, if any, under the Rule 12b-1 Plan) to not more than 1.40% for Class A shares, Class C shares, and Institutional Class Shares, respectively, of the average daily net assets of the Growth Fund and to not more than 1.25% for Class A shares, Class C shares and Institutional Class shares, respectively, of the average daily net assets of the Moderate Growth Fund through at least July 1, 2017. Effective May 1, 2016, the expense limitation was reduced to 1.30% for the Growth Fund’s Class A shares, Class C shares and Institutional shares through at least July 1, 2017. It is expected that the Expense Agreement will continue from year-to-year provided such continuance is approved by the Board of Trustees of the Funds. Please see the table below for information regarding the management fees earned, fee waivers and recoupments, and expenses reimbursed during the six month period ended August 31, 2016, as well as amounts due to (from) the Advisor at August 31, 2016.
| | | Growth Fund | | | Moderate Growth Fund | |
| Management fees earned | | $ | 243,226 | | | $ | 23,136 | |
| Fees recouped (waived) and (expenses reimbursed) | | | 2,376 | | | | (45,062 | ) |
| Payable to (Due from) Adviser | | | 41,280 | | | | (11,160 | ) |
| Stringer Funds | SEMI-ANNUAL REPORT |
NOTES TO THE FINANCIAL STATEMENTSAugust 31, 2016 (Unaudited)
| 5. | ADVISORY FEES AND OTHER RELATED PARTY TRANSACTIONS (continued) |
If, at any time, the annualized expenses of the Funds are less than the annualized expense limitation ratios, the Funds would reimburse the Adviser for any fees previously waived and/or expenses previously assumed; provided, however, that repayment would be payable only to the extent that it (a) can be made during the three (3) years following the time at which the adviser waived fees or assumed expenses for the Funds, and (b) can be repaid without causing the expenses of the Funds to exceed the annualized expense limitation ratios. The amounts subject to repayment by the Funds, pursuant to the aforementioned conditions, are as follows:
| | | February 28, 2017 | | | February 28, 2018 | | | February 28, 2019 | | | February 29, 2020 | | | Totals | |
| Growth Fund | | $ | 22,069 | | | $ | 11,090 | | | $ | - | | | $ | - | | | $ | 33,159 | |
| Moderate Growth Fund | | | - | | | | - | | | | 64,416 | | | | 45,062 | | | | 109,478 | |
The Funds have entered into an Investment Company Services Agreement (“ICSA”) with M3Sixty Administration, LLC (“M3Sixty”). Pursuant to the ICSA, M3Sixty will provide day-to-day operational services to the Funds including, but not limited to: (a) Fund accounting services; (b) financial statement preparation; (c) valuation of the Funds’ portfolio securities; (d) pricing the Funds’ shares; (e) assistance in preparing tax returns; (f) preparation and filing of required regulatory reports; (g) communications with shareholders; (h) coordination of Board and shareholder meetings; (i) monitoring the Funds’ legal compliance; (j) maintaining shareholder account records.
For the six month period ended August 31, 2016, the Funds accrued servicing fees, including out of pocket expenses, and had amounts payable to M3Sixty as follows.
| | | Growth Fund | | | Moderate Growth Fund | |
| Service fees accrued | | $ | 59,536 | | | $ | 28,264 | |
| Service fees payable | | | 9,446 | | | | 3,305 | |
Certain officers and a Trustee of the Funds are also employees of M3Sixty.
The Funds have entered into a Distribution Agreement with Matrix Capital Group, Inc. (the “Distributor”). Pursuant to the Distribution Agreement, the Distributor will provide distribution services to the Funds. The Distributor serves as underwriter/distributor of the Funds.
The Distributor is an affiliate of M3Sixty.
The Funds have adopted a Distribution Plan (“Plan”) pursuant to Rule 12b-1 under the Investment Company Act of 1940 for each class of shares. The Funds may expend up to 1.00% for Class C shares and up to 0.25% for Class A shares of the Funds’ average daily net assets annually to pay for any activity primarily intended to result in the sale of shares of the Funds and the servicing of shareholder accounts, provided that the Trustees have approved the category of expenses for which payment is being made.
The distribution plans for the Class A and Class C shares of the Funds took effect March 27, 2013 for the Growth Fund and March 31, 2015 for the Moderate Growth Fund. For the six month period ended August 31, 2016, the Funds accrued 12b-1 expenses attributable to Class A shares and Class C shares as follows.
| | | Class A | | | Class C | |
| Growth Fund | | $ | 20,867 | | | $ | 99,441 | |
| Moderate Growth Fund | | | 1,480 | | | | 2,526 | |
| Stringer Funds | SEMI-ANNUAL REPORT |
NOTES TO THE FINANCIAL STATEMENTSAugust 31, 2016 (Unaudited)
For U.S. Federal income tax purposes, the cost of securities owned, gross appreciation, gross depreciation, and net unrealized appreciation/(depreciation) of investments at August 31, 2016 were as follows:
| | | Cost | | | Gross Appreciation | | | Gross Depreciation | | | Net Appreciation | |
| Growth Fund | | $ | 44,849,155 | | | $ | 2,916,294 | | | $ | (120,050 | ) | | $ | 2,796,244 | |
| Moderate Growth Fund | | | 6,217,065 | | | | 257,688 | | | | (16,575 | ) | | | 241,113 | |
The differences between book basis unrealized appreciation and tax-basis unrealized appreciation for the Moderate Growth Fund are attributable primarily to the tax deferral of losses on wash sales.
There were no distributions paid by the Funds during the six month period ended August 31, 2016.
The tax character of distributions paid during the fiscal year ended February 29, 2016 for the Funds were as follows:
| | | Long-Term Capital Gains | | | Ordinary Income | |
| Growth Fund | | $ | 1,449,362 | | | $ | 376,958 | |
| Moderate Growth Fund | | | - | | | | 59,037 | |
The Funds’ tax basis distributable earnings are determined only at the end of each fiscal year. As of February 29, 2016, the Funds’ most recent fiscal year end, the components of distributable earnings presented on an income tax basis were as follows:
| | | Undistributed Ordinary Income | | | Undistributed Long-Term Capital Gains/ (Capital Loss Carryforwards) | | | Post-October Capital Losses & Post-December Ordinary Loss | | | Net Unrealized Depreciation | | | Total Distributable Earnings | |
| Growth Fund | | $ | 241 | | | $ | 1,273 | | | $ | (2,427,460 | ) | | $ | (1,382,275 | ) | | $ | (3,808,221 | ) |
| Moderate Growth Fund | | | - | | | | (229,382 | ) | | | (158,465 | ) | | | (119,010 | ) | | | (506,857 | ) |
Under current tax law, net capital losses realized after October 31st and net ordinary losses incurred after December 31st may be deferred and treated as occurring on the first day of the following fiscal year. The Funds’ carryforward losses, post-October losses and post-December losses are determined only at the end of each fiscal year. As of February 29, 2016, the Funds elected to defer net capital losses and net ordinary losses as indicated in the chart below:
| | | Post-October Losses | | | Post-December Losses | |
| | | Deferred | | | Utilized | | | Deferred | | | Utilized | |
| Growth Fund | | $ | 2,265,143 | | | $ | - | | | $ | 162,317 | | | $ | 101,810 | |
| Moderate Growth Fund | | | 154,100 | | | | - | | | | 4,365 | | | | - | |
Under the Regulated Investment Company Modernization Act of 2010 (the Act), net capital losses recognized after December 31, 2010, may be carried forward indefinitely, and their character is retained as short-term and/or long-term. As of February 29, 2016, the Growth Fund had no capital loss carryforwards for federal income tax purposes. As of February 29, 2016, the Moderate Growth Fund had capital loss carryforwards for federal income tax purposes of $229,382 Non-Expiring Short-Term capital loss carryforwards.
| 7. | COMMITMENTS AND CONTINGENCIES |
In the normal course of business, the Trust may enter into contracts that may contain a variety of representations and warranties and provide general indemnifications. The Trust’s maximum exposure under these arrangements is dependent on future claims that may be made against the Funds and, therefore, cannot be estimated; however, management considers the risk of loss from such claims to be remote.
| Stringer Funds | SEMI-ANNUAL REPORT |
NOTES TO THE FINANCIAL STATEMENTSAugust 31, 2016 (Unaudited)
In accordance with GAAP, Management has evaluated the impact of all subsequent events on the Funds through the date the financial statements were issued, and has determined that there were no subsequent events requiring recognition or disclosure in the financial statements.
| Stringer Funds | SEMI-ANNUAL REPORT |
ADDITIONAL INFORMATIONAugust 31, 2016 (Unaudited)
The Funds files their complete schedules of portfolio holdings with the Securities and Exchange Commission (the “Commission”) for the first and third quarters of each fiscal year on Form N-Q. The Funds’ Forms N-Q are available on the Commission’s website at http://www.sec.gov. The Funds’ Forms N-Q may be reviewed and copied at the Commission’s Public Reference Room in Washington, DC. Information on the operation of the Commission’s Public Reference Room may be obtained by calling 1-800-SEC-0330.
A description of the policies and procedures that the Funds use to determine how to vote proxies relating to portfolio securities is available without charge, upon request, by calling 1-877-244-6235; and on the Commission’s website at http://www.sec.gov.
Information regarding how the Funds voted proxies relating to portfolio securities during the most recent 12-month period ended June 30th is available without charge, upon request, by calling 1-877-244-6235; and on the Commission’s website at http://www.sec.gov.
Shareholder Tax Information - The Funds are required to advise you within 60 days of the Funds’ fiscal year end regarding the federal tax status of distributions received by shareholders during the fiscal year.
Tax information is reported from the Funds’ fiscal year and not calendar year, therefore, shareholders should refer to their Form 1099-DIV or other tax information which will be mailed in 2017 to determine the calendar year amounts to be included on their 2016 tax returns. Shareholders should consult their own tax advisors.
| Stringer Funds | SEMI-ANNUAL REPORT |
ADDITIONAL INFORMATIONAugust 31, 2016 (Unaudited)
BOARD OF TRUSTEES, OFFICERS AND PRINCIPAL SHAREHOLDERS - (Unaudited)
The Trustees are responsible for the management and supervision of the Funds. The Trustees approve all significant agreements between the Trust, on behalf of the Funds, and those companies that furnish services to the Funds; review performance of the Funds; and oversee activities of the Funds. This section provides information about the persons who serve as Trustees and Officers to the Trust and Funds, respectively, as well as the entities that provide services to the Funds. The Statement of Additional Information of the Trust includes additional information about the Fund's Trustees and is available upon request, without charge, by calling (877) 244-6235.
Remuneration Paid to Trustees and Officers - Officers of the Trust and Trustees who are “interested persons” of the Trust or the Adviser will receive no salary or fees from the Trust. Each Trustee who is not an “interested person” receives a fee of $1,500 each year plus $200 per Board or committee meeting attended. The Trust reimburses each Trustee and officer for his or her travel and other expenses relating to attendance at such meetings. The Trust reimburses each Trustee and officer for their travel and other expenses relating to attendance at such meetings.
Name of Trustee1 | Aggregate Compensation From the Stringer Funds2 | Pension or Retirement Benefits Accrued As Part of Portfolio Expenses | Estimated Annual Benefits Upon Retirement | Total Compensation From the Stringer Funds Paid to Trustees2 |
| Independent Trustees |
| Art Falk | $2,700 | None | None | $2,700 |
| Thomas Krausz | $2,300 | None | None | $2,300 |
| Tom M. Wirtshafter | $2,300 | None | None | $2,300 |
| Gary DiCenzo | $2,300 | None | None | $2,300 |
| Interested Trustees and Officers |
| Randall K. Linscott | None | Not Applicable | Not Applicable | None |
| Andras P. Teleki | None | Not Applicable | Not Applicable | None |
| Brandon Byrd | None | Not Applicable | Not Applicable | None |
| Larry Beaver | None | Not Applicable | Not Applicable | None |
| Jeremiah Hierseman | None | Not Applicable | Not Applicable | None |
| 1 | Each of the Trustees serves as a Trustee to the ten Funds of the Trust. |
| 2 | Figures are for the six month period ended August 31, 2016. |
| Stringer Funds | SEMI-ANNUAL REPORT |
Information About Your Funds’ Expenses - (Unaudited)
As a shareholder of the Funds, you incur two types of costs: (1) transaction costs, such as the sales charge (load) imposed on certain subscriptions and the contingent deferred sales charge (“CDSC”) imposed on certain short-term redemptions; and (2) ongoing costs, including management fees, distribution and/or service (12b-1) fees; and other Fund expenses. The example below is intended to help you understand your ongoing costs (in dollars) of investing in the Funds and to compare these costs with the ongoing costs of investing in other mutual funds.
The example is based on an investment of $1,000 invested at the beginning of the period and held for the entire period as indicated below.
Actual Expenses – The first section of the table provides information about actual account values and actual expenses (relating to the example $1,000 investment made at the beginning of the period). You may use the information in this section, together with the amount you invested, to estimate the expenses that you paid over the period. Simply divide your account value by $1,000 (for example, an $8,600 account value divided by $1,000 = 8.6), then multiply the result by the number in the first section under the heading entitled “Expenses Paid During Period” to estimate the expenses you paid on your account during this period.
Hypothetical Example for Comparison Purposes – The second section of the table provides information about the hypothetical account values and hypothetical expenses based on the Funds’ actual expense ratios and an assumed rate of return of 5% per year before expenses, which is not the Funds’ actual return. The hypothetical account values and expenses may not be used to estimate the actual ending account balance or expenses you paid for the period. You may use this information to compare the ongoing costs of investing in the Funds to other funds. To do so, compare this 5% hypothetical example with the 5% hypothetical examples that appear in the shareholder reports of the other funds.
Please note that the expenses shown in the table are meant to highlight your ongoing costs only and do not reflect any transactional costs, such as sales charges (loads), CDSC fees, or exchange fees. Therefore, the second section of the table is useful in comparing ongoing costs only, and will not help you determine the relative total costs of owning different funds. In addition, if these transactional costs were included, your costs would have been higher. For more information on transactional costs, please refer to the Funds’ prospectuses.
Expenses and Value of a $1,000 Investment for the period from 03/01/16 through 08/31/16
Growth Fund: | Beginning Account
Value (03/01/2016) | Annualized Expense
Ratio for the Period | Ending Account
Value (08/31/2016) | Expenses Paid
During Period (a) |
| Actual Fund Return (in parentheses) | | | |
| Class A (+10.24%) | $1,000.00 | 1.58% | $1,102.40 | $8.37 |
| Class C (+9.85%) | $1,000.00 | 2.33% | $1,098.50 | $12.32 |
| Institutional Class (+10.31%) | $1,000.00 | 1.33% | $1,103.10 | $7.05 |
| Hypothetical 5% Fund Return | | | |
| Class A | $1,000.00 | 1.65% | $1,017.20 | $8.03 |
| Class C | $1,000.00 | 2.40% | $1,013.50 | $11.83 |
| Institutional Class | $1,000.00 | 1.40% | $1,018.50 | $6.77 |
| (a) | Expenses are equal to the Growth Fund’s annualized expense ratios, multiplied by the average account value over the period, multiplied by 184/365 to reflect the one-half year period. |
Moderate Growth Fund: | Beginning Account
Value (03/01/2016) | Annualized Expense
Ratio for the Period | Ending Account
Value (08/31/2016) | Expenses Paid
During Period (a) |
| Actual Fund Return (in parentheses) | | | |
| Class A (+7.39%) | $1,000.00 | 1.50% | $1,073.90 | $7.84 |
| Class C (+6.98%) | $1,000.00 | 2.25% | $1,069.80 | $11.74 |
| Institutional Class (+7.61%) | $1,000.00 | 1.25% | $1,076.10 | $6.54 |
| Stringer Funds | SEMI-ANNUAL REPORT |
Information About Your Funds’ Expenses - (Unaudited)(continued)
Moderate Growth Fund: | Beginning Account
Value (03/01/2016) | Annualized Expense
Ratio for the Period | Ending Account
Value (08/31/2016) | Expenses Paid
During Period (a) |
| Hypothetical 5% Fund Return | | | |
| Class A | $1,000.00 | 1.50% | $1,017.60 | $7.63 |
| Class C | $1,000.00 | 2.25% | $1,013.90 | $11.42 |
| Institutional Class | $1,000.00 | 1.25% | $1,018.90 | $6.36 |
| (a) | Expenses are equal to the Moderate Growth Fund’s annualized expense ratios, multiplied by the average account value over the period, multiplied by 184/365 to reflect the one-half year period. |
For more information on Fund expenses, please refer to the Funds’ prospectus, which can be obtained from your investment representative or by calling 1-877-244-6235. Please read it carefully before you invest or send money.
Total Fund operating expense ratios as stated in the current Funds’ prospectuses dated June 28, 2016 for the Funds were as follows: |
| Stringer Growth Fund Class A, gross of fee waivers or expense reimbursements | 1.88% |
Stringer Growth Fund Fund Class A, after waiver and reimbursement* | 1.87% |
| Stringer Growth Fund Class C, gross of fee waivers or expense reimbursements | 2.63% |
Stringer Growth Fund Class C, after waiver and reimbursement* | 2.62% |
| Stringer Growth Fund Institutional Class, gross of fee waivers or expense reimbursements | 1.63% |
Stringer Growth Fund Institutional Class, after waiver and reimbursement* | 1.62% |
| Stringer Moderate Growth Fund Class A, gross of fee waivers or expense reimbursements | 3.39% |
Stringer Moderate Growth Fund Fund Class A, after waiver and reimbursement* | 1.83% |
| Stringer Moderate Growth Fund Class C, gross of fee waivers or expense reimbursements | 4.14% |
Stringer Moderate Growth Fund Class C, after waiver and reimbursement* | 2.58% |
| Stringer Moderate Growth Fund Institutional Class, gross of fee waivers or expense reimbursements | 3.14% |
Stringer Moderate Growth Fund Institutional Class, after waiver and reimbursement* | 1.58% |
* Stringer Asset Management, LLC (the “Adviser”) has entered into an Expense Limitation Agreement with the Funds under which it has agreed to waive or reduce its fees and to assume other expenses of the Funds, if necessary, in an amount that limits the Funds’ annual operating expenses (exclusive of interest, taxes, brokerage fees and commissions, acquired funds fees and expenses, shareholder services fees, extraordinary expenses, interest and dividend expenses in connection with securities sold short, and payments, if any, under the Rule 12b-1 Plan) to not more than 1.30% for the Growth Fund and 1.25% for the Moderate Growth Fund through at least July 1, 2017. Subject to approval by the Funds’ Board, any waiver under the Expense Limitation Agreement is subject to repayment by the Funds within the three fiscal years following the year in which such waiver occurred, if the Funds are able to make the payment without exceeding the 1.30% and 1.25% expense limitations. The current contractual agreement cannot be terminated prior to at least one year after the effective date without the Board of Trustees’ approval. Total Gross Operating Expenses (Annualized) during the six month period ended August 31, 2016 were 1.59%, 2.34% and 1.34% for the Stringer Growth Fund Class A, Stringer Growth Fund Class C and Stringer Growth Fund Institutional Class shares, respectively. Total Gross Operating Expenses (Annualized) during the six month period ended August 31, 2016 were 3.07%, 3.82% and 2.82% for the Stringer Moderate Growth Fund Class A, Stringer Growth Fund Class C and Stringer Growth Fund Institutional Class shares, respectively. Please see the Information About Your Funds’ Expenses, the Financial Highlights and Notes to Financial Statements (Note 5) sections of this report for gross and net expense related disclosures during the six month period ended August 31, 2016. |
360 FUNDS 4520 Main Street Suite 1425 Kansas City, MO 64111
INVESTMENT ADVISER Stringer Asset Management, LLC 5050 Poplar Avenue Suite 1103 Memphis, TN 38157
ADMINISTRATOR & TRANSFER AGENT M3Sixty Administration, LLC 4520 Main Street Suite 1425 Kansas City, MO 64111
DISTRIBUTOR Matrix Capital Group, Inc. 106 West 32nd Street New York, NY 10001
INDEPENDENT REGISTERED PUBLIC ACCOUNTING FIRM Sanville & Company 1514 Old York Road Abington, PA 19001
LEGAL COUNSEL Graydon Head & Ritchey LLP 15 West Center Street Lawrenceburg, IN 47025
CUSTODIAN BANK Fifth Third Bank Fifth Third Center
38 Fountain Square Plaza
Cincinnati, OH 45263 |
This page intentionally left blank
Not applicable at this time.
Not applicable at this time.
Not applicable at this time.
Included in semi-annual report to shareholders filed under item 1 of this form.
Not applicable at this time.
Pursuant to the requirements of the Securities Exchange Act of 1934 and the Investment Company Act of 1940, the registrant has duly caused this report to be signed on its behalf by the undersigned, thereunto duly authorized.
Pursuant to the requirements of the Securities Exchange Act of 1934 and the Investment Company Act of 1940, this report has been signed below by the following person on behalf of the registrant and in the capacities and on the date indicated.
Pursuant to the requirements of the Securities Exchange Act of 1934 and the Investment Company Act of 1940, this report has been signed below by the following person on behalf of the registrant and in the capacities and on the date indicated.