Washington, D.C. 20549
M3Sixty Administration, LLC.
The Semi-Annual report to Shareholders of the IMS Family of Funds, series of the 360 Funds, for the period ended December 31, 2016 pursuant to Rule 30e-1 under the Investment Company Act of 1940 (the "1940 Act"), as amended (17 CFR 270.30e-1) is filed herewith.
IMS Capital Value Fund
IMS Strategic Income Fund
IMS Dividend Growth Fund
Semi-Annual Report
December 31, 2016
Fund Advisor:
IMS Capital Management, Inc.
8995 S.E. Otty Road
Portland, OR 97086
Toll Free (800) 934-5550
FUND HOLDINGS – (Unaudited)
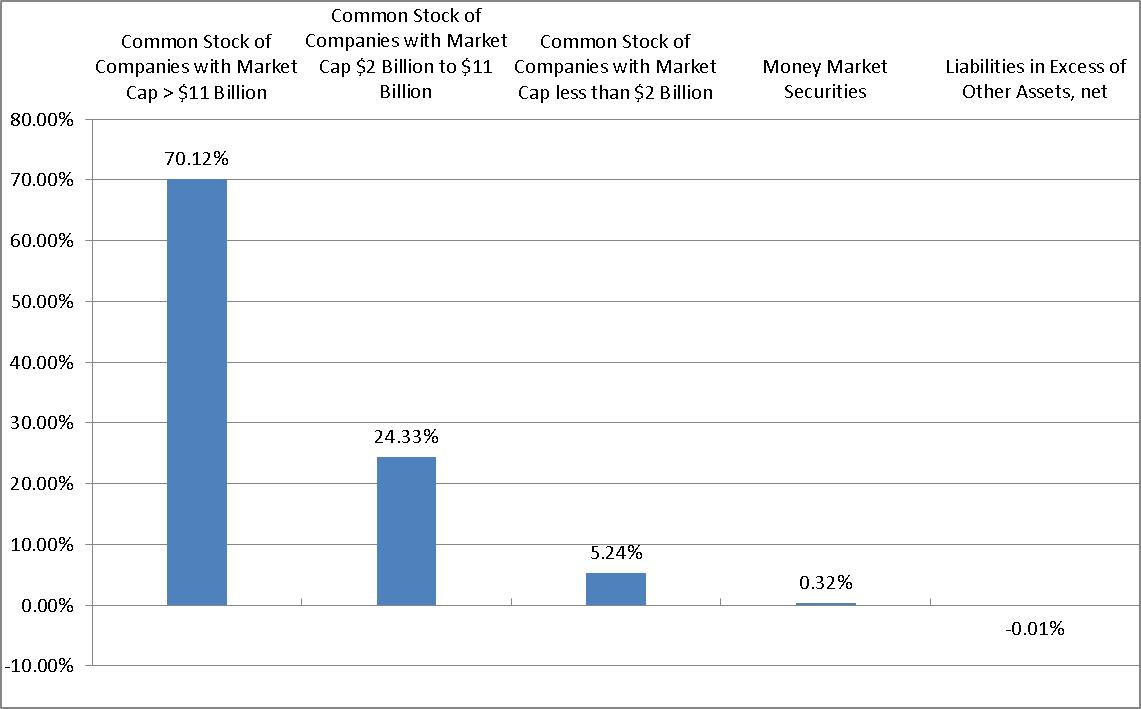
IMS Capital Value Fund Holdings as of December 31, 20161
1 | As a percent of net assets. |
The investment objective of the IMS Capital Value Fund is long-term growth from capital appreciation and, secondarily, income from dividends. The IMS Capital Value Fund typically invests in mid-cap securities, which the Advisor defines as those with a market capitalization of approximately $2 billion to $11 billion, and in large-cap securities, which the Advisor defines as those with a market capitalization of greater than $11 billion.
FUND HOLDINGS – (Unaudited) (continued)
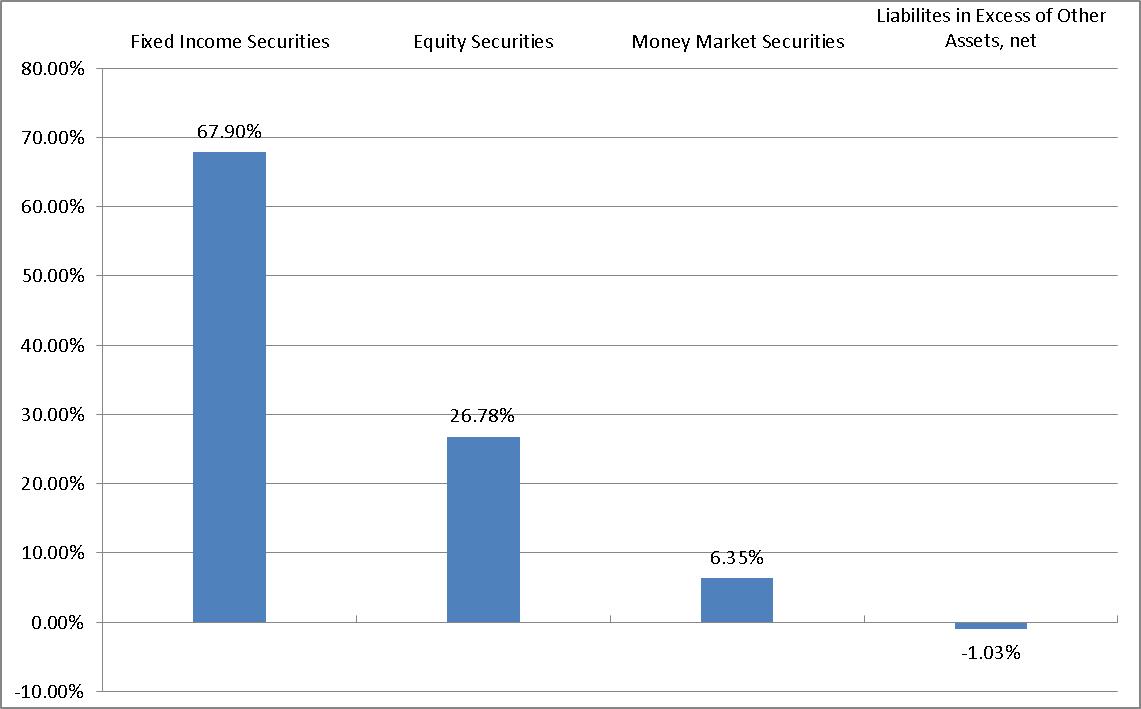
IMS Strategic Income Fund Holdings as of December 31, 20161
1 | As a percent of net assets. |
The investment objective of the IMS Strategic Income Fund is current income, and a secondary objective of capital appreciation. In pursuing its investment objectives, the Strategic Income Fund generally invests in corporate bonds, government bonds, dividend-paying common stocks, preferred and convertible preferred stocks, income trusts (including business trusts, oil royalty trusts and real estate investment trusts), money market instruments and cash equivalents. The Strategic Income Fund may also invest in structured products, such as reverse convertible notes, a type of structured note, and in 144A securities that are purchased in private placements and thus are subject to restrictions on resale (either as a matter of contract or under federal securities laws), but only where the Advisor has determined that a liquid trading market exists. Under normal circumstances, the Strategic Income Fund will invest at least 80% of its assets in dividend paying or other income producing securities.
FUND HOLDINGS – (Unaudited) (continued)
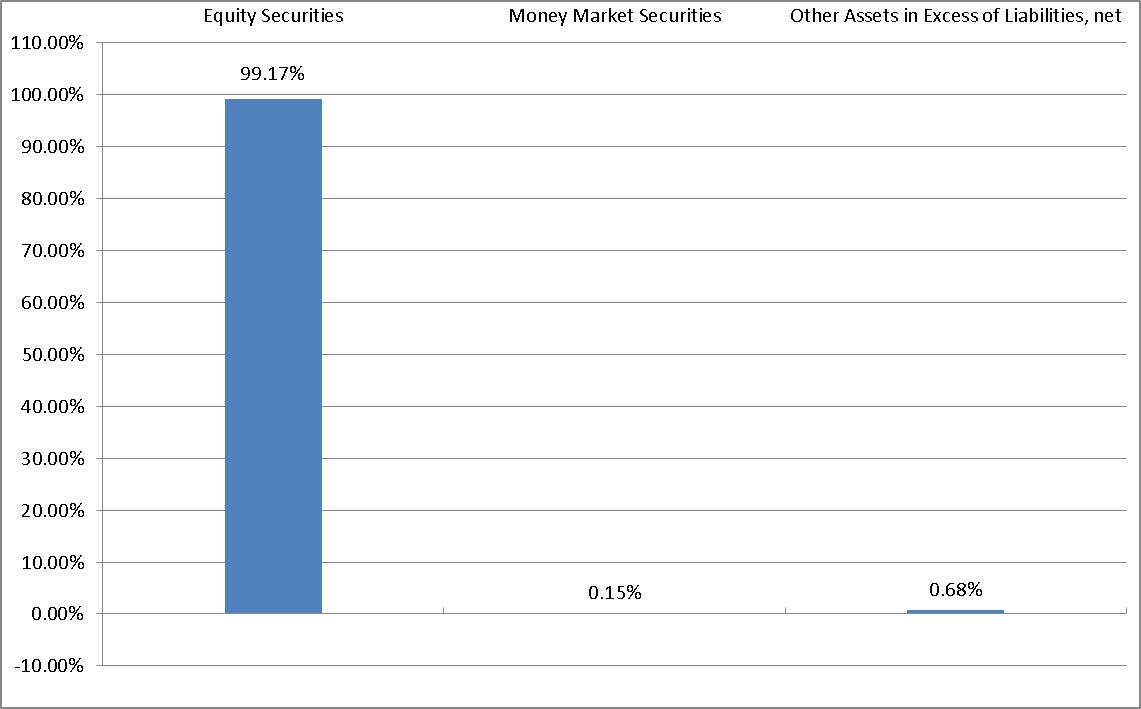
IMS Dividend Growth Fund Holdings as of December 31, 20161
1 | As a percent of net assets. |
The investment objective of the IMS Dividend Growth Fund is long-term growth from capital appreciation and dividends. The Dividend Growth Fund invests primarily in a diversified portfolio of dividend–paying common stocks. The Dividend Growth Fund's Advisor, IMS Capital Management, Inc., employs a combination of fundamental, technical and macro market research to identify companies that the Advisor believes have the ability to maintain or increase their dividend payments, because of their significant cash flow production.
Availability of Portfolio Schedules – (Unaudited)
The Funds file their complete schedules of portfolio holdings with the Securities and Exchange Commission ("SEC") for the first and third quarters of each fiscal year on Form N-Q. The Funds' Forms N-Q are available at the SEC's website at www.sec.gov. The Funds' Forms N-Q may be reviewed and copied at the Public Reference Room in Washington, DC. Information on the operation of the Public Reference Room may be obtained by calling 1-800-SEC-0330.
Summary of Funds' Expenses – (Unaudited)
As a shareholder of the Funds, you incur two types of costs: (1) transaction costs, such as short-term redemption fees; and (2) ongoing costs, including management fees and other Fund expenses. This Example is intended to help you understand your ongoing costs (in dollars) of investing in the Funds and to compare these costs with the ongoing costs of investing in other mutual funds.
The example is based on an investment of $1,000 invested at the beginning of the period and held for the entire period (July 1, 2016 through December 31, 2016).
Actual Expenses
The first line of the table below provides information about actual account values and actual expenses. You may use the information in this line, together with the amount you invested, to estimate the expenses that you paid over the period. Simply divide your account value by $1,000 (for example, an $8,600 account value divided by $1,000 = 8.60), then multiply the result by the number in the first line under the heading entitled "Expenses Paid During Period" to estimate the expenses you paid on your account during this period.
Hypothetical Example for Comparison Purposes
The second line of the table below provides information about hypothetical account values and hypothetical expenses based on the Funds' actual expense ratios and an assumed rate of return of 5% per year before expenses, which are not the Funds' actual returns. The hypothetical account values and expenses may not be used to estimate the actual ending account balance or expenses you paid for the period. You may use this information to compare the ongoing costs of investing in the Funds and other funds. To do so, compare this 5% hypothetical example with the 5% hypothetical examples that appear in the shareholder reports of other funds.
Please note that the expenses shown in the table are meant only to highlight your ongoing costs and do not reflect any transactional costs, such as short-term redemption fees. Therefore, the second line is only useful in comparing ongoing costs only and will not help you determine the relative costs of owning different funds. In addition, if these transactions costs were included, your costs would have been higher.
IMS Funds | Beginning Account Value July 1, 2016 | Ending Account Value December 31, 2016 | Expenses Paid During the Period* July 1, 2016 – December 31, 2016 |
| Capital Value Fund | | | |
| Actual (+5.11%) | $ 1,000.00 | $ 1,051.10 | $ 8.79 |
| Hypothetical** | $ 1,000.00 | $ 1,016.60 | $ 8.64 |
| Strategic Income Fund | | | |
| Actual (-0.07)% | $ 1,000.00 | $ 999.30 | $ 9.93 |
| Hypothetical** | $ 1,000.00 | $ 1,015.30 | $ 10.01 |
| Dividend Growth Fund | | | |
| Actual (+10.23%) | $ 1,000.00 | $ 1,102.30 | $ 10.33 |
| Hypothetical** | $ 1,000.00 | $ 1,015.40 | $ 9.91 |
| * | Expenses are equal to the Funds' annualized expense ratios, multiplied by the average account value over the period, multiplied by 184/365 (to reflect the one-half year period). The annualized expense ratios for the Capital Value Fund, Strategic Income Fund, and the Dividend Growth Fund were 1.70%, 1.97%, and 1.95%, respectively. |
| ** | Assumes a 5% annual return before expenses. |
IMS CAPITAL VALUE FUND
SCHEDULE OF INVESTMENTS
December 31, 2016 (Unaudited)
| COMMON STOCK - 99.69% | | Shares | | | Fair Value | |
| | | | | | | |
| Consumer Discretionary - 31.14% | | | | | | |
Amazon.com, Inc. (a) | | | 1,230 | | | $ | 922,340 | |
| BorgWarner, Inc. | | | 23,400 | | | | 922,896 | |
DISH Network Corp. - Class A (a) | | | 14,500 | | | | 839,985 | |
Dollar Tree, Inc. (a) | | | 17,800 | | | | 1,373,804 | |
| Domino's Pizza, Inc. | | | 4,400 | | | | 700,656 | |
| Ford Motor Co. | | | 65,900 | | | | 799,367 | |
| Genuine Parts Co. | | | 8,200 | | | | 783,428 | |
| Home Depot, Inc. | | | 5,000 | | | | 670,400 | |
Netflix, Inc. (a) | | | 5,600 | | | | 693,280 | |
Noodles & Co. (a) | | | 182,643 | | | | 748,836 | |
| Polaris Industries, Inc. | | | 5,000 | | | | 411,950 | |
| Service Corp. International | | | 30,000 | | | | 852,000 | |
| Starbucks Corp. | | | 16,900 | | | | 938,288 | |
| Walt Disney Co. | | | 8,000 | | | | 833,760 | |
| Yum! Brands, Inc. | | | 12,000 | | | | 759,960 | |
| | | | | | | | 12,250,950 | |
| Consumer Staples - 6.13% | | | | | | | | |
| Dr Pepper Snapple Group, Inc. | | | 10,700 | | | | 970,169 | |
Hain Celestial Group, Inc. (a) | | | 16,600 | | | | 647,898 | |
| Wal-Mart Stores, Inc. | | | 11,500 | | | | 794,880 | |
| | | | | | | | 2,412,947 | |
| Energy - 8.02% | | | | | | | | |
| Apache Corp. | | | 10,000 | | | | 634,700 | |
| EOG Resources, Inc. | | | 8,200 | | | | 829,020 | |
| Occidental Petroleum Corp. | | | 10,200 | | | | 726,546 | |
| Schlumberger Ltd. | | | 11,500 | | | | 965,425 | |
| | | | | | | | 3,155,691 | |
| Financials - 7.44% | | | | | | | | |
| Capital One Financial Corp. | | | 9,600 | | | | 837,504 | |
| Federated Investors, Inc. - Class B | | | 34,900 | | | | 986,972 | |
| Wells Fargo & Co. | | | 20,000 | | | | 1,102,200 | |
| | | | | | | | 2,926,676 | |
| Health Care - 25.04% | | | | | | | | |
| Allergan PLC | | | 3,100 | | | | 651,031 | |
| Bristol-Myers Squibb Co. | | | 12,000 | | | | 701,280 | |
Brookdale Senior Living, Inc. (a) | | | 41,200 | | | | 511,704 | |
Celgene Corp. (a) | | | 6,100 | | | | 706,075 | |
Edwards Lifesciences Corp. (a) | | | 13,000 | | | | 1,218,100 | |
| Gilead Sciences, Inc. | | | 18,200 | | | | 1,303,302 | |
IDEXX Laboratories, Inc. (a) | | | 6,000 | | | | 703,620 | |
InVivo Therapeutics Holdings Corp. (a) | | | 312,398 | | | | 1,312,072 | |
| Patterson Cos., Inc. | | | 30,700 | | | | 1,259,621 | |
| Perrigo Co. PLC | | | 8,800 | | | | 732,424 | |
| Zoetis, Inc. | | | 14,000 | | | | 749,420 | |
| | | | | | | | 9,848,649 | |
IMS CAPITAL VALUE FUND
SCHEDULE OF INVESTMENTS
December 31, 2016 (Unaudited)
| COMMON STOCK - 99.69% (continued) | | Shares | | | Fair Value | |
| | | | | | | |
| Industrials - 6.67% | | | | | | |
| Arconic, Inc. | | | 45,400 | | | $ | 841,716 | |
| Stanley Black & Decker, Inc. | | | 6,800 | | | | 779,892 | |
Stericycle, Inc. (a) | | | 13,000 | | | | 1,001,520 | |
| | | | | | | | 2,623,128 | |
| Information Technology - 13.43% | | | | | | | | |
Alphabet, Inc. - Class C (a) | | | 1,030 | | | | 794,975 | |
| Apple, Inc. | | | 8,000 | | | | 926,560 | |
| Intel Corp. | | | 24,300 | | | | 881,361 | |
| Paychex, Inc. | | | 16,200 | | | | 986,256 | |
PayPal Holdings, Inc. (a) | | | 20,200 | | | | 797,294 | |
| Western Digital Corp. | | | 13,200 | | | | 896,940 | |
| | | | | | | | 5,283,386 | |
| Telecommunication Services - 1.82% | | | | | | | | |
| Verizon Communications, Inc. | | | 13,400 | | | | 715,292 | |
| | | | | | | | | |
| TOTAL COMMON STOCK (Cost $34,928,192) | | | | | | | 39,216,719 | |
| | | | | | | | | |
| MONEY MARKET SECURITIES - 0.32% | | | | | | | | |
Federated Government Obligations Fund - Institutional Shares, 0.40% (b) | | | 125,758 | | | | 125,758 | |
| | | | | | | | | |
| TOTAL MONEY MARKET SECURITIES (Cost $125,758) | | | | | | | 125,758 | |
| | | | | | | | | |
| TOTAL INVESTMENTS (Cost $35,053,950) - 100.01% | | | | | | $ | 39,342,477 | |
| LIABILITIES IN EXCESS OF OTHER ASSETS, NET - (0.01)% | | | | | | | (5,719 | ) |
| NET ASSETS - 100.00% | | | | | | $ | 39,336,758 | |
Percentages are stated as a percent of net assets.
(a) | Non-income producing security. |
(b) | Rate shown represents the 7-day yield at December 31, 2016, is subject to change and resets daily. |
See accompanying notes which are an integral part of these financial statements.
IMS STRATEGIC INCOME FUND
SCHEDULE OF INVESTMENTS
December 31, 2016 (Unaudited)
| COMMON STOCK - 26.78% | | Shares | | | Fair Value | |
| | | | | | | |
| Consumer Discretionary - 1.44% | | | | | | |
| Yum! Brands, Inc. | | | 1,700 | | | $ | 107,661 | |
| | | | | | | | | |
| Consumer Staples - 7.63% | | | | | | | | |
| Clorox Co. | | | 900 | | | | 108,018 | |
| Colgate-Palmolive Co. | | | 1,600 | | | | 104,704 | |
| General Mills, Inc. | | | 2,300 | | | | 142,071 | |
| Hormel Foods Corp. | | | 3,100 | | | | 107,911 | |
| Proctor & Gamble Co. | | | 1,300 | | | | 109,304 | |
| | | | | | | | 572,008 | |
| Energy - 3.92% | | | | | | | | |
| BP PLC - ADR | | | 4,000 | | | | 149,520 | |
| Exxon Mobil Corp. | | | 1,600 | | | | 144,416 | |
| | | | | | | | 293,936 | |
| Health Care - 4.88% | | | | | | | | |
| Abbott Laboratories | | | 2,800 | | | | 107,548 | |
| AbbVie, Inc. | | | 1,700 | | | | 106,454 | |
| Bristol-Myers Squibb Co. | | | 2,600 | | | | 151,944 | |
| | | | | | | | 365,946 | |
| Industrials - 1.89% | | | | | | | | |
| Raytheon Co. | | | 1,000 | | | | 142,000 | |
| | | | | | | | | |
| Real Estate - 1.62% | | | | | | | | |
| Apple Hospitality REIT, Inc. | | | 6,100 | | | | 121,878 | |
| | | | | | | | | |
| Telecommunication Services- 5.40% | | | | | | | | |
| AT&T, Inc. | | | 3,600 | | | | 153,108 | |
| CenturyLink, Inc. | | | 4,300 | | | | 102,254 | |
| Verizon Communications, Inc. | | | 2,800 | | | | 149,464 | |
| | | | | | | | 404,826 | |
| | | | | | | | | |
| TOTAL COMMON STOCK (Cost $1,999,630) | | | | | | | 2,008,255 | |
IMS STRATEGIC INCOME FUND
SCHEDULE OF INVESTMENTS
December 31, 2016 (Unaudited)
| CORPORATE BONDS - 4.63% | | Principal Amount | | | Fair Value | |
| | | | | | | |
Performance Drilling Co. LLC, 6.000%, 09/30/2022 (b) (e) (f) (g) (i) | | $ | 1,420,804 | | | $ | 191,524 | |
Sabine Oil & Gas Corp., 7.250%, 06/15/2019 (e) (g) | | | 1,375,000 | | | | 14 | |
Thornton Drilling Co., 5.000%, 06/15/2018 (b) (e) (f) (g) | | | 477,977 | | | | 155,247 | |
| | | | | | | | | |
| TOTAL CORPORATE BONDS (Cost $3,154,626) | | | | | | | 346,785 | |
| | | | | | | | | |
| FOREIGN BONDS DENOMINATED IN US DOLLARS - 11.57% | | | | | | | | |
| | | | | | | | | |
Cash Store Financial Services, Inc., 11.500%, 01/31/2017, 144A (b) (d) (e) (f) (g) (i) | | | 1,289,000 | | | | 114,258 | |
Newland International Properties Corp., 9.500%, 07/03/2017, 144A (d) (i) | | | 572,479 | | | | 143,120 | |
Newland International Properties Corp., 9.500%, 07/03/2017, Reg S (h) (i) | | | 349,168 | | | | 87,292 | |
Panama Canal Railway Co., 7.000%, 11/01/2026, Reg S (h) | | | 527,800 | | | | 522,522 | |
| | | | | | | | | |
| TOTAL FOREIGN BONDS DENOMINATED IN US DOLLARS (Cost $2,575,480) | | | | | | | 867,192 | |
| | | | | | | | | |
| STRUCTURED NOTES - 46.80% | | | | | | | | |
| | | | | | | | | |
Bank of Nova Scotia Callable Steepener Note Series A, 2.532%, 07/29/2033 (c) | | | 700,000 | | | | 522,620 | |
Barclays Bank PLC Callable Leveraged Steepener Note, 3.552%, 07/31/2034 (c) | | | 250,000 | | | | 201,562 | |
| Citigroup, Inc. Callable Barrier Range Accrual Index Linked Note, 8.000%, 01/30/2023 | | | 448,000 | | | | 439,488 | |
Credit Suisse AG Leveraged CMS Curve and Russell 2000 Index Linked Note, 9.160%, 07/31/2030 ( c ) | | | 450,000 | | | | 361,688 | |
JP Morgan Chase & Co. Callable Range Accrual Rate Linked Note, 10.000%, 05/06/2030 (c) | | | 500,000 | | | | 426,600 | |
Morgan Stanley Fixed to Floating Rate Leveraged CMS and Index Linked Note, 5.510%, 08/30/2028 (c) | | | 350,000 | | | | 265,125 | |
Morgan Stanley Senior Floating Rate Conversion CMS and Index Linked Note, 5.860%, 03/25/2031 (c) | | | 600,000 | | | | 534,000 | |
Natixis US Medium-Term Note Program LLC Callable Fixed-to Floating Capped Range Accrual Note, 8.015%, 10/31/2034 (c) | | | 500,000 | | | | 375,000 | |
SG Structured Products, Inc. Callable Fixed to Variable Barrier Range Dual Index Linked Note, 4.652%, 11/27/2028 (c) | | | 600,000 | | | | 383,220 | |
| | | | | | | | | |
| TOTAL STRUCTURED NOTES (Cost $4,286,234) | | | | | | | 3,509,303 | |
| | | | | | | | | |
| SECURED SUBORDINATED PROMISSORY NOTES - 4.90% | | | | | | | | |
Aequitas Commercial Finance, LLC Secured Subordinated Promissory Note, 11.000%, 07/28/2019, 144A (b) (d) (e) (f) (g) (i) | | | 750,000 | | | | 367,500 | |
| | | | | | | | | |
| TOTAL SECURED SUBORDINATED PROMISSORY NOTES (Cost $750,000) | | | | | | | 367,500 | |
IMS STRATEGIC INCOME FUND
SCHEDULE OF INVESTMENTS
December 31, 2016 (Unaudited)
| | | Principal Amount | | | Fair Value | |
| MONEY MARKET SECURITIES - 6.35% | | | | | | |
Federated Government Obligations Fund - Institutional Shares, 0.40% (a) | | | 476,183 | | | $ | 476,183 | |
| | | | | | | | | |
| TOTAL MONEY MARKET SECURITIES (Cost $476,183) | | | | | | | 476,183 | |
| | | | | | | | |
| | | | | | | | | |
| TOTAL INVESTMENTS (Cost $13,242,153) - 101.03% | | | | | | $ | 7,575,218 | |
| LIABILITIES IN EXCESS OF OTHER ASSETS, NET - (1.03)% | | | | | | | (77,301 | ) |
| NET ASSETS - 100.00% | | | | | | $ | 7,497,917 | |
Percentages are stated as a percent of net assets.
(a) | Variable rate security. Rate shown represents the 7-day yield at December 31, 2016 and resets daily. |
(b) | This security is currently valued by the Advisor using fair valuation procedures approved by the Board of Trustees under the oversight of the Fair Valuation Committee. |
(c) | Variable rate security. Rate shown represents the rate in effect at December 31, 2016. |
(d) | Security exempted from registration under Rule 144A of the Securities Act of 1933. The security may be resold in transactions exempt from registration, normally to qualified institutional investors. |
(e) | Non-income producing security. |
(f) | Security is illiquid at December 31, 2016, at which time the aggregate value of illiquid securities is $828,529 or 11.05% of net assets. |
(h) | Security exempted from registration under Regulation S of the Securities Act of 1933. |
(i) | Partial interest payments made during the six month period ended December 31, 2016. |
ADR - American Depositary Receipt.
See accompanying notes which are an integral part of these financial statements.
IMS DIVIDEND GROWTH FUND
SCHEDULE OF INVESTMENTS
December 31, 2016 (Unaudited)
| COMMON STOCK - 99.17% | | Shares | | | Fair Value | |
| | | | | | | |
| Consumer Discretionary - 10.53% | | | | | | |
| General Motors Co. | | | 9,000 | | | $ | 313,560 | |
| Sturm Ruger & Co., Inc. | | | 3,800 | | | | 200,260 | |
| TJX Cos., Inc. | | | 2,600 | | | | 195,338 | |
| Twenty-First Century Fox, Inc. - Class B | | | 9,500 | | | | 258,875 | |
| | | | | | | | 968,033 | |
| Consumer Staples - 12.45% | | | | | | | | |
| Altria Group, Inc. | | | 4,100 | | | | 277,242 | |
| Nestle SA - ADR | | | 4,200 | | | | 301,308 | |
| Philip Morris International, Inc. | | | 3,450 | | | | 315,640 | |
| Unilever NV - ADR | | | 6,100 | | | | 250,466 | |
| | | | | | | | 1,144,656 | |
| Energy - 8.18% | | | | | | | | |
| Halliburton Co. | | | 6,500 | | | | 351,585 | |
| Helmerich & Payne, Inc. | | | 2,500 | | | | 193,500 | |
| SM Energy Co. | | | 6,000 | | | | 206,880 | |
| | | | | | | | 751,965 | |
| Financials - 18.00% | | | | | | | | |
| Axis Capital Holdings Ltd. | | | 5,300 | | | | 345,931 | |
| CME Group, Inc. | | | 4,000 | | | | 461,400 | |
| M&T Bank Corp. | | | 3,000 | | | | 469,290 | |
PRA Group, Inc. (a) | | | 4,800 | | | | 187,680 | |
| S&P Global, Inc. | | | 1,775 | | | | 190,883 | |
| | | | | | | | 1,655,184 | |
| Health Care - 9.62% | | | | | | | | |
| Abbott Laboratories | | | 6,500 | | | | 249,665 | |
| AbbVie, Inc. | | | 4,800 | | | | 300,576 | |
| Johnson & Johnson | | | 2,900 | | | | 334,109 | |
| | | | | | | | 884,350 | |
| Industrials - 16.18% | | | | | | | | |
| Copa Holdings SA - Class A | | | 3,000 | | | | 272,490 | |
| Lockheed Martin Corp. | | | 1,700 | | | | 424,898 | |
| Parker-Hannifin Corp. | | | 1,800 | | | | 252,000 | |
| United Technologies Corp. | | | 2,600 | | | | 285,012 | |
Veritiv Corp. (a) | | | 4,700 | | | | 252,625 | |
| | | | | | | | 1,487,025 | |
IMS DIVIDEND GROWTH FUND
SCHEDULE OF INVESTMENTS
December 31, 2016 (Unaudited)
| COMMON STOCK - 99.17% (continued) | | Shares | | | Fair Value | |
| | | | | | | |
| Information Technology - 20.96% | | | | | | |
| Apple, Inc. | | | 2,900 | | | $ | 335,878 | |
| CDK Global, Inc. | | | 6,900 | | | | 411,861 | |
| Microsoft Corp. | | | 7,775 | | | | 483,139 | |
| QUALCOMM, Inc. | | | 5,350 | | | | 348,820 | |
| Sabre Corp. | | | 13,900 | | | | 346,805 | |
| | | | | | | | 1,926,503 | |
| Real Estate - 3.25% | | | | | | | | |
| Outfront Media, Inc. | | | 12,000 | | | | 298,440 | |
| | | | | | | | | |
| TOTAL COMMON STOCK (Cost $8,523,860) | | | | | | | 9,116,156 | |
| | | | | | | | | |
| MONEY MARKET SECURITIES - 0.15% | | | | | | | | |
Federated Government Obligations Fund - Institutional Shares, 0.40% (b) | | | 14,077 | | | | 14,077 | |
| | | | | | | | | |
| TOTAL MONEY MARKET SECURITIES (Cost $14,077) | | | | | | | 14,077 | |
| | | | | | | | | |
| TOTAL INVESTMENTS (Cost $8,537,937) - 99.32% | | | | | | $ | 9,130,233 | |
| OTHER ASSETS IN EXCESS OF LIABILITIES, NET - 0.68% | | | | | | | 62,184 | |
| NET ASSETS - 100.00% | | | | | | $ | 9,192,417 | |
Percentages are stated as a percent of net assets.
(a) | Non-income producing security. |
(b) | Rate shown represents the 7-day yield at December 31, 2016, is subject to change and resets daily. |
ADR - American Depositary Receipt.
See accompanying notes which are an integral part of these financial statements.
IMS FAMILY OF FUNDS
STATEMENTS OF ASSETS AND LIABILITIES
December 31, 2016 (Unaudited)
| | | IMS Capital Value Fund | | | IMS Strategic Income Fund | | | IMS Dividend Growth Fund | |
| Assets: | | | | | | | | | |
| Investments in securities: | | | | | | | | | |
| At cost | | $ | 35,053,950 | | | $ | 13,242,153 | | | $ | 8,537,937 | |
| At fair value | | $ | 39,342,477 | | | $ | 7,575,218 | | | $ | 9,130,233 | |
| Receivables: | | | | | | | | | | | | |
| Interest | | | 40 | | | | 73,923 | | | | 10 | |
| Dividends | | | 57,577 | | | | 22,542 | | | | 33,722 | |
| Fund shares sold | | | 325 | | | | - | | | | - | |
| Investments sold | | | - | | | | 585,966 | | | | 50,440 | |
| Prepaid expenses | | | 8,427 | | | | 6,838 | | | | 4,509 | |
| Total assets | | | 39,408,846 | | | | 8,264,487 | | | | 9,218,914 | |
| | | | | | | | | | | | | |
| Liabilities: | | | | | | | | | | | | |
| Payables: | | | | | | | | | | | | |
| Investments purchased | | | - | | | | 752,599 | | | | - | |
| Fund shares redeemed | | | 6,286 | | | | - | | | | 1,000 | |
| Due to advisor | | | 40,995 | | | | 2,508 | | | | 6,286 | |
| Due to administrator, fund accountant and transfer agent | | | 11,311 | | | | 4,784 | | | | 5,408 | |
| Accrued expenses | | | 13,496 | | | | 6,679 | | | | 13,803 | |
| Total liabilities | | | 72,088 | | | | 766,570 | | | | 26,497 | |
| Net Assets | | $ | 39,336,758 | | | $ | 7,497,917 | | | $ | 9,192,417 | |
| | | | | | | | | | | | | |
| Net Assets consist of: | | | | | | | | | | | | |
| Paid-in capital | | $ | 35,753,453 | | | $ | 64,172,685 | | | $ | 9,328,533 | |
| Accumulated net investment loss | | | (21,975 | ) | | | (2,003 | ) | | | 1,864 | |
| Accumulated net realized loss on investments | | | (683,247 | ) | | | (51,005,830 | ) | | | (730,276 | ) |
| Net unrealized appreciation (depreciation) on investments | | | 4,288,527 | | | | (5,666,935 | ) | | | 592,296 | |
| Total Net Assets | | $ | 39,336,758 | | | $ | 7,497,917 | | | $ | 9,192,417 | |
| | | | | | | | | | | | | |
| Shares outstanding (unlimited number of shares authorized, no par value) | | | 1,739,114 | | | | 2,411,767 | | | | 663,332 | |
| Net asset value and offering price per share | | $ | 22.62 | | | $ | 3.11 | | | $ | 13.86 | |
Minimum redemption price per share (a) | | $ | 22.51 | | | $ | 3.09 | | | $ | 13.79 | |
(a) | A redemption fee of 0.50% will be assessed on shares of the Fund that are redeemed within 90 days of purchase. |
See accompanying notes which are an integral part of these financial statements.
IMS FAMILY OF FUNDS
STATEMENTS OF OPERATIONS
For the Six Month Period Ended December 31, 2016 (Unaudited)
| | | IMS Capital Value Fund | | | IMS Strategic Income Fund | | | IMS Dividend Growth Fund | |
| | | | | | | | | | |
| Investment income: | | | | | | | | | |
| Dividends (net of foreign withholding taxes of $3, $421 and $0, respectively) | | $ | 334,434 | | | $ | 88,493 | | | $ | 120,569 | |
| Interest | | | 2,470 | | | | 349,857 | | | | 72 | |
| Total investment income | | | 336,904 | | | | 438,350 | | | | 120,641 | |
| | | | | | | | | | | | | |
| Expenses: | | | | | | | | | | | | |
Investment Advisor fees (a) | | | 240,420 | | | | 52,412 | | | | 56,414 | |
Accounting, administration and transfer agent fees and expenses (a) | | | 57,248 | | | | 19,779 | | | | 22,549 | |
| Registration expenses | | | 6,458 | | | | 5,593 | | | | 2,376 | |
| Miscellaneous expenses | | | 5,463 | | | | 5,075 | | | | 4,578 | |
| Shareholder networking fees | | | 5,546 | | | | 2,773 | | | | 1,008 | |
| Audit expenses | | | 7,741 | | | | 10,446 | | | | 7,903 | |
| Custodian expenses | | | 4,033 | | | | 6,050 | | | | 2,521 | |
| Trustee expenses | | | 5,798 | | | | 5,798 | | | | 5,798 | |
| Pricing expenses | | | 2,521 | | | | 4,789 | | | | 2,269 | |
| Insurance expenses | | | 575 | | | | 574 | | | | 717 | |
| Legal expenses | | | 1,765 | | | | 1,765 | | | | 2,269 | |
| Printing expenses | | | - | | | | - | | | | 1,512 | |
| Interest expenses | | | 45 | | | | 870 | | | | 151 | |
| Total expenses | | | 337,613 | | | | 115,924 | | | | 110,065 | |
Less: Fees waived by Advisor (a) | | | - | | | | (34,162 | ) | | | (22,845 | ) |
| Net expenses | | | 337,613 | | | | 81,762 | | | | 87,220 | |
| | | | | | | | | | | | | |
| Net Investment Income (Loss) | | | (709 | ) | | | 356,588 | | | | 33,421 | |
| | | | | | | | | | | | | |
| Realized and unrealized gain (loss): | | | | | | | | | | | | |
| Net realized gain (loss) on investment securities | | | 3,419,933 | | | | (1,176,072 | ) | | | (10,203 | ) |
| Change in unrealized appreciation (depreciation) on investment securities and foreign currency | | | (1,451,705 | ) | | | 839,763 | | | | 836,284 | |
| Net realized and unrealized gain (loss) on investment securities and foreign currency | | | 1,968,228 | | | | (336,309 | ) | | | 826,081 | |
| | | | | | | | | | | | | |
| | | | | | | | | | | | | |
| Net Increase in Net Assets Resulting from Operations | | $ | 1,967,519 | | | $ | 20,279 | | | $ | 859,502 | |
(a) | See Note 4 in the Notes to Financial Statements. |
See accompanying notes which are an integral part of these financial statements.
IMS STRATEGIC INCOME FUND
STATEMENT OF CASH FLOWS
For the Six Month Period Ended December 31, 2016 (Unaudited)
| Increase (decrease) in cash: | | | |
| Cash flows from operating activities: | | | |
| Net increase in net assets from operations | | $ | 20,279 | |
| Adjustments to reconcile net decrease in net assets from operations to net cash provided from operating activities: | | | | |
| Accretion of discount/Amortization of premium, net | | | (70,180 | ) |
| Purchase of investment securities | | | (14,022,938 | ) |
| Proceeds from disposition of investment securities | | | 15,142,796 | |
| Purchases of short-term investment securities, net | | | (278,755 | ) |
| Decrease in dividends and interest receivable | | | 61,723 | |
| Increase in receivables for securities sold | | | (290,808 | ) |
| Decrease in prepaid expenses | | | 1,818 | |
| Decrease in payable for securities purchased | | | 752,599 | |
| Decrease in accrued expenses | | | (17,817 | ) |
| Net unrealized depreciation on investment securities and foreign currency | | | (839,763 | ) |
| Net realized loss on investment securities | | | 1,186,348 | |
| Net cash provided from operating activities | | | 1,645,302 | |
| | | | | |
| Cash flows from financing activities: | | | | |
| Proceeds from loan | | | 1,925,000 | |
| Payments on loan | | | (2,112,000 | ) |
| Proceeds from Fund shares sold | | | 342,823 | |
| Payment on Fund shares redeemed | | | (1,749,125 | ) |
| Cash distributions paid | | | (52,000 | ) |
| Net cash used in financing activities | | | (1,645,302 | ) |
| | | | | |
| Net decrease in cash | | $ | - | |
| | | | | |
| Cash: | | | | |
| Beginning of period | | $ | - | |
| End of period | | $ | - | |
Supplemental disclosure of cash flow information:
Noncash financing activities not included herein consist of reinvestment of distributions of $360,882, an decrease in receivable for fund shares sold of $500 and an decrease in payable for Fund shares redeemed of $71,219.
Interest paid by the Fund for outstanding balances on the line of credit amounted to $870.
See accompanying notes which are an integral part of these financial statements.
IMS CAPITAL VALUE FUND
STATEMENTS OF CHANGES IN NET ASSETS
| | | Six Month Period Ended December 31, 2016 | | | Year Ended June 30, 2016 | |
| Increase (Decrease) in Net Assets due to: | | | | | | |
| Operations: | | | | | | |
| Net investment loss | | $ | (709 | ) | | $ | (75,693 | ) |
| Net realized gain (loss) on investment securities | | | 3,419,933 | | | | (2,482,555 | ) |
| Change in unrealized depreciation on investment securities | | | (1,451,705 | ) | | | (249,635 | ) |
| Net increase (decrease) in net assets resulting from operations | | | 1,967,519 | | | | (2,807,883 | ) |
| | | | | | | | | |
| Capital share transactions: | | | | | | | | |
| Proceeds from shares purchased | | | 404,259 | | | | 5,800,832 | |
| Amount paid for shares redeemed | | | (1,718,425 | ) | | | (5,026,135 | ) |
| Proceeds from redemption fees | | | 356 | | | | 556 | |
| Net increase (decrease) in net assets from share transactions | | | (1,313,810 | ) | | | 775,253 | |
| | | | | | | | | |
| Total Increase (Decrease) in Net Assets | | | 653,709 | | | | (2,032,630 | ) |
| | | | | | | | | |
| Net Assets: | | | | | | | | |
| Beginning of year/period | | | 38,683,049 | | | | 40,715,679 | |
| | | | | | | | | |
| End of year/period | | $ | 39,336,758 | | | $ | 38,683,049 | |
| Accumulated net investment loss included in net assets at end of year/period | | $ | (21,975 | ) | | $ | (21,266 | ) |
| | | | | | | | | |
| Capital Share Transactions | | | | | | | | |
| Shares purchased | | | 18,170 | | | | 277,553 | |
| Shares issued in reinvestment of distributions | | | - | | | | - | |
| Shares redeemed | | | (76,909 | ) | | | (237,550 | ) |
| Net increase (decrease) in capital shares | | | (58,739 | ) | | | 40,003 | |
See accompanying notes which are an integral part of these financial statements.
IMS STRATEGIC INCOME FUND
STATEMENTS OF CHANGES IN NET ASSETS
| | | Six Month Period Ended December 31, 2016 | | | Year Ended June 30, 2016 | |
| Increase (Decrease) in Net Assets due to: | | | | | | |
| Operations: | | | | | | |
| Net investment income | | $ | 356,588 | | | $ | 1,205,697 | |
| Net realized loss on investment securities and foreign currency | | | (1,176,072 | ) | | | (3,585,379 | ) |
| Change in unrealized appreciation (depreciation) on investment securities and foreign currency | | | 839,763 | | | | (1,221,438 | ) |
| Net increase (decrease) in net assets resulting from operations | | | 20,279 | | | | (3,601,120 | ) |
| | | | | | | | | |
| Distributions | | | | | | | | |
| From net investment income | | | (412,882 | ) | | | (1,151,406 | ) |
| Total distributions | | | (412,882 | ) | | | (1,151,406 | ) |
| | | | | | | | | |
| Capital share transactions: | | | | | | | | |
| Proceeds from shares purchased | | | 342,323 | | | | 533,027 | |
| Reinvestment of distributions | | | 360,882 | | | | 1,030,775 | |
| Amount paid for shares redeemed | | | (1,678,056 | ) | | | (8,811,098 | ) |
| Proceeds from redemption fees | | | 150 | | | | 336 | |
| Net decrease in net assets from share transactions | | | (974,701 | ) | | | (7,246,960 | ) |
| | | | | | | | | |
| Total Decrease in Net Assets | | | (1,367,304 | ) | | | (11,999,486 | ) |
| | | | | | | | | |
| Net Assets: | | | | | | | | |
| Beginning of year/period | | | 8,865,221 | | | | 20,864,707 | |
| | | | | | | | | |
| End of year/period | | $ | 7,497,917 | | | $ | 8,865,221 | |
| Undistributed (accumulated) net investment income (loss) included in net assets at end of year/period | | $ | (2,003 | ) | | $ | 54,291 | |
| | | | | | | | | |
| Capital Share Transactions | | | | | | | | |
| Shares purchased | | | 104,119 | | | | 150,061 | |
| Shares issued in reinvestment of distributions | | | 111,880 | | | | 276,969 | |
| Shares redeemed | | | (518,966 | ) | | | (2,322,167 | ) |
| Net decrease in capital shares | | | (302,967 | ) | | | (1,895,137 | ) |
See accompanying notes which are an integral part of these financial statements.
IMS DIVIDEND GROWTH FUND
STATEMENTS OF CHANGES IN NET ASSETS
| | | Six Month Period Ended December 31, 2016 | | | Year Ended June 30, 2016 | |
| Increase (Decrease) in Net Assets due to: | | | | | | |
| Operations: | | | | | | |
| Net investment income | | $ | 33,421 | | | $ | 77,236 | |
| Net realized loss on investment securities | | | (10,203 | ) | | | (103,303 | ) |
| Change in unrealized appreciation (depreciation) on investment securities | | | 836,284 | | | | (252,790 | ) |
| Net increase (decrease) in net assets resulting from operations | | | 859,502 | | | | (278,857 | ) |
| | | | | | | | | |
| Distributions | | | | | | | | |
| From net investment income | | | (33,195 | ) | | | (78,680 | ) |
| Total distributions | | | (33,195 | ) | | | (78,680 | ) |
| | | | | | | | | |
| Capital share transactions: | | | | | | | | |
| Proceeds from shares purchased | | | 92,579 | | | | 540,706 | |
| Reinvestment of distributions | | | 33,121 | | | | 78,488 | |
| Amount paid for shares redeemed | | | (235,202 | ) | | | (2,076,942 | ) |
| Proceeds from redemption fees | | | 104 | | | | 39 | |
| Net decrease in net assets from share transactions | | | (109,398 | ) | | | (1,457,709 | ) |
| | | | | | | | | |
| Total Increase (Decrease) in Net Assets | | | 716,909 | | | | (1,815,246 | ) |
| | | | | | | | | |
| Net Assets: | | | | | | | | |
| Beginning of year/period | | | 8,475,508 | | | | 10,290,754 | |
| | | | | | | | | |
| End of year/period | | $ | 9,192,417 | | | $ | 8,475,508 | |
| Accumulated undistributed net investment income included in net assets at end of year/period | | $ | 1,864 | | | $ | 1,638 | |
| | | | | | | | | |
| Capital Share Transactions | | | | | | | | |
| Shares purchased | | | 6,970 | | | | 44,427 | |
| Shares issued in reinvestment of distributions | | | 2,412 | | | | 6,466 | |
| Shares redeemed | | | (17,531 | ) | | | (169,365 | ) |
| Net decrease in capital shares | | | (8,149 | ) | | | (118,472 | ) |
See accompanying notes which are an integral part of these financial statements.
IMS CAPITAL VALUE FUND
FINANCIAL HIGHLIGHTS
For a Fund share outstanding throughout each year/period
| | | Six Month Period Ended December 31, 2016 | | | | Year Ended June 30, 2016 | | | Year Ended June 30, 2015 | | | Year Ended June 30, 2014 | | | Year Ended June 30, 2013 | | | Year Ended June 30, 2012 | | |
| | | (Unaudited) | | | | | | | | | | | | | | | | | | |
| | | | | | | | | | | | | | | | | | | | | |
| Net Asset Value, Beginning of Year/Period | | $ | 21.52 | | | | $ | 23.16 | | | $ | 21.10 | | | $ | 17.62 | | | $ | 14.99 | | | $ | 17.11 | | |
| | | | | | | | | | | | | | | | | | | | | | | | | | | |
| Investment Operations: | | | | | | | | | | | | | | | | | | | | | | | | | | |
| Net investment income (loss) | | | - | | (b) | | | (0.04 | ) | | | (0.04 | ) | | | (0.10 | ) | | | 0.01 | | | | (0.07 | ) | (a) |
| Net realized and unrealized gain (loss) on investments | | | 1.10 | | | | | (1.60 | ) | | | 2.10 | | | | 3.58 | | | | 2.62 | | | | (2.05 | ) | |
| Total from investment operations | | | 1.10 | | | | | (1.64 | ) | | | 2.06 | | | | 3.48 | | | | 2.63 | | | | (2.12 | ) | |
| | | | | | | | | | | | | | | | | | | | | | | | | | | |
Paid in capital from redemption fees (c) | | | - | | | | | - | | | | - | | | | - | | | | - | | | | - | | |
| | | | | | | | | | | | | | | | | | | | | | | | | | | |
| Net Asset Value, End of Year/Period | | $ | 22.62 | | | | $ | 21.52 | | | $ | 23.16 | | | $ | 21.10 | | | $ | 17.62 | | | $ | 14.99 | | |
| | | | | | | | | | | | | | | | | | | | | | | | | | | |
Total Return (d) | | | 5.11 | % | (e) | | | (7.08 | )% | | | 9.76 | % | | | 19.75 | % | | | 17.54 | % | | | (12.39 | )% | |
| | | | | | | | | | | | | | | | | | | | | | | | | | | |
| Ratios/Supplemental Data | | | | | | | | | | | | | | | | | | | | | | | | | | |
| Net assets, end of year/period (in 000's) | | $ | 39,337 | | | | $ | 38,683 | | | $ | 40,716 | | | $ | 40,262 | | | $ | 35,031 | | | $ | 40,283 | | |
| | | | | | | | | | | | | | | | | | | | | | | | | | | |
| Ratio of expenses to average net assets: | | | 1.70 | % | (f) | | | 1.69 | % | | | 1.74 | % | | | 2.05 | % | | | 2.06 | % | | | 1.87 | % | |
| | | | | | | | | | | | | | | | | | | | | | | | | | | |
| Ratio of net investment income (loss) to average net assets: | | | 0.00 | % | (f) | | | (0.19 | )% | | | (0.17 | )% | | | (0.50 | )% | | | 0.12 | % | | | (0.46 | )% | |
| | | | | | | | | | | | | | | | | | | | | | | | | | | |
| Portfolio turnover rate | | | 51.44 | % | (e) | | | 64.78 | % | | | 62.98 | % | | | 110.42 | % | | | 146.53 | % | | | 98.21 | % | |
(a) | Per share net investment income (loss) has been calculated using the average shares method. |
(b) | Net investment loss resulted in less than $0.005 per share during the six month period ended December 31, 2016. |
(c) | Redemption fees resulted in less than $0.005 per share. |
(d) | Total return in the above table represents the rate that the investor would have earned or lost on an investment in the Fund assuming reinvestment of dividends. |
IMS STRATEGIC INCOME FUND
FINANCIAL HIGHLIGHTS
For a Fund share outstanding throughout each year/period
| | | Six Month Period Ended December 31, 2016 | | | | Year Ended June 30, 2016 | | | | Year Ended June 30, 2015 | | | | Year Ended June 30, 2014 | | | | Year Ended June 30, 2013 | | | | Year Ended June 30, 2012 | |
| | | (Unaudited) | | | | | | | | | | | | | | | | | | | | | |
| | | | | | | | | | | | | | | | | | | | | | | | |
| Net Asset Value, Beginning of Year/Period | | $ | 3.27 | | | | $ | 4.53 | | | | $ | 5.95 | | | | $ | 6.11 | | | | $ | 6.08 | | | | $ | 6.89 | |
| | | | | | | | | | | | | | | | | | | | | | | | | | | | | | |
| Investment Operations: | | | | | | | | | | | | | | | | | | | | | | | | | | | | | |
| Net investment income | | | 0.14 | | | | | 0.35 | | | | | 0.45 | | | | | 0.56 | | | | | 0.59 | | | | | 0.62 | |
| Net realized and unrealized gain (loss) on investments and foreign currency | | | (0.14 | ) | | | | (1.28 | ) | | | | (1.37 | ) | | | | (0.15 | ) | | | | 0.01 | | (a) | | | (0.82 | ) |
| Total from investment operations | | | - | | | | | (0.93 | ) | | | | (0.92 | ) | | | | 0.41 | | | | | 0.60 | | | | | (0.20 | ) |
| | | | | | | | | | | | | | | | | | | | | | | | | | | | | | |
| Less Distributions to shareholders: | | | | | | | | | | | | | | | | | | | | | | | | | | | | | |
| From net investment income | | | (0.16 | ) | | | | (0.33 | ) | | | | (0.39 | ) | | | | (0.57 | ) | | | | (0.56 | ) | | | | (0.60 | ) |
| Tax return of capital | | | - | | | | | - | | | | | (0.11 | ) | | | | - | | | | | (0.01 | ) | | | | (0.01 | ) |
| Total distributions | | | (0.16 | ) | | | | (0.33 | ) | | | | (0.50 | ) | | | | (0.57 | ) | | | | (0.57 | ) | | | | (0.61 | ) |
| | | | | | | | | | | | | | | | | | | | | | | | | | | | | | |
Paid in capital from redemption fees (b) | | | - | | | | | - | | | | | - | | | | | - | | | | | - | | | | | - | |
| | | | | | | | | | | | | | | | | | | | | | | | | | | | | | |
| Net Asset Value, End of Year/Period | | $ | 3.11 | | | | $ | 3.27 | | | | $ | 4.53 | | | | $ | 5.95 | | | | $ | 6.11 | | | | $ | 6.08 | |
| | | | | | | | | | | | | | | | | | | | | | | | | | | | | | |
Total Return (c) | | | (0.07 | )% | (i) | | | (20.99 | )% | | | | (16.13 | )% | | | | 7.00 | % | | | | 10.02 | % | | | | (2.59 | )% |
| | | | | | | | | | | | | | | | | | | | | | | | | | | | | | |
| Ratios/Supplemental Data | | | | | | | | | | | | | | | | | | | | | | | | | | | | | |
| Net assets, end of year/period (in 000's) | | $ | 7,498 | | | | $ | 8,865 | | | | $ | 20,865 | | | | $ | 37,805 | | | | $ | 38,945 | | | | $ | 34,026 | |
| | | | | | | | | | | | | | | | | | | | | | | | | | | | | | |
| Ratio of expenses to average net assets: | | | 1.97 | % | (h)(j) | | | 1.98 | % | (g) | | | 1.96 | % | (f) | | | 1.94 | % | (e) | | | 1.95 | % | (d) | | | 2.01 | % |
| Ratio of expenses to average net assets before waiver & reimbursement: | | | 2.80 | % | (h)(j) | | | 2.25 | % | (g) | | | 1.92 | % | (f) | | | 2.12 | % | | | | 2.06 | % | | | | 2.01 | % |
| | | | | | | | | | | | | | | | | | | | | | | | | | | | | | |
| Ratio of net investment income to average net assets: | | | 8.60 | % | (h)(j) | | | 9.13 | % | (g) | | | 8.94 | % | (f) | | | 9.27 | % | (e) | | | 9.27 | % | (d) | | | 9.90 | % |
| Ratio of net investment income to average net assets before waiver & reimbursement: | | | 7.77 | % | (h)(j) | | | 8.85 | % | (g) | | | 8.90 | % | (f) | | | 9.08 | % | | | | 9.16 | % | | | | 9.90 | % |
| | | | | | | | | | | | | | | | | | | | | | | | | | | | | | |
| Portfolio turnover rate | | | 181.18 | % | (i) | | | 394.23 | % | | | | 562.40 | % | | | | 371.35 | % | | | | 389.36 | % | | | | 392.81 | % |
(a) | Realized and unrealized gains and losses per share in this caption are balancing amounts necessary to reconcile the changes in net assets value per share for the period, and may not reconcile with the aggregate gains and losses in the statement of operations. |
(b) | Redemption fees resulted in less than $0.005 per share. |
(c) | Total return in the above table represents the rate that the investor would have earned or lost on an investment in the Fund assuming reinvestment of dividends. |
(d) | Effective November 1, 2012, the Advisor agreed to waive fees to maintain Fund expenses at 1.89% (excluding brokerage fees and commissions; borrowing costs, such as (a) interest and (b) dividend expenses on securities sold short; taxes; any indirect expenses, such as acquired fund fees and expenses; any 12b-1 fees; and extraordinary litigation expenses). |
(e) | Effective November 1, 2013, the Advisor agreed to waive fees to maintain Fund expenses at 1.95% (excluding brokerage fees and commissions; borrowing costs, such as (a) interest and (b) dividend expenses on securities sold short; taxes; any indirect expenses, such as acquired fund fees and expenses; any 12b-1 fees; and extraordinary litigation expenses). |
(f) | The ratios include 0.01% of interest expense during the year ended June 30, 2015. |
(g) | The ratios include 0.03% of interest expense during the year ended June 30, 2016. |
(h) | The ratios include 0.02% of interest expense during the six month period ended December 31, 2016. |
See accompanying notes which are an integral part of these financial statements.
IMS DIVIDEND GROWTH FUND
FINANCIAL HIGHLIGHTS
For a Fund share outstanding throughout each year/period
| | | Six Month Period Ended December 31, 2016 | | | | Year Ended June 30, 2016 | | | | Year Ended June 30, 2015 | | | Year Ended June 30, 2014 | | | Year Ended June 30, 2013 | | | Year Ended June 30, 2012 | | |
| | | (Unaudited) | | | | | | | | | | | | | | | | | | | |
| | | | | | | | | | | | | | | | | | | | | | |
| Net Asset Value, Beginning of Year/Period | | $ | 12.62 | | | | $ | 13.03 | | | | $ | 12.44 | | | $ | 10.96 | | | $ | 9.73 | | | $ | 9.85 | | |
| | | | | | | | | | | | | | | | | | | | | | | | | | | | |
| Investment Operations: | | | | | | | | | | | | | | | | | | | | | | | | | | | |
| Net investment income | | | 0.05 | | | | | 0.11 | | | | | 0.09 | | | | 0.16 | | | | 0.30 | | | | 0.25 | | |
| Net realized and unrealized gain (loss) on investments | | | 1.24 | | | | | (0.41 | ) | | | | 0.59 | | | | 1.46 | | | | 1.44 | | | | (0.17 | ) | |
| Total from investment operations | | | 1.29 | | | | | (0.30 | ) | | | | 0.68 | | | | 1.62 | | | | 1.74 | | | | 0.08 | | |
| | | | | | | | | | | | | | | | | | | | | | | | | | | | |
| Less Distributions to shareholders: | | | | | | | | | | | | | | | | | | | | | | | | | | | |
| From net investment income | | | (0.05 | ) | | | | (0.11 | ) | | | | (0.09 | ) | | | (0.14 | ) | | | (0.38 | ) | | | (0.20 | ) | |
| Tax return of capital | | | - | | | | | - | | | | | - | | | | - | | | | (0.13 | ) | | | - | | |
| Total distributions | | | (0.05 | ) | | | | (0.11 | ) | | | | (0.09 | ) | | | (0.14 | ) | | | (0.51 | ) | | | (0.20 | ) | |
| | | | | | | | | | | | | | | | | | | | | | | | | | | | |
Paid in capital from redemption fees (a) | | | - | | | | | - | | | | | - | | | | - | | | | - | | | | - | | |
| | | | | | | | | | | | | | | | | | | | | | | | | | | | |
| Net Asset Value, End of Year/Period | | $ | 13.86 | | | | $ | 12.62 | | | | $ | 13.03 | | | $ | 12.44 | | | $ | 10.96 | | | $ | 9.73 | | |
| | | | | | | | | | | | | | | | | | | | | | | | | | | | |
Total Return (b) | | | 10.23 | % | (e) | | | (2.27 | )% | | | | 5.48 | % | | | 14.88 | % | | | 18.10 | % | | | 0.86 | % | |
| | | | | | | | | | | | | | | | | | | | | | | | | | | | |
| Ratios/Supplemental Data | | | | | | | | | | | | | | | | | | | | | | | | | | | |
| Net assets, end of year/period (in 000's) | | $ | 9,192 | | | | $ | 8,476 | | | | $ | 10,291 | | | $ | 8,670 | | | $ | 8,000 | | | $ | 7,881 | | |
| | | | | | | | | | | | | | | | | | | | | | | | | | | | |
| Ratio of expenses to average net assets: | | | 1.95 | % | (f) | | | 1.96 | % | (d) | | | 1.95 | % | | | 1.96 | % | | | 1.97 | % | | | 2.09 | % | (c) |
| Ratio of expenses to average net assets before waiver & reimbursement: | | | 2.46 | % | (f) | | | 2.37 | % | (d) | | | 2.50 | % | | | 2.50 | % | | | 2.43 | % | | | 2.25 | % | |
| | | | | | | | | | | | | | | | | | | | | | | | | | | | |
| Ratio of net investment income to average net assets: | | | 0.75 | % | (f) | | | 0.85 | % | (d) | | | 0.69 | % | | | 1.39 | % | | | 2.85 | % | | | 2.51 | % | (c) |
| Ratio of net investment income to average net assets before waiver & reimbursement: | | | 0.24 | % | (f) | | | 0.44 | % | (d) | | | 0.14 | % | | | 0.86 | % | | | 2.39 | % | | | 2.35 | % | |
| | | | | | | | | | | | | | | | | | | | | | | | | | | | |
| Portfolio turnover rate | | | 5.19 | % | (e) | | | 6.63 | % | | | | 86.92 | % | | | 240.61 | % | | | 97.55 | % | | | 47.08 | % | |
(a) | Redemption fees resulted in less than $0.005 per share. |
(b) | Total return in the above table represents the rate that the investor would have earned or lost on an investment in the Fund assuming reinvestment of dividends. |
(c) | Effective September 1, 2011, the Advisor agreed to waive fees to maintain Fund expenses at 1.95% (excluding brokerage fees and commissions; borrowing costs, such as (a) interest and (b) dividend expenses on securities sold short; taxes; any indirect expenses, such as acquired fund fees and expenses; any 12b-1 fees; and extraordinary litigation expenses). Prior to that date, the Fund did not have an expense cap. |
(d) | The ratios include 0.01% of interest expense during the year ended June 30, 2016. |
See accompanying notes which are an integral part of these financial statements.
IMS FAMILY OF FUNDS
NOTES TO THE FINANCIAL STATEMENTS
December 31, 2016 (Unaudited)
NOTE 1. ORGANIZATION
The IMS Family of Funds (the "Funds"), comprising the IMS Capital Value Fund (the "Value Fund"), IMS Strategic Income Fund (the "Income Fund") and IMS Dividend Growth Fund (the "Dividend Growth Fund"), were each organized as a diversified series of 360 Funds (the "Trust") on June 20, 2014. The Trust was organized on February 24, 2005 as a Delaware statutory trust. The Trust is registered as an open-end management investment company under the Investment Company Act of 1940 (the "1940 Act"). The investment objective of the Value Fund is to provide long-term growth from capital appreciation and secondarily, income from dividends. The investment objective of the Income Fund is to provide current income and secondarily, capital appreciation. The investment objective of the Dividend Growth Fund is to provide long-term growth from capital appreciation and dividends. The investment advisor of each Fund is IMS Capital Management, Inc. (the "Advisor").
NOTE 2. SIGNIFICANT ACCOUNTING POLICIES
The following is a summary of significant accounting policies followed by each Fund in the preparation of its financial statements. The Funds are investment companies and accordingly follow the investment company accounting and reporting guidance of the Financial Accounting Standards Board ("FASB") Accounting Standards Codification Topic 946 applicable to investment companies.
Securities Valuations – All investments in securities are recorded at their estimated fair value as described in Note 3.
Foreign Currency – Investment securities denominated in foreign currencies are translated into U.S. dollar amounts at the date of valuation. Purchases and sales of investment securities and income and expense items denominated in foreign currencies are translated into U.S. dollar amounts on the respective dates of such transactions. Reported net realized foreign exchange gains or losses arise from currency gains or losses realized between the trade and settlement dates on securities transactions, and the difference between the amounts of dividends, interest and foreign withholding taxes recorded on the Funds' books and the U.S. dollar equivalent of the amounts actually received or paid. The Funds do not isolate that portion of the results of operations resulting from changes in foreign exchange rates on investments from the fluctuations arising from changes in market prices of securities. Such fluctuations are included with the net realized and unrealized gain or loss from investments.
Reverse Convertible Bonds – The Funds may invest in reverse convertible notes, which are short-term notes (i.e., with maturities of one year or less) that are linked to individual equity securities. These notes make regular interest payments by the issuer, but also have a put option attached, giving the issuer the right to exercise that option only if the price of the related security drops below a stated price.
Structured notes, such as reverse convertible notes, are subject to a number of fixed income risks including general market risk, interest rate risk, as well as the risk that the issuer on the note may fail to make interest and/ or principal payments when due, or may default on its obligations entirely. In addition, as a result of imbedded derivative features in these securities, structured notes generally are subject to more risk than investing in a simple note or bond issued by the same issuer.
IMS FAMILY OF FUNDS
NOTES TO THE FINANCIAL STATEMENTS – (continued)
December 31, 2016 (Unaudited)
NOTE 2. SIGNIFICANT ACCOUNTING POLICIES (continued)
Federal Income Taxes – The Funds make no provision for federal income or excise tax. The Funds intend to qualify each year as regulated investment companies ("RICs") under subchapter M of the Internal Revenue Code of 1986, as amended, by complying with the requirements applicable to RICs and by distributing substantially all of their taxable income. The Funds also intend to distribute sufficient net investment income and net capital gains, if any, so that they will not be subject to excise tax on undistributed income and gains. If the required amount of net investment income or gains is not distributed, the Funds could incur a tax expense.
As of and during the fiscal year ended June 30, 2016, the Funds did not have a liability for any unrecognized tax benefits. The Funds recognize interest and penalties, if any, related to unrecognized tax benefits as income tax expense in the statement of operations. During the fiscal year ended June 30, 2016, the Funds did not incur any interest or penalties. The Funds are not subject to examination by U.S. federal tax authorities for tax years prior to 2013.
Expenses – Expenses incurred by the Trust that do not relate to a specific fund of the Trust are allocated to the individual funds based on each Fund's relative net assets or another appropriate basis (as determined by the Board of Trustees (the "Board")).
Security Transactions and Related Income – Each Fund follows industry practice and records security transactions on the trade date for financial reporting purposes. The first in, first out method is used for determining gains or losses for financial statements and income tax purposes. Dividend income is recorded on the ex-dividend date and interest income is recorded on an accrual basis. Dividend income from real estate investment trusts (REITS) and distributions from limited partnerships are recognized on the ex-date and included in dividend income. The calendar year-end classification of distributions received from REITS during the fiscal year are reported subsequent to year end; accordingly, the Funds estimate the character of REIT distributions based on the most recent information available. Income or loss from limited partnerships is reclassified in the components of net assets upon receipt of K-1's. Withholding taxes on foreign dividends have been provided for in accordance with each Fund's understanding of the applicable country's tax rules and rates. Discounts and premiums on securities purchased are amortized or accreted using the effective interest method. For bonds that miss a scheduled interest payment, after the grace period, all interest accrued on the bond is written off and no additional interest will be accrued. However, for illiquid bonds or those bonds fair valued by the Advisor, if the Advisor's research indicates a high recovery rate in restructuring, and the Fund expects to hold the bond until the issue is restructured, past due interest may not be written off in its entirety. The ability of issuers of debt securities held by the Funds to meet their obligations may be affected by economic and political developments in a specific country or region.
IMS FAMILY OF FUNDS
NOTES TO THE FINANCIAL STATEMENTS – (continued)
December 31, 2016 (Unaudited)
NOTE 2. SIGNIFICANT ACCOUNTING POLICIES (continued)
Dividends and Distributions – The Income Fund intends to distribute substantially all of its net investment income as dividends to its shareholders on a monthly basis. The Value Fund and Dividend Growth Fund intend to distribute substantially all of their net investment income as dividends to their shareholders on at least an annual basis. Each Fund intends to distribute its net realized long-term capital gains and its net realized short-term capital gains at least once a year. Dividends to shareholders, which are determined in accordance with income tax regulations, are recorded on the ex-dividend date. The treatment for financial reporting purposes of distributions made to shareholders during the year from net investment income or net realized capital gains may differ from their ultimate treatment for federal income tax purposes. These differences are caused primarily by differences in the timing of the recognition of certain components of income, expense or realized capital gain for federal income tax purposes. Where such differences are permanent in nature, they are reclassified in the components of the net assets based on their ultimate characterization for federal income tax purposes. Any such reclassifications will have no effect on net assets, results of operations or net asset values per share of the Funds. No such reclassifications were made during the six month period ended December 31, 2016.
NOTE 3. SECURITIES VALUATION AND FAIR VALUE MEASUREMENTS
Fair value is defined as the price that a Fund would receive upon selling an investment in an orderly transaction to an independent buyer in the principal or most advantageous market of the investment. Accounting principles generally accepted in the United States of America ("GAAP") establishes a three-tier hierarchy to maximize the use of observable market data and minimize the use of unobservable inputs and to establish classification of fair value measurements for disclosure purposes.
Inputs refer broadly to the assumptions that market participants would use in pricing the asset or liability, including assumptions about risk (the risk inherent in a particular valuation technique used to measure fair value such as a pricing model and/or the risk inherent in the inputs to the valuation technique). Inputs may be observable or unobservable. Observable inputs are inputs that reflect the assumptions market participants would use in pricing the asset or liability developed based on market data obtained from sources independent of the reporting entity. Unobservable inputs are inputs that reflect the reporting entity's own assumptions about the assumptions market participants would use in pricing the asset or liability developed based on the best information available in the circumstances.
Various inputs are used in determining the value of each Fund's investments. These inputs are summarized in the three broad levels listed below.
| | • | Level 1 – quoted prices in active markets for identical securities |
| | • | Level 2 – other significant observable inputs (including, but not limited to, quoted prices for an identical security in an inactive market, quoted prices for similar securities, interest rates, prepayment speeds, credit risk, etc.) |
| | • | Level 3 – significant unobservable inputs (including each Fund's own assumptions in determining fair value of investments based on the best information available) |
The inputs used to measure fair value may fall into different levels of the fair value hierarchy. In such cases, for disclosure purposes, the level in the fair value hierarchy within which the fair value measurement falls in its entirety, is determined based on the lowest level input that is significant to the fair value measurement in its entirety.
IMS FAMILY OF FUNDS
NOTES TO THE FINANCIAL STATEMENTS – (continued)
December 31, 2016 (Unaudited)
NOTE 3. SECURITIES VALUATION AND FAIR VALUE MEASUREMENTS (continued)
Equity securities, including common stock, real estate investment trusts, and preferred securities, are generally valued by using market quotations, but may be valued on the basis of prices furnished by a pricing service when the Advisor believes such prices more accurately reflect the fair value of such securities. Securities that are traded on any stock exchange are generally valued by the pricing service at the last quoted sale price. Lacking a last sale price, an exchange traded security is generally valued by the pricing service at its last bid price.
Securities traded in the NASDAQ over-the-counter market are generally valued by the pricing service at the NASDAQ Official Closing Price. When using the market quotations or close prices provided by the pricing service and when the market is considered active, the security will be classified as a Level 1 security. Sometimes, an equity security owned by a Fund will be valued by the pricing service with factors other than market quotations or when the market is considered inactive. When this happens, the security will be classified as a Level 2 security.
Investments in mutual funds, including money market mutual funds, are generally priced at the ending net asset value (NAV) provided by the service agent of the mutual funds. These securities will be categorized as Level 1 securities.
Fixed income securities such as corporate bonds, municipal bonds, reverse convertible bonds, and foreign bonds denominated in U.S. dollars, when valued using market quotations in an active market, will be categorized as Level 1 securities. However, they may be valued on the basis of prices furnished by a pricing service when the Advisor believes such prices more accurately reflect the fair value of such securities. A pricing service utilizes electronic data processing techniques based on yield spreads relating to securities with similar characteristics to determine prices for normal institutional-size trading units of debt securities without regard to sale or bid prices. These securities will generally be categorized as Level 2 securities. If the Advisor decides that a price provided by the pricing service does not accurately reflect the fair value of the securities, when prices are not readily available from a pricing service, or when certain restricted or illiquid securities are being valued, securities are valued at fair value as determined in good faith by the Advisor, in conformity with guidelines adopted by and subject to review of the Board and the Fair Valuation Committee. These securities will be categorized as Level 3 securities. See the chart on page 26 for more information on the inputs used by the Advisor in determining fair value of such Level 3 securities. The Advisor has used inputs such as evaluated broker quotes in inactive markets, actual trade prices in inactive markets, present value of expected future cash flows, terms of expected bond restructurings, and yields on similar securities in determining the fair value of such Level 3 securities.
Short-term investments in fixed income securities (those with maturities of less than 60 days when acquired) are valued by using the amortized cost method of valuation, which the Board has determined will represent fair value. These securities will be classified as Level 2 securities.
IMS FAMILY OF FUNDS
NOTES TO THE FINANCIAL STATEMENTS – (continued)
December 31, 2016 (Unaudited)
NOTE 3. SECURITIES VALUATION AND FAIR VALUE MEASUREMENTS (continued)
In accordance with the Trust's good faith pricing guidelines, the Advisor is required to consider all appropriate factors relevant to the value of securities for which it has determined other pricing sources are not available or reliable as described above. No single standard exists for determining fair value, because fair value depends upon the circumstances of each individual case. As a general principle, the current fair value of an issue of securities being valued by the Advisor would appear to be the amount which the owner might reasonably expect to receive for them upon their current sale. Methods which are in accordance with this principle may, for example, be based on (i) a multiple of earnings; (ii) a discount from market of a similar freely traded security (including a derivative security or a basket of securities traded on other markets, exchanges or among dealers); or (iii) yield to maturity with respect to debt issues, or a combination of these and other methods. Good faith pricing is permitted if, in the Advisor's opinion, the validity of market quotations appears to be questionable based on factors such as evidence of a thin market in the security based on a small number of quotations, a significant event occurs after the close of a market but before a Fund's NAV calculation that may affect a security's value, or the Advisor is aware of any other data that calls into question the reliability of market quotations. Good faith pricing may also be used in instances when the bonds the Funds invest in may default or otherwise cease to have market quotations readily available.
The Trustees of the 360 Funds adopted the M3Sixty Consolidated Valuation Procedures on June 24, 2014, which established a Valuation Committee to work with the Advisor and report to the Board on securities being fair valued or manually priced. The Lead Chairman and Trustee for the 360 Funds, along with the Fund Principal Financial Officer and Chief Compliance Officer are members of the Valuation Committee which meets at least monthly or, as required, to review the interim actions and coordination with the Advisor in pricing fair valued securities, and consideration of any unresolved valuation issue or a request to change the methodology for manually pricing a security. In turn, the Lead Chairman provides updates to the Board at the regularly scheduled board meetings as well as interim updates to the board members on substantive changes in a daily valuation or methodology issue.
The following is a summary of the inputs used to value the Value Fund's investments as of December 31, 2016:
| | | Valuation Inputs | |
Investments | | Level 1 – Quoted Prices in Active Markets | | | Level 2 – Other Significant Observable Inputs | | | Level 3 – Significant Unobservable Inputs | | | Total | |
| Common Stocks* | | $ | 39,216,719 | | | $ | – | | | $ | – | | | $ | 39,216,719 | |
| Money Market Securities | | | 125,758 | | | | – | | | | – | | | | 125,758 | |
| Total | | $ | 39,342,477 | | | $ | – | | | $ | – | | | $ | 39,342,477 | |
| * | Refer to the Schedule of Investments for industry classifications. |
The Value Fund did not hold any investments at any time during the reporting period in which significant unobservable inputs were used in determining fair value; therefore, no reconciliation of Level 3 securities is included for this reporting period. The Value Fund did not hold any derivative instruments during the reporting period. During the six month period ended December 31, 2016, there were no transfers between levels. The Value Fund recognizes transfers between fair value hierarchy levels at the end of the reporting period.
IMS FAMILY OF FUNDS
NOTES TO THE FINANCIAL STATEMENTS – (continued)
December 31, 2016 (Unaudited)
NOTE 3. SECURITIES VALUATION AND FAIR VALUE MEASUREMENTS (continued)
The following is a summary of the inputs used to value the Income Fund's investments as of December 31, 2016:
| | | Valuation Inputs | |
Investments | | Level 1 – Quoted Prices in Active Markets | | | Level 2 – Other Significant Observable Inputs | | | Level 3 – Significant Unobservable Inputs | | | Total | |
| Common Stocks* | | $ | 2,008,255 | | | $ | – | | | $ | – | | | $ | 2,008,255 | |
| Corporate Bonds | | | – | | | | 14 | | | | 346,771 | | | | 346,785 | |
| Foreign Bonds | | | – | | | | 752,934 | | | | 114,258 | | | | 867,192 | |
| Structured Notes | | | – | | | | 3,509,303 | | | | – | | | | 3,509,303 | |
| Promissory Notes | | | – | | | | – | | | | 367,500 | | | | 367,500 | |
| Money Market Securities | | | 476,183 | | | | – | | | | – | | | | 476,183 | |
| Total | | $ | 2,484,438 | | | $ | 4,262,251 | | | $ | 828,529 | | | $ | 7,575,218 | |
Following is a reconciliation of investments in which significant unobservable inputs (Level 3) were used in determining fair value for the Income Fund:
| | Balance as of June 30, 2016 | Realized gain (loss) | Amortization | Change in unrealized appreciation (depreciation) | Purchases | Sales | Transfers in to Level 3 | Transfers out of Level 3 | Balance as of December 31, 2016 |
| Corporate Bonds | $ 358,989 | $ – | $ – | $ (12,218) | $ – | $ – | $ – | $ – | $ 346,771 |
| Foreign Bonds | 202,582 | (1,015,539) | – | 930,090 | – | (2,875) | – | – | 114,258 |
| Promissory Notes | 392,025 | – | – | (24,525) | – | – | – | – | 367,500 |
| Total | $ 953,596 | $(1,015,539) | $ – | $ 893,347 | $ – | $ (2,875) | $ – | $ – | $ 828,529 |
The following is a quantitative summary of the techniques and inputs used to fair value the Level 3 securities as of December 31, 2016:
Quantitative information about Level 3 fair value measurements |
| | Fair value at 12/31/2016 | Valuation technique(s) | Unobservable input | Range (Weighted Average) |
| Corporate Bonds | $ 346,771 | Asset based | Estimated value of issuers underlying assets (2) | 18%-33% of outstanding debt |
| | | | Discount rate | 20% |
| Foreign Bonds | 114,258 | Asset based | Estimated value of issuers underlying assets (2) | 31% of outstanding debt |
| | | | Marketability discount | 35% |
| Promissory Notes | 367,500 | Asset based | Estimated liquidation value of issuers underlying assets (2) | |
| | | | Marketability discount | 20% |
| (1) | A significant decrease in the input in isolation would result in a significantly lower fair valuation measurement. |
| (2) | A significant increase in this input in isolation would result in a significantly higher fair value measurement. |
IMS FAMILY OF FUNDS
NOTES TO THE FINANCIAL STATEMENTS – (continued)
December 31, 2016 (Unaudited)
NOTE 3. SECURITIES VALUATION AND FAIR VALUE MEASUREMENTS (continued)
The total change in unrealized appreciation (depreciation) attributable to Level 3 investments still held at December 31, 2016 was $(102,067) as shown below.
| | Total Change in Unrealized Appreciation (Depreciation) |
| Corporate Bonds | $ (12,218) |
| Foreign Bonds | (65,324) |
| Promissory Notes | (24,525) |
| Total | $ (102,067) |
The Income Fund did not hold any derivative instruments during the six month period ended December 31, 2016. See reconciliation of investments for Level 3 securities in chart above. The Income Fund recognizes transfers between fair value hierarchy levels at the end of the reporting period.
There were no transfers of assets between levels during the six month period ended December 31, 2016 for the Income Fund.
There were no transfers of assets between Level 2 and Level 3 as of December 31, 2016 for the Income Fund.
The following is a summary of the inputs used to value the Dividend Growth Fund's investments as of December 31, 2016:
| | | Valuation Inputs | |
Investments | | Level 1 – Quoted Prices in Active Markets | | | Level 2 – Other Significant Observable Inputs | | | Level 3 – Significant Unobservable Inputs | | | Total | |
| Common Stocks* | | $ | 9,116,156 | | | $ | – | | | $ | – | | | $ | 9,116,156 | |
| Money Market Securities | | | 14,077 | | | | – | | | | – | | | | 14,077 | |
| Total | | $ | 9,130,233 | | | $ | – | | | $ | – | | | $ | 9,130,233 | |
| * | Refer to the Schedule of Investments for industry classifications. |
The Dividend Growth Fund did not hold any investments at any time during the reporting period in which significant unobservable inputs were used in determining fair value; therefore, no reconciliation of Level 3 securities is included for this reporting period. During the six month period ended December 31, 2016, there were no transfers between levels. The Dividend Growth Fund recognizes transfers between fair value hierarchy levels at the end of the reporting period.
NOTE 4. FEES AND OTHER TRANSACTIONS WITH AFFILIATES
The Advisor serves as investment advisor to the Funds pursuant to an Investment Advisory Agreement (the "Advisory Agreement") with the Trust. Pursuant to the Advisory Agreement, the Advisor manages the operations of the Funds and manages the Funds' investments in accordance with the stated policies of the Funds, subject to approval of the Board of Trustees.
IMS FAMILY OF FUNDS
NOTES TO THE FINANCIAL STATEMENTS – (continued)
December 31, 2016 (Unaudited)
NOTE 4. FEES AND OTHER TRANSACTIONS WITH AFFILIATES (continued)
In addition, the Funds have entered into an Expense Limitation Agreement under which the Advisor has agreed to waive or reduce its fees and to assume other expenses of the Funds, if necessary, in an amount that limits annual operating expenses (exclusive of interest, taxes, brokerage fees and commissions, acquired fund fees and expenses, shareholder servicing fees, extraordinary expenses, and, dividend and interest expenses in connection with securities sold short) to not more than 1.95% of the Funds' average daily net assets through October 31, 2017, subject to the Advisor's right to recoup payments on a rolling three-year basis, so long as the payments would not exceed the 1.95% expense cap.
Under the terms of the Advisory Agreement, the Funds are obligated to pay the Advisor a fee computed and accrued daily and paid monthly. Please see the chart below for information regarding the management fee rates, management fees earned, fee waivers and recoupments, and expenses reimbursed during the six month period ended December 31, 2016, as well as amounts due to the Advisor at December 31, 2016.
| | Value Fund | Income Fund | Dividend Growth Fund |
| Management fee under Advisory Agreement (as a percentage of average net assets) | 1.21% | 1.26% | 1.26% |
| Expense limitation (as a percentage of average net assets) | 1.95% | 1.95% | 1.95% |
| Management fees earned | $ 240,420 | $ 52,412 | $ 56,414 |
| Fees recouped (waived) and (expenses reimbursed) | $ – | $ (34,162) | $ (22,845) |
| Payable to Advisor | $ 40,995 | $ 2,508 | $ 6,286 |
Each waiver or reimbursement by the Advisor is subject to repayment by the Funds within the three fiscal years following the fiscal year in which the particular expense was incurred, provided that the Funds are able to make the repayment without exceeding the expense limitations in effect at the time the expenses were waived or currently in effect, whichever is lower as described above.
The amounts subject to repayment by the Income Fund and Dividend Growth Fund, pursuant to the aforementioned conditions, at June are as follows:
| Fund | Amount | Expires June 30, |
| Income Fund | $ 73,509 | 2017 |
| Income Fund | 36,051 | 2019 |
| Income Fund | 34,162 | 2020 |
| Dividend Growth Fund | 45,290 | 2017 |
| Dividend Growth Fund | 52,469 | 2018 |
| Dividend Growth Fund | 37,010 | 2019 |
| Dividend Growth Fund | 22,845 | 2020 |
There are no amounts subject to repayment by the Value Fund.
IMS FAMILY OF FUNDS
NOTES TO THE FINANCIAL STATEMENTS – (continued)
December 31, 2016 (Unaudited)
NOTE 4. FEES AND OTHER TRANSACTIONS WITH AFFILIATES (continued)
The Trust has entered into an Investment Company Services Agreement (the "Services Agreement") with M3Sixty Administration, LLC ("M3Sixty"). Under the Services Agreement, M3Sixty is responsible for a wide variety of functions, including but not limited to: (a) Fund accounting services; (b) financial statement preparation; (c) valuation of the Funds' portfolio securities; (d) pricing the Funds' shares; (e) assistance in preparing tax returns; (f) preparation and filing of required regulatory reports; (g) communications with shareholders; (h) coordination of Board and shareholder meetings; (i) monitoring the Funds' legal compliance; (j) maintaining shareholder account records.
For the six month period ended December 31, 2016, the Funds accrued servicing fees, including out of pocket expenses, as follows:
| Fund | | Service Fees | |
| Value Fund | | $ | 57,248 | |
| Income Fund | | | 19,779 | |
| Dividend Growth Fund | | | 22,549 | |
Certain officers and a Trustee of the Trust are also employees of M3Sixty.
Matrix Capital Group, Inc. (the "Distributor") acts as the principal distributor of the Funds. There were no payments made to the Distributor by the Funds for six month period ended December 31, 2016.
The Distributor is not affiliated with the Advisor. The Distributor is an affiliate of M3Sixty.
NOTE 5. LINE OF CREDIT
During the six month period ended December 31, 2016, the IMS Funds each respectively entered into an agreement with The Huntington National Bank, the custodian of the Funds' investments, to open secured lines of credit secured by the Funds' investments. Borrowings under this agreement bear interest at LIBOR plus 1.500%. Maximum borrowings for each Fund are lesser of $1,500,000 or 10.000% of the Fund's daily market value. The current agreement expires on June 12, 2017.
| | Value Fund | | | Income Fund | | | Dividend Growth Fund | |
| Total available bank line of credit as of December 31, 2016 | | $ | 1,500,000 | | | $ | 757,522 | | | $ | 913,023 | |
| Average borrowings for the six month period | | $ | 25,967 | | | $ | 26,082 | | | $ | 1,223 | |
| Average interest rate for the six month period | | | 2.021 | % | | | 2.021 | % | | | 2.021 | % |
| Highest balance drawn during the six month period | | $ | 1,435,000 | | | $ | 515,000 | | | $ | 39,000 | |
| Interest rate at December 31, 2016 | | | 2.135 | % | | | 2.135 | % | | | 2.135 | % |
| Line of credit borrowing at December 31, 2016 | | $ | – | | | $ | – | | | $ | – | |
IMS FAMILY OF FUNDS
NOTES TO THE FINANCIAL STATEMENTS – (continued)
December 31, 2016 (Unaudited)
NOTE 6. INVESTMENTS
For the six month period ended December 31, 2016, purchases and sales of investment securities, other than short-term investments and short-term U.S. government obligations were as follows:
| | | Value Fund | | | Income Fund | | | Dividend Growth Fund | |
| Purchases | | | | | | | | | |
| U.S. Government Obligations | | $ | – | | | $ | – | | | $ | – | |
| Other | | | 19,789,387 | | | | 14,022,938 | | | | 458,508 | |
| Sales | | | | | | | | | | | | |
| U.S. Government Obligations | | $ | – | | | $ | – | | | $ | – – | |
| Other | | | 19,967,268 | | | | 15,142,796 | | | | 651,471 | |
As of December 31, 2016, the net unrealized appreciation (depreciation) of investments for tax purposes was as follows:
| | | Value Fund | | | Income Fund | | | Dividend Growth Fund | |
| Gross Appreciation | | $ | 6,410,118 | | | $ | 36,860 | | | $ | 1,140,709 | |
| Gross (Depreciation) | | | (2,276,311 | ) | | | (5,703,795 | ) | | | (548,413 | ) |
| Net Appreciation (Depreciation) on Investments | | $ | 4,133,807 | | | $ | (5,666,935 | ) | | $ | 592,296 | |
| Tax Cost | | $ | 35,208,670 | | | $ | 13,242,153 | | | $ | 8,537,937 | |
The difference between book basis and tax basis unrealized appreciation (depreciation) of investments is primarily attributable to the tax deferral of losses on wash sales.
NOTE 7. ESTIMATES
The preparation of financial statements in conformity with GAAP requires management to make estimates and assumptions that affect the reported amounts of assets and liabilities and disclosure of contingent assets and liabilities at the date of the financial statements and the reported amounts of increases and decreases in net assets from operations during the reporting period. Actual results could differ from those estimates.
NOTE 8. BENEFICIAL OWNERSHIP
The beneficial ownership, either directly or indirectly, of more than 25% of the voting securities of a fund creates a presumption of control of the fund, under Section 2(a)(9) of the Investment Company Act of 1940. As of December 31, 2016, National Financial Securities Corp. ("National Financial") held, for the benefit of its customers, 38.81% of the Value Fund, 32.97% of the Income Fund and 28.29% of the Dividend Growth Fund. As a result, National Financial may be deemed to control the Value Fund, Income Fund and Dividend Growth Fund. As of December 31, 2016, TD Ameritrade, Inc. ("Ameritrade") held, for the benefit of its customers, 30.51% of the Value Fund and 54.85% of the Dividend Growth Fund. As a result, Ameritrade may be deemed to control the Value Fund and Dividend Growth Fund.
IMS FAMILY OF FUNDS
NOTES TO THE FINANCIAL STATEMENTS – (continued)
December 31, 2016 (Unaudited)
NOTE 9. DISTRIBUTIONS TO SHAREHOLDERS
Value Fund – For the six month period ended December 31, 2016, the Value Fund did not pay a distribution.
The tax characterization of distributions for the six month period ended December 31, 2016 and for the fiscal year ended June 30, 2016 was as follows:
Distributions paid from: | | Six Month Period Ended December 31, 2016 | | | Fiscal Year Ended June 30, 2016 | |
| Ordinary Income | | $ | – | | | $ | – | |
| Total Distributions paid | | $ | – | | | $ | – | |
Income Fund – For the six month period ended December 31, 2016, the Income Fund paid monthly distributions totaling $0.160 per share.
The tax characterization of distributions for the six month period ended December 31, 2016 and for the fiscal year ended June 30, 2016 was as follows:
Distributions paid from: | | Six Month Period Ended December 31, 2016 | | | Fiscal Year Ended June 30, 2016 | |
| Ordinary Income | | $ | 412,882 | | | $ | 1,151,406 | |
| Return of Capital | | | – | | | | – | |
| Total Distributions paid | | $ | 412,882 | | | $ | 1,151,406 | |
Dividend Growth Fund – For the six month period ended December 31, 2016, the Dividend Growth Fund paid distributions totaling $0.050 per share.
The tax characterization of distributions for the six month period ended December 31, 2016 and for the fiscal year ended June 30, 2016 was as follows:
Distributions paid from: | | Six Month Period Ended December 31, 2016 | | | Fiscal Year Ended June 30, 2016 | |
| Ordinary Income | | $ | 33,195 | | | $ | 78,680 | |
| Total Distributions paid | | $ | 33,195 | | | $ | 78,680 | |
The Funds' tax basis distributable earnings are determined only at the end of each fiscal year. As of June 30, 2016, the Funds' most recent fiscal year end, the components of distributable earnings (accumulated losses) on a tax basis were as follows:
| | | Value Fund | | | Income Fund | | | Dividend Growth Fund | |
| Undistributed ordinary income | | $ | – | | | $ | 54,291 | | | $ | 1,638 | |
| Accumulated capital and other losses | | | (4,124,446 | ) | | | (49,829,758 | ) | | | (720,073 | ) |
| Net unrealized appreciation (depreciation) | | | 5,740,232 | | | | (6,506,698 | ) | | | (243,988 | ) |
| Other accumulated losses | | | – | | | | – | | | | – | |
| | | $ | 1,615,786 | | | $ | (56,282,165 | ) | | $ | (962,423 | ) |
IMS FAMILY OF FUNDS
NOTES TO THE FINANCIAL STATEMENTS – (continued)
December 31, 2016 (Unaudited)
NOTE 9. DISTRIBUTIONS TO SHAREHOLDERS (continued)
Under current law, capital losses and specified gains realized after October 31, and net investment losses realized after December 31 of a Fund's fiscal year may be deferred and treated as occurring on the first business day of the following fiscal year for tax purposes. For disclosure purposes, these deferrals are included in "accumulated capital and other losses" above.
As of June 30, 2016, accumulated capital and other losses noted above consist of:
| | Capital Loss Carryforwards | | | Post-October Capital Losses | | | | |
Value Fund | | $ | 798,596 | | | $ | 3,304,584 | | | $ | 21,266 | |
Income Fund | | | 47,590,341 | | | | 2,239,417 | | | | – | |
Dividend Growth Fund | | | 632,284 | | | | 87,789 | | | | – | |
NOTE 10. CAPITAL LOSS CARRYFORWARDS
At June 30, 2016, for federal income tax purposes, the Funds have capital loss carryforwards, in the following amounts:
| | | Value Fund | | | Income Fund | | | Dividend Growth Fund | |
| No expiration – short term | | $ | – | | | $ | 7,091,112 | | | $ | – | |
| No expiration – long term | | | – | | | | 6,665,632 | | | | 15,514 | |
| Expires on June 30, 2017 | | | – | | | | 7,045,965 | | | | – | |
| Expires on June 30, 2018 | | | 798,596 | | | | 24,109,306 | | | | 616,770 | |
| Expires on June 30, 2019 | | | – | | | | 2,678,326 | | | | – | |
| | | $ | 798,596 | | | $ | 47,590,341 | | | $ | 632,284 | |
Capital loss carryforwards are available to offset future realized capital gains. To the extent that these carryforwards are used to offset future capital gains, it is probable that the amount offset will not be distributed to shareholders. Non-expiring carryforwards must be utilized prior to the utilization of carryforwards with expiration dates. During the year ended June 30, 2016, the Value Fund, Income Fund and Dividend Growth Fund utilized capital loss carryforwards of $822,029, $0 and $0, respectively. Capital loss carryforwards of $1,678,970 expired in the Income Fund.
IMS FAMILY OF FUNDS
NOTES TO THE FINANCIAL STATEMENTS – (continued)
December 31, 2016 (Unaudited)
NOTE 11. RESTRICTED SECURITIES
Restricted securities are securities that may only be resold upon registration under federal securities laws or in transactions exempt from such registration. In some cases, the issuer of restricted securities has agreed to register such securities for resale, at the issuer's expense, either upon demand by a fund or in connection with another registered offering of the securities. Many restricted securities may be resold in the secondary market in transactions exempt from registration. Such restricted securities may be determined to be liquid. The Funds will not incur any registration costs upon such resale. The Income Fund's restricted securities are valued at the price provided by pricing services or dealers in the secondary market or, if no market prices are available, at the fair value price as determined by the Fund's Advisor or pursuant to the Fund's fair value policy, subject to oversight by the Board of Trustees. The Income Fund has acquired securities, the sale of which is restricted under Rule 144A or Regulation S of the Securities Act of 1933. It is possible that the fair value price may differ significantly from the amount that may ultimately be realized in the near term, and the difference could be material.
At December 31, 2016, the aggregate value of such securities amounted to $1,234,692 and the value amounts to 16.47% of the net assets of the Income Fund.
| Acquisition Date | | Shares or Principal Amount | | Amortized Cost | | Fair Value | |
| Aequitas Commercial Finance, LLC Secured Subordinated Promissory Note, 11.000%, 07/28/2019, 144A | 7/23/2015 | | | 750,000 | | $ | 750,000 | | $ | 367,500 | |
| Cash Store Financial Services, Inc. 11.500%, 01/31/2017, 144A | 5/21/2012(a) | | | 1,289,000 | | | 1,169,210 | | | 114,258 | |
| Newland International Properties Corp., 9.500%, 07/03/2017, 144A | 6/3/2011 | | | 572,479 | | | 485,146 | | | 143,120 | |
| Newland International Properties Corp., 9.500%, 07/03/2017, Reg S | 6/3/2011 | | | 349,168 | | | 295,9029 | | | 87,292 | |
| Panama Canal Railway Co., 7.000%, 11/01/2026, Reg S | 2/27/2013 | | | 527,800 | | | 510,396 | | | 522,522 | |
| | | | | | | $ | 4,494,610 | | $ | 1,234,692 | |
(a) | Purchased on various dates beginning 05/21/2012. |
(b) | Purchased on various dates beginning 03/12/2014. |
NOTE 12. SUBSEQUENT EVENTS
On January 17, 2017, the Income Fund declared a dividend of $48,034, which was payable on January 17, 2017. On February 15, 2017, the Income Fund declared a dividend of $21,752, which was payable on February 15, 2017.
Management has evaluated subsequent events through the issuance of the financial statements and has noted no other such events that would require disclosure.
NOTE 13. AEQUITAS COMMERCIAL FINANCE, LLC
On March 10, 2016, the SEC filed a complaint against, Aequitas Commercial Finance, LLC, an issuer of securities held by the Strategic Income Fund. Subsequently a receiver was appointed over this issuer and its related entities. Since the complaint was filed and the issuer defaulted on interest payments, the Fair Valuation Committee of the Fund, while performing its regular review of valuation, has concluded that reductions in the valuation of the security were warranted and has written off all accrued interest and has not accrued interest since February 17, 2016. The Board and Fair Valuation Committee are monitoring the securities and potential impact on valuation and income. As of December 31, 2016, the Fair Valuation Committee has determined the security is stated at the best estimate of fair value and actual results could differ from that estimate.
TRUSTEES AND OFFICERS – (Unaudited)
The Trustees are responsible for the management and supervision of the Funds. The Trustees approve all significant agreements between the Trust, on behalf of the Funds, and those companies that furnish services to the Funds; review performance of the Funds; and oversee activities of the Funds. This section provides information about the persons who serve as Trustees and Officers to the Trust and Funds, respectively. The Statement of Additional Information for each Fund includes additional information about the Trustees and officers and is available, without charge, upon request by calling the Funds toll-free at (800) 934-5550.
Remuneration Paid to Trustees and Officers - Officers of the Trust and Trustees who are "interested persons" of the Trust or the Advisor will receive no salary or fees from the Trust. Officers of the Trust and interested Trustees do receive compensation directly from certain service providers to the Trust, including Matrix Capital Group and M3Sixty Administration, LLC. Each Trustee who is not an "interested person" receives a fee of $1,000 each year plus $125 per Board or committee meeting. Effective December 16, 2015, each Trustee who is not an "interested person" receives a fee of $1,500 each year plus $200 per Board or committee meeting attended. The Trust reimburses each Trustee and officer for his or her travel and other expenses relating to attendance at such meetings.
Name of Trustee1 | Aggregate Compensation From the IMS Family of Funds2 | Pension or Retirement Benefits Accrued As Part of Portfolio Expenses | Estimated Annual Benefits Upon Retirement | Total Compensation From the IMS Family of Funds Paid to Trustees2 |
| Independent Trustees |
| Art Falk | $ 5,250 | None | None | $ 5,250 |
| Thomas Krausz | $ 3,450 | None | None | $ 3,450 |
| Tom M. Wirtshafter | $ 3,450 | None | None | $ 3,450 |
| Gary DiCenzo | $ 3,450 | None | None | $ 3,450 |
| Interested Trustee |
| Randall K. Linscott | None | None | None | None |
1 | Each of the Trustees serves as a Trustee to three (3) IMS Family of Funds of the Trust. The Trust currently offers seven (7) series of shares. |
2 | Figures are for the six month period ended December 31, 2016. |
OTHER INFORMATION (Unaudited)
The Funds' Statement of Additional Information ("SAI") includes additional information about the trustees and is available without charge, upon request. You may call toll-free at (800) 934-5550 to request a copy of the SAI or to make shareholder inquiries.
The Funds file their complete schedules of portfolio holdings with the Securities and Exchange Commission (the "Commission") for the first and third quarters of each fiscal year on Form N-Q. The Funds' Forms N-Q are available on the Commission's website at http://www.sec.gov. The Funds' Forms N-Q may be reviewed and copied at the Commission's Public Reference Room in Washington, DC. Information on the operation of the Commission's Public Reference Room may be obtained by calling 1-800-SEC-0330.
A description of the policies and procedures that the Funds use to determine how to vote proxies relating to portfolio securities is available without charge, upon request, by calling (800) 934-5550; and on the Commission's website at http://www.sec.gov.
Information regarding how the Funds voted proxies relating to portfolio securities during the most recent 12-month period ended June 30th is available without charge, upon request, by calling (800) 934-5550; and on the Commission's website at http://www.sec.gov.
Shareholder Tax Information - The Funds are required to advise you within 60 days of the Fund's fiscal year end regarding the federal tax status of distributions received by shareholders during the fiscal year. For the six month period ended, 2016, certain distributions paid by the Funds may be subject to a maximum tax rate of 20%. The Income Fund and Dividend Growth Fund intend to designate up to a maximum amount of $412,882 and $33,195, respectively, as taxed at a maximum rate of 20%. There were no distributions paid by the Value Fund.
Tax information is reported from the Funds' fiscal year and not calendar year, therefore, shareholders should refer to their Form 1099-DIV or other tax information which will be mailed in 2017 to determine the calendar year amounts to be included on their 2016 tax returns. Shareholders should consult their own tax advisors.
This page intentionally left blank.
Privacy Notice
| FACTS | WHAT DOES 360 FUNDS DO WITH YOUR PERSONAL INFORMATION? |
| | |
| Why? | Financial companies choose how they share your personal information. Federal law gives consumers the right to limit some but not all sharing. Federal law also requires us to tell you how we collect, share, and protect your personal information. Please read this notice carefully to understand what we do. |
| What? | The types of personal information we collect and share depend on the product or service you have with us. This information can include: § Social Security number § Assets § Retirement Assets § Transaction History § Checking Account Information § Purchase History § Account Balances § Account Transactions § Wire Transfer Instructions When you are no longer our customer, we continue to share your information as described in this notice. |
| How? | All financial companies need to share your personal information to run their everyday business. In the section below, we list the reasons financial companies can share their customers’ personal information; the reasons 360 Funds chooses to share; and whether you can limit this sharing. |
| Reasons we can share your personal information | Does 360 Funds share? | Can you limit this sharing? |
For our everyday business purposes – Such as to process your transactions, maintain your account(s), respond to court orders and legal investigations, or report to credit bureaus | Yes | No |
For our marketing purposes – to offer our products and services to you | No | We don’t share |
| For joint marketing with other financial companies | No | We don’t share |
For our affiliates’ everyday business purposes – information about your transactions and experiences | No | We don’t share |
For our affiliates’ everyday business purposes – information about your creditworthiness | No | We don’t share |
| For nonaffiliates to market to you | No | We don’t share |
| |
| Questions? | Call (877) 244-6235 |
| Who we are |
| Who is providing this notice? | 360 Funds M3Sixty Administration, LLC (Administrator) Matrix Capital Group, Inc. (Distributor) |
| What we do |
How does 360 Funds protect my personal information? | To protect your personal information from unauthorized access and use, we use security measures that comply with federal law. These measures include computer safeguards and secured files and buildings. Our service providers are held accountable for adhering to strict policies and procedures to prevent any misuse of your nonpublic personal information. |
How does 360 Funds collect my personal information? | We collect your personal information, for example, when you § Open an account § Provide account information § Give us your contact information § Make deposits or withdrawals from your account § Make a wire transfer § Tell us where to send the money § Tell us who receives the money § Show your government-issued ID § Show your driver’s license We also collect your personal information from other companies. |
| Why can’t I limit all sharing? | Federal law gives you the right to limit only § Sharing for affiliates’ everyday business purposes – information about your creditworthiness § Affiliates from using your information to market to you § Sharing for nonaffiliates to market to you State laws and individual companies may give you additional rights to limit sharing. |
| | |
| Definitions |
| Affiliates | Companies related by common ownership or control. They can be financial and nonfinancial companies. § M3Sixty Administration, LLC and Matrix Capital Group, Inc., could each be deemed to be an affiliate. |
| Nonaffiliates | Companies not related by common ownership or control. They can be financial and nonfinancial companies § 360 Funds does not share with nonaffiliates so they can market to you. |
| Joint marketing | A formal agreement between nonaffiliated financial companies that together market financial products or services to you. § 360 Funds does not jointly market. |
360 FUNDS 4520 Main Street Suite 1425 Kansas City, MO 64111
INVESTMENT ADVISOR IMS Capital Management, Inc. 8995 S.E. Otty Road, Portland, OR 97086
ADMINISTRATOR & TRANSFER AGENT M3Sixty Administration, LLC 4520 Main Street Suite 1425 Kansas City, MO 64111
DISTRIBUTOR Matrix Capital Group, Inc. 106 West 32nd Street New York, NY 10001
INDEPENDENT REGISTERED PUBLIC ACCOUNTING FIRM Sanville & Company 1514 Old York Road Abington, PA 19001
LEGAL COUNSEL The Law Offices of John H. Lively & Associates, Inc. A member firm of The 1940 Act Law Group™ 11300 Tomahawk Creek Parkway Suite 310 Leawood, KS 66211
CUSTODIAN BANK Huntington National Bank
41 South Street
Columbus, OH 43125
This report is intended only for the information of shareholders or those who have received the Funds' prospectus which contains information about each Fund's management fee and expenses. Please read the prospectus carefully before investing. |
Not applicable at this time.
Not applicable at this time.
Not applicable at this time.
Included in semi-annual report to shareholders filed under item 1 of this form.
Not applicable at this time.
Pursuant to the requirements of the Securities Exchange Act of 1934 and the Investment Company Act of 1940, the registrant has duly caused this report to be signed on its behalf by the undersigned, thereunto duly authorized.
Pursuant to the requirements of the Securities Exchange Act of 1934 and the Investment Company Act of 1940, this report has been signed below by the following person on behalf of the registrant and in the capacities and on the date indicated.
Pursuant to the requirements of the Securities Exchange Act of 1934 and the Investment Company Act of 1940, this report has been signed below by the following person on behalf of the registrant and in the capacities and on the date indicated.