Washington, D.C. 20549
M3Sixty Administration, LLC.
The Semi-Annual report to Shareholders of the Snow Family of Funds, a series of funds that are part of the 360 Funds, for the period ended August 31, 2016 pursuant to Rule 30e-1 under the Investment Company Act of 1940 (the “1940 Act”), as amended (17 CFR 270.30e-1) is filed herewith.
Snow Capital Focused Value Fund
Class A Shares (Ticker Symbol: SFOAX)
Class I Shares (Ticker Symbol: SFOIX)
Snow Capital Hedged Equity Fund
Class A Shares (Ticker Symbol: SHEAX)
Class I Shares (Ticker Symbol: SHEIX)
Snow Capital Inflation Advantaged Equities Fund
Class A Shares (Ticker Symbol: SIAAX)
Class I Shares (Ticker Symbol: SIAIX)
Snow Capital Dividend Plus Fund
Class A Shares (Ticker Symbol: SDPAX)
Class I Shares (Ticker Symbol: SDPIX)
Snow Capital Mid Cap Value Fund
Class A Shares (Ticker Symbol: SNMAX)
Class I Shares (Ticker Symbol: SNMIX)
each a series of the
360 Funds
SEMI-ANNUAL REPORT
August 31, 2016
(Unaudited)
Investment Adviser
Snow Capital Management L.P.
2000 Georgetowne Drive, Suite 200
Sewickley, Pennsylvania 15143
TABLE OF CONTENTS
| INVESTMENT HIGHLIGHTS | 1 |
| SCHEDULES OF INVESTMENTS | 4 |
| STATEMENTS OF ASSETS AND LIABILITIES | 17 |
| STATEMENTS OF OPERATIONS | 19 |
| STATEMENTS OF CHANGES IN NET ASSETS | 21 |
| FINANCIAL HIGHLIGHTS | 26 |
| NOTES TO FINANCIAL STATEMENTS | 36 |
| ADDITIONAL INFORMATION | 46 |
| EXPENSE EXAMPLES | 48 |
| Snow Family of Funds | SEMI-ANNUAL REPORT |
Investment HighlightsAugust 31, 2016 (Unaudited)
Snow Capital Focused Value Fund
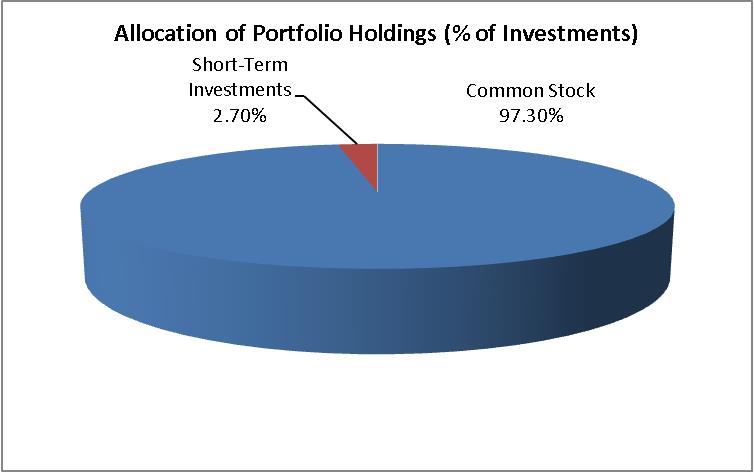
The investment objective of the Fund is long-term growth of capital. The Fund’s principal investment strategy is to invest primarily in equity securities, including common and preferred stocks, convertible securities and shares of other investment companies and exchange-traded funds (“ETFs”) that invest in equity securities, fixed income securities, or other similar investments. Under normal market conditions the Fund will invest at least 80% of its net assets in equity securities of companies with market capitalizations greater than $1 billion.
Snow Capital Hedged Equity Fund
The investment objective of the Fund is long-term growth of capital and protection of investment principal with lower volatility than the U.S. equity market. The Fund’s principal investment strategy is to invest at least 80% of long net assets in equity securities, including common and preferred stocks, convertible securities and shares of other investment companies and exchange-traded funds (“ETFs”) that invest in equity securities. The Adviser will utilize short equity positions in individual equity securities and ETFs to reduce the portfolio’s overall market exposure. The Fund may borrow money from banks or other financial institutions to purchase securities, commonly known as “leveraging,” in an amount not to exceed one-third of its total assets, as permitted by the Investment Company Act of 1940, as amended (the “1940 Act”). The Fund may invest in equity and/or fixed income securities of companies of any size. In addition to domestic securities, the Fund may also directly or indirectly invest in foreign equity, including investments in emerging markets.
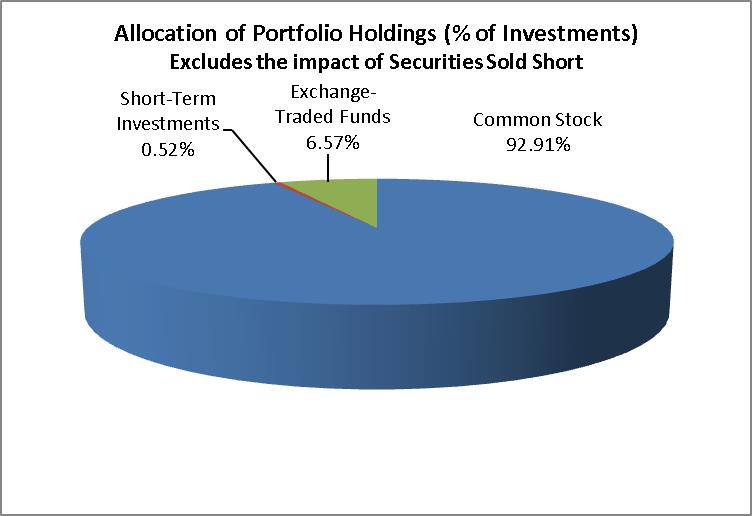
The percentages in the above graphs are based on the portfolio holdings of the Funds as of August 31, 2016 and are subject to change.
For a detailed break-out of holdings by industry and exchange-traded funds by investment type, please refer to the Schedules of Investments.
| Snow Family of Funds | SEMI-ANNUAL REPORT |
Investment HighlightsAugust 31, 2016 (Unaudited)
Snow Capital Inflation Advantaged Equities Fund
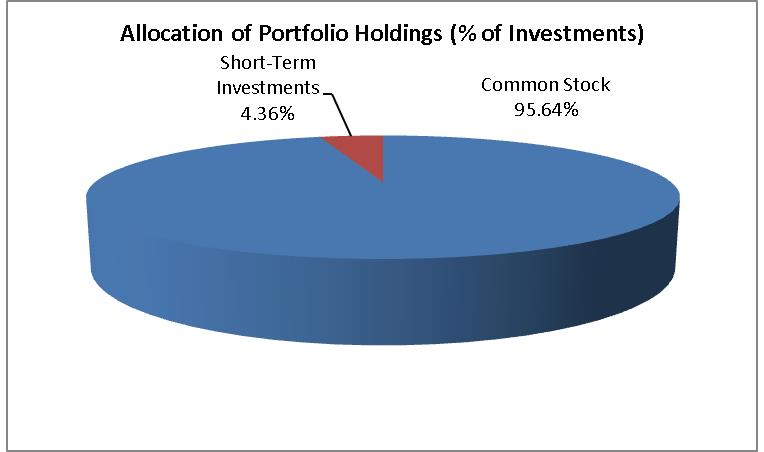
The investment objective of the Fund is long-term growth of capital and protection of investment principal. The Fund’s principal investment strategy is to invest primarily in equity securities, including common and preferred stocks, convertible securities and shares of other investment companies and ETFs that invest in equity securities.
Snow Capital Dividend Plus Fund
The investment objective of the Fund is long-term growth of capital and income. The Fund’s principal investment strategy is to invest in a diversified portfolio of equities, bonds, preferred stock, and options. Under normal market conditions, the Fund will invest at least 80% of its net assets in equity securities that pay a dividend and are within the market capitalization range of the Russell 1000 Value Index. With respect to its remaining assets, the Fund may invest in corporate bonds, sovereign bonds, convertible bonds, preferred stocks, or other securities or instruments whose prices are linked to the value of the underlying common stock of the issuer of the securities. The Fund may have up to 25% of its net assets invested directly or indirectly in foreign equity securities, including investments in emerging markets.
The percentages in the above graphs are based on the portfolio holdings of the Funds as of August 31, 2016 and are subject to change.
For a detailed break-out of holdings by industry and exchange-traded funds by investment type, please refer to the Schedules of Investments.
| Snow Family of Funds | SEMI-ANNUAL REPORT |
Investment HighlightsAugust 31, 2016 (Unaudited)
Snow Capital Mid Cap Value Fund
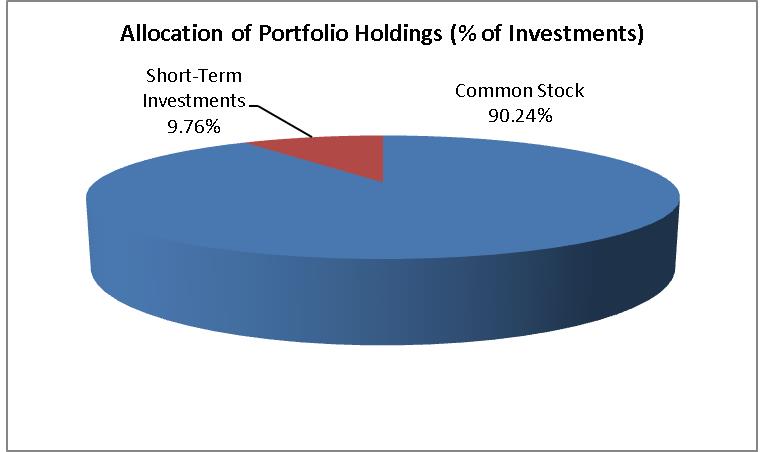
The investment objective of the Fund is long-term growth of capital. The Fund’s principal investment strategy is to invest at least 80% of its net assets in equity securities of companies within the market capitalizations range of the Russell Mid Cap Value Index (“mid-cap securities”). The Fund’s investments in equity securities may include common and preferred stocks, convertible securities and shares of other investment companies and ETFs that invest in equity securities of mid-cap companies. In addition to equity securities, the Fund may also invest up to 15% of its net assets in U.S. Government or U.S. agency obligations. The Fund may have up to 20% of its net assets invested directly or indirectly in foreign equity securities, including investments in emerging markets.
The percentages in the above graph are based on the portfolio holdings of the Fund as of August 31, 2016 and are subject to change.
For a detailed break-out of holdings by industry and exchange-traded funds by investment type, please refer to the Schedules of Investments.
| SNOW FAMILY OF FUNDS | SEMI-ANNUAL REPORT |
Snow Capital Focused Value Fund
SCHEDULE OF INVESTMENTS
August 31, 2016 (Unaudited)
| COMMON STOCK - 96.11% | | Shares | | | Fair Value | |
| | | | | | | |
| Aerospace & Defense - 3.28% | | | | | | |
| Triumph Group, Inc. | | | 605 | | | $ | 19,275 | |
| | | | | | | | | |
| Banks - 12.23% | | | | | | | | |
| JPMorgan Chase & Co. | | | 535 | | | | 36,113 | |
| Bank of America Corp. | | | 2,210 | | | | 35,669 | |
| | | | | | | | 71,782 | |
| Biotechnology - 4.63% | | | | | | | | |
Biogen, Inc. (a) | | | 89 | | | | 27,201 | |
| | | | | | | | | |
| Building Materials - 3.68% | | | | | | | | |
Cemex SAB de CV - ADR (a) | | | 2,607 | | | | 21,612 | |
| | | | | | | | | |
| Chemicals - 4.05% | | | | | | | | |
| Mosaic Co. | | | 790 | | | | 23,755 | |
| | | | | | | | | |
| Computers - 5.09% | | | | | | | | |
| Hewlett-Packard Co. | | | 1,390 | | | | 29,857 | |
| | | | | | | | | |
| Electric - 2.84% | | | | | | | | |
| Exelon Corp. | | | 490 | | | | 16,660 | |
| | | | | | | | | |
| Electronics - 3.24% | | | | | | | | |
Keysight Technologies, Inc. (a) | | | 625 | | | | 19,019 | |
| | | | | | | | | |
| Forest Products & Paper - 4.67% | | | | | | | | |
| International Paper Co. | | | 565 | | | | 27,397 | |
| | | | | | | | | |
| Healthcare - Products - 4.09% | | | | | | | | |
| Zimmer Biomet Holdings, Inc. | | | 185 | | | | 23,978 | |
| | | | | | | | | |
| Home Builders - 2.89% | | | | | | | | |
| PulteGroup, Inc. | | | 795 | | | | 16,989 | |
| | | | | | | | | |
| Insurance - 10.08% | | | | | | | | |
| MetLife, Inc. | | | 780 | | | | 33,852 | |
| Voya Financial, Inc. | | | 865 | | | | 25,293 | |
| | | | | | | | 59,145 | |
| Media - 2.82% | | | | | | | | |
| Viacom, Inc. - Class B | | | 410 | | | | 16,539 | |
| | | | | | | | | |
| Oil & Gas - 8.33% | | | | | | | | |
| BP PLC -ADR | | | 466 | | | | 15,779 | |
| PBF Energy, Inc. - Class A | | | 795 | | | | 17,411 | |
Southwestern Energy Co. (a) | | | 1129 | | | | 15,704 | |
| | | | | | | | 48,894 | |
| Pharmaceuticals - 7.81% | | | | | | | | |
| Teva Pharmaceutical Industries Ltd. - ADR | | | 505 | | | | 25,448 | |
| Merck & Co., Inc. | | | 325 | | | | 20,407 | |
| | | | | | | | 45,855 | |
| SNOW FAMILY OF FUNDS | SEMI-ANNUAL REPORT |
Snow Capital Focused Value Fund
SCHEDULE OF INVESTMENTS
August 31, 2016 (Unaudited)
| COMMON STOCK - 96.11% (continued) | | Shares | | | Fair Value | |
| | | | | | | |
| Pipelines - 4.11% | | | | | | |
| Kinder Morgan, Inc. | | | 1,105 | | | $ | 24,144 | |
| | | | | | | | | |
| Retail - 3.69% | | | | | | | | |
| Dick's Sporting Goods, Inc. | | | 370 | | | | 21,682 | |
| | | | | | | | | |
| Seminconductors - 8.58% | | | | | | | | |
| QUALCOMM, Inc. | | | 520 | | | | 32,796 | |
| Skyworks Solutions, Inc. | | | 235 | | | | 17,592 | |
| | | | | | | | 50,388 | |
| | | | | | | | | |
| TOTAL COMMON STOCK (Cost $543,081) | | | | | | | 564,172 | |
| | | | | | | | | |
| SHORT TERM INVESTMENTS - 2.66% | | | | | | | | |
Fidelity Institutional Money Market Funds - Government Portfolio, 0.26%(b) (Cost $15,651) | | | 15,651 | | | $ | 15,651 | |
| | | | | | | | | |
| TOTAL INVESTMENTS (Cost $558,732) - 98.77% | | | | | | $ | 579,823 | |
| OTHER LIABILITIES IN EXCESS OF ASSETS, NET - 1.23% | | | | | | | 7,196 | |
| NET ASSETS - 100% | | | | | | $ | 587,019 | |
Percentages are stated as a percent of net assets.
| (a) | Non-income producing security. |
| (b) | Rate shown represents the rate at August 31, 2016, is subject to change and resets daily. |
ADR - American Depositary Receipt.
The accompanying notes are an integral part of these financial statements.
| SNOW FAMILY OF FUNDS | SEMI-ANNUAL REPORT |
Snow Capital Hedged Equity Fund
SCHEDULE OF INVESTMENTS
August 31, 2016 (Unaudited)
| COMMON STOCK - 92.21% | | Shares | | | Fair Value | |
| | | | | | | |
| Aerospace & Defense - 4.05% | | | | | | |
| Triumph Group, Inc. | | | 750 | | | $ | 23,895 | |
| | | | | | | | | |
| Banks - 9.48% | | | | | | | | |
| JPMorgan Chase & Co. | | | 420 | | | | 28,350 | |
| Bank of America Corp. | | | 1,710 | | | | 27,599 | |
| | | | | | | | 55,949 | |
| Biotechnology - 3.11% | | | | | | | | |
Biogen, Inc. (a) | | | 60 | | | | 18,338 | |
| | | | | | | | | |
| Building Materials - 1.90% | | | | | | | | |
Cemex SAB de CV - ADR (a) | | | 1,350 | | | | 11,192 | |
| | | | | | | | | |
| Chemicals - 3.21% | | | | | | | | |
| Mosaic Co. | | | 630 | | | | 18,944 | |
| | | | | | | | | |
| Computers - 5.76% | | | | | | | | |
| Hewlett-Packard Co. | | | 1,585 | | | | 34,046 | |
| | | | | | | | | |
| Electric - 1.61% | | | | | | | | |
| Exelon Corp. | | | 280 | | | | 9,519 | |
| | | | | | | | | |
| Electronics - 4.49% | | | | | | | | |
Keysight Technologies, Inc. (a) | | | 870 | | | | 26,474 | |
| | | | | | | | | |
| Forest Products & Paper - 3.45% | | | | | | | | |
| International Paper Co. | | | 420 | | | | 20,366 | |
| | | | | | | | | |
| Healthcare - Products - 4.39% | | | | | | | | |
| Zimmer Biomet Holdings, Inc. | | | 200 | | | | 25,922 | |
| | | | | | | | | |
| Home Builders - 3.80% | | | | | | | | |
| PulteGroup, Inc. | | | 1,050 | | | | 22,439 | |
| | | | | | | | | |
| Insurance - 7.74% | | | | | | | | |
| MetLife, Inc. | | | 635 | | | | 27,559 | |
| Voya Financial, Inc. | | | 620 | | | | 18,129 | |
| | | | | | | | 45,688 | |
| Media - 4.24% | | | | | | | | |
| Viacom, Inc. - Class B | | | 620 | | | | 25,011 | |
| | | | | | | | | |
| Oil & Gas - 6.29% | | | | | | | | |
| BP PLC -ADR | | | 240 | | | | 8,126 | |
| PBF Energy, Inc. - Class A | | | 990 | | | | 21,681 | |
Southwestern Energy Co. (a) | | | 525 | | | | 7,303 | |
| | | | | | | | 37,110 | |
| Pharmaceuticals - 8.66% | | | | | | | | |
| Merck & Company, Inc. | | | 510 | | | | 25,699 | |
| Teva Pharmaceutical Industries Ltd. - ADR | | | 405 | | | | 25,430 | |
| | | | | | | | 51,129 | |
| Pipelines - 4.63% | | | | | | | | |
| Kinder Morgan, Inc. | | | 1,250 | | | | 27,313 | |
| | | | | | | | | |
| Retail - 4.52% | | | | | | | | |
| Dick's Sporting Goods, Inc. | | | 455 | | | | 26,663 | |
| | | | | | | | | |
| Semiconductors - 10.88% | | | | | | | | |
| QUALCOMM, Inc. | | | 615 | | | | 38,788 | |
| Skyworks Solutions, Inc. | | | 340 | | | | 25,452 | |
| | | | | | | | 64,240 | |
| | | | | | | | | |
| TOTAL COMMON STOCK (Cost $528,952) | | | | | | | 544,238 | |
| SNOW FAMILY OF FUNDS | SEMI-ANNUAL REPORT |
Snow Capital Hedged Equity Fund
SCHEDULE OF INVESTMENTS
August 31, 2016 (Unaudited)
| EXCHANGE-TRADED FUNDS - 6.52% | | Shares | | | Fair Value | |
| | | | | | | |
| Equity Funds - 6.52% | | | | | | |
| Consumer Staples Select Sector SPDR Fund | | | 400 | | | $ | 21,768 | |
| Utilities Select Sector SPDR Fund | | | 340 | | | | 16,738 | |
| TOTAL EXCHANGE-TRADED FUNDS (Cost $33,165) | | | | | | | 38,506 | |
| | | | | | | | | |
| SHORT TERM INVESTMENTS - 0.51% | | | | | | | | |
Fidelity Institutional Money Market Funds - Government Portfolio, 0.26%(b) (Cost $3,016) | | | 3,016 | | | | 3,016 | |
| | | | | | | | | |
| TOTAL INVESTMENTS (Cost $565,133) - 99.24% | | | | | | $ | 585,760 | |
| SECURITIES SOLD SHORT (Proceeds, $157,055) - (27.36%) | | | | | | | (161,493 | ) |
| OTHER ASSETS IN EXCESS OF LIABILITIES, NET - 28.12% | | | | | | | 165,953 | |
| NET ASSETS - 100% | | | | | | $ | 590,220 | |
Percentages are stated as a percent of net assets.
| (a) | Non-income producing security. |
| (b) | Rate shown represents the rate at May 31, 2016, is subject to change and resets daily. |
ADR - American Depositary Receipt.
The accompanying notes are an integral part of these financial statements.
| SNOW FAMILY OF FUNDS | SEMI-ANNUAL REPORT |
Snow Capital Hedged Equity Fund
SCHEDULE OF INVESTMENTS
August 31, 2016 (Unaudited)
| SECURITIES SOLD SHORT - (27.36)% | | | | | | |
| | | | | | | |
| COMMON STOCK - (27.36)% | | Shares | | | Fair Value | |
| | | | | | | |
| Aerospace & Defense - (0.77)% | | | | | | |
| General Dynamics, Corp. | | | (30 | ) | | $ | (4,567 | ) |
| | | | | | | | | |
| Apparel- (0.73)% | | | | | | | | |
| VF Corp. | | | (70 | ) | | | (4,343 | ) |
| | | | | | | | | |
| Beverages - (1.22)% | | | | | | | | |
| Brown-Forman Corp. - Class B | | | (50 | ) | | | (2,427 | ) |
| Coca-Cola Co. | | | (110 | ) | | | (4,777 | ) |
| | | | | | | | (7,204 | ) |
| Chemicals - (0.71)% | | | | | | | | |
| EI du Pont de Nemours & Co. | | | (60 | ) | | | (4,176 | ) |
| | | | | | | | | |
| Commerical Services - (2.33)% | | | | | | | | |
| Ecolab, Inc. | | | (40 | ) | | | (4,922 | ) |
| Automatic Data Processing, Inc. | | | (50 | ) | | | (4,491 | ) |
| Moody's Corp. | | | (40 | ) | | | (4,348 | ) |
| | | | | | | | (13,761 | ) |
| Computers - (0.78)% | | | | | | | | |
| Accenture PLC - Class A | | | (40 | ) | | | (4,600 | ) |
| | | | | | | | | |
| Cosmetics & Personal Care - (0.76)% | | | | | | | | |
| Colgate-Palmolive Co. | | | (60 | ) | | | (4,460 | ) |
| | | | | | | | | |
| Distribution & Wholesale - (1.66)% | | | | | | | | |
| Fastenal Co. | | | (110 | ) | | | (4,742 | ) |
LKQ Corp. (a) | | | (140 | ) | | | (5,053 | ) |
| | | | | | | | (9,795 | ) |
| Diversified Financial Services - (1.53)% | | | | | | | | |
| CME Group, Inc. | | | (40 | ) | | | (4,334 | ) |
| Invesco, Ltd. | | | (150 | ) | | | (4,679 | ) |
| | | | | | | | (9,013 | ) |
| Electric - (1.53)% | | | | | | | | |
| Duke Energy Corp. | | | (60 | ) | | | (4,780 | ) |
| SCANA Corp. | | | (60 | ) | | | (4,239 | ) |
| | | | | | | | (9,019 | ) |
| Food - (1.72)% | | | | | | | | |
| Ingredion, Inc. | | | (40 | ) | | | (5,478 | ) |
| Sysco Corp. | | | (90 | ) | | | (4,667 | ) |
| | | | | | | | (10,145 | ) |
| Healthcare - Products - (2.40)% | | | | | | | | |
| DENTSPLY SIRONA, Inc. | | | (80 | ) | | | (4,917 | ) |
Edwards Lifesciences Corp. (a) | | | (40 | ) | | | (4,606 | ) |
| Stryker Corp. | | | (40 | ) | | | (4,626 | ) |
| | | | | | | | (14,149 | ) |
| Miscellaneous Manufacturing - (1.62)% | | | | | | | | |
| AO Smith Corp. | | | (50 | ) | | | (4,824 | ) |
| Illinois Tool Works, Inc. | | | (40 | ) | | | (4,754 | ) |
| | | | | | | | (9,578 | ) |
| Oil & Gas - (2.59)% | | | | | | | | |
| EQT Corp. | | | (70 | ) | | | (5,005 | ) |
| PBF Energy, Inc. - Class A | | | (30 | ) | | | (5,371 | ) |
| Hess Corp. | | | (90 | ) | | | (4,887 | ) |
| | | | | | | | (15,263 | ) |
| Oil & Gas Services - (0.73)% | | | | | | | | |
| Halliburton Co. | | | (100 | ) | | | (4,301 | ) |
| SNOW FAMILY OF FUNDS | SEMI-ANNUAL REPORT |
Snow Capital Hedged Equity Fund
SCHEDULE OF INVESTMENTS
August 31, 2016 (Unaudited)
| SECURITIES SOLD SHORT - (27.36)% (continued) | | | | | | |
| | | | | | | |
| COMMON STOCK - (27.36)% (continued) | | Shares | | | Fair Value | |
| | | | | | | |
| Pharmaceuticals - (0.78)% | | | | | | |
| Zoetis, Inc. | | | (90 | ) | | $ | (4,599 | ) |
| | | | | | | | | |
| Retail - (1.53)% | | | | | | | | |
| Domino's Pizza, Inc. | | | (30 | ) | | | (4,487 | ) |
| L Brands, Inc. | | | (60 | ) | | | (4,573 | ) |
| | | | | | | | (9,060 | ) |
| Software - (2.45)% | | | | | | | | |
Adobe Systems, Inc. (a) | | | (50 | ) | | | (5,116 | ) |
Electronic Arts, Inc. (a) | | | (60 | ) | | | (4,874 | ) |
| MSCI, Inc. | | | (50 | ) | | | (4,506 | ) |
| | | | | | | | (14,496 | ) |
| Telecommunications - (1.52)% | | | | | | | | |
| AT&T, Inc. | | | (110 | ) | | | (4,497 | ) |
Level 3 Communications, Inc. (a) | | | (90 | ) | | | (4,467 | ) |
| | | | | | | | (8,964 | ) |
| | | | | | | | | |
| TOTAL COMMON STOCK SOLD SHORT (Proceeds $160,709) | | | | | | $ | (161,493 | ) |
Percentages are stated as a percent of net assets.
| (a) | Non-income producing security. |
| (b) | Rate shown represents the rate at August 31, 2016, is subject to change and resets daily. |
ADR - American Depositary Receipt.
The accompanying notes are an integral part of these financial statements.
| SNOW FAMILY OF FUNDS | SEMI-ANNUAL REPORT |
Snow Capital Inflation Advantaged Equities Fund
SCHEDULE OF INVESTMENTS
August 31, 2016 (Unaudited)
| COMMON STOCK - 93.92% | | Shares | | | Fair Value | |
| | | | | | | |
| Aerospace & Defense - 2.70% | | | | | | |
| Triumph Group, Inc. | | | 235 | | | $ | 7,487 | |
| | | | | | | | | |
| Banks - 4.36% | | | | | | | | |
| Bank of America Corp. | | | 750 | | | | 12,105 | |
| | | | | | | | | |
| Biotechnology - 2.75% | | | | | | | | |
Biogen, Inc. (a) | | | 25 | | | | 7,641 | |
| | | | | | | | | |
| Building Materials - 2.99% | | | | | | | | |
Cemex SAB de CV - ADR (a) | | | 1,000 | | | | 8,290 | |
| | | | | | | | | |
| Chemicals - 2.71% | | | | | | | | |
| Mosaic Co. | | | 250 | | | | 7,518 | |
| | | | | | | | | |
| Commercial Services - 2.72% | | | | | | | | |
On Assignment, Inc. (a) | | | 200 | | | | 7,542 | |
| | | | | | | | | |
| Electric - 2.82% | | | | | | | | |
| Exelon Corp. | | | 230 | | | | 7,820 | |
| | | | | | | | | |
| Engineering & Construction - 2.15% | | | | | | | | |
| Chicago Bridge & Iron Co. | | | 200 | | | | 5,956 | |
| | | | | | | | | |
| Forest Products & Paper - 3.32% | | | | | | | | |
| International Paper Co. | | | 190 | | | | 9,213 | |
| | | | | | | | | |
| Healthcare - Products - 2.80% | | | | | | | | |
| Zimmer Biomet Holdings, Inc. | | | 60 | | | | 7,777 | |
| | | | | | | | | |
| Home Builders - 3.74% | | | | | | | | |
| PulteGroup, Inc. | | | 485 | | | | 10,364 | |
| | | | | | | | | |
| Insurance - 8.19% | | | | | | | | |
| MetLife, Inc. | | | 185 | | | | 8,029 | |
| Hartford Financial Services Group, Inc. | | | 130 | | | | 5,339 | |
| Voya Financial, Inc. | | | 320 | | | | 9,357 | |
| | | | | | | | 22,725 | |
| Media - 2.54% | | | | | | | | |
| Viacom, Inc. - Class B | | | 175 | | | | 7,060 | |
| | | | | | | | | |
| Mining - 3.45% | | | | | | | | |
| Newmont Mining Corp. | | | 250 | | | | 9,560 | |
| | | | | | | | | |
| Miscellaneous Manufacturing - 6.35% | | | | | | | | |
| Crane Co. | | | 155 | | | | 9,970 | |
| Eaton Corp. PLC | | | 115 | | | | 7,652 | |
| | | | | | | | 17,622 | |
| Oil & Gas - 8.83% | | | | | | | | |
| BP PLC - ADR | | | 280 | | | | 9,481 | |
| PBF Energy, Inc. -A | | | 285 | | | | 6,242 | |
Southwestern Energy Co. (a) | | | 630 | | | | 8,763 | |
| | | | | | | | 24,486 | |
| Packaging & Containers - 3.43% | | | | | | | | |
Owens-Illinois, Inc. (a) | | | 530 | | | | 9,502 | |
| | | | | | | | | |
| Pharmaceuticals - 8.34% | | | | | | | | |
| Teva Pharmaceutical Industries, Ltd. - ADR | | | 120 | | | | 6,047 | |
Lannett Co., Inc. (a) | | | 270 | | | | 9,142 | |
Omega Protein Corp. (a) | | | 315 | | | | 7,941 | |
| | | | | | | | 23,130 | |
| SNOW FAMILY OF FUNDS | SEMI-ANNUAL REPORT |
Snow Capital Inflation Advantaged Equities Fund
SCHEDULE OF INVESTMENTS
August 31, 2016 (Unaudited)
| COMMON STOCK - 93.92% (continued) | | Shares | | | Fair Value | |
| | | | | | | |
| Pipelines - 2.95% | | | | | | |
| Kinder Morgan, Inc. | | | 375 | | | $ | 8,194 | |
| | | | | | | | | |
| Retail - 9.50% | | | | | | | | |
| Dick's Sporting Goods, Inc. | | | 170 | | | | 9,962 | |
| Macy's Inc. | | | 220 | | | | 7,960 | |
| Target Corp. | | | 120 | | | | 8,423 | |
| | | | | | | | 26,345 | |
| Semiconductors - 2.73% | | | | | | | | |
| QUALCOMM, Inc. | | | 120 | | | | 7,567 | |
| | | | | | | | | |
| Software - 2.38% | | | | | | | | |
| Microsoft Corp. | | | 115 | | | | 6,608 | |
| | | | | | | | | |
| Telecommunications - 2.17% | | | | | | | | |
| Verizon Communications, Inc. | | | 115 | | | | 6,018 | |
| | | | | | | | | |
| | | | | | | | | |
| TOTAL COMMON STOCK (Cost $250,558) | | | | | | | 260,530 | |
| | | | | | | | | |
| SHORT TERM INVESTMENTS - 4.27% | | | | | | | | |
Fidelity Institutional Money Market Funds - Government Portfolio, 0.26%(b) (Cost $11,864) | | | 11,864 | | | | 11,864 | |
| | | | | | | | | |
| TOTAL INVESTMENTS (Cost $262,422) - 98.19% | | | | | | $ | 272,394 | |
| OTHER LIABILITIES IN EXCESS OF ASSETS, NET - 1.81% | | | | | | | 5,011 | |
| NET ASSETS - 100% | | | | | | $ | 277,405 | |
Percentages are stated as a percent of net assets.
| (a) | Non-income producing security. |
| (b) | Rate shown represents the rate at May 31, 2016, is subject to change and resets daily. |
ADR - American Depositary Receipt.
The accompanying notes are an integral part of these financial statements.
| SNOW FAMILY OF FUNDS | SEMI-ANNUAL REPORT |
Snow Capital Dividend Plus Fund
SCHEDULE OF INVESTMENTS
August 31, 2016 (Unaudited)
| COMMON STOCK - 82.41% | | Shares | | | Fair Value | |
| | | | | | | |
| Auto Manufacturers - 2.33% | | | | | | |
| General Motors Co. | | | 245 | | | $ | 7,820 | |
| | | | | | | | | |
| Banks - 7.81% | | | | | | | | |
| KeyCorp | | | 835 | | | | 10,488 | |
| FNB Corp. | | | 230 | | | | 2,873 | |
| JPMorgan Chase & Co. | | | 150 | | | | 10,125 | |
| Wells Fargo & Co. | | | 55 | | | | 2,794 | |
| | | | | | | | 26,280 | |
| Chemicals - 3.48% | | | | | | | | |
| A Schulman, Inc. - Class A | | | 230 | | | | 5,865 | |
| Mosaic Co. | | | 195 | | | | 5,864 | |
| | | | | | | | 11,729 | |
| Commerical Services - 1.74% | | | | | | | | |
| H&R Block, Inc. | | | 270 | | | | 5,848 | |
| | | | | | | | | |
| Computers - 6.40% | | | | | | | | |
| NetApp, Inc. | | | 315 | | | | 10,896 | |
| Hewlett Packard Enterprise Co. | | | 495 | | | | 10,633 | |
| | | | | | | | 21,529 | |
| Electric - 2.17% | | | | | | | | |
| Exelon Corp. | | | 215 | | | | 7,310 | |
| | | | | | | | | |
| Food - 2.15% | | | | | | | | |
| Flowers Foods, Inc. | | | 485 | | | | 7,231 | |
| | | | | | | | | |
| Forest Products & Paper - 2.59% | | | | | | | | |
| International Paper Co. | | | 180 | | | | 8,728 | |
| | | | | | | | | |
| Hand & Machine Tools - 2.66% | | | | | | | | |
| Kennametal, Inc. | | | 320 | | | | 8,947 | |
| | | | | | | | | |
| Healthcare - Products - 2.50% | | | | | | | | |
| Zimmer Biomet Holdings, Inc. | | | 65 | | | | 8,425 | |
| | | | | | | | | |
| Healthcare - Services - 1.62% | | | | | | | | |
| Kindred Healthcare, Inc. | | | 495 | | | | 5,465 | |
| | | | | | | | | |
| Home Builders - 3.05% | | | | | | | | |
| PulteGroup, Inc. | | | 480 | | | | 10,258 | |
| | | | | | | | | |
| Home Furnishings - 1.89% | | | | | | | | |
| Harman International Industries, Inc. | | | 75 | | | | 6,352 | |
| | | | | | | | | |
| Insurance - 7.37% | | | | | | | | |
| American International Group, Inc. | | | 160 | | | | 9,573 | |
| Hartford Financial Services Group, Inc. | | | 190 | | | | 8,246 | |
| MetLife, Inc. | | | 170 | | | | 6,982 | |
| | | | | | | | 24,801 | |
| Media - 1.86% | | | | | | | | |
| Viacom, Inc. - Class B | | | 155 | | | | 6,253 | |
| SNOW FAMILY OF FUNDS | SEMI-ANNUAL REPORT |
Snow Capital Dividend Plus Fund
SCHEDULE OF INVESTMENTS
August 31, 2016 (Unaudited)
| COMMON STOCK - 82.41% (continued) | | Shares | | | Fair Value | |
| | | | | | | |
| Miscellaneous Manufacturing - 3.70% | | | | | | |
| Crane Co. | | | 90 | | | $ | 5,789 | |
| Eaton Corp. PLC | | | 100 | | | | 6,653 | |
| | | | | | | | 12,442 | |
| Oil & Gas- 9.85% | | | | | | | | |
| Chevron Corp. | | | 105 | | | | 10,561 | |
| BP PLC - ADR | | | 280 | | | | 9,481 | |
| PBF Energy, Inc. - Class A | | | 270 | | | | 5,913 | |
| Royal Dutch Shell PLC - ADR | | | 147 | | | | 7,188 | |
| | | | | | | | 33,143 | |
| Pharmaceuticals - 2.25% | | | | | | | | |
| Teva Pharmaceutical Industries, Ltd. - ADR | | | 150 | | | | 7,558 | |
| | | | | | | | | |
| Pipelines - 3.93% | | | | | | | | |
| Kinder Morgan, Inc. | | | 605 | | | | 13,219 | |
| | | | | | | | | |
| Real Estate Investment Trusts - 2.54% | | | | | | | | |
| Chimera Investment Corp. | | | 518 | | | | 8,541 | |
| | | | | | | | | |
| Semiconductors - 4.95% | | | | | | | | |
| Cypress Semiconductor Corp. | | | 710 | | | | 8,470 | |
| QUALCOMM, Inc. | | | 130 | | | | 8,199 | |
| | | | | | | | 16,669 | |
| Telecommunications - 2.71% | | | | | | | | |
| Telefonaktiebolaget LM Ericsson - ADR | | | 840 | | | | 5,981 | |
| Verizon Communications, Inc. | | | 60 | | | | 3,140 | |
| | | | | | | | 9,121 | |
| Transportation - 2.86% | | | | | | | | |
| CSX Corp. | | | 340 | | | | 9,615 | |
| | | | | | | | | |
| TOTAL COMMON STOCK (Cost $266,516) | | | | | | | 277,284 | |
| | | | | | | | | |
| PREFERRED STOCK - 9.20% | | | | | | | | |
| | | | | | | | | |
| Banks - 3.32% | | | | | | | | |
| Bank of America Corp., 7.25%, Series L | | | 9 | | | | 11,169 | |
| | | | | | | | | |
| Diversified Financial Services - 2.85% | | | | | | | | |
| Ally Financial, Inc., 6.602%, Series 2 | | | 380 | | | | 9,599 | |
| | | | | | | | | |
| Real Estate Investment Trusts - 3.03% | | | | | | | | |
| Annaly Capital Management, Inc., 7.625%, Series C | | | 400 | | | | 10,180 | |
| | | | | | | | | |
| TOTAL PREFERRED STOCK (Cost $30,631) | | | | | | | 30,948 | |
| SNOW FAMILY OF FUNDS | SEMI-ANNUAL REPORT |
Snow Capital Dividend Plus Fund
SCHEDULE OF INVESTMENTS
August 31, 2016 (Unaudited)
| PARTNERSHIPS - 6.24% | | Shares | | | Fair Value | |
| | | | | | | |
| Diversified Financial Services - 1.76% | | | | | | |
| AllianceBernstein Holding LP | | | 270 | | | $ | 5,910 | |
| | | | | | | | | |
| Oil & Gas - 2.07% | | | | | | | | |
| Suburban Propane Partners LP | | | 210 | | | | 6,962 | |
| | | | | | | | | |
| Pipelines - 2.41% | | | | | | | | |
| Boardwalk Pipeline Partners LP | | | 500 | | | | 8,115 | |
| | | | | | | | | |
| TOTAL PARTNERSHIPS (Cost $18,343) | | | | | | | 20,987 | |
| | | | | | | | | |
| SHORT TERM INVESTMENTS - 0.07% | | | | | | | | |
Fidelity Institutional Money Market Funds - Government Portfolio, 0.26%(b) (Cost $223) | | | 223 | | | | 223 | |
| | | | | | | | | |
| TOTAL INVESTMENTS (Cost $315,713) - 97.92% | | | | | | $ | 329,442 | |
| OTHER LIABIITIES IN EXCESS OF ASSETS, NET - 2.08% | | | | | | | 7,015 | |
| NET ASSETS - 100% | | | | | | $ | 336,457 | |
Percentages are stated as a percent of net assets.
| (a) | Non-income producing security. |
| (b) | Rate shown represents the rate at August 31, 2016, is subject to change and resets daily. |
ADR - American Depositary Receipt.
The accompanying notes are an integral part of these financial statements.
| SNOW FAMILY OF FUNDS | SEMI-ANNUAL REPORT |
Snow Capital Mid Cap Value Fund
SCHEDULE OF INVESTMENTS
August 31, 2016 (Unaudited)
| COMMON STOCK - 88.86% | | Shares | | | Fair Value | |
| | | | | | | |
| Aerospace & Defense - 1.87% | | | | | | |
| Triumph Group, Inc. | | | 190 | | | $ | 6,053 | |
| | | | | | | | | |
| Banks - 5.35% | | | | | | | | |
| KeyCorp | | | 890 | | | | 11,178 | |
| Zions Bancorporation | | | 200 | | | | 6,118 | |
| | | | | | | | 17,296 | |
| Chemicals - 4.24% | | | | | | | | |
| Mosaic Co. | | | 300 | | | | 9,021 | |
| FMC Corp. | | | 100 | | | | 4,694 | |
| | | | | | | | 13,715 | |
| Computers - 7.85% | | | | | | | | |
| NetApp, Inc. | | | 240 | | | | 8,302 | |
| Hewlett Packard Enterprise Co. | | | 400 | | | | 8,592 | |
NCR Corp. (a) | | | 250 | | | | 8,463 | |
| | | | | | | | 25,357 | |
| Diversified Financial Services - 3.72% | | | | | | | | |
| Ally Financial, Inc. | | | 600 | | | | 12,024 | |
| | | | | | | | | |
| Electric - 2.11% | | | | | | | | |
| Exelon Corp. | | | 200 | | | | 6,800 | |
| | | | | | | | | |
| Electronics - 5.40% | | | | | | | | |
| Avnet, Inc. | | | 200 | | | | 8,336 | |
Keysight Technologies, Inc. (a) | | | 300 | | | | 9,129 | |
| | | | | | | | 17,465 | |
| Engineering & Construction - 1.38% | | | | | | | | |
| Chicago Bridge & Iron Co. | | | 150 | | | | 4,467 | |
| | | | | | | | | |
| Forest Products & Paper - 3.98% | | | | | | | | |
| International Paper Co. | | | 265 | | | | 12,850 | |
| | | | | | | | | |
| Healthcare - Products - 2.81% | | | | | | | | |
| Zimmer Biomet Holdings, Inc. | | | 70 | | | | 9,073 | |
| | | | | | | | | |
| Healthcare - Services - 1.29% | | | | | | | | |
Community Health Systems, Inc. (a) | | | 390 | | | | 4,165 | |
| | | | | | | | | |
| Home Builders - Services - 1.32% | | | | | | | | |
| PulteGroup, Inc. | | | 200 | | | | 4,274 | |
| | | | | | | | | |
| Home Furnishings - Services - 2.10% | | | | | | | | |
| Harman International Industries, Inc. | | | 80 | | | | 6,775 | |
| | | | | | | | | |
| Insurance - 7.09% | | | | | | | | |
| Hartford Financial Services Group, Inc. | | | 230 | | | | 9,446 | |
| Voya Financial, Inc. | | | 460 | | | | 13,450 | |
| | | | | | | | 22,896 | |
| Internet - 3.06% | | | | | | | | |
| Symantec Corp. | | | 410 | | | | 9,893 | |
| | | | | | | | | |
| Machinery - Construction & Mining - 0.75% | | | | | | | | |
| Terex Corp. | | | 100 | | | | 2,428 | |
| | | | | | | | | |
| Machinery - Diversified - 1.08% | | | | | | | | |
Zebra Technologies Corp. (a) | | | 50 | | | | 3,498 | |
| SNOW FAMILY OF FUNDS | SEMI-ANNUAL REPORT |
Snow Capital Mid Cap Value Fund
SCHEDULE OF INVESTMENTS
August 31, 2016 (Unaudited)
| COMMON STOCK - 88.86% (continued) | | Shares | | | Fair Value | |
| | | | | | | |
| Media - 3.12% | | | | | | |
| Viacom, Inc. - Class B | | | 250 | | | $ | 10,085 | |
| | | | | | | | | |
| Miscellaneous Manufacturing - 7.89% | | | | | | | | |
| Crane Co. | | | 150 | | | | 9,648 | |
| Eaton Corp. PLC | | | 100 | | | | 6,654 | |
| Textron, Inc. | | | 225 | | | | 9,191 | |
| | | | | | | | 25,493 | |
| Oil & Gas - 3.21% | | | | | | | | |
| Devon Energy Corp. | | | 355 | | | | 7,775 | |
| PBF Energy, Inc. - Class A | | | 60 | | | | 2,600 | |
| | | | | | | | 10,375 | |
| Packaging & Containers - 2.77% | | | | | | | | |
Owens-Illinois, Inc. (a) | | | 500 | | | | 8,965 | |
| | | | | | | | | |
| Real Estate Investments Trusts - 2.87% | | | | | | | | |
| Highwoods Properties, Inc. | | | 175 | | | | 9,282 | |
| | | | | | | | | |
| Retail - 7.89% | | | | | | | | |
| Dick's Sporting Goods, Inc. | | | 150 | | | | 8,790 | |
| Abercrombie & Fitch Co. | | | 200 | | | | 3,548 | |
| Big Lots, Inc. | | | 75 | | | | 3,699 | |
| Kohl's Corp. | | | 50 | | | | 2,219 | |
| Macy's, Inc. | | | 200 | | | | 7,236 | |
| | | | | | | | 25,492 | |
| Semiconductors - 3.77% | | | | | | | | |
| Cypress Semiconductor Corp. | | | 500 | | | | 5,965 | |
| Skyworks Solutions, Inc. | | | 50 | | | | 3,743 | |
Micron Technology, Inc. (a) | | | 150 | | | | 2,474 | |
| | | | | | | | 12,182 | |
| Software - 1.94% | | | | | | | | |
| Open Text Corp. | | | 100 | | | | 6,282 | |
| | | | | | | | | |
| TOTAL COMMON STOCK (Cost $280,863) | | | | | | | 287,185 | |
| | | | | | | | | |
| SHORT TERM INVESTMENTS - 9.61% | | | | | | | | |
Fidelity Institutional Money Market Funds - Government Portfolio, 0.26%(b) (Cost $31,065) | | | 31,065 | | | | 31,065 | |
| | | | | | | | | |
| TOTAL INVESTMENTS (Cost $311,928) - 98.47% | | | | | | $ | 318,250 | |
| OTHER LIABILITES IN EXCESS OF ASSETS, NET - 1.53% | | | | | | | 4,947 | |
| NET ASSETS - 100% | | | | | | $ | 323,197 | |
Percentages are stated as a percent of net assets.
| (a) | Non-income producing security. |
| (b) | Rate shown represents the rate at August 31, 2016, is subject to change and resets daily. |
The accompanying notes are an integral part of these financial statements.
| SNOW FAMILY OF FUNDS | SEMI-ANNUAL REPORT |
STATEMENTS OF ASSETS AND LIABILITIESAugust 31, 2016 (Unaudited)
| | | Snow Capital | | | | Snow Capital | | |
| | | Focused Value Fund | | | | Hedged Equity Fund | | |
| Assets: | | | | | | | | |
| Investments, at value | | $ | 579,823 | | | | $ | 585,760 | | |
| Deposits at broker | | | - | | | | | 163,033 | | |
| Due from advisor | | | 10,887 | | | | | 11,585 | | |
| Receivables: | | | | | | | | | | |
| Interest | | | 4 | | | | | 4 | | |
| Dividends | | | 1,506 | | | | | 1,343 | | |
| Investment securities sold | | | 6,426 | | | | | 50,027 | | |
| Prepaid expenses | | | 1,106 | | | | | 1,106 | | |
| Total assets | | | 599,752 | | | | | 812,858 | | |
| | | | | | | | | | | |
| Liabilities: | | | | | | | | | | |
| Securities sold short, at value | | $ | - | | | | $ | 161,493 | | |
| Payables: | | | | | | | | | | |
| Investment securities purchased | | | 4,877 | | | | | 52,116 | | |
| Accrued distribution (12b-1) fees | | | 111 | | | | | 101 | | |
| Due to administrator | | | 2,909 | | | | | 2,911 | | |
| Due to trustees | | | - | | | | | - | | |
| Accrued expenses | | | 4,836 | | | | | 6,017 | | |
| Total liabilities | | | 12,733 | | | | | 222,638 | | |
| Net Assets | | $ | 587,019 | | | | $ | 590,220 | | |
| | | | | | | | | | | |
| Sources of Net Assets: | | | | | | | | | | |
| Paid-in capital | | $ | 587,248 | | | | $ | 831,103 | | |
| Accumulated net realized loss on investments | | | (24,803 | ) | | | | (264,668 | ) | |
| Undistributed net investment income | | | 3,483 | | | | | 3,943 | | |
| Net unrealized appreciation on investments | | | 21,091 | | | | | 20,626 | | |
| Net unrealized depreciation on securities sold short | | | - | | | | | (784 | ) | |
| Total Net Assets (Unlimited shares of beneficial interest authorized) | | $ | 587,019 | | | | $ | 590,220 | | |
| | | | | | | | | | | |
| Total Investments, at cost | | $ | 558,732 | | | | $ | 565,133 | | |
| Proceeds from securities sold short | | $ | - | | | | $ | 160,709 | | |
| | | | | | | | | | | |
| Class A Shares: | | | | | | | | | | |
| Net assets | | $ | 12,860 | | | | $ | 11,714 | | |
| Shares Outstanding (Unlimited shares of beneficial interest authorized) | | | 656 | | | | | 718 | | |
| Net Asset Value Per Share | | $ | 19.61 | | (d) | | $ | 16.32 | | (d) |
| | | | | | | | | | | |
Maximum Offering Price Per Share (a) | | $ | 20.70 | | | | $ | 17.22 | | |
| | | | | | | | | | | |
Minimum Redemption Price Per Share (b)(c) | | $ | 19.41 | | | | $ | 16.16 | | |
| | | | | | | | | | | |
| Class I Shares: | | | | | | | | | | |
| Net assets | | $ | 574,159 | | | | $ | 579,289 | | |
| Shares Outstanding (Unlimited shares of beneficial interest authorized) | | | 29,228 | | | | | 35,318 | | |
| Net Asset Value and Offering Price Per Share | | $ | 19.64 | | | | $ | 16.40 | | |
| | | | | | | | | | | |
Minimum Redemption Price Per Share (c) | | $ | 19.54 | | | | $ | 16.32 | | |
| (a) | A maximum sales charge of 5.25% is imposed on Class A shares. |
| (b) | Investments in Class A shares made at or above the $1 million breakpoint are not subject to an initial sales charge and may be subject to a 0.50% contingent deferred sales charge ("CDSC") on shares redeemed within one year from the date of purchase. |
| (c) | A redemption fee of 0.50% will be assessed on shares of the Fund that are held for 30 days or less. |
| (d) | NAV does not compute due to rounding. |
The accompanying notes are an integral part of these financial statements.
| SNOW FAMILY OF FUNDS | SEMI-ANNUAL REPORT |
STATEMENTS OF ASSETS AND LIABILITIESAugust 31, 2016 (Unaudited)
| | | Snow Capital | | | | | | | | |
| | | Inflation Advantaged Equities Fund | | | Snow Capital Dividend Plus Fund | | | Snow Capital Mid Cap Value Fund | | |
| Assets: | | | | | | | | | | | | | |
| Investments, at value | | $ | 272,394 | | | $ | 329,442 | | | $ | 318,250 | | |
| Due from advisor | | | 11,461 | | | | 11,678 | | | | 11,636 | | |
| Receivables: | | | | | | | | | | | | | |
| Interest | | | 2 | | | | 1 | | | | 7 | | |
| Dividends | | | 751 | | | | 1,288 | | | | 537 | | |
| Investment securities sold | | | - | | | | 1,266 | | | | - | | |
| Prepaid expenses | | | 1,106 | | | | 1,106 | | | | 1,106 | | |
| Total assets | | | 285,714 | | | | 344,781 | | | | 331,536 | | |
| | | | | | | | | | | | | | |
| Liabilities: | | | | | | | | | | | | | |
| Payables: | | | | | | | | | | | | | |
| Accrued distribution (12b-1) fees | | $ | 99 | | | $ | 104 | | | $ | 108 | | |
| Due to administrator | | | 2,872 | | | | 2,879 | | | | 2,878 | | |
| Due to trustees | | | - | | | | - | | | | - | | |
| Accrued expenses | | | 5,338 | | | | 5,341 | | | | 5,353 | | |
| Total liabilities | | | 8,309 | | | | 8,324 | | | | 8,339 | | |
| Net Assets | | $ | 277,405 | | | $ | 336,457 | | | $ | 323,197 | | |
| | | | | | | | | | | | | | |
| Sources of Net Assets: | | | | | | | | | | | | | |
| Paid-in capital | | $ | 300,410 | | | $ | 329,785 | | | $ | 336,048 | | |
| Accumulated net realized loss on investments | | | (35,500 | ) | | | (13,125 | ) | | | (22,552 | ) | |
| Undistributed net investment income | | | 2,523 | | | | 6,068 | | | | 3,379 | | |
| Net unrealized appreciation on investments | | | 9,972 | | | | 13,729 | | | | 6,322 | | |
| Total Net Assets (Unlimited shares of beneficial interest authorized) | | $ | 277,405 | | | $ | 336,457 | | | $ | 323,197 | | |
| | | | | | | | | | | | | | |
| Total Investments, at cost | | $ | 262,422 | | | $ | 315,713 | | | $ | 311,928 | | |
| | | | | | | | | | | | | | |
| Class A Shares: | | | | | | | | | | | | | |
| Net assets | | $ | 11,004 | | | $ | 13,348 | | | $ | 12,820 | | |
| Shares Outstanding (Unlimited shares of beneficial interest authorized) | | | 589 | | | | 646 | | | | 649 | | |
| Net Asset Value Per Share | | $ | 18.68 | | | $ | 20.66 | | | $ | 19.76 | | (d) |
| | | | | | | | | | | | | | |
| Maximum Offering Price Per Share (a) | | $ | 19.72 | | | $ | 21.80 | | | $ | 20.85 | | |
| | | | | | | | | | | | | | |
| Minimum Redemption Price Per Share (b)(c) | | $ | 18.49 | | | $ | 20.45 | | | $ | 19.56 | | |
| | | | | | | | | | | | | | |
| Class I Shares: | | | | | | | | | | | | | |
| Net assets | | $ | 266,401 | | | $ | 323,109 | | | $ | 310,377 | | |
| Shares Outstanding (Unlimited shares of beneficial interest authorized) | | | 14,235 | | | | 15,611 | | | | 15,682 | | |
| Net Asset Value and Offering Price Per Share | | $ | 18.71 | | | $ | 20.70 | | | $ | 19.79 | | |
| | | | | | | | | | | | | | |
| Minimum Redemption Price Per Share (c) | | $ | 18.62 | | | $ | 20.60 | | | $ | 19.69 | | |
| (a) | A maximum sales charge of 5.25% is imposed on Class A shares. |
| (b) | Investments in Class A shares made at or above the $1 million breakpoint are not subject to an initial sales charge and may be subject to a 0.50% contingent deferred sales charge ("CDSC") on shares redeemed within one year from the date of purchase. |
| (c) | A redemption fee of 0.50% will be assessed on shares of the Fund that are held for 30 days or less. |
| (d) | NAV does not compute due to rounding. |
The accompanying notes are an integral part of these financial statements.
| SNOW FAMILY OF FUNDS | SEMI-ANNUAL REPORT |
STATEMENTS OF OPERATIONSAugust 31, 2016 (Unaudited)
| | | Snow Capital | | | Snow Capital | |
| | | Focused Value Fund | | | Hedged Equity Fund | |
| | | | | | | |
| | | For the | | | For the | |
| | | Six Month Period Ended | | | Six Month Period Ended | |
| | | August 31, 2016 | | | August 31, 2016 | |
| | | (Unaudited) | | | (Unaudited) | |
| Investment income: | | | | | | |
Dividends (a) | | $ | 5,463 | | | $ | 7,463 | |
| Interest | | | 20 | | | | 40 | |
| Total investment income | | | 5,483 | | | | 7,503 | |
| | | | | | | | | |
| Expenses: | | | | | | | | |
| Management fees | | | 1,972 | | | | 2,808 | |
| Distribution (12b-1) fees - Class A | | | 15 | | | | 14 | |
| Administration, Accounting and transfer agent fees and expenses | | | 12,315 | | | | 12,407 | |
| Shareholder reporting and filing | | | 2,168 | | | | 2,168 | |
| Audit fees | | | 2,672 | | | | 2,672 | |
| Legal fees | | | 2,935 | | | | 2,935 | |
| Custodian fees | | | 1,260 | | | | 1,915 | |
| Pricing fees | | | 1,310 | | | | 3,277 | |
| Trustee fees and expenses | | | 7,307 | | | | 7,307 | |
| Registration and filing fees | | | 287 | | | | 287 | |
| Insurance | | | 598 | | | | 598 | |
| Dividends on securities sold short | | | - | | | | 325 | |
| Interest expense | | | - | | | | 42 | |
| Total expenses | | | 32,839 | | | | 36,755 | |
| Less: fees waived and expenses absorbed | | | (30,304 | ) | | | (32,864 | ) |
| Net expenses | | | 2,535 | | | | 3,891 | |
| | | | | | | | | |
| Net investment income | | | 2,948 | | | | 3,612 | |
| | | | | | | | | |
| Realized and unrealized gain (loss): | | | | | | | | |
| Net realized loss on: | | | | | | | | |
| Investments | | | (4,434 | ) | | | (6,717 | ) |
| Securities sold short | | | - | | | | (21,604 | ) |
| Net realized loss on investments | | | (4,434 | ) | | | (28,321 | ) |
| | | | | | | | | |
| Net change in unrealized appreciation on: | | | | | | | | |
| Investments | | | 81,290 | | | | 96,926 | |
| Securities sold short | | | - | | | | 1,642 | |
| Net change in unrealized appreciation | | | 81,290 | | | | 98,568 | |
| | | | | | | | | |
| Net gain on investments | | | 76,856 | | | | 70,247 | |
| | | | | | | | | |
| Net increase in net assets resulting from operations | | $ | 79,804 | | | $ | 73,859 | |
| (a) | Includes foreign taxes withheld of $40 and $39, respectively. |
The accompanying notes are an integral part of these financial statements.
| SNOW FAMILY OF FUNDS | SEMI-ANNUAL REPORT |
STATEMENTS OF OPERATIONSAugust 31, 2016 (Unaudited)
| | | Snow Capital | | | | | | | |
| | | Inflation Advantaged Equities Fund | | | Plus Fund | | | Value Fund | |
| | | | | | | | | | |
| | | For the | | | For the | | | For the | |
| | | Six Month Period Ended | | | Six Month Period Ended | | | Six Month Period Ended | |
| | | August 31, 2016 | | | August 31, 2016 | | | August 31, 2016 | |
| | | (Unaudited) | | | (Unaudited) | | | (Unaudited) | |
| Investment income: | | | | | | | | | |
Dividends (a) | | $ | 3,357 | | | $ | 6,111 | | | $ | 4,642 | |
| Interest | | | 14 | | | | 13 | | | | 52 | |
| Total investment income | | | 3,371 | | | | 6,124 | | | | 4,694 | |
| | | | | | | | | | | | | |
| Expenses: | | | | | | | | | | | | |
| Management fees | | | 1,323 | | | | 1,182 | | | | 1,149 | |
| Distribution (12b-1) fees - Class A | | | 13 | | | | 15 | | | | 15 | |
| Administration, Accounting and transfer agent fees and expenses | | | 12,185 | | | | 12,222 | | | | 12,216 | |
| Shareholder reporting and filing | | | 2,168 | | | | 2,168 | | | | 2,169 | |
| Audit fees | | | 2,672 | | | | 2,672 | | | | 2,672 | |
| Legal fees | | | 2,935 | | | | 2,935 | | | | 2,935 | |
| Custodian fees | | | 1,512 | | | | 1,463 | | | | 1,361 | |
| Pricing fees | | | 1,663 | | | | 2,269 | | | | 2,167 | |
| Trustee fees and expenses | | | 7,307 | | | | 7,307 | | | | 7,307 | |
| Registration and filing fees | | | 287 | | | | 287 | | | | 288 | |
| Insurance | | | 598 | | | | 598 | | | | 597 | |
| Total expenses | | | 32,663 | | | | 33,118 | | | | 32,876 | |
| Less: fees waived and expenses absorbed | | | (30,996 | ) | | | (31,527 | ) | | | (31,329 | ) |
| Net expenses | | | 1,667 | | | | 1,591 | | | | 1,547 | |
| | | | | | | | | | | | | |
| Net investment income | | | 1,704 | | | | 4,533 | | | | 3,147 | |
| | | | | | | | | | | | | |
| Realized and unrealized gain (loss): | | | | | | | | | | | | |
| Net realized gain (loss) on: | | | | | | | | | | | | |
| Investments | | | 6,654 | | | | 5,172 | | | | (1,928 | ) |
| Net realized gain (loss) on investments | | | 6,654 | | | | 5,172 | | | | (1,928 | ) |
| | | | | | | | | | | | | |
| Net change in unrealized appreciation on: | | | | | | | | | | | | |
| Investments | | | 33,410 | | | | 56,348 | | | | 46,012 | |
| Net change in unrealized appreciation | | | 33,410 | | | | 56,348 | | | | 46,012 | |
| | | | | | | | | | | | | |
| Net gain on investments | | | 40,064 | | | | 61,520 | | | | 44,084 | |
| | | | | | | | | | | | | |
| Net increase in net assets resulting from operations | | $ | 41,768 | | | $ | 66,053 | | | $ | 47,231 | |
| (a) | Includes foreign taxes withheld of $13, $38, and $13, respectively. |
The accompanying notes are an integral part of these financial statements.
| SNOW FAMILY OF FUNDS | SEMI-ANNUAL REPORT |
STATEMENTS OF CHANGES IN NET ASSETSAugust 31, 2016
| | | Snow Capital | |
| | | Focused Value Fund | |
| | | | | | | |
| | | For the | | | | |
| | | Six Month Period Ended | | | | |
| | | August 31, 2016 | | | February 29, 2016 | |
| | | (Unaudited) | | | | |
| Increase (decrease) in net assets from: | | | | | | |
| Operations: | | | | | | |
| Net investment income | | $ | 2,948 | | | $ | 3,555 | |
| Net realized loss on investments | | | (4,434 | ) | | | (19,819 | ) |
| Net unrealized appreciation (depreciation) on investments | | | 81,290 | | | | (88,083 | ) |
| Net increase (decrease) in net assets resulting from operations | | | 79,804 | | | | (104,347 | ) |
| | | | | | | | | |
| Distributions to shareholders from: | | | | | | | | |
| Net investment income - Class A | | | - | | | | (93 | ) |
| Net investment income - Class I | | | - | | | | (2,928 | ) |
| Net realized capital gains - Class A | | | - | | | | (22 | ) |
| Net realized capital gains - Class I | | | - | | | | (529 | ) |
| Total distributions | | | - | | | | (3,572 | ) |
| | | | | | | | | |
| Capital share transactions (Note 2): | | | | | | | | |
| Increase in net assets from capital share transactions | | | 243,657 | | | | 3,571 | |
| | | | | | | | | |
| Increase (decrease) in net assets | | | 323,461 | | | | (104,348 | ) |
| | | | | | | | | |
| Net Assets: | | | | | | | | |
| Beginning of period | | | 263,558 | | | | 367,906 | |
| | | | | | | | | |
| End of period | | $ | 587,019 | | | $ | 263,558 | |
| Undistributed net investment income | | $ | 3,483 | | | $ | 535 | |
The accompanying notes are an integral part of these financial statements.
| SNOW FAMILY OF FUNDS | SEMI-ANNUAL REPORT |
STATEMENTS OF CHANGES IN NET ASSETSAugust 31, 2016
| | | Snow Capital | |
| | | Hedged Equity Fund | |
| | | | | | | |
| | | For the | | | | |
| | | Six Month Period Ended | | | | |
| | | August 31, 2016 | | | February 29, 2016 | |
| | | (Unaudited) | | | | |
| Increase (decrease) in net assets from: | | | | | | |
| Operations: | | | | | | |
| Net investment income | | $ | 3,612 | | | $ | 4,606 | |
| Net realized loss on investments | | | (28,321 | ) | | | (67,225 | ) |
| Net unrealized appreciation (depreciation) on investments | | | 98,568 | | | | (72,932 | ) |
| Net increase (decrease) in net assets resulting from operations | | | 73,859 | | | | (135,551 | ) |
| | | | | | | | | |
| Distributions to shareholders from: | | | | | | | | |
| Net investment income - Class A | | | - | | | | (59 | ) |
| Net investment income - Class I | | | - | | | | (4,183 | ) |
| Total distributions | | | - | | | | (4,242 | ) |
| | | | | | | | | |
| Capital share transactions (Note 2): | | | | | | | | |
| Increase in net assets from capital share transactions | | | - | | | | 4,242 | |
| | | | | | | | | |
| Increase (decrease) in net assets | | | 73,859 | | | | (135,551 | ) |
| | | | | | | | | |
| Net Assets: | | | | | | | | |
| Beginning of period | | | 516,361 | | | | 651,912 | |
| | | | | | | | | |
| End of period | | $ | 590,220 | | | $ | 516,361 | |
| Undistributed net investment income | | $ | 3,943 | | | $ | 331 | |
The accompanying notes are an integral part of these financial statements.
| SNOW FAMILY OF FUNDS | SEMI-ANNUAL REPORT |
STATEMENTS OF CHANGES IN NET ASSETSAugust 31, 2016
| | | Snow Capital | |
| | | Inflation Advantaged Equities Fund | |
| | | | | | | |
| | | For the | | | | |
| | | Six Month Period Ended | | | | |
| | | August 31, 2016 | | | February 29, 2016 | |
| | | (Unaudited) | | | | |
| Increase (decrease) in net assets from: | | | | | | |
| Operations: | | | | | | |
| Net investment income | | $ | 1,704 | | | $ | 3,725 | |
| Net realized gain (loss) on investments | | | 6,654 | | | | (36,217 | ) |
| Net unrealized appreciation (depreciation) on investments | | | 33,410 | | | | (57,390 | ) |
| Net increase (decrease) in net assets resulting from operations | | | 41,768 | | | | (89,882 | ) |
| | | | | | | | | |
| Distributions to shareholders from: | | | | | | | | |
| Net investment income - Class A | | | - | | | | (92 | ) |
| Net investment income - Class I | | | - | | | | (2,822 | ) |
| Net realized capital gains - Class A | | | - | | | | (191 | ) |
| Net realized capital gains - Class I | | | - | | | | (4,599 | ) |
| Total distributions | | | - | | | | (7,704 | ) |
| | | | | | | | | |
| Capital share transactions (Note 2): | | | | | | | | |
| Increase in net assets from capital share transactions | | | - | | | | 7,704 | |
| | | | | | | | | |
| Increase (decrease) in net assets | | | 41,768 | | | | (89,882 | ) |
| | | | | | | | | |
| Net Assets: | | | | | | | | |
| Beginning of period | | | 235,637 | | | | 325,519 | |
| | | | | | | | | |
| End of period | | $ | 277,405 | | | $ | 235,637 | |
| Undistributed net investment income | | $ | 2,523 | | | $ | 819 | |
The accompanying notes are an integral part of these financial statements.
| SNOW FAMILY OF FUNDS | SEMI-ANNUAL REPORT |
STATEMENTS OF CHANGES IN NET ASSETSAugust 31, 2016
| | | Snow Capital | |
| | | Dividend Plus Fund | |
| | | | | | | |
| | | For the | | | | |
| | | Six Month Period Ended | | | | |
| | | August 31, 2016 | | | February 29, 2016 | |
| | | (Unaudited) | | | | |
| Increase (decrease) in net assets from: | | | | | | |
| Operations: | | | | | | |
| Net investment income | | $ | 4,533 | | | $ | 8,792 | |
| Net realized gain (loss) on investments | | | 5,172 | | | | (16,812 | ) |
| Net unrealized appreciation (depreciation) on investments | | | 56,348 | | | | (62,417 | ) |
| Net increase (decrease) in net assets resulting from operations | | | 66,053 | | | | (70,437 | ) |
| | | | | | | | | |
| Distributions to shareholders from: | | | | | | | | |
| Net investment income - Class A | | | - | | | | (283 | ) |
| Net investment income - Class I | | | - | | | | (7,449 | ) |
| Total distributions | | | - | | | | (7,732 | ) |
| | | | | | | | | |
| Capital share transactions (Note 2): | | | | | | | | |
| Increase in net assets from capital share transactions | | | - | | | | 7,732 | |
| | | | | | | | | |
| Increase (decrease) in net assets | | | 66,053 | | | | (70,437 | ) |
| | | | | | | | | |
| Net Assets: | | | | | | | | |
| Beginning of period | | | 270,404 | | | | 340,841 | |
| | | | | | | | | |
| End of period | | $ | 336,457 | | | $ | 270,404 | |
| Undistributed net investment income | | $ | 6,068 | | | $ | 1,535 | |
The accompanying notes are an integral part of these financial statements.
| SNOW FAMILY OF FUNDS | SEMI-ANNUAL REPORT |
STATEMENTS OF CHANGES IN NET ASSETSAugust 31, 2016
| | | Snow Capital | | | Snow Capital | |
| | | Mid Cap Value Fund | | | Mid Cap Value Fund | |
| | | | | | | |
| | | For the | | | | |
| | | Six Month Period Ended | | | | |
| | | August 31, 2016 | | | February 29, 2016 | |
| | | (Unaudited) | | | | |
| Increase (decrease) in net assets from: | | | | | | |
| Operations: | | | | | | |
| Net investment income | | $ | 3,147 | | | $ | 1,968 | |
| Net realized loss on investments | | | (1,928 | ) | | | (9,659 | ) |
| Net unrealized appreciation (depreciation) on investments | | | 46,012 | | | | (73,003 | ) |
| Net increase (decrease) in net assets resulting from operations | | | 47,231 | | | | (80,694 | ) |
| | | | | | | | | |
| Distributions to shareholders from: | | | | | | | | |
| Net investment income - Class A | | | - | | | | (44 | ) |
| Net investment income - Class I | | | - | | | | (1,731 | ) |
| Net realized capital gains - Class A | | | - | | | | (436 | ) |
| Net realized capital gains - Class I | | | - | | | | (10,515 | ) |
| Total distributions | | | - | | | | (12,726 | ) |
| | | | | | | | | |
| Capital share transactions (Note 2): | | | | | | | | |
| Increase in net assets from capital share transactions | | | - | | | | 12,726 | |
| | | | | | | | | |
| Increase (decrease) in net assets | | | 47,231 | | | | (80,694 | ) |
| | | | | | | | | |
| Net Assets: | | | | | | | | |
| Beginning of period | | | 275,966 | | | | 356,660 | |
| | | | | | | | | |
| End of period | | $ | 323,197 | | | $ | 275,966 | |
| Undistributed net investment income | | $ | 3,379 | | | $ | 232 | |
The accompanying notes are an integral part of these financial statements.
| SNOW FAMILY OF FUNDS | SEMI-ANNUAL REPORT |
FINANCIAL HIGHLIGHTSAugust 31, 2016
The following tables set forth the per share operating performance data for a share of capital stock outstanding, total return ratios to average net assets and other supplemental data for the period indicated.
| | | Snow Capital Focused Value Fund | | |
| | | | | | | | | | | | | | | |
| | | Class A | | |
| | | For the | | | | For the | | | For the | | | For the | | |
| | | Six Month Period Ended | | | | Year Ended | | | Year Ended | | | Period Ended | | |
| | | August 31, 2016 | | | | February 29, 2016 | | | February 28, 2015 | | | February 28, 2014 (a) | | |
| | | (Unaudited) | | | | | | | | | | | | |
| | | | | | | | | | | | | | | |
| Net Asset Value, Beginning of Period | | $ | 15.96 | | | | $ | 22.54 | | | $ | 24.02 | | | $ | 20.00 | | |
| | | | | | | | | | | | | | | | | | | |
| Investment Operations: | | | | | | | | | | | | | | | | | | |
| Net investment income | | | 0.10 | | (b) | | | 0.17 | | | | 0.10 | | | | 0.11 | | |
| Net realized and unrealized gain (loss) on investments | | | 3.55 | | | | | (6.58 | ) | | | 2.11 | | | | 6.73 | | |
| Total from investment operations | | | 3.65 | | | | | (6.41 | ) | | | 2.21 | | | | 6.84 | | |
| | | | | | | | | | | | | | | | | | | |
| Distributions: | | | | | | | | | | | | | | | | | | |
| From net investment income | | | - | | | | | (0.14 | ) | | | (0.10 | ) | | | (0.11 | ) | |
| From net realized capital gains | | | - | | | | | (0.03 | ) | | | (3.59 | ) | | | (2.71 | ) | |
| Total distributions | | | - | | | | | (0.17 | ) | | | (3.69 | ) | | | (2.82 | ) | |
| | | | | | | | | | | | | | | | | | | |
| Net Asset Value, End of Period | | $ | 19.61 | | | | $ | 15.96 | | | $ | 22.54 | | | $ | 24.02 | | |
| | | | | | | | | | | | | | | | | | | |
Total Return (c) | | | 22.87 | % | (d) | | | (28.52 | )% | | | 8.91 | % | | | 34.48 | % | (d) |
| | | | | | | | | | | | | | | | | | | |
| Ratios/Supplemental Data | | | | | | | | | | | | | | | | | | |
| Net assets, end of period (in 000's) | | $ | 13 | | | | $ | 10 | | | $ | 15 | | | $ | 13 | | |
| | | | | | | | | | | | | | | | | | | |
| Ratio of expenses to average net assets: | | | | | | | | | | | | | | | | | | |
| Before fees waived and expenses absorbed | | | 15.23 | % | (e) | | | 18.63 | % | | | 15.37 | % | | | 17.16 | % | (e) |
| After fees waived and expenses absorbed | | | 1.40 | % | (e) | | | 1.40 | % | | | 1.40 | % | | | 1.40 | % | (e) |
| | | | | | | | | | | | | | | | | | | |
| Ratio of net investment income (loss): | | | | | | | | | | | | | | | | | | |
| Before fees waived and expenses absorbed | | | (12.73 | )% | (e) | | | (16.40 | )% | | | (13.57 | )% | | | (15.23 | )% | (e) |
| After fees waived and expenses absorbed | | | 1.10 | % | (e) | | | 0.82 | % | | | 0.40 | % | | | 0.52 | % | (e) |
| | | | | | | | | | | | | | | | | | | |
| Portfolio turnover rate | | | 43.24 | % | (d) | | | 71.87 | % | | | 84.34 | % | | | 87.78 | % | (d) |
| (a) | The Fund commenced operations on March 28, 2013. |
| (b) | Net investment income per share is based on average shares outstanding for the six month period ended August 31, 2016. |
| (c) | Total Return represents the rate that the investor would have earned or lost on an investment in the Fund, assuming reinvestment of dividends. |
The accompanying notes are an integral part of these financial statements.
| SNOW FAMILY OF FUNDS | SEMI-ANNUAL REPORT |
FINANCIAL HIGHLIGHTSAugust 31, 2016
The following tables set forth the per share operating performance data for a share of capital stock outstanding, total return ratios to average net assets and other supplemental data for the period indicated.
| | | Snow Capital Focused Value Fund | | |
| | | | | | | | | | | | | | | |
| | | Class I | | |
| | | For the | | | | For the | | | For the | | | For the | | |
| | | Six Month Period Ended | | | | Year Ended | | | Year Ended | | | Period Ended | | |
| | | August 31, 2016 | | | | February 29, 2016 | | | February 28, 2015 | | | February 28, 2014 (a) | | |
| | | (Unaudited) | | | | | | | | | | | | |
| | | | | | | | | | | | | | | |
| Net Asset Value, Beginning of Period | | $ | 15.97 | | | | $ | 22.56 | | | $ | 24.03 | | | $ | 20.00 | | |
| | | | | | | | | | | | | | | | | | | |
| Investment Operations: | | | | | | | | | | | | | | | | | | |
| Net investment income | | | 0.11 | | (b) | | | 0.22 | | | | 0.16 | | | | 0.16 | | |
| Net realized and unrealized gain (loss) on investments | | | 3.56 | | | | | (6.59 | ) | | | 2.12 | | | | 6.74 | | |
| Total from investment operations | | | 3.67 | | | | | (6.37 | ) | | | 2.28 | | | | 6.90 | | |
| | | | | | | | | | | | | | | | | | | |
| Distributions: | | | | | | | | | | | | | | | | | | |
| From net investment income | | | - | | | | | (0.19 | ) | | | (0.16 | ) | | | (0.16 | ) | |
| From net realized capital gains | | | - | | | | | (0.03 | ) | | | (3.59 | ) | | | (2.71 | ) | |
| Total distributions | | | - | | | | | (0.22 | ) | | | (3.75 | ) | | | (2.87 | ) | |
| | | | | | | | | | | | | | | | | | | |
| Net Asset Value, End of Period | | $ | 19.64 | | | | $ | 15.97 | | | $ | 22.56 | | | $ | 24.03 | | |
| | | | | | | | | | | | | | | | | | | |
Total Return (c) | | | 22.98 | % | (d) | | | (28.37 | )% | | | 9.21 | % | | | 34.80 | % | (d) |
| | | | | | | | | | | | | | | | | | | |
| Ratios/Supplemental Data | | | | | | | | | | | | | | | | | | |
| Net assets, end of period (in 000's) | | $ | 574 | | | | $ | 253 | | | $ | 353 | | | $ | 323 | | |
| | | | | | | | | | | | | | | | | | | |
| Ratio of expenses to average net assets: | | | | | | | | | | | | | | | | | | |
| Before fees waived and expenses absorbed | | | 14.98 | % | (e) | | | 18.38 | % | | | 15.12 | % | | | 16.91 | % | (e) |
| After fees waived and expenses absorbed | | | 1.15 | % | (e) | | | 1.15 | % | | | 1.15 | % | | | 1.15 | % | (e) |
| | | | | | | | | | | | | | | | | | | |
| Ratio of net investment income (loss): | | | | | | | | | | | | | | | | | | |
| Before fees waived and expenses absorbed | | | (12.48 | )% | (e) | | | (16.15 | )% | | | (13.32 | )% | | | (14.98 | )% | (e) |
| After fees waived and expenses absorbed | | | 1.35 | % | (e) | | | 1.07 | % | | | 0.65 | % | | | 0.77 | % | (e) |
| | | | | | | | | | | | | | | | | | | |
| Portfolio turnover rate | | | 43.24 | % | (d) | | | 71.87 | % | | | 84.34 | % | | | 87.78 | % | (d) |
| (a) | The Fund commenced operations on March 28, 2013. |
| (b) | Net investment income per share is based on average shares outstanding for the six month period ended August 31, 2016. |
| (c) | Total Return represents the rate that the investor would have earned or lost on an investment in the Fund, assuming reinvestment of dividends. |
The accompanying notes are an integral part of these financial statements.
| SNOW FAMILY OF FUNDS | SEMI-ANNUAL REPORT |
FINANCIAL HIGHLIGHTSAugust 31, 2016
The following tables set forth the per share operating performance data for a share of capital stock outstanding, total return ratios to average net assets and other supplemental data for the period indicated.
| | | Snow Capital Hedged Equity Fund | | |
| | | | | | | | | | | | | | | | | |
| | | Class A | | |
| | | For the | | | | For the | | | | For the | | | | For the | | |
| | | Six Month Period Ended | | | | Year Ended | | | | Year Ended | | | | Period Ended | | |
| | | August 31, 2016 | | | | February 29, 2016 | | | | February 28, 2015 | | | | February 28, 2014 (a) | | |
| | | (Unaudited) | | | | | | | | | | | | | | |
| | | | | | | | | | | | | | | | | |
| Net Asset Value, Beginning of Period | | $ | 14.28 | | | | $ | 18.17 | | | | $ | 21.86 | | | | $ | 20.00 | | |
| | | | | | | | | | | | | | | | | | | | | |
| Investment Operations: | | | | | | | | | | | | | | | | | | | | |
| Net investment income (loss) | | | 0.08 | | | | | 0.12 | | | | | 0.05 | | | | | (0.02 | ) | |
| Net realized and unrealized gain (loss) on investments | | | 1.96 | | | | | (3.93 | ) | | | | 1.73 | | | | | 4.16 | | |
| Total from investment operations | | | 2.04 | | | | | (3.81 | ) | | | | 1.78 | | | | | 4.14 | | |
| | | | | | | | | | | | | | | | | | | | | |
| Distributions: | | | | | | | | | | | | | | | | | | | | |
| From net investment income | | | - | | | | | (0.08 | ) | | | | (0.21 | ) | | | | (0.01 | ) | |
| From net realized capital gains | | | - | | | | | - | | | | | (5.26 | ) | | | | (2.27 | ) | |
| Total distributions | | | - | | | | | (0.08 | ) | | | | (5.47 | ) | | | | (2.28 | ) | |
| | | | | | | | | | | | | | | | | | | | | |
| Net Asset Value, End of Period | | $ | 16.32 | | | | $ | 14.28 | | | | $ | 18.17 | | | | $ | 21.86 | | |
| | | | | | | | | | | | | | | | | | | | | |
Total Return (b) | | | 14.15 | % | (c) | | | (21.00 | )% | | | | 7.31 | % | | | | 20.87 | % | (c) |
| | | | | | | | | | | | | | | | | | | | | |
| Ratios/Supplemental Data | | | | | | | | | | | | | | | | | | | | |
| Net assets, end of period (in 000's) | | $ | 12 | | | | $ | 10 | | | | $ | 13 | | | | $ | 12 | | |
| | | | | | | | | | | | | | | | | | | | | |
| Ratio of expenses to average net assets: | | | | | | | | | | | | | | | | | | | | |
| Before fees waived and expenses absorbed | | | 13.34 | % | (d)(e) | | | 11.80 | % | (e) | | | 4.38 | % | (e) | | | 10.90 | % | (d)(e) |
| After fees waived and expenses absorbed | | | 1.63 | % | (d)(e) | | | 1.73 | % | (e) | | | 1.84 | % | (e) | | | 1.93 | % | (d)(e) |
| | | | | | | | | | | | | | | | | | | | | |
| Ratio of net investment income (loss): | | | | | | | | | | | | | | | | | | | | |
| Before fees waived and expenses absorbed | | | (10.66 | )% | (d)(e) | | | (9.56 | )% | (e) | | | (2.45 | )% | (e) | | | (9.09 | )% | (d)(e) |
| After fees waived and expenses absorbed | | | 1.04 | % | (d)(e) | | | 0.51 | % | (e) | | | 0.09 | % | (e) | | | (0.11 | )% | (d)(e) |
| | | | | | | | | | | | | | | | | | | | | |
| Portfolio turnover rate | | | 58.98 | % | (c) | | | 171.16 | % | | | | 518.32 | % | | | | 226.74 | % | (c) |
| (a) | The Fund commenced operations on March 28, 2013. |
| (b) | Total Return represents the rate that the investor would have earned or lost on an investment in the Fund, assuming reinvestment of dividends. |
| (e) | The ratios include 0.13% during the six month period ended August 31, 2016, 0.23% during the fiscal year ended February 29, 2016, 0.34% during the fiscal year ended February 28, 2015 and 0.43% during the period ended February 28, 2014 for dividends on securities sold short and interest expense. |
The accompanying notes are an integral part of these financial statements.
| SNOW FAMILY OF FUNDS | SEMI-ANNUAL REPORT |
FINANCIAL HIGHLIGHTSAugust 31, 2016
The following tables set forth the per share operating performance data for a share of capital stock outstanding, total return ratios to average net assets and other supplemental data for the period indicated.
| | | Snow Capital Hedged Equity Fund | | |
| | | | | | | | | | | | | | | | | |
| | | Class I | | |
| | | For the | | | | For the | | | | For the | | | | For the | | |
| | | Six Month Period Ended | | | | Year Ended | | | | Year Ended | | | | Period Ended | | |
| | | August 31, 2016 | | | | February 29, 2016 | | | | February 28, 2015 | | | | February 28, 2014 (a) | | |
| | | (Unaudited) | | | | | | | | | | | | | | |
| | | | | | | | | | | | | | | | | |
| Net Asset Value, Beginning of Period | | $ | 14.33 | | | | $ | 18.23 | | | | $ | 21.90 | | | | $ | 20.00 | | |
| | | | | | | | | | | | | | | | | | | | | |
| Investment Operations: | | | | | | | | | | | | | | | | | | | | |
| Net investment income | | | 0.10 | | | | | 0.17 | | | | | 0.26 | | | | | 0.03 | | |
| Net realized and unrealized gain (loss) on investments | | | 1.97 | | | | | (3.95 | ) | | | | 1.59 | | | | | 4.17 | | |
| Total from investment operations | | | 2.07 | | | | | (3.78 | ) | | | | 1.85 | | | | | 4.20 | | |
| | | | | | | | | | | | | | | | | | | | | |
| Distributions: | | | | | | | | | | | | | | | | | | | | |
| From net investment income | | | - | | | | | (0.12 | ) | | | | (0.26 | ) | | | | (0.03 | ) | |
| From net realized capital gains | | | - | | | | | - | | | | | (5.26 | ) | | | | (2.27 | ) | |
| Total distributions | | | - | | | | | (0.12 | ) | | | | (5.52 | ) | | | | (2.30 | ) | |
| | | | | | | | | | | | | | | | | | | | | |
| Net Asset Value, End of Period | | $ | 16.40 | | | | $ | 14.33 | | | | $ | 18.23 | | | | $ | 21.90 | | |
| | | | | | | | | | | | | | | | | | | | | |
Total Return (b) | | | 14.31 | % | (c) | | | (20.80 | )% | | | | 7.62 | % | | | | 21.18 | % | (c) |
| | | | | | | | | | | | | | | | | | | | | |
| Ratios/Supplemental Data | | | | | | | | | | | | | | | | | | | | |
| Net assets, end of period (in 000's) | | $ | 579 | | | | $ | 506 | | | | $ | 639 | | | | $ | 594 | | |
| | | | | | | | | | | | | | | | | | | | | |
| Ratio of expenses to average net assets: | | | | | | | | | | | | | | | | | | | | |
| Before fees waived and expenses absorbed | | | 13.09 | % | (d)(e) | | | 11.55 | % | (e) | | | 4.13 | % | (e) | | | 10.66 | % | (d)(e) |
| After fees waived and expenses absorbed | | | 1.38 | % | (d)(e) | | | 1.48 | % | (e) | | | 1.59 | % | (e) | | | 1.68 | % | (d)(e) |
| | | | | | | | | | | | | | | | | | | | | |
| Ratio of net investment income (loss): | | | | | | | | | | | | | | | | | | | | |
| Before fees waived and expenses absorbed | | | (10.41 | )% | (d)(e) | | | (9.30 | )% | (e) | | | (2.20 | )% | (e) | | | (8.84 | )% | (d)(e) |
| After fees waived and expenses absorbed | | | 1.29 | % | (d)(e) | | | 0.76 | % | (e) | | | 0.34 | % | (e) | | | 0.14 | % | (d)(e) |
| | | | | | | | | | | | | | | | | | | | | |
| Portfolio turnover rate | | | 58.98 | % | (c) | | | 171.16 | % | | | | 518.32 | % | | | | 226.74 | % | (c) |
| (a) | The Fund commenced operations on March 28, 2013. |
| (b) | Total Return represents the rate that the investor would have earned or lost on an investment in the Fund, assuming reinvestment of dividends. |
| (e) | The ratios include 0.13% during the six month period ended August 31, 2016, 0.23% during the fiscal year ended February 29, 2016, 0.34% during the fiscal year ended February 28, 2015 and 0.43% during the period ended February 28, 2014 for dividends on securities sold short and interest expense. |
The accompanying notes are an integral part of these financial statements.
| SNOW FAMILY OF FUNDS | SEMI-ANNUAL REPORT |
FINANCIAL HIGHLIGHTSAugust 31, 2016
The following tables set forth the per share operating performance data for a share of capital stock outstanding, total return ratios to average net assets and other supplemental data for the period indicated.
| | | Snow Capital Inflation Advantaged Equities Fund | | |
| | | | | | | | | | | | | | | |
| | | Class A | | |
| | | For the | | | | For the | | | For the | | | For the | | |
| | | Six Month Period Ended | | | | Year Ended | | | Year Ended | | | Period Ended | | |
| | | August 31, 2016 | | | | February 29, 2016 | | | February 28, 2015 | | | February 28, 2014 (a) | | |
| | | (Unaudited) | | | | | | | | | | | | |
| | | | | | | | | | | | | | | |
| Net Asset Value, Beginning of Period | | $ | 15.89 | | | | $ | 22.61 | | | $ | 22.92 | | | $ | 20.00 | | |
| | | | | | | | | | | | | | | | | | | |
| Investment Operations: | | | | | | | | | | | | | | | | | | |
| Net investment income | | | 0.09 | | | | | 0.20 | | | | 0.16 | | | | 0.12 | | |
| Net realized and unrealized gain (loss) on investments | | | 2.70 | | | | | (6.43 | ) | | | 1.89 | | | | 3.64 | | |
| Total from investment operations | | | 2.79 | | | | | (6.23 | ) | | | 2.05 | | | | 3.76 | | |
| | | | | | | | | | | | | | | | | | | |
| Distributions: | | | | | | | | | | | | | | | | | | |
| From net investment income | | | - | | | | | (0.16 | ) | | | (0.16 | ) | | | (0.12 | ) | |
| From net realized capital gains | | | - | | | | | (0.33 | ) | | | (2.20 | ) | | | (0.72 | ) | |
| Total distributions | | | - | | | | | (0.49 | ) | | | (2.36 | ) | | | (0.84 | ) | |
| | | | | | | | | | | | | | | | | | | |
| Net Asset Value, End of Period | | $ | 18.68 | | | | $ | 15.89 | | | $ | 22.61 | | | $ | 22.92 | | |
| | | | | | | | | | | | | | | | | | | |
Total Return (b) | | | 17.56 | % | (c) | | | (27.78 | )% | | | 9.05 | % | | | 18.85 | % | (c) |
| | | | | | | | | | | | | | | | | | | |
| Ratios/Supplemental Data | | | | | | | | | | | | | | | | | | |
| Net assets, end of period (in 000's) | | $ | 11 | | | | $ | 9 | | | $ | 13 | | | $ | 12 | | |
| | | | | | | | | | | | | | | | | | | |
| Ratio of expenses to average net assets: | | | | | | | | | | | | | | | | | | |
| Before fees waived and expenses absorbed | | | 24.94 | % | (d) | | | 21.67 | % | | | 17.76 | % | | | 18.71 | % | (d) |
| After fees waived and expenses absorbed | | | 1.50 | % | (d) | | | 1.50 | % | | | 1.50 | % | | | 1.50 | % | (d) |
| | | | | | | | | | | | | | | | | | | |
| Ratio of net investment income (loss): | | | | | | | | | | | | | | | | | | |
| Before fees waived and expenses absorbed | | | (22.39 | )% | (d) | | | (19.13 | )% | | | (15.57 | )% | | | (16.61 | )% | (d) |
| After fees waived and expenses absorbed | | | 1.05 | % | (d) | | | 1.05 | % | | | 0.68 | % | | | 0.59 | % | (d) |
| | | | | | | | | | | | | | | | | | | |
| Portfolio turnover rate | | | 43.68 | % | (c) | | | 57.21 | % | | | 66.57 | % | | | 33.69 | % | (c) |
| (a) | The Fund commenced operations on March 28, 2013. |
| (b) | Total Return represents the rate that the investor would have earned or lost on an investment in the Fund, assuming reinvestment of dividends. |
The accompanying notes are an integral part of these financial statements.
| SNOW FAMILY OF FUNDS | SEMI-ANNUAL REPORT |
FINANCIAL HIGHLIGHTSAugust 31, 2016
The following tables set forth the per share operating performance data for a share of capital stock outstanding, total return ratios to average net assets and other supplemental data for the period indicated.
| | | Snow Capital Inflation Advantaged Equities Fund | | |
| | | | | | | | | | | | | | |
| | | Class I | | |
| | | For the | | | For the | | | For the | | | For the | | |
| | | Six Month Period Ended | | | Year Ended | | | Year Ended | | | Period Ended | | |
| | | August 31, 2016 | | | February 29, 2016 | | | February 28, 2015 | | | February 28, 2014 (a) | | |
| | | (Unaudited) | | | | | | | | | | | |
| | | | | | | | | | | | | | |
| Net Asset Value, Beginning of Period | | $ | 15.90 | | | $ | 22.62 | | | $ | 22.92 | | | $ | 20.00 | | |
| | | | | | | | | | | | | | | | | | |
| Investment Operations: | | | | | | | | | | | | | | | | | |
| Net investment income | | | 0.12 | | | | 0.25 | | | | 0.22 | | | | 0.17 | | |
| Net realized and unrealized gain (loss) on investments | | | 2.69 | | | | (6.44 | ) | | | 1.90 | | | | 3.64 | | |
| Total from investment operations | | | 2.81 | | | | (6.19 | ) | | | 2.12 | | | | 3.81 | | |
| | | | | | | | | | | | | | | | | | |
| Distributions: | | | | | | | | | | | | | | | | | |
| From net investment income | | | - | | | | (0.20 | ) | | | (0.22 | ) | | | (0.17 | ) | |
| From net realized capital gains | | | - | | | | (0.33 | ) | | | (2.20 | ) | | | (0.72 | ) | |
| Total distributions | | | - | | | | (0.53 | ) | | | (2.42 | ) | | | (0.89 | ) | |
| | | | | | | | | | | | | | | | | | |
| Net Asset Value, End of Period | | $ | 18.71 | | | $ | 15.90 | | | $ | 22.62 | | | $ | 22.92 | | |
| | | | | | | | | | | | | | | | | | |
Total Return (b) | | | 17.67 | % | | | (27.59 | )% | | | 9.36 | % | | | 19.10 | % | (c) |
| | | | | | | | | | | | | | | | | | |
| Ratios/Supplemental Data | | | | | | | | | | | | | | | | | |
| Net assets, end of period (in 000's) | | $ | 266 | | | $ | 226 | | | $ | 313 | | | $ | 286 | | |
| | | | | | | | | | | | | | | | | | |
| Ratio of expenses to average net assets: | | | | | | | | | | | | | | | | | |
| Before fees waived and expenses absorbed | | | 24.69 | % | | | 21.42 | % | | | 17.51 | % | | | 18.46 | % | (d) |
| After fees waived and expenses absorbed | | | 1.25 | % | | | 1.25 | % | | | 1.25 | % | | | 1.25 | % | (d) |
| | | | | | | | | | | | | | | | | | |
| Ratio of net investment income (loss): | | | | | | | | | | | | | | | | | |
| Before fees waived and expenses absorbed | | | (22.14 | )% | | | (18.87 | )% | | | (15.32 | )% | | | (16.36 | )% | (d) |
| After fees waived and expenses absorbed | | | 1.30 | % | | | 1.30 | % | | | 0.93 | % | | | 0.84 | % | (d) |
| | | | | | | | | | | | | | | | | | |
| Portfolio turnover rate | | | 43.68 | % | | | 57.21 | % | | | 66.57 | % | | | 33.69 | % | (c) |
| (a) | The Fund commenced operations on March 28, 2013. |
| (b) | Total Return represents the rate that the investor would have earned or lost on an investment in the Fund, assuming reinvestment of dividends. |
The accompanying notes are an integral part of these financial statements.
| SNOW FAMILY OF FUNDS | SEMI-ANNUAL REPORT |
FINANCIAL HIGHLIGHTSAugust 31, 2016
The following tables set forth the per share operating performance data for a share of capital stock outstanding, total return ratios to average net assets and other supplemental data for the period indicated.
| | | Snow Capital Dividend Plus Fund | | |
| | | | | | | | | | | | | | | |
| | | Class A | | |
| | | For the | | | | For the | | | For the | | | For the | | |
| | | Six Month Period Ended | | | | Year Ended | | | Year Ended | | | Period Ended | | |
| | | August 31, 2016 | | | | February 29, 2016 | | | February 28, 2015 | | | February 28, 2014 (a) | | |
| | | (Unaudited) | | | | | | | | | | | | |
| | | | | | | | | | | | | | | |
| Net Asset Value, Beginning of Period | | $ | 16.62 | | | | $ | 21.54 | | | $ | 22.19 | | | $ | 20.00 | | |
| | | | | | | | | | | | | | | | | | | |
| Investment Operations: | | | | | | | | | | | | | | | | | | |
| Net investment income | | | 0.26 | | | | | 0.45 | | | | 0.48 | | | | 0.36 | | |
| Net realized and unrealized gain (loss) on investments | | | 3.78 | | | | | (4.92 | ) | | | 1.88 | | | | 4.09 | | |
| Total from investment operations | | | 4.04 | | | | | (4.47 | ) | | | 2.36 | | | | 4.45 | | |
| | | | | | | | | | | | | | | | | | | |
| Distributions: | | | | | | | | | | | | | | | | | | |
| From net investment income | | | - | | | | | (0.45 | ) | | | (0.45 | ) | | | (0.37 | ) | |
| From net realized capital gains | | | - | | | | | - | | | | (2.56 | ) | | | (1.89 | ) | |
| Total distributions | | | - | | | | | (0.45 | ) | | | (3.01 | ) | | | (2.26 | ) | |
| | | | | | | | | | | | | | | | | | | |
| Net Asset Value, End of Period | | $ | 20.66 | | | | $ | 16.62 | | | $ | 21.54 | | | $ | 22.19 | | |
| | | | | | | | | | | | | | | | | | | |
Total Return (b) | | | 24.31 | % | (c) | | | (20.87 | )% | | | 10.90 | % | | | 22.36 | % | (c) |
| | | | | | | | | | | | | | | | | | | |
| Ratios/Supplemental Data | | | | | | | | | | | | | | | | | | |
| Net assets, end of period (in 000's) | | $ | 13 | | | | $ | 11 | | | $ | 14 | | | $ | 12 | | |
| | | | | | | | | | | | | | | | | | | |
| Ratio of expenses to average net assets: | | | | | | | | | | | | | | | | | | |
| Before fees waived and expenses absorbed | | | 21.26 | % | (d) | | | 20.72 | % | | | 17.14 | % | | | 18.29 | % | (d) |
| After fees waived and expenses absorbed | | | 1.25 | % | (d) | | | 1.25 | % | | | 1.25 | % | | | 1.25 | % | (d) |
| | | | | | | | | | | | | | | | | | | |
| Ratio of net investment income (loss): | | | | | | | | | | | | | | | | | | |
| Before fees waived and expenses absorbed | | | (17.37 | )% | (d) | | | (16.84 | )% | | | (13.82 | )% | | | (15.25 | )% | (d) |
| After fees waived and expenses absorbed | | | 2.64 | % | (d) | | | 2.64 | % | | | 2.07 | % | | | 1.80 | % | (d) |
| | | | | | | | | | | | | | | | | | | |
| Portfolio turnover rate | | | 38.33 | % | (c) | | | 66.54 | % | | | 83.58 | % | | | 73.96 | % | (c) |
| (a) | The Fund commenced operations on March 28, 2013. |
| (b) | Total Return represents the rate that the investor would have earned or lost on an investment in the Fund, assuming reinvestment of dividends. |
The accompanying notes are an integral part of these financial statements.
| SNOW FAMILY OF FUNDS | SEMI-ANNUAL REPORT |
FINANCIAL HIGHLIGHTSAugust 31, 2016
The following tables set forth the per share operating performance data for a share of capital stock outstanding, total return ratios to average net assets and other supplemental data for the period indicated.
| | | Snow Capital Dividend Plus Fund | | |
| | | | | | | | | | | | | | | |
| | | Class I | | |
| | | For the | | | | For the | | | For the | | | For the | | |
| | | Six Month Period Ended | | | | Year Ended | | | Year Ended | | | Period Ended | | |
| | | August 31, 2016 | | | | February 29, 2016 | | | February 28, 2015 | | | February 28, 2014 (a) | | |
| | | (Unaudited) | | | | | | | | | | | | |
| | | | | | | | | | | | | | | |
| Net Asset Value, Beginning of Period | | $ | 16.63 | | | | $ | 21.55 | | | $ | 22.19 | | | $ | 20.00 | | |
| | | | | | | | | | | | | | | | | | | |
| Investment Operations: | | | | | | | | | | | | | | | | | | |
| Net investment income | | | 0.28 | | | | | 0.50 | | | | 0.54 | | | | 0.42 | | |
| Net realized and unrealized gain (loss) on investments | | | 3.79 | | | | | (4.93 | ) | | | 1.89 | | | | 4.08 | | |
| Total from investment operations | | | 4.07 | | | | | (4.43 | ) | | | 2.43 | | | | 4.50 | | |
| | | | | | | | | | | | | | | | | | | |
| Distributions: | | | | | | | | | | | | | | | | | | |
| From net investment income | | | - | | | | | (0.49 | ) | | | (0.51 | ) | | | (0.42 | ) | |
| From net realized capital gains | | | - | | | | | - | | | | (2.56 | ) | | | (1.89 | ) | |
| Total distributions | | | - | | | | | (0.49 | ) | | | (3.07 | ) | | | (2.31 | ) | |
| | | | | | | | | | | | | | | | | | | |
| Net Asset Value, End of Period | | $ | 20.70 | | | | $ | 16.63 | | | $ | 21.55 | | | $ | 22.19 | | |
| | | | | | | | | | | | | | | | | | | |
Total Return (b) | | | 24.47 | % | (c) | | | (20.67 | )% | | | 11.21 | % | | | 22.61 | % | (c) |
| | | | | | | | | | | | | | | | | | | |
| Ratios/Supplemental Data | | | | | | | | | | | | | | | | | | |
| Net assets, end of period (in 000's) | | $ | 323 | | | | $ | 260 | | | $ | 327 | | | $ | 294 | | |
| | | | | | | | | | | | | | | | | | | |
| Ratio of expenses to average net assets: | | | | | | | | | | | | | | | | | | |
| Before fees waived and expenses absorbed | | | 21.01 | % | (d) | | | 20.47 | % | | | 16.89 | % | | | 18.05 | % | (d) |
| After fees waived and expenses absorbed | | | 1.00 | % | (d) | | | 1.00 | % | | | 1.00 | % | | | 1.00 | % | (d) |
| | | | | | | | | | | | | | | | | | | |
| Ratio of net investment income (loss): | | | | | | | | | | | | | | | | | | |
| Before fees waived and expenses absorbed | | | (17.12 | )% | (d) | | | (16.59 | )% | | | (13.57 | )% | | | (15.00 | )% | (d) |
| After fees waived and expenses absorbed | | | 2.89 | % | (d) | | | 2.89 | % | | | 2.32 | % | | | 2.05 | % | (d) |
| | | | | | | | | | | | | | | | | | | |
| Portfolio turnover rate | | | 38.33 | % | (c) | | | 66.54 | % | | | 83.58 | % | | | 73.96 | % | (c) |
| (a) | The Fund commenced operations on March 28, 2013. |
| (b) | Total Return represents the rate that the investor would have earned or lost on an investment in the Fund, assuming reinvestment of dividends. |
The accompanying notes are an integral part of these financial statements.
| SNOW FAMILY OF FUNDS | SEMI-ANNUAL REPORT |
FINANCIAL HIGHLIGHTSAugust 31, 2016
The following tables set forth the per share operating performance data for a share of capital stock outstanding, total return ratios to average net assets and other supplemental data for the period indicated.
| | | Snow Capital Mid Cap Value Fund | | |
| | | | | | | | | | | | | | | |
| | | Class A | | |
| | | For the | | | | For the | | | For the | | | For the | | |
| | | Six Month Period Ended | | | | Year Ended | | | Year Ended | | | Period Ended | | |
| | | August 31, 2016 | | | | February 29, 2016 | | | February 28, 2015 | | | February 28, 2014 (a) | | |
| | | (Unaudited) | | | | | | | | | | | | |
| | | | | | | | | | | | | | | |
| Net Asset Value, Beginning of Period | | $ | 16.89 | | | | $ | 22.81 | | | $ | 24.12 | | | $ | 20.00 | | |
| | | | | | | | | | | | | | | | | | | |
| Investment Operations: | | | | | | | | | | | | | | | | | | |
| Net investment income | | | 0.17 | | | | | 0.07 | | | | 0.06 | | | | 0.02 | | |
| Net realized and unrealized gain (loss) on investments | | | 2.70 | | | | | (5.22 | ) | | | 2.24 | | | | 5.87 | | |
| Total from investment operations | | | 2.87 | | | | | (5.15 | ) | | | 2.30 | | | | 5.89 | | |
| | | | | | | | | | | | | | | | | | | |
| Distributions: | | | | | | | | | | | | | | | | | | |
| From net investment income | | | - | | | | | (0.07 | ) | | | (0.06 | ) | | | (0.02 | ) | |
| From net realized capital gains | | | - | | | | | (0.70 | ) | | | (3.55 | ) | | | (1.75 | ) | |
| Total distributions | | | - | | | | | (0.77 | ) | | | (3.61 | ) | | | (1.77 | ) | |
| | | | | | | | | | | | | | | | | | | |
| Net Asset Value, End of Period | | $ | 19.76 | | | | $ | 16.89 | | | $ | 22.81 | | | $ | 24.12 | | |
| | | | | | | | | | | | | | | | | | | |
Total Return (b) | | | 16.99 | % | (c) | | | (22.80 | )% | | | 9.58 | % | | | 29.57 | % | (c) |
| | | | | | | | | | | | | | | | | | | |
| Ratios/Supplemental Data | | | | | | | | | | | | | | | | | | |
| Net assets, end of period (in 000's) | | $ | 13 | | | | $ | 11 | | | $ | 14 | | | $ | 13 | | |
| | | | | | | | | | | | | | | | | | | |
| Ratio of expenses to average net assets: | | | | | | | | | | | | | | | | | | |
| Before fees waived and expenses absorbed | | | 21.69 | % | (d) | | | 19.64 | % | | | 16.46 | % | | | 17.79 | % | (d) |
| After fees waived and expenses absorbed | | | 1.25 | % | (d) | | | 1.25 | % | | | 1.25 | % | | | 1.25 | % | (d) |
| | | | | | | | | | | | | | | | | | | |
| Ratio of net investment income (loss): | | | | | | | | | | | | | | | | | | |
| Before fees waived and expenses absorbed | | | (18.63 | )% | (d) | | | (18.02 | )% | | | (14.98 | )% | | | (16.42 | )% | (d) |
| After fees waived and expenses absorbed | | | 1.82 | % | (d) | | | 0.37 | % | | | 0.22 | % | | | 0.12 | % | (d) |
| | | | | | | | | | | | | | | | | | | |
| Portfolio turnover rate | | | 18.33 | % | (c) | | | 36.43 | % | | | 62.06 | % | | | 43.72 | % | (c) |
| (a) | The Fund commenced operations on March 28, 2013. |
| (b) | Total Return represents the rate that the investor would have earned or lost on an investment in the Fund, assuming reinvestment of dividends. |
The accompanying notes are an integral part of these financial statements.
| SNOW FAMILY OF FUNDS | SEMI-ANNUAL REPORT |
FINANCIAL HIGHLIGHTSAugust 31, 2016
The following tables set forth the per share operating performance data for a share of capital stock outstanding, total return ratios to average net assets and other supplemental data for the period indicated.
| | | Snow Capital Mid Cap Value Fund | | |
| | | | | | | | | | | | | | | |
| | | Class I | | |
| | | For the | | | | For the | | | For the | | | For the | | |
| | | Six Month Period Ended | | | | Year Ended | | | Year Ended | | | Period Ended | | |
| | | August 31, 2016 | | | | February 29, 2016 | | | February 28, 2015 | | | February 28, 2014 (a) | | |
| | | (Unaudited) | | | | | | | | | | | | |
| | | | | | | | | | | | | | | |
| Net Asset Value, Beginning of Period | | $ | 16.90 | | | | $ | 22.82 | | | $ | 24.13 | | | $ | 20.00 | | |
| | | | | | | | | | | | | | | | | | | |
| Investment Operations: | | | | | | | | | | | | | | | | | | |
| Net investment income | | | 0.19 | | | | | 0.12 | | | | 0.12 | | | | 0.08 | | |
| Net realized and unrealized gain (loss) on investments | | | 2.70 | | | | | (5.23 | ) | | | 2.24 | | | | 5.87 | | |
| Total from investment operations | | | 2.89 | | | | | (5.11 | ) | | | 2.36 | | | | 5.95 | | |
| | | | | | | | | | | | | | | | | | | |
| Distributions: | | | | | | | | | | | | | | | | | | |
| From net investment income | | | - | | | | | (0.11 | ) | | | (0.12 | ) | | | (0.07 | ) | |
| From net realized capital gains | | | - | | | | | (0.70 | ) | | | (3.55 | ) | | | (1.75 | ) | |
| Total distributions | | | - | | | | | (0.81 | ) | | | (3.67 | ) | | | (1.82 | ) | |
| | | | | | | | | | | | | | | | | | | |
| Net Asset Value, End of Period | | $ | 19.79 | | | | $ | 16.90 | | | $ | 22.82 | | | $ | 24.13 | | |
| | | | | | | | | | | | | | | | | | | |
Total Return (b) | | | 17.10 | % | (c) | | | (22.60 | )% | | | 9.84 | % | | | 29.89 | % | (c) |
| | | | | | | | | | | | | | | | | | | |
| Ratios/Supplemental Data | | | | | | | | | | | | | | | | | | |
| Net assets, end of period (in 000's) | | $ | 310 | | | | $ | 265 | | | $ | 342 | | | $ | 312 | | |
| | | | | | | | | | | | | | | | | | | |
| Ratio of expenses to average net assets: | | | | | | | | | | | | | | | | | | |
| Before fees waived and expenses absorbed | | | 21.45 | % | (d) | | | 19.39 | % | | | 16.20 | % | | | 17.54 | % | (d) |
| After fees waived and expenses absorbed | | | 1.00 | % | (d) | | | 1.00 | % | | | 1.00 | % | | | 1.00 | % | (d) |
| | | | | | | | | | | | | | | | | | | |
| Ratio of net investment income (loss): | | | | | | | | | | | | | | | | | | |
| Before fees waived and expenses absorbed | | | (18.38 | )% | (d) | | | (17.76 | )% | | | (14.73 | )% | | | (16.17 | )% | (d) |
| After fees waived and expenses absorbed | | | 2.06 | % | (d) | | | 0.62 | % | | | 0.48 | % | | | 0.37 | % | (d) |
| | | | | | | | | | | | | | | | | | | |
| Portfolio turnover rate | | | 18.33 | % | (c) | | | 36.43 | % | | | 62.06 | % | | | 43.72 | % | (c) |
| (a) | The Fund commenced operations on March 28, 2013. |
| (b) | Total Return represents the rate that the investor would have earned or lost on an investment in the Fund, assuming reinvestment of dividends. |
The accompanying notes are an integral part of these financial statements.
| Snow Family of Funds | SEMI-ANNUAL REPORT |
NOTES TO THE FINANCIAL STATEMENTSAugust 31, 2016 (Unaudited)
| 1. | ORGANIZATION AND SIGNIFICANT ACCOUNTING POLICIES |
The Snow Family of Funds (the “Funds”) are a series of 360 Funds (the “Trust”). The Trust was organized on February 25, 2005 as a Delaware statutory trust. The Trust is registered as an open end management investment company under the Investment Company Act of 1940 (the “1940 Act”). The Trust currently offers eight series of shares. The following series of the Snow Family Funds: (i) Snow Capital Focused Value Fund (“Focused Value Fund”), (ii) Snow Capital Hedged Equity Fund (“Hedged Equity Fund”), (iii) Snow Capital Inflation Advantaged Equities Fund (“Inflation Advantaged Equities Fund”), (iv) Snow Capital Dividend Plus Fund (“Dividend Plus Fund”), and (v) Snow Capital Mid Cap Value Fund (“Mid Cap Value Fund”) (each a “Fund” and collectively, the Funds) are each an open end management investment company and separate series of the Trust. All of the Funds, except Focused Value Fund and Hedged Equity Fund, are diversified Funds. As non-diversified Funds, the Focused Value Fund and Hedged Equity Fund may invest a significant portion of its assets in a small number of companies. The Funds’ investment adviser is Snow Capital Management, L.P (the “Adviser”). Each Fund offers two classes of shares, Class A and Class I shares. Each class of shares commenced operations on March 28, 2013. Each class differs as to sales and redemption charges and ongoing fees. Income and realized/unrealized gains or losses are allocated to each class based on relative share balances. Each Fund’s investment objectives are as follows:
| Focused Value Fund | Long-term growth of capital |
| Hedged Equity Fund | Long-term growth of capital and protection of investment principal with lower volatility than the U.S. equity market |
| Inflation Advantaged Equities Fund | Long-term growth of capital and protection of investment principal |
| Dividend Plus Fund | Long-term growth of capital and income |
| Mid Cap Value Fund | Long-term growth of capital |
The following is a summary of significant accounting policies consistently followed by the Funds. The Funds are investment companies that follow the accounting and reporting guidance of Accounting Standards Codification Topic 946 applicable to investment companies.
a) Investment Valuations - All investments in securities are recorded at their estimated fair value, as described in Note 2
b) Federal Income Taxes - The Funds have qualified and intend to continue to qualify as regulated investment companies under Subchapter M of the Internal Revenue Code of 1986, as amended (the “Code”). It is the policy of the Funds to comply with the requirements of the Code applicable to regulated investment companies and to distribute substantially all of their net investment company taxable income and net capital gains. Therefore, no provisions for federal income taxes are required.
As of and during the six month period ended August 31, 2016, the Funds did not have a liability for any unrecognized tax expenses. The Funds recognize interest and penalties, if any, related to unrecognized tax expenses as income tax expense in the statements of operations. During the period, the Funds did not incur any interest or penalties. As required by U.S. generally accepted accounting principles (“GAAP”), ASC 740, management has analyzed the Funds’ tax positions taken on Federal income tax returns for all open tax years and has concluded that no provision for income tax is required in these financial statements. The Funds identify their major tax jurisdictions as U.S. Federal and the state of Delaware.
c) Distributions to Shareholders - Dividends from net investment income and distributions of net realized capital gains, if any, will be declared and paid at least annually. Income and capital gain distributions, which are determined in accordance with income tax regulations, are recorded on the ex-dividend date. GAAP requires that permanent financial reporting differences relating to shareholder distributions be reclassified to paid-in capital or net realized gains. There were no reclassifications necessary for any of the Funds during the six month period ended August 31, 2016.
e) Use of Estimates - The preparation of financial statements in conformity with GAAP requires management to make estimates and assumptions that affect the reported amounts of assets and liabilities and disclosure of contingent assets and liabilities at the date of the financial statements and the reported amounts of revenues and expenses during the reporting period. Actual results could differ from those estimates.
| Snow Family of Funds | SEMI-ANNUAL REPORT |
NOTES TO THE FINANCIAL STATEMENTSAugust 31, 2016 (Unaudited)
| 1. | ORGANIZATION AND SIGNIFICANT ACCOUNTING POLICIES (continued) |
f) Other - Investment and shareholder transactions are recorded on trade date. The Funds determine the gain or loss realized from the investment transactions by comparing the original cost of the security lot sold with the net sales proceeds. Dividend income is recognized on the ex-dividend date or as soon as information is available to the Funds and interest income is recognized on an accrual basis. Withholding taxes on foreign dividends have been provided for in accordance with the Funds’ understanding of the applicable country’s tax rules and rates.
g) Short Sales of Securities – A Fund may make short sales, which are transactions in which a Fund sells a security it does not own in anticipation of a decline in the market value of that security. To complete a short sale transaction, a Fund will borrow the security from a broker-dealer, which generally involves the payment of a premium and transaction costs. A Fund then sells the borrowed security to a buyer in the market. A Fund will then cover the short position by buying shares in the market either (i) at its discretion; or (ii) when called by the broker-dealer lender. Until the security is replaced, a Fund is required to pay the broker-dealer lender any dividends or interest that accrues during the period of the loan. In addition, the net proceeds of the short sale will be retained by the broker to the extent necessary to meet regulatory or other requirements, until the short position is closed out.
A Fund will incur a loss as a result of the short sale if the price of the security increases between the date of the short sale and the date on which a Fund replaces the borrowed security. A Fund will realize a gain if the security declines in price between those dates. The amount of any gain will be decreased, and the amount of any loss increased, by the amount of the premium, dividends, interest or expenses a Fund may be required to pay in connection with a short sale. When a Fund makes a short sale, a Fund will segregate liquid assets (such as cash, U.S. government securities, or equity securities) on a Fund’s books and/or in a segregated account at a Fund’s custodian in an amount sufficient to cover the current value of the securities to be replaced as well as any dividends, interest and/or transaction costs due to the broker-dealer lender. In determining the amount to be segregated, any securities that have been sold short by a Fund will be marked to market daily. To the extent the market price of the security sold short increases and more assets are required to meet a Fund’s short sale obligations, additional assets will be segregated to ensure adequate coverage of a Fund’s short position obligations.
In addition, a Fund may make short sales “against the box”, i.e., when a Fund sells a security short when a Fund has segregated securities equivalent in kind and amount to the securities sold short (or securities convertible or exchangeable into such securities) and will hold such securities while the short sale is outstanding. A Fund will incur transaction costs, including interest, in connection with opening, maintaining, and closing short sales against the box.
h) Exchange Traded Funds – A Fund may invest in Exchange Traded Funds (“ETFs”). ETFs are registered investment companies and incur fees and expenses such as operating expenses, licensing fees, registration fees, trustees fees, and marketing expenses, and ETF shareholders, such as a Fund, pay their proportionate share of these expenses. Your cost of investing in a Fund will generally be higher than the cost of investing directly in ETFs. By investing in a Fund, you will indirectly bear fees and expenses charged by the underlying ETFs in which a Fund invests in addition to a Fund's direct fees and expenses.
i) Redemption fees - Shareholders that redeem shares within 30 days of purchase will be assessed a redemption fee of 0.50% of the amount redeemed. The redemption fee is paid directly to and retained by the Funds, and is designed to deter excessive short-term trading and to offset brokerage commissions, market impact and other costs that may be associated with short-term money movement in and out of the Funds. No redemption fees were paid to the Funds during the six month period ended August 31, 2016.
| Snow Family of Funds | SEMI-ANNUAL REPORT |
NOTES TO THE FINANCIAL STATEMENTSAugust 31, 2016 (Unaudited)
Processes and Structure
The Funds’ Board of Trustees has adopted guidelines for valuing securities including in circumstances in which market quotes are not readily available and has delegated to the Adviser the responsibility for determining fair value prices, subject to review by the Board of Trustees.
Hierarchy of Fair Value Inputs
The Trust utilizes various methods to measure the fair value of most of its investments on a recurring basis. GAAP establishes a hierarchy that prioritizes inputs to valuation techniques used to measure fair value. The three levels of inputs are as follows:
| · | Level 1. Unadjusted quoted prices in active markets for identical assets or liabilities that the company has the ability to access. |
| · | Level 2. Observable inputs other than quoted prices included in level 1 that are observable for the asset or liability either directly or indirectly. These inputs may include quoted prices for the identical instrument on an inactive market, prices for similar instruments, interest rates, prepayment speeds, credit risk, yield curves, default rates, and similar data. |
| · | Level 3. Unobservable inputs for the asset or liability to the extent that relevant observable inputs are not available, representing the Trust's own assumptions about the assumptions that a market participant would use in valuing the asset or liability, and that would be based on the best information available. |
The availability of observable inputs can vary from security to security and is affected by a wide variety of factors, including, for example, the type of security, whether the security is new and not yet established in the marketplace, the liquidity of markets, and other characteristics particular to the security. To the extent that valuation is based on models or inputs that are less observable or unobservable in the market, the determination of fair value requires more judgment. Accordingly, the degree of judgment exercised in determining fair value is greatest for instruments categorized in level 3.
The inputs used to measure fair value may fall into different levels of the fair value hierarchy. In such cases, for disclosure purposes, the level in the fair value hierarchy within which the fair value measurement falls in its entirety is determined based on the lowest level input that is significant to the fair value measurement in its entirety.
A description of the valuation techniques applied to the Trust's major categories of assets and liabilities measured at fair value on a recurring basis follows.
Equity securities (common stock, preferred stock and Exchange-Traded Funds). Securities traded on a national securities exchange (or reported on the NASDAQ national market) are stated at the last reported sales price on the day of valuation. To the extent these securities are actively traded, and valuation adjustments are not applied, they are categorized in level 1 of the fair value hierarchy. Certain foreign securities may be fair valued using a pricing service that considers the correlation of the trading patterns of the foreign security to the intraday trading in the U.S. markets for investments such as American Depositary Receipts, financial futures, Exchange Traded Funds, and the movement of the certain indexes of securities based on a statistical analysis of the historical relationship and that are categorized in level 2. Preferred stock and other equities traded on inactive markets or valued by reference to similar instruments are also categorized in level 2.
Money market funds – Money market funds are valued at their net asset value of $1.00 per share and are categorized as Level 1.
| Snow Family of Funds | SEMI-ANNUAL REPORT |
NOTES TO THE FINANCIAL STATEMENTSAugust 31, 2016 (Unaudited)
| 2. | INVESTMENT VALUATION (continued) |
The following table summarizes the inputs used to value the company's assets and liabilities measured at fair value as of August 31, 2016:
Categories (a) | | Level 1 | | | Level 2 | | | Level 3 | | | Total | |
| Focused Value Fund: | | | | | | | | | | | | |
Common Stock (b) | | $ | 564,172 | | | | - | | | | - | | | $ | 564,172 | |
| Short-Term Investments | | | 15,651 | | | | - | | | | - | | | | 15,651 | |
| Total Investments in Securities | | | 579,823 | | | | - | | | | - | | | | 579,823 | |
| Hedged Equity Fund (Assets): | | | | | | | | | | | | | | | | |
Common Stock (b) | | | 544,238 | | | | - | | | | - | | | | 544,238 | |
Exchange-Traded Funds (b) | | | 38,506 | | | | - | | | | - | | | | 38,056 | |
| Short-Term Investments | | | 3,016 | | | | - | | | | - | | | | 3,016 | |
| Total Investments in Securities | | | 585,760 | | | | - | | | | - | | | | 585,760 | |
| Hedged Equity Fund (Liabilities): | | | | | | | | | | | | | | | | |
Common Stock – Sold Short (b) | | | 161,493 | | | | - | | | | - | | | | 161,493 | |
| Total Investments in Securities Sold Short | | | 161,493 | | | | - | | | | - | | | | 161,493 | |
| Inflation Advantaged Equities Fund: | | | | | | | | | | | | | | | | |
Common Stock (b) | | | 260,530 | | | | - | | | | - | | | | 260,530 | |
| Short-Term Investments | | | 11,864 | | | | - | | | | - | | | | 11,864 | |
| Total Investments in Securities | | | 272,394 | | | | - | | | | - | | | | 272,394 | |
| Dividend Plus Fund: | | | | | | | | | | | | | | | | |
Common Stock (b) | | | 277,284 | | | | - | | | | - | | | | 277,284 | |
Partnerships (b) | | | 20,987 | | | | - | | | | - | | | | 20,987 | |
Preferred Stock (b) | | | 30,948 | | | | - | | | | - | | | | 30,948 | |
| Short-Term Investments | | | 223 | | | | - | | | | - | | | | 223 | |
| Total Investments in Securities | | | 329,442 | | | | - | | | | - | | | | 329,442 | |
| Mid Cap Value Fund: | | | | | | | | | | | | | | | | |
Common Stock (b) | | | 287,185 | | | | - | | | | - | | | | 287,185 | |
| Short-Term Investments | | | 31,065 | | | | - | | | | - | | | | 31,065 | |
| Total Investments in Securities | | | 318,250 | | | | - | | | | - | | | | 318,250 | |
| (a) | At August 31, 2016, the Funds held no securities that were considered to be “Level 3” securities (those valued using significant unobservable inputs). Therefore, a reconciliation of assets in which significant unobservable inputs (Level 3) were used in determining fair value is not applicable. |
| (b) | All common stock, partnerships, preferred stock and exchange traded funds held in the Funds are Level 1 securities. For a detailed break-out of stocks by industry and exchange traded funds by investment type, please refer to the Schedules of Investments. |
The Funds recognize transfers, if any, between fair value hierarchy levels at the reporting period end. There were no transfers between levels as of August 31, 2016, from the valuation input levels used on February 29, 2016.
| Snow Family of Funds | SEMI-ANNUAL REPORT |
NOTES TO THE FINANCIAL STATEMENTSAugust 31, 2016 (Unaudited)
| 3. | CAPITAL SHARE TRANSACTIONS |
Transactions in shares of capital stock for the Funds for the six month period ended August 31, 2016 were as follows:
| Focused Value Fund: | | Sold | | | Redeemed | | | Reinvested | | | Net Increase | |
| Class A | | | | | | | | | | | | |
| Shares | | | - | | | | - | | | | - | | | | - | |
| Value | | $ | - | | | $ | - | | | $ | - | | | $ | - | |
| Class I | | | | | | | | | | | | | | | | |
| Shares | | | 13,380 | | | | - | | | | - | | | | 13,380 | |
| Value | | $ | 243,657 | | | $ | - | | | $ | - | | | $ | 243,657 | |
| Hedged Equity Fund: | | Sold | | | Redeemed | | | Reinvested | | | Net Increase | |
| Class A | | | | | | | | | | | | |
| Shares | | | - | | | | - | | | | - | | | | - | |
| Value | | $ | - | | | $ | - | | | $ | - | | | $ | - | |
| Class I | | | | | | | | | | | | | | | | |
| Shares | | | - | | | | - | | | | - | | | | - | |
| Value | | $ | - | | | $ | - | | | $ | - | | | $ | - | |
| Inflation Advantaged Equities Fund: | | Sold | | | Redeemed | | | Reinvested | | | Net Increase | |
| Class A | | | | | | | | | | | | |
| Shares | | | - | | | | - | | | | - | | | | - | |
| Value | | $ | - | | | $ | - | | | $ | - | | | $ | - | |
| Class I | | | | | | | | | | | | | | | | |
| Shares | | | - | | | | - | | | | - | | | | - | |
| Value | | $ | - | | | $ | - | | | $ | - | | | $ | - | |
| Dividend Plus Fund: | | Sold | | | Redeemed | | | Reinvested | | | Net Increase | |
| Class A | | | | | | | | | | | | |
| Shares | | | - | | | | - | | | | - | | | | - | |
| Value | | $ | - | | | $ | - | | | $ | - | | | $ | - | |
| Class I | | | | | | | | | | | | | | | | |
| Shares | | | - | | | | - | | | | - | | | | - | |
| Value | | $ | - | | | $ | - | | | $ | - | | | $ | - | |
| Mid Cap Value Fund: | | Sold | | | Redeemed | | | Reinvested | | | Net Increase | |
| Class A | | | | | | | | | | | | |
| Shares | | | - | | | | - | | | | - | | | | - | |
| Value | | $ | - | | | $ | - | | | $ | - | | | $ | - | |
| Class I | | | | | | | | | | | | | | | | |
| Shares | | | - | | | | - | | | | - | | | | - | |
| Value | | $ | - | | | $ | - | | | $ | - | | | $ | - | |
| Snow Family of Funds | SEMI-ANNUAL REPORT |
NOTES TO THE FINANCIAL STATEMENTSAugust 31, 2016 (Unaudited)
| 3. | CAPITAL SHARE TRANSACTIONS (continued) |
Transactions in shares of capital stock for the Funds for the fiscal year ended February 29, 2016 were as follows:
| Focused Value Fund: | | Sold | | | Redeemed | | | Reinvested | | | Net Increase | |
| Class A | | | | | | | | | | | | |
| Shares | | | - | | | | - | | | | 6 | | | | 6 | |
| Value | | $ | - | | | $ | - | | | $ | 114 | | | $ | 114 | |
| Class I | | | | | | | | | | | | | | | | |
| Shares | | | - | | | | - | | | | 186 | | | | 186 | |
| Value | | $ | - | | | $ | - | | | $ | 3,457 | | | $ | 3,457 | |
| Hedged Equity Fund: | | Sold | | | Redeemed | | | Reinvested | | | Net Increase | |
| Class A | | | | | | | | | | | | |
| Shares | | | - | | | | - | | | | 4 | | | | 4 | |
| Value | | $ | - | | | $ | - | | | $ | 59 | | | $ | 59 | |
| Class I | | | | | | | | | | | | | | | | |
| Shares | | | - | | | | - | | | | 264 | | | | 264 | |
| Value | | $ | - | | | $ | - | | | $ | 4,183 | | | $ | 4,183 | |
| Inflation Advantaged Equities Fund: | | Sold | | | Redeemed | | | Reinvested | | | Net Increase | |
| Class A | | | | | | | | | | | | |
| Shares | | | - | | | | - | | | | 16 | | | | 16 | |
| Value | | $ | - | | | $ | - | | | $ | 283 | | | $ | 283 | |
| Class I | | | | | | | | | | | | | | | | |
| Shares | | | - | | | | - | | | | 416 | | | | 416 | |
| Value | | $ | - | | | $ | - | | | $ | 7,421 | | | $ | 7,421 | |
| Dividend Plus Fund: | | Sold | | | Redeemed | | | Reinvested | | | Net Increase | |
| Class A | | | | | | | | | | | | |
| Shares | | | - | | | | - | | | | 16 | | | | 16 | |
| Value | | $ | - | | | $ | - | | | $ | 283 | | | $ | 283 | |
| Class I | | | | | | | | | | | | | | | | |
| Shares | | | - | | | | - | | | | 425 | | | | 425 | |
| Value | | $ | - | | | $ | - | | | $ | 7,449 | | | $ | 7,449 | |
| Mid Cap Value Fund: | | Sold | | | Redeemed | | | Reinvested | | | Net Increase | |
| Class A | | | | | | | | | | | | |
| Shares | | | - | | | | - | | | | 27 | | | | 27 | |
| Value | | $ | - | | | $ | - | | | $ | 480 | | | $ | 480 | |
| Class I | | | | | | | | | | | | | | | | |
| Shares | | | - | | | | - | | | | 676 | | | | 676 | |
| Value | | $ | - | | | $ | - | | | $ | 12,246 | | | $ | 12,246 | |
| Snow Family of Funds | SEMI-ANNUAL REPORT |
NOTES TO THE FINANCIAL STATEMENTSAugust 31, 2016 (Unaudited)
| 4. | INVESTMENT TRANSACTIONS |
For the six month period ended August 31, 2016, aggregate purchases and sales of investment securities (excluding short-term investments) for the Funds were as follows:
| Fund | | Purchases | | | Sales | |
| Focused Value Fund: | | $ | 413,874 | | | $ | 186,537 | |
| Hedged Equity Fund | | | 317,405 | | | | 316,965 | |
| Inflation Advantaged Equities Fund | | | 110,172 | | | | 118,059 | |
| Dividend Plus Fund | | | 123,012 | | | | 116,388 | |
| Mid Cap Value Fund | | | 49,777 | | | | 59,295 | |
There were no government securities purchased or sold during the period.
| 5. | ADVISORY FEES AND OTHER RELATED PARTY TRANSACTIONS |
The Funds have entered into Investment Advisory Agreements (the “Advisory Agreements”) with the Adviser. Pursuant to the Advisory Agreements, the Adviser provides investment management services to the Funds in accordance with their investment objectives, policies and restrictions. As compensation for the investment advisory services provided to the Funds, the Adviser will receive a monthly management fee equal to an annual rate of each Fund’s net assets for Class A and I shares as follows:
| Fund | | Management Fee Rate | | | Accrued | |
| Focused Value Fund: | | | 0.90 | % | | $ | 1,972 | |
| Hedged Equity Fund | | | 1.00 | % | | | 2,808 | |
| Inflation Advantaged Equities Fund | | | 1.00 | % | | | 1,323 | |
| Dividend Plus Fund | | | 0.75 | % | | | 1,182 | |
| Mid Cap Value Fund | | | 0.75 | % | | | 1,149 | |
The Adviser and the Funds have entered into an Expense Limitation Agreement (“Expense Agreements”) under which the Adviser has agreed to waive or reduce its fees and to assume other expenses of each Fund, if necessary, in an amount that limits annual operating expenses (exclusive of interest, taxes, brokerage fees and commissions, acquired fund fees and expenses, shareholder servicing fees, extraordinary expenses, dividend and interest expenses in connection with securities sold short and payments, if any, under the Rule 12b-1 Plan) to not more than the following average daily net assets of each of the Funds through July 1, 2017:
| Fund | | Expense Limitation | | | Management Fees Waived | | | Expenses Reimbursed | |
| Focused Value Fund: | | | 1.15 | % | | $ | 1,972 | | | $ | 28,332 | |
| Hedged Equity Fund | | | 1.25 | % | | | 2,808 | | | | 30,056 | |
| Inflation Advantaged Equities Fund | | | 1.25 | % | | | 1,323 | | | | 29,673 | |
| Dividend Plus Fund | | | 1.00 | % | | | 1,182 | | | | 30,345 | |
| Mid Cap Value Fund | | | 1.00 | % | | | 1,149 | | | | 30,180 | |
If, at any time, the annualized expenses of Funds were less than the annualized expense limitation ratios, the Funds, would reimburse the Adviser for any fees previously waived and/or expenses previously assumed; provided, however, that repayment would be payable only to the extent that it (a) can be made during the three (3) years following the time at which the adviser waived fees or assumed expenses for the Funds, and (b) can be repaid without causing the expenses of Funds to exceed the annualized expense limitation ratios.
| Snow Family of Funds | SEMI-ANNUAL REPORT |
NOTES TO THE FINANCIAL STATEMENTSAugust 31, 2016 (Unaudited)
| 5. | ADVISORY FEES AND OTHER RELATED PARTY TRANSACTIONS (continued) |
At August 31, 2016, the cumulative unreimbursed amounts paid and/or waived by the Adviser on behalf of the Funds that may be recouped no later than the dates stated below are as follows:
| Fund | | February 28, 2017 | | | February 28, 2018 | | | February 28, 2019 | | | February 29, 2020 | | | Totals | |
| Focused Value Fund: | | $ | 41,973 | | | $ | 50,247 | | | $ | 57,556 | | | $ | 30,304 | | | $ | 180,080 | |
| Hedged Equity Fund | | | 44,997 | | | | 52,882 | | | | 61,229 | | | | 32,864 | | | | 191,972 | |
| Inflation Advantaged Equities Fund | | | 43,053 | | | | 51,025 | | | | 58,384 | | | | 30,996 | | | | 183,458 | |
| Dividend Plus Fund | | | 43,459 | | | | 51,793 | | | | 59,499 | | | | 31,527 | | | | 186,278 | |
| Mid Cap Value Fund | | | 43,536 | | | | 52,361 | | | | 59,190 | | | | 31,329 | | | | 186,416 | |
The Fund has entered into an Investment Company Services Agreement (the “Services Agreement”) with M3Sixty Administration, LLC (“M3Sixty”). Pursuant to the Services Agreement, M3Sixty will provide day-to-day operational services to the Fund including, but not limited to: (a) Fund accounting services; (b) financial statement preparation; (c) valuation of the Fund's portfolio securities; (d) pricing the Fund's shares; (e) assistance in preparing tax returns; (f) preparation and filing of required regulatory reports; (g) communications with shareholders; (h) coordination of Board and shareholder meetings; (i) monitoring the Fund's legal compliance; (j) maintaining shareholder account records.
For the six month period ended August 31, 2016, the Funds accrued servicing fees as follows:
| Fund | | Service Fees | |
| Focused Value Fund: | | $ | 12,315 | |
| Hedged Equity Fund | | | 12,407 | |
| Inflation Advantaged Equities Fund | | | 12,185 | |
| Dividend Plus Fund | | | 12,222 | |
| Mid Cap Value Fund | | | 12,216 | |
Certain officers and a Trustee of the Funds are also employees of M3Sixty.
The Fund has entered into a Distribution Agreement (the “Distribution Agreement”) with Matrix Capital Group, Inc. (the “Distributor”). Pursuant to the Distribution Agreement, the Distributor will provide distribution services to the Funds. The Distributor serves as underwriter/distributor of the Funds.
The Funds have adopted a Distribution Plan (“Plan”) pursuant to Rule 12b-1 of the 1940 Act for the Funds. The Funds may expend up to 0.25% for Class A shares of a Fund’s average daily net assets annually to pay for any activity primarily intended to result in the sale of shares of the Funds and the servicing of shareholder accounts, provided that the Trustees have approved the category of expenses for which payment is being made.
The distribution plans for the Class A shares of the Funds took effect March 28, 2013. For the six month period ended August 31, 2016, the Funds accrued 12b-1 expenses attributable to Class A shares as follows:
| Fund | | Class A 12b-1 Fees | |
| Focused Value Fund: | | $ | 15 | |
| Hedged Equity Fund | | | 14 | |
| Inflation Advantaged Equities Fund | | | 13 | |
| Dividend Plus Fund | | | 15 | |
| Mid Cap Value Fund | | | 15 | |
| Snow Family of Funds | SEMI-ANNUAL REPORT |
NOTES TO THE FINANCIAL STATEMENTSAugust 31, 2016 (Unaudited)
There were no distributions paid by the Funds during the six month period ended August 31, 2016.
The tax character of distributions paid during the fiscal year ended February 29, 2016 for the Funds were as follows:
| Fund | | Long-Term Capital Gains | | | Ordinary Income | |
| Focused Value Fund: | | $ | - | | | $ | 3,572 | |
| Hedged Equity Fund | | | - | | | | 4,242 | |
| Inflation Advantaged Equities Fund | | | 4,790 | | | | 2,914 | |
| Dividend Plus Fund | | | - | | | | 7,732 | |
| Mid Cap Value Fund | | | 10,951 | | | | 1,775 | |
For U.S. Federal income tax purposes, the cost of securities owned, gross appreciation, gross depreciation, and net unrealized appreciation/(depreciation) of investments at August 31, 2016 were as follows:
| Fund | | Tax Cost | | | Gross Unrealized Appreciation | | | Gross Unrealized Depreciation | | | Net Unrealized Appreciation | |
| Focused Value Fund | | $ | 560,187 | | | $ | 51,515 | | | $ | (31,879 | ) | | $ | 19,636 | |
| Hedged Equity Fund | | | 404,425 | | | | 52,244 | | | | (32,402 | ) | | | (19,842 | ) |
| Inflation Advantaged Equities Fund | | | 262,422 | | | | 30,026 | | | | (20,054 | ) | | | 9,972 | |
| Dividend Plus Fund | | | 315,732 | | | | 28,663 | | | | (14,953 | ) | | | 13,710 | |
| Mid Cap Value Fund | | | 311,931 | | | | 38,604 | | | | (32,285 | ) | | | 6,319 | |
The differences between book basis unrealized appreciation and tax-basis unrealized appreciation for the Focused Value Fund and Dividend Plus Fund are attributable primarily to the tax deferral of losses on wash sales.
The Funds’ tax basis distributable earnings are determined only at the end of each fiscal year. The tax character of distributable earnings (deficit) at February 29, 2016, the Funds’ most recent fiscal year end, was as follows:
| Fund | | Unrealized Appreciation (Depreciation) | | | Undistributed Ordinary Income | | | Undistributed Capital Gains / (Capital Loss Carryforwards) | | | Post-October Capital Loss | | | Total Distributable Earnings | |
| Focused Value Fund | | $ | (60,199 | ) | | $ | 535 | | | $ | (1,411 | ) | | $ | (18,958 | ) | | $ | (80,033 | ) |
| Hedged Equity Fund | | | (114,069 | ) | | | 331 | | | | (191,846 | ) | | | (9,158 | ) | | | (314,742 | ) |
| Market Plus Fund | | | (31,379 | ) | | | 1,048 | | | | - | | | | (9,593 | ) | | | (39,924 | ) |
| Inflation Advantaged Equities Fund | | | (23,438 | ) | | | 819 | | | | - | | | | (42,154 | ) | | | (64,773 | ) |
| Dividend Plus Fund | | | (42,619 | ) | | | 1,535 | | | | (3,170 | ) | | | (15,127 | ) | | | (59,381 | ) |
| Mid Cap Value Fund | | | (39,690 | ) | | | 232 | | | | - | | | | (20,624 | ) | | | (60,082 | ) |
The undistributed ordinary income and capital gains shown above differ from corresponding accumulated net investment income and accumulated net realized gain (loss) figures reported in the statements of assets and liabilities due to differing book/tax treatment of short-term capital gains, and certain temporary book/tax differences due to the tax deferral of losses on wash sales.
| Snow Family of Funds | SEMI-ANNUAL REPORT |
NOTES TO THE FINANCIAL STATEMENTSAugust 31, 2016 (Unaudited)
| 6. | TAX MATTERS (continued) |
Under current tax law, net capital losses realized after October 31st and net ordinary losses incurred after December 31st may be deferred and treated as occurring on the first day of the following fiscal year. The Funds’ carryforward losses, post-October losses and post-December losses are determined only at the end of each fiscal year. As of February 29, 2016, the Funds’ most recent fiscal year end, the Funds elected to defer net ordinary losses as indicated in the chart below.
| | | Post-October Losses | | | Post-December Losses | |
| Fund | | Deferred | | | Utilized | | | Deferred | | | Utilized | |
| Focused Value Fund | | $ | 18,959 | | | $ | - | | | $ | - | | | $ | - | |
| Hedged Equity Fund | | | 9,158 | | | | 155,055 | | | | - | | | | - | |
| Market Plus Fund | | | 9,593 | | | | - | | | | - | | | | - | |
| Inflation Advantaged Equities Fund | | | 42,154 | | | | 1,149 | | | | - | | | | - | |
| Dividend Plus Fund | | | 15,127 | | | | 1,141 | | | | - | | | | - | |
| Mid Cap Value Fund | | | 20,624 | | | | - | | | | - | | | | - | |
Under the Regulated Investment Company Modernization Act of 2010 (the Act), net capital losses recognized after December 31, 2010, may be carried forward indefinitely, and their character is retained as short-term and/or long-term. As of February 29, 2016, the Funds had capital loss carryforwards for federal income tax purposes as follows:
| Fund | | Non-Expiring Short-Term | | | Non-Expiring Long-Term | | | Total | |
| Focused Value Fund: | | $ | 1,412 | | | $ | - | | | $ | 1,412 | |
| Hedged Equity Fund | | | 180,557 | | | | 11,289 | | | | 191,846 | |
| Market Plus Fund | | | - | | | | | | | | - | |
| Inflation Advantaged Equities Fund | | | - | | | | - | | | | - | |
| Dividend Plus Fund | | | 3,170 | | | | | | | | 3,170 | |
| Mid Cap Value Fund | | | - | | | | | | | | - | |
The beneficial ownership, either directly or indirectly, of more than 25% of the voting securities of a fund creates a presumption of control of the fund, under Section 2(a)(9) of the Investment Company Act of 1940. As of August 31, 2016, Snow Capital Management, L.P. held 100% of the Funds’ Class A & Class I shares outstanding except for the Focused Value Fund’s Class I shares. As of August 31, 2016, Snow Capital Management, L.P. held 54% of the Focused Value Fund’s Class I shares.
| 8. | COMMITMENTS AND CONTINGENCIES |
In the normal course of business, the Trust may enter into contracts that may contain a variety of representations and warranties and provide general indemnifications. The Trust’s maximum exposure under these arrangements is dependent on future claims that may be made against the Fund and, therefore, cannot be estimated; however, management considers the risk of loss from such claims to be remote.
Effective September 20, 2016, the Hedged Equity Fund, Inflation Advantaged Equities Fund and Mid Cap Value Fund were liquidated and are no longer being offered for sale. Effective October 28, 2016, pursuant to a written consent of the shareholders of the Focused Value Fund and Dividend Plus Fund (the "Acquired Funds"), the Acquired Funds were reorganized into new series of the Trust for Professional Managers, a Delaware statutory trust.
In accordance with GAAP, Management has evaluated the impact of all other subsequent events on the Fund through the date the financial statements were issued, and has determined that there were no other subsequent events requiring recognition or disclosure in the financial statements.
| Snow Family of Funds | SEMI-ANNUAL REPORT |
ADDITIONAL INFORMATIONAugust 31, 2016 (Unaudited)
The Funds file their complete schedules of portfolio holdings with the Securities and Exchange Commission (the “Commission”) for the first and third quarters of each fiscal year on Form N-Q. The Funds’ Forms N-Q are available on the Commission’s website at http://www.sec.gov. The Funds’ Forms N-Q may be reviewed and copied at the Commission’s Public Reference Room in Washington, DC. Information on the operation of the Commission’s Public Reference Room may be obtained by calling 1-800-SEC-0330.
A description of the policies and procedures that the Funds use to determine how to vote proxies relating to portfolio securities is available without charge, upon request, by calling 1-877-244-6235; and on the Commission’s website at http://www.sec.gov.
Information regarding how the Funds voted proxies relating to portfolio securities during the most recent 12-month period ended June 30th is available without charge, upon request, by calling 1-877-244-6235; and on the Commission’s website at http://www.sec.gov.
Shareholder Tax Information - The Funds are required to advise you within 60 days of the Fund’s fiscal year end regarding the federal tax status of distributions received by shareholders during the fiscal year.
Tax information is reported from the Funds’ fiscal year and not calendar year, therefore, shareholders should refer to their Form 1099-DIV or other tax information which will be mailed in 2017 to determine the calendar year amounts to be included on their 2016 tax returns. Shareholders should consult their own tax advisors.
| Snow Family of Funds | SEMI-ANNUAL REPORT |
ADDITIONAL INFORMATIONAugust 31, 2016 (Unaudited)
BOARD OF TRUSTEES, OFFICERS AND PRINCIPAL SHAREHOLDERS - (Unaudited)
The Trustees are responsible for the management and supervision of the Funds. The Trustees approve all significant agreements between the Trust, on behalf of the Funds, and those companies that furnish services to the Funds; review performance of the Funds; and oversee activities of the Funds. This section provides information about the persons who serve as Trustees and Officers to the Trust and Funds, respectively, as well as the entities that provide services to the Funds. The Statement of Additional Information of the Trust includes additional information about the Fund's Trustees and is available upon request, without charge, by calling (877) 244-6235.
Remuneration Paid to Trustees and Officers - Officers of the Trust and Trustees who are “interested persons” of the Trust or the Adviser will receive no salary or fees from the Trust. Each Trustee who is not an “interested person” receives a fee $1,500 each year plus $200 per Board or committee meeting attended. The Trust reimburses each Trustee and officer for his or her travel and other expenses relating to attendance at such meetings.