UNITED STATES
SECURITIES AND EXCHANGE COMMISSION
Washington, D.C. 20549
FORM N-CSR
CERTIFIED SHAREHOLDER REPORT OF REGISTERED
MANAGEMENT INVESTMENT COMPANIES
Investment Company Act file number 811-21777
John Hancock Funds III
(Exact name of registrant as specified in charter)
601 Congress Street, Boston, Massachusetts 02210
(Address of principal executive offices) (Zip code)
George M. Boyd
Senior Counsel and Assistant Vice President
601 Congress Street
Boston, Massachusetts 02210
(Name and address of agent for service)
Registrant's telephone number, including area code: 617-663-4204
| Date of fiscal year end: | February 28 |
| Date of reporting period: | August 31, 2006 |
ITEM 1. REPORT TO SHAREHOLDERS.

| TABLE OF CONTENTS |
| Managers' report |
| page 2 |
| A look at performance |
| page 6 |
| Your expenses |
| page 8 |
| Fund’s investments |
| page 1 0 |
| Financial statements |
| page 1 8 |
| For more information |
| page 40 |
CEO corner
To Our Shareholders,
The future has arrived at John Hancock Funds.
We have always been firm believers in the powerful role the Internet can play in providing fund information to our shareholders and prospective investors. Recently, we launched a redesigned, completely overhauled Web site that is more visually pleasing, easier to navigate and, most importantly, provides more fund information and learning tools without overwhelming the user.
Not long after we embarked on this major project, a study was released by the Investment Company Institute, the mutual fund industry’s main trade group, which found that an overwhelming majority of shareholders consider the Internet the “wave of the future” for accessing fund information.
Our new site sports fresher and faster ways to access account information. New innovations allow investors to view funds by risk level, track the performance of the John Hancock funds of their choice or sort funds by Morningstar, Inc.’s star ratings. Investors who own a John Hancock fund through a qualified retirement plan and don’t pay sales charges when making a purchase have the option of sorting by a “Load Waived” Morningstar Rating, thereby creating an apples-to-apples comparison with no-load funds that may also be available in their retirement plan.
The new site also has more educational tools and interactive modules to educate and assist investors with their financial goals, from college savings to retirement planning. A new “I want to…” feature allows investors to check performance, invest more money, update personal information or download prospectuses and forms quickly and easily.
In another of our ongoing efforts to provide our shareholders with top-notch service, we also redesigned our shareholder reports, as you may have noticed with this report. We hope the larger size, more colorful cover and redesigned presentation of the commentary and data tables will draw you in and make them easier to read.
After you’ve read your shareholder report, we encourage you to visit our new Web site — www.jhfunds.com — and take a tour. It’s easy, fast and fun and allows you to be in control of what you see and do. In short, it’s the wave of the future!
Sincerely,

Keith F. Hartstein,
President and Chief Executive Officer
This commentary reflects the CEO’s views as of August 31, 2006. They are subject to change at any time.
Your fund at a glance
The Fund seeks long-term capital growth by typically investing in U.S. companies that issue stocks included in the Russell 1000 Index and in companies with size and growth characteristics similar to those of companies with stocks in the Index.
From inception June 12, 2006
► U.S. stocks posted decent gains as the threat of higher interest rates seemed to fade.
► The Fund’s performance was aided by the more defensive names in the health care and grocery chain segments.
► Momentum stocks suffered and were the biggest detractors from the Fund’s returns.
John Hancock Intrinsic Value Fund
Fund performance from inception June 12, 2006 through August 31, 2006
Total returns for the Fund are at net asset value with all distributions reinvested. These returns do not reflect the deduction of the maximum sales charge, which would reduce the performance shown above.
| Top 10 holdings | |
| Pfizer, Inc. | 5.5% |
| Citigroup, Inc. | 4.7% |
| Verizon Communications, Inc. | 4.3% |
| AT&T, Inc. | 3.9% |
| Merck & Company, Inc. | 3.6% |
| American International Group, Inc. | 2.9% |
| Fannie Mae | 2.3% |
| Home Depot, Inc. | 2.2% |
| Altria Group, Inc. | 1.9% |
| Morgan Stanley | 1.7% |
As a percentage of net assets on August 31, 2006.
1
SCORECARD
Managers’ report
John Hancock
Intrinsic Value Fund
Despite increased stock market volatility prompted by uncertainty over the economy, interest rates and geopolitical events, U.S. stocks as a whole posted decent gains for the period spanning the Fund’s inception on June 12, 2006, to its semiannual period end on August 31, 2006. The period began just weeks after newly appointed Federal Reserve Board Chairman Ben Bernanke rattled investors by seeming to imply that inflation pressures were mounting and, as a result, interest rates would move higher than the market might previously have anticipated. Equity investors worried that the Fed might raise rates too much and trigger a recession. But beginning in mid-July, stocks staged an impressive rally that accelerated in early August, when the Fed opted not to increase interest rates again for the first time in two years. Against this macroeconomic backdrop, large-company stocks performed in line with their smaller cap counterparts, foreign equities performed better than those in the U.S., and value stocks trumped growth stocks.
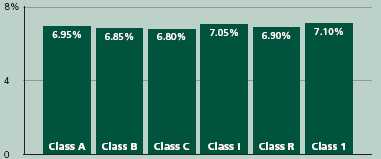
Performance
From its inception on June 12, 2006 through August 31, 2006, John Hancock Intrinsic Value Fund’s Class A, Class B, Class C, Class I, Class R and Class 1 shares returned 6.95%, 6.85%, 6.80%, 7.05%, 6.90% and 7.10%, respectively, at net asset value. By comparison, the Russell 1000 Value Index returned 7.15% and the average large value fund returned 6.09% at net asset value, according to Morningstar, Inc.1
| INVESTMENT | PERIOD’S PERFORMANCE AND WHAT’S BEHIND THE NUMBERS | |
| Merck | ▲ | Bounces back in response to stronger-than-expected sales |
| Kroger | ▲ | Shares rise as investors gravitate to defensive names |
| Home Depot | ▼ | Housing market slowdown prompts worries over future profits |
2

Portfolio Managers, Grantham, Mayo, Van Otterloo & Co. LLC (GMO)
Sam Wilderman, Ed Choi, Donna Murphy, Chuck Joyce and Tara Oliver
“During this abbreviated period,
our best performers were
generated by our valuation
discipline.”
Strategy explained
Since the Fund is new, we are continuing to build our positions, using our time-tested investment process. Although many managers use a single methodology to select stocks, we use two independent disciplines to select stocks for the Fund: valuation and momentum. Over two-thirds of stocks in this portfolio are bought based on valuation. We seek quality companies that are selling for less than their worth with the expectation that they will remain profitable, eventually regain favor in the market and generate above-average returns. Although traditional measures of a stock’s cheapness, such as price-to-book (P/B) or price-to-earnings (P/E) ratios may help investors determine if a company’s stock price is low, such measures do not distinguish between high-quality and low-quality companies. We believe high-quality companies are worth a premium because they can sustain a competitive advantage an d continue to grow over the long term.
The remaining stocks in the Fund are considered “momentum” stocks; that is, we select value stocks that are experiencing price appreciation and/or positive earnings revisions. This momentum typically follows a decline relative to the market. We’ve determined that stocks whose prices have declined for six months, then advanced for 12 months, will tend to continue rising for another 12 to 18 months. Price momentum enables portfolios to benefit from short-term swings in earnings and investor sentiment.
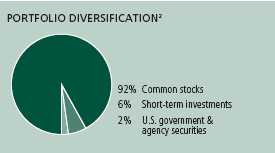
Because momentum and valuation tools tend to perform differently across various market and economic cycles, the Fund’s combination of the two disciplines results in greater diversification in the portfolio. Diversification
3 Intrinsic Value Fund
SECTOR DISTRIBUTION2
| Financial | 29% |
| Consumer, | |
| non-cyclical | 23% |
| Consumer, cyclical | 13% |
| Communications | 11% |
| Industrial | 5% |
| Energy | 4% |
| Technology | 4% |
| Mortgage securities | 4% |
| Basic materials | 1% |
| Utilities | 0.3% |
may help to lower the Fund’s risk level. We also employ a number of other risk control techniques. We typically hold more than 300 common stocks, so that the Fund’s performance isn’t overly dependent on the fortunes of one or a handful of companies. We give more weight to large-cap companies with strong balance sheets and high profit margins. Finally, we limit our holdings by economic sector and company size within the large-cap universe.
Leaders and laggards
During this abbreviated period, our best performers were generated by our valuation discipline. In particular, we saw gains from companies whose shares had been beaten up in prior periods but rallied in response to investors’ growing appetite for defensive stocks — shares of companies whose sales and profits tend to continue to grow even while the broader economy slows. Leading the pack were our stakes in large drug companies Merck & Company, Inc. and Pfizer, Inc. Merck’s net profit rose substantially and the company raised its profit forecast for the full year, helped by strong sales of cholesterol drug Zocor. Pfizer posted strong earnings in August, thanks in large part to stronger-than-expected sales of Lipitor, the anti-cholesterol medication that is one of the best-selling drugs in the world. Investors also cheered a management change and shake-up in the executive suite. A growing move toward defensive stocks also helped our shares in grocery store chains The Kroger Company and Safeway, Inc. Our holdings in Ford Motor Company contributed to performance, as investors looked to the stock as an interesting value play.
Detracting from Fund returns was the fact that we were significantly underweighted relative to the index in some strong-performing energy stocks, which were among the market’s best performers during the period. We also were hurt by some of our momentum plays. Weak performers included home improvement stores Home Depot, Inc. and Lowe’s Companies, Inc., which both slumped as the housing market cooled.
4 Intrinsic Value Fund
“Since we remain very wary of risk, we
will continue to focus on high-quality
companies that we believe can best
weather a market and/or economic
downturn.”
Outlook
The summer stock market rally and the Fed’s decision to pause its interest-rate-raising cycle after 17 consecutive quarter-point hikes since June 2004, appear to have provided investors with reasons for optimism. By the end of the period, stocks overall seemed “priced for perfection,” with investors betting that economic growth would remain moderate and sustainable and that inflation would be contained. But we believe this optimism is likely overblown and that the market is significantly underpricing risk. The investment landscape is always fraught with any number of risks, be it higher-than-expected inflation and interest rates, slower-than-expected economic growth or geopolitical events. But we believe that the economy and financial systems are so highly levered at the moment that even the smallest unfavorable development could result in a significant repricing of risk, meaning that risk ier assets would underperform. Since we remain very wary of risk, we will continue to focus on high-quality companies that we believe can best weather a market and/or economic downturn.
This commentary reflects the views of the portfolio management team through the end of the Fund’s period discussed in this report. The team’s statements reflect their own opinions. As such, they are in no way guarantees of future events and are not intended to be used as investment advice or a recommendation regarding any specific security. They are also subject to change at any time as market and other conditions warrant.
1 Figures from Morningstar, Inc. include reinvested dividends and do not take into account sales charges. Actual load-adjusted performance is lower.
2 As a percentage of net assets on August 31, 2006.
5 Intrinsic Value Fund
A look at performance
| For the period ending August 31, 2006 | ||
| Cumulative total returns | ||
| with maximum sales charge (POP) | ||
| Inception | Since | |
| Class | date | inception |
| A | 6-12-06 | 1.62% |
| B | 6-12-06 | 1.85 |
| C | 6-12-06 | 5.80 |
| I1 | 6-12-06 | 7.05 |
| R1 | 6-12-06 | 6.90 |
| 11 | 6-12-06 | 7.10 |
Performance figures assume all distributions are reinvested. Returns with maximum sales charge reflect a sales charge on Class A shares of 5%, and the applicable contingent deferred sales charge (CDSC) on Class B and Class C shares. The Class B shares’ CDSC declines annually between years 1–6 according to the following schedule: 5, 4, 3, 3, 2, 1%. No sales charge will be assessed after the sixth year. Class C shares held for less than one year are subject to a 1% CDSC. Sales charge is not applicable for Class I, Class R and Class 1 shares.
The returns reflect past results and should not be considered indicative of future performance. The return and principal value of an investment will fluctuate so that shares, when redeemed, may be worth more or less than their original cost. Due to market volatility, the Fund’s current performance may be higher or lower than the performance shown. For performance data current to the most recent month-end, please call 1-800-225-5291 or visit the Fund’s Web site at www.jhfunds.com.
The performance table above and the chart on the next page do not reflect the deduction of taxes that a shareholder would pay on Fund distributions or the redemption of Fund shares.
The Fund’s performance results reflect any applicable expense reductions, without which the expenses would increase and results would have been less favorable.
Since inception performance is calculated with an opening price (prior day’s close) on the inception date.
1 For certain types of investors as described in the Fund’s Class I, Class R and Class 1 share prospectuses.
6 Intrinsic Value Fund
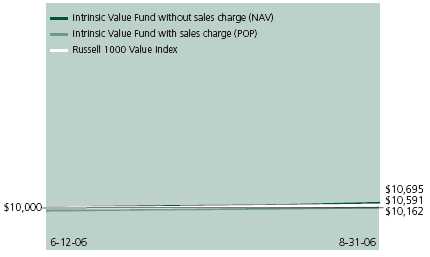
Growth of $10,000
This chart shows what happened to a hypothetical $10,000 investment in Class A shares for the period indicated. For comparison, we’ve shown the same investment in the Russell 1000 Value Index.
| With maximum | ||||
| Class | Period beginning | Without sales charge | sales charge | Index |
| B | 6-12-06 | $10,685 | $10,185 | $10,591 |
| C | 6-12-06 | 10,680 | 10,580 | 10,591 |
| I 1 | 6-12-06 | 10,705 | 10,705 | 10,591 |
| R1 | 6-12-06 | 10,690 | 10,690 | 10,591 |
| 11 | 6-12-06 | 10,710 | 10,710 | 10,715 |
Assuming all distributions were reinvested for the period indicated, the table above shows the value of a $10,000 investment in the Fund’s Class B, Class C, Class I, Class R and Class 1 shares, respectively, as of August 31, 2006. Performance of the classes will vary based on the difference in sales charges paid by shareholders investing in the different classes and the fee structure of those classes.
Russell 1000 Value Index is an unmanaged index containing those securities in the Russell 1000 Index with a less-than-average growth orientation.
It is not possible to invest directly in an index. Index figures do not reflect sales charges which would have resulted in lower values if they did.
1 For certain types of investors as described in the Fund’s Class I, Class R and Class 1 share prospectuses.
7 Intrinsic Value Fund
Your expenses
These examples are intended to help you understand your ongoing operating expenses.
Understanding Fund expenses
As a shareholder of the Fund, you incur two types of costs:
■ Transaction costs which include sales charges (loads) on purchases or redemptions (varies by share class), minimum account fee charge, etc.
■ Ongoing operating expenses including management fees, distribution and service fees (if applicable) and other Fund expenses.
We are going to present only your ongoing operating expenses here.
Actual expenses/actual returns
This example is intended to provide information about your Fund’s actual ongoing operating expenses, and is based on your Fund’s actual return. It assumes an account value of $1,000.00 on June 12, 2006, with the same investment held until August 31, 2006.
| Account value | Ending value | Expenses paid during period | |
| on 6-12-06 | on 8-31-06 | ended 8-31-061 | |
| Class A | $1,000.00 | $1,069.50 | $3.10 |
| Class B | 1,000.00 | 1,068.50 | 4.65 |
| Class C | 1,000.00 | 1,068.00 | 4.65 |
| Class I | 1,000.00 | 1,070.50 | 2.17 |
| Class R | 1,000.00 | 1,069.00 | 3.83 |
| Class 1 | 1,000.00 | 1,071.00 | 2.07 |
Together with the value of your account, you may use this information to estimate the operating expenses that you paid over the period. Simply divide your account value at August 31, 2006 by $1,000.00, then multiply it by the “expenses paid” for your share class from the table above. For example, for an account value of $8,600.00, the operating expenses should be calculated as follows:
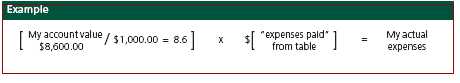
8 Intrinsic Value Fund
Hypothetical example for comparison purposes
This table allows you to compare your Fund’s ongoing operating expenses with those of any other fund. It provides an example of the Fund’s hypothetical account values and hypothetical expenses based on each class’ actual expense ratio and an assumed 5% annual return before expenses (which is not your Fund’s actual return). It assumes an account value of $1,000.00 on June 12, 2006, with the same investment held until August 31, 2006. Look in any other fund shareholder report to find its hypothetical example and you will be able to compare these expenses.
| Account value | Ending value | Expenses paid during period | |
| on 6-12-06 | on 8-31-06 | ended 8-31-061 | |
| Class A | $1,000.00 | $1,008.00 | $3.01 |
| Class B | 1,000.00 | 1,006.50 | 4.51 |
| Class C | 1,000.00 | 1,006.50 | 4.51 |
| Class I | 1,000.00 | 1,008.90 | 2.11 |
| Class R | 1,000.00 | 1,007.30 | 3.71 |
| Class 1 | 1,000.00 | 1,009.00 | 2.01 |
Remember, these examples do not include any transaction costs, such as sales charges; therefore, these examples will not help you to determine the relative total costs of owning different funds. If transaction costs were included, your expenses would have been higher. See the prospectus for details regarding transaction costs.
1 Expenses are equal to the Fund's annualized expense ratio of 1.35%, 2.05%, 2.05%, 0.95%, 1.70% and 0.90% for Class A, Class B, Class C, Class I, Class R and Class 1, respectively, multiplied by the average account value over the period, multiplied by the number of days in the inception period /365 or 366 (to reflect the one-half year period).
Intrinsic Value Fund 9
F I N A N C I A L S T A T E M E N T S
Fund’s investments
Securities owned by the Fund on 8-31-06 (unaudited)
This schedule is divided into two main categories: common stocks and short-term investments. Common stocks are further broken down by industry group. Short-term investments, which represent the Fund’s cash position, are listed last.
| Issuer | Shares | Value |
| Common stocks 93.80% | $15,725,218 | |
| (Cost $14,775,702) | ||
| Aerospace 0.24% | 40,086 | |
| Northrop Grumman Corp. | 600 | 40,086 |
| Agriculture 0.30% | 49,404 | |
| Archer-Daniels-Midland Company | 1,200 | 49,404 |
| Aluminum 0.39% | 65,757 | |
| Alcoa, Inc. | 2,300 | 65,757 |
| Apparel & Textiles 0.99% | 165,217 | |
| Jones Apparel Group, Inc. | 1,000 | 31,300 |
| Liz Claiborne, Inc. | 1,200 | 44,844 |
| Mohawk Industries, Inc. * | 400 | 28,352 |
| Polo Ralph Lauren Corp., Class A | 200 | 11,798 |
| VF Corp. | 700 | 48,923 |
| Auto Parts 0.73% | 122,351 | |
| AutoZone, Inc. * | 200 | 18,060 |
| Johnson Controls, Inc. | 900 | 64,737 |
| O’Reilly Automotive, Inc. * | 1,000 | 29,690 |
| TRW Automotive Holdings Corp. * | 400 | 9,864 |
| Auto Services 0.31% | 52,461 | |
| AutoNation, Inc. * | 2,700 | 52,461 |
| Automobiles 1.22% | 204,885 | |
| Ford Motor Company | 18,600 | 155,682 |
| PACCAR, Inc. | 900 | 49,203 |
| Banking 5.08% | 852,123 | |
| AmSouth Bancorp. | 600 | 17,190 |
| Bank of America Corp. | 4,000 | 205,880 |
| Bank of New York Company, Inc. | 1,500 | 50,625 |
| BB&T Corp. | 1,300 | 55,640 |
| Comerica, Inc. | 1,600 | 91,600 |
| Cullen Frost Bankers, Inc. | 200 | 11,792 |
| Fifth Third Bancorp. | 500 | 19,670 |
| 10 | Intrinsic Value Fund | See notes to financial statements |
F I N A N C I A L S T A T E M E N T S
| Issuer | Shares | Value |
| Banking (continued) | ||
| First Horizon National Corp. | 500 | $19,090 |
| Golden West Financial Corp. | 300 | 22,647 |
| Huntington Bancshares, Inc. | 1,000 | 23,920 |
| KeyCorp | 2,200 | 80,938 |
| National City Corp. | 6,300 | 217,854 |
| US Bancorp | 1,100 | 35,277 |
| Biotechnology 0.16% | 27,585 | |
| Applera Corp. | 900 | 27,585 |
| Broadcasting 0.32% | 53,291 | |
| CBS Corp., Class B | 1,400 | 39,970 |
| News Corp. | 700 | 13,321 |
| Building Materials & Construction 0.36% | 60,564 | |
| American Standard Companies, Inc. | 400 | 16,708 |
| Masco Corp. | 1,600 | 43,856 |
| Business Services 1.28% | 214,231 | |
| Affiliated Computer Services, Inc., Class A * | 700 | 35,938 |
| Cendant Corp. | 5,000 | 9,650 |
| Computer Sciences Corp. * | 500 | 23,690 |
| Convergys Corp. * | 1,300 | 27,131 |
| Electronic Data Systems Corp. | 500 | 11,915 |
| First Data Corp. | 900 | 38,673 |
| Manpower, Inc. | 400 | 23,644 |
| Pitney Bowes, Inc. | 1,000 | 43,590 |
| Cellular Communications 0.03% | 4,676 | |
| Motorola, Inc. | 200 | 4,676 |
| Chemicals 0.23% | 38,016 | |
| PPG Industries, Inc. | 600 | 38,016 |
| Computers & Business Equipment 2.93% | 490,958 | |
| CDW Corp. | 200 | 11,660 |
| Dell, Inc. * | 3,400 | 76,670 |
| Hewlett-Packard Company | 7,700 | 281,512 |
| Ingram Micro, Inc., Class A * | 1,600 | 28,800 |
| International Business Machines Corp. | 700 | 56,679 |
| Lexmark International, Inc. * | 200 | 11,214 |
| Tech Data Corp. * | 700 | 24,423 |
| Construction Materials 0.15% | 24,708 | |
| Martin Marietta Materials, Inc. | 300 | 24,708 |
| Containers & Glass 0.08% | 12,529 | |
| Smurfit-Stone Container Corp. * | 1,100 | 12,529 |
| 11 Intrinsic Value Fund See notes to financial statements |
F I N A N C I A L S T A T E M E N T S
| Issuer | Shares | Value |
| Crude Petroleum & Natural Gas 1.57% | $263,755 | |
| Apache Corp. | 600 | 39,168 |
| Devon Energy Corp. | 700 | 43,743 |
| Marathon Oil Corp. | 600 | 50,100 |
| Occidental Petroleum Corp. | 2,000 | 101,980 |
| Sunoco, Inc. | 400 | 28,764 |
| Electrical Equipment 0.10% | 16,430 | |
| Emerson Electric Company | 200 | 16,430 |
| Electrical Utilities 0.27% | 44,602 | |
| CenterPoint Energy, Inc. | 1,600 | 23,120 |
| Edison International | 100 | 4,364 |
| FirstEnergy Corp. | 300 | 17,118 |
| Electronics 0.31% | 51,824 | |
| Agilent Technologies, Inc. * | 300 | 9,648 |
| Arrow Electronics, Inc. * | 500 | 13,950 |
| Synopsys, Inc. * | 900 | 17,064 |
| Teleflex, Inc. | 200 | 11,162 |
| Financial Services 17.45% | 2,925,960 | |
| Bear Stearns Companies, Inc. | 200 | 26,070 |
| CIT Group, Inc. | 300 | 13,518 |
| Citigroup, Inc. | 15,900 | 784,665 |
| E*TRADE Financial Corp. * | 1,300 | 30,667 |
| Federal Home Loan Mortgage Corp. | 3,800 | 241,680 |
| Federal National Mortgage Association | 7,300 | 384,345 |
| Fiserv, Inc. * | 400 | 17,668 |
| Goldman Sachs Group, Inc. | 1,000 | 148,650 |
| JPMorgan Chase & Company | 5,700 | 260,262 |
| Lehman Brothers Holdings, Inc. | 1,300 | 82,953 |
| Mellon Financial Corp. | 1,700 | 63,291 |
| Merrill Lynch & Company, Inc. | 2,100 | 154,413 |
| Morgan Stanley | 4,300 | 282,897 |
| PNC Financial Services Group, Inc. | 2,100 | 148,659 |
| State Street Corp. (c) | 700 | 43,260 |
| Washington Mutual, Inc. | 5,800 | 242,962 |
| Food & Beverages 1.67% | 280,516 | |
| Dean Foods Company * | 700 | 27,734 |
| Kraft Foods, Inc., Class A | 2,800 | 94,948 |
| Pepsi Bottling Group, Inc. | 400 | 14,004 |
| PepsiAmericas, Inc. | 500 | 11,495 |
| Sara Lee Corp. | 3,100 | 51,553 |
| Starbucks Corp. * | 800 | 24,808 |
| Tyson Foods, Inc., Class A | 3,800 | 55,974 |
| Healthcare Products 0.42% | 71,126 | |
| Johnson & Johnson | 1,100 | 71,126 |
| 12 | Intrinsic Value Fund | See notes to financial statements |
F I N A N C I A L S T A T E M E N T S
| Issuer | Shares | Value |
| Healthcare Services 3.53% | $592,416 | |
| Cardinal Health, Inc. | 2,200 | 148,324 |
| Express Scripts, Inc. * | 600 | 50,448 |
| Health Net, Inc. * | 800 | 33,448 |
| Lincare Holdings, Inc. * | 300 | 11,109 |
| McKesson Corp. | 3,400 | 172,720 |
| Quest Diagnostics, Inc. | 400 | 25,712 |
| UnitedHealth Group, Inc. | 2,900 | 150,655 |
| Holdings Companies/Conglomerates 1.29% | 215,592 | |
| General Electric Company | 5,200 | 177,112 |
| Loews Corp. | 1,000 | 38,480 |
| Homebuilders 0.63% | 105,677 | |
| Centex Corp. | 500 | 25,475 |
| KB Home | 400 | 17,104 |
| Lennar Corp., Class A | 600 | 26,904 |
| M.D.C. Holdings, Inc. | 200 | 8,558 |
| Pulte Homes, Inc. | 500 | 14,835 |
| Ryland Group, Inc. | 300 | 12,801 |
| Hotels & Restaurants 0.31% | 52,342 | |
| Brinker International, Inc. | 600 | 23,082 |
| Wyndham Worldwide Corp. * | 1,000 | 29,260 |
| Household Appliances 0.48% | 80,910 | |
| Whirlpool Corp. | 1,000 | 80,910 |
| Household Products 0.26% | 43,061 | |
| Energizer Holdings, Inc. * | 200 | 13,372 |
| Newell Rubbermaid, Inc. | 1,100 | 29,689 |
| Industrial Machinery 0.52% | 86,489 | |
| Cummins, Inc. | 100 | 11,482 |
| Deere & Company | 300 | 23,430 |
| Flowserve Corp. * | 200 | 10,228 |
| Parker-Hannifin Corp. | 200 | 14,810 |
| Terex Corp. * | 300 | 13,179 |
| W.W. Grainger, Inc. | 200 | 13,360 |
| Insurance 9.99% | 1,674,937 | |
| Aetna, Inc. | 300 | 11,181 |
| AFLAC, Inc. | 3,000 | 135,210 |
| Allstate Corp. | 800 | 46,352 |
| Ambac Financial Group, Inc. | 600 | 51,954 |
| American Financial Group, Inc. | 600 | 28,032 |
| American International Group, Inc. | 7,700 | 491,414 |
| Amerus Group Company | 300 | 20,340 |
| Aon Corp. | 1,800 | 62,226 |
| CIGNA Corp. | 400 | 45,228 |
| Commerce Group, Inc. | 400 | 11,916 |
13 Intrinsic Value Fund See notes to financial statements
F I N A N C I A L S T A T E M E N T S
| Issuer | Shares | Value |
| Insurance (continued) | ||
| Conseco, Inc. * | 600 | $12,420 |
| Fidelity National Financial, Inc. | 1,300 | 52,299 |
| First American Corp. | 700 | 28,434 |
| Hanover Insurance Group, Inc. | 400 | 17,800 |
| Hartford Financial Services Group, Inc. | 200 | 17,172 |
| Lincoln National Corp. | 900 | 54,630 |
| Marsh & McLennan Companies, Inc. | 500 | 13,080 |
| MBIA, Inc. | 1,100 | 67,793 |
| MetLife, Inc. | 800 | 44,024 |
| MGIC Investment Corp. | 400 | 23,148 |
| Nationwide Financial Services, Inc., Class A | 400 | 19,364 |
| Old Republic International Corp. | 1,600 | 33,440 |
| PMI Group, Inc. | 400 | 17,296 |
| Principal Financial Group, Inc. | 400 | 21,296 |
| Progressive Corp. | 2,100 | 51,639 |
| Protective Life Corp. | 400 | 18,412 |
| Prudential Financial, Inc. | 400 | 29,364 |
| Radian Group, Inc. | 400 | 23,952 |
| St. Paul Travelers Companies, Inc. | 1,700 | 74,630 |
| Torchmark Corp. | 700 | 43,547 |
| Transatlantic Holdings, Inc. | 200 | 12,284 |
| UnumProvident Corp. | 2,800 | 53,060 |
| W.R. Berkley Corp. | 1,200 | 42,000 |
| International Oil 1.27% | 212,977 | |
| Anadarko Petroleum Corp. | 2,700 | 126,657 |
| ConocoPhillips | 1,000 | 63,430 |
| Hess Corp. | 500 | 22,890 |
| Leisure Time 0.07% | 11,860 | |
| Walt Disney Company | 400 | 11,860 |
| Life Sciences 0.07% | 11,436 | |
| Pharmaceutical Product Development, Inc. | 300 | 11,436 |
| Manufacturing 0.55% | 92,974 | |
| Eaton Corp. | 400 | 26,600 |
| Harley-Davidson, Inc. | 400 | 23,404 |
| Snap-on, Inc. | 500 | 21,850 |
| SPX Corp. | 400 | 21,120 |
| Medical-Hospitals 0.14% | 23,578 | |
| Health Management Associates, Inc., Class A | 600 | 12,546 |
| Tenet Healthcare Corp. * | 1,400 | 11,032 |
| Metal & Metal Products 0.14% | 22,939 | |
| Reliance Steel & Aluminum Company | 700 | 22,939 |
| Office Furnishings & Supplies 0.31% | 51,576 | |
| Office Depot, Inc. * | 1,400 | 51,576 |
| 14 | Intrinsic Value Fund | See notes to financial statements |
F I N A N C I A L S T A T E M E N T S
| Issuer | Shares | Value |
| Paper 0.18% | $30,741 | |
| International Paper Company | 500 | 17,385 |
| Temple-Inland, Inc. | 300 | 13,356 |
| Petroleum Services 1.37% | 230,078 | |
| Exxon Mobil Corp. | 3,400 | 230,078 |
| Pharmaceuticals 11.03% | 1,849,843 | |
| AmerisourceBergen Corp. | 2,800 | 123,648 |
| Barr Pharmaceuticals, Inc. * | 200 | 11,300 |
| Bristol-Myers Squibb Company | 4,000 | 87,000 |
| Caremark Rx, Inc. | 400 | 23,176 |
| Forest Laboratories, Inc. * | 900 | 44,982 |
| King Pharmaceuticals, Inc. * | 2,500 | 40,550 |
| Merck & Company, Inc. | 14,900 | 604,195 |
| Pfizer, Inc. | 33,200 | 914,992 |
| Photography 0.29% | 48,921 | |
| Eastman Kodak Company | 2,300 | 48,921 |
| Publishing 0.52% | 86,389 | |
| Gannett Company, Inc. | 1,300 | 73,905 |
| Tribune Company | 400 | 12,484 |
| Railroads & Equipment 0.56% | 94,246 | |
| Burlington Northern Santa Fe Corp. | 800 | 53,560 |
| Norfolk Southern Corp. | 200 | 8,546 |
| Union Pacific Corp. | 400 | 32,140 |
| Real Estate 0.16% | 26,750 | |
| Realogy Corp. * | 1,250 | 26,750 |
| Retail Grocery 2.87% | 480,555 | |
| Safeway, Inc. | 6,300 | 194,859 |
| SUPERVALU, Inc. | 2,000 | 57,120 |
| The Kroger Company | 9,600 | 228,576 |
| Retail Trade 6.87% | 1,151,141 | |
| Abercrombie & Fitch Company, Class A | 200 | 12,906 |
| Bed Bath & Beyond, Inc. * | 800 | 26,984 |
| Best Buy Company, Inc. | 300 | 14,100 |
| BJ’s Wholesale Club, Inc. * | 900 | 23,715 |
| Borders Group, Inc. | 500 | 9,565 |
| Circuit City Stores, Inc. | 400 | 9,444 |
| Costco Wholesale Corp. | 800 | 37,432 |
| Dollar General Corp. | 1,500 | 19,290 |
| Dollar Tree Stores, Inc. * | 900 | 25,902 |
| Family Dollar Stores, Inc. | 1,300 | 33,241 |
| Gap, Inc. | 1,400 | 23,534 |
| Home Depot, Inc. | 10,700 | 366,903 |
| Lowe’s Companies, Inc. | 6,200 | 167,772 |
15 Intrinsic Value Fund See notes to financial statements
F I N A N C I A L S T A T E M E N T S
| Issuer | Shares | Value |
| Retail Trade (continued) | ||
| Rent-A-Center, Inc. * | 500 | $13,550 |
| Staples, Inc. | 700 | 15,792 |
| The TJX Companies, Inc. | 1,100 | 29,425 |
| Tiffany & Company | 500 | 15,800 |
| Walgreen Company | 1,300 | 64,298 |
| Wal-Mart Stores, Inc. | 5,400 | 241,488 |
| Sanitary Services 0.14% | 23,996 | |
| Waste Management, Inc. | 700 | 23,996 |
| Semiconductors 0.23% | 38,077 | |
| Intel Corp. | 1,300 | 25,402 |
| Intersil Corp., Class A | 500 | 12,675 |
| Software 0.22% | 36,567 | |
| BEA Systems, Inc. * | 1,500 | 20,595 |
| BMC Software, Inc. * | 600 | 15,972 |
| Steel 0.23% | 39,096 | |
| Nucor Corp. | 800 | 39,096 |
| Telephone 9.99% | 1,674,356 | |
| ALLTEL Corp. | 400 | 21,684 |
| AT&T, Inc. | 20,800 | 647,504 |
| BellSouth Corp. | 4,700 | 191,384 |
| CenturyTel, Inc. | 1,500 | 59,730 |
| Qwest Communications International, Inc. * | 3,600 | 31,716 |
| Verizon Communications, Inc. | 20,300 | 714,154 |
| Windstream Corp. | 620 | 8,184 |
| Tobacco 2.03% | 340,777 | |
| Altria Group, Inc. | 3,700 | 309,061 |
| UST, Inc. | 600 | 31,716 |
| Toys, Amusements & Sporting Goods 0.10% | 16,956 | |
| Mattel, Inc. | 900 | 16,956 |
| Travel Services 0.14% | 24,112 | |
| Sabre Holdings Corp. | 1,100 | 24,112 |
| Trucking & Freight 0.72% | 120,798 | |
| Fedex Corp. | 1,000 | 101,030 |
| Ryder Systems, Inc. | 400 | 19,768 |
| 16 | Intrinsic Value Fund | See notes to financial statements |
F I N A N C I A L S T A T E M E N T S
| Principal | ||
| Issuer, description, maturity date | amount | Value |
| Repurchase agreements 5.37% | $901,000 | |
| (Cost $901,000) | ||
| Repurchase Agreement with State Street Corp. — Dated | ||
| 8/31/2006 at 3.95% to be repurchased at $901,099 on | ||
| 9/1/2006, collateralized by $945,000 Federal National | ||
| Mortgage Association, 4.25% due 8/15/2010 (valued | ||
| at $920,194, including interest) (c) | $901,000 | $901,000 |
| Total investments (cost $15,676,702) (99.17%) | $16,626,218 | |
| Other assets in excess of liabilities 0.83% | 138,497 | |
| Total net assets 100.00% | $16,764,715 | |
* Non-income producing.
(c) Investment is an affiliate of the Trust's subadvisor or custodian bank.
17 Intrinsic Value Fund See notes to financial statements
F I N A N C I A L S T A T E M E N T S
Financial statements
Statement of assets and liabilities 8-31-06 (unaudited)
This Statement of Assets and Liabilities is the Fund’s balance sheet. It shows the value of what the Fund owns, is due and owes. You’ll also find the net asset value and the maximum offering price per share.
| Assets | |
| Investments, at value (Cost $14,775,702) | $15,725,218 |
| Repurchase agreements, at value (Cost $901,200) | 901,000 |
| Cash | 36,634 |
| Receivable for shares sold | 78,069 |
| Dividends and interest receivable | 29,621 |
| Receivable for futures variation margin | 250 |
| Other assets | 28,765 |
| Total assets | 16,799,557 |
| Liabilities | |
| Payable for shares repurchased | 150 |
| Payable to affiliates | |
| Transfer agent fees | 6,822 |
| Fund administration fees | 208 |
| Service fees | 55 |
| Other payables and accrued expenses | 27,607 |
| Total liabilities | 34,842 |
| Net assets | |
| Capital paid-in | 15,696,113 |
| Accumulated undistributed net realized gain on investments and futures contracts | 55,766 |
| Unrealized appreciation on investments and futures contracts | 964,727 |
| Undistributed net investment income | 48,109 |
| Net assets | $16,764,715 |
| Net asset value per share | |
| Based on net asset values and shares outstanding — the Fund has an | |
| unlimited number of shares authorized with no par value. | |
| Class A ($15,938,484 ÷ 744,986 shares) | $21.39 |
| Class B ($210,685 ÷ 9,861 shares) | $21.37 |
| Class C ($282,801 ÷ 13,237 shares) | $21.36 |
| Class I ($118,778 ÷ 5,547 shares) | $21.41 |
| Class R ($106,890 ÷ 5,000 shares) | $21.38 |
| Class 1 ($107,077 ÷ 5,000 shares) | $21.42 |
| Maximum offering price per share | |
| Class Aa ($21.39 ÷ 95%) | $22.52 |
a On single retail sales of less than $50,000. On sales of $50,000 or more and on group sales the offering price is reduced.
18 Intrinsic Value Fund See notes to financial statements
F I N A N C I A L S T A T E M E N T S
Statement of operations For the period ended 8-31-06a (unaudited).
This Statement of Operations summarizes the Fund’s investment income earned and expenses incurred in operating the Fund. It also shows net gains (losses) for the period stated.
| Investment income | |
| Dividends | $83,473 |
| Interest | 11,574 |
| Total investment income | 95,047 |
| Expenses | |
| Investment management fees (Note 3) | 26,925 |
| Distribution and service fees (Note 3) | 10,784 |
| Transfer agent fees (Note 3) | 6,822 |
| Fund administration fees (Note 3) | 209 |
| Blue sky fees (Note 3) | 20,404 |
| Audit and legal fees | 16,710 |
| Custodian fees | 9,047 |
| Printing and postage fees (Note 3) | 4,881 |
| Trustees’ fees (Note 3) | 111 |
| Miscellaneous | 215 |
| Total expenses | 96,108 |
| Less expense reductions (Note 3) | (49,170) |
| Net expenses | 46,938 |
| Net investment income | 48,109 |
| Realized and unrealized gain | |
| Net realized gain on | |
| Investments | 43,350 |
| Futures contracts | 12,416 |
| Change in net unrealized appreciation of | |
| Investments | 949,516 |
| Futures contracts | 15,211 |
| Net realized and unrealized gain | 1,020,493 |
| Increase in net assets from operations | $1,068,602 |
a Period from 6-12-06 (commencement of operations) to 8-31-06.
19 Intrinsic Value Fund See notes to financial statements
F I N A N C I A L S T A T E M E N T S
Statement of changes in net assets
This Statement of Changes in Net Assets shows how the value of the Fund’s net assets has changed during the last period. The difference reflects earnings less expenses, any investment gains and losses, distributions, if any, paid to shareholders and the net of Fund share transactions.
| Period | |
| endeda | |
| 8-31-06 | |
| Increase in net assets | |
| From operations | |
| Net investment income | $48,109 |
| Net realized gain | 55,766 |
| Change in net unrealized appreciation | 964,727 |
| Increase in net assets resulting from operations | 1,068,602 |
| From Fund share transactions | 15,696,113 |
| Net assets | |
| Beginning of period | — |
| End of periodb | $16,764,715 |
a Period from 6-12-06 (commencement of operations) to 8-31-06. Unaudited.
b Includes undistributed net investment income of $48,109.
| 20 | Intrinsic Value Fund | See notes to financial statements |
F I N A N C I A L S T A T E M E N T S
Financial highlights
The Financial highlights show how the Fund’s net asset value for a share has changed since the end of the previous period.
| CLASS A SHARES | |
| Period ended | 8-31-06a,b |
| Per share operating performance | |
| Net asset value, beginning of period | $20.00 |
| Net investment incomeh | 0.06 |
| Net realized and unrealized | |
| gain on investments | 1.33 |
| Total from investment operations | 1.39 |
| Net asset value, end of period | $21.39 |
| Total return (%) | 6.95l,m |
| Ratios and supplemental data | |
| Net assets, end of period | |
| (in millions) | $16 |
| Ratio of net expenses to average | |
| net assets (%) | 1.35r |
| Ratio of gross expenses to average | |
| net assets (%) | 2.31r |
| Ratio of net investment income | |
| to average net assets (%) | 1.40r |
| Portfolio turnover (%) | 8m |
21 Intrinsic Value Fund See notes to financial statements
F I N A N C I A L S T A T E M E N T S
Financial highlights
| CLASS B SHARES | |
| Period ended | 8-31-06a,b |
| Per share operating performance | |
| Net asset value, beginning of period | $20.00 |
| Net investment incomeh | 0.03 |
| Net realized and unrealized | |
| gain on investments | 1.34 |
| Total from investment operations | 1.37 |
| Net asset value, end of period | $21.37 |
| Total return (%) | 6.85l,m |
| Ratios and supplemental data | |
| Net assets, end of period | |
| (in millions) | —i |
| Ratio of net expenses to average | |
| net assets (%) | 2.05r |
| Ratio of gross expenses to average | |
| net assets (%) | 16.56r |
| Ratio of net investment income | |
| to average net assets (%) | 0.74r |
| Portfolio turnover (%) | 8m |
| 22 | Intrinsic Value Fund | See notes to financial statements |
F I N A N C I A L S T A T E M E N T S
| Financial highlights | |
| CLASS C SHARES | |
| Period ended | 8-31-06a,b |
| Per share operating performance | |
| Net asset value, beginning of period | $20.00 |
| Net investment incomeh | 0.03 |
| Net realized and unrealized | |
| gain on investments | 1.33 |
| Total from investment operations | 1.36 |
| Net asset value, end of period | $21.36 |
| Total return (%) | 6.80l,m |
| Ratios and supplemental data | |
| Net assets, end of period | |
| (in millions) | —i |
| Ratio of net expenses to average | |
| net assets (%) | 2.05r |
| Ratio of gross expenses to average | |
| net assets (%) | 14.67r |
| Ratio of net investment income | |
| to average net assets (%) | 0.59r |
| Portfolio turnover (%) | 8m |
23 Intrinsic Value Fund See notes to financial statements
F I N A N C I A L S T A T E M E N T S
Financial highlights
| CLASS I SHARES | |
| Period ended | 8-31-06a,b |
| Per share operating performance | |
| Net asset value, beginning of period | $20.00 |
| Net investment incomeh | 0.08 |
| Net realized and unrealized | |
| gain on investments | 1.33 |
| Total from investment operations | 1.41 |
| Net asset value, end of period | $21.41 |
| Total return (%) | 7.05l,m |
| Ratios and supplemental data | |
| Net assets, end of period | |
| (in millions) | —i |
| Ratio of net expenses to average | |
| net assets (%) | 0.95r |
| Ratio of gross expenses to average | |
| net assets (%) | 18.10r |
| Ratio of net investment income | |
| to average net assets (%) | 1.81r |
| Portfolio turnover (%) | 8m |
| 24 | Intrinsic Value Fund | See notes to financial statements |
F I N A N C I A L S T A T E M E N T S
Financial highlights
| CLASS R SHARES | |
| Period ended | 8-31-06a,b |
| Per share operating performance | |
| Net asset value, beginning of period | $20.00 |
| Net investment incomeh | 0.05 |
| Net realized and unrealized | |
| gain on investments | 1.33 |
| Total from investment operations | 1.38 |
| Net asset value, end of period | $21.38 |
| Total return (%) | 6.90l,m |
| Ratios and supplemental data | |
| Net assets, end of period | |
| (in millions) | —i |
| Ratio of net expenses to average | |
| net assets (%) | 1.70r |
| Ratio of gross expenses to average | |
| net assets (%) | 20.47r |
| Ratio of net investment income | |
| to average net assets (%) | 1.06r |
| Portfolio turnover (%) | 8m |
| 25 | Intrinsic Value Fund | See notes to financial statements |
F I N A N C I A L S T A T E M E N T S
Financial highlights
| CLASS 1 SHARES | |
| Period ended | 8-31-06a,b |
| Per share operating performance | |
| Net asset value, beginning of period | $20.00 |
| Net investment incomeh | 0.08 |
| Net realized and unrealized | |
| gain on investments | 1.34 |
| Total from investment operations | 1.42 |
| Net asset value, end of period | $21.42 |
| Total return (%) | 7.10l,m |
| Ratios and supplemental data | |
| Net assets, end of period | |
| (in millions) | —i |
| Ratio of net expenses to average | |
| net assets (%) | 0.90r |
| Ratio of gross expenses to average | |
| net assets (%) | 1.72r |
| Ratio of net investment income | |
| to average net assets (%) | 1.85r |
| Portfolio turnover (%) | 8m |
a Class A, Class B, Class C, Class I, Class R and Class 1 shares began operations on 6-12-06.
b Unaudited.
h Based on the average of the shares outstanding.
i Less than $500,000.
l Total returns would have been lower had certain expenses not been reduced during the period shown.
m Not annualized.
r Annualized.
26 Intrinsic Value Fund See notes to financial statements
Notes to financial statements (unaudited)
1. Organization
John Hancock Intrinsic Value Fund (the “Fund”) is a newly organized non-diversified series of John Hancock Funds III (the “Trust”). The Trust was established as a Massachusetts business trust on June 9, 2005. The Trust is registered under the Investment Company Act of 1940, as amended (the “1940 Act”), as an open-end investment management company. The investment objective of the Fund is to seek long-term capital growth.
John Hancock Life Insurance Company of New York (“John Hancock New York”) is a wholly owned subsidiary of John Hancock Life Insurance Company (U.S.A.) (“John Hancock USA”). John Hancock USA and John Hancock New York are indirect wholly owned subsidiaries of The Manufacturers Life Insurance Company (“Manulife”), which in turn is a wholly owned subsidiary of Manulife Financial Corporation (“MFC”), a publicly traded company. Manulife Financial Corporation and its subsidiaries are known collectively as “Manulife Financial.”
John Hancock Investment Management Services, LLC (the “Adviser”) is the Adviser to the Trust. John Hancock Funds, LLC (the “Distributor”), a Delaware limited liability company controlled by John Hancock USA, serves as principal underwriter and is a wholly owned subsidiary of the Adviser.
Class 1 shares are sold only to certain exempt separate accounts of John Hancock USA and John Hancock New York.
The Board of Trustees has authorized the issuance of multiple classes of shares of the Fund, including classes designated as Class A, Class B, Class C, Class I, Class R and Class 1 shares. The shares of each class represent an interest in the same portfolio of investments of the Fund, and have equal rights as to voting, redemptions, dividends and liquidation, except that certain expenses, subject to the approval of the Board of Trustees, may be applied differently to each class of shares in accordance with current regulations of the Securities and Exchange Commission and the Internal Revenue Service. Shareholders of a class that bear distribution and service expenses under the terms of a distribution plan have exclusive voting rights to that distribution plan.
The Adviser and other subsidiaries of John Hancock USA owned 725,000 Class A shares, 5,000 Class B shares, 5,000 Class C shares, 5,000 Class I shares, 5,000 Class R shares and 5,000 Class 1 shares of beneficial interest of the Fund on August 31, 2006.
2. Significant accounting policies
In the preparation of the financial statements, the Fund follows the policies described below. The preparation of financial statements in conformity with accounting principles generally accepted in the United States of America requires management to make estimates and assumptions that affect the reported amounts of assets and liabilities at the date of the financial statements and the reported amounts of income and expenses during the reporting period. Actual results may differ from these estimates.
Security valuation
The net asset value of the shares of the Fund is determined daily as of the close of the New York Stock Exchange, normally at 4:00 P.M. Eastern time. Short-term debt instruments with remaining maturities of 60 days or less are valued at amortized cost, and thereafter assume a constant amortization to maturity of any discount or premium, which approximates market value. Investments in State Street Navigator Securities Lending Prime Portfolio are valued at their net asset value each business day. All other securities held by the Fund are valued at the last sale price or official closing price (closing bid price or last evaluated quote if no sale has occurred) as of the close
27 Intrinsic Value Fund
of business on a principal securities exchange (domestic or foreign) or, lacking any sales, at the closing bid price. Securities traded only in the over-the-counter market are valued at the last bid price quoted by brokers making markets in the securities at the close of trading. Fund securities for which there are no such quotations, principally debt securities, are valued based on the valuation provided by an independent pricing service, which utilizes both dealer-supplied and electronic data processing techniques.
Other assets and securities for which no such quotations are readily available are valued at their fair value as determined in good faith under consistently applied procedures established by and under the general supervision of the Board of Trustees. Generally, trading in non-U.S. securities is substantially completed each day at various times prior to the close of trading on the New York Stock Exchange. The values of such securities used in computing the net asset value of a Fund’s shares are generally determined as of such times. Occasionally, significant events that affect the values of such securities may occur between the times at which such values are generally determined and the close of the New York Stock Exchange. In such events, these securities will then be valued at their fair value as determined in good faith under consistently applied procedures established by and under the general supervision of the Board of Trustees.
In deciding whether to make a fair value adjustment to the price of a security, the Trustees or their designee may review a variety of factors, including, developments in foreign markets, the performance of U.S. securities markets and the performance of instruments trading in U.S. markets that represent foreign securities and baskets of foreign securities. The Fund may also fair value securities in other situations, for example, when a particular foreign market is closed, but the Fund is calculating the net asset value. In view of these factors, it is likely that Fund investing significant amounts of assets in securities in foreign markets will be fair valued more frequently than a fund investing significant amounts of assets in frequently traded, U.S. exchange listed securities of large capitalization U.S. issuers.
For purposes of determining when fair value adjustments may be appropriate with respect to the Fund investing in securities in foreign markets that close prior to the New York Stock Exchange, the Fund will, on an ongoing basis, monitor for “significant market events.” A significant market event may be a certain percentage change in the value of an index or of certain exchange traded funds (“ETFs”) that track foreign markets in which the Fund has significant investments. If a significant market event occurs due to a change in the value of the index or of ETFs, the pricing for the Fund will promptly be reviewed and potential adjustments to the net asset value will be recommended to the Trust’s Pricing Committee, where applicable.
Fair value pricing of securities is intended to help ensure that the net asset value of the Fund’s shares reflects the value of the Fund’s securities as of the close of the New York Stock Exchange (as opposed to a value which is no longer accurate as of such close), thus limiting the opportunity for aggressive traders to purchase shares of the Fund at deflated prices, reflecting stale security valuations, and to promptly sell such shares at a gain. However, a security’s valuation may differ depending on the method used for determining value and no assurance can be given that fair value pricing of securities will successfully eliminate all potential opportunities for such trading gains.
Repurchase agreements
The Fund may enter into repurchase agreements. When the Fund enters into a repurchase agreement through its custodian, it receives delivery of securities, the amount of which at the time of purchase and each subsequent business day is required to be maintained at such a level that the market value is generally at least 102% of the repurchase amount. The Fund will take constructive receipt of all securities underlying the repurchase agreements it has entered into until such agreements expire. If the seller defaults, the Fund would suffer a loss to the extent that proceeds from the sale of underlying securities were less than the repurchase amount. The Fund may enter into repurchase agreements maturing within seven days with domestic
28 Intrinsic Value Fund
dealers, banks or other financial institutions deemed to be creditworthy by the Adviser. Collateral for certain tri-party repurchase agreements is held at the custodian bank in a segregated account for the benefit of the Fund and the counterparty.
Security transactions and related investment income
Investment security transactions are accounted for on a trade date plus one basis for daily net asset value calculations. However for financial reporting purposes, investment transactions are reported on trade date. Interest income is accrued as earned. Dividend income is recorded on the ex-dividend date. Foreign dividends are recorded on the ex-date or as soon after the ex-date that the Fund becomes aware of such dividends, net of all taxes. Discounts/premiums are accreted/amortized for financial reporting purposes. Non-cash dividends are recorded at the fair market value of the securities received. Debt obligations may be placed in a non-accrual status and related interest income may be reduced by ceasing current accruals and writing off interest receivables when the collection of all or a portion of interest has become doubtful, based upon consistently applied procedures.
From time to time, the Fund may invest in Real Estate Investment Trusts (“REITs”) and as a result, will estimate the components of distributions from these securities. Distributions from REITs received in excess of income are recorded as a reduction of cost of investments and/or as a realized gain.
The Fund uses the First In, First Out method for fixed income securities and Highest Cost, First Out for all other securities for determining realized gain or loss on investments for both financial and federal income tax reporting purposes.
Multi-class operations
All income, expenses (except for class-specific expenses) and realized and unrealized gains (losses) are allocated to each class of shares based upon the relative net assets of each class. Dividends to shareholders from net investment income are determined at a class level and distributions from capital gains are determined at a Fund level.
Expense allocation
Expenses are allocated based on the relative share of net assets of the Fund at the time the expense was incurred. Class-specific expenses, such as distribution (Rule 12b-1) fees, are accrued daily and charged directly to the respective share classes.
Futures
The Fund may purchase and sell financial futures contracts and options on those contracts. The Fund invests in contracts based on financial instruments such as U.S. Treasury Bonds or Notes on securities indices such as the Standard & Poor’s 500 Index (the “S&P 500 Index”), in order to hedge against a decline in the value of securities owned by the Fund.
Upon entering into futures contracts, the Fund is required to deposit with a broker an amount, termed the initial margin, which typically represents a certain percentage of the purchase price indicated in the futures contract. Payments to and from the broker, known as variation margin, are required to be made on a daily basis as the price of the futures contract fluctuates, making the long or short positions in the contract more or less valuable. If the position is closed out by taking an opposite position prior to the settlement date of the futures contract, a final determination of variation margin is made, cash is required to be paid to or released by the broker, and the Fund realizes a gain or loss.
When the Fund sells a futures contract based on a financial instrument, the Fund becomes obligated to deliver that kind of instrument at an agreed upon date for a specified price. The Fund realizes a gain or loss depending on whether the price of an offsetting purchase is less or more than the price of the initial sale or on whether the price of an offsetting sale is more or less than the price of the initial purchase. The Fund could be exposed to risks if it could not close out futures positions because of an illiquid secondary market or the inability of counterparties to meet the terms of their contracts. Futures contracts are valued at the quoted daily settlement prices established by the exchange on which they trade.
29 Intrinsic Value Fund
| The following is a summary of open futures contracts on August 31, 2006: | ||||
| NUMBER OF | UNREALIZED | |||
| OPEN CONTRACTS | CONTRACTS | POSITION | EXPIRATION | APPRECIATION |
| S&P 500 Index | 2 | Long | Sep 2006 | $15,211 |
Federal income taxes
The Fund qualifies as a “regulated investment company” by complying with the applicable provisions of the Internal Revenue Code and will not be subject to federal income tax on taxable income that is distributed to shareholders. Therefore, no federal income tax provision is required.
New accounting pronouncements
In June 2006, Financial Accounting Standards Board (“FASB”) Interpretation No. 48, Accounting for Uncertainty in Income Taxes (the “Interpretation”) was issued, and is effective for fiscal years beginning after December 15, 2006 and is to be applied to all open tax years as of the effective date. The Interpretation prescribes a minimum threshold for financial statement recognition of the benefit of a tax position taken or expected to be taken in a tax return, and requires certain expanded disclosures. Management is currently evaluating the application of the Interpretation to the Fund, and has not at this time quantified the impact, if any, resulting from the adoption of the Interpretation on the Fund’s financial statements.
In September 2006, FASB Standard No. 157, Fair Value Measurements (“FAS 157”) was issued, and is effective for fiscal years beginning after November 15, 2007. FAS 157 defines fair value, establishing a framework for measuring fair value and expands disclosure about fair value measurements. Management is currently evaluating the application of FAS 157 to the Fund, and its impact, if any, resulting from the adoption of FAS 157 on the Fund’s financial statements.
Distribution of income and gains
The Fund records distributions to shareholders from net investment income and net realized gains, if any, on the ex-dividend date. Distributions paid by the Fund with respect to each class of shares are calculated in the same manner, at the same time and are in the same amount, except for the effect of expenses that may be applied differently to each class. Such distributions, on a tax basis, are determined in conformity with income tax regulations, which may differ from accounting principles generally accepted in the United States of America. Distributions in excess of tax basis earnings and profits, if any, are reported in the Fund’s financial statements as a return of capital.
Capital accounts
The Fund reports the undistributed net investment income and accumulated undistributed net realized gain (loss) accounts on a basis approximating amounts available for future tax distributions (or to offset future taxable realized gains (loss) when a capital loss carryforward is available). Accordingly, the Fund may periodically make reclassifications among certain capital accounts without affecting its net asset value.
3. Investment advisory and other agreements Advisory fees
The Trust has entered into an Investment Advisory Agreement with the Adviser. The Adviser is responsible for managing the corporate and business affairs of the Trust and for selecting and compensating subadvisers to handle the investment and reinvestment of the assets of the Fund, subject to the supervision of the Board of Trustees. Under the Advisory Agreement the Fund pays a monthly management fee to the Adviser equivalent, on an annual basis, to the sum of: (a) 0.78% of the first $500,000,000 of the Fund’s aggregate daily net assets; (b) 0.76% of the next $500,000,000 of the Fund’s aggregate daily net assets; (c) 0.75% of the next $1,500,000,000 of the Fund’s aggregate daily net assets; and (d) 0.74% of the Fund’s aggregate daily net assets in excess of $2,500,000,000. Aggregate net assets include the net assets of the Fund
30 Intrinsic Value Fund
and Intrinsic Value Trust, a series of John Hancock Trust. John Hancock Trust is an open-end investment company advised by the Adviser and distributed by the Distributor. The Fund is not responsible for payment of the subadvisory fees.
Expense reimbursements
The Adviser has agreed contractually to reimburse for certain fund level expenses that exceed 0.08% of the average annual net assets, or to make a payment to a specific class of shares of the Fund in an amount equal to the amount by which the expenses attributable to such class of shares (excluding taxes, portfolio brokerage commissions, interest, litigation and indemnification expenses and other extraordinary expenses not incurred in the ordinary course of the Fund’s business and fees under any agreement or plans of the Fund dealing with services for shareholders and others with beneficial interests in shares of the Fund) exceed the percentage of average annual net assets (on an annualized basis) attributable as follows: 1.35% for Class A, 2.05% for Class B, 2.05% for Class C, 0.95% for Class I, 1.45% for Class R and 0.90% for Class 1. Accordingly, the expense reductions related to this expense limitation amounted to $185, $31,681, $4,340, $4,227, $4,239 and $4,498 for Class A, Class B, Class C, Class I, Class R and Class 1, respectively, for the period ended August 31, 2006. This expense reimbursement shall continue in effect until June 30, 2007 and thereafter until terminated by the Adviser on notice to the Trust.
Administration fees
The Fund has an agreement with the Adviser that requires the Fund to reimburse the Adviser for all expenses associated with providing the administrative, financial, accounting and recordkeeping services of the Fund, including the preparation of all tax returns, annual, semi-annual and periodic reports to shareholders and the preparation of all regulatory reports.
Distribution plan
The Trust has a Distribution Agreement with the Distributor, a wholly owned subsidiary of the Adviser. The Fund has adopted Distribution Plans with respect to Class A, Class B, Class C, Class R and Class 1, pursuant to Rule 12b-1 under the 1940 Act, to reimburse the Distributor for the services it provides as distributor of shares of the Fund. Accordingly, the Fund makes monthly payments to the Distributor at an annual rate not to exceed 0.30%, 1.00%, 1.00%, 0.50% and 0.05% of average daily net asset value of Class A, Class B, Class C, Class R and Class 1, respectively. A maximum of 0.25% of such payments may be service fees, as defined by the Conduct Rules of the National Association of Securities Dealers. Under the Conduct Rules, curtailment of a portion of the Fund’s 12b-1 payments could occur under certain circumstances. In addition, under a Service Plan for Class R shares, the Fund pays up to 0.25% of Class R average daily n et asset value for certain other services.
Sales charges
Class A shares are assessed up-front sales charges of up to 5.00% of net asset value of such shares. During the period ended August 31, 2006, the Fund was informed that the Distributor received net up-front sales charges of $7,127 with regard to sales of Class A shares. Of this amount, $1,242 was retained and used for printing prospectuses, advertising, sales literature and other purposes, $5,885 was paid as sales commissions to unrelated broker-dealers.
Class B shares that are redeemed within six years of purchase are subject to a contingent deferred sales charge (“CDSC”) at declining rates, beginning at 5.00% of the lesser of the current market value at the time of redemption or the original purchase cost of the shares being redeemed. Class C shares that are redeemed within one year of purchase are subject to a CDSC at a rate of 1.00% of the lesser of the current market value at the time of redemption or the original purchase cost of the shares being redeemed. Proceeds from the CDSCs are paid to the Distributor and are used, in whole or in part, to defray its expenses for providing distribution-related services to the Fund in connection with the sale of Class B and Class C shares. During the period ended August 31, 2006, the Fund was informed that the Distributor received no CDSCs for Class B and Class C shares.
31 Intrinsic Value Fund
Transfer agent fees
The Fund has a Transfer Agency Agreement with John Hancock Signature Services, Inc. (“Signature Services”), an indirect subsidiary of MFC. For Class A, Class B, Class C, Class I and Class R shares, the Fund pays a monthly transfer agent fee at an annual rate of 0.05% of each class’s average daily net assets, plus a fee based on the number of shareholder accounts and reimbursement for certain out-of-pocket expenses. Expenses not directly attributable to a particular class of shares are aggregated and allocated to each class on the basis of its relative net asset value.
Signature Services has agreed to limit the transfer agent fees so that such fees do not exceed 0.20% annually of Class A, Class B, Class C, Class I and Class R share average daily net assets. This agreement is effective until December 31, 2006. Signature Services reserves the right to terminate this limitation in the future. Accordingly, there were no transfer agent fees reductions for Class A, Class B, Class C, Class I and Class R shares, respectively, during the period ended August 31, 2006.
| Expenses under the agreements described above for the period ended August 31, 2006, were as follows: | ||||
| Distribution and | Transfer | Printing and | ||
| Share Class | service fees | agent | Blue sky | postage |
| Class A | $9,950 | $6,634 | $4,276 | $4,705 |
| Class B | 299 | 60 | 4,032 | 37 |
| Class C | 356 | 71 | 4,032 | 39 |
| Class I | — | 12 | 4,032 | 36 |
| Class R | 168 | 45 | 4,032 | 32 |
| Class 1 | 11 | — | — | 32 |
| Total | $10,784 | $6,822 | $20,404 | $4,881 |
Trustees’ fees
The Trust compensates each Trustee who is not an employee of the Adviser or its affiliates. Total Trustees’ expenses are allocated to the Fund based on its average daily net asset value.
4. Guarantees and indemnifications
Under the Trust’s organizational documents, its Officers and Trustees are indemnified against certain liability arising out of the performance of their duties to the Trust. Additionally, in the normal course of business, the Trust enters into contracts with service providers that contain general indemnification clauses. The Trust’s maximum exposure under these arrangements is unknown, as this would involve future claims that may be made against the Trust that have not yet occurred. However, based on experience, the Trust believes the risk of loss to be remote.
5. Line of credit
The Fund has entered into an agreement which enables them to participate in a $100 million unsecured committed line of credit with State Street Bank & Trust Company. Borrowings will be made solely to temporarily finance the repurchase of capital shares. Interest is charged to the Fund based on its borrowings at a rate per annum equal to the Federal Funds rate plus 0.50% . In addition, a commitment fee of 0.07% per annum, payable at the end of each calendar quarter, based on the average daily-unused portion of the line of credit, is charged to the Fund on a prorated basis based on average net assets. For the period ended August 31, 2006 there was no borrowings under the line of credit.
32 Intrinsic Value Fund
6. Capital shares
Share activities for the Fund for the period ended August 31, 2006 were as follows:
| Period ended 8-31-06a | ||
| Shares | Amount | |
| Class A shares | ||
| Sold | 745,482 | $14,923,582 |
| Repurchased | (496) | (10,305) |
| Net increase (decrease) | 744,986 | $14,914,277 |
| Class B shares | ||
| Sold | 9,861 | $201,789 |
| Net increase (decrease) | 9,861 | $201,789 |
| Class C shares | ||
| Sold | 13,237 | $270,047 |
| Net increase (decrease) | 13,237 | $270,047 |
| Class I shares | ||
| Sold | 5,547 | $111,000 |
| Net increase (decrease) | 5,547 | $111,000 |
| Class R shares | ||
| Sold | 5,000 | $100,000 |
| Net increase (decrease) | 5,000 | $100,000 |
| Class 1 shares | ||
| Sold | 5,000 | $100,000 |
| Net increase (decrease) | 5,000 | $100,000 |
| Net increase (decrease) | 783,631 | $15,696,113 |
| aPeriod from 6-12-06 (commencement of operations) to 8-31-06. Unaudited. | ||
33 Intrinsic Value Fund
7. Investment transactions
Purchases and proceeds from sales or maturities of securities, other than short- term securities and obligations of the U.S. government, during the period ended August 31, 2006, aggregated $15,887,543 and $1,155,191, respectively.
The cost of investments owned on August 31, 2006, including short-term investments, for federal income tax purposes, was $15,676,702. Gross unrealized appreciation and depreciation of investments aggregated $1,175,580 and $226,064, respectively, resulting in net unrealized appreciation of $949,516.
8. Federal income tax information
Federal income tax regulations may differ from generally accepted accounting principles and income and capital gain distributions determined in accordance with tax regulations may differ from net investment income and realized gains recognized for financial reporting purposes.
34 Intrinsic Value Fund
Evaluation of Advisory and Subadvisory Agreements by the Board of Trustees
This section describes the evaluation by the Board of Trustees of the Advisory Agreement and each of the Subadvisory Agreements.
Evaluation by the Board of Trustees The Board, including all of the Trustees who are not “interested persons” as defined in the Investment Company Act of 1940, as amended (the “Independent Trustees”), is responsible for selecting the Trust’s investment adviser, John Hancock Investment Management Services, LLC (the “Adviser” or “JHIMS”), approving the Adviser’s selection of subadvisers for each series of the Trust (the “Funds”) and approving the Trust’s advisory and sub-advisory agreements (and any sub-subadvisory agreements), their periodic continuation and any amendments. Consistent with SEC rules, the Board regularly evaluates the Trust’s advisory and subadvisory (and sub-subadvisory) arrangements, including consideration of the factors listed below. The Board may also consider other factors (including conditions and trends prevailing generally in the econom y, the securities markets and the industry) and does not treat any single factor as determinative, and each Trustee may attribute different weights to different factors. The Board is furnished with an analysis of its fiduciary obligations in connection with its evaluation and, throughout the evaluation process, the Board is assisted by counsel for the Trust and the Independent Trustees are also separately assisted by independent legal counsel. The factors regularly considered by the Board are:
1. the nature, extent and quality of the services to be provided by the Adviser to the Trust and by the subadvisers to the Funds;
2. the investment performance of the Funds and their subadvisers;
3. the extent to which economies of scale would be realized as a Fund grows and whether fee levels reflect these economies of scale for the benefit of Trust shareholders;
4. the costs of the services to be provided and the profits to be realized by the Adviser and its affiliates (including any subadvisers that are affiliated with the Adviser) from the Adviser’s relationship with the Trust; and
5. comparative services rendered and comparative advisory and subadvisory fee rates.
The Board believes that information relating to all these factors is relevant to its evaluation of the Trust’s advisory agreement. With respect to its evaluation of subadvisory agreements (including sub-subadvisory agreements) the Board believes that, in view of the Trust’s “manager-of managers” advisory structure, the costs of services to be provided and the profits to be realized by those subadvisers that are not affiliated with the Adviser from their relationship with the Trust generally are not a material factor to the Board’s consideration of subadvisory agreements because such fees are paid to sub-advisers by the Adviser and not by the Funds, and because the Board relies on the ability of the Adviser to negotiate such subadvisory fees at arms-length.
In evaluating subadvisory arrangements, the Board also considers other material business relationships that unaffiliated sub-advisers and their affiliates have with the Adviser or its affiliates, including the involvement by certain affiliates of certain subadvisers in the distribution of financial products, including shares of the Trust, offered by the Adviser and other affiliates of the Adviser (“Material Relationships”).
Approval of Advisory Agreement
At its meeting on September 21, 2005, the Board, including all the Independent Trustees, approved the Advisory Agreement between the Trust and JHIMS with respect to each of the Funds.
In approving the Advisory Agreement, and with reference to the factors which it regularly considers, the Board:
(1) (a) considered the high value to the Trust of continuing the relationship with JHIMS as the Trust’s Adviser to the other John Hancock Funds, the skills and competency with which JHIMS
35
has in the past managed the affairs and subadvisory relationships of other funds in the complex, JHIMS’s oversight and monitoring of subadvisers’ investment performance and compliance programs including its timelines in responding to performance issues and the qualifications of JHIMS’s personnel,
(b) considered JHIMS’s compliance policies and procedures and its responsiveness to regulatory changes and mutual fund industry developments, and
(c) JHIMS’s administrative capabilities, including its ability to supervise the other service providers for the Funds and concluded that JHIMS may reasonably be expected to ably perform its services under the Advisory Agreement.
(2) reviewed the investment performance of portfolios that are managed comparable to the Funds; the comparative performance of their respective benchmarks; and JHIMS’ analysis of such performance and its plans and recommendations regarding the Trust’s subadvisory arrangements generally and with respect to the Funds; and concluded that each of the comparably managed funds has performed well or within a range that the Board deemed competitive, and that JHIMS may reasonably be expected to ably monitor the performance of the Funds and their subadvisers;
(3) reviewed the Trust’s advisory fee structure and the incorporation therein of any subadvisory fee breakpoints in the advisory fees charged and concluded (i) that to the extent that Funds have subadvisory fees with breakpoints, those breakpoints are reflected as breakpoints in the advisory fees for Funds, (ii) that all Funds with a subadviser that is not affiliated with the Adviser have subadvisory fees which are the product of arms-length negotiations between the Adviser and the subadviser and which in many, but not all, cases contain breakpoints, and (iii) that, although economies of scale cannot be measured with precision, these arrangements permit shareholders of Funds with advisory fee breakpoints to benefit from economies of scale if those Funds grow;
(4) (a) reviewed the financial statements of JHIMS and John Hancock Life Insurance Company (U.S.A.) (“JHLICO (U.S.A.)”;
(b) reviewed the anticipated profitability of the JHIMS’s relationship with the Funds in terms of the fees it expects to receive with respect to the Funds and whether JHIMS has the financial ability to provide a high level of services to the Funds,
(c) considered that JHIMS derives reputational and other indirect benefits from providing advisory services to the Funds, and
(d) noted that JHIMS will pay the sub-advisory fees out of the advisory fees JHIMS receives from the Funds and concluded that the advisory fees paid by the Trust with respect to the Funds are not unreasonable in light of such information; and
(5) reviewed comparative information with respect to the advisory fee rates and concluded that the anticipated advisory fees for the Funds are within the range of those incurred by other comparable funds and that the advisory structure for the Funds is thus competitive within the industry.
Additional information that the Board considered for a particular Fund is set forth in Appendix A.
Approval of Subadvisory Agreements
At its meeting on September 21, 2005, the Board, including all the Independent Trustees, approved the Subadvisory Agreements.
In making its determination with reference to these respective factors, the Board reviewed:
(i) information relating to each subadviser’s business which included information
36
such as: business performance, assets under management, financial stability and personnel;
(ii) the investment performance of the subadviser’s portfolio managed comparably to the Fund to be managed by the subadviser and comparative performance information relating to the benchmark;
(iii) the proposed subadvisory fee for each Fund to be managed by the subadviser and comparative fee information; and
(iv) information relating to the nature and scope of Material Relationships and their significance to the Adviser and the subadvisers.
The Board’s decision to approve each Sub-advisory Agreement was based on a number of determinations, including the following:
(1) The subadviser has extensive experience and demonstrated skills as a manager and may be expected to provide a high quality of investment personnel to each Fund;
(2) Although not without variation, the current and historical performance of the portfolios of the Subadviser managed comparably to the Fund to be managed by the Subadviser has been within a competitive range of the current and historical performance of these portfolios’ respective benchmark (see Appendix A for further information on performance);
(3) The subadvisory fees are within industry norms and are the product of arms-length negotiation between the Adviser and the subadviser; and
(4) The Material Relationships consist of arrangements in which unaffiliated subadvisers or their affiliates provide advisory, distribution or management services in connection with financial products sponsored by the Trust’s adviser or its affili-ates, which may include other registered investment companies, a 529 education savings plan, managed separate accounts and exempt group annuity contracts sold to qualified plans, and which in no case contained elements which would cause the Board to conclude that approval of the subadvisory agreement with the subadviser would be inappropriate. See (5) below for information relating to the business arrangement between the Trust’s Adviser and GMO.
(5) As a part of the overall business arrangement between the Adviser and GMO under which the Adviser has obtained exclusive rights to certain GMO investment management services for up to five years, the Adviser has agreed that under certain circumstances it (and not the Trust or the particular Fund) will pay GMO a specified amount (ranging from $1 to $12 million) if the subadvisory agreement with respect to any of the following Funds to be subadvised by GMO is terminated within a five year period from the date of its effectiveness: U.S. Core Fund, Active Value Fund, Intrinsic Value Fund, Growth Fund, International Core Fund, International Growth Fund, Global Fund, Value Opportunities Fund, Growth Opportunities Fund and U.S. Quality Equity Fund.
The Adviser has also agreed that, subject to its fiduciary duties as an investment adviser to each of these Funds and its shareholders, it will not recommend to the Board of Trustees to terminate the subadvisory agreement with respect to any of the Funds or to reduce any of the fees payable thereunder to GMO for a five year period from the date of effectiveness of the agreement. Substantially similar agreements (with varying amounts to be paid upon termination) also apply with respect to certain other John Hancock funds that are or will be advised by the Adviser and subadvised by GMO. The Trust is not a party to any of these arrangements, and they are not binding upon the Trust, the Trust’s Funds subadvised by GMO or the Board of Trustees. However, these arrangements present certain conflicts of interest because the Adviser has a financial incentive to support the continuation of GMO subadvisory agreements for as long as the termination provisions described above re main in effect. In approving the Advisory Agreement
37
and the subadvisory agreement with respect to each of the Funds subadvised by GMO, the Board of Trustees, including the Independent Trustees, was aware of and considered these potential conflicts of interest, including any financial obligations of the Adviser to GMO.
The Board concluded that, notwithstanding the potential conflicts of interest, approval of the Advisory Agreement and the subadvisory agreements with GMO is in the best interests of shareholders and contract owners in view of (i) the Adviser’s fiduciary duty and the Board’s fiduciary duty and ability to monitor potential conflicts, (ii) the benefits to shareholders and contract owners generally expected from the exclusive rights to certain GMO investment management services obtained by the Adviser for the benefit of certain Funds of the Trust and other John Hancock funds and (iii) the benefits to such Funds of the Trust expected from the subadvisory services of GMO.
Additional information that the Board considered for a particular fund is set forth in Appendix A.
| Appendix A | |||
| Estimated Fees | |||
| Fund | Performance | and Expenses | Comments |
| Intrinsic Value | See “Comments”. | Subadvisory fees | The Board noted |
| for this Fund were | that the Fund | ||
| lower than the peer | commenced opera- | ||
| group median. | tions in June 2006 | ||
| and has a limited | |||
| Advisory fees for | performance history. | ||
| this Fund were | |||
| higher than the peer | |||
| group median. | |||
| Total expenses for | |||
| this Fund were | |||
| lower than the peer | |||
| group median. | |||
38
For more information
The Fund’s proxy voting policies, procedures and records are available without charge, upon request:
| By phone | On the Fund’s Web site | On the SEC’s Web site |
| 1-800-225-5291 | www.jhfunds.com/proxy | www.sec.gov |
| Trustees | Francis V. Knox, Jr. | Principal distributor |
| James M. Oates, Chairman* | Chief Compliance Officer | John Hancock Funds, LLC |
| Charles L. Bardelis * | Gordon M. Shone | 601 Congress Street |
| James R. Boyle† | Treasurer | Boston, MA 02210-2805 |
| Peter S. Burgess * | John G. Vrysen | |
| Elizabeth G. Cook | Chief Financial Officer | Custodian |
| William H. Cunningham | State Street Bank & Trust Co. | |
| Charles L. Ladner* | Investment adviser | 2 Avenue de Lafayette |
| Hassell H. McClellan | John Hancock Investment | Boston, MA 02111 |
| *Members of the Audit Committee | Management Services, LLC | |
| †Non-Independent Trustee | 601 Congress Street | Transfer agent |
| Boston, MA 02210-2805 | John Hancock Signature | |
| Services, Inc. | ||
| Officers | 1 John Hancock Way, | |
| Keith F. Hartstein | Subadviser | Suite 1000 |
| President and | Grantham, Mayo, | Boston, MA 02217-1000 |
| Chief Executive Officer | Van Otterloo & Co. LLC | |
| Thomas M. Kinzler | 40 Rowes Wharf | Legal counsel |
| Secretary and | Boston, MA 02110 | Kirkpatrick & Lockhart |
| Chief Legal Officer | Nicholson Graham LLP | |
| 1 Lincoln Street | ||
| Boston, MA 02111-2950 | ||
The Fund’s investment objective, risks, charges and expenses are included in the prospectus and should be considered carefully before investing. For a prospectus, call your financial professional, call John Hancock Funds at 1-800-225-5291 or visit the Fund’s Web site at www.jhfunds.com. Please read the prospectus carefully before investing or sending money.
| How to contact us | ||
| Internet | www.jhfunds.com | |
| Regular mail: | Express mail: | |
| John Hancock | John Hancock | |
| Signature Services, Inc. | Signature Services, Inc. | |
| 1 John Hancock Way, Suite 1000 | Mutual Fund Image Operations | |
| Boston, MA 02217-1000 | 380 Stuart Street | |
| Boston, MA 02116 | ||
| Phone | Customer service representatives | 1-800-225-5291 |
| 24-hour automated information | 1-800-338-8080 | |
| TDD line | 1-800-554-6713 | |
A listing of month-end portfolio holdings is available on our Web site, www.jhfunds.com. A more detailed portfolio holdings summary is available on a quarterly basis 60 days after the fiscal quarter on our Web site or upon request by calling 1-800-225-5291, or on the Securities and Exchange Commission’s Web site, www.sec.gov.
40
J O H N H A N C O CK F A M I L Y O F F U N D S
| EQUITY | INTERNATIONAL |
| Balanced Fund | Greater China Opportunities Fund |
| Classic Value Fund | International Classic Value Fund |
| Classic Value Fund II | International Core Fund |
| Core Equity Fund | International Fund |
| Focused Equity Fund | International Growth Fund |
| Growth Fund | |
| Growth Opportunities Fund | INCOME |
| Growth Trends Fund | Bond Fund |
| Intrinsic Value Fund | Government Income Fund |
| Large Cap Equity Fund | High Yield Fund |
| Large Cap Select Fund | Investment Grade Bond Fund |
| Mid Cap Equity Fund | Strategic Income Fund |
| Mid Cap Growth Fund | |
| Multi Cap Growth Fund | TAX-FREE INCOME |
| Small Cap Equity Fund | California Tax-Free Income Fund |
| Small Cap Fund | High Yield Municipal Bond Fund |
| Small Cap Intrinsic Value Fund | Massachusetts Tax-Free Income Fund |
| Sovereign Investors Fund | New York Tax-Free Income Fund |
| U.S. Core Fund | Tax-Free Bond Fund |
| U.S. Global Leaders Growth Fund | |
| Value Opportunities Fund | MONEY MARKET |
| Money Market Fund | |
| ASSET ALLOCATION & LIFESTYLE | U.S. Government Cash Reserve |
| Allocation Core Portfolio | |
| Allocation Growth + Value Portfolio | CLOSED ENDS |
| Lifestyle Aggressive Portfolio | Bank & Thrift Opportunity |
| Lifestyle Balanced Portfolio | Financial Trends |
| Lifestyle Conservative Portfolio | Income Securities |
| Lifestyle Growth Portfolio | Investors Trust |
| Lifestyle Moderate Portfolio | Patriot Global Dividend |
| Patriot Preferred Dividend | |
| SECTOR | Patriot Premium Dividend I |
| Financial Industries Fund | Patriot Premium Dividend II |
| Health Sciences Fund | Patriot Select Dividend |
| Real Estate Fund | Preferred Income |
| Regional Bank Fund | Preferred Income II |
| Technology Fund | Preferred Income III |
| Technology Leaders Fund | Tax-Advantaged Dividend |
For more complete information on any John Hancock Fund and a prospectus, which includes charges and expenses, call your financial professional, or John Hancock Funds at 1-800-225-5291. Please read the prospectus carefully before investing or sending money.

1-800-225-5291
1-800-554-6713 (TDD)
1-800-338-8080 EASI-Line
www.jhfunds.com
Now available: electronic delivery
www.jhfunds.com/edelivery
This report is for the information of the shareholders of John Hancock Intrinsic Value Fund.
510SA 8/06
10/06

| TABLE OF CONTENTS |
| Managers' report |
| page 2 |
| A look at performance |
| page 6 |
| Your expenses |
| page 8 |
| Fund’s investments |
| page 1 0 |
| Financial statements |
| page 22 |
| For more information |
| page 44 |
CEO corner
To Our Shareholders,
The future has arrived at John Hancock Funds.
We have always been firm believers in the powerful role the Internet can play in providing fund information to our shareholders and prospective investors. Recently, we launched a redesigned, completely overhauled Web site that is more visually pleasing, easier to navigate and, most importantly, provides more fund information and learning tools without overwhelming the user.
Not long after we embarked on this major project, a study was released by the Investment Company Institute, the mutual fund industry’s main trade group, which found that an overwhelming majority of shareholders consider the Internet the “wave of the future” for accessing fund information.
Our new site sports fresher and faster ways to access account information. New innovations allow investors to view funds by risk level, track the performance of the John Hancock funds of their choice or sort funds by Morningstar, Inc.’s star ratings. Investors who own a John Hancock fund through a qualified retirement plan and don’t pay sales charges when making a purchase have the option of sorting by a “Load Waived” Morningstar Rating, thereby creating an apples-to-apples comparison with no-load funds that may also be available in their retirement plan.
The new site also has more educational tools and interactive modules to educate and assist investors with their financial goals, from college savings to retirement planning. A new “I want to…” feature allows investors to check performance, invest more money, update personal information or download prospectuses and forms quickly and easily.
In another of our ongoing efforts to provide our shareholders with top-notch service, we also redesigned our shareholder reports, as you may have noticed with this report. We hope the larger size, more colorful cover and redesigned presentation of the commentary and data tables will draw you in and make them easier to read.
After you’ve read your shareholder report, we encourage you to visit our new Web site – www.jhfunds.com – and take a tour. It’s easy, fast and fun and allows you to be in control of what you see and do. In short, it’s the wave of the future!
Sincerely,

| Keith F. Hartstein, President and Chief Executive Officer |
This commentary reflects the CEO’s views as of August 31, 2006. They are subject to change at any time.
Your fund at a glance
The Fund seeks long-term capital growth by typically making equity investments in U.S. companies that issue stocks included in the Russell 2500 Index, and in companies with total market capitalizations similar to those of stocks in the Index (“small- and mid-cap companies.”).
From inception June 12, 2006
| ► U.S. stocks posted decent gains as the threat of higher interest rates seemed to fade. ► An underweight in real estate investment trusts hurt performance relative to the Fund’s benchmark index. ► The Fund’s performance was aided by the more defensive names in the health care sector. |
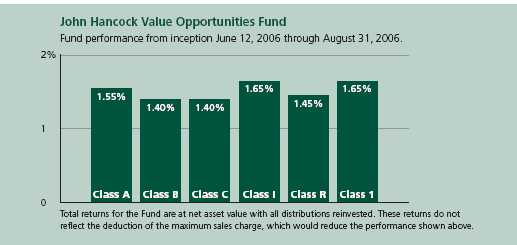
| Top 10 Holdings | ||||
| King Pharmaceuticals, Inc. | 1.4% | PMI Group, Inc. | 1.1% | |
| SUPERVALU Inc. | 1.4% | First American Corp. | 1.0% | |
| Liz Claiborne, Inc. | 1.3% | Old Republic International Corp. | 1.0% | |
| Dollar Tree Stores Inc. | 1.1% | American Financial Group, Inc. | 1.0% | |
| Manpower, Inc. | 1.1% | Tyson Foods Inc., Class A | 0.9% | |
| As a percentage of net assets on August 31, 2006. | ||||
Managers’ report
| John Hancock Value Opportunities Fund |
Despite increased stock market volatility prompted by uncertainty over the economy, interest rates and geopolitical events, U.S. stocks as a whole posted decent gains for the period spanning the Fund’s inception on June 12, 2006 to its semiannual period end on August 31, 2006. The period began just weeks after newly appointed Federal Reserve Board Chairman Ben Bernanke rattled investors by seeming to imply that inflation pressures were mounting and, as a result, interest rates would move higher than the market might previously have anticipated. Equity investors worried that the Fed might raise rates too much and trigger a recession. But beginning in mid-July, stocks staged an impressive rally that accelerated in early August when the Fed opted not to increase interest rates again for the first time in two years. Against this macroeconomic ba ckdrop, large-company stocks performed in line with their smaller-cap counterparts, foreign equities performed better than those in the U.S. and value stocks trumped growth stocks.
Performance
From its inception on June 12, 2006 through August 31, 2006, John Hancock Value Opportunities Fund’s Class A, Class B, Class C, Class I, Class R, and Class 1 shares returned 1.55%, 1.40%, 1.40%, 1.65%, 1.45% and 1.65%, respectively, at net asset value. By comparison, the
SCORECARD
| INVESTMENT | PERIOD’S PERFORMANCE... AND WHAT’S BEHIND THE NUMBERS | |
| REITs | ▼ | Underweighting Real Estate Investment Trusts hurts performance |
| Group 1 Automotive | ▼ | Falters amid weak auto sales |
| NBTY, Inc. | ▲ | Shares jump after positive earnings announcement |
2

Portfolio Managers, Grantham, Mayo, Van Otterloo & Co. LLC (GMO)
Sam Wilderman, Ed Choi, Donna Murphy, Chuck Joyce and Tara Oliver
Russell 2500 Value Index returned 5.58% and the average mid-cap value fund returned 4.57% at net asset value, according to Morningstar, Inc.1
Strategy explained
Since the Fund is new, we are continuing to build our positions, using our time-tested investment process. Although many managers use a single methodology to select stocks, we use two independent disciplines to select stocks for the Fund: valuation and momentum. Over two-thirds of the stocks in this portfolio are bought based on valuation. We seek small- to mid-cap value companies that are selling for less than their worth with the expectation that they will remain profitable, eventually regain favor in the market and generate above-average returns. Although traditional measures of a stock’s cheapness, such as price-to-book (P/B) or price-to-earnings (P/E) ratios may help investors determine if a company’s stock price is low, such measures do not distinguish between high-quality and low-quality companies. We believe high-quality companies are worth a premium because they can sustain a competiti ve advantage and continue to grow over the long term.
| “Our best individual performers were generated by the valuation discipline.” |
The remaining stocks in the Fund are considered “momentum” stocks; that is, we select value stocks that are experiencing price appreciation and/ or positive earnings revisions. This momentum typically follows a decline in share price. We’ve determined that stocks whose prices have declined for six months, then advanced for 12 months, will tend to continue rising for another 12 to 18 months. Price momentum enables portfolios to benefit from short-term swings in earnings and investor sentiment.
Because momentum and valuation tools tend to perform differently across various market and economic cycles, the Fund’s combination of
Value Opportunities Fund
3
the two disciplines results in greater diversification in the portfolio. Diversification may help to lower the Fund’s risk level. We also employ a number of other risk control techniques. We typically hold more than 300 common stocks, so that the Fund’s performance isn’t overly dependent on the fortunes of one or a handful of companies.
Leaders and laggards
During this abbreviated period, the biggest detractor from the Fund’s performance relative to the Russell index was our decision to significantly underweight the real estate investment trust (REIT) sector. Although REITs posted strong gains for the period, we felt that their prices had been bid too high by yield-hungry investors. Our holdings in retail companies were mixed. Holdings in Dollar Tree Stores, Inc. worked in our favor as the company posted rising profits, helped by strong summer sales. In contrast, investments in grocer and food distributor SUPERVALU, Inc. worked against us as its earnings fell, a drop the company attributed to the cost of acquiring more than 1,000 Albertson’s stores. The stock price of Group 1 Automotive, Inc. also slumped amid weak conditions for auto sales.
Our best individual performers were generated by the valuation discipline. In particular, we saw gains from companies whose shares had been beaten up in prior periods but rallied in response to investors’ growing appetite for defensive stocks — shares of companies whose sales and profits tend to continue to grow even while the broader economy slows. Leading this group was food industry stock NBTY, Inc., a maker of nutritional supplements, which saw its share price jump after announcing quarterly earnings that beat analyst estimates. Our stake in grocery retailer Ingles Markets, Inc. also outperformed following a positive earnings announcement. Relative to the Russell index, we were also helped by sidestepping the airlines, which suffered amid rising fuel costs.
| SECTOR DISTRIBUTION2 | |
| Consumer, cyclical | 27% |
| Financial | 26% |
| Consumer, | |
| non-cyclical | 17% |
| Industrial | 11% |
| Technology | 4% |
| Communications | 2% |
| Basic Materials | 2% |
| Utilities | 1% |
| Energy | 0.4% |
| Diversified | 0.3% |
Outlook
The summer stock market rally and the Fed’s decision to pause its interest-rate-raising cycle after 17 consecutive quarter-point hikes since June 2004, appear to have provided investors with reasons for optimism. By the end
Value Opportunities Fund
4
of the period, stocks overall seemed “priced for perfection,” with investors betting that economic growth would remain moderate and sustainable and that inflation would be contained. We believe this optimism is likely overblown and that the market is significantly underpricing risk. The investment landscape is always fraught with any number of risks, be it higher-than-expected inflation and interest rates, slower-than-expected economic growth or geopolitical events. But we believe that the economy and financial systems are so highly levered at the moment that even the smallest unfavorable development could result in a significant re-pricing of risk, meaning that riskier assets would underperform. Since we remain very wary of risk, we will continue to focus on high-quality companies that we believe can best weather a market and/or economic downturn.
| “Since we remain very wary of risk, we will continue to focus on high- quality companies that we believe can best weather a market and/or economic downturn.” |
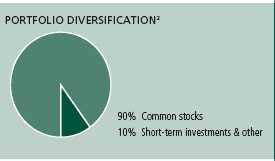
This commentary reflects the views of the portfolio management team through the end of the Fund’s period discussed in this report. The team’s statements reflect their own opinions. As such, they are in no way guarantees of future events and are not intended to be used as investment advice or a recommendation regarding any specific security. They are also subject to change at any time as market and other conditions warrant.
1 Figures from Morningstar, Inc. include reinvested dividends and do not take into account sales charges. Actual load-adjusted performance is lower.
2 As a percentage of net assets on August 31, 2006.
Value Opportunities Fund
5
A look at performance
For the period ending August 31, 2006
| Cumulative total returns | ||
| with maximum sales charge (POP) | ||
| Since | ||
| Class | inception | |
| A | 6-12-06 | –3.52% |
| B | 6-12-06 | –3.60 |
| C | 6-12-06 | 0.40 |
| I1 | 6-12-06 | 1.65 |
| R1 | 6-12-06 | 1.45 |
| 11 | 6-12-06 | 1.65 |
Performance figures assume all distributions are reinvested. Returns with maximum sales charge reflect a sales charge on Class A shares of 5% and the applicable contingent deferred sales charge (CDSC) on Class B and Class C shares. The Class B shares’ CDSC declines annually between years 1–6 according to the following schedule: 5, 4, 3, 3, 2, 1%. No sales charge will be assessed after the sixth year. Class C shares held for less than one year are subject to a 1% CDSC. Sales charge is not applicable for Class I, Class R and Class 1 shares.
The returns reflect past results and should not be considered indicative of future performance. The return and principal value of an investment will fluctuate so that shares, when redeemed, may be worth more or less than their original cost. Due to market volatility, the Fund’s current performance may be higher or lower than the performance shown. For performance data current to the most recent month-end, please call 1-800-225-5291 or visit the Fund’s Web site at www.jhfunds.com.
The performance table above and the chart on the next page do not reflect the deduction of taxes that a shareholder would pay on Fund distributions or the redemption of Fund shares.
The Fund’s performance results reflect any applicable expense reductions, without which the expenses would increase and results would have been less favorable.
Since inception performance is calculated with an opening price (prior day's close) on the inception date.
1 For certain types of investors as described in the Fund’s Class I, Class R and Class 1 share prospectuses.
Value Opportunities Fund
6
Growth of $10,000
This chart shows what happened to a hypothetical $10,000 investment in Class A shares
for the period indicated. For comparison, we’ve shown the same investment in the
Russell 2500 Value Index.
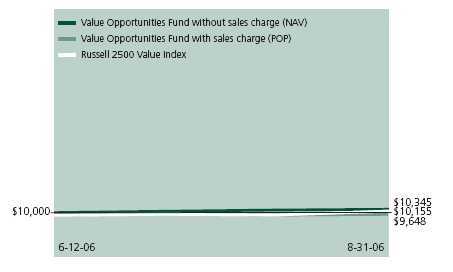
| With maximum | ||||
| Class | Period beginning | Without sales charge | sales charge | Index |
| B | 6-12-06 | $10,140 | $9,640 | $10,345 |
| C | 6-12-06 | 10,140 | 10,040 | 10,345 |
| I 1 | 6-12-06 | 10,165 | 10,165 | 10,345 |
| R1 | 6-12-06 | 10,145 | 10,145 | 10,345 |
| 11 | 6-12-06 | 10,165 | 10,165 | 10,345 |
Assuming all distributions were reinvested for the period indicated, the table above shows the value of a $10,000 investment in the Fund’s Class B, Class C, Class I, Class 1 and Class R shares, respectively, as of August 31, 2006. Performance of the classes will vary based on the difference in sales charges paid by shareholders investing in the different classes and the fee structure of those classes.
Russell 2500 Value Index is an unmanaged index containing those securities in the Russell 2500 Index with a less-than-average growth orientation.
It is not possible to invest directly in an index. Index figures do not reflect sales charges which would have resulted in lower values if they did.
1 For certain types of investors as described in the Fund’s Class I, Class R and Class 1 share prospectuses.
Value Opportunities Fund
7
Your expenses
These examples are intended to help you understand your
ongoing operating expenses.
Understanding Fund expenses
As a shareholder of the Fund, you incur two types of costs:
| ▪ Transaction costs which include sales charges (loads) on purchases or redemptions (varies by share class), minimum account fee charge, etc. ▪ Ongoing operating expenses including management fees, distribution and service fees (if applicable) and other Fund expenses. |
We are going to present only your ongoing operating expenses here.
Actual expenses/actual returns
This example is intended to provide information about your Fund’s actual ongoing operating expenses, and is based on your Fund’s actual return. It assumes an account value of $1,000.00 on June 12, 2006, with the same investment held until August131, 2006.
| Account value | Ending value | Expenses paid during period | |
| on 6-12-06 | on 8-31-06 | ended 8-31-061 | |
| Class A | $1,000.00 | $1,015.50 | $3.02 |
| Class B | 1,000.00 | 1,014.00 | 4.63 |
| Class C | 1,000.00 | 1,014.00 | 4.63 |
| Class I | 1,000.00 | 1,016.50 | 2.22 |
| Class R | 1,000.00 | 1,014.50 | 3.83 |
| Class 1 | 1,000.00 | 1,016.50 | 2.12 |
Together with the value of your account, you may use this information to estimate the operating expenses that you paid over the period. Simply divide your account value at August 31, 2006 by $1,000.00, then multiply it by the “expenses paid” for your share class from the table above. For example, for an account value of $8,600.00, the operating expenses should be calculated as follows:
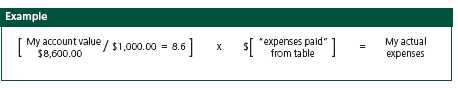
Value Opportunities Fund
8
Hypothetical example for comparison purposes
This table allows you to compare your Fund’s ongoing operating expenses with those of any other fund. It provides an example of the Fund’s hypothetical account values and hypothetical expenses based on each class, actual expense ratio and an assumed 5% annual return before expenses (which is not your Fund’s actual return). It assumes an account value of $1,000.00 on June 12, 2006, with the same investment held until August 31, 2006. Look in any other fund shareholder report to find its hypothetical example and you will be able to compare these expenses.
| Account value | Ending value | Expenses paid during period | |
| on 6-12-06 | on 8-31-06 | ended 8-31-061 | |
| Class A | $1,000.00 | $1,008.00 | $3.01 |
| Class B | 1,000.00 | 1,006.40 | 4.61 |
| Class C | 1,000.00 | 1,006.40 | 4.61 |
| Class I | 1,000.00 | 1,008.80 | 2.21 |
| Class R | 1,000.00 | 1,007.20 | 3.81 |
| Class 1 | 1,000.00 | 1,008.90 | 2.11 |
Remember, these examples do not include any transaction costs, such as sales charges; therefore, these examples will not help you to determine the relative total costs of owning different funds. If transaction costs were included, your expenses would have been higher. See the prospectus for details regarding transaction costs.
1 Expenses are equal to the Fund's annualized expense ratio of 1.39%, 2.09%, 2.09%, 0.99%, 1.74% and 0.43% for Class A, Class B, Class C, Class I, Class R and Class 1, respectively, multiplied by the average account value over the period, multiplied by the number of days in the inception period/365 or 366 (to reflect the one-half year period).
Value Opportunities Fund
9
F I N A N C I A L S T A T E M E N T S
Fund’s investments
Securities owned by the Fund on 8-31-06 (unaudited)
This schedule is divided into two main categories: common stocks and short-term investments. Common stocks are further broken down by industry group. Short-term investments, which represent the Fund’s cash position, are listed last.
| Issuer | Shares | Value |
| Common stocks 90.38% | $15,661,337 | |
| (Cost $15,469,542) | ||
Aerospace 0.42% | 72,013 | |
| Alliant Techsystems, Inc. * | 600 | 45,894 |
| Armor Holdings, Inc. * | 200 | 10,574 |
| Curtiss Wright Corp. | 500 | 15,545 |
Air Freight 0.22% | 38,445 | |
| ExpressJet Holdings, Inc. * | 5,500 | 38,445 |
Air Travel 0.22% | 38,672 | |
| SkyWest, Inc. | 1,600 | 38,672 |
Apparel & Textiles 3.96% | 687,044 | |
| Brown Shoe, Inc. | 1,200 | 38,340 |
| Columbia Sportswear Company * | 2,000 | 97,640 |
| Jones Apparel Group, Inc. | 4,200 | 131,460 |
| Kellwood Company | 1,200 | 32,892 |
| K-Swiss, Inc., Class A | 900 | 24,759 |
| Liz Claiborne, Inc. | 5,800 | 216,746 |
| Polo Ralph Lauren Corp., Class A | 400 | 23,596 |
| Quiksilver, Inc. * | 600 | 8,400 |
| Stride Rite Corp. | 1,000 | 13,750 |
| The Gymboree Corp. * | 500 | 16,775 |
| Timberland Company, Class A * | 2,200 | 62,502 |
| Wolverine World Wide, Inc. | 800 | 20,184 |
Auto Parts 1.87% | 324,292 | |
| American Axle & Manufacturing Holdings, Inc. | 2,600 | 43,394 |
| ArvinMeritor, Inc. | 3,400 | 50,490 |
| BorgWarner, Inc. | 500 | 28,355 |
| Keystone Automotive Industries, Inc. * | 400 | 13,756 |
| O’Reilly Automotive, Inc. * | 2,800 | 83,132 |
| Superior Industries International, Inc. | 1,800 | 30,438 |
| Tenneco, Inc. * | 900 | 20,475 |
| TRW Automotive Holdings Corp. * | 2,200 | 54,252 |
See notes to financial statements
Value Opportunities Fund
10
F I N A N C I A L S T A T E M E N T S
| Issuer | Shares | Value |
Auto Services 0.13% | $22,456 | |
| Copart, Inc. * | 800 | 22,456 |
Automobiles 1.59% | 276,401 | |
| Asbury Automotive Group, Inc. | 700 | 14,343 |
| Group 1 Automotive, Inc. | 2,100 | 95,130 |
| Lithia Motors, Inc., Class A | 1,100 | 28,072 |
| United Auto Group, Inc. | 6,800 | 138,856 |
Banking 7.83% | 1,356,068 | |
| Amcore Financial, Inc. | 300 | 9,015 |
| Anchor BanCorp Wisconsin, Inc. | 1,200 | 35,064 |
| Associated Banc–Corp. | 1,200 | 37,848 |
| Astoria Financial Corp. | 4,200 | 128,940 |
| BancFirst Corp. | 200 | 9,474 |
| BancorpSouth, Inc. | 2,100 | 58,926 |
| BankUnited Financial Corp., Class A | 300 | 7,731 |
| Banner Corp. | 200 | 8,284 |
| Chemical Financial Corp. | 600 | 17,712 |
| Chittenden Corp. | 300 | 8,655 |
| Citizens Banking Corp. | 300 | 7,560 |
| City National Corp. | 500 | 32,900 |
| Commerce Bancshares, Inc. | 1,500 | 75,180 |
| Corus Bankshares, Inc. | 900 | 19,629 |
| Cullen Frost Bankers, Inc. | 400 | 23,584 |
| Dime Community Bancorp, Inc. | 800 | 11,432 |
| Downey Financial Corp. | 900 | 55,251 |
| First Citizens Bancshares, Inc. | 100 | 19,580 |
| First Horizon National Corp. | 400 | 15,272 |
| First Indiana Corp. | 600 | 14,670 |
| First Midwest BanCorp, Inc., Illinois | 500 | 18,675 |
| FirstFed Financial Corp. * | 500 | 25,430 |
| FirstMerit Corp. | 1,400 | 32,214 |
| Flagstar Bancorp, Inc. | 2,800 | 40,712 |
| Greater Bay Bancorp | 1,500 | 42,705 |
| Hancock Holding Company | 400 | 20,736 |
| International Bancshares Corp. | 400 | 11,404 |
| Investors Financial Services Corp. | 400 | 18,544 |
| Irwin Financial Corp. | 600 | 11,424 |
| ITLA Capital Corp. | 500 | 26,225 |
| MAF Bancorp, Inc. | 600 | 24,762 |
| Mercantile Bankshares Corp. | 700 | 25,851 |
| New York Community Bancorp, Inc. | 3,400 | 55,794 |
| Old National Bancorp | 400 | 7,484 |
| Pacific Capital Bancorp | 800 | 22,368 |
| Park National Corp. | 100 | 10,361 |
See notes to financial statements
Value Opportunities Fund
11
F I N A N C I A L S T A T E M E N T S
| Issuer | Shares | Value |
Banking (continued) | ||
| TCF Financial Corp. | 3,000 | $78,210 |
| Trustmark Corp. | 2,500 | 78,925 |
| United Bankshares, Inc. | 400 | 14,908 |
| Valley National Bancorp | 900 | 23,085 |
| Washington Federal, Inc. | 1,500 | 33,330 |
| Webster Financial Corp. | 800 | 37,792 |
| Westamerica Bancorp | 400 | 19,132 |
| Wilmington Trust Corp. | 1,800 | 79,290 |
Biotechnology 0.59% | 103,115 | |
| Applera Corp. | 2,700 | 82,755 |
| Techne Corp. * | 400 | 20,360 |
Broadcasting 0.05% | 8,640 | |
| World Wrestling Entertainment, Inc., Class A | 500 | 8,640 |
Building Materials & Construction 1.10% | 190,215 | |
| Dycom Industries, Inc. * | 400 | 8,100 |
| Eagle Materials, Inc. | 200 | 7,170 |
| EMCOR Group, Inc. * | 2,500 | 138,600 |
| Lennox International, Inc. | 900 | 21,186 |
| NCI Building Systems, Inc. * | 200 | 10,868 |
| U.S. Concrete, Inc. * | 700 | 4,291 |
Business Services 4.16% | 721,045 | |
| Banta Corp. | 400 | 18,820 |
| BearingPoint, Inc. * | 3,100 | 25,916 |
| Black Box Corp. | 400 | 15,416 |
| CDI Corp. | 500 | 10,475 |
| Ceridian Corp. * | 1,100 | 26,257 |
| Convergys Corp. * | 4,500 | 93,915 |
| Corporate Executive Board Company | 200 | 17,528 |
| CSG Systems International, Inc. * | 400 | 10,768 |
| Deluxe Corp. | 2,000 | 35,840 |
| FactSet Research Systems, Inc. | 700 | 30,870 |
| Fair Isaac Corp. | 600 | 21,006 |
| Forrester Research, Inc. * | 400 | 11,808 |
| FTI Consulting, Inc. * | 300 | 6,702 |
| Insight Enterprises, Inc. * | 2,000 | 36,020 |
| Kelly Services, Inc., Class A | 1,300 | 35,503 |
| Lightbridge, Inc. * | 1,100 | 13,090 |
| Manpower, Inc. | 3,100 | 183,241 |
| MAXIMUS, Inc. | 1,100 | 29,282 |
| MPS Group, Inc. * | 1,900 | 26,714 |
| NCO Group, Inc. * | 700 | 18,340 |
| R.H. Donnelley Corp. * | 200 | 10,864 |
See notes to financial statements
Value Opportunities Fund
12
F I N A N C I A L S T A T E M E N T S
| Issuer | Shares | Value |
Business Services (continued) | ||
| Reynolds & Reynolds Company, Class A | 700 | $26,852 |
| Spherion Corp. * | 900 | 6,723 |
| Unisys Corp. * | 1,700 | 9,095 |
Cable and Television 0.06% | 10,713 | |
| Superior Essex, Inc. * | 300 | 10,713 |
Chemicals 0.91% | 157,933 | |
| A. Schulman, Inc. | 500 | 11,795 |
| Airgas, Inc. | 800 | 28,656 |
| H.B. Fuller Company | 1,000 | 19,230 |
| Sensient Technologies Corp. | 2,800 | 56,336 |
| Stepan Company | 700 | 20,636 |
| Valspar Corp. | 800 | 21,280 |
Colleges & Universities 0.55% | 95,438 | |
| Career Education Corp. * | 1,400 | 26,810 |
| Corinthian Colleges, Inc. * | 1,300 | 15,756 |
| ITT Educational Services, Inc. * | 800 | 52,872 |
Commercial Services 0.16% | 27,945 | |
| Pool Corp. | 400 | 15,228 |
| Vertrue, Inc. * | 300 | 12,717 |
Computers & Business Equipment 2.50% | 433,655 | |
| Benchmark Electronics, Inc. * | 400 | 9,976 |
| CDW Corp. | 900 | 52,470 |
| Diebold, Inc. | 1,100 | 46,101 |
| Electronics for Imaging, Inc. * | 1,000 | 23,040 |
| EMS Technologies, Inc. * | 400 | 7,312 |
| Foundry Networks, Inc. * | 1,100 | 13,387 |
| Ingram Micro, Inc., Class A * | 6,900 | 124,200 |
| Intergraph Corp. * | 400 | 14,944 |
| Sykes Enterprises, Inc. * | 1,000 | 20,110 |
| Tech Data Corp. * | 3,500 | 122,115 |
Construction Materials 1.14% | 198,019 | |
| Ameron International Corp. | 700 | 49,098 |
| Comfort Systems USA, Inc. | 600 | 7,818 |
| Granite Construction, Inc. | 600 | 32,190 |
| Louisiana–Pacific Corp. | 1,300 | 25,428 |
| Martin Marietta Materials, Inc. | 300 | 24,708 |
| Simpson Manufacturing, Inc. | 600 | 15,810 |
| Standex International Corp. | 300 | 8,835 |
| Universal Forest Products, Inc. | 700 | 34,132 |
See notes to financial statements
Value Opportunities Fund
13
F I N A N C I A L S T A T E M E N T S
| Issuer | Shares | Value |
Containers & Glass 0.73% | $125,825 | |
| Bemis Company, Inc. | 1,000 | 32,300 |
| Pactiv Corp. * | 600 | 16,038 |
| Smurfit–Stone Container Corp. * | 2,100 | 23,919 |
| Sonoco Products Company | 1,600 | 53,568 |
Cosmetics & Toiletries 0.15% | 25,802 | |
| Estee Lauder Companies, Inc., Class A | 700 | 25,802 |
Domestic Oil 0.29% | 50,164 | |
| Houston Exploration Company * | 300 | 19,245 |
| Stone Energy Corp. * | 700 | 30,919 |
Electrical Equipment 0.58% | 100,614 | |
| A.O. Smith Corp. | 700 | 28,077 |
| Anixter International, Inc. * | 200 | 10,898 |
| Greatbatch, Inc. * | 500 | 12,230 |
| Molex, Inc. | 500 | 18,235 |
| Tektronix, Inc. | 1,100 | 31,174 |
Electrical Utilities 0.94% | 162,126 | |
| Allete, Inc. | 500 | 22,970 |
| Black Hills Corp. | 300 | 10,443 |
| CenterPoint Energy, Inc. | 4,900 | 70,805 |
| Great Plains Energy, Inc. | 300 | 9,156 |
| Otter Tail Corp. | 300 | 9,045 |
| Pepco Holdings, Inc. | 1,300 | 33,007 |
| Quanta Services, Inc. * | 200 | 3,546 |
| TECO Energy, Inc. | 200 | 3,154 |
Electronics 1.80% | 311,558 | |
| Arrow Electronics, Inc. * | 1,300 | 36,270 |
| Avnet, Inc. * | 2,800 | 54,768 |
| AVX Corp. | 1,700 | 28,237 |
| Checkpoint Systems, Inc. * | 700 | 12,705 |
| Imation Corp. | 700 | 27,741 |
| Park Electrochemical Corp. | 400 | 10,440 |
| Synopsys, Inc. * | 2,400 | 45,504 |
| Technitrol, Inc. | 600 | 16,986 |
| Teleflex, Inc. | 700 | 39,067 |
| Thermo Electron Corp. * | 500 | 19,600 |
| Thomas & Betts Corp. * | 200 | 9,032 |
| Vishay Intertechnology, Inc. * | 800 | 11,208 |
Energy 0.08% | 13,607 | |
| MDU Resources Group, Inc. | 150 | 3,675 |
| New Jersey Resources Corp. | 200 | 9,932 |
See notes to financial statements
Value Opportunities Fund
14
F I N A N C I A L S T A T E M E N T S
| Issuer | Shares | Value |
Financial Services 3.39% | $586,808 | |
| A.G. Edwards, Inc. | 300 | 15,846 |
| Advanta Corp., Class B | 300 | 10,158 |
| American Capital Strategies, Ltd. | 400 | 15,492 |
| AmeriCredit Corp. * | 1,700 | 39,933 |
| Delphi Financial Group, Inc. | 900 | 34,992 |
| Federal Agricultural Mortgage Corp., Class C | 600 | 16,830 |
| Fremont General Corp. | 2,500 | 35,700 |
| Fulton Financial Corp. | 800 | 13,360 |
| IndyMac Bancorp, Inc. | 1,500 | 58,650 |
| Investment Technology Group, Inc. * | 900 | 41,589 |
| Janus Capital Group, Inc. | 2,600 | 46,228 |
| Jefferies Group, Inc. | 2,300 | 57,316 |
| Knight Capital Group, Inc. * | 1,400 | 24,444 |
| Leucadia National Corp. | 1,800 | 46,314 |
| Moneygram International, Inc. | 2,000 | 62,800 |
| Piper Jaffray Companies, Inc. * | 200 | 11,716 |
| Raymond James Financial, Inc. | 2,000 | 55,440 |
Food & Beverages 2.51% | 434,382 | |
| ARAMARK Corp., Class B | 400 | 13,116 |
| Corn Products International, Inc. | 300 | 10,350 |
| Del Monte Foods Company | 800 | 8,880 |
| Flowers Foods, Inc. | 900 | 24,435 |
| Hormel Foods Corp. | 1,600 | 58,640 |
| Performance Food Group Company * | 2,800 | 68,908 |
| Pilgrim’s Pride Corp. | 300 | 7,308 |
| Sanderson Farms, Inc. | 900 | 28,134 |
| Smithfield Foods, Inc. * | 1,800 | 54,054 |
| Tyson Foods, Inc., Class A | 10,900 | 160,557 |
Furniture & Fixtures 1.17% | 203,120 | |
| Ethan Allen Interiors, Inc. | 1,700 | 57,375 |
| Furniture Brands International, Inc. | 4,000 | 76,600 |
| La–Z–Boy, Inc. | 3,800 | 53,010 |
| Leggett & Platt, Inc. | 700 | 16,135 |
Healthcare Products 1.09% | 189,338 | |
| DENTSPLY International, Inc. | 900 | 29,322 |
| IDEXX Laboratories, Inc. * | 600 | 55,206 |
| Owens & Minor, Inc. | 2,200 | 70,774 |
| Respironics, Inc. * | 600 | 22,146 |
| STERIS Corp. | 500 | 11,890 |
See notes to financial statements
Value Opportunities Fund
15
F I N A N C I A L S T A T E M E N T S
| Issuer | Shares | Value |
Healthcare Services 1.96% | $339,958 | |
| Amerigroup Corp. * | 400 | 12,616 |
| Apria Healthcare Group, Inc. * | 1,900 | 38,741 |
| Health Net, Inc. * | 2,500 | 104,525 |
| Lincare Holdings, Inc. * | 3,000 | 111,090 |
| Omnicare, Inc. | 600 | 27,186 |
| Pediatrix Medical Group, Inc. * | 1,000 | 45,800 |
Homebuilders 2.33% | 403,714 | |
| Beazer Homes USA, Inc. | 700 | 28,210 |
| Hovnanian Enterprises, Inc., Class A * | 600 | 15,894 |
| KB Home | 1,500 | 64,140 |
| M.D.C. Holdings, Inc. | 1,700 | 72,743 |
| M/I Homes, Inc. | 1,300 | 42,068 |
| Meritage Homes Corp. * | 200 | 8,190 |
| NVR, Inc. * | 100 | 51,365 |
| Ryland Group, Inc. | 1,900 | 81,073 |
| Standard Pacific Corp. | 900 | 21,537 |
| Toll Brothers, Inc. * | 700 | 18,494 |
Hotels & Restaurants 3.27% | 566,689 | |
| Applebee’s International, Inc. | 1,800 | 37,350 |
| Brinker International, Inc. | 2,000 | 76,940 |
| CBRL Group, Inc. | 1,600 | $60,544 |
| CEC Entertainment, Inc. * | 600 | 19,128 |
| Darden Restaurants, Inc. | 1,100 | 38,940 |
| IHOP Corp. | 600 | 28,014 |
| Jack In the Box, Inc. * | 1,500 | 71,970 |
| O’Charley’s, Inc. * | 1,200 | 22,188 |
| OSI Restaurant Partners, Inc. | 1,400 | 43,358 |
| Papa Johns International, Inc. * | 1,700 | 57,800 |
| RARE Hospitality International, Inc. * | 600 | 17,184 |
| Ruby Tuesday, Inc. | 1,200 | 30,984 |
| Ryan’s Restaurant Group, Inc. * | 2,700 | 42,552 |
| Sonic Corp. * | 900 | 19,737 |
Household Appliances 0.04% | 7,296 | |
| Technical Olympic USA, Inc. | 600 | 7,296 |
Household Products 0.88% | 152,179 | |
| Blyth, Inc. | 1,900 | 40,812 |
| Energizer Holdings, Inc. * | 1,100 | 73,546 |
| Tupperware Brands Corp. | 2,100 | 37,821 |
Industrial Machinery 1.57% | 271,214 | |
| AGCO Corp. * | 1,300 | 32,305 |
| Cummins, Inc. | 400 | 45,928 |
| Flowserve Corp. * | 1,200 | 61,368 |
| Kennametal, Inc. | 200 | 10,548 |
| NACCO Industries, Inc., Class A | 100 | 13,353 |
See notes to financial statements
Value Opportunities Fund
16
F I N A N C I A L S T A T E M E N T S
| Issuer | Shares | Value |
Industrial Machinery (continued) | ||
| Rofin Sinar Technologies, Inc. * | 200 | $10,952 |
| Tennant Company | 400 | 10,824 |
| Terex Corp. * | 1,600 | 70,288 |
| Valmont Industries, Inc. | 300 | 15,648 |
Industrials 0.46% | 79,546 | |
| Crane Company | 1,700 | 67,966 |
| Lawson Products, Inc. | 300 | 11,580 |
Insurance 14.29% | 2,475,478 | |
| Alfa Corp. | 700 | 11,830 |
| American Financial Group, Inc. | 3,600 | 168,192 |
| American National Insurance Company | 200 | 23,008 |
| Amerus Group Company | 1,900 | 128,820 |
| Argonaut Group, Inc. * | 300 | 9,225 |
| Arthur J. Gallagher & Company | 300 | 8,040 |
| Brown & Brown, Inc. | 1,700 | 50,898 |
| Commerce Group, Inc. | 3,100 | 92,349 |
| Conseco, Inc. * | 1,200 | 24,840 |
| Donegal Group, Inc. | 400 | 7,436 |
| Erie Indemnity Company, Class A | 1,400 | 71,456 |
| FBL Financial Group, Inc., Class A | 600 | 19,896 |
| First American Corp. | 4,300 | 174,666 |
| Great American Financial Resources, Inc. | 600 | 12,564 |
| Hanover Insurance Group, Inc. | 1,300 | $57,850 |
| Harleysville Group, Inc. | 300 | 10,797 |
| HCC Insurance Holdings, Inc. | 1,200 | 38,988 |
| Hilb, Rogal and Hamilton Company | 400 | 17,308 |
| Kansas City Life Insurance Company | 200 | 8,538 |
| LandAmerica Financial Group, Inc. | 1,400 | 88,536 |
| Mercury General Corp. | 1,800 | 90,486 |
| National Western Life Insurance Company, Class A * | 200 | 46,060 |
| Nationwide Financial Services, Inc., Class A | 2,900 | 140,389 |
| Navigators Group, Inc. * | 300 | 13,824 |
| Old Republic International Corp. | 8,100 | 169,290 |
| PMI Group, Inc. | 4,200 | 181,608 |
| Presidential Life Corp. | 500 | 11,785 |
| Protective Life Corp. | 2,300 | 105,869 |
| Radian Group, Inc. | 2,200 | 131,736 |
| Reinsurance Group of America, Inc. | 2,000 | 103,360 |
| Selective Insurance Group, Inc. | 300 | 15,606 |
| Stancorp Financial Group, Inc. | 2,000 | 93,140 |
| Stewart Information Services Corp. | 1,500 | 51,165 |
| Transatlantic Holdings, Inc. | 1,300 | 79,846 |
| Triad Guaranty, Inc. * | 600 | 30,162 |
See notes to financial statements
Value Opportunities Fund
17
F I N A N C I A L S T A T E M E N T S
| Issuer | Shares | Value |
Insurance (continued) | ||
| United Fire & Casualty Company | 600 | $16,788 |
| Universal American Financial Corp. * | 1,900 | 29,127 |
| W.R. Berkley Corp. | 4,000 | 140,000 |
Leisure Time 0.31% | 54,430 | |
| Brunswick Corp. | 1,100 | 31,570 |
| Polaris Industries, Inc. | 600 | 22,860 |
Life Sciences 0.42% | 72,428 | |
| Pharmaceutical Product Development, Inc. | 1,900 | 72,428 |
Manufacturing 1.28% | 222,100 | |
| Acuity Brands, Inc. | 800 | 34,184 |
| AptarGroup, Inc. | 200 | 10,300 |
| Barnes Group, Inc. | 1,000 | 16,420 |
| Cameron International Corp. * | 300 | 14,373 |
| Lancaster Colony Corp. | 400 | 17,656 |
| Nordson Corp. | 500 | 20,020 |
| Snap–on, Inc. | 800 | 34,960 |
| SPX Corp. | 600 | 31,680 |
| Stanley Works | 900 | 42,507 |
Medical–Hospitals 0.55% | 96,020 | |
| Tenet Healthcare Corp. * | 5,000 | 39,400 |
| Universal Health Services, Inc., Class B | 1,000 | 56,620 |
Metal & Metal Products 0.54% | 93,538 | |
| Mueller Industries, Inc. | 400 | 15,328 |
| Reliance Steel & Aluminum Company | 1,800 | 58,986 |
| Timken Company | 600 | 19,224 |
| Mining 0.25% | 44,024 | |
| Lincoln Electric Holding, Inc. | 800 | 44,024 |
Mobile Homes 0.52% | 90,848 | |
| Thor Industries, Inc. | 1,600 | 67,488 |
| Winnebago Industries, Inc. | 800 | 23,360 |
Newspapers 0.33% | 57,196 | |
| Lee Enterprises, Inc. | 400 | 9,904 |
| The New York Times Company, Class A | 2,100 | 47,292 |
Office Furnishings & Supplies 0.54% | 93,841 | |
| Global Imaging Systems, Inc. * | 400 | 8,772 |
| IKON Office Solutions, Inc. | 2,000 | 28,500 |
| OfficeMax, Inc. | 700 | 29,071 |
| United Stationers, Inc. * | 600 | 27,498 |
Paper 0.35% | 60,599 | |
| P.H. Glatfelter Company | 500 | 7,175 |
| Temple-Inland, Inc. | 1,200 | 53,424 |
See notes to financial statements
Value Opportunities Fund
18
F I N A N C I A L S T A T E M E N T S
| Issuer | Shares | Value |
Petroleum Services 0.04% | $7,208 | |
| World Fuel Services Corp. | 200 | 7,208 |
Pharmaceuticals 1.62% | 280,556 | |
| King Pharmaceuticals, Inc. * | 15,400 | 249,788 |
| Watson Pharmaceuticals, Inc. * | 1,200 | 30,768 |
Publishing 0.22% | 37,468 | |
| Valassis Communications, Inc. * | 1,900 | 37,468 |
Railroads & Equipment 0.09% | 14,844 | |
| GATX Corp. | 400 | 14,844 |
Real Estate 1.07% | 186,089 | |
| American Home Mortgage Investment Corp., REIT | 600 | 19,020 |
| Annaly Mortgage Management, Inc., REIT | 3,200 | 40,032 |
| Anworth Mortgage Asset Corp., REIT | 1,900 | 14,877 |
| MFA Mortgage Investments, Inc., REIT | 1,900 | 13,357 |
| New Century Financial Corp., REIT | 500 | 19,355 |
| Redwood Trust, Inc., REIT | 500 | 24,320 |
| Thornburg Mortgage, Inc., REIT | 2,400 | 55,128 |
Retail 0.18% | 30,654 | |
| Tween Brands, Inc. * | 900 | 30,654 |
Retail Grocery 2.54% | 440,085 | |
| Ingles Markets, Inc. | 1,900 | 48,640 |
| Nash-Finch Company | 900 | 20,565 |
| Ruddick Corp. | 2,300 | 59,317 |
| Smart & Final, Inc. * | 1,900 | 31,483 |
| SUPERVALU, Inc. | 8,700 | 248,472 |
| Weis Markets, Inc. | 800 | 31,608 |
Retail Trade 8.79% | 1,522,732 | |
| 99 Cents Only Stores * | 700 | 7,952 |
| Abercrombie & Fitch Company, Class A | 700 | 45,171 |
| AnnTaylor Stores Corp. * | 800 | 31,840 |
| Big Lots, Inc. * | 1,900 | 34,865 |
| BJ’s Wholesale Club, Inc. * | 3,300 | 86,955 |
| Borders Group, Inc. | 600 | 11,478 |
| Casey’s General Stores, Inc. | 1,100 | 26,004 |
| Cato Corp., Class A | 1,400 | 32,522 |
| Charming Shoppes, Inc. * | 1,700 | 22,372 |
| Circuit City Stores, Inc. | 2,000 | 47,220 |
| Claire’s Stores, Inc. | 1,300 | 35,529 |
| Conn’s, Inc. * | 400 | 7,980 |
| Dillard’s, Inc., Class A | 1,200 | 37,416 |
| Dollar Tree Stores, Inc. * | 6,600 | 189,948 |
| Family Dollar Stores, Inc. | 4,600 | 117,622 |
| First Cash Financial Services, Inc. * | 400 | 8,332 |
See notes to financial statements
Value Opportunities Fund
19
F I N A N C I A L S T A T E M E N T S
| Issuer | Shares | Value |
Retail Trade (continued) | ||
| Foot Locker, Inc. | 500 | $12,050 |
| Fossil, Inc. * | 1,400 | 26,348 |
| Longs Drug Stores Corp. | 1,000 | 45,430 |
| NBTY, Inc. * | 2,800 | 89,208 |
| Pacific Sunwear of California, Inc. * | 1,300 | 17,368 |
| Payless ShoeSource, Inc. * | 1,700 | 39,882 |
| Pier 1 Imports, Inc. | 2,500 | 15,975 |
| RadioShack Corp. | 2,900 | 52,374 |
| Regis Corp. | 700 | 25,683 |
| Rent-A-Center, Inc. * | 3,400 | 92,140 |
| Ross Stores, Inc. | 1,700 | 41,633 |
| Sonic Automotive, Inc. | 2,700 | 57,105 |
| Steven Madden, Ltd. * | 1,100 | 40,535 |
| Talbots, Inc. | 1,900 | 41,819 |
| The Buckle, Inc. | 600 | 20,340 |
| The Dress Barn, Inc. * | 1,100 | 19,415 |
| The Yankee Candle, Inc. | 800 | 20,680 |
| Tiffany & Company | 1,200 | 37,920 |
| United Rentals, Inc. * | 1,500 | 32,490 |
| Williams–Sonoma, Inc. | 1,100 | 32,406 |
| Zale Corp. * | 700 | 18,725 |
Sanitary Services 0.18% | 31,020 | |
| Allied Waste Industries, Inc. * | 3,000 | 31,020 |
Semiconductors 0.51% | 87,966 | |
| Intersil Corp., Class A | 2,600 | 65,910 |
| QLogic Corp. * | 1,200 | 22,056 |
Software 1.24% | 215,482 | |
| BEA Systems, Inc. * | 5,900 | 81,007 |
| BMC Software, Inc. * | 2,000 | 53,240 |
| Citrix Systems, Inc. * | 1,000 | $30,680 |
| Compuware Corp. * | 2,500 | 19,000 |
| EPIQ Systems, Inc. * | 600 | 8,928 |
| JDA Software Group, Inc. * | 600 | 9,954 |
| Novell, Inc. * | 1,900 | 12,673 |
Steel 0.11% | 19,110 | |
| Worthington Industries, Inc. | 1,000 | 19,110 |
Telecommunications Equipment & Services 0.60% | 103,745 | |
| Commscope, Inc. * | 900 | 26,289 |
| Polycom, Inc. * | 900 | 21,411 |
| Tellabs, Inc. * | 5,500 | 56,045 |
See notes to financial statements
Value Opportunities Fund
20
F I N A N C I A L S T A T E M E N T S
| Issuer | Shares | Value |
Telephone 1.03% | $177,669 | |
| Atlantic Tele-Network, Inc. | 500 | 9,195 |
| CenturyTel, Inc. | 3,900 | 155,298 |
| Harris Corp. | 300 | 13,176 |
Tires & Rubber 0.24% | 42,160 | |
| Goodyear Tire & Rubber Company * | 3,100 | 42,160 |
Tobacco 0.29% | 50,093 | |
| Schweitzer Mauduit International, Inc. | 400 | 7,600 |
| Universal Corp. | 1,100 | 42,493 |
Travel Services 0.56% | 96,448 | |
| Sabre Holdings Corp. | 4,400 | 96,448 |
Trucking & Freight 0.99% | 171,457 | |
| Arkansas Best Corp. | 1,300 | 57,395 |
| EGL, Inc. * | 400 | 12,228 |
| Navistar International Corp. * | 800 | 18,352 |
| Oshkosh Truck Corp. | 300 | 15,510 |
| Ryder Systems, Inc. | 1,000 | 49,420 |
| Swift Transportation, Inc. * | 800 | 18,552 |
| Principal | ||
| Issuer, description, maturity date | amount | Value |
| Repurchase agreements 8.56% | $1,483,000 | |
| (Cost $1,483,000) | ||
| Repurchase Agreement with State Street Corp. | ||
| — Dated 8/31/2006 at 3.95% to be repurchased | ||
| at $1,483,163 on 9/1/2006, collateralized by | ||
| $1,555,000 Federal National Mortgage Association, | ||
| 4.25% due 8/15/2010 (valued at $1,514,181, | ||
| including interest) (c) | $1,483,000 | $1,483,000 |
| Total investments (cost $16,952,542) 98.94% | $17,144,337 | |
| Other assets in excess of liabilities 1.06% | 183,878 | |
| Total net assets 100.00% | $17,328,215 | |
REIT Real Estate Investment Trust
* Non-income producing.
(c) Investment is an affiliate of the Trust's subadvisor or custodian bank.
See notes to financial statements
Value Opportunities Fund
21
F I N A N C I A L S T A T E M E N T S
Financial statements
Statement of assets and liabilities 8-31-06 (unaudited)
This Statement of Assets and Liabilities is the Fund’s balance sheet. It shows the value
of what the Fund owns, is due and owes. You’ll also find the net asset value and the
maximum offering price per share.
| Assets | |
| Investments, at value (Cost $15,469,542) | $15,661,337 |
| Repurchase agreements, at value (Cost $1,483,000) | 1,483,000 |
| Cash | 47,427 |
| Receivable for shares sold | 120,344 |
| Dividends and interest receivable | 18,757 |
| Other assets | 29,054 |
| Total assets | 17,359,919 |
| Liabilities | |
| Payable for futures variation margin | 600 |
| Payable to affiliates | |
| Transfer agent fees | 6,933 |
| Fund administration fees | 212 |
| Trustees fees | 112 |
| Service fees | 53 |
| Other payables | 23,794 |
| Total liabilities | 31,704 |
| Net assets | |
| Capital paid-in | 17,093,828 |
| Accumulated undistributed net realized gain on investments and futures contracts | 10,195 |
| Unrealized appreciation on investments and futures contracts | 215,199 |
| Undistributed net investment income | 8,993 |
| Net assets | $17,328,215 |
| Net asset value per share | |
| Based on net asset values and shares outstanding — The Fund has an | |
| unlimited number of shares authorized with no par value. | |
| Class A ($16,348,091 ÷ 804,936 shares) | $20.31 |
| Class B ($148,606 ÷ 7,328 shares) | $20.28 |
| Class C ($495,325 ÷ 24,419 shares) | $20.28 |
| Class I ($133,076 ÷ 6,547 shares) | $20.33 |
| Class R ($101,470 ÷ 5,000 shares) | $20.29 |
| Class 1 ($101,647 ÷ 5,000 shares) | $20.33 |
| Maximum offering price per share | |
| Class Aa ($20.31 ÷ 95%) | $21.38 |
a On single retail sales of less than $50,000. On sales of $50,000 or more and on group sales the offering price is reduced.
See notes to financial statements
Value Opportunities Fund
22
F I N A N C I A L S T A T E M E N T S
Statement of operations For the period ended 8-31-06a (unaudited)
This Statement of Operations summarizes the Fund’s investment income earned
and expenses incurred in operating the Fund. It also shows net gains (losses) for
the period stated.
| Investment income | |
| Dividends | $45,095 |
| Interest | 13,047 |
| Total investment income | 58,142 |
| Expenses | |
| Investment management fees (Note 3) | 28,053 |
| Class A Distribution and service fees (Note 3) | 11,015 |
| Transfer agent fees (Note 3) | 6,933 |
| Fund administration fees (Note 3) | 212 |
| Blue sky fees (Note 3) | 20,404 |
| Audit and legal fees | 17,005 |
| Custodian fees | 9,650 |
| Printing and postage fees (Note 3) | 5,004 |
| Trustees’ fees (Note 3) | 113 |
| Miscellaneous | 218 |
| Total expenses | 98,607 |
| Less expense reductions (Note 3) | (49,458) |
| Net expenses | 49,149 |
| Net investment income | 8,993 |
| Realized and unrealized gain | |
| Net realized gain (loss) on | |
| Investments | (2,284) |
| Futures contracts | 12,479 |
| Change in net unrealized appreciation of | |
| Investments | 191,795 |
| Futures contracts | 23,404 |
| Net realized and unrealized gain | 225,394 |
| Increase in net assets from operations | $234,387 |
a Period from 6-12-06 (commencement of operations) to 8-31-06.
See notes to financial statements
Value Opportunities Fund
23
F I N A N C I A L S T A T E M E N T S
Statement of changes in net assets
This Statement of Changes in Net Assets shows how the value of the Fund’s net assets
has changed during the last period. The difference reflects earnings less expenses, any
investment gains and losses, distributions, if any, paid to shareholders and the net of
Fund share transactions.
| Period | |
| endeda | |
| 8-31-06 | |
| Increase in net assets | |
| From operations | |
| Net investment income | $8,993 |
| Net realized gain | 10,195 |
| Change in net unrealized appreciation | 215,199 |
| Increase in net assets resulting from operations | 234,387 |
| From Fund share transactions | 17,093,828 |
| Net assets | |
| Beginning of period | — |
| End of periodb | $17,328,215 |
a Period from 6-12-06 (commencement of operations) to 8-31-06. Unaudited.
b Includes undistributed net investment income of $8,993.
See notes to financial statements
Value Opportunities Fund
24
F I N A N C I A L S T A T E M E N T S
Financial highlights
The Financial highlights show how the Fund’s net asset value for a share has changed
since the end of the previous period.
| CLASS A SHARES | |
| Period ended | 8-31-06a, b |
| Per share operating performance | |
| Net asset value, beginning of period | $20.00 |
| Net investment incomeh | 0.01 |
| Net realized and unrealized | |
| gain on investments | 0.30 |
| Total from investment operations | 0.31 |
| Net asset value, end of period | $20.31 |
| Total return (%) | 1.55l,m |
| Ratios and supplemental data | |
| Net assets, end of period | |
| (in millions) | $16 |
| Ratio of net expenses to average | |
| net assets (%) | 1.39r |
| Ratio of gross expenses to average | |
| net assets (%) | 2.34r |
| Ratio of net investment income | |
| to average net assets (%) | 0.26r |
| Portfolio turnover (%) | 7m |
See notes to financial statements
Value Opportunities Fund
25
F I N A N C I A L S T A T E M E N T S
Financial highlights
| CLASS B SHARES | |
| Period ended | 8-31-06a, b |
| Per share operating performance | |
| Net asset value, beginning of period | $20.00 |
| Net investment lossh | (0.02)z |
| Net realized and unrealized | |
| gain on investments | 0.30 |
| Total from investment operations | 0.28 |
| Net asset value, end of period | $20.28 |
| Total return (%) | 1.40l,m |
| Ratios and supplemental data | |
| Net assets, end of period | |
| (in millions) | —i |
| Ratio of net expenses to average | |
| net assets (%) | 2.09r |
| Ratio of gross expenses to average | |
| net assets (%) | 19.78r |
| Ratio of net investment loss | |
| to average net assets (%) | (0.39)r |
| Portfolio turnover (%) | 7m |
See notes to financial statements
Value Opportunities Fund
26
F I N A N C I A L S T A T E M E N T S
Financial highlights
| CLASS C SHARES | |
| Period ended | 8-31-06a, b |
| Per share operating performance | |
| Net asset value, beginning of period | $20.00 |
| Net investment lossh | (0.01)z |
| Net realized and unrealized | |
| gain on investments | 0.29 |
| Total from investment operations | 0.28 |
| Net asset value, end of period | $20.28 |
| Total return (%) | 1.40l,m |
| Ratios and supplemental data | |
| Net assets, end of period | |
| (in millions) | —i |
| Ratio of net expenses to average | |
| net assets (%) | 2.09r |
| Ratio of gross expenses to average | |
| net assets (%) | 11.34r |
| Ratio of net investment loss | |
| to average net assets (%) | (0.22)r |
| Portfolio turnover (%) | 7m |
See notes to financial statements
Value Opportunities Fund
27
F I N A N C I A L S T A T E M E N T S
Financial highlights
| CLASS I SHARES | |
| Period ended | 8-31-06a, b |
| Per share operating performance | |
| Net asset value, beginning of period | $20.00 |
| Net investment incomeh | 0.03 |
| Net realized and unrealized | |
| gain on investments | 0.30 |
| Total from investment operations | 0.33 |
| Net asset value, end of period | $20.33 |
| Total return (%) | 1.65l,m |
| Ratios and supplemental data | |
| Net assets, end of period | |
| (in millions) | —i |
| Ratio of net expenses to average | |
| net assets (%) | 0.99r |
| Ratio of gross expenses to average | |
| net assets (%) | 18.54r |
| Ratio of net investment income | |
| to average net assets (%) | 0.69r |
| Portfolio turnover (%) | 7m |
See notes to financial statements
Value Opportunities Fund
28
F I N A N C I A L S T A T E M E N T S
Financial highlights
| CLASS R SHARES | |
| Period ended | 8-31-06a, b |
| Per share operating performance | |
| Net asset value, beginning of period | $20.00 |
| Net investment lossh | —y |
| Net realized and unrealized | |
| gain on investments | 0.29 |
| Total from investment operations | 0.29 |
| Net asset value, end of period | $20.29 |
| Total return (%) | 1.45l,m |
| Ratios and supplemental data | |
| Net assets, end of period | |
| (in millions) | —i |
| Ratio of net expenses to average | |
| net assets (%) | 1.74r |
| Ratio of gross expenses to average | |
| net assets (%) | 21.02r |
| Ratio of net investment loss | |
| to average net assets (%) | (0.08)r |
| Portfolio turnover (%) | 7m |
See notes to financial statements
Value Opportunities Fund
29
F I N A N C I A L S T A T E M E N T S
Financial highlights
| CLASS 1 SHARES | |
| Period ended | 8-31-06a,b |
| Per share operating performance | |
| Net asset value, beginning of period | $20.00 |
| Net investment incomeh | 0.03 |
| Net realized and unrealized | |
| gain on investments | 0.30 |
| Total from investment operations | 0.33 |
| Net asset value, end of period | $20.33 |
| Total return (%) | 1.65l,m |
| Ratios and supplemental data | |
| Net assets, end of period | |
| (in millions) | —i |
| Ratio of net expenses to average | |
| net assets (%) | 0.94r |
| Ratio of gross expenses to average | |
| net assets (%) | 1.74r |
| Ratio of net investment income | |
| to average net assets (%) | 0.72r |
| Portfolio turnover (%) | 7m |
a Class A, Class B, Class C, Class I, Class R and Class 1 shares began operations on 6-12-06.
b Unaudited.
h Based on the average of the shares outstanding.
i Less than $500,000.
l Total returns would have been lower had certain expenses not been reduced during the period shown.
m Not annualized.
r Annualized.
y Net investment loss is less than $0.01 per share.
See notes to financial statements
Value Opportunities Fund
30
Notes to financial statements (unaudited)
1. Organization
John Hancock Value Opportunities Fund (the “Fund”) is a newly organized diversified series of John Hancock Funds III (the “Trust”). The Trust was established as a Massachusetts business trust on June 9, 2005. The Trust is registered under the Investment Company Act of 1940, as amended (the “1940 Act”), as an open-end investment management company. The investment objective of the Fund is to seek long-term capital growth.
John Hancock Life Insurance Company of New York (“John Hancock New York”) is a wholly owned subsidiary of John Hancock Life Insurance Company (U.S.A.) (“John Hancock USA”). John Hancock USA and John Hancock New York are indirect wholly owned subsidiaries of The Manufacturers Life Insurance Company (“Manulife”), which in turn is a wholly owned subsidiary of Manulife Financial Corporation (“MFC”), a publicly traded company. Manulife Financial Corporation and its subsidiaries are known collectively as “Manulife Financial.”
John Hancock Investment Management Services, LLC (the “Adviser”) is the Adviser to the Trust. John Hancock Funds, LLC (the “Distributor”), a Delaware limited liability company controlled by John Hancock USA serves as principal underwriter and is a wholly owned subsidiary of the Adviser.
Class 1 shares are sold only to certain exempt separate accounts of John Hancock USA and John Hancock New York.
The Board of Trustees has authorized the issuance of multiple classes of shares of the Fund, including classes designated as Class A, Class B, Class C, Class I, Class R and Class 1 shares. The shares of each class represent an interest in the same portfolio of investments of the Fund, and have equal rights as to voting, redemptions, dividends and liquidation, except that certain expenses, subject to the approval of the Board of Trustees, may be applied differently to each class of shares in accordance with current regulations of the Securities and Exchange Commission and the Internal Revenue Service. Shareholders of a class that bear distribution and service expenses under the terms of a distribution plan have exclusive voting rights to that distribution plan.
The Adviser and other subsidiaries of John Hancock USA owned 725,000 Class A shares, 5,000 Class B shares, 5,000 Class C shares, 5,000 Class I shares, 5,000 Class R shares and 5,000 Class 1 shares of beneficial interest of the Fund on August 31, 2006.
2. Significant accounting policies
In the preparation of the financial statements, the Fund follows the policies described below. The preparation of financial statements in conformity with accounting principles generally accepted in the United States of America requires management to make estimates and assumptions that affect the reported amounts of assets and liabilities at the date of the financial statements and the reported amounts of income and expenses during the reporting period. Actual results may differ from these estimates.
Security valuation
The net asset value of the shares of the Fund is determined daily as of the close of the New York Stock Exchange, normally at 4:00 p.m. Eastern time. Short-term debt instruments with remaining maturities of 60 days or less are valued at amortized cost, and thereafter assume a constant amortization to maturity of any discount or premium, which approximates market value. Investments in State Street Navigator Securities Lending Prime Portfolio are valued at their net asset value each business day. All other securities held by the Fund are valued at the last sale price or official closing price (closing bid price or last
Value Opportunities Fund
31
evaluated quote if no sale has occurred) as of the close of business on a principal securities exchange (domestic or foreign) or, lacking any sales, at the closing bid price. Securities traded only in the over-the-counter market are valued at the last bid price quoted by brokers making markets in the securities at the close of trading. Fund securities for which there are no such quotations, principally debt securities, are valued based on the valuation provided by an independent pricing service, which utilizes both dealer-supplied and electronic data processing techniques.
Other assets and securities for which no such quotations are readily available are valued at their fair value as determined in good faith under consistently applied procedures established by and under the general supervision of the Board of Trustees. Generally, trading in non-U.S. securities is substantially completed each day at various times prior to the close of trading on the New York Stock Exchange. The values of such securities used in computing the net asset value of a Fund’s shares are generally determined as of such times. Occasionally, significant events that affect the values of such securities may occur between the times at which such values are generally determined and the close of the New York Stock Exchange. In such events, these securities will then be valued at their fair value as determined in good faith under consistently applied procedures established by and under the general supervision of the Board of Trustees.
In deciding whether to make a fair value adjustment to the price of a security, the Trustees or their designee may review a variety of factors, including, developments in foreign markets, the performance of U.S. securities markets and the performance of instruments trading in U.S. markets that represent foreign securities and baskets of foreign securities. The Fund may also fair value securities in other situations, for example, when a particular foreign market is closed, but the Fund is calculating the net asset value. In view of these factors, it is likely that Fund investing significant amounts of assets in securities in foreign markets will be fair valued more frequently than a fund investing significant amounts of assets in frequently traded, U.S. exchange listed securities of large capitalization U.S. issuers.
For purposes of determining when fair value adjustments may be appropriate with respect to the Fund investing in securities in foreign markets that close prior to the New York Stock Exchange, the Fund will, on an ongoing basis, monitor for “significant market events.” A significant market event may be a certain percentage change in the value of an index or of certain exchange traded funds (“ETFs”) that track foreign markets in which the Fund has significant investments. If a significant market event occurs due to a change in the value of the index or of ETFs, the pricing for the Fund will promptly be reviewed and potential adjustments to the net asset value will be recommended to the Trust’s Pricing Committee, where applicable.
Fair value pricing of securities is intended to help ensure that the net asset value of the Fund’s shares reflects the value of the Fund’s securities as of the close of the New York Stock Exchange (as opposed to a value which is no longer accurate as of such close), thus limiting the opportunity for aggressive traders to purchase shares of the Fund at deflated prices, reflecting stale security valuations, and to promptly sell such shares at a gain. However, a security’s valuation may differ depending on the method used for determining value and no assurance can be given that fair value pricing of securities will successfully eliminate all potential opportunities for such trading gains.
Repurchase agreements
The Fund may enter into repurchase agreements. When the Fund enters into a repurchase agreement through its custodian, it receives delivery of securities, the amount of which at the time of purchase and each subsequent business day is required to be maintained at such a level that the market value is generally at least 102% of the repurchase amount. The Fund will take constructive receipt of all securities underlying the repurchase agreements it has entered into until such agreements expire. If the seller defaults, the Fund would suffer a loss to the extent that proceeds from the sale of underlying securities were less than the repurchase amount. The Fund may enter into repurchase agreements maturing within seven days with
Value Opportunities Fund
32
domestic dealers, banks or other financial institutions deemed to be creditworthy by the Adviser. Collateral for certain tri-party repurchase agreements is held at the custodian bank in a segregated account for the benefit of the Fund and the counterparty.
Security transactions and related investment income
Investment security transactions are accounted for on a trade date plus one basis for daily net asset value calculations. However for financial reporting purposes, investment transactions are reported on trade date. Interest income is accrued as earned. Dividend income is recorded on the ex-dividend date. Foreign dividends are recorded on the ex-date or as soon after the ex-date that the Fund becomes aware of such dividends, net of all taxes. Discounts/premiums are accreted/amortized for financial reporting purposes. Non-cash dividends are recorded at the fair market value of the securities received. Debt obligations may be placed in a non-accrual status and related interest income may be reduced by ceasing current accruals and writing off interest receivables when the collection of all or a portion of interest has become doubtful, based upon consistently applied procedures.
From time to time, the Fund may invest in Real Estate Investment Trusts (“REITs”) and as a result, will estimate the components of distributions from these securities. Distributions from REITs received in excess of income are recorded as a reduction of cost of investments and/or as a realized gain.
The Fund uses the First In, First Out method for fixed income securities and Highest Cost, First Out for all other securities for determining realized gain or loss on investments for both financial and federal income tax reporting purposes.
Multi-class operations
All income, expenses (except for class-specific expenses) and realized and unrealized gains (losses) are allocated to each class of shares based upon the relative net assets of each class. Dividends to shareholders from net investment income are determined at a class level and distributions from capital gains are determined at a Fund level.
Expense allocation
Expenses are allocated based on the relative share of net assets of the Fund at the time the expense was incurred. Class-specific expenses, such as distribution (Rule 12b-1) fees, are accrued daily and charged directly to the respective share classes.
Futures
The Fund may purchase and sell financial futures contracts and options on those contracts. The Fund invests in contracts based on financial instruments such as U.S. Treasury Bonds or Notes on securities indices such as the Russell 2000 Index, in order to hedge against a decline in the value of securities owned by the Fund.
Upon entering into futures contracts, the Fund is required to deposit with a broker an amount, termed the initial margin, which typically represents a certain percentage of the purchase price indicated in the futures contract. Payments to and from the broker, known as variation margin, are required to be made on a daily basis as the price of the futures contract fluctuates, making the long or short positions in the contract more or less valuable. If the position is closed out by taking an opposite position prior to the settlement date of the futures contract, a final determination of variation margin is made, cash is required to be paid to or released by the broker, and the Fund realizes a gain or loss.
When the Fund sells a futures contract based on a financial instrument, the Fund becomes obligated to deliver that kind of instrument at an agreed upon date for a specified price. The Fund realizes a gain or loss depending on whether the price of an offsetting purchase is less or more than the price of the initial sale or on whether the price of an offsetting sale is more or less than the price of the initial purchase. The Fund could be exposed to risks if it could not close out futures positions because of an illiquid secondary market or the inability of counterparties to meet the terms of their contracts. Futures contracts are valued at the quoted daily settlement prices established by the exchange on which they trade.
Value Opportunities Fund
33
| The following is a summary of open futures contracts on August 31, 2006: | ||||
| NUMBER OF | UNREALIZED | |||
| OPEN CONTRACTS | CONTRACTS | POSITION | EXPIRATION | APPRECIATION |
| Russell 2000 Index | 3 | Long | Sep 2006 | $23,404 |
Federal income taxes
The Fund qualifies as a “regulated investment company” by complying with the applicable provisions of the Internal Revenue Code and will not be subject to federal income tax on taxable income that is distributed to shareholders. Therefore, no federal income tax provision is required.
New accounting pronouncements
In June 2006, Financial Accounting Standards Board (“FASB”) Interpretation No. 48, Accounting for Uncertainty in Income Taxes (the “Interpretation”) was issued, and is effective for fiscal years beginning after December 15, 2006 and is to be applied to all open tax years as of the effective date. The Interpretation prescribes a minimum threshold for financial statement recognition of the benefit of a tax position taken or expected to be taken in a tax return, and requires certain expanded disclosures. Management is currently evaluating the application of the Interpretation to the Fund, and has not at this time quantified the impact, if any, resulting from the adoption of the Interpretation on the Fund’s financial statements.
In September 2006, FASB Standard No. 157, Fair Value Measurements (“FAS 157”) was issued, and is effective for fiscal years beginning after November 15, 2007. FAS 157 defines fair value, establishing a framework for measuring fair value and expands disclosure about fair value measurements. Management is currently evaluating the application of FAS 157 to the Fund, and its impact, if any, resulting from the adoption of FAS 157 on the Fund’s financial statements.
Distribution of income and gains
The Fund records distributions to shareholders from net investment income and net realized gains, if any, on the ex-dividend date. Distributions paid by the Fund with respect to each class of shares are calculated in the same manner, at the same time and are in the same amount, except for the effect of expenses that may be applied differently to each class. Such distributions, on a tax basis, are determined in conformity with income tax regulations, which may differ from accounting principles generally accepted in the United States of America. Distributions in excess of tax basis earnings and profits, if any, are reported in the Fund’s financial statements as a return of capital.
Capital accounts
The Fund reports the undistributed net investment income and accumulated undistributed net realized gain (loss) accounts on a basis approximating amounts available for future tax distributions (or to offset future taxable realized gains when a capital loss carryforward is available). Accordingly, the Fund may periodically make reclassifications among certain capital accounts without affecting its net asset value.
| 3. Investment advisory and other agreements |
Advisory fees
The Trust has entered into an Investment Advisory Agreement with the Adviser. The Adviser is responsible for managing the corporate and business affairs of the Trust and for selecting and compensating subadvisers to handle the investment and reinvestment of the assets of the Fund, subject to the supervision of the Board of Trustees. Under the Advisory Agreement the Fund pays a monthly management fee to the Adviser equivalent, on an annual basis, to the sum of: (a) 0.80% of the first $500,000,000 of the Fund’s aggregate daily net assets; (b) 0.78% of the next $500,000,000 of the Fund’s aggregate daily net assets; (c) 0.77% of the next $1,500,000,000 of the Fund’s aggregate daily net assets; and (d) 0.76% of the Fund’s aggregate daily net assets in excess of $2,500,000,000. Aggregate net assets include the net assets of the Fund and Value Opportunities Trust, a series of John Hancock
Value Opportunities Fund
34
Trust. John Hancock Trust is an open-end investment company advised by the Adviser and distributed by the Distributor. The Fund is not responsible for payment of the subadvisory fees.
Expense reimbursements
The Adviser has agreed contractually to reimburse for certain fund level expenses that exceed 0.09% of the average annual net assets, or to make a payment to a specific class of shares of the Fund in an amount equal to the amount by which the expenses attributable to such class of shares (excluding taxes, portfolio brokerage commissions, interest, litigation and indemnification expenses and other extraordinary expenses not incurred in the ordinary course of the Fund’s business and fees under any agreement or plans of the Fund dealing with services for shareholders and others with beneficial interests in shares of the Fund) exceed the percentage of average annual net assets (on an annualized basis) attributable as follows: 1.39% for Class A, 2.09% for Class B, 2.09% for Class C, 0.99 % for Class I, 1.49% for Class R and 0.94% for Class 1. Accordingly, the expense reductions related to this expense limitation amounted to $31,883, $4,231, $4,723, $4,217, $4,228 and $17 6 for Class A, Class B, Class C, Class I, Class R and Class 1, respectively, for the period ended August 31, 2006. This expense reimbursement shall continue in effect until June 30, 2007 and thereafter until terminated by the Adviser on notice to the Trust.
Administration fees
The Fund has an agreement with the Adviser that requires the Fund to reimburse the Adviser for all expenses associated with providing the administrative, financial, accounting and recordkeeping services of the Fund, including the preparation of all tax returns, annual, semiannual and periodic reports to shareholders and the preparation of all regulatory reports.
Distribution plan
The Trust has a Distribution Agreement with the Distributor, a wholly owned subsidiary of the Adviser. The Fund has adopted Distribution Plans with respect to Class A, Class B, Class C, Class R and Class 1 pursuant to Rule 12b-1 under the Investment Company Act of 1940, to reimburse the Distributor for the services it provides as distributor of shares of the Fund. Accordingly, the Fund makes monthly payments to the Distributor at an annual rate not to exceed 0.30%, 1.00%, 1.00%, 0.50% and 0.05% of average daily net asset value of Class A, Class B, Class C, Class R and Class 1, respectively. A maximum of 0.25% of such payments may be service fees, as defined by the Conduct Rules of the National Association of Securities Dealers. Under the Conduct Rules, curtailment of a portion of the Fund’s 12b-1 payments could occur under certain circumstances. In addition, under a Service Plan for Class R shares, the Fund pays up to 0.25% of Class R average daily net asset value for certain other services.
Sales charges
Class A shares are assessed up-front sales charges of up to 5.00% of net asset value of such shares. During the period ended August 31, 2006, the fund was informed that the Distributor received net up-front sales charges of $10,527 with regard to sales of Class A shares. Of this amount, $1,849 was retained and used for printing prospectuses, advertising, sales literature and other purposes, $8,678 was paid as sales commissions to unrelated broker-dealers.
Class B shares that are redeemed within six years of purchase are subject to a contingent deferred sales charge (“CDSC”) at declining rates, beginning at 5.00% of the lesser of the current market value at the time of redemption or the original purchase cost of the shares being redeemed. Class C shares that are redeemed within one year of purchase are subject to a CDSC at a rate of 1.00% of the lesser of the current market value at the time of redemption or the original purchase cost of the shares being redeemed. Proceeds from the CDSCs are paid to the Distributor and are used, in whole or in part, to defray its expenses for providing distribution-related services to the Fund in connection with the sale of Class B and Class C shares. During the period ended August 31, 2006, the Fund was informed that the Distributor received no CDSCs for Class B and Class C shares.
Value Opportunities Fund
35
Transfer agent fees
The Fund has a Transfer Agency Agreement with John Hancock Signature Services, Inc. (“Signature Services”), an indirect subsidiary of MFC. For Class A, Class B, Class C, Class I and Class R shares, the Fund pays a monthly transfer agent fee at an annual rate of 0.05% of each class’s average daily net assets, plus a fee based on the number of shareholder accounts and reimbursement for certain out-of-pocket expenses. Expenses not directly attributable to a particular class of shares are aggregated and allocated to each class on the basis of its relative net asset value.
Signature Services has agreed to limit the transfer agent fees so that such fees do not exceed 0.20% annually of Class A, Class B, Class C, Class I and Class R share average daily net assets. This agreement is effective until December 31, 2006. Signature Services reserves the right to terminate this limitation in the future. Accordingly, there were no transfer agent fees reductions for Class A, Class B, Class C, Class I and Class R shares, respectively, during the period ended August 31, 2006.
Expenses under the agreements described above for the period ended August 31, 2006, were as follows:
| Distribution and | Transfer | Printing and | ||
| Share Class | service fees | agent | Blue sky | postage |
| Class A | $10,091 | $6,727 | $4,275 | $4,824 |
| Class B | 239 | 48 | 4,032 | 33 |
| Class C | 511 | 102 | 4,033 | 50 |
| Class I | — | 12 | 4,032 | 35 |
| Class R | 163 | 44 | 4,032 | 31 |
| Class 1 | 11 | — | — | 31 |
| Total | $11,015 | $6,933 | $20,404 | $5,004 |
Trustees’ fees
The Trust compensates each Trustee who is not an employee of the Adviser or its affiliates. Total Trustees’ expenses are allocated to the Fund based on its average daily net asset value.
4. Guarantees and indemnifications
Under the Trust’s organizational documents, its Officers and Trustees are indemnified against certain liability arising out of the performance of their duties to the Trust. Additionally, in the normal course of business, the Trust enters into contracts with service providers that contain general indemnification clauses. The Trust’s maximum exposure under these arrangements is unknown, as this would involve future claims that may be made against the Trust that have not yet occurred. However, based on experience, the Trust believes the risk of loss to be remote.
5. Line of credit
The Fund has entered into an agreement which enables them to participate in a $100 million unsecured committed line of credit with State Street Bank & Trust Company. Borrowings will be made solely to temporarily finance the repurchase of capital shares. Interest is charged to the Fund based on its borrowings at a rate per annum equal to the Federal Funds rate plus 0.50% . In addition, a commitment fee of 0.07% per annum, payable at the end of each calendar quarter, based on the average daily-unused portion of the line of credit, is charged to the Fund on a prorated basis based on average net assets. For the period ended August 31, 2006 there was no borrowings under the line of credit.
Value Opportunities Fund
36
6. Capital shares
Share activities for the Fund for the period ended August 31, 2006 were as follows:
| Period ended 8-31-06a | ||
| Shares | Amount | |
| Class A shares | ||
| Sold | 805,141 | $16,136,880 |
| Repurchased | (205) | (4,072) |
| Net increase | 804,936 | $16,132,808 |
| Class B shares | ||
| Sold | 7,328 | $146,483 |
| Net increase | 7,328 | $146,483 |
| Class C shares | ||
| Sold | 24,419 | $483,527 |
| Net increase | 24,419 | $483,527 |
| Class I shares | ||
| Sold | 6,547 | $131,010 |
| Net increase | 6,547 | $131,010 |
| Class R shares | ||
| Sold | 5,000 | $100,000 |
| Net increase | 5,000 | $100,000 |
| Class 1 shares | ||
| Sold | 5,000 | $100,000 |
| Net increase | 5,000 | $100,000 |
| Net increase | 853,230 | $17,093,828) |
aPeriod from 6-12-06 (commencement of operations) to 8-31-06. Unaudited.
7. Investment transactions
Purchases and proceeds from sales or maturities of securities, other than short-term securities and obligations of the U.S. government, during the period ended August 31, 2006, aggregated $16,581,883 and $1,110,057, respectively.
The cost of investments owned on August 31, 2006, including short-term investments, for federal income tax purposes, was $16,952,542. Gross unrealized appreciation and depreciation of investments aggregated $700,977 and $509,182, respectively, resulting in net unrealized appreciation of $191,795.
8. Federal income tax information
Federal income tax regulations may differ from generally accepted accounting principles and income and capital gain distributions determined in accordance with tax regulations may differ from net investment income and realized gains recognized for financial reporting purposes.
Value Opportunities Fund
37
Evaluation of Advisory and Subadvisory
Agreements by the Board of Trustees
| This section describes the evaluation by the Board of Trustees of the Advisory Agreement and each of the Subadvisory Agreements. |
Evaluation by the Board of Trustees The Board, including all of the Trustees who are not “interested persons” as defined in the Investment Company Act of 1940, as amended (the “Independent Trustees”), is responsible for selecting the Trust’s investment adviser, John Hancock Investment Management Services, LLC (the “Adviser” or “JHIMS”), approving the Adviser’s selection of subadvisers for each series of the Trust (the “Funds”) and approving the Trust’s advisory and sub-advisory agreements (and any sub-subadvisory agreements), their periodic continuation and any amendments. Consistent with SEC rules, the Board regularly evaluates the Trust’s advisory and subadvisory (and sub-subadvisory) arrangements, including consideration of the factors listed below. The Board may also consider other factors (including conditions and trends prevailing generally in the econom y, the securities markets and the industry) and does not treat any single factor as determinative, and each Trustee may attribute different weights to different factors. The Board is furnished with an analysis of its fiduciary obligations in connection with its evaluation and, throughout the evaluation process, the Board is assisted by counsel for the Trust and the Independent Trustees are also separately assisted by independent legal counsel. The factors regularly considered by the Board are:
1. the nature, extent and quality of the services to be provided by the Adviser to the Trust and by the subadvisers to the Funds;
2. the investment performance of the Funds and their subadvisers;
3. the extent to which economies of scale would be realized as a Fund grows and whether fee levels reflect these economies of scale for the benefit of Trust shareholders;
4. the costs of the services to be provided and the profits to be realized by the Adviser and its affiliates (including any subadvisers that are affiliated with the Adviser) from the Adviser’s relationship with the Trust; and
5. comparative services rendered and comparative advisory and subadvisory fee rates.
The Board believes that information relating to all these factors is relevant to its evaluation of the Trust’s advisory agreement. With respect to its evaluation of subadvisory agreements (including sub-subadvisory agreements) the Board believes that, in view of the Trust’s “manager-of managers” advisory structure, the costs of services to be provided and the profits to be realized by those subadvisers that are not affiliated with the Adviser from their relationship with the Trust generally are not a material factor to the Board’s consideration of subadvisory agreements because such fees are paid to sub-advisers by the Adviser and not by the Funds, and because the Board relies on the ability of the Adviser to negotiate such subadvisory fees at arms-length.
In evaluating subadvisory arrangements, the Board also considers other material business relationships that unaffiliated sub-advisers and their affiliates have with the Adviser or its affiliates, including the involvement by certain affiliates of certain subadvisers in the distribution of financial products, including shares of the Trust, offered by the Adviser and other affiliates of the Adviser (“Material Relationships”).
Approval of Advisory Agreement
At its meeting on September 21, 2005, the Board, including all the Independent Trustees, approved the Advisory Agreement between the Trust and JHIMS with respect to each of the Funds.
In approving the Advisory Agreement, and with reference to the factors which it regularly considers, the Board:
(1) (a) considered the high value to the Trust of continuing the relationship with JHIMS as the Trust’s Adviser to the other John Hancock Funds, the skills and competency with which JHIMS
38
has in the past managed the affairs and subadvisory relationships of other funds in the complex, JHIMS’s oversight and monitoring of subadvisers’ investment performance and compliance programs including its timelines in responding to performance issues and the qualifications of JHIMS’s personnel,
(b) considered JHIMS’s compliance policies and procedures and its responsiveness to regulatory changes and mutual fund industry developments, and
(c) JHIMS’s administrative capabilities, including its ability to supervise the other service providers for the Funds and concluded that JHIMS may reasonably be expected to ably perform its services under the Advisory Agreement.
(2) reviewed the investment performance of portfolios that are managed comparable to the Funds; the comparative performance of their respective benchmarks; and JHIMS’ analysis of such performance and its plans and recommendations regarding the Trust’s subadvisory arrangements generally and with respect to the Funds; and concluded that each of the comparably managed funds has performed well or within a range that the Board deemed competitive, and that JHIMS may reasonably be expected to ably monitor the performance of the Funds and their subadvisers;
(3) reviewed the Trust’s advisory fee structure and the incorporation therein of any subadvisory fee breakpoints in the advisory fees charged and concluded (i) that to the extent that Funds have subadvisory fees with breakpoints, those breakpoints are reflected as breakpoints in the advisory fees for Funds, (ii) that all Funds with a subadviser that is not affiliated with the Adviser have subadvisory fees which are the product of arms-length negotiations between the Adviser and the subadviser and which in many, but not all, cases contain breakpoints, and (iii) that, although economies of scale cannot be measured with precision, these arrangements permit shareholders of Funds with advisory fee breakpoints to benefit from economies of scale if those Funds grow;
(4) (a) reviewed the financial statements of JHIMS and John Hancock Life Insurance Company (U.S.A.) (“JHLICO (U.S.A.)”;
(b) reviewed the anticipated profitability of the JHIMS’s relationship with the Funds in terms of the fees it expects to receive with respect to the Funds and whether JHIMS has the financial ability to provide a high level of services to the Funds,
(c) considered that JHIMS derives reputational and other indirect benefits from providing advisory services to the Funds, and
(d) noted that JHIMS will pay the sub-advisory fees out of the advisory fees JHIMS receives from the Funds and concluded that the advisory fees paid by the Trust with respect to the Funds are not unreasonable in light of such information; and
(5) reviewed comparative information with respect to the advisory fee rates and concluded that the anticipated advisory fees for the Funds are within the range of those incurred by other comparable funds and that the advisory structure for the Funds is thus competitive within the industry.
Additional information that the Board considered for a particular Fund is set forth in Appendix A.
Approval of Subadvisory Agreements
At its meeting on September 21, 2005, the Board, including all the Independent Trustees, approved the Subadvisory Agreements.
In making its determination with reference to these respective factors, the Board reviewed:
(i) information relating to each subadviser’s business which included information
39
such as: business performance, assets under management, financial stability and personnel;
(ii) the investment performance of the subad-viser’s portfolio managed comparably to the Fund to be managed by the subadviser and comparative performance information relating to the benchmark;
(iii) the proposed subadvisory fee for each Fund to be managed by the subadviser and comparative fee information; and
(iv) information relating to the nature and scope of Material Relationships and their significance to the Adviser and the subadvisers.
The Board’s decision to approve each Sub-advisory Agreement was based on a number of determinations, including the following:
(1) The subadviser has extensive experience and demonstrated skills as a manager and may be expected to provide a high quality of investment personnel to each Fund;
(2) Although not without variation, the current and historical performance of the portfolios of the Subadviser managed comparably to the Fund to be managed by the Subadviser has been within a competitive range of the current and historical performance of these portfolios’ respective benchmark (see Appendix A for further information on performance);
(3) The subadvisory fees are within industry norms and are the product of arms-length negotiation between the Adviser and the subadviser; and
(4) The Material Relationships consist of arrangements in which unaffiliated subad-visers or their affiliates provide advisory, distribution or management services in connection with financial products sponsored by the Trust’s adviser or its affiliates, which may include other registered investment companies, a 529 education savings plan, managed separate accounts and exempt group annuity contracts sold to qualified plans, and which in no case contained elements which would cause the Board to conclude that approval of the subadvisory agreement with the subadviser would be inappropriate. See (5) below for information relating to the business arrangement between the Trust’s Adviser and GMO.
(5) As a part of the overall business arrangement between the Adviser and GMO under which the Adviser has obtained exclusive rights to certain GMO investment management services for up to five years, the Adviser has agreed that under certain circumstances it (and not the Trust or the particular Fund) will pay GMO a specified amount (ranging from $1 to $12 million) if the subadvisory agreement with respect to any of the following Funds to be subadvised by GMO is terminated within a five year period from the date of its effectiveness: U.S. Core Fund, Active Value Fund, Intrinsic Value Fund, Growth Fund, International Core Fund, International Growth Fund, Global Fund, Value Opportunities Fund, Growth Opportunities Fund and U.S. Quality Equity Fund.
The Adviser has also agreed that, subject to its fiduciary duties as an investment adviser to each of these Funds and its shareholders, it will not recommend to the Board of Trustees to terminate the subadvisory agreement with respect to any of the Funds or to reduce any of the fees payable thereunder to GMO for a five year period from the date of effectiveness of the agreement. Substantially similar agreements (with varying amounts to be paid upon termination) also apply with respect to certain other John Hancock funds that are or will be advised by the Adviser and subadvised by GMO. The Trust is not a party to any of these arrangements, and they are not binding upon the Trust, the Trust’s Funds subadvised by GMO or the Board of Trustees. However, these arrangements present certain conflicts of interest because the Adviser has a financial incentive to support the continuation of GMO subadvisory agreements for as long as the termination provisions described above re main in effect. In approving the Advisory Agreement
40
and the subadvisory agreement with respect to each of the Funds subadvised by GMO, the Board of Trustees, including the Independent Trustees, was aware of and considered these potential conflicts of interest, including any financial obligations of the Adviser to GMO.
The Board concluded that, notwithstanding the potential conflicts of interest, approval of the Advisory Agreement and the subadvisory agreements with GMO is in the best interests of shareholders and contract owners in view of (i) the Adviser’s fiduciary duty and the Board’s fiduciary duty and ability to monitor potential conflicts, (ii) the benefits to shareholders and contract owners generally expected from the exclusive rights to certain GMO investment management services obtained by the Adviser for the benefit of certain Funds of the Trust and other John Hancock funds and (iii) the benefits to such Funds of the Trust expected from the subadvisory services of GMO.
Additional information that the Board considered for a particular fund is set forth in Appendix A.
Appendix A
| Estimated Fees | |||
| Fund | Performance | and Expenses | Comments |
| Value Opportunities | See “Comments”. | Subadvisory fees | The Board noted |
| for this Fund were | that the Fund | ||
| lower than the peer | commenced opera- | ||
| group median. | tions in June 2006 | ||
| and has a limited | |||
| Advisory fees for | performance history. | ||
| this Fund were | |||
| lower than the peer | |||
| group median. | |||
| Total expenses for | |||
| this Fund were | |||
| lower than the peer | |||
| group median. | |||
41
For more information
The Fund’s proxy voting policies, procedures and records are available without charge, upon request:
| By phone | On the Fund’s Web site | On the SEC’s Web site |
| 1-800-225-5291 | www.jhfunds.com/proxy | www.sec.gov |
| Trustees | Francis V. Knox, Jr. | Principal distributor |
| James M. Oates, Chairman* | Chief Compliance Officer | John Hancock Funds, LLC |
| Charles L. Bardelis * | Gordon M. Shone | 601 Congress Street |
| James R. Boyle† | Treasurer | Boston, MA 02210-2805 |
| Peter S. Burgess * | John G. Vrysen | |
| Elizabeth G. Cook | Chief Financial Officer | Custodian |
| William H. Cunningham | State Street Bank & Trust Co. | |
| Charles L. Ladner* | Investment adviser | 2 Avenue de Lafayette |
| Hassell H. McClellan | John Hancock Investment | Boston, MA 02111 |
| *Members of the Audit Committee | Management Services, LLC | |
| †Non-Independent Trustee | 601 Congress Street | Transfer agent |
| Boston, MA 02210-2805 | John Hancock Signature | |
| Officers | Services, Inc. | |
| Keith F. Hartstein | Subadviser | 1 John Hancock Way, |
| President and | Grantham, Mayo, | Suite 1000 |
| Chief Executive Officer | Van Otterloo & Co. LLC | Boston, MA 02217-1000 |
| Thomas M. Kinzler | 40 Rowes Wharf | |
| Secretary and | Boston, MA 02110 | Legal counsel |
| Chief Legal Officer | Kirkpatrick & Lockhart | |
| Nicholson Graham LLP | ||
| 1 Lincoln Street | ||
| Boston, MA 02111-2950 | ||
The Fund’s investment objective, risks, charges and expenses are included in the prospectus and should be considered carefully before investing. For a prospectus, call your financial professional, call John Hancock Funds at 1-800-225-5291 or visit the Fund’s Web site at www.jhfunds.com. Please read the prospectus carefully before investing or sending money.
| How to contact us | ||
| Internet | www.jhfunds.com | |
| Regular mail: | Express mail: | |
| John Hancock | John Hancock | |
| Signature Services, Inc. | Signature Services, Inc. | |
| 1 John Hancock Way, Suite 1000 | Mutual Fund Image Operations | |
| Boston, MA 02217-1000 | 380 Stuart Street | |
| Boston, MA 02116 | ||
| Phone | Customer service representatives | 1-800-225-5291 |
| 24-hour automated information | 1-800-338-8080 | |
| TDD line | 1-800-554-6713 | |
A listing of month-end portfolio holdings is available on our Web site, www.jhfunds.com. A more detailed portfolio holdings summary is available on a quarterly basis 60 days after the fiscal quarter on our Web site or upon request by calling 1-800-225-5291, or on the Securities and Exchange Commission’s Web site, www.sec.gov.
44
J O H N H A N C O C K F A M I L Y O F F U N D S
| EQUITY | INTERNATIONAL |
| Balanced Fund | Greater China Opportunities Fund |
| Classic Value Fund | International Classic Value Fund |
| Classic Value Fund II | International Core Fund |
| Core Equity Fund | International Fund |
| Focused Equity Fund | International Growth Fund |
| Growth Fund | |
| Growth Opportunities Fund | INCOME |
| Growth Trends Fund | Bond Fund |
| Intrinsic Value Fund | Government Income Fund |
| Large Cap Equity Fund | High Yield Fund |
| Large Cap Select Fund | Investment Grade Bond Fund |
| Mid Cap Equity Fund | Strategic Income Fund |
| Mid Cap Growth Fund | |
| Multi Cap Growth Fund | TAX-FREE INCOME |
| Small Cap Equity Fund | California Tax-Free Income Fund |
| Small Cap Fund | High Yield Municipal Bond Fund |
| Small Cap Intrinsic Value Fund | Massachusetts Tax-Free Income Fund |
| Sovereign Investors Fund | New York Tax-Free Income Fund |
| U.S. Core Fund | Tax-Free Bond Fund |
| U.S. Global Leaders Growth Fund | |
| Value Opportunities Fund | MONEY MARKET |
| Money Market Fund | |
| ASSET ALLOCATION & LIFESTYLE | U.S. Government Cash Reserve |
| Allocation Core Portfolio | |
| Allocation Growth + Value Portfolio | CLOSED-END |
| Lifestyle Aggressive Portfolio | Bank & Thrift Opportunity |
| Lifestyle Balanced Portfolio | Financial Trends |
| Lifestyle Conservative Portfolio | Income Securities |
| Lifestyle Growth Portfolio | Investors Trust |
| Lifestyle Moderate Portfolio | Patriot Global Dividend |
| Patriot Preferred Dividend | |
| SECTOR | Patriot Premium Dividend I |
| Financial Industries Fund | Patriot Premium Dividend II |
| Health Sciences Fund | Patriot Select Dividend |
| Real Estate Fund | Preferred Income |
| Regional Bank Fund | Preferred Income II |
| Technology Fund | Preferred Income III |
| Technology Leaders Fund | Tax-Advantaged Dividend |
For more complete information on any John Hancock Fund and a prospectus, which includes charges and expenses, call your financial professional, or John Hancock Funds at 1-800-225-5291. Please read the prospectus carefully before investing or sending money.

| 1-800-225-5291 1-800-554-6713 (TDD) 1-800-338-8080 (EASI-Line) www.jhfunds. com |
| Now available: electronic delivery www.jhfunds. com/edelivery |
This report is for the information of the shareholders of John Hancock Value Opportunities Fund.
| 630SA 8/06 10/06 |

| TABLE OF CONTENTS |
| Manager’s report |
| page 2 |
| A look at performance |
| page 6 |
| Your expenses |
| page 8 |
| Fund’s investments |
| page 1 0 |
| Financial statements |
| page 1 8 |
| For more information |
| page 4 0 |
CEO corner
To Our Shareholders,
The future has arrived at John Hancock Funds.
We have always been firm believers in the powerful role the Internet can play in providing fund information to our shareholders and prospective investors. Recently, we launched a redesigned, completely overhauled Web site that is more visually pleasing, easier to navigate and, most importantly, provides more fund information and learning tools without overwhelming the user.
Not long after we embarked on this major project, a study was released by the Investment Company Institute, the mutual fund industry’s main trade group, which found that an overwhelming majority of shareholders consider the Internet the “wave of the future” for accessing fund information.
Our new site sports fresher and faster ways to access account information. New innovations allow investors to view funds by risk level, track the performance of the John Hancock funds of their choice, or sort funds by Morningstar, Inc.’s star ratings. Investors who own a John Hancock fund through a qualified retirement plan and don’t pay sales charges when making a purchase have the option of sorting by a “Load Waived” Morningstar Rating, thereby creating an apples-to-apples comparison with no-load funds that may also be available in their retirement plan.
The new site also has more educational tools and interactive modules to educate and assist investors with their financial goals, from college savings to retirement planning. A new “I want to…” feature allows investors to check performance, invest more money, update personal information or download prospectuses and forms quickly and easily.
In another of our ongoing efforts to provide our shareholders with top-notch service, we also redesigned our shareholder reports, as you may have noticed with this report. We hope the larger size, more colorful cover and redesigned presentation of the commentary and data tables will draw you in and make them easier to read.
After you’ve read your shareholder report, we encourage you to visit our new Web site – www.jhfunds.com – and take a tour. It’s easy, fast and fun and allows you to be in control of what you see and do. In short, it’s the wave of the future!
Sincerely,

| Keith F. Hartstein, President and Chief Executive Officer |
This commentary reflects the CEO’s views as of August 31, 2006. They are subject to change at any time.
Your fund at a glance
The Fund seeks high total return relative to its benchmark, currently the S&P 500 Index,
by making equity investments in U.S. companies with capitalizations similar to the
capitalizations of companies that issue stock included in the S&P 5000 Index.
Since inception on June 12, 2006.
| ► U.S. stocks posted decent gains as the threat of higher interest rates seemed to fade. ► The Fund’s performance was aided by the more defensive names in the health care and grocery chain segments. ► Momentum stocks suffered and were the biggest detractors from the Fund’s returns. |
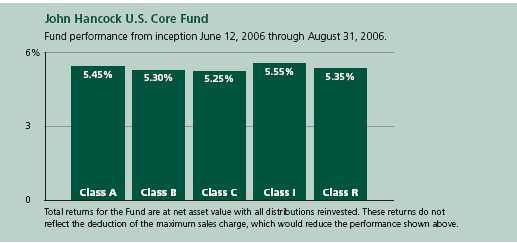
| Top 10 Holdings | ||||
| Pfizer, Inc. | 4.7% | Lowe's Companies, Inc. | 2.2% | |
| Merck & Company, Inc. | 3.5% | Verizon Communications, Inc. | 2.2% | |
| Home Depot, Inc. | 3.2% | UnitedHealth Group, Inc. | 2.0% | |
| Wal-Mart Stores, Inc. | 3.0% | American International Group, Inc. | 2.0% | |
| Citigroup, Inc. | 2.6% | AT&T, Inc. | 2.0% | |
As a percentage of net assets on August 31, 2006.
1
Managers’ report
| John Hancock U.S. Core Fund |
Despite increased stock market volatility prompted by uncertainty over the economy, interest rates and geopolitical events, U.S. stocks as a whole posted decent gains for the period spanning the Fund’s inception on June 12, 2006, to its semiannual period end on August 31, 2006. The period began just weeks after newly appointed Federal Reserve Board Chairman Ben Bernanke rattled investors by seeming to imply that inflation pressures were mounting and, as a result, interest rates would move higher than the market might previously have anticipated. Equity investors worried that the Fed might raise rates too much and trigger a recession. But beginning in mid-July, stocks staged an impressive rally that accelerated in early August when the Fed opted not to increase interest rates again for the first time in two years. Against this macroeconomic backdrop, large-company stocks performed in line with their smaller-cap counterp arts, foreign equities performed better than those in the U.S. and value stocks trumped growth stocks.
Performance
From its inception on June 12, 2006 through August 31, 2006, John Hancock U.S. Core Fund’s Class A, Class B, Class C, Class I and Class R shares returned 5.45%, 5.30%, 5.25%, 5.55%, and 5.35%, respectively, at net asset value. By comparison, the Standard & Poor’s 500 Index
SCORECARD
| INVESTMENT | PERIOD’S PERFORMANCE... AND WHAT’S BEHIND THE NUMBERS | |
| Merck | ▲ | Bounces back in response to stronger-than-expected sales |
| Kroger | ▲ | Shares rise as investors gravitate to defensive names |
| Home Depot | ▼ | Housing market slowdown prompts worries over future profits |
2

Portfolio Managers, Grantham, Mayo, Van Otterloo & Co. LLC (GMO)
Sam Wilderman, Ed Choi, Donna Murphy, Chuck Joyce and Tara Oliver
returned 5.92% and the average large blend fund returned 5.40% at net asset value, according to Morningstar, Inc.1
Strategy explained
Since the Fund is new, we are continuing to build our positions, using our time-tested investment process. Although many managers use a single methodology to select stocks, we use two independent disciplines: valuation and momentum. Over two-thirds of the stocks in this portfolio are bought based on valuation. We seek quality companies that are selling for less than their worth, with the expectation that they will remain profitable, eventually re-gain favor in the market and generate above-average returns. Although traditional measures of a stock’s cheapness, such as price-to-book (P/B) or price-to-earnings (P/E) ratios may help investors determine if a company’s stock price is low, such measures do not distinguish between high-quality and low-quality companies. We believe high-quality companies are worth a premium because they can sustain a competitive advantage and continue to grow over the long term.
| “During this abbreviated period, our best performers were generated by our valuation discipline…” |
The remaining stocks in the Fund are considered “momentum” stocks, that is, stocks that are experiencing price appreciation and/or positive earnings revisions. This momentum typically follows a decline relative to the market. We’ve determined that stocks whose prices have declined for six months, then advanced for 12 months, will tend to continue rising for another 12 to 18 months. Price momentum enables portfolios to benefit from short-term swings in earnings and investor sentiment.
Because momentum and valuation tools tend to perform differently across various market and economic cycles, the Fund’s combination of
U.S. Core Fund
3
the two disciplines results in greater diversification in the portfolio. Diversification may help to lower the Fund’s risk level. We also employ a number of other risk control techniques. We typically hold more than 300 common stocks, so that the Fund’s performance isn’t overly dependent on the fortunes of one or a handful of companies. We give more weight to large-cap companies with strong balance sheets and high profit margins. Finally, we limit our holdings by economic sectors and company size within the large-cap universe.
Leaders and laggards
During this abbreviated period, our best performers were generated by our valuation discipline. In particular, we saw gains from companies whose shares had been beaten up in prior periods but rallied in response to investors’ growing appetite for defensive stocks — shares of companies whose sales and profits tend to continue to grow even while the broader economy slows. Leading the pack were our stakes in large drug companies Merck & Company and Pfizer, Inc. Merck’s net profit rose substantially and the company raised its profit forecast for the full year, helped by strong sales of cholesterol drug Zocor. Pfizer posted strong earnings in August, thanks in large part to stronger-than-expected sales of Lipitor, the anti-cholesterol medication that is one of the best-selling drugs in the world. Investors also cheered a management change and shake-up in the executive suite. A growing move toward defensive stocks also helped our shares in grocery store chains The Kroger Company and Safeway, Inc.
| SECTOR DISTRIBUTION2 | |
| Consumer, | |
| non-cyclical | 26% |
| Financial | 20% |
| Consumer, cyclical | 17% |
| Industrial | 10% |
| Communications | 9% |
| Technology | 6% |
| Energy | 4% |
| Mortgage securities | 2% |
| Basic materials | 1% |
| Utilities | 0.3% |
Detracting from the Fund’s returns were some of our momentum plays. QUALCOMM, Inc. faltered amid concerns surrounding a number of battles it faced, including a royalty-payments battle with Nokia, the world’s top cell-phone maker and QUALCOMM’S largest licensee. We also lost ground with Starbucks Corp. It posted disappointing summer sales figures, blaming the results on long lines at its stores for its icy blended drinks, which take longer to make than the standard cup of coffee. That development worried investors who feared that it was a sign that the chain's growth may be decelerating. Other weak performers included home building and improvement stores
U.S. Core Fund
4
Home Depot, Inc. and Lowe’s Companies, Inc., which both slumped as the housing market cooled.
| “…we will continue to focus on high- quality companies that we believe can best weather a market and/or economic downturn.” |
Outlook
The summer stock market rally and the Fed’s decision to pause in its interest-rate-raising cycle after 17 consecutive quarter-point hikes since June 2004, appear to have provided investors with reasons for optimism. By the end of the period, stocks overall seemed “priced for perfection,” with investors betting that economic growth would remain moderate and sustainable and that inflation would be contained. We believe this optimism is likely overblown and that the market is significantly underpricing risk. The investment landscape is always fraught with any number of risks, be it higher-than-expected inflation and interest rates, slower-than-expected economic growth or geopolitical events. But we believe that the economy and financial systems are so highly levered at the moment that even the smallest unfavorable development could result in a significant re-pricing of risk, meaning that riskier assets would underperform. Since we remain very wary of risk, we will continue to focus on high-quality companies that we believe can best weather a market and/or economic downturn.
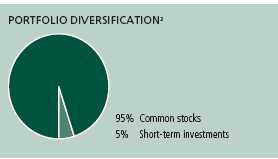
This commentary reflects the views of the portfolio management team through the end of the Fund’s period discussed in this report. The team’s statements reflect their own opinions. As such, they are in no way guarantees of future events and are not intended to be used as investment advice or a recommendation regarding any specific security. They are also subject to change at any time as market and other conditions warrant.
1 Figures from Morningstar, Inc. include reinvested dividends and do not take into account sales charges. Actual load-adjusted performance is lower.
2 As a percentage of net assets on August 31, 2006.
U.S. Core Fund
5
A look at performance
For the period ending August 31, 2006
| Cumulative total returns | ||
| With maximum sales charge (POP) | ||
| Inception | Since | |
| Class | date | inception |
| A | 6-12-06 | 0.19% |
| B | 6-12-06 | 0.30 |
| C | 6-12-06 | 4.25 |
| I1 | 6-12-06 | 5.55 |
| R1 | 6-12-06 | 5.35 |
Performance figures assume all distributions are reinvested. Returns with maximum sales charge reflect a sales charge on Class A shares of 5%, and the applicable contingent deferred sales charge (CDSC) on Class B and Class C shares. The Class B shares’ CDSC declines annually between years 1–6 according to the following schedule: 5, 4, 3, 3, 2, 1%. No sales charge will be assessed after the sixth year. Class C shares held for less than one year are subject to a 1% CDSC. Sales charge is not applicable for Class I and Class R shares.
The returns reflect past results and should not be considered indicative of future performance. The return and principal value of an investment will fluctuate so that shares, when redeemed, may be worth more or less than their original cost. Due to market volatility, the Fund’s current performance may be higher or lower than the performance shown. For performance data current to the most recent month-end, please call 1-800-225-5291 or visit the Fund’s Web site at www.jhfunds.com.
The performance table above and the chart on the next page do not reflect the deduction of taxes that a shareholder would pay on Fund distributions or the redemption of Fund shares.
The Fund’s performance results reflect any applicable expense reductions, without which the expenses would increase and results would have been less favorable.
Since inception performance is calculated with an opening price (prior day’s close) on the inception date.
1 For certain types of investors as described in the Fund’s Class I and Class R share prospectuses.
U.S. Core Fund
6
Growth of $10,000
This chart shows what happened to a hypothetical $10,000 investment in Class A shares
for the period indicated. For comparison, we’ve shown the same investment in the
Standard & Poor’s 500 Index.
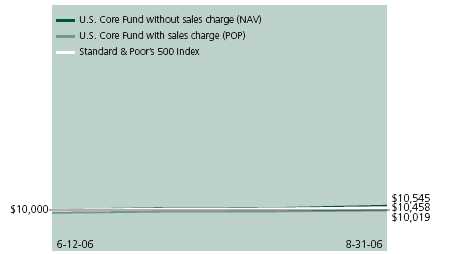
| Class | Period beginning | Without sales charge | With maximum sales charge | Index |
| B | 6-12-06 | $10,530 | $10,030 | $10,458 |
| C | 6-12-06 | 10,525 | 10,425 | 10,458 |
| I 1 | 6-12-06 | 10,555 | 10,555 | 10,458 |
| R1 | 6-12-06 | 10,535 | 10,535 | 10,458 |
Assuming all distributions were reinvested for the period indicated, the table above shows the value of a $10,000 investment in the Fund’s Class B, Class C, Class I and Class R shares, respectively, as of August 31, 2006. Performance of the classes will vary based on the difference in sales charges paid by shareholders investing in the different classes and the fee structure of those classes.
Standard & Poor’s 500 Index is an unmanaged index that includes 500 widely traded common stocks.
It is not possible to invest directly in an index. Index figures do not reflect sales charges which would have resulted in lower values if they did.
1 For certain types of investors as described in the Fund’s Class I and Class R share prospectuses.
U.S. Core Fund
7
Your expenses
These examples are intended to help you understand your ongoing
operating expenses.
Understanding Fund expenses
As a shareholder of the Fund, you incur two types of costs:
| ▪ Transaction costs which include sales charges (loads) on purchases or redemptions (varies by share class), minimum account fee charge, etc. ▪ Ongoing operating expenses including management fees, distribution and service fees (if applicable) and other Fund expenses. |
We are going to present only your ongoing operating expenses here.
Actual expenses/actual returns
This example is intended to provide information about your Fund’s actual ongoing operating expenses, and is based on your Fund’s actual return. It assumes an account value of $1,000.00 on June 12, 2006, with the same investment held until August 31, 2006.
| Account value | Ending value | Expenses paid during period | |
| on 6-12-06 | on 8-31-06 | ended 8-31-061 | |
| Class A | $1,000.00 | $1,054.50 | $3.04 |
| Class B | 1,000.00 | 1,053.00 | 4.61 |
| Class C | 1,000.00 | 1,052.50 | 4.61 |
| Class I | 1,000.00 | 1,055.50 | 2.14 |
| Class R | 1,000.00 | 1,053.50 | 3.83 |
Together with the value of your account, you may use this information to estimate the operating expenses that you paid over the period. Simply divide your account value at August 31, 2006 by $1,000.00, then multiply it by the “expenses paid” for your share class from the table above. For example, for an account value of $8,600.00, the operating expenses should be calculated as follows:
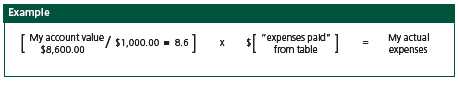
U.S. Core Fund
8
Hypothetical example for comparison purposes
This table allows you to compare your Fund’s ongoing operating expenses with those of any other fund. It provides an example of the Fund’s hypothetical account values and hypothetical expenses based on each class’ actual expense ratio and an assumed 5% annual return before expenses (which is not your Fund’s actual return). It assumes an account value of $1,000.00 on June 12, 2006, with the same investment held until August 31, 2006. Look in any other fund shareholder report to find its hypothetical example and you will be able to compare these expenses.
| Account value | Ending value | Expenses paid during period | |
| on 6-12-06 | on 8-31-06 | ended 8-31-061 | |
| Class A | $1,000.00 | $1,008.00 | $2.97 |
| Class B | 1,000.00 | 1,006.47 | 4.51 |
| Class C | 1,000.00 | 1,006.47 | 4.51 |
| Class I | 1,000.00 | 1,008.88 | 2.09 |
| Class R | 1,000.00 | 1,007.23 | 3.74 |
Remember, these examples do not include any transaction costs, such as sales charges; therefore, these examples will not help you to determine the relative total costs of owning different funds. If transaction costs were included, your expenses would have been higher. See the prospectus for details regarding transaction costs.
1 Expenses are equal to the Fund's annualized expense ratio of 1.35%, 2.05%, 2.05%, 0.95% and 1.70% for Class A, Class B, Class C, Class I and Class R respectively, multiplied by the average account value over the period, multiplied by number of days in most recent fiscal half-year/365 or 366 (to reflect the one-half year period).
U.S. Core Fund
9
F I N A N C I A L S T A T E M E N T S
Fund’s investments
Securities owned by the Fund on 8-31-06 (unaudited)
| This schedule is divided into two main categories: common stocks and short-term investments. Common stocks are further broken down by industry group. Short-term investments, which represent the Fund’s cash position, are listed last. |
| Issuer | Shares | Value |
| Common stocks 94.88% | $15,582,338 | |
| (Cost $14,853,694) | ||
Aerospace 1.52% | $250,044 | |
| Boeing Company | 600 | 44,940 |
| General Dynamics Corp. | 400 | 27,020 |
| Goodrich Corp. | 200 | 7,790 |
| Lockheed Martin Corp. | 200 | 16,520 |
| Northrop Grumman Corp. | 900 | 60,129 |
| Raytheon Company | 300 | 14,163 |
| Textron, Inc. | 200 | 16,772 |
| United Technologies Corp. | 1,000 | 62,710 |
Agriculture 0.43% | 69,989 | |
| Archer-Daniels-Midland Company | 1,700 | 69,989 |
Aluminum 0.37% | 60,039 | |
| Alcoa, Inc. | 2,100 | 60,039 |
Apparel & Textiles 0.44% | 71,642 | |
| Liz Claiborne, Inc. | 600 | 22,422 |
| Mohawk Industries, Inc. * | 300 | 21,264 |
| VF Corp. | 400 | 27,956 |
Auto Parts 0.54% | 88,308 | |
| AutoZone, Inc. * | 500 | 45,150 |
| Johnson Controls, Inc. | 600 | 43,158 |
Auto Services 0.26% | 42,746 | |
| AutoNation, Inc. * | 2,200 | 42,746 |
Automobiles 0.57% | 93,903 | |
| Ford Motor Company | 7,300 | 61,101 |
| PACCAR, Inc. | 600 | 32,802 |
Banking 2.43% | 399,135 | |
| Bank of America Corp. | 2,500 | 128,675 |
| Bank of New York Company, Inc. | 900 | 30,375 |
| BB&T Corp. | 900 | 38,520 |
| Comerica, Inc. | 600 | 34,350 |
See notes to financial statements
U.S. Core Fund
10
F I N A N C I A L S T A T E M E N T S
| Issuer | Shares | Value |
Banking (continued) | ||
| Fifth Third Bancorp. | 400 | $15,736 |
| Golden West Financial Corp. | 200 | 15,098 |
| KeyCorp | 400 | 14,716 |
| National City Corp. | 2,800 | 96,824 |
| Northern Trust Corp. | 100 | 5,599 |
| US Bancorp | 600 | 19,242 |
Biotechnology 0.61% | 99,548 | |
| Amgen, Inc. * | 500 | 33,965 |
| Applera Corp. | 900 | 27,585 |
| Biogen Idec, Inc. * | 300 | 13,242 |
| Genentech, Inc. * | 300 | 24,756 |
Broadcasting 0.17% | 28,547 | |
| CBS Corp., Class B | 400 | 11,420 |
| News Corp. | 900 | 17,127 |
Building Materials & Construction 0.29% | 46,990 | |
| American Standard Companies, Inc. | 600 | 25,062 |
| Masco Corp. | 800 | 21,928 |
Business Services 2.21% | 362,647 | |
| Affiliated Computer Services, Inc., Class A * | 600 | 30,804 |
| Computer Sciences Corp. * | 600 | 28,428 |
| DST Systems, Inc. * | 200 | 11,806 |
| Electronic Data Systems Corp. | 900 | 21,447 |
| First Data Corp. | 1,700 | 73,049 |
| H & R Block, Inc. | 500 | 10,515 |
| Manpower, Inc. | 500 | 29,555 |
| Moody’s Corp. | 1,400 | 85,652 |
| Paychex, Inc. | 500 | 17,955 |
| Pitney Bowes, Inc. | 800 | 34,872 |
| Robert Half International, Inc. | 600 | 18,564 |
Cellular Communications 0.40% | 65,464 | |
| Motorola, Inc. | 2,800 | 65,464 |
Chemicals 0.28% | 45,234 | |
| Air Products & Chemicals, Inc. | 200 | 13,258 |
| E.I. Du Pont De Nemours & Company | 800 | 31,976 |
Computers & Business Equipment 2.91% | 477,711 | |
| CDW Corp. | 300 | 17,490 |
| Dell, Inc. * | 5,900 | 133,045 |
| Hewlett-Packard Company | 6,700 | 244,952 |
| International Business Machines Corp. | 600 | 48,582 |
| Lexmark International, Inc. * | 600 | 33,642 |
See notes to financial statements
U.S. Core Fund
11
F I N A N C I A L S T A T E M E N T S
| Issuer | Shares | Value |
| Construction Materials 0.10% | $16,472 | |
| Martin Marietta Materials, Inc. | 200 | 16,472 |
Cosmetics & Toiletries 0.40% | 66,206 | |
| Avon Products, Inc. | 600 | 17,226 |
| Colgate-Palmolive Company | 500 | 29,930 |
| Kimberly-Clark Corp. | 300 | 19,050 |
Crude Petroleum & Natural Gas 1.31% | 214,798 | |
| Apache Corp. | 400 | 26,112 |
| Devon Energy Corp. | 500 | 31,245 |
| Marathon Oil Corp. | 600 | 50,100 |
| Occidental Petroleum Corp. | 1,400 | 71,386 |
| Sunoco, Inc. | 500 | 35,955 |
Drugs & Health Care 0.21% | 34,090 | |
| Wyeth | 700 | 34,090 |
Electrical Equipment 0.80% | 131,440 | |
| Emerson Electric Company | 1,600 | 131,440 |
Electrical Utilities 0.29% | 47,344 | |
| CenterPoint Energy, Inc. | 1,000 | 14,450 |
| Edison International | 100 | 4,364 |
| FirstEnergy Corp. | 500 | 28,530 |
Electronics 0.46% | 75,034 | |
| Agilent Technologies, Inc. * | 1,200 | 38,592 |
| Arrow Electronics, Inc. * | 500 | 13,950 |
| Jabil Circuit, Inc. | 400 | 10,732 |
| Thermo Electron Corp. * | 300 | 11,760 |
Financial Services 11.52% | 1,892,311 | |
| Bear Stearns Companies, Inc. | 300 | 39,105 |
| Charles Schwab Corp. | 3,400 | 55,454 |
| CIT Group, Inc. | 400 | 18,024 |
| Citigroup, Inc. | 8,500 | 419,475 |
| E*TRADE Financial Corp. * | 1,500 | 35,385 |
| Federal Home Loan Mortgage Corp. | 1,000 | 63,600 |
| Federal National Mortgage Association | 4,300 | 226,395 |
| Federated Investors, Inc., Class B | 500 | 16,740 |
| Fiserv, Inc. * | 400 | 17,668 |
| Goldman Sachs Group, Inc. | 1,100 | 163,515 |
| JPMorgan Chase & Company | 5,300 | 241,998 |
| Lehman Brothers Holdings, Inc. | 1,500 | 95,715 |
| Mellon Financial Corp. | 1,200 | 44,676 |
| Merrill Lynch & Company, Inc. | 2,000 | 147,060 |
| Morgan Stanley | 1,000 | 65,790 |
| PNC Financial Services Group, Inc. | 1,000 | 70,790 |
| State Street Corp. (c) | 800 | 49,440 |
| Washington Mutual, Inc. | 2,900 | 121,481 |
See notes to financial statements
U.S. Core Fund
12
F I N A N C I A L S T A T E M E N T S
| Issuer | Shares | Value |
Food & Beverages 3.33% | $546,285 | |
| Campbell Soup Company | 300 | 11,271 |
| Dean Foods Company * | 800 | 31,696 |
| H.J. Heinz Company | 500 | 20,920 |
| Kraft Foods, Inc., Class A | 700 | 23,737 |
| Pepsi Bottling Group, Inc. | 700 | 24,507 |
| PepsiCo, Inc. | 300 | 19,584 |
| Sara Lee Corp. | 1,500 | 24,945 |
| Starbucks Corp. * | 4,800 | 148,848 |
| Sysco Corp. | 400 | 12,556 |
| The Coca–Cola Company | 4,600 | 206,126 |
| Tyson Foods, Inc., Class A | 1,500 | 22,095 |
Healthcare Products 1.23% | 201,589 | |
| Baxter International, Inc. | 300 | 13,314 |
| Becton, Dickinson & Company | 200 | 13,940 |
| Biomet, Inc. | 300 | 9,813 |
| Johnson & Johnson | 2,000 | 129,320 |
| Stryker Corp. | 400 | 19,212 |
| Varian Medical Systems, Inc. * | 300 | 15,990 |
Healthcare Services 5.14% | 844,978 | |
| Cardinal Health, Inc. | 2,000 | 134,840 |
| Express Scripts, Inc. * | 1,600 | 134,528 |
| Health Net, Inc. * | 600 | 25,086 |
| IMS Health, Inc. | 400 | 10,916 |
| Lincare Holdings, Inc. * | 400 | 14,812 |
| McKesson Corp. | 2,900 | 147,320 |
| Quest Diagnostics, Inc. | 700 | 44,996 |
| UnitedHealth Group, Inc. | 6,400 | 332,480 |
Holdings Companies/Conglomerates 1.40% | 230,542 | |
| General Electric Company | 5,300 | 180,518 |
| Loews Corp. | 1,300 | 50,024 |
Homebuilders 0.38% | 63,012 | |
| Centex Corp. | 400 | 20,380 |
| KB Home | 300 | 12,828 |
| Lennar Corp., Class A | 400 | 17,936 |
| Pulte Homes, Inc. | 400 | 11,868 |
Hotels & Restaurants 0.29% | 48,430 | |
| Darden Restaurants, Inc. | 500 | 17,700 |
| McDonald’s Corp. | 500 | 17,950 |
| Wendy’s International, Inc. | 200 | 12,780 |
Household Appliances 0.39% | 64,728 | |
| Whirlpool Corp. | 800 | 64,728 |
See notes to financial statements
U.S. Core Fund
13
F I N A N C I A L S T A T E M E N T S
| Issuer | Shares | Value |
Household Products 0.23% | $37,663 | |
| Energizer Holdings, Inc. * | 200 | 13,372 |
| Newell Rubbermaid, Inc. | 900 | 24,291 |
Industrial Machinery 1.20% | 196,541 | |
| Caterpillar, Inc. | 1,400 | 92,890 |
| Cummins, Inc. | 100 | 11,482 |
| Deere & Company | 400 | 31,240 |
| ITT Industries, Inc. | 400 | 19,580 |
| Parker-Hannifin Corp. | 200 | 14,810 |
| Terex Corp. * | 300 | 13,179 |
| W.W. Grainger, Inc. | 200 | 13,360 |
Industrials 0.13% | 22,008 | |
| Fastenal Company | 600 | 22,008 |
Insurance 7.57% | 1,243,947 | |
| AFLAC, Inc. | 2,900 | 130,703 |
| Allstate Corp. | 500 | 28,970 |
| Ambac Financial Group, Inc. | 400 | 34,636 |
| American International Group, Inc. | 5,200 | 331,864 |
| Aon Corp. | 1,800 | 62,226 |
| Brown & Brown, Inc. | 400 | 11,976 |
| Chubb Corp. | 600 | 30,096 |
| CIGNA Corp. | 300 | 33,921 |
| Fidelity National Financial, Inc. | 900 | 36,207 |
| First American Corp. | 300 | 12,186 |
| Lincoln National Corp. | 800 | 48,560 |
| Marsh & McLennan Companies, Inc. | 200 | 5,232 |
| MBIA, Inc. | 500 | 30,815 |
| MetLife, Inc. | 700 | 38,521 |
| MGIC Investment Corp. | 300 | 17,361 |
| Old Republic International Corp. | 1,100 | 22,990 |
| PMI Group, Inc. | 500 | 21,620 |
| Principal Financial Group, Inc. | 400 | 21,296 |
| Progressive Corp. | 4,500 | 110,655 |
| Prudential Financial, Inc. | 400 | 29,364 |
| Radian Group, Inc. | 300 | 17,964 |
| St. Paul Travelers Companies, Inc. | 1,200 | 52,680 |
| Torchmark Corp. | 500 | 31,105 |
| Transatlantic Holdings, Inc. | 200 | 12,284 |
| UnumProvident Corp. | 1,700 | 32,215 |
| W.R. Berkley Corp. | 1,100 | 38,500 |
International Oil 0.94% | 154,978 | |
| Anadarko Petroleum Corp. | 2,100 | 98,511 |
| ChevronTexaco Corp. | 100 | 6,440 |
| ConocoPhillips | 500 | 31,715 |
| Hess Corp. | 400 | 18,312 |
See notes to financial statements
U.S. Core Fund
14
F I N A N C I A L S T A T E M E N T S
| Issuer | Shares | Value |
Leisure Time 0.50% | $81,740 | |
| International Game Technology, Inc. | 1,500 | 58,020 |
| Walt Disney Company | 800 | 23,720 |
Liquor 0.47% | 77,412 | |
| Anheuser–Busch Companies, Inc. | 1,100 | 54,318 |
| Brown Forman Corp., Class B | 300 | 23,094 |
Manufacturing 1.73% | 283,466 | |
| 3M Company | 300 | 21,510 |
| Danaher Corp. | 1,300 | 86,177 |
| Eaton Corp. | 500 | 33,250 |
| Harley–Davidson, Inc. | 700 | 40,957 |
| Illinois Tool Works, Inc. | 1,800 | 79,020 |
| Rockwell Automation, Inc. | 400 | 22,552 |
Office Furnishings & Supplies 0.46% | 75,016 | |
| Avery Dennison Corp. | 200 | 12,388 |
| Office Depot, Inc. * | 1,700 | 62,628 |
Paper 0.17% | 27,264 | |
| International Paper Company | 400 | 13,908 |
| Temple–Inland, Inc. | 300 | 13,356 |
Petroleum Services 1.46% | 239,397 | |
| Baker Hughes, Inc. | 700 | 49,826 |
| BJ Services Company | 200 | 6,862 |
| Exxon Mobil Corp. | 2,700 | 182,709 |
Pharmaceuticals 11.27% | 1,851,738 | |
| Abbott Laboratories | 400 | 19,480 |
| Allergan, Inc. | 400 | 45,824 |
| AmerisourceBergen Corp. | 2,100 | 92,736 |
| Barr Pharmaceuticals, Inc. * | 500 | 28,250 |
| Bristol-Myers Squibb Company | 3,800 | 82,650 |
| Caremark Rx, Inc. | 700 | 40,558 |
| Forest Laboratories, Inc. * | 3,400 | 169,932 |
| King Pharmaceuticals, Inc. * | 1,700 | 27,574 |
| Merck & Company, Inc. | 14,200 | 575,810 |
| Pfizer, Inc. | 27,900 | 768,924 |
Photography 0.10% | 17,016 | |
| Eastman Kodak Company | 800 | 17,016 |
Publishing 0.21% | 34,110 | |
| Gannett Company, Inc. | 600 | 34,110 |
Railroads & Equipment 1.01% | 165,765 | |
| Burlington Northern Santa Fe Corp. | 1,200 | 80,340 |
| CSX Corp. | 400 | 12,088 |
| Norfolk Southern Corp. | 400 | 17,092 |
| Union Pacific Corp. | 700 | 56,245 |
See notes to financial statements
U.S. Core Fund
15
F I N A N C I A L S T A T E M E N T S
| Issuer | Shares | Value |
Retail Grocery 1.55% | $254,924 | |
| Safeway, Inc. | 2,900 | 89,697 |
| SUPERVALU, Inc. | 1,200 | 34,272 |
| The Kroger Company | 5,500 | 130,955 |
Retail Trade 11.60% | 1,906,047 | |
| Abercrombie & Fitch Company, Class A | 200 | 12,906 |
| Bed Bath & Beyond, Inc. * | 1,600 | 53,968 |
| Best Buy Company, Inc. | 800 | 37,600 |
| Chico’s FAS, Inc. * | 600 | 11,064 |
| Circuit City Stores, Inc. | 400 | 9,444 |
| Costco Wholesale Corp. | 1,400 | 65,506 |
| Dollar General Corp. | 1,500 | 19,290 |
| Family Dollar Stores, Inc. | 700 | 17,899 |
| Home Depot, Inc. | 15,500 | 531,495 |
| Lowe’s Companies, Inc. | 13,500 | 365,310 |
| Nordstrom, Inc. | 200 | 7,470 |
| Ross Stores, Inc. | 400 | 9,796 |
| Staples, Inc. | 2,400 | 54,144 |
| The TJX Companies, Inc. | 1,700 | 45,475 |
| Tiffany & Company | 600 | 18,960 |
| Walgreen Company | 3,200 | 158,272 |
| Wal-Mart Stores, Inc. | 10,900 | 487,448 |
Sanitary Services 0.33% | 54,510 | |
| Ecolab, Inc. | 300 | 13,374 |
| Waste Management, Inc. | 1,200 | 41,136 |
Semiconductors 1.16% | 190,757 | |
| Applied Materials, Inc. | 1,200 | 20,256 |
| Intel Corp. | 3,800 | 74,252 |
| Microchip Technology, Inc. | 400 | 13,664 |
| National Semiconductor Corp. | 400 | 9,716 |
| NVIDIA Corp. * | 600 | 17,466 |
| Texas Instruments, Inc. | 1,700 | 55,403 |
Software 0.64% | 105,172 | |
| BEA Systems, Inc. * | 1,800 | 24,714 |
| BMC Software, Inc. * | 800 | 21,296 |
| Citrix Systems, Inc. * | 500 | 15,340 |
| Intuit, Inc. * | 600 | 18,132 |
| Microsoft Corp. | 1,000 | 25,690 |
Steel 0.33% | 53,757 | |
| Nucor Corp. | 1,100 | 53,757 |
Telecommunications Equipment & Services 1.25% | 206,142 | |
| Corning, Inc. * | 800 | 17,792 |
| QUALCOMM, Inc. | 5,000 | 188,350 |
See notes to financial statements
U.S. Core Fund
16
F I N A N C I A L S T A T E M E N T S
| Issuer | Shares | Value |
Telephone 6.28% | $1,031,385 | |
| ALLTEL Corp. | 100 | 5,421 |
| AT&T, Inc. | 10,400 | 323,752 |
| BellSouth Corp. | 6,700 | 272,824 |
| CenturyTel, Inc. | 600 | 23,892 |
| Harris Corp. | 300 | 13,176 |
| Qwest Communications International, Inc. * | 4,200 | 37,002 |
| Verizon Communications, Inc. | 10,100 | 355,318 |
Tobacco 1.71% | 281,056 | |
| Altria Group, Inc. | 2,800 | 233,884 |
| Reynolds American, Inc. | 400 | 26,028 |
| UST, Inc. | 400 | 21,144 |
Transportation 0.61% | 99,436 | |
| C.H. Robinson Worldwide, Inc. | 1,300 | 59,566 |
| Expeditors International of Washington, Inc. | 1,000 | 39,870 |
Trucking & Freight 1.29% | 211,885 | |
| Fedex Corp. | 2,000 | 202,060 |
| J.B. Hunt Transport Services, Inc. | 500 | 9,825 |
| Principal | ||
| Issuer, description, maturity date | amount | Value |
| Repurchase agreements 4.64% | $763,000 | |
| (Cost $763,000) | ||
| Repurchase Agreement 4.64% | 763,000 | |
| Repurchase Agreement with State Street Corp. dated | ||
| 8/31/2006 at 3.95% to be repurchased at $763,084 | ||
| on 9/1/2006, collateralized by $780,000 Federal | ||
| Home Loan Bank, 4.90% due 9/29/2010 (valued at | ||
| $780,975, including interest) (c) | $763,000 | 763,000 |
| Total investments (cost $15,616,694) 99.52% | $16,345,338 | |
| Other assets in excess of liabilities 0.48% | 78,541 | |
| Total net assets 100.00% | $16,423,879 | |
* Non-income producing.
(c) Investment is an affiliate of the Trust’s Subadvisor or custodian bank.
See notes to financial statements
U.S. Core Fund
17
F I N A N C I A L S T A T E M E N T S
Financial statements
Statement of assets and liabilities 8-31-06 (unaudited)
| This Statement of Assets and Liabilities is the Fund’s balance sheet. It shows the value of what the Fund owns, is due and owes. You’ll also find the net asset value and the maximum offering price per share. |
| Assets | |
| Investments, at value (Cost $14,853,694) | $15,582,338 |
| Repurchase agreements, at value (Cost $763,000) | 763,000 |
| Cash | 18,836 |
| Receivable for shares sold | 36,583 |
| Dividends and interest receivable | 28,432 |
| Receivable for futures variation margin | 125 |
| Other assets | 26,805 |
| Total assets | 16,456,119 |
| Liabilities | |
| Payable to affiliates | |
| Fund administration fees | 208 |
| Service fees | 55 |
| Transfer agent fees | 6,831 |
| Other payables and accrued expenses | 25,146 |
| Total liabilities | 32,240 |
| Net assets | |
| Capital paid-in | 15,591,972 |
| Accumulated undistributed net realized gain on investments and futures contracts | 66,595 |
| Unrealized appreciation on investments and futures contracts | 736,362 |
| Undistributed net investment income | 28,950 |
| Net assets | $16,423,879 |
| Net asset value per share | |
| Based on net asset values and shares outstanding — The Fund has an | |
| unlimited number of shares authorized with no par value. | |
| Class A ($15,875,026 ÷ 752,810 shares) | $21.09 |
| Class B ($107,183 ÷ 5,090 shares) | $21.06 |
| Class C ($219,275 ÷ 10,415 shares) | $21.05 |
| Class I ($117,037 ÷ 5,545 shares) | $21.11 |
| Class R ($105,358 ÷ 5,000 shares) | $21.07 |
| Maximum offering price per share | |
| Class Aa ($21.09 ÷ 95%) | $22.20 |
a On single retail sales of less than $50,000. On sales of $50,000 or more, and on group sales, the offering price is reduced.
See notes to financial statements
U.S. Core Fund
18
F I N A N C I A L S T A T E M E N T S
Statement of operations For the period ended 8-31-06a. (unaudited)
This Statement of Operations summarizes the Fund’s investment income earned
and expenses incurred in operating the Fund. It also shows net gains (losses) for
the period stated.
| Investment income | |
| Dividends | 64,577 |
| Interest | 11,109 |
| Total investment income | 75,686 |
| Expenses | |
| Investment management fees (Note 3) | 26,089 |
| Distribution and service fees (Note 3) | 10,730 |
| Transfer agent fees (Note 3) | 6,830 |
| Fund administration fees (Note 3) | 208 |
| Blue sky fees (Note 3) | 20,405 |
| Audit and legal fees | 16,950 |
| Custodian fees | 7,539 |
| Printing and postage fees (Note 3) | 4,869 |
| Trustees’ fees (Note 3) | 111 |
| Miscellaneous | 214 |
| Total expenses | 93,945 |
| Less expense reductions (Note 3) | (47,209) |
| Net expenses | 46,736 |
| Net investment income | 28,950 |
| Realized and unrealized gain | |
| Net realized gain on | |
| Investments | 54,206 |
| Futures contracts | 12,389 |
| Change in net unrealized appreciation (depreciation) of | |
| Investments | 728,644 |
| Futures contracts | 7,718 |
| Net realized and unrealized gain | 802,957 |
| Increase in net assets from operations | $831,907 |
aPeriod from 6-12-06 (commencement of operations) to 8-31-06.
See notes to financial statements
U.S. Core Fund
19
F I N A N C I A L S T A T E M E N T S
Statement of changes in net assets (unaudited)
This Statement of Changes in Net Assets shows how the value of the Fund’s net assets
has changed during the period. The difference reflects earnings less expenses, any
investment gains and losses, distributions, if any, paid to shareholders and the net of
Fund share transactions.
| Period ended | |
| 8-31-06a | |
| Increase (decrease) in net assets | |
| From operations | |
| Net investment income | $28,950 |
| Net realized gain | 66,595 |
| Change in net unrealized appreciation (depreciation) | 736,362 |
| Increase in net assets resulting from operations | 831,907 |
| From Fund share transactions | 15,591,972 |
| Net assets | |
| Beginning of period | — |
| End of periodb | $16,423,879 |
a Period from 6-12-06 (commencement of operations) to 8-31-06. Unaudited.
b Includes undistributed net investment income of $28,950.
See notes to financial statements
U.S. Core Fund
20
F I N A N C I A L S T A T E M E N T S
Financial highlights
| The Financial highlights show how the Fund’s net asset value for a share has changed since the end of the previous period. |
| CLASS A SHARES | |
| Period ended | 8-31-06a,b |
| Per share operating performance | |
| Net asset value, beginning of period | $20.00 |
| Net investment incomeh | 0.04 |
| Net realized and unrealized | |
| gain on investments | 1.05 |
| Total from investment operations | 1.09 |
| Net asset value, end of period | $21.09 |
| Total return (%) | 5.45l,m |
| Ratios and supplemental data | |
| Net assets, end of period | |
| (in millions) | $16 |
| Ratio of net expenses to average | |
| net assets (%) | 1.35r |
| Ratio of gross expenses to average | |
| net assets (%) | 2.26r |
| Ratio of net investment income | |
| to average net assets (%) | 0.85r |
| Portfolio turnover (%) | 10m |
See notes to financial statements
U.S. Core Fund
21
F I N A N C I A L S T A T E M E N T S
Financial highlights
| CLASS B SHARES | |
| Period ended | 8-31-06a,b |
| Per share operating performance | |
| Net asset value, beginning of period | $20.00 |
| Net investment incomeh | 0.01 |
| Net realized and unrealized | |
| gain on investments | 1.05 |
| Total from investment operations | 1.06 |
| Net asset value, end of period | $21.06 |
| Total return (%) | 5.30l,m |
| Ratios and supplemental data | |
| Net assets, end of period | |
| (in millions) | —i |
| Ratio of net expenses to average | |
| net assets (%) | 2.05r |
| Ratio of gross expenses to average | |
| net assets (%) | 20.78r |
| Ratio of net investment income | |
| to average net assets (%) | 0.16r |
| Portfolio turnover (%) | 10m |
See notes to financial statements
U.S. Core Fund
22
F I N A N C I A L S T A T E M E N T S
Financial highlights
| CLASS C SHARES | |
| Period ended | 8-31-06a,b |
| Per share operating performance | |
| Net asset value, beginning of period | $20.00 |
| Net investment incomeh | 0.01 |
| Net realized and unrealized | |
| gain on investments | 1.04 |
| Total from investment operations | 1.05 |
| Net asset value, end of period | $21.05 |
| Total return (%) | 5.25l,m |
| Ratios and supplemental data | |
| Net assets, end of period | |
| (in millions) | —i |
| Ratio of net expenses to average | |
| net assets (%) | 2.05r |
| Ratio of gross expenses to average | |
| net assets (%) | 14.50r |
| Ratio of net investment income | |
| to average net assets (%) | 0.20r |
| Portfolio turnover (%) | 10m |
See notes to financial statements
U.S. Core Fund
23
F I N A N C I A L S T A T E M E N T S
Financial highlights
| CLASS I SHARES | |
| Period ended | 8-31-06a,b |
| Per share operating performance | |
| Net asset value, beginning of period | $20.00 |
| Net investment incomeh | 0.06 |
| Net realized and unrealized | |
| gain on investments | 1.05 |
Total from investment operations | 1.11 |
Net asset value, end of period | $21.11 |
Total return (%) | 5.55l,m |
| Ratios and supplemental data | |
| Net assets, end of period | |
| (in millions) | —i |
| Ratio of net expenses to average | |
| net assets (%) | 0.95r |
| Ratio of gross expenses to average | |
| net assets (%) | 18.19r |
| Ratio of net investment income | |
| to average net assets (%) | 1.25r |
| Portfolio turnover (%) | 10m |
See notes to financial statements
U.S. Core Fund
24
F I N A N C I A L S T A T E M E N T S
Financial highlights
| CLASS R SHARES | |
| Period ended | 8-31-06a,b |
| Per share operating performance | |
| Net asset value, beginning of period | $20.00 |
| Net investment incomeh | 0.02 |
| Net realized and unrealized | |
| gain on investments | 1.05 |
| Total from investment operations | 1.07 |
| Net asset value, end of period | $21.07 |
| Total return (%) | 5.35l,m |
| Ratios and supplemental data | |
| Net assets, end of period | |
| (in millions) | —i |
| Ratio of net expenses to average | |
| net assets (%) | 1.70r |
| Ratio of gross expenses to average | |
| net assets (%) | 20.49r |
| Ratio of net investment income | |
| to average net assets (%) | 0.50r |
| Portfolio turnover (%) | 10m |
| a Class A, Class B, Class C, Class I, Class R and Class 1 shares began operations on 6-12-06. b Unaudited. h Based on the average of the shares outstanding. i Less than $500,000. l Total returns would have been lower had certain expenses not been reduced during the period shown. m Not annualized. r Annualized. |
See notes to financial statements
U.S. Core Fund
25
Notes to financial statements (unaudited)
1. Organization
John Hancock U.S. Core Fund (the “Fund”) is a newly organized diversified series of John Hancock Funds III (the “Trust”). The Trust was established as a Massachusetts business trust on June 9, 2005. The Trust is registered under the Investment Company Act of 1940, as amended (the “1940 Act”), as an open-end investment management company. The investment objective of the Fund is to seek high total return relative to its benchmark.
John Hancock Life Insurance Company of New York (“John Hancock New York”) is a wholly owned subsidiary of John Hancock Life Insurance Company (U.S.A.) (“John Hancock USA”). John Hancock USA and John Hancock New York are indirect wholly owned subsidiaries of The Manufacturers Life Insurance Company (“Manulife”), which in turn is a wholly owned subsidiary of Manulife Financial Corporation (“MFC”), a publicly traded company. Manulife Financial Corporation and its subsidiaries are known collectively as “Manulife Financial.”
John Hancock Investment Management Services, LLC (the “Adviser”) is the Adviser to the Trust. John Hancock Funds, LLC (the “Distributor”), a Delaware limited liability company controlled by John Hancock USA, serves as principal underwriter and is a wholly owned subsidiary of the Adviser.
The Board of Trustees has authorized the issuance of multiple classes of shares of the Fund, including classes designated as Class A, Class B, Class C, Class I and Class R shares. The shares of each class represent an interest in the same portfolio of investments of the Fund, and have equal rights as to voting, redemptions, dividends and liquidation, except that certain expenses, subject to the approval of the Board of Trustees, may be applied differently to each class of shares in accordance with current regulations of the Securities and Exchange Commission and the Internal Revenue Service. Shareholders of a class that bear distribution and service expenses under the terms of a distribution plan have exclusive voting rights to that distribution plan.
The Adviser and other subsidiaries of John Hancock Life Insurance Company owned 730,000 Class A shares, 5,000 Class B shares, 5,000 Class C shares, 5,000 Class I shares and 5,000 Class R shares of beneficial interest of the Fund on August 31, 2006.
2. Significant accounting policies
In the preparation of the financial statements, the Fund follows the policies described below. The preparation of financial statements in conformity with accounting principles generally accepted in the United States of America requires management to make estimates and assumptions that affect the reported amounts of assets and liabilities at the date of the finan-cial statements and the reported amounts of income and expenses during the reporting period. Actual results may differ from these estimates.
Security valuation
The net asset value of the shares of the Fund is determined daily as of the close of the New York Stock Exchange, normally at 4:00 p.m. Eastern time. Short-term debt instruments with remaining maturities of 60 days or less are valued at amortized cost, and thereafter assume a constant amortization to maturity of any discount or premium, which approximates market value. Investments in State Street Navigator Securities Lending Prime Portfolio are valued at their net asset value each business day. All other securities held by the Fund are valued at the last sale price or official closing price (closing bid price or last evaluated quote if no sale has occurred) as of the close of business on a principal securities exchange (domestic or foreign) or, lacking any sales, at the closing bid price. Securities traded only in the over-the-counter market are valued at
U.S. Core Fund
26
the last bid price quoted by brokers making markets in the securities at the close of trading. Fund securities for which there are no such quotations, principally debt securities, are valued based on the valuation provided by an independent pricing service, which utilizes both dealer-supplied and electronic data processing techniques.
Other assets and securities for which no such quotations are readily available are valued at their fair value as determined in good faith under consistently applied procedures established by and under the general supervision of the Board of Trustees. Generally, trading in non-U.S. securities is substantially completed each day at various times prior to the close of trading on the New York Stock Exchange. The values of such securities used in computing the net asset value of a Fund’s shares are generally determined as of such times. Occasionally, significant events that affect the values of such securities may occur between the times at which such values are generally determined and the close of the New York Stock Exchange. In such events, these securities will then be valued at their fair value as determined in good faith under consistently applied procedures established by and under the general supervision of the Board of Trustees.
In deciding whether to make a fair value adjustment to the price of a security, the Trustees or their designee may review a variety of factors, including, developments in foreign markets, the performance of U.S. securities markets and the performance of instruments trading in U.S. markets that represent foreign securities and baskets of foreign securities. The Fund may also fair value securities in other situations, for example, when a particular foreign market is closed, but the Fund is calculating the net asset value. In view of these factors, it is likely that Fund investing significant amounts of assets in securities in foreign markets will be fair valued more frequently than a fund investing significant amounts of assets in frequently traded, U.S. exchange listed securities of large capitalization U.S. issuers.
For purposes of determining when fair value adjustments may be appropriate with respect to the Fund investing in securities in foreign markets that close prior to the New York Stock Exchange, the Fund will, on an ongoing basis, monitor for “significant market events.” A significant market event may be a certain percentage change in the value of an index or of certain Exchange Traded Funds (“ETFs”) that track foreign markets in which the Fund has significant investments. If a significant market event occurs due to a change in the value of the index or of ETFs, the pricing for the Fund will promptly be reviewed and potential adjustments to the net asset value will be recommended to the Trust’s Pricing Committee, where applicable.
Fair value pricing of securities is intended to help ensure that the net asset value of the Fund’s shares reflects the value of the Fund’s securities as of the close of the New York Stock Exchange (as opposed to a value which is no longer accurate as of such close), thus limiting the opportunity for aggressive traders to purchase shares of the Fund at deflated prices, reflecting stale security valuations, and to promptly sell such shares at a gain. However, a security’s valuation may differ depending on the method used for determining value and no assurance can be given that fair value pricing of securities will successfully eliminate all potential opportunities for such trading gains.
Repurchase agreements
The Fund may enter into repurchase agreements. When the Fund enters into a repurchase agreement through its custodian, it receives delivery of securities, the amount of which at the time of purchase and each subsequent business day is required to be maintained at such a level that the market value is generally at least 102% of the repurchase amount. The Fund will take constructive receipt of all securities underlying the repurchase agreements it has entered into until such agreements expire. If the seller defaults, the Fund would suffer a loss to the extent that proceeds from the sale of underlying securities were less than the repurchase amount. The Fund may enter into repurchase agreements maturing within seven days with domestic dealers, banks or other financial institutions deemed to be creditworthy by the Adviser. Collateral for certain tri-party repurchase
U.S. Core Fund
27
agreements is held at the custodian bank in a segregated account for the benefit of the Fund and the counterparty.
| Security transactions and related investment income |
Investment security transactions are accounted for on a trade date plus one basis for daily net asset value calculations. However for financial reporting purposes, investment transactions are reported on trade date. Interest income is accrued as earned. Dividend income is recorded on the ex-dividend date. Foreign dividends are recorded on the ex-date or as soon after the ex-date that the Fund becomes aware of such dividends, net of all taxes. Discounts/premiums are accreted/amortized for financial reporting purposes. Non-cash dividends are recorded at the fair market value of the securities received. Debt obligations may be placed in a non-accrual status and related interest income may be reduced by ceasing current accruals and writing off interest receivables when the collection of all or a portion of interest has become doubtful, based upon consistently applied procedures.
Inflation indexed securities are fixed-income securities whose principal value is periodically adjusted according to the rate of inflation. Interest is accrued based upon the principal value, which is adjusted for inflation. Principal of inflation index protected securities is increased or decreased by the rate of change in the Consumer Price Index. Interest income includes accretion of discounts and amortization of premiums as well as accretion or amortization of principal of inflation index protected securities.
From time to time, the Fund may invest in Real Estate Investment Trusts (“REITs”) and as a result, will estimate the components of distributions from these securities. Distributions from REITs received in excess of income are recorded as a reduction of cost of investments and/or as a realized gain.
The Fund uses the First In, First Out method for fixed income securities and Highest Cost, First Out for all other securities for determining realized gain or loss on investments for both financial and federal income tax reporting purposes.
Multi-class operations
All income, expenses (except for class-specific expenses) and realized and unrealized gains (losses) are allocated to each class of shares based upon the relative net assets of each class. Dividends to shareholders from net investment income are determined at a class level and distributions from capital gains are determined at a Fund level.
Expense allocation
Expenses are allocated based on the relative share of net assets of the Fund at the time the expense was incurred. Class-specific expenses, such as distribution (Rule 12b-1) fees, are accrued daily and charged directly to the respective share classes.
Futures
The Fund may purchase and sell financial futures contracts and options on those contracts. The Fund invests in contracts based on financial instruments such as U.S. Treasury Bonds or Notes on securities indices such as the Standard & Poor’s 500 Index (the “S&P 500 Index”), in order to hedge against a decline in the value of securities owned by the Fund.
Upon entering into futures contracts, the Fund is required to deposit with a broker an amount, termed the initial margin, which typically represents a certain percentage of the purchase price indicated in the futures contract. Payments to and from the broker, known as variation margin, are required to be made on a daily basis as the price of the futures contract fluctuates, making the long or short positions in the contract more or less valuable. If the position is closed out by taking an opposite position prior to the settlement date of the futures contract, a final determination of variation margin is made, cash is required to be paid to or released by the broker, and the Fund realizes a gain or loss.
When the Fund sells a futures contract based on a financial instrument, the Fund becomes obligated to deliver that kind of instrument at an agreed upon date for a specified price. The Fund realizes a gain or loss depending on whether the price of an offsetting purchase is less or more than the price of the initial sale or on whether the price of an offsetting sale is
U.S. Core Fund
28
more or less than the price of the initial purchase. The Fund could be exposed to risks if it could not close out futures positions because of an illiquid secondary market or the inability of counterparties to meet the terms of their contracts. Futures contracts are valued at the quoted daily settlement prices established by the exchange on which they trade.
| The following is a summary of open futures contracts on August 31, 2006: | ||||
| NUMBER OF | UNREALIZED | |||
| OPEN CONTRACTS | CONTRACTS | POSITION | EXPIRATION | APPRECIATION |
| S&P 500 Index | 1 | Long | Sep 2006 | $7,718 |
Federal income taxes
The Fund qualifies as a “regulated investment company” by complying with the applicable provisions of the Internal Revenue Code and will not be subject to federal income tax on taxable income that is distributed to shareholders. Therefore, no federal income tax provision is required.
New accounting pronouncements
In June 2006, Financial Accounting Standards Board (“FASB”) Interpretation No. 48, Accounting for Uncertainty in Income Taxes (the “Interpretation”) was issued, and is effective for fiscal years beginning after December 15, 2006 and is to be applied to all open tax years as of the effective date. The Interpretation prescribes a minimum threshold for financial statement recognition of the benefit of a tax position taken or expected to be taken in a tax return, and requires certain expanded disclosures. Management is currently evaluating the application of the Interpretation to the Fund, and has not at this time quantified the impact, if any, resulting from the adoption of the Interpretation on the Fund’s financial statements.
In September 2006, FASB Standard No. 157, Fair Value Measurements (“FAS 157”) was issued, and is effective for fiscal years beginning after November 15, 2007. FAS 157 defines fair value, establishing a framework for measuring fair value and expands disclosure about fair value measurements. Management is currently evaluating the application of FAS 157 to the Fund, and its impact, if any, resulting from the adoption of FAS 157 on the Fund’s financial statements.
Distribution of income and gains
The Fund records distributions to shareholders from net investment income and net realized gains, if any, on the ex-dividend date. Distributions paid by the Fund with respect to each class of shares are calculated in the same manner, at the same time and are in the same amount, except for the effect of expenses that may be applied differently to each class. Such distributions, on a tax basis, are determined in conformity with income tax regulations, which may differ from accounting principles generally accepted in the United States of America. Distributions in excess of tax basis earnings and profits, if any, are reported in the Fund’s financial statements as a return of capital.
Capital accounts
The Fund reports the undistributed net investment income and accumulated undistributed net realized gain (loss) accounts on a basis approximating amounts available for future tax distributions (or to offset future taxable realized gains when a capital loss carryforward is available). Accordingly, the Fund may periodically make reclassifications among certain capital accounts without affecting its net asset value.
| 3. Investment advisory and other agreements |
Advisory fees
The Trust has entered into an Investment Advisory Agreement with the Adviser. The Adviser is responsible for managing the corporate and business affairs of the Trust and for selecting and compensating subadvisers to handle the investment and reinvestment of the
U.S. Core Fund
29
assets of the Fund, subject to the supervision of the Board of Trustees. Under the Advisory Agreement the Fund pays a monthly management fee to the Adviser equivalent, on an annual basis, to the sum of: (a) 0.78% of the first $500,000,000 of the Fund’s aggregate daily net assets; (b) 0.76% of the next $500,000,000 of the Fund’s aggregate daily net assets; (c) 0.75% of the next $1,500,000,000 of the Fund’s aggregate daily net assets; and (d) 0.74% of the Fund’s aggregate daily net assets in excess of $2,500,000,000. Aggregate net assets include the net assets of the Fund, the U.S. Core Trust and a portion of the net assets of the Managed Trust that is subadvised by Grantham, Mayo Van Otterloo and Co., LLC. U.S. Core Trust and Managed Trust are a series of John Hancock Trust. John Hancock Trust is an open-end investment company advised by the Adviser and distributed by the Distributor. The Fund is not responsible for payment of the subadvisory fees.
Expense reimbursements
The Adviser has agreed contractually to reimburse for certain fund level expenses that exceed 0.10% of the average annual net assets, or to make a payment to a specific class of shares of the Fund in an amount equal to the amount by which the expenses attributable to such class of shares (excluding taxes, portfolio brokerage commissions, interest, litigation and indemnification expenses and other extraordinary expenses not incurred in the ordinary course of the Fund’s business and fees under any agreement or plans of the Fund dealing with services for shareholders and others with beneficial interests in shares of the Fund) exceed the percentage of average annual net assets (on an annualized basis) attributable as follows: 1.35% for Class A, 2.05% for Class B, 2.05% for Class C, 0.95% for Class I and 1.45% for Class R. Accordingly, the expense reductions related to this expense limitation amounted to $30,181, $4,205, $4,383, $4,223 and $4,217 for Class A, Class B, Class C, Class I and Class R, respectively, for the period ended August 31, 2006. This expense reimbursement shall continue in effect until June 30, 2007 and thereafter until terminated by the Adviser on notice to the Trust.
Administration fees
The Fund has an agreement with the Adviser that requires the Fund to reimburse the Adviser for all expenses associated with providing the administrative, financial, accounting and recordkeeping services of the Fund, including the preparation of all tax returns, annual, semiannual and periodic reports to shareholders and the preparation of all regulatory reports.
Distribution plan
The Trust has a Distribution Agreement with the Distributor, a wholly owned subsidiary of the Adviser. The Fund has adopted Distribution Plans with respect to Class A, Class B, Class C and Class R, pursuant to Rule 12b-1 under the 1940 Act, to reimburse the Distributor for the services it provides as distributor of shares of the Fund. Accordingly, the Fund makes monthly payments to the Distributor at an annual rate not to exceed 0.30%, 1.00%, 1.00% and 0.50% of average daily net asset value of Class A, Class B, Class C and Class R, respectively. A maximum of 0.25% of such payments may be service fees, as defined by the Conduct Rules of the National Association of Securities Dealers. Under the Conduct Rules, curtailment of a portion of the Fund’s 12b-1 payments could occur under certain circumstances. In addition, under a Service Plan for Class R shares, the Fund pays up to 0.25% of Class R average daily net asset value for certain other services.
Sales charges
Class A shares are assessed up-front sales charges of up to 5.00% of net asset value of such shares. During the period ended August 31, 2006, the Fund was informed that the Distributor received net up-front sales charges of $17,864 with regard to sales of Class A shares. Of this amount, $2,836 was retained and used for printing prospectuses, advertising, sales literature and other purposes, $15,026 was paid as sales commissions to unrelated broker-dealers and $2 was paid as sales commissions to sales personnel of Signator Investors, Inc., a related broker-dealer, an indirect-subsidiary of MFC.
Class B shares that are redeemed within six years of purchase are subject to a contingent deferred sales charge (“CDSC”) at declining rates, beginning at 5.00% of the lesser of
U.S. Core Fund
30
the current market value at the time of redemption or the original purchase cost of the shares being redeemed. Class C shares that are redeemed within one year of purchase are subject to a CDSC at a rate of 1.00% of the lesser of the current market value at the time of redemption or the original purchase cost of the shares being redeemed. Proceeds from the CDSCs are paid to the Distributor and are used, in whole or in part, to defray its expenses for providing distribution-related services to the Fund in connection with the sale of Class B and Class C shares. During the period ended August 31, 2006, the Fund was informed that the Distributor received no CDSCs for Class B and Class C shares.
Transfer agent fees
The Fund has a Transfer Agency Agreement with John Hancock Signature Services, Inc. (“Signature Services”), an indirect subsidiary of MFC. For Class A, Class B, Class C, Class I and Class R shares, the Fund pays a monthly transfer agent fee at an annual rate of 0.05% of each class’ average daily net assets, plus a fee based on the number of shareholder accounts and reimbursement for certain out-of-pocket expenses. Expenses not directly attributable to a particular class of shares are aggregated and allocated to each class on the basis of its relative net asset value.
Signature Services has agreed to limit the transfer agent fees so that such fees do not exceed 0.20% annually of Class A, Class B, Class C, Class I and Class R share average daily net assets. This agreement is effective until December 31, 2006. Signature Services reserves the right to terminate this limitation in the future. Accordingly, there were no transfer agent fees reductions for Class A, Class B, Class C, Class I and Class R, during the period ended August 31, 2006.
| Expenses under the agreements described above for the period ended August 31, 2006, were as follows: |
| Distribution | Transfer | Printing and | ||
| Share Class | and service fees | agent | Blue sky | postage |
| Class A | $9,987 | $6,658 | $4,275 | $4,726 |
| Class B | 224 | 45 | 4,032 | 32 |
| Class C | 352 | 70 | 4,033 | 44 |
| Class I | — | 12 | 4,043 | 35 |
| Class R | 167 | 45 | 4,022 | 32 |
| Total | $10,730 | $6,830 | $20,405 | $4,869 |
Trustees’ fees
The Trust compensates each Trustee who is not an employee of the Adviser or its affiliates. Total Trustees’ expenses are allocated to the Fund based on its average daily net asset value.
4. Guarantees and indemnifications
Under the Trust’s organizational documents, its Officers and Trustees are indemnified against certain liability arising out of the performance of their duties to the Trust. Additionally, in the normal course of business, the Trust enters into contracts with service providers that contain general indemnification clauses. The Trust’s maximum exposure under these arrangements is unknown, as this would involve future claims that may be made against the Trust that have not yet occurred. However, based on experience, the Trust believes the risk of loss to be remote.
5. Line of credit
The Fund has entered into an agreement which enables them to participate in a $100 million unsecured committed line of credit with State Street Bank & Trust Company. Borrowings will be made solely to temporarily finance the repurchase of capital shares. Interest is charged to the Fund based on its borrowings at a rate per annum equal to the Federal Funds rate plus 0.50% . In addition, a commitment fee of
U.S. Core Fund
31
0.07% per annum, payable at the end of each calendar quarter, based on the average daily-unused portion of the line of credit, is charged to the Fund on a prorated basis based on average net assets. For the period ended August 31, 2006, there was no borrowings under the line of credit.
6. Capital shares
Share activities for the Fund for the period ended August 31, 2006 were as follows:
| Period ended 8-31-06a | ||
| Shares | Amount | |
| Class A shares | ||
| Sold | 752,810 | $15,069,156 |
| Net increase | 752,810 | $15,069,156 |
| Class B shares | ||
| Sold | 5,090 | $101,884 |
| Net increase | 5,090 | $101,884 |
| Class C shares | ||
| Sold | 10,415 | $209,932 |
| Net increase | 10,415 | $209,932 |
| Class I shares | ||
| Sold | 5,545 | $111,000 |
| Net increase | 5,545 | $111,000 |
| Class R shares | ||
| Sold | 5,000 | $100,000 |
| Net increase | 5,000 | $100,000 |
| Net increase | 778,860 | $15,591,972 |
aPeriod from 6-12-06 (commencement of operations) to 8-31-06. Unaudited.
7. Investment transactions
Purchases and proceeds from sales or maturities of securities, other than short-term securities and obligations of the U.S. government, during the period ended August 31, 2006, aggregated $16,297,157 and $1,497,669, respectively.
The cost of investments owned on August 31, 2006, including short-term investments, for federal income tax purposes, was $15,616,694. Gross unrealized appreciation and depreciation of investments aggregated $1,057,983 and $329,339, respectively, resulting in net unrealized appreciation of $728,644.
8. Federal income tax information
Federal income tax regulations may differ from generally accepted accounting principles and income and capital gain distributions determined in accordance with tax regulations may differ from net investment income and realized gains recognized for financial reporting purposes.
U.S. Core Fund
32
| Evaluation of Advisory and Subadvisory Agreements by the Board of Trustees |
| This section describes the evaluation by the Board of Trustees of the Advisory Agreement and each of the Subadvisory Agreements. |
Evaluation by the Board of Trustees The Board, including all of the Trustees who are not “interested persons” as defined in the Investment Company Act of 1940, as amended (the “Independent Trustees”), is responsible for selecting the Trust’s investment adviser, John Hancock Investment Management Services, LLC (the “Adviser” or “JHIMS”), approving the Adviser’s selection of subadvisers for each series of the Trust (the “Funds”) and approving the Trust’s advisory and sub-advisory agreements (and any sub-subadvisory agreements), their periodic continuation and any amendments. Consistent with SEC rules, the Board regularly evaluates the Trust’s advisory and subadvisory (and sub-subadvisory) arrangements, including consideration of the factors listed below. The Board may also consider other factors (including conditions and trends prevailing generally in the econom y, the securities markets and the industry) and does not treat any single factor as determinative, and each Trustee may attribute different weights to different factors. The Board is furnished with an analysis of its fiduciary obligations in connection with its evaluation and, throughout the evaluation process, the Board is assisted by counsel for the Trust and the Independent Trustees are also separately assisted by independent legal counsel. The factors regularly considered by the Board are:
1. the nature, extent and quality of the services to be provided by the Adviser to the Trust and by the subadvisers to the Funds;
2. the investment performance of the Funds and their subadvisers;
3. the extent to which economies of scale would be realized as a Fund grows and whether fee levels reflect these economies of scale for the benefit of Trust shareholders;
4. the costs of the services to be provided and the profits to be realized by the Adviser and its affiliates (including any subadvisers that are affiliated with the Adviser) from the Adviser’s relationship with the Trust; and
5. comparative services rendered and comparative advisory and subadvisory fee rates.
The Board believes that information relating to all these factors is relevant to its evaluation of the Trust’s advisory agreement. With respect to its evaluation of subadvisory agreements (including sub-subadvisory agreements) the Board believes that, in view of the Trust’s “manager-of managers” advisory structure, the costs of services to be provided and the profits to be realized by those subadvisers that are not affiliated with the Adviser from their relationship with the Trust generally are not a material factor to the Board’s consideration of subadvisory agreements because such fees are paid to sub-advisers by the Adviser and not by the Funds, and because the Board relies on the ability of the Adviser to negotiate such subadvisory fees at arms-length.
In evaluating subadvisory arrangements, the Board also considers other material business relationships that unaffiliated sub-advisers and their affiliates have with the Adviser or its affiliates, including the involvement by certain affiliates of certain subadvisers in the distribution of financial products, including shares of the Trust, offered by the Adviser and other affiliates of the Adviser (“Material Relationships”).
Approval of Advisory Agreement
At its meeting on September 21, 2005, the Board, including all the Independent Trustees, approved the Advisory Agreement between the Trust and JHIMS with respect to each of the Funds.
In approving the Advisory Agreement, and with reference to the factors which it regularly considers, the Board:
(1) (a) considered the high value to the Trust of continuing the relationship with JHIMS as the Trust’s Adviser to the other John Hancock Funds, the skills and competency with which JHIMS
33
has in the past managed the affairs and subadvisory relationships of other funds in the complex, JHIMS’s oversight and monitoring of subadvisers’ investment performance and compliance programs including its timelines in responding to performance issues and the qualifications of JHIMS’s personnel,
(b) considered JHIMS’s compliance policies and procedures and its responsiveness to regulatory changes and mutual fund industry developments, and
(c) JHIMS’s administrative capabilities, including its ability to supervise the other service providers for the Funds and concluded that JHIMS may reasonably be expected to ably perform its services under the Advisory Agreement.
(2) reviewed the investment performance of portfolios that are managed comparable to the Funds; the comparative performance of their respective benchmarks; and JHIMS’ analysis of such performance and its plans and recommendations regarding the Trust’s subadvisory arrangements generally and with respect to the Funds; and concluded that each of the comparably managed funds has performed well or within a range that the Board deemed competitive, and that JHIMS may reasonably be expected to ably monitor the performance of the Funds and their subadvisers;
(3) reviewed the Trust’s advisory fee structure and the incorporation therein of any subadvisory fee breakpoints in the advisory fees charged and concluded (i) that to the extent that Funds have subadvisory fees with breakpoints, those breakpoints are reflected as breakpoints in the advisory fees for Funds, (ii) that all Funds with a subadviser that is not affiliated with the Adviser have subadvisory fees which are the product of arms-length negotiations between the Adviser and the subadviser and which in many, but not all, cases contain breakpoints, and (iii) that, although economies of scale cannot be measured with precision, these arrangements permit shareholders of Funds with advisory fee breakpoints to benefit from economies of scale if those Funds grow;
(4) (a) reviewed the financial statements of JHIMS and John Hancock Life Insurance Company (U.S.A.) (“JHLICO (U.S.A.)”;
(b) reviewed the anticipated profitability of the JHIMS’s relationship with the Funds in terms of the fees it expects to receive with respect to the Funds and whether JHIMS has the financial ability to provide a high level of services to the Funds,
(c) considered that JHIMS derives reputational and other indirect benefits from providing advisory services to the Funds, and
(d) noted that JHIMS will pay the sub-advisory fees out of the advisory fees JHIMS receives from the Funds and concluded that the advisory fees paid by the Trust with respect to the Funds are not unreasonable in light of such information; and
(5) reviewed comparative information with respect to the advisory fee rates and concluded that the anticipated advisory fees for the Funds are within the range of those incurred by other comparable funds and that the advisory structure for the Funds is thus competitive within the industry.
Additional information that the Board considered for a particular Fund is set forth in Appendix A.
Approval of Subadvisory Agreements
At its meeting on September 21, 2005, the Board, including all the Independent Trustees, approved the Subadvisory Agreements.
In making its determination with reference to these respective factors, the Board reviewed:
(i) information relating to each subadviser’s business which included information
34
such as: business performance, assets under management, financial stability and personnel;
(ii) the investment performance of the subad-viser’s portfolio managed comparably to the Fund to be managed by the subadviser and comparative performance information relating to the benchmark;
(iii) the proposed subadvisory fee for each Fund to be managed by the subadviser and comparative fee information; and
(iv) information relating to the nature and scope of Material Relationships and their significance to the Adviser and the subadvisers.
The Board’s decision to approve each Sub-advisory Agreement was based on a number of determinations, including the following:
(1) The subadviser has extensive experience and demonstrated skills as a manager and may be expected to provide a high quality of investment personnel to each Fund;
(2) Although not without variation, the current and historical performance of the portfolios of the Subadviser managed comparably to the Fund to be managed by the Subadviser has been within a competitive range of the current and historical performance of these portfolios’ respective benchmark (see Appendix A for further information on performance);
(3) The subadvisory fees are within industry norms and are the product of arms-length negotiation between the Adviser and the subadviser; and
(4) The Material Relationships consist of arrangements in which unaffiliated subad-visers or their affiliates provide advisory, distribution or management services in connection with financial products sponsored by the Trust’s adviser or its affiliates, which may include other registered investment companies, a 529 education savings plan, managed separate accounts and exempt group annuity contracts sold to qualified plans, and which in no case contained elements which would cause the Board to conclude that approval of the subadvisory agreement with the subadviser would be inappropriate. See (5) below for information relating to the business arrangement between the Trust’s Adviser and GMO.
(5) As a part of the overall business arrangement between the Adviser and GMO under which the Adviser has obtained exclusive rights to certain GMO investment management services for up to five years, the Adviser has agreed that under certain circumstances it (and not the Trust or the particular Fund) will pay GMO a specified amount (ranging from $1 to $12 million) if the subadvisory agreement with respect to any of the following Funds to be subadvised by GMO is terminated within a five year period from the date of its effectiveness: U.S. Core Fund, Active Value Fund, Intrinsic Value Fund, Growth Fund, International Core Fund, International Growth Fund, Global Fund, Value Opportunities Fund, Growth Opportunities Fund and U.S. Quality Equity Fund.
The Adviser has also agreed that, subject to its fiduciary duties as an investment adviser to each of these Funds and its shareholders, it will not recommend to the Board of Trustees to terminate the subadvisory agreement with respect to any of the Funds or to reduce any of the fees payable thereunder to GMO for a five year period from the date of effectiveness of the agreement. Substantially similar agreements (with varying amounts to be paid upon termination) also apply with respect to certain other John Hancock funds that are or will be advised by the Adviser and subadvised by GMO. The Trust is not a party to any of these arrangements, and they are not binding upon the Trust, the Trust’s Funds subadvised by GMO or the Board of Trustees. However, these arrangements present certain conflicts of interest because the Adviser has a financial incentive to support the continuation of GMO subadvisory agreements for as long as the termination provisions described above re main in effect. In approving the Advisory Agreement
35
and the subadvisory agreement with respect to each of the Funds subadvised by GMO, the Board of Trustees, including the Independent Trustees, was aware of and considered these potential conflicts of interest, including any financial obligations of the Adviser to GMO.
The Board concluded that, notwithstanding the potential conflicts of interest, approval of the Advisory Agreement and the subadvisory agreements with GMO is in the best interests of shareholders and contract owners in view of (i) the Adviser’s fiduciary duty and the Board’s fiduciary duty and ability to monitor potential conflicts, (ii) the benefits to shareholders and contract owners generally expected from the exclusive rights to certain GMO investment management services obtained by the Adviser for the benefit of certain Funds of the Trust and other John Hancock funds and (iii) the benefits to such Funds of the Trust expected from the subadvisory services of GMO.
Additional information that the Board considered for a particular fund is set forth in Appendix A.
| Appendix A | |||
| Estimated Fees | |||
| Fund | Performance | and Expenses | Comments |
| U.S. Core | See “Comments”. | Subadvisory fees | The Board noted |
| for this Fund were | that the Fund | ||
| higher than the peer | commenced opera- | ||
| group median. | tions in June 2006 | ||
| and has a limited | |||
| Advisory fees for | performance history. | ||
| this Fund were | |||
| higher than the peer | |||
| group median. | |||
| Total expenses for | |||
| this Fund were | |||
| lower than the peer | |||
| group median. | |||
For more information
| The Fund’s proxy voting policies, procedures and records are available without charge, upon request: |
| By phone | On the Fund’s Web site | On the SEC’s Web site |
| 1-800-225-5291 | www.jhfunds.com/proxy | www.sec.gov |
| Trustees | Francis V. Knox, Jr. | Principal distributor |
| James M. Oates, Chairman* | Chief Compliance Officer | John Hancock Funds, LLC |
| Charles L. Bardelis * | Gordon M. Shone | 601 Congress Street |
| James R. Boyle† | Treasurer | Boston, MA 02210-2805 |
| Peter S. Burgess * | John G. Vrysen | |
| Elizabeth G. Cook | Chief Financial Officer | Custodian |
| Charles L. Ladner* | State Street Bank & Trust Co. | |
| William H. Cunningham | Investment adviser | 2 Avenue de Lafayette |
| Hassell H. McClellan | John Hancock Investment | Boston, MA 02111 |
| *Members of the Audit Committee | Management Services, LLC | |
| †Non-Independent Trustee | 601 Congress Street | Transfer agent |
| Boston, MA 02210-2805 | John Hancock Signature | |
| Officers | Services, Inc. | |
| Keith F. Hartstein | Subadviser | 1 John Hancock Way, |
| President and | Grantham, Mayo, | Suite 1000 |
| Chief Executive Officer | Van Otterloo & Co. LLC | Boston, MA 02217-1000 |
| Thomas M. Kinzler | 40 Rowes Wharf | |
| Secretary and | Boston, MA 02110 | Legal counsel |
| Chief Legal Officer | Kirkpatrick & Lockhart | |
| Nicholson Graham LLP | ||
| 1 Lincoln Street | ||
| Boston, MA 02111-2950 | ||
The Fund’s investment objective, risks, charges and expenses are included in the prospectus and should be considered carefully before investing. For a prospectus, call your financial professional, call John Hancock Funds at 1-800-225-5291 or visit the Fund’s Web site at www.jhfunds.com. Please read the prospectus carefully before investing or sending money.
| How to contact us | ||
| Internet | www.jhfunds.com | |
| Regular mail: | Express mail: | |
| John Hancock | John Hancock | |
| Signature Services, Inc. | Signature Services, Inc. | |
| 1 John Hancock Way, Suite 1000 | Mutual Fund Image Operations | |
| Boston, MA 02217-1000 | 380 Stuart Street | |
| Boston, MA 02116 | ||
| Phone | Customer service representatives | 1-800-225-5291 |
| 24-hour automated information | 1-800-338-8080 | |
| TDD line | 1-800-554-6713 | |
A listing of month-end portfolio holdings is available on our Web site, www.jhfunds.com. A more detailed portfolio holdings summary is available on a quarterly basis 60 days after the fiscal quarter on our Web site or upon request by calling 1-800-225-5291, or on the Securities and Exchange Commission’s Web site, www.sec.gov.
40
J O H N H A N C O C K F A M I L Y O F F U N D S
| EQUITY | INTERNATIONAL |
| Balanced Fund | Greater China Opportunities Fund |
| Classic Value Fund | International Classic Value Fund |
| Classic Value Fund II | International Core Fund |
| Core Equity Fund | International Fund |
| Focused Equity Fund | International Growth Fund |
| Growth Fund | |
| Growth Opportunities Fund | INCOME |
| Growth Trends Fund | Bond Fund |
| Intrinsic Value Fund | Government Income Fund |
| Large Cap Equity Fund | High Yield Fund |
| Large Cap Select Fund | Investment Grade Bond Fund |
| Mid Cap Equity Fund | Strategic Income Fund |
| Mid Cap Growth Fund | |
| Multi Cap Growth Fund | TAX-EXEMPT INCOME |
| Small Cap Equity Fund | California Tax-Free Income Fund |
| Small Cap Fund | High Yield Municipal Bond Fund |
| Small Cap Intrinsic Value Fund | Massachusetts Tax-Free Income Fund |
| Sovereign Investors Fund | New York Tax-Free Income Fund |
| U.S. Core Fund | Tax-Free Bond Fund |
| U.S. Global Leaders Growth Fund | |
| Value Opportunities Fund | MONEY MARKET |
| Money Market Fund | |
| ASSET ALLOCATION & LIFESTYLE | U.S. Government Cash Reserve |
| Allocation Core Portfolio | |
| Allocation Growth + Value Portfolio | CLOSED-END |
| Lifestyle Aggressive Portfolio | Bank & Thrift Opportunity |
| Lifestyle Balanced Portfolio | Financial Trends |
| Lifestyle Conservative Portfolio | Income Securities |
| Lifestyle Growth Portfolio | Investors Trust |
| Lifestyle Moderate Portfolio | Patriot Global Dividend |
| Patriot Preferred Dividend | |
| SECTOR | Patriot Premium Dividend I |
| Financial Industries Fund | Patriot Premium Dividend II |
| Health Sciences Fund | Patriot Select Dividend |
| Real Estate Fund | Preferred Income |
| Regional Bank Fund | Preferred Income II |
| Technology Fund | Preferred Income III |
| Technology Leaders Fund | Tax-Advantaged Dividend |
For more complete information on any John Hancock Fund and a prospectus, which includes charges and expenses, call your financial professional, or John Hancock Funds at 1-800-225-5291. Please read the prospectus carefully before investing or sending money.

| 1-800-225-5291 1-800-554-6713 (TDD) 1-800-338-8080 EASI-Line www.jhfunds. com |
Now available: electronic delivery
www.jhfunds. com/edelivery
This report is for the information of the shareholders of John Hancock U.S. Core Fund.
| 650SA 8/06 10/06 |

| TABLE OF CONTENTS |
| Manager’s report |
| page 2 |
| A look at performance |
| page 6 |
| Your expenses |
| page 8 |
| Fund’s investments |
| page 1 0 |
| Financial statements |
| page 2 1 |
| For more information |
| page 48 |
CEO corner
To Our Shareholders,
The future has arrived at John Hancock Funds.
We have always been firm believers in the powerful role the Internet can play in providing fund information to our shareholders and prospective investors. Recently, we launched a redesigned, completely overhauled Web site that is more visually pleasing, easier to navigate and, most importantly, provides more fund information and learning tools without overwhelming the user.
Not long after we embarked on this major project, a study was released by the Investment Company Institute, the mutual fund industry’s main trade group, which found that an overwhelming majority of shareholders consider the Internet the “wave of the future” for accessing fund information.
Our new site sports fresher and faster ways to access account information. New innovations allow investors to view funds by risk level, track the performance of the John Hancock funds of their choice or sort funds by Morningstar, Inc.’s star ratings. Investors who own a John Hancock fund through a qualified retirement plan and don’t pay sales charges when making a purchase have the option of sorting by a “Load Waived” Morningstar Rating, thereby creating an apples-to-apples comparison with no-load funds that may also be available in their retirement plan.
The new site also has more educational tools and interactive modules to educate and assist investors with their financial goals, from college savings to retirement planning. A new “I want to…” feature allows investors to check performance, invest more money, update personal information or download prospectuses and forms quickly and easily.
In another of our ongoing efforts to provide our shareholders with top-notch service, we also redesigned our shareholder reports, as you may have noticed with this report. We hope the larger size, more colorful cover and redesigned presentation of the commentary and data tables will draw you in and make them easier to read.
After you’ve read your shareholder report, we encourage you to visit our new Web site – www.jhfunds.com – and take a tour. It’s easy, fast and fun and allows you to be in control of what you see and do. In short, it’s the wave of the future!
Sincerely,

Keith F. Hartstein,
President and Chief Executive Officer
This commentary reflects the CEO’s views as of August 31, 2006. They are subject to change at any time.
Your fund at a glance
The Fund seeks high total return by, under normal circumstances, investing at least 80% of its assets in a diversified portfolio of equity investments from a number of developed markets outside the U.S.
Over the last six months
► The Fund slightly outperformed the MSCI EAFE Index during a choppy period for global stocks.
► The U.S. dollar depreciated against most foreign currencies, which significantly boosted the Fund’s absolute returns.
► Momentum picks outperformed early in the period, with valuation becoming more useful following the market’s pullback in May and June.
John Hancock International Core Fund
Fund performance for the six months ended August 31, 2006.
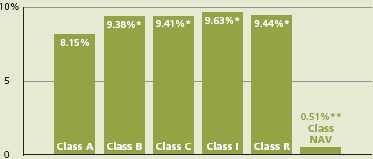
Total returns for the Fund are at net asset value with all distributions reinvested. These returns do not reflect the deduction of the maximum sales charge, which would reduce the performance shown above.
* From inception June 12, 2006 through August 31, 2006.
**From inception August 29, 2006.
| Top 10 holdings | |
| Total SA | 3.0% |
| GlaxoSmithKline | 2.9% |
| ING Groep NV | 2.4% |
| AstraZeneca Group PLC | 2.3% |
| Honda Motor Company Ltd. | 2.2% |
| BNP Paribas SA | 2.2% |
| Takeda Pharmaceutical | |
| Company, Ltd. | 1.9% |
| Eni SpA | 1.8% |
| Rio Tinto PLC | 1.7% |
| Royal Bank of Scotland | |
| Group PLC | 1.5% |
As a percentage of net assets on August 31, 2006.
1
Managers’ report
John Hancock
International Core Fund
Aided significantly by weakness in the U.S. dollar against most major currencies, foreign equities turned in solid gains from March through August across a broad range of countries, including the United Kingdom, Switzerland, Spain, France and Australia. Mirroring their U.S. counterparts, international stocks rallied until early May before losing ground over concerns about higher interest rates. However, the markets found their footing over the summer and recovered toward the end of the review period.
Moderate growth in corporate earnings was tempered by concerns over sluggish economic growth in Europe. In Japan, second-quarter economic growth came in below expectations but still managed to extend that country’s streak of consecutive quarterly GDP gains to six. The inflationary implications of high crude oil prices led a number of central banks to hike short-term interest rates during the period, providing added justification for expectations of generally decelerating economic growth.
Looking at performance
For the six months ended August 31, 2006, John Hancock International Core Fund’s Class A shares returned 8.15% at net asset value. By comparison, the Morgan Stanley Capital International Europe, Australia and Far East (MSCI EAFE) Index returned 7.94%, while the average foreign large value fund monitored by Morningstar, Inc. gained 7.19% .1 The Fund’s Class B, Class C, Class I and Class R shares,
SCORECARD
| INVESTMENT | PERIOD’S PERFORMANCE... AND WHAT’S BEHIND THE NUMBERS | |
| AstraZeneca | ▲ | Inexpensive valuation, strong earnings growth |
| Arcelor | ▲ | Takeover target |
| Mitsui Trust Holdings | ▼ | Hampered by weak Japanese market |
2

Portfolio Managers, Grantham, Mayo, Van Otterloo & Co. LLC (GMO)
Tom Hancock, Tom Rosalanko, Rick Suvak and John Breedis
which began trading on June 12, 2006, returned 9.38%, 9.41%, 9.63% and 9.44%, respectively, through the end of August 2006. Class NAV shares, which began trading on August 29, 2006, returned 0.51% . Keep in mind that your returns will differ from those listed above if you were not invested in the Fund for the entire period for your respective share class and did not reinvest all distributions.
Despite choppy market conditions, our strategy of focusing on valuation and to a lesser extent momentum, performed admirably. Valuation, as we use it, encompasses various measures of quality as well as traditional valuation yardsticks such as price-to-earnings and price-to-book ratios. In other words, we look for cheap stocks of good companies, not just cheap stocks. Similarly, unlike many momentum investors, our momentum analysis takes account of earnings estimate revisions along with pure price momentum.
The valuation and momentum strategies are complementary. For example, our momentum picks did better from March through early May, when investor sentiment was generally optimistic However, our valuation strategy performed better from May onward, when investors’ outlook was more guarded.
“Despite choppy market
conditions, our strategy of
focusing on valuation and—to
a lesser extent—momentum
performed admirably.”
Health care stands out
Health care was by far the biggest contributor among the Fund’s sectors. To a large extent, that was because of favorable stock selection in the pharmaceuticals group, where U.K.-based AstraZeneca Group PLC and GlaxoSmithKline PLC, along with Japanese holding Takeda Pharmaceutical Company, Ltd., Germany’s Schering AG and Roche Holdings AG — headquartered in Switzerland — aided the Fund’s performance. Our take on the drug group was that investors overreacted to fears of weakening product
3 International Core Fund
| SECTOR DISTRIBUTION2 | |
| Financial | 27% |
| Consumer, cyclical | 16% |
| Consumer, | |
| non-cyclical | 14% |
| Energy | 10% |
| Basic materials | 8% |
| Industrial | 8% |
| Utilities | 5% |
| Communications | 5% |
| Technology | 2% |
| Diversified | 0.4% |
pipelines and increasing encroachment on the turf of branded drugs by generics. While these fears have some basis in fact, we felt they unduly overshadowed the capability of many higher-quality drug firms to adapt and prosper.
Secondarily, the Fund’s performance benefited from the consumer discretionary and information technology sectors. In the former, our picks in the auto manufacturing sector added value, particularly Honda Motor Company, Ltd., a dominant Japanese manufacturer, and France-based Renault Regie Nationale SA. Given the widely publicized difficulties of U.S. auto companies, we thought some of the better foreign manufacturers might be good contrarian bets, enabling the Fund to capitalize on excessive pessimism toward the group. In technology, the Fund was helped mainly by maintaining an underweighted exposure to a sector that performed relatively poorly.
Among countries, the Fund received the biggest boost from its holdings in France and Germany, in both cases primarily because of favorable stock selection. French stocks that aided performance included steel producer Arcelor, which received a lucrative buyout offer from Mittal Steel, and French bank BNP Paribas SA. In addition to Schering AG, another German holding worthy of mention included mining stock ThyssenKrupp AG. Also having a positive impact was ING Groep NV, a Dutch financial services stock.
Overweighting Japan hurts
Among the factors detracting from performance were some positions in Japanese stock index futures. These positions were initiated as part of our attempt to maintain an overweighted exposure to that country, where we think stocks are fairly cheap and corporate profitability is likely to grow faster than in most other countries in the Fund’s investment universe. In the short term, however, the overall weak performance of Japanese stocks more than offset favorable stock selection in Japan. What’s more, the Japanese yen—bucking the trend in other major currencies—weakened against the U.S. dollar, further hampering our Japanese holdings. Consequently, four of the Fund’s five biggest detractors were Japanese stocks: Mitsui Trust Holdings, Inc. and Resona Holdings, Inc., both commercial banks, along with trading
4 International Core Fundcompany/distributor Mitsubishi Corp. and retailer Daiei Inc.
The other member of that quintet was U.K. telecommunication services giant Vodafone Group PLC, which performed well but detracted from performance versus the benchmark because we underweighted it. However, during the period we increased the Fund’s exposure to telecom services generally and specifically to Vodafone, as our models indicated good value there. Elsewhere, underweighting the U.K. had a modestly negative impact on performance, as did stock picking in the financials sector.
“Health care was by far the biggest
contributor among the Fund’s sectors.”
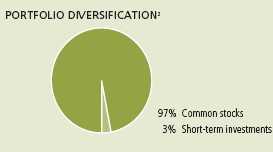
Outlook
We are watching several factors with interest. Currently, many investors are positioned for a substantial fall in the price of crude oil. Such a fall would require a radical shift in the supply/demand conditions currently underpinning the energy markets. While we don’t profess to be able to forecast oil prices, we think it makes more sense to take high oil prices at face value and not to assume there will be a significant near-term change in this market. Consequently, we think energy stocks offer good values, along with favorable momentum patterns. We also are monitoring the performance of higher-quality stocks, which have been performing better in 2006, no doubt in response to fears of slowing global economies. If this trend continues, we likely will move the Fund to a more defensive stance, increasing its exposure to quality and lowering its stake in more volatile stocks. That said, we will stay flexible and remain vigilant for any opportunities presented by our ongoing analyses of valuation and momentum.
This commentary reflects the views of the portfolio management team through the end of the Fund’s period discussed in this report. The team’ statements reflect their own opinions. As such, they are in no way guarantees of future events and are not intended to be used as investment advice or a recommendation regarding any specific security. They are also subject to change at any time as market and other conditions warrant.
International investing involves special risks such as political, economic and currency risks and differences in accounting standards and financial reporting.
1 Figures from Morningstar, Inc. include reinvested dividends and do not take into account sales charges. Actual load-adjusted performance is lower.
2 As a percentage of net assets on August 31, 2006.
5 International Core Fund
A look at performance
| For the period ending August 31, 2006 | |||
| Cumulative total returns | |||
| with maximum sales charge (POP) | |||
| Inception | Six | Since | |
| Class | date | months | inception |
| A 1,2 | 9-16-05 | 2.74% | 13.67% |
| B | 6-12-06 | — | 4.38 |
| C | 6-12-06 | — | 8.41 |
| I 3 | 6-12-06 | — | 9.63 |
| R 3 | 6-12-06 | — | 9.44 |
| NAV 3 | 8-29-06 | — | 0.51 |
Performance figures assume all distributions are reinvested. Returns with maximum sales charge reflect a sales charge on Class A shares of 5%, and the applicable contingent deferred sales charge (CDSC) on Class B and Class C shares. The Class B shares’ CDSC declines annually between years 1–6 according to the following schedule: 5, 4, 3, 3, 2, 1%. No sales charge will be assessed after the sixth year. Class C shares held for less than one year are subject to a 1% CDSC. Sales charge is not applicable for Class I, Class R and NAV shares.
The returns reflect past results and should not be considered indicative of future performance. The return and principal value of an investment will fluctuate so that shares, when redeemed, may be worth more or less than their original cost. Due to market volatility, the Fund’s current performance may be higher or lower than the performance shown. For performance data current to the most recent month-end, please call 1-800-225-5291 or visit the Fund’s Web site at www.jhfunds.com.
The performance table above and the chart on the next page do not reflect the deduction of taxes that a shareholder would pay on Fund distributions or the redemption of Fund shares.
The Fund’s performance results reflect any applicable expense reductions, without which the expenses would increase and results would have been less favorable.
Since inception performance is calculated with an opening price (prior day’s close) on the inception date.
1 Effective June 12,2006, shareholders of the former GMO International Disciplined Equity Fund (the “Predecessor Fund”) became owners of that number of full and fractional shares of John Hancock International Core Fund Class A. Additionally, the accounting and performance history of the former GMO International Disciplined Equity Fund was redesignated as that of John Hancock International Core Fund Class A.
2 Class A performance linked back to the Predecessor Fund.
3 For certain types of investors as described in the Fund’s Class I, Class R and Class NAV share prospectuses.
6 International Core Fund
Growth of $10,000
This chart shows what happened to a hypothetical $10,000 investment in Class A1 shares for the period indicated. For comparison, we’ve shown the same investment in the MSCI EAFE Net Total Return Index.
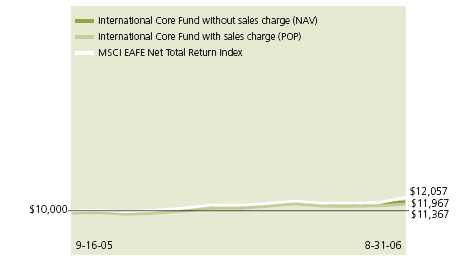
| Class | Period beginning | Without sales charge | With maximum sales charge | Index |
| B | 6-12-06 | $10,938 | $10,438 | $10,833 |
| C | 6-12-06 | 10,941 | 10,841 | 10,833 |
| I 2 | 6-12-06 | 10,963 | 10,963 | 10,833 |
| R2 | 6-12-06 | 10,944 | 10,944 | 10,833 |
| NAV2 | 8-29-06 | 10,051 | 10,051 | 10,077 |
Assuming all distributions were reinvested for the period indicated, the table above shows the value of a $10,000 investment in the Fund’s Class B, Class C, Class I, Class R and NAV shares, respectively, as of August 31, 2006. Performance of the classes will vary based on the difference in sales charges paid by shareholders investing in the different classes and the fee structure of those classes.
MSCI EAFE Net Total Return Index (Europe, Australasia, Far East) is a free float-adjusted market capitalization index that is designed to measure developed market equity performance, excluding the US & Canada. As of June 2006 the MSCI EAFE Index consisted of the following 21 developed market country indices: Australia, Austria, Belgium, Denmark, Finland, France, Germany, Greece, Hong Kong, Ireland, Italy, Japan, the Netherlands, New Zealand, Norway, Portugal, Singapore, Spain, Sweden, Switzerland and the United Kingdom. Returns are calculated and presented net of withholding tax.
It is not possible to invest directly in an index. Index figures do not reflect sales charges which would have resulted in lower values if they did.
1 Class A performance linked back to the Predecessor Fund.
2 For certain types of investors as described in the Fund's Class I, Class R and Class NAV share prospectuses.
7 International Core Fund
Your expenses
These examples are intended to help you understand your ongoing operating expenses.
Understanding Fund expenses
As a shareholder of the Fund, you incur two types of costs:
■ Transaction costs which include sales charges (loads) on purchases or redemptions (varies by share class), minimum account fee charge, etc.
■ Ongoing operating expenses including management fees, distribution and service fees (if applicable) and other Fund expenses.
We are going to present only your ongoing operating expenses here.
Actual expenses/actual returns
This example is intended to provide information about your Fund’s actual ongoing operating expenses, and is based on your Fund’s actual return. It assumes an account value of $1,000.00 on dates indicated below per class, with the same investment held until August 31, 2006.
| Account value | Ending value | Expenses paid during period | |
| on 3-1-06 | on 8-31-06 | ended 8-31-061 | |
| Class A | $1,000.00 | $1,081.50 | $7.70 |
| Account value | Ending value | Expenses paid during period | |
| on 6-12-06 | on 8-31-06 | ended 8-31-061 | |
| Class B | $1,000.00 | $1,093.80 | $5.55 |
| Class C | 1,000.00 | 1,094.10 | 5.55 |
| Class I | 1,000.00 | 1,096.30 | 2.83 |
| Class R | 1,000.00 | 1,094.40 | 4.50 |
| Account value | Ending value | Expenses paid during period | |
| on 8-29-06 | on 8-31-06 | ended 8-31-061 | |
| Class NAV | $1,000.00 | $1,000.00 | $0.10 |
Together with the value of your account, you may use this information to estimate the operating expenses that you paid over the period. Simply divide your account value at August 31, 2006 by $1,000.00, then multiply it by the “expenses paid” for your share
8 International Core Fund
class from the table above. For example, for an account value of $8,600.00, the operating expenses should be calculated as follows:
Hypothetical example for comparison purposes
This table allows you to compare your Fund’s ongoing operating expenses with those of any other fund. It provides an example of the Fund’s hypothetical account values and hypothetical expenses based on each class’ actual expense ratio and an assumed 5% annual return before expenses (which is not your Fund’s actual return). It assumes an account value of $1,000.00 on dates indicated below per class, with the same investment held until August 31, 2006. Look in any other fund shareholder report to find its hypothetical example and you will be able to compare these expenses.
| Account value | Ending value | Expenses paid during period | |
| on 3-1-06 | on 8-31-06 | ended 8-31-061 | |
| Class A | $1,000.00 | $1,017.81 | $7.47 |
| Account value | Ending value | Expenses paid during period | |
| on 6-12-06 | on 8-31-06 | ended 8-31-061 | |
| Class B | $1,000.00 | $1,005.66 | $5.31 |
| Class C | 1,000.00 | 1,005.66 | 5.31 |
| Class I | 1,000.00 | 1,008.26 | 2.71 |
| Class R | 1,000.00 | 1,006.66 | 4.31 |
| Account value | Ending value | Expenses paid during period | |
| on 8-29-06 | on 8-31-06 | ended 8-31-061 | |
| Class NAV | $1,000.00 | $1,000.17 | $0.10 |
Remember, these examples do not include any transaction costs, such as sales charges; therefore, these examples will not help you to determine the relative total costs of owning different funds. If transaction costs were included, your expenses would have been higher. See the prospectus for details regarding transaction costs.
1 Expenses are equal to the Fund's annualized expense ratio of 1.47%, 2.41%, 2.41%, 1.21%, 1.95% and 1.09% for Class A, Class B, Class C, Class I, Class R and Class NAV, respectively, multiplied by the average account value over the period, multiplied by the number of days in the inception period /365 or 366 (to reflect the one-half year period).
International Core Fund
9
F I N A N C I A L S T A T E M E N T S
Fund’s investments
Securities owned by the Fund on 8-31-06 (unaudited)
This schedule is divided into four main categories: common stocks, preferred stocks, warrants and short-term investments. Common stocks, preferred stocks and warrants are further broken down by country. Short-term investments, which represent the Fund’s cash position, are listed last.
| Issuer | Shares | Value |
| Common stocks 97.05% | $1,019,685,173 | |
| (Cost $889,381,933) | ||
| Australia 2.22% | 23,328,061 | |
| Amcor, Ltd. | 180,576 | $924,379 |
| Aristocrat Leisure, Ltd. | 2 | 20 |
| Australia and New Zealand Bank Group, Ltd. | 129,945 | 2,701,429 |
| BHP Billiton, Ltd. (a) | 248,113 | 5,243,205 |
| Commonwealth Bank of Australia, Ltd. | 50,428 | 1,758,918 |
| Foster’s Group, Ltd. | 185,647 | 842,699 |
| General Property Trust, Ltd. | 4,157 | 14,493 |
| Investa Property Group, Ltd. | 533,966 | 965,449 |
| Mirvac Group, Ltd. | 348,661 | 1,215,590 |
| Qantas Airways, Ltd., ADR | 279,717 | 734,082 |
| Rio Tinto, Ltd. | 48,707 | 2,710,717 |
| Santos, Ltd. | 2,432 | 20,762 |
| Stockland Company, Ltd. | 125,276 | 691,949 |
| Telstra Corp., Ltd. | 613,941 | 1,686,152 |
| Woodside Petroleum, Ltd. | 23,563 | 759,675 |
| Woolworths, Ltd. | 104,942 | 1,657,247 |
| Zinifex, Ltd. | 154,353 | 1,401,295 |
| Austria 0.43% | 4,480,440 | |
| Austrian Airlines AG * | 244 | 2,029 |
| Bohler Uddeholm AG | 13,735 | 737,961 |
| Flughafen Wien AG | 137 | 11,092 |
| Mayr-Melnhof Karton AG | 67 | 11,741 |
| Oesterreichische Elektrizitaets AG, Class A | 12,090 | 608,128 |
| OMV AG | 25,937 | 1,380,948 |
| Voestalpine AG | 45,680 | 1,728,541 |
| Belgium 0.87% | 9,138,427 | |
| Bekaert SA | 47 | 4,605 |
| Belgacom SA | 205 | 7,230 |
| Colruyt SA | 2,859 | 485,334 |
| Delhaize Group | 13,567 | 1,031,790 |
See notes to financial statements
International Core Fund
10
F I N A N C I A L S T A T E M E N T S
| Issuer | Shares | Value |
| Belgium (continued) | ||
| Dexia | 87,950 | $2,255,826 |
| Fortis Group SA | 96,789 | 3,761,571 |
| UCB SA | 27,197 | 1,592,071 |
| Bermuda 0.08% | 870,801 | |
| Esprit Holdings, Ltd. | 1,500 | 12,479 |
| Frontline, Ltd. | 7,100 | 289,768 |
| Noble Group, Ltd. | 38,000 | 26,085 |
| Yue Yuen Industrial Holdings, Ltd. | 187,500 | 542,469 |
| Canada 2.10% | 22,098,250 | |
| Alcan Aluminum, Ltd. USD | 46,100 | 2,070,782 |
| BCE, Inc. | 40,100 | 999,012 |
| Canadian Imperial Bank of Commerce | 38,200 | 2,772,878 |
| Canadian Natural Resources, Ltd. | 91,900 | 4,819,010 |
| EnCana Corp. CAD | 25,400 | 1,331,225 |
| Goldcorp, Inc. | 46,000 | 1,269,869 |
| Magna International, Inc. | 11,000 | 788,434 |
| National Bank of Canada | 29,300 | 1,587,784 |
| Nexen, Inc. | 13,400 | 779,674 |
| Petro-Canada | 98,400 | 4,196,882 |
| Royal Bank of Canada | 33,500 | 1,482,700 |
| Denmark 0.25% | 2,646,620 | |
| A P Moller-Maersk A/S | 113 | 918,510 |
| A P Moller-Maersk A/S | 1 | 8,317 |
| Danske Bank AS | 23,700 | 910,382 |
| DSV AS | 5,000 | 809,411 |
| Finland 2.43% | 25,528,004 | |
| Amer Group Oyj | 22,950 | 509,375 |
| Elcoteq SE | 13,650 | 247,084 |
| Fortum Corp. Oyj | 142,600 | 3,830,842 |
| Kesko Oyj | 37,500 | 1,584,991 |
| Metra Oyj, B Shares | 500 | 20,634 |
| Metso Oyj | 53,600 | 1,991,209 |
| Neste Oil Oyj | 28,750 | 904,750 |
| Nokia AB Oyj | 299,100 | 6,255,897 |
| OKO Bank A | 31,100 | 504,470 |
| Oriola-KD Oyj * | 16,600 | 39,923 |
| Outokumpu Oyj (a) | 85,400 | 2,168,572 |
| Rautaruukki Oyj | 75,600 | 2,205,018 |
| Sampo Oyj, A Shares | 194,400 | 4,016,282 |
| YIT Oyj | 57,600 | 1,248,957 |
See notes to financial statements
International Core Fund
11
F I N A N C I A L S T A T E M E N T S
| Issuer | Shares | Value |
| France 10.74% | $112,878,695 | |
| Air France KLM | 459 | 12,507 |
| Alstom RGPT * | 22,051 | 2,076,163 |
| Arkema * | 187 | 7,279 |
| Assurances Generales de France | 6,504 | 815,384 |
| AXA Group | 58,374 | 2,165,573 |
| BNP Paribas SA | 218,852 | 23,223,216 |
| Business Objects SA * | 464 | 12,934 |
| Cap Gemini SA | 38,452 | 2,103,353 |
| Carrefour SA | 44,900 | 2,766,230 |
| Casino Guich-Perrachon SA | 31,968 | 2,737,925 |
| Compagnie De Saint Gobain SA | 45,362 | 3,362,800 |
| Compagnie Generale des Etablissements Michelin, Class B | 28,446 | 1,928,646 |
| Credit Agricole S.A. | 131,882 | 5,349,796 |
| Lafarge SA | 12,398 | 1,593,944 |
| L’Oreal SA | 17,426 | 1,821,274 |
| LVMH Moet Hennessy SA | 12,154 | 1,249,282 |
| Pernod-Ricard SA | 6 | 1,307 |
| Peugeot SA (a) | 88,762 | 5,004,095 |
| Pinault-Printemps-Redoute SA | 6,230 | 859,137 |
| Publicis Groupe SA | 39,561 | 1,559,751 |
| Renault Regie Nationale SA | 82,547 | 9,598,881 |
| Sanofi-Aventis | 16,831 | 1,508,251 |
| Schneider Electric SA | 13,478 | 1,435,374 |
| Societe Generale | 36,575 | 5,895,360 |
| Suez SA (a) | 35,547 | 1,517,906 |
| Total SA (a) | 460,138 | 31,020,883 |
| Vallourec SA | 12,141 | 2,717,991 |
| Zodiac SA | 8,792 | 533,453 |
| Germany 8.09% | 84,999,746 | |
| Adidas-Salomon AG | 11,966 | 569,439 |
| Allianz AG | 16,276 | 2,756,086 |
| Altana AG | 50,925 | 3,003,222 |
| Bankgesellschaft Berlin AG * | 2,100 | 12,734 |
| Bayerische Motoren Werke (BMW) AG | 83,277 | 4,308,158 |
| Celesio AG | 320 | 16,211 |
| Commerzbank AG | 143,966 | 5,027,800 |
| DaimlerChrysler AG | 83,101 | 4,379,847 |
| Degussa AG * | 18 | 1,068 |
| Deutsche Bank AG | 86,859 | 9,905,847 |
| Deutsche Boerse AG | 22,278 | 3,376,292 |
| Deutsche Lufthansa AG | 760 | 15,031 |
| Deutsche Post AG | 99,574 | 2,520,851 |
| Deutsche Postbank AG | 10,861 | 846,419 |
| E.ON AG | 60,439 | 7,666,714 |
| Fresenius AG | 7,657 | 1,314,322 |
See notes to financial statements
International Core Fund
12
F I N A N C I A L S T A T E M E N T S
| Issuer | Shares | Value |
| Germany (continued) | ||
| Heidelberger Druckmaschinen AG | 214 | $8,574 |
| Henkel KGaA | 5,022 | 571,771 |
| Hochtief AG | 24,872 | 1,413,652 |
| KarstadtQuelle AG * | 22,495 | 497,837 |
| MAN AG | 33,214 | 2,537,019 |
| Merck & Company AG | 8,041 | 797,097 |
| Muenchener Rueckversicherungs-GesellschaftAG | 66,490 | 10,001,042 |
| Puma AG | 4,531 | 1,569,227 |
| Salzgitter AG | 25,075 | 2,243,158 |
| SAP AG | 10,542 | 2,010,606 |
| Solarworld AG | 12,776 | 754,915 |
| Suedzucker AG (a) | 66,268 | 1,648,842 |
| Thyssen Krupp AG | 221,505 | 7,531,716 |
| Tui AG (a) | 106,351 | 2,073,395 |
| Volkswagen AG (a) | 70,471 | 5,620,854 |
| Hong Kong 0.40% | 4,195,610 | |
| Cheung Kong Holdings, Ltd. | 1,000 | 11,052 |
| CLP Holdings, Ltd. | 215,000 | 1,360,173 |
| Hang Lung Group, Ltd. | 9,000 | 24,013 |
| Hong Kong Electric Holdings, Ltd. | 244,000 | 1,167,142 |
| Hong Kong Exchange & Clearing, Ltd. | 168,500 | 1,148,329 |
| MTR Corp. | 189,500 | 484,901 |
| Ireland 0.76% | 7,982,891 | |
| Anglo Irish Bank Corp. PLC | 415 | 6,849 |
| Bank of Ireland | 401 | 7,592 |
| CRH PLC | 85,391 | 2,957,031 |
| DCC PLC | 28,609 | 717,322 |
| Depfa Bank PLC | 192,889 | 3,582,857 |
| Kerry Group PLC | 31,953 | 711,240 |
| Italy 2.84% | 29,801,171 | |
| Banca Intesa SpA — Non convertible | 1,977 | 12,576 |
| Banca Monte dei Paschi Siena SpA (a) | 340,910 | 2,070,428 |
| Banco Popolare Di Verona e Novara SpA | 60,175 | 1,785,910 |
| Benetton Group SpA | 45,126 | 674,256 |
| Eni SpA (a) | 602,575 | 18,423,174 |
| Fiat SpA — RNC * | 36,746 | 488,876 |
| Fiat SpA * (a) | 112,054 | 1,602,598 |
| Fondiaria-Sai SpA | 19,158 | 613,922 |
| Impregilo SpA * | 160,989 | 594,667 |
| Italcementi SpA | 34,166 | 538,469 |
| UniCredito Italiano SpA | 376,564 | 2,996,295 |
See notes to financial statements
International Core Fund
13
F I N A N C I A L S T A T E M E N T S
| Issuer | Shares | Value |
| Japan 25.49% | $267,787,283 | |
| Acom Company, Ltd. | 310 | 13,868 |
| Aderans Company, Ltd. | 11,700 | 303,080 |
| AEON Company, Ltd. | 72,000 | 1,812,961 |
| Alps Electric Company (a) | 40,300 | 452,261 |
| Amada Company, Ltd. | 93,000 | 971,565 |
| Asics Corp. | 50,000 | 625,027 |
| Astellas Pharmaceuticals, Inc. | 700 | 28,393 |
| Canon, Inc. | 97,800 | 4,866,874 |
| Chubu Electric Power Company, Inc. | 151,900 | 4,116,075 |
| Chugoku Electric Power Company, Inc. | 800 | 16,940 |
| Cosmo Oil Company, Ltd. | 133,000 | 585,923 |
| Daido Steel Company, Ltd. | 130,000 | 999,191 |
| Daiei Inc. * | 84,550 | 1,635,452 |
| Daiichi Sankyo Company, Ltd. | 65,722 | 1,814,488 |
| Daikyo, Inc. * | 231,000 | 1,188,905 |
| Daito Trust Construction Company, Ltd. | 100 | 5,198 |
| Daiwa Securities Group, Inc. | 325,000 | 3,874,356 |
| East Japan Railway Company | 289 | 2,135,086 |
| Eisai Company, Ltd. | 52,400 | 2,495,982 |
| Elpida Memory, Inc. * | 18,000 | 796,046 |
| Fanuc, Ltd. | 100 | 7,933 |
| Fuji Electric Holdings | 142,000 | 721,162 |
| Fuji Heavy Industries, Ltd. | 317,000 | 1,834,119 |
| Fujikura, Ltd. | 129,000 | 1,524,630 |
| Fujitsu, Ltd. | 160,000 | 1,282,945 |
| Furukawa Electric Company, Ltd. | 3,000 | 20,783 |
| Haseko Corp. * | 726,500 | 2,600,060 |
| Hokkaido Electric Power Company, Inc. | 47,200 | 1,166,376 |
| Hokugin Financial Group, Inc. | 2,000 | 7,874 |
| Honda Motor Company, Ltd. | 687,400 | 23,371,190 |
| Hoya Corp. | 300 | 10,916 |
| Ibiden Company, Ltd. | 28,600 | 1,464,667 |
| Isetan Company, Ltd. | 45,000 | 759,235 |
| Ishikawajima–Harima Heavy Industries Company, Ltd. (a) | 436,000 | 1,270,606 |
| Isuzu Motors, Ltd. (a) | 409,000 | 1,327,843 |
| Itochu Corp. | 601,000 | 5,044,395 |
| Kansai Electric Power Company, Ltd. | 156,100 | 3,744,378 |
| Kao Corp. (a) | 89,000 | 2,373,738 |
| Kawasaki Heavy Industries, Ltd. | 284,000 | 897,823 |
| Kawasaki Kisen Kaisha, Ltd. | 252,000 | 1,638,413 |
| Keisei Electric Railway Company, Ltd. | 58,000 | 351,890 |
| Kenedix, Inc. | 212 | 1,022,470 |
| Kirin Brewery Company, Ltd. | 74,000 | 1,028,452 |
| KK DaVinci Advisors * | 925 | 835,499 |
| Kobe Steel Company, Ltd. | 288,000 | 920,285 |
See notes to financial statements
International Core Fund14
F I N A N C I A L S T A T E M E N T S
| Issuer | Shares | Value |
| Japan (continued) | ||
| Komatsu, Ltd. | 224,000 | $4,094,244 |
| Konami Corp. | 47,800 | 1,217,860 |
| Kubota Corp. | 237,000 | 1,950,850 |
| Kyushu Electric Power | 81,600 | 1,946,913 |
| LeoPalace21 Corp. | 36,000 | 1,276,128 |
| Marubeni Corp. | 502,000 | 2,682,067 |
| Mazda Motor Corp. | 374,000 | 2,396,557 |
| Mediceo Holdings Company, Ltd. | 32,300 | 601,385 |
| Mitsubishi Corp. | 364,400 | 7,421,209 |
| Mitsubishi Estate Company, Ltd. | 148,000 | 3,190,661 |
| Mitsubishi Heavy Industries, Ltd. | 516,000 | 2,163,282 |
| Mitsubishi Materials Corp. | 315,000 | 1,371,608 |
| Mitsubishi Rayon Company, Ltd. (a) | 205,000 | 1,414,938 |
| Mitsubishi UFJ Financial Group, Inc. | 965 | 13,156,661 |
| Mitsui & Company, Ltd. | 194,000 | 2,808,623 |
| Mitsui Fudosan Company, Ltd. | 1,000 | 22,411 |
| Mitsui Trust Holdings, Inc. | 399,000 | 4,671,518 |
| Mizuho Financial Group, Inc. | 967 | 7,819,718 |
| Mizuho Trust & Banking Company, Ltd. * | 414,000 | 977,189 |
| Murata Manufacturing Company, Ltd. | 200 | 13,770 |
| NGK Spark Plug Company, Ltd. | 37,000 | 753,526 |
| Nidec Corp. | 100 | 7,252 |
| Nikko Cordial Corp. | 95,000 | 1,206,169 |
| Nikon Corp. | 64,000 | 1,158,877 |
| Nintendo Company, Ltd. | 8,900 | 1,826,186 |
| Nippon Mining Holdings, Inc. | 500 | 3,664 |
| Nippon Sheet Glass Company, Ltd. | 135,000 | 652,252 |
| Nippon Telegraph & Telephone Corp. | 1,182 | 5,972,698 |
| Nippon Yusen Kabushiki Kaisha | 131,000 | 811,529 |
| Nissan Chemical Industries, Ltd. | 62,000 | 804,618 |
| Nissan Diesel Motor Company, Ltd. * | 2,000 | 8,129 |
| Nissan Motor Company, Ltd. | 1,048,400 | 11,917,393 |
| Nisshin Seifun Group, Inc. | 1,100 | 11,754 |
| Nomura Securities Company, Ltd. | 182,300 | 3,526,232 |
| NTT DoCoMo, Inc. | 3,209 | 4,976,678 |
| Ono Pharmaceutical Company, Ltd. | 500 | 23,305 |
| Orix Corp. | 15,190 | 4,031,942 |
| Osaka Gas Company, Ltd. | 668,000 | 2,459,001 |
| Promise Company, Ltd. | 250 | 11,184 |
| Resona Holdings, Inc. * (a) | 1,870 | 5,895,786 |
| Ricoh Company, Ltd. | 244,000 | 4,792,467 |
| SANKYO Company, Ltd. | 200 | 10,822 |
| Sapporo Hokuyo Holdings, Inc. | 4 | 43,969 |
| Seven & I Holdings Company, Ltd. | 28,900 | 1,021,985 |
| Shimizu Corp. | 2,000 | 11,861 |
See notes to financial statements
International Core Fund
15
F I N A N C I A L S T A T E M E N T S
| Issuer | Shares | Value |
| Japan (continued) | ||
| Shinko Electric Industries Company, Ltd. | 37,100 | $1,078,020 |
| Shinko Securities Company, Ltd. | 182,000 | 736,654 |
| Showa Shell Sekiyu K.K. | 48,400 | 540,688 |
| Sojitz Holdings Corp. * | 6,200 | 21,872 |
| Sony Corp. | 57,300 | 2,480,372 |
| Sumitomo Chemical Company, Ltd. | 160,000 | 1,259,767 |
| Sumitomo Corp. | 214,000 | 2,893,937 |
| Sumitomo Light Metal Industries, Ltd. | 202,000 | 444,088 |
| Sumitomo Metal Industries, Ltd. | 233,000 | 958,962 |
| Sumitomo Metal Mining Company, Ltd. | 185,000 | 2,608,964 |
| Sumitomo Mitsui Financial Group, Inc. | 102 | 1,147,288 |
| Sumitomo Realty & Development Company, Ltd. | 111,000 | 3,272,634 |
| Sumitomo Trust & Banking Company, Ltd. | 175,000 | 1,865,494 |
| TAIHEIYO CEMENT CORP. | 225,000 | 847,429 |
| Taisho Pharmaceuticals Company, Ltd. | 42,000 | 821,354 |
| Takashimaya Company, Ltd. | 53,000 | 668,399 |
| Takeda Pharmaceutical Company, Ltd. | 299,700 | 19,842,947 |
| Teijin, Ltd. | 1,000 | 5,368 |
| Terumo Corp. | 200 | 7,499 |
| The Japan Steel Works, Ltd. | 84,000 | 596,242 |
| The Tokyo Electric Power Company, Ltd. | 47,900 | 1,367,347 |
| Toho Zinc Company, Ltd. * | 89,000 | 691,645 |
| Tohoku Electric Power Company, Inc. | 73,700 | 1,670,504 |
| Tokyo Electron, Ltd. | 25,700 | 1,690,631 |
| Tokyo Gas Company, Ltd. | 437,000 | 2,327,340 |
| Tokyo Seimitsu Company, Ltd. | 13,400 | 647,420 |
| TonenGeneral Sekiyu K.K. | 113,000 | 1,020,664 |
| Toray Industries, Inc. | 195,000 | 1,555,281 |
| Toshiba Corp. | 202,000 | 1,438,984 |
| Toyo Tire & Rubber Company, Ltd. | 50,000 | 221,550 |
| Toyota Motor Corp. | 262,200 | 14,232,150 |
| Ube Industries, Ltd. | 39,000 | 106,676 |
| Yamada Denki Company, Ltd. | 5,610 | 602,326 |
| YASKAWA Electric Corp. | 88,000 | 1,014,563 |
| Netherland Antilles 0.24% | 2,489,463 | |
| GHV Split Vermoege * | 98 | 125 |
| Mittal Steel Company NV * | 74,700 | 2,489,338 |
| Netherlands 8.96% | 94,151,785 | |
| ABN AMRO Holdings NV | 556,429 | 15,844,931 |
| Aegon NV | 442,782 | 7,896,019 |
| Akzo Nobel NV | 36,282 | 2,086,762 |
| Buhrmann NV | 63,376 | 861,003 |
| Corio NV | 2,542 | 170,885 |
| CSM NV | 28,997 | 884,331 |
| DSM NV | 32,394 | 1,279,668 |
See notes to financial statements
International Core Fund
16
F I N A N C I A L S T A T E M E N T S
| Issuer | Shares | Value | |
| Netherlands (continued) | |||
| Euronext NV | 24,121 | $2,166,147 | |
| Hagemeyer N.V. * | 177,015 | 894,463 | |
| Heineken Holding NV | 26,318 | 1,054,460 | |
| Heineken NV (a) | 112,213 | 5,197,891 | |
| ING Groep NV | 574,726 | 24,813,616 | |
| Koninklijke Ahold NV * | 138,861 | 1,330,508 | |
| Oce-Van Der Grinten NV | 34,453 | 597,203 | |
| Reed Elsevier NV | 170,176 | 2,725,575 | |
| Royal Dutch Shell PLC, A Shares | GBP | 122,232 | 4,231,790 |
| Royal Dutch Shell PLC, A Shares | NLG | 304,451 | 10,511,767 |
| Royal Dutch Shell PLC, B Shares | GBP | 201,349 | 7,200,707 |
| Stork N.V. * | 11,161 | 549,549 | |
| TNT Post Group NV | 55,700 | 2,091,312 | |
| Vedior NV | 62,236 | 1,149,647 | |
| Wereldhave NV | 5,849 | 613,551 | |
| Norway 0.45% | 4,763,671 | ||
| Norsk Hydro ASA | 123,400 | 3,181,821 | |
| Statoil ASA | 58,650 | 1,581,850 | |
| Singapore 1.01% | 10,577,225 | ||
| Ascendas Real Estate Investment Trust * | 212,000 | 277,582 | |
| CapitaLand, Ltd. * | 406,000 | 1,228,348 | |
| ComfortDelGro Corp., Ltd. | 8,000 | 7,627 | |
| Cosco Corp. Singapore, Ltd. | 845,000 | 821,744 | |
| DBS Group Holdings, Ltd. | 307,000 | 3,512,363 | |
| Keppel Corp., Ltd. | 35,000 | 333,693 | |
| Keppel Land, Ltd. | 218,000 | 615,216 | |
| K-REIT Asia * | 44,000 | 41,391 | |
| MobileOne, Ltd. | 6,000 | 7,780 | |
| Neptune Orient Lines, Ltd. | 362,000 | 444,073 | |
| SembCorp Industries, Ltd. | 369,000 | 816,195 | |
| SembCorp Marine, Ltd. | 103,000 | 226,518 | |
| Singapore Press Holdings, Ltd. | 2,000 | 5,059 | |
| Singapore Technologies Engineering, Ltd. | 176,000 | 326,651 | |
| Singapore Telecommunications, Ltd., ADR * | 728,650 | 1,153,206 | |
| StarHub Ltd. | 496,000 | 759,779 | |
| Spain 1.21% | 12,706,113 | ||
| ACS Actividades SA | 13,764 | 616,442 | |
| Fomento de Construcciones SA | 13,034 | 1,015,431 | |
| Gas Natural SDG SA | 37,098 | 1,240,068 | |
| Iberdrola SA | 111,706 | 4,141,239 | |
| Repsol SA | 198,316 | 5,692,933 | |
See notes to financial statements
International Core Fund
17
F I N A N C I A L S T A T E M E N T S
| Issuer | Shares | Value |
| Sweden 1.47% | $15,467,933 | |
| Alfa Laval AB | 18,800 | 621,486 |
| Atlas Copco AB, Series A | 80,400 | 2,069,677 |
| Boliden AB | 83,900 | 1,574,956 |
| Electrolux AB, Series B | 123,700 | 1,912,297 |
| Nordea Bank AB | 58,700 | 737,305 |
| Sandvik AB | 128,800 | 1,408,908 |
| Skandinaviska Enskilda Banken AB, Series A | 68,400 | 1,770,211 |
| Svenska Cellulosa AB, Series B | 32,900 | 1,410,019 |
| Svenska Handelsbanken AB, Series A | 36,200 | 944,361 |
| Tele2 AB, Series B | 138,100 | 1,367,676 |
| Teliasonera AB | 267,000 | 1,651,037 |
| Switzerland 5.05% | 53,051,034 | |
| ABB, Ltd. | 491,931 | 6,519,471 |
| Compagnie Financiere Richemont AG, Series A | 36,926 | 1,753,963 |
| Credit Suisse Group AG | 36,298 | 2,019,825 |
| Logitech International SA * | 250 | 5,390 |
| Nestle SA | 15,733 | 5,397,578 |
| Novartis AG | 36,142 | 2,058,017 |
| Roche Holdings AG | 55 | 10,668 |
| Roche Holdings AG | 51,399 | 9,453,216 |
| Serono AG, Series B | 1,390 | 966,702 |
| Swiss Life Holding * | 2,777 | 670,221 |
| Swiss Re | 39,958 | 3,041,304 |
| Swisscom AG | 60 | 20,074 |
| UBS AG * | 164,869 | 9,307,875 |
| Unaxis Holding AG * | 1,967 | 578,764 |
| Zurich Financial Services AG | 49,471 | 11,247,966 |
| United Kingdom 21.96% | 230,741,950 | |
| Aegis Group PLC | 6,738 | 16,374 |
| Alliance & Leicester PLC | 88,801 | 1,733,137 |
| Anglo American PLC | 304,432 | 13,157,290 |
| ARM Holdings PLC | 2,123 | 4,796 |
| Arriva PLC | 65,091 | 736,725 |
| AstraZeneca Group PLC | 373,221 | 24,167,038 |
| Aviva PLC | 223,804 | 3,141,897 |
| BAE Systems PLC | 186,595 | 1,315,092 |
| Barclays PLC | 144,419 | 1,806,292 |
| Barratt Developments PLC | 153,112 | 2,893,643 |
| BBA Group PLC | 178,712 | 905,980 |
| Berkeley Group Holdings PLC * | 21,501 | 524,342 |
| BG Group PLC | 469,168 | 6,126,843 |
| BHP Billiton PLC | 89,286 | 1,700,142 |
| Boots Group PLC | 203,293 | 2,981,567 |
| British American Tobacco Australasia, Ltd. | 103,238 | 2,827,938 |
| BT Group PLC | 2,032,431 | 9,530,168 |
See notes to financial statements
International Core Fund
18
F I N A N C I A L S T A T E M E N T S
| Issuer | Shares | Value |
| United Kingdom (continued) | ||
| Bunzl PLC | 1,183 | $14,684 |
| Burberry Group PLC | 1,096 | 9,976 |
| Cable & Wireless PLC | 646,614 | 1,509,852 |
| Cadbury Schweppes PLC | 285,771 | 3,038,770 |
| Centrica PLC | 931,410 | 5,226,738 |
| Cobham PLC | 422,715 | 1,381,059 |
| Compass Group PLC | 361,578 | 1,755,640 |
| CSR PLC * | 43,366 | 966,818 |
| Dixons Group PLC | 735,445 | 2,867,952 |
| EMI Group PLC | 208,500 | 1,061,948 |
| George Wimpey PLC | 354,889 | 3,382,191 |
| GKN PLC | 3,014 | 17,487 |
| GlaxoSmithKline PLC | 1,065,033 | 30,146,285 |
| GUS PLC | 171,689 | 3,185,940 |
| Hanson PLC | 130,029 | 1,637,442 |
| HBOS PLC | 375,165 | 7,157,989 |
| IMI PLC | 101,079 | 972,444 |
| Imperial Chemical Industries PLC | 259,624 | 1,838,431 |
| Imperial Tobacco Group PLC | 212,379 | 7,312,367 |
| Invensys PLC * | 2,646 | 10,219 |
| J Sainsbury PLC | 349,908 | 2,372,910 |
| Johnson Matthey PLC | 30,786 | 773,613 |
| Kingfisher PLC | 476,817 | 2,140,580 |
| Ladbrokes PLC | 124,216 | 903,219 |
| Lloyds TSB Group PLC | 308,606 | 3,061,445 |
| Man Group PLC | 312,015 | 2,506,184 |
| Marks & Spencer Group PLC | 309,618 | 3,489,654 |
| Next Group PLC | 95,494 | 3,028,165 |
| Northern Rock | 37,616 | 797,839 |
| Rank Group PLC | 139,455 | 566,369 |
| Rio Tinto PLC | 359,511 | 18,170,695 |
| Rolls-Royce Group PLC * | 79,499 | 659,728 |
| Royal & Sun Alliance PLC | 1,090,447 | 2,872,911 |
| Royal Bank of Scotland Group PLC | 477,148 | 16,174,416 |
| Scottish & Newcastle PLC | 120,210 | 1,258,826 |
| Scottish Power PLC * | 215,876 | 2,548,085 |
| Severn Trent PLC | 111 | 2,777 |
| Smiths News PLC * | 2,121 | 19,165 |
| Standard Chartered PLC | 38,429 | 961,286 |
| Tate & Lyle PLC | 118,508 | 1,651,289 |
| Taylor Woodrow PLC | 488,058 | 3,184,442 |
| Tomkins PLC | 329,133 | 1,781,236 |
| United Utilities PLC | 138,889 | 1,813,745 |
| Vodafone Group PLC * | 4,278,878 | 9,258,680 |
| Wolseley PLC | 30,402 | 662,179 |
| Xstrata PLC | 67,306 | 3,019,016 |
See notes to financial statements
International Core Fund
19
F I N A N C I A L S T A T E M E N T S
| Issuer | Shares | Value |
| Preferred stocks 0.40% | $4,161,114 | |
| (Cost $2,990,637) | ||
| Germany 0.22% | 2,314,696 | |
| Bayerische Motoren Werke (BMW) AG | 9,672 | 491,080 |
| Henkel KGaA-Vorzug, Non-Voting | 8,226 | 1,049,049 |
| RWE AG, Non-Voting | 89 | 7,346 |
| Volkswagen AG, Non-Voting | 13,526 | 767,221 |
| Italy 0.18% | 1,846,418 | |
| IFI-Istituto Finanziario Industriale SPA * | 22,785 | 545,062 |
| Unipol SpA | 431,508 | 1,301,356 |
| Issuer | Shares | Value |
| Warrants 0.00% | $152 | |
| (Cost $141) | ||
| Switzerland 0.00% | 152 | |
| Swisscom AG (Expiration Date 09/13/06, strike price CHF$450.00) | 60 | 152 |
| Principal | ||
| Issuer, description | amount | Value |
| Short term investments 3.68% | $38,712,988 | |
| (Cost $38,712,988) | ||
| State Street Navigator Securities Lending Prime Portfolio (c) | $38,712,988 | 38,712,988 |
| Principal | ||
| Issuer, description, maturity date | amount | Value |
| Repurchase agreements 1.94% | $20,392,000 | |
| (Cost $20,392,000) | ||
| Repurchase Agreement with State Street Corp. dated 8/31/2006 | ||
| at 3.95% to be repurchased at $20,394,237 on 9/1/2006, | ||
| collateralized by $20,725,000 Federal Home Loan Mortgage Corp., | ||
| 2.75% due 12/28/2006 (valued at $20,802,719, including interest) (c) | $20,392,000 | $20,392,000 |
| Total investments (Cost $951,477,699) 103.07% | $1,082,951,427 | |
| Liabilities in excess of other assets (3.07)% | (32,292,210) | |
| Total net assets 100.00% | $1,050,659,217 | |
| CAD | Canadian Dollar |
| CHF | Swiss Franc |
| GBP | British Pound |
| NLG | Netherlands Guilder |
| USD | US Dollar |
| ADR | American Depository Receipt |
* Non-income producing.
(a) All or a portion of this security was out on loan.
(c) Investment is an affiliate of the Trust’s subadvisor or custodian bank.
See notes to financial statements
International Core Fund
20
F I N A N C I A L S T A T E M E N T S
Financial statements
Statement of assets and liabilities 8-31-06 (unaudited)
This Statement of Assets and Liabilities is the Fund’s balance sheet. It shows the value of what the Fund owns, is due and owes. You’ll also find the net asset value and the maximum offering price per share.
| Assets | |
| Investments, at value (Cost $931,085,699) including | |
| $36,810,845 of Securities loaned | $1,062,559,427 |
| Repurchase agreements, at value (Cost $20,392,000) | 20,392,000 |
| Cash | 5,350,565 |
| Foreign cash, at value (cost $231,001) | 231,122 |
| Receivable for investments sold | 66,789 |
| Receivable for shares sold | 1,952,460 |
| Receivable for forward foreign currency exchange contracts | 209,317 |
| Dividends and interest receivable | 72,243 |
| Receivable for futures variation margin | 231,613 |
| Other assets | 16,017 |
| Total assets | 1,091,081,553 |
| Liabilities | |
| Payable upon return of securities loaned (Note 2) | 38,712,988 |
| Payable for forward foreign currency exchange contracts | 1,604,740 |
| Payable to affiliates | |
| Fund administration fees | 240 |
| Service fees | 56 |
| Other payables and accrued expenses | 104,312 |
| Total liabilities | 40,422,336 |
| Net assets | |
| Capital paid-in | 919,491,429 |
| Accumulated undistributed net realized gain on investments, foreign | |
| currency and forward foreign currency contracts | 583,072 |
| Unrealized appreciation on investments, futures contracts, foreign currency | |
| and forward foreign currency contracts | 130,276,274 |
| Undistributed net investment income | 308,442 |
| Net assets | $1,050,659,217 |
See notes to financial statements
International Core Fund
21
F I N A N C I A L S T A T E M E N T S
Statement of assets and liabilities 8-31-06 (unaudited)
| Net asset value per share | |
| Based on net asset values and shares outstanding — The Fund has an | |
| unlimited number of shares authorized with no par value. | |
| Class A ($20,187,280 ÷ 513,231 shares) | $39.33 |
| Class B ($202,352 ÷ 5,151 shares) | $39.28 |
| Class C ($968,537 ÷ 24,652 shares) | $39.29 |
| Class I ($121,560 ÷ 3,088 shares) | $39.37a |
| Class R ($109,431 ÷ 2,784 shares) | $39.31 |
| Class NAV ($1,029,070,057 ÷ 26,136,542 shares) | $39.37 |
| Maximum offering price per share | |
| Class A b ($39.33 ÷ 95%) | $41.40 |
a Net assets and shares outstanding have been rounded for presentation purpose. The net asset value is as reported on August 31, 2006.
b On single retail sales of less than $50,000. On sales of $50,000 or more and on group sales the offering price is reduced.
See notes to financial statements
International Core Fund
22
F I N A N C I A L S T A T E M E N T S
Statement of operations For the period ended 8-31-06 (unaudited)
This Statement of Operations summarizes the Fund’s investment income earned and expenses incurred in operating the Fund. It also shows net gains (losses) for the period stated.
| Investment income | |
| Dividends (net of foreign withholding taxes of $54,087) | $423,504 |
| Interest | 15,322 |
| Total investment income | 438,826 |
| Expenses | |
| Investment management fees (Note 3) | 127,738 |
| Transfer agent fees (Note 3) | 23,623 |
| Distribution and service fees (Note 3) | 13,323 |
| Fund administration fees (Note 3) | 240 |
| Audit and legal fees | 65,419 |
| Custodian fees | 64,104 |
| Blue sky fees (Note 3) | 20,405 |
| Printing and postage fees (Note 3) | 17,219 |
| Registration and filing fees | 6,091 |
| Trustees’ fees (Note 3) | 3,897 |
| Miscellaneous | 5,428 |
| Total expenses | 347,487 |
| Less expense reductions (Note 3) | (172,672) |
| Net expenses | 174,815 |
| Net investment income | 264,011 |
| Realized and unrealized gain (loss) | |
| Net realized gain on | |
| Investments | 574,215 |
| Foreign currency transactions | 49,530 |
| Change in net unrealized appreciation (depreciation) of | |
| Investments | 6,982,442 |
| Futures contracts | 197,587 |
| Translation of assets and liabilities in foreign currencies | (1,401,523) |
| Net realized and unrealized gain | 6,402,251 |
| Increase in net assets from operations | $6,666,262 |
See notes to financial statements
International Core Fund
23
F I N A N C I A L S T A T E M E N T S
Statement of changes in net assets
These Statements of Changes in Net Assets show how the value of the Fund’s net assets has changed during the last two periods. The difference reflects earnings less expenses, any investment gains and losses, distributions, if any, paid to shareholders and the net of Fund share transactions.
| Period | Period | |
| endeda | endedb | |
| 2-28-06 | 8-31-06 | |
| Increase (decrease) in net assets | ||
| From operations | ||
| Net investment income | $86,760 | $264,011 |
| Net realized gain | 52,057 | 623,745 |
| Change in net unrealized appreciation (depreciation) | 1,556,207 | 5,778,506 |
| Increase (decrease) in net assets resulting from operations | 1,695,024 | 6,666,262 |
| From Fund share transactions | 15,078,711 | 1,027,219,220 |
| Net assets | ||
| Beginning of period | — | $16,773,735 |
| End of periodc | $16,773,735 | $1,050,659,217 |
a Period from 9-15-05 (commencement of operations) to 2-28-06.
b Semiannual period from 3-1-06 through 8-31-06. Unaudited.
c Includes undistributed net investment income of $86,760 and $308,442, respectively.
d Conversion amount from John Hancock Funds II International Stock.
See notes to financial statements
International Core Fund
24
F I N A N C I A L S T A T E M E N T S
Financial highlights
The Financial highlights show how the Fund’s net asset value for a share has changed since the end of the previous period.
| CLASS A SHARES | ||
| Period ended | 2-28-06d | 8-31-06c,t,s |
| Per share operating performance | ||
| Net asset value, beginning of period | $32.60 | $36.26 |
| Net investment incomeh | 0.19 | 0.60 |
| Net realized and unrealized | ||
| gain on investments | 3.47 | 2.47 |
| Total from investment operations | 3.66 | 3.07 |
| Net asset value, end of period | $36.26 | $39.33 |
| Total return (%) | 11.23m | 8.15l,m,y |
| Ratios and supplemental data | ||
| Net assets, end of period | ||
| (in millions) | $17 | $20 |
| Ratio of net expenses to average | ||
| net assets (%) | 0.55r | 1.47r |
| Ratio of gross expenses to average | ||
| net assets (%) | 2.22r | 3.55r |
| Ratio of net investment income | ||
| to average net assets (%) | 1.23r | 3.72r |
| Portfolio turnover (%) | 22m | —m,x |
See notes to financial statements
International Core Fund
25
F I N A N C I A L S T A T E M E N T S
Financial highlights
| CLASS B SHARES | |
| Period ended | 8-31-06a,c |
| Per share operating performance | |
| Net asset value, beginning of period | $35.92 |
| Net investment incomeh | 0.04 |
| Net realized and unrealized | |
| gain on investments | 3.32 |
| Total from investment operations | 3.36 |
| Net asset value, end of period | $39.28 |
| Total return (%) | 9.38l,m |
| Ratios and supplemental data | |
| Net assets, end of period | |
| (in millions) | —n |
| Ratio of net expenses to average | |
| net assets (%) | 2.41r |
| Ratio of gross expenses to average | |
| net assets (%) | 16.45r |
| Ratio of net investment income | |
| to average net assets (%) | 0.51r |
| Portfolio turnover (%) | —m,x |
See notes to financial statements
International Core Fund
26
F I N A N C I A L S T A T E M E N T S
Financial highlights
| CLASS C SHARES | |
| Period ended | 8-31-06a,c |
| Per share operating performance | |
| Net asset value, beginning of period | $35.92 |
| Net investment incomeh | 0.07 |
| Net realized and unrealized | |
| gain on investments | 3.30 |
| Total from investment operations | 3.37 |
| Net asset value, end of period | $39.29 |
| Total return (%) | 9.41l,m |
| Ratios and supplemental data | |
| Net assets, end of period | |
| (in millions) | $1 |
| Ratio of net expenses to average | |
| net assets (%) | 2.41r |
| Ratio of gross expenses to average | |
| net assets (%) | 7.22r |
| Ratio of net investment income | |
| to average net assets (%) | 0.85r |
| Portfolio turnover (%) | —m,x |
See notes to financial statements
International Core Fund
27
F I N A N C I A L S T A T E M E N T S
Financial highlights
| CLASS I SHARES | |
| Period ended | 8-31-06a,c |
| Per share operating performance | |
| Net asset value, beginning of period | $35.92 |
| Net investment incomeh | 0.13 |
| Net realized and unrealized | |
| gain on investments | 3.32 |
| Total from investment operations | 3.45 |
| Net asset value, end of period | $39.37 |
| Total return (%) | 9.63l,m |
| Ratios and supplemental data | |
| Net assets, end of period | |
| (in millions) | —n |
| Ratio of net expenses to average | |
| net assets (%) | 1.21r |
| Ratio of gross expenses to average | |
| net assets (%) | 17.89r |
| Ratio of net investment income | |
| to average net assets (%) | 1.60r |
| Portfolio turnover (%) | —m,x |
See notes to financial statements
International Core Fund
28
F I N A N C I A L S T A T E M E N T S
Financial highlights
| CLASS R SHARES | |
| Period ended | 8-31-06a,c |
| Per share operating performance | |
| Net asset value, beginning of period | $35.92 |
| Net investment incomeh | 0.07 |
| Net realized and unrealized | |
| gain on investments | 3.32 |
| Total from investment operations | 3.39 |
| Net asset value, end of period | $39.31 |
| Total return (%) | 9.44l,m |
| Ratios and supplemental data | |
| Net assets, end of period | |
| (in millions) | —n |
| Ratio of net expenses to average | |
| net assets (%) | 1.95r |
| Ratio of gross expenses to average | |
| net assets (%) | 20.34r |
| Ratio of net investment income | |
| to average net assets (%) | 0.84r |
| Portfolio turnover (%) | —m,x |
See notes to financial statements
International Core Fund
29
F I N A N C I A L S T A T E M E N T S
Financial highlights
| CLASS NAV | |
| Period ended | 8-31-06b,c |
| Per share operating performance | |
| Net asset value, beginning of period | $39.18 |
| Net investment lossh | —j |
| Net realized and unrealized | |
| gain on investments | 0.19 |
| Total from investment operations | 0.19 |
| Net asset value, end of period | $39.37 |
| Total return (%) | 0.51l,m |
| Ratios and supplemental data | |
| Net assets, end of period | |
| (in millions) | $1,029 |
| Ratio of net expenses to average | |
| net assets (%) | 1.09r |
| Ratio of net investment loss | |
| to average net assets (%) | (0.27)r |
| Portfolio turnover (%) | —m,x |
a Class B, Class C, Class I and Class R shares began operations on 6-12-06.
b Class NAV shares began operations on 8-29-06.
c Unaudited.
d Class A shares began operations on 9-16-05.
h Based on the average of the shares outstanding.
j Net investment loss is less than $0.01 per share.
l Total returns would have been lower had certain expenses not been reduced during the period shown.
m Not annualized.
n Less than $500,000.
r Annualized.
s Effective June 12, 2006, shareholders of the former GMO International Disciplined Equity Fund (the “Predecessor Fund”) became owners of an equal number of full and fractional Class A shares of the John Hancock International Core Fund. Additionally, the accounting and performance history of the former GMO International Disciplined Equity Fund was redesignated as that of John Hancock International Core Fund Class A.
t Semiannual period from 3-1-06 through 8-31-06. Unaudited.
x Portfolio turnover less than 1.00% .
y Class A total return linked back to the Predecessor Fund.
See notes to financial statements
International Core Fund
30
Notes to financial statements (unaudited)
1. Organization
John Hancock International Core Fund (the “Fund”) is a newly organized diversified series of John Hancock Funds III (the “Trust”). The Trust was established as a Massachusetts business trust on June 9, 2005. The Trust is registered under the Investment Company Act of 1940, as amended (the “1940 Act”), as an open-end investment management company. The investment objective of the Fund is to seek high total return.
John Hancock Life Insurance Company of New York (“John Hancock New York”) is a wholly owned subsidiary of John Hancock Life Insurance Company (U.S.A.) (“John Hancock USA”). John Hancock USA and John Hancock New York are indirect wholly owned subsidiaries of The Manufacturers Life Insurance Company (“Manulife”), which in turn is a wholly owned subsidiary of Manulife Financial Corporation (“MFC”), a publicly traded company. Manulife Financial Corporation and its subsidiaries are known collectively as “Manulife Financial.”
John Hancock Investment Management Services, LLC (the “Adviser”) is the Adviser to the Trust. John Hancock Fund, LLC (the “Distributor”), a Delaware limited liability company controlled by John Hancock USA, serves as principal underwriter and is a wholly owned subsidiary of the Adviser.
Class NAV shares are sold to the Lifestyle Portfolios, which are other funds of John Hancock Trust and John Hancock Fund II, and to certain institutional investors.
The Board of Trustees has authorized the issuance of multiple classes of shares of the Fund, including classes designated as Class A, Class B, Class C, Class I, Class R and Class NAV shares. The shares of each class represent an interest in the same portfolio of investments of the Fund and have equal rights as to voting, redemptions, dividends and liquidation, except that certain expenses, subject to the approval of the Board of Trustees, may be applied differently to each class of shares in accordance with current regulations of the Securities and Exchange Commission and the Internal Revenue Service. Shareholders of a class that bear distribution and service expenses under the terms of a distribution plan have exclusive voting rights to that distribution plan.
The Adviser and other subsidiaries of John Hancock USA owned 2,784 Class A shares, 2,784 Class B shares, 2,784 Class C shares, 2,784 Class I shares and 2,784 Class R shares of beneficial interest of the Fund on August 31, 2006.
The Fund is the accounting and performance successor to the GMO International Disciplined Equity Fund (the “Predecessor Fund”), a diversified open-end management investment company organized as a Massachusetts corporation. On June 12, 2006, the Fund acquired substantially all the assets and assumed the liabilities of the Predecessor Fund pursuant to an agreement and plan of reorganization, in exchange for Class A shares of the Fund.
2. Significant accounting policies
In the preparation of the financial statements, the Fund follows the policies described below. The preparation of financial statements in conformity with accounting principles generally accepted in the United States of America requires management to make estimates and assumptions that affect the reported amounts of assets and liabilities at the date of the financial statements and the reported amounts of income and expenses during the reporting period. Actual results may differ from these estimates.
Security valuation
The net asset value of the shares of the Fund is determined daily as of the close of the New York Stock Exchange, normally at 4:00 p.m. Eastern
International Core Fund
31
time. Short-term debt instruments with remaining maturities of 60 days or less are valued at amortized cost and thereafter assume a constant amortization to maturity of any discount or premium, which approximates market value. Investments in State Street Navigator Securities Lending Prime Portfolio are valued at their net asset value each business day. All other securities held by the Fund are valued at the last sale price or official closing price (closing bid price or last evaluated quote if no sale has occurred) as of the close of business on a principal securities exchange (domestic or foreign) or, lacking any sales, at the closing bid price. Securities traded only in the over-the-counter market are valued at the last bid price quoted by brokers making markets in the securities at the close of trading. Fund securities for which there are no such quotations, principally debt securities, are valued based on the valuation provided by an independent pricing service, whic h utilizes both dealer-supplied and electronic data processing techniques.
Other assets and securities for which no such quotations are readily available are valued at their fair value as determined in good faith under consistently applied procedures established by and under the general supervision of the Board of Trustees. Generally, trading in non-U.S. securities is substantially completed each day at various times prior to the close of trading on the New York Stock Exchange. The values of such securities used in computing the net asset value of a Fund’s shares are generally determined as of such times. Occasionally, significant events that affect the values of such securities may occur between the times at which such values are generally determined and the close of the New York Stock Exchange. In such events, these securities will then be valued at their fair value as determined in good faith under consistently applied procedures established by and under the general supervision of the Board of Trustees.
In deciding whether to make a fair value adjustment to the price of a security, the Trustees or their designee may review a variety of factors, including, developments in foreign markets, the performance of U.S. securities markets and the performance of instruments trading in U.S. markets that represent foreign securities and baskets of foreign securities. The Fund may also fair value securities in other situations, for example, when a particular foreign market is closed, but the Fund is calculating the net asset value. In view of these factors, it is likely that Fund investing significant amounts of assets in securities in foreign markets will be fair valued more frequently than a fund investing significant amounts of assets in frequently traded, U.S. exchange listed securities of large capitalization U.S. issuers.
For purposes of determining when fair value adjustments may be appropriate with respect to the Fund investing in securities in foreign markets that close prior to the New York Stock Exchange, the Fund will, on an ongoing basis, monitor for “significant market events.” A “significant market event” may be a certain percentage change in the value of an index or of certain exchange traded funds (“ETFs”) that track foreign markets in which the Fund has significant investments. If a significant market event occurs due to a change in the value of the index or of ETFs, the pricing for the Fund will promptly be reviewed and potential adjustments to the net asset value will be recommended to the Trust’s Pricing Committee, where applicable.
Fair value pricing of securities is intended to help ensure that the net asset value of the Fund’s shares reflects the value of the Fund’s securities as of the close of the New York Stock Exchange (as opposed to a value which is no longer accurate as of such close), thus limiting the opportunity for aggressive traders to purchase shares of the Fund at deflated prices, reflecting stale security valuations, and to promptly sell such shares at a gain. However, a security’s valuation may differ depending on the method used for determining value and no assurance can be given that fair value pricing of securities will successfully eliminate all potential opportunities for such trading gains.
Repurchase agreements
The Fund may enter into repurchase agreements. When the Fund enters into a repurchase agreement through its custodian, it receives delivery of securities, the amount of which at the time of purchase and each subsequent business day is required to be
International Core Fund
32
maintained at such a level that the market value is generally at least 102% of the repurchase amount. The Fund will take constructive receipt of all securities underlying the repurchase agreements it has entered into until such agreements expire. If the seller defaults, the Fund would suffer a loss to the extent that proceeds from the sale of underlying securities were less than the repurchase amount. The Fund may enter into repurchase agreements maturing within seven days with domestic dealers, banks or other financial institutions deemed to be creditworthy by the Adviser. Collateral for certain tri-party repurchase agreements is held at the custodian bank in a segregated account for the benefit of the Fund and the counterparty.
Foreign currency transactions
The accounting records of the Fund is maintained in U.S. dollars. Foreign currency amounts are translated into U.S. dollars on the following basis:
(i) market value of securities, other assets and other liabilities at the current rate of exchange at period end of such currencies against U.S. dollars; and
(ii) purchases and sales of securities, income and expenses at the rate of exchange quoted on the respective dates of such transactions.
Net realized gains and losses on foreign currency transactions represent net gains and losses from sales and maturities of foreign currency contracts, disposition of foreign currencies, the difference between the amount of net investment income accrued and the U.S. dollar amount actually received, and gains and losses between trade and settlement date on purchases and sales of securities. The effects of changes in foreign currency exchange rates on investments in securities are included with the net realized and unrealized gain or loss on investment securities.
The Fund may be subject to capital gains and repatriation taxes imposed by certain countries in which the Fund invests. Such taxes are generally based upon income and/or capital gains earned or repatriated. Taxes are accrued based upon net investment income, net realized gains and net unrealized appreciation.
Investing in securities of foreign companies and foreign governments involves special risks and consideration not typically associated with investing in securities of domestic companies and the U. S. Government. These risks include revaluation of currencies and future adverse political and economic developments. Moreover, securities of foreign companies and foreign governments and their markets may be less liquid and their prices more volatile than those of the United States.
Security transactions and related investment income
Investment security transactions are accounted for on a trade date plus one basis for daily net asset value calculations. However for financial reporting purposes, investment transactions are reported on trade date. Interest income is accrued as earned. Dividend income is recorded on the ex-dividend date. Foreign dividends are recorded on the ex-date or as soon after the ex-date that the Fund becomes aware of such dividends, net of all taxes. Discounts/premiums are accreted/amortized for financial reporting purposes. Non-cash dividends are recorded at the fair market value of the securities received. Debt obligations may be placed in a non-accrual status and related interest income may be reduced by ceasing current accruals and writing off interest receivables when the collection of all or a portion of interest has become doubtful, based upon consistently applied procedures.
From time to time, the Fund may invest in Real Estate Investment Trusts (“REITs”) and as a result, will estimate the components of distributions from these securities. Distributions from REITs received in excess of income are recorded as a reduction of cost of investments and/or as a realized gain.
The Fund uses the First In, First Out method for fixed income securities and Highest Cost, First Out for all other securities for determining realized gain or loss on investments for both financial and federal income tax reporting purposes.
Multi-class operations
All income, expenses (except for class-specific expenses) and realized and unrealized gains (losses) are allocated to each class of shares
International Core Fund
33
based upon the relative net assets of each class. Dividends to shareholders from net investment income are determined at a class level and distributions from capital gains are determined at a Fund level.
Expense allocation
Expenses are allocated based on the relative share of net assets of the Fund at the time the expense was incurred. Class-specific expenses, such as distribution (Rule 12b-1) fees, are accrued daily and charged directly to the respective share classes.
There were no written options for the period ended August 31, 2006.
Securities lending
The Fund may lend securities in amounts up to 33 1 / 3% of each Fund’s total non-cash assets to brokers, dealers and other financial institutions, provided such loans are callable at any time and are at all times fully secured by cash, cash equivalents or securities issued or guaranteed by the U.S. Government or its agencies or instrumentalities, marked to market to the value of the loaned securities on a daily basis. The Fund may bear the risk of delay in recovery of, or even of rights in, the securities loaned should the borrower of the securities fail financially. Consequently, loans of the Fund’s securities will only be made to firms deemed by the subadvisers to be creditworthy. The Fund receives compensation for lending its securities either in the form of fees or by retaining a portion of interest on the investment of any cash received as collateral. Cash collateral is in vested in the State Street Navigator Securities Lending Prime Portfolio.
All collateral received will be in an amount equal to at least 100% of the market value of the loaned securities and is intended to be maintained at that level during the period of the loan. The market value of the loaned securities is determined at the close of business of the Fund and any additional required collateral is delivered to the Fund the next business day. During the loan period, the Fund continues to retain rights of ownership, including dividends and interest of the loaned securities. At August 31, 2006, the Fund loaned securities having a market value of $36,810,845 collateralized by securities in the amount of $38,712,988.
Futures
The Fund may purchase and sell financial futures contracts and options on those contracts. The Fund invests in contracts based on financial instruments such as U.S. Treasury Bonds or Notes on securities indices such as the Standard & Poor’s 500 Index, in order to hedge against a decline in the value of securities owned by the Fund.
Upon entering into futures contracts, the Fund is required to deposit with a broker an amount, termed the initial margin, which typically represents a certain percentage of the purchase price indicated in the futures contract. Payments to and from the broker, known as variation margin, are required to be made on a daily basis as the price of the futures contract fluctuates, making the long or short positions in the contract more or less valuable. If the position is closed out by taking an opposite position prior to the settlement date of the futures contract, a final determination of variation margin is made, cash is required to be paid to or released by the broker and the Fund realizes a gain or loss.
When the Fund sells a futures contract based on a financial instrument, the Fund becomes obligated to deliver that kind of instrument at an agreed upon date for a specified price. The Fund realizes a gain or loss depending on whether the price of an offsetting purchase is less or more than the price of the initial sale or on whether the price of an offsetting sale is more or less than the price of the initial purchase. The Fund could be exposed to risks if it could not close out futures positions because of an illiquid secondary market or the inability of counterparties to meet the terms of their contracts. Futures contracts are valued at the quoted daily settlement prices established by the exchange on which they trade.
International Core Fund
34
| The following is a summary of open futures contracts on August 31, 2006: | ||||
| UNREALIZED | ||||
| NUMBER OF | APPRECIATION | |||
| OPEN CONTRACTS | CONTRACTS | POSITION | EXPIRATION | (DEPRECIATION) |
| CAC 40 10 Euro Index | 43 | Short | Sep 2006 | $1,525 |
| DAX Index | 171 | Long | Sep 2006 | 26,193 |
| EOE Dutch Stock Index | 12 | Short | Sep 2006 | 549 |
| FTSE 100 Index | 2 | Long | Sep 2006 | 1,420 |
| FTSE 100 Index | 152 | Short | Sep 2006 | (25,118) |
| Hang Seng Stock Index | 2 | Short | Sep 2006 | (4,154) |
| IBEX 35 Index | 6 | Short | Sep 2006 | 414 |
| MSCI Singapore Stock Index | 167 | Long | Sep 2006 | 64,853 |
| OMX 30 Stockholm Stock Index | 35 | Short | Sep 2006 | (2,551) |
| S&P/MIB 30 Index | 4 | Short | Sep 2006 | (4,576) |
| S&P/Toronto Stock Exchange | ||||
| 60 Index | 148 | Short | Sep 2006 | 18,052 |
| SPI 200 Index | 62 | Short | Sep 2006 | (61,907) |
| TOPIX Index | 112 | Long | Sep 2006 | 182,887 |
| $197,587 | ||||
The Fund had no open swap contracts on August 31, 2006.
Forward foreign currency contracts
The Fund may purchase and sell forward foreign currency contracts in order to hedge a specific transaction or Fund position. Forward foreign currency contracts are valued at forward foreign currency exchange rates and marked to market daily. Net realized gains (losses) on foreign currency and forward foreign currency contracts shown in the Statements of Operations include net gains or losses realized by a Fund on contracts that have matured.
The net U.S. dollar value of foreign currency underlying all contractual commitments held at the end of the period, the resulting net unrealized appreciation (depreciation) and related net receivable or payable amount are determined using forward foreign currency exchange rates supplied by a quotation service. The Fund could be exposed to risks in excess of amounts recognized on the Statements of Assets and Liabilities if the counterparties to the contracts are unable to meet the terms of their contracts or if the value of the forward foreign currency contract changes unfavorably.
At August 31, 2006, the Fund entered into forward foreign currency contracts, which contractually obligate the Fund to deliver currencies at future dates. Open forward foreign currency contracts on August 31, 2006 were as follows:
35 International Core Fund
| UNREALIZED | |||
| CURRENCY | PRINCIPAL AMOUNT | APPRECIATION | |
| BUYS | COVERED BY CONTRACT | SETTLEMENT DATE | (DEPRECIATION) |
| Euro | 335,000 | Nov 2006 | $2,758 |
| Japanese Yen | 823,575,839 | Nov 2006 | (64,191) |
| Japanese Yen | 1,647,151,678 | Nov 2006 | (126,376) |
| Japanese Yen | 823,575,839 | Nov 2006 | (66,372) |
| Japanese Yen | 849,672,836 | Nov 2006 | (69,340) |
| Japanese Yen | 823,575,839 | Nov 2006 | (58,837) |
| Japanese Yen | 823,575,839 | Nov 2006 | (48,501) |
| Japanese Yen | 823,575,839 | Nov 2006 | (51,182) |
| Norwegian Krone | 21,747,312 | Nov 2006 | (28,723) |
| Norwegian Krone | 43,494,624 | Nov 2006 | (50,775) |
| Norwegian Krone | 21,747,312 | Nov 2006 | (30,414) |
| Norwegian Krone | 21,747,313 | Nov 2006 | (31,150) |
| Norwegian Krone | 21,747,312 | Nov 2006 | (25,945) |
| Norwegian Krone | 21,747,312 | Nov 2006 | (27,113) |
| Norwegian Krone | 21,747,312 | Nov 2006 | (23,855) |
| Swedish Krona | 35,742,507 | Nov 2006 | (42,205) |
| Swedish Krona | 71,485,014 | Nov 2006 | (98,036) |
| Swedish Krona | 35,742,507 | Nov 2006 | (45,485) |
| Swedish Krona | 35,742,510 | Nov 2006 | (47,035) |
| Swedish Krona | 35,742,507 | Nov 2006 | (44,011) |
| Swedish Krona | 35,742,507 | Nov 2006 | (45,477) |
| Swedish Krona | 35,742,507 | Nov 2006 | (46,103) |
| Swiss Franc | 10,671,882 | Nov 2006 | (15,883) |
| Swiss Franc | 21,343,764 | Nov 2006 | 3,137 |
| Swiss Franc | 10,671,882 | Nov 2006 | (27,954) |
| Swiss Franc | 10,671,882 | Nov 2006 | (22,036) |
| Swiss Franc | 10,671,882 | Nov 2006 | (6,616) |
| Swiss Franc | 10,671,882 | Nov 2006 | (6,666) |
| Swiss Franc | 10,671,882 | Nov 2006 | (5,295) |
| ($1,149,681) | |||
36 International Core Fund
| UNREALIZED | |||
| CURRENCY | PRINCIPAL AMOUNT | APPRECIATION | |
| SELLS | COVERED BY CONTRACT | SETTLEMENT DATE | (DEPRECIATION) |
| Australian Dollar | 2,117,473 | Nov 2006 | ($107) |
| Australian Dollar | 4,235,136 | Nov 2006 | (26) |
| Australian Dollar | 2,117,318 | Nov 2006 | (263) |
| Australian Dollar | 2,115,933 | Nov 2006 | (1,650) |
| Australian Dollar | 2,116,214 | Nov 2006 | (1,367) |
| Australian Dollar | 2,115,852 | Nov 2006 | (1,728) |
| Australian Dollar | 2,114,985 | Nov 2006 | (2,596) |
| Canadian Dollar | 472,175 | Nov 2006 | (3,997) |
| Canadian Dollar | 945,291 | Nov 2006 | (7,054) |
| Canadian Dollar | 472,560 | Nov 2006 | (3,612) |
| Canadian Dollar | 471,800 | Nov 2006 | (4,372) |
| Canadian Dollar | 472,726 | Nov 2006 | (3,447) |
| Canadian Dollar | 472,561 | Nov 2006 | (3,612) |
| Canadian Dollar | 472,300 | Nov 2006 | (3,873) |
| Danish Kroner | 370,697 | Nov 2006 | 478 |
| Danish Kroner | 741,254 | Nov 2006 | 816 |
| Danish Kroner | 370,827 | Nov 2006 | 608 |
| Danish Kroner | 370,955 | Nov 2006 | 736 |
| Danish Kroner | 370,763 | Nov 2006 | 544 |
| Danish Kroner | 370,723 | Nov 2006 | 504 |
| Danish Kroner | 370,616 | Nov 2006 | 397 |
| Euro | 9,347,514 | Nov 2006 | 11,677 |
| Euro | 18,705,675 | Nov 2006 | 34,000 |
| Euro | 9,357,812 | Nov 2006 | 21,976 |
| Euro | 13,520,930 | Nov 2006 | 27,965 |
| Euro | 9,353,527 | Nov 2006 | 17,691 |
| Euro | 9,352,547 | Nov 2006 | 16,710 |
| Euro | 9,351,138 | Nov 2006 | 15,301 |
| Hong Kong Dollar | 421,306 | Nov 2006 | 179 |
| Hong Kong Dollar | 842,553 | Nov 2006 | 297 |
| Hong Kong Dollar | 421,182 | Nov 2006 | 54 |
| Hong Kong Dollar | 421,258 | Nov 2006 | 130 |
| Hong Kong Dollar | 421,241 | Nov 2006 | 113 |
| Hong Kong Dollar | 421,255 | Nov 2006 | 127 |
| Hong Kong Dollar | 421,242 | Nov 2006 | 114 |
| Japanese Yen | 5,518,988 | Nov 2006 | 51,124 |
| Pound Sterling | 6,769,069 | Nov 2006 | (43,807) |
| Pound Sterling | 13,520,609 | Nov 2006 | (105,145) |
| Pound Sterling | 6,767,721 | Nov 2006 | (45,155) |
| Pound Sterling | 14,083,953 | Nov 2006 | (74,053) |
| Pound Sterling | 6,768,758 | Nov 2006 | (44,118) |
| Pound Sterling | 6,764,826 | Nov 2006 | (48,050) |
| Pound Sterling | 6,761,743 | Nov 2006 | (51,133) |
| Swiss Franc | 1,761,120 | Nov 2006 | 1,882 |
| ($245,742) | |||
37 International Core Fund
Federal income taxes
The Fund qualifies as a “regulated investment company” by complying with the applicable provisions of the Internal Revenue Code and will not be subject to federal income tax on taxable income that is distributed to shareholders. Therefore, no federal income tax provision is required.
New accounting pronouncements
In June 2006, Financial Accounting Standards Board (“FASB”) Interpretation No. 48, Accounting for Uncertainty in Income Taxes (the “Interpretation”) was issued, and is effective for fiscal years beginning after December 15, 2006 and is to be applied to all open tax years as of the effective date. The Interpretation prescribes a minimum threshold for financial statement recognition of the benefit of a tax position taken or expected to be taken in a tax return, and requires certain expanded disclosures. Management is currently evaluating the application of the Interpretation to the Fund and has not at this time quantified the impact, if any, resulting from the adoption of the Interpretation on the Fund’s financial statements.
In September 2006, FASB Standard No. 157, Fair Value Measurements (“FAS 157”) was issued, and is effective for fiscal years beginning after November 15, 2007. FAS 157 defines fair value, establishing a framework for measuring fair value and expands disclosure about fair value measurements. Management is currently evaluating the application of FAS 157 to the Fund, and its impact, if any, resulting from the adoption of FAS 157 on the Fund’s financial statements.
Distribution of income and gains
The Fund records distributions to shareholders from net investment income and net realized gains, if any, on the ex-dividend date. Distributions paid by the Fund with respect to each class of shares are calculated in the same manner, at the same time and are in the same amount, except for the effect of expenses that may be applied differently to each class. Such distributions, on a tax basis, are determined in conformity with income tax regulations, which may differ from accounting principles generally accepted in the United States of America. Distributions in excess of tax basis earnings and profits, if any, are reported in the Fund’s financial statements as a return of capital.
Capital accounts
The Fund reports the undistributed net investment income and accumulated undistributed net realized gain (loss) accounts on a basis approximating amounts available for future tax distributions (or to offset future taxable realized gains when a capital loss carryforward is available). Accordingly, the Fund may periodically make reclassifications among certain capital accounts without affecting its net asset value.
3. Investment advisory and
other agreements
Advisory fees
The Trust has entered into an Investment Advisory Agreement with the Adviser. The Adviser is responsible for managing the corporate and business affairs of the Trust and for selecting and compensating subadvisers to handle the investment and reinvestment of the assets of the Fund, subject to the supervision of the Board of Trustees. Under the Advisory Agreement, the Fund pays a monthly management fee to the Adviser equivalent, on an annual basis, to the sum of: (a) 0.92% of the first $100,000,000 of the Fund’s aggregate daily net assets; (b) 0.895% of the next $900,000,000 of the Fund’s aggregate daily net assets; and (c) 0.88% of the Fund’s aggregate daily net assets in excess of $1,000,000,000. Aggregate net assets include the net assets of the Fund and International Core Trust, a series of John Hancock Trust and International Stock Fund, a series of John Hancock Funds II. John Hancock Trust and John Hancock Funds II are open-end investment companies advised by the Adviser and distributed by the Distributor. The Fund is not responsible for payment of the subadvisory fees.
Prior to June 12, 2006, the Predecessor Fund paid a monthly management fee to its investment adviser, Grantham, Mayo, Van Otterloo & Co. LLC, at an annual rate of 0.40% of the Predecessor Fund’s average daily net assets.
Expense reimbursements
The Adviser has agreed contractually to reimburse for certain fund level expenses that exceed 0.20% of the average annual net assets, or to make a payment to a specific class of shares of the Fund in an amount equal to the amount by
38 International Core Fund
which the expenses attributable to such class of shares (excluding taxes, portfolio brokerage commissions, interest, litigation and indem-nification expenses and other extraordinary expenses not incurred in the ordinary course of the Fund’s business and fees under any agreement or plans of the Fund dealing with services for shareholders and others with beneficial interests in shares of the Fund) exceed the percentage of average annual net assets (on an annualized basis) attributable as follows: 1.70% for Class A, 2.40% for Class B, 2.40% for Class C, 1.20% for Class I and 1.70% for Class R. Accordingly, the expense reductions related to this expense limitation amounted to $154,747, $4,268, $5,252, $4,182 and $4,223 for Class A, Class B, Class C, Class I and Class R, respectively, for the period ended August 31, 2006. This expense reimbursement shall continue in effect until June 30, 2007 and thereafter until terminated by the Adviser on notice to the Trust.
Administration fees
The Fund has an agreement with the Adviser that requires the Fund to reimburse the Adviser for all expenses associated with providing the administrative, financial, accounting and recordkeeping services of the Fund, including the preparation of all tax returns, annual, semi-annual and periodic reports to shareholders and the preparation of all regulatory reports.
Distribution plan
The Trust has a Distribution Agreement with the Distributor, a wholly owned subsidiary of the Adviser. The Fund has adopted Distribution Plans with respect to Class A, Class B, Class C and Class R, pursuant to Rule 12b-1 under the 1940 Act, to reimburse the Distributor for the services it provides as distributor of shares of the Fund. Accordingly, the Fund makes monthly payments to the Distributor at an annual rate not to exceed 0.30%, 1.00%, 1.00% and 0.50% of average daily net asset value of Class A, Class B, Class C and Class R, respectively. A maximum of 0.25% of such payments may be service fees, as defined by the Conduct Rules of the National Association of Securities Dealers. Under the Conduct Rules, curtailment of a portion of the Fund’s 12b-1 payments could occur under certain circumstances. In addition, under a Service Plan for Class R shares, the Fund pays up to 0.25% of Class R average daily net asset value for certai n other services.
Prior to June 12, 2006, Funds Distributor, Inc. served as the Predecessor Fund’s principal underwriter and was compensated at an annual rate of 0.15% of the Predecessor Fund’s average daily net asset value.
Sales charges
Class A shares are assessed up-front sales charges of up to 5.00% of net asset value of such shares. During the period ended August 31, 2006, the Fund was informed that the Distributor received net up-front sales charges of $7,954 with regard to sales of Class A shares. Of this amount, $1,280 was retained and used for printing prospectuses, advertising, sales literature and other purposes, $6,672 was paid as sales commissions to unrelated broker-dealers and $2 was paid as sales commissions to sales personnel of Signator Investors, Inc., a related broker-dealer, an indirect subsidiary of MFC.
Class B shares that are redeemed within six years of purchase are subject to a contingent deferred sales charge (“CDSC”) at declining rates, beginning at 5.00% of the lesser of the current market value at the time of redemption or the original purchase cost of the shares being redeemed. Class C shares that are redeemed within one year of purchase are subject to a CDSC at a rate of 1.00% of the lesser of the current market value at the time of redemption or the original purchase cost of the shares being redeemed. Proceeds from the CDSCs are paid to the Distributor and are used, in whole or in part, to defray its expenses for providing distribution-related services to the Fund in connection with the sale of Class B and Class C shares. During the period ended August 31, 2006, CDSCs received by the Distributor amounted to $1 for Class B shares.
Transfer agent fees
The Fund has a Transfer Agency Agreement with John Hancock Signature Services, Inc. (“Signature Services”), an indirect subsidiary of MFC. For Class A, Class B, Class C, Class I and Class R shares, the Fund pays a monthly transfer agent fee at an annual rate of 0.05% of
39 International Core Fund
each class’ average daily net assets, plus a fee based on the number of shareholder accounts and reimbursement for certain out-of-pocket expenses. Expenses not directly attributable to a particular class of shares are aggregated and allocated to each class on the basis of its relative net asset value.
Signature Services has agreed to limit the transfer agent fees so that such fees do not exceed 0.20% annually of Class A, Class B, Class C, Class I and Class R share average daily net assets. This agreement is effective until December 31, 2006. Signature Services reserves the right to terminate this limitation in the future. Accordingly, there were no transfer agent fees reductions for Class A, Class B, Class C, Class I and Class R shares, respectively, during the period ended August 31, 2006. Prior to June 12, 2006, Investors Bank & Trust Company served as the Predecessor Fund’s transfer agent and Brown Brothers Harriman & Co. served as fund accountant.
Expenses under the agreements described above for the period ended August 31, 2006 were as follows:
| Distribution and | Transfer | Printing and | ||
| Share Class | service fees | agent | Blue sky | postage |
| Class A | $11,756 | $23,123 | $4,274 | $16,989 |
| Class B | 304 | 91 | 4,032 | 40 |
| Class C | 1,092 | 328 | 4,035 | 121 |
| Class I | — | 12 | 4,032 | 36 |
| Class R | 171 | 69 | 4,032 | 33 |
| Class NAV | — | — | — | — |
| Total | $13,323 | $23,623 | $20,405 | $17,219 |
Trustees’ fees
The Trust compensates each Trustee who is not an employee of the Adviser or its affiliates. Total Trustees’ expenses are allocated to the Fund based on its average daily net asset value.
4. Guarantees and indemnifications
Under the Trust’s organizational documents, its Officers and Trustees are indemnified against certain liability arising out of the performance of their duties to the Trust. Additionally, in the normal course of business, the Trust enters into contracts with service providers that contain general indemnification clauses. The Trust’s maximum exposure under these arrangements is unknown, as this would involve future claims that may be made against the Trust that have not yet occurred. However, based on experience, the Trust believes the risk of loss to be remote.
5. Line of credit
The Fund has entered into an agreement which enables them to participate in a $100 million unsecured committed line of credit with State Street Bank & Trust Company. Borrowings will be made solely to temporarily finance the repurchase of capital shares. Interest is charged to the Fund based on its borrowings at a rate per annum equal to the Federal Funds rate plus 0.50% . In addition, a commitment fee of 0.07% per annum, payable at the end of each calendar quarter, based on the average daily-unused portion of the line of credit, is charged to the Fund on a prorated basis based on average net assets. For the period ended August 31, 2006, there was no borrowings under the line of credit.
40 International Core Fund
6. Capital shares
Share activities for the Fund for the period ended August 31, 2006 were as follows:
| Period ended 2-28-06a | Period ended 8-31-06 | |||
| Shares | Amount | Shares | Amount | |
| Class A shares | ||||
| Sold | 462,581 | $15,078,711 | 53,557 | $1,942,659 |
| Repurchased | — | — | (2,907) | (112,348) |
| Reclassification of capital accounts — | 135,059 | — | — | |
| Net increase | 462,581 | $15,213,770 | 50,650 | $1,830,311b |
| Class B shares | ||||
| Sold | — | — | 5,932 | $219,907 |
| Repurchased | — | — | (781) | (28,478) |
| Net increase | — | — | 5,151 | $191,429c |
| Class C shares | ||||
| Sold | — | — | 24,652 | $929,051 |
| Net increase | — | — | 24,652 | $929,051c |
| Class I shares | ||||
| Sold | — | — | 3,088 | $111,000 |
| Net increase | — | — | 3,088 | $111,000c |
| Class R shares | ||||
| Sold | — | — | 2,784 | $100,000 |
| Net increase | — | — | 2,784 | $100,000c |
| Class NAV shares | ||||
| Issued in reorganization | — | — | 26,136,542 | $1,024,057,429 |
| Net increase | — | — | 26,136,542 | $1,024,057,429d |
| Net Increase | 462,581 | $15,213,770 | 26,222,867 | $1,027,219,220 |
aPeriod from 9-16-05 (commencement of operations) to 2-28-06.
bSemiannual period from 3-1-06 through 8-31-06. Unaudited.
cPeriod from 6-12-06 (commencement of operations) to 8-31-06. Unaudited.
dPeriod from 8-29-06 (commencement of operations) to 8-31-06. Unaudited.
7. Investment transactions
Purchases and proceeds from sales or maturities of securities, other than short-term securities and obligations of the U.S. government, during the period ended August 31, 2006, aggregated $893,658,653 and $1,492,047, respectively.
The cost of investments owned on August 31, 2006, including short-term investments, for federal income tax purposes, was $952,206,165. Gross unrealized appreciation and depreciation of investments aggregated $140,923,209 and $10,177,947, respectively, resulting in net unrealized appreciation of $130,745,262. The difference between book basis and tax basis net unrealized appreciation of investments is attributable to John Hancock Life Insurance Company’s election under the Internal Revenue Service Reg.1.337(d) -(7)(c)(1) to recognize the net unrealized gain on the securities contributed to the fund on the reorganization date (see Note 10 Reorganization).
8. Federal income tax information
Federal income tax regulations may differ from generally accepted accounting principles and income and capital gain distributions determined in accordance with tax regulations may differ from net investment income and realized
41 International Core Fund
gains recognized for financial reporting purposes. Accordingly, the composition of net assets for tax purposes differs from amounts reflected in the accompanying financial statements. These differences are primarily due to differing treatment for futures and options transactions, foreign currency transactions, paydowns, market discount on debt securities, losses deferred with respect to wash sales, investments in passive foreign investment companies, equalization debits and excise tax regulations.
9. Acquisition
On June 12, 2006, the Fund acquired substantially all of the assets and liabilities of the Predecessor Fund in exchange solely for Class A shares of the Fund. The acquisition was accounted for as a tax-free exchange of 462,581 Class A shares of the Fund for the net assets of the former Predecessor Fund, which amounted to $16,617,195, including $884,271 of unrealized appreciation, after the close of business on June 9, 2006. Accounting and performance history of the former Predecessor Fund was redesignated as that of Class A of the Fund.
10. Reorganization
On August 29, 2006, the Board of Trustees of John Hancock International Stock Fund Class NAV (the “International Stock Fund Class NAV”) approved an Agreement and Plan of Reorganization, which provided for the transfer of substantially all of the assets and liabilities of the International Stock Fund Class NAV in exchange for the Class NAV of the Fund. The acquisition was accounted for as a tax-free exchange of 26,136,542 of the Class NAV shares of the Fund for the net assets of the International Stock Fund Class NAV, which amounted to $1,025,518,808, including the total of $122,941,561 on unrealized depreciation, after the close of business on August 29, 2006.
42 International Core Fund
Evaluation of Advisory and Subadvisory
Agreements by the Board of Trustees
This section describes the evaluation by the Board of Trustees of the Advisory Agreement and each of the Subadvisory Agreements.
Evaluation by the Board of Trustees The Board, including all of the Trustees who are not “interested persons” as defined in the Investment Company Act of 1940, as amended (the “Independent Trustees”), is responsible for selecting the Trust’s investment adviser, John Hancock Investment Management Services, LLC (the “Adviser” or “JHIMS”), approving the Adviser’s selection of subadvisers for each series of the Trust (the “Funds”) and approving the Trust’s advisory and sub-advisory agreements (and any sub-subadvisory agreements), their periodic continuation and any amendments. Consistent with SEC rules, the Board regularly evaluates the Trust’s advisory and subadvisory (and sub-subadvisory) arrangements, including consideration of the factors listed below. The Board may also consider other factors (including conditions and trends prevailing generally in the economy, the securities markets and the industry) and does not treat any single factor as determinative, and each Trustee may attribute different weights to different factors. The Board is furnished with an analysis of its fiduciary obligations in connection with its evaluation and, throughout the evaluation process, the Board is assisted by counsel for the Trust and the Independent Trustees are also separately assisted by independent legal counsel. The factors regularly considered by the Board are:
1. the nature, extent and quality of the services to be provided by the Adviser to the Trust and by the subadvisers to the Funds;
2. the investment performance of the Funds and their subadvisers;
3. the extent to which economies of scale would be realized as a Fund grows and whether fee levels reflect these economies of scale for the benefit of Trust shareholders;
4. the costs of the services to be provided and the profits to be realized by the Adviser and
its affiliates (including any subadvisers that are affiliated with the Adviser) from the Adviser’s relationship with the Trust; and
5. comparative services rendered and comparative advisory and subadvisory fee rates.
The Board believes that information relating to all these factors is relevant to its evaluation of the Trust’s advisory agreement. With respect to its evaluation of subadvisory agreements (including sub-subadvisory agreements) the Board believes that, in view of the Trust’s “manager-of managers” advisory structure, the costs of services to be provided and the profits to be realized by those subadvisers that are not affili-ated with the Adviser from their relationship with the Trust generally are not a material factor to the Board’s consideration of subadvisory agreements because such fees are paid to sub-advisers by the Adviser and not by the Funds, and because the Board relies on the ability of the Adviser to negotiate such subadvisory fees at arms-length.
In evaluating subadvisory arrangements, the Board also considers other material business relationships that unaffiliated sub-advisers and their affiliates have with the Adviser or its affiliates, including the involvement by certain affiliates of certain subadvisers in the distribution of financial products, including shares of the Trust, offered by the Adviser and other affiliates of the Adviser (“Material Relationships”).
Approval of Advisory Agreement
At its meeting on September 21, 2005, the Board, including all the Independent Trustees, approved the Advisory Agreement between the Trust and JHIMS with respect to each of the Funds.
In approving the Advisory Agreement, and with reference to the factors which it regularly considers, the Board:
(1) (a) considered the high value to the Trust of continuing the relationship with JHIMS as the Trust’s Adviser to the other John Hancock Funds, the skills and competency with which JHIMS
43
has in the past managed the affairs and subadvisory relationships of other funds in the complex, JHIMS’s oversight and monitoring of subadvisers’ investment performance and compliance programs including its timelines in responding to performance issues and the qualifications of JHIMS’s personnel,
(b) considered JHIMS’s compliance policies and procedures and its responsiveness to regulatory changes and mutual fund industry developments, and
(c) JHIMS’s administrative capabilities, including its ability to supervise the other service providers for the Funds and concluded that JHIMS may reasonably be expected to ably perform its services under the Advisory Agreement.
(2) reviewed the investment performance of portfolios that are managed comparable to the Funds; the comparative performance of their respective benchmarks; and JHIMS’ analysis of such performance and its plans and recommendations regarding the Trust’s subadvisory arrangements generally and with respect to the Funds; and concluded that each of the comparably managed funds has performed well or within a range that the Board deemed competitive, and that JHIMS may reasonably be expected to ably monitor the performance of the Funds and their subadvisers;
(3) reviewed the Trust’s advisory fee structure and the incorporation therein of any subadvisory fee breakpoints in the advisory fees charged and concluded (i) that to the extent that Funds have subadvisory fees with breakpoints, those breakpoints are reflected as breakpoints in the advisory fees for Funds, (ii) that all Funds with a subadviser that is not affiliated with the Adviser have subadvisory fees which are the product of arms-length negotiations between the Adviser and the subadviser and which in many, but not all, cases contain breakpoints, and (iii) that, although economies of scale cannot be measured with precision, these arrangements permit shareholders of Funds with advisory fee breakpoints to benefit from economies of scale if those Funds grow;
(4) (a) reviewed the financial statements of JHIMS and John Hancock Life Insurance Company (U.S.A.) (“JHLICO (U.S.A.)”;
(b) reviewed the anticipated profitability of the JHIMS’s relationship with the Funds in terms of the fees it expects to receive with respect to the Funds and whether JHIMS has the financial ability to provide a high level of services to the Funds,
(c) considered that JHIMS derives reputational and other indirect benefits from providing advisory services to the Funds, and
(d) noted that JHIMS will pay the sub-advisory fees out of the advisory fees JHIMS receives from the Funds and concluded that the advisory fees paid by the Trust with respect to the Funds are not unreasonable in light of such information; and
(5) reviewed comparative information with respect to the advisory fee rates and concluded that the anticipated advisory fees for the Funds are within the range of those incurred by other comparable funds and that the advisory structure for the Funds is thus competitive within the industry.
Additional information that the Board considered for a particular Fund is set forth in Appendix A.
Approval of Subadvisory Agreements
At its meeting on September 21, 2005, the Board, including all the Independent Trustees, approved the Subadvisory Agreements.
In making its determination with reference to these respective factors, the Board reviewed:
(i) information relating to each subadviser’s business which included information
44
such as: business performance, assets under management, financial stability and personnel;
(ii) the investment performance of the subad-viser’s portfolio managed comparably to the Fund to be managed by the subadviser and comparative performance information relating to the benchmark;
(iii) the proposed subadvisory fee for each Fund to be managed by the subadviser and comparative fee information; and
(iv) information relating to the nature and scope of Material Relationships and their significance to the Adviser and the subadvisers.
The Board’s decision to approve each Sub-advisory Agreement was based on a number of determinations, including the following:
(1) The subadviser has extensive experience and demonstrated skills as a manager and may be expected to provide a high quality of investment personnel to each Fund;
(2) Although not without variation, the current and historical performance of the portfolios of the Subadviser managed comparably to the Fund to be managed by the Subadviser has been within a competitive range of the current and historical performance of these portfolios’ respective benchmark (see Appendix A for further information on performance);
(3) The subadvisory fees are within industry norms and are the product of arms-length negotiation between the Adviser and the subadviser; and
(4) The Material Relationships consist of arrangements in which unaffiliated subad-visers or their affiliates provide advisory, distribution or management services in connection with financial products sponsored by the Trust’s adviser or its affili-ates, which may include other registered investment companies, a 529 education savings plan, managed separate accounts and exempt group annuity contracts sold to qualified plans, and which in no case contained elements which would cause the Board to conclude that approval of the subadvisory agreement with the subadviser would be inappropriate. See (5) below for information relating to the business arrangement between the Trust’s Adviser and GMO.
(5) As a part of the overall business arrangement between the Adviser and GMO under which the Adviser has obtained exclusive rights to certain GMO investment management services for up to five years, the Adviser has agreed that under certain circumstances it (and not the Trust or the particular Fund) will pay GMO a specified amount (ranging from $1 to $12 million) if the subadvisory agreement with respect to any of the following Funds to be subadvised by GMO is terminated within a five year period from the date of its effectiveness: U.S. Core Fund, Active Value Fund, Intrinsic Value Fund, Growth Fund, International Core Fund, International Growth Fund, Global Fund, Value Opportunities Fund, Growth Opportunities Fund and U.S. Quality Equity Fund.
The Adviser has also agreed that, subject to its fiduciary duties as an investment adviser to each of these Funds and its shareholders, it will not recommend to the Board of Trustees to terminate the subadvisory agreement with respect to any of the Funds or to reduce any of the fees payable thereunder to GMO for a five year period from the date of effectiveness of the agreement. Substantially similar agreements (with varying amounts to be paid upon termination) also apply with respect to certain other John Hancock funds that are or will be advised by the Adviser and subadvised by GMO. The Trust is not a party to any of these arrangements, and they are not binding upon the Trust, the Trust’s Funds subadvised by GMO or the Board of Trustees. However, these arrangements present certain conflicts of interest because the Adviser has a financial incentive to support the continuation of GMO subadvisory agreements for as long as the termination provisions described above re main in effect. In approving the Advisory Agreement
45
and the subadvisory agreement with respect to each of the Funds subadvised by GMO, the Board of Trustees, including the Independent Trustees, was aware of and considered these potential conflicts of interest, including any financial obligations of the Adviser to GMO.
The Board concluded that, notwithstanding the potential conflicts of interest, approval of the Advisory Agreement and the subadvisory agreements with GMO is in the best interests of shareholders and contract owners in view of (i) the Adviser’s fiduciary duty and the Board’s fiduciary duty and ability to monitor potential conflicts, (ii) the benefits to shareholders and contract owners generally expected from the exclusive rights to certain GMO investment management services obtained by the Adviser for the benefit of certain Funds of the Trust and other John Hancock funds and (iii) the benefits to such Funds of the Trust expected from the subadvisory services of GMO.
Additional information that the Board considered for a particular fund is set forth in Appendix A.
| Appendix A | |||
| Estimated Fees | |||
| Fund | Performance | and Expenses | Comments |
| International Core | See “Comments”. | Subadvisory fees | The Board noted |
| for this Fund were | that the Fund | ||
| higher than the peer | has a limited | ||
| group median. | performance history. | ||
| Advisory fees for | |||
| this Fund were | |||
| lower than the peer | |||
| group median. | |||
| Total expenses for | |||
| this Fund were | |||
| higher than the peer | |||
| group median. | |||
46
For more information
The Fund’s proxy voting policies, procedures and records are available without charge, upon request:
| By phone | On the Fund’s Web site | On the SEC’s Web site |
| 1-800-225-5291 | www.jhfunds.com/proxy | www.sec.gov |
| Trustees | Francis V. Knox, Jr. | Principal distributor |
| James M. Oates, Chairman* | Chief Compliance Officer | John Hancock Funds, LLC |
| Charles L. Bardelis * | Gordon M. Shone | 601 Congress Street |
| James R. Boyle† | Treasurer | Boston, MA 02210-2805 |
| Peter S. Burgess * | John G. Vrysen | |
| Elizabeth G. Cook | Chief Financial Officer | Custodian |
| William H. Cunningham | State Street Bank & Trust Co. | |
| Charles L. Ladner* | 2 Avenue de Lafayette | |
| Hassell H. McClellan | Investment adviser | Boston, MA 02111 |
| *Members of the Audit Committee | John Hancock Investment | |
| †Non-Independent Trustee | Management Services, LLC | Transfer agent |
| 601 Congress Street | John Hancock Signature | |
| Boston, MA 02210-2805 | Services, Inc. | |
| Officers | 1 John Hancock Way, | |
| Keith F. Hartstein | Subadviser | Suite 1000 |
| President and | Grantham, Mayo, | Boston, MA 02217-1000 |
| Chief Executive Officer | Van Otterloo & Co. LLC | |
| Thomas M. Kinzler | 40 Rowes Wharf | Legal counsel |
| Secretary and | Boston, MA 02110 | Kirkpatrick & Lockhart |
| Chief Legal Officer | Nicholson Graham LLP | |
| 1 Lincoln Street | ||
| Boston, MA 02111-2950 | ||
The Fund’s investment objective, risks, charges and expenses are included in the prospectus and should be considered carefully before investing. For a prospectus, call your financial professional, call John Hancock Funds at 1-800-225-5291 or visit the Fund’s Web site at www.jhfunds.com. Please read the prospectus carefully before investing or sending money.
| How to contact us | ||
| Internet | www.jhfunds.com | |
| Regular mail: | Express mail: | |
| John Hancock | John Hancock | |
| Signature Services, Inc. | Signature Services, Inc. | |
| 1 John Hancock Way, Suite 1000 | Mutual Fund Image Operations | |
| Boston, MA 02217-1000 | 380 Stuart Street | |
| Boston, MA 02116 | ||
| Phone | Customer service representatives | 1-800-225-5291 |
| 24-hour automated information | 1-800-338-8080 | |
| TDD line | 1-800-554-6713 | |
A listing of month-end portfolio holdings is available on our Web site, www.jhfunds.com. A more detailed portfolio holdings summary is available on a quarterly basis 60 days after the fiscal quarter on our Web site or upon request by calling 1-800-225-5291, or on the Securities and Exchange Commission’s Web site, www.sec.gov.
48
J O H N H A N C O C K F A M I L Y O F F U N D S
| EQUITY | INTERNATIONAL |
| Balanced Fund | Greater China Opportunities Fund |
| Classic Value Fund | International Classic Value Fund |
| Classic Value Fund II | International Core Fund |
| Core Equity Fund | International Fund |
| Focused Equity Fund | International Growth Fund |
| Growth Fund | |
| Growth Opportunities Fund | INCOME |
| Growth Trends Fund | Bond Fund |
| Intrinsic Value Fund | Government Income Fund |
| Large Cap Equity Fund | High Yield Fund |
| Large Cap Select Fund | Investment Grade Bond Fund |
| Mid Cap Equity Fund | Strategic Income Fund |
| Mid Cap Growth Fund | |
| Multi Cap Growth Fund | TAX-FREE INCOME |
| Small Cap Equity Fund | California Tax-Free Income Fund |
| Small Cap Fund | High Yield Municipal Bond Fund |
| Small Cap Intrinsic Value Fund | Massachusetts Tax-Free Income Fund |
| Sovereign Investors Fund | New York Tax-Free Income Fund |
| U.S. Core Fund | Tax-Free Bond Fund |
| U.S. Global Leaders Growth Fund | |
| Value Opportunities Fund | MONEY MARKET |
| Money Market Fund | |
| ASSET ALLOCATION & LIFESTYLE | U.S. Government Cash Reserve |
| Allocation Core Portfolio | |
| Allocation Growth + Value Portfolio | CLOSED-END |
| Lifestyle Aggressive Portfolio | Bank & Thrift Opportunity |
| Lifestyle Balanced Portfolio | Financial Trends |
| Lifestyle Conservative Portfolio | Income Securities |
| Lifestyle Growth Portfolio | Investors Trust |
| Lifestyle Moderate Portfolio | Patriot Global Dividend |
| Patriot Preferred Dividend | |
| SECTOR | Patriot Premium Dividend I |
| Financial Industries Fund | Patriot Premium Dividend II |
| Health Sciences Fund | Patriot Select Dividend |
| Real Estate Fund | Preferred Income |
| Regional Bank Fund | Preferred Income II |
| Technology Fund | Preferred Income III |
| Technology Leaders Fund | Tax-Advantaged Dividend |
For more complete information on any John Hancock Fund and a prospectus, which includes charges and expenses, call your financial professional, or John Hancock Funds at 1-800-225-5291. Please read the prospectus carefully before investing or sending money.

1-800-225-5291
1-800-554-6713 (TDD)
1-800-338-8080 (EASI-Line)
www.jhfunds.com
Now available: electronic delivery
www.jhfunds.com/edelivery
This report is for the information of the shareholders of John Hancock International Core Fund.
660SA 8/06
10/06

| TABLE OF CONTENTS |
| Managers’ report |
| page 2 |
| A look at performance |
| page 6 |
| Your expenses |
| page 8 |
| Fund’s investments |
| page 1 0 |
| Financial statements |
| page 21 |
| For more information |
| page 44 |
CEO corner
To Our Shareholders,
The future has arrived at John Hancock Funds.
We have always been firm believers in the powerful role the Internet can play in providing fund information to our shareholders and prospective investors. Recently, we launched a redesigned, completely overhauled Web site that is more visually pleasing, easier to navigate and, most importantly, provides more fund information and learning tools without overwhelming the user.
Not long after we embarked on this major project, a study was released by the Investment Company Institute, the mutual fund industry’s main trade group, which found that an overwhelming majority of shareholders consider the Internet the “wave of the future” for accessing fund information.
Our new site sports fresher and faster ways to access account information. New innovations allow investors to view funds by risk level, track the performance of the John Hancock funds of their choice, or sort funds by Morningstar, Inc.’s star ratings. Investors who own a John Hancock fund through a qualified retirement plan and don’t pay sales charges when making a purchase have the option of sorting by a “Load Waived” Morningstar Rating, thereby creating an apples-to-apples comparison with no-load funds that may also be available in their retirement plan.
The new site also has more educational tools and interactive modules to educate and assist investors with their financial goals, from college savings to retirement planning. A new “I want to…” feature allows investors to check performance, invest more money, update personal information or download prospectuses and forms quickly and easily.
In another of our ongoing efforts to provide our shareholders with top-notch service, we also redesigned our shareholder reports, as you may have noticed with this report. We hope the larger size, more colorful cover and redesigned presentation of the commentary and data tables will draw you in and make them easier to read.
After you’ve read your shareholder report, we encourage you to visit our new Web site – www.jhfunds.com – and take a tour. It’s easy, fast and fun and allows you to be in control of what you see and do. In short, it’s the wave of the future!
Sincerely,

Keith F. Hartstein,
President and Chief Executive Officer
This commentary reflects the CEO’s views as of August 31, 2006. They are subject to change at any time.
Your fund at a glance
The Fund seeks long-term capital growth by, under normal circumstances, investing at least 80% of its assets in small- and mid-cap companies whose stocks are included in the Russell 2500 Index and in companies with total market capitalizations similar to those of companies with stocks in the Index.
Over the last six months
► Small-company stocks struggled amid uncertainty over the global economy, interest rates, inflation and geopolitical events.
► Technology stocks detracted most from the Fund’s absolute and relative returns.
► The Fund’s performance was aided by energy-related stocks.
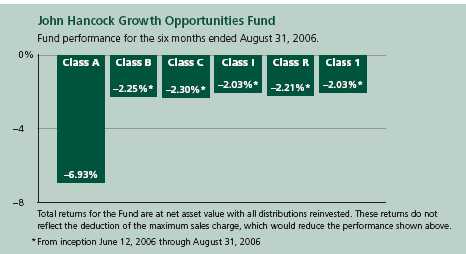
| Top 10 holdings | ||||
| Terex Corp. | 1.2% | Thor Industries, Inc. | 0.9% | |
| Memc Electronic Materials Inc. | 1.2% | Health Net, Inc. | 0.9% | |
| Fastenal Company | 1.1% | O'Reilly Automotive, Inc. | 0.8% | |
| Citrix Systems, Inc. | 1.0% | Allegheny Technologies, Inc. | 0.8% | |
| Akamai Technologies, Inc. | 0.9% | Reliance Steel & Aluminum Company | 0.8% | |
| As a percentage of net assets on August 31, 2006. | ||||
1
Managers’ report
John Hancock
Growth Opportunities Fund
Small-company growth stocks struggled during the six-month period that ended August 31, 2006, faltering in the initial months amid uncertainty over the global economy, interest rates, inflation and geopolitical events. In the spring, newly appointed Federal Reserve Board Chairman Ben Bernanke rattled investors by seeming to imply that inflation pressures were mounting and, as a result, interest rates would move higher than the market might previously have anticipated. Equity investors worried that the Fed might raise rates too much and trigger a recession. But beginning in mid-July, small-company growth stocks staged somewhat of a recovery that accelerated in early August when the Fed opted not to increase interest rates again for the first time in two years. Despite this rebound, small-company stocks significantly lagged their larger-company counterparts, and growth stocks overall traile d value stocks, as investors increasingly gravitated to less risky segments of the equity market.
Performance
For the six months that ended August 31, 2006, John Hancock Growth Opportunities Fund’s Class A shares returned –6.93% at net asset value. By comparison, the Russell 2500 Growth Index returned –4.65% and the average mid-cap growth fund returned –5.26% at net asset value, according to Morningstar, Inc.1 From their inception on June 12, 2006 through August 31, 2006, the Fund’s more recently issued Class B,
SCORECARD
| INVESTMENT | PERIOD’S PERFORMANCE...AND WHAT’S BEHIND THE NUMBERS | |
| Toll Brothers | ▼ | Housing market slump hurt luxury homebuilders |
| Citrix Systems | ▼ | Sold off following earnings announcement |
| Frontier Oil | ▲ | High oil prices helped boost earnings |
Growth Opportunities Fund
2

Portfolio Managers, Grantham, Mayo, Van Otterloo & Co. LLC (GMO)
Sam Wilderman, Ed Choi, Donna Murphy, Chuck Joyce and Tara Oliver
Class C, Class I, Class R, and Class 1 shares returned –2.25%, –2.30%, –2.03%, –2.21% and –2.03%, respectively, at net asset value.
Strategy explained
Since the Fund is new, we are continuing to build our positions, using our time-tested investment process. Although many managers use a single methodology to select stocks, we use two independent disciplines to select stocks for the Fund: valuation and momentum. In keeping with the growth style of the Fund, more than half of the stocks in the Fund are considered “momentum” stocks, that is, stocks that are experiencing price appreciation and/or positive earnings revisions. This momentum typically follows a decline in share price. We’ve determined that stocks whose prices have declined for six months, then advanced for 12 months, will tend to continue rising for another 12 to 18 months. Price momentum enables portfolios to benefit from short-term swings in earnings and investor sentiment.
“In a period where small-cap
growth stocks as a group
suffered losses, we enjoyed a
few bright spots.”
The remaining stocks in this portfolio are bought based on valuation. We seek small- to mid-cap growth companies that are selling for less than their worth, with the expectation that they will remain profitable, eventually regain favor in the market and generate above-average returns. Although traditional measures of a stock’s cheapness, such as price-to-book (P/B) or price-to-earnings (P/E) ratios may help investors determine if a company’s stock price is low, such measures do not distinguish between high-quality and low-quality companies. We believe high-quality companies are worth a premium because they can sustain a competitive advantage and continue to grow over the long term.
Because momentum and valuation tools tend to perform differently across various market and economic cycles, the Fund’s combination of
Growth Opportunities Fund
3
the two disciplines results in greater diversification in the portfolio. Diversification may help to lower the Fund’s risk level. We also employ a number of other risk control techniques. We typically hold more than 300 common stocks, so that the Fund’s performance isn’t overly dependent on the fortunes of one or a handful of companies. Finally, we limit our holdings by economic sector and company size within the small-cap universe.
Leaders and laggards
Detracting most from the Fund’s absolute and relative returns during the six months ending August 31, 2006 was our exposure to technology stocks, many of which suffered towards the end of the period as investors sought to reduce risk in their portfolios. Several of our biggest individual detractors were technology issues which declined following earnings or profit announcements. Those among this group included information technology developer Citrix Systems, Inc., technology outsourcer Plexus Corp. and Tellabs, Inc. — a telecom equipment company. In addition, two of our health care picks, Omnicare, Inc. and Viropharma, negatively impacted returns during the period. Omnicare suffered after announcing declines in cash flow relating to a dispute with UnitedHealth Group and a large debt load stemming from acquisitions made in 2005. Drug developer Viropharma declined following a change in policy that the company said might hurt its ability to protect a top-selling a ntibiotic drug from generic competition.
| SECTOR DISTRIBUTION2 | |
| Consumer cyclical | 22% |
| Consumer | |
| non-cyclical | 17% |
| Industrial | 15% |
| Technology | 12% |
| Financial | 6% |
| Energy | 5% |
| Communications | 4% |
| Basic materials | 4% |
| Diversified | 0.2% |
| Utilities | 0.1% |
In a period where small-cap growth stocks as a group suffered losses, we enjoyed a few bright spots. Overweighting energy-related companies — including Frontier Oil Corp. and Giant Industries, Inc. — worked in our favor, as they performed well amid strong prices for oil. Drink distributor Hansen Natural Corp. also performed well. The California-based company was helped by stronger sales.
Outlook
The summer stock market rally and the Fed’s decision to pause in its interest-rate-raising cycle after 17 consecutive quarter-point hikes since June 2004, appear to have provided investors with reasons for optimism. By the end of
Growth Opportunities Fund
4
the period, stocks overall seemed “priced for perfection,” with investors betting that economic growth would remain moderate and sustainable and that inflation will be contained. We believe this optimism is likely overblown and that the market is significantly underpricing risk. The investment landscape is always fraught with any number of risks, be it higher-than-expected inflation and interest rates, slower-than-expected economic growth or geopolitical events. But we believe that the economy and financial systems are so highly levered at the moment that even the smallest unfavorable development could result in a significant repricing of risk, meaning that riskier assets would underperform. Since we remain very wary of risk, we will continue to focus on high-quality companies that we believe can best weather a market and/or economic downturn.
“Since we remain very wary of risk,
we will continue to focus on high-
quality companies that we believe
can best weather a market and/or
economic downturn.”
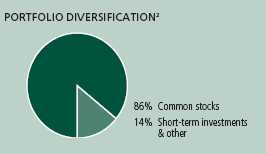
This commentary reflects the views of the portfolio management team through the end of the Fund’s period discussed in this report. The team’s statements reflect their own opinions. As such, they are in no way guarantees of future events and are not intended to be used as investment advice or a recommendation regarding any specific security. They are also subject to change at any time as market and other conditions warrant.
1 Figures from Morningstar, Inc. include reinvested dividends and do not take into account sales charges. Actual load-adjusted performance is lower.
2 As a percentage of net assets on August 31, 2006.
Growth Opportunities Fund
5
A look at performance
For the period ending August 31, 2006
| Cumulative total returns | |||
| with maximum sales charge (POP) | |||
| Inception | Since | ||
| Class | date | inception | |
| A 1,2 | 9-16-05 | –3.82% | |
| B | 6-12-06 | –7.14 | |
| C | 6-12-06 | –3.27 | |
| I 3 | 6-12-06 | –2.03 | |
| R 3 | 6-12-06 | –2.21 | |
| 1 3 | 6-12-06 | –2.03 | |
Performance figures assume all distributions are reinvested. Returns with maximum sales charge reflect a sales charge on Class A shares of 5%, and the applicable contingent deferred sales charge (CDSC) on Class B and Class C shares. The Class B shares’ CDSC declines annually between years 1–6 according to the following schedule: 5, 4, 3, 3, 2, 1%. No sales charge will be assessed after the sixth year. Class C shares held for less than one year are subject to a 1% CDSC. Sales charge is not applicable for Class 1, Class I and Class R shares.
The returns reflect past results and should not be considered indicative of future performance. The return and principal value of an investment will fluctuate so that shares, when redeemed, may be worth more or less than their original cost. Due to market volatility, the Fund’s current performance may be higher or lower than the performance shown. For performance data current to the most recent month-end, please call 1-800-225-5291 or visit the Fund’s Web site at www.jhfunds.com.
The performance table above and the chart on the next page do not reflect the deduction of taxes that a shareholder would pay on Fund distributions or the redemption of Fund shares.
The Fund’s performance results reflect any applicable expense reductions, without which the expenses would increase and results would have been less favorable.
Since inception performance is calculated with an opening price (prior day’s close) on the inception date.
1 Effective June 12, 2006, shareholders of the former GMO Small/Mid Cap Growth Fund (the “Predecessor Fund”) became owners of that number of full and fractional shares of John Hancock Growth Opportunities Fund. Additionally, the accounting and performance history of the former GMO Small/Mid Cap Growth Fund was redesignated as that of Class A of John Hancock Growth Opportunities Fund.
2 Performance linked to the Predecessor Fund.
3 For certain types of investors as described in the Fund’s Class I, Class R and Class 1 share prospectuses.
Growth Opportunities Fund
6
Growth of $10,000
This chart shows what happened to a hypothetical $10,000 investment in Class A shares1 for the period indicated. For comparison, we’ve shown the same investment in Russell 2500 Growth Index.
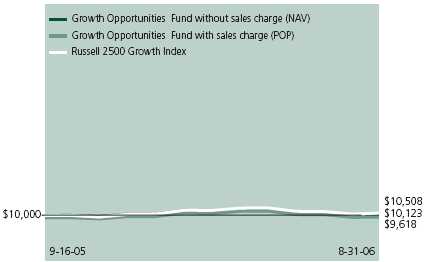
| With maximum | ||||
| Class | Period beginning | Without sales charge | sales charge | Index |
| B | 6-12-06 | $9,775 | $9,286 | $10,011 |
| C | 6-12-06 | 9,770 | 9,673 | 10,011 |
| I 2 | 6-12-06 | 9,797 | 9,797 | 10,011 |
| R2 | 6-12-06 | 9,779 | 9,779 | 10,011 |
| 12 | 6-12-06 | 9,797 | 9,797 | 10,011 |
Assuming all distributions were reinvested for the period indicated, the table above shows the value of a $10,000 investment in the Fund’s Class B, Class C, Class I, Class R and Class 1 shares, respectively, as of August 31, 2006.
Performance of the classes will vary based on the difference in sales charges paid by shareholders investing in the different classes and the fee structure of those classes.
Russell 2500 Growth Index is an unmanaged index containing those securities in the Russell 2500 Index with a greater-than-average growth orientation.
It is not possible to invest directly in an index. Index figures do not reflect sales charges and which would have resulted in lower values if they did.
1 Performance linked to the Predecessor Fund.
2 For certain types of investors as described in the Fund’s Class I, Class R and Class 1 share prospectuses.
Growth Opportunities Fund
7
Your expenses
These examples are intended to help you understand your ongoing operating expenses.
Understanding Fund expenses
As a shareholder of the Fund, you incur two types of costs:
■ Transaction costs which include sales charges (loads) on purchases or redemptions (varies by share class), minimum account fee charge, etc.
■ Ongoing operating expenses including management fees, distribution and service fees (if applicable) and other Fund expenses.
We are going to present only your ongoing operating expenses here.
Actual expenses/actual returns
This example is intended to provide information about your Fund’s actual ongoing operating expenses, and is based on your Fund’s actual return. It assumes an account value of $1,000.00 on the date indicated per class, with the same investment held until August 31, 2006.
| Account value | Ending value | Expenses paid during | |
| on 3-1-06 | on 8-31-06 | period ended 8-31-06 1 | |
| Class A | $1,000.00 | $930.70 | $4.57 |
| Account value | Ending value | Expenses paid during | |
| on 6-12-06 | on 8-31-06 | period ended 8-31-06 1 | |
| Class B | $1,000.00 | $977.50 | $4.88 |
| Class C | 1,000.00 | 977.00 | 4.87 |
| Class I | 1,000.00 | 979.70 | 2.49 |
| Class R | 1,000.00 | 977.90 | 4.10 |
| Class 1 | 1,000.00 | 979.70 | 2.39 |
Together with the value of your account, you may use this information to estimate the operating expenses that you paid over the period. Simply divide your account value at August 31, 2006 by $1,000.00, then multiply it by the “expenses paid” for your share class from the table above. For example, for an account value of $8,600.00, the operating expenses should be calculated as follows:
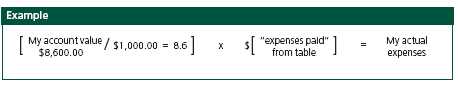
Growth Opportunities Fund
8
Hypothetical example for comparison purposes
This table allows you to compare your Fund’s ongoing operating expenses with those of any other fund. It provides an example of the Fund’s hypothetical account values and hypothetical expenses based on each class’ actual expense ratio and an assumed 5% annual return before expenses (which is not your Fund’s actual return). It assumes an account value of $1,000.00 on June 12, 2006, with the same investment held until August 31, 2006. Look in any other fund shareholder report to find its hypothetical example and you will be able to compare these expenses.
| Account value | Ending value | Expenses paid during | |
| on 3-1-06 | on 8-31-06 | period ended 8-31-061 | |
| Class A | $1,000.00 | $1,020.47 | $4.79 |
| Account value | Ending value | Expenses paid during | |
| on 6-12-06 | on 8-31-06 | period ended 8-31-06 1 | |
| Class B | $1,000.00 | $1,006.03 | $4.95 |
| Class C | 1,000.00 | 1,006.03 | 4.95 |
| Class I | 1,000.00 | 1,008.44 | 2.53 |
| Class R | 1,000.00 | 1,006.82 | 4.16 |
| Class 1 | 1,000.00 | 1,008.55 | 2.42 |
Remember, these examples do not include any transaction costs, such as sales charges; therefore, these examples will not help you to determine the relative total costs of owning different funds. If transaction costs were included, your expenses would have been higher. See the prospectus for details regarding transaction costs.
1 Expenses are equal to the Fund's annualized expense ratio of 0.94%, 2.25%, 2.25%, 1.15%, 1.89% and 1.10% for Class A, Class B, Class C, Class I, Class R and Class 1, respectively, multiplied by the average account value over the period, multiplied by the number of days in the inception period/365 or 366 (to reflect the one-half year period).
Growth Opportunities Fund
9
Fund’s investments
F I N A N C I A L S T A T E M E N T S
Securities owned by the Fund on 8-31-06. (unaudited)
This schedule is divided into two main categories: common stocks and short-term investments. Common stocks are further broken down by industry group. Short-term investments, which represent the Fund’s cash position, are listed last.
| Issuer | Shares | Value |
| Common stocks 86.06% | $2,557,748 | |
| (Cost $2,573,767) | ||
| Advertising 0.68% | 20,370 | |
| Monster Worldwide, Inc. * | 500 | 20,370 |
| Aerospace 0.38% | 11,267 | |
| Alliant Techsystems, Inc. * | 100 | 7,649 |
| Orbital Sciences Corp., Class A * | 200 | 3,618 |
| Air Freight 0.12% | 3,495 | |
| ExpressJet Holdings, Inc. * | 500 | 3,495 |
| Air Travel 1.25% | 37,299 | |
| Airtran Holdings, Inc. * | 200 | 2,290 |
| AMR Corp. * | 600 | 12,390 |
| Continental Airlines, Inc., Class B * | 300 | 7,527 |
| SkyWest, Inc. | 100 | 2,417 |
| US Airways Group, Inc. * | 300 | 12,675 |
| Apparel & Textiles 2.32% | 68,823 | |
| Columbia Sportswear Company * | 200 | 9,764 |
| Deckers Outdoor Corp. * | 100 | 4,101 |
| Guess?, Inc. * | 400 | 16,320 |
| Joseph A. Bank Clothiers, Inc. * | 25 | 598 |
| K–Swiss, Inc., Class A | 300 | 8,253 |
| Liz Claiborne, Inc. | 200 | 7,474 |
| Oakley, Inc. | 200 | 3,290 |
| Oxford Industries, Inc. | 100 | 4,108 |
| The Gymboree Corp. * | 200 | 6,710 |
| Timberland Company, Class A * | 200 | 5,682 |
| Wolverine World Wide, Inc. | 100 | 2,523 |
| Auto Parts 0.91% | 27,191 | |
| Keystone Automotive Industries, Inc. * | 100 | 3,439 |
| O’Reilly Automotive, Inc. * | 800 | 23,752 |
| Auto Services 0.19% | 5,614 | |
| Copart, Inc. * | 200 | 5,614 |
See notes to financial statements
Growth Opportunities Fund
10
F I N A N C I A L S T A T E M E N T S
| Issuer | Shares | Value |
| Automobiles 0.15% | $4,530 | |
| Group 1 Automotive, Inc. | 100 | 4,530 |
| Banking 1.28% | 38,203 | |
| Corus Bankshares, Inc. | 200 | 4,362 |
| Cullen Frost Bankers, Inc. | 100 | 5,896 |
| Digital Insight Corp. * | 200 | 5,202 |
| Flagstar Bancorp, Inc. | 100 | 1,454 |
| Hancock Holding Company | 100 | 5,184 |
| Investors Financial Services Corp. | 100 | 4,636 |
| Nara Bancorp, Inc. | 100 | 1,850 |
| TCF Financial Corp. | 200 | 5,214 |
| Wilmington Trust Corp. | 100 | 4,405 |
| Biotechnology 0.92% | 27,390 | |
| Cephalon, Inc. * | 100 | 5,702 |
| Millipore Corp. * | 100 | 6,418 |
| Techne Corp. * | 300 | 15,270 |
| Broadcasting 0.08% | 2,316 | |
| Sinclair Broadcast Group, Inc., Class A | 300 | 2,316 |
| Building Materials & Construction 0.70% | 20,897 | |
| Eagle Materials, Inc. | 300 | 10,755 |
| Lennox International, Inc. | 200 | 4,708 |
| NCI Building Systems, Inc. * | 100 | 5,434 |
| Business Services 5.81% | 172,586 | |
| Administaff, Inc. | 200 | 6,910 |
| Ceridian Corp. * | 300 | 7,161 |
| Corporate Executive Board Company | 200 | 17,528 |
| CSG Systems International, Inc. * | 200 | 5,384 |
| DST Systems, Inc. * | 200 | 11,806 |
| Equifax, Inc. | 100 | 3,179 |
| FactSet Research Systems, Inc. | 400 | 17,640 |
| Fair Isaac Corp. | 200 | 7,002 |
| Global Payments, Inc. | 300 | 11,415 |
| Informatica Corp. * | 300 | 4,392 |
| Insight Enterprises, Inc. * | 100 | 1,801 |
| Iron Mountain, Inc. * | 300 | 12,297 |
| Jacobs Engineering Group, Inc. * | 100 | 8,709 |
| Kendle International, Inc. * | 100 | 2,642 |
| Manpower, Inc. | 300 | 17,733 |
| MPS Group, Inc. * | 300 | 4,218 |
| Pre-Paid Legal Services, Inc. | 200 | 7,512 |
| Robert Half International, Inc. | 600 | 18,564 |
| Spherion Corp. * | 400 | 2,988 |
| TALX Corp. | 150 | 3,705 |
See notes to financial statements
Growth Opportunities Fund
11
F I N A N C I A L S T A T E M E N T S
| Issuer | Shares | Value |
| Cable and Television 0.12% | $3,594 | |
| Time Warner Telecom, Inc., Class A * | 200 | 3,594 |
| Cellular Communications 0.78% | 23,081 | |
| Brightpoint, Inc. * | 860 | 14,310 |
| Crown Castle International Corp. * | 100 | 3,436 |
| NII Holdings, Inc. * | 100 | 5,335 |
| Chemicals 0.45% | 13,357 | |
| Airgas, Inc. | 200 | 7,164 |
| Newmarket Corp. | 100 | 6,193 |
| Coal 0.11% | 3,275 | |
| Arch Coal, Inc. | 100 | 3,275 |
| Colleges & Universities 0.80% | 23,657 | |
| Career Education Corp. * | 200 | 3,830 |
| ITT Educational Services, Inc. * | 300 | 19,827 |
| Commercial Services 0.50% | 14,907 | |
| CB Richard Ellis Group, Inc. * | 300 | 6,900 |
| Cenveo, Inc. * | 200 | 4,200 |
| Pool Corp. | 100 | 3,807 |
| Computers & Business Equipment 2.47% | 73,470 | |
| Brocade Communications Systems, Inc. * | 500 | 3,100 |
| CDW Corp. | 100 | 5,830 |
| Electronics for Imaging, Inc. * | 200 | 4,608 |
| Foundry Networks, Inc. * | 500 | 6,085 |
| Ingram Micro, Inc., Class A * | 600 | 10,800 |
| Intergraph Corp. * | 200 | 7,472 |
| Komag, Inc. * | 100 | 3,596 |
| National Instruments Corp. | 100 | 2,776 |
| Plexus Corp. * | 400 | 7,928 |
| Sybase, Inc. * | 200 | 4,614 |
| Sykes Enterprises, Inc. * | 200 | 4,022 |
| Tech Data Corp. * | 100 | 3,489 |
| Western Digital Corp. * | 500 | 9,150 |
| Construction & Mining Equipment 0.17% | 5,163 | |
| Bucyrus International, Inc., Class A | 100 | 5,163 |
| Construction Materials 2.09% | 62,049 | |
| Columbus McKinnon Corp. * | 200 | 3,698 |
| Florida Rock Industries, Inc. | 200 | 7,438 |
| Granite Construction, Inc. | 100 | 5,365 |
| JLG Industries, Inc. | 500 | 8,730 |
| Martin Marietta Materials, Inc. | 200 | 16,472 |
| Simpson Manufacturing, Inc. | 200 | 5,270 |
| Universal Forest Products, Inc. | 100 | 4,876 |
| USG Corp. * | 200 | 10,200 |
See notes to financial statements
Growth Opportunities Fund
12
F I N A N C I A L S T A T E M E N T S
| Issuer | Shares | Value |
| Containers & Glass 0.18% | $5,346 | |
| Pactiv Corp. * | 200 | 5,346 |
| Cosmetics & Toiletries 0.21% | 6,316 | |
| Estee Lauder Companies, Inc., Class A | 100 | 3,686 |
| Playtex Products, Inc. * | 200 | 2,630 |
| Crude Petroleum & Natural Gas 0.43% | 12,765 | |
| Cabot Oil & Gas Corp., Class A | 100 | 5,106 |
| Helmerich & Payne, Inc. | 100 | 2,453 |
| Patterson-UTI Energy, Inc. | 100 | 2,740 |
| Vaalco Energy, Inc. * | 300 | 2,466 |
| Domestic Oil 1.38% | 40,960 | |
| Frontier Oil Corp. | 300 | 9,810 |
| Giant Industries, Inc. * | 100 | 8,170 |
| Helix Energy Solutions Group, Inc. * | 100 | 3,846 |
| Holly Corp. | 100 | 4,582 |
| Oil States International, Inc. * | 200 | 6,392 |
| St. Mary Land & Exploration Company | 200 | 8,160 |
| Drugs & Health Care 0.93% | 27,688 | |
| Abaxis, Inc. * | 200 | 4,804 |
| ALPHARMA Inc., Class A | 200 | 4,188 |
| CNS, Inc. | 200 | 5,640 |
| Mentor Corp. | 100 | 4,854 |
| Meridian Bioscience, Inc. | 200 | 4,772 |
| OraSure Technologies, Inc. * | 500 | 3,430 |
| Electrical Equipment 2.52% | 74,819 | |
| Anaren, Inc. * | 200 | 4,512 |
| Encore Wire Corp. * | 300 | 11,268 |
| General Cable Corp. * | 200 | 7,706 |
| Greatbatch, Inc. * | 200 | 4,892 |
| Lamson & Sessions Company * | 200 | 5,054 |
| Molex, Inc. | 300 | 10,941 |
| Tektronix, Inc. | 300 | 8,502 |
| Watsco, Inc. | 100 | 4,394 |
| Wesco International, Inc. * | 300 | 17,550 |
| Electrical Utilities 0.10% | 2,890 | |
| CenterPoint Energy, Inc. | 200 | 2,890 |
| Electronics 1.39% | 41,415 | |
| Avnet, Inc. * | 300 | 5,868 |
| AVX Corp. | 200 | 3,322 |
| Daktronics, Inc. | 200 | 4,174 |
| Multi-Fineline Electronix, Inc. * | 100 | 2,258 |
| Rogers Corp. * | 100 | 5,802 |
| Supertex, Inc. * | 100 | 3,537 |
| Thomas & Betts Corp. * | 200 | 9,032 |
See notes to financial statements
Growth Opportunities Fund
13
F I N A N C I A L S T A T E M E N T S
| Issuer | Shares | Value |
| Electronics (continued) | ||
| TTM Technologies, Inc. * | 300 | $3,858 |
| Zoran Corp. * | 200 | 3,564 |
| Financial Services 2.87% | 85,392 | |
| Bankrate, Inc. * | 100 | 2,842 |
| Federated Investors, Inc., Class B | 200 | 6,696 |
| Fremont General Corp. | 100 | 1,428 |
| IndyMac Bancorp, Inc. | 100 | 3,910 |
| Investment Technology Group, Inc. * | 400 | 18,484 |
| Jefferies Group, Inc. | 300 | 7,476 |
| Leucadia National Corp. | 200 | 5,146 |
| Moneygram International, Inc. | 300 | 9,420 |
| Nasdaq Stock Market, Inc. * | 100 | 2,851 |
| Piper Jaffray Companies, Inc. * | 100 | 5,858 |
| Raymond James Financial, Inc. | 250 | 6,930 |
| SEI Investments Company | 100 | 5,104 |
| The First Marblehead Corp. | 100 | 5,250 |
| World Acceptance Corp. * | 100 | 3,997 |
| Food & Beverages 0.81% | 24,135 | |
| Flowers Foods, Inc. | 100 | 2,715 |
| Hansen Natural Corp. * | 200 | 5,504 |
| Performance Food Group Company * | 100 | 2,461 |
| Sanderson Farms, Inc. | 200 | 6,252 |
| Seabord Corp. | 3 | 4,200 |
| Smithfield Foods, Inc. * | 100 | 3,003 |
| Furniture & Fixtures 0.23% | 6,750 | |
| Ethan Allen Interiors, Inc. | 200 | 6,750 |
| Gas & Pipeline Utilities 0.43% | 12,854 | |
| Maverick Tube Corp. * | 200 | 12,854 |
| Healthcare Products 3.60% | 106,897 | |
| Bausch & Lomb, Inc. | 100 | 4,841 |
| Computer Programs & Systems, Inc. | 100 | 3,402 |
| Cytyc Corp. * | 200 | 4,778 |
| DENTSPLY International, Inc. | 100 | 3,258 |
| Henry Schein, Inc. * | 300 | 14,961 |
| Hologic, Inc. * | 200 | 8,636 |
| IDEXX Laboratories, Inc. * | 200 | 18,402 |
| Intuitive Surgical, Inc. * | 100 | 9,440 |
| Owens & Minor, Inc. | 100 | 3,217 |
| PetMed Express, Inc. * | 500 | 6,250 |
| PSS World Medical, Inc. * | 200 | 3,880 |
| ResMed, Inc. * | 200 | 8,136 |
| Respironics, Inc. * | 400 | 14,764 |
| Thoratec Corp. * | 200 | 2,932 |
See notes to financial statements
Growth Opportunities Fund
14
F I N A N C I A L S T A T E M E N T S
| Issuer | Shares | Value |
| Healthcare Services 2.81% | $83,467 | |
| Apria Healthcare Group, Inc. * | 300 | 6,117 |
| Cerner Corp. * | 200 | 9,212 |
| Health Net, Inc. * | 600 | 25,086 |
| Lincare Holdings, Inc. * | 400 | 14,812 |
| Odyssey Healthcare, Inc. * | 200 | 3,208 |
| Omnicare, Inc. | 300 | 13,593 |
| Pediatrix Medical Group, Inc. * | 200 | 9,160 |
| Per-Se Technologies, Inc. * | 100 | 2,279 |
| Holdings Companies/Conglomerates 0.18% | 5,387 | |
| United Industrial Corp. | 100 | 5,387 |
| Homebuilders 0.85% | 25,130 | |
| Beazer Homes USA, Inc. | 100 | 4,030 |
| Hovnanian Enterprises, Inc., Class A * | 100 | 2,649 |
| KB Home | 100 | 4,276 |
| M.D.C. Holdings, Inc. | 100 | 4,279 |
| M/I Homes, Inc. | 100 | 3,236 |
| Ryland Group, Inc. | 100 | 4,267 |
| Standard Pacific Corp. | 100 | 2,393 |
| Hotels & Restaurants 1.95% | 57,990 | |
| Applebee’s International, Inc. | 300 | 6,225 |
| Brinker International, Inc. | 400 | 15,388 |
| CEC Entertainment, Inc. * | 100 | 3,188 |
| Choice Hotels, Inc. | 100 | 3,791 |
| Darden Restaurants, Inc. | 100 | 3,540 |
| OSI Restaurant Partners, Inc. | 100 | 3,097 |
| Papa Johns International, Inc. * | 400 | 13,600 |
| Ruby Tuesday, Inc. | 100 | 2,582 |
| Sonic Corp. * | 300 | 6,579 |
| Household Appliances 0.09% | 2,611 | |
| Drew Industries, Inc. * | 100 | 2,611 |
| Household Products 0.78% | 23,092 | |
| Blyth, Inc. | 100 | 2,148 |
| Energizer Holdings, Inc. * | 200 | 13,372 |
| Select Comfort Corp. * | 200 | 3,970 |
| Tupperware Brands Corp. | 200 | 3,602 |
| Industrial Machinery 4.62% | 137,435 | |
| Ceradyne, Inc. * | 100 | 4,407 |
| Cummins, Inc. | 100 | 11,482 |
| Flowserve Corp. * | 200 | 10,228 |
| FMC Technologies, Inc. * | 300 | 17,646 |
| Grant Prideco, Inc. * | 500 | 20,765 |
| Joy Global, Inc. | 400 | 17,416 |
| Manitowoc, Inc. | 200 | 8,840 |
See notes to financial statements
Growth Opportunities Fund
15
F I N A N C I A L S T A T E M E N T S
| Issuer | Shares | Value |
| Industrial Machinery (continued) | ||
| Middleby Corp. * | 100 | $7,854 |
| NATCO Group, Inc. * | 100 | 3,653 |
| Terex Corp. * | 800 | 35,144 |
| Industrials 1.73% | 51,324 | |
| Brookfield Homes Corp. | 100 | 2,360 |
| Crane Company | 200 | 7,996 |
| Fastenal Company | 900 | 33,012 |
| Harsco Corp. | 100 | 7,956 |
| Insurance 2.84% | 84,352 | |
| American Financial Group, Inc. | 100 | 4,672 |
| Brown & Brown, Inc. | 700 | 20,958 |
| Erie Indemnity Company, Class A | 100 | 5,104 |
| Hanover Insurance Group, Inc. | 100 | 4,450 |
| HCC Insurance Holdings, Inc. | 200 | 6,498 |
| PMI Group, Inc. | 100 | 4,324 |
| Radian Group, Inc. | 100 | 5,988 |
| Reinsurance Group of America, Inc. | 100 | 5,168 |
| Stancorp Financial Group, Inc. | 100 | 4,657 |
| Universal American Financial Corp. * | 100 | 1,533 |
| W.R. Berkley Corp. | 600 | 21,000 |
| Internet Service Provider 0.23% | 6,896 | |
| Salesforce.Com, Inc. * | 200 | 6,896 |
| Internet Software 1.14% | 33,805 | |
| Akamai Technologies, Inc. * | 700 | 27,440 |
| Checkfree Corp. * | 100 | 3,580 |
| RSA Security, Inc. * | 100 | 2,785 |
| Leisure Time 0.23% | 6,917 | |
| Brunswick Corp. | 100 | 2,870 |
| Movie Gallery, Inc. * | 100 | 237 |
| Polaris Industries, Inc. | 100 | 3,810 |
| Life Sciences 0.77% | 22,872 | |
| Pharmaceutical Product Development, Inc. | 600 | 22,872 |
| Liquor 0.52% | 15,396 | |
| Brown Forman Corp., Class B | 200 | 15,396 |
| Manufacturing 0.84% | 25,006 | |
| Acuity Brands, Inc. | 100 | 4,273 |
| Cameron International Corp. * | 200 | 9,582 |
| Kaydon Corp. | 100 | 3,811 |
| Nordson Corp. | 100 | 4,004 |
| Trinity Industries, Inc. | 100 | 3,336 |
See notes to financial statements
Growth Opportunities Fund
16
F I N A N C I A L S T A T E M E N T S
| Issuer | Shares | Value |
| Medical–Hospitals 0.36% | $10,672 | |
| RehabCare Group, Inc. * | 100 | 1,468 |
| Universal Health Services, Inc., Class B | 100 | 5,662 |
| VCA Antech, Inc. * | 100 | 3,542 |
| Metal & Metal Products 1.95% | 57,897 | |
| A. M. Castle & Company | 100 | 2,826 |
| Commercial Metals Company | 400 | 8,636 |
| Matthews International Corp., Class A | 100 | 3,560 |
| Mueller Industries, Inc. | 100 | 3,832 |
| Reliance Steel & Aluminum Company | 700 | 22,939 |
| Timken Company | 100 | 3,204 |
| Titanium Metals Corp. * | 500 | 12,900 |
| Mining 0.47% | 13,835 | |
| Lincoln Electric Holding, Inc. | 200 | 11,006 |
| Stillwater Mining Company * | 300 | 2,829 |
| Mobile Homes 0.95% | 28,228 | |
| Thor Industries, Inc. | 600 | 25,308 |
| Winnebago Industries, Inc. | 100 | 2,920 |
| Office Furnishings & Supplies 0.38% | 11,397 | |
| Herman Miller, Inc. | 100 | 2,824 |
| HNI Corp. | 100 | 3,990 |
| United Stationers, Inc. * | 100 | 4,583 |
| Petroleum Services 1.16% | 34,427 | |
| Oceaneering International, Inc. * | 100 | 3,597 |
| RPC, Inc. | 400 | 8,176 |
| Tesoro Petroleum Corp. | 100 | 6,461 |
| TETRA Technologies, Inc. * | 100 | 2,781 |
| Tidewater, Inc. | 100 | 4,761 |
| W-H Energy Services, Inc. * | 100 | 5,047 |
| World Fuel Services Corp. | 100 | 3,604 |
| Pharmaceuticals 1.00% | 29,688 | |
| Endo Pharmaceutical Holdings, Inc. * | 400 | 13,212 |
| Hi-Tech Pharmacal Company, Inc. * | 100 | 1,711 |
| King Pharmaceuticals, Inc. * | 600 | 9,732 |
| Regeneron Pharmaceuticals, Inc. * | 100 | 1,588 |
| Vertex Pharmaceuticals, Inc. * | 100 | 3,445 |
| Publishing 0.07% | 1,972 | |
| Valassis Communications, Inc. * | 100 | 1,972 |
| Railroads & Equipment 0.09% | 2,821 | |
| Wabtec Corp. | 100 | 2,821 |
See notes to financial statements
Growth Opportunities Fund
17
F I N A N C I A L S T A T E M E N T S
| Issuer | Shares | Value |
| Retail 0.34% | $10,218 | |
| Tween Brands, Inc. * | 300 | 10,218 |
| Retail Grocery 0.34% | 10,147 | |
| The Great Atlantic & Pacific Tea Company, Inc. * | 300 | 6,879 |
| Wild Oats Markets, Inc. * | 200 | 3,268 |
| Retail Trade 8.37% | 248,749 | |
| Abercrombie & Fitch Company, Class A | 100 | 6,453 |
| Advance Auto Parts, Inc. | 200 | 6,024 |
| American Eagle Outfitters, Inc. | 400 | 15,452 |
| AnnTaylor Stores Corp. * | 300 | 11,940 |
| BJ’s Wholesale Club, Inc. * | 100 | 2,635 |
| CarMax, Inc. * | 100 | 3,769 |
| Cato Corp., Class A | 200 | 4,646 |
| Charlotte Russe Holding, Inc. * | 200 | 5,340 |
| Charming Shoppes, Inc. * | 600 | 7,896 |
| Childrens Place Retail Stores, Inc. * | 100 | 5,797 |
| Circuit City Stores, Inc. | 300 | 7,083 |
| Citi Trends, Inc. * | 100 | 3,143 |
| Claire’s Stores, Inc. | 600 | 16,398 |
| Conn’s, Inc. * | 100 | 1,995 |
| Dollar Tree Stores, Inc. * | 400 | 11,512 |
| Family Dollar Stores, Inc. | 500 | 12,785 |
| First Cash Financial Services, Inc. * | 200 | 4,166 |
| Fossil, Inc. * | 100 | 1,882 |
| Genesco, Inc. * | 100 | 2,748 |
| Hibbett Sporting Goods, Inc. * | 150 | 3,680 |
| Kenneth Cole Productions, Inc., Class A | 100 | 2,341 |
| Longs Drug Stores Corp. | 100 | 4,543 |
| MSC Industrial Direct Company, Inc., Class A | 200 | 7,872 |
| NBTY, Inc. * | 200 | 6,372 |
| Pacific Sunwear of California, Inc. * | 300 | 4,008 |
| Pantry, Inc. * | 100 | 4,686 |
| Payless ShoeSource, Inc. * | 300 | 7,038 |
| RadioShack Corp. | 200 | 3,612 |
| Regis Corp. | 100 | 3,669 |
| Rent-A-Center, Inc. * | 200 | 5,420 |
| Ross Stores, Inc. | 200 | 4,898 |
| Steven Madden, Ltd. * | 200 | 7,370 |
| Talbots, Inc. | 300 | 6,603 |
| The Dress Barn, Inc. * | 600 | 10,590 |
| The Men’s Wearhouse, Inc. | 300 | 10,635 |
| Tiffany & Company | 200 | 6,320 |
| Tractor Supply Company * | 100 | 4,258 |
| United Rentals, Inc. * | 200 | 4,332 |
| Williams Sonoma, Inc. | 300 | 8,838 |
See notes to financial statements
Growth Opportunities Fund
18
F I N A N C I A L S T A T E M E N T S
| Issuer | Shares | Value |
| Sanitary Services 0.10% | $3,102 | |
| Allied Waste Industries, Inc. * | 300 | 3,102 |
| Semiconductors 3.48% | 103,390 | |
| Amkor Technology, Inc. * | 700 | 3,969 |
| Cymer, Inc. * | 100 | 4,115 |
| Diodes, Inc. * | 100 | 3,744 |
| Intersil Corp., Class A | 400 | 10,140 |
| Lam Research Corp. * | 200 | 8,558 |
| Memc Electronic Materials, Inc. * | 900 | 34,812 |
| Micrel, Inc. * | 600 | 6,012 |
| Netlogic Microsystems, Inc. * | 100 | 2,951 |
| OmniVision Technologies, Inc. * | 500 | 8,300 |
| ON Semiconductor Corp. * | 500 | 3,005 |
| QLogic Corp. * | 200 | 3,676 |
| Silicon Laboratories, Inc. * | 400 | 14,108 |
| Software 3.83% | 113,812 | |
| Advent Software, Inc. * | 100 | 3,275 |
| American Reprographics Company * | 100 | 3,052 |
| ANSYS, Inc. * | 100 | 4,674 |
| BEA Systems, Inc. * | 800 | 10,984 |
| BMC Software, Inc. * | 700 | 18,634 |
| Citrix Systems, Inc. * | 1,000 | 30,680 |
| Compuware Corp. * | 500 | 3,800 |
| Neoware Systems, Inc. * | 100 | 1,290 |
| Novell, Inc. * | 500 | 3,335 |
| Quality Systems, Inc. * | 100 | 4,010 |
| Red Hat, Inc. * | 800 | 18,592 |
| SPSS, Inc. * | 100 | 2,537 |
| Transaction Systems Architects, Inc., Class A * | 200 | 6,634 |
| VeriFone Holdings, Inc. * | 100 | 2,315 |
| Steel 2.23% | 66,300 | |
| Alaska Steel Holding Corp. * | 500 | 6,305 |
| Allegheny Technologies, Inc. | 400 | 22,940 |
| Carpenter Technology Corp. | 100 | 9,584 |
| Steel Dynamics, Inc. | 300 | 15,837 |
| United States Steel Corp. | 200 | 11,634 |
| Telecommunications Equipment & Services 1.22% | 36,416 | |
| ADTRAN, Inc. | 500 | 12,435 |
| Aeroflex, Inc. * | 300 | 3,126 |
| Commscope, Inc. * | 400 | 11,684 |
| Tellabs, Inc. * | 900 | 9,171 |
| Telephone 0.30% | 8,784 | |
| Harris Corp. | 200 | 8,784 |
See notes to financial statements
Growth Opportunities Fund
19
F I N A N C I A L S T A T E M E N T S
| Issuer | Shares | Value |
| Tires & Rubber 0.05% | $1,360 | |
| Goodyear Tire & Rubber Company * | 100 | 1,360 |
| Transportation 0.47% | 13,869 | |
| American Commercial Lines, Inc. * | 100 | 5,250 |
| Kirby Corp. * | 200 | 5,866 |
| Pacer International, Inc. | 100 | 2,753 |
| Trucking & Freight 1.96% | 58,223 | |
| Arkansas Best Corp. | 100 | 4,415 |
| Celadon Group, Inc. * | 200 | 3,706 |
| EGL, Inc. * | 300 | 9,171 |
| Forward Air Corp. | 200 | 6,428 |
| Landstar Systems, Inc. | 200 | 8,540 |
| Old Dominion Freight Lines, Inc. * | 100 | 3,192 |
| Oshkosh Truck Corp. | 300 | 15,510 |
| Ryder Systems, Inc. | 100 | 4,942 |
| Swift Transportation, Inc. * | 100 | 2,319 |
| Principal | ||
| Issuer, description, maturity date | amount | Value |
| Short-term investments 12.38% | $368,000 | |
| (Cost $368,000) | ||
| Repurchase Agreement 12.38% | 368,000 | |
| Repurchase Agreement with State Street Corp. dated | ||
| 8/31/2006 at 3.95% to be repurchased at $368,040 | ||
| on 9/1/2006, collateralized by $375,000 Federal | ||
| Home Loan Mortgage Corp., 5.00% due 12/28/2007 | ||
| (valued at $376,406, including interest) (c) | $368,000 | 368,000 |
| Total investments (cost $2,941,767) 98.44% | $2,925,748 | |
| Other assets in Excess of Liabilities 1.56% | 46,437 | |
| Total net assets 100.00% | $2,972,185 | |
* Non-income producing.
(c) Investment is an affiliate of the Trust’s subadvisor or custodian bank.
See notes to financial statements
Growth Opportunities Fund
20
Financial statements
F I N A N C I A L S T A T E M E N T S
Statement of assets and liabilities 8-31-06 (unaudited)
This Statement of Assets and Liabilities is the Fund’s balance sheet. It shows the value of what the Fund owns, is due and owes. You’ll also find the net asset value and the maximum offering price per share.
| Assets | |
| Investments, at value (Cost $2,573,767) | $2,557,748 |
| Repurchase agreements, at value (Cost $368,000) | 368,000 |
| Cash | 6,824 |
| Receivable for shares sold | 76,495 |
| Dividends and interest receivable | 1,124 |
| Other assets | 21,052 |
| Total assets | 3,031,243 |
| Liabilities | |
| Payable for futures variation margin | 80 |
| Payable to affiliates | |
| Transfer agent fees | 1,011 |
| Service fees | 52 |
| Fund administration fees | 32 |
| Other payables and accrued expenses | 57,883 |
| Total liabilities | 59,058 |
| Net assets | |
| Capital paid-in | 2,940,097 |
| Accumulated undistributed net realized gain on investments and futures contracts | 43,987 |
| Unrealized depreciation on investments and futures contracts | (12,566) |
| Undistributed net investment income | 667 |
| Net assets | $2,972,185 |
| Net asset value per share | |
| Based on net asset values and shares outstanding — The Fund has an | |
| unlimited number of shares authorized with no par value. | |
| Class A ($2,334,629 ÷ 107,402 shares) | $21.74 |
| Class B ($159,894 ÷ 7,366 shares) | $21.71 |
| Class C ($172,665 ÷ 7,955 shares) | $21.70a |
| Class I ($108,889 ÷ 5,005 shares) | $21.76 |
| Class R ($97,969 ÷ 4,511 shares) | $21.72 |
| Class 1 ($98,139 ÷ 4,511 shares) | $21.76 |
| Maximum offering price per share | |
| Class Ab ($21.74 ÷ 95%) | $22.88 |
a Net assets and shares outstanding have been rounded for presentation purposes. The net asset value is as reported on August 31, 2006.
b On single retail sales of less than $50,000. On sales of $50,000 or more and on group sales the offering price is reduced.
See notes to financial statements
Growth Opportunities Fund
21
F I N A N C I A L S T A T E M E N T S
Statement of operations For the period ended 8-31-06. (unaudited)
This Statement of Operations summarizes the Fund’s investment income earned and expenses incurred in operating the Fund. It also shows net gains (losses) for the period stated.
| Investment income | |
| Dividends | 6,358 |
| Interest | 2,248 |
| Total investment income | 8,606 |
| Expenses | |
| Investment management fees (Note 3) | 6,168 |
| Distribution and service fees (Note 3) | 2,803 |
| Transfer agent fees (Note 3) | 1,011 |
| Fund administration fees (Note 3) | 32 |
| Audit and legal fees | 38,478 |
| Custodian fees | 24,826 |
| Blue sky fees (Note 3) | 20,405 |
| Registration and filing fees | 1,899 |
| Printing and postage fees (Note 3) | 738 |
| Trustees’ fees (Note 3) | 25 |
| Miscellaneous | 1,505 |
| Total expenses | 97,890 |
| Less expense reductions (Note 3) | (86,619) |
| Net expenses | 11,271 |
| Net investment loss | (2,665) |
| Realized and unrealized gain (loss) | |
| Net realized gain (loss) on | |
| Investments | 35,119 |
| Futures contracts | (2,971) |
| Change in net unrealized appreciation (depreciation) of | |
| Investments | (162,519) |
| Futures contracts | 3,453 |
| Net realized and unrealized loss | (126,918) |
| Decrease in net assets from operations | (129,583) |
See notes to financial statements
Growth Opportunities Fund
22
F I N A N C I A L S T A T E M E N T S
Statement of changes in net assets
These Statements of Changes in Net Assets show how the value of the Fund’s net assets has changed during the last two periods. The difference reflects earnings less expenses, any investment gains and losses, distributions, if any, paid to shareholders and the net of Fund share transactions.
| Year | Period | |
| ended | ended | |
| 2-28-06 a | 8-31-06b | |
| Increase (decrease) in net assets | ||
| From operations | ||
| Net investment income (loss) | $3,332 | ($2,665) |
| Net realized gain | 11,839 | 32,148 |
| Change in net unrealized appreciation (depreciation) | 146,500 | (159,066) |
| Increase (decrease) in net assets resulting from operations | 161,671 | (129,583) |
| From Fund share transactions | 1,736,387 | 1,203,710 |
| Net assets | ||
| Beginning of period | — | $1,898,058 |
| End of period c | $1,898,058 | $2,972,185 |
a Period from 9-16-05 (commencement of operations) to 2-28-06.
b Semiannual period from 3-1-06 through 8-31-06. Unaudited.
c Includes undistributed net investment income of $3,332 and $667, respectively.
See notes to financial statements
Growth Opportunities Fund
23
F I N A N C I A L S T A T E M E N T S
Financial highlights
| CLASS A SHARES | ||
| Period ended | 2-28-06d | 8-31-06b,c,e |
| Per share operating performance | ||
| Net asset value, beginning of period | $21.31 | $23.29 |
| Net investment income (loss)h | 0.04 | (0.02) |
| Net realized and unrealized | ||
| gain (loss) on investments | 1.94 | (1.53) |
| Total from investment operations | 1.98 | (1.55) |
| Net asset value, end of period | $23.29 | $21.74 |
| Total return (%)l | 9.29m | (6.93)m,s |
| Ratios and supplemental data | ||
| Net assets, end of period | ||
| (in millions) | $1,898 | $2 |
| Ratio of net expenses to average | ||
| net assets (%) | 0.48r | 0.94r |
| Ratio of gross expenses to average | ||
| net assets (%) | 5.45r | 7.69r |
| Ratio of net investment income | ||
| (loss) to average net assets (%) | 0.41r | (0.16)r |
| Portfolio turnover (%) | 43m | 17m |
See notes to financial statements
Growth Opportunities Fund
24
F I N A N C I A L S T A T E M E N T S
Financial highlights
| CLASS B SHARES | |
| Period ended | 8-31-06a,b |
| Per share operating performance | |
| Net asset value, beginning of period | $22.17 |
| Net investment lossh | (0.07) |
| Net realized and unrealized loss | |
| on investments | (0.39) |
| Total from investment operations | (0.46) |
| Net asset value, end of period | $21.71 |
| Total return (%)l | (2.25)m |
| Ratios and supplemental data | |
| Net assets, end of period | |
| (in millions) | —i |
| Ratio of net expenses to average | |
| net assets (%) | 2.25r |
| Ratio of gross expenses to average | |
| net assets (%) | 22.81r |
| Ratio of net investment loss | |
| to average net assets (%) | (1.40)r |
| Portfolio turnover (%) | 17m |
See notes to financial statements
Growth Opportunities Fund
25
F I N A N C I A L S T A T E M E N T S
Financial highlights
| CLASS C SHARES | |
| Period ended | 8-31-06a,b |
| Per share operating performance | |
| Net asset value, beginning of period | $22.17 |
| Net investment lossh | (0.07) |
| Net realized and unrealized loss | |
| on investments | (0.40) |
| Total from investment operations | (0.47) |
| Net asset value, end of period | $21.70 |
| Total return (%)l | (2.30)m |
| Ratios and supplemental data | |
| Net assets, end of period | |
| (in millions) | —i |
| Ratio of net expenses to average | |
| net assets (%) | 2.25r |
| Ratio of gross expenses to average | |
| net assets (%) | 20.97r |
| Ratio of net investment loss | |
| to average net assets (%) | (1.42)r |
| Portfolio turnover (%) | 17m |
See notes to financial statements
Growth Opportunities Fund
26
F I N A N C I A L S T A T E M E N T S
Financial highlights
| CLASS I SHARES | |
| Period ended | 8-31-06a,b |
| Per share operating performance | |
| Net asset value, beginning of period | $22.17 |
| Net investment lossh | (0.02) |
| Net realized and unrealized loss | |
| on investments | (0.39) |
| Total from investment operations | (0.41) |
| Net asset value, end of period | $21.76 |
| Total return (%)l | (2.03)m |
| Ratios and supplemental data | |
| Net assets, end of period | |
| (in millions) | —i |
| Ratio of net expenses to average | |
| net assets (%) | 1.15r |
| Ratio of gross expenses to average | |
| net assets (%) | 22.01r |
| Ratio of net investment loss | |
| to average net assets (%) | (0.32)r |
| Portfolio turnover (%) | 17m |
See notes to financial statements
Growth Opportunities Fund
27
F I N A N C I A L S T A T E M E N T S
Financial highlights
| CLASS R SHARES | |
| Period ended | 8-31-06a,b |
| Per share operating performance | |
| Net asset value, beginning of period | $22.17 |
| Net investment lossh | (0.05) |
| Net realized and unrealized loss | |
| on investments | (0.40) |
| Total from investment operations | (0.45) |
| Net asset value, end of period | $21.72 |
| Total return (%)l | (2.21)m |
| Ratios and supplemental data | |
| Net assets, end of period | |
| (in millions) | —i |
| Ratio of net expenses to average | |
| net assets (%) | 1.89r |
| Ratio of gross expenses to average | |
| net assets (%) | 24.39r |
| Ratio of net investment loss | |
| to average net assets (%) | (1.07)r |
| Portfolio turnover (%) | 17m |
See notes to financial statements
Growth Opportunities Fund
28
F I N A N C I A L S T A T E M E N T S
Financial highlights
| CLASS 1 SHARES | |
| Period ended | 8-31-06a,b |
| Per share operating performance | |
| Net asset value, beginning of period | $22.17 |
| Net investment lossh | (0.01) |
| Net realized and unrealized loss | |
| on investments | (0.40) |
| Total from investment operations | (0.41) |
| Net asset value, end of period | $21.76 |
| Total return (%)l | (2.03)m |
| Ratios and supplemental data | |
| Net assets, end of period | |
| (in millions) | —i |
| Ratio of net expenses to average | |
| net assets (%) | 1.10r |
| Ratio of gross expenses to average | |
| net assets (%) | 4.69r |
| Ratio of net investment loss | |
| to average net assets (%) | (0.27)r |
| Portfolio turnover (%) | 17m |
a Class B, Class C, Class I, Class R and Class 1 shares began operations on 6-12-06.
b Unaudited.
c Effective June 12, 2006, shareholders of the former GMO Small/Mid Cap Growth Fund (the “Predecessor Fund”) became owners of an equal number of full and fractional Class A shares of the John Hancock Growth Opportunities Fund. Additionally, the accounting and performance history of the former GMO Small/Mid Cap Growth Fund was redesignated as that of John Hancock Growth Opportunities Fund Class A.
d Class A shares began operations on 9-16-05.
e Semiannual period from 3-1-06 through 8-31-06.
h Based on the average of the shares outstanding.
i Less than $500,000.
l Total returns would have been lower had certain expenses not been reduced during the period shown.
m Not annualized.
r Annualized.
s Class A total return linked back to the Predecessor Fund.
See notes to financial statements
Growth Opportunities Fund
29
Notes to financial statements (unaudited)
1. Organization
John Hancock Growth Opportunities Fund (the “Fund”) is a newly organized non-diversified series of John Hancock Funds III (the “Trust”). The Trust was established as a Massachusetts business trust on June 9, 2005. The Trust is registered under the Investment Company Act of 1940, as amended (the “1940 Act”), as an open-end investment management company. The investment objective of the Fund is to seek long-term capital growth.
John Hancock Life Insurance Company of New York (“John Hancock New York”) is a wholly owned subsidiary of John Hancock Life Insurance Company (U.S.A.) (“John Hancock USA”). John Hancock USA and John Hancock New York are indirect wholly owned subsidiaries of The Manufacturers Life Insurance Company (“Manulife”), which in turn is a wholly owned subsidiary of Manulife Financial Corporation (“MFC”), a publicly traded company. Manulife Financial Corporation and its subsidiaries are known collectively as “Manulife Financial.”
John Hancock Investment Management Services, LLC (the “Adviser”) is the Adviser to the Trust. John Hancock Funds, LLC (the “Distributor”), a Delaware limited liability company controlled by John Hancock USA, serves as principal underwriter and is a wholly owned subsidiary of the Adviser.
Class 1 shares are sold only to certain exempt separate accounts of John Hancock USA and John Hancock New York.
The Board of Trustees has authorized the issuance of multiple classes of shares of the Fund, including classes designated as Class A, Class B, Class C, Class I, Class R and Class 1 shares. The shares of each class represent an interest in the same portfolio of investments of the Fund, and have equal rights as to voting, redemptions, dividends and liquidation, except that certain expenses, subject to the approval of the Board of Trustees, may be applied differently to each class of shares in accordance with current regulations of the Securities and Exchange Commission and the Internal Revenue Service. Shareholders of a class that bear distribution and service expenses under the terms of a distribution plan have exclusive voting rights to that distribution plan.
The Adviser and other subsidiaries of John Hancock Life Insurance Company owned 4,511 Class B shares, 4,511 Class C shares, 4,511 Class I shares, 4,511 Class R shares and 4,511 Class 1 shares of beneficial interest of the Fund on August 31, 2006.
The Fund is the accounting and performance successor to the GMO Small/Mid Cap Growth Fund (the “Predecessor Fund”), a diversified open-end management investment company organized as a Massachusetts business trust. On June 12, 2006, the Fund acquired substantially all the assets and assumed the liabilities of the Predecessor Fund pursuant to an agreement and plan of reorganization, in exchange for Class A shares of the Fund.
2. Significant accounting policies
In the preparation of the financial statements, the Fund follows the policies described below. The preparation of financial statements in conformity with accounting principles generally accepted in the United States of America requires management to make estimates and assumptions that affect the reported amounts of assets and liabilities at the date of the financial statements and the reported amounts of income and expenses during the reporting period. Actual results may differ from these estimates.
Security valuation
The net asset value of the shares of the Fund is determined daily as of the close of the New York Stock Exchange, normally at 4:00 p.m. Eastern time. Short-term debt instruments
Growth Opportunities Fund
30
with remaining maturities of 60 days or less are valued at amortized cost, and thereafter assume a constant amortization to maturity of any discount or premium, which approximates market value. Investments in State Street Navigator Securities Lending Prime Portfolio are valued at their net asset value each business day. All other securities held by the Fund are valued at the last sale price or official closing price (closing bid price or last evaluated quote if no sale has occurred) as of the close of business on a principal securities exchange (domestic or foreign) or, lacking any sales, at the closing bid price. Securities traded only in the over-the-counter market are valued at the last bid price quoted by brokers making markets in the securities at the close of trading. Fund securities for which there are no such quotations, principally debt securities, are valued based on the valuation provided by an independent pricing service, which utilizes both dealer-supplied a nd electronic data processing techniques.
Other assets and securities for which no such quotations are readily available are valued at their fair value as determined in good faith under consistently applied procedures established by and under the general supervision of the Board of Trustees. Generally, trading in non-U.S. securities is substantially completed each day at various times prior to the close of trading on the New York Stock Exchange. The values of such securities used in computing the net asset value of a Fund’s shares are generally determined as of such times. Occasionally, significant events that affect the values of such securities may occur between the times at which such values are generally determined and the close of the New York Stock Exchange. In such events, these securities will then be valued at their fair value as determined in good faith under consistently applied procedures established by and under the general supervision of the Board of Trustees.
In deciding whether to make a fair value adjustment to the price of a security, the Trustees or their designee may review a variety of factors, including, developments in foreign markets, the performance of U.S. securities markets and the performance of instruments trading in U.S. markets that represent foreign securities and baskets of foreign securities. The Fund may also fair value securities in other situations, for example, when a particular foreign market is closed, but the Fund is calculating the net asset value. In view of these factors, it is likely that Fund investing significant amounts of assets in securities in foreign markets will be fair valued more frequently than a fund investing significant amounts of assets in frequently traded, U.S. exchange listed securities of large capitalization U.S. issuers.
For purposes of determining when fair value adjustments may be appropriate with respect to the Fund investing in securities in foreign markets that close prior to the New York Stock Exchange, the Fund will, on an ongoing basis, monitor for “significant market events.” A significant market event may be a certain percentage change in the value of an index or of certain Exchange Traded Funds (“ETFs”) that track foreign markets in which the Fund has significant investments. If a significant market event occurs due to a change in the value of the index or of ETFs, the pricing for the Fund will promptly be reviewed and potential adjustments to the net asset value will be recommended to the Trust’s Pricing Committee, where applicable.
Fair value pricing of securities is intended to help ensure that the net asset value of the Fund’s shares reflects the value of the Fund’s securities as of the close of the New York Stock Exchange (as opposed to a value which is no longer accurate as of such close), thus limiting the opportunity for aggressive traders to purchase shares of the Fund at deflated prices, reflecting stale security valuations, and to promptly sell such shares at a gain. However, a security’s valuation may differ depending on the method used for determining value and no assurance can be given that fair value pricing of securities will successfully eliminate all potential opportunities for such trading gains.
Repurchase agreements
The Fund may enter into repurchase agreements. When the Fund enters into a repurchase agreement through its custodian, it receives delivery of securities, the amount of which at the time of purchase and each subsequent business day is required to be
Growth Opportunities Fund
31
maintained at such a level that the market value is generally at least 102% of the repurchase amount. The Fund will take constructive receipt of all securities underlying the repurchase agreements it has entered into until such agreements expire. If the seller defaults, the Fund would suffer a loss to the extent that proceeds from the sale of underlying securities were less than the repurchase amount. The Fund may enter into repurchase agreements maturing within seven days with domestic dealers, banks or other financial institutions deemed to be creditworthy by the Adviser. Collateral for certain tri-party repurchase agreements is held at the custodian bank in a segregated account for the benefit of the Fund and the counterparty.
Security transactions and
related investment income
Investment security transactions are accounted for on a trade date plus one basis for daily net asset value calculations. However for financial reporting purposes, investment transactions are reported on trade date. Interest income is accrued as earned. Dividend income is recorded on the ex-dividend date. Foreign dividends are recorded on the ex-date or as soon after the ex-date that the Fund becomes aware of such dividends, net of all taxes. Discounts/premiums are accreted/amortized for financial reporting purposes. Non-cash dividends are recorded at the fair market value of the securities received. Debt obligations may be placed in a non-accrual status and related interest income may be reduced by ceasing current accruals and writing off interest receivables when the collection of all or a portion of interest has become doubtful, based upon consistently applied procedures.
From time to time, the Fund may invest in Real Estate Investment Trusts (“REITs”) and as a result, will estimate the components of distributions from these securities. Distributions from REITs received in excess of income are recorded as a reduction of cost of investments and/or as a realized gain.
The Fund uses the First In, First Out method for fixed income securities and Highest Cost, First Out for all other securities for determining realized gain or loss on investments for both financial and federal income tax reporting purposes.
Multi-class operations
All income, expenses (except for class-specific expenses) and realized and unrealized gains (losses) are allocated to each class of shares based upon the relative net assets of each class. Dividends to shareholders from net investment income are determined at a class level and distributions from capital gains are determined at a Fund level.
Expense allocation
Expenses are allocated based on the relative share of net assets of the Fund at the time the expense was incurred. Class-specific expenses, such as distribution (Rule 12b-1) fees, are accrued daily and charged directly to the respective share classes.
Futures
The Fund may purchase and sell financial futures contracts and options on those contracts. The Fund invests in contracts based on financial instruments such as U.S. Treasury Bonds or Notes on securities indices such as the Russell 2000 Mini Index, in order to hedge against a decline in the value of securities owned by the Fund.
Upon entering into futures contracts, the Fund is required to deposit with a broker an amount, termed the initial margin, which typically represents a certain percentage of the purchase price indicated in the futures contract. Payments to and from the broker, known as variation margin, are required to be made on a daily basis as the price of the futures contract fluctuates, making the long or short positions in the contract more or less valuable. If the position is closed out by taking an opposite position prior to the settlement date of the futures contract, a final determination of variation margin is made, cash is required to be paid to or released by the broker, and the Fund realizes a gain or loss.
When the Fund sells a futures contract based on a financial instrument, the Fund becomes obligated to deliver that kind of instrument at an agreed upon date for a specified price. The Fund realizes a gain or loss depending on
Growth Opportunities Fund
32
whether the price of an offsetting purchase is less or more than the price of the initial sale or on whether the price of an offsetting sale is more or less than the price of the initial purchase. The Fund could be exposed to risks if it could not close out futures positions because of an illiquid secondary market or the inability of counterparties to meet the terms of their contracts. Futures contracts are valued at the quoted daily settlement prices established by the exchange on which they trade.
| The following is a summary of open futures contracts on August 31, 2006: | ||||
| NUMBER OF | UNREALIZED | |||
| OPEN CONTRACTS | CONTRACTS | POSITION | EXPIRATION | APPRECIATION |
| Russell 2000 Mini Index | 2 | Long | Sep 2006 | $3,453 |
Federal income taxes
The Fund qualifies as a “regulated investment company” by complying with the applicable provisions of the Internal Revenue Code and will not be subject to federal income tax on taxable income that is distributed to shareholders. Therefore, no federal income tax provision is required.
New accounting pronouncements
In June 2006, Financial Accounting Standards Board (“FASB”) Interpretation No. 48, Accounting for Uncertainty in Income Taxes (the “Interpretation”) was issued, and is effective for fiscal years beginning after December 15, 2006 and is to be applied to all open tax years as of the effective date. The Interpretation prescribes a minimum threshold for financial statement recognition of the benefit of a tax position taken or expected to be taken in a tax return, and requires certain expanded disclosures. Management is currently evaluating the application of the Interpretation to the Fund, and has not at this time quantified the impact, if any, resulting from the adoption of the Interpretation on the Fund’s financial statements.
In September 2006, FASB Standard No. 157, Fair Value Measurements (“FAS 157”) was issued, and is effective for fiscal years beginning after November 15, 2007. FAS 157 defines fair value, establishing a framework for measuring fair value and expands disclosure about fair value measurements. Management is currently evaluating the application of FAS 157 to the Fund, and its impact, if any, resulting from the adoption of FAS 157 on the Fund’s financial statements.
Distribution of income and gains
The Fund records distributions to shareholders from net investment income and net realized gains, if any, on the ex-dividend date. Distributions paid by the Fund with respect to each class of shares are calculated in the same manner, at the same time and are in the same amount, except for the effect of expenses that may be applied differently to each class. Such distributions, on a tax basis, are determined in conformity with income tax regulations, which may differ from accounting principles generally accepted in the United States of America. Distributions in excess of tax basis earnings and profits, if any, are reported in the Fund’s finan-cial statements as a return of capital.
Capital accounts
The Fund reports the undistributed net investment income and accumulated undistributed net realized gain (loss) accounts on a basis approximating amounts available for future tax distributions (or to offset future taxable realized gains when a capital loss carryforward is available). Accordingly, the Fund may periodically make reclassifications among certain capital accounts without affecting its net asset value.
3. Investment advisory and
other agreements
Advisory fees
The Trust has entered into an Investment Advisory Agreement with the Adviser. The Adviser is responsible for managing the corporate and business affairs of the Trust and for selecting and compensating subadvisers to handle the investment and reinvestment of the assets of the Fund, subject to the
Growth Opportunities Fund
33
supervision of the Board of Trustees. Under the Advisory Agreement the Fund pays a monthly management fee to the Adviser equivalent, on an annual basis, to the sum of: (a) 0.80% of the first $500,000,000 of the Fund’s aggregate daily net assets; (b) 0.78% of the next $500,000,000 of the Fund’s aggregate daily net assets; (c) 0.77% of the next $1,500,000,000 of the Fund’s aggregate daily net assets; and (d) 0.76% of the Fund’s aggregate daily net assets in excess of $2,500,000,000. Aggregate net assets include the net assets of the Fund and Growth Opportunities Trust, a series of John Hancock Trust. John Hancock Trust is an open-end investment company advised by the Adviser and distributed by the Distributor. The Fund is not responsible for payment of the subadvisory fees.
Prior to June 12, 2006, the Predecessor Fund paid a monthly management fee to its investment adviser, Grantham, Mayo Van Otterloo & Co., LLC, at an annual rate of 0.33% of the Predecessor Fund’s average daily net assets.
Expense reimbursements
The Adviser has agreed contractually to reimburse for certain fund level expenses that exceed 0.24% of the average annual net assets, or to make a payment to a specific class of shares of the Fund in an amount equal to the amount by which the expenses attributable to such class of shares (excluding taxes, portfolio brokerage commissions, interest, litigation and indem-nification expenses and other extraordinary expenses not incurred in the ordinary course of the Fund’s business and fees under any agreement or plans of the Fund dealing with services for shareholders and others with beneficial interests in shares of the Fund) exceed the percentage of average annual net assets (on an annualized basis) attributable as follows: 1.54% for Class A, 2.24% for Class B, 2.24% for Class C, 1.14% for Class I, 1.64% for Class R and 1.09% for Class 1. Accordingly, the expense reductions related to this expense limitation amounted to $65,647, $5,144, $5,332, $4,890, $4,834 and $772 f or Class A, Class B, Class C, Class I, Class R and Class 1, respectively, for the period ended August 31, 2006. This expense reimbursement shall continue in effect until June 30, 2007 and thereafter until terminated by the Adviser on notice to the Trust.
Administration fees
The Fund has an agreement with the Adviser that requires the Fund to reimburse the Adviser for all expenses associated with providing the administrative, financial, accounting and record-keeping services of the Fund, including the preparation of all tax returns, annual, semiannual and periodic reports to shareholders and the preparation of all regulatory reports.
Distribution plan
The Trust has a Distribution Agreement with the Distributor, a wholly owned subsidiary of the Adviser. The Fund has adopted Distribution Plans with respect to Class A, Class B, Class C, Class R and Class 1, pursuant to Rule 12b-1 under the 1940 Act, to reimburse the Distributor for the services it provides as distributor of shares of the Fund. Accordingly, the Fund makes monthly payments to the Distributor at an annual rate not to exceed 0.30%, 1.00%, 1.00%, 0.50% and 0.05% of average daily net asset value of Class A, Class B, Class C, Class R and Class 1, respectively. A maximum of 0.25% of such payments may be service fees, as defined by the Conduct Rules of the National Association of Securities Dealers. Under the Conduct Rules, curtailment of a portion of the Fund’s 12b-1 payments could occur under certain circumstances. In addition, under a Service Plan for Class R shares, the Fund pays up to 0.25% of Class R average daily net asset value for certain other service s.
Prior to June 12, 2006, Funds Distributor, Inc. served as the Predecessor Fund’s principal underwriter and was compensated at an annual rate of 0.15% of the Predecessor Fund’s average daily net asset value.
Sales charges
Class A shares are assessed up-front sales charges of up to 5.00% of net asset value of such shares. During the period ended August 31, 2006, the Fund was informed that the Distributor received net up-front sales charges of $3,245 with regard to sales of Class A shares. Of this amount, $532 was retained and used for printing prospectuses, advertising, sales literature and other purposes
Growth Opportunities Fund
34
and $2,713 was paid as sales commissions to unrelated broker-dealers.
Class B shares that are redeemed within six years of purchase are subject to a contingent deferred sales charge (“CDSC”) at declining rates, beginning at 5.00% of the lesser of the current market value at the time of redemption or the original purchase cost of the shares being redeemed. Class C shares that are redeemed within one year of purchase are subject to a CDSC at a rate of 1.00% of the lesser of the current market value at the time of redemption or the original purchase cost of the shares being redeemed. Proceeds from the CDSCs are paid to the Distributor and are used, in whole or in part, to defray its expenses for providing distribution-related services to the Fund in connection with the sale of Class B and Class C shares. During the period ended August 31, 2006, the Fund was informed that the Distributor received no CDSCs for Class B and Class C shares.
Transfer agent fees
The Fund has a Transfer Agency Agreement with John Hancock Signature Services, Inc. (“Signature Services”), an indirect subsidiary of MFC. For Class A, Class B, Class C, Class I, and Class R shares, the Fund pays a monthly transfer agent fee at an annual rate of 0.05% of each class’ average daily net assets, plus a fee based on the number of shareholder accounts and reimbursement for certain out-of-pocket expenses. Expenses not directly attributable to a particular class of shares are aggregated and allocated to each class on the basis of its relative net asset value.
Signature Services has agreed to limit the transfer agent fees so that such fees do not exceed 0.20% annually of Class A, Class B, Class C, Class I and Class R share average daily net assets. This agreement is effective until December 31, 2006. Signature Services reserves the right to terminate this limitation in the future. Accordingly, there were no transfer agent fees reductions for Class A, Class B, Class C, Class I and Class R, during the period ended August 31, 2006.
Prior to June 12, 2006, Investors Bank and Trust Company served as the Predecessor Fund’s transfer agent and fund accountant.
Expenses under the agreements described above for the period ended August 31, 2006, were as follows:
| Distribution | Transfer | Printing and | ||
| Share Class | and service fees | agent | Blue sky | postage |
| Class A | $2,097 | $849 | $4,235 | $572 |
| Class B | 250 | 50 | 4,042 | 31 |
| Class C | 285 | 57 | 4,043 | 39 |
| Class I | — | 12 | 4,043 | 34 |
| Class R | 160 | 43 | 4,042 | 31 |
| Class 1 | 11 | — | — | 31 |
| Total | $2,803 | $1,011 | $20,405 | $738 |
Growth Opportunities Fund
35
Trustees’ fees
The Trust compensates each Trustee who is not an employee of the Adviser or its affiliates. Total Trustees’ expenses are allocated to the Fund based on its average daily net asset value.
4. Guarantees and indemnifications
Under the Trust’s organizational documents, its Officers and Trustees are indemnified against certain liability arising out of the performance of their duties to the Trust. Additionally, in the normal course of business, the Trust enters into contracts with service providers that contain general indemnification clauses. The Trust’s maximum exposure under these arrangements is unknown, as this would involve future claims that may be made against the Trust that have not yet occurred. However, based on experience, the Trust believes the risk of loss to be remote.
5. Line of credit
The Fund has entered into an agreement which enables them to participate in a $100 million unsecured committed line of credit with State Street Bank & Trust Company. Borrowings will be made solely to temporarily finance the repurchase of capital shares. Interest is charged to the Fund based on its borrowings at a rate per annum equal to the Federal Funds rate plus 0.50% . In addition, a commitment fee of 0.07% per annum, payable at the end of each calendar quarter, based on the average daily-unused portion of the line of credit, is charged to the Fund on a prorated basis based on average net assets. For the period ended August 31, 2006, there were no borrowings under the line of credit.
6. Capital shares
Share activities for the Fund for the period ended August 31, 2006 were as follows:
| Year ended 2-28-06a | Period ended 8-31-06 | |||
| Shares | Amount | Shares | Amount | |
| Class A shares | ||||
| Sold | 81,480 | $1,736,387 | 26,844 | $576,923 |
| Repurchased | 0 | 0 | (922) | (20,941) |
| Net increase | 81,480 | $1,736,387 | 25,922 | $555,982b |
| Class B shares | ||||
| Sold | 0 | $0 | 7,366 | $161,231 |
| Net increase | 0 | $0 | 7,366 | $161,231c |
| Class C shares | ||||
| Sold | 0 | $0 | 7,955 | $175,497 |
| Net increase | 0 | $0 | 7,955 | $175,497c |
| Class I shares | ||||
| Sold | 0 | $0 | 5,005 | $111,000 |
| Net increase | 0 | $0 | 5,005 | $111,000c |
| Class R shares | ||||
| Sold | 0 | $0 | 4,511 | $100,000 |
| Net increase | 0 | $0 | 4,511 | $100,000c |
| Class 1 shares | ||||
| Sold | 0 | $0 | 4,511 | $100,000 |
| Net increase | 0 | $0 | 4,511 | $100,000c |
| Net increase | 81,480 | $1,736,387 | 55,270 | $1,203,710 |
aPeriod from 9-16-05 (commencement of operations) to 2-28-06.
bSemiannual period from 3-1-06 through 8-31-06. Unaudited.
cPeriod from 6-12-06 (commencement of operations) to 8-31-06. Unaudited.
Growth Opportunities Fund
36
7. Investment transactions
Purchases and proceeds from sales or maturities of securities, other than short-term securities and obligations of the U.S. government, during the period ended August 31, 2006, aggregated $3,005,224 and $400,134, respectively.
The cost of investments owned on August 31, 2006, including short-term investments, for federal income tax purposes, was $2,941,767. Gross unrealized appreciation and depreciation of investments aggregated $155,257 and $171,276, respectively, resulting in net unrealized depreciation of $16,019.
8. Federal income tax information
Federal income tax regulations may differ from generally accepted accounting principles and income and capital gain distributions determined in accordance with tax regulations may differ from net investment income and realized gains recognized for financial reporting purposes.
9. Acquisition
On June 12, 2006, the Fund acquired substantially all of the assets and liabilities of the Predecessor Fund in exchange solely for Class A shares of the Fund. The acquisition was accounted for as a tax-free exchange of 104,033 Class A shares of the Fund for the net assets of the Predecessor Fund, which amounted to $2,252,894, including $67,894 of unrealized depreciation, after the close of business on June 9, 2006. Accounting and performance history of the Predecessor Fund was redesignated as that of Class A of the Fund.
Growth Opportunities Fund
37
Evaluation of Advisory and Subadvisory
Agreements by the Board of Trustees
This section describes the evaluation
by the Board of Trustees of the
Advisory Agreement and each of the
Subadvisory Agreements.
Evaluation by the Board of Trustees
The Board, including all of the Trustees who are not “interested persons” as defined in the Investment Company Act of 1940, as amended (the “Independent Trustees”), is responsible for selecting the Trust’s investment adviser, John Hancock Investment Management Services, LLC (the “Adviser” or “JHIMS”), approving the Adviser’s selection of subadvisers for each series of the Trust (the “Funds”) and approving the Trust’s advisory and sub-advisory agreements (and any sub-subadvisory agreements), their periodic continuation and any amendments. Consistent with SEC rules, the Board regularly evaluates the Trust’s advisory and subadvisory (and sub-subadvisory) arrangements, including consideration of the factors listed below. The Board may also consider other factors (including conditions and trends prevailing generally in the economy, the securities markets and the industry) and does not treat any single factor as determinative, and each Trustee m ay attribute different weights to different factors. The Board is furnished with an analysis of its fiduciary obligations in connection with its evaluation and, throughout the evaluation process, the Board is assisted by counsel for the Trust and the Independent Trustees are also separately assisted by independent legal counsel. The factors regularly considered by the Board are:
1. the nature, extent and quality of the services to be provided by the Adviser to the Trust and by the subadvisers to the Funds;
2. the investment performance of the Funds and their subadvisers;
3. the extent to which economies of scale would be realized as a Fund grows and whether fee levels reflect these economies of scale for the benefit of Trust shareholders;
4. the costs of the services to be provided and the profits to be realized by the Adviser and its affiliates (including any subadvisers that are affiliated with the Adviser) from the Adviser’s relationship with the Trust; and
5. comparative services rendered and comparative advisory and subadvisory fee rates.
The Board believes that information relating to all these factors is relevant to its evaluation of the Trust’s advisory agreement. With respect to its evaluation of subadvisory agreements (including sub-subadvisory agreements) the Board believes that, in view of the Trust’s “manager-of managers” advisory structure, the costs of services to be provided and the profits to be realized by those subadvisers that are not affili-ated with the Adviser from their relationship with the Trust generally are not a material factor to the Board’s consideration of subadvisory agreements because such fees are paid to sub-advisers by the Adviser and not by the Funds, and because the Board relies on the ability of the Adviser to negotiate such subadvisory fees at arms-length.
In evaluating subadvisory arrangements, the Board also considers other material business relationships that unaffiliated sub-advisers and their affiliates have with the Adviser or its affiliates, including the involvement by certain affiliates of certain subadvisers in the distribution of financial products, including shares of the Trust, offered by the Adviser and other affiliates of the Adviser (“Material Relationships”).
Approval of Advisory Agreement
At its meeting on September 21, 2005, the Board, including all the Independent Trustees, approved the Advisory Agreement between the Trust and JHIMS with respect to each of the Funds.
In approving the Advisory Agreement, and with reference to the factors which it regularly considers, the Board:
(1) (a) considered the high value to the Trust of continuing the relationship with JHIMS as the Trust’s Adviser to the other John Hancock Funds, the skills and competency with which JHIMS
38
has in the past managed the affairs and subadvisory relationships of other funds in the complex, JHIMS’s oversight and monitoring of subadvisers’ investment performance and compliance programs including its timelines in responding to performance issues and the qualifications of JHIMS’s personnel,
(b) considered JHIMS’s compliance policies and procedures and its responsiveness to regulatory changes and mutual fund industry developments, and
(c) JHIMS’s administrative capabilities, including its ability to supervise the other service providers for the Funds and concluded that JHIMS may reasonably be expected to ably perform its services under the Advisory Agreement.
(2) reviewed the investment performance of portfolios that are managed comparable to the Funds; the comparative performance of their respective benchmarks; and JHIMS’ analysis of such performance and its plans and recommendations regarding the Trust’s subadvisory arrangements generally and with respect to the Funds; and concluded that each of the comparably managed funds has performed well or within a range that the Board deemed competitive, and that JHIMS may reasonably be expected to ably monitor the performance of the Funds and their subadvisers;
(3) reviewed the Trust’s advisory fee structure and the incorporation therein of any subadvisory fee breakpoints in the advisory fees charged and concluded (i) that to the extent that Funds have subadvisory fees with breakpoints, those breakpoints are reflected as breakpoints in the advisory fees for Funds, (ii) that all Funds with a subadviser that is not affiliated with the Adviser have subadvisory fees which are the product of arms-length negotiations between the Adviser and the subadviser and which in many, but not all, cases contain breakpoints, and (iii) that, although economies of scale cannot be measured with precision, these arrangements permit shareholders of Funds with advisory fee breakpoints to benefit from economies of scale if those Funds grow;
(4) (a) reviewed the financial statements of JHIMS and John Hancock Life Insurance Company (U.S.A.) (“JHLICO (U.S.A.)”;
(b) reviewed the anticipated profitability of the JHIMS’s relationship with the Funds in terms of the fees it expects to receive with respect to the Funds and whether JHIMS has the financial ability to provide a high level of services to the Funds,
(c) considered that JHIMS derives reputational and other indirect benefits from providing advisory services to the Funds, and
(d) noted that JHIMS will pay the sub-advisory fees out of the advisory fees JHIMS receives from the Funds and concluded that the advisory fees paid by the Trust with respect to the Funds are not unreasonable in light of such information; and
(5) reviewed comparative information with respect to the advisory fee rates and concluded that the anticipated advisory fees for the Funds are within the range of those incurred by other comparable funds and that the advisory structure for the Funds is thus competitive within the industry.
Additional information that the Board considered for a particular Fund is set forth in Appendix A.
Approval of Subadvisory Agreements
At its meeting on September 21, 2005, the Board, including all the Independent Trustees, approved the Subadvisory Agreements.
In making its determination with reference to these respective factors, the Board reviewed:
(i) information relating to each subadviser’s business which included information
39
such as: business performance, assets under management, financial stability and personnel;
(ii) the investment performance of the subad-viser’s portfolio managed comparably to the Fund to be managed by the subadviser and comparative performance information relating to the benchmark;
(iii) the proposed subadvisory fee for each Fund to be managed by the subadviser and comparative fee information; and
(iv) information relating to the nature and scope of Material Relationships and their significance to the Adviser and the subadvisers.
The Board’s decision to approve each Sub-advisory Agreement was based on a number of determinations, including the following:
(1) The subadviser has extensive experience and demonstrated skills as a manager and may be expected to provide a high quality of investment personnel to each Fund;
(2) Although not without variation, the current and historical performance of the portfolios of the Subadviser managed comparably to the Fund to be managed by the Subadviser has been within a competitive range of the current and historical performance of these portfolios’ respective benchmark (see Appendix A for further information on performance);
(3) The subadvisory fees are within industry norms and are the product of arms-length negotiation between the Adviser and the subadviser; and
(4) The Material Relationships consist of arrangements in which unaffiliated subad-visers or their affiliates provide advisory, distribution or management services in connection with financial products sponsored by the Trust’s adviser or its affiliates, which may include other registered investment companies, a 529 education savings plan, managed separate accounts and exempt group annuity contracts sold to qualified plans, and which in no case contained elements which would cause the Board to conclude that approval of the subadvisory agreement with the subadviser would be inappropriate. See (5) below for information relating to the business arrangement between the Trust’s Adviser and GMO.
(5) As a part of the overall business arrangement between the Adviser and GMO under which the Adviser has obtained exclusive rights to certain GMO investment management services for up to five years, the Adviser has agreed that under certain circumstances it (and not the Trust or the particular Fund) will pay GMO a specified amount (ranging from $1 to $12 million) if the subadvisory agreement with respect to any of the following Funds to be subadvised by GMO is terminated within a five year period from the date of its effectiveness: U.S. Core Fund, Active Value Fund, Intrinsic Value Fund, Growth Fund, International Core Fund, International Growth Fund, Global Fund, Value Opportunities Fund, Growth Opportunities Fund and U.S. Quality Equity Fund.
The Adviser has also agreed that, subject to its fiduciary duties as an investment adviser to each of these Funds and its shareholders, it will not recommend to the Board of Trustees to terminate the subadvisory agreement with respect to any of the Funds or to reduce any of the fees payable thereunder to GMO for a five year period from the date of effectiveness of the agreement. Substantially similar agreements (with varying amounts to be paid upon termination) also apply with respect to certain other John Hancock funds that are or will be advised by the Adviser and subadvised by GMO. The Trust is not a party to any of these arrangements, and they are not binding upon the Trust, the Trust’s Funds subadvised by GMO or the Board of Trustees. However, these arrangements present certain conflicts of interest because the Adviser has a financial incentive to support the continuation of GMO subadvisory agreements for as long as the termination provisions described above re main in effect. In approving the Advisory Agreement
40
and the subadvisory agreement with respect to each of the Funds subadvised by GMO, the Board of Trustees, including the Independent Trustees, was aware of and considered these potential conflicts of interest, including any financial obligations of the Adviser to GMO.
The Board concluded that, notwithstanding the potential conflicts of interest, approval of the Advisory Agreement and the subadvisory agreements with GMO is in the best interests of shareholders and contract owners in view of (i) the Adviser’s fiduciary duty and the Board’s fiduciary duty and ability to monitor potential conflicts, (ii) the benefits to shareholders and contract owners generally expected from the exclusive rights to certain GMO investment management services obtained by the Adviser for the benefit of certain Funds of the Trust and other John Hancock funds and (iii) the benefits to such Funds of the Trust expected from the subadvisory services of GMO.
Additional information that the Board considered for a particular fund is set forth in Appendix A.
| Appendix A | |||
| Estimated Fees | |||
| Fund | Performance | and Expenses | Comments |
| Growth | See “Comments”. | Subadvisory fees | The Board noted |
| Opportunities | for this Fund were | that the Fund has a | |
| lower than the peer | limited performance | ||
| group median. | history. | ||
| Advisory fees for | |||
| this Fund were | |||
| lower than the peer | |||
| group median. | |||
| Total expenses for | |||
| this Fund were | |||
| lower than the peer | |||
| group median. | |||
41
For more information
The Fund’s proxy voting policies, procedures and records are available without charge, upon request:
| By phone | On the Fund’s Web site | On the SEC’s Web site |
| 1-800-225-5291 | www.jhfunds.com/proxy | www.sec.gov |
| Trustees | Francis V. Knox, Jr. | Principal distributor |
| James M. Oates, Chairman* | Chief Compliance Officer | John Hancock Funds, LLC |
| Charles L. Bardelis * | 601 Congress Street | |
| James R. Boyle† | Gordon M. Shone | Boston, MA 02210-2805 |
| Peter S. Burgess * | Treasurer | |
| Elizabeth G. Cook | Custodian | |
| William H. Cunningham | John G. Vrysen | State Street Bank & Trust Co. |
| Charles L. Ladner* | Chief Financial Officer | 2 Avenue de Lafayette |
| Hassell H. McClellan | Boston, MA 02111 | |
| *Members of the Audit Committee | Investment adviser | |
| †Non-Independent Trustee | John Hancock Investment | Transfer agent |
| Management Services, LLC | John Hancock Signature | |
| Officers | 601 Congress Street | Services, Inc. |
| Keith F. Hartstein | Boston, MA 02210-2805 | 1 John Hancock Way, |
| President and | Suite 1000 | |
| Chief Executive Officer | Subadviser | Boston, MA 02217-1000 |
| Grantham, Mayo, | ||
| Thomas M. Kinzler | Van Otterloo & Co. LLC | Legal counsel |
| Secretary and | 40 Rowes Wharf | Kirkpatrick & Lockhart |
| Chief Legal Officer | Boston, MA 02110 | Nicholson Graham LLP |
| 1 Lincoln Street | ||
| Boston, MA 02111-2950 | ||
The Fund’s investment objective, risks, charges and expenses are included in the prospectus and should be considered carefully before investing. For a prospectus, call your financial professional, call John Hancock Funds at 1-800-225-5291 or visit the Fund’s Web site at www.jhfunds.com. Please read the prospectus carefully before investing or sending money.
| How to contact us | ||
| Internet | www.jhfunds.com | |
| Regular mail: | Express mail: | |
| John Hancock | John Hancock | |
| Signature Services, Inc. | Signature Services, Inc. | |
| 1 John Hancock Way, Suite 1000 | Mutual Fund Image Operations | |
| Boston, MA 02217-1000 | 380 Stuart Street | |
| Boston, MA 02116 | ||
| Phone | Customer service representatives | 1-800-225-5291 |
| 24-hour automated information | 1-800-338-8080 | |
| TDD line | 1-800-554-6713 | |
A listing of month-end portfolio holdings is available on our Web site, www.jhfunds.com. A more detailed portfolio holdings summary is available on a quarterly basis 60 days after the fiscal quarter on our Web site or upon request by calling 1-800-225-5291, or on the Securities and Exchange Commission’s Web site, www.sec.gov.
44
J O H N H A N C O C K F A M I L Y O F F U N D S
| EQUITY | INTERNATIONAL |
| Balanced Fund | Greater China Opportunities Fund |
| Classic Value Fund | International Classic Value Fund |
| Classic Value Fund II | International Core Fund |
| Core Equity Fund | International Fund |
| Focused Equity Fund | International Growth Fund |
| Growth Fund | |
| Growth Opportunities Fund | INCOME |
| Growth Trends Fund | Bond Fund |
| Intrinsic Value Fund | Government Income Fund |
| Large Cap Equity Fund | High Yield Fund |
| Large Cap Select Fund | Investment Grade Bond Fund |
| Mid Cap Equity Fund | Strategic Income Fund |
| Mid Cap Growth Fund | |
| Multi Cap Growth Fund | TAX-FREE INCOME |
| Small Cap Equity Fund | California Tax-Free Income Fund |
| Small Cap Fund | High Yield Municipal Bond Fund |
| Small Cap Intrinsic Value Fund | Massachusetts Tax-Free Income Fund |
| Sovereign Investors Fund | New York Tax-Free Income Fund |
| U.S. Core Fund | Tax-Free Bond Fund |
| U.S. Global Leaders Growth Fund | |
| Value Opportunities Fund | MONEY MARKET |
| Money Market Fund | |
| ASSET ALLOCATION & LIFESTYLE | U.S. Government Cash Reserve |
| Allocation Core Portfolio | |
| Allocation Growth + Value Portfolio | CLOSED-END |
| Lifestyle Aggressive Portfolio | Bank & Thrift Opportunity |
| Lifestyle Balanced Portfolio | Financial Trends |
| Lifestyle Conservative Portfolio | Income Securities |
| Lifestyle Growth Portfolio | Investors Trust |
| Lifestyle Moderate Portfolio | Patriot Global Dividend |
| Patriot Preferred Dividend | |
| SECTOR | Patriot Premium Dividend I |
| Financial Industries Fund | Patriot Premium Dividend II |
| Health Sciences Fund | Patriot Select Dividend |
| Real Estate Fund | Preferred Income |
| Regional Bank Fund | Preferred Income II |
| Technology Fund | Preferred Income III |
| Technology Leaders Fund | Tax-Advantaged Dividend |
For more complete information on any John Hancock Fund and a prospectus, which includes charges and expenses, call your financial professional, or John Hancock Funds at 1-800-225-5291. Please read the prospectus carefully before investing or sending money.

1-800-225-5291
1-800-554-6713 (TDD)
1-800-338-8080 EASI-Line
www.jhfunds. com
Now available: electronic delivery
www.jhfunds.com/edelivery
This report is for the information of the shareholders of John Hancock Growth Opportunities Fund.
840SA 8/06
10/06

| TABLE OF CONTENTS |
| Manager’s report |
| page 2 |
| A look at performance |
| page 6 |
| Your expenses |
| page 8 |
| Fund’s investments |
| page 1 0 |
| Financial statements |
| page 1 8 |
| For more information |
| page 4 0 |
CEO corner
To Our Shareholders,
The future has arrived at John Hancock Funds.
We have always been firm believers in the powerful role the Internet can play in providing fund information to our shareholders and prospective investors. Recently, we launched a redesigned, completely overhauled Web site that is more visually pleasing, easier to navigate and, most importantly, provides more fund information and learning tools without overwhelming the user.
Not long after we embarked on this major project, a study was released by the Investment Company Institute, the mutual fund industry’s main trade group, which found that an overwhelming majority of shareholders consider the Internet the “wave of the future” for accessing fund information.
Our new site sports fresher and faster ways to access account information. New innovations allow investors to view funds by risk level, track the performance of the John Hancock funds of their choice or sort funds by Morningstar, Inc.’s star ratings. Investors who own a John Hancock fund through a qualified retirement plan and don’t pay sales charges when making a purchase have the option of sorting by a “Load Waived” Morningstar Rating, thereby creating an apples-to-apples comparison with no-load funds that may also be available in their retirement plan.
The new site also has more educational tools and interactive modules to educate and assist investors with their financial goals, from college savings to retirement planning. A new “I want to…” feature allows investors to check performance, invest more money, update personal information or download prospectuses and forms quickly and easily.
In another of our ongoing efforts to provide our shareholders with top-notch service, we also redesigned our shareholder reports, as you may have noticed with this report. We hope the larger size, more colorful cover and redesigned presentation of the commentary and data tables will draw you in and make them easier to read.
After you’ve read your shareholder report, we encourage you to visit our new Web site — www.jhfunds.com — and take a tour. It’s easy, fast and fun and allows you to be in control of what you see and do. In short, it’s the wave of the future!
Sincerely,

| Keith F. Hartstein, President and Chief Executive Officer |
| This commentary reflects the CEO’s views as of August 31, 2006. They are subject to change at any time. |
Your fund at a glance
| The Fund seeks long-term capital growth by typically investing in U.S. companies that issue stocks included in the Russell 1000 Index and in companies with size and growth characteristics similar to those of companies with stocks in the Index. |
Since inception June 12, 2006
| ► U.S. stocks posted decent gains as the threat of higher interest rates seemed to fade. ► The Fund’s performance was aided by the more defensive names in the health care and grocery chain segments. ► Momentum stocks suffered and were the biggest detractors from the Fund’s returns. |
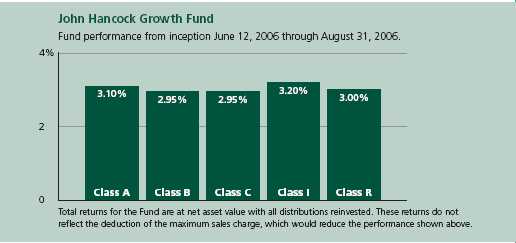
| Top 10 holdings | ||||
| Home Depot Inc. | 3.4% | QUALCOMM, Inc. | 2.2% | |
| Merck & Co. | 3.2% | Lowe’s Companies, Inc. | 2.1% | |
| Pfizer Inc. | 3.0% | Wal-Mart Stores, Inc. | 2.1% | |
| American International Group | 2.5% | Exxon Mobil Corp. | 2.0% | |
| UnitedHealth Group Inc. | 2.2% | Genentech, Inc. | 1.6% | |
As a percentage of net assets on August 31, 2006.
1
Managers’ report
| John Hancock Growth Fund |
Despite increased stock market volatility prompted by uncertainty over the economy, interest rates and geopolitical events, U.S. stocks as a whole posted decent gains for the period spanning the Fund’s inception on June 12, 2006, to its semiannual period end on August 31, 2006. The period began just weeks after newly appointed Federal Reserve Board Chairman Ben Bernanke rattled investors by seeming to imply that inflation pressures were mounting and, as a result, interest rates would move higher than the market might previously have anticipated. Equity investors worried that the Fed might raise rates too much and trigger a recession. But beginning in mid-July, stocks staged an impressive rally that accelerated in early August, when the Fed opted not to increase interest rates again for the first time in two years. Against this macroeconomic backdrop, large-company stocks performed in line with their smaller-cap counterparts, foreign equities performed better than those in the U.S. and value stocks trumped growth stocks.
Performance
From its inception on June 12, 2006 through August 31, 2006, John Hancock Growth Fund’s Class A, Class B, Class C, Class I and Class R shares returned 3.10%, 2.95%, 2.95%, 3.20% and 3.00% respectively, at net asset value. By comparison, the Russell 1000 Growth Index
SCORECARD
| INVESTMENT | PERIOD’S PERFORMANCE... AND WHAT’S BEHIND THE NUMBERS | |
| Merck | ▲ | Bounces back in response to stronger-than-expected sales |
| Kroger | ▲ | Shares rise as investors gravitate to defensive names |
| Home Depot | ▼ | Housing market slowdown prompts worries over future profits |
2

| Portfolio Managers, Grantham, Mayo, Van Otterloo & Co. LLC (GMO) Sam Wilderman, Ed Choi, Donna Murphy, Chuck Joyce and Tara Oliver |
returned 4.05% and the average large growth fund returned 3.82% at net asset value, according to Morningstar, Inc.1
Strategy explained
Since the Fund is new, we are continuing to build our positions, using our time-tested investment process. Although many managers use a single methodology to select stocks, we use two independent disciplines to select stocks for the Fund: valuation and momentum. Half of the stocks in the Fund are considered “momentum” stocks, that is, stocks that are experiencing price appreciation and/or positive earnings revisions. This momentum typically follows a decline relative to the market. We’ve determined that stocks whose prices have declined for six months, then advanced for 12 months, will tend to continue rising for another 12 to 18 months. Price momentum enables portfolios to benefit from short-term swings in earnings and investor sentiment.
| “During this abbreviated period, our best performers were generated by our valuation discipline.” |
The remaining stocks in this portfolio are bought based on valuation. We seek growth companies that are selling for less than their worth, with the expectation that they will remain profitable, eventually regain favor in the market and generate above-average returns. Although traditional measures of a stock’s cheapness, such as price-to-book (P/B) or price-to-earnings (P/E) ratios may help investors determine if a company’s stock price is low, such measures do not distinguish between high-quality and low-quality companies. We believe high-quality companies are worth a premium because they can sustain a competitive advantage and continue to grow over the long term.
Growth Fund
3
Because momentum and valuation tools tend to perform differently across various market and economic cycles, the Fund’s combination of the two disciplines results in greater diversification in the portfolio. Diversification may help to lower the Fund’s risk level. We also employ a number of other risk control techniques. We typically hold more than 300 common stocks, so that the Fund’s performance isn’t overly dependent on the fortunes of one or a handful of companies. We give more weight to large-cap companies with strong balance sheets and high profit margins. Finally, we limit our holdings by economic sector and company size within the large-cap universe.
Leaders and laggards
During this abbreviated period, our best performers were generated by our valuation discipline. In particular, we saw gains from companies whose shares had been beaten up in prior periods but rallied in response to investors’ growing appetite for defensive stocks — shares of companies whose sales and profits tend to continue to grow even while the broader economy slows. Leading the pack were our stakes in large drug companies Merck & Company, Inc. and Pfizer, Inc. Merck’s net profit rose substantially and the company raised its profit forecast for the full year, helped by strong sales of cholesterol drug Zocor. Pfizer posted strong earnings in August, thanks in large part to stronger-than-expected sales of Lipitor, the anti-cholesterol medication that is one of the best-selling drugs in the world. Investors also cheered a management change and shake-up in the executive suite. A growing move toward defensive stocks also he lped our shares in grocery store chains The Kroger Company and Safeway. We also enjoyed good gains from Exxon Mobil Corp., which was buoyed by continued high energy prices.
| SECTOR DISTRIBUTION2 | |
| Consumer | |
| non-cyclical | 28% |
| Consumer cyclical | 19% |
| Industrial | 14% |
| Financial | 14% |
| Technology | 8% |
| Communications | 7% |
| Energy | 5% |
| Basic materials | 1% |
Detracting from Fund returns were some of our momentum plays. QUALCOMM, Inc. faltered amid concerns surrounding a number of battles it faced, including a royalty-payments battle with Nokia, the world’s top cell-phone maker and QUALCOMM’s largest licensee. We also lost ground with Starbucks Corp. It posted disappointing summer sales fig-ures, blaming the results on long lines at its stores for its icy blended drinks, which take longer to make than the standard
Growth Fund
4
cup of coffee. That development worried investors who feared that it was a sign that the chain’s growth may be decelerating. Other weak performers included home improvement stores Home Depot, Inc. and Lowe’s Companies, Inc., which both slumped as the housing market cooled.
| “Since we remain very wary of risk, we will continue to focus on high-quality companies that we believe can best weather a market and/or economic downturn.” |
Outlook
The summer stock market rally and the Fed’s decision to pause its interest-rate-raising cycle after 17 consecutive quarter-point hikes since June 2004, appear to have provided investors with reasons for optimism. By the end of the period, stocks overall seemed “priced for perfection,” with investors betting that economic growth would remain moderate and sustainable and that inflation would be contained. But we believe this optimism is likely overblown and that the market is significantly underpricing risk. The investment landscape is always fraught with any number of risks, be it higher-than-expected inflation and interest rates, slower-than-expected economic growth or geopolitical events. But we believe that the economy and financial systems are so highly levered at the moment that even the smallest unfavorable development could result in a significant re-pricing of risk, meaning that ris kier assets would underperform. Since we remain very wary of risk, we will continue to focus on high-quality companies that we believe can best weather a market and/or economic downturn.
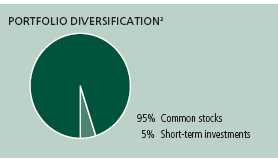
This commentary reflects the views of the portfolio management team through the end of the Fund’s period discussed in this report. The team’s statements reflect their own opinions. As such, they are in no way guarantees of future events and are not intended to be used as investment advice or a recommendation regarding any specific security. They are also subject to change at any time as market and other conditions warrant.
1 Figures from Morningstar, Inc. include reinvested dividends and do not take into account sales charges. Actual load-adjusted performance is lower.
2 As a percentage of net assets on August 31, 2006.
Growth Fund
5
A look at performance
For the period ending August 31, 2006
| Cumulative total returns | ||
| with maximum sales charge (POP) | ||
| Inception | Since | |
| Class | date | inception |
| A | 6-12-06 | –2.04% |
| B | 6-12-06 | –2.05 |
| C | 6-12-06 | 1.95 |
| I1 | 6-12-06 | 3.20 |
| R1 | 6-12-06 | 3.00 |
Performance figures assume all distributions are reinvested. Returns with maximum sales charge reflect a sales charge on Class A shares of 5%, and the applicable contingent deferred sales charge (CDSC) on Class B and Class C shares. The Class B shares’ CDSC declines annually between years 1–6 according to the following schedule: 5, 4, 3, 3, 2, 1%. No sales charge will be assessed after the sixth year. Class C shares held for less than one year are subject to a 1% CDSC. Sales charge is not applicable for Class I and Class R shares.
The returns reflect past results and should not be considered indicative of future performance. The return and principal value of an investment will fluctuate so that shares, when redeemed, may be worth more or less than their original cost. Due to market volatility, the Fund’s current performance may be higher or lower than the performance shown. For performance data current to the most recent month-end, please call 1-800-225-5291 or visit the Fund’s Web site at www.jhfunds.com.
The performance table above and the chart on the next page do not reflect the deduction of taxes that a shareholder would pay on Fund distributions or the redemption of Fund shares.
The Fund’s performance results reflect any applicable expense reductions, without which the expenses would increase and results would have been less favorable.
Since inception performance is calculated with an opening price (prior day’s close) on the inception date.
1 For certain types of investors as described in the Fund’s Class I and Class R share prospectuses.
Growth Fund
6
Growth of $10,000
This chart shows what happened to a hypothetical $10,000 investment in Class A shares
for the period indicated. For comparison, we’ve shown the same investment in the
Russell 1000 Growth Index.
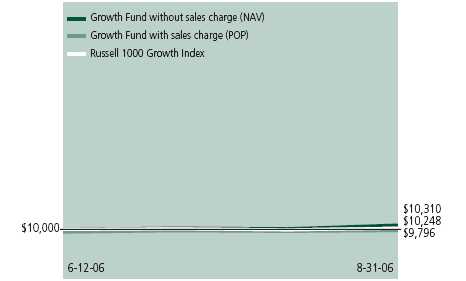
| Class | Period beginning | Without sales charge | With maximum sales charge | Index |
| B | 6-12-06 | $10,295 | $9,795 | $10,248 |
| C | 6-12-06 | 10,295 | 10,195 | 10,248 |
| I 1 | 6-12-06 | 10,320 | 10,320 | 10,248 |
| R1 | 6-12-06 | 10,300 | 10,300 | 10,248 |
Assuming all distributions were reinvested for the period indicated, the table above shows the value of a $10,000 investment in the Fund’s Class B, Class C, Class I and Class R shares, respectively, as of August 31, 2006. Performance of the classes will vary based on the difference in sales charges paid by shareholders investing in the different classes and the fee structure of those classes.
Russell 1000 Growth Index is an unmanaged index that contains those stocks from the Russell 1000 Index with a greater-than-average growth orientation.
It is not possible to invest directly in an index. Index figures do not reflect sales charges which would have resulted in lower values if they did.
1 For certain types of investors as described in the Fund’s Class I and Class R share prospectuses.
Growth Fund
7
Your expenses
| These examples are intended to help you understand your ongoing operating expenses. |
Understanding Fund expenses
As a shareholder of the Fund, you incur two types of costs:
| ▪ Transaction costs which include sales charges (loads) on purchases or redemptions (varies by share class), minimum account fee charge, etc. ▪ Ongoing operating expenses including management fees, distribution and service fees (if applicable) and other Fund expenses. |
We are going to present only your ongoing operating expenses here.
Actual expenses/actual returns
This example is intended to provide information about your Fund’s actual ongoing operating expenses, and is based on your Fund’s actual return. It assumes an account value of $1,000.00 on June 12, 2006, with the same investment held until August 31, 2006.
| Account value | Ending value | Expenses paid during | |
| on 6-12-06 | on 8-31-06 | period ended 8-31-061 | |
| Class A | $1,000.00 | $1,031.00 | $3.15 |
| Class B | 1,000.00 | 1,029.50 | 4.67 |
| Class C | 1,000.00 | 1,029.50 | 4.67 |
| Class I | 1,000.00 | 1,032.00 | 2.24 |
| Class R | 1,000.00 | 1,030.00 | 3.86 |
Together with the value of your account, you may use this information to estimate the operating expenses that you paid over the period. Simply divide your account value at August 31, 2006 by $1,000.00, then multiply it by the “expenses paid” for your share class from the table above. For example, for an account value of $8,600.00, the operating expenses should be calculated as follows:
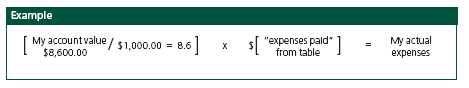
Growth Fund
8
Hypothetical example for comparison purposes
This table allows you to compare your Fund’s ongoing operating expenses with those of any other fund. It provides an example of the Fund’s hypothetical account values and hypothetical expenses based on each class’ actual expense ratio and an assumed 5% annual return before expenses (which is not your Fund’s actual return). It assumes an account value of $1,000.00 on June 12, 2006, with the same investment held until August 31, 2006. Look in any other fund shareholder report to find its hypothetical example and you will be able to compare these expenses.
| Account value | Ending value | Expenses paid during | |
| on 6-12-06 | on 8-31-06 | period ended 8-31-061 | |
| Class A | $1,000.00 | $1,007.86 | $3.11 |
| Class B | 1,000.00 | 1,006.36 | 4.61 |
| Class C | 1,000.00 | 1,006.36 | 4.61 |
| Class I | 1,000.00 | 1,008.76 | 2.21 |
| Class R | 1,000.00 | 1,007.16 | 3.81 |
Remember, these examples do not include any transaction costs, such as sales charges; therefore, these examples will not help you to determine the relative total costs of owning different funds. If transaction costs were included, your expenses would have been higher. See the prospectus for details regarding transaction costs.
1 Expenses are equal to the Fund's annualized expense ratio of 1.40%, 2.10%, 2.10%, 1.00% and 1.75% for Class A, Class B, Class C, Class I, and Class R respectively, multiplied by the average account value over the period, multiplied by the number of days in the inception period /365 or 366 (to reflect the one-half year period).
Growth Fund
9
F I N A N C I A L S T A T E M E N T S
Fund’s investments
Securities owned by the Fund on 8-31-06 (unaudited)
This schedule is divided into two main categories: common stocks and short-term
investments. Common stocks are further broken down by industry group. Short-term
investments, which represent the Fund’s cash position, are listed last.
| Issuer | Shares | Value |
| Common stocks 95.45% | $22,067,443 | |
| (Cost $21,491,980) | ||
Advertising 0.16% | $36,666 | |
| Monster Worldwide, Inc. * | 900 | $36,666 |
Aerospace 1.72% | 398,701 | |
| Boeing Company | 1,300 | 97,370 |
| General Dynamics Corp. | 600 | 40,530 |
| Goodrich Corp. | 600 | 23,370 |
| Northrop Grumman Corp. | 1,300 | 86,853 |
| Textron, Inc. | 300 | 25,158 |
| United Technologies Corp. | 2,000 | 125,420 |
Agriculture 0.68% | 156,446 | |
| Archer-Daniels-Midland Company | 3,800 | 156,446 |
Aluminum 0.22% | 51,462 | |
| Alcoa, Inc. | 1,800 | 51,462 |
Apparel & Textiles 0.26% | 60,856 | |
| Liz Claiborne, Inc. | 300 | 11,211 |
| Mohawk Industries, Inc. * | 500 | 35,440 |
| Timberland Company, Class A * | 500 | 14,205 |
Auto Parts 0.77% | 179,093 | |
| AutoZone, Inc. * | 600 | 54,180 |
| Johnson Controls, Inc. | 1,200 | 86,316 |
| O’Reilly Automotive, Inc. * | 1,300 | 38,597 |
Auto Services 0.25% | 58,290 | |
| AutoNation, Inc.* | 3,000 | 58,290 |
Automobiles 0.21% | 49,203 | |
| PACCAR, Inc. | 900 | 49,203 |
Banking 0.07% | 15,098 | |
| Golden West Financial Corp. | 200 | 15,098 |
See notes to financial statements
Growth Fund
10
F I N A N C I A L S T A T E M E N T S
| Issuer | Shares | Value |
Biotechnology 2.70% | $623,736 | |
| Amgen, Inc.* | 1,600 | 108,688 |
| Applera Corp. | 2,200 | 67,430 |
| Biogen Idec, Inc.* | 600 | 26,484 |
| Genentech, Inc.* | 4,500 | 371,340 |
| Millipore Corp.* | 300 | 19,254 |
| Techne Corp.* | 600 | 30,540 |
Broadcasting 0.13% | 31,104 | |
| Univision Communications, Inc., Class A* | 900 | 31,104 |
Building Materials & Construction 0.29% | 67,744 | |
| American Standard Companies, Inc. | 900 | 37,593 |
| Masco Corp. | 1,100 | 30,151 |
Business Services 3.29% | 761,068 | |
| Affiliated Computer Services, Inc., Class A* | 600 | 30,804 |
| Ceridian Corp.* | 1,300 | 31,031 |
| Computer Sciences Corp.* | 200 | 9,476 |
| DST Systems, Inc.* | 700 | 41,321 |
| Equifax, Inc. | 600 | 19,074 |
| Fair Isaac Corp. | 1,200 | 42,012 |
| First Data Corp. | 2,400 | 103,128 |
| Fluor Corp. | 400 | 34,568 |
| Global Payments, Inc. | 800 | 30,440 |
| Manpower, Inc. | 700 | 41,377 |
| Moody’s Corp. | 3,900 | 238,602 |
| Paychex, Inc. | 1,700 | 61,047 |
| Pitney Bowes, Inc. | 800 | 34,872 |
| Robert Half International, Inc. | 1,400 | 43,316 |
Cellular Communications 1.15% | 266,532 | |
| Motorola, Inc. | 11,400 | 266,532 |
Chemicals 0.24% | 55,958 | |
| E.I. Du Pont De Nemours & Company | 1,400 | 55,958 |
Colleges & Universities 0.14% | 33,045 | |
| ITT Educational Services, Inc.* | 500 | 33,045 |
Computers & Business Equipment 3.05% | 704,394 | |
| CDW Corp. | 600 | 34,980 |
| Cognizant Technology Solutions Corp., Class A* | 200 | 13,982 |
| Dell, Inc.* | 7,900 | 178,145 |
| Hewlett–Packard Company | 8,600 | 314,416 |
| International Business Machines Corp. | 1,300 | 105,261 |
| Lexmark International, Inc.* | 600 | 33,642 |
| Network Appliance, Inc.* | 700 | 23,968 |
See notes to financial statements
Growth Fund
11
F I N A N C I A L S T A T E M E N T S
| Construction Materials 0.29% | $65,888 | |
| Martin Marietta Materials, Inc. | 800 | 65,888 |
Cosmetics & Toiletries 0.23% | 53,874 | |
| Colgate–Palmolive Company | 900 | 53,874 |
Crude Petroleum & Natural Gas 0.95% | 220,746 | |
| Devon Energy Corp. | 200 | 12,498 |
| Marathon Oil Corp. | 900 | 75,150 |
| Occidental Petroleum Corp. | 1,200 | 61,188 |
| Sunoco, Inc. | 1,000 | 71,910 |
Drugs & Health Care 0.42% | 97,320 | |
| Mentor Corp. | 500 | 24,270 |
| Wyeth | 1,500 | 73,050 |
Electrical Equipment 1.25% | 289,765 | |
| Emerson Electric Company | 3,100 | 254,665 |
| Wesco International, Inc.* | 600 | 35,100 |
Electronics 0.84% | 195,083 | |
| Agilent Technologies, Inc.* | 5,200 | 167,232 |
| AVX Corp. | 700 | 11,627 |
| Harman International Industries, Inc. | 200 | 16,224 |
Financial Services 7.21% | 1,667,415 | |
| Bear Stearns Companies, Inc. | 500 | 65,175 |
| Charles Schwab Corp. | 9,300 | 151,683 |
| Chicago Merchantile Exchange Holdings, Inc. | 100 | 44,000 |
| E*TRADE Financial Corp.* | 4,800 | 113,232 |
| Federated Investors, Inc., Class B | 1,300 | 43,524 |
| Fiserv, Inc.* | 300 | 13,251 |
| Goldman Sachs Group, Inc. | 2,100 | 312,165 |
| Investment Technology Group, Inc.* | 300 | 13,863 |
| Jefferies Group, Inc. | 800 | 19,936 |
| JPMorgan Chase & Company | 5,500 | 251,130 |
| Lehman Brothers Holdings, Inc. | 1,900 | 121,239 |
| Mellon Financial Corp. | 2,400 | 89,352 |
| Merrill Lynch & Company, Inc. | 2,700 | 198,531 |
| Moneygram International, Inc. | 900 | 28,260 |
| Morgan Stanley | 1,400 | 92,106 |
| Raymond James Financial, Inc. | 400 | 11,088 |
| State Street Corp. (c) | 1,600 | 98,880 |
Food & Beverages 3.25% | 752,158 | |
| Dean Foods Company* | 800 | 31,696 |
| H.J. Heinz Company | 300 | 12,552 |
| Pepsi Bottling Group, Inc. | 400 | 14,004 |
| Sara Lee Corp. | 1,900 | 31,597 |
| Starbucks Corp.* | 11,300 | 350,413 |
See notes to financial statements
Growth Fund
12
F I N A N C I A L S T A T E M E N T S
| Issuer | Shares | Value |
Food & Beverages (continued) | ||
| Sysco Corp. | 800 | $25,112 |
| The Coca-Cola Company | 6,400 | 286,784 |
Healthcare Products 2.08% | 479,865 | |
| Baxter International, Inc. | 900 | 39,942 |
| Henry Schein, Inc.* | 500 | 24,935 |
| IDEXX Laboratories, Inc.* | 200 | 18,402 |
| Johnson & Johnson | 2,500 | 161,650 |
| Medtronic, Inc. | 1,200 | 56,280 |
| Respironics, Inc.* | 1,200 | 44,292 |
| Stryker Corp. | 800 | 38,424 |
| Varian Medical Systems, Inc.* | 1,800 | 95,940 |
Healthcare Services 5.68% | 1,312,172 | |
| Cardinal Health, Inc. | 1,900 | 128,098 |
| Express Scripts, Inc.* | 3,700 | 311,096 |
| Health Net, Inc.* | 2,200 | 91,982 |
| Humana, Inc.* | 100 | 6,093 |
| Lincare Holdings, Inc.* | 1,100 | 40,733 |
| McKesson Corp. | 2,500 | 127,000 |
| Omnicare, Inc. | 600 | 27,186 |
| Quest Diagnostics, Inc. | 1,000 | 64,280 |
| UnitedHealth Group, Inc. | 9,600 | 498,720 |
| Weight Watchers International, Inc. | 400 | 16,984 |
Holdings Companies/Conglomerates 0.86% | 199,576 | |
| General Electric Company | 3,600 | 122,616 |
| Loews Corp. | 2,000 | 76,960 |
Homebuilders 0.22% | 51,117 | |
| Centex Corp. | 400 | 20,380 |
| Lennar Corp., Class A | 400 | 17,936 |
| Ryland Group, Inc. | 300 | 12,801 |
| Hotels & Restaurants 0.50% | 115,596 | |
| Applebee’s International, Inc. | 1,100 | 22,825 |
| Brinker International, Inc. | 800 | 30,776 |
| Darden Restaurants, Inc. | 900 | 31,860 |
| Sonic Corp.* | 500 | 10,965 |
| Wendy’s International, Inc. | 300 | 19,170 |
Household Appliances 0.21% | 48,546 | |
| Whirlpool Corp. | 600 | 48,546 |
Household Products 0.21% | 48,459 | |
| Energizer Holdings, Inc.* | 200 | 13,372 |
| Newell Rubbermaid, Inc. | 1,300 | 35,087 |
See notes to financial statements
Growth Fund
13
F I N A N C I A L S T A T E M E N T S
| Issuer | Shares | Value |
Industrial Machinery 2.63% | $607,316 | |
| Caterpillar, Inc. | 4,200 | 278,670 |
| Cummins, Inc. | 500 | 57,410 |
| Deere & Company | 800 | 62,480 |
| Flowserve Corp.* | 600 | 30,684 |
| FMC Technologies, Inc.* | 500 | 29,410 |
| ITT Industries, Inc. | 600 | 29,370 |
| Parker–Hannifin Corp. | 600 | 44,430 |
| Terex Corp.* | 1,400 | 61,502 |
| W.W. Grainger, Inc. | 200 | 13,360 |
Industrials 0.39% | 89,022 | |
| Crane Company | 300 | 11,994 |
| Fastenal Company | 2,100 | 77,028 |
Insurance 6.23% | 1,440,955 | |
| AFLAC, Inc. | 4,600 | 207,322 |
| Ambac Financial Group, Inc. | 400 | 34,636 |
| American International Group, Inc. | 8,900 | 567,998 |
| Aon Corp. | 2,400 | 82,968 |
| Brown & Brown, Inc. | 1,100 | 32,934 |
| Chubb Corp. | 800 | 40,128 |
| Lincoln National Corp. | 400 | 24,280 |
| MBIA, Inc. | 500 | 30,815 |
| Old Republic International Corp. | 700 | 14,630 |
| PMI Group, Inc. | 800 | 34,592 |
| Progressive Corp. | 6,800 | 167,212 |
| Radian Group, Inc. | 200 | 11,976 |
| St. Paul Travelers Companies, Inc. | 2,200 | 96,580 |
| Torchmark Corp. | 400 | 24,884 |
| W.R. Berkley Corp. | 2,000 | 70,000 |
International Oil 0.55% | 127,452 | |
| Anadarko Petroleum Corp. | 1,500 | 70,365 |
| ConocoPhillips | 900 | 57,087 |
Internet Service Provider 0.66% | 151,412 | |
| Google, Inc., Class A* | 400 | 151,412 |
Leisure Time 0.49% | 112,172 | |
| International Game Technology, Inc. | 2,900 | 112,172 |
Life Sciences 0.12% | 26,684 | |
| Pharmaceutical Product Development, Inc. | 700 | 26,684 |
Liquor 0.34% | 79,590 | |
| Anheuser-Busch Companies, Inc. | 1,300 | 64,194 |
| Brown Forman Corp., Class B | 200 | 15,396 |
See notes to financial statements
Growth Fund
14
F I N A N C I A L S T A T E M E N T S
| Issuer | Shares | Value |
Manufacturing 1.67% | $387,215 | |
| Cameron International Corp.* | 300 | 14,373 |
| Danaher Corp. | 1,700 | 112,693 |
| Harley-Davidson, Inc. | 900 | 52,659 |
| Illinois Tool Works, Inc. | 2,800 | 122,920 |
| Rockwell Automation, Inc. | 1,500 | 84,570 |
Medical-Hospitals 0.06% | 14,637 | |
| Health Management Associates, Inc., Class A | 700 | 14,637 |
Metal & Metal Products 0.20% | 45,878 | |
| Reliance Steel & Aluminum Company | 1,400 | 45,878 |
Mining 0.10% | 22,012 | |
| Lincoln Electric Holding, Inc. | 400 | 22,012 |
Mobile Homes 0.15% | 33,744 | |
| Thor Industries, Inc. | 800 | 33,744 |
Office Furnishings & Supplies 0.76% | 176,832 | |
| Office Depot, Inc.* | 4,800 | 176,832 |
Petroleum Services 3.10% | 717,692 | |
| Baker Hughes, Inc. | 2,800 | 199,304 |
| BJ Services Company | 1,500 | 51,465 |
| Exxon Mobil Corp. | 6,900 | 466,923 |
Pharmaceuticals 10.15% | 2,345,371 | |
| Abbott Laboratories | 700 | 34,090 |
| Allergan, Inc. | 1,400 | 160,384 |
| AmerisourceBergen Corp. | 1,700 | 75,072 |
| Barr Pharmaceuticals, Inc.* | 1,100 | 62,150 |
| Bristol-Myers Squibb Company | 3,400 | 73,950 |
| Caremark Rx, Inc. | 1,200 | 69,528 |
| Celgene Corp.* | 1,200 | 48,828 |
| Endo Pharmaceutical Holdings, Inc.* | 700 | 23,121 |
| Forest Laboratories, Inc.* | 5,900 | 294,882 |
| Gilead Sciences, Inc.* | 800 | 50,720 |
| King Pharmaceuticals, Inc.* | 2,100 | 34,062 |
| Merck & Company, Inc. | 18,400 | 746,120 |
| Pfizer, Inc. | 24,400 | 672,464 |
Railroads & Equipment 1.47% | 340,560 | |
| Burlington Northern Santa Fe Corp. | 2,500 | 167,375 |
| CSX Corp. | 1,200 | 36,264 |
| Norfolk Southern Corp. | 1,700 | 72,641 |
| Union Pacific Corp. | 800 | 64,280 |
Retail Grocery 0.69% | 159,040 | |
| SUPERVALU, Inc. | 900 | 25,704 |
| The Kroger Company | 5,600 | 133,336 |
See notes to financial statements
Growth Fund
15
F I N A N C I A L S T A T E M E N T S
| Issuer | Shares | Value |
Retail Trade 12.43% | $2,872,480 | |
| Abercrombie & Fitch Company, Class A | 200 | 12,906 |
| Advance Auto Parts, Inc. | 600 | 18,072 |
| AnnTaylor Stores Corp. * | 700 | 27,860 |
| Bed Bath & Beyond, Inc. * | 2,700 | 91,071 |
| Best Buy Company, Inc. | 1,900 | 89,300 |
| BJ’s Wholesale Club, Inc. * | 800 | 21,080 |
| Chico’s FAS, Inc. * | 1,300 | 23,972 |
| Circuit City Stores, Inc. | 2,200 | 51,942 |
| Claire’s Stores, Inc. | 1,900 | 51,927 |
| Costco Wholesale Corp. | 2,700 | 126,333 |
| Dollar General Corp. | 2,300 | 29,578 |
| Dollar Tree Stores, Inc. * | 1,000 | 28,780 |
| Home Depot, Inc. | 22,600 | 774,954 |
| Limited Brands, Inc. | 600 | 15,438 |
| Lowe’s Companies, Inc. | 18,200 | 492,492 |
| Nordstrom, Inc. | 1,500 | 56,025 |
| Staples, Inc. | 4,300 | 97,008 |
| The Men’s Wearhouse, Inc. | 600 | 21,270 |
| The TJX Companies, Inc. | 1,600 | 42,800 |
| Tiffany & Company | 1,600 | 50,560 |
| Walgreen Company | 5,200 | 257,192 |
| Wal–Mart Stores, Inc. | 11,000 | 491,920 |
Sanitary Services 0.30% | 68,616 | |
| Allied Waste Industries, Inc. * | 1,000 | 10,340 |
| Waste Management, Inc. | 1,700 | 58,276 |
Semiconductors 2.83% | 654,135 | |
| Applied Materials, Inc. | 3,200 | 54,016 |
| Broadcom Corp., Class A * | 700 | 20,608 |
| Intel Corp. | 7,100 | 138,734 |
| Intersil Corp., Class A | 1,300 | 32,955 |
| Lam Research Corp. * | 300 | 12,837 |
| Microchip Technology, Inc. | 1,500 | 51,240 |
| Micron Technology, Inc. * | 1,100 | 19,008 |
| National Semiconductor Corp. | 2,500 | 60,725 |
| NVIDIA Corp. * | 2,800 | 81,508 |
| Texas Instruments, Inc. | 5,600 | 182,504 |
Software 1.13% | 260,827 | |
| BEA Systems, Inc. * | 5,800 | 79,634 |
| BMC Software, Inc. * | 2,400 | 63,888 |
| Citrix Systems, Inc. * | 2,400 | 73,632 |
| Microsoft Corp. | 1,700 | 43,673 |
See notes to financial statements
Growth Fund
16
F I N A N C I A L S T A T E M E N T S
| Issuer | Shares | Value |
Steel 0.70% | $161,271 | |
| Nucor Corp. | 3,300 | 161,271 |
Telecommunications Equipment & Services 3.11% | 718,409 | |
| ADTRAN, Inc. | 1,400 | 34,818 |
| Corning, Inc.* | 7,600 | 169,024 |
| QUALCOMM, Inc. | 13,200 | 497,244 |
| Tellabs, Inc.* | 1,700 | 17,323 |
Telephone 1.58% | 365,191 | |
| AT&T, Inc. | 900 | 28,017 |
| BellSouth Corp. | 5,500 | 223,960 |
| CenturyTel, Inc. | 700 | 27,874 |
| Harris Corp. | 900 | 39,528 |
| Qwest Communications International, Inc.* | 5,200 | 45,812 |
Tobacco 1.14% | 263,381 | |
| Altria Group, Inc. | 2,900 | 242,237 |
| UST, Inc. | 400 | 21,144 |
Transportation 1.31% | 302,712 | |
| C.H. Robinson Worldwide, Inc. | 3,300 | 151,206 |
| Expeditors International of Washington, Inc. | 3,800 | 151,506 |
Trucking & Freight 1.63% | 375,861 | |
| Fedex Corp. | 3,300 | 333,399 |
| Landstar Systems, Inc. | 300 | 12,810 |
| Ryder Systems, Inc. | 600 | 29,652 |
| Principal | ||
| Issuer, description, maturity date | amount | Value |
| Repurchase agreements 4.06% | $937,000 | |
| (Cost $937,000) | ||
| Repurchase Agreement with State Street Corp. | ||
| dated 08/31/2006 at 3.95% to be repurchased at | ||
| $937,103 on 9/1/2006, collateralized by $985,000 | ||
| Federal National Mortgage Association, 4.25% due | ||
| 08/15/2010 (valued at $959,144, including interest) (c) | $937,000 | $937,000 |
| Total investments (cost $22,428,980) 99.51% | $23,004,443 | |
| Other assets in excess of liabilities 0.49% | 114,246 | |
| Total net assets 100.00% | $23,118,689 | |
| * Non-income producing. (c) Investment is an affiliate of the Trust's subadvisor or custodian bank. |
See notes to financial statements
Growth Fund
17
F I N A N C I A L S T A T E M E N T S
Financial statements
Statement of assets and liabilities 8-31-06 (unaudited)
| This Statement of Assets and Liabilities is the Fund’s balance sheet. It shows the value of what the Fund owns, is due and owes. You’ll also find the net asset value and the maximum offering price per share. |
| Assets | |
| Investments, at value (Cost $21,491,980) | 22,067,443 |
| Repurchase agreements, at value (Cost $937,000) | 937,000 |
| Cash | 36,415 |
| Receivable for shares sold | 49,995 |
| Dividends and interest receivable | 35,332 |
| Receivable for futures variation margin | 250 |
| Other assets | 29,413 |
| Total assets | 23,155,848 |
| Liabilities | |
| Payable to affiliates | |
| Transfer agent fees | 7,293 |
| Fund administration fees | 269 |
| Service fees | 54 |
| Other payables and accrued expenses | 29,543 |
| Total liabilities | 37,159 |
| Net assets | |
| Capital paid-in | 22,506,547 |
| Accumulated undistributed net realized loss on investments and futures contracts | (4,315) |
| Net unrealized appreciation on investments and futures contracts | 603,599 |
| Undistributed net investment income | 12,858 |
| Net assets | $23,118,689 |
| Net asset value per share | |
| Based on net asset values and shares outstanding — The Fund has an | |
| unlimited number of shares authorized with no par value. | |
| Class A ($15,253,994 ÷ 739,844 shares) | $20.62 |
| Class B ($158,666 ÷ 7,707 shares) | $20.59 |
| Class C ($117,572 ÷ 5,711 shares) | $20.59 |
| Class I ($7,485,445 ÷ 362,686 shares) | $20.64 |
| Class R ($103,012 ÷ 5,000 shares) | $20.60 |
| Maximum offering price per share | |
| Class Aa ($20.62 ÷ 95%) | $21.71 |
| a On single retail sales of less than $50,000. On sales of $50,000 or more and on group sales the offering price is reduced. |
See notes to financial statements
Growth Fund
18
F I N A N C I A L S T A T E M E N T S
Statement of operations For the period ended 8-31-06 (unaudited)a
| This Statement of Operations summarizes the Fund’s investment income earned and expenses incurred in operating the Fund. It also shows net gains (losses) for the period stated. |
| Investment income | |
| Dividends | 55,500 |
| Interest | 17,091 |
| Total investment income | 72,591 |
| Expenses | |
| Investment management fees (Note 3) | 36,811 |
| Distribution and service fees (Note 3) | 10,413 |
| Transfer agent fees (Note 3) | 7,293 |
| Fund administration fees (note 3) | 269 |
| Blue sky fees (Note 3) | 20,405 |
| Audit and legal fees | 17,737 |
| Custodian fees | 9,176 |
| Printing and postage fees (Note 3) | 7,027 |
| Trustees’ fees (Note 3) | 143 |
| Miscellaneous | 277 |
| Total expenses | 109,551 |
| Less expense reductions (Note 3) | (49,818) |
| Net expenses | 59,733 |
| Net investment income | 12,858 |
| Realized and unrealized gain (loss) | |
| Net realized gain (loss) on | |
| Investments | (9,835) |
| Futures contracts | 5,520 |
| Change in net unrealized appreciation of | |
| Investments | 575,463 |
| Futures contracts | 28,136 |
| Net realized and unrealized gain | 599,284 |
| Increase in net assets from operations | $612,142 |
a Period from 6-12-06 (commencement of operations) to 8-31-06.
See notes to financial statements
Growth Fund
19
F I N A N C I A L S T A T E M E N T S
Statement of changes in net assets
This Statement of Changes in Net Assets shows how the value of the Fund’s net assets
has changed during the period. The difference reflects earnings less expenses, any
investment gains and losses, distributions, if any, paid to shareholders and the net of
Fund share transactions.
| Period | |
| ended | |
| 8-31-06a | |
| Increase (decrease) in net assets | |
| From operations | |
| Net investment income | $12,858 |
| Net realized loss | (4,315) |
| Change in net unrealized appreciation (depreciation) | 603,599 |
| Increase in net assets resulting from operations | 612,142 |
| From Fund share transactions | 22,506,547 |
| Net assets | |
| Beginning of period | — |
| End of periodb | $23,118,689 |
a Period from 6-12-06 (commencement of operations) to 8-31-06. Unaudited.
b Includes undistributed net investment income of $12,858.
See notes to financial statements
Growth Fund
20
F I N A N C I A L S T A T E M E N T S
Financial highlights
The Financial highlights show how the Fund’s net asset value for a share has changed since the end of the previous period.
| CLASS A SHARES | |
| Period ended | 8-31-06a,b |
| Per share operating performance | |
| Net asset value, beginning of period | $20.00 |
| Net investment incomeh | 0.01 |
| Net realized and unrealized | |
| gain on investments | 0.61 |
| Total from investment operations | 0.62 |
| Net asset value, end of period | $20.62 |
| Total return (%) | 3.10l,m |
| Ratios and supplemental data | |
| Net assets, end of period | |
| (in millions) | $15 |
| Ratio of net expenses to average | |
| net assets (%) | 1.40r |
| Ratio of gross expenses to average | |
| net assets (%) | 2.13r |
| Ratio of net investment income | |
| to average net assets (%) | 0.20r |
| Portfolio turnover (%) | 14m |
See notes to financial statements
Growth Fund
21
F I N A N C I A L S T A T E M E N T S
Financial highlights
| CLASS B SHARES | |
| Period ended | 8-31-06a,b |
| Per share operating performance | |
| Net asset value, beginning of period | $20.00 |
| Net investment lossh | (0.02) |
| Net realized and unrealized | |
| gain on investments | 0.61 |
| Total from investment operations | 0.59 |
| Net asset value, end of period | $20.59 |
| Total return (%) | 2.95l,m |
| Ratios and supplemental data | |
| Net assets, end of period | |
| (in millions) | $—n |
| Ratio of net expenses to average | |
| net assets (%) | 2.10r |
| Ratio of gross expenses to average | |
| net assets (%) | 19.64r |
| Ratio of net investment loss | |
| to average net assets (%) | (0.47)r |
| Portfolio turnover (%) | 14m |
See notes to financial statements
Growth Fund
22
F I N A N C I A L S T A T E M E N T S
Financial highlights
| CLASS C SHARES | |
| Period ended | 8-31-06a,b |
| Per share operating performance | |
| Net asset value, beginning of period | $20.00 |
| Net investment lossh | (0.02) |
| Net realized and unrealized | |
| gain on investments | 0.61 |
| Total from investment operations | 0.59 |
| Net asset value, end of period | $20.59 |
| Total return (%) | 2.95l,m |
| Ratios and supplemental data | |
| Net assets, end of period | |
| (in millions) | $—n |
| Ratio of net expenses to average | |
| net assets (%) | 2.10r |
| Ratio of gross expenses to average | |
| net assets (%) | 20.17r |
| Ratio of net investment loss | |
| to average net assets (%) | (0.49)r |
| Portfolio turnover (%) | 14m |
See notes to financial statements
Growth Fund
23
F I N A N C I A L S T A T E M E N T S
Financial highlights
| CLASS I SHARES | |
| Period ended | 8-31-06a,b |
| Per share operating performance | |
| Net asset value, beginning of period | $20.00 |
| Net investment incomeh | 0.02 |
| Net realized and unrealized | |
| gain on investments | 0.62 |
| Total from investment operations | 0.64 |
| Net asset value, end of period | $20.64 |
| Total return (%) | 3.20l,m |
| Ratios and supplemental data | |
| Net assets, end of period | |
| (in millions) | $7 |
| Ratio of net expenses to average | |
| net assets (%) | 1.00r |
| Ratio of gross expenses to average | |
| net assets (%) | 2.06r |
| Ratio of net investment income | |
| to average net assets (%) | 0.53r |
| Portfolio turnover (%) | 14m |
See notes to financial statements
Growth Fund
24
F I N A N C I A L S T A T E M E N T S
Financial highlights
| CLASS R SHARES | |
| Period ended | 8-31-06a,b |
| Per share operating performance | |
| Net asset value, beginning of period | $20.00 |
| Net investment lossh | (0.01) |
| Net realized and unrealized | |
| gain on investments | 0.61 |
| Total from investment operations | 0.60 |
| Net asset value, end of period | $20.60 |
| Total return (%) | 3.00l,m |
| Ratios and supplemental data | |
| Net assets, end of period | |
| (in millions) | $—n |
| Ratio of net expenses to average | |
| net assets (%) | 1.75r |
| Ratio of gross expenses to average | |
| net assets (%) | 20.63r |
| Ratio of net investment loss | |
| to average net assets (%) | (0.15)r |
| Portfolio turnover (%) | 14m |
a Class A, Class B, Class C, Class I, Class R and Class 1 shares began operations on 6-12-06.
b Unaudited.
h Based on the average of the shares outstanding.
l Total returns would have been lower had certain expenses not been reduced during the period shown.
m Not annualized.
n Less than $500,000.
r Annualized.
See notes to financial statements
Growth Fund
25
Notes to financial statements (unaudited)
1. Organization
John Hancock Growth Fund (the “Fund”) is a newly organized non-diversified series of John Hancock Funds III (the “Trust”). The Trust was established as a Massachusetts business trust on June 9, 2005. The Trust is registered under the Investment Company Act of 1940, as amended (the “1940 Act”), as an open-end investment management company. The investment objective of the Fund is to seek long-term capital growth.
John Hancock Life Insurance Company of New York (“John Hancock New York”) is a wholly owned subsidiary of John Hancock Life Insurance Company (U.S.A.) (“John Hancock USA”). John Hancock USA and John Hancock New York are indirect wholly owned subsidiaries of The Manufacturers Life Insurance Company (“Manulife”), which in turn is a wholly owned subsidiary of Manulife Financial Corporation (“MFC”), a publicly traded company. Manulife Financial Corporation and its subsidiaries are known collectively as “Manulife Financial.”
John Hancock Investment Management Services, LLC (the “Adviser”) is the Adviser to the Trust. The John Hancock Funds, LLC (the “Distributor”), a Delaware limited liability company controlled by John Hancock USA, serves as principal underwriter and is a wholly owned subsidiary of the Adviser.
The Board of Trustees has authorized the issuance of multiple classes of shares of the Fund, including classes designated as Class A, Class B, Class C, Class I and Class R shares. The shares of each class represent an interest in the same portfolio of investments of the Fund, and have equal rights as to voting, redemptions, dividends and liquidation, except that certain expenses, subject to the approval of the Board of Trustees, may be applied differently to each class of shares in accordance with current regulations of the Securities and Exchange Commission and the Internal Revenue Service.
Shareholders of a class that bear distribution and service expenses under the terms of a distribution plan have exclusive voting rights to that distribution plan.
The Adviser and other subsidiaries of John Hancock USA owned 730,000 Class A shares, 5,000 Class B shares, 5,000 Class C shares, 5,000 Class I shares and 5,000 Class R shares of beneficial interest of the Fund on August 31, 2006.
2. Significant accounting policies
In the preparation of the financial statements, the Fund follows the policies described below. The preparation of financial statements in conformity with accounting principles generally accepted in the United States of America requires management to make estimates and assumptions that affect the reported amounts of assets and liabilities at the date of the financial statements and the reported amounts of income and expenses during the reporting period. Actual results may differ from these estimates.
Security valuation
The net asset value of the shares of the Fund is determined daily as of the close of the New York Stock Exchange, normally at 4:00 P.M. Eastern time. Short-term debt instruments with remaining maturities of 60 days or less are valued at amortized cost, and thereafter assume a constant amortization to maturity of any discount or premium, which approximates market value. Investments in State Street Navigator Securities Lending Prime Portfolio are valued at their net asset value each business day. All other securities held by the Fund are valued at the last sale price or official closing price (closing bid price or last evaluated quote if no sale has occurred) as of the close of business on a principal securities exchange (domestic or foreign) or, lacking any sales, at the closing bid price. Securities traded only in the over-the-counter market are valued at the last bid price quoted by brokers making
Growth Fund
26
markets in the securities at the close of trading. Fund securities for which there are no such quotations, principally debt securities, are valued based on the valuation provided by an independent pricing service, which utilizes both dealer-supplied and electronic data processing techniques.
Other assets and securities for which no such quotations are readily available are valued at their fair value as determined in good faith under consistently applied procedures established by and under the general supervision of the Board of Trustees. Generally, trading in non-U.S. securities is substantially completed each day at various times prior to the close of trading on the New York Stock Exchange. The values of such securities used in computing the net asset value of a Fund’s shares are generally determined as of such times. Occasionally, significant events that affect the values of such securities may occur between the times at which such values are generally determined and the close of the New York Stock Exchange. In such events, these securities will then be valued at their fair value as determined in good faith under consistently applied procedures established by and under the general supervision of the Board of Trustees.
In deciding whether to make a fair value adjustment to the price of a security, the Trustees or their designee may review a variety of factors, including, developments in foreign markets, the performance of U.S. securities markets and the performance of instruments trading in U.S. markets that represent foreign securities and baskets of foreign securities. The Fund may also fair value securities in other situations, for example, when a particular foreign market is closed, but the Fund is calculating the net asset value. In view of these factors, it is likely that Fund investing significant amounts of assets in securities in foreign markets will be fair valued more frequently than a fund investing significant amounts of assets in frequently traded, U.S. exchange listed securities of large capitalization U.S. issuers.
For purposes of determining when fair value adjustments may be appropriate with respect to the Fund investing in securities in foreign markets that close prior to the New York Stock Exchange, the Fund will, on an ongoing basis, monitor for “significant market events.” A significant market event may be a certain percentage change in the value of an index or of certain exchange traded funds (“ETFs”) that track foreign markets in which the Fund has significant investments. If a significant market event occurs due to a change in the value of the index or of ETFs, the pricing for the Fund will promptly be reviewed and potential adjustments to the net asset value will be recommended to the Trust’s Pricing Committee, where applicable.
Fair value pricing of securities is intended to help ensure that the net asset value of the Fund’s shares reflects the value of the Fund’s securities as of the close of the New York Stock Exchange (as opposed to a value which is no longer accurate as of such close), thus limiting the opportunity for aggressive traders to purchase shares of the Fund at deflated prices, reflecting stale security valuations, and to promptly sell such shares at a gain. However, a security’s valuation may differ depending on the method used for determining value and no assurance can be given that fair value pricing of securities will successfully eliminate all potential opportunities for such trading gains.
Repurchase agreements
The Fund may enter into repurchase agreements. When the Fund enters into a repurchase agreement through its custodian, it receives delivery of securities, the amount of which at the time of purchase and each subsequent business day is required to be maintained at such a level that the market value is generally at least 102% of the repurchase amount. The Fund will take constructive receipt of all securities underlying the repurchase agreements it has entered into until such agreements expire. If the seller defaults, the Fund would suffer a loss to the extent that proceeds from the sale of underlying securities were less than the repurchase amount. The Fund may enter into repurchase agreements maturing within seven days with domestic dealers, banks or other financial institutions deemed to be creditworthy by the Adviser. Collateral for certain tri-party repurchase agreements is held at the custodian bank in a
Growth Fund
27
segregated account for the benefit of the Fund and the counterparty.
| Security transactions and related investment income |
Investment security transactions are accounted for on a trade date plus one basis for daily net asset value calculations. However for financial reporting purposes, investment transactions are reported on trade date. Interest income is accrued as earned. Dividend income is recorded on the ex-dividend date. Foreign dividends are recorded on the ex-date or as soon after the ex-date that the Fund becomes aware of such dividends, net of all taxes. Discounts/premiums are accreted/amortized for financial reporting purposes. Non-cash dividends are recorded at the fair market value of the securities received. Debt obligations may be placed in a non-accrual status and related interest income may be reduced by ceasing current accruals and writing off interest receivables when the collection of all or a portion of interest has become doubtful, based upon consistently applied procedures.
From time to time, the Fund may invest in Real Estate Investment Trusts (“REITs”) and as a result, will estimate the components of distributions from these securities. Distributions from REITs received in excess of income are recorded as a reduction of cost of investments and/or as a realized gain.
The Fund uses the First In, First Out method for fixed income securities and Highest Cost, First Out for all other securities for determining realized gain or loss on investments for both financial and federal income tax reporting purposes.
Multi-class operations
All income, expenses (except for class-specific expenses) and realized and unrealized gains (losses) are allocated to each class of shares based upon the relative net assets of each class. Dividends to shareholders from net investment income are determined at a class level and distributions from capital gains are determined at a Fund level.
Expense allocation
Expenses are allocated based on the relative share of net assets of the Fund at the time the expense was incurred. Class-specific expenses, such as distribution (Rule 12b-1) fees, are accrued daily and charged directly to the respective share classes.
Futures
The Fund may purchase and sell financial futures contracts and options on those contracts. The Fund invests in contracts based on financial instruments such as U.S. Treasury Bonds or Notes on securities indices such as the Standard & Poor’s 500 Index (the “S&P 500 Index”), in order to hedge against a decline in the value of securities owned by the Fund.
Upon entering into futures contracts, the Fund is required to deposit with a broker an amount, termed the initial margin, which typically represents a certain percentage of the purchase price indicated in the futures contract. Payments to and from the broker, known as variation margin, are required to be made on a daily basis as the price of the futures contract fluctuates, making the long or short positions in the contract more or less valuable. If the position is closed out by taking an opposite position prior to the settlement date of the futures contract, a final determination of variation margin is made, cash is required to be paid to or released by the broker, and the Fund realizes a gain or loss.
When the Fund sells a futures contract based on a financial instrument, the Fund becomes obligated to deliver that kind of instrument at an agreed upon date for a specified price. The Fund realizes a gain or loss depending on whether the price of an offsetting purchase is less or more than the price of the initial sale or on whether the price of an offsetting sale is more or less than the price of the initial purchase. The Fund could be exposed to risks if it could not close out futures positions because of an illiquid secondary market or the inability of counterparties to meet the terms of their contracts. Futures contracts are valued at the quoted daily settlement prices established by the exchange on which they trade.
Growth Fund
28
The following is a summary of open futures contracts on August 31, 2006:
| NUMBER OF | UNREALIZED | |||
| OPEN CONTRACTS | CONTRACTS | POSITION | EXPIRATION | APPRECIATION |
| S&P 500 Index | 2 | Long | Sept 2006 | $28,136 |
Federal income taxes
The Fund qualifies as a “regulated investment company” by complying with the applicable provisions of the Internal Revenue Code and will not be subject to federal income tax on taxable income that is distributed to shareholders. Therefore, no federal income tax provision is required.
New accounting pronouncements
In June 2006, Financial Accounting Standards Board (“FASB”) Interpretation No. 48, Accounting for Uncertainty in Income Taxes (the “Interpretation”) was issued, and is effective for fiscal years beginning after December 15, 2006 and is to be applied to all open tax years as of the effective date. The Interpretation prescribes a minimum threshold for financial statement recognition of the benefit of a tax position taken or expected to be taken in a tax return, and requires certain expanded disclosures. Management is currently evaluating the application of the Interpretation to the Fund, and has not at this time quantified the impact, if any, resulting from the adoption of the Interpretation on the Fund’s financial statements.
In September 2006, FASB Standard No. 157, Fair Value Measurements (“FAS 157”) was issued, and is effective for fiscal years beginning after November 15, 2007. FAS 157 defines fair value, establishing a framework for measuring fair value and expands disclosure about fair value measurements. Management is currently evaluating the application of FAS 157 to the Fund, and its impact, if any, resulting from the adoption of FAS 157 on the Fund’s financial statements.
Distribution of income and gains
The Fund records distributions to shareholders from net investment income and net realized gains, if any, on the ex-dividend date. Distributions paid by the Fund with respect to each class of shares are calculated in the same manner, at the same time and are in the same amount, except for the effect of expenses that may be applied differently to each class. Such distributions, on a tax basis, are determined in conformity with income tax regulations, which may differ from accounting principles generally accepted in the United States of America. Distributions in excess of tax basis earnings and profits, if any, are reported in the Fund’s financial statements as a return of capital.
Capital accounts
The Fund reports the undistributed net investment income and accumulated undistributed net realized gain (loss) accounts on a basis approximating amounts available for future tax distributions (or to offset future taxable realized gains when a capital loss carryforward is available). Accordingly, the Fund may periodically make reclassifications among certain capital accounts without affecting its net asset value.
| 3. Investment advisory and other agreements |
Advisory fees
The Trust has entered into an Investment Advisory Agreement with the Adviser. The Adviser is responsible for managing the corporate and business affairs of the Trust and for selecting and compensating subadvisers to handle the investment and reinvestment of the assets of the Fund, subject to the supervision of the Board of Trustees. Under the Advisory Agreement the Fund pays a monthly management fee to the Adviser equivalent, on an annual basis, to the sum of: (a) 0.80% of the first $500,000,000 of the Fund’s aggregate daily net assets; (b) 0.78% of the next $500,000,000 of the Fund’s aggregate daily net assets; (c) 0.77% of the next $1,500,000,000 of the Fund’s aggregate daily net assets; and (d) 0.76% of the Fund’s aggregate daily net assets in excess of $2,500,000,000. Aggregate net assets include the net assets of the Fund and Growth Trust, a series of John Hancock Trust. John Hancock Trust is an open-end
Growth Fund
29
investment company advised by the Adviser and distributed by the Distributor. The Fund is not responsible for payment of the subadvisory fees.
Expense reimbursements
The Adviser has agreed contractually to reimburse for certain fund level expenses that exceed 0.11% of the average annual net assets, or to make a payment to a specific class of shares of the Fund in an amount equal to the amount by which the expenses attributable to such class of shares (excluding taxes, portfolio brokerage commissions, interest, litigation and indem-nification expenses and other extraordinary expenses not incurred in the ordinary course of the Fund’s business and fees under any agreement or plans of the Fund dealing with services for shareholders and others with beneficial interests in shares of the Fund) exceed the percentage of average annual net assets (on an annualized basis) attributable as follows: 1.40% for Class A, 2.10% for Class B, 2.10% for Class C, 1.00% for Class I and 1.50% for Class R. Accordingly, the expense reductions related to this expense limitation amounted to $23,705, $4,200, $4,172, $13,554 and $4,187 for Class A, Class B, Class C, Class I and Class R, respectively, for the period ended August 31, 2006. The Adviser reserves the right to terminate this limitation in the future. This expense reimbursement shall continue in effect until June 30, 2007 and thereafter until terminated by the Adviser on notice to the Trust.
Administration fees
The Fund has an agreement with the Adviser that requires the Fund to reimburse the Adviser for all expenses associated with providing the administrative, financial, accounting and recordkeeping services of the Fund, including the preparation of all tax returns, annual, semiannual and periodic reports to shareholders and the preparation of all regulatory reports.
Distribution plan
The Trust has a Distribution Agreement with the Distributor, a wholly owned subsidiary of the Adviser. The Fund has adopted Distribution Plans with respect to Class A, Class B, Class C and Class R, pursuant to Rule 12b-1 under the 1940 Act, to reimburse the Distributor for the services it provides as distributor of shares of the Fund. Accordingly, the Fund makes monthly payments to the Distributor at an annual rate not to exceed 0.30%, 1.00%, 1.00% and 0.50% of average daily net asset value of Class A, Class B, Class C and Class R, respectively. A maximum of 0.25% of such payments may be service fees, as defined by the Conduct Rules of the National Association of Securities Dealers. Under the Conduct Rules, curtailment of a portion of the Fund’s 12b-1 payments could occur under certain circumstances. In addition, under a Service Plan for Class R shares, the Fund pays up to 0.25% of Class R average daily net asset value for certain other services.
Sales charges
Class A shares are assessed up-front sales charges of up to 5.00% of net asset value of such shares. During the period ended August 31, 2006, the Fund was informed that the Distributor received net up-front sales charges of $3,541 with regard to sales of Class A shares. Of this amount, $539 was retained and used for printing prospectuses, advertising, sales literature and other purposes, $3,002 was paid as sales commissions to unrelated broker-dealers.
Class B shares that are redeemed within six years of purchase are subject to a contingent deferred sales charge (“CDSC”) at declining rates, beginning at 5.00% of the lesser of the current market value at the time of redemption or the original purchase cost of the shares being redeemed. Class C shares that are redeemed within one year of purchase are subject to a CDSC at a rate of 1.00% of the lesser of the current market value at the time of redemption or the original purchase cost of the shares being redeemed. Proceeds from the CDSCs are paid to the Distributor and are used, in whole or in part, to defray its expenses for providing distribution-related services to the Fund in connection with the sale of Class B and Class C shares. During the period ended August 31, 2006, the Fund was informed that the Distributor received no CDSCs for Class B and Class C shares.
Growth Fund
30
Transfer agent fees
The Fund has a Transfer Agency Agreement with John Hancock Signature Services, Inc. (“Signature Services”), an indirect subsidiary of MFC. For Class A, Class B, Class C, Class I and Class R shares, the Fund pays a monthly transfer agent fee at an annual rate of 0.05% of each class’ average daily net assets, plus a fee based on the number of shareholder accounts and reimbursement for certain out-of-pocket expenses. Expenses not directly attributable to a particular class of shares are aggregated and allocated to each class on the basis of its relative net asset value.
Signature Services has agreed to limit the transfer agent fees so that such fees do not exceed 0.20% annually of Class A, Class B, Class C, Class I and Class R share average daily net assets. This agreement is effective until December 31, 2006. Signature Services reserves the right to terminate this limitation in the future. Accordingly, there were no transfer agent fees reductions for Class A, Class B, Class C, Class I and Class R shares, respectively, during the period ended August 31, 2006.
Expenses under the agreements described above for the period ended August 31, 2006, were as follows:
| Distribution and | Transfer | Printing and | ||
| Share Class | service fees | agent | Blue sky | postage |
| Class A | $9,778 | $6,518 | $4,218 | $4,639 |
| Class B | 239 | 48 | 4,032 | 31 |
| Class C | 231 | 46 | 4,032 | 32 |
| Class I | — | 637 | 4,091 | 2,293 |
| Class R | 165 | 44 | 4,032 | 32 |
| Total | $10,413 | $7,293 | $20,405 | $7,027 |
Trustees’ fees
The Trust compensates each Trustee who is not an employee of the Adviser or its affiliates. Total Trustees’ expenses are allocated to the Fund based on its average daily net asset value.
4. Guarantees and indemnifications
Under the Trust’s organizational documents, its Officers and Trustees are indemnified against certain liability arising out of the performance of their duties to the Trust. Additionally, in the normal course of business, the Trust enters into contracts with service providers that contain general indemnification clauses. The Trust’s maximum exposure under these arrangements is unknown, as this would involve future claims that may be made against the Trust that have not yet occurred. However, based on experience, the Trust believes the risk of loss to be remote.
5. Line of credit
The Fund has entered into an agreement which enables them to participate in a $100 million unsecured committed line of credit with State Street Bank & Trust Company. Borrowings will be made solely to temporarily finance the repurchase of capital shares. Interest is charged to the Fund based on its borrowings at a rate per annum equal to the Federal Funds rate plus 0.50% . In addition, a commitment fee of 0.07% per annum, payable at the end of each calendar quarter, based on the average daily-unused portion of the line of credit, is charged to the Fund on a prorated basis based on average net assets. For the period ended August 31, 2006, there was no borrowings under the line of credit.
Growth Fund
31
6. Capital shares
Share activities for the Fund for the period ended August 31, 2006 were as follows:
| Period ended 8-31-06a | ||
| Shares | Amount | |
| Class A shares | ||
| Sold | 739,844 | $14,801,101 |
| Net increase | 739,844 | $14,801,101 |
| Class B shares | ||
| Sold | 7,707 | $154,989 |
| Net increase | 7,707 | $154,989 |
| Class C shares | ||
| Sold | 5,711 | $114,457 |
| Net increase | 5,711 | $114,457 |
| Class I shares | ||
| Sold | 362,686 | $7,336,000 |
| Net increase | 362,686 | $7,336,000 |
| Class R shares | ||
| Sold | 5,000 | $100,000 |
| Net increase | 5,000 | $100,000 |
| Net increase | 1,120,948 | $22,506,547 |
aPeriod from 6-12-06 (commencement of operations) to 8-31-06. (Unaudited).
7. Investment transactions
Purchases and proceeds from sales or maturities of securities, other than short-term securities and obligations of the U.S. government, during the period ended August 31, 2006, aggregated $24,159,918 and $2,658,103, respectively.
The cost of investments owned on August 31, 2006, including short-term investments, for federal income tax purposes, was $22,428,980. Gross unrealized appreciation and depreciation of investments aggregated $1,228,143 and $652,680, respectively, resulting in net unrealized appreciation of $575,463.
8. Federal income tax information
Federal income tax regulations may differ from generally accepted accounting principles and income and capital gain distributions determined in accordance with tax regulations may differ from net investment income and realized gains recognized for financial reporting purposes.
Growth Fund
32
| Evaluation of Advisory and Subadvisory Agreements by the Board of Trustees |
| This section describes the evaluation by the Board of Trustees of the Advisory Agreement and each of the Subadvisory Agreements. |
Evaluation by the Board of Trustees The Board, including all of the Trustees who are not “interested persons” as defined in the Investment Company Act of 1940, as amended (the “Independent Trustees”), is responsible for selecting the Trust’s investment adviser, John Hancock Investment Management Services, LLC (the “Adviser” or “JHIMS”), approving the Adviser’s selection of subadvisers for each series of the Trust (the “Funds”) and approving the Trust’s advisory and sub-advisory agreements (and any sub-subadvisory agreements), their periodic continuation and any amendments. Consistent with SEC rules, the Board regularly evaluates the Trust’s advisory and subadvisory (and sub-subadvisory) arrangements, including consideration of the factors listed below. The Board may also consider other factors (including conditions and trends prevailing generally in the econom y, the securities markets and the industry) and does not treat any single factor as determinative, and each Trustee may attribute different weights to different factors. The Board is furnished with an analysis of its fiduciary obligations in connection with its evaluation and, throughout the evaluation process, the Board is assisted by counsel for the Trust and the Independent Trustees are also separately assisted by independent legal counsel. The factors regularly considered by the Board are:
1. the nature, extent and quality of the services to be provided by the Adviser to the Trust and by the subadvisers to the Funds;
2. the investment performance of the Funds and their subadvisers;
3. the extent to which economies of scale would be realized as a Fund grows and whether fee levels reflect these economies of scale for the benefit of Trust shareholders;
4. the costs of the services to be provided and the profits to be realized by the Adviser and its affiliates (including any subadvisers that are affiliated with the Adviser) from the Adviser’s relationship with the Trust; and
5. comparative services rendered and comparative advisory and subadvisory fee rates.
The Board believes that information relating to all these factors is relevant to its evaluation of the Trust’s advisory agreement. With respect to its evaluation of subadvisory agreements (including sub-subadvisory agreements) the Board believes that, in view of the Trust’s “manager-of managers” advisory structure, the costs of services to be provided and the profits to be realized by those subadvisers that are not affiliated with the Adviser from their relationship with the Trust generally are not a material factor to the Board’s consideration of subadvisory agreements because such fees are paid to sub-advisers by the Adviser and not by the Funds, and because the Board relies on the ability of the Adviser to negotiate such subadvisory fees at arms-length.
In evaluating subadvisory arrangements, the Board also considers other material business relationships that unaffiliated sub-advisers and their affiliates have with the Adviser or its affiliates, including the involvement by certain affiliates of certain subadvisers in the distribution of financial products, including shares of the Trust, offered by the Adviser and other affiliates of the Adviser (“Material Relationships”).
Approval of Advisory Agreement
At its meeting on September 21, 2005, the Board, including all the Independent Trustees, approved the Advisory Agreement between the Trust and JHIMS with respect to each of the Funds.
In approving the Advisory Agreement, and with reference to the factors which it regularly considers, the Board:
(1) (a) considered the high value to the Trust of continuing the relationship with JHIMS as the Trust’s Adviser to the other John Hancock Funds, the skills and competency with which JHIMS
33
has in the past managed the affairs and subadvisory relationships of other funds in the complex, JHIMS’s oversight and monitoring of subadvisers’ investment performance and compliance programs including its timelines in responding to performance issues and the qualifications of JHIMS’s personnel,
(b) considered JHIMS’s compliance policies and procedures and its responsiveness to regulatory changes and mutual fund industry developments, and
(c) JHIMS’s administrative capabilities, including its ability to supervise the other service providers for the Funds and concluded that JHIMS may reasonably be expected to ably perform its services under the Advisory Agreement.
(2) reviewed the investment performance of portfolios that are managed comparable to the Funds; the comparative performance of their respective benchmarks; and JHIMS’ analysis of such performance and its plans and recommendations regarding the Trust’s subadvisory arrangements generally and with respect to the Funds; and concluded that each of the comparably managed funds has performed well or within a range that the Board deemed competitive, and that JHIMS may reasonably be expected to ably monitor the performance of the Funds and their subadvisers;
(3) reviewed the Trust’s advisory fee structure and the incorporation therein of any subadvisory fee breakpoints in the advisory fees charged and concluded (i) that to the extent that Funds have subadvisory fees with breakpoints, those breakpoints are reflected as breakpoints in the advisory fees for Funds, (ii) that all Funds with a subadviser that is not affiliated with the Adviser have subadvisory fees which are the product of arms-length negotiations between the Adviser and the subadviser and which in many, but not all, cases contain breakpoints, and (iii) that, although economies of scale cannot be measured with precision, these arrangements permit shareholders of Funds with advisory fee breakpoints to benefit from economies of scale if those Funds grow;
(4) (a) reviewed the financial statements of JHIMS and John Hancock Life Insurance Company (U.S.A.) (“JHLICO (U.S.A.)”;
(b) reviewed the anticipated profitability of the JHIMS’s relationship with the Funds in terms of the fees it expects to receive with respect to the Funds and whether JHIMS has the financial ability to provide a high level of services to the Funds,
(c) considered that JHIMS derives reputational and other indirect benefits from providing advisory services to the Funds, and
(d) noted that JHIMS will pay the sub-advisory fees out of the advisory fees JHIMS receives from the Funds and concluded that the advisory fees paid by the Trust with respect to the Funds are not unreasonable in light of such information; and
(5) reviewed comparative information with respect to the advisory fee rates and concluded that the anticipated advisory fees for the Funds are within the range of those incurred by other comparable funds and that the advisory structure for the Funds is thus competitive within the industry.
Additional information that the Board considered for a particular Fund is set forth in Appendix A.
Approval of Subadvisory Agreements
At its meeting on September 21, 2005, the Board, including all the Independent Trustees, approved the Subadvisory Agreements.
In making its determination with reference to these respective factors, the Board reviewed:
(i) information relating to each subadviser’s business which included information
34
such as: business performance, assets under management, financial stability and personnel;
(ii) the investment performance of the subad-viser’s portfolio managed comparably to the Fund to be managed by the subadviser and comparative performance information relating to the benchmark;
(iii) the proposed subadvisory fee for each Fund to be managed by the subadviser and comparative fee information; and
(iv) information relating to the nature and scope of Material Relationships and their significance to the Adviser and the subadvisers.
The Board’s decision to approve each Sub-advisory Agreement was based on a number of determinations, including the following:
(1) The subadviser has extensive experience and demonstrated skills as a manager and may be expected to provide a high quality of investment personnel to each Fund;
(2) Although not without variation, the current and historical performance of the portfolios of the Subadviser managed comparably to the Fund to be managed by the Subadviser has been within a competitive range of the current and historical performance of these portfolios’ respective benchmark (see Appendix A for further information on performance);
(3) The subadvisory fees are within industry norms and are the product of arms-length negotiation between the Adviser and the subadviser; and
(4) The Material Relationships consist of arrangements in which unaffiliated subad-visers or their affiliates provide advisory, distribution or management services in connection with financial products sponsored by the Trust’s adviser or its affili-ates, which may include other registered investment companies, a 529 education savings plan, managed separate accounts and exempt group annuity contracts sold to qualified plans, and which in no case contained elements which would cause the Board to conclude that approval of the subadvisory agreement with the subadviser would be inappropriate. See (5) below for information relating to the business arrangement between the Trust’s Adviser and GMO.
(5) As a part of the overall business arrangement between the Adviser and GMO under which the Adviser has obtained exclusive rights to certain GMO investment management services for up to five years, the Adviser has agreed that under certain circumstances it (and not the Trust or the particular Fund) will pay GMO a specified amount (ranging from $1 to $12 million) if the subadvisory agreement with respect to any of the following Funds to be subadvised by GMO is terminated within a five year period from the date of its effectiveness: U.S. Core Fund, Active Value Fund, Intrinsic Value Fund, Growth Fund, International Core Fund, International Growth Fund, Global Fund, Value Opportunities Fund, Growth Opportunities Fund and U.S. Quality Equity Fund.
The Adviser has also agreed that, subject to its fiduciary duties as an investment adviser to each of these Funds and its shareholders, it will not recommend to the Board of Trustees to terminate the subadvisory agreement with respect to any of the Funds or to reduce any of the fees payable thereunder to GMO for a five year period from the date of effectiveness of the agreement. Substantially similar agreements (with varying amounts to be paid upon termination) also apply with respect to certain other John Hancock funds that are or will be advised by the Adviser and subadvised by GMO. The Trust is not a party to any of these arrangements, and they are not binding upon the Trust, the Trust’s Funds subadvised by GMO or the Board of Trustees. However, these arrangements present certain conflicts of interest because the Adviser has a financial incentive to support the continuation of GMO subadvisory agreements for as long as the termination provisions described above re main in effect. In approving the Advisory Agreement
35
and the subadvisory agreement with respect to each of the Funds subadvised by GMO, the Board of Trustees, including the Independent Trustees, was aware of and considered these potential conflicts of interest, including any financial obligations of the Adviser to GMO.
The Board concluded that, notwithstanding the potential conflicts of interest, approval of the Advisory Agreement and the subadvisory agreements with GMO is in the best interests of shareholders and contract owners in view of (i) the Adviser’s fiduciary duty and the Board’s fiduciary duty and ability to monitor potential conflicts, (ii) the benefits to shareholders and contract owners generally expected from the exclusive rights to certain GMO investment management services obtained by the Adviser for the benefit of certain Funds of the Trust and other John Hancock funds and (iii) the benefits to such Funds of the Trust expected from the subadvisory services of GMO.
Additional information that the Board considered for a particular fund is set forth in Appendix A.
| Appendix A | |||
| Estimated Fees | |||
| Fund | Performance | and Expenses | Comments |
| Growth | See “Comments”. | Subadvisory fees | The Board noted |
| for this Fund were | that the Fund | ||
| higher than the peer | commenced opera- | ||
| group median. | tions in June 2006 | ||
| and has a limited | |||
| Advisory fees for | performance history. | ||
| this Fund were | |||
| higher than the peer | |||
| group median. | |||
| Total expenses for | |||
| this Fund were | |||
| lower than the peer | |||
| group median. | |||
36
For more information
The Fund’s proxy voting policies, procedures and records are available without charge, upon request:
| By phone | On the Fund’s Web site | On the SEC’s Web site |
| 1-800-225-5291 | www.jhfunds.com/proxy | www.sec.gov |
| Trustees | Francis V. Knox, Jr. | Principal distributor |
| James M. Oates, Chairman* | Chief Compliance Officer | John Hancock Funds, LLC |
| Charles L. Bardelis * | Gordon M. Shone | 601 Congress Street |
| James R. Boyle† | Treasurer | Boston, MA 02210-2805 |
| Peter S. Burgess * | John G. Vrysen | |
| Elizabeth G. Cook | Chief Financial Officer | Custodian |
| William H. Cunningham | State Street Bank & Trust Co. | |
| Charles L. Ladner* | Investment adviser | 2 Avenue de Lafayette |
| Hassell H. McClellan | John Hancock Investment | Boston, MA 02111 |
| *Members of the Audit Committee | Management Services, LLC | |
| †Non-Independent Trustee | 601 Congress Street | Transfer agent |
| Boston, MA 02210-2805 | John Hancock Signature | |
| Officers | Services, Inc. | |
| Keith F. Hartstein | Subadviser | 1 John Hancock Way, |
| President and | Suite 1000 | |
| Chief Executive Officer | Grantham, Mayo, | Boston, MA 02217-1000 |
| Thomas M. Kinzler | Van Otterloo & Co. LLC | |
| Secretary and | 40 Rowes Wharf | Legal counsel |
| Chief Legal Officer | Boston, MA 02110 | Kirkpatrick & Lockhart |
| Nicholson Graham LLP | ||
| 1 Lincoln Street | ||
| Boston, MA 02111-2950 | ||
The Fund’s investment objective, risks, charges and expenses are included in the prospectus and should be considered carefully before investing. For a prospectus, call your financial professional, call John Hancock Funds at 1-800-225-5291 or visit the Fund’s Web site at www.jhfunds.com. Please read the prospectus carefully before investing or sending money.
| How to contact us | ||
| Internet | www.jhfunds.com | |
| Regular mail: | Express mail: | |
| John Hancock | John Hancock | |
| Signature Services, Inc. | Signature Services, Inc. | |
| 1 John Hancock Way, Suite 1000 | Mutual Fund Image Operations | |
| Boston, MA 02217-1000 | 380 Stuart Street | |
| Boston, MA 02116 | ||
| Phone | Customer service representatives | 1-800-225-5291 |
| 24-hour automated information | 1-800-338-8080 | |
| TDD line | 1-800-554-6713 | |
A listing of month-end portfolio holdings is available on our Web site, www.jhfunds.com. A more detailed portfolio holdings summary is available on a quarterly basis 60 days after the fiscal quarter on our Web site or upon request by calling 1-800-225-5291, or on the Securities and Exchange Commission’s Web site, www.sec.gov.
40
J O H N H A N C O C K F A M I L Y O F F U N D S
| EQUITY | INTERNATIONAL |
| Balanced Fund | Greater China Opportunities Fund |
| Classic Value Fund | International Classic Value Fund |
| Classic Value Fund II | International Core Fund |
| Core Equity Fund | International Fund |
| Focused Equity Fund | International Growth Fund |
| Growth Fund | |
| Growth Opportunities Fund | INCOME |
| Growth Trends Fund | Bond Fund |
| Intrinsic Value Fund | Government Income Fund |
| Large Cap Equity Fund | High Yield Fund |
| Large Cap Select Fund | Investment Grade Bond Fund |
| Mid Cap Equity Fund | Strategic Income Fund |
| Mid Cap Growth Fund | |
| Multi Cap Growth Fund | TAX- FREE INCOME |
| Small Cap Equity Fund | California Tax-Free Income Fund |
| Small Cap Fund | High Yield Municipal Bond Fund |
| Small Cap Intrinsic Value Fund | Massachusetts Tax-Free Income Fund |
| Sovereign Investors Fund | New York Tax-Free Income Fund |
| U.S. Core Fund | Tax-Free Bond Fund |
| U.S. Global Leaders Growth Fund | |
| Value Opportunities Fund | MONEY MARKET |
| Money Market Fund | |
| ASSET ALLOCATION & LIFESTYLE | U.S. Government Cash Reserve |
| Allocation Core Portfolio | |
| Allocation Growth + Value Portfolio | CLOSED-END |
| Lifestyle Aggressive Portfolio | Bank & Thrift Opportunity |
| Lifestyle Balanced Portfolio | Financial Trends |
| Lifestyle Conservative Portfolio | Income Securities |
| Lifestyle Growth Portfolio | Investors Trust |
| Lifestyle Moderate Portfolio | Patriot Global Dividend |
| Patriot Preferred Dividend | |
| SECTOR | Patriot Premium Dividend I |
| Financial Industries Fund | Patriot Premium Dividend II |
| Health Sciences Fund | Patriot Select Dividend |
| Real Estate Fund | Preferred Income |
| Regional Bank Fund | Preferred Income II |
| Technology Fund | Preferred Income III |
| Technology Leaders Fund | Tax-Advantaged Dividend |
For more complete information on any John Hancock Fund and a prospectus, which includes charges and expenses, call your financial professional, or John Hancock Funds at 1-800-225-5291. Please read the prospectus carefully before investing or sending money.
| 1-800-225-5291 1-800-554-6713 (TDD) 1-800-338-8080 EASI-Line www.jhfunds. com |
| Now available: electronic delivery www.jhfunds. com/edelivery |
This report is for the information of the shareholders of John Hancock Growth Fund.
860SA 8/06
10/06

TABLE OF CONTENTS |
| Managers' report |
| page 2 |
| A look at performance |
| page 6 |
| Your expenses |
| page 8 |
| Fund’s investments |
| page 1 0 |
| Financial statements |
| page 1 5 |
| For more information |
| page 36 |
CEO corner
To Our Shareholders,
The future has arrived at John Hancock Funds.
We have always been firm believers in the powerful role the Internet can play in providing fund information to our shareholders and prospective investors. Recently, we launched a redesigned, completely overhauled Web site that is more visually pleasing, easier to navigate and, most importantly, provides more fund information and learning tools without overwhelming the user.
Not long after we embarked on this major project, a study was released by the Investment Company Institute, the mutual fund industry’s main trade group, which found that an overwhelming majority of shareholders consider the Internet the “wave of the future” for accessing fund information.
Our new site sports fresher and faster ways to access account information. New innovations allow investors to view funds by risk level, track the performance of the John Hancock funds of their choice or sort funds by Morningstar, Inc.’s star ratings. Investors who own a John Hancock fund through a qualified retirement plan and don’t pay sales charges when making a purchase have the option of sorting by a “Load Waived” Morningstar Rating, thereby creating an apples-to-apples comparison with no-load funds that may also be available in their retirement plan.
The new site also has more educational tools and interactive modules to educate and assist investors with their financial goals, from college savings to retirement planning. A new “I want to…” feature allows investors to check performance, invest more money, update personal information or download prospectuses and forms quickly and easily.
In another of our ongoing efforts to provide our shareholders with top-notch service, we also redesigned our shareholder reports, as you may have noticed with this report. We hope the larger size, more colorful cover and redesigned presentation of the commentary and data tables will draw you in and make them easier to read.
After you’ve read your shareholder report, we encourage you to visit our new Web site – www.jhfunds.com – and take a tour. It’s easy, fast and fun and allows you to be in control of what you see and do. In short, it’s the wave of the future!
Sincerely,

Keith F. Hartstein,
President and Chief Executive Officer
This commentary reflects the CEO’s views as of August 31, 2006. They are subject to change at any time.
Your fund at a glance
The Fund seeks high total return primarily through capital appreciation by, under normal circumstances, investing at least 80% of its assets in a diversified portfolio of equity investments from a number of developed markets outside the U.S.
Since inception June 12, 2006
► The Fund outperformed its benchmark, boosted by stock selection in materials, health care and financials.
► Foreign growth stocks continued to trade at relatively narrow premiums to value shares.
► Valuation worked better than momentum during the period, as investor sentiment remained guarded.
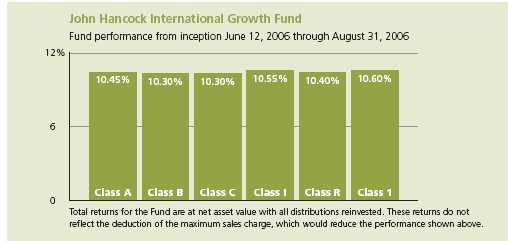
| Top 10 holdings | |||
| Total SA | 3.8% | AstraZeneca Group PLC | 2.2% |
| Honda Motor Company, Ltd. | 3.1% | GlaxoSmithKline PLC | 2.1% |
| ING Groep NV | 3.0% | Royal Dutch Shell PLC | 1.9% |
| Anglo American PLC | 2.7% | Roche Holdings AG | 1.7% |
| Eni SpA | 2.3% | Toyota Motor Corp. | 1.6% |
As a percentage of net assets on August 31, 2006.
1
Managers’ report
John Hancock
International Growth Fund
International growth stocks turned in solid gains during the brief review period, paced by strength across a broad range of countries, including Switzerland, Spain, France and the United Kingdom. The Fund’s inception date of June 12, 2006 occurred near a recent market low, enabling it to benefit from a rally that unfolded over the remainder of the period.
Despite sluggish economic growth in Europe, corporate earnings there continued to grow at a moderately rapid pace. In Japan, second-quarter economic growth came in below expectations but still managed to extend that country’s streak of consecutive quarterly GDP gains to six. The inflationary implications of high crude oil prices led a number of central banks to hike short-term interest rates during the period, providing added justification for expectations of generally decelerating economic growth.
Looking at performance
From their inception on June 12, 2006, through August 31, 2006, John Hancock International Growth Fund’s Class A, Class B, Class C, Class I, Class R and Class 1 shares returned 10.45%, 10.30%, 10.30%, 10.55%,10.40% and 10.60%, respectively, at net asset value. By comparison, the Standard & Poor’s/Citigroup Primary Market Index (PMI) Europe, Pacific, Asia Composite (EPAC) Growth Style Index (S&P/ Citigroup Index) returned 9.16%, while the average foreign large growth
SCORECARD
| INVESTMENT | PERIOD’S PERFORMANCE... AND WHAT’S BEHIND THE NUMBERS | |
| AstraZeneca | ▲ | Inexpensive valuation, strong earnings growth |
| Anglo American | ▲ | High gold prices lift profit margins |
| SOFTBANK | ▼ | Momentum reversal |
2

Portfolio Managers, Grantham, Mayo, Van Otterloo & Co. LLC (GMO)
Tom Hancock, Tom Rosalanko, Rick Suvak and John Breedis
fund monitored by Morningstar Inc. gained 10.19% .1 Keep in mind that your returns will differ from those listed above if you were not invested in the Fund for the entire period and did not reinvest all distributions.
Our strategy of focusing on momentum and—to a slightly lesser extent—valuation worked admirably. Unlike many momentum investors, our momentum analysis takes account of earnings estimate revisions along with pure price momentum. Likewise, valuation, as we use it, encompasses various measures of quality as well as traditional valuation yardsticks such as price-to-earnings and price-to-book ratios. In other words, we look for cheap stocks of good companies, not just cheap stocks.
The momentum and valuation strategies are complementary. For example, our momentum picks did better earlier in 2006, when investor sentiment was comparatively optimistic. However, our valuation strategy performed better during the summer months, when investors’ outlook was more guarded.
“Stock selection in materials,
health care and financials made
notable contributions to the
Fund’s performance versus the
S&P/Citigroup Index.”
Materials, health care and financials stand out
Stock selection in materials, health care and financials made notable contributions to the Fund’s performance versus the S&P/Citigroup Index. In materials, the Fund’s overweighted stake in U.K.-based gold mining stock Anglo American PLC paid off, as did an out-of-index position in Australian industrial metals producer Zinifex, Ltd. In health care, the Fund was aided by its investments in the pharmaceuticals group, particularly French drug stock Sanofi-Aventis, two U.K.-based firms — AstraZeneca Group, PLC and GlaxoSmithKline PLC — and Roche Holdings, AG — headquartered in Switzerland. Our take on the drug
International Growth Fund
3
group was that investors overreacted to fears of weakening product pipelines and increasing encroachment by generics on the turf of branded drugs. While these fears have some basis in fact, we felt they unduly overshadowed the capability of many higher-quality drug firms to adapt and prosper.
In financials, which typically is the largest sector weighting in both the benchmark and the Fund, performance was boosted by ING Groep NV, a Dutch provider of banking, asset management and related services. Other financial holdings adding value were French commercial bank BNP Paribas SA and diversified financial services providers Deutsche Boerse AG and Fortis Group SA, based in Germany and Belgium, respectively.
Among countries, the Fund received the biggest boost versus the index from its holdings in the U.K. and Japan, as our stock picking enabled the Fund to handily outpace the benchmark in both cases.
Consumer staples, utilities detract
A lighter-than-benchmark stake in the consumer staples sector modestly detracted from our results. Given the Fund’s growth mandate, it normally carries an underweighted exposure to consumer staples, which includes companies that tend to offer stable but unexciting earnings growth. Over complete market cycles we believe that our focus on other sectors should pay off, but during the review period, when defensive sectors led the market, it hurt the Fund’s results. Additionally, our stock selection in utilities — another defensive sector — could have been better. Looking at countries, our picks in Germany and Norway exerted a modest drag on performance.
| SECTOR DISTRIBUTION2 | |
| Financial | 24% |
| Consumer, cyclical | 17% |
| Consumer, | |
| non-cyclical | 15% |
| Energy | 14% |
| Basic materials | 12% |
| Industrial | 8% |
| Technology | 3% |
| Utilities | 3% |
| Communications | 1.7% |
| Diversified | 0.5% |
Among individual holdings, performance suffered from positions in Japanese telecommunication services provider SOFTBANK Corp. The stock was one of our momentum plays, and unfortunately its momentum sharply reversed soon after we bought it. Other disappointments included two stocks in the auto manufacturing group, France-based Peugeot SA and Nissan Motor Company, Ltd., a Japanese holding. Further, not owning Spanish commercial bank
International Growth Fund
4
Banco Bilbao Vizcaya Argentaria S.A. and German electric utility E.ON AG hurt, as both posted double-digit gains.
“Our strategy of focusing on
momentum and—to a slightly lesser
extent—valuation worked admirably.”
Outlook
We are watching several factors with interest. Currently, many investors are positioned for a substantial fall in the price of crude oil. Such a fall would require a radical shift in the supply/demand conditions currently underpinning the energy markets. While we don’t profess to be able to forecast oil prices, we think it makes more sense to take high oil prices at face value and not to assume there will be a sig-nificant near-term change in this market. Consequently, we think energy stocks offer good values, along with favorable momentum characteristics. We also are monitoring the spread between growth and value stocks, which has narrowed over the past six years to extreme levels on a historical basis. When quality growth stocks can be purchased for only a slight premium over the cost of value shares, it is generally a favorable time to invest in growth. That said, we will stay flexible and remain vigil ant for any opportunities presented by our ongoing analyses of momentum and valuation.
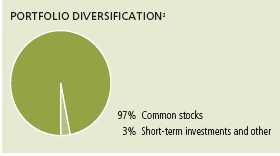
This commentary reflects the views of the portfolio management team through the end of the Fund’s period discussed in this report. The team’s statements reflect their own opinions. As such, they are in no way guarantees of future events and are not intended to be used as investment advice or a recommendation regarding any specific security. They are also subject to change at any time as market and other conditions warrant.
International investing involves special risks such as political, economic and currency risks and differences in accounting standards and financial reporting.
1 Figures from Morningstar, Inc. include reinvested dividends and do not take into account sales charges. Actual load-adjusted performance is lower.
2 As a percentage of net assets on August 31, 2006.
International Growth Fund
5
A look at performance
| For the period ending August 31, 2006 | ||
| Cumulative total returns | ||
| with maximum sales charge (POP) | ||
| Inception | Since | |
| Class | date | inception |
| A | 6-12-06 | 4.94% |
| B | 6-12-06 | 5.30 |
| C | 6-12-06 | 9.30 |
| I1 | 6-12-06 | 10.55 |
| R1 | 6-12-06 | 10.40 |
| 11 | 6-12-06 | 10.60 |
Performance figures assume all distributions are reinvested. Returns with maximum sales charge reflect a sales charge on Class A shares of 5%, and the applicable contingent deferred sales charge (CDSC) on Class B and Class C shares. The Class B shares’ CDSC declines annually between years 1–6 according to the following schedule: 5, 4, 3, 3, 2, 1%. No sales charge will be assessed after the sixth year. Class C shares held for less than one year are subject to a 1% CDSC. Sales charge is not applicable for Class I, Class R and Class 1 shares.
The returns reflect past results and should not be considered indicative of future performance. The return and principal value of an investment will fluctuate so that shares, when redeemed, may be worth more or less than their original cost. Due to market volatility, the Fund’s current performance may be higher or lower than the performance shown. For performance data current to the most recent month-end, please call 1-800-225-5291 or visit the Fund’s Web site at www.jhfunds.com.
The performance table above and the chart on the next page do not reflect the deduction of taxes that a shareholder would pay on Fund distributions or the redemption of Fund shares.
The Fund’s performance results reflect any applicable expense reductions, without which the expenses would increase and results would have been less favorable.
Since inception performance is calculated with an opening price (prior day’s close) on the inception date.
1 For certain types of investors as described in the Fund’s Class I, Class R and Class 1 share prospectuses.
International Growth Fund
6
Growth of $10,000
This chart shows what happened to a hypothetical $10,000 investment in Class A shares
for the period indicated. For comparison, we’ve shown the same investment in two
separate indexes.
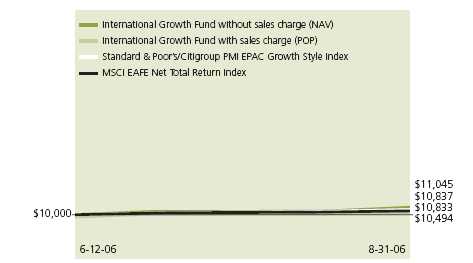
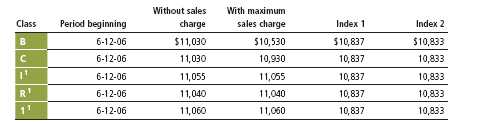
Assuming all distributions were reinvested for the period indicated, the table above shows the value of a $10,000 investment in the Fund’s Class B, Class C, Class I, Class R and Class 1 shares, respectively, as of August 31, 2006. Performance of the classes will vary based on the difference in sales charges paid by shareholders investing in the different classes and the fee structure of those classes.
S&P/Citigroup Primary Market Index (“PMI”) Europe, Pacific, Asia Composite (“EPAC”) Growth Style Index — Index 1 — is an independently maintained and published index composed of stocks in the EPAC regions of the PMI that have a growth style. The PMI is the large-capitalization stock component of the S&P/Citigroup Broad Market Index (“BMI”) (which includes listed shares of companies from developed and emerging market countries with a total available market capitalization of at least the local equivalent of USD100 million), representing the top 80% of available capital of the BMI in each country.
MSCI EAFE Net Total Return Index (Europe, Australasia, Far East) — Index 2 — is a free float-adjusted market capitalization index that is designed to measure developed market equity performance, excluding the U.S. & Canada. As of June 2006 the MSCI EAFE Index consisted of the following 21 developed market country indices: Australia, Austria, Belgium, Denmark, Finland, France, Germany, Greece, Hong Kong, Ireland, Italy, Japan, the Netherlands, New Zealand, Norway, Portugal, Singapore, Spain, Sweden, Switzerland and the United Kingdom. Returns are calculated and presented net of withholding tax.
It is not possible to invest directly in an index. Index figures do not reflect sales charges which would have resulted in lower values if they did.
1 For certain types of investors as described in the Fund’s Class I, Class R and Class 1 share prospectuses.
International Growth Fund
7
Your expenses
These examples are intended to help you understand your ongoing operating expenses.
Understanding Fund expenses
As a shareholder of the Fund, you incur two types of costs:
■ Transaction costs which include sales charges (loads) on purchases or redemptions (varies by share class), minimum account fee charge, etc.
■ Ongoing operating expenses including management fees, distribution and service fees (if applicable) and other Fund expenses.
We are going to present only your ongoing operating expenses here.
Actual expenses/actual returns
This example is intended to provide information about your Fund’s actual ongoing operating expenses, and is based on your Fund’s actual return. It assumes an account value of $1,000.00 on June 12, 2006, with the same investment held until August 31, 2006.
| Account value | Ending value | Expenses paid during | |
| on 6-12-06 | on 8-31-06 | period ended 8-31-061 | |
| Class A | $1,000.00 | $1,104.50 | $3.89 |
| Class B | 1,000.00 | 1,103.00 | 5.57 |
| Class C | 1,000.00 | 1,103.00 | 5.57 |
| Class I | 1,000.00 | 1,105.50 | 2.74 |
| Class R | 1,000.00 | 1,104.00 | 4.52 |
| Class 1 | 1,000.00 | 1,106.00 | 2.63 |
Together with the value of your account, you may use this information to estimate the operating expenses that you paid over the period. Simply divide your account value at August 31, 2006 by $1,000.00, then multiply it by the “expenses paid” for your share class from the table above. For example, for an account value of $8,600.00, the operating expenses should be calculated as follows:
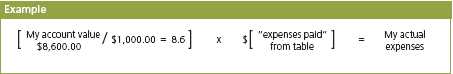
International Growth Fund
8
Hypothetical example for comparison purposes
This table allows you to compare your Fund’s ongoing operating expenses with those of any other fund. It provides an example of the Fund’s hypothetical account values and hypothetical expenses based on each class’ actual expense ratio and an assumed 5% annual return before expenses (which is not your Fund’s actual return). It assumes an account value of $1,000.00 on June 12, 2006, with the same investment held until August 31, 2006. Look in any other fund shareholder report to find its hypothetical example and you will be able to compare these expenses.
| Account value | Ending value | Expenses paid during | |
| on 6-12-06 | on 8-31-06 | period ended 8-31-061 | |
| Class A | $1,000.00 | $1,007.30 | $3.71 |
| Class B | 1,000.00 | 1,005.70 | 5.32 |
| Class C | 1,000.00 | 1,005.70 | 5.32 |
| Class I | 1,000.00 | 1,008.40 | 2.61 |
| Class R | 1,000.00 | 1,006.70 | 4.31 |
| Class 1 | 1,000.00 | 1,008.50 | 2.51 |
Remember, these examples do not include any transaction costs, such as sales charges; therefore, these examples will not help you to determine the relative total costs of owning different funds. If transaction costs were included, your expenses would have been higher. See the prospectus for details regarding transaction costs.
1 Expenses are equal to the Fund's annualized expense ratio of 1.70%, 2.40%, 2.40%, 1.20%, 1.95% and 1.15% for Class A, Class B, Class C, Class I, Class R and Class 1, respectively, multiplied by the average account value over the period, multiplied by the number of days in the inception period /365 or 366 (to reflect the one-half year period).
International Growth Fund
9
F I N A N C I A L S T A T E M E N T S
Fund’s investments
Securities owned by the Fund on 8-31-06 (unaudited)
This schedule is divided into three main categories: common stocks, preferred stocks and short-term investments. Common stocks and preferred stocks are further broken down by country. Short-term investments, which represent the Fund’s cash position, are listed last.
| Issuer | Shares | Value |
| Common stocks 96.22% | $16,199,626 | |
| (Cost $14,811,207) | ||
| Australia 5.27% | 886,508 | |
| Australia and New Zealand Bank Group, Ltd. | 3,566 | 74,134 |
| BHP Billiton, Ltd. | 2,238 | 47,294 |
| CSL, Ltd. | 1,148 | 44,535 |
| CSR, Ltd. | 17,494 | 42,040 |
| Macquarie Bank, Ltd. | 932 | 46,074 |
| NRMA Insurance Group, Ltd. | 23,027 | 94,336 |
| Promina Group | 10,620 | 47,640 |
| QBE Insurance Group, Ltd. | 3,351 | 60,998 |
| Rio Tinto, Ltd. | 2,211 | 123,050 |
| Westpac Banking Corp., Ltd. | 4,613 | 82,245 |
| Woodside Petroleum, Ltd. | 2,210 | 71,251 |
| Woolworths, Ltd. | 3,216 | 50,787 |
| Zinifex, Ltd. | 11,249 | 102,124 |
| Austria 0.76% | 127,819 | |
| Oesterreichische Elektrizitaets AG, Class A | 1,073 | 53,972 |
| OMV AG | 1,387 | 73,847 |
| Belgium 1.33% | 224,829 | |
| Fortis Group SA | 2,793 | 108,546 |
| KBC Bancassurance Holding NV | 616 | 66,233 |
| UCB SA | 855 | 50,050 |
| Bermuda 0.60% | 100,932 | |
| Esprit Holdings, Ltd. | 6,000 | 49,917 |
| Frontline, Ltd. | 1,250 | 51,015 |
| Canada 3.07% | 517,162 | |
| Barrick Gold Corp. | 1,600 | 53,495 |
| Canadian Natural Resources, Ltd. | 1,900 | 99,631 |
See notes to financial statements
International Growth Fund
10
F I N A N C I A L S T A T E M E N T S
| Issuer | Shares | Value |
| Canada (continued) | ||
| EnCana Corp. CAD | 1,400 | $73,375 |
| Goldcorp, Inc. | 1,700 | 46,930 |
| Nexen, Inc. | 900 | 52,366 |
| Petro-Canada | 2,100 | 89,568 |
| Royal Bank of Canada | 2,300 | 101,797 |
| Denmark 0.35% | 59,060 | |
| Novo Nordisk AS | 800 | 59,060 |
| Finland 2.71% | 456,786 | |
| Fortum Corp. Oyj | 1,800 | 48,356 |
| Metso Oyj | 2,400 | 89,158 |
| Nokia AB Oyj | 8,450 | 176,738 |
| Rautaruukki Oyj | 1,700 | 49,584 |
| Sampo Oyj, A Shares | 2,400 | 49,584 |
| YIT Oyj | 2,000 | 43,366 |
| France 9.37% | 1,577,497 | |
| BNP Paribas SA | 1,439 | 152,698 |
| Carrefour SA | 781 | 48,116 |
| Credit Agricole S.A. | 1,271 | 51,558 |
| European Aeronautic Defence & Space Company | 2,166 | 65,226 |
| LVMH Moet Hennessy SA | 746 | 76,680 |
| Peugeot SA | 1,458 | 82,197 |
| Renault Regie Nationale SA | 1,386 | 161,169 |
| Sanofi-Aventis | 495 | 44,358 |
| Societe Generale | 868 | 139,909 |
| Total SA | 9,564 | 644,771 |
| Vallourec SA | 495 | 110,815 |
| Germany 4.83% | 813,235 | |
| Altana AG | 1,163 | 68,586 |
| Bayerische Motoren Werke (BMW) AG | 1,752 | 90,636 |
| Continental AG | 748 | 79,899 |
| Deutsche Boerse AG | 644 | 97,600 |
| Puma AG | 254 | 87,968 |
| Salzgitter AG | 849 | 75,950 |
| SAP AG | 736 | 140,372 |
| Solarworld AG | 948 | 56,016 |
| Thyssen Krupp AG | 1,412 | 48,012 |
| Volkswagen AG | 855 | 68,196 |
| Hong Kong 0.55% | 92,041 | |
| Cheung Kong Holdings, Ltd. | 4,000 | 44,207 |
| Hong Kong Electric Holdings, Ltd. | 10,000 | 47,834 |
| Ireland 0.77% | 130,336 | |
| Anglo Irish Bank Corp. PLC | 3,122 | 51,520 |
| CRH PLC | 2,276 | 78,816 |
See notes to financial statements
International Growth Fund
11
F I N A N C I A L S T A T E M E N T S
| Issuer | Shares | Value |
| Italy 3.73% | $628,864 | |
| Banco Popolare Di Verona e Novara SpA | 3,369 | 99,987 |
| Eni SpA | 12,842 | 392,632 |
| Saipem SpA | 2,112 | 47,254 |
| UniCredito Italiano SpA | 11,184 | 88,991 |
| Japan 27.05% | 4,553,587 | |
| AEON Company, Ltd. | 3,900 | 98,202 |
| Aisin Seiki Company | 1,500 | 45,503 |
| Astellas Pharmaceuticals, Inc. | 1,500 | 60,841 |
| Canon, Inc. | 5,050 | 251,306 |
| Chiyoda Corp. | 3,000 | 65,826 |
| Chubu Electric Power Company, Inc. | 1,800 | 48,775 |
| Denso Corp. | 2,800 | 97,584 |
| East Japan Railway Company | 12 | 88,654 |
| Fast Retailing Company, Ltd. | 500 | 46,653 |
| Honda Motor Company, Ltd. | 15,400 | 523,591 |
| Hoya Corp. | 2,600 | 94,602 |
| Ibiden Company, Ltd. | 1,000 | 51,212 |
| Itochu Corp. | 10,000 | 83,933 |
| JFE Holdings, Inc. | 1,100 | 44,804 |
| Kansai Electric Power Company, Ltd. | 2,100 | 50,373 |
| Kawasaki Heavy Industries, Ltd. | 14,000 | 44,259 |
| Kirin Brewery Company, Ltd. | 3,000 | 41,694 |
| Kobe Steel Company, Ltd. | 17,000 | 54,322 |
| Komatsu, Ltd. | 5,000 | 91,389 |
| Konica Minolta Holdings, Inc. | 4,000 | 52,320 |
| LeoPalace21 Corp. | 2,600 | 92,165 |
| Mazda Motor Corp. | 11,000 | 70,487 |
| Mitsubishi Estate Company, Ltd. | 4,000 | 86,234 |
| Mitsubishi Gas & Chemicals Company, Inc. | 4,000 | 43,663 |
| Mitsubishi UFJ Financial Group, Inc. | 15 | 204,508 |
| Mitsui Fudosan Company, Ltd. | 4,000 | 89,643 |
| Mitsui O.S.K. Lines, Ltd. | 7,000 | 53,385 |
| Mitsui Sumitomo Insurance Company, Ltd. | 6,000 | 73,214 |
| Mitsui Trust Holdings, Inc. | 5,000 | 58,540 |
| Nintendo Company, Ltd. | 400 | 82,076 |
| Nissan Motor Company, Ltd. | 18,800 | 213,704 |
| Nitto Denko Corp. | 700 | 50,283 |
| Nomura Securities Company, Ltd. | 4,800 | 92,847 |
| Orix Corp. | 260 | 69,013 |
| Osaka Gas Company, Ltd. | 14,000 | 51,536 |
| Resona Holdings, Inc. * | 79 | 249,073 |
| Ricoh Company, Ltd. | 4,000 | 78,565 |
| Shin-Etsu Chemical Company, Ltd. | 900 | 51,306 |
| SOFTBANK Corp. | 5,400 | 93,869 |
| Sony Corp. | 1,100 | 47,616 |
See notes to financial statements
International Growth Fund
12
F I N A N C I A L S T A T E M E N T S
| Issuer | Shares | Value |
| Japan (continued) | ||
| Sumitomo Chemical Company, Ltd. | 6,000 | $47,241 |
| Sumitomo Metal Mining Company, Ltd. | 4,000 | 56,410 |
| Sumitomo Realty & Development Company, Ltd. | 2,000 | 58,966 |
| Takashimaya Company, Ltd. | 3,000 | 37,834 |
| Takeda Pharmaceutical Company, Ltd. | 2,100 | 139,040 |
| Tokyo Gas Company, Ltd. | 13,000 | 69,234 |
| Toyota Motor Corp. | 5,000 | 271,399 |
| Yamada Denki Company, Ltd. | 800 | 85,893 |
| Netherlands 7.69% | 1,294,279 | |
| ABN AMRO Holdings NV | 3,957 | 112,680 |
| Euronext NV | 955 | 85,762 |
| Heineken NV | 1,946 | 90,142 |
| ING Groep NV | 11,535 | 498,020 |
| Royal Dutch Shell PLC, A Shares GBP | 9,375 | 324,572 |
| Royal Dutch Shell PLC, B Shares GBP | 5,120 | 183,103 |
| Norway 1.50% | 252,312 | |
| Norsk Hydro ASA | 4,730 | 121,961 |
| Statoil ASA | 3,050 | 82,262 |
| Telenor ASA | 3,800 | 48,089 |
| Spain 0.62% | 104,859 | |
| Industria de Diseno Textil SA | 2,328 | 104,859 |
| Sweden 3.82% | 642,549 | |
| Assa Abloy AB, Series B | 3,000 | 52,589 |
| Atlas Copco AB, Series A | 1,800 | 46,336 |
| Atlas Copco AB, Series B | 1,800 | 43,479 |
| Boliden AB | 4,000 | 75,087 |
| Electrolux AB, Series B | 3,400 | 52,561 |
| Nordea Bank AB | 6,000 | 75,363 |
| Sandvik AB | 5,800 | 63,445 |
| Skandinaviska Enskilda Banken AB, Series A | 2,000 | 51,761 |
| SKF AB, Series B | 3,200 | 45,715 |
| Ssab Svenskt Stal AB, Series A | 2,400 | 46,212 |
| Svenska Cellulosa AB, Series B | 2,100 | 90,001 |
| Switzerland 5.16% | 868,380 | |
| Credit Suisse Group AG | 826 | 45,963 |
| Geberit AG | 43 | 49,981 |
| Nestle SA | 206 | 70,673 |
| Novartis AG | 1,657 | 94,354 |
| Roche Holdings AG | 1,556 | 286,177 |
| Serono AG, Series B | 69 | 47,987 |
| Swiss Re | 804 | 61,195 |
| UBS AG * | 3,756 | 212,050 |
See notes to financial statements
International Growth Fund
13
F I N A N C I A L S T A T E M E N T S
| Issuer | Shares | Value |
| United Kingdom 17.04% | $2,868,590 | |
| Anglo American PLC | 10,351 | 447,361 |
| AstraZeneca Group PLC | 5,716 | 370,126 |
| Barratt Developments PLC | 3,513 | 66,392 |
| BHP Billiton PLC | 7,045 | 134,148 |
| British American Tobacco Australasia, Ltd. | 1,807 | 49,498 |
| BT Group PLC | 10,967 | 51,425 |
| Cadbury Schweppes PLC | 4,802 | 51,062 |
| Centrica PLC | 29,226 | 164,006 |
| GlaxoSmithKline PLC | 12,352 | 349,629 |
| HSBC Holdings PLC | 2,614 | 47,388 |
| Imperial Tobacco Group PLC | 4,607 | 158,622 |
| Man Group PLC | 15,810 | 126,990 |
| Marks & Spencer Group PLC | 12,109 | 136,479 |
| Morrison W Supermarket | 17,956 | 75,572 |
| Next Group PLC | 3,078 | 97,605 |
| Northern Rock | 4,768 | 101,130 |
| Reckitt Benckiser PLC | 1,251 | 51,878 |
| Rio Tinto PLC | 5,032 | 254,331 |
| Royal Bank of Scotland Group PLC | 3,981 | 134,948 |
| Preferred stocks 0.62% | $103,816 | |
| (Cost $89,146) | ||
| Germany 0.62% | 103,816 | |
| Porsche AG, Non–Voting | 48 | 49,136 |
| Volkswagen AG, Non–Voting | 964 | 54,680 |
| Principal | ||
| Issuer, description, maturity date | amount | Value |
| Repurchase agreements 1.42% | $240,000 | |
| (Cost $240,000) | ||
| Repurchase Agreement with State Street Corp. dated | ||
| 08/31/2006 at 3.95% to be repurchased at $240,026 | ||
| on 9/1/2006, collateralized by $250,000 Federal | ||
| Home Loan Mortgage Corp., 2.00% due 03/05/2019 | ||
| (valued at $246,563, including interest) (c) | $240,000 | $240,000 |
| Total investments (cost $15,140,353) 98.26% | $16,543,442 | |
| Other assets in excess of liabilities 1.74% | 293,027 | |
| Total net assets 100.00% | $16,836,469 | |
CAD — Canadian dollar
GBP — British pound
* Non-income producing.
(c) Investment is an affiliate of the Trust’s subadvisor or custodian bank.
See notes to financial statements
International Growth Fund
14
F I N A N C I A L S T A T E M E N T S
Financial statements
Statement of assets and liabilities 8-31-06 (unaudited)
This Statement of Assets and Liabilities is the Fund’s balance sheet. It shows the value of what the Fund owns, is due and owes. You’ll also find the net asset value and the maximum offering price per share.
| Assets | |
| Investments, at value (Cost $14,900,353) | $16,303,442 |
| Repurchase agreements, at value (Cost $240,000) | 240,000 |
| Cash | 224 |
| Foreign currency, at value (Cost $181,801) | 180,800 |
| Receivable for shares sold | 85,177 |
| Dividends and interest receivable | 37,489 |
| Other assets | 25,896 |
| Total assets | 16,873,028 |
| Liabilities | |
| Payable to affiliates | |
| Transfer agent fees | 10,349 |
| Fund administration fees | 211 |
| Service fees | 57 |
| Other payables and accrued expenses | 25,942 |
| Total liabilities | 36,559 |
| Net assets | |
| Capital paid-in | 15,265,883 |
| Accumulated undistributed net realized gain on investments, | |
| foreign currency and forward foreign currency contracts | 150,779 |
| Unrealized appreciation on investments, foreign currency | |
| and forward foreign currency contracts | 1,402,219 |
| Undistributed net investment income | 17,588 |
| Net assets | $16,836,469 |
| Net asset value per share | |
| Based on net asset values and shares outstanding — The Fund has an | |
| unlimited number of shares authorized with no par value. | |
| Class A ($16,094,216 ÷ 728,599 shares) | $22.09 |
| Class B ($148,570 ÷ 6,736 shares) | $22.06 |
| Class C ($250,234 ÷ 11,342 shares) | $22.06 |
| Class I ($122,484 ÷ 5,539 shares) | $22.11 |
| Class R ($110,386 ÷ 5,000 shares) | $22.08 |
| Class 1 ($110,579 ÷ 5,000 shares) | $22.12 |
| Maximum offering price per share | |
| Class Aa ($22.09 ÷ 95%) | $23.25 |
a On single retail sales of less than $50,000. On sales of $50,000 or more and on group sales the offering price is reduced.
See notes to financial statements
International Growth Fund
15
F I N A N C I A L S T A T E M E N T S
Statement of operations For the period ended 8-31-06. (unaudited)a
This Statement of Operations summarizes the Fund’s investment income earned and expenses incurred in operating the Fund. It also shows net gains (losses) for the period stated.
| Investment income | |
| Dividends (net of foreign withholding taxes of $4,943) | $69,753 |
| Interest | 7,429 |
| Total investment income | 77,182 |
| Expenses | |
| Investment management fees (Note 3) | 32,146 |
| Distribution and service fees (Note 3) | 10,842 |
| Transfer agent fees (Note 3) | 10,351 |
| Fund administration fees (Note 3) | 211 |
| Blue sky fees (Note 3) | 20,403 |
| Audit and legal fees | 17,599 |
| Custodian fees | 9,047 |
| Printing and postage fees (Note 3) | 4,967 |
| Trustees’ fees (Note 3) | 112 |
| Miscellaneous | 217 |
| Total expenses | 105,895 |
| Less expense reductions (Note 3) | (46,301) |
| Net expenses | 59,594 |
| Net investment income | 17,588 |
| Realized and unrealized gain | |
| Net realized gain on | |
| Investments | 141,309 |
| Foreign currency transactions | 9,470 |
| Change in net unrealized appreciation of | |
| Investments | 1,403,089 |
| Translation of assets and liabilities in foreign currencies | (870) |
| Net realized and unrealized gain (loss) | 1,552,998 |
| Increase in net assets from operations | $1,570,586 |
a Period from 6-12-06 (commencement of operations) to 8-31-06.
See notes to financial statements
International Growth Fund
16
F I N A N C I A L S T A T E M E N T S
Statement of changes in net assets
This Statement of Changes in Net Assets shows how the value of the Fund’s net assets has changed during the period. The difference reflects earnings less expenses, any investment gains and losses, distributions, if any, paid to shareholders and the net of Fund share transactions.
| Period ended | |
| 8-31-06 a | |
| Increase in net assets | |
| From operations | |
| Net investment income | $17,588 |
| Net realized gain | 150,779 |
| Change in net unrealized appreciation (depreciation) | 1,402,219 |
| Increase in net assets resulting from operations | 1,570,586 |
| From Fund share transactions | 15,265,883 |
| Net assets | |
| Beginning of period | — |
| End of periodb | $16,836,469 |
a Period from 6-12-06 (commencement of operations) to 8-31-06. Unaudited.
b Includes undistributed net investment income of $17,588.
See notes to financial statements
International Growth Fund
17
F I N A N C I A L S T A T E M E N T S
Financial highlights
The Financial highlights show how the Fund’s net asset value for a share has changed since the end of the previous period.
| CLASS A SHARES | |
| Period ended | 8-31-06a,b |
| Per share operating performance | |
| Net asset value, beginning of period | $20.00 |
| Net investment incomeh | 0.02 |
| Net realized and unrealized | |
| gain on investments | 2.07 |
| Total from investment operations | 2.09 |
| Net asset value, end of period | $22.09 |
| Total return (%) | 10.45l,m |
| Ratios and supplemental data | |
| Net assets, end of period | |
| (in millions) | $16 |
| Ratio of net expenses to average | |
| net assets (%) | 1.70r |
| Ratio of gross expenses to average | |
| net assets (%) | 2.57r |
| Ratio of net investment income | |
| to average net assets (%) | 0.51r |
| Portfolio turnover (%) | 9m |
See notes to financial statements
International Growth Fund
18
F I N A N C I A L S T A T E M E N T S
Financial highlights
| CLASS B SHARES | |
| Period ended | 8-31-06a,b |
| Per share operating performance | |
| Net asset value, beginning of period | $20.00 |
| Net investment lossh | (0.01) |
| Net realized and unrealized | |
| gain on investments | 2.07 |
| Total from investment operations | 2.06 |
| Net asset value, end of period | $22.06 |
| Total return (%) | 10.30l,m |
| Ratios and supplemental data | |
| Net assets, end of period | |
| (in millions) | —i |
| Ratio of net expenses to average | |
| net assets (%) | 2.40r |
| Ratio of gross expenses to average | |
| net assets (%) | 19.75r |
| Ratio of net investment income | |
| (loss) to average net assets (%) | (0.21)r |
| Portfolio turnover (%) | 9m |
See notes to financial statements
International Growth Fund
19
F I N A N C I A L S T A T E M E N T S
Financial highlights
| CLASS C SHARES | |
| Period ended | 8-31-06a,b |
| Per share operating performance | |
| Net asset value, beginning of period | $20.00 |
| Net investment lossh | —j |
| Net realized and unrealized | |
| gain (loss) on investments | 2.06 |
| Total from investment operations | 2.06 |
| Net asset value, end of period | $22.06 |
| Total return (%) | 10.30l,m |
| Ratios and supplemental data | |
| Net assets, end of period | |
| (in millions) | —i |
| Ratio of net expenses to average | |
| net assets (%) | 2.40r |
| Ratio of gross expenses to average | |
| net assets (%) | 16.01r |
| Ratio of net investment loss | |
| to average net assets (%) | (0.10)r |
| Portfolio turnover (%) | 9m |
See notes to financial statements
International Growth Fund
20
F I N A N C I A L S T A T E M E N T S
Financial highlights
| CLASS I SHARES | |
| Period ended | 8-31-06a,b |
| Per share operating performance | |
| Net asset value, beginning of period | $20.00 |
| Net investment incomeh | 0.05 |
| Net realized and unrealized | |
| gain on investments | 2.06 |
| Total from investment operations | 2.11 |
| Net asset value, end of period | $22.11 |
| Total return (%) | 10.55l,m |
| Ratios and supplemental data | |
| Net assets, end of period | |
| (in millions) | —i |
| Ratio of net expenses to average | |
| net assets (%) | 1.20r |
| Ratio of gross expenses to average | |
| net assets (%) | 17.85r |
| Ratio of net investment income | |
| to average net assets (%) | 1.00r |
| Portfolio turnover (%) | 9m |
See notes to financial statements
International Growth Fund
21
F I N A N C I A L S T A T E M E N T S
Financial highlights
| CLASS R SHARES | |
| Period ended | 8-31-06a,b |
| Per share operating performance | |
| Net asset value, beginning of period | $20.00 |
| Net investment incomeh | 0.01 |
| Net realized and unrealized | |
| gain on investments | 2.07 |
| Total from investment operations | 2.08 |
| Net asset value, end of period | $22.08 |
| Total return (%) | 10.40l,m |
| Ratios and supplemental data | |
| Net assets, end of period | |
| (in millions) | —i |
| Ratio of net expenses to average | |
| net assets (%) | 1.95r |
| Ratio of gross expenses to average | |
| net assets (%) | 20.28r |
| Ratio of net investment income | |
| to average net assets (%) | 0.26r |
| Portfolio turnover (%) | 9m |
See notes to financial statements
International Growth Fund
22
F I N A N C I A L S T A T E M E N T S
Financial highlights
| CLASS 1 SHARES | |
| Period ended | 8-31-06a,b |
| Per share operating performance | |
| Net asset value, beginning of period | $20.00 |
| Net investment incomeh | 0.05 |
| Net realized and unrealized | |
| gain on investments | 2.07 |
| Total from investment operations | 2.12 |
| Net asset value, end of period | $22.12 |
| Total return (%) | 10.60l,m |
| Ratios and supplemental data | |
| Net assets, end of period | |
| (in millions) | —i |
| Ratio of net expenses to average | |
| net assets (%) | 1.15r |
| Ratio of gross expenses to average | |
| net assets (%) | 1.89r |
| Ratio of net investment income | |
| to average net assets (%) | 1.06r |
| Portfolio turnover (%) | 9m |
a Class A, Class B, Class C, Class I, Class R and Class 1 shares began operations on 6-12-06.
b Unaudited.
h Based on the average of the shares outstanding.
i Less than $500,000.
j Less than $0.01 per share.
l Total returns would have been lower had certain expenses not been reduced during the period shown.
m Not annualized.
r Annualized.
See notes to financial statements
International Growth Fund
23
Notes to financial statements (unaudited)
1. Organization
John Hancock International Growth Fund (the “Fund”) is a newly organized diversified series of John Hancock Funds III (the “Trust”). The Trust was established as a Massachusetts business trust on June 9, 2005. The Trust is registered under the Investment Company Act of 1940, as amended (the “1940 Act”), as an open-end investment management company. The investment objective of the Fund is to seek high total return primarily through capital appreciation.
John Hancock Life Insurance Company of New York (“John Hancock New York”) is a wholly owned subsidiary of John Hancock Life Insurance Company (U.S.A.) (“John Hancock USA”). John Hancock USA and John Hancock New York are indirect wholly owned subsidiaries of The Manufacturers Life Insurance Company (“Manulife”), which in turn is a wholly owned subsidiary of Manulife Financial Corporation (“MFC”), a publicly traded company. Manulife Financial Corporation and its subsidiaries are known collectively as “Manulife Financial.”
John Hancock Investment Management Services, LLC (the “Adviser”) is the Adviser to the Trust. John Hancock Funds, LLC (the “Distributor”), a Delaware limited liability company controlled by John Hancock USA, serves as principal underwriter and is a wholly owned subsidiary of the Adviser.
Class 1 shares are sold only to certain exempt separate accounts of John Hancock USA and John Hancock New York. Class NAV shares are sold to the Lifestyle Portfolios, which are other funds of John Hancock Trust and John Hancock Funds II, and to certain institutional investors.
The Board of Trustees have authorized the issuance of multiple classes of shares of the Fund, including classes designated as Class A, Class B, Class C, Class I, Class R and Class 1 shares. The shares of each class represent an interest in the same portfolio of investments of the Fund, and have equal rights as to voting, redemptions, dividends and liquidation, except that certain expenses, subject to the approval of the Board of Trustees, may be applied differently to each class of shares in accordance with current regulations of the Securities and Exchange Commission and the Internal Revenue Service. Shareholders of a class that bear distribution and service expenses under the terms of a distribution plan have exclusive voting rights to that distribution plan.
The Adviser and other subsidiaries of John Hancock USA owned 725,000 Class A shares, 5,000 Class B shares, 5,000 Class C shares, 5,000 Class I shares, 5,000 Class R shares and 5,000 Class 1 shares of beneficial interest of the Fund on august 31, 2006.
2. Significant accounting policies
In the preparation of the financial statements, the Fund follows the policies described below. The preparation of financial statements in conformity with accounting principles generally accepted in the United States of America requires management to make estimates and assumptions that affect the reported amounts of assets and liabilities at the date of the financial statements and the reported amounts of income and expenses during the reporting period. Actual results may differ from these estimates.
Security valuation
The net asset value of the shares of the Fund is determined daily as of the close of the New York Stock Exchange, normally at 4:00 P.M. Eastern time. Short-term debt instruments with remaining maturities of 60 days or less are valued at amortized cost, and thereafter assume a constant amortization to maturity of any discount or premium, which approximates market value. Investments in State Street Navigator Securities
International Growth Fund
24
Lending Prime Portfolio are valued at their net asset value each business day. All other securities held by the Fund are valued at the last sale price or official closing price (closing bid price or last evaluated quote if no sale has occurred) as of the close of business on a principal securities exchange (domestic or foreign) or, lacking any sales, at the closing bid price. Securities traded only in the over-the-counter market are valued at the last bid price quoted by brokers making markets in the securities at the close of trading. Fund securities for which there are no such quotations, principally debt securities, are valued based on the valuation provided by an independent pricing service, which utilizes both dealer-supplied and electronic data processing techniques.
Other assets and securities for which no such quotations are readily available are valued at their fair value as determined in good faith under consistently applied procedures established by and under the general supervision of the Board of Trustees. Generally, trading in non-U.S. securities is substantially completed each day at various times prior to the close of trading on the New York Stock Exchange. The values of such securities used in computing the net asset value of a Fund’s shares are generally determined as of such times. Occasionally, significant events that affect the values of such securities may occur between the times at which such values are generally determined and the close of the New York Stock Exchange. In such events, these securities will then be valued at their fair value as determined in good faith under consistently applied procedures established by and under the general supervision of the Board of Trustees.
In deciding whether to make a fair value adjustment to the price of a security, the Trustees or their designee may review a variety of factors, including, developments in foreign markets, the performance of U.S. securities markets and the performance of instruments trading in U.S. markets that represent foreign securities and baskets of foreign securities. The Fund may also fair value securities in other situations, for example, when a particular foreign market is closed, but the Fund is calculating the net asset value. In view of these factors, it is likely that Fund investing significant amounts of assets in securities in foreign markets will be fair valued more frequently than a fund investing significant amounts of assets in frequently traded, U.S. exchange listed securities of large capitalization U.S. issuers.
For purposes of determining when fair value adjustments may be appropriate with respect to the Fund investing in securities in foreign markets that close prior to the New York Stock Exchange, the Fund will, on an ongoing basis, monitor for “significant market events.” A significant market event may be a certain percentage change in the value of an index or of certain exchange traded funds (“ETFs”) that track foreign markets in which the Fund has significant investments. If a significant market event occurs due to a change in the value of the index or of ETFs, the pricing for the Fund will promptly be reviewed and potential adjustments to the net asset value will be recommended to the Trust’s Pricing Committee, where applicable.
Fair value pricing of securities is intended to help ensure that the net asset value of the Fund’s shares reflects the value of the Fund’s securities as of the close of the New York Stock Exchange (as opposed to a value which is no longer accurate as of such close), thus limiting the opportunity for aggressive traders to purchase shares of the Fund at deflated prices, reflecting stale security valuations, and to promptly sell such shares at a gain. However, a security’s valuation may differ depending on the method used for determining value and no assurance can be given that fair value pricing of securities will successfully eliminate all potential opportunities for such trading gains.
Repurchase agreements
The Fund may enter into repurchase agreements. When the Fund enters into a repurchase agreement through its custodian, it receives delivery of securities, the amount of which at the time of purchase and each subsequent business day is required to be maintained at such a level that the market value is generally at least 102% of the repurchase amount. The Fund will take constructive receipt of all securities underlying the repurchase agreements it has entered into until such agreements expire. If the seller defaults, the Fund would suffer a loss to the extent that
International Growth Fund
25
proceeds from the sale of underlying securities were less than the repurchase amount. The Fund may enter into repurchase agreements maturing within seven days with domestic dealers, banks or other financial institutions deemed to be creditworthy by the Adviser. Collateral for certain tri-party repurchase agreements is held at the custodian bank in a segregated account for the benefit of the Fund and the counterparty.
Foreign currency transactions
The accounting records of the Fund is maintained in U.S. dollars. Foreign currency amounts are translated into U.S. dollars on the following basis:
(i) market value of securities, other assets and other liabilities at the current rate of exchange at period end of such currencies against U.S. dollars; and
(ii) purchases and sales of securities, income and expenses at the rate of exchange quoted on the respective dates of such transactions.
Net realized gains and losses on foreign currency transactions represent net gains and losses from sales and maturities of foreign currency contracts, disposition of foreign currencies, the difference between the amount of net investment income accrued and the U.S. dollar amount actually received, and gains and losses between trade and settlement date on purchases and sales of securities. The effects of changes in foreign currency exchange rates on investments in securities are included with the net realized and unrealized gain or loss on investment securities.
The Fund may be subject to capital gains and repatriation taxes imposed by certain countries in which the Fund invests. Such taxes are generally based upon income and/or capital gains earned or repatriated. Taxes are accrued based upon net investment income, net realized gains and net unrealized appreciation.
Investing in securities of foreign companies and foreign governments involves special risks and consideration not typically associated with investing in securities of domestic companies and the U. S. Government. These risks include revaluation of currencies and future adverse political and economic developments. Moreover, securities of foreign companies and foreign governments and their markets may be less liquid and their prices more volatile than those of the United States.
Security transactions and related investment income
Investment security transactions are accounted for on a trade date plus one basis for daily net asset value calculations. However for financial reporting purposes, investment transactions are reported on trade date. Interest income is accrued as earned. Dividend income is recorded on the ex-dividend date. Foreign dividends are recorded on the ex-date or as soon after the ex-date that the Fund becomes aware of such dividends, net of all taxes. Discounts/premiums are accreted/amortized for financial reporting purposes. Non-cash dividends are recorded at the fair market value of the securities received. Debt obligations may be placed in a non-accrual status and related interest income may be reduced by ceasing current accruals and writing off interest receivables when the collection of all or a portion of interest has become doubtful, based upon consistently applied procedures.
From time to time, the Fund may invest in Real Estate Investment Trusts (“REITs”) and as a result, will estimate the components of distributions from these securities. Distributions from REITs received in excess of income are recorded as a reduction of cost of investments and/or as a realized gain.
The Fund uses the First In, First Out method for fixed income securities and Highest Cost, First Out for all other securities for determining realized gain or loss on investments for both financial and federal income tax reporting purposes.
Multi-class operations
All income, expenses (except for class-specific expenses) and realized and unrealized gains (losses) are allocated to each class of shares based upon the relative net assets of each class. Dividends to shareholders from net investment income are determined at a class level and distributions from capital gains are determined at a Fund level.
International Growth Fund
26
Expense allocation
Expenses are allocated based on the relative share of net assets of the Fund at the time the expense was incurred. Class-specific expenses, such as distribution (Rule 12b-1) fees, are accrued daily and charged directly to the respective share classes.
Forward foreign currency contracts
The Fund may purchase and sell forward foreign currency contracts in order to hedge a specific transaction or Fund position. Forward foreign currency contracts are valued at forward foreign currency exchange rates and marked to market daily. Net realized gains (losses) on foreign currency and forward foreign currency contracts shown in the Statements of Operations include net gains or losses realized by a Fund on contracts that have matured.
The net U.S. dollar value of foreign currency underlying all contractual commitments held at the end of the period, the resulting net unrealized appreciation (depreciation) and related net receivable or payable amount are determined using forward foreign currency exchange rates supplied by a quotation service. The Fund could be exposed to risks in excess of amounts recognized on the Statements of Assets and Liabilities if the counterparties to the contracts are unable to meet the terms of their contracts or if the value of the forward foreign currency contract changes unfavorably.
The fund had no open forward currency exchange contracts on August 31, 2006.
Federal income taxes
The Fund qualifies as a “regulated investment company” by complying with the applicable provisions of the Internal Revenue Code and will not be subject to federal income tax on taxable income that is distributed to shareholders. Therefore, no federal income tax provision is required.
New accounting pronouncements
In June 2006, Financial Accounting Standards Board (“FASB”) Interpretation No. 48, Accounting for Uncertainty in Income Taxes (the “Interpretation”) was issued, and is effective for fiscal years beginning after December 15, 2006 and is to be applied to all open tax years as of the effective date. The Interpretation prescribes a minimum threshold for financial statement recognition of the benefit of a tax position taken or expected to be taken in a tax return, and requires certain expanded disclosures. Management is currently evaluating the application of the Interpretation to the Fund, and has not at this time quantified the impact, if any, resulting from the adoption of the Interpretation on the Fund’s financial statements.
In September 2006, FASB Standard No. 157, Fair Value Measurements (“FAS 157”) was issued, and is effective for fiscal years beginning after November 15, 2007. FAS 157 defines fair value, establishing a framework for measuring fair value and expands disclosure about fair value measurements. Management is currently evaluating the application of FAS 157 to the Fund, and its impact, if any, resulting from the adoption of FAS 157 on the Fund’s financial statements.
Distribution of income and gains
The Fund records distributions to shareholders from net investment income and net realized gains, if any, on the ex-dividend date. Distributions paid by the Fund with respect to each class of shares are calculated in the same manner, at the same time and are in the same amount, except for the effect of expenses that may be applied differently to each class. Such distributions, on a tax basis, are determined in conformity with income tax regulations, which may differ from accounting principles generally accepted in the United States of America. Distributions in excess of tax basis earnings and profits, if any, are reported in the Fund’s financial statements as a return of capital.
Capital accounts
The Fund reports the undistributed net investment income and accumulated undistributed net realized gain (loss) accounts on a basis approximating amounts available for future tax distributions (or to offset future taxable realized gains when a capital loss carryforward is available). Accordingly, the Fund may periodically make reclassifications among certain capital accounts without affecting its net asset value.
International Growth Fund
27
3. Investment advisory and other agreements
Advisory fees
The Trust has entered into an Investment Advisory Agreement with the Adviser. The Adviser is responsible for managing the corporate and business affairs of the Trust and for selecting and compensating subadvisers to handle the investment and reinvestment of the assets of the Fund, subject to the supervision of the Board of Trustees. Under the Advisory Agreement, the Fund pays a monthly management fee to the Adviser equivalent, on an annual basis, to the sum of: (a) 0.920% of the first $100,000,000 of the Fund’s aggregate daily net assets; (b) 0.895% of the next $900,000,000 of the Fund’s aggregate daily net assets; and (c) 0.880% of the Fund’s aggregate daily net assets in excess of $1,000,000,000. Aggregate net assets include the net assets of the Fund and International Growth Trust, a series of John Hancock Trust. John Hancock Trust is an open-end investment company advised by the Adviser and distributed by the Distributor. The Fund is not responsible fo r payment of the subadvisory fees.
Expense reimbursements
The Adviser has agreed contractually to reimburse for certain fund level expenses that exceed 0.20% of the average annual net assets, or to make a payment to a specific class of shares of the Fund in an amount equal to the amount by which the expenses attributable to such class of shares (excluding taxes, portfolio brokerage commissions, interest, litigation and indem-nification expenses and other extraordinary expenses not incurred in the ordinary course of the Fund’s business and fees under any agreement or plans of the Fund dealing with services for shareholders and others with ben-eficial interests in shares of the Fund) exceed the percentage of average annual net assets (on an annualized basis) attributable as follows: 1.70% for Class A, 2.40% for Class B, 2.40% for Class C, 1.20% for Class I, 1.70% for Class R and 1.15% for Class 1. Accordingly, the expense reductions related to this expense limitation amounted to $29,160, $4,209, $4,299, $4,211, $4,250 and $1 72 for Class A, Class B, Class C, Class I, Class R and Class 1, respectively, for the period ended August 31, 2006. This expense reimbursement shall continue in effect until June 30, 2007 and thereafter until terminated by the Adviser on notice to the Trust.
Administration fees
The Fund has an agreement with the Adviser that requires the Fund to reimburse the Adviser for all expenses associated with providing the administrative, financial, accounting and recordkeeping services of the Fund, including the preparation of all tax returns, annual, semi-annual and periodic reports to shareholders and the preparation of all regulatory reports.
Distribution plan
The Trust has a Distribution Agreement with the Distributor, a wholly owned subsidiary of the Adviser. The Fund has adopted Distribution Plans with respect to Class A, Class B, Class C, Class R and Class 1, pursuant to Rule 12b-1 under the 1940 Act, to reimburse the Distributor for the services it provides as distributor of shares of the Fund. Accordingly, the Fund makes monthly payments to the Distributor at an annual rate not to exceed 0.30%, 1.00%, 1.00%, 0.50% and 0.05% of average daily net asset value of Class A, Class B, Class C, Class R and Class 1 respectively. A maximum of 0.25% of such payments may be service fees, as defined by the Conduct Rules of the National Association of Securities Dealers. Under the Conduct Rules, curtailment of a portion of the Fund’s 12b-1 payments could occur under certain circumstances. In addition, under a Service Plan for Class R shares, the Fund pays up to 0.25% of Class R average daily net asset value for certain other servi ces.
Sales charges
Class A shares are assessed up-front sales charges of up to 5.00% of net asset value of such shares. During the period ended August 31, 2006, the Fund was informed that the Distributor received net up-front sales charges of $602 with regard to sales of Class A shares. Of this amount, $102 was retained and used for printing prospectuses, advertising, sales literature and other purposes and $500 was paid as sales commissions to unrelated broker-dealers.
Class B shares that are redeemed within six years of purchase are subject to a contingent
International Growth Fund
28
deferred sales charge (“CDSC”) at declining rates, beginning at 5.00% of the lesser of the current market value at the time of redemption or the original purchase cost of the shares being redeemed. Class C shares that are redeemed within one year of purchase are subject to a CDSC at a rate of 1.00% of the lesser of the current market value at the time of redemption or the original purchase cost of the shares being redeemed. Proceeds from the CDSCs are paid to the Distributor and are used, in whole or in part, to defray its expenses for providing distribution-related services to the Fund in connection with the sale of Class B and Class C shares. During the period ended August 31, 2006, the Fund was informed that the Distributor received no CDSCs for Class B and Class C shares.
Transfer agent fees
The Fund has a Transfer Agency Agreement with John Hancock Signature Services, Inc. (“Signature Services”), an indirect subsidiary of MFC. For Class A, Class B, Class C, Class I and Class R shares, the Fund pays a monthly transfer agent fee at an annual rate of 0.05% of each class’ average daily net assets, plus a fee based on the number of shareholder accounts and reimbursement for certain out-of-pocket expenses. Expenses not directly attributable to a particular class of shares are aggregated and allocated to each class on the basis of its relative net asset value.
Signature Services has agreed to limit the transfer agent fees so that such fees do not exceed 0.20% annually of Class A, Class B, Class C, Class I and Class R share average daily net assets. This agreement is effective until December 31, 2006. Signature Services reserves the right to terminate this limitation in the future. Accordingly, there were no transfer agent fees reductions for Class A, Class B, Class C, Class I and Class R shares, respectively, during the period ended August 31, 2006.
| Expenses under the agreements described above for the period ended August 31, 2006, were | ||||
| as follows: | ||||
| Distribution and | Transfer | Printing and | ||
| Share Class | service fees | agent | Blue sky | postage |
| Class A | $10,100 | $10,100 | $4,275 | $4,787 |
| Class B | 242 | 73 | 4,032 | 35 |
| Class C | 316 | 95 | 4,032 | 43 |
| Class I | — | 13 | 4,032 | 36 |
| Class R | 172 | 70 | 4,032 | 33 |
| Class 1 | 12 | — | — | 33 |
| Total | $10,842 | $10,351 | $20,403 | $4,967 |
Trustees’ fees
The Trust compensates each Trustee who is not an employee of the Adviser or its affiliates. Total Trustees’ expenses are allocated to the Fund based on its average daily net asset value.
4. Guarantees and indemnifications
Under the Trust’s organizational documents, its Officers and Trustees are indemnified against certain liability arising out of the performance of their duties to the Trust. Additionally, in the normal course of business, the Trust enters into contracts with service providers that contain general indemnification clauses. The Trust’s maximum exposure under these arrangements is unknown, as this would involve future claims that may be made against the Trust that have not yet occurred. However, based on experience, the Trust believes the risk of loss to be remote.
5. Line of credit
The Fund has entered into an agreement which enables them to participate in a $100 million unsecured committed line of credit with State Street Bank & Trust Company. Borrowings will be made solely to temporarily finance the repurchase of capital shares. Interest is charged to the Fund based on its borrowings at a rate per annum equal to the Federal Funds rate plus 0.50% . In addition, a commitment fee of 0.07% per annum, payable
International Growth Fund
29
at the end of each calendar quarter, based on the average daily-unused portion of the line of credit, is charged to the Fund on a prorated basis based on average net assets. For the period ended August 31, 2006, there was no borrowings under the line of credit.
6. Capital shares
Share activities for the Fund for the period ended August 31, 2006 were as follows:
| Period ended 8-31-06a | ||
| Shares | Amount | |
| Class A shares | ||
| Sold | 728,599 | $14,577,946 |
| Net increase | 728,599 | $14,577,946 |
| Class B shares | ||
| Sold | 8,057 | $166,393 |
| Repurchased | (1,321) | (27,095) |
| Net increase | 6,736 | $139,298 |
| Class C shares | ||
| Sold | 11,342 | $237,639 |
| Net increase | 11,342 | $237,639 |
| Class I shares | ||
| Sold | 5,539 | $111,000 |
| Net increase | 5,539 | $111,000 |
| Class R shares | ||
| Sold | 5,000 | $100,000 |
| Net increase | 5,000 | $100,000 |
| Class 1 shares | ||
| Sold | 5,000 | $100,000 |
| Net increase | 5,000 | $100,000 |
| Net increase | 762,216 | $15,265,883 |
aPeriod from 6-12-06 (commencement of operations) to 8-31-06. Unaudited.
7. Investment transactions
Purchases and proceeds from sales or maturities of securities, other than short-term securities and obligations of the U.S. government, during the period ended August 31, 2006, aggregated $16,163,066 and $1,404,023, respectively.
The cost of investments owned on August 31, 2006, including short-term investments, for federal income tax purposes, was $15,140,353. Gross unrealized appreciation and depreciation of investments aggregated $1,465,285 and $62,196, respectively, resulting in net unrealized appreciation of $1,403,089.
8. Federal income tax information
Federal income tax regulations may differ from generally accepted accounting principles and income and capital gain distributions determined in accordance with tax regulations may differ from net investment income and realized gains recognized for financial reporting purposes.
International Growth Fund
Evaluation of Advisory and Subadvisory Agreements by the Board of Trustees
This section describes the evaluation by the Board of Trustees of the Advisory Agreement and each of the Subadvisory Agreements.
Evaluation by the Board of Trustees The Board, including all of the Trustees who are not “interested persons” as defined in the Investment Company Act of 1940, as amended (the “Independent Trustees”), is responsible for selecting the Trust’s investment adviser, John Hancock Investment Management Services, LLC (the “Adviser” or “JHIMS”), approving the Adviser’s selection of subadvis-ers for each series of the Trust (the “Funds”) and approving the Trust’s advisory and sub-advisory agreements (and any sub-subadvisory agreements), their periodic continuation and any amendments. Consistent with SEC rules, the Board regularly evaluates the Trust’s advisory and subadvisory (and sub-subadvisory) arrangements, including consideration of the factors listed below. The Board may also consider other factors (including conditions and trends prevailing generally in the econo my, the securities markets and the industry) and does not treat any single factor as determinative, and each Trustee may attribute different weights to different factors. The Board is furnished with an analysis of its fiduciary obligations in connection with its evaluation and, throughout the evaluation process, the Board is assisted by counsel for the Trust and the Independent Trustees are also separately assisted by independent legal counsel. The factors regularly considered by the Board are:
1. the nature, extent and quality of the services to be provided by the Adviser to the Trust and by the subadvisers to the Funds;
2. the investment performance of the Funds and their subadvisers;
3. the extent to which economies of scale would be realized as a Fund grows and whether fee levels reflect these economies of scale for the benefit of Trust shareholders;
4. the costs of the services to be provided and the profits to be realized by the Adviser and its affiliates (including any subadvisers that are affiliated with the Adviser) from the Adviser’s relationship with the Trust; and
5. comparative services rendered and comparative advisory and subadvisory fee rates.
The Board believes that information relating to all these factors is relevant to its evaluation of the Trust’s advisory agreement. With respect to its evaluation of subadvisory agreements (including sub-subadvisory agreements) the Board believes that, in view of the Trust’s “manager-of managers” advisory structure, the costs of services to be provided and the profits to be realized by those subadvisers that are not affiliated with the Adviser from their relationship with the Trust generally are not a material factor to the Board’s consideration of subadvisory agreements because such fees are paid to sub-advisers by the Adviser and not by the Funds, and because the Board relies on the ability of the Adviser to negotiate such subadvisory fees at arms-length.
In evaluating subadvisory arrangements, the Board also considers other material business relationships that unaffiliated sub-advisers and their affiliates have with the Adviser or its affiliates, including the involvement by certain affiliates of certain subadvisers in the distribution of financial products, including shares of the Trust, offered by the Adviser and other affiliates of the Adviser (“Material Relationships”).
Approval of Advisory Agreement
At its meeting on September 21, 2005, the Board, including all the Independent Trustees, approved the Advisory Agreement between the Trust and JHIMS with respect to each of the Funds.
In approving the Advisory Agreement, and with reference to the factors which it regularly considers, the Board:
(1) (a) considered the high value to the Trust of continuing the relationship with JHIMS as the Trust’s Adviser to the other John Hancock Funds, the skills and competency with which JHIMS
31
has in the past managed the affairs and subadvisory relationships of other funds in the complex, JHIMS’s oversight and monitoring of subadvisers’ investment performance and compliance programs including its timelines in responding to performance issues and the qualifications of JHIMS’s personnel,
(b) considered JHIMS’s compliance policies and procedures and its responsiveness to regulatory changes and mutual fund industry developments, and
(c) JHIMS’s administrative capabilities, including its ability to supervise the other service providers for the Funds and concluded that JHIMS may reasonably be expected to ably perform its services under the Advisory Agreement.
(2) reviewed the investment performance of portfolios that are managed comparable to the Funds; the comparative performance of their respective benchmarks; and JHIMS’ analysis of such performance and its plans and recommendations regarding the Trust’s subadvisory arrangements generally and with respect to the Funds; and concluded that each of the comparably managed funds has performed well or within a range that the Board deemed competitive, and that JHIMS may reasonably be expected to ably monitor the performance of the Funds and their subadvisers;
(3) reviewed the Trust’s advisory fee structure and the incorporation therein of any subadvisory fee breakpoints in the advisory fees charged and concluded (i) that to the extent that Funds have subadvisory fees with breakpoints, those breakpoints are reflected as breakpoints in the advisory fees for Funds, (ii) that all Funds with a subadviser that is not affiliated with the Adviser have subadvisory fees which are the product of arms-length negotiations between the Adviser and the subadviser and which in many, but not all, cases contain breakpoints, and (iii) that, although economies of scale cannot be measured with precision, these arrangements permit shareholders of Funds with advisory fee breakpoints to benefit from economies of scale if those Funds grow;
(4) (a) reviewed the financial statements of JHIMS and John Hancock Life Insurance Company (U.S.A.) (“JHLICO (U.S.A.)”;
(b) reviewed the anticipated profitability of the JHIMS’s relationship with the Funds in terms of the fees it expects to receive with respect to the Funds and whether JHIMS has the financial ability to provide a high level of services to the Funds,
(c) considered that JHIMS derives reputational and other indirect benefits from providing advisory services to the Funds, and
(d) noted that JHIMS will pay the sub-advisory fees out of the advisory fees JHIMS receives from the Funds and concluded that the advisory fees paid by the Trust with respect to the Funds are not unreasonable in light of such information; and
(5) reviewed comparative information with respect to the advisory fee rates and concluded that the anticipated advisory fees for the Funds are within the range of those incurred by other comparable funds and that the advisory structure for the Funds is thus competitive within the industry.
Additional information that the Board considered for a particular Fund is set forth in Appendix A.
Approval of Subadvisory Agreements
At its meeting on September 21, 2005, the Board, including all the Independent Trustees, approved the Subadvisory Agreements.
In making its determination with reference to these respective factors, the Board reviewed:
(i) information relating to each subadviser’s business which included information
32
such as: business performance, assets under management, financial stability and personnel;
(ii) the investment performance of the subad-viser’s portfolio managed comparably to the Fund to be managed by the subadviser and comparative performance information relating to the benchmark;
(iii) the proposed subadvisory fee for each Fund to be managed by the subadviser and comparative fee information; and
(iv) information relating to the nature and scope of Material Relationships and their significance to the Adviser and the subadvisers.
The Board’s decision to approve each Sub-advisory Agreement was based on a number of determinations, including the following:
(1) The subadviser has extensive experience and demonstrated skills as a manager and may be expected to provide a high quality of investment personnel to each Fund;
(2) Although not without variation, the current and historical performance of the portfolios of the Subadviser managed comparably to the Fund to be managed by the Subadviser has been within a competitive range of the current and historical performance of these portfolios’ respective benchmark (see Appendix A for further information on performance);
(3) The subadvisory fees are within industry norms and are the product of arms-length negotiation between the Adviser and the subadviser; and
(4) The Material Relationships consist of arrangements in which unaffiliated subadvisers or their affiliates provide advisory, distribution or management services in connection with financial products sponsored by the Trust’s adviser or its affiliates, which may include other registered investment companies, a 529 education savings plan, managed separate accounts and exempt group annuity contracts sold to qualified plans, and which in no case contained elements which would cause the Board to conclude that approval of the subadvisory agreement with the subadviser would be inappropriate. See (5) below for information relating to the business arrangement between the Trust’s Adviser and GMO.
(5) As a part of the overall business arrangement between the Adviser and GMO under which the Adviser has obtained exclusive rights to certain GMO investment management services for up to five years, the Adviser has agreed that under certain circumstances it (and not the Trust or the particular Fund) will pay GMO a specified amount (ranging from $1 to $12 million) if the subadvisory agreement with respect to any of the following Funds to be subadvised by GMO is terminated within a five year period from the date of its effectiveness: U.S. Core Fund, Active Value Fund, Intrinsic Value Fund, Growth Fund, International Core Fund, International Growth Fund, Global Fund, Value Opportunities Fund, Growth Opportunities Fund and U.S. Quality Equity Fund.
The Adviser has also agreed that, subject to its fiduciary duties as an investment adviser to each of these Funds and its shareholders, it will not recommend to the Board of Trustees to terminate the subadvisory agreement with respect to any of the Funds or to reduce any of the fees payable thereunder to GMO for a five year period from the date of effectiveness of the agreement. Substantially similar agreements (with varying amounts to be paid upon termination) also apply with respect to certain other John Hancock funds that are or will be advised by the Adviser and subadvised by GMO. The Trust is not a party to any of these arrangements, and they are not binding upon the Trust, the Trust’s Funds subadvised by GMO or the Board of Trustees. However, these arrangements present certain conflicts of interest because the Adviser has a financial incentive to support the continuation of GMO subadvisory agreements for as long as the termination provisions described above re main in effect. In approving the Advisory Agreement
33
and the subadvisory agreement with respect to each of the Funds subadvised by GMO, the Board of Trustees, including the Independent Trustees, was aware of and considered these potential conflicts of interest, including any financial obligations of the Adviser to GMO.
The Board concluded that, notwithstanding the potential conflicts of interest, approval of the Advisory Agreement and the subadvisory agreements with GMO is in the best interests of shareholders and contract owners in view of (i) the Adviser’s fiduciary duty and the Board’s fiduciary duty and ability to monitor potential conflicts, (ii) the benefits to shareholders and contract owners generally expected from the exclusive rights to certain GMO investment management services obtained by the Adviser for the benefit of certain Funds of the Trust and other John Hancock funds and (iii) the benefits to such Funds of the Trust expected from the subadvisory services of GMO.
Additional information that the Board considered for a particular fund is set forth in Appendix A.
| Appendix A | |||
| Estimated Fees | |||
| Fund | Performance | and Expenses | Comments |
| International | See “Comments”. | Subadvisory fees | The Board noted |
| Growth | for this Fund were | that the Fund | |
| higher than the peer | commenced opera- | ||
| group median. | tions in June 2006 | ||
| and has a limited | |||
| Advisory fees for | performance history. | ||
| this Fund were | |||
| lower than the peer | |||
| group median. | |||
| Total expenses for | |||
| this Fund were | |||
| higher than the peer | |||
| group median. | |||
34
For more information
The Fund’s proxy voting policies, procedures and records are available without charge, upon request:
| By phone | On the Fund’s Web site | On the SEC’s Web site |
| 1-800-225-5291 | www.jhfunds.com/proxy | www.sec.gov |
| Trustees | Francis V. Knox, Jr. | Principal distributor |
| James M. Oates, Chairman* | Chief Compliance Officer | John Hancock Funds, LLC |
| Charles L. Bardelis * | Gordon M. Shone | 601 Congress Street |
| James R. Boyle† | Treasurer | Boston, MA 02210-2805 |
| Peter S. Burgess * | ||
| Elizabeth G. Cook | John G. Vrysen | Custodian |
| William H. Cunningham | Chief Financial Officer | State Street Bank & Trust Co. |
| Charles L. Ladner* | 2 Avenue de Lafayette | |
| Hassell H. McClellan | Investment adviser | Boston, MA 02111 |
| John Hancock Investment | ||
| *Members of the Audit Committee | Management Services, LLC | Transfer agent |
| †Non-Independent Trustee | 601 Congress Street | John Hancock Signature |
| Boston, MA 02210-2805 | Services, Inc. | |
| Officers | 1 John Hancock Way, | |
| Keith F. Hartstein | Subadviser | Suite 1000�� |
| President and | Grantham, Mayo, | Boston, MA 02217-1000 |
| Chief Executive Officer | Van Otterloo & Co. LLC | |
| 40 Rowes Wharf | Legal counsel | |
| Thomas M. Kinzler | Boston, MA 02110 | Kirkpatrick & Lockhart |
| Secretary and | Nicholson Graham LLP | |
| Chief Legal Officer | 1 Lincoln Street | |
| Boston, MA 02111-2950 | ||
The Fund’s investment objective, risks, charges and expenses are included in the prospectus and should be considered carefully before investing. For a prospectus, call your financial professional, call John Hancock Funds at 1-800-225-5291 or visit the Fund’s Web site at www.jhfunds.com. Please read the prospectus carefully before investing or sending money.
| How to contact us | ||
| Internet | www.jhfunds.com | |
| Regular mail: | Express mail: | |
| John Hancock | John Hancock | |
| Signature Services, Inc. | Signature Services, Inc. | |
| 1 John Hancock Way, Suite 1000 | Mutual Fund Image Operations | |
| Boston, MA 02217-1000 | 380 Stuart Street | |
| Boston, MA 02116 | ||
| Phone | Customer service representatives | 1-800-225-5291 |
| 24-hour automated information | 1-800-338-8080 | |
| TDD line | 1-800-554-6713 | |
A listing of month-end portfolio holdings is available on our Web site, www.jhfunds.com. A more detailed portfolio holdings summary is available on a quarterly basis 60 days after the fiscal quarter on our Web site or upon request by calling 1-800-225-5291, or on the Securities and Exchange Commission’s Web site, www.sec.gov.
36
J O H N H A N C O C K F A M I L Y O F F U N D S
EQUITY
Balanced Fund
Classic Value Fund
Classic Value Fund II
Core Equity Fund
Focused Equity Fund
Growth Fund
Growth Opportunities Fund
Growth Trends Fund
Intrinsic Value Fund
Large Cap Equity Fund
Large Cap Select Fund
Mid Cap Equity Fund
Mid Cap Growth Fund
Multi Cap Growth Fund
Small Cap Equity Fund
Small Cap Fund
Small Cap Intrinsic Value Fund
Sovereign Investors Fund
U.S. Core Fund
U.S. Global Leaders Growth Fund
Value Opportunities Fund
ASSET ALLOCATION & LIFESTYLE
Allocation Core Portfolio
Allocation Growth + Value Portfolio
Lifestyle Aggressive Portfolio
Lifestyle Balanced Portfolio
Lifestyle Conservative Portfolio
Lifestyle Growth Portfolio
Lifestyle Moderate Portfolio
SECTOR
Financial Industries Fund
Health Sciences Fund
Real Estate Fund
Regional Bank Fund
Technology Fund
Technology Leaders Fund
INTERNATIONAL
Greater China Opportunities Fund
International Classic Value Fund
International Core Fund
International Fund
International Growth Fund
INCOME
Bond Fund
Government Income Fund
High Yield Fund
Investment Grade Bond Fund
Strategic Income Fund
TAX-FREE INCOME
California Tax-Free Income Fund
High Yield Municipal Bond Fund
Massachusetts Tax-Free Income Fund
New York Tax-Free Income Fund
Tax-Free Bond Fund
MONEY MARKET
Money Market Fund
U.S. Government Cash Reserve
CLOSED-END
Bank & Thrift Opportunity
Financial Trends
Income Securities
Investors Trust
Patriot Global Dividend
Patriot Preferred Dividend
Patriot Premium Dividend I
Patriot Premium Dividend II
Patriot Select Dividend
Preferred Income
Preferred Income II
Preferred Income III
Tax-Advantaged Dividend
For more complete information on any John Hancock Fund and a prospectus, which includes charges and expenses, call your financial professional, or John Hancock Funds at 1-800-225-5291. Please read the prospectus carefully before investing or sending money.

1-800-225-5291
1-800-554-6713 (TDD)
1-800-338-8080 EASI-Line
www.jhfunds. com
Now available: electronic delivery
www.jhfunds. com/edelivery
This report is for the information of the shareholders of John Hancock International Growth Fund.
870SA 8/06
10/06
ITEM 2. CODE OF ETHICS.
As of the end of the period, August 31, 2006, the registrant has adopted a code of ethics, as defined in Item 2 of Form N-CSR, that applies to its Chief Executive Officer, Chief Financial Officer and Treasurer (respectively, the principal executive officer, the principal financial officer and the principal accounting officer, the “Senior Financial Officers”). A copy of the code of ethics is filed as an exhibit to this Form N-CSR.
ITEM 3. AUDIT COMMITTEE FINANCIAL EXPERT.
Not applicable at this time.
ITEM 4. PRINCIPAL ACCOUNTANT FEES AND SERVICES.
Not applicable at this time.
ITEM 5. AUDIT COMMITTEE OF LISTED REGISTRANTS.
Not applicable at this time.
ITEM 6. SCHEDULE OF INVESTMENTS.
Not applicable.
ITEM 7. DISCLOSURE OF PROXY VOTING POLICIES AND PROCEDURES FOR CLOSED-END
MANAGEMENT INVESTMENT COMPANIES.
Not applicable.
ITEM 8. PORTFOLIO MANAGERS OF CLOSED-END MANAGEMENT INVESTMENT
COMPANIES.
Not applicable.
ITEM 9. PURCHASES OF EQUITY SECURITIES BY CLOSED-END MANAGEMENT
INVESTMENT COMPANY AND AFFILIATED PURCHASERS.
Not applicable.
ITEM 10. SUBMISSION OF MATTERS TO A VOTE OF SECURITY HOLDERS.
The registrant has adopted procedures by which shareholders may recommend nominees to the registrant's Board of Trustees. A copy of the procedures is filed as an exhibit to this Form N-CSR. See attached “John Hancock Funds – Governance Committee Charter”.
ITEM 11. CONTROLS AND PROCEDURES.
(a) Based upon their evaluation of the registrant's disclosure controls and procedures as conducted within 90 days of the filing date of this Form N-CSR, the registrant's principal executive officer and principal financial officer have concluded that those disclosure controls and procedures provide reasonable assurance that the material information required to be disclosed by the registrant on this report is recorded, processed, summarized and reported within the time periods specified in the Securities and Exchange Commission's rules and forms.
(b) There were no changes in the registrant's internal control over financial reporting that occurred during the registrant's most recent fiscal half-year (the registrant's second fiscal half-year in the case of an annual report) that have materially affected, or are reasonably likely to materially affect, the registrant's internal control over financial reporting.
ITEM 12. EXHIBITS.
(a)(1) Code of Ethics for Senior Financial Officers is attached.
(a)(2) Separate certifications for the registrant's principal executive officer and principal financial officer, as required by Section 302 of the Sarbanes-Oxley Act of 2002 and Rule 30a-2(a) under the Investment Company Act of 1940, are attached.
(b) Separate certifications for the registrant's principal executive officer and principal financial officer, as required by 18 U.S.C. Section 1350, as adopted pursuant to Section 906 of the Sarbanes-Oxley Act of 2002, and Rule 30a-2(b) under the Investment Company Act of 1940, are attached. The certifications furnished pursuant to this paragraph are not deemed to be "filed" for purposes of Section 18 of the Securities Exchange Act of 1934, or otherwise subject to the liability of that section. Such certifications are not deemed to be incorporated by reference into any filing under the Securities Act of 1933 or the Securities Exchange Act of 1934, except to the extent that the Registrant specifically incorporates them by reference.
(c)(1) Submission of Matters to a Vote of Security Holders is attached. See attached “John Hancock Funds – Governance Committee Charter”.
(c)(2) Proxy Voting Policies and Procedures are attached.
(c)(3) Contact person at the registrant.
SIGNATURES
Pursuant to the requirements of the Securities Exchange Act of 1934 and the Investment Company Act of 1940, the registrant has duly caused this report to be signed on its behalf by the undersigned, thereunto duly authorized.
John Hancock Funds III
By: /s/ Keith F. Hartstein
-------------------------------------
Keith F. Hartstein
President and Chief Executive Officer
Date: October 27, 2006
Pursuant to the requirements of the Securities Exchange Act of 1934 and the Investment Company Act of 1940, this report has been signed below by the following persons on behalf of the registrant and in the capacities and on the dates indicated.
By: /s/ Keith F. Hartstein
-------------------------------------
Keith F. Hartstein
President and Chief Executive Officer
Date: October 27, 2006
By: /s/ John G. Vrysen
- -------------------------------------
John G. Vrysen
Executive Vice President and Chief Financial Officer
Date: October 27, 2006