UNITED STATES
SECURITIES AND EXCHANGE COMMISSION
Washington, D.C. 20549
FORM N-CSR
CERTIFIED SHAREHOLDER REPORT OF REGISTERED
MANAGEMENT INVESTMENT COMPANIES
Investment Company Act file number 811-21777
John Hancock Funds III
(Exact name of registrant as specified in charter)
601 Congress Street, Boston, Massachusetts 02210
(Address of principal executive offices) (Zip code)
Gordon M. Shone
Treasurer
601 Congress Street
Boston, Massachusetts 02210
(Name and address of agent for service)
Registrant's telephone number, including area code: 617-663-3000
| Date of fiscal year end: | February 28 |
| Date of reporting period: | August 31, 2007 |
ITEM 1. REPORT TO SHAREHOLDERS.

| TABLE OF CONTENTS | ||
| Your fund at a glance | ||
| page 1 | ||
| Managers’ report | ||
| page 2 | ||
| A look at performance | ||
| page 6 | ||
| Your expenses | ||
| page 8 | ||
| Fund’s investments | ||
| page 10 | ||
| Financial statements | ||
| page 18 | ||
| Notes to financial | ||
| statements | ||
| page 28 | ||
| For more information | ||
| page 40 | ||
CEO corner
To Our Shareholders,
Volatility returned to the U.S. stock market in the six-month period ended August 31, 2007; however, stocks still posted a strong gain of 5.70%, as measured by the Standard & Poor’s 500 Index. The market experienced a particularly sharp downturn in August, as the subprime mortgage market’s woes increased. Rising defaults and an ensuing credit crunch caused heightened fears about their potential impact on U.S. economic growth. Foreign markets felt some ripple effects from the subprime issue, but they continued nonetheless to benefit from solid economic growth and outperformed the U.S. market in this period.
During this period of volatility, the U.S. stock market also passed a significant milestone — the broad Standard & Poor’s 500 Index climbed beyond the record it had set seven years ago. From its peak in March 2000, the stock market spiraled downward three consecutive years, bottoming in 2002. The upturn began in 2003, and the market has advanced each year since, finally setting a new high for the first time on May 30, 2007. During that period, the S&P 500 Index experienced five significant short-term sell-offs of 6% or more, with the August subprime-induced meltdown being the most recent.
This nearly complete market cycle highlights the importance of two investment principles you have heard us speak of often: diversification and patience. By allocating your investments among different asset classes, investment styles and portfolio managers, you are likely to be well represented through all phases of a complete market cycle, with the winners helping to cushion the fall of the losers.
The challenge for investors with a diversified portfolio is to properly evaluate your investments to tell the difference between an underperforming manager and an out-of-favor style, while also understanding the role each investment plays in your portfolio. That’s where your financial professional can provide true value. He or she can help you make those assessments and also counsel patience, because a properly diversified portfolio by its very nature will typically have something lagging or out of favor — a concept that can be difficult to live with, but necessary to embrace. If everything in your portfolio is “working,” then you are not truly diversified, but rather are leveraged to the current market and the flavor of the day. If so, you are bound to be out of step in the near future.
The recent volatility in the securities markets has prompted many investors to question how long this type of market cycle will last. History tells us it will indeed end and that when it does, today’s leaders may well turn into laggards and vice versa. The subprime mortgage market woes are just the latest example of why investors should be both patient and well-diversified. For with patience and a diversified portfolio, it could be easier to weather the market’s twists and turns and reach your long-term goals.
Sincerely,

Keith F. Hartstein,
President and Chief Executive Officer
This commentary reflects the CEO’s views as of August 31, 2007. They are subject to change at any time.
Your fund at a glance
The Fund seeks long-term capital growth by typically investing in U.S. companies that issue stocks included in the Russell 1000 Index and in companies with size and value characteristics similar to those of companies with stocks in the Index.
Over the last six months
► Despite heightened volatility, the broad U.S. market, as measured by the S&P 500 Index, gained ground.
► The services, retail and manufacturing sectors detracted from Fund performance, while technology and financials added value.
► The Fund's momentum discipline was able to capitalize on the rising broad market.
| Top 10 holdings | ||||
| Exxon Mobil Corp. | 7.9% | Home Depot, Inc. | 2.7% | |
| Citigroup, Inc. | 4.7% | Chevron Corp. | 2.7% | |
| Verizon Communications, Inc. | 3.7% | Federal National Mortgage Assn. | 2.4% | |
| Pfizer, Inc. | 3.5% | AT&T, Inc. | 2.4% | |
| Merck & Company, Inc. | 3.1% | Wal-Mart Stores, Inc. | 2.2% | |
As a percentage of net assets on August 31, 2007.
1
Managers’ report
John Hancock
Intrinsic Value Fund
U.S. investors entered the six-month review period on March 1, 2007 still reeling from the market’s late-February swoon. Their big question was whether the recent fall was the beginning of a major correction or just a brief hiccup in the middle of a bull market. Though some of the concerns surrounding the decline — including the first sign of trouble in subprime mortgages — were still present, investors appeared to shake them off. Less than two months into the review period, the Standard & Poor’s 500 Index had recovered all of its lost ground, entering the summer poised to continue its ascent. With historically-low market volatility, the continuation of strong corporate profits and a glut of private equity deals fueled by ubiquitous financial liquidity, there seemed to be almost no ceiling to the market’s potential. Hopes for a smooth summer, however, would turn out to be short-lived.
Beginning in July, as many market indexes touched record highs, credit concerns similar to those seen in February flared up again. Distress in subprime mortgages quickly spilled over into the broader credit and equity markets. Just weeks after the S&P 500 Index set an all-time high, the Federal Reserve began injecting liquidity into a faltering financial system in an attempt to stem the turmoil taking place in the credit market. As equity market volatility returned with a vengeance, investor tolerance for risk abated and the broad market indexes plunged lower in the first days of August. And while hopes for a Federal Reserve rate
SCORECARD
| INVESTMENT | PERIOD’S PERFORMANCE ... AND WHAT’S BEHIND THE NUMBERS | ||
| Exxon Mobil | ▲ | Benefited from rising oil prices over the period | |
| Forest Laboratories | ▼ | Promising stroke medication failed late-stage trials | |
| Kohl’s | ▼ | Fund’s overweight position hurt when same-store sales declined | |
2
From the Grantham, Mayo, Van Otterloo & Co. LLC (GMO)
Portfolio Management Team
cut helped stabilize things somewhat, investors ended the review period much in the same way they began it — wondering whether the market would rally again or if risk aversion was here to stay. Despite the volatility, the S&P 500 Index posted gains in the six-month period.
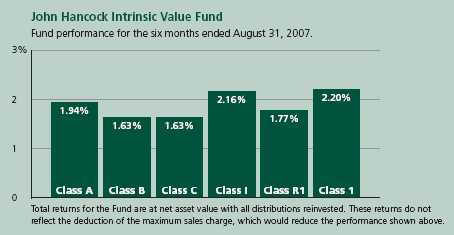
Looking at performance
For the six months ended August 31, 2007, John Hancock Intrinsic Value Fund’s Class A, Class B, Class C, Class I, Class R1 and Class 1 shares returned 1.94%, 1.63%, 1.63%, 2.16%, 1.77% and 2.20%, respectively, at net asset value. By comparison, the Russell 1000 Value Index returned 2.76%, while the average large value fund monitored by Morningstar, Inc. gained 3.81% .1 Keep in mind that your returns will differ from those listed above if you were not invested in the Fund for the entire period or did not reinvest all distributions. See pages six and seven for historical performance information.
“Despite the volatility, the S&P
500 Index posted gains in the
six-month period.”
In a generally rising market, our primary stock selection tools — valuation and momentum — performed differently. Valuation, which determines the positioning for the majority of this Fund’s assets, was the key driver of the relative performance shortfall. The late-period market turmoil notwithstanding, the period as a whole was dominated by strong investor appetite for risky, lower-quality stocks — securities that our valuation discipline found overvalued. The lower-risk, higher-quality securities that our valuation discipline found attractive underperformed for much of the period in a risk-oriented market. While these higher-quality selections fared better later in the period as risk aversion returned, they still finished the period in negative territory.
Intrinsic Value Fund
3
Our momentum discipline was able to capitalize on the rising broad market. The discipline is designed to identify stocks that have performed well recently and appear poised to continue outperforming. With this orientation, the momentum discipline was able to add value during the period by selecting many of the leading performers and following their outperformance. The discipline also benefited from its underweight position in financial company stocks, leaving it less exposed to the spreading troubles from subprime mortgages.
Services, retail and manufacturing limit gains
The sector detracting most from performance during the period was services, where our stock selection negatively impacted the Fund’s returns. For example, an overweight position in Gannett Company, Inc. detracted from relative returns as shares fell after an earnings report triggered worries about the state of the company’s newspaper business. Our valuation model continues to find the company attractive and maintains its overweight position.
Retail was another sector detracting from the Fund’s performance because of our overweight position. For example, an overweight position in Wal-Mart Stores, Inc. detracted from relative returns as shares fell amid short-term concerns about a lower quarterly profit report. Home Depot, Inc. also struggled during the period, as worries about weakness in the housing sector sent shares lower. Our valuation model continues to find each of these high-quality companies attractive and maintains overweight positions in both.
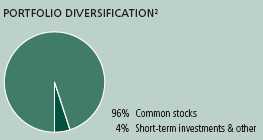
| SECTOR DISTRIBUTION2 | |
| Financial | 23% |
| Consumer non-cyclical | 18% |
| Consumer cyclical | 16% |
| Energy | 13% |
| Communications | 10% |
| Technology | 5% |
| Industrial | 4% |
| Government | 2% |
| Basic materials | 2% |
| Mortgage securities | 1% |
Also detracting from performance was the manufacturing sector. Our underweight position drove the negative relative returns. An underweight in General Electric Company was particularly detrimental, as the company’s shares advanced during the period after it reported strong quarterly earnings and increased its stock buyback plan.
Technology and financials add value
On the positive side, our aversion to risky companies did pay off in certain sectors. In particular, as we mentioned earlier, our underweight position in the financial sector was helpful to returns, as we were able to add value during the period
Intrinsic Value Fund
4
by owning less of this risky sector as troubles in the credit market stemming from subprime mortgages drove financial shares lower. For example, having either underweighted or no positions in JPMorgan Chase & Company and Lehman Brothers Holdings added value in a period in which investors sold off financial companies. Though some of our financial holdings, like National City Corp., detracted from returns, the underweight position made this sector a strong contributor to overall relative returns. Another sector adding to relative returns was technology, where strong stock selection helped add value. One strong performer was our overweight of Intel Corp., as the company’s shares rose during a period in which large-cap technology stocks were among the market leaders.
“Valuation, which determines
the positioning for the majority
of this Fund’s assets, was
the key driver of the relative
performance shortfall.”
Outlook
The market volatility at the end of the period left investors wondering if the bull market has finally come to an end. The upcoming months will show whether the market’s recent trend toward risk aversion — especially in the troubled sub-prime mortgage sector — will persist or if risk-taking will resume in full force. The Fund remains overweight in higher-quality stocks and we believe it is well positioned to face further volatility in the market.
This commentary reflects the views of the portfolio management team through the end of the Fund’s period discussed in this report. The team’s statements reflect their own opinions. As such, they are in no way guarantees of future events and are not intended to be used as investment advice or a recommendation regarding any specific security. They are also subject to change at any time as market and other conditions warrant.
1 Figures from Morningstar, Inc. include reinvested dividends and do not take into account sales charges. Actual load-adjusted performance is lower.
2 As a percentage of net assets on August 31, 2007.
Intrinsic Value Fund
5
A look at performance
For the periods ended August 31, 2007
| Average annual returns | Cumulative total returns | |||||||||
| with maximum sales charge (POP) | with maximum sales charge (POP) | |||||||||
| Inception | Since | Since | ||||||||
| Class | date | 1-year | 5-year | 10-year | inception | 6-month | 1-year | 5-year | 10-year | inception |
| A | 6-12-06 | 4.28% | — | — | 9.33% | –3.14% | 4.28% | — | — | 11.57% |
| B | 6-12-06 | 4.02 | — | — | 10.06 | –3.37 | 4.02 | — | — | 12.49 |
| C | 6-12-06 | 8.07 | — | — | 13.24 | 0.63 | 8.07 | — | — | 16.49 |
| I1 | 6-12-06 | 10.23 | — | — | 14.43 | 2.16 | 10.23 | — | — | 18.00 |
| R1 1 | 6-12-06 | 9.37 | — | — | 13.58 | 1.77 | 9.37 | — | — | 16.91 |
| 11 | 6-12-06 | 10.25 | — | — | 14.50 | 2.20 | 10.25 | — | — | 18.07 |
Performance figures assume all distributions are reinvested. Public offering price (POP) figures reflect maximum sales charge on Class A shares of 5%, and the applicable contingent deferred sales charge (CDSC) on Class B and Class C shares. The Class B shares’ CDSC declines annually between years 1 to 6 according to the following schedule 5, 4, 3, 3, 2, 1%. No sales charge will be assessed after the sixth year. Class C shares held for less than one year are subject to a 1% CDSC. Sales charge is not applicable for Class I, Class R1 and Class 1 shares.
The expense ratios of the Fund, both net (including any fee waivers or expense limitations) and gross (excluding any fee waivers or expense limitations), are set forth according to the most recent publicly available Prospectuses for the Fund and may differ from the expense ratios disclosed in the Financial Highlights tables in this report. The waivers and expense limitations are contractual at least until 6-30-08. The net expenses are as follows: Class A — 1.34%, Class B — 2.04%, Class C — 2.04%, Class I — 0.95%, Class R1 — 1.69%, Class 1 — 0.90% . Had the fee waivers and expense limitations not been in place, the gross expenses would be as follows: Class A — 1.94%, Class B — 9.00%, Class C — 10.08%, Class I — 17.60%, Class R1 — 20.85%, Class 1 — 1.44% .
The returns reflect past results and should not be considered indicative of future performance. The return and principal value of an investment will fluctuate so that shares, when redeemed, may be worth more or less than their original cost. Due to market volatility, the Fund’s current performance may be higher or lower than the performance shown. For performance data current to the most recent month-end, please call 1-800-225-5291 or visit the Fund’s Web site at www.jhfunds.com.
The performance table above and the chart on the next page do not reflect the deduction of taxes that a shareholder would pay on fund distributions or the redemption of fund shares.
The Fund’s performance results reflect any applicable expense reductions, without which the expenses increase and results would have been less favorable.
Performance is calculated with an opening price (prior day’s close) on the inception date.
1 For certain types of investors as described in the Fund’s Class I, Class R1 and Class 1 share prospectuses.
Intrinsic Value Fund
6
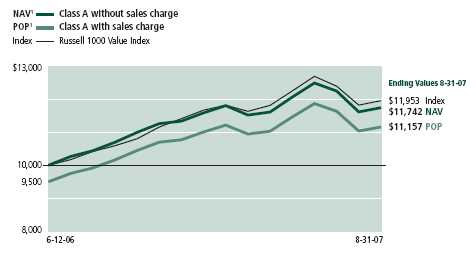
Growth of $10,000
This chart shows what happened to a hypothetical $10,000 investment in Intrinsic Value Fund Class A shares for the period indicated. For comparison, we’ve shown the same investment in the Russell 1000 Value Index.
| With maximum | ||||
| Class | Period beginning | Without sales charge | sales charge | Index |
| B | 6-12-06 | $11,649 | $11,249 | $11,953 |
| C2 | 6-12-06 | 11,649 | 11,649 | 11,953 |
| I3 | 6-12-06 | 11,800 | 11,800 | 11,953 |
| R1 3 | 6-12-06 | 11,691 | 11,691 | 11,953 |
| 13 | 6-12-06 | 11,807 | 11,807 | 11,953 |
Assuming all distributions were reinvested for the period indicated, the table above shows the value of a $10,000 investment in the Fund’s Class B, Class C, Class I, Class R1 and Class 1 shares, respectively, as of August 31, 2007. Performance of the classes will vary based on the difference in sales charges paid by shareholders investing in the different classes and the fee structure of those classes.
Russell 1000 Value Index is an unmanaged index containing those securities in the Russell 1000 Index with a less-than-average growth orientation.
It is not possible to invest directly in an index. Index figures do not reflect sales charges, which would have resulted in lower values if they did.
1 NAV represents net asset value and POP represents public offering price.
2 No contingent deferred sales charge applicable.
3 For certain types of investors as described in the Fund’s Class I, Class R1 and Class 1 share prospectuses.
Intrinsic Value Fund
7
Your expenses
These examples are intended to help you understand your ongoing operating expenses.
Understanding fund expenses
As a shareholder of the Fund, you incur two types of costs:
■ Transaction costs which include sales charges (loads) on purchases or redemptions (varies by share class), minimum account fee charge, etc.
■ Ongoing operating expenses including management fees, distribution and service fees (if applicable) and other fund expenses.
We are going to present only your ongoing operating expenses here.
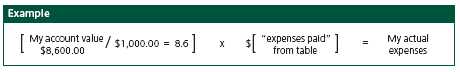
Actual expenses/actual returns
This example is intended to provide information about your fund’s actual ongoing operating expenses, and is based on your fund’s actual return. It assumes an account value of $1,000.00 on March 1, 2007, with the same investment held until August 31, 2007.
| Account value | Ending value | Expenses paid during period | |
| on 3-1-07 | on 8-31-07 | ended 8-31-071 | |
| Class A | $1,000.00 | $1,019.40 | $6.85 |
| Class B | 1,000.00 | 1,016.30 | 10.44 |
| Class C | 1,000.00 | 1,016.30 | 10.44 |
| Class I | 1,000.00 | 1,021.60 | 4.83 |
| Class R1 | 1,000.00 | 1,017.70 | 8.67 |
| Class 1 | 1,000.00 | 1,022.00 | 4.57 |
Together with the value of your account, you may use this information to estimate the operating expenses that you paid over the period. Simply divide your account value at August 31, 2007 by $1,000.00, then multiply it by the “expenses paid” for your share class from the table above. For example, for an account value of $8,600.00, the operating expenses should be calculated as follows:
Intrinsic Value Fund
8
Hypothetical example for comparison purposes
This table allows you to compare your fund’s ongoing operating expenses with those of any other fund. It provides an example of the Fund’s hypothetical account values and hypothetical expenses based on each class’s actual expense ratio and an assumed 5% annualized return before expenses (which is not your fund’s actual return). It assumes an account value of $1,000.00 on March 1, 2007, with the same investment held until August 31, 2007. Look in any other fund shareholder report to find its hypothetical example and you will be able to compare these expenses.
| Account value | Ending value | Expenses paid during period | |
| on 3-1-07 | on 8-31-07 | ended 8-31-07 1 | |
| Class A | $1,000.00 | $1,018.35 | $6.85 |
| Class B | 1,000.00 | 1,014.78 | 10.43 |
| Class C | 1,000.00 | 1,014.78 | 10.43 |
| Class I | 1,000.00 | 1,020.36 | 4.82 |
| Class R1 | 1,000.00 | 1,016.54 | 8.67 |
| Class 1 | 1,000.00 | 1,020.61 | 4.57 |
Remember, these examples do not include any transaction costs, such as sales charges; therefore, these examples will not help you to determine the relative total costs of owning different funds. If transaction costs were included, your expenses would have been higher. See the prospectus for details regarding transaction costs.
1 Expenses are equal to the Fund’s annualized expense ratio of 1.35%, 2.06%, 2.06%, 0.95%, 1.71% and 0.90% for Class A, Class B, Class C, Class I, Class R1, and Class 1 respectively, multiplied by the average account value over the period, multiplied by the number of days in the inception period /365 or 366 (to reflect the one-half year period).
Intrinsic Value Fund
9
F I N A N C I A L S T A T E M E N T S
Fund’s investments
Securities owned by the Fund on 8-31-07 (unaudited)
This schedule is divided into three main categories: common stocks, short-term investments and repurchase agreements. Common stocks are further broken down by industry group. Repurchase agreements, which represent the Fund’s cash position, are listed last.
| Issuer | Shares | Value |
| Common stocks 95.95% | $20,591,726 | |
| (Cost $19,365,375) | ||
| Aerospace 0.56% | 120,698 | |
| General Dynamics Corp. | 700 | 54,992 |
| Northrop Grumman Corp. | 600 | 47,304 |
| Raytheon Company | 300 | 18,402 |
| Aluminum 0.15% | 32,877 | |
| Alcoa, Inc. | 900 | 32,877 |
| Apparel & Textiles 1.14% | 245,012 | |
| Cintas Corp. | 300 | 10,995 |
| Coach, Inc. * | 400 | 17,812 |
| Jones Apparel Group, Inc. | 1,400 | 26,866 |
| Liz Claiborne, Inc. | 1,800 | 61,506 |
| Mohawk Industries, Inc. * | 200 | 17,462 |
| NIKE, Inc., Class B | 400 | 22,536 |
| VF Corp. | 1,100 | 87,835 |
| Auto Parts 0.53% | 114,132 | |
| Autoliv, Inc. | 500 | 28,685 |
| AutoZone, Inc. * | 300 | 36,387 |
| Johnson Controls, Inc. | 200 | 22,620 |
| O’Reilly Automotive, Inc. * | 400 | 14,216 |
| TRW Automotive Holdings Corp. * | 400 | 12,224 |
| Auto Services 0.42% | 90,909 | |
| AutoNation, Inc. * | 3,200 | 60,736 |
| Avis Budget Group, Inc. * | 1,300 | 30,173 |
| Automobiles 1.90% | 407,657 | |
| Ford Motor Company * | 23,000 | 179,630 |
| General Motors Corp. | 3,800 | 116,812 |
| PACCAR, Inc. | 1,300 | 111,215 |
| Banking 5.43% | 1,165,229 | |
| Bank of America Corp. | 8,600 | 435,848 |
| BB&T Corp. | 2,200 | 87,406 |
| Comerica, Inc. | 2,200 | 122,716 |
See notes to financial statements
Intrinsic Value Fund
10
F I N A N C I A L S T A T E M E N T S
| Issuer | Shares | Value |
| Banking (continued) | ||
| Downey Financial Corp. | 200 | $11,318 |
| Fifth Third Bancorp | 1,100 | 39,259 |
| First Horizon National Corp. (a) | 1,400 | 42,952 |
| Huntington BancShares, Inc. | 1,000 | 17,210 |
| KeyCorp | 2,500 | 83,250 |
| National City Corp. | 8,000 | 215,280 |
| US Bancorp | 3,400 | 109,990 |
| Broadcasting 0.66% | 141,621 | |
| CBS Corp., Class B | 3,200 | 100,832 |
| Liberty Media Corp. — Capital, Series A * | 300 | 32,697 |
| News Corp., Class A | 400 | 8,092 |
| Building Materials & Construction 0.41% | 87,588 | |
| American Standard Companies, Inc. | 400 | 14,732 |
| Masco Corp. | 2,800 | 72,856 |
| Business Services 0.94% | 201,495 | |
| Affiliated Computer Services, Inc., Class A * | 500 | 25,015 |
| Computer Sciences Corp. * | 500 | 27,975 |
| First Data Corp. | 1,200 | 39,864 |
| Fiserv, Inc. * | 600 | 27,912 |
| Moody’s Corp. | 200 | 9,170 |
| NCR Corp. * | 200 | 9,954 |
| Pitney Bowes, Inc. | 700 | 31,269 |
| R.R. Donnelley & Sons Company | 600 | 21,492 |
| Unisys Corp. * | 1,200 | 8,844 |
| Cable and Television 1.13% | 241,610 | |
| Comcast Corp., Class A * | 3,950 | 103,056 |
| Time Warner, Inc. | 7,300 | 138,554 |
| Chemicals 1.17% | 251,263 | |
| Albemarle Corp. | 600 | 24,282 |
| Dow Chemical Company | 1,900 | 80,997 |
| Eastman Chemical Company | 400 | 26,704 |
| Lubrizol Corp. | 200 | 12,716 |
| Lyondell Chemical Company | 400 | 18,544 |
| PPG Industries, Inc. | 1,200 | 88,020 |
| Colleges & Universities 0.33% | 70,650 | |
| Career Education Corp. * | 900 | 26,730 |
| ITT Educational Services, Inc. * | 400 | 43,920 |
| Computers & Business Equipment 3.14% | 674,224 | |
| CDW Corp. * | 200 | 17,214 |
| Cisco Systems, Inc. * | 2,700 | 86,184 |
| Dell, Inc. * | 5,300 | 149,725 |
| EMC Corp. * | 2,900 | 57,014 |
See notes to financial statements
Intrinsic Value Fund
11
F I N A N C I A L S T A T E M E N T S
| Issuer | Shares | Value |
| Computers & Business Equipment (continued) | ||
| Hewlett-Packard Company | 1,800 | $88,830 |
| Ingram Micro, Inc., Class A * | 1,600 | 31,424 |
| International Business Machines Corp. (a) | 1,500 | 175,035 |
| Lexmark International, Inc. * | 800 | 29,808 |
| Tech Data Corp. * | 1,000 | 38,990 |
| Construction Materials 0.21% | 45,743 | |
| Louisiana-Pacific Corp. (a) | 600 | 11,238 |
| Sherwin-Williams Company | 500 | 34,505 |
| Cosmetics & Toiletries 0.34% | 73,198 | |
| International Flavors & Fragrances, Inc. | 500 | 25,115 |
| Kimberly-Clark Corp. | 700 | 48,083 |
| Crude Petroleum & Natural Gas 0.70% | 149,318 | |
| Apache Corp. | 400 | 30,952 |
| Devon Energy Corp. | 700 | 52,717 |
| Occidental Petroleum Corp. | 900 | 51,021 |
| Sunoco, Inc. | 200 | 14,628 |
| Electrical Utilities 1.05% | 225,075 | |
| American Electric Power Company, Inc. | 1,200 | 53,376 |
| CenterPoint Energy, Inc. (a) | 600 | 9,732 |
| CMS Energy Corp. | 600 | 9,792 |
| Edison International | 500 | 26,355 |
| Entergy Corp. | 900 | 93,258 |
| Pinnacle West Capital Corp. | 300 | 11,952 |
| Xcel Energy, Inc. | 1,000 | 20,610 |
| Electronics 0.31% | 66,990 | |
| Arrow Electronics, Inc. * | 400 | 16,784 |
| Avnet, Inc. * | 600 | 23,586 |
| Synopsys, Inc. * | 400 | 10,928 |
| Tyco Electronics, Ltd. * | 450 | 15,692 |
| Energy 0.05% | 11,006 | |
| Sempra Energy | 200 | 11,006 |
| Financial Services 11.99% | 2,573,779 | |
| American Capital Strategies, Ltd. (a) | 300 | 12,387 |
| AmeriCredit Corp. * | 600 | 10,386 |
| Bank of New York Mellon Corp. | 1,115 | 45,079 |
| Citigroup, Inc. | 21,500 | 1,007,920 |
| Countrywide Financial Corp. | 1,600 | 31,760 |
| Discover Financial Services * | 2,200 | 50,908 |
| Federal Home Loan Mortgage Corp. | 4,600 | 283,406 |
| Federal National Mortgage Association | 8,000 | 524,880 |
| JP Morgan Chase & Company | 2,600 | 115,752 |
| Merrill Lynch & Company, Inc. | 1,500 | 110,550 |
| Morgan Stanley (c) | 4,000 | 249,480 |
See notes to financial statements
Intrinsic Value Fund
12
F I N A N C I A L S T A T E M E N T S
| Issuer | Shares | Value |
| Financial Services (continued) | ||
| PNC Financial Services Group, Inc. | 300 | $21,111 |
| Washington Mutual, Inc. | 3,000 | 110,160 |
| Food & Beverages 2.60% | 558,785 | |
| Coca-Cola Enterprises, Inc. | 1,100 | 26,202 |
| ConAgra Foods, Inc. | 2,200 | 56,562 |
| Corn Products International, Inc. | 300 | 13,560 |
| General Mills, Inc. | 700 | 39,116 |
| Kraft Foods, Inc., Class A | 5,022 | 161,005 |
| Pepsi Bottling Group, Inc. | 700 | 24,213 |
| PepsiAmericas, Inc. | 500 | 14,800 |
| Pilgrim’s Pride Corp. | 300 | 12,177 |
| Sara Lee Corp. | 2,600 | 43,212 |
| The Coca-Cola Company | 1,600 | 86,048 |
| Tyson Foods, Inc., Class A | 3,800 | 81,890 |
| Forest Products 0.16% | 34,085 | |
| Weyerhaeuser Company | 500 | 34,085 |
| Gas & Pipeline Utilities 0.04% | 9,420 | |
| NiSource, Inc. | 500 | 9,420 |
| Healthcare Products 1.07% | 230,385 | |
| Bausch & Lomb, Inc. | 100 | 6,320 |
| Covidien, Ltd. * | 450 | 17,924 |
| Johnson & Johnson | 1,100 | 67,969 |
| Patterson Companies, Inc. * | 600 | 22,068 |
| Stryker Corp. | 800 | 53,440 |
| Zimmer Holdings, Inc. * | 800 | 62,664 |
| Healthcare Services 2.70% | 578,807 | |
| Cardinal Health, Inc. | 1,400 | 95,732 |
| Coventry Health Care, Inc. * | 200 | 11,474 |
| Express Scripts, Inc. * | 1,000 | 54,750 |
| Lincare Holdings, Inc. * | 600 | 21,594 |
| McKesson Corp. | 3,400 | 194,514 |
| Medco Health Solutions, Inc. * | 300 | 25,635 |
| Quest Diagnostics, Inc. | 600 | 32,850 |
| UnitedHealth Group, Inc. | 2,200 | 110,022 |
| WellPoint, Inc. * | 400 | 32,236 |
| Holdings Companies/Conglomerates 1.76% | 377,039 | |
| General Electric Company | 9,700 | 377,039 |
| Homebuilders 0.67% | 144,130 | |
| Centex Corp. | 1,100 | 31,801 |
| D.R. Horton, Inc. | 500 | 7,555 |
| KB Home (a) | 700 | 21,238 |
| Lennar Corp., Class A (a) | 1,200 | 33,924 |
See notes to financial statements
Intrinsic Value Fund
13
F I N A N C I A L S T A T E M E N T S
| Issuer | Shares | Value |
| Homebuilders (continued) | ||
| M.D.C. Holdings, Inc. | 400 | $17,796 |
| Pulte Homes, Inc. | 500 | 8,320 |
| Toll Brothers, Inc. * | 1,100 | 23,496 |
| Hotels & Restaurants 1.03% | 220,040 | |
| McDonald’s Corp. | 4,300 | 211,775 |
| Starbucks Corp. * | 300 | 8,265 |
| Household Products 0.15% | 31,779 | |
| Energizer Holdings, Inc. * | 300 | 31,779 |
| Industrial Machinery 0.16% | 35,431 | |
| Deere & Company | 100 | 13,606 |
| Ingersoll-Rand Company, Class A | 200 | 10,386 |
| Pall Corp. | 300 | 11,439 |
| Insurance 9.18% | 1,969,294 | |
| ACE, Ltd. | 500 | 28,880 |
| Aetna, Inc. | 2,900 | 147,639 |
| AFLAC, Inc. | 1,900 | 101,289 |
| Allstate Corp. | 6,300 | 344,925 |
| Ambac Financial Group, Inc. | 800 | 50,256 |
| American International Group, Inc. | 5,800 | 382,800 |
| Chubb Corp. | 300 | 15,339 |
| CIGNA Corp. | 1,200 | 62,016 |
| Commerce Group, Inc. | 400 | 12,752 |
| Conseco, Inc. * | 1,200 | 16,872 |
| First American Corp. | 700 | 29,281 |
| Hartford Financial Services Group, Inc. | 300 | 26,673 |
| Lincoln National Corp. | 100 | 6,088 |
| MBIA, Inc. | 1,500 | 90,000 |
| MetLife, Inc. | 900 | 57,645 |
| MGIC Investment Corp. | 800 | 24,128 |
| Nationwide Financial Services, Inc., Class A | 400 | 21,408 |
| Old Republic International Corp. | 1,600 | 29,104 |
| PMI Group, Inc. | 1,000 | 31,680 |
| Progressive Corp. | 2,100 | 42,714 |
| Protective Life Corp. | 400 | 16,720 |
| Prudential Financial, Inc. | 800 | 71,824 |
| Radian Group, Inc. | 600 | 10,584 |
| SAFECO Corp. | 800 | 46,416 |
| The Travelers Companies, Inc. | 3,200 | 161,728 |
| Torchmark Corp. | 900 | 55,404 |
| Transatlantic Holdings, Inc. | 200 | 14,166 |
| UnumProvident Corp. | 2,900 | 70,963 |
See notes to financial statements
Intrinsic Value Fund
14
F I N A N C I A L S T A T E M E N T S
| Issuer | Shares | Value |
| International Oil 11.88% | $2,550,680 | |
| Anadarko Petroleum Corp. | 1,100 | 53,878 |
| Chevron Corp. | 6,500 | 570,440 |
| ConocoPhillips | 2,900 | 237,481 |
| Exxon Mobil Corp. | 19,700 | 1,688,881 |
| Internet Retail 0.11% | 23,262 | |
| Expedia, Inc. * | 500 | 14,925 |
| IAC/InterActiveCorp. * | 300 | 8,337 |
| Internet Software 0.05% | 10,725 | |
| McAfee, Inc. * | 300 | 10,725 |
| Leisure Time 0.41% | 88,505 | |
| Brunswick Corp. | 800 | 20,120 |
| Carnival Corp. | 1,500 | 68,385 |
| Liquor 0.23% | 49,400 | |
| Anheuser-Busch Companies, Inc. | 1,000 | 49,400 |
| Manufacturing 0.52% | 110,813 | |
| Danaher Corp. | 400 | 31,064 |
| Harley-Davidson, Inc. | 800 | 43,032 |
| Honeywell International, Inc. | 300 | 16,845 |
| Tyco International, Ltd. | 450 | 19,872 |
| Medical-Hospitals 0.14% | 30,273 | |
| Tenet Healthcare Corp. * | 2,700 | 9,153 |
| Universal Health Services, Inc., Class B | 400 | 21,120 |
| Office Furnishings & Supplies 0.07% | 14,208 | |
| OfficeMax, Inc. | 400 | 14,208 |
| Petroleum Services 0.13% | 27,404 | |
| Valero Energy Corp. | 400 | 27,404 |
| Pharmaceuticals 7.76% | 1,665,449 | |
| Abbott Laboratories | 700 | 36,337 |
| AmerisourceBergen Corp. | 2,400 | 114,840 |
| Forest Laboratories, Inc. * | 1,700 | 63,971 |
| King Pharmaceuticals, Inc. * | 1,400 | 21,042 |
| Merck & Company, Inc. | 13,100 | 657,227 |
| Pfizer, Inc. | 30,600 | 760,104 |
| Watson Pharmaceuticals, Inc. * | 400 | 11,928 |
| Photography 0.19% | 40,005 | |
| Eastman Kodak Company | 1,500 | 40,005 |
| Publishing 1.18% | 253,216 | |
| Gannett Company, Inc. | 3,600 | 169,200 |
| McGraw-Hill Companies, Inc. | 400 | 20,184 |
| The New York Times Company, Class A (a) | 1,400 | 30,772 |
| Tribune Company | 1,200 | 33,060 |
See notes to financial statements
Intrinsic Value Fund
15
F I N A N C I A L S T A T E M E N T S
| Issuer | Shares | Value |
| Real Estate 0.25% | $52,811 | |
| Annaly Capital Management, Inc., REIT | 2,300 | 32,407 |
| iStar Financial, Inc., REIT | 300 | 10,980 |
| Thornburg Mortgage, Inc., REIT (a) | 800 | 9,424 |
| Retail Grocery 1.98% | 424,901 | |
| Safeway, Inc. | 5,500 | 174,515 |
| SUPERVALU, Inc. | 1,400 | 59,010 |
| The Kroger Company | 7,200 | 191,376 |
| Retail Trade 9.16% | 1,965,218 | |
| Abercrombie & Fitch Company, Class A | 200 | 15,740 |
| American Eagle Outfitters, Inc. | 400 | 10,332 |
| Bed Bath & Beyond, Inc. * | 800 | 27,712 |
| Big Lots, Inc. * | 900 | 26,793 |
| BJ’s Wholesale Club, Inc. * | 900 | 31,500 |
| Dillard’s, Inc., Class A | 100 | 2,374 |
| Dollar Tree Stores, Inc. * | 1,700 | 73,865 |
| Family Dollar Stores, Inc. | 1,200 | 35,136 |
| Foot Locker, Inc. | 500 | 8,355 |
| Gap, Inc. | 2,600 | 48,776 |
| Home Depot, Inc. | 15,300 | 586,143 |
| Kohl’s Corp. * | 900 | 53,370 |
| Lowe’s Companies, Inc. | 8,900 | 276,434 |
| Rite Aid Corp. *(a) | 6,300 | 31,941 |
| Staples, Inc. | 1,100 | 26,125 |
| Target Corp. | 2,400 | 158,232 |
| The TJX Companies, Inc. | 700 | 21,343 |
| Tiffany & Company | 200 | 10,266 |
| Walgreen Company | 1,100 | 49,577 |
| Wal-Mart Stores, Inc. | 10,800 | 471,204 |
| Semiconductors 1.46% | 313,332 | |
| Intel Corp. | 10,000 | 257,500 |
| KLA-Tencor Corp. | 400 | 22,988 |
| Novellus Systems, Inc. * | 1,200 | 32,844 |
| Software 0.50% | 108,156 | |
| Compuware Corp. * | 2,000 | 16,220 |
| Microsoft Corp. | 3,200 | 91,936 |
| Telecommunications Equipment & Services 3.84% | 824,156 | |
| Polycom, Inc. * | 800 | 24,248 |
| Verizon Communications, Inc. | 19,100 | 799,908 |
See notes to financial statements
Intrinsic Value Fund
16
F I N A N C I A L S T A T E M E N T S
| Issuer | Shares | Value |
| Telephone 2.57% | $550,607 | |
| AT&T, Inc. | 12,727 | 507,425 |
| CenturyTel, Inc. | 900 | 43,182 |
| Tires & Rubber 0.04% | 8,298 | |
| Goodyear Tire & Rubber Company * | 300 | 8,298 |
| Tobacco 0.60% | 129,657 | |
| Altria Group, Inc. | 1,300 | 90,233 |
| UST, Inc. | 800 | 39,424 |
| Toys, Amusements & Sporting Goods 0.44% | 94,605 | |
| Hasbro, Inc. | 900 | 25,389 |
| Mattel, Inc. | 3,200 | 69,216 |
| Trucking & Freight 0.36% | 76,776 | |
| FedEx Corp. | 700 | 76,776 |
| Principal | ||
| Issuer, description, maturity date | amount | Value |
| Short-term investments 0.83% | $178,406 | |
| (Cost $178,406) | ||
| John Hancock Cash Investment Trust (c) | $178,406 | 178,406 |
| Repurchase agreements 3.89% | $836,000 | |
| (Cost $836,000) | ||
| Repurchase Agreement with State Street Corp. dated 08-31-07 at | ||
| 4.60% to be repurchased at $836,427 on 09-04-07, collateralized | ||
| by $885,000 FederalHome Loan Mortgage Corp., 4.00%, due | ||
| 06-12-13 (valued at $854,025, including interest) | $836,000 | 836,000 |
| Total investments (Cost $20,379,781) 100.67% | $21,606,132 | |
| Other assets in excess of liabilities (0.67%) | (144,621) | |
| Total net assets 100.00% | $21,461,511 | |
Percentages are stated as a percent of net assets.
REIT Real Estate Investment Trust
* Non-income-producing.
(a) All or a portion of this security was out on loan.
(c) Investment is an affiliate of the Trust’s adviser or subadviser.
See notes to financial statements
Intrinsic Value Fund
17
F I N A N C I A L S T A T E M E N T S
Financial statements
Statement of assets and liabilities 8-31-07 (unaudited)
This Statement of Assets and Liabilities is the Fund’s balance sheet. It shows the value of what the Fund owns, is due and owes. You’ll also find the net asset value and the maximum offering price per share.
| Assets | |
| Investments, at value (cost $19,365,375) | |
| including $174,908 of securities loaned (Note 2) | $20,591,726 |
| Repurchase agreement, at value (cost $836,000) | 836,000 |
| Investments in affiliated issuers, at value (cost $178,406) | 178,406 |
| Total investments, at value (cost $20,379,781) | 21,606,132 |
| Cash | 85 |
| Cash collateral at broker for futures contracts | 40,000 |
| Receivable for fund shares sold | 12,865 |
| Dividends and interest receivable | 47,353 |
| Receivable for futures variation margin | 6,040 |
| Receivable due from adviser | 43,329 |
| Other assets | 6,761 |
| Total assets | 21,762,565 |
| Liabilities | |
| Payable for fund shares repurchased | 93,762 |
| Payable upon return of securities loaned (Note 2) | 178,406 |
| Payable to affiliates | |
| Fund administration fees | 42 |
| Transfer agent fees | 266 |
| Distribution and service fees | 347 |
| Other payables and accrued expenses | 28,231 |
| Total liabilities | 301,054 |
| Net assets | |
| Capital paid-in | $18,978,631 |
| Undistributed net investment income | 155,850 |
| Accumulated undistributed net realized gain on | |
| investments and future contracts | 1,119,686 |
| Net unrealized appreciation on investments and future contracts | 1,207,344 |
| Net assets | $21,461,511 |
See notes to financial statements
Intrinsic Value Fund
18
F I N A N C I A L S T A T E M E N T S
Statement of assets and liabilities (continued)
| Net asset value per share | |
| Based on net asset values and shares outstanding — the Fund has an | |
| unlimited number of shares authorized with no par value. | |
| Class A ($20,242,210 ÷ 875,426 shares) | $23.12 |
| Class B ($431,204 ÷ 18,743 shares)1 | $23.01 |
| Class C ($396,951 ÷ 17,254 shares)1 | $23.01 |
| Class I ($155,385 ÷ 6,700 shares) | $23.19 |
| Class R1 ($117,690 ÷ 5,109 shares) | $23.032 |
| Class 1($118,071 ÷ 5,090 shares) | $23.20 |
| Maximum offering price per share | |
| Class A3 ($23.12 ÷ 95%) | $24.34 |
1 Redemption price per share is equal to the net asset value less any applicable contingent deferred sales charge.
2 Net assets and shares outstanding have been rounded for presentation purposes. The net asset value is as reported August 31, 2007.
3 On single retail sales of less than $50,000. On sales of $50,000 or more and on group sales the offering price is reduced.
See notes to financial statements
Intrinsic Value Fund
19
F I N A N C I A L S T A T E M E N T S
Statement of operations For the period ended 8-31-07 (unaudited)1
This Statement of Operations summarizes the Fund’s investment income earned and expenses incurred in operating the Fund. It also shows net gains (losses) for the period stated.
| Investment income | |
| Dividends | $243,172 |
| Interest | 19,461 |
| Total investment income | 262,633 |
| Expenses | |
| Investment management fees (Note 3) | 85,434 |
| Distribution and service fees (Note 3) | 35,585 |
| Transfer agent fees (Note 3) | 8,281 |
| Fund administration fees (Note 3) | 3,061 |
| Audit and legal fees | 52,631 |
| Blue sky fees (Note 3) | 45,994 |
| Custodian fees | 12,056 |
| Registration and filing fees | 11,622 |
| Printing and postage fees (Note 3) | 5,196 |
| Trustees’ fees (Note 3) | 612 |
| Miscellaneous | 200 |
| Total expenses | 260,672 |
| Less expense reductions (Note 3) | (110,303) |
| Net expenses | 150,369 |
| Net investment income | 112,264 |
| Realized and unrealized gain (loss) | |
| Net realized gain on | |
| Investments | 742,043 |
| Futures contracts | 41,072 |
| 783,115 | |
| Change in net unrealized appreciation (depreciation) of | |
| Investments | (496,100) |
| Futures contracts | (15,650) |
| (511,750) | |
| Net realized and unrealized gain | 271,365 |
| Increase in net assets from operations | $383,629 |
1 Semiannual period from 3-1-07 to 8-31-07.
See notes to financial statements
Intrinsic Value Fund
20
F I N A N C I A L S T A T E M E N T S
Statement of changes in net assets
These Statements of Changes in Net Assets show how the value of the Fund’s net assets has changed during the last two periods. The difference reflects earnings less expenses, any investment gains and losses, distributions, if any, paid to shareholders and the net of Fund share transactions.
| Period | Period | |
| ended | ended | |
| 2-28-071 | 8-31-072 | |
| Increase (decrease) in net assets | ||
| From operations | ||
| Net investment income | $143,510 | $112,264 |
| Net realized gain | 526,061 | 783,115 |
| Change in net unrealized appreciation (depreciation) | 1,719,094 | (511,750) |
| Increase in net assets resulting from operations | 2,388,665 | 383,629 |
| Distributions to shareholders | ||
| From net investment income | ||
| Class A | (108,035) | — |
| Class B | (1,017) | — |
| Class C | (762) | — |
| Class I | (985) | — |
| Class R1 | (620) | — |
| Class 1 | (914) | — |
| From net realized gain | ||
| Class A | (179,361) | — |
| Class B | (3,802) | — |
| Class C | (2,850) | — |
| Class I | (1,241) | — |
| Class R1 | (1,118) | — |
| Class 1 | (1,118) | — |
| Total distributions | (301,823) | — |
| From Fund share transactions | 18,224,388 | 766,652 |
| Total increase | 20,311,230 | 1,150,281 |
| Net assets | ||
| Beginning of period | — | 20,311,230 |
| End of period3 | $20,311,230 | $21,461,511 |
1 Period from 6-12-06 (commencement of operations) to 2-28-07.
2 Semiannual period from 3-1-07 to 8-31-07. Unaudited.
3 Includes undistributed net investment income of $43,586 and $155,850, respectively.
See notes to financial statements
Intrinsic Value Fund
21
F I N A N C I A L S T A T E M E N T S
Financial highlights
The Financial Highlights show how the Fund’s net asset value for a share has changed since the end of the previous period.
| CLASS A SHARES | ||
| Period ended | 2-28-071 | 8-31-072 |
| Per share operating performance | ||
| Net asset value, beginning of period | $20.00 | 22.68 |
| Net investment income3 | 0.18 | 0.12 |
| Net realized and unrealized | ||
| gain on investments | 2.85 | 0.32 |
| Total from investment operations | 3.03 | 0.44 |
| Less distributions | ||
| From net investment income | (0.13) | — |
| From net realized gain | (0.22) | — |
| (0.35) | — | |
| Net asset value, end of period | $22.68 | 23.12 |
| Total return4,5,6 (%) | 15.19 | 1.94 |
| Ratios and supplemental data | ||
| Net assets, end of period | ||
| (in millions) | $19 | $20 |
| Ratio of net expenses to average | ||
| net assets7 (%) | 1.34 | 1.35 |
| Ratio of gross expenses to average | ||
| net assets7,8 (%) | 1.94 | 2.02 |
| Ratio of net investment income | ||
| to average net assets7 (%) | 1.13 | 1.05 |
| Portfolio turnover6 (%) | 32 | 26 |
See notes to financial statements
Intrinsic Value Fund
22
F I N A N C I A L S T A T E M E N T S
Financial highlights
| CLASS B SHARES | ||
| Period ended | 2-28-071 | 8-31-072 |
| Per share operating performance | ||
| Net asset value, beginning of period | $20.00 | $22.64 |
| Net investment income3 | 0.07 | 0.04 |
| Net realized and unrealized | ||
| gain on investments | 2.85 | 0.33 |
| Total from investment operations | 2.92 | 0.37 |
| Less distributions | ||
| From net investment income | (0.06) | — |
| From net realized gain | (0.22) | — |
| (0.28) | — | |
| Net asset value, end of period | $22.64 | $23.01 |
| Total return4,5,6 (%) | 14.61 | 1.63 |
| Ratios and supplemental data | ||
| Net assets, end of period | ||
| (in millions) | —9 | — 9 |
| Ratio of net expenses to average | ||
| net assets7 (%) | 2.04 | 2.05 |
| Ratio of gross expenses to average | ||
| net assets7,8 (%) | 9.00 | 6.74 |
| Ratio of net investment income | ||
| to average net assets7 (%) | 0.42 | 0.35 |
| Portfolio turnover6 (%) | 32 | 26 |
See notes to financial statements
Intrinsic Value Fund
23
F I N A N C I A L S T A T E M E N T S
Financial highlights
| CLASS C SHARES | ||
| Period ended | 2-28-071 | 8-31-07 2 |
| Per share operating performance | ||
| Net asset value, beginning of period | $20.00 | $22.64 |
| Net investment income3 | 0.06 | 0.04 |
| Net realized and unrealized | ||
| gain on investments | 2.86 | 0.33 |
| Total from investment operations | 2.92 | 0.37 |
| Less distributions | ||
| From net investment income | (0.06) | — |
| From net realized gain | (0.22) | — |
| (0.28) | — | |
| Net asset value, end of period | $22.64 | $23.01 |
| Total return4,5,6 (%) | 14.61 | 1.63 |
| Ratios and supplemental data | ||
| Net assets, end of period | ||
| (in millions) | —9 | —9 |
| Ratio of net expenses to average | ||
| net assets7 (%) | 2.04 | 2.05 |
| Ratio of gross expenses to average | ||
| net assets7,8 (%) | 10.08 | 8.20 |
| Ratio of net investment income | ||
| to average net assets7 (%) | 0.37 | 0.35 |
| Portfolio turnover6 (%) | 32 | 26 |
See notes to financial statements
Intrinsic Value Fund
24
F I N A N C I A L S T A T E M E N T S
Financial highlights
| CLASS I SHARES | ||
| Period ended | 2-28-071 | 8-31-072 |
| Per share operating performance | ||
| Net asset value, beginning of period | $20.00 | $22.70 |
| Net investment income3 | 0.24 | 0.17 |
| Net realized and unrealized | ||
| gain on investments | 2.86 | 0.32 |
| Total from investment operations | 3.10 | 0.49 |
| Less distributions | ||
| From net investment income | (0.18) | — |
| From net realized gain | (0.22) | — |
| (0.40) | — | |
| Net asset value, end of period | $22.70 | $23.19 |
| Total return4,5,6 (%) | 15.50 | 2.16 |
| Ratios and supplemental data | ||
| Net assets, end of period | ||
| (in millions) | —9 | —9 |
| Ratio of net expenses to average | ||
| net assets7 (%) | 0.95 | 0.95 |
| Ratio of gross expenses to average | ||
| net assets7,8 (%) | 17.60 | 14.74 |
| Ratio of net investment income | ||
| to average net assets7 (%) | 1.53 | 1.45 |
| Portfolio turnover6 (%) | 32 | 26 |
See notes to financial statements
Intrinsic Value Fund
25
F I N A N C I A L S T A T E M E N T S
Financial highlights
| CLASS R1 SHARES | ||
| Period ended | 2-28-071 | 8-31-072 |
| Per share operating performance | ||
| Net asset value, beginning of period | $20.00 | $22.63 |
| Net investment income3 | 0.12 | 0.08 |
| Net realized and unrealized | ||
| gain on investments | 2.85 | 0.32 |
| Total from investment operations | 2.97 | 0.40 |
| Less distributions | ||
| From net investment income | (0.12) | — |
| From net realized gain | (0.22) | — |
| (0.34) | — | |
| Net asset value, end of period | $22.63 | $23.03 |
| Total return4,5,6 (%) | 14.88 | 1.77 |
| Ratios and supplemental data | ||
| Net assets, end of period | ||
| (in millions) | —9 | —9 |
| Ratio of net expenses to average | ||
| net assets7 (%) | 1.69 | 1.71 |
| Ratio of gross expenses to average | ||
| net assets7,8 (%) | 20.85 | 17.98 |
| Ratio of net investment income | ||
| to average net assets7 (%) | 0.78 | 0.70 |
| Portfolio turnover6 (%) | 32 | 26 |
See notes to financial statements
Intrinsic Value Fund
26
F I N A N C I A L S T A T E M E N T S
Financial highlights
| CLASS 1 SHARES | ||
| Period ended | 2-28-071 | 8-31-072 |
| Per share operating performance | ||
| Net asset value, beginning of period | $20.00 | $22.70 |
| Net investment income3 | 0.25 | 0.18 |
| Net realized and unrealized | ||
| gain on investments | 2.85 | 0.32 |
| Total from investment operations | 3.10 | 0.50 |
| Less distributions | ||
| From net investment income | (0.18) | — |
| From net realized gain | (0.22) | — |
| (0.40) | — | |
| Net asset value, end of period | $22.70 | $23.20 |
| Total return4,5,6 (%) | 15.53 | 2.20 |
| Ratios and supplemental data | ||
| Net assets, end of period | ||
| (in millions) | —9 | —9 |
| Ratio of net expenses to average | ||
| net assets7 (%) | 0.90 | 0.90 |
| Ratio of gross expenses to average | ||
| net assets7,8 (%) | 1.44 | 1.58 |
| Ratio of net investment income | ||
| to average net assets7 (%) | 1.58 | 1.50 |
| Portfolio turnover6 (%) | 32 | 26 |
1 Class A, Class B, Class C, Class I, Class R1 and Class 1 shares began operations on 6-12-06.
2 Semiannual period from 3-1-07 to 8-31-07. Unaudited.
3 Based on the average of the shares outstanding.
4 Assumes dividend reinvestment.
5 Total returns would have been lower had certain expenses not been reduced during the periods shown.
6 Not annualized.
7 Annualized.
8 Does not take into consideration expense reductions during the periods shown.
9 Less than $500,000.
See notes to financial statements
Intrinsic Value Fund
27
Notes to financial statements (unaudited)
1. Organization
John Hancock Intrinsic Value Fund (the Fund) is a newly organized non-diversified series of John Hancock Funds III (the Trust). The Trust was established as a Massachusetts business trust on June 9, 2005. The Trust is registered under the Investment Company Act of 1940, as amended (the 1940 Act), as an open-end investment management company. The investment objective of the Fund is to seek long-term capital growth.
John Hancock Life Insurance Company of New York (John Hancock New York) is a wholly owned subsidiary of John Hancock Life Insurance Company (U.S.A.) (John Hancock USA). John Hancock USA and John Hancock New York are indirect wholly owned subsidiaries of The Manufacturers Life Insurance Company (Manulife), which in turn is a wholly owned subsidiary of Manulife Financial Corporation (MFC), a publicly traded company. MFC and its subsidiaries are known collectively as “Manulife Financial.”
John Hancock Investment Management Services, LLC (the Adviser), a Delaware limited liability company controlled by John Hancock USA, serves as investment adviser for the Trust and John Hancock Funds, LLC (the Distributor), a Delaware limited liability company, an affiliate of the Adviser, serves as principal underwriter.
The Board of Trustees has authorized the issuance of multiple classes of shares of the Fund, including classes designated as Class A, Class B, Class C, Class I, Class R1, Class 1, Class 3 and Class NAV shares. The shares of each class represent an interest in the same portfolio of investments of the Fund, and have equal rights as to voting, redemptions, dividends and liquidation, except that certain expenses, subject to the approval of the Board of Trustees, may be applied differently to each class of shares in accordance with current regulations of the Securities and Exchange Commission (SEC) and the Internal Revenue Service. Shareholders of a class that bear distribution and service expenses under the terms of a distribution plan have exclusive voting rights to that distribution plan. Class B shares will convert to Class A shares eight years after purchase.
Class 1 shares are sold only to certain exempt separate accounts of John Hancock USA and John Hancock New York.
The Adviser and affiliates of John Hancock USA owned 736,437, 5,088, 5,077 and 5,089 shares of beneficial interest of Class A, Class I, Class R1 and Class 1, respectively, on August 31, 2007.
2. Significant accounting policies
In the preparation of the financial statements, the Fund follows the policies described below. The preparation of financial statements in conformity with accounting principles generally accepted in the United States of America requires management to make estimates and assumptions that affect the reported amounts of assets and liabilities at the date of the financial statements and the reported amounts of income and expenses during the reporting period. Actual results may differ from these estimates.
Security valuation
The net asset value of the shares of Class A, Class B, Class C, Class I, Class R1 and Class 1 of the Fund is determined daily as of the close of the New York Stock Exchange (NYSE), normally at 4:00 p.m., Eastern Time. Short-term debt instruments with remaining maturities of 60 days or less are valued at amortized cost, and thereafter assume a constant amortization to maturity of any discount or premium, which approximates market value. Investments in John Hancock Cash Investments Trust (JHCIT), an affiliate of John Hancock Advisers, LLC (JHA),
Intrinsic Value Fund
28
a wholly owned subsidiary of John Hancock Financial Services, Inc., a subsidiary of MFC, are valued at their net asset value each business day. All other securities held by the Fund are valued at the last sale price or official closing price (closing bid price or last evaluated quote if no sale has occurred) as of the close of business on a principal securities exchange (domestic or foreign) on which they trade or, lacking any sales, at the closing bid price. Securities traded only in the over-the- counter market are valued at the last bid price quoted by brokers making markets in the securities at the close of trading. Securities for which there are no such quotations, principally debt securities, are valued based on the valuation provided by an independent pricing service, which utilizes both dealer-supplied and electronic data processing techniques, which take into account factors such as institutional-size trading in similar grou ps of securities, yield, quality, coupon rate, maturity, type of issue, trading characteristics and other market data.
Other assets and securities for which no such quotations are readily available are valued at their fair value as determined in good faith under consistently applied procedures established by and under the general supervision of the Board of Trustees. Generally, trading in non-U.S. securities is substantially completed each day at various times prior to the close of trading on the NYSE. The values of such securities used in computing the net asset value of a Fund’s shares are generally determined as of such times. Occasionally, significant events that affect the values of such securities may occur between the times at which such values are generally determined and the close of the NYSE. Upon such an occurrence, these securities will be valued at their fair value as determined in good faith under consistently applied procedures established by and under the general supervision of the Board of Trustees.
Repurchase agreements
The Fund may enter into repurchase agreements. When the Fund enters into a repurchase agreement through its custodian, it receives delivery of securities, the amount of which at the time of purchase and each subsequent business day is required to be maintained at such a level that the market value is generally at least 102% of the repurchase amount. The Fund will take constructive receipt of all securities underlying the repurchase agreements it has entered into until such agreements expire. If the seller defaults, the Fund would suffer a loss to the extent that proceeds from the sale of underlying securities were less than the repurchase amount. The Fund may enter into repurchase agreements maturing within seven days with domestic dealers, banks or other financial institutions deemed to be creditworthy by the Adviser. Collateral for certain tri-party repurchase agreements is held at the custodian bank in a segregated account for the benefit of the Fund and the counterparty.
Security transactions and related investment income
Investment security transactions are accounted for on a trade date plus one basis for daily net asset value calculations. However, for financial reporting purposes, investment transactions are reported on trade date. Interest income is accrued as earned. Dividend income is recorded on the ex-dividend date. Foreign dividends are recorded on the ex-date or when the Fund becomes aware of the dividends from cash collections. Discounts/ premiums are accreted/amortized for financial reporting purposes. Non-cash dividends are recorded at the fair market value of the securities received. Debt obligations may be placed in a non-accrual status and related interest income may be reduced by ceasing current accruals and writing off interest receivables when the collection of all or a portion of interest has become doubtful, based upon consistently applied procedures.
From time to time, the Fund may invest in Real Estate Investment Trusts (REITs) and as a result, will estimate the components of distributions from these securities.
Intrinsic Value Fund
29
Distributions from REITs received in excess of income are recorded as a reduction of cost of investments and/or as a realized gain.
The Fund uses the First In, First Out method for fixed-income securities and Highest Cost, First Out for all other securities for determining realized gain or loss on investments for both financial and federal income tax reporting purposes.
Multi-class allocations
All income, expenses (except for class-specific expenses) and realized and unrealized gains (losses) are allocated to each class of shares based upon the relative net assets of each class.
Dividends to shareholders from net investment income are determined at a class level and distributions from capital gains are determined at a Fund level.
Expense allocation
Expenses are allocated based on the relative share of net assets of the Fund at the time the expense was incurred. Class-specific expenses, such as distribution (Rule 12b-1) fees, are accrued daily and charged directly to the respective share classes.
Securities lending
The Fund may lend securities in amounts up to 33 1 / 3% of the Fund’s total assets. Such loans are callable at any time and are at all times fully secured by cash, cash equivalents or securities issued or guaranteed by the U.S. government or its agencies or instrumentalities, marked to market on a daily basis. The Fund may bear the risk of delay in recovery of, or even of rights in, the securities loaned should the borrower of the securities fail financially. The Fund receives compensation for lending its securities either in the form of fees or by retaining a portion of interest on the investment of any cash received as collateral. The Fund invests in cash collateral received in connection with securities lending transactions in JHCIT, a Delaware common law trust and an affiliated fund. JHCIT is exempt from registration under Section 3(c)(7) of the 1940 Act (pursuant to exemptive order issued by the SEC) and is managed by the Adviser, for which the Adviser receives an investment advisory fee of 0.04% of the average daily net assets of JHCIT.
All collateral received will be in an amount equal to at least 100% of the market value of the loaned securities and is intended to be maintained at that level during the period of the loan. The market value of the loaned securities is determined at the close of business of the Fund and any additional required collateral is delivered to the Fund the next business day. During the loan period, the Fund continues to retain rights of ownership, including dividends and interest of the loaned securities. At August 31, 2007, the Fund loaned securities having a market value of $174,908 collateralized by securities in the amount of $178,406.
Futures
The Fund may purchase and sell financial futures contracts and options on those contracts. The Fund invests in contracts based on financial instruments such as U.S. Treasury Bonds or Notes or on securities indexes, such as the Standard & Poor’s 500 Index, in order to hedge against a decline in the value of securities owned by the Fund.
Initial margin deposits required upon entering into futures contracts are satisfied by the delivery of specific securities or cash as collateral to the broker (the Funds’ agent in acquiring the futures position). If the position is closed out by taking an opposite position prior to the settlement date of the futures contract, a final determination of variation margin is made, cash is required to be paid to or released by the broker, and the Fund realizes a gain or loss.
When the Fund sells a futures contract based on a financial instrument, the Fund becomes obligated to deliver that kind of instrument at an agreed upon date for a specified price. The Fund realizes a gain or loss depending on whether the price of an offsetting purchase is less or more than the price of the initial sale or on whether the price of an offsetting sale is more or less than the price of the initial purchase. The Fund could be exposed to risks if it could not close out futures positions because of an illiquid secondary market or the inability of counterparties to meet the terms of their contracts. Futures contracts are valued at the
Intrinsic Value Fund
30
The following is a summary of open futures contracts on August 31, 2007:
| NUMBER OF | UNREALIZED | |||
| OPEN CONTRACTS | CONTRACTS | POSITION | EXPIRATION | DEPRECIATION |
| S&P 500 Index | 8 | Long | Sep 2007 | ($19,007) |
quoted daily settlement prices established by the exchange on which they trade.
Federal income taxes
The Fund qualifies as a “regulated investment company” by complying with the applicable provisions of the Internal Revenue Code and will not be subject to federal income tax on taxable income that is distributed to shareholders. Therefore, no federal income tax provision is required.
New accounting pronouncements
In June 2006, Financial Accounting Standards Board (FASB) Interpretation No. 48, Accounting for Uncertainty in Income Taxes (the Interpretation), was issued and is effective for fiscal years beginning after December 15, 2006, and is to be applied to all open tax years as of the effective date. This Interpretation prescribes a minimum threshold for financial statement recognition of the benefit of a tax position taken or expected to be taken in a tax return and requires certain expanded disclosures. Management has evaluated the application of this Interpretation to the Fund and does not believe there is a material impact resulting from the adoption of this Interpretation on the Fund’s financial statements.
In September 2006, FASB Standard No. 157, Fair Value Measurements (FAS 157), was issued and is effective for fiscal years beginning after November 15, 2007. FAS 157 defines fair value, establishing a framework for measuring fair value and expands disclosure about fair value measurements. Management is currently evaluating the application of FAS 157 to the Fund and its impact, if any, resulting from the adoption of FAS 157 on the Fund’s financial statements.
Distribution of income and gains
The Fund records distributions to shareholders from net investment income and net realized gains, if any, on the ex-dividend date. During the period ended February 28, 2007, the tax character of distributions paid was as follows: ordinary income $270,360 and long-term capital gains $31,463. Distributions paid by the Fund with respect to each class of shares are calculated in the same manner, at the same time and are in the same amount, except for the effect of expenses that may be applied differently to each class.
Such distributions on a tax basis, are determined in conformity with income tax regulations, which may differ from accounting principles generally accepted in the United States of America. Distributions in excess of tax basis earnings and profits, if any, are reported in the Fund’s financial statements as a return of capital.
Capital accounts
The Fund reports the undistributed net investment income and accumulated undistributed net realized gain (loss) accounts on a basis approximating amounts available for future tax distributions (or to offset future taxable realized gains when a capital loss carryforward is available). Accordingly, the Fund may periodically make reclassifications among certain capital accounts without affecting its net asset value.
3. Investment advisory and other agreements
Advisory fees
The Trust has entered into an Investment Advisory Agreement with the Adviser. The Adviser is responsible for managing the corporate and business affairs of the Trust and for selecting and compensating subadvisers to handle the investment of the assets of the Fund, subject to the supervision of the Trust’s Board of Trustees. Under the Advisory Agreement, the Fund pays a monthly management fee to the Adviser equivalent, on an annual basis, to the sum of: (a) 0.78% of the first $500,000,000 of the Fund’s aggregate daily net assets; (b) 0.76% of the next $500,000,000 of the Fund’s aggregate daily net assets; (c) 0.75% of the next $1,500,000,000 of the Fund’s aggregate daily
Intrinsic Value Fund
31
net assets; and (d) 0.74% of the Fund’s aggregate daily net assets in excess of $2,500,000,000. Aggregate net assets include the net assets of the Fund and Intrinsic Value Trust, a series of John Hancock Trust and the Intrinsic Value Fund, a series of John Hancock Funds II. The Adviser has a subadvisory agreement with Grantham, Mayo, Van Otterloo & Co. LLC. The Fund is not responsible for payment of the subadvisory fees.
Expense reimbursements
The Adviser has agreed contractually to reimburse for certain fund level expenses that exceed 0.08% of the average annual net assets, or to make a payment to a specific class of shares of the Fund in an amount equal to the amount by which the expenses attributable to such class of shares (excluding taxes, portfolio brokerage commissions, interest, litigation and indemnification expenses and other extraordinary expenses not incurred in the ordinary course of the Fund’s business and fees under any agreement or plans of the Fund dealing with services for shareholders and others with beneficial interests in shares of the Fund) exceed the percentage of average annual net assets (on an annualized basis) attributable as follows: 1.35% for Class A, 2.05% for Class B, 2.05% for Class C, 0.95% for Class I, 1.45% for Class R1 and 0.90% for Class 1. Accordingly, the expense reductions related to this expense limitation amounted to $69,037, $10,825, $10,468, $9,720, $9,847 and $406 for Class A, Class B, Class C, Class I, Class R1 and Class 1, respectively, for the period ended August 31, 2007. This expense reimbursement shall continue in effect until June 30, 2008 and thereafter until terminated by the Adviser on notice to the Trust.
Administration fees
The Fund has an agreement with the Adviser that requires the Fund to reimburse the Adviser for all expenses associated with providing the administrative, financial, accounting and recordkeeping services of the Fund, including the preparation of all tax returns, annual, semiannual and periodic reports to shareholders and the preparation of all regulatory reports. These expenses are allocated based on the relative net assets of each class. The compensation for the period amounted to $3,061 with an effective rate of 0.03% of the Fund’s average daily net asset value.
Distribution plan
The Trust has a Distribution Agreement with the Distributor. The Fund has adopted Distribution Plans with respect to Class A, Class B, Class C, Class R1 and Class 1, pursuant to Rule 12b-1 under the 1940 Act, to reimburse the Distributor for the services it provides as distributor of shares of the Fund. Accordingly, the Fund makes monthly payments to the Distributor at an annual rate not to exceed 0.30%, 1.00%, 1.00%, 0.50% and 0.05% of average daily net asset value of Class A, Class B, Class C, Class R1 and Class 1, respectively. A maximum of 0.25% of such payments may be service fees, as defined by the Conduct Rules of Financial Industry Regulatory Authority (formerly the National Association of Securities Dealers). Under the Conduct Rules, curtailment of a portion of the Fund’s 12b-1 payments could occur under certain circumstances. In addition, under a Service Plan for Class R1 shares, the Fund pays up to 0.25% of Class R1 a verage daily net asset value for certain other services.
Sales charges
Class A shares are assessed up-front sales charges of up to 5.00% of net asset value of such shares. During the period ended August 31, 2007, the Fund was informed that the Distributor received net up-front sales charges of $88,410 with regard to sales of Class A shares. Of this amount, $14,523 was retained and used for printing prospectuses, advertising, sales literature and other purposes, $73,154 was paid as sales commissions to unrelated broker-dealers and $733 was paid as sales commissions to sales personnel of Signator Investors, Inc. (Signator Investors), a related broker-dealer, an indirect subsidiary of MFC.
Class B shares that are redeemed within six years of purchase are subject to a contingent deferred sales charge (CDSC) at declining rates, beginning at 5.00% of the lesser of the current market value at the time of redemption or the original purchase cost of the shares being redeemed. Class C shares that are redeemed within one year of purchase
Intrinsic Value Fund
32
are subject to a CDSC at a rate of 1.00% of the lesser of the current market value at the time of redemption or the original purchase cost of the shares being redeemed. Proceeds from the CDSCs are paid to the Distributor and are used, in whole or in part, to defray its expenses for providing distribution-related services to the Fund in connection with the sale of Class B and Class C shares. During the period ended August 31, 2007, CDSCs received by JH Funds amounted to $49 for Class B shares and $103 for Class C shares.
Transfer agent fees
The Fund has a Transfer Agency Agreement with John Hancock Signature Services, Inc. (Signature Services), an indirect subsidiary of MFC. For Class A, Class B, Class C, Class I and Class R1 shares, the Fund pays a monthly transfer agent fee at an annual rate of 0.05% of each class’ average daily net assets, plus a fee based on the number of shareholder accounts and reimbursement for certain out-of-pocket expenses. Expenses not directly attributable to a particular class of shares are aggregated and allocated to each class on the basis of its relative net asset value.
Signature Services has agreed to limit the transfer agent fees so that such fees do not exceed 0.20% annually of Class A, Class B, Class C, Class I and Class R1 share average daily net assets. This agreement is effective until December 31, 2007. Signature Services reserves the right to terminate this limitation in the future. Accordingly, there were no transfer agent fee reductions for Class A, Class B, Class C, Class I and Class R1 shares, respectively, during the period ended August 31, 2007.
Expenses under the agreements described above for the period ended August 31, 2007, were as follows:
| Distribution and | Transfer | Blue sky | Printing and | |
| Share class | service fees | agent fees | fees | postage fees |
| Class A | $31,076 | $7,411 | $9,424 | $4,427 |
| Class B | 2,315 | 463 | 9,157 | 176 |
| Class C | 1,708 | 342 | 9,211 | 41 |
| Class I | — | 35 | 9,101 | 166 |
| Class R1 | 455 | 30 | 9,101 | 378 |
| Class 1 | 31 | — | — | 8 |
| Total | 35,585 | 8,281 | 45,994 | 5,196 |
Trustees’ fees
The Trust compensates each Trustee who is not an employee of the Adviser or its affiliates. Total Trustees’ expenses are allocated to the Fund based on its average daily net asset value.
4. Guarantees and indemnifications
Under the Trust’s organizational documents, its Officers and Trustees are indemnified against certain liability arising out of the performance of their duties to the Trust. Additionally, in the normal course of business, the Trust enters into contracts with service providers that contain general indemnification clauses. The Trust’s maximum exposure under these arrangements is unknown, as this would involve future claims that may be made against the Trust that have not yet occurred. However, based on experience, the Trust believes the risk of loss to be remote.
5. Line of credit
The Fund has entered into an agreement which enables it to participate in a $100 million unsecured committed line of credit with State Street Corporation. Borrowings will be made solely to temporarily finance the repurchase of capital shares. Interest is charged to the Fund based on its borrowings at a rate per annum equal to the Federal Funds rate plus 0.50%. In addition, a commitment fee of 0.07% per annum, payable at the end of each calendar
Intrinsic Value Fund
33
quarter, based on the average daily-unused portion of the line of credit, is charged to the Fund on a prorated basis based on average net assets. For the period ended August 31, 2007, there were no borrowings under the line of credit.
6. Capital shares
Share activities for the Fund for the periods ended February 28, 2007 and August 31, 2007, were as follows:
| Period ended 2-28-07 1 | Period ended 8-31-072 | |||
| Shares | Amount | Shares | Amount | |
| Class A | ||||
| Sold | 838,725 | $17,032,947 | 60,561 | $1,429,482 |
| Distributions reinvested | 12,374 | 281,144 | — | — |
| Repurchased | (4,497) | (101,945) | (31,737) | (747,591) |
| Net increase | 846,602 | $17,212,146 | 28,824 | $681,891 |
| Class B | ||||
| Sold | 25,686 | $554,475 | 4,340 | $104,542 |
| Distributions reinvested | 201 | 4,563 | — | — |
| Repurchased | (5,219) | (119,072) | (6,265) | (151,835) |
| Net increase (decrease) | 20,668 | $439,966 | (1,925) | ($47,293) |
| Class C | ||||
| Sold | 23,486 | $503,103 | 5,938 | $138,311 |
| Distributions reinvested | 135 | 3,064 | — | — |
| Repurchased | (10,948) | (251,638) | (1,357) | (31,481) |
| Net increase | 12,673 | $254,529 | 4,581 | $106,830 |
| Class I | ||||
| Sold | 5,547 | 111,000 | 1,055 | $25,224 |
| Distributions reinvested | 98 | 2,226 | — | — |
| Net increase | 5,645 | 113,226 | 1,055 | $25,224 |
| Class R1 | ||||
| Sold | 5,033 | 100,750 | — | — |
| Distributions reinvested | 76 | 1,738 | — | — |
| Net increase | 5,109 | 102,488 | — | — |
| Class 1 | ||||
| Sold | 5,000 | $100,000 | — | — |
| Distributions reinvested | 90 | 2,033 | — | — |
| Net increase | 5,090 | $102,033 | — | — |
| Net increase | 895,787 | $18,224,388 | 32,535 | $766,652 |
1 Period from 6-12-06 (commencement of operations) to 2-28-07.
2 Semiannual period from 3-1-07 to 8-31-07. Unaudited.
7. Investment transactions
Purchases and proceeds from sales or maturities of securities, other than short-term securities and obligations of the U.S. government, during the period ended August 31, 2007, aggregated $6,262,314 and $5,382,657, respectively.
The cost of investments owned on August 31, 2007, including short-term investments, for federal income tax purposes, was $20,382,880. Gross unrealized appreciation and depreciation of investments aggregated $2,069,701 and $846,449, respectively, resulting in net unrealized appreciation of $1,223,252.
Intrinsic Value Fund
34
8. Federal income tax information
Federal income tax regulations may differ from generally accepted accounting principles and income and capital gain distributions determined in accordance with tax regulations may differ from net investment income and realized gains recognized for financial reporting purposes.
Intrinsic Value Fund
35
Evaluation of Advisory and Subadvisory Agreements by the Board of Trustees
This section describes the evaluation by the Board of Trustees of the Advisory Agreement and each of the Subadvisory Agreements.
Evaluation by the Board of Trustees The Board, including all of the Trustees who are not “interested persons” as defined in the Investment Company Act of 1940, as amended (the Independent Trustees), is responsible for selecting the Trust’s investment adviser, John Hancock Investment Management Services, LLC (the Adviser or JHIMS), approving the Adviser’s selection of subadvisers for each series of the Trust (the Funds) and approving the Trust’s advisory and subadvisory agreements (and any sub-subadvisory agreements), their periodic continuation and any amendments. Consistent with SEC rules, the Board regularly evaluates the Trust’s advisory and subadvisory (and sub-subadvisory) arrangements, including consideration of the factors listed below. The Board may also consider other factors (including conditions and trends prevailing gene rally in the economy, the securities markets and the industry) and does not treat any single factor as determinative, and each Trustee may attribute different weights to different factors. The Board is furnished with an analysis of its fiduciary obligations in connection with its evaluation and, throughout the evaluation process, the Board is assisted by counsel for the Trust and the Independent Trustees are also separately assisted by independent legal counsel. The factors regularly considered by the Board are:
1. the nature, extent and quality of the services to be provided by the Adviser to the Trust and by the subadvisers to the Funds;
2. the investment performance of the Funds and their subadvisers;
3. the extent to which economies of scale would be realized as a Fund grows and whether fee levels reflect these economies of scale for the benefit of Trust shareholders;
4. the costs of the services to be provided and the profits to be realized by the Adviser and its affiliates (including any subadvisers that are affiliated with the Adviser) from the Adviser’s relationship with the Trust; and
5. comparative services rendered and comparative advisory and subadvisory fee rates.
The Board believes that information relating to all these factors is relevant to its evaluation of the Trust’s advisory agreement. With respect to its evaluation of subadvisory agreements (including sub-subadvisory agreements) the Board believes that, in view of the Trust’s “manager of managers” advisory structure, the costs of services to be provided and the profits to be realized by those subadvisers that are not affiliated with the Adviser from their relationship with the Trust generally are not a material factor to the Board’s consideration of subadvisory agreements because such fees are paid to subadvisers by the Adviser and not by the Funds, and because the Board relies on the ability of the Adviser to negotiate such subadvisory fees at arm’s-length.
In evaluating subadvisory arrangements, the Board also considers other material business relationships that unaffiliated subadvisers and their affiliates have with the Adviser or its affiliates, including the involvement by certain affiliates of certain subadvisers in the distribution of financial products, including shares of the Trust, offered by the Adviser and other affiliates of the Adviser (Material Relationships).
Approval of Advisory Agreement
At its meeting on June 5, 2007, the Board, including all the Independent Trustees, approved the Advisory Agreement between the Trust and JHIMS with respect to each of the Funds.
In approving the Advisory Agreement, and with reference to the factors which it regularly considers, the Board:
(1) (a) considered the high value to the Trust of continuing the relationship with JHIMS as the Trust’s Adviser to the other John Hancock Funds, the skills and competency with which JHIMS
36
has in the past managed the affairs and subadvisory relationships of other funds in the complex, JHIMS’s oversight and monitoring of subadvisers’ investment performance and compliance programs including its timelines in responding to performance issues and the qualifications of JHIMS’s personnel,
(b) considered JHIMS’s compliance policies and procedures and its responsiveness to regulatory changes and mutual fund industry developments, and
(c) JHIMS’s administrative capabilities, including its ability to supervise the other service providers for the Funds and concluded that JHIMS may reasonably be expected to ably perform its services under the Advisory Agreement.
(2) reviewed the investment performance of portfolios that are managed comparable to the Funds; the comparative performance of their respective benchmarks; and JHIMS’ analysis of such performance and its plans and recommendations regarding the Trust’s subadvisory arrangements generally and with respect to the Funds; and concluded that each of the comparably managed funds has performed well or within a range that the Board deemed competitive, and that JHIMS may reasonably be expected to ably monitor the performance of the Funds and their subadvisers;
(3) reviewed the Trust’s advisory fee structure and the incorporation therein of any subadvisory fee breakpoints in the advisory fees charged and concluded (i) that to the extent that Funds have subadvisory fees with breakpoints, those breakpoints are reflected as breakpoints in the advisory fees for Funds, (ii) that all Funds with a subadviser that is not affiliated with the Adviser have subadvisory fees which are the product of arm’s-length negotiations between the Adviser and the subadviser and which in many, but not all, cases contain breakpoints, and (iii) that, although economies of scale cannot be measured with precision, these arrangements permit shareholders of Funds with advisory fee breakpoints to benefit from economies of scale if those Funds grow;
(4) (a) reviewed the financial statements of JHIMS and John Hancock Life Insurance Company (U.S.A.) (JHLICO (U.S.A.));
(b) reviewed the anticipated profitability of the JHIMS’s relationship with the Funds in terms of the fees it expects to receive with respect to the Funds and whether JHIMS has the financial ability to provide a high level of services to the Funds,
(c) considered that JHIMS derives reputational and other indirect benefits from providing advisory services to the Funds, and
(d) noted that JHIMS will pay the subadvisory fees out of the advisory fees JHIMS receives from the Funds and concluded that the advisory fees paid by the Trust with respect to the Funds are not unreasonable in light of such information; and
(5) reviewed comparative information with respect to the advisory fee rates and concluded that the anticipated advisory fees for the Funds are within the range of those incurred by other comparable funds and that the advisory structure for the Funds is thus competitive within the industry.
Additional information that the Board considered for a particular Fund is set forth in Appendix A.
Approval of Subadvisory Agreements
At its meeting on June 5, 2007, the Board, including all the Independent Trustees, approved the Subadvisory Agreements.
In making its determination with reference to these respective factors, the Board reviewed:
(i) information relating to each subadviser’s business which included information
37
such as: business performance, assets under management, financial stability and personnel;
(ii) the investment performance of the subadviser’s portfolio managed comparably to the Fund to be managed by the subadviser and comparative performance information relating to the benchmark;
(iii) the proposed subadvisory fee for each Fund to be managed by the subadviser and comparative fee information; and
(iv) information relating to the nature and scope of Material Relationships and their significance to the Adviser and the subadvisers.
The Board’s decision to approve each Subadvisory Agreement was based on a number of determinations, including the following:
(1) The subadviser has extensive experience and demonstrated skills as a manager and may be expected to provide a high quality of investment personnel to each Fund;
(2) Although not without variation, the current and historical performance of the portfolios of the Subadviser managed comparably to the Fund to be managed by the Subadviser has been within a competitive range of the current and historical performance of these portfolios’ respective benchmark (see Appendix A for further information on performance);
(3) The subadvisory fees are within industry norms and are the product of arm’s-length negotiation between the Adviser and the subadviser; and
(4) The Material Relationships consist of arrangements in which unaffiliated subadvisers or their affiliates provide advisory, distribution or management services in connection with financial products sponsored by the Trust’s adviser or its affiliates, which may include other registered investment companies, a 529 education savings plan, managed separate accounts and exempt group annuity contracts sold to qualified plans, and which in no case contained elements which would cause the Board to conclude that approval of the subadvisory agreement with the subadviser would be inappropriate. See (5) below for information relating to the business arrangement between the Trust’s Adviser and GMO.
(5) As a part of the overall business arrangement between the Adviser and GMO under which the Adviser has obtained exclusive rights to certain GMO investment management services for up to five years, the Adviser has agreed that under certain circumstances it (and not the Trust or the particular Fund) will pay GMO a specified amount (ranging from $1 to $12 million) if the subadvisory agreement with respect to any of the following Funds to be subadvised by GMO is terminated within a five-year period from the date of its effectiveness: U.S. Core Fund, Active Value Fund, Intrinsic Value Fund, Growth Fund, International Core Fund, International Growth Fund, Global Fund, Value Opportunities Fund, Growth Opportunities Fund and U.S. Quality Equity Fund.
The Adviser has also agreed that, subject to its fiduciary duties as an investment adviser to each of these Funds and its shareholders, it will not recommend to the Board of Trustees to terminate the subadvisory agreement with respect to any of the Funds or to reduce any of the fees payable thereunder to GMO for a five-year period from the date of effectiveness of the agreement. Substantially similar agreements (with varying amounts to be paid upon termination) also apply with respect to certain other John Hancock funds that are or will be advised by the Adviser and subadvised by GMO. The Trust is not a party to any of these arrangements, and they are not binding upon the Trust, the Trust’s Funds subadvised by GMO or the Board of Trustees. However, these arrangements present certain conflicts of interest because the Adviser has a financial incentive to support the continuation of GMO subadvisory agreements for as long as the ter mination provisions described above remain in effect. In approving the Advisory Agreement and the subadvisory agreement with respect to
38
each of the Funds subadvised by GMO, the Board of Trustees, including the Independent Trustees, was aware of and considered these potential conflicts of interest, including any financial obligations of the Adviser to GMO.
The Board concluded that, notwithstanding the potential conflicts of interest, approval of the Advisory Agreement and the subadvisory agreements with GMO is in the best interests of shareholders and contract owners in view of (i) the Adviser’s fiduciary duty and the Board’s fiduciary duty and ability to monitor potential conflicts, (ii) the benefits to shareholders and contract owners generally expected from the exclusive rights to certain GMO investment management services obtained by the Adviser for the benefit of certain Funds of the Trust and other John Hancock funds and (iii) the benefits to such Funds of the Trust expected from the subadvisory services of GMO.
Additional information that the Board considered for a particular fund is set forth in Appendix A.
| Appendix A | |||
| Estimated Fees | |||
| Fund | Performance | and Expenses | Comments |
| Intrinsic Value | See Comments. | Subadvisory fees | The Board noted |
| for this Fund were | that the Fund | ||
| lower than the peer | commenced opera- | ||
| group median. | tions in June 2006 | ||
| and has a limited | |||
| Advisory fees for | performance history. | ||
| this Fund were | |||
| higher than the peer | |||
| group median. | |||
| Total expenses for | |||
| this Fund were | |||
| lower than the peer | |||
| group median. | |||
39
For more information
The Fund’s proxy voting policies, procedures and records are available without charge,
upon request:
| By phone | On the Fund’s Web site | On the SEC’s Web site |
| 1-800-225-5291 | www.jhfunds.com/proxy | www.sec.gov |
| Trustees | Charles A. Rizzo | Principal distributor |
| Ronald R. Dion, Chairman | Chief Financial Officer | John Hancock Funds, LLC |
| James R. Boyle† | 601 Congress Street | |
| James F. Carlin | Gordon M. Shone | Boston, MA 02210-2805 |
| William H. Cunningham | Treasurer | |
| Charles L. Ladner* | Custodian | |
| Dr. John A. Moore* | John G. Vrysen | State Street Bank & Trust Co. |
| Patti McGill Peterson* | Chief Operating Officer | 2 Avenue de Lafayette |
| Steven R. Pruchansky | Boston, MA 02111 | |
| *Members of the Audit Committee | Investment adviser | |
| †Non-Independent Trustee | John Hancock Investment | Transfer agent |
| Management Services, LLC | John Hancock Signature | |
| Officers | 601 Congress Street | Services, Inc. |
| Keith F. Hartstein | Boston, MA 02210-2805 | One John Hancock Way, |
| President and | Suite 1000 | |
| Chief Executive Officer | Subadviser | Boston, MA 02217-1000 |
| Grantham, Mayo, | ||
| Thomas M. Kinzler | Van Otterloo & Co. LLC | Legal counsel |
| Secretary and Chief Legal Officer | 40 Rowes Wharf | Kirkpatrick & Lockhart |
| Boston, MA 02110 | Preston Gates Ellis LLP | |
| Francis V. Knox, Jr. | One Lincoln Street | |
| Chief Compliance Officer | Boston, MA 02111-2950 | |
| How to contact us | ||
| Internet | www.jhfunds.com | |
| Regular mail: | Express mail: | |
| John Hancock | John Hancock | |
| Signature Services, Inc. | Signature Services, Inc. | |
| One John Hancock Way, Suite 1000 | Mutual Fund Image Operations | |
| Boston, MA 02217-1000 | 380 Stuart Street | |
| Boston, MA 02116 | ||
| Phone | Customer service representatives | 1-800-225-5291 |
| EASI-Line | 1-800-338-8080 | |
| TDD line | 1-800-554-6713 | |
A listing of month-end portfolio holdings is available on our Web site, www.jhfunds.com. A more detailed portfolio holdings summary is available on a quarterly basis 60 days after the fiscal quarter on our Web site or upon request by calling 1-800-225-5291, or on the SEC’s Web site, www.sec.gov.
40
J O H N H A N C O C K F A M I L Y O F F U N D S
| EQUITY | INTERNATIONAL/GLOBAL |
| Balanced Fund | Global Opportunities Fund |
| Classic Value Fund | Global Shareholder Yield Fund |
| Classic Value Fund II | Greater China Opportunities Fund |
| Classic Value Mega Cap Fund | International Allocation Portfolio |
| Core Equity Fund | International Classic Value Fund |
| Growth Fund | International Core Fund |
| Growth Opportunities Fund | International Growth Fund |
| Growth Trends Fund | |
| Intrinsic Value Fund | INCOME |
| Large Cap Equity Fund | Bond Fund |
| Large Cap Select Fund | Government Income Fund |
| Mid Cap Equity Fund | High Yield Fund |
| Multi Cap Growth Fund | Investment Grade Bond Fund |
| Small Cap Equity Fund | Strategic Income Fund |
| Small Cap Fund | |
| Small Cap Intrinsic Value Fund | TAX-FREE INCOME |
| Sovereign Investors Fund | California Tax-Free Income Fund |
| U.S. Core Fund | High Yield Municipal Bond Fund |
| U.S. Global Leaders Growth Fund | Massachusetts Tax-Free Income Fund |
| Value Opportunities Fund | New York Tax-Free Income Fund |
| Tax-Free Bond Fund | |
| ASSET ALLOCATION | |
| Lifecycle 2010 Portfolio | MONEY MARKET |
| Lifecycle 2015 Portfolio | Money Market Fund |
| Lifecycle 2020 Portfolio | |
| Lifecycle 2025 Portfolio | CLOSED-END |
| Lifecycle 2030 Portfolio | Bank and Thrift Opportunity Fund |
| Lifecycle 2035 Portfolio | Financial Trends Fund, Inc. |
| Lifecycle 2040 Portfolio | Income Securities Trust |
| Lifecycle 2045 Portfolio | Investors Trust |
| Lifecycle Retirement Portfolio | Patriot Premium Dividend Fund II |
| Lifestyle Aggressive Portfolio | Preferred Income Fund |
| Lifestyle Balanced Portfolio | Preferred Income II Fund |
| Lifestyle Conservative Portfolio | Preferred Income III Fund |
| Lifestyle Growth Portfolio | Tax-Advantaged Dividend Income Fund |
| Lifestyle Moderate Portfolio | Tax-Advantaged Global Shareholder Yield Fund |
| SECTOR | |
| Financial Industries Fund | |
| Health Sciences Fund | |
| Real Estate Fund | |
| Regional Bank Fund | |
| Technology Fund | |
| Technology Leaders Fund | |
The Fund’s investment objectives, risks, charges and expenses are included in the prospectus and should be considered carefully before investing. For a prospectus, contact your financial professional, call John Hancock Funds at 1-800-225-5291 or visit the Fund’s Web site at www.jhfunds.com. Please read the prospectus carefully before investing or sending money.

1-800-225-5291
1-800-554-6713 TDD
1-800-338-8080 EASI-Line
www.jhfunds.com
Now available: electronic delivery
www.jhfunds.com/edelivery
| This report is for the information of the shareholders of John Hancock Intrinsic Value Fund. | 510SA 8/07 |
| It is not authorized for distribution to prospective investors unless preceded or accompanied by a prospectus. | 10/07 |

| TABLE OF CONTENTS |
| Your fund at a glance |
| page 1 |
| Managers’ report |
| page 2 |
| A look at performance |
| page 6 |
| Your expenses |
| page 8 |
| Fund’s investments |
| page 10 |
| Financial statements |
| page 22 |
| Notes to financial |
| statements |
| page 31 |
| For more information |
| page 44 |
CEO corner
To Our Shareholders,
Volatility returned to the U.S. stock market in the six-month period ended August 31, 2007; however, stocks still posted a strong gain of 5.70%, as measured by the Standard & Poor’s 500 Index. The market experienced a particularly sharp downturn in August, as the subprime mortgage market’s woes increased. Rising defaults and an ensuing credit crunch caused heightened fears about their potential impact on U.S. economic growth. Foreign markets felt some ripple effects from the subprime issue, but they continued nonetheless to benefit from solid economic growth and outperformed the U.S. market in this period.
During this period of volatility, the U.S. stock market also passed a significant milestone — the broad Standard & Poor’s 500 Index climbed beyond the record it had set seven years ago. From its peak in March 2000, the stock market spiraled downward three consecutive years, bottoming in 2002. The upturn began in 2003, and the market has advanced each year since, finally setting a new high for the first time on May 30, 2007. During that period, the S&P 500 Index experienced five significant short-term sell-offs of 6% or more, with the August subprime-induced meltdown being the most recent.
This nearly complete market cycle highlights the importance of two investment principles you have heard us speak of often: diversification and patience. By allocating your investments among different asset classes, investment styles and portfolio managers, you are likely to be well represented through all phases of a complete market cycle, with the winners helping to cushion the fall of the losers.
The challenge for investors with a diversified portfolio is to properly evaluate your investments to tell the difference between an underperforming manager and an out-of-favor style, while also understanding the role each investment plays in your portfolio. That’s where your financial professional can provide true value. He or she can help you make those assessments and also counsel patience, because a properly diversified portfolio by its very nature will typically have something lagging or out of favor — a concept that can be difficult to live with, but necessary to embrace. If everything in your portfolio is “working,” then you are not truly diversified, but rather are lever aged to the current market and the flavor of the day. If so, you are bound to be out of step in the near future.
The recent volatility in the securities markets has prompted many investors to question how long this type of market cycle will last. History tells us it will indeed end and that when it does, today’s leaders may well turn into laggards and vice versa. The subprime mortgage market woes are just the latest example of why investors should be both patient and well-diversified. For with patience and a diversified portfolio, it could be easier to weather the market’s twists and turns and reach your long-term goals.
Sincerely,

Keith F. Hartstein,
President and Chief Executive Officer
This commentary reflects the CEO’s views as of August 31, 2007. They are subject to change at any time.
Your fund at a glance
The Fund seeks long-term capital growth by typically investing in U.S. companies that issue stocks included in the Russell 2500 Index, and in companies with total market capitalizations similar to those of stocks in the Index. Under normal circumstances, the Fund invests at least 80% of its assets in small- and mid-cap companies.
Over the last six months
► Despite heightened volatility, the broad U.S. market, as measured by the S&P 500 Index, gained ground.
► The financial sector — both an overweight and stock selections — detracted the most from relative returns, while stock selections in the retail sector added value.
► The Fund's momentum and valuation selection criteria both lagged the market.
John Hancock Value Opportunities Fund
Fund performance for the six months ended August 31, 2007.
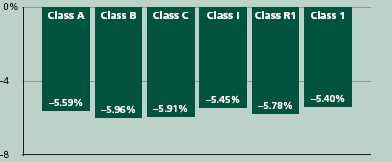
Total returns for the Fund are at net asset value with all distributions reinvested. These returns do not reflect the deduction of the maximum sales charge, which would reduce the performance shown above.
| Top 10 holdings |
| ||||
| Dollar Tree Stores, Inc. | 1.6% | CDW Corp. | 1.0% | ||
| Liz Claiborne, Inc. | 1.3% | First American Corp. | 1.0% | ||
| Tyson Foods, Inc., Class A | 1.1% | AutoNation, Inc. | 1.0% | ||
| SUPERVALU, Inc. | 1.1% | Energizer Holdings, Inc. | 1.0% | ||
| Deluxe Corp. | 1.0% | Commerce Group, Inc. | 1.0% | ||
As a percentage of net assets on August 31, 2007.
1
Managers’ report
John Hancock
Value Opportunities Fund
U.S. investors entered the six-month review period on March 1, 2007 still reeling from the market’s late-February swoon. Their big question was whether the recent fall was the beginning of a major correction or just a brief hiccup in the middle of a bull market. Though some of the concerns surrounding the decline — including the first sign of trouble in subprime mortgages — were still present, investors appeared to shake them off. Less than two months into the review period, the Standard & Poor’s 500 Index had recovered all of its lost ground, entering the summer poised to continue its ascent. With historically low market volatility, the continuation of strong corporate profits and a glut of private equity deals fueled by ubiquitous financial liquidity, there seemed to be almost no ceiling to the market’s potential.
Hopes for a smooth summer, however, would turn out to be short-lived. Beginning in July, as many market indexes touched record highs, credit concerns similar to those seen in February flared up again. Distress in subprime mortgages quickly spilled over into the broader credit and equity markets. Just weeks after the S&P 500 Index set an all-time high, the Federal Reserve began injecting liquidity into a faltering financial system, in an attempt to stem the turmoil taking place in the credit market. As equity market volatility returned with a vengeance, investor tolerance for risk abated and the broad market indexes plunged lower in the first days of August. And while hopes for a Federal Reserve
SCORECARD
| INVESTMENT | PERIOD’S PERFORMANCE... AND WHAT’S BEHIND THE NUMBERS | |
| Dollar Tree | ▲ | Same-store sales increased and earnings forecasts were raised |
| Jones Apparel | ▼ | Shares went on a rollercoaster ride on speculation of a takeover bid |
| that never materialized | ||
| Liz Claiborne | ▼ | Domestic wholesale business lagged for the period and earnings |
| forecasts were decreased |
2
From the Grantham, Mayo, Van Otterloo & Co. LLC (GMO)
Portfolio Management Team
rate cut helped stabilize things somewhat, investors ended the review period much in the same way they began it — wondering whether the market would rally again or if risk aversion was here to stay. Despite the volatility, the S&P 500 Index posted gains in the six-month period.
“Despite the volatility, the S&P
500 Index posted gains in the
six-month period.”
Looking at performance
For the six months ended August 31, 2007, John Hancock Value Opportunities Fund’s Class A, Class B, Class C, Class I, Class R1 and Class 1 shares returned –5.59%, –5.96%, –5.91%, –5.45%, –5.78% and –5.40%, respectively, at net asset value. By comparison, the Russell 2500 Value Index returned –3.28% while the average mid cap value fund monitored by Morningstar, Inc. returned 1.02% .1 Keep in mind that your returns will differ from those listed above if you were not invested in the Fund for the entire period or did not reinvest all distributions. See pages six and seven for historical performance information.
During the period, our primary stock selection tools — valuation and momentum — both lagged the market. Our valuation discipline performed reasonably well over the first several months of the period, but suffered in the later portion as both its sector and stock selections lagged the market. In the small-cap value universe, our valuation discipline suffered from its selections in the financial sector, as troubles in the subprime mortgage sector negatively impacted all financials — even those our discipline identified as undervalued.
Our momentum discipline also lagged the benchmark. The discipline is designed to identify stocks that have performed well recently and appear
Value Opportunities Fund
3
poised to continue outperforming. During the period, stock selection negatively impacted the discipline’s returns, particularly in the final months, as its picks were unable to outperform the market.
“During the period, our primary
stock selection tools — valuation
and momentum — both lagged
the market.”
Financials, consumer goods and services limit gains
The financial sector detracted the most from relative returns for the period, as both stock selection and our overweight position negatively impacted the Fund’s returns, as the sector was hit hard by troubles in subprime mortgages. For example, our overweight in Radian Group, Inc. detracted from returns when the company’s shares plunged after its debt was downgraded over concerns regarding its subsidiary’s exposure to subprime mortgages. Our overweight position in Triad Guaranty, Inc. suffered similarly.
The consumer goods sector also detracted from the Fund’s performance due both to stock selection and an overweight position. Much of the negative attribution in this sector came from two of our biggest disappointments during the period — Liz Claiborne, Inc. and Jones Apparel Group, Inc. Liz Claiborne issued a worse-than-expected outlook for the year, which sent shares plunging. Jones Apparel Group’s shares fell after the company announced that it was not pursuing a sale, prompting selling by investors who had bought the company’s shares on speculation that it would be taken over.
Also detracting from performance was the services sector. Our overweight position and stock selection drove the negative relative returns. An overweight position in Westwood One, Inc. negatively impacted returns during a period in which the radio broadcasting company reported lower quarterly profits. Not owning KBR, Inc. also negatively impacted returns as the company’s shares increased following its spinoff from Halliburton.
| SECTOR DISTRIBUTION2 | |
| Consumer cyclical | 27% |
| Financial | 26% |
| Consumer non-cyclical | 19% |
| Industrial | 9% |
| Communications | 4% |
| Basic materials | 4% |
| Technology | 3% |
| Utilities | 2% |
| Energy | 1% |
Retail and construction add value
On the positive side, stock selection in the retail sector added to relative returns. The sector included one of our biggest
Value Opportunities Fund
4
stock contributors, Dollar Tree Stores, Inc., which added to returns after increasing its earnings forecast and reported better-than-expected same store sales. Our underweight position in construction also added to returns, helped by avoiding the troubles in subprime. With worries abounding that mortgage troubles would lead to a decline in real estate prices and new home construction, our underweight position in the sector added to relative returns as shares declined. Not owning companies like RAIT Financial Trust and Duke Realty Corp. also added to relative returns for the period.
Outlook
The market volatility at the end of the period left investors wondering if the bull market has finally come to an end. The upcoming months will show whether the market’s recent trend toward risk aversion — especially in the troubled subprime mortgage sector — will persist. We believe the Fund remains strongly positioned with a mix of undervalued and strong momentum stocks.
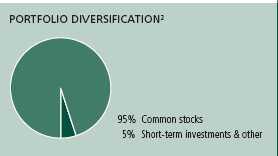
This commentary reflects the views of the portfolio management team through the end of the Fund’s period discussed in this report. The team’s statements reflect their own opinions. As such, they are in no way guarantees of future events and are not intended to be used as investment advice or a recommendation regarding any specific security. They are also subject to change at any time as market and other conditions warrant.
1 Figures from Morningstar, Inc. include reinvested dividends and do not take into account sales charges. Actual load-adjusted performance is lower.
2 As a percentage of net assets on August 31, 2007.
Value Opportunities Fund
5
A look at performance
For the periods ended August 31, 2007
| Average annual returns | Cumulative total returns | ||||||||||
| with maximum sales charge (POP) | with maximum sales charge (POP) | ||||||||||
| Inception | Since | Since | |||||||||
| Class | date | 1-year | 5-year | 10-year | inception | 6-month | 1-year | 5-year | 10-year | inception | |
| A | 6-12-06 | –0.15% | — | — | 1.15% | –10.32% | –0.15% | — | — | 1.41% | |
| B | 6-12-06 | –0.63 | — | — | 1.49 | –10.66 | –0.63 | — | — | 1.83 | |
| C | 6-12-06 | 3.42 | — | — | 4.77 | –6.85 | 3.42 | — | — | 5.88 | |
| I1 | 6-12-06 | 5.50 | — | — | 5.86 | –5.45 | 5.50 | — | — | 7.24 | |
| R1 1 | 6-12-06 | 4.76 | — | — | 5.09 | –5.78 | 4.76 | — | — | 6.28 | |
| 11 | 6-12-06 | 5.57 | — | — | 5.92 | –5.40 | 5.57 | — | — | 7.31 | |
Performance figures assume all distributions are reinvested. Public offering price (POP) figures reflect maximum sales charge on Class A shares of 5%, and the applicable contingent deferred sales charge (CDSC) on Class B and Class C shares. The Class B shares’ CDSC declines annually between years 1 to 6 according to the following schedule 5, 4, 3, 3, 2, 1%. No sales charge will be assessed after the sixth year. Class C shares held for less than one year are subject to a 1% CDSC. Sales charge is not applicable for Class I, Class R1 and Class 1 shares.
The expense ratios of the Fund, both net (including any fee waivers or expense limitations) and gross (excluding any fee waivers or expense limitations), are set forth according to the most recent publicly available Prospectuses for the Fund and may differ from the expense ratios disclosed in the Financial Highlights tables in this report. The waivers and expense limitations are contractual at least until 6-30-08. The net expenses are as follows: Class A — 1.41%, Class B — 2.11%, Class C — 2.11%, Class I — 1.02%, Class R1 — 1.76%, Class 1 — 0.97% . Had the fee waivers and expense limitations not been in place, the gross expenses would be as follows: Class A — 2.16%, Class B — 11.34%, Class C — 5.12%, Class I — 12.66%, Class R1 — 21.72%, Class 1 — 1.70% .
The returns reflect past results and should not be considered indicative of future performance. The return and principal value of an investment will fluctuate so that shares, when redeemed, may be worth more or less than their original cost. Due to market volatility, the Fund’s current performance may be higher or lower than the performance shown. For performance data current to the most recent month-end, please call 1-800-225-5291 or visit the Fund’s Web site at www.jhfunds.com.
The performance table above and the chart on the next page do not reflect the deduction of taxes that a shareholder would pay on fund distributions or the redemption of fund shares.
The Fund’s performance results reflect any applicable expense reductions, without which the expenses increase and results would have been less favorable.
Performance is calculated with an opening price (prior day’s close) on the inception date.
1 For certain types of investors as described in the Fund’s Class I, Class R1 and Class 1 share prospectuses.
Value Opportunities Fund
6
Growth of $10,000
This chart shows what happened to a hypothetical $10,000 investment in Value Opportunities Fund Class A shares for the period indicated. For comparison, we’ve shown the same investment in the Russell 2500 Value Index.
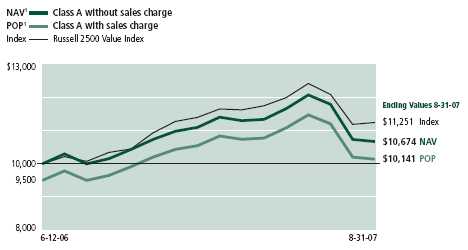
| With maximum | ||||
| Class | Period beginning | Without sales charge | sales charge | Index |
| B | 6-12-06 | $10,583 | $10,183 | $11,251 |
| C2 | 6-12-06 | 10,588 | 10,588 | 11,251 |
| I3 | 6-12-06 | 10,724 | 10,724 | 11,251 |
| R1 3 | 6-12-06 | 10,628 | 10,628 | 11,251 |
| 13 | 6-12-06 | 10,731 | 10,731 | 11,251 |
Assuming all distributions were reinvested for the period indicated, the table above shows the value of a $10,000 investment in the Fund’s Class B, Class C, Class I, Class R1 and Class 1 shares, respectively, as of August 31, 2007. Performance of the classes will vary based on the difference in sales charges paid by shareholders investing in the different classes and the fee structure of those classes.
Russell 2500 Value Index is an unmanaged index containing those securities in the Russell 2500 Index with a less-than-average growth orientation.
It is not possible to invest directly in an index. Index figures do not reflect sales charges, which would have resulted in lower values if they did.
1 NAV represents net asset value and POP represents public offering price.
2 No contingent deferred sales charge applicable.
3 For certain types of investors as described in the Fund’s Class I, Class R1 and Class 1 share prospectuses.
Value Opportunities Fund
7
Your expenses
These examples are intended to help you understand your ongoing operating expenses.
Understanding fund expenses
As a shareholder of the Fund, you incur two types of costs:
■ Transaction costs which include sales charges (loads) on purchases or redemptions (varies by share class), minimum account fee charge, etc.
■ Ongoing operating expenses including management fees, distribution and service fees (if applicable) and other fund expenses.
We are going to present only your ongoing operating expenses here.
Actual expenses/actual returns
This example is intended to provide information about your fund’s actual ongoing operating expenses, and is based on your fund’s actual return. It assumes an account value of $1,000.00 on March 1, 2007, with the same investment held until August 31, 2007.
| Account value | Ending value | Expenses paid during period | |
| on 3-1-07 | on 8-31-07 | on 8-31-071 | |
| Class A | $1,000.00 | $944.10 | $6.79 |
| Class B | 1,000.00 | 940.40 | 10.24 |
| Class C | 1,000.00 | 940.90 | 10.25 |
| Class I | 1,000.00 | 945.50 | 4.84 |
| Class R1 | 1,000.00 | 942.20 | 8.54 |
| Class 1 | 1,000.00 | 946.00 | 4.60 |
Together with the value of your account, you may use this information to estimate the operating expenses that you paid over the period. Simply divide your account value at August 31, 2007 by $1,000.00, then multiply it by the “expenses paid” for your share class from the table above. For example, for an account value of $8,600.00, the operating expenses should be calculated as follows:
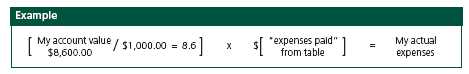
Value Opportunities Fund
8
Hypothetical example for comparison purposes
This table allows you to compare your fund’s ongoing operating expenses with those of any other fund. It provides an example of the Fund’s hypothetical account values and hypothetical expenses based on each class’s actual expense ratio and an assumed 5% annualized return before expenses (which is not your fund’s actual return). It assumes an account value of $1,000.00 on March 1, 2007, with the same investment held until August 31, 2007. Look in any other fund shareholder report to find its hypothetical example and you will be able to compare these expenses.
| Account value | Ending value | Expenses paid during period | |
| on 3-1-07 | on 8-31-07 | on 8-31-07 1 | |
| Class A | $1,000.00 | $1,018.15 | $7.05 |
| Class B | 1,000.00 | 1,014.58 | 10.63 |
| Class C | 1,000.00 | 1,014.58 | 10.63 |
| Class I | 1,000.00 | 1,020.16 | 5.03 |
| Class R1 | 1,000.00 | 1,016.34 | 8.87 |
| Class 1 | 1,000.00 | 1,020.41 | 4.77 |
Remember, these examples do not include any transaction costs, such as sales charges; therefore, these examples will not help you to determine the relative total costs of owning different funds. If transaction costs were included, your expenses would have been higher. See the prospectus for details regarding transaction costs.
1 Expenses are equal to the Fund’s annualized expense ratio of 1.39%, 2.10%, 2.10%, 0.99%, 1.75% and 0.94% for Class A, Class B, Class C, Class I, Class R1 and Class 1, respectively, multiplied by the average account value over the period, multiplied by the number of days in the inception period/365 or 366 (to reflect the one-half year period).
Value Opportunities Fund
9
F I N A N C I A L S T A T E M E N T S
Fund’s investments
Securities owned by the Fund on 8-31-07 (unaudited)
This schedule is divided into three main categories: common stocks, rights and short-term investments. Common stocks and rights are further broken down by industry group. Short-term investments, which represent the Fund’s cash position, are listed last.
| Issuer | Shares | Value |
| Common stocks 95.12% | $21,436,939 | |
| (Cost $20,741,546) | ||
| Aerospace 0.67% | 150,387 | |
| Alliant Techsystems, Inc. * | 1,100 | 115,841 |
| Curtiss-Wright Corp. | 500 | 22,800 |
| Woodward Governor Company | 200 | 11,746 |
| Air Freight 0.11% | 23,980 | |
| ExpressJet Holdings, Inc. * | 5,500 | 23,980 |
| Apparel & Textiles 3.41% | 767,861 | |
| Columbia Sportswear Company | 2,200 | 131,824 |
| Deckers Outdoor Corp. * | 200 | 18,838 |
| Jones Apparel Group, Inc. | 5,800 | 111,302 |
| Kellwood Company | 1,300 | 25,610 |
| K-Swiss, Inc., Class A | 1,200 | 28,944 |
| Liz Claiborne, Inc. | 8,600 | 293,862 |
| Oakley, Inc. | 1,000 | 28,770 |
| Perry Ellis International, Inc. * | 800 | 21,832 |
| Phillips-Van Heusen Corp. | 400 | 23,292 |
| The Warnaco Group, Inc. * | 300 | 10,470 |
| Timberland Company, Class A * | 2,200 | 44,198 |
| Wolverine World Wide, Inc. | 1,100 | 28,919 |
| Auto Parts 2.43% | 546,762 | |
| American Axle & Manufacturing Holdings, Inc. | 2,100 | 48,972 |
| ArvinMeritor, Inc. | 5,600 | 97,720 |
| Autoliv, Inc. | 2,200 | 126,214 |
| BorgWarner, Inc. | 1,300 | 109,850 |
| CSK Auto Corp. * | 1,600 | 21,152 |
| O’Reilly Automotive, Inc. * | 1,500 | 53,310 |
| Superior Industries International, Inc. | 200 | 3,976 |
| TRW Automotive Holdings Corp. * | 2,800 | 85,568 |
| Auto Services 1.46% | 329,670 | |
| AutoNation, Inc. * | 11,200 | 212,576 |
| Avis Budget Group, Inc. * | 2,300 | 53,383 |
See notes to financial statements
Value Opportunities Fund
10
F I N A N C I A L S T A T E M E N T S
| Issuer | Shares | Value |
| Auto Services (continued) | ||
| Copart, Inc. * | 1,500 | $44,010 |
| Lithia Motors, Inc., Class A | 1,100 | 19,701 |
| Automobiles 1.09% | 246,700 | |
| Asbury Automotive Group, Inc. | 2,900 | 62,698 |
| Group 1 Automotive, Inc. | 2,100 | 73,626 |
| Penske Auto Group, Inc. | 5,600 | 110,376 |
| Banking 9.01% | 2,029,429 | |
| AMCORE Financial, Inc. | 300 | 8,034 |
| Anchor BanCorp Wisconsin, Inc. (a) | 1,200 | 31,608 |
| Associated Banc-Corp. | 4,200 | 118,482 |
| Astoria Financial Corp. | 3,100 | 80,817 |
| BancFirst Corp. | 200 | 9,018 |
| BancorpSouth, Inc. | 2,700 | 67,473 |
| Bank of Hawaii Corp. | 400 | 20,564 |
| Banner Corp. | 200 | 6,444 |
| Chemical Financial Corp. | 600 | 15,192 |
| Chittenden Corp. | 800 | 27,824 |
| Citizens Banking Corp. | 1,700 | 29,971 |
| City National Corp. | 1,700 | 121,363 |
| Commerce Bancshares, Inc. | 1,585 | 74,020 |
| Corus Bankshares, Inc. (a) | 1,300 | 17,368 |
| Dime Community Bancorp, Inc. | 800 | 10,904 |
| Downey Financial Corp. | 1,900 | 107,521 |
| First BanCorp Puerto Rico (a) | 900 | 9,045 |
| First Citizens Bancshares, Inc. | 100 | 17,725 |
| First Horizon National Corp. (a) | 6,100 | 187,148 |
| First Indiana Corp. | 600 | 18,552 |
| FirstFed Financial Corp. *(a) | 1,400 | 70,350 |
| FirstMerit Corp. (a) | 3,400 | 65,688 |
| Flagstar Bancorp, Inc. (a) | 3,900 | 47,970 |
| Frontier Financial Corp. | 600 | 14,748 |
| Greater Bay Bancorp | 2,100 | 59,115 |
| Imperial Capital Bancorp, Inc. * | 500 | 17,300 |
| International Bancshares Corp. | 440 | 10,129 |
| MAF Bancorp, Inc. | 1,200 | 64,428 |
| New York Community Bancorp, Inc. | 3,000 | 53,070 |
| Old National Bancorp | 800 | 12,704 |
| Pacific Capital Bancorp (a) | 2,200 | 55,484 |
| Park National Corp. | 100 | 9,092 |
| Popular, Inc. (a) | 4,800 | 59,232 |
| TCF Financial Corp. | 6,000 | 151,620 |
| Trustmark Corp. | 3,300 | 93,192 |
| United Bankshares, Inc. | 800 | 25,040 |
| Valley National Bancorp (a) | 1,365 | 30,985 |
See notes to financial statements
Value Opportunities Fund
11
F I N A N C I A L S T A T E M E N T S
| Issuer | Shares | Value |
| Banking (continued) | ||
| Washington Federal, Inc. | 2,400 | $63,696 |
| Webster Financial Corp. | 1,300 | 55,198 |
| Westamerica Bancorp (a) | 1,100 | 53,405 |
| Whitney Holding Corp. | 500 | 13,850 |
| Wilmington Trust Corp. | 600 | 24,060 |
| Biotechnology 0.28% | 62,666 | |
| Immucor, Inc. * | 400 | 13,340 |
| Pharmanet Development Group, Inc. * | 400 | 11,520 |
| Techne Corp. * | 600 | 37,806 |
| Broadcasting 0.42% | 95,544 | |
| Belo Corp., Class A | 2,700 | 46,548 |
| Discovery Holding Company * | 800 | 20,096 |
| Westwood One, Inc. | 10,000 | 28,900 |
| Building Materials & Construction 0.30% | 67,067 | |
| Dycom Industries, Inc. * | 1,100 | 32,483 |
| EMCOR Group, Inc. * | 300 | 9,405 |
| Lennox International, Inc. | 700 | 25,179 |
| Business Services 3.71% | 836,156 | |
| ABM Industries, Inc. | 2,200 | 51,436 |
| CDI Corp. | 500 | 14,300 |
| Convergys Corp. * | 3,300 | 55,275 |
| Deluxe Corp. | 6,000 | 228,120 |
| FactSet Research Systems, Inc. | 1,100 | 65,923 |
| FTI Consulting, Inc. * | 300 | 15,756 |
| Insight Enterprises, Inc. * | 2,100 | 49,812 |
| Kelly Services, Inc., Class A | 1,800 | 40,896 |
| Manpower, Inc. | 900 | 63,234 |
| MAXIMUS, Inc. | 400 | 17,112 |
| Perot Systems Corp., Class A * | 600 | 9,378 |
| Pre-Paid Legal Services, Inc. * | 400 | 22,076 |
| R.H. Donnelley Corp. * | 600 | 35,298 |
| Resources Connection, Inc. * | 900 | 27,000 |
| ScanSource, Inc. * | 600 | 16,620 |
| Total Systems Services, Inc. (a) | 2,700 | 74,898 |
| Unisys Corp. * | 2,800 | 20,636 |
| Watson Wyatt Worldwide, Inc., Class A | 600 | 28,386 |
| Cable & Television 0.04% | 9,331 | |
| LIN TV Corp. * | 700 | 9,331 |
| Cellular Communications 0.72% | 161,875 | |
| Telephone & Data Systems, Inc. | 2,500 | 161,875 |
| Chemicals 2.68% | 604,499 | |
| Albemarle Corp. | 3,200 | 129,504 |
| Ashland, Inc. | 700 | 41,853 |
See notes to financial statements
Value Opportunities Fund
12
F I N A N C I A L S T A T E M E N T S
| Issuer | Shares | Value |
| Chemicals (continued) | ||
| Cabot Corp. | 1,200 | $48,408 |
| Celanese Corp., Series A | 600 | 21,552 |
| Eastman Chemical Company | 800 | 53,408 |
| FMC Corp. | 200 | 18,000 |
| Hercules, Inc. * | 1,300 | 27,066 |
| Lubrizol Corp. | 1,700 | 108,086 |
| PolyOne Corp. * | 500 | 4,015 |
| Sensient Technologies Corp. | 3,700 | 100,233 |
| Sigma-Aldrich Corp. | 700 | 31,360 |
| Stepan Company | 700 | 21,014 |
| Colleges & Universities 1.25% | 281,918 | |
| Career Education Corp. * | 4,100 | 121,770 |
| Corinthian Colleges, Inc. * | 2,800 | 39,368 |
| ITT Educational Services, Inc. * | 1,100 | 120,780 |
| Computers & Business Equipment 3.51% | 791,818 | |
| Avocent Corp. * | 1,000 | 29,520 |
| CACI International, Inc., Class A * | 600 | 30,612 |
| CDW Corp. * | 2,600 | 223,782 |
| Diebold, Inc. | 200 | 8,774 |
| EMS Technologies, Inc. * | 400 | 9,816 |
| Ingram Micro, Inc., Class A * | 9,500 | 186,580 |
| Lexmark International, Inc. * | 1,200 | 44,712 |
| Tech Data Corp. * | 5,000 | 194,950 |
| Western Digital Corp. * | 2,700 | 63,072 |
| Construction Materials 0.55% | 124,063 | |
| Louisiana-Pacific Corp. (a) | 2,500 | 46,825 |
| Simpson Manufacturing Company, Inc. | 2,000 | 66,000 |
| Standex International Corp. | 300 | 7,509 |
| Universal Forest Products, Inc. | 100 | 3,729 |
| Containers & Glass 0.90% | 202,139 | |
| Bemis Company, Inc. | 1,500 | 44,805 |
| Greif, Inc., Class A | 800 | 46,576 |
| Sealed Air Corp. | 1,600 | 42,320 |
| Sonoco Products Company | 1,900 | 68,438 |
| Cosmetics & Toiletries 1.07% | 242,102 | |
| Alberto-Culver Company | 4,300 | 99,631 |
| Chattem, Inc. *(a) | 700 | 43,197 |
| Estee Lauder Companies, Inc., Class A | 1,300 | 54,067 |
| International Flavors & Fragrances, Inc. | 900 | 45,207 |
| Crude Petroleum & Natural Gas 0.43% | 96,382 | |
| Cimarex Energy Company | 900 | 32,229 |
| Pogo Producing Company | 500 | 24,905 |
| Unit Corp. * | 800 | 39,248 |
See notes to financial statements
Value Opportunities Fund
13
F I N A N C I A L S T A T E M E N T S
| Issuer | Shares | Value |
| Drugs & Health Care 0.16% | $35,561 | |
| Invacare Corp. | 800 | 18,536 |
| Molina Healthcare, Inc. * | 500 | 17,025 |
| Electrical Equipment 0.15% | 33,548 | |
| Anixter International, Inc. * | 400 | 30,708 |
| AZZ, Inc. * | 100 | 2,840 |
| Electrical Utilities 1.74% | 391,582 | |
| Alliant Energy Corp. | 700 | 26,516 |
| CenterPoint Energy, Inc. (a) | 4,900 | 79,478 |
| CMS Energy Corp. | 1,300 | 21,216 |
| El Paso Electric Company * | 500 | 11,160 |
| Great Plains Energy, Inc. | 900 | 25,506 |
| Northeast Utilities | 700 | 19,355 |
| NSTAR | 1,300 | 42,601 |
| OGE Energy Corp. | 700 | 23,604 |
| Pepco Holdings, Inc. | 800 | 22,304 |
| Pinnacle West Capital Corp. | 700 | 27,888 |
| Reliant Energy, Inc. * | 1,500 | 38,265 |
| UIL Holding Corp. | 400 | 12,396 |
| Westar Energy, Inc. | 1,700 | 41,293 |
| Electronics 1.33% | 299,026 | |
| Arrow Electronics, Inc. * | 1,600 | 67,136 |
| Avnet, Inc. * | 3,600 | 141,516 |
| Synopsys, Inc. * | 1,600 | 43,712 |
| Teleflex, Inc. | 600 | 46,662 |
| Energy 0.51% | 116,039 | |
| Energen Corp. | 1,200 | 64,440 |
| Energy East Corp. | 1,500 | 40,035 |
| Headwaters, Inc. * | 700 | 11,564 |
| Financial Services 1.88% | 423,461 | |
| A.G. Edwards, Inc. | 600 | 50,148 |
| American Capital Strategies, Ltd. (a) | 1,800 | 74,322 |
| AmeriCredit Corp. * | 3,600 | 62,316 |
| Federal Agricultural Mortgage Corp., Class C | 600 | 19,560 |
| Fulton Financial Corp. | 2,000 | 29,400 |
| Interactive Data Corp. | 1,300 | 35,542 |
| Irwin Financial Corp. | 600 | 6,390 |
| Janus Capital Group, Inc. | 800 | 21,272 |
| Knight Capital Group, Inc. * | 400 | 5,496 |
| MCG Capital Corp. (a) | 1,400 | 20,328 |
| MoneyGram International, Inc. | 1,300 | 27,651 |
| SEI Investments Company | 2,800 | 71,036 |
See notes to financial statements
Value Opportunities Fund
14
F I N A N C I A L S T A T E M E N T S
| Issuer | Shares | Value |
| Food & Beverages 3.95% | $890,948 | |
| Chiquita Brands International, Inc. * | 2,200 | 34,320 |
| Corn Products International, Inc. | 200 | 9,040 |
| Dean Foods Company * | 2,500 | 67,150 |
| Del Monte Foods Company | 2,400 | 25,296 |
| Hormel Foods Corp. | 600 | 21,378 |
| J.M. Smucker Company | 2,000 | 110,020 |
| M & F Worldwide Corp. * | 300 | 16,920 |
| McCormick & Company, Inc. | 1,200 | 43,008 |
| Performance Food Group Company * | 3,400 | 96,696 |
| Pilgrim’s Pride Corp. (a) | 900 | 36,531 |
| Ralcorp Holdings, Inc. * | 1,100 | 67,969 |
| Sanderson Farms, Inc. | 900 | 37,746 |
| Seaboard Corp.�� | 4 | 8,316 |
| Smithfield Foods, Inc. * | 2,100 | 68,733 |
| Tyson Foods, Inc., Class A | 11,500 | 247,825 |
| Funeral Services 0.24% | 54,990 | |
| Service Corp. International | 4,500 | 54,990 |
| Furniture & Fixtures 1.29% | 289,612 | |
| American Woodmark Corp. (a) | 1,000 | 30,170 |
| Ethan Allen Interiors, Inc. (a) | 2,000 | 67,200 |
| Furniture Brands International, Inc. (a) | 4,900 | 55,762 |
| La-Z-Boy, Inc. (a) | 4,000 | 38,560 |
| Leggett & Platt, Inc. | 4,800 | 97,920 |
| Gas & Pipeline Utilities 0.28% | 63,795 | |
| Nicor, Inc. | 500 | 20,780 |
| ONEOK, Inc. | 700 | 32,795 |
| UGI Corp. | 400 | 10,220 |
| Healthcare Products 1.59% | 357,653 | |
| CONMED Corp. * | 1,400 | 40,670 |
| Cytyc Corp. * | 600 | 25,644 |
| IDEXX Laboratories, Inc. * | 600 | 67,050 |
| Owens & Minor, Inc. | 2,800 | 111,720 |
| Patterson Companies, Inc. * | 1,900 | 69,882 |
| Respironics, Inc. * | 900 | 42,687 |
| Healthcare Services 1.51% | 340,813 | |
| AMERIGROUP Corp. * | 1,300 | 41,171 |
| Apria Healthcare Group, Inc. * | 4,400 | 117,172 |
| Kindred Healthcare, Inc. * | 1,600 | 31,712 |
| Lincare Holdings, Inc. * | 2,200 | 79,178 |
| Pediatrix Medical Group, Inc. * | 1,200 | 71,580 |
| Homebuilders 1.83% | 413,458 | |
| Centex Corp. | 1,100 | 31,801 |
| KB Home (a) | 3,200 | 97,088 |
See notes to financial statements
Value Opportunities Fund
15
F I N A N C I A L S T A T E M E N T S
| Issuer | Shares | Value |
| Homebuilders (continued) | ||
| Lennar Corp., Class A (a) | 400 | $11,308 |
| M.D.C. Holdings, Inc. | 3,100 | 137,919 |
| M/I Homes, Inc. (a) | 1,800 | 32,814 |
| Toll Brothers, Inc. * | 4,800 | 102,528 |
| Hotels & Restaurants 2.33% | 524,644 | |
| Ameristar Casinos, Inc. | 300 | 8,673 |
| Applebee’s International, Inc. | 2,200 | 54,582 |
| Bob Evans Farms, Inc. | 300 | 10,011 |
| Brinker International, Inc. | 2,700 | 77,868 |
| CBRL Group, Inc. | 1,800 | 67,356 |
| CEC Entertainment, Inc. * | 1,500 | 46,050 |
| Jack in the Box, Inc. * | 2,000 | 124,440 |
| O’Charley’s, Inc. | 1,900 | 30,932 |
| RARE Hospitality International, Inc. * | 1,600 | 60,432 |
| Ruby Tuesday, Inc. | 2,000 | 44,300 |
| Household Products 1.78% | 401,861 | |
| Blyth, Inc. | 4,400 | 98,384 |
| Church & Dwight, Inc. | 600 | 26,958 |
| Energizer Holdings, Inc. * | 2,000 | 211,860 |
| Tupperware Brands Corp. | 2,100 | 64,659 |
| Industrial Machinery 0.96% | 217,022 | |
| AGCO Corp. * | 1,200 | 51,840 |
| Cascade Corp. | 600 | 44,166 |
| Crane Company | 700 | 31,353 |
| NACCO Industries, Inc., Class A | 100 | 11,847 |
| Pall Corp. | 1,600 | 61,008 |
| Tennant Company | 400 | 16,808 |
| Industrials 0.05% | 10,956 | |
| Lawson Products, Inc. | 300 | 10,956 |
| Insurance 12.90% | 2,908,163 | |
| Alfa Corp. | 700 | 12,460 |
| Alleghany Corp. * | 100 | 41,200 |
| American Financial Group, Inc. | 4,100 | 115,620 |
| American National Insurance Company | 200 | 25,210 |
| Axis Capital Holdings, Ltd. | 300 | 10,830 |
| Brown & Brown, Inc. | 2,000 | 53,840 |
| Commerce Group, Inc. | 6,600 | 210,408 |
| Conseco, Inc. * | 700 | 9,842 |
| Donegal Group, Inc. | 400 | 6,012 |
| Erie Indemnity Company, Class A | 1,400 | 78,246 |
| FBL Financial Group, Inc., Class A | 600 | 23,478 |
| First American Corp. | 5,100 | 213,333 |
| Great American Financial Resources, Inc. | 600 | 14,616 |
| Harleysville Group, Inc. | 300 | 9,678 |
See notes to financial statements
Value Opportunities Fund
16
F I N A N C I A L S T A T E M E N T S
| Issuer | Shares | Value |
| Insurance (continued) | ||
| HCC Insurance Holdings, Inc. | 1,700 | $46,937 |
| Hilb, Rogal and Hamilton Company | 500 | 23,350 |
| Horace Mann Educators Corp. | 500 | 9,670 |
| Kansas City Life Insurance Company | 200 | 8,964 |
| LandAmerica Financial Group, Inc. (a) | 1,500 | 83,085 |
| Markel Corp. * | 300 | 142,698 |
| Mercury General Corp. | 2,200 | 115,896 |
| MGIC Investment Corp. | 1,200 | 36,192 |
| National Western Life Insurance Company, Class A * | 200 | 51,800 |
| Nationwide Financial Services, Inc., Class A | 3,100 | 165,912 |
| Odyssey Re Holdings Corp. | 2,300 | 83,306 |
| Old Republic International Corp. | 10,100 | 183,719 |
| Philadelphia Consolidated Holding Corp. * | 3,400 | 136,068 |
| PMI Group, Inc. | 4,100 | 129,888 |
| Presidential Life Corp. | 500 | 8,650 |
| Protective Life Corp. | 2,100 | 87,780 |
| Radian Group, Inc. | 2,400 | 42,336 |
| Reinsurance Group of America, Inc. | 3,800 | 206,378 |
| RLI Corp. | 800 | 48,120 |
| Safety Insurance Group, Inc. | 1,300 | 44,382 |
| Selective Insurance Group, Inc. | 1,400 | 29,540 |
| Stancorp Financial Group, Inc. | 2,000 | 94,200 |
| Stewart Information Services Corp. | 2,100 | 77,826 |
| Transatlantic Holdings, Inc. | 1,900 | 134,577 |
| Triad Guaranty, Inc. * | 2,100 | 35,133 |
| Unitrin, Inc. | 400 | 18,184 |
| Zenith National Insurance Corp. | 900 | 38,799 |
| Internet Software 0.13% | 28,600 | |
| McAfee, Inc. * | 800 | 28,600 |
| Investment Companies 0.03% | 6,196 | |
| KKR Financial Holdings LLC | 400 | 6,196 |
| Leisure Time 0.70% | 157,900 | |
| Brunswick Corp. | 4,000 | 100,600 |
| Polaris Industries, Inc. (a) | 1,200 | 57,300 |
| Life Sciences 0.53% | 118,983 | |
| PerkinElmer, Inc. | 1,200 | 32,892 |
| Pharmaceutical Product Development, Inc. | 700 | 24,521 |
| Waters Corp. * | 1,000 | 61,570 |
| Liquor 0.16% | 35,784 | |
| Molson Coors Brewing Company, Class B | 400 | 35,784 |
| Manufacturing 0.95% | 213,406 | |
| AptarGroup, Inc. | 1,700 | 61,761 |
| Lancaster Colony Corp. | 600 | 24,402 |
See notes to financial statements
Value Opportunities Fund
17
F I N A N C I A L S T A T E M E N T S
| Issuer | Shares | Value |
| Manufacturing (continued) | ||
| Snap-on, Inc. | 500 | $24,490 |
| SPX Corp. | 700 | 63,035 |
| Stanley Works | 700 | 39,718 |
| Medical — Hospitals 0.48% | 108,414 | |
| Health Management Associates, Inc., Class A | 3,500 | 23,835 |
| Lifepoint Hospitals, Inc. * | 1,200 | 33,720 |
| Tenet Healthcare Corp. * | 4,100 | 13,899 |
| Universal Health Services, Inc., Class B | 700 | 36,960 |
| Metal & Metal Products 0.97% | 218,994 | |
| Commercial Metals Company | 800 | 23,112 |
| Matthews International Corp., Class A | 600 | 25,884 |
| Mueller Industries, Inc. | 1,100 | 38,104 |
| Quanex Corp. | 1,700 | 73,627 |
| Reliance Steel & Aluminum Company | 1,100 | 58,267 |
| Mining 0.17% | 38,135 | |
| Cleveland-Cliffs, Inc. | 500 | 38,135 |
| Mobile Homes 0.45% | 101,177 | |
| Thor Industries, Inc. | 2,300 | 101,177 |
| Newspapers 0.15% | 34,740 | |
| Lee Enterprises, Inc. | 2,000 | 34,740 |
| Office Furnishings & Supplies 0.55% | 124,104 | |
| OfficeMax, Inc. | 1,500 | 53,280 |
| United Stationers, Inc. * | 1,200 | 70,824 |
| Paper 0.41% | 92,477 | |
| Rock-Tenn Company, Class A | 1,100 | 31,889 |
| Temple-Inland, Inc. | 1,100 | 60,588 |
| Petroleum Services 0.66% | 148,504 | |
| Tesoro Petroleum Corp. | 1,800 | 88,794 |
| Tidewater, Inc. | 500 | 32,725 |
| World Fuel Services Corp. | 700 | 26,985 |
| Pharmaceuticals 1.02% | 229,270 | |
| Endo Pharmaceutical Holdings, Inc. * | 600 | 19,128 |
| King Pharmaceuticals, Inc. * | 11,600 | 174,348 |
| Par Pharmaceutical Companies, Inc. * | 400 | 8,956 |
| Watson Pharmaceuticals, Inc. * | 900 | 26,838 |
| Publishing 0.83% | 188,030 | |
| American Greetings Corp., Class A | 500 | 12,370 |
| Scholastic Corp. * | 1,100 | 37,488 |
| The New York Times Company, Class A (a) | 5,000 | 109,900 |
| Valassis Communications, Inc. *(a) | 3,100 | 28,272 |
| Real Estate 2.36% | 532,765 | |
| Annaly Capital Management, Inc., REIT | 10,000 | 140,900 |
| Anthracite Capital, Inc., REIT | 2,800 | 25,368 |
See notes to financial statements
Value Opportunities Fund
18
F I N A N C I A L S T A T E M E N T S
| Issuer | Shares | Value |
| Real Estate (continued) | ||
| Anworth Mortgage Asset Corp., REIT | 1,900 | $10,222 |
| Avatar Holdings, Inc. * | 100 | 6,078 |
| Entertainment Properties Trust, REIT | 800 | 38,272 |
| Inland Real Estate Corp., REIT | 600 | 9,288 |
| iStar Financial, Inc., REIT | 1,900 | 69,540 |
| MFA Mortgage Investments, Inc., REIT | 1,900 | 14,725 |
| Newcastle Investment Corp., REIT | 2,200 | 36,608 |
| Redwood Trust, Inc., REIT (a) | 2,600 | 97,058 |
| Senior Housing Properties Trust, REIT | 400 | 8,136 |
| Thornburg Mortgage, Inc., REIT (a) | 6,500 | 76,570 |
| Retail Grocery 1.97% | 444,021 | |
| Ingles Markets, Inc. | 1,900 | 57,209 |
| Nash Finch Company (a) | 1,800 | 67,518 |
| Ruddick Corp. | 1,500 | 48,870 |
| SUPERVALU, Inc. | 5,600 | 236,040 |
| Weis Markets, Inc. | 800 | 34,384 |
| Retail Trade 8.17% | 1,841,722 | |
| 99 Cents Only Stores * | 700 | 8,645 |
| Advance Auto Parts, Inc. | 1,500 | 53,340 |
| American Eagle Outfitters, Inc. | 2,000 | 51,660 |
| Big Lots, Inc. * | 3,100 | 92,287 |
| BJ’s Wholesale Club, Inc. * | 3,600 | 126,000 |
| Borders Group, Inc. (a) | 400 | 6,000 |
| Chico’s FAS, Inc. * | 1,500 | 23,970 |
| Dillard’s, Inc., Class A | 400 | 9,496 |
| Dollar Tree Stores, Inc. * | 8,200 | 356,290 |
| Family Dollar Stores, Inc. | 5,100 | 149,328 |
| Foot Locker, Inc. | 2,800 | 46,788 |
| Fossil, Inc. * | 3,500 | 117,285 |
| Jo-Ann Stores, Inc. * | 400 | 9,000 |
| Longs Drug Stores Corp. | 600 | 31,638 |
| Pacific Sunwear of California, Inc. * | 3,100 | 43,431 |
| RadioShack Corp. | 4,000 | 95,080 |
| Regis Corp. | 2,500 | 82,525 |
| Rent-A-Center, Inc. * | 4,900 | 94,178 |
| Rite Aid Corp. *(a) | 21,700 | 110,019 |
| Ross Stores, Inc. | 1,500 | 41,745 |
| Saks, Inc. * | 1,200 | 19,404 |
| Sonic Automotive, Inc. | 2,800 | 74,480 |
| Talbots, Inc. (a) | 800 | 17,024 |
| The Buckle, Inc. | 600 | 22,446 |
| The Men’s Wearhouse, Inc. | 300 | 15,204 |
| Tiffany & Company | 1,000 | 51,330 |
| Tuesday Morning Corp. (a) | 400 | 4,220 |
See notes to financial statements
Value Opportunities Fund
19
F I N A N C I A L S T A T E M E N T S
| Issuer | Shares | Value |
| Retail Trade (continued) | ||
| Tween Brands, Inc. * | 400 | $11,800 |
| Williams-Sonoma, Inc. (a) | 1,100 | 36,663 |
| Zale Corp. * | 1,800 | 40,446 |
| Semiconductors 0.39% | 87,227 | |
| Intersil Corp., Class A | 400 | 13,328 |
| Novellus Systems, Inc. * | 2,700 | 73,899 |
| Software 0.77% | 172,676 | |
| Citrix Systems, Inc. * | 1,200 | 43,620 |
| Compuware Corp. * | 7,000 | 56,770 |
| EPIQ Systems, Inc. * | 900 | 14,607 |
| Manhattan Associates, Inc. * | 800 | 23,104 |
| Sybase, Inc. * | 1,500 | 34,575 |
| Steel 0.34% | 77,378 | |
| Schnitzer Steel Industries, Inc. | 600 | 35,058 |
| Worthington Industries, Inc. (a) | 2,000 | 42,320 |
| Telecommunications Equipment & Services 0.58% | 131,109 | |
| ADC Telecommunications, Inc. * | 600 | 10,980 |
| Plantronics, Inc. | 1,800 | 51,120 |
| Polycom, Inc. * | 1,500 | 45,465 |
| Premiere Global Services, Inc. * | 1,800 | 23,544 |
| Telephone 0.97% | 218,256 | |
| Atlantic Tele-Network, Inc. | 500 | 16,740 |
| CenturyTel, Inc. | 4,200 | 201,516 |
| Tires & Rubber 0.55% | 124,016 | |
| Cooper Tire & Rubber Company | 1,000 | 24,440 |
| Goodyear Tire & Rubber Company * | 3,600 | 99,576 |
| Tobacco 0.37% | 82,811 | |
| Schweitzer Mauduit International, Inc. | 400 | 9,116 |
| Universal Corp. | 1500 | 73,695 |
| Toys, Amusements & Sporting Goods 0.71% | 159,081 | |
| Hasbro, Inc. | 4,600 | 129,766 |
| Jakks Pacific, Inc. * | 500 | 11,235 |
| Marvel Entertainment, Inc. * | 800 | 18,080 |
| Transportation 0.62% | 139,371 | |
| Horizon Lines, Inc. | 400 | 11,284 |
| Overseas Shipholding Group, Inc. | 1,500 | 107,100 |
| Saia, Inc. * | 500 | 9,395 |
| Teekay Shipping Corp. | 200 | 11,592 |
| Trucking & Freight 0.61% | 138,311 | |
| Arkansas Best Corp. | 1,600 | 57,440 |
| Werner Enterprises, Inc. | 1,200 | 22,332 |
| YRC Worldwide, Inc. * | 1,900 | 58,539 |
See notes to financial statements
Value Opportunities Fund
20
F I N A N C I A L S T A T E M E N T S
| Issuer | Rights | Value |
| Rights 0.00% | $84 | |
| (Cost $836,000) | ||
| Investment companies 0.00% | 84 | |
| KKR Financial Holding LLC Expiration Date: 09/11/2007, | ||
| Strike price: $14.40 | 78 | 84 |
| Principal | ||
| Issuer, description, maturity date | amount | Value |
| Short-term investments 12.95% | $2,917,848 | |
| (Cost $2,917,848) | ||
| Repurchase Agreement 4.40% | 992,000 | |
| Repurchase Agreement with State Street Corp. dated 08-31-07 at | ||
| 4.60% to be repurchased at $992,507 on 09-04-07, | ||
| collateralized by $1,050,000 Federal Home Loan Mortgage Corp., | ||
| 4.00%, due 06-12-13 (valued at $1,013,250, including interest) | $992,000 | 992,000 |
| Shares | ||
| Cash Equivalents 8.55% | 1,925,848 | |
| John Hancock Cash Investment Trust (c) | 1,925,848 | 1,925,848 |
| Total investments (Cost $24,495,394) 108.07% | $24,354,871 | |
| Other assets in excess of liabilities (8.07%) | (1,818,309) | |
| Total net assets 100.00% | $22,536,562 | |
Percentages are stated as a percent of net assets.
REIT Real Estate Investment Trust
* Non-income-producing.
(a) All or a portion of this security was out on loan.
(c) Investment is an affiliate of the Trust’s adviser or subadviser.
See notes to financial statements
Value Opportunities Fund
21
F I N A N C I A L S T A T E M E N T S
Financial statements
Statement of assets and liabilities 8-31-07 (unaudited)
This Statement of Assets and Liabilities is the Fund’s balance sheet. It shows the value of what the Fund owns, is due and owes. You’ll also find the net asset value and the maximum offering price per share.
| Assets | |
| Investments in unaffiliated issuers, at value (cost $21,577,546) | |
| including $1,888,086 of securities loaned (Note 2) | $21,437,023 |
| Repurchase agreement, at value (cost $992,000) | 992,000 |
| Investments in affiliated issuers, at value (cost $1,925,848) | 1,925,848 |
| Total investments, at value (cost $24,495,394) | 24,354,871 |
| Cash | 128 |
| Cash collateral at broker for futures contracts | 41,280 |
| Receivable for fund shares sold | 23,316 |
| Dividends and interest receivable | 31,290 |
| Receivable for futures variation margin | 7,957 |
| Receivable due from adviser | 46,603 |
| Other assets | 9,185 |
| Total assets | 24,514,630 |
| Liabilities | |
| Payable for fund shares repurchased | 12,515 |
| Payable upon return of securities loaned (Note 2) | 1,925,848 |
| Payable to affiliates | |
| Fund administration fees | 202 |
| Transfer agent fees | 895 |
| Distribution and service fees | 347 |
| Other payables and accrued expenses | 38,261 |
| Total liabilities | 1,978,068 |
| Net assets | |
| Capital paid-in | $21,820,807 |
| Accumulated undistributed net realized gain on investments and futures contracts | 837,024 |
| Net unrealized depreciation on investments and futures contracts | (154,919) |
| Accumulated net investment income | 33,650 |
| Net assets | $22,536,562 |
| Net asset value per share | |
| Based on net asset valued and shares outstanding — the Fund has an | |
| unlimited number of shares authorized with no par value. | |
| Class A ($19,780,106 ÷ 936,933) | $21.11 |
| Class B ($390,484 ÷ 18,593)1 | $21.00 |
| Class C ($1,528,215 ÷ 72,746)1 | $21.01 |
| Class I ($289,166 ÷ 13,657) | $21.17 |
| Class R1 ($127,811 ÷ 6,078) | $21.03 |
| Class 1 ($420,780 ÷ 19,865) | $21.18 |
| Maximum offering price per share | |
| Class A2 ($21.11 ÷ 95%) | $22.22 |
1 Redemption price is equal to the net asset value less any applicable contingent deferred sales charge.
2 On single retail sales of less than $50,000. On sales of $50,000 or more and on group sales the offering price is reduced.
See notes to financial statements
Value Opportunities Fund
22
F I N A N C I A L S T A T E M E N T S
Statement of operations For the period ended 8-31-071 (unaudited)
This Statement of Operations summarizes the Fund’s investment income earned and expenses incurred in operating the Fund. It also shows net gains (losses) for the period stated.
| Investment income | |
| Dividends | $177,565 |
| Interest | 23,958 |
| Securities lending | 2,385 |
| Less foreign taxes withheld | (6) |
| Total investment income | 203,902 |
| Expenses | |
| Investment management fees (Note 3) | 94,700 |
| Distribution and service fees (Note 3) | 41,757 |
| Transfer agent fees (Note 3) | 9,553 |
| Fund administration fees (Note 3) | 3,300 |
| Audit and legal fees | 52,971 |
| Blue sky fees (Note 3) | 47,248 |
| Custodian fees | 28,500 |
| Registration and filing fees | 12,539 |
| Printing and postage fees (Note 3) | 5,561 |
| Trustees’ fees (Note 3) | 661 |
| Miscellaneous | 166 |
| Total expenses | 296,956 |
| Less expense reductions (Note 3) | (126,704) |
| Net expenses | 170,252 |
| Net investment income | 33,650 |
| Realized and unrealized gain (loss) | |
| Net realized gain on | |
| Investments | 522,506 |
| Futures contracts | 28,305 |
| 550,811 | |
| Change in net unrealized depreciation of | |
| Investments | (1,958,376) |
| Futures contracts | (11,436) |
| (1,969,812) | |
| Net realized and unrealized loss | (1,419,001) |
| Decrease in net assets from operations | ($1,385,351) |
1 Semiannual period from 3-1-07 to 8-31-07.
See notes to financial statements
Value Opportunities Fund
23
F I N A N C I A L S T A T E M E N T S
Statement of changes in net assets
These Statements of Changes in Net Assets show how the value of the Fund’s net assets has changed during the last two periods. The difference reflects earnings less expenses, any investment gains and losses, distributions, if any, paid to shareholders and the net of Fund share transactions.
| Period | Period | |
| ended1 | ended2 | |
| 2-28-07 | 8-31-07 | |
| Increase (decrease) in net assets | ||
| From operations | ||
| Net investment income | $60,627 | $33,650 |
| Net realized gain | 437,545 | 550,811 |
| Change in net unrealized appreciation (depreciation) | 1,814,893 | (1,969,812) |
| Increase (decrease) in net assets resulting from operations | 2,313,065 | (1,385,351) |
| Distributions to shareholders | ||
| From net investment income | ||
| Class A | (70,959) | — |
| Class B | (135) | — |
| Class C | (747) | — |
| Class I | (1,369) | — |
| Class R1 | (372) | — |
| Class 1 | (880) | — |
| From net realized gain | ||
| Class A | (135,189) | — |
| Class B | (1,747) | — |
| Class C | (9,633) | — |
| Class I | (1,755) | — |
| Class R1 | (807) | — |
| Class 1 | (1,083) | — |
| Total distributions | (224,676) | — |
| From Fund share transactions | 20,103,746 | 1,729,778 |
| Total increase | 22,192,135 | 344,427 |
| Net assets | ||
| Beginning of period | — | 22,192,135 |
| End of period3 | $22,192,135 | $22,536,562 |
1 Period from 6-12-06 (commencement of operations) to 2-28-07.
2 Semiannual period from 3-1-07 to 8-31-07. Unaudited.
3 Includes accumulated net investment income of $0 and $33,650.
See notes to financial statements
Value Opportunities Fund
24
F I N A N C I A L S T A T E M E N T S
Financial highlights
The Financial Highlights show how the Fund’s net asset value for a share has changed since the end of the previous period.
| CLASS A SHARES | ||
| Period ended | 2-28-071 | 8-31-072 |
| Per share operating performance | ||
| Net asset value, beginning of period | $20.00 | $22.36 |
| Net investment income3 | 0.074 | 0.04 |
| Net realized and unrealized | ||
| gain (loss) on investments | 2.53 | (1.29) |
| Total from investment operations | 2.60 | (1.25) |
| Less distributions | ||
| From net investment income | (0.08) | — |
| From net realized gain | (0.16) | — |
| (0.24) | — | |
| Net asset value, end of period | $22.36 | $21.11 |
| Total return5,6,7 (%) | 13.06 | (5.59) |
| Ratios and supplemental data | ||
| Net assets, end of period | ||
| (in millions) | $20 | $20 |
| Ratio of net expenses to average | ||
| net assets8 (%) | 1.38 | 1.39 |
| Ratio of gross expenses to average | ||
| net assets8,9 (%) | 2.13 | 2.15 |
| Ratio of net investment income | ||
| to average net assets8 (%) | 0.474 | 0.33 |
| Portfolio turnover7 (%) | 30 | 31 |
See notes to financial statements
Value Opportunities Fund
25
F I N A N C I A L S T A T E M E N T S
Financial highlights
| CLASS B SHARES | ||
| Period ended | 2-28-071 | 8-31-072 |
| Per share operating performance | ||
| Net asset value, beginning of period | $20.00 | $22.33 |
| Net investment loss3 | (0.01)4 | (0.04) |
| Net realized and unrealized | ||
| gain (loss) on investments | 2.51 | (1.29) |
| Total from investment operations | 2.50 | (1.33) |
| Less distributions | ||
| From net investment income | (0.01) | — |
| From net realized gain | (0.16) | — |
| (0.17) | — | |
| Net asset value, end of period | $22.33 | $21.00 |
| Total return5,6,7 (%) | 12.54 | (5.96) |
| Ratios and supplemental data | ||
| Net assets, end of period | ||
| (in millions) | —10 | —10 |
| Ratio of net expenses to average | ||
| net assets8 (%) | 2.08 | 2.09 |
| Ratio of gross expenses to average | ||
| net assets8,9 (%) | 11.31 | 7.61 |
| Ratio of net investment loss | ||
| to average net assets8 (%) | (0.07)4 | (0.36) |
| Portfolio turnover7 (%) | 30 | 31 |
See notes to financial statements
Value Opportunities Fund
26
F I N A N C I A L S T A T E M E N T S
Financial highlights
| CLASS C SHARES | ||
| Period ended | 2-28-071 | 8-31-072 |
| Per share operating performance | ||
| Net asset value, beginning of period | $20.00 | $22.33 |
| Net investment loss3 | (0.01)4 | (0.04) |
| Net realized and unrealized | ||
| gain (loss) on investments | 2.51 | (1.28) |
| Total from investment operations | 2.50 | (1.32) |
| Less distributions | ||
| From net investment income | (0.01) | — |
| From net realized gain | (0.16) | — |
| (0.17) | — | |
| Net asset value, end of period | $22.33 | $21.01 |
| Total return5,6,7 (%) | 12.54 | (5.91) |
| Ratios and supplemental data | ||
| Net assets, end of period | ||
| (in millions) | $1 | $2 |
| Ratio of net expenses to average | ||
| net assets8 (%) | 2.08 | 2.09 |
| Ratio of gross expenses to average | ||
| net assets8,9 (%) | 5.09 | 4.03 |
| Ratio of net investment loss | ||
| to average net assets8 (%) | (0.07)4 | (0.37) |
| Portfolio turnover7 (%) | 30 | 31 |
See notes to financial statements
Value Opportunities Fund
27
F I N A N C I A L S T A T E M E N T S
Financial highlights
| CLASS I SHARES | ||
| Period ended | 2-28-071 | 8-31-072 |
| Per share operating performance | ||
| Net asset value, beginning of period | $20.00 | $22.39 |
| Net investment income3 | 0.154 | 0.08 |
| Net realized and unrealized | ||
| gain (loss) on investments | 2.53 | (1.30) |
| Total from investment operations | 2.68 | (1.22) |
| Less distributions | ||
| From net investment income | (0.13) | — |
| From net realized gain | (0.16) | — |
| (0.29) | — | |
| Net asset value, end of period | $22.39 | $21.17 |
| Total return5,6,7 (%) | 13.42 | (5.45) |
| Ratios and supplemental data | ||
| Net assets, end of period | ||
| (in millions) | —10 | —10 |
| Ratio of net expenses to average | ||
| net assets8 (%) | 0.99 | 0.99 |
| Ratio of gross expenses to average | ||
| net assets8,9 (%) | 12.63 | 7.88 |
| Ratio of net investment income | ||
| to average net assets8 (%) | 0.964 | 0.74 |
| Portfolio turnover7 (%) | 30 | 31 |
See notes to financial statements
Value Opportunities Fund
28
F I N A N C I A L S T A T E M E N T S
Financial highlights
| CLASS R1 SHARES | ||
| Period ended | 2-28-071 | 8-31-072 |
| Per share operating performance | ||
| Net asset value, beginning of period | $20.00 | $22.32 |
| Net investment income3 | 0.024 | —11 |
| Net realized and unrealized | ||
| gain (loss) on investments | 2.53 | (1.29) |
| Total from investment operations | 2.55 | (1.29) |
| Less distributions | ||
| From net investment income | (0.07) | — |
| From net realized gain | (0.16) | — |
| (0.23) | — | |
| Net asset value, end of period | $22.32 | $21.03 |
| Total return5,6,7 (%) | 12.80 | (5.78) |
| Ratios and supplemental data | ||
| Net assets, end of period | ||
| (in millions) | —10 | —10 |
| Ratio of net expenses to average | ||
| net assets8 (%) | 1.73 | 1.74 |
| Ratio of gross expenses to average | ||
| net assets8,9 (%) | 21.69 | 17.53 |
| Ratio of net investment income | ||
| (loss) to average net assets 8 (%) | 0.124 | (0.01) |
| Portfolio turnover7 (%) | 30 | 31 |
See notes to financial statements
Value Opportunities Fund
29
F I N A N C I A L S T A T E M E N T S
Financial highlights
| CLASS 1 SHARES | ||
| Period ended | 2-28-071 | 8-31-072 |
| Per share operating performance | ||
| Net asset value, beginning of period | $20.00 | $22.39 |
| Net investment income3 | 0.144 | 0.09 |
| Net realized and unrealized | ||
| gain (loss) on investments | 2.54 | (1.30) |
| Total from investment operations | 2.68 | (1.21) |
| Less distributions | ||
| From net investment income | (0.13) | — |
| From net realized gain | (0.16) | — |
| (0.29) | — | |
| Net asset value, end of period | $22.39 | $21.18 |
| Total return5,6,7 (%) | 13.44 | (5.40) |
| Ratios and supplemental data | ||
| Net assets, end of period | ||
| (in millions) | —10 | —10 |
| Ratio of net expenses to average | ||
| net assets8 (%) | 0.94 | 0.94 |
| Ratio of gross expenses to average | ||
| net assets8,9 (%) | 1.67 | 1.79 |
| Ratio of net investment income | ||
| to average net assets8 (%) | 0.894 | 0.83 |
| Portfolio turnover7 (%) | 30 | 31 |
1 Class A, Class B, Class C, Class I, Class R1 and Class 1 shares began operations on 6-12-06.
2 Semiannual period from 3-1-07 to 8-31-07. Unaudited.
3 Based on the average of the shares outstanding.
4 Net investment income (loss) per share and ratio of net investment income (loss) to average net assets reflects a special dividend received by the Fund which amounted to the following amounts:
| Percentage | ||
| of average | ||
| Per share | net assets | |
| Class A | $0.02 | 0.09% |
| Class B | 0.02 | 0.10 |
| Class C | 0.02 | 0.10 |
| Class I | 0.02 | 0.10 |
| Class R1 | 0.02 | 0.09 |
| Class 1 | 0.02 | 0.09 |
5 Assumes dividend reinvestment.
6 Total returns would have been lower had certain expenses not been reduced during the periods shown.
7 Not annualized.
8 Annualized.
9 Does not take into consideration expense reductions during the periods shown.
10 Less than $500,000.
11 Net investment loss is less than $0.01 per share.
See notes to financial statements
Value Opportunities Fund
30
Notes to financial statements (unaudited)
1. Organization
John Hancock Value Opportunities Fund (the Fund) is a newly organized non-diversified series of John Hancock Funds III (the Trust). The Trust was established as a Massachusetts business trust on June 9, 2005. The Trust is registered under the Investment Company Act of 1940, as amended (the 1940 Act), as an open-end investment management company. The investment objective of the Fund is to seek long-term capital growth.
John Hancock Life Insurance Company of New York (John Hancock New York) is a wholly owned subsidiary of John Hancock Life Insurance Company (U.S.A.) (John Hancock USA). John Hancock USA and John Hancock New York are indirect wholly owned subsidiaries of The Manufacturers Life Insurance Company (Manulife), which in turn is a wholly owned subsidiary of Manulife Financial Corporation (MFC), a publicly traded company. MFC and its subsidiaries are known collectively as “Manulife Financial.”
John Hancock Investment Management Services, LLC (the Adviser), a Delaware limited liability company controlled by John Hancock USA, serves as investment adviser for the Trust and John Hancock Funds, LLC (the Distributor), a Delaware limited liability company, an affiliate of the Adviser, serves as principal underwriter.
The Board of Trustees has authorized the issuance of multiple classes of shares of the Fund, including classes designated as Class A, Class B, Class C, Class I, Class R1, Class 1, Class 3 and Class NAV shares. The shares of each class represent an interest in the same portfolio of investments of the Fund, and have equal rights as to voting, redemptions, dividends and liquidation, except that certain expenses, subject to the approval of the Board of Trustees, may be applied differently to each class of shares in accordance with current regulations of the Securities and Exchange Commission and the Internal Revenue Service. Shareholders of a class that bear distribution and service expenses under the terms of a distribution plan have exclusive voting rights to that distribution plan. Class B shares will convert to Class A shares eight years after purchase.
Class 1 shares are sold only to certain exempt separate accounts of John Hancock USA and John Hancock New York.
The Adviser and other affiliates of John Hancock USA owned 733,141, 5,065, 5,054 and 5,066 shares of beneficial interest of Class A, Class I, Class R1 and Class 1, respectively, of the Fund on August 31, 2007.
2. Significant accounting policies
In the preparation of the financial statements, the Fund follows the policies described below. The preparation of financial statements in conformity with accounting principles generally accepted in the United States of America requires management to make estimates and assumptions that affect the reported amounts of assets and liabilities at the date of the financial statements and the reported amounts of income and expenses during the reporting period. Actual results may differ from these estimates.
Security valuation
The net asset value of the Class A, Class B, Class C, Class I, Class R1 and Class 1 shares of the Fund is determined daily as of the close of the New York Stock Exchange (NYSE), normally at 4:00 p.m., Eastern Time. Short-term debt instruments with remaining maturities of 60 days or less are valued at amortized cost, and thereafter assume a constant amortization to maturity of any discount or premium, which approximates market value. Investments in John Hancock Cash Investment Trust (JHCIT), an affiliate of the John Hancock Advisers, LLC (JHA), a wholly owned subsidiary of John Hancock Financial Services,
Value Opportunities Fund
31
Inc., a subsidiary of MFC are valued at their net asset value each business day. All other securities held by the Fund are valued at the last sale price or official closing price (closing bid price or last evaluated quote if no sale has occurred) as of the close of business on a principal securities exchange (domestic or foreign) on which they trade or, lacking any sales, at the closing bid price. Securities traded only in the over-the counter market are valued at the last bid price quoted by brokers making markets in the securities at the close of trading. Securities for which there are no such quotations, principally debt securities, are valued based on the valuation provided by an independent pricing service, which utilizes both dealer-supplied and electronic data processing techniques, which take into account factors such as institutional-size trading in similar groups of securities, yield, quality, coupon rate, maturity, type of issue, trading characteristics and other market data.
Other assets and securities for which no such quotations are readily available are valued at their fair value as determined in good faith under consistently applied procedures established by and under the general supervision of the Board of Trustees. Generally, trading in non-U.S. securities is substantially completed each day at various times prior to the close of trading on the NYSE. The values of such securities used in computing the net asset value of a Fund’s shares are generally determined as of such times. Occasionally, significant events that affect the values of such securities may occur between the times at which such values are generally determined and the close of the NYSE. Upon such an occurrence, these securities will then be valued at their fair value as determined in good faith under consistently applied procedures established by and under the general supervision of the Board of Trustees.
Repurchase agreements
The Fund may enter into repurchase agreements. When the Fund enters into a repurchase agreement through its custodian, it receives delivery of securities, the amount of which at the time of purchase and each subsequent business day is required to be maintained at such a level that the market value is generally at least 102% of the repurchase amount. The Fund will take constructive receipt of all securities underlying the repurchase agreements it has entered into until such agreements expire. If the seller defaults, the Fund would suffer a loss to the extent that proceeds from the sale of underlying securities were less than the repurchase amount. The Fund may enter into repurchase agreements maturing within seven days with domestic dealers, banks or other financial institutions deemed to be creditworthy by the Adviser. Collateral for certain tri-party repurchase agr eements is held at the custodian bank in a segregated account for the benefit of the Fund and the counterparty.
Security transactions and related investment income
Investment security transactions are accounted for on a trade date plus one basis for daily net asset value calculations. However, for financial reporting purposes, investment transactions are reported on trade date. Interest income is accrued as earned. Dividend income is recorded on the ex-dividend date. Foreign dividends are recorded on the ex-date or when the Fund becomes aware of the dividends from cash collections. Discounts/ premiums are accreted/amortized for financial reporting purposes. Non-cash dividends are recorded at the fair market value of the securities received. Debt obligations may be placed in a non-accrual status and related interest income may be reduced by ceasing current accruals and writing off interest receivables when the collection of all or a portion of interest has become doubtful, based upon consistently applied procedures.
From time to time, the Fund may invest in Real Estate Investment Trusts (REITs) and as a result, will estimate the components of distributions from these securities. Distributions from REITs received in excess of income are recorded as a reduction of cost of investments and/or as a realized gain.
The Fund uses the First In, First Out method for fixed income securities and Highest Cost,
Value Opportunities Fund
32
First Out for all other securities for determining realized gain or loss on investments for both financial and federal income tax reporting purposes.
Multi-class allocations
All income, expenses (except for class-specific expenses) and realized and unrealized gains (losses) are allocated to each class of shares based upon the relative net assets of each class. Dividends to shareholders from net investment income are determined at a class level and distributions from capital gains are determined at a Fund level.
Expense allocation
Expenses are allocated based on the relative share of net assets of the Fund at the time the expense was incurred. Class-specific expenses, such as distribution (Rule 12b-1) fees, are accrued daily and charged directly to the respective share classes.
Securities lending
The Fund may lend securities in amounts up to 33 1 / 3% of the Fund’s total assets. Such loans are callable at any time and are at all times fully secured by cash, cash equivalents or securities issued or guaranteed by the U.S. government or its agencies or instrumentalities and marked-to-market on a daily basis. The Fund may bear the risk of delay in recovery of, or even of rights in, the securities loaned should the borrower of the securities fail financially.
The Fund receives compensation for lending their securities either in the form of fees and/or by retaining a portion of interest on the investment of any cash received as collateral. The Fund invests in cash collateral received in connection with securities lending transactions in JHCIT, a Delaware common law trust and an affiliated fund. JHCIT is exempt from registration under Section 3(c)(7) of the 1940 Act (pursuant to exemptive order issued by the SEC) and is managed by the Adviser, for which the Adviser receives an investment advisory fee of 0.04% of the average daily net assets of the JHCIT.
All collateral received will be in an amount equal to at least 100% of the market value of the loaned securities and is intended to be maintained at that level during the period of the loan. The market value of the loaned securities is determined at the close of business of the Fund and any additional required collateral is delivered to the Fund the next business day. During the loan period, the Fund continues to retain rights of ownership, including dividends and interest of the loaned securities. As of August 31, 2007, the Fund loaned securities having a market value of $1,888,086 collateralized by cash invested in securities in the amount of $1,925,848.
Futures
The Fund may purchase and sell financial futures contracts and options on those contracts. The Fund invests in contracts based on financial instruments such as U.S. Treasury Bonds or Notes or on securities indices such as the Standard & Poor’s 500 Index, in order to hedge against a decline in the value of securities owned by the Fund.
Initial margin deposits required upon entering into futures contracts are satisfied by the delivery of specific securities or cash as collateral to the broker (the Funds’ agent in acquiring the futures position). If the position is closed out by taking an opposite position prior to the settlement date of the futures contract, a final determination of variation margin is made, cash is required to be paid to or released by the broker and the Fund realizes a gain or loss.
When the Fund sells a futures contract based on a financial instrument, the Fund becomes obligated to deliver that kind of instrument at an agreed upon date for a specified price. The Fund realizes a gain or loss depending on whether the price of an offsetting purchase is less or more than the price of the initial sale or on whether the price of an offsetting sale is more or less than the price of the initial purchase. The Fund could be exposed to risks if it could not close out futures positions because of an illiquid secondary market or the inability of counterparties to meet the terms of their contracts. Futures contracts are valued at the quoted daily settlement prices established by the exchange on which they trade.
Value Opportunities Fund
33
The following is a summary of open futures contracts on August 31, 2007:
| UNREALIZED | ||||
| NUMBER OF | APPRECIATION | |||
| OPEN CONTRACTS | CONTRACTS | POSITION | EXPIRATION | (DEPRECIATION) |
| Russell 2000 E-mini | ||||
| Index Futures | 4 | Long | Sep 2007 | ($14,663) |
| S&P Mid 400 E-mini | ||||
| Index Futures | 4 | Long | Sep 2007 | $267 |
| ($14,396) | ||||
Federal income taxes
The Fund qualifies as a “regulated investment company” by complying with the applicable provisions of the Internal Revenue Code and will not be subject to federal income tax on taxable income. Therefore, no federal income tax provision is required.
New accounting pronouncements
In June 2006, Financial Accounting Standards Board (FASB) Interpretation No. 48, Accounting for Uncertainty in Income Taxes (the Interpretation) was issued, and is effective for fiscal years beginning after December 15, 2006 and is to be applied to all open tax years as of the effective date. This Interpretation prescribes a minimum threshold for financial statement recognition of the benefit of a tax position taken or expected to be taken in a tax return, and requires certain expanded disclosures. Management has evaluated the application of this Interpretation to the Fund and does not believe there is a material impact resulting from the adoption of this Interpretation on the Fund’s financial statements.
In September 2006, FASB Standard No. 157, Fair Value Measurements (FAS 157), was issued and is effective for fiscal years beginning after November 15, 2007. FAS 157 defines fair value, establishing a framework for measuring fair value and expands disclosure about fair value measurements. Management is currently evaluating the application of FAS 157 to the Fund and its impact, if any, resulting from the adoption of FAS 157 on the Fund’s financial statements.
Distribution of income and gains
The Fund records distributions to shareholders from net investment income and net realized gains, if any, on the ex-dividend date. During the year ended February 28, 2007, the tax character of distributions paid was as follows: ordinary income $164,683 and long-term capital gains $59,993. Distributions paid by the Fund with respect to each class of shares are calculated in the same manner, at the same time and are in the same amount, except for the effect of expenses that may be applied differently to each class.
Such distributions, on a tax basis, are determined in conformity with income tax regulations, which may differ from accounting principles generally accepted in the United States of America. Distributions in excess of tax basis earnings and profits, if any, are reported in the Fund’s financial statements as a return of capital.
Capital accounts
The Fund reports the undistributed net investment income and accumulated undistributed net realized gain (loss) accounts on a basis approximating amounts available for future tax distributions (or to offset future taxable realized gains when a capital loss carryforward is available). Accordingly, the Fund may periodically make reclassifications among certain capital accounts without affecting its net asset value.
Value Opportunities Fund
34
3. Investment advisory and other agreements Advisory fees
The Trust has entered into an Investment Advisory Agreement with the Adviser. The Adviser is responsible for managing the corporate and business affairs of the Trust and for selecting and compensating subadvisers to handle the investment of the assets of the Fund, subject to the supervision of the Trust’s Board of Trustees. Under the Advisory Agreement, the Fund pays a monthly management fee to the Adviser equivalent, on an annual basis, to the sum of: (a) 0.80% of the first $500,000,000 of the Fund’s aggregate daily net assets; (b) 0.78% of the next $500,000,000 of the Fund’s aggregate daily net assets; (c) 0.77% of the next $1,500,000,000 of the Fund’s aggregate daily net assets; and (d) 0.76% of the Fund’s aggregate daily net assets in excess of $2,500,000,000. Aggregate net assets include the net assets of the Fund and Value Opportunities Trust, a series of John Hancock Trust and the Value Opportunities F und, a series of John Hancock Funds II. The Adviser has a subadvisory agreement with Grantham, Mayo, Van Otterloo & Co. LLC. The Fund is not responsible for payment of the subadvisory fees.
Expense reimbursements
The Adviser has agreed contractually to reimburse for certain fund level expenses that exceed 0.09% of the average annual net assets, or to make a payment to a specific class of shares of the Fund in an amount equal to the amount by which the expenses attributable to such class of shares (excluding taxes, portfolio brokerage commissions, interest, litigation and indemnification expenses and other extraordinary expenses not incurred in the ordinary course of the Fund’s business and fees under any agreement or plans of the Fund dealing with services for shareholders and others with beneficial interests in shares of the Fund) exceed the percentage of average annual net assets (on an annualized basis) attributable as follows: 1.39% for Class A, 2.09% for Class B, 2.09% for Class C, 0.99% for Class I, 1.49% for Class R1 and 0.94% for Class 1. Accordingly, the expense reductions related to this expense limitation amounted to $79,139, $10,699, $15,089, $10,512, $9,914 and $1,351 for Class A, Class B, Class C, Class I, Class R1 and Class 1, respectively, for the period ended August 31, 2007. This expense reimbursement shall continue in effect until June 30, 2008 and thereafter until terminated by the Adviser on notice to the Trust.
Administration fees
The Fund has an agreement with the Adviser that requires the Fund to reimburse the Adviser for all expenses associated with providing the administrative, financial, accounting and recordkeeping services of the Fund, including the preparation of all tax returns, annual, semiannual and periodic reports to shareholders and the preparation of all regulatory reports. These expenses are allocated based on the relative net assets of each class. The compensation for the period amounted to $3,300 with an effective rate of 0.03% of the Fund’s average daily net assets.
Distribution plan
The Trust has a Distribution Agreement with the Distributor. The Fund has adopted Distribution Plans with respect to Class A, Class B, Class C, Class R1 and Class 1, pursuant to Rule 12b-1 under the 1940 Act, to reimburse the Distributor for the services it provides as distributor of shares of the Fund. Accordingly, the Fund makes monthly payments to the Distributor at an annual rate not to exceed 0.30%, 1.00%, 1.00%, 0.50% and 0.05% of average daily net asset value of Class A, Class B, Class C, Class R1 and Class 1, respectively. A maximum of 0.25% of such payments may be service fees, as defined by the Conduct Rules of Financial Industry Regulatory Authority (formerly the National Association of Securities Dealers). Under the Conduct Rules, curtailment of a portion of the Fund’s 12b-1 payments could occur under certain circumstances. In addition, under a Service Plan for Class R1 shares, the Fund pays up to 0.25% of Class R1 a verage daily net asset value for certain other services.
Sales charges
Class A shares are assessed up-front sales charges of up to 5.00% of net asset value of such shares. During the period ended August 31, 2007, the Fund was informed that the Distributor received net up-front sales charges of $33,817 with regard to sales of Class A shares. Of this amount, $3,570 was retained and used for printing prospectuses,
Value Opportunities Fund
35
advertising, sales literature and other purposes, $30,230 was paid as sales commissions to unrelated brokerdealers and $17 was paid as sales commissions to sales personnel of Signator Investors, Inc. (Signator Investors), a related broker-dealer and indirect subsidiary of MFC.
Class B shares that are redeemed within six years of purchase are subject to a contingent deferred sales charge (CDSC) at declining rates, beginning at 5.00% of the lesser of the current market value at the time of redemption or the original purchase cost of the shares being redeemed. Class C shares that are redeemed within one year of purchase are subject to a CDSC at a rate of 1.00% of the lesser of the current market value at the time of redemption or the original purchase cost of the shares being redeemed. Proceeds from the CDSCs are paid to the Distributor and are used, in whole or in part, to defray its expenses for providing distribution-related services to the Fund in connection with the sale of Class B and Class C shares. During the period ended August 31, 2007, CDSCs received by JH Funds amounted to $538 for Class B shares and $710 for Class C shares.
Transfer agent fees
The Fund has a Transfer Agency Agreement with John Hancock Signature Services, Inc. (Signature Services), an indirect subsidiary of MFC. For Class A, Class B, Class C, Class I and Class R1 shares, the Fund pays a monthly transfer agent fee at an annual rate of 0.05% of each class’ average daily net assets, plus a fee based on the number of shareholder accounts and reimbursement for certain out-of-pocket expenses. Expenses not directly attributable to a particular class of shares are aggregated and allocated to each class on the basis of its relative net asset value.
Signature Services has agreed to limit the transfer agent fees so that such fees do not exceed 0.20% annually of Class A, Class B, Class C, Class I and Class R1 share average daily net assets. This agreement is effective until December 31, 2007. Signature Services reserves the right to terminate this limitation in the future. Accordingly, there were no transfer agent fee reductions for Class A, Class B, Class C, Class I and Class R1 shares, respectively, during the period ended August 31, 2007.
Expenses under the agreements described above for the period ended August 31, 2007, were as follows:
| Distribution and | Transfer | Blue sky | Printing and | |
| Share class | service fees | agent fees | fees | postage fees |
| Class A | $31,462 | $7,496 | $10,842 | $4,546 |
| Class B | 1,944 | 389 | 9,102 | 129 |
| Class C | 7,799 | 1,560 | 9,102 | 164 |
| Class I | — | 76 | 9,101 | 341 |
| Class R1 | 472 | 32 | 9,101 | 370 |
| Class 1 | 80 | — | — | 11 |
| Total | $41,757 | $9,553 | $47,248 | $5,561 |
Trustees’ fees
The Trust compensates each Trustee who is not an employee of the Adviser or its affiliates. Total Trustees’ expenses are allocated to the Fund based on its average daily net asset value.
4. Guarantees and indemnifications
Under the Trust’s organizational documents, its Officers and Trustees are indemnified against certain liability arising out of the performance of their duties to the Trust. Additionally, in the normal course of business, the Trust enters into contracts with service providers that contain general indemnification clauses. The Trust’s maximum exposure under these arrangements is unknown, as this would involve future claims that may be made against the Trust that have not yet occurred. However,
Value Opportunities Fund
36
based on experience, the Trust believes the risk of loss to be remote.
5. Line of credit
The Fund has entered into an agreement which enables it to participate in a $100 million unsecured committed line of credit with State Street Corporation. Borrowings will be made solely to temporarily finance the repurchase of capital shares. Interest is charged to the Fund based on its borrowings at a rate per annum equal to the Federal Funds rate plus 0.50% . In addition, a commitment fee of 0.07% per annum, payable at the end of each calendar quarter, based on the average daily-unused portion of the line of credit, is charged to the Fund on a prorated basis based on average net assets. For the period ended August 31, 2007, there were no borrowings under the line of credit.
6. Capital shares
Share activities for the Fund for the period ended February 28, 2007, and the period ended August 31, 2007, were as follows:
| Period ended 2-28-071 | Period ended 8-31-072 | |||
| Shares | Amount | Shares | Amount | |
| Class A shares | ||||
| Sold | 941,272 | $19,088,419 | 61,327 | $1,400,012 |
| Distributions reinvested | 9,278 | 203,273 | — | — |
| Repurchased | (60,859) | (1,306,606) | (14,085) | (316,598) |
| Net increase | 889,691 | $17,985,086 | 47,242 | $1,083,414 |
| Class B shares | ||||
| Sold | 21,277 | $445,406 | 5,638 | $127,201 |
| Distributions reinvested | 78 | 1,721 | — | — |
| Repurchased | (7,339) | (162,632) | (1,061) | (24,602) |
| Net increase | 14,016 | $284,495 | 4,577 | $102,599 |
| Class C shares | ||||
| Sold | 69,790 | $1,449,685 | 15,566 | $354,904 |
| Distributions reinvested | 414 | 9,061 | — | — |
| Repurchased | (7,105) | (155,548) | (5,919) | (134,979) |
| Net increase | 63,099 | $1,303,198 | 9,647 | $219,925 |
| Class I shares | ||||
| Sold | 11,800 | $245,442 | 4,128 | $95,135 |
| Distributions reinvested | 117 | 2,570 | — | — |
| Repurchased | — | — | (2,388) | (51,000) |
| Net increase | 11,917 | $248,012 | 1,740 | $44,135 |
| Class R1 shares | ||||
| Sold | 5,000 | $100,000 | 1,024 | 24,457 |
| Distributions reinvested | 54 | 1,179 | — | — |
| Net increase | 5,054 | $101,179 | 1,024 | 24,457 |
| Class 1 shares | ||||
| Sold | 8,549 | $179,825 | 13,199 | $300,258 |
| Distributions reinvested | 90 | 1,963 | — | — |
| Repurchased | (1) | (12) | (1,972) | (45,010) |
| Net increase | 8,638 | $181,776 | 11,227 | $255,248 |
| Net increase | 992,415 | $20,103,746 | 75,457 | $1,729,778 |
1Period from 6-12-06 (commencement of operations) to 2-28-07.
2Semiannual period from 3-1-07 to 8-31-07. Unaudited.
Value Opportunities Fund
37
7. Investment transactions
Purchases and proceeds from sales or maturities of securities, other than short-term securities and obligations of the U.S. government, during the period ended August 31, 2007, aggregated $8,300,349 and $6,748,913, respectively.
The cost of investments owned on August 31, 2007, including short-term investments, for federal income tax purposes, was $24,511,420. Gross unrealized appreciation and depreciation of investments aggregated $1,873,195 and $2,029,744, respectively, resulting in net unrealized depreciation of $156,549.
8. Federal income tax information
Federal income tax regulations may differ from generally accepted accounting principles and income and capital gain distributions determined in accordance with tax regulations may differ from net investment income and realized gains recognized for financial reporting purposes.
Value Opportunities Fund
38
Evaluation of Advisory and Subadvisory Agreements by the Board of Trustees
This section describes the evaluation by the Board of Trustees of the Advisory Agreement and each of the Subadvisory Agreements.
Evaluation by the Board of Trustees
The Board, including all of the Trustees who are not “interested persons” as defined in the Investment Company Act of 1940, as amended (the Independent Trustees), is responsible for selecting the Trust’s investment adviser, John Hancock Investment Management Services, LLC (the Adviser or JHIMS), approving the Adviser’s selection of subadvisers for each series of the Trust (the Funds) and approving the Trust’s advisory and subadvisory agreements (and any sub-subadvisory agreements), their periodic continuation and any amendments. Consistent with SEC rules, the Board regularly evaluates the Trust’s advisory and subadvisory (and sub-subadvisory) arrangements, including consideration of the factors listed below. The Board may also consider other factors (including conditions and trends prevailing generally in the economy, the securities markets and the industry) and does not treat any single factor as determ inative, and each Trustee may attribute different weights to different factors. The Board is furnished with an analysis of its fiduciary obligations in connection with its evaluation and, throughout the evaluation process, the Board is assisted by counsel for the Trust and the Independent Trustees are also separately assisted by independent legal counsel. The factors regularly considered by the Board are:
1. the nature, extent and quality of the services to be provided by the Adviser to the Trust and by the subadvisers to the Funds;
2. the investment performance of the Funds and their subadvisers;
3. the extent to which economies of scale would be realized as a Fund grows and whether fee levels reflect these economies of scale for the benefit of Trust shareholders;
4. the costs of the services to be provided and the profits to be realized by the Adviser and its affiliates (including any subadvisers that are affiliated with the Adviser) from the Adviser’s relationship with the Trust; and
5. comparative services rendered and comparative advisory and subadvisory fee rates.
The Board believes that information relating to all these factors is relevant to its evaluation of the Trust’s advisory agreement. With respect to its evaluation of subadvisory agreements (including sub-subadvisory agreements) the Board believes that, in view of the Trust’s “manager of managers” advisory structure, the costs of services to be provided and the profits to be realized by those subadvisers that are not affiliated with the Adviser from their relationship with the Trust generally are not a material factor to the Board’s consideration of subadvisory agreements because such fees are paid to subadvisers by the Adviser and not by the Funds, and because the Board relies on the ability of the Adviser to negotiate such subad-visory fees at arm’s-length.
In evaluating subadvisory arrangements, the Board also considers other material business relationships that unaffiliated sub-advisers and their affiliates have with the Adviser or its affiliates, including the involvement by certain affiliates of certain subadvisers in the distribution of financial products, including shares of the Trust, offered by the Adviser and other affiliates of the Adviser (Material Relationships).
Approval of Advisory Agreement
At its meeting on June 5, 2007, the Board, including all the Independent Trustees, approved the Advisory Agreement between the Trust and JHIMS with respect to each of the Funds.
In approving the Advisory Agreement, and with reference to the factors which it regularly considers, the Board:
(1) (a) considered the high value to the Trust of continuing the relationship with JHIMS as the Trust’s Adviser to the other John Hancock Funds, the skills and competency with which JHIMS has in the past managed the affairs
39
and subadvisory relationships of other funds in the complex, JHIMS’s oversight and monitoring of subadvisers’ investment performance and compliance programs including its timelines in responding to performance issues and the qualifications of JHIMS’s personnel,
(b) considered JHIMS’s compliance policies and procedures and its responsiveness to regulatory changes and mutual fund industry developments, and
(c) JHIMS’s administrative capabilities, including its ability to supervise the other service providers for the Funds and concluded that JHIMS may reasonably be expected to ably perform its services under the Advisory Agreement.
(2) reviewed the investment performance of portfolios that are managed comparable to the Funds; the comparative performance of their respective benchmarks; and JHIMS’ analysis of such performance and its plans and recommendations regarding the Trust’s subadvisory arrangements generally and with respect to the Funds; and concluded that each of the comparably managed funds has performed well or within a range that the Board deemed competitive, and that JHIMS may reasonably be expected to ably monitor the performance of the Funds and their subadvisers;
(3) reviewed the Trust’s advisory fee structure and the incorporation therein of any subadvisory fee breakpoints in the advisory fees charged and concluded (i) that to the extent that Funds have subadvisory fees with breakpoints, those breakpoints are reflected as breakpoints in the advisory fees for Funds, (ii) that all Funds with a subadviser that is not affiliated with the Adviser have subadvisory fees which are the product of arm’s-length negotiations between the Adviser and the subadviser and which in many, but not all, cases contain breakpoints, and (iii) that, although economies of scale cannot be measured with precision, these arrangements permit shareholders of Funds with advisory fee breakpoints to benefit from economies of scale if those Funds grow;
(4) (a) reviewed the financial statements of JHIMS and John Hancock Life Insurance Company (U.S.A.) (JHLICO (U.S.A.));
(b) reviewed the anticipated profitability of the JHIMS’s relationship with the Funds in terms of the fees it expects to receive with respect to the Funds and whether JHIMS has the financial ability to provide a high level of services to the Funds,
(c) considered that JHIMS derives reputational and other indirect benefits from providing advisory services to the Funds, and
(d) noted that JHIMS will pay the subadvisory fees out of the advisory fees JHIMS receives from the Funds and concluded that the advisory fees paid by the Trust with respect to the Funds are not unreasonable in light of such information; and
(5) reviewed comparative information with respect to the advisory fee rates and concluded that the anticipated advisory fees for the Funds are within the range of those incurred by other comparable funds and that the advisory structure for the Funds is thus competitive within the industry.
Additional information that the Board considered for a particular Fund is set forth in Appendix A.
Approval of Subadvisory Agreements
At its meeting on June 5, 2007, the Board, including all the Independent Trustees, approved the Subadvisory Agreements.
In making its determination with reference to these respective factors, the Board reviewed:
(i) information relating to each subadviser’s business which included information such as: business performance, assets
40
under management, financial stability and personnel;
(ii) the investment performance of the subad-viser’s portfolio managed comparably to the Fund to be managed by the subadviser and comparative performance information relating to the benchmark;
(iii) the proposed subadvisory fee for each Fund to be managed by the subadviser and comparative fee information; and
(iv) information relating to the nature and scope of Material Relationships and their significance to the Adviser and the subadvisers.
The Board’s decision to approve each Subadvisory Agreement was based on a number of determinations, including the following:
(1) The subadviser has extensive experience and demonstrated skills as a manager and may be expected to provide a high quality of investment personnel to each Fund;
(2) Although not without variation, the current and historical performance of the portfolios of the Subadviser managed comparably to the Fund to be managed by the Subadviser has been within a competitive range of the current and historical performance of these portfolios’ respective benchmark (see Appendix A for further information on performance);
(3) The subadvisory fees are within industry norms and are the product of arm’s-length negotiation between the Adviser and the subadviser; and
(4) The Material Relationships consist of arrangements in which unaffiliated subad-visers or their affiliates provide advisory, distribution or management services in connection with financial products sponsored by the Trust’s adviser or its affili-ates, which may include other registered investment companies, a 529 education savings plan, managed separate accounts and exempt group annuity contracts sold to qualified plans, and which in no case contained elements which would cause the Board to conclude that approval of the subadvisory agreement with the subadviser would be inappropriate. See (5) below for information relating to the business arrangement between the Trust’s Adviser and GMO.
(5) As a part of the overall business arrangement between the Adviser and GMO under which the Adviser has obtained exclusive rights to certain GMO investment management services for up to five years, the Adviser has agreed that under certain circumstances it (and not the Trust or the particular Fund) will pay GMO a specified amount (ranging from $1 to $12 million) if the subadvisory agreement with respect to any of the following Funds to be subadvised by GMO is terminated within a five-year period from the date of its effectiveness: U.S. Core Fund, Active Value Fund, Intrinsic Value Fund, Growth Fund, International Core Fund, International Growth Fund, Global Fund, Value Opportunities Fund, Growth Opportunities Fund and U.S. Quality Equity Fund.
The Adviser has also agreed that, subject to its fiduciary duties as an investment adviser to each of these Funds and its shareholders, it will not recommend to the Board of Trustees to terminate the subadvisory agreement with respect to any of the Funds or to reduce any of the fees payable thereunder to GMO for a five-year period from the date of effectiveness of the agreement. Substantially similar agreements (with varying amounts to be paid upon termination) also apply with respect to certain other John Hancock funds that are or will be advised by the Adviser and subadvised by GMO. The Trust is not a party to any of these arrangements, and they are not binding upon the Trust, the Trust’s Funds subadvised by GMO or the Board of Trustees. However, these arrangements present certain conflicts of interest because the Adviser has a financial incentive to support the continuation of GMO subadvisory agreements for as long as the ter mination provisions described above remain in effect. In approving the Advisory Agreement and the subadvisory agreement with respect to each of the Funds subadvised by GMO, the Board of Trustees, including the Independent
41
Trustees, was aware of and considered these potential conflicts of interest, including any financial obligations of the Adviser to GMO.
The Board concluded that, notwithstanding the potential conflicts of interest, approval of the Advisory Agreement and the subadvisory agreements with GMO is in the best interests of shareholders and contract owners in view of (i) the Adviser’s fiduciary duty and the Board’s fiduciary duty and ability to monitor potential conflicts, (ii) the benefits to shareholders and contract owners generally expected from the exclusive rights to certain GMO investment management services obtained by the Adviser for the benefit of certain Funds of the Trust and other John Hancock funds and (iii) the benefits to such Funds of the Trust expected from the subadvisory services of GMO.
Additional information that the Board considered for a particular fund is set forth in Appendix A.
| Appendix A | |||
| Estimated Fees | |||
| Fund | Performance | and Expenses | Comments |
| Value Opportunities | See Comments. | Subadvisory fees | The Board noted |
| for this Fund were | that the Fund | ||
| lower than the peer | commenced opera- | ||
| group median. | tions in June 2006 | ||
| and has a limited | |||
| Advisory fees for | performance history. | ||
| this Fund were | |||
| lower than the peer | |||
| group median. | |||
| Total expenses for | |||
| this Fund were | |||
| lower than the peer | |||
| group median. | |||
42
Why John Hancock Funds?
For more than three decades, John Hancock Funds has been helping individual, corporate and institutional clients reach their most important financial goals. With so many fund companies to choose from, why should you invest with us?
►A name you know and trust
When you invest with John Hancock Funds, you are investing with one of the most recognized and respected names in the financial services industry. Our parent company has been helping individuals and institutions increase and protect wealth since 1862.
►Solutions across the investing spectrum
We offer equity, income, international, sector and asset allocation investment solutions managed by leading institutional money managers. Each of our funds utilizes a disciplined, team approach to portfolio management and research, leveraging the expertise of seasoned investment professionals.
►Committed to you
Our shareholders come first. We work hard to provide you with the products you need to build a solid financial foundation. We’re proud to offer you award-winning services and tools, like the www.jhfunds.com Web site, to help you every step of the way.
For more information
The Fund’s proxy voting policies, procedures and records are available without charge, upon request:
| By phone | On the Fund’s Web site | On the SEC’s Web site |
| 1-800-225-5291 | www.jhfunds.com/proxy | www.sec.gov |
| Trustees | Charles A. Rizzo | Principal distributor |
| Ronald R. Dion, Chairman | Chief Financial Officer | John Hancock Funds, LLC |
| James R. Boyle† | 601 Congress Street | |
| James F. Carlin | Gordon M. Shone | Boston, MA 02210-2805 |
| William H. Cunningham | Treasurer | |
| Charles L. Ladner* | Custodian | |
| Dr. John A. Moore* | John G. Vrysen | State Street Bank & Trust Co. |
| Patti McGill Peterson* | Chief Operating Officer | 2 Avenue de Lafayette |
| Steven R. Pruchansky | Boston, MA 02111 | |
| *Members of the Audit Committee | Investment adviser | |
| †Non-Independent Trustee | John Hancock Investment | Transfer agent |
| Management Services, LLC | John Hancock Signature | |
| Officers | 601 Congress Street | Services, Inc. |
| Keith F. Hartstein | Boston, MA 02210-2805 | One John Hancock Way, |
| President and | Suite 1000 | |
| Chief Executive Officer | Subadviser | Boston, MA 02217-1000 |
| Grantham, Mayo, Van | ||
| Thomas M. Kinzler | Otterloo & Co. LLC | Legal counsel |
| Secretary and Chief Legal Officer | 40 Rowes Wharf | Kirkpatrick & Lockhart |
| Boston, MA 02110 | Preston Gates Ellis LLP | |
| Francis V. Knox, Jr. | One Lincoln Street | |
| Chief Compliance Officer | Boston, MA 02111-2950 | |
| How to contact us | ||
| Internet | www.jhfunds.com | |
| Regular mail: | Express mail: | |
| John Hancock | John Hancock | |
| Signature Services, Inc. | Signature Services, Inc. | |
| One John Hancock Way, Suite 1000 | Mutual Fund Image Operations | |
| Boston, MA 02217-1000 | 380 Stuart Street | |
| Boston, MA 02116 | ||
| Phone | Customer service representatives | 1-800-225-5291 |
| EASI-Line | 1-800-338-8080 | |
| TDD line | 1-800-554-6713 | |
A listing of month-end portfolio holdings is available on our Web site, www.jhfunds.com. A more detailed portfolio holdings summary is available on a quarterly basis 60 days after the fiscal quarter on our Web site or upon request by calling 1-800-225-5291, or on the SEC’s Web site, www.sec.gov.
44
J O H N H A N C O C K F A M I L Y O F F U N D S
| EQUITY | INTERNATIONAL/GLOBAL |
| Balanced Fund | Global Opportunities Fund |
| Classic Value Fund | Global Shareholder Yield Fund |
| Classic Value Fund II | Greater China Opportunities Fund |
| Classic Value Mega Cap Fund | International Allocation Portfolio |
| Core Equity Fund | International Classic Value Fund |
| Growth Fund | International Core Fund |
| Growth Opportunities Fund | International Growth Fund |
| Growth Trends Fund | |
| Intrinsic Value Fund | INCOME |
| Large Cap Equity Fund | Bond Fund |
| Large Cap Select Fund | Government Income Fund |
| Mid Cap Equity Fund | High Yield Fund |
| Multi Cap Growth Fund | Investment Grade Bond Fund |
| Small Cap Equity Fund | Strategic Income Fund |
| Small Cap Fund | |
| Small Cap Intrinsic Value Fund | TAX-FREE INCOME |
| Sovereign Investors Fund | California Tax-Free Income Fund |
| U.S. Core Fund | High Yield Municipal Bond Fund |
| U.S. Global Leaders Growth Fund | Massachusetts Tax-Free Income Fund |
| Value Opportunities Fund | New York Tax-Free Income Fund |
| Tax-Free Bond Fund | |
| ASSET ALLOCATION | MONEY MARKET |
| Lifecycle 2010 Portfolio | Money Market Fund |
| Lifecycle 2015 Portfolio | |
| Lifecycle 2020 Portfolio | CLOSED-END |
| Lifecycle 2025 Portfolio | Bank and Thrift Opportunity Fund |
| Lifecycle 2030 Portfolio | Financial Trends Fund, Inc. |
| Lifecycle 2035 Portfolio | Income Securities Trust |
| Lifecycle 2040 Portfolio | Investors Trust |
| Lifecycle 2045 Portfolio | Patriot Premium Dividend Fund II |
| Lifecycle Retirement Portfolio | Preferred Income Fund |
| Lifestyle Aggressive Portfolio | Preferred Income II Fund |
| Lifestyle Balanced Portfolio | Preferred Income III Fund |
| Lifestyle Conservative Portfolio | Tax-Advantaged Dividend Income Fund |
| Lifestyle Growth Portfolio | Tax-Advantaged Global Shareholder Yield Fund |
| Lifestyle Moderate Portfolio | |
| SECTOR | |
| Financial Industries Fund | |
| Health Sciences Fund | |
| Real Estate Fund | |
| Regional Bank Fund | |
| Technology Fund | |
| Technology Leaders Fund | |
The Fund’s investment objectives, risks, charges and expenses are included in the prospectus and should be considered carefully before investing. For a prospectus, contact your financial professional, call John Hancock Funds at 1-800-225-5291 or visit the Fund’s Web site at www.jhfunds.com. Please read the prospectus carefully before investing or sending money.

1-800-225-5291
1-800-554-6713 TDD
1-800-338-8080 EASI-Line
www.jhfunds.com
Now available: electronic delivery
www.jhfunds.com/edelivery
This report is for the information of the shareholders of John Hancock Value Opportunities Fund.
It is not authorized for distribution to prospective investors unless preceded or accompanied by a prospectus
630SA 8/07
10/07

| TABLE OF CONTENTS | ||
| Your fund at a glance | ||
| page 1 | ||
| Managers’ report | ||
| page 2 | ||
| A look at performance | ||
| page 6 | ||
| Your expenses | ||
| page 8 | ||
| Fund’s investments | ||
| page 10 | ||
| Financial statements | ||
| page 19 | ||
| Notes to financial | ||
| statements | ||
| page 27 | ||
| For more information | ||
| page 40 | ||
CEO corner
To Our Shareholders,
Volatility returned to the U.S. stock market in the six-month period ended August 31, 2007; however, stocks still posted a strong gain of 5.70%, as measured by the Standard & Poor’s 500 Index. The market experienced a particularly sharp downturn in August, as the subprime mortgage market’s woes increased. Rising defaults and an ensuing credit crunch caused heightened fears about their potential impact on U.S. economic growth. Foreign markets felt some ripple effects from the subprime issue, but they continued nonetheless to benefit from solid economic growth and outperformed the U.S. market in this period.
During this period of volatility, the U.S. stock market also passed a significant milestone — the broad Standard & Poor’s 500 Index climbed beyond the record it had set seven years ago. From its peak in March 2000, the stock market spiraled downward three consecutive years, bottoming in 2002. The upturn began in 2003, and the market has advanced each year since, finally setting a new high for the first time on May 30, 2007. During that period, the S&P 500 Index experienced five significant short-term sell-offs of 6% or more, with the August subprime-induced meltdown being the most recent.
This nearly complete market cycle highlights the importance of two investment principles you have heard us speak of often: diversification and patience. By allocating your investments among different asset classes, investment styles and portfolio managers, you are likely to be well represented through all phases of a complete market cycle, with the winners helping to cushion the fall of the losers.
The challenge for investors with a diversified portfolio is to properly evaluate your investments to tell the difference between an underperforming manager and an out-of-favor style, while also understanding the role each investment plays in your portfolio. That’s where your financial professional can provide true value. He or she can help you make those assessments and also counsel patience, because a properly diversified portfolio by its very nature will typically have something lagging or out of favor — a concept that can be difficult to live with, but necessary to embrace. If everything in your portfolio is “working,” then you are not truly diversified, but rather are leveraged to the current market and the flavor of the day. If so, you are bound to be out of step in the near future.
The recent volatility in the securities markets has prompted many investors to question how long this type of market cycle will last. History tells us it will indeed end and that when it does, today’s leaders may well turn into laggards and vice versa. The subprime mortgage market woes are just the latest example of why investors should be both patient and well-diversified. For with patience and a diversified portfolio, it could be easier to weather the market’s twists and turns and reach your long-term goals.
Sincerely,

Keith F. Hartstein,
President and Chief Executive Officer
This commentary reflects the CEO’s views as of August 31, 2007. They are subject to change at any time.
Your fund at a glance
The Fund seeks high total return by typically making equity investments in U.S. companies with capitalizations similar to the capitalizations of companies that issue stock included in the S&P 500 Index. Under normal circumstances, the Fund invests at least 80% of its assets in investments tied economically to the U.S.
Over the last six months
► Despite heightened volatility, the broad U.S. market, as measured by the S&P 500 Index, gained ground.
► Stock selection and positioning in the retail, manufacturing and machinery sectors held the Fund back, while good stock picks and underweights in financials and construction helped.
► The Fund's valuation stock selection tool worked against the Fund in a period mostly dominated by a focus on lower-quality securities, while our momentum tool was able to capitalize on the rising market.
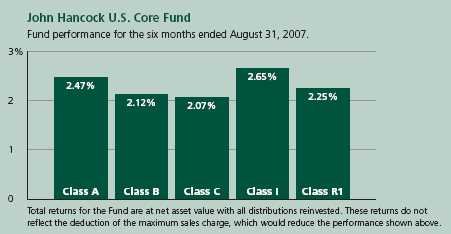
| Top 10 holdings | ||||
| Exxon Mobil Corp. | 6.4% | Citigroup, Inc. | 2.9% | |
| Merck & Company, Inc. | 3.6% | Pfizer, Inc. | 2.8% | |
| Wal-Mart Stores, Inc. | 3.5% | Home Depot, Inc. | 2.5% | |
| Microsoft Corp. | 3.2% | AT&T, Inc. | 2.3% | |
| International Business Machines Corp. | 3.1% | Chevron Corp. | 2.3% | |
As a percentage of net assets on August 31, 2007.
1
Managers’ report
John Hancock
U.S. Core Fund
U.S. investors entered the six-month review period on March 2007 still reeling from the market’s late-February swoon. Their big question was whether the recent fall was the beginning of a major correction or just a brief hiccup in the middle of a bull market. Though some of the concerns surrounding the decline — including the first sign of trouble in subprime mortgages —were still present, investors appeared to shake them off. Less than two months into the review period, the S&P 500 Index had recovered all of its lost ground, entering the summer poised to continue its ascent.
With historically low market volatility, the continuation of strong corporate profits and a glut of private equity deals fueled by ubiquitous financial liquidity, there seemed to be almost no ceiling to the market’s potential. Hopes for a smooth summer, however, would turn out to be short-lived. Beginning in July, as many market indexes touched record highs, credit concerns similar to those seen in February flared up again. Distress in subprime mortgages quickly spilled over into the broader credit and equity markets. Just weeks after the S&P 500 set an all-time high, the Federal Reserve began injecting liquidity into a faltering financial system, in an attempt to stem the turmoil taking place in the credit market. As equity market volatility returned with a vengeance, investor tolerance for risk abated and the broad market indexes plunged lower in the first days of August. And while hopes for a Federal Reserve rate cut helped stabilize things somewhat, investor s ended the review period
SCORECARD
| INVESTMENT | PERIOD’S PERFORMANCE ... AND WHAT’S BEHIND THE NUMBERS | |
| Exxon Mobil | ▲ | Benefited from rising oil prices |
| Wal-Mart | ▼ | Low quarterly profit report hurt performance |
| Schlumberger | ▼ | Fund’s underweight position in this oil exploration firm hurt |
| performance as the stock rose along with the prices of oil and gas |
2
From the Grantham, Mayo, Van Otterloo & Co. LLC (GMO)
Portfolio Management Team
much in the same way they began it — wondering whether the market would rally again or if risk aversion was here to stay. Despite the volatility, the S&P 500 Index posted gains in the six-month period.
Looking at performance
For the six months ended August 31, 2007, John Hancock U.S. Core Fund’s Class A, Class B, Class C, Class I and Class R1 shares returned 2.47%, 2.12%, 2.07%, 2.65% and 2.25%, respectively, at net asset value. By comparison, the S&P 500 Index returned 5.70%, while the average large blend fund monitored by Morningstar, Inc. gained 5.14% .1 Keep in mind that your returns will differ from those listed above if you were not invested in the Fund for the entire period or did not reinvest all distributions. See pages six and seven for historical performance information.
“Despite the volatility, the S&P
500 Index posted gains in the six-
month period.”
In a generally rising market, our primary stock selection tools — valuation and momentum — performed differently. Valuation, which determines the positioning for the majority of this Fund’s assets, was the key driver of the relative performance shortfall. The late-period market turmoil notwithstanding, the period as a whole was dominated by strong investor appetite for risky, lower-quality stocks — securities that our valuation discipline found overvalued. The lower-risk, higher-quality securities that our valuation discipline found attractive underperformed for much of the period in a risk-oriented market. While these higher-quality selections fared better later in the period as risk aversion returned, they still finished the period in negative territory.
U.S. Core Fund
3
Our momentum discipline was able to capitalize on the rising broad market. The discipline is designed to identify stocks that have performed well recently and appear poised to continue outperforming. With this orientation, the momentum discipline was able to add value during the period by selecting many of the market’s best performers and following their outperformance. The discipline also benefited from its underweight position in financial company stocks, leaving it less exposed to the spreading troubles from subprime mortgages.
Retail, machinery and manufacturing limit gains
The sector detracting most from performance during the period was retail stores, where our stock selection and overweight position negatively impacted the Fund’s returns. For example, an overweight position in Wal-Mart Stores, Inc. detracted from relative returns as shares fell amid short-term concerns about a lower quarterly profit report. Our valuation model continues to find this high-quality company attractive and maintains its overweight position.
Machinery was another sector detracting from the Fund’s performance. Our underweight position drove relative returns as the sector outperformed the market. For example, not owning Schlumberger detracted from relative returns for the period, as strong profit reports stemming from the company’s exposure to oil and gas exploration helped its shares move higher. Though this move was positive for shareholders in the short term, our valuation discipline continues to find the stock unattractive and we maintain our 2 underweight position.
| SECTOR DISTRIBUTION | |
| Consumer non-cyclical | 22% |
| Consumer cyclical | 20% |
| Technology | 13% |
| Financial | 13% |
| Energy | 11% |
| Communications | 8% |
| Industrial | 5% |
| Basic materials | 1% |
| Government | 1% |
| Utilities | 1% |
Also detracting from performance was the manufacturing sector. Again, an underweight position drove the negative relative returns. An underweight in General Electric Company was particularly detrimental, as the company’s shares advanced during the period after it reported strong quarterly earnings and increased its stock buyback plan. In addition, an underweight in 3M Co. detracted from returns as the company’s shares rose during the period. While 3M is a high-quality company, it is unattractive based on valuation at this point, resulting in its underweight position.
U.S. Core Fund
4
Financials and construction add value
On the positive side, our aversion to risky companies did pay off in certain sectors. In particular, as we mentioned earlier, our underweight position in the financial sector helped returns, as we were able to add value during the period by owning less of this risky sector as troubles in the credit market stemming from sub-prime mortgages drove financial shares lower. For example, selling JPMorgan Chase & Company and not owning Lehman Brothers Holdings added value in a period where investors sold off financial companies. Our underweight position in construction also benefited indirectly by avoiding the troubles in subprime. With worries abounding that mortgage troubles would lead to a decline in real estate prices and new home construction, our underweight position in the sector added to relative returns as shares declined. Not owning companies like Simon Property Group and Vornado Realty Trust added to re lative returns for the period.
“Valuation, which determines the
positioning for the majority of
this Fund’s assets, was the key
driver of the relative
performance shortfall.”
Outlook
The market volatility at the end of the period left investors wondering if the bull market has finally come to an end. The upcoming months will show whether the market’s recent trend toward risk aversion — especially in the troubled subprime mortgage sector — will persist or if risk-taking will resume in full force. The Fund remains overweight in higher-quality stocks and we believe it is well positioned to face further volatility in the market.
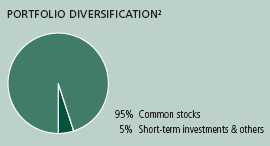
This commentary reflects the views of the portfolio management team through the end of the Fund’s period discussed in this report. The team’s statements reflect their own opinions. As such, they are in no way guarantees of future events and are not intended to be used as investment advice or a recommendation regarding any specific security. They are also subject to change at any time as market and other conditions warrant.
1 Figures from Morningstar, Inc. include reinvested dividends and do not take into account sales charges. Actual load-adjusted performance is lower.
2 As a percentage of net assets on August 31, 2007.
U.S. Core Fund
5
A look at performance
| For the periods ended August 31, 2007 | ||||||||||
| Average annual returns | Cumulative total returns | |||||||||
| with maximum sales charge (POP) | with maximum sales charge (POP) | |||||||||
| Inception | Since | Since | ||||||||
| Class | date | 1-year | 5-year | 10-year | inception | 6-month | 1-year | 5-year | 10-year | inception |
| A | 6-12-06 | 3.99% | — | — | 7.81% | –2.65% | 3.99% | — | — | 9.67% |
| B | 6-12-06 | 3.68 | — | — | 8.43 | –2.88 | 3.68 | — | — | 10.44 |
| C | 6-12-06 | 7.73 | — | — | 11.62 | 1.07 | 7.73 | — | — | 14.44 |
| I1 | 6-12-06 | 9.85 | — | — | 12.81 | 2.65 | 9.85 | — | — | 15.94 |
| R1 1 | 6-12-06 | 9.08 | — | — | 11.99 | 2.25 | 9.08 | — | — | 14.92 |
Performance figures assume all distributions are reinvested. Public offering price (POP) figures reflect maximum sales charge on Class A shares of 5%, and the applicable contingent deferred sales charge (CDSC) on Class B and Class C shares. The Class B shares’ CDSC declines annually between years 1 to 6 according to the following schedule 5, 4, 3, 3, 2, 1%. No sales charge will be assessed after the sixth year. Class C shares held for less than one year are subject to a 1% CDSC. Sales charge is not applicable for Class I and Class R1 shares.
The expense ratios of the Fund, both net (including any fee waivers or expense limitations) and gross (excluding any fee waivers or expense limitations), are set forth according to the most recent publicly available Prospectuses for the Fund and may differ from the expense ratios disclosed in the Financial Highlights tables in this report. The waivers and expense limitations are contractual at least until 6-30-08. The net expenses are as follows: Class A — 1.34%, Class B — 2.04%, Class C — 2.04%, Class I — 0.95%, Class R1 — 1.69% . Had the fee waivers and expense limitations not been in place, the gross expenses would be as follows: Class A — 1.93%, Class B — 13.58%, Class C — 3.82%, Class I — 17.83%, Class R1 — 21.12% .
The returns reflect past results and should not be considered indicative of future performance. The return and principal value of an investment will fluctuate so that shares, when redeemed, may be worth more or less than their original cost. Due to market volatility, the Fund’s current performance may be higher or lower than the performance shown. For performance data current to the most recent month-end, please call 1-800-225-5291 or visit the Fund’s Web site at www.jhfunds.com.
The performance table above and the chart on the next page do not reflect the deduction of taxes that a shareholder would pay on fund distributions or the redemption of fund shares.
The Fund’s performance results reflect any applicable expense reductions, without which the expenses would increase and results would have been less favorable.
Performance is calculated with an opening price (prior day’s close) on the inception date.
1 For certain types of investors as described in the Fund’s Class I and Class R1 share prospectuses.
U.S. Core Fund
6
Growth of $10,000
This chart shows what happened to a hypothetical $10,000 investment in U.S. Core Fund Class A shares for the period indicated. For comparison, we’ve shown the same investment in the Standard & Poor’s 500 Index.
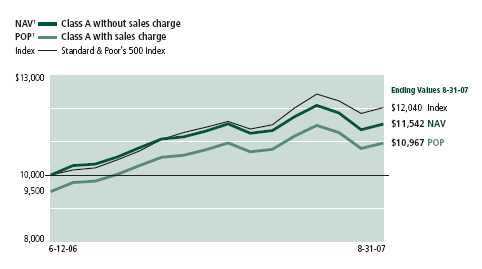
| With maximum | ||||
| Class | Period beginning | Without sales charge | sales charge | Index |
| B | 6-12-06 | $11,444 | $11,044 | $12,040 |
| C2 | 6-12-06 | 11,444 | 11,444 | 12,040 |
| I3 | 6-12-06 | 11,594 | 11,594 | 12,040 |
| R1 3 | 6-12-06 | 11,492 | 11,492 | 12,040 |
Assuming all distributions were reinvested for the period indicated, the table above shows the value of a $10,000 investment in the Fund’s Class B, Class C, Class I and Class R1 shares, respectively, as of August 31, 2007. Performance of the classes will vary based on the difference in sales charges paid by shareholders investing in the different classes and the fee structure of those classes.
Standard & Poor’s 500 Index is an unmanaged index that includes 500 widely traded common stocks.
It is not possible to invest directly in an index. Index figures do not reflect sales charges, which would have resulted in lower values if they did.
1 NAV represents net asset value and POP represents public offering price.
2 No contingent deferred sales charge applicable.
3 For certain types of investors as described in the Fund’s Class I and Class R1 share prospectuses.
U.S. Core Fund
7
Your expenses
These examples are intended to help you understand your ongoing operating expenses.
Understanding fund expenses
As a shareholder of the Fund, you incur two types of costs:
■ Transaction costs which include sales charges (loads) on purchases or redemptions (varies by share class), minimum account fee charge, etc.
■ Ongoing operating expenses including management fees, distribution and service fees (if applicable) and other fund expenses.
We are going to present only your ongoing operating expenses here.
Actual expenses/actual returns
This example is intended to provide information about your fund’s actual ongoing operating expenses, and is based on your fund’s actual return. It assumes an account value of $1,000.00 on March 1, 2007, with the same investment held until August 31, 2007.
| Account value | Ending value | Expenses paid during period | |
| on 3-1-07 | on 8-31-07 | ended 8-31-071 | |
| Class A | $1,000.00 | $1,024.70 | $6.88 |
| Class B | 1,000.00 | 1,021.20 | 10.41 |
| Class C | 1,000.00 | 1,020.70 | 10.41 |
| Class I | 1,000.00 | 1,026.50 | 4.86 |
| Class R1 | 1,000.00 | 1,022.50 | 8.70 |
Together with the value of your account, you may use this information to estimate the operating expenses that you paid over the period. Simply divide your account value at August 31, 2007 by $1,000.00, then multiply it by the “expenses paid” for your share class from the table above. For example, for an account value of $8,600.00, the operating expenses should be calculated as follows:

U.S. Core Fund
8
Hypothetical example for comparison purposes
This table allows you to compare your fund’s ongoing operating expenses with those of any other fund. It provides an example of the Fund’s hypothetical account values and hypothetical expenses based on each class’s actual expense ratio and an assumed 5% annualized return before expenses (which is not your fund’s actual return). It assumes an account value of $1,000.00 on March 1, 2007, with the same investment held until August 31, 2007. Look in any other fund shareholder report to find its hypothetical example and you will be able to compare these expenses.
| Account value | Ending value | Expenses paid during period | |
| on 3-1-07 | on 8-31-07 | ended 8-31-07 1 | |
| Class A | $1,000.00 | $1,018.41 | $6.86 |
| Class B | 1,000.00 | 1,014.91 | 10.38 |
| Class C | 1,000.00 | 1,014.91 | 10.38 |
| Class I | 1,000.00 | 1,020.41 | 4.85 |
| Class R1 | 1,000.00 | 1,016.61 | 8.67 |
Remember, these examples do not include any transaction costs, such as sales charges; therefore, these examples will not help you to determine the relative total costs of owning different funds. If transaction costs were included, your expenses would have been higher. See the prospectus for details regarding transaction costs.
1 Expenses are equal to the Fund’s annualized expense ratio of 1.35%, 2.05%, 2.06%, 0.95% and 1.70% for Class A, Class B, Class C, Class I and Class R1 respectively, multiplied by the average account value over the period, multiplied by the number of days in the inception period/365 or 366 (to reflect the one-half year period).
U.S. Core Fund
9
F I N A N C I A L S T A T E M E N T S
Fund’s investments
Securities owned by the Fund on 8-31-07 (unaudited)
This schedule is divided into three main categories: common stocks, short-term investments and repurchase agreements. Common stocks are further broken down by industry group. Repurchase agreements, which represent the Fund’s cash position, are listed last.
| Issuer | Shares | Value |
| Common stocks 95.13% | $23,806,504 | |
| (Cost $22,475,683) | ||
| Advertising 0.16% | 40,744 | |
| Omnicom Group, Inc. | 800 | 40,744 |
| Aerospace 0.80% | 199,718 | |
| General Dynamics Corp. | 400 | 31,424 |
| Goodrich Corp. | 200 | 12,632 |
| Lockheed Martin Corp. | 900 | 89,226 |
| Northrop Grumman Corp. | 100 | 7,884 |
| Rockwell Collins, Inc. | 200 | 13,774 |
| United Technologies Corp. | 600 | 44,778 |
| Aluminum 0.10% | 25,571 | |
| Alcoa, Inc. | 700 | 25,571 |
| Apparel & Textiles 1.83% | 458,082 | |
| Cintas Corp. | 300 | 10,995 |
| Coach, Inc. * | 3,100 | 138,043 |
| Liz Claiborne, Inc. | 1,000 | 34,170 |
| Mohawk Industries, Inc. * | 200 | 17,462 |
| NIKE, Inc., Class B | 2,600 | 146,484 |
| Polo Ralph Lauren Corp., Class A | 200 | 15,108 |
| VF Corp. | 1,200 | 95,820 |
| Auto Parts 0.57% | 142,600 | |
| Autoliv, Inc. | 400 | 22,948 |
| AutoZone, Inc. * | 800 | 97,032 |
| Johnson Controls, Inc. | 200 | 22,620 |
| Auto Services 0.17% | 41,756 | |
| AutoNation, Inc. * | 2,200 | 41,756 |
| Automobiles 1.42% | 354,144 | |
| Ford Motor Company * | 11,800 | 92,158 |
| General Motors Corp. | 2,400 | 73,776 |
| PACCAR, Inc. | 2,200 | 188,210 |
See notes to financial statements
U.S. Core Fund
10
F I N A N C I A L S T A T E M E N T S
| Issuer | Shares | Value |
| Banking 2.10% | $524,888 | |
| Bank of America Corp. | 4,400 | 222,992 |
| BB&T Corp. | 1,200 | 47,676 |
| Comerica, Inc. | 1,000 | 55,780 |
| Fifth Third Bancorp | 1,000 | 35,690 |
| First Horizon National Corp. | 600 | 18,408 |
| National City Corp. | 3,200 | 86,112 |
| US Bancorp | 1,800 | 58,230 |
| Broadcasting 0.33% | 83,457 | |
| CBS Corp., Class B | 1,700 | 53,567 |
| Liberty Media Corp. — Capital, Series A * | 200 | 21,798 |
| News Corp., Class A | 400 | 8,092 |
| Building Materials & Construction 0.29% | 71,737 | |
| American Standard Companies, Inc. | 1,100 | 40,513 |
| Masco Corp. | 1,200 | 31,224 |
| Business Services 1.05% | 261,733 | |
| Affiliated Computer Services, Inc., Class A * | 400 | 20,012 |
| DST Systems, Inc. * | 200 | 15,292 |
| First Data Corp. | 1,300 | 43,186 |
| Fiserv, Inc. * | 1,700 | 79,084 |
| Manpower, Inc. | 200 | 14,052 |
| Moody’s Corp. | 500 | 22,925 |
| NCR Corp. * | 200 | 9,954 |
| Pitney Bowes, Inc. | 800 | 35,736 |
| R.R. Donnelley & Sons Company | 600 | 21,492 |
| Cable & Television 0.97% | 242,523 | |
| Comcast Corp., Class A * | 3,500 | 91,315 |
| DIRECTV Group, Inc. * | 1,600 | 37,328 |
| Time Warner, Inc. | 6,000 | 113,880 |
| Chemicals 0.87% | 218,781 | |
| Dow Chemical Company | 1,700 | 72,471 |
| E.I. Du Pont de Nemours & Company | 1,100 | 53,625 |
| Eastman Chemical Company | 400 | 26,704 |
| Lubrizol Corp. | 400 | 25,432 |
| Lyondell Chemical Company | 400 | 18,544 |
| PPG Industries, Inc. | 300 | 22,005 |
| Colleges & Universities 0.04% | 10,980 | |
| ITT Educational Services, Inc. * | 100 | 10,980 |
| Computers & Business Equipment 8.99% | 2,250,586 | |
| Apple, Inc. * | 1,400 | 193,872 |
| CDW Corp. * | 900 | 77,463 |
| Cisco Systems, Inc. * | 14,300 | 456,456 |
| Cognizant Technology Solutions Corp., Class A * | 200 | 14,702 |
See notes to financial statements
U.S. Core Fund
11
F I N A N C I A L S T A T E M E N T S
| Issuer | Shares | Value |
| Computers & Business Equipment (continued) | ||
| Dell, Inc. * | 16,400 | $463,300 |
| EMC Corp. * | 6,000 | 117,960 |
| Hewlett-Packard Company | 1,700 | 83,895 |
| International Business Machines Corp. | 6,600 | 770,154 |
| Juniper Networks, Inc. * | 400 | 13,168 |
| Lexmark International, Inc. * | 1,600 | 59,616 |
| Construction Materials 0.27% | 68,708 | |
| Martin Marietta Materials, Inc. | 100 | 13,500 |
| Sherwin-Williams Company | 800 | 55,208 |
| Containers & Glass 0.15% | 36,563 | |
| Owens-Illinois, Inc. * | 400 | 16,088 |
| Pactiv Corp. * | 700 | 20,475 |
| Cosmetics & Toiletries 0.91% | 228,104 | |
| Avon Products, Inc. | 1,100 | 37,785 |
| Colgate-Palmolive Company | 100 | 6,632 |
| Estee Lauder Companies, Inc., Class A | 300 | 12,477 |
| International Flavors & Fragrances, Inc. | 400 | 20,092 |
| Kimberly-Clark Corp. | 2,200 | 151,118 |
| Crude Petroleum & Natural Gas 0.57% | 142,693 | |
| Apache Corp. | 500 | 38,690 |
| Devon Energy Corp. | 500 | 37,655 |
| Marathon Oil Corp. | 600 | 32,334 |
| Occidental Petroleum Corp. | 600 | 34,014 |
| Drugs & Health Care 0.06% | 13,890 | |
| Wyeth | 300 | 13,890 |
| Educational Services 0.14% | 35,202 | |
| Apollo Group, Inc., Class A * | 600 | 35,202 |
| Electrical Utilities 1.03% | 257,764 | |
| American Electric Power Company, Inc. | 1,400 | 62,272 |
| CenterPoint Energy, Inc. | 700 | 11,354 |
| Constellation Energy Group | 200 | 16,588 |
| Edison International | 400 | 21,084 |
| Entergy Corp. | 900 | 93,258 |
| The AES Corp. * | 1,800 | 32,598 |
| Xcel Energy, Inc. | 1,000 | 20,610 |
| Electronics 0.21% | 52,737 | |
| Arrow Electronics, Inc. * | 300 | 12,588 |
| Avnet, Inc. * | 600 | 23,586 |
| Tyco Electronics, Ltd. * | 475 | 16,563 |
| Energy 0.04% | 11,006 | |
| Sempra Energy | 200 | 11,006 |
See notes to financial statements
U.S. Core Fund
12
F I N A N C I A L S T A T E M E N T S
| Issuer | Shares | Value |
| Financial Services 5.85% | $1,463,303 | |
| Citigroup, Inc. | 15,400 | 721,952 |
| Countrywide Financial Corp. | 1,200 | 23,820 |
| Discover Financial Services * | 700 | 16,198 |
| Federal Home Loan Mortgage Corp. | 1,000 | 61,610 |
| Federal National Mortgage Association | 4,400 | 288,684 |
| Franklin Resources, Inc. | 500 | 65,885 |
| Goldman Sachs Group, Inc. | 700 | 123,207 |
| Morgan Stanley | 1,400 | 87,318 |
| SEI Investments Company | 400 | 10,148 |
| The First Marblehead Corp. | 500 | 16,745 |
| Washington Mutual, Inc. | 1,300 | 47,736 |
| Food & Beverages 2.28% | 571,048 | |
| ConAgra Foods, Inc. | 2,300 | 59,133 |
| General Mills, Inc. | 400 | 22,352 |
| H.J. Heinz Company | 100 | 4,509 |
| Kraft Foods, Inc., Class A | 3,622 | 116,122 |
| Pepsi Bottling Group, Inc. | 300 | 10,377 |
| Sara Lee Corp. | 1,500 | 24,930 |
| Sysco Corp. | 3,000 | 100,140 |
| The Coca-Cola Company | 3,500 | 188,230 |
| Tyson Foods, Inc., Class A | 2,100 | 45,255 |
| Forest Products 0.16% | 40,902 | |
| Weyerhaeuser Company | 600 | 40,902 |
| Gas & Pipeline Utilities 0.04% | 9,420 | |
| NiSource, Inc. | 500 | 9,420 |
| Healthcare Products 4.67% | 1,168,320 | |
| Baxter International, Inc. | 1,800 | 98,568 |
| Becton, Dickinson & Company | 400 | 30,776 |
| C.R. Bard, Inc. | 200 | 16,678 |
| Covidien, Ltd. * | 475 | 18,919 |
| Johnson & Johnson | 7,700 | 475,783 |
| Patterson Companies, Inc. * | 700 | 25,746 |
| St. Jude Medical, Inc. * | 600 | 26,142 |
| Stryker Corp. | 2,900 | 193,720 |
| Zimmer Holdings, Inc. * | 3,600 | 281,988 |
| Healthcare Services 3.22% | 807,094 | |
| Cardinal Health, Inc. | 2,000 | 136,760 |
| Coventry Health Care, Inc. * | 400 | 22,948 |
| Express Scripts, Inc. * | 2,100 | 114,975 |
| Health Net, Inc. * | 400 | 21,916 |
| McKesson Corp. | 2,500 | 143,025 |
| Medco Health Solutions, Inc. * | 400 | 34,180 |
| Quest Diagnostics, Inc. | 1,500 | 82,125 |
| UnitedHealth Group, Inc. | 4,700 | 235,047 |
| WellPoint, Inc. * | 200 | 16,118 |
See notes to financial statements
U.S. Core Fund
13
F I N A N C I A L S T A T E M E N T S
| Issuer | Shares | Value |
| Holdings Companies/Conglomerates 0.08% | $19,435 | |
| General Electric Company | 500 | 19,435 |
| Homebuilders 0.20% | 49,730 | |
| Centex Corp. | 200 | 5,782 |
| D.R. Horton, Inc. | 500 | 7,555 |
| KB Home | 100 | 3,034 |
| Lennar Corp., Class A | 500 | 14,135 |
| Toll Brothers, Inc. * | 900 | 19,224 |
| Hotels & Restaurants 1.84% | 459,664 | |
| Marriott International, Inc., Class A | 1,600 | 71,072 |
| McDonald’s Corp. | 5,100 | 251,175 |
| Starbucks Corp. * | 1,900 | 52,345 |
| Yum! Brands, Inc. | 2,600 | 85,072 |
| Household Products 0.21% | 52,965 | |
| Energizer Holdings, Inc. * | 500 | 52,965 |
| Industrial Machinery 0.65% | 163,003 | |
| Cummins, Inc. | 200 | 23,684 |
| Deere & Company | 300 | 40,818 |
| Ingersoll-Rand Company, Class A | 800 | 41,544 |
| ITT Corp. | 400 | 27,196 |
| Pall Corp. | 300 | 11,439 |
| W.W. Grainger, Inc. | 200 | 18,322 |
| Insurance 6.19% | 1,548,647 | |
| ACE, Ltd. | 600 | 34,656 |
| Aetna, Inc. | 1,400 | 71,274 |
| AFLAC, Inc. | 1,600 | 85,296 |
| Allstate Corp. | 5,300 | 290,175 |
| Ambac Financial Group, Inc. | 800 | 50,256 |
| American International Group, Inc. | 3,800 | 250,800 |
| Brown & Brown, Inc. | 400 | 10,768 |
| Chubb Corp. | 400 | 20,452 |
| CIGNA Corp. | 1,500 | 77,520 |
| First American Corp. | 500 | 20,915 |
| Hartford Financial Services Group, Inc. | 200 | 17,782 |
| MBIA, Inc. | 900 | 54,000 |
| MetLife, Inc. | 700 | 44,835 |
| MGIC Investment Corp. | 500 | 15,080 |
| Old Republic International Corp. | 1,100 | 20,009 |
| PMI Group, Inc. | 800 | 25,344 |
| Progressive Corp. | 2,700 | 54,918 |
| Prudential Financial, Inc. | 700 | 62,846 |
| Radian Group, Inc. | 500 | 8,820 |
| SAFECO Corp. | 800 | 46,416 |
| The Travelers Companies, Inc. | 3,300 | 166,782 |
See notes to financial statements
U.S. Core Fund
14
F I N A N C I A L S T A T E M E N T S
| Issuer | Shares | Value |
| Insurance (continued) | ||
| Torchmark Corp. | 500 | $30,780 |
| Transatlantic Holdings, Inc. | 200 | 14,166 |
| UnumProvident Corp. | 2,200 | 53,834 |
| W.R. Berkley Corp. | 700 | 20,923 |
| International Oil 9.54% | 2,387,267 | |
| Anadarko Petroleum Corp. | 700 | 34,286 |
| Chevron Corp. | 6,500 | 570,440 |
| ConocoPhillips | 2,400 | 196,536 |
| Exxon Mobil Corp. | 18,500 | 1,586,005 |
| Internet Retail 0.26% | 65,893 | |
| Amazon.com, Inc. * | 200 | 15,982 |
| eBay, Inc. * | 700 | 23,870 |
| Expedia, Inc. * | 500 | 14,925 |
| IAC/InterActiveCorp. * | 400 | 11,116 |
| Internet Software 0.22% | 54,005 | |
| McAfee, Inc. * | 700 | 25,025 |
| VeriSign, Inc. * | 900 | 28,980 |
| Leisure Time 0.29% | 71,502 | |
| Carnival Corp. | 1,200 | 54,708 |
| MGM MIRAGE * | 200 | 16,794 |
| Life Sciences 0.15% | 36,942 | |
| Waters Corp. * | 600 | 36,942 |
| Liquor 0.53% | 133,380 | |
| Anheuser-Busch Companies, Inc. | 2,700 | 133,380 |
| Manufacturing 1.72% | 431,424 | |
| Danaher Corp. | 1,300 | 100,958 |
| Eaton Corp. | 300 | 28,266 |
| Harley-Davidson, Inc. | 3,100 | 166,749 |
| Honeywell International, Inc. | 1,200 | 67,380 |
| Illinois Tool Works, Inc. | 500 | 29,085 |
| SPX Corp. | 200 | 18,010 |
| Tyco International, Ltd. | 475 | 20,976 |
| Metal & Metal Products 0.21% | 52,124 | |
| Precision Castparts Corp. | 400 | 52,124 |
| Petroleum Services 0.38% | 94,272 | |
| Tesoro Petroleum Corp. | 800 | 39,464 |
| Valero Energy Corp. | 800 | 54,808 |
| Pharmaceuticals 8.53% | 2,135,218 | |
| Abbott Laboratories | 1,200 | 62,292 |
| AmerisourceBergen Corp. | 2,300 | 110,055 |
| Bristol-Myers Squibb Company | 1,000 | 29,150 |
| Forest Laboratories, Inc. * | 4,200 | 158,046 |
See notes to financial statements
U.S. Core Fund
15
F I N A N C I A L S T A T E M E N T S
| Issuer | Shares | Value |
| Pharmaceuticals (continued) | ||
| King Pharmaceuticals, Inc. * | 1,100 | $16,533 |
| Merck & Company, Inc. | 17,800 | 893,026 |
| Pfizer, Inc. | 28,100 | 698,004 |
| Schering-Plough Corp. | 5,600 | 168,112 |
| Publishing 0.75% | 186,671 | |
| Gannett Company, Inc. | 2,800 | 131,600�� |
| McGraw-Hill Companies, Inc. | 600 | 30,276 |
| Tribune Company | 900 | 24,795 |
| Railroads & Equipment 0.06% | 15,257 | |
| CSX Corp. | 100 | 4,100 |
| Union Pacific Corp. | 100 | 11,157 |
| Retail Grocery 1.10% | 274,828 | |
| Safeway, Inc. | 3,500 | 111,055 |
| SUPERVALU, Inc. | 1,300 | 54,795 |
| The Kroger Company | 4,100 | 108,978 |
| Retail Trade 12.14% | 3,039,305 | |
| Abercrombie & Fitch Company, Class A | 800 | 62,960 |
| American Eagle Outfitters, Inc. | 2,250 | 58,118 |
| Bed Bath & Beyond, Inc. * | 2,500 | 86,600 |
| Best Buy Company, Inc. | 400 | 17,580 |
| CarMax, Inc. * | 800 | 18,128 |
| Family Dollar Stores, Inc. | 1,200 | 35,136 |
| Gap, Inc. | 500 | 9,380 |
| Home Depot, Inc. | 16,100 | 616,791 |
| J.C. Penney Company, Inc. | 400 | 27,504 |
| Kohl’s Corp. * | 3,700 | 219,410 |
| Limited Brands, Inc. | 1,300 | 30,108 |
| Lowe’s Companies, Inc. | 11,600 | 360,296 |
| Nordstrom, Inc. | 1,200 | 57,720 |
| PetSmart, Inc. | 300 | 10,410 |
| RadioShack Corp. | 1,400 | 33,278 |
| Ross Stores, Inc. | 400 | 11,132 |
| Sears Holdings Corp. * | 100 | 14,356 |
| Staples, Inc. | 3,700 | 87,875 |
| Target Corp. | 3,500 | 230,755 |
| The TJX Companies, Inc. | 1,600 | 48,784 |
| Tiffany & Company | 600 | 30,798 |
| Walgreen Company | 2,500 | 112,675 |
| Wal-Mart Stores, Inc. | 19,700 | 859,511 |
See notes to financial statements
U.S. Core Fund
16
F I N A N C I A L S T A T E M E N T S
| Issuer | Shares | Value |
| Semiconductors 1.39% | $348,949 | |
| Analog Devices, Inc. | 800 | 29,504 |
| Intel Corp. | 9,000 | 231,750 |
| KLA-Tencor Corp. | 700 | 40,229 |
| Novellus Systems, Inc. * | 800 | 21,896 |
| Xilinx, Inc. | 1,000 | 25,570 |
| Software 4.00% | 1,000,540 | |
| Adobe Systems, Inc. * | 300 | 12,825 |
| BMC Software, Inc. * | 400 | 12,248 |
| Citrix Systems, Inc. * | 400 | 14,540 |
| Intuit, Inc. * | 600 | 16,386 |
| Microsoft Corp. | 27,300 | 784,329 |
| Oracle Corp. * | 7,900 | 160,212 |
| Telecommunications Equipment & Services 1.34% | 334,218 | |
| Avaya, Inc. * | 200 | 3,366 |
| Verizon Communications, Inc. | 7,900 | 330,852 |
| Telephone 2.42% | 605,906 | |
| AT&T, Inc. | 14,475 | 577,118 |
| CenturyTel, Inc. | 600 | 28,788 |
| Tires & Rubber 0.11% | 27,660 | |
| Goodyear Tire & Rubber Company * | 1,000 | 27,660 |
| Tobacco 0.61% | 152,284 | |
| Altria Group, Inc. | 1,200 | 83,292 |
| UST, Inc. | 1,400 | 68,992 |
| Toys, Amusements & Sporting Goods 0.40% | 100,905 | |
| Hasbro, Inc. | 1,200 | 33,852 |
| Mattel, Inc. | 3,100 | 67,053 |
| Transportation 0.04% | 9,808 | |
| C.H. Robinson Worldwide, Inc. | 200 | 9,808 |
| Trucking & Freight 0.48% | 120,648 | |
| FedEx Corp. | 1,100 | 120,648 |
See notes to financial statements
U.S. Core Fund
17
F I N A N C I A L S T A T E M E N T S
| Principal | ||
| Issuer, description, maturity date | amount | Value |
| Short-term investments 0.20% | $49,760 | |
| (Cost $49,760) | ||
| John Hancock Cash Investment Trust (c) | $49,760 | 49,760 |
| Repurchase agreements 3.72% | $931,000 | |
| (Cost $931,000) | ||
| Repurchase Agreement with State Street Corp. dated | ||
| 8-31-07 at 4.60% to be repurchased at $931,476 | ||
| on 9-4-07, collateralized by $985,000 Federal | ||
| Home Loan Mortgage Corp., 4.00%, due 6-12-13 | ||
| (valued at $950,525, including interest) | $931,000 | 931,000 |
| Total investments (Cost $23,456,443) 99.05% | $24,787,264 | |
| Other assets in excess of liabilities 0.95% | $238,069 | |
| Total net assets 100.00% | $25,025,333 | |
Percentages are stated as a percent of net assets.
* Non-income-producing.
(a) All or a portion of this security was out on loan.
(c) Investment is an affiliate of the Trust’s adviser or subadviser.
See notes to financial statements
U.S. Core Fund
18
F I N A N C I A L S T A T E M E N T S
Financial statements
Statement of assets and liabilities 8-31-07 (unaudited)
This Statement of Assets and Liabilities is the Fund’s balance sheet. It shows the value of what the Fund owns, is due and owes. You’ll also find the net asset value and the maximum offering price per share.
| Assets | |
| Investments, at value (Cost $22,475,683) including $48,784 | |
| of securities loaned (Note 2) | $23,806,504 |
| Repurchase agreement, at value (Cost $931,000) | 931,000 |
| Investments in affiliated issuers, at value (Cost $49,760 (Note 2)) | 49,760 |
| Total investments, at value (Cost $23,456,443) | 24,787,264 |
| Cash | 613 |
| Cash collateral at broker for futures contracts | 35,000 |
| Receivable for fund shares sold | 165,961 |
| Dividends and interest receivable | 56,092 |
| Receivable for futures variation margin | 6,040 |
| Receivable due from adviser | 55,995 |
| Other assets | 7,105 |
| Total assets | 25,114,070 |
| Liabilities | |
| Payable for fund shares repurchased | 3,356 |
| Payable upon return of securities loaned (Note 2) | 49,760 |
| Payable to affiliates | |
| Fund administration fees | 387 |
| Transfer agent fees | 1,386 |
| Distribution and service fees | 340 |
| Other payables and accrued expenses | 33,508 |
| Total liabilities | 88,737 |
| Net assets | |
| Capital paid-in | $22,705,452 |
| Accumulated undistributed net realized gain on investments and futures contracts | 884,426 |
| Net unrealized appreciation on investments and futures contracts | 1,321,742 |
| Undistributed net investment income | 113,713 |
| Net assets | $25,025,333 |
| Net asset value per share | |
| Based on net asset values and shares outstanding — The Fund has an | |
| unlimited number of shares authorized with no par value. | |
| Class A ($20,594,054 ÷ 903,823 shares) | $22.79 |
| Class B ($348,207 ÷ 15,362 shares)1 | $22.67 |
| Class C ($3,839,556 ÷ 169,372 shares)1 | $22.67 |
| Class I ($128,607 ÷ 5,627 shares) | $22.852 |
| Class R1 ($114,909 ÷ 5,062 shares) | $22.70 |
| Maximum offering price per share | |
| Class A3 ($22.79 ÷ 95%) | $23.99 |
1 Redemption price is equal to net asset value less any applicable contingent deferred sales charges.
2 Net assets and shares outstanding have been rounded for presentation purposes. The net asset value is as reported on August 31, 2007.
3 On single retail sales of less than $50,000. On sales of $50,000 or more and on group sales the offering price is reduced.
See notes to financial statements
U.S. Core Fund
19
F I N A N C I A L S T A T E M E N T S
Statement of operations For the period ended 8-31-07 (unaudited)1
This Statement of Operations summarizes the Fund’s investment income earned and expenses incurred in operating the Fund. It also shows net gains (losses) for the period stated.
| Investment income | |
| Dividends | $241,843 |
| Interest | 23,084 |
| Total investment income | 264,927 |
| Expenses | |
| Investment management fees (Note 3) | 95,167 |
| Distribution and service fees (Note 3) | 51,626 |
| Transfer agent fees (Note 3) | 9,904 |
| Fund administration fees (Note 3) | 3,404 |
| Audit and legal fees | 65,372 |
| Blue sky fees (Note 3) | 45,816 |
| Custodian fees | 16,687 |
| Registration and filing fees | 12,207 |
| Printing and postage fees (Note 3) | 5,440 |
| Trustees’ fees (Note 3) | 686 |
| Miscellaneous | 218 |
| Total expenses | 306,527 |
| Less expense reductions (Note 3) | (123,642) |
| Net expenses | 182,885 |
| Net investment income | 82,042 |
| Realized and unrealized gain (loss) | |
| Net realized gain on | |
| Investments | 509,504 |
| Futures contracts | 38,089 |
| 547,593 | |
| Change in net unrealized appreciation (depreciation) of | |
| Investments | (79,687) |
| Futures contracts | (3,529) |
| (83,216) | |
| Net realized and unrealized gain | 464,377 |
| Increase in net assets from operations | $546,419 |
1 Semiannual period from 3-1-07 to 8-31-07.
See notes to financial statements
U.S. Core Fund
20
F I N A N C I A L S T A T E M E N T S
Statement of changes in net assets
These Statements of Changes in Net Assets show how the value of the Fund’s net assets has changed during the last two periods. The difference reflects earnings less expenses, any investment gains and losses, distributions, if any, paid to shareholders and the net of Fund share transactions.
| Period | Period | |
| ended1 | ended2 | |
| 2-28-07 | 8-31-07 | |
| Increase in net assets | ||
| From operations | ||
| Net investment income | $98,228 | $82,042 |
| Net realized gain | 531,494 | 547,593 |
| Change in net unrealized appreciation (depreciation) | 1,404,958 | (83,216) |
| Increase in net assets resulting from operations | 2,034,680 | 546,419 |
| Distributions to shareholders | ||
| From net investment income | ||
| Class A | (75,450) | — |
| Class B | (174) | — |
| Class C | (2,087) | — |
| Class I | (737) | — |
| Class R1 | (400) | — |
| From net realized gain | ||
| Class A | (165,121) | — |
| Class B | (2,107) | — |
| Class C | (25,345) | — |
| Class I | (1,098) | — |
| Class R1 | (990) | — |
| Total distributions | (273,509) | — |
| From Fund share transactions | 21,350,742 | 1,367,001 |
| Total increase | 23,111,913 | 1,913,420 |
| Net assets | ||
| Beginning of period | — | 23,111,913 |
| End of period3 | $23,111,913 | $25,025,333 |
1 Period from 6-12-06 (commencement of operations) to 2-28-07.
2 Semiannual period from 3-1-07 to 8-31-07. Unaudited.
3 Includes undistributed net investment income of $31,671 and $113,713, respectively.
See notes to financial statements
U.S. Core Fund
21
F I N A N C I A L S T A T E M E N T S
Financial highlights
The Financial Highlights show how the Fund’s net asset value for a share has changed since the end of the previous period.
| CLASS A SHARES | ||
| Period ended | 2-28-071 | 8-31-072 |
| Per share operating performance | ||
| Net asset value, beginning of period | $20.00 | $22.24 |
| Net investment income3 | 0.12 | 0.09 |
| Net realized and unrealized | ||
| gain on investments | 2.41 | 0.46 |
| Total from investments operations | 2.53 | 0.55 |
| Less distributions | ||
| From net investment income | (0.09) | — |
| From net realized gain | (0.20) | — |
| (0.29) | — | |
| Net asset value, end of period | $22.24 | $22.79 |
| Total return4,5,6 (%) | 12.64 | 2.47 |
| Ratios and supplemental data | ||
| Net assets, end of period (in millions) | $19 | $21 |
| Ratio of net expenses to average | ||
| net assets9 (%) | 1.34 | 1.35 |
| Ratio of gross expenses to average | ||
| net assets8,9 (%) | 1.93 | 2.05 |
| Ratio of net investment income | ||
| to average net assets9 (%) | 0.76 | 0.77 |
| Portfolio turnover6 (%) | 36 | 30 |
See notes to financial statements
U.S. Core Fund
22
F I N A N C I A L S T A T E M E N T S
Financial highlights
| CLASS B SHARES | ||
| Period ended | 2-28-071 | 8-31-072 |
| Per share operating performance | ||
| Net asset value, beginning of period | $20.00 | $22.20 |
| Net investment income3 | 0.02 | 0.01 |
| Net realized and unrealized | ||
| gain on investments | 2.40 | 0.46 |
| Total from investments operations | 2.42 | 0.47 |
| Less distributions | ||
| From net investment income | (0.02) | — |
| From net realized gain | (0.20) | — |
| (0.22) | — | |
| Net asset value, end of period | $22.20 | $22.67 |
| Total return4,5,6 (%) | 12.07 | 2.12 |
| Ratios and supplemental data | ||
| Net assets, end of period (in millions) | —7 | —7 |
| Ratio of net expenses to average | ||
| net assets9 (%) | 2.04 | 2.05 |
| Ratio of gross expenses to average | ||
| net assets8,9 (%) | 13.58 | 8.35 |
| Ratio of net investment income | ||
| to average net assets9 (%) | 0.12 | 0.08 |
| Portfolio turnover6 (%) | 36 | 30 |
See notes to financial statements
U.S. Core Fund
23
F I N A N C I A L S T A T E M E N T S
Financial highlights
| CLASS C SHARES | ||
| Period ended | 2-28-071 | 8-31-072 |
| Per share operating performance | ||
| Net asset value, beginning of period | $20.00 | $22.21 |
| Net investment income3 | 0.03 | 0.01 |
| Net realized and unrealized | ||
| gain on investments | 2.40 | 0.45 |
| Total from investments operations | 2.43 | 0.46 |
| Less distributions | ||
| From net investment income | (0.02) | — |
| From net realized gain | (0.20) | — |
| (0.22) | — | |
| Net asset value, end of period | $22.21 | $22.67 |
| Total return4,5,6 (%) | 12.12 | 2.07 |
| Ratios and supplemental data | ||
| Net assets, end of period (in millions) | $3 | $4 |
| Ratio of net expenses to average | ||
| net assets9 (%) | 2.04 | 2.05 |
| Ratio of gross expenses to average | ||
| net assets8,9 (%) | 3.82 | 3.21 |
| Ratio of net investment income | ||
| to average net assets9 (%) | 0.16 | 0.07 |
| Portfolio turnover6 (%) | 36 | 30 |
See notes to financial statements
U.S. Core Fund
24
F I N A N C I A L S T A T E M E N T S
Financial highlights
| CLASS I SHARES | ||
| Period ended | 2-28-071 | 8-31-072 |
| Per share operating performance | ||
| Net asset value, beginning of period | $20.00 | $22.26 |
| Net investment income3 | 0.18 | 0.14 |
| Net realized and unrealized | ||
| gain on investments | 2.41 | 0.45 |
| Total from investments operations | 2.59 | 0.59 |
| Less distributions | ||
| From net investment income | (0.13) | — |
| From net realized gain | (0.20) | — |
| (0.33) | — | |
| Net asset value, end of period | $22.26 | $22.85 |
| Total return4,5,6 (%) | 12.95 | 2.65 |
| Ratios and supplemental data | ||
| Net assets, end of period | ||
| (in millions) | —7 | —7 |
| Ratio of net expenses to average | ||
| net assets9 (%) | 0.95 | 0.95 |
| Ratio of gross expenses to average | ||
| net assets8,9 (%) | 17.83 | 15.77 |
| Ratio of net investment income | ||
| to average net assets9 (%) | 1.16 | 1.17 |
| Portfolio turnover6 (%) | 36 | 30 |
See notes to financial statements
U.S. Core Fund
25
F I N A N C I A L S T A T E M E N T S
Financial highlights
| CLASS R1 SHARES | ||
| Period ended | 2-28-071 | 8-31-072 |
| Per share operating performance | ||
| Net asset value, beginning of period | $20.00 | $22.20 |
| Net investment income3 | 0.06 | 0.05 |
| Net realized and unrealized | ||
| gain on investments | 2.42 | 0.45 |
| Total from investments operations | 2.48 | 0.50 |
| Less distributions | ||
| From net investment income | (0.08) | — |
| From net realized gain | (0.20) | — |
| (0.28) | — | |
| Net asset value, end of period | $22.20 | $22.70 |
| Total return4,5,6 (%) | 12.38 | 2.25 |
| Ratios and supplemental data | ||
| Net assets, end of period | ||
| (in millions) | —7 | —7 |
| Ratio of net expenses to average | ||
| net assets9 (%) | 1.69 | 1.70 |
| Ratio of gross expenses to average | ||
| net assets8.9 (%) | 21.12 | 18.53 |
| Ratio of net investment income | ||
| to average net assets9 (%) | 0.41 | 0.42 |
| Portfolio turnover rate6 (%) | 36 | 30 |
1 Class A, Class B, Class C, Class I and Class R1 shares began operations on 6-12-06.
2 Semiannual period from 3-1-07 to 8-31-07. Unaudited.
3 Based on the average of the shares outstanding.
4 Assumes dividend reinvestment.
5 Total returns would have been lower had certain expenses not been reduced during the periods shown.
6 Not annualized.
7 Less than $500,000.
8 Does not take into consideration expense reductions during the periods shown.
9 Annualized.
See notes to financial statements
U.S. Core Fund
26
Notes to financial statements (unaudited)
1. Organization
John Hancock U.S. Core Fund (the Fund) is a newly organized diversified series of John Hancock Funds III (the Trust). The Trust was established as a Massachusetts business trust on June 9, 2005. The Trust is registered under the Investment Company Act of 1940, as amended (the 1940 Act), as an open-end investment management company. The investment objective of the Fund is to seek high total return.
John Hancock Life Insurance Company of New York (John Hancock New York) is a wholly owned subsidiary of John Hancock Life Insurance Company (U.S.A.) (John Hancock USA). John Hancock USA and John Hancock New York are indirect wholly owned subsidiaries of The Manufacturers Life Insurance Company (Manulife), which in turn is a wholly owned subsidiary of Manulife Financial Corporation (MFC), a publicly traded company. MFC and its subsidiaries are known collectively as “Manulife Financial.”
John Hancock Investment Management Services, LLC (the Adviser) a Delaware limited liability company controlled by John Hancock USA, serves as investment adviser for the Trust and John Hancock Funds, LLC (the Distributor), a Delaware limited liability company, an affiliate of the Adviser, serves as principal underwriter.
The Board of Trustees have authorized the issuance of multiple classes of shares of the Fund, including classes designated as Class A, Class B, Class C, Class I, Class R1, Class 1, Class 3 and Class NAV shares. The shares of each class represent an interest in the same portfolio of investments of the Fund, and have equal rights as to voting, redemptions, dividends and liquidation, except that certain expenses, subject to the approval of the Board of Trustees, may be applied differently to each class of shares in accordance with current regulations of the Securities and Exchange Commission (SEC) and the Internal Revenue Service. Shareholders of a class that bears distribution and service expenses under the terms of a distribution plan have exclusive voting rights to that distribution plan. Class B shares will convert to Class A shares eight years after purchase.
The Adviser and other subsidiaries of John Hancock USA owned 739,443, 5,048, 5,074 and 5,062 shares of beneficial interest of Class A, Class B, Class I and Class R1, respectively, of the Fund on August 31, 2007.
2. Significant accounting policies
In the preparation of the financial statements, the Fund follows the policies described below. The preparation of financial statements in conformity with accounting principles generally accepted in the United States of America requires management to make estimates and assumptions that affect the reported amounts of assets and liabilities at the date of the financial statements and the reported amounts of income and expenses during the reporting period. Actual results may differ from these estimates.
Security valuation
The net asset value of the shares of Class A, Class B, Class C, Class I and Class R1 of the Fund is determined daily as of the close of the New York Stock Exchange (NYSE), normally at 4:00 P.M., Eastern Time. Short-term debt instruments with remaining maturities of 60 days or less are valued at amortized cost, and thereafter assume a constant amortization to maturity of any discount or premium, which approximates market value. Investments in John Hancock Cash Investment Trust (JHCIT), an affiliate of John Hancock Advisers, LLC (JHA), a wholly owned subsidiary of John Hancock Financial Services, Inc., a subsidiary of MFC, are valued at their net asset value each business day. All other securities held by the Fund are valued at the last sale price or official closing price (closing bid price or last evaluated
U.S. Core Fund
27
quote if no sale has occurred) as of the close of business on a principal securities exchange (domestic or foreign) on which they trade or, lacking any sales, at the closing bid price. Securities traded only in the over-the-counter market are valued at the last bid price quoted by brokers making markets in the securities at the close of trading. Securities for which there are no such quotations, principally debt securities, are valued based on the valuation provided by an independent pricing service, which utilizes both dealer-supplied and electronic data processing techniques, which take into account factors such as institutional size trading in similar groups of securities, yield, quality, coupon rate, maturity, type of issue, trading characteristics and other market data.
Other assets and securities for which no such quotations are readily available are valued at their fair value as determined in good faith under consistently applied procedures established by and under the general supervision of the Board of Trustees. Generally, trading in non-U.S. securities is substantially completed each day at various times prior to the close of trading on the NYSE. The values of such securities used in computing the net asset value of a Fund’s shares are generally determined as of such times. Occasionally, significant events that affect the values of such securities may occur between the times at which such values are generally determined and the close of the NYSE. Upon such an occurrence, these securities will then be valued at their fair value as determined in good faith under consistently applied procedures established by and under the general supervision of the Board of Trustees.
Repurchase agreements
The Fund may enter into repurchase agreements. When the Fund enters into a repurchase agreement through its custodian, it receives delivery of securities, the amount of which at the time of purchase and each subsequent business day is required to be maintained at such a level that the market value is generally at least 102% of the repurchase amount. The Fund will take constructive receipt of all securities underlying the repurchase agreements it has entered into until such agreements expire. If the seller defaults, the Fund would suffer a loss to the extent that proceeds from the sale of underlying securities were less than the repurchase amount. The Fund may enter into repurchase agreements maturing within seven days with domestic dealers, banks or other financial institutions deemed to be credit-worthy by the Adviser. Collateral for certain tri-party repurchase agreements is held at the custodian bank in a segregated account for the benef it of the Fund and the counterparty.
Security transactions and related investment income
Investment security transactions are accounted for on a trade date plus one basis for daily net asset value calculations. However, for financial reporting purposes, investment transactions are reported on trade date. Interest income is accrued as earned. Dividend income is recorded on the ex-dividend date. Foreign dividends are recorded on the ex-date or when the Fund becomes aware of the dividends from cash collections. Discounts/premiums are accreted/amortized for financial reporting purposes. Non-cash dividends are recorded at the fair market value of the securities received. Debt obligations may be placed in a non-accrual status and related interest income may be reduced by ceasing current accruals and writing off interest receivables when the collection of all or a portion of interest has become doubtful, based upon consistently applied procedures.
From time to time, the Fund may invest in Real Estate Investment Trusts (REITs) and, as a result, will estimate the components of distributions from these securities. Distributions from REITs received in excess of income are recorded as a reduction of cost of investments and/or as a realized gain.
The Fund uses the First In, First Out method for fixed-income securities and Highest Cost, First Out for all other securities for determining realized gain or loss on investments for both financial and federal income tax reporting purposes.
U.S. Core Fund
28
Multi-class allocations
All income, expenses (except for class-specific expenses) and realized and unrealized gains (losses) are allocated to each class of shares based upon the relative net assets of each class. Dividends to shareholders from net investment income are determined at a class level and distributions from capital gains are determined at a Fund level.
Expense allocation
Expenses are allocated based on the relative share of net assets of the Fund at the time the expense was incurred. Class-specific expenses, such as distribution (Rule 12b-1) fees, are accrued daily and charged directly to the respective share classes.
Securities lending
The Fund may lend securities in amounts up to 33 1 / 3% of the Fund’s total assets. Such loans are callable at any time and are at all times fully secured by cash, cash equivalents or securities issued or guaranteed by the U.S. government or its agencies or instrumentalities and marked-to-market on a daily basis. The Fund may bear the risk of delay in recovery of, or even of rights in, the securities loaned should the borrower of the securities fail financially. The Fund receives compensation for lending its securities either in the form of fees and/or by retaining a portion of interest on the investment of any cash received as collateral. The Fund invests in cash collateral received in connection with securities lending transactions in JHCIT, a Delaware common law trust and an affiliated fund. JHCIT is exempt from registration under Section 3(c)(7) of the 1940 Act (pursuant to exem ptive order issued by the SEC) and is managed by the Adviser, for which the Adviser receives an investment advisory fee of 0.04% of the average daily net assets of JHCIT.
All collateral received will be in an amount equal to at least 100% of the market value of the loaned securities and is intended to be maintained at that level during the period of the loan. The market value of the loaned securities is determined at the close of business of the Fund and any additional required collateral is delivered to the Fund the next business day. During the loan period, the Fund continues to retain rights of ownership, including dividends and interest of the loaned securities. At August 31, 2007, the Fund loaned securities having a market value of $48,784 collateralized by securities in the amount of $49,760.
Futures
The Fund may purchase and sell financial futures contracts and options on those contracts. The Fund invests in contracts based on financial instruments, such as U.S. Treasury Bonds or Notes, or on securities indexes, such as the Standard & Poor’s 500 Index, in order to hedge against a decline in the value of securities owned by the Fund.
Initial margin deposits required upon entering into futures contracts are satisfied by the delivery of specific securities or cash as collateral to the broker (the Funds’ agent in acquiring the futures position). If the position is closed out by taking an opposite position prior to the settlement date of the futures contract, a final determination of variation margin is made, cash is required to be paid to or released by the broker and the Fund realizes a gain or loss.
When the Fund sells a futures contract based on a financial instrument, the Fund becomes obligated to deliver that kind of instrument at an agreed upon date for a specified price. The Fund realizes a gain or loss depending on whether the price of an offsetting purchase is less or more than the price of the initial sale or on whether the price of an offsetting sale is more or less than the price of the initial purchase. The Fund could be exposed to risks if it could not close out futures positions because of an illiquid secondary market or the inability of counterparties to meet the terms of their contracts. Futures contracts are valued at the quoted daily settlement prices established by the exchange on which they trade.
The following is a summary of open futures contracts on August 31, 2007:
| NUMBER OF | UNREALIZED | |||
| OPEN CONTRACTS | CONTRACTS | POSITION | EXPIRATION | DEPRECIATION |
| S&P 500 Index | 8 | Long | Sep 2007 | ($9,079) |
U.S. Core Fund
29
Federal income taxes
The Fund qualifies as a “regulated investment company” by complying with the applicable provisions of the Internal Revenue Code and will not be subject to federal income tax on taxable income. Therefore, no federal income tax provision is required.
New accounting pronouncements
In June 2006, Financial Accounting Standards Board (FASB) Interpretation No. 48, Accounting for Uncertainty in Income Taxes (the Interpretation), was issued and is effective for fiscal years beginning after December 15, 2006, and is to be applied to all open tax years as of the effective date. This Interpretation prescribes a minimum threshold for financial statement recognition of the benefit of a tax position taken or expected to be taken in a tax return, and requires certain expanded disclosures. Management has evaluated the application of this Interpretation to the Fund and does not believe there is a material impact resulting from the adoption of this Interpretation on the Fund’s financial statements.
In September 2006, FASB Standard No. 157, Fair Value Measurements (FAS 157), was issued and is effective for fiscal years beginning after November 15, 2007. FAS 157 defines fair value, establishing a framework for measuring fair value and expands disclosure about fair value measurements. Management is currently evaluating the application of FAS 157 to the Fund and its impact, if any, resulting from the adoption of FAS 157 on the Fund’s financial statements.
Distribution of income and gains
The Fund records distributions to shareholders from net investment income and net realized gains, if any, on the ex-dividend date. There were no distributions during the period ended August 31, 2007. Distributions paid by the Fund with respect to each class of shares are calculated in the same manner, at the same time and are in the same amount, except for the effect of expenses that may be applied differently to each class.
Such distributions, on a tax basis, are determined in conformity with income tax regulations, which may differ from accounting principles generally accepted in the United States of America. Distributions in excess of tax basis earnings and profits, if any, are reported in the Fund’s financial statements as a return of capital.
Capital accounts
The Fund reports the undistributed net investment income and accumulated undistributed net realized gain (loss) accounts on a basis approximating amounts available for future tax distributions (or to offset future taxable realized gains when a capital loss carryforward is available). Accordingly, the Fund may periodically make reclassifications among certain capital accounts without affecting its net asset value.
3. Investment advisory and other agreements
Advisory fees
The Trust has entered into an Investment Advisory Agreement with the Adviser. The Adviser is responsible for managing the corporate and business affairs of the Trust and for selecting and compensating subadvisers to handle the investment of the assets of the Fund, subject to the supervision of the Trust’s Board of Trustees. Under the Advisory Agreement the Fund pays a monthly management fee to the Adviser equivalent, on an annual basis, to the sum of: (a) 0.78% of the first $500,000,000 of the Fund’s aggregate daily net assets; (b) 0.76% of the next $500,000,000 of the Fund’s aggregate daily net assets; (c) 0.75% of the next $1,500,000,000 of the Fund’s aggregate daily net assets; and (d) 0.74% of the Fund’s aggregate daily net assets in excess of $2,500,000,000. Aggregate net assets include the net assets of the Fund, the U.S. Core Trust, Growth and Income Trust, and a portion of the net assets of the Managed Trust Series of John Hancock Trust, the U.S. Core Fund, a series of John Hancock Funds II, that are subadvised by Grantham, Mayo, Van Otterloo & Co. LLC. The Adviser has a subadvisory agreement with Grantham, Mayo, Van Otterloo & Co. LLC. The Fund is not responsible for payment of the subadvisory fees.
Expense reimbursements
The Adviser has agreed contractually to reimburse for certain fund level expenses
U.S. Core Fund
30
that exceed 0.10% of the average annual net assets, or to make a payment to a specific class of shares of the Fund in an amount equal to the amount by which the expenses attributable to such class of shares (excluding taxes, portfolio brokerage commissions, interest, litigation and indemnification expenses and other extraordinary expenses not incurred in the ordinary course of the Fund’s business and fees under any agreement or plans of the Fund dealing with services for shareholders and others with beneficial interests in shares of the Fund) exceed the percentage of average annual net assets (on an annualized basis) attributable as follows: 1.35% for Class A, 2.05% for Class B, 2.05% for Class C, 0.95% for Class I and 1.45% for Class R1. Accordingly, the expense reductions related to this expense limitation amounted to $72,507, $10,415, $21,161, $9,698 and $9,861 for Class A, Class B, Class C, Class I and Class R1, respectively, for the period ended August 31, 2007 . This expense reimbursement shall continue in effect until June 30, 2008 and thereafter until terminated by the Adviser on notice to the Trust.
Administration fees
The Fund has an agreement with the Adviser that requires the Fund to reimburse the Adviser for all expenses associated with providing the administrative, financial, accounting and recordkeeping services of the Fund, including the preparation of all tax returns, annual, semiannual and periodic reports to shareholders and the preparation of all regulatory reports. These expenses are allocated based on the relative net assets of each class. The compensation for the period amounted to $3,404 with an effective rate of 0.03% of the Fund’s average daily net asset value.
Distribution plan
The Trust has a Distribution Agreement with the Distributor. The Fund has adopted Distribution Plans with respect to Class A, Class B, Class C and Class R1, pursuant to Rule 12b-1 under the 1940 Act, to reimburse the Distributor for the services it provides as distributor of shares of the Fund. Accordingly, the Fund makes monthly payments to the Distributor at an annual rate not to exceed 0.30%, 1.00%, 1.00% and 0.50% of average daily net asset value of Class A, Class B, Class C and Class R1, respectively. A maximum of 0.25% of such payments may be service fees, as defined by the Conduct Rules of the Financial Industry Regulatory Authority (formerly the National Association of Securities Dealers). Under the Conduct Rules, curtailment of a portion of the Fund’s 12b-1 payments could occur under certain circumstances. In addition, under a Service Plan for Class R1 shares, the Fund pays up to 0.25% of Class R1 average daily net asset value for certain other services.
Sales charges
Class A shares are assessed up-front sales charges of up to 5.00% of net asset value of such shares. During the period ended August 31, 2007, the Fund was informed that the Distributor received net up-front sales charges of $85,504 with regard to sales of Class A shares. Of this amount, $13,381 was retained and used for printing prospectuses, advertising, sales literature and other purposes, $72,081 was paid as sales commissions to unrelated broker-dealers and $42 was paid as sales commissions to sales personnel of Signator Investors, Inc. (Signator Investors), a related broker-dealer, an indirect subsidiary of MFC.
Class B shares that are redeemed within six years of purchase are subject to a contingent deferred sales charge (CDSC) at declining rates, beginning at 5.00% of the lesser of the current market value at the time of redemption or the original purchase cost of the shares being redeemed. Class C shares that are redeemed within one year of purchase are subject to a CDSC at a rate of 1.00% of the lesser of the current market value at the time of redemption or the original purchase cost of the shares being redeemed. Proceeds from the CDSCs are paid to the Distributor and are used, in whole or in part, to defray its expenses for providing distribution-related services to the Fund in connection with the sale of Class B and Class C shares. During the period ended August 31, 2007, CDSCs received by the Distributor amounted to $148 for Class B shares and $23 for Class C shares.
U.S. Core Fund
31
Transfer agent fees
The Fund has a Transfer Agency Agreement with John Hancock Signature Services, Inc. (Signature Services), an indirect subsidiary of MFC. For Class A, Class B, Class C, Class I and Class R1 shares, the Fund pays a monthly transfer agent fee at an annual rate of 0.05% of each class’ average daily net assets, plus a fee based on the number of shareholder accounts and reimbursement for certain out-of-pocket expenses. Expenses not directly attributable to a particular class of shares are aggregated and allocated to each class on the basis of its relative net asset value.
Signature Services has agreed to limit the transfer agent fees so that such fees do not exceed 0.20% annually of Class A, Class B, Class C, Class I and Class R1 share average daily net assets. This agreement is effective until December 31, 2007. Signature Services reserves the right to terminate this limitation in the future. Accordingly, there were no transfer agent fee reductions for Class A, Class B, Class C, Class I and Class R1 shares, respectively, during the period ended August 31, 2007.
Expenses under the agreements described above for the period ended August 31, 2007, were as follows:
| Distribution and | Transfer | Blue sky | Printing and | |
| Share class | service fees | agent fees | fees | postage fees |
| Class A | $31,155 | $7,269 | $9,348 | $4,472 |
| Class B | 1,659 | 332 | 9,119 | 106 |
| Class C | 18,372 | 2,241 | 9,117 | 332 |
| Class I | — | 33 | 9,116 | 161 |
| Class R1 | 440 | 29 | 9,116 | 369 |
| Total | $51,626 | $9,904 | $45,816 | $5,440 |
Trustees’ fees
The Trust compensates each Trustee who is not an employee of the Adviser or its affiliates. Total Trustees’ expenses are allocated to the Fund based on its average daily net asset value.
4. Guarantees and indemnifications
Under the Trust’s organizational documents, its Officers and Trustees are indemnified against certain liability arising out of the performance of their duties to the Trust. Additionally, in the normal course of business, the Trust enters into contracts with service providers that contain general indemnification clauses. The Trust’s maximum exposure under these arrangements is unknown, as this would involve future claims that may be made against the Trust that have not yet occurred. However, based on experience, the Trust believes the risk of loss to be remote.
5. Line of credit
The Fund has entered into an agreement which enables it to participate in a $100 million unsecured committed line of credit with State Street Corporation. Borrowings will be made solely to temporarily finance the repurchase of capital shares. Interest is charged to the Fund based on its borrowings at a rate per annum equal to the Federal Funds rate plus 0.50% . In addition, a commitment fee of 0.07% per annum, payable at the end of each calendar quarter, based on the average daily-unused portion of the line of credit, is charged to the Fund on a prorated basis based on average net assets. For the period ended August 31, 2007, there were no borrowings under the line of credit.
U.S. Core Fund
32
6. Capital shares
Share activities for the Fund for the periods ended February 28, 2007 and August 31, 2007 were as follows:
| Period ended 2-28-071 | Period ended 8-31-072 | |||
| Shares | Amount | Shares | Amount | |
| Class A | ||||
| Sold | 864,514 | $17,543,185 | 61,751 | $1,418,572 |
| Distributions reinvested | 10,725 | 239,263 | — | — |
| Repurchased | (2,906) | (65,923) | (30,261) | (702,045) |
| Net increase | 872,333 | $17,716,525 | 31,490 | $716,527 |
| Class B | ||||
| Sold | 13,046 | $278,326 | 3,424 | $78,289 |
| Distributions reinvested | 94 | 2,087 | — | — |
| Repurchased | (292) | (6,586) | (910) | (21,220) |
| Net increase | 12,848 | $273,827 | 2,514 | $57,069 |
| Class C | ||||
| Sold | 147,710 | $3,240,381 | 26,940 | $618,372 |
| Distributions reinvested | 1,205 | 26,878 | — | — |
| Repurchased | (5,402) | (121,094) | (1,081) | (24,967) |
| Net increase | 143,513 | $3,146,165 | 25,859 | $593,405 |
| Class I | ||||
| Sold | 5,545 | $111,000 | — | — |
| Distributions reinvested | 82 | 1,835 | — | — |
| Net increase | 5,627 | $112,835 | — | — |
| Class R1 | ||||
| Sold | 5,000 | $100,000 | — | — |
| Distributions reinvested | 62 | 1,390 | — | — |
| Net increase | 5,062 | $101,390 | — | — |
| Net increase | 1,039,383 | $21,350,742 | 59,865 | $1,367,001 |
1Period from 6-12-06 (commencement of operations) to 2-28-07.
2Semiannual period from 3-1-07 to 8-31-07. Unaudited.
7. Investment transactions
Purchases and proceeds from sales or maturities of securities, other than short-term securities and obligations of the U.S. government, during the year ended August 31, 2007, aggregated $8,203,890 and $7,137,233, respectively.
The cost of investments owned on August 31, 2007, including short-term investments, for federal income tax purposes, was $23,466,253. Gross unrealized appreciation and depreciation of investments aggregated $2,158,082 and $837,071, respectively, resulting in net unrealized appreciation of $1,321,011. The difference between book basis and tax basis net unrealized appreciation of investments is attributable primarily to the tax deferral of losses on certain sales of securities.
8. Federal income tax information
Federal income tax regulations may differ from generally accepted accounting principles and income and capital gain distributions determined in accordance with tax regulations may differ from net investment income and realized gains recognized for financial reporting purposes.
U.S. Core Fund
33
Evaluation of Advisory and Subadvisory Agreements by the Board of Trustees
This section describes the evaluation by the Board of Trustees of the Advisory Agreement and each of the Subadvisory Agreements.
Evaluation by the Board of Trustees
The Board, including all of the Trustees who are not “interested persons” as defined in the Investment Company Act of 1940, as amended (the Independent Trustees), is responsible for selecting the Trust’s investment adviser, John Hancock Investment Management Services, LLC (the Adviser or JHIMS), approving the Adviser’s selection of subadvisers for each series of the Trust (the Funds) and approving the Trust’s advisory and subadvisory agreements (and any sub-subadvisory agreements), their periodic continuation and any amendments. Consistent with SEC rules, the Board regularly evaluates the Trust’s advisory and subadvisory (and sub-subadvisory) arrangements, including consideration of the factors listed below. The Board may also consider other factors (including conditions and trends prevailing generally in the economy, the securities markets and the industry) and does not treat any single factor as determinative, and each Trustee may attribut e different weights to different factors. The Board is furnished with an analysis of its fiduciary obligations in connection with its evaluation and, throughout the evaluation process, the Board is assisted by counsel for the Trust and the Independent Trustees are also separately assisted by independent legal counsel. The factors regularly considered by the Board are:
1. the nature, extent and quality of the services to be provided by the Adviser to the Trust and by the subadvisers to the Funds;
2. the investment performance of the Funds and their subadvisers;
3. the extent to which economies of scale would be realized as a Fund grows and whether fee levels reflect these economies of scale for the benefit of Trust shareholders;
4. the costs of the services to be provided and the profits to be realized by the Adviser and its affiliates (including any subadvisers that are affiliated with the Adviser) from the Adviser’s relationship with the Trust; and
5. comparative services rendered and comparative advisory and subadvisory fee rates.
The Board believes that information relating to all these factors is relevant to its evaluation of the Trust’s advisory agreement. With respect to its evaluation of subadvisory agreements (including sub-subadvisory agreements) the Board believes that, in view of the Trust’s “manager of managers” advisory structure, the costs of services to be provided and the profits to be realized by those subadvisers that are not affiliated with the Adviser from their relationship with the Trust generally are not a material factor to the Board’s consideration of subadvisory agreements because such fees are paid to subadvisers by the Adviser and not by the Funds, and because the Board relies on the ability of the Adviser to negotiate such subadvisory fees at arm’s-length.
In evaluating subadvisory arrangements, the Board also considers other material business relationships that unaffiliated subadvisers and their affiliates have with the Adviser or its affiliates, including the involvement by certain affiliates of certain subadvisers in the distribution of financial products, including shares of the Trust, offered by the Adviser and other affiliates of the Adviser (Material Relationships).
Approval of Advisory Agreement
At its meeting on June 5, 2007, the Board, including all the Independent Trustees, approved the Advisory Agreement between the Trust and JHIMS with respect to each of the Funds.
In approving the Advisory Agreement, and with reference to the factors which it regularly considers, the Board:
(1) (a) considered the high value to the Trust of continuing the relationship with JHIMS as the Trust’s Adviser to the other John Hancock Funds, the skills and competency with which JHIMS
34
has in the past managed the affairs and subadvisory relationships of other funds in the complex, JHIMS’s oversight and monitoring of subadvisers’ investment performance and compliance programs including its timelines in responding to performance issues and the qualifications of JHIMS’s personnel,
(b) considered JHIMS’s compliance policies and procedures and its responsiveness to regulatory changes and mutual fund industry developments, and
(c) JHIMS’s administrative capabilities, including its ability to supervise the other service providers for the Funds and concluded that JHIMS may reasonably be expected to ably perform its services under the Advisory Agreement.
(2) reviewed the investment performance of portfolios that are managed comparable to the Funds; the comparative performance of their respective benchmarks; and JHIMS’ analysis of such performance and its plans and recommendations regarding the Trust’s subadvisory arrangements generally and with respect to the Funds; and concluded that each of the comparably managed funds has performed well or within a range that the Board deemed competitive, and that JHIMS may reasonably be expected to ably monitor the performance of the Funds and their subadvisers;
(3) reviewed the Trust’s advisory fee structure and the incorporation therein of any subadvisory fee breakpoints in the advisory fees charged and concluded (i) that to the extent that Funds have subadvisory fees with breakpoints, those breakpoints are reflected as breakpoints in the advisory fees for Funds, (ii) that all Funds with a subadviser that is not affiliated with the Adviser have subadvisory fees which are the product of arm’s-length negotiations between the Adviser and the subadviser and which in many, but not all, cases contain breakpoints, and (iii) that, although economies of scale cannot be measured with precision, these arrangements permit shareholders of Funds with advisory fee breakpoints to benefit from economies of scale if those Funds grow;
(4) (a) reviewed the financial statements of JHIMS and John Hancock Life Insurance Company (U.S.A.) (JHLICO (U.S.A.));
(b) reviewed the anticipated profitability of the JHIMS’s relationship with the Funds in terms of the fees it expects to receive with respect to the Funds and whether JHIMS has the financial ability to provide a high level of services to the Funds,
(c) considered that JHIMS derives reputational and other indirect benefits from providing advisory services to the Funds, and
(d) noted that JHIMS will pay the subadvisory fees out of the advisory fees JHIMS receives from the Funds and concluded that the advisory fees paid by the Trust with respect to the Funds are not unreasonable in light of such information; and
(5) reviewed comparative information with respect to the advisory fee rates and concluded that the anticipated advisory fees for the Funds are within the range of those incurred by other comparable funds and that the advisory structure for the Funds is thus competitive within the industry.
Additional information that the Board considered for a particular Fund is set forth in Appendix A.
Approval of Subadvisory Agreements
At its meeting on June 5, 2007, the Board, including all the Independent Trustees, approved the Subadvisory Agreements.
In making its determination with reference to these respective factors, the Board reviewed:
(i) information relating to each subadviser’s business which included information
35
such as: business performance, assets under management, financial stability and personnel;
(ii) the investment performance of the subadviser’s portfolio managed comparably to the Fund to be managed by the subadviser and comparative performance information relating to the benchmark;
(iii) the proposed subadvisory fee for each Fund to be managed by the subadviser and comparative fee information; and
(iv) information relating to the nature and scope of Material Relationships and their significance to the Adviser and the subadvisers.
The Board’s decision to approve each Subadvisory Agreement was based on a number of determinations, including the following:
(1) The subadviser has extensive experience and demonstrated skills as a manager and may be expected to provide a high quality of investment personnel to each Fund;
(2) Although not without variation, the current and historical performance of the portfolios of the Subadviser managed comparably to the Fund to be managed by the Subadviser has been within a competitive range of the current and historical performance of these portfolios’ respective benchmark (see Appendix A for further information on performance);
(3) The subadvisory fees are within industry norms and are the product of arm’s-length negotiation between the Adviser and the subadviser; and
(4) The Material Relationships consist of arrangements in which unaffiliated subadvisers or their affiliates provide advisory, distribution or management services in connection with financial products sponsored by the Trust’s adviser or its affiliates, which may include other registered investment companies, a 529 education savings plan, managed separate accounts and exempt group annuity contracts sold to qualified plans, and which in no case contained elements which would cause the Board to conclude that approval of the subadvisory agreement with the subadviser would be inappropriate. See (5) below for information relating to the business arrangement between the Trust’s Adviser and GMO.
(5) As a part of the overall business arrangement between the Adviser and GMO under which the Adviser has obtained exclusive rights to certain GMO investment management services for up to five years, the Adviser has agreed that under certain circumstances it (and not the Trust or the particular Fund) will pay GMO a specified amount (ranging from $1 to $12 million) if the subadvisory agreement with respect to any of the following Funds to be subadvised by GMO is terminated within a five-year period from the date of its effectiveness: U.S. Core Fund, Active Value Fund, Intrinsic Value Fund, Growth Fund, International Core Fund, International Growth Fund, Global Fund, Value Opportunities Fund, Growth Opportunities Fund and U.S. Quality Equity Fund.
The Adviser has also agreed that, subject to its fiduciary duties as an investment adviser to each of these Funds and its shareholders, it will not recommend to the Board of Trustees to terminate the subadvisory agreement with respect to any of the Funds or to reduce any of the fees payable thereunder to GMO for a five-year period from the date of effectiveness of the agreement. Substantially similar agreements (with varying amounts to be paid upon termination) also apply with respect to certain other John Hancock funds that are or will be advised by the Adviser and subadvised by GMO. The Trust is not a party to any of these arrangements, and they are not binding upon the Trust, the Trust’s Funds subadvised by GMO or the Board of Trustees. However, these arrangements present certain conflicts of interest because the Adviser has a financial incentive to support the continuation of GMO subadvisory agreements for as long as the termination provisions described above re main in effect. In approving the Advisory Agreement and the subadvisory agreement with respect to each of the Funds subadvised by GMO, the
36
Board of Trustees, including the Independent Trustees, was aware of and considered these potential conflicts of interest, including any financial obligations of the Adviser to GMO.
The Board concluded that, notwithstanding the potential conflicts of interest, approval of the Advisory Agreement and the subadvisory agreements with GMO is in the best interests of shareholders and contract owners in view of (i) the Adviser’s fiduciary duty and the Board’s fiduciary duty and ability to monitor potential conflicts, (ii) the benefits to shareholders and contract owners generally expected from the exclusive rights to certain GMO investment management services obtained by the Adviser for the benefit of certain Funds of the Trust and other John Hancock funds and (iii) the benefits to such Funds of the Trust expected from the subadvisory services of GMO.
Additional information that the Board considered for a particular fund is set forth in Appendix A.
| Appendix A | |||
| Estimated Fees | |||
| Fund | Performance | and Expenses | Comments |
| U.S. Core | See Comments. | Subadvisory fees | The Board noted |
| for this Fund were | that the Fund | ||
| higher than the peer | commenced opera- | ||
| group median. | tions in June 2006 | ||
| and has a limited | |||
| Advisory fees for | performance history. | ||
| this Fund were | |||
| higher than the peer | |||
| group median. | |||
| Total expenses for | |||
| this Fund were | |||
| lower than the peer | |||
| group median. | |||
37
Why John Hancock Funds?
For more than three decades, John Hancock Funds has been helping individual, corporate and institutional clients reach their most important financial goals. With so many fund companies to choose from, why should you invest with us?
► A name you know and trust
When you invest with John Hancock Funds, you are investing with one of the most recognized and respected names in the financial services industry. Our parent company has been helping individuals and institutions increase and protect wealth since 1862.
► Solutions across the investing spectrum
We offer equity, income, international, sector and asset allocation investment solutions managed by leading institutional money managers. Each of our funds utilizes a disciplined, team approach to portfolio management and research, leveraging the expertise of seasoned investment professionals.
► Committed to you
Our shareholders come first. We work hard to provide you with the products you need to build a solid financial foundation. We’re proud to offer you award-winning services and tools, like the www.jhfunds.com Web site, to help you every step of the way.
For immediate insight and answers,
turn to www.jhfunds.com
Discover the new and improved www.jhfunds.com.
■ View accounts, statements and fund information.
■ Access college and retirement planning calculators and investment education.
■ Gain investment ideas, expand your knowledge and become a more informed investor.
This is just the beginning of how much you can do.
Now is the ideal time to experience our Web site that received the following recognition in 2006:

“Best Innovation: Redesigned Web Site” by the Mutual Fund Education Alliance.

“Outstanding Web Site” by the Web Marketing Association.

“Creative excellence on the Web, Silver Award winner” by W3.
Discover convenience and comprehensive resources at one
easy-to-access location. Your financial professional can steer you to the tools that
will help you the most and enable you to transform your knowledge into action.
See how far www.jhfunds.com can take you!
For more information
The Fund’s proxy voting policies, procedures and records are available without charge, upon request:
| By phone | On the Fund’s Web site | On the SEC’s Web site |
| 1-800-225-5291 | www.jhfunds.com/proxy | www.sec.gov |
| Trustees | Charles A. Rizzo | Principal distributor |
| Ronald R. Dion, Chairman | Chief Financial Officer | John Hancock Funds, LLC |
| James R. Boyle† | 601 Congress Street | |
| James F. Carlin | Gordon M. Shone | Boston, MA 02210-2805 |
| William H. Cunningham | Treasurer | |
| Charles L. Ladner* | Custodian | |
| Dr. John A. Moore* | John G. Vrysen | State Street Bank & Trust Co. |
| Patti McGill Peterson* | Chief Operating Officer | 2 Avenue de Lafayette |
| Steven R. Pruchansky | Boston, MA 02111 | |
| *Members of the Audit Committee | Investment adviser | |
| †Non-Independent Trustee | John Hancock Investment | Transfer agent |
| Management Services, LLC | John Hancock Signature | |
| Officers | 601 Congress Street | Services, Inc. |
| Keith F. Hartstein | Boston, MA 02210-2805 | One John Hancock Way, |
| President and | Suite 1000 | |
| Chief Executive Officer | Subadviser | Boston, MA 02217-1000 |
| Grantham, Mayo, | ||
| Thomas M. Kinzler | Van Otterloo & Co. LLC | Legal counsel |
| Secretary and Chief Legal Officer | 40 Rowes Wharf | Kirkpatrick & Lockhart |
| Boston, MA 02110 | Preston Gates Ellis LLP | |
| Francis V. Knox, Jr. | One Lincoln Street | |
| Chief Compliance Officer | Boston, MA 02111-2950 | |
| How to contact us | ||
| Internet | www.jhfunds.com | |
| Regular mail: | Express mail: | |
| John Hancock | John Hancock | |
| Signature Services, Inc. | Signature Services, Inc. | |
| One John Hancock Way, Suite 1000 | Mutual Fund Image Operations | |
| Boston, MA 02217-1000 | 380 Stuart Street | |
| Boston, MA 02116 | ||
| Phone | Customer service representatives | 1-800-225-5291 |
| EASI-Line | 1-800-338-8080 | |
| TDD line | 1-800-554-6713 | |
A listing of month-end portfolio holdings is available on our Web site, www.jhfunds.com. A more detailed portfolio holdings summary is available on a quarterly basis 60 days after the fiscal quarter on our Web site or upon request by calling 1-800-225-5291, or on the SEC’s Web site, www.sec.gov.
40
J O H N H A N C O C K F A M I L Y O F F U N D S
| EQUITY | INTERNATIONAL/GLOBAL |
| Balanced Fund | Global Opportunities Fund |
| Classic Value Fund | Global Shareholder Yield Fund |
| Classic Value Fund II | Greater China Opportunities Fund |
| Classic Value Mega Cap Fund | International Allocation Portfolio |
| Core Equity Fund | International Classic Value Fund |
| Growth Fund | International Core Fund |
| Growth Opportunities Fund | International Growth Fund |
| Growth Trends Fund | |
| Intrinsic Value Fund | INCOME |
| Large Cap Equity Fund | Bond Fund |
| Large Cap Select Fund | Government Income Fund |
| Mid Cap Equity Fund | High Yield Fund |
| Multi Cap Growth Fund | Investment Grade Bond Fund |
| Small Cap Equity Fund | Strategic Income Fund |
| Small Cap Fund | |
| Small Cap Intrinsic Value Fund | TAX-FREE INCOME |
| Sovereign Investors Fund | California Tax-Free Income Fund |
| U.S. Core Fund | High Yield Municipal Bond Fund |
| U.S. Global Leaders Growth Fund | Massachusetts Tax-Free Income Fund |
| Value Opportunities Fund | New York Tax-Free Income Fund |
| Tax-Free Bond Fund | |
| ASSET ALLOCATION | |
| Lifecycle 2010 Portfolio | MONEY MARKET |
| Lifecycle 2015 Portfolio | Money Market Fund |
| Lifecycle 2020 Portfolio | |
| Lifecycle 2025 Portfolio | CLOSED-END |
| Lifecycle 2030 Portfolio | Bank and Thrift Opportunity Fund |
| Lifecycle 2035 Portfolio | Financial Trends Fund, Inc. |
| Lifecycle 2040 Portfolio | Income Securities Trust |
| Lifecycle 2045 Portfolio | Investors Trust |
| Lifecycle Retirement Portfolio | Patriot Premium Dividend Fund II |
| Lifestyle Aggressive Portfolio | Preferred Income Fund |
| Lifestyle Balanced Portfolio | Preferred Income II Fund |
| Lifestyle Conservative Portfolio | Preferred Income III Fund |
| Lifestyle Growth Portfolio | Tax-Advantaged Dividend Income Fund |
| Lifestyle Moderate Portfolio | Tax-Advantaged Global Shareholder Yield Fund |
| SECTOR | |
| Financial Industries Fund | |
| Health Sciences Fund | |
| Real Estate Fund | |
| Regional Bank Fund | |
| Technology Fund | |
| Technology Leaders Fund | |
The Fund’s investment objectives, risks, charges and expenses are included in the prospectus and should be considered carefully before investing. For a prospectus, contact your financial professional, call John Hancock Funds at 1-800-225-5291 or visit the Fund’s Web site at www.jhfunds.com. Please read the prospectus carefully before investing or sending money.

1-800-225-5291
1-800-554-6713 TDD
1-800-338-8080 EASI-Line
www.jhfunds.com
Now available: electronic delivery
www.jhfunds.com/edelivery
| This report is for the information of the shareholders of John Hancock U.S. Core Fund. | 650SA 8/07 |
| It is not authorized for distribution to prospective investors unless preceded or accompanied by a prospectus. | 10/07 |

| TABLE OF CONTENTS |
| Your fund at a glance |
| page 1 |
| Managers’ report |
| page 2 |
| A look at performance |
| page 6 |
| Your expenses |
| page 8 |
| Fund’s investments |
| page 10 |
| Financial statements |
| page 19 |
| Notes to financial |
| statements |
| page 30 |
| For more information |
| page 48 |
CEO corner
To Our Shareholders,
Volatility returned to the U.S. stock market in the six-month period ended August 31, 2007; however, stocks still posted a strong gain of 5.70%, as measured by the Standard & Poor’s 500 Index. The market experienced a particularly sharp downturn in August, as the subprime mortgage market’s woes increased. Rising defaults and an ensuing credit crunch caused heightened fears about their potential impact on U.S. economic growth. Foreign markets felt some ripple effects from the subprime issue, but they continued nonetheless to benefit from solid economic growth and outperformed the U.S. market in this period.
During this period of volatility, the U.S. stock market also passed a significant milestone — the broad Standard & Poor’s 500 Index climbed beyond the record it had set seven years ago. From its peak in March 2000, the stock market spiraled downward three consecutive years, bottoming in 2002. The upturn began in 2003, and the market has advanced each year since, finally setting a new high for the first time on May 30, 2007. During that period, the S&P 500 Index experienced five significant short-term sell-offs of 6% or more, with the August subprime-induced meltdown being the most recent.
This nearly complete market cycle highlights the importance of two investment principles you have heard us speak of often: diversification and patience. By allocating your investments among different asset classes, investment styles and portfolio managers, you are likely to be well represented through all phases of a complete market cycle, with the winners helping to cushion the fall of the losers.
The challenge for investors with a diversified portfolio is to properly evaluate your investments to tell the difference between an underperforming manager and an out-of-favor style, while also understanding the role each investment plays in your portfolio. That’s where your financial professional can provide true value. He or she can help you make those assessments and also counsel patience, because a properly diversified portfolio by its very nature will typically have something lagging or out of favor — a concept that can be difficult to live with, but necessary to embrace. If everything in your portfolio is “working,” then you are not truly diversified, but rather are leveraged to the current market and the flavor of the day. If so, you are bound to be out of step in the near future.
The recent volatility in the securities markets has prompted many investors to question how long this type of market cycle will last. History tells us it will indeed end and that when it does, today’s leaders may well turn into laggards and vice versa. The subprime mortgage market woes are just the latest example of why investors should be both patient and well-diversified. For with patience and a diversified portfolio, it could be easier to weather the market’s twists and turns and reach your long-term goals.
Sincerely,

Keith F. Hartstein,
President and Chief Executive Officer
This commentary reflects the CEO’s views as of August 31, 2007. They are subject to change at any time.
Your fund at a glance
The Fund seeks high total return by investing in a diversified portfolio of equity investments from a number of developed markets outside the U.S. Under normal circumstances, the Fund invests at least 80% of its assets in equity investments of non-U.S. issuers.
Over the last six months
► Global stock returns were dampened by concerns about the U.S. subprime mortgage market, which triggered a sharp market slide from mid-July to mid-August.
► Momentum trumped valuation as a selection tool, as investors were largely attracted to stocks exhibiting strong price momentum without regard to the quality of earnings or related qualitative measures.
►The Fund finished ahead of the MSCI EAFE Net Total Return Index and posted a respectable single-digit gain.
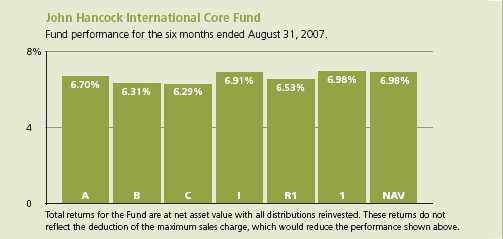
| Top 10 holdings | ||||
| GlaxoSmithKline PLC | 3.0% | Royal Bank of Scotland Group PLC | 1.9% | |
| Total SA | 3.1% | ABN AMRO Holdings NV | 1.7% | |
| Vodafone Group PLC | 2.9% | ING Groep NV | 1.5% | |
| Eni SpA | 2.7% | Honda Motor Company, Ltd. | 1.5% | |
| Sanofi-Aventis SA | 2.0% | Takeda Pharmaceutical Company, Ltd. | 1.3% | |
As a percentage of net assets on August 31, 2007.
Managers’ report
John Hancock
International Core Fund
Foreign stock markets turned in solid gains during the six months ended August 31, 2007, aided by positive fundamentals and continued weakness in the U.S. dollar. On a country basis, the strongest absolute returns for the benchmark MSCI EAFE Total Return Index came from Finland, Germany and Hong Kong, while Japan’s single-digit loss was a significant drag on the final tally, particularly given that country’s average benchmark weighting of more than 21%. After encouraging signs during the past few years, deflation re-emerged as a concern for the Japanese economy, with consumer prices falling for five consecutive months recently.
The period was marked by increasing share price volatility. As March began, global stock markets were still reeling from waterfall declines at the end of February that were triggered by a sharp drop in Chinese stocks. Subsequently, share prices in most markets rallied nicely, but encountered more trouble near period-end in the form of intensifying concerns about the U.S. subprime mortgage market. Despite the July–August swoon, however, stock prices rallied in the second half of August to post respectable gains for the period overall.
Although most problem subprime loans were originated by U.S. companies, many foreign banks, insurance companies and other financial institutions could be vulnerable because U.S. mortgages are routinely securitized and sold around the world. The Fund owned two bank
SCORECARD
| INVESTMENT | PERIOD’S PERFORMANCE . . . AND WHAT’S BEHIND THE NUMBERS | |
| ABN AMRO | ▲ | Bidding war boosts the stock |
| Nintendo | ▲ | Wii hardware platform a hit with consumers |
| Honda | ▼ | Yen rally dampens prospects for Japanese exporters |
2
From the Grantham, Mayo, Van Otterloo & Co. LLC (GMO)
Portfolio Management Team
stocks, BNP Paribas and Macquarie Bank, Ltd. that run hedge funds that suffered some damage as a result of the deteriorating subprime market. Neither stock was among the Fund’s largest detractors for the period and, in both cases, the hedge funds involved represented a small part of the bank’s business.
“Foreign stock markets turned
in solid gains during the six
months ended August 31, 2007,
aided by positive fundamentals
and continued weakness in the
U.S. dollar.”
Looking at performance
For the six months ended August 31, 2007, John Hancock International Core Fund’s Class A, Class B, Class C, Class I, Class R1, Class 1 and Class NAV shares returned 6.70%, 6.31%, 6.29%, 6.91%, 6.53%, 6.98% and 6.98% at net asset value. By comparison, the MSCI EAFE Net Total Return Index returned 5.83%, while the average foreign large value fund monitored by Morningstar, Inc. gained 6.15% 1. Keep in mind that your returns will differ from those listed above if you were not invested in the Fund for the entire period for your respective share class or did not reinvest all distributions.
Looking at the two primary criteria we use to evaluate the markets, momentum was more fruitful than valuation during the period. Although investors’ appetite for risk diminished near the end of the period, as subprime mortgage concerns intensified, for most of the period investors preferred stocks of lower quality and strong momentum, paying less attention to valuations and earnings quality. Additionally, investors were most attracted by pure price momentum; positive earnings revisions, an important component of our momentum criteria, were less effective as a selection tool.
International Core Fund
3
Positioning in Japan helps
On a country basis, the Fund was aided most by stock selection in Japan, where underweighting financial stocks proved rewarding. In our opinion, Japanese banks and other financial stocks were unattractive from both valuation and momentum perspectives, hampered by mediocre profitability and high debt compared with rivals in other countries. Not owning index component Mitsubishi UFJ Financial Group Inc., Japan’s largest bank, was especially helpful given that stock’s double-digit loss. Further helping the Fund’s results was an overweighted position in Japan-based video game maker Nintendo Company, Ltd., which continued to enjoy robust sales of its Wii hardware platform following the product’s successful launch in November 2006. The Fund’s positioning in Japan also included a number of companies whose primary business is trading commodities such as copper and other industrial metals. Strong metals prices support ed by globally robust spending on power plants, energy exploration and other infrastructure spending aided these stocks as a group, although no individual position among them stood out.
Another strong performer for the Fund was Dutch bank ABM AMRO Holdings NV, which surged higher as a result of a bidding war for the company. Overweighting U.K. wireless telecommunication services provider Vodafone Group PLC proved timely as well, as the stock was relatively inexpensive at the beginning of the period and gained ground on speculation that the company might sell its sizable stake in Verizon Wireless. Rounding out the top five contributors was German automaker Volkswagen AG, which rebounded from an extremely low valuation amid the company’s reorganization efforts.
| SECTOR DISTRIBUTION2 | |
| Financial | 22% |
| Consumer cyclical | 16% |
| Consumer non-cyclical | 15% |
| Energy | 11% |
| Basic materials | 8% |
| Industrial | 8% |
| Communications | 7% |
| Utilities | 4% |
| Technology | 3% |
| Diversified | 0.4% |
Light exposure to Australia, stake in U.K. hurt
Underweighting Australia-based BHP Billiton, Ltd., the world’s largest mining company and an important benchmark component, was detrimental to performance. Despite what we thought was an expensive valuation, the stock gained significant growth during the period, reflecting in part the strong results of materials stocks overall. Overweighting a pair of Japanese automakers, Honda Motor Co., Ltd. and Nissan Motor Co., Ltd., also hurt. Both stocks lost ground
International Core Fund
4
in August, as a rally in the Japanese yen dimmed prospects for exporters in that country.
“Looking at the two primary
criteria we use to evaluate the
markets, momentum was more
fruitful than valuation during
the period.”
Our relatively large stake in U.K.-based drug company GlaxoSmithKline PLC further undermined the Fund’s results. The stock was hurt in part by research showing that Glaxo’s Avandia medication, a treatment for type 2 diabetes, might raise the risk of heart problems. Lastly, the share price of Royal Bank of Scotland Group PLC faltered in response to investor fears that the company might be overpaying in its quest to buy ABM AMRO, mentioned earlier as a contributor.
Outlook
From a top-down perspective, we are somewhat concerned about the U.S. economy and the effects that a slowdown or credit crunch there might have on foreign stock markets. That said, we’ve found that over the long term we have benefited from a disciplined adherence to our valuation and momentum criteria. Currently, our valuation yardsticks, which include various measures of quality as well as pure valuation parameters, are primarily steering us toward large-cap companies offering stable earnings growth, exemplified by pharmaceutical stocks, among others. Meanwhile, our momentum gauges continue to dictate a healthy exposure to commodity-driven stocks, as the recent trends there still appear favorable, despite more-problematic readings in the final two months of the period.
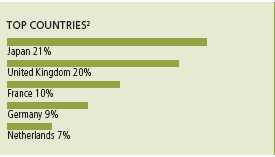
This commentary reflects the views of the portfolio management team through the end of the Fund’s period discussed in this report. The team’s statements reflect their own opinions. As such, they are in no way guarantees of future events and are not intended to be used as investment advice or a recommendation regarding any specific security. They are also subject to change at any time as market and other conditions warrant.
International investing involves special risks such as political, economic and currency risks and differences in accounting standards and financial reporting.
1 Figures from Morningstar, Inc. include reinvested dividends and do not take into account sales charges. Actual load-adjusted performance is lower.
2 As a percentage of net assets on August 31, 2007.
International Core Fund
5
A look at performance
For the periods ended August 31, 2007
| Average annual returns | Cumulative total returns | ||||||||||
| with maximum sales charge (POP) | with maximum sales charge (POP) | ||||||||||
| Inception | Since | Since | |||||||||
| Class | date | 1-year | 5-year | 10-year | inception | 6-month | 1-year | 5-year | 10-year | inception | |
| A1,2 | 9-16-05 | 12.57% | — | — | 16.94% | 1.36% | 12.57% | — | — | 35.82% | |
| B | 6-12-06 | 12.62 | — | — | 19.66 | 1.31 | 12.62 | — | — | 24.65 | |
| C | 6-12-06 | 16.59 | — | — | 22.78 | 5.29 | 16.59 | — | — | 28.65 | |
| I3 | 6-12-06 | 18.96 | — | — | 24.15 | 6.91 | 18.96 | — | — | 30.41 | |
| R1 3 | 6-12-06 | 18.09 | — | — | 23.24 | 6.53 | 18.09 | — | — | 29.24 | |
| 13 | 11-6-06 | — | — | — | — | 6.98 | — | — | — | 15.65 | |
| NAV3 | 8-29-06 | 19.11 | — | — | 19.60 | 6.98 | 19.11 | — | — | 19.71 | |
Performance figures assume all distributions are reinvested. Public offering price (POP) figures reflect maximum sales charge on Class A shares of 5%, and the applicable contingent deferred sales charge (CDSC) on Class B and Class C shares. The Class B shares’ CDSC declines annually between years 1 to 6 according to the following schedule 5, 4, 3, 3, 2, 1%. No sales charge will be assessed after the sixth year. Class C shares held for less than one year are subject to a 1% CDSC. Sales charge is not applicable for Class I, Class R1, Class 1 and Class NAV shares.
The expense ratios of the Fund, both net (including any fee waivers or expense limitations) and gross (excluding any fee waivers or expense limitations), are set forth according to the most recent publicly available Prospectuses for the Fund and may differ from the expense ratios disclosed in the Financial Highlights tables in this report. The waivers and expense limitations are contractual at least until 6-30-08. The net expenses are as follows: Class A — 1.61%, Class B — 2.39%, Class C — 2.39%, Class I — 1.20%, Class R1 — 1.94%, Class 1 — 1.14% . Had the fee waivers and expense limitations not been in place, the gross expenses would be as follows: Class A — 2.23%, Class B — 6.83%, Class C — 3.72%, Class I — 12.52%, Class R1 — 20.40%, Class 1 — 1.23% .
The returns reflect past results and should not be considered indicative of future performance. The return and principal value of an investment will fluctuate so that shares, when redeemed, may be worth more or less than their original cost. Due to market volatility, the Fund’s current performance may be higher or lower than the performance shown. For performance data current to the most recent month-end, please call 1-800-225-5291 or visit the Fund’s Web site at www.jhfunds.com.
The performance table above and the chart on the next page do not reflect the deduction of taxes that a shareholder would pay on fund distributions or the redemption of fund shares.
The Fund’s performance results reflect any applicable expense reductions, without which the expenses increase and results would have been less favorable.
Performance is calculated with an opening price (prior day’s close) on the inception date.
1 Effective June 12, 2006, shareholders of the former GMO International Disciplined Equity Fund (the Predecessor Fund ) became owners of that number of full and fractional shares of John Hancock International Core Fund Class A. Additionally, the accounting and performance history of the former GMO International Disciplined Equity Fund was redesignated as that of John Hancock International Core Fund Class A.
2 Class A performance linked back to the Predecessor Fund.
3 For certain types of investors as described in the Fund’s Class I, Class R1, Class 1 and Class NAV share prospectuses.
International Core Fund
6
Growth of $10,000
This chart shows what happened to a hypothetical $10,000 investment in International
Core Fund Class A1 shares for the period indicated. For comparison, we’ve shown the
same investment in the MSCI EAFE Net Total Return Index.
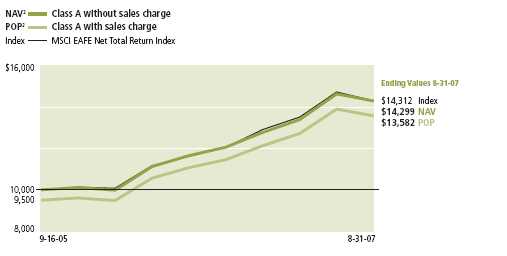
| With maximum | ||||
| Class | Period beginning | Without sales charge | sales charge | Index |
| B | 6-12-06 | $12,865 | $12,465 | $12,859 |
| C3 | 6-12-06 | 12,865 | 12,865 | 12,859 |
| I4 | 6-12-06 | 13,041 | 13,041 | 12,859 |
| R1 4 | 6-12-06 | 12,924 | 12,924 | 12,859 |
| 14 | 11-6-06 | 11,565 | 11,565 | 11,432 |
| NAV4 | 8-29-06 | 11,971 | 11,971 | 11,963 |
Assuming all distributions were reinvested for the period indicated, the table above shows the value of a $10,000 investment in the Fund’s Class B, Class C, Class I, Class R1, Class 1 and Class NAV shares, respectively, as of August 31, 2007. Performance of the classes will vary based on the difference in sales charges paid by shareholders investing in the different classes and the fee structure of those classes.
MSCI EAFE Net Total Return Index (Europe, Australasia, Far East) is a free float-adjusted market capitalization index is designed to measure developed market equity performance, excluding the U.S. and Canada. As of June 2006, the MSCI EAFE Index consisted of the following 21 developed market country indexes: Australia, Austria, Belgium, Denmark, Finland, France, Germany, Greece, Hong Kong, Ireland, Italy, Japan, Netherlands, New Zealand, Norway, Portugal, Singapore, Spain, Sweden, Switzerland and United Kingdom. Returns are calculated and presented net of withholding tax.
It is not possible to invest directly in an index. Index figures do not reflect sales charges, which would have resulted in lower values if they did.
1 Class A performance linked back to the Predecessor Fund.
2 NAV represents net asset value and POP represents public offering price.
3 No contingent deferred sales charge applicable.
4 For certain types of investors as described in the Fund’s Class I, Class R1, Class 1 and Class NAV share prospectuses.
International Core Fund
7
Your expenses
These examples are intended to help you understand your ongoing operating expenses.
Understanding fund expenses
As a shareholder of the Fund, you incur two types of costs:
▪ Transaction costs which include sales charges (loads) on purchases or redemptions (varies by share class), minimum account fee charge, etc.
▪ Ongoing operating expenses including management fees, distribution and service fees (if applicable) and other fund expenses.
We are going to present only your ongoing operating expenses here.
Actual expenses/actual returns
This example is intended to provide information about your fund’s actual ongoing operating expenses, and is based on your fund’s actual return. It assumes an account value of $1,000.00 on March 1, 2007, with the same investment held until August 31, 2007.
| Account value | Ending value | Expenses paid during period | |
| on 3-1-07 | on 8-31-07 | ended 8-31-071 | |
| Class A | $1,000.00 | $1,067.00 | $8.68 |
| Class B | 1,000.00 | 1,063.10 | 12.48 |
| Class C | 1,000.00 | 1,062.90 | 12.48 |
| Class I | 1,000.00 | 1,069.10 | 6.21 |
| Class R1 | 1,000.00 | 1,065.30 | 10.22 |
| Class 1 | 1,000.00 | 1,069.80 | 5.90 |
| Class NAV | 1,000.00 | 1,070.00 | 5.59 |
Together with the value of your account, you may use this information to estimate the operating expenses that you paid over the period. Simply divide your account value at August 31, 2007 by $1,000.00, then multiply it by the “expenses paid” for your share class from the table above. For example, for an account value of $8,600.00, the operating expenses should be calculated as follows:
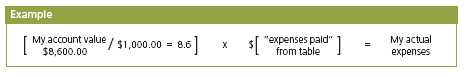
International Core Fund
8
Hypothetical example for comparison purposes
This table allows you to compare your fund’s ongoing operating expenses with those of any other fund. It provides an example of the Fund’s hypothetical account values and hypothetical expenses based on each class’s actual expense ratio and an assumed 5% annualized return before expenses (which is not your fund’s actual return). It assumes an account value of $1,000.00 on March 1, 2007, with the same investment held until August 31, 2007. Look in any other fund shareholder report to find its hypothetical example and you will be able to compare these expenses.
| Account value | Ending value | Expenses paid during period | |
| on 3-1-07 | on 8-31-07 | ended 8-31-07 1 | |
| Class A | $1,000.00 | $1,016.74 | $8.47 |
| Class B | 1,000.00 | 1,013.04 | 12.18 |
| Class C | 1,000.00 | 1,013.04 | 12.18 |
| Class I | 1,000.00 | 1,019.14 | 6.06 |
| Class R1 | 1,000.00 | 1,015.24 | 9.98 |
| Class 1 | 1,000.00 | 1,019.44 | 5.76 |
| Class NAV | 1,000.00 | 1,019.74 | 5.45 |
Remember, these examples do not include any transaction costs, such as sales charges; therefore, these examples will not help you to determine the relative total costs of owning different funds. If transaction costs were included, your expenses would have been higher. See the prospectus for details regarding transaction costs.
1 Expenses are equal to the Fund’s annualized expense ratio of 1.67%, 2.41%, 2.41%, 1.19%, 1.96%, 1.14% and 1.08% for Class A, Class B, Class C, Class I, Class R1, Class 1 and Class NAV, respectively, multiplied by the average account value over the period, multiplied by the number of days in the inception period /365 or 366 (to reflect the one-half year period).
International Core Fund
9
Fund’s investments
F I N A N C I A L S T A T E M E N T S
Securities owned by the Fund on 8-31-07 (unaudited)
This schedule is divided into four main categories: common stocks, preferred stocks,
short-term investments and repurchase agreements. Common stocks and preferred stocks
are further broken down by country. Repurchase agreements, which represent the Fund’s
cash position, are listed last.
| Issuer | Shares | Value |
| Common stocks 93.65% | $1,542,291,996 | |
| (Cost $1,284,046,696) | ||
| Australia 3.35% | 55,101,029 | |
| Amcor, Ltd. (a) | 194,168 | 1,209,472 |
| Australia and New Zealand Banking Group, Ltd. | 199,913 | 4,733,938 |
| BHP Billiton, Ltd. | 76,533 | 2,394,455 |
| Bluescope Steel, Ltd. (a) | 179,693 | 1,558,775 |
| Commonwealth Bank of Australia, Ltd. | 52,504 | 2,361,527 |
| CSL, Ltd. | 33,154 | 2,651,148 |
| Foster’s Group, Ltd. | 199,357 | 1,026,462 |
| Macquarie Bank, Ltd. (a) | 41,031 | 2,442,223 |
| Mirvac Group, Ltd. | 487,145 | 2,135,640 |
| Qantas Airways, Ltd., ADR (a) | 300,772 | 1,369,334 |
| QBE Insurance Group, Ltd. | 87,568 | 2,486,731 |
| Rio Tinto, Ltd. (a) | 58,126 | 4,416,776 |
| Stockland Company, Ltd. | 546,078 | 3,820,071 |
| Suncorp-Metway, Ltd. | 338,316 | 5,547,740 |
| TABCORP Holdings, Ltd. (a) | 136,687 | 1,705,324 |
| Telstra Corp., Ltd. (a) | 932,729 | 3,334,934 |
| Westpac Banking Corp., Ltd. (a) | 157,333 | 3,492,531 |
| Woodside Petroleum, Ltd. (a) | 65,160 | 2,398,365 |
| Woolworths, Ltd. (a) | 153,635 | 3,747,910 |
| Zinifex, Ltd. | 165,755 | 2,267,673 |
| Austria 0.35% | 5,743,074 | |
| OMV AG | 27,834 | 1,726,950 |
| Voestalpine AG | 49,032 | 4,016,124 |
| Belgium 1.41% | 23,248,545 | |
| Belgacom SA | 40,944 | 1,798,713 |
| Colruyt SA | 3,066 | 655,809 |
| Delhaize Group | 21,021 | 2,064,619 |
| Dexia (a) | 222,498 | 6,143,744 |
| Fortis Group SA | 217,403 | 7,983,873 |
| Interbrew | 20,080 | 1,650,958 |
See notes to financial statements
International Core Fund
10
F I N A N C I A L S T A T E M E N T S
| Issuer | Shares | Value |
| Belgium (continued) | ||
| Solvay SA | 8,778 | $1,304,727 |
| UCB SA (a) | 29,180 | 1,646,102 |
| Bermuda 0.23% | 3,774,046 | |
| Esprit Holdings, Ltd. | 179,000 | 2,600,377 |
| Noble Group, Ltd. (a) | 518,361 | 567,816 |
| Yue Yuen Industrial Holdings, Ltd. | 201,218 | 605,853 |
| Canada 2.81% | 46,247,696 | |
| AUR Resources, Inc. | 32,100 | 1,231,599 |
| BCE, Inc. | 69,288 | 2,649,884 |
| Canadian Imperial Bank of Commerce | 84,470 | 7,654,369 |
| Canadian Natural Resources, Ltd. | 72,137 | 4,930,944 |
| EnCana Corp. | 140,897 | 8,256,903 |
| Magna International, Inc. | 16,600 | 1,490,401 |
| National Bank of Canada | 61,165 | 3,180,742 |
| Potash Corp. of Saskatchewan, Inc. | 57,400 | 5,086,159 |
| Research In Motion, Ltd. * | 99,300 | 8,482,012 |
| Rogers Communications, Inc., Class B | 72,300 | 3,284,683 |
| Denmark 0.38% | 6,253,535 | |
| A P Moller- Maersk AS, Series A | 121 | 1,565,421 |
| Danske Bank AS (a) | 25,519 | 1,049,046 |
| FLS Industries AS, B Shares | 38,450 | 3,639,068 |
| Finland 1.73% | 28,563,630 | |
| Elcoteq SE, A shares | 14,700 | 112,336 |
| Kesko Oyj (a) | 30,810 | 1,817,755 |
| Metra Oyj, B Shares (a) | 19,800 | 1,237,157 |
| Neste Oil Oyj | 53,047 | 1,840,485 |
| Nokia AB Oyj | 371,941 | 12,268,810 |
| Outokumpu Oyj (a) | 91,904 | 2,793,649 |
| Rautaruukki Oyj | 81,209 | 4,446,130 |
| Sampo Oyj, A Shares | 140,604 | 4,047,308 |
| France 10.43% | 171,801,478 | |
| Accor SA | 24,709 | 2,113,549 |
| Air France KLM (a) | 50,858 | 2,107,575 |
| Alstom RGPT | 12,862 | 2,316,312 |
| BNP Paribas SA | 181,615 | 19,089,365 |
| Bouygues SA | 35,943 | 2,822,930 |
| Carrefour SA | 48,225 | 3,365,951 |
| Casino Guich-Perrachon SA (a) | 34,335 | 3,501,318 |
| Compagnie de Saint-Gobain SA (a) | 48,722 | 5,283,240 |
| Compagnie Generale des Etablissements Michelin, Class B | 39,287 | 4,937,408 |
See notes to financial statements
International Core Fund
11
F I N A N C I A L S T A T E M E N T SF
| Issuer | Shares | Value |
| France (continued) | ||
| Credit Agricole SA (a) | 160,184 | $6,024,691 |
| Electricite de France (a) | 20,271 | 2,045,141 |
| Groupe DANONE | 45,856 | 3,486,362 |
| Lafarge SA (a) | 12,067 | 1,870,637 |
| Pernod-Ricard SA (a) | 7 | 1,472 |
| Pinault-Printemps-Redoute SA | 6,688 | 1,155,056 |
| PSA Peugeot Citroen SA | 114,059 | 9,687,930 |
| Renault Regie Nationale SA | 88,641 | 11,923,247 |
| Sanofi-Aventis SA | 390,896 | 32,056,475 |
| Societe Generale | 7,251 | 1,165,834 |
| Total SA | 684,068 | 51,366,707 |
| Unibail-Rodamco (a) | 7,326 | 1,757,257 |
| Vinci SA, ADR | 52,442 | 3,723,021 |
| Germany 8.58% | 141,299,720 | |
| Adidas-Salomon AG (a) | 35,599 | 2,093,103 |
| Allianz AG | 61,699 | 13,239,645 |
| BASF AG | 84,150 | 11,139,930 |
| Bayerische Motoren Werke (BMW) AG | 89,416 | 5,440,047 |
| Commerzbank AG | 65,043 | 2,669,544 |
| DaimlerChrysler AG | 98,141 | 8,722,570 |
| Deutsche Bank AG (a) | 118,368 | 14,632,568 |
| Deutsche Boerse AG | 27,828 | 3,074,548 |
| Deutsche Lufthansa AG | 120,027 | 3,505,302 |
| Deutsche Post AG | 132,636 | 3,857,379 |
| Fresenius AG | 35,241 | 2,595,433 |
| Henkel KGaA | 16,200 | 759,953 |
| Infineon Technologies AG * (a) | 181,341 | 2,825,342 |
| MAN AG | 47,990 | 6,888,739 |
| Muenchener Rueckversicherungs-Gesellschaft AG | 95,967 | 16,595,370 |
| Salzgitter AG | 26,934 | 5,322,637 |
| Siemens AG | 100,847 | 12,668,590 |
| Suedzucker AG (a) | 49,851 | 960,291 |
| Thyssen Krupp AG | 144,141 | 8,428,844 |
| TUI AG * | 114,133 | 2,964,426 |
| Volkswagen AG | 62,476 | 12,915,459 |
| Greece 0.07% | 1,228,784 | |
| National Bank of Greece SA | 20,688 | 1,228,784 |
| Hong Kong 0.83% | 13,631,154 | |
| Bank of East Asia, Ltd. | 476,000 | 2,647,105 |
| BOC Hong Kong Holdings, Ltd. | 868,000 | 2,086,494 |
| CLP Holdings, Ltd. | 730,904 | 5,033,497 |
| Hong Kong Electric Holdings, Ltd. | 538,354 | 2,699,345 |
| Pacific Basin Shipping, Ltd. | 651,000 | 1,164,713 |
See notes to financial statements
International Core Fund
12
F I N A N C I A L S T A T E M E N T S
| Issuer | Shares | Value |
| Ireland 1.26% | $20,746,955 | |
| Allied Irish Banks PLC | 58,505 | 1,493,233 |
| Anglo Irish Bank Corp. PLC | 160,848 | 3,006,121 |
| Bank of Ireland | 113,392 | 2,085,909 |
| CRH PLC | 146,326 | 6,333,881 |
| DCC PLC, Dublin | 19,438 | 514,697 |
| Depfa Bank PLC (a) | 308,956 | 5,866,109 |
| Kerry Group PLC | 34,358 | 836,721 |
| Kingspan Group PLC | 23,574 | 610,284 |
| Italy 3.62% | 59,667,625 | |
| Enel SpA | 902,300 | 9,335,347 |
| Eni SpA | 1,264,163 | 43,722,357 |
| Fiat SpA — RNC | 39,512 | 906,064 |
| Fiat SpA (a) | 165,715 | 4,425,097 |
| Fondiaria-Sai SpA | 20,600 | 664,480 |
| Italcementi SpA | 36,738 | 614,280 |
| Japan 21.23% | 349,596,835 | |
| Acom Company, Ltd. (a) | 41,180 | 1,228,046 |
| Alps Electric Company, Ltd. | 46 | 539 |
| Astellas Pharmaceuticals, Inc. | 62,400 | 2,891,318 |
| Canon, Inc. | 157,200 | 8,969,403 |
| Chubu Electric Power Company, Inc. (a) | 163,099 | 4,345,779 |
| Cosmo Oil Company, Ltd. | 143,000 | 645,725 |
| Daiei, Inc. * (a) | 54,808 | 413,062 |
| Daiichi Sankyo Company, Ltd. | 167,753 | 4,575,051 |
| Daikyo, Inc. (a) | 212,888 | 764,198 |
| Eisai Company, Ltd. | 56,280 | 2,343,349 |
| Fuji Heavy Industries, Ltd. (a) | 340,116 | 1,425,085 |
| Fuji Photo Film Company, Ltd. (a) | 92,300 | 3,974,266 |
| Haseko Corp. * (a) | 779,847 | 2,099,982 |
| Hitachi, Ltd. | 199,000 | 1,282,647 |
| Hokkaido Electric Power Company, Inc. | 66,699 | 1,507,715 |
| Honda Motor Company, Ltd. | 738,112 | 24,250,792 |
| Hoya Corp. (a) | 68,900 | 2,387,991 |
| Isuzu Motors, Ltd. (a) | 439,542 | 2,382,942 |
| Itochu Corp. | 911,047 | 9,834,483 |
| Japan Real Estate Investment Corp. | 126 | 1,398,005 |
| Japan Tobacco, Inc. | 977 | 5,423,663 |
| JFE Holdings, Inc. (a) | 93,000 | 6,053,116 |
| Kansai Electric Power Company, Ltd. | 167,700 | 3,916,431 |
| Kao Corp. (a) | 95,050 | 2,701,526 |
| Kawasaki Kisen Kaisha, Ltd. (a) | 593,000 | 7,624,867 |
| Komatsu, Ltd. | 67,600 | 2,076,097 |
| Konami Corp. (a) | 51,323 | 1,294,264 |
| Kyocera Corp. (a) | 27,300 | 2,498,224 |
See notes to financial statements
International Core Fund
13
F I N A N C I A L S T A T E M E N T S
| Issuer | Shares | Value |
| Japan (continued) | ||
| Kyushu Electric Power Company, Inc. | 87,580 | $2,336,233 |
| Marubeni Corp. | 992,824 | 8,070,811 |
| Mitsubishi Corp. | 550,695 | 15,451,126 |
| Mitsubishi Estate Company, Ltd. (a) | 169,404 | 4,527,141 |
| Mitsubishi Heavy Industries, Ltd. (a) | 393,000 | 2,399,855 |
| Mitsui & Company, Ltd. | 453,560 | 9,424,576 |
| Mitsui Engineering & Shipbuilding Company, Ltd. (a) | 298,000 | 1,553,958 |
| Mitsui Fudosan Company, Ltd. | 96,000 | 2,510,495 |
| Mitsui O.S.K. Lines, Ltd. (a) | 399,000 | 5,858,905 |
| Mitsui Trust Holdings, Inc. | 674,553 | 5,622,711 |
| Mitsumi Electric Company, Ltd. (a) | 57,000 | 2,135,916 |
| NGK INSULATORS, LTD. (a) | 69,000 | 2,279,137 |
| Nintendo Company, Ltd. (a) | 27,700 | 12,744,567 |
| Nippon Building Fund, Inc. (a) | 188 | 2,408,512 |
| Nippon Oil Corp. (a) | 812,000 | 6,829,469 |
| Nippon Steel Corp. | 1,650,000 | 11,525,461 |
| Nippon Telegraph & Telephone Corp. | 1,565 | 7,201,938 |
| Nippon Yusen Kabushiki Kaisha (a) | 503,000 | 4,958,013 |
| Nissan Motor Company, Ltd. (a) | 1,261,500 | 12,046,270 |
| Nomura Research Institute, Ltd. | 40,700 | 1,369,471 |
| NTT Data Corp. (a) | 307 | 1,484,600 |
| NTT DoCoMo, Inc. | 5,794 | 8,828,852 |
| Osaka Gas Company, Ltd. | 1,273,120 | 4,726,708 |
| Pacific Metals Company, Ltd. (a) | 158,000 | 2,181,343 |
| Resona Holdings, Inc. (a) | 3,601 | 7,573,185 |
| Ricoh Company, Ltd. | 315,000 | 6,930,752 |
| SEGA SAMMY HOLDINGS, INC. (a) | 105,400 | 1,599,877 |
| Seven & I Holdings Company, Ltd. (a) | 220,500 | 5,877,037 |
| Shin-Etsu Chemical Company, Ltd. | 37,400 | 2,702,868 |
| Shinko Securities Company, Ltd. | 196,000 | 932,545 |
| Showa Shell Sekiyu K.K. (a) | 92,300 | 1,117,898 |
| SOFTBANK Corp. (a) | 101,600 | 1,949,389 |
| Sojitz Holdings Corp. * (a) | 890,100 | 3,702,438 |
| Sony Corp. | 47,100 | 2,254,057 |
| Sumco Corp. (a) | 96,300 | 5,143,689 |
| Sumitomo Corp. | 328,596 | 5,666,191 |
| Sumitomo Metal Industries, Ltd. | 357,000 | 1,799,904 |
| Taisho Pharmaceuticals Company, Ltd. | 44,790 | 876,108 |
| Takeda Pharmaceutical Company, Ltd. (a) | 321,789 | 22,007,789 |
| Takefuji Corp. (a) | 58,880 | 1,579,381 |
| TDK Corp. | 26,900 | 2,299,295 |
| Terumo Corp. | 32,000 | 1,500,394 |
| The Japan Steel Works, Ltd. (a) | 166,000 | 2,447,821 |
See notes to financial statements
International Core Fund
14
F I N A N C I A L S T A T E M E N T S
| Issuer | Shares | Value |
| Japan (continued) | ||
| The Tokyo Electric Power Company, Ltd. | 160,939 | $4,219,365 |
| Tokyo Electron, Ltd. (a) | 21,600 | 1,545,587 |
| Tokyo Gas Company, Ltd. | 469,397 | 2,331,260 |
| Tokyo Steel Manufacturing Company, Ltd. (a) | 77,300 | 1,021,680 |
| Tokyu Land Corp. | 164,000 | 1,509,856 |
| TonenGeneral Sekiyu K.K. (a) | 121,133 | 1,199,395 |
| Toyota Motor Corp. (a) | 225,000 | 13,024,440 |
| Netherlands 7.13% | 117,398,182 | |
| ABN AMRO Holdings NV (a) | 597,495 | 27,804,354 |
| Aegon NV | 475,478 | 8,685,160 |
| Akzo Nobel NV | 25,624 | 2,022,244 |
| CSM NV | 10,198 | 338,693 |
| DSM NV (a) | 34,775 | 1,780,760 |
| Heineken Holding NV (a) | 28,268 | 1,554,091 |
| Heineken NV (a) | 138,273 | 8,776,682 |
| ING Groep NV | 617,133 | 24,869,353 |
| Koninklijke (Royal) KPN NV | 102,079 | 1,595,947 |
| Koninklijke Ahold NV * (a) | 115,042 | 1,543,735 |
| Mittal Steel Company NV | 283,743 | 18,633,591 |
| Reed Elsevier NV | 253,329 | 4,575,970 |
| Royal Dutch Shell PLC, A Shares, EUR (a) | 327,014 | 12,683,008 |
| TNT Post Group NV | 59,827 | 2,534,594 |
| Norway 0.48% | 7,831,888 | |
| Renewable Energy Corp AS * (a) | 81,770 | 3,104,369 |
| Statoil ASA (a) | 121,368 | 3,496,241 |
| Yara International ASA (a) | 46,200 | 1,231,278 |
| Portugal 0.14% | 2,363,123 | |
| Banco Comercial dos Acores, SA (a) | 505,228 | 2,363,123 |
| Singapore 2.27% | 37,378,549 | |
| Capitaland, Ltd. * (a) | 388,000 | 1,884,278 |
| City Developments, Ltd. | 307,000 | 3,009,614 |
| Cosco Corp. Singapore, Ltd. | 908,600 | 3,008,843 |
| DBS Group Holdings, Ltd. | 412,231 | 5,418,675 |
| Keppel Corp., Ltd. | 338,000 | 2,837,537 |
| Keppel Land, Ltd. (a) | 307,538 | 1,554,902 |
| K-REIT Asia * (a) | 46,908 | 74,646 |
| Neptune Orient Lines, Ltd. (a) | 577,488 | 1,854,728 |
| Oversea-Chinese Banking Corp., Ltd. | 643,000 | 3,615,290 |
| SembCorp Industries, Ltd. | 396,802 | 1,468,789 |
| SembCorp Marine, Ltd. | 662,573 | 1,816,127 |
| Singapore Exchange, Ltd. | 314,000 | 2,012,005 |
See notes to financial statements
International Core Fund
15
F I N A N C I A L S T A T E M E N T S
| Issuer | Shares | Value |
| Singapore (continued) | ||
| Singapore Telecommunications, Ltd. (a) | 2,294,350 | $5,488,115 |
| United Overseas Bank, Ltd. | 244,000 | 3,335,000 |
| Spain 1.24% | 20,393,823 | |
| ACS Actividades SA | 31,527 | 1,737,429 |
| Gas Natural SDG SA (a) | 39,851 | 2,127,344 |
| Repsol SA | 259,557 | 9,364,993 |
| Telefonica SA | 287,717 | 7,164,057 |
| Sweden 2.22% | 36,604,952 | |
| Alfa Laval AB | 20,200 | 1,222,437 |
| Electrolux AB, Series B (a) | 132,773 | 2,993,347 |
| Hennes & Mauritz AB, B shares | 99,800 | 5,654,146 |
| Investor AB | 47,200 | 1,167,877 |
| Nordea Bank AB | 132,800 | 2,033,220 |
| Sandvik AB * | 198,400 | 4,063,312 |
| Scania AB, Series B * (a) | 177,600 | 4,152,908 |
| Skandinaviska Enskilda Banken AB, Series A | 98,800 | 2,999,891 |
| Svenska Handelsbanken AB, Series A | 38,800 | 1,083,698 |
| Swedbank AB, A shares (a) | 101,300 | 3,334,767 |
| Tele2 AB, Series B | 60,620 | 1,112,857 |
| Volvo AB, Series B * | 390,500 | 6,786,492 |
| Switzerland 3.61% | 59,391,429 | |
| Credit Suisse Group AG | 38,980 | 2,561,682 |
| Geberit AG, ADR | 11,610 | 1,716,548 |
| Nestle SA | 12,880 | 5,621,295 |
| Novartis AG | 413,189 | 21,810,989 |
| Swatch Group AG, BR shares (a) | 8,824 | 2,654,181 |
| Swatch Group AG (a) | 6,236 | 351,897 |
| Swiss Re | 82,754 | 6,991,667 |
| Unaxis Holding AG * | 3,934 | 1,273,994 |
| Zurich Financial Services AG | 57,057 | 16,409,176 |
| United Kingdom 20.28% | 334,025,944 | |
| 3i Group PLC * | 272,432 | 5,811,226 |
| Alliance & Leicester PLC | 95,433 | 2,032,788 |
| AstraZeneca Group PLC | 333,510 | 16,439,767 |
| Aviva PLC | 573,873 | 8,222,532 |
| Barratt Developments PLC | 164,331 | 3,086,597 |
| BG Group PLC | 294,896 | 4,720,128 |
| BHP Billiton PLC | 130,505 | 3,827,780 |
| Biffa PLC | 111 | 566 |
| BT Group PLC | 1,914,504 | 12,211,816 |
| Burberry Group PLC | 50,746 | 627,246 |
| Capita Group PLC | 70,517 | 1,070,047 |
| Centrica PLC | 999,965 | 7,795,110 |
See notes to financial statements
International Core Fund
16
F I N A N C I A L S T A T E M E N T S
| Issuer | Shares | Value |
| United Kingdom (continued) | ||
| Compass Group PLC | 388,415 | $2,553,041 |
| Dixons Group PLC | 1,112,561 | 3,491,480 |
| GlaxoSmithKline PLC | 2,038,762 | 53,215,240 |
| HBOS PLC | 264,049 | 4,694,615 |
| Home Retail Group | 411,560 | 3,448,495 |
| Imperial Chemical Industries PLC | 279,166 | 3,567,833 |
| Imperial Tobacco Group PLC | 151,536 | 6,858,574 |
| International Power PLC | 496,624 | 4,059,852 |
| Invensys PLC * | 243,749 | 1,687,945 |
| J Sainsbury PLC | 375,943 | 4,209,474 |
| Kingfisher PLC | 512,023 | 2,158,848 |
| National Grid PLC, ADR | 324,230 | 4,860,009 |
| Next Group PLC | 102,537 | 4,008,577 |
| Old Mutual PLC (a) | 1,491,786 | 4,818,437 |
| Reckitt Benckiser PLC | 117,463 | 6,406,345 |
| Rio Tinto PLC | 247,030 | 17,066,843 |
| Royal & Sun Alliance PLC | 1,171,012 | 3,349,694 |
| Royal Bank of Scotland Group PLC | 2,635,065 | 30,625,930 |
| Royal Dutch Shell PLC, A Shares, GBP | 336,847 | 13,091,411 |
| Royal Dutch Shell PLC, B Shares | 216,227 | 8,433,488 |
| Scottish & Southern Energy PLC | 161,591 | 4,631,245 |
| Taylor Woodrow PLC | 890,383 | 6,259,766 |
| Tesco PLC | 759,582 | 6,531,523 |
| Tomkins PLC | 362,218 | 1,747,789 |
| Unilever PLC | 154,381 | 4,879,740 |
| United Utilities PLC | 149,177 | 2,085,224 |
| Vodafone Group PLC | 14,790,692 | 47,807,833 |
| William Morrison Supermarket PLC | 751,788 | 4,357,807 |
| Wolseley PLC | 104,984 | 2,206,639 |
| Xstrata PLC | 86,098 | 5,066,644 |
| Issuer | Shares | Value |
| Preferred stocks 0.43% | $7,091,883 | |
| (Cost $4,293,619) | ||
| Germany 0.38% | 6,253,227 | |
| Bayerische Motoren Werke (BMW) AG | 10,400 | 516,608 |
| Porsche AG | 1,683 | 3,012,259 |
| Volkswagen AG | 21,756 | 2,724,360 |
| Italy 0.05% | 838,656 | |
| Unipol SpA | 262,792 | 838,656 |
See notes to financial statements
International Core Fund
17
F I N A N C I A L S T A T E M E N T S
| Principal | ||
| Issuer | amount | Value |
| Short-term investments 18.04% | $297,089,490 | |
| (Cost $297,089,490) | ||
| John Hancock Cash Investment Trust (c) | $297,089,490 | 297,089,490 |
| Repurchase agreements 4.95% | $81,486,000 | |
| (Cost $81,486,000) | ||
| Repurchase Agreement with State Street Corp. dated 08-31-07 at | ||
| 4.60% to be repurchased at $81,527,648 on 09-04-07, collateralized | ||
| by $80,405,000 Federal Home Loan Mortgage Corp., 5.45%, due | ||
| 09-22-11 (valued at $83,118,669, including interest) | $81,486,000 | 81,486,000 |
| Total investments (Cost $1,666,915,805) 117.07% | $1,927,959,369 | |
| Liabilities in excess of other assets (17.07%) | (281,058,886) | |
| Total net assets 100.00% | $1,646,900,483 | |
Percentages are stated as a percent of net assets.
The portfolio had the following five top industry concentrations as of August 31, 2007 (as a percentage of total net assets):
| Banking | 11.46% |
| International Oil | 9.31% |
| Automobiles | 7.55% |
| Pharmaceuticals | 7.02% |
| Insurance | 6.71% |
Key to Security Abbreviation and Legend:
ADR American Depository Receipt
EUR European Currency
GBP British Pound
* Non-income producing.
(a) All or a portion of this security was out on loan.
(c) Investment is an affiliate of the Trust’s adviser or subadviser.
See notes to financial statements
International Core Fund
18
Financial statements
F I N A N C I A L S T A T E M E N T S
Statement of assets and liabilities 8-31-07 (unaudited)
This Statement of Assets and Liabilities is the Fund’s balance sheet. It shows the value
of what the Fund owns, is due and owes. You’ll also find the net asset value and the
maximum public offering price per share.
| Assets | |
| Investments, at value (cost $1,288,340,315) | |
| including $282,942,372 of securities loaned (Note 2) | $1,549,383,879 |
| Repurchase agreement, at value (cost $81,486,000) | 81,486,000 |
| Investments in affiliated issuers, at value (cost $297,089,490) (Note 2) | 297,089,490 |
| Total investments, at value (cost $1,666,915,805) | 1,927,959,369 |
| Cash | 716 |
| Cash collateral at broker for futures contracts | 9,350,000 |
| Foreign currency, at value (cost $1,791,225) | 1,791,289 |
| Receivable for investments sold | 1,404,974 |
| Receivable for forward foreign currency exchange contracts (Note 2) | 804,171 |
| Receivable for fund shares sold | 429,817 |
| Dividends and interest receivable | 5,358,001 |
| Receivable for futures variation margin | 836,829 |
| Receivable due from adviser | 29,608 |
| Other assets | 29,300 |
| Total assets | 1,947,994,074 |
| Liabilities | |
| Payable for investments purchased | 31 |
| Payable for forward foreign currency exchange contracts (Note 2) | 3,379,320 |
| Payable for fund shares repurchased | 101,346 |
| Payable upon return of securities loaned (Note 2) | 297,089,490 |
| Payable to affiliates | |
| Fund administration fees | 27,740 |
| Transfer agent fees | 97,135 |
| Distribution and service fees | 50,351 |
| Other payables and accrued expenses | 348,178 |
| Total liabilities | 301,093,591 |
| Net assets | |
| Capital paid-in | $1,259,979,180 |
| Accumulated net investment income | 20,500,435 |
| Accumulated undistributed net realized gain on investments, | |
| futures contracts and foreign currency transactions | 109,150,704 |
| Net unrealized appreciation on investments, | |
| futures contracts and foreign currency translation | 257,270,164 |
| Net assets | $1,646,900,483 |
See notes to financial statements
International Core Fund
19
F I N A N C I A L S T A T E M E N T S
Statement of assets and liabilities (continued)
| Net asset value per share | |
| Based on net asset values and shares outstanding — the Fund has an | |
| unlimited number of shares authorized with no par value. | |
| Class A ($127,502,700 ÷ 2,759,620 shares) | $46.20 |
| Class B ($24,365,092 ÷ 532,011 shares)1 | $45.80 |
| Class C ($15,273,277 ÷ 333,467 shares)1 | $45.80 |
| Class I ($1,790,856 ÷ 38,575 shares) | $46.43 |
| Class R1 ($130,876 ÷ 2,845 shares) | $46.012 |
| Class 1 ($86,437,975 ÷ 1,860,576 shares) | $46.46 |
| Class NAV ($1,391,399,707 ÷ 29,951,575 shares) | $46.45 |
| Maximum offering price per share | |
| Class A3 ($46.20 ÷ 95%) | $48.63 |
1 Redemption price per share is equal to the net asset value less any applicable contingent deferred sales charge.
2 Net assets and shares outstanding have been rounded for presentation purposes. The net asset value is as reported on August 31, 2007.
3 On single retail sales of less than $50,000. On sales of $50,000 or more and on group sales the offering price is reduced.
See notes to financial statements
International Core Fund
20
F I N A N C I A L S T A T E M E N T S
Statement of operations For the period ended 8-31-071 (unaudited)
This Statement of Operations summarizes the Fund’s investment income earned
and expenses incurred in operating the Fund. It also shows net gains (losses) for
the period stated.
| Investment income | |
| Dividends | $34,885,171 |
| Interest | 1,423,868 |
| Securities lending | 681,369 |
| Less foreign taxes withheld | (3,431,506) |
| Total investment income | 33,558,902 |
| Expenses | |
| Investment management fees (Note 3) | 6,857,978 |
| Distribution and service fees (Note 3) | 248,961 |
| Transfer agent fees (Note 3) | 91,563 |
| Fund administration fees (Note 3) | 66,474 |
| Custodian fees | 839,374 |
| Audit and legal fees | 547,269 |
| Registration and filing fees | 69,806 |
| Blue sky fees (Note 3) | 46,030 |
| Trustees’ fees (Note 3) | 39,798 |
| Printing and postage fees (Note 3) | 10,841 |
| Miscellaneous | 8,219 |
| Total expenses | 8,826,313 |
| Less expense reductions (Note 3) | (59,999) |
| Net expenses | 8,766,314 |
| Net investment income | 24,792,588 |
| Realized and unrealized gain (loss) | |
| Net realized gain (loss) on | |
| Investments | 69,814,406 |
| Futures contracts | 9,884,222 |
| Foreign currency transactions | (1,241,493) |
| 78,457,135 | |
| Change in net unrealized appreciation (depreciation) of | |
| Investments | (2,508,618) |
| Futures contracts | (1,202,713) |
| Translation of assets and liabilities in foreign currencies | (4,267,804) |
| (7,979,135) | |
| Net realized and unrealized gain | 70,478,000 |
| Increase in net assets from operations | $95,270,588 |
1 Semiannual period from 3-1-07 to 8-31-07.
See notes to financial statements
International Core Fund
21
F I N A N C I A L S T A T E M E N T S
Statement of changes in net assets
These Statements of Changes in Net Assets show how the value of the Fund’s net assets
has changed during the last two periods. The difference reflects earnings less expenses,
any investment gains and losses, distributions, if any, paid to shareholders and the net of
Fund share transactions.
| Year | Period | |
| ended | ended | |
| 2-28-07 | 8-31-071 | |
| Increase (decrease) in net assets | ||
| From operations | ||
| Net investment income | $2,484,546 | $24,792,588 |
| Net realized gain | 36,328,435 | 78,457,135 |
| Change in net unrealized appreciation | 101,813,528 | (7,979,135) |
| Increase in net assets resulting from operations | 140,626,509 | 95,270,588 |
| From net investment income | ||
| Class 1 | (56,793) | — |
| Class NAV | (986,755) | — |
| From net realized gain | ||
| Class A | (73,495) | — |
| Class B | (6,331) | — |
| Class C | (22,267) | — |
| Class I | (1,930) | — |
| Class R1 | (1,056) | — |
| Class 1 | (731,024) | — |
| Class NAV | (10,547,441) | — |
| Total distributions | (12,427,092) | — |
| From Fund share transactions | 1,198,322,023 | 208,334,720 |
| Total increase | 1,326,521,440 | 303,605,308 |
| Net assets | ||
| Beginning of period | 16,773,735 | 1,343,295,175 |
| End of period2 | $1,343,295,175 | $1,646,900,483 |
1 Semiannual period from 3-1-07 to 8-31-07. Unaudited
2 Includes accumulated (distributions in excess of) net investment income of ($28,697) and $20,500,435, respectively.
See notes to financial statements
International Core Fund
22
F I N A N C I A L S T A T E M E N T S
Financial highlights
The Financial Highlights show how the Fund’s net asset value for a share has changed
since the end of the previous period.
CLASS A SHARES
| Period ended | 2-28-061 | 2-28-072 | 8-31-073 |
| Per share operating performance | |||
| Net asset value, beginning of period | $32.60 | $36.26 | $43.30 |
| Net investment income4 | 0.19 | 0.63 | 0.37 |
| Net realized and unrealized | |||
| gain on investments | 3.47 | 6.79 | 2.53 |
| Total from investment operations | 3.66 | 7.42 | 2.90 |
| Less distributions | |||
| From net realized gain | — | (0.38) | — |
| Net asset value, end of period | $36.26 | $43.30 | $46.20 |
| Total return5,6 (%) | 11.237 | 20.4810 | 6.707 |
| Ratios and supplemental data | |||
| Net assets, end of period | |||
| (in millions) | $17 | $12 | $128 |
| Ratio of net expenses to average | |||
| net assets (%) | 0.559 | 1.40 | 1.679 |
| Ratio of gross expenses to average | |||
| net assets8 (%) | 2.229 | 2.23 | 1.679 |
| Ratio of net investment income | |||
| to average net assets (%) | 1.239 | 1.58 | 1.599 |
| Portfolio turnover (%) | 227 | 37 | 227 |
See notes to financial statements
International Core Fund
23
F I N A N C I A L S T A T E M E N T S
Financial highlights
| CLASS B SHARES | ||
| Period ended | 2-28-0711 | 8-31-073 |
| Per share operating performance | ||
| Net asset value, beginning of period | $35.92 | $43.08 |
| Net investment income (loss)4 | (0.25) | 0.16 |
| Net realized and unrealized | ||
| gain on investments | 7.79 | 2.56 |
| Total from investment operations | 7.54 | 2.72 |
| Less distributions | ||
| From net realized gain | (0.38) | — |
| Net asset value, end of period | $43.08 | $45.80 |
| Total return5,6,7 (%) | 21.01 | 6.31 |
| Ratios and supplemental data | ||
| Net assets, end of period | ||
| (in millions) | $1 | $24 |
| Ratio of net expenses to average | ||
| net assets9 (%) | 2.39 | 2.40 |
| Ratio of gross expenses to average | ||
| net assets8,9 (%) | 6.83 | 2.61 |
| Ratio of net investment income | ||
| (loss) to average net assets 9 (%) | (0.84) | 0.72 |
| Portfolio turnover7 (%) | 37 | 22 |
See notes to financial statements
International Core Fund
24
F I N A N C I A L S T A T E M E N T S
Financial highlights
| CLASS C SHARES | ||
| Period ended | 2-28-0711 | 8-31-073 |
| Per share operating performance | ||
| Net asset value, beginning of period | $35.92 | $43.09 |
| Net investment income (loss)4 | (0.24) | 0.34 |
| Net realized and unrealized | ||
| gain on investments | 7.79 | 2.37 |
| Total from investment operations | 7.55 | 2.71 |
| Less distributions | ||
| From net realized gain | (0.38) | — |
| Net asset value, end of period | $43.09 | $45.80 |
| Total return5,6,7 (%) | 21.04 | 6.29 |
| Ratios and supplemental data | ||
| Net assets, end of period | ||
| (in millions) | $4 | $15 |
| Ratio of net expenses to average | ||
| net assets9 (%) | 2.39 | 2.40 |
| Ratio of gross expenses to average | ||
| net assets8,9 (%) | 3.72 | 2.51 |
| Ratio of net investment income | ||
| (loss) to average net assets 9 (%) | (0.79) | 1.47 |
| Portfolio turnover7 (%) | 37 | 22 |
See notes to financial statements
International Core Fund
25
F I N A N C I A L S T A T E M E N T S
Financial highlights
| CLASS I SHARES | ||
| Period ended | 2-28-0711 | 8-31-073 |
| Per share operating performance | ||
| Net asset value, beginning of period | $35.92 | $43.43 |
| Net investment income4 | 0.16 | 0.55 |
| Net realized and unrealized | ||
| gain on investments | 7.73 | 2.45 |
| Total from investment operations | 7.89 | 3.00 |
| Less distributions | ||
| From net realized gain | ||
| (0.38) | — | |
| Net asset value, end of period | $43.43 | $46.43 |
| Total return5,6,7 (%) | 21.99 | 6.91 |
| Ratios and supplemental data | ||
| Net assets, end of period | ||
| (in millions) | —14 | $2 |
| Ratio of net expenses to average | ||
| net assets9 (%) | 1.20 | 1.19 |
| Ratio of gross expenses to average | ||
| net assets8,9 (%) | 12.52 | 3.53 |
| Ratio of net investment income | ||
| to average net assets9 (%) | 0.56 | 2.40 |
| Portfolio turnover7 (%) | 37 | 22 |
See notes to financial statements
International Core Fund
26
F I N A N C I A L S T A T E M E N T S
Financial highlights
| CLASS R1 SHARES | ||
| Period ended | 2-28-0711 | 8-31-073 |
| Per share operating performance | ||
| Net asset value, beginning of period | $35.92 | $43.19 |
| Net investment income (loss)4 | (0.03) | 0.57 |
| Net realized and unrealized | ||
| gain on investments | 7.68 | 2.25 |
| Total from investment operations | 7.65 | 2.82 |
| Less distributions | ||
| From net realized gain | (0.38) | — |
| Net asset value, end of period | $43.19 | $46.01 |
| Total return5,6,7 (%) | 21.32 | 6.53 |
| Ratios and supplemental data | ||
| Net assets, end of period | ||
| (in millions) | —14 | — |
| Ratio of net expenses to average | ||
| net assets9 (%) | 1.94 | 1.95 |
| Ratio of gross expenses to average | ||
| net assets8,9 (%) | 20.40 | 16.35 |
| Ratio of net investment income | ||
| (loss) to average net assets 9 (%) | (0.10) | 2.46 |
| Portfolio turnover7 (%) | 37 | 22 |
See notes to financial statements
International Core Fund
27
F I N A N C I A L S T A T E M E N T S
Financial highlights
| CLASS 1 SHARES | ||
| Period ended | 2-28-0713 | 8-31-073 |
| Per share operating performance | ||
| Net asset value, beginning of period | $40.56 | $43.43 |
| Net investment income4 | 0.02 | 0.76 |
| Net realized and unrealized | ||
| gain on investments | 3.26 | 2.27 |
| Total from investment operations | 3.28 | 3.03 |
| Less distributions | ||
| From net investment income | (0.03) | — |
| From net realized gain | (0.38) | — |
| (0.41) | — | |
| Net asset value, end of period | $43.43 | $46.46 |
| Total return5,6,7 (%) | 8.11 | 6.98 |
| Ratios and supplemental data | ||
| Net assets, end of period | ||
| (in millions) | $82 | $86 |
| Ratio of net expenses to average | ||
| net assets9 (%) | 1.17 | 1.14 |
| Ratio of gross expenses to average | ||
| net assets8,9 (%) | 1.23 | 1.14 |
| Ratio of net investment income | ||
| to average net assets9 (%) | 0.16 | 3.28 |
| Portfolio turnover7 (%) | 37 | 22 |
See notes to financial statements
International Core Fund
28
F I N A N C I A L S T A T E M E N T S
Financial highlights
| CLASS NAV SHARES | ||
| Period ended | 2-28-0712 | 8-31-073 |
| Per share operating performance | ||
| Net asset value, beginning of period | $39.18 | $43.42 |
| Net investment income4 | 0.08 | 0.77 |
| Net realized and unrealized | ||
| gain on investments | 4.58 | 2.26 |
| Total from investment operations | 4.66 | 3.03 |
| Less distributions | ||
| From net investment income | (0.04) | — |
| From net realized gain | (0.38) | — |
| (0.42) | — | |
| Net asset value, end of period | $43.42 | $46.45 |
| Total return5,7 (%) | 11.90 | 6.98 |
| Ratios and supplemental data | ||
| Net assets, end of period | ||
| (in millions) | $1,244 | $1,391 |
| Ratio of net expenses to average | ||
| net assets9 (%) | 1.08 | 1.08 |
| Ratio of gross expenses to average | ||
| net assets9 (%) | 1.08 | 1.09 |
| Ratio of net investment income | ||
| to average net assets9 (%) | 0.38 | 3.33 |
| Portfolio turnover7 (%) | 37 | 22 |
1 Class A shares began operations on 9-16-05.
2 Effective June 12, 2006, shareholders of the former GMO International Disciplined Equity Fund (the Predecessor Fund) became owners of an equal number of full and fractional Class A shares of the John Hancock International Core Fund. Additionally, the accounting and performance history of the former GMO International Disciplined Equity Fund was redesignated as that of John Hancock International Core Fund Class A.
3 Semiannual period from 3-1-07 to 8-31-07. Unaudited.
4 Based on the average of the shares outstanding.
5 Assumes dividend reinvestment.
6 Total returns would have been lower had certain expenses not been reduced during the period shown.
7 Not annualized.
8 Does not take into consideration expense reductions during the periods shown.
9 Annualized.
10 Class A returns linked back to the Predecessor Fund.
11 Class B, Class C, Class I and Class R1 shares began operations on 6-12-06.
12 Class NAV shares began operations on 8-29-06.
13 Class 1 shares began operations on 11-6-06.
14 Less than $500,000.
See notes to financial statements
International Core Fund
29
Notes to financial statements (unaudited)
1. Organization
John Hancock International Core Fund (the Fund) is a newly organized non-diversified series of John Hancock Funds III (the Trust). The Trust was established as a Massachusetts business trust on June 9, 2005. The Trust is registered under the Investment Company Act of 1940, as amended (the 1940 Act), as an open-end investment management company. The investment objective of the Fund is to seek high total return.
John Hancock Life Insurance Company of New York (John Hancock New York) is a wholly owned subsidiary of John Hancock Life Insurance Company (U.S.A.) (John Hancock USA). John Hancock USA and John Hancock New York are indirect wholly owned subsidiaries of The Manufacturers Life Insurance Company (Manulife), which in turn is a wholly owned subsidiary of Manulife Financial Corporation (MFC), a publicly traded company. MFC and its subsidiaries are known collectively as “Manulife Financial.”
John Hancock Investment Management Services, LLC (the Adviser), a Delaware limited liability company controlled by John Hancock USA, serves as investment adviser for the Trust and John Hancock Funds, LLC (the Distributor), a Delaware limited liability company, an affiliate of the Adviser, serves as principal underwriter.
The Board of Trustees has authorized the issuance of multiple classes of shares of the Fund, including classes designated as Class A, Class B, Class C, Class I, Class R1, Class 1, Class 3 and Class NAV shares. The shares of each class represent an interest in the same portfolio of investments of the Fund, and have equal rights as to voting, redemptions, dividends and liquidation, except that certain expenses, subject to the approval of the Board of Trustees, may be applied differently to each class of shares in accordance with current regulations of the Securities and Exchange Commission (SEC) and the Internal Revenue Service. Shareholders of a class that bear distribution and service expenses under the terms of a distribution plan have exclusive voting rights to that distribution plan. Class B shares will convert to Class A shares eight years after purchase.
Class 1 shares are sold only to certain exempt separate accounts of John Hancock USA and John Hancock New York. Class NAV shares are sold to affiliated funds of funds, which are funds of funds within the John Hancock funds complex.
The Adviser and other subsidiaries of John Hancock USA owned 739,994, 5,087, 5,115, 5,104 and 5,116 shares of beneficial interest of Class A, Class B, Class I, Class R1 and Class 1, respectively, on August 31, 2007.
The Fund is the accounting and performance successor to the GMO International Disciplined Equity Fund (the Predecessor Fund), a diversified open-end investment management company organized as a Massachusetts corporation on September 16, 2005. On June 12, 2006, the Fund acquired substantially all the assets and assumed the liabilities of the Predecessor Fund pursuant to an agreement and plan of reorganization, in exchange for Class A shares of the Fund.
2. Significant accounting policies
In the preparation of the financial statements, the Fund follows the policies described below. The preparation of financial statements in conformity with accounting principles generally accepted in the United States of America requires management to make estimates and assumptions that affect the reported amounts of assets and liabilities at the date of the financial statements and the reported amounts of income and expenses during the reporting period. Actual results may differ from these estimates.
International Core Fund
30
Security valuation
The net asset value of the shares of the Fund is determined daily as of the close of the New York Stock Exchange (NYSE), normally at 4:00 p.m., Eastern Time. Short-term debt instruments with remaining maturities of 60 days or less are valued at amortized cost, and thereafter assume a constant amortization to maturity of any discount or premium, which approximates market value. Investments in John Hancock Cash Investments Trust (JHCIT), an affiliate of John Hancock Advisers, LLC (JHA), a wholly owned subsidiary of John Hancock Financial Services, Inc., a subsidiary of MFC, are valued at their net asset value each business day. All other securities held by the Fund are valued at the last sale price or official closing price (closing bid price or last evaluated quote if no sale has occurred) as of the close of business on a principal securities exchange (domestic or foreign) on which they trade or, lacking any sales, at the closing bid price. Securities traded only in the over-the-counter market are valued at the last bid price quoted by brokers making markets in the securities at the close of trading. Securities for which there are no such quotations, principally debt securities, are valued based on the valuation provided by an independent pricing service, which utilizes both dealer-supplied and electronic data processing techniques, which take into account factors such as institutional-size trading in similar groups of securities, yield, quality, coupon rate, maturity, type of issue, trading characteristics and other market data.
Other assets and securities for which no such quotations are readily available are valued at their fair value as determined in good faith under consistently applied procedures established by and under the general supervision of the Board of Trustees. Generally, trading in non-U.S. securities is substantially completed each day at various times prior to the close of trading on the NYSE. The values of such securities used in computing the net asset value of a Fund’s shares are generally determined as of such times. Occasionally, significant events that affect the values of such securities may occur between the times at which such values are generally determined and the close of the NYSE. Upon such an occurrence, these securities will then be valued at their fair value as determined in good faith under consistently applied procedures established by and under the g eneral supervision of the Board of Trustees.
Repurchase agreements
The Fund may enter into repurchase agreements. When the Fund enters into a repurchase agreement through its custodian, it receives delivery of securities, the amount of which at the time of purchase and each subsequent business day is required to be maintained at such a level that the market value is generally at least 102% of the repurchase amount. The Fund will take constructive receipt of all securities underlying the repurchase agreements it has entered into until such agreements expire. If the seller defaults, the Fund would suffer a loss to the extent that proceeds from the sale of underlying securities were less than the repurchase amount. The Fund may enter into repurchase agreements maturing within seven days with domestic dealers, banks or other financial institutions deemed to be creditworthy by the Adviser. Collateral for certain tri-party repurchase agreements is held at the custodian bank in a segregated account for the benefit of the Fund and the counterparty.
Foreign currency transactions
The accounting records of the Fund are maintained in U.S. dollars. Foreign currency amounts are translated into U.S. dollars on the following basis:
(1) market value of securities, other assets and other liabilities at the current rate of exchange at period end of such currencies against U.S. dollars; and
(2) purchases and sales of securities, income and expenses at the rate of exchange quoted on the respective dates of such transactions.
Net realized gains and losses on foreign currency transactions represent net gains and losses from sales and maturities of foreign currency contracts, disposition of foreign currencies, the difference between the amount of net investment income accrued and the U.S. dollar amount actually received, and gains and losses between trade and settlement date
International Core Fund
31
on purchases and sales of securities. The effects of changes in foreign currency exchange rates on investments in securities are included with the net realized and unrealized gain or loss on investment securities.
The Fund may be subject to capital gains and repatriation taxes imposed by certain countries in which the Fund invests. Such taxes are generally based upon income and/or capital gains earned or repatriated. Taxes are accrued based upon net investment income, net realized gains and net unrealized appreciation.
Investing in securities of foreign companies and foreign governments involves special risks and consideration not typically associated with investing in securities of domestic companies and the U.S. Government. These risks include revaluation of currencies and future adverse political and economic developments. Moreover, securities of foreign companies and foreign governments and their markets may be less liquid and their prices more volatile than those of the United States.
Security transactions and
related investment income
Investment security transactions are accounted for on a trade date plus one basis for daily net asset value calculations. However, for financial reporting purposes, investment transactions are reported on trade date. Interest income is accrued as earned. Dividend income is recorded on the ex-dividend date. Foreign dividends are recorded on the ex-date or when the Fund becomes aware of the dividends from cash collections. Discounts/ premiums are accreted/amortized for financial reporting purposes. Non-cash dividends are recorded at the fair market value of the securities received. Debt obligations may be placed in a non-accrual status and related interest income may be reduced by ceasing current accruals and writing off interest receivables when the collection of all or a portion of interest has become doubtful, based upon consistently applied procedures.
From time to time, the Fund may invest in Real Estate Investment Trusts (REITs) and as a result, will estimate the components of distributions from these securities.
Distributions from REITs received in excess of income are recorded as a reduction of cost of investments and/or as a realized gain.
The Fund uses the First In, First Out method for fixed income securities and Highest Cost, First Out for all other securities for determining realized gain or loss on investments for both financial and federal income tax reporting purposes.
Multi-class allocations
All income, expenses (except for class-specific expenses) and realized and unrealized gains (losses) are allocated to each class of shares based upon the relative net assets of each class.
Dividends to shareholders from net investment income are determined at a class level and distributions from capital gains are determined at a Fund level.
Expense allocation
Expenses are allocated based on the relative share of net assets of the Fund at the time the expense was incurred. Class-specific expenses, such as distribution (Rule 12b-1) fees, are accrued daily and charged directly to the respective share classes.
Securities lending
The Fund may lend securities in amounts up to 33 1 / 3% of the Fund’s total assets. Such loans are callable at any time and are at all times fully secured by cash, cash equivalents or securities issued or guaranteed by the U.S. government or its agencies or instrumentalities and marked to market on a daily basis. The Fund may bear the risk of delay in recovery of, or even of rights in, the securities loaned should the borrower of the securities fail financially. Consequently, loans of the Fund’s securities will only be made to firms deemed by the subadvisers to be creditworthy. The Fund receives compensation for lending its securities either in the form of fees and/or by retaining a portion of interest on the investment of any cash received as collateral. The Fund i nvests in cash collateral received in connection with securities lending transactions in JHCIT, a Delaware common law trust and affiliated fund. JHCIT is exempt from registration under Section 3(c)(7) of the 1940 Act (pursuant to exemptive order issued by the SEC) and is managed by the
International Core Fund
32
Adviser, for which the Adviser receives an investment advisory fee of 0.04% of the average daily net assets of JHCIT
All collateral received will be in an amount equal to at least 100% of the market value of the loaned securities and is intended to be maintained at that level during the period of the loan. The market value of the loaned securities is determined at the close of business of the Fund and any additional required collateral is delivered to the Fund the next business day. During the loan period, the Fund continues to retain rights of ownership, including dividends and interest of the loaned securities. At August 31, 2007, the Fund loaned securities having a market value of $282,942,372 collateralized by securities in the amount of $297,089,490.
Futures
The Fund may purchase and sell financial futures contracts and options on those contracts. The Fund invests in contracts based on financial instruments such as U.S. Treasury Bonds or Notes or on securities indices such as the Standard & Poor’s 500 Index, in order to hedge against a decline in the value of securities owned by the Fund.
Initial margin deposits required upon entering into futures contracts are satisfied by the delivery of specific securities or cash as collateral to the broker (the Funds’ agent in acquiring the futures position). If the position is closed out by taking an opposite position prior to the settlement date of the futures contract, a final determination of variation margin is made, cash is required to be paid to or released by the broker and the Fund realizes a gain or loss.
When the Fund sells a futures contract based on a financial instrument, the Fund becomes obligated to deliver that kind of instrument at an agreed upon date for a specified price. The Fund realizes a gain or loss depending on whether the price of an offsetting purchase is less or more than the price of the initial sale or on whether the price of an offsetting sale is more or less than the price of the initial purchase. The Fund could be exposed to risks if it could not close out futures positions because of an illiquid secondary market or the inability of counterparties to meet the terms of their contracts. Futures contracts are valued at the quoted daily settlement prices established by the exchange on which they trade.
| The following is a summary of open futures contracts on August 31, 2007: | |||||
| UNREALIZED | |||||
| NUMBER OF | APPRECIATION | ||||
| OPEN CONTRACTS | CONTRACTS | POSITION | EXPIRATION | (DEPRECIATION) | |
| Share Price Index 200 | 5 | Long | Sep 2007 | $ 25,161 | |
| DAX Index | 231 | Long | Sep 2007 | (1,258,344) | |
| CAC 40 10 Euro Index | 37 | Long | Sep 2007 | 69,820 | |
| IBEX 35 Index | 1 | Long | Sep 2007 | (1,863) | |
| S&P MIB 30 Index | 23 | Long | Sep 2007 | (307,162) | |
| EOE Dutch Stock Index | 8 | Long | Sep 2007 | 23,754 | |
| FTSE 100 Index | 138 | Long | Sep 2007 | 65,520 | |
| Hang Seng Stock Index | 6 | Long | Sep 2007 | 39,396 | |
| TOPIX Index | 29 | Long | Sep 2007 | (49,130) | |
| OMX 30 Stock Index | 35 | Long | Sep 2007 | 13,535 | |
| MSCI Singapore Stock Index | 8 | Long | Sep 2007 | 19,033 | |
| S&P/Toronto Stock | |||||
| Exchange 60 Index | 236 | Short | Sep 2007 | 50,503 | |
| ($1,309,777) | |||||
International Core Fund
33
Forward foreign currency contracts
The Fund may purchase and sell forward foreign currency contracts in order to hedge a specific transaction or Fund position. Forward foreign currency contracts are valued at forward foreign currency exchange rates and marked to market daily. Net realized gains (losses) on foreign currency and forward foreign currency contracts shown in the Statements of Operations include net gains or losses realized by the Fund on contracts that have matured.
The net U.S. dollar value of foreign currency underlying all contractual commitments held at the end of the period, the resulting net unrealized appreciation (depreciation) and related net receivable or payable amount are determined using forward foreign currency exchange rates supplied by a quotation service. The Fund could be exposed to risks in excess of amounts recognized on the Statements of Assets and Liabilities if the counterparties to the contracts are unable to meet the terms of their contracts or if the value of the forward foreign currency contract changes unfavorably.
At August 31, 2007, the Fund entered into forward foreign currency contracts, which contractually obligate the Fund to deliver currency at future dates.
| Open forward foreign currency contracts on August 31, 2007, were as follows: | ||||||||
| UNREALIZED | ||||||||
| PRINCIPAL AMOUNT | SETTLEMENT | APPRECIATION | ||||||
| CURRENCY | COVERED BY CONTRACT | DATE | (DEPRECIATION) | |||||
| Buys | ||||||||
| Euro | 10,125,000 | Nov 2007 | $ 69,807 | |||||
| Japanese Yen | 377,377,000 | Nov 2007 | 60,271 | |||||
| Japanese Yen | 906,659,024 | Nov 2007 | (49,276) | |||||
| Japanese Yen | 906,659,024 | Nov 2007 | (38,309) | |||||
| Japanese Yen | 906,659,024 | Nov 2007 | (49,948) | |||||
| Japanese Yen | 906,659,024 | Nov 2007 | (77,047) | |||||
| Japanese Yen | 906,659,024 | Nov 2007 | (63,685) | |||||
| Japanese Yen | 906,659,024 | Nov 2007 | (72,119) | |||||
| Japanese Yen | 906,659,024 | Nov 2007 | (93,586) | |||||
| New Zealand Dollar | 9,584,000 | Nov 2007 | (548,612) | |||||
| New Zealand Dollar | 1,829,630 | Nov 2007 | 8,756 | |||||
| New Zealand Dollar | 1,829,630 | Nov 2007 | 7,082 | |||||
| New Zealand Dollar | 1,829,630 | Nov 2007 | 13,699 | |||||
| New Zealand Dollar | 1,829,630 | Nov 2007 | 8,540 | |||||
| New Zealand Dollar | 1,829,630 | Nov 2007 | 9,949 | |||||
| New Zealand Dollar | 1,829,630 | Nov 2007 | 12,816 | |||||
| New Zealand Dollar | 1,829,630 | Nov 2007 | 8,540 | |||||
| Norwegian Krone | 5,549,020 | Nov 2007 | 18,428 | |||||
| Norwegian Krone | 5,549,020 | Nov 2007 | 18,712 | |||||
| Norwegian Krone | 5,549,020 | Nov 2007 | 16,548 | |||||
| Norwegian Krone | 5,549,020 | Nov 2007 | 17,892 | |||||
| Norwegian Krone | 5,549,020 | Nov 2007 | 17,181 | |||||
| Norwegian Krone | 5,549,020 | Nov 2007 | 16,613 | |||||
| Norwegian Krone | 5,549,020 | Nov 2007 | 16,991 | |||||
| Pound Sterling | 1,549,000 | Nov 2007 | (20,778) | |||||
| Pound Sterling | 799,000 | Nov 2007 | 14,017 | |||||
| Swedish Krona | 20,207,000 | Nov 2007 | (82,399) | |||||
| Swedish Krona | 40,318,508 | Nov 2007 | 34,629 | |||||
| Swedish Krona | 40,318,508 | Nov 2007 | 32,432 | |||||
| Swedish Krona | 40,318,508 | Nov 2007 | 44,383 | |||||
| Swedish Krona | 40,318,508 | Nov 2007 | 37,449 | |||||
| Swedish Krona | 40,318,508 | Nov 2007 | 33,806 | |||||
| Swedish Krona | 40,318,508 | Nov 2007 | 45,242 | |||||
International Core Fund
34
| UNREALIZED | ||||||||
| PRINCIPAL AMOUNT | SETTLEMENT | APPRECIATION | ||||||
| CURRENCY | COVERED BY CONTRACT | DATE | (DEPRECIATION) | |||||
| Buys continued | ||||||||
| Swedish Krona | 40,318,508 | Nov 2007 | $ 47,675 | |||||
| Swiss Franc | 19,817,167 | Nov 2007 | 2,232 | |||||
| Swiss Franc | 19,817,167 | Nov 2007 | (4,508) | |||||
| Swiss Franc | 19,817,167 | Nov 2007 | 6,200 | |||||
| Swiss Franc | 19,817,167 | Nov 2007 | 1,378 | |||||
| Swiss Franc | 19,817,167 | Nov 2007 | (16,970) | |||||
| Swiss Franc | 19,817,167 | Nov 2007 | (11,447) | |||||
| Swiss Franc | 19,817,167 | Nov 2007 | (18,006) | |||||
| ($525,422) | ||||||||
| Sells | ||||||||
| Australian Dollar | 2,918,220 | Nov 2007 | ($42,982) | |||||
| Australian Dollar | 2,906,559 | Nov 2007 | (54,642) | |||||
| Australian Dollar | 2,897,348 | Nov 2007 | (63,853) | |||||
| Australian Dollar | 2,907,506 | Nov 2007 | (53,696) | |||||
| Australian Dollar | 2,906,778 | Nov 2007 | (54,424) | |||||
| Australian Dollar | 2,899,562 | Nov 2007 | (61,640) | |||||
| Australian Dollar | 2,918,704 | Nov 2007 | (42,497) | |||||
| Canadian Dollar | 1,871,414 | Nov 2007 | (4,387) | |||||
| Canadian Dollar | 1,874,569 | Nov 2007 | (1,232) | |||||
| Canadian Dollar | 1,870,882 | Nov 2007 | (4,920) | |||||
| Canadian Dollar | 1,872,910 | Nov 2007 | (2,892) | |||||
| Canadian Dollar | 1,868,619 | Nov 2007 | (7,182) | |||||
| Canadian Dollar | 1,871,660 | Nov 2007 | (4,141) | |||||
| Canadian Dollar | 1,872,511 | Nov 2007 | (3,291) | |||||
| Danish Kroner | 819,548 | Nov 2007 | (9,078) | |||||
| Danish Kroner | 819,136 | Nov 2007 | (9,491) | |||||
| Danish Kroner | 818,426 | Nov 2007 | (10,200) | |||||
| Danish Kroner | 818,159 | Nov 2007 | (10,468) | |||||
| Danish Kroner | 818,805 | Nov 2007 | (9,822) | |||||
| Danish Kroner | 818,383 | Nov 2007 | (10,243) | |||||
| Danish Kroner | 818,708 | Nov 2007 | (9,918) | |||||
| Euro | 12,460,705 | Nov 2007 | (149,461) | |||||
| Euro | 12,458,825 | Nov 2007 | (151,342) | |||||
| Euro | 12,458,751 | Nov 2007 | (151,415) | |||||
| Euro | 12,449,100 | Nov 2007 | (161,066) | |||||
| Euro | 12,447,441 | Nov 2007 | (162,726) | |||||
| Euro | 12,443,938 | Nov 2007 | (166,228) | |||||
| Euro | 12,453,248 | Nov 2007 | (156,918) | |||||
| Hong Kong Dollar | 579,982 | Nov 2007 | (1,099) | |||||
| Hong Kong Dollar | 579,896 | Nov 2007 | (1,184) | |||||
| Hong Kong Dollar | 579,937 | Nov 2007 | (1,144) | |||||
| Hong Kong Dollar | 579,774 | Nov 2007 | (1,307) | |||||
| Hong Kong Dollar | 579,848 | Nov 2007 | (1,233) | |||||
| Norwegian Krone | 4,857,605 | Nov 2007 | 56,670 | |||||
| Norwegian Krone | 4,857,386 | Nov 2007 | 55,247 | |||||
| Pound Sterling | 5,862,252 | Nov 2007 | (87,477) | |||||
| Pound Sterling | 5,865,317 | Nov 2007 | (84,412) | |||||
| Pound Sterling | 5,856,625 | Nov 2007 | (93,104) | |||||
International Core Fund
35
| UNREALIZED | |||||
| PRINCIPAL AMOUNT | SETTLEMENT | APPRECIATION | |||
| CURRENCY | COVERED BY CONTRACT | DATE | (DEPRECIATION) | ||
| Sells continued | |||||
| Pound Sterling | 5,853,073 | Nov 2007 | ($96,657) | ||
| Pound Sterling | 5,854,852 | Nov 2007 | (94,877) | ||
| Pound Sterling | 5,846,341 | Nov 2007 | (103,389) | ||
| Pound Sterling | 5,853,138 | Nov 2007 | (96,592) | ||
| Swiss Franc | 3,863,831 | Nov 2007 | 70,987 | ||
| ($2,049,726) | |||||
Federal income taxes
The Fund qualifies as a “regulated investment company” by complying with the applicable provisions of the Internal Revenue Code and will not be subject to federal income tax on taxable income. Therefore, no federal income tax provision is required.
New accounting pronouncements
In June 2006, Financial Accounting Standards Board (FASB) Interpretation No. 48, Accounting for Uncertainty in Income Taxes (the Interpretation), was issued and is effective for fiscal years beginning after December 15, 2006, and is to be applied to all open tax years as of the effective date. This Interpretation prescribes a minimum threshold for financial statement recognition of the benefit of a tax position taken or expected to be taken in a tax return, and requires certain expanded disclosures. Management has evaluated the application of this Interpretation to the Fund and does not believe there is a material impact resulting from the adoption of this Interpretation on the Fund’s financial statements.
In September 2006, FASB Standard No. 157, Fair Value Measurements (FAS 157), was issued and is effective for fiscal years beginning after November 15, 2007. FAS 157 defines fair value, establishing a framework for measuring fair value and expands disclosure about fair value measurements. Management is currently evaluating the application of FAS 157 to the Fund and its impact, if any, resulting from the adoption of FAS 157 on the Fund’s financial statements.
Distribution of income and gains
The Fund records distributions to shareholders from net investment income and net realized gains, if any, on the ex-dividend date. During the period ended February 28, 2007, the tax character of distributions paid was as follows: ordinary income $12,427,092. Distributions paid by the Fund with respect to each class of shares are calculated in the same manner, at the same time and are in the same amount, except for the effect of expenses that may be applied differently to each class.
Such distributions, on a tax basis, are determined in conformity with income tax regulations, which may differ from accounting principles generally accepted in the United States of America. Distributions in excess of tax basis earnings and profits, if any, are reported in the Fund’s financial statements as a return of capital.
Capital accounts
The Fund reports the undistributed net investment income and accumulated undistributed net realized gain (loss) accounts on a basis approximating amounts available for future tax distributions (or to offset future taxable realized gains when a capital loss carryforward is available). Accordingly, the Fund may periodically make reclassifications among certain capital accounts without affecting its net asset value.
International Core Fund
36
3. Investment advisory and other agreements Advisory fees
The Trust has entered into an Investment Advisory Agreement with the Adviser. The Adviser is responsible for managing the corporate and business affairs of the Trust and for selecting and compensating subadvisers to handle the investment of the assets of the Fund, subject to the supervision of the Trust’s Board of Trustees. Under the Advisory Agreement, the Fund pays a monthly management fee to the Adviser equivalent, on an annual basis, to the sum of: (a) 0.92% of the first $100,000,000 of the Fund’s aggregate daily net assets; (b) 0.895% of the next $900,000,000 of the Fund’s aggregate daily net assets; (c) 0.880% of the Fund’s aggregate daily net assets in excess of $1,000,000,000. Aggregate net assets include the net assets of the Fund and International Core Trust, a series of John Hancock Trust and International Core Fund, a series of John Hancock Funds II. The Adviser has a subadvisory agreement with Grantha m, Mayo, Van Otterloo & Co. LLC. The Fund is not responsible for payment of the subadvisory fees.
Expense reimbursements
The Adviser has agreed contractually to reimburse for certain fund level expenses that exceed 0.20% of the average annual net assets, or to make a payment to a specific class of shares of the Fund in an amount equal to the amount by which the expenses attributable to such class of shares (excluding taxes, portfolio brokerage commissions, interest, litigation and indemnification expenses and other extraordinary expenses not incurred in the ordinary course of the Fund’s business and fees under any agreement or plans of the Fund dealing with services for shareholders and others with beneficial interests in shares of the Fund) exceed the percentage of average annual net assets (on an annualized basis) attributable as follows: 1.70% for Class A, 2.40% for Class B, 2.40% for Class C, 1.20% for Class I, 1.70% for Class R1, 1.15% for Class 1 and 1.10% for Class NAV.. Accordingly, the expense reductions related to this expense limitation amounted to $1,703, $14,002, $5,539, $9,543, $9,454, $1,156 and $18,602 for Class A, Class B, Class C, Class I, Class R1, Class 1 and Class NAV, respectively, for the period ended August 31, 2007. This expense reimbursement shall continue in effect until June 30, 2008 and thereafter until terminated by the Adviser on notice to the Trust.
Administration fees
The Fund has an agreement with the Adviser that requires the Fund to reimburse the Adviser for all expenses associated with providing the administrative, financial, accounting and recordkeeping services of the Fund, including the preparation of all tax returns, annual, semi-annual and periodic reports to shareholders and the preparation of all regulatory reports. These expenses are allocated based on the relative net assets of each class. The compensation for the period amounted to $66,474 with an effective rate of 0.01% of the Fund’s average daily net asset value.
Distribution plan
The Trust has a Distribution Agreement with the Distributor. The Fund has adopted Distribution Plans with respect to Class A, Class B, Class C, Class R1 and Class 1, pursuant to Rule 12b-1 under the 1940 Act, to reimburse the Distributor for the services it provides as distributor of shares of the Fund. Accordingly, the Fund makes monthly payments to the Distributor at an annual rate not to exceed 0.30%, 1.00%, 1.00%, 0.50% and 0.05% of average daily net asset value of Class A, Class B, Class C, Class R1 and Class 1, respectively. A maximum of 0.25% of such payments may be service fees, as defined by the Conduct Rules of Financial Industry Regulatory Authority (formerly the National Association of Securities Dealers). Under the Conduct Rules, curtailment of a portion of the Fund’s 12b-1 payments could occur under certain circumstances. In addition, under a Service Plan for Class R1 shares, the Fund pays up to 0.25% of Class R1 a verage daily net asset value for certain other services.
Sales charges
Class A shares are assessed up-front sales charges of up to 5.00% of net asset value of such shares. During the period ended August 31, 2007, the Fund was informed that the Distributor received net up-front sales charges of $308,924 with regard to sales of Class A shares. Of this amount, $26,560 was retained and used for printing
International Core Fund
37
prospectuses, advertising, sales literature and other purposes, $277,807 was paid as sales commissions to unrelated broker-dealers and $4,557 was paid as sales commissions to sales personnel of Signator Investors, Inc. (Signator Investors), a related broker-dealer, an indirect subsidiary of MFC.
Class B shares that are redeemed within six years of purchase are subject to a contingent deferred sales charge (CDSC) at declining rates, beginning at 5.00% of the lesser of the current market value at the time of redemption or the original purchase cost of the shares being redeemed. Class C shares that are redeemed within one year of purchase are subject to a CDSC at a rate of 1.00% of the lesser of the current market value at the time of redemption or the original purchase cost of the shares being redeemed. Proceeds from the CDSCs are paid to the Distributor and are used, in whole or in part, to defray its expenses for providing distribution-related services to the Fund in connection with the sale of Class B and Class C shares. During the period ended August 31, 2007, CDSCs received by Distributor amounted to $7,385 for Class B shares and $996 for Class C shares.
Transfer agent fees
The Fund has a Transfer Agency Agreement with John Hancock Signature Services, Inc. (Signature Services), an indirect subsidiary of MFC. For Class A, Class B, Class C, Class I and Class R1 shares, the Fund pays a monthly transfer agent fee at an annual rate of 0.05% of each class’ average daily net assets, plus a fee based on the number of shareholder accounts and reimbursement for certain out-of-pocket expenses. Expenses not directly attributable to a particular class of shares are aggregated and allocated to each class on the basis of its relative net asset value.
Signature Services has agreed to limit the transfer agent fees so that such fees do not exceed 0.30% annually of Class A, Class B, Class C, Class I and Class R1 share average daily net assets. This agreement is effective until December 31, 2007. Signature Services reserves the right to terminate this limitation in the future. Accordingly, there were no transfer agent fee reductions for Class A, Class B, Class C, Class I and Class R1 shares, respectively, during the period ended August 31, 2007.
Expenses under the agreements described above for the period ended August 31, 2007, were as follows:
| Distribution and | Transfer | Blue sky | Printing and | |
| Share class | service fees | agent fees | fees | postage fees |
| Class A | $106,933 | $60,654 | $9,570 | $6,444 |
| Class B | 68,717 | 20,615 | 9,157 | 463 |
| Class C | 50,876 | 10,057 | 9,101 | 484 |
| Class I | — | 204 | 9,101 | 410 |
| Class R1 | 494 | 33 | 9,101 | 398 |
| Class 1 | 21,941 | — | — | 2,642 |
| Total | $248,961 | $91,563 | $46,030 | $10,841 |
Trustees’ fees
The Trust compensates each Trustee who is not an employee of the Adviser or its affiliates.
Total Trustees’ expenses are allocated to the Fund based on its average daily net asset value.
4. Guarantees and indemnifications
Under the Trust’s organizational documents, its Officers and Trustees are indemnified against certain liability arising out of the performance of their duties to the Trust. Additionally, in the normal course of business, the Trust enters into contracts with service providers that contain general indemnification clauses. The Trust’s maximum exposure under these arrangements is unknown, as this would involve future claims that may be made against the Trust that have not yet occurred. However, based on experience, the Trust believes the risk of loss to be remote.
International Core Fund
38
5. Line of credit
The Fund has entered into an agreement which enables it to participate in a $100 million unsecured committed line of credit with State Street Corporation. Borrowings will be made solely to temporarily finance the repurchase of capital shares. Interest is charged to the Fund based on its borrowings at a rate per annum equal to the Federal Funds rate plus 0.50% . In addition, a commitment fee of 0.07% per annum, payable at the end of each calendar quarter, based on the average daily-unused portion of the line of credit, is charged to the Fund on a prorated basis based on average net assets. For the period ended August 31, 2007, there were no borrowings under the line of credit.
International Core Fund
39
6. Capital shares
Share activities for the Fund for the periods ended February 28, 2007 and August 31, 2007, were as follows:
| Year ended 2-28-07 | Period ended 8-31-074 | |||
| Shares | Amount | Shares | Amount | |
| Class A | ||||
| Sold | 284,321 | $11,617,841 | 431,573 | $20,011,622 |
| Issued in reorganization | — | — | 2,188,767 | 102,289,840 |
| Distributions reinvested | 1,655 | 70,124 | (9) | (463) |
| Repurchased | (468,712) | (19,816,280) | (140,556) | (6,571,127) |
| Net increase (decrease) | (182,736) | ($8,128,315) | 2,479,775 | $115,729,872 |
| Class B | ||||
| Sold | 27,188 | $1,088,930 | 53,444 | $2,467,056 |
| Issued in reorganization | — | — | 519,204 | 24,096,951 |
| Distributions reinvested | 145 | 6,146 | (146) | (7,108) |
| Repurchased | (4,739) | (194,969) | (63,085) | (2,949,063) |
| Net increase | 22,594 | $900,1071 | 509,417 | $23,607,836 |
| Class C | ||||
| Sold | 108,359 | $4,434,998 | 125,625 | $5,822,830 |
| Issued in reorganization | — | — | 123,192 | 5,718,520 |
| Distributions reinvested | 478 | 20,196 | — | — |
| Repurchased | (4,754) | (197,095) | (19,433) | (889,553) |
| Net increase | 104,083 | $4,258,0991 | 229,384 | $10,651,797 |
| Class I | ||||
| Sold | 5,134 | $189,482 | 30,389 | $1,459,623 |
| Issued in reorganization | — | — | 3,865 | 181,228 |
| Distributions reinvested | 45 | 1,930 | — | — |
| Repurchased | (46) | (2,038) | (812) | (38,628) |
| Net increase | 5,133 | $189,3741 | 33,442 | $1,602,223 |
| Class R1 | ||||
| Sold | 2,820 | $101,500 | — | — |
| Distributions reinvested | 25 | 1,056 | — | — |
| Net increase | 2,845 | $102,5561 | — | — |
| Class 1 | ||||
| Sold | 48,304 | $2,043,017 | 118,764 | $5,510,547 |
| Issued in reorganization | 1,953,542 | 79,235,655 | — | — |
| Distributions reinvested | 18,537 | 787,817 | — | — |
| Repurchased | (138,020) | (5,874,002) | (140,551) | (6,418,148) |
| Net increase (decrease) | 1,882,363 | $76,192,4872 | (21,787) | ($907,601) |
| Class NAV shares | ||||
| Sold | 3,063,357 | $123,822,093 | 2,609,720 | $118,979,274 |
| Issued in reorganization | 26,094,263 | 1,022,391,188 | — | — |
| Distributions reinvested | 271,456 | 11,534,195 | — | — |
| Repurchased | (788,527) | (32,939,761) | (1,298,694) | (61,328,681) |
| Net increase | 28,640,549 | $1,124,807,7153 | 1,311,026 | $57,650,593 |
| Net increase | 30,474,831 | $1,198,322,023 | 4,541,257 | $208,334,720 |
1 Period from 6-12-06 (commencement of operations) to 2-28-07.
2 Period from 11-6-06 (commencement of operations) to 2-28-07.
3 Period from 8-29-06 (commencement of operations) to 2-28-07.
4 Semiannual period from 3-1-07 to 8-31-07. Unaudited.
International Core Fund
40
7. Investment transactions
Purchases and proceeds from sales or maturities of securities, other than short-term securities and obligations of the U.S. government, during the period ended August 31, 2007, aggregated $355,987,937 and $316,342,615, respectively.
The cost of investments owned on August 31, 2007, including short-term investments, for federal income tax purposes, was $1,668,064,372. Gross unrealized appreciation and depreciation of investments aggregated $289,983,027 and $30,088,030, respectively, resulting in net unrealized appreciation of $259,894,997.
8. Federal income tax information
Federal income tax regulations may differ from generally accepted accounting principles and income and capital gain distributions determined in accordance with tax regulations may differ from net investment income and realized gains recognized for financial reporting purposes.
9. Reorganization
On June 12, 2006, the Fund acquired substantially all of the assets and liabilities of the Predecessor Fund in exchange solely for Class A shares of the Fund. The acquisition was accounted for as a tax-free exchange of 462,581 Class A shares of the Fund for the net assets of the Predecessor Fund, which amounted to $16,617,195, including $884,271 of unrealized appreciation, after the close of business on June 9, 2006. Accounting and performance history of the Predecessor Fund was redesignated as that of Class A of the Fund.
On August 29, 2006, the Board of Trustees of John Hancock Funds II International Stock Fund (the International Stock Fund) approved an Agreement and Plan of Reorganization, which provided for the transfer of substantially all of the assets and liabilities of the International Stock Fund Class NAV in exchange for the Class NAV of the Fund. The acquisition was accounted for as a tax-free exchange of 26,094,263 of the Class NAV shares of the Fund for the net assets of the International Stock Fund Class NAV, which amounted to $1,022,391,188, including the total of $122,941,561 of unrealized appreciation, after the close of business on August 29, 2006.
In addition, on August 29, 2006, the Board of Trustees of International Stock Fund approved an agreement and Plan of Reorganization, which provided for the transfer of substantially all of the assets and liabilities of the International Stock Fund Class 1 in exchange for the Class 1 of the Fund. The acquisition was accounted for as a tax-free exchange of 1,953,542 of the Class 1 shares of the Fund for the net assets of the International Stock Fund Class 1, which amounted to $79,235,655, including the total of $14,608,110 of unrealized appreciation, after the close of business on November 6, 2006.
On April 18, 2007, the shareholders of John Hancock International Fund (International Fund) approved an Agreement and Plan of Reorganization, which provided for the transfer of substantially all of the assets and liabilities of the International Fund in exchange for Class A, Class B, Class C and Class I shares of the Fund. The acquisition was accounted for as a tax-free exchange of 2,188,767 Class A shares, 519,204 Class B shares, 123,192 Class C shares and 3,865 Class I shares of the Fund for the net assets of the International Fund, which amounted to $102,289,840, $24,096,952, $5,718,520 and $181,228 for Class A, Class B, Class C and Class I shares of the International Fund, respectively, including the total of $24,329,893 of unrealized appreciation, after the close of business on May 25, 2007.
41
Evaluation of Advisory and Subadvisory
Agreements by the Board of Trustees
This section describes the evaluation
by the Board of Trustees of the
Advisory Agreement and each of the
Subadvisory Agreements.
Evaluation by the Board of Trustees The Board, including all of the Trustees who are not “interested persons” as defined in the Investment Company Act of 1940, as amended (the Independent Trustees), is responsible for selecting the Trust’s investment adviser, John Hancock Investment Management Services, LLC (the Adviser or JHIMS), approving the Adviser’s selection of subadvisers for each series of the Trust (the Funds) and approving the Trust’s advisory and subadvisory agreements (and any subsubadvisory agreements), their periodic continuation and any amendments. Consistent with SEC rules, the Board regularly evaluates the Trust’s advisory and subadvisory (and subsubadvisory) arrangements, including consideration of the factors listed below. The Board may also consider other factors (including conditions and trends prevailing genera lly in the economy, the securities markets and the industry) and does not treat any single factor as determinative, and each Trustee may attribute different weights to different factors. The Board is furnished with an analysis of its fiduciary obligations in connection with its evaluation and, throughout the evaluation process, the Board is assisted by counsel for the Trust and the Independent Trustees are also separately assisted by independent legal counsel. The factors regularly considered by the Board are:
1. the nature, extent and quality of the services to be provided by the Adviser to the Trust and by the subadvisers to the Funds;
2. the investment performance of the Funds and their subadvisers;
3. the extent to which economies of scale would be realized as a Fund grows and whether fee levels reflect these economies of scale for the benefit of Trust shareholders;
4. the costs of the services to be provided and the profits to be realized by the Adviser and its affiliates (including any subadvisers that are affiliated with the Adviser) from the Adviser’s relationship with the Trust; and
5. comparative services rendered and comparative advisory and subadvisory fee rates.
The Board believes that information relating to all these factors is relevant to its evaluation of the Trust’s advisory agreement. With respect to its evaluation of subadvisory agreements (including subsubadvisory agreements) the Board believes that, in view of the Trust’s “manager of managers” advisory structure, the costs of services to be provided and the profits to be realized by those subadvisers that are not affiliated with the Adviser from their relationship with the Trust generally are not a material factor to the Board’s consideration of subadvisory agreements because such fees are paid to subadvisers by the Adviser and not by the Funds, and because the Board relies on the ability of the Adviser to negotiate such subadvisory fees at arm’s-length.
In evaluating subadvisory arrangements, the Board also considers other material business relationships that unaffiliated subadvisers and their affiliates have with the Adviser or its affiliates, including the involvement by certain affiliates of certain subadvisers in the distribution of financial products, including shares of the Trust, offered by the Adviser and other affiliates of the Adviser (Material Relationships).
Approval of Advisory Agreement
At its meeting on June 5, 2007, the Board, including all the Independent Trustees, approved the Advisory Agreement between the Trust and JHIMS with respect to each of the Funds.
In approving the Advisory Agreement, and with reference to the factors which it regularly considers, the Board:
(1) (a) considered the high value to the Trust of continuing the relationship with JHIMS as the Trust’s Adviser to the other John Hancock Funds, the skills and competency with which JHIMS
42
has in the past managed the affairs and subadvisory relationships of other funds in the complex, JHIMS’s oversight and monitoring of subadvisers’ investment performance and compliance programs including its timelines in responding to performance issues and the qualifications of JHIMS’s personnel,
(b) considered JHIMS’s compliance policies and procedures and its responsiveness to regulatory changes and mutual fund industry developments, and
(c) JHIMS’s administrative capabilities, including its ability to supervise the other service providers for the Funds and concluded that JHIMS may reasonably be expected to ably perform its services under the Advisory Agreement.
(2) reviewed the investment performance of portfolios that are managed comparable to the Funds; the comparative performance of their respective benchmarks; and JHIMS’ analysis of such performance and its plans and recommendations regarding the Trust’s subadvisory arrangements generally and with respect to the Funds; and concluded that each of the comparably managed funds has performed well or within a range that the Board deemed competitive, and that JHIMS may reasonably be expected to ably monitor the performance of the Funds and their subadvisers;
(3) reviewed the Trust’s advisory fee structure and the incorporation therein of any subadvisory fee breakpoints in the advisory fees charged and concluded (i) that to the extent that Funds have subadvisory fees with breakpoints, those breakpoints are reflected as breakpoints in the advisory fees for Funds, (ii) that all Funds with a subadviser that is not affiliated with the Adviser have subadvisory fees which are the product of arm’s-length negotiations between the Adviser and the subadviser and which in many, but not all, cases contain breakpoints, and (iii) that, although economies of scale cannot be measured with precision, these arrangements permit shareholders of Funds with advisory fee breakpoints to benefit from economies of scale if those Funds grow;
(4) (a) reviewed the financial statements of JHIMS and John Hancock Life Insurance Company (U.S.A.) (JHLICO (U.S.A.));
(b) reviewed the anticipated profitability of the JHIMS’s relationship with the Funds in terms of the fees it expects to receive with respect to the Funds and whether JHIMS has the financial ability to provide a high level of services to the Funds,
(c) considered that JHIMS derives reputational and other indirect benefits from providing advisory services to the Funds, and
(d) noted that JHIMS will pay the subadvisory fees out of the advisory fees JHIMS receives from the Funds and concluded that the advisory fees paid by the Trust with respect to the Funds are not unreasonable in light of such information; and
(5) reviewed comparative information with respect to the advisory fee rates and concluded that the anticipated advisory fees for the Funds are within the range of those incurred by other comparable funds and that the advisory structure for the Funds is thus competitive within the industry.
Additional information that the Board considered for a particular Fund is set forth in Appendix A.
Approval of Subadvisory Agreements
At its meeting on June 5, 2007, the Board, including all the Independent Trustees, approved the Subadvisory Agreements.
In making its determination with reference to these respective factors, the Board reviewed:
(i) information relating to each subadviser’s business which included information
43
such as: business performance, assets under management, financial stability and personnel;
(ii) the investment performance of the subadviser’s portfolio managed comparably to the Fund to be managed by the subadviser and comparative performance information relating to the benchmark;
(iii) the proposed subadvisory fee for each Fund to be managed by the subadviser and comparative fee information; and
(iv) information relating to the nature and scope of Material Relationships and their significance to the Adviser and the subadvisers.
The Board’s decision to approve each Subadvisory Agreement was based on a number of determinations, including the following:
(1) The subadviser has extensive experience and demonstrated skills as a manager and may be expected to provide a high quality of investment personnel to each Fund;
(2) Although not without variation, the current and historical performance of the portfolios of the Subadviser managed comparably to the Fund to be managed by the Subadviser has been within a competitive range of the current and historical performance of these portfolios’ respective benchmark (see Appendix A for further information on performance);
(3) The subadvisory fees are within industry norms and are the product of arm’s-length negotiation between the Adviser and the subadviser; and
(4) The Material Relationships consist of arrangements in which unaffiliated subadvisers or their affiliates provide advisory, distribution or management services in connection with financial products sponsored by the Trust’s adviser or its affiliates, which may include other registered investment companies, a 529 education savings plan, managed separate accounts and exempt group annuity contracts sold to qualified plans, and which in no case contained elements which would cause the Board to conclude that approval of the subadvisory agreement with the subadviser would be inappropriate. See (5) below for information relating to the business arrangement between the Trust’s Adviser and GMO.
(5) As a part of the overall business arrangement between the Adviser and GMO under which the Adviser has obtained exclusive rights to certain GMO investment management services for up to five years, the Adviser has agreed that under certain circumstances it (and not the Trust or the particular Fund) will pay GMO a specified amount (ranging from $1 to $12 million) if the subadvisory agreement with respect to any of the following Funds to be subadvised by GMO is terminated within a five-year period from the date of its effectiveness: U.S. Core Fund, Active Value Fund, Intrinsic Value Fund, Growth Fund, International Core Fund, International Growth Fund, Global Fund, Value Opportunities Fund, Growth Opportunities Fund and U.S. Quality Equity Fund.
The Adviser has also agreed that, subject to its fiduciary duties as an investment adviser to each of these Funds and its shareholders, it will not recommend to the Board of Trustees to terminate the subadvisory agreement with respect to any of the Funds or to reduce any of the fees payable thereunder to GMO for a five-year period from the date of effectiveness of the agreement. Substantially similar agreements (with varying amounts to be paid upon termination) also apply with respect to certain other John Hancock funds that are or will be advised by the Adviser and subadvised by GMO. The Trust is not a party to any of these arrangements, and they are not binding upon the Trust, the Trust’s Funds subadvised by GMO or the Board of Trustees. However, these arrangements present certain conflicts of interest because the Adviser has a financial incentive to support the continuation of GMO subadvisory agreements for as long as the ter mination provisions described above remain in effect. In approving the Advisory Agreement and the subadvisory agreement with respect to
44
each of the Funds subadvised by GMO, the Board of Trustees, including the Independent Trustees, was aware of and considered these potential conflicts of interest, including any financial obligations of the Adviser to GMO.
The Board concluded that, notwithstanding the potential conflicts of interest, approval of the Advisory Agreement and the subadvisory agreements with GMO is in the best interests of shareholders and contract owners in view of (i) the Adviser’s fiduciary duty and the Board’s fiduciary duty and ability to monitor potential conflicts, (ii) the benefits to shareholders and contract owners generally expected from the exclusive rights to certain GMO investment management services obtained by the Adviser for the benefit of certain Funds of the Trust and other John Hancock funds and (iii) the benefits to such Funds of the Trust expected from the subadvisory services of GMO.
Additional information that the Board considered for a particular fund is set forth in Appendix A.
Appendix A
| Estimated Fees | |||
| Fund | Performance | and Expenses | Comments |
| International Core | See Comments. | Subadvisory fees | The Board noted |
| for this Fund were | that the Fund | ||
| higher than the peer | commenced | ||
| group median. | operations in | ||
| June 2006 and | |||
| Advisory fees for | has a limited | ||
| this Fund were | performance history. | ||
| lower than the peer | |||
| group median. | |||
| Total expenses for | |||
| this Fund were | |||
| higher than the peer | |||
| group median. | |||
45
Why John Hancock Funds?
For more than three decades, John Hancock Funds has been helping individual, corporate and institutional clients reach their most important financial goals. With so many fund companies to choose from, why should you invest with us?
►A name you know and trust
When you invest with John Hancock Funds, you are investing with one of the most recognized and respected names in the financial services industry. Our parent company has been helping individuals and institutions increase and protect wealth since 1862.
►Solutions across the investing spectrum
We offer equity, income, international, sector and asset allocation investment solutions managed by leading institutional money managers. Each of our funds utilizes a disciplined, team approach to portfolio management and research, leveraging the expertise of seasoned investment professionals.
►Committed to you
Our shareholders come first. We work hard to provide you with the products you need to build a solid financial foundation. We’re proud to offer you award-winning services and tools, like the www.jhfunds.com Web site, to help you every step of the way.
For immediate insight and answers,
turn to www.jhfunds.com
Discover the new and improved www.jhfunds.com.
▪ View accounts, statements and fund information.
▪ Access college and retirement planning calculators and investment education.
▪ Gain investment ideas, expand your knowledge and become a more informed investor.

This is just the beginning of how much you can do.
Now is the ideal time to experience our Web site that received the following recognition in 2006:

“Best Innovation: Redesigned Web Site” by the Mutual Fund
Education Alliance.

“Outstanding Web Site” by the Web Marketing Association.

“Creative excellence on the Web, Silver Award winner” by W3.
Discover convenience and comprehensive resources at one easy-to-access location. Your financial professional can steer you to the tools
that will help you the most and enable you to transform your knowledge into action.
See how far www.jhfunds.com can take you!
For more information
The Fund’s proxy voting policies, procedures and records are available without charge, upon request:
| By phone | On the Fund’s Web site | On the SEC’s Web site |
| 1-800-225-5291 | www.jhfunds.com/proxy | www.sec.gov |
| Trustees | Charles A. Rizzo | Principal distributor |
| Ronald R. Dion, Chairman | Chief Financial Officer | John Hancock Funds, LLC |
| James R. Boyle† | Gordon M. Shone | 601 Congress Street |
| James F. Carlin | Treasurer | Boston, MA 02210-2805 |
| William H. Cunningham | ||
| Charles L. Ladner* | John G. Vrysen | Custodian |
| Dr. John A. Moore* | Chief Operating Officer | State Street Bank & Trust Co. |
| Patti McGill Peterson* | 2 Avenue de Lafayette | |
| Steven R. Pruchansky | Investment adviser | Boston, MA 02111 |
| John Hancock Investment | ||
| *Members of the Audit Committee | Management Services, LLC | Transfer agent |
| †Non-Independent Trustee | 601 Congress Street | John Hancock Signature |
| Boston, MA 02210-2805 | Services, Inc. | |
| Officers | One John Hancock Way, | |
| Keith F. Hartstein | Subadviser | Suite 1000 |
| President and | Grantham, Mayo, Van | Boston, MA 02217-1000 |
| Chief Executive Officer | Otterloo & Co. LLC | |
| Thomas M. Kinzler | 40 Rowes Wharf | Legal counsel |
| Secretary and Chief Legal Officer | Boston, MA 02110 | Kirkpatrick & Lockhart |
| Francis V. Knox, Jr. | Preston Gates Ellis LLP | |
| Chief Compliance Officer | One Lincoln Street | |
| Boston, MA 02111-2950 | ||
| How to contact us | ||
| Internet | www.jhfunds.com | |
| Regular mail: | Express mail: | |
| John Hancock | John Hancock | |
| Signature Services, Inc. | Signature Services, Inc. | |
| One John Hancock Way, Suite 1000 | Mutual Fund Image Operations | |
| Boston, MA 02217-1000 | 380 Stuart Street | |
| Boston, MA 02116 | ||
| Phone | Customer service representatives | 1-800-225-5291 |
| EASI-Line | 1-800-338-8080 | |
| TDD line | 1-800-554-6713 | |
A listing of month-end portfolio holdings is available on our Web site, www.jhfunds.com. A more detailed portfolio holdings summary is available on a quarterly basis 60 days after the fiscal quarter on our Web site or upon request by calling 1-800-225-5291, or on the SEC’s Web site, www.sec.gov.
48
J O H N H A N C O C K F A M I L Y O F F U N D S
| EQUITY | INTERNATIONAL/GLOBAL |
| Balanced Fund | Global Opportunities Fund |
| Classic Value Fund | Global Shareholder Yield Fund |
| Classic Value Fund II | Greater China Opportunities Fund |
| Classic Value Mega Cap Fund | International Allocation Portfolio |
| Core Equity Fund | International Classic Value Fund |
| Growth Fund | International Core Fund |
| Growth Opportunities Fund | International Growth Fund |
| Growth Trends Fund | |
| Intrinsic Value Fund | INCOME |
| Large Cap Equity Fund | Bond Fund |
| Large Cap Select Fund | Government Income Fund |
| Mid Cap Equity Fund | High Yield Fund |
| Multi Cap Growth Fund | Investment Grade Bond Fund |
| Small Cap Equity Fund | Strategic Income Fund |
| Small Cap Fund | |
| Small Cap Intrinsic Value Fund | TAX-FREE INCOME |
| Sovereign Investors Fund | California Tax-Free Income Fund |
| U.S. Core Fund | High Yield Municipal Bond Fund |
| U.S. Global Leaders Growth Fund | Massachusetts Tax-Free Income Fund |
| Value Opportunities Fund | New York Tax-Free Income Fund |
| Tax-Free Bond Fund | |
| ASSET ALLOCATION | |
| Lifecycle 2010 Portfolio | MONEY MARKET |
| Lifecycle 2015 Portfolio | Money Market Fund |
| Lifecycle 2020 Portfolio | |
| Lifecycle 2025 Portfolio | CLOSED - END |
| Lifecycle 2030 Portfolio | Bank and Thrift Opportunity Fund |
| Lifecycle 2035 Portfolio | Financial Trends Fund, Inc. |
| Lifecycle 2040 Portfolio | Income Securities Trust |
| Lifecycle 2045 Portfolio | Investors Trust |
| Lifecycle Retirement Portfolio | Patriot Premium Dividend Fund II |
| Lifestyle Aggressive Portfolio | Preferred Income Fund |
| Lifestyle Balanced Portfolio | Preferred Income II Fund |
| Lifestyle Conservative Portfolio | Preferred Income III Fund |
| Lifestyle Growth Portfolio | Tax-Advantaged Dividend Income Fund |
| Lifestyle Moderate Portfolio | Tax-Advantaged Global Shareholder Yield Fund |
| SECTOR | |
| Financial Industries Fund | |
| Health Sciences Fund | |
| Real Estate Fund | |
| Regional Bank Fund | |
| Technology Fund | |
| Technology Leaders Fund | |
The Fund’s investment objectives, risks, charges and expenses are included in the prospectus and should be considered carefully before investing. For a prospectus, contact your financial professional, call John Hancock Funds at 1-800-225-5291 or visit the Fund’s Web site at www.jhfunds.com. Please read the prospectus carefully before investing or sending money.

1-800-225-5291
1-800-554-6713 TDD
1-800-338-8080 EASI-Line
www.jhfunds. com
Now available: electronic delivery
www.jhfunds. com/edelivery
This report is for the information of the shareholders of John Hancock International Core Fund.
It is not authorized for distribution to prospective investors unless preceded or accompanied by a prospectus.
660SA 8/07
10/07

| TABLE OF CONTENTS | ||
| Your fund at a glance | ||
| page 1 | ||
| Managers’ report | ||
| page 2 | ||
| A look at performance | ||
| page 6 | ||
| Your expenses | ||
| page 8 | ||
| Fund’s investments | ||
| page 10 | ||
| Financial statements | ||
| page 23 | ||
| Notes to financial | ||
| statements | ||
| page 32 | ||
| For more information | ||
| page 48 | ||
CEO corner
To Our Shareholders,
Volatility returned to the U.S. stock market in the six-month period ended August 31, 2007; however, stocks still posted a strong gain of 5.70%, as measured by the Standard & Poor’s 500 Index. The market experienced a particularly sharp downturn in August, as the subprime mortgage market’s woes increased. Rising defaults and an ensuing credit crunch caused heightened fears about their potential impact on U.S. economic growth. Foreign markets felt some ripple effects from the subprime issue, but they continued nonetheless to benefit from solid economic growth and outperformed the U.S. market in this period.
During this period of volatility, the U.S. stock market also passed a significant milestone — the broad Standard & Poor’s 500 Index climbed beyond the record it had set seven years ago. From its peak in March 2000, the stock market spiraled downward three consecutive years, bottoming in 2002. The upturn began in 2003, and the market has advanced each year since, finally setting a new high for the first time on May 30, 2007. During that period, the S&P 500 Index experienced five significant short-term sell-offs of 6% or more, with the August subprime-induced meltdown being the most recent.
This nearly complete market cycle highlights the importance of two investment principles you have heard us speak of often: diversification and patience. By allocating your investments among different asset classes, investment styles and portfolio managers, you are likely to be well represented through all phases of a complete market cycle, with the winners helping to cushion the fall of the losers.
The challenge for investors with a diversified portfolio is to properly evaluate your investments to tell the difference between an underperforming manager and an out-of-favor style, while also understanding the role each investment plays in your portfolio. That’s where your financial professional can provide true value. He or she can help you make those assessments and also counsel patience, because a properly diversified portfolio by its very nature will typically have something lagging or out of favor — a concept that can be difficult to live with, but necessary to embrace. If everything in your portfolio is “working,” then you are not truly diversified, but rather are leveraged to the current market and the flavor of the day. If so, you are bound to be out of step in the near future.
The recent volatility in the securities markets has prompted many investors to question how long this type of market cycle will last. History tells us it will indeed end and that when it does, today’s leaders may well turn into laggards and vice versa. The subprime mortgage market woes are just the latest example of why investors should be both patient and well-diversified. For with patience and a diversified portfolio, it could be easier to weather the market’s twists and turns and reach your long-term goals.
Sincerely,

Keith F. Hartstein,
President and Chief Executive Officer
This commentary reflects the CEO’s views as of August 31, 2007. They are subject to change at any time.
Your fund at a glance
The Fund seeks long-term capital growth by typically making equity investments in U.S. companies that issue stocks included in the Russell 2500 Index and in companies with total market capitalizations similar to those of companies in the Index. Under normal circumstances, the Fund invests at least 80% of its assets in small- and mid-cap companies.
Over the last six months
► Despite heightened volatility, the broad U.S. market, as measured by the S&P 500 Index, gained ground.
► On a relative basis, stock selection and an underweighting in the oil and gas sector held the Fund back. An overweight in the primary process sector, and underweight in metals and mining, plus good stock selection in both sectors, helped.
► The Fund’s momentum and valuation selection criteria both lagged the market.
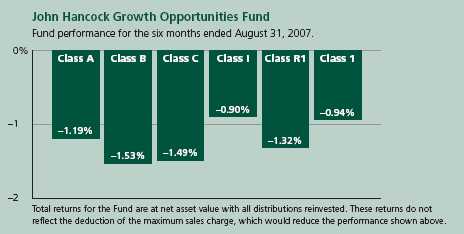
| Top 10 holdings | ||||
| Energizer Holdings, Inc. | 1.8% | Goodyear Tire & Rubber Company | 1.2% | |
| American Eagle Outfitters, Inc. | 1.7% | ITT Educational Services, Inc. | 1.1% | |
| McAfee, Inc. | 1.4% | Avnet, Inc. | 1.1% | |
| Waters Corp. | 1.3% | SEI Investments Company | 1.1% | |
| Pinnacle Gas Resources, Inc. | 1.2% | CarMax, Inc. | 1.0% | |
As a percentage of net assets on August 31, 2007.
1
Managers’ report
John Hancock
Growth Opportunities Fund
U.S. investors entered the six-month review period on March 1, 2007 still reeling from the market’s late-February swoon. Their big question was whether the recent fall was the beginning of a major correction or just a brief hiccup in the middle of a bull market. Though some of the concerns surrounding the decline — including the first sign of trouble in subprime mortgages — were still present, investors appeared to shake them off. Less than two months into the review period, the Standard & Poor’s 500 Index had recovered all of its lost ground, entering the summer poised to continue its ascent. With historically low market volatility, the continuation of strong corporate profits and a glut of private equity deals fueled by ubiquitous financial liquidity, there seemed to be almost no ceiling to the market’s potential.
Hopes for a smooth summer, however, would turn out to be short-lived. Beginning in July, as many market indexes touched record highs, credit concerns similar to those seen in February flared up again. Distress in subprime mortgages quickly spilled over into the broader credit and equity markets. Just weeks after the S&P 500 Index set an all-time high, the Federal Reserve began injecting liquidity into a faltering financial system, in an attempt to stem the turmoil taking place in the credit market. As equity market volatility returned with a vengeance,
SCORECARD
| INVESTMENT | PERIOD’S PERFORMANCE ... AND WHAT’S BEHIND THE NUMBERS | |
| Priceline.com | ▲ | Stock rose on increased earnings forecasts and improvements in |
| operating performance and credit ratings | ||
| American Eagle | ▼ | Low quarterly profit report hurt performance |
| Outfitters | ||
| First Marblehead | ▼ | Shares dropped after some of their largest customers bought Sallie Mae, |
| creating speculation that First Marblehead would lose their business | ||
2
From the Grantham, Mayo, Van Otterloo & Co. LLC (GMO)
Portfolio Management Team
investor tolerance for risk abated and the broad market indexes plunged lower in the first days of August. And while hopes for a Federal Reserve rate cut helped stabilize things somewhat, investors ended the review period much in the same way they began it — wondering whether the market would rally again or if risk aversion was here to stay. Despite the volatility, the S&P 500 Index posted gains in the six-month period.
“Despite the volatility, the S&P
500 Index posted gains in the
six-month period.”
Looking at performance
For the six months ended August 31, 2007, John Hancock Growth Opportunities Fund’s Class A, Class B, Class C, Class I, Class R1, and Class 1 shares returned –1.19%, –1.53%, –1.49%, –0.90%, –1.32% and –0.94%, respectively, at net asset value. By comparison, the Russell 2500 Growth Index returned 4.98%, while the average mid-cap growth fund monitored by Morningstar, Inc. gained 7.92% .1 Keep in mind that your returns will differ from those listed above if you were not invested in the Fund for the entire period or did not reinvest all distributions. See pages six and seven for historical performance information.
During the period, our primary stock selection tools — valuation and momentum — both lagged the market. Our valuation discipline performed reasonably well over the first several months of the period, but suffered in the middle and later portions as its sector and stock selections both lagged the market. In the small-cap growth universe, our valuation discipline suffered from its selections in the financial sector, as troubles in the subprime mortgage sector negatively impacted all financials — even those our discipline identified as undervalued.
Growth Opportunities Fund
3
Our momentum discipline also lagged the rising market. The discipline is designed to identify stocks that have performed well recently and appear poised to continue outperforming. During the period, stock selection negatively impacted the discipline’s returns, as its picks were unable to outperform the market.
“During the period, our primary
stock selection tools — valuation
and momentum — both lagged
the market.”
Oil & gas, financials and retail limit gains
The sector detracting most from performance during the period was oil and gas, where our stock selection and underweight position negatively impacted the Fund’s returns. For example, not owning Denbury Resources Inc. negatively impacted returns after shares jumped amid record production coupled with rising oil prices.
The financial sector also detracted from the Fund’s performance. Our valuation and momentum disciplines both found attractive stocks within the sector, but even attractive names suffered in the decline in financial shares amid the troubles in subprime mortgages. For instance, our overweight position in First Marblehead Corp. detracted from relative returns after the company’s shares fell over speculation that several of its customers would pull their business. Even a share buy-back announced by the company couldn’t keep shares from ending the period in negative territory.
Also detracting from performance was the retail sector. Our overweight position and stock selection drove the negative relative returns. An overweight position in American Eagle Outfitters, Inc. negatively impacted returns after the company gave a worse-than-expected short-term outlook. Though the stock worked against us during the review period, it remains attractive according to both our valuation and momentum disciplines and is held at an overweight.
| SECTOR DISTRIBUTION2 | |
| Consumer cyclical | 28% |
| Consumer non-cyclical | 20% |
| Industrial | 18% |
| Technology | 8% |
| Basic materials | 7% |
| Financial | 7% |
| Communications | 6% |
| Energy | 3% |
| Utilities | 1% |
Primary process and metals & mining add value
On the positive side, our overweight position and stock selection in the primary process sector added to relative returns. Our overweight position in AK Steel Holding Corp. added to relative returns as the company’s shares soared following
Growth Opportunities Fund
4
a report that Arcelor Mittal is planning to acquire the company at a premium. Additionally, our overweight position in Commercial Metals Company outperformed during the period, helped by a strong quarterly profit report. We took profits and sold our stake. Our underweight position in the metals and mining sector also added to relative returns. Not owning Coeur d’Alene Mines Corp. added to relative returns as the company’s shares plunged following a revenue and earnings decrease.
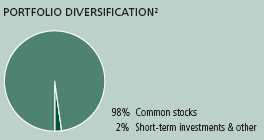
Outlook
The market volatility at the end of the period left investors wondering if the bull market has finally come to an end. The upcoming months will show whether the market’s recent trend toward risk aversion — especially in the troubled subprime mortgage sector — will persist. We believe the Fund remains strongly positioned, with a mix of undervalued and strong momentum stocks.
This commentary reflects the views of the portfolio management team through the end of the Fund’s period discussed in this report. The team’s statements reflect their own opinions. As such, they are in no way guarantees of future events and are not intended to be used as investment advice or a recommendation regarding any specific security. They are also subject to change at any time as market and other conditions warrant.
1 Figures from Morningstar, Inc. include reinvested dividends and do not take into account sales charges. Actual load-adjusted performance is lower.
2 As a percentage of net assets on August 31, 2007.
Growth Opportunities Fund
5
A look at performance
| For the periods ended August 31, 2007 | ||||||||||
| Average annual returns | Cumulative total returns | |||||||||
| with maximum sales charge (POP) | with maximum sales charge (POP) | |||||||||
| Inception | Since | Since | ||||||||
| Class | date | 1-year | 5-year | 10-year | inception | 6-month | 1-year | 5-year | 10-year | inception |
| A1,2 | 9-16-05 | 6.18% | — | — | 4.16% | –6.13% | 6.18% | — | — | 8.31% |
| B | 6-12-06 | 6.02 | — | — | 3.83 | –6.45 | 6.02 | — | — | 4.72 |
| C | 6-12-06 | 10.12 | — | — | 7.08 | –2.47 | 10.12 | — | — | 8.76 |
| I3 | 6-12-06 | 12.29 | — | — | 8.25 | –0.90 | 12.29 | — | — | 10.21 |
| R1 3 | 6-12-06 | 11.39 | — | — | 7.37 | –1.32 | 11.39 | — | — | 9.12 |
| 13 | 6-12-06 | 12.29 | — | — | 8.25 | –0.94 | 12.29 | — | — | 10.21 |
Performance figures assume all distributions are reinvested. Public offering price (POP) figures reflect maximum sales charge on Class A shares of 5%, and the applicable contingent deferred sales charge (CDSC) on Class B and Class C shares. The Class B shares’ CDSC declines annually between years 1 to 6 according to the following schedule 5, 4, 3, 3, 2, 1%. No sales charge will be assessed after the sixth year. Class C shares held for less than one year are subject to a 1% CDSC. Sales charge is not applicable for Class I, Class R1 and Class 1 shares.
The expense ratios of the Fund, both net (including any fee waivers or expense limitations) and gross (excluding any fee waivers or expense limitations), are set forth according to the most recent publicly available Prospectuses for the Fund and may differ from the expense ratios disclosed in the Financial Highlights tables in this report. The waivers and expense limitations are contractual at least until 6-30-08. The net expenses are as follows: Class A — 1.54%, Class B — 2.23%, Class C — 2.23%, Class I — 1.14%, Class R1 — 1.89%, Class 1 — 1.10% . Had the fee waivers and expense limitations not been in place, the gross expenses would be as follows: Class A — 5.60%, Class B — 14.63%, Class C — 10.44%, Class I — 16.26%, Class R1 — 24.21%, Class 1 — 3.82% .
The returns reflect past results and should not be considered indicative of future performance. The return and principal value of an investment will fluctuate so that shares, when redeemed, may be worth more or less than their original cost. Due to market volatility, the Fund’s current performance may be higher or lower than the performance shown. For performance data current to the most recent month-end, please call 1-800-225-5291 or visit the Fund’s Web site at www.jhfunds.com.
The performance table above and the chart on the next page do not reflect the deduction of taxes that a shareholder would pay on fund distributions or the redemption of fund shares.
The Fund’s performance results reflect any applicable expense reductions, without which the expenses would increase and results would have been less favorable.
Performance is calculated with an opening price (prior day’s close) on the inception date.
1 Effective June 12, 2006, shareholders of the former GMO Small/Mid Cap Growth Fund (the Predecessor Fund) became owners of that number of full and fractional shares of John Hancock Growth Opportunities Fund. Additionally, the accounting and performance history of the former GMO Small/Mid Cap Growth Fund was redesignated as that of Class A of John Hancock Growth Opportunities Fund.
2 Performance linked to the Predecessor Fund.
3 For certain types of investors as described in the Fund’s Class I, Class R1 and Class 1 share prospectuses.
Growth Opportunities Fund
6
Growth of $10,000
This chart shows what happened to a hypothetical $10,000 investment in Growth Opportunities Fund Class A shares1 for the period indicated. For comparison, we’ve shown the same investment in the Russell 2500 Growth Index.
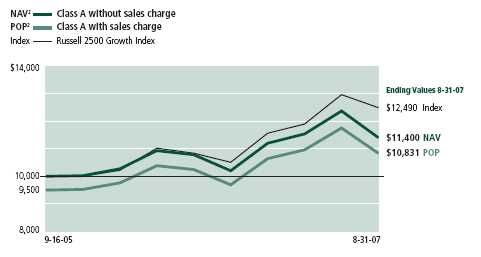
| With maximum | ||||
| Class | Period beginning | Without sales charge | sales charge | Index |
| B | 6-12-06 | $10,872 | $10,472 | $11,899 |
| C3 | 6-12-06 | 10,876 | 10,876 | 11,899 |
| I4 | 6-12-06 | 11,021 | 11,021 | 11,899 |
| R1 4 | 6-12-06 | 10,912 | 10,912 | 11,899 |
| 14 | 6-12-06 | 11,021 | 11,021 | 11,899 |
Assuming all distributions were reinvested for the period indicated, the table above shows the value of a $10,000 investment in the Fund’s Class B, Class C, Class I, Class R1 and Class 1 shares, respectively, as of August 31, 2007. Performance of the classes will vary based on the difference in sales charges paid by shareholders investing in the different classes and the fee structure of those classes.
Russell 2500 Growth Index is an unmanaged index containing those securities in the Russell 2500 Index with a greater-than-average growth orientation.
It is not possible to invest directly in an index. Index figures do not reflect sales charges, which would have resulted in lower values if they did.
1 Performance linked to the Predecessor Fund.
2 NAV represents net asset value and POP represents public offering price.
3 No contingent deferred sales charge applicable.
4 For certain types of investors as described in the Fund’s Class I, Class R1 and Class 1 share prospectuses.
Growth Opportunities Fund
7
Your expenses
These examples are intended to help you understand your ongoing operating expenses.
Understanding fund expenses
As a shareholder of the Fund, you incur two types of costs:
■ Transaction costs which include sales charges (loads) on purchases or redemptions (varies by share class), minimum account fee charge, etc.
■ Ongoing operating expenses including management fees, distribution and service fees (if applicable) and other fund expenses.
We are going to present only your ongoing operating expenses here.
Actual expenses/actual returns
This example is intended to provide information about your fund’s actual ongoing operating expenses, and is based on your fund’s actual return. It assumes an account value of $1,000.00 on March 1, 2007, with the same investment held until August 31, 2007.
| Account value | Ending value | Expenses paid during period | |
| on 3-1-07 | on 8-31-07 | on 8-31-071 | |
| Class A | $1,000.00 | $988.10 | $7.60 |
| Class B | 1,000.00 | 984.70 | 11.22 |
| Class C | 1,000.00 | 985.10 | 11.13 |
| Class I | 1,000.00 | 991.00 | 5.00 |
| Class R1 | 1,000.00 | 986.80 | 9.14 |
| Class 1 | 1,000.00 | 990.60 | 5.10 |
Together with the value of your account, you may use this information to estimate the operating expenses that you paid over the period. Simply divide your account value at August 31, 2007 by $1,000.00, then multiply it by the “expenses paid” for your share class from the table above. For example, for an account value of $8,600.00, the operating expenses should be calculated as follows:
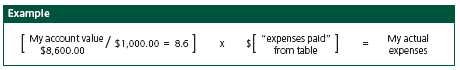
Growth Opportunities Fund
8
Hypothetical example for comparison purposes
This table allows you to compare your fund’s ongoing operating expenses with those of any other fund. It provides an example of the Fund’s hypothetical account values and hypothetical expenses based on each class’s actual expense ratio and an assumed 5% annualized return before expenses (which is not your fund’s actual return). It assumes an account value of $1,000.00 on March 1, 2007, with the same investment held until August 31, 2007. Look in any other fund shareholder report to find its hypothetical example and you will be able to compare these expenses.
| Account value | Ending value | Expenses paid during period | |
| on 3-1-07 | on 8-31-07 | on 8-31-07 1 | |
| Class A | $1,000.00 | $1,017.50 | $7.71 |
| Class B | 1,000.00 | 1,013.83 | 11.39 |
| Class C | 1,000.00 | 1,013.93 | 11.29 |
| Class I | 1,000.00 | 1,020.11 | 5.08 |
| Class R1 | 1,000.00 | 1,015.94 | 9.27 |
| Class 1 | 1,000.00 | 1,020.01 | 5.18 |
Remember, these examples do not include any transaction costs, such as sales charges; therefore, these examples will not help you to determine the relative total costs of owning different funds. If transaction costs were included, your expenses would have been higher. See the prospectus for details regarding transaction costs.
1 Expenses are equal to the Fund’s annualized expense ratio of 1.52%, 2.25%, 2.23%, 1.00%, 1.83% and 1.02% for Class A, Class B, Class C, Class I, Class R1 and Class 1, respectively, multiplied by the average account value over the period, multiplied by the number of days in the inception period/365 or 366 (to reflect the one-half year period).
Growth Opportunities Fund
9
F I N A N C I A L S T A T E M E N T S
Fund’s investments
Securities owned by the Fund on 8-31-07 (unaudited)
This schedule is divided into two main categories: common stocks and short-term investments. Common stocks are further broken down by industry group. Short-term investments, which represent the Fund’s cash position, are listed last.
| Issuer | Shares | Value |
| Common stocks 98.17% | $113,445,181 | |
| (Cost $121,177,716) | ||
| Advertising 0.44% | 513,945 | |
| Interpublic Group of Companies, Inc. * | 38,700 | 423,765 |
| ValueClick, Inc. * | 4,500 | 90,180 |
| Aerospace 0.82% | 947,729 | |
| Alliant Techsystems, Inc. * | 4,400 | 463,364 |
| Innovative Solutions & Support, Inc. * (a) | 3,800 | 68,628 |
| Teledyne Technologies, Inc. * | 6,800 | 339,388 |
| Woodward Governor Company | 1,300 | 76,349 |
| Air Travel 0.75% | 869,884 | |
| Continental Airlines, Inc., Class B * | 12,600 | 419,076 |
| Pinnacle Airline Corp. * | 8,100 | 132,759 |
| UAL Corp. * | 6,700 | 318,049 |
| Aluminum 0.02% | 17,650 | |
| Superior Essex, Inc. * | 500 | 17,650 |
| Apparel & Textiles 4.33% | 5,166,744 | |
| Bebe Stores, Inc. (a) | 23,500 | 327,825 |
| Columbia Sportswear Company (a) | 3,800 | 227,696 |
| Crocs, Inc. * (a) | 10,600 | 625,824 |
| Deckers Outdoor Corp. * | 4,200 | 395,598 |
| Guess?, Inc. | 13,700 | 726,100 |
| Jos. A. Bank Clothiers, Inc. * (a) | 2,200 | 66,330 |
| K-Swiss, Inc., Class A | 6,100 | 147,132 |
| Liz Claiborne, Inc. | 4,000 | 136,680 |
| Maidenform Brands, Inc. * | 3,000 | 51,120 |
| Mothers Work, Inc. * | 900 | 18,405 |
| Oakley, Inc. | 7,300 | 210,021 |
| Perry Ellis International, Inc. * | 4,200 | 114,618 |
| Phillips-Van Heusen Corp. | 11,300 | 657,999 |
| Polo Ralph Lauren Corp., Class A | 5,400 | 407,916 |
| Steven Madden, Ltd. | 6,800 | 167,416 |
| The Gymboree Corp. * | 5,700 | 228,513 |
| The Warnaco Group, Inc. * | 6,900 | 240,810 |
| Timberland Company, Class A * | 6,500 | 130,585 |
See notes to financial statements
Growth Opportunities Fund
10
F I N A N C I A L S T A T E M E N T S
| Issuer | Shares | Value |
| Apparel & Textiles (continued) | ||
| Volcom, Inc. * (a) | 1,000 | $39,030 |
| Wolverine World Wide, Inc. | 9,400 | 247,126 |
| Auto Parts 0.77% | 884,722 | |
| BorgWarner, Inc. | 800 | 67,600 |
| CSK Auto Corp. * | 7,100 | 93,862 |
| Gentex Corp. | 14,100 | 282,564 |
| O’Reilly Automotive, Inc. * | 12,400 | 440,696 |
| Auto Services 0.57% | 655,270 | |
| AutoNation, Inc. * | 10,100 | 191,698 |
| Copart, Inc. * | 15,800 | 463,572 |
| Automobiles 0.14% | 164,782 | |
| Group 1 Automotive, Inc. | 4,700 | 164,782 |
| Banking 0.80% | 927,897 | |
| Downey Financial Corp. | 3,900 | 220,701 |
| FirstFed Financial Corp. * | 3,300 | 165,825 |
| Frontier Financial Corp. | 4,900 | 120,442 |
| Hancock Holding Company | 2,500 | 100,000 |
| TCF Financial Corp. | 12,700 | 320,929 |
| Biotechnology 0.99% | 1,140,995 | |
| Immucor, Inc. * | 27,600 | 920,460 |
| Techne Corp. * | 3,500 | 220,535 |
| Broadcasting 0.43% | 497,385 | |
| Discovery Holding Company * | 12,500 | 314,000 |
| Sinclair Broadcast Group, Inc., Class A | 12,700 | 158,242 |
| Westwood One, Inc. | 8,700 | 25,143 |
| Building Materials & Construction 0.44% | 513,701 | |
| Apogee Enterprises, Inc. | 2,800 | 70,476 |
| Lennox International, Inc. | 6,500 | 233,805 |
| Perini Corp. * | 3,700 | 209,420 |
| Business Services 4.58% | 5,294,314 | |
| Alliance Data Systems Corp. * | 1,100 | 86,295 |
| Ceridian Corp. * | 4,300 | 147,275 |
| COMSYS IT Partners, Inc. * | 2,500 | 47,525 |
| Deluxe Corp. | 5,500 | 209,110 |
| Diamond Management & Technology Consultants, Inc. | 4,200 | 42,294 |
| Dun & Bradstreet Corp. | 1,300 | 126,815 |
| Equifax, Inc. | 4,800 | 184,896 |
| EZCORP, Inc., Class A * | 15,700 | 191,069 |
| FactSet Research Systems, Inc. | 16,400 | 982,852 |
| First Consulting Group, Inc. * | 2,300 | 21,781 |
| Healthcare Services Group, Inc. | 3,000 | 64,260 |
| Huron Consulting Group, Inc. * | 1,100 | 72,655 |
| Jacobs Engineering Group, Inc. * | 9,600 | 634,464 |
See notes to financial statements
Growth Opportunities Fund
11
F I N A N C I A L S T A T E M E N T S
| Issuer | Shares | Value |
| Business Services (continued) | ||
| Manpower, Inc. | 2,100 | $147,546 |
| MPS Group, Inc. * | 800 | 11,008 |
| Pre-Paid Legal Services, Inc. * (a) | 7,300 | 402,887 |
| Resources Connection, Inc. * | 11,200 | 336,000 |
| ScanSource, Inc. * | 4,600 | 127,420 |
| Syntel, Inc. | 2,300 | 79,511 |
| TeleTech Holdings, Inc. * | 22,700 | 663,975 |
| Total Systems Services, Inc. (a) | 10,300 | 285,722 |
| Tyler Technologies, Inc. * | 900 | 13,347 |
| Volt Information Sciences, Inc. * | 10,900 | 164,045 |
| Waste Industries USA, Inc. | 900 | 29,205 |
| Watson Wyatt Worldwide, Inc., Class A | 4,700 | 222,357 |
| Cellular Communications 0.39% | 446,775 | |
| Telephone & Data Systems, Inc. | 6,900 | 446,775 |
| Chemicals 3.84% | 4,438,343 | |
| Airgas, Inc. | 3,400 | 157,148 |
| Albemarle Corp. | 28,300 | 1,145,301 |
| Cabot Corp. | 6,000 | 242,040 |
| Celanese Corp., Series A | 12,500 | 449,000 |
| CF Industries Holdings, Inc. | 5,600 | 354,648 |
| Eastman Chemical Company | 5,000 | 333,800 |
| Hercules, Inc. * | 23,400 | 487,188 |
| Innospec, Inc. | 1,900 | 47,196 |
| Lubrizol Corp. | 2,300 | 146,234 |
| Newmarket Corp. | 4,700 | 219,537 |
| PolyOne Corp. * | 11,600 | 93,148 |
| Terra Industries, Inc. * | 13,900 | 360,983 |
| W. R. Grace & Company * | 18,000 | 402,120 |
| Colleges & Universities 1.91% | 2,210,052 | |
| Career Education Corp. * | 23,800 | 706,860 |
| Corinthian Colleges, Inc. * | 13,200 | 185,592 |
| ITT Educational Services, Inc. * | 12,000 | 1,317,600 |
| Commercial Services 0.20% | 227,349 | |
| Chemed Corp. | 2,700 | 167,508 |
| HMS Holdings Corp. * | 1,900 | 44,745 |
| PeopleSupport, Inc. * | 1,200 | 15,096 |
| Computers & Business Equipment 1.30% | 1,505,607 | |
| Avocent Corp. * | 2,100 | 61,992 |
| CDW Corp. * | 1,300 | 111,891 |
| Foundry Networks, Inc. * | 6,500 | 120,185 |
| Ingram Micro, Inc., Class A * | 19,400 | 381,016 |
| Lexmark International, Inc. * | 2,600 | 96,876 |
| Micros Systems, Inc. * | 1,200 | 72,408 |
| NETGEAR, Inc. * | 3,000 | 84,180 |
| Parametric Technology Corp. * | 9,500 | 167,295 |
See notes to financial statements
Growth Opportunities Fund
12
F I N A N C I A L S T A T E M E N T S
| Issuer | Shares | Value |
| Computers & Business Equipment (continued) | ||
| Stratasys, Inc. * (a) | 1,400 | $35,210 |
| Synaptics, Inc. * | 2,500 | 108,250 |
| Western Digital Corp. * | 11,400 | 266,304 |
| Construction & Mining Equipment 0.06% | 71,160 | |
| Gulf Islands Fabrication, Inc. | 2,000 | 71,160 |
| Construction Materials 1.16% | 1,337,202 | |
| Columbus McKinnon Corp. * | 600 | 16,302 |
| Martin Marietta Materials, Inc. | 8,000 | 1,080,000 |
| Simpson Manufacturing Company, Inc. | 7,300 | 240,900 |
| Containers & Glass 2.06% | 2,384,631 | |
| Ball Corp. | 1,000 | 52,380 |
| Greif, Inc., Class A | 7,500 | 436,650 |
| Owens-Illinois, Inc. * | 21,500 | 864,730 |
| Pactiv Corp. * | 18,000 | 526,500 |
| Sealed Air Corp. | 12,200 | 322,690 |
| Silgan Holdings, Inc. | 1,300 | 66,417 |
| Sonoco Products Company | 3,200 | 115,264 |
| Correctional Facilities 0.59% | 680,334 | |
| Corrections Corp. of America * | 17,000 | 436,220 |
| The Geo Group, Inc. * | 8,200 | 244,114 |
| Cosmetics & Toiletries 1.44% | 1,662,915 | |
| Alberto-Culver Company | 8,000 | 185,360 |
| Bare Escentuals, Inc. * | 1,600 | 39,360 |
| Chattem, Inc. * (a) | 8,700 | 536,877 |
| Estee Lauder Companies, Inc., Class A | 5,500 | 228,745 |
| International Flavors & Fragrances, Inc. | 13,100 | 658,013 |
| Playtex Products, Inc. * | 800 | 14,560 |
| Crude Petroleum & Natural Gas 1.50% | 1,737,330 | |
| Cabot Oil & Gas Corp. | 4,000 | 133,360 |
| Pinnacle Gas Resources, Inc. * | 300,000 | 1,395,000 |
| Unit Corp. * | 2,100 | 103,026 |
| Vaalco Energy, Inc. * | 1,900 | 7,448 |
| Western Refining, Inc. | 1,900 | 98,496 |
| Domestic Oil 0.67% | 775,277 | |
| Frontier Oil Corp. | 5,900 | 242,077 |
| Holly Corp. (a) | 8,000 | 533,200 |
| Drugs & Health Care 0.51% | 589,774 | |
| Candela Corp. * | 1,200 | 8,664 |
| Mannatech, Inc. (a) | 8,100 | 66,744 |
| Molina Healthcare, Inc. * | 7,600 | 258,780 |
| Parexel International Corp. * | 200 | 8,602 |
| Savient Pharmaceuticals, Inc. * | 7,800 | 102,804 |
| West Pharmaceutical Services, Inc. | 3,600 | 144,180 |
See notes to financial statements
Growth Opportunities Fund
13
F I N A N C I A L S T A T E M E N T S
| Issuer | Shares | Value |
| Educational Services 0.05% | $60,805 | |
| DeVry, Inc. | 1,500 | 51,795 |
| Universal Technical Institute, Inc. * (a) | 500 | 9,010 |
| Electrical Equipment 1.37% | 1,584,511 | |
| Anixter International, Inc. * | 3,100 | 237,987 |
| AZZ, Inc. * | 2,700 | 76,680 |
| Encore Wire Corp. | 1,500 | 39,000 |
| FLIR Systems, Inc. * | 14,800 | 728,752 |
| Genlyte Group, Inc. * | 1,500 | 108,855 |
| GrafTech International, Ltd. * | 8,500 | 142,715 |
| Littelfuse, Inc. * | 1,900 | 63,460 |
| Molex, Inc. | 5,000 | 130,750 |
| Universal Electronics, Inc. * | 700 | 20,300 |
| Varian, Inc. * | 600 | 36,012 |
| Electrical Utilities 0.35% | 408,983 | |
| CenterPoint Energy, Inc. | 10,400 | 168,688 |
| Quanta Services, Inc. * (a) | 8,500 | 240,295 |
| Electronics 2.57% | 2,966,836 | |
| Avnet, Inc. * | 32,800 | 1,289,368 |
| AVX Corp. | 1,600 | 25,152 |
| II-VI, Inc. * | 5,400 | 168,480 |
| Integrated Electrical Services, Inc. * | 3,300 | 77,088 |
| Mentor Graphics Corp. * | 11,700 | 163,332 |
| Multi-Fineline Electronix, Inc. * (a) | 1,300 | 16,497 |
| Rogers Corp. * | 5,600 | 230,664 |
| Synopsys, Inc. * | 17,100 | 467,172 |
| Trimble Navigation, Ltd. * | 12,900 | 455,499 |
| TTM Technologies, Inc. * | 6,300 | 73,584 |
| Energy 0.54% | 618,876 | |
| Energen Corp. | 7,100 | 381,270 |
| First Solar, Inc. * | 1,500 | 155,610 |
| SunPower Corp., Class A * | 1,200 | 81,996 |
| Financial Services 4.91% | 5,670,117 | |
| A.G. Edwards, Inc. | 4,300 | 359,394 |
| Advance America Cash Advance Centers, Inc. | 900 | 11,295 |
| Affiliated Managers Group, Inc. * (a) | 1,450 | 164,213 |
| American Capital Strategies, Ltd. (a) | 8,000 | 330,320 |
| AmeriCredit Corp. * | 5,400 | 93,474 |
| Cohen & Steers, Inc. (a) | 3,000 | 99,690 |
| Eaton Vance Corp. | 10,000 | 383,900 |
| Fremont General Corp. (a) | 11,200 | 50,400 |
| IndyMac Bancorp, Inc. (a) | 3,000 | 72,600 |
| Interactive Data Corp. | 3,600 | 98,424 |
| IntercontinentalExchange, Inc. * | 4,700 | 685,589 |
| Janus Capital Group, Inc. | 5,000 | 132,950 |
See notes to financial statements
Growth Opportunities Fund
14
F I N A N C I A L S T A T E M E N T S
| Issuer | Shares | Value |
| Financial Services (continued) | ||
| Knight Capital Group, Inc. * | 3,600 | $49,464 |
| MoneyGram International, Inc. | 5,300 | 112,731 |
| People’s United Financial, Inc. | 26,250 | 464,100 |
| SEI Investments Company | 50,800 | 1,288,796 |
| Student Loan Corp. | 900 | 177,525 |
| The First Marblehead Corp. (a) | 26,500 | 887,485 |
| World Acceptance Corp. * (a) | 6,700 | 207,767 |
| Food & Beverages 1.53% | 1,768,386 | |
| Corn Products International, Inc. | 3,800 | 171,760 |
| M & F Worldwide Corp. * | 2,700 | 152,280 |
| McCormick & Company, Inc. | 12,500 | 448,000 |
| MGP Ingredients, Inc. (a) | 3,000 | 43,380 |
| Ralcorp Holdings, Inc. * | 8,600 | 531,394 |
| Sanderson Farms, Inc. | 3,200 | 134,208 |
| Seaboard Corp. | 44 | 91,476 |
| Spartan Stores, Inc. | 7,700 | 195,888 |
| Funeral Services 0.11% | 128,310 | |
| Service Corp. International | 10,500 | 128,310 |
| Furniture & Fixtures 0.37% | 426,372 | |
| American Woodmark Corp. (a) | 3,600 | 108,612 |
| Ethan Allen Interiors, Inc. (a) | 4,600 | 154,560 |
| Leggett & Platt, Inc. | 8,000 | 163,200 |
| Gas & Pipeline Utilities 0.16% | 186,850 | |
| Equitable Resources, Inc. | 2,500 | 122,975 |
| UGI Corp. | 2,500 | 63,875 |
| Healthcare Products 2.89% | 3,342,930 | |
| Cytyc Corp. * | 500 | 21,370 |
| Dade Behring Holdings, Inc. | 2,300 | 173,673 |
| DENTSPLY International, Inc. | 3,500 | 137,830 |
| Hillenbrand Industries, Inc. | 700 | 40,285 |
| IDEXX Laboratories, Inc. * | 4,400 | 491,700 |
| Kinetic Concepts, Inc. * | 9,700 | 583,067 |
| Owens & Minor, Inc. | 3,900 | 155,610 |
| Patterson Companies, Inc. * | 24,800 | 912,144 |
| Respironics, Inc. * | 7,800 | 369,954 |
| USANA Health Sciences, Inc. * (a) | 7,700 | 293,216 |
| Zoll Medical Corp. * | 7,100 | 164,081 |
| Healthcare Services 2.70% | 3,119,163 | |
| AMERIGROUP Corp. * | 14,300 | 452,881 |
| Apria Healthcare Group, Inc. * | 27,400 | 729,662 |
| CorVel Corp. * | 4,350 | 109,055 |
| Covance, Inc. * | 4,500 | 329,940 |
| LHC Group, Inc. * (a) | 1,700 | 34,051 |
| Lincare Holdings, Inc. * | 7,200 | 259,128 |
See notes to financial statements
Growth Opportunities Fund
15
F I N A N C I A L S T A T E M E N T S
| Issuer | Shares | Value |
| Healthcare Services (continued) | ||
| Odyssey Healthcare, Inc. * | 5,700 | $55,746 |
| Pediatrix Medical Group, Inc. * | 4,200 | 250,530 |
| WellCare Health Plans, Inc. * | 9,100 | 898,170 |
| Holdings Companies/Conglomerates 0.02% | 27,652 | |
| United Industrial Corp. | 400 | 27,652 |
| Homebuilders 1.69% | 1,946,901 | |
| AMREP Corp. * | 2,500 | 84,000 |
| Beazer Homes USA, Inc. | 6,200 | 65,534 |
| KB Home | 6,700 | 203,278 |
| M.D.C. Holdings, Inc. | 6,300 | 280,287 |
| NVR, Inc. * | 1,300 | 727,350 |
| Ryland Group, Inc. | 5,100 | 146,064 |
| Standard Pacific Corp. (a) | 6,000 | 60,180 |
| Toll Brothers, Inc. * | 17,800 | 380,208 |
| Hotels & Restaurants 2.42% | 2,793,443 | |
| Ameristar Casinos, Inc. | 4,300 | 124,313 |
| Applebee’s International, Inc. | 8,200 | 203,442 |
| Brinker International, Inc. | 15,700 | 452,788 |
| Buffalo Wild Wings, Inc. * (a) | 5,800 | 201,666 |
| CBRL Group, Inc. | 2,800 | 104,776 |
| CEC Entertainment, Inc. * | 9,900 | 303,930 |
| Chipotle Mexican Grill, Inc., Class A * (a) | 1,900 | 197,581 |
| Choice Hotels International, Inc. | 2,900 | 108,692 |
| CKE Restaurants, Inc. | 700 | 11,865 |
| Jack in the Box, Inc. * | 12,700 | 790,194 |
| Papa John’s International, Inc. * | 400 | 10,144 |
| Ruby Tuesday, Inc. | 7,800 | 172,770 |
| Sonic Corp. * | 5,100 | 111,282 |
| Household Products 3.50% | 4,042,969 | |
| Blyth, Inc. | 8,700 | 194,532 |
| Church & Dwight, Inc. | 9,100 | 408,863 |
| Energizer Holdings, Inc. * | 19,400 | 2,055,042 |
| Jarden Corp. * | 2,300 | 75,417 |
| Select Comfort Corp. * (a) | 9,900 | 169,785 |
| Tempur-Pedic International, Inc. (a) | 30,900 | 893,010 |
| Tupperware Brands Corp. | 8,000 | 246,320 |
| Industrial Machinery 3.03% | 3,498,318 | |
| AGCO Corp. * | 9,700 | 419,040 |
| Cascade Corp. | 1,800 | 132,498 |
| Crane Company | 3,500 | 156,765 |
| Dresser-Rand Group, Inc. * | 2,500 | 92,175 |
| FMC Technologies, Inc. * | 600 | 56,820 |
| Gorman-Rupp Company | 1,300 | 44,265 |
| Graco, Inc. | 3,800 | 153,558 |
See notes to financial statements
Growth Opportunities Fund
16
F I N A N C I A L S T A T E M E N T S
| Issuer | Shares | Value |
| Industrial Machinery (continued) | ||
| Lincoln Electric Holdings, Inc. | 2,500 | $179,850 |
| Middleby Corp. * | 5,600 | 411,824 |
| Pall Corp. | 15,600 | 594,828 |
| Rofin-Sinar Technologies, Inc. * | 900 | 62,703 |
| Sauer-Danfoss, Inc. | 2,900 | 77,778 |
| Terex Corp. * | 8,600 | 686,968 |
| The Manitowoc Company, Inc. | 5,400 | 429,246 |
| Industrials 0.29% | 335,787 | |
| Brookfield Homes Corp. | 1,900 | 37,658 |
| Fastenal Company (a) | 1,900 | 86,659 |
| Harsco Corp. | 3,800 | 211,470 |
| Insurance 2.17% | 2,505,048 | |
| Alleghany Corp. * | 300 | 123,600 |
| Brown & Brown, Inc. | 18,000 | 484,560 |
| Erie Indemnity Company, Class A | 2,400 | 134,136 |
| HCC Insurance Holdings, Inc. | 2,400 | 66,264 |
| Markel Corp. * | 800 | 380,528 |
| Meadowbrook Insurance Group, Inc. * | 2,300 | 20,309 |
| National Western Life Insurance Company, Class A * | 200 | 51,800 |
| Odyssey Re Holdings Corp. | 5,600 | 202,832 |
| Philadelphia Consolidated Holding Corp. * | 9,200 | 368,184 |
| PMI Group, Inc. | 4,500 | 142,560 |
| Presidential Life Corp. | 1,900 | 32,870 |
| Radian Group, Inc. | 100 | 1,764 |
| Reinsurance Group of America, Inc. | 5,300 | 287,843 |
| Transatlantic Holdings, Inc. | 1,800 | 127,494 |
| Triad Guaranty, Inc. * (a) | 4,800 | 80,304 |
| Internet Content 0.18% | 210,043 | |
| Travelzoo, Inc. * | 10,900 | 210,043 |
| Internet Retail 1.04% | 1,204,388 | |
| PetMed Express, Inc. * | 3,400 | 50,966 |
| Priceline.com, Inc. * (a) | 13,900 | 1,153,422 |
| Internet Software 1.36% | 1,574,803 | |
| McAfee, Inc. * | 43,700 | 1,562,275 |
| VASCO Data Security International, Inc. * | 400 | 12,528 |
| Leisure Time 0.57% | 652,813 | |
| Brunswick Corp. | 5,900 | 148,385 |
| Polaris Industries, Inc. (a) | 5,200 | 248,300 |
| WMS Industries, Inc. * | 8,700 | 256,128 |
| Life Sciences 1.49% | 1,721,192 | |
| Pharmaceutical Product Development, Inc. | 6,600 | 231,198 |
| Waters Corp. * | 24,200 | 1,489,994 |
See notes to financial statements
Growth Opportunities Fund
17
F I N A N C I A L S T A T E M E N T S
| Issuer | Shares | Value |
| Manufacturing 1.73% | $1,995,150 | |
| Acuity Brands, Inc. | 6,300 | 331,002 |
| AptarGroup, Inc. | 1,900 | 69,027 |
| Carlisle Companies, Inc. | 4,800 | 236,304 |
| Ceradyne, Inc. * | 4,300 | 310,804 |
| General Cable Corp. * | 1,500 | 87,270 |
| GenTek, Inc. * | 500 | 15,375 |
| Insteel Industries, Inc. (a) | 4,800 | 90,720 |
| Kaydon Corp. | 1,400 | 73,920 |
| Mettler-Toledo International, Inc. * | 2,700 | 254,637 |
| Nordson Corp. | 3,300 | 165,693 |
| Snap-on, Inc. | 2,000 | 97,960 |
| Spartan Motors, Inc. | 8,750 | 129,500 |
| Stanley Works | 1,700 | 96,458 |
| Sturm Ruger & Company, Inc. * | 2,000 | 36,480 |
| Medical-Hospitals 0.72% | 836,508 | |
| Lifepoint Hospitals, Inc. * | 6,600 | 185,460 |
| Manor Care, Inc. | 4,400 | 281,116 |
| Medcath Corp. * | 3,800 | 111,530 |
| Universal Health Services, Inc., Class B | 3,500 | 184,800 |
| VCA Antech, Inc. * | 1,800 | 73,602 |
| Metal & Metal Products 0.99% | 1,148,452 | |
| Brush Engineered Materials, Inc. * | 2,600 | 125,580 |
| Crown Holdings, Inc. * | 7,000 | 168,140 |
| Matthews International Corp., Class A | 3,900 | 168,246 |
| Mueller Industries, Inc. | 4,000 | 138,560 |
| Quanex Corp. | 2,500 | 108,275 |
| Reliance Steel & Aluminum Company | 8,300 | 439,651 |
| Mining 0.76% | 877,105 | |
| Cleveland-Cliffs, Inc. (a) | 11,500 | 877,105 |
| Mobile Homes 0.48% | 554,274 | |
| Thor Industries, Inc. | 12,600 | 554,274 |
| Office Furnishings & Supplies 0.47% | 537,472 | |
| Herman Miller, Inc. | 11,800 | 342,436 |
| OfficeMax, Inc. | 2,500 | 88,800 |
| United Stationers, Inc. * | 1,800 | 106,236 |
| Paper 0.23% | 263,868 | |
| Buckeye Technologies, Inc. * | 4,100 | 63,837 |
| Rock-Tenn Company, Class A | 6,900 | 200,031 |
| Petroleum Services 0.82% | 947,685 | |
| Complete Production Services, Inc. * | 3,200 | 71,040 |
| GulfMark Offshore, Inc. * | 600 | 27,510 |
| Tesoro Petroleum Corp. | 9,500 | 468,635 |
| Tidewater, Inc. | 4,400 | 287,980 |
| World Fuel Services Corp. | 2,400 | 92,520 |
See notes to financial statements
Growth Opportunities Fund
18
F I N A N C I A L S T A T E M E N T S
| Issuer | Shares | Value |
| Pharmaceuticals 0.62% | $718,830 | |
| American Oriental Bioengineering, Inc. * (a) | 11,200 | 104,160 |
| Endo Pharmaceutical Holdings, Inc. * | 3,250 | 103,610 |
| King Pharmaceuticals, Inc. * | 8,700 | 130,761 |
| Medicis Pharmaceutical Corp., Class A (a) | 9,300 | 284,022 |
| Par Pharmaceutical Companies, Inc. * | 4,300 | 96,277 |
| Plastics 0.04% | 51,828 | |
| AEP Industries, Inc. * | 1,400 | 51,828 |
| Publishing 0.22% | 250,272 | |
| Consolidated Graphics, Inc. * | 2,400 | 159,072 |
| Valassis Communications, Inc. * (a) | 10,000 | 91,200 |
| Real Estate 0.43% | 492,007 | |
| Alexander’s, Inc., REIT * | 100 | 39,975 |
| Avatar Holdings, Inc. * (a) | 900 | 54,702 |
| Entertainment Properties Trust, REIT | 300 | 14,352 |
| Home Properties, Inc., REIT (a) | 1,900 | 96,558 |
| iStar Financial, Inc., REIT | 6,300 | 230,580 |
| Jones Lang LaSalle, Inc. | 500 | 55,840 |
| Retail Grocery 0.31% | 360,088 | |
| Ingles Markets, Inc. | 2,300 | 69,253 |
| SUPERVALU, Inc. | 6,900 | 290,835 |
| Retail Trade 13.37% | 15,452,651 | |
| Advance Auto Parts, Inc. | 16,550 | 588,518 |
| Aeropostale, Inc. * | 24,600 | 509,220 |
| American Eagle Outfitters, Inc. | 75,800 | 1,957,914 |
| AnnTaylor Stores Corp. * | 400 | 12,536 |
| Big 5 Sporting Goods Corp. | 2,600 | 54,080 |
| Big Lots, Inc. * | 23,200 | 690,664 |
| BJ’s Wholesale Club, Inc. * | 2,700 | 94,500 |
| Bon-Ton Stores, Inc. (a) | 4,600 | 132,572 |
| Cabela’s, Inc. * | 5,200 | 122,876 |
| CarMax, Inc. * | 52,800 | 1,196,448 |
| Cash America International, Inc. | 4,500 | 162,270 |
| Charlotte Russe Holding, Inc. * | 2,700 | 47,169 |
| Chico’s FAS, Inc. * | 13,500 | 215,730 |
| Children’s Place Retail Stores, Inc. * | 2,800 | 80,528 |
| Christopher & Banks Corp. (a) | 11,700 | 141,336 |
| Dick’s Sporting Goods, Inc. * | 3,100 | 201,190 |
| Dollar Tree Stores, Inc. * | 20,700 | 899,415 |
| Family Dollar Stores, Inc. | 15,800 | 462,624 |
| First Cash Financial Services, Inc. * | 8,400 | 179,928 |
| Fossil, Inc. * | 17,100 | 573,021 |
| FTD Group, Inc. | 2,600 | 46,202 |
| GameStop Corp., Class A * | 2,600 | 130,364 |
| J. Crew Group, Inc. * | 2,800 | 139,468 |
See notes to financial statements
Growth Opportunities Fund
19
F I N A N C I A L S T A T E M E N T S
| Issuer | Shares | Value |
| Retail Trade (continued) | ||
| MSC Industrial Direct Company, Inc., Class A | 1,000 | $51,800 |
| NBTY, Inc. * | 25,200 | 924,840 |
| New York & Company, Inc. * | 1,200 | 7,920 |
| Pacific Sunwear of California, Inc. * | 12,000 | 168,120 |
| Pantry, Inc. * | 300 | 9,999 |
| PetSmart, Inc. | 17,400 | 603,780 |
| RadioShack Corp. | 37,500 | 891,375 |
| Regis Corp. | 2,600 | 85,826 |
| Rent-A-Center, Inc. * | 17,000 | 326,740 |
| Rite Aid Corp. * (a) | 48,400 | 245,388 |
| Ross Stores, Inc. | 15,000 | 417,450 |
| Saks, Inc. * | 10,500 | 169,785 |
| Systemax, Inc. * (a) | 1,300 | 24,180 |
| The Buckle, Inc. | 3,750 | 140,287 |
| The Men’s Wearhouse, Inc. | 11,000 | 557,480 |
| Tiffany & Company | 21,200 | 1,088,196 |
| Tween Brands, Inc. * | 6,800 | 200,600 |
| Urban Outfitters, Inc. * | 30,000 | 687,000 |
| Williams-Sonoma, Inc. (a) | 6,400 | 213,312 |
| Sanitary Services 0.28% | 320,000 | |
| Nalco Holding Company | 12,800 | 320,000 |
| Semiconductors 1.91% | 2,211,416 | |
| Amkor Technology, Inc. * | 23,700 | 273,024 |
| Novellus Systems, Inc. * | 14,700 | 402,339 |
| ON Semiconductor Corp. * | 8,900 | 104,308 |
| Skyworks Solutions, Inc. * | 26,400 | 208,296 |
| Tessera Technologies, Inc. * | 900 | 32,967 |
| Varian Semiconductor Equipment Associates, Inc. * | 21,400 | 1,190,482 |
| Software 2.08% | 2,398,412 | |
| Activision, Inc. * | 6,600 | 128,634 |
| BMC Software, Inc. * | 32,700 | 1,001,274 |
| Citrix Systems, Inc. * | 4,400 | 159,940 |
| Compuware Corp. * | 36,600 | 296,826 |
| FARO Technologies, Inc. * | 2,500 | 100,525 |
| i2 Technologies, Inc. * (a) | 3,500 | 55,580 |
| Macrovision Corp. * | 4,700 | 111,531 |
| Manhattan Associates, Inc. * | 6,500 | 187,720 |
| Riverbed Technology, Inc. * | 1,200 | 53,280 |
| Sybase, Inc. * | 9,400 | 216,670 |
| Synchronoss Technologies, Inc. * | 1,200 | 41,688 |
| Take-Two Interactive Software, Inc. * (a) | 2,800 | 44,744 |
See notes to financial statements
Growth Opportunities Fund
20
F I N A N C I A L S T A T E M E N T S
| Issuer | Shares | Value |
| Steel 1.29% | $1,495,204 | |
| AK Steel Holding Corp. * | 18,400 | 736,000 |
| Chaparral Steel Company | 3,400 | 290,700 |
| Steel Dynamics, Inc. | 10,800 | 468,504 |
| Telecommunications Equipment & Services 1.89% | 2,178,454 | |
| ADC Telecommunications, Inc. * | 8,900 | 162,870 |
| CommScope, Inc. * | 3,400 | 192,440 |
| Comtech Telecommunications Corp. * | 4,500 | 191,520 |
| Golden Telecom, Inc. (a) | 3,900 | 267,579 |
| J2 Global Communications, Inc. * | 4,600 | 156,400 |
| Plantronics, Inc. | 2,600 | 73,840 |
| Polycom, Inc. * | 25,700 | 778,967 |
| Premiere Global Services, Inc. * | 4,500 | 58,860 |
| SAVVIS, Inc. * | 2,800 | 111,244 |
| Sonus Networks, Inc. * | 28,700 | 165,886 |
| UTStarcom, Inc. * (a) | 6,200 | 18,848 |
| Tires & Rubber 1.15% | 1,333,212 | |
| Goodyear Tire & Rubber Company * (a) | 48,200 | 1,333,212 |
| Tobacco 0.06% | 73,150 | |
| Alliance One International, Inc. * | 9,500 | 73,150 |
| Toys, Amusements & Sporting Goods 1.28% | 1,479,950 | |
| Hasbro, Inc. | 37,000 | 1,043,770 |
| Marvel Entertainment, Inc. * | 19,300 | 436,180 |
| Transportation 0.34% | 389,426 | |
| Horizon Lines, Inc. (a) | 3,300 | 93,093 |
| Kirby Corp. * | 300 | 11,484 |
| Overseas Shipholding Group, Inc. | 3,700 | 264,180 |
| Saia, Inc. * | 1,100 | 20,669 |
| Trucking & Freight 0.54% | 622,504 | |
| Arkansas Best Corp. | 4,400 | 157,960 |
| Celadon Group, Inc. * | 4,500 | 70,200 |
| Forward Air Corp. | 3,300 | 115,632 |
| J.B. Hunt Transport Services, Inc. | 3,800 | 109,326 |
| Old Dominion Freight Lines, Inc. * | 3,100 | 89,280 |
| YRC Worldwide, Inc. * | 2,600 | 80,106 |
See notes to financial statements
Growth Opportunities Fund
21
F I N A N C I A L S T A T E M E N T S
| Principal | ||
| Issuer, description, maturity date | amount | Value |
| Short-term investments 13.22% | $15,270,409 | |
| (Cost $15,270,409) | ||
| Repurchase Agreements 1.80% | 2,077,000 | |
| Repurchase Agreement with State Street Corp. dated 08-31-07 | ||
| at 4.60% to be repurchased at $2,078,062 on 09-04-07, | ||
| collateralized by $2,200,000 Federal Home Loan Mortgage Corp., | ||
| 4.00%, due 06-12-13 (valued at $2,123,000, including interest) | $2,077,000 | 2,077,000 |
| Issuer | Shares | Value |
| Cash Equivalents 11.42% | 13,193,409 | |
| John Hancock Cash Investment Trust (c) | 13,193,409 | 13,193,409 |
| Total investments (Cost $136,448,125) 111.39% | $128,715,590 | |
| Liabilities in excess of other assets (11.39%) | (13,162,638) | |
| Total net assets 100.00% | $115,552,952 | |
Percentages are stated as a percent of net assets.
* Non-income-producing.
REIT Real Estate Investment Trust.
(a) All or a portion of this security was out on loan.
(c) Investment is an affiliate of the Trust’s adviser or subadviser.
See notes to financial statements
Growth Opportunities Fund
22
F I N A N C I A L S T A T E M E N T S
Financial statements
Statement of assets and liabilities 8-31-07 (unaudited)
This Statement of Assets and Liabilities is the Fund’s balance sheet. It shows the value of what the Fund owns, is due and owes. You’ll also find the net asset value per share and the maximum offering price per share.
| Assets | |
| Investments in unaffiliated issuers, at value (cost $121,177,716) including | |
| $12,934,715 of securities loaned (Note 2) | $113,445,181 |
| Repurchase agreement, at value (cost $2,077,000) | 2,077,000 |
| Investments in affiliated issuers, at value (cost $13,193,409) | 13,193,409 |
| Total investments, at value (cost $136,448,125) | 128,715,590 |
| Cash | 832 |
| Cash collateral at broker for futures contracts | 100,000 |
| Receivable for fund shares sold | 24,833 |
| Dividends and interest receivable | 34,420 |
| Receivable for futures variation margin | 10,113 |
| Receivable due from adviser | 87,923 |
| Other assets | 24,331 |
| Total assets | 128,998,042 |
| Liabilities | |
| Payable for fund shares repurchased | 180,937 |
| Payable upon return of securities loaned (Note 2) | 13,193,409 |
| Payable to affiliates | |
| Fund administration fees | 1,979 |
| Transfer agent fees | 9,326 |
| Distribution and service fees | 44,040 |
| Other payables and accrued expenses | 15,399 |
| Total liabilities | 13,445,090 |
| Net assets | |
| Capital paid-in | $101,559,890 |
| Accumulated undistributed net realized gain on investments and futures contracts | 22,034,610 |
| Net unrealized depreciation on investments and futures contracts | (7,730,183) |
| Accumulated net investment loss | (311,365) |
| Net assets | $115,552,952 |
| Net asset value per share | |
| Based on net asset valued and shares outstanding — the Fund has an | |
| unlimited number of shares authorized with no par value. | |
| Class A ($93,473,295 ÷ 3,886,219) | $24.05 |
| Class B ($17,805,358 ÷ 746,146)1 | $23.86 |
| Class C ($3,626,930 ÷ 151,917)1 | $23.87 |
| Class I ($216,127 ÷ 8,936) | $24.19 |
| Class R1 ($116,149 ÷ 4,849) | $23.95 |
| Class 1 ($315,093 ÷ 13,023) | $24.19 |
| Maximum offering price per share | |
| Class A2 ($24.05 ÷ 95%) | $25.32 |
1 Redemption price is equal to net asset value less any applicable contingent deferred sales charge.
2 On single retail sales of less than $50,000. On sales of $50,000 or more and on group sales offering price is reduced.
See notes to financial statements
Growth Opportunities Fund
23
F I N A N C I A L S T A T E M E N T S
Statement of operations For the period ended 8-31-07 (unaudited)1
This Statement of Operations summarizes the Fund’s investment income earned and expenses incurred in operating the Fund. It also shows net gains (losses) for the period stated.
| Investment income | |
| Dividends | $194,590 |
| Interest | 32,682 |
| Securities lending | 12,895 |
| Total investment income | 240,167 |
| Expenses | |
| Investment management fees (Note 3) | 267,726 |
| Distribution and service fees (Note 3) | 143,623 |
| Transfer agent fees (Note 3) | 58,524 |
| Fund administration fees (Note 3) | 2,056 |
| Audit and legal fees | 109,551 |
| Blue sky fees (Note 3) | 45,867 |
| Custodian fees | 40,050 |
| Registration and filing fees | 16,703 |
| Printing and postage fees (Note 3) | 3,207 |
| Trustees’ fees (Note 3) | 282 |
| Miscellaneous | 888 |
| Total expenses | 688,477 |
| Less expense reductions (Note 3) | (136,945) |
| Net expenses | 551,532 |
| Net investment loss | (311,365) |
| Realized and unrealized gain (loss) | |
| Net realized gain (loss) on | |
| Investments | 22,174,819 |
| Futures contracts | (224,010) |
| 21,950,809 | |
| Changes in net unrealized appreciation (depreciation) of | |
| Investments in unaffiliated issuers | (29,394,968) |
| Futures contracts | 12,808 |
| (29,382,160) | |
| Net realized and unrealized loss | (7,431,351) |
| Decrease in net assets from operations | ($7,742,716) |
1 Semiannual period from 3-1-07 to 8-31-07.
See notes to financial statements
Growth Opportunities Fund
24
F I N A N C I A L S T A T E M E N T S
Statement of changes in net assets
These Statements of Changes in Net Assets show how the value of the Fund’s net assets has changed during the last two periods. The difference reflects earnings less expenses, any investment gains and losses, distributions, if any, paid to shareholders and the net of Fund share transactions.
| Year | Period | |
| ended | ended | |
| 2-28-07 | 8-31-071 | |
| Increase (decrease) in net assets | ||
| From operations | ||
| Net investment loss | ($15,019) | ($311,365) |
| Net realized gain | 145,591 | 21,950,809 |
| Change in net unrealized appreciation (depreciation) | 223,455 | (29,382,160) |
| Increase (decrease) in net assets resulting from operations | 354,027 | (7,742,716) |
| Distributions to shareholders | ||
| From net realized gain | ||
| Class A | (38,393) | — |
| Class B | (2,305) | — |
| Class C | (5,246) | — |
| Class I | (1,806) | — |
| Class R1 | (1,078) | — |
| Class 1 | (1,082) | — |
| Total distributions | (49,910) | — |
| From Fund share transactions | 4,626,956 | 116,466,537 |
| Total increase | 4,931,073 | 108,723,821 |
| Net assets | ||
| Beginning of period | 1,898,058 | 6,829,131 |
| End of period2 | $6,829,131 | $115,552,952 |
1 Semiannual period from 3-1-07 to 8-31-07. Unaudited.
2 Includes accumulated net investment income (loss) of $0 and ($311,365), respectively.
See notes to financial statements
Growth Opportunities Fund
25
F I N A N C I A L S T A T E M E N T S
Financial highlights
The Financial Highlights show how the Fund’s net asset value for a share has changed since the end of the previous period.
| CLASS A SHARES | |||
| Period ended | 2-28-061 | 2-28-072 | 8-31-074 |
| Per share operating performance | |||
| Net asset value, beginning of period | 21.31 | $23.29 | $24.34 |
| Net investment income (loss)6 | 0.04 | (0.07)7 | (0.10) |
| Net realized and unrealized | |||
| gain (loss) on investments | 1.94 | 1.36 | (0.19) |
| Total from investment operations | 1.98 | 1.29 | (0.29) |
| Less distributions | |||
| From net realized gain | — | (0.24) | — |
| Net asset value, end of period | $23.29 | $24.34 | $24.05 |
| Total return8,10 (%) | 9.299 | 5.5712 | (1.19)9 |
| Ratios and supplemental data | |||
| Net assets, end of period | |||
| (in millions) | $2 | $5 | $93 |
| Ratio of net expenses to average | |||
| net assets (%) | 0.4811 | 1.32 | 1.5211 |
| Ratio of gross expenses to average | |||
| net assets (%) | 5.4511,13 | 5.59 | 1.8211,13 |
| Ratio of net investment income (loss) | |||
| to average net assets (%) | 0.4111 | (0.34)7 | (0.80)11 |
| Portfolio turnover (%) | 4310 | 96 | 16210 |
See notes to financial statements
Growth Opportunities Fund
26
F I N A N C I A L S T A T E M E N T S
Financial highlights
| CLASS B SHARES | ||
| Period ended | 2-28-073 | 8-31-074 |
| Per share operating performance | ||
| Net asset value, beginning of period | $22.17 | $24.23 |
| Net investment loss6 | (0.20)7 | (0.18) |
| Net realized and unrealized | ||
| gain (loss) on investments | 2.50 | (0.19) |
| Total from investment operations | 2.30 | (0.37) |
| Less distributions | ||
| From net realized gain | (0.24) | — |
| Net asset value, end of period | $24.23 | $23.86 |
| Total return8,10 (%) | 10.409 | (1.53)9 |
| Ratios and supplemental data | ||
| Net assets, end of period | ||
| (in millions) | —14 | $18 |
| Ratio of net expenses to average | ||
| net assets (%) | 2.2211 | 2.2411 |
| Ratio of gross expenses to average | ||
| net assets (%) | 14.6211,13 | 2.6311,13 |
| Ratio of net investment loss | ||
| to average net assets (%) | (1.21)7,11 | (1.53)11 |
| Portfolio turnover (%) | 9610 | 16210 |
See notes to financial statements
Growth Opportunities Fund
27
F I N A N C I A L S T A T E M E N T S
Financial highlights
| CLASS C SHARES | ||
| Period ended | 2-28-073 | 8-31-074 |
| Per share operating performance | ||
| Net asset value, beginning of period | $22.17 | $24.23 |
| Net investment loss6 | (0.19)7 | (0.19) |
| Net realized and unrealized | ||
| gain (loss) on investments | 2.49 | (0.17) |
| Total from investment operations | 2.30 | (0.36) |
| Less distributions | ||
| From net realized gain | (0.24) | — |
| Net asset value, end of period | $24.23 | $23.87 |
| Total return8,10 (%) | 10.409 | (1.49)9 |
| Ratios and supplemental data | ||
| Net assets, end of period | ||
| (in millions) | $1 | $4 |
| Ratio of net expenses to average | ||
| net assets (%) | 2.2211 | 2.2311 |
| Ratio of gross expenses to average | ||
| net assets (%) | 10.4311,13 | 3.5011,13 |
| Ratio of net investment loss | ||
| to average net assets (%) | (1.15)7,11 | (1.52)11 |
| Portfolio turnover (%) | 9610 | 16210 |
See notes to financial statements
Growth Opportunities Fund
28
F I N A N C I A L S T A T E M E N T S
Financial highlights
| CLASS I SHARES | ||
| Period ended | 2-28-073 | 8-31-074 |
| Per share operating performance | ||
| Net asset value, beginning of period | $22.17 | $24.41 |
| Net investment loss6 | (0.02)7 | (0.04) |
| Net realized and unrealized | ||
| gain (loss) on investments | 2.50 | (0.18) |
| Total from investment operations | 2.48 | (0.22) |
| Less distributions | ||
| From net realized gain | (0.24) | — |
| Net asset value, end of period | $24.41 | $24.19 |
| Total return8,10 (%) | 11.229 | (0.90)9 |
| Ratios and supplemental data | ||
| Net assets, end of period | ||
| (in millions) | —14 | —14 |
| Ratio of net expenses to average | ||
| net assets (%) | 1.1311 | 1.0011 |
| Ratio of gross expenses to average | ||
| net assets (%) | 16.2611,13 | 10.1211,13 |
| Ratio of net investment loss | ||
| to average net assets (%) | (0.10)7,11 | (0.32)11 |
| Portfolio turnover (%) | 9610 | 16210 |
See notes to financial statements
Growth Opportunities Fund
29
F I N A N C I A L S T A T E M E N T S
Financial highlights
| CLASS R1 SHARES | ||
| Period ended | 2-28-073,5 | 8-31-074 |
| Per share operating performance | ||
| Net asset value, beginning of period | $22.17 | $24.27 |
| Net investment loss6 | (0.14)7 | (0.14) |
| Net realized and unrealized | ||
| gain (loss) on investments | 2.48 | (0.18) |
| Total from investment operations | 2.34 | (0.32) |
| Less distributions | ||
| From net realized gain | (0.24) | — |
| Net asset value, end of period | $24.27 | $23.95 |
| Total return8,10 (%) | 10.589 | (1.32)9 |
| Ratios and supplemental data | ||
| Net assets, end of period | ||
| (in millions) | —14 | —14 |
| Ratio of net expenses to average | ||
| net assets (%) | 1.8811 | 1.8311 |
| Ratio of gross expenses to average | ||
| net assets (%) | 24.2011,13 | 18.8911,13 |
| Ratio of net investment loss | ||
| to average net assets (%) | (0.86)7,11 | (1.15)11 |
| Portfolio turnover (%) | 9610 | 16210 |
See notes to financial statements
Growth Opportunities Fund
30
F I N A N C I A L S T A T E M E N T S
Financial highlights
| CLASS 1 SHARES | ||
| Period ended | 2-28-073 | 8-31-074 |
| Per share operating performance | ||
| Net asset value, beginning of period | $22.17 | $24.42 |
| Net investment loss6 | (0.02)7 | (0.04) |
| Net realized and unrealized | ||
| gain (loss) on investments | 2.51 | (0.19) |
| Total from investment operations | 2.49 | (0.23) |
| Less distributions | ||
| From net realized gain | (0.24) | — |
| Net asset value, end of period | $24.42 | $24.19 |
| Total return8,10 (%) | 11.269 | (0.94)9 |
| Ratios and supplemental data | ||
| Net assets, end of period | ||
| (in millions) | —14 | —14 |
| Ratio of net expenses to average | ||
| net assets (%) | 1.0911 | 1.0211 |
| Ratio of gross expenses to average | ||
| net assets (%) | 3.8111,13 | 2.2311,13 |
| Ratio of net investment loss | ||
| to average net assets (%) | (0.10)7,11 | (0.34)11 |
| Portfolio turnover (%) | 9610 | 16210 |
1 Class A shares began operations on 9-16-05.
2 Effective June 12, 2006, shareholders of the former GMO Small/Mid Cap Growth Fund (the Predecessor Fund) became owners of an equal number of full and fractional Class A shares of the John Hancock Growth Opportunities Fund. Additionally, the accounting and performance history of the former GMO Small/Mid Cap Growth Fund was redesignated as that of John Hancock Growth Opportunities Fund Class A.
3 Class B, Class C, Class I, Class R1 and Class 1 shares began operations on 6-12-06.
4 Semiannual period from 3-1-07 to 8-31-07. Unaudited.
5 Effective November 6, 2006, the Board of Trustees elected to change the name of Class R to Class R1.
6 Based on the average of the shares outstanding.
7 Net investment loss per share and ratio of net investment loss to average net assets reflects a special dividend received by the Fund which amounted to the following amounts:
| Percentage | ||
| of average | ||
| Per share | net assets | |
| Class A | $0.03 | 0.14% |
| Class B | 0.02 | 0.11 |
| Class C | 0.03 | 0.11 |
| Class I | 0.03 | 0.11 |
| Class R1 | 0.02 | 0.11 |
| Class 1 | 0.02 | 0.10 |
8 Assumes dividend reinvestment.
9 Total returns would have been lower had certain expenses not been reduced during the periods shown.
10 Not annualized.
11 Annualized.
12 Class A returns linked back to the Predecessor Fund.
13 Does not take into consideration expense reductions during the periods shown.
14 Less than $500,000.
See notes to financial statements
Growth Opportunities Fund
31
Notes to financial statements (unaudited)
1. Organization
John Hancock Growth Opportunities Fund (the Fund) is a newly organized non-diversified series of John Hancock Funds III (the Trust). The Trust was established as a Massachusetts business trust on June 9, 2005. The Trust is registered under the Investment Company Act of 1940, as amended (the 1940 Act), as an open-end investment management company. The investment objective of the Fund is to seek long-term capital growth.
John Hancock Life Insurance Company of New York (John Hancock New York) is a wholly owned subsidiary of John Hancock Life Insurance Company (U.S.A.) (John Hancock USA). John Hancock USA and John Hancock New York are indirect wholly owned subsidiaries of The Manufacturers Life Insurance Company (Manulife), which in turn is a wholly owned subsidiary of Manulife Financial Corporation (MFC), a publicly traded company. MFC and its subsidiaries are known collectively as “Manulife Financial.”
John Hancock Investment Management Services, LLC (the Adviser), a Delaware limited liability company controlled by John Hancock USA, serves as investment adviser for the Trust and John Hancock Funds, LLC (the Distributor), a Delaware limited liability company, an affiliate of the Adviser, serves as principal underwriter.
The Board of Trustees has authorized the issuance of multiple classes of shares of the Fund, including classes designated as Class A, Class B, Class C, Class I, Class R1, Class 1, Class 3 and Class NAV shares. The shares of each class represent an interest in the same portfolio of investments of the Fund, and have equal rights as to voting, redemptions, dividends and liquidation, except that certain expenses, subject to the approval of the Board of Trustees, may be applied differently to each class of shares in accordance with current regulations of the Securities and Exchange Commission (SEC) and the Internal Revenue Service. Shareholders of a class that bear distribution and service expenses under the terms of a distribution plan have exclusive voting rights to that distribution plan. Class B shares will convert to Class A eight years after purchase.
Class 1 shares are sold only to certain exempt separate accounts of John Hancock USA and John Hancock New York.
The Fund is the accounting and performance successor to the GMO Small/Mid Cap Growth Fund (the Predecessor Fund), a diversified open-end management investment company organized as a Massachusetts business trust. On June 12, 2006, the Fund acquired substantially all the assets and assumed the liabilities of the Predecessor Fund pursuant to an agreement and plan of reorganization, in exchange for Class A shares of the Fund.
The Adviser and other affiliates of John Hancock USA owned 81,374, 4,556, 4,556, 4,556, 4,556 and 4,556 shares of beneficial interest of Class A, Class B, Class C, Class I, Class R1 and Class 1, respectively, of the Fund on August 31, 2007.
2. Significant accounting policies
In the preparation of the financial statements, the Fund follows the policies described below. The preparation of financial statements in conformity with accounting principles generally accepted in the United States of America requires management to make estimates and assumptions that affect the reported amounts of assets and liabilities at the date of the financial statements and the reported amounts of income and expenses during the reporting period. Actual results may differ from these estimates.
Growth Opportunities Fund
32
Security valuation
The net asset value of the shares of Class A, Class B, Class C, Class I, Class R1 and Class 1 of the Fund is determined daily as of the close of the New York Stock Exchange (NYSE), normally at 4:00 p.m., Eastern Time. Short-term debt instruments with remaining maturities of 60 days or less are valued at amortized cost, and thereafter assume a constant amortization to maturity of any discount or premium, which approximates market value. Investments in John Hancock Cash Investment Trust (JHCIT), an affiliate of the John Hancock Advisers, LLC (JHA), a wholly owned subsidiary of John Hancock Financial Services, Inc., a subsidiary of MFC, are valued at their net asset value each business day. All other securities held by the Fund are valued at the last sale price or official closing price (closing bid price or last evaluate d quote if no sale has occurred) as of the close of business on a principal securities exchange (domestic or foreign) on which they trade or, lacking any sales, at the closing bid price. Securities traded only in the over-the counter market are valued at the last bid price quoted by brokers making markets in the securities at the close of trading. Fund securities for which there are no such quotations, principally debt securities, are valued based on the valuation provided by an independent pricing service, which utilizes both dealer-supplied and electronic data processing techniques, which take into account factors such as institutional-size trading in similar groups of securities, yield, quality, coupon rate, maturity, type of issue, trading characteristics and other market data.
Other assets and securities for which no such quotations are readily available are valued at their fair value as determined in good faith under consistently applied procedures established by and under the general supervision of the Board of Trustees. Generally, trading in non-U.S. securities is substantially completed each day at various times prior to the close of trading on the NYSE. The values of such securities used in computing the net asset value of a Fund’s shares are generally determined as of such times. Occasionally, significant events that affect the values of such securities may occur between the times at which such values are generally determined and the close of the NYSE. Upon such an occurrence, these securities will then be valued at their fair value as determined in good faith under consistently applied procedures established by and under the general supervision of the Board of Trustees.
Repurchase agreements
The Fund may enter into repurchase agreements. When the Fund enters into a repurchase agreement through its custodian, it receives delivery of securities, the amount of which at the time of purchase and each subsequent business day is required to be maintained at such a level that the market value is generally at least 102% of the repurchase amount. The Fund will take constructive receipt of all securities underlying the repurchase agreements it has entered into until such agreements expire. If the seller defaults, the Fund would suffer a loss to the extent that proceeds from the sale of underlying securities were less than the repurchase amount. The Fund may enter into repurchase agreements maturing within seven days with domestic dealers, banks or other financial institutions deemed to be creditworthy by the Adviser. Collateral for certain tri-party repurchase agreements is held at the custodian bank in a segregated account for the benefit of the Fund and the counterpa rty.
Security transactions and related investment income
Investment security transactions are accounted for on a trade date plus one basis for daily net asset value calculations. However, for financial reporting purposes, investment transactions are reported on trade date. Interest income is accrued as earned. Dividend income is recorded on the ex-dividend date. Foreign dividends are recorded on the ex-date or when the Fund becomes aware of the dividends from cash collections. Discounts/premiums are accreted/amortized for financial reporting purposes. Non-cash dividends are recorded at the fair market value of the securities received. Debt obligations may be placed in a non-accrual status and related interest income may be reduced by ceasing current accruals and writing off interest receivables when the collection of all
Growth Opportunities Fund
33
or a portion of interest has become doubtful, based upon consistently applied procedures.
From time to time, the Fund may invest in Real Estate Investment Trusts (REITs) and as a result, will estimate the components of distributions from these securities. Distributions from REITs received in excess of income are recorded as a reduction of cost of investments and/or as a realized gain.
The Fund uses the First In, First Out method for fixed income securities and Highest Cost, First Out for all other securities for determining realized gain or loss on investments for both financial and federal income tax reporting purposes.
Multi-class allocations
All income, expenses (except for class-specific expenses) and realized and unrealized gains (losses) are allocated to each class of shares based upon the relative net assets of each class. Dividends to shareholders from net investment income are determined at a class level and distributions from capital gains are determined at a Fund level.
Expense allocation
Expenses are allocated based on the relative share of net assets of the Fund at the time the expense was incurred. Class-specific expenses, such as distribution (Rule 12b-1) fees, are accrued daily and charged directly to the respective share classes.
Securities lending
The Fund may lend securities in amounts up to 33 1 / 3% of the Fund’s total assets. Such loans are callable at any time and are at all times fully secured by cash, cash equivalents or securities issued or guaranteed by the U.S. government or its agencies or instrumentalities and marked-to-market on a daily basis. The Fund may bear the risk of delay in recovery of, or even of rights in, the securities loaned should the borrower of the securities fail financially.
The Fund receives compensation for lending its securities either in the form of fees and/or by retaining a portion of interest on the investment of any cash received as collateral. The Fund invests in cash collateral received in connection with securities lending transactions in JHCIT, a Delaware common law trust and an affiliated fund. JHCIT is exempt from registration under Section 3(c)(7) of the 1940 Act (pursuant to exemptive order issued by the SEC) and is managed by the Adviser, for which the Adviser receives an investment advisory fee of 0.04% of the average daily net assets of the JHCIT.
All collateral received will be in an amount equal to at least 100% of the market value of the loaned securities and is intended to be maintained at that level during the period of the loan. The market value of the loaned securities is determined at the close of business of the Fund and any additional required collateral is delivered to the Fund the next business day. During the loan period, the Fund continues to retain rights of ownership, including dividends and interest of the loaned securities. As of August 31, 2007, the Fund loaned securities having a market value of $12,934,715 collateralized by cash invested in securities in the amount of $13,193,409.
Futures
The Fund may purchase and sell financial futures contracts and options on those contracts. The Fund invests in contracts based on financial instruments such as U.S. Treasury Bonds or Notes or on securities indices such as the Standard & Poor’s 500 Index, in order to hedge against a decline in the value of securities owned by the Fund.
Initial margin deposits required upon entering into futures contracts are satisfied by the delivery of specific securities or cash as collateral to the broker (the Funds’ agent in acquiring the futures position). If the position is closed out by taking an opposite position prior to the settlement date of the futures contract, a final determination of variation margin is made, cash is required to be paid to or released by the broker and the Fund realizes a gain or loss.
When the Fund sells a futures contract based on a financial instrument, the Fund becomes obligated to deliver that kind of instrument at an agreed upon date for a specified price. The Fund realizes a gain or loss depending on whether the price of an offsetting purchase is less or more than the price of the initial sale or on whether the price of an offsetting sale is more or less than the price of the initial purchase. The Fund could
Growth Opportunities Fund
34
be exposed to risks if it could not close out futures positions because of an illiquid secondary market or the inability of counterparties to meet the terms of their contracts. Futures contracts are valued at the quoted daily settlement prices established by the exchange on which they trade.
The following is a summary of open futures contracts on August 31, 2007:
| NUMBER OF | UNREALIZED | |||
| OPEN CONTRACTS | CONTRACTS | POSITION | EXPIRATION | APPRECIATION |
| Russell 2000 E-mini | ||||
| Index Futures | 4 | Long | Sep 2007 | $1,630 |
| S&P Mid 400 E-mini | ||||
| Index Futures | 3 | Long | Sep 2007 | 722 |
| $2,352 | ||||
Federal income taxes
The Fund qualifies as a “regulated investment company” by complying with the applicable provisions of the Internal Revenue Code and will not be subject to federal income tax on taxable income. Therefore, no federal income tax provision is required.
New accounting pronouncements
In June 2006, Financial Accounting Standards Board (FASB) Interpretation No. 48, Accounting for Uncertainty in Income Taxes (the Interpretation) was issued, and is effective for fiscal years beginning after December 15, 2006 and is to be applied to all open tax years as of the effective date. This Interpretation prescribes a minimum threshold for financial statement recognition of the benefit of a tax position taken or expected to be taken in a tax return, and requires certain expanded disclosures. Management has evaluated the application of this Interpretation to the Fund and does not believe there is a material impact resulting from the adoption of this Interpretation on the Fund’s financial statements.
In September 2006, FASB Standard No. 157, Fair Value Measurements (FAS 157), was issued and is effective for fiscal years beginning after November 15, 2007. FAS 157 defines fair value, establishing a framework for measuring fair value and expands disclosure about fair value measurements. Management is currently evaluating the application of FAS 157 to the Fund and its impact, if any, resulting from the adoption of FAS 157 on the Fund’s financial statements.
Distribution of income and gains
The Fund records distributions to shareholders from net investment income and net realized gains, if any, on the ex-dividend date. During the year ended February 28, 2007, the tax character of distributions paid was as follows: ordinary income $37,434 and long-term capital gains $12,476. Distributions paid by the Fund with respect to each class of shares are calculated in the same manner, at the same time and are in the same amount, except for the effect of expenses that may be applied differently to each class.
Such distributions, on a tax basis, are determined in conformity with income tax regulations, which may differ from accounting principles generally accepted in the United States of America. Distributions in excess of tax basis earnings and profits, if any, are reported in the Fund’s financial statements as a return of capital.
Capital accounts
The Fund reports the undistributed net investment income and accumulated undistributed net realized gain (loss) accounts on a basis approximating amounts available for future tax distributions (or to offset future taxable realized gains when a capital loss carryforward is available). Accordingly, the Fund may periodically make reclassifications among certain capital accounts without affecting its net asset value.
Growth Opportunities Fund
35
3. Investment advisory and other agreements
Advisory fees
The Trust has entered into an Investment Advisory Agreement with the Adviser. The Adviser is responsible for managing the corporate and business affairs of the Trust and for selecting and compensating subadvisers to handle the investment of the assets of the Fund, subject to the supervision of the Trust’s Board of Trustees. Under the Advisory Agreement, the Fund pays a monthly management fee to the Adviser equivalent, on an annual basis, to the sum of: (a) 0.80% of the first $500,000,000 of the Fund’s aggregate daily net assets; (b) 0.78% of the next $500,000,000 of the Fund’s aggregate daily net assets; (c) 0.77% of the next $1,500,000,000 of the Fund’s aggregate daily net assets; and (d) 0.76% of the Fund’s aggregate daily net assets in excess of $2,500,000,000. Aggregate net assets include the net assets of the Fund and Growth Opportunities Trust, a series of John Hancock Trust and Growth Opportunities Fund, a series of John Hancock Funds II. The Adviser has a subadvisory agreement with Grantham, Mayo, Van Otterloo & Co. LLC. The Fund is not responsible for payment of the subadvisory fees.
Expense reimbursements
The Adviser has agreed contractually to reimburse for certain fund level expenses that exceed 0.24% of the average annual net assets, or to make a payment to a specific class of shares of the Fund in an amount equal to the amount by which the expenses attributable to such class of shares (excluding taxes, portfolio brokerage commissions, interest, litigation and indemnification expenses and other extraordinary expenses not incurred in the ordinary course of the Fund’s business and fees under any agreement or plans of the Fund dealing with services for shareholders and others with beneficial interests in shares of the Fund) exceed the percentage of average annual net assets (on an annualized basis) attributable as follows: 1.54% for Class A, 2.24% for Class B, 2.24% for Class C, 1.14% for Class I, 1.64% for Class R1 and 1.09% for Class 1. Accordingly, the expense reductions related to this expense limitation amounted to $80,192, $19,565, $14,595, $10,584, $10,078 and $1,931 for Class A, Class B, Class C, Class I, Class R1 and Class 1, respectively, for the period ended August 31, 2007. This expense reimbursement shall continue in effect until June 30, 2008 and thereafter until terminated by the Adviser on notice to the Trust.
Administration fees
The Fund has an agreement with the Adviser that requires the Fund to reimburse the Adviser for all expenses associated with providing the administrative, financial, accounting and recordkeeping services of the Fund, including the preparation of all tax returns, annual, semiannual and periodic reports to shareholders and the preparation of all regulatory reports. These expenses are allocated based on the relative net assets of each class. The compensation for the period amounted to $2,056 with an effective rate of 0.01% of the Fund’s average daily net assets.
Distribution plan
The Trust has a Distribution Agreement with the Distributor. The Fund has adopted Distribution Plans with respect to Class A, Class B, Class C, Class R1 and Class 1, pursuant to Rule 12b-1 under the 1940 Act, to reimburse the Distributor for the services it provides as distributor of shares of the Fund. Accordingly, the Fund makes monthly payments to the Distributor at an annual rate not to exceed 0.30%, 1.00%, 1.00%, 0.50% and 0.05% of average daily net asset value of Class A, Class B, Class C, Class R1 and Class 1, respectively. A maximum of 0.25% of such payments may be service fees, as defined by the Conduct Rules of Financial Industry Regulatory Authority (formerly the National Association of Securities Dealers). Under the Conduct Rules, curtailment of a portion of the Fund’s 12b-1 payments could occur under certain circumstances. In addition, under a Service Plan for Class R1 shares, the Fund pays up to 0.25% of Class R1 average daily net asset value for certa in other services.
Sales charges
Class A shares are assessed up-front sales charges of up to 5.00% of net asset value of such shares. During the period ended August 31, 2007, the Fund was informed
Growth Opportunities Fund
36
that the Distributor received net up-front sales charges of $49,385 with regard to sales of Class A shares. Of this amount, ($9,808) was retained and used for printing prospectuses, advertising, sales literature and other purposes, $57,377 was paid as sales commissions to unrelated brokerdealers and $1,816 was paid as sales commissions to sales personnel of Signator Investors, Inc. (Signator Investors), a related broker-dealer and indirect subsidiary of MFC.
Class B shares that are redeemed within six years of purchase are subject to a contingent deferred sales charge (CDSC) at declining rates, beginning at 5.00% of the lesser of the current market value at the time of redemption or the original purchase cost of the shares being redeemed. Class C shares that are redeemed within one year of purchase are subject to a CDSC at a rate of 1.00% of the lesser of the current market value at the time of redemption or the original purchase cost of the shares being redeemed. Proceeds from the CDSCs are paid to the Distributor and are used, in whole or in part, to defray its expenses for providing distribution-related services to the Fund in connection with the sale of Class B and Class C shares. During the period ended August 31, 2007, CDSCs received by JH Funds amount to $8,944 for Class B and $99 for Class C.
Transfer agent fees
The Fund has a Transfer Agency Agreement with John Hancock Signature Services, Inc. (Signature Services), an indirect subsidiary of MFC. For Class A, Class B, Class C, Class I and Class R1 shares, the Fund pays a monthly transfer agent fee at an annual rate of 0.05% of each class’ average daily net assets, plus a fee based on the number of shareholder accounts and reimbursement for certain out-of-pocket expenses. Expenses not directly attributable to a particular class of shares are aggregated and allocated to each class on the basis of its relative net asset value.
Signature Services has agreed to limit the transfer agent fees so that such fees do not exceed 0.20% annually of Class A, Class B, Class C, Class I and Class R1 share average daily net assets. This agreement is effective until December 31, 2007. Signature Services reserves the right to terminate this limitation in the future. Accordingly, there were no transfer agent fee reductions for Class A, Class B, Class C, Class I and Class R1 shares, respectively, during the period ended August 31, 2007.
Expenses under the agreements described above for the period ended August 31, 2007, were as follows:
| Distribution and | Transfer | Blue sky | Printing and | |
| Share Class | service fees | agent fees | fees | postage fees |
| Class A | $80,662 | $45,949 | $9,472 | $2,223 |
| Class B | 50,903 | 10,181 | 9,115 | 245 |
| Class C | 11,534 | 2,307 | 9,094 | 91 |
| Class I | — | 58 | 9,092 | 261 |
| Class R1 | 444 | 29 | 9,094 | 363 |
| Class 1 | 80 | — | — | 24 |
| Total | $143,623 | $58,524 | $45,867 | $3,207 |
Growth Opportunities Fund
37
Trustees’ fees
The Trust compensates each Trustee who is not an employee of the Adviser or its affiliates. Total Trustees’ expenses are allocated to the Fund based on its average daily net asset value.
4. Guarantees and indemnifications
Under the Trust’s organizational documents, its Officers and Trustees are indemnified against certain liability arising out of the performance of their duties to the Trust. Additionally, in the normal course of business, the Trust enters into contracts with service providers that contain general indemnification clauses. The Trust’s maximum exposure under these arrangements is unknown, as this would involve future claims that may be made against the Trust that have not yet occurred. However, based on experience, the Trust believes the risk of loss to be remote.
5. Line of credit
The Fund has entered into an agreement which enables it to participate in a $100 million unsecured committed line of credit with State Street Corporation. Borrowings will be made solely to temporarily finance the repurchase of capital shares. Interest is charged to the Fund based on its borrowings at a rate per annum equal to the Federal Funds rate plus 0.50% . In addition, a commitment fee of 0.07% per annum, payable at the end of each calendar quarter, based on the average daily-unused portion of the line of credit, is charged to the Fund on a prorated basis based on average net assets. For the period ended August 31, 2007, there were no borrowings under the line of credit.
Growth Opportunities Fund
38
6. Capital shares
Share activities for the Fund for the period ended February 28, 2007 and the period ended August 31, 2007, were as follows:
| Period ended 2-28-07 | Period ended 8-31-071 | |||
| Shares | Amount | Shares | Amount | |
| Class A | ||||
| Sold | 134,743 | $3,150,486 | 77,613 | $1,932,312 |
| Issued in reorganization | — | — | 3,812,316 | 97,964,692 |
| Distributions reinvested | 1,586 | 37,457 | — | — |
| Repurchased | (4,238) | (100,934) | (217,281) | (5,381,515) |
| Net increase | 132,091 | $3,087,009 | 3,672,648 | $94,515,489 |
| Class B | ||||
| Sold | 16,576 | $380,025 | 17,433 | $432,144 |
| Issued in reorganization | — | — | 781,214 | 19,954,401 |
| Distributions reinvested | 89 | 2,095 | — | — |
| Repurchased | (64) | (1,503) | (69,102) | (1,701,628) |
| Net increase | 16,601 | $380,6172 | 729,545 | $18,684,917 |
| Class C | ||||
| Sold | 26,822 | $617,497 | 12,986 | $320,122 |
| Issued in reorganization | — | — | 126,693 | 3,236,288 |
| Distributions reinvested | 112 | 2,625 | — | — |
| Repurchased | (1) | (14) | (14,695) | (367,986) |
| Net increase | 26,933 | $620,1082 | 124,984 | $3,188,424 |
| Class I | ||||
| Sold | 8,222 | $183,402 | 680 | $17,455 |
| Issued in reorganization | — | — | 2,192 | 56,536 |
| Distributions reinvested | 76 | 1,806 | — | — |
| Repurchased | — | — | (2,234) | (54,819) |
| Net increase | 8,298 | $185,2082 | 638 | $19,172 |
| Class R1 | ||||
| Sold | 4,574 | $101,500 | 229 | $6,010 |
| Distributions reinvested | 46 | 1,078 | — | — |
| Net increase | 4,620 | $102,5782 | 229 | $6,010 |
| Class 1 | ||||
| Sold | 10,706 | $250,671 | 8,473 | $210,517 |
| Distributions reinvested | 46 | 1,082 | — | — |
| Repurchased | (13) | (317) | (6,189) | (157,992) |
| Net increase | 10,739 | $251,4362 | 2,284 | $52,525 |
| Net increase | 199,282 | $4,626,956 | 4,530,328 | $116,466,537 |
1 Semiannual period from 3-1-07 to 8-31-07. Unaudited.
2 Period from 6-12-06 (commencement of operations) to 2-28-07.
Growth Opportunities Fund
39
7. Investment transactions
Purchases and proceeds from sales or maturities of securities, other than short-term securities and obligations of the U.S. government, during the period ended August 31, 2007, aggregated $115,712,724 and $144,382,474, respectively.
The cost of investments owned on August 31, 2007, including short-term investments, for federal income tax purposes, was $136,520,540. Gross unrealized appreciation and depreciation of investments aggregated $4,516,536 and $12,321,486, respectively, resulting in net unrealized depreciation of $7,804,950. The difference between book basis and tax basis net unrealized depreciation of investments is attributable primarily to tax deferral of losses on certain sales of securities.
8. Federal income tax information
Federal income tax regulations may differ from generally accepted accounting principles and income and capital gain distributions determined in accordance with tax regulations may differ from net investment income and realized gains recognized for financial reporting purposes.
9. Reorganization
On June 12, 2006, the Fund acquired substantially all of the assets and liabilities of the Predecessor Fund in exchange solely for Class A shares of the Fund. The acquisition was accounted for as a tax-free exchange of 81,480 Class A shares of the Fund for the net assets of the Predecessor Fund, which amounted to $1,806,642, including $14,098 of unrealized depreciation, after the close of business on June 9, 2006. Accounting and performance history of the Predecessor Fund was redesignated as that of Class A of the Fund.
On May 9, 2007, the shareholders of John Hancock Mid Cap Growth Fund (Mid Cap Growth Fund) approved an Agreement and Plan of Reorganization, which provided for the transfer of substantially all of the assets and liabilities of the Mid Cap Growth Fund in exchange for Class A, Class B, Class C and Class I shares of the Fund. The acquisition was accounted for as a tax-free exchange of 3,812,316 Class A shares, 781,214 Class B shares, 126,693 Class C shares and 2,192 Class I shares of the Fund for the net assets of the Mid Cap Growth Fund, which amounted to $97,964,692, $19,954,400, $3,236,288 and $56,536 for Class A, Class B, Class C and Class I shares of the Mid Cap Growth Fund, respectively, including the total of $21,282,022 of unrealized appreciation, after the close of business on May 25, 2007.
Growth Opportunities Fund
40
Evaluation of Advisory and Subadvisory Agreements by the Board of Trustees
This section describes the evaluation by the Board of Trustees of the Advisory Agreement and each of the Subadvisory Agreements.
Evaluation by the Board of Trustees
The Board, including all of the Trustees who are not “interested persons” as defined in the Investment Company Act of 1940, as amended (the Independent Trustees), is responsible for selecting the Trust’s investment adviser, John Hancock Investment Management Services, LLC (the Adviser or JHIMS), approving the Adviser’s selection of subadvisers for each series of the Trust (the Funds) and approving the Trust’s advisory and subadvisory agreements (and any sub-subadvisory agreements), their periodic continuation and any amendments. Consistent with SEC rules, the Board regularly evaluates the Trust’s advisory and subadvisory (and sub-subadvisory) arrangements, including consideration of the factors listed below. The Board may also consider other factors (including conditions and trends prevailing generally in the economy, the securities markets and the industry) and does not treat any single factor as determinative, and each Trustee may attribut e different weights to different factors. The Board is furnished with an analysis of its fiduciary obligations in connection with its evaluation and, throughout the evaluation process, the Board is assisted by counsel for the Trust and the Independent Trustees are also separately assisted by independent legal counsel. The factors regularly considered by the Board are:
1. the nature, extent and quality of the services to be provided by the Adviser to the Trust and by the subadvisers to the Funds;
2. the investment performance of the Funds and their subadvisers;
3. the extent to which economies of scale would be realized as a Fund grows and whether fee levels reflect these economies of scale for the benefit of Trust shareholders;
4. the costs of the services to be provided and the profits to be realized by the Adviser and its affiliates (including any subadvisers that are affiliated with the Adviser) from the Adviser’s relationship with the Trust; and
5. comparative services rendered and comparative advisory and subadvisory fee rates.
The Board believes that information relating to all these factors is relevant to its evaluation of the Trust’s advisory agreement. With respect to its evaluation of subadvisory agreements (including sub-subadvisory agreements) the Board believes that, in view of the Trust’s “manager of managers” advisory structure, the costs of services to be provided and the profits to be realized by those subadvisers that are not affiliated with the Adviser from their relationship with the Trust generally are not a material factor to the Board’s consideration of subadvisory agreements because such fees are paid to subadvisers by the Adviser and not by the Funds, and because the Board relies on the ability of the Adviser to negotiate such subadvisory fees at arm’s-length.
In evaluating subadvisory arrangements, the Board also considers other material business relationships that unaffiliated subadvisers and their affiliates have with the Adviser or its affiliates, including the involvement by certain affiliates of certain subadvisers in the distribution of financial products, including shares of the Trust, offered by the Adviser and other affiliates of the Adviser (Material Relationships).
Approval of Advisory Agreement
At its meeting on June 5, 2007, the Board, including all the Independent Trustees, approved the Advisory Agreement between the Trust and JHIMS with respect to each of the Funds.
In approving the Advisory Agreement, and with reference to the factors which it regularly considers, the Board:
(1) (a) considered the high value to the Trust of continuing the relationship with JHIMS as the Trust’s Adviser to the other John Hancock Funds, the skills and competency with which JHIMS
41
has in the past managed the affairs and subadvisory relationships of other funds in the complex, JHIMS’s oversight and monitoring of subadvisers’ investment performance and compliance programs including its timelines in responding to performance issues and the qualifications of JHIMS’s personnel,
(b) considered JHIMS’s compliance policies and procedures and its responsiveness to regulatory changes and mutual fund industry developments, and
(c) JHIMS’s administrative capabilities, including its ability to supervise the other service providers for the Funds and concluded that JHIMS may reasonably be expected to ably perform its services under the Advisory Agreement.
(2) reviewed the investment performance of portfolios that are managed comparable to the Funds; the comparative performance of their respective benchmarks; and JHIMS’ analysis of such performance and its plans and recommendations regarding the Trust’s subadvisory arrangements generally and with respect to the Funds; and concluded that each of the comparably managed funds has performed well or within a range that the Board deemed competitive, and that JHIMS may reasonably be expected to ably monitor the performance of the Funds and their subadvisers;
(3) reviewed the Trust’s advisory fee structure and the incorporation therein of any subadvisory fee breakpoints in the advisory fees charged and concluded (i) that to the extent that Funds have subadvisory fees with breakpoints, those breakpoints are reflected as breakpoints in the advisory fees for Funds, (ii) that all Funds with a subadviser that is not affiliated with the Adviser have subadvisory fees which are the product of arm’s-length negotiations between the Adviser and the subadviser and which in many, but not all, cases contain breakpoints, and (iii) that, although economies of scale cannot be measured with precision, these arrangements permit shareholders of Funds with advisory fee breakpoints to benefit from economies of scale if those Funds grow;
(4) (a) reviewed the financial statements of JHIMS and John Hancock Life Insurance Company (U.S.A.) (JHLICO (U.S.A.));
(b) reviewed the anticipated profitability of the JHIMS’s relationship with the Funds in terms of the fees it expects to receive with respect to the Funds and whether JHIMS has the financial ability to provide a high level of services to the Funds,
(c) considered that JHIMS derives reputational and other indirect benefits from providing advisory services to the Funds, and
(d) noted that JHIMS will pay the sub-advisory fees out of the advisory fees JHIMS receives from the Funds and concluded that the advisory fees paid by the Trust with respect to the Funds are not unreasonable in light of such information; and
(5) reviewed comparative information with respect to the advisory fee rates and concluded that the anticipated advisory fees for the Funds are within the range of those incurred by other comparable funds and that the advisory structure for the Funds is thus competitive within the industry.
Additional information that the Board considered for a particular Fund is set forth in Appendix A.
Approval of Subadvisory Agreements
At its meeting on June 5, 2007, the Board, including all the Independent Trustees, approved the Subadvisory Agreements.
In making its determination with reference to these respective factors, the Board reviewed:
(i) information relating to each subadviser’s business which included information
42
such as: business performance, assets under management, financial stability and personnel;
(ii) the investment performance of the subadviser’s portfolio managed comparably to the Fund to be managed by the subadviser and comparative performance information relating to the benchmark;
(iii) the proposed subadvisory fee for each Fund to be managed by the subadviser and comparative fee information; and
(iv) information relating to the nature and scope of Material Relationships and their significance to the Adviser and the subadvisers.
The Board’s decision to approve each Subadvisory Agreement was based on a number of determinations, including the following:
(1) The subadviser has extensive experience and demonstrated skills as a manager and may be expected to provide a high quality of investment personnel to each Fund;
(2) Although not without variation, the current and historical performance of the portfolios of the Subadviser managed comparably to the Fund to be managed by the Subadviser has been within a competitive range of the current and historical performance of these portfolios’ respective benchmark (see Appendix A for further information on performance);
(3) The subadvisory fees are within industry norms and are the product of arm’s-length negotiation between the Adviser and the subadviser; and
(4) The Material Relationships consist of arrangements in which unaffiliated subadvisers or their affiliates provide advisory, distribution or management services in connection with financial products sponsored by the Trust’s adviser or its affiliates, which may include other registered investment companies, a 529 education savings plan, managed separate accounts and exempt group annuity contracts sold to qualified plans, and which in no case contained elements which would cause the Board to conclude that approval of the subadvisory agreement with the subadviser would be inappropriate. See (5) below for information relating to the business arrangement between the Trust’s Adviser and GMO.
(5) As a part of the overall business arrangement between the Adviser and GMO under which the Adviser has obtained exclusive rights to certain GMO investment management services for up to five years, the Adviser has agreed that under certain circumstances it (and not the Trust or the particular Fund) will pay GMO a specified amount (ranging from $1 to $12 million) if the subadvisory agreement with respect to any of the following Funds to be subadvised by GMO is terminated within a five-year period from the date of its effectiveness: U.S. Core Fund, Active Value Fund, Intrinsic Value Fund, Growth Fund, International Core Fund, International Growth Fund, Global Fund, Value Opportunities Fund, Growth Opportunities Fund and U.S. Quality Equity Fund.
The Adviser has also agreed that, subject to its fiduciary duties as an investment adviser to each of these Funds and its shareholders, it will not recommend to the Board of Trustees to terminate the subadvisory agreement with respect to any of the Funds or to reduce any of the fees payable thereunder to GMO for a five-year period from the date of effectiveness of the agreement. Substantially similar agreements (with varying amounts to be paid upon termination) also apply with respect to certain other John Hancock funds that are or will be advised by the Adviser and subadvised by GMO. The Trust is not a party to any of these arrangements, and they are not binding upon the Trust, the Trust’s Funds subadvised by GMO or the Board of Trustees. However, these arrangements present certain conflicts of interest because the Adviser has a financial incentive to support the continuation of GMO subadvisory agreements for as long as the termination provisions described above re main in effect. In approving the Advisory Agreement and the subadvisory agreement with respect to
43
each of the Funds subadvised by GMO, the Board of Trustees, including the Independent Trustees, was aware of and considered these potential conflicts of interest, including any financial obligations of the Adviser to GMO.
The Board concluded that, notwithstanding the potential conflicts of interest, approval of the Advisory Agreement and the subadvisory agreements with GMO is in the best interests of shareholders and contract owners in view of (i) the Adviser’s fiduciary duty and the Board’s fiduciary duty and ability to monitor potential conflicts, (ii) the benefits to shareholders and contract owners generally expected from the exclusive rights to certain GMO investment management services obtained by the Adviser for the benefit of certain Funds of the Trust and other John Hancock funds and (iii) the benefits to such Funds of the Trust expected from the subadvisory services of GMO.
Additional information that the Board considered for a particular fund is set forth in Appendix A.
Appendix A
| Estimated Fees | |||
| Fund | Performance | and Expenses | Comments |
| Growth | See Comments. | Subadvisory fees | The Board noted |
| Opportunities | for this Fund were | that the Fund com- | |
| lower than the peer | menced operations | ||
| group median. | in June 2006 and | ||
| has a limited | |||
| Advisory fees for | performance history. | ||
| this Fund were | |||
| lower than the peer | |||
| group median. | |||
| Total expenses for | |||
| this Fund were | |||
| lower than the peer | |||
| group median. | |||
44
Why John Hancock Funds?
For more than three decades, John Hancock Funds has been helping individual, corporate and institutional clients reach their most important financial goals. With so many fund companies to choose from, why should you invest with us?
► A name you know and trust
When you invest with John Hancock Funds, you are investing with one of the most recognized and respected names in the financial services industry. Our parent company has been helping individuals and institutions increase and protect wealth since 1862.
► Solutions across the investing spectrum
We offer equity, income, international, sector and asset allocation investment solutions managed by leading institutional money managers. Each of our funds utilizes a disciplined, team approach to portfolio management and research, leveraging the expertise of seasoned investment professionals.
► Committed to you
Our shareholders come first. We work hard to provide you with the products you need to build a solid financial foundation. We’re proud to offer you award-winning services and tools, like the www.jhfunds.com Web site, to help you every step of the way.
For immediate insight and answers,
turn to www.jhfunds.com
Discover the new and improved www.jhfunds.com.
■ View accounts, statements and fund information.
■ Access college and retirement planning calculators and investment education.
■ Gain investment ideas, expand your knowledge and become a more informed investor.

This is just the beginning of how much you can do.
Now is the ideal time to experience our Web site that received the following recognition in 2006:

“Best Innovation: Redesigned Web Site” by the Mutual Fund Education Alliance.

“Outstanding Web Site” by the Web Marketing Association.

“Creative excellence on the Web, Silver Award winner” by W3.
Discover convenience and comprehensive resources at one
easy-to-access location. Your financial professional can steer you to the tools that
will help you the most and enable you to transform your knowledge into action.
See how far www.jhfunds.com can take you!
At the heart of John Hancock Funds is
AWARD-WINNING SERVICE
How our exceptional customer service can benefit you:

We’re committed to providing you with answers, solving problems and saving you time.

We’re ready to go one step further by offering a range of resources so you can build your knowledge and expand your skills.

We’re determined to regularly exceed your expectations.
Experience award-winning, world-class service.
Consider the recognition that we received in 2006.
■ John Hancock Signature Services, Inc. (JHSS) is the transfer and shareholder services agent for John Hancock Funds. JHSS was awarded “Best-In-Class” honors and “5-Star” performer status for telephone customer service for all of 2006 from the National Quality Review.
■ Winner of Source Media’s Fund Operations Awards in the category of Efficiencies/Streamlining.
■ One of four finalists for Best Customer Service Organization, Financial Services at The American Business Awards, “The Stevies.” ™

Let us demonstrate the
difference that world-class
service can make.
Call our customer service representatives at 1-800-225-5291
Monday to Friday 8:00 a.m. – 7:00 p.m., ET
It will be our pleasure and privilege to help you.
For more information
The Fund’s proxy voting policies, procedures and records are available without charge, upon request:
| By phone | On the Fund’s Web site | On the SEC’s Web site |
| 1-800-225-5291 | www.jhfunds.com/proxy | www.sec.gov |
| Trustees | Charles A. Rizzo | Principal distributor |
| Ronald R. Dion, Chairman | Chief Financial Officer | John Hancock Funds, LLC |
| James R. Boyle† | 601 Congress Street | |
| James F. Carlin | Gordon M. Shone | Boston, MA 02210-2805 |
| William H. Cunningham | Treasurer | |
| Charles L. Ladner* | Custodian | |
| Dr. John A. Moore* | John G. Vrysen | State Street Bank & Trust Co. |
| Patti McGill Peterson* | Chief Operating Officer | 2 Avenue de Lafayette |
| Steven R. Pruchansky | Boston, MA 02111 | |
| *Members of the Audit Committee | Investment adviser | |
| †Non-Independent Trustee | John Hancock Investment | Transfer agent |
| Management Services, LLC | John Hancock Signature | |
| Officers | 601 Congress Street | Services, Inc. |
| Keith F. Hartstein | Boston, MA 02210-2805 | One John Hancock Way, |
| President and | Suite 1000 | |
| Chief Executive Officer | Subadviser | Boston, MA 02217-1000 |
| Grantham, Mayo, | ||
| Thomas M. Kinzler | Van Otterloo & Co. LLC | Legal counsel |
| Secretary and Chief Legal Officer | 40 Rowes Wharf | Kirkpatrick & Lockhart |
| Boston, MA 02110 | Preston Gates Ellis LLP | |
| Francis V. Knox, Jr. | One Lincoln Street | |
| Chief Compliance Officer | Boston, MA 02111-2950 | |
| How to contact us | ||
| Internet | www.jhfunds.com | |
| Regular mail: | Express mail: | |
| John Hancock | John Hancock | |
| Signature Services, Inc. | Signature Services, Inc. | |
| One John Hancock Way, Suite 1000 | Mutual Fund Image Operations | |
| Boston, MA 02217-1000 | 380 Stuart Street | |
| Boston, MA 02116 | ||
| Phone | Customer service representatives | 1-800-225-5291 |
| EASI-Line | 1-800-338-8080 | |
| TDD line | 1-800-554-6713 | |
A listing of month-end portfolio holdings is available on our Web site, www.jhfunds.com. A more detailed portfolio holdings summary is available on a quarterly basis 60 days after the fiscal quarter on our Web site or upon request by calling 1-800-225-5291, or on the SEC’s Web site, www.sec.gov.
48
J O H N H A N C O C K F A M I L Y O F F U N D S
| EQUITY | INTERNATIONAL/GLOBAL |
| Balanced Fund | Global Opportunities Fund |
| Classic Value Fund | Global Shareholder Yield Fund |
| Classic Value Fund II | Greater China Opportunities Fund |
| Classic Value Mega Cap Fund | International Allocation Portfolio |
| Core Equity Fund | International Classic Value Fund |
| Growth Fund | International Core Fund |
| Growth Opportunities Fund | International Growth Fund |
| Growth Trends Fund | |
| Intrinsic Value Fund | INCOME |
| Large Cap Equity Fund | Bond Fund |
| Large Cap Select Fund | Government Income Fund |
| Mid Cap Equity Fund | High Yield Fund |
| Multi Cap Growth Fund | Investment Grade Bond Fund |
| Small Cap Equity Fund | Strategic Income Fund |
| Small Cap Fund | |
| Small Cap Intrinsic Value Fund | TAX-FREE INCOME |
| Sovereign Investors Fund | California Tax-Free Income Fund |
| U.S. Core Fund | High Yield Municipal Bond Fund |
| U.S. Global Leaders Growth Fund | Massachusetts Tax-Free Income Fund |
| Value Opportunities Fund | New York Tax-Free Income Fund |
| Tax-Free Bond Fund | |
| ASSET ALLOCATION | |
| Lifecycle 2010 Portfolio | MONEY MARKET |
| Lifecycle 2015 Portfolio | Money Market Fund |
| Lifecycle 2020 Portfolio | |
| Lifecycle 2025 Portfolio | CLOSED-END |
| Lifecycle 2030 Portfolio | Bank and Thrift Opportunity Fund |
| Lifecycle 2035 Portfolio | Financial Trends Fund, Inc. |
| Lifecycle 2040 Portfolio | Income Securities Trust |
| Lifecycle 2045 Portfolio | Investors Trust |
| Lifecycle Retirement Portfolio | Patriot Premium Dividend Fund II |
| Lifestyle Aggressive Portfolio | Preferred Income Fund |
| Lifestyle Balanced Portfolio | Preferred Income II Fund |
| Lifestyle Conservative Portfolio | Preferred Income III Fund |
| Lifestyle Growth Portfolio | Tax-Advantaged Dividend Income Fund |
| Lifestyle Moderate Portfolio | Tax-Advantaged Global Shareholder Yield Fund |
| SECTOR | |
| Financial Industries Fund | |
| Health Sciences Fund | |
| Real Estate Fund | |
| Regional Bank Fund | |
| Technology Fund | |
| Technology Leaders Fund | |
The Fund’s investment objectives, risks, charges and expenses are included in the prospectus and should be considered carefully before investing. For a prospectus, contact your financial professional, call John Hancock Funds at 1-800-225-5291 or visit the Fund’s Web site at www.jhfunds.com. Please read the prospectus carefully before investing or sending money.

1-800-225-5291
1-800-554-6713 TDD
1-800-338-8080 EASI-Line
www.jhfunds.com
Now available: electronic delivery
www.jhfunds.com/edelivery
| This report is for the information of the shareholders of John Hancock Growth Opportunities Fund. | 840SA 8/07 |
| It is not authorized for distribution to prospective investors unless preceded or accompanied by a prospectus. | 10/07 |

| TABLE OF CONTENTS |
| Your fund at a glance |
| page 1 |
| Managers’ report |
| page 2 |
| A look at performance |
| page 6 |
| Your expenses |
| page 8 |
| Fund’s investments |
| page 10 |
| Financial statements |
| page 18 |
| Notes to financial |
| statements |
| page 26 |
| For more information |
| page 40 |
CEO corner
To Our Shareholders,
Volatility returned to the U.S. stock market in the six-month period ended August 31, 2007; however, stocks still posted a strong gain of 5.70%, as measured by the Standard & Poor’s 500 Index. The market experienced a particularly sharp downturn in August, as the subprime mortgage market’s woes increased. Rising defaults and an ensuing credit crunch caused heightened fears about their potential impact on U.S. economic growth. Foreign markets felt some ripple effects from the subprime issue, but they continued nonetheless to benefit from solid economic growth and outperformed the U.S. market in this period.
During this period of volatility, the U.S. stock market also passed a significant milestone — the broad Standard & Poor’s 500 Index climbed beyond the record it had set seven years ago. From its peak in March 2000, the stock market spiraled downward three consecutive years, bottoming in 2002. The upturn began in 2003, and the market has advanced each year since, finally setting a new high for the first time on May 30, 2007. During that period, the S&P 500 Index experienced five significant short-term sell-offs of 6% or more, with the August subprime-induced meltdown being the most recent.
This nearly complete market cycle highlights the importance of two investment principles you have heard us speak of often: diversification and patience. By allocating your investments among different asset classes, investment styles and portfolio managers, you are likely to be well represented through all phases of a complete market cycle, with the winners helping to cushion the fall of the losers.
The challenge for investors with a diversified portfolio is to properly evaluate your investments to tell the difference between an underperforming manager and an out-of-favor style, while also understanding the role each investment plays in your portfolio. That’s where your financial professional can provide true value. He or she can help you make those assessments and also counsel patience, because a properly diversified portfolio by its very nature will typically have something lagging or out of favor — a concept that can be difficult to live with, but necessary to embrace. If everything in your portfolio is “working,” then you are not truly diversified, but rather are leveraged to the current market and the flavor of the day. If so, you are bound to be out of step in the near future.
The recent volatility in the securities markets has prompted many investors to question how long this type of market cycle will last. History tells us it will indeed end and that when it does, today’s leaders may well turn into laggards and vice versa. The subprime mortgage market woes are just the latest example of why investors should be both patient and well-diversified. For with patience and a diversified portfolio, it could be easier to weather the market’s twists and turns and reach your long-term goals.
Sincerely,

Keith F. Hartstein,
President and Chief Executive Officer
This commentary reflects the CEO’s views as of August 31, 2007. They are subject to change at any time.
Your fund at a glance
The Fund seeks long-term capital growth by typically investing in U.S. companies that issue stocks included in the Russell 1000 Index and in companies with size and growth characteristics similar to those of companies with stocks in the Index.
Over the last six months
► Despite heightened volatility, the broad U.S. market, as measured by the S&P 500 Index, gained ground.
► The Fund’s overweight position and stock selection in the oil and gas sector added to relative returns, while an overweight in retail stores and stock selection held the Fund back.
► The Fund’s valuation selection criteria lagged the market, while its momentum discipline fared better in the rising market.
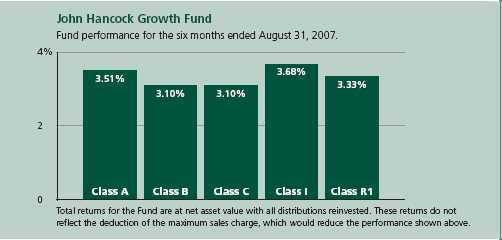
| Top 10 holdings | ||||
| Exxon Mobil Corp. | 4.0% | Cisco Systems, Inc. | 2.4% | |
| International Business Machines Corp. | 3.6% | Home Depot, Inc. | 2.3% | |
| Microsoft Corp. | 3.4% | Dell, Inc. | 2.3% | |
| Merck & Company, Inc. | 3.4% | Wal-Mart Stores, Inc. | 2.1% | |
| Apple, Inc. | 3.3% | Chevron Corp. | 1.8% | |
As a percentage of net assets on August 31, 2007.
1
Managers’ report
John Hancock
Growth Fund
U.S. investors entered the six-month review period on March 1, 2007 still reeling from the market’s late-February swoon. Their big question was whether the recent fall was the beginning of a major correction or just a brief hiccup in the middle of a bull market. Though some of the concerns surrounding the decline — including the first sign of trouble in subprime mortgages — were still present, investors appeared to shake them off. Less than two months into the review period, the Standard & Poor’s 500 Index had recovered all of its lost ground, entering the summer poised to continue its ascent. With historically low market volatility, the continuation of strong corporate profits and a glut of private equity deals fueled by ubiquitous financial liquidity, there seemed to be almost no ceiling to the market’s potential. Hopes for a smooth summer, however, would turn out to be short-lived.
Beginning in July, as many market indexes touched record highs, credit concerns similar to those seen in February flared up again. Distress in subprime mortgages quickly spilled over into the broader credit and equity markets. Just weeks after the S&P 500 Index hit an all-time high, the Federal Reserve began injecting liquidity into a faltering financial system, in an attempt to stem the turmoil taking place in the credit market. As equity market volatility returned with a vengeance, investor tolerance for risk abated and the broad market indexes plunged lower in the first days of August. And while hopes for a Federal Reserve rate
SCORECARD
| INVESTMENT | PERIOD’S PERFORMANCE . . .AND WHAT’S BEHIND THE NUMBERS | |
| Exxon Mobil | ▲ | Benefited from rising oil prices over the period |
| Forest Laboratories | ▲ | Promising stroke medication failed late-stage trials |
| Kohl’s | ▼ | Fund’s overweight position hurt when same-store sales declined |
2
From the Grantham, Mayo, Van Otterloo & Co. LLC (GMO)
Portfolio Management Team
cut helped stabilize things somewhat, investors ended the review period much in the same way they began it — wondering whether the market would rally again or if risk aversion was here to stay. Despite the volatility, the S&P 500 Index posted gains in the six-month period.
Looking at performance
During the six months ended August 31, 2007, John Hancock Growth Fund’s Class A, Class B, Class C, Class I and Class R1 shares returned 3.51%, 3.10%, 3.10%, 3.68% and 3.33%, respectively, at net asset value. By comparison, the Russell 1000 Growth Index returned 7.46%, while the average large growth fund monitored by Morning-star, Inc. gained 7.77% .1 Keep in mind that your returns will differ from those listed above if you were not invested in the Fund for the entire period or did not reinvest all distributions. See pages six and seven for historical performance information.
“Despite the volatility, the S&P
500 Index posted gains in the
six-month period.”
In a generally rising market, our primary stock selection tools —valuation and momentum — performed differently. Valuation was the key driver of the relative performance shortfall. The late-period market turmoil notwithstanding, the period as a whole was dominated by strong investor appetite for risky, lower-quality stocks — securities which our valuation discipline found overvalued. The lower-risk, higher-quality securities that our valuation discipline found attractive underperformed for much of the period in a risk-oriented market. While these higher-quality selections fared better later in the period as risk aversion returned, they still finished the period in negative territory.
Growth Fund
3
Our momentum discipline fared better in the rising market. The discipline is designed to identify stocks that have performed well recently and appear poised to continue outperforming. With this orientation, the momentum discipline was able to approximately keep pace with the market during the period by selecting many of the leading performers and following their outperformance.
Retail, machinery and technology limit gains
The sector detracting most from performance during the period was retail stores, where our stock selection and overweight position negatively impacted the Fund’s returns. For example, an overweight position in Kohl’s Corp. detracted from relative returns as shares fell after the company announced that same-store sales had declined. Our valuation model continues to find this high-quality company attractive and maintains its overweight position.
“Valuation was the key driver of the
relative performance shortfall.”
Machinery was another sector detracting from the Fund’s performance. Our underweight position drove relative returns as the sector outperformed the market. For example, an underweight in Schlumberger, Ltd. detracted from relative returns for the period, as strong profit reports stemming from the company’s exposure to oil and gas exploration helped its shares move higher. Though this move was positive for shareholders in the short-term, our valuation discipline continues to find the stock unattractive and we maintain our underweight position.
| SECTOR DISTRIBUTION2 | |
| Consumer cyclical | 23% |
| Consumer non-cyclical | 21% |
| Technology | 19% |
| Communications | 9% |
| Energy | 7% |
| Industrial | 6% |
| Financial | 6% |
| Basic materials | 2% |
| Utilities | 1% |
Also detracting from performance was the technology sector. Our underweight position and stock selection drove the negative relative returns. For instance, our overweight position in Lexmark International, Inc. negatively impacted returns after the company trimmed its profit outlook, while an underweight in Hewlett Packard Company limited returns as the company raised its earnings guidance during the period.
Growth Fund
4
Oil & gas and construction add value
On the positive side, our overweight position and stock selection in the oil and gas sector added to relative returns. The sector included the Fund’s biggest contributor, Exxon Mobil Corp., which benefited from rising oil prices during the period, positively impacting our overweight position. In addition, our aversion to risky companies did pay off in certain sectors. Our underweight position in construction benefited indirectly by avoiding the troubles related to subprime mortgages. With worries abounding that mortgage troubles would lead to a decline in real estate prices and new home construction, our underweight position in the sector added to relative returns as shares declined. For example, not owning Simon Property Group added to relative returns for the period.
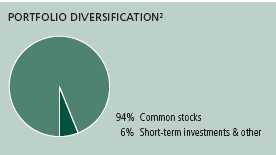
Outlook
The market volatility at the end of the period left investors wondering if the bull market has finally come to an end. The upcoming months will show whether the market’s recent trend toward risk aversion — especially in the troubled subprime mortgage sector — will persist or if risk-taking will resume in full force. The Fund remains overweight in higher-quality stocks and we believe it is well positioned to face further volatility in the market.
This commentary reflects the views of the portfolio management team through the end of the Fund’s period discussed in this report. The team’s statements reflect their own opinions. As such, they are in no way guarantees of future events and are not intended to be used as investment advice or a recommendation regarding any specific security. They are also subject to change at any time as market and other conditions warrant.
1 Figures from Morningstar, Inc. include reinvested dividends and do not take into account sales charges. Actual load-adjusted performance is lower.
2 As a percentage of net assets on August 31, 2007.
Growth Fund
5
A look at performance
For the periods ended August 31, 2007
| Average annual returns | Cumulative total returns | ||||||||||
| with maximum sales charge (POP) | with maximum sales charge (POP) | ||||||||||
| Inception | Since | Since | |||||||||
| Class | date | 1-year | 5-year | 10-year | inception | 6-month | 1-year | 5-year | 10-year | inception | |
| A | 6-12-06 | 4.48% | — | — | 6.28% | –1.67% | 4.48% | — | — | 7.76% | |
| B | 6-12-06 | 4.22 | — | — | 6.82 | –1.90 | 4.22 | — | — | 8.44 | |
| C | 6-12-06 | 8.22 | — | — | 10.02 | 2.10 | 8.22 | — | — | 12.44 | |
| I1 | 6-12-06 | 10.69 | — | — | 11.45 | 3.68 | 10.69 | — | — | 14.24 | |
| R1 1 | 6-12-06 | 9.62 | — | — | 10.40 | 3.33 | 9.62 | — | — | 12.91 | |
Performance figures assume all distributions are reinvested. Public offering price (POP) figures reflect maximum sales charge on Class A shares of 5%, and the applicable contingent deferred sales charge (CDSC) on Class B and Class C shares. The Class B shares’ CDSC declines annually between years 1 to 6 according to the following schedule 5, 4, 3, 3, 2, 1%. No sales charge will be assessed after the sixth year. Class C shares held for less than one year are subject to a 1% CDSC. Sales charge is not applicable for Class I and Class R1 shares.
The expense ratios of the Fund, both net (including any fee waivers or expense limitations) and gross (excluding any fee waivers or expense limitations), are set forth according to the most recent publicly available Prospectuses for the Fund and may differ from the expense ratios disclosed in the Financial Highlights tables in this report. The waivers and expense limitations are contractual at least until 6-30-08. The net expenses are as follows: Class A — 1.39%, Class B — 2.09%, Class C — 2.10%, Class I — 1.00%, Class R1 — 1.74% . Had the fee waivers and expense limitations not been in place, the gross expenses would be as follows: Class A — 2.00%, Class B — 11.94%, Class C — 7.70%, Class I — 1.90%, Class R1 — 21.55% .
The returns reflect past results and should not be considered indicative of future performance. The return and principal value of an investment will fluctuate so that shares, when redeemed, may be worth more or less than their original cost. Due to market volatility, the Fund’s current performance may be higher or lower than the performance shown. For performance data current to the most recent month-end, please call 1-800-225-5291 or visit the Fund’s Web site at www.jhfunds.com.
The performance table above and the chart on the next page do not reflect the deduction of taxes that a shareholder would pay on fund distributions or the redemption of fund shares.
The Fund’s performance results reflect any applicable expense reductions, without which the expenses would increase and results would have been less favorable.
Performance is calculated with an opening price (prior day’s close) on the inception date.
1 For certain types of investors as described in the Fund’s Class I and Class R1 share prospectuses.
Growth Fund
6
Growth of $10,000
This chart shows what happened to a hypothetical $10,000 investment in Growth
Fund Class A shares for the period indicated. For comparison, we’ve shown the same
investment in the Russell 1000 Growth Index.
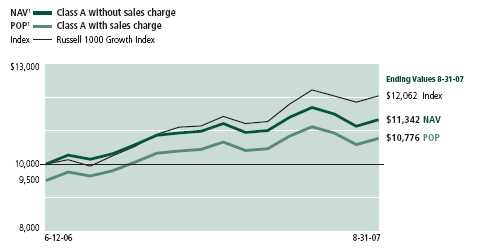
| With maximum | ||||
| Class | Period beginning | Without sales charge | sales charge | Index |
| B | 6-12-06 | $11,244 | $10,844 | $12,062 |
| C2 | 6-12-06 | 11,244 | 11,244 | 12,062 |
| I3 | 6-12-06 | 11,424 | 11,424 | 12,062 |
| R1 3 | 6-12-06 | 11,291 | 11,291 | 12,062 |
Assuming all distributions were reinvested for the period indicated, the table above shows the value of a $10,000 investment in the Fund’s Class B, Class C, Class I and Class R1 shares, respectively, as of August 31, 2007. Performance of the classes will vary based on the difference in sales charges paid by shareholders investing in the different classes and the fee structure of those classes.
Russell 1000 Growth Index is an unmanaged index containing those securities in the Russell 1000 Index with a greater-than-average growth orientation.
It is not possible to invest directly in an index. Index figures do not reflect sales charges, which would have resulted in lower values if they did.
1 NAV represents net asset value and POP represents public offering price.
2 No contingent deferred sales charge applicable.
3 For certain types of investors as described in the Fund’s Class I and Class R1 share prospectuses.
Growth Fund
7
Your expenses
These examples are intended to help you understand your ongoing operating expenses.
Understanding fund expenses
As a shareholder of the Fund, you incur two types of costs:
▪ Transaction costs which include sales charges (loads) on purchases or redemptions (varies by share class), minimum account fee charge, etc.
▪ Ongoing operating expenses including management fees, distribution and service fees (if applicable) and other fund expenses.
We are going to present only your ongoing operating expenses here.
Actual expenses/actual returns
This example is intended to provide information about your fund’s actual ongoing operating expenses, and is based on your fund’s actual return. It assumes an account value of $1,000.00 on March 1, 2007, with the same investment held until August 31, 2007.
| Account value | Ending value | Expenses paid during period | |
| on 3-1-07 | on 8-31-07 | ended 8-31-071 | |
| Class A | $1,000.00 | $1,035.10 | $7.12 |
| Class B | 1,000.00 | 1,031.00 | 10.76 |
| Class C | 1,000.00 | 1,031.00 | 10.76 |
| Class I | 1,000.00 | 1,036.80 | 5.09 |
| Class R1 | 1,000.00 | 1,033.30 | 8.95 |
Together with the value of your account, you may use this information to estimate the operating expenses that you paid over the period. Simply divide your account value at August 31, 2007 by $1,000.00, then multiply it by the “expenses paid” for your share class from the table above. For example, for an account value of $8,600.00, the operating expenses should be calculated as follows:
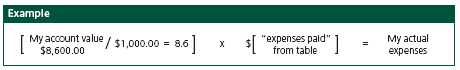
Growth Fund
8
Hypothetical example for comparison purposes
This table allows you to compare your fund’s ongoing operating expenses with those of any other fund. It provides an example of the Fund’s hypothetical account values and hypothetical expenses based on each class’s actual expense ratio and an assumed 5% annualized return before expenses (which is not your fund’s actual return). It assumes an account value of $1,000.00 on March 1, 2007, with the same investment held until August 31, 2007. Look in any other fund shareholder report to find its hypothetical example and you will be able to compare these expenses.
| Account value | Ending value | Expenses paid during period | |
| on 3-1-07 | on 8-31-07 | ended 8-31-07 1 | |
| Class A | $1,000.00 | $1,018.14 | $7.06 |
| Class B | 1,000.00 | 1,014.54 | 10.68 |
| Class C | 1,000.00 | 1,014.54 | 10.68 |
| Class I | 1,000.00 | 1,020.14 | 5.05 |
| Class R1 | 1,000.00 | 1,016.34 | 8.87 |
Remember, these examples do not include any transaction costs, such as sales charges; therefore, these examples will not help you to determine the relative total costs of owning different funds. If transaction costs were included, your expenses would have been higher. See the prospectus for details regarding transaction costs.
1 Expenses are equal to the Fund’s annualized expense ratio of 1.40%, 2.11%, 2.11%, 1.00% and 1.76% for Class A, Class B, Class C, Class I, and Class R1 respectively, multiplied by the average account value over the period, multiplied by the number of days in the inception period/365 or 366 (to reflect the one-half year period).
Growth Fund
9
Fund’s investments
F I N A N C I A L S T A T E M E N T S
Securities owned by the Fund on 8-31-07 (unaudited)
This schedule is divided into two main categories: common stocks and repurchase
agreements. Common stocks are further broken down by industry group. Repurchase
agreements, which represent the Fund’s cash position, are listed last.
| Issuer | Shares | Value |
| Common stocks 93.85% | $25,825,433 | |
| (Cost $24,323,017) | ||
| Advertising 0.28% | 78,284 | |
| Interpublic Group of Companies, Inc. * | 1,400 | 15,330 |
| Omnicom Group, Inc. | 1,000 | 50,930 |
| ValueClick, Inc. * | 600 | 12,024 |
| Aerospace 0.80% | 218,769 | |
| General Dynamics Corp. | 600 | 47,136 |
| Goodrich Corp. | 400 | 25,264 |
| Lockheed Martin Corp. | 1,100 | 109,054 |
| United Technologies Corp. | 500 | 37,315 |
| Agriculture 0.28% | 76,714 | |
| Monsanto Company | 1,100 | 76,714 |
| Apparel & Textiles 2.28% | 627,858 | |
| Coach, Inc. * | 6,400 | 284,992 |
| Liz Claiborne, Inc. | 600 | 20,502 |
| NIKE, Inc., Class B | 3,500 | 197,190 |
| Polo Ralph Lauren Corp., Class A | 600 | 45,324 |
| VF Corp. | 1,000 | 79,850 |
| Auto Parts 0.81% | 221,784 | |
| AutoZone, Inc. * | 1,000 | 121,290 |
| Johnson Controls, Inc. | 700 | 79,170 |
| O’Reilly Automotive, Inc. * | 600 | 21,324 |
| Auto Services 0.15% | 39,858 | |
| AutoNation, Inc. * | 2,100 | 39,858 |
| Automobiles 1.09% | 299,425 | |
| PACCAR, Inc. | 3,500 | 299,425 |
| Biotechnology 0.26% | 71,928 | |
| Amgen, Inc. * | 400 | 20,044 |
| Immucor, Inc. * | 800 | 26,680 |
| Techne Corp. * | 400 | 25,204 |
See notes to financial statements
Growth Fund
10
F I N A N C I A L S T A T E M E N T S
| Issuer | Shares | Value |
| Broadcasting 0.43% | $118,512 | |
| Liberty Global, Inc., Class A * | 1,000 | 40,980 |
| Liberty Media Corp. — Capital, Series A * | 600 | 65,394 |
| News Corp., Class A | 600 | 12,138 |
| Building Materials & Construction 0.33% | 91,233 | |
| American Standard Companies, Inc. | 1,700 | 62,611 |
| Masco Corp. | 1,100 | 28,622 |
| Business Services 1.15% | 317,174 | |
| Affiliated Computer Services, Inc., Class A * | 400 | 20,012 |
| FactSet Research Systems, Inc. | 500 | 29,965 |
| First Data Corp. | 1,400 | 46,508 |
| Fiserv, Inc. * | 2,500 | 116,300 |
| Moody’s Corp. | 700 | 32,095 |
| NCR Corp. * | 500 | 24,885 |
| Pitney Bowes, Inc. | 500 | 22,335 |
| R.R. Donnelley & Sons Company | 700 | 25,074 |
| Cable & Television 1.87% | 514,732 | |
| Comcast Corp., Class A * | 8,950 | 233,505 |
| DIRECTV Group, Inc. * | 8,500 | 198,305 |
| EchoStar Communications Corp., Class A * | 300 | 12,696 |
| Time Warner, Inc. | 3,700 | 70,226 |
| Cellular Communications 0.09% | 25,900 | |
| Telephone & Data Systems, Inc. | 400 | 25,900 |
| Chemicals 0.58% | 159,852 | |
| Albemarle Corp. | 1,400 | 56,658 |
| Celanese Corp., Series A | 1,100 | 39,512 |
| Hercules, Inc. * | 1,500 | 31,230 |
| Lyondell Chemical Company | 700 | 32,452 |
| Colleges & Universities 0.33% | 89,640 | |
| Career Education Corp. * | 800 | 23,760 |
| ITT Educational Services, Inc. * | 600 | 65,880 |
| Computers & Business Equipment 14.25% | 3,922,460 | |
| Apple, Inc. * | 6,500 | 900,120 |
| CDW Corp. * | 1,200 | 103,284 |
| Cisco Systems, Inc. * | 20,900 | 667,128 |
| Cognizant Technology Solutions Corp., Class A * | 800 | 58,808 |
| Dell, Inc. * | 22,500 | 635,625 |
| EMC Corp. * | 16,500 | 324,390 |
| Hewlett-Packard Company | 2,500 | 123,375 |
| Ingram Micro, Inc., Class A * | 600 | 11,784 |
| International Business Machines Corp. | 8,400 | 980,196 |
| Juniper Networks, Inc. * | 1,200 | 39,504 |
| Lexmark International, Inc. * | 2,100 | 78,246 |
See notes to financial statements
Growth Fund
11
F I N A N C I A L S T A T E M E N T S
| Issuer | Shares | Value |
| Construction Materials 0.58% | $159,014 | |
| Martin Marietta Materials, Inc. | 400 | 54,000 |
| Sherwin-Williams Company | 1,000 | 69,010 |
| Vulcan Materials Company | 400 | 36,004 |
| Containers & Glass 0.30% | 81,901 | |
| Owens-Illinois, Inc. * | 800 | 32,176 |
| Pactiv Corp. * | 1,700 | 49,725 |
| Correctional Facilities 0.07% | 20,528 | |
| Corrections Corp. of America * | 800 | 20,528 |
| Cosmetics & Toiletries 1.01% | 277,824 | |
| Avon Products, Inc. | 900 | 30,915 |
| Estee Lauder Companies, Inc., Class A | 600 | 24,954 |
| International Flavors & Fragrances, Inc. | 1,000 | 50,230 |
| Kimberly-Clark Corp. | 2,500 | 171,725 |
| Crude Petroleum & Natural Gas 0.37% | 102,828 | |
| Apache Corp. | 500 | 38,690 |
| Devon Energy Corp. | 400 | 30,124 |
| Occidental Petroleum Corp. | 600 | 34,014 |
| Educational Services 0.15% | 41,069 | |
| Apollo Group, Inc., Class A * | 700 | 41,069 |
| Electrical Equipment 0.18% | 49,546 | |
| FLIR Systems, Inc. * | 900 | 44,316 |
| Molex, Inc. | 200 | 5,230 |
| Electrical Utilities 1.26% | 347,867 | |
| American Electric Power Company, Inc. | 600 | 26,688 |
| CenterPoint Energy, Inc. (a) | 1,800 | 29,196 |
| Constellation Energy Group, Inc. | 1,000 | 82,940 |
| Dynegy, Inc., Class A * | 2,500 | 20,225 |
| Entergy Corp. | 800 | 82,896 |
| Mirant Corp. * | 600 | 23,382 |
| Public Service Enterprise Group, Inc. | 400 | 33,996 |
| Quanta Services, Inc. * | 500 | 14,135 |
| The AES Corp. * | 1,900 | 34,409 |
| Electronics 0.35% | 96,014 | |
| Amphenol Corp., Class A | 300 | 10,833 |
| Avnet, Inc. * | 1,200 | 47,172 |
| L-3 Communications Holdings, Inc. | 200 | 19,702 |
| Tyco Electronics, Ltd. * | 525 | 18,307 |
| Energy 0.12% | 33,018 | |
| Sempra Energy | 600 | 33,018 |
| Financial Services 2.67% | 735,211 | |
| Citigroup, Inc. | 1,900 | 89,072 |
| Countrywide Financial Corp. | 1,000 | 19,850 |
| Discover Financial Services * | 1,150 | 26,611 |
See notes to financial statements
Growth Fund
12
F I N A N C I A L S T A T E M E N T S
| Issuer | Shares | Value |
| Financial Services (continued) | ||
| Eaton Vance Corp. | 800 | $30,712 |
| Franklin Resources, Inc. | 1,100 | 144,947 |
| Goldman Sachs Group, Inc. | 1,300 | 228,813 |
| MoneyGram International, Inc. | 600 | 12,762 |
| Morgan Stanley (c) | 1,200 | 74,844 |
| People’s United Financial, Inc. | 1,230 | 21,746 |
| SEI Investments Company | 1,800 | 45,666 |
| The First Marblehead Corp. (a) | 1,200 | 40,188 |
| Food & Beverages 1.52% | 418,402 | |
| Kraft Foods, Inc., Class A | 1,207 | 38,696 |
| McCormick & Company, Inc. | 900 | 32,256 |
| Sara Lee Corp. | 1,100 | 18,282 |
| Sysco Corp. | 3,900 | 130,182 |
| The Coca-Cola Company | 3,700 | 198,986 |
| Healthcare Products 5.86% | 1,611,313 | |
| Baxter International, Inc. | 2,700 | 147,852 |
| Becton, Dickinson & Company | 600 | 46,164 |
| C.R. Bard, Inc. | 400 | 33,356 |
| Covidien, Ltd. * | 525 | 20,911 |
| IDEXX Laboratories, Inc. * | 200 | 22,350 |
| Johnson & Johnson | 7,200 | 444,888 |
| Kinetic Concepts, Inc. * | 600 | 36,066 |
| Medtronic, Inc. | 500 | 26,420 |
| Patterson Companies, Inc. * | 1,200 | 44,136 |
| Respironics, Inc. * | 500 | 23,715 |
| St. Jude Medical, Inc. * | 1,400 | 60,998 |
| Stryker Corp. | 4,800 | 320,640 |
| Zimmer Holdings, Inc. * | 4,900 | 383,817 |
| Healthcare Services 3.55% | 976,810 | |
| Cardinal Health, Inc. | 1,200 | 82,056 |
| Coventry Health Care, Inc. * | 300 | 17,211 |
| Express Scripts, Inc. * | 3,100 | 169,725 |
| Lincare Holdings, Inc. * | 800 | 28,792 |
| McKesson Corp. | 1,500 | 85,815 |
| Medco Health Solutions, Inc. * | 700 | 59,815 |
| Quest Diagnostics, Inc. | 1,800 | 98,550 |
| UnitedHealth Group, Inc. | 7,100 | 355,071 |
| WellCare Health Plans, Inc. * | 400 | 39,480 |
| WellPoint, Inc. * | 500 | 40,295 |
| Homebuilders 0.07% | 20,173 | |
| Centex Corp. | 600 | 17,346 |
| Lennar Corp., Class A | 100 | 2,827 |
See notes to financial statements
Growth Fund
13
F I N A N C I A L S T A T E M E N T S
| Issuer | Shares | Value |
| Hotels & Restaurants 2.98% | $819,746 | |
| Hilton Hotels Corp. | 600 | 27,570 |
| Jack in the Box, Inc. * | 600 | 37,332 |
| Marriott International, Inc., Class A | 2,600 | 115,492 |
| McDonald’s Corp. | 8,800 | 433,400 |
| Starbucks Corp. * | 3,200 | 88,160 |
| Yum! Brands, Inc. | 3,600 | 117,792 |
| Household Products 0.61% | 166,605 | |
| Church & Dwight, Inc. | 300 | 13,479 |
| Energizer Holdings, Inc. * | 1,200 | 127,116 |
| Tempur-Pedic International, Inc. (a) | 900 | 26,010 |
| Industrial Machinery 0.79% | 217,067 | |
| Crane Company | 300 | 13,437 |
| Cummins, Inc. | 300 | 35,526 |
| Deere & Company | 500 | 68,030 |
| ITT Corp. | 600 | 40,794 |
| Lincoln Electric Holdings, Inc. | 400 | 28,776 |
| Pall Corp. | 800 | 30,504 |
| Insurance 3.43% | 942,992 | |
| Aetna, Inc. | 1,900 | 96,729 |
| AFLAC, Inc. | 1,700 | 90,627 |
| Allstate Corp. | 1,400 | 76,650 |
| Ambac Financial Group, Inc. | 600 | 37,692 |
| American International Group, Inc. | 2,000 | 132,000 |
| Brown & Brown, Inc. | 1,100 | 29,612 |
| CIGNA Corp. | 2,800 | 144,704 |
| Hartford Financial Services Group, Inc. | 400 | 35,564 |
| MBIA, Inc. | 500 | 30,000 |
| PMI Group, Inc. | 800 | 25,344 |
| Progressive Corp. | 1,100 | 22,374 |
| Prudential Financial, Inc. | 800 | 71,824 |
| The Travelers Companies, Inc. | 2,600 | 131,404 |
| Torchmark Corp. | 300 | 18,468 |
| International Oil 6.32% | 1,738,117 | |
| Anadarko Petroleum Corp. | 700 | 34,286 |
| Chevron Corp. | 5,600 | 491,456 |
| ConocoPhillips | 1,300 | 106,457 |
| Exxon Mobil Corp. | 12,900 | 1,105,918 |
| Internet Retail 1.99% | 546,281 | |
| Amazon.com, Inc. * | 3,600 | 287,676 |
| eBay, Inc. * | 4,800 | 163,680 |
| Expedia, Inc. * | 1,600 | 47,760 |
| IAC/InterActiveCorp. * | 1,100 | 30,569 |
| Priceline.com, Inc. * | 200 | 16,596 |
See notes to financial statements
Growth Fund
14
F I N A N C I A L S T A T E M E N T S
| Issuer | Shares | Value |
| Internet Software 0.41% | $113,224 | |
| McAfee, Inc. * | 1,800 | 64,350 |
| Symantec Corp. * | 1,400 | 26,334 |
| VeriSign, Inc. * | 700 | 22,540 |
| Leisure Time 0.82% | 226,719 | |
| MGM MIRAGE * | 2,700 | 226,719 |
| Life Sciences 0.27% | 73,884 | |
| Waters Corp. * | 1,200 | 73,884 |
| Liquor 0.43% | 118,560 | |
| Anheuser-Busch Companies, Inc. | 2,400 | 118,560 |
| Manufacturing 2.09% | 576,406 | |
| Danaher Corp. | 1,600 | 124,256 |
| Harley-Davidson, Inc. | 4,500 | 242,055 |
| Honeywell International, Inc. | 2,500 | 140,375 |
| Illinois Tool Works, Inc. | 800 | 46,536 |
| Tyco International, Ltd. | 525 | 23,184 |
| Metal & Metal Products 0.72% | 198,472 | |
| Precision Castparts Corp. | 1,200 | 156,372 |
| Southern Copper Corp. (a) | 400 | 42,100 |
| Mining 0.11% | 30,508 | |
| Cleveland-Cliffs, Inc. | 400 | 30,508 |
| Mobile Homes 0.18% | 48,389 | |
| Thor Industries, Inc. | 1,100 | 48,389 |
| Petroleum Services 0.71% | 195,921 | |
| Schlumberger, Ltd. | 700 | 67,550 |
| Transocean, Inc. * | 700 | 73,563 |
| Valero Energy Corp. | 800 | 54,808 |
| Pharmaceuticals 6.23% | 1,713,557 | |
| Abbott Laboratories | 500 | 25,955 |
| Bristol-Myers Squibb Company | 100 | 2,915 |
| Celgene Corp. * | 400 | 25,684 |
| Forest Laboratories, Inc. * | 5,100 | 191,913 |
| Merck & Company, Inc. | 18,400 | 923,128 |
| Pfizer, Inc. | 5,100 | 126,684 |
| Schering-Plough Corp. | 13,900 | 417,278 |
| Publishing 0.33% | 91,376 | |
| Gannett Company, Inc. | 1,300 | 61,100 |
| McGraw-Hill Companies, Inc. | 600 | 30,276 |
| Railroads & Equipment 0.09% | 24,600 | |
| CSX Corp. | 600 | 24,600 |
| Real Estate 0.09% | 24,855 | |
| General Growth Properties, Inc., REIT | 500 | 24,855 |
See notes to financial statements
Growth Fund
15
F I N A N C I A L S T A T E M E N T S
| Issuer | Shares | Value |
| Retail Grocery 0.50% | $138,482 | |
| Safeway, Inc. | 1,600 | 50,768 |
| The Kroger Company | 3,300 | 87,714 |
| Retail Trade 12.41% | 3,414,887 | |
| Abercrombie & Fitch Company, Class A | 1,100 | 86,570 |
| Advance Auto Parts, Inc. | 500 | 17,780 |
| American Eagle Outfitters, Inc. | 3,400 | 87,822 |
| Bed Bath & Beyond, Inc. * | 3,000 | 103,920 |
| Best Buy Company, Inc. | 900 | 39,555 |
| Big Lots, Inc. * | 1,100 | 32,747 |
| CarMax, Inc. * | 2,700 | 61,182 |
| Dollar Tree Stores, Inc. * | 1,300 | 56,485 |
| Family Dollar Stores, Inc. | 1,900 | 55,632 |
| Gap, Inc. | 1,700 | 31,892 |
| Home Depot, Inc. | 16,700 | 639,777 |
| J.C. Penney Company, Inc. | 600 | 41,256 |
| Kohl’s Corp. * | 4,600 | 272,780 |
| Limited Brands, Inc. | 2,000 | 46,320 |
| Lowe’s Companies, Inc. | 12,200 | 378,932 |
| Nordstrom, Inc. | 2,600 | 125,060 |
| RadioShack Corp. | 1,400 | 33,278 |
| Sears Holdings Corp. * | 400 | 57,424 |
| Staples, Inc. | 4,300 | 102,125 |
| Target Corp. | 5,000 | 329,650 |
| The TJX Companies, Inc. | 1,300 | 39,637 |
| Tiffany & Company | 900 | 46,197 |
| Walgreen Company | 3,200 | 144,224 |
| Wal-Mart Stores, Inc. | 13,400 | 584,642 |
| Sanitary Services 0.09% | 24,166 | |
| Ecolab, Inc. | 100 | 4,166 |
| Nalco Holding Company | 800 | 20,000 |
| Semiconductors 1.18% | 323,263 | |
| Intel Corp. | 9,800 | 252,350 |
| KLA-Tencor Corp. | 700 | 40,229 |
| Xilinx, Inc. | 1,200 | 30,684 |
| Software 5.29% | 1,456,319 | |
| Activision, Inc. * | 1,600 | 31,184 |
| Adobe Systems, Inc. * | 1,300 | 55,575 |
| Autodesk, Inc. * | 500 | 23,160 |
| BMC Software, Inc. * | 1,700 | 52,054 |
| CA, Inc. | 1,300 | 32,747 |
| Citrix Systems, Inc. * | 100 | 3,635 |
| Compuware Corp. * | 2,000 | 16,220 |
| Intuit, Inc. * | 1,000 | 27,310 |
| Microsoft Corp. | 32,600 | 936,598 |
| Oracle Corp. * | 13,700 | 277,836 |
See notes to financial statements
Growth Fund
16
F I N A N C I A L S T A T E M E N T S
| Issuer | Shares | Value |
| Telecommunications Equipment & Services 0.12% | $33,341 | |
| Polycom, Inc. * | 1,100 | 33,341 |
| Telephone 0.71% | 195,363 | |
| AT&T, Inc. | 4,900 | 195,363 |
| Tires & Rubber 0.24% | 66,384 | |
| Goodyear Tire & Rubber Company * | 2,400 | 66,384 |
| Tobacco 0.61% | 169,081 | |
| Altria Group, Inc. | 1,300 | 90,233 |
| UST, Inc. | 1,600 | 78,848 |
| Toys, Amusements & Sporting Goods 0.51% | 141,155 | |
| Hasbro, Inc. | 1,400 | 39,494 |
| Mattel, Inc. | 4,700 | 101,661 |
| Transportation 0.11% | 29,424 | |
| C.H. Robinson Worldwide, Inc. | 600 | 29,424 |
| Trucking & Freight 0.44% | 120,648 | |
| FedEx Corp. | 1,100 | 120,648 |
| Principal | ||
| Issuer, description, maturity date | amount | Value |
| Short-term investments 0.40% | $109,327 | |
| (Cost $109,327) | ||
| John Hancock Cash Investment Trust (c) | $109,327 | 109,327 |
| Repurchase agreements 5.66% | $1,558,000 | |
| (Cost $1,558,000) | ||
| Repurchase Agreement with State Street Corp. dated 08-31-07 at 4.60% | ||
| to be repurchased at $1,558,796 on 09-04-07, collateralized by | ||
| $1,650,000 Federal Home Loan Mortgage Corp., 4.00%, due 06-12-13 | ||
| (Valued at $1,592,250, including interest) | $1,558,000 | 1,558,000 |
| Total investments (Cost $25,990,344) 99.91% | $27,492,760 | |
| Other assets in excess of liabilities 0.09% | 24,230 | |
| Total net assets 100.00% | $27,516,990 | |
Percentages are stated as a percent of net assets.
REIT Real Estate Investment Trust
* Non-income producing.
(a) All or a portion of this security was out on loan.
(c) Investment is an affiliate of the Trust’s advisor or subadvisor.
See notes to financial statements
Growth Fund
17
Financial statements
F I N A N C I A L S T A T E M E N T S
Statement of assets and liabilities 8-31-07 (unaudited)
This Statement of Assets and Liabilities is the Fund’s balance sheet. It shows the value
of what the Fund owns, is due and owes. You’ll also find the net asset value and the
maximum offering price per share.
| Assets | |
| Investments, at value (Cost $24,323,017) | |
| including $107,183 of securities loaned (Note 2) | $25,825,433 |
| Repurchase agreement, at value (Cost $1,558,000) | 1,558,000 |
| Investments in affiliated issuers, at value (Cost $109,327) | 109,327 |
| Total investments, at value (Cost $25,990,344) | 27,492,760 |
| Cash | 419 |
| Cash collateral at broker for futures contracts | 67,200 |
| Receivable for fund shares sold | 1,075 |
| Dividends and interest receivable | 40,396 |
| Receivable for futures variation margin | 12,835 |
| Receivable due from adviser | 45,893 |
| Other assets | 8,864 |
| Total assets | 27,669,442 |
| Liabilities | |
| Payable for fund shares repurchased | 754 |
| Payable upon return of securities loaned (Note 2) | 109,327 |
| Payable to affiliates | |
| Transfer agent fees | 544 |
| Distribution and service fees | 332 |
| Other payables and accrued expenses | 41,495 |
| Total liabilities | 152,452 |
| Net assets | |
| Capital paid-in | $24,829,643 |
| Accumulated undistributed net realized gain on investments and futures contracts | 1,173,903 |
| Net unrealized appreciation on investments and futures contracts | 1,514,207 |
| Undistributed net investment loss | (763) |
| Net assets | $27,516,990 |
| Net asset value per share | |
| Based on net asset values and shares outstanding — The Fund has an | |
| unlimited number of shares authorized with no par value. | |
| Class A ($24,321,015 ÷ 1,085,502 shares) | $22.41 |
| Class B ($786,356 ÷ 35,328 shares)1 | $22.26 |
| Class C ($2,020,278 ÷ 90,757 shares)1 | $22.26 |
| Class I ($276,451 ÷ 12,270 shares) | $22.53 |
| Class R ($112,890 ÷ 5,059 shares) | $22.322 |
| Maximum offering price per share | |
| Class A3 ($22.41 ÷ 95%) | $23.59 |
1 Redemption price is equal to the net asset value less any applicable contingent deferred sales charge.
2 Net assets and shares outstanding have been rounded for presentation purposes. The net asset value is as reported on August 31, 2007.
3 On single retail sales of less than $50,000. On sales of $50,000 or more and on group sales the offering price is reduced.
See notes to financial statements
Growth Fund
18
F I N A N C I A L S T A T E M E N T S
Statement of operations For the period ended 8-31-07 (unaudited)1
This Statement of Operations summarizes the Fund’s investment income earned
and expenses incurred in operating the Fund. It also shows net gains (losses) for
the period stated.
| Investment income | |
| Dividends | $154,151 |
| Interest | 28,402 |
| Total investment income | 182,553 |
| Expenses | |
| Investment management fees (Note 3) | 100,705 |
| Distribution and service fees (Note 3) | 44,939 |
| Transfer agent fees (Note 3) | 10,309 |
| Fund administration fees (Note 3) | 3,478 |
| Audit and legal fees | 56,594 |
| Blue sky fees (Note 3) | 45,737 |
| Custodian fees | 18,649 |
| Registration and filing fees | 12,089 |
| Printing and postage fees (Note 3) | 6,360 |
| Trustees’ fees (Note 3) | 734 |
| Miscellaneous | 168 |
| Total expenses | 299,762 |
| Less expense reductions (Note 3) | (116,446) |
| Net expenses | 183,316 |
| Net investment loss | (763) |
| Realized and unrealized gain (loss) | |
| Net realized gain (loss) on | |
| Investments | 537,064 |
| Futures contracts | (5,961) |
| 531,103 | |
| Change in net unrealized appreciation (depreciation) of | |
| Investments | 190,000 |
| Futures contracts | 24,753 |
| 214,753 | |
| Net realized and unrealized gain | 745,856 |
| Increase in net assets from operations | $745,093 |
1 Semiannual period from 3-1-07 to 8-31-07.
See notes to financial statements
Growth Fund
19
F I N A N C I A L S T A T E M E N T S
Statement of changes in net assets
These Statements of Changes in Net Assets show how the value of the Fund’s net assets
has changed during the last two periods. The difference reflects earnings less expenses,
any investment gains and losses, distributions, if any, paid to shareholders and the net of
Fund share transactions.
| Period | Period | |
| ended | ended | |
| 2-28-071 | 8-31-072 | |
| Increase in net assets | ||
| From operations | ||
| Net investment income (loss) | $13,947 | ($763) |
| Net realized gain | 863,241 | 531,103 |
| Change in net unrealized appreciation (depreciation) | 1,299,454 | 214,753 |
| Increase in net assets resulting from operations | 2,176,642 | 745,093 |
| Distributions to shareholders | ||
| From net investment income | ||
| Class A | (38,325) | — |
| Class I | (108) | — |
| Class R1 | (163) | — |
| From net realized gain | ||
| Class A | (197,001) | — |
| Class B | (2,867) | — |
| Class C | (6,435) | — |
| Class I | (281) | — |
| Class R1 | (1,108) | — |
| Total distributions | (246,288) | — |
| From Fund share transactions | 20,208,114 | 4,633,429 |
| Total increase | 22,138,468 | 5,378,522 |
| Net assets | ||
| Beginning of period | — | 22,138,468 |
| End of period3 | $22,138,468 | $27,516,990 |
1 Period from 6-12-06 (commencement of operations) to 2-28-07.
2 Semiannual period from 3-1-07 to 8-31-07. Unaudited.
3 Includes undistributed net investment income (loss) of $0 and ($763), respectively.
See notes to financial statements
Growth Fund
20
F I N A N C I A L S T A T E M E N T S
Financial highlights
The Financial Highlights show how the Fund’s net asset value for a share has changed
since the end of the previous period.
| CLASS A SHARES | ||
| Period ended | 2-28-071 | 8-31-072 |
| Per share operating performance | ||
| Net asset value, beginning of period | $20.00 | $21.65 |
| Net investment income3 | —4 | 0.01 |
| Net realized and unrealized gain | ||
| on investments | 1.91 | 0.75 |
| Total from investments operations | 1.91 | 0.76 |
| Less distributions | ||
| From net investment income | (0.04) | — |
| From net realized gain | (0.22) | — |
| (0.26) | — | |
| Net asset value, end of period | $21.65 | $22.41 |
| Total return5,6,7 (%) | 9.57 | 3.51 |
| Ratios and supplemental data | ||
| Net assets, end of period | ||
| (in millions) | $21 | $24 |
| Ratio of net expenses to average | ||
| net assets10 (%) | 1.39 | 1.40 |
| Ratio of gross expenses to average | ||
| net assets9,10 (%) | 2.00 | 2.02 |
| Ratio of net investment income | ||
| to average net assets 10 (%) | 0.01 | 0.05 |
| Portfolio turnover7 (%) | 93 | 46 |
See notes to financial statements
Growth Fund
21
F I N A N C I A L S T A T E M E N T S
Financial highlights
| CLASS B SHARES | ||
| Period ended | 2-28-071 | 8-31-072 |
| Per share operating performance | ||
| Net asset value, beginning of period | $20.00 | $21.59 |
| Net investment loss3 | (0.11) | (0.07) |
| Net realized and unrealized | ||
| gain on investments | 1.92 | 0.74 |
| Total from investments operations | 1.81 | 0.67 |
| Less distributions | ||
| From net realized gain | (0.22) | — |
| Net asset value, end of period | $21.59 | $22.26 |
| Total return5,6,7 (%) | 9.05 | 3.10 |
| Ratios and supplemental data | ||
| Net assets, end of period | ||
| (in millions) | —8 | $1 |
| Ratio of net expenses to average | ||
| net assets10 (%) | 2.09 | 2.10 |
| Ratio of gross expenses to average | ||
| net assets9,10 (%) | 11.94 | 5.91 |
| Ratio of net investment loss | ||
| to average net assets10 (%) | (0.68) | (0.65) |
| Portfolio turnover7 (%) | 93 | 46 |
See notes to financial statements
Growth Fund
22
F I N A N C I A L S T A T E M E N T S
Financial highlights
| CLASS C SHARES | ||
| Period ended | 2-28-071 | 8-31-072 |
| Per share operating performance | ||
| Net asset value, beginning of period | $20.00 | $21.59 |
| Net investment loss3 | (0.10) | (0.07) |
| Net realized and unrealized | ||
| gain on investments | 1.91 | 0.74 |
| Total from investments operations | 1.81 | 0.67 |
| Less distributions | ||
| From net realized gain | (0.22) | — |
| Net asset value, end of period | $21.59 | $22.26 |
| Total return5,6,7 (%) | 9.05 | 3.10 |
| Ratios and supplemental data | ||
| Net assets, end of period | ||
| (in millions) | $1 | $2 |
| Ratio of net expenses to average | ||
| net assets10 (%) | 2.10 | 2.10 |
| Ratio of gross expenses to average | ||
| net assets9,10 (%) | 7.70 | 4.05 |
| Ratio of net investment loss | ||
| to average net assets10 (%) | (0.66) | (0.67) |
| Portfolio turnover7 (%) | 93 | 46 |
See notes to financial statements
Growth Fund
23
F I N A N C I A L S T A T E M E N T S
Financial highlights
| CLASS I SHARES | ||
| Period ended | 2-28-071 | 8-31-072 |
| Per share operating performance | ||
| Net asset value, beginning of period | $20.00 | $21.73 |
| Net investment income3 | 0.06 | 0.05 |
| Net realized and unrealized | ||
| gain on investments | 1.97 | 0.75 |
| Total from investments operations | 2.03 | 0.80 |
| Less distributions | ||
| From net investment income | (0.08) | — |
| From net realized gain | (0.22) | — |
| (0.30) | — | |
| Net asset value, end of period | $21.73 | $22.53 |
| Total return5,6,7 (%) | 10.18 | 3.68 |
| Ratios and supplemental data | ||
| Net assets, end of period | ||
| (in millions) | —8 | —8 |
| Ratio of net expenses to average | ||
| net assets10 (%) | 1.00 | 1.00 |
| Ratio of gross expenses to average | ||
| net assets9,10 (%) | 1.90 | 11.63 |
| Ratio of net investment income | ||
| to average net assets10 (%) | 0.43 | 0.41 |
| Portfolio turnover7 (%) | 93 | 46 |
Growth Fund
24
F I N A N C I A L S T A T E M E N T S
Financial highlights
| CLASS R1 SHARES | ||
| Period ended | 2-28-071 | 8-31-072 |
| Per share operating performance | ||
| Net asset value, beginning of period | $20.00 | $21.60 |
| Net investment loss3 | (0.05) | (0.03) |
| Net realized and unrealized | ||
| gain on investments | 1.90 | 0.75 |
| Total from investments operations | 1.85 | 0.72 |
| Less distributions | ||
| From net investment income | (0.03) | — |
| From net realized gain | (0.22) | — |
| (0.25) | — | |
| Net asset value, end of period | $21.60 | $22.32 |
| Total return5,6,7 (%) | 9.27 | 3.33 |
| Ratios and supplemental data | ||
| Net assets, end of period | ||
| (in millions) | —8 | —8 |
| Ratio of net expenses to average | ||
| net assets10 (%) | 1.74 | 1.75 |
| Ratio of gross expenses to average | ||
| net assets9,10 (%) | 21.55 | 18.92 |
| Ratio of net investment income loss | ||
| to average net assets10 (%) | (0.34) | (0.30) |
| Portfolio turnover7 (%) | 93 | 46 |
1 Class A, Class B, Class C, Class I and Class R1 shares began operations on 6-12-06.
2 Semiannual period from 3-1-07 to 8-31-07. Unaudited.
3 Based on the average of the shares outstanding.
4 Less than $0.01 per share.
5 Assumes dividend reinvestment.
6 Total returns would have been lower had certain expenses not been reduced during the periods shown.
7 Not annualized.
8 Less than $500,000.
9 Does not take into consideration expense reduction during period shown.
10 Annualized.
See notes to financial statements
Growth Fund
25
Notes to financial statements (unaudited)
1. Organization
John Hancock Growth Fund (the Fund) is a newly organized non-diversified series of John Hancock Funds III (the Trust). The Trust was established as a Massachusetts business trust on June 9, 2005. The Trust is registered under the Investment Company Act of 1940, as amended (the 1940 Act), as an open-end investment management company. The investment objective of the Fund is to seek long-term capital growth.
John Hancock Life Insurance Company of New York (John Hancock New York) is a wholly owned subsidiary of John Hancock Life Insurance Company (U.S.A.) (John Hancock USA). John Hancock USA and John Hancock New York are indirect wholly owned subsidiaries of The Manufacturers Life Insurance Company (Manulife), which in turn is a wholly owned subsidiary of Manulife Financial Corporation (MFC), a publicly traded company. MFC and its subsidiaries are known collectively as “Manulife Financial.”
John Hancock Investment Management Services, LLC (the Adviser) a Delaware limited liability company controlled by John Hancock USA, serves as investment adviser for the Trust and John Hancock Funds, LLC (the Distributor), a Delaware limited liability company, an affiliate of the Adviser, serves as principal underwriter.
The Board of Trustees have authorized the issuance of multiple classes of shares of the Fund, including classes designated as Class A, Class B, Class C, Class I, Class R1, Class 1, Class 3 and Class NAV shares. The shares of each class represent an interest in the same portfolio of investments of the Fund, and have equal rights as to voting, redemptions, dividends and liquidation, except that certain expenses, subject to the approval of the Board of Trustees, may be applied differently to each class of shares in accordance with current regulations of the Securities and Exchange Commission (SEC) and the Internal Revenue Service. Shareholders of a class that bears distribution and service expenses under the terms of a distribution plan have exclusive voting rights to that distribution plan. Class B shares will convert to Class A shares eight years after purchase.
The Adviser and other subsidiaries of John Hancock USA owned 738,902, 5,051, 5,051 and 5,050 shares of beneficial interest of Class A, Class B, Class C and Class R1, respectively, of the Fund on August 31, 2007.
2. Significant accounting policies
In the preparation of the financial statements, the Fund follows the policies described below. The preparation of financial statements in conformity with accounting principles generally accepted in the United States of America requires management to make estimates and assumptions that affect the reported amounts of assets and liabilities at the date of the financial statements and the reported amounts of income and expenses during the reporting period. Actual results may differ from these estimates.
Security valuation
The net asset value of the shares of Class A, Class B, Class C, Class I and Class R1 of the Fund is determined daily as of the close of the New York Stock Exchange (NYSE), normally at 4:00 p.m., Eastern Time. Short-term debt instruments with remaining maturities of 60 days or less are valued at amortized cost, and thereafter assume a constant amortization to maturity of any discount or premium, which approximates market value. Investments in John Hancock Cash Investment Trust (JHCIT), an affiliate of John Hancock Advisers, LLC (JHA), a wholly owned subsidiary of John Hancock Financial Services, Inc., a subsidiary of MFC, are valued at their net asset value each business day. All other securities held by the Fund are valued
Growth Fund
26
at the last sale price or official closing price (closing bid price or last evaluated quote if no sale has occurred) as of the close of business on a principal securities exchange (domestic or foreign) on which they trade or, lacking any sales, at the closing bid price. Securities traded only in the over-the-counter market are valued at the last bid price quoted by brokers making markets in the securities at the close of trading. Securities for which there are no such quotations, principally debt securities, are valued based on the valuation provided by an independent pricing service, which utilizes both dealer-supplied and electronic data processing techniques, which take into account factors such as institutional size trading in similar groups of securities, yield, quality, coupon rate, maturity, type of issue, trading characteristics and other market data.
Other assets and securities for which no such quotations are readily available are valued at their fair value as determined in good faith under consistently applied procedures established by and under the general supervision of the Board of Trustees. Generally, trading in non-U.S. securities is substantially completed each day at various times prior to the close of trading on the NYSE. The values of such securities used in computing the net asset value of a Fund’s shares are generally determined as of such times. Occasionally, significant events that affect the values of such securities may occur between the times at which such values are generally determined and the close of the NYSE. Upon such an occurrence, these securities will be valued at their fair value as determined in good faith under consistently applied procedures established by and under the general supervision of the Board of Trustees.
Repurchase agreements
The Fund may enter into repurchase agreements. When the Fund enters into a repurchase agreement through its custodian, it receives delivery of securities, the amount of which at the time of purchase and each subsequent business day is required to be maintained at such a level that the market value is generally at least 102% of the repurchase amount. The Fund will take constructive receipt of all securities underlying the repurchase agreements it has entered into until such agreements expire. If the seller defaults, the Fund would suffer a loss to the extent that proceeds from the sale of underlying securities were less than the repurchase amount. The Fund may enter into repurchase agreements maturing within seven days with domestic dealers, banks or other financial institutions deemed to be creditworthy by the Adviser. Collateral for certain tri-party repurchase agr eements is held at the custodian bank in a segregated account for the benefit of the Fund and the counterparty.
Security transactions and related
investment income
Security transactions and related investment income Investment security transactions are accounted for on a trade date plus one basis for daily net asset value calculations. However, for financial reporting purposes, investment transactions are reported on trade date. Interest income is accrued as earned. Dividend income is recorded on the ex-dividend date. Foreign dividends are recorded on the ex-date or when the Fund becomes aware of the dividends from cash collections. Discounts/premiums are accreted/amortized for financial reporting purposes. Non-cash dividends are recorded at the fair market value of the securities received. Debt obligations may be placed in a non-accrual status and related interest income may be reduced by ceasing current accruals and writing off interest receivables when the collection of all or a portion of interest has become doubtful, based upon consistently applied procedures.
From time to time, the Fund may invest in Real Estate Investment Trusts (REITs) and, as a result, will estimate the components of distributions from these securities. Distributions from REITs received in excess of income are recorded as a reduction of cost of investments and/or as a realized gain.
The Fund uses the First In, First Out method for fixed income securities and Highest Cost, First Out for all other securities for determining realized gain or loss on investments for both financial and federal income tax reporting purposes.
Growth Fund
27
Multi-class allocations
All income, expenses (except for class-specific expenses) and realized and unrealized gains (losses) are allocated to each class of shares based upon the relative net assets of each class. Dividends to shareholders from net investment income are determined at a class level and distributions from capital gains are determined at a Fund level.
Expense allocation
Expenses are allocated based on the relative share of net assets of the Fund at the time the expense was incurred. Class-specific expenses, such as distribution (Rule 12b-1) fees, are accrued daily and charged directly to the respective share classes.
Securities lending
The Fund may lend securities in amounts up to 33 1 / 3% of the Fund’s total assets. Such loans are callable at any time and are at all times fully secured by cash, cash equivalents or securities issued or guaranteed by the U.S. government or its agencies or instrumentalities and marked-to-market on a daily basis. The Fund may bear the risk of delay in recovery of, or even of rights in, the securities loaned should the borrower of the securities fail financially. The Fund receives compensation for lending its securities either in the form of fees and/or by retaining a portion of interest on the investment of any cash received as collateral. The Fund invests in cash collateral received in connection with securities lending transactions in JHCIT, a Delaware common law trust and an affiliated fund. JHCIT is exempt from registration under Section 3(c)(7) of the 1940 Act (pursuant to exemptive order issued by the SEC) and is managed by the Adviser, for which the Adviser receives an investment advisory fee of 0.04% of the average daily net assets of the JHCIT.
All collateral received will be in an amount equal to at least 100% of the market value of the loaned securities and is intended to be maintained at that level during the period of the loan. The market value of the loaned securities is determined at the close of business of the Fund and any additional required collateral is delivered to the Fund the next business day. During the loan period, the Fund continues
to retain rights of ownership, including dividends and interest of the loaned securities. At August 31, 2007, the Fund loaned securities having a market value of $107,183 collateralized by securities in the amount of $109,327.
Futures
The Fund may purchase and sell financial futures contracts and options on those contracts. The Fund invests in contracts based on financial instruments such as U.S. Treasury Bonds or Notes or on securities indices such as the Standard & Poor’s 500 Index, in order to hedge against a decline in the value of securities owned by the Fund.
Initial margin deposits required upon entering into futures contracts are satisfied by the delivery of specific securities or cash as collateral to the broker (the Funds’ agent in acquiring the futures position). If the position is closed out by taking an opposite position prior to the settlement date of the futures contract, a final determination of variation margin is made, cash is required to be paid to or released by the broker and the Fund realizes a gain or loss.
When the Fund sells a futures contract based on a financial instrument, the Fund becomes obligated to deliver that kind of instrument at an agreed upon date for a specified price. The Fund realizes a gain or loss depending on whether the price of an offsetting purchase is less or more than the price of the initial sale or on whether the price of an offsetting sale is more or less than the price of the initial purchase. The Fund could be exposed to risks if it could not close out futures positions because of an illiquid secondary market or the inability of counterparties to meet the terms of their contracts. Futures contracts are valued at the quoted daily settlement prices established by the exchange on which they trade.
Growth Fund
28
| The following is a summary of open futures contracts on August 31, 2007: | ||||
| NUMBER OF | UNREALIZED | |||
| OPEN CONTRACTS | CONTRACTS | POSITION | EXPIRATION | APPRECIATION |
| S&P 500 Index | 17 | Long | Sep 2007 | $11,791 |
Federal income taxes
The Fund qualifies as a “regulated investment company” by complying with the applicable provisions of the Internal Revenue Code and will not be subject to federal income tax on taxable income. Therefore, no federal income tax provision is required.
New accounting pronouncements
In June 2006, Financial Accounting Standards Board (FASB) Interpretation No. 48, Accounting for Uncertainty in Income Taxes (the Interpretation), was issued and is effective for fiscal years beginning after December 15, 2006, and is to be applied to all open tax years as of the effective date. This Interpretation prescribes a minimum threshold for financial statement recognition of the benefit of a tax position taken or expected to be taken in a tax return, and requires certain expanded disclosures. Management has evaluated the application of this Interpretation to the Fund and does not believe there is a material impact resulting from the adoption of this Interpretation on the Fund’s financial statements.
In September 2006, FASB Standard No. 157, Fair Value Measurements (FAS 157), was issued and is effective for fiscal years beginning after November 15, 2007. FAS 157 defines fair value, establishing a framework for measuring fair value and expands disclosure about fair value measurements. Management is currently evaluating the application of FAS 157 to the Fund and its impact, if any, resulting from the adoption of FAS 157 on the Fund’s financial statements.
Distribution of income and gains
The Fund records distributions to shareholders from net investment income and net realized gains, if any, on the ex-dividend date. During the period ended February 28, 2007, the tax character of distributions paid was as follows: ordinary income $205,911 and long-term capital gains $40,377. Distributions paid by the Fund with respect to each class of shares are calculated in the same manner, at the same time and are in the same amount, except for the effect of expenses that may be applied differently to each class.
Such distributions, on a tax basis, are determined in conformity with income tax regulations, which may differ from accounting principles generally accepted in the United States of America. Distributions in excess of tax basis earnings and profits, if any, are reported in the Fund’s financial statements as a return of capital.
Capital accounts
The Fund reports the undistributed net investment income and accumulated undistributed net realized gain (loss) accounts on a basis approximating amounts available for future tax distributions (or to offset future taxable realized gains when a capital loss carryforward is available). Accordingly, the Fund may periodically make reclassifications among certain capital accounts without affecting its net asset value.
3. Investment advisory and
other agreements
Advisory fees
The Trust has entered into an Investment Advisory Agreement with the Adviser. The Adviser is responsible for managing the corporate and business affairs of the Trust and for selecting and compensating subadvisers to handle the investment of the assets of the Fund, subject to the supervision of the Trust’s Board of Trustees. Under the Advisory Agreement the Fund pays a monthly management fee to the Adviser equivalent, on an annual basis, to the sum of: (a) 0.80% of the first $500,000,000 of the Fund’s aggregate daily net assets, (b) 0.78% of the next $500,000,000 of the Fund’s aggregate daily net assets, (c) 0.77% of the next $1,500,000,000 of the Fund’s aggregate daily net assets and (d) 0.76% of the Fund’s aggregate daily net assets in excess of
Growth Fund
29
$2,500,000,000. Aggregate net assets include the net assets of the Fund and Growth Trust, a series of John Hancock Trust and the Growth Fund, a series of John Hancock Funds II. The Adviser has a subadvisory agreement with Grantham, Mayo, Van Otterloo & Co. LLC. The Fund is not responsible for payment of the subadvisory fees.
Expense reimbursements
The Adviser has agreed contractually to reimburse for certain fund level expenses that exceed 0.11% of the average annual net assets, or to make a payment to a specific class of shares of the Fund in an amount equal to the amount by which the expenses attributable to such class of shares (excluding taxes, portfolio brokerage commissions, interest, litigation and indemnification expenses and other extraordinary expenses not incurred in the ordinary course of the Fund’s business and fees under any agreement or plans of the Fund dealing with services for shareholders and others with beneficial interests in shares of the Fund) exceed the percentage of average annual net assets (on an annualized basis) attributable as follows: 1.40% for Class A, 2.10% for Class B, 2.10% for Class C, 1.00% for Class I and 1.50% for Class R1. Accordingly, the expense reductions related to this expense limitation amounted to $70,323, $11,279, $14,287, $ 10,781 and $9,776 for Class A, Class B, Class C, Class I and Class R1, respectively, for the period ended August 31, 2007. This expense reimbursement shall continue in effect until June 30, 2008 and thereafter until terminated by the Adviser on notice to the Trust.
Administration fees
The Fund has an agreement with the Adviser that requires the Fund to reimburse the Adviser for all expenses associated with providing the administrative, financial, accounting and recordkeeping services of the Fund, including the preparation of all tax returns, annual, semiannual and periodic reports to shareholders and the preparation of all regulatory reports. These expenses are allocated based on the relative net assets of each class. The compensation for the period amounted to $3,478 with an effective rate of 0.03% of the Fund’s average daily net asset value.
Distribution plan
The Trust has a Distribution Agreement with the Distributor. The Fund has adopted Distribution Plans with respect to Class A, Class B, Class C and Class R1, pursuant to Rule 12b-1 under the 1940 Act, to reimburse the Distributor for the services it provides as distributor of shares of the Fund. Accordingly, the Fund makes monthly payments to the Distributor at an annual rate not to exceed 0.30%, 1.00%, 1.00% and 0.50% of average daily net asset value of Class A, Class B, Class C and Class R1, respectively. A maximum of 0.25% of such payments may be service fees, as defined by the Conduct Rules of the Financial Industry Regulatory Authority (formerly the National Association of Securities Dealers). Under the Conduct Rules, curtailment of a portion of the Fund’s 12b-1 payments could occur under certain circumstances. In addition, under a Service Plan for Class R1 shares, the Fund pays up to 0.25% of Class R1 average daily net asse t value for certain other services.
Sales charges
Class A shares are assessed up-front sales charges of up to 5.00% of net asset value of such shares. During the period ended August 31, 2007, the Fund was informed that the Distributor received net up-front sales charges of $56,656 with regard to sales of Class A shares. Of this amount, ($2,496) was retained and used for printing prospectuses, advertising, sales literature and other purposes, $59,012 was paid as sales commissions to unrelated broker-dealers and $140 was paid as sales commissions to sales personnel of Signator Investors, Inc. (Signator Investors), a related broker-dealer, an indirect subsidiary of MFC.
Class B shares that are redeemed within six years of purchase are subject to a contingent deferred sales charge (CDSC) at declining rates, beginning at 5.00% of the lesser of the current market value at the time of redemption or the original purchase cost of the shares being redeemed. Class C shares that are redeemed within one year of purchase are subject to a CDSC at a rate of 1.00% of the lesser of the current market value at the time of redemption or the original purchase cost of the shares being redeemed. Proceeds from the CDSCs
Growth Fund
30
are paid to the Distributor and are used, in whole or in part, to defray its expenses for providing distribution-related services to the Fund in connection with the sale of Class B and Class C shares. During the period ended August 31, 2007, CDSCs received by the Distributor amounted to $1,457 for Class B shares and $474 for Class C shares.
Transfer agent fees
The Fund has a Transfer Agency Agreement with John Hancock Signature Services, Inc. (Signature Services), an indirect subsidiary of MFC. For Class A, Class B, Class C, Class I and Class R1 shares, the Fund pays a monthly transfer agent fee at an annual rate of 0.05% of each class’ average daily net assets, plus a fee based on the number of shareholder accounts and reimbursement for certain out-of-pocket expenses. Expenses not directly attributable to a particular class of shares are aggregated and allocated to each class on the basis of its relative net asset value.
Signature Services has agreed to limit the transfer agent fees so that such fees do not exceed 0.20% annually of Class A, Class B, Class C, Class I and Class R1 share average daily net assets. This agreement is effective until December 31, 2007. Signature Services reserves the right to terminate this limitation in the future. Accordingly, there were no transfer agent fee reductions for Class A, Class B, Class C, Class I and Class R1 shares, respectively, during the period ended August 31, 2007.
Expenses under the agreements described above for the period ended August 31, 2007, were as follows:
| Distribution and | Transfer | Blue sky | Printing and | |
| Share class | service fees | agent fees | fees | postage fees |
| Class A | $34,193 | $8,165 | $9,376 | $4,673 |
| Class B | 2,969 | 594 | 9,103 | 148 |
| Class C | 7,349 | 1,470 | 9,103 | 99 |
| Class I | — | 51 | 9,054 | 1,080 |
| Class R1 | 428 | 29 | 9,101 | 360 |
| Total | 44,939 | 10,309 | 45,737 | 6,360 |
Trustees’ fees
The Trust compensates each Trustee who is not an employee of the Adviser or its affiliates. Total Trustees’ expenses are allocated to the Fund based on its average daily net asset value.
4. Guarantees and indemnifications
Under the Trust’s organizational documents, its Officers and Trustees are indemnified against certain liability arising out of the performance of their duties to the Trust. Additionally, in the normal course of business, the Trust enters into contracts with service providers that contain general indemnification clauses. The Trust’s maximum exposure under these arrangements is unknown, as this would involve future claims that may be made against the Trust that have not yet occurred. However, based on experience, the Trust believes the risk of loss to be remote.
5. Line of credit
The Fund has entered into an agreement which enables it to participate in a $100 million unsecured committed line of credit with State Street Corporation. Borrowings will be made solely to temporarily finance the repurchase of capital shares. Interest is charged to the Fund based on its borrowings at a rate per annum equal to the Federal Funds rate plus 0.50% . In addition, a commitment fee of 0.07% per annum, payable at the end of each calendar quarter, based on the average daily-unused portion of the line of credit, is charged to the Fund on a prorated basis based on average net assets. For the period ended August 31, 2007, there were no borrowings under the line of credit.
Growth Fund
31
6. Capital shares
Share activities for the Fund for the periods ended February 28, 2007 and August 31, 2007 were as follows:
| Period ended 2-28-07 1 | Period ended 8-31-07 2 | |||
| Shares | Amount | Shares | Amount | |
| Class A | ||||
| Sold | 941,625 | $19,160,734 | 153,272 | $3,450,371 |
| Distributions reinvested | 10,718 | 232,682 | — | — |
| Repurchased | (3,531) | (77,567) | (16,582) | (370,818) |
| Net increase | 948,812 | $19,315,849 | 136,690 | $3,079,553 |
| Class B | ||||
| Sold | 19,722 | $418,160 | 18,342 | $402,833 |
| Distributions reinvested | 132 | 2,867 | — | — |
| Repurchased | (217) | (4,845) | (2,651) | (58,728) |
| Net increase | 19,637 | $416,182 | 15,691 | $344,105 |
| Class C | ||||
| Sold | 42,249 | $911,629 | 49,138 | $1,099,277 |
| Distributions reinvested | 277 | 6,002 | — | — |
| Repurchased | (13) | (287) | (894) | (19,383) |
| Net increase | 42,513 | $917,344 | 48,244 | $1,079,894 |
| Class I | ||||
| Sold | 368,724 | $7,471,000 | 7,959 | $180,653 |
| Distributions reinvested | 18 | 389 | — | — |
| Repurchased | (362,143) | (8,013,922) | (2,288) | (50,776) |
| Net increase (decrease) | 6,599 | ($542,533) | 5,671 | $129,877 |
| Class R1 | ||||
| Sold | 5,000 | $100,000 | — | — |
| Distributions reinvested | 59 | 1,272 | — | — |
| Net increase | 5,059 | $101,272 | — | — |
| Net increase | 1,022,620 | $20,208,114 | 206,296 | $4,633,429 |
1Period from 6-12-06 (commencement of operations) to 2-28-07.
2Semiannual period from 3-1-07 to 8-31-07. Unaudited.
7. Investment transactions
Purchases and proceeds from sales or maturities of securities, other than short-term securities and obligations of the U.S. government, during the period ended August 31, 2007, aggregated $14,965,998 and $10,930,504, respectively.
The cost of investments owned on August 31, 2007, including short-term investments, for federal income tax purposes, was $26,051,455. Gross unrealized appreciation and depreciation of investments aggregated $2,218,267 and $776,962, respectively, resulting in net unrealized appreciation of $1,441,305. The difference between book basis and tax basis net unrealized appreciation of investments is attributable primarily to the tax deferral of losses on certain sales of securities.
8. Federal income tax information
Federal income tax regulations may differ from generally accepted accounting principles and income and capital gain distributions determined in accordance with tax regulations may differ from net investment income and realized gains recognized for financial reporting purposes.
Growth Fund
32
Evaluation of Advisory and Subadvisory
Agreements by the Board of Trustees
This section describes the evaluation
by the Board of Trustees of the
Advisory Agreement and each of the
Subadvisory Agreements.
Evaluation by the Board of Trustees
The Board, including all of the Trustees who are not “interested persons” as defined in the Investment Company Act of 1940, as amended (the Independent Trustees), is responsible for selecting the Trust’s investment adviser, John Hancock Investment Management Services, LLC (the Adviser or JHIMS), approving the Adviser’s selection of subadvisers for each series of the Trust (the Funds) and approving the Trust’s advisory and sub-advisory agreements (and any sub-subadvisory agreements), their periodic continuation and any amendments. Consistent with SEC rules, the Board regularly evaluates the Trust’s advisory and subadvisory (and sub-subadvisory) arrangements, including consideration of the factors listed below. The Board may also consider other factors (including conditions and trends prevailing generally in the economy, the securities markets and the industry) and does not treat any single factor as deter minative, and each Trustee may attribute different weights to different factors. The Board is furnished with an analysis of its fiduciary obligations in connection with its evaluation and, throughout the evaluation process, the Board is assisted by counsel for the Trust and the Independent Trustees are also separately assisted by independent legal counsel. The factors regularly considered by the Board are:
1. the nature, extent and quality of the services to be provided by the Adviser to the Trust and by the subadvisers to the Funds;
2. the investment performance of the Funds and their subadvisers;
3. the extent to which economies of scale would be realized as a Fund grows and whether fee levels reflect these economies of scale for the benefit of Trust shareholders;
4. the costs of the services to be provided and the profits to be realized by the Adviser and its affiliates (including any subadvisers that are affiliated with the Adviser) from the Adviser’s relationship with the Trust; and
5. comparative services rendered and comparative advisory and subadvisory fee rates.
The Board believes that information relating to all these factors is relevant to its evaluation of the Trust’s advisory agreement. With respect to its evaluation of subadvisory agreements (including sub-subadvisory agreements) the Board believes that, in view of the Trust’s “manager of managers” advisory structure, the costs of services to be provided and the profits to be realized by those subadvisers that are not affiliated with the Adviser from their relationship with the Trust generally are not a material factor to the Board’s consideration of subadvisory agreements because such fees are paid to subadvisers by the Adviser and not by the Funds, and because the Board relies on the ability of the Adviser to negotiate such subadvisory fees at arm’s-length.
In evaluating subadvisory arrangements, the Board also considers other material business relationships that unaffiliated subadvisers and their affiliates have with the Adviser or its affiliates, including the involvement by certain affiliates of certain subadvisers in the distribution of financial products, including shares of the Trust, offered by the Adviser and other affiliates of the Adviser (Material Relationships).
Approval of Advisory Agreement
At its meeting on June 5, 2007, the Board, including all the Independent Trustees, approved the Advisory Agreement between the Trust and JHIMS with respect to each of the Funds.
In approving the Advisory Agreement, and with reference to the factors which it regularly considers, the Board:
(1) (a) considered the high value to the Trust of continuing the relationship with JHIMS as the Trust’s Adviser to the other John Hancock Funds, the skills and competency with which JHIMS
33
has in the past managed the affairs and subadvisory relationships of other funds in the complex, JHIMS’s oversight and monitoring of subadvisers’ investment performance and compliance programs including its timelines in responding to performance issues and the qualifications of JHIMS’s personnel,
(b) considered JHIMS’s compliance policies and procedures and its responsiveness to regulatory changes and mutual fund industry developments, and
(c) JHIMS’s administrative capabilities, including its ability to supervise the other service providers for the Funds and concluded that JHIMS may reasonably be expected to ably perform its services under the Advisory Agreement.
(2) reviewed the investment performance of portfolios that are managed comparable to the Funds; the comparative performance of their respective benchmarks; and JHIMS’ analysis of such performance and its plans and recommendations regarding the Trust’s subadvisory arrangements generally and with respect to the Funds; and concluded that each of the comparably managed funds has performed well or within a range that the Board deemed competitive, and that JHIMS may reasonably be expected to ably monitor the performance of the Funds and their subadvisers;
(3) reviewed the Trust’s advisory fee structure and the incorporation therein of any subadvisory fee breakpoints in the advisory fees charged and concluded (i) that to the extent that Funds have subadvisory fees with breakpoints, those breakpoints are reflected as breakpoints in the advisory fees for Funds, (ii) that all Funds with a subadviser that is not affiliated with the Adviser have subadvisory fees which are the product of arm’s-length negotiations between the Adviser and the subadviser and which in many, but not all, cases contain breakpoints, and (iii) that, although economies of scale cannot be measured with precision, these arrangements permit shareholders of Funds with advisory fee breakpoints to benefit from economies of scale if those Funds grow;
(4) (a) reviewed the financial statements of JHIMS and John Hancock Life Insurance Company (U.S.A.) (JHLICO (U.S.A.));
(b) reviewed the anticipated profitability of the JHIMS’s relationship with the Funds in terms of the fees it expects to receive with respect to the Funds and whether JHIMS has the financial ability to provide a high level of services to the Funds,
(c) considered that JHIMS derives reputational and other indirect benefits from providing advisory services to the Funds, and
(d) noted that JHIMS will pay the subadvisory fees out of the advisory fees JHIMS receives from the Funds and concluded that the advisory fees paid by the Trust with respect to the Funds are not unreasonable in light of such information; and
(5) reviewed comparative information with respect to the advisory fee rates and concluded that the anticipated advisory fees for the Funds are within the range of those incurred by other comparable funds and that the advisory structure for the Funds is thus competitive within the industry.
Additional information that the Board considered for a particular Fund is set forth in Appendix A.
Approval of Subadvisory Agreements
At its meeting on June 5, 2007, the Board, including all the Independent Trustees, approved the Subadvisory Agreements.
In making its determination with reference to these respective factors, the Board reviewed:
34
(i) information relating to each subadviser’s business which included information such as: business performance, assets under management, financial stability and personnel;
(ii) the investment performance of the subadviser’s portfolio managed comparably to the Fund to be managed by the subadviser and comparative performance information relating to the benchmark;
(iii) the proposed subadvisory fee for each Fund to be managed by the subadviser and comparative fee information; and
(iv) information relating to the nature and scope of Material Relationships and their significance to the Adviser and the subadvisers.
The Board’s decision to approve each Subadvisory Agreement was based on a number of determinations, including the following:
(1) The subadviser has extensive experience and demonstrated skills as a manager and may be expected to provide a high quality of investment personnel to each Fund;
(2) Although not without variation, the current and historical performance of the portfolios of the Subadviser managed comparably to the Fund to be managed by the Subadviser has been within a competitive range of the current and historical performance of these portfolios’ respective benchmark (see Appendix A for further information on performance);
(3) The subadvisory fees are within industry norms and are the product of arm’s-length negotiation between the Adviser and the subadviser; and
(4) The Material Relationships consist of arrangements in which unaffiliated subadvisers or their affiliates provide advisory, distribution or management services in connection with financial products sponsored by the Trust’s adviser or its affiliates, which may include other registered investment companies, a 529 education savings plan, managed separate accounts and exempt group annuity contracts sold to qualified plans, and which in no case contained elements which would cause the Board to conclude that approval of the subadvisory agreement with the subadviser would be inappropriate. See (5) below for information relating to the business arrangement between the Trust’s Adviser and GMO.
(5) As a part of the overall business arrangement between the Adviser and GMO under which the Adviser has obtained exclusive rights to certain GMO investment management services for up to five years, the Adviser has agreed that under certain circumstances it (and not the Trust or the particular Fund) will pay GMO a specified amount (ranging from $1 to $12 million) if the subadvisory agreement with respect to any of the following Funds to be subadvised by GMO is terminated within a five-year period from the date of its effectiveness: U.S. Core Fund, Active Value Fund, Intrinsic Value Fund, Growth Fund, International Core Fund, International Growth Fund, Global Fund, Value Opportunities Fund, Growth Opportunities Fund and U.S. Quality Equity Fund.
The Adviser has also agreed that, subject to its fiduciary duties as an investment adviser to each of these Funds and its shareholders, it will not recommend to the Board of Trustees to terminate the subadvisory agreement with respect to any of the Funds or to reduce any of the fees payable thereunder to GMO for a five-year period from the date of effectiveness of the agreement. Substantially similar agreements (with varying amounts to be paid upon termination) also apply with respect to certain other John Hancock funds that are or will be advised by the Adviser and subadvised by GMO. The Trust is not a party to any of these arrangements, and they are not binding upon the Trust, the Trust’s Funds subadvised by GMO or the Board of Trustees. However, these arrangements present certain conflicts of interest because the Adviser has a financial incentive to support the continuation of GMO subadvisory agreements for as long as the ter mination provisions described above remain in effect. In approving the Advisory Agreement
35
and the subadvisory agreement with respect to each of the Funds subadvised by GMO, the Board of Trustees, including the Independent Trustees, was aware of and considered these potential conflicts of interest, including any financial obligations of the Adviser to GMO.
The Board concluded that, notwithstanding the potential conflicts of interest, approval of the Advisory Agreement and the subadvisory agreements with GMO is in the best interests of shareholders and contract owners in view of (i) the Adviser’s fiduciary duty and the Board’s fiduciary duty and ability to monitor potential conflicts, (ii) the benefits to shareholders and contract owners generally expected from the exclusive rights to certain GMO investment management services obtained by the Adviser for the benefit of certain Funds of the Trust and other John Hancock funds and (iii) the benefits to such Funds of the Trust expected from the subadvisory services of GMO.
Additional information that the Board considered for a particular fund is set forth in Appendix A.
| Appendix A | |||
| Estimated Fees | |||
| Fund | Performance | and Expenses | Comments |
| Growth | See Comments. | Subadvisory fees | The Board noted |
| for this Fund were | that the Fund | ||
| higher than the peer | commenced opera- | ||
| group median. | tions in June 2006 | ||
| and has a limited | |||
| Advisory fees for | performance history. | ||
| this Fund were | |||
| higher than the peer | |||
| group median. | |||
| Total expenses for | |||
| this Fund were | |||
| lower than the peer | |||
| group median. | |||
Why John Hancock Funds?
For more than three decades, John Hancock Funds has been helping individual, corporate and institutional clients reach their most important financial goals. With so many fund companies to choose from, why should you invest with us?
► A name you know and trust
When you invest with John Hancock Funds, you are investing with one of the most recognized and respected names in the financial services industry. Our parent company has been helping individuals and institutions increase and protect wealth since 1862.
► Solutions across the investing spectrum
We offer equity, income, international, sector and asset allocation investment solutions managed by leading institutional money managers. Each of our funds utilizes a disciplined, team approach to portfolio management and research, leveraging the expertise of seasoned investment professionals.
► Committed to you
Our shareholders come first. We work hard to provide you with the products you need to build a solid financial foundation. We’re proud to offer you award-winning services and tools, like the www.jhfunds.com Web site, to help you every step of the way.
For immediate insight and answers,
turn to www.jhfunds.com
Discover the new and improved www.jhfunds.com.
n View accounts, statements and fund information.
n Access college and retirement planning calculators and investment education.
n Gain investment ideas, expand your knowledge and become a more informed investor.

This is just the beginning of how much you can do.
Now is the ideal time to experience our Web site that received the following recognition in 2006:

“Best Innovation: Redesigned Web Site” by the Mutual Fund Education Alliance.

“Outstanding Web Site” by the Web Marketing Association.

“Creative excellence on the Web, Silver Award winner” by W3.
Discover convenience and comprehensive resources at one
easy-to-access location. Your financial professional can steer you to the tools that
will help you the most and enable you to transform your knowledge into action.
See how far www.jhfunds.com can take you!
At the heart of John Hancock Funds is
AWARD-WINNING SERVICE
How our exceptional customer service can benefit you:
We’re committed to providing you with answers, solving problems and saving you time.

We’re ready to go one step further by offering a range of resources so
you can build your knowledge and expand your skills.

We’re determined to regularly exceed your expectations.
Experience award-winning, world-class service.
Consider the recognition that we received in 2006.
n John Hancock Signature Services, Inc. (JHSS) is the transfer and shareholder services agent for John Hancock Funds. JHSS was awarded “Best-In-Class” honors and “5-Star” performer status for telephone customer service for all of 2006 from the National Quality Review.
n Winner of Source Media’s Fund Operations Awards in the category of Efficiencies/Streamlining.
n One of four finalists for Best Customer Service Organization, Financial Services at The American Business Awards, “The Stevies.” ™

Let us demonstrate the
difference that world-class
service can make.
Call our customer service representatives at 1-800-225-5291 Monday to Friday 8:00 a.m. – 7:00 p.m., ET
It will be our pleasure and privilege to help you.
For more information
The Fund’s proxy voting policies, procedures and records are available without charge,
upon request:
| By phone | On the Fund’s Web site | On the SEC’s Web site |
| 1-800-225-5291 | www.jhfunds.com/proxy | www.sec.gov |
| Trustees | Charles A. Rizzo | Principal distributor |
| Ronald R. Dion, Chairman | Chief Financial Officer | John Hancock Funds, LLC |
| James R. Boyle† | Gordon M. Shone | 601 Congress Street |
| James F. Carlin | Treasurer | Boston, MA 02210-2805 |
| William H. Cunningham | ||
| Charles L. Ladner * | John G. Vrysen | Custodian |
| Dr. John A. Moore * | Chief Operating Officer | State Street Bank & Trust Co. |
| Patti McGill Peterson * | 2 Avenue de Lafayette | |
| Steven R. Pruchansky | Investment adviser | Boston, MA 02111 |
| John Hancock Investment | ||
| *Members of the Audit Committee | Management Services, LLC | Transfer agent |
| †Non-Independent Trustee | 601 Congress Street | John Hancock Signature |
| Officers | Boston, MA 02210-2805 | Services, Inc. |
| One John Hancock Way, | ||
| Keith F. Hartstein | Subadviser | Suite 1000 |
| President and | Grantham, Mayo, | Boston, MA 02217-1000 |
| Chief Executive Officer | Van Otterloo & Co. LLC | |
| Thomas M. Kinzler | 40 Rowes Wharf | Legal counsel |
| Secretary and Chief Legal Officer | Boston, MA 02110 | Kirkpatrick & Lockhart |
| Francis V. Knox, Jr. | Preston Gates Ellis LLP | |
| Chief Compliance Officer | One Lincoln Street | |
| Boston, MA 02111-2950 | ||
| How to contact us | ||
| Internet | www.jhfunds.com | |
| Regular mail: | Express mail: | |
| John Hancock | John Hancock | |
| Signature Services, Inc. | Signature Services, Inc. | |
| One John Hancock Way, Suite 1000 | Mutual Fund Image Operations | |
| Boston, MA 02217-1000 | 380 Stuart Street | |
| Boston, MA 02116 | ||
| Phone | Customer service representatives | 1-800-225-5291 |
| EASI-Line | 1-800-338-8080 | |
| TDD line | 1-800-554-6713 | |
A listing of month-end portfolio holdings is available on our Web site, www.jhfunds.com. A more detailed portfolio holdings summary is available on a quarterly basis 60 days after the fiscal quarter on our Web site or upon request by calling 1-800-225-5291, or on the SEC’s Web site, www.sec.gov.
40
J O H N H A N C O C K O F F U N D S
| EQUITY | INTERNATIONAL/GLOBAL |
| Balanced Fund | Global Opportunities Fund |
| Classic Value Fund | Global Shareholder Yield Fund |
| Classic Value Fund II | Greater China Opportunities Fund |
| Classic Value Mega Cap Fund | International Allocation Portfolio |
| Core Equity Fund | International Classic Value Fund |
| Growth Fund | International Core Fund |
| Growth Opportunities Fund | International Growth Fund |
| Growth Trends Fund | |
| Intrinsic Value Fund | INCOME |
| Large Cap Equity Fund | Bond Fund |
| Large Cap Select Fund | Government Income Fund |
| Mid Cap Equity Fund | High Yield Fund |
| Multi Cap Growth Fund | Investment Grade Bond Fund |
| Small Cap Equity Fund | Strategic Income Fund |
| Small Cap Fund | |
| Small Cap Intrinsic Value Fund | TAX-FREE INCOME |
| Sovereign Investors Fund | California Tax-Free Income Fund |
| U.S. Core Fund | High Yield Municipal Bond Fund |
| U.S. Global Leaders Growth Fund | Massachusetts Tax-Free Income Fund |
| Value Opportunities Fund | New York Tax-Free Income Fund |
| Tax-Free Bond Fund | |
| ASSET ALLOCATION | |
| Lifecycle 2010 Portfolio | MONEY MARKET |
| Lifecycle 2015 Portfolio | Money Market Fund |
| Lifecycle 2020 Portfolio | |
| Lifecycle 2025 Portfolio | CLOSED - END |
| Lifecycle 2030 Portfolio | Bank and Thrift Opportunity Fund |
| Lifecycle 2035 Portfolio | Financial Trends Fund, Inc. |
| Lifecycle 2040 Portfolio | Income Securities Trust |
| Lifecycle 2045 Portfolio | Investors Trust |
| Lifecycle Retirement Portfolio | Patriot Premium Dividend Fund II |
| Lifestyle Aggressive Portfolio | Preferred Income Fund |
| Lifestyle Balanced Portfolio | Preferred Income II Fund |
| Lifestyle Conservative Portfolio | Preferred Income III Fund |
| Lifestyle Growth Portfolio | Tax-Advantaged Dividend Income Fund |
| Lifestyle Moderate Portfolio | Tax-Advantaged Global Shareholder Yield Fund |
| SECTOR | |
| Financial Industries Fund | |
| Health Sciences Fund | |
| Real Estate Fund | |
| Regional Bank Fund | |
| Technology Fund | |
| Technology Leaders Fund | |
The Fund’s investment objectives, risks, charges and expenses are included in the prospectus and should be considered carefully before investing. For a prospectus, contact your financial professional, call John Hancock Funds at 1-800-225-5291 or visit the Fund’s Web site at www.jhfunds.com. Please read the prospectus carefully before investing or sending money.

1-800-225-5291
1-800-554-6713 TDD
1-800-338-8080 EASI-Line
www.jhfunds. com
Now available: electronic delivery
www.jhfunds. com/edelivery
This report is for the information of the shareholders of John Hancock Growth Fund.
It is not authorized for distribution to prospective investors unless preceded or accompanied by a prospectus.
860SA 8/07
10/07

| TABLE OF CONTENTS |
| Your fund at a glance |
| page 1 |
| Managers’ report |
| page 2 |
| A look at performance |
| page 6 |
| Your expenses |
| page 8 |
| Fund’s investments |
| page 1 0 |
| Financial statements |
| page 1 8 |
| Notes to financial |
| statements |
| page 2 8 |
| For more information |
| page 4 4 |
CEO corner
To Our Shareholders,
Volatility returned to the U.S. stock market in the six-month period ended August 31, 2007; however, stocks still posted a strong gain of 5.70%, as measured by the Standard & Poor’s 500 Index. The market experienced a particularly sharp downturn in August, as the subprime mortgage market’s woes increased. Rising defaults and an ensuing credit crunch caused heightened fears about their potential impact on U.S. economic growth. Foreign markets felt some ripple effects from the subprime issue, but they continued nonetheless to benefit from solid economic growth and outperformed the U.S. market in this period.
During this period of volatility, the U.S. stock market also passed a significant milestone — the broad Standard & Poor’s 500 Index climbed beyond the record it had set seven years ago. From its peak in March 2000, the stock market spiraled downward three consecutive years, bottoming in 2002. The upturn began in 2003, and the market has advanced each year since, finally setting a new high for the first time on May 30, 2007. During that period, the S&P 500 Index experienced five significant short-term sell-offs of 6% or more, with the August subprime-induced meltdown being the most recent.
This nearly complete market cycle highlights the importance of two investment principles you have heard us speak of often: diversification and patience. By allocating your investments among different asset classes, investment styles and portfolio managers, you are likely to be well represented through all phases of a complete market cycle, with the winners helping to cushion the fall of the losers.
The challenge for investors with a diversified portfolio is to properly evaluate your investments to tell the difference between an underperforming manager and an out-of-favor style, while also understanding the role each investment plays in your portfolio. That’s where your financial professional can provide true value. He or she can help you make those assessments and also counsel patience, because a properly diversified portfolio by its very nature will typically have something lagging or out of favor — a concept that can be difficult to live with, but necessary to embrace. If everything in your portfolio is “working,” then you are not truly diversified, but rather are leveraged to the current market and the flavor of the day. If so, you are bound to be out of step in the near future.
The recent volatility in the securities markets has prompted many investors to question how long this type of market cycle will last. History tells us it will indeed end and that when it does, today’s leaders may well turn into laggards and vice versa. The subprime mortgage market woes are just the latest example of why investors should be both patient and well-diversified. For with patience and a diversified portfolio, it could be easier to weather the market’s twists and turns and reach your long-term goals.
Sincerely,

Keith F. Hartstein,
President and Chief Executive Officer
This commentary reflects the CEO’s views as of August 31, 2007. They are subject to change at any time.
Your fund at a glance
The Fund seeks high total return by, under normal circumstances, investing at least 80% of its assets in a diversified portfolio of equity investments from a number of developed markets outside the U.S.
Over the last six months
► Global stock returns were dampened by concerns about the U.S. subprime mortgage market, which triggered a sharp market slide from mid-July to mid-August.
► The Fund finished slightly behind its benchmark while posting a respectable single-digit gain.
► Momentum trumped valuation as a selection tool, as investors were largely attracted to stocks exhibiting strong price momentum without regard to the quality of earnings or related qualitative measures.
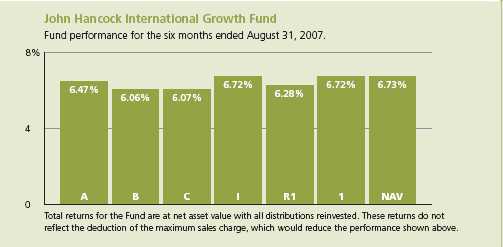
| Top 10 holdings | |||||
| Total SA | 2.7% | Nippon Steel Corp. | 1.5% | ||
| Vodafone Group PLC | 2.1% | Research in Motion, Ltd. | 1.4% | ||
| Telefonica SA | 2.0% | Siemens AG | 1.3% | ||
| Eni SpA | 1.9% | ||||
| Muenchener Rueckversicherungs– | |||||
| Sanofi-Aventis SA | 1.8% | Gesellschaft AG | 1.3% | ||
| Royal Dutch Shell PLC | 1.3% | ||||
As a percentage of net assets on August 31, 2007.
1
Managers’ report
John Hancock
International Growth Fund
Foreign stock markets turned in solid gains during the six months ended August 31, 2007, aided by positive fundamentals and continued weakness in the U.S. dollar. On a country basis, the strongest absolute returns for the Fund’s benchmark index came from Finland, Iceland and Denmark, while Japan’s single-digit loss was a significant drag on the final tally, particularly given that country’s average benchmark weighting of more than 21%. After encouraging signs during the past few years, deflation re-emerged as a concern for the Japanese economy, with consumer prices falling for five consecutive months recently.
The period was marked by increasing share price volatility. As March began, global stock markets were still reeling from waterfall declines at the end of February that were triggered by a sharp drop in Chinese stocks. Subsequently, share prices in most markets rallied nicely but encountered more trouble near period-end in the form of intensifying concerns about the U.S. subprime mortgage market. Despite the July-August swoon, however, stock prices rallied in the second half of August to post respectable gains for the period overall.
Although most problem subprime loans were originated by U.S. companies, many foreign banks, insurance companies and other financial institutions could be vulnerable because U.S. mortgages are routinely securitized and sold around the world. The Fund owned two bank stocks, Macquarie Bank, Ltd. and BNP Paribas SA, that run hedge funds that
SCORECARD
| INVESTMENT | PERIOD’S PERFORMANCE . . . AND WHAT’S BEHIND THE NUMBERS | |
| Research in Motion | ▲ | Reports of stronger-than-expected profits boosted the share price of |
| the Canadian maker of the BlackBerry | ||
| Salzgitter | ▲ | Strong profits report and continued demand for its products helped |
| shares of this German steelmaker | ||
| Honda Motor | ▼ | Shares of the Japanese auto maker were hurt by a surging yen relative |
| to the U.S. dollar, falling U.S. sales and Japanese production cuts | ||
2
From the Grantham, Mayo, Van Otterloo & Co. LLC (GMO) Portfolio Management Team
suffered some damage as a result of the deteriorating subprime market. Neither stock was among the Fund’s largest detractors for the period and, in both cases, the hedge funds involved represented a small part of the bank’s business.
“Foreign stock markets turned in
solid gains during the six months
ended August 31, 2007, aided
by positive fundamentals and
continued weakness in the
U.S. dollar.”
Looking at performance
For the six months ended August 31, 2007, John Hancock International Growth Fund’s Class A, Class B, Class C, Class I, Class R1, Class 1 and Class NAV shares returned 6.47%, 6.06%, 6.07%, 6.72%, 6.28%, 6.72% and 6.73% at net asset value. By comparison, the S&P/Citigroup Primary Market Index (PMI) Europe, Pacific, Asia Composite (EPAC) Growth Style Index returned 7.03%, while the average foreign large blend fund monitored by Morningstar, Inc. gained 7.18% 1. Keep in mind that your returns will differ from those listed above if you were not invested in the Fund for the entire period for your respective share class or did not reinvest all distributions.
Looking at the two primary criteria we use to evaluate the markets, momentum was more fruitful than valuation during the period. Although investors’ appetite for risk diminished near the end of the period, as subprime mortgage concerns intensified, for most of the period investors preferred stocks of lower quality and strong momentum, paying less attention to valuations and earnings quality. Additionally, investors were most attracted by pure price momentum; positive earnings revisions, an important component of our momentum criteria, were less effective as a selection tool.
Positioning in Canada and Japan helps
On a country basis, the Fund was aided most by its positioning in Canada, where a combination of effective stock picking and a strengthening Canadian dollar boosted our returns. The Fund’s standout Canada-based holding was
International Growth Fund
3
Research in Motion, Ltd., which recently launched a new version of its popular BlackBerry handheld messaging device, the Pearl, and delivered robust second-quarter earnings that caused its stock to soar.
Stock selection also was beneficial in Japan, where underweighting the financial sector proved rewarding. In our opinion, Japanese banks and other financial stocks were unattractive from both valuation and momentum perspectives, hampered by mediocre profitability and high debt compared with rivals in other countries. Not owning Mitsubishi UFJ Financial Group, Inc. and underweighting Sumitomo Mitsui Financial Group, two of Japan’s largest banks and important benchmark components as well, were especially helpful decisions given those stocks’ double-digit losses. Further aiding the Fund’s results was an overweighted position in Japan-based video game maker Nintendo Company, Ltd., which continued to enjoy robust sales of its Wii hardware platform following the product’s successful launch in November 2006. The Fund’s positioning in Japan also included a number of companies whose primary business is trading commodi ties such as copper and other industrial metals. Strong metals prices supported by globally robust spending on power plants, energy exploration and other infrastructure spending aided these stocks as a group, although no individual position among them stood out.
Rounding out the top five contributors was German steel producer Salzgitter AG, which posted a solid gain in response to positive earnings revisions and a strong environment for steel companies overall.
| SECTOR DISTRIBUTION2 | |
| Financial | 20% |
| Consumer non-cyclical | 17% |
| Industrial | 13% |
| Consumer cyclical | 11% |
| Energy | 11% |
| Basic materials | 10% |
| Communications | 9% |
| Technology | 4% |
| Utilities | 4% |
| Diversified | 0.1% |
Light exposure to Australia; U.K. picks dampen results
Underweighting Australia-based BHP Billiton, Ltd., the world’s largest mining company and an important benchmark component, was detrimental to performance. Despite what we thought was an expensive valuation, the stock gained significant ground during the period, reflecting in part the strong results of materials stocks overall. Finnish cellular handset maker Nokia AB further undermined our results. As the stock gained momentum, we increased the Fund’s stake in it, but our sizable underweighting early in the period was counterproductive.
Two German stocks, conglomerate Siemens AG and electric and gas utility E.ON AG, also detracted. In the case of Siemens,
4
International Growth Fund
our momentum analysis flagged the stock too late for us to benefit fully from its rally, which reversed sooner than we expected. On the other hand, despite our view that the valuation of E.ON was stretched, prompting us to sell it earlier in the period, the stock continued higher. We bought it back later in the period, but missed the earlier move up.
“Looking at the two primary criteria
we use to evaluate the markets,
momentum was more fruitful than
valuation during the period.”
Overweighting Japanese automaker Honda Motor Co. Ltd. also hurt. The stock lost ground in August, as a rally in the Japanese yen dimmed prospects for exporters in that country. Additionally, while no individual U.K. position made our list of the five largest detractors, the United Kingdom was the country that detracted most from the Fund’s performance.
Outlook
From a top-down perspective, we are somewhat concerned about the U.S. economy and the effects that a slowdown or credit crunch there might have on foreign stock markets. That said, we’ve found that over the long term, we benefit from a disciplined adherence to our valuation and momentum criteria. Currently, our valuation yardsticks, which include various measures of quality as well as pure valuation parameters, are primarily steering us toward large-cap companies offering stable earnings growth, exemplified by pharmaceutical stocks, among others. Meanwhile, our momentum gauges continue to dictate a healthy exposure to commodity-driven stocks, as the recent trends there still appear favorable, despite more problematic readings in the final two months of the period.

This commentary reflects the views of the portfolio management team through the end of the Fund’s period discussed in this report. The team’s statements reflect their own opinions. As such, they are in no way guarantees of future events and are not intended to be used as investment advice or a recommendation regarding any specific security. They are also subject to change at any time as market and other conditions warrant.
International investing involves special risks such as political, economic and currency risks and differences in accounting standards and financial reporting.
1 Figures from Morningstar, Inc. include reinvested dividends and do not take into account sales charges. Actual load-adjusted performance is lower.
2 As a percentage of net assets on August 31, 2007.
International Growth Fund
5
A look at performance
For the periods ended August 31, 2007
| Average annual returns | Cumulative total returns | ||||||||||
| with maximum sales charge (POP) | with maximum sales charge (POP) | ||||||||||
| Inception | Since | Since | |||||||||
| Class | date | 1-year | 5-year | 10-year | inception | 6-month | 1-year | 5-year | 10-year | inception | |
| A | 6-12-06 | 11.90% | — | — | 18.84% | 1.15% | 11.90% | — | — | 23.60% | |
| B | 6-12-06 | 11.97 | — | — | 19.95 | 1.06 | 11.97 | — | — | 25.01 | |
| C | 6-12-06 | 15.92 | — | — | 23.03 | 5.07 | 15.92 | — | — | 28.96 | |
| I1 | 6-12-06 | 18.35 | — | — | 24.48 | 6.72 | 18.35 | — | — | 30.84 | |
| R1 1 | 6-12-06 | 17.37 | — | — | 23.51 | 6.28 | 17.37 | — | — | 29.58 | |
| 11 | 6-12-06 | 18.32 | — | — | 24.50 | 6.72 | 18.32 | — | — | 30.87 | |
| NAV1 | 12-27-06 | — | — | — | — | 6.73 | — | — | — | 7.59 | |
Performance figures assume all distributions are reinvested. Public offering price (POP) figures reflect maximum sales charge on Class A shares of 5%, and the applicable contingent deferred sales charge (CDSC) on Class B and Class C shares. The Class B shares’ CDSC declines annually between years 1 to 6 according to the following schedule 5, 4, 3, 3, 2, 1%. No sales charge will be assessed after the sixth year. Class C shares held for less than one year are subject to a 1% CDSC. Sales charge is not applicable for Class I, Class R1, Class 1 and Class NAV shares.
The expense ratios of the Fund, both net (including any fee waivers or expense limitations) and gross (excluding any fee waivers or expense limitations), are set forth according to the most recent publicly available Prospectuses for the Fund and may differ from the expense ratios disclosed in the Financial Highlights tables in this report. The waivers and expense limitations are contractual at least until 6-30-08. The net expenses are as follows: Class A — 1.66%, Class B — 2.39%, Class C — 2.39%, Class I — 1.19%, Class R1 — 1.94%, Class 1 — 1.15%, Class NAV — 1.10% . Had the fee waivers and expense limitations not been in place, the gross expenses would be as follows: Class A — 2.28%, Class B — 10.94%, Class C — 6.71%, Class I — 17.20%, Class R1 — 20.78%, Class 1 — 2.00%, Class NAV &# 151; 2.75% .
The returns reflect past results and should not be considered indicative of future performance. The return and principal value of an investment will fluctuate so that shares, when redeemed, may be worth more or less than their original cost. Due to market volatility, the Fund’s current performance may be higher or lower than the performance shown. For performance data current to the most recent month-end, please call 1-800-225-5291 or visit the Fund’s Web site at www.jhfunds.com.
The performance table above and the chart on the next page do not reflect the deduction of taxes that a shareholder would pay on fund distributions or the redemption of fund shares.
The Fund’s performance results reflect any applicable expense reductions, without which the expenses increase and results would have been less favorable.
Performance is calculated with an opening price (prior day’s close) on the inception date.
1 For certain types of investors as described in the Fund’s Class I, Class R1, Class 1 and Class NAV share prospectuses.
International Growth Fund
6
Growth of $10,000
This chart shows what happened to a hypothetical $10,000 investment in International
Growth Fund Class A shares for the period indicated. For comparison, we’ve shown the
same investment in two separate indexes.
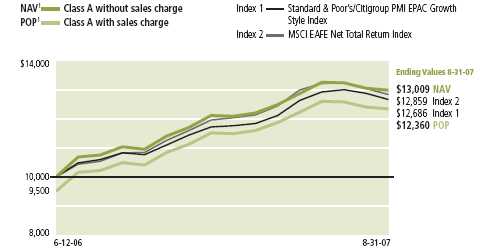
| Without sales | With maximum | ||||
| Class | Period beginning | charge | sales charge | Index 1 | Index 2 |
| B | 6-12-06 | $12,901 | $12,501 | $12,686 | $12,859 |
| C2 | 6-12-06 | 12,896 | 12,896 | 12,686 | 12,859 |
| I3 | 6-12-06 | 13,084 | 13,084 | 12,686 | 12,859 |
| R1 3 | 6-12-06 | 12,958 | 12,958 | 12,686 | 12,859 |
| 13 | 6-12-06 | 13,087 | 13,087 | 12,686 | 12,859 |
| NAV3 | 12-27-06 | 10,759 | 10,759 | 10,838 | 10,767 |
Assuming all distributions were reinvested for the period indicated, the table above shows the value of a $10,000 investment in the Fund’s Class B, Class C, Class I, Class R1, Class 1 and Class NAV shares, respectively, as of August 31, 2007. Performance of the classes will vary based on the difference in sales charges paid by shareholders investing in the different classes and the fee structure of those classes.
S&P/Citigroup Primary Market Index (PMI) Europe, Pacific, Asia Composite (EPAC) Growth Style Index — Index 1 — is an independently maintained and published index composed of stocks in the EPAC regions of the PMI that have a growth style. The PMI is the large-capitalization stock component of the S&P/Citigroup Broad Market Index (BMI) (which includes listed shares of companies from developed and emerging market countries with a total available market capitalization of at least the local equivalent of USD100 million), representing the top 80% of available capital of the BMI in each country.
MSCI EAFE (Europe, Australasia, Far East) Net Total Return Index— Index 2 — is a free float-adjusted market capitalization index that is designed to measure developed market equity performance, excluding the U.S. and Canada. As of June 2006, the MSCI EAFE Index consisted of the following 21 developed market country indexes: Australia, Austria, Belgium, Denmark, Finland, France, Germany, Greece, Hong Kong, Ireland, Italy, Japan, Netherlands, New Zealand, Norway, Portugal, Singapore, Spain, Sweden, Switzerland and United Kingdom. Returns are calculated and presented net of withholding tax.
It is not possible to invest directly in an index. Index figures do not reflect sales charges, which would have resulted in lower values if they did.
1 NAV represents net asset value and POP represents public offering price.
2 No contingent deferred sales charge applicable.
3 For certain types of investors as described in the Fund’s Class I, Class R1, Class 1 and Class NAV share prospectuses.
International Growth Fund
7
Your expenses
These examples are intended to help you understand your ongoing operating expenses.
Understanding fund expenses
As a shareholder of the Fund, you incur two types of costs:
▪ Transaction costs which include sales charges (loads) on purchases or redemptions (varies by share class), minimum account fee charge, etc.
▪ Ongoing operating expenses including management fees, distribution and service fees (if applicable) and other fund expenses.
We are going to present only your ongoing operating expenses here.
Actual expenses/actual returns
This example is intended to provide information about your fund’s actual ongoing operating expenses, and is based on your fund’s actual return. It assumes an account value of $1,000.00 on March 1, 2007, with the same investment held until August 31, 2007.
| Account value | Ending value | Expenses paid during period | ||
| on 3-1-07 | on 8-31-07 | ended 8-31-071 | ||
| Class A | $1,000.00 | $1,064.70 | $8.26 | |
| Class B | 1,000.00 | 1,060.60 | 12.47 | |
| Class C | 1,000.00 | 1,060.70 | 12.47 | |
| Class I | 1,000.00 | 1,067.20 | 6.20 | |
| Class R1 | 1,000.00 | 1,062.80 | 10.21 | |
| Class 1 | 1,000.00 | 1,067.20 | 5.99 | |
| Class NAV | 1,000.00 | 1,067.30 | 5.69 | |
Together with the value of your account, you may use this information to estimate the operating expenses that you paid over the period. Simply divide your account value at August 31, 2007 by $1,000.00, then multiply it by the “expenses paid” for your share class from the table above. For example, for an account value of $8,600.00, the operating expenses should be calculated as follows:
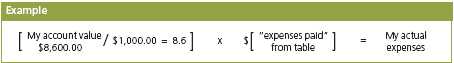
International Growth Fund
8
Hypothetical example for comparison purposes
This table allows you to compare your fund’s ongoing operating expenses with those of any other fund. It provides an example of the Fund’s hypothetical account values and hypothetical expenses based on each class’s actual expense ratio and an assumed 5% annualized return before expenses (which is not your fund’s actual return). It assumes an account value of $1,000.00 on March 1, 2007, with the same investment held until August 31, 2007. Look in any other fund shareholder report to find its hypothetical example and you will be able to compare these expenses.
| Account value | Ending value | Expenses paid during period | ||
| on 3-1-07 | on 8-31-07 | ended 8-31-07 1 | ||
| Class A | $1,000.00 | $1,017.14 | $8.07 | |
| Class B | 1,000.00 | 1,013.04 | 12.18 | |
| Class C | 1,000.00 | 1,013.04 | 12.18 | |
| Class I | 1,000.00 | 1,019.14 | 6.06 | |
| Class R1 | 1,000.00 | 1,015.24 | 9.98 | |
| Class 1 | 1,000.00 | 1,019.34 | 5.86 | |
| Class NAV | 1,000.00 | 1,019.64 | 5.55 | |
Remember, these examples do not include any transaction costs, such as sales charges; therefore, these examples will not help you to determine the relative total costs of owning different funds. If transaction costs were included, your expenses would have been higher. See the prospectus for details regarding transaction costs.
1 Expenses are equal to the Fund’s annualized expense ratio of 1.60%, 2.41%, 2.41%, 1.20%, 1.96%, 1.15% and 1.10% for Class A, Class B, Class C, Class I, Class R1, Class 1 and Class NAV respectively, multiplied by the average account value over the period, multiplied by the number of days in the inception period /365 or 366 (to reflect the one-half year period).
International Growth Fund
9
Fund’s investments
F I N A N C I A L S T A T E M E N T S
Securities owned by the Fund on 8-31-07 (unaudited)
This schedule is divided into four main categories: common stocks, preferred stocks,
rights and repurchase agreements. Common stocks, preferred stocks and rights are
further broken down by country. Repurchase agreements, which represent the Fund’s
cash position, are listed last.
| Issuer | Shares | Value |
| Common stocks 95.25% | $33,973,998 | |
| (Cost $31,739,824) | ||
| Australia 5.54% | 1,975,279 | |
| Australia and New Zealand Banking Group, Ltd. | 4,305 | 101,943 |
| Australian Stock Exchange, Ltd. | 1,676 | 63,246 |
| BHP Billiton, Ltd. | 2,238 | 70,019 |
| Bluescope Steel, Ltd. | 8,905 | 77,248 |
| Coles Myer, Ltd. | 5,395 | 62,354 |
| CSL, Ltd. | 2,495 | 199,512 |
| CSR, Ltd. | 17,494 | 47,899 |
| Foster’s Group, Ltd. | 16,592 | 85,430 |
| Lend Lease Corp. | 3,799 | 59,526 |
| Lihir Gold, Ltd. * | 8,098 | 20,450 |
| Macquarie Bank, Ltd. | 2,600 | 154,756 |
| NRMA Insurance Group, Ltd. | 17,611 | 72,315 |
| Oxiana, Ltd. | 15,700 | 42,074 |
| QBE Insurance Group, Ltd. | 6,892 | 195,717 |
| Suncorp-Metway, Ltd. | 2,771 | 45,439 |
| Telstra Corp., Ltd. | 1,528 | 5,463 |
| Toll Holdings, Ltd. | 6,198 | 68,632 |
| Westfield Group | 3,211 | 54,789 |
| Westpac Banking Corp., Ltd. | 6,151 | 136,542 |
| Woodside Petroleum, Ltd. | 4,634 | 170,565 |
| Woolworths, Ltd. | 3,995 | 97,458 |
| WorleyParsons, Ltd. | 916 | 28,750 |
| Zinifex, Ltd. | 8,417 | 115,152 |
| Austria 0.86% | 308,461 | |
| Erste Bank der Oesterreichischen Sparkassen AG | 536 | 38,970 |
| Immofinanz Immobilien Anlage AG * | 4,969 | 61,674 |
| OMV AG | 1,138 | 70,607 |
| Raiffeisen International Bank Holding AG | 305 | 44,162 |
| Voestalpine AG | 1,136 | 93,048 |
| Belgium 1.74% | 620,871 | |
| Belgacom SA | 1,667 | 73,233 |
| Colruyt SA | 209 | 44,705 |
See notes to financial statements
International Growth Fund
10
F I N A N C I A L S T A T E M E N T S
| Issuer | Shares | Value |
| Belgium (continued) | ||
| Fortis Group SA | 4,140 | $152,037 |
| Interbrew | 863 | 70,955 |
| KBC Bancassurance Holding NV | 447 | 56,169 |
| Solvay SA | 397 | 59,008 |
| UCB SA | 2,017 | 113,783 |
| Union Miniere SA | 222 | 50,981 |
| Bermuda 0.81% | 290,251 | |
| Esprit Holdings, Ltd. | 8,500 | 123,482 |
| Frontline, Ltd. | 1,500 | 70,175 |
| Li & Fung, Ltd. | 26,000 | 96,594 |
| Canada 3.81% | 1,359,234 | |
| Bank Nova Scotia Halifax | 1,300 | 64,305 |
| Canadian Imperial Bank of Commerce | 1,300 | 117,801 |
| EnCana Corp. | 4,200 | 246,130 |
| Potash Corp. of Saskatchewan, Inc. | 2,900 | 256,966 |
| Research In Motion, Ltd. * | 5,700 | 486,883 |
| Royal Bank of Canada | 1,200 | 61,744 |
| Suncor Energy, Inc. | 1,400 | 125,405 |
| Cayman Islands 0.08% | 28,750 | |
| Foxconn International Holdings, Ltd. * | 11,000 | 28,750 |
| Denmark 2.33% | 831,689 | |
| A P Moller – Maersk AS, Series A | 6 | 77,624 |
| A P Moller – Maersk AS | 14 | 183,450 |
| Carlsberg AS, B Shares | 375 | 50,604 |
| Danske Bank AS | 1,200 | 49,330 |
| H. Lundbeck AS | 2,600 | 61,247 |
| Novo Nordisk AS | 2,050 | 228,796 |
| Sydbank AS | 1,344 | 61,518 |
| Topdanmark AS * | 150 | 24,174 |
| Vestas Wind Systems AS * | 1,400 | 94,946 |
| Finland 1.53% | 543,982 | |
| Elisa Oyj, A Shares | 2,865 | 80,016 |
| Kone Corp. Oyj | 434 | 28,495 |
| Metso Oyj | 400 | 25,733 |
| Nokia AB Oyj | 6,533 | 215,497 |
| Nokian Renkaat Oyj | 2,157 | 76,207 |
| Rautaruukki Oyj | 1,693 | 92,691 |
| YIT Oyj | 836 | 25,343 |
| France 8.01% | 2,857,092 | |
| BNP Paribas SA | 2,163 | 227,351 |
| Bouygues SA | 1,171 | 91,969 |
| Carrefour SA | 1,187 | 82,849 |
| Casino Guich-Perrachon SA | 262 | 26,717 |
See notes to financial statements
International Growth Fund
11
F I N A N C I A L S T A T E M E N T S
| Issuer | Shares | Value |
| France (continued) | ||
| Compagnie Generale des Etablissements Michelin, Class B | 260 | $32,676 |
| Credit Agricole SA | 3,869 | 145,517 |
| Electricite de France | 1,372 | 138,421 |
| Hermes International SA | 597 | 64,352 |
| PSA Peugeot Citroen SA | 1,705 | 144,819 |
| Publicis Groupe SA | 486 | 21,037 |
| Renault Regie Nationale SA | 422 | 56,764 |
| Sanofi-Aventis SA | 7,838 | 642,776 |
| Schneider Electric SA | 408 | 54,013 |
| Societe Television Francaise 1 | 530 | 15,379 |
| Total SA | 12,828 | 963,255 |
| Unibail-Rodamco | 622 | 149,197 |
| Germany 7.20% | 2,569,418 | |
| Altana AG | 1,163 | 26,609 |
| BASF AG | 1,140 | 150,915 |
| Beiersdorf AG | 656 | 44,086 |
| Bilfinger Berger AG | 738 | 60,634 |
| Deutsche Bank AG | 2,321 | 286,920 |
| Deutsche Boerse AG | 1,230 | 135,895 |
| E.ON AG | 451 | 75,710 |
| Fresenius Medical Care AG | 2,126 | 104,600 |
| Henkel KGaA | 501 | 25,827 |
| MAN AG | 984 | 141,249 |
| Merck & Company AG * | 413 | 53,030 |
| Muenchener Rueckversicherungs – Gesellschaft AG | 2,655 | 459,124 |
| Premiere AG * | 2,829 | 61,720 |
| Salzgitter AG | 849 | 167,777 |
| Siemens AG | 3,723 | 467,690 |
| Stada Arzneimittel AG | 958 | 61,534 |
| Thyssen Krupp AG | 1,299 | 75,961 |
| United Internet AG | 1,551 | 29,770 |
| Volkswagen AG | 679 | 140,367 |
| Greece 0.09% | 31,920 | |
| Bank of Piraeus SA | 935 | 31,920 |
| Hong Kong 0.77% | 274,225 | |
| BOC Hong Kong Holdings, Ltd. | 16,500 | 39,662 |
| Hong Kong Electric Holdings, Ltd. | 10,000 | 50,141 |
| Hong Kong Exchange & Clearing, Ltd. | 10,000 | 184,422 |
| Ireland 2.24% | 797,169 | |
| Allied Irish Banks PLC | 3,743 | 95,533 |
| Anglo Irish Bank Corp. PLC | 10,614 | 198,367 |
| Bank of Ireland | 5,055 | 92,990 |
| C&C Group PLC | 5,225 | 38,297 |
| CRH PLC | 2,975 | 128,776 |
| Depfa Bank PLC | 7,155 | 135,851 |
See notes to financial statements
International Growth Fund
12
F I N A N C I A L S T A T E M E N T S
| Issuer | Shares | Value |
| Ireland (continued) | ||
| Irish Life & Permanent PLC | 1,675 | $41,599 |
| Kingspan Group PLC | 2,540 | 65,756 |
| Italy 2.31% | 825,591 | |
| AEM SpA | 13,177 | 48,154 |
| Capitalia SpA | 3,250 | 31,043 |
| Eni SpA | 19,274 | 666,611 |
| Saipem SpA | 1,193 | 44,842 |
| Telecom Italia SpA | 12,338 | 34,941 |
| Japan 20.21% | 7,207,945 | |
| Aiful Corp. | 1,200 | 23,924 |
| Ajinomoto Company, Inc. | 5,000 | 63,056 |
| Asahi Breweries, Ltd. | 2,000 | 29,699 |
| Astellas Pharmaceuticals, Inc. | 2,600 | 120,472 |
| Canon, Inc. | 6,000 | 342,344 |
| Casio Computer Company, Ltd. | 2,000 | 30,535 |
| Chiyoda Corp. | 1,000 | 17,144 |
| Denso Corp. | 1,700 | 59,503 |
| Eisai Company, Ltd. | 2,000 | 83,275 |
| Fast Retailing Company, Ltd. | 200 | 11,751 |
| Fuji Photo Film Company, Ltd. | 4,200 | 180,844 |
| Honda Motor Company, Ltd. | 6,800 | 223,415 |
| Hoya Corp. | 3,800 | 131,703 |
| Inpex Holdings, Inc. | 2 | 18,255 |
| Isuzu Motors, Ltd. | 21,000 | 113,850 |
| Japan Tobacco, Inc. | 20 | 111,027 |
| JFE Holdings, Inc. | 2,100 | 136,683 |
| Kansai Electric Power Company, Ltd. | 3,400 | 79,403 |
| Kawasaki Heavy Industries, Ltd. | 11,000 | 43,101 |
| Kawasaki Kisen Kaisha, Ltd. | 14,000 | 180,014 |
| KDDI Corp. | 6 | 46,258 |
| Keyence Corp. | 400 | 88,775 |
| Komatsu, Ltd. | 4,100 | 125,917 |
| Konica Minolta Holdings, Inc. | 4,500 | 70,354 |
| Kubota Corp. | 2,000 | 15,584 |
| Mitsubishi Corp. | 1,000 | 28,058 |
| Mitsubishi Estate Company, Ltd. | 5,000 | 133,620 |
| Mitsubishi Gas & Chemicals Company, Inc. | 4,000 | 33,678 |
| Mitsubishi Heavy Industries, Ltd. | 23,000 | 140,450 |
| Mitsubishi Rayon Company, Ltd. | 3,000 | 19,111 |
| Mitsui O.S.K. Lines, Ltd. | 20,000 | 293,679 |
| Mitsui Trust Holdings, Inc. | 11,000 | 91,690 |
| Mizuho Financial Group, Inc. | 13 | 81,676 |
| Nikon Corp. | 2,000 | 62,451 |
| Nintendo Company, Ltd. | 800 | 368,074 |
| Nippon Oil Corp. | 21,000 | 176,624 |
See notes to financial statements
International Growth Fund
13
F I N A N C I A L S T A T E M E N T S
| Issuer | Shares | Value |
| Japan (continued) | ||
| Nippon Steel Corp. | 75,000 | $523,885 |
| Nippon Telegraph & Telephone Corp. | 5 | 23,009 |
| Nippon Yusen Kabushiki Kaisha | 17,000 | 167,567 |
| Olympus Optical Company, Ltd. | 2,000 | 84,892 |
| Orix Corp. | 200 | 42,446 |
| Osaka Gas Company, Ltd. | 14,000 | 51,978 |
| Pacific Metals Company, Ltd. | 5,000 | 69,030 |
| Resona Holdings, Inc. | 64 | 134,597 |
| Ricoh Company, Ltd. | 3,000 | 66,007 |
| SBI Holdings, Inc. | 233 | 62,199 |
| SEGA SAMMY HOLDINGS, INC. | 3,000 | 45,537 |
| Sekisui House, Ltd. | 2,000 | 26,001 |
| Seven & I Holdings Company, Ltd. | 2,600 | 69,298 |
| Shin-Etsu Chemical Company, Ltd. | 2,400 | 173,446 |
| Shinsei Bank, Ltd. | 6,000 | 20,006 |
| SOFTBANK Corp. | 4,000 | 76,748 |
| Sony Corp. | 3,900 | 186,642 |
| Sumco Corp. | 1,400 | 74,778 |
| Sumitomo Heavy Industries, Ltd. | 3,000 | 33,524 |
| Sumitomo Metal Industries, Ltd. | 12,000 | 60,501 |
| Sumitomo Metal Mining Company, Ltd. | 2,000 | 39,560 |
| Sumitomo Mitsui Financial Group, Inc. | 8 | 63,079 |
| Sumitomo Realty & Development Company, Ltd. | 2,000 | 65,382 |
| Suzuki Motor Corp. | 2,000 | 54,017 |
| Takeda Pharmaceutical Company, Ltd. | 4,900 | 335,121 |
| TDK Corp. | 1,500 | 128,213 |
| Terumo Corp. | 2,600 | 121,907 |
| Tokyo Electron, Ltd. | 900 | 64,399 |
| Tokyo Gas Company, Ltd. | 12,000 | 59,598 |
| Tokyo Steel Manufacturing Company, Ltd. | 2,600 | 34,364 |
| Toyota Motor Corp. | 6,500 | 376,262 |
| Toyota Tsusho Corp. | 1,000 | 24,759 |
| Trend Micro, Inc. | 500 | 20,500 |
| Yahoo Japan Corp. | 142 | 52,696 |
| Netherlands 2.27% | 808,258 | |
| ABN AMRO Holdings NV | 4,182 | 194,609 |
| ASML Holding NV * | 2,404 | 71,399 |
| DSM NV | 2,420 | 123,924 |
| Heineken NV | 2,722 | 172,775 |
| NG Groep NV | 2,606 | 105,017 |
| Randstad Holdings NV | 1,915 | 107,478 |
| Reed Elsevier NV | 1,830 | 33,056 |
| Norway 1.80% | 641,939 | |
| Orkla ASA | 4,203 | 68,308 |
| Renewable Energy Corp AS * | 1,894 | 71,905 |
See notes to financial statements
International Growth Fund
14
F I N A N C I A L S T A T E M E N T S
| Issuer | Shares | Value |
| Norway (continued) | ||
| Statoil ASA | 5,450 | $156,998 |
| Tandberg ASA | 4,600 | 100,427 |
| Telenor ASA | 9,900 | 183,004 |
| Yara International ASA | 2,300 | 61,297 |
| Portugal 0.08% | 27,842 | |
| Electricidade De Portugal, SA | 5,065 | 27,842 |
| Singapore 1.64% | 585,823 | |
| Capitaland, Ltd. * | 25,000 | 121,410 |
| Cosco Corp. Singapore, Ltd. | 34,000 | 112,592 |
| Keppel Corp., Ltd. | 6,000 | 50,370 |
| Keppel Land, Ltd. | 12,000 | 60,672 |
| Singapore Airlines, Ltd. | 3,000 | 37,458 |
| Singapore Telecommunications, Ltd. | 85,000 | 203,321 |
| Spain 5.17% | 1,843,093 | |
| Abertis Infraestructuras SA | 2,157 | 65,568 |
| Acerinox SA | 3,413 | 86,026 |
| ACS Actividades SA | 1,756 | 96,772 |
| Banco de Sabadell SA | 3,032 | 29,546 |
| Banco Popular Espanol SA | 5,109 | 93,383 |
| Banco Santander Central Hispano SA | 3,052 | 55,831 |
| Cintra Concesiones de Infraestructuras de Transporte SA | 2,701 | 42,616 |
| Gas Natural SDG SA | 2,871 | 153,261 |
| Grupo Ferrovial SA | 318 | 27,957 |
| Iberdrola SA | 2,359 | 131,017 |
| Industria de Diseno Textil SA | 2,005 | 117,862 |
| Repsol SA | 3,700 | 133,498 |
| Sacyr Vallehermoso SA | 2,064 | 81,889 |
| Telefonica SA | 29,232 | 727,867 |
| Sweden 4.50% | 1,605,316 | |
| Alfa Laval AB | 1,300 | 78,672 |
| Boliden AB * | 2,150 | 45,417 |
| Getinge AB, Series B | 1,000 | 21,957 |
| Hennes & Mauritz AB, B Shares | 7,600 | 430,576 |
| Nordea Bank AB | 5,200 | 79,614 |
| Sandvik AB * | 11,600 | 237,573 |
| Scania AB, Series B * | 4,600 | 107,564 |
| Skandinaviska Enskilda Banken AB, Series A | 1,100 | 33,400 |
| SSAB Svenskt Stal AB, Series A | 2,400 | 82,164 |
| Swedbank AB, A Shares | 2,700 | 88,883 |
| Swedish Match AB | 1,800 | 34,968 |
| Tele2 AB, Series B | 2,900 | 53,238 |
| Volvo AB, Series A * | 6,200 | 107,956 |
| Volvo AB, Series B * | 11,700 | 203,334 |
See notes to financial statements
International Growth Fund
15
F I N A N C I A L S T A T E M E N T S
| Issuer | Shares | Value |
| Switzerland 4.27% | $1,523,946 | |
| Actelion Ltd * | 2,580 | 143,530 |
| Adecco SA | 833 | 54,510 |
| Compagnie Financiere Richemont AG, Series A | 352 | 21,876 |
| Credit Suisse Group AG | 4,221 | 277,395 |
| Geberit AG, ADR | 570 | 84,275 |
| Logitech International SA * | 1,293 | 35,075 |
| Nobel Biocare Holding AG, Series BR | 215 | 58,761 |
| Novartis AG | 7,169 | 378,430 |
| Phonak Holding AG | 294 | 26,107 |
| Societe Generale de Surveillance Holdings AG | 17 | 20,402 |
| Swatch Group Ag, BR Shares | 194 | 58,353 |
| Synthes AG | 369 | 42,265 |
| Zurich Financial Services AG | 1,123 | 322,967 |
| United Kingdom 17.99% | 6,415,904 | |
| 3i Group PLC * | 8,401 | 179,201 |
| Alliance & Leicester PLC | 867 | 18,468 |
| Anglo American PLC | 1,208 | 69,365 |
| AstraZeneca Group PLC | 8,972 | 442,258 |
| Aviva PLC | 7,433 | 106,501 |
| Barratt Developments PLC | 3,513 | 65,984 |
| BG Group PLC | 20,142 | 322,394 |
| BHP Billiton PLC | 8,113 | 237,959 |
| British Land Company PLC | 952 | 24,909 |
| BT Group PLC | 18,196 | 116,065 |
| Burberry Group PLC | 4,055 | 50,122 |
| Capita Group PLC | 5,094 | 77,298 |
| Carnival PLC | 1,157 | 51,424 |
| Centrica PLC | 21,755 | 169,589 |
| Enterprise Inns PLC | 4,227 | 55,112 |
| GlaxoSmithKline PLC | 6,236 | 162,770 |
| Greene King PLC | 2,880 | 58,466 |
| HBOS PLC | 8,160 | 145,079 |
| Imperial Tobacco Group PLC | 4,126 | 186,744 |
| Inchcape PLC | 4,704 | 44,995 |
| Marks & Spencer Group PLC | 5,404 | 68,321 |
| Michael Page International PLC | 2,995 | 29,066 |
| Mondi PLC | 206 | 2,034 |
| National Grid PLC, ADR | 8,397 | 125,866 |
| Next Group PLC | 3,692 | 144,335 |
| Old Mutual PLC | 26,747 | 86,392 |
| Reckitt Benckiser PLC | 3,972 | 216,630 |
| Reuters Group PLC | 9,449 | 121,792 |
| Rio Tinto PLC | 5,779 | 399,260 |
| Royal Bank of Scotland Group PLC | 37,058 | 430,705 |
| Royal Dutch Shell PLC, A Shares | 11,717 | 455,376 |
See notes to financial statements
International Growth Fund
16
F I N A N C I A L S T A T E M E N T S
| Issuer | Shares | Value | ||
| United Kingdom (continued) | ||||
| Royal Dutch Shell PLC, B Shares | 4,623 | $180,311 | ||
| Scottish & Southern Energy PLC | 5,809 | 166,488 | ||
| Smith & Nephew PLC | 9,039 | 106,514 | ||
| Tesco PLC | 26,613 | 228,841 | ||
| Travis Perkins PLC | 2,014 | 72,721 | ||
| Vodafone Group PLC | 227,022 | 733,801 | ||
| William Morrison Supermarket PLC | 45,328 | 262,748 | ||
| Preferred stocks 0.62% | $223,013 | |||
| (Cost $166,062) | ||||
| Germany 0.62% | 223,013 | |||
| Porsche AG | 68 | 121,707 | ||
| Volkswagen AG | 809 | 101,306 | ||
| Expiration | Strike | Principal | ||
| Issuer | date | price | amount | Value |
| Rights 0.00% | $1,626 | |||
| (Cost $0) | ||||
| Greece 0.00% | 1,626 | |||
| Piraeus Bank SA | 9-10-07 | EUR 0.89 | $935 | 1,626 |
| Principal | ||||
| Issuer, description, maturity date | amount | Value | ||
| Repurchase agreements 2.83% | $1,009,000 | |||
| (Cost $1,009,000) | ||||
| Repurchase Agreement with State Street Corp. dated 08-31-07 | ||||
| at 4.60% to be repurchased at $1,009,516 on 09-04-07, | ||||
| collateralized by $1,040,000 Federal National Mortgage Association, | ||||
| 4.375%, due 07-17-13 (valued at $1,032,200, including interest) | $1,009,000 | 1,009,000 | ||
| Total investments (Cost $32,914,886) 98.70% | $35,207,637 | |||
| Other assets in excess of liabilities 1.30% | $462,014 | |||
| Total net assets 100.00% | $35,669,651 | |||
Percentages are stated as a percent of net assets.
ADR American Depositary Receipt
EUR European Currency
* Non-income producing.
See notes to financial statements
International Growth Fund
17
Financial statements
F I N A N C I A L S T A T E M E N T S
Statement of assets and liabilities 8-31-07 (unaudited)
This Statement of Assets and Liabilities is the Fund’s balance sheet. It shows the value
of what the Fund owns, is due and owes. You’ll also find the net asset value and the
maximum offering price per share.
| Assets | |
| Investments, at value (cost $31,905,886) | $34,198,637 |
| Repurchase agreement, at value (cost $1,009,000) | 1,009,000 |
| Total investments, at value (cost $32,914,886) | 35,207,637 |
| Cash | 158 |
| Cash collateral at broker for futures contracts | 271,981 |
| Foreign currency, at value (cost $170,049) | 169,634 |
| Receivable for forward foreign currency exchange contracts (Note 2) | 19,584 |
| Receivable for fund shares sold | 8,669 |
| Dividends and interest receivable | 65,814 |
| Receivable for futures variation margin (Note 2) | 14,538 |
| Receivable due from adviser | 56,655 |
| Other assets | 6,815 |
| Total assets | 35,821,485 |
| Liabilities | |
| Payable for forward foreign currency exchange contracts (Note 2) | 103,503 |
| Payable for fund shares repurchased | 5,968 |
| Payable to affiliates | |
| Fund administration fees | 395 |
| Transfer agent fees | 2,257 |
| Distribution and service fees | 363 |
| Other payables and accrued expenses | 39,348 |
| Total liabilities | 151,834 |
| Net assets | |
| Capital paid-in | $30,986,826 |
| Undistributed net investment income | 289,924 |
| Accumulated undistributed net realized gain on investments, | |
| futures contracts and foreign currency transactions | 2,133,291 |
| Net unrealized appreciation on investments, futures contracts | |
| and foreign currencies translations | 2,259,610 |
| Net assets | $35,669,651 |
| Net asset value per share | |
| Based on net asset values and shares outstanding – the Fund has an | |
| unlimited number of shares authorized with no par value. | |
| Class A ($25,414,778 ÷ 997,156 shares) | $25.49 |
| Class B ($936,856 ÷ 36,941 shares)1 | $25.36 |
| Class C ($1,814,653 ÷ 71,597 shares)1 | $25.35 |
| Class I ($326,078 ÷ 12,745 shares) | $25.58 |
| Class R1 ($130,364 ÷ 5,134 shares) | $25.39 |
| Class 1($1,411,229 ÷ 55,175 shares) | $25.58 |
| Class NAV ($5,635,693 ÷ 220,711 shares) | $25.53 |
| Maximum offering price per share | |
| Class A2 ($25.49 ÷ 95%) | $26.83 |
1 Redemption price per share is equal to the net asset value less any applicable contingent deferred sales charge.
2 On single retail sales of less than $50,000. On sales of $50,000 or more and on group sales the offering price is reduced.
See notes to financial statements
International Growth Fund
18
F I N A N C I A L S T A T E M E N T S
Statement of operations For the period ended 8-31-071 (unaudited)
This Statement of Operations summarizes the Fund’s investment income earned
and expenses incurred in operating the Fund. It also shows net gains (losses) for
the period stated.
| Investment income | |
| Dividends | $591,661 |
| Interest | 29,674 |
| Less foreign taxes withheld | (56,482) |
| Total investment income | 564,853 |
| Expenses | |
| Investment management fees (Note 3) | 144,469 |
| Distribution and service fees (Note 3) | 47,438 |
| Transfer agent fees (Note 3) | 11,068 |
| Fund administration fees (Note 3) | 3,640 |
| Custodian fees | 60,721 |
| Audit and legal fees | 56,183 |
| Blue sky fees (Note 3) | 46,112 |
| Registration and filing fees | 12,805 |
| Printing and postage fees (Note 3) | 5,686 |
| Trustees’ fees (Note 3) | 688 |
| Miscellaneous | 591 |
| Total expenses | 389,401 |
| Less expense reductions (Note 3) | (143,169) |
| Net expenses | 246,232 |
| Net investment income | 318,621 |
| Realized and unrealized gain (loss) | |
| Net realized gain on | |
| Investments | 1,581,401 |
| Futures contracts | 87,208 |
| Foreign currency transactions | 33,221 |
| 1,701,830 | |
| Change in net unrealized appreciation (depreciation) of | |
| Investments | (417,818) |
| Futures contracts | 73,679 |
| Translation of assets and liabilities in foreign currencies | (92,780) |
| (436,919) | |
| Net realized and unrealized gain | 1,264,911 |
| Increase in net assets from operations | $1,583,532 |
| 1 Semiannual period from 3-1-07 to 8-31-07. | |
See notes to financial statements
International Growth Fund
19
F I N A N C I A L S T A T E M E N T S
Statement of changes in net assets
These Statements of Changes in Net Assets show how the value of the Fund’s net assets
has changed during the last two periods. The difference reflects earnings less expenses,
any investment gains and losses, distributions, if any, paid to shareholders and the net of
Fund share transactions.
| Period | Period | |
| ended1 | ended2 | |
| 2-28-07 | 8-31-07 | |
| Increase (decrease) in net assets | ||
| From operations | ||
| Net investment income (loss) | ($12,185) | $318,621 |
| Net realized gain | 803,556 | 1,701,830 |
| Change in net unrealized appreciation (depreciation) | 2,696,529 | (436,919) |
| Increase in net assets resulting from operations | 3,487,900 | 1,583,532 |
| Distributions to shareholders | ||
| From net investment income | ||
| Class A | (70,554) | — |
| Class B | (221) | — |
| Class C | (267) | — |
| Class I | (805) | — |
| Class R1 | (455) | — |
| Class 1 | (786) | — |
| From net realized gain | ||
| Class A | (308,669) | — |
| Class B | (5,885) | — |
| Class C | (7,134) | — |
| Class I | (2,205) | — |
| Class R1 | (1,991) | — |
| Class 1 | (2,075) | — |
| Total distributions | (401,047) | — |
| From Fund share transactions | 20,460,257 | 10,539,009 |
| Total increase | 23,547,110 | 12,122,541 |
| Net assets | ||
| Beginning of period | — | 23,547,110 |
| End of period3 | $23,547,110 | $35,669,651 |
1 Period from 6-12-06 (commencement of operations) to 2-28-07.
2 Semiannual period from 3-1-07 to 8-31-07. Unaudited.
3 Includes accumulated (distributions in excess of) net investment income of ($28,697) and $289,924, respectively.
See notes to financial statements
International Growth Fund
20
F I N A N C I A L S T A T E M E N T S
Financial highlights
The Financial Highlights show how the Fund’s net asset value for a share has changed since the end of the previous period.
| CLASS A SHARES | ||
| Period ended | 2-28-071 | 8-31-072 |
| Per share operating performance | ||
| Net asset value, beginning of period | $20.00 | $23.94 |
| Net investment income (loss)3 | (0.01) | 0.26 |
| Net realized and unrealized | ||
| gain on investments | 4.44 | 1.29 |
| Total from investment operations | 4.43 | 1.55 |
| Less distributions | ||
| From net investment income | (0.09) | — |
| From net realized gain | (0.40) | — |
| (0.49) | — | |
| Net asset value, end of period | $23.94 | $25.49 |
| Total return4,5,6 (%) | 22.18 | 6.47 |
| Ratios and supplemental data | ||
| Net assets, end of period | ||
| (in millions) | $20 | $25 |
| Ratio of net expenses to average | ||
| net assets7 (%) | 1.66 | 1.60 |
| Ratio of gross expenses to average | ||
| net assets7,8 (%) | 2.28 | 2.27 |
| Ratio of net investment income | ||
| (loss) to average net assets 7 (%) | (0.06) | 2.01 |
| Portfolio turnover6 (%) | 41 | 45 |
See notes to financial statements
International Growth Fund
21
F I N A N C I A L S T A T E M E N T S
Financial highlights
| CLASS B SHARES | ||
| Period ended | 2-28-071 | 8-31-072 |
| Per share operating performance | ||
| Net asset value, beginning of period | $20.00 | $23.91 |
| Net investment income (loss)3 | (0.16) | 0.14 |
| Net realized and unrealized | ||
| gain on investments | 4.48 | 1.31 |
| Total from investment operations | 4.32 | 1.45 |
| Less distributions | ||
| From net investment income | (0.01) | — |
| From net realized gain | (0.40) | — |
| (0.41) | — | |
| Net asset value, end of period | $23.91 | $25.36 |
| Total return4,5,6 (%) | 21.64 | 6.06 |
| Ratios and supplemental data | ||
| Net assets, end of period | ||
| (in millions) | $1 | $1 |
| Ratio of net expenses to average | ||
| net assets7 (%) | 2.39 | 2.40 |
| Ratio of gross expenses to average | ||
| net assets7,8 (%) | 10.94 | 5.72 |
| Ratio of net investment income | ||
| (loss) to average net assets 7 (%) | (0.94) | 1.11 |
| Portfolio turnover6 (%) | 41 | 45 |
See notes to financial statements
International Growth Fund
22
F I N A N C I A L S T A T E M E N T S
Financial highlights
| CLASS C SHARES | ||
| Period ended | 2-28-071 | 8-31-072 |
| Per share operating performance | ||
| Net asset value, beginning of period | $20.00 | $23.90 |
| Net investment income (loss)3 | (0.16) | 0.17 |
| Net realized and unrealized | ||
| gain on investments | 4.47 | 1.28 |
| Total from investment operations | 4.31 | 1.45 |
| Less distributions | ||
| From net investment income | (0.01) | — |
| From net realized gain | (0.40) | — |
| (0.41) | — | |
| Net asset value, end of period | $23.90 | $25.35 |
| Total return4,5,6 (%) | 21.59 | 6.07 |
| Ratios and supplemental data | ||
| Net assets, end of period | ||
| (in millions) | $2 | $2 |
| Ratio of net expenses to average | ||
| net assets7 (%) | 2.39 | 2.40 |
| Ratio of gross expenses to average | ||
| net assets7,8 (%) | 6.71 | 4.05 |
| Ratio of net investment income | ||
| (loss) to average net assets 7 (%) | (0.98) | 1.36 |
| Portfolio turnover6 (%) | 41 | 45 |
See notes to financial statements
International Growth Fund
23
F I N A N C I A L S T A T E M E N T S
Financial highlights
| CLASS I SHARES | ||
| Period ended | 2-28-071 | 8-31-072 |
| Per share operating performance | ||
| Net asset value, beginning of period | $20.00 | $23.97 |
| Net investment income3 | 0.07 | 0.25 |
| Net realized and unrealized | ||
| gain on investments | 4.45 | 1.36 |
| Total from investment operations | 4.52 | 1.61 |
| Less distributions | ||
| From net investment income | (0.15) | — |
| From net realized gain | (0.40) | — |
| (0.55) | — | |
| Net asset value, end of period | $23.97 | $25.58 |
| Total return4,5,6 (%) | 22.60 | 6.72 |
| Ratios and supplemental data | ||
| Net assets, end of period | ||
| (in millions) | —9 | —9 |
| Ratio of net expenses to average | ||
| net assets7 (%) | 1.19 | 1.20 |
| Ratio of gross expenses to average | ||
| net assets7,8 (%) | 17.20 | 4.72 |
| Ratio of net investment income | ||
| to average net assets7 (%) | 0.42 | 1.96 |
| Portfolio turnover6 (%) | 41 | 45 |
See notes to financial statements
International Growth Fund
24
F I N A N C I A L S T A T E M E N T S
Financial highlights
| CLASS R1 SHARES | ||
| Period ended | 2-28-071 | 8-31-072 |
| Per share operating performance | ||
| Net asset value, beginning of period | $20.00 | $23.89 |
| Net investment income (loss)3 | (0.05) | 0.22 |
| Net realized and unrealized | ||
| gain on investments | 4.43 | 1.28 |
| Total from investment operations | 4.38 | 1.50 |
| Less distributions | ||
| From net investment income | (0.09) | — |
| From net realized gain | (0.40) | — |
| (0.49) | — | |
| Net asset value, end of period | $23.89 | $25.39 |
| Total return4,5,6 (%) | 21.92 | 6.28 |
| Ratios and supplemental data | ||
| Net assets, end of period | ||
| (in millions) | —9 | —9 |
| Ratio of net expenses to average | ||
| net assets7 (%) | 1.94 | 1.95 |
| Ratio of gross expenses to average | ||
| net assets7,8 (%) | 20.78 | 17.21 |
| Ratio of net investment income | ||
| (loss) to average net assets 7 (%) | (0.32) | 1.76 |
| Portfolio turnover6 (%) | 41 | 45 |
See notes to financial statements
International Growth Fund
25
F I N A N C I A L S T A T E M E N T S
Financial highlights
| CLASS 1 SHARES | ||
| Period ended | 2-28-071 | 8-31-072 |
| Per share operating performance | ||
| Net asset value, beginning of period | $20.00 | $23.97 |
| Net investment income3 | 0.07 | 0.30 |
| Net realized and unrealized | ||
| gain on investments | 4.45 | 1.31 |
| Total from investment operations | 4.52 | 1.61 |
| Less distributions | ||
| From net investment income | (0.15) | — |
| From net realized gain | (0.40) | — |
| (0.55 ) | — | |
| Net asset value, end of period | $23.97 | $25.58 |
| Total return4,5,6 (%) | 22.63 | 6.72 |
| Ratios and supplemental data | ||
| Net assets, end of period | ||
| (in millions) | $1 | $1 |
| Ratio of net expenses to average | ||
| net assets7 (%) | 1.15 | 1.15 |
| Ratio of gross expenses to average | ||
| net assets7,8 (%) | 2.00 | 1.90 |
| Ratio of net investment income | ||
| to average net assets7 (%) | 0.41 | 2.36 |
| Portfolio turnover6 (%) | 41 | 45 |
See notes to financial statements
International Growth Fund
26
F I N A N C I A L S T A T E M E N T S
Financial highlights
| CLASS NAV SHARES | ||
| Period ended | 2-28-0710 | 8-31-072 |
| Per share operating performance | ||
| Net asset value, beginning of period | $23.73 | $23.92 |
| Net investment income3 | 0.01 | 0.32 |
| Net realized and unrealized | ||
| gain on investments | 0.18 | 1.29 |
| Total from investment operations | 0.19 | 1.61 |
| Net asset value, end of period | $23.92 | $25.53 |
| Total return4,5,6 (%) | 0.80 | 6.73 |
| Ratios and supplemental data | ||
| Net assets, end of period | ||
| (in millions) | $1 | $6 |
| Ratio of net expenses to average | ||
| net assets7 (%) | 1.13 | 1.10 |
| Ratio of gross expenses to average | ||
| net assets7,8 (%) | 2.75 | 1.84 |
| Ratio of net investment income | ||
| to average net assets7 (%) | 0.14 | 2.52 |
| Portfolio turnover6 (%) | 41 | 45 |
1 Class A, Class B, Class C, Class I, Class R1 and Class 1 shares began operations on 6-12-06.
2 Semiannual period from 3-1-07 to 8-31-07. Unaudited.
3 Based on the average of the shares outstanding.
4 Assumes dividend reinvestment.
5 Total returns would have been lower had certain expenses not been reduced during the periods shown.
6 Not annualized.
7 Annualized.
8 Does not take into consideration expense reductions during periods shown.
9 Less than $500,000.
10 Class NAV shares began operations on 12-27-06.
See notes to financial statements
International Growth Fund
27
Notes to financial statements (unaudited)
1. Organization
John Hancock International Growth Fund (the Fund) is a newly organized non-diversified series of John Hancock Funds III (the Trust). The Trust was established as a Massachusetts business trust on June 9, 2005. The Trust is registered under the Investment Company Act of 1940, as amended (the 1940 Act), as an open-end investment management company. The investment objective of the Fund is to seek high total return.
John Hancock Life Insurance Company of New York (John Hancock New York) is a wholly owned subsidiary of John Hancock Life Insurance Company (U.S.A.) (John Hancock USA). John Hancock USA and John Hancock New York are indirect wholly owned subsidiaries of The Manufacturers Life Insurance Company (Manulife), which in turn is a wholly owned subsidiary of Manulife Financial Corporation (MFC), a publicly traded company. MFC and its subsidiaries are known collectively as “Manulife Financial.”
John Hancock Investment Management Services, LLC (the Adviser), a Delaware limited liability company controlled by John Hancock USA, serves as investment adviser for the Trust and John Hancock Funds, LLC (the Distributor), a Delaware limited liability company, an affiliate of the Adviser, serves as principal underwriter.
The Board of Trustees has authorized the issuance of multiple classes of shares of the Fund, including classes designated as Class A, Class B, Class C, Class I, Class R1, Class 1, Class 3 and Class NAV shares. The shares of each class represent an interest in the same portfolio of investments of the Fund, and have equal rights as to voting, redemptions, dividends and liquidation, except that certain expenses, subject to the approval of the Board of Trustees, may be applied differently to each class of shares in accordance with current regulations of the
Securities and Exchange Commission (SEC) and the Internal Revenue Service. Shareholders of a class that bear distribution and service expenses under the terms of a distribution plan have exclusive voting rights to that distribution plan. Class B shares will convert to Class A shares eight years after purchase.
Class 1 shares are sold only to certain exempt separate accounts of John Hancock USA and John Hancock New York. Class NAV shares are sold to affiliated funds of funds, which are funds of funds within the John Hancock funds complex.
The Adviser and other affiliates of John Hancock USA owned 739,994, 5,087, 5,115, 5,104 and 5,116 shares of beneficial interest of Class A, Class B, Class I, Class R1 and Class 1, respectively, on August 31, 2007.
2. Significant accounting policies
In the preparation of the financial statements, the Fund follows the policies described below. The preparation of financial statements in conformity with accounting principles generally accepted in the United States of America requires management to make estimates and assumptions that affect the reported amounts of assets and liabilities at the date of the financial statements and the reported amounts of income and expenses during the reporting period. Actual results may differ from these estimates.
Security valuation
The net asset value of the shares of Class A, Class B, Class C, Class I, Class R1, Class 1 and Class NAV of the Fund is determined daily as of the close of the New York Stock Exchange (NYSE), normally at 4:00 p.m., Eastern Time. Short-term debt instruments with remaining maturities of 60 days or less are valued at amortized cost, and thereafter assume a constant amortization to maturity of any discount or premium, which approximates market
International Growth Fund
28
value. Investments in John Hancock Cash Investments Trust (JHCIT), an affiliate of John Hancock Advisers, LLC (JHA), a wholly owned subsidiary of John Hancock Financial Services, Inc., a subsidiary of MFC, are valued at their net asset value each business day. All other securities held by the Fund are valued at the last sale price or official closing price (closing bid price or last evaluated quote if no sale has occurred) as of the close of business on a principal securities exchange (domestic or foreign) on which they trade or, lacking any sales, at the closing bid price. Securities traded only in the over-the- counter market are valued at the last bid price quoted by brokers making markets in the securities at the close of trading. Securities for which there are no such quotations, principally debt securities, are valued based on the valuation provided by an independent pricing service, which utilizes both dealer-supplied and elec tronic data processing techniques, which take into account factors such as institutional-size trading in similar groups of securities, yield, quality, coupon rate, maturity, type of issue, trading characteristics and other market data.
Other assets and securities for which no such quotations are readily available are valued at their fair value as determined in good faith under consistently applied procedures established by and under the general supervision of the Board of Trustees. Generally, trading in non-U.S. securities is substantially completed each day at various times prior to the close of trading on the NYSE. The values of such securities used in computing the net asset value of a Fund’s shares are generally determined as of such times. Occasionally, significant events that affect the values of such securities may occur between the times at which such values are generally determined and the close of the NYSE. Upon such an occurrence, these securities will be valued at their fair value as determined in good faith under consistently applied procedures established by and under the general supervision of the Board of Trustees.
Repurchase agreements
The Fund may enter into repurchase agreements. When the Fund enters into a repurchase agreement through its custodian, it receives delivery of securities, the amount of which at the time of purchase and each subsequent business day is required to be maintained at such a level that the market value is generally at least 102% of the repurchase amount. The Fund will take constructive receipt of all securities underlying the repurchase agreements it has entered into until such agreements expire. If the seller defaults, the Fund would suffer a loss to the extent that proceeds from the sale of underlying securities were less than the repurchase amount. The Fund may enter into repurchase agreements maturing within seven days with domestic dealers, banks or other financial institutions deemed to be creditworthy by the Adviser. Collateral for certain tri-party repurchase agr eements is held at the custodian bank in a segregated account for the benefit of the Fund and the counterparty.
Foreign currency transactions
The accounting records of the Fund are maintained in U.S. dollars. Foreign currency amounts are translated into U.S. dollars on the following basis:
(1) market value of securities, other assets and other liabilities at the current rate of exchange at period end of such currencies against U.S. dollars; and
(2) purchases and sales of securities, income and expenses at the rate of exchange quoted on the respective dates of such transactions.
Net realized gains and losses on foreign currency transactions represent net gains and losses from sales and maturities of foreign currency contracts, disposition of foreign currencies, the difference between the amount of net investment income accrued and the U.S. dollar amount actually received, and gains and losses between trade and settlement date on purchases and sales of securities. The effects of changes in foreign currency exchange rates on investments in securities are included with the net realized and unrealized gain or loss on investment securities.
The Fund may be subject to capital gains and repatriation taxes imposed by certain countries in which the Fund invests. Such taxes
International Growth Fund
29
are generally based upon income and/or capital gains earned or repatriated. Taxes are accrued based upon net investment income, net realized gains and net unrealized appreciation.
Investing in securities of foreign companies and foreign governments involves special risks and consideration not typically associated with investing in securities of domestic companies and the U.S. Government. These risks include revaluation of currencies and future adverse political and economic developments. Moreover, securities of foreign companies and foreign governments and their markets may be less liquid and their prices more volatile than those of the United States.
Security transactions and related
investment income
Investment security transactions are accounted for on a trade date plus one basis for daily net asset value calculations. However, for financial reporting purposes, investment transactions are reported on trade date. Interest income is accrued as earned. Dividend income is recorded on the ex-dividend date. Foreign dividends are recorded on the ex-date or when the Fund becomes aware of the dividends from cash collections. Discounts/ premiums are accreted/amortized for financial reporting purposes. Non-cash dividends are recorded at the fair market value of the securities received. Debt obligations may be placed in a non-accrual status and related interest income may be reduced by ceasing current accruals and writing off interest receivables when the collection of all or a portion of interest has become doubtful, based upon consistently applied procedures.
From time to time, the Fund may invest in Real Estate Investment Trusts (REITs) and as a result, will estimate the components of distributions from these securities. Distributions from REITs received in excess of income are recorded as a reduction of cost of investments and/or as a realized gain.
The Fund uses the First In, First Out method for fixed income securities and Highest Cost, First Out for all other securities for determining realized gain or loss on investments for both financial and federal income tax reporting purposes.
Multi-class allocations
All income, expenses (except for class-specific expenses) and realized and unrealized gains (losses) are allocated to each class of shares based upon the relative net assets of each class.
Dividends to shareholders from net investment income are determined at a class level and distributions from capital gains are determined at a Fund level.
Expense allocation
Expenses are allocated based on the relative share of net assets of the Fund at the time the expense was incurred. Class-specific expenses, such as distribution (Rule 12b-1) fees, are accrued daily and charged directly to the respective share classes.
Futures
The Fund may purchase and sell financial futures contracts and options on those contracts. The Fund invests in contracts based on financial instruments such as U.S. Treasury Bonds or Notes or on securities indices such as the Standard & Poor’s 500 Index, in order to hedge against a decline in the value of securities owned by the Fund.
Initial margin deposits required upon entering into futures contracts are satisfied by the delivery of specific securities or cash as collateral to the broker (the Funds’ agent in acquiring the futures position). If the position is closed out by taking an opposite position prior to the settlement date of the futures contract, a final determination of variation margin is made, cash is required to be paid to or released by the broker and the Fund realizes a gain or loss.
When the Fund sells a futures contract based on a financial instrument, the Fund becomes obligated to deliver that kind of instrument at an agreed upon date for a specified price. The Fund realizes a gain or loss depending on whether the price of an offsetting purchase is less or more than the price of the initial sale or on whether the price of an offsetting sale is more or less than the price of the initial purchase. The Fund could be exposed to risks if it could not close out futures positions because
International Growth Fund
30
of an illiquid secondary market or the inability of counterparties to meet the terms of their contracts. Futures contracts are valued at the quoted daily settlement prices established by the exchange on which they trade.
| The following is a summary of open futures contracts on August 31, 2007: | |||||
| UNREALIZED | |||||
| NUMBER OF | APPRECIATION | ||||
| OPEN CONTRACTS | CONTRACTS | POSITION | EXPIRATION | (DEPRECIATION) | |
| DAX Index | 2 | Long | Sep 2007 | $ 15,167 | |
| CAC 40 10 Euro Index | 2 | Long | Sep 2007 | 2,238 | |
| FTSE Index | 1 | Long | Sep 2007 | 2,568 | |
| Hang Seng Index | 4 | Long | Sep 2007 | 26,264 | |
| OMX 30 Stock Index | 24 | Long | Sep 2007 | 8,452 | |
| MSCI Singapore Stock Index | 6 | Long | Sep 2007 | 14,275 | |
| S&P TSE 60 Index | 7 | Short | Sep 2007 | (11,699) | |
| S&P MIB 30 Index | 1 | Short | Sep 2007 | (6,970) | |
| $50,295 | |||||
Forward foreign currency contracts
The Fund may purchase and sell forward foreign currency contracts in order to hedge a specific transaction or Fund position. Forward foreign currency contracts are valued at forward foreign currency exchange rates and marked to market daily. Net realized gains (losses) on foreign currency and forward foreign currency contracts shown in the Statements of Operations include net gains or losses realized by the Fund on contracts that have matured.
The net U.S. dollar value of foreign currency underlying all contractual commitments held at the end of the period, the resulting net unrealized appreciation (depreciation) and related net receivable or payable amount are determined using forward foreign currency exchange rates supplied by a quotation service. The Fund could be exposed to risks in excess of amounts recognized on the Statements of Assets and Liabilities if the counterparties to the contracts are unable to meet the terms of their contracts or if the value of the forward foreign currency contract changes unfavorably.
At August 31, 2007, the Fund entered into forward foreign currency contracts, which contractually obligate the Fund to deliver currency at future dates.
International Growth Fund
31
Open forward foreign currency contracts on August 31, 2007 were as follows:
| UNREALIZED | ||||
| PRINCIPAL AMOUNT | SETTLEMENT | APPRECIATION | ||
| CURRENCY | COVERED BY CONTRACT | DATE | (DEPRECIATION) | |
| Buys | ||||
| Canadian Dollar | $156,000 | Nov 2007 | $97 | |
| Euro | 198,000 | Nov 2007 | 3,216 | |
| Japanese Yen | 267,319,550 | Nov 2007 | (18,777) | |
| New Zealand Dollar | 159,000 | Nov 2007 | (9,102) | |
| New Zealand Dollar | 609,439 | Nov 2007 | 2,359 | |
| Norwegian Krone | 1,323,000 | Nov 2007 | 4,461 | |
| Singapore Dollar | 170,000 | Nov 2007 | 268 | |
| Swedish Krona | 2,993,394 | Nov 2007 | 2,408 | |
| Swiss Franc | 187,000 | Nov 2007 | (2,919) | |
| Swiss Franc | 1,247,220 | Nov 2007 | (284) | |
| Swiss Franc | 1,247,220 | Nov 2007 | (1,068) | |
| ($19,341) | ||||
| Sells | ||||
| Australian Dollar | 630,034 | Nov 2007 | ($11,844) | |
| Australian Dollar | 610,031 | Nov 2007 | (12,968) | |
| Australian Dollar | 614,058 | Nov 2007 | (8,941) | |
| Danish Kroner | 191,124 | Nov 2007 | 2,106 | |
| Danish Kroner | 599,608 | Nov 2007 | (7,671) | |
| Euro | 1,036,230 | Nov 2007 | (13,057) | |
| Hong Kong Dollar | 330,514 | Nov 2007 | (788) | |
| Norwegian Krone | 292,097 | Nov 2007 | 3,408 | |
| Pound Sterling | 190,500 | Nov 2007 | 1,261 | |
| Pound Sterling | 992,521 | Nov 2007 | (16,084) | |
| ($64,578) | ||||
Federal income taxes
The Fund qualifies as a “regulated investment company” by complying with the applicable provisions of the Internal Revenue Code and will not be subject to federal income tax on taxable income. Therefore, no federal income tax provision is required.
New accounting pronouncements
In June 2006, Financial Accounting Standards Board (FASB) Interpretation No. 48, Accounting for Uncertainty in Income Taxes (the Interpretation), was issued and is effective for fiscal years beginning after December 15, 2006, and is to be applied to all open tax years as of the effective date. This Interpretation prescribes a minimum threshold for financial statement recognition of the benefit of a tax position taken or expected to be taken in a tax return and requires certain expanded disclosures. Management has evaluated the application of this Interpretation to the Fund and does not believe there is a material impact resulting from the adoption of this Interpretation on the Fund’s financial statemen ts.
In September 2006, FASB Standard No. 157, Fair Value Measurements (FAS 157), was issued and is effective for fiscal years beginning after November 15, 2007. FAS 157 defines fair value, establishing a framework for measuring fair value and expands disclosure about fair value measurements. Management is currently evaluating the application of FAS 157 to the Fund and its impact, if any, resulting from the adoption of FAS 157 on the Fund’s financial statements.
Distribution of income and gains
The Fund records distributions to shareholders from net investment income and net realized gains, if any, on the ex-dividend date. During the period ended February 28, 2007, the tax character of distributions paid was as follows: ordinary income $401,047. Distributions paid by the Fund with respect to each class of shares are calculated in the same manner, at the same time and are in the same amount, except for the
International Growth Fund
32
effect of expenses that may be applied differently to each class.
Such distributions, on a tax basis, are determined in conformity with income tax regulations, which may differ from accounting principles generally accepted in the United States of America. Distributions in excess of tax basis earnings and profits, if any, are reported in the Fund’s financial statements as a return of capital.
Capital accounts
The Fund reports the undistributed net investment income and accumulated undistributed net realized gain (loss) accounts on a basis approximating amounts available for future tax distributions (or to offset future taxable realized gains when a capital loss carryforward is available). Accordingly, the Fund may periodically make reclassifications among certain capital accounts without affecting its net asset value.
3. Investment advisory and other agreements Advisory fees
The Trust has entered into an Investment Advisory Agreement with the Adviser. The Adviser is responsible for managing the corporate and business affairs of the Trust and for selecting and compensating subad-visers to handle the investment of the assets of the Fund, subject to the supervision of the Trust’s Board of Trustees. Under the Advisory Agreement, the Fund pays a monthly management fee to the Adviser equivalent, on an annual basis, to the sum of: (a) 0.92% of the first $100,000,000 of the Fund’s aggregate daily net assets; (b) 0.895% of the next $900,000,000 of the Fund’s aggregate daily net assets; (c) 0.880% of the Fund’s aggregate daily net assets in excess of $1,000,000,000. Aggregate net assets include the net assets of the Fund and International Growth Trust, a series of John Hancock Trust and the International Growth Fund, a series of John Hancock Funds II. The Advisor has a subadvisory agreement wit h Grantham, Mayo, Van Otterloo & Co. LLC. The Fund is not responsible for payment of the subadvisory fees.
Expense reimbursements
The Adviser has agreed contractually to reimburse for certain fund level expenses that exceed 0.20% of the average annual net assets, or to make a payment to a specific class of shares of the Fund in an amount equal to the amount by which the expenses attributable to such class of shares (excluding taxes, portfolio brokerage commissions, interest, litigation and indemnification expenses and other extraordinary expenses not incurred in the ordinary course of the Fund’s business and fees under any agreement or plans of the Fund dealing with services for shareholders and others with beneficial interests in shares of the Fund) exceed the percentage of average annual net assets (on an annualized basis) attributable as follows: 1.70% for Class A, 2.40% for Class B, 2.40% for Class C, 1.20% for Class I, 1.70% for Class R1, 1.15% for Class 1 and 1.10% for Class NAV. Accordingly, the expense reductions related to this expense limitation amounted to $76,363, $11,858, $14,379, $11,204, $9,897, $3,811 and $15,657 for Class A, Class B, Class C, Class I, Class R1, Class 1 and Class NAV, respectively, for the period ended August 31, 2007. This expense reimbursement shall continue in effect until June 30, 2008 and thereafter until terminated by the Adviser on notice to the Trust.
Administration fees
The Fund has an agreement with the Adviser that requires the Fund to reimburse the Adviser for all expenses associated with providing the administrative, financial, accounting and recordkeeping services of the Fund, including the preparation of all tax returns, annual, semi-annual and periodic reports to shareholders and the preparation of all regulatory reports. These expenses are allocated based on the relative net assets of each class. The compensation for the period amounted to $3,640 with an effective rate of 0.02% of the Fund’s average daily net asset value.
Distribution plan
The Trust has a Distribution Agreement with the Distributor. The Fund has adopted Distribution Plans with respect to Class A, Class B, Class C, Class R1 and Class 1, pursuant
International Growth Fund
33
to Rule 12b-1 under the 1940 Act, to reimburse the Distributor for the services it provides as distributor of shares of the Fund. Accordingly, the Fund makes monthly payments to the Distributor at an annual rate not to exceed 0.30%, 1.00%, 1.00%, 0.50% and 0.05% of average daily net asset value of Class A, Class B, Class C, Class R1 and Class 1, respectively. A maximum of 0.25% of such payments may be service fees, as defined by the Conduct Rules of the National Association of Securities Dealers. Under the Conduct Rules, curtailment of a portion of the Fund’s 12b-1 payments could occur under certain circumstances.
In addition, under a Service Plan for Class R1 shares, the Fund pays up to 0.25% of Class R1 average daily net asset value for certain other services.
Sales charges
Class A shares are assessed up-front sales charges of up to 5.00% of net asset value of such shares. During the period ended August 31, 2007, the Fund was informed that the Distributor received net up-front sales charges of $31,699 with regard to sales of Class A shares. Of this amount, ($25,770) was retained and used for printing prospectuses, advertising, sales literature and other purposes, and $57,469 was paid as sales commissions to unrelated broker-dealers.
Class B shares that are redeemed within six years of purchase are subject to a contingent deferred sales charge (CDSC) at declining rates, beginning at 5.00% of the lesser of the current market value at the time of redemption or the original purchase cost of the shares being redeemed. Class C shares that are redeemed within one year of purchase are subject to a CDSC at a rate of 1.00% of the lesser of the current market value at the time of redemption or the original purchase cost of the shares being redeemed. Proceeds from the CDSCs are paid to the Distributor and are used, in whole or in part, to defray its expenses for providing distribution-related services to the Fund in connection with the sale of Class B and Class C shares. During the period ended August 31, 2007, CDSCs received by JH Funds amounted to $216 for Class B shares and $873 for Class C shares.
Transfer agent fees
The Fund has a Transfer Agency Agreement with John Hancock Signature Services, Inc. (Signature Services), an indirect subsidiary of MFC. For Class A, Class B, Class C, Class I and Class R1 shares, the Fund pays a monthly transfer agent fee at an annual rate of 0.05% of each class’ average daily net assets, plus a fee based on the number of shareholder accounts and reimbursement for certain out-of-pocket expenses. Expenses not directly attributable to a particular class of shares are aggregated and allocated to each class on the basis of its relative net asset value.
Signature Services has agreed to limit the transfer agent fees so that such fees do not exceed 0.30% annually of Class A, Class B, Class C, Class I and Class R1 share average daily net assets. This agreement is effective until December 31, 2007. Signature Services reserves the right to terminate this limitation in the future. Accordingly, there were no transfer agent fee reductions for Class A, Class B, Class C, Class I and Class R1 shares, respectively, during the period ended August 31, 2007.
International Growth Fund
34
Expenses under the agreements described above for the period ended August 31, 2007, were as follows:
| Distribution and | Transfer | Blue sky | Printing and | |
| Share class | service fees | agent fees | fees | postage fees |
| Class A | $34,328 | $8,010 | $9,348 | $4,527 |
| Class B | 3,587 | 1,076 | 9,117 | 164 |
| Class C | 8,778 | 1,789 | 9,415 | 145 |
| Class I | — | 160 | 9,116 | 432 |
| Class R1 | 488 | 33 | 9,116 | 396 |
| Class 1 | 257 | — | — | 22 |
| Total | $47,438 | $11,068 | $46,112 | $5,686 |
Trustees’ fees
The Trust compensates each Trustee who is not an employee of the Adviser or its affiliates. Total Trustees’ expenses are allocated to the Fund based on its average daily net asset value.
4. Guarantees and indemnifications
Under the Trust’s organizational documents, its Officers and Trustees are indemnified against certain liability arising out of the performance of their duties to the Trust. Additionally, in the normal course of business, the Trust enters into contracts with service providers that contain general indemnification clauses. The Trust’s maximum exposure under these arrangements is unknown, as this would involve future claims that may be made against the Trust that have not yet occurred. However, based on experience, the Trust believes the risk of loss to be remote.
5. Line of credit
The Fund has entered into an agreement which enables it to participate in a $100 million unsecured committed line of credit with State Street Corporation. Borrowings will be made solely to temporarily finance the repurchase of capital shares. Interest is charged to the Fund based on its borrowings at a rate per annum equal to the Federal Funds rate plus 0.50% . In addition, a commitment fee of 0.07% per annum, payable at the end of each calendar quarter, based on the average daily-unused portion of the line of credit, is charged to the Fund on a prorated basis based on average net assets. For the period ended August 31, 2007, there were no borrowings under the line of credit.
International Growth Fund
35
| 6. Capital shares | ||||
| Share activities for the Fund for the periods ended February 28, 2007 and August 31, 2007, were | ||||
| as follows: | ||||
| Period ended 2-28-07 | Period ended 8-31-073 | |||
| Shares | Amount | Shares | Amount | |
| Class A | ||||
| Sold | 813,928 | $16,553,865 | 183,984 | $4,739,996 |
| Distributions reinvested | 15,834 | 374,467 | — | — |
| Repurchased | (1,140) | (26,802) | (15,450) | (390,983) |
| Net increase | 828,622 | $16,901,5301 | 168,534 | $4,349,013 |
| Class B | ||||
| Sold | 23,398 | $520,275 | 18,816 | $485,746 |
| Distributions reinvested | 247 | 5,833 | — | — |
| Repurchased | (2,408) | (52,838) | (3,112) | (79,330) |
| Net increase | 21,237 | $473,2701 | 15,704 | $406,416 |
| Class C | ||||
| Sold | 70,102 | $1,611,040 | 13,540 | $335,159 |
| Distributions reinvested | 313 | 7,402 | — | — |
| Repurchased | (5,000) | (118,700) | (7,358) | (188,371) |
| Net increase | 65,415 | $1,499,7421 | 6,182 | $146,788 |
| Class I | ||||
| Sold | 8,739 | $188,288 | 119,979 | $3,118,870 |
| Distributions reinvested | 127 | 3,010 | — | — |
| Repurchased | — | — | (116,100) | (3,006,687) |
| Net increase | 8,866 | $191,2981 | 3,879 | $112,183 |
| Class R1 | ||||
| Sold | 5,000 | $100,000 | 30 | $770 |
| Distributions reinvested | 104 | 2,445 | — | — |
| Net increase | 5,104 | $102,4451 | 30 | $770 |
| Class 1 | ||||
| Sold | 23,720 | $544,869 | 35,537 | $896,941 |
| Distributions reinvested | 121 | 2,861 | — | — |
| Repurchased | (785) | (18,107) | (3,418) | (86,951) |
| Net increase | 23,056 | $529,6231 | 32,119 | $809,990 |
| Class NAV | ||||
| Sold | 31,844 | $770,789 | 191,386 | $4,769,278 |
| Repurchased | (362) | (8,440) | (2,157) | (55,429) |
| Net increase | 31,482 | $762,3492 | 189,229 | $4,713,849 |
| Net increase | 983,782 | $20,460,257 | 415,677 | $10,539,009 |
1Period from 6-12-06 (commencement of operations) to 2-28-07.
2Period from 12-27-06 (commencement of operations) to 2-28-07.
3Semiannual period from 3-1-07 to 8-31-07. Unaudited.
International Growth Fund
36
7. Investment transactions
Purchases and proceeds from sales or maturities of securities, other than short-term securities and obligations of the U.S. government, during the period ended August 31, 2007, aggregated $23,792,823 and $12,934,724, respectively.
The cost of investments owned on August 31, 2007, including short-term investments, for federal income tax purposes, was $33,086,915. Gross unrealized appreciation and depreciation of investments aggregated $3,381,857 and $1,261,135, respectively, resulting in net unrealized appreciation of $2,120,722.
8. Federal income tax information
Federal income tax regulations may differ from generally accepted accounting principles and income and capital gain distributions determined in accordance with tax regulations may differ from net investment income and realized gains recognized for financial reporting purposes.
International Growth Fund
37
Evaluation of Advisory and Subadvisory
Agreements by the Board of Trustees
This section describes the evaluation
by the Board of Trustees of the
Advisory Agreement and each of the
Subadvisory Agreements.
Evaluation by the Board of Trustees
The Board, including all of the Trustees who are not “interested persons” as defined in the Investment Company Act of 1940, as amended (the Independent Trustees), is responsible for selecting the Trust’s investment adviser, John Hancock Investment Management Services, LLC (the Adviser or JHIMS), approving the Adviser’s selection of subadvisers for each series of the Trust (the Funds) and approving the Trust’s advisory and subadvisory agreements (and any sub-subadvisory agreements), their periodic continuation and any amendments. Consistent with SEC rules, the Board regularly evaluates the Trust’s advisory and subadvisory (and sub-subadvisory) arrangements, including consideration of the factors listed below. The Board may also consider other factors (including conditions and trends prevailing generally in the economy, the securities markets and the industry) and does not treat any single factor as determ inative, and each Trustee may attribute different weights to different factors. The Board is furnished with an analysis of its fiduciary obligations in connection with its evaluation and, throughout the evaluation process, the Board is assisted by counsel for the Trust and the Independent Trustees are also separately assisted by independent legal counsel. The factors regularly considered by the Board are:
1. the nature, extent and quality of the services to be provided by the Adviser to the Trust and by the subadvisers to the Funds;
2. the investment performance of the Funds and their subadvisers;
3. the extent to which economies of scale would be realized as a Fund grows and whether fee levels reflect these economies of scale for the benefit of Trust shareholders;
4. the costs of the services to be provided and the profits to be realized by the Adviser and its affiliates (including any subadvisers that are affiliated with the Adviser) from the Adviser’s relationship with the Trust; and
5. comparative services rendered and comparative advisory and subadvisory fee rates.
The Board believes that information relating to all these factors is relevant to its evaluation of the Trust’s advisory agreement. With respect to its evaluation of subadvisory agreements (including sub-subadvisory agreements) the Board believes that, in view of the Trust’s “manager of managers” advisory structure, the costs of services to be provided and the profits to be realized by those subadvisers that are not affiliated with the Adviser from their relationship with the Trust generally are not a material factor to the Board’s consideration of subadvisory agreements because such fees are paid to subadvisers by the Adviser and not by the Funds, and because the Board relies on the ability of the Adviser to negotiate such subadvisory fees at arm’s-length.
In evaluating subadvisory arrangements, the Board also considers other material business relationships that unaffiliated sub-advisers and their affiliates have with the Adviser or its affiliates, including the involvement by certain affiliates of certain subadvisers in the distribution of financial products, including shares of the Trust, offered by the Adviser and other affiliates of the Adviser (Material Relationships).
Approval of Advisory Agreement
At its meeting on June 5, 2007, the Board, including all the Independent Trustees, approved the Advisory Agreement between the Trust and JHIMS with respect to each of the Funds.
In approving the Advisory Agreement, and with reference to the factors which it regularly considers, the Board:
(1) (a) considered the high value to the Trust of continuing the relationship with JHIMS as the Trust’s Adviser to the other John Hancock Funds, the skills and competency with which JHIMS
38
has in the past managed the affairs and subadvisory relationships of other funds in the complex, JHIMS’s oversight and monitoring of subadvisers’ investment performance and compliance programs including its timelines in responding to performance issues and the qualifications of JHIMS’s personnel,
(b) considered JHIMS’s compliance policies and procedures and its responsiveness to regulatory changes and mutual fund industry developments, and
(c) JHIMS’s administrative capabilities, including its ability to supervise the other service providers for the Funds and concluded that JHIMS may reasonably be expected to ably perform its services under the Advisory Agreement.
(2) reviewed the investment performance of portfolios that are managed comparable to the Funds; the comparative performance of their respective benchmarks; and JHIMS’ analysis of such performance and its plans and recommendations regarding the Trust’s subadvisory arrangements generally and with respect to the Funds; and concluded that each of the comparably managed funds has performed well or within a range that the Board deemed competitive, and that JHIMS may reasonably be expected to ably monitor the performance of the Funds and their subadvisers;
(3) reviewed the Trust’s advisory fee structure and the incorporation therein of any subadvisory fee breakpoints in the advisory fees charged and concluded (i) that to the extent that Funds have subadvisory fees with breakpoints, those breakpoints are reflected as breakpoints in the advisory fees for Funds, (ii) that all Funds with a subadviser that is not affiliated with the Adviser have subadvisory fees which are the product of arm’s-length negotiations between the Adviser and the subadviser and which in many, but not all, cases contain breakpoints, and (iii) that, although economies of scale cannot be measured with precision, these arrangements permit shareholders of Funds with advisory fee breakpoints to benefit from economies of scale if those Funds grow;
(4) (a) reviewed the financial statements of JHIMS and John Hancock Life Insurance Company (U.S.A.) (JHLICO (U.S.A.));
(b) reviewed the anticipated profitability of the JHIMS’s relationship with the Funds in terms of the fees it expects to receive with respect to the Funds and whether JHIMS has the financial ability to provide a high level of services to the Funds,
(c) considered that JHIMS derives reputational and other indirect benefits from providing advisory services to the Funds, and
(d) noted that JHIMS will pay the sub-advisory fees out of the advisory fees JHIMS receives from the Funds and concluded that the advisory fees paid by the Trust with respect to the Funds are not unreasonable in light of such information; and
(5) reviewed comparative information with respect to the advisory fee rates and concluded that the anticipated advisory fees for the Funds are within the range of those incurred by other comparable funds and that the advisory structure for the Funds is thus competitive within the industry.
Additional information that the Board considered for a particular Fund is set forth in Appendix A.
Approval of Subadvisory Agreements
At its meeting on June 5, 2007, the Board, including all the Independent Trustees, approved the Subadvisory Agreements.
In making its determination with reference to these respective factors, the Board reviewed:
(i) information relating to each subadviser’s business which included information
39
such as: business performance, assets under management, financial stability and personnel;
(ii) the investment performance of the subadviser’s portfolio managed comparably to the Fund to be managed by the subadviser and comparative performance information relating to the benchmark;
(iii) the proposed subadvisory fee for each Fund to be managed by the subadviser and comparative fee information; and
(iv) information relating to the nature and scope of Material Relationships and their significance to the Adviser and the subadvisers.
The Board’s decision to approve each Sub-advisory Agreement was based on a number of determinations, including the following:
(1) The subadviser has extensive experience and demonstrated skills as a manager and may be expected to provide a high quality of investment personnel to each Fund;
(2) Although not without variation, the current and historical performance of the portfolios of the Subadviser managed comparably to the Fund to be managed by the Subadviser has been within a competitive range of the current and historical performance of these portfolios’ respective benchmark (see Appendix A for further information on performance);
(3) The subadvisory fees are within industry norms and are the product of arm’s-length negotiation between the Adviser and the subadviser; and
(4) The Material Relationships consist of arrangements in which unaffiliated subadvisers or their affiliates provide advisory, distribution or management services in connection with financial products sponsored by the Trust’s adviser or its affiliates, which may include other registered investment companies, a 529 education savings plan, managed separate accounts and exempt group annuity contracts sold to qualified plans, and which in no case contained elements which would cause the Board to conclude that approval of the subadvisory agreement with the subadviser would be inappropriate. See (5) below for information relating to the business arrangement between the Trust’s Adviser and GMO.
(5) As a part of the overall business arrangement between the Adviser and GMO under which the Adviser has obtained exclusive rights to certain GMO investment management services for up to five years, the Adviser has agreed that under certain circumstances it (and not the Trust or the particular Fund) will pay GMO a specified amount (ranging from $1 to $12 million) if the subadvisory agreement with respect to any of the following Funds to be subadvised by GMO is terminated within a five-year period from the date of its effectiveness: U.S. Core Fund, Active Value Fund, Intrinsic Value Fund, Growth Fund, International Core Fund, International Growth Fund, Global Fund, Value Opportunities Fund, Growth Opportunities Fund and U.S. Quality Equity Fund.
The Adviser has also agreed that, subject to its fiduciary duties as an investment adviser to each of these Funds and its shareholders, it will not recommend to the Board of Trustees to terminate the subadvisory agreement with respect to any of the Funds or to reduce any of the fees payable thereunder to GMO for a five-year period from the date of effectiveness of the agreement. Substantially similar agreements (with varying amounts to be paid upon termination) also apply with respect to certain other John Hancock funds that are or will be advised by the Adviser and subadvised by GMO. The Trust is not a party to any of these arrangements, and they are not binding upon the Trust, the Trust’s Funds subadvised by GMO or the Board of Trustees. However, these arrangements present certain conflicts of interest because the Adviser has a financial incentive to support the continuation of GMO subadvisory agreements for as long as the ter mination provisions described above remain in effect. In approving the Advisory Agreement and the subadvisory agreement with respect to
40
each of the Funds subadvised by GMO, the Board of Trustees, including the Independent Trustees, was aware of and considered these potential conflicts of interest, including any financial obligations of the Adviser to GMO.
The Board concluded that, notwithstanding the potential conflicts of interest, approval of the Advisory Agreement and the subadvisory agreements with GMO is in the best interests of shareholders and contract owners in view of (i) the Adviser’s fiduciary duty and the Board’s fiduciary duty and ability to monitor potential conflicts, (ii) the benefits to shareholders and contract owners generally expected from the exclusive rights to certain GMO investment management services obtained by the Adviser for the benefit of certain Funds of the Trust and other John Hancock funds and (iii) the benefits to such Funds of the Trust expected from the subadvisory services of GMO.
Additional information that the Board considered for a particular fund is set forth in Appendix A.
Appendix A
| Estimated Fees | |||
| Fund | Performance | and Expenses | Comments |
| International | See Comments. | Subadvisory fees | The Board noted |
| Growth | for this Fund were | that the Fund | |
| higher than the peer | commenced opera- | ||
| group median. | tions in June 2006 | ||
| and has a limited | |||
| Advisory fees for | performance history. | ||
| this Fund were | |||
| lower than the peer | |||
| group median. | |||
| Total expenses for | |||
| this Fund were | |||
| higher than the peer | |||
| group median. | |||
Why John Hancock Funds?
For more than three decades, John Hancock Funds has been helping individual, corporate and institutional clients reach their most important financial goals. With so many fund companies to choose from, why should you invest with us?
► A name you know and trust
When you invest with John Hancock Funds, you are investing with one of the most recognized and respected names in the financial services industry. Our parent company has been helping individuals and institutions increase and protect wealth since 1862.
► Solutions across the investing spectrum
We offer equity, income, international, sector and asset allocation investment solutions managed by leading institutional money managers. Each of our funds utilizes a disciplined, team approach to portfolio management and research, leveraging the expertise of seasoned investment professionals.
► Committed to you
Our shareholders come first. We work hard to provide you with the products you need to build a solid financial foundation. We’re proud to offer you award-winning services and tools, like the www.jhfunds.com Web site, to help you every step of the way.
For immediate insight and answers,
turn to www.jhfunds.com
Discover the new and improved www.jhfunds.com.
▪ View accounts, statements and fund information.
▪ Access college and retirement planning calculators and investment education.
▪ Gain investment ideas, expand your knowledge and become a more informed investor.

This is just the beginning of how much you can do.
Now is the ideal time to experience our Web site that received the following recognition in 2006:
 “Best Innovation: Redesigned Web Site” by the Mutual Fund Education Alliance.
 “Outstanding Web Site” by the Web Marketing Association.
 “Creative excellence on the Web, Silver Award winner” by W3.
Discover convenience and comprehensive resources at one
easy-to-access location. Your financial professional can steer you to the tools that
will help you the most and enable you to transform your knowledge into action.
See how far www.jhfunds.com can take you!
For more information
The Fund’s proxy voting policies, procedures and records are available without charge,
upon request:
| By phone | On the Fund’s Web site | On the SEC’s Web site |
| 1-800-225-5291 | www.jhfunds.com/proxy | www.sec.gov |
| Trustees | Charles A. Rizzo | Principal distributor |
| Ronald R. Dion, Chairman | Chief Financial Officer | John Hancock Funds, LLC |
| James R. Boyle† | Gordon M. Shone | 601 Congress Street |
| James F. Carlin | Treasurer | Boston, MA 02210-2805 |
| William H. Cunningham | John G. Vrysen | |
| Charles L. Ladner * | Chief Operating Officer | Custodian |
| Dr. John A. Moore * | State Street Bank & Trust Co. | |
| Patti McGill Peterson * | Investment adviser | 2 Avenue de Lafayette |
| Steven R. Pruchansky | John Hancock Investment | Boston, MA 02111 |
| Management Services, LLC | ||
| *Members of the Audit Committee | 601 Congress Street | Transfer agent |
| †Non-Independent Trustee | Boston, MA 02210-2805 | John Hancock Signature |
| Services, Inc. | ||
| Officers | Subadviser | One John Hancock Way, |
| Keith F. Hartstein | Grantham, Mayo, | Suite 1000 |
| President and | Van Otterloo & Co. LLC | Boston, MA 02217-1000 |
| Chief Executive Officer | 40 Rowes Wharf | |
| Boston, MA 02110 | Legal counsel | |
| Thomas M. Kinzler | Kirkpatrick & Lockhart | |
| Francis V. Knox, Jr. | Preston Gates Ellis LLP | |
| Chief Compliance Officer | One Lincoln Street | |
| Boston, MA 02111-2950 | ||
| How to contact us | ||
| Internet | www.jhfunds.com | |
| Regular mail: | Express mail: | |
| John Hancock | John Hancock | |
| Signature Services, Inc. | Signature Services, Inc. | |
| One John Hancock Way, Suite 1000 | Mutual Fund Image Operations | |
| Boston, MA 02217-1000 | 380 Stuart Street | |
| Boston, MA 02116 | ||
| Phone | Customer service representatives | 1-800-225-5291 |
| EASI-Line | 1-800-338-8080 | |
| TDD line | 1-800-554-6713 | |
A listing of month-end portfolio holdings is available on our Web site, www.jhfunds.com. A more detailed portfolio holdings summary is available on a quarterly basis 60 days after the fiscal quarter on our Web site or upon request by calling 1-800-225-5291, or on the SEC’s Web site, www.sec.gov.
44
J O H N H A N C O C K F A M I L Y O F F U N D S
| EQUITY | INTERNATIONAL/GLOBAL |
| Balanced Fund | Global Opportunities Fund |
| Classic Value Fund | Global Shareholder Yield Fund |
| Classic Value Fund II | Greater China Opportunities Fund |
| Classic Value Mega Cap Fund | International Allocation Portfolio |
| Core Equity Fund | International Classic Value Fund |
| Growth Fund | International Core Fund |
| Growth Opportunities Fund | International Growth Fund |
| Growth Trends Fund | |
| Intrinsic Value Fund | INCOME |
| Large Cap Equity Fund | Bond Fund |
| Large Cap Select Fund | Government Income Fund |
| Mid Cap Equity Fund | High Yield Fund |
| Multi Cap Growth Fund | Investment Grade Bond Fund |
| Small Cap Equity Fund | Strategic Income Fund |
| Small Cap Fund | |
| Small Cap Intrinsic Value Fund | TAX-FREE INCOME |
| Sovereign Investors Fund | California Tax-Free Income Fund |
| U.S. Core Fund | High Yield Municipal Bond Fund |
| U.S. Global Leaders Growth Fund | Massachusetts Tax-Free Income Fund |
| Value Opportunities Fund | New York Tax-Free Income Fund |
| Tax-Free Bond Fund | |
| ASSET ALLOCATION | |
| Lifecycle 2010 Portfolio | MONEY MARKET |
| Lifecycle 2015 Portfolio | Money Market Fund |
| Lifecycle 2020 Portfolio | |
| Lifecycle 2025 Portfolio | CLOSED - END |
| Lifecycle 2030 Portfolio | Bank and Thrift Opportunity Fund |
| Lifecycle 2035 Portfolio | Financial Trends Fund, Inc. |
| Lifecycle 2040 Portfolio | Income Securities Trust |
| Lifecycle 2045 Portfolio | Investors Trust |
| Lifecycle Retirement Portfolio | Patriot Premium Dividend Fund II |
| Lifestyle Aggressive Portfolio | Preferred Income Fund |
| Lifestyle Balanced Portfolio | Preferred Income II Fund |
| Lifestyle Conservative Portfolio | Preferred Income III Fund |
| Lifestyle Growth Portfolio | Tax-Advantaged Dividend Income Fund |
| Lifestyle Moderate Portfolio | Tax-Advantaged Global Shareholder Yield Fund |
| SECTOR | |
| Financial Industries Fund | |
| Health Sciences Fund | |
| Real Estate Fund | |
| Regional Bank Fund | |
| Technology Fund | |
| Technology Leaders Fund | |
The Fund’s investment objectives, risks, charges and expenses are included in the prospectus and should be considered carefully before investing. For a prospectus, contact your financial professional, call John Hancock Funds at 1-800-225-5291 or visit the Fund’s Web site at www.jhfunds.com. Please read the prospectus carefully before investing or sending money.

1-800-225-5291
1-800-554-6713 TDD
1-800-338-8080 EASI-Line
www.jhfunds. com
Now available: electronic delivery
www.jhfunds. com/edelivery
This report is for the information of the shareholders of John Hancock International Growth Fund.
It is not authorized for distribution to prospective investors unless preceded or accompanied by a prospectus.
870SA 8/07
10/07

| TABLE OF CONTENTS |
| Your portfolio at a |
| glance |
| page 1 |
| Managers’ report |
| page 2 |
| A look at performance |
| page 6 |
| Your expenses |
| page 8 |
| Financial statements |
| page 11 |
| Portfolio’s investments |
| page 10 |
| Notes to financial |
| statements |
| page 18 |
| For more information |
| page 28 |
CEO corner
To Our Shareholders,
Volatility returned to the U.S. stock market in the six-month period ended August 31, 2007; however, stocks still posted a strong gain of 5.70%, as measured by the Standard & Poor’s 500 Index. The market experienced a particularly sharp downturn in August, as the subprime mortgage market’s woes increased. Rising defaults and an ensuing credit crunch caused heightened fears about their potential impact on U.S. economic growth. Foreign markets felt some ripple effects from the subprime issue, but they continued nonetheless to benefit from solid economic growth and outperformed the U.S. market in this period.
During this period of volatility, the U.S. stock market also passed a significant milestone — the broad Standard & Poor’s 500 Index climbed beyond the record it had set seven years ago. From its peak in March 2000, the stock market spiraled downward three consecutive years, bottoming in 2002. The upturn began in 2003, and the market has advanced each year since, finally setting a new high for the first time on May 30, 2007. During that period, the S&P 500 Index experienced five significant short-term sell-offs of 6% or more, with the August subprime-induced meltdown being the most recent.
This nearly complete market cycle highlights the importance of two investment principles you have heard us speak of often: diversification and patience. By allocating your investments among different asset classes, investment styles and portfolio managers, you are likely to be well represented through all phases of a complete market cycle, with the winners helping to cushion the fall of the losers.
The challenge for investors with a diversified portfolio is to properly evaluate your investments to tell the difference between an underperforming manager and an out-of-favor style, while also understanding the role each investment plays in your portfolio. That’s where your financial professional can provide true value. He or she can help you make those assessments and also counsel patience, because a properly diversified portfolio by its very nature will typically have something lagging or out of favor — a concept that can be difficult to live with, but necessary to embrace. If everything in your portfolio is “working,” then you are not truly diversified, but rather are leveraged to the current market and the flavor of the day. If so, you are bound to be out of step in the near future.
The recent volatility in the securities markets has prompted many investors to question how long this type of market cycle will last. History tells us it will indeed end and that when it does, today’s leaders may well turn into laggards and vice versa. The subprime mortgage market woes are just the latest example of why investors should be both patient and well-diversified. For with patience and a diversified portfolio, it could be easier to weather the market’s twists and turns and reach your long-term goals.
Sincerely,

Keith F. Hartstein,
President and Chief Executive Officer
This commentary reflects the CEO’s views as of August 31, 2007. They are subject to change at any time.
Your Portfolio at a glance
The Portfolio seeks long-term growth of capital. To pursue this goal, the Portfolio, which is a fund of funds, invests in a number of other funds of the John Hancock Funds complex, as well as in the securities of other investment companies. Under normal circumstances, the Portfolio allocates assets among affiliated underlying funds that invest principally in foreign equity securities of issuers of any market capitalization and in foreign fixed-income securities of various types and credit qualities.
Over the last six months
► Foreign financial markets overall produced gains that were modestly higher than the U.S., with emerging markets producing a much stronger gain.
► Overweights in China, Hong Kong and Canada and an underweight in Japan boosted the Portfolio's performance versus its benchmark index.
► One of the portfolio's six underlying funds — Greater China Opportunities — produced very strong results.
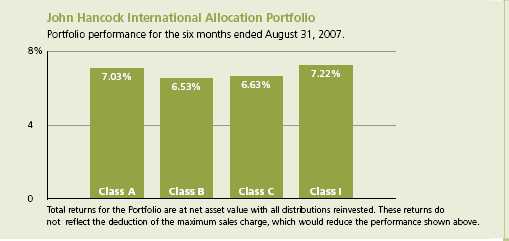
| Asset allocation | % of Total |
| International Large Cap | 72.0% |
| International Small Cap | 25.0% |
| China | 3.0% |
As a percentage of net assets on August 31, 2007.
1
Managers’ report
John Hancock
International Allocation Portfolio
For this six-month reporting period ended August 31, 2007, foreign markets in general slightly outperformed the U.S. market, but emerging markets, in particular, recorded stellar returns in a period marked by heightened volatility.
At the end of February, a short-term sell-off in China’s market sparked a decline in global equity markets, with riskier asset classes suffering steeper declines. However, the decline was short-lived and investors soon resumed the search for higher absolute returns, favoring riskier asset types, such as equities from smaller companies, non-U.S. equities and, particularly, emerging market equities. The desire for higher returns was fed by abundant global liquidity created by low interest rates across the globe. After rallying in March, April and May, global markets experienced a slight pullback in June. A surge of corporate buyout deals by private equity firms, as well as hopes for an economic “soft landing,” helped fuel the gains. However, sentiment began to change toward the end of June on worries about a continued housing slowdown, the possibility of an overheated economy and higher energy prices, which put pressure on returns.
SCORECARD
| INVESTMENT | PERIOD’S PERFORMANCE . . . AND WHAT’S BEHIND THE NUMBERS | |
| Greater China | ▲ | Benefited from investments in the financial, telecom and |
| Opportunities | industrial sectors | |
| (MFC Global)1 | ||
| International | ▲ | Benefited from overweights to Hong Kong and Canada and excellent |
| Opportunities | security selection within telecommunications and energy sectors | |
| (Marsico)1 | ||
| International | ▲ | Underperformed from an overweight to Japan and to the financial |
| Classic Value | sector, and poor security selection overall | |
| (Pzena)1 | ||
1The Fund’s investment manager.
2
From the MFC Global Investment Management (U.S.A.), LLC
Portfolio Management Team
From mid-July through mid-August, the markets went through a significant rough patch. Stocks across the board tumbled as concerns in the credit market caused a flight from riskier asset classes. Market volatility increased in response to problems with subprime mortgage defaults and delinquencies, and from the accompanying fears that this crisis could cause a severe slowdown or recession.
“…foreign markets in general
slightly outperformed the U.S.
market, but emerging markets,
in particular, recorded stellar
returns in a period marked by
higher volatility.”
Overall, investors were rewarded for staying the course through all of the market’s gyrations. For the six months ended August 31, 2007, international equity markets gained 6.18%, as measured by the MSCI EAFE Gross Total Return Index, outpacing the 5.70% return of the U.S. market, as measured by the Standard & Poor’s 500 Index. Large-capitalization stocks outperformed small-cap stocks, while growth stocks generally outpaced value stocks. On a sector basis, energy and materials stocks climbed in the high teens, while financials posted negative returns as the subprime crisis moved beyond the U.S. borders. Emerging-market stocks, which seemed largely unaffected by the subprime problem, returned approximately 23% over the period, as measured by the MSCI Emerging Market Index.
Portfolio strategy
John Hancock International Allocation Portfolio seeks long-term growth of capital by investing in foreign securities. We believe that the Portfolio’s major advantage lies in its diversification, which can offer the potential for both higher returns and lower risk. The Portfolio is designed with multiple layers of diversification. First, the Portfolio has exposure to a variety of international asset classes, including large- and small-capitalization
International Allocation Portfolio
3
companies, as well as companies domiciled in both developed and emerging markets. Second, the Portfolio is allocated across investment styles, so it is exposed to both value and growth stocks. Third, the Portfolio provides diversification across several leading asset managers, carefully chosen through our robust due diligence process.
The Portfolio, which is a fund of funds, remained invested during the period in the same six underlying international funds that originally launched at the Portfolio’s inception. These include International Small Company Fund (Dimensional Financial Advisors, Inc.), International Growth Fund (Grantham, Mayo, Van Otterloo & Co.), International Value Fund (Franklin Templeton), International Classic Value (Pzena Investment Management LLC), Greater China Opportunities Fund (MFC Global Investment Management (U.S.A.) Ltd.) and International Opportunities Fund (Marsico Capital Management, LLC).
Fund performance
For the six months ended August 31, 2007, John Hancock International Allocation Portfolio’s Class A, Class B, Class C and Class I shares returned 7.03%, 6.53%, 6.63% and 7.22%, respectively, at net asset value. By comparison, the MSCI EAFE Gross Total Return Index returned 6.18% and the average Morningstar, Inc. foreign large blend fund returned 7.18% .1 In this period, the Portfolio outperformed its benchmark index primarily due to an underweight in Japan and an overweight in China, Hong Kong and Canada, while an underweight in Germany detracted from results. Within the economic sectors, an overweight in industrials and an underweight in financials were the largest relative positives.
The Portfolio’s performance was positively impacted by allocations to Greater China Opportunities, International Opportunities, International Growth Fund and International Value Fund. International Small Company lagged the broad MSCI EAFE Index, but beat its MSCI EAFE Small Cap Index benchmark. International Classic Value, meanwhile, underperformed due to an overweight in Japan and the financial sector, and poor security selection overall.
Greater China Opportunities Fund, the most aggressive position in the Portfolio, performed very well over the period, benefiting
International Allocation Portfolio
4
from investments in the financial, telecom and industrial sectors. International Opportunities, another major contributor during the period, benefited from its overweight in Hong Kong and Canada, and from excellent security selection within telecommunications and energy.
Outlook
We continue to believe that global equity valuations are reasonable, and we are maintaining our positive outlook, even when taking into account the potential for a modest contraction in global growth. In our view, the non-U.S. economy is fine, and emerging economies, in particular, are in good shape, based on expectations for high economic growth, coupled with strong corporate and country balance sheets. However, the road to higher equity prices both at home and abroad, including emerging markets, could remain bumpy as economic uncertainty and market volatility take center stage.
“...the Portfolio outperformed
its benchmark index primarily
due to an underweight in Japan
and an overweight in China,
Hong Kong and Canada, while
an underweight in Germany
detracted from results.”
Global credit markets continue to experience problems, forcing intervention from central banks in the form of liquidity infusions. A silver lining, however, is that global inflation is currently stable, thus allowing the U.S. Federal Reserve and global central banks ample room to fully utilize its monetary policy arsenal — primarily in the form of interest rate cuts.
Despite the notion of “globalization,” the fact remains that investing in non-U.S. markets — and in emerging markets in particular — brings unique risks. That said, investing in a diversified international portfolio can help smooth out the short-term ups and downs of volatile markets and help offset some of these risks, while pursuing long-term growth.
This commentary reflects the views of the portfolio managers through the end of the Portfolio’s period discussed in this report. The managers’ statements reflect their own opinions. As such, they are in no way guarantees of future events and are not intended to be used as investment advice or a recommendation regarding any specific security. They are also subject to change at any time as market and other conditions warrant.
International investing involves special risks such as political, economic and currency risks and differences in accounting standards and financial reporting. See the prospectus for the risks of investing in small-cap stocks. See the prospectus for the risks of investing in high-yield bonds.
1 Figures from Morningstar, Inc. include reinvested dividends and do not take into account sales charges. Actual load-adjusted performance is lower.
International Allocation Portfolio
5
A look at performance
For the periods ended August 31, 2007
| Cumulative total returns | |||||
| with maximum sales charge (POP) | |||||
| Inception | Since | ||||
| Class | date | 6-month | inception | ||
| A | 12-29-06 | 1.72% | 1.23% | ||
| B | 12-29-06 | 1.53 | 1.00 | ||
| C | 12-29-06 | 5.63 | 5.10 | ||
| I1 | 12-29-06 | 7.22 | 6.90 | ||
Performance figures assume all distributions are reinvested. Public offering price (POP) figures reflect maximum sales charge on Class A shares of 5%, and the applicable contingent deferred sales charge (CDSC) on Class B and Class C shares. The Class B shares’ CDSC declines annually between years 1 to 6 according to the following schedule 5, 4, 3, 3, 2, 1%. No sales charge will be assessed after the sixth year. Class C shares held for less than one year are subject to a 1% CDSC. Sales charge is not applicable for Class I shares.
The expense ratios of the Fund, both net (including any fee waivers or expense limitations) and gross (excluding any fee waivers or expense limitations), are set forth according to the most recent publicly available Prospectuses for the Fund and may differ from the expense ratios disclosed in the Financial Highlights tables in this report. The waivers and expense limitations are contractual at least until 6-30-08. The net expenses are as follows: Class A — 1.70%, Class B — 2.40%, Class C — 2.40%, Class I — 1.25% . Had the fee waivers and expense limitations not been in place, the gross expenses would be as follows: Class A — 1.79%, Class B — 2.67%, Class C — 2.55%, Class I — 1.39% .
The returns reflect past results and should not be considered indicative of future performance. The return and principal value of an investment will fluctuate so that shares, when redeemed, may be worth more or less than their original cost. Due to market volatility, the Fund’s current performance may be higher or lower than the performance shown. For performance data current to the most recent month-end, please call 1-800-225-5291 or visit the Portfolio’s Web site at www.jhfunds.com.
The performance table above and the chart on the next page do not reflect the deduction of taxes that a shareholder would pay on fund distributions or the redemption of fund shares.
The Portfolio’s performance results reflect any applicable expense reductions, without which the expenses increase and results would have been less favorable.
Performance is calculated with an opening price (prior day’s close) on the inception date.
1 For certain types of investors as described in the Fund’s Class I share prospectus.
International Allocation Portfolio
6
Growth of $10,000
This chart shows what happened to a hypothetical $10,000 investment in International
Allocation Portfolio Class A shares for the period indicated. For comparison, we’ve shown
the same investment in two separate indexes.
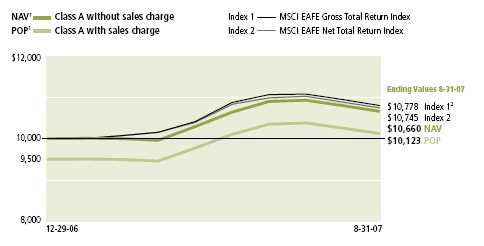
| With maximum | |||||
| Class | Period beginning | Without sales charge | sales charge | Index 1 | Index 2 |
| B2 | 12-29-06 | $10,600 | $10,100 | $10,778 | $10,745 |
| C2 | 12-29-06 | 10,610 | 10,510 | 10,778 | 10,745 |
| I2,3 | 12-29-06 | 10,690 | 10,690 | 10,778 | 10,745 |
Assuming all distributions were reinvested for the period indicated, the table above shows the value of a $10,000 investment in the fund’s Class B, Class C and Class I shares, respectively, as of August 31, 2007. Performance of the classes will vary based on the difference in sales charges paid by shareholders investing in the different classes and the fee structure of those classes.
MSCI EAFE Gross Total Return Index — Index 1 — is an unmanaged market capitalization weighted composite of securities in 21 developed markets outside of North America, in Europe, Australia and the Far East. The MSCI EAFE® (gross) Index includes the maximum dividend reinvestment. The Composite Index figures do not reflect any deduction for fees, taxes or expenses.
MSCI EAFE Net Total Return Index (Europe, Australasia, Far East) — Index 2 — is a free float-adjusted market capitalization index that is designed to measure developed market equity performance, excluding the U.S. and Canada. As of June 2006, the MSCI EAFE Index consisted of the following 21 developed market country indexes: Australia, Austria, Belgium, Denmark, Finland, France, Germany, Greece, Hong Kong, Ireland, Italy, Japan, Netherlands, New Zealand, Norway, Portugal, Singapore, Spain, Sweden, Switzerland and the United Kingdom. Returns are calculated and presented net of withholding tax.
It is not possible to invest directly in an index. Index figures do not reflect sales charges, which would have resulted in lower values if they did.
1 NAV represents net asset value and POP represents public offering price.
2 Index 1 figure as of closest month-end to fund inception date.
3 For certain types of investors as described in the Fund’s Class I share prospectus.
International Allocation Portfolio
7
Your expenses
These examples are intended to help you understand your ongoing operating expenses.
Understanding fund expenses
As a shareholder of the Fund, you incur two types of costs:
▪ Transaction costs which include sales charges (loads) on purchases or redemptions (varies by share class), minimum account fee charge, etc.
▪ Ongoing operating expenses including management fees, distribution and service fees (if applicable) and other fund expenses.
We are going to present only your ongoing operating expenses here.
Actual expenses/actual returns
This example is intended to provide information about your fund’s actual ongoing operating expenses, and is based on your fund’s actual return. It assumes an account value of $1,000.00 on March 1, 2007, with the same investment held until August 31, 2007.
| Account value | Ending value | Expenses paid during period | |
| on 3-1-07 | on 8-31-07 | ended 8-31-071 | |
| Class A | $1,000.00 | $1,070.30 | $3.21 |
| Class B | 1,000.00 | 1,065.30 | 6.92 |
| Class C | 1,000.00 | 1,066.30 | 6.92 |
| Class I | 1,000.00 | 1,072.20 | 0.93 |
Together with the value of your account, you may use this information to estimate the operating expenses that you paid over the period. Simply divide your account value at August 31, 2007 by $1,000.00, then multiply it by the “expenses paid” for your share class from the table above. For example, for an account value of $8,600.00, the operating expenses should be calculated as follows:
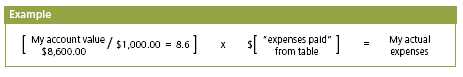
International Allocation Portfolio
8
Hypothetical example for comparison purposes
This table allows you to compare your fund’s ongoing operating expenses with those of any other fund. It provides an example of the Fund’s hypothetical account values and hypothetical expenses based on each class’s actual expense ratio and an assumed 5% annualized return before expenses (which is not your fund’s actual return). It assumes an account value of $1,000.00 on March 1, 2007, with the same investment held until August 31, 2007. Look in any other fund shareholder report to find its hypothetical example and you will be able to compare these expenses.
| Account value | Ending value | Expenses paid during period | |||
| on 3-1-07 | on 8-31-07 | ended 8-31-07 1 | |||
| Class A | $1,000.00 | $1,022.04 | $3.13 | ||
| Class B | 1,000.00 | 1,018.44 | 6.76 | ||
| Class C | 1,000.00 | 1,018.44 | 6.76 | ||
| Class I | 1,000.00 | 1,024.24 | 0.91 | ||
Remember, these examples do not include any transaction costs, such as sales charges; therefore, these examples will not help you to determine the relative total costs of owning different funds. If transaction costs were included, your expenses would have been higher. See the prospectus for details regarding transaction costs.
1 Expenses are equal to the Fund’s annualized expense ratio of 0.61%, 1.33%, 1.33% and 0.17% for Class A, Class B, Class C and Class I respectively, multiplied by the average account value over the period, multiplied by the number of days in the inception period/365 or 366 (to reflect the one-half year period).
International Allocation Portfolio
9
Portfolio’s investments
F I N A N C I A L S T A T E M E N T S
Securities owned by the Portfolio on 8-31-07 (unaudited)
Portfolio of investments, showing all affiliated underlying funds.
| Issuer | Shares | Value | |
| Investment companies 99.86% | $34,653,878 | ||
| (Cost $33,777,900) | |||
| John Hancock Funds 17.99% | 6,240,626 | ||
| Greater China Opportunities* (MFC Global | |||
| Investment Management (U.S.A.) Limited) (1) | 45,337 | 1,103,491 | |
| International Classic Value* | |||
| (Pzena Investment Management, LLC) (1) | 474,343 | 5,137,135 | |
| John Hancock Funds II 65.94% | 22,882,097 | ||
| International Opportunities | |||
| (Marsico Capital Management, LLC) (1) | 395,955 | 7,665,689 | |
| International Small Company | |||
| (Dimensional Fund Advisors, Inc.) (1) | 750,525 | 8,653,553 | |
| International Value | |||
| (Franklin® Templeton®) (1) | 333,140 | 6,562,855 | |
| John Hancock Funds III 15.93% | 5,527,187 | ||
| International Growth* | |||
| (Grantham, Mayo, Van Otterloo & Co.) (1) | 216,498 | 5,527,187 | |
| Total investment (Cost $33,777,900) 99.86% | $34,649,910 | ||
| Other assets in excess of liabilities 0.14% | $48,983 | ||
| Total net assets 100.00% | $34,698,893 | ||
Percentages are stated as a percent of net assets.
(1) The underlying fund’s subadviser.
* Non-income-producing.
See notes to financial statements
International Allocation Portfolio
10
Financial statements
F I N A N C I A L S T A T E M E N T S
Statement of assets and liabilities 8-31-07 (unaudited)
This Statement of Assets and Liabilities is the Portfolio’s balance sheet. It shows the value
of what the Portfolio owns, is due and owes. You’ll also find the net asset value and the
maximum offering price per share.
| Assets | |
| Investments in affiliated funds, at value (Cost $33,777,900) | $34,649,910 |
| Receivable for investments sold | 19,775 |
| Receivable for fund shares sold | 173,466 |
| Receivable due from adviser | 80,243 |
| Total assets | 34,923,394 |
| Liabilities | |
| Due to custodian | 115,855 |
| Payable for investments purchased | 841 |
| Payable for fund shares repurchased | 75,004 |
| Payable to affiliates | |
| Fund administration fees | 690 |
| Transfer agent fees | 12,257 |
| Other payables and accrued expenses | 19,854 |
| Total liabilities | 224,501 |
| Net assets | |
| Capital paid-in | $33,892,624 |
| Accumulated undistributed net realized gain on investments | 27,995 |
| Net unrealized appreciation on investments | 872,010 |
| Undistributed net investment loss | (93,736) |
| Net assets | $34,698,893 |
| Net asset value per share | |
| Based on net asset values and shares outstanding — The Portfolio has an | |
| unlimited number of shares authorized with no par value. | |
| Class A ($26,993,113 ÷ 2,531,068 shares) | $10.66 |
| Class B ($1,399,561 ÷ 132,005 shares)1 | $10.60 |
| Class C ($5,672,511 ÷ 534,581 shares)1 | $10.61 |
| Class I ($633,708 ÷ 59,279 shares) | $10.69 |
| Maximum offering price per share | |
| Class A2 ($10.66 ÷ 95%) | $11.22 |
1 Redemption price is equal to net asset value less any applicable contingent deferred sales charges.
2 On single retail sales of less than $50,000. On sales of $50,000 or more and on group sales the offering price is reduced.
See notes to financial statements
International Allocation Portfolio
11
F I N A N C I A L S T A T E M E N T S
Statement of operations For the period ended 8-31-07 (unaudited)1
This Statement of Operations summarizes the Portfolio’s investment income earned
and expenses incurred in operating the Portfolio. It also shows net gains (losses) for
the period stated.
| Investment income | |
| Total investment income | — |
| Expenses | |
| Investment management fees (Note 3) | 17,046 |
| Distribution and service fees (Note 3) | 53,108 |
| Transfer agent fees (Note 3) | 23,364 |
| Fund administration fees (Note 3) | 1,342 |
| Blue sky fees (Note 3) | 70,977 |
| Audit and legal fees | 44,610 |
| Registration and filing fees | 12,422 |
| Custodian fees | 6,073 |
| Printing and postage fees (Note 3) | 2,914 |
| Trustees’ fees (Note 3) | 184 |
| Miscellaneous | 7,986 |
| Total expenses | 240,026 |
| Less expense reductions (Note 3) | (146,290) |
| Net expenses | 93,736 |
| Net investment loss | (93,736) |
| Realized and unrealized gain | |
| Net realized gain on investments in affiliated underlying funds | 28,590 |
| Change in net unrealized appreciation (depreciation) of | |
| investments in affiliated underlying funds | 954,037 |
| Net realized and unrealized gain | 982,627 |
| Increase in net assets from operations | $888,891 |
1 Semiannual period from 3-1-07 to 8-31-07.
See notes to financial statements
International Allocation Portfolio
12
F I N A N C I A L S T A T E M E N T S
Statement of changes in net assets
These Statements of Changes in Net Assets show how the value of the Portfolio’s net
assets has changed during the last two periods. The difference reflects earnings less
expenses, any investment gains and losses, distributions, if any, paid to shareholders and
the net of Portfolio share transactions.
| Period | Period | |
| ended | ended | |
| 2-28-071 | 8-31-072 | |
| Increase (decrease) in net assets | ||
| From operations | ||
| Net investment loss | ($1,551) | ($93,736) |
| Net realized gain (loss) | (547) | 28,590 |
| Change in net unrealized appreciation (depreciation) | (82,027) | 954,037 |
| Increase (decrease) in net assets resulting from operations | (84,125) | 888,891 |
| From Portfolio share transactions | 4,651,047 | 29,243,080 |
| Total increase | 4,566,922 | 30,131,971 |
| Net assets | ||
| Beginning of period | — | 4,566,922 |
| End of period3 | $4,566,922 | $34,698,893 |
1 Period from 12-29-06 (commencement of operations) to 2-28-07.
2 Semiannual period from 3-1-07 to 8-31-07. Unaudited.
3 Includes undistributed net investment loss of $0 and $93,736, respectively.
See notes to financial statements
International Allocation Portfolio
13
F I N A N C I A L S T A T E M E N T S
Financial highlights
The Financial Highlights show how the Portfolio’s net asset value for a share has changed
since the end of the previous period.
| CLASS A SHARES | ||
| Period ended | 2-28-071 | 8-31-072 |
| Per share operating performance | ||
| Net asset value, beginning of period | $10.00 | $9.96 |
| Net investment loss3 | (0.01) | (0.03) |
| Net realized and unrealized gain | ||
| (loss) on investments | (0.03) | 0.73 |
| Total from investment operations | (0.04) | 0.70 |
| Net asset value, end of period | $9.96 | $10.66 |
| Total return5,6,7 (%) | (0.40) | 7.03 |
| Ratios and supplemental data | ||
| Net assets, end of period (in millions) | $3 | $27 |
| Ratio of net expenses to average | ||
| net assets10 (%) | 0.60 | 0.61 |
| Ratio of gross expenses to average | ||
| net assets9,10 (%) | 8.53 | 1.34 |
| Ratio of net investment loss | ||
| to average net assets10 (%) | (0.60) | (0.61) |
| Portfolio turnover7 (%) | 3 | 2 |
See notes to financial statements
International Allocation Portfolio
14
F I N A N C I A L S T A T E M E N T S
Financial highlights
| CLASS B SHARES | ||
| Period ended | 2-28-071 | 8-31-072 |
| Per share operating performance | ||
| Net asset value, beginning of period | $10.00 | $9.95 |
| Net investment loss3 | (0.02) | (0.07) |
| Net realized and unrealized gain | ||
| (loss) on investments | (0.03) | 0.72 |
| Total from investment operations | (0.05) | 0.65 |
| Net asset value, end of period | $9.95 | $10.60 |
| Total return5,6,7 (%) | (0.50) | 6.53 |
| Ratios and supplemental data | ||
| Net assets, end of period (in millions) | —8 | $1 |
| Ratio of net expenses to average | ||
| net assets10 (%) | 1.26 | 1.33 |
| Ratio of gross expenses to average | ||
| net assets9,10 (%) | 28.58 | 6.09 |
| Ratio of net investment loss | ||
| to average net assets10 (%) | (1.26) | (1.33) |
| Portfolio turnover7 (%) | 3 | 2 |
See notes to financial statements
International Allocation Portfolio
15
F I N A N C I A L S T A T E M E N T S
Financial highlights
| CLASS C SHARES | ||
| Period ended | 2-28-071 | 8-31-072 |
| Per share operating performance | ||
| Net asset value, beginning of period | $10.00 | $9.95 |
| Net investment loss3 | (0.02) | (0.07) |
| Net realized and unrealized gain | ||
| (loss) on investments | (0.03) | 0.73 |
| Total from investment operations | (0.05) | 0.66 |
| Net asset value, end of period | $9.95 | $10.61 |
| Total return5,6,7 (%) | (0.50) | 6.63 |
| Ratios and supplemental data | ||
| Net assets, end of period (in millions) | $1 | $6 |
| Ratio of net expenses to average | ||
| net assets10 (%) | 1.27 | 1.33 |
| Ratio of gross expenses to average | ||
| net assets9,10 (%) | 18.62 | 2.99 |
| Ratio of net investment loss | ||
| to average net assets10 (%) | (1.27) | (1.33) |
| Portfolio turnover7 (%) | 3 | 2 |
See notes to financial statements
International Allocation Portfolio
16
F I N A N C I A L S T A T E M E N T S
Financial highlights
| CLASS I SHARES | ||
| Period ended | 2-28-071 | 8-31-072 |
| Per share operating performance | ||
| Net asset value, beginning of period | $10.00 | $9.97 |
| Net investment loss3 | (0.00)4 | (0.01) |
| Net realized and unrealized gain | ||
| (loss) on investments | (0.03) | 0.73 |
| Total from investment operations | (0.03) | 0.72 |
| Net asset value, end of period | $9.97 | $10.69 |
| Total return5,6,7 (%) | (0.30) | 7.22 |
| Ratios and supplemental data | ||
| Net assets, end of period (in millions) | —8 | $1 |
| Ratio of net expenses to average | ||
| net assets10 (%) | 0.17 | 0.17 |
| Ratio of gross expenses to average | ||
| net assets9,10 (%) | 25.01 | 8.23 |
| Ratio of net investment loss | ||
| to average net assets10 (%) | (0.17) | (0.17) |
| Portfolio turnover7 (%) | 3 | 2 |
1 Class A, Class B, Class C and Class I shares began operations on 12-29-06.
2 Semiannual period from 3-1-07 to 8-31-07. Unaudited.
3 Based on the average of the shares outstanding.
4 Less than $(0.01) per share.
5 Assumes dividend reinvestment.
6 Total returns would have been lower had certain expenses not been reduced during the periods shown.
7 Not annualized.
8 Less than $500,000.
9 Does not take into consideration expense reductions during the periods shown.
10 Annualized.
See notes to financial statements
International Allocation Portfolio
17
Notes to financial statements (unaudited)
1. Organization
John Hancock International Allocation Portfolio (the Portfolio) is a newly organized diversified series of John Hancock Funds III (the Trust). The Trust was established as a Massachusetts business trust on June 9, 2005. The Trust is registered under the Investment Company Act of 1940, as amended (the 1940 Act), as an open-end investment management company. The investment objective of the Portfolio is to seek long term growth of capital.
The Portfolio operates as a “fund of funds,” investing in Class NAV shares of affiliated underlying funds within the John Hancock funds complex and in other permitted investments. The Portfolio may also invest in similar class NAV shares and in classes of shares of nonaffiliated funds that could have sales charges and be subject to distributor and/or Rule 12b-1 fees. The affiliated underlying funds’ accounting policies are outlined in the shareholder reports, available without charge by calling 1-800-225-5291 or on the Securities and Exchange Commission (SEC) Web site at www.sec.gov. The affiliated underlying funds are not covered by this report.
John Hancock Life Insurance Company of New York (John Hancock New York) is a wholly owned subsidiary of John Hancock Life Insurance Company (U.S.A.) (John Hancock USA). John Hancock USA and John Hancock New York are indirect wholly owned subsidiaries of The Manufacturers Life Insurance Company (Manulife), which in turn is a wholly owned subsidiary of Manulife Financial Corporation (MFC), a publicly traded company. MFC and its subsidiaries are known collectively as “Manulife Financial.”
John Hancock Investment Management Services, LLC (the Adviser), a Delaware limited liability company controlled by John Hancock USA, serves as investment adviser for the Trust and John Hancock Funds, LLC (the Distributor), a Delaware limited liability company, an affiliate of the Adviser, serves as principal underwriter.
The Board of Trustees has authorized the issuance of multiple classes of shares of the Portfolio, including classes designated as Class A, Class B, Class C and Class I shares. The shares of each class represent an interest in the same portfolio of investments of the Portfolio, and have equal rights as to voting, redemptions, dividends and liquidation, except that certain expenses, subject to the approval of the Board of Trustees, may be applied differently to each class of shares in accordance with current regulations of the SEC and the Internal Revenue Service. Shareholders of a class that bears distribution and service expenses under the terms of a distribution plan have exclusive voting rights to that distribution plan. Class B shares will convert to Class A shares eight years after purchase.
The Adviser and other subsidiaries of John Hancock USA owned 1,470,565, 10,000, 10,000 and 10,000 shares of beneficial interest of Class A, Class B, Class C and Class I, respectively, of the Portfolio on August 31, 2007.
2. Significant accounting policies
In the preparation of the financial statements, the Portfolio follows the policies described below. The preparation of financial statements in conformity with accounting principles generally accepted in the United States of America requires management to make estimates and assumptions that affect the reported amounts of assets and liabilities at the date of the financial statements and the reported amounts of income and expenses during the reporting period. Actual results may differ from these estimates.
International Allocation Portfolio
18
Security valuation
The net asset value of the shares of Class A, Class B, Class C and Class I of the Portfolio is determined daily as of the close of the New York Stock Exchange (NYSE), normally at 4:00 P.M., Eastern Time. Investments in the underlying funds are valued at their respective net asset values each business day, or at fair value as determined in good faith in accordance with procedures approved by the Trustees. Securities in the affiliated underlying funds’ portfolios are valued in accordance with their respective valuation polices, as outlined in the affiliated underlying funds’ financial statements. Short-term debt investments that have a remaining maturity of 60 days or less are valued at amortized cost, and thereafter assume a constant amortization to maturity of any discount or premium, whi ch approximates market value. All other securities held by the portfolios are valued at the last sale price or official closing price (closing bid price or last evaluated quote if no sale has occurred) as of the close of business on the principal securities exchange (domestic or foreign) on which they trade or, lacking any sales, at the closing bid price. Securities traded only in the over-the-counter market are valued at the last bid price quoted by brokers making markets in the securities at the close of trading. Securities for which there are no such quotations, principally debt securities, are valued based on the valuation provided by an independent pricing service, which utilizes both dealer-supplied and electronic data processing techniques, which take into account factors such as institutional-size trading in similar groups of securities, yield, quality, coupon rate, maturity, type of issue, trading characteristics and other market data.
Security transactions and related investment income
Investment security transactions in the underlying funds are accounted for on a trade date plus one basis for daily net asset value calculations. However, for financial reporting purposes, investment transactions are reported on trade date. Interest income is accrued as earned.
Dividend income and capital gain distributions from the underlying funds are recorded on the ex-dividend date.
Gains and losses on securities sold are determined on the basis of specific identified cost for both financial and federal income tax reporting purposes.
Multi-class allocations
All income, expenses (except for class-specific expenses) and realized and unrealized gains (losses) are allocated to each class of shares based upon the relative net assets of each class. Dividends to shareholders from net investment income are determined at a class level and distributions from capital gains are determined at a series level.
Expense allocation
Expenses not directly attributable to a particular Portfolio or class of shares are allocated based on the relative share of net assets of the Portfolio or share class at the time the expense was incurred. Class-specific expenses, such as transfer agency fees, blue sky fees, printing and postage fees and distribution and service fees, are accrued daily and charged directly to the respective share classes. Expenses in the Portfolio’s Statement of Operations reflect the expenses of the Portfolio and do not include any indirect expenses related to the underlying funds. Because the underlying funds have varied expense levels and the Portfolio may own different proportions of the underlying funds at different times, the amount of fees and expenses incurred indirectly by the Portfolio will vary.
Federal income taxes
The Portfolio qualifies as a “regulated investment company” by complying with the applicable provisions of the Internal Revenue Code and will not be subject to federal income tax on taxable income. Therefore, no federal income tax provision is required.
New accounting pronouncements
In June 2006, Financial Accounting Standards Board (FASB) Interpretation No. 48, Accounting for Uncertainty in Income Taxes (the Interpretation), was issued and is effective for fiscal years beginning after December 15, 2006,
International Allocation Portfolio
19
and is to be applied to all open tax years as of the effective date. This Interpretation prescribes a minimum threshold for financial statement recognition of the benefit of a tax position taken or expected to be taken in a tax return, and requires certain expanded disclosures. Management has evaluated the application of this Interpretation to the Portfolio and does not believe there is a material impact resulting from the adoption of this Interpretation on the Portfolio’s financial statements.
In September 2006, FASB Standard No. 157, Fair Value Measurements (FAS 157), was issued and is effective for fiscal years beginning after November 15, 2007. FAS 157 defines fair value, establishing a framework for measuring fair value and expands disclosure about fair value measurements. Management is currently evaluating the application of FAS 157 to the Portfolio and its impact, if any, resulting from the adoption of FAS 157 on the Portfolio’s financial statements.
Distribution of income and gains
The Portfolio records distributions to shareholders from net investment income and net realized gains, if any, on the ex-dividend date. During the period ended August 31, 2007, there were no distributions. Distributions paid by the Portfolio with respect to each class of shares are calculated in the same manner, at the same time and are in the same amount, except for the effect of expenses that may be applied differently to each class.
Such distributions on a tax basis, are determined in conformity with income tax regulations, which may differ from accounting principles generally accepted in the United States of America. Distributions in excess of tax basis earnings and profits, if any, are reported in the Portfolio’s financial statements as a return of capital.
Capital accounts
The Portfolio reports the undistributed net investment income and accumulated undistributed net realized gain (loss) accounts on a basis approximating amounts available for future tax distributions (or to offset future taxable realized gains when a capital loss carryforward is available). Accordingly, the Portfolio may periodically make reclassifications among certain capital accounts without affecting its net asset value.
3. Investment advisory and other agreements
Advisory fees
The Trust has entered into an Investment Advisory Agreement with the Adviser. The Adviser is responsible for managing the corporate and business affairs of the Trust and for selecting and compensating subadvisers to handle the investment of the assets of the Portfolio, subject to the supervision of the Trust’s Board of Trustees. Under the Advisory Agreement the Portfolio pays the Adviser a management fee that has two components: (a) a fee on assets invested in the funds of the Trust or other affiliated funds (Fund Assets) and (b) a fee on assets not invested in affiliated funds (Other Assets). The Portfolio pays a monthly management fee to the Adviser equivalent, on an annual basis, to the sum of: (a) 0.05% of the first $500,000,000 of the Portfolio’s Fund Assets, (b) 0.04% of the Portfolio’s Fund Assets in excess of $500,000,000, (c) 0.50% of the first $500,000,000 of the Portfolio’s Other Assets and (d) 0.49% of the Portfolio’s Other Assets in excess of $500,000,000. The Portfolio is not responsible for payment of the subadvisory fees.
Expense reimbursements
The Adviser has agreed contractually to waive advisory fees or to reimburse for Portfolio expenses to the extent that total Portfolio operating expenses exceed the percentage of average annual net assets (on an annualized basis) attributable as follows: 0.63% for Class A, 1.33% for Class B, 1.33% for Class C and 0.18% for Class I. Accordingly, the expense reductions related to this expense limitation amounted to $77,124, $20,205, $28,027 and $20,934 for Class A, Class B, Class C and Class I, respectively, for the period ended August 31, 2007. This expense reimbursement shall continue in effect until June 30, 2008 and thereafter until terminated by the Adviser on notice to the Trust.
International Allocation Portfolio
20
Administration fees
The Portfolio has an agreement with the Adviser that requires the Portfolio to reimburse the Adviser for all expenses associated with providing the administrative, financial, accounting and recordkeeping services of the Portfolio, including the preparation of all tax returns, annual, semiannual and periodic reports to shareholders and the preparation of all regulatory reports. These expenses are allocated based on the relative net assets of each class. The compensation for the period amounted to $1,342 with an effective rate of 0.01% of the Portfolio’s average daily net asset value.
Distribution plan
The Trust has a Distribution Agreement with the Distributor. The Portfolio has adopted Distribution Plans with respect to Class A, Class B and Class C, pursuant to Rule 12b-1 under the 1940 Act, to reimburse the Distributor for the services it provides as distributor of shares of the Portfolio. Accordingly, the Portfolio makes monthly payments to the Distributor at an annual rate not to exceed 0.30%, 1.00% and 1.00% of average daily net asset value of Class A, Class B and Class C, respectively. A maximum of 0.25% of such payments may be service fees, as defined by the Conduct Rules of the Financial Industry Regulatory Authority (formerly the National Association of Securities Dealers). Under the Conduct Rules, curtailment of a portion of the Portfolio’s 12b-1 payments could occur under certain circumstances.
Sales charges
Class A shares are assessed up-front sales charges of up to 5.00% of net asset value of such shares. During the period ended August 31, 2007, The Fund was informed that the Distributor received net up-front sales charges of $220,941 with regard to sales of Class A shares. Of this amount, $35,032 was retained and used for printing prospectuses, advertising, sales literature and other purposes, $185,098 was paid as sales commissions to unrelated broker-dealers and $811 was paid as sales commissions to sales personnel of Signator Investors, Inc. (Signator Investors) a related broker-dealer, and indirect subsidiary of MFC.
Class B shares that are redeemed within six years of purchase are subject to a contingent deferred sales charge (CDSC) at declining rates, beginning at 5.00% of the lesser of the current market value at the time of redemption or the original purchase cost of the shares being redeemed. Class C shares that are redeemed within one year of purchase are subject to a CDSC at a rate of 1.00% of the lesser of the current market value at the time of redemption or the original purchase cost of the shares being redeemed. Proceeds from the CDSCs are paid to the Distributor and are used, in whole or in part, to defray its expenses for providing distribution-related services to the Portfolio in connection with the sale of Class B and Class C shares. During the period ended August 31, 2007, CDSCs received by the Distributor amounted to $660 for Class B shares and $1,067 for Class C shares.
Transfer agent fees
The Portfolio has a Transfer Agency Agreement with John Hancock Signature Services, Inc. (Signature Services), an indirect subsidiary of MFC. For Class A, Class B, Class C and Class I shares, the Portfolio pays a monthly transfer agent fee at an annual rate of 0.05% of each class’ average daily net assets, plus a fee based on the number of shareholder accounts and reimbursement for certain out-of-pocket expenses. Expenses not directly attributable to a particular class of shares are aggregated and allocated to each class on the basis of its relative net asset value.
Signature Services has agreed to limit the transfer agent fees so that such fees do not exceed 0.30% annually of Class A, Class B, Class C and Class I share average daily net assets. This agreement is effective until December 31, 2007. Signature Services reserves the right to terminate this limitation in the future. Accordingly, there were no transfer agent fee reductions for Class A, Class B, Class C and Class I shares, respectively, during the period ended August 31, 2007.
International Allocation Portfolio
21
Expenses under the agreements described above for the period ended August 31, 2007, were as follows:
| Distribution and | Transfer | Blue sky | Printing and | |
| Share class | service fees | agent fees | fees | postage fees |
| Class A | $31,891 | $18,990 | $17,424 | $1,648 |
| Class B | 4,264 | 853 | 17,424 | 325 |
| Class C | 16,953 | 3,391 | 17,479 | 327 |
| Class I | — | 130 | 18,650 | 614 |
| Total | $53,108 | $23,364 | $70,977 | $2,914 |
Trustees’ fees
The Trust compensates each Trustee who is not an employee of the Adviser or its affiliates. Total Trustees’ expenses are allocated to the Portfolio based on its average daily net asset value.
4. Guarantees and indemnifications
Under the Trust’s organizational documents, its Officers and Trustees are indemnified against certain liability arising out of the performance of their duties to the Trust. Additionally, in the normal course of business, the Trust enters into contracts with service providers that contain general indemnification clauses. The Trust’s maximum exposure under these arrangements is unknown, as this would involve future claims that may be made against the Trust that have not yet occurred. However, based on experience, the Trust believes the risk of loss to be remote.
5. Line of credit
The Portfolio has entered into an agreement which enables it to participate in a $100 million unsecured committed line of credit with State Street Corporation. Borrowings will be made solely to temporarily finance the repurchase of capital shares. Interest is charged to the Portfolio based on its borrowings at a rate per annum equal to the Federal Funds rate plus 0.50%. In addition, a commitment fee of 0.07% per annum, payable at the end of each calendar quarter, based on the average daily-unused portion of the line of credit, is charged to the Portfolio on a prorated basis based on average net assets. For the period ended August 31, 2007, there were no borrowings under the line of credit.
International Allocation Portfolio
22
6. Capital shares
Share activities for the Portfolio for periods ended February 28, 2007 and August 31, 2007 were as follows:
| Period ended 2-28-07 1 | Period ended 8-31-07 2 | |||
| Shares | Amount | Shares | Amount | |
| Class A | ||||
| Sold | 326,619 | $3,320,543 | 2,270,122 | $23,658,189 |
| Repurchased | — | — | (65,673) | (707,990) |
| Net increase | 326,619 | $3,320,543 | 2,204,449 | $22,950,199 |
| Class B | ||||
| Sold | 19,756 | $198,648 | 126,264 | $1,348,427 |
| Repurchased | (27) | (277) | (13,988) | (149,298) |
| Net increase | 19,729 | $198,371 | 112,276 | $1,199,129 |
| Class C | ||||
| Sold | 91,833 | $927,133 | 451,605 | $4,786,857 |
| Repurchased | — | — | (8,857) | (93,496) |
| Net increase | 91,833 | $927,133 | 442,748 | $4,693,361 |
| Class I | ||||
| Sold | 20,460 | $205,000 | 41,507 | $430,391 |
| Repurchased | — | — | (2,688) | (30,000) |
| Net increase | 20,460 | $205,000 | 38,819 | $400,391 |
| Net increase | 458,641 | $4,651,047 | 2,798,292 | $29,243,080 |
1Period from 12-29-06 (commencement of operations) to 2-28-07.
2Semiannual period from 3-1-07 to 8-31-07. Unaudited.
7. Investment transactions
Purchases and proceeds from sales or maturities of securities, other than short-term securities, during the year ended August 31, 2007, aggregated $30,124,293 and $492,591, respectively.
The cost of investments owned on August 31, 2007, including short-term investments, for federal income tax purposes, was $33,793,336. Gross unrealized appreciation and depreciation of investments aggregated $1,038,674 and $182,100, respectively, resulting in net unrealized appreciation of $856,574. The difference between book basis and tax basis net unrealized appreciation of investments is attributable primarily to the tax deferral of losses on certain sales of securities.
8. Investment in affiliated underlying funds
The Portfolio invests primarily in the affiliated underlying funds that are managed by affiliates of the Adviser. The Portfolio does not invest in the affiliated underlying funds for the purpose of exercising management or control. A summary of the Portfolio’s transactions in the securities of affiliated issuers is set forth below.
| Beginning | Ending | |||||
| Affiliate — | Share | Shares | Shares | Share | Sale | Ending |
| Class NAV | Amount | Purchased | Sold | Amount | Proceeds | Value |
| JHF Greater China Opportunities Fund | 6,802 | 40,471 | 1,936 | 45,337 | $47,054 | $1,103,491 |
| JHF International Classic Value Fund | 55,898 | 422,784 | 4,339 | 474,343 | 58,680 | 5,137,135 |
| JHF II International Opportunities Fund | 50,726 | 350,937 | 5,708 | 395,955 | 122,992 | 7,665,689 |
| JHF II International Small Company Fund | 93,498 | 667,563 | 10,536 | 750,525 | 141,977 | 8,653,553 |
| JHF II International Value Fund | 41,799 | 295,061 | 3,720 | 333,140 | 85,072 | 6,562,855 |
| JHF III International Growth Fund | 27,268 | 192,519 | 3,289 | 216,498 | 93,677 | 5,527,187 |
9. Federal income tax information
Federal income tax regulations may differ from generally accepted accounting principles and income and capital gain distributions determined in accordance with tax regulations may differ from net investment income and realized gains recognized for financial reporting purposes.
International Allocation Portfolio
23
Evaluation of Advisory and Subadvisory
Agreements by the Board of Trustees
This section describes the evaluation
by the Board of Trustees of the
Advisory Agreement and each of the
Subadvisory Agreements.
Evaluation by the Board of Trustees
The Board, including the Independent Trustees, is responsible for selecting the Trust’s Adviser, approving the Adviser’s selection of subadvisers for each of the portfolios of the Trust (the Funds) and approving the Trust’s advisory and subadvisory agreements, their periodic continuation and any amendments. Consistent with Securities and Exchange Commission (SEC) rules, the Board regularly evaluates the Trust’s advisory and subadvisory arrangements, including consideration of the factors listed below. The Board may also consider other factors (including conditions and trends prevailing generally in the economy, the securities markets and the industry) and does not treat any single factor as determinative, and each Trustee may attribute different weights to different factors. The Board is furnished with an analysis of its fiduciary obligations in connection with its evaluation and, throughout the evaluation process , the Board is assisted by counsel for the Trust and the Independent Trustees are also separately assisted by independent legal counsel. The factors considered by the Board are:
1. the nature, extent and quality of the services to be provided by the Adviser to the Trust and by the subadvisers to the Funds;
2. the investment performance of the Funds and their subadvisers;
3. the extent to which economies of scale would be realized as a Fund grows and whether fee levels reflect these economies of scale for the benefit of Trust shareholders;
4. the costs of the services to be provided and the profits to be realized by the Adviser and its affiliates (including any subadvisers that are affiliated with the Adviser) from the Adviser’s relationship with the Trust; and
5. comparative services rendered and comparative advisory and subadvisory fee rates.
The Board believes that information relating to all of these factors is relevant to its evaluation of the Trust’s advisory agreement. With respect to its evaluation of subadvisory agreements not affiliated with the Adviser, the Board believes that, in view of the Trust’s “manager of managers” advisory structure, the costs of the services to be provided and the profits to be realized by those subadvisers that are not affiliated with the Adviser from their relationship with the Trust generally are not a material factor in the Board’s consideration of these subadvisory agreements because such fees are paid by the Adviser and not by the Funds and the Board relies on the ability of the Adviser to negotiate the subadvisory fees at arm’s-length.
In evaluating subadvisory arrangements, the Board also considers other material business relationships that unaffiliated subadvisers and their affiliates have with the Adviser or its affiliates, including the involvement by certain affiliates of certain subadvisers in the distribution of financial products, including shares of the Trust, offered by the Adviser and other affiliates of the Adviser (Material Relationships).
Approval of Advisory Agreement
At its meeting on June 5, 2007, the Board, including all the Independent Trustees, approved the Advisory Agreement Amendment.
In approving the Advisory Agreement Amendment, and with reference to the factors that it regularly considers, the Board:
(1) (a) considered the high value to the Trust of continuing its relationship with JHIMS as the Trust’s adviser, the skills and competency with which JHIMS has in the past managed the Trust’s affairs and its subadvisory relationships, JHIMS’s oversight and monitoring of the subadvisers’ investment performance and compliance programs including its timeliness in responding to performance issues and the qualifications of JHIMS’ personnel,
(b) considered JHIMS’s compliance policies and procedures and its responsiveness to regulatory changes and mutual fund industry developments, and
24
(c) considered JHIMS’s administrative capabilities, including its ability to supervise the other service providers for the Funds and concluded that JHIMS may reasonably be expected to perform its services under the Advisory Agreement with respect to the International Allocation Portfolio;
(2) since there are no funds managed by the proposed Subadviser to the International Allocation Portfolio that have comparable investment objectives and policies to those of the International Allocation Portfolio, the Board considered the Subadviser’s performance in managing other portfolios in the Trust, John Hancock Funds II and John Hancock Trust and that JHIMS may reasonably be expected to ably monitor the performance of the International Allocation Portfolio and its Subadviser.
(3) reviewed the advisory fee structure and the incorporation therein of any subadvisory fee breakpoints in the advisory fees charged and concluded (i) that two of the three subadvisory breakpoints are reflected as breakpoints in the advisory fees for the International Allocation Portfolio, (ii) that the subadvisory consulting fee for DeAM is the product of arm’s-length negotiations between MFC Global and DeAM and contains breakpoints, and (iii) that, although economies of scale cannot be measured with precision, these arrangements permit shareholders of the International Allocation Portfolio to benefit from economies of scale if the assets of such fund grow;
(4) (a) reviewed the anticipated profitability of the JHIMS’s relationship with the International Allocation Portfolio in terms of the total amount of annual advisory fees it would receive with respect to the International Allocation Portfolio and whether JHIMS has the financial ability to provide a high level of services to the International Allocation Portfolio,
(b) considered that JHIMS derives reputational and other indirect benefits from providing advisory services to the New Portfolio, and
(c) noted that JHIMS will pay the subadvisory fee out of the advisory fees JHIMS will receive from the International Allocation Portfolio and concluded that the advisory fees to be paid by the Trust with respect to these funds are not unreasonable in light of such information; and
(5) The Trustees reviewed the advisory fee to be paid to the Adviser for the International Allocation Portfolio and concluded that the advisory fee to be paid to the Adviser with respect to the International Portfolio is based on services provided that are in addition to, rather than duplicative of, the services provided pursuant to the advisory agreements for the underlying portfolios of the International Portfolio and that the additional services are necessary because of the differences between the investment policies, strategies and techniques of the International Portfolio and those of its underlying portfolios.
Additional information that the Board considered for the International Portfolio is set forth in Appendix A.
Approval of Subadvisory Agreements
At its meeting on June 5, 2007, the Board, including all the Independent Trustees, approved the Subadvisory Agreements.
In making its determination with respect to the factors that its considers, the Board reviewed:
(1) information relating to each subadviser’s business, which may include information such as: business performance, representative clients, assets under management, financial stability, personnel and past subadvisory services to the Trust;
(2) the investment performance of other John Hancock Funds II and John Hancock Trust portfolios managed by MFC Global and DeAM; and
25
(3) information relating to the nature and scope of Material Relationships and their significance to the Trust’s adviser and unaffiliated subadvisers.
The Board’s decision to approve the Subadvisory Agreements was based on a number of determinations, including the following:
(1) Each Subadviser has extensive experience and demonstrated skills as a manager;
(2) With respect to each Subadviser except MFC Global, the subadvisory fees are a product of arm’s-length negotiation between the Adviser and the Subadviser and generally are competitive within the range of industry norms;
(3) Neither MFC Global nor DeAM currently managed comparable funds although the Board is generally satisfied with both MFC Global’s and DeAM’s management of other Trust portfolios which they currently subadvise; and
(4) The Material Relationships consist of arrangements in which the Subadviser (except MFC Global) or its affiliates provide advisory, distribution or management services in connection with financial products sponsored by the Trust’s adviser or its affiliates, which may include other registered investment companies, a 529 education savings plan, managed separate accounts and exempt group annuity contracts sold to qualified plans, and which in no case contained elements which would cause the Board to conclude that approval of the subadvisory agreement with the Subadviser would be inappropriate.
In addition, the Trustees reviewed the subadvisory fee to be paid to MFC Global and DeAM for the International Allocation Portfolio and concluded that the subadvisory fee to be paid to MFC Global and DeAM with respect to International Allocation Portfolio is based on services provided that are in addition to, rather than duplicative of, the services provided pursuant to the subadvisory agreements for the underlying portfolios of the International Allocation Portfolio and that the additional services are necessary because of the differences between the investment policies, strategies and techniques of the International Allocation Portfolio and those of its underlying portfolios.
26
Appendix A
| Performance of | |||
| Portfolio | Trust, as of | Fees and | |
| (Subadviser) | June 5, 2007 | Expenses | Comments |
| International | See “Comments.” | The advisory fee | The Board noted that |
| Allocation | for this Portfolio is | this portfolio com- | |
| Portfolio (MFC | lower than its peer | menced operations | |
| Global Investment | group median. | on December 29, | |
| Management | 2006 and did not | ||
| (U.S.A.) Limited) | See “Comments.” | have a complete year | |
| of performance. | |||
| The Board further | |||
| noted that MFC | |||
| Global (U.S.A.)/MFC | |||
| Global (U.S.) do not | |||
| currently manage | |||
| a comparable fund | |||
| although they are | |||
| generally satisfied | |||
| with MFC Global | |||
| (U.S.A.)/MFC Global | |||
| (U.S.) management | |||
| of other Trust port- | |||
| folios which they | |||
| currently subadvise. | |||
| The Board noted that | |||
| based on estimates, | |||
| total expenses for | |||
| this Portfolio are | |||
| lower than the peer | |||
| group median. | |||
27
For more information
The Portfolio’s proxy voting policies, procedures and records are available without charge, upon request:
| By phone | On the Portfolio’s Web site | On the SEC’s Web site |
| 1-800-225-5291 | www.jhfunds.com/proxy | www.sec.gov |
| Trustees | Charles A. Rizzo | Principal distributor |
| Ronald R. Dion, Chairman | Chief Financial Officer | John Hancock Funds, LLC |
| James R. Boyle† | Gordon M. Shone | 601 Congress Street |
| James F. Carlin | Treasurer | Boston, MA 02210-2805 |
| John G. Vrysen | ||
| William H. Cunningham | Chief Operating Officer | Custodian |
| Charles L. Ladner* | State Street Bank & Trust Co. | |
| Dr. John A. Moore* | Investment adviser | 2 Avenue de Lafayette |
| Patti McGill Peterson* | John Hancock Investment | Boston, MA 02111 |
| Steven R. Pruchansky | Management Services, LLC | |
| *Members of the Audit Committee | 601 Congress Street | Transfer agent |
| †Non-Independent Trustee | Boston, MA 02210-2805 | John Hancock Signature |
| Services, Inc. | ||
| Officers | Subadviser | One John Hancock Way, |
| Keith F. Hartstein | MFC Global Investment | Suite 1000 |
| President and | Management (U.S.A.) Limited | Boston, MA 02217-1000 |
| Chief Executive Officer | 200 Bloor Street East | |
| Thomas M. Kinzler | Toronto, Ontario, Canada | Legal counsel |
| Secretary and Chief Legal Officer | M4W IE5 | Kirkpatrick & Lockhart |
| Francis V. Knox, Jr. | Preston Gates Ellis LLP | |
| Chief Compliance Officer | One Lincoln Street | |
| Boston, MA 02111-2950 | ||
| How to contact us | ||
| Internet | www.jhfunds.com | |
| Regular mail: | Express mail: | |
| John Hancock | John Hancock | |
| Signature Services, Inc. | Signature Services, Inc. | |
| One John Hancock Way, Suite 1000 | Mutual Fund Image Operations | |
| Boston, MA 02217-1000 | 380 Stuart Street | |
| Boston, MA 02116 | ||
| Phone | Customer service representatives | 1-800-225-5291 |
| EASI-Line | 1-800-338-8080 | |
| TDD line | 1-800-554-6713 | |
A listing of month-end portfolio holdings is available on our Web site, www.jhfunds.com. A more detailed portfolio holdings summary is available on a quarterly basis 60 days after the fiscal quarter on our Web site or upon request by calling 1-800-225-5291, or on the SEC’s Web site, www.sec.gov.
28
JOHN HANCOCK FAMILY OF FUNDS
| Equity | INTERNATIONAL/GLOBAL |
| Balanced Fund | Global Opportunities Fund |
| Classic Value Fund | Global Shareholder Yield Fund |
| Classic Value Fund II | Greater China Opportunities Fund |
| Classic Value Mega Cap Fund | International Allocation Portfolio |
| Core Equity Fund | International Classic Value Fund |
| Growth Fund | International Core Fund |
| Growth Opportunities Fund | International Growth Fund |
| Growth Trends Fund | |
| Intrinsic Value Fund | INCOME |
| Large Cap Equity Fund | Bond Fund |
| Large Cap Select Fund | Government Income Fund |
| Mid Cap Equity Fund | High Yield Fund |
| Multi Cap Growth Fund | Investment Grade Bond Fund |
| Small Cap Equity Fund | Strategic Income Fund |
| Small Cap Fund | |
| Small Cap Intrinsic Value Fund | TAX-FREE |
| Sovereign Investors Fund | California Tax-Free Income Fund |
| U.S. Core Fund | High Yield Municipal Bond Fund |
| U.S. Global Leaders Growth Fund | Massachusetts Tax-Free Income Fund |
| Value Opportunities Fund | New York Tax-Free Income Fund |
| Tax-Free Bond Fund | |
| ASSET ALLOCATION | |
| Lifecycle 2010 Portfolio | MONEY MARKET |
| Lifecycle 2015 Portfolio | Money Market Fund |
| Lifecycle 2020 Portfolio | |
| Lifecycle 2025 Portfolio | CLOSED - END |
| Lifecycle 2030 Portfolio | Bank and Thrift Opportunity Fund |
| Lifecycle 2035 Portfolio | Financial Trends Fund, Inc. |
| Lifecycle 2040 Portfolio | Income Securities Trust |
| Lifecycle 2045 Portfolio | Investors Trust |
| Lifecycle Retirement Portfolio | Patriot Premium Dividend Fund II |
| Lifestyle Aggressive Portfolio | Preferred Income Fund |
| Lifestyle Balanced Portfolio | Preferred Income II Fund |
| Lifestyle Conservative Portfolio | Preferred Income III Fund |
| Lifestyle Growth Portfolio | Tax-Advantaged Dividend Income Fund |
| Lifestyle Moderate Portfolio | Tax-Advantaged Global Shareholder Yield Fund |
| SECTOR | |
| Financial Industries Fund | |
| Health Sciences Fund | |
| Real Estate Fund | |
| Regional Bank Fund | |
| Technology Fund | |
| Technology Leaders Fund | |
The Fund’s investment objectives, risks, charges and expenses are included in the prospectus and should be considered carefully before investing. For a prospectus, contact your financial professional, call John Hancock Funds at 1-800-225-5291 or visit the Fund’s Web site at www.jhfunds.com. Please read the prospectus carefully before investing or sending money.

1-800-225-5291
1-800-554-6713 TDD
1-800-338-8080 EASI-Line
www.jhfunds. com
Now available: electronic delivery
www.jhfunds. com/edelivery
This report is for the information of the shareholders of John Hancock International Allocation Portfolio.
It is not authorized for distribution to prospective investors unless preceded or accompanied by a prospectus.
318SA 8/07
10/07

| TABLE OF CONTENTS |
| Your fund at a glance |
| page 1 |
| Managers’ report |
| page 2 |
| A look at performance |
| page 6 |
| Your expenses |
| page 8 |
| Fund’s investments |
| page 10 |
| Financial statements |
| page 14 |
| Notes to financial |
| statements |
| page 22 |
| For more information |
| page 36 |
CEO corner
To Our Shareholders,
Volatility returned to the U.S. stock market in the six-month period ended August 31, 2007; however, stocks still posted a strong gain of 5.70%, as measured by the Standard & Poor’s 500 Index. The market experienced a particularly sharp downturn in August, as the subprime mortgage market’s woes increased. Rising defaults and an ensuing credit crunch caused heightened fears about their potential impact on U.S. economic growth. Foreign markets felt some ripple effects from the subprime issue, but they continued nonetheless to benefit from solid economic growth and outperformed the U.S. market in this period.
During this period of volatility, the U.S. stock market also passed a significant milestone — the broad Standard & Poor’s 500 Index climbed beyond the record it had set seven years ago. From its peak in March 2000, the stock market spiraled downward three consecutive years, bottoming in 2002. The upturn began in 2003, and the market has advanced each year since, finally setting a new high for the first time on May 30, 2007. During that period, the S&P 500 Index experienced five significant short-term sell-offs of 6% or more, with the August subprime-induced meltdown being the most recent.
This nearly complete market cycle highlights the importance of two investment principles you have heard us speak of often: diversification and patience. By allocating your investments among different asset classes, investment styles and portfolio managers, you are likely to be well represented through all phases of a complete market cycle, with the winners helping to cushion the fall of the losers.
The challenge for investors with a diversified portfolio is to properly evaluate your investments to tell the difference between an underperforming manager and an out-of-favor style, while also understanding the role each investment plays in your portfolio. That’s where your financial professional can provide true value. He or she can help you make those assessments and also counsel patience, because a properly diversified portfolio by its very nature will typically have something lagging or out of favor — a concept that can be difficult to live with, but necessary to embrace. If everything in your portfolio is “working,” then you are not truly diversified, but rather are leveraged to the current market and the flavor of the day. If so, you are bound to be out of step in the near future.
The recent volatility in the securities markets has prompted many investors to question how long this type of market cycle will last. History tells us it will indeed end and that when it does, today’s leaders may well turn into laggards and vice versa. The subprime mortgage market woes are just the latest example of why investors should be both patient and well-diversified. For with patience and a diversified portfolio, it could be easier to weather the market’s twists and turns and reach your long-term goals.
Sincerely,

Keith F. Hartstein,
President and Chief Executive Officer
This commentary reflects the CEO’s views as of August 31, 2007. They are subject to change at any time.
Your fund at a glance
The Fund seeks to provide a high level of income. Capital appreciation is a secondary investment objective. The Fund will seek to achieve its objective by investing in a diversified portfolio of global equity securities that have a history of attractive dividend yields and positive growth in free cash flow. Under normal circumstances, the Fund invests at least 80% of its total assets in equity securities of dividend-paying companies located throughout the world.
Since inception
► Stocks performed well despite the U.S. housing slowdown and subprime credit crunch; global economic growth remained healthy.
► The Fund invested in companies worldwide with a history of attractive dividend yields and positive growth in free cash flow to provide tax-advantaged income and capital appreciation potential in a globally diversified portfolio.
► Many of the portfolio's leading contributors were in the utility and telecommunication services sectors, while several of the largest detractors were energy and industrial holdings.
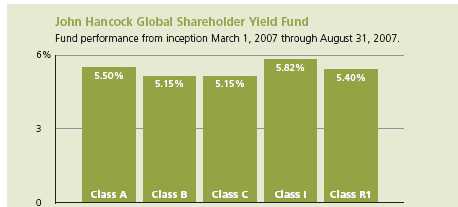
Total returns for the Fund are at net asset value with all distributions reinvested. These returns do not
reflect the deduction of the maximum sales charge, which would reduce the performance shown above.
| Top 10 holdings | ||||
| Windstream Corp. | 2.0% | Citizens Communications Company | 2.0% | |
| Duke Energy Corp. | 2.0% | E.I. Du Pont de Nemours & Company | 2.0% | |
| AllianceBernstein Holding LP | 2.0% | AT&T, Inc. | 1.9% | |
| RWE AG | 2.0% | Enel SpA | 1.8% | |
| Reynolds American, Inc. | 2.0% | Verizon Communications, Inc. | 1.8% | |
As a percentage of net assets on August 31, 2007.
1
Managers’ report
John Hancock
Global Shareholder Yield Fund
Despite a bumpy ride, stocks managed positive returns during the six months ended August 31, 2007, when the S&P/Citigroup Broad Market Index-World Equity Index rose 6.34% . It was a volatile period in which many U.S. and foreign stock indexes reached all-time highs, before sliding sharply in July and August on worry about the effect of subprime housing woes in the United States on economic growth.
Indeed, tighter credit standards and lower home prices caused many analysts to slash their future growth estimates for the world’s leading economy. But despite questions about the United States, economies in Europe and Asia appeared to be healthy. Prior to the trouble in the U.S. subprime mortgage market, foreign central banks had been raising interest rates in an effort to keep their economies from overheating. Rapid growth was also evident among many emerging-market countries. As a result, emerging-market shares outperformed those of developed economies for the six months. Looking at returns by style, growth beat value across all capitalization ranges among both foreign and domestic shares, as measured by the Russell indexes.
Performance
From the Fund’s March 1, 2007 inception to August 31, 2007, John Hancock Global Shareholder Yield Fund’s Class A, Class B, Class C, Class I and Class R1 shares posted total returns of 5.50%, 5.15%,
SCORECARD
| INVESTMENT | PERIOD’S PERFORMANCE... AND WHAT’S BEHIND THE NUMBERS | |
| Southern Copper | ▲ | Top contributor enjoyed rising copper prices and low production costs |
| ABN AMRO | ▲ | Dutch financial services giant was the subject of a bidding war |
| Tomkins | ▼ | Hurt by exposure to U.S. housing and automotive industries, as well |
| as currency effect of weaker dollar |
2

Portfolio Managers, Epoch Investment Partners, Inc.
William W. Priest, CFA, CPA, Eric Sappenfield, Michael A. Welhoelter, CFA,
Daniel Geber and David N. Pearl
5.15%, 5.82% and 5.40%, respectively, at net asset value. That compares with the 6.34% return of the S&P/Citigroup Broad Market Index-World Equity Index and the 7.12% average return of the world stock funds tracked by Morningstar, Inc.1 Keep in mind that your net asset value return will be different from the Fund’s performance if you were not invested for the entire period or did not reinvest all Fund distributions.
“Despite a bumpy ride, stocks
managed positive returns
during the six months ended
August 31, 2007…”
Process
We search the globe for firms generating sustainable free cash flow that is returned to shareholders in the form of dividend payouts, share buybacks or debt paydowns (shareholder yield). The focus on shareholder yield is predicated on the belief that the price-earnings multiple expansion that drove stock market returns in the 1980s and 1990s, when interest rates were trending lower, will not play as significant a role in market returns going forward. As the contribution from multiple expansion declines, dividend payouts and earnings growth (the other factors in equity returns) become more significant. We seek to produce a sustainable return by investing in a portfolio of companies throughout the world with a history of attractive dividend yields and positive growth in free cash flow. We believe this strategy will provide shareholders a globally diversified portfolio offering a unique combination of tax-advantaged income and capital appreciation potential.
In terms of portfolio construction, we build the portfolio stock by stock, buying what we believe are superior individual securities according to our measure of shareholder yield. As a result, while we are benchmark aware, the portfolio’s sector and country weightings are byproducts of our search for individual companies offering attractive cash flow and yield
Global Shareholder Yield Fund
3
characteristics. We believe that owning such companies will provide the best performance over time for our shareholders.
Key contributors
The portfolio’s focus on free cash flow naturally points it toward utility and telecommunication services firms, which were home to several of the portfolio’s leading contributors to return, including German utility RWE AG; Verizon Communications, Inc.; Manitoba Telecom Services, Inc.; and the Yellow Pages Income Fund, among others. Generally speaking, these companies are attractive because of their histories of using generous free cash flow to pay dividends, buy back shares and/or pay down debt.
Nevertheless, the top two contributors to performance were mining firm Southern Copper and ABN AMRO Holdings NV, the Dutch-based financial services giant. ABN was the subject of a bidding war during the period, making it a leading contributor to results for the six months.
Southern Copper was attractive due to its significant free cash flow and dividend yield in excess of 6% as of August 31. The world’s number-three copper producer enjoyed significant revenue growth in recent quarters on strong global demand and low production costs relative to current prices. The resulting excess free cash flow continues to be returned to shareholders through high dividend payments.
| SECTOR DISTRIBUTION2 | |
| Communications | 30% |
| Utilities | 13% |
| Consumer non-cyclical | 12% |
| Financial | 11% |
| Energy | 9% |
| Industrial | 5% |
| Basic materials | 3% |
| Diversified | 1% |
| Technology | 1% |
| Consumer cyclical | 0.5% |
Leading detractors
Several of the Fund’s leading detractors from performance were in the industrials and energy sectors; in addition, the portfolio’s financial holdings produced slightly negative results. Notable detractors from returns in these sectors included industrial firms Veidekke ASA and Tomkins PLC, as well as energy holding Great Plains Energy, Inc. British auto parts and construction materials manufacturer Tomkins, for example, has been hurt by the slowdown in U.S. housing and automotive industries, as well as currency effects from the weaker dollar. Nevertheless, we like the fact that the company continues to grow outside of the United States, pay a dividend of approximately 6% and optimize its balance sheet by selling off non-core business units.
Global Shareholder Yield Fund
4
In addition, the Fund’s financials shares had a slightly negative return, as the entire sector was weighed down by worry about exposure to subprime loans, either directly through loan portfolios or through underwriting and brokerage businesses. We have a relatively small holding in this sector because of our emphasis on free cash flow and transparency of financial statements. As a result, our approach to business analysis pointed us away from subprime exposure and kept us underweight in the sector as a whole, helping mitigate the effect of financials’ poor performance.
“The portfolio’s focus on free cash
flow naturally points it toward
utility and telecommunication
services firms, which were home
to several of the portfolio’s
leading contributors to return…”
Outlook
Going forward, we expect an increase in home loan defaults and foreclosures in the U.S. to lead to tighter lending standards and declining consumer sentiment. This is likely to weigh on consumer spending, the job market and, ultimately, on U.S. economic growth. Against that backdrop, we would expect financial market volatility to continue. But while U.S. growth is likely to slow, the global economy appears on solid footing. Regional economies are growing at a healthy clip, and rising living standards for literally billions of people around the globe remain a key support for growth going forward. It is our belief that a global focus on high-quality companies with what we consider to be superior shareholder yield characteristics — abundant free cash flow with a history of creating shareholder value — has the potential to give positive performance in these un certain times.
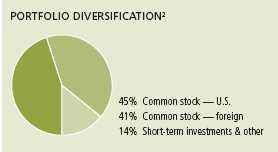
This commentary reflects the views of the portfolio managers through the end of the Fund’s period discussed in this report. The managers’ statements reflect their own opinions. As such, they are in no way guarantees of future events and are not intended to be used as investment advice or a recommendation regarding any specific security. They are also subject to change at any time as market and other conditions warrant.
International investing involves special risks such as political, economic and currency risks and differences in accounting standards and financial reporting.
1 Figures from Morningstar, Inc. include reinvested dividends and do not take into account sales charges. Actual load-adjusted performance is lower.
2 As a percentage of net assets on August 31, 2007.
Global Shareholder Yield Fund
5
A look at performance
For the periods ended August 31, 2007
| Cumulative total returns | ||||||
| with maximum sales charge (POP) | ||||||
| Inception | Since | |||||
| Class | date | 6-month | inception | |||
| A | 3-1-07 | 0.19% | 0.19% | |||
| B | 3-1-07 | 0.15 | 0.15 | |||
| C | 3-1-07 | 4.15 | 4.15 | |||
| I1 | 3-1-07 | 5.82 | 5.82 | |||
| R1 1 | 3-1-07 | 5.40 | 5.40 | |||
Performance figures assume all distributions are reinvested. Public offering price (POP) figures reflect maximum sales charge on Class A shares of 5%, and the applicable contingent deferred sales charge (CDSC) on Class B and Class C shares. The Class B shares’ CDSC declines annually between years 1 to 6 according to the following schedule 5, 4, 3, 3, 2, 1%. No sales charge will be assessed after the sixth year. Class C shares held for less than one year are subject to a 1% CDSC. Sales charge is not applicable for Class I and Class R1 shares.
The expense ratios of the Fund, both net (including any fee waivers or expense limitations) and gross (excluding any fee waivers or expense limitations), are set forth according to the most recent publicly available Prospectuses for the Fund and may differ from the expense ratios disclosed in the Financial Highlights tables in this report. A portion of the waivers and expense limitations are contractual at least until 02-29-08. The net expenses are as follows: Class A — 1.55%, Class B — 2.25%, Class C — 2.25%, Class I — 1.10%, Class R1 — 1.40% . Had the fee waivers and expense limitations not been in place, the gross expenses would be as follows: Class A — 1.65%, Class B — 2.58%, Class C — 2.41%, Class I — 1.26%, Class R1 — 2.53% .
The returns reflect past results and should not be considered indicative of future performance. The return and principal value of an investment will fluctuate so that shares, when redeemed, may be worth more or less than their original cost. Due to market volatility, the Fund’s current performance may be higher or lower than the performance shown. For performance data current to the most recent month-end, please call 1-800-225-5291 or visit the Fund’s Web site at www.jhfunds.com.
The performance table above and the chart on the next page do not reflect the deduction of taxes that a shareholder would pay on fund distributions or the redemption of fund shares.
The Fund’s performance results reflect any applicable expense reductions, without which the expenses increase and results would have been less favorable.
Performance is calculated with an opening price (prior day’s close) on the inception date.
1 For certain types of investors as described in the Fund’s Class I and Class R1 share prospectuses.
Global Shareholder Yield Fund
6
Growth of $10,000
This chart shows what happened to a hypothetical $10,000 investment in Global
Shareholder Yield Fund Class A shares for the period indicated. For comparison, we’ve
shown the same investment in the S&P 500/Citigroup BMI World Index.
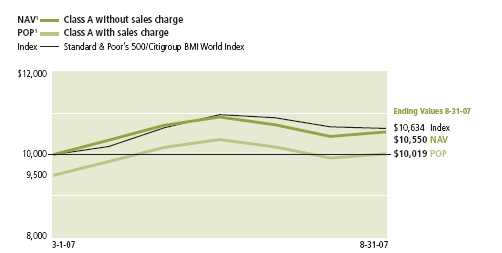
| Without | With maximum | |||
| Class | Period beginning | sales charge | sales charge | Index |
| B | 3-1-07 | $10,515 | $10,015 | $10,634 |
| C | 3-1-07 | 10,515 | 10,415 | 10,634 |
| I2 | 3-1-07 | 10,582 | 10,582 | 10,634 |
| R1 2 | 3-1-07 | 10,540 | 10,540 | 10,634 |
Assuming all distributions were reinvested for the period indicated, the table above shows the value of a $10,000 investment in the fund’s Class B, Class C , Class I and Class R1 shares, respectively, as of August 31, 2007. Performance of the classes will vary based on the difference in sales charges paid by shareholders investing in the different classes and the fee structure of those classes.
S&P 500/Citigroup BMI World is an unmanaged subset of the BMI Global Index that reflects the stock markets of over 30 countries and over 9,000 securities with values expressed in U.S. dollars. The BMI World Index represents the developed market portion of the broader index.
It is not possible to invest directly in an index. Index figures do not reflect sales charges, which would have resulted in lower values if they did.
1 NAV represents net asset value and POP represents public offering price.
2 For certain types of investors as described in the Fund’s Class I and Class R1 share prospectuses.
Global Shareholder Yield Fund
7
Your expenses
These examples are intended to help you understand your ongoing operating expenses.
Understanding fund expenses
As a shareholder of the Fund, you incur two types of costs:
■ Transaction costs which include sales charges (loads) on purchases or redemptions (varies by share class), minimum account fee charge, etc.
■ Ongoing operating expenses including management fees, distribution and service fees (if applicable) and other fund expenses.
We are going to present only your ongoing operating expenses here.
Actual expenses/actual returns
This example is intended to provide information about your fund’s actual ongoing operating expenses, and is based on your fund’s actual return. It assumes an account value of $1,000.00 on March 1, 2007, with the same investment held until August 31, 2007.
| Account value | Ending value | Expenses paid during period | |
| on 3-1-07 | on 8-31-07 | on 8-31-071 | |
| Class A | $1,000.00 | $1,055.00 | $7.03 |
| Class B | 1,000.00 | 1,051.50 | 11.19 |
| Class C | 1,000.00 | 1,051.50 | 11.14 |
| Class I | 1,000.00 | 1,058.20 | 5.48 |
| Class R1 | 1,000.00 | 1,054.00 | 8.36 |
Together with the value of your account, you may use this information to estimate the operating expenses that you paid over the period. Simply divide your account value at August 31, 2007 by $1,000.00, then multiply it by the “expenses paid” for your share class from the table above. For example, for an account value of $8,600.00, the operating expenses should be calculated as follows:
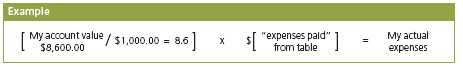
Global Shareholder Yield Fund
8
Hypothetical example for comparison purposes
This table allows you to compare your fund’s ongoing operating expenses with those of any other fund. It provides an example of the Fund’s hypothetical account values and hypothetical expenses based on each class’s actual expense ratio and an assumed 5% annualized return before expenses (which is not your fund’s actual return). It assumes an account value of $1,000.00 on March 1, 2007, with the same investment held until August 31, 2007. Look in any other fund shareholder report to find its hypothetical example and you will be able to compare these expenses.
| Account value | Ending value | Expenses paid during period | |
| on 3-1-07 | on 8-31-07 | on 8-31-07 1 | |
| Class A | $1,000.00 | $1,018.30 | $6.90 |
| Class B | 1,000.00 | 1,014.23 | 10.99 |
| Class C | 1,000.00 | 1,014.28 | 10.94 |
| Class I | 1,000.00 | 1,019.81 | 5.38 |
| Class R1 | 1,000.00 | 1,016.99 | 8.21 |
Remember, these examples do not include any transaction costs, such as sales charges; therefore, these examples will not help you to determine the relative total costs of owning different funds. If transaction costs were included, your expenses would have been higher. See the prospectus for details regarding transaction costs.
1 Expenses are equal to the Fund’s annualized expense ratio of 1.36%, 2.17%, 2.16%, 1.06% and 1.62% for Class A, Class B, Class C, Class I and Class R1, respectively, multiplied by the average account value over the period, multiplied by number of days in most recent fiscal half-year/365 or 366 (to reflect the one-half year period).
Global Shareholder Yield Fund
9
F I N A N C I A L S T A T E M E N T S
Fund’s investments
Securities owned by the Fund on 8-31-07 (unaudited)
This schedule is divided into two main categories: common stocks and repurchase agreements. Common stocks are further broken down by country. Repurchase agreements, which represent the Fund’s cash position, are listed last.
| Issuer | Shares | Value |
| Common stocks 86.83% | $29,906,242 | |
| (Cost $29,930,328) | ||
| Australia 6.05% | 2,084,260 | |
| APN News & Media, Ltd. | 97,500 | 437,599 |
| Australia and New Zealand Banking Group, Ltd. | 6,700 | 158,656 |
| John Fairfax Holdings, Ltd. | 132,900 | 503,172 |
| Macquarie Infrastructure Group, Ltd. | 31,493 | 84,726 |
| NRMA Insurance Group, Ltd. | 75,900 | 311,664 |
| St George Bank, Ltd. | 15,000 | 419,736 |
| Westpac Banking Corp., Ltd. | 7,600 | 168,707 |
| Austria 1.09% | 374,933 | |
| Telekom Austria AG | 14,500 | 374,933 |
| Belgium 2.85% | 982,759 | |
| Belgacom SA | 12,500 | 549,138 |
| Fortis Group SA | 3,300 | 121,189 |
| Interbrew | 3,800 | 312,432 |
| Canada 3.35% | 1,154,432 | |
| Manitoba Telecom Services, Inc. | 11,000 | 514,535 |
| TransAlta Corp. | 4,400 | 124,571 |
| Yellow Pages Income Fund | 39,900 | 515,326 |
| China 0.21% | 73,103 | |
| PetroChina Company, Ltd., Class H | 50,000 | 73,103 |
| Finland 0.98% | 336,793 | |
| Fortum Corp. Oyj | 10,150 | 336,793 |
| France 3.73% | 1,283,030 | |
| France Telecom SA | 19,400 | 585,123 |
| PagesJaunes Groupe SA | 14,300 | 289,748 |
| Vivendi SA | 10,000 | 408,159 |
| Germany 1.96% | 675,419 | |
| RWE AG | 6,000 | 675,419 |
See notes to financial statements
Global Shareholder Yield Fund
10
F I N A N C I A L S T A T E M E N T S
| Issuer | Shares | Value |
| Hong Kong 0.17% | $58,582 | |
| Vitasoy International Holdings, Ltd. | 138,000 | 58,582 |
| Ireland 1.25% | 429,842 | |
| Independent News & Media PLC | 56,600 | 265,854 |
| Irish Life & Permanent PLC — London | 1,200 | 29,877 |
| Irish Life & Permanent PLC | 5,400 | 134,111 |
| Italy 6.20% | 2,136,296 | |
| Enel SpA | 60,200 | 622,840 |
| Eni SPA, SADR | 4,900 | 338,002 |
| Mondadori (Arnoldo) Editore SpA | 33,800 | 319,189 |
| T.E.R.N.A SpA | 144,000 | 511,042 |
| Telecom Italia SpA | 121,900 | 345,223 |
| Malaysia 0.21% | 71,840 | |
| British American Tobacco Malaysia BHD | 6,000 | 71,840 |
| Netherlands 0.90% | 308,918 | |
| ABN AMRO Holdings NV | 3,000 | 139,604 |
| Wolters Kluwer NV | 5,800 | 169,314 |
| Norway 2.22% | 763,582 | |
| Statoil ASA, ADR | 17,800 | 512,284 |
| Veidekke ASA | 27,400 | 251,298 |
| Philippines 0.38% | 129,206 | |
| Philippine Long Distance Telephone Company, SADR | 2,200 | 129,206 |
| Singapore 0.99% | 342,200 | |
| Singapore Press Holdings, Ltd. | 120,000 | 342,200 |
| Sweden 0.50% | 172,899 | |
| Swedish Match AB | 8,900 | 172,899 |
| Switzerland 1.52% | 523,723 | |
| Nestle SA | 1,200 | 523,723 |
| Taiwan 0.73% | 250,598 | |
| Far EasTone Telecommunications Co., Ltd. (c) | 208,000 | 250,598 |
| United Kingdom 7.66% | 2,639,179 | |
| Barclays PLC | 21,100 | 261,599 |
| De La Rue PLC * | 7,560 | 113,839 |
| Diageo PLC, SADR | 6,000 | 512,520 |
| GKN PLC | 22,600 | 168,307 |
| Legal & General Group PLC | 59,400 | 174,276 |
| Lloyds TSB Group PLC | 30,670 | 337,651 |
| National Grid PLC, ADR | 28,300 | 424,199 |
| Tomkins PLC | 69,400 | 334,872 |
| Vodafone Group PLC | 96,500 | 311,916 |
See notes to financial statements
Global Shareholder Yield Fund
11
F I N A N C I A L S T A T E M E N T S
| Issuer | Shares | Value |
| United States 43.88% | $15,114,648 | |
| AllianceBernstein Holding LP * | 8,200 | 677,402 |
| Altria Group, Inc. | 4,800 | 333,168 |
| AT&T, Inc. | 16,300 | 649,881 |
| Automatic Data Processing, Inc. | 7,100 | 324,754 |
| Ball Corp. | 8,000 | 419,040 |
| Bank of America Corp. | 6,400 | 324,352 |
| Bristol-Myers Squibb Company | 12,500 | 364,375 |
| CBS Corp., Class B | 10,300 | 324,553 |
| Citizens Communications Company | 45,700 | 663,107 |
| ConocoPhillips | 4,000 | 327,560 |
| DaVita, Inc. * | 2,800 | 161,056 |
| Diamond Offshore Drilling, Inc. | 1,600 | 168,256 |
| Duke Energy Corp. | 37,000 | 678,580 |
| E.I. Du Pont de Nemours & Company | 13,600 | 663,000 |
| GateHouse Media, Inc. | 19,800 | 257,796 |
| General Electric Company | 12,800 | 497,536 |
| General Maritime Corp. | 4,100 | 106,026 |
| Great Plains Energy, Inc. | 17,400 | 493,116 |
| Health Care Property Investors, Inc., REIT | 4,900 | 149,058 |
| Idearc, Inc. | 14,700 | 501,711 |
| Iowa Telecommunications Services, Inc. | 6,000 | 111,060 |
| Magellan Midstream Partners LP | 7,900 | 339,700 |
| ONEOK Partners LP | 7,800 | 499,122 |
| Packaging Corp. of America | 12,800 | 333,440 |
| Pfizer, Inc. | 12,400 | 308,016 |
| Progress Energy, Inc. | 10,700 | 490,916 |
| Reynolds American, Inc. | 10,100 | 667,812 |
| Southern Copper Corp. | 4,800 | 505,200 |
| Spectra Energy Corp. | 10,700 | 248,775 |
| TECO Energy, Inc. | 20,800 | 329,472 |
| Telecom Corporation of New Zealand | 13,500 | 327,240 |
| The Laclede Group, Inc. | 3,800 | 124,032 |
| The Southern Company | 9,100 | 322,959 |
| US Bancorp | 14,500 | 469,075 |
| UST, Inc. | 10,100 | 497,728 |
| Verizon Communications, Inc. | 14,600 | 611,448 |
| Westar Energy, Inc. | 6,600 | 160,314 |
| Windstream Corp. | 47,900 | 684,012 |
See notes to financial statements
Global Shareholder Yield Fund
12
F I N A N C I A L S T A T E M E N T S
| Principal | ||
| Issuer, description, maturity date | amount | Value |
| Repurchase agreements 14.36% | $4,946,000 | |
| (Cost $4,946,000) | ||
| Repurchase Agreement with State Street Corp. dated | ||
| 8-31-07 at 4.60% to be repurchased at $4,948,528 | ||
| on 9-4-07, collateralized by $5,230,000 Federal | ||
| Home Loan Mortgage Corp., 4% due 6-12-13 | ||
| (valued at $5,046,950, including interest) | $4,946,000 | 4,946,000 |
| Total investments (Cost $34,876,328) 101.19% | $34,852,242 | |
| Liabilities in excess of other assets (1.19%) | (409,171) | |
| Total net assets 100.00% | $34,443,071 | |
Percentages are stated as a percent of net assets.
ADR American Depositary Receipt.
SADR Sponsored American Depositary Receipts.
* Non-Income Producing.
(c) Investment is an affiliate of the Trust’s advisor or subadvisor.
See notes to financial statements
Global Shareholder Yield Fund
13
F I N A N C I A L S T A T E M E N T S
Financial statements
Statement of assets and liabilities 8-31-07 (unaudited)
This Statement of Assets and Liabilities is the Fund’s balance sheet. It shows the value of what the Fund owns, is due and owes. You’ll also find the net asset value per share and the maximum offering price per share.
| Assets | |
| Investments, at value (Cost $29,930,328) | $29,906,242 |
| Repurchase agreement, at value (Cost $4,946,000) | 4,946,000 |
| Total investments, at value (Cost $34,876,328) | 34,852,242 |
| Cash | 955 |
| Foreign currency, at value (Cost $29,300) | 29,312 |
| Receivable for investments sold | 155,769 |
| Receivable for fund shares sold | 648,656 |
| Dividends and interest receivable | 103,348 |
| Receivable due from adviser | 10,898 |
| Other assets | 10,196 |
Total assets | 35,811,376 |
| Liabilities | |
| Payable for investments purchased | 1,283,837 |
| Payable for fund shares repurchased | 9,812 |
| Payable to affiliates | |
| Fund administration fees | 1,609 |
| Transfer agent fees | 13,135 |
| Distribution and service fees | 260 |
| Other payables and accrued expenses | 59,652 |
| Total liabilities | 1,368,305 |
| Net assets | |
| Capital paid-in | $34,177,585 |
| Accumulated undistributed net realized gain on investments | 33,828 |
| Net unrealized depreciation on investments | (23,411) |
| Undistributed net investment income | 255,069 |
| Net assets | $34,443,071 |
| Net asset value per share | |
| Based on net asset values and shares outstanding — The Fund has an | |
| unlimited number of shares authorized with no par value. | |
| Class A ($27,591,303 ÷ 2,639,542 shares) | $10.45 |
| Class B ($1,045,817 ÷ 100,159 shares)1 | $10.44 |
| Class C ($3,028,396 ÷ 289,963 shares)1 | $10.44 |
| Class I ($2,672,184 ÷ 255,324 shares) | $10.47 |
| Class RI ($105,371 ÷ 10,087 shares) | $10.45 |
| Maximum offering price per share | |
| Class A2 ($10.45 ÷ 95%) | $11.00 |
1 Redemption price is equal to net asset value less any applicable contingent deferred sales charges.
2 On single retail sales of less than $50,000. On sales of $50,000 or more and on group sales the offering price is reduced.
See notes to financial statements
Global Shareholder Yield Fund
14
F I N A N C I A L S T A T E M E N T S
Statement of operations For the period ended 8-31-07 (unaudited)1
This Statement of Operations summarizes the Fund’s investment income earned and expenses incurred in operating the Fund. It also shows net gains (losses) for the period stated.
| Investment income | |
| Dividends | $664,762 |
| Interest | 67,373 |
| Less foreign taxes withheld | (39,343) |
| Total investment income | 692,792 |
| Expenses | |
| Investment management fees (Note 3) | 113,834 |
| Distribution and service fees (Note 3) | 41,409 |
| Transfer agent fees (Note 3) | 20,899 |
| Fund administration fees (Note 3) | 2,252 |
| Blue sky fees (Note 3) | 41,026 |
| Custodian fees | 23,097 |
| Audit and legal fees | 20,697 |
| Printing and postage fees (Note 3) | 4,053 |
| Registration and filing fees | 1,304 |
| Trustees’ fees (Note 3) | 378 |
| Miscellaneous | 143 |
| Total expenses | 269,092 |
| Less expense reductions (Note 3) | (100,371) |
| Net expenses | 168,721 |
| Net investment income | 524,071 |
| Realized and unrealized gain (loss) | |
| Net realized gain on | |
| Investments | 12,158 |
| Foreign currency transactions | 21,670 |
| 33,828 | |
| Change in net unrealized appreciation (depreciation) of | |
| Investments | (24,086) |
| Translation of assets and liabilities in foreign currencies | 675 |
| (23,411) | |
| Net realized and unrealized gain | 10,417 |
| Increase in net assets from operations | $534,488 |
| 1 Semiannual period from 3-1-07 (commencement of operations) to 8-31-07. | |
See notes to financial statements
Global Shareholder Yield Fund
15
F I N A N C I A L S T A T E M E N T S
Statement of changes in net assets
This Statement of Changes in Net Assets shows how the value of the Fund’s net assets has changed since inception. The difference reflects earnings less expenses, any investment gains and losses, distributions, if any, paid to shareholders and the net of Fund share transactions.
| Period | |
| ended | |
| 8-31-071 | |
| Increase (decrease) in net assets | |
| From operations | |
| Net investment income | $524,071 |
| Net realized gain | 33,828 |
| Change in net unrealized appreciation (depreciation) | (23,411) |
| Increase in net assets resulting from operations | 534,488 |
| Distributions to shareholders | |
| From net investment income | |
| Class A | (231,809) |
| Class B | (5,562) |
| Class C | (15,088) |
| Class I | (15,624) |
| Class R1 | (919) |
| Total distributions | (269,002) |
| From Fund share transactions | 34,177,585 |
| Total increase | 34,443,071 |
| Net assets | |
| Beginning of period | — |
| End of period2 | $34,443,071 |
1 Semiannual period from 3-1-07 (commencement of operations) to 8-31-07. Unaudited.
2 Includes undistributed net investment income of $255,069.
See notes to financial statements
Global Shareholder Yield Fund
16
F I N A N C I A L S T A T E M E N T S
Financial highlights
| CLASS A SHARES | |
| Period ended | 8-31-071,2 |
| Per share operating performance | |
| Net asset value, beginning of period | $10.00 |
| Net investment income3 | 0.24 |
| Net realized and unrealized | |
| gain on investments | 0.31 |
| Total from investment operations | 0.55 |
| Less distributions | |
| From net investment income | (0.10) |
| Net asset value, end of period | $10.45 |
| Total return4,5 (%) | 5.506 |
| Ratios and supplemental data | |
| Net assets, end of period | |
| (in millions) | $28 |
| Ratio of net expenses to average | |
| net assets (%) | 1.367 |
| Ratio of gross expenses to average | |
| net assets (%) | 1.947,8 |
| Ratio of net investment income | |
| to average net assets (%) | 4.507 |
| Portfolio turnover (%) | 196 |
See notes to financial statements
Global Shareholder Yield Fund
17
F I N A N C I A L S T A T E M E N T S
Financial highlights
| CLASS B SHARES | |
| Period ended | 8-31-071,2 |
| Per share operating performance | |
| Net asset value, beginning of period | $10.00 |
| Net investment income3 | 0.16 |
| Net realized and unrealized | |
| gain on investments | 0.36 |
| Total from investment operations | 0.52 |
| Less distributions | |
| From net investment income | (0.08) |
| Net asset value, end of period | $10.44 |
| Total return4,5 (%) | 5.156 |
| Ratios and supplemental data | |
| Net assets, end of period | |
| (in millions) | $1 |
| Ratio of net expenses to average | |
| net assets (%) | 2.177 |
| Ratio of gross expenses to average | |
| net assets (%) | 5.877,8 |
| Ratio of net investment income | |
| to average net assets (%) | 3.197 |
| Portfolio turnover (%) | 196 |
See notes to financial statements
Global Shareholder Yield Fund
18
F I N A N C I A L S T A T E M E N T S
Financial highlights
| CLASS C SHARES | |
| Period ended | 8-31-071,2 |
| Per share operating performance | |
| Net asset value, beginning of period | $10.00 |
| Net investment income3 | 0.17 |
| Net realized and unrealized | |
| gain on investments | 0.35 |
| Total from investment operations | 0.52 |
| Less distributions | |
| From net investment income | (0.08) |
| Net asset value, end of period | $10.44 |
| Total return4,5 (%) | 5.156 |
| Ratios and supplemental data | |
| Net assets, end of period | |
| (in millions) | $3 |
| Ratio of net expenses to average | |
| net assets (%) | 2.167 |
| Ratio of gross expenses to average | |
| net assets (%) | 3.767,8 |
| Ratio of net investment | |
| gain to average net assets (%) | 3.327 |
| Portfolio turnover (%) | 196 |
See notes to financial statements
Global Shareholder Yield Fund
19
F I N A N C I A L S T A T E M E N T S
Financial highlights
| CLASS I SHARES | |
| Period ended | 8-31-071,2 |
| Per share operating performance | |
| Net asset value, beginning of period | $10.00 |
| Net investment income3 | 0.21 |
| Net realized and unrealized | |
| gain on investments | 0.37 |
| Total from investment operations | 0.58 |
| Less distributions | |
| From net investment income | (0.11) |
| Net asset value, end of period | $10.47 |
| Total return4,5 (%) | 5.826 |
| Ratios and supplemental data | |
| Net assets, end of period | |
| (in millions) | $3 |
| Ratio of net expenses to average | |
| net assets (%) | 1.067 |
| Ratio of gross expenses to average | |
| net assets (%) | 3.227,8 |
| Ratio of net investment income | |
| to average net assets (%) | 4.037 |
| Portfolio turnover (%) | 196 |
See notes to financial statements
Global Shareholder Yield Fund
20
F I N A N C I A L S T A T E M E N T S
Financial highlights
| CLASS R1 SHARES | |
| Period ended | 8-31-071,2 |
| Per share operating performance | |
| Net asset value, beginning of period | $10.00 |
| Net investment income3 | 0.23 |
| Net realized and unrealized | |
| gain on investments | 0.31 |
| Total from investment operations | 0.54 |
| Less distributions | |
| From net investment income | (0.09) |
| Net asset value, end of period | $10.45 |
| Total return4,5 (%) | 5.406 |
| Ratios and supplemental data | |
| Net assets, end of period | |
| (in millions) | —9 |
| Ratio of net expenses to average | |
| net assets (%) | 1.627 |
| Ratio of gross expenses to average | |
| net assets (%) | 19.017,8 |
| Ratio of net investment income | |
| to average net assets (%) | 4.417 |
| Portfolio turnover (%) | 196 |
1 Semiannual period from 3-1-07 to 8-31-07. Unaudited.
2 Class A, Class B, Class C, Class I and Class R1 shares began operations on 3-1-07.
3 Based on the average of the shares outstanding.
4 Assumes dividend reinvestment.
5 Total returns would have been lower had certain expenses not been reduced during the periods shown.
6 Not annualized.
7 Annualized.
8 Does not take into consideration expense reductions during the periods shown.
9 Less than $500,000.
See notes to financial statements
Global Shareholder Yield Fund
21
Notes to financial statements (unaudited)
1. Organization
John Hancock Global Shareholder Yield Fund (the Fund) is a newly organized diversified series of John Hancock Funds III (the Trust). The Trust was established as a Massachusetts business trust on June 9, 2005. The Trust is registered under the Investment Company Act of 1940, as amended (the 1940 Act), as an open-end investment management company. The primary objective of the Fund is to seek to provide a high level of income. Capital appreciation is a secondary investment objective.
John Hancock Life Insurance Company of New York (John Hancock New York) is a wholly owned subsidiary of John Hancock Life Insurance Company (U.S.A.) (John Hancock USA). John Hancock USA and John Hancock New York are indirect wholly owned subsidiaries of The Manufacturers Life Insurance Company (Manulife), which in turn is a wholly owned subsidiary of Manulife Financial Corporation (MFC), a publicly traded company. MFC and its subsidiaries are known collectively as “Manulife Financial.”
John Hancock Investment Management Services, LLC (the Adviser), a Delaware limited liability company, controlled by John Hancock USA, serves as investment adviser for the Trust and John Hancock Funds, LLC (the Distributor), a Delaware limited liability company, an affiliate of the Adviser, serves as principal underwriter.
The Board of Trustees has authorized the issuance of multiple classes of shares of the Fund, including classes designated as Class A, Class B, Class C, Class I, Class R1 and Class NAV shares. The shares of each class represent an interest in the same portfolio of investments of the Fund, and have equal rights as to voting, redemptions, dividends and liquidation, except that certain expenses, subject to the approval of the Board of Trustees, may be applied differently to each class of shares in accordance with current regulations of the Securities and Exchange Commission and the Internal Revenue Service. Shareholders of a class that bear distribution and service expenses under the terms of a distribution plan have exclusive voting rights to that distribution plan. Class B shares will convert to Class A eight years after purchase.
The Adviser and other subsidiaries of John Hancock USA owned 1,460,000, 10,000, 10,000, 10,000 and 10,000 shares of beneficial interest of Class A, Class B, Class C, Class I and Class R1, respectively, of the Fund on August 31, 2007.
2. Significant accounting policies
In the preparation of the financial statements, the Fund follows the policies described below. The preparation of financial statements in conformity with accounting principles generally accepted in the United States of America requires management to make estimates and assumptions that affect the reported amounts of assets and liabilities at the date of the financial statements and the reported amounts of income and expenses during the reporting period. Actual results may differ from these estimates.
Security valuation
The net asset value of the shares of Class A, Class B, Class C, Class I and Class R1 of the Fund is determined daily as of the close of the New York Stock Exchange (NYSE), normally at 4:00 p.m., Eastern Time. Short-term debt instruments with remaining maturities of 60 days or less are valued at amortized cost, and thereafter assume a constant amortization to maturity of any discount or premium, which approximates market value. All other securities held by the Fund are valued at the last sale price or official closing price (closing bid price or last evaluated quote if no sale has occurred) as of the close of business on a principal securities exchange (domestic or foreign) on which they trade or, lacking
Global Shareholder Yield Fund
22
any sales, at the closing bid price. Securities traded only in the over-the-counter market are valued at the last bid price quoted by brokers making markets in the securities at the close of trading. Securities for which there are no such quotations, principally debt securities, are valued based on the valuation provided by an independent pricing service, which utilizes both dealer-supplied and electronic data processing techniques, which take into account factors such as institutional size trading in similar groups of securities, yield, quality, coupon rate, maturity, type of issue, trading characteristics and other market data.
Other assets and securities for which no such quotations are readily available are valued at their fair value as determined in good faith under consistently applied procedures established by and under the general supervision of the Board of Trustees. Generally, trading in non-U.S. securities is substantially completed each day at various times prior to the close of trading on the NYSE. The values of such securities used in computing the net asset value of a Fund’s shares are generally determined as of such times. Occasionally, significant events that affect the values of such securities may occur between the times at which such values are generally determined and the close of the NYSE. Upon such an occurrence, these securities will then be valued at their fair value as determined in good faith under consistently applied procedures established by and under the general supervision of the Board of Trustees.
Repurchase agreements
The Fund may enter into repurchase agreements. When the Fund enters into a repurchase agreement through its custodian, it receives delivery of securities, the amount of which at the time of purchase and each subsequent business day is required to be maintained at such a level that the market value is generally at least 102% of the repurchase amount. The Fund will take constructive receipt of all securities underlying the repurchase agreements it has entered into until such agreements expire. If the seller defaults, the Fund would suffer a loss to the extent that proceeds from the sale of underlying securities were less than the repurchase amount. The Fund may enter into repurchase agreements maturing within seven days with domestic dealers, banks or other financial institutions deemed to be creditworthy by the Adviser. Collateral for certain tri-party repurchase agr eements is held at the custodian bank in a segregated account for the benefit of the Fund and the counterparty.
Foreign currency transactions
The accounting records of the Fund are maintained in U.S. dollars. Foreign currency amounts are translated into U.S. dollars on the following basis:
(1) market value of securities, other assets and other liabilities at the current rate of exchange at period end of such currencies against U.S. dollars; and
(2) purchases and sales of securities, income and expenses at the rate of exchange quoted on the respective dates of such transactions.
Net realized gains and losses on foreign currency transactions represent net gains and losses from sales and maturities of foreign currency contracts, disposition of foreign currencies, the difference between the amount of net investment income accrued and the U.S. dollar amount actually received, and gains and losses between trade and settlement date on purchases and sales of securities. The effects of changes in foreign currency exchange rates on investments in securities are included with the net realized and unrealized gain or loss on investment securities.
The Fund may be subject to capital gains and repatriation taxes imposed by certain countries in which the Fund invests. Such taxes are generally based upon income and/or capital gains earned or repatriated. Taxes are accrued based upon net investment income, net realized gains and net unrealized appreciation.
Investing in securities of foreign companies and foreign governments involves special risks and consideration not typically associated with investing in securities of domestic companies and the U.S. Government. These risks include revaluation of currencies and future adverse political and economic
Global Shareholder Yield Fund
23
developments. Moreover, securities of foreign companies and foreign governments and their markets may be less liquid and their prices more volatile than those of the United States.
Security transactions and related investment income
Investment security transactions are accounted for on a trade date plus one basis for daily net asset value calculations. However, for financial reporting purposes, investment transactions are reported on trade date. Interest income is accrued as earned. Dividend income is recorded on the ex-dividend date. Foreign dividends are recorded on the ex-date or when the Fund becomes aware of the dividends from cash collections. Discounts/ premiums are accreted/amortized for financial reporting purposes. Non-cash dividends are recorded at the fair market value of the securities received. Debt obligations may be placed in a non-accrual status and related interest income may be reduced by ceasing current accruals and writing off interest receivables when the collection of all or a portion of interest has become doubtful, based upon consistently applied procedures.
From time to time, the Fund may invest in Real Estate Investment Trusts (REITs) and, as a result, will estimate the components of distributions from these securities. Distributions from REITs received in excess of income are recorded as a reduction of cost of investments and/or as a realized gain.
The Fund uses the First In, First Out method for fixed income securities and Highest Cost, First Out for all other securities for determining realized gain or loss on investments for both financial and federal income tax reporting purposes.
Multi-class allocations
All income, expenses (except for class-specific expenses) and realized and unrealized gains (losses) are allocated to each class of shares based upon the relative net assets of each class. Dividends to shareholders from net investment income are determined at a class level and distributions from capital gains are determined at a Fund level.
Expense allocation
Expenses are allocated based on the relative share of net assets of the Fund at the time the expense was incurred. Class-specific expenses, such as distribution (Rule 12b-1) fees, are accrued daily and charged directly to the respective share classes.
Futures
The Fund may purchase and sell financial futures contracts and options on those contracts. The Fund invests in contracts based on financial instruments such as U.S. Treasury Bonds or Notes or on securities indices such as the Standard & Poor’s 500 Index, in order to hedge against a decline in the value of securities owned by the Fund.
Initial margin deposits required upon entering into futures contracts are satisfied by the delivery of specific securities or cash as collateral to the broker (the Funds’ agent in acquiring the futures position). If the position is closed out by taking an opposite position prior to the settlement date of the futures contract, a final determination of variation margin is made, cash is required to be paid to or released by the broker and the Fund realizes a gain or loss.
If the position is closed out by taking an opposite position prior to the settlement date of the futures contract, a final determination of variation margin is made, cash is required to be paid to or released by the broker, and the Fund realizes a gain or loss.
When the Fund sells a futures contract based on a financial instrument, the Fund becomes obligated to deliver that kind of instrument at an agreed upon date for a specified price. The Fund realizes a gain or loss depending on whether the price of an offsetting purchase is less or more than the price of the initial sale or on whether the price of an offsetting sale is more or less than the price of the initial purchase. The Fund could be exposed to risks if it could not close out futures positions because of an illiquid secondary market or the inability of counterparties to meet the terms of their contracts. Futures contracts are valued at the quoted daily settlement prices established by the exchange on which they trade. The
Global Shareholder Yield Fund
24
Fund had no open financial futures contracts on August 31, 2007.
Forward foreign currency contracts
The Fund may purchase and sell forward foreign currency contracts in order to hedge a specific transaction or Fund position. Forward foreign currency contracts are valued at forward foreign currency exchange rates and marked to market daily. Net realized gains (losses) on foreign currency and forward foreign currency contracts shown in the Statements of Operations include net gains or losses realized by the Fund on contracts that have matured.
The net U.S. dollar value of foreign currency underlying all contractual commitments held at the end of the period, the resulting net unrealized appreciation (depreciation) and related net receivable or payable amount are determined using forward foreign currency exchange rates supplied by a quotation service. The Fund could be exposed to risks in excess of amounts recognized on the Statements of Assets and Liabilities if the counterparties to the contracts are unable to meet the terms of their contracts or if the value of the forward foreign currency contract changes unfavorably. The Fund had no open forward foreign currency exchange contracts on August 31, 2007.
Federal income taxes
The Fund qualifies as a “regulated investment company” by complying with the applicable provisions of the Internal Revenue Code and will not be subject to federal income tax on taxable income. Therefore, no federal income tax provision is required.
New accounting pronouncements
In June 2006, Financial Accounting Standards Board (FASB) Interpretation No. 48, Accounting for Uncertainty in Income Taxes (the Interpretation), was issued and is effective for fiscal years beginning after December 15, 2006, and is to be applied to all open tax years as of the effective date. This Interpretation prescribes a minimum threshold for financial statement recognition of the benefit of a tax position taken or expected to be taken in a tax return, and requires certain expanded disclosures.
Management has evaluated the application of this Interpretation to the Fund and does not believe there is a material impact resulting from the adoption of this Interpretation on the Fund’s financial statements.
In September 2006, FASB Standard No. 157, Fair Value Measurements (FAS 157), was issued and is effective for fiscal years beginning after November 15, 2007. FAS 157 defines fair value, establishing a framework for measuring fair value and expands disclosure about fair value measurements. Management is currently evaluating the application of FAS 157 to the Fund and its impact, if any, resulting from the adoption of FAS 157 on the Fund’s financial statements.
Distribution of income and gains
The Fund records distributions to shareholders from net investment income and net realized gains, if any, on the ex-dividend date. Distributions paid by the Fund with respect to each class of shares are calculated in the same manner, at the same time and are in the same amount, except for the effect of expenses that may be applied differently to each class.
Such distributions, on a tax basis, are determined in conformity with income tax regulations, which may differ from accounting principles generally accepted in the United States of America. Distributions in excess of tax basis earnings and profits, if any, are reported in the Fund’s financial statements as a return of capital.
Capital accounts
The Fund reports the undistributed net investment income and accumulated undistributed net realized gain (loss) accounts on a basis approximating amounts available for future tax distributions (or to offset future taxable realized gains when a capital loss carryforward is available). Accordingly, the Fund may periodically make reclassifications among certain capital accounts without affecting its net asset value.
Global Shareholder Yield Fund
25
3. Investment advisory and other agreements
Advisory fees
The Trust has entered into an Investment Advisory Agreement with the Adviser. The Adviser is responsible for managing the corporate and business affairs of the Trust and for selecting and compensating subadvisers to handle the investment of the assets of the Fund, subject to the supervision of the Trust’s Board of Trustees. Under the Advisory Agreement, the Fund pays a monthly management fee to the Adviser equivalent, on an annual basis, to the sum of: (a) 0.950% of the first $500,000,000 of the Fund’s aggregate daily net assets; (b) 0.925% of the next $500,000,000 of the Fund’s aggregate daily net assets; and (c) 0.900% of the Fund’s aggregate daily net assets in excess of $1,000,000,000. The Adviser has a subadvisory agreement with Epoch Investment Partners, Inc. The Fund is not responsible for payment of the subadvisory fees.
Expense reimbursements
The Adviser has agreed contractually to reimburse or to make a payment to a specific class of shares of the Fund in an amount equal to the amount by which the expenses attributable to such class of shares (excluding taxes, portfolio brokerage commissions, interest, litigation and indemnification expenses and other extraordinary expenses not incurred in the ordinary course of the Fund’s business and fees under any agreement or plans of the Fund dealing with services for shareholders and others with beneficial interests in shares of the Fund) exceed the percentage of average annual net assets (on an annualized basis) attributable as follows: 1.55% for Class A, 2.25% for Class B, 2.25% for Class C, 1.10% for Class I and 1.60% for Class R1. Accordingly, the expense reductions related to this expense limitation amounted to $60,725, $9,274, $11,107, $10,029 and $9,236 for Class A, Class B, Class C, Class I and Class R1, respectively, for the period ended August 31, 2007. This expense reimbursement shall continue in effect until February 29, 2008 and thereafter until terminated by the Adviser on notice to the Trust.
Administration fees
The Fund has an agreement with the Adviser that requires the Fund to reimburse the Adviser for all expenses associated with providing the administrative, financial, accounting and recordkeeping services of the Fund, including the preparation of all tax returns, annual, semi-annual and periodic reports to shareholders and the preparation of all Regulatory reports. These expenses are allocated based on the relative net assets of each class. The compensation for the period amounted to $2,252 with an effective rate of 0.02% of the Fund’s average daily net asset value.
Distribution plan
The Trust has a Distribution Agreement with the Distributor. The Fund has adopted Distribution Plans with respect to Class A, Class B, Class C and Class R1, pursuant to Rule 12b-1 under the 1940 Act, to reimburse the Distributor for the services it provides as distributor of shares of the Fund. Accordingly, the Fund makes monthly payments to the Distributor at an annual rate not to exceed 0.30%, 1.00%, 1.00% and 0.50% of average daily net asset value of Class A, Class B, Class C and Class R1, respectively. A maximum of 0.25% of such payments may be service fees, as defined by the Conduct Rules of Financial Industry Regulatory Authority (formerly the National Association of Securities Dealers). Under the Conduct Rules, curtailment of a portion of the Fund’s 12b-1 payments could occur under certain circumstances. In addition, under a Service Plan for Class R1 shares, the Fund pays up to 0.25% of Class R1 average daily net asset va lue for certain other services.
Sales charges
Class A shares are assessed up-front sales charges of up to 5.00% of net asset value of such shares. During the period ended August 31, 2007, the Fund was informed that the Distributor received net up-front sales charges of $148,270 with regard to sales of Class A shares. Of this amount, $9,012 was retained and used for printing prospectuses, advertising, sales literature and other purposes and $138,587 was paid as sales commissions to unrelated broker-dealers and $671 was paid as sales commissions to sales personnel of
Global Shareholder Yield Fund
26
Signator Investors, Inc. (Signator Investors), a related broker-dealer, an indirect subsidiary of MFC.
Class B shares that are redeemed within six years of purchase are subject to a contingent deferred sales charge (CDSC) at declining rates, beginning at 5.00% of the lesser of the current market value at the time of redemption or the original purchase cost of the shares being redeemed. Class C shares that are redeemed within one year of purchase are subject to a CDSC at a rate of 1.00% of the lesser of the current market value at the time of redemption or the original purchase cost of the shares being redeemed. Proceeds from the CDSCs are paid to the Distributor and are used, in whole or in part, to defray its expenses for providing distribution-related services to the Fund in connection with the sale of Class B and Class C shares. During the period ended August 31, 2007, JH Funds received no CDSCs with regard to Class B and Class C shares.
Transfer agent fees
The Fund has a Transfer Agency Agreement with John Hancock Signature Services, Inc. (Signature Services), an indirect subsidiary of MFC. For Class A, Class B, Class C, Class I and Class R1 shares, the Fund pays a monthly transfer agent fee at an annual rate of 0.05% of each class’s average daily net assets, plus a fee based on the number of shareholder accounts and reimbursement for certain out-of-pocket expenses. Expenses not directly attributable to a particular class of shares are aggregated and allocated to each class on the basis of its relative net asset value.
Signature Services has agreed to limit the transfer agent fees so that such fees do not exceed 0.20% annually of Class A, Class B, Class C, Class I and Class R1 share average daily net assets. This agreement is effective until December 31, 2007. Signature Services reserves the right to terminate this limitation in the future. Accordingly, there were no transfer agent fee reductions for Class A, Class B, Class C, Class I and Class R1 shares, respectively, during the period ended August 31, 2007.
Expenses under the agreement described above for the period ended August 31, 2007, were as follows:
| Distribution and | Transfer | Blue sky | Printing and | |
| Share class | service fees | agent fees | fees | postage fees |
| Class A | $31,556 | $18,749 | $8,106 | $2,999 |
| Class B | 2,513 | 502 | 8,107 | 195 |
| Class C | 6,940 | 1,388 | 8,107 | 195 |
| Class I | — | 233 | 8,106 | 310 |
| Class R1 | 400 | 27 | 8,600 | 354 |
| Total | $41,409 | $20,899 | $41,026 | $4,053 |
Trustees’ fees
The Trust compensates each Trustee who is not an employee of the Adviser or its affiliates. Total Trustees’ expenses are allocated to the Fund based on its average daily net asset value.
4. Guarantees and indemnifications
Under the Trust’s organizational documents, its Officers and Trustees are indemnified against certain liability arising out of the performance of their duties to the Trust. Additionally, in the normal course of business, the Trust enters into contracts with service providers that contain general indemnification clauses. The Trust’s maximum exposure under these arrangements is unknown, as this would involve future claims that may be made against the Trust that have not yet occurred. However, based on experience, the Trust believes the risk of loss to be remote.
5. Line of credit
The Fund has entered into an agreement which enables it to participate in a $100 million unsecured committed line of credit with State Street Corporation. Borrowings will be made
Global Shareholder Yield Fund
27
solely to temporarily finance the repurchase of capital shares. Interest is charged to the Fund based on its borrowings at a rate per annum equal to the Federal Funds rate plus 0.50% . In addition, a commitment fee of 0.07% per annum, payable at the end of each calendar quarter, based on the average daily-unused portion of the line of credit, is charged to the Fund on a prorated basis based on average net assets. For the period ended August 31, 2007, there were no borrowings under the line of credit.
6. Capital shares
Share activities for the Fund for the period ended August 31, 2007 were as follows:
| Period ended 8-31-07 | ||
| Shares | Amount | |
| Class A | ||
| Sold | 2,692,658 | $27,753,774 |
| Distributions reinvested | 20,916 | 222,126 |
| Repurchased | (74,032) | (772,844) |
| Net increase | 2,639,542 | $27,203,056 |
| Class B | ||
| Sold | 99,757 | $1,062,012 |
| Distributions reinvested | 496 | 5,271 |
| Repurchased | (94) | (1,022) |
| Net increase | 100,159 | $1,066,261 |
| Class C | ||
| Sold | 295,718 | $3,145,258 |
| Distributions reinvested | 1,295 | 13,770 |
| Repurchased | (7,050) | (72,953) |
| Net increase | 289,963 | $3,086,075 |
| Class I | ||
| Sold | 256,558 | $2,734,505 |
| Distributions reinvested | 366 | 3,896 |
| Repurchased | (1,600) | (17,127) |
| Net increase | 255,324 | $2,721,274 |
| Class R1 | ||
| Sold | 10,000 | $100,000 |
| Distributions reinvested | 87 | 919 |
| Net increase | 10,087 | $100,919 |
| Net increase | 3,295,075 | $34,177,585 |
7. Investment transactions
Purchases and proceeds from sales or maturities of securities, other than short-terms securities and obligations of the U.S. government, during the period ended August 31, 2007, aggregated $34,153,835 and $4,235,665, respectively.
The cost of investments owned on August 31, 2007, including short-term investments, for federal income tax purposes, was $34,890,931. Gross unrealized appreciation and depreciation of investments aggregated $950,929 and $989,618, respectively, resulting in net unrealized depreciation of $38,689. The difference between book basis and tax basis net unrealized depreciation of investments is attributable primarily to tax deferral of losses on certain sales of securities.
Global Shareholder Yield Fund
28
8. Transaction in securities of affiliated issuers
Affiliated issuers, as defined by the 1940 Act, are those in which the Fund’s holdings of an issuer represent 5% or more of the outstanding voting securities of the issuer. A summary of the Fund’s transactions in the securities of these issuers during the period ended August 31, 2007 is set forth below.
| Beginning | Ending | ||||
| share | share | Realized | Dividend | Ending | |
| Affiliate | amount | amount | gain (loss) | income | value |
| Far EasTone Telecommunications | |||||
| Co., Ltd. | |||||
| bought: 208,000 shares | |||||
| sold: none | — | 208,000 | — | — | $250,597.93 |
| Total | 208,000 | $250,597.93 | |||
9. Federal income tax information
Federal income tax regulations may differ from generally accepted accounting principles and income and capital gain distributions determined in accordance with tax regulations may differ from net investment income and realized gains recognized for financial reporting purposes.
Global Shareholder Yield Fund
29
Evaluation of Advisory and Subadvisory
Agreements by the Board of Trustees
This section describes the evaluation by the Board of Trustees of:
(a) an amendment (the Advisory Agreement Amendment) to the advisory agreement between John Hancock Funds III (the Trust) and John Hancock Investment Management, LLC (the Adviser or JHIMS) to add the John Hancock Global Shareholder Yield Fund (the Fund).
(b) a subadvisory agreement (the Epoch Subadvisory Agreement) between the Adviser and Epoch Investment Partners, Inc. (Epoch or Subadviser) to add the Fund.
Evaluation by the Board of Trustees
The Board, including the Independent Trustees, is responsible for selecting the Trust’s Adviser, approving the Adviser’s selection of subadvisers for the Fund and approving the Trust’s advisory and subadvisory agreement, their periodic continuation and any amendments. Consistent with SEC rules, the Board regularly evaluates the Trust’s advisory and subadvisory arrangements, including consideration of the factors listed below. The Board may also consider other factors (including conditions and trends prevailing generally in the economy, the securities markets and the industry) and does not treat any single factor as determinative, and each Trustee may attribute different weights to different factors. The Board is furnished with an analysis of its fiduciary obligations in connection with its evaluation and, throughout the evaluation process, the Board is assisted by counsel for the Trust and the Independent Trustees are also separately assisted by independent legal counsel. The factors considered by the Board are:
1. the nature, extent and quality of the services to be provided by the Adviser to the Trust and by the subadvisers to the Fund;
2. the investment performance of the Fund and their subadvisers;
3. the extent to which economies of scale would be realized as a Fund grows and whether fee levels reflect these economies of scale for the benefit of Trust shareholders;
4. the costs of the services to be provided and the profits to be realized by the Adviser and its affiliates (including any subadvisers that are affiliated with the Adviser) from the Adviser’s relationship with the Trust; and
5. comparative services rendered and comparative advisory and subadvisory fee rates.
The Board believes that information relating to these factors is relevant to its evaluation of the Trust’s advisory agreement. With respect to its evaluation of subadvisory agreements not affiliated with the Adviser, the Board believes that, in view of the Trust’s “manager of managers” advisory structure, the costs of the services to be provided and the profits to be realized by those subadvisers that are not affiliated with the Adviser from their relationship with the Trust generally are not a material factor in the Board’s consideration of these subadvisory agreements because such fees are paid by the Adviser and not by the Fund and the Board relies on the ability of the Adviser to negotiate the subadvisory fees at arm’s-length.
In evaluating subadvisory arrangements, the Board also considers other material business relationships that unaffiliated subadvisers and their affiliates have with the Adviser or its affiliates, including the involvement by certain affiliates of certain subadvisers in the distribution of financial products, including shares of the Trust, offered by the Adviser and other affiliates of the Adviser (Material Relationships).
Approval of Advisory Agreement
At its meeting on December 12-13, 2006, the Board, including all the Independent Trustees, approved the Advisory Agreement Amendment.
In approving the Advisory Agreement Amendment, and with reference to the factors that it regularly considers, the Board:
(1) (a) considered the high value to the Trust of continuing its relationship with JHIMS as the Trust’s adviser, the skills and
30
competency with which JHIMS has in the past managed the Trust’s affairs and its subadvisory relationships, JHIMS’s oversight and monitoring of the subadviser’s investment performance and compliance programs including its timeliness in responding to performance issues and the qualifications of JHIMS’ personnel,
(b) considered JHIMS’s compliance policies and procedures and its responsiveness to regulatory changes and mutual fund industry developments, and
(c) considered JHIMS’s administrative capabilities, including its ability to supervise the other service providers for the Fund and concluded that JHIMS may reasonably be expected to perform its services under the Advisory Agreement with respect to the Fund;
(2) reviewed the investment performance of portfolios of the Subadviser that are managed comparably to the Fund as set forth in Appendix A; the comparative performance of its benchmark; and JHIMS’ analysis of such performance and its plans and recommendations regarding the Trust’s subadvisory arrangements generally and with respect to the Fund; and concluded that the portfolios of the Subadviser that are managed comparably to the Fund have performed well or within a range that the Board deemed competitive, and that JHIMS may reasonably be expected to ably monitor the performance of the Fund and its Subadviser.
(3) reviewed the advisory fee structure for the Fund and the incorporation therein of any subadvisory fee breakpoints in the advisory fees charged and concluded (i) that all subadvisory breakpoints are reflected as breakpoints in the advisory fees for the Fund, and (ii) that, although economies of scale cannot be measured with precision, these arrangements permit shareholders of the Fund to benefit from economies of scale if the assets of such fund grow;
(4) (a) reviewed the anticipated profitability of the JHIMS’s relationship with the Fund in terms of the total amount of annual advisory fees it would receive with respect to the Fund and whether JHIMS has the financial ability to provide a high level of services to the Fund,
(b) considered that JHIMS derives reputational and other indirect benefits from providing advisory services to the Fund, and
(c) noted that JHIMS will pay the subadvisory fee out of the advisory fees JHIMS will receive from the Fund and concluded that the advisory fees to be paid by the Trust with respect to the Fund are not unreasonable in light of such information; and
(5) (a) reviewed comparative information with respect to the advisory fee rates and concluded that the anticipated advisory fees for the Fund, are generally within a competitive range of those incurred by other comparable funds. In this regard, the Board took into account management’s discussion with respect to the advisory fee structure. The Board also noted that the Adviser pays the subadvisory fees of the Fund. The Board also took into account the level and quality of services expected to be provided by JHIMS with respect to the Fund, as well as the other factors considered.
Approval of Subadvisory Agreements
At its meeting on December 12-13, 2006, the Board, including all the Independent Trustees, approved the Subadvisory Agreement.
In making its determination with respect to the factors that it considers, the Board reviewed:
(1) information relating to Epoch’s business, which may include information such as: business performance, representative clients, assets under management, financial stability, personnel and past subadvisory services to the Trust, John Hancock Funds II and John Hancock Trust;
31
(2) the investment performance of the Subadviser’s portfolios managed comparably to the Fund and comparative performance information relating to the benchmark;
(3) the proposed subadvisory fee for the Fund and comparative fee information; and
(4) information relating to the nature and scope of Material Relationships and their significance to the Trust’s adviser and unaffiliated subadvisers.
The Board’s decision to approve the Subadvisory Agreement was based on a number of determinations, including the following:
(1) The Subadviser has extensive experience and demonstrated skills as a manager;
(2) With respect to the Subadviser, the sub-advisory fees are a product of arm’s-length negotiation between the Adviser and the Subadviser and generally are competitive within the range of industry norms;
(3) For the Fund all subadvisory breakpoints are reflected as breakpoints in the advisory fees,
(4) Although not without variation, the current and historical performance of the portfolios of the Subadviser managed comparably to the Fund has been within the range of the current and historical performance of these portfolios’ respective benchmark (see Appendix A for further information on performance); and
(5) The Material Relationships consist of arrangements in which the Subadviser or its affiliates provide advisory, distribution or management services in connection with financial products sponsored by the Trust’s adviser or its affiliates, which may include other registered investment companies, a 529 education savings plan, managed separate accounts and exempt group annuity contracts sold to qualified plans, and which in no case contained elements which would cause the Board to conclude that approval of the subadvisory agreement with the Subadviser would be inappropriate.
Additional information that the Board considered for the Fund is set forth in Appendix A.
| Appendix A | |||
| Performance | |||
| Portfolio | of Trust, as of | ||
| (Subadviser) | Sept. 30, 2006 | Fees and Expenses | Comments |
| JH Global | There is no track | See Comments | The portfolio will |
| Shareholder | record for the Global | commence opera- | |
| Yield Fund | Shareholder Yield | tions on or about | |
| Fund. However, | March 1, 2007 | ||
| (Epoch Investments | performance of | and has no perform- | |
| Partners, Inc.) | the Epoch Global | ance history. The | |
| Equity Shareholder | current subadviser | ||
| Yield Fund, a similar | manages one | ||
| fund managed by | comparable fund. | ||
| Epoch Investment | |||
| Partners, beats the | Based on estimates, | ||
| benchmark for the | total expenses for | ||
| year-to-date period | this Portfolio are | ||
| (Fund’s inception | higher than the peer | ||
| was 12/27/05). | group average. | ||
32
Why John Hancock Funds?
For more than three decades, John Hancock Funds has been helping individual, corporate and institutional clients reach their most important financial goals. With so many fund companies to choose from, why should you invest with us?
► A name you know and trust
When you invest with John Hancock Funds, you are investing with one of the most recognized and respected names in the financial services industry. Our parent company has been helping individuals and institutions increase and protect wealth since 1862.
► Solutions across the investing spectrum
We offer equity, income, international, sector and asset allocation investment solutions managed by leading institutional money managers. Each of our funds utilizes a disciplined, team approach to portfolio management and research, leveraging the expertise of seasoned investment professionals.
► Committed to you
Our shareholders come first. We work hard to provide you with the products you need to build a solid financial foundation. We’re proud to offer you award-winning services and tools, like the www.jhfunds.com Web site, to help you every step of the way.
For immediate insight and answers,
turn to www.jhfunds.com
Discover the new and improved www.jhfunds.com.
n View accounts, statements and fund information.
n Access college and retirement planning calculators and investment education.
n Gain investment ideas, expand your knowledge and become a more informed investor.

This is just the beginning of how much you can do.
Now is the ideal time to experience our Web site that received the following recognition in 2006:

“Best Innovation: Redesigned Web Site” by the Mutual Fund Education Alliance.

“Outstanding Web Site” by the Web Marketing Association.

“Creative excellence on the Web, Silver Award winner” by W3.
Discover convenience and comprehensive resources at one easy-to-access location. Your financial professional can steer you to the tools that will help you the most and enable you to transform your knowledge into action.
See how far www.jhfunds.com can take you!
At the heart of John Hancock Funds is
AWARD-WINNING SERVICE
How our exceptional customer service can benefit you:

We’re committed to providing you with answers, solving problems and saving you time.

We’re ready to go one step further by offering a range of resources so you can build your knowledge and expand your skills.

We’re determined to regularly exceed your expectations.
Experience award-winning, world-class service.
Consider the recognition that we received in 2006.
n John Hancock Signature Services, Inc. (JHSS) is the transfer and shareholder services agent for John Hancock Funds. JHSS was awarded “Best-In-Class” honors and “5-Star” performer status for telephone customer service for all of 2006 from the National Quality Review.
n Winner of Source Media’s Fund Operations Awards in the category of Efficiencies/Streamlining.
n One of four finalists for Best Customer Service Organization, Financial Services at The American Business Awards, “The Stevies.” ™

Let us demonstrate the
difference that world-class
service can make.
Call our customer service representatives at 1-800-225-5291 Monday to Friday 8:00 a.m. – 7:00 p.m., ET
It will be our pleasure and privilege to help you.
For more information
The Fund’s proxy voting policies, procedures and records are available without charge, upon request:
| By phone | On the Fund’s Web site | On the SEC’s Web site |
| 1-800-225-5291 | www.jhfunds.com/proxy | www.sec.gov |
| Trustees | Charles A. Rizzo | Custodian |
| Ronald R. Dion, Chairman | Chief Financial Officer | State Street Bank & Trust Co. |
| James R. Boyle† | 2 Avenue de Lafayette | |
| James F. Carlin | Gordon M. Shone | Boston, MA 02111 |
| William H. Cunningham | Treasurer | |
| Charles L. Ladner* | ||
| Dr. John A. Moore* | John G. Vrysen | Transfer agent |
| Patti McGill Peterson* | Chief Operating Officer | John Hancock Signature |
| Steven R. Pruchansky | Services, Inc. | |
| *Members of the Audit Committee | Investment adviser | One John Hancock Way, |
| †Non-Independent Trustee | John Hancock Investment | Suite 1000 |
| Management Services, LLC | Boston, MA 02217-1000 | |
| 601 Congress Street | ||
| Officers | Boston, MA 02210-2805 | Legal counsel |
| Keith F. Hartstein | Kirkpatrick & Lockhart | |
| President and | Subadviser | Preston Gates Ellis LLP |
| Chief Executive Officer | Epoch Investment Partners, Inc. | One Lincoln Street |
| 640 Fifth Avenue, 18th Floor | Boston, MA 02111-2950 | |
| Thomas M. Kinzler | New York, NY 10019 | |
| Secretary and Chief Legal Officer | ||
| Francis V. Knox, Jr. | ||
| Chief Compliance Officer | ||
| How to contact us | ||
| Internet | www.jhfunds.com | |
| Regular mail: | Express mail: | |
| John Hancock | John Hancock | |
| Signature Services, Inc. | Signature Services, Inc. | |
| One John Hancock Way, Suite 1000 | Mutual Fund Image Operations | |
| Boston, MA 02217-1000 | 380 Stuart Street | |
| Boston, MA 02116 | ||
| Phone | Customer service representatives | 1-800-225-5291 |
| EASI-Line | 1-800-338-8080 | |
| TDD line | 1-800-554-6713 | |
A listing of month-end portfolio holdings is available on our Web site, www.jhfunds.com. A more detailed portfolio holdings summary is available on a quarterly basis 60 days after the fiscal quarter on our Web site or upon request by calling 1-800-225-5291, or on the SEC’s Web site, www.sec.gov.
36
J O H N H A N C O C K F A M I L Y O F F U N D S
EQUITY
Balanced Fund
Classic Value Fund
Classic Value Fund II
Classic Value Mega Cap Fund
Core Equity Fund
Growth Fund
Growth Opportunities Fund
Growth Trends Fund
Intrinsic Value Fund
Large Cap Equity Fund
Large Cap Select Fund
Mid Cap Equity Fund
Multi Cap Growth Fund
Small Cap Equity Fund
Small Cap Fund
Small Cap Intrinsic Value Fund
Sovereign Investors Fund
U.S. Core Fund
U.S. Global Leaders Growth Fund
Value Opportunities Fund
ASSET ALLOCATION
Lifecycle 2010 Portfolio
Lifecycle 2015 Portfolio
Lifecycle 2020 Portfolio
Lifecycle 2025 Portfolio
Lifecycle 2030 Portfolio
Lifecycle 2035 Portfolio
Lifecycle 2040 Portfolio
Lifecycle 2045 Portfolio
Lifecycle Retirement Portfolio
Lifestyle Aggressive Portfolio
Lifestyle Balanced Portfolio
Lifestyle Conservative Portfolio
Lifestyle Growth Portfolio
Lifestyle Moderate Portfolio
SECTOR
Financial Industries Fund
Health Sciences Fund
Real Estate Fund
Regional Bank Fund
Technology Fund
Technology Leaders Fund
INTERNATIONAL/GLOBAL
Global Opportunities Fund
Global Shareholder Yield Fund
Greater China Opportunities Fund
International Allocation Portfolio
International Classic Value Fund
International Core Fund
International Growth Fund
INCOME
Bond Fund
Government Income Fund
High Yield Fund
Investment Grade Bond Fund
Strategic Income Fund
TAX-FREE INCOME
California Tax-Free Income Fund
High Yield Municipal Bond Fund
Massachusetts Tax-Free Income Fund
New York Tax-Free Income Fund
Tax-Free Bond Fund
MONEY MARKET
Money Market Fund
CLOSED-END
Bank and Thrift Opportunity Fund
Financial Trends Fund, Inc.
Income Securities Trust
Investors Trust
Patriot Premium Dividend Fund II
Preferred Income Fund
Preferred Income II Fund
Preferred Income III Fund
Tax-Advantaged Dividend Income Fund
Tax-Advantaged Global Shareholder Yield Fund
The Fund’s investment objectives, risks, charges and expenses are included in the prospectus and should be considered carefully before investing. For a prospectus, contact your financial professional, call John Hancock Funds at 1-800-225-5291 or visit the Fund’s Web site at www.jhfunds.com. Please read the prospectus carefully before investing or sending money.

1-800-225-5291
1-800-554-6713 TDD
1-800-338-8080 EASI-Line
www.jhfunds. com
Now available: electronic delivery
www.jhfunds. com/edelivery
This report is for the information of the shareholders of John Hancock Global Shareholder Yield Fund.
It is not authorized for distribution to prospective investors unless preceded or accompanied by a prospectus. 320SA 8/07
&nb sp; 10/07

| TABLE OF CONTENTS |
| Your fund at a glance |
| page 1 |
| Managers’ report |
| page 2 |
| A look at performance |
| page 6 |
| Your expenses |
| page 8 |
| Fund’s investments |
| page 10 |
| Financial statements |
| page 12 |
| Notes to financial |
| statements |
| page 20 |
| For more information |
| page 32 |
CEO corner
To Our Shareholders,
Volatility returned to the U.S. stock market in the six-month period ended August 31, 2007; however, stocks still posted a strong gain of 5.70%, as measured by the Standard & Poor’s 500 Index. The market experienced a particularly sharp downturn in August, as the subprime mortgage market’s woes increased. Rising defaults and an ensuing credit crunch caused heightened fears about their potential impact on U.S. economic growth. Foreign markets felt some ripple effects from the subprime issue, but they continued nonetheless to benefit from solid economic growth and outperformed the U.S. market in this period.
During this period of volatility, the U.S. stock market also passed a significant milestone — the broad Standard & Poor’s 500 Index climbed beyond the record it had set seven years ago. From its peak in March 2000, the stock market spiraled downward three consecutive years, bottoming in 2002. The upturn began in 2003, and the market has advanced each year since, finally setting a new high for the first time on May 30, 2007. During that period, the S&P 500 Index experienced five significant short-term sell-offs of 6% or more, with the August subprime-induced meltdown being the most recent.
This nearly complete market cycle highlights the importance of two investment principles you have heard us speak of often: diversification and patience. By allocating your investments among different asset classes, investment styles and portfolio managers, you are likely to be well represented through all phases of a complete market cycle, with the winners helping to cushion the fall of the losers.
The challenge for investors with a diversified portfolio is to properly evaluate your investments to tell the difference between an underperforming manager and an out-of-favor style, while also understanding the role each investment plays in your portfolio. That’s where your financial professional can provide true value. He or she can help you make those assessments and also counsel patience, because a properly diversified portfolio by its very nature will typically have something lagging or out of favor — a concept that can be difficult to live with, but necessary to embrace. If everything in your portfolio is “working,” then you are not truly diversified, but rather are leveraged to the current market and the flavor of the day. If so, you are bound to be out of step in the near future.
The recent volatility in the securities markets has prompted many investors to question how long this type of market cycle will last. History tells us it will indeed end and that when it does, today’s leaders may well turn into laggards and vice versa. The subprime mortgage market woes are just the latest example of why investors should be both patient and well-diversified. For with patience and a diversified portfolio, it could be easier to weather the market’s twists and turns and reach your long-term goals.
Sincerely,

Keith F. Hartstein,
President and Chief Executive Officer
This commentary reflects the CEO’s views as of August 31, 2007. They are subject to change at any time.
Your fund at a glance
The Fund seeks long-term growth of capital by investing at least 80% of its assets in domestic equity securities of mega-cap companies — defined as having a market capitalization of approximately $15 billion or greater as of January 1, 2007 — that it believes are currently undervalued relative to the market, based on estimated future earnings and cash flow.
Since inception
► Stocks advanced despite increased volatility and fallout from the subprime mortgage meltdown.
► The Fund declined modestly, trailing its value-oriented benchmark index and peer group average.
► Information technology stocks added value, while the energy and financial sectors detracted from results.
John Hancock Classic Value Mega Cap Fund
Fund performance from inception March 1, 2007 through August 31, 2007.
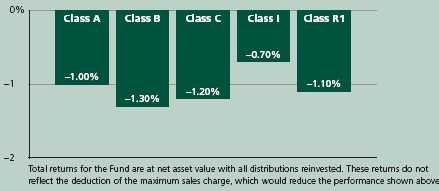
| Top 10 holdings | |||||
| Federal Home Loan Mortgage Corp. | 5.0% | Federal National Mortgage Assn. | 4.1% | ||
| Home Depot, Inc. | 4.9% | Northrop Grumman Corp. | 3.7% | ||
| Wal-Mart Stores, Inc. | 4.9% | Johnson & Johnson | 3.5% | ||
| Alcatel SA | 4.8% | Bank of America Corp. | 3.5% | ||
| Citigroup, Inc. | 4.8% | Allstate Corp. | 3.2% | ||
As a percentage of net assets on August 31, 2007.
1
Managers’ report
John Hancock
Classic Value Mega Cap Fund
Despite an increasingly volatile environment, the U.S. stock market posted positive results for the six months ended August 31, 2007. Stocks remained on an upward trajectory during the first half of the period as the market continued to benefit from better-than-expected corporate earnings and heavy merger activity, the latter fueled primarily by private equity firm takeovers.
However, in the last few months of the period, the housing and sub-prime mortgage markets took a turn for the worse, leading to concerns about an impending credit crunch and its potential impact on the U.S. economy. As a result, the stock market grew more volatile and gave back some of its earlier gains.
Nonetheless, the major stock indexes gained about 5% for the six-month period. Large-cap stocks delivered the best results, outperforming small- and mid-cap issues, while growth stocks outpaced value shares by a wide margin. For example, the Russell 1000 Growth Index returned 7.46%, compared with the 2.76% return of the Russell 1000 Value Index.
Fund performance
From the Fund’s inception on March 1, 2007, through August 31, 2007, John Hancock Classic Value Mega Cap Fund’s Class A, Class B, Class C, Class I and Class R1 shares posted total returns of –1.00%, –1.30%, –1.20%, –0.70% and –1.10%, respectively, at net asset value.
SCORECARD
| INVESTMENT | PERIOD’S PERFORMANCE... AND WHAT’S BEHIND THE NUMBERS | |
| First Data | ▲ | Electronic payment processor acquired at a premium by a private |
| equity firm | ||
| Union Pacific | ▲ | Increased demand and better operating efficiency boosted |
| railroad company | ||
| Amgen | ▼ | Controversial safety issues regarding one of the biotechnology firm’s |
| products weighed on the stock price |

Portfolio Managers, Pzena Investment Management, LLC
Richard S. Pzena, John P. Goetz and Antonio DeSpirito III
The Fund trailed the 2.76% return of the Russell 1000 Value Index and 4.30% return of the Russell Top 200 Value Index, as well as the 3.81% return of the average large value fund, according to Morningstar, Inc.1 Keep in mind that your net asset value return will be different from the Fund’s performance if you were not invested in the Fund for the entire period or did not reinvest all distributions.
“Despite an increasingly volatile
environment, the U.S. stock
market posted positive results
for the six months ended
August 31, 2007.”
Fund strategy
We select our investments from a universe of the 250 largest U.S. stocks, with a focus on the most undervalued segment. We generally seek companies that display four key characteristics: (1) a low price relative to normal earnings; (2) current earnings that are below normal; (3) a credible plan to restore earnings to normal levels; and (4) a solid business with a sustainable competitive advantage and downside protection.
Energy detracted
The Fund’s underperformance of its benchmark index and peer group average resulted primarily from its substantial underweight position in the energy sector. As long-term value investors, we have largely avoided the energy sector because earnings are unsustainably high, with profitability well above historical norms. However, energy stocks were by far the best performers in the stock market during the period, gaining more than 20% as a group thanks to resurgent oil and gas prices. As a result, our underweight detracted significantly from performance relative to the index.
In addition, the portfolio’s sole energy holding, BP PLC, underperformed the overall energy sector. BP has faced a litany of operational issues — the company is in the process of replacing 16 miles of corroded oil pipeline
Classic Value Mega Cap Fund
3
| SECTOR DISTRIBUTION2 | |
| Financial | 37% |
| Consumer non-cyclical | 20% |
| Consumer cyclical | 10% |
| Communications | 7% |
| Industrial | 5% |
| Mortgage securities | 5% |
| Technology | 4% |
| Government | 4% |
| Utilities | 3% |
| Energy | 2% |
in Alaska after several leaks last year, production has been weakened by protracted refinery outages and equipment problems led to delays in starting up its Gulf of Mexico production platforms. We believe all of these issues should be temporary in nature.
Financials — short-term challenges, long-term opportunities
The financial sector, which comprises almost 40% of the portfolio, came under considerable pressure amid the turmoil in the mortgage market. It wasn’t just mortgage-related stocks, though. With few exceptions, the entire sector was punished indiscriminately, in our view, reflecting investors’ extreme fear of financial stocks in a deteriorating and uncertain credit environment.
Although the portfolio’s sizable weighting in financial stocks contributed to its underperformance of the benchmark index over the past six months, the degree of pessimism in the financial sector, which has pushed its valuation relative to the overall stock market down to its cheapest level in 17 years, has provided us with a wealth of attractive investment opportunities. Our investments in the financial sector are well diversified, ranging from government-sponsored mortgage lenders to life and property/casualty insurers, commercial banks and investment banks.
In a smaller way, we have been raising exposure to some deeply discounted financials as market fears have worsened. A good example is mortgage lender Countrywide Financial Corp. As the nation’s largest mortgage originator, the company had some notable exposure to subprime mortgages and, as a result, investors abandoned the stock, which lost nearly half of its value during the period. However, Countrywide is a well-diversified company that includes mortgage servicing, mortgage broker and general banking operations. We believe that the strength and stability of these businesses, as well as Countrywide’s low cost structure, will provide a cushion against the subprime fallout. We have been adding to our position as the stock price has fallen.
Winners in financials and technology
Not all of the portfolio’s financial stocks declined during the period. Our top performance contributor was government-sponsored mortgage lender Fannie Mae, which
Classic Value Mega Cap Fund
4
posted double-digit gains. Fannie is in the process of restating earnings from past years because of accounting irregularities, but the company expects to be caught up on its financial reporting by early 2008. Once that happens, Fannie should be free to deploy excess capital that it has been forced to hold until its accounting is current. In addition, government-sponsored lenders like Fannie and its sibling, Freddie Mac (also a portfolio holding), play at the safest end of the mortgage market, and their government-like status can allow them to benefit from the current market turmoil in the form of higher guarantee fees and wider credit spreads.
An overweight in information technology stocks also contributed favorably to portfolio performance. One of the top performers was Oracle Corp., the dominant database software maker. Oracle’s success consolidating and integrating the acquisitions of several application software makers provided a strong boost to the stock.
“The Fund’s underperformance
of its benchmark index and peer
group average resulted primarily
from its substantial underweight
position in the energy sector.”
Outlook
The recent downturn and increased volatility in the stock market has provided some excitement for deep-value investors like us after several years of compressed valuations. We seek out highly discounted companies in areas of the market that are under stress, and the financial sector is currently one of those areas. We have been trimming or selling some of our better-performing financial stocks and shifting these assets into attractively valued alternatives, and we expect to continue in this vein going forward.
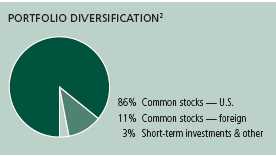
This commentary reflects the views of the portfolio managers through the end of the Fund’s period discussed in this report. The managers’ statements reflect their own opinions. As such, they are in no way guarantees of future events and are not intended to be used as investment advice or a recommendation regarding any specific security. They are also subject to change at any time as market and other conditions warrant.
1 Figures from Morningstar, Inc. include reinvested dividends and do not take into account sales charges. Actual load-adjusted performance is lower.
2 As a percentage of net assets on August 31, 2007.
Classic Value Mega Cap Fund
5
A look at performance
For the periods ended August 31, 2007
| Cumulative total returns | ||||
| with maximum sales charge (POP) | ||||
| Inception | Since | |||
| Class | date | 6-month | inception | |
| A | 3-1-07 | –5.98% | –5.98% | |
| B | 3-1-07 | –6.24 | –6.24 | |
| C | 3-1-07 | –2.19 | –2.19 | |
| I1 | 3-1-07 | –0.70 | –0.70 | |
| R1 1 | 3-1-07 | –1.10 | –1.10 | |
Performance figures assume all distributions are reinvested. Public offering price (POP) figures reflect maximum sales charge on Class A shares of 5%, and the applicable contingent deferred sales charge (CDSC) on Class B and Class C shares. The Class B shares’ CDSC declines annually between years 1 to 6 according to the following schedule 5, 4, 3, 3, 2, 1%. No sales charge will be assessed after the sixth year. Class C shares held for less than one year are subject to a 1% CDSC. Sales charge is not applicable for Class I and Class R1 shares.
The expense ratios of the Fund, both net (including any fee waivers or expense limitations) and gross (excluding any fee waivers or expense limitations), are set forth according to the most recent publicly available Prospectuses for the Fund and may differ from the expense ratios disclosed in the Financial Highlights tables in this report. The waivers and expense limitations are contractual at least until 02-29-08. The net expenses are as follows: Class A — 1.37%, Class B — 2.12%, Class C — 2.12%, Class I — 0.97%, Class R1 — 1.72% . Had the fee waivers and expense limitations not been in place, the gross expenses would be as follows: Class A — 1.42%, Class B — 2.40%, Class C — 2.23%, Class I — 1.08%, Class R1 — 2.35% .
The returns reflect past results and should not be considered indicative of future performance. The return and principal value of an investment will fluctuate so that shares, when redeemed, may be worth more or less than their original cost. Due to market volatility, the Fund’s current performance may be higher or lower than the performance shown. For performance data current to the most recent month-end, please call 1-800-225-5291 or visit the Fund’s Web site at www.jhfunds.com.
The performance table above and the chart on the next page do not reflect the deduction of taxes that a shareholder would pay on fund distributions or the redemption of fund shares.
The Fund’s performance results reflect any applicable expense reductions, without which the expenses increase and results would have been less favorable.
Performance is calculated with an opening price (prior day’s close) on the inception date.
1 For certain types of investors as described in the Fund’s Class I and Class R1 share prospectuses.
Classic Value Mega Cap Fund
6
Growth of $10,000
This chart shows what happened to a hypothetical $10,000 investment in Classic Value Mega Cap Fund Class A shares for the period indicated. For comparison, we’ve shown the same investment in two separate indexes.
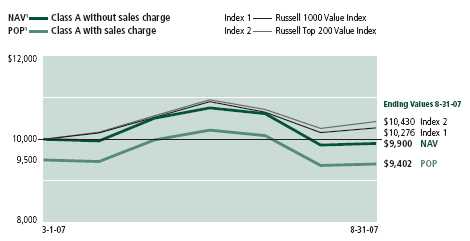
| Without sales | With maximum | ||||
| Class | Period beginning | charge | sales charge | Index 1 | Index 2 |
| B | 3-1-07 | $9,870 | $9,377 | $10,276 | $10,430 |
| C | 3-1-07 | 9,880 | 9,781 | 10,276 | 10,430 |
| I2 | 3-1-07 | 9,930 | 9,930 | 10,276 | 10,430 |
| R12 | 3-1-07 | 9,890 | 9,890 | 10,276 | 10,430 |
Assuming all distributions were reinvested for the period indicated, the table above shows the value of a $10,000 investment in the fund’s Class B, Class C, Class I and Class R1 shares, respectively, as of August 31, 2007. Performance of the classes will vary based on the difference in sales charges paid by shareholders investing in the different classes and the fee structure of those classes.
Russell 1000 Value — Index 1 is an unmanaged index containing those securities in the Russell 1000 Index with a less-than-average growth orientation.
Russell Top 200 Value — Index 2 is an unmanaged index which measures the performance of the largest 200 companies within the Russell 3000 Index with a less-than-average growth orientation.
It is not possible to invest directly in an index. Index figures do not reflect sales charges, which would have resulted in lower values if they did.
1 NAV represents net asset value and POP represents public offering price.
2 For certain types of investors as described in the Fund’s Class I and Class R1 share prospectuses.
Classic Value Mega Cap Fund
7
Your expenses
These examples are intended to help you understand your ongoing operating expenses.
Understanding fund expenses
As a shareholder of the Fund, you incur two types of costs:
■ Transaction costs which include sales charges (loads) on purchases or redemptions (varies by share class), minimum account fee charge, etc.
■ Ongoing operating expenses including management fees, distribution and service fees (if applicable) and other fund expenses.
We are going to present only your ongoing operating expenses here.
Actual expenses/actual returns
This example is intended to provide information about your fund’s actual ongoing operating expenses, and is based on your fund’s actual return. It assumes an account value of $1,000.00 on March 1, 2007, with the same investment held until August 31, 2007.
| Account value | Ending value | Expenses paid during period | |
| on 3-1-07 | on 8-31-07 | on 8-31-071 | |
| Class A | $1,000.00 | $990.00 | $6.85 |
| Class B | 1,000.00 | 987.00 | 10.59 |
| Class C | 1,000.00 | 988.00 | 10.59 |
| Class I | 1,000.00 | 993.00 | 4.86 |
| Class R1 | 1,000.00 | 989.00 | 8.60 |
Together with the value of your account, you may use this information to estimate the operating expenses that you paid over the period. Simply divide your account value at August 31, 2007 by $1,000.00, then multiply it by the “expenses paid” for your share class from the table above. For example, for an account value of $8,600.00, the operating expenses should be calculated as follows:
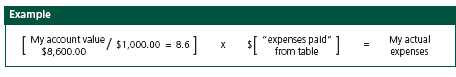
Classic Value Mega Cap Fund
8
Hypothetical example for comparison purposes
This table allows you to compare your fund’s ongoing operating expenses with those of any other fund. It provides an example of the Fund’s hypothetical account values and hypothetical expenses based on each class’s actual expense ratio and an assumed 5% annualized return before expenses (which is not your fund’s actual return). It assumes an account value of $1,000.00 on March 1, 2007, with the same investment held until August 31, 2007. Look in any other fund shareholder report to find its hypothetical example and you will be able to compare these expenses.
| Account value | Ending value | Expenses paid during period | |
| on 3-1-07 | on 8-31-07 | on 8-31-07 1 | |
| Class A | $1,000.00 | $1,018.25 | $6.95 |
| Class B | 1,000.00 | 1,014.48 | 10.74 |
| Class C | 1,000.00 | 1,014.48 | 10.74 |
| Class I | 1,000.00 | 1,020.26 | 4.93 |
| Class R1 | 1,000.00 | 1,016.49 | 8.72 |
Remember, these examples do not include any transaction costs, such as sales charges; therefore, these examples will not help you to determine the relative total costs of owning different funds. If transaction costs were included, your expenses would have been higher. See the prospectus for details regarding transaction costs.
1 Expenses are equal to the Fund’s annualized expense ratio of 1.37%, 2.12%, 2.12%, 0.97% and 1.72% for Class A, Class B, Class C, Class I and Class R1 respectively, multiplied by the average account value over the period, multiplied by the number of days in the inception period /365 or 366 (to reflect the one-half year period).
Classic Value Mega Cap Fund
9
F I N A N C I A L S T A T E M E N T S
Fund’s investments
Securities owned by the Fund on 8-31-07 (unaudited)
This schedule is divided into two main categories: common stocks and repurchase agreements. Common stocks are further broken down by industry group. Repurchase agreements, which represent the Fund’s cash position, are listed last.
| Issuer | Shares | Value |
| Common stocks 97.41% | $6,380,542 | |
| (Cost $6,637,133) | ||
| Aerospace 3.64% | 238,490 | |
| Northrop Grumman Corp. | 3,025 | 238,490 |
| Banking 3.48% | 228,060 | |
| Bank of America Corp. | 4,500 | 228,060 |
| Biotechnology 2.09% | 136,550 | |
| Amgen, Inc. * | 2,725 | 136,550 |
| Cable & Television 1.91% | 125,286 | |
| Viacom, Inc., Class B * | 3,175 | 125,286 |
| Cosmetics & Toiletries 1.55% | 101,318 | |
| Kimberly-Clark Corp. | 1,475 | 101,318 |
| Electronics 0.43% | 28,314 | |
| Tyco Electronics, Ltd. * | 812 | 28,314 |
| Energy 2.69% | 176,096 | |
| Sempra Energy | 3,200 | 176,096 |
| Financial Services 29.91% | 1,959,063 | |
| Capital One Financial Corp. | 3,500 | 226,310 |
| Citigroup, Inc. | 6,675 | 312,924 |
| Countrywide Financial Corp. | 6,375 | 126,544 |
| Discover Financial Services * | 675 | 15,619 |
| Federal Home Loan Mortgage Corp. | 5,250 | 323,452 |
| Federal National Mortgage Association | 4,050 | 265,721 |
| JP Morgan Chase & Company | 4,125 | 183,645 |
| Lehman Brothers Holdings, Inc. | 3,475 | 190,534 |
| Morgan Stanley | 1,875 | 116,944 |
| Washington Mutual, Inc. | 5,375 | 197,370 |
| Food & Beverages 2.50% | 163,870 | |
| Kraft Foods, Inc., Class A | 3,350 | 107,401 |
| The Coca-Cola Company | 1,050 | 56,469 |
| Healthcare Products 6.10% | 399,470 | |
| Boston Scientific Corp. * | 10,675 | 136,960 |
| Covidien, Ltd. * | 812 | 32,342 |
| Johnson & Johnson | 3,725 | 230,168 |
See notes to financial statements
Classic Value Mega Cap Fund
10
F I N A N C I A L S T A T E M E N T S
| Issuer | Shares | Value |
| Healthcare Services 1.93% | $126,503 | |
| Cardinal Health, Inc. | 1,850 | 126,503 |
| Insurance 12.83% | 840,074 | |
| ACE, Ltd. | 3,375 | 194,940 |
| Allstate Corp. | 3,800 | 208,050 |
| Chubb Corp. | 2,550 | 130,381 |
| MetLife, Inc. | 2,375 | 152,119 |
| Progressive Corp. | 7,600 | 154,584 |
| International Oil 2.08% | 136,404 | |
| BP PLC, ADR | 2,025 | 136,404 |
| Manufacturing 0.55% | 35,858 | |
| Tyco International, Ltd. | 812 | 35,858 |
| Pharmaceuticals 5.84% | 382,714 | |
| Bristol-Myers Squibb Company | 6,525 | 190,204 |
| Pfizer, Inc. | 7,750 | 192,510 |
| Railroads & Equipment 0.85% | 55,785 | |
| Union Pacific Corp. | 500 | 55,785 |
| Retail Trade 9.78% | 640,436 | |
| Home Depot, Inc. | 8,375 | 320,846 |
| Wal-Mart Stores, Inc. | 7,325 | 319,590 |
| Software 4.44% | 290,891 | |
| Microsoft Corp. | 5,325 | 152,987 |
| Oracle Corp. * | 6,800 | 137,904 |
| Telecommunications Equipment & Services 4.81% | 315,360 | |
| Alcatel SA, ADR | 28,800 | 315,360 |
| Principal | ||
| Issuer, description, maturity date | amount | Value |
| Repurchase agreements 2.02% | $132,000 | |
| (Cost $132,000) | ||
| Repurchase Agreement with State Street Corp. dated 08-31-07 at 4.60% | ||
| to be repurchased at $132,067 on 09-04-07, collateralized by $140,000 | ||
| Federal National Mortgage Association, 5.49%, due 01-11-23 (Valued at | ||
| $138,600, including interest) | $132,000 | 132,000 |
| Total investments (Cost $6,769,133) 99.43% | $6,512,542 | |
| Other assets in excess of liabilities 0.57% | $37,627 | |
| Total net assets 100.00% | $6,550,169 | |
Percentages are stated as a percent of net assets.
ADR American Depositary Receipt
* Non-income producing.
See notes to financial statements
Classic Value Mega Cap Fund
11
F I N A N C I A L S T A T E M E N T S
Financial statements
Statement of assets and liabilities 8-31-07 (unaudited)
This Statement of Assets and Liabilities is the Fund’s balance sheet. It shows the value of what the Fund owns, is due and owes. You’ll also find the net asset value per share and the maximum offering price per share.
| Assets | |
| Investments, at value (Cost $6,637,133) | $6,380,542 |
| Repurchase agreement, at value (Cost $132,000) | 132,000 |
| Total investments, at value (cost $6,769,133) | 6,512,542 |
| Cash | 361 |
| Receivable for investments sold | 128,309 |
| Receivable for fund shares sold | 43,754 |
| Dividends and interest receivable | 27,269 |
| Receivable due from adviser | 10,755 |
| Other assets | 8,307 |
| Total assets | 6,731,297 |
| Liabilities | |
| Payable for investments purchased | 115,497 |
| Payable to affiliates | |
| Fund administration fees | 529 |
| Transfer agent fees | 3,198 |
| Service fees | 224 |
| Other payables and accrued expenses | 61,680 |
| Total liabilities | 181,128 |
| Net assets | |
| Capital paid-in | 6,671,677 |
| Undistributed net investment income | 47,518 |
| Accumulated undistributed net realized gain on investments | 87,565 |
| Net unrealized depreciation on investments | (256,591) |
| Net Assets | $6,550,169 |
| Net asset value per share | |
| Based on net asset valued and shares outstanding — the Fund has an | |
| unlimited number of shares authorized with no par value. | |
| Class A ($5,539,318 ÷ 559,352 ) | $9.90 |
| Class B ($143,918 ÷ 14,578)1 | $9.87 |
| Class C ($515,598 ÷ 52,211)1 | $9.88 |
| Class I ($201,987 ÷ 20,337) | $9.93 |
| Class R1 ($149,348 ÷ 15,098) | $9.89 |
| Maximum offering price per share | |
| Class A2 ($9.90 ÷ 95%) | $10.42 |
1 Redemption price is equal to net asset value less any applicable contingent deferred sales charges.
2 On single retail sales of less than $50,000. On sales of $50,000 or more and on group sales offering price is reduced.
See notes to financial statements
Classic Value Mega Cap Fund
12
F I N A N C I A L S T A T E M E N T S
Statement of operations For the period ended 8-31-07 (unaudited)1
This Statement of Operations summarizes the Fund’s investment income earned and expenses incurred in operating the Fund. It also shows net gains (losses) for the period stated.
| Investment income | |
| Dividends | $78,201 |
| Interest | 10,637 |
| Less foreign taxes withheld | (615) |
| Total investment income | 88,223 |
| Expenses | |
| Investment management fees (Note 3) | 24,527 |
| Distribution and service fees (Note 3) | 8,588 |
| Transfer agent fees (Note 3) | 5,052 |
| Fund administration fees (Note 3) | 717 |
| Blue sky fees (Note 3) | 41,026 |
| Audit and legal fees | 18,155 |
| Printing and postage fees (Note 3) | 2,281 |
| Custodian fees | 7,041 |
| Registration and filing fees | 939 |
| Trustees’ fees (Note 3) | 123 |
| Miscellaneous | 46 |
| Total expenses | 108,495 |
| Less expense reductions (Note 3) | (67,790) |
| Net expenses | 40,705 |
| Net investment income | 47,518 |
| Realized and unrealized gain (loss) | |
| Net realized gain on investments | 87,565 |
| Change in net unrealized appreciation (depreciation) of investments | (256,591) |
| Net realized and unrealized loss | (169,026) |
| Decrease in net assets from operations | ($121,508) |
1 Semiannual period from 3-1-07 (commencement of operations) to 8-31-07.
See notes to financial statements
Classic Value Mega Cap Fund
13
F I N A N C I A L S T A T E M E N T S
Statement of changes in net assets
This Statement of Changes in Net Assets shows how the value of the Fund’s net assets has changed since inception. The difference reflects earnings less expenses, any investment gains and losses, distributions, if1any, paid to shareholders and the net of Fund share transactions.
| Period | |
| ended1 | |
| 8-31-07 | |
| Increase (decrease) in net assets | |
| From operations | |
| Net investment income | $47,518 |
| Net realized gain | 87,565 |
| Change in net unrealized appreciation (depreciation) | (256,591) |
| Decrease in net assets resulting from operations | (121,508) |
| From Fund share transactions | 6,671,677 |
| Total increase | 6,550,169 |
| Net assets | |
| Beginning of period | — |
| End of period2 | $6,550,169 |
1 Semiannual period from 3-1-07 (commencement of operations) to 8-31-07. Unaudited.
2 Includes net investment income of $47,518.
See notes to financial statements
Classic Value Mega Cap Fund
14
F I N A N C I A L S T A T E M E N T S
Financial highlights
The Financial Highlights show how the Fund’s net asset value for a share has changed since the end of the previous period.
| CLASS A SHARES | |
| Period ended | 8-31-071,2 |
| Per share operating performance | |
| Net asset value, beginning of period | $10.00 |
| Net investment income3 | 0.09 |
| Net realized and unrealized loss | |
| on investments | (0.19) |
| Total from investment operations | (0.10) |
| Net asset value, end of period | $9.90 |
| Total return4,5,6 (%) | (1.00) |
| Ratios and supplemental data | |
| Net assets, end of period | |
| (in millions) | $6 |
| Ratio of net expenses to average | |
| net assets7 (%) | 1.37 |
| Ratio of gross expenses to average | |
| net assets7,8 (%) | 2.59 |
| Ratio of net investment income | |
| to average net assets7 (%) | 1.64 |
| Portfolio turnover6 (%) | 16 |
See notes to financial statements
Classic Value Mega Cap Fund
15
F I N A N C I A L S T A T E M E N T S
Financial highlights
| CLASS B SHARES | |
| Period ended | 8-31-071,2 |
| Per share operating performance | |
| Net asset value, beginning of period | $10.00 |
| Net investment income3 | 0.06 |
| Net realized and unrealized loss | |
| on investments | (0.19) |
| Total from investment operations | (0.13) |
| Net asset value, end of period | $9.87 |
| Total return4,5,6 (%) | (1.30) |
| Ratios and supplemental data | |
| Net assets, end of period | |
| (in millions) | —9 |
| Ratio of net expenses to average | |
| net assets7 (%) | 2.12 |
| Ratio of gross expenses to average | |
| net assets7,8 (%) | 17.04 |
| Ratio of net investment income | |
| to average net assets7 (%) | 1.12 |
| Portfolio turnover6 (%) | 16 |
See notes to financial statements
Classic Value Mega Cap Fund
16
F I N A N C I A L S T A T E M E N T S
Financial highlights
| CLASS C SHARES | |
| Period ended | 8-31-071,2 |
| Per share operating performance | |
| Net asset value, beginning of period | $10.00 |
| Net investment income3 | 0.09 |
| Net realized and unrealized loss | |
| on investments | (0.21) |
| Total from investment operations | (0.12) |
| Net asset value, end of period | $9.88 |
| Total return4,5,6 (%) | (1.20) |
| Ratios and supplemental data | |
| Net assets, end of period | |
| (in millions) | $1 |
| Ratio of net expenses to average | |
| net assets7 (%) | 2.12 |
| Ratio of gross expenses to average | |
| net assets7,8 (%) | 11.81 |
| Ratio of net investment income | |
| to average net assets7 (%) | 1.89 |
| Portfolio turnover6 (%) | 16 |
See notes to financial statements
Classic Value Mega Cap Fund
17
F I N A N C I A L S T A T E M E N T S
Financial highlights
| CLASS I SHARES | |
| Period ended | 8-31-071,2 |
| Per share operating performance | |
| Net asset value, beginning of period | $10.00 |
| Net investment income3 | 0.13 |
| Net realized and unrealized loss | |
| on investments | (0.20) |
| Total from investment operations | (0.07) |
| Net asset value, end of period | $9.93 |
| Total return4,5,6 (%) | (0.70) |
| Ratios and supplemental data | |
| Net assets, end of period | |
| (in millions) | —9 |
| Ratio of net expenses to average | |
| net assets7 (%) | 0.97 |
| Ratio of gross expenses to average | |
| net assets7,8 (%) | 15.87 |
| Ratio of net investment income | |
| to average net assets7 (%) | 2.51 |
| Portfolio turnover6 (%) | 16 |
See notes to financial statements
Classic Value Mega Cap Fund
18
F I N A N C I A L S T A T E M E N T S
Financial highlights
| CLASS R1 SHARES | |
| Period ended | 8-31-071,2 |
| Per share operating performance | |
| Net asset value, beginning of period | $10.00 |
| Net investment income3 | 0.07 |
| Net realized and unrealized loss | |
| on investments | (0.18) |
| Total from investment operations | (0.11) |
| Net asset value, end of period | $9.89 |
| Total return4,5,6 (%) | (1.10) |
| Ratios and supplemental data | |
| Net assets, end of period | |
| (in millions) | —9 |
| Ratio of net expenses to average | |
| net assets7 (%) | 1.72 |
| Ratio of gross expenses to average | |
| net assets7,8 (%) | 14.71 |
| Ratio of net investment income | |
| to average net assets7 (%) | 1.37 |
| Portfolio turnover6 (%) | 16 |
1 Semiannual period from 3-1-07 to 8-31-07. Unaudited.
2 Class A, Class B, Class C, Class I and Class R1 shares began operations on 3-1-07.
3 Based on the average of the shares outstanding.
4 Assumes dividend reinvestment.
5 Total returns would have been lower had certain expenses not been reduced during the period shown.
6 Not annualized.
7 Annualized.
8 Does not take into consideration expense reductions during the periods shown.
9 Less than $500,000.
See notes to financial statements
Classic Value Mega Cap Fund
19
Notes to financial statements (unaudited)
1. Organization
John Hancock Classic Value Mega Cap Fund (the Fund) is a newly organized non-diversified series of John Hancock Funds III (the Trust). The Trust was established as a Massachusetts business trust on June 9, 2005. The Trust is registered under the Investment Company Act of 1940, as amended (the 1940 Act), as an open-end investment management company. The investment objective of the Fund is to seek long-term growth of capital.
John Hancock Life Insurance Company of New York (John Hancock New York) is a wholly owned subsidiary of John Hancock Life Insurance Company (U.S.A.) (John Hancock USA). John Hancock USA and John Hancock New York are indirect wholly owned subsidiaries of The Manufacturers Life Insurance Company (Manulife), which in turn is a wholly owned subsidiary of Manulife Financial Corporation (MFC), a publicly traded company. MFC and its subsidiaries are known collectively as “Manulife Financial.”
John Hancock Investment Management Services, LLC (the Adviser), a Delaware limited liability company controlled by John Hancock USA, serves as investment adviser for the Trust and John Hancock Funds, LLC (the Distributor), a Delaware limited liability company, an affiliate of the Adviser, serves as principal underwriter.
The Board of Trustees has authorized the issuance of multiple classes of shares of the Fund, including classes designated as Class A, Class B, Class C, Class I, Class R1 and Class NAV shares. The shares of each class represent an interest in the same portfolio of investments of the Fund, and have equal rights as to voting, redemptions, dividends and liquidation, except that certain expenses, subject to the approval of the Board of Trustees, may be applied differently to each class of shares in accordance with current regulations of the Securities and Exchange Commission and the Internal Revenue Service. Shareholders of a class that bear distribution and service expenses under the terms of a distribution plan have exclusive voting rights to that distribution plan. Class B shares will convert to Class A shares eight years after purchase.
The Adviser and other subsidiaries of John Hancock USA owned 460,000, 10,000, 10,000, 10,000 and 10,000 shares of beneficial interest of Class A, Class B, Class C, Class I and Class R1, respectively, of the Fund on August 31, 2007.
2. Significant accounting policies
In the preparation of the financial statements, the Fund follows the policies described below. The preparation of financial statements in conformity with accounting principles generally accepted in the United States of America requires management to make estimates and assumptions that affect the reported amounts of assets and liabilities at the date of the financial statements and the reported amounts of income and expenses during the reporting period. Actual results may differ from these estimates.
Security valuation
The net asset value of the shares of Class A, Class B, Class C, Class I and Class R1 of the Fund is determined daily as of the close of the New York Stock Exchange (NYSE), normally at 4:00 p.m., Eastern Time. Short-term debt instruments with remaining maturities of 60 days or less are valued at amortized cost, and thereafter assume a constant amortization to maturity of any discount or premium, which approximates market value. All other securities held by the Fund are valued at the last sale price or official closing price (closing bid price or last evaluated quote if no sale has occurred) as of the close of business on a principal securities exchange (domestic or foreign) on which they trade or, lacking any sales, at the closing bid price. Securities traded only in the over-the-counter
Classic Value Mega Cap Fund
20market are valued at the last bid price quoted by brokers making markets in the securities at the close of trading. Securities for which there are no such quotations, principally debt securities, are valued based on the valuation provided by an independent pricing service, which utilizes both dealer-supplied and electronic data processing techniques, which take into account factors such as institutional size trading in similar groups of securities, yield, quality, coupon rate, maturity, type of issue, trading characteristics and other market data.
Other assets and securities for which no such quotations are readily available are valued at their fair value as determined in good faith under consistently applied procedures established by and under the general supervision of the Board of Trustees. Generally, trading in non-U.S. securities is substantially completed each day at various times prior to the close of trading on the NYSE. The values of such securities used in computing the net asset value of a Fund’s shares are generally determined as of such times. Occasionally, significant events that affect the values of such securities may occur between the times at which such values are generally determined and the close of the NYSE. Upon such an occurrence, these securities will be valued at their fair value as determined in good faith under consistently applied procedures established by and under the general supervision of the Board of Trustees.
Repurchase agreements
The Fund may enter into repurchase agreements. When the Fund enters into a repurchase agreement through its custodian, it receives delivery of securities, the amount of which at the time of purchase and each subsequent business day is required to be maintained at such a level that the market value is generally at least 102% of the repurchase amount. The Fund will take constructive receipt of all securities underlying the repurchase agreements it has entered into until such agreements expire. If the seller defaults, the Fund would suffer a loss to the extent that proceeds from the sale of underlying securities were less than the repurchase amount. The Fund may enter into repurchase agreements maturing within seven days with domestic dealers, banks or other financial institutions deemed to be creditworthy by the Adviser. Collateral for certain tri-party repurchase agr eements is held at the custodian bank in a segregated account for the benefit of the Fund and the counterparty.
Security transactions and related investment income
Investment security transactions are accounted for on a trade date plus one basis for daily net asset value calculations. However, for financial reporting purposes, investment transactions are reported on trade date. Interest income is accrued as earned. Dividend income is recorded on the ex-dividend date. Foreign dividends are recorded on the ex-date or when the Fund becomes aware of the dividends from cash collections. Discounts/ premiums are accreted/amortized for financial reporting purposes. Non-cash dividends are recorded at the fair market value of the securities received. Debt obligations may be placed in a non-accrual status and related interest income may be reduced by ceasing current accruals and writing off interest receivables when the collection of all or a portion of interest has become doubtful, based upon consistently applied procedures.
From time to time, the Fund may invest in Real Estate Investment Trusts (REITs) and as a result, will estimate the components of distributions from these securities. Distributions from REITs received in excess of income are recorded as a reduction of cost of investments and/or as a realized gain.
The Fund uses the First In, First Out method for fixed income securities and Highest Cost, First Out for all other securities for determining realized gain or loss on investments for both financial and federal income tax reporting purposes.
Multi-class allocations
All income, expenses (except for class-specific expenses) and realized and unrealized gains (losses) are allocated to each class of shares based upon the relative net assets of each class. Dividends to shareholders from net investment income are determined at a class level and distributions from capital gains are determined at a Fund level.
Classic Value Mega Cap Fund
21
Expense allocation
Expenses are allocated based on the relative share of net assets of the Fund at the time the expense was incurred. Class-specific expenses, such as distribution (Rule 12b-1) fees, are accrued daily and charged directly to the respective share classes.
Futures
The Fund may purchase and sell financial futures contracts and options on those contracts. The Fund invests in contracts based on financial instruments such as U.S. Treasury Bonds or Notes or on securities indices such as the Standard & Poor’s 500 Index, in order to hedge against a decline in the value of securities owned by the Fund.
Initial margin deposits required upon entering into futures contracts are satisfied by the delivery of specific securities or cash as collateral to the broker (the Funds’ agent in acquiring the futures position). If the position is closed out by taking an opposite position prior to the settlement date of the futures contract, a final determination of variation margin is made, cash is required to be paid to or released by the broker and the Fund realizes a gain or loss.
When the Fund sells a futures contract based on a financial instrument, the Fund becomes obligated to deliver that kind of instrument at an agreed upon date for a specified price. The Fund realizes a gain or loss depending on whether the price of an offsetting purchase is less or more than the price of the initial sale or on whether the price of an offsetting sale is more or less than the price of the initial purchase. The Fund could be exposed to risks if it could not close out futures positions because of an illiquid secondary market or the inability of counterparties to meet the terms of their contracts. Futures contracts are valued at the quoted daily settlement prices established by the exchange on which they trade. The Fund had no open financial futures contracts on August 31, 2007.
Federal income taxes
The Fund qualifies as a “regulated investment company” by complying with the applicable provisions of the Internal Revenue Code and will not be subject to federal income tax on taxable income. Therefore, no federal income tax provision is required.
New accounting pronouncements
In June 2006, Financial Accounting Standards Board (FASB) Interpretation No. 48, Accounting for Uncertainty in Income Taxes (the Interpretation), was issued and is effective for fiscal years beginning after December 15, 2006, and is to be applied to all open tax years as of the effective date. This Interpretation prescribes a minimum threshold for financial statement recognition of the benefit of a tax position taken or expected to be taken in a tax return, and requires certain expanded disclosures. Management has evaluated the application of this Interpretation to the Fund and does not believe there is a material impact resulting from the adoption of this Interpretation on the Fund’s financial statements.
In September 2006, FASB Standard No. 157, Fair Value Measurements (FAS 157), was issued and is effective for fiscal years beginning after November 15, 2007. FAS 157 defines fair value, establishing a framework for measuring fair value and expands disclosure about fair value measurements. Management is currently evaluating the application of FAS 157 to the Fund and its impact, if any, resulting from the adoption of FAS 157 on the Fund’s financial statements.
Distribution of income and gains
The Fund records distributions to shareholders from net investment income and net realized gains, if any, on the ex-dividend date. There were no distributions during the period ended August 31, 2007. Distributions paid by the Fund with respect to each class of shares are calculated in the same manner, at the same time and are in the same amount, except for the effect of expenses that may be applied differently to each class.
Such distributions, on a tax basis, are determined in conformity with income tax regulations, which may differ from accounting principles generally accepted in the United States of America. Distributions in excess of tax basis earnings and profits, if any, are reported in the Fund’s financial statements as a return of capital.
Classic Value Mega Cap Fund
22
Capital accounts
The Fund reports the undistributed net investment income and accumulated undistributed net realized gain (loss) accounts on a basis approximating amounts available for future tax distributions (or to offset future taxable realized gains when a capital loss carryforward is available). Accordingly, the Fund may periodically make reclassifications among certain capital accounts without affecting its net asset value.
3. Investment advisory and other agreements
Advisory fees
The Trust has entered into an Investment Advisory Agreement with the Adviser. The Adviser is responsible for managing the corporate and business affairs of the Trust and for selecting and compensating subadvisers to handle the investment of the assets of the Fund, subject to the supervision of the Trust’s Board of Trustees. Under the Advisory Agreement the Fund pays a monthly management fee to the Adviser equivalent, on an annual basis, to the sum of: (a) 0.85% of the first $2,500,000,000 of the Fund’s aggregate daily net assets; (b) 0.825% of the next $2,500,000,000 of the Fund’s aggregate daily net assets; and (c) 0.80% of the Fund’s aggregate daily net assets in excess of $5,000,000,000. The Adviser has a subadvisory agreement with Pzena Investment Management, LLC. The Fund is not responsible for payment of the subadvisory fees.
Expense reimbursements
The Adviser has agreed contractually to reimburse or to make a payment to a specific class of shares of the Fund in an amount equal to the amount by which the expenses attributable to such class of shares (excluding taxes, portfolio brokerage commissions, interest, litigation and indemnification expenses and other extraordinary expenses not incurred in the ordinary course of the Fund’s business and fees under any agreement or plans of the Fund dealing with services for shareholders and others with beneficial interests in shares of the Fund) exceed the percentage of average annual net assets (on an annualized basis) attributable as follows: 1.37% for Class A, 2.12% for Class B, 2.12% for Class C, 0.97% for Class I and 1.47% for Class R1. Accordingly, the expense reductions related to this expense limitation amounted to $31,056, $8,893, $9,191, $8,944 and $ 9,706 for Class A, Class B, Class C, Class I and Class R1, respectively, for the period ended August 31, 2007. This expense reimbursement shall continue in effect until February 29, 2008 and thereafter until terminated by the Adviser on notice to the Trust.
Administration fees
The Fund has an agreement with the Adviser that requires the Fund to reimburse the Adviser for all expenses associated with providing the administrative, financial, accounting and recordkeeping services of the Fund, including the preparation of all tax returns, annual, semiannual and periodic reports to shareholders and the preparation of all regulatory reports. These expenses are allocated based on the relative net assets of each class. The compensation for the period amounted to $717 with an effective rate of 0.03% of the Fund’s average daily net asset value.
Distribution plan
The Trust has a Distribution Agreement with the Distributor. The Fund has adopted Distribution Plans with respect to Class A, Class B, Class C and Class R1, pursuant to Rule 12b-1 under the 1940 Act, to reimburse the Distributor for the services it provides as distributor of shares of the Fund. Accordingly, the Fund makes monthly payments to the Distributor at an annual rate not to exceed 0.30%, 1.00%, 1.00% and 0.50% of average daily net asset value of Class A, Class B, Class C and Class R1, respectively. A maximum of 0.25% of such payments may be service fees, as defined by the Conduct Rules of the Financial Industry Regulatory Authority (formerly the National Association of Securities Dealers). Under the Conduct Rules, curtailment of a portion of the Fund’s 12b-1 payments could occur under certain circumstances. In addition, under a Service Plan for Class R1 shares, the Fund pays up to 0.25% of Class R1 average daily net asse t value for certain other services.
Sales charges
Class A shares are assessed up-front sales charges of up to 5.00% of net asset value of such shares. During the period ended August 31, 2007, the Fund was informed that
Classic Value Mega Cap Fund
23
the Distributor received net up-front sales charges of $19,677 with regard to sales of Class A shares. Of this amount, $3,182 was retained and used for printing prospectuses, advertising, sales literature and other purposes and $16,495 was paid as sales commissions to unrelated broker-dealers and $0 was paid as sales commissions to sales personnel of Signator Investors, Inc. (Signator Investors), a related broker-dealer, an indirect subsidiary of MFC.
Class B shares that are redeemed within six years of purchase are subject to a contingent deferred sales charge (CDSC) at declining rates, beginning at 5.00% of the lesser of the current market value at the time of redemption or the original purchase cost of the shares being redeemed. Class C shares that are redeemed within one year of purchase are subject to a CDSC at a rate of 1.00% of the lesser of the current market value at the time of redemption or the original purchase cost of the shares being redeemed. Proceeds from the CDSCs are paid to the Distributor and are used, in whole or in part, to defray its expenses for providing distribution-related services to the Fund in connection with the sale of Class B and Class C shares. JH Funds received no CDSCs with regard to Class B and Class C shares.
Transfer agent fees
The Fund has a Transfer Agency Agreement with John Hancock Signature Services, Inc. (Signature Services), an indirect subsidiary of MFC. For Class A, Class B, Class C, Class I and Class R1 shares, the Fund pays a monthly transfer agent fee at an annual rate of 0.05% of each class’s average daily net assets, plus a fee based on the number of shareholder accounts and reimbursement for certain out-of-pocket expenses. Expenses not directly attributable to a particular class of shares are aggregated and allocated to each class on the basis of its relative net asset value.
Signature Services has agreed to limit the transfer agent fees so that such fees do not exceed 0.20% annually of Class A, Class B, Class C, Class I and Class R1 share average daily net assets. This agreement is effective until December 31, 2007. Signature Services reserves the right to terminate this limitation in the future. Accordingly, there were no transfer agent fee reductions for Class A, Class B, Class C, Class I and Class R1 shares, respectively, during the period ended August 31, 2007.
| Expenses under the agreements described above for the period ended August 31, 2007, were as follows: | ||||
| Distribution and | Transfer | Blue sky | Printing and | |
| Share class | service fees | agent fees | fees | postage fees |
| Class A | $6,495 | $4,678 | $8,106 | $1,265 |
| Class B | 592 | 118 | 8,106 | 195 |
| Class C | 943 | 189 | 8,106 | 95 |
| Class I | — | 30 | 8,106 | 241 |
| Class R1 | 558 | 37 | 8,602 | 385 |
| Total | $8,588 | $5,052 | $41,026 | $2,281 |
Trustees’ fees
The Trust compensates each Trustee who is not an employee of the Adviser or its affiliates. Total Trustees’ expenses are allocated to the Fund based on its average daily net asset value.
4. Guarantees and indemnifications
Under the Trust’s organizational documents, its Officers and Trustees are indemnified against certain liability arising out of the performance of their duties to the Trust. Additionally, in the normal course of business, the Trust enters into contracts with service providers that contain general indemnification clauses. The Trust’s maximum exposure under these arrangements is unknown, as this would involve future claims that may be made against the Trust that have not yet occurred. However, based on experience, the Trust believes the risk of loss to be remote.
Classic Value Mega Cap Fund
24
5. Line of credit
The Fund has entered into an agreement which enables it to participate in a $100 million unsecured committed line of credit with State Street Corporation. Borrowings will be made solely to temporarily finance the repurchase of capital shares. Interest is charged to the Fund based on its borrowings at a rate per annum equal to the Federal Funds rate plus 0.50% . In addition, a commitment fee of 0.07% per annum, payable at the end of each calendar quarter, based on the average daily-unused portion of the line of credit, is charged to the Fund on a prorated basis based on average net assets. For the period ended August 31, 2007, there were no borrowings under the line of credit.
6. Capital shares
Share activities for the Fund for the period ended August 31, 2007 were as follows:
| Period ended 8-31-071 | ||
| Shares | Amount | |
| Class A | ||
| Sold | 570,676 | $5,751,393 |
| Repurchased | (11,324) | (113,720) |
| Net increase | 559,352 | $5,637,673 |
| Class B | ||
| Sold | 14,595 | $147,734 |
| Repurchased | (17) | (168) |
| Net increase | 14,578 | $147,566 |
| Class C | ||
| Sold | 52,211 | $530,158 |
| Net increase | 52,211 | $530,158 |
| Class I | ||
| Sold | 20,337 | $205,270 |
| Net increase | 20,337 | $205,270 |
| Class R1 | ||
| Sold | 15,219 | $152,310 |
| Repurchased | (121) | (1,300) |
| Net increase | 15,098 | $151,010 |
| Net increase | 661,576 | $6,671,677 |
| 1Semiannual period from 3-1-07 (commencement of operations) to 8-31-07. Unaudited. | ||
7. Investment transactions
Purchases and proceeds from sales or maturities of securities, other than short-term securities and obligations of the U.S. government, during the period ended August 31, 2007, aggregated $7,438,332 and $888,764, respectively.
The cost of investments owned on August 31, 2007, including short-term investments, for federal income tax purposes, was $6,769,133. Gross unrealized appreciation and depreciation of investments aggregated $134,615 and $391,206, respectively, resulting in net unrealized depreciation of $256,591.
8. Federal income tax information
Federal income tax regulations may differ from generally accepted accounting principles and income and capital gain distributions determined in accordance with tax regulations may differ from net investment income and realized gains recognized for financial reporting purposes.
Classic Value Mega Cap Fund
25
Evaluation of Advisory and Subadvisory Agreements by the Board of Trustees
This section describes the evaluation by the Board of Trustees of:
(a) an amendment (the Advisory Agreement Amendment) to the advisory agreement between John Hancock Funds III (the Trust) and John Hancock Investment Management, LLC (the Adviser or JHIMS) to add the John Hancock Classic Value Mega Cap Fund (the Fund).
(b) a subadvisory agreement (the Pzena Subadvisory Agreement) between the Adviser and Pzena Investment Management Company (Pzena or Subadviser) to add the Fund.
Evaluation by the Board of Trustees
The Board, including the Independent Trustees, is responsible for selecting the Trust’s Adviser, approving the Adviser’s selection of subadvisers for the Fund and approving the Trust’s advisory and subadvisory agreement, their periodic continuation and any amendments. Consistent with SEC rules, the Board regularly evaluates the Trust’s advisory and subadvisory arrangements, including consideration of the factors listed below. The Board may also consider other factors (including conditions and trends prevailing generally in the economy, the securities markets and the industry) and does not treat any single factor as determinative, and each Trustee may attribute different weights to different factors. The Board is furnished with an analysis of its fiduciary obligations in connection with its evaluation and, throughout the evaluation process, the Board is assisted by counsel for the Trust and the Independent Trustees are also separately assisted by independent legal counsel. The factors considered by the Board are:
1. the nature, extent and quality of the services to be provided by the Adviser to the Trust and by the subadvisers to the Fund;
2. the investment performance of the Fund and their subadvisers;
3. the extent to which economies of scale would be realized as a Fund grows and whether fee levels reflect these economies of scale for the benefit of Trust shareholders;
4. the costs of the services to be provided and the profits to be realized by the Adviser and its affiliates (including any subadvisers that are affiliated with the Adviser) from the Adviser’s relationship with the Trust; and
5. comparative services rendered and comparative advisory and subadvisory fee rates.
The Board believes that information relating to these factors is relevant to its evaluation of the Trust’s advisory agreement. With respect to its evaluation of subadvisory agreements not affili-ated with the Adviser, the Board believes that, in view of the Trust’s “manager of managers” advisory structure, the costs of the services to be provided and the profits to be realized by those subadvisers that are not affiliated with the Adviser from their relationship with the Trust generally are not a material factor in the Board’s consideration of these subadvisory agreements because such fees are paid by the Adviser and not by the Fund and the Board relies on the ability of the Adviser to negotiate the subadvisory fees at arm’s-length.
In evaluating subadvisory arrangements, the Board also considers other material business relationships that unaffiliated subadvisers and their affiliates have with the Adviser or its affiliates, including the involvement by certain affiliates of certain subadvisers in the distribution of financial products, including shares of the Trust, offered by the Adviser and other affiliates of the Adviser (Material Relationships).
Approval of Advisory Agreement
At its meeting on December 12–13, 2006, the Board, including all the Independent Trustees, approved the Advisory Agreement Amendment. In approving the Advisory Agreement Amendment, and with reference to the factors that it regularly considers, the Board:
(1) (a) considered the high value to the Trust of continuing its relationship with JHIMS as the Trust’s adviser, the skills and competency with which JHIMS has in the past managed the Trust’s affairs and its subadvi-sory relationships, JHIMS’s oversight and monitoring of the subadviser’s investment
26
performance and compliance programs including its timeliness in responding to performance issues and the qualifications of JHIMS’ personnel,
(b) considered JHIMS’s compliance policies and procedures and its responsiveness to regulatory changes and mutual fund industry developments, and
(c) considered JHIMS’s administrative capabilities, including its ability to supervise the other service providers for the Fund and concluded that JHIMS may reasonably be expected to perform its services under the Advisory Agreement with respect to the Fund;
(2) reviewed the investment performance of portfolios of the Subadviser that are managed comparably to the Fund as set forth in Appendix A; the comparative performance of its benchmark; and JHIMS’ analysis of such performance and its plans and recommendations regarding the Trust’s subadvisory arrangements generally and with respect to the Fund; and concluded that the portfolios of the Subadviser that are managed comparably to the Fund have performed well or within a range that the Board deemed competitive, and that JHIMS may reasonably be expected to ably monitor the performance of the Fund and its Subadviser.
(3) reviewed the advisory fee structure for the Fund and the incorporation therein of any subadvisory fee breakpoints in the advisory fees charged and concluded (i) that all subadvisory breakpoints are reflected as breakpoints in the advisory fees for the Fund, and (ii) that, although economies of scale cannot be measured with precision, these arrangements permit shareholders of the Fund to benefit from economies of scale if the assets of such fund grow;
(4) (a) reviewed the anticipated profitability of the JHIMS’s relationship with the Fund in terms of the total amount of annual advisory fees it would receive with respect to the Fund and whether JHIMS has the financial ability to provide a high level of services to the Fund,
(b) considered that JHIMS derives reputational and other indirect benefits from providing advisory services to the Fund, and
(c) noted that JHIMS will pay the subadvisory fee out of the advisory fees JHIMS will receive from the Fund and concluded that the advisory fees to be paid by the Trust with respect to the Fund are not unreasonable in light of such information; and
(5) (a) reviewed comparative information with respect to the advisory fee rates and concluded that the anticipated advisory fees for the Fund, are generally within a competitive range of those incurred by other comparable funds. In this regard, the Board took into account management’s discussion with respect to the advisory fee structure. The Board also noted that the Adviser pays the subad-visory fees of the Fund. The Board also took into account the level and quality of services expected to be provided by JHIMS with respect to the Fund, as well as the other factors considered.
Approval of Subadvisory Agreements
At its meeting on December 12–13, 2006, the Board, including all the Independent Trustees, approved the Subadvisory Agreement.
In making its determination with respect to the factors that it considers, the Board reviewed:
(1) information relating to Pzena’s business, which may include information such as: business performance, representative clients, assets under management, financial stability, personnel and past subadvisory services to the Trust, John Hancock Funds II and John Hancock Trust;
(2) the investment performance of the Subadviser’s portfolios managed comparably to the Fund and comparative performance information relating to the benchmark;
27
(3) the proposed subadvisory fee for the Fund and comparative fee information; and
(4) information relating to the nature and scope of Material Relationships and their significance to the Trust’s adviser and unaffiliated subadvisers.
The Board’s decision to approve the Subadvisory Agreement was based on a number of determinations, including the following:
(1) The Subadviser has extensive experience and demonstrated skills as a manager;
(2) With respect to the Subadviser, the subadvisory fees are a product of arm’s-length negotiation between the Adviser and the Subadviser and generally are competitive within the range of industry norms;
(3) For the Fund all subadvisory breakpoints are reflected as breakpoints in the advisory fees,
(4) Although not without variation, the current and historical performance of the portfolios of the Subadviser managed comparably to the Fund has been within the range of the current and historical performance of these portfolios’ respective benchmark (see Appendix A for further information on performance); and
(5) The Material Relationships consist of arrangements in which the Subadviser or its affiliates provide advisory, distribution or management services in connection with financial products sponsored by the Trust’s adviser or its affiliates, which may include other registered investment companies, a 529 education savings plan, managed separate accounts and exempt group annuity contracts sold to qualified plans, and which in no case contained elements which would cause the Board to conclude that approval of the subadvisory agreement with the Subadviser would be inappropriate.
Additional information that the Board considered for the Fund is set forth in Appendix A.
| Appendix A | |||
| Portfolio | Performance of Trust | Fees and | |
| (Subadviser) | as of Sept 30, 2006 | Expenses | Comments |
| JH Classic Value | There is no track | See Comments | The portfolio will com- |
| Mega Cap Fund | record for the Classic | mence operations on or | |
| Value Mega Cap | about March 1, 2007 and | ||
| (Pzena Investment | Fund. However, | has no performance | |
| Management, LLC.) | performance of the | history. The current sub- | |
| Classic Value Fund, a | adviser manages two | ||
| similar fund managed | other comparable funds. | ||
| by Pzena Investment | |||
| Management, beats | Based on estimates, | ||
| the benchmark for | total expenses for this | ||
| the past 1-, 3-, 5- and | Portfolio is higher than | ||
| 10-year periods. The | the peer group average. | ||
| investment universe | |||
| of the Classic Value | |||
| Fund is the largest 500 | |||
| U.S. stocks, while the | |||
| universe of the Classic | |||
| Value Mega Cap Fund | |||
| will be the largest 250 | |||
| U.S. stocks. | |||
28
Why John Hancock Funds?
For more than three decades, John Hancock Funds has been helping individual, corporate and institutional clients reach their most important financial goals. With so many fund companies to choose from, why should you invest with us?
► A name you know and trust
When you invest with John Hancock Funds, you are investing with one of the most recognized and respected names in the financial services industry. Our parent company has been helping individuals and institutions increase and protect wealth since 1862.
► Solutions across the investing spectrum
We offer equity, income, international, sector and asset allocation investment solutions managed by leading institutional money managers. Each of our funds utilizes a disciplined, team approach to portfolio management and research, leveraging the expertise of seasoned investment professionals.
► Committed to you
Our shareholders come first. We work hard to provide you with the products you need to build a solid financial foundation. We’re proud to offer you award-winning services and tools, like the www.jhfunds.com Web site, to help you every step of the way.
For immediate insight and answers,
turn to www.jhfunds.com
Discover the new and improved www.jhfunds.com.
n View accounts, statements and fund information.
n Access college and retirement planning calculators and investment education.
n Gain investment ideas, expand your knowledge and become a more informed investor.

This is just the beginning of how much you can do.
Now is the ideal time to experience our Web site that received the following recognition in 2006:
 “Best Innovation: Redesigned Web Site” by the Mutual Fund Education Alliance.
 “Outstanding Web Site” by the Web Marketing Association.
 “Creative excellence on the Web, Silver Award winner” by W3.
Discover convenience and comprehensive resources at oneeasy-to-access location. Your financial professional can steer you to the tools that will help you the most and enable you to transform your knowledge into action.
See how far www.jhfunds.com can take you!
At the heart of John Hancock Funds is
AWARD-WINNING SERVICE
How our exceptional customer service can benefit you:

We’re committed to providing you with answers, solving problems and saving you time.

We’re ready to go one step further by offering a range of resources so you can build your knowledge and expand your skills.

We’re determined to regularly exceed your expectations.
Experience award-winning, world-class service.
Consider the recognition that we received in 2006.
n John Hancock Signature Services, Inc. (JHSS) is the transfer and shareholder services agent for John Hancock Funds. JHSS was awarded “Best-In-Class” honors and “5-Star” performer status for telephone customer service for all of 2006 from the National Quality Review.
n Winner of Source Media’s Fund Operations Awards in the category of Efficiencies/Streamlining.
n One of four finalists for Best Customer Service Organization, Financial Services at The American Business Awards, “The Stevies.” ™

Let us demonstrate the
difference that world-class
service can make.
Call our customer service representatives at 1-800-225-5291
Monday to Friday 8:00 a.m. – 7:00 p.m., ET
It will be our pleasure and privilege to help you.
For more information
The Fund’s proxy voting policies, procedures and records are available without charge, upon request:
| By phone | On the Fund’s Web site | On the SEC’s Web site |
| 1-800-225-5291 | www.jhfunds.com/proxy | www.sec.gov |
| Trustees | Charles A. Rizzo | Custodian |
| Ronald R. Dion, Chairman | Chief Financial Officer | State Street Bank & Trust Co. |
| James R. Boyle† | 2 Avenue de Lafayette | |
| James F. Carlin | Gordon M. Shone | Boston, MA 02111 |
| William H. Cunningham | Treasurer | |
| Charles L. Ladner* | Transfer agent | |
| Dr. John A. Moore* | John G. Vrysen | John Hancock Signature |
| Patti McGill Peterson* | Chief Operating Officer | Services, Inc. |
| Steven R. Pruchansky | One John Hancock Way, | |
| *Members of the Audit Committee | Investment adviser | Suite 1000 |
| †Non-Independent Trustee | John Hancock Investment | Boston, MA 02217-1000 |
| Management Services, LLC | ||
| Officers | 601 Congress Street | Legal counsel |
| Keith F. Hartstein | Boston, MA 02210-2805 | Kirkpatrick & Lockhart |
| President and | Preston Gates Ellis LLP | |
| Chief Executive Officer | Subadviser | One Lincoln Street |
| Pzena Investment | Boston, MA 02111-2950 | |
| Thomas M. Kinzler | Management, LLC | |
| Secretary and Chief Legal Officer | 120 West 45th Street, | |
| 20th Floor | ||
| Francis V. Knox, Jr. | New York, NY 10036 | |
| Chief Compliance Officer | ||
| How to contact us | ||
| Internet | www.jhfunds.com | |
| Regular mail: | Express mail: | |
| John Hancock | John Hancock | |
| Signature Services, Inc. | Signature Services, Inc. | |
| One John Hancock Way, Suite 1000 | Mutual Fund Image Operations | |
| Boston, MA 02217-1000 | 380 Stuart Street | |
| Boston, MA 02116 | ||
| Phone | Customer service representatives | 1-800-225-5291 |
| EASI-Line | 1-800-338-8080 | |
| TDD line | 1-800-554-6713 | |
A listing of month-end portfolio holdings is available on our Web site, www.jhfunds.com. A more detailed portfolio holdings summary is available on a quarterly basis 60 days after the fiscal quarter on our Web site or upon request by calling 1-800-225-5291, or on the SEC’s Web site, www.sec.gov.
32
J O H N H A N C O C K F A M I LY O F F U N D S
| EQUITY | INTERNATIONAL |
| Balanced Fund | Global Opportunities Fund |
| Classic Value Fund | Global Shareholder Yield Fund |
| Classic Value Fund II | Greater China Opportunities Fund |
| Classic Value Mega Cap Fund | International Allocation Portfolio |
| Core Equity Fund | International Classic Value Fund |
| Growth Fund | International Core Fund |
| Growth Opportunities Fund | International Growth Fund |
| Growth Trends Fund | |
| Intrinsic Value Fund | INCOME |
| Large Cap Equity Fund | Bond Fund |
| Large Cap Select Fund | Government Income Fund |
| Mid Cap Equity Fund | High Yield Fund |
| Multi Cap Growth Fund | Investment Grade Bond Fund |
| Small Cap Equity Fund | Strategic Income Fund |
| Small Cap Fund | tAx-FrEE incomE |
| Small Cap Intrinsic Value Fund | California Tax-Free Income Fund |
| Sovereign Investors Fund | High Yield Municipal Bond Fund |
| U.S. Core Fund | Massachusetts Tax-Free Income Fund |
| U.S. Global Leaders Growth Fund | New York Tax-Free Income Fund |
| Value Opportunities Fund | Tax-Free Bond Fund |
| ASSET ALLOCATION | MONEY MARKET |
| Lifecycle 2010 Portfolio | Money Market Fund |
| Lifecycle 2015 Portfolio | |
| Lifecycle 2020 Portfolio | CLOSED-END |
| Lifecycle 2025 Portfolio | Bank and Thrift Opportunity Fund |
| Lifecycle 2030 Portfolio | Financial Trends Fund, Inc. |
| Lifecycle 2035 Portfolio | Income Securities Trust |
| Lifecycle 2040 Portfolio | Investors Trust |
| Lifecycle 2045 Portfolio | Patriot Premium Dividend Fund II |
| Lifecycle Retirement Portfolio | Preferred Income Fund |
| Lifestyle Aggressive Portfolio | Preferred Income II Fund |
| Lifestyle Balanced Portfolio | Preferred Income III Fund |
| Lifestyle Conservative Portfolio | Tax-Advantaged Dividend Income Fund |
| Lifestyle Growth Portfolio | Tax-Advantaged Global Shareholder Yield Fund |
| Lifestyle Moderate Portfolio | |
| SECTOR | |
| Financial Industries Fund | |
| Health Sciences Fund | |
| Real Estate Fund | |
| Regional Bank Fund | |
| Technology Fund | |
| Technology Leaders Fund | |
The Fund’s investment objectives, risks, charges and expenses are included in the prospectus and should be considered carefully before investing. For a prospectus, contact your financial professional, call John Hancock Funds at 1-800-225-5291 or visit the Fund’s Web site at www.jhfunds.com. Please read the prospectus carefully before investing or sending money.

1-800-225-5291
1-800-554-6713 TDD
1-800-338-8080 EASI-Line
www.jhfunds.com
Now available:electronic delivery
www.jhfunds.com/edelivery
This report is for the information of the shareholders of John Hancock Classic Value Mega Cap Fund.
It is not authorized for distribution to prospective investors unless preceded or accompanied by a prospectus.
322SA 8/07
10/07
ITEM 2. CODE OF ETHICS.
As of the end of the period, August 31, 2007, the registrant has adopted a code of ethics, as defined in Item 2 of Form N-CSR, that applies to its Chief Executive Officer and Chief Financial Officer (respectively, the principal executive officerand the principal financial officer, the “Coveredl Officers”). A copy of the code of ethics is filed as an exhibit to this Form N-CSR.
ITEM 3. AUDIT COMMITTEE FINANCIAL EXPERT.
Not applicable at this time.
ITEM 4. PRINCIPAL ACCOUNTANT FEES AND SERVICES.
Not applicable at this time.
ITEM 5. AUDIT COMMITTEE OF LISTED REGISTRANTS.
Not applicable at this time.
ITEM 6. SCHEDULE OF INVESTMENTS.
Not applicable.
ITEM 7. DISCLOSURE OF PROXY VOTING POLICIES AND PROCEDURES FOR CLOSED-END MANAGEMENT INVESTMENT COMPANIES.
Not applicable.
ITEM 8. PORTFOLIO MANAGERS OF CLOSED-END MANAGEMENT INVESTMENT COMPANIES.
Not applicable.
ITEM 9. PURCHASES OF EQUITY SECURITIES BY CLOSED-END MANAGEMENT INVESTMENT COMPANY AND AFFILIATED PURCHASERS.
Not applicable.
ITEM 10. SUBMISSION OF MATTERS TO A VOTE OF SECURITY HOLDERS.
The registrant has adopted procedures by which shareholders may recommend nominees to the registrant's Board of Trustees. A copy of the procedures is filed as an exhibit to this Form N-CSR. See attached “John Hancock Funds – Governance Committee Charter”.
ITEM 11. CONTROLS AND PROCEDURES.
(a) EVALUATION OF DISCLOSURE CONTROLS AND PROCEDURES. The registrant maintains disclosure controls and procedures that are designed to ensure that information required to be disclosed in this Form N-CSR is recorded, processed, summarized and reported within the time periods specified in the rules and forms of the Securities and Exchange Commission. Such disclosure and procedures include controls and procedures designed to
ensure that such information is accumulated and communicated to the registrant’s management, including its principal executive officer and principal financial officer, as appropriate, to allow timely decisions regarding required disclosure.
Within 90 days prior to the filing date of this Form N-CSR, the registrant had carried out an evaluation, under the supervision and with the participation of the registrant’s management, including the registrant’s principal executive officer and the registrant’s principal financial officer, of the effectiveness of the design and operation of the registrant’s disclosure controls and procedures relating to information required to be disclosed on Form N-CSR. Based on such evaluation, the registrant’s principal executive officer and principal financial officer concluded that the registrant’s disclosure controls and procedures are operating effectively to ensure that:
(i) information required to be disclosed in this Form N-CSR is recorded, processed, summarized and reported within the periods specified in the rules and forms of the Securities and Exchange Commission, and (ii) information is accumulated and communicated to the registrant’s management, including its principal executive officer and principal financial officer, as appropriate, to allow timely decisions regarding required disclosure.
(b) CHANGE IN REGISTRANT’S INTERNAL CONTROL: Not applicable.
ITEM 12. EXHIBITS.
(a)(1) See attached Code of Ethics.
(a)(2)(i) CERTIFICATION OF PRINCIPAL EXECUTIVE OFFICER.
(a)(2)(ii) CERTIFICATION OF PRINCIPAL FINANCIAL OFFICER.
(b) CERTIFICATION PURSUANT TO Rule 30a-2(b) OF THE INVESTMENT COMPANY ACT OF 1940.
(c)(1) Submission of Matters to a Vote of Security Holders is attached. See attached “John Hancock Funds – Governance Committee Charter”.
(c)(2) Contact person at the registrant.
SIGNATURES
Pursuant to the requirements of the Securities Exchange Act of 1934 and the Investment Company Act of 1940, the registrant has duly caused this report to be signed on its behalf by the undersigned, thereunto duly authorized.
John Hancock Funds III
By: /s/ Keith F. Hartstein
-------------------------------------
Keith F. Hartstein
President and Chief Executive Officer
Date: October 26, 2007
Pursuant to the requirements of the Securities Exchange Act of 1934 and the Investment Company Act of 1940, this report has been signed below by the following persons on behalf of the registrant and in the capacities and on the dates indicated.
By: /s/ Keith F. Hartstein
-------------------------------------
Keith F. Hartstein
President and Chief Executive Officer
Date: October 26, 2007
By: /s/ Charles A. Rizzo
-------------------------------------
Charles A. Rizzo
Chief Financial Officer
Date: October 26, 2007