UNITED STATES
SECURITIES AND EXCHANGE COMMISSION
Washington, D.C. 20549
FORM N-CSR
CERTIFIED SHAREHOLDER REPORT OF REGISTERED
MANAGEMENT INVESTMENT COMPANIES
Investment Company Act file number 811-21777
John Hancock Funds III
(Exact name of registrant as specified in charter)
200 Berkeley Street, Boston, Massachusetts 02116
(Address of principal executive offices) (Zip code)
Salvatore Schiavone
Treasurer
200 Berkeley Street
Boston, Massachusetts 02116
(Name and address of agent for service)
Registrant's telephone number, including area code:617-663-4497
| Date of fiscal year end: | March 31 |
| | |
| Date of reporting period: | March 31, 2020 |
ITEM 1. REPORTS TO STOCKHOLDERS.
John Hancock
Disciplined Value Mid Cap Fund
Annual report 3/31/2020
Beginning on January 1, 2021, as permitted by regulations adopted by the Securities and Exchange Commission, paper copies of the fund's shareholder reports like this one will no longer be sent by mail, unless you specifically request paper copies of the reports from the fund or from your financial intermediary. Instead, the reports will be made available on a website, and you will be notified by mail each time a report is posted and provided with a website link to access the report.
If you already elected to receive shareholder reports electronically, you will not be affected by this change, and you do not need to take any action. You may elect to receive shareholder reports and other communications electronically by calling John Hancock Investment Management at 800-225-5291 (Class A and Class C shares) or 888-972-8696 (Class I, Class R2, Class R4, Class R6, and Class ADV) or by contacting your financial intermediary.
You may elect to receive all reports in paper, free of charge, at any time. You can inform John Hancock Investment Management or your financial intermediary that you wish to continue receiving paper copies of your shareholder reports by following the instructions listed above. Your election to receive reports in paper will apply to all funds held with John Hancock Investment Management or your financial intermediary.

A message to shareholders
Dear shareholder,
Global financial markets were on pace to deliver strong returns during the 12 months ended March 31, 2020, until heightened fears over the coronavirus (COVID-19) sent markets tumbling during the last five weeks of the period. After the longest bull market in U.S. history, we're now in bear market territory.
In response to the sell-off, the U.S. Federal Reserve acted quickly, lowering interest rates to zero and reinstating quantitative easing, as well as announcing its plans to shore up short-term debt. These steps, along with the passage of an estimated $2 trillion federal economic stimulus bill, helped lift the markets in the final two weeks of March.
The continued spread of COVID-19, trade disputes, rising unemployment, and other geopolitical tensions may continue to create uncertainty among businesses and investors. Your financial professional can helpposition your portfolio so that it's sufficiently diversified to seek to meet your long-term objectives and to withstand the inevitable bouts of market volatility along the way.
On behalf of everyone at John Hancock Investment Management, I'd like to take this opportunity to welcome new shareholders and thank existing shareholders for the continued trust you've placed in us.
Sincerely,
Andrew G. Arnott
President and CEO,
John Hancock Investment Management
Head of Wealth and Asset Management,
United States and Europe
This commentary reflects the CEO's views as of this report's period end and are subject to change at any time. Diversification does not guarantee investment returns and does not eliminate risk of loss. All investments entail risks, including the possible loss of principal. For more up-to-date information, you can visit our website at jhinvestments.com.
John Hancock
Disciplined Value Mid Cap Fund
Table of contents
| | | |
| 2 | | Your fund at a glance |
| 5 | | Manager's discussion of fund performance |
| 7 | | A look at performance |
| 9 | | Your expenses |
| 11 | | Fund's investments |
| 17 | | Financial statements |
| 21 | | Financial highlights |
| 28 | | Notes to financial statements |
| 36 | | Report of independent registered public accounting firm |
| 37 | | Tax information |
| 38 | | Statement regarding liquidity risk management |
| 41 | | Trustees and Officers |
| 45 | | More information |
ANNUAL REPORT | JOHN HANCOCK DISCIPLINED VALUE MID CAP FUND 1
INVESTMENT OBJECTIVE
The fund seeks long-term growth of capital with current income as a secondary objective.
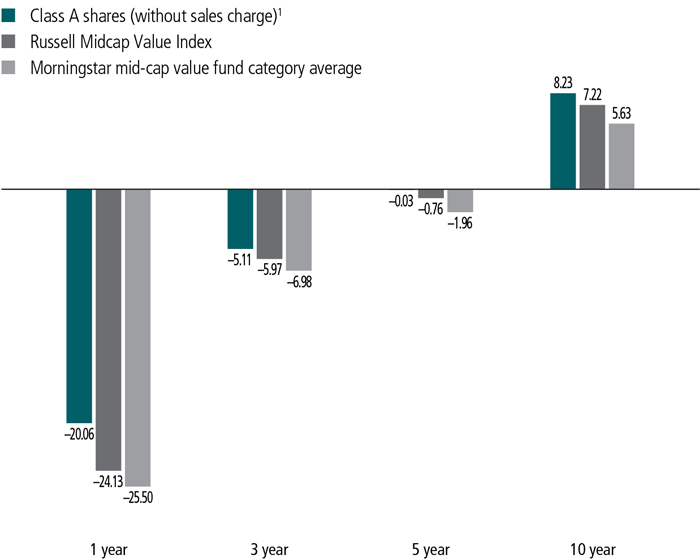
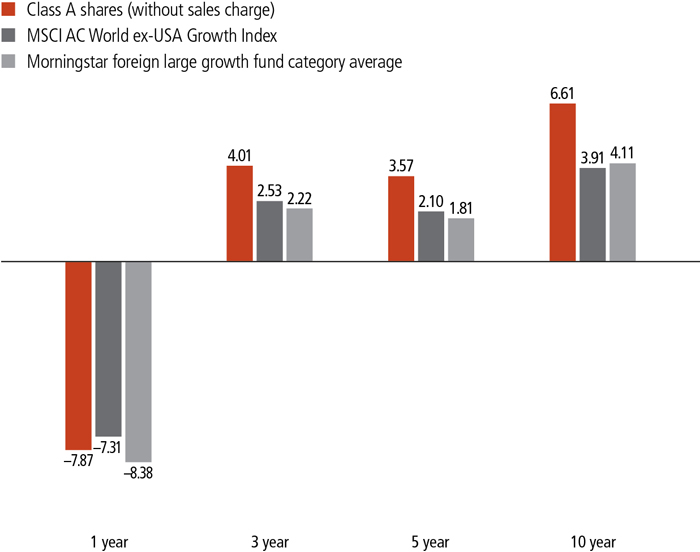
AVERAGE ANNUAL TOTAL RETURNS AS OF 3/31/2020 (%)
The Russell Midcap Value Index is an unmanaged index that measures the performance of those Russell Midcap Index companies with lower price-to-book ratios and lower forecasted growth values.
It is not possible to invest directly in an index. Index figures do not reflect expenses or sales charges, which would result in lower returns.
Figures from Morningstar, Inc. include reinvested distributions and do not take into account sales charges. Actual load-adjusted performance is lower.
| 1 | After the close of business on 7-9-10, holders of Investor shares of the former Robeco Boston Partners Mid Cap Value Fund (the predecessor fund) became owners of an equal number of full and fractional Class A shares of John Hancock Disciplined Value Mid Cap Fund, which were first offered on 7-12-10. Returns shown prior to Class A shares' commencement dates are those of the predecessor fund's Investor shares. |
The past performance shown here reflects reinvested distributions and the beneficial effect of any expense reductions, and does not guarantee future results. Performance of the other share classes will vary based on the difference in the fees and expenses of those classes. Shares will fluctuate in value and, when redeemed, may be worth more or less than their original cost. Current month-end performance may be lower or higher than the performance cited, and can be found at jhinvestments.com or by calling 800-225-5291. For further information on the fund's objectives, risks, and strategy, see the fund's prospectus. The fund recently experienced negative short-term performance due to market volatility associated with the COVID-19 pandemic.
ANNUAL REPORT | JOHN HANCOCK DISCIPLINED VALUE MID CAP FUND 2
PERFORMANCE HIGHLIGHTS OVER THE LAST TWELVE MONTHS
The fund's benchmark, the Russell Midcap Value Index, lost 24.13% during the period
Concerns about the economic impact of the coronavirus caused stocks to fall sharply in February and March, reversing all of the market's previous gains.
The fund posted a loss but outperformed its benchmark
Sector allocations and stock selection both contributed to the fund's positive relative performance.
Stock selection was the primary contributor
The fund produced the best relative performance in the consumer discretionary, industrials, and information technology sectors.
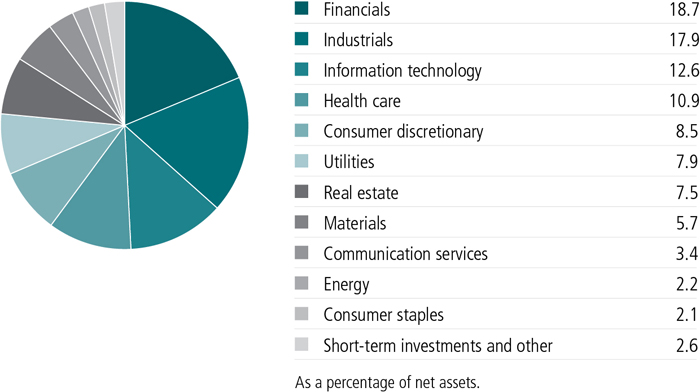
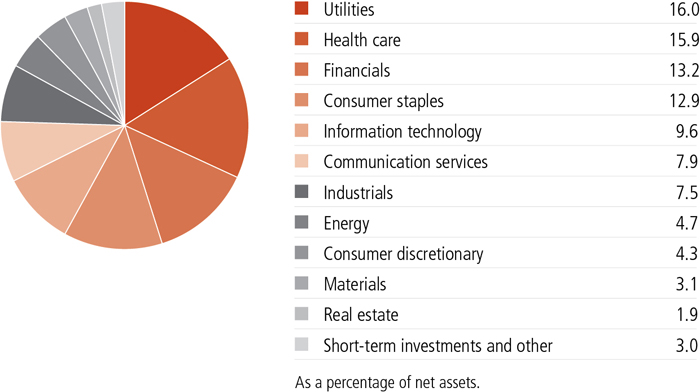
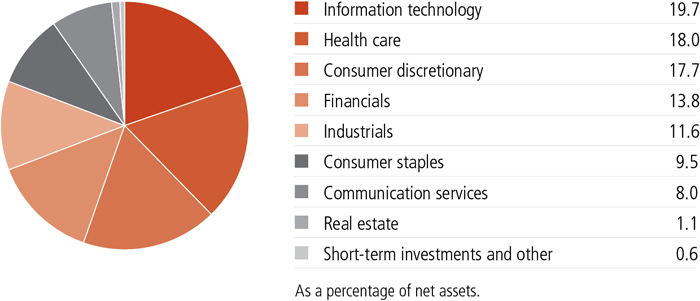
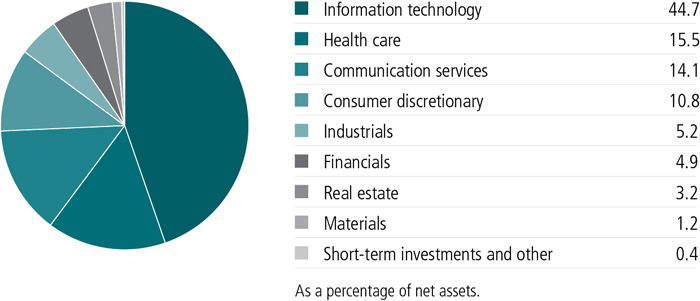
SECTOR COMPOSITION AS OF 3/31/2020 (%)
ANNUAL REPORT | JOHN HANCOCK DISCIPLINED VALUE MID CAP FUND 3
A note about risks
The fund may be subject to various risks as described in the fund's prospectus. A widespread health crisis such as a global pandemic could cause substantial market volatility, exchange-trading suspensions and closures, impact the ability to complete redemptions, and affect fund performance. For example, the novel coronavirus disease (COVID-19) has resulted in significant disruptions to global business activity. The impact of a health crisis and other epidemics and pandemics that may arise in the future could affect the global economy in ways that cannot necessarily be foreseen at the present time. A health crisis may exacerbate other pre-existing political, social, and economic risks. Any such impact could adversely affect the fund's performance, resulting in losses to your investment. For more information, please refer to the "Principal risks" section of the prospectus.
ANNUAL REPORT | JOHN HANCOCK DISCIPLINED VALUE MID CAP FUND 4
Manager's discussion of fund performance
How would you describe the market environment during the 12 months ended March 31, 2020?
Stocks performed reasonably well for the majority of the reporting period, as investors were cheered by the combination of a gradual economic expansion and progress toward a resolution of the trade dispute between the United States and China. This favorable backdrop changed abruptly in mid-February, however, when the spread of the coronavirus led to a rapid deterioration in the outlook for economic growth and corporate earnings. The value style underperformed over the full year, with a particularly weak showing in the downturn. As global growth prospects became more uncertain, investors appeared to gravitate toward stocks with the perceived ability to generate rising profits even in a protracted recession.
What factors affected the fund's performance?
While the fund was affected by the macroeconomic downturn as a result of the coronavirus, it did outpace its benchmark, the Russell Mid Cap Value Index. The fund generated a strong relative performance in the consumer discretionary sector, where it benefited from having zero weightings in cruise line operators that lagged considerably once the extent of the coronavirus became known. Communication services was an additional area of strength thanks to the fund's positions in the video game companies Activision Blizzard, Inc., Electronic Arts, Inc., and NetEase, Inc., all of which rallied on expectations that consumers' increased time at home will
TOP 10 HOLDINGS AS OF 3/31/2020 (%)
| | |
| Alleghany Corp. | 2.0 |
| Xcel Energy, Inc. | 1.8 |
| L3Harris Technologies, Inc. | 1.6 |
| Dover Corp. | 1.5 |
| AMETEK, Inc. | 1.5 |
| Aon PLC | 1.4 |
| Boston Properties, Inc. | 1.4 |
| Equity Residential | 1.4 |
| Huntington Bancshares, Inc. | 1.3 |
| FMC Corp. | 1.3 |
| TOTAL | 15.2 |
| As a percentage of net assets. |
| Cash and cash equivalents are not included. |
ANNUAL REPORT | JOHN HANCOCK DISCIPLINED VALUE MID CAP FUND 5
lead to higher demand. The stock selection process also aided results in information technology, led by investments in Fidelity National Information Services, Inc., KLA Corp., and Leidos Holdings, Inc. Outside of these three sectors, Humana, Inc. and L3Harris Technologies Inc.—both of which bucked the overall trend and posted positive total returns—were key contributors.
Conversely, underweights in the utilities and consumer staples sectors detracted from results. However, we view these defensive sectors as expensive, given that most companies are trading at a significant valuation premium to the market despite their modest growth, uneven business momentum, and substandard returns on capital. Stock selection in the energy sector also cost the fund some relative performance. Positions in Marathon Petroleum Corp., Noble Energy Corp., and Apergy Corp. hurt results as the combination of increased supply and falling demand for crude oil led to a large oversupply of the commodity.
What are your broader thoughts regarding the current state of the markets?
The recent market downturn, while dramatic, also presented potential opportunities. We therefore used the sell-off to add to companies with positive cash flows, strong balance sheets, and predictable growth characteristics.
MANAGED BY
| | |
 | Steven L. Pollack, CFA
On the fund since 2001
Investing since 1984 |
 | Joseph F. Feeney, Jr., CFA
On the fund since 2010
Investing since 1985 |

The views expressed in this report are exclusively those of Steven L. Pollack, CFA, Boston Partners, and are subject to change. They are not meant as investment advice. Please note that the holdings discussed in this report may not have been held by the fund for the entire period. Portfolio composition is subject to review in accordance with the fund's investment strategy and may vary in the future. Current and future portfolio holdings are subject to risk. Boston Partners is an indirect, wholly owned subsidiary of Orix Corporation of Japan.
ANNUAL REPORT | JOHN HANCOCK DISCIPLINED VALUE MID CAP FUND 6
TOTAL RETURNS FOR THE PERIOD ENDED MARCH 31, 2020
| | | | | | | | |
Average annual total returns (%)
with maximum sales charge | | Cumulative total returns (%)
with maximum sales charge |
| | 1-year | 5-year | 10-year | | | 5-year | 10-year |
| Class A1 | -24.04 | -1.05 | 7.67 | | | -5.15 | 109.48 |
| Class C1 | -21.41 | -0.78 | 7.52 | | | -3.82 | 106.56 |
| Class I1,2 | -19.84 | 0.21 | 8.52 | | | 1.07 | 126.54 |
| Class R21,2 | -20.14 | -0.17 | 8.11 | | | -0.87 | 118.19 |
| Class R41,2 | -19.96 | 0.07 | 8.30 | | | 0.34 | 121.90 |
| Class R61,2 | -19.72 | 0.32 | 8.56 | | | 1.63 | 127.40 |
| Class ADV1,2 | -20.06 | -0.04 | 8.20 | | | -0.22 | 119.90 |
| Index† | -24.13 | -0.76 | 7.22 | | | -3.76 | 100.78 |
Performance figures assume all distributions are reinvested. Figures reflect maximum sales charges on Class A shares of 5% and the applicable contingent deferred sales charge (CDSC) on Class C shares. Class C shares sold within one year of purchase are subject to a 1% CDSC. Sales charges are not applicable to Class I, Class R2, Class R4, Class R6, and Class ADV shares.
The expense ratios of the fund, both net (including any fee waivers and/or expense limitations) and gross (excluding any fee waivers and/or expense limitations), are set forth according to the most recent publicly available prospectuses for the fund and may differ from those disclosed in the Financial highlights tables in this report. Net expenses reflect contractual expense limitations in effect until July 31, 2021 and are subject to change. Had the contractual fee waivers and expense limitations not been in place, gross expenses would apply. The expense ratios are as follows:
| | | | | | | | |
| | Class A | Class C | Class I | Class R2 | Class R4 | Class R6 | Class ADV |
| Gross (%) | 1.12 | 1.87 | 0.87 | 1.27 | 1.12 | 0.77 | 1.12 |
| Net (%) | 1.11 | 1.86 | 0.86 | 1.26 | 1.01 | 0.76 | 1.11 |
Please refer to the most recent prospectus and annual or semiannual report for more information on expenses and any expense limitation arrangements for each class.
The returns reflect past results and should not be considered indicative of future performance. The return and principal value of an investment will fluctuate so that shares, when redeemed, may be worth more or less than their original cost. Due to market volatility and other factors, the fund's current performance may be higher or lower than the performance shown. For current to the most recent month-end performance data, please call 800-225-5291 or visit the fund's website at jhinvestments.com.
The performance table above and the chart on the next page do not reflect the deduction of taxes that a shareholder would pay on fund distributions or the redemption of fund shares. The fund's performance results reflect any applicable fee waivers or expense reductions, without which the expenses would increase and results would have been less favorable.
| † | Index is the Russell Midcap Value Index. |
See the following page for footnotes.
ANNUAL REPORT | JOHN HANCOCK DISCIPLINED VALUE MID CAP FUND 7
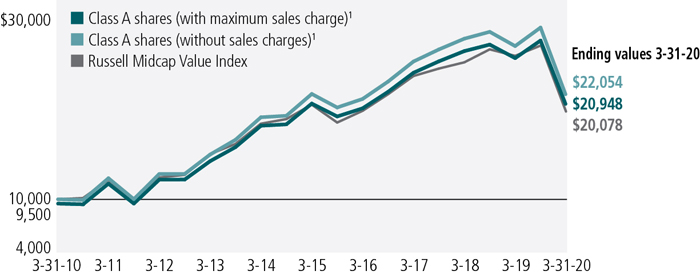
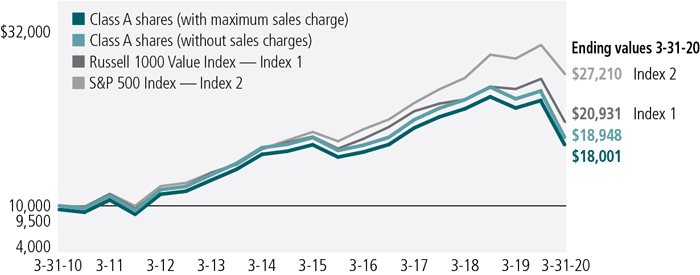
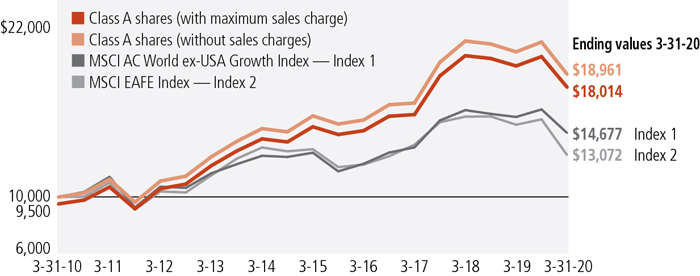
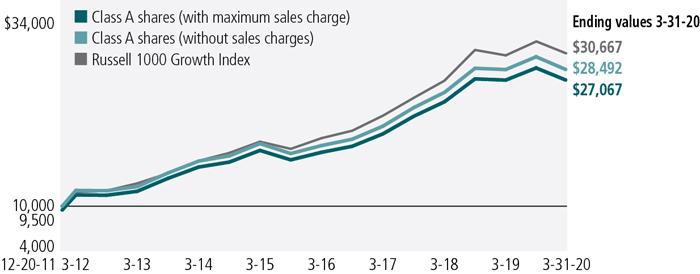
This chart and table show what happened to a hypothetical $10,000 investment in John Hancock Disciplined Value Mid Cap Fund for the share classes and periods indicated, assuming all distributions were reinvested. For comparison, we've shown the same investment in the Russell Midcap Value Index.
| | | | | |
| | Start date | With maximum
sales charge ($) | Without
sales charge ($) | Index ($) |
| Class C1,3 | 3-31-10 | 20,656 | 20,656 | 20,078 |
| Class I1,2 | 3-31-10 | 22,654 | 22,654 | 20,078 |
| Class R21,2 | 3-31-10 | 21,819 | 21,819 | 20,078 |
| Class R41,2 | 3-31-10 | 22,190 | 22,190 | 20,078 |
| Class R61,2 | 3-31-10 | 22,740 | 22,740 | 20,078 |
| Class ADV1,2 | 3-31-10 | 21,990 | 21,990 | 20,078 |
The Russell Midcap Value Index is an unmanaged index that measures the performance of those Russell Midcap companies with lower price-to-book ratios and lower forecasted growth values.
It is not possible to invest directly in an index. Index figures do not reflect expenses or sales charges, which would result in lower returns.
Footnotes related to performance pages
| 1 | Class A, Class C, Class R2, Class R4, and Class R6 shares were first offered on 7-12-10, 8-15-11, 3-1-12, 7-2-13, and 9-1-11, respectively; Class I and Class ADV shares were first offered on 7-12-10. Investor shares and Institutional shares of Robeco Boston Partners Mid Cap Value Fund (the predecessor fund) were first offered on 6-2-97. Returns shown prior to Class A and Class ADV shares' commencement dates are those of the predecessor fund's Investor shares. Returns shown prior to Class I shares' commencement date are those of the predecessor fund's Institutional shares. Returns shown prior to Class C, Class R2, Class R4, and Class R6 shares' commencement dates are those of the predecessor fund's Investor shares (prior to 7-12-10) and the fund's Class A shares (from 7-12-10), that have not been adjusted for class-specific expenses; otherwise, returns would vary. |
| 2 | For certain types of investors, as described in the fund's prospectuses. |
| 3 | The contingent deferred sales charge is not applicable. |
ANNUAL REPORT | JOHN HANCOCK DISCIPLINED VALUE MID CAP FUND 8
These examples are intended to help you understand your ongoing operating expenses of investing in the fund so you can compare these costs with the ongoing costs of investing in other mutual funds.
Understanding fund expenses
As a shareholder of the fund, you incur two types of costs:
■Transaction costs,which include sales charges (loads) on purchases or redemptions (varies by share class), minimum account fee charge, etc.
■Ongoing operating expenses, including management fees, distribution and service fees (if applicable), and other fund expenses.
We are presenting only your ongoing operating expenses here.
Actual expenses/actual returns
The first line of each share class in the table on the following page is intended to provide information about the fund’s actual ongoing operating expenses, and is based on the fund’s actual return. It assumes an account value of $1,000.00 on October 1, 2019, with the same investment held until March 31, 2020.
Together with the value of your account, you may use this information to estimate the operating expenses that you paid over the period. Simply divide your account value at March 31, 2020, by $1,000.00, then multiply it by the “expenses paid” for your share class from the table. For example, for an account value of $8,600.00, the operating expenses should be calculated as follows:
Hypothetical example for comparison purposes
The second line of each share class in the table on the following page allows you to compare the fund’s ongoing operating expenses with those of any other fund. It provides an example of the fund’s hypothetical account values and hypothetical expenses based on each class’s actual expense ratio and an assumed 5% annualized return before expenses (which is not the class’s actual return). It assumes an account value of $1,000.00 on October 1, 2019, with the same investment held until March 31, 2020. Look in any other fund shareholder report to find its hypothetical example and you will be able to compare these expenses.
| | ANNUAL REPORT | JOHN HANCOCK DISCIPLINED VALUE MID CAP FUND | 9 |
Please remember that these hypothetical account values and expenses may not be used to estimate the actual ending account balance or expenses you paid for the period.
Remember, these examples do not include any transaction costs, therefore, these examples will not help you to determine the relative total costs of owning different funds. If transaction costs were included, your expenses would have been higher. See the prospectuses for details regarding transaction costs.
SHAREHOLDER EXPENSE EXAMPLE CHART
| | | Account
value on
10-1-2019 | Ending
value on
3-31-2020 | Expenses
paid during
period ended
3-31-20201 | Annualized
expense
ratio |
| Class A | Actual expenses/actual returns | $1,000.00 | $742.30 | $4.88 | 1.12% |
| | Hypothetical example | 1,000.00 | 1,019.40 | 5.65 | 1.12% |
| Class C | Actual expenses/actual returns | 1,000.00 | 739.90 | 8.13 | 1.87% |
| | Hypothetical example | 1,000.00 | 1,015.70 | 9.42 | 1.87% |
| Class I | Actual expenses/actual returns | 1,000.00 | 743.40 | 3.79 | 0.87% |
| | Hypothetical example | 1,000.00 | 1,020.70 | 4.40 | 0.87% |
| Class R2 | Actual expenses/actual returns | 1,000.00 | 742.10 | 5.49 | 1.26% |
| | Hypothetical example | 1,000.00 | 1,018.70 | 6.36 | 1.26% |
| Class R4 | Actual expenses/actual returns | 1,000.00 | 742.90 | 4.40 | 1.01% |
| | Hypothetical example | 1,000.00 | 1,020.00 | 5.10 | 1.01% |
| Class R6 | Actual expenses/actual returns | 1,000.00 | 744.10 | 3.31 | 0.76% |
| | Hypothetical example | 1,000.00 | 1,021.20 | 3.84 | 0.76% |
| Class ADV | Actual expenses/actual returns | 1,000.00 | 742.50 | 4.88 | 1.12% |
| | Hypothetical example | 1,000.00 | 1,019.40 | 5.65 | 1.12% |
| 1 | Expenses are equal to the annualized expense ratio, multiplied by the average account value over the period, multiplied by 183/366 (to reflect the one-half year period). |
| 10 | JOHN HANCOCK DISCIPLINED VALUE MID CAP FUND | ANNUAL REPORT | |
AS OF 3-31-20
| | | | | Shares | Value |
| Common stocks 97.4% | | | | | $9,656,126,377 |
| (Cost $10,061,263,287) | | | | | |
| Communication services 3.4% | | | 338,494,863 |
| Entertainment 2.3% | | | |
| Activision Blizzard, Inc. | | | 1,603,921 | 95,401,221 |
| Electronic Arts, Inc. (A) | | | 719,474 | 72,069,711 |
| NetEase, Inc., ADR | | | 188,565 | 60,521,822 |
| Interactive media and services 0.2% | | | |
| Yelp, Inc. (A)(B) | | | 1,006,196 | 18,141,714 |
| Media 0.9% | | | |
| Altice USA, Inc., Class A (A) | | | 2,772,336 | 61,795,369 |
| Omnicom Group, Inc. | | | 556,740 | 30,565,026 |
| Consumer discretionary 8.5% | | | 839,252,983 |
| Auto components 0.9% | | | |
| Gentex Corp. | | | 2,336,828 | 51,784,108 |
| Lear Corp. | | | 406,404 | 33,020,325 |
| Hotels, restaurants and leisure 1.5% | | | |
| International Game Technology PLC (B) | | | 3,066,118 | 18,243,402 |
| Las Vegas Sands Corp. | | | 1,089,027 | 46,250,977 |
| Wyndham Destinations, Inc. | | | 1,332,009 | 28,904,595 |
| Wyndham Hotels & Resorts, Inc. | | | 797,828 | 25,139,560 |
| Wynn Resorts, Ltd. | | | 476,836 | 28,700,759 |
| Household durables 1.5% | | | |
| Lennar Corp., A Shares | | | 828,308 | 31,641,366 |
| Mohawk Industries, Inc. (A) | | | 843,766 | 64,328,720 |
| Whirlpool Corp. (B) | | | 661,906 | 56,791,535 |
| Internet and direct marketing retail 1.5% | | | |
| eBay, Inc. | | | 3,487,849 | 104,844,741 |
| Expedia Group, Inc. | | | 708,662 | 39,876,411 |
| Multiline retail 0.3% | | | |
| Dollar Tree, Inc. (A) | | | 437,229 | 32,123,215 |
| Specialty retail 2.8% | | | |
| AutoZone, Inc. (A) | | | 122,265 | 103,436,190 |
| Best Buy Company, Inc. | | | 947,437 | 54,003,909 |
| Foot Locker, Inc. | | | 1,752,843 | 38,650,188 |
| Ross Stores, Inc. | | | 508,006 | 44,181,282 |
| Tractor Supply Company | | | 441,534 | 37,331,700 |
| Consumer staples 2.1% | | | 209,743,522 |
| Beverages 0.4% | | | |
| Coca-Cola European Partners PLC | | | 1,200,961 | 45,072,066 |
| SEE NOTES TO FINANCIAL STATEMENTS | ANNUAL REPORT | JOHN HANCOCK DISCIPLINED VALUE MID CAP FUND | 11 |
| | | | | Shares | Value |
| Consumer staples (continued) | | | |
| Food products 1.7% | | | |
| Nomad Foods, Ltd. (A) | | | 4,298,765 | $79,785,078 |
| Tyson Foods, Inc., Class A | | | 1,466,846 | 84,886,378 |
| Energy 2.2% | | | 217,723,895 |
| Energy equipment and services 0.1% | | | |
| Apergy Corp. (A)(B) | | | 1,871,701 | 10,762,281 |
| Oil, gas and consumable fuels 2.1% | | | |
| ConocoPhillips | | | 1,240,887 | 38,219,320 |
| Marathon Petroleum Corp. | | | 2,098,323 | 49,562,389 |
| Noble Energy, Inc. | | | 5,357,312 | 32,358,164 |
| Pioneer Natural Resources Company | | | 388,388 | 27,245,418 |
| Valero Energy Corp. | | | 1,313,411 | 59,576,323 |
| Financials 18.7% | | | 1,851,684,113 |
| Banks 5.2% | | | |
| East West Bancorp, Inc. | | | 1,870,496 | 48,146,567 |
| Fifth Third Bancorp | | | 6,105,373 | 90,664,789 |
| Huntington Bancshares, Inc. | | | 15,932,624 | 130,806,843 |
| KeyCorp | | | 9,926,785 | 102,940,760 |
| Regions Financial Corp. | | | 3,487,544 | 31,283,270 |
| Truist Financial Corp. | | | 3,526,596 | 108,760,221 |
| Capital markets 2.8% | | | |
| Ameriprise Financial, Inc. | | | 1,177,250 | 120,644,580 |
| Moody's Corp. | | | 115,802 | 24,492,123 |
| Raymond James Financial, Inc. | | | 441,707 | 27,915,882 |
| State Street Corp. | | | 774,235 | 41,243,498 |
| TD Ameritrade Holding Corp. | | | 1,750,640 | 60,677,182 |
| Consumer finance 1.2% | | | |
| Discover Financial Services | | | 1,681,758 | 59,988,308 |
| Navient Corp. | | | 3,357,933 | 25,453,132 |
| SLM Corp. | | | 4,633,533 | 33,315,102 |
| Insurance 9.5% | | | |
| Alleghany Corp. | | | 358,876 | 198,225,159 |
| American International Group, Inc. | | | 1,935,934 | 46,946,400 |
| Aon PLC | | | 866,710 | 143,041,818 |
| Everest Re Group, Ltd. | | | 227,655 | 43,805,375 |
| Globe Life, Inc. | | | 742,894 | 53,466,081 |
| Loews Corp. | | | 1,311,517 | 45,680,137 |
| Marsh & McLennan Companies, Inc. | | | 714,824 | 61,803,683 |
| Reinsurance Group of America, Inc. (B) | | | 1,295,157 | 108,974,510 |
| The Allstate Corp. | | | 1,026,689 | 94,178,182 |
| The Progressive Corp. | | | 999,997 | 73,839,778 |
| The Travelers Companies, Inc. | | | 418,803 | 41,608,078 |
| 12 | JOHN HANCOCK DISCIPLINED VALUE MID CAP FUND | ANNUAL REPORT | SEE NOTES TO FINANCIAL STATEMENTS |
| | | | | Shares | Value |
| Financials (continued) | | | |
| Insurance (continued) | | | |
| Willis Towers Watson PLC | | | 198,897 | $33,782,655 |
| Health care 10.9% | | | 1,079,710,134 |
| Health care equipment and supplies 1.2% | | | |
| Boston Scientific Corp. (A) | | | 1,377,816 | 44,958,136 |
| Zimmer Biomet Holdings, Inc. | | | 782,501 | 79,095,201 |
| Health care providers and services 6.4% | | | |
| AmerisourceBergen Corp. | | | 1,221,625 | 108,113,813 |
| Centene Corp. (A) | | | 1,635,263 | 97,150,975 |
| DaVita, Inc. (A) | | | 582,398 | 44,297,192 |
| Humana, Inc. | | | 394,350 | 123,833,787 |
| Laboratory Corp. of America Holdings (A) | | | 684,000 | 86,450,760 |
| McKesson Corp. | | | 346,821 | 46,911,008 |
| Molina Healthcare, Inc. (A) | | | 330,462 | 46,168,846 |
| Universal Health Services, Inc., Class B | | | 784,396 | 77,717,956 |
| Health care technology 0.5% | | | |
| Change Healthcare, Inc. (A)(B) | | | 4,746,936 | 47,421,891 |
| Life sciences tools and services 2.3% | | | |
| Avantor, Inc. (A)(B) | | | 2,966,067 | 37,046,177 |
| ICON PLC (A) | | | 587,737 | 79,932,232 |
| IQVIA Holdings, Inc. (A) | | | 710,003 | 76,580,924 |
| PPD, Inc. (A)(B) | | | 1,685,202 | 30,013,448 |
| Pharmaceuticals 0.5% | | | |
| Jazz Pharmaceuticals PLC (A) | | | 541,586 | 54,017,788 |
| Industrials 17.9% | | | 1,774,098,958 |
| Aerospace and defense 3.8% | | | |
| Curtiss-Wright Corp. | | | 596,692 | 55,140,308 |
| Huntington Ingalls Industries, Inc. | | | 458,927 | 83,621,089 |
| L3Harris Technologies, Inc. | | | 861,888 | 155,243,267 |
| Spirit AeroSystems Holdings, Inc., Class A | | | 830,719 | 19,879,106 |
| Textron, Inc. | | | 2,316,163 | 61,772,067 |
| Air freight and logistics 0.7% | | | |
| Expeditors International of Washington, Inc. | | | 1,002,408 | 66,880,662 |
| Airlines 0.7% | | | |
| Southwest Airlines Company | | | 1,970,943 | 70,185,280 |
| Building products 1.5% | | | |
| Masco Corp. | | | 1,703,112 | 58,876,582 |
| Owens Corning | | | 1,490,955 | 57,863,964 |
| Trane Technologies PLC | | | 414,843 | 34,261,883 |
| Commercial services and supplies 0.1% | | | |
| KAR Auction Services, Inc. | | | 1,169,447 | 14,033,364 |
| SEE NOTES TO FINANCIAL STATEMENTS | ANNUAL REPORT | JOHN HANCOCK DISCIPLINED VALUE MID CAP FUND | 13 |
| | | | | Shares | Value |
| Industrials (continued) | | | |
| Electrical equipment 3.8% | | | |
| AMETEK, Inc. | | | 2,055,100 | $148,008,302 |
| Eaton Corp. PLC | | | 1,518,680 | 117,986,249 |
| EnerSys | | | 545,030 | 26,989,886 |
| Hubbell, Inc. | | | 374,030 | 42,916,202 |
| Rockwell Automation, Inc. | | | 246,097 | 37,138,498 |
| Machinery 4.6% | | | |
| Cummins, Inc. | | | 431,719 | 58,420,215 |
| Dover Corp. | | | 1,795,586 | 150,721,489 |
| ITT, Inc. | | | 1,558,631 | 70,699,502 |
| Oshkosh Corp. | | | 807,127 | 51,922,480 |
| PACCAR, Inc. | | | 853,105 | 52,150,309 |
| Parker-Hannifin Corp. | | | 527,637 | 68,450,348 |
| Professional services 0.7% | | | |
| ManpowerGroup, Inc. | | | 692,093 | 36,674,008 |
| Robert Half International, Inc. | | | 962,628 | 36,339,207 |
| Road and rail 1.2% | | | |
| Kansas City Southern (B) | | | 963,317 | 122,514,656 |
| Trading companies and distributors 0.8% | | | |
| HD Supply Holdings, Inc. (A) | | | 2,652,481 | 75,410,035 |
| Information technology 12.6% | | | 1,245,685,454 |
| Electronic equipment, instruments and components 1.7% | | | |
| Arrow Electronics, Inc. (A) | | | 575,166 | 29,833,860 |
| Flex, Ltd. (A) | | | 3,395,720 | 28,439,155 |
| TE Connectivity, Ltd. | | | 1,773,199 | 111,676,072 |
| IT services 4.4% | | | |
| Amdocs, Ltd. | | | 763,731 | 41,982,293 |
| EVERTEC, Inc. (B) | | | 1,522,985 | 34,617,449 |
| Fidelity National Information Services, Inc. | | | 906,811 | 110,304,490 |
| Global Payments, Inc. | | | 416,909 | 60,130,785 |
| Leidos Holdings, Inc. | | | 1,082,828 | 99,241,186 |
| Science Applications International Corp. | | | 1,150,504 | 85,862,114 |
| Semiconductors and semiconductor equipment 4.5% | | | |
| Analog Devices, Inc. | | | 431,546 | 38,688,099 |
| KLA Corp. | | | 619,423 | 89,035,862 |
| Lam Research Corp. | | | 173,927 | 41,742,480 |
| Marvell Technology Group, Ltd. (B) | | | 2,003,438 | 45,337,802 |
| NXP Semiconductors NV | | | 1,008,779 | 83,658,042 |
| ON Semiconductor Corp. (A)(B) | | | 3,254,690 | 40,488,344 |
| Qorvo, Inc. (A) | | | 1,291,368 | 104,123,002 |
| Software 0.6% | | | |
| CDK Global, Inc. | | | 1,705,867 | 56,037,731 |
| 14 | JOHN HANCOCK DISCIPLINED VALUE MID CAP FUND | ANNUAL REPORT | SEE NOTES TO FINANCIAL STATEMENTS |
| | | | | Shares | Value |
| Information technology (continued) | | | |
| Technology hardware, storage and peripherals 1.4% | | | |
| Hewlett Packard Enterprise Company | | | 3,913,714 | $38,002,163 |
| Western Digital Corp. | | | 1,847,764 | 76,903,938 |
| Xerox Holdings Corp. | | | 1,561,805 | 29,580,587 |
| Materials 5.7% | | | 569,933,772 |
| Chemicals 4.2% | | | |
| Corteva, Inc. | | | 4,692,427 | 110,272,035 |
| DuPont de Nemours, Inc. | | | 1,068,879 | 36,448,774 |
| FMC Corp. | | | 1,564,831 | 127,831,044 |
| Nutrien, Ltd. (B) | | | 1,315,994 | 44,664,836 |
| PPG Industries, Inc. | | | 508,695 | 42,526,902 |
| The Mosaic Company | | | 5,083,688 | 55,005,504 |
| Construction materials 0.4% | | | |
| Eagle Materials, Inc. | | | 649,042 | 37,917,034 |
| Containers and packaging 0.7% | | | |
| Avery Dennison Corp. | | | 380,574 | 38,769,073 |
| Graphic Packaging Holding Company | | | 2,650,070 | 32,330,854 |
| Metals and mining 0.4% | | | |
| Steel Dynamics, Inc. | | | 1,959,526 | 44,167,716 |
| Real estate 7.5% | | | 743,044,959 |
| Equity real estate investment trusts 7.5% | | | |
| American Homes 4 Rent, Class A | | | 3,041,148 | 70,554,634 |
| Boston Properties, Inc. | | | 1,524,535 | 140,607,863 |
| Douglas Emmett, Inc. | | | 2,778,191 | 84,762,607 |
| Duke Realty Corp. | | | 2,668,324 | 86,400,331 |
| Equity Residential | | | 2,232,816 | 137,787,075 |
| Kilroy Realty Corp. | | | 1,196,483 | 76,215,967 |
| Prologis, Inc. | | | 838,640 | 67,401,497 |
| Regency Centers Corp. | | | 2,063,882 | 79,314,985 |
| Utilities 7.9% | | | 786,753,724 |
| Electric utilities 6.3% | | | |
| American Electric Power Company, Inc. | | | 802,477 | 64,182,110 |
| Edison International | | | 1,545,372 | 84,670,932 |
| Entergy Corp. | | | 1,302,734 | 122,417,914 |
| Evergy, Inc. | | | 1,393,659 | 76,720,928 |
| FirstEnergy Corp. | | | 2,422,931 | 97,086,845 |
| Xcel Energy, Inc. | | | 3,036,843 | 183,121,633 |
| Independent power and renewable electricity producers 0.7% | | | |
| Vistra Energy Corp. | | | 4,186,832 | 66,821,839 |
| SEE NOTES TO FINANCIAL STATEMENTS | ANNUAL REPORT | JOHN HANCOCK DISCIPLINED VALUE MID CAP FUND | 15 |
| | | | | Shares | Value |
| Utilities (continued) | | | |
| Multi-utilities 0.9% | | | |
| DTE Energy Company | | | 965,900 | $91,731,523 |
|
| | | Yield (%) | | Shares | Value |
| Short-term investments 2.4% | | | | | $243,544,819 |
| (Cost $243,519,710) | | | | | |
| Short-term funds 2.4% | | | | | 243,544,819 |
| John Hancock Collateral Trust (C) | 1.1260(D) | | 5,776,951 | 57,755,072 |
| State Street Institutional U.S. Government Money Market Fund, Premier Class | 0.3210(D) | | 185,789,747 | 185,789,747 |
|
| Total investments (Cost $10,304,782,997) 99.8% | | | $9,899,671,196 |
| Other assets and liabilities, net 0.2% | | | | 16,697,197 |
| Total net assets 100.0% | | | | | $9,916,368,393 |
| The percentage shown for each investment category is the total value of the category as a percentage of the net assets of the fund. |
| Security Abbreviations and Legend |
| ADR | American Depositary Receipt |
| (A) | Non-income producing security. |
| (B) | All or a portion of this security is on loan as of 3-31-20. |
| (C) | Investment is an affiliate of the fund, the advisor and/or subadvisor. This security represents the investment of cash collateral received for securities lending. |
| (D) | The rate shown is the annualized seven-day yield as of 3-31-20. |
At 3-31-20, the aggregate cost of investments for federal income tax purposes was $10,501,474,033. Net unrealized depreciation aggregated to $601,802,837, of which $1,173,787,372 related to gross unrealized appreciation and $1,775,590,209 related to gross unrealized depreciation.
| 16 | JOHN HANCOCK DISCIPLINED VALUE MID CAP FUND | ANNUAL REPORT | SEE NOTES TO FINANCIAL STATEMENTS |
STATEMENT OF ASSETS AND LIABILITIES 3-31-20
| Assets | |
| Unaffiliated investments, at value (Cost $10,247,053,034) including $55,787,795 of securities loaned | $9,841,916,124 |
| Affiliated investments, at value (Cost $57,729,963) | 57,755,072 |
| Total investments, at value (Cost $10,304,782,997) | 9,899,671,196 |
| Dividends and interest receivable | 20,924,427 |
| Receivable for fund shares sold | 50,279,369 |
| Receivable for investments sold | 35,697,382 |
| Receivable for securities lending income | 267,161 |
| Other assets | 383,336 |
| Total assets | 10,007,222,871 |
| Liabilities | |
| Payable for investments purchased | 9,608,270 |
| Payable for fund shares repurchased | 21,088,277 |
| Payable upon return of securities loaned | 57,859,052 |
| Payable to affiliates | |
| Accounting and legal services fees | 423,616 |
| Transfer agent fees | 833,374 |
| Distribution and service fees | 22,201 |
| Trustees' fees | 10,100 |
| Other liabilities and accrued expenses | 1,009,588 |
| Total liabilities | 90,854,478 |
| Net assets | $9,916,368,393 |
| Net assets consist of | |
| Paid-in capital | $10,519,338,744 |
| Total distributable earnings (loss) | (602,970,351) |
| Net assets | $9,916,368,393 |
| |
| SEE NOTES TO FINANCIAL STATEMENTS | ANNUAL REPORT | JOHN HANCOCK Disciplined Value Mid Cap Fund | 17 |
STATEMENT OF ASSETS AND LIABILITIES (continued)
| Net asset value per share | |
| Based on net asset value and shares outstanding - the fund has an unlimited number of shares authorized with no par value | |
| Class A ($781,772,665 ÷ 52,427,602 shares)1 | $14.91 |
| Class C ($107,242,920 ÷ 7,178,967 shares)1 | $14.94 |
| Class I ($6,348,844,749 ÷ 407,441,290 shares) | $15.58 |
| Class R2 ($76,838,643 ÷ 4,948,984 shares) | $15.53 |
| Class R4 ($55,107,888 ÷ 3,539,397 shares) | $15.57 |
| Class R6 ($2,546,096,485 ÷ 163,456,281 shares) | $15.58 |
| Class ADV ($465,043 ÷ 31,267 shares) | $14.87 |
| Maximum offering price per share | |
| Class A (net asset value per share ÷ 95%)2 | $15.69 |
| 1 | Redemption price per share is equal to net asset value less any applicable contingent deferred sales charge. |
| 2 | On single retail sales of less than $50,000. On sales of $50,000 or more and on group sales the offering price is reduced. |
| 18 | JOHN HANCOCK Disciplined Value Mid Cap Fund | ANNUAL REPORT | SEE NOTES TO FINANCIAL STATEMENTS |
STATEMENT OF OPERATIONS For the year ended 3-31-20
| Investment income | |
| Dividends | $233,246,877 |
| Interest | 5,198,243 |
| Securities lending | 857,998 |
| Less foreign taxes withheld | (648,717) |
| Total investment income | 238,654,401 |
| Expenses | |
| Investment management fees | 92,523,645 |
| Distribution and service fees | 5,362,679 |
| Accounting and legal services fees | 2,353,497 |
| Transfer agent fees | 12,232,205 |
| Trustees' fees | 245,919 |
| Custodian fees | 1,321,110 |
| State registration fees | 263,182 |
| Printing and postage | 574,695 |
| Professional fees | 255,735 |
| Other | 356,019 |
| Total expenses | 115,488,686 |
| Less expense reductions | (1,041,416) |
| Net expenses | 114,447,270 |
| Net investment income | 124,207,131 |
| Realized and unrealized gain (loss) | |
| Net realized gain (loss) on | |
| Unaffiliated investments and foreign currency transactions | 113,308,828 |
| Affiliated investments | (124,944) |
| | 113,183,884 |
| Change in net unrealized appreciation (depreciation) of | |
| Unaffiliated investments and translation of assets and liabilities in foreign currencies | (2,735,680,647) |
| Affiliated investments | 25,048 |
| | (2,735,655,599) |
| Net realized and unrealized loss | (2,622,471,715) |
| Decrease in net assets from operations | $(2,498,264,584) |
| SEE NOTES TO FINANCIAL STATEMENTS | ANNUAL REPORT | JOHN HANCOCK Disciplined Value Mid Cap Fund | 19 |
STATEMENTS OF CHANGES IN NET ASSETS
| | Year ended
3-31-20 | Year ended
3-31-19 |
| Increase (decrease) in net assets | | |
| From operations | | |
| Net investment income | $124,207,131 | $109,792,218 |
| Net realized gain | 113,183,884 | 475,252,358 |
| Change in net unrealized appreciation (depreciation) | (2,735,655,599) | (1,083,555,809) |
| Decrease in net assets resulting from operations | (2,498,264,584) | (498,511,233) |
| Distributions to shareholders | | |
| From earnings | | |
| Class A | (25,996,912) | (144,723,293) |
| Class C | (2,622,914) | (22,813,889) |
| Class I | (214,061,726) | (917,596,549) |
| Class R2 | (2,428,506) | (15,192,670) |
| Class R4 | (2,021,537) | (9,323,306) |
| Class R6 | (83,982,247) | (316,546,525) |
| Class ADV | (17,729) | (186,668) |
| Total distributions | (331,131,571) | (1,426,382,900) |
| From fund share transactions | 396,141,647 | (384,273,493) |
| Total decrease | (2,433,254,508) | (2,309,167,626) |
| Net assets | | |
| Beginning of year | 12,349,622,901 | 14,658,790,527 |
| End of year | $9,916,368,393 | $12,349,622,901 |
| 20 | JOHN HANCOCK Disciplined Value Mid Cap Fund | ANNUAL REPORT | SEE NOTES TO FINANCIAL STATEMENTS |
| CLASS A SHARES Period ended | 3-31-20 | 3-31-19 | 3-31-18 | 3-31-17 | 3-31-16 |
| Per share operating performance | | | | | |
| Net asset value, beginning of period | $19.08 | $22.35 | $21.61 | $18.49 | $20.19 |
| Net investment income1 | 0.14 | 0.12 | 0.07 | 0.10 | 0.13 |
| Net realized and unrealized gain (loss) on investments | (3.83) | (1.01) | 2.11 | 3.57 | (0.63) |
| Total from investment operations | (3.69) | (0.89) | 2.18 | 3.67 | (0.50) |
| Less distributions | | | | | |
| From net investment income | (0.14) | (0.13) | (0.06) | (0.14) | (0.07) |
| From net realized gain | (0.34) | (2.25) | (1.38) | (0.41) | (1.13) |
| Total distributions | (0.48) | (2.38) | (1.44) | (0.55) | (1.20) |
| Net asset value, end of period | $14.91 | $19.08 | $22.35 | $21.61 | $18.49 |
| Total return (%)2,3 | (20.06) | (2.98) | 10.15 | 19.96 | (2.59) |
| Ratios and supplemental data | | | | | |
| Net assets, end of period (in millions) | $782 | $1,184 | $1,547 | $2,088 | $1,971 |
| Ratios (as a percentage of average net assets): | | | | | |
| Expenses before reductions | 1.12 | 1.11 | 1.11 | 1.12 | 1.13 |
| Expenses including reductions | 1.12 | 1.10 | 1.10 | 1.12 | 1.12 |
| Net investment income | 0.70 | 0.58 | 0.30 | 0.48 | 0.70 |
| Portfolio turnover (%) | 54 | 53 | 53 | 50 | 47 |
| 1 | Based on average daily shares outstanding. |
| 2 | Total returns would have been lower had certain expenses not been reduced during the applicable periods. |
| 3 | Does not reflect the effect of sales charges, if any. |
| SEE NOTES TO FINANCIAL STATEMENTS | ANNUAL REPORT | JOHN HANCOCK Disciplined Value Mid Cap Fund | 21 |
| CLASS C SHARES Period ended | 3-31-20 | 3-31-19 | 3-31-18 | 3-31-17 | 3-31-16 |
| Per share operating performance | | | | | |
| Net asset value, beginning of period | $19.13 | $22.42 | $21.77 | $18.65 | $20.43 |
| Net investment loss1 | (0.01) | (0.04) | (0.10) | (0.05) | (0.01) |
| Net realized and unrealized gain (loss) on investments | (3.84) | (1.00) | 2.13 | 3.58 | (0.64) |
| Total from investment operations | (3.85) | (1.04) | 2.03 | 3.53 | (0.65) |
| Less distributions | | | | | |
| From net realized gain | (0.34) | (2.25) | (1.38) | (0.41) | (1.13) |
| Net asset value, end of period | $14.94 | $19.13 | $22.42 | $21.77 | $18.65 |
| Total return (%)2,3 | (20.63) | (3.72) | 9.35 | 18.99 | (3.27) |
| Ratios and supplemental data | | | | | |
| Net assets, end of period (in millions) | $107 | $182 | $278 | $319 | $329 |
| Ratios (as a percentage of average net assets): | | | | | |
| Expenses before reductions | 1.87 | 1.86 | 1.86 | 1.87 | 1.88 |
| Expenses including reductions | 1.87 | 1.85 | 1.85 | 1.87 | 1.87 |
| Net investment loss | (0.07) | (0.19) | (0.43) | (0.27) | (0.06) |
| Portfolio turnover (%) | 54 | 53 | 53 | 50 | 47 |
| 1 | Based on average daily shares outstanding. |
| 2 | Total returns would have been lower had certain expenses not been reduced during the applicable periods. |
| 3 | Does not reflect the effect of sales charges, if any. |
| 22 | JOHN HANCOCK Disciplined Value Mid Cap Fund | ANNUAL REPORT | SEE NOTES TO FINANCIAL STATEMENTS |
| CLASS I SHARES Period ended | 3-31-20 | 3-31-19 | 3-31-18 | 3-31-17 | 3-31-16 |
| Per share operating performance | | | | | |
| Net asset value, beginning of period | $19.91 | $23.22 | $22.39 | $19.14 | $20.86 |
| Net investment income1 | 0.20 | 0.18 | 0.14 | 0.16 | 0.20 |
| Net realized and unrealized gain (loss) on investments | (4.00) | (1.06) | 2.19 | 3.69 | (0.67) |
| Total from investment operations | (3.80) | (0.88) | 2.33 | 3.85 | (0.47) |
| Less distributions | | | | | |
| From net investment income | (0.19) | (0.18) | (0.12) | (0.19) | (0.12) |
| From net realized gain | (0.34) | (2.25) | (1.38) | (0.41) | (1.13) |
| Total distributions | (0.53) | (2.43) | (1.50) | (0.60) | (1.25) |
| Net asset value, end of period | $15.58 | $19.91 | $23.22 | $22.39 | $19.14 |
| Total return (%)2 | (19.84) | (2.79) | 10.46 | 20.25 | (2.35) |
| Ratios and supplemental data | | | | | |
| Net assets, end of period (in millions) | $6,349 | $7,784 | $9,799 | $9,512 | $7,802 |
| Ratios (as a percentage of average net assets): | | | | | |
| Expenses before reductions | 0.87 | 0.88 | 0.86 | 0.86 | 0.87 |
| Expenses including reductions | 0.87 | 0.87 | 0.85 | 0.86 | 0.86 |
| Net investment income | 0.97 | 0.82 | 0.58 | 0.75 | 0.99 |
| Portfolio turnover (%) | 54 | 53 | 53 | 50 | 47 |
| 1 | Based on average daily shares outstanding. |
| 2 | Total returns would have been lower had certain expenses not been reduced during the applicable periods. |
| SEE NOTES TO FINANCIAL STATEMENTS | ANNUAL REPORT | JOHN HANCOCK Disciplined Value Mid Cap Fund | 23 |
| CLASS R2 SHARES Period ended | 3-31-20 | 3-31-19 | 3-31-18 | 3-31-17 | 3-31-16 |
| Per share operating performance | | | | | |
| Net asset value, beginning of period | $19.85 | $23.14 | $22.32 | $19.09 | $20.81 |
| Net investment income1 | 0.11 | 0.09 | 0.04 | 0.07 | 0.11 |
| Net realized and unrealized gain (loss) on investments | (3.98) | (1.04) | 2.19 | 3.68 | (0.66) |
| Total from investment operations | (3.87) | (0.95) | 2.23 | 3.75 | (0.55) |
| Less distributions | | | | | |
| From net investment income | (0.11) | (0.09) | (0.03) | (0.11) | (0.04) |
| From net realized gain | (0.34) | (2.25) | (1.38) | (0.41) | (1.13) |
| Total distributions | (0.45) | (2.34) | (1.41) | (0.52) | (1.17) |
| Net asset value, end of period | $15.53 | $19.85 | $23.14 | $22.32 | $19.09 |
| Total return (%)2 | (20.14) | (3.14) | 10.03 | 19.76 | (2.74) |
| Ratios and supplemental data | | | | | |
| Net assets, end of period (in millions) | $77 | $131 | $188 | $216 | $234 |
| Ratios (as a percentage of average net assets): | | | | | |
| Expenses before reductions | 1.26 | 1.27 | 1.26 | 1.27 | 1.27 |
| Expenses including reductions | 1.25 | 1.26 | 1.25 | 1.26 | 1.27 |
| Net investment income | 0.54 | 0.41 | 0.17 | 0.35 | 0.56 |
| Portfolio turnover (%) | 54 | 53 | 53 | 50 | 47 |
| 1 | Based on average daily shares outstanding. |
| 2 | Total returns would have been lower had certain expenses not been reduced during the applicable periods. |
| 24 | JOHN HANCOCK Disciplined Value Mid Cap Fund | ANNUAL REPORT | SEE NOTES TO FINANCIAL STATEMENTS |
| CLASS R4 SHARES Period ended | 3-31-20 | 3-31-19 | 3-31-18 | 3-31-17 | 3-31-16 |
| Per share operating performance | | | | | |
| Net asset value, beginning of period | $19.90 | $23.20 | $22.38 | $19.13 | $20.85 |
| Net investment income1 | 0.17 | 0.15 | 0.09 | 0.12 | 0.16 |
| Net realized and unrealized gain (loss) on investments | (4.00) | (1.05) | 2.20 | 3.70 | (0.66) |
| Total from investment operations | (3.83) | (0.90) | 2.29 | 3.82 | (0.50) |
| Less distributions | | | | | |
| From net investment income | (0.16) | (0.15) | (0.09) | (0.16) | (0.09) |
| From net realized gain | (0.34) | (2.25) | (1.38) | (0.41) | (1.13) |
| Total distributions | (0.50) | (2.40) | (1.47) | (0.57) | (1.22) |
| Net asset value, end of period | $15.57 | $19.90 | $23.20 | $22.38 | $19.13 |
| Total return (%)2 | (19.96) | (2.90) | 10.26 | 20.09 | (2.50) |
| Ratios and supplemental data | | | | | |
| Net assets, end of period (in millions) | $55 | $74 | $97 | $95 | $104 |
| Ratios (as a percentage of average net assets): | | | | | |
| Expenses before reductions | 1.11 | 1.12 | 1.12 | 1.11 | 1.12 |
| Expenses including reductions | 1.00 | 1.01 | 1.01 | 1.00 | 1.02 |
| Net investment income | 0.81 | 0.68 | 0.42 | 0.60 | 0.81 |
| Portfolio turnover (%) | 54 | 53 | 53 | 50 | 47 |
| 1 | Based on average daily shares outstanding. |
| 2 | Total returns would have been lower had certain expenses not been reduced during the applicable periods. |
| SEE NOTES TO FINANCIAL STATEMENTS | ANNUAL REPORT | JOHN HANCOCK Disciplined Value Mid Cap Fund | 25 |
| CLASS R6 SHARES Period ended | 3-31-20 | 3-31-19 | 3-31-18 | 3-31-17 | 3-31-16 |
| Per share operating performance | | | | | |
| Net asset value, beginning of period | $19.90 | $23.21 | $22.38 | $19.13 | $20.85 |
| Net investment income1 | 0.23 | 0.21 | 0.17 | 0.18 | 0.22 |
| Net realized and unrealized gain (loss) on investments | (4.00) | (1.07) | 2.18 | 3.69 | (0.67) |
| Total from investment operations | (3.77) | (0.86) | 2.35 | 3.87 | (0.45) |
| Less distributions | | | | | |
| From net investment income | (0.21) | (0.20) | (0.14) | (0.21) | (0.14) |
| From net realized gain | (0.34) | (2.25) | (1.38) | (0.41) | (1.13) |
| Total distributions | (0.55) | (2.45) | (1.52) | (0.62) | (1.27) |
| Net asset value, end of period | $15.58 | $19.90 | $23.21 | $22.38 | $19.13 |
| Total return (%)2 | (19.72) | (2.66) | 10.56 | 20.35 | (2.25) |
| Ratios and supplemental data | | | | | |
| Net assets, end of period (in millions) | $2,546 | $2,994 | $2,748 | $1,774 | $1,053 |
| Ratios (as a percentage of average net assets): | | | | | |
| Expenses before reductions | 0.76 | 0.77 | 0.77 | 0.77 | 0.77 |
| Expenses including reductions | 0.76 | 0.76 | 0.76 | 0.76 | 0.76 |
| Net investment income | 1.08 | 0.96 | 0.71 | 0.86 | 1.13 |
| Portfolio turnover (%) | 54 | 53 | 53 | 50 | 47 |
| 1 | Based on average daily shares outstanding. |
| 2 | Total returns would have been lower had certain expenses not been reduced during the applicable periods. |
| 26 | JOHN HANCOCK Disciplined Value Mid Cap Fund | ANNUAL REPORT | SEE NOTES TO FINANCIAL STATEMENTS |
| CLASS ADV SHARES Period ended | 3-31-20 | 3-31-19 | 3-31-18 | 3-31-17 | 3-31-16 |
| Per share operating performance | | | | | |
| Net asset value, beginning of period | $19.03 | $22.30 | $21.56 | $18.46 | $20.15 |
| Net investment income1 | 0.14 | 0.11 | 0.07 | 0.11 | 0.12 |
| Net realized and unrealized gain (loss) on investments | (3.82) | (1.00) | 2.11 | 3.54 | (0.63) |
| Total from investment operations | (3.68) | (0.89) | 2.18 | 3.65 | (0.51) |
| Less distributions | | | | | |
| From net investment income | (0.14) | (0.13) | (0.06) | (0.14) | (0.05) |
| From net realized gain | (0.34) | (2.25) | (1.38) | (0.41) | (1.13) |
| Total distributions | (0.48) | (2.38) | (1.44) | (0.55) | (1.18) |
| Net asset value, end of period | $14.87 | $19.03 | $22.30 | $21.56 | $18.46 |
| Total return (%)2 | (20.06) | (2.98) | 10.17 | 19.88 | (2.59) |
| Ratios and supplemental data | | | | | |
| Net assets, end of period (in millions) | $—3 | $1 | $2 | $2 | $1 |
| Ratios (as a percentage of average net assets): | | | | | |
| Expenses before reductions | 1.12 | 1.11 | 1.11 | 1.13 | 1.42 |
| Expenses including reductions | 1.12 | 1.10 | 1.10 | 1.12 | 1.16 |
| Net investment income | 0.71 | 0.49 | 0.32 | 0.55 | 0.63 |
| Portfolio turnover (%) | 54 | 53 | 53 | 50 | 47 |
| 1 | Based on average daily shares outstanding. |
| 2 | Total returns would have been lower had certain expenses not been reduced during the applicable periods. |
| 3 | Less than $500,000. |
| SEE NOTES TO FINANCIAL STATEMENTS | ANNUAL REPORT | JOHN HANCOCK Disciplined Value Mid Cap Fund | 27 |
| Notes to financial statements | |
Note 1—Organization
John Hancock Disciplined Value Mid Cap Fund (the fund) is a series of John Hancock Funds III (the Trust), an open-end management investment company organized as a Massachusetts business trust and registered under the Investment Company Act of 1940, as amended (the 1940 Act). The investment objective of the fund is to seek long-term growth of capital with current income as a secondary objective.
The fund may offer multiple classes of shares. The shares currently outstanding are detailed in the Statement of assets and liabilities. Class A and Class C shares are offered to all investors. Class I shares are offered to institutions and certain investors. Class R2 and Class R4 shares are available only to certain retirement and 529 plans. Class R6 shares are only available to certain retirement plans, institutions and other investors. Class ADV shares are available only to investors who acquired Class A shares as a result of the reorganization of the Robeco Boston Partners Mid Cap Value Fund into the fund. Class C shares convert to Class A shares ten years after purchase (certain exclusions may apply). Shareholders of each class have exclusive voting rights to matters that affect that class. The distribution and service fees, if any, and transfer agent fees for each class may differ.
Note 2—Significant accounting policies
The financial statements have been prepared in conformity with accounting principles generally accepted in the United States of America (US GAAP), which require management to make certain estimates and assumptions as of the date of the financial statements. Actual results could differ from those estimates and those differences could be significant. The fund qualifies as an investment company under Topic 946 of Accounting Standards Codification of US GAAP.
Events or transactions occurring after the end of the fiscal period through the date that the financial statements were issued have been evaluated in the preparation of the financial statements. The following summarizes the significant accounting policies of the fund:
Security valuation. Investments are stated at value as of the scheduled close of regular trading on the New York Stock Exchange (NYSE), normally at 4:00 P.M., Eastern Time. In case of emergency or other disruption resulting in the NYSE not opening for trading or the NYSE closing at a time other than the regularly scheduled close, the net asset value (NAV) may be determined as of the regularly scheduled close of the NYSE pursuant to the fund's Valuation Policies and Procedures.
In order to value the securities, the fund uses the following valuation techniques: Equity securities, including exchange-traded or closed-end funds, are typically valued at the last sale price or official closing price on the exchange or principal market where the security trades. In the event there were no sales during the day or closing prices are not available, the securities are valued using the last available bid price. Investments by the fund in open-end mutual funds, including John Hancock Collateral Trust (JHCT), are valued at their respective NAVs each business day.
In certain instances, the Pricing Committee may determine to value equity securities using prices obtained from another exchange or market if trading on the exchange or market on which prices are typically obtained did not open for trading as scheduled, or if trading closed earlier than scheduled, and trading occurred as normal on another exchange or market.
Other portfolio securities and assets, for which reliable market quotations are not readily available, are valued at fair value as determined in good faith by the fund's Pricing Committee following procedures established by the Board of Trustees. The frequency with which these fair valuation procedures are used cannot be predicted and fair value of securities may differ significantly from the value that would have been used had a ready market for such securities existed.
The fund uses a three-tier hierarchy to prioritize the pricing assumptions, referred to as inputs, used in valuation techniques to measure fair value. Level 1 includes securities valued using quoted prices in active markets for identical securities, including registered investment companies. Level 2 includes securities valued using other
| 28 | JOHN HANCOCK Disciplined Value Mid Cap Fund | ANNUAL REPORT | |
significant observable inputs. Observable inputs may include quoted prices for similar securities, interest rates, prepayment speeds and credit risk. Prices for securities valued using these inputs are received from independent pricing vendors and brokers and are based on an evaluation of the inputs described. Level 3 includes securities valued using significant unobservable inputs when market prices are not readily available or reliable, including the fund's own assumptions in determining the fair value of investments. Factors used in determining value may include market or issuer specific events or trends, changes in interest rates and credit quality. The inputs or methodology used for valuing securities are not necessarily an indication of the risks associated with investing in those securities. Changes in valuation techniques and related inputs may result in transfers into or out of an assigned level within the disclosure hierarchy.
As of March 31, 2020, all investments are categorized as Level 1 under the hierarchy described above.
Security transactions and related investment income. Investment security transactions are accounted for on a trade date plus one basis for daily NAV calculations. However, for financial reporting purposes, investment transactions are reported on trade date. Interest income is accrued as earned. Dividend income is recorded on the ex-date, except for dividends of certain foreign securities where the dividend may not be known until after the ex-date. In those cases, dividend income, net of withholding taxes, is recorded when the fund becomes aware of the dividends. Non-cash dividends, if any, are recorded at the fair market value of the securities received. Gains and losses on securities sold are determined on the basis of identified cost and may include proceeds from litigation.
Real estate investment trusts. The fund may invest in real estate investment trusts (REITs). Distributions from REITs may be recorded as income and subsequently characterized by the REIT at the end of the fiscal year as a reduction of cost of investments and/or as a realized gain. As a result, the fund will estimate the components of distributions from these securities. Such estimates are revised when the actual components of the distributions are known.
Securities lending. The fund may lend its securities to earn additional income. The fund receives collateral from the borrower in an amount not less than the market value of the loaned securities. The fund will invest its cash collateral in JHCT, an affiliate of the fund, which has a floating NAV and is registered with the Securities and Exchange Commission (SEC) as an investment company. JHCT invests in short-term money market investments. The fund will receive the benefit of any gains and bear any losses generated by JHCT with respect to the cash collateral.
The fund has the right to recall loaned securities on demand. If a borrower fails to return loaned securities when due, then the lending agent is responsible and indemnifies the fund for the lent securities. The lending agent uses the collateral received from the borrower to purchase replacement securities of the same issue, type, class and series of the loaned securities. If the value of the collateral is less than the purchase cost of replacement securities, the lending agent is responsible for satisfying the shortfall but only to the extent that the shortfall is not due to any decrease in the value of JHCT.
Although the risk of loss on securities lent is mitigated by receiving collateral from the borrower and through lending agent indemnification, the fund could experience a delay in recovering securities or could experience a lower than expected return if the borrower fails to return the securities on a timely basis. The fund receives compensation for lending its securities by retaining a portion of the return on the investment of the collateral and compensation from fees earned from borrowers of the securities. Securities lending income received by the fund is net of fees retained by the securities lending agent. Net income received from JHCT is a component of securities lending income as recorded on the Statement of operations.
Obligations to repay collateral received by the fund are shown on the Statement of assets and liabilities as Payable upon return of securities loaned and are secured by the loaned securities. As of March 31, 2020, the fund loaned securities valued at $55,787,795 and received $57,859,052 of cash collateral.
| | ANNUAL REPORT | JOHN HANCOCK Disciplined Value Mid Cap Fund | 29 |
Foreign investing. Assets, including investments, and liabilities denominated in foreign currencies are translated into U.S. dollar values each day at the prevailing exchange rate. Purchases and sales of securities, income and expenses are translated into U.S. dollars at the prevailing exchange rate on the date of the transaction. The effect of changes in foreign currency exchange rates on the value of securities is reflected as a component of the realized and unrealized gains (losses) on investments. Foreign investments are subject to a decline in the value of a foreign currency versus the U.S. dollar, which reduces the dollar value of securities denominated in that currency.
Funds that invest internationally generally carry more risk than funds that invest strictly in U.S. securities. Risks can result from differences in economic and political conditions, regulations, market practices (including higher transaction costs), accounting standards and other factors.
Foreign taxes. The fund may be subject to withholding tax on income, capital gains or repatriation taxes imposed by certain countries, a portion of which may be recoverable. Foreign taxes are accrued based upon the fund's understanding of the tax rules and rates that exist in the foreign markets in which it invests. Taxes are accrued based on gains realized by the fund as a result of certain foreign security sales. In certain circumstances, estimated taxes are accrued based on unrealized appreciation of such securities. Investment income is recorded net of foreign withholding taxes.
Overdraft. The fund may have the ability to borrow from banks for temporary or emergency purposes, including meeting redemption requests that otherwise might require the untimely sale of securities. Pursuant to the fund's custodian agreement, the custodian may loan money to the fund to make properly authorized payments. The fund is obligated to repay the custodian for any overdraft, including any related costs or expenses. The custodian may have a lien, security interest or security entitlement in any fund property that is not otherwise segregated or pledged, to the extent of any overdraft, and to the maximum extent permitted by law.
Line of credit. The fund and other affiliated funds have entered into a syndicated line of credit agreement with Citibank, N.A. as the administrative agent that enables them to participate in a $750 million unsecured committed line of credit. Excluding commitments designated for a certain fund and subject to the needs of all other affiliated funds, the fund can borrow up to an aggregate commitment amount of $500 million, subject to asset coverage and other limitations as specified in the agreement. A commitment fee payable at the end of each calendar quarter, based on the average daily unused portion of the line of credit, is charged to each participating fund based on a combination of fixed and asset based allocations and is reflected in Other expenses on the Statement of operations. For the year ended March 31, 2020, the fund had no borrowings under the line of credit. Commitment fees for the year ended March 31, 2020 were $32,988.
Expenses. Within the John Hancock group of funds complex, expenses that are directly attributable to an individual fund are allocated to such fund. Expenses that are not readily attributable to a specific fund are allocated among all funds in an equitable manner, taking into consideration, among other things, the nature and type of expense and the fund’s relative net assets. Expense estimates are accrued in the period to which they relate and adjustments are made when actual amounts are known.
Class allocations. Income, common expenses and realized and unrealized gains (losses) are determined at the fund level and allocated daily to each class of shares based on the net assets of the class. Class-specific expenses, such as distribution and service fees, if any, and transfer agent fees, for all classes, are charged daily at the class level based on the net assets of each class and the specific expense rates applicable to each class.
Federal income taxes. The fund intends to continue to qualify as a regulated investment company by complying with the applicable provisions of the Internal Revenue Code and will not be subject to federal income tax on taxable income that is distributed to shareholders. Therefore, no federal income tax provision is required.
For federal income tax purposes, net capital losses of $24,009,816 that are a result of security transactions occurring after October 31, 2019, are treated as occurring on April 1, 2020, the first day of the fund’s next taxable year.
| 30 | JOHN HANCOCK Disciplined Value Mid Cap Fund | ANNUAL REPORT | |
As of March 31, 2020, the fund had no uncertain tax positions that would require financial statement recognition, derecognition or disclosure. The fund's federal tax returns are subject to examination by the Internal Revenue Service for a period of three years.
Distribution of income and gains. Distributions to shareholders from net investment income and net realized gains, if any, are recorded on the ex-date. The fund generally declares and pays dividends annually. Capital gain distributions, if any, are typically distributed annually.
The tax character of distributions for the years ended March 31, 2020 and 2019 was as follows:
| | March 31, 2020 | March 31, 2019 |
| Ordinary income | $118,353,152 | $151,378,321 |
| Long-term capital gains | 212,778,419 | 1,275,004,579 |
| Total | $331,131,571 | $1,426,382,900 |
Distributions paid by the fund with respect to each class of shares are calculated in the same manner, at the same time and in the same amount, except for the effect of class level expenses that may be applied differently to each class. As of March 31, 2020, the components of distributable earnings on a tax basis consisted of $22,842,302 of undistributed ordinary income.
Such distributions and distributable earnings, on a tax basis, are determined in conformity with income tax regulations, which may differ from US GAAP. Distributions in excess of tax basis earnings and profits, if any, are reported in the fund's financial statements as a return of capital.
Capital accounts within the financial statements are adjusted for permanent book-tax differences. These adjustments have no impact on net assets or the results of operations. Temporary book-tax differences, if any, will reverse in a subsequent period. Book-tax differences are primarily attributable to wash sale loss deferrals and treatment of a portion of the proceeds from redemptions as distributions for tax purposes.
Note 3—Guarantees and indemnifications
Under the Trust's organizational documents, its Officers and Trustees are indemnified against certain liabilities arising out of the performance of their duties to the Trust, including the fund. Additionally, in the normal course of business, the fund enters into contracts with service providers that contain general indemnification clauses. The fund's maximum exposure under these arrangements is unknown, as this would involve future claims that may be made against the fund that have not yet occurred. The risk of material loss from such claims is considered remote.
Note 4—Fees and transactions with affiliates
John Hancock Investment Management LLC (the Advisor) serves as investment advisor for the fund. John Hancock Investment Management Distributors LLC (the Distributor), an affiliate of the Advisor, serves as principal underwriter of the fund. The Advisor and the Distributor are indirect, wholly owned subsidiaries of Manulife Financial Corporation. Prior to June 28, 2019, the Advisor was known as John Hancock Advisers, LLC and the Distributor was known as John Hancock Funds, LLC.
Management fee. The fund has an investment management agreement with the Advisor under which the fund pays a daily management fee to the Advisor equivalent on an annual basis to the sum of: (a) 0.800% of the first $500 million of the fund’s average daily net assets; (b) 0.775% of the next $500 million of the fund’s average daily net assets; (c) 0.750% of the next $500 million of the fund’s average daily net assets; (d) 0.725% of the next $1 billion of the fund’s average daily net assets; and (e) 0.700% of the fund’s average daily net assets in excess of $2.5 billion. The Advisor has a subadvisory agreement with Boston Partners Global Investors, Inc., an indirect, wholly owned subsidiary of Orix Corporation of Japan. The fund is not responsible for payment of the subadvisory fees.
| | ANNUAL REPORT | JOHN HANCOCK Disciplined Value Mid Cap Fund | 31 |
The Advisor has contractually agreed to waive a portion of its management fee and/or reimburse expenses for certain funds of the John Hancock group of funds complex, including the fund (the participating portfolios). This waiver is based upon aggregate net assets of all the participating portfolios. The amount of the reimbursement is calculated daily and allocated among all the participating portfolios in proportion to the daily net assets of each fund. During the year ended March 31, 2020, this waiver amounted to 0.01% of the fund’s average daily net assets. This arrangement expires on July 31, 2021, unless renewed by mutual agreement of the fund and the Advisor based upon a determination that this is appropriate under the circumstances at that time.
For the year ended March 31, 2020, the expense reductions described above amounted to the following:
| Class | Expense reduction |
| Class A | $83,808 |
| Class C | 12,295 |
| Class I | 617,999 |
| Class R2 | 8,909 |
| Class | Expense reduction |
| Class R4 | $5,743 |
| Class R6 | 235,045 |
| Class ADV | 50 |
| Total | $963,849 |
Expenses waived or reimbursed in the current fiscal period are not subject to recapture in future fiscal periods.
The investment management fees, including the impact of the waivers and reimbursements as described above, incurred for the year ended March 31, 2020, were equivalent to a net annual effective rate of 0.70% of the fund's average daily net assets.
Accounting and legal services. Pursuant to a service agreement, the fund reimburses the Advisor for all expenses associated with providing the administrative, financial, legal, compliance, accounting and recordkeeping services to the fund, including the preparation of all tax returns, periodic reports to shareholders and regulatory reports, among other services. These expenses are allocated to each share class based on its relative net assets at the time the expense was incurred. These accounting and legal services fees incurred for the year ended March 31, 2020 amounted to an annual rate of 0.02% of the fund's average daily net assets.
Distribution and service plans. The fund has a distribution agreement with the Distributor. The fund has adopted distribution and service plans for certain classes as detailed below pursuant to Rule 12b-1 under the 1940 Act, to pay the Distributor for services provided as the distributor of shares of the fund. In addition, under a service plan for certain classes as detailed below, the fund pays for certain other services. The fund may pay up to the following contractual rates of distribution and service fees under these arrangements, expressed as an annual percentage of average daily net assets for each class of the fund's shares:
| Class | Rule 12b-1 Fee | Service fee |
| Class A | 0.30% | — |
| Class C | 1.00% | — |
| Class R2 | 0.25% | 0.25% |
| Class R4 | 0.25% | 0.10% |
| Class ADV | 0.25% | — |
Currently only 0.25% is charged to Class A shares for Rule 12b-1 fees.
The fund's Distributor has contractually agreed to waive 0.10% of Rule12b-1 fees for Class R4 shares. The current waiver agreement expires on July 31, 2021, unless renewed by mutual agreement of the fund and the Distributor based upon a determination that this is appropriate under the circumstances at the time. This contractual waiver amounted to $77,567 for Class R4 shares for the year ended March 31, 2020.
| 32 | JOHN HANCOCK Disciplined Value Mid Cap Fund | ANNUAL REPORT | |
Sales charges. Class A shares are assessed up-front sales charges, which resulted in payments to the Distributor amounting to $997,601 for the year ended March 31, 2020. Of this amount, $156,664 was retained and used for printing prospectuses, advertising, sales literature and other purposes and $840,937 was paid as sales commissions to broker-dealers.
Class A and Class C shares may be subject to contingent deferred sales charges (CDSCs). Certain Class A shares that are acquired through purchases of $1 million or more and are redeemed within one year of purchase are subject to a 1.00% sales charge. Class C shares that are redeemed within one year of purchase are subject to a 1.00% CDSC. CDSCs are applied to the lesser of the current market value at the time of redemption or the original purchase cost of the shares being redeemed. Proceeds from CDSCs are used to compensate the Distributor for providing distribution-related services in connection with the sale of these shares. During the year ended March 31, 2020, CDSCs received by the Distributor amounted to $5,451 and $4,613 for Class A and Class C shares, respectively.
Transfer agent fees. The John Hancock group of funds has a complex-wide transfer agent agreement with John Hancock Signature Services, Inc. (Signature Services), an affiliate of the Advisor. The transfer agent fees paid to Signature Services are determined based on the cost to Signature Services (Signature Services Cost) of providing recordkeeping services. It also includes out-of-pocket expenses, including payments made to third-parties for recordkeeping services provided to their clients who invest in one or more John Hancock funds. In addition, Signature Services Cost may be reduced by certain fees that Signature Services receives in connection with retirement and small accounts. Signature Services Cost is calculated monthly and allocated, as applicable, to five categories of share classes: Retail Share and Institutional Share Classes of Non-Municipal Bond Funds, Class R6 Shares, Retirement Share Classes and Municipal Bond Share Classes. Within each of these categories, the applicable costs are allocated to the affected John Hancock affiliated funds and/or classes, based on the relative average daily net assets.
Class level expenses. Class level expenses for the year ended March 31, 2020 were as follows:
| Class | Distribution and service fees | Transfer agent fees |
| Class A | $2,831,032 | $1,372,107 |
| Class C | 1,661,725 | 201,105 |
| Class I | — | 10,238,457 |
| Class R2 | 598,239 | 14,881 |
| Class R4 | 270,000 | 9,659 |
| Class R6 | — | 395,178 |
| Class ADV | 1,683 | 818 |
| Total | $5,362,679 | $12,232,205 |
Trustee expenses. The fund compensates each Trustee who is not an employee of the Advisor or its affiliates. The costs of paying Trustee compensation and expenses are allocated to the fund based on its net assets relative to other funds within the John Hancock group of funds complex.
Interfund lending program. Pursuant to an Exemptive Order issued by the SEC, the fund, along with certain other funds advised by the Advisor or its affiliates, may participate in an interfund lending program. This program provides an alternative credit facility allowing the fund to borrow from, or lend money to, other participating affiliated funds. At period end, no interfund loans were outstanding. The fund's activity in this program during the period for which loans were outstanding was as follows:
Borrower
or Lender | Weighted Average
Loan Balance | Days
Outstanding | Weighted Average
Interest Rate | Interest Income
(Expense) |
| Lender | $34,600,705 | 8 | 1.573% | $12,094 |
| | ANNUAL REPORT | JOHN HANCOCK Disciplined Value Mid Cap Fund | 33 |
Note 5—Fund share transactions
Transactions in fund shares for the years ended March 31, 2020 and 2019 were as follows:
| | Year Ended 3-31-20 | Year Ended 3-31-19 |
| | Shares | Amount | Shares | Amount |
| Class A shares | | | | |
| Sold | 13,654,022 | $265,293,757 | 9,600,767 | $196,392,115 |
| Distributions reinvested | 1,080,962 | 22,667,783 | 7,176,446 | 124,941,934 |
| Repurchased | (24,370,445) | (471,965,836) | (23,945,531) | (486,398,627) |
| Net decrease | (9,635,461) | $(184,004,296) | (7,168,318) | $(165,064,578) |
| Class C shares | | | | |
| Sold | 646,233 | $12,714,167 | 535,694 | $10,538,379 |
| Distributions reinvested | 110,510 | 2,326,246 | 1,097,981 | 19,203,695 |
| Repurchased | (3,069,943) | (60,355,776) | (4,549,113) | (92,210,346) |
| Net decrease | (2,313,200) | $(45,315,363) | (2,915,438) | $(62,468,272) |
| Class I shares | | | | |
| Sold | 132,026,217 | $2,651,759,012 | 96,199,367 | $2,043,980,260 |
| Distributions reinvested | 8,328,620 | 182,396,777 | 42,216,483 | 766,651,337 |
| Repurchased | (123,797,738) | (2,419,758,033) | (169,569,857) | (3,552,367,272) |
| Net increase (decrease) | 16,557,099 | $414,397,756 | (31,154,007) | $(741,735,675) |
| Class R2 shares | | | | |
| Sold | 1,106,934 | $21,770,845 | 1,473,157 | $30,719,374 |
| Distributions reinvested | 97,034 | 2,119,217 | 678,989 | 12,303,280 |
| Repurchased | (2,850,860) | (59,144,063) | (3,661,304) | (79,802,365) |
| Net decrease | (1,646,892) | $(35,254,001) | (1,509,158) | $(36,779,711) |
| Class R4 shares | | | | |
| Sold | 1,516,265 | $31,772,255 | 878,937 | $19,103,976 |
| Distributions reinvested | 92,350 | 2,021,537 | 513,681 | 9,323,305 |
| Repurchased | (1,809,529) | (38,067,820) | (1,849,341) | (38,431,474) |
| Net decrease | (200,914) | $(4,274,028) | (456,723) | $(10,004,193) |
| Class R6 shares | | | | |
| Sold | 42,572,165 | $851,126,502 | 48,812,674 | $1,040,348,591 |
| Distributions reinvested | 3,643,329 | 79,716,046 | 16,526,815 | 299,796,417 |
| Repurchased | (33,199,308) | (680,251,869) | (33,281,169) | (707,145,429) |
| Net increase | 13,016,186 | $250,590,679 | 32,058,320 | $632,999,579 |
| 34 | JOHN HANCOCK Disciplined Value Mid Cap Fund | ANNUAL REPORT | |
| | Year Ended 3-31-20 | Year Ended 3-31-19 |
| | Shares | Amount | Shares | Amount |
| Class ADV shares | | | | |
| Sold | 6,498 | $131,200 | 1,749 | $38,161 |
| Distributions reinvested | 844 | 17,640 | 10,753 | 186,669 |
| Repurchased | (6,990) | (147,940) | (76,260) | (1,445,473) |
| Net increase (decrease) | 352 | $900 | (63,758) | $(1,220,643) |
| Total net increase (decrease) | 15,777,170 | $396,141,647 | (11,209,082) | $(384,273,493) |
Note 6—Purchase and sale of securities
Purchases and sales of securities, other than short-term investments, amounted to $6,984,511,390 and $6,826,532,840, respectively, for the year ended March 31, 2020.
Note 7—Investment in affiliated underlying funds
The fund may invest in affiliated underlying funds that are managed by the Advisor and its affiliates. Information regarding the fund's fiscal year to date purchases and sales of the affiliated underlying funds as well as income and capital gains earned by the fund, if any, is as follows:
| | | | | | | | Dividends and distributions |
| Affiliate | Ending
share
amount | Beginning
value | Cost of
purchases | Proceeds
from shares
sold | Realized
gain
(loss) | Change in
unrealized
appreciation
(depreciation) | Income
distributions
received | Capital gain
distributions
received | Ending
value |
| John Hancock Collateral Trust* | 5,776,951 | $6,143,864 | $1,211,240,638 | $(1,159,529,534) | $(124,944) | $25,048 | $857,998 | — | $57,755,072 |
| * | Refer to the Securities lending note within Note 2 for details regarding this investment. |
Note 8—Coronavirus (COVID-19) pandemic
The novel COVID-19 disease has resulted in significant disruptions to global business activity. A widespread health crisis such as a global pandemic could cause substantial market volatility, exchange trading suspensions and closures, impact the ability to complete redemptions, and affect fund performance.
| | ANNUAL REPORT | JOHN HANCOCK Disciplined Value Mid Cap Fund | 35 |
Report of Independent Registered Public Accounting Firm
To the Board of Trustees of John Hancock Funds III and Shareholders of John Hancock Disciplined Value Mid Cap Fund
Opinion on the Financial Statements
We have audited the accompanying statement of assets and liabilities, including the Fund’s investments, of John Hancock Disciplined Value Mid Cap Fund (one of the funds constituting John Hancock Funds III, referred to hereafter as the "Fund") as of March 31, 2020, the related statement of operations for the year ended March 31, 2020, the statements of changes in net assets for each of the two years in the period ended March 31, 2020, including the related notes, and the financial highlights for each of the five years in the period ended March 31, 2020 (collectively referred to as the “financial statements”). In our opinion, the financial statements present fairly, in all material respects, the financial position of the Fund as of March 31, 2020, the results of its operations for the year then ended, the changes in its net assets for each of the two years in the period ended March 31, 2020 and the financial highlights for each of the five years in the period ended March 31, 2020 in conformity with accounting principles generally accepted in the United States of America.
Basis for Opinion
These financial statements are the responsibility of the Fund’s management. Our responsibility is to express an opinion on the Fund’s financial statements based on our audits. We are a public accounting firm registered with the Public Company Accounting Oversight Board (United States) (PCAOB) and are required to be independent with respect to the Fund in accordance with the U.S. federal securities laws and the applicable rules and regulations of the Securities and Exchange Commission and the PCAOB.
We conducted our audits of these financial statements in accordance with the standards of the PCAOB. Those standards require that we plan and perform the audit to obtain reasonable assurance about whether the financial statements are free of material misstatement, whether due to error or fraud.
Our audits included performing procedures to assess the risks of material misstatement of the financial statements, whether due to error or fraud, and performing procedures that respond to those risks. Such procedures included examining, on a test basis, evidence regarding the amounts and disclosures in the financial statements. Our audits also included evaluating the accounting principles used and significant estimates made by management, as well as evaluating the overall presentation of the financial statements. Our procedures included confirmation of securities owned as of March 31, 2020 by correspondence with the custodian, transfer agents, and brokers; when replies were not received from the brokers, we performed other auditing procedures. We believe that our audits provide a reasonable basis for our opinion.
/s/ PricewaterhouseCoopers LLP
Boston, Massachusetts
May 13, 2020
We have served as the auditor of one or more investment companies in the John Hancock group of funds since 1988.
| 36 | JOHN HANCOCK DISCIPLINED VALUE MID CAP FUND | ANNUAL REPORT | |
| Tax information (Unaudited) | |
For federal income tax purposes, the following information is furnished with respect to the distributions of the fund, if any, paid during its taxable year ended March 31, 2020.
The fund reports the maximum amount allowable of its net taxable income as eligible for the corporate dividends-received deduction.
The fund reports the maximum amount allowable of its net taxable income as qualified dividend income as provided in the Jobs and Growth Tax Relief Reconciliation Act of 2003.
The fund paid $223,358,975 in long term capital gain dividends.
The fund reports the maximum amount allowable of its Section 199A dividends as defined in Proposed Treasury Regulation §1.199A-3(d).
Eligible shareholders will be mailed a 2020 Form 1099-DIV in early 2021. This will reflect the tax character of all distributions paid in calendar year 2020.
Please consult a tax advisor regarding the tax consequences of your investment in the fund.
| | ANNUAL REPORT | JOHN HANCOCK DISCIPLINED VALUE MID CAP FUND | 37 |
STATEMENT REGARDING LIQUIDITY RISK MANAGEMENT
Operation of the Liquidity Risk Management Program
This section describes operation and effectiveness of the Liquidity Risk Management Program (LRMP) established in accordance with Rule 22e-4 under the Investment Company Act of 1940, as amended (the Liquidity Rule). The Board of Trustees (the Board) of each Fund in the John Hancock Group of Funds (each a Fund and collectively, the Funds) that is subject to the requirements of the Liquidity Rule has appointed John Hancock Investment Management, LLC and John Hancock Variable Trust Advisers, LLC (together, the Advisor) to serve as Administrator of the LRMP with respect to each of the Funds, including John Hancock Disciplined Value Mid Cap Fund, subject to the oversight of the Board. In order to provide a mechanism and process to perform the functions necessary to administer the LRMP, the Advisor established the Liquidity Risk Management Committee (the Committee). The Fund's subadvisor, Boston Partners Global Investors, Inc. (the Subadvisor) executes the day-to-day investment management and security-level activities of the Fund in accordance with the requirements of the LRMP, subject to the supervision of the Advisor and the Board.
The Committee holds monthly meetings to: (1) review the day-to-day operations of the LRMP; (2) review and approve month end liquidity classifications; (3) review quarterly testing and determinations, as applicable; and (4) review other LRMP related material. The Committee also conducts daily, monthly, quarterly, and annual quantitative and qualitative assessments of each subadvisor to a Fund that is subject to the requirements of the Liquidity Rule and is a part of the LRMP to monitor investment performance issues, risks and trends. In addition, the Committee may conduct ad-hoc reviews and meetings with subadvisors as issues and trends are identified, including potential liquidity and valuation issues.
The Committee provided the Board at an in-person meeting held on March 15-18, 2020 with a written report which addressed the Committee's assessment of the adequacy and effectiveness of the implementation and operation of the LRMP and any material changes to the LRMP. The report, which covered the period December 1, 2018 through December 31, 2019, included an assessment of important aspects of the LRMP including, but not limited to:
• Operation of the Fund's Redemption-In-Kind Procedures;
• Highly Liquid Investment Minimum (HLIM) determination;
• Compliance with the 15% limit on illiquid investments;
• Reasonably Anticipated Trade Size (RATS) determination;
• Security-level liquidity classifications; and
• Liquidity risk assessment.
The report also covered material liquidity matters which occurred or were reported during this period applicable to the Fund, if any, and the Committee's actions to address such matters.
Redemption-In-Kind Procedures
Rule 22e-4 requires any fund that engages in or reserves the right to engage in in-kind redemptions to adopt and implement written policies and procedures regarding in-kind redemptions as part of the management of its liquidity risk. These procedures address the process for redeeming in kind, as well as the circumstances under which the Fund would consider redeeming in kind. Anticipated large redemption activity will be evaluated to identify situations where redeeming in securities instead of cash may be appropriate.
ANNUAL REPORT | JOHN HANCOCK DISCIPLINED VALUE MID CAP FUND 38
As part of its annual assessment of the LRMP, the Committee reviewed the implementation and operation of the Redemption-In-Kind Procedures and determined they are operating in a manner that such procedures are adequate and effective to manage in-kind redemptions on behalf of the Fund as part of the LRMP.
Highly Liquid Investment Minimum determination
The Committee uses an HLIM model to determine a Fund's HLIM. This process incorporates the Fund's investment strategy, historical redemptions, liquidity classification rollup percentages and cash balances, redemption policy, access to funding sources, distribution channels and client concentrations. If the Fund falls below its established HLIM for a period greater than 7 consecutive calendar days, the Committee prepares a report to the Board within one business day following the seventh consecutive calendar day with an explanation of how the Fund plans to restore its HLIM within a reasonable period of time.
Based on the HLIM model, the Committee has determined that the Fund qualifies as a Primarily Highly Liquid Fund (PHLF). It is therefore not required to establish a HLIM. The Fund is tested quarterly to confirm its PHLF status.
As part of its annual assessment of the LRMP, the Committee reviewed the policies and procedures in place with respect to HLIM and PHLF determinations, and determined that such policies and procedures are operating in a manner that is adequate and effective as part of the LRMP.
Compliance with the 15% limit on illiquid investments
Rule 22e-4 sets an aggregate illiquid investment limit of 15% for a fund. Funds are prohibited from acquiring an illiquid investment if this results in greater than 15% of its net assets being classified as illiquid. When applying this limit, the Committee defines "illiquid investment" to mean any investment that the Fund reasonably expects cannot be sold or disposed of in current market conditions in seven calendar days or less without the sale or disposition significantly changing the market value of the investment. If a 15% illiquid investment limit breach occurs for longer than 1 business day, the Fund is required to notify the Board and provide a plan on how to bring illiquid investments within the 15% threshold, and after 7 days confidentially notify the Securities and Exchange Commission (the SEC).
In February 2019, as a result of extended security markets closures in connection with the Chinese New Year in certain countries, the SEC released guidance, and the Committee approved and adopted an Extended Market Holiday Policy to plan for and monitor known Extended Market Holidays (defined as all expected market holiday closures spanning four or more calendar days).
As part of its annual assessment of the LRMP, the Committee reviewed the policies and procedures in place with respect to the 15% illiquid investment limit and determined such policies and procedures are operating in a manner that is adequate and effective as part of the LMRP.
Reasonably Anticipated Trade Size determination
In order to assess the liquidity risk of a Fund, the Committee considers the impact on the Fund that redemptions of a RATS would have under both normal and reasonably foreseeable stressed conditions. Modelling the Fund's RATS requires quantifying cash flow volatility and analyzing distribution channel concentration and redemption risk. The model is designed to estimate the amount of assets that the Fund could reasonably anticipate trading on a given day, during both normal and reasonably foreseeable stressed conditions, to satisfy redemption requests.
ANNUAL REPORT | JOHN HANCOCK DISCIPLINED VALUE MID CAP FUND 39
As part of its annual assessment of the LRMP, the Committee reviewed the policies and procedures in place with respect to RATS determinations and determined that such policies and procedures are operating in a manner that is adequate and effective at making RATS determinations as part of the LRMP.
Security-level liquidity classifications
When classifying the liquidity of portfolio securities, the Fund adheres to the liquidity classification procedures established by the Advisor. In assigning a liquidity classification to Fund portfolio holdings, the following key inputs, among others, are considered: the Fund's RATS, feedback from the applicable Subadvisor on market-, trading- and investment-specific considerations, an assessment of current market conditions and fund portfolio holdings, and a value impact standard. The Subadvisor also provides position-level data to the Committee for use in monthly classification reconciliation in order to identify any classifications that may need to be changed as a result of the above considerations.
As part of its annual assessment of the LRMP, the Committee reviewed the policies and procedures in place with respect to security-level liquidity classifications and determined that such policies and procedures are operating in a manner that is adequate and effective as part of the LRMP.
Liquidity risk assessment
The Committee periodically reviews and assesses, the Fund's liquidity risk, including its investment strategy and liquidity of portfolio investments during both normal and reasonably foreseeable stressed conditions (including whether the investment strategy is appropriate for an open-end fund, the extent to which the strategy involves a relatively concentrated portfolio or large positions in particular issuers, and the use of borrowings for investment purposes and derivatives), cash flow analysis during both normal and reasonably foreseeable stressed conditions, and holdings of cash and cash equivalents, as well as borrowing arrangements and other funding sources.
The Committee also monitors global events, such as the COVID-19 Coronavirus, that could impact the markets and liquidity of portfolio investments and their classifications.
As part of its annual assessment of the LRMP, the Committee reviewed Fund-Level Liquidity Risk Assessment Reports for each of the Funds and determined that the investment strategy for each Fund continues to be appropriate for an open-ended structure.
Adequacy and Effectiveness
Based on the review and assessment conducted by the Committee, the Committee has determined that the LRMP has been implemented, and is operating in a manner that is adequate and effective at assessing and managing the liquidity risk of each Fund.
ANNUAL REPORT | JOHN HANCOCK DISCIPLINED VALUE MID CAP FUND 40
This chart provides information about the Trustees and Officers who oversee your John Hancock fund. Officers elected by the Trustees manage the day-to-day operations of the fund and execute policies formulated by the Trustees.
Independent Trustees
| | | |
Name, year of birth
Position(s) held with Trust
Principal occupation(s) and other
directorships during past 5 years | Trustee
of the
Trust
since1 | Number of John
Hancock funds
overseen by
Trustee |
| Hassell H. McClellan, Born: 1945 | 2012 | 204 |
Trustee and Chairperson of the Board
Director/Trustee, Virtus Funds (since 2008); Director, The Barnes Group (since 2010); Associate Professor, The Wallace E. Carroll School of Management, Boston College (retired 2013). Trustee (since 2005) and Chairperson of the Board (since 2017) of various trusts within the John Hancock Fund Complex. |
| | | |
| Charles L. Bardelis,2 Born: 1941 | 2012 | 204 |
Trustee
Director, Island Commuter Corp. (marine transport). Trustee of various trusts within the John Hancock Fund Complex (since 1988). |
| | | |
| James R. Boyle,Born: 1959 | 2015 | 204 |
Trustee
Chief Executive Officer, Foresters Financial (since 2018); Chairman and Chief Executive Officer, Zillion Group, Inc. (formerly HealthFleet, Inc.) (healthcare) (2014-2018); Executive Vice President and Chief Executive Officer, U.S. Life Insurance Division of Genworth Financial, Inc. (insurance) (January 2014-July 2014); Senior Executive Vice President, Manulife Financial, President and Chief Executive Officer, John Hancock (1999-2012); Chairman and Director, John Hancock Investment Management LLC, John Hancock Investment Management Distributors LLC, and John Hancock Variable Trust Advisers LLC (2005-2010). Trustee of various trusts within the John Hancock Fund Complex (2005-2014 and since 2015). |
| | | |
| Peter S. Burgess,2 Born: 1942 | 2012 | 204 |
Trustee
Consultant (financial, accounting, and auditing matters) (since 1999); Certified Public Accountant; Partner, Arthur Andersen (independent public accounting firm) (prior to 1999); Director, Lincoln Educational Services Corporation (since 2004); Director, Symetra Financial Corporation (2010-2016); Director, PMA Capital Corporation (2004-2010). Trustee of various trusts within the John Hancock Fund Complex (since 2005). |
| | | |
| William H. Cunningham, Born: 1944 | 2006 | 204 |
Trustee
Professor, University of Texas, Austin, Texas (since 1971); former Chancellor, University of Texas System and former President of the University of Texas, Austin, Texas; Chairman (since 2009) and Director (since 2006), Lincoln National Corporation (insurance); Director, Southwest Airlines (since 2000); former Director, LIN Television (2009-2014). Trustee of various trusts within the John Hancock Fund Complex (since 1986). |
| | | |
| Grace K. Fey, Born: 1946 | 2012 | 204 |
Trustee
Chief Executive Officer, Grace Fey Advisors (since 2007); Director and Executive Vice President, Frontier Capital Management Company (1988-2007); Director, Fiduciary Trust (since 2009). Trustee of various trusts within the John Hancock Fund Complex (since 2008). |
ANNUAL REPORT | JOHN HANCOCK DISCIPLINED VALUE MID CAP FUND 41
Independent Trustees (continued)
| | | |
Name, year of birth
Position(s) held with Trust
Principal occupation(s) and other
directorships during past 5 years | Trustee
of the
Trust
since1 | Number of John
Hancock funds
overseen by
Trustee |
| Deborah C. Jackson, Born: 1952 | 2008 | 204 |
Trustee
President, Cambridge College, Cambridge, Massachusetts (since 2011); Board of Directors, Massachusetts Women's Forum (since 2018); Board of Directors, National Association of Corporate Directors/New England (since 2015); Board of Directors, Association of Independent Colleges and Universities of Massachusetts (2014-2017); Chief Executive Officer, American Red Cross of Massachusetts Bay (2002-2011); Board of Directors of Eastern Bank Corporation (since 2001); Board of Directors of Eastern Bank Charitable Foundation (since 2001); Board of Directors of American Student Assistance Corporation (1996-2009); Board of Directors of Boston Stock Exchange (2002-2008); Board of Directors of Harvard Pilgrim Healthcare (health benefits company) (2007-2011). Trustee of various trusts within the John Hancock Fund Complex (since 2008). |
| | | |
| James M. Oates,2Born: 1946 | 2012 | 204 |
Trustee
Managing Director, Wydown Group (financial consulting firm) (since 1994); Chairman and Director, Emerson Investment Management, Inc. (2000-2015); Independent Chairman, Hudson Castle Group, Inc. (formerly IBEX Capital Markets, Inc.) (financial services company) (1997-2011); Director, Stifel Financial (since 1996); Director, Investor Financial Services Corporation (1995-2007); Director, Connecticut River Bancorp (1998-2014); Director/Trustee, Virtus Funds (since 1988). Trustee (since 2004) and Chairperson of the Board (2005-2016) of various trusts within the John Hancock Fund Complex. |
| | | |
| Steven R. Pruchansky, Born: 1944 | 2006 | 204 |
Trustee and Vice Chairperson of the Board
Managing Director, Pru Realty (since 2017); Chairman and Chief Executive Officer, Greenscapes of Southwest Florida, Inc. (since 2014); Director and President, Greenscapes of Southwest Florida, Inc. (until 2000); Member, Board of Advisors, First American Bank (until 2010); Managing Director, Jon James, LLC (real estate) (since 2000); Partner, Right Funding, LLC (2014-2017); Director, First Signature Bank & Trust Company (until 1991); Director, Mast Realty Trust (until 1994); President, Maxwell Building Corp. (until 1991). Trustee (since 1992), Chairperson of the Board (2011-2012), and Vice Chairperson of the Board (since 2012) of various trusts within the John Hancock Fund Complex. |
| | | |
| Gregory A. Russo, Born: 1949 | 2008 | 204 |
Trustee
Director and Audit Committee Chairman (since 2012), and Member, Audit Committee and Finance Committee (since 2011), NCH Healthcare System, Inc. (holding company for multi-entity healthcare system); Director and Member (2012-2018) and Finance Committee Chairman (2014-2018), The Moorings, Inc. (nonprofit continuing care community); Vice Chairman, Risk & Regulatory Matters, KPMG LLP (KPMG) (2002-2006); Vice Chairman, Industrial Markets, KPMG (1998-2002); Chairman and Treasurer, Westchester County, New York, Chamber of Commerce (1986-1992); Director, Treasurer, and Chairman of Audit and Finance Committees, Putnam Hospital Center (1989-1995); Director and Chairman of Fundraising Campaign, United Way of Westchester and Putnam Counties, New York (1990-1995). Trustee of various trusts within the John Hancock Fund Complex (since 2008). |
ANNUAL REPORT | JOHN HANCOCK DISCIPLINED VALUE MID CAP FUND 42
Non-Independent Trustees3
| | | |
Name, year of birth
Position(s) held with Trust
Principal occupation(s) and other
directorships during past 5 years | Trustee
of the
Trust
since1 | Number of John
Hancock funds
overseen by
Trustee |
| Andrew G. Arnott, Born: 1971 | 2017 | 204 |
President and Non-Independent Trustee
Head of Wealth and Asset Management, United States and Europe, for John Hancock and Manulife (since 2018); Executive Vice President, John Hancock Financial Services (since 2009, including prior positions); Director and Executive Vice President, John Hancock Investment Management LLC (since 2005, including prior positions); Director and Executive Vice President, John Hancock Variable Trust Advisers LLC (since 2006, including prior positions); President, John Hancock Investment Management Distributors LLC (since 2004, including prior positions); President of various trusts within the John Hancock Fund Complex (since 2007, including prior positions). Trustee of various trusts within the John Hancock Fund Complex (since 2017). |
| | | |
| Marianne Harrison, Born: 1963 | 2018 | 204 |
Non-Independent Trustee
President and CEO, John Hancock (since 2017); President and CEO, Manulife Canadian Division (2013-2017); Member, Board of Directors, CAE Inc. (since 2019); Member, Board of Directors, MA Competitive Partnership Board (since 2018); Member, Board of Directors, American Council of Life Insurers (ACLI) (since 2018); Member, Board of Directors, Communitech, an industry-led innovation center that fosters technology companies in Canada (2017-2019); Member, Board of Directors, Manulife Assurance Canada (2015-2017); Board Member, St. Mary's General Hospital Foundation (2014-2017); Member, Board of Directors, Manulife Bank of Canada (2013-2017); Member, Standing Committee of the Canadian Life & Health Assurance Association (2013-2017); Member, Board of Directors, John Hancock USA, John Hancock Life & Health, John Hancock New York (2012-2013). Trustee of various trusts within the John Hancock Fund Complex (since 2018). |
Principal officers who are not Trustees
| | |
Name, year of birth
Position(s) held with Trust
Principal occupation(s)
during past 5 years | Officer
of the
Trust
since |
| Francis V. Knox, Jr.,Born: 1947 | 2006 |
Chief Compliance Officer
Vice President, John Hancock Financial Services (since 2005); Chief Compliance Officer, various trusts within the John Hancock Fund Complex, John Hancock Investment Management LLC, and John Hancock Variable Trust Advisers LLC (since 2005). |
| | |
| Charles A. Rizzo, Born: 1957 | 2007 |
Chief Financial Officer
Vice President, John Hancock Financial Services (since 2008); Senior Vice President, John Hancock Investment Management LLC and John Hancock Variable Trust Advisers LLC (since 2008); Chief Financial Officer of various trusts within the John Hancock Fund Complex (since 2007). |
| | |
| Salvatore Schiavone, Born: 1965 | 2010 |
Treasurer
Assistant Vice President, John Hancock Financial Services (since 2007); Vice President, John Hancock Investment Management LLC and John Hancock Variable Trust Advisers LLC (since 2007); Treasurer of various trusts within the John Hancock Fund Complex (since 2007, including prior positions). |
ANNUAL REPORT | JOHN HANCOCK DISCIPLINED VALUE MID CAP FUND 43
Principal officers who are notTrustees (continued)
| | |
Name, year of birth
Position(s) held with Trust
Principal occupation(s)
during past 5 years | Officer
of the
Trust
since |
| Christopher (Kit) Sechler,Born: 1973 | 2018 |
Chief Legal Officer and Secretary
Vice President and Deputy Chief Counsel, John Hancock Investments (since 2015); Assistant Vice President and Senior Counsel (2009-2015), John Hancock Investment Management; Chief Legal Officer and Secretary of various trusts within the John Hancock Fund Complex (since 2018); Assistant Secretary of John Hancock Investment Management LLC and John Hancock Variable Trust Advisers LLC (since 2009). |
The business address for all Trustees and Officers is 200 Berkeley Street, Boston, Massachusetts 02116-5023.
The Statement of Additional Information of the fund includes additional information about members of the Board of Trustees of the Trust and is available without charge, upon request, by calling 800-225-5291.
| 1 | Each Trustee holds office until his or her successor is elected and qualified, or until the Trustee's death, retirement, resignation, or removal. Mr. Boyle has served as Trustee at various times prior to the date listed in the table. |
| 2 | Member of the Audit Committee. |
| 3 | The Trustee is a Non-Independent Trustee due to current or former positions with the Advisor and certain affiliates. |
ANNUAL REPORT | JOHN HANCOCK DISCIPLINED VALUE MID CAP FUND 44
| | |
Trustees
Hassell H. McClellan,Chairperson
Steven R. Pruchansky,Vice Chairperson
Andrew G. Arnott†
Charles L. Bardelis*
James R. Boyle
Peter S. Burgess*
William H. Cunningham
Grace K. Fey
Marianne Harrison†
Deborah C. Jackson
James M. Oates*
Gregory A. Russo
Officers
Andrew G. Arnott
President
Francis V. Knox, Jr.
Chief Compliance Officer
Charles A. Rizzo
Chief Financial Officer
Salvatore Schiavone
Treasurer
Christopher (Kit) Sechler
Secretary and Chief Legal Officer
| Investment advisor
John Hancock Investment Management LLC
Subadvisor
Boston Partners Global Investors, Inc.
Portfolio Managers
Joseph F. Feeney, Jr., CFA
Steven L. Pollack, CFA
Principal distributor
John Hancock Investment Management Distributors LLC
Custodian
State Street Bank and Trust Company
Transfer agent
John Hancock Signature Services, Inc.
Legal counsel
K&L Gates LLP
Independent registered public accounting firm
PricewaterhouseCoopers LLP
|
* Member of the Audit Committee
† Non-Independent Trustee
The fund's proxy voting policies and procedures, as well as the fund proxy voting record for the most recent twelve-month period ended June 30, are available free of charge on the Securities and Exchange Commission (SEC) website at sec.gov or on our website.
All of the fund's holdings as of the end of the third month of every fiscal quarter are filed with the SEC on Form N-PORT within 60 days of the end of the fiscal quarter. The fund's Form N-PORT filings are available on our website and the SEC's website, sec.gov.
We make this information on your fund, as well asmonthly portfolio holdings, and other fund details available on our website at jhinvestments.com or by calling 800-225-5291.
| | | | |
| | You can also contact us: |
| | 800-225-5291
jhinvestments.com | Regular mail:
John Hancock Signature Services, Inc.
P.O. Box 55913
Boston, MA 02205-5913
| Express mail:
John Hancock Signature Services, Inc.
2000 Crown Colony Drive
Suite 55913
Quincy, MA 02169-0953
|
ANNUAL REPORT | JOHN HANCOCK DISCIPLINED VALUE MID CAP FUND 45
John Hancock family of funds
| | | |
DOMESTIC EQUITY FUNDS
Blue Chip Growth
Classic Value
Disciplined Value
Disciplined Value Mid Cap
Equity Income
Financial Industries
Fundamental All Cap Core
Fundamental Large Cap Core
New Opportunities
Regional Bank
Small Cap Core
Small Cap Growth
Small Cap Value
U.S. Global Leaders Growth
U.S. Quality Growth
GLOBAL AND INTERNATIONAL EQUITY FUNDS
Disciplined Value International
Emerging Markets
Emerging Markets Equity
Fundamental Global Franchise
Global Equity
Global Shareholder Yield
Global Thematic Opportunities
International Dynamic Growth
International Growth
International Small Company
| | INCOME FUNDS
Bond
California Tax-Free Income
Emerging Markets Debt
Floating Rate Income
Government Income
High Yield
High Yield Municipal Bond
Income
Investment Grade Bond
Money Market
Short Duration Bond
Short Duration Credit Opportunities
Strategic Income Opportunities
Tax-Free Bond
ALTERNATIVE AND SPECIALTY FUNDS
Absolute Return Currency
Alternative Asset Allocation
Alternative Risk Premia
Diversified Macro
Infrastructure
Multi-Asset Absolute Return
Seaport Long/Short
|
A fund's investment objectives, risks, charges, and expenses should be considered carefully before investing. The prospectus contains this and other important information about the fund. To obtain a prospectus, contact your financial professional, call John Hancock Investment Management at 800-225-5291, or visit our website at jhinvestments.com. Please read the prospectus carefully before investing or sending money.
| | | |
ASSET ALLOCATION
Balanced
Multi-Asset High Income
Multi-Index Lifetime Portfolios
Multi-Index Preservation Portfolios
Multimanager Lifestyle Portfolios
Multimanager Lifetime Portfolios
Retirement Income 2040
EXCHANGE-TRADED FUNDS
John Hancock Multifactor Consumer Discretionary ETF
John Hancock Multifactor Consumer Staples ETF
John Hancock Multifactor Developed International ETF
John Hancock Multifactor Emerging Markets ETF
John Hancock Multifactor Energy ETF
John Hancock Multifactor Financials ETF
John Hancock Multifactor Healthcare ETF
John Hancock Multifactor Industrials ETF
John Hancock Multifactor Large Cap ETF
John Hancock Multifactor Materials ETF
John Hancock Multifactor Media and
Communications ETF
John Hancock Multifactor Mid Cap ETF
John Hancock Multifactor Small Cap ETF
John Hancock Multifactor Technology ETF
John Hancock Multifactor Utilities ETF
| | ENVIRONMENTAL, SOCIAL, AND
GOVERNANCE FUNDS
ESG All Cap Core
ESG Core Bond
ESG International Equity
ESG Large Cap Core
CLOSED-END FUNDS
Financial Opportunities
Hedged Equity & Income
Income Securities Trust
Investors Trust
Preferred Income
Preferred Income II
Preferred Income III
Premium Dividend
Tax-Advantaged Dividend Income
Tax-Advantaged Global Shareholder Yield
|
John Hancock Multifactor ETF shares are bought and sold at market price (not NAV), and are not individually redeemed
from the fund. Brokerage commissions will reduce returns.
John Hancock ETFs are distributed by Foreside Fund Services, LLC, and are subadvised by Dimensional Fund Advisors LP.
Foreside is not affiliated with John Hancock Investment Management Distributors LLC or Dimensional Fund Advisors LP.
Dimensional Fund Advisors LP receives compensation from John Hancock in connection with licensing rights to the
John Hancock Dimensional indexes. Dimensional Fund Advisors LP does not sponsor, endorse, or sell, and makes no
representation as to the advisability of investing in, John Hancock Multifactor ETFs.
John Hancock Investment Management
A trusted brand
John Hancock Investment Management is a premier asset manager
representing one of America's most trusted brands, with a heritage of
financial stewardship dating back to 1862. Helping our shareholders
pursue their financial goals is at the core of everything we do. It's why
we support the role of professional financial advice and operate with
the highest standards of conduct and integrity.
A better way to invest
We serve investors globally through a unique multimanager approach:
We search the world to find proven portfolio teams with specialized
expertise for every strategy we offer, then we apply robust investment
oversight to ensure they continue to meet our uncompromising
standards and serve the best interests of our shareholders.
Results for investors
Our unique approach to asset management enables us to provide
a diverse set of investments backed by some of the world's best
managers, along with strong risk-adjusted returns across asset classes.
John Hancock Investment Management Distributors LLC n Member FINRA, SIPC
200 Berkeley Street n Boston, MA 02116-5010 n 800-225-5291 n jhinvestments.com
This report is for the information of the shareholders of John Hancock Disciplined Value Mid Cap Fund. It is not authorized for distribution to prospective investors unless preceded or accompanied by a prospectus.
John Hancock
Disciplined Value Fund
Annual report 3/31/2020
Beginning on January 1, 2021, as permitted by regulations adopted by the Securities and Exchange Commission, paper copies of the fund's shareholder reports like this one will no longer be sent by mail, unless you specifically request paper copies of the reports from the fund or from your financial intermediary. Instead, the reports will be made available on a website, and you will be notified by mail each time a report is posted and provided with a website link to access the report.
If you already elected to receive shareholder reports electronically, you will not be affected by this change, and you do not need to take any action. You may elect to receive shareholder reports and other communications electronically by calling John Hancock Investment Management at 800-225-5291 (Class A, Class B and Class C shares) or 888-972-8696 (Class I, Class I2, Class R1, Class R2, Class R3, Class R4, Class R5, and Class R6) or by contacting your financial intermediary.
You may elect to receive all reports in paper, free of charge, at any time. You can inform John Hancock Investment Management or your financial intermediary that you wish to continue receiving paper copies of your shareholder reports by following the instructions listed above. Your election to receive reports in paper will apply to all funds held with John Hancock Investment Management or your financial intermediary.
A message to shareholders
Dear shareholder,
Global financial markets were on pace to deliver strong returns during the 12 months ended March 31, 2020, until heightened fears over the coronavirus (COVID-19) sent markets tumbling during the last five weeks of the period. After the longest bull market in U.S. history, we're now in bear market territory.
In response to the sell-off, the U.S. Federal Reserve acted quickly, lowering interest rates to zero and reinstating quantitative easing, as well as announcing its plans to shore up short-term debt. These steps, along with the passage of an estimated $2 trillion federal economic stimulus bill, helped lift the markets in the final two weeks of March.
The continued spread of COVID-19, trade disputes, rising unemployment, and other geopolitical tensions may continue to create uncertainty among businesses and investors. Your financial professional can helpposition your portfolio so that it's sufficiently diversified to seek to meet your long-term objectives and to withstand the inevitable bouts of market volatility along the way.
On behalf of everyone at John Hancock Investment Management, I'd like to take this opportunity to welcome new shareholders and thank existing shareholders for the continued trust you've placed in us.
Sincerely,
Andrew G. Arnott
President and CEO,
John Hancock Investment Management
Head of Wealth and Asset Management,
United States and Europe
This commentary reflects the CEO's views as of this report's period end and are subject to change at any time. Diversification does not guarantee investment returns and does not eliminate risk of loss. All investments entail risks, including the possible loss of principal. For more up-to-date information, you can visit our website at jhinvestments.com.
John Hancock
Disciplined Value Fund
Table of contents
| | | |
| 2 | | Your fund at a glance |
| 4 | | Manager's discussion of fund performance |
| 6 | | A look at performance |
| 8 | | Your expenses |
| 10 | | Fund's investments |
| 15 | | Financial statements |
| 19 | | Financial highlights |
| 31 | | Notes to financial statements |
| 41 | | Report of independent registered public accounting firm |
| 42 | | Tax information |
| 43 | | Statement regarding liquidity risk management |
| 46 | | Trustees and Officers |
| 50 | | More information |
ANNUAL REPORT | JOHN HANCOCK DISCIPLINED VALUE FUND 1
INVESTMENT OBJECTIVE
The fund seeks to provide long-term growth of capital primarily through investment in equity securities. Current income is a secondary objective.
AVERAGE ANNUAL TOTAL RETURNS AS OF 3/31/2020 (%)
The Russell 1000 Value Index is an unmanaged index containing those securities in the Russell 1000 Index with a lower price-to-book ratio and less-than-average growth orientation.
It is not possible to invest directly in an index. Index figures do not reflect expenses or sales charges, which would result in lower returns.
Figures from Morningstar, Inc. include reinvested distributions and do not take into account sales charges. Actual load-adjusted performance is lower.
The past performance shown here reflects reinvested distributions and the beneficial effect of any expense reductions, and does not guarantee future results. Performance of the other share classes will vary based on the difference in the fees and expenses of those classes. Shares will fluctuate in value and, when redeemed, may be worth more or less than their original cost. Current month-end performance may be lower or higher than the performance cited, and can be found at jhinvestments.com or by calling 800-225-5291. For further information on the fund's objectives, risks, and strategy, see the fund's prospectus. The fund recently experienced negative short-term performance due to market volatility associated with the COVID-19 pandemic.
ANNUAL REPORT | JOHN HANCOCK DISCIPLINED VALUE FUND 2
PERFORMANCE HIGHLIGHTS OVER THE LAST TWELVE MONTHS
The fund's benchmark, the Russell 1000 Value Index, lost 17.17% during the period
After performing well through mid-February, U.S. equities turned sharply lower once the full impact of the coronavirus became evident.
Sector allocation adversely affected the fund's performance
Underweight positions in the defensive utilities and consumer staples sectors were the largest detractors.
Stock selection also detracted from returns
The fund's holdings in the healthcare sector experienced the widest margin of underperformance.
SECTOR COMPOSITION AS OF 3/31/2020 (%)
A note about risks
The fund may be subject to various risks as described in the fund's prospectus. A widespread health crisis such as a global pandemic could cause substantial market volatility, exchange-trading suspensions and closures, impact the ability to complete redemptions, and affect fund performance. For example, the novel coronavirus disease (COVID-19) has resulted in significant disruptions to global business activity. The impact of a health crisis and other epidemics and pandemics that may arise in the future could affect the global economy in ways that cannot necessarily be foreseen at the present time. A health crisis may exacerbate other pre-existing political, social, and economic risks. Any such impact could adversely affect the fund's performance, resulting in losses to your investment. For more information, please refer to the "Principal risks" section of the prospectus.
ANNUAL REPORT | JOHN HANCOCK DISCIPLINED VALUE FUND 3
Manager's discussion of fund performance
How would you describe the market environment during the 12 months ended March 31, 2020?
After moving steadily higher throughout most of the period, U.S. equities plunged once the spread of the coronavirus led to shutdowns across various segments of the global economy in February and March. With no way to assess the outlook for economic growth or corporate earnings in the coming year, investors chose to sell higher-risk assets and move into relative safe havens such as U.S. Treasuries. Value stocks trailed growth by a wide margin over the full period, due in part to investors' expectation that higher-growth companies would be in a better position to withstand an economic downturn.
What factors affected the fund's performance?
The fund was affected by macroeconomic downturn as a result of the coronavirus. Sector allocations and stock selection both played a role in the fund's shortfall versus the benchmark, the Russell 1000 Value Index. Underweights in the defensive utilities and consumer staples sectors detracted from relative performance. We view these sectors as "expensive defensives," with most companies trading at a significant premium to the market despite their modest growth, uneven business momentum, and substandard returns on capital. A slight overweight in energy also pressured results, but we reduced the fund's weighting in this sector in the latter part of the period.
| | | | | |
TOP 10 HOLDINGS
AS OF 3/31/20 (%) | | COUNTRY COMPOSITION
AS OF 3/31/20 (%) |
| Berkshire Hathaway, Inc., Class B | 4.6 | | United States | 86.5 |
| Bank of America Corp. | 3.4 | | Canada | 3.0 |
| JPMorgan Chase & Co. | 3.1 | | Switzerland | 2.9 |
| Johnson & Johnson | 3.1 | | Ireland | 2.4 |
| Cigna Corp. | 2.9 | | United Kingdom | 1.9 |
| Pfizer, Inc. | 2.6 | | Bermuda | 1.3 |
| Verizon Communications, Inc. | 2.6 | | Netherlands | 1.1 |
| Barrick Gold Corp. | 2.5 | | Other Countries | 0.9 |
| The Procter & Gamble Company | 2.4 | | TOTAL | 100.0 | |
| Chubb, Ltd. | 2.3 | | | |
| TOTAL | 29.5 | | | |
| As a percentage of net assets. | | As a percentage of net assets. |
| Cash and cash equivalents are not included. | | |
ANNUAL REPORT | JOHN HANCOCK DISCIPLINED VALUE FUND 4
In terms of stock selection, the fund experienced the widest margin of underperformance in the healthcare sector. An underweight in Johnson & Johnson and a zero weight in Gilead Sciences, Inc. accounted for the majority of the deficit. However, we made up for some of the shortfall through an overweight position in the sector as a whole. The fund's holdings in financials also lagged. Insurance company American International Group, Inc., which trailed its sector peers on concerns that reinsurance claims for business-interruption insurance may increase rapidly, was a key detractor. The mega-cap banking stocks Wells Fargo & Company and JPMorgan Chase & Co. further weighed on relative performance. Although the fund's energy holdings finished slightly behind the benchmark components, the sector was home to several of the largest individual detractors for the period, including Noble Energy, Inc. and Marathon Petroleum Corp. We sold the position in Noble Energy.
On the positive side, we added value through an investment in Barrick Gold Corp. The stock delivered a gain well ahead of the broader market, as rising gold prices were expected to fuel higher profits. A number of information technology stocks also contributed to results, highlighted by Microsoft Corp. and semiconductor companies KLA Corp. and Lam Research Corp.
MANAGED BY
| | |
 | Mark E. Donovan, CFA
On the fund since 2008 and its predecessor since 1997
Investing since 1981 |
 | David J. Pyle, CFA
On the fund since 2008 and its predecessor since 2005
Investing since 1995 |
 | Stephanie T. McGirr
On the fund since 2018
Investing since 2002 |
 | David T. Cohen, CFA
On the fund since 2018
Investing since 2005 |
The views expressed in this report are exclusively those of Mark E. Donovan, CFA, Boston Partners, and are subject to change. They are not meant as investment advice. Please note that the holdings discussed in this report may not have been held by the fund for the entire period. Portfolio composition is subject to review in accordance with the fund's investment strategy and may vary in the future. Current and future portfolio holdings are subject to risk. Boston Partners is an indirect, wholly owned subsidiary of Orix Corporation of Japan.
ANNUAL REPORT | JOHN HANCOCK DISCIPLINED VALUE FUND 5
TOTAL RETURNS FOR THE PERIOD ENDED MARCH 31, 2020
| | | | | | | | |
Average annual total returns (%)
with maximum sales charge | | Cumulative total returns (%)
with maximum sales charge |
| | 1-year | 5-year | 10-year | | | 5-year | 10-year |
| Class A | -24.94 | -0.99 | 6.05 | | | -4.87 | 80.01 |
| Class B | -25.29 | -1.03 | 5.76 | | | -5.07 | 75.09 |
| Class C | -22.25 | -0.71 | 5.79 | | | -3.52 | 75.60 |
| Class I1 | -20.77 | 0.28 | 6.91 | | | 1.41 | 95.00 |
| Class I21 | -20.77 | 0.27 | 6.91 | | | 1.36 | 94.99 |
| Class R11 | -21.27 | -0.37 | 6.17 | | | -1.84 | 81.92 |
| Class R21,2 | -21.08 | -0.11 | 6.47 | | | -0.57 | 87.23 |
| Class R31 | -21.16 | -0.26 | 6.28 | | | -1.30 | 83.89 |
| Class R41 | -20.87 | 0.13 | 6.69 | | | 0.66 | 91.14 |
| Class R51 | -20.74 | 0.33 | 6.95 | | | 1.65 | 95.84 |
| Class R61,2 | -20.66 | 0.39 | 6.94 | | | 1.94 | 95.70 |
| Class NAV1 | -20.64 | 0.40 | 7.03 | | | 2.04 | 97.31 |
| Index 1† | -17.17 | 1.90 | 7.67 | | | 9.89 | 109.31 |
| Index 2† | -6.98 | 6.73 | 10.53 | | | 38.47 | 172.10 |
Performance figures assume all distributions have been reinvested. Figures reflect maximum sales charge on Class A shares of 5%, and the applicable contingent deferred sales charge (CDSC) on Class B and Class C shares. The Class B shares' CDSC declines annually between years 1 to 6 according to the following schedule: 5%, 4%, 3%, 3%, 2%, and 1%. No sales charge will be assessed after the sixth year. Class C shares sold within one year of purchase are subject to a 1% CDSC. Sales charges are not applicable to Class I, Class I2, Class R1, Class R2, Class R3, Class R4, Class R5, Class R6, and Class NAV shares.
The expense ratios of the fund, both net (including any fee waivers and/or expense limitations) and gross (excluding any fee waivers and/or expense limitations), are set forth according to the most recent publicly available prospectuses for the fund and may differ from those disclosed in the Financial highlights tables in this report. Net expenses reflect contractual expense limitations in effect until July 31, 2021 and are subject to change. Had the contractual fee waivers and expense limitations not been in place, gross expenses would apply. The expense ratios are as follows:
| | | | | | | | | | | | | |
| | Class A | Class B | Class C | Class I | Class I2 | Class R1 | Class R2 | Class R3 | Class R4 | Class R5 | Class R6 | Class NAV |
| Gross (%) | 1.06 | 1.81 | 1.81 | 0.81 | 0.81 | 1.46 | 1.21 | 1.36 | 1.06 | 0.76 | 0.71 | 0.70 |
| Net (%) | 1.05 | 1.80 | 1.80 | 0.80 | 0.80 | 1.45 | 1.20 | 1.35 | 0.95 | 0.75 | 0.70 | 0.69 |
Please refer to the most recent prospectus and annual or semiannual report for more information on expenses and any expense limitation arrangements for each class.
The returns reflect past results and should not be considered indicative of future performance. The return and principal value of an investment will fluctuate so that shares, when redeemed, may be worth more or less than their original cost. Due to market volatility and other factors, the fund's current performance may be higher or lower than the performance shown. For current to the most recent month-end performance data, please call 800-225-5291 or visit the fund's website at jhinvestments.com.
The performance table above and the chart on the next page do not reflect the deduction of taxes that a shareholder would pay on fund distributions or the redemption of fund shares. The fund's performance results reflect any applicable fee waivers or expense reductions, without which the expenses would increase and results would have been less favorable.
| † | Index 1 is the Russell 1000 Value Index; Index 2 is the S&P 500 Index. |
See the following page for footnotes.
ANNUAL REPORT | JOHN HANCOCK DISCIPLINED VALUE FUND 6
This chart and table show what happened to a hypothetical $10,000 investment in John Hancock Disciplined Value Fund for the share classes and periods indicated, assuming all distributions were reinvested. For comparison, we've shown the same investment in two separate indexes.
| | | | | | |
| | Start date | With maximum
sales charge ($) | Without
sales charge ($) | Index 1 ($) | Index 2 ($) |
| Class B3 | 3-31-10 | 17,509 | 17,509 | 20,931 | 27,210 |
| Class C3 | 3-31-10 | 17,560 | 17,560 | 20,931 | 27,210 |
| Class I1 | 3-31-10 | 19,500 | 19,500 | 20,931 | 27,210 |
| Class I21 | 3-31-10 | 19,499 | 19,499 | 20,931 | 27,210 |
| Class R11 | 3-31-10 | 18,192 | 18,192 | 20,931 | 27,210 |
| Class R21,2 | 3-31-10 | 18,723 | 18,723 | 20,931 | 27,210 |
| Class R31 | 3-31-10 | 18,389 | 18,389 | 20,931 | 27,210 |
| Class R41 | 3-31-10 | 19,114 | 19,114 | 20,931 | 27,210 |
| Class R51 | 3-31-10 | 19,584 | 19,584 | 20,931 | 27,210 |
| Class R61,2 | 3-31-10 | 19,570 | 19,570 | 20,931 | 27,210 |
| Class NAV1 | 3-31-10 | 19,731 | 19,731 | 20,931 | 27,210 |
The Russell 1000 Value Index is an unmanaged index containing those securities in the Russell 1000 Index with a lower price-to-book ratio and less-than-average growth orientation.
The S&P 500 Index is an unmanaged index that includes 500 widely traded common stocks.
It is not possible to invest directly in an index. Index figures do not reflect expenses or sales charges, which would result in lower returns.
Footnotes related to performance pages
| 1 | For certain types of investors, as described in the fund's prospectuses. |
| 2 | Class R6, and Class R2 shares were first offered on 9-1-11, and 3-1-12, respectively. Returns shown prior to Class R2 and Class R6 shares' commencement dates are those of Class A shares that have not been adjusted for class-specific expenses; otherwise, returns would vary. |
| 3 | The contingent deferred sales charge is not applicable. |
ANNUAL REPORT | JOHN HANCOCK DISCIPLINED VALUE FUND 7
These examples are intended to help you understand your ongoing operating expenses of investing in the fund so you can compare these costs with the ongoing costs of investing in other mutual funds.
Understanding fund expenses
As a shareholder of the fund, you incur two types of costs:
■Transaction costs,which include sales charges (loads) on purchases or redemptions (varies by share class), minimum account fee charge, etc.
■Ongoing operating expenses, including management fees, distribution and service fees (if applicable), and other fund expenses.
We are presenting only your ongoing operating expenses here.
Actual expenses/actual returns
The first line of each share class in the table on the following page is intended to provide information about the fund’s actual ongoing operating expenses, and is based on the fund’s actual return. It assumes an account value of $1,000.00 on October 1, 2019, with the same investment held until March 31, 2020.
Together with the value of your account, you may use this information to estimate the operating expenses that you paid over the period. Simply divide your account value at March 31, 2020, by $1,000.00, then multiply it by the “expenses paid” for your share class from the table. For example, for an account value of $8,600.00, the operating expenses should be calculated as follows:
Hypothetical example for comparison purposes
The second line of each share class in the table on the following page allows you to compare the fund’s ongoing operating expenses with those of any other fund. It provides an example of the fund’s hypothetical account values and hypothetical expenses based on each class’s actual expense ratio and an assumed 5% annualized return before expenses (which is not the class’s actual return). It assumes an account value of $1,000.00 on October 1, 2019, with the same investment held until March 31, 2020. Look in any other fund shareholder report to find its hypothetical example and you will be able to compare these expenses.
| 8 | JOHN HANCOCK DISCIPLINED VALUE FUND | ANNUAL REPORT | |
Please remember that these hypothetical account values and expenses may not be used to estimate the actual ending account balance or expenses you paid for the period.
Remember, these examples do not include any transaction costs, therefore, these examples will not help you to determine the relative total costs of owning different funds. If transaction costs were included, your expenses would have been higher. See the prospectuses for details regarding transaction costs.
SHAREHOLDER EXPENSE EXAMPLE CHART
| | | Account
value on
10-1-2019 | Ending
value on
3-31-2020 | Expenses
paid during
period ended
3-31-20201 | Annualized
expense
ratio |
| Class A | Actual expenses/actual returns | $1,000.00 | $757.20 | $4.66 | 1.06% |
| | Hypothetical example | 1,000.00 | 1,019.70 | 5.35 | 1.06% |
| Class B | Actual expenses/actual returns | 1,000.00 | 754.50 | 7.94 | 1.81% |
| | Hypothetical example | 1,000.00 | 1,016.00 | 9.12 | 1.81% |
| Class C | Actual expenses/actual returns | 1,000.00 | 754.70 | 7.94 | 1.81% |
| | Hypothetical example | 1,000.00 | 1,016.00 | 9.12 | 1.81% |
| Class I | Actual expenses/actual returns | 1,000.00 | 757.90 | 3.56 | 0.81% |
| | Hypothetical example | 1,000.00 | 1,021.00 | 4.09 | 0.81% |
| Class I2 | Actual expenses/actual returns | 1,000.00 | 757.90 | 3.60 | 0.82% |
| | Hypothetical example | 1,000.00 | 1,020.90 | 4.14 | 0.82% |
| Class R1 | Actual expenses/actual returns | 1,000.00 | 755.60 | 6.36 | 1.45% |
| | Hypothetical example | 1,000.00 | 1,017.80 | 7.31 | 1.45% |
| Class R2 | Actual expenses/actual returns | 1,000.00 | 756.80 | 5.27 | 1.20% |
| | Hypothetical example | 1,000.00 | 1,019.00 | 6.06 | 1.20% |
| Class R3 | Actual expenses/actual returns | 1,000.00 | 756.30 | 5.93 | 1.35% |
| | Hypothetical example | 1,000.00 | 1,018.30 | 6.81 | 1.35% |
| Class R4 | Actual expenses/actual returns | 1,000.00 | 757.70 | 4.17 | 0.95% |
| | Hypothetical example | 1,000.00 | 1,020.30 | 4.80 | 0.95% |
| Class R5 | Actual expenses/actual returns | 1,000.00 | 758.20 | 3.30 | 0.75% |
| | Hypothetical example | 1,000.00 | 1,021.30 | 3.79 | 0.75% |
| Class R6 | Actual expenses/actual returns | 1,000.00 | 758.60 | 3.08 | 0.70% |
| | Hypothetical example | 1,000.00 | 1,021.50 | 3.54 | 0.70% |
| Class NAV | Actual expenses/actual returns | 1,000.00 | 758.80 | 3.03 | 0.69% |
| | Hypothetical example | 1,000.00 | 1,021.60 | 3.49 | 0.69% |
| 1 | Expenses are equal to the annualized expense ratio, multiplied by the average account value over the period, multiplied by 183/366 (to reflect the one-half year period). |
| | ANNUAL REPORT | JOHN HANCOCK DISCIPLINED VALUE FUND | 9 |
AS OF 3-31-20
| | | | | Shares | Value |
| Common stocks 97.2% | | | | | $10,312,325,717 |
| (Cost $11,442,673,544) | | | | | |
| Communication services 5.9% | | | 621,509,971 |
| Diversified telecommunication services 2.6% | | | |
| Verizon Communications, Inc. | | | 5,064,143 | 272,096,403 |
| Interactive media and services 2.0% | | | |
| Alphabet, Inc., Class A (A)(B) | | | 136,604 | 158,727,018 |
| Facebook, Inc., Class A (A) | | | 340,771 | 56,840,603 |
| Media 1.3% | | | |
| Comcast Corp., Class A | | | 3,893,134 | 133,845,947 |
| Consumer discretionary 5.8% | | | 618,749,914 |
| Auto components 0.2% | | | |
| Lear Corp. (B) | | | 123,586 | 10,041,363 |
| Magna International, Inc. | | | 338,360 | 10,800,451 |
| Hotels, restaurants and leisure 0.9% | | | |
| Las Vegas Sands Corp. | | | 1,153,208 | 48,976,744 |
| Wyndham Destinations, Inc. | | | 1,117,281 | 24,244,998 |
| Wyndham Hotels & Resorts, Inc. | | | 766,695 | 24,158,559 |
| Household durables 1.0% | | | |
| Lennar Corp., A Shares | | | 1,109,619 | 42,387,446 |
| Mohawk Industries, Inc. (A) | | | 857,732 | 65,393,488 |
| Internet and direct marketing retail 0.1% | | | |
| Booking Holdings, Inc. (A) | | | 8,182 | 11,007,408 |
| Specialty retail 3.5% | | | |
| AutoZone, Inc. (A) | | | 252,573 | 213,676,758 |
| Best Buy Company, Inc. | | | 2,067,596 | 117,852,972 |
| Foot Locker, Inc. | | | 1,332,984 | 29,392,297 |
| Williams-Sonoma, Inc. (B) | | | 266,588 | 11,335,322 |
| Textiles, apparel and luxury goods 0.1% | | | |
| Ralph Lauren Corp. | | | 141,884 | 9,482,108 |
| Consumer staples 4.7% | | | 494,685,331 |
| Beverages 0.3% | | | |
| Coca-Cola European Partners PLC | | | 794,950 | 29,834,474 |
| Food and staples retailing 0.7% | | | |
| The Kroger Company | | | 2,267,572 | 68,299,269 |
| Household products 3.7% | | | |
| Kimberly-Clark Corp. | | | 1,090,480 | 139,439,678 |
| The Procter & Gamble Company | | | 2,337,381 | 257,111,910 |
| 10 | JOHN HANCOCK DISCIPLINED VALUE FUND | ANNUAL REPORT | SEE NOTES TO FINANCIAL STATEMENTS |
| | | | | Shares | Value |
| Energy 3.3% | | | $347,484,163 |
| Oil, gas and consumable fuels 3.3% | | | |
| ConocoPhillips | | | 2,561,020 | 78,879,416 |
| Marathon Petroleum Corp. | | | 3,884,974 | 91,763,086 |
| Pioneer Natural Resources Company | | | 154,781 | 10,857,887 |
| TOTAL SA, ADR | | | 1,488,851 | 55,444,811 |
| Valero Energy Corp. | | | 2,436,926 | 110,538,963 |
| Financials 25.2% | | | 2,675,684,651 |
| Banks 11.3% | | | |
| Bank of America Corp. | | | 17,163,885 | 364,389,279 |
| Citigroup, Inc. | | | 2,734,776 | 115,188,765 |
| Fifth Third Bancorp | | | 1,896,273 | 28,159,654 |
| Huntington Bancshares, Inc. | | | 4,351,163 | 35,723,048 |
| JPMorgan Chase & Co. | | | 3,680,241 | 331,332,097 |
| KeyCorp | | | 2,815,304 | 29,194,702 |
| Truist Financial Corp. | | | 3,079,382 | 94,968,141 |
| Wells Fargo & Company | | | 6,986,306 | 200,506,982 |
| Capital markets 0.2% | | | |
| The Charles Schwab Corp. | | | 786,064 | 26,427,472 |
| Consumer finance 0.4% | | | |
| Discover Financial Services | | | 1,044,000 | 37,239,480 |
| Diversified financial services 4.6% | | | |
| Berkshire Hathaway, Inc., Class B (A) | | | 2,665,641 | 487,359,143 |
| Insurance 8.7% | | | |
| Aflac, Inc. | | | 2,413,303 | 82,631,495 |
| American International Group, Inc. | | | 5,970,606 | 144,787,196 |
| Chubb, Ltd. | | | 2,152,577 | 240,421,325 |
| Everest Re Group, Ltd. | | | 732,654 | 140,977,283 |
| Marsh & McLennan Companies, Inc. | | | 579,590 | 50,111,351 |
| Reinsurance Group of America, Inc. | | | 143,364 | 12,062,647 |
| The Progressive Corp. | | | 2,514,247 | 185,651,998 |
| The Travelers Companies, Inc. | | | 690,011 | 68,552,593 |
| Health care 21.3% | | | 2,260,853,484 |
| Health care equipment and supplies 2.2% | | | |
| Medtronic PLC | | | 1,897,766 | 171,140,538 |
| Zimmer Biomet Holdings, Inc. | | | 667,749 | 67,496,069 |
| Health care providers and services 9.3% | | | |
| AmerisourceBergen Corp. | | | 1,800,879 | 159,377,792 |
| Anthem, Inc. | | | 912,283 | 207,124,732 |
| Cigna Corp. | | | 1,732,227 | 306,915,980 |
| McKesson Corp. | | | 1,216,560 | 164,551,906 |
| UnitedHealth Group, Inc. | | | 588,796 | 146,833,946 |
| SEE NOTES TO FINANCIAL STATEMENTS | ANNUAL REPORT | JOHN HANCOCK DISCIPLINED VALUE FUND | 11 |
| | | | | Shares | Value |
| Health care (continued) | | | |
| Pharmaceuticals 9.8% | | | |
| GlaxoSmithKline PLC, ADR (B) | | | 4,436,244 | $168,089,285 |
| Johnson & Johnson | | | 2,496,856 | 327,412,727 |
| Merck & Company, Inc. | | | 2,164,252 | 166,517,549 |
| Novartis AG, ADR | | | 796,926 | 65,706,549 |
| Novo Nordisk A/S, ADR | | | 605,668 | 36,461,214 |
| Pfizer, Inc. | | | 8,370,870 | 273,225,197 |
| Industrials 12.6% | | | 1,332,311,607 |
| Aerospace and defense 3.7% | | | |
| Huntington Ingalls Industries, Inc. | | | 479,697 | 87,405,590 |
| Northrop Grumman Corp. | | | 299,953 | 90,750,780 |
| Textron, Inc. | | | 430,285 | 11,475,701 |
| United Technologies Corp. (B) | | | 2,186,459 | 206,248,677 |
| Air freight and logistics 0.8% | | | |
| United Parcel Service, Inc., Class B | | | 929,855 | 86,867,054 |
| Airlines 0.3% | | | |
| Southwest Airlines Company | | | 906,088 | 32,265,794 |
| Building products 0.8% | | | |
| Owens Corning | | | 2,161,488 | 83,887,349 |
| Electrical equipment 1.9% | | | |
| AMETEK, Inc. | | | 543,673 | 39,155,329 |
| Eaton Corp. PLC | | | 2,070,821 | 160,882,083 |
| Machinery 3.1% | | | |
| Caterpillar, Inc. | | | 512,892 | 59,515,988 |
| Cummins, Inc. | | | 530,344 | 71,766,150 |
| Deere & Company | | | 733,445 | 101,332,761 |
| Dover Corp. | | | 1,108,697 | 93,064,026 |
| Professional services 0.1% | | | |
| Robert Half International, Inc. | | | 266,884 | 10,074,871 |
| Road and rail 1.8% | | | |
| Kansas City Southern | | | 736,550 | 93,674,429 |
| Union Pacific Corp. | | | 681,782 | 96,158,533 |
| Trading companies and distributors 0.1% | | | |
| United Rentals, Inc. (A) | | | 75,553 | 7,786,492 |
| Information technology 9.5% | | | 1,007,861,435 |
| Communications equipment 0.5% | | | |
| Cisco Systems, Inc. | | | 1,491,582 | 58,634,088 |
| IT services 0.3% | | | |
| Leidos Holdings, Inc. | | | 300,200 | 27,513,330 |
| Semiconductors and semiconductor equipment 5.2% | | | |
| Applied Materials, Inc. | | | 338,882 | 15,527,573 |
| 12 | JOHN HANCOCK DISCIPLINED VALUE FUND | ANNUAL REPORT | SEE NOTES TO FINANCIAL STATEMENTS |
| | | | | Shares | Value |
| Information technology (continued) | | | |
| Semiconductors and semiconductor equipment (continued) | | | |
| KLA Corp. | | | 736,860 | $105,916,256 |
| Lam Research Corp. | | | 476,341 | 114,321,840 |
| Micron Technology, Inc. (A) | | | 3,274,296 | 137,716,890 |
| NXP Semiconductors NV | | | 1,447,475 | 120,039,102 |
| ON Semiconductor Corp. (A)(B) | | | 887,352 | 11,038,659 |
| Qorvo, Inc. (A) | | | 557,193 | 44,926,472 |
| Software 2.7% | | | |
| Microsoft Corp. | | | 698,464 | 110,154,757 |
| Oracle Corp. | | | 2,638,404 | 127,514,065 |
| VMware, Inc., Class A (A) | | | 445,017 | 53,891,559 |
| Technology hardware, storage and peripherals 0.8% | | | |
| Western Digital Corp. | | | 1,938,175 | 80,666,844 |
| Materials 6.8% | | | 724,121,383 |
| Chemicals 2.5% | | | |
| Celanese Corp. | | | 151,015 | 11,082,991 |
| Corteva, Inc. | | | 3,615,476 | 84,963,686 |
| DuPont de Nemours, Inc. | | | 3,238,418 | 110,430,054 |
| FMC Corp. | | | 560,129 | 45,756,938 |
| PPG Industries, Inc. | | | 124,611 | 10,417,480 |
| Construction materials 0.7% | | | |
| CRH PLC, ADR | | | 2,984,949 | 80,116,031 |
| Containers and packaging 0.1% | | | |
| Westrock Company | | | 379,534 | 10,725,631 |
| Metals and mining 3.5% | | | |
| Barrick Gold Corp. | | | 14,682,251 | 268,978,838 |
| Newmont Corp. | | | 1,362,684 | 61,702,332 |
| Yamana Gold, Inc. (B) | | | 14,526,328 | 39,947,402 |
| Utilities 2.1% | | | 229,063,778 |
| Electric utilities 1.6% | | | |
| Edison International | | | 3,058,935 | 167,599,049 |
| FirstEnergy Corp. | | | 141,716 | 5,678,560 |
| Independent power and renewable electricity producers 0.5% | | | |
| Vistra Energy Corp. | | | 3,495,374 | 55,786,169 |
|
| | | Yield (%) | | Shares | Value |
| Short-term investments 2.9% | | | | | $300,482,481 |
| (Cost $300,479,546) | | | | | |
| Short-term funds 2.9% | | | | | 300,482,481 |
| John Hancock Collateral Trust (C) | 1.1260(D) | | 606,508 | 6,063,564 |
| State Street Institutional U.S. Government Money Market Fund, Premier Class | 0.3210(D) | | 294,418,917 | 294,418,917 |
| SEE NOTES TO FINANCIAL STATEMENTS | ANNUAL REPORT | JOHN HANCOCK DISCIPLINED VALUE FUND | 13 |
|
| Total investments (Cost $11,743,153,090) 100.1% | | | $10,612,808,198 |
| Other assets and liabilities, net (0.1%) | | | | (6,335,330) |
| Total net assets 100.0% | | | | | $10,606,472,868 |
| The percentage shown for each investment category is the total value of the category as a percentage of the net assets of the fund. |
| Security Abbreviations and Legend |
| ADR | American Depositary Receipt |
| (A) | Non-income producing security. |
| (B) | All or a portion of this security is on loan as of 3-31-20. |
| (C) | Investment is an affiliate of the fund, the advisor and/or subadvisor. This security represents the investment of cash collateral received for securities lending. |
| (D) | The rate shown is the annualized seven-day yield as of 3-31-20. |
At 3-31-20, the aggregate cost of investments for federal income tax purposes was $11,784,138,651. Net unrealized depreciation aggregated to $1,171,330,453, of which $633,369,401 related to gross unrealized appreciation and $1,804,699,854 related to gross unrealized depreciation.
| 14 | JOHN HANCOCK DISCIPLINED VALUE FUND | ANNUAL REPORT | SEE NOTES TO FINANCIAL STATEMENTS |
STATEMENT OF ASSETS AND LIABILITIES 3-31-20
| Assets | |
| Unaffiliated investments, at value (Cost $11,737,092,461) including $5,845,836 of securities loaned | $10,606,744,634 |
| Affiliated investments, at value (Cost $6,060,629) | 6,063,564 |
| Total investments, at value (Cost $11,743,153,090) | 10,612,808,198 |
| Dividends and interest receivable | 21,457,155 |
| Receivable for fund shares sold | 63,258,986 |
| Receivable for investments sold | 36,551,409 |
| Receivable for securities lending income | 1,090,230 |
| Other assets | 423,294 |
| Total assets | 10,735,589,272 |
| Liabilities | |
| Payable for investments purchased | 96,299,095 |
| Payable for fund shares repurchased | 24,449,444 |
| Payable upon return of securities loaned | 6,056,803 |
| Payable to affiliates | |
| Accounting and legal services fees | 438,600 |
| Transfer agent fees | 711,542 |
| Distribution and service fees | 22,592 |
| Trustees' fees | 12,694 |
| Other liabilities and accrued expenses | 1,125,634 |
| Total liabilities | 129,116,404 |
| Net assets | $10,606,472,868 |
| Net assets consist of | |
| Paid-in capital | $11,905,925,269 |
| Total distributable earnings (loss) | (1,299,452,401) |
| Net assets | $10,606,472,868 |
| |
| SEE NOTES TO FINANCIAL STATEMENTS | ANNUAL REPORT | JOHN HANCOCK Disciplined Value Fund | 15 |
STATEMENT OF ASSETS AND LIABILITIES (continued)
| Net asset value per share | |
| Based on net asset value and shares outstanding - the fund has an unlimited number of shares authorized with no par value | |
| Class A ($730,977,476 ÷ 48,167,045 shares)1 | $15.18 |
| Class B ($1,921,830 ÷ 136,092 shares)1 | $14.12 |
| Class C ($139,956,308 ÷ 9,877,994 shares)1 | $14.17 |
| Class I ($5,249,578,042 ÷ 358,442,885 shares) | $14.65 |
| Class I2 ($31,934,835 ÷ 2,180,410 shares) | $14.65 |
| Class R1 ($10,275,442 ÷ 702,593 shares) | $14.63 |
| Class R2 ($42,335,809 ÷ 2,893,255 shares) | $14.63 |
| Class R3 ($9,377,435 ÷ 641,416 shares) | $14.62 |
| Class R4 ($73,559,091 ÷ 5,019,775 shares) | $14.65 |
| Class R5 ($61,303,486 ÷ 4,177,644 shares) | $14.67 |
| Class R6 ($3,368,694,919 ÷ 229,604,144 shares) | $14.67 |
| Class NAV ($886,558,195 ÷ 60,402,397 shares) | $14.68 |
| Maximum offering price per share | |
| Class A (net asset value per share ÷ 95%)2 | $15.98 |
| 1 | Redemption price per share is equal to net asset value less any applicable contingent deferred sales charge. |
| 2 | On single retail sales of less than $50,000. On sales of $50,000 or more and on group sales the offering price is reduced. |
| 16 | JOHN HANCOCK Disciplined Value Fund | ANNUAL REPORT | SEE NOTES TO FINANCIAL STATEMENTS |
STATEMENT OF OPERATIONS For the year ended 3-31-20
| Investment income | |
| Dividends | $364,760,418 |
| Interest | 3,552,177 |
| Securities lending | 1,174,490 |
| Less foreign taxes withheld | (3,336,220) |
| Total investment income | 366,150,865 |
| Expenses | |
| Investment management fees | 95,928,949 |
| Distribution and service fees | 5,912,414 |
| Accounting and legal services fees | 2,623,894 |
| Transfer agent fees | 11,202,553 |
| Trustees' fees | 288,976 |
| Custodian fees | 1,594,807 |
| State registration fees | 366,771 |
| Printing and postage | 642,048 |
| Professional fees | 288,337 |
| Other | 405,174 |
| Total expenses | 119,253,923 |
| Less expense reductions | (1,202,742) |
| Net expenses | 118,051,181 |
| Net investment income | 248,099,684 |
| Realized and unrealized gain (loss) | |
| Net realized gain (loss) on | |
| Unaffiliated investments and foreign currency transactions | (42,289,758) |
| Affiliated investments | (32,857) |
| | (42,322,615) |
| Change in net unrealized appreciation (depreciation) of | |
| Unaffiliated investments and translation of assets and liabilities in foreign currencies | (2,856,604,095) |
| Affiliated investments | 3,279 |
| | (2,856,600,816) |
| Net realized and unrealized loss | (2,898,923,431) |
| Decrease in net assets from operations | $(2,650,823,747) |
| SEE NOTES TO FINANCIAL STATEMENTS | ANNUAL REPORT | JOHN HANCOCK Disciplined Value Fund | 17 |
STATEMENTS OF CHANGES IN NET ASSETS
| | Year ended
3-31-20 | Year ended
3-31-19 |
| Increase (decrease) in net assets | | |
| From operations | | |
| Net investment income | $248,099,684 | $217,933,817 |
| Net realized gain (loss) | (42,322,615) | 1,084,887,904 |
| Change in net unrealized appreciation (depreciation) | (2,856,600,816) | (1,233,949,764) |
| Increase (decrease) in net assets resulting from operations | (2,650,823,747) | 68,871,957 |
| Distributions to shareholders | | |
| From earnings | | |
| Class A | (56,946,059) | (96,773,159) |
| Class B | (182,380) | (565,315) |
| Class C | (10,620,453) | (19,995,932) |
| Class I | (435,736,847) | (656,997,874) |
| Class I2 | (2,535,381) | (4,341,818) |
| Class R1 | (827,170) | (1,460,119) |
| Class R2 | (4,693,632) | (8,904,584) |
| Class R3 | (726,592) | (1,150,321) |
| Class R4 | (6,169,593) | (13,999,852) |
| Class R5 | (8,353,442) | (16,429,256) |
| Class R6 | (268,564,030) | (412,557,295) |
| Class NAV | (64,632,066) | (98,778,716) |
| Total distributions | (859,987,645) | (1,331,954,241) |
| From fund share transactions | (791,429,067) | 1,172,354,452 |
| Total decrease | (4,302,240,459) | (90,727,832) |
| Net assets | | |
| Beginning of year | 14,908,713,327 | 14,999,441,159 |
| End of year | $10,606,472,868 | $14,908,713,327 |
| 18 | JOHN HANCOCK Disciplined Value Fund | ANNUAL REPORT | SEE NOTES TO FINANCIAL STATEMENTS |
| CLASS A SHARES Period ended | 3-31-20 | 3-31-19 | 3-31-18 | 3-31-17 | 3-31-16 |
| Per share operating performance | | | | | |
| Net asset value, beginning of period | $20.25 | $22.11 | $20.71 | $17.64 | $19.44 |
| Net investment income1 | 0.30 | 0.26 | 0.20 | 0.18 | 0.16 |
| Net realized and unrealized gain (loss) on investments | (4.20) | (0.28) | 2.39 | 3.08 | (1.18) |
| Total from investment operations | (3.90) | (0.02) | 2.59 | 3.26 | (1.02) |
| Less distributions | | | | | |
| From net investment income | (0.25) | (0.23) | (0.18) | (0.19) | (0.19) |
| From net realized gain | (0.92) | (1.61) | (1.01) | — | (0.59) |
| Total distributions | (1.17) | (1.84) | (1.19) | (0.19) | (0.78) |
| Net asset value, end of period | $15.18 | $20.25 | $22.11 | $20.71 | $17.64 |
| Total return (%)2,3 | (20.99) | 0.45 | 12.42 | 18.50 | (5.29) |
| Ratios and supplemental data | | | | | |
| Net assets, end of period (in millions) | $731 | $1,092 | $1,289 | $1,449 | $2,375 |
| Ratios (as a percentage of average net assets): | | | | | |
| Expenses before reductions | 1.07 | 1.06 | 1.06 | 1.07 | 1.08 |
| Expenses including reductions | 1.06 | 1.05 | 1.05 | 1.06 | 1.07 |
| Net investment income | 1.44 | 1.18 | 0.92 | 0.96 | 0.87 |
| Portfolio turnover (%) | 88 | 69 | 45 | 65 | 61 |
| 1 | Based on average daily shares outstanding. |
| 2 | Total returns would have been lower had certain expenses not been reduced during the applicable periods. |
| 3 | Does not reflect the effect of sales charges, if any. |
| SEE NOTES TO FINANCIAL STATEMENTS | ANNUAL REPORT | JOHN HANCOCK Disciplined Value Fund | 19 |
| CLASS B SHARES Period ended | 3-31-20 | 3-31-19 | 3-31-18 | 3-31-17 | 3-31-16 |
| Per share operating performance | | | | | |
| Net asset value, beginning of period | $18.92 | $20.76 | $19.52 | $16.64 | $18.38 |
| Net investment income1 | 0.11 | 0.09 | 0.03 | 0.03 | 0.02 |
| Net realized and unrealized gain (loss) on investments | (3.89) | (0.26) | 2.24 | 2.91 | (1.12) |
| Total from investment operations | (3.78) | (0.17) | 2.27 | 2.94 | (1.10) |
| Less distributions | | | | | |
| From net investment income | (0.10) | (0.06) | (0.02) | (0.06) | (0.05) |
| From net realized gain | (0.92) | (1.61) | (1.01) | — | (0.59) |
| Total distributions | (1.02) | (1.67) | (1.03) | (0.06) | (0.64) |
| Net asset value, end of period | $14.12 | $18.92 | $20.76 | $19.52 | $16.64 |
| Total return (%)2,3 | (21.56) | (0.34) | 11.61 | 17.66 | (6.02) |
| Ratios and supplemental data | | | | | |
| Net assets, end of period (in millions) | $2 | $6 | $9 | $13 | $14 |
| Ratios (as a percentage of average net assets): | | | | | |
| Expenses before reductions | 1.82 | 1.81 | 1.81 | 1.82 | 1.85 |
| Expenses including reductions | 1.81 | 1.80 | 1.80 | 1.81 | 1.84 |
| Net investment income | 0.59 | 0.42 | 0.16 | 0.18 | 0.09 |
| Portfolio turnover (%) | 88 | 69 | 45 | 65 | 61 |
| 1 | Based on average daily shares outstanding. |
| 2 | Total returns would have been lower had certain expenses not been reduced during the applicable periods. |
| 3 | Does not reflect the effect of sales charges, if any. |
| 20 | JOHN HANCOCK Disciplined Value Fund | ANNUAL REPORT | SEE NOTES TO FINANCIAL STATEMENTS |
| CLASS C SHARES Period ended | 3-31-20 | 3-31-19 | 3-31-18 | 3-31-17 | 3-31-16 |
| Per share operating performance | | | | | |
| Net asset value, beginning of period | $18.98 | $20.82 | $19.57 | $16.69 | $18.43 |
| Net investment income1 | 0.13 | 0.09 | 0.03 | 0.03 | 0.02 |
| Net realized and unrealized gain (loss) on investments | (3.92) | (0.26) | 2.25 | 2.91 | (1.12) |
| Total from investment operations | (3.79) | (0.17) | 2.28 | 2.94 | (1.10) |
| Less distributions | | | | | |
| From net investment income | (0.10) | (0.06) | (0.02) | (0.06) | (0.05) |
| From net realized gain | (0.92) | (1.61) | (1.01) | — | (0.59) |
| Total distributions | (1.02) | (1.67) | (1.03) | (0.06) | (0.64) |
| Net asset value, end of period | $14.17 | $18.98 | $20.82 | $19.57 | $16.69 |
| Total return (%)2,3 | (21.51) | (0.35) | 11.58 | 17.61 | (6.00) |
| Ratios and supplemental data | | | | | |
| Net assets, end of period (in millions) | $140 | $235 | $275 | $293 | $309 |
| Ratios (as a percentage of average net assets): | | | | | |
| Expenses before reductions | 1.82 | 1.81 | 1.81 | 1.82 | 1.83 |
| Expenses including reductions | 1.81 | 1.80 | 1.80 | 1.81 | 1.82 |
| Net investment income | 0.67 | 0.43 | 0.16 | 0.18 | 0.12 |
| Portfolio turnover (%) | 88 | 69 | 45 | 65 | 61 |
| 1 | Based on average daily shares outstanding. |
| 2 | Total returns would have been lower had certain expenses not been reduced during the applicable periods. |
| 3 | Does not reflect the effect of sales charges, if any. |
| SEE NOTES TO FINANCIAL STATEMENTS | ANNUAL REPORT | JOHN HANCOCK Disciplined Value Fund | 21 |
| CLASS I SHARES Period ended | 3-31-20 | 3-31-19 | 3-31-18 | 3-31-17 | 3-31-16 |
| Per share operating performance | | | | | |
| Net asset value, beginning of period | $19.58 | $21.45 | $20.12 | $17.14 | $18.91 |
| Net investment income1 | 0.34 | 0.30 | 0.25 | 0.22 | 0.20 |
| Net realized and unrealized gain (loss) on investments | (4.05) | (0.27) | 2.32 | 3.00 | (1.14) |
| Total from investment operations | (3.71) | 0.03 | 2.57 | 3.22 | (0.94) |
| Less distributions | | | | | |
| From net investment income | (0.30) | (0.29) | (0.23) | (0.24) | (0.24) |
| From net realized gain | (0.92) | (1.61) | (1.01) | — | (0.59) |
| Total distributions | (1.22) | (1.90) | (1.24) | (0.24) | (0.83) |
| Net asset value, end of period | $14.65 | $19.58 | $21.45 | $20.12 | $17.14 |
| Total return (%)2 | (20.77) | 0.64 | 12.71 | 18.80 | (5.02) |
| Ratios and supplemental data | | | | | |
| Net assets, end of period (in millions) | $5,250 | $7,399 | $6,988 | $7,540 | $6,730 |
| Ratios (as a percentage of average net assets): | | | | | |
| Expenses before reductions | 0.82 | 0.82 | 0.81 | 0.81 | 0.81 |
| Expenses including reductions | 0.81 | 0.81 | 0.80 | 0.80 | 0.80 |
| Net investment income | 1.69 | 1.43 | 1.17 | 1.18 | 1.13 |
| Portfolio turnover (%) | 88 | 69 | 45 | 65 | 61 |
| 1 | Based on average daily shares outstanding. |
| 2 | Total returns would have been lower had certain expenses not been reduced during the applicable periods. |
| 22 | JOHN HANCOCK Disciplined Value Fund | ANNUAL REPORT | SEE NOTES TO FINANCIAL STATEMENTS |
| CLASS I2 SHARES Period ended | 3-31-20 | 3-31-19 | 3-31-18 | 3-31-17 | 3-31-16 |
| Per share operating performance | | | | | |
| Net asset value, beginning of period | $19.58 | $21.45 | $20.12 | $17.14 | $18.92 |
| Net investment income1 | 0.34 | 0.30 | 0.25 | 0.22 | 0.20 |
| Net realized and unrealized gain (loss) on investments | (4.05) | (0.27) | 2.32 | 3.00 | (1.15) |
| Total from investment operations | (3.71) | 0.03 | 2.57 | 3.22 | (0.95) |
| Less distributions | | | | | |
| From net investment income | (0.30) | (0.29) | (0.23) | (0.24) | (0.24) |
| From net realized gain | (0.92) | (1.61) | (1.01) | — | (0.59) |
| Total distributions | (1.22) | (1.90) | (1.24) | (0.24) | (0.83) |
| Net asset value, end of period | $14.65 | $19.58 | $21.45 | $20.12 | $17.14 |
| Total return (%)2 | (20.77) | 0.64 | 12.71 | 18.80 | (5.07) |
| Ratios and supplemental data | | | | | |
| Net assets, end of period (in millions) | $32 | $50 | $54 | $54 | $49 |
| Ratios (as a percentage of average net assets): | | | | | |
| Expenses before reductions | 0.82 | 0.82 | 0.81 | 0.81 | 0.82 |
| Expenses including reductions | 0.81 | 0.81 | 0.80 | 0.80 | 0.81 |
| Net investment income | 1.69 | 1.43 | 1.16 | 1.18 | 1.11 |
| Portfolio turnover (%) | 88 | 69 | 45 | 65 | 61 |
| 1 | Based on average daily shares outstanding. |
| 2 | Total returns would have been lower had certain expenses not been reduced during the applicable periods. |
| SEE NOTES TO FINANCIAL STATEMENTS | ANNUAL REPORT | JOHN HANCOCK Disciplined Value Fund | 23 |
| CLASS R1 SHARES Period ended | 3-31-20 | 3-31-19 | 3-31-18 | 3-31-17 | 3-31-16 |
| Per share operating performance | | | | | |
| Net asset value, beginning of period | $19.56 | $21.41 | $20.09 | $17.13 | $18.90 |
| Net investment income1 | 0.21 | 0.16 | 0.11 | 0.10 | 0.09 |
| Net realized and unrealized gain (loss) on investments | (4.05) | (0.26) | 2.32 | 2.98 | (1.15) |
| Total from investment operations | (3.84) | (0.10) | 2.43 | 3.08 | (1.06) |
| Less distributions | | | | | |
| From net investment income | (0.17) | (0.14) | (0.10) | (0.12) | (0.12) |
| From net realized gain | (0.92) | (1.61) | (1.01) | — | (0.59) |
| Total distributions | (1.09) | (1.75) | (1.11) | (0.12) | (0.71) |
| Net asset value, end of period | $14.63 | $19.56 | $21.41 | $20.09 | $17.13 |
| Total return (%)2 | (21.27) | 0.01 | 11.99 | 18.00 | (5.66) |
| Ratios and supplemental data | | | | | |
| Net assets, end of period (in millions) | $10 | $16 | $21 | $27 | $26 |
| Ratios (as a percentage of average net assets): | | | | | |
| Expenses before reductions | 1.45 | 1.46 | 1.46 | 1.47 | 1.48 |
| Expenses including reductions | 1.44 | 1.45 | 1.45 | 1.46 | 1.47 |
| Net investment income | 1.03 | 0.77 | 0.52 | 0.53 | 0.48 |
| Portfolio turnover (%) | 88 | 69 | 45 | 65 | 61 |
| 1 | Based on average daily shares outstanding. |
| 2 | Total returns would have been lower had certain expenses not been reduced during the applicable periods. |
| 24 | JOHN HANCOCK Disciplined Value Fund | ANNUAL REPORT | SEE NOTES TO FINANCIAL STATEMENTS |
| CLASS R2 SHARES Period ended | 3-31-20 | 3-31-19 | 3-31-18 | 3-31-17 | 3-31-16 |
| Per share operating performance | | | | | |
| Net asset value, beginning of period | $19.57 | $21.43 | $20.10 | $17.13 | $18.90 |
| Net investment income1 | 0.23 | 0.22 | 0.16 | 0.14 | 0.13 |
| Net realized and unrealized gain (loss) on investments | (4.03) | (0.27) | 2.33 | 2.99 | (1.14) |
| Total from investment operations | (3.80) | (0.05) | 2.49 | 3.13 | (1.01) |
| Less distributions | | | | | |
| From net investment income | (0.22) | (0.20) | (0.15) | (0.16) | (0.17) |
| From net realized gain | (0.92) | (1.61) | (1.01) | — | (0.59) |
| Total distributions | (1.14) | (1.81) | (1.16) | (0.16) | (0.76) |
| Net asset value, end of period | $14.63 | $19.57 | $21.43 | $20.10 | $17.13 |
| Total return (%)2 | (21.08) | 0.24 | 12.30 | 18.32 | (5.42) |
| Ratios and supplemental data | | | | | |
| Net assets, end of period (in millions) | $42 | $102 | $135 | $135 | $136 |
| Ratios (as a percentage of average net assets): | | | | | |
| Expenses before reductions | 1.21 | 1.21 | 1.21 | 1.21 | 1.22 |
| Expenses including reductions | 1.20 | 1.20 | 1.20 | 1.21 | 1.21 |
| Net investment income | 1.17 | 1.02 | 0.76 | 0.78 | 0.74 |
| Portfolio turnover (%) | 88 | 69 | 45 | 65 | 61 |
| 1 | Based on average daily shares outstanding. |
| 2 | Total returns would have been lower had certain expenses not been reduced during the applicable periods. |
| SEE NOTES TO FINANCIAL STATEMENTS | ANNUAL REPORT | JOHN HANCOCK Disciplined Value Fund | 25 |
| CLASS R3 SHARES Period ended | 3-31-20 | 3-31-19 | 3-31-18 | 3-31-17 | 3-31-16 |
| Per share operating performance | | | | | |
| Net asset value, beginning of period | $19.55 | $21.41 | $20.09 | $17.12 | $18.89 |
| Net investment income1 | 0.23 | 0.18 | 0.13 | 0.12 | 0.10 |
| Net realized and unrealized gain (loss) on investments | (4.05) | (0.27) | 2.32 | 2.99 | (1.14) |
| Total from investment operations | (3.82) | (0.09) | 2.45 | 3.11 | (1.04) |
| Less distributions | | | | | |
| From net investment income | (0.19) | (0.16) | (0.12) | (0.14) | (0.14) |
| From net realized gain | (0.92) | (1.61) | (1.01) | — | (0.59) |
| Total distributions | (1.11) | (1.77) | (1.13) | (0.14) | (0.73) |
| Net asset value, end of period | $14.62 | $19.55 | $21.41 | $20.09 | $17.12 |
| Total return (%)2 | (21.16) | 0.08 | 12.10 | 18.17 | (5.57) |
| Ratios and supplemental data | | | | | |
| Net assets, end of period (in millions) | $9 | $12 | $16 | $22 | $30 |
| Ratios (as a percentage of average net assets): | | | | | |
| Expenses before reductions | 1.35 | 1.36 | 1.35 | 1.36 | 1.37 |
| Expenses including reductions | 1.34 | 1.35 | 1.34 | 1.35 | 1.37 |
| Net investment income | 1.15 | 0.86 | 0.63 | 0.66 | 0.57 |
| Portfolio turnover (%) | 88 | 69 | 45 | 65 | 61 |
| 1 | Based on average daily shares outstanding. |
| 2 | Total returns would have been lower had certain expenses not been reduced during the applicable periods. |
| 26 | JOHN HANCOCK Disciplined Value Fund | ANNUAL REPORT | SEE NOTES TO FINANCIAL STATEMENTS |
| CLASS R4 SHARES Period ended | 3-31-20 | 3-31-19 | 3-31-18 | 3-31-17 | 3-31-16 |
| Per share operating performance | | | | | |
| Net asset value, beginning of period | $19.59 | $21.45 | $20.12 | $17.14 | $18.92 |
| Net investment income1 | 0.30 | 0.27 | 0.22 | 0.19 | 0.18 |
| Net realized and unrealized gain (loss) on investments | (4.05) | (0.27) | 2.32 | 3.00 | (1.16) |
| Total from investment operations | (3.75) | — | 2.54 | 3.19 | (0.98) |
| Less distributions | | | | | |
| From net investment income | (0.27) | (0.25) | (0.20) | (0.21) | (0.21) |
| From net realized gain | (0.92) | (1.61) | (1.01) | — | (0.59) |
| Total distributions | (1.19) | (1.86) | (1.21) | (0.21) | (0.80) |
| Net asset value, end of period | $14.65 | $19.59 | $21.45 | $20.12 | $17.14 |
| Total return (%)2 | (20.87) | 0.52 | 12.54 | 18.63 | (5.22) |
| Ratios and supplemental data | | | | | |
| Net assets, end of period (in millions) | $74 | $143 | $231 | $286 | $268 |
| Ratios (as a percentage of average net assets): | | | | | |
| Expenses before reductions | 1.06 | 1.06 | 1.06 | 1.07 | 1.06 |
| Expenses including reductions | 0.95 | 0.95 | 0.95 | 0.96 | 0.96 |
| Net investment income | 1.50 | 1.26 | 1.02 | 1.03 | 1.00 |
| Portfolio turnover (%) | 88 | 69 | 45 | 65 | 61 |
| 1 | Based on average daily shares outstanding. |
| 2 | Total returns would have been lower had certain expenses not been reduced during the applicable periods. |
| SEE NOTES TO FINANCIAL STATEMENTS | ANNUAL REPORT | JOHN HANCOCK Disciplined Value Fund | 27 |
| CLASS R5 SHARES Period ended | 3-31-20 | 3-31-19 | 3-31-18 | 3-31-17 | 3-31-16 |
| Per share operating performance | | | | | |
| Net asset value, beginning of period | $19.62 | $21.48 | $20.15 | $17.16 | $18.94 |
| Net investment income1 | 0.34 | 0.31 | 0.26 | 0.23 | 0.21 |
| Net realized and unrealized gain (loss) on investments | (4.06) | (0.26) | 2.32 | 3.00 | (1.15) |
| Total from investment operations | (3.72) | 0.05 | 2.58 | 3.23 | (0.94) |
| Less distributions | | | | | |
| From net investment income | (0.31) | (0.30) | (0.24) | (0.24) | (0.25) |
| From net realized gain | (0.92) | (1.61) | (1.01) | — | (0.59) |
| Total distributions | (1.23) | (1.91) | (1.25) | (0.24) | (0.84) |
| Net asset value, end of period | $14.67 | $19.62 | $21.48 | $20.15 | $17.16 |
| Total return (%)2 | (20.74) | 0.75 | 12.73 | 18.88 | (5.02) |
| Ratios and supplemental data | | | | | |
| Net assets, end of period (in millions) | $61 | $166 | $198 | $200 | $275 |
| Ratios (as a percentage of average net assets): | | | | | |
| Expenses before reductions | 0.76 | 0.76 | 0.76 | 0.76 | 0.77 |
| Expenses including reductions | 0.75 | 0.75 | 0.75 | 0.75 | 0.76 |
| Net investment income | 1.70 | 1.48 | 1.22 | 1.27 | 1.16 |
| Portfolio turnover (%) | 88 | 69 | 45 | 65 | 61 |
| 1 | Based on average daily shares outstanding. |
| 2 | Total returns would have been lower had certain expenses not been reduced during the applicable periods. |
| 28 | JOHN HANCOCK Disciplined Value Fund | ANNUAL REPORT | SEE NOTES TO FINANCIAL STATEMENTS |
| CLASS R6 SHARES Period ended | 3-31-20 | 3-31-19 | 3-31-18 | 3-31-17 | 3-31-16 |
| Per share operating performance | | | | | |
| Net asset value, beginning of period | $19.61 | $21.48 | $20.14 | $17.16 | $18.94 |
| Net investment income1 | 0.36 | 0.32 | 0.27 | 0.24 | 0.23 |
| Net realized and unrealized gain (loss) on investments | (4.06) | (0.27) | 2.33 | 3.00 | (1.15) |
| Total from investment operations | (3.70) | 0.05 | 2.60 | 3.24 | (0.92) |
| Less distributions | | | | | |
| From net investment income | (0.32) | (0.31) | (0.25) | (0.26) | (0.27) |
| From net realized gain | (0.92) | (1.61) | (1.01) | — | (0.59) |
| Total distributions | (1.24) | (1.92) | (1.26) | (0.26) | (0.86) |
| Net asset value, end of period | $14.67 | $19.61 | $21.48 | $20.14 | $17.16 |
| Total return (%)2 | (20.66) | 0.76 | 12.84 | 18.97 | (5.00) |
| Ratios and supplemental data | | | | | |
| Net assets, end of period (in millions) | $3,369 | $4,584 | $4,564 | $3,077 | $2,024 |
| Ratios (as a percentage of average net assets): | | | | | |
| Expenses before reductions | 0.71 | 0.71 | 0.71 | 0.72 | 0.72 |
| Expenses including reductions | 0.70 | 0.70 | 0.70 | 0.69 | 0.69 |
| Net investment income | 1.81 | 1.54 | 1.25 | 1.27 | 1.26 |
| Portfolio turnover (%) | 88 | 69 | 45 | 65 | 61 |
| 1 | Based on average daily shares outstanding. |
| 2 | Total returns would have been lower had certain expenses not been reduced during the applicable periods. |
| SEE NOTES TO FINANCIAL STATEMENTS | ANNUAL REPORT | JOHN HANCOCK Disciplined Value Fund | 29 |
| CLASS NAV SHARES Period ended | 3-31-20 | 3-31-19 | 3-31-18 | 3-31-17 | 3-31-16 |
| Per share operating performance | | | | | |
| Net asset value, beginning of period | $19.62 | $21.49 | $20.15 | $17.16 | $18.94 |
| Net investment income1 | 0.36 | 0.33 | 0.27 | 0.24 | 0.23 |
| Net realized and unrealized gain (loss) on investments | (4.06) | (0.28) | 2.34 | 3.01 | (1.15) |
| Total from investment operations | (3.70) | 0.05 | 2.61 | 3.25 | (0.92) |
| Less distributions | | | | | |
| From net investment income | (0.32) | (0.31) | (0.26) | (0.26) | (0.27) |
| From net realized gain | (0.92) | (1.61) | (1.01) | — | (0.59) |
| Total distributions | (1.24) | (1.92) | (1.27) | (0.26) | (0.86) |
| Net asset value, end of period | $14.68 | $19.62 | $21.49 | $20.15 | $17.16 |
| Total return (%)2 | (20.64) | 0.77 | 12.85 | 18.95 | (4.95) |
| Ratios and supplemental data | | | | | |
| Net assets, end of period (in millions) | $887 | $1,105 | $1,219 | $1,245 | $750 |
| Ratios (as a percentage of average net assets): | | | | | |
| Expenses before reductions | 0.70 | 0.70 | 0.70 | 0.70 | 0.70 |
| Expenses including reductions | 0.69 | 0.69 | 0.69 | 0.69 | 0.69 |
| Net investment income | 1.83 | 1.54 | 1.28 | 1.27 | 1.25 |
| Portfolio turnover (%) | 88 | 69 | 45 | 65 | 61 |
| 1 | Based on average daily shares outstanding. |
| 2 | Total returns would have been lower had certain expenses not been reduced during the applicable periods. |
| 30 | JOHN HANCOCK Disciplined Value Fund | ANNUAL REPORT | SEE NOTES TO FINANCIAL STATEMENTS |
| Notes to financial statements | |
Note 1—Organization
John Hancock Disciplined Value Fund (the fund) is a series of John Hancock Funds III (the Trust), an open-end management investment company organized as a Massachusetts business trust and registered under the Investment Company Act of 1940, as amended (the 1940 Act). The investment objective of the fund is to seek to provide long-term growth of capital primarily through investment in equity securities. Current income is a secondary objective.
The fund may offer multiple classes of shares. The shares currently outstanding are detailed in the Statement of assets and liabilities. Class A and Class C shares are offered to all investors. Class B and Class I2 shares are closed to new investors. Class I shares are offered to institutions and certain investors. Class R1, Class R2, Class R3, Class R4 and Class R5 shares are available only to certain retirement and 529 plans. Class R6 shares are only available to certain retirement plans, institutions and other investors. Class NAV shares are offered to John Hancock affiliated funds of funds, retirement plans for employees of John Hancock and/or Manulife Financial Corporation, and certain 529 plans. Class B shares convert to Class A shares eight years after purchase. Class C shares convert to Class A shares ten years after purchase (certain exclusions may apply). Shareholders of each class have exclusive voting rights to matters that affect that class. The distribution and service fees, if any, and transfer agent fees for each class may differ.
Note 2—Significant accounting policies
The financial statements have been prepared in conformity with accounting principles generally accepted in the United States of America (US GAAP), which require management to make certain estimates and assumptions as of the date of the financial statements. Actual results could differ from those estimates and those differences could be significant. The fund qualifies as an investment company under Topic 946 of Accounting Standards Codification of US GAAP.
Events or transactions occurring after the end of the fiscal period through the date that the financial statements were issued have been evaluated in the preparation of the financial statements. The following summarizes the significant accounting policies of the fund:
Security valuation. Investments are stated at value as of the scheduled close of regular trading on the New York Stock Exchange (NYSE), normally at 4:00 P.M., Eastern Time. In case of emergency or other disruption resulting in the NYSE not opening for trading or the NYSE closing at a time other than the regularly scheduled close, the net asset value (NAV) may be determined as of the regularly scheduled close of the NYSE pursuant to the fund's Valuation Policies and Procedures.
In order to value the securities, the fund uses the following valuation techniques: Equity securities, including exchange-traded or closed-end funds, are typically valued at the last sale price or official closing price on the exchange or principal market where the security trades. In the event there were no sales during the day or closing prices are not available, the securities are valued using the last available bid price. Investments by the fund in open-end mutual funds, including John Hancock Collateral Trust (JHCT), are valued at their respective NAVs each business day.
In certain instances, the Pricing Committee may determine to value equity securities using prices obtained from another exchange or market if trading on the exchange or market on which prices are typically obtained did not open for trading as scheduled, or if trading closed earlier than scheduled, and trading occurred as normal on another exchange or market.
Other portfolio securities and assets, for which reliable market quotations are not readily available, are valued at fair value as determined in good faith by the fund's Pricing Committee following procedures established by the Board of Trustees. The frequency with which these fair valuation procedures are used cannot be predicted and fair value of securities may differ significantly from the value that would have been used had a ready market for such securities existed.
| | ANNUAL REPORT | JOHN HANCOCK Disciplined Value Fund | 31 |
The fund uses a three-tier hierarchy to prioritize the pricing assumptions, referred to as inputs, used in valuation techniques to measure fair value. Level 1 includes securities valued using quoted prices in active markets for identical securities, including registered investment companies. Level 2 includes securities valued using other significant observable inputs. Observable inputs may include quoted prices for similar securities, interest rates, prepayment speeds and credit risk. Prices for securities valued using these inputs are received from independent pricing vendors and brokers and are based on an evaluation of the inputs described. Level 3 includes securities valued using significant unobservable inputs when market prices are not readily available or reliable, including the fund's own assumptions in determining the fair value of investments. Factors used in determining value may include market or issuer specific events or trends, changes in interest rates and credit quality. The inputs or methodology used for valuing securities are not necessarily an indication of the risks associated with investing in those securities. Changes in valuation techniques and related inputs may result in transfers into or out of an assigned level within the disclosure hierarchy.
As of March 31, 2020, all investments are categorized as Level 1 under the hierarchy described above.
Security transactions and related investment income. Investment security transactions are accounted for on a trade date plus one basis for daily NAV calculations. However, for financial reporting purposes, investment transactions are reported on trade date. Interest income is accrued as earned. Dividend income is recorded on the ex-date, except for dividends of certain foreign securities where the dividend may not be known until after the ex-date. In those cases, dividend income, net of withholding taxes, is recorded when the fund becomes aware of the dividends. Non-cash dividends, if any, are recorded at the fair market value of the securities received. Gains and losses on securities sold are determined on the basis of identified cost and may include proceeds from litigation.
Real estate investment trusts. The fund may invest in real estate investment trusts (REITs). Distributions from REITs may be recorded as income and subsequently characterized by the REIT at the end of the fiscal year as a reduction of cost of investments and/or as a realized gain. As a result, the fund will estimate the components of distributions from these securities. Such estimates are revised when the actual components of the distributions are known.
Securities lending. The fund may lend its securities to earn additional income. The fund receives collateral from the borrower in an amount not less than the market value of the loaned securities. The fund will invest its cash collateral in JHCT, an affiliate of the fund, which has a floating NAV and is registered with the Securities and Exchange Commission (SEC) as an investment company. JHCT invests in short-term money market investments. The fund will receive the benefit of any gains and bear any losses generated by JHCT with respect to the cash collateral.
The fund has the right to recall loaned securities on demand. If a borrower fails to return loaned securities when due, then the lending agent is responsible and indemnifies the fund for the lent securities. The lending agent uses the collateral received from the borrower to purchase replacement securities of the same issue, type, class and series of the loaned securities. If the value of the collateral is less than the purchase cost of replacement securities, the lending agent is responsible for satisfying the shortfall but only to the extent that the shortfall is not due to any decrease in the value of JHCT.
Although the risk of loss on securities lent is mitigated by receiving collateral from the borrower and through lending agent indemnification, the fund could experience a delay in recovering securities or could experience a lower than expected return if the borrower fails to return the securities on a timely basis. The fund receives compensation for lending its securities by retaining a portion of the return on the investment of the collateral and compensation from fees earned from borrowers of the securities. Securities lending income received by the fund is net of fees retained by the securities lending agent. Net income received from JHCT is a component of securities lending income as recorded on the Statement of operations.
| 32 | JOHN HANCOCK Disciplined Value Fund | ANNUAL REPORT | |
Obligations to repay collateral received by the fund are shown on the Statement of assets and liabilities as Payable upon return of securities loaned and are secured by the loaned securities. As of March 31, 2020, the fund loaned securities valued at $5,845,836 and received $6,056,803 of cash collateral.
Foreign investing. Assets, including investments, and liabilities denominated in foreign currencies are translated into U.S. dollar values each day at the prevailing exchange rate. Purchases and sales of securities, income and expenses are translated into U.S. dollars at the prevailing exchange rate on the date of the transaction. The effect of changes in foreign currency exchange rates on the value of securities is reflected as a component of the realized and unrealized gains (losses) on investments. Foreign investments are subject to a decline in the value of a foreign currency versus the U.S. dollar, which reduces the dollar value of securities denominated in that currency.
Funds that invest internationally generally carry more risk than funds that invest strictly in U.S. securities. Risks can result from differences in economic and political conditions, regulations, market practices (including higher transaction costs), accounting standards and other factors.
Foreign taxes. The fund may be subject to withholding tax on income, capital gains or repatriation taxes imposed by certain countries, a portion of which may be recoverable. Foreign taxes are accrued based upon the fund's understanding of the tax rules and rates that exist in the foreign markets in which it invests. Taxes are accrued based on gains realized by the fund as a result of certain foreign security sales. In certain circumstances, estimated taxes are accrued based on unrealized appreciation of such securities. Investment income is recorded net of foreign withholding taxes.
Overdraft. The fund may have the ability to borrow from banks for temporary or emergency purposes, including meeting redemption requests that otherwise might require the untimely sale of securities. Pursuant to the fund's custodian agreement, the custodian may loan money to the fund to make properly authorized payments. The fund is obligated to repay the custodian for any overdraft, including any related costs or expenses. The custodian may have a lien, security interest or security entitlement in any fund property that is not otherwise segregated or pledged, to the extent of any overdraft, and to the maximum extent permitted by law.
Line of credit. The fund and other affiliated funds have entered into a syndicated line of credit agreement with Citibank, N.A. as the administrative agent that enables them to participate in a $750 million unsecured committed line of credit. Excluding commitments designated for a certain fund and subject to the needs of all other affiliated funds, the fund can borrow up to an aggregate commitment amount of $500 million, subject to asset coverage and other limitations as specified in the agreement. A commitment fee payable at the end of each calendar quarter, based on the average daily unused portion of the line of credit, is charged to each participating fund based on a combination of fixed and asset based allocations and is reflected in Other expenses on the Statement of operations. Commitment fees for the year ended March 31, 2020 were $37,530.
Expenses. Within the John Hancock group of funds complex, expenses that are directly attributable to an individual fund are allocated to such fund. Expenses that are not readily attributable to a specific fund are allocated among all funds in an equitable manner, taking into consideration, among other things, the nature and type of expense and the fund’s relative net assets. Expense estimates are accrued in the period to which they relate and adjustments are made when actual amounts are known.
Class allocations. Income, common expenses and realized and unrealized gains (losses) are determined at the fund level and allocated daily to each class of shares based on the net assets of the class. Class-specific expenses, such as distribution and service fees, if any, and transfer agent fees, for all classes, are charged daily at the class level based on the net assets of each class and the specific expense rates applicable to each class.
Federal income taxes. The fund intends to continue to qualify as a regulated investment company by complying with the applicable provisions of the Internal Revenue Code and will not be subject to federal income tax on taxable income that is distributed to shareholders. Therefore, no federal income tax provision is required.
| | ANNUAL REPORT | JOHN HANCOCK Disciplined Value Fund | 33 |
For federal income tax purposes, net capital losses of $215,001,850 that are a result of security transactions occurring after October 31, 2019, are treated as occurring on April 1, 2020, the first day of the fund’s next taxable year.
As of March 31, 2020, the fund had no uncertain tax positions that would require financial statement recognition, derecognition or disclosure. The fund's federal tax returns are subject to examination by the Internal Revenue Service for a period of three years.
Distribution of income and gains. Distributions to shareholders from net investment income and net realized gains, if any, are recorded on the ex-date. The fund generally declares and pays dividends annually. Capital gain distributions, if any, are typically distributed annually.
The tax character of distributions for the years ended March 31, 2020 and 2019 was as follows:
| | March 31, 2020 | March 31, 2019 |
| Ordinary income | $209,421,349 | $207,942,145 |
| Long-term capital gains | 650,566,296 | 1,124,012,096 |
| Total | $859,987,645 | $1,331,954,241 |
Distributions paid by the fund with respect to each class of shares are calculated in the same manner, at the same time and in the same amount, except for the effect of class level expenses that may be applied differently to each class. As of March 31, 2020, the components of distributable earnings on a tax basis consisted of $86,879,902 of undistributed ordinary income.
Such distributions and distributable earnings, on a tax basis, are determined in conformity with income tax regulations, which may differ from US GAAP. Distributions in excess of tax basis earnings and profits, if any, are reported in the fund's financial statements as a return of capital.
Capital accounts within the financial statements are adjusted for permanent book-tax differences. These adjustments have no impact on net assets or the results of operations. Temporary book-tax differences, if any, will reverse in a subsequent period. Book-tax differences are primarily attributable to wash sale loss deferrals and treatment of a portion of the proceeds from redemptions as distributions for tax purposes.
Note 3—Guarantees and indemnifications
Under the Trust's organizational documents, its Officers and Trustees are indemnified against certain liabilities arising out of the performance of their duties to the Trust, including the fund. Additionally, in the normal course of business, the fund enters into contracts with service providers that contain general indemnification clauses. The fund's maximum exposure under these arrangements is unknown, as this would involve future claims that may be made against the fund that have not yet occurred. The risk of material loss from such claims is considered remote.
Note 4—Fees and transactions with affiliates
John Hancock Investment Management LLC (the Advisor) serves as investment advisor for the fund. John Hancock Investment Management Distributors LLC (the Distributor), an affiliate of the Advisor, serves as principal underwriter of the fund. The Advisor and the Distributor are indirect, wholly owned subsidiaries of Manulife Financial Corporation. Prior to June 28, 2019, the Advisor was known as John Hancock Advisers, LLC and the Distributor was known as John Hancock Funds, LLC.
Management fee. The fund has an investment management agreement with the Advisor under which the fund pays a daily management fee to the Advisor equivalent on an annual basis to the sum of: (a) 0.750% of the first $500 million of the fund’s average daily net assets; (b) 0.725% of the next $500 million of the fund’s average daily net assets; (c) 0.700% of the next $500 million of the fund’s average daily net assets; (d) 0.675% of the next $1 billion of the fund’s average daily net assets; (e) 0.650% of the next $10 billion of the fund’s average daily net
| 34 | JOHN HANCOCK Disciplined Value Fund | ANNUAL REPORT | |
assets; and (f) 0.625% of the fund’s average daily net assets in excess of $12.5 billion. The Advisor has a subadvisory agreement with Boston Partners Global Investors, Inc., an indirect, wholly owned subsidiary of Orix Corporation of Japan. The fund is not responsible for payment of the subadvisory fees.
The Advisor has contractually agreed to waive a portion of its management fee and/or reimburse expenses for certain funds of the John Hancock group of funds complex, including the fund (the participating portfolios). This waiver is based upon aggregate net assets of all the participating portfolios. The amount of the reimbursement is calculated daily and allocated among all the participating portfolios in proportion to the daily net assets of each fund. During the year ended March 31, 2020, this waiver amounted to 0.01% of the fund’s average daily net assets. This arrangement expires on July 31, 2021, unless renewed by mutual agreement of the fund and the Advisor based upon a determination that this is appropriate under the circumstances at that time.
For the year ended March 31, 2020, the expense reductions described above amounted to the following:
| Class | Expense reduction |
| Class A | $77,388 |
| Class B | 292 |
| Class C | 15,950 |
| Class I | 544,699 |
| Class I2 | 3,201 |
| Class R1 | 1,170 |
| Class R2 | 6,231 |
| Class | Expense reduction |
| Class R3 | $951 |
| Class R4 | 8,823 |
| Class R5 | 10,640 |
| Class R6 | 332,713 |
| Class NAV | 81,343 |
| Total | $1,083,401 |
Expenses waived or reimbursed in the current fiscal period are not subject to recapture in future fiscal periods.
The investment management fees, including the impact of the waivers and reimbursements as described above, incurred for the year ended March 31, 2020, were equivalent to a net annual effective rate of 0.65% of the fund's average daily net assets.
Accounting and legal services. Pursuant to a service agreement, the fund reimburses the Advisor for all expenses associated with providing the administrative, financial, legal, compliance, accounting and recordkeeping services to the fund, including the preparation of all tax returns, periodic reports to shareholders and regulatory reports, among other services. These expenses are allocated to each share class based on its relative net assets at the time the expense was incurred. These accounting and legal services fees incurred for the year ended March 31, 2020 amounted to an annual rate of 0.02% of the fund's average daily net assets.
Distribution and service plans. The fund has a distribution agreement with the Distributor. The fund has adopted distribution and service plans for certain classes as detailed below pursuant to Rule 12b-1 under the 1940 Act, to pay the Distributor for services provided as the distributor of shares of the fund. In addition, under a service plan for certain classes as detailed below, the fund pays for certain other services. The fund may pay up to the following contractual rates of distribution and service fees under these arrangements, expressed as an annual percentage of average daily net assets for each class of the fund's shares:
| Class | Rule 12b-1 Fee | Service fee |
| Class A | 0.30% | — |
| Class B | 1.00% | — |
| Class C | 1.00% | — |
| Class R1 | 0.50% | 0.25% |
| Class R2 | 0.25% | 0.25% |
| Class R3 | 0.50% | 0.15% |
| Class R4 | 0.25% | 0.10% |
| Class R5 | — | 0.05% |
| | ANNUAL REPORT | JOHN HANCOCK Disciplined Value Fund | 35 |
Currently only 0.25% is charged to Class A shares for Rule 12b-1 fees.
The fund's Distributor has contractually agreed to waive 0.10% of Rule12b-1 fees for Class R4 shares. The current waiver agreement expires on July 31, 2021, unless renewed by mutual agreement of the fund and the Distributor based upon a determination that this is appropriate under the circumstances at the time. This contractual waiver amounted to $119,341 for Class R4 shares for the year ended March 31, 2020.
Sales charges. Class A shares are assessed up-front sales charges, which resulted in payments to the Distributor amounting to $879,024 for the year ended March 31, 2020. Of this amount, $139,049 was retained and used for printing prospectuses, advertising, sales literature and other purposes and $739,975 was paid as sales commissions to broker-dealers.
Class A, Class B and Class C shares may be subject to contingent deferred sales charges (CDSCs). Certain Class A shares that are acquired through purchases of $1 million or more and are redeemed within one year of purchase are subject to a 1.00% sales charge. Class B shares that are redeemed within six years of purchase are subject to CDSCs, at declining rates, beginning at 5.00%. Class C shares that are redeemed within one year of purchase are subject to a 1.00% CDSC. CDSCs are applied to the lesser of the current market value at the time of redemption or the original purchase cost of the shares being redeemed. Proceeds from CDSCs are used to compensate the Distributor for providing distribution-related services in connection with the sale of these shares. During the year ended March 31, 2020, CDSCs received by the Distributor amounted to $7,058, $7 and $11,551 for Class A, Class B and Class C shares, respectively.
Transfer agent fees. The John Hancock group of funds has a complex-wide transfer agent agreement with John Hancock Signature Services, Inc. (Signature Services), an affiliate of the Advisor. The transfer agent fees paid to Signature Services are determined based on the cost to Signature Services (Signature Services Cost) of providing recordkeeping services. It also includes out-of-pocket expenses, including payments made to third-parties for recordkeeping services provided to their clients who invest in one or more John Hancock funds. In addition, Signature Services Cost may be reduced by certain fees that Signature Services receives in connection with retirement and small accounts. Signature Services Cost is calculated monthly and allocated, as applicable, to five categories of share classes: Retail Share and Institutional Share Classes of Non-Municipal Bond Funds, Class R6 Shares, Retirement Share Classes and Municipal Bond Share Classes. Within each of these categories, the applicable costs are allocated to the affected John Hancock affiliated funds and/or classes, based on the relative average daily net assets.
Class level expenses. Class level expenses for the year ended March 31, 2020 were as follows:
| Class | Distribution and service fees | Transfer agent fees |
| Class A | $2,613,277 | $1,266,805 |
| Class B | 39,565 | 4,763 |
| Class C | 2,154,854 | 260,815 |
| Class I | — | 9,013,143 |
| Class I2 | — | 53,084 |
| Class R1 | 117,168 | 1,959 |
| Class R2 | 419,362 | 10,376 |
| Class R3 | 82,306 | 1,596 |
| Class R4 | 414,703 | 14,687 |
| Class R5 | 71,179 | 17,663 |
| Class R6 | — | 557,662 |
| Total | $5,912,414 | $11,202,553 |
| 36 | JOHN HANCOCK Disciplined Value Fund | ANNUAL REPORT | |
Trustee expenses. The fund compensates each Trustee who is not an employee of the Advisor or its affiliates. The costs of paying Trustee compensation and expenses are allocated to the fund based on its net assets relative to other funds within the John Hancock group of funds complex.
Interfund lending program. Pursuant to an Exemptive Order issued by the SEC, the fund, along with certain other funds advised by the Advisor or its affiliates, may participate in an interfund lending program. This program provides an alternative credit facility allowing the fund to borrow from, or lend money to, other participating affiliated funds. At period end, no interfund loans were outstanding. Interest expense is included in Other expenses on the Statement of operations. The fund's activity in this program during the period for which loans were outstanding was as follows:
Borrower
or Lender | Weighted Average
Loan Balance | Days
Outstanding | Weighted Average
Interest Rate | Interest Income
(Expense) |
| Borrower | $22,000,000 | 1 | 0.625% | $(382) |
| Lender | $6,583,955 | 6 | 2.115% | $2,321 |
Note 5—Fund share transactions
Transactions in fund shares for the years ended March 31, 2020 and 2019 were as follows:
| | Year Ended 3-31-20 | Year Ended 3-31-19 |
| | Shares | Amount | Shares | Amount |
| Class A shares | | | | |
| Sold | 8,099,695 | $161,568,240 | 9,569,929 | $207,425,723 |
| Distributions reinvested | 2,637,777 | 55,762,596 | 4,960,098 | 94,985,868 |
| Repurchased | (16,480,693) | (325,837,430) | (18,918,870) | (406,531,010) |
| Net decrease | (5,743,221) | $(108,506,594) | (4,388,843) | $(104,119,419) |
| Class B shares | | | | |
| Sold | 1,192 | $22,584 | 11,891 | $237,117 |
| Distributions reinvested | 8,442 | 166,393 | 28,822 | 516,784 |
| Repurchased | (164,821) | (3,165,681) | (205,780) | (4,153,192) |
| Net decrease | (155,187) | $(2,976,704) | (165,067) | $(3,399,291) |
| Class C shares | | | | |
| Sold | 644,136 | $12,311,289 | 1,904,627 | $37,952,720 |
| Distributions reinvested | 489,485 | 9,682,020 | 1,016,186 | 18,281,188 |
| Repurchased | (3,633,809) | (68,564,142) | (3,767,579) | (76,202,010) |
| Net decrease | (2,500,188) | $(46,570,833) | (846,766) | $(19,968,102) |
| Class I shares | | | | |
| Sold | 102,018,395 | $1,907,812,951 | 111,952,595 | $2,334,678,792 |
| Distributions reinvested | 17,973,096 | 366,291,706 | 29,864,095 | 552,485,754 |
| Repurchased | (139,397,179) | (2,680,658,813) | (89,707,048) | (1,831,894,283) |
| Net increase (decrease) | (19,405,688) | $(406,554,156) | 52,109,642 | $1,055,270,263 |
| | ANNUAL REPORT | JOHN HANCOCK Disciplined Value Fund | 37 |
| | Year Ended 3-31-20 | Year Ended 3-31-19 |
| | Shares | Amount | Shares | Amount |
| Class I2 shares | | | | |
| Sold | 72,243 | $1,448,534 | 116,398 | $2,415,486 |
| Distributions reinvested | 124,145 | 2,530,085 | 234,229 | 4,333,235 |
| Repurchased | (575,124) | (11,394,741) | (320,123) | (6,990,181) |
| Net increase (decrease) | (378,736) | $(7,416,122) | 30,504 | $(241,460) |
| Class R1 shares | | | | |
| Sold | 197,405 | $3,877,157 | 269,688 | $5,592,580 |
| Distributions reinvested | 30,916 | 630,377 | 47,717 | 883,243 |
| Repurchased | (350,335) | (6,893,030) | (483,663) | (10,113,192) |
| Net decrease | (122,014) | $(2,385,496) | (166,258) | $(3,637,369) |
| Class R2 shares | | | | |
| Sold | 733,520 | $14,089,125 | 919,555 | $18,862,900 |
| Distributions reinvested | 189,843 | 3,870,898 | 362,873 | 6,716,771 |
| Repurchased | (3,237,649) | (65,014,511) | (2,370,440) | (50,415,063) |
| Net decrease | (2,314,286) | $(47,054,488) | (1,088,012) | $(24,835,392) |
| Class R3 shares | | | | |
| Sold | 270,206 | $5,400,467 | 90,292 | $1,868,437 |
| Distributions reinvested | 35,261 | 718,612 | 62,178 | 1,150,285 |
| Repurchased | (292,433) | (5,770,953) | (294,238) | (6,083,846) |
| Net increase (decrease) | 13,034 | $348,126 | (141,768) | $(3,065,124) |
| Class R4 shares | | | | |
| Sold | 942,602 | $18,482,411 | 1,274,605 | $27,157,069 |
| Distributions reinvested | 302,431 | 6,169,593 | 755,931 | 13,999,851 |
| Repurchased | (3,500,335) | (70,587,011) | (5,504,672) | (117,568,717) |
| Net decrease | (2,255,302) | $(45,935,007) | (3,474,136) | $(76,411,797) |
| Class R5 shares | | | | |
| Sold | 728,176 | $14,187,537 | 994,259 | $20,610,888 |
| Distributions reinvested | 409,081 | 8,353,442 | 886,630 | 16,429,257 |
| Repurchased | (5,399,053) | (108,668,647) | (2,638,461) | (54,438,870) |
| Net decrease | (4,261,796) | $(86,127,668) | (757,572) | $(17,398,725) |
| Class R6 shares | | | | |
| Sold | 43,133,272 | $824,215,152 | 45,397,477 | $956,142,171 |
| Distributions reinvested | 12,963,310 | 264,581,161 | 22,117,614 | 409,618,214 |
| Repurchased | (60,250,923) | (1,189,814,359) | (46,226,115) | (964,352,069) |
| Net increase (decrease) | (4,154,341) | $(101,018,046) | 21,288,976 | $401,408,316 |
| 38 | JOHN HANCOCK Disciplined Value Fund | ANNUAL REPORT | |
| | Year Ended 3-31-20 | Year Ended 3-31-19 |
| | Shares | Amount | Shares | Amount |
| Class NAV shares | | | | |
| Sold | 10,253,020 | $187,949,281 | 2,989,409 | $61,144,563 |
| Distributions reinvested | 3,165,135 | 64,632,066 | 5,330,746 | 98,778,716 |
| Repurchased | (9,328,190) | (189,813,426) | (8,731,977) | (191,170,727) |
| Net increase (decrease) | 4,089,965 | $62,767,921 | (411,822) | $(31,247,448) |
| Total net increase (decrease) | (37,187,760) | $(791,429,067) | 61,988,878 | $1,172,354,452 |
Affiliates of the fund owned 85% of shares of Class NAV on March 31, 2020. Such concentration of shareholders’ capital could have a material effect on the fund if such shareholders redeem from the fund.
Note 6—Purchase and sale of securities
Purchases and sales of securities, other than short-term investments, amounted to $12,443,960,920 and $13,967,255,806, respectively, for the year ended March 31, 2020.
Note 7—Industry or sector risk
The fund may invest a large percentage of its assets in one or more particular industries or sectors of the economy. If a large percentage of the fund’s assets are economically tied to a single or small number of industries or sectors of the economy, the fund will be less diversified than a more broadly diversified fund, and it may cause the fund to underperform if that industry or sector underperforms. In addition, focusing on a particular industry or sector may make the fund’s NAV more volatile. Further, a fund that invests in particular industries or sectors is particularly susceptible to the impact of market, economic, regulatory and other factors affecting those industries or sectors.
Note 8—Investment by affiliated funds
Certain investors in the fund are affiliated funds that are managed by the Advisor and its affiliates. The affiliated funds do not invest in the fund for the purpose of exercising management or control; however, this investment may represent a significant portion of the fund's net assets. At March 31, 2020, funds within the John Hancock group of funds complex held 7.0% of the fund's net assets. There were no affiliated funds with an ownership of 5% or more of the fund's net assets.
Note 9—Investment in affiliated underlying funds
The fund may invest in affiliated underlying funds that are managed by the Advisor and its affiliates. Information regarding the fund's fiscal year to date purchases and sales of the affiliated underlying funds as well as income and capital gains earned by the fund, if any, is as follows:
| | | | | | | | Dividends and distributions |
| Affiliate | Ending
share
amount | Beginning
value | Cost of
purchases | Proceeds
from shares
sold | Realized
gain
(loss) | Change in
unrealized
appreciation
(depreciation) | Income
distributions
received | Capital gain
distributions
received | Ending
value |
| John Hancock Collateral Trust* | 606,508 | $66,309,596 | $935,159,549 | $(995,376,003) | $(32,857) | $3,279 | $1,174,490 | — | $6,063,564 |
| * | Refer to the Securities lending note within Note 2 for details regarding this investment. |
| | ANNUAL REPORT | JOHN HANCOCK Disciplined Value Fund | 39 |
Note 10—Coronavirus (COVID-19) pandemic
The novel COVID-19 disease has resulted in significant disruptions to global business activity. A widespread health crisis such as a global pandemic could cause substantial market volatility, exchange trading suspensions and closures, impact the ability to complete redemptions, and affect fund performance.
| 40 | JOHN HANCOCK Disciplined Value Fund | ANNUAL REPORT | |
Report of Independent Registered Public Accounting Firm
To the Board of Trustees of John Hancock Funds III and Shareholders of John Hancock Disciplined Value Fund
Opinion on the Financial Statements
We have audited the accompanying statement of assets and liabilities, including the Fund’s investments, of John Hancock Disciplined Value Fund (one of the funds constituting John Hancock Funds III, referred to hereafter as the "Fund") as of March 31, 2020, the related statement of operations for the year ended March 31, 2020, the statements of changes in net assets for each of the two years in the period ended March 31, 2020, including the related notes, and the financial highlights for each of the five years in the period ended March 31, 2020 (collectively referred to as the “financial statements”). In our opinion, the financial statements present fairly, in all material respects, the financial position of the Fund as of March 31, 2020, the results of its operations for the year then ended, the changes in its net assets for each of the two years in the period ended March 31, 2020 and the financial highlights for each of the five years in the period ended March 31, 2020 in conformity with accounting principles generally accepted in the United States of America.
Basis for Opinion
These financial statements are the responsibility of the Fund’s management. Our responsibility is to express an opinion on the Fund’s financial statements based on our audits. We are a public accounting firm registered with the Public Company Accounting Oversight Board (United States) (PCAOB) and are required to be independent with respect to the Fund in accordance with the U.S. federal securities laws and the applicable rules and regulations of the Securities and Exchange Commission and the PCAOB.
We conducted our audits of these financial statements in accordance with the standards of the PCAOB. Those standards require that we plan and perform the audit to obtain reasonable assurance about whether the financial statements are free of material misstatement, whether due to error or fraud.
Our audits included performing procedures to assess the risks of material misstatement of the financial statements, whether due to error or fraud, and performing procedures that respond to those risks. Such procedures included examining, on a test basis, evidence regarding the amounts and disclosures in the financial statements. Our audits also included evaluating the accounting principles used and significant estimates made by management, as well as evaluating the overall presentation of the financial statements. Our procedures included confirmation of securities owned as of March 31, 2020 by correspondence with the custodian, transfer agents, and brokers; when replies were not received from the brokers, we performed other auditing procedures. We believe that our audits provide a reasonable basis for our opinion.
/s/ PricewaterhouseCoopers LLP
Boston, Massachusetts
May 13, 2020
We have served as the auditor of one or more investment companies in the John Hancock group of funds since 1988.
| | ANNUAL REPORT | JOHN HANCOCK DISCIPLINED VALUE FUND | 41 |
| Tax information (Unaudited) | |
For federal income tax purposes, the following information is furnished with respect to the distributions of the fund, if any, paid during its taxable year ended March 31, 2020.
The fund reports the maximum amount allowable of its net taxable income as eligible for the corporate dividends-received deduction.
The fund reports the maximum amount allowable of its net taxable income as qualified dividend income as provided in the Jobs and Growth Tax Relief Reconciliation Act of 2003.
The fund paid $671,825,250 in long term capital gain dividends.
The fund reports the maximum amount allowable of its Section 199A dividends as defined in Proposed Treasury Regulation §1.199A-3(d).
Eligible shareholders will be mailed a 2020 Form 1099-DIV in early 2021. This will reflect the tax character of all distributions paid in calendar year 2020.
Please consult a tax advisor regarding the tax consequences of your investment in the fund.
| 42 | JOHN HANCOCK DISCIPLINED VALUE FUND | ANNUAL REPORT | |
STATEMENT REGARDING LIQUIDITY RISK MANAGEMENT
Operation of the Liquidity Risk Management Program
This section describes operation and effectiveness of the Liquidity Risk Management Program (LRMP) established in accordance with Rule 22e-4 under the Investment Company Act of 1940, as amended (the Liquidity Rule). The Board of Trustees (the Board) of each Fund in the John Hancock Group of Funds (each a Fund and collectively, the Funds) that is subject to the requirements of the Liquidity Rule has appointed John Hancock Investment Management, LLC and John Hancock Variable Trust Advisers, LLC (together, the Advisor) to serve as Administrator of the LRMP with respect to each of the Funds, including John Hancock Disciplined Value Fund, subject to the oversight of the Board. In order to provide a mechanism and process to perform the functions necessary to administer the LRMP, the Advisor established the Liquidity Risk Management Committee (the Committee). The Fund's subadvisor, Boston Partners Global Investors, Inc. (the Subadvisor) executes the day-to-day investment management and security-level activities of the Fund in accordance with the requirements of the LRMP, subject to the supervision of the Advisor and the Board.
The Committee holds monthly meetings to: (1) review the day-to-day operations of the LRMP; (2) review and approve month end liquidity classifications; (3) review quarterly testing and determinations, as applicable; and (4) review other LRMP related material. The Committee also conducts daily, monthly, quarterly, and annual quantitative and qualitative assessments of each subadvisor to a Fund that is subject to the requirements of the Liquidity Rule and is a part of the LRMP to monitor investment performance issues, risks and trends. In addition, the Committee may conduct ad-hoc reviews and meetings with subadvisors as issues and trends are identified, including potential liquidity and valuation issues.
The Committee provided the Board at an in-person meeting held on March 15-18, 2020 with a written report which addressed the Committee's assessment of the adequacy and effectiveness of the implementation and operation of the LRMP and any material changes to the LRMP. The report, which covered the period December 1, 2018 through December 31, 2019, included an assessment of important aspects of the LRMP including, but not limited to:
• Operation of the Fund's Redemption-In-Kind Procedures;
• Highly Liquid Investment Minimum (HLIM) determination;
• Compliance with the 15% limit on illiquid investments;
• Reasonably Anticipated Trade Size (RATS) determination;
• Security-level liquidity classifications; and
• Liquidity risk assessment.
The report also covered material liquidity matters which occurred or were reported during this period applicable to the Fund, if any, and the Committee's actions to address such matters.
Redemption-In-Kind Procedures
Rule 22e-4 requires any fund that engages in or reserves the right to engage in in-kind redemptions to adopt and implement written policies and procedures regarding in-kind redemptions as part of the management of its liquidity risk. These procedures address the process for redeeming in kind, as well as the circumstances under which the Fund would consider redeeming in kind. Anticipated large redemption activity will be evaluated to identify situations where redeeming in securities instead of cash may be appropriate.
ANNUAL REPORT | JOHN HANCOCK DISCIPLINED VALUE FUND 43
As part of its annual assessment of the LRMP, the Committee reviewed the implementation and operation of the Redemption-In-Kind Procedures and determined they are operating in a manner that such procedures are adequate and effective to manage in-kind redemptions on behalf of the Fund as part of the LRMP.
Highly Liquid Investment Minimum determination
The Committee uses an HLIM model to determine a Fund's HLIM. This process incorporates the Fund's investment strategy, historical redemptions, liquidity classification rollup percentages and cash balances, redemption policy, access to funding sources, distribution channels and client concentrations. If the Fund falls below its established HLIM for a period greater than 7 consecutive calendar days, the Committee prepares a report to the Board within one business day following the seventh consecutive calendar day with an explanation of how the Fund plans to restore its HLIM within a reasonable period of time.
Based on the HLIM model, the Committee has determined that the Fund qualifies as a Primarily Highly Liquid Fund (PHLF). It is therefore not required to establish a HLIM. The Fund is tested quarterly to confirm its PHLF status.
As part of its annual assessment of the LRMP, the Committee reviewed the policies and procedures in place with respect to HLIM and PHLF determinations, and determined that such policies and procedures are operating in a manner that is adequate and effective as part of the LRMP.
Compliance with the 15% limit on illiquid investments
Rule 22e-4 sets an aggregate illiquid investment limit of 15% for a fund. Funds are prohibited from acquiring an illiquid investment if this results in greater than 15% of its net assets being classified as illiquid. When applying this limit, the Committee defines "illiquid investment" to mean any investment that the Fund reasonably expects cannot be sold or disposed of in current market conditions in seven calendar days or less without the sale or disposition significantly changing the market value of the investment. If a 15% illiquid investment limit breach occurs for longer than 1 business day, the Fund is required to notify the Board and provide a plan on how to bring illiquid investments within the 15% threshold, and after 7 days confidentially notify the Securities and Exchange Commission (the SEC).
In February 2019, as a result of extended security markets closures in connection with the Chinese New Year in certain countries, the SEC released guidance, and the Committee approved and adopted an Extended Market Holiday Policy to plan for and monitor known Extended Market Holidays (defined as all expected market holiday closures spanning four or more calendar days).
As part of its annual assessment of the LRMP, the Committee reviewed the policies and procedures in place with respect to the 15% illiquid investment limit and determined such policies and procedures are operating in a manner that is adequate and effective as part of the LMRP.
Reasonably Anticipated Trade Size determination
In order to assess the liquidity risk of a Fund, the Committee considers the impact on the Fund that redemptions of a RATS would have under both normal and reasonably foreseeable stressed conditions. Modelling the Fund's RATS requires quantifying cash flow volatility and analyzing distribution channel concentration and redemption risk. The model is designed to estimate the amount of assets that the Fund could reasonably anticipate trading on a given day, during both normal and reasonably foreseeable stressed conditions, to satisfy redemption requests.
ANNUAL REPORT | JOHN HANCOCK DISCIPLINED VALUE FUND 44
As part of its annual assessment of the LRMP, the Committee reviewed the policies and procedures in place with respect to RATS determinations and determined that such policies and procedures are operating in a manner that is adequate and effective at making RATS determinations as part of the LRMP.
Security-level liquidity classifications
When classifying the liquidity of portfolio securities, the Fund adheres to the liquidity classification procedures established by the Advisor. In assigning a liquidity classification to Fund portfolio holdings, the following key inputs, among others, are considered: the Fund's RATS, feedback from the applicable Subadvisor on market-, trading- and investment-specific considerations, an assessment of current market conditions and fund portfolio holdings, and a value impact standard. The Subadvisor also provides position-level data to the Committee for use in monthly classification reconciliation in order to identify any classifications that may need to be changed as a result of the above considerations.
As part of its annual assessment of the LRMP, the Committee reviewed the policies and procedures in place with respect to security-level liquidity classifications and determined that such policies and procedures are operating in a manner that is adequate and effective as part of the LRMP.
Liquidity risk assessment
The Committee periodically reviews and assesses, the Fund's liquidity risk, including its investment strategy and liquidity of portfolio investments during both normal and reasonably foreseeable stressed conditions (including whether the investment strategy is appropriate for an open-end fund, the extent to which the strategy involves a relatively concentrated portfolio or large positions in particular issuers, and the use of borrowings for investment purposes and derivatives), cash flow analysis during both normal and reasonably foreseeable stressed conditions, and holdings of cash and cash equivalents, as well as borrowing arrangements and other funding sources.
The Committee also monitors global events, such as the COVID-19 Coronavirus, that could impact the markets and liquidity of portfolio investments and their classifications.
As part of its annual assessment of the LRMP, the Committee reviewed Fund-Level Liquidity Risk Assessment Reports for each of the Funds and determined that the investment strategy for each Fund continues to be appropriate for an open-ended structure.
Adequacy and Effectiveness
Based on the review and assessment conducted by the Committee, the Committee has determined that the LRMP has been implemented, and is operating in a manner that is adequate and effective at assessing and managing the liquidity risk of each Fund.
ANNUAL REPORT | JOHN HANCOCK DISCIPLINED VALUE FUND 45
This chart provides information about the Trustees and Officers who oversee your John Hancock fund. Officers elected by the Trustees manage the day-to-day operations of the fund and execute policies formulated by the Trustees.
Independent Trustees
| | | |
Name, year of birth
Position(s) held with Trust
Principal occupation(s) and other
directorships during past 5 years | Trustee
of the
Trust
since1 | Number of John
Hancock funds
overseen by
Trustee |
| Hassell H. McClellan, Born: 1945 | 2012 | 204 |
Trustee and Chairperson of the Board
Director/Trustee, Virtus Funds (since 2008); Director, The Barnes Group (since 2010); Associate Professor, The Wallace E. Carroll School of Management, Boston College (retired 2013). Trustee (since 2005) and Chairperson of the Board (since 2017) of various trusts within the John Hancock Fund Complex. |
| | | |
| Charles L. Bardelis,2 Born: 1941 | 2012 | 204 |
Trustee
Director, Island Commuter Corp. (marine transport). Trustee of various trusts within the John Hancock Fund Complex (since 1988). |
| | | |
| James R. Boyle,Born: 1959 | 2015 | 204 |
Trustee
Chief Executive Officer, Foresters Financial (since 2018); Chairman and Chief Executive Officer, Zillion Group, Inc. (formerly HealthFleet, Inc.) (healthcare) (2014-2018); Executive Vice President and Chief Executive Officer, U.S. Life Insurance Division of Genworth Financial, Inc. (insurance) (January 2014-July 2014); Senior Executive Vice President, Manulife Financial, President and Chief Executive Officer, John Hancock (1999-2012); Chairman and Director, John Hancock Investment Management LLC, John Hancock Investment Management Distributors LLC, and John Hancock Variable Trust Advisers LLC (2005-2010). Trustee of various trusts within the John Hancock Fund Complex (2005-2014 and since 2015). |
| | | |
| Peter S. Burgess,2 Born: 1942 | 2012 | 204 |
Trustee
Consultant (financial, accounting, and auditing matters) (since 1999); Certified Public Accountant; Partner, Arthur Andersen (independent public accounting firm) (prior to 1999); Director, Lincoln Educational Services Corporation (since 2004); Director, Symetra Financial Corporation (2010-2016); Director, PMA Capital Corporation (2004-2010). Trustee of various trusts within the John Hancock Fund Complex (since 2005). |
| | | |
| William H. Cunningham, Born: 1944 | 2006 | 204 |
Trustee
Professor, University of Texas, Austin, Texas (since 1971); former Chancellor, University of Texas System and former President of the University of Texas, Austin, Texas; Chairman (since 2009) and Director (since 2006), Lincoln National Corporation (insurance); Director, Southwest Airlines (since 2000); former Director, LIN Television (2009-2014). Trustee of various trusts within the John Hancock Fund Complex (since 1986). |
| | | |
| Grace K. Fey, Born: 1946 | 2012 | 204 |
Trustee
Chief Executive Officer, Grace Fey Advisors (since 2007); Director and Executive Vice President, Frontier Capital Management Company (1988-2007); Director, Fiduciary Trust (since 2009). Trustee of various trusts within the John Hancock Fund Complex (since 2008). |
ANNUAL REPORT | JOHN HANCOCK DISCIPLINED VALUE FUND 46
Independent Trustees (continued)
| | | |
Name, year of birth
Position(s) held with Trust
Principal occupation(s) and other
directorships during past 5 years | Trustee
of the
Trust
since1 | Number of John
Hancock funds
overseen by
Trustee |
| Deborah C. Jackson, Born: 1952 | 2008 | 204 |
Trustee
President, Cambridge College, Cambridge, Massachusetts (since 2011); Board of Directors, Massachusetts Women's Forum (since 2018); Board of Directors, National Association of Corporate Directors/New England (since 2015); Board of Directors, Association of Independent Colleges and Universities of Massachusetts (2014-2017); Chief Executive Officer, American Red Cross of Massachusetts Bay (2002-2011); Board of Directors of Eastern Bank Corporation (since 2001); Board of Directors of Eastern Bank Charitable Foundation (since 2001); Board of Directors of American Student Assistance Corporation (1996-2009); Board of Directors of Boston Stock Exchange (2002-2008); Board of Directors of Harvard Pilgrim Healthcare (health benefits company) (2007-2011). Trustee of various trusts within the John Hancock Fund Complex (since 2008). |
| | | |
| James M. Oates,2Born: 1946 | 2012 | 204 |
Trustee
Managing Director, Wydown Group (financial consulting firm) (since 1994); Chairman and Director, Emerson Investment Management, Inc. (2000-2015); Independent Chairman, Hudson Castle Group, Inc. (formerly IBEX Capital Markets, Inc.) (financial services company) (1997-2011); Director, Stifel Financial (since 1996); Director, Investor Financial Services Corporation (1995-2007); Director, Connecticut River Bancorp (1998-2014); Director/Trustee, Virtus Funds (since 1988). Trustee (since 2004) and Chairperson of the Board (2005-2016) of various trusts within the John Hancock Fund Complex. |
| | | |
| Steven R. Pruchansky, Born: 1944 | 2006 | 204 |
Trustee and Vice Chairperson of the Board
Managing Director, Pru Realty (since 2017); Chairman and Chief Executive Officer, Greenscapes of Southwest Florida, Inc. (since 2014); Director and President, Greenscapes of Southwest Florida, Inc. (until 2000); Member, Board of Advisors, First American Bank (until 2010); Managing Director, Jon James, LLC (real estate) (since 2000); Partner, Right Funding, LLC (2014-2017); Director, First Signature Bank & Trust Company (until 1991); Director, Mast Realty Trust (until 1994); President, Maxwell Building Corp. (until 1991). Trustee (since 1992), Chairperson of the Board (2011-2012), and Vice Chairperson of the Board (since 2012) of various trusts within the John Hancock Fund Complex. |
| | | |
| Gregory A. Russo, Born: 1949 | 2008 | 204 |
Trustee
Director and Audit Committee Chairman (since 2012), and Member, Audit Committee and Finance Committee (since 2011), NCH Healthcare System, Inc. (holding company for multi-entity healthcare system); Director and Member (2012-2018) and Finance Committee Chairman (2014-2018), The Moorings, Inc. (nonprofit continuing care community); Vice Chairman, Risk & Regulatory Matters, KPMG LLP (KPMG) (2002-2006); Vice Chairman, Industrial Markets, KPMG (1998-2002); Chairman and Treasurer, Westchester County, New York, Chamber of Commerce (1986-1992); Director, Treasurer, and Chairman of Audit and Finance Committees, Putnam Hospital Center (1989-1995); Director and Chairman of Fundraising Campaign, United Way of Westchester and Putnam Counties, New York (1990-1995). Trustee of various trusts within the John Hancock Fund Complex (since 2008). |
ANNUAL REPORT | JOHN HANCOCK DISCIPLINED VALUE FUND 47
Non-Independent Trustees3
| | | |
Name, year of birth
Position(s) held with Trust
Principal occupation(s) and other
directorships during past 5 years | Trustee
of the
Trust
since1 | Number of John
Hancock funds
overseen by
Trustee |
| Andrew G. Arnott, Born: 1971 | 2017 | 204 |
President and Non-Independent Trustee
Head of Wealth and Asset Management, United States and Europe, for John Hancock and Manulife (since 2018); Executive Vice President, John Hancock Financial Services (since 2009, including prior positions); Director and Executive Vice President, John Hancock Investment Management LLC (since 2005, including prior positions); Director and Executive Vice President, John Hancock Variable Trust Advisers LLC (since 2006, including prior positions); President, John Hancock Investment Management Distributors LLC (since 2004, including prior positions); President of various trusts within the John Hancock Fund Complex (since 2007, including prior positions). Trustee of various trusts within the John Hancock Fund Complex (since 2017). |
| | | |
| Marianne Harrison, Born: 1963 | 2018 | 204 |
Non-Independent Trustee
President and CEO, John Hancock (since 2017); President and CEO, Manulife Canadian Division (2013-2017); Member, Board of Directors, CAE Inc. (since 2019); Member, Board of Directors, MA Competitive Partnership Board (since 2018); Member, Board of Directors, American Council of Life Insurers (ACLI) (since 2018); Member, Board of Directors, Communitech, an industry-led innovation center that fosters technology companies in Canada (2017-2019); Member, Board of Directors, Manulife Assurance Canada (2015-2017); Board Member, St. Mary's General Hospital Foundation (2014-2017); Member, Board of Directors, Manulife Bank of Canada (2013-2017); Member, Standing Committee of the Canadian Life & Health Assurance Association (2013-2017); Member, Board of Directors, John Hancock USA, John Hancock Life & Health, John Hancock New York (2012-2013). Trustee of various trusts within the John Hancock Fund Complex (since 2018). |
Principal officers who are not Trustees
| | |
Name, year of birth
Position(s) held with Trust
Principal occupation(s)
during past 5 years | Officer
of the
Trust
since |
| Francis V. Knox, Jr.,Born: 1947 | 2006 |
Chief Compliance Officer
Vice President, John Hancock Financial Services (since 2005); Chief Compliance Officer, various trusts within the John Hancock Fund Complex, John Hancock Investment Management LLC, and John Hancock Variable Trust Advisers LLC (since 2005). |
| | |
| Charles A. Rizzo, Born: 1957 | 2007 |
Chief Financial Officer
Vice President, John Hancock Financial Services (since 2008); Senior Vice President, John Hancock Investment Management LLC and John Hancock Variable Trust Advisers LLC (since 2008); Chief Financial Officer of various trusts within the John Hancock Fund Complex (since 2007). |
| | |
| Salvatore Schiavone, Born: 1965 | 2010 |
Treasurer
Assistant Vice President, John Hancock Financial Services (since 2007); Vice President, John Hancock Investment Management LLC and John Hancock Variable Trust Advisers LLC (since 2007); Treasurer of various trusts within the John Hancock Fund Complex (since 2007, including prior positions). |
ANNUAL REPORT | JOHN HANCOCK DISCIPLINED VALUE FUND 48
Principal officers who are notTrustees (continued)
| | |
Name, year of birth
Position(s) held with Trust
Principal occupation(s)
during past 5 years | Officer
of the
Trust
since |
| Christopher (Kit) Sechler,Born: 1973 | 2018 |
Chief Legal Officer and Secretary
Vice President and Deputy Chief Counsel, John Hancock Investments (since 2015); Assistant Vice President and Senior Counsel (2009-2015), John Hancock Investment Management; Chief Legal Officer and Secretary of various trusts within the John Hancock Fund Complex (since 2018); Assistant Secretary of John Hancock Investment Management LLC and John Hancock Variable Trust Advisers LLC (since 2009). |
The business address for all Trustees and Officers is 200 Berkeley Street, Boston, Massachusetts 02116-5023.
The Statement of Additional Information of the fund includes additional information about members of the Board of Trustees of the Trust and is available without charge, upon request, by calling 800-225-5291.
| 1 | Each Trustee holds office until his or her successor is elected and qualified, or until the Trustee's death, retirement, resignation, or removal. Mr. Boyle has served as Trustee at various times prior to the date listed in the table. |
| 2 | Member of the Audit Committee. |
| 3 | The Trustee is a Non-Independent Trustee due to current or former positions with the Advisor and certain affiliates. |
ANNUAL REPORT | JOHN HANCOCK DISCIPLINED VALUE FUND 49
| | |
Trustees
Hassell H. McClellan,Chairperson
Steven R. Pruchansky,Vice Chairperson
Andrew G. Arnott†
Charles L. Bardelis*
James R. Boyle
Peter S. Burgess*
William H. Cunningham
Grace K. Fey
Marianne Harrison†
Deborah C. Jackson
James M. Oates*
Gregory A. Russo
Officers
Andrew G. Arnott
President
Francis V. Knox, Jr.
Chief Compliance Officer
Charles A. Rizzo
Chief Financial Officer
Salvatore Schiavone
Treasurer
Christopher (Kit) Sechler
Secretary and Chief Legal Officer
| Investment advisor
John Hancock Investment Management LLC
Subadvisor
Boston Partners Global Investors, Inc.
Portfolio Managers
David T. Cohen, CFA
Mark E. Donovan, CFA
Stephanie T. McGirr
David J. Pyle, CFA
Principal distributor
John Hancock Investment Management Distributors LLC
Custodian
State Street Bank and Trust Company
Transfer agent
John Hancock Signature Services, Inc.
Legal counsel
K&L Gates LLP
Independent registered public accounting firm
PricewaterhouseCoopers LLP
|
* Member of the Audit Committee
† Non-Independent Trustee
The fund's proxy voting policies and procedures, as well as the fund proxy voting record for the most recent twelve-month period ended June 30, are available free of charge on the Securities and Exchange Commission (SEC) website at sec.gov or on our website.
All of the fund's holdings as of the end of the third month of every fiscal quarter are filed with the SEC on Form N-PORT within 60 days of the end of the fiscal quarter. The fund's Form N-PORT filings are available on our website and the SEC's website, sec.gov.
We make this information on your fund, as well asmonthly portfolio holdings, and other fund details available on our website at jhinvestments.com or by calling 800-225-5291.
| | | | |
| | You can also contact us: |
| | 800-225-5291
jhinvestments.com | Regular mail:
John Hancock Signature Services, Inc.
P.O. Box 55913
Boston, MA 02205-5913
| Express mail:
John Hancock Signature Services, Inc.
2000 Crown Colony Drive
Suite 55913
Quincy, MA 02169-0953
|
ANNUAL REPORT | JOHN HANCOCK DISCIPLINED VALUE FUND 50
John Hancock family of funds
| | | |
DOMESTIC EQUITY FUNDS
Blue Chip Growth
Classic Value
Disciplined Value
Disciplined Value Mid Cap
Equity Income
Financial Industries
Fundamental All Cap Core
Fundamental Large Cap Core
New Opportunities
Regional Bank
Small Cap Core
Small Cap Growth
Small Cap Value
U.S. Global Leaders Growth
U.S. Quality Growth
GLOBAL AND INTERNATIONAL EQUITY FUNDS
Disciplined Value International
Emerging Markets
Emerging Markets Equity
Fundamental Global Franchise
Global Equity
Global Shareholder Yield
Global Thematic Opportunities
International Dynamic Growth
International Growth
International Small Company
| | INCOME FUNDS
Bond
California Tax-Free Income
Emerging Markets Debt
Floating Rate Income
Government Income
High Yield
High Yield Municipal Bond
Income
Investment Grade Bond
Money Market
Short Duration Bond
Short Duration Credit Opportunities
Strategic Income Opportunities
Tax-Free Bond
ALTERNATIVE AND SPECIALTY FUNDS
Absolute Return Currency
Alternative Asset Allocation
Alternative Risk Premia
Diversified Macro
Infrastructure
Multi-Asset Absolute Return
Seaport Long/Short
|
A fund's investment objectives, risks, charges, and expenses should be considered carefully before investing. The prospectus contains this and other important information about the fund. To obtain a prospectus, contact your financial professional, call John Hancock Investment Management at 800-225-5291, or visit our website at jhinvestments.com. Please read the prospectus carefully before investing or sending money.
| | | |
ASSET ALLOCATION
Balanced
Multi-Asset High Income
Multi-Index Lifetime Portfolios
Multi-Index Preservation Portfolios
Multimanager Lifestyle Portfolios
Multimanager Lifetime Portfolios
Retirement Income 2040
EXCHANGE-TRADED FUNDS
John Hancock Multifactor Consumer Discretionary ETF
John Hancock Multifactor Consumer Staples ETF
John Hancock Multifactor Developed International ETF
John Hancock Multifactor Emerging Markets ETF
John Hancock Multifactor Energy ETF
John Hancock Multifactor Financials ETF
John Hancock Multifactor Healthcare ETF
John Hancock Multifactor Industrials ETF
John Hancock Multifactor Large Cap ETF
John Hancock Multifactor Materials ETF
John Hancock Multifactor Media and
Communications ETF
John Hancock Multifactor Mid Cap ETF
John Hancock Multifactor Small Cap ETF
John Hancock Multifactor Technology ETF
John Hancock Multifactor Utilities ETF
| | ENVIRONMENTAL, SOCIAL, AND
GOVERNANCE FUNDS
ESG All Cap Core
ESG Core Bond
ESG International Equity
ESG Large Cap Core
CLOSED-END FUNDS
Financial Opportunities
Hedged Equity & Income
Income Securities Trust
Investors Trust
Preferred Income
Preferred Income II
Preferred Income III
Premium Dividend
Tax-Advantaged Dividend Income
Tax-Advantaged Global Shareholder Yield
|
John Hancock Multifactor ETF shares are bought and sold at market price (not NAV), and are not individually redeemed
from the fund. Brokerage commissions will reduce returns.
John Hancock ETFs are distributed by Foreside Fund Services, LLC, and are subadvised by Dimensional Fund Advisors LP.
Foreside is not affiliated with John Hancock Investment Management Distributors LLC or Dimensional Fund Advisors LP.
Dimensional Fund Advisors LP receives compensation from John Hancock in connection with licensing rights to the
John Hancock Dimensional indexes. Dimensional Fund Advisors LP does not sponsor, endorse, or sell, and makes no
representation as to the advisability of investing in, John Hancock Multifactor ETFs.
John Hancock Investment Management
A trusted brand
John Hancock Investment Management is a premier asset manager
representing one of America's most trusted brands, with a heritage of
financial stewardship dating back to 1862. Helping our shareholders
pursue their financial goals is at the core of everything we do. It's why
we support the role of professional financial advice and operate with
the highest standards of conduct and integrity.
A better way to invest
We serve investors globally through a unique multimanager approach:
We search the world to find proven portfolio teams with specialized
expertise for every strategy we offer, then we apply robust investment
oversight to ensure they continue to meet our uncompromising
standards and serve the best interests of our shareholders.
Results for investors
Our unique approach to asset management enables us to provide
a diverse set of investments backed by some of the world's best
managers, along with strong risk-adjusted returns across asset classes.
John Hancock Investment Management Distributors LLC n Member FINRA, SIPC
200 Berkeley Street n Boston, MA 02116-5010 n 800-225-5291 n jhinvestments.com
This report is for the information of the shareholders of John Hancock Disciplined Value Fund. It is not authorized for distribution to prospective investors unless preceded or accompanied by a prospectus.
John Hancock
Global Shareholder Yield Fund
Annual report 3/31/2020
Beginning on January 1, 2021, as permitted by regulations adopted by the Securities and Exchange Commission, paper copies of the fund's shareholder reports like this one will no longer be sent by mail, unless you specifically request paper copies of the reports from the fund or from your financial intermediary. Instead, the reports will be made available on a website, and you will be notified by mail each time a report is posted and provided with a website link to access the report.
If you already elected to receive shareholder reports electronically, you will not be affected by this change, and you do not need to take any action. You may elect to receive shareholder reports and other communications electronically by calling John Hancock Investment Management at 800-225-5291 (Class A, Class B and Class C shares) or 888-972-8696 (Class I, Class R2, and Class R6) or by contacting your financial intermediary.
You may elect to receive all reports in paper, free of charge, at any time. You can inform John Hancock Investment Management or your financial intermediary that you wish to continue receiving paper copies of your shareholder reports by following the instructions listed above. Your election to receive reports in paper will apply to all funds held with John Hancock Investment Management or your financial intermediary.

A message to shareholders
Dear shareholder,
Global financial markets were on pace to deliver strong returns during the 12 months ended March 31, 2020, until heightened fears over the coronavirus (COVID-19) sent markets tumbling during the last five weeks of the period.
In response to the sell-off, governments and banks in some of the hardest hit areas throughout the world enacted policies and stimulus efforts designed to reignite their respective economies. While these measures helped lift equity and fixed-income markets in the United States during the final two weeks of March, results were mixed in other areas of the world.
The continued spread of COVID-19, trade disputes, rising unemployment, and other geopolitical tensions may continue to create uncertainty among businesses and investors. Your financial professional can helpposition your portfolio so that it's sufficiently diversified to seek to meet your long-term objectives and to withstand the inevitable bouts of market volatility along the way.
On behalf of everyone at John Hancock Investment Management, I'd like to take this opportunity to welcome new shareholders and thank existing shareholders for the continued trust you've placed in us.
Sincerely,
Andrew G. Arnott
President and CEO,
John Hancock Investment Management
Head of Wealth and Asset Management,
United States and Europe
This commentary reflects the CEO's views as of this report's period end and are subject to change at any time. Diversification does not guarantee investment returns and does not eliminate risk of loss. All investments entail risks, including the possible loss of principal. For more up-to-date information, you can visit our website at jhinvestments.com.
John Hancock
Global Shareholder Yield Fund
Table of contents
| | | |
| 2 | | Your fund at a glance |
| 5 | | Manager's discussion of fund performance |
| 7 | | A look at performance |
| 9 | | Your expenses |
| 11 | | Fund's investments |
| 15 | | Financial statements |
| 19 | | Financial highlights |
| 26 | | Notes to financial statements |
| 35 | | Report of independent registered public accounting firm |
| 36 | | Tax information |
| 37 | | Statement regarding liquidity risk management |
| 40 | | Trustees and Officers |
| 44 | | More information |
ANNUAL REPORT | JOHN HANCOCK GLOBAL SHAREHOLDER YIELD FUND 1
INVESTMENT OBJECTIVE
The fund seeks to provide a high level of income as its primary objective. Capital appreciation is a secondary investment objective.
AVERAGE ANNUAL TOTAL RETURNS AS OF 3/31/2020 (%)
The MSCI World Index is a free float-adjusted market capitalization weighted index that is designed to measure the equity market performance of developed markets.
It is not possible to invest directly in an index. Index figures do not reflect expenses or sales charges, which would result in lower returns.
Figures from Morningstar, Inc. include reinvested distributions and do not take into account sales charges. Actual load-adjusted performance is lower.
The past performance shown here reflects reinvested distributions and the beneficial effect of any expense reductions, and does not guarantee future results. Performance of the other share classes will vary based on the difference in the fees and expenses of those classes. Shares will fluctuate in value and, when redeemed, may be worth more or less than their original cost. Current month-end performance may be lower or higher than the performance cited, and can be found at jhinvestments.com or by calling 800-225-5291. For further information on the fund's objectives, risks, and strategy, see the fund's prospectus. The fund recently experienced negative short-term performance due to market volatility associated with the COVID-19 pandemic.
ANNUAL REPORT | JOHN HANCOCK GLOBAL SHAREHOLDER YIELD FUND 2
PERFORMANCE HIGHLIGHTS OVER THE LAST TWELVE MONTHS
A pandemic interrupted positive momentum for developed-market equities
Most global developed-market stocks posted negative returns, as the COVID-19 pandemic triggered an abrupt downward shift in market momentum.
The fund trailed its benchmark index
The fund underperformed its benchmark, the MSCI World Index, owing in part to the negative impact from the fund's underweight in the information technology sector and its overweight in the energy sector.
The fund's positioning in selected sectors aided relative performance
Our stock selection in the industrials sector and the fund's overweight in the utilities sector provided a measure of downside protection relative to the benchmark.
SECTOR COMPOSITION AS OF 3/31/2020 (%)
ANNUAL REPORT | JOHN HANCOCK GLOBAL SHAREHOLDER YIELD FUND 3
A note about risks
The fund may be subject to various risks as described in the fund's prospectus. A widespread health crisis such as a global pandemic could cause substantial market volatility, exchange-trading suspensions and closures, impact the ability to complete redemptions, and affect fund performance. For example, the novel coronavirus disease (COVID-19) has resulted in significant disruptions to global business activity. The impact of a health crisis and other epidemics and pandemics that may arise in the future could affect the global economy in ways that cannot necessarily be foreseen at the present time. A health crisis may exacerbate other pre-existing political, social, and economic risks. Any such impact could adversely affect the fund's performance, resulting in losses to your investment. For more information, please refer to the "Principal risks" section of the prospectus.
ANNUAL REPORT | JOHN HANCOCK GLOBAL SHAREHOLDER YIELD FUND 4
Manager's discussion of fund performance
What were the main drivers of global developed-market equity performance during the 12 months ended March 31, 2020?
Most global stocks, as measured by the fund's benchmark, generated positive momentum during the middle of the period, but the emergence of the COVID-19 pandemic in the period's closing months produced an abrupt shift, and stocks sustained deep losses overall.
Early in the period, stocks were lifted by dovish central bank comments, which helped to offset the negative impact from trade frictions and downgrades to the global economic outlook. However, trade tensions eased as the United States and China eventually reached a phase one agreement. The COVID-19 outbreak began to weigh on global markets in January, and the resulting public health crisis and eventual near-shutdown of large segments of an already-fragile global economy triggered extreme market volatility starting in February.
How did the fund perform in this environment?
The fund underperformed the benchmark by a wide margin, owing in part to the negative impact from its underweight in information technology, the top performer at the sector level. An overweight in energy also had a negative impact, as that sector was the weakest performer, owing in part to a sharp decline in prices of crude oil, which slid to the lowest levels in 18 years. Stock selection in the real estate sector was another key detractor, as COVID-19-related shutdowns, social distancing rules,
| | | | | |
TOP 10 HOLDINGS
AS OF 3/31/20 (%) | | TOP 10 COUNTRIES
AS OF 3/31/20 (%) |
| Verizon Communications, Inc. | 2.3 | | United States | 54.9 |
| Microsoft Corp. | 2.0 | | United Kingdom | 9.5 |
| Dominion Energy, Inc. | 1.9 | | France | 6.6 |
| Duke Energy Corp. | 1.8 | | Canada | 6.1 |
| National Grid PLC | 1.7 | | Germany | 5.5 |
| Pfizer, Inc. | 1.7 | | Italy | 3.6 |
| Snam SpA | 1.7 | | Switzerland | 3.5 |
| Takeda Pharmaceutical Company, Ltd. | 1.6 | | Japan | 2.4 |
| BAE Systems PLC | 1.5 | | South Korea | 1.0 |
| Philip Morris International, Inc. | 1.5 | | Australia | 0.9 |
| TOTAL | 17.7 | | TOTAL | 94.0 |
| As a percentage of net assets. | | As a percentage of net assets. |
| Cash and cash equivalents are not included. | | Cash and cash equivalents are not included. |
ANNUAL REPORT | JOHN HANCOCK GLOBAL SHAREHOLDER YIELD FUND 5
and quarantines had a devastating effect on businesses, which fueled concern for commercial real estate operators and landlords as tenants sought rent relief.
On the positive side, relative performance was aided by selection in the industrials sector, notably in the aerospace and defense industry; an underweight in the sector had a positive impact as well. The fund's overweight in utilities was beneficial, as the sector provided a measure of downside protection relative to the broader market.
At the individual security level, what were the key drivers of relative performance?
Positions in the energy sector had a significantly negative impact, including Occidental Petroleum Corp. (United States), Royal Dutch Shell PLC (Netherlands), and Enterprise Products Partners LP (United States). Other notable detractors were positions in Unibail-Rodamco-Westfield (France), a commercial real estate company, and Imperial Brands PLC (United Kingdom), a tobacco company. We sold the fund's positions in all of the above, except for Enterprise Products.
Among the positions that had the most positive impact were three U.K.-based companies: pharmaceutical maker AstraZeneca PLC, electric and gas utility National Grid PLC, and defense contractor BAE Systems PLC.
MANAGED BY
| | |
 | William W. Priest, CFA
On the fund since 2007
Investing since 1965 |
 | John Tobin, Ph.D., CFA
On the fund since 2014
Investing since 1981 |
 | Kera Van Valen, CFA
On the fund since 2014
Investing since 2001 |
 | Michael A. Welhoelter, CFA
On the fund since 2007
Investing since 1986 |

The views expressed in this report are exclusively those of Kera Van Valen, CFA, Epoch Investment Partners, Inc., and are subject to change. They are not meant as investment advice. Please note that the holdings discussed in this report may not have been held by the fund for the entire period. Portfolio composition is subject to review in accordance with the fund's investment strategy and may vary in the future. Current and future portfolio holdings are subject to risk.
ANNUAL REPORT | JOHN HANCOCK GLOBAL SHAREHOLDER YIELD FUND 6
TOTAL RETURNS FOR THE PERIOD ENDED MARCH 31, 2020
| | | | | | | | | | | | |
Average annual
total returns (%)
with maximum
sales charge | | Cumulative
total returns (%)
with maximum
sales charge | | SEC
30-day
yield (%)
subsidized | | SEC
30-day
yield (%)
unsubsidized1 |
| | 1-year | 5-year |
10-year | | | 5-year |
10-year | | as of
3-31-20 | | as of
3-31-20 |
| Class A | -22.06 | -1.60 | 4.42 | | | -7.75 | 54.05 | | 3.27 | | 3.06 |
| Class B | -22.50 | -1.64 | 4.33 | | | -7.95 | 52.73 | | 2.54 | | 2.38 |
| Class C | -19.37 | -1.33 | 4.19 | | | -6.46 | 50.77 | | 2.62 | | 2.46 |
| Class I2 | -17.77 | -0.33 | 5.30 | | | -1.66 | 67.61 | | 3.72 | | 3.56 |
| Class R22,3 | -18.10 | -0.74 | 4.84 | | | -3.64 | 60.39 | | 3.37 | | 3.25 |
| Class R62,3 | -17.69 | -0.21 | 5.31 | | | -1.04 | 67.84 | | 3.83 | | 3.69 |
| Class NAV2 | -17.77 | -0.23 | 5.41 | | | -1.15 | 69.30 | | 3.84 | | 3.72 |
| Index† | -10.39 | 3.25 | 6.57 | | | 17.31 | 88.98 | | — | | — |
Performance figures assume all distributions have been reinvested. Figures reflect maximum sales charges on Class A shares of 5%, and the applicable contingent deferred sales charge (CDSC) on Class B and Class C shares. The Class B shares' CDSC declines annually between years 1 to 6 according to the following schedule: 5%, 4%, 3%, 3%, 2%, and 1%. No sales charge will be assessed after the sixth year. Class C shares sold within one year of purchase are subject to a 1% CDSC. Sales charges are not applicable to Class I, Class R2, Class R6, and Class NAV shares.
The expense ratios of the fund, both net (including any fee waivers and/or expense limitations) and gross (excluding any fee waivers and/or expense limitations), are set forth according to the most recent publicly available prospectuses for the fund and may differ from those disclosed in the Financial highlights tables in this report. Net expenses reflect contractual expense limitations in effect until July 31, 2021 and are subject to change. Had the contractual fee waivers and expense limitations not been in place, gross expenses would apply. The expense ratios are as follows:
| | | | | | | | |
| | Class A | Class B | Class C | Class I | Class R2 | Class R6 | Class NAV |
| Gross (%) | 1.28 | 1.98 | 1.98 | 0.98 | 1.38 | 0.88 | 0.87 |
| Net (%) | 1.09 | 1.84 | 1.84 | 0.84 | 1.24 | 0.74 | 0.86 |
Please refer to the most recent prospectus and annual or semiannual report for more information on expenses and any expense limitation arrangements for each class.
The returns reflect past results and should not be considered indicative of future performance. The return and principal value of an investment will fluctuate so that shares, when redeemed, may be worth more or less than their original cost. Due to market volatility and other factors, the fund's current performance may be higher or lower than the performance shown. For current to the most recent month-end performance data, please call 800-225-5291 or visit the fund's website at jhinvestments.com.
The performance table above and the chart on the next page do not reflect the deduction of taxes that a shareholder would pay on fund distributions or the redemption of fund shares. The fund's performance results reflect any applicable fee waivers or expense reductions, without which the expenses would increase and results would have been less favorable.
| † | Index is the MSCI World Index. |
See the following page for footnotes.
ANNUAL REPORT | JOHN HANCOCK GLOBAL SHAREHOLDER YIELD FUND 7
This chart and table show what happened to a hypothetical $10,000 investment in John Hancock Global Shareholder Yield Fund for the share classes and periods indicated, assuming all distributions were reinvested. For comparison, we've shown the same investment in the MSCI World Index.
| | | | | |
| | Start date | With maximum
sales charge ($) | Without
sales charge ($) | Index ($) |
| Class B4 | 3-31-10 | 15,273 | 15,273 | 18,898 |
| Class C4 | 3-31-10 | 15,077 | 15,077 | 18,898 |
| Class I2 | 3-31-10 | 16,761 | 16,761 | 18,898 |
| Class R22,3 | 3-31-10 | 16,039 | 16,039 | 18,898 |
| Class R62,3 | 3-31-10 | 16,784 | 16,784 | 18,898 |
| Class NAV2 | 3-31-10 | 16,930 | 16,930 | 18,898 |
The MSCI World Index is a free float-adjusted market capitalization weighted index that is designed to measure the equity market performance of developed markets.
It is not possible to invest directly in an index. Index figures do not reflect expenses or sales charges, which would result in lower returns.
Footnotes related to performance pages
| 1 | Unsubsidized yield reflects what the yield would have been without the effect of reimbursements and waivers. |
| 2 | For certain types of investors, as described in the fund's prospectuses. |
| 3 | Class R2 and Class R6 shares were first offered 3-1-12 and 9-1-11, respectively. The returns prior to these dates are those of Class A shares that have not been adjusted for class-specific expenses; otherwise, returns would vary. |
| 4 | The contingent deferred sales charge is not applicable. |
ANNUAL REPORT | JOHN HANCOCK GLOBAL SHAREHOLDER YIELD FUND 8
These examples are intended to help you understand your ongoing operating expenses of investing in the fund so you can compare these costs with the ongoing costs of investing in other mutual funds.
Understanding fund expenses
As a shareholder of the fund, you incur two types of costs:
■Transaction costs,which include sales charges (loads) on purchases or redemptions (varies by share class), minimum account fee charge, etc.
■Ongoing operating expenses, including management fees, distribution and service fees (if applicable), and other fund expenses.
We are presenting only your ongoing operating expenses here.
Actual expenses/actual returns
The first line of each share class in the table on the following page is intended to provide information about the fund’s actual ongoing operating expenses, and is based on the fund’s actual return. It assumes an account value of $1,000.00 on October 1, 2019, with the same investment held until March 31, 2020.
Together with the value of your account, you may use this information to estimate the operating expenses that you paid over the period. Simply divide your account value at March 31, 2020, by $1,000.00, then multiply it by the “expenses paid” for your share class from the table. For example, for an account value of $8,600.00, the operating expenses should be calculated as follows:
Hypothetical example for comparison purposes
The second line of each share class in the table on the following page allows you to compare the fund’s ongoing operating expenses with those of any other fund. It provides an example of the fund’s hypothetical account values and hypothetical expenses based on each class’s actual expense ratio and an assumed 5% annualized return before expenses (which is not the class’s actual return). It assumes an account value of $1,000.00 on October 1, 2019, with the same investment held until March 31, 2020. Look in any other fund shareholder report to find its hypothetical example and you will be able to compare these expenses.
| | ANNUAL REPORT | JOHN HANCOCK GLOBAL SHAREHOLDER YIELD FUND | 9 |
Please remember that these hypothetical account values and expenses may not be used to estimate the actual ending account balance or expenses you paid for the period.
Remember, these examples do not include any transaction costs, therefore, these examples will not help you to determine the relative total costs of owning different funds. If transaction costs were included, your expenses would have been higher. See the prospectuses for details regarding transaction costs.
SHAREHOLDER EXPENSE EXAMPLE CHART
| | | Account
value on
10-1-2019 | Ending
value on
3-31-2020 | Expenses
paid during
period ended
3-31-20201 | Annualized
expense
ratio |
| Class A | Actual expenses/actual returns | $1,000.00 | $796.20 | $4.89 | 1.09% |
| | Hypothetical example | 1,000.00 | 1,019.60 | 5.50 | 1.09% |
| Class B | Actual expenses/actual returns | 1,000.00 | 793.80 | 8.25 | 1.84% |
| | Hypothetical example | 1,000.00 | 1,015.80 | 9.27 | 1.84% |
| Class C | Actual expenses/actual returns | 1,000.00 | 793.80 | 8.25 | 1.84% |
| | Hypothetical example | 1,000.00 | 1,015.80 | 9.27 | 1.84% |
| Class I | Actual expenses/actual returns | 1,000.00 | 797.20 | 3.77 | 0.84% |
| | Hypothetical example | 1,000.00 | 1,020.80 | 4.24 | 0.84% |
| Class R2 | Actual expenses/actual returns | 1,000.00 | 795.50 | 5.48 | 1.22% |
| | Hypothetical example | 1,000.00 | 1,018.90 | 6.16 | 1.22% |
| Class R6 | Actual expenses/actual returns | 1,000.00 | 798.20 | 3.33 | 0.74% |
| | Hypothetical example | 1,000.00 | 1,021.30 | 3.74 | 0.74% |
| Class NAV | Actual expenses/actual returns | 1,000.00 | 797.50 | 3.33 | 0.74% |
| | Hypothetical example | 1,000.00 | 1,021.30 | 3.74 | 0.74% |
| 1 | Expenses are equal to the annualized expense ratio, multiplied by the average account value over the period, multiplied by 183/366 (to reflect the one-half year period). |
| 10 | JOHN HANCOCK GLOBAL SHAREHOLDER YIELD FUND | ANNUAL REPORT | |
AS OF 3-31-20
| | | | | Shares | Value |
| Common stocks 97.0% | | | | | $1,432,580,761 |
| (Cost $1,463,308,750) | | | | | |
| Australia 0.9% | | | | | 13,039,770 |
| Commonwealth Bank of Australia (A) | | | 193,430 | 7,298,131 |
| Macquarie Group, Ltd. | | | 107,808 | 5,741,639 |
| Canada 6.1% | | | | | 89,990,417 |
| BCE, Inc. | | | 496,289 | 20,358,675 |
| Fortis, Inc. | �� | | 332,101 | 12,806,879 |
| Nutrien, Ltd. | | | 385,670 | 13,089,640 |
| Pembina Pipeline Corp. (A) | | | 386,866 | 7,257,346 |
| Rogers Communications, Inc., Class B | | | 234,392 | 9,783,405 |
| Royal Bank of Canada | | | 189,546 | 11,740,727 |
| TELUS Corp. (A) | | | 945,816 | 14,953,745 |
| Denmark 0.9% | | | | | 12,711,944 |
| Novo Nordisk A/S, B Shares | | | 212,873 | 12,711,944 |
| France 6.6% | | | | | 97,108,611 |
| AXA SA | | | 1,136,427 | 19,241,937 |
| Cie Generale des Etablissements Michelin SCA | | | 140,511 | 12,306,646 |
| Danone SA | | | 191,307 | 12,243,319 |
| Sanofi | | | 235,003 | 20,345,377 |
| SCOR SE | | | 352,704 | 7,759,932 |
| TOTAL SA | | | 436,954 | 16,463,920 |
| Vinci SA | | | 107,056 | 8,747,480 |
| Germany 5.5% | | | | | 81,593,054 |
| Allianz SE | | | 128,915 | 21,953,923 |
| BASF SE | | | 290,231 | 13,565,977 |
| Deutsche Post AG | | | 458,422 | 12,289,669 |
| Deutsche Telekom AG | | | 610,326 | 7,882,633 |
| Muenchener Rueckversicherungs-Gesellschaft AG | | | 82,712 | 16,630,950 |
| Siemens AG | | | 110,705 | 9,269,902 |
| Italy 3.6% | | | | | 52,505,757 |
| Assicurazioni Generali SpA | | | 798,950 | 10,821,621 |
| Snam SpA | | | 5,411,557 | 24,732,463 |
| Terna Rete Elettrica Nazionale SpA | | | 2,696,789 | 16,951,673 |
| Japan 2.4% | | | | | 34,974,274 |
| Takeda Pharmaceutical Company, Ltd. | | | 786,800 | 23,956,574 |
| Tokio Marine Holdings, Inc. | | | 240,800 | 11,017,700 |
| Norway 0.8% | | | | | 12,590,999 |
| Orkla ASA | | | 1,469,587 | 12,590,999 |
| SEE NOTES TO FINANCIAL STATEMENTS | ANNUAL REPORT | JOHN HANCOCK GLOBAL SHAREHOLDER YIELD FUND | 11 |
| | | | | Shares | Value |
| Singapore 0.6% | | | | | $9,124,190 |
| Singapore Exchange, Ltd. | | | 1,416,700 | 9,124,190 |
| South Korea 1.0% | | | | | 14,636,269 |
| Samsung Electronics Company, Ltd., GDR (B) | | | 14,797 | 14,636,269 |
| Switzerland 3.5% | | | | | 51,932,608 |
| Nestle SA | | | 166,070 | 17,000,220 |
| Novartis AG | | | 259,732 | 21,427,588 |
| Roche Holding AG | | | 41,974 | 13,504,800 |
| Taiwan 0.7% | | | | | 10,515,759 |
| Taiwan Semiconductor Manufacturing Company, Ltd., ADR | | | 220,041 | 10,515,759 |
| United Kingdom 9.5% | | | | | 140,463,836 |
| AstraZeneca PLC, ADR | | | 328,268 | 14,660,449 |
| BAE Systems PLC | | | 3,524,279 | 22,643,515 |
| British American Tobacco PLC | | | 500,000 | 17,032,592 |
| British American Tobacco PLC, ADR (A) | | | 176,392 | 6,030,842 |
| Coca-Cola European Partners PLC | | | 244,522 | 9,176,911 |
| GlaxoSmithKline PLC | | | 977,386 | 18,339,792 |
| Lloyds Banking Group PLC | | | 13,556,929 | 5,300,091 |
| National Grid PLC | | | 2,176,400 | 25,429,603 |
| Unilever PLC | | | 433,274 | 21,850,041 |
| United States 54.9% | | | | | 811,393,273 |
| AbbVie, Inc. | | | 269,670 | 20,546,157 |
| Altria Group, Inc. | | | 528,578 | 20,440,111 |
| Ameren Corp. | | | 135,134 | 9,841,809 |
| American Electric Power Company, Inc. (A) | | | 190,209 | 15,212,916 |
| Amgen, Inc. | | | 65,773 | 13,334,160 |
| AT&T, Inc. | | | 739,215 | 21,548,117 |
| BlackRock, Inc. | | | 22,143 | 9,742,256 |
| Broadcom, Inc. | | | 37,072 | 8,789,771 |
| CenterPoint Energy, Inc. | | | 953,587 | 14,732,919 |
| Chevron Corp. | | | 105,237 | 7,625,473 |
| Cisco Systems, Inc. | | | 443,072 | 17,417,160 |
| CME Group, Inc. | | | 46,217 | 7,991,381 |
| Comcast Corp., Class A | | | 246,948 | 8,490,072 |
| Dominion Energy, Inc. (A) | | | 379,691 | 27,409,893 |
| Dow, Inc. | | | 335,443 | 9,808,353 |
| Duke Energy Corp. | | | 329,464 | 26,647,048 |
| Eaton Corp. PLC | | | 187,154 | 14,539,994 |
| Emerson Electric Company | | | 223,031 | 10,627,427 |
| Entergy Corp. | | | 184,513 | 17,338,687 |
| Enterprise Products Partners LP (A) | | | 860,434 | 12,304,206 |
| Exxon Mobil Corp. | | | 194,330 | 7,378,710 |
| FirstEnergy Corp. | | | 492,754 | 19,744,653 |
| 12 | JOHN HANCOCK GLOBAL SHAREHOLDER YIELD FUND | ANNUAL REPORT | SEE NOTES TO FINANCIAL STATEMENTS |
| | | | | Shares | Value |
| United States (continued) | | | | | |
| Hanesbrands, Inc. (A) | | | 693,609 | $5,458,703 |
| IBM Corp. | | | 178,298 | 19,778,597 |
| Intel Corp. | | | 248,742 | 13,461,917 |
| Iron Mountain, Inc. | | | 623,650 | 14,842,870 |
| Johnson & Johnson | | | 141,713 | 18,582,826 |
| Kimberly-Clark Corp. | | | 125,927 | 16,102,285 |
| KLA Corp. | | | 87,254 | 12,541,890 |
| Las Vegas Sands Corp. | | | 297,773 | 12,646,419 |
| Lazard, Ltd., Class A (A) | | | 319,756 | 7,533,451 |
| Leggett & Platt, Inc. | | | 237,381 | 6,333,325 |
| Lockheed Martin Corp. | | | 37,194 | 12,606,906 |
| LyondellBasell Industries NV, Class A | | | 196,721 | 9,763,263 |
| Magellan Midstream Partners LP | | | 289,402 | 10,560,279 |
| McDonald's Corp. | | | 43,051 | 7,118,483 |
| Merck & Company, Inc. | | | 286,412 | 22,036,539 |
| MetLife, Inc. | | | 391,650 | 11,972,741 |
| Microsoft Corp. | | | 184,467 | 29,092,291 |
| People's United Financial, Inc. (A) | | | 849,073 | 9,382,257 |
| PepsiCo, Inc. | | | 105,237 | 12,638,964 |
| Pfizer, Inc. | | | 770,743 | 25,157,052 |
| Philip Morris International, Inc. | | | 304,350 | 22,205,376 |
| Phillips 66 | | | 161,443 | 8,661,417 |
| PPL Corp. | | | 615,877 | 15,199,844 |
| Target Corp. | | | 116,598 | 10,840,116 |
| Texas Instruments, Inc. | | | 161,443 | 16,132,999 |
| The Coca-Cola Company | | | 245,155 | 10,848,109 |
| The Home Depot, Inc. | | | 44,247 | 8,261,357 |
| The PNC Financial Services Group, Inc. | | | 66,969 | 6,410,273 |
| The Procter & Gamble Company | | | 108,226 | 11,904,860 |
| Truist Financial Corp. | | | 296,577 | 9,146,435 |
| United Parcel Service, Inc., Class B | | | 93,278 | 8,714,031 |
| UnitedHealth Group, Inc. | | | 40,061 | 9,990,412 |
| Verizon Communications, Inc. | | | 627,044 | 33,691,078 |
| Watsco, Inc. (A) | | | 68,762 | 10,866,459 |
| WEC Energy Group, Inc. | | | 113,010 | 9,959,571 |
| Wells Fargo & Company | | | 233,794 | 6,709,888 |
| Welltower, Inc. | | | 278,041 | 12,728,717 |
|
| | | Yield (%) | | Shares | Value |
| Short-term investments 2.1% | | | | $31,461,673 |
| (Cost $31,469,568) | | | | | |
| Short-term funds 2.1% | | | | | 31,461,673 |
| John Hancock Collateral Trust (C) | 1.1260(D) | | 3,146,954 | 31,461,673 |
| SEE NOTES TO FINANCIAL STATEMENTS | ANNUAL REPORT | JOHN HANCOCK GLOBAL SHAREHOLDER YIELD FUND | 13 |
|
| Total investments (Cost $1,494,778,318) 99.1% | | | $1,464,042,434 |
| Other assets and liabilities, net 0.9% | | | 13,508,589 |
| Total net assets 100.0% | | | | | $1,477,551,023 |
| The percentage shown for each investment category is the total value of the category as a percentage of the net assets of the fund. |
| Security Abbreviations and Legend |
| ADR | American Depositary Receipt |
| GDR | Global Depositary Receipt |
| (A) | All or a portion of this security is on loan as of 3-31-20. |
| (B) | These securities are exempt from registration under Rule 144A of the Securities Act of 1933. Such securities may be resold, normally to qualified institutional buyers, in transactions exempt from registration. |
| (C) | Investment is an affiliate of the fund, the advisor and/or subadvisor. This security represents the investment of cash collateral received for securities lending. |
| (D) | The rate shown is the annualized seven-day yield as of 3-31-20. |
At 3-31-20, the aggregate cost of investments for federal income tax purposes was $1,499,256,916. Net unrealized depreciation aggregated to $35,214,482, of which $186,388,178 related to gross unrealized appreciation and $221,602,660 related to gross unrealized depreciation.
| 14 | JOHN HANCOCK GLOBAL SHAREHOLDER YIELD FUND | ANNUAL REPORT | SEE NOTES TO FINANCIAL STATEMENTS |
STATEMENT OF ASSETS AND LIABILITIES 3-31-20
| Assets | |
| Unaffiliated investments, at value (Cost $1,463,308,750) including $30,823,577 of securities loaned | $1,432,580,761 |
| Affiliated investments, at value (Cost $31,469,568) | 31,461,673 |
| Total investments, at value (Cost $1,494,778,318) | 1,464,042,434 |
| Cash | 25,940,395 |
| Foreign currency, at value (Cost $1,259,538) | 1,264,065 |
| Dividends and interest receivable | 7,319,771 |
| Receivable for fund shares sold | 1,705,902 |
| Receivable for investments sold | 14,026,652 |
| Receivable for securities lending income | 38,665 |
| Receivable from affiliates | 6,012 |
| Other assets | 151,164 |
| Total assets | 1,514,495,060 |
| Liabilities | |
| Payable for investments purchased | 2,767,301 |
| Payable for fund shares repurchased | 2,155,710 |
| Payable upon return of securities loaned | 31,628,006 |
| Payable to affiliates | |
| Accounting and legal services fees | 59,231 |
| Transfer agent fees | 101,636 |
| Distribution and service fees | 111 |
| Trustees' fees | 1,805 |
| Other liabilities and accrued expenses | 230,237 |
| Total liabilities | 36,944,037 |
| Net assets | $1,477,551,023 |
| Net assets consist of | |
| Paid-in capital | $1,600,059,549 |
| Total distributable earnings (loss) | (122,508,526) |
| Net assets | $1,477,551,023 |
| |
| SEE NOTES TO FINANCIAL STATEMENTS | ANNUAL REPORT | JOHN HANCOCK Global Shareholder Yield Fund | 15 |
STATEMENT OF ASSETS AND LIABILITIES (continued)
| Net asset value per share | |
| Based on net asset value and shares outstanding - the fund has an unlimited number of shares authorized with no par value | |
| Class A ($257,157,599 ÷ 29,834,065 shares)1 | $8.62 |
| Class B ($836,865 ÷ 96,860 shares)1 | $8.64 |
| Class C ($44,036,261 ÷ 5,097,227 shares)1 | $8.64 |
| Class I ($604,896,226 ÷ 69,916,176 shares) | $8.65 |
| Class R2 ($550,577 ÷ 63,550 shares) | $8.66 |
| Class R6 ($245,163,820 ÷ 28,384,832 shares) | $8.64 |
| Class NAV ($324,909,675 ÷ 37,586,952 shares) | $8.64 |
| Maximum offering price per share | |
| Class A (net asset value per share ÷ 95%)2 | $9.07 |
| 1 | Redemption price per share is equal to net asset value less any applicable contingent deferred sales charge. |
| 2 | On single retail sales of less than $50,000. On sales of $50,000 or more and on group sales the offering price is reduced. |
| 16 | JOHN HANCOCK Global Shareholder Yield Fund | ANNUAL REPORT | SEE NOTES TO FINANCIAL STATEMENTS |
STATEMENT OF OPERATIONS For the year ended 3-31-20
| Investment income | |
| Dividends | $81,881,951 |
| Interest | 641,323 |
| Securities lending | 494,724 |
| Less foreign taxes withheld | (3,599,589) |
| Total investment income | 79,418,409 |
| Expenses | |
| Investment management fees | 15,633,150 |
| Distribution and service fees | 1,674,810 |
| Accounting and legal services fees | 353,824 |
| Transfer agent fees | 1,489,956 |
| Trustees' fees | 38,923 |
| Custodian fees | 502,096 |
| State registration fees | 136,172 |
| Printing and postage | 103,452 |
| Professional fees | 87,847 |
| Other | 73,662 |
| Total expenses | 20,093,892 |
| Less expense reductions | (2,934,528) |
| Net expenses | 17,159,364 |
| Net investment income | 62,259,045 |
| Realized and unrealized gain (loss) | |
| Net realized gain (loss) on | |
| Unaffiliated investments and foreign currency transactions | (66,117,259) |
| Affiliated investments | (102,226) |
| | (66,219,485) |
| Change in net unrealized appreciation (depreciation) of | |
| Unaffiliated investments and translation of assets and liabilities in foreign currencies | (311,873,543) |
| Affiliated investments | (8,469) |
| | (311,882,012) |
| Net realized and unrealized loss | (378,101,497) |
| Decrease in net assets from operations | $(315,842,452) |
| SEE NOTES TO FINANCIAL STATEMENTS | ANNUAL REPORT | JOHN HANCOCK Global Shareholder Yield Fund | 17 |
STATEMENTS OF CHANGES IN NET ASSETS
| | Year ended
3-31-20 | Year ended
3-31-19 |
| Increase (decrease) in net assets | | |
| From operations | | |
| Net investment income | $62,259,045 | $74,015,611 |
| Net realized gain (loss) | (66,219,485) | 27,988,241 |
| Change in net unrealized appreciation (depreciation) | (311,882,012) | (343,263) |
| Increase (decrease) in net assets resulting from operations | (315,842,452) | 101,660,589 |
| Distributions to shareholders | | |
| From earnings | | |
| Class A | (15,750,740) | (18,749,401) |
| Class B | (84,788) | (251,126) |
| Class C | (2,561,797) | (4,077,675) |
| Class I | (39,251,704) | (47,923,352) |
| Class R2 | (33,638) | (56,799) |
| Class R6 | (16,610,095) | (24,556,365) |
| Class NAV | (22,256,224) | (27,887,901) |
| Total distributions | (96,548,986) | (123,502,619) |
| From fund share transactions | (147,804,453) | (272,070,100) |
| Total decrease | (560,195,891) | (293,912,130) |
| Net assets | | |
| Beginning of year | 2,037,746,914 | 2,331,659,044 |
| End of year | $1,477,551,023 | $2,037,746,914 |
| 18 | JOHN HANCOCK Global Shareholder Yield Fund | ANNUAL REPORT | SEE NOTES TO FINANCIAL STATEMENTS |
| CLASS A SHARES Period ended | 3-31-20 | 3-31-19 | 3-31-181 | 2-28-18 | 2-28-17 | 2-29-16 |
| Per share operating performance | | | | | | |
| Net asset value, beginning of period | $11.03 | $11.14 | $11.31 | $10.78 | $9.89 | $11.78 |
| Net investment income2 | 0.33 | 0.35 | 0.04 | 0.32 | 0.27 | 0.33 |
| Net realized and unrealized gain (loss) on investments | (2.21) | 0.16 | (0.16) | 0.53 | 0.92 | (1.42) |
| Total from investment operations | (1.88) | 0.51 | (0.12) | 0.85 | 1.19 | (1.09) |
| Less distributions | | | | | | |
| From net investment income | (0.33) | (0.35) | (0.05) | (0.32) | (0.30) | (0.32) |
| From net realized gain | (0.20) | (0.27) | — | — | — | (0.48) |
| Total distributions | (0.53) | (0.62) | (0.05) | (0.32) | (0.30) | (0.80) |
| Net asset value, end of period | $8.62 | $11.03 | $11.14 | $11.31 | $10.78 | $9.89 |
| Total return (%)3,4 | (17.96) | 4.86 | (1.03)5 | 7.87 | 12.21 | (9.38) |
| Ratios and supplemental data | | | | | | |
| Net assets, end of period (in millions) | $257 | $334 | $348 | $355 | $381 | $470 |
| Ratios (as a percentage of average net assets): | | | | | | |
| Expenses before reductions | 1.29 | 1.28 | 1.306 | 1.27 | 1.29 | 1.29 |
| Expenses including reductions | 1.09 | 1.09 | 1.096 | 1.09 | 1.26 | 1.28 |
| Net investment income | 2.96 | 3.18 | 3.786 | 2.85 | 2.62 | 3.03 |
| Portfolio turnover (%) | 33 | 16 | 2 | 19 | 25 | 33 |
| 1 | For the one-month period ended 3-31-18. The fund changed its fiscal year end from February 28 to March 31. |
| 2 | Based on average daily shares outstanding. |
| 3 | Total returns would have been lower had certain expenses not been reduced during the applicable periods. |
| 4 | Does not reflect the effect of sales charges, if any. |
| 5 | Not annualized. |
| 6 | Annualized. |
| SEE NOTES TO FINANCIAL STATEMENTS | ANNUAL REPORT | JOHN HANCOCK Global Shareholder Yield Fund | 19 |
| CLASS B SHARES Period ended | 3-31-20 | 3-31-19 | 3-31-181 | 2-28-18 | 2-28-17 | 2-29-16 |
| Per share operating performance | | | | | | |
| Net asset value, beginning of period | $11.05 | $11.15 | $11.30 | $10.78 | $9.89 | $11.78 |
| Net investment income2 | 0.27 | 0.27 | 0.03 | 0.25 | 0.20 | 0.25 |
| Net realized and unrealized gain (loss) on investments | (2.23) | 0.17 | (0.15) | 0.50 | 0.92 | (1.42) |
| Total from investment operations | (1.96) | 0.44 | (0.12) | 0.75 | 1.12 | (1.17) |
| Less distributions | | | | | | |
| From net investment income | (0.25) | (0.27) | (0.03) | (0.23) | (0.23) | (0.24) |
| From net realized gain | (0.20) | (0.27) | — | — | — | (0.48) |
| Total distributions | (0.45) | (0.54) | (0.03) | (0.23) | (0.23) | (0.72) |
| Net asset value, end of period | $8.64 | $11.05 | $11.15 | $11.30 | $10.78 | $9.89 |
| Total return (%)3,4 | (18.59) | 4.16 | (1.05)5 | 6.98 | 11.42 | (10.10) |
| Ratios and supplemental data | | | | | | |
| Net assets, end of period (in millions) | $1 | $4 | $7 | $7 | $11 | $12 |
| Ratios (as a percentage of average net assets): | | | | | | |
| Expenses before reductions | 1.99 | 1.97 | 2.006 | 1.97 | 1.99 | 2.02 |
| Expenses including reductions | 1.84 | 1.84 | 1.846 | 1.84 | 1.97 | 2.02 |
| Net investment income | 2.41 | 2.49 | 3.036 | 2.19 | 1.94 | 2.31 |
| Portfolio turnover (%) | 33 | 16 | 2 | 19 | 25 | 33 |
| 1 | For the one-month period ended 3-31-18. The fund changed its fiscal year end from February 28 to March 31. |
| 2 | Based on average daily shares outstanding. |
| 3 | Total returns would have been lower had certain expenses not been reduced during the applicable periods. |
| 4 | Does not reflect the effect of sales charges, if any. |
| 5 | Not annualized. |
| 6 | Annualized. |
| 20 | JOHN HANCOCK Global Shareholder Yield Fund | ANNUAL REPORT | SEE NOTES TO FINANCIAL STATEMENTS |
| CLASS C SHARES Period ended | 3-31-20 | 3-31-19 | 3-31-181 | 2-28-18 | 2-28-17 | 2-29-16 |
| Per share operating performance | | | | | | |
| Net asset value, beginning of period | $11.05 | $11.16 | $11.31 | $10.78 | $9.90 | $11.79 |
| Net investment income2 | 0.25 | 0.27 | 0.03 | 0.24 | 0.20 | 0.25 |
| Net realized and unrealized gain (loss) on investments | (2.21) | 0.16 | (0.15) | 0.52 | 0.91 | (1.41) |
| Total from investment operations | (1.96) | 0.43 | (0.12) | 0.76 | 1.11 | (1.16) |
| Less distributions | | | | | | |
| From net investment income | (0.25) | (0.27) | (0.03) | (0.23) | (0.23) | (0.25) |
| From net realized gain | (0.20) | (0.27) | — | — | — | (0.48) |
| Total distributions | (0.45) | (0.54) | (0.03) | (0.23) | (0.23) | (0.73) |
| Net asset value, end of period | $8.64 | $11.05 | $11.16 | $11.31 | $10.78 | $9.90 |
| Total return (%)3,4 | (18.59) | 4.06 | (1.05)5 | 6.98 | 11.41 | (10.02) |
| Ratios and supplemental data | | | | | | |
| Net assets, end of period (in millions) | $44 | $75 | $107 | $110 | $126 | $133 |
| Ratios (as a percentage of average net assets): | | | | | | |
| Expenses before reductions | 1.99 | 1.97 | 2.006 | 1.97 | 1.99 | 1.99 |
| Expenses including reductions | 1.84 | 1.84 | 1.846 | 1.84 | 1.97 | 1.98 |
| Net investment income | 2.27 | 2.49 | 3.036 | 2.11 | 1.92 | 2.33 |
| Portfolio turnover (%) | 33 | 16 | 2 | 19 | 25 | 33 |
| 1 | For the one-month period ended 3-31-18. The fund changed its fiscal year end from February 28 to March 31. |
| 2 | Based on average daily shares outstanding. |
| 3 | Total returns would have been lower had certain expenses not been reduced during the applicable periods. |
| 4 | Does not reflect the effect of sales charges, if any. |
| 5 | Not annualized. |
| 6 | Annualized. |
| SEE NOTES TO FINANCIAL STATEMENTS | ANNUAL REPORT | JOHN HANCOCK Global Shareholder Yield Fund | 21 |
| CLASS I SHARES Period ended | 3-31-20 | 3-31-19 | 3-31-181 | 2-28-18 | 2-28-17 | 2-29-16 |
| Per share operating performance | | | | | | |
| Net asset value, beginning of period | $11.07 | $11.18 | $11.35 | $10.82 | $9.93 | $11.83 |
| Net investment income2 | 0.36 | 0.38 | 0.04 | 0.36 | 0.31 | 0.37 |
| Net realized and unrealized gain (loss) on investments | (2.22) | 0.16 | (0.15) | 0.51 | 0.91 | (1.43) |
| Total from investment operations | (1.86) | 0.54 | (0.11) | 0.87 | 1.22 | (1.06) |
| Less distributions | | | | | | |
| From net investment income | (0.36) | (0.38) | (0.06) | (0.34) | (0.33) | (0.36) |
| From net realized gain | (0.20) | (0.27) | — | — | — | (0.48) |
| Total distributions | (0.56) | (0.65) | (0.06) | (0.34) | (0.33) | (0.84) |
| Net asset value, end of period | $8.65 | $11.07 | $11.18 | $11.35 | $10.82 | $9.93 |
| Total return (%)3 | (17.77) | 5.10 | (0.96)4 | 8.10 | 12.51 | (9.13) |
| Ratios and supplemental data | | | | | | |
| Net assets, end of period (in millions) | $605 | $815 | $881 | $894 | $1,245 | $957 |
| Ratios (as a percentage of average net assets): | | | | | | |
| Expenses before reductions | 0.99 | 0.99 | 1.005 | 0.97 | 0.97 | 0.97 |
| Expenses including reductions | 0.84 | 0.84 | 0.845 | 0.84 | 0.95 | 0.97 |
| Net investment income | 3.22 | 3.44 | 4.035 | 3.12 | 2.91 | 3.37 |
| Portfolio turnover (%) | 33 | 16 | 2 | 19 | 25 | 33 |
| 1 | For the one-month period ended 3-31-18. The fund changed its fiscal year end from February 28 to March 31. |
| 2 | Based on average daily shares outstanding. |
| 3 | Total returns would have been lower had certain expenses not been reduced during the applicable periods. |
| 4 | Not annualized. |
| 5 | Annualized. |
| 22 | JOHN HANCOCK Global Shareholder Yield Fund | ANNUAL REPORT | SEE NOTES TO FINANCIAL STATEMENTS |
| CLASS R2 SHARES Period ended | 3-31-20 | 3-31-19 | 3-31-181 | 2-28-18 | 2-28-17 | 2-29-16 |
| Per share operating performance | | | | | | |
| Net asset value, beginning of period | $11.08 | $11.19 | $11.35 | $10.82 | $9.93 | $11.82 |
| Net investment income2 | 0.32 | 0.33 | 0.03 | 0.30 | 0.26 | 0.32 |
| Net realized and unrealized gain (loss) on investments | (2.22) | 0.16 | (0.14) | 0.53 | 0.92 | (1.43) |
| Total from investment operations | (1.90) | 0.49 | (0.11) | 0.83 | 1.18 | (1.11) |
| Less distributions | | | | | | |
| From net investment income | (0.32) | (0.33) | (0.05) | (0.30) | (0.29) | (0.30) |
| From net realized gain | (0.20) | (0.27) | — | — | — | (0.48) |
| Total distributions | (0.52) | (0.60) | (0.05) | (0.30) | (0.29) | (0.78) |
| Net asset value, end of period | $8.66 | $11.08 | $11.19 | $11.35 | $10.82 | $9.93 |
| Total return (%)3 | (18.10) | 4.68 | (0.98)4 | 7.68 | 12.04 | (9.51) |
| Ratios and supplemental data | | | | | | |
| Net assets, end of period (in millions) | $1 | $1 | $1 | $1 | $1 | $1 |
| Ratios (as a percentage of average net assets): | | | | | | |
| Expenses before reductions | 1.34 | 1.36 | 1.385 | 1.37 | 1.36 | 1.86 |
| Expenses including reductions | 1.22 | 1.22 | 1.245 | 1.24 | 1.34 | 1.43 |
| Net investment income | 2.86 | 3.02 | 3.625 | 2.62 | 2.50 | 2.92 |
| Portfolio turnover (%) | 33 | 16 | 2 | 19 | 25 | 33 |
| 1 | For the one-month period ended 3-31-18. The fund changed its fiscal year end from February 28 to March 31. |
| 2 | Based on average daily shares outstanding. |
| 3 | Total returns would have been lower had certain expenses not been reduced during the applicable periods. |
| 4 | Not annualized. |
| 5 | Annualized. |
| SEE NOTES TO FINANCIAL STATEMENTS | ANNUAL REPORT | JOHN HANCOCK Global Shareholder Yield Fund | 23 |
| CLASS R6 SHARES Period ended | 3-31-20 | 3-31-19 | 3-31-181 | 2-28-18 | 2-28-17 | 2-29-16 |
| Per share operating performance | | | | | | |
| Net asset value, beginning of period | $11.06 | $11.16 | $11.34 | $10.81 | $9.92 | $11.81 |
| Net investment income2 | 0.37 | 0.39 | 0.04 | 0.31 | 0.30 | 0.38 |
| Net realized and unrealized gain (loss) on investments | (2.22) | 0.17 | (0.16) | 0.57 | 0.93 | (1.42) |
| Total from investment operations | (1.85) | 0.56 | (0.12) | 0.88 | 1.23 | (1.04) |
| Less distributions | | | | | | |
| From net investment income | (0.37) | (0.39) | (0.06) | (0.35) | (0.34) | (0.37) |
| From net realized gain | (0.20) | (0.27) | — | — | — | (0.48) |
| Total distributions | (0.57) | (0.66) | (0.06) | (0.35) | (0.34) | (0.85) |
| Net asset value, end of period | $8.64 | $11.06 | $11.16 | $11.34 | $10.81 | $9.92 |
| Total return (%)3 | (17.69) | 5.31 | (1.03)4 | 8.22 | 12.66 | (8.94) |
| Ratios and supplemental data | | | | | | |
| Net assets, end of period (in millions) | $245 | $351 | $477 | $483 | $2 | $1 |
| Ratios (as a percentage of average net assets): | | | | | | |
| Expenses before reductions | 0.88 | 0.88 | 0.895 | 0.87 | 0.87 | 1.45 |
| Expenses including reductions | 0.74 | 0.74 | 0.745 | 0.74 | 0.85 | 0.85 |
| Net investment income | 3.34 | 3.57 | 4.135 | 2.61 | 2.85 | 3.48 |
| Portfolio turnover (%) | 33 | 16 | 2 | 19 | 25 | 33 |
| 1 | For the one-month period ended 3-31-18. The fund changed its fiscal year end from February 28 to March 31. |
| 2 | Based on average daily shares outstanding. |
| 3 | Total returns would have been lower had certain expenses not been reduced during the applicable periods. |
| 4 | Not annualized. |
| 5 | Annualized. |
| 24 | JOHN HANCOCK Global Shareholder Yield Fund | ANNUAL REPORT | SEE NOTES TO FINANCIAL STATEMENTS |
| CLASS NAV SHARES Period ended | 3-31-20 | 3-31-19 | 3-31-181 | 2-28-18 | 2-28-17 | 2-29-16 |
| Per share operating performance | | | | | | |
| Net asset value, beginning of period | $11.06 | $11.17 | $11.34 | $10.81 | $9.92 | $11.82 |
| Net investment income2 | 0.37 | 0.39 | 0.04 | 0.36 | 0.32 | 0.37 |
| Net realized and unrealized gain (loss) on investments | (2.22) | 0.16 | (0.15) | 0.52 | 0.91 | (1.42) |
| Total from investment operations | (1.85) | 0.55 | (0.11) | 0.88 | 1.23 | (1.05) |
| Less distributions | | | | | | |
| From net investment income | (0.37) | (0.39) | (0.06) | (0.35) | (0.34) | (0.37) |
| From net realized gain | (0.20) | (0.27) | — | — | — | (0.48) |
| Total distributions | (0.57) | (0.66) | (0.06) | (0.35) | (0.34) | (0.85) |
| Net asset value, end of period | $8.64 | $11.06 | $11.17 | $11.34 | $10.81 | $9.92 |
| Total return (%)3 | (17.77) | 5.30 | (0.94)4 | 8.11 | 12.76 | (9.03) |
| Ratios and supplemental data | | | | | | |
| Net assets, end of period (in millions) | $325 | $458 | $511 | $514 | $535 | $554 |
| Ratios (as a percentage of average net assets): | | | | | | |
| Expenses before reductions | 0.87 | 0.87 | 0.885 | 0.86 | 0.86 | 0.86 |
| Expenses including reductions | 0.74 | 0.74 | 0.745 | 0.74 | 0.85 | 0.85 |
| Net investment income | 3.32 | 3.54 | 4.135 | 3.19 | 3.03 | 3.45 |
| Portfolio turnover (%) | 33 | 16 | 2 | 19 | 25 | 33 |
| 1 | For the one-month period ended 3-31-18. The fund changed its fiscal year end from February 28 to March 31. |
| 2 | Based on average daily shares outstanding. |
| 3 | Total returns would have been lower had certain expenses not been reduced during the applicable periods. |
| 4 | Not annualized. |
| 5 | Annualized. |
| SEE NOTES TO FINANCIAL STATEMENTS | ANNUAL REPORT | JOHN HANCOCK Global Shareholder Yield Fund | 25 |
| Notes to financial statements | |
Note 1—Organization
John Hancock Global Shareholder Yield Fund (the fund) is a series of John Hancock Funds III (the Trust), an open-end management investment company organized as a Massachusetts business trust and registered under the Investment Company Act of 1940, as amended (the 1940 Act). The investment objective of the fund is to seek to provide a high level of income. Capital appreciation is a secondary investment objective.
The fund may offer multiple classes of shares. The shares currently outstanding are detailed in the Statement of assets and liabilities. Class A and Class C shares are offered to all investors. Class B shares are closed to new investors. Class I shares are offered to institutions and certain investors. Class R2 shares are available only to certain retirement and 529 plans. Class R6 shares are only available to certain retirement plans, institutions and other investors. Class NAV shares are offered to John Hancock affiliated funds of funds, retirement plans for employees of John Hancock and/or Manulife Financial Corporation, and certain 529 plans. Class B shares convert to Class A shares eight years after purchase. Class C shares convert to Class A shares ten years after purchase (certain exclusions may apply). Shareholders of each class have exclusive voting rights to matters that affect that class. The distribution and service fees, if any, and transfer agent fees for each class may differ.
Note 2—Significant accounting policies
The financial statements have been prepared in conformity with accounting principles generally accepted in the United States of America (US GAAP), which require management to make certain estimates and assumptions as of the date of the financial statements. Actual results could differ from those estimates and those differences could be significant. The fund qualifies as an investment company under Topic 946 of Accounting Standards Codification of US GAAP.
Events or transactions occurring after the end of the fiscal period through the date that the financial statements were issued have been evaluated in the preparation of the financial statements. The following summarizes the significant accounting policies of the fund:
Security valuation. Investments are stated at value as of the scheduled close of regular trading on the New York Stock Exchange (NYSE), normally at 4:00 P.M., Eastern Time. In case of emergency or other disruption resulting in the NYSE not opening for trading or the NYSE closing at a time other than the regularly scheduled close, the net asset value (NAV) may be determined as of the regularly scheduled close of the NYSE pursuant to the fund's Valuation Policies and Procedures.
In order to value the securities, the fund uses the following valuation techniques: Equity securities, including exchange-traded or closed-end funds, are typically valued at the last sale price or official closing price on the exchange or principal market where the security trades. In the event there were no sales during the day or closing prices are not available, the securities are valued using the last available bid price. Investments by the fund in open-end mutual funds, including John Hancock Collateral Trust (JHCT), are valued at their respective NAVs each business day. Foreign securities and currencies are valued in U.S. dollars based on foreign currency exchange rates supplied by an independent pricing vendor.
In certain instances, the Pricing Committee may determine to value equity securities using prices obtained from another exchange or market if trading on the exchange or market on which prices are typically obtained did not open for trading as scheduled, or if trading closed earlier than scheduled, and trading occurred as normal on another exchange or market.
Other portfolio securities and assets, for which reliable market quotations are not readily available, are valued at fair value as determined in good faith by the fund's Pricing Committee following procedures established by the Board of Trustees. The frequency with which these fair valuation procedures are used cannot be predicted and fair value of securities may differ significantly from the value that would have been used had a ready market for such securities existed. Trading in foreign securities may be completed before the scheduled daily close of trading on the NYSE. Significant events at the issuer or market level may affect the values of securities between the time when the valuation of the securities is generally determined and the close of the NYSE. If a significant event occurs,
| 26 | JOHN HANCOCK Global Shareholder Yield Fund | ANNUAL REPORT | |
these securities may be fair valued, as determined in good faith by the fund's Pricing Committee, following procedures established by the Board of Trustees. The fund uses fair value adjustment factors provided by an independent pricing vendor to value certain foreign securities in order to adjust for events that may occur between the close of foreign exchanges or markets and the close of the NYSE.
The fund uses a three-tier hierarchy to prioritize the pricing assumptions, referred to as inputs, used in valuation techniques to measure fair value. Level 1 includes securities valued using quoted prices in active markets for identical securities, including registered investment companies. Level 2 includes securities valued using other significant observable inputs. Observable inputs may include quoted prices for similar securities, interest rates, prepayment speeds and credit risk. Prices for securities valued using these inputs are received from independent pricing vendors and brokers and are based on an evaluation of the inputs described. Level 3 includes securities valued using significant unobservable inputs when market prices are not readily available or reliable, including the fund's own assumptions in determining the fair value of investments. Factors used in determining value may include market or issuer specific events or trends, changes in interest rates and credit quality. The inputs or methodology used for valuing securities are not necessarily an indication of the risks associated with investing in those securities. Changes in valuation techniques and related inputs may result in transfers into or out of an assigned level within the disclosure hierarchy.
The following is a summary of the values by input classification of the fund's investments as of March 31, 2020, by major security category or type:
| | Total
value at
3-31-20 | Level 1
quoted
price | Level 2
significant
observable
inputs | Level 3
significant
unobservable
inputs |
| Investments in securities: | | | | |
| Assets | | | | |
| Common stocks | | | | |
| Australia | $13,039,770 | — | $13,039,770 | — |
| Canada | 89,990,417 | $89,990,417 | — | — |
| Denmark | 12,711,944 | — | 12,711,944 | — |
| France | 97,108,611 | — | 97,108,611 | — |
| Germany | 81,593,054 | — | 81,593,054 | — |
| Italy | 52,505,757 | — | 52,505,757 | — |
| Japan | 34,974,274 | — | 34,974,274 | — |
| Norway | 12,590,999 | — | 12,590,999 | — |
| Singapore | 9,124,190 | — | 9,124,190 | — |
| South Korea | 14,636,269 | — | 14,636,269 | — |
| Switzerland | 51,932,608 | — | 51,932,608 | — |
| Taiwan | 10,515,759 | 10,515,759 | — | — |
| United Kingdom | 140,463,836 | 29,868,202 | 110,595,634 | — |
| United States | 811,393,273 | 811,393,273 | — | — |
| Short-term investments | 31,461,673 | 31,461,673 | — | — |
| Total investments in securities | $1,464,042,434 | $973,229,324 | $490,813,110 | — |
Security transactions and related investment income. Investment security transactions are accounted for on a trade date plus one basis for daily NAV calculations. However, for financial reporting purposes, investment transactions are reported on trade date. Interest income is accrued as earned. Dividend income is recorded on the ex-date, except for dividends of certain foreign securities where the dividend may not be known until after the
| | ANNUAL REPORT | JOHN HANCOCK Global Shareholder Yield Fund | 27 |
ex-date. In those cases, dividend income, net of withholding taxes, is recorded when the fund becomes aware of the dividends. Non-cash dividends, if any, are recorded at the fair market value of the securities received. Gains and losses on securities sold are determined on the basis of identified cost and may include proceeds from litigation.
Real estate investment trusts. The fund may invest in real estate investment trusts (REITs). Distributions from REITs may be recorded as income and subsequently characterized by the REIT at the end of the fiscal year as a reduction of cost of investments and/or as a realized gain. As a result, the fund will estimate the components of distributions from these securities. Such estimates are revised when the actual components of the distributions are known.
Securities lending. The fund may lend its securities to earn additional income. The fund receives collateral from the borrower in an amount not less than the market value of the loaned securities. The fund will invest its cash collateral in JHCT, an affiliate of the fund, which has a floating NAV and is registered with the Securities and Exchange Commission (SEC) as an investment company. JHCT invests in short-term money market investments. The fund will receive the benefit of any gains and bear any losses generated by JHCT with respect to the cash collateral.
The fund has the right to recall loaned securities on demand. If a borrower fails to return loaned securities when due, then the lending agent is responsible and indemnifies the fund for the lent securities. The lending agent uses the collateral received from the borrower to purchase replacement securities of the same issue, type, class and series of the loaned securities. If the value of the collateral is less than the purchase cost of replacement securities, the lending agent is responsible for satisfying the shortfall but only to the extent that the shortfall is not due to any decrease in the value of JHCT.
Although the risk of loss on securities lent is mitigated by receiving collateral from the borrower and through lending agent indemnification, the fund could experience a delay in recovering securities or could experience a lower than expected return if the borrower fails to return the securities on a timely basis. The fund receives compensation for lending its securities by retaining a portion of the return on the investment of the collateral and compensation from fees earned from borrowers of the securities. Securities lending income received by the fund is net of fees retained by the securities lending agent. Net income received from JHCT is a component of securities lending income as recorded on the Statement of operations.
Obligations to repay collateral received by the fund are shown on the Statement of assets and liabilities as Payable upon return of securities loaned and are secured by the loaned securities. As of March 31, 2020, the fund loaned securities valued at $30,823,577 and received $31,628,006 of cash collateral.
Foreign investing. Assets, including investments, and liabilities denominated in foreign currencies are translated into U.S. dollar values each day at the prevailing exchange rate. Purchases and sales of securities, income and expenses are translated into U.S. dollars at the prevailing exchange rate on the date of the transaction. The effect of changes in foreign currency exchange rates on the value of securities is reflected as a component of the realized and unrealized gains (losses) on investments. Foreign investments are subject to a decline in the value of a foreign currency versus the U.S. dollar, which reduces the dollar value of securities denominated in that currency.
Funds that invest internationally generally carry more risk than funds that invest strictly in U.S. securities. Risks can result from differences in economic and political conditions, regulations, market practices (including higher transaction costs), accounting standards and other factors.
Foreign taxes. The fund may be subject to withholding tax on income, capital gains or repatriation taxes imposed by certain countries, a portion of which may be recoverable. Foreign taxes are accrued based upon the fund's understanding of the tax rules and rates that exist in the foreign markets in which it invests. Taxes are accrued based on gains realized by the fund as a result of certain foreign security sales. In certain circumstances, estimated taxes are accrued based on unrealized appreciation of such securities. Investment income is recorded net of foreign withholding taxes.
| 28 | JOHN HANCOCK Global Shareholder Yield Fund | ANNUAL REPORT | |
Overdraft. The fund may have the ability to borrow from banks for temporary or emergency purposes, including meeting redemption requests that otherwise might require the untimely sale of securities. Pursuant to the fund's custodian agreement, the custodian may loan money to the fund to make properly authorized payments. The fund is obligated to repay the custodian for any overdraft, including any related costs or expenses. The custodian may have a lien, security interest or security entitlement in any fund property that is not otherwise segregated or pledged, to the extent of any overdraft, and to the maximum extent permitted by law.
Line of credit. The fund and other affiliated funds have entered into a syndicated line of credit agreement with Citibank, N.A. as the administrative agent that enables them to participate in a $750 million unsecured committed line of credit. Excluding commitments designated for a certain fund and subject to the needs of all other affiliated funds, the fund can borrow up to an aggregate commitment amount of $500 million, subject to asset coverage and other limitations as specified in the agreement. A commitment fee payable at the end of each calendar quarter, based on the average daily unused portion of the line of credit, is charged to each participating fund based on a combination of fixed and asset based allocations and is reflected in Other expenses on the Statement of operations. For the year ended March 31, 2020, the fund had no borrowings under the line of credit. Commitment fees for the year ended March 31, 2020 were $6,859.
Expenses. Within the John Hancock group of funds complex, expenses that are directly attributable to an individual fund are allocated to such fund. Expenses that are not readily attributable to a specific fund are allocated among all funds in an equitable manner, taking into consideration, among other things, the nature and type of expense and the fund’s relative net assets. Expense estimates are accrued in the period to which they relate and adjustments are made when actual amounts are known.
Class allocations. Income, common expenses and realized and unrealized gains (losses) are determined at the fund level and allocated daily to each class of shares based on the net assets of the class. Class-specific expenses, such as distribution and service fees, if any, and transfer agent fees, for all classes, are charged daily at the class level based on the net assets of each class and the specific expense rates applicable to each class.
Federal income taxes. The fund intends to continue to qualify as a regulated investment company by complying with the applicable provisions of the Internal Revenue Code and will not be subject to federal income tax on taxable income that is distributed to shareholders. Therefore, no federal income tax provision is required.
For federal income tax purposes, net capital losses of $87,225,016 that are a result of security transactions occurring after October 31, 2019, are treated as occurring on April 1, 2020, the first day of the fund’s next taxable year.
As of March 31, 2020, the fund had no uncertain tax positions that would require financial statement recognition, derecognition or disclosure. The fund's federal tax returns are subject to examination by the Internal Revenue Service for a period of three years.
Distribution of income and gains. Distributions to shareholders from net investment income and net realized gains, if any, are recorded on the ex-date. The fund generally declares and pays dividends quarterly. Capital gain distributions, if any, are typically distributed annually.
The tax character of distributions for the years ended March 31, 2020 and 2019 was as follows:
| | March 31, 2020 | March 31, 2019 |
| Ordinary income | $67,470,050 | $72,791,029 |
| Long-term capital gains | 29,078,936 | 50,711,590 |
| Total | $96,548,986 | $123,502,619 |
Distributions paid by the fund with respect to each class of shares are calculated in the same manner, at the same time and in the same amount, except for the effect of class level expenses that may be applied differently to each class. As of March 31, 2020, there were no distributable earnings on a tax basis.
| | ANNUAL REPORT | JOHN HANCOCK Global Shareholder Yield Fund | 29 |
Such distributions and distributable earnings, on a tax basis, are determined in conformity with income tax regulations, which may differ from US GAAP. Distributions in excess of tax basis earnings and profits, if any, are reported in the fund's financial statements as a return of capital.
Capital accounts within the financial statements are adjusted for permanent book-tax differences. These adjustments have no impact on net assets or the results of operations. Temporary book-tax differences, if any, will reverse in a subsequent period. Book-tax differences are primarily attributable to partnerships and wash sale loss deferrals.
Note 3—Guarantees and indemnifications
Under the Trust's organizational documents, its Officers and Trustees are indemnified against certain liabilities arising out of the performance of their duties to the Trust, including the fund. Additionally, in the normal course of business, the fund enters into contracts with service providers that contain general indemnification clauses. The fund's maximum exposure under these arrangements is unknown, as this would involve future claims that may be made against the fund that have not yet occurred. The risk of material loss from such claims is considered remote.
Note 4—Fees and transactions with affiliates
John Hancock Investment Management LLC (the Advisor) serves as investment advisor for the fund. John Hancock Investment Management Distributors LLC (the Distributor), an affiliate of the Advisor, serves as principal underwriter of the fund. The Advisor and the Distributor are indirect, wholly owned subsidiaries of Manulife Financial Corporation. Prior to June 28, 2019, the Advisor was known as John Hancock Advisers, LLC and the Distributor was known as John Hancock Funds, LLC.
Management fee. The fund has an investment management agreement with the Advisor under which the fund pays a daily management fee to the Advisor, equivalent on an annual basis to the sum of 0.800% of average daily net assets. The Advisor has a subadvisory agreement with Epoch Investment Partners, Inc. The fund is not responsible for payment of the subadvisory fees.
The Advisor has contractually agreed to waive a portion of its management fee and/or reimburse expenses for certain funds of the John Hancock group of funds complex, including the fund (the participating portfolios). This waiver is based upon aggregate net assets of all the participating portfolios. The amount of the reimbursement is calculated daily and allocated among all the participating portfolios in proportion to the daily net assets of each fund. During the year ended March 31, 2020, this waiver amounted to 0.01% of the fund’s average daily net assets. This arrangement expires on July 31, 2021, unless renewed by mutual agreement of the fund and the Advisor based upon a determination that this is appropriate under the circumstances at that time.
The Advisor contractually agrees to reduce its management fee or, if necessary, make payment to the applicable class in an amount equal to the amount by which expenses of Class A, Class B, Class C, Class I, Class R2, and Class R6 shares, as applicable, exceed 1.09%, 1.84%, 1.84%, 0.84%, 1.24%, and 0.74%, respectively, of average net assets attributable to the applicable class. For purposes of this agreement, “expenses of Class A, Class B, Class C, Class I, Class R2, and Class R6 shares” means all class expenses (including fund expenses attributable to the class), excluding taxes, brokerage commissions, interest expense, litigation and indemnification expenses and other extraordinary expenses not incurred in the ordinary course of the fund’s business, acquired fund fees and expenses paid indirectly, and short dividend expense. This agreement expires on July 31, 2021, unless renewed by mutual agreement of the fund and the Advisor based on upon a determination that this is appropriate under the circumstances at that time.
The Advisor has voluntarily agreed to reduce its management fee for the fund, or if necessary, make payment to the fund, in an amount equal to the amount by which the fund’s expenses exceed 0.74% of average net assets, on an annualized basis. Expenses means all the expenses of the fund, excluding taxes, brokerage commissions, interest expense, litigation and indemnification expenses and other extraordinary expenses not incurred in the
| 30 | JOHN HANCOCK Global Shareholder Yield Fund | ANNUAL REPORT | |
ordinary course of the fund’s business, advisory fees, class-specific expenses, borrowing costs, prime brokerage fees, acquired fund fees and expenses paid indirectly, and short dividend expense. This voluntary expense reduction will continue in effect until terminated at any time by the Advisor on notice to the fund.
For the year ended March 31, 2020, the expense reductions described above amounted to the following:
| Class | Expense reduction |
| Class A | $653,307 |
| Class B | 3,320 |
| Class C | 96,189 |
| Class I | 1,172,801 |
| Class | Expense reduction |
| Class R2 | $935 |
| Class R6 | 456,168 |
| Class NAV | 551,808 |
| Total | $2,934,528 |
Expenses waived or reimbursed in the current fiscal period are not subject to recapture in future fiscal periods.
The investment management fees, including the impact of the waivers and reimbursements as described above, incurred for the year ended March 31, 2020, were equivalent to a net annual effective rate of 0.65% of the fund's average daily net assets.
Accounting and legal services. Pursuant to a service agreement, the fund reimburses the Advisor for all expenses associated with providing the administrative, financial, legal, compliance, accounting and recordkeeping services to the fund, including the preparation of all tax returns, periodic reports to shareholders and regulatory reports, among other services. These expenses are allocated to each share class based on its relative net assets at the time the expense was incurred. These accounting and legal services fees incurred for the year ended March 31, 2020 amounted to an annual rate of 0.02% of the fund's average daily net assets.
Distribution and service plans. The fund has a distribution agreement with the Distributor. The fund has adopted distribution and service plans for certain classes as detailed below pursuant to Rule 12b-1 under the 1940 Act, to pay the Distributor for services provided as the distributor of shares of the fund. In addition, under a service plan for certain classes as detailed below, the fund pays for certain other services. The fund may pay up to the following contractual rates of distribution and service fees under these arrangements, expressed as an annual percentage of average daily net assets for each class of the fund's shares:
| Class | Rule 12b-1 Fee | Service fee |
| Class A | 0.30% | — |
| Class B | 1.00% | — |
| Class C | 1.00% | — |
| Class R2 | 0.25% | 0.25% |
Sales charges. Class A shares are assessed up-front sales charges, which resulted in payments to the Distributor amounting to $413,268 for the year ended March 31, 2020. Of this amount, $71,553 was retained and used for printing prospectuses, advertising, sales literature and other purposes and $341,715 was paid as sales commissions to broker-dealers.
Class A, Class B and Class C shares may be subject to contingent deferred sales charges (CDSCs). Certain Class A shares that are acquired through purchases of $1 million or more and are redeemed within one year of purchase are subject to a 1.00% sales charge. Class B shares that are redeemed within six years of purchase are subject to CDSCs, at declining rates, beginning at 5.00%. Class C shares that are redeemed within one year of purchase are subject to a 1.00% CDSC. CDSCs are applied to the lesser of the current market value at the time of redemption or the original purchase cost of the shares being redeemed. Proceeds from CDSCs are used to compensate the Distributor for providing distribution-related services in connection with the sale of these shares. During the year ended March 31, 2020, CDSCs received by the Distributor amounted to $2,478 and $1,493 for Class A and Class C shares, respectively. During the year ended March 31, 2020, there were no CDSCs received by the Distributor for Class B shares.
| | ANNUAL REPORT | JOHN HANCOCK Global Shareholder Yield Fund | 31 |
Transfer agent fees. The John Hancock group of funds has a complex-wide transfer agent agreement with John Hancock Signature Services, Inc. (Signature Services), an affiliate of the Advisor. The transfer agent fees paid to Signature Services are determined based on the cost to Signature Services (Signature Services Cost) of providing recordkeeping services. It also includes out-of-pocket expenses, including payments made to third-parties for recordkeeping services provided to their clients who invest in one or more John Hancock funds. In addition, Signature Services Cost may be reduced by certain fees that Signature Services receives in connection with retirement and small accounts. Signature Services Cost is calculated monthly and allocated, as applicable, to five categories of share classes: Retail Share and Institutional Share Classes of Non-Municipal Bond Funds, Class R6 Shares, Retirement Share Classes and Municipal Bond Share Classes. Within each of these categories, the applicable costs are allocated to the affected John Hancock affiliated funds and/or classes, based on the relative average daily net assets.
Class level expenses. Class level expenses for the year ended March 31, 2020 were as follows:
| Class | Distribution and service fees | Transfer agent fees |
| Class A | $992,243 | $401,131 |
| Class B | 23,057 | 2,766 |
| Class C | 656,066 | 79,344 |
| Class I | — | 965,829 |
| Class R2 | 3,444 | 91 |
| Class R6 | — | 40,795 |
| Total | $1,674,810 | $1,489,956 |
Trustee expenses. The fund compensates each Trustee who is not an employee of the Advisor or its affiliates. The costs of paying Trustee compensation and expenses are allocated to the fund based on its net assets relative to other funds within the John Hancock group of funds complex.
Note 5—Fund share transactions
Transactions in fund shares for the years ended March 31, 2020 and 2019 were as follows:
| | Year Ended 3-31-20 | Year Ended 3-31-19 |
| | Shares | Amount | Shares | Amount |
| Class A shares | | | | |
| Sold | 5,060,895 | $55,505,983 | 5,161,275 | $56,794,764 |
| Distributions reinvested | 1,426,626 | 15,435,830 | 1,729,739 | 18,423,338 |
| Repurchased | (6,920,446) | (74,350,835) | (7,845,691) | (86,052,357) |
| Net decrease | (432,925) | $(3,409,022) | (954,677) | $(10,834,255) |
| Class B shares | | | | |
| Sold | 1,022 | $13,714 | 4,751 | $53,547 |
| Distributions reinvested | 6,585 | 73,013 | 18,486 | 196,711 |
| Repurchased | (245,982) | (2,647,333) | (290,776) | (3,181,473) |
| Net decrease | (238,375) | $(2,560,606) | (267,539) | $(2,931,215) |
| 32 | JOHN HANCOCK Global Shareholder Yield Fund | ANNUAL REPORT | |
| | Year Ended 3-31-20 | Year Ended 3-31-19 |
| | Shares | Amount | Shares | Amount |
| Class C shares | | | | |
| Sold | 177,891 | $1,935,032 | 274,532 | $3,029,238 |
| Distributions reinvested | 224,189 | 2,461,371 | 368,049 | 3,918,414 |
| Repurchased | (2,136,687) | (23,207,373) | (3,370,446) | (37,274,570) |
| Net decrease | (1,734,607) | $(18,810,970) | (2,727,865) | $(30,326,918) |
| Class I shares | | | | |
| Sold | 13,847,419 | $151,299,218 | 12,921,368 | $142,302,285 |
| Distributions reinvested | 3,591,473 | 38,902,359 | 4,441,626 | 47,545,936 |
| Repurchased | (21,095,735) | (226,991,285) | (22,619,195) | (249,211,116) |
| Net decrease | (3,656,843) | $(36,789,708) | (5,256,201) | $(59,362,895) |
| Class R2 shares | | | | |
| Sold | 10,495 | $115,586 | 11,527 | $127,833 |
| Distributions reinvested | 3,059 | 33,350 | 5,270 | 56,283 |
| Repurchased | (21,581) | (243,938) | (48,362) | (535,315) |
| Net decrease | (8,027) | $(95,002) | (31,565) | $(351,199) |
| Class R6 shares | | | | |
| Sold | 5,075,379 | $54,966,937 | 6,476,957 | $71,621,251 |
| Distributions reinvested | 1,535,978 | 16,606,455 | 2,295,625 | 24,540,724 |
| Repurchased | (9,996,795) | (108,749,059) | (19,726,348) | (215,104,129) |
| Net decrease | (3,385,438) | $(37,175,667) | (10,953,766) | $(118,942,154) |
| Class NAV shares | | | | |
| Sold | 1,794,177 | $16,247,432 | 352,106 | $3,936,930 |
| Distributions reinvested | 2,054,726 | 22,256,224 | 2,605,631 | 27,887,901 |
| Repurchased | (7,644,056) | (87,467,134) | (7,312,294) | (81,146,295) |
| Net decrease | (3,795,153) | $(48,963,478) | (4,354,557) | $(49,321,464) |
| Total net decrease | (13,251,368) | $(147,804,453) | (24,546,170) | $(272,070,100) |
Affiliates of the fund owned 100% of shares of Class NAV on March 31, 2020. Such concentration of shareholders’ capital could have a material effect on the fund if such shareholders redeem from the fund.
Note 6—Purchase and sale of securities
Purchases and sales of securities, other than short-term investments, amounted to $621,249,634 and $794,148,348, respectively, for the year ended March 31, 2020.
Note 7—Investment by affiliated funds
Certain investors in the fund are affiliated funds that are managed by the Advisor and its affiliates. The affiliated funds do not invest in the fund for the purpose of exercising management or control; however, this investment may represent a significant portion of the fund's net assets. At March 31, 2020, funds within the John Hancock group of funds complex held 22.0% of the fund's net assets. The following fund(s) had an affiliate ownership of 5% or more of the fund's net assets:
| | ANNUAL REPORT | JOHN HANCOCK Global Shareholder Yield Fund | 33 |
| Fund | Affiliated Concentration |
| John Hancock Funds II Multimanager Lifestyle Growth Portfolio | 7.4% |
| John Hancock Funds II Multimanager Lifestyle Balanced Portfolio | 7.2% |
Note 8—Investment in affiliated underlying funds
The fund may invest in affiliated underlying funds that are managed by the Advisor and its affiliates. Information regarding the fund's fiscal year to date purchases and sales of the affiliated underlying funds as well as income and capital gains earned by the fund, if any, is as follows:
| | | | | | | | Dividends and distributions |
| Affiliate | Ending
share
amount | Beginning
value | Cost of
purchases | Proceeds
from shares
sold | Realized
gain
(loss) | Change in
unrealized
appreciation
(depreciation) | Income
distributions
received | Capital gain
distributions
received | Ending
value |
| John Hancock Collateral Trust* | 3,146,954 | $28,542,057 | $926,134,232 | $(923,103,921) | $(102,226) | $(8,469) | $494,724 | — | $31,461,673 |
| * | Refer to the Securities lending note within Note 2 for details regarding this investment. |
Note 9—Coronavirus (COVID-19) pandemic
The novel COVID-19 disease has resulted in significant disruptions to global business activity. A widespread health crisis such as a global pandemic could cause substantial market volatility, exchange trading suspensions and closures, impact the ability to complete redemptions, and affect fund performance.
| 34 | JOHN HANCOCK Global Shareholder Yield Fund | ANNUAL REPORT | |
Report of Independent Registered Public Accounting Firm
To the Board of Trustees of John Hancock Funds III and Shareholders of John Hancock Global Shareholder Yield Fund
Opinion on the Financial Statements
We have audited the accompanying statement of assets and liabilities, including the Fund’s investments, of John Hancock Global Shareholder Yield Fund (one of the funds constituting John Hancock Funds III, referred to hereafter as the "Fund") as of March 31, 2020, the related statement of operations for the year ended March 31, 2020, the statements of changes in net assets for each of the two years in the period ended March 31, 2020, including the related notes, and the financial highlights for each of the periods indicated therein (collectively referred to as the “financial statements”). In our opinion, the financial statements present fairly, in all material respects, the financial position of the Fund as of March 31, 2020, the results of its operations for the year then ended, the changes in its net assets for each of the two years in the period ended March 31, 2020 and the financial highlights for each of the periods indicated therein in conformity with accounting principles generally accepted in the United States of America.
Basis for Opinion
These financial statements are the responsibility of the Fund’s management. Our responsibility is to express an opinion on the Fund’s financial statements based on our audits. We are a public accounting firm registered with the Public Company Accounting Oversight Board (United States) (PCAOB) and are required to be independent with respect to the Fund in accordance with the U.S. federal securities laws and the applicable rules and regulations of the Securities and Exchange Commission and the PCAOB.
We conducted our audits of these financial statements in accordance with the standards of the PCAOB. Those standards require that we plan and perform the audit to obtain reasonable assurance about whether the financial statements are free of material misstatement, whether due to error or fraud.
Our audits included performing procedures to assess the risks of material misstatement of the financial statements, whether due to error or fraud, and performing procedures that respond to those risks. Such procedures included examining, on a test basis, evidence regarding the amounts and disclosures in the financial statements. Our audits also included evaluating the accounting principles used and significant estimates made by management, as well as evaluating the overall presentation of the financial statements. Our procedures included confirmation of securities owned as of March 31, 2020 by correspondence with the custodian, transfer agent and broker; when replies were not received from the broker, we performed other auditing procedures. We believe that our audits provide a reasonable basis for our opinion.
/s/ PricewaterhouseCoopers LLP
Boston, Massachusetts
May 13, 2020
We have served as the auditor of one or more investment companies in the John Hancock group of funds since 1988.
| | ANNUAL REPORT | JOHN HANCOCK GLOBAL SHAREHOLDER YIELD FUND | 35 |
| Tax information (Unaudited) | |
For federal income tax purposes, the following information is furnished with respect to the distributions of the fund, if any, paid during its taxable year ended March 31, 2020.
The fund reports the maximum amount allowable of its net taxable income as eligible for the corporate dividends-received deduction.
The fund reports the maximum amount allowable of its net taxable income as qualified dividend income as provided in the Jobs and Growth Tax Relief Reconciliation Act of 2003.
The fund paid $29,078,936 in long term capital gain dividends.
The fund reports the maximum amount allowable of its Section 199A dividends as defined in Proposed Treasury Regulation §1.199A-3(d).
Eligible shareholders will be mailed a 2020 Form 1099-DIV in early 2021. This will reflect the tax character of all distributions paid in calendar year 2020.
Please consult a tax advisor regarding the tax consequences of your investment in the fund.
| 36 | JOHN HANCOCK GLOBAL SHAREHOLDER YIELD FUND | ANNUAL REPORT | |
STATEMENT REGARDING LIQUIDITY RISK MANAGEMENT
Operation of the Liquidity Risk Management Program
This section describes operation and effectiveness of the Liquidity Risk Management Program (LRMP) established in accordance with Rule 22e-4 under the Investment Company Act of 1940, as amended (the Liquidity Rule). The Board of Trustees (the Board) of each Fund in the John Hancock Group of Funds (each a Fund and collectively, the Funds) that is subject to the requirements of the Liquidity Rule has appointed John Hancock Investment Management, LLC and John Hancock Variable Trust Advisers, LLC (together, the Advisor) to serve as Administrator of the LRMP with respect to each of the Funds, including John Hancock Global Shareholder Yield Fund, subject to the oversight of the Board. In order to provide a mechanism and process to perform the functions necessary to administer the LRMP, the Advisor established the Liquidity Risk Management Committee (the Committee). The Fund's subadvisor, Epoch Investment Partners, Inc. (the Subadvisor) executes the day-to-day investment management and security-level activities of the Fund in accordance with the requirements of the LRMP, subject to the supervision of the Advisor and the Board.
The Committee holds monthly meetings to: (1) review the day-to-day operations of the LRMP; (2) review and approve month end liquidity classifications; (3) review quarterly testing and determinations, as applicable; and (4) review other LRMP related material. The Committee also conducts daily, monthly, quarterly, and annual quantitative and qualitative assessments of each subadvisor to a Fund that is subject to the requirements of the Liquidity Rule and is a part of the LRMP to monitor investment performance issues, risks and trends. In addition, the Committee may conduct ad-hoc reviews and meetings with subadvisors as issues and trends are identified, including potential liquidity and valuation issues.
The Committee provided the Board at an in-person meeting held on March 15-18, 2020 with a written report which addressed the Committee's assessment of the adequacy and effectiveness of the implementation and operation of the LRMP and any material changes to the LRMP. The report, which covered the period December 1, 2018 through December 31, 2019, included an assessment of important aspects of the LRMP including, but not limited to:
• Operation of the Fund's Redemption-In-Kind Procedures;
• Highly Liquid Investment Minimum (HLIM) determination;
• Compliance with the 15% limit on illiquid investments;
• Reasonably Anticipated Trade Size (RATS) determination;
• Security-level liquidity classifications; and
• Liquidity risk assessment.
The report also covered material liquidity matters which occurred or were reported during this period applicable to the Fund, if any, and the Committee's actions to address such matters.
Redemption-In-Kind Procedures
Rule 22e-4 requires any fund that engages in or reserves the right to engage in in-kind redemptions to adopt and implement written policies and procedures regarding in-kind redemptions as part of the management of its liquidity risk. These procedures address the process for redeeming in kind, as well as the circumstances under which the Fund would consider redeeming in kind. Anticipated large redemption activity will be evaluated to identify situations where redeeming in securities instead of cash may be appropriate.
ANNUAL REPORT | JOHN HANCOCK GLOBAL SHAREHOLDER YIELD FUND 37
As part of its annual assessment of the LRMP, the Committee reviewed the implementation and operation of the Redemption-In-Kind Procedures and determined they are operating in a manner that such procedures are adequate and effective to manage in-kind redemptions on behalf of the Fund as part of the LRMP.
Highly Liquid Investment Minimum determination
The Committee uses an HLIM model to determine a Fund's HLIM. This process incorporates the Fund's investment strategy, historical redemptions, liquidity classification rollup percentages and cash balances, redemption policy, access to funding sources, distribution channels and client concentrations. If the Fund falls below its established HLIM for a period greater than 7 consecutive calendar days, the Committee prepares a report to the Board within one business day following the seventh consecutive calendar day with an explanation of how the Fund plans to restore its HLIM within a reasonable period of time.
Based on the HLIM model, the Committee has determined that the Fund qualifies as a Primarily Highly Liquid Fund (PHLF). It is therefore not required to establish a HLIM. The Fund is tested quarterly to confirm its PHLF status.
As part of its annual assessment of the LRMP, the Committee reviewed the policies and procedures in place with respect to HLIM and PHLF determinations, and determined that such policies and procedures are operating in a manner that is adequate and effective as part of the LRMP.
Compliance with the 15% limit on illiquid investments
Rule 22e-4 sets an aggregate illiquid investment limit of 15% for a fund. Funds are prohibited from acquiring an illiquid investment if this results in greater than 15% of its net assets being classified as illiquid. When applying this limit, the Committee defines "illiquid investment" to mean any investment that the Fund reasonably expects cannot be sold or disposed of in current market conditions in seven calendar days or less without the sale or disposition significantly changing the market value of the investment. If a 15% illiquid investment limit breach occurs for longer than 1 business day, the Fund is required to notify the Board and provide a plan on how to bring illiquid investments within the 15% threshold, and after 7 days confidentially notify the Securities and Exchange Commission (the SEC).
In February 2019, as a result of extended security markets closures in connection with the Chinese New Year in certain countries, the SEC released guidance, and the Committee approved and adopted an Extended Market Holiday Policy to plan for and monitor known Extended Market Holidays (defined as all expected market holiday closures spanning four or more calendar days).
As part of its annual assessment of the LRMP, the Committee reviewed the policies and procedures in place with respect to the 15% illiquid investment limit and determined such policies and procedures are operating in a manner that is adequate and effective as part of the LMRP.
Reasonably Anticipated Trade Size determination
In order to assess the liquidity risk of a Fund, the Committee considers the impact on the Fund that redemptions of a RATS would have under both normal and reasonably foreseeable stressed conditions. Modelling the Fund's RATS requires quantifying cash flow volatility and analyzing distribution channel concentration and redemption risk. The model is designed to estimate the amount of assets that the Fund could reasonably anticipate trading on a given day, during both normal and reasonably foreseeable stressed conditions, to satisfy redemption requests.
ANNUAL REPORT | JOHN HANCOCK GLOBAL SHAREHOLDER YIELD FUND 38
As part of its annual assessment of the LRMP, the Committee reviewed the policies and procedures in place with respect to RATS determinations and determined that such policies and procedures are operating in a manner that is adequate and effective at making RATS determinations as part of the LRMP.
Security-level liquidity classifications
When classifying the liquidity of portfolio securities, the Fund adheres to the liquidity classification procedures established by the Advisor. In assigning a liquidity classification to Fund portfolio holdings, the following key inputs, among others, are considered: the Fund's RATS, feedback from the applicable Subadvisor on market-, trading- and investment-specific considerations, an assessment of current market conditions and fund portfolio holdings, and a value impact standard. The Subadvisor also provides position-level data to the Committee for use in monthly classification reconciliation in order to identify any classifications that may need to be changed as a result of the above considerations.
As part of its annual assessment of the LRMP, the Committee reviewed the policies and procedures in place with respect to security-level liquidity classifications and determined that such policies and procedures are operating in a manner that is adequate and effective as part of the LRMP.
Liquidity risk assessment
The Committee periodically reviews and assesses, the Fund's liquidity risk, including its investment strategy and liquidity of portfolio investments during both normal and reasonably foreseeable stressed conditions (including whether the investment strategy is appropriate for an open-end fund, the extent to which the strategy involves a relatively concentrated portfolio or large positions in particular issuers, and the use of borrowings for investment purposes and derivatives), cash flow analysis during both normal and reasonably foreseeable stressed conditions, and holdings of cash and cash equivalents, as well as borrowing arrangements and other funding sources.
The Committee also monitors global events, such as the COVID-19 Coronavirus, that could impact the markets and liquidity of portfolio investments and their classifications.
As part of its annual assessment of the LRMP, the Committee reviewed Fund-Level Liquidity Risk Assessment Reports for each of the Funds and determined that the investment strategy for each Fund continues to be appropriate for an open-ended structure.
Adequacy and Effectiveness
Based on the review and assessment conducted by the Committee, the Committee has determined that the LRMP has been implemented, and is operating in a manner that is adequate and effective at assessing and managing the liquidity risk of each Fund.
ANNUAL REPORT | JOHN HANCOCK GLOBAL SHAREHOLDER YIELD FUND 39
This chart provides information about the Trustees and Officers who oversee your John Hancock fund. Officers elected by the Trustees manage the day-to-day operations of the fund and execute policies formulated by the Trustees.
Independent Trustees
| | | |
Name, year of birth
Position(s) held with Trust
Principal occupation(s) and other
directorships during past 5 years | Trustee
of the
Trust
since1 | Number of John
Hancock funds
overseen by
Trustee |
| Hassell H. McClellan, Born: 1945 | 2012 | 204 |
Trustee and Chairperson of the Board
Director/Trustee, Virtus Funds (since 2008); Director, The Barnes Group (since 2010); Associate Professor, The Wallace E. Carroll School of Management, Boston College (retired 2013). Trustee (since 2005) and Chairperson of the Board (since 2017) of various trusts within the John Hancock Fund Complex. |
| | | |
| Charles L. Bardelis,2 Born: 1941 | 2012 | 204 |
Trustee
Director, Island Commuter Corp. (marine transport). Trustee of various trusts within the John Hancock Fund Complex (since 1988). |
| | | |
| James R. Boyle,Born: 1959 | 2015 | 204 |
Trustee
Chief Executive Officer, Foresters Financial (since 2018); Chairman and Chief Executive Officer, Zillion Group, Inc. (formerly HealthFleet, Inc.) (healthcare) (2014-2018); Executive Vice President and Chief Executive Officer, U.S. Life Insurance Division of Genworth Financial, Inc. (insurance) (January 2014-July 2014); Senior Executive Vice President, Manulife Financial, President and Chief Executive Officer, John Hancock (1999-2012); Chairman and Director, John Hancock Investment Management LLC, John Hancock Investment Management Distributors LLC, and John Hancock Variable Trust Advisers LLC (2005-2010). Trustee of various trusts within the John Hancock Fund Complex (2005-2014 and since 2015). |
| | | |
| Peter S. Burgess,2 Born: 1942 | 2012 | 204 |
Trustee
Consultant (financial, accounting, and auditing matters) (since 1999); Certified Public Accountant; Partner, Arthur Andersen (independent public accounting firm) (prior to 1999); Director, Lincoln Educational Services Corporation (since 2004); Director, Symetra Financial Corporation (2010-2016); Director, PMA Capital Corporation (2004-2010). Trustee of various trusts within the John Hancock Fund Complex (since 2005). |
| | | |
| William H. Cunningham, Born: 1944 | 2006 | 204 |
Trustee
Professor, University of Texas, Austin, Texas (since 1971); former Chancellor, University of Texas System and former President of the University of Texas, Austin, Texas; Chairman (since 2009) and Director (since 2006), Lincoln National Corporation (insurance); Director, Southwest Airlines (since 2000); former Director, LIN Television (2009-2014). Trustee of various trusts within the John Hancock Fund Complex (since 1986). |
| | | |
| Grace K. Fey, Born: 1946 | 2012 | 204 |
Trustee
Chief Executive Officer, Grace Fey Advisors (since 2007); Director and Executive Vice President, Frontier Capital Management Company (1988-2007); Director, Fiduciary Trust (since 2009). Trustee of various trusts within the John Hancock Fund Complex (since 2008). |
ANNUAL REPORT | JOHN HANCOCK GLOBAL SHAREHOLDER YIELD FUND 40
Independent Trustees (continued)
| | | |
Name, year of birth
Position(s) held with Trust
Principal occupation(s) and other
directorships during past 5 years | Trustee
of the
Trust
since1 | Number of John
Hancock funds
overseen by
Trustee |
| Deborah C. Jackson, Born: 1952 | 2008 | 204 |
Trustee
President, Cambridge College, Cambridge, Massachusetts (since 2011); Board of Directors, Massachusetts Women's Forum (since 2018); Board of Directors, National Association of Corporate Directors/New England (since 2015); Board of Directors, Association of Independent Colleges and Universities of Massachusetts (2014-2017); Chief Executive Officer, American Red Cross of Massachusetts Bay (2002-2011); Board of Directors of Eastern Bank Corporation (since 2001); Board of Directors of Eastern Bank Charitable Foundation (since 2001); Board of Directors of American Student Assistance Corporation (1996-2009); Board of Directors of Boston Stock Exchange (2002-2008); Board of Directors of Harvard Pilgrim Healthcare (health benefits company) (2007-2011). Trustee of various trusts within the John Hancock Fund Complex (since 2008). |
| | | |
| James M. Oates,2Born: 1946 | 2012 | 204 |
Trustee
Managing Director, Wydown Group (financial consulting firm) (since 1994); Chairman and Director, Emerson Investment Management, Inc. (2000-2015); Independent Chairman, Hudson Castle Group, Inc. (formerly IBEX Capital Markets, Inc.) (financial services company) (1997-2011); Director, Stifel Financial (since 1996); Director, Investor Financial Services Corporation (1995-2007); Director, Connecticut River Bancorp (1998-2014); Director/Trustee, Virtus Funds (since 1988). Trustee (since 2004) and Chairperson of the Board (2005-2016) of various trusts within the John Hancock Fund Complex. |
| | | |
| Steven R. Pruchansky, Born: 1944 | 2006 | 204 |
Trustee and Vice Chairperson of the Board
Managing Director, Pru Realty (since 2017); Chairman and Chief Executive Officer, Greenscapes of Southwest Florida, Inc. (since 2014); Director and President, Greenscapes of Southwest Florida, Inc. (until 2000); Member, Board of Advisors, First American Bank (until 2010); Managing Director, Jon James, LLC (real estate) (since 2000); Partner, Right Funding, LLC (2014-2017); Director, First Signature Bank & Trust Company (until 1991); Director, Mast Realty Trust (until 1994); President, Maxwell Building Corp. (until 1991). Trustee (since 1992), Chairperson of the Board (2011-2012), and Vice Chairperson of the Board (since 2012) of various trusts within the John Hancock Fund Complex. |
| | | |
| Gregory A. Russo, Born: 1949 | 2008 | 204 |
Trustee
Director and Audit Committee Chairman (since 2012), and Member, Audit Committee and Finance Committee (since 2011), NCH Healthcare System, Inc. (holding company for multi-entity healthcare system); Director and Member (2012-2018) and Finance Committee Chairman (2014-2018), The Moorings, Inc. (nonprofit continuing care community); Vice Chairman, Risk & Regulatory Matters, KPMG LLP (KPMG) (2002-2006); Vice Chairman, Industrial Markets, KPMG (1998-2002); Chairman and Treasurer, Westchester County, New York, Chamber of Commerce (1986-1992); Director, Treasurer, and Chairman of Audit and Finance Committees, Putnam Hospital Center (1989-1995); Director and Chairman of Fundraising Campaign, United Way of Westchester and Putnam Counties, New York (1990-1995). Trustee of various trusts within the John Hancock Fund Complex (since 2008). |
ANNUAL REPORT | JOHN HANCOCK GLOBAL SHAREHOLDER YIELD FUND 41
Non-Independent Trustees3
| | | |
Name, year of birth
Position(s) held with Trust
Principal occupation(s) and other
directorships during past 5 years | Trustee
of the
Trust
since1 | Number of John
Hancock funds
overseen by
Trustee |
| Andrew G. Arnott, Born: 1971 | 2017 | 204 |
President and Non-Independent Trustee
Head of Wealth and Asset Management, United States and Europe, for John Hancock and Manulife (since 2018); Executive Vice President, John Hancock Financial Services (since 2009, including prior positions); Director and Executive Vice President, John Hancock Investment Management LLC (since 2005, including prior positions); Director and Executive Vice President, John Hancock Variable Trust Advisers LLC (since 2006, including prior positions); President, John Hancock Investment Management Distributors LLC (since 2004, including prior positions); President of various trusts within the John Hancock Fund Complex (since 2007, including prior positions). Trustee of various trusts within the John Hancock Fund Complex (since 2017). |
| | | |
| Marianne Harrison, Born: 1963 | 2018 | 204 |
Non-Independent Trustee
President and CEO, John Hancock (since 2017); President and CEO, Manulife Canadian Division (2013-2017); Member, Board of Directors, CAE Inc. (since 2019); Member, Board of Directors, MA Competitive Partnership Board (since 2018); Member, Board of Directors, American Council of Life Insurers (ACLI) (since 2018); Member, Board of Directors, Communitech, an industry-led innovation center that fosters technology companies in Canada (2017-2019); Member, Board of Directors, Manulife Assurance Canada (2015-2017); Board Member, St. Mary's General Hospital Foundation (2014-2017); Member, Board of Directors, Manulife Bank of Canada (2013-2017); Member, Standing Committee of the Canadian Life & Health Assurance Association (2013-2017); Member, Board of Directors, John Hancock USA, John Hancock Life & Health, John Hancock New York (2012-2013). Trustee of various trusts within the John Hancock Fund Complex (since 2018). |
Principal officers who are not Trustees
| | |
Name, year of birth
Position(s) held with Trust
Principal occupation(s)
during past 5 years | Officer
of the
Trust
since |
| Francis V. Knox, Jr.,Born: 1947 | 2006 |
Chief Compliance Officer
Vice President, John Hancock Financial Services (since 2005); Chief Compliance Officer, various trusts within the John Hancock Fund Complex, John Hancock Investment Management LLC, and John Hancock Variable Trust Advisers LLC (since 2005). |
| | |
| Charles A. Rizzo, Born: 1957 | 2007 |
Chief Financial Officer
Vice President, John Hancock Financial Services (since 2008); Senior Vice President, John Hancock Investment Management LLC and John Hancock Variable Trust Advisers LLC (since 2008); Chief Financial Officer of various trusts within the John Hancock Fund Complex (since 2007). |
| | |
| Salvatore Schiavone, Born: 1965 | 2010 |
Treasurer
Assistant Vice President, John Hancock Financial Services (since 2007); Vice President, John Hancock Investment Management LLC and John Hancock Variable Trust Advisers LLC (since 2007); Treasurer of various trusts within the John Hancock Fund Complex (since 2007, including prior positions). |
ANNUAL REPORT | JOHN HANCOCK GLOBAL SHAREHOLDER YIELD FUND 42
Principal officers who are notTrustees (continued)
| | |
Name, year of birth
Position(s) held with Trust
Principal occupation(s)
during past 5 years | Officer
of the
Trust
since |
| Christopher (Kit) Sechler,Born: 1973 | 2018 |
Chief Legal Officer and Secretary
Vice President and Deputy Chief Counsel, John Hancock Investments (since 2015); Assistant Vice President and Senior Counsel (2009-2015), John Hancock Investment Management; Chief Legal Officer and Secretary of various trusts within the John Hancock Fund Complex (since 2018); Assistant Secretary of John Hancock Investment Management LLC and John Hancock Variable Trust Advisers LLC (since 2009). |
The business address for all Trustees and Officers is 200 Berkeley Street, Boston, Massachusetts 02116-5023.
The Statement of Additional Information of the fund includes additional information about members of the Board of Trustees of the Trust and is available without charge, upon request, by calling 800-225-5291.
| 1 | Each Trustee holds office until his or her successor is elected and qualified, or until the Trustee's death, retirement, resignation, or removal. Mr. Boyle has served as Trustee at various times prior to the date listed in the table. |
| 2 | Member of the Audit Committee. |
| 3 | The Trustee is a Non-Independent Trustee due to current or former positions with the Advisor and certain affiliates. |
ANNUAL REPORT | JOHN HANCOCK GLOBAL SHAREHOLDER YIELD FUND 43
| | |
Trustees
Hassell H. McClellan,Chairperson
Steven R. Pruchansky,Vice Chairperson
Andrew G. Arnott†
Charles L. Bardelis*
James R. Boyle
Peter S. Burgess*
William H. Cunningham
Grace K. Fey
Marianne Harrison†
Deborah C. Jackson
James M. Oates*
Gregory A. Russo
Officers
Andrew G. Arnott
President
Francis V. Knox, Jr.
Chief Compliance Officer
Charles A. Rizzo
Chief Financial Officer
Salvatore Schiavone
Treasurer
Christopher (Kit) Sechler
Secretary and Chief Legal Officer
| Investment advisor
John Hancock Investment Management LLC
Subadvisor
Epoch Investment Partners, Inc.
Portfolio Managers
William W. Priest, CFA
John M. Tobin, Ph.D., CFA
Kera Van Valen, CFA
Michael A. Welhoelter, CFA
Principal distributor
John Hancock Investment Management Distributors LLC
Custodian
Citibank, N.A.
Transfer agent
John Hancock Signature Services, Inc.
Legal counsel
K&L Gates LLP
Independent registered public accounting firm
PricewaterhouseCoopers LLP
|
* Member of the Audit Committee
† Non-Independent Trustee
The fund's proxy voting policies and procedures, as well as the fund proxy voting record for the most recent twelve-month period ended June 30, are available free of charge on the Securities and Exchange Commission (SEC) website at sec.gov or on our website.
All of the fund's holdings as of the end of the third month of every fiscal quarter are filed with the SEC on Form N-PORT within 60 days of the end of the fiscal quarter. The fund's Form N-PORT filings are available on our website and the SEC's website, sec.gov.
We make this information on your fund, as well asmonthly portfolio holdings, and other fund details available on our website at jhinvestments.com or by calling 800-225-5291.
| | | | |
| | You can also contact us: |
| | 800-225-5291
jhinvestments.com | Regular mail:
John Hancock Signature Services, Inc.
P.O. Box 55913
Boston, MA 02205-5913
| Express mail:
John Hancock Signature Services, Inc.
2000 Crown Colony Drive
Suite 55913
Quincy, MA 02169-0953
|
ANNUAL REPORT | JOHN HANCOCK GLOBAL SHAREHOLDER YIELD FUND 44
John Hancock family of funds
| | | |
DOMESTIC EQUITY FUNDS
Blue Chip Growth
Classic Value
Disciplined Value
Disciplined Value Mid Cap
Equity Income
Financial Industries
Fundamental All Cap Core
Fundamental Large Cap Core
New Opportunities
Regional Bank
Small Cap Core
Small Cap Growth
Small Cap Value
U.S. Global Leaders Growth
U.S. Quality Growth
GLOBAL AND INTERNATIONAL EQUITY FUNDS
Disciplined Value International
Emerging Markets
Emerging Markets Equity
Fundamental Global Franchise
Global Equity
Global Shareholder Yield
Global Thematic Opportunities
International Dynamic Growth
International Growth
International Small Company
| | INCOME FUNDS
Bond
California Tax-Free Income
Emerging Markets Debt
Floating Rate Income
Government Income
High Yield
High Yield Municipal Bond
Income
Investment Grade Bond
Money Market
Short Duration Bond
Short Duration Credit Opportunities
Strategic Income Opportunities
Tax-Free Bond
ALTERNATIVE AND SPECIALTY FUNDS
Absolute Return Currency
Alternative Asset Allocation
Alternative Risk Premia
Diversified Macro
Infrastructure
Multi-Asset Absolute Return
Seaport Long/Short
|
A fund's investment objectives, risks, charges, and expenses should be considered carefully before investing. The prospectus contains this and other important information about the fund. To obtain a prospectus, contact your financial professional, call John Hancock Investment Management at 800-225-5291, or visit our website at jhinvestments.com. Please read the prospectus carefully before investing or sending money.
| | | |
ASSET ALLOCATION
Balanced
Multi-Asset High Income
Multi-Index Lifetime Portfolios
Multi-Index Preservation Portfolios
Multimanager Lifestyle Portfolios
Multimanager Lifetime Portfolios
Retirement Income 2040
EXCHANGE-TRADED FUNDS
John Hancock Multifactor Consumer Discretionary ETF
John Hancock Multifactor Consumer Staples ETF
John Hancock Multifactor Developed International ETF
John Hancock Multifactor Emerging Markets ETF
John Hancock Multifactor Energy ETF
John Hancock Multifactor Financials ETF
John Hancock Multifactor Healthcare ETF
John Hancock Multifactor Industrials ETF
John Hancock Multifactor Large Cap ETF
John Hancock Multifactor Materials ETF
John Hancock Multifactor Media and
Communications ETF
John Hancock Multifactor Mid Cap ETF
John Hancock Multifactor Small Cap ETF
John Hancock Multifactor Technology ETF
John Hancock Multifactor Utilities ETF
| | ENVIRONMENTAL, SOCIAL, AND
GOVERNANCE FUNDS
ESG All Cap Core
ESG Core Bond
ESG International Equity
ESG Large Cap Core
CLOSED-END FUNDS
Financial Opportunities
Hedged Equity & Income
Income Securities Trust
Investors Trust
Preferred Income
Preferred Income II
Preferred Income III
Premium Dividend
Tax-Advantaged Dividend Income
Tax-Advantaged Global Shareholder Yield
|
John Hancock Multifactor ETF shares are bought and sold at market price (not NAV), and are not individually redeemed
from the fund. Brokerage commissions will reduce returns.
John Hancock ETFs are distributed by Foreside Fund Services, LLC, and are subadvised by Dimensional Fund Advisors LP.
Foreside is not affiliated with John Hancock Investment Management Distributors LLC or Dimensional Fund Advisors LP.
Dimensional Fund Advisors LP receives compensation from John Hancock in connection with licensing rights to the
John Hancock Dimensional indexes. Dimensional Fund Advisors LP does not sponsor, endorse, or sell, and makes no
representation as to the advisability of investing in, John Hancock Multifactor ETFs.
John Hancock Investment Management
A trusted brand
John Hancock Investment Management is a premier asset manager
representing one of America's most trusted brands, with a heritage of
financial stewardship dating back to 1862. Helping our shareholders
pursue their financial goals is at the core of everything we do. It's why
we support the role of professional financial advice and operate with
the highest standards of conduct and integrity.
A better way to invest
We serve investors globally through a unique multimanager approach:
We search the world to find proven portfolio teams with specialized
expertise for every strategy we offer, then we apply robust investment
oversight to ensure they continue to meet our uncompromising
standards and serve the best interests of our shareholders.
Results for investors
Our unique approach to asset management enables us to provide
a diverse set of investments backed by some of the world's best
managers, along with strong risk-adjusted returns across asset classes.
John Hancock Investment Management Distributors LLC n Member FINRA, SIPC
200 Berkeley Street n Boston, MA 02116-5010 n 800-225-5291 n jhinvestments.com
This report is for the information of the shareholders of John Hancock Global Shareholder Yield Fund. It is not authorized for distribution to prospective investors unless preceded or accompanied by a prospectus.
John Hancock
International Growth Fund
Annual report 3/31/2020
Beginning on January 1, 2021, as permitted by regulations adopted by the Securities and Exchange Commission, paper copies of the fund's shareholder reports like this one will no longer be sent by mail, unless you specifically request paper copies of the reports from the fund or from your financial intermediary. Instead, the reports will be made available on a website, and you will be notified by mail each time a report is posted and provided with a website link to access the report.
If you already elected to receive shareholder reports electronically, you will not be affected by this change, and you do not need to take any action. You may elect to receive shareholder reports and other communications electronically by calling John Hancock Investment Management at 800-225-5291 (Class A, Class B and Class C shares) or 888-972-8696 (Class I, Class R2, Class R4, and Class R6) or by contacting your financial intermediary.
You may elect to receive all reports in paper, free of charge, at any time. You can inform John Hancock Investment Management or your financial intermediary that you wish to continue receiving paper copies of your shareholder reports by following the instructions listed above. Your election to receive reports in paper will apply to all funds held with John Hancock Investment Management or your financial intermediary.
A message to shareholders
Dear shareholder,
Global financial markets were on pace to deliver strong returns during the 12 months ended March 31, 2020, until heightened fears over the coronavirus (COVID-19) sent markets tumbling during the last five weeks of the period.
In response to the sell-off, governments and banks in some of the hardest hit areas throughout the world enacted policies and stimulus efforts designed to reignite their respective economies. While these measures helped lift equity and fixed-income markets in the United States during the final two weeks of March, results were mixed in other areas of the world.
The continued spread of COVID-19, trade disputes, rising unemployment, and other geopolitical tensions may continue to create uncertainty among businesses and investors. Your financial professional can helpposition your portfolio so that it's sufficiently diversified to seek to meet your long-term objectives and to withstand the inevitable bouts of market volatility along the way.
On behalf of everyone at John Hancock Investment Management, I'd like to take this opportunity to welcome new shareholders and thank existing shareholders for the continued trust you've placed in us.
Sincerely,
Andrew G. Arnott
President and CEO,
John Hancock Investment Management
Head of Wealth and Asset Management,
United States and Europe
This commentary reflects the CEO's views as of this report's period end and are subject to change at any time. Diversification does not guarantee investment returns and does not eliminate risk of loss. All investments entail risks, including the possible loss of principal. For more up-to-date information, you can visit our website at jhinvestments.com.
John Hancock
International Growth Fund
Table of contents
| | | |
| 2 | | Your fund at a glance |
| 5 | | Manager's discussion of fund performance |
| 7 | | A look at performance |
| 9 | | Your expenses |
| 11 | | Fund's investments |
| 14 | | Financial statements |
| 18 | | Financial highlights |
| 27 | | Notes to financial statements |
| 37 | | Report of independent registered public accounting firm |
| 38 | | Tax information |
| 39 | | Statement regarding liquidity risk management |
| 42 | | Trustees and Officers |
| 46 | | More information |
ANNUAL REPORT | JOHN HANCOCK INTERNATIONAL GROWTH FUND 1
INVESTMENT OBJECTIVE
The fund seeks high total return primarily through capital appreciation.
AVERAGE ANNUAL TOTAL RETURNS AS OF 3/31/2020 (%)
The MSCI AC World ex-USA Growth Index is a free float-adjusted market capitalization index that is designed to measure the equity performance of growth-oriented stocks in developed (excluding the U.S.) and emerging markets.
It is not possible to invest directly in an index. Index figures do not reflect expenses or sales charges, which would result in lower returns.
Figures from Morningstar, Inc. include reinvested distributions and do not take into account sales charges. Actual load-adjusted performance is lower.
The past performance shown here reflects reinvested distributions and the beneficial effect of any expense reductions, and does not guarantee future results. Performance of the other share classes will vary based on the difference in the fees and expenses of those classes. Shares will fluctuate in value and, when redeemed, may be worth more or less than their original cost. Current month-end performance may be lower or higher than the performance cited, and can be found at jhinvestments.com or by calling 800-225-5291. For further information on the fund's objectives, risks, and strategy, see the fund's prospectus. The fund recently experienced negative short-term performance due to market volatility associated with the COVID-19 pandemic.
ANNUAL REPORT | JOHN HANCOCK INTERNATIONAL GROWTH FUND 2
PERFORMANCE HIGHLIGHTS OVER THE LAST TWELVE MONTHS
The fund underperformed its benchmark
The fund posted a negative return for the period and trailed its benchmark, the MSCI AC World ex-USA Growth Index.
Performance effects of security selection
Stock picking in the healthcare and industrials sectors detracted from the fund's relative performance, offset by selection in financials and communication services.
Opportunities at period end
The fund maintained overweights in information technology, healthcare, and financials; consumer staples, materials, and energy remained notable underweights.
SECTOR COMPOSITION AS OF 3/31/2020 (%)
ANNUAL REPORT | JOHN HANCOCK INTERNATIONAL GROWTH FUND 3
A note about risks
The fund may be subject to various risks as described in the fund's prospectus. A widespread health crisis such as a global pandemic could cause substantial market volatility, exchange-trading suspensions and closures, impact the ability to complete redemptions, and affect fund performance. For example, the novel coronavirus disease (COVID-19) has resulted in significant disruptions to global business activity. The impact of a health crisis and other epidemics and pandemics that may arise in the future could affect the global economy in ways that cannot necessarily be foreseen at the present time. A health crisis may exacerbate other pre-existing political, social, and economic risks. Any such impact could adversely affect the fund's performance, resulting in losses to your investment. For more information, please refer to the "Principal risks" section of the prospectus.
ANNUAL REPORT | JOHN HANCOCK INTERNATIONAL GROWTH FUND 4
Manager's discussion of fund performance
How did the fund perform during the 12 months ended March 31, 2020?
In a difficult market environment characterized by dramatic volatility in the period's final weeks, as the coronavirus and its economic and social effects took center stage, the fund had a negative return and trailed the return of its benchmark, the MSCI AC World ex-USA Growth Index. From the standpoint of security selection, picks in the information technology and healthcare sectors notably detracted, while selection in financials and communication services were offsetting positives. A relative underweight in the consumer staples sector and an overweight in the lagging financials category detracted. An overweight in information technology and underweight in energy, the market's weakest-performing sector this period, contributed.
Which stocks detracted and which added value?
The fund's biggest individual detractors were two French holdings, aerospace components company Safran SA and aircraft manufacturer Airbus SE. Shares of both companies came under pressure as efforts to curb the spread of the coronavirus dramatically curtailed airline traffic. We eliminated Safran from the portfolio. Other notable detractors included Irish aircraft-leasing company AerCap Holdings NV and U.K.-based food service company Compass Group PLC.
The fund's top relative contributor was Spanish wireless telecommunication services provider Cellnex Telecom S.A. The stock held up better than the market in the first
| | | | | |
TOP 10 HOLDINGS
AS OF 3/31/20 (%) | | TOP 10 COUNTRIES
AS OF 3/31/20 (%) |
| Alibaba Group Holding, Ltd., ADR | 5.4 | | China | 19.2 |
| Nestle SA | 5.0 | | Switzerland | 14.9 |
| Tencent Holdings, Ltd. | 5.0 | | France | 9.6 |
Taiwan Semiconductor Manufacturing
Company, Ltd. | 4.3 | | Japan | 9.1 |
| Roche Holding AG | 4.2 | | United Kingdom | 7.9 |
| AstraZeneca PLC | 3.1 | | Taiwan | 6.9 |
| Novartis AG | 3.0 | | Netherlands | 6.3 |
| AIA Group, Ltd. | 2.8 | | Ireland | 5.3 |
| ASML Holding NV | 2.8 | | Hong Kong | 4.1 |
| Hoya Corp. | 2.2 | | Spain | 3.5 |
| TOTAL | 37.8 | | TOTAL | 86.8 |
| As a percentage of net assets. | | As a percentage of net assets. |
| Cash and cash equivalents are not included. | | Cash and cash equivalents are not included. |
ANNUAL REPORT | JOHN HANCOCK INTERNATIONAL GROWTH FUND 5
quarter of 2020, supported by its leading market position in European cell tower infrastructure, which facilitates work-from-home capabilities, as well as its continued revenue growth and better visibility for free cash flow. Other positions that significantly contributed included Hoya Corp., a Japan-based manufacturer of optical products used in healthcare and technology applications, and ASML Holding N.V., a Netherlands-based semiconductor manufacturer.
How did you position the fund at period end?
The macroeconomic indicators we follow suggest the global economy is declining. We've accordingly moved to overweight quality and capital return factors while underweighting growth and valuation factors in our investment process. We've increased the fund's exposure to the information technology (IT) sector, as we believe IT spending will continue to expand, particularly given the recent phenomenon of social distancing. We also maintained an overweighting in healthcare and financials, particularly among high-quality insurance companies rather than banks, to which we've been reducing exposure in light of the current low interest-rate environment.
The fund is underweight in consumer staples, which we believe offers less-attractive valuation upside, and materials and energy, two sectors that are often too capital intensive to rank highly for quality. From a regional perspective, the fund remains overweight in China and Europe, where we hold high-quality companies that we view as global leaders and are attractively valued compared to multinational firms in other regions.
MANAGED BY
| | |
 | John A. Boselli, CFA
On the fund since 2014
Investing since 1996 |

The views expressed in this report are exclusively those of John A. Boselli, CFA, Wellington Management Company LLP, and are subject to change. They are not meant as investment advice. Please note that the holdings discussed in this report may not have been held by the fund for the entire period. Portfolio composition is subject to review in accordance with the fund's investment strategy and may vary in the future. Current and future portfolio holdings are subject to risk.
ANNUAL REPORT | JOHN HANCOCK INTERNATIONAL GROWTH FUND 6
TOTAL RETURNS FOR THE PERIOD ENDED MARCH 31, 2020
| | | | | | | | |
Average annual total returns (%)
with maximum sales charge | | Cumulative total returns (%)
with maximum sales charge |
| | 1-year | 5-year | 10-year | | | 5-year | 10-year |
| Class A | -12.48 | 2.51 | 6.06 | | | 13.19 | 80.14 |
| Class B | -13.08 | 2.47 | 5.98 | | | 13.00 | 78.77 |
| Class C | -9.44 | 2.84 | 5.83 | | | 15.04 | 76.28 |
| Class I1 | -7.61 | 3.87 | 6.97 | | | 20.91 | 96.11 |
| Class R21,2 | -7.98 | 3.44 | 6.55 | | | 18.42 | 88.52 |
| Class R41,2 | -7.77 | 3.70 | 6.68 | | | 19.91 | 90.89 |
| Class R61,2 | -7.52 | 3.99 | 6.83 | | | 21.63 | 93.62 |
| Class 11 | -7.55 | 3.95 | 7.04 | | | 21.40 | 97.42 |
| Class NAV1,2 | -7.51 | 3.98 | 6.82 | | | 21.55 | 93.42 |
| Index 1† | -7.31 | 2.10 | 3.91 | | | 10.97 | 46.77 |
| Index2† | -14.38 | -0.62 | 2.72 | | | -3.05 | 30.72 |
Performance figures assume all distributions have been reinvested. Figures reflect maximum sales charges on Class A shares of 5%, and the applicable contingent deferred sales charge (CDSC) on Class B and Class C shares. The Class B shares' CDSC declines annually between years 1 to 6 according to the following schedule: 5%, 4%, 3%, 3%, 2%, and 1%. No sales charge will be assessed after the sixth year. Class C shares sold within one year of purchase are subject to a 1% CDSC. Sales charges are not applicable to Class I, Class R2, Class R4, Class R6, Class 1, and Class NAV shares.
The expense ratios of the fund, both net (including any fee waivers and/or expense limitations) and gross (excluding any fee waivers and/or expense limitations), are set forth according to the most recent publicly available prospectuses for the fund and may differ from those disclosed in the Financial highlights tables in this report. Net expenses reflect contractual fee waivers and expense limitations in effect until July 31, 2021 and are subject to change. Had the contractual fee waivers and expense limitations not been in place, gross expenses would apply. The expense ratios are as follows:
| | | | | | | | | | |
| | Class A | Class B | Class C | Class I | Class R2 | Class R4 | Class R6 | Class 1 | Class NAV |
| Gross (%) | 1.29 | 1.99 | 1.99 | 0.99 | 1.39 | 1.24 | 0.89 | 0.92 | 0.87 |
| Net (%) | 1.28 | 1.98 | 1.98 | 0.98 | 1.38 | 1.13 | 0.88 | 0.91 | 0.86 |
Please refer to the most recent prospectuses and annual or semiannual report for more information on expenses and any expense limitation arrangements for each class.
The returns reflect past results and should not be considered indicative of future performance. The return and principal value of an investment will fluctuate so that shares, when redeemed, may be worth more or less than their original cost. Due to market volatility and other factors, the fund's current performance may be higher or lower than the performance shown. For current to the most recent month-end performance data, please call 800-225-5291 or visit the fund's website at jhinvestments.com.
The performance table above and the chart on the next page do not reflect the deduction of taxes that a shareholder would pay on fund distributions or the redemption of fund shares. The fund's performance results reflect any applicable fee waivers or expense reductions, without which the expenses would increase and results would have been less favorable.
| † | Index 1 is the MSCI AC World ex-USA Growth Index; Index 2 is the MSCI EAFE Index. |
See the following page for footnotes.
ANNUAL REPORT | JOHN HANCOCK INTERNATIONAL GROWTH FUND 7
This chart and table show what happened to a hypothetical $10,000 investment in John Hancock International Growth Fund for the share classes and periods indicated, assuming all distributions were reinvested. For comparison, we've shown the same investment in two separate indexes.
| | | | | | |
| | Start date | With maximum
sales charge ($) | Without
sales charge ($) | Index 1 ($) | Index 2 ($) |
| Class B3 | 3-31-10 | 17,877 | 17,877 | 14,677 | 13,072 |
| Class C3 | 3-31-10 | 17,628 | 17,628 | 14,677 | 13,072 |
| Class I1 | 3-31-10 | 19,611 | 19,611 | 14,677 | 13,072 |
| Class R21,2 | 3-31-10 | 18,852 | 18,852 | 14,677 | 13,072 |
| Class R41,2 | 3-31-10 | 19,089 | 19,089 | 14,677 | 13,072 |
| Class R61,2 | 3-31-10 | 19,362 | 19,362 | 14,677 | 13,072 |
| Class 11 | 3-31-10 | 19,742 | 19,742 | 14,677 | 13,072 |
| Class NAV1,2 | 3-31-10 | 19,342 | 19,342 | 14,677 | 13,072 |
The MSCI AC World ex-USA Growth Index is a free float-adjusted market capitalization index that is designed to measure the equity performance of growth-oriented stocks in developed (excluding the U.S.) and emerging markets.
The MSCI EAFE Index is a free float-adjusted market capitalization index that is designed to measure the equity market performance of developed markets, excluding the U.S. and Canada.
It is not possible to invest directly in an index. Index figures do not reflect expenses or sales charges, which would result in lower returns.
Footnotes related to performance pages
| 1 | For certain types of investors, as described in the fund's prospectuses. |
| 2 | Class R2, Class R4, and Class R6 shares were first offered on 3-27-15. Class NAV shares were first offered on 6-2-15. The returns prior to these dates are those of Class A shares that have not been adjusted for class-specific expenses; otherwise, returns would vary. |
| 3 | The contingent deferred sales charge is not applicable. |
ANNUAL REPORT | JOHN HANCOCK INTERNATIONAL GROWTH FUND 8
These examples are intended to help you understand your ongoing operating expenses of investing in the fund so you can compare these costs with the ongoing costs of investing in other mutual funds.
Understanding fund expenses
As a shareholder of the fund, you incur two types of costs:
■Transaction costs,which include sales charges (loads) on purchases or redemptions (varies by share class), minimum account fee charge, etc.
■Ongoing operating expenses, including management fees, distribution and service fees (if applicable), and other fund expenses.
We are presenting only your ongoing operating expenses here.
Actual expenses/actual returns
The first line of each share class in the table on the following page is intended to provide information about the fund’s actual ongoing operating expenses, and is based on the fund’s actual return. It assumes an account value of $1,000.00 on October 1, 2019, with the same investment held until March 31, 2020.
Together with the value of your account, you may use this information to estimate the operating expenses that you paid over the period. Simply divide your account value at March 31, 2020, by $1,000.00, then multiply it by the “expenses paid” for your share class from the table. For example, for an account value of $8,600.00, the operating expenses should be calculated as follows:
Hypothetical example for comparison purposes
The second line of each share class in the table on the following page allows you to compare the fund’s ongoing operating expenses with those of any other fund. It provides an example of the fund’s hypothetical account values and hypothetical expenses based on each class’s actual expense ratio and an assumed 5% annualized return before expenses (which is not the class’s actual return). It assumes an account value of $1,000.00 on October 1, 2019, with the same investment held until March 31, 2020. Look in any other fund shareholder report to find its hypothetical example and you will be able to compare these expenses.
| | ANNUAL REPORT | JOHN HANCOCK INTERNATIONAL GROWTH FUND | 9 |
Please remember that these hypothetical account values and expenses may not be used to estimate the actual ending account balance or expenses you paid for the period.
Remember, these examples do not include any transaction costs, therefore, these examples will not help you to determine the relative total costs of owning different funds. If transaction costs were included, your expenses would have been higher. See the prospectuses for details regarding transaction costs.
SHAREHOLDER EXPENSE EXAMPLE CHART
| | | Account
value on
10-1-2019 | Ending
value on
3-31-2020 | Expenses
paid during
period ended
3-31-20201 | Annualized
expense
ratio |
| Class A | Actual expenses/actual returns | $1,000.00 | $890.40 | $6.10 | 1.29% |
| | Hypothetical example | 1,000.00 | 1,018.60 | 6.51 | 1.29% |
| Class B | Actual expenses/actual returns | 1,000.00 | 887.30 | 9.39 | 1.99% |
| | Hypothetical example | 1,000.00 | 1,015.10 | 10.03 | 1.99% |
| Class C | Actual expenses/actual returns | 1,000.00 | 887.00 | 9.39 | 1.99% |
| | Hypothetical example | 1,000.00 | 1,015.10 | 10.03 | 1.99% |
| Class I | Actual expenses/actual returns | 1,000.00 | 891.40 | 4.68 | 0.99% |
| | Hypothetical example | 1,000.00 | 1,020.10 | 5.00 | 0.99% |
| Class R2 | Actual expenses/actual returns | 1,000.00 | 889.60 | 6.52 | 1.38% |
| | Hypothetical example | 1,000.00 | 1,018.10 | 6.96 | 1.38% |
| Class R4 | Actual expenses/actual returns | 1,000.00 | 890.80 | 5.34 | 1.13% |
| | Hypothetical example | 1,000.00 | 1,019.40 | 5.70 | 1.13% |
| Class R6 | Actual expenses/actual returns | 1,000.00 | 892.00 | 4.16 | 0.88% |
| | Hypothetical example | 1,000.00 | 1,020.60 | 4.45 | 0.88% |
| Class 1 | Actual expenses/actual returns | 1,000.00 | 891.90 | 4.35 | 0.92% |
| | Hypothetical example | 1,000.00 | 1,020.40 | 4.65 | 0.92% |
| Class NAV | Actual expenses/actual returns | 1,000.00 | 892.30 | 4.12 | 0.87% |
| | Hypothetical example | 1,000.00 | 1,020.70 | 4.40 | 0.87% |
| 1 | Expenses are equal to the annualized expense ratio, multiplied by the average account value over the period, multiplied by 183/366 (to reflect the one-half year period). |
| 10 | JOHN HANCOCK INTERNATIONAL GROWTH FUND | ANNUAL REPORT | |
AS OF 3-31-20
| | | | | Shares | Value |
| Common stocks 99.4% | | | | | $7,653,107,316 |
| (Cost $6,955,325,353) | | | | | |
| Australia 1.1% | | | | | 87,739,486 |
| Goodman Group | | | 11,970,447 | 87,739,486 |
| Canada 3.0% | | | | | 227,483,277 |
| Dollarama, Inc. | | | 3,217,369 | 89,253,241 |
| Intact Financial Corp. | | | 1,599,368 | 138,230,036 |
| China 19.2% | | | | | 1,477,163,938 |
| Alibaba Group Holding, Ltd., ADR (A) | | | 2,137,203 | 415,643,238 |
| ANTA Sports Products, Ltd. | | | 13,585,000 | 98,582,316 |
| China Tower Corp., Ltd., H Shares (B) | | | 380,338,642 | 84,511,572 |
| CSPC Pharmaceutical Group, Ltd. | | | 66,377,345 | 130,570,186 |
| Kweichow Moutai Company, Ltd., Class A | | | 638,446 | 99,219,300 |
| Ping An Insurance Group Company of China, Ltd., H Shares | | | 9,802,892 | 95,737,604 |
| Shenzhou International Group Holdings, Ltd. | | | 7,798,100 | 81,802,580 |
| TAL Education Group, ADR (A) | | | 1,680,921 | 89,525,852 |
| Tencent Holdings, Ltd. | | | 7,719,800 | 381,571,290 |
| Denmark 1.5% | | | | | 113,786,903 |
| DSV Panalpina A/S | | | 1,251,381 | 113,786,903 |
| France 9.6% | | | | | 737,896,362 |
| Airbus SE | | | 1,691,609 | 109,078,227 |
| Edenred | | | 3,000,010 | 124,498,947 |
| L'Oreal SA | | | 489,178 | 126,604,679 |
| LVMH Moet Hennessy Louis Vuitton SE | | | 418,496 | 153,484,116 |
| Schneider Electric SE | | | 1,350,554 | 114,152,834 |
| Worldline SA (A)(B)(C) | | | 1,865,049 | 110,077,559 |
| Germany 3.2% | | | | | 243,270,715 |
| adidas AG | | | 585,949 | 130,096,797 |
| Deutsche Boerse AG | | | 823,777 | 113,173,918 |
| Hong Kong 4.1% | | | | | 313,693,249 |
| AIA Group, Ltd. | | | 24,466,725 | 219,090,735 |
| Hong Kong Exchanges & Clearing, Ltd. | | | 3,157,700 | 94,602,514 |
| Ireland 5.3% | | | | | 409,579,431 |
| Accenture PLC, Class A | | | 705,371 | 115,158,869 |
| Experian PLC | | | 3,809,407 | 105,868,271 |
| ICON PLC (A) | | | 672,553 | 91,467,208 |
| Medtronic PLC | | | 1,076,570 | 97,085,083 |
| Japan 9.1% | | | | | 701,843,390 |
| Bandai Namco Holdings, Inc. | | | 1,627,200 | 78,924,478 |
| SEE NOTES TO FINANCIAL STATEMENTS | ANNUAL REPORT | JOHN HANCOCK INTERNATIONAL GROWTH FUND | 11 |
| | | | | Shares | Value |
| Japan (continued) | | | | | |
| Hoya Corp. | | | 1,956,900 | $166,398,200 |
| Keyence Corp. | | | 484,400 | 155,740,686 |
| SMC Corp. | | | 232,400 | 97,432,242 |
| Tokio Marine Holdings, Inc. | | | 2,177,100 | 99,612,271 |
| Tokyo Electron, Ltd. | | | 556,600 | 103,735,513 |
| Netherlands 6.3% | | | | | 488,887,038 |
| ASML Holding NV | | | 809,531 | 213,404,536 |
| Koninklijke Philips NV | | | 2,772,895 | 113,847,867 |
| Wolters Kluwer NV | | | 2,279,398 | 161,634,635 |
| Spain 3.5% | | | | | 265,971,831 |
| Cellnex Telecom SA (A)(B) | | | 3,324,691 | 150,816,346 |
| Industria de Diseno Textil SA | | | 4,443,814 | 115,155,485 |
| Sweden 2.8% | | | | | 219,231,757 |
| EQT AB (A)(C) | | | 8,629,670 | 102,611,339 |
| Swedish Match AB | | | 2,059,716 | 116,620,418 |
| Switzerland 14.9% | | | | | 1,146,672,289 |
| Logitech International SA | | | 1,977,651 | 84,697,706 |
| Nestle SA | | | 3,762,268 | 385,135,082 |
| Novartis AG | | | 2,761,584 | 227,827,471 |
| Partners Group Holding AG | | | 188,696 | 129,193,703 |
| Roche Holding AG | | | 994,021 | 319,818,327 |
| Taiwan 6.9% | | | | | 528,128,201 |
| Largan Precision Company, Ltd. | | | 733,000 | 92,555,382 |
| MediaTek, Inc. | | | 9,940,000 | 106,688,287 |
| Taiwan Semiconductor Manufacturing Company, Ltd. | | | 36,533,323 | 328,884,532 |
| United Kingdom 7.9% | | | | | 611,000,658 |
| Aon PLC | | | 434,303 | 71,677,367 |
| AstraZeneca PLC | | | 2,714,113 | 241,823,871 |
| BAE Systems PLC | | | 16,339,232 | 104,979,668 |
| Compass Group PLC | | | 7,064,155 | 110,060,072 |
| IHS Markit, Ltd. | | | 1,374,328 | 82,459,680 |
| United States 1.0% | | | | | 80,758,791 |
| Amdocs, Ltd. | | | 1,469,143 | 80,758,791 |
|
| | | Yield (%) | | Shares | Value |
| Short-term investments 0.4% | | | | $28,302,480 |
| (Cost $28,301,878) | | | | | |
| Short-term funds 0.1% | | | | | 3,802,480 |
| John Hancock Collateral Trust (D) | 1.1260(E) | | 380,343 | 3,802,480 |
| 12 | JOHN HANCOCK INTERNATIONAL GROWTH FUND | ANNUAL REPORT | SEE NOTES TO FINANCIAL STATEMENTS |
| | | | | Par value^ | Value |
| Repurchase agreement 0.3% | | | | | 24,500,000 |
| Bank of America Corp. Tri-Party Repurchase Agreement dated 3-31-20 at 0.010% to be repurchased at $15,700,004 on 4-1-20, collateralized by $15,319,200 U.S. Treasury Notes, 2.500% due 2-15-22 (valued at $16,014,089) | | | 15,700,000 | 15,700,000 |
| Societe Generale Tri-Party Repurchase Agreement dated 3-31-20 at 0.010% to be repurchased at $8,800,002 on 4-1-20, collateralized by $5,199,487 Federal National Mortgage Association, 3.000% due 11-1-49 (valued at $5,527,044), $3,230,681 Government National Mortgage Association, 3.000% due 12-20-49 (valued at $3,448,865) and $100 U.S. Treasury Bills, 0.000% due 6-18-20 (valued at $100) | | | 8,800,000 | 8,800,000 |
|
| Total investments (Cost $6,983,627,231) 99.8% | | | $7,681,409,796 |
| Other assets and liabilities, net 0.2% | | | 17,031,648 |
| Total net assets 100.0% | | | | | $7,698,441,444 |
| The percentage shown for each investment category is the total value of the category as a percentage of the net assets of the fund. |
| ^All par values are denominated in U.S. dollars unless otherwise indicated. |
| Security Abbreviations and Legend |
| ADR | American Depositary Receipt |
| (A) | Non-income producing security. |
| (B) | These securities are exempt from registration under Rule 144A of the Securities Act of 1933. Such securities may be resold, normally to qualified institutional buyers, in transactions exempt from registration. |
| (C) | All or a portion of this security is on loan as of 3-31-20. |
| (D) | Investment is an affiliate of the fund, the advisor and/or subadvisor. This security represents the investment of cash collateral received for securities lending. |
| (E) | The rate shown is the annualized seven-day yield as of 3-31-20. |
At 3-31-20, the aggregate cost of investments for federal income tax purposes was $7,035,130,054. Net unrealized appreciation aggregated to $646,279,742, of which $1,049,301,282 related to gross unrealized appreciation and $403,021,540 related to gross unrealized depreciation.
| SEE NOTES TO FINANCIAL STATEMENTS | ANNUAL REPORT | JOHN HANCOCK INTERNATIONAL GROWTH FUND | 13 |
STATEMENT OF ASSETS AND LIABILITIES 3-31-20
| Assets | |
| Unaffiliated investments, at value (Cost $6,979,825,353) including $3,403,141 of securities loaned | $7,677,607,316 |
| Affiliated investments, at value (Cost $3,801,878) | 3,802,480 |
| Total investments, at value (Cost $6,983,627,231) | 7,681,409,796 |
| Cash | 56,628 |
| Foreign currency, at value (Cost $819,739) | 819,960 |
| Dividends and interest receivable | 21,815,993 |
| Receivable for fund shares sold | 23,476,220 |
| Receivable for investments sold | 20,755,456 |
| Receivable for securities lending income | 10,094 |
| Other assets | 235,617 |
| Total assets | 7,748,579,764 |
| Liabilities | |
| Foreign capital gains tax payable | 2,571,159 |
| Payable for investments purchased | 24,443,875 |
| Payable for fund shares repurchased | 17,258,223 |
| Payable upon return of securities loaned | 3,843,532 |
| Payable to affiliates | |
| Accounting and legal services fees | 300,418 |
| Transfer agent fees | 588,813 |
| Distribution and service fees | 7,193 |
| Trustees' fees | 7,931 |
| Other liabilities and accrued expenses | 1,117,176 |
| Total liabilities | 50,138,320 |
| Net assets | $7,698,441,444 |
| Net assets consist of | |
| Paid-in capital | $7,440,471,251 |
| Total distributable earnings (loss) | 257,970,193 |
| Net assets | $7,698,441,444 |
| |
| 14 | JOHN HANCOCK International Growth Fund | ANNUAL REPORT | SEE NOTES TO FINANCIAL STATEMENTS |
STATEMENT OF ASSETS AND LIABILITIES (continued)
| Net asset value per share | |
| Based on net asset value and shares outstanding - the fund has an unlimited number of shares authorized with no par value | |
| Class A ($456,089,312 ÷ 18,558,745 shares)1 | $24.58 |
| Class B ($368,531 ÷ 15,305 shares)1 | $24.08 |
| Class C ($180,641,090 ÷ 7,516,764 shares)1 | $24.03 |
| Class I ($4,677,374,038 ÷ 189,887,696 shares) | $24.63 |
| Class R2 ($29,655,138 ÷ 1,205,287 shares) | $24.60 |
| Class R4 ($7,207,895 ÷ 292,723 shares) | $24.62 |
| Class R6 ($1,434,030,688 ÷ 58,172,743 shares) | $24.65 |
| Class 1 ($58,870,896 ÷ 2,391,339 shares) | $24.62 |
| Class NAV ($854,203,856 ÷ 34,699,800 shares) | $24.62 |
| Maximum offering price per share | |
| Class A (net asset value per share ÷ 95%)2 | $25.87 |
| 1 | Redemption price per share is equal to net asset value less any applicable contingent deferred sales charge. |
| 2 | On single retail sales of less than $50,000. On sales of $50,000 or more and on group sales the offering price is reduced. |
| SEE NOTES TO FINANCIAL STATEMENTS | ANNUAL REPORT | JOHN HANCOCK International Growth Fund | 15 |
STATEMENT OF OPERATIONS For the year ended 3-31-20
| Investment income | |
| Dividends | $178,970,078 |
| Securities lending | 2,041,424 |
| Interest | 1,214,473 |
| Less foreign taxes withheld | (19,943,204) |
| Total investment income | 162,282,771 |
| Expenses | |
| Investment management fees | 75,673,527 |
| Distribution and service fees | 4,403,028 |
| Accounting and legal services fees | 1,697,610 |
| Transfer agent fees | 8,118,778 |
| Trustees' fees | 180,398 |
| Custodian fees | 3,350,708 |
| State registration fees | 209,515 |
| Printing and postage | 318,321 |
| Professional fees | 221,313 |
| Other | 455,641 |
| Total expenses | 94,628,839 |
| Less expense reductions | (700,685) |
| Net expenses | 93,928,154 |
| Net investment income | 68,354,617 |
| Realized and unrealized gain (loss) | |
| Net realized gain (loss) on | |
| Unaffiliated investments and foreign currency transactions | (55,538,167)1 |
| Affiliated investments | (42,736) |
| | (55,580,903) |
| Change in net unrealized appreciation (depreciation) of | |
| Unaffiliated investments and translation of assets and liabilities in foreign currencies | (639,220,880)2 |
| Affiliated investments | 416 |
| | (639,220,464) |
| Net realized and unrealized loss | (694,801,367) |
| Decrease in net assets from operations | $(626,446,750) |
| |
| 1 | Net of foreign taxes of $(9,540,173). |
| 2 | Net of $845,205 decrease in deferred foreign withholding taxes. |
| 16 | JOHN HANCOCK International Growth Fund | ANNUAL REPORT | SEE NOTES TO FINANCIAL STATEMENTS |
STATEMENTS OF CHANGES IN NET ASSETS
| | Year ended
3-31-20 | Year ended
3-31-19 |
| Increase (decrease) in net assets | | |
| From operations | | |
| Net investment income | $68,354,617 | $87,829,784 |
| Net realized loss | (55,580,903) | (327,404,032) |
| Change in net unrealized appreciation (depreciation) | (639,220,464) | (203,438,382) |
| Decrease in net assets resulting from operations | (626,446,750) | (443,012,630) |
| Distributions to shareholders | | |
| From earnings | | |
| Class A | (2,418,886) | (14,660,561) |
| Class B | — | (20,861) |
| Class C | — | (4,998,651) |
| Class I | (39,918,280) | (144,368,088) |
| Class R2 | (119,573) | (906,042) |
| Class R4 | (54,100) | (191,219) |
| Class R6 | (14,116,540) | (49,853,759) |
| Class 1 | (571,277) | (2,141,203) |
| Class NAV | (8,104,635) | (28,574,370) |
| Total distributions | (65,303,291) | (245,714,754) |
| From fund share transactions | (1,050,898,927) | 245,618,755 |
| Total decrease | (1,742,648,968) | (443,108,629) |
| Net assets | | |
| Beginning of year | 9,441,090,412 | 9,884,199,041 |
| End of year | $7,698,441,444 | $9,441,090,412 |
| SEE NOTES TO FINANCIAL STATEMENTS | ANNUAL REPORT | JOHN HANCOCK International Growth Fund | 17 |
| CLASS A SHARES Period ended | 3-31-20 | 3-31-19 | 3-31-181 | 2-28-18 | 2-28-17 | 2-29-16 |
| Per share operating performance | | | | | | |
| Net asset value, beginning of period | $26.79 | $28.52 | $28.43 | $21.69 | $19.90 | $21.64 |
| Net investment income2 | 0.13 | 0.19 | 0.02 | 0.11 | 0.17 | 0.10 |
| Net realized and unrealized gain (loss) on investments | (2.22) | (1.31) | 0.07 | 6.69 | 1.75 | (1.81) |
| Total from investment operations | (2.09) | (1.12) | 0.09 | 6.80 | 1.92 | (1.71) |
| Less distributions | | | | | | |
| From net investment income | (0.12) | (0.15) | — | (0.06) | (0.13) | (0.03) |
| From net realized gain | — | (0.46) | — | — | — | — |
| Total distributions | (0.12) | (0.61) | — | (0.06) | (0.13) | (0.03) |
| Net asset value, end of period | $24.58 | $26.79 | $28.52 | $28.43 | $21.69 | $19.90 |
| Total return (%)3,4 | (7.87) | (3.69) | 0.325 | 31.38 | 9.62 | (7.86) |
| Ratios and supplemental data | | | | | | |
| Net assets, end of period (in millions) | $456 | $609 | $827 | $803 | $427 | $615 |
| Ratios (as a percentage of average net assets): | | | | | | |
| Expenses before reductions | 1.30 | 1.28 | 1.296 | 1.29 | 1.32 | 1.38 |
| Expenses including reductions | 1.29 | 1.28 | 1.286 | 1.28 | 1.32 | 1.37 |
| Net investment income | 0.45 | 0.72 | 0.696 | 0.41 | 0.79 | 0.48 |
| Portfolio turnover (%) | 80 | 98 | 4 | 65 | 94 | 82 |
| 1 | For the one-month period ended 3-31-18. The fund changed its fiscal year end from February 28 to March 31. |
| 2 | Based on average daily shares outstanding. |
| 3 | Total returns would have been lower had certain expenses not been reduced during the applicable periods. |
| 4 | Does not reflect the effect of sales charges, if any. |
| 5 | Not annualized. |
| 6 | Annualized. |
| 18 | JOHN HANCOCK International Growth Fund | ANNUAL REPORT | SEE NOTES TO FINANCIAL STATEMENTS |
| CLASS B SHARES Period ended | 3-31-20 | 3-31-19 | 3-31-181 | 2-28-18 | 2-28-17 | 2-29-16 |
| Per share operating performance | | | | | | |
| Net asset value, beginning of period | $26.33 | $28.06 | $27.99 | $21.45 | $19.70 | $21.55 |
| Net investment income (loss)2 | (0.06) | 0.02 | —3 | (0.04) | 0.04 | 0.02 |
| Net realized and unrealized gain (loss) on investments | (2.19) | (1.29) | 0.07 | 6.58 | 1.71 | (1.87) |
| Total from investment operations | (2.25) | (1.27) | 0.07 | 6.54 | 1.75 | (1.85) |
| Less distributions | | | | | | |
| From net investment income | — | — | — | — | — | — |
| From net realized gain | — | (0.46) | — | — | — | — |
| Total distributions | — | (0.46) | — | — | — | — |
| Net asset value, end of period | $24.08 | $26.33 | $28.06 | $27.99 | $21.45 | $19.70 |
| Total return (%)4,5 | (8.51) | (4.36) | 0.256 | 30.49 | 8.88 | (8.58) |
| Ratios and supplemental data | | | | | | |
| Net assets, end of period (in millions) | $—7 | $1 | $2 | $2 | $2 | $2 |
| Ratios (as a percentage of average net assets): | | | | | | |
| Expenses before reductions | 2.00 | 1.98 | 1.998 | 1.99 | 2.03 | 2.32 |
| Expenses including reductions | 1.99 | 1.98 | 1.988 | 1.98 | 2.02 | 2.12 |
| Net investment income (loss) | (0.21) | 0.08 | (0.01)8 | (0.15) | 0.19 | 0.07 |
| Portfolio turnover (%) | 80 | 98 | 4 | 65 | 94 | 82 |
| 1 | For the one-month period ended 3-31-18. The fund changed its fiscal year end from February 28 to March 31. |
| 2 | Based on average daily shares outstanding. |
| 3 | Less than $0.005 per share. |
| 4 | Total returns would have been lower had certain expenses not been reduced during the applicable periods. |
| 5 | Does not reflect the effect of sales charges, if any. |
| 6 | Not annualized. |
| 7 | Less than $500,000. |
| 8 | Annualized. |
| SEE NOTES TO FINANCIAL STATEMENTS | ANNUAL REPORT | JOHN HANCOCK International Growth Fund | 19 |
| CLASS C SHARES Period ended | 3-31-20 | 3-31-19 | 3-31-181 | 2-28-18 | 2-28-17 | 2-29-16 |
| Per share operating performance | | | | | | |
| Net asset value, beginning of period | $26.27 | $28.00 | $27.93 | $21.40 | $19.66 | $21.49 |
| Net investment income (loss)2 | (0.06) | —3 | —3 | (0.09) | 0.01 | (0.07) |
| Net realized and unrealized gain (loss) on investments | (2.18) | (1.27) | 0.07 | 6.62 | 1.73 | (1.76) |
| Total from investment operations | (2.24) | (1.27) | 0.07 | 6.53 | 1.74 | (1.83) |
| Less distributions | | | | | | |
| From net investment income | — | — | — | — | — | — |
| From net realized gain | — | (0.46) | — | — | — | — |
| Total distributions | — | (0.46) | — | — | — | — |
| Net asset value, end of period | $24.03 | $26.27 | $28.00 | $27.93 | $21.40 | $19.66 |
| Total return (%)4,5 | (8.53) | (4.37) | 0.256 | 30.51 | 8.85 | (8.52) |
| Ratios and supplemental data | | | | | | |
| Net assets, end of period (in millions) | $181 | $263 | $349 | $333 | $145 | $113 |
| Ratios (as a percentage of average net assets): | | | | | | |
| Expenses before reductions | 2.00 | 1.98 | 1.997 | 1.99 | 2.03 | 2.08 |
| Expenses including reductions | 1.99 | 1.98 | 1.987 | 1.98 | 2.02 | 2.07 |
| Net investment income (loss) | (0.24) | (0.01) | (0.01)7 | (0.33) | 0.03 | (0.33) |
| Portfolio turnover (%) | 80 | 98 | 4 | 65 | 94 | 82 |
| 1 | For the one-month period ended 3-31-18. The fund changed its fiscal year end from February 28 to March 31. |
| 2 | Based on average daily shares outstanding. |
| 3 | Less than $0.005 per share. |
| 4 | Total returns would have been lower had certain expenses not been reduced during the applicable periods. |
| 5 | Does not reflect the effect of sales charges, if any. |
| 6 | Not annualized. |
| 7 | Annualized. |
| 20 | JOHN HANCOCK International Growth Fund | ANNUAL REPORT | SEE NOTES TO FINANCIAL STATEMENTS |
| CLASS I SHARES Period ended | 3-31-20 | 3-31-19 | 3-31-181 | 2-28-18 | 2-28-17 | 2-29-16 |
| Per share operating performance | | | | | | |
| Net asset value, beginning of period | $26.84 | $28.59 | $28.49 | $21.72 | $19.94 | $21.67 |
| Net investment income2 | 0.21 | 0.24 | 0.02 | 0.18 | 0.20 | 0.16 |
| Net realized and unrealized gain (loss) on investments | (2.22) | (1.30) | 0.08 | 6.72 | 1.77 | (1.80) |
| Total from investment operations | (2.01) | (1.06) | 0.10 | 6.90 | 1.97 | (1.64) |
| Less distributions | | | | | | |
| From net investment income | (0.20) | (0.23) | — | (0.13) | (0.19) | (0.09) |
| From net realized gain | — | (0.46) | — | — | — | — |
| Total distributions | (0.20) | (0.69) | — | (0.13) | (0.19) | (0.09) |
| Net asset value, end of period | $24.63 | $26.84 | $28.59 | $28.49 | $21.72 | $19.94 |
| Total return (%)3 | (7.61) | (3.45) | 0.354 | 31.82 | 9.96 | (7.59) |
| Ratios and supplemental data | | | | | | |
| Net assets, end of period (in millions) | $4,677 | $5,576 | $5,631 | $5,424 | $2,380 | $1,168 |
| Ratios (as a percentage of average net assets): | | | | | | |
| Expenses before reductions | 1.00 | 1.00 | 1.005 | 0.99 | 1.02 | 1.06 |
| Expenses including reductions | 0.99 | 0.99 | 0.995 | 0.98 | 1.01 | 1.06 |
| Net investment income | 0.74 | 0.89 | 0.985 | 0.70 | 0.94 | 0.73 |
| Portfolio turnover (%) | 80 | 98 | 4 | 65 | 94 | 82 |
| 1 | For the one-month period ended 3-31-18. The fund changed its fiscal year end from February 28 to March 31. |
| 2 | Based on average daily shares outstanding. |
| 3 | Total returns would have been lower had certain expenses not been reduced during the applicable periods. |
| 4 | Not annualized. |
| 5 | Annualized. |
| SEE NOTES TO FINANCIAL STATEMENTS | ANNUAL REPORT | JOHN HANCOCK International Growth Fund | 21 |
| CLASS R2 SHARES Period ended | 3-31-20 | 3-31-19 | 3-31-181 | 2-28-18 | 2-28-17 | 2-29-162 |
| Per share operating performance | | | | | | |
| Net asset value, beginning of period | $26.82 | $28.55 | $28.45 | $21.71 | $19.92 | $21.46 |
| Net investment income (loss)3 | 0.12 | 0.15 | 0.02 | 0.13 | (0.02) | 0.02 |
| Net realized and unrealized gain (loss) on investments | (2.25) | (1.30) | 0.08 | 6.65 | 1.91 | (1.56) |
| Total from investment operations | (2.13) | (1.15) | 0.10 | 6.78 | 1.89 | (1.54) |
| Less distributions | | | | | | |
| From net investment income | (0.09) | (0.12) | — | (0.04) | (0.10) | — |
| From net realized gain | — | (0.46) | — | — | — | — |
| Total distributions | (0.09) | (0.58) | — | (0.04) | (0.10) | — |
| Net asset value, end of period | $24.60 | $26.82 | $28.55 | $28.45 | $21.71 | $19.92 |
| Total return (%)4 | (7.98) | (3.81) | 0.355 | 31.23 | 9.54 | (7.18)5 |
| Ratios and supplemental data | | | | | | |
| Net assets, end of period (in millions) | $30 | $43 | $43 | $37 | $12 | $1 |
| Ratios (as a percentage of average net assets): | | | | | | |
| Expenses before reductions | 1.39 | 1.38 | 1.326 | 1.40 | 1.42 | 1.906 |
| Expenses including reductions | 1.38 | 1.37 | 1.316 | 1.39 | 1.42 | 1.526 |
| Net investment income (loss) | 0.41 | 0.54 | 0.716 | 0.49 | (0.08) | 0.116 |
| Portfolio turnover (%) | 80 | 98 | 4 | 65 | 94 | 827 |
| 1 | For the one-month period ended 3-31-18. The fund changed its fiscal year end from February 28 to March 31. |
| 2 | The inception date for Class R2 shares is 3-27-15. |
| 3 | Based on average daily shares outstanding. |
| 4 | Total returns would have been lower had certain expenses not been reduced during the applicable periods. |
| 5 | Not annualized. |
| 6 | Annualized. |
| 7 | Portfolio turnover is shown for the period from 3-1-15 to 2-29-16. |
| 22 | JOHN HANCOCK International Growth Fund | ANNUAL REPORT | SEE NOTES TO FINANCIAL STATEMENTS |
| CLASS R4 SHARES Period ended | 3-31-20 | 3-31-19 | 3-31-181 | 2-28-18 | 2-28-17 | 2-29-162 |
| Per share operating performance | | | | | | |
| Net asset value, beginning of period | $26.84 | $28.57 | $28.48 | $21.72 | $19.94 | $21.46 |
| Net investment income3 | 0.16 | 0.22 | 0.02 | 0.17 | 0.19 | 0.05 |
| Net realized and unrealized gain (loss) on investments | (2.22) | (1.30) | 0.07 | 6.69 | 1.75 | (1.54) |
| Total from investment operations | (2.06) | (1.08) | 0.09 | 6.86 | 1.94 | (1.49) |
| Less distributions | | | | | | |
| From net investment income | (0.16) | (0.19) | — | (0.10) | (0.16) | (0.03) |
| From net realized gain | — | (0.46) | — | — | — | — |
| Total distributions | (0.16) | (0.65) | — | (0.10) | (0.16) | (0.03) |
| Net asset value, end of period | $24.62 | $26.84 | $28.57 | $28.48 | $21.72 | $19.94 |
| Total return (%)4 | (7.77) | (3.53) | 0.325 | 31.60 | 9.81 | (6.95)5 |
| Ratios and supplemental data | | | | | | |
| Net assets, end of period (in millions) | $7 | $8 | $8 | $9 | $5 | $3 |
| Ratios (as a percentage of average net assets): | | | | | | |
| Expenses before reductions | 1.24 | 1.24 | 1.256 | 1.24 | 1.25 | 1.666 |
| Expenses including reductions | 1.13 | 1.13 | 1.146 | 1.13 | 1.14 | 1.246 |
| Net investment income | 0.58 | 0.80 | 0.836 | 0.64 | 0.88 | 0.246 |
| Portfolio turnover (%) | 80 | 98 | 4 | 65 | 94 | 827 |
| 1 | For the one-month period ended 3-31-18. The fund changed its fiscal year end from February 28 to March 31. |
| 2 | The inception date for Class R4 shares is 3-27-15. |
| 3 | Based on average daily shares outstanding. |
| 4 | Total returns would have been lower had certain expenses not been reduced during the applicable periods. |
| 5 | Not annualized. |
| 6 | Annualized. |
| 7 | Portfolio turnover is shown for the period from 3-1-15 to 2-29-16. |
| SEE NOTES TO FINANCIAL STATEMENTS | ANNUAL REPORT | JOHN HANCOCK International Growth Fund | 23 |
| CLASS R6 SHARES Period ended | 3-31-20 | 3-31-19 | 3-31-181 | 2-28-18 | 2-28-17 | 2-29-162 |
| Per share operating performance | | | | | | |
| Net asset value, beginning of period | $26.86 | $28.61 | $28.50 | $21.73 | $19.95 | $21.46 |
| Net investment income3 | 0.24 | 0.27 | 0.03 | 0.05 | 0.20 | 0.12 |
| Net realized and unrealized gain (loss) on investments | (2.22) | (1.30) | 0.08 | 6.88 | 1.79 | (1.53) |
| Total from investment operations | (1.98) | (1.03) | 0.11 | 6.93 | 1.99 | (1.41) |
| Less distributions | | | | | | |
| From net investment income | (0.23) | (0.26) | — | (0.16) | (0.21) | (0.10) |
| From net realized gain | — | (0.46) | — | — | — | — |
| Total distributions | (0.23) | (0.72) | — | (0.16) | (0.21) | (0.10) |
| Net asset value, end of period | $24.65 | $26.86 | $28.61 | $28.50 | $21.73 | $19.95 |
| Total return (%)4 | (7.52) | (3.32) | 0.395 | 31.91 | 10.08 | (6.59)5 |
| Ratios and supplemental data | | | | | | |
| Net assets, end of period (in millions) | $1,434 | $1,836 | $1,795 | $1,702 | $18 | $2 |
| Ratios (as a percentage of average net assets): | | | | | | |
| Expenses before reductions | 0.89 | 0.89 | 0.896 | 0.90 | 0.93 | 1.376 |
| Expenses including reductions | 0.88 | 0.88 | 0.886 | 0.89 | 0.90 | 0.956 |
| Net investment income | 0.85 | 1.01 | 1.096 | 0.16 | 0.95 | 0.606 |
| Portfolio turnover (%) | 80 | 98 | 4 | 65 | 94 | 827 |
| 1 | For the one-month period ended 3-31-18. The fund changed its fiscal year end from February 28 to March 31. |
| 2 | The inception date for Class R6 shares is 3-27-15. |
| 3 | Based on average daily shares outstanding. |
| 4 | Total returns would have been lower had certain expenses not been reduced during the applicable periods. |
| 5 | Not annualized. |
| 6 | Annualized. |
| 7 | Portfolio turnover is shown for the period from 3-1-15 to 2-29-16. |
| 24 | JOHN HANCOCK International Growth Fund | ANNUAL REPORT | SEE NOTES TO FINANCIAL STATEMENTS |
| CLASS 1 SHARES Period ended | 3-31-20 | 3-31-19 | 3-31-181 | 2-28-18 | 2-28-17 | 2-29-16 |
| Per share operating performance | | | | | | |
| Net asset value, beginning of period | $26.83 | $28.57 | $28.47 | $21.71 | $19.93 | $21.65 |
| Net investment income2 | 0.23 | 0.28 | 0.03 | 0.21 | 0.23 | 0.23 |
| Net realized and unrealized gain (loss) on investments | (2.22) | (1.30) | 0.07 | 6.70 | 1.76 | (1.84) |
| Total from investment operations | (1.99) | (1.02) | 0.10 | 6.91 | 1.99 | (1.61) |
| Less distributions | | | | | | |
| From net investment income | (0.22) | (0.26) | — | (0.15) | (0.21) | (0.11) |
| From net realized gain | — | (0.46) | — | — | — | — |
| Total distributions | (0.22) | (0.72) | — | (0.15) | (0.21) | (0.11) |
| Net asset value, end of period | $24.62 | $26.83 | $28.57 | $28.47 | $21.71 | $19.93 |
| Total return (%)3 | (7.55) | (3.32) | 0.354 | 31.86 | 10.04 | (7.49) |
| Ratios and supplemental data | | | | | | |
| Net assets, end of period (in millions) | $59 | $78 | $93 | $91 | $50 | $39 |
| Ratios (as a percentage of average net assets): | | | | | | |
| Expenses before reductions | 0.93 | 0.92 | 0.925 | 0.93 | 0.95 | 1.00 |
| Expenses including reductions | 0.92 | 0.92 | 0.925 | 0.92 | 0.94 | 0.99 |
| Net investment income | 0.82 | 1.05 | 1.065 | 0.79 | 1.09 | 1.06 |
| Portfolio turnover (%) | 80 | 98 | 4 | 65 | 94 | 82 |
| 1 | For the one-month period ended 3-31-18. The fund changed its fiscal year end from February 28 to March 31. |
| 2 | Based on average daily shares outstanding. |
| 3 | Total returns would have been lower had certain expenses not been reduced during the applicable periods. |
| 4 | Not annualized. |
| 5 | Annualized. |
| SEE NOTES TO FINANCIAL STATEMENTS | ANNUAL REPORT | JOHN HANCOCK International Growth Fund | 25 |
| CLASS NAV SHARES Period ended | 3-31-20 | 3-31-19 | 3-31-181 | 2-28-18 | 2-28-17 | 2-29-162 |
| Per share operating performance | | | | | | |
| Net asset value, beginning of period | $26.82 | $28.57 | $28.47 | $21.71 | $19.93 | $22.66 |
| Net investment income3 | 0.24 | 0.29 | 0.03 | 0.23 | 0.19 | 0.11 |
| Net realized and unrealized gain (loss) on investments | (2.21) | (1.31) | 0.07 | 6.69 | 1.81 | (2.72) |
| Total from investment operations | (1.97) | (1.02) | 0.10 | 6.92 | 2.00 | (2.61) |
| Less distributions | | | | | | |
| From net investment income | (0.23) | (0.27) | — | (0.16) | (0.22) | (0.12) |
| From net realized gain | — | (0.46) | — | — | — | — |
| Total distributions | (0.23) | (0.73) | — | (0.16) | (0.22) | (0.12) |
| Net asset value, end of period | $24.62 | $26.82 | $28.57 | $28.47 | $21.71 | $19.93 |
| Total return (%)4 | (7.51) | (3.27) | 0.355 | 31.91 | 10.10 | (11.57)5 |
| Ratios and supplemental data | | | | | | |
| Net assets, end of period (in millions) | $854 | $1,028 | $1,136 | $1,151 | $864 | $86 |
| Ratios (as a percentage of average net assets): | | | | | | |
| Expenses before reductions | 0.88 | 0.87 | 0.876 | 0.88 | 0.91 | 0.946 |
| Expenses including reductions | 0.87 | 0.87 | 0.876 | 0.87 | 0.90 | 0.936 |
| Net investment income | 0.87 | 1.06 | 1.106 | 0.89 | 0.91 | 0.696 |
| Portfolio turnover (%) | 80 | 98 | 4 | 65 | 94 | 827 |
| 1 | For the one-month period ended 3-31-18. The fund changed its fiscal year end from February 28 to March 31. |
| 2 | The inception date for Class NAV shares is 6-2-15. |
| 3 | Based on average daily shares outstanding. |
| 4 | Total returns would have been lower had certain expenses not been reduced during the applicable periods. |
| 5 | Not annualized. |
| 6 | Annualized. |
| 7 | The portfolio turnover is shown for the period from 3-1-15 to 2-29-16. |
| 26 | JOHN HANCOCK International Growth Fund | ANNUAL REPORT | SEE NOTES TO FINANCIAL STATEMENTS |
| Notes to financial statements | |
Note 1—Organization
John Hancock International Growth Fund (the fund) is a series of John Hancock Funds III (the Trust), an open-end management investment company organized as a Massachusetts business trust and registered under the Investment Company Act of 1940, as amended (the 1940 Act). The investment objective of the fund is to seek high total return primarily through capital appreciation.
The fund may offer multiple classes of shares. The shares currently outstanding are detailed in the Statement of assets and liabilities. Class A and Class C shares are offered to all investors. Class B shares are closed to new investors. Class I shares are offered to institutions and certain investors. Class R2 and Class R4 shares are available only to certain retirement and 529 plans. Class R6 shares are only available to certain retirement plans, institutions and other investors. Class 1 shares are offered only to certain affiliates of Manulife Financial Corporation (MFC). Class NAV shares are offered to John Hancock affiliated funds of funds, retirement plans for employees of John Hancock and/or Manulife Financial Corporation, and certain 529 plans. Class B shares convert to Class A shares eight years after purchase. Class C shares convert to Class A shares ten years after purchase (certain exclusions may apply). Shareholders of each class have exclusive voting rights to matters that affect that class. The distribution and service fees, if any, and transfer agent fees for each class may differ.
The fund is closed to new investors, except as provided in the fund’s prospectus.
Note 2—Significant accounting policies
The financial statements have been prepared in conformity with accounting principles generally accepted in the United States of America (US GAAP), which require management to make certain estimates and assumptions as of the date of the financial statements. Actual results could differ from those estimates and those differences could be significant. The fund qualifies as an investment company under Topic 946 of Accounting Standards Codification of US GAAP.
Events or transactions occurring after the end of the fiscal period through the date that the financial statements were issued have been evaluated in the preparation of the financial statements. The following summarizes the significant accounting policies of the fund:
Security valuation. Investments are stated at value as of the scheduled close of regular trading on the New York Stock Exchange (NYSE), normally at 4:00 P.M., Eastern Time. In case of emergency or other disruption resulting in the NYSE not opening for trading or the NYSE closing at a time other than the regularly scheduled close, the net asset value (NAV) may be determined as of the regularly scheduled close of the NYSE pursuant to the fund's Valuation Policies and Procedures.
In order to value the securities, the fund uses the following valuation techniques: Equity securities, including exchange-traded or closed-end funds, are typically valued at the last sale price or official closing price on the exchange or principal market where the security trades. In the event there were no sales during the day or closing prices are not available, the securities are valued using the last available bid price. Investments by the fund in open-end mutual funds, including John Hancock Collateral Trust (JHCT), are valued at their respective NAVs each business day. Debt obligations are typically valued based on the evaluated prices provided by an independent pricing vendor. Independent pricing vendors utilize matrix pricing, which takes into account factors such as institutional-size trading in similar groups of securities, yield, quality, coupon rate, maturity, type of issue, trading characteristics and other market data, as well as broker supplied prices. Foreign securities and currencies are valued in U.S. dollars based on foreign currency exchange rates supplied by an independent pricing vendor.
In certain instances, the Pricing Committee may determine to value equity securities using prices obtained from another exchange or market if trading on the exchange or market on which prices are typically obtained did not open for trading as scheduled, or if trading closed earlier than scheduled, and trading occurred as normal on another exchange or market.
| | ANNUAL REPORT | JOHN HANCOCK International Growth Fund | 27 |
Other portfolio securities and assets, for which reliable market quotations are not readily available, are valued at fair value as determined in good faith by the fund's Pricing Committee following procedures established by the Board of Trustees. The frequency with which these fair valuation procedures are used cannot be predicted and fair value of securities may differ significantly from the value that would have been used had a ready market for such securities existed. Trading in foreign securities may be completed before the scheduled daily close of trading on the NYSE. Significant events at the issuer or market level may affect the values of securities between the time when the valuation of the securities is generally determined and the close of the NYSE. If a significant event occurs, these securities may be fair valued, as determined in good faith by the fund's Pricing Committee, following procedures established by the Board of Trustees. The fund uses fair value adjustment factors provided by an independent pricing vendor to value certain foreign securities in order to adjust for events that may occur between the close of foreign exchanges or markets and the close of the NYSE.
The fund uses a three-tier hierarchy to prioritize the pricing assumptions, referred to as inputs, used in valuation techniques to measure fair value. Level 1 includes securities valued using quoted prices in active markets for identical securities, including registered investment companies. Level 2 includes securities valued using other significant observable inputs. Observable inputs may include quoted prices for similar securities, interest rates, prepayment speeds and credit risk. Prices for securities valued using these inputs are received from independent pricing vendors and brokers and are based on an evaluation of the inputs described. Level 3 includes securities valued using significant unobservable inputs when market prices are not readily available or reliable, including the fund's own assumptions in determining the fair value of investments. Factors used in determining value may include market or issuer specific events or trends, changes in interest rates and credit quality. The inputs or methodology used for valuing securities are not necessarily an indication of the risks associated with investing in those securities. Changes in valuation techniques and related inputs may result in transfers into or out of an assigned level within the disclosure hierarchy.
The following is a summary of the values by input classification of the fund's investments as of March 31, 2020, by major security category or type:
| | Total
value at
3-31-20 | Level 1
quoted
price | Level 2
significant
observable
inputs | Level 3
significant
unobservable
inputs |
| Investments in securities: | | | | |
| Assets | | | | |
| Common stocks | | | | |
| Australia | $87,739,486 | — | $87,739,486 | — |
| Canada | 227,483,277 | $227,483,277 | — | — |
| China | 1,477,163,938 | 505,169,090 | 971,994,848 | — |
| Denmark | 113,786,903 | — | 113,786,903 | — |
| France | 737,896,362 | — | 737,896,362 | — |
| Germany | 243,270,715 | — | 243,270,715 | — |
| Hong Kong | 313,693,249 | — | 313,693,249 | — |
| Ireland | 409,579,431 | 303,711,160 | 105,868,271 | — |
| Japan | 701,843,390 | — | 701,843,390 | — |
| Netherlands | 488,887,038 | — | 488,887,038 | — |
| Spain | 265,971,831 | — | 265,971,831 | — |
| Sweden | 219,231,757 | — | 219,231,757 | — |
| Switzerland | 1,146,672,289 | — | 1,146,672,289 | — |
| Taiwan | 528,128,201 | — | 528,128,201 | — |
| United Kingdom | 611,000,658 | 154,137,047 | 456,863,611 | — |
| 28 | JOHN HANCOCK International Growth Fund | ANNUAL REPORT | |
| | Total
value at
3-31-20 | Level 1
quoted
price | Level 2
significant
observable
inputs | Level 3
significant
unobservable
inputs |
| United States | $80,758,791 | $80,758,791 | — | — |
| Short-term investments | 28,302,480 | 3,802,480 | $24,500,000 | — |
| Total investments in securities | $7,681,409,796 | $1,275,061,845 | $6,406,347,951 | — |
Repurchase agreements. The fund may enter into repurchase agreements. When the fund enters into a repurchase agreement, it receives collateral that is held in a segregated account by the fund's custodian, or for tri-party repurchase agreements, collateral is held at a third-party custodian bank in a segregated account for the benefit of the fund. The collateral amount is marked-to-market and monitored on a daily basis to ensure that the collateral held is in an amount not less than the principal amount of the repurchase agreement plus any accrued interest. Collateral received by the fund for repurchase agreements is disclosed in the Fund's investments as part of the caption related to the repurchase agreement.
Repurchase agreements are typically governed by the terms and conditions of the Master Repurchase Agreement and/or Global Master Repurchase Agreement (collectively, MRA). Upon an event of default, the non-defaulting party may close out all transactions traded under the MRA and net amounts owed. Absent an event of default, assets and liabilities resulting from repurchase agreements are not offset in the Statement of assets and liabilities. In the event of a default by the counterparty, realization of the collateral proceeds could be delayed, during which time the collateral value may decline or the counterparty may have insufficient assets to pay claims resulting from close-out of the transactions.
Security transactions and related investment income. Investment security transactions are accounted for on a trade date plus one basis for daily NAV calculations. However, for financial reporting purposes, investment transactions are reported on trade date. Interest income is accrued as earned. Dividend income is recorded on the ex-date, except for dividends of certain foreign securities where the dividend may not be known until after the ex-date. In those cases, dividend income, net of withholding taxes, is recorded when the fund becomes aware of the dividends. Non-cash dividends, if any, are recorded at the fair market value of the securities received. Gains and losses on securities sold are determined on the basis of identified cost and may include proceeds from litigation.
Securities lending. The fund may lend its securities to earn additional income. The fund receives collateral from the borrower in an amount not less than the market value of the loaned securities. The fund will invest its cash collateral in JHCT, an affiliate of the fund, which has a floating NAV and is registered with the Securities and Exchange Commission (SEC) as an investment company. JHCT invests in short-term money market investments. The fund will receive the benefit of any gains and bear any losses generated by JHCT with respect to the cash collateral.
The fund has the right to recall loaned securities on demand. If a borrower fails to return loaned securities when due, then the lending agent is responsible and indemnifies the fund for the lent securities. The lending agent uses the collateral received from the borrower to purchase replacement securities of the same issue, type, class and series of the loaned securities. If the value of the collateral is less than the purchase cost of replacement securities, the lending agent is responsible for satisfying the shortfall but only to the extent that the shortfall is not due to any decrease in the value of JHCT.
Although the risk of loss on securities lent is mitigated by receiving collateral from the borrower and through lending agent indemnification, the fund could experience a delay in recovering securities or could experience a lower than expected return if the borrower fails to return the securities on a timely basis. The fund receives compensation for lending its securities by retaining a portion of the return on the investment of the collateral and
| | ANNUAL REPORT | JOHN HANCOCK International Growth Fund | 29 |
compensation from fees earned from borrowers of the securities. Securities lending income received by the fund is net of fees retained by the securities lending agent. Net income received from JHCT is a component of securities lending income as recorded on the Statement of operations.
Obligations to repay collateral received by the fund are shown on the Statement of assets and liabilities as Payable upon return of securities loaned and are secured by the loaned securities. As of March 31, 2020, the fund loaned securities valued at $3,403,141 and received $3,843,532 of cash collateral.
Foreign investing. Assets, including investments, and liabilities denominated in foreign currencies are translated into U.S. dollar values each day at the prevailing exchange rate. Purchases and sales of securities, income and expenses are translated into U.S. dollars at the prevailing exchange rate on the date of the transaction. The effect of changes in foreign currency exchange rates on the value of securities is reflected as a component of the realized and unrealized gains (losses) on investments. Foreign investments are subject to a decline in the value of a foreign currency versus the U.S. dollar, which reduces the dollar value of securities denominated in that currency.
Funds that invest internationally generally carry more risk than funds that invest strictly in U.S. securities. Risks can result from differences in economic and political conditions, regulations, market practices (including higher transaction costs), accounting standards and other factors.
Foreign taxes. The fund may be subject to withholding tax on income, capital gains or repatriation taxes imposed by certain countries, a portion of which may be recoverable. Foreign taxes are accrued based upon the fund's understanding of the tax rules and rates that exist in the foreign markets in which it invests. Taxes are accrued based on gains realized by the fund as a result of certain foreign security sales. In certain circumstances, estimated taxes are accrued based on unrealized appreciation of such securities. Investment income is recorded net of foreign withholding taxes.
Overdraft. The fund may have the ability to borrow from banks for temporary or emergency purposes, including meeting redemption requests that otherwise might require the untimely sale of securities. Pursuant to the fund's custodian agreement, the custodian may loan money to the fund to make properly authorized payments. The fund is obligated to repay the custodian for any overdraft, including any related costs or expenses. The custodian may have a lien, security interest or security entitlement in any fund property that is not otherwise segregated or pledged, to the extent of any overdraft, and to the maximum extent permitted by law.
Line of credit. The fund and other affiliated funds have entered into a syndicated line of credit agreement with Citibank, N.A. as the administrative agent that enables them to participate in a $750 million unsecured committed line of credit. Excluding commitments designated for a certain fund and subject to the needs of all other affiliated funds, the fund can borrow up to an aggregate commitment amount of $500 million, subject to asset coverage and other limitations as specified in the agreement. A commitment fee payable at the end of each calendar quarter, based on the average daily unused portion of the line of credit, is charged to each participating fund based on a combination of fixed and asset based allocations and is reflected in Other expenses on the Statement of operations. Commitment fees for the year ended March 31, 2020 were $24,533.
Expenses. Within the John Hancock group of funds complex, expenses that are directly attributable to an individual fund are allocated to such fund. Expenses that are not readily attributable to a specific fund are allocated among all funds in an equitable manner, taking into consideration, among other things, the nature and type of expense and the fund’s relative net assets. Expense estimates are accrued in the period to which they relate and adjustments are made when actual amounts are known.
Class allocations. Income, common expenses and realized and unrealized gains (losses) are determined at the fund level and allocated daily to each class of shares based on the net assets of the class. Class-specific expenses, such as distribution and service fees, if any, and transfer agent fees, for all classes, are charged daily at the class level based on the net assets of each class and the specific expense rates applicable to each class.
| 30 | JOHN HANCOCK International Growth Fund | ANNUAL REPORT | |
Federal income taxes. The fund intends to continue to qualify as a regulated investment company by complying with the applicable provisions of the Internal Revenue Code and will not be subject to federal income tax on taxable income that is distributed to shareholders. Therefore, no federal income tax provision is required.
For federal income tax purposes, as of March 31, 2020, the fund has a short-term capital loss carryforward of $391,104,401 available to offset future net realized capital gains. This carryforward does not expire.
As of March 31, 2020, the fund had no uncertain tax positions that would require financial statement recognition, derecognition or disclosure. The fund's federal tax returns are subject to examination by the Internal Revenue Service for a period of three years.
Distribution of income and gains. Distributions to shareholders from net investment income and net realized gains, if any, are recorded on the ex-date. The fund generally declares and pays dividends annually. Capital gain distributions, if any, are typically distributed annually.
The tax character of distributions for the years ended March 31, 2020 and 2019 was as follows:
| | March 31, 2020 | March 31, 2019 |
| Ordinary income | $65,303,291 | $86,299,307 |
| Long-term capital gains | — | 159,415,447 |
| Total | $65,303,291 | $245,714,754 |
Distributions paid by the fund with respect to each class of shares are calculated in the same manner, at the same time and in the same amount, except for the effect of class level expenses that may be applied differently to each class. As of March 31, 2020, the components of distributable earnings on a tax basis consisted of $5,091,303 of undistributed ordinary income.
Such distributions and distributable earnings, on a tax basis, are determined in conformity with income tax regulations, which may differ from US GAAP. Distributions in excess of tax basis earnings and profits, if any, are reported in the fund's financial statements as a return of capital.
Capital accounts within the financial statements are adjusted for permanent book-tax differences. These adjustments have no impact on net assets or the results of operations. Temporary book-tax differences, if any, will reverse in a subsequent period. Book-tax differences are primarily attributable to foreign currency transactions, investments in passive foreign investment companies, wash sale loss deferrals and foreign capital gains tax.
Note 3—Guarantees and indemnifications
Under the Trust's organizational documents, its Officers and Trustees are indemnified against certain liabilities arising out of the performance of their duties to the Trust, including the fund. Additionally, in the normal course of business, the fund enters into contracts with service providers that contain general indemnification clauses. The fund's maximum exposure under these arrangements is unknown, as this would involve future claims that may be made against the fund that have not yet occurred. The risk of material loss from such claims is considered remote.
Note 4—Fees and transactions with affiliates
John Hancock Investment Management LLC (the Advisor) serves as investment advisor for the fund. John Hancock Investment Management Distributors LLC (the Distributor), an affiliate of the Advisor, serves as principal underwriter of the fund. The Advisor and the Distributor are indirect, wholly owned subsidiaries of Manulife Financial Corporation. Prior to June 28, 2019, the Advisor was known as John Hancock Advisers, LLC and the Distributor was known as John Hancock Funds, LLC.
Management fee. The fund has an investment management agreement with the Advisor under which the fund pays a daily management fee to the Advisor, equivalent on an annual basis to the sum of (a) 0.900% of the first $500 million of the fund’s aggregate average daily net assets (together with the assets of any other applicable
| | ANNUAL REPORT | JOHN HANCOCK International Growth Fund | 31 |
fund identified in the advisory agreement); (b) 0.850% of the next $500 million of the fund’s aggregate average daily net assets, and (c) 0.800% of the fund’s aggregate average daily net assets in excess of $1 billion. The Advisor has a subadvisory agreement with Wellington Management Company LLP. The fund is not responsible for payment of the subadvisory fees.
The Advisor has contractually agreed to waive a portion of its management fee and/or reimburse expenses for certain funds of the John Hancock group of funds complex, including the fund (the participating portfolios). This waiver is based upon aggregate net assets of all the participating portfolios. The amount of the reimbursement is calculated daily and allocated among all the participating portfolios in proportion to the daily net assets of each fund. During the year ended March 31, 2020, this waiver amounted to 0.01% of the fund’s average daily net assets. This arrangement expires on July 31, 2021, unless renewed by mutual agreement of the fund and the Advisor based upon a determination that this is appropriate under the circumstances at that time.
For the year ended March 31, 2020, the expense reductions described above amounted to the following:
| Class | Expense reduction |
| Class A | $42,745 |
| Class B | 54 |
| Class C | 17,752 |
| Class I | 416,129 |
| Class R2 | 2,845 |
| Class | Expense reduction |
| Class R4 | $613 |
| Class R6 | 132,198 |
| Class 1 | 5,640 |
| Class NAV | 74,424 |
| Total | $692,400 |
Expenses waived or reimbursed in the current fiscal period are not subject to recapture in future fiscal periods.
The investment management fees, including the impact of the waivers and reimbursements as described above, incurred for the year ended March 31, 2020, were equivalent to a net annual effective rate of 0.80% of the fund's average daily net assets.
Accounting and legal services. Pursuant to a service agreement, the fund reimburses the Advisor for all expenses associated with providing the administrative, financial, legal, compliance, accounting and recordkeeping services to the fund, including the preparation of all tax returns, periodic reports to shareholders and regulatory reports, among other services. These expenses are allocated to each share class based on its relative net assets at the time the expense was incurred. These accounting and legal services fees incurred for the year ended March 31, 2020 amounted to an annual rate of 0.02% of the fund's average daily net assets.
Distribution and service plans. The fund has a distribution agreement with the Distributor. The fund has adopted distribution and service plans for certain classes as detailed below pursuant to Rule 12b-1 under the 1940 Act, to pay the Distributor for services provided as the distributor of shares of the fund. In addition, under a service plan for certain classes as detailed below, the fund pays for certain other services. The fund may pay up to the following contractual rates of distribution and service fees under these arrangements, expressed as an annual percentage of average daily net assets for each class of the fund's shares:
| Class | Rule 12b-1 Fee | Service fee |
| Class A | 0.30% | — |
| Class B | 1.00% | — |
| Class C | 1.00% | — |
| Class R2 | 0.25% | 0.25% |
| Class R4 | 0.25% | 0.10% |
| Class 1 | 0.05% | — |
| 32 | JOHN HANCOCK International Growth Fund | ANNUAL REPORT | |
The fund's Distributor has contractually agreed to waive 0.10% of Rule12b-1 fees for Class R4 shares. The current waiver agreement expires on July 31, 2021, unless renewed by mutual agreement of the fund and the Distributor based upon a determination that this is appropriate under the circumstances at the time. This contractual waiver amounted to $8,285 for Class R4 shares for the year ended March 31, 2020.
Sales charges. Class A shares are assessed up-front sales charges, which resulted in payments to the Distributor amounting to $160,925 for the year ended March 31, 2020. Of this amount, $27,265 was retained and used for printing prospectuses, advertising, sales literature and other purposes and $133,660 was paid as sales commissions to broker-dealers.
Class A, Class B and Class C shares may be subject to contingent deferred sales charges (CDSCs). Certain Class A shares that are acquired through purchases of $1 million or more and are redeemed within one year of purchase are subject to a 1.00% sales charge. Class B shares that are redeemed within six years of purchase are subject to CDSCs, at declining rates, beginning at 5.00%. Class C shares that are redeemed within one year of purchase are subject to a 1.00% CDSC. CDSCs are applied to the lesser of the current market value at the time of redemption or the original purchase cost of the shares being redeemed. Proceeds from CDSCs are used to compensate the Distributor for providing distribution-related services in connection with the sale of these shares. During the year ended March 31, 2020, CDSCs received by the Distributor amounted to $1,329, $3 and $6,814 for Class A, Class B and Class C shares, respectively.
Transfer agent fees. The John Hancock group of funds has a complex-wide transfer agent agreement with John Hancock Signature Services, Inc. (Signature Services), an affiliate of the Advisor. The transfer agent fees paid to Signature Services are determined based on the cost to Signature Services (Signature Services Cost) of providing recordkeeping services. It also includes out-of-pocket expenses, including payments made to third-parties for recordkeeping services provided to their clients who invest in one or more John Hancock funds. In addition, Signature Services Cost may be reduced by certain fees that Signature Services receives in connection with retirement and small accounts. Signature Services Cost is calculated monthly and allocated, as applicable, to five categories of share classes: Retail Share and Institutional Share Classes of Non-Municipal Bond Funds, Class R6 Shares, Retirement Share Classes and Municipal Bond Share Classes. Within each of these categories, the applicable costs are allocated to the affected John Hancock affiliated funds and/or classes, based on the relative average daily net assets.
Class level expenses. Class level expenses for the year ended March 31, 2020 were as follows:
| Class | Distribution and service fees | Transfer agent fees |
| Class A | $1,734,593 | $700,730 |
| Class B | 7,309 | 881 |
| Class C | 2,401,499 | 290,780 |
| Class I | — | 6,898,760 |
| Class R2 | 192,618 | 4,760 |
| Class R4 | 28,871 | 1,033 |
| Class R6 | — | 221,834 |
| Class 1 | 38,138 | — |
| Total | $4,403,028 | $8,118,778 |
Trustee expenses. The fund compensates each Trustee who is not an employee of the Advisor or its affiliates. The costs of paying Trustee compensation and expenses are allocated to the fund based on its net assets relative to other funds within the John Hancock group of funds complex.
Interfund lending program. Pursuant to an Exemptive Order issued by the SEC, the fund, along with certain other funds advised by the Advisor or its affiliates, may participate in an interfund lending program. This program provides an alternative credit facility allowing the fund to borrow from, or lend money to, other participating
| | ANNUAL REPORT | JOHN HANCOCK International Growth Fund | 33 |
affiliated funds. At period end, no interfund loans were outstanding. Interest expense is included in Other expenses on the Statement of operations. The fund's activity in this program during the period for which loans were outstanding was as follows:
Borrower
or Lender | Weighted Average
Loan Balance | Days
Outstanding | Weighted Average
Interest Rate | Interest Income
(Expense) |
| Borrower | $10,603,094 | 12 | 1.710% | $(6,043) |
| Lender | $5,674,808 | 4 | 1.941% | 1,224 |
Note 5—Fund share transactions
Transactions in fund shares for the years ended March 31, 2020 and 2019 were as follows:
| | Year Ended 3-31-20 | Year Ended 3-31-19 |
| | Shares | Amount | Shares | Amount |
| Class A shares | | | | |
| Sold | 2,446,594 | $68,358,288 | 3,934,860 | $107,881,677 |
| Distributions reinvested | 80,353 | 2,361,574 | 588,267 | 14,212,523 |
| Repurchased | (6,692,046) | (183,226,522) | (10,780,632) | (288,739,157) |
| Net decrease | (4,165,099) | $(112,506,660) | (6,257,505) | $(166,644,957) |
| Class B shares | | | | |
| Sold | 734 | $20,222 | 1,025 | $27,679 |
| Distributions reinvested | — | — | 735 | 17,482 |
| Repurchased | (22,043) | (603,733) | (27,519) | (722,736) |
| Net decrease | (21,309) | $(583,511) | (25,759) | $(677,575) |
| Class C shares | | | | |
| Sold | 254,037 | $6,963,940 | 924,629 | $24,604,117 |
| Distributions reinvested | — | — | 197,102 | 4,679,208 |
| Repurchased | (2,740,410) | (73,029,343) | (3,565,527) | (92,001,072) |
| Net decrease | (2,486,373) | $(66,065,403) | (2,443,796) | $(62,717,747) |
| Class I shares | | | | |
| Sold | 49,477,777 | $1,366,902,827 | 95,608,369 | $2,596,657,426 |
| Distributions reinvested | 1,167,622 | 34,363,108 | 5,206,727 | 125,950,713 |
| Repurchased | (68,467,588) | (1,865,250,138) | (90,103,831) | (2,356,584,416) |
| Net increase (decrease) | (17,822,189) | $(463,984,203) | 10,711,265 | $366,023,723 |
| Class R2 shares | | | | |
| Sold | 202,705 | $5,575,034 | 441,295 | $11,837,910 |
| Distributions reinvested | 3,673 | 108,135 | 33,567 | 812,332 |
| Repurchased | (598,767) | (16,480,184) | (370,850) | (10,005,761) |
| Net increase (decrease) | (392,389) | $(10,797,015) | 104,012 | $2,644,481 |
| 34 | JOHN HANCOCK International Growth Fund | ANNUAL REPORT | |
| | Year Ended 3-31-20 | Year Ended 3-31-19 |
| | Shares | Amount | Shares | Amount |
| Class R4 shares | | | | |
| Sold | 140,115 | $3,952,475 | 69,035 | $1,861,755 |
| Distributions reinvested | 1,838 | 54,100 | 7,905 | 191,219 |
| Repurchased | (145,979) | (4,067,537) | (74,859) | (2,008,808) |
| Net increase (decrease) | (4,026) | $(60,962) | 2,081 | $44,166 |
| Class R6 shares | | | | |
| Sold | 8,691,254 | $245,579,858 | 17,610,134 | $484,165,158 |
| Distributions reinvested | 475,842 | 14,013,544 | 2,047,381 | 49,546,630 |
| Repurchased | (19,333,160) | (539,601,756) | (14,078,112) | (373,109,601) |
| Net increase (decrease) | (10,166,064) | $(280,008,354) | 5,579,403 | $160,602,187 |
| Class 1 shares | | | | |
| Sold | 153,496 | $4,299,780 | 394,196 | $10,902,977 |
| Distributions reinvested | 19,424 | 571,277 | 88,589 | 2,141,203 |
| Repurchased | (702,781) | (19,373,039) | (833,044) | (22,291,454) |
| Net decrease | (529,861) | $(14,501,982) | (350,259) | $(9,247,274) |
| Class NAV shares | | | | |
| Sold | 2,253,310 | $63,614,641 | 1,905,823 | $49,201,008 |
| Distributions reinvested | 275,574 | 8,104,635 | 1,182,714 | 28,574,370 |
| Repurchased | (6,147,081) | (174,110,113) | (4,532,900) | (122,183,627) |
| Net decrease | (3,618,197) | $(102,390,837) | (1,444,363) | $(44,408,249) |
| Total net increase (decrease) | (39,205,507) | $(1,050,898,927) | 5,875,079 | $245,618,755 |
Affiliates of the fund owned 100% and 90% of shares of Class 1 and Classs NAV, respectively, on March 31, 2020. Such concentration of shareholders’ capital could have a material effect on the fund if such shareholders redeem from the fund.
Note 6—Purchase and sale of securities
Purchases and sales of securities, other than short-term investments, amounted to $7,381,183,034 and $8,462,828,229, respectively, for the year ended March 31, 2020.
Note 7—Investment by affiliated funds
Certain investors in the fund are affiliated funds that are managed by the Advisor and its affiliates. The affiliated funds do not invest in the fund for the purpose of exercising management or control; however, this investment may represent a significant portion of the fund's net assets. At March 31, 2020, funds within the John Hancock group of funds complex held 10.0% of the fund's net assets. There were no affiliated funds with an ownership of 5% or more of the fund's net assets.
| | ANNUAL REPORT | JOHN HANCOCK International Growth Fund | 35 |
Note 8—Investment in affiliated underlying funds
The fund may invest in affiliated underlying funds that are managed by the Advisor and its affiliates. Information regarding the fund's fiscal year to date purchases and sales of the affiliated underlying funds as well as income and capital gains earned by the fund, if any, is as follows:
| | | | | | | | Dividends and distributions |
| Affiliate | Ending
share
amount | Beginning
value | Cost of
purchases | Proceeds
from shares
sold | Realized
gain
(loss) | Change in
unrealized
appreciation
(depreciation) | Income
distributions
received | Capital gain
distributions
received | Ending
value |
| John Hancock Collateral Trust* | 380,343 | $35,310,762 | $1,877,809,147 | $(1,909,275,109) | $(42,736) | $416 | $2,041,424 | — | $3,802,480 |
| * | Refer to the Securities lending note within Note 2 for details regarding this investment. |
Note 9—Coronavirus (COVID-19) pandemic
The novel COVID-19 disease has resulted in significant disruptions to global business activity. A widespread health crisis such as a global pandemic could cause substantial market volatility, exchange trading suspensions and closures, impact the ability to complete redemptions, and affect fund performance.
| 36 | JOHN HANCOCK International Growth Fund | ANNUAL REPORT | |
Report of Independent Registered Public Accounting Firm
To the Board of Trustees of John Hancock Funds III and Shareholders of John Hancock International Growth Fund
Opinion on the Financial Statements
We have audited the accompanying statement of assets and liabilities, including the Fund’s investments, of John Hancock International Growth Fund (one of the funds constituting John Hancock Funds III, referred to hereafter as the "Fund") as of March 31, 2020, the related statement of operations for the year ended March 31, 2020, the statements of changes in net assets for each of the two years in the period ended March 31, 2020, including the related notes, and the financial highlights for each of the periods indicated therein (collectively referred to as the “financial statements”). In our opinion, the financial statements present fairly, in all material respects, the financial position of the Fund as of March 31, 2020, the results of its operations for the year then ended, the changes in its net assets for each of the two years in the period ended March 31, 2020 and the financial highlights for each of the periods indicated therein in conformity with accounting principles generally accepted in the United States of America.
Basis for Opinion
These financial statements are the responsibility of the Fund’s management. Our responsibility is to express an opinion on the Fund’s financial statements based on our audits. We are a public accounting firm registered with the Public Company Accounting Oversight Board (United States) (PCAOB) and are required to be independent with respect to the Fund in accordance with the U.S. federal securities laws and the applicable rules and regulations of the Securities and Exchange Commission and the PCAOB.
We conducted our audits of these financial statements in accordance with the standards of the PCAOB. Those standards require that we plan and perform the audit to obtain reasonable assurance about whether the financial statements are free of material misstatement, whether due to error or fraud.
Our audits included performing procedures to assess the risks of material misstatement of the financial statements, whether due to error or fraud, and performing procedures that respond to those risks. Such procedures included examining, on a test basis, evidence regarding the amounts and disclosures in the financial statements. Our audits also included evaluating the accounting principles used and significant estimates made by management, as well as evaluating the overall presentation of the financial statements. Our procedures included confirmation of securities owned as of March 31, 2020 by correspondence with the custodian, transfer agent and broker; when replies were not received from the broker, we performed other auditing procedures. We believe that our audits provide a reasonable basis for our opinion.
/s/ PricewaterhouseCoopers LLP
Boston, Massachusetts
May 13, 2020
We have served as the auditor of one or more investment companies in the John Hancock group of funds since 1988.
| | ANNUAL REPORT | JOHN HANCOCK INTERNATIONAL GROWTH FUND | 37 |
| Tax information (Unaudited) | |
For federal income tax purposes, the following information is furnished with respect to the distributions of the fund, if any, paid during its taxable year ended March 31, 2020.
The fund reports the maximum amount allowable of its net taxable income as eligible for the corporate dividends-received deduction.
The fund reports the maximum amount allowable of its net taxable income as qualified dividend income as provided in the Jobs and Growth Tax Relief Reconciliation Act of 2003.
Income derived from foreign sources was $141,811,676. The fund intends to pass through foreign tax credits of $24,094,300.
The fund reports the maximum amount allowable of its Section 199A dividends as defined in Proposed Treasury Regulation §1.199A-3(d).
Eligible shareholders will be mailed a 2020 Form 1099-DIV in early 2021. This will reflect the tax character of all distributions paid in calendar year 2020.
Please consult a tax advisor regarding the tax consequences of your investment in the fund.
| 38 | JOHN HANCOCK INTERNATIONAL GROWTH FUND | ANNUAL REPORT | |
STATEMENT REGARDING LIQUIDITY RISK MANAGEMENT
Operation of the Liquidity Risk Management Program
This section describes operation and effectiveness of the Liquidity Risk Management Program (LRMP) established in accordance with Rule 22e-4 under the Investment Company Act of 1940, as amended (the Liquidity Rule). The Board of Trustees (the Board) of each Fund in the John Hancock Group of Funds (each a Fund and collectively, the Funds) that is subject to the requirements of the Liquidity Rule has appointed John Hancock Investment Management, LLC and John Hancock Variable Trust Advisers, LLC (together, the Advisor) to serve as Administrator of the LRMP with respect to each of the Funds, including John Hancock International Growth Fund, subject to the oversight of the Board. In order to provide a mechanism and process to perform the functions necessary to administer the LRMP, the Advisor established the Liquidity Risk Management Committee (the Committee). The Fund's subadvisor, Wellington Management Company, LLP (the Subadvisor) executes the day-to-day investment management and security-level activities of the Fund in accordance with the requirements of the LRMP, subject to the supervision of the Advisor and the Board.
The Committee holds monthly meetings to: (1) review the day-to-day operations of the LRMP; (2) review and approve month end liquidity classifications; (3) review quarterly testing and determinations, as applicable; and (4) review other LRMP related material. The Committee also conducts daily, monthly, quarterly, and annual quantitative and qualitative assessments of each subadvisor to a Fund that is subject to the requirements of the Liquidity Rule and is a part of the LRMP to monitor investment performance issues, risks and trends. In addition, the Committee may conduct ad-hoc reviews and meetings with subadvisors as issues and trends are identified, including potential liquidity and valuation issues.
The Committee provided the Board at an in-person meeting held on March 15-18, 2020 with a written report which addressed the Committee's assessment of the adequacy and effectiveness of the implementation and operation of the LRMP and any material changes to the LRMP. The report, which covered the period December 1, 2018 through December 31, 2019, included an assessment of important aspects of the LRMP including, but not limited to:
• Operation of the Fund's Redemption-In-Kind Procedures;
• Highly Liquid Investment Minimum (HLIM) determination;
• Compliance with the 15% limit on illiquid investments;
• Reasonably Anticipated Trade Size (RATS) determination;
• Security-level liquidity classifications; and
• Liquidity risk assessment.
The report also covered material liquidity matters which occurred or were reported during this period applicable to the Fund, if any, and the Committee's actions to address such matters.
Redemption-In-Kind Procedures
Rule 22e-4 requires any fund that engages in or reserves the right to engage in in-kind redemptions to adopt and implement written policies and procedures regarding in-kind redemptions as part of the management of its liquidity risk. These procedures address the process for redeeming in kind, as well as the circumstances under which the Fund would consider redeeming in kind. Anticipated large redemption activity will be evaluated to identify situations where redeeming in securities instead of cash may be appropriate.
ANNUAL REPORT | JOHN HANCOCK INTERNATIONAL GROWTH FUND 39
As part of its annual assessment of the LRMP, the Committee reviewed the implementation and operation of the Redemption-In-Kind Procedures and determined they are operating in a manner that such procedures are adequate and effective to manage in-kind redemptions on behalf of the Fund as part of the LRMP.
Highly Liquid Investment Minimum determination
The Committee uses an HLIM model to determine a Fund's HLIM. This process incorporates the Fund's investment strategy, historical redemptions, liquidity classification rollup percentages and cash balances, redemption policy, access to funding sources, distribution channels and client concentrations. If the Fund falls below its established HLIM for a period greater than 7 consecutive calendar days, the Committee prepares a report to the Board within one business day following the seventh consecutive calendar day with an explanation of how the Fund plans to restore its HLIM within a reasonable period of time.
Based on the HLIM model, the Committee has determined that the Fund qualifies as a Primarily Highly Liquid Fund (PHLF). It is therefore not required to establish a HLIM. The Fund is tested quarterly to confirm its PHLF status.
As part of its annual assessment of the LRMP, the Committee reviewed the policies and procedures in place with respect to HLIM and PHLF determinations, and determined that such policies and procedures are operating in a manner that is adequate and effective as part of the LRMP.
Compliance with the 15% limit on illiquid investments
Rule 22e-4 sets an aggregate illiquid investment limit of 15% for a fund. Funds are prohibited from acquiring an illiquid investment if this results in greater than 15% of its net assets being classified as illiquid. When applying this limit, the Committee defines "illiquid investment" to mean any investment that the Fund reasonably expects cannot be sold or disposed of in current market conditions in seven calendar days or less without the sale or disposition significantly changing the market value of the investment. If a 15% illiquid investment limit breach occurs for longer than 1 business day, the Fund is required to notify the Board and provide a plan on how to bring illiquid investments within the 15% threshold, and after 7 days confidentially notify the Securities and Exchange Commission (the SEC).
In February 2019, as a result of extended security markets closures in connection with the Chinese New Year in certain countries, the SEC released guidance, and the Committee approved and adopted an Extended Market Holiday Policy to plan for and monitor known Extended Market Holidays (defined as all expected market holiday closures spanning four or more calendar days).
As part of its annual assessment of the LRMP, the Committee reviewed the policies and procedures in place with respect to the 15% illiquid investment limit and determined such policies and procedures are operating in a manner that is adequate and effective as part of the LMRP.
Reasonably Anticipated Trade Size determination
In order to assess the liquidity risk of a Fund, the Committee considers the impact on the Fund that redemptions of a RATS would have under both normal and reasonably foreseeable stressed conditions. Modelling the Fund's RATS requires quantifying cash flow volatility and analyzing distribution channel concentration and redemption risk. The model is designed to estimate the amount of assets that the Fund could reasonably anticipate trading on a given day, during both normal and reasonably foreseeable stressed conditions, to satisfy redemption requests.
ANNUAL REPORT | JOHN HANCOCK INTERNATIONAL GROWTH FUND 40
As part of its annual assessment of the LRMP, the Committee reviewed the policies and procedures in place with respect to RATS determinations and determined that such policies and procedures are operating in a manner that is adequate and effective at making RATS determinations as part of the LRMP.
Security-level liquidity classifications
When classifying the liquidity of portfolio securities, the Fund adheres to the liquidity classification procedures established by the Advisor. In assigning a liquidity classification to Fund portfolio holdings, the following key inputs, among others, are considered: the Fund's RATS, feedback from the applicable Subadvisor on market-, trading- and investment-specific considerations, an assessment of current market conditions and fund portfolio holdings, and a value impact standard. The Subadvisor also provides position-level data to the Committee for use in monthly classification reconciliation in order to identify any classifications that may need to be changed as a result of the above considerations.
As part of its annual assessment of the LRMP, the Committee reviewed the policies and procedures in place with respect to security-level liquidity classifications and determined that such policies and procedures are operating in a manner that is adequate and effective as part of the LRMP.
Liquidity risk assessment
The Committee periodically reviews and assesses, the Fund's liquidity risk, including its investment strategy and liquidity of portfolio investments during both normal and reasonably foreseeable stressed conditions (including whether the investment strategy is appropriate for an open-end fund, the extent to which the strategy involves a relatively concentrated portfolio or large positions in particular issuers, and the use of borrowings for investment purposes and derivatives), cash flow analysis during both normal and reasonably foreseeable stressed conditions, and holdings of cash and cash equivalents, as well as borrowing arrangements and other funding sources.
The Committee also monitors global events, such as the COVID-19 Coronavirus, that could impact the markets and liquidity of portfolio investments and their classifications.
As part of its annual assessment of the LRMP, the Committee reviewed Fund-Level Liquidity Risk Assessment Reports for each of the Funds and determined that the investment strategy for each Fund continues to be appropriate for an open-ended structure.
Adequacy and Effectiveness
Based on the review and assessment conducted by the Committee, the Committee has determined that the LRMP has been implemented, and is operating in a manner that is adequate and effective at assessing and managing the liquidity risk of each Fund.
ANNUAL REPORT | JOHN HANCOCK INTERNATIONAL GROWTH FUND 41
This chart provides information about the Trustees and Officers who oversee your John Hancock fund. Officers elected by the Trustees manage the day-to-day operations of the fund and execute policies formulated by the Trustees.
Independent Trustees
| | | |
Name, year of birth
Position(s) held with Trust
Principal occupation(s) and other
directorships during past 5 years | Trustee
of the
Trust
since1 | Number of John
Hancock funds
overseen by
Trustee |
| Hassell H. McClellan, Born: 1945 | 2012 | 204 |
Trustee and Chairperson of the Board
Director/Trustee, Virtus Funds (since 2008); Director, The Barnes Group (since 2010); Associate Professor, The Wallace E. Carroll School of Management, Boston College (retired 2013). Trustee (since 2005) and Chairperson of the Board (since 2017) of various trusts within the John Hancock Fund Complex. |
| | | |
| Charles L. Bardelis,2 Born: 1941 | 2012 | 204 |
Trustee
Director, Island Commuter Corp. (marine transport). Trustee of various trusts within the John Hancock Fund Complex (since 1988). |
| | | |
| James R. Boyle,Born: 1959 | 2015 | 204 |
Trustee
Chief Executive Officer, Foresters Financial (since 2018); Chairman and Chief Executive Officer, Zillion Group, Inc. (formerly HealthFleet, Inc.) (healthcare) (2014-2018); Executive Vice President and Chief Executive Officer, U.S. Life Insurance Division of Genworth Financial, Inc. (insurance) (January 2014-July 2014); Senior Executive Vice President, Manulife Financial, President and Chief Executive Officer, John Hancock (1999-2012); Chairman and Director, John Hancock Investment Management LLC, John Hancock Investment Management Distributors LLC, and John Hancock Variable Trust Advisers LLC (2005-2010). Trustee of various trusts within the John Hancock Fund Complex (2005-2014 and since 2015). |
| | | |
| Peter S. Burgess,2 Born: 1942 | 2012 | 204 |
Trustee
Consultant (financial, accounting, and auditing matters) (since 1999); Certified Public Accountant; Partner, Arthur Andersen (independent public accounting firm) (prior to 1999); Director, Lincoln Educational Services Corporation (since 2004); Director, Symetra Financial Corporation (2010-2016); Director, PMA Capital Corporation (2004-2010). Trustee of various trusts within the John Hancock Fund Complex (since 2005). |
| | | |
| William H. Cunningham, Born: 1944 | 2006 | 204 |
Trustee
Professor, University of Texas, Austin, Texas (since 1971); former Chancellor, University of Texas System and former President of the University of Texas, Austin, Texas; Chairman (since 2009) and Director (since 2006), Lincoln National Corporation (insurance); Director, Southwest Airlines (since 2000); former Director, LIN Television (2009-2014). Trustee of various trusts within the John Hancock Fund Complex (since 1986). |
| | | |
| Grace K. Fey, Born: 1946 | 2012 | 204 |
Trustee
Chief Executive Officer, Grace Fey Advisors (since 2007); Director and Executive Vice President, Frontier Capital Management Company (1988-2007); Director, Fiduciary Trust (since 2009). Trustee of various trusts within the John Hancock Fund Complex (since 2008). |
ANNUAL REPORT | JOHN HANCOCK INTERNATIONAL GROWTH FUND 42
Independent Trustees (continued)
| | | |
Name, year of birth
Position(s) held with Trust
Principal occupation(s) and other
directorships during past 5 years | Trustee
of the
Trust
since1 | Number of John
Hancock funds
overseen by
Trustee |
| Deborah C. Jackson, Born: 1952 | 2008 | 204 |
Trustee
President, Cambridge College, Cambridge, Massachusetts (since 2011); Board of Directors, Massachusetts Women's Forum (since 2018); Board of Directors, National Association of Corporate Directors/New England (since 2015); Board of Directors, Association of Independent Colleges and Universities of Massachusetts (2014-2017); Chief Executive Officer, American Red Cross of Massachusetts Bay (2002-2011); Board of Directors of Eastern Bank Corporation (since 2001); Board of Directors of Eastern Bank Charitable Foundation (since 2001); Board of Directors of American Student Assistance Corporation (1996-2009); Board of Directors of Boston Stock Exchange (2002-2008); Board of Directors of Harvard Pilgrim Healthcare (health benefits company) (2007-2011). Trustee of various trusts within the John Hancock Fund Complex (since 2008). |
| | | |
| James M. Oates,2Born: 1946 | 2012 | 204 |
Trustee
Managing Director, Wydown Group (financial consulting firm) (since 1994); Chairman and Director, Emerson Investment Management, Inc. (2000-2015); Independent Chairman, Hudson Castle Group, Inc. (formerly IBEX Capital Markets, Inc.) (financial services company) (1997-2011); Director, Stifel Financial (since 1996); Director, Investor Financial Services Corporation (1995-2007); Director, Connecticut River Bancorp (1998-2014); Director/Trustee, Virtus Funds (since 1988). Trustee (since 2004) and Chairperson of the Board (2005-2016) of various trusts within the John Hancock Fund Complex. |
| | | |
| Steven R. Pruchansky, Born: 1944 | 2006 | 204 |
Trustee and Vice Chairperson of the Board
Managing Director, Pru Realty (since 2017); Chairman and Chief Executive Officer, Greenscapes of Southwest Florida, Inc. (since 2014); Director and President, Greenscapes of Southwest Florida, Inc. (until 2000); Member, Board of Advisors, First American Bank (until 2010); Managing Director, Jon James, LLC (real estate) (since 2000); Partner, Right Funding, LLC (2014-2017); Director, First Signature Bank & Trust Company (until 1991); Director, Mast Realty Trust (until 1994); President, Maxwell Building Corp. (until 1991). Trustee (since 1992), Chairperson of the Board (2011-2012), and Vice Chairperson of the Board (since 2012) of various trusts within the John Hancock Fund Complex. |
| | | |
| Gregory A. Russo, Born: 1949 | 2008 | 204 |
Trustee
Director and Audit Committee Chairman (since 2012), and Member, Audit Committee and Finance Committee (since 2011), NCH Healthcare System, Inc. (holding company for multi-entity healthcare system); Director and Member (2012-2018) and Finance Committee Chairman (2014-2018), The Moorings, Inc. (nonprofit continuing care community); Vice Chairman, Risk & Regulatory Matters, KPMG LLP (KPMG) (2002-2006); Vice Chairman, Industrial Markets, KPMG (1998-2002); Chairman and Treasurer, Westchester County, New York, Chamber of Commerce (1986-1992); Director, Treasurer, and Chairman of Audit and Finance Committees, Putnam Hospital Center (1989-1995); Director and Chairman of Fundraising Campaign, United Way of Westchester and Putnam Counties, New York (1990-1995). Trustee of various trusts within the John Hancock Fund Complex (since 2008). |
ANNUAL REPORT | JOHN HANCOCK INTERNATIONAL GROWTH FUND 43
Non-Independent Trustees3
| | | |
Name, year of birth
Position(s) held with Trust
Principal occupation(s) and other
directorships during past 5 years | Trustee
of the
Trust
since1 | Number of John
Hancock funds
overseen by
Trustee |
| Andrew G. Arnott, Born: 1971 | 2017 | 204 |
President and Non-Independent Trustee
Head of Wealth and Asset Management, United States and Europe, for John Hancock and Manulife (since 2018); Executive Vice President, John Hancock Financial Services (since 2009, including prior positions); Director and Executive Vice President, John Hancock Investment Management LLC (since 2005, including prior positions); Director and Executive Vice President, John Hancock Variable Trust Advisers LLC (since 2006, including prior positions); President, John Hancock Investment Management Distributors LLC (since 2004, including prior positions); President of various trusts within the John Hancock Fund Complex (since 2007, including prior positions). Trustee of various trusts within the John Hancock Fund Complex (since 2017). |
| | | |
| Marianne Harrison, Born: 1963 | 2018 | 204 |
Non-Independent Trustee
President and CEO, John Hancock (since 2017); President and CEO, Manulife Canadian Division (2013-2017); Member, Board of Directors, CAE Inc. (since 2019); Member, Board of Directors, MA Competitive Partnership Board (since 2018); Member, Board of Directors, American Council of Life Insurers (ACLI) (since 2018); Member, Board of Directors, Communitech, an industry-led innovation center that fosters technology companies in Canada (2017-2019); Member, Board of Directors, Manulife Assurance Canada (2015-2017); Board Member, St. Mary's General Hospital Foundation (2014-2017); Member, Board of Directors, Manulife Bank of Canada (2013-2017); Member, Standing Committee of the Canadian Life & Health Assurance Association (2013-2017); Member, Board of Directors, John Hancock USA, John Hancock Life & Health, John Hancock New York (2012-2013). Trustee of various trusts within the John Hancock Fund Complex (since 2018). |
Principal officers who are not Trustees
| | |
Name, year of birth
Position(s) held with Trust
Principal occupation(s)
during past 5 years | Officer
of the
Trust
since |
| Francis V. Knox, Jr.,Born: 1947 | 2006 |
Chief Compliance Officer
Vice President, John Hancock Financial Services (since 2005); Chief Compliance Officer, various trusts within the John Hancock Fund Complex, John Hancock Investment Management LLC, and John Hancock Variable Trust Advisers LLC (since 2005). |
| | |
| Charles A. Rizzo, Born: 1957 | 2007 |
Chief Financial Officer
Vice President, John Hancock Financial Services (since 2008); Senior Vice President, John Hancock Investment Management LLC and John Hancock Variable Trust Advisers LLC (since 2008); Chief Financial Officer of various trusts within the John Hancock Fund Complex (since 2007). |
| | |
| Salvatore Schiavone, Born: 1965 | 2010 |
Treasurer
Assistant Vice President, John Hancock Financial Services (since 2007); Vice President, John Hancock Investment Management LLC and John Hancock Variable Trust Advisers LLC (since 2007); Treasurer of various trusts within the John Hancock Fund Complex (since 2007, including prior positions). |
ANNUAL REPORT | JOHN HANCOCK INTERNATIONAL GROWTH FUND 44
Principal officers who are notTrustees (continued)
| | |
Name, year of birth
Position(s) held with Trust
Principal occupation(s)
during past 5 years | Officer
of the
Trust
since |
| Christopher (Kit) Sechler,Born: 1973 | 2018 |
Chief Legal Officer and Secretary
Vice President and Deputy Chief Counsel, John Hancock Investments (since 2015); Assistant Vice President and Senior Counsel (2009-2015), John Hancock Investment Management; Chief Legal Officer and Secretary of various trusts within the John Hancock Fund Complex (since 2018); Assistant Secretary of John Hancock Investment Management LLC and John Hancock Variable Trust Advisers LLC (since 2009). |
The business address for all Trustees and Officers is 200 Berkeley Street, Boston, Massachusetts 02116-5023.
The Statement of Additional Information of the fund includes additional information about members of the Board of Trustees of the Trust and is available without charge, upon request, by calling 800-225-5291.
| 1 | Each Trustee holds office until his or her successor is elected and qualified, or until the Trustee's death, retirement, resignation, or removal. Mr. Boyle has served as Trustee at various times prior to the date listed in the table. |
| 2 | Member of the Audit Committee. |
| 3 | The Trustee is a Non-Independent Trustee due to current or former positions with the Advisor and certain affiliates. |
ANNUAL REPORT | JOHN HANCOCK INTERNATIONAL GROWTH FUND 45
| | |
Trustees
Hassell H. McClellan,Chairperson
Steven R. Pruchansky,Vice Chairperson
Andrew G. Arnott†
Charles L. Bardelis*
James R. Boyle
Peter S. Burgess*
William H. Cunningham
Grace K. Fey
Marianne Harrison†
Deborah C. Jackson
James M. Oates*
Gregory A. Russo
Officers
Andrew G. Arnott
President
Francis V. Knox, Jr.
Chief Compliance Officer
Charles A. Rizzo
Chief Financial Officer
Salvatore Schiavone
Treasurer
Christopher (Kit) Sechler
Secretary and Chief Legal Officer
| Investment advisor
John Hancock Investment Management LLC
Subadvisor
Wellington Management Company LLP
Portfolio Manager
John A. Boselli, CFA
Principal distributor
John Hancock Investment Management Distributors LLC
Custodian
Citibank. N.A.
Transfer agent
John Hancock Signature Services, Inc.
Legal counsel
K&L Gates LLP
Independent registered public accounting firm
PricewaterhouseCoopers LLP
|
* Member of the Audit Committee
† Non-Independent Trustee
The fund's proxy voting policies and procedures, as well as the fund proxy voting record for the most recent twelve-month period ended June 30, are available free of charge on the Securities and Exchange Commission (SEC) website at sec.gov or on our website.
All of the fund's holdings as of the end of the third month of every fiscal quarter are filed with the SEC on Form N-PORT within 60 days of the end of the fiscal quarter. The fund's Form N-PORT filings are available on our website and the SEC's website, sec.gov.
We make this information on your fund, as well asmonthly portfolio holdings, and other fund details available on our website at jhinvestments.com or by calling 800-225-5291.
| | | | |
| | You can also contact us: |
| | 800-225-5291
jhinvestments.com | Regular mail:
John Hancock Signature Services, Inc.
P.O. Box 55913
Boston, MA 02205-5913
| Express mail:
John Hancock Signature Services, Inc.
2000 Crown Colony Drive
Suite 55913
Quincy, MA 02169-0953
|
ANNUAL REPORT | JOHN HANCOCK INTERNATIONAL GROWTH FUND 46
John Hancock family of funds
| | | |
DOMESTIC EQUITY FUNDS
Blue Chip Growth
Classic Value
Disciplined Value
Disciplined Value Mid Cap
Equity Income
Financial Industries
Fundamental All Cap Core
Fundamental Large Cap Core
New Opportunities
Regional Bank
Small Cap Core
Small Cap Growth
Small Cap Value
U.S. Global Leaders Growth
U.S. Quality Growth
GLOBAL AND INTERNATIONAL EQUITY FUNDS
Disciplined Value International
Emerging Markets
Emerging Markets Equity
Fundamental Global Franchise
Global Equity
Global Shareholder Yield
Global Thematic Opportunities
International Dynamic Growth
International Growth
International Small Company
| | INCOME FUNDS
Bond
California Tax-Free Income
Emerging Markets Debt
Floating Rate Income
Government Income
High Yield
High Yield Municipal Bond
Income
Investment Grade Bond
Money Market
Short Duration Bond
Short Duration Credit Opportunities
Strategic Income Opportunities
Tax-Free Bond
ALTERNATIVE AND SPECIALTY FUNDS
Absolute Return Currency
Alternative Asset Allocation
Alternative Risk Premia
Diversified Macro
Infrastructure
Multi-Asset Absolute Return
Seaport Long/Short
|
A fund's investment objectives, risks, charges, and expenses should be considered carefully before investing. The prospectus contains this and other important information about the fund. To obtain a prospectus, contact your financial professional, call John Hancock Investment Management at 800-225-5291, or visit our website at jhinvestments.com. Please read the prospectus carefully before investing or sending money.
| | | |
ASSET ALLOCATION
Balanced
Multi-Asset High Income
Multi-Index Lifetime Portfolios
Multi-Index Preservation Portfolios
Multimanager Lifestyle Portfolios
Multimanager Lifetime Portfolios
Retirement Income 2040
EXCHANGE-TRADED FUNDS
John Hancock Multifactor Consumer Discretionary ETF
John Hancock Multifactor Consumer Staples ETF
John Hancock Multifactor Developed International ETF
John Hancock Multifactor Emerging Markets ETF
John Hancock Multifactor Energy ETF
John Hancock Multifactor Financials ETF
John Hancock Multifactor Healthcare ETF
John Hancock Multifactor Industrials ETF
John Hancock Multifactor Large Cap ETF
John Hancock Multifactor Materials ETF
John Hancock Multifactor Media and
Communications ETF
John Hancock Multifactor Mid Cap ETF
John Hancock Multifactor Small Cap ETF
John Hancock Multifactor Technology ETF
John Hancock Multifactor Utilities ETF
| | ENVIRONMENTAL, SOCIAL, AND
GOVERNANCE FUNDS
ESG All Cap Core
ESG Core Bond
ESG International Equity
ESG Large Cap Core
CLOSED-END FUNDS
Financial Opportunities
Hedged Equity & Income
Income Securities Trust
Investors Trust
Preferred Income
Preferred Income II
Preferred Income III
Premium Dividend
Tax-Advantaged Dividend Income
Tax-Advantaged Global Shareholder Yield
|
John Hancock Multifactor ETF shares are bought and sold at market price (not NAV), and are not individually redeemed
from the fund. Brokerage commissions will reduce returns.
John Hancock ETFs are distributed by Foreside Fund Services, LLC, and are subadvised by Dimensional Fund Advisors LP.
Foreside is not affiliated with John Hancock Investment Management Distributors LLC or Dimensional Fund Advisors LP.
Dimensional Fund Advisors LP receives compensation from John Hancock in connection with licensing rights to the
John Hancock Dimensional indexes. Dimensional Fund Advisors LP does not sponsor, endorse, or sell, and makes no
representation as to the advisability of investing in, John Hancock Multifactor ETFs.
John Hancock Investment Management
A trusted brand
John Hancock Investment Management is a premier asset manager
representing one of America's most trusted brands, with a heritage of
financial stewardship dating back to 1862. Helping our shareholders
pursue their financial goals is at the core of everything we do. It's why
we support the role of professional financial advice and operate with
the highest standards of conduct and integrity.
A better way to invest
We serve investors globally through a unique multimanager approach:
We search the world to find proven portfolio teams with specialized
expertise for every strategy we offer, then we apply robust investment
oversight to ensure they continue to meet our uncompromising
standards and serve the best interests of our shareholders.
Results for investors
Our unique approach to asset management enables us to provide
a diverse set of investments backed by some of the world's best
managers, along with strong risk-adjusted returns across asset classes.
John Hancock Investment Management Distributors LLC n Member FINRA, SIPC
200 Berkeley Street n Boston, MA 02116-5010 n 800-225-5291 n jhinvestments.com
This report is for the information of the shareholders of John Hancock International Growth Fund. It is not authorized for distribution to prospective investors unless preceded or accompanied by a prospectus.
John Hancock
U.S. Quality Growth Fund
Annual report 3/31/2020
Beginning on January 1, 2021, as permitted by regulations adopted by the Securities and Exchange Commission, paper copies of the fund's shareholder reports like this one will no longer be sent by mail, unless you specifically request paper copies of the reports from the fund or from your financial intermediary. Instead, the reports will be made available on a website, and you will be notified by mail each time a report is posted and provided with a website link to access the report.
If you already elected to receive shareholder reports electronically, you will not be affected by this change, and you do not need to take any action. You may elect to receive shareholder reports and other communications electronically by calling John Hancock Investment Management at 800-225-5291 (Class A and Class C shares) or 888-972-8696 (Class I, Class R2, Class R4, and Class R6) or by contacting your financial intermediary.
You may elect to receive all reports in paper, free of charge, at any time. You can inform John Hancock Investment Management or your financial intermediary that you wish to continue receiving paper copies of your shareholder reports by following the instructions listed above. Your election to receive reports in paper will apply to all funds held with John Hancock Investment Management or your financial intermediary.
A message to shareholders
Dear shareholder,
Global financial markets were on pace to deliver strong returns during the 12 months ended March 31, 2020, until heightened fears over the coronavirus (COVID-19) sent markets tumbling during the last five weeks of the period. After the longest bull market in U.S. history, we're now in bear market territory.
In response to the sell-off, the U.S. Federal Reserve acted quickly, lowering interest rates to zero and reinstating quantitative easing, as well as announcing its plans to shore up short-term debt. These steps, along with the passage of an estimated $2 trillion federal economic stimulus bill, helped lift the markets in the final two weeks of March.
The continued spread of COVID-19, trade disputes, rising unemployment, and other geopolitical tensions may continue to create uncertainty among businesses and investors. Your financial professional can helpposition your portfolio so that it's sufficiently diversified to seek to meet your long-term objectives and to withstand the inevitable bouts of market volatility along the way.
On behalf of everyone at John Hancock Investment Management, I'd like to take this opportunity to welcome new shareholders and thank existing shareholders for the continued trust you've placed in us.
Sincerely,
Andrew G. Arnott
President and CEO,
John Hancock Investment Management
Head of Wealth and Asset Management,
United States and Europe
This commentary reflects the CEO's views as of this report's period end and are subject to change at any time. Diversification does not guarantee investment returns and does not eliminate risk of loss. All investments entail risks, including the possible loss of principal. For more up-to-date information, you can visit our website at jhinvestments.com.
John Hancock
U.S. Quality Growth Fund
Table of contents
| | | |
| 2 | | Your fund at a glance |
| 4 | | Manager's discussion of fund performance |
| 6 | | A look at performance |
| 8 | | Your expenses |
| 10 | | Fund's investments |
| 13 | | Financial statements |
| 16 | | Financial highlights |
| 23 | | Notes to financial statements |
| 32 | | Report of independent registered public accounting firm |
| 33 | | Tax information |
| 34 | | Statement regarding liquidity risk management |
| 37 | | Trustees and Officers |
| 41 | | More information |
ANNUAL REPORT | JOHN HANCOCK U.S. QUALITY GROWTH FUND 1
INVESTMENT OBJECTIVE
The fund seeks long-term capital appreciation.
AVERAGE ANNUAL TOTAL RETURNS AS OF 3/31/2020 (%)
The Russell 1000 Growth Index is an unmanaged index that measures the performance of the large-cap growth segment of the U.S. equity universe. It includes those Russell 1000 Index companies with higher price-to-book ratios and higher forecasted growth values.
It is not possible to invest directly in an index. Index figures do not reflect expenses or sales charges, which would result in lower returns.
Figures from Morningstar, Inc. include reinvested distributions and do not take into account sales charges. Actual load-adjusted performance is lower. Since-inception returns for the Morningstar fund category average are not available.
The past performance shown here reflects reinvested distributions and the beneficial effect of any expense reductions, and does not guarantee future results. Performance of the other share classes will vary based on the difference in the fees and expenses of those classes. Shares will fluctuate in value and, when redeemed, may be worth more or less than their original cost. Current month-end performance may be lower or higher than the performance cited, and can be found at jhinvestments.com or by calling 800-225-5291. For further information on the fund's objectives, risks, and strategy, see the fund's prospectus. The fund recently experienced negative short-term performance due to market volatility associated with the COVID-19 pandemic.
ANNUAL REPORT | JOHN HANCOCK U.S. QUALITY GROWTH FUND 2
PERFORMANCE HIGHLIGHTS OVER THE LAST TWELVE MONTHS
The fund posted a positive return, but underperformed its benchmark
The fund modestly trailed its benchmark, the Russell 1000 Growth Index, for the period.
Challenges came from security selection
Security selection in the information technology and consumer staples sectors detracted, partly offset by favorable picks in the industrials sectors.
Sector positioning was positive
Sector allocation, deriving from our stock-by-stock investment approach, added value, reflecting the fund's underweight in industrials and overweight in information technology.
SECTOR COMPOSITION AS OF 3/31/2020 (%)
A note about risks
The fund may be subject to various risks as described in the fund's prospectus. A widespread health crisis such as a global pandemic could cause substantial market volatility, exchange-trading suspensions and closures, impact the ability to complete redemptions, and affect fund performance. For example, the novel coronavirus disease (COVID-19) has resulted in significant disruptions to global business activity. The impact of a health crisis and other epidemics and pandemics that may arise in the future could affect the global economy in ways that cannot necessarily be foreseen at the present time. A health crisis may exacerbate other pre-existing political, social, and economic risks. Any such impact could adversely affect the fund's performance, resulting in losses to your investment. For more information, please refer to the "Principal risks" section of the prospectus.
ANNUAL REPORT | JOHN HANCOCK U.S. QUALITY GROWTH FUND 3
Manager's discussion of fund performance
How did the fund perform during the 12 months ended March 31, 2020?
In a difficult market environment characterized by dramatic volatility in the period's final month, as the coronavirus and its economic and social effects took center stage, the fund posted a small gain; however, it trailed the increase of its benchmark, the Russell 1000 Growth Index. Security selection in the information technology and consumer staples sectors were the primary relative performance challenges, partly offset by favorable picks in industrials. Sector allocation was positive, driven by a slight underweighting in industrials and an overweight in the outperforming information technology.
Which stocks detracted the most and which contributed?
A notable detractor was Sysco Corp., a food distributor to restaurants, healthcare, and education institutions. The stock underperformed due to the negative earnings impact of widespread restaurant and school closures in the wake of the coronavirus. We sold this position during the period.
Another detractor was consumer electronics giant Apple, Inc. The fund lacked ownership of this large benchmark component for roughly the first two-thirds of the fiscal year, thus missing out on a portion of the stock's strong gain. Further hampering relative performance was an overweight in FleetCor Technologies, Inc., a provider of payment products and services to commercial fleets.
TOP 10 HOLDINGS AS OF 3/31/2020 (%)
| | |
| Microsoft Corp. | 9.8 |
| Apple, Inc. | 9.3 |
| Alphabet, Inc., Class A | 6.0 |
| Amazon.com, Inc. | 5.6 |
| Facebook, Inc., Class A | 4.3 |
| Visa, Inc., Class A | 3.4 |
| UnitedHealth Group, Inc. | 3.0 |
| Mastercard, Inc., Class A | 2.8 |
| Adobe, Inc. | 2.6 |
| Netflix, Inc. | 2.4 |
| TOTAL | 49.2 |
| As a percentage of net assets. |
| Cash and cash equivalents are not included. |
ANNUAL REPORT | JOHN HANCOCK U.S. QUALITY GROWTH FUND 4
On the positive side, the fund benefited from a position in Total System Services, Inc., which was no longer held at period end. Shares of this merchant acquirer and payment technology solutions company rose on news that the company agreed to be acquired by fund holding Global Payments, Inc. Also adding value was aerospace and defense company The Boeing Company, a weak-performing benchmark component the fund sold midway through the period.
How was the fund positioned at period end?
We've increased the fund's exposure to the information technology (IT) sector, as we believe IT spending will continue to expand, particularly given the recent phenomenon of social distancing. We also grew the fund's exposure to communication services, as companies in this sector are benefiting from increased online consumption of services and entertainment. Meanwhile, we reduced the fund's overweight in financials, given the challenges these companies face in a lower interest-rate environment, and various consumer-oriented companies at risk of generating lower earnings in the face of shuttering businesses.
As of period end, the fund also continued to underweight consumer staples, which we believe offers less-attractive valuation upside, and materials and energy, two sectors that are often too capital-intensive to rank highly for quality in our process. The macroeconomic indicators we follow suggest the U.S. economy is declining. We have accordingly moved to overweight quality and capital return factors while underweighting growth and valuation factors in our investment process.
MANAGED BY
| | |
| | John A. Boselli, CFA
On the fund since 2018
Investing since 1996 |
The views expressed in this report are exclusively those of John A. Boselli, CFA, Wellington Management Company LLP, and are subject to change. They are not meant as investment advice. Please note that the holdings discussed in this report may not have been held by the fund for the entire period. Portfolio composition is subject to review in accordance with the fund's investment strategy and may vary in the future. Current and future portfolio holdings are subject to risk.
ANNUAL REPORT | JOHN HANCOCK U.S. QUALITY GROWTH FUND 5
TOTAL RETURNS FOR THE PERIOD ENDED MARCH 31, 2020
| | | | | | | | |
Average annual total returns (%)
with maximum sales charge | | Cumulative total returns (%)
with maximum sales charge |
| | 1-year | 5-year | Since
inception1 | | | 5-year | Since
inception1 |
| Class A | -4.94 | 7.94 | 12.78 | | | 46.53 | 170.67 |
| Class C2 | -1.69 | 8.24 | 12.90 | | | 48.55 | 173.26 |
| Class I3 | 0.26 | 9.33 | 13.81 | | | 56.20 | 192.04 |
| Class R22,3 | -0.12 | 8.91 | 13.39 | | | 53.22 | 183.18 |
| Class R42,3 | 0.17 | 9.18 | 13.56 | | | 55.11 | 186.69 |
| Class R62,3 | 0.38 | 9.46 | 13.74 | | | 57.13 | 190.42 |
| Class NAV3 | 0.39 | 9.46 | 13.98 | | | 57.11 | 195.62 |
| Index† | 0.91 | 10.36 | 14.49 | | | 63.71 | 206.67 |
Performance figures assume all distributions are reinvested. Figures reflect the maximum sales charge on Class A shares of 5% and the applicable contingent deferred sales charge (CDSC) on Class C shares. Class C shares sold within one year of purchase are subject to a 1% CDSC. Sales charges are not applicable to Class I, Class R2, Class R4, Class R6, and Class NAV shares.
The expense ratios of the fund, both net (including any fee waivers or expense limitations) and gross (excluding any fee waivers or expense limitations), are set forth according to the most recent publicly available prospectuses for the fund and may differ from those disclosed in the Financial highlights tables in this report. Net expenses reflect contractual expense limitations in effect until July 31, 2021 and are subject to change. Had the contractual fee waivers and expense limitations not been in place, gross expenses would apply. The expense ratios are as follows:
| | | | | | | | |
| | Class A | Class C | Class I | Class R2 | Class R4 | Class R6 | Class NAV |
| Gross (%) | 1.01 | 1.76 | 0.76 | 1.15 | 1.00 | 0.65 | 0.64 |
| Net (%) | 1.00 | 1.75 | 0.75 | 1.14 | 0.89 | 0.64 | 0.63 |
Please refer to the most recent prospectus and annual or semiannual report for more information on expenses and any expense limitation arrangements for each class.
The returns reflect past results and should not be considered indicative of future performance. The return and principal value of an investment will fluctuate so that shares, when redeemed, may be worth more or less than their original cost. Due to market volatility and other factors, the fund's current performance may be higher or lower than the performance shown. For current to the most recent month-end performance data, please call 800-225-5291 or visit the fund's website at jhinvestments.com.
The performance table above and the chart on the next page do not reflect the deduction of taxes that a shareholder would pay on fund distributions or the redemption of fund shares. The fund's performance results reflect any applicable fee waivers or expense reductions, without which the expenses would increase and results would have been less favorable.
| † | Index is the Russell 1000 Growth Index. |
See the following page for footnotes.
ANNUAL REPORT | JOHN HANCOCK U.S. QUALITY GROWTH FUND 6
This chart and table show what happened to a hypothetical $10,000 investment in John Hancock U.S. Quality Growth Fund for the share classes and periods indicated, assuming all distributions were reinvested. For comparison, we've shown the same investment in the Russell 1000 Growth Index.
| | | | | |
| | Start date | With maximum
sales charge ($) | Without
sales charge ($) | Index ($) |
| Class C2,4 | 12-20-11 | 27,326 | 27,326 | 30,667 |
| Class I3 | 12-20-11 | 29,204 | 29,204 | 30,667 |
| Class R22,3 | 12-20-11 | 28,318 | 28,318 | 30,667 |
| Class R42,3 | 12-20-11 | 28,669 | 28,669 | 30,667 |
| Class R62,3 | 12-20-11 | 29,042 | 29,042 | 30,667 |
| Class NAV3 | 12-20-11 | 29,562 | 29,562 | 30,667 |
The Russell 1000 Growth Index is an unmanaged index that measures the performance of the large-cap growth segment of the U.S. equity universe. It includes those Russell 1000 companies with higher price-to-book ratios and higher forecasted growth values.
It is not possible to invest directly in an index. Index figures do not reflect expenses or sales charges, which would result in lower returns.
Footnotes related to performance pages
| 1 | From 12-20-11. |
| 2 | Class C shares were first offered on 8-28-14; Class R2, Class R4, and Class R6 shares were first offered on 3-27-15. Returns prior to these dates are those of Class A shares that have not been adjusted for class-specific expenses; otherwise, returns would vary. |
| 3 | For certain types of investors, as described in the fund's prospectuses. |
| 4 | The contingent deferred sales charge is not applicable. |
ANNUAL REPORT | JOHN HANCOCK U.S. QUALITY GROWTH FUND 7
These examples are intended to help you understand your ongoing operating expenses of investing in the fund so you can compare these costs with the ongoing costs of investing in other mutual funds.
Understanding fund expenses
As a shareholder of the fund, you incur two types of costs:
■Transaction costs,which include sales charges (loads) on purchases or redemptions (varies by share class), minimum account fee charge, etc.
■Ongoing operating expenses, including management fees, distribution and service fees (if applicable), and other fund expenses.
We are presenting only your ongoing operating expenses here.
Actual expenses/actual returns
The first line of each share class in the table on the following page is intended to provide information about the fund’s actual ongoing operating expenses, and is based on the fund’s actual return. It assumes an account value of $1,000.00 on October 1, 2019, with the same investment held until March 31, 2020.
Together with the value of your account, you may use this information to estimate the operating expenses that you paid over the period. Simply divide your account value at March 31, 2020, by $1,000.00, then multiply it by the “expenses paid” for your share class from the table. For example, for an account value of $8,600.00, the operating expenses should be calculated as follows:
Hypothetical example for comparison purposes
The second line of each share class in the table on the following page allows you to compare the fund’s ongoing operating expenses with those of any other fund. It provides an example of the fund’s hypothetical account values and hypothetical expenses based on each class’s actual expense ratio and an assumed 5% annualized return before expenses (which is not the class’s actual return). It assumes an account value of $1,000.00 on October 1, 2019, with the same investment held until March 31, 2020. Look in any other fund shareholder report to find its hypothetical example and you will be able to compare these expenses.
| 8 | JOHN HANCOCK U.S. QUALITY GROWTH FUND | ANNUAL REPORT | |
Please remember that these hypothetical account values and expenses may not be used to estimate the actual ending account balance or expenses you paid for the period.
Remember, these examples do not include any transaction costs, therefore, these examples will not help you to determine the relative total costs of owning different funds. If transaction costs were included, your expenses would have been higher. See the prospectuses for details regarding transaction costs.
SHAREHOLDER EXPENSE EXAMPLE CHART
| | | Account
value on
10-1-2019 | Ending
value on
3-31-2020 | Expenses
paid during
period ended
3-31-20201 | Annualized
expense
ratio |
| Class A | Actual expenses/actual returns | $1,000.00 | $943.10 | $4.81 | 0.99% |
| | Hypothetical example | 1,000.00 | 1,020.10 | 5.00 | 0.99% |
| Class C | Actual expenses/actual returns | 1,000.00 | 939.80 | 8.44 | 1.74% |
| | Hypothetical example | 1,000.00 | 1,016.30 | 8.77 | 1.74% |
| Class I | Actual expenses/actual returns | 1,000.00 | 944.30 | 3.65 | 0.75% |
| | Hypothetical example | 1,000.00 | 1,021.30 | 3.79 | 0.75% |
| Class R2 | Actual expenses/actual returns | 1,000.00 | 942.50 | 5.49 | 1.13% |
| | Hypothetical example | 1,000.00 | 1,019.40 | 5.70 | 1.13% |
| Class R4 | Actual expenses/actual returns | 1,000.00 | 943.50 | 4.28 | 0.88% |
| | Hypothetical example | 1,000.00 | 1,020.60 | 4.45 | 0.88% |
| Class R6 | Actual expenses/actual returns | 1,000.00 | 945.00 | 3.06 | 0.63% |
| | Hypothetical example | 1,000.00 | 1,021.90 | 3.18 | 0.63% |
| Class NAV | Actual expenses/actual returns | 1,000.00 | 945.10 | 3.06 | 0.63% |
| | Hypothetical example | 1,000.00 | 1,021.90 | 3.18 | 0.63% |
| 1 | Expenses are equal to the annualized expense ratio, multiplied by the average account value over the period, multiplied by 183/366 (to reflect the one-half year period). |
| | ANNUAL REPORT | JOHN HANCOCK U.S. QUALITY GROWTH FUND | 9 |
AS OF 3-31-20
| | | | | Shares | Value |
| Common stocks 99.6% | | | | | $938,816,889 |
| (Cost $818,401,711) | | | | | |
| Communication services 14.1% | | | 132,679,960 |
| Entertainment 2.4% | | | |
| Netflix, Inc. (A) | | | 60,095 | 22,565,673 |
| Interactive media and services 10.2% | | | |
| Alphabet, Inc., Class A (A) | | | 48,286 | 56,105,918 |
| Facebook, Inc., Class A (A) | | | 241,609 | 40,300,381 |
| Media 1.5% | | | |
| Charter Communications, Inc., Class A (A) | | | 31,418 | 13,707,988 |
| Consumer discretionary 10.8% | | | 102,087,361 |
| Internet and direct marketing retail 5.6% | | | |
| Amazon.com, Inc. (A) | | | 27,118 | 52,872,507 |
| Specialty retail 5.2% | | | |
| Ross Stores, Inc. | | | 172,344 | 14,988,758 |
| The Home Depot, Inc. | | | 104,239 | 19,462,464 |
| The TJX Companies, Inc. | | | 308,798 | 14,763,632 |
| Financials 4.9% | | | 46,000,602 |
| Capital markets 2.2% | | | |
| Ares Management Corp., Class A | | | 369,910 | 11,441,316 |
| The Blackstone Group, Inc., Class A | | | 207,016 | 9,433,719 |
| Consumer finance 1.3% | | | |
| American Express Company | | | 141,616 | 12,123,746 |
| Insurance 1.4% | | | |
| The Progressive Corp. | | | 176,081 | 13,001,821 |
| Health care 15.5% | | | 146,264,282 |
| Biotechnology 1.8% | | | |
| Vertex Pharmaceuticals, Inc. (A) | | | 70,171 | 16,697,189 |
| Health care equipment and supplies 6.0% | | | |
| Abbott Laboratories | | | 184,988 | 14,597,403 |
| Baxter International, Inc. | | | 145,562 | 11,818,179 |
| Becton, Dickinson and Company | | | 44,061 | 10,123,896 |
| Danaher Corp. | | | 72,536 | 10,039,708 |
| Medtronic PLC | | | 111,565 | 10,060,930 |
| Health care providers and services 4.3% | | | |
| Anthem, Inc. | | | 51,774 | 11,754,769 |
| UnitedHealth Group, Inc. | | | 113,986 | 28,425,829 |
| Life sciences tools and services 1.2% | | | |
| Agilent Technologies, Inc. | | | 165,327 | 11,840,720 |
| 10 | JOHN HANCOCK U.S. QUALITY GROWTH FUND | ANNUAL REPORT | SEE NOTES TO FINANCIAL STATEMENTS |
| | | | | Shares | Value |
| Health care (continued) | | | |
| Pharmaceuticals 2.2% | | | |
| Eli Lilly & Company | | | 150,704 | $20,905,659 |
| Industrials 5.2% | | | 48,716,409 |
| Aerospace and defense 3.0% | | | |
| L3Harris Technologies, Inc. | | | 61,957 | 11,159,695 |
| Lockheed Martin Corp. | | | 48,884 | 16,569,232 |
| Professional services 2.2% | | | |
| Equifax, Inc. | | | 85,274 | 10,185,979 |
| TransUnion | | | 163,214 | 10,801,503 |
| Information technology 44.7% | | | 421,444,162 |
| Electronic equipment, instruments and components 1.2% | | | |
| CDW Corp. | | | 122,555 | 11,430,705 |
| IT services 13.9% | | | |
| Accenture PLC, Class A | | | 107,869 | 17,610,693 |
| Exela Technologies, Inc., PIPE (A)(B) | | | 111,723 | 22,903 |
| Fidelity National Information Services, Inc. | | | 109,402 | 13,307,659 |
| FleetCor Technologies, Inc. (A) | | | 54,567 | 10,178,928 |
| Global Payments, Inc. | | | 96,964 | 13,985,118 |
| Mastercard, Inc., Class A | | | 110,304 | 26,645,034 |
| PayPal Holdings, Inc. (A) | | | 184,794 | 17,692,178 |
| Visa, Inc., Class A | | | 197,718 | 31,856,324 |
| Semiconductors and semiconductor equipment 4.4% | | | |
| KLA Corp. | | | 82,715 | 11,889,454 |
| Teradyne, Inc. | | | 239,780 | 12,988,883 |
| Texas Instruments, Inc. | | | 161,814 | 16,170,073 |
| Software 15.9% | | | |
| Adobe, Inc. (A) | | | 76,847 | 24,455,790 |
| Intuit, Inc. | | | 60,610 | 13,940,300 |
| Microsoft Corp. | | | 586,911 | 92,561,734 |
| salesforce.com, Inc. (A) | | | 132,079 | 19,016,734 |
| Technology hardware, storage and peripherals 9.3% | | | |
| Apple, Inc. | | | 344,849 | 87,691,652 |
| Materials 1.2% | | | 11,048,246 |
| Chemicals 1.2% | | | |
| FMC Corp. | | | 135,246 | 11,048,246 |
| Real estate 3.2% | | | 30,575,867 |
| Equity real estate investment trusts 3.2% | | | |
| American Tower Corp. | | | 82,403 | 17,943,253 |
| Digital Realty Trust, Inc. | | | 90,941 | 12,632,614 |
|
| SEE NOTES TO FINANCIAL STATEMENTS | ANNUAL REPORT | JOHN HANCOCK U.S. QUALITY GROWTH FUND | 11 |
| | | Yield (%) | | Shares | Value |
| Short-term investments 1.1% | | | | | $10,166,349 |
| (Cost $10,166,349) | | | | | |
| Short-term funds 1.1% | | | | | 10,166,349 |
| State Street Institutional U.S. Government Money Market Fund, Premier Class | 0.3210(C) | | 10,166,349 | 10,166,349 |
|
| Total investments (Cost $828,568,060) 100.7% | | | $948,983,238 |
| Other assets and liabilities, net (0.7%) | | | | (6,155,645) |
| Total net assets 100.0% | | | | | $942,827,593 |
| The percentage shown for each investment category is the total value of the category as a percentage of the net assets of the fund. |
| Security Abbreviations and Legend |
| PIPE | Private Investment in Public Equity |
| (A) | Non-income producing security. |
| (B) | Security is valued using significant unobservable inputs and is classified as Level 3 in the fair value hierarchy. Refer to Note 2 to the financial statements. |
| (C) | The rate shown is the annualized seven-day yield as of 3-31-20. |
At 3-31-20, the aggregate cost of investments for federal income tax purposes was $834,171,944. Net unrealized appreciation aggregated to $114,811,294, of which $145,571,617 related to gross unrealized appreciation and $30,760,323 related to gross unrealized depreciation.
| 12 | JOHN HANCOCK U.S. QUALITY GROWTH FUND | ANNUAL REPORT | SEE NOTES TO FINANCIAL STATEMENTS |
STATEMENT OF ASSETS AND LIABILITIES 3-31-20
| Assets | |
| Unaffiliated investments, at value (Cost $828,568,060) | $948,983,238 |
| Dividends and interest receivable | 237,156 |
| Receivable for fund shares sold | 3,252,244 |
| Receivable for securities lending income | 129 |
| Other assets | 110,433 |
| Total assets | 952,583,200 |
| Liabilities | |
| Payable for investments purchased | 6,735,323 |
| Payable for fund shares repurchased | 2,762,009 |
| Payable to affiliates | |
| Accounting and legal services fees | 36,588 |
| Transfer agent fees | 84,728 |
| Distribution and service fees | 241 |
| Trustees' fees | 382 |
| Other liabilities and accrued expenses | 136,336 |
| Total liabilities | 9,755,607 |
| Net assets | $942,827,593 |
| Net assets consist of | |
| Paid-in capital | $830,644,992 |
| Total distributable earnings (loss) | 112,182,601 |
| Net assets | $942,827,593 |
| |
| Net asset value per share | |
| Based on net asset value and shares outstanding - the fund has an unlimited number of shares authorized with no par value | |
| Class A ($458,361,106 ÷ 28,229,466 shares)1 | $16.24 |
| Class C ($22,596,345 ÷ 1,433,029 shares)1 | $15.77 |
| Class I ($320,834,042 ÷ 19,582,953 shares) | $16.38 |
| Class R2 ($812,525 ÷ 49,616 shares) | $16.38 |
| Class R4 ($869,782 ÷ 53,010 shares) | $16.41 |
| Class R6 ($99,221,682 ÷ 6,043,287 shares) | $16.42 |
| Class NAV ($40,132,111 ÷ 2,445,388 shares) | $16.41 |
| Maximum offering price per share | |
| Class A (net asset value per share ÷ 95%)2 | $17.09 |
| 1 | Redemption price per share is equal to net asset value less any applicable contingent deferred sales charge. |
| 2 | On single retail sales of less than $50,000. On sales of $50,000 or more and on group sales the offering price is reduced. |
| SEE NOTES TO FINANCIAL STATEMENTS | ANNUAL REPORT | JOHN HANCOCK U.S. Quality Growth Fund | 13 |
STATEMENT OF OPERATIONS For the year ended 3-31-20
| Investment income | |
| Dividends | $9,440,414 |
| Interest | 122,987 |
| Securities lending | 3,198 |
| Total investment income | 9,566,599 |
| Expenses | |
| Investment management fees | 5,251,115 |
| Distribution and service fees | 1,493,196 |
| Accounting and legal services fees | 156,728 |
| Transfer agent fees | 983,953 |
| Trustees' fees | 14,060 |
| Custodian fees | 105,419 |
| State registration fees | 126,606 |
| Printing and postage | 101,104 |
| Professional fees | 105,669 |
| Other | 47,869 |
| Total expenses | 8,385,719 |
| Less expense reductions | (69,400) |
| Net expenses | 8,316,319 |
| Net investment income | 1,250,280 |
| Realized and unrealized gain (loss) | |
| Net realized gain (loss) on | |
| Unaffiliated investments | (1,512,073) |
| Affiliated investments | (1,468) |
| | (1,513,541) |
| Change in net unrealized appreciation (depreciation) of | |
| Unaffiliated investments | (21,077,986) |
| | (21,077,986) |
| Net realized and unrealized loss | (22,591,527) |
| Decrease in net assets from operations | $(21,341,247) |
| 14 | JOHN HANCOCK U.S. Quality Growth Fund | ANNUAL REPORT | SEE NOTES TO FINANCIAL STATEMENTS |
STATEMENTS OF CHANGES IN NET ASSETS
| | Year ended
3-31-20 | Year ended
3-31-19 |
| Increase (decrease) in net assets | | |
| From operations | | |
| Net investment income | $1,250,280 | $1,088,219 |
| Net realized gain (loss) | (1,513,541) | 723,086,484 |
| Change in net unrealized appreciation (depreciation) | (21,077,986) | (485,932,482) |
| Increase (decrease) in net assets resulting from operations | (21,341,247) | 238,242,221 |
| Distributions to shareholders | | |
| From earnings | | |
| Class A | — | (83,061,817) |
| Class C | — | (1,692,850) |
| Class I | (416,220) | (5,130,366) |
| Class R2 | — | (174,632) |
| Class R4 | (414) | (156,581) |
| Class R6 | (216,751) | (1,983,279) |
| Class NAV | (89,547) | (267,256,660) |
| Total distributions | (722,932) | (359,456,185) |
| From fund share transactions | | |
| Fund share transactions | 186,865,267 | (1,167,772,986) |
| Issued in reorganization | 229,828,003 | — |
| From fund share transactions | 416,693,270 | (1,167,772,986) |
| Total increase (decrease) | 394,629,091 | (1,288,986,950) |
| Net assets | | |
| Beginning of year | 548,198,502 | 1,837,185,452 |
| End of year | $942,827,593 | $548,198,502 |
| SEE NOTES TO FINANCIAL STATEMENTS | ANNUAL REPORT | JOHN HANCOCK U.S. Quality Growth Fund | 15 |
| CLASS A SHARES Period ended | 3-31-20 | 3-31-19 | 3-31-18 | 3-31-17 | 3-31-16 |
| Per share operating performance | | | | | |
| Net asset value, beginning of period | $16.23 | $17.94 | $16.89 | $15.33 | $16.44 |
| Net investment income (loss)1 | 0.01 | (0.01) | 0.01 | 0.04 | 0.03 |
| Net realized and unrealized gain (loss) on investments | —2 | 2.22 | 3.62 | 2.12 | (0.24) |
| Total from investment operations | 0.01 | 2.21 | 3.63 | 2.16 | (0.21) |
| Less distributions | | | | | |
| From net investment income | — | (0.03) | (0.03) | (0.04) | (0.05) |
| From net realized gain | — | (3.89) | (2.55) | (0.56) | (0.85) |
| Total distributions | — | (3.92) | (2.58) | (0.60) | (0.90) |
| Net asset value, end of period | $16.24 | $16.23 | $17.94 | $16.89 | $15.33 |
| Total return (%)3,4 | 0.06 | 12.22 | 21.91 | 14.34 | (1.45) |
| Ratios and supplemental data | | | | | |
| Net assets, end of period (in millions) | $458 | $404 | $379 | $343 | $18 |
| Ratios (as a percentage of average net assets): | | | | | |
| Expenses before reductions | 1.01 | 1.10 | 1.10 | 1.11 | 1.19 |
| Expenses including reductions | 1.00 | 1.09 | 1.09 | 1.10 | 1.18 |
| Net investment income (loss) | 0.03 | (0.07) | 0.03 | 0.27 | 0.20 |
| Portfolio turnover (%) | 915 | 886 | 83 | 94 | 90 |
| 1 | Based on average daily shares outstanding. |
| 2 | Less than $0.005 per share. |
| 3 | Total returns would have been lower had certain expenses not been reduced during the applicable periods. |
| 4 | Does not reflect the effect of sales charges, if any. |
| 5 | Excludes in-kind transactions and merger activity. |
| 6 | Excludes in-kind transactions. |
| 16 | JOHN HANCOCK U.S. Quality Growth Fund | ANNUAL REPORT | SEE NOTES TO FINANCIAL STATEMENTS |
| CLASS C SHARES Period ended | 3-31-20 | 3-31-19 | 3-31-18 | 3-31-17 | 3-31-16 |
| Per share operating performance | | | | | |
| Net asset value, beginning of period | $15.88 | $17.71 | $16.80 | $15.32 | $16.51 |
| Net investment loss1 | (0.12) | (0.14) | (0.13) | (0.08) | (0.09) |
| Net realized and unrealized gain (loss) on investments | 0.012 | 2.20 | 3.59 | 2.12 | (0.25) |
| Total from investment operations | (0.11) | 2.06 | 3.46 | 2.04 | (0.34) |
| Less distributions | | | | | |
| From net realized gain | — | (3.89) | (2.55) | (0.56) | (0.85) |
| Net asset value, end of period | $15.77 | $15.88 | $17.71 | $16.80 | $15.32 |
| Total return (%)3,4 | (0.69) | 11.44 | 20.95 | 13.53 | (2.24) |
| Ratios and supplemental data | | | | | |
| Net assets, end of period (in millions) | $23 | $12 | $18 | $17 | $1 |
| Ratios (as a percentage of average net assets): | | | | | |
| Expenses before reductions | 1.76 | 1.85 | 1.85 | 1.86 | 2.50 |
| Expenses including reductions | 1.75 | 1.84 | 1.84 | 1.85 | 1.94 |
| Net investment loss | (0.72) | (0.85) | (0.72) | (0.48) | (0.54) |
| Portfolio turnover (%) | 915 | 886 | 83 | 94 | 90 |
| 1 | Based on average daily shares outstanding. |
| 2 | The amount shown for a share outstanding does not correspond with the aggregate net gain (loss) on investments for the period due to the timing of the sales and repurchases of shares in relation to fluctuating market values of the investments of the fund. |
| 3 | Total returns would have been lower had certain expenses not been reduced during the applicable periods. |
| 4 | Does not reflect the effect of sales charges, if any. |
| 5 | Excludes in-kind transactions and merger activity. |
| 6 | Excludes in-kind transactions. |
| SEE NOTES TO FINANCIAL STATEMENTS | ANNUAL REPORT | JOHN HANCOCK U.S. Quality Growth Fund | 17 |
| CLASS I SHARES Period ended | 3-31-20 | 3-31-19 | 3-31-18 | 3-31-17 | 3-31-16 |
| Per share operating performance | | | | | |
| Net asset value, beginning of period | $16.36 | $18.05 | $16.98 | $15.41 | $16.53 |
| Net investment income1 | 0.05 | 0.04 | 0.06 | 0.08 | 0.08 |
| Net realized and unrealized gain (loss) on investments | (0.01) | 2.23 | 3.64 | 2.13 | (0.24) |
| Total from investment operations | 0.04 | 2.27 | 3.70 | 2.21 | (0.16) |
| Less distributions | | | | | |
| From net investment income | (0.02) | (0.07) | (0.08) | (0.08) | (0.11) |
| From net realized gain | — | (3.89) | (2.55) | (0.56) | (0.85) |
| Total distributions | (0.02) | (3.96) | (2.63) | (0.64) | (0.96) |
| Net asset value, end of period | $16.38 | $16.36 | $18.05 | $16.98 | $15.41 |
| Total return (%)2 | 0.26 | 12.55 | 22.12 | 14.70 | (1.17) |
| Ratios and supplemental data | | | | | |
| Net assets, end of period (in millions) | $321 | $115 | $20 | $17 | $10 |
| Ratios (as a percentage of average net assets): | | | | | |
| Expenses before reductions | 0.76 | 0.87 | 0.84 | 0.85 | 0.90 |
| Expenses including reductions | 0.75 | 0.86 | 0.83 | 0.84 | 0.88 |
| Net investment income | 0.28 | 0.25 | 0.31 | 0.47 | 0.50 |
| Portfolio turnover (%) | 913 | 884 | 83 | 94 | 90 |
| 1 | Based on average daily shares outstanding. |
| 2 | Total returns would have been lower had certain expenses not been reduced during the applicable periods. |
| 3 | Excludes in-kind transactions and merger activity. |
| 4 | Excludes in-kind transactions. |
| 18 | JOHN HANCOCK U.S. Quality Growth Fund | ANNUAL REPORT | SEE NOTES TO FINANCIAL STATEMENTS |
| CLASS R2 SHARES Period ended | 3-31-20 | 3-31-19 | 3-31-18 | 3-31-17 | 3-31-16 |
| Per share operating performance | | | | | |
| Net asset value, beginning of period | $16.40 | $18.08 | $17.02 | $15.44 | $16.55 |
| Net investment income (loss)1 | (0.02) | (0.04) | (0.02) | 0.03 | 0.01 |
| Net realized and unrealized gain (loss) on investments | —2 | 2.25 | 3.64 | 2.14 | (0.25) |
| Total from investment operations | (0.02) | 2.21 | 3.62 | 2.17 | (0.24) |
| Less distributions | | | | | |
| From net investment income | — | —2 | (0.01) | (0.03) | (0.02) |
| From net realized gain | — | (3.89) | (2.55) | (0.56) | (0.85) |
| Total distributions | — | (3.89) | (2.56) | (0.59) | (0.87) |
| Net asset value, end of period | $16.38 | $16.40 | $18.08 | $17.02 | $15.44 |
| Total return (%)3 | (0.12) | 12.13 | 21.68 | 14.30 | (1.63) |
| Ratios and supplemental data | | | | | |
| Net assets, end of period (in millions) | $1 | $1 | $1 | $1 | $—4 |
| Ratios (as a percentage of average net assets): | | | | | |
| Expenses before reductions | 1.15 | 1.25 | 1.22 | 1.18 | 4.73 |
| Expenses including reductions | 1.14 | 1.25 | 1.21 | 1.17 | 1.32 |
| Net investment income (loss) | (0.11) | (0.22) | (0.11) | 0.19 | 0.06 |
| Portfolio turnover (%) | 915 | 886 | 83 | 94 | 90 |
| 1 | Based on average daily shares outstanding. |
| 2 | Less than $0.005 per share. |
| 3 | Total returns would have been lower had certain expenses not been reduced during the applicable periods. |
| 4 | Less than $500,000. |
| 5 | Excludes in-kind transactions and merger activity. |
| 6 | Excludes in-kind transactions. |
| SEE NOTES TO FINANCIAL STATEMENTS | ANNUAL REPORT | JOHN HANCOCK U.S. Quality Growth Fund | 19 |
| CLASS R4 SHARES Period ended | 3-31-20 | 3-31-19 | 3-31-18 | 3-31-17 | 3-31-16 |
| Per share operating performance | | | | | |
| Net asset value, beginning of period | $16.39 | $18.08 | $17.01 | $15.43 | $16.55 |
| Net investment income1 | 0.03 | 0.01 | 0.03 | 0.07 | 0.04 |
| Net realized and unrealized gain (loss) on investments | —2 | 2.24 | 3.65 | 2.14 | (0.25) |
| Total from investment operations | 0.03 | 2.25 | 3.68 | 2.21 | (0.21) |
| Less distributions | | | | | |
| From net investment income | (0.01) | (0.05) | (0.06) | (0.07) | (0.06) |
| From net realized gain | — | (3.89) | (2.55) | (0.56) | (0.85) |
| Total distributions | (0.01) | (3.94) | (2.61) | (0.63) | (0.91) |
| Net asset value, end of period | $16.41 | $16.39 | $18.08 | $17.01 | $15.43 |
| Total return (%)3 | 0.17 | 12.36 | 22.05 | 14.60 | (1.47) |
| Ratios and supplemental data | | | | | |
| Net assets, end of period (in millions) | $1 | $1 | $1 | $—4 | $—4 |
| Ratios (as a percentage of average net assets): | | | | | |
| Expenses before reductions | 1.00 | 1.10 | 1.06 | 1.02 | 4.73 |
| Expenses including reductions | 0.89 | 1.00 | 0.95 | 0.91 | 1.13 |
| Net investment income | 0.15 | 0.03 | 0.18 | 0.44 | 0.25 |
| Portfolio turnover (%) | 915 | 886 | 83 | 94 | 90 |
| 1 | Based on average daily shares outstanding. |
| 2 | Less than $0.005 per share. |
| 3 | Total returns would have been lower had certain expenses not been reduced during the applicable periods. |
| 4 | Less than $500,000. |
| 5 | Excludes in-kind transactions and merger activity. |
| 6 | Excludes in-kind transactions. |
| 20 | JOHN HANCOCK U.S. Quality Growth Fund | ANNUAL REPORT | SEE NOTES TO FINANCIAL STATEMENTS |
| CLASS R6 SHARES Period ended | 3-31-20 | 3-31-19 | 3-31-18 | 3-31-17 | 3-31-16 |
| Per share operating performance | | | | | |
| Net asset value, beginning of period | $16.39 | $18.08 | $17.01 | $15.42 | $16.55 |
| Net investment income1 | 0.07 | 0.05 | 0.05 | 0.09 | 0.10 |
| Net realized and unrealized gain (loss) on investments | —2 | 2.24 | 3.67 | 2.16 | (0.25) |
| Total from investment operations | 0.07 | 2.29 | 3.72 | 2.25 | (0.15) |
| Less distributions | | | | | |
| From net investment income | (0.04) | (0.09) | (0.10) | (0.10) | (0.13) |
| From net realized gain | — | (3.89) | (2.55) | (0.56) | (0.85) |
| Total distributions | (0.04) | (3.98) | (2.65) | (0.66) | (0.98) |
| Net asset value, end of period | $16.42 | $16.39 | $18.08 | $17.01 | $15.42 |
| Total return (%)3 | 0.38 | 12.68 | 22.26 | 14.87 | (1.09) |
| Ratios and supplemental data | | | | | |
| Net assets, end of period (in millions) | $99 | $15 | $9 | $1 | $—4 |
| Ratios (as a percentage of average net assets): | | | | | |
| Expenses before reductions | 0.65 | 0.75 | 0.75 | 0.75 | 4.75 |
| Expenses including reductions | 0.64 | 0.74 | 0.74 | 0.73 | 0.73 |
| Net investment income | 0.37 | 0.29 | 0.25 | 0.50 | 0.65 |
| Portfolio turnover (%) | 915 | 886 | 83 | 94 | 90 |
| 1 | Based on average daily shares outstanding. |
| 2 | Less than $0.005 per share. |
| 3 | Total returns would have been lower had certain expenses not been reduced during the applicable periods. |
| 4 | Less than $500,000. |
| 5 | Excludes in-kind transactions and merger activity. |
| 6 | Excludes in-kind transactions. |
| SEE NOTES TO FINANCIAL STATEMENTS | ANNUAL REPORT | JOHN HANCOCK U.S. Quality Growth Fund | 21 |
| CLASS NAV SHARES Period ended | 3-31-20 | 3-31-19 | 3-31-18 | 3-31-17 | 3-31-16 |
| Per share operating performance | | | | | |
| Net asset value, beginning of period | $16.38 | $18.07 | $17.00 | $15.42 | $16.55 |
| Net investment income1 | 0.07 | 0.03 | 0.07 | 0.10 | 0.10 |
| Net realized and unrealized gain (loss) on investments | —2 | 2.26 | 3.65 | 2.14 | (0.25) |
| Total from investment operations | 0.07 | 2.29 | 3.72 | 2.24 | (0.15) |
| Less distributions | | | | | |
| From net investment income | (0.04) | (0.09) | (0.10) | (0.10) | (0.13) |
| From net realized gain | — | (3.89) | (2.55) | (0.56) | (0.85) |
| Total distributions | (0.04) | (3.98) | (2.65) | (0.66) | (0.98) |
| Net asset value, end of period | $16.41 | $16.38 | $18.07 | $17.00 | $15.42 |
| Total return (%)3 | 0.39 | 12.69 | 22.30 | 14.81 | (1.09) |
| Ratios and supplemental data | | | | | |
| Net assets, end of period (in millions) | $40 | $—4 | $1,410 | $1,592 | $1,666 |
| Ratios (as a percentage of average net assets): | | | | | |
| Expenses before reductions | 0.64 | 0.74 | 0.73 | 0.73 | 0.74 |
| Expenses including reductions | 0.63 | 0.73 | 0.73 | 0.73 | 0.74 |
| Net investment income | 0.41 | 0.18 | 0.40 | 0.61 | 0.64 |
| Portfolio turnover (%) | 915 | 886 | 83 | 94 | 90 |
| 1 | Based on average daily shares outstanding. |
| 2 | Less than $0.005 per share. |
| 3 | Total returns would have been lower had certain expenses not been reduced during the applicable periods. |
| 4 | Less than $500,000. |
| 5 | Excludes in-kind transactions and merger activity. |
| 6 | Excludes in-kind transactions. |
| 22 | JOHN HANCOCK U.S. Quality Growth Fund | ANNUAL REPORT | SEE NOTES TO FINANCIAL STATEMENTS |
| Notes to financial statements | |
Note 1—Organization
John Hancock U.S. Quality Growth Fund (the fund) is a series of John Hancock Funds III (the Trust), an open-end management investment company organized as a Massachusetts business trust and registered under the Investment Company Act of 1940, as amended (the 1940 Act). The investment objective of the fund is to seek long-term capital appreciation.
The fund may offer multiple classes of shares. The shares currently outstanding are detailed in the Statement of assets and liabilities. Class A and Class C shares are offered to all investors. Class I shares are offered to institutions and certain investors. Class R2 and Class R4 shares are available only to certain retirement and 529 plans. Class R6 shares are only available to certain retirement plans, institutions and other investors. Class NAV shares are offered to John Hancock affiliated funds of funds, retirement plans for employees of John Hancock and/or Manulife Financial Corporation, and certain 529 plans. Class C shares convert to Class A shares ten years after purchase (certain exclusions may apply). Shareholders of each class have exclusive voting rights to matters that affect that class. The distribution and service fees, if any, and transfer agent fees for each class may differ.
Note 2—Significant accounting policies
The financial statements have been prepared in conformity with accounting principles generally accepted in the United States of America (US GAAP), which require management to make certain estimates and assumptions as of the date of the financial statements. Actual results could differ from those estimates and those differences could be significant. The fund qualifies as an investment company under Topic 946 of Accounting Standards Codification of US GAAP.
Events or transactions occurring after the end of the fiscal period through the date that the financial statements were issued have been evaluated in the preparation of the financial statements. The following summarizes the significant accounting policies of the fund:
Security valuation. Investments are stated at value as of the scheduled close of regular trading on the New York Stock Exchange (NYSE), normally at 4:00 P.M., Eastern Time. In case of emergency or other disruption resulting in the NYSE not opening for trading or the NYSE closing at a time other than the regularly scheduled close, the net asset value (NAV) may be determined as of the regularly scheduled close of the NYSE pursuant to the fund's Valuation Policies and Procedures.
In order to value the securities, the fund uses the following valuation techniques: Equity securities, including exchange-traded or closed-end funds, are typically valued at the last sale price or official closing price on the exchange or principal market where the security trades. In the event there were no sales during the day or closing prices are not available, the securities are valued using the last available bid price. Investments by the fund in open-end mutual funds are valued at their respective NAVs each business day.
In certain instances, the Pricing Committee may determine to value equity securities using prices obtained from another exchange or market if trading on the exchange or market on which prices are typically obtained did not open for trading as scheduled, or if trading closed earlier than scheduled, and trading occurred as normal on another exchange or market.
Other portfolio securities and assets, for which reliable market quotations are not readily available, are valued at fair value as determined in good faith by the fund's Pricing Committee following procedures established by the Board of Trustees. The frequency with which these fair valuation procedures are used cannot be predicted and fair value of securities may differ significantly from the value that would have been used had a ready market for such securities existed.
The fund uses a three-tier hierarchy to prioritize the pricing assumptions, referred to as inputs, used in valuation techniques to measure fair value. Level 1 includes securities valued using quoted prices in active markets for identical securities, including registered investment companies. Level 2 includes securities valued using other significant observable inputs. Observable inputs may include quoted prices for similar securities, interest rates,
| | ANNUAL REPORT | JOHN HANCOCK U.S. Quality Growth Fund | 23 |
prepayment speeds and credit risk. Prices for securities valued using these inputs are received from independent pricing vendors and brokers and are based on an evaluation of the inputs described. Level 3 includes securities valued using significant unobservable inputs when market prices are not readily available or reliable, including the fund's own assumptions in determining the fair value of investments. Factors used in determining value may include market or issuer specific events or trends, changes in interest rates and credit quality. The inputs or methodology used for valuing securities are not necessarily an indication of the risks associated with investing in those securities. Changes in valuation techniques and related inputs may result in transfers into or out of an assigned level within the disclosure hierarchy.
The following is a summary of the values by input classification of the fund's investments as of March 31, 2020, by major security category or type:
| | Total
value at
3-31-20 | Level 1
quoted
price | Level 2
significant
observable
inputs | Level 3
significant
unobservable
inputs |
| Investments in securities: | | | | |
| Assets | | | | |
| Common stocks | | | | |
| Communication services | $132,679,960 | $132,679,960 | — | — |
| Consumer discretionary | 102,087,361 | 102,087,361 | — | — |
| Financials | 46,000,602 | 46,000,602 | — | — |
| Health care | 146,264,282 | 146,264,282 | — | — |
| Industrials | 48,716,409 | 48,716,409 | — | — |
| Information technology | 421,444,162 | 421,421,259 | — | $22,903 |
| Materials | 11,048,246 | 11,048,246 | — | — |
| Real estate | 30,575,867 | 30,575,867 | — | — |
| Short-term investments | 10,166,349 | 10,166,349 | — | — |
| Total investments in securities | $948,983,238 | $948,960,335 | — | $22,903 |
Security transactions and related investment income. Investment security transactions are accounted for on a trade date plus one basis for daily NAV calculations. However, for financial reporting purposes, investment transactions are reported on trade date. Interest income is accrued as earned. Dividend income is recorded on the ex-date, except for dividends of certain foreign securities where the dividend may not be known until after the ex-date. In those cases, dividend income, net of withholding taxes, is recorded when the fund becomes aware of the dividends. Non-cash dividends, if any, are recorded at the fair market value of the securities received. Gains and losses on securities sold are determined on the basis of identified cost and may include proceeds from litigation.
Real estate investment trusts. The fund may invest in real estate investment trusts (REITs). Distributions from REITs may be recorded as income and subsequently characterized by the REIT at the end of the fiscal year as a reduction of cost of investments and/or as a realized gain. As a result, the fund will estimate the components of distributions from these securities. Such estimates are revised when the actual components of the distributions are known.
Securities lending. The fund may lend its securities to earn additional income. The fund receives collateral from the borrower in an amount not less than the market value of the loaned securities. The fund will invest its cash collateral in John Hancock Collateral Trust (JHCT), an affiliate of the fund, which has a floating NAV and is registered with the Securities and Exchange Commission (SEC) as an investment company. JHCT invests in short-term money market investments. The fund will receive the benefit of any gains and bear any losses generated by JHCT with respect to the cash collateral.
| 24 | JOHN HANCOCK U.S. Quality Growth Fund | ANNUAL REPORT | |
The fund has the right to recall loaned securities on demand. If a borrower fails to return loaned securities when due, then the lending agent is responsible and indemnifies the fund for the lent securities. The lending agent uses the collateral received from the borrower to purchase replacement securities of the same issue, type, class and series of the loaned securities. If the value of the collateral is less than the purchase cost of replacement securities, the lending agent is responsible for satisfying the shortfall but only to the extent that the shortfall is not due to any decrease in the value of JHCT.
Although the risk of loss on securities lent is mitigated by receiving collateral from the borrower and through lending agent indemnification, the fund could experience a delay in recovering securities or could experience a lower than expected return if the borrower fails to return the securities on a timely basis. The fund receives compensation for lending its securities by retaining a portion of the return on the investment of the collateral and compensation from fees earned from borrowers of the securities. Securities lending income received by the fund is net of fees retained by the securities lending agent. Net income received from JHCT is a component of securities lending income as recorded on the Statement of operations. As of March 31, 2020, there were no securities on loan.
Overdraft. The fund may have the ability to borrow from banks for temporary or emergency purposes, including meeting redemption requests that otherwise might require the untimely sale of securities. Pursuant to the fund's custodian agreement, the custodian may loan money to the fund to make properly authorized payments. The fund is obligated to repay the custodian for any overdraft, including any related costs or expenses. The custodian may have a lien, security interest or security entitlement in any fund property that is not otherwise segregated or pledged, to the extent of any overdraft, and to the maximum extent permitted by law.
Line of credit. The fund and other affiliated funds have entered into a syndicated line of credit agreement with Citibank, N.A. as the administrative agent that enables them to participate in a $750 million unsecured committed line of credit. Excluding commitments designated for a certain fund and subject to the needs of all other affiliated funds, the fund can borrow up to an aggregate commitment amount of $500 million, subject to asset coverage and other limitations as specified in the agreement. A commitment fee payable at the end of each calendar quarter, based on the average daily unused portion of the line of credit, is charged to each participating fund based on a combination of fixed and asset based allocations and is reflected in Other expenses on the Statement of operations. For the year ended March 31, 2020, the fund had no borrowings under the line of credit. Commitment fees for the year ended March 31, 2020 were $4,240.
Expenses. Within the John Hancock group of funds complex, expenses that are directly attributable to an individual fund are allocated to such fund. Expenses that are not readily attributable to a specific fund are allocated among all funds in an equitable manner, taking into consideration, among other things, the nature and type of expense and the fund’s relative net assets. Expense estimates are accrued in the period to which they relate and adjustments are made when actual amounts are known.
Class allocations. Income, common expenses and realized and unrealized gains (losses) are determined at the fund level and allocated daily to each class of shares based on the net assets of the class. Class-specific expenses, such as distribution and service fees, if any, and transfer agent fees, for all classes, are charged daily at the class level based on the net assets of each class and the specific expense rates applicable to each class.
Federal income taxes. The fund intends to continue to qualify as a regulated investment company by complying with the applicable provisions of the Internal Revenue Code and will not be subject to federal income tax on taxable income that is distributed to shareholders. Therefore, no federal income tax provision is required.
For federal income tax purposes, as of March 31, 2020, the fund has a short-term capital loss carryforward of $3,294,396 available to offset future net realized capital gains. This carryforward does not expire.
Availability of a certain amount of the loss carryforwards, which were acquired on April 12, 2019, in a merger with John Hancock Funds II U.S. Growth Fund, may be limited in a given year.
| | ANNUAL REPORT | JOHN HANCOCK U.S. Quality Growth Fund | 25 |
As of March 31, 2020, the fund had no uncertain tax positions that would require financial statement recognition, derecognition or disclosure. The fund's federal tax returns are subject to examination by the Internal Revenue Service for a period of three years.
Distribution of income and gains. Distributions to shareholders from net investment income and net realized gains, if any, are recorded on the ex-date. The fund generally declares and pays dividends annually. Capital gain distributions, if any, are typically distributed annually.
The tax character of distributions for the years ended March 31, 2020 and 2019 was as follows:
| | March 31, 2020 | March 31, 2019 |
| Ordinary income | $722,932 | $83,257,183 |
| Long-term capital gains | — | 276,199,002 |
| Total | $722,932 | $359,456,185 |
Distributions paid by the fund with respect to each class of shares are calculated in the same manner, at the same time and in the same amount, except for the effect of class level expenses that may be applied differently to each class. As of March 31, 2020, the components of distributable earnings on a tax basis consisted of $665,703 of undistributed ordinary income.
Such distributions and distributable earnings, on a tax basis, are determined in conformity with income tax regulations, which may differ from US GAAP. Distributions in excess of tax basis earnings and profits, if any, are reported in the fund's financial statements as a return of capital.
Capital accounts within the financial statements are adjusted for permanent book-tax differences. These adjustments have no impact on net assets or the results of operations. Temporary book-tax differences, if any, will reverse in a subsequent period. Book-tax differences are primarily attributable to wash sale loss deferrals and merger related adjustments.
Note 3—Guarantees and indemnifications
Under the Trust's organizational documents, its Officers and Trustees are indemnified against certain liabilities arising out of the performance of their duties to the Trust, including the fund. Additionally, in the normal course of business, the fund enters into contracts with service providers that contain general indemnification clauses. The fund's maximum exposure under these arrangements is unknown, as this would involve future claims that may be made against the fund that have not yet occurred. The risk of material loss from such claims is considered remote.
Note 4—Fees and transactions with affiliates
John Hancock Investment Management LLC (the Advisor) serves as investment advisor for the fund. John Hancock Investment Management Distributors LLC (the Distributor), an affiliate of the Advisor, serves as principal underwriter of the fund. The Advisor and the Distributor are indirect, wholly owned subsidiaries of Manulife Financial Corporation. Prior to June 28, 2019, the Advisor was known as John Hancock Advisers, LLC and the Distributor was known as John Hancock Funds, LLC.
Management fee. The fund has an investment management agreement with the Advisor under which the fund pays a daily management fee to the Advisor equivalent on an annual basis to the sum of: (a) 0.600% of the first $500 million of the fund’s aggregate net assets; (b) 0.550% of the next $1.0 billion of the fund’s aggregate net assets; and (c) 0.530% of the fund’s aggregate net assets in excess of $1.5 billion. Effective July 1, 2019, aggregate net assets include the net assets of the fund and Manulife U.S. Diversified Growth Equity Fund, a series trust of The Manufacturers Life Insurance Company. Prior to April 12, 2019, aggregate net assets included the net assets of the fund and U.S. Growth Fund, a series of John Hancock Funds II. The advisor has a subadvisory agreement with Wellington Management Company LLP. The fund is not responsible for payment of the subadvisory fees.
| 26 | JOHN HANCOCK U.S. Quality Growth Fund | ANNUAL REPORT | |
The Advisor has contractually agreed to waive a portion of its management fee and/or reimburse expenses for certain funds of the John Hancock group of funds complex, including the fund (the participating portfolios). This waiver is based upon aggregate net assets of all the participating portfolios. The amount of the reimbursement is calculated daily and allocated among all the participating portfolios in proportion to the daily net assets of each fund. During the year ended March 31, 2020, this waiver amounted to 0.01% of the fund’s average daily net assets. This arrangement expires on July 31, 2021, unless renewed by mutual agreement of the fund and the Advisor based upon a determination that this is appropriate under the circumstances at that time.
For the year ended March 31, 2020, the expense reductions described above amounted to the following:
| Class | Expense reduction |
| Class A | $37,352 |
| Class C | 1,623 |
| Class I | 19,759 |
| Class R2 | 71 |
| Class | Expense reduction |
| Class R4 | $64 |
| Class R6 | 7,418 |
| Class NAV | 2,240 |
| Total | $68,527 |
Expenses waived or reimbursed in the current fiscal period are not subject to recapture in future fiscal periods.
The investment management fees, including the impact of the waivers and reimbursements as described above, incurred for the year ended March 31, 2020, were equivalent to a net annual effective rate of 0.56% of the fund's average daily net assets.
Accounting and legal services. Pursuant to a service agreement, the fund reimburses the Advisor for all expenses associated with providing the administrative, financial, legal, compliance, accounting and recordkeeping services to the fund, including the preparation of all tax returns, periodic reports to shareholders and regulatory reports, among other services. These expenses are allocated to each share class based on its relative net assets at the time the expense was incurred. These accounting and legal services fees incurred for the year ended March 31, 2020 amounted to an annual rate of 0.02% of the fund's average daily net assets.
Distribution and service plans. The fund has a distribution agreement with the Distributor. The fund has adopted distribution and service plans for certain classes as detailed below pursuant to Rule 12b-1 under the 1940 Act, to pay the Distributor for services provided as the distributor of shares of the fund. In addition, under a service plan for certain classes as detailed below, the fund pays for certain other services. The fund may pay up to the following contractual rates of distribution and service fees under these arrangements, expressed as an annual percentage of average daily net assets for each class of the fund's shares:
| Class | Rule 12b-1 Fee | Service fee |
| Class A | 0.25% | — |
| Class C | 1.00% | — |
| Class R2 | 0.25% | 0.25% |
| Class R4 | 0.25% | 0.10% |
The fund's Distributor has contractually agreed to waive 0.10% of Rule12b-1 fees for Class R4 shares. The current waiver agreement expires on July 31, 2021, unless renewed by mutual agreement of the fund and the Distributor based upon a determination that this is appropriate under the circumstances at the time. This contractual waiver amounted to $873 for Class R4 shares for the year ended March 31, 2020.
Sales charges. Class A shares are assessed up-front sales charges, which resulted in payments to the Distributor amounting to $427,513 for the year ended March 31, 2020. Of this amount, $69,709 was retained and used for printing prospectuses, advertising, sales literature and other purposes and $357,804 was paid as sales commissions to broker-dealers.
| | ANNUAL REPORT | JOHN HANCOCK U.S. Quality Growth Fund | 27 |
Class A and Class C shares may be subject to contingent deferred sales charges (CDSCs). Certain Class A shares that are acquired through purchases of $1 million or more and are redeemed within one year of purchase are subject to a 1.00% sales charge. Class C shares that are redeemed within one year of purchase are subject to a 1.00% CDSC. CDSCs are applied to the lesser of the current market value at the time of redemption or the original purchase cost of the shares being redeemed. Proceeds from CDSCs are used to compensate the Distributor for providing distribution-related services in connection with the sale of these shares. During the year ended March 31, 2020, CDSCs received by the Distributor amounted to $815 and $2,892 for Class A and Class C shares, respectively.
Transfer agent fees. The John Hancock group of funds has a complex-wide transfer agent agreement with John Hancock Signature Services, Inc. (Signature Services), an affiliate of the Advisor. The transfer agent fees paid to Signature Services are determined based on the cost to Signature Services (Signature Services Cost) of providing recordkeeping services. It also includes out-of-pocket expenses, including payments made to third-parties for recordkeeping services provided to their clients who invest in one or more John Hancock funds. In addition, Signature Services Cost may be reduced by certain fees that Signature Services receives in connection with retirement and small accounts. Signature Services Cost is calculated monthly and allocated, as applicable, to five categories of share classes: Retail Share and Institutional Share Classes of Non-Municipal Bond Funds, Class R6 Shares, Retirement Share Classes and Municipal Bond Share Classes. Within each of these categories, the applicable costs are allocated to the affected John Hancock affiliated funds and/or classes, based on the relative average daily net assets.
Class level expenses. Class level expenses for the year ended March 31, 2020 were as follows:
| Class | Distribution and service fees | Transfer agent fees |
| Class A | $1,265,542 | $614,859 |
| Class C | 219,798 | 26,767 |
| Class I | — | 329,320 |
| Class R2 | 4,802 | 120 |
| Class R4 | 3,054 | 109 |
| Class R6 | — | 12,778 |
| Total | $1,493,196 | $983,953 |
Trustee expenses. The fund compensates each Trustee who is not an employee of the Advisor or its affiliates. The costs of paying Trustee compensation and expenses are allocated to the fund based on its net assets relative to other funds within the John Hancock group of funds complex.
Interfund lending program. Pursuant to an Exemptive Order issued by the SEC, the fund, along with certain other funds advised by the Advisor or its affiliates, may participate in an interfund lending program. This program provides an alternative credit facility allowing the fund to borrow from, or lend money to, other participating affiliated funds. At period end, no interfund loans were outstanding. The fund's activity in this program during the period for which loans were outstanding was as follows:
Borrower
or Lender | Weighted Average
Loan Balance | Days
Outstanding | Weighted Average
Interest Rate | Interest Income
(Expense) |
| Lender | $2,441,535 | 5 | 1.712% | $580 |
| 28 | JOHN HANCOCK U.S. Quality Growth Fund | ANNUAL REPORT | |
Note 5—Fund share transactions
Transactions in fund shares for the years ended March 31, 2020 and 2019 were as follows:
| | Year Ended 3-31-20 | Year Ended 3-31-19 |
| | Shares | Amount | Shares | Amount |
| Class A shares | | | | |
| Sold | 3,023,155 | $53,258,748 | 2,190,898 | $37,187,427 |
| Issued in reorganization (Note 9) | 4,540,944 | 75,293,391 | — | — |
| Distributions reinvested | — | — | 4,951,957 | 80,912,745 |
| Repurchased | (4,242,450) | (74,258,441) | (3,373,280) | (55,260,901) |
| Net increase | 3,321,649 | $54,293,698 | 3,769,575 | $62,839,271 |
| Class C shares | | | | |
| Sold | 711,141 | $11,948,771 | 374,821 | $5,572,801 |
| Issued in reorganization (Note 9) | 374,818 | 6,079,328 | — | — |
| Distributions reinvested | — | — | 91,024 | 1,459,117 |
| Repurchased | (387,791) | (6,566,893) | (724,672) | (13,006,185) |
| Net increase (decrease) | 698,168 | $11,461,206 | (258,827) | $(5,974,267) |
| Class I shares | | | | |
| Sold | 13,078,856 | $233,950,325 | 6,662,479 | $101,675,911 |
| Issued in reorganization (Note 9) | 4,260,837 | 71,208,808 | — | — |
| Distributions reinvested | 22,425 | 414,859 | 308,435 | 5,047,263 |
| Repurchased | (4,828,389) | (83,891,080) | (1,031,980) | (16,000,869) |
| Net increase | 12,533,729 | $221,682,912 | 5,938,934 | $90,722,305 |
| Class R2 shares | | | | |
| Sold | 25,337 | $455,795 | 5,407 | $89,857 |
| Distributions reinvested | — | — | 10,401 | 171,599 |
| Repurchased | (32,442) | (616,700) | (3,345) | (57,599) |
| Net increase (decrease) | (7,105) | $(160,905) | 12,463 | $203,857 |
| Class R4 shares | | | | |
| Sold | 7,348 | $126,515 | 4,965 | $89,513 |
| Distributions reinvested | 22 | 414 | 9,493 | 156,581 |
| Repurchased | (4,602) | (79,440) | (5,284) | (96,119) |
| Net increase | 2,768 | $47,489 | 9,174 | $149,975 |
| Class R6 shares | | | | |
| Sold | 2,190,777 | $39,155,732 | 502,744 | $7,838,421 |
| Issued in reorganization (Note 9) | 4,614,044 | 77,246,476 | — | — |
| Distributions reinvested | 11,697 | 216,751 | 120,357 | 1,983,279 |
| Repurchased | (1,692,994) | (29,940,487) | (212,973) | (3,444,592) |
| Net increase | 5,123,524 | $86,678,472 | 410,128 | $6,377,108 |
| | ANNUAL REPORT | JOHN HANCOCK U.S. Quality Growth Fund | 29 |
| | Year Ended 3-31-20 | Year Ended 3-31-19 |
| | Shares | Amount | Shares | Amount |
| Class NAV shares | | | | |
| Sold | 3,029,075 | $52,879,3701 | 441,456 | $7,977,037 |
| Distributions reinvested | 4,835 | 89,547 | 16,148,421 | 267,256,374 |
| Repurchased | (591,550) | (10,278,519) | (94,579,725) | (1,597,324,646) |
| Net increase (decrease) | 2,442,360 | $42,690,398 | (77,989,848) | $(1,322,091,235) |
| Total net increase (decrease) | 24,115,093 | $416,693,270 | (68,108,401) | $(1,167,772,986) |
| 1 | Includes in-kind subscriptions of approximately $18.4 million by affiliates of the fund. The cost basis of the contributed securities is equal to the market value of the securities on the date of the subscription. |
Affiliates of the fund owned 100% of shares of Class NAV on March 31, 2020. Such concentration of shareholders’ capital could have a material effect on the fund if such shareholders redeem from the fund.
Note 6—Purchase and sale of securities
Purchases and sales of securities, other than short-term investments, amounted to $822,843,399 and $646,611,631, respectively, for the year ended March 31, 2020.
Note 7—Industry or sector risk
The fund may invest a large percentage of its assets in one or more particular industries or sectors of the economy. If a large percentage of the fund’s assets are economically tied to a single or small number of industries or sectors of the economy, the fund will be less diversified than a more broadly diversified fund, and it may cause the fund to underperform if that industry or sector underperforms. In addition, focusing on a particular industry or sector may make the fund’s NAV more volatile. Further, a fund that invests in particular industries or sectors is particularly susceptible to the impact of market, economic, regulatory and other factors affecting those industries or sectors.
Note 8—Investment in affiliated underlying funds
The fund may invest in affiliated underlying funds that are managed by the Advisor and its affiliates. Information regarding the fund's fiscal year to date purchases and sales of the affiliated underlying funds as well as income and capital gains earned by the fund, if any, is as follows:
| | | | | | | | Dividends and distributions |
| Affiliate | Ending
share
amount | Beginning
value | Cost of
purchases | Proceeds
from shares
sold | Realized
gain
(loss) | Change in
unrealized
appreciation
(depreciation) | Income
distributions
received | Capital gain
distributions
received | Ending
value |
| John Hancock Collateral Trust* | — | — | $57,672,225 | $(57,670,757) | $(1,468) | — | $3,198 | — | — |
| * | Refer to the Securities lending note within Note 2 for details regarding this investment. |
Note 9—Reorganization
On March 15, 2019, the shareholders of John Hancock Funds II U.S. Growth Fund (the Acquired Fund) voted to approve an Agreement and Plan of Reorganization (the Agreement) which provided for an exchange of shares of U.S. Quality Growth Fund (the Acquiring Fund) with a value equal to the net assets transferred. The Agreement provided for (a) the acquisition of all the assets, subject to all of the liabilities, of the Acquired Fund in exchange
| 30 | JOHN HANCOCK U.S. Quality Growth Fund | ANNUAL REPORT | |
for shares of the Acquiring Fund with a value equal to the net assets transferred; (b) the liquidation of the Acquired Fund; and (c) the distribution to the Acquired Fund’s shareholders of such Acquiring Fund’s shares. The reorganization was intended to achieve a more consistent long-term performance record and stronger prospects for growth and achieve potential opportunities for economies of scale. As a result of the reorganization, the Acquiring Fund is the legal and accounting survivor.
The reorganization qualified as a tax-free reorganization for federal income tax purposes with no gain or loss recognized by the Acquired Fund or their shareholders. Thus, the investments were transferred to the Acquiring Fund at the Acquired Fund’s identified cost. All distributable amounts of net income and realized gains from the Acquired Fund were distributed prior to the reorganization. In addition, the Acquired Fund and Acquiring Fund will bear a pro-rata portion of the costs that are incurred in connection with the reorganization. The effective time of the reorganization occurred immediately after the close of regularly scheduled trading on the New York Stock Exchange (NYSE) on April 12, 2019. The following outlines the reorganization:
Acquiring
Fund | Acquired
Fund | Net Asset
Value of the
Acquired
Fund | Appreciation
of the
Acquired
Fund’s
Investment | Shares
Redeemed
by the
Acquired
Fund | Shares
Issued
by the
Acquiring
Fund | Acquiring
Fund
Net Assets
Prior to
Combination | Acquiring
Fund
Total Net
Assets After
Combination |
U.S. Quality
Growth Fund | John Hancock Funds II U.S. Growth Fund | $229,828,003 | $51,116,210 | 18,999,208 | 13,790,643 | $582,981,914 | $812,809,917 |
Because the combined fund has been managed as a single integrated fund since the reorganization was completed, it is not practicable to separate the amounts of net investment income and gains attributable to the Acquired Fund that have been included in the Acquiring Fund’s Statement of operations at March 31, 2020. See Note 5 for capital shares issued in connection with the above referenced reorganization.
Assuming the acquisition had been completed on April 1, 2019, the beginning of the reporting period, the Acquiring Fund’s pro forma results of operations for the year ended March 31, 2020 are as follows:
| Net investment income | $1,339,950 |
| Net realized and unrealized gain (loss) | (17,564,058) |
| Increase (decrease) in net assets from operations | ($16,224,108) |
Note 10—Coronavirus (COVID-19) pandemic
The novel COVID-19 disease has resulted in significant disruptions to global business activity. A widespread health crisis such as a global pandemic could cause substantial market volatility, exchange trading suspensions and closures, impact the ability to complete redemptions, and affect fund performance.
| | ANNUAL REPORT | JOHN HANCOCK U.S. Quality Growth Fund | 31 |
Report of Independent Registered Public Accounting Firm
To the Board of Trustees of John Hancock Funds III and Shareholders of John Hancock U.S. Quality Growth Fund
Opinion on the Financial Statements
We have audited the accompanying statement of assets and liabilities, including the Fund’s investments, of John Hancock U.S. Quality Growth Fund (one of the funds constituting John Hancock Funds III, referred to hereafter as the "Fund") as of March 31, 2020, the related statement of operations for the year ended March 31, 2020, the statements of changes in net assets for each of the two years in the period ended March 31, 2020, including the related notes, and the financial highlights for each of the five years in the period ended March 31, 2020 (collectively referred to as the “financial statements”). In our opinion, the financial statements present fairly, in all material respects, the financial position of the Fund as of March 31, 2020, the results of its operations for the year then ended, the changes in its net assets for each of the two years in the period ended March 31, 2020 and the financial highlights for each of the five years in the period ended March 31, 2020 in conformity with accounting principles generally accepted in the United States of America.
Basis for Opinion
These financial statements are the responsibility of the Fund’s management. Our responsibility is to express an opinion on the Fund’s financial statements based on our audits. We are a public accounting firm registered with the Public Company Accounting Oversight Board (United States) (PCAOB) and are required to be independent with respect to the Fund in accordance with the U.S. federal securities laws and the applicable rules and regulations of the Securities and Exchange Commission and the PCAOB.
We conducted our audits of these financial statements in accordance with the standards of the PCAOB. Those standards require that we plan and perform the audit to obtain reasonable assurance about whether the financial statements are free of material misstatement, whether due to error or fraud.
Our audits included performing procedures to assess the risks of material misstatement of the financial statements, whether due to error or fraud, and performing procedures that respond to those risks. Such procedures included examining, on a test basis, evidence regarding the amounts and disclosures in the financial statements. Our audits also included evaluating the accounting principles used and significant estimates made by management, as well as evaluating the overall presentation of the financial statements. Our procedures included confirmation of securities owned as of March 31, 2020 by correspondence with the custodian, transfer agent and brokers; when replies were not received from the brokers, we performed other auditing procedures. We believe that our audits provide a reasonable basis for our opinion.
/s/ PricewaterhouseCoopers LLP
Boston, Massachusetts
May 13, 2020
We have served as the auditor of one or more investment companies in the John Hancock group of funds since 1988.
| 32 | JOHN HANCOCK U.S. QUALITY GROWTH FUND | ANNUAL REPORT | |
| Tax information (Unaudited) | |
For federal income tax purposes, the following information is furnished with respect to the distributions of the fund, if any, paid during its taxable year ended March 31, 2020.
The fund reports the maximum amount allowable of its net taxable income as eligible for the corporate dividends-received deduction.
The fund reports the maximum amount allowable of its net taxable income as qualified dividend income as provided in the Jobs and Growth Tax Relief Reconciliation Act of 2003.
The fund reports the maximum amount allowable of its Section 199A dividends as defined in Proposed Treasury Regulation §1.199A-3(d).
Eligible shareholders will be mailed a 2020 Form 1099-DIV in early 2021. This will reflect the tax character of all distributions paid in calendar year 2020.
Please consult a tax advisor regarding the tax consequences of your investment in the fund.
| | ANNUAL REPORT | JOHN HANCOCK U.S. QUALITY GROWTH FUND | 33 |
STATEMENT REGARDING LIQUIDITY RISK MANAGEMENT
Operation of the Liquidity Risk Management Program
This section describes operation and effectiveness of the Liquidity Risk Management Program (LRMP) established in accordance with Rule 22e-4 under the Investment Company Act of 1940, as amended (the Liquidity Rule). The Board of Trustees (the Board) of each Fund in the John Hancock Group of Funds (each a Fund and collectively, the Funds) that is subject to the requirements of the Liquidity Rule has appointed John Hancock Investment Management, LLC and John Hancock Variable Trust Advisers, LLC (together, the Advisor) to serve as Administrator of the LRMP with respect to each of the Funds, including John Hancock U.S. Quality Growth Fund, subject to the oversight of the Board. In order to provide a mechanism and process to perform the functions necessary to administer the LRMP, the Advisor established the Liquidity Risk Management Committee (the Committee). The Fund's subadvisor, Wellington Management Company, LLP (the Subadvisor) executes the day-to-day investment management and security-level activities of the Fund in accordance with the requirements of the LRMP, subject to the supervision of the Advisor and the Board.
The Committee holds monthly meetings to: (1) review the day-to-day operations of the LRMP; (2) review and approve month end liquidity classifications; (3) review quarterly testing and determinations, as applicable; and (4) review other LRMP related material. The Committee also conducts daily, monthly, quarterly, and annual quantitative and qualitative assessments of each subadvisor to a Fund that is subject to the requirements of the Liquidity Rule and is a part of the LRMP to monitor investment performance issues, risks and trends. In addition, the Committee may conduct ad-hoc reviews and meetings with subadvisors as issues and trends are identified, including potential liquidity and valuation issues.
The Committee provided the Board at an in-person meeting held on March 15-18, 2020 with a written report which addressed the Committee's assessment of the adequacy and effectiveness of the implementation and operation of the LRMP and any material changes to the LRMP. The report, which covered the period December 1, 2018 through December 31, 2019, included an assessment of important aspects of the LRMP including, but not limited to:
• Operation of the Fund's Redemption-In-Kind Procedures;
• Highly Liquid Investment Minimum (HLIM) determination;
• Compliance with the 15% limit on illiquid investments;
• Reasonably Anticipated Trade Size (RATS) determination;
• Security-level liquidity classifications; and
• Liquidity risk assessment.
The report also covered material liquidity matters which occurred or were reported during this period applicable to the Fund, if any, and the Committee's actions to address such matters.
Redemption-In-Kind Procedures
Rule 22e-4 requires any fund that engages in or reserves the right to engage in in-kind redemptions to adopt and implement written policies and procedures regarding in-kind redemptions as part of the management of its liquidity risk. These procedures address the process for redeeming in kind, as well as the circumstances under which the Fund would consider redeeming in kind. Anticipated large redemption activity will be evaluated to identify situations where redeeming in securities instead of cash may be appropriate.
ANNUAL REPORT | JOHN HANCOCK U.S. QUALITY GROWTH FUND 34
As part of its annual assessment of the LRMP, the Committee reviewed the implementation and operation of the Redemption-In-Kind Procedures and determined they are operating in a manner that such procedures are adequate and effective to manage in-kind redemptions on behalf of the Fund as part of the LRMP.
Highly Liquid Investment Minimum determination
The Committee uses an HLIM model to determine a Fund's HLIM. This process incorporates the Fund's investment strategy, historical redemptions, liquidity classification rollup percentages and cash balances, redemption policy, access to funding sources, distribution channels and client concentrations. If the Fund falls below its established HLIM for a period greater than 7 consecutive calendar days, the Committee prepares a report to the Board within one business day following the seventh consecutive calendar day with an explanation of how the Fund plans to restore its HLIM within a reasonable period of time.
Based on the HLIM model, the Committee has determined that the Fund qualifies as a Primarily Highly Liquid Fund (PHLF). It is therefore not required to establish a HLIM. The Fund is tested quarterly to confirm its PHLF status.
As part of its annual assessment of the LRMP, the Committee reviewed the policies and procedures in place with respect to HLIM and PHLF determinations, and determined that such policies and procedures are operating in a manner that is adequate and effective as part of the LRMP.
Compliance with the 15% limit on illiquid investments
Rule 22e-4 sets an aggregate illiquid investment limit of 15% for a fund. Funds are prohibited from acquiring an illiquid investment if this results in greater than 15% of its net assets being classified as illiquid. When applying this limit, the Committee defines "illiquid investment" to mean any investment that the Fund reasonably expects cannot be sold or disposed of in current market conditions in seven calendar days or less without the sale or disposition significantly changing the market value of the investment. If a 15% illiquid investment limit breach occurs for longer than 1 business day, the Fund is required to notify the Board and provide a plan on how to bring illiquid investments within the 15% threshold, and after 7 days confidentially notify the Securities and Exchange Commission (the SEC).
In February 2019, as a result of extended security markets closures in connection with the Chinese New Year in certain countries, the SEC released guidance, and the Committee approved and adopted an Extended Market Holiday Policy to plan for and monitor known Extended Market Holidays (defined as all expected market holiday closures spanning four or more calendar days).
As part of its annual assessment of the LRMP, the Committee reviewed the policies and procedures in place with respect to the 15% illiquid investment limit and determined such policies and procedures are operating in a manner that is adequate and effective as part of the LMRP.
Reasonably Anticipated Trade Size determination
In order to assess the liquidity risk of a Fund, the Committee considers the impact on the Fund that redemptions of a RATS would have under both normal and reasonably foreseeable stressed conditions. Modelling the Fund's RATS requires quantifying cash flow volatility and analyzing distribution channel concentration and redemption risk. The model is designed to estimate the amount of assets that the Fund could reasonably anticipate trading on a given day, during both normal and reasonably foreseeable stressed conditions, to satisfy redemption requests.
ANNUAL REPORT | JOHN HANCOCK U.S. QUALITY GROWTH FUND 35
As part of its annual assessment of the LRMP, the Committee reviewed the policies and procedures in place with respect to RATS determinations and determined that such policies and procedures are operating in a manner that is adequate and effective at making RATS determinations as part of the LRMP.
Security-level liquidity classifications
When classifying the liquidity of portfolio securities, the Fund adheres to the liquidity classification procedures established by the Advisor. In assigning a liquidity classification to Fund portfolio holdings, the following key inputs, among others, are considered: the Fund's RATS, feedback from the applicable Subadvisor on market-, trading- and investment-specific considerations, an assessment of current market conditions and fund portfolio holdings, and a value impact standard. The Subadvisor also provides position-level data to the Committee for use in monthly classification reconciliation in order to identify any classifications that may need to be changed as a result of the above considerations.
As part of its annual assessment of the LRMP, the Committee reviewed the policies and procedures in place with respect to security-level liquidity classifications and determined that such policies and procedures are operating in a manner that is adequate and effective as part of the LRMP.
Liquidity risk assessment
The Committee periodically reviews and assesses, the Fund's liquidity risk, including its investment strategy and liquidity of portfolio investments during both normal and reasonably foreseeable stressed conditions (including whether the investment strategy is appropriate for an open-end fund, the extent to which the strategy involves a relatively concentrated portfolio or large positions in particular issuers, and the use of borrowings for investment purposes and derivatives), cash flow analysis during both normal and reasonably foreseeable stressed conditions, and holdings of cash and cash equivalents, as well as borrowing arrangements and other funding sources.
The Committee also monitors global events, such as the COVID-19 Coronavirus, that could impact the markets and liquidity of portfolio investments and their classifications.
As part of its annual assessment of the LRMP, the Committee reviewed Fund-Level Liquidity Risk Assessment Reports for each of the Funds and determined that the investment strategy for each Fund continues to be appropriate for an open-ended structure.
Adequacy and Effectiveness
Based on the review and assessment conducted by the Committee, the Committee has determined that the LRMP has been implemented, and is operating in a manner that is adequate and effective at assessing and managing the liquidity risk of each Fund.
ANNUAL REPORT | JOHN HANCOCK U.S. QUALITY GROWTH FUND 36
This chart provides information about the Trustees and Officers who oversee your John Hancock fund. Officers elected by the Trustees manage the day-to-day operations of the fund and execute policies formulated by the Trustees.
Independent Trustees
| | | |
Name, year of birth
Position(s) held with Trust
Principal occupation(s) and other
directorships during past 5 years | Trustee
of the
Trust
since1 | Number of John
Hancock funds
overseen by
Trustee |
| Hassell H. McClellan, Born: 1945 | 2012 | 204 |
Trustee and Chairperson of the Board
Director/Trustee, Virtus Funds (since 2008); Director, The Barnes Group (since 2010); Associate Professor, The Wallace E. Carroll School of Management, Boston College (retired 2013). Trustee (since 2005) and Chairperson of the Board (since 2017) of various trusts within the John Hancock Fund Complex. |
| | | |
| Charles L. Bardelis,2 Born: 1941 | 2012 | 204 |
Trustee
Director, Island Commuter Corp. (marine transport). Trustee of various trusts within the John Hancock Fund Complex (since 1988). |
| | | |
| James R. Boyle,Born: 1959 | 2015 | 204 |
Trustee
Chief Executive Officer, Foresters Financial (since 2018); Chairman and Chief Executive Officer, Zillion Group, Inc. (formerly HealthFleet, Inc.) (healthcare) (2014-2018); Executive Vice President and Chief Executive Officer, U.S. Life Insurance Division of Genworth Financial, Inc. (insurance) (January 2014-July 2014); Senior Executive Vice President, Manulife Financial, President and Chief Executive Officer, John Hancock (1999-2012); Chairman and Director, John Hancock Investment Management LLC, John Hancock Investment Management Distributors LLC, and John Hancock Variable Trust Advisers LLC (2005-2010). Trustee of various trusts within the John Hancock Fund Complex (2005-2014 and since 2015). |
| | | |
| Peter S. Burgess,2 Born: 1942 | 2012 | 204 |
Trustee
Consultant (financial, accounting, and auditing matters) (since 1999); Certified Public Accountant; Partner, Arthur Andersen (independent public accounting firm) (prior to 1999); Director, Lincoln Educational Services Corporation (since 2004); Director, Symetra Financial Corporation (2010-2016); Director, PMA Capital Corporation (2004-2010). Trustee of various trusts within the John Hancock Fund Complex (since 2005). |
| | | |
| William H. Cunningham, Born: 1944 | 2006 | 204 |
Trustee
Professor, University of Texas, Austin, Texas (since 1971); former Chancellor, University of Texas System and former President of the University of Texas, Austin, Texas; Chairman (since 2009) and Director (since 2006), Lincoln National Corporation (insurance); Director, Southwest Airlines (since 2000); former Director, LIN Television (2009-2014). Trustee of various trusts within the John Hancock Fund Complex (since 1986). |
| | | |
| Grace K. Fey, Born: 1946 | 2012 | 204 |
Trustee
Chief Executive Officer, Grace Fey Advisors (since 2007); Director and Executive Vice President, Frontier Capital Management Company (1988-2007); Director, Fiduciary Trust (since 2009). Trustee of various trusts within the John Hancock Fund Complex (since 2008). |
ANNUAL REPORT | JOHN HANCOCK U.S. QUALITY GROWTH FUND 37
Independent Trustees (continued)
| | | |
Name, year of birth
Position(s) held with Trust
Principal occupation(s) and other
directorships during past 5 years | Trustee
of the
Trust
since1 | Number of John
Hancock funds
overseen by
Trustee |
| Deborah C. Jackson, Born: 1952 | 2008 | 204 |
Trustee
President, Cambridge College, Cambridge, Massachusetts (since 2011); Board of Directors, Massachusetts Women's Forum (since 2018); Board of Directors, National Association of Corporate Directors/New England (since 2015); Board of Directors, Association of Independent Colleges and Universities of Massachusetts (2014-2017); Chief Executive Officer, American Red Cross of Massachusetts Bay (2002-2011); Board of Directors of Eastern Bank Corporation (since 2001); Board of Directors of Eastern Bank Charitable Foundation (since 2001); Board of Directors of American Student Assistance Corporation (1996-2009); Board of Directors of Boston Stock Exchange (2002-2008); Board of Directors of Harvard Pilgrim Healthcare (health benefits company) (2007-2011). Trustee of various trusts within the John Hancock Fund Complex (since 2008). |
| | | |
| James M. Oates,2Born: 1946 | 2012 | 204 |
Trustee
Managing Director, Wydown Group (financial consulting firm) (since 1994); Chairman and Director, Emerson Investment Management, Inc. (2000-2015); Independent Chairman, Hudson Castle Group, Inc. (formerly IBEX Capital Markets, Inc.) (financial services company) (1997-2011); Director, Stifel Financial (since 1996); Director, Investor Financial Services Corporation (1995-2007); Director, Connecticut River Bancorp (1998-2014); Director/Trustee, Virtus Funds (since 1988). Trustee (since 2004) and Chairperson of the Board (2005-2016) of various trusts within the John Hancock Fund Complex. |
| | | |
| Steven R. Pruchansky, Born: 1944 | 2006 | 204 |
Trustee and Vice Chairperson of the Board
Managing Director, Pru Realty (since 2017); Chairman and Chief Executive Officer, Greenscapes of Southwest Florida, Inc. (since 2014); Director and President, Greenscapes of Southwest Florida, Inc. (until 2000); Member, Board of Advisors, First American Bank (until 2010); Managing Director, Jon James, LLC (real estate) (since 2000); Partner, Right Funding, LLC (2014-2017); Director, First Signature Bank & Trust Company (until 1991); Director, Mast Realty Trust (until 1994); President, Maxwell Building Corp. (until 1991). Trustee (since 1992), Chairperson of the Board (2011-2012), and Vice Chairperson of the Board (since 2012) of various trusts within the John Hancock Fund Complex. |
| | | |
| Gregory A. Russo, Born: 1949 | 2008 | 204 |
Trustee
Director and Audit Committee Chairman (since 2012), and Member, Audit Committee and Finance Committee (since 2011), NCH Healthcare System, Inc. (holding company for multi-entity healthcare system); Director and Member (2012-2018) and Finance Committee Chairman (2014-2018), The Moorings, Inc. (nonprofit continuing care community); Vice Chairman, Risk & Regulatory Matters, KPMG LLP (KPMG) (2002-2006); Vice Chairman, Industrial Markets, KPMG (1998-2002); Chairman and Treasurer, Westchester County, New York, Chamber of Commerce (1986-1992); Director, Treasurer, and Chairman of Audit and Finance Committees, Putnam Hospital Center (1989-1995); Director and Chairman of Fundraising Campaign, United Way of Westchester and Putnam Counties, New York (1990-1995). Trustee of various trusts within the John Hancock Fund Complex (since 2008). |
ANNUAL REPORT | JOHN HANCOCK U.S. QUALITY GROWTH FUND 38
Non-Independent Trustees3
| | | |
Name, year of birth
Position(s) held with Trust
Principal occupation(s) and other
directorships during past 5 years | Trustee
of the
Trust
since1 | Number of John
Hancock funds
overseen by
Trustee |
| Andrew G. Arnott, Born: 1971 | 2017 | 204 |
President and Non-Independent Trustee
Head of Wealth and Asset Management, United States and Europe, for John Hancock and Manulife (since 2018); Executive Vice President, John Hancock Financial Services (since 2009, including prior positions); Director and Executive Vice President, John Hancock Investment Management LLC (since 2005, including prior positions); Director and Executive Vice President, John Hancock Variable Trust Advisers LLC (since 2006, including prior positions); President, John Hancock Investment Management Distributors LLC (since 2004, including prior positions); President of various trusts within the John Hancock Fund Complex (since 2007, including prior positions). Trustee of various trusts within the John Hancock Fund Complex (since 2017). |
| | | |
| Marianne Harrison, Born: 1963 | 2018 | 204 |
Non-Independent Trustee
President and CEO, John Hancock (since 2017); President and CEO, Manulife Canadian Division (2013-2017); Member, Board of Directors, CAE Inc. (since 2019); Member, Board of Directors, MA Competitive Partnership Board (since 2018); Member, Board of Directors, American Council of Life Insurers (ACLI) (since 2018); Member, Board of Directors, Communitech, an industry-led innovation center that fosters technology companies in Canada (2017-2019); Member, Board of Directors, Manulife Assurance Canada (2015-2017); Board Member, St. Mary's General Hospital Foundation (2014-2017); Member, Board of Directors, Manulife Bank of Canada (2013-2017); Member, Standing Committee of the Canadian Life & Health Assurance Association (2013-2017); Member, Board of Directors, John Hancock USA, John Hancock Life & Health, John Hancock New York (2012-2013). Trustee of various trusts within the John Hancock Fund Complex (since 2018). |
Principal officers who are not Trustees
| | |
Name, year of birth
Position(s) held with Trust
Principal occupation(s)
during past 5 years | Officer
of the
Trust
since |
| Francis V. Knox, Jr.,Born: 1947 | 2006 |
Chief Compliance Officer
Vice President, John Hancock Financial Services (since 2005); Chief Compliance Officer, various trusts within the John Hancock Fund Complex, John Hancock Investment Management LLC, and John Hancock Variable Trust Advisers LLC (since 2005). |
| | |
| Charles A. Rizzo, Born: 1957 | 2007 |
Chief Financial Officer
Vice President, John Hancock Financial Services (since 2008); Senior Vice President, John Hancock Investment Management LLC and John Hancock Variable Trust Advisers LLC (since 2008); Chief Financial Officer of various trusts within the John Hancock Fund Complex (since 2007). |
| | |
| Salvatore Schiavone, Born: 1965 | 2010 |
Treasurer
Assistant Vice President, John Hancock Financial Services (since 2007); Vice President, John Hancock Investment Management LLC and John Hancock Variable Trust Advisers LLC (since 2007); Treasurer of various trusts within the John Hancock Fund Complex (since 2007, including prior positions). |
ANNUAL REPORT | JOHN HANCOCK U.S. QUALITY GROWTH FUND 39
Principal officers who are notTrustees (continued)
| | |
Name, year of birth
Position(s) held with Trust
Principal occupation(s)
during past 5 years | Officer
of the
Trust
since |
| Christopher (Kit) Sechler,Born: 1973 | 2018 |
Chief Legal Officer and Secretary
Vice President and Deputy Chief Counsel, John Hancock Investments (since 2015); Assistant Vice President and Senior Counsel (2009-2015), John Hancock Investment Management; Chief Legal Officer and Secretary of various trusts within the John Hancock Fund Complex (since 2018); Assistant Secretary of John Hancock Investment Management LLC and John Hancock Variable Trust Advisers LLC (since 2009). |
The business address for all Trustees and Officers is 200 Berkeley Street, Boston, Massachusetts 02116-5023.
The Statement of Additional Information of the fund includes additional information about members of the Board of Trustees of the Trust and is available without charge, upon request, by calling 800-225-5291.
| 1 | Each Trustee holds office until his or her successor is elected and qualified, or until the Trustee's death, retirement, resignation, or removal. Mr. Boyle has served as Trustee at various times prior to the date listed in the table. |
| 2 | Member of the Audit Committee. |
| 3 | The Trustee is a Non-Independent Trustee due to current or former positions with the Advisor and certain affiliates. |
ANNUAL REPORT | JOHN HANCOCK U.S. QUALITY GROWTH FUND 40
| | |
Trustees
Hassell H. McClellan,Chairperson
Steven R. Pruchansky,Vice Chairperson
Andrew G. Arnott†
Charles L. Bardelis*
James R. Boyle
Peter S. Burgess*
William H. Cunningham
Grace K. Fey
Marianne Harrison†
Deborah C. Jackson
James M. Oates*
Gregory A. Russo
Officers
Andrew G. Arnott
President
Francis V. Knox, Jr.
Chief Compliance Officer
Charles A. Rizzo
Chief Financial Officer
Salvatore Schiavone
Treasurer
Christopher (Kit) Sechler
Secretary and Chief Legal Officer
| Investment advisor
John Hancock Investment Management LLC
Subadvisor
Wellington Management Company LLP
Portfolio Manager
John A. Boselli, CFA
Principal distributor
John Hancock Investment Management Distributors LLC
Custodian
State Street Bank and Trust Company
Transfer agent
John Hancock Signature Services, Inc.
Legal counsel
K&L Gates LLP
Independent registered public accounting firm
PricewaterhouseCoopers LLP
|
* Member of the Audit Committee
† Non-Independent Trustee
The fund's proxy voting policies and procedures, as well as the fund proxy voting record for the most recent twelve-month period ended June 30, are available free of charge on the Securities and Exchange Commission (SEC) website at sec.gov or on our website.
All of the fund's holdings as of the end of the third month of every fiscal quarter are filed with the SEC on Form N-PORT within 60 days of the end of the fiscal quarter. The fund's Form N-PORT filings are available on our website and the SEC's website, sec.gov.
We make this information on your fund, as well asmonthly portfolio holdings, and other fund details available on our website at jhinvestments.com or by calling 800-225-5291.
| | | | |
| | You can also contact us: |
| | 800-225-5291
jhinvestments.com | Regular mail:
John Hancock Signature Services, Inc.
P.O. Box 55913
Boston, MA 02205-5913
| Express mail:
John Hancock Signature Services, Inc.
2000 Crown Colony Drive
Suite 55913
Quincy, MA 02169-0953
|
ANNUAL REPORT | JOHN HANCOCK U.S. QUALITY GROWTH FUND 41
John Hancock family of funds
| | | |
DOMESTIC EQUITY FUNDS
Blue Chip Growth
Classic Value
Disciplined Value
Disciplined Value Mid Cap
Equity Income
Financial Industries
Fundamental All Cap Core
Fundamental Large Cap Core
New Opportunities
Regional Bank
Small Cap Core
Small Cap Growth
Small Cap Value
U.S. Global Leaders Growth
U.S. Quality Growth
GLOBAL AND INTERNATIONAL EQUITY FUNDS
Disciplined Value International
Emerging Markets
Emerging Markets Equity
Fundamental Global Franchise
Global Equity
Global Shareholder Yield
Global Thematic Opportunities
International Dynamic Growth
International Growth
International Small Company
| | INCOME FUNDS
Bond
California Tax-Free Income
Emerging Markets Debt
Floating Rate Income
Government Income
High Yield
High Yield Municipal Bond
Income
Investment Grade Bond
Money Market
Short Duration Bond
Short Duration Credit Opportunities
Strategic Income Opportunities
Tax-Free Bond
ALTERNATIVE AND SPECIALTY FUNDS
Absolute Return Currency
Alternative Asset Allocation
Alternative Risk Premia
Diversified Macro
Infrastructure
Multi-Asset Absolute Return
Seaport Long/Short
|
A fund's investment objectives, risks, charges, and expenses should be considered carefully before investing. The prospectus contains this and other important information about the fund. To obtain a prospectus, contact your financial professional, call John Hancock Investment Management at 800-225-5291, or visit our website at jhinvestments.com. Please read the prospectus carefully before investing or sending money.
| | | |
ASSET ALLOCATION
Balanced
Multi-Asset High Income
Multi-Index Lifetime Portfolios
Multi-Index Preservation Portfolios
Multimanager Lifestyle Portfolios
Multimanager Lifetime Portfolios
Retirement Income 2040
EXCHANGE-TRADED FUNDS
John Hancock Multifactor Consumer Discretionary ETF
John Hancock Multifactor Consumer Staples ETF
John Hancock Multifactor Developed International ETF
John Hancock Multifactor Emerging Markets ETF
John Hancock Multifactor Energy ETF
John Hancock Multifactor Financials ETF
John Hancock Multifactor Healthcare ETF
John Hancock Multifactor Industrials ETF
John Hancock Multifactor Large Cap ETF
John Hancock Multifactor Materials ETF
John Hancock Multifactor Media and
Communications ETF
John Hancock Multifactor Mid Cap ETF
John Hancock Multifactor Small Cap ETF
John Hancock Multifactor Technology ETF
John Hancock Multifactor Utilities ETF
| | ENVIRONMENTAL, SOCIAL, AND
GOVERNANCE FUNDS
ESG All Cap Core
ESG Core Bond
ESG International Equity
ESG Large Cap Core
CLOSED-END FUNDS
Financial Opportunities
Hedged Equity & Income
Income Securities Trust
Investors Trust
Preferred Income
Preferred Income II
Preferred Income III
Premium Dividend
Tax-Advantaged Dividend Income
Tax-Advantaged Global Shareholder Yield
|
John Hancock Multifactor ETF shares are bought and sold at market price (not NAV), and are not individually redeemed
from the fund. Brokerage commissions will reduce returns.
John Hancock ETFs are distributed by Foreside Fund Services, LLC, and are subadvised by Dimensional Fund Advisors LP.
Foreside is not affiliated with John Hancock Investment Management Distributors LLC or Dimensional Fund Advisors LP.
Dimensional Fund Advisors LP receives compensation from John Hancock in connection with licensing rights to the
John Hancock Dimensional indexes. Dimensional Fund Advisors LP does not sponsor, endorse, or sell, and makes no
representation as to the advisability of investing in, John Hancock Multifactor ETFs.
John Hancock Investment Management
A trusted brand
John Hancock Investment Management is a premier asset manager
representing one of America's most trusted brands, with a heritage of
financial stewardship dating back to 1862. Helping our shareholders
pursue their financial goals is at the core of everything we do. It's why
we support the role of professional financial advice and operate with
the highest standards of conduct and integrity.
A better way to invest
We serve investors globally through a unique multimanager approach:
We search the world to find proven portfolio teams with specialized
expertise for every strategy we offer, then we apply robust investment
oversight to ensure they continue to meet our uncompromising
standards and serve the best interests of our shareholders.
Results for investors
Our unique approach to asset management enables us to provide
a diverse set of investments backed by some of the world's best
managers, along with strong risk-adjusted returns across asset classes.
John Hancock Investment Management Distributors LLC n Member FINRA, SIPC
200 Berkeley Street n Boston, MA 02116-5010 n 800-225-5291 n jhinvestments.com
This report is for the information of the shareholders of John Hancock U.S. Quality Growth Fund. It is not authorized for distribution to prospective investors unless preceded or accompanied by a prospectus.
ITEM 2. CODE OF ETHICS.
As of the end of the year, March 31, 2020, the registrant has adopted a code of ethics, as defined in Item 2 of Form N-CSR, that applies to its Chief Executive Officer, Chief Financial Officer and Treasurer (respectively, the principal executive officer, the principal financial officer and the principal accounting officer, the “Covered Officers”). A copy of the code of ethics is filed as an exhibit to this Form N-CSR.
ITEM 3. AUDIT COMMITTEE FINANCIAL EXPERT.
Peter S. Burgess is the audit committee financial expert and is “independent”, pursuant to general instructions on Form N-CSR Item 3.
ITEM 4. PRINCIPAL ACCOUNTANT FEES AND SERVICES.
(a) Audit Fees
The aggregate fees billed for professional services rendered by the principal accountant for the audits of the registrant’s annual financial statements or services that are normally provided by the accountant in connection with statutory and regulatory filings or engagements amounted to the following for the fiscal years ended March 31, 2020 and 2019. These fees were billed to the registrant and were approved by the registrant’s audit committee.
| Fund | March 31, 2020 | March 31, 2019 |
| Disciplined Value Fund | $ 39,251 | $ 37,595 |
| Disciplined Value Mid Cap Fund | 50,464 | 51,292 |
| Global Shareholder Yield | 39,827 | 38,144 |
| International Growth | 52,503 | 50,277 |
| U.S. Quality Growth Fund | 40,527 | 38,812 |
| Total | $ 222,572 | $ 216,120 |
(b) Audit-Related Services
Audit-related fees for assurance and related services by the principal accountant are billed to the registrant or to the registrant’s investment adviser (not including any sub-adviser whose role is primarily portfolio management and is subcontracted with or overseen by another investment adviser), and any entity controlling, controlled by, or under common control with the adviser ("control affiliates") that provides ongoing services to the registrant. The nature of the services provided was affiliated service provider internal controls reviews and merger related fees. Amounts billed to the registrant were as follows:
| Fund | March 31, 2020 | March 31, 2019 |
| Disciplined Value Fund | $ 616 | $ 571 |
| Disciplined Value Mid Cap Fund | 616 | 571 |
| Global Shareholder Yield | 616 | 571 |
| International Growth | 616 | 571 |
| U.S. Quality Growth Fund | 616 | 7,571 |
| Total | $ 3,080 | $ 9,855 |
Amounts billed to control affiliates were $116,467 and $113,000 for the fiscal years ended March 31, 2020 and 2019, respectively.
(c) Tax Fees
The aggregate fees billed for professional services rendered by the principal accountant for tax compliance, tax advice and tax planning (“tax fees”) amounted to the following for the fiscal years ended March 31, 2020 and 2019. The nature of the services comprising the tax fees was the review of the registrant’s tax returns and tax distribution requirements. These fees were billed to the registrant and were approved by the registrant’s audit committee.
| Fund | March 31, 2020 | March 31, 2019 |
| Disciplined Value Fund | $ 3,837 | $ 3,725 |
| Disciplined Value Mid Cap Fund | 3,837 | 3,725 |
| Global Shareholder Yield | 3,837 | 3,725 |
| International Growth | 4,403 | 4,275 |
| U.S. Quality Growth Fund | 3,837 | 9,225 |
| Total | $ 19,751 | $ 24,675 |
(d) All Other Fees
The nature of the services comprising all other fees is advisory services provided to the investment manager. Other fees amounted to the following for the fiscal years ended March 31, 2020 and 2019:
| Fund | March 31, 2020 | March 31, 2019 |
| Disciplined Value Fund | $ 841 | $ 102 |
| Disciplined Value Mid Cap Fund | 1,202 | 102 |
| Global Shareholder Yield | 1,202 | 102 |
| International Growth | 1,952 | 102 |
| U.S. Quality Growth Fund | 1,952 | 102 |
| Total | $ 7,149 | $ 510 |
(e)(1) Audit Committee Pre-Approval Policies and Procedures:
The trust’s Audit Committee must pre-approve all audit and non-audit services provided by the independent registered public accounting firm (the “Auditor”) relating to the operations or financial reporting of the funds. Prior to the commencement of any audit or non-audit services to a fund, the Audit Committee reviews the services to determine whether they are appropriate and permissible under applicable law.
The trust’s Audit Committee has adopted policies and procedures to, among other purposes, provide a framework for the Committee’s consideration of audit-related and non-audit services by the Auditor. The policies and procedures require that any audit-related and non-audit service provided by the Auditor and any non-audit service provided by the Auditor to a fund service provider that relates directly to the operations and financial reporting of a fund are subject to approval by the Audit Committee before such service is provided. Audit-related services provided by the Auditor that are expected to exceed $25,000 per year/per fund are subject to specific pre-approval by the Audit Committee. Tax services provided by the Auditor that are expected to exceed $30,000 per year/per fund are subject to specific pre-approval by the Audit Committee.
All audit services, as well as the audit-related and non-audit services that are expected to exceed the amounts stated above, must be approved in advance of provision of the service by formal resolution of the Audit Committee. At the regularly scheduled Audit Committee meetings, the Committee reviews a report summarizing the services, including fees, provided by the Auditor.
(e)(2) Services approved pursuant to paragraph (c)(7)(i)(C) of Rule 2-01 of Regulation S-X:
Audit-Related Fees, Tax Fees and All Other Fees:
There were no amounts that were approved by the Audit Committee pursuant to the de minimis exception under Rule 2-01 of Regulation S-X.
(f) According to the registrant’s principal accountant for the fiscal year ended March 31, 2020, the percentage of hours spent on the audit of the registrant's financial statements for the most recent fiscal year that were attributed to work performed by persons who were not full-time, permanent employees of principal accountant was less than 50%.
(g) The aggregate non-audit fees billed by the registrant’s principal accountant for non-audit services rendered to the registrant and rendered to the registrant's control affiliates were $1,108,881 for the fiscal year ended March 31, 2020 and $889,301 for the fiscal year ended March 31, 2019.
(h) The audit committee of the registrant has considered the non-audit services provided by the registrant’s principal accountant to the control affiliates and has determined that the services that were not pre-approved are compatible with maintaining the principal accountant’s independence.
ITEM 5. AUDIT COMMITTEE OF LISTED REGISTRANTS.
The registrant has a separately-designated standing audit committee comprised of independent trustees. The members of the audit committee are as follows:
Peter S. Burgess
Charles L. Bardelis
Theron S. Hoffman
ITEM 6. SCHEDULE OF INVESTMENTS.
ITEM 7. DISCLOSURE OF PROXY VOTING POLICIES AND PROCEDURES FOR CLOSED-END MANAGEMENT INVESTMENT COMPANIES.
Not applicable.
ITEM 8. PORTFOLIO MANAGERS OF CLOSED-END MANAGEMENT INVESTMENT COMPANIES.
Not applicable.
ITEM 9. PURCHASES OF EQUITY SECURITIES BY CLOSED-END MANAGEMENT INVESTMENT COMPANY AND AFFILIATED PURCHASERS.
Not applicable.
ITEM 10. SUBMISSION OF MATTERS TO A VOTE OF SECURITY HOLDERS.
The registrant has adopted procedures by which shareholders may recommend nominees to the registrant's Board of Trustees. A copy of the procedures is filed as an exhibit to this Form N-CSR. See attached “John Hancock Funds – Nominating, Governance and Administration Committee Charter”.
ITEM 11. CONTROLS AND PROCEDURES.
(a) Based upon their evaluation of the registrant's disclosure controls and procedures as conducted within 90 days of the filing date of this Form N-CSR, the registrant's principal executive officer and principal financial officer have concluded that those disclosure controls and procedures provide reasonable assurance that the material information required to be disclosed by the registrant on this report is recorded, processed, summarized and reported within the time periods specified in the Securities and Exchange Commission's rules and forms.
(b) There were no changes in the registrant's internal control over financial reporting that occurred during the period covered by this report that have materially affected, or are reasonably likely to materially affect, the registrant's internal control over financial reporting.
ITEM 12. DISCLOSURE OF SECURITIES LENDING ACTIVITIES FOR CLOSED-END MANAGEMENT INVESTMENT COMPANIES.
Not applicable.
ITEM 13. EXHIBITS.
(a)(1) Code of Ethics for Covered Officers is attached.
(a)(2) Separate certifications for the registrant's principal executive officer and principal financial officer, as required by Section 302 of the Sarbanes-Oxley Act of 2002 and Rule 30a-2(a) under the Investment Company Act of 1940, are attached.
(b)(1) Separate certifications for the registrant's principal executive officer and principal financial officer, as required by 18 U.S.C. Section 1350, as adopted pursuant to Section 906 of the Sarbanes-Oxley Act of 2002, and Rule 30a-2(b) under the Investment Company Act of 1940, are attached. The certifications furnished pursuant to this paragraph are not deemed to be "filed" for purposes of Section 18 of the Securities Exchange Act of 1934, or otherwise subject to the liability of that section. Such certifications are not deemed to be incorporated by reference into any filing under the Securities Act of 1933 or the Securities Exchange Act of 1934, except to the extent that the Registrant specifically incorporates them by reference.
(c)(1) Submission of Matters to a Vote of Security Holders is attached. See attached “John Hancock Funds – Nominating, Governance and Administration Committee Charter”.
SIGNATURES
Pursuant to the requirements of the Securities Exchange Act of 1934 and the Investment Company Act of 1940, the registrant has duly caused this report to be signed on its behalf by the undersigned, thereunto duly authorized.
John Hancock Funds III
By:
/s/ Andrew Arnott
________________________________
Andrew Arnott
President
Date: May 12, 2020
Pursuant to the requirements of the Securities Exchange Act of 1934 and the Investment Company Act of 1940, this report has been signed below by the following persons on behalf of the registrant and in the capacities and on the dates indicated.
By:
/s/ Andrew Arnott
________________________________
Andrew Arnott
President
Date: May 12, 2020
By:
/s/ Charles A. Rizzo
________________________________
Charles A. Rizzo
Chief Financial Officer
Date: May 12, 2020